UNITED STATES
SECURITIES AND EXCHANGE COMMISSION
Washington, D.C. 20549
FORM N-CSR
CERTIFIED SHAREHOLDER REPORT OF REGISTERED
MANAGEMENT INVESTMENT COMPANIES
Investment Company Act file number 811-21503
The FBR Funds
(Exact name of registrant as specified in charter)
1001 Nineteenth Street North
Arlington, VA 22209
(Address of principal executive offices) (Zip code)
Registrant’s telephone number, including area code: 703.469.1040
William Ginivan
General Counsel
FBR Capital Markets, Inc.
Potomac Tower
1001 Nineteenth Street North
Arlington, VA 22209
(Name and address of agent for service)Date of fiscal year end: October 31, 2009
Date of reporting period: April 30, 2009
ITEM 1. REPORT TO SHAREHOLDERS.
The following is a copy of the report transmitted to shareholders pursuant to Rule 30e-1 under the Investment Company Act of 1940 (17CRF 270.30e-1).

THE FBR FUNDS
FBR Pegasus FundTM
FBR Pegasus Mid Cap FundTM
FBR Pegasus Small Cap FundTM
FBR Pegasus Small Cap Growth FundTM
FBR Focus Fund
FBR Large Cap Financial Fund
FBR Small Cap Financial Fund
FBR Technology Fund
FBR Gas Utility Index Fund
FBR Fund for Government Investors
Semi-Annual Report
April 30, 2009
[THIS PAGE INTENTIONALLY LEFT BLANK]
The FBR Funds
Semi-Annual Letter to Shareholders
Dear Shareholder,
We are pleased to present the The FBR Funds’ Semi-Annual Report for the six-month period ended April 30, 2009.
These past six months were among the most turbulent in recent history for equity investors. Never before in my investing career has the importance of disciplined fundamental security analysis been so overlooked by investors in favor of fear, pessimism and emotion. Without question there has been no shortage of macroeconomic releases which, when filtered through the popular media, left even the most rational minds wondering about the permanence of the current recession and future trajectory of the economy. The past six months have truly tested every measure of confidence, trust, belief, hope and courage to a degree which has not been experienced in many generations.
Recent data show signs of reprieve, indicating a possible economic bottoming which has lifted investors’ spirits and risk appetite. In April, consumer confidence jumped, capital-goods orders rose and the Government revised upwards its previous estimate of GDP. LIBOR (a measure of short-term bank lending costs) has decreased from 4.8% in October of last year to below 1% today. Credit spreads have narrowed and financial institutions have recently been successful at raising capital to improve reserve positions and rebuild their balance sheets. The Federal Reserve and U.S. Treasury’s stabilization policies have begun to take hold and we have seen activity return to some of the nation’s most battered housing markets. In April, existing home sales rose as we witnessed a large increase in first-time home buyers who accounted for 53% of transactions1.
Over the course of the reporting period, the value of money market funds exceeded stock funds for the first time in sixteen years. To put the severity of investors’ anxiety in context, in the summer of 2007 the value of stock funds were three times greater than those in money market funds. According to mutual fund consulting firm, Strategic Insight, during April of this year, stock and bond mutual fund flows experienced a dramatic rebound as investors began to move cash off the sidelines and back into equities. Total long-term fund net inflows surpassed $52 billion, a level of activity not seen since February of last year2. Despite the magnitude of money in motion, the total equity fund assets under management for our complex essentially remained flat over the reporting period. In fact, the month of April was particularly strong as our equity funds garnered net inflows. The strength continued into May nearly doubling our total year-to-date net inflows.
The effects of last fall’s damage continue to haunt long-term investors. The ten-year returns through the end of April for the S&P 500 Index remained in negative territory down 2.48% and the average domestic equity fund returned just 0.49%3. I am extremely proud to share with you that according to Morningstar, the Investor Class of both the FBR Focus Fund and FBR Small Cap Financial Fund ranked in the top 1% of all domestic equity funds for the same ten-year period returning 10.00% and 8.69%, respectively.
Morningstar fund rankings are based solely on total returns generated by each fund across the various time periods in each Morningstar category. For the trailing one-, five- and ten-year periods ended April 30, 2009, the Investor Class of the FBR Focus Fund ranked in the top 6% (906 out of 14,511 funds),
|
| 1 | | Standard and Poor’s Global Economic Policy Committee Notes; April 29, 2009. |
| 2 | | Strategic Insight Mutual Fund Research and Consulting® LLC; Highlights of April 2009 Mutual Fund Industry Results. |
| 3 | | Morningstar Direct; April 30, 2009. |
2
top 3% (336 out of 10,545 funds), and top 1% (81 out of 6,820 funds) of all domestic equity funds, respectively and the Investor Class of the FBR Small Cap Financial Fund ranked in the top 1% (197 out of 14,511 funds), top 9% (979 out of 10,545 funds) and top 1% (157 out of 6,820) of all domestic equity funds, respectively.
| | | | For the Period Ended April 30, 2009 | |
| | | |
| |
| | | 1-yr | | 5-yrs | | 10-yrs |
| | |
| |
| |
|
| FBR Focus Fund Investor Class | | (18.84 | )% | | 4.32 | % | | | 10.00 | % |
| FBR Small Cap Financial Fund Investor Class | | (10.11 | )% | | (2.05 | )% | | | 8.69 | % |
For the 2009 semi-annual reporting period, all eight of our actively managed equity funds, both traditional asset class and specialty, delivered on our objective of providing investors with downside protection by outperforming each of their respective Morningstar category averages. In general, this relative outperformance is attributable to the investing philosophy that serves as a guideline for all of our portfolio managers which emphasizes balance sheet strength, durable revenues and attractive valuations. We firmly believe that on a relative and absolute basis, outperformance in difficult markets is a key factor in creating long-term wealth for our clients.
We are fully aware that the prospect for timing the lows in the stock market is virtually impossible. As long-term investors, shareholders should take comfort in knowing that each of our portfolio managers has a well thought out plan of action and is diligently executing against their objectives on a daily basis to give your money the best chance to participate in the eventual stabilization and recovery of the economy. In our experience, the careful selection of individual securities paired with a heavy emphasis on buying at the right price can dramatically reduce a portfolio’s risk profile and enhance the opportunity for outperformance over a full market cycle.
As in prior years, what follows in this report is a discussion with each portfolio manager with respect to the performance of their fund over the first half of fiscal year 2009 and their outlook going forward.
All of us at The FBR Funds want to thank you for your continued support, and we look forward to serving your investment needs in the years ahead. If you would like more timely updates, fbrfunds.com provides monthly performance data, and other important fund information. As always, we welcome your questions and comments. You can reach us via e-mail at fbrfundsinfo@fbr.com or toll free at 888.200.4710.
Sincerely,

| David Ellison |
| President, Chief Investment Officer and Trustee |
| The FBR Funds |
| |
|
Past performance is no guarantee of future results. The performance data quoted represents past performance and the current performance may be lower or higher than the data quoted. Investment return and principal will fluctuate so that investors’ shares, when redeemed may be worth more or less than their original value. The performance data does not reflect the deduction of redemption fees and if reflected, the redemption fee would reduce the performance quoted. To obtain performance data current to the most recent month-end call 888.888.0025. |
3
The FBR Funds
FBR Pegasus FundTM
Management Overview
Portfolio Manager(s): Robert Barringer, CFA® and Ryan Kelley, CFA®
Over the last six months, how did the Fund perform?
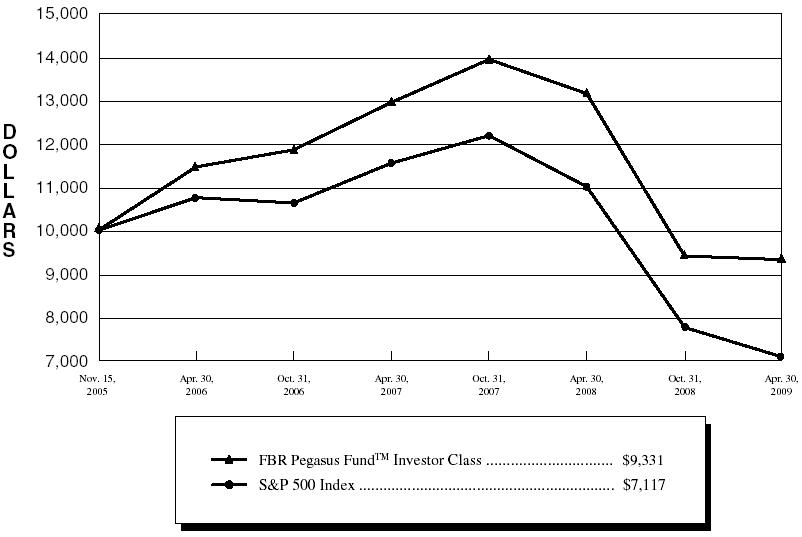
For the six-month period ended April 30, 2009, the Investor Class of the FBR Pegasus FundTM returned -0.89%. This compares to the S&P 500 Index and the Morningstar Large Blend Category average which returned -8.53% and -6.71%, for the same period, respectively.
What factors contributed to the Fund’s performance?
The Investor Class of the Fund outperformed its benchmark, the S&P 500 Index, by 7.64% and its peers, represented by the Morningstar Large Blend Category average, by 5.82%. Given the dramatic moves in stock prices over the past six months, we are encouraged by our relative performance during a difficult market. The FBR Funds are driven by a philosophy of outperforming over a complete market cycle, and we feel that the past six months’ performance has provided solid proof that downside protection is beneficial over the long-term.
Our performance was driven primarily by stock selection. The vast majority of the Fund’s outperformance relative to its benchmark during the past six months was attributable to our ability to choose and weight individual securities within each sector, regardless of the sector’s overall performance.
Relative to the S&P 500 Index, the Fund benefited from its underexposure to the health care and industrial sectors. During this time period, financials were the worst performing group of stocks in the S&P 500 Index. While we were overweight this sector, the financial stocks we owned were only down on average 12% versus financial stocks in the S&P 500 Index which were down on average 29%.
Individual stock selection in and underexposure to the information technology sector were the largest detractors from the Fund’s performance relative to the benchmark. The Fund’s underweight to the telecommunications sector also negatively contributed to relative performance.
What is the outlook for the Fund?
We believe superior long-term investment performance is generated through individual stock selection. We invest in industry leading companies with robust business models that exhibit defensive characteristics such as; low levels of debt, high profit margins and skilled management teams. During this tumultuous market, we believe we are seeing opportunities to
4
The FBR Funds
FBR Pegasus FundTM
Management Overview (continued)
commit new capital in solid, long-term winners at distressed valuations. Overall, we are confident in our investment process as we head into the second half of 2009, despite uncertainties that exist in the market.
|
The opinions expressed in this commentary reflect those of the Portfolio Manager(s) as of the date written. Any such opinions are subject to change based on market or other conditions. These opinions may not be relied upon as investment advice. Investment decisions for The FBR Funds are based on several factors, and may not be relied upon as an indication of trading intent on behalf of any FBR Fund. Security positions can and do change. |
5
The FBR Funds
FBR Pegasus FundTM
Comparison of Changes in Value of $10,000 Investment in
Investor Class Shares(1)(2) vs. S&P 500 Index(1)(3)
(unaudited)
| Total Returns—For the Periods Ended April 30, 2009(4) | |
| | | | | | | Annualized | | Cumulative | |
| | | | | | | Since | | Since | |
| | | | One Year | | Inception(5) | | Inception(6) | |
| | | |
| |
| |
| |
FBR Pegasus FundTM Investor Class(1)(2) | | | (28.98 | )% | | (1.98 | )% | | N/A | | |
FBR Pegasus FundTM I Class(2)(6) | | | N/A | | | N/A | | | (29.95 | )% | |
S&P 500 Index(1)(3) | | | (35.31 | )% | | (9.36 | )% | | (36.14 | )% | |
PAST PERFORMANCE IS NO GUARANTEE OF FUTURE RESULTS.
The performance data quoted represents past performance and the current performance may be lower or higher than the performance data quoted. The investment return and principal will fluctuate so that investors’ shares, when redeemed, may be worth more or less than their original cost. The performance data does not reflect the deduction of taxes that a shareholder would pay on Fund distributions or redemption fees. If reflected, the redemption fee would reduce the performance data quoted. To obtain performance data current to the most recent month-end, please call 888.200.4710 or visit www.fbrfunds.com.
|
| (1) | | The graph assumes a hypothetical $10,000 initial investment in the Fund and reflects the reinvestment of dividends and all Fund expenses. Investors should note that the Fund is a professionally managed mutual fund while the index is unmanaged, does not incur expenses and is not available for investment. The performance of the index includes reinvested dividends, and does not reflect sales charges or expenses. |
| (2) | | FBR Fund Advisers, Inc. waived a portion of its advisory fees and agreed to contractually reimburse a portion of the Fund’s operating expenses, as necessary, to maintain existing expense limitations, as set forth in the notes to the financial statements. Total returns shown include fee waivers and expense reimbursements; total returns would have been lower had there been no waiver of fees and/or reimbursement of expenses in excess of expense limitations. |
| (3) | | The S&P 500 Index is a capitalization-weighted index of 500 stocks. The index is designed to represent the broad domestic economy through changes in aggregate market value of 500 stocks representing all major industries. |
| (4) | | The total returns shown do not reflect the deduction of taxes that a shareholder would pay on fund distributions or the redemption of fund shares. |
| (5) | | For the period November 15, 2005 (commencement of investment operations) through April 30, 2009. |
| (6) | | For the period May 30, 2008 (inception of share class) through April 30, 2009. |
6
| The FBR Funds |
|
| FBR Pegasus FundTM |
| Portfolio Summary |
April 30, 2009
(unaudited) |
The following provides a breakdown of the Fund by industry sectors. The underlying securities represent a percentage of the portfolio investments.
| Industry Sector | | % of Total Investments |
| |
|
| Financials | | 18.6 | % |
| Information Technology | 18.5 | % |
| Energy | | 11.3 | % |
| Consumer Staples | 10.1 | % |
| Industrials | | 10.1 | % |
| Consumer Discretionary | 10.1 | % |
| Health Care | | 9.4 | % |
| Materials | | 5.7 | % |
| Utilities | | 1.6 | % |
| Telecommunication Services | 0.5 | % |
| | | | |
| Cash | | 4.1 | % |
7
| The FBR Funds |
|
| FBR Pegasus FundTM |
| Portfolio of Investments |
April 30, 2009
(unaudited) |
|
| | | | | | VALUE |
| | SHARES | | | | (NOTE 2) |
|
| | | | COMMON STOCKS — 97.6% | | | | |
| | | | Consumer Discretionary — 10.3% | | | | |
| | 10,600 | | American Eagle Outfitters, Inc. | | $ | 157,092 | |
| | 1,650 | | Apollo Group, Inc., Class A* | | | 103,868 | |
| | 6,550 | | Carnival Corp. | | | 176,064 | |
| | 3,000 | | Kohl’s Corp.* | | | 136,050 | |
| | 11,900 | | Lowe’s Companies, Inc. | | | 255,849 | |
| | 4,000 | | Target Corp. | | | 165,040 | |
| | 3,825 | | The Gap, Inc. | | | 59,441 | |
| | 3,000 | | Tiffany & Co. | | | 86,820 | |
| | | | | |
| |
| | | | | | | 1,140,224 | |
| | | | | |
| |
| | | | Consumer Staples — 10.3% | | | | |
| | 950 | | Brown-Forman Corp., Class B | | | 44,175 | |
| | 800 | | Bunge Ltd. | | | 38,408 | |
| | 3,250 | | Campbell Soup Co. | | | 83,590 | |
| | 1,475 | | Colgate-Palmolive Co. | | | 87,025 | |
| | 1,400 | | Kellogg Co. | | | 58,954 | |
| | 1,550 | | Ralcorp Holdings, Inc.* | | | 88,598 | |
| | 2,950 | | The Coca-Cola Co. | | | 126,998 | |
| | 1,200 | | The Hershey Co. | | | 43,368 | |
| | 2,002 | | The J.M. Smucker Co. | | | 78,879 | |
| | 1,512 | | The Procter & Gamble Co. | | | 74,753 | |
| | 7,500 | | Unilever PLC ADR | | | 145,950 | |
| | 4,900 | | Walgreen Co. | | | 154,007 | |
| | 2,350 | | Wal-Mart Stores, Inc. | | | 118,440 | |
| | | | | |
| |
| | | | | | | 1,143,145 | |
| | | | | |
| |
| | | | Energy — 11.5% | | | | |
| | 2,677 | | Apache Corp. | | | 195,045 | |
| | 4,075 | | Cimarex Energy Co. | | | 109,618 | |
| | 4,000 | | ConocoPhillips | | | 164,000 | |
| | 800 | | Exxon Mobil Corp. | | | 53,336 | |
| | 1,600 | | Newfield Exploration Co.* | | | 49,888 | |
| | 1,885 | | Occidental Petroleum Corp. | | | 106,107 | |
| | 3,600 | | Petro-Canada | | | 113,508 | |
| | 1,830 | | PetroChina Company Ltd. ADR | | | 159,045 | |
| | 5,000 | | Pioneer Natural Resources Co. | | | 115,600 | |
8
| The FBR Funds |
|
| FBR Pegasus FundTM |
| Portfolio of Investments (continued) |
April 30, 2009
(unaudited) |
|
| | | | | | VALUE |
| | SHARES | | | | (NOTE 2) |
|
| | | | Energy — 11.5% (continued) | | | | |
| | 1,800 | | Pride International, Inc.* | | $ | 40,860 | |
| | 1,498 | | Royal Dutch Shell PLC, Class A ADR | | | 68,429 | |
| | 4,900 | | Valero Energy Corp. | | | 97,216 | |
| | | | | |
| |
| | | | | | | 1,272,652 | |
| | | | | |
| |
| | | | Financials — 18.9% | | | | |
| | 1,350 | | ACE Ltd. | | | 62,532 | |
| | 21,300 | | Bank of America Corp. | | | 190,209 | |
| | 3,125 | | Franklin Resources, Inc. | | | 189,000 | |
| | 2,700 | | HCC Insurance Holdings, Inc. | | | 64,584 | |
| | 12,500 | | Hudson City Bancorp, Inc. | | | 157,000 | |
| | 700 | | IntercontinentalExchange, Inc.* | | | 61,320 | |
| | 8,200 | | JPMorgan Chase & Co. | | | 270,600 | |
| | 11,400 | | Manulife Financial Corp. | | | 194,940 | |
| | 3,100 | | People’s United Financial, Inc. | | | 48,422 | |
| | 1,000 | | Prudential Financial, Inc. | | | 28,880 | |
| | 7,900 | | SEI Investments Co. | | | 110,837 | |
| | 8,650 | | T. Rowe Price Group, Inc. | | | 333,197 | |
| | 1,725 | | The Goldman Sachs Group, Inc. | | | 221,663 | |
| | 8,400 | | Wells Fargo & Co. | | | 168,084 | |
| | | | | |
| |
| | | | | | | 2,101,268 | |
| | | | | |
| |
| | | | Health Care — 9.5% | | | | |
| | 2,240 | | Abbott Laboratories | | | 93,744 | |
| | 375 | | Baxter International, Inc. | | | 18,188 | |
| | 1,325 | | Becton, Dickinson and Co. | | | 80,136 | |
| | 820 | | C.R. Bard, Inc. | | | 58,737 | |
| | 3,000 | | Eli Lilly and Co. | | | 98,760 | |
| | 1,900 | | Forest Laboratories, Inc.* | | | 41,211 | |
| | 3,700 | | Johnson & Johnson | | | 193,731 | |
| | 1,483 | | Life Technologies Corp.* | | | 55,316 | |
| | 4,300 | | Merck & Company, Inc. | | | 104,232 | |
| | 1,800 | | Novartis AG ADR | | | 68,238 | |
| | 1,720 | | Novo Nordisk A/S ADR | | | 81,717 | |
| | 900 | | St. Jude Medical, Inc.* | | | 30,168 | |
| | 3,100 | | Wyeth | | | 131,440 | |
| | | | | |
| |
| | | | | | | 1,055,618 | |
| | | | | |
| |
9
| The FBR Funds |
|
| FBR Pegasus FundTM |
| Portfolio of Investments (continued) |
April 30, 2009
(unaudited) |
|
| | | | | | VALUE |
| | SHARES | | | | (NOTE 2) |
|
| | | | Industrials — 10.3% | | | | |
| | 6,815 | | 3M Co. | | $ | 392,544 | |
| | 3,800 | | ABB Ltd. ADR | | | 54,036 | |
| | 1,900 | | Burlington Northern Santa Fe Corp. | | | 128,212 | |
| | 1,200 | | Copart, Inc.* | | | 37,668 | |
| | 1,250 | | Cummins, Inc. | | | 42,500 | |
| | 1,000 | | Fastenal Co. | | | 38,360 | |
| | 13,200 | | General Electric Co. | | | 166,980 | |
| | 2,600 | | Rockwell Automation, Inc. | | | 82,134 | |
| | 4,050 | | Union Pacific Corp. | | | 199,017 | |
| | | | | |
| |
| | | | | | | 1,141,451 | |
| | | | | |
| |
| | | | Information Technology — 18.8% | | | | |
| | 2,450 | | Accenture Ltd., Class A | | | 72,104 | |
| | 3,600 | | Adobe Systems, Inc.* | | | 98,460 | |
| | 1,525 | | Apple, Inc.* | | | 191,891 | |
| | 1,700 | | Automatic Data Processing, Inc. | | | 59,840 | |
| | 4,000 | | Canon, Inc. ADR | | | 120,840 | |
| | 9,200 | | Cisco Systems, Inc.* | | | 177,744 | |
| | 1,000 | | Global Payments, Inc. | | | 32,060 | |
| | 425 | | Google, Inc., Class A* | | | 168,287 | |
| | 12,900 | | Intel Corp. | | | 203,562 | |
| | 2,200 | | International Business Machines Corp. | | | 227,061 | |
| | 1,060 | | Kyocera Corp. ADR | | | 82,235 | |
| | 3,000 | | Maxim Integrated Products, Inc. | | | 40,650 | |
| | 2,000 | | MEMC Electronic Materials, Inc.* | | | 32,400 | |
| | 4,850 | | Microsoft Corp. | | | 98,261 | |
| | 10,450 | | Oracle Corp. | | | 202,103 | |
| | 4,000 | | SAP AG ADR | | | 152,360 | |
| | 10,400 | | Total System Services, Inc. | | | 129,688 | |
| | | | | |
| |
| | | | | | | 2,089,546 | |
| | | | | |
| |
| | | | Materials — 5.8% | | | | |
| | 3,500 | | BHP Billiton Ltd. ADR | | | 168,490 | |
| | 2,450 | | Freeport-McMoRan Copper & Gold, Inc. | | | 104,493 | |
| | 1,550 | | Sigma-Aldrich Corp. | | | 67,952 | |
10
| The FBR Funds |
|
| FBR Pegasus FundTM |
| Portfolio of Investments (continued) |
April 30, 2009
(unaudited) |
|
| | | | | | VALUE |
| | SHARES | | | | (NOTE 2) |
|
| | | | Materials — 5.8% (continued) | | | | |
| | 12,300 | | Teck Resources Ltd., Class B | | $ | 129,642 | |
| | 6,400 | | United States Steel Corp. | | | 169,920 | |
| | | | | |
| |
| | | | | | | 640,497 | |
| | | | | |
| |
| | | | Telecommunication Services — 0.5% | | | | |
| | 1,850 | | America Movil S.A.B. de C.V., Series L ADR | | | 60,773 | |
| | | | | |
| |
| | | | | | | | |
| | | | Utilities — 1.7% | | | | |
| | 1,826 | | Edison International | | | 52,059 | |
| | 1,675 | | PG&E Corp. | | | 62,176 | |
| | 1,517 | | Sempra Energy | | | 69,813 | |
| | | | | |
| |
| | | | | | | 184,048 | |
| | | | | |
| |
| | | | Total Common Stocks (Cost $11,178,537) | | | 10,829,222 | |
| | | | | |
| |
| | | | | | | | |
| | | | MONEY MARKET FUND — 4.0% | | | | |
| | 443,426 | | JPMorgan 100% U.S. Treasury Securities Money Market Fund (Cost $443,426) | | | 443,426 | |
| | | | | |
| |
| | | | | | | | |
| | | | Total Investments — 101.6% (Cost $11,621,963) | | | 11,272,648 | |
| | | | | | | | |
| | | | Liabilities Less Other Assets — (1.6%) | | | (182,422 | ) |
| | | | | |
| |
| | | | | | | | |
| | | | Net Assets — 100.0% | | $ | 11,090,226 | |
| | | | | |
| |
|
| * | | Non-income producing security |
| ADR | | American Depositary Receipts |
| PLC | | Public Liability Company |
| Note: | | For presentation purposes, the Fund has grouped some of the industry categories. For purposes of categorizing securities for compliance with Section 8(b)(1) of the Investment Company Act of 1940, the Fund uses more specific industry classifications. |
The accompanying notes are an integral part of the financial statements.
11
The FBR Funds
FBR Pegasus Mid Cap FundTM
Management Overview
Portfolio Manager: Ryan Kelley, CFA®
Over the last six months, how did the Fund perform?
For the six-month period ended April 30, 2009, the Investor Class of the FBR Pegasus Mid Cap FundTM returned 0.85%. This compares to the Russell Midcap Index and the Morningstar Mid Blend Category average which returned -1.64% and -1.43%, for the same period, respectively.
What factors contributed to the Fund’s performance?
The Investor Class of the Fund outperformed its benchmark, the Russell Midcap Index, by 2.49% and its peers, represented by the Morningstar Mid Blend Category average, by 2.28%. Given the dramatic moves in stock prices over the past six months, we are encouraged by our relative performance during a difficult market. The FBR Funds are driven by a philosophy of outperforming over a complete market cycle, and we feel that the past six months’ performance has provided solid proof that downside protection is beneficial over the long-term.
Sector selection, a description of a fund’s relative exposure to different industries, is a major determinant of fund performance. Relative to the Russell Midcap Index, the Fund benefited from its underexposure to the financials and utilities sectors, which were the two worst performing sectors in the Russell Midcap Index. Consumer discretionary and telecommunications stocks performed best, yet we were underweight those sectors during this time period. Individual stock selection in the healthcare sector was the single largest detractor from the Fund’s performance relative to the benchmark.
Overall, our outperformance was driven primarily by stock selection, as the majority of our excess return above our benchmark was attributable to our ability to choose and weight individual securities within each sector, regardless of a sector’s overall performance. Simply put, we tend to own the right stocks, regardless of their sector’s performance.
What is the outlook for the Fund?
We strive to provide solid long-term returns for our shareholders while protecting against the downside and exhibiting a lower level of volatility. Since its inception in February 2007, the Fund has managed to achieve this objective through the implementation of its disciplined investment process. Over its 26 months of existence, the Fund has consistently outperformed its benchmark and delivered top decile performance relative to its mid blend peers. It has done so with 25% less volatility than its benchmark, as measured by standard deviation, and a 75% downside capture ratio. In other words, when the benchmark is down 1%, the Fund typically is down only 0.75%. We continue to aim for these types of metrics.
12
The FBR Funds
FBR Pegasus Mid Cap FundTM
Management Overview (continued)
The Fund’s average cash levels remain between 5% and 15%, well within our comfort range. We note that in the tables below, cash on April 30, 2009 exceeded 20%, due to a large inflow of new cash in the week preceding the close of the reporting period. We believe we are seeing opportunities in the capital markets to commit new capital in solid, long-term winners at distressed valuations. As demonstrated above, our disciplined and consistent investment process and ability to under- or over-weight specific sectors of the market allow us to maintain our long-term orientation and construct a well-rounded and balanced portfolio. Our focus remains on uncovering stocks with sound business models, improving fundamentals selling at attractive valuations. Companies that exhibit a combination of these characteristics provide us the confidence necessary to make investments in companies within out of favor sectors, while enhancing the opportunity to preserve capital in declining markets reducing the overall risk profile of the portfolio.
|
The opinions expressed in this commentary reflect those of the Portfolio Manager as of the date written. Any such opinions are subject to change based on market or other conditions. These opinions may not be relied upon as investment advice. Investment decisions for The FBR Funds are based on several factors, and may not be relied upon as an indication of trading intent on behalf of any FBR Fund. Security positions can and do change. |
13
The FBR Funds
FBR Pegasus Mid Cap FundTM
Comparison of Changes in Value of $10,000 Investment in
Investor Class Shares(1)(2) vs. Russell Midcap Index(1)(3)
(unaudited)
| Total Returns—For the Periods Ended April 30, 2009(4) | |
| | | | | | Annualized | | Cumulative | |
| | | | | | Since | | Since | |
| | | One Year | | Inception(5) | | Inception(6) | |
| | |
| |
| |
| |
FBR Pegasus Mid Cap FundTM Investor Class(1)(2) | | (24.25 | )% | | (7.97 | )% | | N/A | | |
FBR Pegasus Mid Cap FundTM I Class(2)(6) | | N/A | | | N/A | | | (28.23 | )% | |
Russell Midcap Index(1)(3) | | (36.03 | )% | | (19.33 | )% | | (38.42 | )% | |
PAST PERFORMANCE IS NO GUARANTEE OF FUTURE RESULTS.
The performance data quoted represents past performance and the current performance may be lower or higher than the performance data quoted. The investment return and principal will fluctuate so that investors’ shares, when redeemed, may be worth more or less than their original cost. The performance data does not reflect the deduction of taxes that a shareholder would pay on Fund distributions or redemption fees. If reflected, the redemption fee would reduce the performance data quoted. To obtain performance data current to the most recent month-end, please call 888.200.4710 or visit www.fbrfunds.com.
|
| (1) | | The graph assumes a hypothetical $10,000 initial investment in the Fund and reflects the reinvestment of dividends and all Fund expenses. Investors should note that the Fund is a professionally managed mutual fund while the index is unmanaged, does not incur expenses and is not available for investment. The performance of the index includes reinvested dividends, and does not reflect sales charges or expenses. |
| (2) | | FBR Fund Advisers, Inc. waived a portion of its advisory fees and agreed to contractually reimburse a portion of the Fund’s operating expenses, as necessary, to maintain existing expense limitations, as set forth in the notes to the financial statements. Total returns shown include fee waivers and expense reimbursements; total returns would have been lower had there been no waiver of fees and/or reimbursement of expenses in excess of expense limitations. |
| (3) | | The Russell Midcap Index measures the performance of the 800 smallest companies in the Russell 1000 Index, which represents approximately 31% of the total market capitalization of the Russell 1000 Index. |
| (4) | | The total returns shown do not reflect the deduction of taxes that a shareholder would pay on fund distributions or the redemption of fund shares. |
| (5) | | For the period February 28, 2007 (commencement of investment operations) through April 30, 2009. |
| (6) | | For the period May 30, 2008 (inception of share class) through April 30, 2009. |
14
| The FBR Funds |
|
| FBR Pegasus Mid Cap FundTM |
| Portfolio Summary |
April 30, 2009
(unaudited) |
The following provides a breakdown of the Fund by industry sectors. The underlying securities represent a percentage of the portfolio investments.
| Industry Sector | | % of Total Investments |
| |
|
| Financials | | 15.1 | % |
| Consumer Discretionary | 13.7 | % |
| Information Technology | 10.7 | % |
| Industrials | | 7.5 | % |
| Health Care | | 7.5 | % |
| Energy | | 6.1 | % |
| Consumer Staples | 6.0 | % |
| Utilities | | 5.5 | % |
| Materials | | 5.2 | % |
| Telecommunication Services | 1.0 | % |
| | | | |
| Cash | | 21.7 | % |
15
| The FBR Funds |
|
| FBR Pegasus Mid Cap FundTM |
| Portfolio of Investments |
April 30, 2009
(unaudited) |
|
| | | | | | | VALUE | |
| | SHARES | | | | | (NOTE 2) | |
|
| | | | COMMON STOCKS — 85.5% | | | | |
| | | | Consumer Discretionary — 15.0% | | | | |
| | 7,965 | | Abercrombie & Fitch Co., Class A | | $ | 215,532 | |
| | 13,225 | | American Eagle Outfitters, Inc. | | | 195,995 | |
| | 600 | | Apollo Group, Inc., Class A* | | | 37,770 | |
| | 535 | | ITT Educational Services, Inc.* | | | 53,912 | |
| | 2,545 | | Magna International, Inc., Class A | | | 86,428 | |
| | 11,925 | | Mattel, Inc. | | | 178,398 | |
| | 5,200 | | Tiffany & Co. | | | 150,488 | |
| | 2,750 | | VF Corp. | | | 162,993 | |
| | | | | |
| |
| | | | | | | 1,081,516 | |
| | | | | |
| |
| | | | Consumer Staples — 6.5% | | | | |
| | 3,350 | | Alberto-Culver Co. | | | 74,672 | |
| | 2,525 | | BJ’s Wholesale Club, Inc.* | | | 84,184 | |
| | 2,310 | | Bunge Ltd. | | | 110,903 | |
| | 3,075 | | Hansen Natural Corp.* | | | 125,336 | |
| | 7,075 | | Tyson Foods, Inc., Class A | | | 74,571 | |
| | | | | |
| |
| | | | | | | 469,666 | |
| | | | | |
| |
| | | | Energy — 6.7% | | | | |
| | 5,048 | | ENSCO International, Inc. | | | 142,757 | |
| | 4,970 | | Helmerich & Payne, Inc. | | | 153,175 | |
| | 8,000 | | Pioneer Natural Resources Co. | | | 184,961 | |
| | | | | |
| |
| | | | | | | 480,893 | |
| | | | | |
| |
| | | | Financials — 16.4% | | | | |
| | 3,850 | | Annaly Capital Management, Inc. | | | 54,170 | |
| | 3,150 | | BB&T Corp. | | | 73,521 | |
| | 2,040 | | Capitol Federal Financial | | | 79,478 | |
| | 2,325 | | Comerica, Inc. | | | 48,779 | |
| | 2,175 | | Commerce Bancshares, Inc. | | | 71,993 | |
| | 11,425 | | Hudson City Bancorp, Inc. | | | 143,497 | |
| | 10,550 | | KeyCorp | | | 64,883 | |
| | 1,090 | | M&T Bank Corp. | | | 57,171 | |
| | 6,200 | | New York Community Bancorp, Inc. | | | 70,122 | |
| | 9,075 | | People’s United Financial, Inc. | | | 141,751 | |
| | 16,100 | | Regions Financial Corp. | | | 72,289 | |
| | 5,350 | | SEI Investments Co. | | | 75,061 | |
16
| The FBR Funds |
|
| FBR Pegasus Mid Cap FundTM |
| Portfolio of Investments (continued) |
April 30, 2009
(unaudited) |
|
| | | | | | | VALUE | |
| | SHARES | | | | | (NOTE 2) | |
|
| | | | Financials — 16.4% (continued) | | | | |
| | 4,690 | | T. Rowe Price Group, Inc. | | $ | 180,658 | |
| | 2,000 | | The Hanover Insurance Group, Inc. | | | 59,960 | |
| | | | | |
| |
| | | | | | | 1,193,333 | |
| | | | | |
| |
| | | | Health Care — 8.2% | | | | |
| | 355 | | Bio-Rad Laboratories, Inc., Class A* | | | 24,740 | |
| | 2,396 | | C.R. Bard, Inc. | | | 171,625 | |
| | 4,088 | | Forest Laboratories, Inc.* | | | 88,669 | |
| | 1,030 | | Lincare Holdings, Inc.* | | | 24,854 | |
| | 1,810 | | Techne Corp. | | | 103,568 | |
| | 5,250 | | Varian Medical Systems, Inc.* | | | 175,193 | |
| | | | | |
| |
| | | | | | | 588,649 | |
| | | | | |
| |
| | | | Industrials — 8.2% | | | | |
| | 4,375 | | Copart, Inc.* | | | 137,331 | |
| | 2,818 | | Cummins, Inc. | | | 95,812 | |
| | 1,350 | | Equifax, Inc. | | | 39,366 | |
| | 950 | | Fastenal Co. | | | 36,442 | |
| | 1,625 | | Kubota Corp. ADR | | | 48,734 | |
| | 2,425 | | Pall Corp. | | | 64,044 | |
| | 2,800 | | Ritchie Bros. Auctioneers, Inc. | | | 62,720 | |
| | 2,412 | | Roper Industries, Inc. | | | 109,963 | |
| | | | | |
| |
| | | | | | | 594,412 | |
| | | | | |
| |
| | | | Information Technology — 11.7% | | | | |
| | 22,900 | | Activision Blizzard, Inc.* | | | 246,633 | |
| | 7,525 | | Check Point Software Technologies Ltd.* | | | 174,354 | |
| | 2,720 | | FactSet Research Systems, Inc. | | | 145,765 | |
| | 4,000 | | Global Payments, Inc. | | | 128,240 | |
| | 1,775 | | Ingram Micro, Inc., Class A* | | | 25,773 | |
| | 4,625 | | Paychex, Inc. | | | 124,921 | |
| | | | | |
| |
| | | | | | | 845,686 | |
| | | | | |
| |
| | | | Materials — 5.7% | | | | |
| | 5,150 | | Compania de Minas Buenaventura S.A.A. ADR | | | 108,974 | |
| | 2,100 | | Ecolab, Inc. | | | 80,955 | |
| | 2,580 | | Sigma-Aldrich Corp. | | | 113,107 | |
| | 3,950 | | United States Steel Corp. | | | 104,873 | |
| | | | | |
| |
| | | | | | | 407,909 | |
| | | | | |
| |
17
| The FBR Funds |
|
| FBR Pegasus Mid Cap FundTM |
| Portfolio of Investments (continued) |
April 30, 2009
(unaudited) |
|
| | | | | | | VALUE | |
| | SHARES | | | | | (NOTE 2) | |
|
| | | | Telecommunication Services — 1.1% | | | | |
| | 2,700 | | Telephone and Data Systems, Inc. | | $ | 77,409 | |
| | | | | |
| |
| | | | Utilities — 6.0% | | | | |
| | 2,290 | | Energen Corp. | | | 82,715 | |
| | 2,175 | | Pinnacle West Capital Corp. | | | 59,552 | |
| | 2,938 | | Questar Corp. | | | 87,316 | |
| | 1,900 | | SCANA Corp. | | | 57,418 | |
| | 1,350 | | Sempra Energy | | | 62,127 | |
| | 2,850 | | Westar Energy, Inc. | | | 49,961 | |
| | 1,900 | | Xcel Energy, Inc. | | | 35,036 | |
| | | | | |
| |
| | | | | | | 434,125 | |
| | | | | |
| |
| | | | Total Common Stocks (Cost $6,209,237) | | | 6,173,598 | |
| | | | | |
| |
| | | | | | | | |
| | | | MONEY MARKET FUND — 23.7% | | | | |
| | 1,711,276 | | JPMorgan 100% U.S. Treasury Securities Money Market Fund (Cost $1,711,276) | | | 1,711,276 | |
| | | | | |
| |
| | | | | | | | |
| | | | Total Investments — 109.2% (Cost $7,920,513) | | | 7,884,874 | |
| | | | | | | | |
| | | | Liabilities Less Other Assets — (9.2%) | | | (665,761 | ) |
| | | | | |
| |
| | | | | | | | |
| | | | Net Assets — 100.0% | | $ | 7,219,113 | |
| | | | | |
| |
|
| * | | Non-income producing security |
| ADR | | American Depositary Receipts |
| Note: | | For presentation purposes, the Fund has grouped some of the industry categories. For purposes of categorizing securities for compliance with Section 8(b)(1) of the Investment Company Act of 1940, the Fund uses more specific industry classifications. |
The accompanying notes are an integral part of the financial statements.
18
The FBR Funds
FBR Pegasus Small Cap FundTM
Management Overview
Portfolio Manager: Robert Barringer, CFA®
Over the last six months, how did the Fund perform?
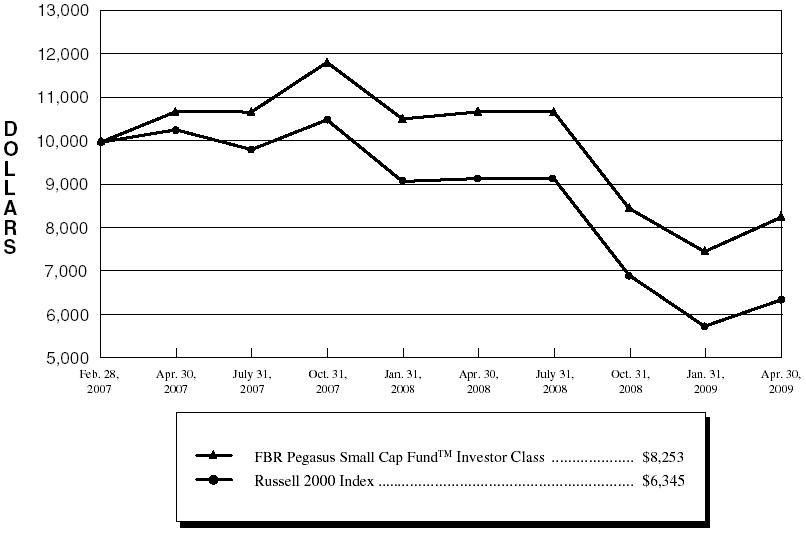
For the six-month period ended April 30, 2009, the Investor Class of the FBR Pegasus Small Cap FundTM returned -2.61%. This compares to the Russell 2000 Index and the Morningstar Small Blend Category average, which returned -8.40% and -3.27%, for the same period, respectively.
What factors contributed to the Fund’s performance?
I believe the Investor Class of the Fund outperformed the Russell 2000 Index over the course of the reporting period due to a number of factors. The majority of the Fund’s return and relative outperformance was attributable to selection effect; our ability to choose and emphasize different securities than the benchmark, rather than industry allocation. An important and beneficial portfolio move was to underweight the financial sector during this unprecedented and tumultuous period, while remaining focused on companies with differentiated strategies and solid balance sheets. The market was concerned with the overall strength and viability of the entire financial system, especially those financial institutions deemed to have weak capital structures. By emphasizing the stronger, better managed and capitalized financial companies, the Fund was able to enhance its relative performance.
During this period, stock selection was also a key driver in both the industrial and consumer discretionary sectors as well. The market favored companies with adequate financing and solid balance sheets that managed to weather the financial storm and are positioned to gain share in their respective markets as the economy recovers. In particular, our investments in several consumer apparel companies and in the depressed building products companies with low to no debt worked well.
Our overweight and security selection in the consumer staples sector detracted slightly from performance. Certain companies represented in the Russell 2000 Index, which we consider to be fundamentally lower-quality, performed very well over the reporting period as investor’s appetite for risk seemed to return along with increased optimism.
What is the outlook for the Fund?
We continue to believe that the long-term outlook for small-caps and the Fund is very attractive, even after the market’s recent rebound off the March lows and positive performance year-to-date. Companies categorized as “value” investments were hit particularly hard, with the financials and cyclicals impacted the most in the aftermath of market downturn from its peak in 2007. What had previously been an extremely painful and unnerving experience for all investors, has evolved into a very attractive opportunity to purchase many high quality, industry leading companies and tilt the portfolio towards these more “value” oriented areas. Some of the more interesting opportunities available in
19
The FBR Funds
FBR Pegasus Small Cap FundTM
Management Overview (continued)
the small-cap investment universe center on companies that were previously classified as mid-caps or in some cases even large-caps, which have fallen into the small-cap arena. While their market caps today are considered small, these companies may provide substantial leverage to the stabilization and ultimate recovery of the economy. In my view, we are in the very early stages of a global recovery period and I am excited about the opportunity to continue to execute our investment process at a time where an abundance of attractive investments can be uncovered for patient, long-term investors.
|
The opinions expressed in this commentary reflect those of the Portfolio Manager as of the date written. Any such opinions are subject to change based on market or other conditions. These opinions may not be relied upon as investment advice. Investment decisions for The FBR Funds are based on several factors, and may not be relied upon as an indication of trading intent on behalf of any FBR Fund. Security positions can and do change. |
20
The FBR Funds
FBR Pegasus Small Cap FundTM
Comparison of Changes in Value of $10,000 Investment in
Investor Class Shares(1)(2) vs. Russell 2000 Index(1)(3)
(unaudited)
| Total Returns—For the Periods Ended April 30, 2009(4) | |
| | | | | | Annualized | | Cumulative | |
| | | | | | Since | | Since | |
| | | One Year | | Inception(5) | | Inception(6) | |
| | |
| |
| |
| |
FBR Pegasus Small Cap FundTM Investor Class(1)(2) | | (22.89 | )% | | (8.48 | )% | | N/A | | |
FBR Pegasus Small Cap FundTM I Class(2)(6) | | N/A | | | N/A | | | (25.80 | )% | |
Russell 2000 Index(1)(3) | | (30.74 | )% | | (18.89 | )% | | (33.54 | )% | |
PAST PERFORMANCE IS NO GUARANTEE OF FUTURE RESULTS.
The performance data quoted represents past performance and the current performance may be lower or higher than the performance data quoted. The investment return and principal will fluctuate so that investors’ shares, when redeemed, may be worth more or less than their original cost. The performance data does not reflect the deduction of taxes that a shareholder would pay on Fund distributions or redemption fees. If reflected, the redemption fee would reduce the performance data quoted. To obtain performance data current to the most recent month-end, please call 888.200.4710 or visit www.fbrfunds.com.
|
| (1) | | The graph assumes a hypothetical $10,000 initial investment in the Fund and reflects the reinvestment of dividends and all Fund expenses. Investors should note that the Fund is a professionally managed mutual fund while the index is unmanaged, does not incur expenses and is not available for investment. The performance of the index includes reinvested dividends, and does not reflect sales charges or expenses. |
| (2) | | FBR Fund Advisers, Inc. waived a portion of its advisory fees and agreed to contractually reimburse a portion of the Fund’s operating expenses, as necessary, to maintain existing expense limitations, as set forth in the notes to the financial statements. Total returns shown include fee waivers and expense reimbursements; total returns would have been lower had there been no waiver of fees and/or reimbursement of expenses in excess of expense limitations. |
| (3) | | The Russell 2000 Index is comprised of the smallest of the 2000 companies of the Russell 3000 Index, representing approximately 8% of the Russell 3000’s total market capitalization. |
| (4) | | The total returns shown do not reflect the deduction of taxes that a shareholder would pay on fund distributions or the redemption of fund shares. |
| (5) | | For the period February 28, 2007 (commencement of investment operations) through April 30, 2009. |
| (6) | | For the period May 30, 2008 (inception of share class) through April 30, 2009. |
21
| The FBR Funds |
|
| FBR Pegasus Small Cap FundTM |
| Portfolio Summary |
April 30, 2009
(unaudited) |
The following provides a breakdown of the Fund by industry sectors. The underlying securities represent a percentage of the portfolio investments.
| Industry Sector | | % of Total Investments |
| |
|
| Financials | | 26.2 | % |
| Industrials | | 18.0 | % |
| Information Technology | 15.6 | % |
| Consumer Discretionary | 14.2 | % |
| Health Care | | 10.6 | % |
| Materials | | 6.2 | % |
| Consumer Staples | 2.7 | % |
| Energy | | 2.0 | % |
| Utilities | | 0.8 | % |
| | | | |
| Cash | | 3.7 | % |
22
| The FBR Funds |
|
| FBR Pegasus Small Cap FundTM |
| Portfolio of Investments |
April 30, 2009
(unaudited) |
|
| | | | | | | VALUE | |
| | SHARES | | | | | (NOTE 2) | |
|
| | | | COMMON STOCKS — 101.3% | | | | |
| | | | Consumer Discretionary — 15.0% | | | | |
| | 4,100 | | Abercrombie & Fitch Co., Class A | | $ | 110,946 | |
| | 6,800 | | American Eagle Outfitters, Inc. | | | 100,776 | |
| | 2,200 | | CarMax, Inc.* | | | 28,072 | |
| | 7,700 | | Chico’s FAS, Inc.* | | | 58,828 | |
| | 3,000 | | Interactive Data Corp. | | | 67,440 | |
| | 90 | | NVR, Inc.* | | | 45,483 | |
| | 4,500 | | Pool Corp. | | | 80,370 | |
| | 3,050 | | Snap-On, Inc. | | | 103,456 | |
| | 3,250 | | The Black & Decker Corp. | | | 130,974 | |
| | 750 | | The Buckle, Inc. | | | 28,028 | |
| | 1,325 | | The Gymboree Corp.* | | | 45,580 | |
| | 1,400 | | The Men’s Wearhouse, Inc. | | | 26,096 | |
| | 1,450 | | The Timberland Co., Class A* | | | 23,548 | |
| | 2,875 | | Tiffany & Co. | | | 83,203 | |
| | 3,850 | | Williams-Sonoma, Inc. | | | 53,900 | |
| | 5,225 | | Wolverine World Wide, Inc. | | | 108,837 | |
| | | | | |
| |
| | | | | | | 1,095,537 | |
| | | | | |
| |
| | | | Consumer Staples — 2.9% | | | | |
| | 2,950 | | Alberto-Culver Co. | | | 65,756 | |
| | 2,000 | | BJ’s Wholesale Club, Inc.* | | | 66,680 | |
| | 3,375 | | Flowers Foods, Inc. | | | 77,962 | |
| | | | | |
| |
| | | | | | | 210,398 | |
| | | | | |
| |
| | | | Energy — 2.1% | | | | |
| | 1,700 | | Concho Resources, Inc.* | | | 46,614 | |
| | 1,990 | | Denbury Resources, Inc.* | | | 32,397 | |
| | 2,150 | | Goodrich Petroleum Corp.* | | | 49,300 | |
| | 400 | | SEACOR Holdings, Inc.* | | | 26,288 | |
| | | | | |
| |
| | | | | | | 154,599 | |
| | | | | |
| |
| | | | Financials — 27.6% | | | | |
| | 3,235 | | American Financial Group, Inc. | | | 56,871 | |
| | 5,950 | | Arthur J. Gallagher & Co. | | | 133,756 | |
| | 667 | | Bank of Marin Bancorp | | | 17,085 | |
| | 2,700 | | Capitol Federal Financial | | | 105,192 | |
| | 9,635 | | Cohen & Steers, Inc. | | | 141,827 | |
23
| The FBR Funds |
|
| FBR Pegasus Small Cap FundTM |
| Portfolio of Investments (continued) |
April 30, 2009
(unaudited) |
|
| | | | | | | VALUE | |
| | SHARES | | | | | (NOTE 2) | |
|
| | | | Financials — 27.6% (continued) | | | | |
| | 4,300 | | Commerce Bancshares, Inc. | | $ | 142,330 | |
| | 5,100 | | ESSA Bancorp, Inc. | | | 69,564 | |
| | 13,900 | | First Niagara Financial Group, Inc. | | | 188,205 | |
| | 3,600 | | Fox Chase Bancorp, Inc.* | | | 34,128 | |
| | 1,465 | | HCC Insurance Holdings, Inc. | | | 35,043 | |
| | 3,450 | | Home Federal Bancorp, Inc. | | | 34,811 | |
| | 7,050 | | Knight Capital Group, Inc., Class A* | | | 109,205 | |
| | 415 | | Markel Corp.* | | | 119,105 | |
| | 2,050 | | National Health Investors, Inc. | | | 54,981 | |
| | 2,950 | | Odyssey Re Holdings Corp. | | | 112,956 | |
| | 3,325 | | optionsXpress Holdings, Inc. | | | 54,730 | |
| | 15,560 | | SEI Investments Co. | | | 218,306 | |
| | 2,950 | | The Hanover Insurance Group, Inc. | | | 88,441 | |
| | 5,440 | | Torchmark Corp. | | | 159,555 | |
| | 1,200 | | Validus Holdings Ltd. | | | 26,880 | |
| | 4,985 | | Waddell & Reed Financial, Inc., Class A | | | 111,714 | |
| | | | | |
| |
| | | | | | | 2,014,685 | |
| | | | | |
| |
| | | | Health Care — 11.1% | | | | |
| | 500 | | Bio-Rad Laboratories, Inc., Class A* | | | 34,845 | |
| | 600 | | Dionex Corp.* | | | 37,800 | |
| | 1,870 | | IDEXX Laboratories, Inc.* | | | 73,491 | |
| | 2,300 | | Lincare Holdings, Inc.* | | | 55,499 | |
| | 1,900 | | MEDNAX, Inc.* | | | 68,210 | |
| | 750 | | National HealthCare Corp. | | | 29,775 | |
| | 8,680 | | Patterson Companies, Inc.* | | | 177,592 | |
| | 6,150 | | STERIS Corp. | | | 148,215 | |
| | 2,575 | | Techne Corp. | | | 147,342 | |
| | 1,700 | | VCA Antech, Inc.* | | | 42,534 | |
| | | | | |
| |
| | | | | | | 815,303 | |
| | | | | |
| |
| | | | Industrials — 18.9% | | | | |
| | 2,325 | | A.O. Smith Corp. | | | 72,284 | |
| | 2,350 | | American Woodmark Corp. | | | 48,645 | |
| | 1,475 | | Arkansas Best Corp. | | | 34,043 | |
| | 2,210 | | Carlisle Companies, Inc. | | | 50,278 | |
| | 8,400 | | Continental Airlines, Inc., Class B* | | | 88,368 | |
| | 1,565 | | Donaldson Company, Inc. | | | 51,629 | |
24
| The FBR Funds |
|
| FBR Pegasus Small Cap FundTM |
| Portfolio of Investments (continued) |
April 30, 2009
(unaudited) |
|
| | | | | | | VALUE | |
| | SHARES | | | | | (NOTE 2) | |
|
| | | | Industrials — 18.9% (continued) | | | | |
| | 3,550 | | Equifax, Inc. | | $ | 103,518 | |
| | 2,950 | | Genesee & Wyoming, Inc., Class A* | | | 88,500 | |
| | 2,180 | | Graco, Inc. | | | 51,426 | |
| | 1,180 | | Granite Construction, Inc. | | | 46,551 | |
| | 4,150 | | Insteel Industries, Inc. | | | 30,918 | |
| | 4,200 | | KBR, Inc. | | | 65,604 | |
| | 3,350 | | Lennox International, Inc. | | | 106,832 | |
| | 1,200 | | Lincoln Electric Holdings, Inc. | | | 53,436 | |
| | 1,775 | | Mueller Industries, Inc. | | | 38,997 | |
| | 4,200 | | Pall Corp. | | | 110,921 | |
| | 2,770 | | Rollins, Inc. | | | 49,860 | |
| | 2,015 | | Simpson Manufacturing Company, Inc. | | | 44,854 | |
| | 3,575 | | The Toro Co. | | | 108,608 | |
| | 875 | | Valmont Industries, Inc. | | | 55,808 | |
| | 2,800 | | Werner Enterprises, Inc. | | | 45,780 | |
| | 1,850 | | Woodward Governor Co. | | | 36,926 | |
| | | | | |
| |
| | | | | | | 1,383,786 | |
| | | | | |
| |
| | | | Information Technology — 16.4% | | | | |
| | 5,300 | | ADTRAN, Inc. | | | 112,095 | |
| | 1,325 | | Cymer, Inc.* | | | 37,643 | |
| | 1,950 | | Intersil Corp., Class A | | | 22,620 | |
| | 1,500 | | j2 Global Communications, Inc.* | | | 35,985 | |
| | 2,250 | | Jack Henry & Associates, Inc. | | | 40,545 | |
| | 6,200 | | MICROS Systems, Inc.* | | | 130,076 | |
| | 9,200 | | NCR Corp.* | | | 93,380 | |
| | 2,600 | | Parametric Technology Corp.* | | | 28,990 | |
| | 11,150 | | QLogic Corp.* | | | 158,107 | |
| | 1,500 | | SPSS, Inc.* | | | 46,350 | |
| | 2,350 | | Sybase, Inc.* | | | 79,806 | |
| | 11,100 | | Teradata Corp.* | | | 185,592 | |
| | 18,150 | | Total System Services, Inc. | | | 226,331 | |
| | | | | |
| |
| | | | | | | 1,197,520 | |
| | | | | |
| |
| | | | Materials — 6.5% | | | | |
| | 200 | | CF Industries Holdings, Inc. | | | 14,410 | |
| | 1,500 | | H.B. Fuller Co. | | | 26,490 | |
| | 1,925 | | Pactiv Corp.* | | | 42,081 | |
25
| The FBR Funds |
|
| FBR Pegasus Small Cap FundTM |
| Portfolio of Investments (continued) |
April 30, 2009
(unaudited) |
|
| | | | | | | VALUE | |
| | SHARES | | | | | (NOTE 2) | |
|
| | | | Materials — 6.5% (continued) | | | | |
| | 1,350 | | Schnitzer Steel Industries, Inc., Class A | | $ | 66,906 | |
| | 2,250 | | Sensient Technologies Corp. | | | 52,605 | |
| | 1,375 | | Terra Industries, Inc. | | | 36,438 | |
| | 5,800 | | The Valspar Corp. | | | 139,199 | |
| | 3,800 | | United States Steel Corp. | | | 100,890 | |
| | | | | |
| |
| | | | | | | 479,019 | |
| | | | | |
| |
| | | | Utilities — 0.8% | | | | |
| | 880 | | Energen Corp. | | | 31,785 | |
| | 1,850 | | The Empire District Electric Co. | | | 27,695 | |
| | | | | |
| |
| | | | | | | 59,480 | |
| | | | | |
| |
| | | | Total Common Stocks (Cost $7,051,424) | | | 7,410,327 | |
| | | | | |
| |
| | | | | | | | |
| | | | MONEY MARKET FUND — 3.8% | | | | |
| | 278,480 | | JPMorgan 100% U.S. Treasury Securities Money Market Fund (Cost $278,480) | | | 278,480 | |
| | | | | |
| |
| | | | | | | | |
| | | | Total Investments — 105.1% (Cost $7,329,904) | | | 7,688,807 | |
| | | | | | | | |
| | | | Liabilities Less Other Assets — (5.1%) | | | (371,374 | ) |
| | | | | |
| |
| | | | | | | | |
| | | | Net Assets — 100.0% | | $ | 7,317,433 | |
| | | | | |
| |
|
| * | | Non-income producing security |
| Note: | | For presentation purposes, the Fund has grouped some of the industry categories. For purposes of categorizing securities for compliance with Section 8(b)(1) of the Investment Company Act of 1940, the Fund uses more specific industry classifications. |
The accompanying notes are an integral part of the financial statements.
26
The FBR Funds
FBR Pegasus Small Cap Growth FundTM
Management Overview
Portfolio Manager: Robert Barringer, CFA®
Over the last six months, how did the Fund perform?
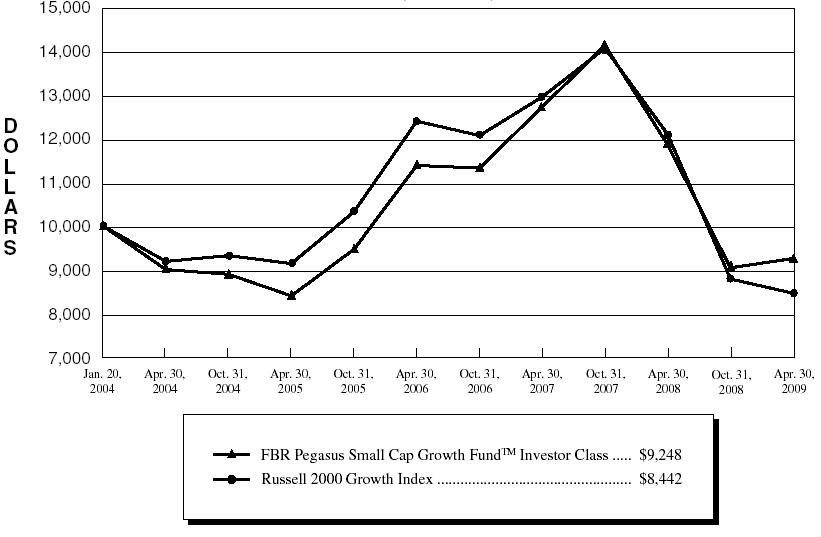
For the six-month period ended April 30, 2009, the Investor Class of the FBR Pegasus Small Cap Growth FundTM returned 2.40%. This compares to the Morningstar Small Cap Growth Fund Index and the Russell 2000 Growth Index, which returned -3.22% and -3.77%, for the same period, respectively.
What factors contributed to the Fund’s performance?
The Investor Class of the Fund outperformed the Russell 2000 Growth Index over the course of the reporting period due to a number of factors, including a combination of sector selection and individual stock selection. One of the more fruitful portfolio moves was to underweight the industrials for the reporting period while limiting investments in the sector to a few select companies with differentiated strategies and solid balance sheets. The Fund benefited from its lack of exposure to the aerospace and defense industries, both which performed poorly. Stock selection in the healthcare sector was also an important positive contributor to the Fund’s outperformance. In particular the Fund’s position in Cerner Corp., a company that is a major player in the electronic medical records space, was a key driver. The market came to appreciate Cerner’s current profitability, and the potential for sustainable growth of its business for the foreseeable future under an administration that is making electronic medical records a priority. Despite being penalized for an underweight allocation to the consumer discretionary sector, the top-performing sector of the Russell 2000 Growth Index during the reporting period, the Fund outperformed due to superior stock selection, most notably its positions in ITT Educational Services, Inc. and Priceline.com, Inc.
On the negative side, the Fund’s overweight to the energy sector was the largest detractor of relative performance. During the reporting period, the decline of oil prices negatively impacted the smaller companies in the sector, as the market favored larger and more diversified companies with lower breakeven oil price business models.
What is the outlook for the Fund?
I am optimistic about the outlook for the Fund at this time, and, as I write this piece, the market is solidly in positive territory year-to-date. While the economy faces definite challenges ahead, business and consumers have proven remarkably resilient, and I am seeing signs of stabilization; the first step before growth. For example, the capital markets are now open again for many companies, and fears are declining around whether some companies in the financial area in particular, will survive.
Current valuations for small-cap growth companies are reasonable, particularly in the more cyclical areas that were inordinately impacted by fears of an extended global slowdown. As healing across the financial segment continues, investor’s fears will
27
The FBR Funds
FBR Pegasus Small Cap Growth FundTM
Management Overview (continued)
continue to abate, and rational thinking will certainly return. I remain confident in the investment process employed by the Fund which is designed to identify industry leading small growth companies, with strong balance sheets, adequate financing and higher than average returns on owner’s capital. Our relentless attention to valuations and ultimately the purchase price of the Fund’s holdings has the potential to provide upside participation while decreasing the overall risk-profile of the Fund.
|
The opinions expressed in this commentary reflect those of the Portfolio Manager as of the date written. Any such opinions are subject to change based on market or other conditions. These opinions may not be relied upon as investment advice. Investment decisions for The FBR Funds are based on several factors, and may not be relied upon as an indication of trading intent on behalf of any FBR Fund. Security positions can and do change. |
28
The FBR Funds
FBR Pegasus Small Cap Growth FundTM
Comparison of Changes in Value of $10,000 Investment in
Investor Class Shares(1)(2) vs. Russell 2000 Growth Index(1)(3)
(unaudited)
| Total Returns—For the Periods Ended April 30, 2009(4) | |
| | | | | | | | | Annualized | | Cumulative | |
| | | | | | Annualized | | Since | | Since | |
| | | One Year | | Five Year | | Inception(5) | | Inception(6) | |
| | |
| |
| |
| |
| |
FBR Pegasus Small Cap Growth FundTM | | | | | | | | | | | | | |
| Investor Class(1)(2) | | (22.12 | )% | | 0.57 | % | | (1.47 | )% | | N/A | | |
FBR Pegasus Small Cap Growth FundTM I Class(2)(6) | | N/A | | | N/A | | | N/A | | | (26.40 | )% | |
FBR Pegasus Small Cap Growth FundTM | | | | | | | | | | | | | |
| R Class (2)(6) | | N/A | | | N/A | | | N/A | | | (26.70 | )% | |
Russell 2000 Growth Index(1)(3) | | (30.36 | )% | | (1.67 | )% | | (3.16 | )% | | (33.74 | )% | |
PAST PERFORMANCE IS NO GUARANTEE OF FUTURE RESULTS.
The performance data quoted represents past performance and the current performance may be lower or higher than the performance data quoted. The investment return and principal will fluctuate so that investors’ shares, when redeemed, may be worth more or less than their original cost. The performance data does not reflect the deduction of taxes that a shareholder would pay on Fund distributions or redemption fees. If reflected, the redemption fee would reduce the performance data quoted. To obtain performance data current to the most recent month-end, please call 888.200.4710 or visit www.fbrfunds.com.
|
| (1) | | The graph assumes a hypothetical $10,000 initial investment in the Fund and reflects the reinvestment of dividends and all Fund expenses. Investors should note that the Fund is a professionally managed mutual fund while the index is unmanaged, does not incur expenses and is not available for investment. The performance of the index includes reinvested dividends, and does not reflect sales charges or expenses. |
| (2) | | FBR Fund Advisers, Inc. waived a portion of its advisory fees and agreed to contractually reimburse a portion of the Fund’s operating expenses, as necessary, to maintain existing expense limitations, as set forth in the notes to the financial statements. Total returns shown includes fee waivers and expense reimbursements, if any; total returns would have been lower had there been no waiver of fees and/or reimbursement of expenses in excess of expense limitations. |
| (3) | | The Russell 2000 Growth Index measures the performance of the small-cap growth segment of the U.S. equity universe. It includes those Russell 2000 companies with higher price-to-value ratios and higher forecasted growth values. |
| (4) | | The total returns shown do not reflect the deduction of taxes that a shareholder would pay on fund distributions or the redemption of fund shares. |
| (5) | | For the period January 20, 2004 (commencement of investment operations) through April 30, 2009. |
| (6) | | For the period May 30, 2008 (inception of share class) through April 30, 2009. |
29
| The FBR Funds |
|
| FBR Pegasus Small Cap Growth FundTM |
| Portfolio Summary |
April 30, 2009
(unaudited) |
The following provides a breakdown of the Fund by industry sectors. The underlying securities represent a percentage of the portfolio investments.
| Industry Sector | | % of Total Investments |
| |
|
| Information Technology | 23.6 | % |
| Health Care | | 20.6 | % |
| Industrials | | 18.2 | % |
| Consumer Discretionary | 16.3 | % |
| Financials | | 12.3 | % |
| Energy | | 2.9 | % |
| Consumer Staples | 1.9 | % |
| Materials | | 1.7 | % |
| Telecommunication Services | 0.6 | % |
| Utilities | | 0.4 | % |
| | | | |
| Cash | | 1.5 | % |
30
| The FBR Funds |
|
| FBR Pegasus Small Cap Growth FundTM |
| Portfolio of Investments |
April 30, 2009
(unaudited) |
|
| | | | | | | VALUE | |
| | SHARES | | | | | (NOTE 2) | |
|
| | | | COMMON STOCKS — 100.3% | | | | |
| | | | Consumer Discretionary — 16.6% | | | | |
| | 1,800 | | Aéropostale, Inc.* | | $ | 61,145 | |
| | 940 | | Capella Education Co.* | | | 48,297 | |
| | 500 | | Chipotle Mexican Grill, Inc., Class A* | | | 40,545 | |
| | 650 | | DreamWorks Animation SKG, Inc., Class A* | | | 15,607 | |
| | 1,300 | | Gentex Corp. | | | 17,381 | |
| | 1,900 | | Guess?, Inc. | | | 49,476 | |
| | 445 | | ITT Educational Services, Inc.* | | | 44,843 | |
| | 1,460 | | J. Crew Group, Inc.* | | | 25,127 | |
| | 690 | | Morningstar, Inc.* | | | 27,372 | |
| | 1,725 | | Penn National Gaming, Inc.* | | | 58,685 | |
| | 1,500 | | Polaris Industries, Inc. | | | 50,175 | |
| | 475 | | Priceline.com, Inc.* | | | 46,118 | |
| | 1,400 | | Under Armour, Inc., Class A* | | | 32,956 | |
| | 1,800 | | Urban Outfitters, Inc.* | | | 35,082 | |
| | | | | |
| |
| | | | | | | 552,809 | |
| | | | | |
| |
| | | | Consumer Staples — 1.9% | | | | |
| | 275 | | Energizer Holdings, Inc.* | | | 15,758 | |
| | 1,200 | | Hansen Natural Corp.* | | | 48,912 | |
| | | | | |
| |
| | | | | | | 64,670 | |
| | | | | |
| |
| | | | Energy — 2.9% | | | | |
| | 1,050 | | Basic Energy Services, Inc.* | | | 10,710 | |
| | 1,900 | | Cal Dive International, Inc.* | | | 15,048 | |
| | 640 | | Comstock Resources, Inc.* | | | 22,054 | |
| | 300 | | Core Laboratories N.V. | | | 24,969 | |
| | 1,300 | | Superior Energy Services, Inc.* | | | 24,973 | |
| | | | | |
| |
| | | | | | | 97,754 | |
| | | | | |
| |
| | | | Financials — 12.5% | | | | |
| | 1,200 | | Comerica, Inc. | | | 25,176 | |
| | 1,300 | | Commerce Bancshares, Inc. | | | 43,030 | |
| | 1,500 | | Flagstone Reinsurance Holdings Ltd. | | | 13,890 | |
| | 2,350 | | Fox Chase Bancorp, Inc.* | | | 22,278 | |
| | 1,245 | | Investment Technology Group, Inc.* | | | 28,361 | |
| | 100 | | Markel Corp.* | | | 28,700 | |
31
| The FBR Funds |
|
| FBR Pegasus Small Cap Growth FundTM |
| Portfolio of Investments (continued) |
April 30, 2009
(unaudited) |
|
| | | | | | | VALUE | |
| | SHARES | | | | | (NOTE 2) | |
|
| | | | Financials — 12.5% (continued) | | | | |
| | 1,725 | | optionsXpress Holdings, Inc. | | $ | 28,394 | |
| | 3,500 | | Regions Financial Corp. | | | 15,715 | |
| | 3,500 | | SEI Investments Co. | | | 49,105 | |
| | 1,275 | | Stifel Financial Corp.* | | | 62,768 | |
| | 2,000 | | thinkorswim Group, Inc.* | | | 19,000 | |
| | 3,700 | | TradeStation Group, Inc.* | | | 30,007 | |
| | 1,625 | | Waddell & Reed Financial, Inc., Class A | | | 36,416 | |
| | 600 | | Zenith National Insurance Corp. | | | 13,674 | |
| | | | | |
| |
| | | | | | | 416,514 | |
| | | | | |
| |
| | | | Health Care — 21.0% | | | | |
| | 375 | | Alexion Pharmaceuticals, Inc.* | | | 12,533 | |
| | 500 | | AMERIGROUP Corp.* | | | 14,935 | |
| | 325 | | Bio-Rad Laboratories, Inc., Class A* | | | 22,649 | |
| | 1,730 | | Cerner Corp.* | | | 93,073 | |
| | 1,000 | | Crucell N.V. ADR* | | | 20,990 | |
| | 1,500 | | Cypress Bioscience, Inc.* | | | 10,800 | |
| | 2,025 | | Dendreon Corp.* | | | 42,930 | |
| | 725 | | Gen-Probe, Inc.* | | | 34,916 | |
| | 1,165 | | IDEXX Laboratories, Inc.* | | | 45,785 | |
| | 1,000 | | Kinetic Concepts, Inc.* | | | 24,760 | |
| | 1,640 | | Lincare Holdings, Inc.* | | | 39,573 | |
| | 650 | | MEDNAX, Inc.* | | | 23,335 | |
| | 825 | | Mettler-Toledo International, Inc.* | | | 50,845 | |
| | 350 | | OSI Pharmaceuticals, Inc.* | | | 11,750 | |
| | 3,050 | | Patterson Companies, Inc.* | | | 62,403 | |
| | 1,200 | | Perrigo Co. | | | 31,104 | |
| | 600 | | Pharmaceutical Product Development, Inc. | | | 11,766 | |
| | 600 | | ResMed, Inc.* | | | 23,070 | |
| | 1,130 | | Techne Corp. | | | 64,658 | |
| | 175 | | United Therapeutics Corp.* | | | 10,992 | |
| | 1,900 | | VCA Antech, Inc.* | | | 47,538 | |
| | | | | |
| |
| | | | | | | 700,405 | |
| | | | | |
| |
| | | | Industrials — 18.5% | | | | |
| | 750 | | Badger Meter, Inc. | | | 29,220 | |
| | 2,275 | | Copart, Inc.* | | | 71,411 | |
32
| The FBR Funds |
|
| FBR Pegasus Small Cap Growth FundTM |
| Portfolio of Investments (continued) |
April 30, 2009
(unaudited) |
|
| | | | | | | VALUE | |
| | SHARES | | | | | (NOTE 2) | |
|
| | | | Industrials — 18.5% (continued) | | | | |
| | 1,150 | | Crane Co. | | $ | 26,554 | |
| | 1,875 | | Genessee & Wyoming, Inc., Class A* | | | 56,250 | |
| | 3,000 | | Heartland Express, Inc. | | | 44,850 | |
| | 800 | | Kaydon Corp. | | | 25,568 | |
| | 3,075 | | KBR, Inc. | | | 48,032 | |
| | 2,750 | | Knight Transportation, Inc. | | | 48,620 | |
| | 600 | | L.B. Foster Co.* | | | 19,650 | |
| | 1,200 | | Layne Christensen Co.* | | | 25,992 | |
| | 750 | | Lennox International, Inc. | | | 23,918 | |
| | 300 | | Lincoln Electric Holdings, Inc. | | | 13,359 | |
| | 925 | | Pall Corp. | | | 24,429 | |
| | 1,200 | | Ritchie Bros. Auctioneers, Inc. | | | 26,880 | |
| | 400 | | Valmont Industries, Inc. | | | 25,512 | |
| | 1,500 | | Westinghouse Air Brake Technologies | | | 57,210 | |
| | 410 | | Watson Wyatt Worldwide, Inc., Class A | | | 21,751 | |
| | 1,425 | | Woodward Governor Co. | | | 28,443 | |
| | | | | |
| |
| | | | | | | 617,649 | |
| | | | | |
| |
| | | | Information Technology — 24.1% | | | | |
| | 525 | | ANSYS, Inc.* | | | 14,501 | |
| | 3,175 | | Compuware Corp.* | | | 23,749 | |
| | 675 | | Concur Technologies, Inc.* | | | 18,272 | |
| | 1,300 | | FactSet Research Systems, Inc. | | | 69,666 | |
| | 1,400 | | Fidelity National Information Services, Inc. | | | 24,990 | |
| | 1,900 | | Global Payments, Inc. | | | 60,914 | |
| | 950 | | Hittite Microwave Corp.* | | | 35,302 | |
| | 3,050 | | Informatica Corp.* | | | 48,495 | |
| | 2,677 | | Jack Henry & Associates, Inc. | | | 48,240 | |
| | 1,500 | | JDA Software Group, Inc.* | | | 21,165 | |
| | 2,700 | | Metavante Technologies, Inc.* | | | 63,693 | |
| | 3,095 | | MICROS Systems, Inc.* | | | 64,932 | |
| | 2,100 | | Parametric Technology Corp.* | | | 23,415 | |
| | 1,125 | | Polycom, Inc.* | | | 20,970 | |
| | 3,025 | | QLogic Corp.* | | | 42,895 | |
| | 950 | | Quality Systems, Inc. | | | 50,939 | |
33
| The FBR Funds |
|
| FBR Pegasus Small Cap Growth FundTM |
| Portfolio of Investments (continued) |
April 30, 2009
(unaudited) |
|
| | | | | | | VALUE | |
| | SHARES | | | | | (NOTE 2) | |
|
| | | | Information Technology — 24.1% (continued) | | | | |
| | 2,525 | | Quest Software, Inc.* | | $ | 36,688 | |
| | 1,200 | | SPSS, Inc.* | | | 37,080 | |
| | 900 | | Supertex, Inc.* | | | 23,148 | |
| | 1,400 | | Sybase, Inc.* | | | 47,544 | |
| | 885 | | Syntel, Inc. | | | 24,532 | |
| | | | | |
| |
| | | | | | | 801,130 | |
| | | | | |
| |
| | | | Materials — 1.7% | | | | |
| | 900 | | Allegheny Technologies, Inc. | | | 29,457 | |
| | 1,125 | | Balchem Corp. | | | 28,001 | |
| | | | | |
| |
| | | | | | | 57,458 | |
| | | | | |
| |
| | | | Telecommunication Services — 0.6% | | | | |
| | 750 | | SBA Communications Corp., Class A* | | | 18,900 | |
| | | | | |
| |
| | | | | | | | |
| | | | Utilities — 0.5% | | | | |
| | 350 | | ITC Holdings Corp. | | | 15,236 | |
| | | | | |
| |
| | | | | | | | |
| | | | Total Common Stocks (Cost $3,450,277) | | | 3,342,525 | |
| | | | | |
| |
| | | | | | | | |
| | | | MONEY MARKET FUND — 1.6% | | | | |
| | 52,640 | | JPMorgan 100% U.S. Treasury Securities Money Market Fund (Cost $52,640) | | | 52,640 | |
| | | | | |
| |
| | | | | | | | |
| | | | Total Investments — 101.9% (Cost $3,502,917) | | | 3,395,165 | |
| | | | | | | | |
| | | | Liabilities Less Other Assets — (1.9%) | | | (64,127 | ) |
| | | | | |
| |
| | | | | | | | |
| | | | Net Assets — 100.0% | | $ | 3,331,038 | |
| | | | | |
| |
|
| * | | Non-income producing security |
| ADR | | American Depositary Receipts |
The accompanying notes are an integral part of the financial statements.
34
The FBR Funds
FBR Focus Fund
Management Overview
Investment Sub Adviser: Akre Capital Management, LLC
Portfolio Manager: Charles T. Akre, Jr.
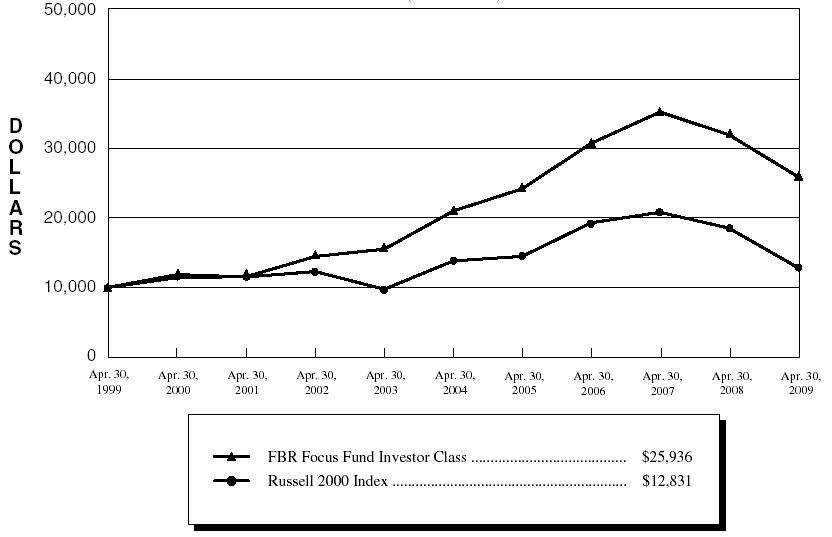
Fellow shareholders know all too well that calendar year 2008 was a terrible experience for holders of common stocks, and in the Investor Class of the FBR Focus Fund (FBRVX), we were down 34%. Our experience was modestly better (300 basis points) than the S&P 500 Index, and approximately even with the Russell 2000 Index. Even though this was a difficult experience for many of us, our longer term ten year record (through 4/30/09) is 10.00%, which compares very favorably with the S&P 500 Index at -2.48% and the Russell 2000 Index at 2.53% for the same period.
Over the course of the 2009 semi-annual reporting period (six months ended 4/30/09), the Investor Class of the FBR Focus Fund returned 8.72% while the S&P 500 Index, Russell 2000 Index and Morningstar Mid Cap Growth Category average returned -8.53%, -8.40% and -0.85%, respectively.
The last week of February and the first week of March represented a true “blood running in the streets”, a phrase often associated with the French Revolution. This phenomenon, while accurately reflecting the carnage taking place with individual share prices, also created unique opportunities to make purchases at unheard of prices. In hindsight we bought way too little, but managed to position the Fund such that during the balance of March and all of April the Investor Class of the Fund experienced an important reversal, and ended April with a year to date return of 12.89%.
It will not surprise you to know that the portfolio today looks very much like it did a year ago; heavy concentration in a select group of businesses we believe are better than average in all important aspects. There are also a few new positions, and a few businesses no longer in the portfolio. This is to be expected.
As I recently reread the October 2007 letter to you, I was surprised by my thoughts about the deteriorating housing and credit markets, simply because it has taken an additional eighteen months for the bubble’s bursting to run its course in the stock market. In the economy in general, we are likely to have more downside as it relates to this classic debt deleveraging taking place. Worth paying close attention to will be the effect on consumer discretionary spending, absent the massive amounts of money available from home refinancing and home equity loans. I believe our portfolio of unique businesses is today well positioned to succeed in the economic environment we face!
But beyond this massive deleveraging coupled with the schizophrenic fears of both deflation and inflation, we have our eye on something additional. Our friend in Dallas, Texas, Shad Rowe, reminded us of the concept of “American Exceptionalism” which simply stated is “When the going gets tough, the tough get going”. I have written in the past about the nearly universal desire of outsiders to want admission to the U.S. The simple
35
The FBR Funds
FBR Focus Fund
Management Overview (continued)
reason for this desire is the enormous opportunity which exists here in greater abundance than anywhere else in the world. The American spirit is a factor which no quantitative model can properly account for, yet it has been such an important factor throughout our history. I remember well the explosion in the stock market on January 17, 1991, when U.S. Troops went into Kuwait City. The rally extended for a decade with very little interruption, despite many negatives in the economy, including the disruptive effect of the work of the RTC (Resolution Trust Corporation) absorbing 1,000 financial institutions and spewing out those assets. My closing comments today are that in the midst of all our problems; do not underestimate the American people!
|
The opinions expressed in this commentary reflect those of the Portfolio Manager as of the date written. Any such opinions are subject to change based on market or other conditions. These opinions may not be relied upon as investment advice. Investment decisions for The FBR Funds are based on several factors, and may not be relied upon as an indication of trading intent on behalf of any FBR Fund. Security positions can and do change. |
36
The FBR Funds
FBR Focus Fund
Comparison of Changes in Value of $10,000 Investment in
Investor Class Shares(1)(2) vs. Russell 2000 Index(1)(3)
(unaudited)
| Total Returns—For the Periods Ended April 30, 2009(4) | |
| | | | | | | | | | | | | Cumulative | |
| | | | | Annualized | | Annualized | | | Since | |
| | | One Year | | Five Year | | Ten Year | | | Inception(5) | |
| | |
| |
| |
| | |
| |
FBR Focus Fund Investor Class(1)(2) | | (18.84 | )% | | 4.32 | % | | 10.00 | % | | | N/A | | |
FBR Focus Fund I Class(2)(5) | | N/A | | | N/A | | | N/A | | | | (20.65 | )% | |
FBR Focus Fund R Class(2)(5) | | N/A | | | N/A | | | N/A | | | | (21.68 | )% | |
Russell 2000 Index(1)(3) | | (30.74 | )% | | (1.45 | )% | | 2.53 | % | | | (33.54 | )% | |
PAST PERFORMANCE IS NO GUARANTEE OF FUTURE RESULTS.
The performance data quoted represents past performance and the current performance may be lower or higher than the performance data quoted. The investment return and principal will fluctuate so that investors’ shares, when redeemed, may be worth more or less than their original cost. The performance data does not reflect the deduction of taxes that a shareholder would pay on Fund distributions or redemption fees. If reflected, the redemption fee would reduce the performance data quoted. To obtain performance data current to the most recent month-end, please call 888.200.4710 or visit www.fbrfunds.com.
|
| (1) | | The graph assumes a hypothetical $10,000 initial investment in the Fund and reflects the reinvestment of dividends and all Fund expenses. Investors should note that the Fund is a professionally managed mutual fund while the index is unmanaged, does not incur expenses and is not available for investment. The performance of the index includes reinvested dividends, and does not reflect sales charges or expenses. |
| (2) | | FBR Fund Advisers, Inc. waived a portion of its advisory fees and agreed to contractually reimburse a portion of the Fund’s operating expenses, as necessary, to maintain existing expense limitations, as set forth in the notes to the financial statements. Total returns shown include fee waivers and expense reimbursements, if any; total returns would have been lower had there been no waiver of fees and/or reimbursement of expenses in excess of expense limitations. |
| (3) | | The Russell 2000 Index is comprised of the smallest of the 2000 companies of the Russell 3000 Index, representing approximately 8% of the Russell 3000’s total market capitalization. |
| (4) | | The total returns shown do not reflect the deduction of taxes that a shareholder would pay on fund distributions or the redemption of fund shares. |
| (5) | | For the period May 30, 2008 (inception of share class) through April 30, 2009. |
37
The FBR Funds
FBR Focus Fund
Portfolio Summary
April 30, 2009
(unaudited)
The following provides a breakdown of the Fund by industry sectors. The underlying securities represent a percentage of the portfolio investments.
| Industry Sector | | % of Total Investments |
| |
|
| Consumer Discretionary | 48.9 | % |
| Financials | | 17.8 | % |
| Telecommunication Services | 12.3 | % |
| Industrials | | 6.3 | % |
| | | | |
| Cash | | 14.7 | % |
38
The FBR Funds
FBR Focus Fund
Portfolio of Investments
April 30, 2009
(unaudited)
|
| | | | | | | VALUE | |
| | SHARES | | | | | (NOTE 2) | |
|
| | | | COMMON STOCKS — 84.9% | | | | |
| | | | Consumer Discretionary — 48.6% | | | | |
| | 5,791,474 | | 99 Cents Only Stores* † | | $ | 62,200,431 | |
| | 1,600,000 | | Bally Technologies, Inc.* | | | 41,888,000 | |
| | 3,127,088 | | CarMax, Inc.* | | | 39,901,643 | |
| | 1,830,000 | | Lamar Advertising Co., Class A* | | | 30,927,000 | |
| | 933,797 | | Monarch Casino & Resort, Inc.* † | | | 9,543,405 | |
| | 1,622,076 | | O’Reilly Automotive, Inc.* | | | 63,017,653 | |
| | 2,881,420 | | Penn National Gaming, Inc.* | | | 98,025,908 | |
| | 896,730 | | Pinnacle Entertainment, Inc.* | | | 11,191,190 | |
| | 1,804,800 | | Pool Corp. | | | 32,233,728 | |
| | | | | |
| |
| | | | | | | 388,928,958 | |
| | | | | |
| |
| | | | Financials — 17.8% | | | | |
| | 2,091,512 | | AmeriCredit Corp.* | | | 21,270,677 | |
| | 80 | | Berkshire Hathaway, Inc., Class B* | | | 245,200 | |
| | 776,913 | | Encore Capital Group, Inc.* | | | 6,790,220 | |
| | 252,815 | | Enstar Group Ltd.* | | | 18,035,822 | |
| | 1,667,025 | | Flagstone Reinsurance Holdings Ltd. | | | 15,436,652 | |
| | 337,840 | | HFF, Inc., Class A* | | | 912,168 | |
| | 255,400 | | Markel Corp.* | | | 73,299,800 | |
| | 125,000 | | T. Rowe Price Group, Inc. | | | 4,815,000 | |
| | 173,137 | | White River Capital, Inc.* | | | 1,232,735 | |
| | | | | |
| |
| | | | | | | 142,038,274 | |
| | | | | |
| |
| | | | Industrials — 6.3% | | | | |
| | 730,160 | | American Woodmark Corp.† | | | 15,114,312 | |
| | 811,824 | | Dynamex, Inc.* † | | | 11,941,931 | |
| | 183,200 | | Iron Mountain, Inc.* | | | 5,219,368 | |
| | 800,000 | | Simpson Manufacturing Company, Inc. | | | 17,808,000 | |
| | | | | |
| |
| | | | | | | 50,083,611 | |
| | | | | |
| |
| | | | Telecommunication Services — 12.2% | | | | |
| | 3,074,000 | | American Tower Corp., Class A* | | | 97,630,240 | |
| | | | | |
| |
| | | | | | | | |
| | | | Total Common Stocks (Cost $600,956,143) | | | 678,681,083 | |
| | | | | |
| |
39
The FBR Funds
FBR Focus Fund
Portfolio of Investments (continued)
April 30, 2009
(unaudited)
|
| | | | | | | VALUE | |
| | SHARES | | | | | (NOTE 2) | |
|
| | | | MONEY MARKET FUND — 14.6% | | | | |
| | 117,073,189 | | JPMorgan 100% U.S. Treasury Securities Money Market Fund (Cost $117,073,189) | | $ | 117,073,189 | |
| | | | | |
| |
| | | | | | | | |
| | | | Total Investments — 99.5% (Cost $718,029,332) | | | 795,754,272 | |
| | | | | | | | |
| | | | Other Assets Less Liabilities — 0.5% | | | 4,130,656 | |
| | | | | |
| |
| | | | | | | | |
| | | | Net Assets — 100.0% | | $ | 799,884,928 | |
| | | | | |
| |
|
| * | | Non-income producing security |
| † | | Affiliated issuer as defined in the Investment Company Act of 1940 (ownership of at least 5% of the outstanding voting securities of an issuer) |
| Note: | | For presentation purposes, the Fund has grouped some of the industry categories. For purposes of categorizing securities for compliance with Section 8(b)(1) of the Investment Company Act of 1940, the Fund uses more specific industry classifications. |
The accompanying notes are an integral part of the financial statements.
40
| The FBR Funds |
|
| FBR Large Cap Financial Fund |
| Management Overview |
Portfolio Manager: David Ellison
Over the last six months, how did the Fund perform?
For the six-month period ended April 30, 2009, the FBR Large Cap Financial Fund returned -9.73%. This compares to the Philadelphia Bank Index, the S&P 500 Index and the Morningstar Specialty-Financial Category average, which returned -42.83%, -8.53% and -15.92% for the same period, respectively.
What factors contributed to the Fund’s performance?
The Fund has been positioned conservatively over the last 18 months and we have seen favorable results relative to industry benchmarks during this period. Conservative positioning was taken in light of deteriorating industry conditions most notably seen in the rise in troubled assets throughout the entire financial services industry. The Fund has been concentrated in the most conservatively run institutions and the portfolio has carried high cash balances. Conservative companies have lower risk lending, investing and business strategies and a history of managing through difficult industry conditions. Cash balances ended the period at 8.8% and were as high as 63% during the reporting period. While this type of positioning of the Fund is unusual it was deemed necessary given the extremely negative industry conditions over the last 18 months.
What is the outlook for the Fund and the financial services sector?
It is my belief that better times are ahead for the sector and the related equities. The last 18-24 months have been quite shocking to even the most seasoned financial services investors. I have observed, studied and invested in this industry for over 26 years and have been at times astonished at how quickly and how severely conditions deteriorated in late 2008.
The bad news is that industry practices in the past were stretched to the extremes of risk, leverage, complexity and growth to satisfy the needs of investors demanding faster EPS growth and company executives seeking ever higher bonuses. The good news today and going forward is that all such practices are in the process of changing. Companies now are looking to reduce risk, leverage, complexity and growth to satisfy the needs of regulators and the desire of managers to keep their jobs and save the company.
Overall economic conditions are also showing some improvement. Short-term lending rates have declined, credit spreads have narrowed, housing prices and activity has picked up in some of the hardest hit regions of the country, housing inventories have declined, new capital has been raised and government programs and policies to improve liquidity and stabilize certain markets is showing some success.
This more conservative posture by managements and a stabilizing economy will sow the seeds of better EPS performance going forward. Over the course of my career I have made most of my money by committing new capital and investing in financial stocks during the
41
| The FBR Funds |
|
| FBR Large Cap Financial Fund |
| Management Overview (continued) |
years when industry conditions and fundamentals go from ugly to okay to good to great. Conditions today are ugly and this reality has been reflected in financial stock performance over the last 18 months.
I believe that a well researched portfolio of financial companies will benefit from improved industry and overall economic conditions. This improvement should manifest itself in favorable stock performance going forward. As a consequence, I would expect the Fund to be more fully invested and more aggressively positioned than it has been in recent periods.
|
The opinions expressed in this commentary reflect those of the Portfolio Manager as of the date written. Any such opinions are subject to change based on market or other conditions. These opinions may not be relied upon as investment advice. Investment decisions for The FBR Funds are based on several factors, and may not be relied upon as an indication of trading intent on behalf of any FBR Fund. Security positions can and do change. |
42
The FBR Funds
FBR Large Cap Financial Fund
Comparison of Changes in Value of $10,000 Investment in
Investor Class Shares(1)(2) vs. S&P 500 Index(1)(3)
(unaudited)
| Total Returns—For the Periods Ended April 30, 2009(4) |
| | | | | | | | | Annualized | | Annualized | |
| | | | | One Year | | | Five Year | | Ten Year | |
| | | | |
| | |
| |
| |
| | FBR Large Cap Financial Fund Investor Class(1)(2) | | | (25.51 | )% | | | (3.70 | )% | | | 1.61% | |
| | S&P 500 Index(1)(3) | | | (35.31 | )% | | | (2.70 | )% | | | (2.48)% | |
| | | | | | | | | | | | | | |
PAST PERFORMANCE IS NO GUARANTEE OF FUTURE RESULTS.
The performance data quoted represents past performance and the current performance may be lower or higher than the performance data quoted. The investment return and principal will fluctuate so that investors’ shares, when redeemed, may be worth more or less than their original cost. The performance data does not reflect the deduction of taxes that a shareholder would pay on Fund distributions or redemption fees. If reflected, the redemption fee would reduce the performance data quoted. To obtain performance data current to the most recent month-end, please call 888.200.4710 or visit www.fbrfunds.com.
|
| (1) | | The graph assumes a hypothetical $10,000 initial investment in the Fund and reflects the reinvestment of dividends and all Fund expenses. Investors should note that the Fund is a professionally managed mutual fund while the index is unmanaged, does not incur expenses and is not available for investment. The performance of the index includes reinvested dividends, and does not reflect sales charges or expenses. |
| (2) | | FBR Fund Advisers, Inc. waived a portion of its advisory fees and agreed to contractually reimburse a portion of the Fund’s operating expenses, as necessary, to maintain existing expense limitations, as set forth in the notes to the financial statements. Total returns shown include fee waivers and expense reimbursements, if any; total returns would have been lower had there been no waiver of fees and/or reimbursement of expenses in excess of expense limitations. |
| (3) | | The S&P 500 Index is a capitalization-weighted index of 500 stocks. The index is designed to represent the broad domestic economy through changes in aggregate market value of 500 stocks representing all major industries. |
| (4) | | The total returns shown do not reflect the deduction of taxes that a shareholder would pay on fund distributions or the redemption of fund shares. |
43
| The FBR Funds |
|
| FBR Large Cap Financial Fund |
| Portfolio Summary |
April 30, 2009
(unaudited) |
The following provides a breakdown of the Fund by industry sectors. The underlying securities represent a percentage of the portfolio investments.
| Industry Sector | | % of Total Investments |
| |
|
| Commercial Banks | | 28.9 | % |
| Insurance | | | 16.4 | % |
| Diversified Financial Services | | 13.3 | % |
| Consumer Finance | | 10.7 | % |
| Capital Markets | | 10.6 | % |
| Thrifts and Mortgage Finance | | 6.7 | % |
| IT Services | | | 3.5 | % |
| Real Estate Investment Trusts | | 1.3 | % |
| | | | | |
| Cash | | | 8.6 | % |
44
| The FBR Funds |
|
| FBR Large Cap Financial Fund |
| Portfolio of Investments |
April 30, 2009
(unaudited) |
| |
|
| | | | | | VALUE | |
| SHARES | | | | | (NOTE 2) | |
|
| | | COMMON STOCKS — 93.3% | | | | |
| | | Capital Markets — 10.8% | | | | |
| 4,000 | | Ameriprise Financial, Inc. | | $ | 105,400 | |
| 32,000 | | Morgan Stanley | | | 756,480 | |
| 7,000 | | The Goldman Sachs Group, Inc. | | | 899,500 | |
| | | | |
| |
| | | | | | 1,761,380 | |
| | | | |
| |
| | | Commercial Banks — 29.5% | | | | |
| 5,000 | | BB&T Corp. | | | 116,700 | |
| 33,000 | | Comerica, Inc. | | | 692,340 | |
| 131,000 | | KeyCorp | | | 805,650 | |
| 6,000 | | M&T Bank Corp. | | | 314,700 | |
| 68,000 | | SunTrust Banks, Inc. | | | 981,920 | |
| 20,000 | | The PNC Financial Services Group, Inc. | | | 794,000 | |
| 17,000 | | U.S. Bancorp | | | 309,740 | |
| 40,000 | | Wells Fargo & Co. | | | 800,400 | |
| | | | |
| |
| | | | | | 4,815,450 | |
| | | | |
| |
| | | Consumer Finance — 10.9% | | | | |
| 25,000 | | American Express Co. | | | 630,500 | |
| 52,000 | | Capital One Financial Corp. | | | 870,480 | |
| 35,000 | | Discover Financial Services | | | 284,550 | |
| | | | |
| |
| | | | | | 1,785,530 | |
| | | | |
| |
| | | Diversified Financial Services — 13.6% | | | | |
| 101,000 | | Bank of America Corp. | | | 901,930 | |
| 85,000 | | Citigroup, Inc. | | | 259,250 | |
| 32,000 | | JPMorgan Chase & Co. | | | 1,056,000 | |
| | | | |
| |
| | | | | | 2,217,180 | |
| | | | |
| |
| | | Insurance — 16.7% | | | | |
| 5,000 | | ACE Ltd. | | | 231,600 | |
| 210 | | Berkshire Hathaway, Inc., Class B* | | | 643,650 | |
| 25,000 | | Fidelity National Financial, Inc., Class A | | | 453,250 | |
| 19,000 | | MetLife, Inc. | | | 565,250 | |
| 15,000 | | Prudential Financial, Inc. | | | 433,200 | |
| 17,000 | | The Allstate Corp. | | | 396,610 | |
| | | | |
| |
| | | | | | 2,723,560 | |
| | | | |
| |
45
| The FBR Funds |
|
| FBR Large Cap Financial Fund |
| Portfolio of Investments (continued) |
April 30, 2009
(unaudited) |
| |
|
| | | | | | VALUE | |
| SHARES | | | | | (NOTE 2) | |
|
| | | IT Services — 3.6% | | | | |
| 9,000 | | Visa, Inc., Class A | | $ | 584,640 | |
| | | | |
| |
| | | Real Estate Investment Trusts — 1.3% | | | | |
| 15,000 | | Annaly Capital Management, Inc. | | | 211,050 | |
| | | | |
| |
| | | Thrifts and Mortgage Finance — 6.9% | | | | |
| 45,000 | | Hudson City Bancorp, Inc. | | | 565,200 | |
| 30,000 | | New York Community Bancorp, Inc. | | | 339,300 | |
| 10,000 | | People’s United Financial, Inc. | | | 156,200 | |
| 5,000 | | TFS Financial Corp. | | | 58,650 | |
| | | | |
| |
| | | | | | 1,119,350 | |
| | | | |
| |
| | | Total Common Stocks (Cost $13,048,514) | | | 15,218,140 | |
| | | | |
| |
| | | MONEY MARKET FUND — 8.8% | | | | |
| 1,431,621 | | JPMorgan 100% U.S. Treasury Securities Money Market Fund (Cost $1,431,621) | | | 1,431,621 | |
| | | | |
| |
| | | | | | |
| | | Total Investments — 102.1% (Cost $14,480,135) | | | 16,649,761 | |
| | | | | | |
| | | Liabilities Less Other Assets — (2.1%) | | | (337,986 | ) |
| | | | |
| |
| | | | | | |
| | | Net Assets — 100.0% | | $ | 16,311,775 | |
| | | | |
| |
|
| * | | Non-income producing security |
The accompanying notes are an integral part of the financial statements.
46
The FBR Funds
FBR Small Cap Financial Fund
Management Overview
Portfolio Manager: David Ellison
Over the last six months, how did the Fund perform?
For the six-month period ended April 30, 2009, the Investor Class of the FBR Small Cap Financial Fund returned -7.15%. This compares to the NASDAQ Bank Index, Russell 2000 Index, and the Morningstar Specialty-Financial Category average which returned -29.55%, -8.40% and -15.92% for the same period, respectively.
What factors contributed to the Fund’s performance?
The Fund has been positioned conservatively over the last 18 months and we have seen favorable results relative to industry benchmarks during this period. Conservative positioning was taken in light of deteriorating industry conditions most notably seen in the rise in troubled assets throughout the entire financial services industry. The Fund has been concentrated in the most conservatively run institutions and the portfolio has carried high cash balances. Conservative companies have lower risk lending, investing and business strategies and a history of managing through difficult industry conditions. Cash balances ended the period at 25.9% and were as high as 64% during the reporting period. While this type of positioning of the Fund is unusual it was deemed necessary given the extremely negative industry conditions over the last 18 months.
What is the outlook for the Fund and the financial services sector?
It is my belief that better times are ahead for the sector and the related equities. The last 18-24 months have been quite shocking to even the most seasoned financial service investors. I have observed, studied and invested in this industry for 26 years and have been at times astonished at how quickly and how severe conditions became in late 2008.
The bad news is that industry practices in the past were stretched to the extremes of risk, leverage, complexity and growth to satisfy the needs of investors demanding faster EPS growth and company executives seeking ever higher bonuses. The good news today and going forward is that all such practices are in the process of changing. Companies now are looking to reduce risk, leverage, complexity and growth to satisfy the needs of regulators and the desire of managers to keep their jobs and save the company.
Overall economic conditions are also showing some improvement. Short term lending rates have declined, credit spreads have narrowed, housing prices and activity has picked up in some of the hardest hit regions of the country, housing inventories have declined, new capital has been raised and government programs and policies to improve liquidity and stabilize certain markets is showing some success.
This more conservative posture by managements and a stabilizing economy will sow the seeds of better EPS performance going forward. I have made most of my money in financial stocks over the years when industry conditions go from ugly to okay to good to
47
The FBR Funds
FBR Small Cap Financial Fund
Management Overview (continued)
great. Conditions today are ugly and this reality has been reflected in financial stock performance over the last 18 months.
I believe that a well researched portfolio of financial companies will benefit from improved industry and overall economic conditions. This improvement should manifest itself in favorable stock performance going forward. As a consequence, I would expect the Fund to be more fully invested and more aggressively positioned than it has been in recent periods.
|
The opinions expressed in this commentary reflect those of the Portfolio Manager as of the date written. Any such opinions are subject to change based on market or other conditions. These opinions may not be relied upon as investment advice. Investment decisions for The FBR Funds are based on several factors, and may not be relied upon as an indication of trading intent on behalf of any FBR Fund. Security positions can and do change. |
48
The FBR Funds
FBR Small Cap Financial Fund
Comparison of Changes in Value of $10,000 Investment in
Investor Class Shares(1)(2) vs. Russell 2000 Index(1)(3)
(unaudited)
| Total Returns—For the Periods Ended April 30, 2009(4) | |
| | | | | | | | | | | | | | | | Cumulative | |
| | | | | | | | | Annualized | | | Annualized | | Since | |
| | | | | One Year | | | Five Year | | | Ten Year | | Inception(5) | |
| | | | |
| | |
| | |
| |
| |
| | FBR Small Cap Financial Fund Investor Class(1)(2) | | | (10.11 | )% | | | (2.05 | )% | | | 8.69 | % | | N/A | | |
| | FBR Small Cap Financial Fund I Class(2)(5) | | | N/A | | | | N/A | | | | N/A | | | (7.16 | )% | |
| | FBR Small Cap Financial Fund R Class(2)(5) | | | N/A | | | | N/A | | | | N/A | | | (8.23 | )% | |
| | Russell 2000 Index(1)(3) | | | (30.74 | )% | | | (1.45 | )% | | | 2.53 | % | | (33.54 | )% | |
| | | |
PAST PERFORMANCE IS NO GUARANTEE OF FUTURE RESULTS.
The performance data quoted represents past performance and the current performance may be lower or higher than the performance data quoted. The investment return and principal will fluctuate so that investors’ shares, when redeemed, may be worth more or less than their original cost. The performance data does not reflect the deduction of taxes that a shareholder would pay on Fund distributions or redemption fees. If reflected, the redemption fee would reduce the performance data quoted. To obtain performance data current to the most recent month-end, please call 888.200.4710 or visit www.fbrfunds.com.
|
| (1) | | The graph assumes a hypothetical $10,000 initial investment in the Fund and reflects the reinvestment of dividends and all Fund expenses. Investors should note that the Fund is a professionally managed mutual fund while the index is unmanaged, does not incur expenses and is not available for investment. The performance of the index includes reinvested dividends, and does not reflect sales charges or expenses. |
| (2) | | FBR Fund Advisers, Inc. waived a portion of its advisory fees and agreed to contractually reimburse a portion of the Fund’s operating expenses, as necessary, to maintain existing expense limitations, as set forth in the notes to the financial statements. Total returns shown include fee waivers and expense reimbursements, if any; total returns would have been lower had there been no waiver of fees and/or reimbursement of expenses in excess of expense limitations. |
| (3) | | The Russell 2000 Index is comprised of the smallest of the 2000 companies of the Russell 3000 Index, representing approximately 8% of the Russell 3000’s total market capitalization. |
| (4) | | The total returns shown do not reflect the deduction of taxes that a shareholder would pay on fund distributions or the redemption of fund shares. |
| (5) | | For the period May 30, 2008 (inception of share class) through April 30, 2009. |
49
| The FBR Funds |
|
| FBR Small Cap Financial Fund |
| Portfolio Summary |
April 30, 2009
(unaudited) |
The following provides a breakdown of the Fund by industry sectors. The underlying securities represent a percentage of the portfolio investments.
| Industry Sector | | % of Total Investments |
| |
|
| Commerical Banks | | 35.2 | % |
| Thrifts and Mortgage Finance | | 23.4 | % |
| Insurance | | | 6.0 | % |
| Household Durables | | 4.4 | % |
| Real Estate Investment Trusts | | 4.2 | % |
| Diversified Financial Services | | 1.2 | % |
| | | | | |
| Cash | | | 25.6 | % |
50
| The FBR Funds |
|
| FBR Small Cap Financial Fund |
| Portfolio of Investments |
April 30, 2009
(unaudited) |
| |
|
| | | | | | VALUE | |
| SHARES | | | | | (NOTE 2) | |
|
| | | COMMON STOCKS — 75.9% | | | | |
| | | Commercial Banks — 35.8% | | | | |
| 96,917 | | 1st Source Corp. | | $ | 1,903,450 | |
| 15,000 | | Associated Banc-Corp. | | | 232,050 | |
| 15,000 | | BancFirst Corp. | | | 640,500 | |
| 72,391 | | Bancorp Rhode Island, Inc. | | | 1,339,957 | |
| 30,000 | | BancorpSouth, Inc. | | | 697,500 | |
| 60,000 | | BOK Financial Corp. | | | 2,259,600 | |
| 6,112 | | Camden National Corp. | | | 177,248 | |
| 176,613 | | Cape Bancorp, Inc.* | | | 1,227,460 | |
| 825,000 | | CapitalSource, Inc. | | | 2,549,250 | |
| 40,000 | | Cathay General Bancorp | | | 448,800 | |
| 177,600 | | Central Pacific Financial Corp. | | | 1,040,736 | |
| 45,000 | | City National Corp. | | | 1,647,000 | |
| 171,900 | | Comerica, Inc. | | | 3,606,462 | |
| 180,000 | | CVB Financial Corp. | | | 1,081,800 | |
| 160,000 | | East West Bancorp, Inc. | | | 1,092,800 | |
| 700,000 | | Fifth Third Bancorp | | | 2,870,000 | |
| 10,000 | | First Commonwealth Financial Corp. | | | 86,700 | |
| 8,900 | | First Financial Corp. | | | 330,190 | |
| 258,600 | | First Horizon National Corp. | | | 2,976,486 | |
| 67,800 | | FirstMerit Corp. | | | 1,315,998 | |
| 140,000 | | Fulton Financial Corp. | | | 925,400 | |
| 220,000 | | Glacier Bancorp, Inc. | | | 3,370,400 | |
| 250,000 | | Huntington Bancshares, Inc. | | | 697,500 | |
| 216,345 | | Independent Bank Corp. | | | 4,318,245 | |
| 232,400 | | Investors Bancorp, Inc.* | | | 2,128,784 | |
| 39,162 | | Lakeland Bancorp, Inc. | | | 333,269 | |
| 100,000 | | Marshall & Ilsley Corp. | | | 578,000 | |
| 44,263 | | MB Financial, Inc. | | | 603,305 | |
| 501,717 | | Nara Bancorp, Inc. | | | 1,861,370 | |
| 80,000 | | National Penn Bancshares, Inc. | | | 647,200 | |
| 61,887 | | Pacific Premier Bancorp, Inc.* | | | 262,401 | |
| 100,000 | | Regions Financial Corp. | | | 449,000 | |
| 198,783 | | State Bancorp, Inc. | | | 1,637,972 | |
51
| The FBR Funds |
|
| FBR Small Cap Financial Fund |
| Portfolio of Investments (continued) |
April 30, 2009
(unaudited) |
| |
|
| | | | | | VALUE | |
| SHARES | | | | | (NOTE 2) | |
|
| | | Commercial Banks — 35.8% (continued) | | | | |
| 45,000 | | Susquehanna Bancshares, Inc. | | $ | 362,700 | |
| 90,000 | | SVB Financial Group* | | | 1,868,400 | |
| 75,000 | | Synovus Financial Corp. | | | 242,250 | |
| 260,700 | | TCF Financial Corp. | | | 3,626,337 | |
| 937,200 | | The South Financial Group, Inc. | | | 1,555,752 | |
| 18,288 | | TowneBank | | | 315,102 | |
| 10,000 | | United Bankshares, Inc. | | | 259,400 | |
| 687,200 | | Webster Financial Corp. | | | 3,594,056 | |
| 59,698 | | Western Alliance Bancorp.* | | | 388,634 | |
| 72,800 | | Whitney Holding Corp. | | | 870,688 | |
| 80,600 | | Wilmington Trust Corp. | | | 1,169,506 | |
| 75,000 | | Wilshire Bancorp, Inc. | | | 303,000 | |
| 26,000 | | Wintrust Financial Corp. | | | 442,000 | |
| 240,000 | | Zions Bancorp. | | | 2,623,200 | |
| | | | |
| |
| | | | | | 62,957,858 | |
| | | | |
| |
| | | Diversified Financial Services — 1.3% | | | | |
| 525,000 | | CIT Group, Inc. | | | 1,165,500 | |
| 70,000 | | Interactive Brokers Group, Inc., Class A* | | | 1,032,500 | |
| | | | |
| |
| | | | | | 2,198,000 | |
| | | | |
| |
| | | Household Durables — 4.5% | | | | |
| 70,000 | | Centex Corp. | | | 765,800 | |
| 80,000 | | D.R. Horton, Inc. | | | 1,044,000 | |
| 200,000 | | KB Home | | | 3,614,000 | |
| 115,000 | | Lennar Corp., Class A | | | 1,120,100 | |
| 120,000 | | Pulte Homes, Inc. | | | 1,381,200 | |
| | | | |
| |
| | | | | | 7,925,100 | |
| | | | |
| |
| | | Insurance — 6.2% | | | | |
| 45,000 | | Assurant, Inc. | | | 1,099,800 | |
| 359,988 | | Assured Guaranty Ltd. | | | 3,477,484 | |
| 185,000 | | MBIA, Inc.* | | | 875,050 | |
| 160,000 | | Principal Financial Group, Inc. | | | 2,614,400 | |
| 289,107 | | XL Capital Ltd., Class A | | | 2,749,408 | |
| | | | |
| |
| | | | | | 10,816,142 | |
| | | | |
| |
52
| The FBR Funds |
|
| FBR Small Cap Financial Fund |
| Portfolio of Investments (continued) |
April 30, 2009
(unaudited) |
| |
|
| | | | | | VALUE | |
| SHARES | | | | | (NOTE 2) | |
|
| | | Real Estate Investment Trusts — 4.3% | | | | |
| 205,850 | | Anworth Mortgage Asset Corp. | | $ | 1,323,616 | |
| 73,850 | | Capstead Mortgage Corp. | | | 841,152 | |
| 358,108 | | Chimera Investment Corp. | | | 1,264,121 | |
| 224,250 | | MFA Mortgage Investments, Inc. | | | 1,320,833 | |
| 168,514 | | Redwood Trust, Inc. | | | 2,741,722 | |
| | | | |
| |
| | | | | | 7,491,444 | |
| | | | |
| |
| | | Thrifts and Mortgage Finance — 23.8% | | | | |
| 290,000 | | Astoria Financial Corp. | | | 2,395,400 | |
| 325,792 | | Bank Mutual Corp. | | | 3,345,884 | |
| 380,000 | | Brookline Bancorp, Inc. | | | 3,769,600 | |
| 20,000 | | Capitol Federal Financial | | | 779,200 | |
| 172,762 | | Danvers Bancorp, Inc. | | | 2,506,777 | |
| 324,264 | | Dime Community Bancshares, Inc. | | | 2,704,362 | |
| 115,000 | | First Niagara Financial Group, Inc. | | | 1,557,100 | |
| 430,121 | | Flushing Financial Corp. | | | 3,961,414 | |
| 99,331 | | Hingham Institution for Savings | | | 2,779,281 | |
| 55,824 | | Home Federal Bancorp, Inc. | | | 563,264 | |
| 210,000 | | Hudson City Bancorp, Inc. | | | 2,637,600 | |
| 130,000 | | NewAlliance Bancshares, Inc. | | | 1,678,300 | |
| 30,000 | | Northwest Bancorp, Inc. | | | 527,400 | |
| 45,883 | | OceanFirst Financial Corp. | | | 557,478 | |
| 179,238 | | Parkvale Financial Corp. | | | 1,901,715 | |
| 54,525 | | People’s United Financial, Inc. | | | 851,681 | |
| 154,600 | | Provident Financial Services, Inc. | | | 1,649,582 | |
| 60,000 | | Provident New York Bancorp | | | 508,200 | |
| 42,369 | | United Financial Bancorp, Inc. | | | 562,237 | |
| 141,734 | | Washington Federal, Inc. | | | 1,839,707 | |
| 140,304 | | Westfield Financial, Inc. | | | 1,310,439 | |
| 128,252 | | WSFS Financial Corp. | | | 3,476,912 | |
| | | | |
| |
| | | | | | 41,863,533 | |
| | | | |
| |
| | | Total Common Stocks (Cost $135,574,368) | | | 133,252,077 | |
| | | | |
| |
53
| The FBR Funds |
|
| FBR Small Cap Financial Fund |
| Portfolio of Investments (continued) |
April 30, 2009
(unaudited) |
| |
|
| | | | | | VALUE | |
| SHARES | | | | | (NOTE 2) | |
|
| | | MONEY MARKET FUND — 25.9% | | | | |
| 45,552,841 | | JPMorgan 100% U.S. Treasury Securities Money Market Fund (Cost $45,552,841) | | $ | 45,552,841 | |
| | | | |
| |
| | | | | | | |
| | | Total Investments — 101.8% (Cost $181,127,209) | | | 178,804,918 | |
| | | | | | | |
| | | Liabilities Less Other Assets — (1.8%) | | | (3,119,336 | ) |
| | | | |
| |
| | | | | | |
| | | Net Assets — 100.0% | | $ | 175,685,582 | |
| | | | |
| |
|
| * | | Non-income producing security |
The accompanying notes are an integral part of the financial statements.
54
| The FBR Funds |
|
| FBR Technology Fund |
| Management Overview |
Portfolio Manager(s): David Ellison and Winsor Aylesworth
Over the last six months, how did the Fund perform?
For the six-month period ended April 30, 2009, the FBR Technology Fund returned 7.61%. This compares to the NASDAQ Composite Index and the Morningstar Specialty Technology Category average which returned 0.37% and 8.11% for the same period, respectively.
What factors contributed to the Fund’s performance?
For the most recent six-month period, the Fund comfortably outperformed the NASDAQ Composite Index and slightly underperformed against its peer group average. This six-month period was a period of great stock market volatility, multiple periods of pronounced declines and strong rallies. The performance of the Fund was characterized by higher than normal cash positions and holdings in large “best of breed” technology companies such as Apple, Inc., Intel Corp. and Cisco Systems, Inc. This approach dampened the markets’ volatility while allowing us to participate in the sector’s rally in the first four months of 2009. Two examples of this approach that were major contributors to the Fund’s performance were Amazon.com, Inc. and Research In Motion Ltd. These two holdings were up over 35% for the period. The larger than normal cash position was a drag on performance and the primary factor in the slight underperformance relative to our peers as the technology sector rallied in the back half of the reporting period.
What is the outlook for the Fund and the technology sector?
In the October 2008 Management Overview, we expressed our opinion that technology would lead the economy out of the current economic downturn. We continue to believe that technologies of various shapes and sizes, developed and those still in concept, will continue to drive increased productivity and more efficient ways to solve the problems that face today’s world. This is the premise that remains the foundation of our bullish outlook for the technology sector.
The challenge is in knowing when the economy has bottomed and recovery is in sight. Has the recent rally just been a bear market bounce or the beginning of a long-term bull market? The economy still faces many challenges as the impact of the various governmental programs and policies have not fully materialized. In this environment, it is even more important to stick to a conservative investment philosophy.
The Fund will continue to invest in technology companies that have strong balance sheets with minimal debt. Companies with a demonstrated track record of growing tangible book value that are profitable and have historically been sound investments, will continue to be a cornerstone of the portfolio. Finally, certain themes of energy efficiency, infrastructure innovations, biotechnology and global warming solutions will remain powerful secular
55
| The FBR Funds |
|
| FBR Technology Fund |
| Management Overview (continued) |
growth trends that we will invest in. The cash position of the Fund will ebb and flow and be used to take advantage of buying companies that meet these parameters when pricing becomes attractive and “lighten up” when there has been sizable appreciation.
While we expect the near term future to continue to be volatile, we think the Fund is well positioned to weather the storm and move forward. As fellow shareholders, we thank you.
|
The opinions expressed in this commentary reflect those of the Portfolio Manager(s) as of the date written. Any such opinions are subject to change based on market or other conditions. These opinions may not be relied upon as investment advice. Investment decisions for The FBR Funds are based on several factors, and may not be relied upon as an indication of trading intent on behalf of any FBR Fund. Security positions can and do change. |
56
The FBR Funds
FBR Technology Fund
Comparison of Changes in Value of $10,000 Investment in
Investor Class Shares(1)(2) vs. Various Indices(1)(3)
(unaudited)
| Total Returns—For the Periods Ended April 30, 2009(4) |
| | | | | | | | | | | | | Annualized | |
| | | | | | | | | Annualized | | | Since | |
| | | | | One Year | | | Five Year | | | Inception(5) | |
| | | | |
| | |
| | |
| |
| | FBR Technology Fund Investor Class(1)(2) | | | (28.67 | )% | | | (1.10 | )% | | | 0.86 | % | |
| | S&P 500 Index(1)(3) | | | (35.31 | )% | | | (2.70 | )% | | | (1.53 | )% | |
| | NASDAQ Composite Index(1)(3) | | | (28.09 | )% | | | (1.43 | )% | | | (0.79 | )% | |
| | | | | | | | | | | | | | | |
PAST PERFORMANCE IS NO GUARANTEE OF FUTURE RESULTS.
The performance data quoted represents past performance and the current performance may be lower or higher than the performance data quoted. The investment return and principal will fluctuate so that investors’ shares, when redeemed, may be worth more or less than their original cost. The performance data does not reflect the deduction of taxes that a shareholder would pay on Fund distributions or redemption fees. If reflected, the redemption fee would reduce the performance data quoted. To obtain performance data current to the most recent month-end, please call 888.200.4710 or visit www.fbrfunds.com.
|
| (1) | | The graph assumes a hypothetical $10,000 initial investment in the Fund and reflects the reinvestment of dividends and all Fund expenses. Investors should note that the Fund is a professionally managed mutual fund while the indices are unmanaged, do not incur expenses and are not available for investment. The performance of the indices includes reinvested dividends, and does not reflect sales charges or expenses. |
| (2) | | FBR Fund Advisers, Inc. waived a portion of its advisory fees and agreed to contractually reimburse a portion of the Fund’s operating expenses, as necessary, to maintain existing expense limitations, as set forth in the notes to the financial statements. Total returns shown include fee waivers and expense reimbursements, if any; total returns would have been lower had there been no waiver of fees and/or reimbursement of expenses in excess of expense limitations. |
| (3) | | The S&P 500 Index is a capitalization-weighted index of 500 stocks. The index is designed to represent the broad domestic economy through changes in aggregate market value of 500 stocks representing all major industries. The NASDAQ Composite Index is a broad-based capitalization-weighted index of all NASDAQ National Market and Small Cap stocks. |
| (4) | | The total returns shown do not reflect the deduction of taxes that a shareholder would pay on fund distributions or the redemption of fund shares. |
| (5) | | For the period February 1, 2002 (commencement of investment operations) through April 30, 2009. |
57
| The FBR Funds |
|
| FBR Technology Fund |
| Portfolio Summary |
April 30, 2009
(unaudited) |
The following provides a breakdown of the Fund by industry sectors. The underlying securities represent a percentage of the portfolio investments.
| Industry Sector | | % of Total Investments |
| |
|
| Technology, Hardware and Equipment | | 23.0 | % |
| Pharmaceuticals, Biotechnology and Life Sciences | | 21.9 | % |
| Software and Services | | 18.3 | % |
| Health Care Equipment and Services | | 9.1 | % |
| Capital Goods | | | 7.2 | % |
| Semiconductors and Semiconductor Equipment | | 5.5 | % |
| Retailing | | | 2.4 | % |
| Telecommunication Services | | 1.3 | % |
| Commercial and Professional Services | | 0.6 | % |
| Materials | | | 0.4 | % |
| Utilities | | | 0.4 | % |
| | | | | |
| Cash | | | 9.9 | % |
58
| The FBR Funds |
|
| FBR Technology Fund |
| Portfolio of Investments |
April 30, 2009
(unaudited) |
| |
|
| | | | | | VALUE | |
| SHARES | | | | | (NOTE 2) | |
|
| | | COMMON STOCKS — 89.5% | | | | |
| | | Capital Goods — 7.1% | | | | |
| 1,510 | | Cummins, Inc. | | $ | 51,340 | |
| 1,070 | | Energy Conversion Devices, Inc.* | | | 19,667 | |
| 575 | | First Solar, Inc.* | | | 107,691 | |
| 1,010 | | Precision Castparts Corp. | | | 75,609 | |
| 2,100 | | Quanta Services, Inc.* | | | 47,733 | |
| 2,682 | | SunPower Corp., Class B* | | | 68,016 | |
| 4,160 | | Vestas Wind Systems A/S ADR* | | | 89,855 | |
| | | | |
| |
| | | | | | 459,911 | |
| | | | |
| |
| | | Commercial and Professional Services — 0.6% | | | | |
| 1,770 | | Fuel Tech, Inc.* | | | 23,204 | |
| 735 | | Tetra Tech, Inc.* | | | 18,052 | |
| | | | |
| |
| | | | | | 41,256 | |
| | | | |
| |
| | | Health Care Equipment and Services — 9.0% | | | | |
| 2,640 | | Alcon, Inc. | | | 242,906 | |
| 1,115 | | Cerner Corp.* | | | 59,987 | |
| 5,565 | | Covidien Ltd. | | | 183,534 | |
| 335 | | Intuitive Surgical, Inc.* | | | 48,150 | |
| 1,385 | | Varian Medical Systems, Inc.* | | | 46,217 | |
| | | | |
| |
| | | | | | 580,794 | |
| | | | |
| |
| | | Materials — 0.4% | | | | |
| 1,665 | | Calgon Carbon Corp.* | | | 28,272 | |
| | | | |
| |
| | | | | | | |
| | | Pharmaceuticals, Biotechnology and Life Sciences — 21.7% | | | | |
| 3,415 | | Biogen Idec, Inc.* | | | 165,081 | |
| 5,700 | | Bristol-Myers Squibb Co. | | | 109,440 | |
| 875 | | Cephalon, Inc.* | | | 57,409 | |
| 1,540 | | Covance, Inc.* | | | 60,491 | |
| 2,985 | | Forest Laboratories, Inc.* | | | 64,745 | |
| 3,375 | | Genzyme Corp.* | | | 179,989 | |
| 5,225 | | Gilead Sciences, Inc.* | | | 239,304 | |
| 2,020 | | Johnson & Johnson | | | 105,767 | |
| 1,610 | | Life Technologies Corp.* | | | 60,053 | |
| 4,755 | | Novartis AG ADR | | | 180,262 | |
59
| The FBR Funds |
|
| FBR Technology Fund |
| Portfolio of Investments (continued) |
April 30, 2009
(unaudited) |
| |
|
| | | | | | VALUE | |
| SHARES | | | | | (NOTE 2) | |
|
| | | Pharmaceuticals, Biotechnology and Life Sciences — 21.7% (continued) | | | | |
| 1,800 | | Pharmaceutical Product Development, Inc. | | $ | 35,298 | |
| 1,500 | | Sepracor, Inc.* | | | 21,315 | |
| 595 | | United Therapeutics Corp.* | | | 37,372 | |
| 1,130 | | Waters Corp.* | | | 49,912 | |
| 875 | | Watson Pharmaceuticals, Inc.* | | | 27,073 | |
| | | | |
| |
| | | | | | 1,393,511 | |
| | | | |
| |
| | | Retailing — 2.4% | | | | |
| 1,940 | | Amazon.com, Inc.* | | | 156,209 | |
| | | | |
| |
| | | | | | | |
| | | Semiconductors and Semiconductor Equipment — 5.5% | | | | |
| 11,425 | | Intel Corp. | | | 180,286 | |
| 6,325 | | Marvell Technology Group Ltd.* | | | 69,449 | |
| 5,325 | | MEMC Electronic Materials, Inc.* | | | 86,265 | |
| 2,350 | | PMC-Sierra, Inc.* | | | 18,612 | |
| | | | |
| |
| | | | | | 354,612 | |
| | | | |
| |
| | | Software and Services — 18.2% | | | | |
| 5,775 | | Adobe Systems, Inc.* | | | 157,946 | |
| 3,015 | | Amdocs Ltd.* | | | 63,104 | |
| 280 | | Baidu.com, Inc. ADR* | | | 65,212 | |
| 2,655 | | Check Point Software Technologies Ltd.* | | | 61,516 | |
| 3,850 | | Cognizant Technology Solutions Corp., Class A* | | | 95,442 | |
| 915 | | Global Payments, Inc. | | | 29,335 | |
| 605 | | Google, Inc., Class A* | | | 239,562 | |
| 1,750 | | IAC/InterActiveCorp* | | | 28,035 | |
| 625 | | MAXIMUS, Inc. | | | 25,206 | |
| 1,325 | | Parametric Technology Corp.* | | | 14,774 | |
| 855 | | salesforce.com, inc.* | | | 36,603 | |
| 2,250 | | VASCO Data Security International, Inc.* | | | 15,570 | |
| 3,880 | | VMware, Inc., Class A* | | | 101,190 | |
| 1,570 | | Vocus, Inc.* | | | 26,690 | |
| 14,875 | | Yahoo!, Inc.* | | | 212,564 | |
| | | | |
| |
| | | | | | 1,172,749 | |
| | | | |
| |
60
| The FBR Funds |
|
| FBR Technology Fund |
| Portfolio of Investments (continued) |
April 30, 2009
(unaudited) |
| |
|
| | | | | | VALUE | |
| SHARES | | | | | (NOTE 2) | |
|
| | | Technology, Hardware and Equipment — 22.9% | | | | |
| 2,068 | | Apple, Inc.* | | $ | 260,216 | |
| 12,175 | | Cisco Systems, Inc.* | | | 235,221 | |
| 14,825 | | Corning, Inc. | | | 216,742 | |
| 1,870 | | Dolby Laboratories, Inc., Class A* | | | 75,043 | |
| 12,885 | | EMC Corp.* | | | 161,449 | |
| 1,865 | | Harris Corp. | | | 57,032 | |
| 6,465 | | Juniper Networks, Inc.* | | | 139,967 | |
| 3,185 | | Research In Motion Ltd.* | | | 221,358 | |
| 2,160 | | Teradata Corp.* | | | 36,115 | |
| 2,775 | | Western Digital Corp.* | | | 65,268 | |
| | | | |
| |
| | | | | | 1,468,411 | |
| | | | |
| |
| | | Telecommunication Services — 1.3% | | | | |
| 2,450 | | United States Cellular Corp.* | | | 83,300 | |
| | | | |
| |
| | | Utilities — 0.4% | | | | |
| 730 | | Ormat Technologies, Inc. | | | 25,696 | |
| | | | |
| |
| | | Total Common Stocks (Cost $5,242,858) | | | 5,764,721 | |
| | | | |
| |
| | | | | | | |
| | | MONEY MARKET FUND — 9.8% | | | | |
| 633,651 | | JPMorgan 100% U.S. Treasury Securities Money Market Fund (Cost $633,651) | | | 633,651 | |
| | | | |
| |
| | | | | | | |
| | | Total Investments — 99.3% (Cost $5,876,509) | | | 6,398,372 | |
| | | | | | |
| | | Other Assets Less Liabilities — 0.7% | | | 42,832 | |
| | | | |
| |
| | | | | | |
| | | Net Assets — 100.0% | | $ | 6,441,204 | |
| | | | |
| |
|
| * | | Non-income producing security |
| ADR | | American Depositary Receipts |
The accompanying notes are an integral part of the financial statements.
61
| The FBR Funds |
|
| FBR Gas Utility Index Fund |
| Management Overview |
Portfolio Manager: Winsor Aylesworth
Over the last six months, how did the Fund perform?
For the six months ended April 30, 2009, the Investor Class of the FBR Gas Utility Index Fund’s total return was -9.62%. This compares to the American Gas Association (AGA) Stock Index, S&P 500 Index and the Morningstar Specialty Utilities Category average which returned -9.83%, -8.53% and -7.14% for the same period, respectively.
What factors contributed to the Fund’s performance?
For the six-month period ended April 30, 2009, the Fund tracked and slightly outperformed its index, and underperformed against the S&P 500 Index and the Utility Fund Average. Since the Fund’s objective is to track the AGA Index (less fund expenses) the short-term comparisons to other measures may vary over different time periods.
The Fund’s outperformance to its index is a function of various cash levels being held for redemptions during a general down market. It is not from the stock selection process. This is the nature of an index fund as the Fund’s holdings tend to replicate the index in composition and weightings. These same cash positions would generate some slight underperformance during general up markets.
The major factor in the sector continues to be the worldwide economic downturn and its associated issues. This economic downturn has had a negative impact on the revenues of the companies that comprise the Index as, in general, the overall demand for energy has declined. In addition, the “credit crisis” has added uncertainty about the availability and cost of credit to this credit intensive industry. These two issues have almost universally resulted in lower stock prices for the Fund’s companies.
A positive factor influencing the industry and sector is the on-going dialogue about the long-term detrimental effects of green house gases on our environment and alternate sources of “clean” energy. These developments are positive for the industry as natural gas is the most viable and cleanest burning energy source that is readily available for residential, commercial and industrial consumption. Ultimately this should improve demand and increase the volumes of natural gas that is pumped through the transmission lines of our portfolio companies which results in growing revenues.
What is the outlook for the Fund and the utility sector?
As I mentioned in October’s annual report, the immediate outlook for the sector is contingent on the direction of the economy. Around the world, governments are trying to take steps to stem the flow of the downturn. Governments are spending large sums to put people to work and create growth. Whether these plans work without creating other issues such as inflation is a big question.
62
| The FBR Funds |
|
| FBR Gas Utility Index Fund |
| Management Overview (continued) |
The overall supply of natural gas is in good shape. This good supply and the lower demand have resulted in low wholesale prices for the resource. This alone should help stabilize and ultimately act as a positive for the industry. As we have said before, most users prefer a stable price so they can plan their future.
It is this uncertainty that makes planning for the utility sector difficult. Will decreases in demand continue? What will be the capital costs tied to the various “Green” issues? How will the regulators handle rate requests in this environment? How will the turmoil in the financial sector impact the utility sector? With all these issues in a state of flux, companies in the portfolio will certainly face challenges. We continue to expect some will handle these better than others, and there will be some who find M&A activity as a potential solution.
It is comforting to us that natural gas is a fuel of choice going forward in this environment. It is clean with minimal solar warming issues. It is also readily available within the political control of the United States. Companies that are involved in the distribution and use of this fuel, while not immune to issues, should do well as the economy goes forward. As a fellow shareholder, I thank you for your support.
|
The opinions expressed in this commentary reflect those of the Portfolio Manager as of the date written. Any such opinions are subject to change based on market or other conditions. These opinions may not be relied upon as investment advice. Investment decisions for The FBR Funds are based on several factors, and may not be relied upon as an indication of trading intent on behalf of any FBR Fund. Security positions can and do change. |
63
The FBR Funds
FBR Gas Utility Index Fund
Comparison of Changes in Value of $10,000 Investment in
Investor Class Shares(1)(2) vs. Various Indices(1)(3)
(unaudited)
| Total Returns—For the Periods Ended April 30, 2009(4)(5) |
| | | | | | | | | | | | | | | | | Cumulative | |
| | | | | | | | | Annualized | | | Annualized | | | Since | |
| | | | | One Year | | | Five Year | | | Ten Year | | | Inception(6) | |
| | | | |
| | |
| | |
| | |
| |
| | FBR Gas Utility Index Fund Investor Class(1)(2) | | | (30.80 | )% | | | 5.13 | % | | | 4.60 | % | | | N/A | | |
| | FBR Gas Utility Index Fund R Class(2)(6) | | | N/A | | | | N/A | | | | N/A | | | | (34.99 | )% | |
| | S&P 500 Index(1)(3) | | | (35.31 | )% | | | (2.70 | )% | | | (2.48 | )% | | | (36.14 | )% | |
| | AGA Stock Index(1)(3) | | | (30.31 | )% | | | 5.43 | % | | | 5.29 | % | | | N/A | | |
| | | | | | | | | | | | | | | | | | | |
PAST PERFORMANCE IS NO GUARANTEE OF FUTURE RESULTS.
The performance data quoted represents past performance and the current performance may be lower or higher than the performance data quoted. The investment return and principal will fluctuate so that investors’ shares, when redeemed, may be worth more or less than their original cost. The performance data does not reflect the deduction of taxes that a shareholder would pay on Fund distributions or redemption fees. If reflected, the redemption fee would reduce the performance data quoted. To obtain performance data current to the most recent month-end, please call 888.200.4710 or visit www.fbrfunds.com.
|
| (1) | | The graph assumes a hypothetical $10,000 initial investment in the Fund and reflects the reinvestment of dividends and all Fund expenses. Investors should note that the Fund is a professionally managed mutual fund while the indices are unmanaged, do not incur expenses and are not available for investment. The performance of the indices includes reinvested dividends, and does not reflect sales charges or expenses. |
| (2) | | FBR Fund Advisers, Inc. waived a portion of its advisory fees and agreed to contractually reimburse a portion of the Fund’s operating expenses, as necessary, to maintain existing expense limitations, as set forth in the notes to the financial statements. Total returns shown include fee waivers and expense reimbursements, if any; total returns would have been lower had there been no waiver of fees and/or reimbursement of expenses in excess of expense limitations. |
| (3) | | The S&P 500 Index is a capitalization-weighted index of 500 stocks. The index is designed to represent the broad domestic economy through changes in aggregate market value of 500 stocks representing all major industries. The AGA Stock Index is a market capitalization-weighted index, adjusted monthly, consisting of member companies of the American Gas Association. |
| (4) | | The total returns shown do not reflect the deduction of taxes that a shareholder would pay on fund distributions or the redemption of fund shares. |
| (5) | | Effective April 1, 2003, the Fund changed its fiscal year-end from March 31 to October 31. |
| (6) | | For the period May 30, 2008 (inception of share class) through April 30, 2009. |
64
| The FBR Funds |
|
| FBR Gas Utility Index Fund |
| Portfolio Summary |
April 30, 2009
(unaudited) |
The following provides a breakdown of the Fund by industry sectors. The underlying securities represent a percentage of the portfolio investments.
| Industry Sector | | % of Total Investments |
| |
|
| Multi-Utilities | | 36.7 | % |
| Gas Utilities | | | 25.9 | % |
| Oil, Gas and Consumable Fuels | | 22.3 | % |
| Electric Utilities | | 13.3 | % |
| Independent Power Producers and Energy Traders | | 0.3 | % |
| | | | | |
| Cash | | | 1.5 | % |
65
| The FBR Funds |
|
| FBR Gas Utility Index Fund |
| Portfolio of Investments |
April 30, 2009
(unaudited) |
| |
|
| | | | | | VALUE | |
| SHARES | | | | | (NOTE 2) | |
|
| | | COMMON STOCKS — 98.4% | | | | |
| | | Electric Utilities — 13.3% | | | | |
| 750 | | ALLETE, Inc. | | $ | 19,530 | |
| 76,537 | | Duke Energy Corp. | | | 1,056,976 | |
| 245,640 | | E.ON AG ADR | | | 8,265,785 | |
| 3,015 | | Entergy Corp. | | | 195,282 | |
| 64,325 | | Exelon Corp. | | | 2,967,312 | |
| 259,900 | | Iberdrola S.A. ADR | | | 8,155,662 | |
| 6,778 | | MGE Energy, Inc. | | | 207,949 | |
| 28,375 | | Northeast Utilities | | | 596,443 | |
| 12,825 | | NV Energy, Inc. | | | 131,456 | |
| 12,516 | | Pepco Holdings, Inc. | | | 149,566 | |
| 5,075 | | The Empire District Electric Co. | | | 75,973 | |
| 4,505 | | UniSource Energy Corp. | | | 118,572 | |
| | | | |
| |
| | | | | | 21,940,506 | |
| | | | |
| |
| | | Gas Utilities — 25.9% | | | | |
| 116,250 | | AGL Resources, Inc. | | | 3,623,513 | |
| 167,150 | | Atmos Energy Corp. | | | 4,130,276 | |
| 9,365 | | Chesapeake Utilities Corp. | | | 274,301 | |
| 1,625 | | Corning Natural Gas Corp. | | | 25,204 | |
| 6,007 | | Delta Natural Gas Company, Inc. | | | 124,645 | |
| 46,025 | | Energen Corp. | | | 1,662,423 | |
| 7,010 | | Energy West, Inc. | | | 59,585 | |
| 92,300 | | EQT Corp. | | | 3,104,049 | |
| 92,600 | | National Fuel Gas Co. | | | 3,028,946 | |
| 56,450 | | New Jersey Resources Corp. | | | 1,858,334 | |
| 81,650 | | Nicor, Inc. | | | 2,624,231 | |
| 50,800 | | Northwest Natural Gas Co. | | | 2,077,720 | |
| 136,700 | | ONEOK, Inc. | | | 3,577,439 | |
| 140,750 | | Piedmont Natural Gas Company, Inc. | | | 3,437,115 | |
| 134,100 | | Questar Corp. | | | 3,985,451 | |
| 4,193 | | RGC Resources, Inc. | | | 106,922 | |
| 49,260 | | South Jersey Industries, Inc. | | | 1,709,815 | |
| 82,400 | | Southwest Gas Corp. | | | 1,665,304 | |
66
| The FBR Funds |
|
| FBR Gas Utility Index Fund |
| Portfolio of Investments (continued) |
April 30, 2009
(unaudited) |
| |
|
| | | | | | VALUE | |
| SHARES | | | | | (NOTE 2) | |
|
| | | Gas Utilities — 25.9% (continued) | | | | |
| 36,550 | | The Laclede Group, Inc. | | $ | 1,267,554 | |
| 63,950 | | UGI Corp. | | | 1,467,013 | |
| 89,100 | | WGL Holdings, Inc. | | | 2,774,574 | |
| | | | |
| |
| | | | | | 42,584,414 | |
| | | | |
| |
| | | Independent Power Producers and Energy Traders — 0.3% | | | | |
| 18,325 | | Constellation Energy Group, Inc. | | | 441,266 | |
| | | | |
| |
| | | Multi-Utilities — 36.6% | | | | |
| 22,375 | | Alliant Energy Corp. | | | 500,305 | |
| 24,125 | | Ameren Corp. | | | 555,358 | |
| 19,225 | | Avista Corp. | | | 289,336 | |
| 16,650 | | Black Hills Corp. | | | 331,002 | |
| 239,600 | | CenterPoint Energy, Inc. | | | 2,549,344 | |
| 6,550 | | CH Energy Group, Inc. | | | 291,082 | |
| 124,350 | | CMS Energy Corp. | | | 1,494,687 | |
| 83,875 | | Consolidated Edison, Inc. | | | 3,114,279 | |
| 271,500 | | Dominion Resources, Inc. | | | 8,188,440 | |
| 43,025 | | DTE Energy Co. | | | 1,272,249 | |
| 59,171 | | Integrys Energy Group, Inc. | | | 1,562,706 | |
| 94,400 | | MDU Resources Group, Inc. | | | 1,658,608 | |
| 198,461 | | National Grid PLC ADR | | | 8,265,900 | |
| 315,750 | | NiSource, Inc. | | | 3,470,093 | |
| 21,376 | | NorthWestern Corp. | | | 447,186 | |
| 20,825 | | NSTAR | | | 654,113 | |
| 185,825 | | PG&E Corp. | | | 6,897,824 | |
| 209,000 | | Public Service Enterprise Group, Inc. | | | 6,236,560 | |
| 173,325 | | Sempra Energy | | | 7,976,417 | |
| 47,275 | | TECO Energy, Inc. | | | 500,642 | |
| 50,655 | | Vectren Corp. | | | 1,123,021 | |
| 25,225 | | Wisconsin Energy Corp. | | | 1,007,991 | |
| 103,050 | | Xcel Energy, Inc. | | | 1,900,242 | |
| | | | |
| |
| | | | | | 60,287,385 | |
| | | | |
| |
67
| The FBR Funds |
|
| FBR Gas Utility Index Fund |
| Portfolio of Investments (continued) |
April 30, 2009
(unaudited) |
| |
|
| | | | | | VALUE | |
| SHARES | | | | | (NOTE 2) | |
|
| | | Oil, Gas and Consumable Fuels — 22.3% | | | | |
| 85,825 | | Cheniere Energy, Inc.* | | $ | 338,151 | |
| 771,750 | | El Paso Corp. | | | 5,325,075 | |
| 257,817 | | Enbridge, Inc. | | | 7,953,654 | |
| 185,157 | | Southern Union Co. | | | 2,945,848 | |
| 540,718 | | Spectra Energy Corp. | | | 7,840,411 | |
| 305,850 | | The Williams Companies, Inc. | | | 4,312,485 | |
| 321,300 | | TransCanada Corp. | | | 8,022,861 | |
| | | | |
| |
| | | | | | 36,738,485 | |
| | | | |
| |
| | | Total Common Stocks (Cost $117,579,621) | | | 161,992,056 | |
| | | | |
| |
| | | MONEY MARKET FUND — 1.5% | | | | |
| 2,492,687 | | JPMorgan 100% U.S. Treasury Securities Money Market Fund (Cost $2,492,687) | | | 2,492,687 | |
| | | | |
| |
| | | | | | |
| | | Total Investments — 99.9% (Cost $120,072,308) | | | 164,484,743 | |
| | | | | | |
| | | Other Assets Less Liabilities — 0.1% | | | 158,012 | |
| | | | |
| |
| | | | | | |
| | | Net Assets — 100.0% | | $ | 164,642,755 | |
| | | | |
| |
|
| * | | Non-income producing security |
| ADR | | American Depositary Receipts |
| PLC | | Public Liability Company |
The accompanying notes are an integral part of the financial statements.
68
| The FBR Funds |
|
| FBR Fund for Government Investors |
| Management Overview |
Portfolio Manager: William Barlow Sanders, III
Over the last six months, how did the Fund perform?
For the six-month period ended April 30, 2009 the FBR Fund for Government Investors appreciated 0.20%.1
What factors contributed to the Fund’s performance?
During the Fund’s semi-annual period, the Federal Open Market Committee (the “Fed”), at its December meeting, reduced the Fed Funds target rate from 1.00% to a range of 0-0.25%. The Fed maintained this “accommodative” (essentially zero) rate target throughout the period as it acknowledged the extreme weak nature of the economy and risks to its growth.
Most of the reporting period was characterized by continued economic freefall but, towards its end, the pace of economic deceleration slowed and it appears that the Armageddon scenario of a total collapse of our financial system is off the table for the time. Due to very aggressive actions by the Fed to maintain liquidity and increase confidence in the system, including conventional and non-conventional tools, we are at a point where the economy may be in a bottoming process. Economic signals are still bleak but the noticeable deceleration in the rate of change has lead investors to begin to see several “green shoots” of recovery in the distance. Deleveraging is continuing but not at such a frantic pace anymore. Balance sheets are being recapitalized and repaired and banks are lending again (albeit much more responsibly). The housing market and consumer spending, both vitally important economic drivers, are still weak but beginning to show signs of stabilization. When growth does return it will be at lower levels than we have seen in some time. After many years of a 0% savings rate, in a quick turnaround, consumers are now saving 5% of their incomes which is a substantial hit to GDP of which 70% comes from consumer spending. We still have a long way to go to get to healthier economic growth levels but, most now agree, we have stepped back from the abyss and the Depression scenario is now off the table.
Due to the massive credit contraction and deleveraging in the economy deflation is still a meaningful risk, but it is pretty amazing that we are now actually starting to hear talk of how and when the Fed can start withdrawing liquidity from the system and winding down its special programs. These steps will be necessary to prevent runaway inflation down the road and allow the markets and system to stand on their own feet unfettered by government intervention. It will truly be a delicate dance as to when to begin and the actual strategy to employ in unwinding its multi-faceted involvement in the economy but the fact that we avoided soup lines gives me cause for optimism.
|
| 1 | During the period, FBR Fund Advisers, Inc. voluntarily waived expenses that were otherwise payable by the Fund. Without these voluntary fee waivers, performance results would have been lower than the amount indicated. |
69
| The FBR Funds |
|
| FBR Fund for Government Investors |
| Management Overview (continued) |
What is the outlook for the Fund?
Given the precarious nature of our country’s economic footing, the Fed has indicated it intends to keep the target rate at 0-0.25% for the foreseeable future meaning the return of the Fund will be at a near zero rate as well. Short Treasury rates are at extremely low levels as there is still significant investor demand for their safety. As soon as the economy starts to get some traction, the Fed should start to move its target rate up and short rates will follow which will raise the Fund’s yield. Hopefully, I will be discussing that with you in our next communication.
The performance of the Fund remains linked to the movements of the Fed Funds target rate. Regardless of what the Fed does (or doesn’t do next) the Fund will stay with our conservative investment style of owning only the highest quality and most liquid government issued and sponsored securities.
An additional item worth mentioning is that the Fund has continued its participation in the U.S. Treasury Department’s Temporary Guarantee Program for Money Market Funds which runs to September 18, 2009.
|
The U.S. Treasury Temporary Guarantee Program provides a guarantee to participating money market mutual fund shareholders based on the number of shares invested in the Fund at the close of business on September 19, 2008. Any increase in the number of shares the investor holds after the close of business on September 19, 2008 will not be guaranteed. If a shareholder closes their account with the Fund or broker-dealer, any future investment in the Fund will not be guaranteed. If the number of shares an investor holds fluctuates over the period, the investor will be covered for either the number of shares held at the close of business on September 19, 2008 or the current amount, whichever is less. The program will expire on September 18, 2009 unless extended. |
| |
An investment in the Fund is not insured or guaranteed by the Federal Deposit Insurance Corporation or any other government agency. Although the Fund seeks to preserve the value of your investment at $1.00 per share, it is possible to lose money by investing in the Fund. |
| |
The opinions expressed in this commentary reflect those of the Portfolio Manager as of the date written. Any such opinions are subject to change based on market or other conditions. These opinions may not be relied upon as investment advice. Investment decisions for The FBR Funds are based on several factors, and may not be relied upon as an indication of trading intent on behalf of any FBR Fund .. Security positions can and do change. |
70
| The FBR Funds |
|
| FBR Fund for Government Investors |
| Portfolio Summary |
April 30, 2009
(unaudited) |
The following provides a breakdown of the Fund by maturity schedule1. The underlying securities represent a percentage of the portfolio investments.
| Time to Maturity | | % of Total Investments |
| |
|
| Greater than 90 days | | 49.4 | % |
| 30 days or Less | | 24.7 | % |
| 61 to 90 days | | 18.8 | % |
| 31 to 60 days | | 7.1 | % |
|
| 1 | The maturity date used for each security in the portfolio to determine the schedule is the shorter of the next interest rate reset date or the final maturity date. |
71
| The FBR Funds |
|
| FBR Fund for Government Investors |
| Portfolio of Investments |
April 30, 2009
(unaudited) |
| |
|
| | | | | | | | MATURITY | | | | |
| PAR | | | | RATE | | | DATE | | VALUE |
|
| | | U.S. GOVERNMENT AND AGENCY OBLIGATIONS — 90.3% | | | | | | | | | | | |
| | | Federal Home Loan Bank — 54.1% | | | | | | | | | | | |
| $ 6,000,000 | | FHLB | | 1.98 | % | | | 6/30/09 | | | $ | 6,014,524 | |
| 6,000,000 | | FHLB | | 2.56 | | | | 8/4/09 | | | | 6,030,564 | |
| 5,000,000 | | FHLB | | 5.25 | | | | 8/5/09 | | | | 5,063,596 | |
| 5,000,000 | | FHLB | | 3.75 | | | | 8/18/09 | | | | 5,050,156 | |
| 8,000,000 | | FHLB Discount Note* | | 0.4 | | | | 5/29/09 | | | | 7,997,511 | |
| 10,000,000 | | FHLB Discount Note* | | 0.51 | | | | 7/27/09 | | | | 9,987,675 | |
| 6,000,000 | | FHLB Discount Note* | | 0.57 | | | | 9/2/09 | | | | 5,988,220 | |
| | | | | | | | | | | |
| |
| | | | | | | | | | | | | 46,132,246 | |
| | | | | | | | | | | |
| |
| | | Federal Home Loan Mortgage Corporation — 22.7% | | | | | | | | | | | |
| 5,000,000 | | FHLMC | | 5.25 | | | | 5/21/09 | | | | 5,013,429 | |
| 2,326,000 | | FHLMC | | 6.625 | | | | 9/15/09 | | | | 2,380,956 | |
| 6,000,000 | | Freddie Mac Discount Note* | | 0.47 | | | | 6/15/09 | | | | 5,996,475 | |
| 6,000,000 | | Freddie Mac Discount Note* | �� | 0.7 | | | | 9/21/09 | | | | 5,983,317 | |
| | | | | | | | | | | |
| |
| | | | | | | | | | | | | 19,374,177 | |
| | | | | | | | | | | |
| |
| | | Federal National Mortgage Association — 13.5% | | | | | | | | | | | |
| 3,450,000 | | FNMA | | 6.625 | | | | 9/15/09 | | | | 3,531,556 | |
| 8,000,000 | | Fannie Mae Discount Note* | | 0.34 | | | | 9/30/09 | | | | 7,988,515 | |
| | | | | | | | | | | |
| |
| | | | | | | | | | | | | 11,520,071 | |
| | | | | | | | | | | |
| |
| | | MONEY MARKET FUNDS — 9.4% | | | | | | | | | | | |
| 2,838,783 | | JPMorgan 100% U.S. Treasury Securities Money Market Fund | | | | | | | | | | 2,838,783 | |
| 5,188,851 | | JPMorgan U.S. Government Money Market Fund | | | | | | | | | | 5,188,851 | |
| | | | | | | | | | | |
| |
| | | | | | | | | | | | | 8,027,634 | |
| | | | | | | | | | | |
| |
| | | | | | | | | | | | | | |
| | | Total Investments — 99.7% (Amortized Cost $85,054,128)† | | | | | | | | | | 85,054,128 | |
| | | | | | | | | | | | | | |
| | | Other Assets Less Liabilities — 0.3% | | | | | | | | | | 266,277 | |
| | | | | | | | | | | |
| |
| | | | | | |
| | | Net Assets — 100.0% | | | | | | | | | $ | 85,320,405 | |
| | | | | | | | | | | |
| |
|
| * | Interest rates for the discount notes represent the yield to maturity at the date of purchase. |
| † | Same cost is used for federal income tax purposes. |
Weighted Average Maturity of Portfolio: 84 Days
The accompanying notes are an integral part of the financial statements.
72
The FBR Funds
Statements of Assets and Liabilities
April 30, 2009
(unaudited)
| | | | | | | | FBR |
| | | FBR | | Pegasus Mid Cap |
| | | Pegasus FundTM | | FundTM |
| | |
| |
|
| ASSETS | | | | | | | | | | |
Investment Securities at Cost | | | $ | 11,621,963 | | | | $ | 7,920,513 | |
| | | |
| | | |
| |
Investment Securities at Value (Note 2) | | | $ | 11,272,648 | | | | $ | 7,884,874 | |
Receivable for Capital Shares Sold | | | | — | | | | | 11,057 | |
Receivable for Investment Securities Sold | | | | — | | | | | 61,685 | |
Dividends and Interest Receivable | | | | 5,086 | | | | | 5,810 | |
Receivable from Adviser | | | | 2,177 | | | | | 5,170 | |
Prepaid Expenses | | | | 10,224 | | | | | 13,347 | |
| | | |
| | | |
| |
Total Assets | | | | 11,290,135 | | | | | 7,981,943 | |
| | | |
| | | |
| |
| LIABILITIES | | | | | | | | | | |
Payable for Investment Securities Purchased | | | | 164,318 | | | | | 729,546 | |
Administration Fee Payable (Note 3) | | | | 156 | | | | | 87 | |
Distribution and Service Fees Payable (Note 3) | | | | 1,941 | | | | | 1,075 | |
Other Accrued Expenses | | | | 33,494 | | | | | 32,122 | |
| | | |
| | | |
| |
Total Liabilities | | | | 199,909 | | | | | 762,830 | |
| | | |
| | | |
| |
| NET ASSETS | | | $ | 11,090,226 | | | | $ | 7,219,113 | |
| | | |
| | | |
| |
| Net Assets Consist of: | | | | | | | | | | |
Paid-in capital | | | $ | 12,734,826 | | | | $ | 8,344,120 | |
Accumulated net investment income | | | | 19,237 | | | | | 7,954 | |
Accumulated net realized loss on investments | | | | (1,314,522 | ) | | | | (1,097,322 | ) |
Net unrealized depreciation on investments | | | | (349,315 | ) | | | | (35,639 | ) |
| | | |
| | | |
| |
| NET ASSETS | | | $ | 11,090,226 | | | | $ | 7,219,113 | |
| | | |
| | | |
| |
| Pricing of Investor Class Shares | | | | | | | | | | |
Net assets attributable to Investor Class shares | | | $ | 11,020,135 | | | | $ | 7,147,353 | |
Shares of Beneficial Interest Outstanding (unlimited number of shares authorized, no par value) | | | | 1,373,619 | | | | | 880,958 | |
| | | |
| | | |
| |
Net Asset Value Per Share | | | $ | 8.02 | | | | $ | 8.11 | |
| | | |
| | | |
| |
| Pricing of I Class Shares | | | | | | | | | | |
Net assets attributable to I Class shares | | | $ | 70,091 | | | | $ | 71,760 | |
Shares of Beneficial Interest Outstanding (unlimited number of shares authorized, no par value) | | | | 10,094 | | | | | 10,224 | |
| | | |
| | | |
| |
Net Asset Value Per Share | | | $ | 6.94 | | | | $ | 7.02 | |
| | | |
| | | |
| |
73
The FBR Funds
Statements of Assets and Liabilities (continued)
April 30, 2009
(unaudited)
| | | FBR | | FBR |
| | | Pegasus Small Cap | | Pegasus Small Cap |
| | | FundTM | | Growth FundTM |
| | |
| |
|
| ASSETS | | | | | | | | | | |
Investment Securities at Cost | | | $ | 7,329,904 | | | | $ | 3,502,917 | |
| | | |
| | | |
| |
Investment Securities at Value (Note 2) | | | $ | 7,688,807 | | | | $ | 3,395,165 | |
Receivable for Investment Securities Sold | | | | 220,119 | | | | | — | |
Dividends and Interest Receivable | | | | 6,409 | | | | | 1,358 | |
Receivable from Adviser | | | | 3,129 | | | | | 7,519 | |
Prepaid Expenses | | | | 13,412 | | | | | 13,444 | |
| | | |
| | | |
| |
Total Assets | | | | 7,931,876 | | | | | 3,417,486 | |
| | | |
| | | |
| |
| LIABILITIES | | | | | | | | | | |
Payable for Capital Shares Redeemed | | | | 6,930 | | | | | — | |
Payable for Investment Securities Purchased | | | | 573,777 | | | | | 52,215 | |
Administration Fee Payable (Note 3) | | | | 110 | | | | | 50 | |
Distribution and Service Fees Payable (Note 3) | | | | 1,360 | | | | | 619 | |
Other Accrued Expenses | | | | 32,266 | | | | | 33,564 | |
| | | |
| | | |
| |
Total Liabilities | | | | 614,443 | | | | | 86,448 | |
| | | |
| | | |
| |
| NET ASSETS | | | $ | 7,317,433 | | | | $ | 3,331,038 | |
| | | |
| | | |
| |
| Net Assets Consist of: | | | | | | | | | | |
Paid-in capital | | | $ | 7,846,361 | | | | $ | 4,131,059 | |
Accumulated net investment income (loss) | | | | 8,984 | | | | | (10,717 | ) |
Accumulated net realized loss on investments | | | | (896,815 | ) | | | | (681,552 | ) |
Net unrealized appreciation (depreciation) on investments | | | | 358,903 | | | | | (107,752 | ) |
| | | |
| | | |
| |
| NET ASSETS | | | $ | 7,317,433 | | | | $ | 3,331,038 | |
| | | |
| | | |
| |
| Pricing of Investor Class Shares | | | | | | | | | | |
Net assets attributable to Investor Class shares | | | $ | 7,243,208 | | | | $ | 3,184,138 | |
Shares of Beneficial Interest Outstanding (unlimited number of shares authorized, no par value) | | | | 881,070 | | | | | 373,726 | |
| | | |
| | | |
| |
Net Asset Value Per Share | | | $ | 8.22 | | | | $ | 8.52 | |
| | | |
| | | |
| |
| Pricing of I Class Shares | | | | | | | | | | |
Net assets attributable to I Class shares | | | $ | 74,225 | | | | $ | 73,620 | |
Shares of Beneficial Interest Outstanding (unlimited number of shares authorized, no par value) | | | | 10,000 | | | | | 10,000 | |
| | | |
| | | |
| |
Net Asset Value Per Share | | | $ | 7.42 | | | | $ | 7.36 | |
| | | |
| | | |
| |
| Pricing of R Class Shares | | | | | | | | | | |
Net assets attributable to R Class shares | | | $ | — | | | | $ | 73,280 | |
Shares of Beneficial Interest Outstanding (unlimited number of shares authorized, no par value) | | | | — | | | | | 10,000 | |
| | | |
| | | |
| |
Net Asset Value Per Share | | | $ | — | | | | $ | 7.33 | |
| | | |
| | | |
| |
74
The FBR Funds
Statements of Assets and Liabilities (continued)
April 30, 2009
(unaudited)
| | | | | | | | FBR | | FBR |
| | | FBR | | Large Cap | | Small Cap |
| | | Focus Fund | | Financial Fund | | Financial Fund |
| | |
| |
| |
|
| ASSETS | | | | | | | | | | | | | | | |
Investment Securities | | | | | | | | | | | | | | | |
Securities at Cost: | | | | | | | | | | | | | | | |
Unaffiliated Issuers | | | $ | 608,950,660 | | | | $ | 14,480,135 | | | | $ | 181,127,209 | |
Affiliated Issuers | | | | 109,078,672 | | | | | — | | | | | — | |
| | | |
| | | |
| | | |
| |
Total securities | | | $ | 718,029,332 | | | | $ | 14,480,135 | | | | $ | 181,127,209 | |
| | | |
| | | |
| | | |
| |
Securities at Value (Note 2): | | | | | | | | | | | | | | | |
Unaffiliated issuers | | | $ | 696,954,193 | | | | $ | 16,649,761 | | | | $ | 178,804,918 | |
Affiliated Issuers | | | | 98,800,079 | | | | | — | | | | | — | |
| | | |
| | | |
| | | |
| |
Total securities | | | | 795,754,272 | | | | | 16,649,761 | | | | | 178,804,918 | |
Receivable for Capital Shares Sold | | | | 5,559,475 | | | | | 21,957 | | | | | 207,248 | |
Receivable for Investment Securities Sold | | | | 603,546 | | | | | 219,795 | | | | | 130,899 | |
Dividends and Interest Receivable | | | | 561 | | | | | 15,799 | | | | | 223,425 | |
Prepaid Expenses | | | | 43,970 | | | | | 10,154 | | | | | 28,414 | |
| | | |
| | | |
| | | |
| |
Total Assets | | | | 801,961,824 | | | | | 16,917,466 | | | | | 179,394,904 | |
| | | |
| | | |
| | | |
| |
| LIABILITIES | | | | | | | | | | | | | | | |
Payable for Capital Shares Redeemed | | | | 851,691 | | | | | — | | | | | 74,634 | |
Payable for Investment Securities Purchased | | | | 79,979 | | | | | 553,741 | | | | | 3,345,871 | |
Investment Advisory Fee Payable (Note 3) | | | | 535,558 | | | | | 8,953 | | | | | 123,881 | |
Administration Fee Payable (Note 3) | | | | 11,918 | | | | | 256 | | | | | 2,789 | |
Distribution and Service Fees Payable (Note 3) | | | | 145,126 | | | | | 3,195 | | | | | 34,866 | |
Other Accrued Expenses | | | | 452,624 | | | | | 39,546 | | | | | 127,281 | |
| | | |
| | | |
| | | |
| |
Total Liabilities | | | | 2,076,896 | | | | | 605,691 | | | | | 3,709,322 | |
| | | |
| | | |
| | | |
| |
| NET ASSETS | | | $ | 799,884,928 | | | | $ | 16,311,775 | | | | $ | 175,685,582 | |
| | | |
| | | |
| | | |
| |
| Net Assets Consist of: | | | | | | | | | | | | | | | |
Paid-in capital | | | $ | 739,075,359 | | | | $ | 24,129,770 | | | | $ | 198,082,182 | |
Accumulated net investment income (loss) | | | | (3,620,934 | ) | | | | 13,080 | | | | | 150,678 | |
Accumulated net realized loss on investments and foreign currency transactions | | | | (13,294,437 | ) | | | | (10,000,701 | ) | | | | (20,224,987 | ) |
Net unrealized appreciation (depreciation) on investments | | | | 77,724,940 | | | | | 2,169,626 | | | | | (2,322,291 | ) |
| | | |
| | | |
| | | |
| |
| NET ASSETS | | | $ | 799,884,928 | | | | $ | 16,311,775 | | | | $ | 175,685,582 | |
| | | |
| | | |
| | | |
| |
| Pricing of Investor Class Shares | | | | | | | | | | | | | | | |
Net assets attributable to Investor Class shares | | | $ | 779,689,101 | | | | $ | 16,311,775 | | | | $ | 175,450,138 | |
Shares of Beneficial Interest Outstanding (unlimited number of shares authorized, no par value) | | | | 22,481,638 | | | | | 1,640,264 | | | | | 12,579,496 | |
| | | |
| | | |
| | | |
| |
Net Asset Value Per Share | | | $ | 34.68 | | | | $ | 9.94 | | | | $ | 13.95 | |
| | | |
| | | |
| | | |
| |
| Pricing of I Class Shares | | | | | | | | | | | | | | | |
Net assets attributable to I Class shares | | | $ | 20,047,129 | | | | $ | — | | | | $ | 124,660 | |
Shares of Beneficial Interest Outstanding (unlimited number of shares authorized, no par value) | | | | 10,359,055 | | | | | — | | | | | 13,728 | |
| | | |
| | | |
| | | |
| |
Net Asset Value Per Share | | | $ | 1.94 | | | | $ | — | | | | $ | 9.08 | |
| | | |
| | | |
| | | |
| |
| Pricing of R Class Shares | | | | | | | | | | | | | | | |
Net assets attributable to R Class shares | | | $ | 148,698 | | | | $ | — | | | | $ | 110,784 | |
Shares of Beneficial Interest Outstanding (unlimited number of shares authorized, no par value) | | | | 78,905 | | | | | — | | | | | 12,277 | |
| | | |
| | | |
| | | |
| |
Net Asset Value Per Share | | | $ | 1.88 | | | | $ | — | | | | $ | 9.02 | |
| | | |
| | | |
| | | |
| |
75
The FBR Funds
Statements of Assets and Liabilities (continued)
April 30, 2009
(unaudited)
| | | | | | | | | | | | | FBR |
| | | | | | | | FBR | | Fund for |
| | | FBR | | Gas Utility | | Government |
| | | Technology Fund | | Index Fund | | Investors** |
| | |
| |
| |
|
| ASSETS | | | | | | | | | | | | | | | |
Investment Securities at Cost* | | | $ | 5,876,509 | | | | $ | 120,072,308 | | | | $ | 85,054,128 | |
| | | |
| | | |
| | | |
| |
Investment Securities at Value* (Note 2) | | | $ | 6,398,372 | | | | $ | 164,484,743 | | | | $ | 85,054,128 | |
Receivable for Investment Securities Sold | | | | 81,799 | | | | | 336,417 | | | | | — | |
Receivable for Capital Shares Sold | | | | 2,649 | | | | | 23,150 | | | | | 176,686 | |
Dividends and Interest Receivable | | | | 2,109 | | | | | 239,169 | | | | | 360,310 | |
Receivable from Adviser | | | | 410 | | | | | — | | | | | — | |
Prepaid Expenses | | | | 8,498 | | | | | 15,389 | | | | | 27,502 | |
| | | |
| | | |
| | | |
| |
Total Assets | | | | 6,493,837 | | | | | 165,098,868 | | | | | 85,618,626 | |
| | | |
| | | |
| | | |
| |
| LIABILITIES | | | | | | | | | | | | | | | |
Payable for Capital Shares Redeemed | | | | 15,546 | | | | | 54,911 | | | | | 223,610 | |
Payable for Investment Securities Purchased | | | | — | | | | | 223,514 | | | | | — | |
Investment Advisory Fee Payable (Note 3) | | | | — | | | | | 52,478 | | | | | 6,004 | |
Administration Fee Payable (Note 3) | | | | 107 | | | | | 2,662 | | | | | 1,432 | |
Distribution and Service Fees Payable (Note 3) | | | | 1,343 | | | | | 26 | | | | | — | |
Other Accrued Expenses | | | | 35,637 | | | | | 122,522 | | | | | 67,175 | |
| | | |
| | | |
| | | |
| |
Total Liabilities | | | | 52,633 | | | | | 456,113 | | | | | 298,221 | |
| | | |
| | | |
| | | |
| |
| NET ASSETS | | | $ | 6,441,204 | | | | $ | 164,642,755 | | | | $ | 85,320,405 | |
| | | |
| | | |
| | | |
| |
| Net Assets Consist of: | | | | | | | | | | | | | | | |
Paid-in capital | | | $ | 12,065,345 | | | | $ | 135,968,966 | | | | $ | 85,507,072 | |
Accumulated net investment income (loss) | | | | (30,264 | ) | | | | 124,309 | | | | | — | |
Accumulated net realized loss on investments | | | | (6,115,740 | ) | | | | (15,862,955 | ) | | | | (186,667 | ) |
Net unrealized appreciation on investments | | | | 521,863 | | | | | 44,412,435 | | | | | — | |
| | | |
| | | |
| | | |
| |
| NET ASSETS | | | $ | 6,441,204 | | | | $ | 164,642,755 | | | | $ | 85,320,405 | |
| | | |
| | | |
| | | |
| |
| Pricing of Investor Class Shares | | | | | | | | | | | | | | | |
Net assets attributable to Investor Class shares | | | $ | 6,441,204 | | | | $ | 164,577,697 | | | | $ | 85,320,405 | |
Shares of Beneficial Interest Outstanding (unlimited number of shares authorized, no par value) | | | | 860,164 | | | | | 12,773,904 | | | | | 85,507,067 | |
| | | |
| | | |
| | | |
| |
Net Asset Value Per Share | | | $ | 7.49 | | | | $ | 12.88 | | | | $ | 1.00 | |
| | | |
| | | |
| | | |
| |
| Pricing of R Class Shares | | | | | | | | | | | | | | | |
Net assets attributable to R Class shares | | | $ | — | | | | $ | 65,058 | | | | $ | — | |
Shares of Beneficial Interest Outstanding (unlimited number of shares authorized, no par value) | | | | — | | | | | 11,713 | | | | | — | |
| | | |
| | | |
| | | |
| |
Net Asset Value Per Share | | | $ | — | | | | $ | 5.55 | | | | $ | — | |
| | | |
| | | |
| | | |
| |
|
| * | | For the FBR Fund for Government Investors, securities are reported at amortized cost. |
| ** | | References to Investor Class for FBR Fund for Government Investors shall be deemed to refer to current outstanding shares of the Fund. |
| | | |
| The accompanying notes are an integral part of the financial statements. |
76
The FBR Funds
Statements of Operations
For the Six Months Ended April 30, 2009
(unaudited)
| | | | | | | | FBR |
| | | FBR | | Pegasus Mid Cap |
| | | Pegasus FundTM | | FundTM |
| | |
| |
|
| Investment Income | | | | | | | | | | |
Dividends1 | | | $ | 68,929 | | | | $ | 45,038 | |
Interest | | | | 376 | | | | | 361 | |
| | | |
| | | |
| |
Total Investment Income | | | | 69,305 | | | | | 45,399 | |
| | | |
| | | |
| |
| Expenses | | | | | | | | | | |
Investment Advisory fees (Note 3) | | | | 28,658 | | | | | 20,129 | |
Administration fees (Note 3) | | | | 1,029 | | | | | 874 | |
Distribution and Service fees – Investor Class (Note 3) | | | | 7,880 | | | | | 5,510 | |
Professional fees | | | | 23,887 | | | | | 23,887 | |
Registration fees – Investor Class | | | | 7,505 | | | | | 7,670 | |
Registration fees – I Class | | | | 3,819 | | | | | 3,221 | |
Trustees’ fees | | | | 7,900 | | | | | 7,900 | |
Shareholder administrative fees – Investor Class | | | | 6,656 | | | | | 5,244 | |
Compliance fees | | | | 4,158 | | | | | 4,064 | |
Reports to shareholders – Investor Class | | | | 1,940 | | | | | 1,536 | |
Reports to shareholders – I Class | | | | 253 | | | | | 299 | |
Transfer agent fees – Investor Class | | | | 1,791 | | | | | 1,539 | |
Transfer agent fees – I Class | | | | 225 | | | | | 226 | |
Accounting services fees | | | | 1,166 | | | | | 1,273 | |
Insurance fees | | | | 729 | | | | | 254 | |
Custodian fees | | | | 134 | | | | | 91 | |
Other expenses | | | | 1,899 | | | | | 1,579 | |
| | | |
| | | |
| |
Total expenses before waivers and related reimbursements | | | | 99,629 | | | | | 85,296 | |
Less waivers and related reimbursements | | | | (59,704 | ) | | | | (55,183 | ) |
| | | |
| | | |
| |
Total expenses after waivers and related reimbursements | | | | 39,925 | | | | | 30,113 | |
| | | |
| | | |
| |
Net Investment Income | | | | 29,380 | | | | | 15,286 | |
| | | |
| | | |
| |
| Net Realized and Unrealized Gain (Loss) on Investments | | | | | | | | | | |
Net Realized Loss on Investment Transactions | | | | (430,657 | ) | | | | (914,220 | ) |
Change in Net Unrealized Appreciation/Depreciation of Investments | | | | 689,921 | | | | | 968,664 | |
| | | |
| | | |
| |
Net Gain on Investments | | | | 259,264 | | | | | 54,444 | |
| | | |
| | | |
| |
| Net Increase in Net Assets Resulting from Operations | | | $ | 288,644 | | | | $ | 69,730 | |
| | | |
| | | |
| |
| | |
|
| 1 | Net of foreign taxes withheld of $307 and $184 for the FBR Pegasus FundTM and FBR Pegasus Mid Cap FundTM, respectively. |
77
The FBR Funds
Statements of Operations (continued)
For the Six Months Ended April 30, 2009
(unaudited)
| | | FBR | | FBR |
| | | Pegasus Small Cap | | Pegasus Small Cap |
| | | FundTM | | Growth FundTM |
| | |
| |
|
| Investment Income | | | | | | | | | | |
Dividends1 | | | $ | 39,886 | | | | $ | 9,155 | |
Interest | | | | 169 | | | | | 113 | |
| | | |
| | | |
| |
Total Investment Income | | | | 40,055 | | | | | 9,268 | |
| | | |
| | | |
| |
| Expenses | | | | | | | | | | |
Investment Advisory fees (Note 3) | | | | 19,285 | | | | | 12,393 | |
Administration fees (Note 3) | | | | 801 | | | | | 522 | |
Distribution and Service fees – Investor Class (Note 3) | | | | 5,272 | | | | | 3,282 | |
Distribution and Service fees – R Class (Note 3) | | | | — | | | | | 160 | |
Professional fees | | | | 23,887 | | | | | 25,275 | |
Trustees’ fees | | | | 7,900 | | | | | 7,900 | |
Registration fees – Investor Class | | | | 7,689 | | | | | 7,600 | |
Registration fees – I Class | | | | 3,220 | | | | | 3,217 | |
Registration fees – R Class | | | | — | | | | | 3,227 | |
Shareholder administrative fees – Investor Class | | | | 4,860 | | | | | 5,266 | |
Compliance fees | | | | 4,065 | | | | | 4,140 | |
Reports to shareholders – Investor Class | | | | 1,620 | | | | | 1,577 | |
Reports to shareholders – I Class | | | | 270 | | | | | 275 | |
Reports to shareholders – R Class | | | | — | | | | | 315 | |
Accounting services fees | | | | 1,339 | | | | | 1,179 | |
Transfer agent fees – Investor Class | | | | 1,292 | | | | | 1,660 | |
Transfer agent fees – I Class | | | | 226 | | | | | 226 | |
Transfer agent fees – R Class | | | | — | | | | | 227 | |
Insurance fees | | | | 311 | | | | | 275 | |
Custodian fees | | | | 87 | | | | | 57 | |
Other expenses | | | | 1,578 | | | | | 1,584 | |
| | | |
| | | |
| |
Total expenses before waivers and related reimbursements | | | | 83,702 | | | | | 80,357 | |
Less waivers and related reimbursements | | | | (52,631 | ) | | | | (60,372 | ) |
| | | |
| | | |
| |
Total expenses after waivers and related reimbursements | | | | 31,071 | | | | | 19,985 | |
| | | |
| | | |
| |
Net Investment Income (Loss) | | | | 8,984 | | | | | (10,717 | ) |
| | | |
| | | |
| |
| Net Realized and Unrealized Gain (Loss) on Investments | | | | | | | | | | |
Net Realized Loss on Investment Transactions | | | | (672,501 | ) | | | | (556,395 | ) |
Change in Net Unrealized Appreciation/Depreciation of Investments | | | | 1,045,540 | | | | | 613,173 | |
| | | |
| | | |
| |
Net Gain on Investments | | | | 373,039 | | | | | 56,778 | |
| | | |
| | | |
| |
| Net Increase in Net Assets Resulting from Operations | | | $ | 382,023 | | | | $ | 46,061 | |
| | | |
| | | |
| |
|
| 1 | Net of foreign taxes withheld of $0 and $24 for the FBR Pegasus Small Cap FundTM and FBR Pegasus Small Cap Growth FundTM, respectively. |
78
The FBR Funds
Statements of Operations (continued)
For the Six Months Ended April 30, 2009
(unaudited)
| | | | | | | | FBR | | FBR |
| | | | | | | | Large Cap | | Small Cap |
| | | FBR | | Financial | | Financial |
| | | Focus Fund | | Fund | | Fund |
| | |
| |
| |
|
| Investment Income | | | | | | | | | | | | | | | |
Dividends from Unaffiliated Issuers1 | | | $ | 827,688 | | | | $ | 225,352 | | | | $ | 1,672,040 | |
Dividends from Affiliated Issuers | | | | 150,047 | | | | | — | | | | | — | |
Interest | | | | 45,202 | | | | | 7,245 | | | | | 71,401 | |
| | | |
| | | |
| | | |
| |
Total Investment Income | | | | 1,022,937 | | | | | 232,597 | | | | | 1,743,441 | |
| | | |
| | | |
| | | |
| |
| Expenses | | | | | | | | | | | | | | | |
Investment Advisory fees (Note 3) | | | | 2,875,872 | | | | | 81,992 | | | | | 747,858 | |
Administration fees (Note 3) | | | | 116,107 | | | | | 4,064 | | | | | 33,866 | |
Distribution and Service fees – Investor Class (Note 3) | | | | 780,478 | | | | | 22,775 | | | | | 206,852 | |
Distribution and Service fees – R Class (Note 3) | | | | 195 | | | | | — | | | | | 230 | |
Shareholder administrative fees – Investor Class | | | | 388,087 | | | | | 12,860 | | | | | 114,355 | |
Shareholder administrative fees – I Class | | | | 2,673 | | | | | — | | | | | — | |
Shareholder administrative fees – R Class | | | | — | | | | | — | | | | | — | |
Transfer agent fees – Investor Class | | | | 135,801 | | | | | 8,097 | | | | | 43,866 | |
Transfer agent fees – I Class | | | | 371 | | | | | — | | | | | 255 | |
Transfer agent fees – R Class | | | | 230 | | | | | — | | | | | 235 | |
Insurance fees | | | | 85,838 | | | | | 983 | | | | | 10,056 | |
Accounting services fees | | | | 78,547 | | | | | 4,150 | | | | | 28,318 | |
Reports to shareholders – Investor Class | | | | 61,138 | | | | | 2,713 | | | | | 14,301 | |
Reports to shareholders – I Class | | | | 302 | | | | | — | | | | | 238 | |
Reports to shareholders – R Class | | | | 264 | | | | | — | | | | | 272 | |
Compliance fees | | | | 33,207 | | | | | 4,867 | | | | | 11,198 | |
Professional fees | | | | 27,092 | | | | | 24,067 | | | | | 25,895 | |
Registration fees – Investor Class | | | | 21,649 | | | | | 9,784 | | | | | 15,802 | |
Registration fees – I Class | | | | 7,561 | | | | | — | | | | | 4,205 | |
Registration fees – R Class | | | | 3,943 | | | | | — | | | | | 3,774 | |
Custodian fees | | | | 14,106 | | | | | 606 | | | | | 4,604 | |
Trustees’ fees | | | | 7,900 | | | | | 7,900 | | | | | 7,900 | |
Other expenses | | | | 6,677 | | | | | 1,819 | | | | | 3,054 | |
| | | |
| | | |
| | | |
| |
Total expenses before waivers and related reimbursements | | | | 4,648,038 | | | | | 186,677 | | | | | 1,277,134 | |
Less waivers and related reimbursements | | | | (4,167 | ) | | | | (9,469 | ) | | | | (8,093 | ) |
| | | |
| | | |
| | | |
| |
Total expenses after waivers and related reimbursements | | | | 4,643,871 | | | | | 177,208 | | | | | 1,269,041 | |
| | | |
| | | |
| | | |
| |
Net Investment Income (Loss) | | | | (3,620,934 | ) | | | | 55,389 | | | | | 474,400 | |
| | | |
| | | |
| | | |
| |
| Net Realized and Unrealized Gain (Loss) on Investments | | | | | | | | | | | | | | | |
Net Realized Loss on Investments: | | | | | | | | | | | | | | | |
Unaffiliated Issuers | | | | (12,105,693 | ) | | | | (5,542,892 | ) | | | | (10,744,945 | ) |
Affiliated Issuers | | | | (1,190,045 | ) | | | | — | | | | | — | |
Change in Net Unrealized Appreciation/Depreciation of Investments | | | | 72,435,234 | | | | | 2,117,819 | | | | | (4,598,417 | ) |
| | | |
| | | |
| | | |
| |
Net Gain (Loss) on Investments | | | | 59,139,496 | | | | | (3,425,073 | ) | | | | (15,343,362 | ) |
| | | |
| | | |
| | | |
| |
| Net Increase (Decrease) in Net Assets Resulting from Operations | | | $ | 55,518,562 | | | | $ | (3,369,684 | ) | | | $ | (14,868,962 | ) |
| | | |
| | | |
| | | |
| |
|
| 1 | Net of foreign taxes withheld of $10,828, $0 and $0 for the FBR Focus Fund, FBR Large Cap Financial Fund and FBR Small Cap Financial Fund, respectively. |
79
The FBR Funds
Statements of Operations (continued)
For the Six Months Ended April 30, 2009
(unaudited)
| | | | | | | | | | | | | FBR |
| | | FBR | | FBR | | Fund for |
| | | Technology | | Gas Utility | | Government |
| | | Fund | | Index Fund | | Investors* |
| | |
| |
| |
|
| Investment Income | | | | | | | | | | | | | | | |
Dividends1 | | | $ | 31,041 | | | | $ | 3,537,386 | | | | $ | — | |
Interest (Note 2) | | | | 686 | | | | | 8,866 | | | | | 581,207 | |
| | | |
| | | |
| | | |
| |
Total Investment Income | | | | 31,727 | | | | | 3,546,252 | | | | | 581,207 | |
| | | |
| | | |
| | | |
| |
| Expenses | | | | | | | | | | | | | | | |
Investment Advisory fees (Note 3) | | | | 28,611 | | | | | 345,778 | | | | | 239,589 | |
Administration fees (Note 3) | | | | 853 | | | | | 67,997 | | | | | 18,354 | |
Distribution and Service fees – Investor Class (Note 3) | | | | 7,948 | | | | | — | | | | | — | |
Distribution and Service fees – R Class (Note 3) | | | | — | | | | | 163 | | | | | — | |
Professional fees | | | | 24,486 | | | | | 25,151 | | | | | 36,129 | |
Registration fees – Investor Class | | | | 10,003 | | | | | 11,129 | | | | | 11,496 | |
Registration fees – R Class | | | | — | | | | | 3,111 | | | | | — | |
Trustees’ fees | | | | 7,900 | | | | | 7,900 | | | | | 7,900 | |
Shareholder administrative fees – Investor Class | | | | 6,405 | | | | | 50,366 | | | | | — | |
Compliance fees | | | | 4,249 | | | | | 12,148 | | | | | 8,099 | |
Reports to shareholders – Investor Class | | | | 3,561 | | | | | 13,267 | | | | | 3,749 | |
Reports to shareholders – R Class | | | | — | | | | | 264 | | | | | — | |
Transfer agent fees – Investor Class | | | | 2,887 | | | | | 69,714 | | | | | 47,524 | |
Transfer agent fees – R Class | | | | — | | | | | 230 | | | | | — | |
Insurance fees (Note 9) | | | | 1,901 | | | | | 18,171 | | | | | 32,905 | |
Accounting services fees | | | | 861 | | | | | 25,500 | | | | | 13,806 | |
Custodian fees | | | | 74 | | | | | 4,397 | | | | | 2,452 | |
Reimbursement of Fund expenses Paid by Adviser | | | | — | | | | | 78 | | | | | — | |
Other expenses | | | | 2,014 | | | | | 4,863 | | | | | 2,771 | |
| | | |
| | | |
| | | |
| |
Total expenses before waivers and related reimbursements | | | | 101,753 | | | | | 660,227 | | | | | 424,774 | |
Less waivers and related reimbursements | | | | (39,762 | ) | | | | (3,520 | ) | | | | (53,540 | ) |
| | | |
| | | |
| | | |
| |
Total expenses after waivers and related reimbursements | | | | 61,991 | | | | | 656,707 | | | | | 371,234 | |
| | | |
| | | |
| | | |
| |
Net Investment Income (Loss) | | | | (30,264 | ) | | | | 2,889,545 | | | | | 209,973 | |
| | | |
| | | |
| | | |
| |
| Net Realized and Unrealized Gain (Loss) on Investments | | | | | | | | | | | | | | | |
Net Realized Loss on Investment Transactions | | | | (2,019,333 | ) | | | | (2,680,227 | ) | | | | — | |
Change in Net Unrealized Appreciation/Depreciation of Investments | | | | 2,392,060 | | | | | (19,553,385 | ) | | | | — | |
| | | |
| | | |
| | | |
| |
Net Gain (Loss) on Investments | | | | 372,727 | | | | | (22,233,612 | ) | | | | — | |
| | | |
| | | |
| | | |
| |
| Net Increase (Decrease) in Net Assets Resulting from Operations | | | $ | 342,463 | | | | $ | (19,344,067 | ) | | | $ | 209,973 | |
| | | |
| | | |
| | | |
| |
| | |
|
| 1 | Net of foreign taxes withheld of $0, $55,812 and $0 for the FBR Technology Fund, FBR Gas Utility Index Fund, and FBR Fund for Government Investors, respectively. |
| * | References to Investor Class for FBR Fund for Government Investors shall be deemed to refer to current outstanding shares of the Fund. |
| | |
| The accompanying notes are an integral part of the financial statements. |
80
The FBR Funds
Statements of Changes in Net Assets
| | | FBR Pegasus FundTM | | FBR Pegasus Mid Cap FundTM |
| | |
| |
|
| | | For the | | | | | | | For the | | | | | |
| | | Six Months | | For the | | Six Months | | For the |
| | | Ended | | Year | | Ended | | Year |
| | | April 30, | | Ended | | April 30, | | Ended |
| | | 2009 | | October 31, | | 2009 | | October 31, |
| | | (unaudited) | | 2008 | | (unaudited) | | 2008 |
| | |
| |
| |
| |
|
| From Investment Activities | | | | | | | | | | | | | | | | | | | | |
Net Investment Income (Loss) | | | $ | 29,380 | | | | $ | 45,953 | | | | $ | 15,286 | | | | $ | (5,243 | ) |
Net Realized Loss on Investment Transactions | | | | (430,657 | ) | | | | (865,416 | ) | | | | (914,220 | ) | | | | (104,237 | ) |
Change in Net Unrealized Appreciation/Depreciation of Investments | | | | 689,921 | | | | | (2,374,702 | ) | | | | 968,664 | | | | | (1,370,588 | ) |
| | | |
| | | |
| | | |
| | | |
| |
Net Increase (Decrease) in Net Assets Resulting from Operations | | | | 288,644 | | | | | (3,194,165 | ) | | | | 69,730 | | | | | (1,480,068 | ) |
| | | |
| | | |
| | | |
| | | |
| |
| Distributions to Shareholders | | | | | | | | | | | | | | | | | | �� | | |
Distributions to Investor Class | | | | | | | | | | | | | | | | | | | | |
Shareholders: | | | | | | | | | | | | | | | | | | | | |
From Net Investment Income | | | | (37,990 | ) | | | | — | | | | | (7,042 | ) | | | | — | |
From Net Realized Gain on Investments | | | | — | | | | | (1,227,692 | ) | | | | (63,787 | ) | | | | (45,373 | ) |
Distributions to I Class Shareholders: | | | | | | | | | | | | | | | | | | | | |
From Net Investment Income | | | | (633 | ) | | | | — | | | | | (290 | ) | | | | — | |
From Net Realized Gain on Investments | | | | — | | | | | — | | | | | (1,220 | ) | | | | — | |
| | | |
| | | |
| | | |
| | | |
| |
Total Distributions to Shareholders | | | | (38,623 | ) | | | | (1,227,692 | ) | | | | (72,339 | ) | | | | (45,373 | ) |
| | | |
| | | |
| | | |
| | | |
| |
| From Share Transactions | | | | | | | | | | | | | | | | | | | | |
Net Increase (Decrease) in Net Assets | | | | | | | | | | | | | | | | | | | | |
Resulting from Share Transactions | | | | 6,195,332 | | | | | (3,970,132 | ) | | | | 3,043,001 | | | | | 1,831,335 | |
| | | |
| | | |
| | | |
| | | |
| |
Total Increase (Decrease) in Net Assets | | | | 6,445,353 | | | | | (8,391,989 | ) | | | | 3,040,392 | | | | | 305,894 | |
| Net Assets – Beginning of Period | | | | 4,644,873 | | | | | 13,036,862 | | | | | 4,178,721 | | | | | 3,872,827 | |
| | | |
| | | |
| | | |
| | | |
| |
| Net Assets – End of Period | | | $ | 11,090,226 | | | | $ | 4,644,873 | | | | $ | 7,219,113 | | | | $ | 4,178,721 | |
| | | |
| | | |
| | | |
| | | |
| |
| Accumulated Net Investment Income | | | $ | 19,237 | | | | $ | 28,480 | | | | $ | 7,954 | | | | $ | — | |
| | | |
| | | |
| | | |
| | | |
| |
81
The FBR Funds
Statements of Changes in Net Assets (continued)
| | | FBR Pegasus | | FBR Pegasus |
| | | Small Cap FundTM | | Small Cap Growth FundTM |
| | |
| |
|
| | | For the | | | | | | | For the | | | | | |
| | | Six Months | | For the | | Six Months | | For the |
| | | Ended | | Year | | Ended | | Year |
| | April 30, | | Ended | | April 30, | | Ended |
| | | 2009 | | October 31, | | 2009 | | October 31, |
| | | (unaudited) | | 2008 | | (unaudited) | | 2008 |
| | |
| |
| |
| |
|
| From Investment Activities | | | | | | | | | | | | | | | | | | | | |
Net Investment Gain (Loss) | | | $ | 8,984 | | | | $ | (16,895 | ) | | | $ | (10,717 | ) | | | $ | (50,863 | ) |
Net Realized Loss on Investment Transactions | | | | (672,501 | ) | | | | (215,521 | ) | | | | (556,395 | ) | | | | (113,150 | ) |
Change in Net Unrealized Appreciation/Depreciation of Investments | | | | 1,045,540 | | | | | (1,305,323 | ) | | | | 613,173 | | | | | (1,745,044 | ) |
| | | |
| | | |
| | | |
| | | |
| |
Net Increase (Decrease) in Net Assets Resulting from Operations | | | | 382,023 | | | | | (1,537,739 | ) | | | | 46,061 | | | | | (1,909,057 | ) |
| | | |
| | | |
| | | |
| | | |
| |
| Distributions to Investor Class Shareholders | | | | | | | | | | | | | | | | | | | | |
From Net Realized Gain on Investments | | | | — | | | | | (18,282 | ) | | | | — | | | | | (184,307 | ) |
| | | |
| | | |
| | | |
| | | |
| |
| From Share Transactions | | | | | | | | | | | | | | | | | | | | |
Net Increase (Decrease) in Net Assets Resulting from Share Transactions | | | | 2,860,954 | | | | | 730,763 | | | | | 310,726 | | | | | (383,014 | ) |
| | | |
| | | |
| | | |
| | | |
| |
Total Increase (Decrease) in Net Assets | | | | 3,242,977 | | | | | (825,258 | ) | | | | 356,787 | | | | | (2,476,378 | ) |
| Net Assets – Beginning of Period | | | | 4,074,456 | | | | | 4,899,714 | | | | | 2,974,251 | | | | | 5,450,629 | |
| | | |
| | | |
| | | |
| | | |
| |
| Net Assets – End of Period | | | $ | 7,317,433 | | | | $ | 4,074,456 | | | | $ | 3,331,038 | | | | $ | 2,974,251 | |
| | | |
| | | |
| | | |
| | | |
| |
| Accumulated Net Investment Income (Loss) | | | $ | 8,984 | | | | $ | — | | | | $ | (10,717 | ) | | | $ | — | |
| | | |
| | | |
| | | |
| | | |
| |
82
The FBR Funds
Statements of Changes in Net Assets (continued)
| | | | | | | | | | | FBR Large Cap | | FBR Small Cap |
| | | FBR Focus Fund | | Financial Fund | | Financial Fund |
| | |
| |
| |
|
| | | For the | | | | | | For the | | | | | | For the | | | | |
| | | Six Months | | For the | | Six Months | | For the | | Six Months | | For the |
| | | Ended | | Year | | Ended | | Year | | Ended | | Year |
| | | April 30, | | Ended | | April 30, | | Ended | | April 30, | | Ended |
| | | 2009 | | October 31, | | 2009 | | October 31, | | 2009 | | October 31, |
| | | (unaudited) | | 2008 | | (unaudited) | | 2008 | | (unaudited) | | 2008 |
| | |
| |
| |
| |
| |
| |
|
| From Investment Activities | | | | | | | | | | | | | | | | | | | | | | | | |
Net Investment Income (Loss) | | $ | (3,620,934 | ) | | $ | (7,451,904 | ) | | $ | 55,389 | | | $ | 263,207 | | | $ | 474,400 | | | $ | 2,926,458 | |
Net Realized Gain (Loss) on Investments and Foreign Currency Transactions: | | | | | | | | | | | | | | | | | | | | | | | | |
Unaffiliated Issuers | | | (12,105,693 | ) | | | 107,376,971 | | | | (5,542,892 | ) | | | (4,360,933 | ) | | | (10,744,945 | ) | | | (8,683,919 | ) |
Affiliated Issuers | | | (1,190,045 | ) | | | 306,220 | | | | — | | | | — | | | | — | | | | — | |
Change in Net Unrealized Appreciation/Depreciation of Investments | | | 72,435,234 | | | | (561,328,510 | ) | | | 2,117,819 | | | | (144,204 | ) | | | (4,598,417 | ) | | | (6,492,140 | ) |
| | |
| | |
| | |
| | |
| | |
| | |
| |
Net Increase (Decrease) in Net Assets Resulting from Operations | | | 55,518,562 | | | | (461,097,223 | ) | | | (3,369,684 | ) | | | (4,241,930 | ) | | | (14,868,962 | ) | | | (12,249,601 | ) |
| | |
| | |
| | |
| | |
| | |
| | |
| |
| Distributions to Shareholders | | | | | | | | | | | | | | | | | | | | | | | | |
Distributions to Investor Class Shareholders: | | | | | | | | | | | | | | | | | | | | | | | | |
From Net Investment Income | | | — | | | | (3,048,132 | ) | | | (243,517 | ) | | | (177,807 | ) | | | (2,340,677 | ) | | | (2,225,546 | ) |
From Net Realized Gain on Investments | | | (96,017,062 | ) | | | (13,064,697 | ) | | | — | | | | (2,910,983 | ) | | | — | | | | (36,692,651 | ) |
Distributions to I Class Shareholders: | | | | | | | | | | | | | | | | | | | | | | | | |
From Net Investment Income | | | — | | | | — | | | | — | | | | — | | | | (2,105 | ) | | | — | |
From Net Realized Gain on Investments | | | (10,311,502 | ) | | | — | | | | — | | | | — | | | | — | | | | — | |
Distributions to R Class Shareholders: | | | | | | | | | | | | | | | | | | | | | | | | |
From Net Investment Income | | | — | | | | — | | | | — | | | | — | | | | (1,617 | ) | | | — | |
From Net Realized Gain on Investments | | | (51,918 | ) | | | — | | | | — | | | | — | | | | — | | | | — | |
| | |
| | |
| | |
| | |
| | |
| | |
| |
Total Distributions to Shareholders | | | (106,380,482 | ) | | | (16,112,829 | ) | | | (243,517 | ) | | | (3,088,790 | ) | | | (2,344,399 | ) | | | (38,918,197 | ) |
| | |
| | |
| | |
| | |
| | |
| | |
| |
| From Share Transactions | | | | | | | | | | | | | | | | | | | | | | | | |
Net Increase (Decrease) in Net Assets Resulting from Share Transactions | | | 116,063,007 | | | | (344,445,550 | ) | | | (4,347,136 | ) | | | 15,651,691 | | | | 7,044,279 | | | | 92,808,229 | |
| | |
| | |
| | |
| | |
| | |
| | |
| |
Total Increase (Decrease) in Net Assets | | | 65,201,087 | | | | (821,655,602 | ) | | | (7,960,337 | ) | | | 8,320,971 | | | | (10,169,082 | ) | | | 41,640,431 | |
| Net Assets – Beginning of Period | | | 734,683,841 | | | | 1,556,339,443 | | | | 24,272,112 | | | | 15,951,141 | | | | 185,854,664 | | | | 144,214,233 | |
| | |
| | |
| | |
| | |
| | |
| | |
| |
| Net Assets – End of Period | | $ | 799,884,928 | | | $ | 734,683,841 | | | $ | 16,311,775 | | | $ | 24,272,112 | | | $ | 175,685,582 | | | $ | 185,854,664 | |
| | |
| | |
| | |
| | |
| | |
| | |
| |
Accumulated Net Investment Income (Loss) | | $ | (3,620,934 | ) | | $ | — | | | $ | 13,080 | | | $ | 201,208 | | | $ | 150,678 | | | $ | 2,020,677 | |
| | |
| | |
| | |
| | |
| | |
| | |
| |
83
The FBR Funds
Statements of Changes in Net Assets (continued)
| | | | | | | | | | | FBR Gas Utility | | FBR Fund for |
| | | FBR Technology Fund | | Index Fund | | Government Investors* |
| | |
| |
| |
|
| | | For the | | | | | | For the | | | | | | For the | | | | |
| | | Six Months | | For the | | Six Months | | For the | | Six Months | | For the |
| | | Ended | | Year | | Ended | | Year | | Ended | | Year |
| | | April 30, | | Ended | | April 30, | | Ended | | April 30, | | Ended |
| | | 2009 | | October 31, | | 2009 | | October 31, | | 2009 | | October 31, |
| | | (unaudited) | | 2008 | | | (unaudited) | | | | 2008 | | | (unaudited) | | 2008 |
| | |
| |
| |
| |
| |
| |
|
| From Investment Activities | | | | | | | | | | | | | | | | | | | | | | | | |
Net Investment Income (Loss) | | $ | (30,264 | ) | | $ | (129,045 | ) | | $ | 2,889,545 | | | $ | 6,280,430 | | | $ | 209,973 | | | $ | 3,449,163 | |
Net Realized Gain (Loss) on | | | | | | | | | | | | | | | | | | | | | | | | |
Investment Transactions | | | (2,019,333 | ) | | | (4,038,866 | ) | | | (2,680,227 | ) | | | 7,401,347 | | | | — | | | | 3,286 | |
Change in Net Unrealized | | | | | | | | | | | | | | | | | | | | | | | | |
Appreciation/Depreciation of | | | | | | | | | | | | | | | | | | | | | | | | |
Investments | | | 2,392,060 | | | | (5,504,400 | ) | | | (19,553,385 | ) | | | (90,938,539 | ) | | | — | | | | — | |
| | |
| | |
| | |
| | |
| | |
| | |
| |
Net Increase (Decrease) in | | | | | | | | | | | | | | | | | | | | | | | | |
Net Assets Resulting | | | | | | | | | | | | | | | | | | | | | | | | |
from Operations | | | 342,463 | | | | (9,672,311 | ) | | | (19,344,067 | ) | | | (77,256,762 | ) | | | 209,973 | | | | 3,452,449 | |
| | |
| | |
| | |
| | |
| | |
| | |
| |
| Distributions to Shareholders | | | | | | | | | | | | | | | | | | | | | | | | |
Distributions to Investor Class | | | | | | | | | | | | | | | | | | | | | | | | |
Shareholders: | | | | | | | | | | | | | | | | | | | | | | | | |
From Net Investment Income | | | — | | | | — | | | | (2,842,418 | ) | | | (6,287,721 | ) | | | (209,973 | ) | | | (3,449,161 | ) |
From Net Realized Gain on | | | | | | | | | | | | | | | | | | | | | | | | |
Investments | | | — | | | | (3,527,911 | ) | | | (9,577,973 | ) | | | (21,582,320 | ) | | | — | | | | — | |
Distributions to R Class Shareholders: | | | | | | | | | | | | | | | | | | | | | | | | |
From Net Investment Income | | | — | | | | — | | | | (2,358 | ) | | | — | | | | — | | | | — | |
From Net Realized Gain on | | | | | | | | | | | | | | | | | | | | | | | | |
Investments | | | — | | | | — | | | | (7,498 | ) | | | (703 | ) | | | — | | | | — | |
| | |
| | |
| | |
| | |
| | |
| | |
| |
Total Distributions to | | | | | | | | | | | | | | | | | | | | | | | | |
Shareholders | | | — | | | | (3,527,911 | ) | | | (12,430,247 | ) | | | (27,870,744 | ) | | | (209,973 | ) | | | (3,449,161 | ) |
| | |
| | |
| | |
| | |
| | |
| | |
| |
| From Share Transactions | | | | | | | | | | | | | | | | | | | | | | | | |
Net Increase (Decrease) in | | | | | | | | | | | | | | | | | | | | | | | | |
Net Assets Resulting from | | | | | | | | | | | | | | | | | | | | | | | | |
Share Transactions | | | (1,590,380 | ) | | | (20,045,495 | ) | | | (2,223,728 | ) | | | 17,817,133 | | | | (19,745,874 | ) | | | (75,976,982 | ) |
| | |
| | |
| | |
| | |
| | |
| | |
| |
Total Decrease in Net Assets | | | (1,247,917 | ) | | | (33,245,717 | ) | | | (33,998,042 | ) | | | (87,310,373 | ) | | | (19,745,874 | ) | | | (75,973,694 | ) |
| Net Assets – Beginning of Period | | | 7,689,121 | | | | 40,934,838 | | | | 198,640,797 | | | | 285,951,170 | | | | 105,066,279 | | | | 181,039,973 | |
| | |
| | |
| | |
| | |
| | |
| | |
| |
| Net Assets – End of Period | | $ | 6,441,204 | | | $ | 7,689,121 | | | $ | 164,642,755 | | | $ | 198,640,797 | | | $ | 85,320,405 | | | $ | 105,066,279 | |
| | |
| | |
| | |
| | |
| | |
| | |
| |
| Accumulated Net Investment | | | | | | | | | | | | | | | | | | | | | | | | |
Income (Loss) | | $ | (30,264 | ) | | $ | — | | | $ | 124,309 | | | $ | 79,540 | | | $ | — | | | $ | — | |
| | |
| | |
| | |
| | |
| | |
| | |
| |
|
| * | | References to Investor Class for FBR Fund for Government Investors shall be deemed to refer to current outstanding shares of the Fund. |
The accompanying notes are an integral part of the financial statements.
84
The FBR Funds
Financial Highlights
The following tables provide per share data for a share outstanding throughout each period for each Fund. Other data includes investment performance, ratios to average net assets and other supplemental information.
| | | FBR Pegasus FundTM — Investor Class |
| | |
|
| | | For the | | | | | | | | | | | | |
| | | Six Months | | | | | | | | | | For the |
| | | Ended | | For the Years | | Period |
| | | April 30, | | Ended October 31, | | Ended |
| | | 2009 | |
| | October 31, |
| | | (unaudited) | | 2008 | | 2007 | | 2006* |
| | |
| |
| |
| |
|
| Per Share Operating Performance: | | | | | | | | | | | | | | | | |
Net Asset Value – Beginning of Period | | $ | 8.14 | | | $ | 13.40 | | | $ | 11.84 | | | $ | 10.00 | |
| | |
| | |
| | |
| | |
| |
Income (Loss) from Investment Operations: | | | | | | | | | | | | | | | | |
Net Investment Income (Loss)1,2 | | | 0.01 | | | | 0.08 | | | | (0.04 | ) | | | (0.01 | ) |
Net Realized and Unrealized Gain (Loss) on Investments1,3 | | | (0.08 | ) | | | (4.05 | ) | | | 2.05 | | | | 1.84 | |
| | |
| | |
| | |
| | |
| |
Total from Investment Operations | | | (0.07 | ) | | | (3.97 | ) | | | 2.01 | | | | 1.83 | |
| | |
| | |
| | |
| | |
| |
Distributions to Shareholders: | | | | | | | | | | | | | | | | |
From Net Investment Income | | | (0.05 | ) | | | — | | | | — | | | | (0.00 | )4 |
From Net Realized Gain | | | — | | | | (1.30 | ) | | | (0.45 | ) | | | — | |
| | |
| | |
| | |
| | |
| |
Total Distributions | | | (0.05 | ) | | | (1.30 | ) | | | (0.45 | ) | | | (0.00 | )4 |
| | |
| | |
| | |
| | |
| |
Paid-in Capital from Redemption Fees5 | | | 0.00 | 4 | | | 0.01 | | | | 0.00 | 4 | | | 0.01 | |
| | |
| | |
| | |
| | |
| |
Net Increase (Decrease) in Net Asset Value | | | (0.12 | ) | | | (5.26 | ) | | | 1.56 | | | | 1.84 | |
| | |
| | |
| | |
| | |
| |
Net Asset Value – End of Period | | $ | 8.02 | | | $ | 8.14 | | | $ | 13.40 | | | $ | 11.84 | |
| | |
| | |
| | |
| | |
| |
| Total Investment Return6 | | | (0.89)% | (A) | | | (32.37)% | | | | 17.52% | | | | 18.45% | (A) |
| Ratios to Average Net Assets: | | | | | | | | | | | | | | | | |
Expenses After Waivers and Related Reimbursements2 | | | 1.25% | (B) | | | 1.71% | | | | 1.97% | | | | 1.94% | (B) |
Expenses Before Waivers and Related Reimbursements | | | 3.00% | (B) | | | 2.55% | | | | 2.21% | | | | 2.74% | (B) |
Net Investment Income (Loss) After Waivers and Related | | | | | | | | | | | | | | | | |
Reimbursements2 | | | 0.92% | (B) | | | 0.51% | | | | (0.30)% | | | | (0.23)% | (B) |
Net Investment Loss Before Waivers and Related Reimbursements | | | (0.83)% | (B) | | | (0.33)% | | | | (0.54)% | | | | (1.03)% | (B) |
| Supplementary Data: | | | | | | | | | | | | | | | | |
Portfolio Turnover Rate | | | 21% | (A) | | | 39% | | | | 108% | | | | 166% | (A) |
Net Assets at End of Period (in thousands) | | $ | 11,020 | | | $ | 4,574 | | | $ | 13,037 | | | $ | 13,349 | |
|
| * | | Represents the period from commencement of operations (November 15, 2005) through October 31, 2006. |
| 1 | | Calculated based on shares outstanding on the first and last day of the respective periods, except for dividends and distributions, if any, which are based on the actual shares outstanding on the dates of distributions. |
| 2 | | Prior to May 30, 2008, reflects fees waived and reimbursed by FBR Fund Advisers, Inc. pursuant to a contractual expense limitation of 1.95% (excluding interest, taxes, brokerage commissions, dividend expenses, acquired fund fees and expenses, extraordinary legal expenses, or any other extraordinary expenses). As of May 30, 2008, reflects fees waived and reimbursed by FBR Fund Advisers, Inc. pursuant to a contractual expense limitation of 1.25% (excluding interest, taxes, brokerage commissions, dividend expenses, acquired fund fees and expenses, extraordinary legal expenses, or any other extraordinary expenses). |
| 3 | | The amounts shown for a share outstanding throughout the period may not be in accordance with the changes in the aggregate gains and losses on investments during the period because of the timing of sales and repurchases of Fund shares in relation to fluctuating net asset values during the period. |
| 4 | | Less than $0.01 |
| 5 | | Calculated based on average shares outstanding. |
| 6 | | Total investment return is calculated assuming a purchase of shares on the first day and a sale on the last day of each period reported and will include reinvestment of dividends and distributions, if any. |
| (A) | | Not Annualized |
| (B) | | Annualized |
85
The FBR Funds
Financial Highlights (continued)
| | | | FBR Pegasus FundTM — I Class |
| | | |
|
| | | For the | | | | | |
| | | Six Months Ended | | For the |
| | | April 30, 2009 | | Period Ended |
| | | (unaudited) | | October 31, 2008* |
| | |
| |
|
| Per Share Operating Performance: | | | | | | | | | | |
Net Asset Value – Beginning of Period | | | $ | 7.07 | | | | $ | 10.00 | |
| | | |
| | | |
| |
Income (Loss) from Investment Operations: | | | | | | | | | | |
Net Investment Income1,2 | | | | 0.04 | | | | | 0.03 | |
Net Realized and Unrealized Loss on Investments1,3 | | | | (0.11 | ) | | | | (2.96 | ) |
| | | |
| | | |
| |
Total from Investment Operations | | | | (0.07 | ) | | | | (2.93 | ) |
| | | |
| | | |
| |
Distributions to Shareholders: | | | | | | | | | | |
From Net Investment Income | | | | (0.06 | ) | | | | — | |
| | | |
| | | |
| |
Net Decrease in Net Asset Value | | | | (0.13 | ) | | | | (2.93 | ) |
| | | |
| | | |
| |
Net Asset Value – End of Period | | | $ | 6.94 | | | | $ | 7.07 | |
| | | |
| | | |
| |
| Total Investment Return4 | | | | (0.92)% | (A) | | | | (29.30)% | (A) |
| Ratios to Average Net Assets: | | | | | | | | | | |
Expenses After Waivers and Related Reimbursements2 | | | | 1.00% | (B) | | | | 1.01% | (B) |
Expenses Before Waivers and Related Reimbursements | | | | 15.53% | (B) | | | | 4.11% | (B) |
Net Investment Income After Waivers and Related Reimbursements2 | | | | 1.35% | (B) | | | | 0.88% | (B) |
Net Investment Loss Before Waivers and Related Reimbursements | | | | (13.18)% | (B) | | | | (2.22)% | (B) |
| Supplementary Data: | | | | | | | | | | |
Portfolio Turnover Rate | | | | 21% | (A) | | | | 39% | |
Net Assets at End of Period (in thousands) | | | $ | 70 | | | | $ | 71 | |
|
| * | | Represents the period from inception of share class (May 30, 2008) through October 31, 2008. |
| 1 | | Calculated based on shares outstanding on the first and last day of the period, except for dividends and distributions, if any, which are based on the actual shares outstanding on the dates of distributions. |
| 2 | | Reflects fees waived and reimbursed by FBR Fund Advisers, Inc. pursuant to a contractual expense limitation of 1.00% (excluding interest, taxes, brokerage commissions, dividend expenses, acquired fund fees and expenses, extraordinary legal expenses, or any other extraordinary expenses). |
| 3 | | The amounts shown for a share outstanding throughout the period may not be in accordance with the changes in the aggregate gains and losses on investments during the period because of the timing of sales and repurchases of Fund shares in relation to fluctuating net asset values during the period. |
| 4 | | Total investment return is calculated assuming a purchase of shares on the first day and a sale on the last day of each period reported and will include reinvestment of dividends and distributions, if any. |
| (A) | | Not Annualized |
| (B) | | Annualized |
86
The FBR Funds
Financial Highlights (continued)
| | | FBR Pegasus Mid Cap FundTM — Investor Class |
| | |
|
| | | For the | | | | | | | | | | |
| | | Six Months | | | | | | | | | | |
| | | Ended | | For the | | For the |
| | | April 30, 2009 | | Year Ended | | Period Ended |
| | | (unaudited) | | October 31, 2008 | | October 31, 2007* |
| |
| | |
| |
|
| Per Share Operating Performance: | | | | | | | | | | | | | | | |
Net Asset Value – Beginning of Period | | | $ | 8.18 | | | | $ | 11.30 | | | | $ | 10.00 | |
| | | |
| | | |
| | | |
| |
Income (Loss) from Investment Operations: | | | | | | | | | | | | | | | |
Net Investment Income (Loss)1,2 | | | | 0.02 | | | | | (0.01 | ) | | | | (0.02 | ) |
Net Realized and Unrealized Gain (Loss) on Investments1,3 | | | | 0.03 | | | | | (3.00 | ) | | | | 1.32 | |
| | | |
| | | |
| | | |
| |
Total from Investment Operations | | | | 0.05 | | | | | (3.01 | ) | | | | 1.30 | |
| | | |
| | | |
| | | |
| |
Distributions to Shareholders: | | | | | | | | | | | | | | | |
From Net Investment Income | | | | (0.01 | ) | | | | — | | | | | — | |
From Net Realized Gain | | | | (0.12 | ) | | | | (0.13 | ) | | | | — | |
| | | |
| | | |
| | | |
| |
Total Distributions | | | | (0.13 | ) | | | | (0.13 | ) | | | | — | |
| | | |
| | | |
| | | |
| |
Paid-in Capital from Redemption Fees4 | | | | 0.01 | | | | | 0.02 | | | | | 0.00 | 5 |
| | | |
| | | |
| | | |
| |
Net Increase (Decrease) in Net Asset Value | | | | (0.07 | ) | | | | (3.12 | ) | | | | 1.30 | |
| | | |
| | | |
| | | |
| |
Net Asset Value – End of Period | | | $ | 8.11 | | | | $ | 8.18 | | | | $ | 11.30 | |
| | | |
| | | |
| | | |
| |
| Total Investment Return6 | | | | 0.85% | (A) | | | | (26.71)% | | | | | 13.00% | (A) |
| Ratios to Average Net Assets: | | | | | | | | | | | | | | | |
Expenses After Waivers and Related Reimbursements2 | | | | 1.35% | (B) | | | | 1.66% | | | | | 1.95% | (B) |
Expenses Before Waivers and Related Reimbursements | | | | 3.66% | (B) | | | | 3.71% | | | | | 4.17% | (B) |
Net Investment Income (Loss) After Waivers and Related | | | | | | | | | | | | | | | |
Reimbursements2 | | | | 0.68% | (B) | | | | (0.13)% | | | | | (0.36)% | (B) |
Net Investment Loss Before Waivers and Related Reimbursements | | | | (1.63)% | (B) | | | | (2.18)% | | | | | (2.58)% | (B) |
| Supplementary Data: | | | | | | | | | | | | | | | |
Portfolio Turnover Rate | | | | 51% | (A) | | | | 93% | | | | | 135% | (A) |
Net Assets at End of Period (in thousands) | | | $ | 7,147 | | | | $ | 4,108 | | | | $ | 3,873 | |
|
| * | | Represents the period from commencement of operations (February 28, 2007) through October 31, 2007. |
| 1 | | Calculated based on shares outstanding on the first and last day of the respective periods, except for dividends and distributions, if any, which are based on the actual shares outstanding on the dates of distributions. |
| 2 | | Prior to May 30, 2008, reflects fees waived and reimbursed by FBR Fund Advisers, Inc. pursuant to a contractual expense limitation of 1.95% (excluding interest, taxes, brokerage commissions, dividend expenses, acquired fund fees and expenses, extraordinary legal expenses, or any other extraordinary expenses). As of May 30, 2008, reflects fees waived and reimbursed by FBR Fund Advisers, Inc. pursuant to a contractual expense limitation of 1.35% (excluding interest, taxes, brokerage commissions, dividend expenses, acquired fund fees and expenses, extraordinary legal expenses, or any other extraordinary expenses). |
| 3 | | The amounts shown for a share outstanding throughout the period may not be in accordance with the changes in the aggregate gains and losses on investments during the period because of the timing of sales and repurchases of Fund shares in relation to fluctuating net asset values during the period. |
| 4 | | Calculated based on average shares outstanding. |
| 5 | | Less than $0.01 |
| 6 | | Total investment return is calculated assuming a purchase of shares on the first day and a sale on the last day of each period reported and will include reinvestment of dividends and distributions, if any. |
| (A) | | Not Annualized |
| (B) | | Annualized |
87
The FBR Funds
Financial Highlights (continued)
| | | | FBR Pegasus Mid Cap FundTM — I Class |
| | | |
|
| | | For the | | | | | |
| | | Six Months Ended | | For the |
| | | April 30, 2009 | | Period Ended |
| | | (unaudited) | | October 31, 2008* |
| | |
| |
|
| Per Share Operating Performance: | | | | | | | | | | |
Net Asset Value – Beginning of Period | | | $ | 7.11 | | | | $ | 10.00 | |
| | | |
| | | |
| |
Income (Loss) from Investment Operations: | | | | | | | | | | |
Net Investment Income1,2 | | | | 0.03 | | | | | 0.02 | |
Net Realized and Unrealized Gain (Loss) on Investments1,3 | | | | 0.03 | | | | | (2.91 | ) |
| | | |
| | | |
| |
Total from Investment Operations | | | | 0.06 | | | | | (2.89 | ) |
| | | |
| | | |
| |
Distributions to Shareholders: | | | | | | | | | | |
From Net Investment Income | | | | (0.03 | ) | | | | — | |
From Net Realized Gain | | | | (0.12 | ) | | | | — | |
| | | |
| | | |
| |
Total Distributions | | | | (0.15 | ) | | | | — | |
| | | |
| | | |
| |
Net Decrease in Net Asset Value | | | | (0.09 | ) | | | | (2.89 | ) |
| | | |
| | | |
| |
Net Asset Value – End of Period | | | $ | 7.02 | | | | $ | 7.11 | |
| | | |
| | | |
| |
| Total Investment Return4 | | | | 0.95% | (A) | | | | (28.90)% | (A) |
| Ratios to Average Net Assets: | | | | | | | | | | |
Expenses After Waivers and Related Reimbursements2 | | | | 1.10% | (B) | | | | 1.10% | (B) |
Expenses Before Waivers and Related Reimbursements | | | | 14.13% | (B) | | | | 4.54% | (B) |
Net Investment Income After Waivers and Related Reimbursements2 | | | | 0.96% | (B) | | | | 0.47% | (B) |
Net Investment Loss Before Waivers and Related Reimbursements | | | | (12.07)% | (B) | | | | (2.97)% | (B) |
| Supplementary Data: | | | | | | | | | | |
Portfolio Turnover Rate | | | | 51% | (A) | | | | 93% | |
Net Assets at End of Period (in thousands) | | | $ | 72 | | | | $ | 71 | |
|
| * | | Represents the period from inception of share class (May 30, 2008) through October 31, 2008. |
| 1 | | Calculated based on shares outstanding on the first and last day of the period, except for dividends and distributions, if any, which are based on the actual shares outstanding on the dates of distributions. |
| 2 | | Reflects fees waived and reimbursed by FBR Fund Advisers, Inc. pursuant to a contractual expense limitation of 1.10% (excluding interest, taxes, brokerage commissions, dividend expenses, acquired fund fees and expenses, extraordinary legal expenses, or any other extraordinary expenses). |
| 3 | | The amounts shown for a share outstanding throughout the period may not be in accordance with the changes in the aggregate gains and losses on investments during the period because of the timing of sales and repurchases of Fund shares in relation to fluctuating net asset values during the period. |
| 4 | | Total investment return is calculated assuming a purchase of shares on the first day and a sale on the last day of each period reported and will include reinvestment of dividends and distributions, if any. |
| (A) | | Not Annualized |
| (B) | | Annualized |
88
The FBR Funds
Financial Highlights (continued)
| | | FBR Pegasus Small Cap FundTM — Investor Class |
| | |
|
| | | For the | | | | | | | | | | |
| | | Six Months Ended | | For the | | For the |
| | | April 30, 2009 | | Year Ended | | Period Ended |
| | | (unaudited) | | October 31, 2008 | | October 31, 2007* |
| | |
| |
| |
|
| Per Share Operating Performance: | | | | | | | | | | | | | | | |
Net Asset Value – Beginning of Period | | | $ | 8.44 | | | | $ | 11.85 | | | | $ | 10.00 | |
| | | |
| | | |
| | | |
| |
Income (Loss) from Investment Operations: | | | | | | | | | | | | | | | |
Net Investment Income (Loss)1,2 | | | | 0.01 | | | | | (0.03 | ) | | | | (0.04 | ) |
Net Realized and Unrealized Gain (Loss) on Investments1,3 | | | | (0.24 | ) | | | | (3.35 | ) | | | | 1.89 | |
| | | |
| | | |
| | | |
| |
Total from Investment Operations | | | | (0.23 | ) | | | | (3.38 | ) | | | | 1.85 | |
| | | |
| | | |
| | | |
| |
Distributions to Shareholders: | | | | | | | | | | | | | | | |
From Net Realized Gain | | | | — | | | | | (0.04 | ) | | | | — | |
| | | |
| | | |
| | | |
| |
Paid-in Capital from Redemption Fees4 | | | | 0.01 | | | | | 0.01 | | | | | 0.00 | 5 |
| | | |
| | | |
| | | |
| |
Net Increase (Decrease) in Net Asset Value | | | | (0.22 | ) | | | | (3.41 | ) | | | | 1.85 | |
| | | |
| | | |
| | | |
| |
Net Asset Value – End of Period | | | $ | 8.22 | | | | $ | 8.44 | | | | $ | 11.85 | |
| | | |
| | | |
| | | |
| |
| Total Investment Return6 | | | | (2.61)% | (A) | | | | (28.49)% | | | | | 18.50% | (A) |
| Ratios to Average Net Assets: | | | | | | | | | | | | | | | |
Expenses After Waivers and Related Reimbursements2 | | | | 1.45% | (B) | | | | 1.74% | | | | | 1.95% | (B) |
Expenses Before Waivers and Related Reimbursements | | | | 3.74% | (B) | | | | 3.55% | | | | | 3.77% | (B) |
Net Investment Income (Loss) After Waivers and Related | | | | | | | | | | | | | | | |
Reimbursements2 | | | | 0.41% | (B) | | | | (0.36)% | | | | | (0.61)% | (B) |
Net Investment Loss Before Waivers and Related Reimbursements | | | | (1.88)% | (B) | | | | (2.17)% | | | | | (2.43)% | (B) |
| Supplementary Data: | | | | | | | | | | | | | | | |
Portfolio Turnover Rate | | | | 103% | (A) | | | | 207% | | | | | 107% | (A) |
Net Assets at End of Period (in thousands) | | | $ | 7,243 | | | | $ | 3,998 | | | | $ | 4,900 | |
|
| * | | Represents the period from commencement of operations (February 28, 2007) through October 31, 2007. |
| 1 | | Calculated based on shares outstanding on the first and last day of the respective periods, except for dividends and distributions, if any, which are based on the actual shares outstanding on the dates of distributions. |
| 2 | | Prior to May 30, 2008, reflects fees waived and reimbursed by FBR Fund Advisers, Inc. pursuant to a contractual expense limitation of 1.95% (excluding interest, taxes, brokerage commissions, dividend expenses, acquired fund fees and expenses, extraordinary legal expenses, or any other extraordinary expenses). As of May 30, 2008, reflects fees waived and reimbursed by FBR Fund Advisers, Inc. pursuant to a contractual expense limitation of 1.45% (excluding interest, taxes, brokerage commissions, dividend expenses, acquired fund fees and expenses, extraordinary legal expenses, or any other extraordinary expenses). |
| 3 | | The amounts shown for a share outstanding throughout the period may not be in accordance with the changes in the aggregate gains and losses on investments during the period because of the timing of sales and repurchases of Fund shares in relation to fluctuating net asset values during the period. |
| 4 | | Calculated based on average shares outstanding. |
| 5 | | Less than $0.01 |
| 6 | | Total investment return is calculated assuming a purchase of shares on the first day and a sale on the last day of each period reported and will include reinvestment of dividends and distributions, if any. |
| (A) | | Not Annualized |
| (B) | | Annualized |
89
The FBR Funds
Financial Highlights (continued)
| | | | FBR Pegasus Small Cap FundTM — I Class |
| | | |
|
| | | For the | | | | | |
| | | Six Months Ended | | For the |
| | | April 30, 2009 | | Period Ended |
| | | (unaudited) | | October 31, 2008* |
| | |
| |
|
| Per Share Operating Performance: | | | | | | | | | | |
Net Asset Value – Beginning of Period | | | $ | 7.62 | | | | $ | 10.00 | |
| | | |
| | | |
| |
Income (Loss) from Investment Operations: | | | | | | | | | | |
Net Investment Income1,2 | | | | 0.02 | | | | | 0.01 | |
Net Realized and Unrealized Loss on Investments1,3 | | | | (0.22 | ) | | | | (2.39 | ) |
| | | |
| | | |
| |
Total from Investment Operations | | | | (0.20 | ) | | | | (2.38 | ) |
| | | |
| | | |
| |
Net Asset Value – End of Period | | | $ | 7.42 | | | | $ | 7.62 | |
| | | |
| | | |
| |
| Total Investment Return4 | | | | (2.62)% | (A) | | | | (23.80)% | (A) |
| Ratios to Average Net Assets: | | | | | | | | | | |
Expenses After Waivers and Related Reimbursements2 | | | | 1.20% | (B) | | | | 1.20% | (B) |
Expenses Before Waivers and Related Reimbursements | | | | 13.85% | (B) | | | | 4.56% | (B) |
Net Investment Income After Waivers and Related Reimbursements2 | | | | 0.69% | (B) | | | | 0.23% | (B) |
Net Investment Loss Before Waivers and Related Reimbursements | | | | (11.96)% | (B) | | | | (3.13)% | (B) |
| Supplementary Data: | | | | | | | | | | |
Portfolio Turnover Rate | | | | 103% | (A) | | | | 207% | |
Net Assets at End of Period (in thousands) | | | $ | 74 | | | | $ | 76 | |
|
| * | | Represents the period from inception of share class (May 30, 2008) through October 31, 2008. |
| 1 | | Calculated based on shares outstanding on the first and last day of the period, except for dividends and distributions, if any, which are based on the actual shares outstanding on the dates of distributions. |
| 2 | | Reflects fees waived and reimbursed by FBR Fund Advisers, Inc. pursuant to a contractual expense limitation of 1.20% (excluding interest, taxes, brokerage commissions, dividend expenses, acquired fund fees and expenses, extraordinary legal expenses, or any other extraordinary expenses). |
| 3 | | The amounts shown for a share outstanding throughout the period may not be in accordance with the changes in the aggregate gains and losses on investments during the period because of the timing of sales and repurchases of Fund shares in relation to fluctuating net asset values during the period. |
| 4 | | Total investment return is calculated assuming a purchase of shares on the first day and a sale on the last day of each period reported and will include reinvestment of dividends and distributions, if any. |
| (A) | | Not Annualized |
| (B) | | Annualized |
90
The FBR Funds
Financial Highlights (continued)
| | | | FBR Pegasus Small Cap Growth FundTM — Investor Class |
| | | |
|
| | | | For the | | | | | | | | | | | | | | | | | | | | |
| | | | Six Months | | | | | | | | | | | | | | | | | | For the |
| | | | Ended | | | | | | | | | | | | | | | | | | Period |
| | | | April 30, | | For the Years Ended October 31, | | Ended |
| | | | 2009 | |
| | October 31, |
| | | | (unaudited) | | 2008 | | 2007 | | 2006 | | 2005 | | 2004* |
| | | |
| |
| |
| |
| |
| |
|
| Per Share Operating Performance: | | | | | | | | | | | | | | | | | | | | | | | | | |
Net Asset Value – Beginning of Period | | | $ | 8.32 | | | $ | 13.56 | | | $ | 11.34 | | | $ | 9.46 | | | $ | 8.88 | | | $ | 10.00 | |
| | | |
| | |
| | |
| | |
| | |
| | |
| |
Income (Loss) from Investment Operations: | | | | | | | | | | | | | | | | | | | | | | | | | |
Net Investment Loss1,2 | | | | (0.03 | ) | | | (0.15 | ) | | | (0.19 | ) | | | (0.15 | ) | | | (0.16 | ) | | | (0.11 | ) |
Net Realized and Unrealized Gain (Loss) on Investments1,3 | | | | 0.22 | | | | (4.64 | ) | | | 2.92 | | | | 2.02 | | | | 0.70 | | | | (1.06 | ) |
| | | |
| | |
| | |
| | |
| | |
| | |
| |
Total from Investment Operations | | | | 0.19 | | | | (4.79 | ) | | | 2.73 | | | | 1.87 | | | | 0.54 | | | | (1.17 | ) |
| | | |
| | |
| | |
| | |
| | |
| | |
| |
Distributions to Shareholders: | | | | | | | | | | | | | | | | | | | | | | | | | |
From Net Realized Gain | | | | — | | | | (0.47 | ) | | | (0.52 | ) | | | — | | | | — | | | | — | |
| | | |
| | |
| | |
| | |
| | |
| | |
| |
Paid-in Capital from Redemption Fees4 | | | | 0.01 | | | | 0.02 | | | | 0.01 | | | | 0.01 | | | | 0.04 | | | | 0.05 | |
| | | |
| | |
| | |
| | |
| | |
| | |
| |
Net Increase (Decrease) in Net Asset Value | | | | 0.20 | | | | (5.24 | ) | | | 2.22 | | | | 1.88 | | | | 0.58 | | | | (1.12 | ) |
| | | |
| | |
| | |
| | |
| | |
| | |
| |
Net Asset Value – End of Period | | | $ | 8.52 | | | $ | 8.32 | | | $ | 13.56 | | | $ | 11.34 | | | $ | 9.46 | | | $ | 8.88 | |
| | | |
| | |
| | |
| | |
| | |
| | |
| |
| Total Investment Return5 | | | | 2.40% | (A) | | | (36.32)% | | | | 25.06% | | | | 19.87% | | | | 6.53% | | | | (11.20)% | (A) |
| Ratios to Average Net Assets: | | | | | | | | | | | | | | | | | | | | | | | | | |
Expenses After Waivers and Related | | | | | | | | | | | | | | | | | | | | | | | | | |
Reimbursements2 | | | | 1.45% | (B) | | | 1.76% | | | | 1.95% | | | | 1.95% | | | | 1.95% | | | | 1.95% | (B) |
Expenses Before Waivers and Related | | | | | | | | | | | | | | | | | | | | | | | | | |
Reimbursements | | | | 5.34% | (B) | | | 4.29% | | | | 3.81% | | | | 5.45% | | | | 9.14% | | | | 6.43% | (B) |
Net Investment Loss After Waivers and Related Reimbursements2 | | | | (0.78)% | (B) | | | (1.28)% | | | | (1.65)% | | | | (1.65)% | | | | (1.68)% | | | | (1.79)% | (B) |
Net Investment Loss Before Waivers and Related Reimbursements | | | | (4.67)% | (B) | | | (3.81)% | | | | (3.51)% | | | | (5.15)% | | | | (8.87)% | | | | (6.27)% | (B) |
| Supplementary Data: | | | | | | | | | | | | | | | | | | | | | | | | | |
Portfolio Turnover Rate | | | | 44% | (A) | | | 139% | | | | 108% | | | | 152% | | | | 246% | | | | 150% | (A) |
Net Assets at End of Period (in thousands) | | | $ | 3,184 | | | $ | 2,831 | | | $ | 5,451 | | | $ | 3,592 | | | $ | 1,759 | | | $ | 1,440 | |
|
| * | | Represents the period from commencement of operations (January 20, 2004) through October 31, 2004. |
| 1 | | Calculated based on shares outstanding on the first and last day of the respective periods, except for dividends and distributions, if any, which are based on the actual shares outstanding on the date of distributions. |
| 2 | | Prior to May 30, 2008, reflects fees waived and reimbursed by FBR Fund Advisers, Inc. pursuant to a contractual expense limitation of 1.95% (excluding interest, taxes, brokerage commissions, dividend expenses, acquired fund fees and expenses, extraordinary legal expenses, or any other extraordinary expenses). As of May 30, 2008, reflects fees waived and reimbursed by FBR Fund Advisers, Inc. pursuant to a contractual expense limitation of 1.45% (excluding interest, taxes, brokerage commissions, dividend expenses, acquired fund fees and expenses, extraordinary legal expenses, or any other extraordinary expenses). |
| 3 | | The amounts shown for a share outstanding throughout the respective periods may not be in accordance with the changes in the aggregate gains and losses on investments during the respective periods because of the timing of sales and repurchases of Fund shares in relation to fluctuating net asset values during the respective periods. |
| 4 | | Calculated based on average shares outstanding. |
| 5 | | Total investment return is calculated assuming a purchase of shares on the first day and a sale on the last day of each period reported and will include reinvestment of dividends and distributions, if any. |
| (A) | | Not Annualized |
| (B) | | Annualized |
91
The FBR Funds
Financial Highlights (continued)
| | | FBR Pegasus Small Cap Growth FundTM — I Class |
| | |
|
| | | For the | | | | | | | |
| | | Six Months Ended | | | For the | |
| | | April 30, 2009 | | | Period Ended | |
| | | (unaudited) | | | October 31, 2008* | |
| | |
| | |
| |
| Per Share Operating Performance: | | | | | | | | | | | | |
Net Asset Value – Beginning of Period | | | $ | 7.19 | | | | | $ | 10.00 | | |
| | | |
| | | | |
| | |
Income (Loss) from Investment Operations: | | | | | | | | | | | | |
Net Investment Loss1,2 | | | | (0.02 | ) | | | | | (0.03 | ) | |
Net Realized and Unrealized Gain (Loss) on Investments1,3 | | | | 0.19 | | | | | | (2.78 | ) | |
| | | |
| | | | |
| | |
Total from Investment Operations | | | | 0.17 | | | | | | (2.81 | ) | |
| | | |
| | | | |
| | |
Net Asset Value – End of Period | | | $ | 7.36 | | | | | $ | 7.19 | | |
| | | |
| | | | |
| | |
| Total Investment Return4 | | | | 2.36% | (A) | | | | | (28.10)% | (A) | |
| Ratios to Average Net Assets: | | | | | | | | | | | | |
Expenses After Waivers and Related Reimbursements2 | | | | 1.20% | (B) | | | | | 1.20% | (B) | |
Expenses Before Waivers and Related Reimbursements | | | | 15.41% | (B) | | | | | 4.98% | (B) | |
Net Investment Loss After Waivers and Related Reimbursements2 | | | | (0.52)% | (B) | | | | | (0.74)% | (B) | |
Net Investment Loss Before Waivers and Related Reimbursements | | | | (14.73)% | (B) | | | | | (4.52)% | (B) | |
| Supplementary Data: | | | | | | | | | | | | |
Portfolio Turnover Rate | | | | 44% | (A) | | | | | 139% | | |
Net Assets at End of Period (in thousands) | | | $ | 74 | | | | | $ | 72 | | |
|
| * | | Represents the period from inception of share class (May 30, 2008) through October 31, 2008. |
| 1 | | Calculated based on shares outstanding on the first and last day of the period, except for dividends and distributions, if any, which are based on the actual shares outstanding on the dates of distributions. |
| 2 | | Reflects fees waived and reimbursed by FBR Fund Advisers, Inc. pursuant to a contractual expense limitation of 1.20% (excluding interest, taxes, brokerage commissions, dividend expenses, acquired fund fees and expenses, extraordinary legal expenses, or any other extraordinary expenses). |
| 3 | | The amounts shown for a share outstanding throughout the period may not be in accordance with the changes in the aggregate gains and losses on investments during the period because of the timing of sales and repurchases of Fund shares in relation to fluctuating net asset values during the period. |
| 4 | | Total investment return is calculated assuming a purchase of shares on the first day and a sale on the last day of each period reported and will include reinvestment of dividends and distributions, if any. |
| (A) | | Not Annualized |
| (B) | | Annualized |
92
The FBR Funds
Financial Highlights (continued)
| | | FBR Pegasus Small Cap Growth FundTM — R Class |
| | |
|
| | | For the | | | | | | | |
| | | Six Months Ended | | | For the | |
| | | April 30, 2009 | | | Period Ended | |
| | | (unaudited) | | | October 31, 2008* | |
| | |
| | |
| |
| Per Share Operating Performance: | | | | | | | | | | | | |
Net Asset Value – Beginning of Period | | | $ | 7.17 | | | | | $ | 10.00 | | |
| | | |
| | | | |
| | |
Income (Loss) from Investment Operations: | | | | | | | | | | | | |
Net Investment Loss1,2 | | | | (0.03 | ) | | | | | (0.05 | ) | |
Net Realized and Unrealized Gain (Loss) on Investments1,3 | | | | 0.19 | | | | | | (2.78 | ) | |
| | | |
| | | | |
| | |
Total from Investment Operations | | | | 0.16 | | | | | | (2.83 | ) | |
| | | |
| | | | |
| | |
Net Asset Value – End of Period | | | $ | 7.33 | | | | | $ | 7.17 | | |
| | | |
| | | | |
| | |
| Total Investment Return4 | | | | 2.23% | (A) | | | | | (28.30)% | (A) | |
| Ratios to Average Net Assets: | | | | | | | | | | | | |
Expenses After Waivers and Related Reimbursements2 | | | | 1.70% | (B) | | | | | 1.70% | (B) | |
Expenses Before Waivers and Related Reimbursements | | | | 16.10% | (B) | | | | | 5.51% | (B) | |
Net Investment Loss After Waivers and Related Reimbursements2 | | | | (1.02)% | (B) | | | | | (1.24)% | (B) | |
Net Investment Loss Before Waivers and Related Reimbursements | | | | (15.42)% | (B) | | | | | (5.05)% | (B) | |
| Supplementary Data: | | | | | | | | | | | | |
Portfolio Turnover Rate | | | | 44% | (A) | | | | | 139% | | |
Net Assets at End of Period (in thousands) | | | $ | 73 | | | | | $ | 72 | | |
|
| * | | Represents the period from inception of share class (May 30, 2008) through October 31, 2008. |
| 1 | | Calculated based on shares outstanding on the first and last day of the period, except for dividends and distributions, if any, which are based on the actual shares outstanding on the dates of distributions. |
| 2 | | Reflects fees waived and reimbursed by FBR Fund Advisers, Inc. pursuant to a contractual expense limitation of 1.70% (excluding interest, taxes, brokerage commissions, dividend expenses, acquired fund fees and expenses, extraordinary legal expenses, or any other extraordinary expenses). |
| 3 | | The amounts shown for a share outstanding throughout the period may not be in accordance with the changes in the aggregate gains and losses on investments during the period because of the timing of sales and repurchases of Fund shares in relation to fluctuating net asset values during the period. |
| 4 | | Total investment return is calculated assuming a purchase of shares on the first day and a sale on the last day of each period reported and will include reinvestment of dividends and distributions, if any. |
| (A) | | Not Annualized |
| (B) | | Annualized |
| | | |
93
The FBR Funds
Financial Highlights (continued)
| | | FBR Focus Fund — Investor Class |
| | |
|
| | | For the | | | | | | | | | | | | | | | | | | | | |
| | | Six Months | | | | | | | | | | | | | | | | | | | | |
| | | Ended | | | | | | | | | | | | | | | | | | | | |
| | | April 30, | | For the Years Ended October 31, |
| | | 2009 | |
|
| | | (unaudited) | | 2008 | | 2007 | | 2006 | | 2005 | | 2004 |
| | |
| |
| |
| |
| |
| |
|
| Per Share Operating Performance: | | | | | | | | | | | | | | | | | | | | | | | | | | |
Net Asset Value – Beginning of Period | | | $ | 37.40 | | | | $ | 57.97 | | | $ | 49.36 | | | $ | 40.36 | | | $ | 37.68 | | | $ | 31.57 | |
| | | |
| | | |
| | |
| | |
| | |
| | |
| |
Income (Loss) from Investment Operations: | | | | | | | | | | | | | | | | | | | | | | | | | | |
Net Investment Income (Loss)1,2 | | | | (0.16 | ) | | | | (0.44 | ) | | | 0.08 | | | | (0.43 | ) | | | (0.27 | ) | | | (0.17 | ) |
Net Realized and Unrealized Gain (Loss) on Investments1,3 | | | | 2.63 | | | | | (19.51 | ) | | | 8.63 | | | | 10.20 | | | | 3.51 | | | | 6.30 | |
| | | |
| | | |
| | |
| | |
| | |
| | |
| |
Total from Investment Operations | | | | 2.47 | | | | | (19.95 | ) | | | 8.71 | | | | 9.77 | | | | 3.24 | | | | 6.13 | |
| | | |
| | | |
| | |
| | |
| | |
| | |
| |
Distributions to Shareholders: | | | | | | | | | | | | | | | | | | | | | | | | | | |
From Net Investment Income | | | | — | | | | | (0.12 | ) | | | — | | | | — | | | | — | | | | — | |
From Net Realized Gain | | | | (5.19 | ) | | | | (0.51 | ) | | | (0.12 | ) | | | (0.77 | ) | | | (0.57 | ) | | | (0.03 | ) |
| | | |
| | | |
| | |
| | |
| | |
| | |
| |
Total Distributions | | | | (5.19 | ) | | | | (0.63 | ) | | | (0.12 | ) | | | (0.77 | ) | | | (0.57 | ) | | | (0.03 | ) |
| | | |
| | | |
| | |
| | |
| | |
| | |
| |
Paid-in Capital from Redemption Fees4 | | | | 0.00 | 5 | | | | 0.01 | | | | 0.02 | | | | 0.00 | 5 | | | 0.01 | | | | 0.01 | |
| | | |
| | | |
| | |
| | |
| | |
| | |
| |
Net Increase (Decrease) in Net Asset Value | | | | (2.72 | ) | | | | (20.57 | ) | | | 8.61 | | | | 9.00 | | | | 2.68 | | | | 6.11 | |
| | | |
| | | |
| | |
| | |
| | |
| | |
| |
Net Asset Value – End of Period | | | $ | 34.68 | | | | $ | 37.40 | | | $ | 57.97 | | | $ | 49.36 | | | $ | 40.36 | | | $ | 37.68 | |
| | | |
| | | |
| | |
| | |
| | |
| | |
| |
| Total Investment Return6 | | | | 8.72% | (A) | | | | (34.73)% | | | | 17.72% | | | | 24.53% | | | | 8.63% | | | | 19.46% | |
| Ratios to Average Net Assets: | | | | | | | | | | | | | | | | | | | | | | | | | | |
Expenses After Waivers2 | | | | 1.46% | (B) | | | | 1.42% | | | | 1.40% | | | | 1.38% | | | | 1.50% | | | | 1.59% | |
Expenses Before Waivers | | | | 1.46% | (B) | | | | 1.42% | | | | 1.40% | | | | 1.40% | | | | 1.53% | | | | 1.59% | |
Net Investment Income (Loss) After Waivers2 | | | | (1.14)% | (B) | | | | (0.67)% | | | | 0.14% | | | | (0.94)% | | | | (0.56)% | | | | (0.75)% | |
Net Investment Income (Loss) Before Waivers | | | | (1.14)% | (B) | | | | (0.67)% | | | | 0.14% | | | | (0.96)% | | | | (0.59)% | | | | (0.75)% | |
| Supplementary Data: | | | | | | | | | | | | | | | | | | | | | | | | | | |
Portfolio Turnover Rate | | | | 3% | (A) | | | | 17% | | | | 5% | | | | 3% | | | | 20% | | | | 19% | |
Net Assets at End of Period (in thousands) | | | $ | 779,689 | | | | $ | 717,780 | | | $ | 1,556,339 | | | $ | 929,590 | | | $ | 805,858 | | | $ | 825,497 | |
|
| 1 | | Calculated based on shares outstanding on the first and last day of the respective periods, except for dividends and distributions, if any, which are based on the actual shares outstanding on the dates of distributions. |
| 2 | | Reflects fees waived by FBR Fund Advisers, Inc. pursuant to a contractual expense limitation of 1.95% (excluding interest, taxes, brokerage commissions, dividend expenses, acquired fund fees and expenses, extraordinary legal expenses, or any other extraordinary expenses) and fees voluntarily waived by the Distributor in an amount attributable to marketing expenses for the Fund while closed to new investors. |
| 3 | | The amounts shown for a share outstanding throughout the respective periods may not be in accordance with the changes in the aggregate gains and losses on investments during the respective periods because of the timing of sales and repurchases of Fund shares in relation to fluctuating net asset values during the respective periods. |
| 4 | | Calculated based on average shares outstanding. |
| 5 | | Less than $0.01 |
| 6 | | Total investment return is calculated assuming a purchase of shares on the first day and a sale on the last day of each period reported and will include reinvestment of dividends and distributions, if any. |
| (A) | | Not Annualized |
| (B) | | Annualized |
94
The FBR Funds
Financial Highlights (continued)
| | | FBR Focus Fund — I Class |
| | |
|
| | | For the | | | | | | |
| | | Six Months Ended | | | For the |
| | | April 30, 2009 | | | Period Ended |
| | | (unaudited) | | | October 31, 2008* |
| | |
| | |
|
| Per Share Operating Performance: | | | | | | | | | | | |
Net Asset Value – Beginning of Period | | | $ | 7.27 | | | | | $ | 10.00 | |
| | | |
| | | | |
| |
Loss from Investment Operations: | | | | | | | | | | | |
Net Investment Loss1 | | | | (0.01 | ) | | | | | (0.01 | ) |
Net Realized and Unrealized Loss on Investments1,2 | | | | (0.13 | ) | | | | | (2.73 | ) |
| | | |
| | | | |
| |
Total from Investment Operations | | | | (0.14 | ) | | | | | (2.74 | ) |
| | | |
| | | | |
| |
Distributions to Shareholders: | | | | | | | | | | | |
From Net Realized Gain | | | | (5.19 | ) | | | | | — | |
| | | |
| | | | |
| |
Paid-in Capital from Redemption Fees3 | | | | — | | | | | | 0.01 | |
| | | |
| | | | |
| |
Net Decrease in Net Asset Value | | | | (5.33 | ) | | | | | (2.73 | ) |
| | | |
| | | | |
| |
Net Asset Value – End of Period | | | $ | 1.94 | | | | | $ | 7.27 | |
| | | |
| | | | |
| |
| Total Investment Return4 | | | | 9.15% | (A) | | | | | (27.30)% | (A) |
| Ratios to Average Net Assets: | | | | | | | | | | | |
Expenses After Waivers | | | | 1.16% | (B) | | | | | 1.05% | (B) |
Expenses Before Waivers | | | | 1.16% | (B) | | | | | 1.05% | (B) |
Net Investment Loss After Waivers | | | | (0.84)% | (B) | | | | | (0.70)% | (B) |
Net Investment Loss Before Waivers | | | | (0.84)% | (B) | | | | | (0.70)% | (B) |
| Supplementary Data: | | | | | | | | | | | |
Portfolio Turnover Rate | | | | 3% | (A) | | | | | 17% | |
Net Assets at End of Period (in thousands) | | | $ | 20,047 | | | | | $ | 16,831 | |
|
| * | | Represents the period from inception of share class (May 30, 2008) through October 31, 2008. |
| 1 | | Calculated based on shares outstanding on the first and last day of the period, except for dividends and distributions, if any, which are based on the actual shares outstanding on the dates of distributions. |
| 2 | | The amounts shown for a share outstanding throughout the period may not be in accordance with the changes in the aggregate gains and losses on investments during the period because of the timing of sales and repurchases of Fund shares in relation to fluctuating net asset values during the period. |
| 3 | | Calculated based on average shares outstanding. |
| 4 | | Total investment return is calculated assuming a purchase of shares on the first day and a sale on the last day of each period reported and will include reinvestment of dividends and distributions, if any. |
| (A) | | Not Annualized |
| (B) | | Annualized |
95
The FBR Funds
Financial Highlights (continued)
| | | FBR Focus Fund — R Class |
| | |
|
| | | For the | | | | | |
| | | Six Months Ended | | | For the |
| | | April 30, 2009 | | | Period Ended |
| | | (unaudited) | | | October 31, 2008* |
| | |
| | |
|
| Per Share Operating Performance: | | | | | | | | | | | |
Net Asset Value – Beginning of Period | | | $ | 7.24 | | | | | $ | 10.00 | |
| | | |
| | | | |
| |
Loss from Investment Operations: | | | | | | | | | | | |
Net Investment Loss1,2 | | | | (0.01 | ) | | | | | (0.05 | ) |
Net Realized and Unrealized Loss on Investments1,3 | | | | (0.16 | ) | | | | | (2.71 | ) |
| | | |
| | | | |
| |
Total from Investment Operations | | | | (0.17 | ) | | | | | (2.76 | ) |
| | | |
| | | | |
| |
Distributions to Shareholders: | | | | | | | | | | | |
From Net Realized Gain | | | | (5.19 | ) | | | | | — | |
| | | |
| | | | |
| |
Net Decrease in Net Asset Value | | | | (5.36 | ) | | | | | (2.76 | ) |
| | | |
| | | | |
| |
Net Asset Value – End of Period | | | $ | 1.88 | | | | | $ | 7.24 | |
| | | |
| | | | |
| |
| Total Investment Return4 | | | | 8.17% | (A) | | | | | (27.60)% | (A) |
| Ratios to Average Net Assets: | | | | | | | | | | | |
Expenses After Waivers and Related Reimbursements2 | | | | 2.20% | (B) | | | | | 1.80% | (B) |
Expenses Before Waivers and Related Reimbursements | | | | 12.88% | (B) | | | | | 3.79% | (B) |
Net Investment Loss After Waivers and Related Reimbursements2 | | | | (1.91)% | (B) | | | | | (1.36)% | (B) |
Net Investment Loss Before Waivers and Related Reimbursements | | | | (12.59)% | (B) | | | | | (3.35)% | (B) |
| Supplementary Data: | | | | | | | | | | | |
Portfolio Turnover Rate | | | | 3% | (A) | | | | | 17% | |
Net Assets at End of Period (in thousands) | | | $ | 149 | | | | | $ | 72 | |
|
| * | | Represents the period from inception of share class (May 30, 2008) through October 31, 2008. |
| 1 | | Calculated based on shares outstanding on the first and last day of the period, except for dividends and distributions, if any, which are based on the actual shares outstanding on the dates of distributions. |
| 2 | | Reflects fees waived and reimbursed by FBR Fund Advisers, Inc. pursuant to a contractual expense limitation of 2.20% (excluding interest, taxes, brokerage commissions, dividend expenses, acquired fund fees and expenses, extraordinary legal expenses, or any other extraordinary expenses). |
| 3 | | The amounts shown for a share outstanding throughout the period may not be in accordance with the changes in the aggregate gains and losses on investments during the period because of the timing of sales and repurchases of Fund shares in relation to fluctuating net asset values during the period. |
| 4 | | Total investment return is calculated assuming a purchase of shares on the first day and a sale on the last day of each period reported and will include reinvestment of dividends and distributions, if any. |
| (A) | | Not Annualized |
| (B) | | Annualized |
96
The FBR Funds
Financial Highlights (continued)
| | | FBR Large Cap Financial Fund — Investor Class |
| | |
|
| | | For the | | | | | | | | | | | | | | | | | | | | |
| | | Six Months | | | | | | | | | | | | | | | | | | | | |
| | | Ended | | | | | | | | | | | | | | | | | | | | |
| | | April 30, | | For the Years Ended October 31, |
| | | 2009 | |
|
| | | (unaudited) | | 2008 | | 2007 | | 2006 | | 2005 | | 2004 |
| | |
| |
| |
| |
| |
| |
|
| Per Share Operating Performance: | | | | | | | | | | | | | | | | | | | | | | | | | | |
Net Asset Value – Beginning of Period | | | $ | 11.14 | | | | $ | 18.71 | | | $ | 21.67 | | | $ | 21.84 | | | $ | 24.46 | | | $ | 22.43 | |
| | | |
| | | |
| | |
| | |
| | |
| | |
| |
Income (Loss) from Investment Operations: | | | | | | | | | | | | | | | | | | | | | | | | | | |
Net Investment Income1,2 | | | | 0.03 | | | | | 0.14 | | | | 0.14 | | | | 0.13 | | | | 0.13 | | | | 0.08 | |
Net Realized and Unrealized Gain (Loss) on Investments1,3 | | | | (1.12 | ) | | | | (3.86 | ) | | | (0.97 | ) | | | 2.72 | | | | 0.15 | | | | 2.08 | |
| | | |
| | | |
| | |
| | |
| | |
| | |
| |
Total from Investment Operations | | | | (1.09 | ) | | | | (3.72 | ) | | | (0.83 | ) | | | 2.85 | | | | 0.28 | | | | 2.16 | |
| | | |
| | | |
| | |
| | |
| | |
| | |
| |
Distributions to Shareholders: | | | | | | | | | | | | | | | | | | | | | | | | | | |
From Net Investment Income | | | | (0.12 | ) | | | | (0.18 | ) | | | (0.11 | ) | | | (0.16 | ) | | | (0.08 | ) | | | (0.07 | ) |
From Net Realized Gain | | | | — | | | | | (3.68 | ) | | | (2.02 | ) | | | (2.86 | ) | | | (2.82 | ) | | | (0.08 | ) |
| | | |
| | | |
| | |
| | |
| | |
| | |
| |
Total Distributions | | | | (0.12 | ) | | | | (3.86 | ) | | | (2.13 | ) | | | (3.02 | ) | | | (2.90 | ) | | | (0.15 | ) |
| | | |
| | | |
| | |
| | |
| | |
| | |
| |
Paid-in Capital from Redemption Fees4 | | | | 0.01 | | | | | 0.01 | | | | 0.00 | 5 | | | 0.00 | 5 | | | 0.00 | 5 | | | 0.02 | |
| | | |
| | | |
| | |
| | |
| | |
| | |
| |
Net Increase (Decrease) in Net Asset Value | | | | (1.20 | ) | | | | (7.57 | ) | | | (2.96 | ) | | | (0.17 | ) | | | (2.62 | ) | | | 2.03 | |
| | | |
| | | |
| | |
| | |
| | |
| | |
| |
Net Asset Value – End of Period | | | $ | 9.94 | | | | $ | 11.14 | | | $ | 18.71 | | | $ | 21.67 | | | $ | 21.84 | | | $ | 24.46 | |
| | | |
| | | |
| | |
| | |
| | |
| | |
| |
| Total Investment Return6 | | | | (9.73)% | (A) | | | | (23.76)% | | | | (4.59)% | | | | 14.21% | | | | 0.86% | | | | 9.76% | |
| Ratios to Average Net Assets: | | | | | | | | | | | | | | | | | | | | | | | | | | |
Expenses After Waivers2 | | | | 1.94% | (B) | | | | 1.88% | | | | 1.89% | | | | 1.83% | | | | 1.95% | | | | 1.91% | |
Expenses Before Waivers | | | | 2.05% | (B) | | | | 2.01% | | | | 1.92% | | | | 1.84% | | | | 1.96% | | | | 1.94% | |
Net Investment Income After Waivers2 | | | | 0.61% | (B) | | | | 1.63% | | | | 0.59% | | | | 0.68% | | | | 0.62% | | | | 0.28% | |
Net Investment Income Before Waivers | | | | 0.50% | (B) | | | | 1.50% | | | | 0.56% | | | | 0.67% | | | | 0.61% | | | | 0.25% | |
| Supplementary Data: | | | | | | | | | | | | | | | | | | | | | | | | | | |
Portfolio Turnover Rate | | | | 224% | (A) | | | | 509% | | | | 95% | | | | 54% | | | | 41% | | | | 42% | |
Net Assets at End of Period (in thousands) | | | $ | 16,312 | | | | $ | 24,272 | | | $ | 15,951 | | | $ | 26,313 | | | $ | 29,037 | | | $ | 30,384 | |
|
| 1 | | Calculated based on shares outstanding on the first and last day of the respective periods, except for dividends and distributions, if any, which are based on the actual shares outstanding on the dates of distributions. |
| 2 | | Reflects fees waived by FBR Fund Advisers, Inc. pursuant to a contractual expense limitation of 1.95% (excluding interest, taxes, brokerage commissions, dividend expenses, acquired fund fees and expenses, extraordinary legal expenses, or any other extraordinary expenses) and effective May 30, 2008, the recoupment of certain previously waived fees. |
| 3 | | The amounts shown for a share outstanding throughout the respective periods may not be in accordance with the changes in the aggregate gains and losses on investments during the respective periods because of the timing of sales and repurchases of Fund shares in relation to fluctuating net asset values during the respective periods. |
| 4 | | Calculated based on average shares outstanding. |
| 5 | | Less than $0.01 |
| 6 | | Total investment return is calculated assuming a purchase of shares on the first day and a sale on the last day of each period reported and will include reinvestment of dividends and distributions, if any. |
| (A) | | Not Annualized |
| (B) | | Annualized |
97
The FBR Funds
Financial Highlights (continued)
| | | FBR Small Cap Financial Fund — Investor Class |
| | |
|
| | | For the | | | | | | | | | | | | | | | | | | | | |
| | | Six Months | | | | | | | | | | | | | | | | | | | | |
| | | Ended | | | | | | | | | | | | | | | | | | | | |
| | | April 30, | | For the Years Ended October 31, |
| | | 2009 | |
|
| | | (unaudited) | | 2008 | | 2007 | | 2006 | | 2005 | | 2004 |
| | |
| |
| |
| |
| |
| |
|
| | | | | | | | | | | | | | | | | | | | | | | | | | | |
| Per Share Operating Performance: | | | | | | | | | | | | | | | | | | | | | | | | | | |
Net Asset Value – Beginning of Period | | | $ | 15.22 | | | | $ | 23.18 | | | $ | 32.70 | | | $ | 32.96 | | | $ | 36.41 | | | $ | 32.56 | |
| | | |
| | | |
| | |
| | |
| | |
| | |
| |
Income (Loss) from Investment Operations: | | | | | | | | | | | | | | | | | | | | | | | | | | |
Net Investment Income1 | | | | 0.03 | | | | | 0.24 | | | | 0.29 | | | | 0.14 | | | | 0.23 | | | | 0.13 | |
Net Realized and Unrealized Gain (Loss) on Investments1,2 | | | | (1.12 | ) | | | | (1.69 | ) | | | (5.31 | ) | | | 3.44 | | | | 0.85 | | | | 4.40 | |
| | | |
| | | |
| | |
| | |
| | |
| | |
| |
Total from Investment Operations | | | | (1.09 | ) | | | | (1.45 | ) | | | (5.02 | ) | | | 3.58 | | | | 1.08 | | | | 4.53 | |
| | | |
| | | |
| | |
| | |
| | |
| | |
| |
Distributions to Shareholders: | | | | | | | | | | | | | | | | | | | | | | | | | | |
From Net Investment Income | | | | (0.19 | ) | | | | (0.28 | ) | | | (0.15 | ) | | | (0.14 | ) | | | (0.18 | ) | | | (0.07 | ) |
From Net Realized Gain | | | | — | | | | | (6.24 | ) | | | (4.35 | ) | | | (3.70 | ) | | | (4.36 | ) | | | (0.65 | ) |
| | | |
| | | |
| | |
| | |
| | |
| | |
| |
Total Distributions | | | | (0.19 | ) | | | | (6.52 | ) | | | (4.50 | ) | | | (3.84 | ) | | | (4.54 | ) | | | (0.72 | ) |
| | | |
| | | |
| | |
| | |
| | |
| | |
| |
Paid-in Capital from Redemption Fees3 | | | | 0.01 | | | | | 0.01 | | | | 0.00 | 4 | | | 0.00 | 4 | | | 0.01 | | | | 0.04 | |
| | | |
| | | |
| | |
| | |
| | |
| | |
| |
Net Increase (Decrease) in Net Asset Value | | | | (1.27 | ) | | | | (7.96 | ) | | | (9.52 | ) | | | (0.26 | ) | | | (3.45 | ) | | | 3.85 | |
| | | |
| | | |
| | |
| | |
| | |
| | |
| |
Net Asset Value – End of Period | | | $ | 13.95 | | | | $ | 15.22 | | | $ | 23.18 | | | $ | 32.70 | | | $ | 32.96 | | | $ | 36.41 | |
| | | |
| | | |
| | |
| | |
| | |
| | |
| |
| Total Investment Return5 | | | | (7.15)% | (A) | | | | (6.76)% | | | | (18.02)% | | | | 11.81% | | | | 2.63% | | | | 14.29% | |
| Ratios to Average Net Assets: | | | | | | | | | | | | | | | | | | | | | | | | | | |
Expenses After Waivers | | | | 1.53% | (B) | | | | 1.49% | | | | 1.51% | | | | 1.46% | | | | 1.55% | | | | 1.59% | |
Expenses Before Waivers | | | | 1.53% | (B) | | | | 1.49% | | | | 1.51% | | | | 1.46% | | | | 1.55% | | | | 1.59% | |
Net Investment Income After Waivers | | | | 0.57% | (B) | | | | 1.48% | | | | 0.93% | | | | 0.45% | | | | 0.69% | | | | 0.40% | |
Net Investment Income Before Waivers | | | | 0.57% | (B) | | | | 1.48% | | | | 0.93% | | | | 0.45% | | | | 0.69% | | | | 0.40% | |
| Supplementary Data: | | | | | | | | | | | | | | | | | | | | | | | | | | |
Portfolio Turnover Rate | | | | 77% | (A) | | | | 147% | | | | 13% | | | | 8% | | | | 15% | | | | 36% | |
Net Assets at End of Period (in thousands) | | | $ | 175,450 | | | | $ | 181,803 | | | $ | 144,214 | | | $ | 346,155 | | | $ | 463,333 | | | $ | 594,625 | |
|
| 1 | | Calculated based on shares outstanding on the first and last day of the respective periods, except for dividends and distributions, if any, which are based on the actual shares outstanding on the dates of distributions. |
| 2 | | The amounts shown for a share outstanding throughout the respective periods may not be in accordance with the changes in the aggregate gains and losses on investments during the respective periods because of the timing of sales and repurchases of Fund shares in relation to fluctuating net asset values during the respective periods. |
| 3 | | Calculated based on average shares outstanding. |
| 4 | | Less than $0.01 |
| 5 | | Total investment return is calculated assuming a purchase of shares on the first day and a sale on the last day of each period reported and will include reinvestment of dividends and distributions, if any. |
| (A) | | Not Annualized |
| (B) | | Annualized |
98
The FBR Funds
Financial Highlights (continued)
| | | FBR Small Cap Financial Fund — I Class |
| | |
|
| | | For the | | | | | |
| | | Six Months Ended | | For the |
| | | April 30, 2009 | | Period Ended |
| | | (unaudited) | | October 31, 2008* |
| | |
| |
|
| Per Share Operating Performance: | | | | | | | | | | |
Net Asset Value – Beginning of Period | | | $ | 9.96 | | | | $ | 10.00 | |
| | | |
| | | |
| |
Income (Loss) from Investment Operations: | | | | | | | | | | |
Net Investment Income1,2 | | | | 0.77 | | | | | 0.02 | |
Net Realized and Unrealized Loss on Investments1,3 | | | | (1.44 | ) | | | | (0.06 | ) |
| | | |
| | | |
| |
Total from Investment Operations | | | | (0.67 | ) | | | | (0.04 | ) |
| | | |
| | | |
| |
Distributions to Shareholders: | | | | | | | | | | |
From Net Investment Income | | | | (0.21 | ) | | | | — | |
| | | |
| | | |
| |
Net Decrease in Net Asset Value | | | | (0.88 | ) | | | | (0.04 | ) |
| | | |
| | | |
| |
Net Asset Value – End of Period | | | $ | 9.08 | | | | $ | 9.96 | |
| | | |
| | | |
| |
| Total Investment Return4 | | | | (6.79)% | (A) | | | | (0.40)% | (A) |
| Ratios to Average Net Assets: | | | | | | | | | | |
Expenses After Waivers and Related Reimbursements2 | | | | 1.19% | (B) | | | | 1.31% | (B) |
Expenses Before Waivers and Related Reimbursements | | | | 2.52% | (B) | | | | 1.31% | (B) |
Net Investment Income After Waivers and Related Reimbursements2 | | | | 1.28% | (B) | | | | 1.49% | (B) |
Net Investment Income (Loss) Before Waivers and Related Reimbursements | | | | (0.05)% | (B) | | | | 1.49% | (B) |
| Supplementary Data: | | | | | | | | | | |
Portfolio Turnover Rate | | | | 77% | (A) | | | | 147% | |
Net Assets at End of Period (in thousands) | | | $ | 125 | | | | $ | 3,952 | |
|
| * | | Represents the period from inception of share class (May 30, 2008) through October 31, 2008. |
| 1 | | Calculated based on shares outstanding on the first and last day of the period, except for dividends and distributions, if any, which are based on the actual shares outstanding on the dates of distributions. |
| 2 | | Reflects fees waived and reimbursed by FBR Fund Advisers, Inc. pursuant to a contractual expense limitation of 1.70% (excluding interest, taxes, brokerage commissions, dividend expenses, acquired fund fees and expenses, extraordinary legal expenses, or any other extraordinary expenses and effective May 30, 2008, the recoupment of certain previously waived fees. |
| 3 | | The amounts shown for a share outstanding throughout the period may not be in accordance with the changes in the aggregate gains and losses on investments during the period because of the timing of sales and repurchases of Fund shares in relation to fluctuating net asset values during the period. |
| 4 | | Total investment return is calculated assuming a purchase of shares on the first day and a sale on the last day of each period reported and will include reinvestment of dividends and distributions, if any. |
| (A) | | Not Annualized |
| (B) | | Annualized |
99
The FBR Funds
Financial Highlights (continued)
| | | FBR Small Cap Financial Fund — R Class |
| | |
|
| | | For the | | | | | |
| | | Six Months Ended | | For the |
| | | April 30, 2009 | | Period Ended |
| | | (unaudited) | | October 31, 2008* |
| | |
| |
|
| Per Share Operating Performance: | | | | | | | | | | |
Net Asset Value – Beginning of Period | | | $ | 9.93 | | | | $ | 10.00 | |
| | | |
| | | |
| |
Income (Loss) from Investment Operations: | | | | | | | | | | |
Net Investment Income1,2 | | | | 0.01 | | | | | 0.08 | |
Net Realized and Unrealized Loss on Investments1,3 | | | | (0.76 | ) | | | | (0.15 | ) |
| | | |
| | | |
| |
Total from Investment Operations | | | | (0.75 | ) | | | | (0.07 | ) |
| | | |
| | | |
| |
Distributions to Shareholders: | | | | | | | | | | |
From Net Investment Income | | | | (0.16 | ) | | | | — | |
| | | |
| | | |
| |
Net Decrease in Net Asset Value | | | | (0.91 | ) | | | | (0.07 | ) |
| | | |
| | | |
| |
Net Asset Value – End of Period | | | $ | 9.02 | | | | $ | 9.93 | |
| | | |
| | | |
| |
| Total Investment Return4 | | | | (7.58)% | (A) | | | | (0.70)% | (A) |
| Ratios to Average Net Assets: | | | | | | | | | | |
Expenses After Waivers and Related Reimbursements2 | | | | 2.20% | (B) | | | | 1.86% | (B) |
Expenses Before Waivers and Related Reimbursements | | | | 10.84% | (B) | | | | 3.54% | (B) |
Net Investment Income (Loss) After Waivers and Related Reimbursements2 | | | | (0.08)% | (B) | | | | 1.83% | (B) |
Net Investment Income (Loss) Before Waivers and Related Reimbursements | | | | (8.72)% | (B) | | | | 0.15% | (B) |
| Supplementary Data: | | | | | | | | | | |
Portfolio Turnover Rate | | | | 77% | (A) | | | | 147% | |
Net Assets at End of Period (in thousands) | | | $ | 111 | | | | $ | 99 | |
|
| * | | Represents the period from inception of share class (May 30, 2008) through October 31, 2008. |
| 1 | | Calculated based on shares outstanding on the first and last day of the period, except for dividends and distributions, if any, which are based on the actual shares outstanding on the dates of distributions. |
| 2 | | Reflects fees waived and reimbursed by FBR Fund Advisers, Inc. pursuant to a contractual expense limitation of 2.20% (excluding interest, taxes, brokerage commissions, dividend expenses, acquired fund fees and expenses, extraordinary legal expenses, or any other extraordinary expenses). |
| 3 | | The amounts shown for a share outstanding throughout the period may not be in accordance with the changes in the aggregate gains and losses on investments during the period because of the timing of sales and repurchases of Fund shares in relation to fluctuating net asset values during the period. |
| 4 | | Total investment return is calculated assuming a purchase of shares on the first day and a sale on the last day of each period reported and will include reinvestment of dividends and distributions, if any. |
| (A) | | Not Annualized |
| (B) | | Annualized |
100
The FBR Funds
Financial Highlights (continued)
| | | FBR Technology Fund — Investor Class |
| | |
|
| | | For the | | | | | | | | | | | | | | | | | | | | |
| | | Six Months | | | | | | | | | | | | | | | | | | | | |
| | | Ended | | | | | | | | | | | | | | | | | | | | |
| | | April 30, | | For the Years Ended October 31, |
| | | 2009 | |
|
| | | (unaudited) | | 2008 | | 2007 | | 2006 | | 2005 | | 2004 |
| | |
| |
| |
| |
| |
| |
|
| Per Share Operating Performance: | | | | | | | | | | | | | | | | | | | | | | | | |
Net Asset Value – Beginning of Period | | $ | 6.96 | | | $ | 13.34 | | | $ | 11.97 | | | $ | 10.82 | | | $ | 10.96 | | | $ | 11.03 | |
| | |
| | |
| | |
| | |
| | |
| | |
| |
Income (Loss) from Investment Operations: | | | | | | | | | | | | | | | | | | | | | | | | |
Net Investment Loss1,2 | | | (0.04 | ) | | | (0.12 | ) | | | (0.05 | ) | | | (0.04 | ) | | | (0.05 | ) | | | (0.14 | ) |
Net Realized and Unrealized Gain (Loss) on Investments1,3 | | | 0.57 | | | | (5.03 | ) | | | 1.81 | | | | 1.77 | | | | 1.53 | | | | 0.24 | |
| | |
| | |
| | |
| | |
| | |
| | |
| |
Total from Investment Operations | | | 0.53 | | | | (5.15 | ) | | | 1.76 | | | | 1.73 | | | | 1.48 | | | | 0.10 | |
| | |
| | |
| | |
| | |
| | |
| | |
| |
Distributions to Shareholders: | | | | | | | | | | | | | | | | | | | | | | | | |
From Net Realized Gain | | | — | | | | (1.23 | ) | | | (0.39 | ) | | | (0.58 | ) | | | (1.62 | ) | | | (0.20 | ) |
| | |
| | |
| | |
| | |
| | |
| | |
| |
Paid-in Capital from Redemption Fees4 | | | 0.00 | 5 | | | 0.00 | 5 | | | 0.00 | 5 | | | 0.00 | 5 | | | 0.00 | 5 | | | 0.03 | |
| | |
| | |
| | |
| | |
| | |
| | |
| |
Net Increase (Decrease) in Net Asset Value | | | 0.53 | | | | (6.38 | ) | | | 1.37 | | | | 1.15 | | | | (0.14 | ) | | | (0.07 | ) |
| | |
| | |
| | |
| | |
| | |
| | |
| |
Net Asset Value – End of Period | | $ | 7.49 | | | $ | 6.96 | | | $ | 13.34 | | | $ | 11.97 | | | $ | 10.82 | | | $ | 10.96 | |
| | |
| | |
| | |
| | |
| | |
| | |
| |
| Total Investment Return6 | | | 7.61% | (A) | | | (42.30)% | | | | 15.18% | | | | 16.40% | | | | 14.51% | | | | 1.17% | |
| Ratios to Average Net Assets: | | | | | | | | | | | | | | | | | | | | | | | | |
Expenses After Waivers and Related Reimbursements2 | | | 1.95% | (B) | | | 1.84% | | | | 1.70% | | | | 1.87% | | | | 1.94% | | | | 1.95% | |
Expenses Before Waivers and Related Reimbursements | | | 3.20% | (B) | | | 1.92% | | | | 1.70% | | | | 1.92% | | | | 2.74% | | | | 3.21% | |
Net Investment Loss After Waivers and Related Reimbursements2 | | | (0.95)% | (B) | | | (0.60)% | | | | (0.41)% | | | | (0.60)% | | | | (0.77)% | | | | (1.23)% | |
Net Investment Loss Before Waivers and Related Reimbursements | | | (2.20)% | (B) | | | (0.68)% | | | | (0.41)% | | | | (0.65)% | | | | (1.57)% | | | | (2.49)% | |
| Supplementary Data: | | | | | | | | | | | | | | | | | | | | | | | | |
Portfolio Turnover Rate | | | 97% | (A) | | | 175% | | | | 229% | | | | 108% | | | | 100% | | | | 99% | |
Net Assets at End of Period (in thousands) | | $ | 6,441 | | | $ | 7,689 | | | $ | 40,935 | | | $ | 39,407 | | | $ | 14,810 | | | $ | 6,608 | |
|
| 1 | | Calculated based on shares outstanding on the first and last day of the respective periods, except for dividends and distributions, if any, which are based on the actual shares outstanding on the dates of distributions. |
| 2 | | Reflects fees waived and reimbursed by FBR Fund Advisers, Inc. pursuant to a contractual expense limitation of 1.95% (excluding interest, taxes, brokerage commissions, dividend expenses, acquired fund fees and expenses, extraordinary legal expenses, or any other extraordinary expenses) and effective May 30, 2008, the recoupment of certain previously waived fees. |
| 3 | | The amounts shown for a share outstanding throughout the respective periods may not be in accordance with the changes in the aggregate gains and losses on investments during the respective periods because of the timing of sales and repurchases of Fund shares in relation to fluctuating net asset values during the respective periods. |
| 4 | | Calculated based on average shares outstanding. |
| 5 | | Less than $0.01 |
| 6 | | Total investment return is calculated assuming a purchase of shares on the first day and a sale on the last day of each period reported and will include reinvestment of dividends and distributions, if any. |
| (A) | | Not Annualized |
| (B) | | Annualized |
101
The FBR Funds
Financial Highlights (continued)
| | FBR Gas Utility Index Fund — Investor Class |
| |
|
| | | For the | | | | | | | | | | | | | | | | | | | | |
| | | Six Months | | | | | | | | | | | | | | | | | | | | |
| | | Ended | | | | | | | | | | | | | | | | | | | | |
| | | April 30, | | For the Years Ended October 31, | |
| | | 2009 | |
| |
| | | (unaudited) | | 2008 | | | 2007 | | | 2006 | | | 2005 | | | 2004 | |
| | |
| |
| | |
| | |
| | |
| | |
| |
| Per Share Operating Performance: | | | | | | | | | | | | | | | | | | | | | | | | | |
Net Asset Value – Beginning of Period | | | $ | 15.26 | | | $ | 23.14 | | | $ | 19.48 | | | $ | 17.25 | | | $ | 14.67 | | | $ | 12.51 | |
| | | |
| | |
| | |
| | |
| | |
| | |
| |
Income (Loss) from Investment Operations: | | | | | | | | | | | | | | | | | | | | | | | | | |
Net Investment Income1,2 | | | | 0.22 | | | | 0.47 | | | | 0.47 | | | | 0.50 | | | | 0.52 | | | | 0.38 | |
Net Realized and Unrealized Gain (Loss) on Investments1,3 | | | | (1.65 | ) | | | (6.13 | ) | | | 3.67 | | | | 2.34 | | | | 2.47 | | | | 2.17 | |
| | | |
| | |
| | |
| | |
| | |
| | |
| |
Total from Investment Operations | | | | (1.43 | ) | | | (5.66 | ) | | | 4.14 | | | | 2.84 | | | | 2.99 | | | | 2.55 | |
| | | |
| | |
| | |
| | |
| | |
| | |
| |
Distributions to Shareholders: | | | | | | | | | | | | | | | | | | | | | | | | | |
From Net Investment Income | | | | (0.22 | ) | | | (0.47 | ) | | | (0.48 | ) | | | (0.61 | ) | | | (0.41 | ) | | | (0.39 | ) |
From Net Realized Gain | | | | (0.74 | ) | | | (1.75 | ) | | | — | | | | — | | | | — | | | | — | |
| | | |
| | |
| | |
| | |
| | |
| | |
| |
Total Distributions | | | | (0.96 | ) | | | (2.22 | ) | | | (0.48 | ) | | | (0.61 | ) | | | (0.41 | ) | | | (0.39 | ) |
| | | |
| | |
| | |
| | |
| | |
| | |
| |
Paid-in Capital from Redemption Fees4 | | | | 0.01 | | | | 0.00 | 5 | | | 0.00 | 5 | | | 0.00 | 5 | | | 0.00 | 5 | | | 0.00 | 5 |
| | | |
| | |
| | |
| | |
| | |
| | |
| |
Net Increase (Decrease) in Net Asset Value | | | | (2.38 | ) | | | (7.88 | ) | | | 3.66 | | | | 2.23 | | | | 2.58 | | | | 2.16 | |
| | | |
| | |
| | |
| | |
| | |
| | |
| |
Net Asset Value – End of Period | | | $ | 12.88 | | | $ | 15.26 | | | $ | 23.14 | | | $ | 19.48 | | | $ | 17.25 | | | $ | 14.67 | |
| | | |
| | |
| | |
| | |
| | |
| | |
| |
| Total Investment Return6 | | | | (9.62)% | (A) | | | (26.81)% | | | | 21.51% | | | | 16.84% | | | | 20.48% | | | | 20.63% | |
| Ratios to Average Net Assets: | | | | | | | | | | | | | | | | | | | | | | | | | |
Expenses After Waivers2 | | | | 0.76% | (B) | | | 0.70% | | | | 0.75% | | | | 0.80% | | | | 0.80% | | | | 0.85% | |
Expenses Before Waivers | | | | 0.76% | (B) | | | 0.70% | | | | 0.75% | | | | 0.80% | | | | 0.80% | | | | 0.88% | |
Net Investment Income After Waivers2 | | | | 3.34% | (B) | | | 2.39% | | | | 2.21% | | | | 2.69% | | | | 3.18% | | | | 2.90% | |
Net Investment Income Before Waivers | | | | 3.34% | (B) | | | 2.39% | | | | 2.21% | | | | 2.69% | | | | 3.18% | | | | 2.87% | |
| Supplementary Data: | | | | | | | | | | | | | | | | | | | | | | | | | |
Portfolio Turnover Rate | | | | 13% | (A) | | | 27% | | | | 22% | | | | 16% | | | | 20% | | | | 34% | |
Net Assets at End of Period (in thousands) | | | $ | 164,578 | | | $ | 198,569 | | | $ | 285,951 | | | $ | 270,031 | | | $ | 295,804 | | | $ | 220,545 | |
|
| 1 | | Calculated based on shares outstanding on the first and last day of the respective periods, except for dividends and distributions, if any, which are based on the actual shares outstanding on the dates of distributions. |
| 2 | | Reflects fees waived by FBR Fund Advisers, Inc. pursuant to a contractual expense limitation of 0.85% (excluding interest, taxes, brokerage commissions, dividend expenses, acquired fund fees and expenses, extraordinary legal expenses, or any other extraordinary expenses) and effective May 30, 2008, the recoupment of certain previously waived fees. |
| 3 | | The amounts shown for a share outstanding throughout the respective periods may not be in accordance with the changes in the aggregate gains and losses on investments during the respective periods because of the timing of sales and repurchases of Fund shares in relation to fluctuating net asset values during the respective periods. |
| 4 | | Calculated based on average shares outstanding. |
| 5 | | Less than $0.01 |
| 6 | | Total investment return is calculated assuming a purchase of shares on the first day and a sale on the last day of each period reported and will include reinvestment of dividends and distributions, if any. |
| (A) | | Not Annualized |
| (B) | | Annualized |
102
The FBR Funds
Financial Highlights (continued)
| | | FBR Gas Utility Index Fund — R Class |
| | |
|
| | | For the | | | | | |
| | | Six Months Ended | | For the |
| | | April 30, 2009 | | Period Ended |
| | | (unaudited) | | October 31, 2008* |
| | |
| |
|
| Per Share Operating Performance: | | | | | | | | | | |
Net Asset Value – Beginning of Period | | | $ | 7.16 | | | | $ | 10.00 | |
| | | |
| | | |
| |
Income (Loss) from Investment Operations: | | | | | | | | | | |
Net Investment Income1,2 | | | | 0.08 | | | | | 0.07 | |
Net Realized and Unrealized Loss on Investments1,3 | | | | (0.74 | ) | | | | (2.84 | ) |
| | | |
| | | |
| |
Total from Investment Operations | | | | (0.66 | ) | | | | (2.77 | ) |
| | | |
| | | |
| |
Distributions to Shareholders: | | | | | | | | | | |
From Net Investment Income | | | | (0.21 | ) | | | | (0.07 | ) |
From Net Realized Gain | | | | (0.74 | ) | | | | — | |
| | | |
| | | |
| |
Total Distributions | | | | (0.95 | ) | | | | (0.07 | ) |
| | | |
| | | |
| |
Net Decrease in Net Asset Value | | | | (1.61 | ) | | | | (2.84 | ) |
| | | |
| | | |
| |
Net Asset Value – End of Period | | | $ | 5.55 | | | | $ | 7.16 | |
| | | |
| | | |
| |
| Total Investment Return4 | | | | (9.91)% | (A) | | | | (27.84)% | (A) |
| Ratios to Average Net Assets: | | | | | | | | | | |
Expenses After Waivers and Related Reimbursements2 | | | | 1.35% | (B) | | | | 1.19% | (B) |
Expenses Before Waivers and Related Reimbursements | | | | 12.14% | (B) | | | | 3.39% | (B) |
Net Investment Income After Waivers and Related Reimbursements2 | | | | 2.73% | (B) | | | | 1.87% | (B) |
Net Investment Loss Before Waivers and Related Reimbursements | | | | (8.06)% | (B) | | | | (0.33)% | (B) |
| Supplementary Data: | | | | | | | | | | |
Portfolio Turnover Rate | | | | 13% | (A) | | | | 27% | |
Net Assets at End of Period (in thousands) | | | $ | 65 | | | | $ | 72 | |
|
| * | | Represents the period from inception of share class (May 30, 2008) through October 31, 2008. |
| 1 | | Calculated based on shares outstanding on the first and last day of the period, except for dividends and distributions, if any, which are based on the actual shares outstanding on the dates of distributions. |
| 2 | | Reflects fees waived by FBR Fund Advisers, Inc. pursuant to a contractual expense limitation of 1.35% (excluding interest, taxes, brokerage commissions, dividend expenses, acquired fund fees and expenses, extraordinary legal expenses, or any other extraordinary expenses). |
| 3 | | The amounts shown for a share outstanding throughout the period may not be in accordance with the changes in the aggregate gains and losses on investments during the period because of the timing of sales and repurchases of Fund shares in relation to fluctuating net asset values during the period. |
| 4 | | Total investment return is calculated assuming a purchase of shares on the first day and a sale on the last day of each period reported and will include reinvestment of dividends and distributions, if any. |
| (A) | | Not Annualized |
| (B) | | Annualized |
103
The FBR Funds
Financial Highlights (continued)
| | | FBR Fund for Government Investors |
| | |
|
| | | For the | | | | | | | | | | | | | | | | | | | | | | | | | | |
| | | Six Months | | | | | | | | | | | | | | | | | | For the | | For the |
| | | Ended | | | | | | | | | | | | | | | | | | Period | | Year |
| | | April 30, | | For the Years Ended October 31, | | Ended | | Ended |
| | | 2009 | |
| | | October 31, | | December 31, |
| | | (unaudited) | | | 2008 | | | | 2007 | | | | 2006 | | | | 2005 | | | 2004* | | 2003 |
| | |
| |
| | |
| | |
| | |
| | |
| |
|
| Per Share Operating Performance: | | | | | | | | | | | | | | | | | | | | | | | | | | | | |
Net Asset Value – Beginning of Period | | | $ | 1.00 | | | $ | 1.00 | | | $ | 1.00 | | | $ | 1.00 | | | $ | 1.00 | | | | $ | 1.00 | | | | $ | 1.00 | |
| | | |
| | |
| | |
| | |
| | |
| | | |
| | | |
| |
Income (Loss) from Investment Operations: | | | | | | | | | | | | | | | | | | | | | | | | | | | | | | | |
Net Investment Income1,2 | | | | 0.00 | 3 | | | 0.02 | | | | 0.04 | | | | 0.04 | | | | 0.02 | | | | | 0.00 | 3 | | | | 0.00 | 3 |
Net Realized Loss on Investments1,4 | | | | — | | | | — | | | | — | | | | (0.00 | )3 | | | (0.00 | )3 | | | | (0.00 | )3 | | | | (0.00 | )3 |
| | | |
| | |
| | |
| | |
| | |
| | | |
| | | |
| |
Total From Investment Operations | | | | 0.00 | 3 | | | 0.02 | | | | 0.04 | | | | 0.04 | | | | 0.02 | | | | | 0.00 | 3 | | | | 0.00 | 3 |
| | | |
| | |
| | |
| | |
| | |
| | | |
| | | |
| |
Distributions to Shareholders: | | | | | | | | | | | | | | | | | | | | | | | | | | | | | | | |
From Net Investment Income | | | | (0.00 | )3 | | | (0.02 | ) | | | (0.04 | ) | | | (0.04 | ) | | | (0.02 | ) | | | | (0.00 | )3 | | | | (0.00 | )3 |
| | | |
| | |
| | |
| | |
| | |
| | | |
| | | |
| |
Net Asset Value – End of Period | | | $ | 1.00 | | | $ | 1.00 | | | $ | 1.00 | | | $ | 1.00 | | | $ | 1.00 | | | | $ | 1.00 | | | | $ | 1.00 | |
| | | |
| | |
| | |
| | |
| | |
| | | |
| | | |
| |
| Total Investment Return5 | | | | 0.20% | (A) | | | 2.31% | | | | 4.46% | | | | 3.89% | | | | 1.96% | | | | | 0.42% | (A) | | | | 0.42% | |
| Ratios to Average Net Assets: | | | | | | | | | | | | | | | | | | | | | | | | | | | | | | | |
Expenses After Waivers2 | | | | 0.77% | (B) | | | 0.79% | | | | 0.83% | | | | 0.85% | | | | 0.76% | | | | | 0.75% | (B) | | | | 0.75% | |
Expenses Before Waivers | | | | 0.88% | (B) | | | 0.79% | | | | 0.83% | | | | 0.85% | | | | 0.86% | | | | | 0.85% | (B) | | | | 0.82% | |
Net Investment Income After Waivers2 | | | | 0.44% | (B) | | | 2.48% | | | | 4.37% | | | | 3.81% | | | | 1.92% | | | | | 0.50% | (B) | | | | 0.43% | |
Net Investment Income Before Waivers | | | | 0.33% | (B) | | | 2.48% | | | | 4.37% | | | | 3.81% | | | | 1.82% | | | | | 0.40% | (B) | | | | 0.36% | |
| Supplementary Data: | | | | | | | | | | | | | | | | | | | | | | | | | | | | | | | |
Net Assets at End of Period (in thousands) | | | $ | 85,320 | | | $ | 105,066 | | | $ | 181,040 | | | $ | 211,171 | | | $ | 251,675 | | | | $ | 288,761 | | | | $ | 341,413 | |
|
| * | | Effective March 1, 2004, the Fund’s fiscal year end changed to October 31. |
| 1 | | Calculated based on shares outstanding on the first and last day of the respective periods, except for dividends and distributions, if any, which are based on the actual shares outstanding on the dates of distributions. |
| 2 | | Prior to November 1, 2005, reflects fees waived by FBR Fund Advisers, Inc. (“Fund Advisers”) pursuant to a contractual advisory fee waiver of 0.10% (excluding interest, taxes, brokerage commissions, dividend expenses, acquired fund fees and expenses, extraordinary legal expenses, or any other extraordinary expenses). For the period ended April 30, 2009, Fund Advisers voluntarily absorbed expenses that were otherwise payable by the Fund. |
| 3 | | Less than $0.01 |
| 4 | | The amounts shown for a share outstanding throughout the respective periods may not be in accordance with the changes in the aggregate gains and losses in investments during the respective periods because of the timing of sales and repurchases of Fund shares in relation to fluctuating net asset values during the respective periods. |
| 5 | | Total investment return is calculated assuming a purchase of shares on the first day and a sale on the last day of each period reported and will include reinvestment of dividends and distributions, if any. |
| (A) | | Not Annualized |
| (B) | | Annualized |
The accompanying notes are an integral part of the financial statements.
104
The FBR Funds
Schedule of Shareholder Expenses
(unaudited)
As a shareholder of the Funds, you incur two types of costs: (1) transaction costs, including reinvested dividends or other distributions; redemption fees; and exchange fees; and (2) ongoing costs, including investment advisory fees; distribution (12b-1) fees; and other Fund expenses. This example is intended to help you understand your ongoing costs (in dollars) of investing in the Funds and to compare these costs with the ongoing costs of investing in other mutual funds.
The example is based on an investment of $1,000 invested at the beginning of the period and held for the entire period (November 1, 2008 through April 30, 2009).
Actual Expenses
The table on the following page provides information about actual account values and actual expenses. You may use the information in this line, together with the amount you invested, to estimate the expenses that you paid over the period. Simply divide your account value by $1,000 (for example, an $8,600 account value divided by $1,000 = 8.6), then multiply the result by the number in the first line under the heading entitled “Expenses Paid During the Six Months Ended April 30, 2009” to estimate the expenses you paid on your account during this period.
105
The FBR Funds
Schedule of Shareholder Expenses (continued)
(unaudited)
| | | | | | | | | | | | | | | Expenses Paid |
| | | Net Expense | | Beginning | | Ending | | During the |
| | | Ratio | | Account | | Account | | Six Months |
| | | Annualized | | Value | | Value | | Ended |
| | | April 30, 2009 | | November 1, 2008 | | April 30, 2009 | | April 30, 2009* |
| | |
| |
| |
| |
|
| Pegasus Fund | | | | | | | | | | | | | | | | |
Investor Class | | | 1.25 | % | | $ | 1,000.00 | | | $ | 991.10 | | | $ | 6.20 | |
I Class | | | 1.00 | | | | 1,000.00 | | | | 990.80 | | | | 4.94 | |
| Pegasus Mid Cap Fund | | | | | | | | | | | | | | | | |
Investor Class | | | 1.35 | | | | 1,000.00 | | | | 1,008.50 | | | | 6.72 | |
I Class | | | 1.10 | | | | 1,000.00 | | | | 1,009.50 | | | | 5.46 | |
| Pegasus Small Cap Fund | | | | | | | | | | | | | | | | |
Investor Class | | | 1.45 | | | | 1,000.00 | | | | 973.90 | | | | 7.11 | |
I Class | | | 1.20 | | | | 1,000.00 | | | | 973.80 | | | | 5.86 | |
| Pegasus Small Cap Growth Fund | | | | | | | | | | | | | | | | |
Investor Class | | | 1.45 | | | | 1,000.00 | | | | 1,024.00 | | | | 7.28 | |
I Class | | | 1.20 | | | | 1,000.00 | | | | 1,023.60 | | | | 6.02 | |
R Class | | | 1.70 | | | | 1,000.00 | | | | 1,022.30 | | | | 8.52 | |
| Focus Fund | | | | | | | | | | | | | | | | |
Investor Class | | | 1.46 | | | | 1,000.00 | | | | 1,087.20 | | | | 7.55 | |
I Class | | | 1.16 | | | | 1,000.00 | | | | 1,091.50 | | | | 6.03 | |
R Class | | | 2.20 | | | | 1,000.00 | | | | 1,081.70 | | | | 11.37 | |
| Large Cap Financial Fund | | | | | | | | | | | | | | | | |
Investor Class | | | 1.94 | | | | 1,000.00 | | | | 902.70 | | | | 9.17 | |
| Small Cap Financial Fund | | | | | | | | | | | | | | | | |
Investor Class | | | 1.53 | | | | 1,000.00 | | | | 928.50 | | | | 7.30 | |
I Class | | | 1.19 | | | | 1,000.00 | | | | 932.10 | | | | 5.66 | |
R Class | | | 2.20 | | | | 1,000.00 | | | | 924.20 | | | | 10.53 | |
| Technology Fund | | | | | | | | | | | | | | | | |
Investor Class | | | 1.95 | | | | 1,000.00 | | | | 1,076.10 | | | | 10.03 | |
| Gas Utility Index Fund | | | | | | | | | | | | | | | | |
Investor Class | | | 0.76 | | | | 1,000.00 | | | | 903.80 | | | | 3.58 | |
R Class | | | 1.35 | | | | 1,000.00 | | | | 900.90 | | | | 6.37 | |
| Fund for Government | | | | | | | | | | | | | | | | |
Investors | | | 0.77 | | | | 1,000.00 | | | | 1,002.00 | | | | 3.85 | |
|
| * | | Expenses are equal to the Fund’s annualized expense ratio, multiplied by the average account value over the period, multiplied by the number of days in most recent fiscal half-year then divided by 365. |
106
The FBR Funds
Schedule of Shareholder Expenses (continued)
(unaudited)
Hypothetical Example for Comparison Purposes
The table on the following page provides information about hypothetical account values and hypothetical expenses based on the Funds’ actual expense ratio and an assumed rate of return of 5% per year before expenses, which is not the Funds’ actual return. The hypothetical account values and expenses may not be used to estimate the actual ending account balance or expenses you paid for the period. You may use this information to compare the ongoing costs of investing in the Funds and other funds. To do so, compare this 5% hypothetical example with the 5% hypothetical examples that appear in the shareholder reports of the other funds.
107
The FBR Funds
Schedule of Shareholder Expenses (continued)
(unaudited)
| | | | | | | | | | | | | | | Expenses Paid |
| | | Net Expense | | Beginning | | Ending | | During the |
| | | Ratio | | Account | | Account | | Six Months |
| | | Annualized | | Value | | Value | | Ended |
| | | April 30, 2009 | | November 1, 2008 | | April 30, 2009 | | April 30, 2009* |
| | |
| |
| |
| |
|
| Pegasus Fund | | | | | | | | | | | | | | | | |
Investor Class | | | 1.25 | % | | $ | 1,000.00 | | | $ | 1,018.57 | | | $ | 6.28 | |
I Class | | | 1.00 | | | | 1,000.00 | | | | 1,019.83 | | | | 5.01 | |
| Pegasus Mid Cap Fund | | | | | | | | | | | | | | | | |
Investor Class | | | 1.35 | | | | 1,000.00 | | | | 1,018.11 | | | | 6.75 | |
I Class | | | 1.10 | | | | 1,000.00 | | | | 1,019.36 | | | | 5.49 | |
| Pegasus Small Cap Fund | | | | | | | | | | | | | | | | |
Investor Class | | | 1.45 | | | | 1,000.00 | | | | 1,017.59 | | | | 7.27 | |
I Class | | | 1.20 | | | | 1,000.00 | | | | 1,018.86 | | | | 5.99 | |
| Pegasus Small Cap Growth Fund | | | | | | | | | | | | | | | | |
Investor Class | | | 1.45 | | | | 1,000.00 | | | | 1,017.60 | | | | 7.25 | |
I Class | | | 1.20 | | | | 1,000.00 | | | | 1,018.84 | | | | 6.01 | |
R Class | | | 1.70 | | | | 1,000.00 | | | | 1,016.36 | | | | 8.50 | |
| Focus Fund | | | | | | | | | | | | | | | | |
Investor Class | | | 1.46 | | | | 1,000.00 | | | | 1,017.56 | | | | 7.30 | |
I Class | | | 1.16 | | | | 1,000.00 | | | | 1,019.03 | | | | 5.82 | |
R Class | | | 2.20 | | | | 1,000.00 | | | | 1,013.87 | | | | 11.00 | |
| Large Cap Financial Fund | | | | | | | | | | | | | | | | |
Investor Class | | | 1.94 | | | | 1,000.00 | | | | 1,015.16 | | | | 9.71 | |
| Small Cap Financial Fund | | | | | | | | | | | | | | | | |
Investor Class | | | 1.53 | | | | 1,000.00 | | | | 1,017.22 | | | | 7.64 | |
I Class | | | 1.19 | | | | 1,000.00 | | | | 1,018.91 | | | | 5.94 | |
R Class | | | 2.20 | | | | 1,000.00 | | | | 1,013.89 | | | | 10.98 | |
| Technology Fund | | | | | | | | | | | | | | | | |
Investor Class | | | 1.95 | | | | 1,000.00 | | | | 1,015.13 | | | | 9.73 | |
| Gas Utility Index Fund | | | | | | | | | | | | | | | | |
Investor Class | | | 0.76 | | | | 1,000.00 | | | | 1,021.03 | | | | 3.80 | |
R Class | | | 1.35 | | | | 1,000.00 | | | | 1,018.10 | | | | 6.76 | |
| Fund for Government | | | | | | | | | | | | | | | | |
Investors | | | 0.77 | | | | 1,000.00 | | | | 1,020.95 | | | | 3.88 | |
|
| * | | Expenses are equal to the Fund’s annualized expense ratio, multiplied by the average account value over the period, multiplied by the number of days in most recent fiscal half-year then divided by 365. |
108
The FBR Funds
Notes to Financial Statements
(unaudited)
1. Organization
The FBR Funds (the “Trust”) is registered under the Investment Company Act of 1940, as amended, (“1940 Act”) as an open-end management investment company. The Trust was organized as a business trust under the laws of the State of Delaware on September 29, 2003. The Trust currently consists of ten series which represent interests in one of the following investment portfolios: FBR Pegasus FundTM (“Pegasus Fund”), FBR Pegasus Mid Cap FundTM (“Pegasus Mid Cap Fund”), FBR Pegasus Small Cap FundTM (“Pegasus Small Cap Fund”), FBR Pegasus Small Cap Growth FundTM (“Pegasus Small Cap Growth Fund”), FBR Focus Fund (“Focus Fund”), FBR Large Cap Financial Fund (“Large Cap Financial Fund”), FBR Small Cap Financial Fund (“Small Cap Financial Fund”), FBR Technology Fund (“Technology Fund”), FBR Gas Utility Index Fund (“Gas Utility Index Fund”) and FBR Fund for Government Investors (“Money Market Fund”), (each a “Fund” and collectively, the “Funds”). The Trust is authorized to issue an unlimited number of shares of beneficial interest with no par value which may be issued in more than one class or series. Effective May 30, 2008, certain of the Funds began offering new share classes: R Class shares intended for retirement investors and I Class shares intended for institutional investors. The initial class of shares are now referred to as Investor Class, in all Funds except for the Money Market Fund.
The Pegasus Fund, a non-diversified fund, invests in the stocks of companies of any size without regard to market capitalization. The investment objective of the Fund is capital appreciation.
The Pegasus Mid Cap Fund, a non-diversified fund, invests, under normal circumstances, at least 80% of its net assets plus the amount of any borrowings for investment purposes in securities of mid capitalization (“mid-cap”) companies. The investment objective of the Fund is capital appreciation.
The Pegasus Small Cap Fund, a non-diversified fund, invests, under normal circumstances, at least 80% of its net assets plus the amount of any borrowings for investment purposes in securities of small capitalization (“small-cap”) companies. The investment objective of the Fund is capital appreciation.
The Pegasus Small Cap Growth Fund, a non-diversified fund, invests, under normal circumstances, at least 80% of its net assets plus the amount of any borrowings for investment purposes in securities of small-cap companies. The investment objective of the Fund is long-term capital appreciation.
The Focus Fund, a non-diversified fund, invests, under normal circumstances, primarily in securities of companies traded in domestic markets. The investment objective of the Fund is capital appreciation.
The Large Cap Financial Fund, a non-diversified fund, invests, under normal circumstances, at least 80% of its net assets plus the amount of any borrowings for investment purposes in securities of large capitalization (“large-cap”) companies principally engaged in the business of financial services including, but not limited to, commercial banks, savings and loan
109
The FBR Funds
Notes to Financial Statements (continued)
(unaudited)
associations, consumer and industrial finance companies, securities brokerage companies, insurance companies, real estate and leasing companies, holding companies for each of the foregoing types of business, or companies that combine some or all of these businesses. The investment objective of the Fund is capital appreciation.
The Small Cap Financial Fund, a non-diversified fund, invests, under normal circumstances, at least 80% of its net assets plus the amount of any borrowings for investment purposes in securities of small-cap companies principally engaged in the business of providing financial services to consumers and industry. The investment objective of the Fund is capital appreciation.
The Technology Fund, a non-diversified fund, invests, under normal circumstances, at least 80% of its net assets plus the amount of any borrowings for investment purposes in securities of companies that are principally engaged in the research, design, development, manufacturing or distributing products or services in the technology industry. The investment objective of the Fund is long-term capital appreciation.
The Gas Utility Index Fund, a diversified fund, invests, under normal circumstances, at least 85% of its net assets in the common stock of companies that have natural gas distribution and transmission operations. The investment objective of the Fund is income and capital appreciation.
The Money Market Fund, a diversified fund, invests, under normal circumstances, at least 95% of its total assets in fixed-rate and floating-rate short-term instruments issued or guaranteed by the U.S. Government, its agencies or instrumentalities and in repurchase agreements secured by such instruments. The investment objective of the Fund is current income consistent with liquidity and preservation of capital.
2. Significant Accounting Policies
The following is a summary of the Funds’ significant accounting policies:
Portfolio Valuation — The net asset value per share (“NAV”) of each Fund is determined as of the close of regular trading on the New York Stock Exchange (“NYSE”) (normally 4:00 p.m., Eastern Time) on each business day that the exchange is open for trading. Each Fund’s securities are valued at the last sale price on the securities exchange or national securities market on which such securities are primarily traded. Securities that are quoted by NASDAQ are valued at the NASDAQ Official Closing Price. Securities not listed on an exchange or national securities market, or securities in which there were no transactions, are valued at the average of the most recent bid and ask prices, except in the case of open short positions where the ask price is used for valuation purposes. The bid price is used when no ask price is available. Short-term investments are carried at amortized cost, which approximates market value. Restricted securities, as well as securities or other assets for which market quotations are not readily available, or are not valued by a pricing service approved by the Funds’ Board of Trustees (the “Board”), are valued at fair value in good faith by, or at the direction of, the Board.
110
The FBR Funds
Notes to Financial Statements (continued)
(unaudited)
Effective November 1, 2008, the Funds adopted Statement on Financial Accounting Standards (SFAS) No. 157,“Fair Value Measurements.” SFAS No. 157 establishes a single authoritative definition of fair value, sets out a framework for measuring fair value and requires additional disclosures about fair value measurements.
Various inputs are used in determining the value of the Funds’ investments. These inputs are summarized in the three broad levels listed below:
| • | | Level 1 – quoted prices in active markets for identical securities |
| • | | Level 2 – other significant observable inputs (including quoted prices for similar securities, interest rates, prepayment speeds, credit risk, etc.) |
| • | | Level 3 – significant unobservable inputs (including the Fund’s own assumptions in determining the fair value of investments) |
The inputs or methodology used for valuing securities are not necessarily an indication of the risk associated with investing in those securities. For example, securities maturing within 60 days of the filing are valued using amortized cost, in accordance with rules under the Investment Company Act of 1940. Generally, amortized cost approximates the current fair value of a security, but since the value is not obtained from a quoted price in an active market, such securities are reflected as Level 2.
The following is a summary of the inputs used to value the Funds’ net assets as of April 30, 2009:
| | | | | | | Level 2 – Other | | Level 3 – Significant |
| | | Level 1 – Quoted | | Significant | | Unobservable |
| | | Prices | | Observable Inputs | | Inputs |
| | |
| |
| |
|
| Pegasus Fund | | $ | 11,272,648 | | | $ | — | | | $ | — | |
| Pegasus Mid Cap Fund | | | 7,884,874 | | | | — | | | | — | |
| Pegasus Small Cap Fund | | | 7,688,807 | | | | — | | | | — | |
| Pegasus Small Cap Growth Fund | | | 3,395,165 | | | | — | | | | — | |
| Focus Fund | | | 795,754,272 | | | | — | | | | — | |
| Large Cap Financial Fund | | | 16,649,761 | | | | — | | | | — | |
| Small Cap Financial Fund | | | 178,804,918 | | | | — | | | | — | |
| Technology Fund | | | 6,398,372 | | | | — | | | | — | |
| Gas Utility Index Fund | | | 164,484,743 | | | | — | | | | — | |
| Fund for Government Investors | | | 8,027,634 | | | | 77,026,494 | | | | — | |
Share Valuation — The NAV of each Fund is calculated by dividing the sum of the value of the securities held by each Fund, plus cash or other assets, minus all liabilities (including estimated accrued expenses) by the total number of shares outstanding of each Fund, rounded to the nearest cent. Each Fund’s shares will not be priced on the days on which the NYSE is closed for trading. The offering and redemption price per share of each Fund is equal to each Fund’s NAV. The Funds, except for the Money Market Fund, charge a 1% redemption fee on shares redeemed or exchanged within 90 days of purchase. These fees are
111
The FBR Funds
Notes to Financial Statements (continued)
(unaudited)
deducted from the redemption proceeds otherwise payable to the shareholder. The Funds will retain the fee charged as paid-in capital and such fees become part of that Fund’s daily NAV calculation.
Investment Income — Dividend income is recorded on the ex-dividend date. Interest income, which includes the amortization of premium and accretion of discount, if any, is recorded on an accrual basis.
Expenses — The Funds pay all operational expenses, which are either charged directly to a Fund for which the expense is attributable or are allocated proportionately among the Funds based on allocation methods approved by the Board.
Distributions to Shareholders — Each Fund, except the Gas Utility Index Fund and Money Market Fund, declares and pays any dividends from its net investment income, if any, annually. The Gas Utility Index Fund declares and pays any such dividends quarterly. The Money Market Fund declares dividends each day the Fund is open for business and pays monthly. Distributions from net realized capital gains, if any, will be distributed at least annually for each Fund. Income and capital gain distributions are determined in accordance with U.S. federal income tax regulations.
Allocations — Investment income earned, realized capital gains and losses, and unrealized appreciation and depreciation for the Funds are allocated daily to each class of shares based upon its proportionate share of total net assets of the Fund. Class specific expenses are charged directly to the class incurring the expense. Common expenses, which are not attributable to a specific class, are allocated daily to each class of shares based upon its proportionate share of total net assets of the Fund. Expenses not directly billed to a Fund are allocated proportionally among all Funds daily in relation to net assets of each Fund or another reasonable measure.
Security Transactions — Security transactions are accounted for on the trade date. Securities sold are determined on a specific identification basis.
Estimates — The preparation of financial statements in accordance with U.S. generally accepted accounting principles requires management to make estimates and assumptions that may affect the reported amounts of assets and liabilities and disclosure of contingent assets and liabilities at the date of the financial statements and the reported amounts of income and expenses during the reporting period. Actual results could differ from those estimates.
Repurchase Agreements — The Funds have agreed to purchase securities from financial institutions subject to the seller’s agreement to repurchase them at an agreed-upon time and price (“repurchase agreement”). The financial institutions with whom each Fund enters into repurchase agreements are banks and broker/dealers which the adviser considers creditworthy pursuant to criteria approved by the Board. The seller under a repurchase agreement will be required to maintain the value of the securities as collateral, subject to the agreement at not less than the repurchase price plus accrued interest. The adviser marks to
112
The FBR Funds
Notes to Financial Statements (continued)
(unaudited)
market daily the value of the collateral, and, if necessary, requires the seller to maintain additional securities, to ensure that the value is not less than the repurchase price. Default by or bankruptcy of the seller would, however, expose each Fund to possible loss because of adverse market action or delays in connection with the disposition of the underlying securities.
3. Transactions with Affiliates
Investment Adviser — FBR Fund Advisers, Inc. (“Fund Advisers”) serves as investment adviser to the Funds. For its advisory services, Fund Advisers receives a monthly fee at an annual rate of 0.90% of the average daily net assets of the Pegasus Fund, Pegasus Mid Cap Fund, Pegasus Small Cap Fund, Pegasus Small Cap Growth Fund, Focus Fund, Large Cap Financial Fund, Small Cap Financial Fund, and Technology Fund, and at an annual rate of 0.40% of the average daily net assets of the Gas Utility Index Fund. The Money Market Fund pays a management fee at an annual rate based on the Fund’s average daily net assets of 0.50% on the first $500 million, 0.45% on the next $250 million, 0.40% on the next $250 million, and 0.35% on net assets over $1 billion.
Fund Advisers has contractually agreed to limit each Fund’s total operating expenses and to maintain these limitations with regard to each Fund through October 31, 2011. The Money Market Fund has a limitation of 1.00% of the Fund’s average daily net assets, (excluding interest, taxes, brokerage commissions, dividend expenses, acquired fund fees and expenses, extraordinary legal expenses, or any other extraordinary expenses). The following are the limits for the Equity Funds, based on average daily net assets (excluding interest, taxes, brokerage commissions, dividend expenses, acquired fund fees and expenses, extraordinary legal expenses, or any other extraordinary expenses).
| | | | | | Investor Class | | | | | | |
| | | | | | Prior to May 30, | | | | | | |
| | | Investor Class | | | 2008 | | | I Class | | | R Class |
| | |
| | |
| | |
| | |
|
| Pegasus Fund | | 1.25% | | | 1.95% | | | 1.00% | | | NA |
| Pegasus Mid Cap Fund | | 1.35% | | | 1.95% | | | 1.10% | | | NA |
| Pegasus Small Cap Fund | | 1.45% | | | 1.95% | | | 1.20% | | | NA |
| Pegasus Small Cap Growth Fund | | 1.45% | | | 1.95% | | | 1.20% | | | 1.70% |
| Focus Fund | | 1.95% | | | 1.95% | | | 1.70% | | | 2.20% |
| Large Cap Financial Fund | | 1.95% | | | 1.95% | | | NA | | | NA |
| Small Cap Financial Fund | | 1.95% | | | 1.95% | | | 1.70% | | | 2.20% |
| Technology Fund | | 1.95% | | | 1.95% | | | NA | | | NA |
| Gas Utility Index Fund | | 0.85% | | | 0.85% | | | NA | | | 1.35% |
Effective May 30, 2008, the Adviser may recoup any waived amount from a Fund pursuant to this agreement if such reimbursement does not cause the Fund to exceed existing expense limitations and the reimbursement is made within three years after the year in which the Adviser incurred the expense.
113
The FBR Funds
Notes to Financial Statements (continued)
(unaudited)
As of April 30, 2009, the Funds had the following amounts (and year of expiration) subject to repayment to the Adviser:
| | | Year Fees | | | Repayment | | | | |
| | | Waived | | | Expires | | Balance |
| | |
| | |
| |
|
| Pegasus Fund - Investor Class | | 2008 | | | 2011 | | $ | 42,645 | |
| | | 2009 | | | 2012 | | | 54,998 | |
| Pegasus Fund - I Class | | 2008 | | | 2011 | | | 1,153 | |
| | | 2009 | | | 2012 | | | 4,706 | |
| Pegasus Mid Cap Fund - Investor Class | | 2008 | | | 2011 | | | 37,881 | |
| | | 2009 | | | 2012 | | | 50,914 | |
| Pegasus Mid Cap Fund - I Class | | 2008 | | | 2011 | | | 1,295 | |
| | | 2009 | | | 2012 | | | 4,269 | |
| Pegasus Small Cap Fund - Investor Class | | 2008 | | | 2011 | | | 36,709 | |
| | | 2009 | | | 2012 | | | 48,353 | |
| Pegasus Small Cap Fund - I Class | | 2008 | | | 2011 | | | 1,298 | |
| | | 2009 | | | 2012 | | | 4,278 | |
| Pegasus Small Cap Growth Fund - Investor Class | | 2008 | | | 2011 | | | 44,078 | |
| | | 2009 | | | 2012 | | | 51,165 | |
| Pegasus Small Cap Growth Fund - I Class | | 2008 | | | 2011 | | | 1,436 | |
| | | 2009 | | | 2012 | | | 4,580 | |
| Pegasus Small Cap Growth Fund - R Class | | 2008 | | | 2011 | | | 1,450 | |
| | | 2009 | | | 2012 | | | 4,627 | |
| Focus Fund - R Class | | 2008 | | | 2011 | | | 709 | |
| | | 2009 | | | 2012 | | | 4,167 | |
| Large Cap Financial Fund - Investor Class | | 2008 | | | 2011 | | | 104 | |
| | | 2009 | | | 2012 | | | 9,469 | |
| Small Cap Financial Fund - I Class | | 2009 | | | 2012 | | | 4,110 | |
| Small Cap Financial Fund - R Class | | 2008 | | | 2011 | | | 687 | |
| | | 2009 | | | 2012 | | | 3,983 | |
| Technology Fund - Investor Class | | 2008 | | | 2011 | | | 7,400 | |
| | | 2009 | | | 2012 | | | 39,762 | |
| Gas Utility Index Fund - R Class | | 2008 | | | 2011 | | | 823 | |
| | | 2009 | | | 2012 | | | 3,520 | |
During the six months ended April 30, 2009, the Gas Utility Index Fund - Investor Class repaid the Adviser $78 for fees waived during the fiscal year ended October 31, 2008.
Administrator — JPMorgan Chase Bank N.A. (“JPMorgan”) serves as the administrator to the Funds and provides pursuant to an Administration Agreement (“Agreement”) day-to-day administrative services including monitoring portfolio compliance, determining compliance with provisions of the Internal Revenue Code and preparing the Funds’ registration statements. Pursuant to the Agreement, JPMorgan receives a monthly fee based on average daily net assets of the Trust.
Pursuant to the Administrative Services Agreement, the Adviser also provides administrative services to the Funds including oversight of service providers. The Adviser receives 0.02% of average daily net assets of the Trust. The Adviser also provides the Funds with office
114
The FBR Funds
Notes to Financial Statements (continued)
(unaudited)
space, facilities and business equipment and generally administers the Funds’ business affairs and provides the services of executive and clerical personnel for administering the affairs of the Funds. The Adviser compensates all personnel, Officers and Trustees of the Funds if such persons are employees of the Adviser. For the six months ended April 30, 2009, JPMorgan earned $98,253 and Fund Advisers earned $111,637 in Administrator fees.
Plan of Distribution — The Trust, on behalf of the Investor Class shares of each Fund, except the Gas Utility Index Fund and Money Market Fund, has adopted a Distribution Plan (the “Plan”) pursuant to Rule 12b-1 under the 1940 Act. Under the Investor Class Plan, each Fund may pay FBR Investment Services, Inc. (the “Distributor”) a fee at an annual rate of up to 0.25% of each Fund’s average daily net assets. The Trust has also adopted a Distribution Plan for R Class shareholders of certain Funds that pays a fee at an annual rate of up to 0.50% of each Fund’s average daily net assets. Fees paid to the Distributor under the Plans are payable without regard to actual expenses incurred.
Brokerage Commissions — For the six months ended April 30, 2009, the Small Cap Financial Fund and the Large Cap Financial Fund paid $30,778 and $1,910, respectively, in brokerage commissions from portfolio transactions to FBR Capital Markets & Co. (“FBR & Co.”), an affiliate of Fund Advisers and the Distributor. No other Fund paid commissions to FBR & Co. during the period.
Trustees’ Fees — Each Trustee of the Trust who is not an employee or affiliate of Fund Advisers receives an annual retainer fee of $25,000 and an additional meeting fee of $2,500 for each regular meeting attended. In addition, each Trustee that serves on the Audit Committee or Nominating Committee receives a meeting fee of $1,000 for attendance at the meeting. If a Trustee participates by teleconference, the meeting fee is $1,000. The Chairman of the Board, an independent Trustee, receives an additional $2,000 for each meeting attended, and the Audit Committee Chairman receives an additional $1,000 for each committee meeting attended.
4. Investment Transactions
For the six months ended April 30, 2009, purchases and sales of investment securities (excluding short-term securities and U.S. government obligations) for each Fund were as follows:
| | | Purchases | | Sales |
| | |
| |
|
| Pegasus Fund | | $ | 7,664,102 | | $ | 1,312,556 |
| Pegasus Mid Cap Fund | | | 4,614,155 | | | 2,161,406 |
| Pegasus Small Cap Fund | | | 7,601,393 | | | 4,478,231 |
| Pegasus Small Cap Growth Fund | | | 1,632,767 | | | 1,219,875 |
| Focus Fund | | | 20,657,400 | | | 52,639,635 |
| Large Cap Financial Fund | | | 28,252,015 | | | 26,813,112 |
| Small Cap Financial Fund | | | 119,036,817 | | | 65,395,921 |
| Technology Fund | | | 5,172,027 | | | 6,391,924 |
| Gas Utility Index Fund | | | 23,783,776 | | | 22,201,867 |
115
The FBR Funds
Notes to Financial Statements (continued)
(unaudited)
5. Capital Share Transactions
| | FBR Pegasus FundTM | | FBR Pegasus Mid Cap FundTM |
| |
| |
|
| | For the | | For the | | For the | | For the |
| | Six Months | | Year | | Six Months | | Year |
| | Ended | | Ended | | Ended | | Ended |
| | April 30, 2009 | | October 31, | | April 30, 2009 | | October 31, |
| | (unaudited) | | 2008(A) | | (unaudited) | | 2008(A) |
| |
| |
| |
| |
|
| Capital Transactions: | | | | | | | | | | | | | | | | | | | |
| Investor Class | | | | | | | | | | | | | | | | | | | |
Proceeds from Sale of Shares | | $ | 7,484,755 | | | | $ | 1,161,675 | | | | $ | 4,160,600 | | | | $ | 2,480,431 | |
Reinvestment of Distributions | | | 37,852 | | | | | 1,222,454 | | | | | 70,620 | | | | | 45,373 | |
Cost of Shares Redeemed | | | (1,331,829 | ) | | | | (6,458,569 | ) | | | | (1,193,733 | ) | | | | (800,665 | ) |
Redemption Fees | | | 3,921 | | | | | 4,308 | | | | | 4,005 | | | | | 6,196 | |
| | |
| | | |
| | | |
| | | |
| |
Investor Class Transactions | | $ | 6,194,699 | | | | $ | (4,070,132 | ) | | | $ | 3,041,492 | | | | $ | 1,731,335 | |
| | |
| | | |
| | | |
| | | |
| |
| I Class | | | | | | | | | | | | | | | | | | | |
Proceeds from Sale of Shares | | $ | — | | | | $ | 100,000 | | | | $ | — | | | | $ | 100,000 | |
Reinvestment of Distributions | | | 633 | | | | | — | | | | | 1,509 | | | | | — | |
| | |
| | | |
| | | |
| | | |
| |
I Class Transactions | | $ | 633 | | | | $ | 100,000 | | | | $ | 1,509 | | | | $ | 100,000 | |
| | |
| | | |
| | | |
| | | |
| |
| Net Increase (Decrease) from | | | | | | | | | | | | | | | | | | | |
Capital Transactions | | $ | 6,195,332 | | | | $ | (3,970,132 | ) | | | $ | 3,043,001 | | | | $ | 1,831,335 | |
| | |
| | | |
| | | |
| | | |
| |
| Share Transactions: | | | | | | | | | | | | | | | | | | | |
| Investor Class | | | | | | | | | | | | | | | | | | | |
Sold | | | 992,009 | | | | | 109,163 | | | | | 525,892 | | | | | 233,519 | |
Issued in Reinvestment of Distributions | | | 4,834 | | | | | 106,208 | | | | | 9,098 | | | | | 4,248 | |
Redeemed | | | (184,849 | ) | | | | (626,810 | ) | | | | (156,190 | ) | | | | (78,303 | ) |
| | |
| | | |
| | | |
| | | |
| |
Change in Investor Class Shares | | | 811,994 | | | | | (411,439 | ) | | | | 378,800 | | | | | 159,464 | |
| | |
| | | |
| | | |
| | | |
| |
| I Class | | | | | | | | | | | | | | | | | | | |
Sold | | | — | | | | | 10,000 | | | | | — | | | | | 10,000 | |
Issued in Reinvestment of Distributions | | | 93 | | | | | — | | | | | 224 | | | | | — | |
| | |
| | | |
| | | |
| | | |
| |
Change in I Class Shares | | | 93 | | | | | 10,000 | | | | | 224 | | | | | 10,000 | |
| | |
| | | |
| | | |
| | | |
| |
| Net Increase (Decrease) from | | | | | | | | | | | | | | | | | | | |
Share Transactions | | | 812,087 | | | | | (401,439 | ) | | | | 379,024 | | | | | 169,464 | |
| | |
| | | |
| | | |
| | | |
| |
|
| (A) | I Class represents the period from commencement of operations (May 30, 2008) through October 31, 2008. |
116
The FBR Funds
Notes to Financial Statements (continued)
(unaudited)
| | FBR Pegasus | | FBR Pegasus Small |
| | Small Cap FundTM | | Cap Growth FundTM |
| |
| |
|
| | For the | | For the | | For the | | For the |
| | Six Months | | Year | | Six Months | | Year |
| | Ended | | Ended | | Ended | | Ended |
| | April 30, 2009 | | October 31, | | April 30, 2009 | | October 31, |
| | (unaudited) | | 2008(A) | | (unaudited) | | 2008(A) |
| |
| |
| |
| |
|
| Capital Transactions: | | | | | | | | | | | | | | | | | | | |
| Investor Class | | | | | | | | | | | | | | | | | | | |
Proceeds from Sale of Shares | | $ | 4,174,858 | | | | $ | 1,521,957 | | | | $ | 1,668,087 | | | | $ | 1,422,406 | |
Reinvestment of Distributions | | | — | | | | | 18,282 | | | | | — | | | | | 182,969 | |
Cost of Shares Redeemed | | | (1,318,650 | ) | | | | (913,849 | ) | | | | (1,361,323 | ) | | | | (2,194,149 | ) |
Redemption Fees | | | 4,633 | | | | | 4,373 | | | | | 3,962 | | | | | 5,760 | |
| | |
| | | |
| | | |
| | | |
| |
Investor Class Transactions | | $ | 2,860,841 | | | | $ | 630,763 | | | | $ | 310,726 | | | | $ | (583,014 | ) |
| | |
| | | |
| | | |
| | | |
| |
| I Class | | | | | | | | | | | | | | | | | | | |
Proceeds from Sale of Shares | | $ | 113 | | | | $ | 100,000 | | | | $ | — | | | | $ | 100,000 | |
| | |
| | | |
| | | |
| | | |
| |
| R Class | | | | | | | | | | | | | | | | | | | |
Proceeds from Sale of Shares | | $ | — | | | | $ | — | | | | $ | — | | | | $ | 100,000 | |
| | |
| | | |
| | | |
| | | |
| |
| Net Increase (Decrease) from | | | | | | | | | | | | | | | | | | | |
Capital Transactions | | $ | 2,860,954 | | | | $ | 730,763 | | | | $ | 310,726 | | | | $ | (383,014 | ) |
| | |
| | | |
| | | |
| | | |
| |
| Share Transactions: | | | | | | | | | | | | | | | | | | | |
| Investor Class | | | | | | | | | | | | | | | | | | | |
Sold | | | 585,581 | | | | | 147,259 | | | | | 216,279 | | | | | 128,491 | |
Issued in Reinvestment of Distributions | | | — | | | | | 1,647 | | | | | — | | | | | 14,864 | |
Redeemed | | | (178,251 | ) | | | | (88,720 | ) | | | | (182,849 | ) | | | | (204,934 | ) |
| | |
| | | |
| | | |
| | | |
| |
Change in Investor Class Shares | | | 407,330 | | | | | 60,186 | | | | | 33,430 | | | | | (61,579 | ) |
| | |
| | | |
| | | |
| | | |
| |
| I Class | | | | | | | | | | | | | | | | | | | |
Sold | | | — | | | | | 10,000 | | | | | — | | | | | 10,000 | |
| | |
| | | |
| | | |
| | | |
| |
| R Class | | | | | | | | | | | | | | | | | | | |
Sold | | | — | | | | | — | | | | | — | | | | | 10,000 | |
| | |
| | | |
| | | |
| | | |
| |
| Net Increase (Decrease) from | | | | | | | | | | | | | | | | | | | |
Share Transactions | | | 407,330 | | | | | 70,186 | | | | | 33,430 | | | | | (41,579 | ) |
| | |
| | | |
| | | |
| | | |
| |
|
| (A) | I and R Classes represents the period from commencement of operations (May 30, 2008) through October 31, 2008. |
117
The FBR Funds
Notes to Financial Statements (continued)
(unaudited)
| | | | | | | | | | | | FBR Large Cap | | FBR Small Cap |
| | FBR Focus Fund | | Financial Fund | | Financial Fund |
| |
| |
| |
|
| | For the | | For the | | For the | | For the | | For the | | For the |
| | Six Months | | Year | | Six Months | | Year | | Six Months | | Year |
| | Ended | | Ended | | Ended | | Ended | | Ended | | Ended |
| | April 30, 2009 | | October 31, | | April 30, 2009 | | October 31, | | April 30, 2009 | | October 31, |
| | (unaudited) | | 2008(A) | | (unaudited) | | 2008 | | (unaudited) | | 2008(A) |
| |
| |
| |
| |
| |
| |
|
| Capital Transactions: | | | | | | | | | | | | | | | | | | | | | | | | | | | | | |
| Investor Class | | | | | | | | | | | | | | | | | | | | | | | | | | | | | |
Proceeds from Sale of Shares | | $ | 148,671,518 | | | | $ | 242,764,089 | | | | $ | 3,483,219 | | | | $ | 19,045,180 | | | | $ | 61,333,958 | | | | $ | 120,651,140 | |
Reinvestment of Distributions | | | 93,731,941 | | | | | 15,739,960 | | | | | 237,972 | | | | | 3,006,657 | | | | | 2,289,047 | | | | | 38,016,471 | |
Cost of Shares Redeemed | | | (138,057,743 | ) | | | | (623,446,112 | ) | | | | (8,079,847 | ) | | | | (6,416,743 | ) | | | | (53,100,478 | ) | | | | (70,151,653 | ) |
Redemption Fees | | | 67,619 | | | | | 199,536 | | | | | 11,520 | | | | | 16,597 | | | | | 64,095 | | | | | 88,771 | |
| | |
| | | |
| | | |
| | | |
| | | |
| | | |
| |
Investor Class Transactions | | $ | 104,413,335 | | | | $ | (364,742,527 | ) | | | $ | (4,347,136 | ) | | | $ | 15,651,691 | | | | $ | 10,586,622 | | | | $ | 88,604,729 | |
| | |
| | | |
| | | |
| | | |
| | | |
| | | |
| |
| I Class | | | | | | | | | | | | | | | | | | | | | | | | | | | | | |
Proceeds from Sale of Shares | | $ | 8,571,838 | | | | $ | 21,017,714 | | | | $ | — | | | | $ | — | | | | $ | 29,382 | | | | $ | 4,103,500 | |
Reinvestment of Distributions | | | 10,311,502 | | | | | — | | | | | — | | | | | — | | | | | 2,105 | | | | | — | |
Cost of Shares Redeemed | | | (7,344,819 | ) | | | | (826,926 | ) | | | | — | | | | | — | | | | | (3,593,550 | ) | | | | — | |
Redemption Fees | | | 664 | | | | | 6,189 | | | | | — | | | | | — | | | | | — | | | | | — | |
| | |
| | | |
| | | |
| | | |
| | | |
| | | |
| |
I Class Transactions | | $ | 11,539,185 | | | | $ | 20,196,977 | | | | $ | — | | | | $ | — | | | | $ | (3,562,063 | ) | | | $ | 4,103,500 | |
| | |
| | | |
| | | |
| | | |
| | | |
| | | |
| |
| R Class | | | | | | | | | | | | | | | | | | | | | | | | | | | | | |
Proceeds from Sale of Shares | | $ | 58,569 | | | | $ | 100,000 | | | | $ | — | | | | $ | — | | | | $ | 18,103 | | | | $ | 100,000 | |
Reinvestment of Distributions | | | 51,918 | | | | | — | | | | | — | | | | | — | | | | | 1,617 | | | | | — | |
| | |
| | | |
| | | |
| | | |
| | | |
| | | |
| |
R Class Transactions | | $ | 110,487 | | | | $ | 100,000 | | | | $ | — | | | | $ | — | | | | $ | 19,720 | | | | $ | 100,000 | |
| | |
| | | |
| | | |
| | | |
| | | |
| | | |
| |
| Net Increase (Decrease) from | | | | | | | | | | | | | | | | | | | | | | | | | | | | | |
Capital Transactions | | $ | 116,063,007 | | | | $ | (344,445,550 | ) | | | $ | (4,347,136 | ) | | | $ | 15,651,691 | | | | $ | 7,044,279 | | | | $ | 92,808,229 | |
| | |
| | | |
| | | |
| | | |
| | | |
| | | |
| |
| Share Transactions: | | | | | | | | | | | | | | | | | | | | | | | | | | | | | |
| Investor Class | | | | | | | | | | | | | | | | | | | | | | | | | | | | | |
Sold | | | 4,830,358 | | | | | 5,020,713 | | | | | 373,729 | | | | | 1,601,744 | | | | | 4,494,355 | | | | | 7,680,706 | |
Issued in Reinvestment of Distributions | | | 3,112,984 | | | | | 292,791 | | | | | 24,258 | | | | | 215,340 | | | | | 160,185 | | | | | 2,408,457 | |
Redeemed | | | (4,653,119 | ) | | | | (12,970,312 | ) | | | | (936,907 | ) | | | | (490,236 | ) | | | | (4,016,875 | ) | | | | (4,369,117 | ) |
| | |
| | | |
| | | |
| | | |
| | | |
| | | |
| |
Change in Investor Class Shares | | | 3,290,223 | | | | | (7,656,808 | ) | | | | (538,920 | ) | | | | 1,326,848 | | | | | 637,665 | | | | | 5,720,046 | |
| | |
| | | |
| | | |
| | | |
| | | |
| | | |
| |
| I Class | | | | | | | | | | | | | | | | | | | | | | | | | | | | | |
Sold | | | 5,625,143 | | | | | 2,432,067 | | | | | — | | | | | — | | | | | 3,502 | | | | | 396,829 | |
Issued in Reinvestment of Distributions | | | 6,137,799 | | | | | — | | | | | — | | | | | — | | | | | 226 | | | | | — | |
Redeemed | | | (3,717,823 | ) | | | | (118,131 | ) | | | | — | | | | | — | | | | | (386,829 | ) | | | | — | |
| | |
| | | |
| | | |
| | | |
| | | |
| | | |
| |
Change in I Class Shares | | | 8,045,119 | | | | | 2,313,936 | | | | | — | | | | | — | | | | | (383,101 | ) | | | | 396,829 | |
| | |
| | | |
| | | |
| | | |
| | | |
| | | |
| |
| R Class | | | | | | | | | | | | | | | | | | | | | | | | | | | | | |
Sold | | | 37,248 | | | | | 10,000 | | | | | — | | | | | — | | | | | 2,103 | | | | | 10,000 | |
Issued in Reinvestment of Distributions | | | 31,657 | | | | | — | | | | | — | | | | | — | | | | | 174 | | | | | — | |
| | |
| | | |
| | | |
| | | |
| | | |
| | | |
| |
Change in R Class Shares | | | 68,905 | | | | | 10,000 | | | | | — | | | | | — | | | | | 2,277 | | | | | 10,000 | |
| | |
| | | |
| | | |
| | | |
| | | |
| | | |
| |
| Net Increase (Decrease) from | | | | | | | | | | | | | | | | | | | | | | | | | | | | | |
Share Transactions | | | 11,404,247 | | | | | (5,332,872 | ) | | | | (538,920 | ) | | | | 1,326,848 | | | | | 256,841 | | | | | 6,126,875 | |
| | |
| | | |
| | | |
| | | |
| | | |
| | | |
| |
|
| (A) | I and R Classes represent the period from commencement of operations (May 30, 2008) through October 31, 2008. |
118
The FBR Funds
Notes to Financial Statements (continued)
(unaudited)
| | | | | | | | | | | | FBR Gas Utility | | FBR Fund for |
| | FBR Technology Fund | | Index Fund | | Government Investors |
| |
| |
| |
|
| | For the | | For the | | For the | | For the | | For the | | For the |
| | Six Months | | Year | | Six Months | | Year | | Six Months | | Year |
| | Ended | | Ended | | Ended | | Ended | | Ended | | Ended |
| | April 30, 2009 | | October 31, | | April 30, 2009 | | October 31, | | April 30, 2009 | | October 31, |
| | (unaudited) | | 2008 | | (unaudited) | | 2008(A) | | (unaudited) | | 2008 |
| |
| |
| |
| |
| |
| |
|
| Capital Transactions: | | | | | | | | | | | | | | | | | | | | | | | | | | | | | |
| Investor Class | | | | | | | | | | | | | | | | | | | | | | | | | | | | | |
Proceeds from Sale of Shares | | $ | 1,436,619 | | | | $ | 3,374,900 | | | | $ | 8,939,672 | | | | $ | 42,282,293 | | | | $ | 47,525,952 | | | | $ | 362,869,090 | |
Reinvestment of Distributions | | | — | | | | | 3,499,542 | | | | | 11,669,843 | | | | | 26,128,693 | | | | | 197,457 | | | | | 3,317,780 | |
Cost of Shares Redeemed | | | (3,031,382 | ) | | | | (26,928,727 | ) | | | | (22,925,160 | ) | | | | (50,729,541 | ) | | | | (67,469,283 | ) | | | | (442,163,852 | ) |
Redemption Fees | | | 4,383 | | | | | 8,790 | | | | | 82,061 | | | | | 34,985 | | | | | — | | | | | — | |
| | |
| | | |
| | | |
| | | |
| | | |
| | | |
| |
Investor Class Transactions | | $ | (1,590,380 | ) | | | $ | (20,045,495 | ) | | | $ | (2,233,584 | ) | | | $ | 17,716,430 | | | | $ | (19,745,874 | ) | | | $ | (75,976,982 | ) |
| | |
| | | |
| | | |
| | | |
| | | |
| | | |
| |
| R Class | | | | | | | | | | | | | | | | | | | | | | | | | | | | | |
Proceeds from Sale of Shares | | $ | — | | | | $ | — | | | | $ | — | | | | $ | 100,000 | | | | $ | — | | | | $ | — | |
Reinvestment of Distributions | | | — | | | | | — | | | | | 9,856 | | | | | 703 | | | | | — | | | | | — | |
| | |
| | | |
| | | |
| | | |
| | | |
| | | |
| |
R Class Transactions | | $ | — | | | | $ | — | | | | $ | 9,856 | | | | $ | 100,703 | | | | $ | — | | | | $ | — | |
| | |
| | | |
| | | |
| | | |
| | | |
| | | |
| |
| Net Increase (Decrease) from | | | | | | | | | | | | | | | | | | | | | | | | | | | | | |
Capital Transactions | | $ | (1,590,380 | ) | | | $ | (20,045,495 | ) | | | $ | (2,223,728 | ) | | | $ | 17,817,133 | | | | $ | (19,745,874 | ) | | | $ | (75,976,982 | ) |
| | |
| | | |
| | | |
| | | |
| | | |
| | | |
| |
| Share Transactions: | | | | | | | | | | | | | | | | | | | | | | | | | | | | | |
| Investor Class | | | | | | | | | | | | | | | | | | | | | | | | | | | | | |
Sold | | | 214,062 | | | | | 317,798 | | | | | 665,503 | | | | | 2,162,416 | | | | | 47,525,952 | | | | | 362,869,090 | |
Issued in Reinvestment of Distributions | | | — | | | | | 301,686 | | | | | 848,782 | | | | | 1,264,848 | | | | | 197,452 | | | | | 3,317,780 | |
Redeemed | | | (459,137 | ) | | | | (2,582,759 | ) | | | | (1,752,770 | ) | | | | (2,770,992 | ) | | | | (67,469,283 | ) | | | | (442,163,852 | ) |
| | |
| | | |
| | | |
| | | |
| | | |
| | | |
| |
Change in Investor Class Shares | | | (245,075 | ) | | | | (1,963,275 | ) | | | | (238,485 | ) | | | | 656,272 | | | | | (19,745,879 | ) | | | | (75,976,982 | ) |
| | |
| | | |
| | | |
| | | |
| | | |
| | | |
| |
| R Class | | | | | | | | | | | | | | | | | | | | | | | | | | | | | |
Sold | | | — | | | | | — | | | | | — | | | | | 10,000 | | | | | — | | | | | — | |
Issued in Reinvestment of Distributions | | | — | | | | | — | | | | | 1,635 | | | | | 78 | | | | | — | | | | | — | |
| | |
| | | |
| | | |
| | | |
| | | |
| | | |
| |
Change in R Class Shares | | | — | | | | | — | | | | | 1,635 | | | | | 10,078 | | | | | — | | | | | — | |
| | |
| | | |
| | | |
| | | |
| | | |
| | | |
| |
| Net Increase (Decrease) from | | | | | | | | | | | | | | | | | | | | | | | | | | | | | |
Share Transactions | | | (245,075 | ) | | | | (1,963,275 | ) | | | | (236,850 | ) | | | | 666,350 | | | | | (19,745,879 | ) | | | | (75,976,982 | ) |
| | |
| | | |
| | | |
| | | |
| | | |
| | | |
| |
|
| (A) | R Class represents the period from commencement of operations (May 30, 2008) through October 31, 2008. |
6. Federal Income Taxes
It is each Fund’s policy to continue to comply with the special provisions of the Internal Revenue Code that are applicable to regulated investment companies. As provided therein, in any fiscal year in which a Fund so qualifies and distributes at least 90% of its taxable net income, the Fund (but not the shareholders) will be relieved of federal income tax on the income distributed. Accordingly, no provision for income taxes has been made.
In order to avoid imposition of the excise tax applicable to regulated investment companies, it is also each Fund’s intention to declare and pay as dividends in each calendar year at least 98% of its net investment income (earned during the calendar year) and 98% of its net realized capital gains (earned during the twelve months ending October 31) plus undistributed amounts from prior years.
119
The FBR Funds
Notes to Financial Statements (continued)
(unaudited)
Income and capital gain distributions are determined in accordance with income tax regulations that may differ from accounting principles that are generally accepted in the United States of America. As a result, the character of tax-basis distributions and the composition of net assets for tax purposes may differ from those reflected in the Funds’ financial statements. These book/tax differences may be temporary or permanent in nature. Temporary differences are primarily the result of wash sales. Reclassifications for permanent differences are made to components of capital. These reclassifications have no effect on net assets or net asset value per share.
The tax character of distributions paid for the Investor Class of each Fund’s tax year was as follows:
| | | Ordinary Income | | | Long-Term Capital Gains | |
| | |
| | |
| |
| | | Dollar | | | Per share | | | Dollar | | | Per share | |
| | | Amount | | | Amount | | | Amount | | | Amount | |
| | |
| | |
| | |
| | |
| |
| Pegasus Fund | | | | | | | | | | | | | | | | |
For the Year Ended October 31, 2008 | | $ | 1,227,454 | | | $ | 1.304188 | | | $ | 238 | | | $ | 0.000253 | |
For the Year Ended October 31, 2007 | | | 585,158 | | | | 0.453075 | | | | — | | | | | |
| Pegasus Mid Cap Fund | | | | | | | | | | | | | | | | |
For the Year Ended October 31, 2008 | | | 45,373 | | | | 0.132774 | | | | — | | | | — | |
For the Period Ended October 31, 2007 | | | — | | | | — | | | | — | | | | — | |
| Pegasus Small Cap Fund | | | | | | | | | | | | | | | | |
For the Year Ended October 31, 2008 | | | 18,282 | | | | 0.043977 | | | | — | | | | — | |
For the Period Ended October 31, 2007 | | | — | | | | — | | | | — | | | | — | |
| Pegasus Small Cap Growth Fund | | | | | | | | | | | | | | | | |
For the Year Ended October 31, 2008 | | | 166,019 | | | | 0.419678 | | | | 18,288 | | | | 0.046230 | |
For the Year Ended October 31, 2007 | | | 125,836 | | | | 0.389248 | | | | 41,912 | | | | 0.129706 | |
| Focus Fund | | | | | | | | | | | | | | | | |
For the Year Ended October 31, 2008 | | | 2,637,313 | | | | 0.103979 | | | | 13,475,516 | | | | 0.526807 | |
For the Year Ended October 31, 2007 | | | — | | | | — | | | | 2,384,603 | | | | 0.123866 | |
| Large Cap Financial Fund | | | | | | | | | | | | | | | | |
For the Year Ended October 31, 2008 | | | 177,807 | | | | 0.184406 | | | | 2,910,983 | | | | 3.683686 | |
For the Year Ended October 31, 2007 | | | 145,001 | | | | 0.111451 | | | | 2,416,486 | | | | 2.017514 | |
| Small Cap Financial Fund | | | | | | | | | | | | | | | | |
For the Year Ended October 31, 2008 | | | 2,225,546 | | | | 0.282040 | | | | 36,692,650 | | | | 6.235751 | |
For the Year Ended October 31, 2007 | | | 2,428,021 | | | | 0.225500 | | | | 43,232,104 | | | | 4.275126 | |
| Technology Fund | | | | | | | | | | | | | | | | |
For the Year Ended October 31, 2008 | | | 2,491,355 | | | | 0.867487 | | | | 1,036,556 | | | | 0.360928 | |
For the Year Ended October 31, 2007 | | | 718,645 | | | | 0.202896 | | | | 677,401 | | | | 0.191251 | |
| Gas Utility Index Fund | | | | | | | | | | | | | | | | |
For the Year Ended October 31, 2008 | | | 6,995,329 | | | | 0.602035 | | | | 20,875,415 | | | | 1.692401 | |
For the Year Ended October 31, 2007 | | | 6,504,234 | | | | 0.483831 | | | | — | | | | — | |
| Fund for Government Investors | | | | | | | | | | | | | | | | |
For the Year Ended October 31, 2008 | | | 3,449,161 | | | | 0.022910 | | | | — | | | | — | |
For the Year Ended October 31, 2007 | | | 8,612,056 | | | | 0.043674 | | | | — | | | | — | |
120
The FBR Funds
Notes to Financial Statements (continued)
(unaudited)
The following information is computed on a tax basis for each item:
| | As of October 31, 2008 |
| |
|
| | | | | | | | | | | | | | Pegasus | | | | |
| | | Pegasus | Pegasus | Pegasus | Small Cap | | Focus |
| | | Fund | Mid Cap Fund | Small Cap Fund | Growth Fund | | Fund |
| | |
|
|
|
| |
|
Tax cost of investment securities | | $ | 5,920,238 | | | $ | 5,387,410 | | | $ | 4,966,182 | | | $ | 3,836,726 | | | $ | 730,739,790 | |
| | |
| | |
| | |
| | |
| | |
| |
| Gross unrealized appreciation | | | 4,117 | | | | 15,161 | | | | 91,797 | | | | 57,156 | | | | 174,402,382 | |
| Gross unrealized depreciation | | | (1,205,140 | ) | | | (1,199,203 | ) | | | (809,255 | ) | | | (862,023 | ) | | | (169,112,676 | ) |
| | |
| | |
| | |
| | |
| | |
| |
Net unrealized appreciation (depreciation) | | | (1,201,023 | ) | | | (1,184,042 | ) | | | (717,458 | ) | | | (804,867 | ) | | | 5,289,706 | |
| Undistributed ordinary income | | | 28,480 | | | | 61,644 | | | | — | | | | — | | | | — | |
Undistributed long-term capital gains | | | — | | | | — | | | | — | | | | — | | | | 106,381,783 | |
| Capital loss carryforward | | | (722,078 | ) | | | — | | | | (193,493 | ) | | | (41,215 | ) | | | — | |
| | |
| | |
| | |
| | |
| | |
| |
| Accumulated earnings (deficit) | | $ | (1,894,621 | ) | | $ | (1,122,398 | ) | | $ | (910,951 | ) | | $ | (846,082 | ) | | $ | 111,671,489 | |
| | |
| | |
| | |
| | |
| | |
| |
| | As of October 31, 2008 |
| |
|
| | | | | | | | | | | | | | | | | | | Fund for |
| | Large Cap | Small Cap | | Technology | | Gas Utility | | Government |
| | Financial Fund | Financial Fund | | Fund | | Index Fund | | Investors |
| |
|
| |
| |
| |
|
Tax cost of investment securities | | $ | 31,684,188 | | | $ | 198,315,026 | | | $ | 10,933,141 | | | $ | 146,841,683 | | | $ | 103,761,067 | |
| | |
| | |
| | |
| | |
| | |
| |
| Gross unrealized appreciation | | | — | | | | 9,393,772 | | | | — | | | | 69,486,677 | | | | — | |
| Gross unrealized depreciation | | | (1,912,457 | ) | | | (10,427,172 | ) | | | (3,240,625 | ) | | | (18,703,586 | ) | | | — | |
| | |
| | |
| | |
| | |
| | |
| |
Net unrealized appreciation (depreciation) | | | (1,912,457 | ) | | | (1,033,400 | ) | | | (3,240,625 | ) | | | 50,783,091 | | | | — | |
| Undistributed ordinary income | | | 201,208 | | | | 2,020,677 | | | | — | | | | 79,540 | | | | — | |
Undistributed long-term capital gains | | | — | | | | — | | | | — | | | | 9,585,472 | | | | — | |
| Capital loss carryforward | | | (2,493,545 | ) | | | (6,170,516 | ) | | | (2,725,979 | ) | | | — | | | | (186,667 | ) |
| | |
| | |
| | |
| | |
| | |
| |
| Accumulated earnings (deficit) | | $ | (4,204,794 | ) | | $ | (5,183,239 | ) | | $ | (5,966,604 | ) | | $ | 60,448,103 | | | $ | (186,667 | ) |
| | |
| | |
| | |
| | |
| | |
| |
Unused capital loss carryforwards as of October 31, 2008, were as follows:
| | | Amount | | Expires October 31, |
| | |
| |
|
| Pegasus Fund | | $ | 722,078 | | 2016 |
| Pegasus Small Cap Fund | | | 193,493 | | 2016 |
| Pegasus Small Cap Growth Fund | | | 41,215 | | 2016 |
| Large Cap Financial Fund | | | 2,493,545 | | 2016 |
| Small Cap Financial Fund | | | 6,170,516 | | 2016 |
| Technology Fund | | | 2,725,979 | | 2016 |
| Fund for Government Investors | | | 20,568 | | 2011 |
| Fund for Government Investors | | | 165,106 | | 2012 |
| Fund for Government Investors | | | 970 | | 2013 |
| Fund for Government Investors | | | 23 | | 2014 |
121
The FBR Funds
Notes to Financial Statements (continued)
(unaudited)
During the year ended October 31, 2008, the Fund for Government Investors utilized $3,286 of capital loss carryforwards. The capital loss carryforwards may be utilized in the current and future years to offset net realized capital gains, if any, prior to distributing such gains to shareholders.
The following reclassifications, the result of permanent differences between financial statement and income tax reporting requirements, have been made to the components of capital. These reclassifications have no impact on the net assets or net asset value per share of the Funds.
| | | | | | | Accumulated | | | | |
| | | Undistributed | | Net Realized | | Paid-In |
| | | Income (Loss) | | Gain (Loss) | | Capital |
| | |
| |
| |
|
| Pegasus Fund | | $ | (17,473 | ) | | $ | 17,403 | | | $ | 70 | |
| Pegasus Mid Cap Fund | | | 5,243 | | | | (5,243 | ) | | | — | |
| Pegasus Small Cap Fund | | | 16,895 | | | | — | | | | (16,895 | ) |
| Pegasus Small Cap Growth Fund | | | 50,863 | | | | — | | | | (50,863 | ) |
| Focus Fund | | | 8,412,061 | | | | (1,301,408 | ) | | | (7,110,653 | ) |
| Large Cap Financial Fund | | | 1,684 | | | | (1,684 | ) | | | — | |
| Small Cap Financial Fund | | | — | | | | — | | | | — | |
| Technology Fund | | | 129,045 | | | | — | | | | (129,045 | ) |
| Gas Utility Index Fund | | | — | | | | 1 | | | | (1 | ) |
On July 13, 2006, the FASB released FASB Interpretation No. 48 “Accounting for Uncertainty in Income Taxes” (FIN 48). FIN 48 provides guidance for how uncertain tax positions should be recognized, measured, presented and disclosed in the financial statements. FIN 48 requires the evaluation of tax positions taken or expected to be taken in the course of preparing the Funds’ tax returns to determine whether the tax positions are “more-likely-than-not” of being sustained by the applicable tax authority. Tax positions not deemed to meet the more-likely-than-not threshold will be required to be recorded as a tax benefit or expense in the current year. Adoption of FIN 48 is required for fiscal years beginning after December 15, 2006 and is to be applied to all open tax years as of the effective date. The Funds have analyzed their tax positions taken on Federal income tax returns for all open tax years (tax years ended December 31, 2005 through 2008) for purposes of implementing FIN 48 and have concluded that no provision for income tax is required in their financial statements.
122
The FBR Funds
Notes to Financial Statements (continued)
(unaudited)
As of April 30, 2009, the Federal Tax Cost of securities and the resulting net unrealized appreciation (depreciation) are as follows:
| | | | | | | Gross | | | Gross | | Net Unrealized |
| | | Federal | | | Unrealized | | | Unrealized | | Appreciation |
| | | Tax Cost | | | Appreciation | | | Depreciation | | (Depreciation) |
| | |
| | |
| | |
| |
|
| Pegasus Fund | | $ | 11,785,231 | | | $ | 759,920 | | | $ | (1,272,503 | ) | | $ | (512,583 | ) |
| Pegasus Mid Cap Fund | | | 8,100,252 | | | | 340,180 | | | | (5,55,558 | ) | | | (215,378 | ) |
| Pegasus Small Cap Fund | | | 7,360,725 | | | | 717,483 | | | | (389,401 | ) | | | 328,082 | |
| Pegasus Small Cap Growth Fund | | | 3,586,859 | | | | 239,982 | | | | (431,676 | ) | | | (191,694 | ) |
| Focus Fund | | | 718,029,332 | | | | 195,554,289 | | | | (117,829,349 | ) | | | 77,724,940 | |
| Large Cap Financial Fund | | | 16,692,310 | | | | 1,518,081 | | | | (1,560,630 | ) | | | (42,549 | ) |
| Small Cap Financial Fund | | | 184,509,809 | | | | 13,141,402 | | | | (18,846,294 | ) | | | (5,704,892 | ) |
| Technology Fund | | | 7,291,086 | | | | 132,208 | | | | (1,024,922 | ) | | | (892,714 | ) |
| Gas Utility Index Fund | | | 133,255,036 | | | | 51,170,980 | | | | (19,941,273 | ) | | | 31,229,707 | |
| Fund for Government Investors | | | 85,054,128 | | | | — | | | | — | | | | — | |
7. Investments in Affiliates
Affiliated issuers, as defined by the 1940 Act, are those in which a Fund’s holdings represent 5% or more of the outstanding voting securities of the issuer. A summary of each Fund’s investments in affiliates, if any, for the six months ended April 30, 2009, is noted below:
| | | SHARE ACTIVITY | | | | | | | | | | | | | |
| | |
| | | | | | | | | | | | | |
| | | Balance | | | | | | Balance | | | Realized | | | | | | Value | | Acquisition |
| Affiliate | | 10/31/08 | | Purchases | | Sales | | 04/30/09 | | | Gain(Loss) | | | Dividends | | 04/30/09 | | Cost |
|
| FBR Focus Fund | | | | | | | | | | | | | | | | | | | | | | |
99 Cents Only Stores | | 5,791,474 | | — | | — | | 5,791,474 | | | $ | — | | | $ | — | | $ | 62,200,431 | | $ | 66,728,709 |
American Woodmark Corp. | | 850,000 | | — | | 119,840 | | 730,160 | | | | (1,514,645 | ) | | | 150,047 | | | 15,114,312 | | | 24,162,041 |
Dynamex, Inc. | | 598,610 | | 213,214 | | — | | 811,824 | | | | — | | | | — | | | 11,941,931 | | | 13,954,901 |
Monarch Casino & Resort, Inc. | | 992,000 | | — | | 58,203 | | 933,797 | | | | 324,600 | | | | — | | | 9,543,405 | | | 4,233,021 |
8. Commitments and Contingencies
In the normal course of business, the Funds enter into contracts that contain a variety of representations and warranties and which provide general indemnifications. The Funds’ maximum exposure under these arrangements is unknown, as this would involve future claims that may be made against the Funds that have not yet occurred. However, based on experience, the Funds expect the risk of loss to be remote.
9. U.S. Treasury Temporary Guarantee Program for Money Market Funds
On October 7, 2008, the Board of Trustees approved the Money Market Fund’s participation in the U.S. Department of the Treasury’s Temporary Guarantee Program for Money Market Funds (the “Program”) through December 18, 2008. The Money Market Fund applied for continued participation in the Program through the Program’s extension date of September 18, 2009 (the “Extension Period”). The participation fee for the initial three-month term of the Program was 0.01% of the net asset value of the Money Market Fund as of September 19, 2008, which was split equally between the Money Market Fund and FBR
123
The FBR Funds
Notes to Financial Statements (continued)
(unaudited)
Fund Advisers. The participation fee for the continued participation in the program through September 18, 2009 is 0.015% of the net asset value of the Money Market Fund as of September 19, 2008. This expense will be borne entirely by the Money Market Fund without regard to any expense limitation currently in effect. As a requirement of participation in the Program, the Money Market Fund has agreed to liquidate if its net asset value declines to below $0.995 (a “Guarantee Event”) if such Guarantee Event is not cured. The Program protects investors for the lesser of the number of shares held as of the close of business on September 19, 2008 or the amount held at liquidation, whichever is less.
124
The FBR Funds
Important Supplemental Information (unaudited)
Proxy Voting Guidelines
Fund Advisers is responsible for exercising the voting rights associated with the securities purchased and held by the Funds. A description of the policies and procedures Fund Advisers uses in fulfilling this responsibility is included in the Funds’ Statement of Additional Information and is available without charge, upon request, by calling 888.888.0025. The policies and procedures are also available on the Securities and Exchange Commission’s (“SEC”) website at http://www.sec.gov. Information on how the Funds voted proxies relating to portfolio securities during the most recent 12 month period ended June 30 is available without charge, upon request, by calling 888.888.0025 and is also available on the SEC’s website at http://www.sec.gov.
Portfolio Holdings
The Funds file their complete schedule of holdings with the SEC for the first and third quarters of each fiscal year on Form N-Q. The Funds’Form N-Q is available on the SEC’s website at http://www.sec.gov. You may review and make copies at the SEC’s Public Reference Room in Washington, D.C. You may also obtain copies after paying a duplicating fee by writing the SEC’s Public Reference Section, Washington, D.C. 20549-0102 or by electronic request to publicinfo@sec.gov. Information on the operation of the Public Reference Room may be obtained by calling 800.SEC.0330. A copy of the quarterly holdings report is available, without charge, upon request, by calling 888.888.0025.
125
[THIS PAGE INTENTIONALLY LEFT BLANK]
THE FBR FUNDS
888.888.0025
fbrfundsinfo@fbr.com
www.fbrfunds.com
Investment Adviser
FBR FUND ADVISERS, INC.
1001 NINETEENTH STREET NORTH
ARLINGTON, VIRGINIA 22209
Distributor
FBR INVESTMENT SERVICES, INC.
1001 NINETEENTH STREET NORTH
ARLINGTON, VIRGINIA 22209
Transfer Agent
JPMORGAN CHASE BANK, N.A.
P.O. BOX 5354
CINCINNATI, OHIO 45201
Independent Registered Public Accounting Firm
TAIT, WELLER, AND BAKER LLP
1818 MARKET STREET
PHILADELPHIA, PENNSYLVANIA 19103
This report is not authorized
for distribution to prospective
investors unless it is preceded or
accompanied by a current prospectus.
ITEM 2. CODE OF ETHICS.
Not applicable for semiannual reports.
ITEM 3. AUDIT COMMITTEE FINANCIAL EXPERT.
Not applicable for semiannual reports.
ITEM 4. PRINCIPAL ACCOUNTANT FEES AND SERVICES.
Not applicable for semiannual reports.
ITEMS 5. AUDIT COMMITTEE OF LISTED REGISTRANTS.
Not applicable.
ITEM 6. SCHEDULE OF INVESTMENTS.
Contained in Item 1.
ITEM 7. DISCLOSURE OF PROXY VOTING POLICIES AND PROCEDURES FOR CLOSED-END MANAGEMENT INVESTMENT COMPANIES.
Not applicable.
ITEM 8. PORTFOLIO MANAGERS OF CLOSED-END MANAGEMENT INVESTMENT COMPANIES.
Not applicable.
ITEM 9. PURCHASES OF EQUITY SECURITIES BY CLOSED-END MANAGEMENT INVESTMENT COMPANY AND AFFLIIATED PURCHASERS.
Not applicable.
ITEM 10. SUBMISSION OF MATTERS TO A VOTE OF SECURITY HOLDERS.
There have been no material changes to the procedures by which shareholders may recommend nominees to the Board.
| ITEM 11. CONTROLS AND PROCEDURES. |
| (a) | | Based upon their evaluation of the Registrant’s disclosure controls and procedures as conducted within 90 days of the filing date of this Form N-CSR, the Registrant’s PFO and PEO have concluded that those disclosure controls and procedures provide reasonable assurance that the material information required to be disclosed by the Registrant in this Form N-CSR has been recorded, processed, summarized and reported within the time periods specified in the Securities and Exchange Commission’s rules and forms. |
| (b) | | There were no changes in the Registrant’s internal controls over financial reporting as defined in Rule 30a-3(d) under the Act (17 CFR 270.30a-3(d)) that occurred during the second fiscal |
| | | half-year of the period covered by this report that has materially affected, or is reasonably likely to materially affect, the Registrant’s internal control over financial reporting. |
| | | |
| ITEM 12. EXHIBITS. |
| File the exhibits listed below as part of this Form. Letter or number the exhibits in the sequence indicated. |
| (a) | | (1) Not applicable. |
| | | (2) A separate certification for each principal executive officer and principal financial officer of the Registrant as required by Rule 30a-2(a) under the Act (17 CFR 270.30a-2): Attached herewith. |
| | | (3) Not applicable. |
| (b) | | (1) The certifications required by Rule 30a-2(b) of the Investment Company Act of 1940 and Section 906 of the Sarbanes-Oxley Act of 2002: Attached herewith. |
SIGNATURES
Pursuant to the requirements of the Securities Exchange Act of 1934 and the Investment Company Act of 1940, the registrant has duly caused this report to be signed on its behalf by the undersigned, thereunto duly authorized.
| (Registrant) | | The FBR Funds |
|
| By (Signature and Title)* | | /s/ Kimberly J. Bradshaw | | June 23, 2009 | |
| | |
| |
| | | Kimberly J. Bradshaw | | Date | |
| | | Treasurer, Secretary and Principal Financial Officer | | | |
| | | The FBR Funds | | | |
Pursuant to the requirements of the Securities Exchange Act of 1934 and the Investment Company Act of 1940, this report has been signed below by the following persons on behalf of the registrant and in the capacities and on the dates indicated.
| By (Signature and Title) | | /s/ David H. Ellison | | June 23, 2009 | |
| | |
| |
| | | David H. Ellison | | Date | |
| | | President and Principal Executive Officer | | | |
| | | The FBR Funds | | | |
| | | | | | |
| | | | | | |
| By (Signature and Title) | | /s/ Kimberly J. Bradshaw | | June 23, 2009 | |
| | |
| |
| | | Kimberly J. Bradshaw | | Date | |
| | | Treasurer, Secretary and Principal Financial Officer | | | |
| | | The FBR Funds | | | |