The FBR Funds
Semi-Annual Letter to Shareholders
Dear Shareholder:
The market, our Funds, and their relevant benchmark indices all generated positive returns during the first six months of the Funds’ current fiscal year. We are certainly pleased our Funds managed to participate in the rising tide of the market, which, as investors, you should expect. However, we do not hang our hats on short-term performance. Rather, as money managers, we take this opportunity to remain focused on our investment process and discipline that carried us to this point. You can find a more detailed discussion of each Fund’s performance following this letter.
From a business and operational perspective, we managed to carry the momentum created last fiscal year through the first half of this fiscal year. In November, we successfully launched the FBR Pegasus FundTM (FBRPX), the seventh member of our equity fund product line-up. The Pegasus Fund is designed to act as a core component of any diversified financial plan. I encourage you to discuss with your financial advisor how the Pegasus Fund, along with our other Funds, may complement your portfolio. In an effort to keep costs going in the right direction, FBR Fund Advisers adopted and implemented a new operating expense structure. The benefits are already evident in the lower fund expense ratios detailed in the financial highlights section of this report. Finally, in February, we announced the shareholder approval and completion of the reorganization of the FBR Maryland and Virginia Tax-Free Portfolios into the MTB Group of Funds.
You may recall we closed the FBR Small Cap Fund (FBRVX) to new investors as of October 1, 2004. I would like to take this opportunity to remind you that existing shareholders retain the ability to make additional contributions to their accounts as long as they were established prior to the closing. I would also like to point out that the Fund remains open to all new tax-advantaged accounts. Please contact shareholder services at 888.888.0025 if you would like further information.
As always, we thank you for the trust you have placed in our Funds. We welcome and encourage your questions and comments. You can reach us via e-mail at funds@fbr.com.
Sincerely,

David Ellison
President and Trustee
The FBR Funds
There are risks associated with investing in The FBR Funds. Each Fund, except the Fund for Government Investors, invests primarily in equity securities, therefore, fluctuations in the stock market, as well as in the value of particular equity securities held by the Funds, can affect each Fund’s performance. For further information about the risks associated with each Fund, please refer to the Funds’ prospectus.
2
The FBR Funds
FBR Pegasus FundTM
Management Overview
Co-Portfolio Managers: Robert C. Barringer, CFA, Ryan Kelley, CFA, and Winsor Aylesworth
How did the Fund perform?
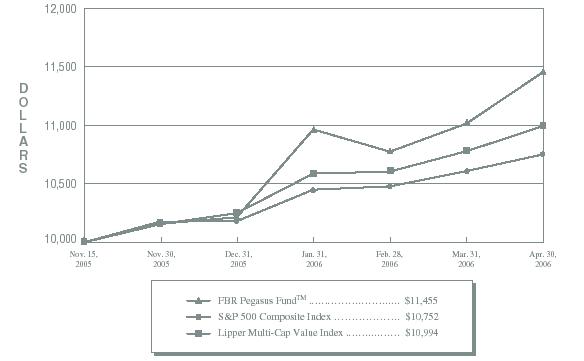
The Pegasus Fund appreciated 14.55% from its inception on November 15, 2005 through April 30, 2006. During this time period, the S&P 500 Composite Index and the Lipper Multi-Cap Value Index returned 7.52% and 9.94%, respectively.
What factors contributed to the Fund’s performance?
The Fund’s outperformance can be attributed to overweight positions in the energy, industrials, and basic materials sectors and underweight positions in the healthcare, consumer staples and consumer discretionary sectors. During this initial time period, our investment process led us to position the portfolio in this manner as the companies in the former list of sectors contained the highest degree of financial strength, attractive valuation, and proven records of consistent growth.
What is the outlook for the Fund?
Guided by our sensible and disciplined investment process, we feel confident that the outlook for the Fund is bright. The Fund’s broad investment mandate provides the flexibility to invest in securities from a wide market spectrum in search of suitable investment opportunities. That means we can always migrate the portfolio over time, to those companies and sectors which are most attractive based on our process.
Although the sectors and companies in which the Fund is invested have provided solid performance over this reporting period, we currently believe that they remain attractively valued. Energy, industrials, basic materials and utilities, in particular, are areas that continue to be characterized by low debt, reasonable valuations and the continued growth in book value that we look for through our investment selection process.
|
The opinions expressed in this commentary reflect those of the Portfolio Manager as of the date written. Any such opinions are subject to change based on market or other conditions. These opinions may not be relied upon as investment advice. Investment decisions for the FBR Funds are based on several factors, and may not be relied upon as an indication of trading intent on behalf of any FBR Fund. Security positions can and do change. |
3
The FBR Funds
FBR Pegasus FundTM
Comparison of Changes in Value of $10,000 Investment in
Fund Shares(1)(2) vs. Various Indices(1)(3)
(unaudited)
| | | | | | | | | | | |
| Total Returns—For the Periods Ended April 30, 2006(4) |
| | | | | | | | | Cumulative
Since
Inception(5) | | |
| | | | | | | | |
| | |
FBR Pegasus FundTM(1)(2) | | | | | | | | 14.55% | | |
S&P 500 Composite Index(1)(3) | | | | | | | | 7.52% | | |
Lipper Multi-Cap Value Index(1)(3) | | | | | | | | 9.94% | | |
| | | | | | | | | | | |
PAST PERFORMANCE IS NO GUARANTEE OF FUTURE RESULTS.
The performance data quoted represents past performance and the current performance may be lower or higher than the performance data quoted. The investment return and principal will fluctuate so that investors’ shares, when redeemed, may be worth more or less than their original cost. To obtain performance data current to the most recent month-end,
please call 888.200.4710 or visit www.fbrfunds.com.
|
| (1) | The graph assumes a hypothetical $10,000 initial investment in the Fund and reflects the reinvestment of dividends and all Fund expenses. Investors should note that the Fund is a professionally managed mutual fund while the indices are unmanaged, do not incur expenses and are not available for investment. The performance of the indices includes reinvested dividends, and does not reflect sales charges or expenses, except for the Lipper Multi-Cap Value Index which reflects fund expenses. |
| (2) | FBR Fund Advisers, Inc. waived a portion of its advisory fees and agreed to contractually reimburse a portion of the Fund's operating expenses, as necessary, to maintain existing expense limitations, as set forth in the notes to the financial statements. Total returns shown include fee waivers and expense reimbursements; total returns would have been lower had there been no waiver of fees and/or reimbursement of expenses in excess of expense limitations. |
| (3) | S&P 500 Composite Index is a capitalization-weighted index of 500 stocks. The index is designed to represent the broad domestic economy through changes in aggregate market value of 500 stocks representing all major industries. The Lipper Multi-Cap Value Index is an equally weighted index of the largest thirty funds within the multi-cap value fund classification as defined by Lipper Inc. The index is rebalanced quarterly. Lipper Analytical Services, Inc., is a nationally recognized organization that reports on mutual fund total return performance and calculates fund rankings. Each Lipper Average is based on a universe of funds with similar investment objectives. |
| (4) | The total returns shown do not reflect the deduction of taxes that a shareholder would pay on fund distributions or the redemption of fund shares. |
| (5) | For the period November 15, 2005 (commencement of investment operations) through April 30, 2006. |
4
The FBR Funds
FBR Pegasus FundTM
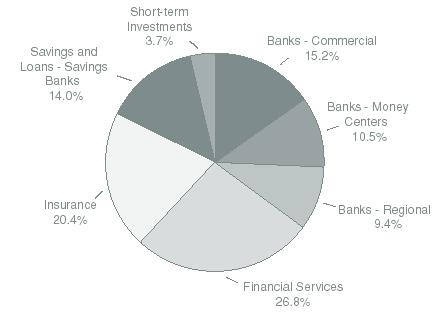
Portfolio Summary
April 30, 2006
(unaudited)
The following chart provides a visual breakdown of the Fund by industry sectors. The underlying securities represent a percentage of the portfolio investments.
5
The FBR Funds
FBR Pegasus FundTM
Portfolio of Investments
April 30, 2006
(unaudited)
|
| | | | | | VALUE | |
| | SHARES | | | | (NOTE 2) | |
|
| | | | COMMON STOCKS — 94.8% | | | | |
| | | | Airlines — 2.3% | | | | |
| | 7,667 | | Southwest Airlines Co. | | $ | 124,359 | |
| | | | | |
| |
| | | | Audio and Video Equipment — 3.8% | | | | |
| | 4,212 | | Sony Corp. ADR | | | 206,135 | |
| | | | | |
| |
| | | | Auto and Truck Parts — 1.5% | | | | |
| | 1,015 | | Magna International, Inc., Class A | | | 79,627 | |
| | | | | |
| |
| | | | Banks - Regional — 1.1% | | | | |
| | 531 | | Bank of Montreal | | | 30,798 | |
| | 185 | | Comerica, Inc. | | | 10,521 | |
| | 430 | | KeyCorp | | | 16,435 | |
| | | | | |
| |
| | | | | | | 57,754 | |
| | | | | |
| |
| | | | Communications Services — 0.9% | | | | |
| | 1,939 | | AT&T, Inc. | | | 50,821 | |
| | | | | |
| |
| | | | Computer Peripherals — 3.0% | | | | |
| | 2,092 | | Canon, Inc. ADR | | | 158,574 | |
| | | | | |
| |
| | | | Construction Services — 0.9% | | | | |
| | 529 | | Lennar Corp., Class A | | | 29,058 | |
| | 538 | | Toll Brothers, Inc.* | | | 17,297 | |
| | | | | |
| |
| | | | | | | 46,355 | |
| | | | | |
| |
| | | | Electric Utilities — 2.8% | | | | |
| | 548 | | Constellation Energy Group, Inc. | | | 30,096 | |
| | 3,026 | | Edison International | | | 122,281 | |
| | | | | |
| |
| | | | | | | 152,377 | |
| | | | | |
| |
| | | | Electronic Instruments and Controls — 2.9% | | | | |
| | 2,450 | | LG.Philips LCD Company Ltd. ADR* | | | 51,573 | |
| | 1,233 | | TDK Corp. ADR | | | 102,869 | |
| | | | | |
| |
| | | | | | | 154,442 | |
| | | | | |
| |
| | | | Food Processing — 1.4% | | | | |
| | 2,132 | | Archer Daniels Midland Co. | | | 77,477 | |
| | | | | |
| |
6
The FBR Funds
FBR Pegasus FundTM
Portfolio of Investments (continued)
April 30, 2006
(unaudited)
|
| | | | | | VALUE | |
| | SHARES | | | | (NOTE 2) | |
|
| | | | Insurance - Accident and Health — 0.8% | | | | |
| | 419 | | Assurant, Inc. | | $ | 20,183 | |
| | 1,024 | | UnumProvident Corp. | | | 20,798 | |
| | | | | |
| |
| | | | | | | 40,981 | |
| | | | | |
| |
| | | | Insurance - Life — 7.1% | | | | |
| | 1,540 | | Genworth Financial, Inc., Class A | | | 51,128 | |
| | 570 | | Lincoln National Corp. | | | 33,106 | |
| | 2,414 | | MetLife, Inc. | | | 125,769 | |
| | 901 | | Principal Financial Group, Inc. | | | 46,230 | |
| | 1,622 | | Prudential Financial, Inc. | | | 126,727 | |
| | | | | |
| |
| | | | | | | 382,960 | |
| | | | | |
| |
| | | | Insurance - Property and Casualty — 11.7% | | | | |
| | 1,029 | | ACE Ltd. | | | 57,151 | |
| | 2,445 | | American International Group, Inc. | | | 159,535 | |
| | 815 | | CNA Financial Corp.* | | | 26,194 | |
| | 207 | | Everest Re Group Ltd. | | | 18,837 | |
| | 840 | | Loews Corp. | | | 89,166 | |
| | 395 | | Safeco Corp. | | | 20,501 | |
| | 1,348 | | The Chubb Corp. | | | 69,476 | |
| | 989 | | The Hartford Financial Services Group, Inc. | | | 90,919 | |
| | 2,219 | | The St. Paul Travelers Companies, Inc. | | | 97,702 | |
| | | | | |
| |
| | | | | | | 629,481 | |
| | | | | |
| |
| | | | Investment Services — 4.2% | | | | |
| | 2,406 | | Morgan Stanley | | | 154,706 | |
| | 478 | | The Bear Stearns Companies, Inc. | | | 68,120 | |
| | | | | |
| |
| | | | | | | 222,826 | |
| | | | | |
| |
| | | | Iron and Steel — 3.1% | | | | |
| | 2,213 | | Mittal Steel Company N.V., Class A NYS | | | 82,965 | |
| | 1,205 | | United States Steel Corp. | | | 82,543 | |
| | | | | |
| |
| | | | | | | 165,508 | |
| | | | | |
| |
| | | | Metal Mining — 5.2% | | | | |
| | 2,068 | | Inco Ltd | | | 116,780 | |
| | 1,880 | | Phelps Dodge Corp. | | | 162,037 | |
| | | | | |
| |
| | | | | | | 278,817 | |
| | | | | |
| |
7
The FBR Funds
FBR Pegasus FundTM
Portfolio of Investments (continued)
April 30, 2006
(unaudited)
|
| | | | | | VALUE | |
| | SHARES | | | | (NOTE 2) | |
|
| | | | Oil and Gas Operations — 18.0% | | | | |
| | 1,855 | | Anadarko Petroleum Corp. | | $ | 194,441 | |
| | 2,927 | | Apache Corp. | | | 207,962 | |
| | 1,700 | | Chevron Corp. | | | 103,734 | |
| | 800 | | Marathon Oil Corp. | | | 63,488 | |
| | 1,290 | | Occidental Petroleum Corp. | | | 132,535 | |
| | 2,218 | | Royal Dutch Shell PLC, Class A ADR | | | 151,112 | |
| | 2,392 | | Sempra Energy | | | 110,080 | |
| | | | | |
| |
| | | | | | | 963,352 | |
| | | | | |
| |
| | | | Photography — 1.0% | | | | |
| | 1,625 | | Fuji Photo Film Company Ltd. ADR | | | 55,413 | |
| | | | | |
| |
| | | | | | | | |
| | | | Railroads — 11.8% | | | | |
| | 1,480 | | Canadian Pacific Railway Ltd. | | | 78,647 | |
| | 2,161 | | CSX Corp | | | 148,007 | |
| | 3,814 | | Norfolk Southern Corp. | | | 205,955 | |
| | 2,168 | | Union Pacific Corp. | | | 197,743 | |
| | | | | |
| �� |
| | | | | | | 630,352 | |
| | | | | |
| |
| | | | Retail - Specialty — 1.5% | | | | |
| | 1,504 | | Costco Wholesale Corp. | | | 81,863 | |
| | | | | |
| |
| | | | Savings and Loans - Savings Banks — 0.9% | | | | |
| | 650 | | Golden West Financial Corp. | | | 46,716 | |
| | | | | |
| |
| | | | Semiconductors — 8.9% | | | | |
| | 1,359 | | Freescale Semiconductor, Inc., Class B* | | | 43,040 | |
| | 1,735 | | Kyocera Corp. ADR | | | 162,881 | |
| | 6,635 | | Micron Technology, Inc.* | | | 112,596 | |
| | 8,700 | | STMicroelectronics N.V. NYS | | | 159,210 | |
| | | | | |
| |
| | | | | | | 477,727 | |
| | | | | |
| |
| | | | Total Common Stocks (Cost $4,775,506) | | | 5,083,917 | |
| | | | | |
| |
8
The FBR Funds
FBR Pegasus FundTM
Portfolio of Investments (continued)
April 30, 2006
(unaudited)
|
| | | | | | VALUE | |
| | PAR | | | | (NOTE 2) | |
|
| | | | REPURCHASE AGREEMENTS — 6.1% | | | | |
| $ | 325,000 | | With Mizuho Securities, Inc. dated 4/28/06 at 4.62% to be repurchased at $325,125 on
5/1/06, collateralized by U.S. Treasury Bond, 7.25% due 5/15/06, value $173,415;
U.S. Treasury Bond, 8.75% due 8/15/20, value $39,122; U.S. Treasury Note,
2.625% due 11/15/06, value $119,580 (Cost $325,000) | | $ | 325,000 | |
| | | | | |
| |
| | | | Total Investments — 100.9% | | | | |
| | | | (Cost $5,100,506) | | | 5,408,917 | |
| | | | | | | | |
| | | | Liabilities Less Other Assets — (0.9%) | | | (45,922 | ) |
| | | | | |
| |
| | | | | | | | |
| | | | Net Assets — 100.0% | | $ | 5,362,995 | |
| | | | | |
| |
|
| * | | Non-income producing security |
| ADR | | American Depositary Receipts |
| NYS | | New York Shares |
| Note: | | For presentation purposes, the Fund has grouped some of the industry categories. For purposes of categorizing securities for |
| | | compliance with Section 8(b)(1) of the Investment Company Act of 1940, the Fund uses more specific industry classifications. |
The accompanying notes are an integral part of the financial statements.
9
| The FBR Funds |
|
| FBR Large Cap Financial Fund |
| Management Overview |
Portfolio Manager: David Ellison
How did the Fund perform?
For the six-month period ended April 30, 2006, the FBR Large Cap Financial Fund returned 9.88%. This compares to the S&P 500 Composite Index and the Lipper Financial Services Fund Index, which returned 9.64% and 13.34%, respectively, for the same period.
What factors contributed to the Fund’s performance?
As indicated above, the Fund performed slightly better than the S&P 500 Composite Index and underperformed the Lipper Financial Services Fund Index for the six-months ended April 30, 2006. Being underweight in brokerage related stocks hurt performance during the period. I have always tended to overweight the more traditional bank and thrift companies which have been fighting interest rate increases and yield curve flattening. I will continue to overweight the Fund’s holdings in the more traditional bank and thrift business models because, over time, I expect they will deliver superior earnings growth ahead of, and with less volatility than, competing models in the financial services sector.
What is the outlook for the Fund and the financial services sector?
A number of concerns surrounding the financial services industry has weighed heavily on financial stock valuations over the last couple of years. These concerns include 1) rising short-term interest rates, 2) the flattening yield curve (the difference between long and short dated debt securities), 3) possible credit problems associated with a slow down or decline in the residential housing market, 4) pricing pressure in capital market activities, most noticeably on stock trading commission rates, 5) sluggish commercial loan demand, and finally 6) anemic merger and acquisition activity.
In spite of all these concerns, industry fundamentals remain favorable and the outlook is for conditions to persist. The industry has been well aware of, and consequently prepared for, the current rising rate environment and the potential credit problems based on their operating experience through previous cycles. Also, the regulators have been focused on these concerns and have pushed for conservative positioning in the industry relative to interest rates and credit behavior. I believe the financial services sector will do better relative to the market as these concerns are addressed or resolved by the companies, regulators, and the Federal Reserve.
I will continue to concentrate the Fund’s holdings in financial stocks that follow low risk business strategies and trade at below average peer valuations. This strategy has the intended effect of reducing potential downside performance associated with macro market changes like interest rates and credit. It will also provide the best opportunity to perform well over the long term as these companies continue to deliver consistent earnings growth.
The opinions expressed in this commentary reflect those of the Portfolio Manager as of the date written. Any such opinions are subject to change based on market or other conditions. These opinions may not be relied upon as investment advice. Investment decisions for the FBR Funds are based on several factors, and may not be relied upon as an indication of trading intent on behalf of any FBR Fund. Security positions can and do change.
10
| The FBR Funds |
|
| FBR Large Cap Financial Fund |
| |
| Comparison of Changes in Value of $10,000 Investment in |
| Fund Shares(1)(2) vs. Various Indices(1)(3) |
| (unaudited) |
| Total Returns—For the Periods Ended April 30, 2006(4) |
| | | | | | | | | Annualized | |
| | | | | | Annualized | | Since | |
| | | One Year | | Five Year | | Inception(5) | |
| | |
| |
| |
| |
FBR Large Cap Financial Fund(1)(2) | | 11.62 | % | | 8.18 | % | | 11.52 | % | |
S&P 500 Composite Index(1)(3) | | 15.41 | % | | 2.70 | % | | 7.87 | % | |
Lipper Financial Services Fund Index(1)(3) | | 22.96 | % | | 8.43 | % | | 11.14 | % | |
PAST PERFORMANCE IS NO GUARANTEE OF FUTURE RESULTS.
The performance data quoted represents past performance and the current performance may be lower or higher than the performance data quoted. The investment return and principal will fluctuate so that investors’ shares, when redeemed, may be worth more or less than their original cost. To obtain performance data current to the most recent month-end,
please call 888.200.4710 or visit www.fbrfunds.com.
| (1) | | The graph assumes a hypothetical $10,000 initial investment in the Fund and reflects the reinvestment of dividends and all Fund expenses. Investors should note that the Fund is a professionally managed mutual fund while the indices are unmanaged, do not incur expenses and are not available for investment. The performance of the indices includes reinvested dividends, and does not reflect sales charges or expenses, except for the Lipper Financial Services Fund Index which reflects fund expenses. |
| (2) | | FBR Fund Advisers, Inc. waived a portion of its advisory fees and agreed to contractually reimburse a portion of the Fund’s operating expenses, as necessary, to maintain existing expense limitations, as set forth in the notes to the financial statements. Total returns shown include fee waivers and expense reimbursements, if any; total returns would have been lower had there been no waiver of fees and/or reimbursement of expenses in excess of expense limitations. |
| (3) | | S&P 500 Composite Index is a capitalization-weighted index of 500 stocks. The index is designed to represent the broad domestic economy through changes in aggregate market value of 500 stocks representing all major industries. The Lipper Financial Services Fund Index is an equally weighted index of the largest thirty funds within the financial services fund classification as defined by Lipper Inc. The index is rebalanced quarterly. Lipper Analytical Services, Inc., is a nationally recognized organization that reports on mutual fund total return performance and calculates fund rankings. Each Lipper Average is based on a universe of funds with similar investment objectives. |
| (4) | | The total returns shown do not reflect the deduction of taxes that a shareholder would pay on fund distributions or the redemption of fund shares. |
| (5) | | For the period January 3, 1997 (commencement of investment operations) through April 30, 2006. Certain purchases made by shareholders within this period would have been subject to an initial maximum sales charge of up to 5.50%. As a result, total returns for such shareholders would have been lower. |
11
| The FBR Funds |
|
| FBR Large Cap Financial Fund |
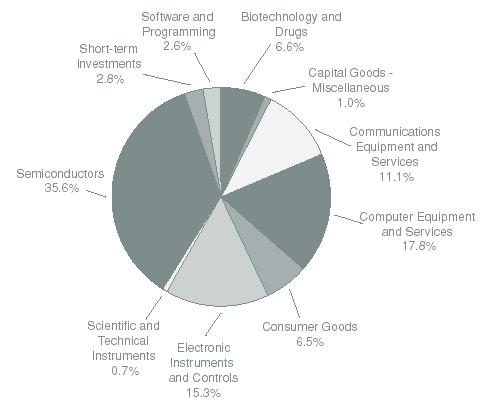
| Portfolio Summary |
| April 30, 2006 |
| (unaudited) |
The following chart provides a visual breakdown of the Fund by industry sectors. The underlying securities represent a percentage of the portfolio investments.
12
| The FBR Funds |
|
| FBR Large Cap Financial Fund |
| Portfolio of Investments |
| April 30, 2006 |
| (unaudited) |
|
| | | | | | VALUE | |
| | SHARES | | | | (NOTE 2) | |
|
| | | | COMMON STOCKS — 96.3% | | | | |
| | | | Banks - Commercial — 15.2% | | | | |
| | 24,000 | | Comerica, Inc. | | $ | 1,364,880 | |
| | 37,000 | | KeyCorp | | | 1,414,140 | |
| | 18,000 | | SunTrust Banks, Inc. | | | 1,391,940 | |
| | 3,000 | | UnionBanCal Corp. | | | 210,270 | |
| | | | | |
| |
| | | | | | | 4,381,230 | |
| | | | | |
| |
| | | | Banks - Money Centers — 10.5% | | | | |
| | 24,000 | | Bank of America Corp. | | | 1,198,080 | |
| | 22,000 | | Citigroup, Inc. | | | 1,098,900 | |
| | 12,000 | | Wachovia Corp. | | | 718,200 | |
| | | | | |
| |
| | | | | | | 3,015,180 | |
| | | | | |
| |
| | | | Banks - Regional — 9.4% | | | | |
| | 4,000 | | First Horizon National Corp. | | | 169,680 | |
| | 87,000 | | Mitsubishi UFJ Financial Group, Inc. ADR | | | 1,362,420 | |
| | 28,000 | | National City Corp. | | | 1,033,200 | |
| | 6,000 | | Susquehanna Bancshares, Inc. | | | 143,220 | |
| | | | | |
| |
| | | | | | | 2,708,520 | |
| | | | | |
| |
| | | | Financial Services — 26.7% | | | | |
| | 3,000 | | Capital One Financial Corp. | | | 259,920 | |
| | 17,000 | | CIT Group, Inc. | | | 918,170 | |
| | 5,000 | | Countrywide Financial Corp. | | | 203,300 | |
| | 14,000 | | Fannie Mae (Federal National Mortgage) | | | 708,400 | |
| | 22,000 | | Freddie Mac (Federal Home Loan) | | | 1,343,320 | |
| | 32,000 | | JP Morgan Chase & Co | | | 1,452,160 | |
| | 8,500 | | Merrill Lynch & Company, Inc. | | | 648,210 | |
| | 15,000 | | Morgan Stanley | | | 964,500 | |
| | 6,000 | | The Bear Stearns Companies, Inc. | | | 855,060 | |
| | 2,300 | | The Goldman Sachs Group, Inc. | | | 368,667 | |
| | | | | |
| |
| | | | | | | 7,721,707 | |
| | | | | |
| |
| | | | Insurance - Accident and Health — 2.8% | | | | |
| | 39,000 | | UnumProvident Corp. | | | 792,090 | |
| | | | | |
| |
| | | | Insurance - Life — 11.9% | | | | |
| | 4,000 | | Conseco, Inc.* | | | 101,000 | |
| | 20,000 | | Genworth Financial, Inc., Class A | | | 664,000 | |
13
| The FBR Funds |
|
| FBR Large Cap Financial Fund |
| Portfolio of Investments (continued) |
| April 30, 2006 |
| (unaudited) |
|
| | | | | | VALUE |
| | SHARES | | | | (NOTE 2) |
|
| | | | Insurance - Life — 11.9% (continued) | | | | |
| | 6,000 | | Lincoln National Corp. | | $ | 348,480 | |
| | 16,000 | | MetLife, Inc. | | | 833,600 | |
| | 15,000 | | Principal Financial Group, Inc. | | | 769,650 | |
| | 9,000 | | Prudential Financial, Inc. | | | 703,170 | |
| | | | | |
| |
| | | | | | | 3,419,900 | |
| | | | | |
| |
| | | | Insurance - Property and Casualty — 5.8% | | | | |
| | 3,000 | | Cincinnati Financial Corp. | | | 127,920 | |
| | 29,000 | | CNA Financial Corp.* | | | 932,060 | |
| | 5,000 | | The Hartford Financial Services Group, Inc. | | | 459,650 | |
| | 3,000 | | The PMI Group, Inc. | | | 138,450 | |
| | | | | |
| |
| | | | | | | 1,658,080 | |
| | | | | |
| |
| | | | Savings and Loans - Savings Banks — 14.0% | | | | |
| | 46,000 | | Astoria Financial Corp. | | | 1,440,720 | |
| | 21,000 | | Golden West Financial Corp. | | | 1,509,270 | |
| | 28,000 | | Sovereign Bancorp, Inc. | | | 620,760 | |
| | 7,000 | | Washington Mutual, Inc. | | | 315,420 | |
| | 3,000 | | Webster Financial Corp. | | | 140,850 | |
| | | | | |
| |
| | | | | | | 4,027,020 | |
| | | | | |
| |
| | | | Total Common Stocks (Cost $23,228,441) | | | 27,723,727 | |
| | | | | |
| |
| PAR | | | | | | |
| | | | | | |
| | | | REPURCHASE AGREEMENTS — 3.7% | | | | |
| $ | 1,058,000 | | With Mizuho Securities, Inc. dated 4/28/06 at 4.62% to be repurchased at $1,058,407 | | | | |
| | | | on 5/1/06, collateralized by U.S. Treasury Bond, 7.25% due 5/15/06, value $564,533; | | | | |
| | | | U.S. Treasury Bond, 8.75% due 8/15/20, value $127,358; U.S. Treasury Note, | | | | |
| | | | 2.625% due 11/15/06, value $389,280 (Cost $1,058,000) | | | 1,058,000 | |
| | | | | |
| |
| | | | Total Investments — 100.0% (Cost $24,286,441) | | | 28,781,727 | |
| | | |
Liabilities Less Other Assets — N.M. | | | (8,473 | ) |
| | | | | |
| |
| | | | | | | | |
| | | | Net Assets — 100.0% | | $ | 28,773,254 | |
| | | | | |
| |
| * | | Non-income producing security |
| ADR | | American Depositary Receipts |
| N.M. | | Not Meaningful |
| The accompanying notes are an integral part of the financial statements. |
| |
| 14 |
| The FBR Funds |
|
| FBR Large Cap Technology Fund |
| Management Overview |
Portfolio Managers: David Ellison and Winsor Aylesworth
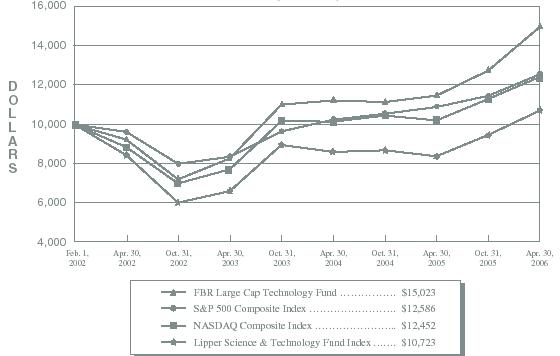
How did the Fund perform?
For the six-month period ended April 30, 2006, the FBR Large Cap Technology Fund appreciated 17.56%. This compares to the S&P 500 Composite Index, the NASDAQ Composite Index and the Lipper Science & Technology Fund Index, which returned 9.64%, 10.02%, and 13.22%, respectively, for the same period.
What factors contributed to the Fund’s performance?
The Fund’s overall conservative investment philosophy continues to reward investors with above average performance. We continue to invest and maintain investments in the larger technology companies with minimal debt, a history of profits and a track record of growing book value.
As we mentioned in the last annual report, the technology sector tends to perform in line with the overall economy of not only the United States, but of the world. The last six months have been a period of modest growth in most of the major economies of the world, which has helped the Fund’s performance. This has been somewhat offset by a generally rising interest rate environment with few new “must have” consumer electronics.
What is the outlook for the Fund and the technology sector?
Indications are that the next six months may be a period of modest performance for the technology sector as we await the release of new products from such vendors as Sony, Microsoft, Nokia and Canon. Semiconductor companies in particular are facing overall pricing pressures and some supply management issues. Long term, the sector is unlike any other in that it covers an area that thrives in providing new cost effective solutions to the problems of businesses and the enjoyment of one’s personal life. Although the “iPod” phenomena may have peaked, by owning a diversified portfolio of quality large cap technology companies, fellow investors should be well rewarded as we await the next great discovery.
The opinions expressed in this commentary reflect those of the Portfolio Manager as of the date written. Any such opinions are subject to change based on market or other conditions. These opinions may not be relied upon as investment advice. Investment decisions for the FBR Funds are based on several factors, and may not be relied upon as an indication of trading intent on behalf of any FBR Fund. Security positions can and do change.
15
| The FBR Funds |
|
| FBR Large Cap Technology Fund |
| |
| Comparison of Changes in Value of $10,000 Investment in |
| Fund Shares(1)(2) vs. Various Indices(1)(3) |
| (unaudited) |
Total Returns—For the Periods Ended April 30, 2006(4) |
| | | | | | Annualized | | |
| | | | | | Since | | |
| | | One Year | | | Inception(5) | | |
| | |
| |
| |
FBR Large Cap Technology Fund(1) (2) | | 30.73 | % | | 10.07 | % | |
S&P 500 Composite Index(1) (3) | | 15.41 | % | | 5.57 | % | |
NASDAQ Composite Index(1) (3) | | 21.89 | % | | 5.30 | % | |
Lipper Science & Technology Fund Index(1) (3) | | 28.04 | % | | 1.66 | % | |
PAST PERFORMANCE IS NO GUARANTEE OF FUTURE RESULTS.
The performance data quoted represents past performance and the current performance may be lower or higher than the performance data quoted. The investment return and principal will fluctuate so that investors’ shares, when redeemed, may be worth more or less than their original cost. To obtain performance data current to the most recent month-end,
please call 888.200.4710 or visit www.fbrfunds.com.
| (1) | | The graph assumes a hypothetical $10,000 initial investment in the Fund and reflects the reinvestment of dividends and all Fund expenses. Investors should note that the Fund is a professionally managed mutual fund while the indices are unmanaged, do not incur expenses and are not available for investment. The performance of the indices includes reinvested dividends, and does not reflect sales charges or expenses, except for the Lipper Science & Technology Fund Index which reflects fund expenses. |
| (2) | | FBR Fund Advisers, Inc. waived a portion of its advisory fees and agreed to contractually reimburse a portion of the Fund’s operating expenses, as necessary, to maintain existing expense limitations, as set forth in the notes to the financial statements. Total returns shown include fee waivers and expense reimbursements, if any; total returns would have been lower had there been no waiver of fees and/or reimbursement of expenses in excess of expense limitations. |
| (3) | | S&P 500 Composite Index is a capitalization-weighted index of 500 stocks. The index is designed to represent the broad domestic economy through changes in aggregate market value of 500 stocks representing all major industries. The NASDAQ Composite Index is a broad-based capitalization-weighted index of all NASDAQ National Market and Small Cap stocks. The Lipper Technology & Science Fund Index is an equally weighted index of the largest thirty funds within the science and technology fund classification as defined by Lipper Inc. The index is rebalanced quarterly. Lipper Analytical Services, Inc., is a nationally recognized organization that reports on mutual fund total return performance and calculates fund rankings. Each Lipper Average is based on a universe of funds with similar investment objectives. |
| (4) | | The total returns shown do not reflect the deduction of taxes that a shareholder would pay on fund distributions or the redemption of fund shares. |
| (5) | | For the period February 1, 2002 (commencement of investment operations) through April 30, 2006. |
16
| The FBR Funds |
|
| FBR Large Cap Technology Fund |
| Portfolio Summary |
| April 30, 2006 |
| (unaudited) |
The following chart provides a visual breakdown of the Fund by industry sectors. The underlying securities represent a percentage of the portfolio investments.
17
| The FBR Funds |
|
| FBR Large Cap Technology Fund |
| Portfolio of Investments |
| April 30, 2006 |
| (unaudited) |
|
| | | | | | VALUE | |
| | SHARES | | | | (NOTE 2) | |
|
| | | | COMMON STOCKS — 98.2% | | | | |
| | | | Audio and Video Equipment — 2.6% | | | | |
| | 13,300 | | Sony Corp.ADR | | $ | 650,902 | |
| | | | | |
| |
| | | | Biotechnology and Drugs — 6.7% | | | | |
| | 1,375 | | ALTANA AG ADR | | | 86,804 | |
| | 3,100 | | AmerisourceBergen Corp. | | | 133,765 | |
| | 8,300 | | Merck & Co., Inc. | | | 285,686 | |
| | 10,955 | | Novartis AG ADR | | | 630,022 | |
| | 26,375 | | Schering-Plough Corp. | | | 509,565 | |
| | | | | |
| |
| | | | | | | 1,645,842 | |
| | | | | |
| |
| | | | Capital Goods - Miscellaneous — 1.0% | | | | |
| | 2,400 | | Cummins, Inc. | | | 250,800 | |
| | | | | |
| |
| | | | Communications Equipment — 7.0% | | | | |
| | 12,850 | | Comverse Technology, Inc.* | | | 291,053 | |
| | 6,800 | | LM Ericsson Telephone Co. ADR | | | 241,196 | |
| | 48,500 | | Motorola, Inc. | | | 1,035,474 | |
| | 6,425 | | Nokia Oyj ADR | | | 145,591 | |
| | | | | |
| |
| | | | | | | 1,713,314 | |
| | | | | |
| |
| | | | Communications Services — 4.2% | | | | |
| | 39,625 | | AT&T, Inc. | | | 1,038,571 | |
| | | | | |
| |
| | | | Computer Hardware — 2.1% | | | | |
| | 3,850 | | Apple Computer, Inc.* | | | 271,002 | |
| | 3,080 | | International Business Machines Corp. | | | 253,607 | |
| | | | | |
| |
| | | | | | | 524,609 | |
| | | | | |
| |
| | | | Computer Peripherals — 5.0% | | | | |
| | 14,250 | | Canon, Inc. ADR | | | 1,080,150 | |
| | 4,500 | | Hewlett-Packard Co | | | 146,115 | |
| | | | | |
| |
| | | | | | | 1,226,265 | |
| | | | | |
| |
| | | | Computer Services — 3.7% | | | | |
| | 9,200 | | Computer Sciences Corp.* | | | 538,660 | |
| | 9,300 | | NCR Corp.* | | | 366,420 | |
| | | | | |
| |
| | | | | | | 905,080 | |
| | | | | |
| |
18
| The FBR Funds |
|
| FBR Large Cap Technology Fund |
| Portfolio of Investments (continued) |
| April 30, 2006 |
| (unaudited) |
|
| | | | | | VALUE | |
| | SHARES | | | | (NOTE 2) | |
|
| | | | Computer Storage Devices — 6.2% | | | | |
| | 33,575 | | EMC Corp.* | | $ | 453,598 | |
| | 7,500 | | SanDisk Corp.* | | | 478,725 | |
| | 22,800 | | Seagate Technology* | | | 605,568 | |
| | | | | |
| |
| | | | | | | 1,537,891 | |
| | | | | |
| |
| | | | Electronic Instruments and Controls — 15.5% | | | | |
| | 20,040 | | Agilent Technologies, Inc.* | | | 769,937 | |
| | 10,025 | | American Power Conversion Corp. | | | 222,956 | |
| | 6,000 | | Arrow Electronics, Inc.* | | | 217,200 | |
| | 27,500 | | AU Optronics Corp. ADR | | | 451,825 | |
| | 8,675 | | Jabil Circuit, Inc.* | | | 338,238 | |
| | 36,500 | | LG.Philips LCD Company Ltd. ADR* | | | 768,325 | |
| | 8,400 | | Molex, Inc. | | | 311,808 | |
| | 42,100 | | Solectron Corp.* | | | 168,400 | |
| | 6,875 | | TDK Corp. ADR | | | 573,581 | |
| | | | | |
| |
| | | | | | | 3,822,270 | |
| | | | | |
| |
| | | | Personal and Household Products — 3.0% | | | | |
| | 14,975 | | McKesson Corp. | | | 727,635 | |
| | | | | |
| |
| | | | Photography — 0.9% | | | | |
| | 6,690 | | Fuji Photo Film Company Ltd. ADR | | | 228,129 | |
| | | | | |
| |
| | | | Retail - Catalog and Mail Order — 0.9% | | | | |
| | 3,800 | | CDW Corp | | | 226,176 | |
| | | | | |
| |
| | | | Scientific and Technical Instruments — 0.7% | | | | |
| | 5,800 | | Applera Corp. - Applied Biosystems Group | | | 167,272 | |
| | | | | |
| |
| | | | Semiconductors — 36.0% | | | | |
| | 21,650 | | Advanced Micro Devices, Inc.* | | | 700,378 | |
| | 18,475 | | Analog Devices, Inc. | | | 700,572 | |
| | 34,050 | | Applied Materials, Inc. | | | 611,198 | |
| | 27,000 | | Flextronics International Ltd.* | | | 306,720 | |
| | 19,642 | | Freescale Semiconductor, Inc., Class B* | | | 622,062 | |
| | 35,000 | | Infineon Technologies AG ADR* | | | 427,700 | |
| | 44,700 | | Intel Corp. | | | 893,105 | |
19
| The FBR Funds |
|
| FBR Large Cap Technology Fund |
| Portfolio of Investments (continued) |
| April 30, 2006 |
| (unaudited) |
|
| | | | | | VALUE | |
| | SHARES | | | | (NOTE 2) | |
|
| | | | Semiconductors — 36.0% (continued) | | | | |
| | 9,675 | | KLA-Tencor Corp. | | $ | 465,948 | |
| | 9,000 | | Kyocera Corp. ADR | | | 844,920 | |
| | 30,950 | | Micron Technology, Inc.* | | | 525,222 | |
| | 3,075 | | National Semiconductor Corp. | | | 92,189 | |
| | 8,700 | | Novellus Systems, Inc.* | | | 214,890 | |
| | 45,200 | | STMicroelectronics N.V. NYS | | | 827,160 | |
| | 44,000 | | Taiwan Semiconductor Manufacturing Company Ltd. ADR | | | 461,120 | |
| | 20,500 | | Texas Instruments, Inc. | | | 711,555 | |
| | 17,100 | | Xilinx, Inc. | | | 473,157 | |
| | | | | |
| |
| | | | | | | 8,877,896 | |
| | | | | |
| |
| | | | Software and Programming — 2.7% | | | | |
| | 15,200 | | Check Point Software Technologies Ltd.* | | | 294,120 | |
| | 23,400 | | Compuware Corp.* | | | 179,712 | |
| | 7,500 | | Microsoft Corp. | | | 181,125 | |
| | | | | |
| |
| | | | | | | 654,957 | |
| | | | | |
| |
| | | | Total Common Stocks (Cost $22,232,728) | | | 24,197,609 | |
| | | | | |
| |
| PAR | | | | | | |
| | | | | | |
| | | | REPURCHASE AGREEMENTS — 2.9% | | | | |
| $ | 706,000 | | With Mizuho Securities, Inc. dated 4/28/06 at 4.62% to be repurchased at | | | | |
| | | | $706,272 on 5/1/06, collateralized by U.S. Treasury Bond, 7.25% due 5/15/06, | | | | |
| | | | value $376,711; U.S. Treasury Bond, 8.75% due 8/15/20, value $84,986; U.S. Treasury | | | | |
| | | | Note, 2.625% due 11/15/06, value $259,765 (Cost $706,000) | | | 706,000 | |
| | | | | |
| |
| | | | Total Investments — 101.1% | | | | |
| | | | (Cost $22,938,728) | | | 24,903,609 | |
| | | |
Liabilities Less Other Assets — (1.1%) | | | (279,946 | ) |
| | | | | |
| |
| | | | | | | | |
| | | | Net Assets — 100.0% | | $ | 24,623,663 | |
| | | | | |
| |
|
| * | | Non-income producing security |
| ADR | | American Depositary Receipts |
| NYS | | New York Shares |
| The accompanying notes are an integral part of the financial statements. |
| |
| 20 |
The FBR Funds
FBR Small Cap Fund
Management Overview
Portfolio Manager: Charles T. Akre, Jr.
How did the Fund perform?
For the six-month period ended April 30, 2006, the FBR Small Cap Fund appreciated 23.33%. This compares to the Russell 2000 Index and the Lipper Small Cap Growth Index, which returned 18.93% and 18.53%, respectively, for the same period.
What factors contributed to the Fund’s performance?
During the first six months of the Fund’s 2006 fiscal year, I reduced the overall number of Fund holdings by about a third from a year earlier, thereby increasing the concentration of assets in the top holdings. As of the end of this reporting period, the top ten positions accounted for seventy percent of the Fund’s total assets. While many of these businesses were growing real economic value on a per share basis in 2005, their individual market prices were not reflective of that growth. In 2006, the share prices have more accurately reflected the solid underlying results being achieved by the companies held in the Fund’s portfolio, which helped the Fund’s performance.
As I have written in the past, I expect the majority of the growth in the value of the Fund’s assets to be driven by the underlying economics of the individual companies the Fund owns, which from time to time may or may not be fully reflected in the price of the stock.
What is the outlook for the Fund and the small cap sector?
After almost seven years of outperformance, it is a widely held belief that small-cap stocks have had their run. Many investors are now focusing their attention on the old-fashioned large-cap growth stocks because many feel they can be purchased at very modest valuations. As I have said in the past, I do not spend a lot of time analyzing market trends and my investment process is exactly the same through each and every market cycle.
You may recall that as part of our discipline I have always been unwilling to “pay-up” for any business, regardless of its market cap size and industry sector. So, I will continue to search for those few outstanding businesses which meet the investing requirements, and buy them only when attractively priced. Many companies are more attractive at the time this letter was written than at April 30th.
The Fund’s mandate is to focus on companies with market caps of less than three billion, and I will continue to focus our seasoned, bottom-up investment process in that universe of the market.
The opinions expressed in this commentary reflect those of the Portfolio Manager as of the date written. Any such opinions are subject to change based on market or other conditions. These opinions may not be relied upon as investment advice. Investment decisions for the FBR Funds are based on several factors, and may not be relied upon as an indication of trading intent on behalf of any FBR Fund. Security positions can and do change.
21
The FBR Funds
FBR Small Cap Fund
Comparison of Changes in Value of $10,000 Investment in
Fund Shares(1)(2) vs. Various Indices (1)(3)
(unaudited)
| | Total Returns—For the Periods Ended April 30, 2006(4) | |
| | | | | | | | | | | | Annualized | |
| | | | | | | | Annualized | | Since | |
| | | | One Year | | Five Year | | Inception(5) | |
| | | |
| |
| |
| |
| | FBR Small Cap Fund(1)(2) | | | 27.08 | % | | | 21.66 | % | | | 18.03 | % | |
| | Russell 2000 Index(1)(3) | | | 33.47 | % | | | 10.90 | % | | | 9.72 | % | |
| | Lipper Small Cap Growth Index(1)(3) | | | 32.48 | % | | | 5.92 | % | | | 7.71 | % | |
PAST PERFORMANCE IS NO GUARANTEE OF FUTURE RESULTS.
The performance data quoted represents past performance and the current performance may be lower or higher than the performance data quoted. The investment return and principal will fluctuate so that investors’ shares, when redeemed, may be worth more or less than their original cost. To obtain performance data current to the most recent month-end,
please call 888.200.4710 or visit www.fbrfunds.com.
|
| (1) | | The graph assumes a hypothetical $10,000 initial investment in the Fund and reflects the reinvestment of dividends and all Fund expenses. Investors should note that the Fund is a professionally managed mutual fund while the indices are unmanaged, do not incur expenses and are not available for investment. The performance of the indices includes reinvested dividends, and does not reflect sales charges or expenses, except for the Lipper Small Cap Growth Index which reflects fund expenses. |
| (2) | | FBR Fund Advisers, Inc. waived a portion of its advisory fees and agreed to contractually reimburse a portion of the Fund’s operating expenses, as necessary, to maintain existing expense limitations, as set forth in the notes to the financial statements. Total returns shown include fee waivers and expense reimbursements, if any; total returns would have been lower had there been no waiver of fees and/or reimbursement of expenses in excess of expense limitations. |
| (3) | | Russell 2000 Index is comprised of the smallest of the 2000 companies of the Russell 3000 Index, representing approximately 8% of the Russell 3000’s total market-capitalization. The Lipper Small Cap Growth Index is an equally weighted index of the largest thirty funds within the small-cap fund classification as defined by Lipper Inc. The index is rebalanced quarterly. Lipper Analytical Services, Inc., is a nationally recognized organization that reports on mutual fund total return performance and calculates fund rankings. Each Lipper Average is based on a universe of funds with similar investment objectives. |
| (4) | | The total returns shown do not reflect the deduction of taxes that a shareholder would pay on fund distributions or the redemption of fund shares. |
| (5) | | For the period January 3, 1997 (commencement of investment operations) through April 30, 2006. Certain purchases made by shareholders within this period would have been subject to an initial maximum sales charge of up to 5.50%. As a result, total returns for such shareholders would have been lower. |
22
The FBR Funds
FBR Small Cap Fund
Portfolio Summary
April 30, 2006
(unaudited)
The following chart provides a visual breakdown of the Fund by industry sectors. The underlying securities represent a percentage of the portfolio investments.
23
The FBR Funds
FBR Small Cap Fund
Portfolio of Investments
April 30, 2006
(unaudited)
|
| | | | | | VALUE | |
| | SHARES | | | | (NOTE 2) | |
|
| | | | COMMON STOCKS — 93.8% | | | | |
| | | | Biotechnology and Drugs — 0.4% | | | | |
| | 228,100 | | Bradley Pharmaceuticals, Inc.* | | $ | 3,385,004 | |
| | | | | |
| |
| | | | | | | | |
| | | | Casinos and Gaming — 33.1% | | | | |
| | 1,600,000 | | Bally Technologies, Inc.* | | | 28,640,000 | |
| | 49,882 | | Florida Gaming Corp.* | | | 773,171 | |
| | 20,000 | | International Game Technology | | | 758,600 | |
| | 212,300 | | Isle of Capri Casinos, Inc.* | | | 6,623,760 | |
| | 992,000 | | Monarch Casino & Resort, Inc.*† | | | 31,228,160 | |
| | 4,100,000 | | Penn National Gaming, Inc.* | | | 166,952,000 | |
| | 1,471,407 | | Pinnacle Entertainment, Inc.* | | | 40,169,411 | |
| | 157,500 | | Shuffle Master, Inc.* | | | 5,819,625 | |
| | 250,000 | | Station Casinos, Inc. | | | 19,270,000 | |
| | | | | |
| |
| | | | | | | 300,234,727 | |
| | | | | |
| |
| | | | Communications Services — 15.4% | | | | |
| | 4,107,256 | | American Tower Corp., Class A* | | | 140,221,720 | |
| | | | | |
| |
| | | | | | | | |
| | | | Construction - Supplies and Fixtures — 5.0% | | | | |
| | 730,850 | | American Woodmark Corp. | | | 25,404,346 | |
| | 514,600 | | Simpson Manufacturing Company, Inc. | | | 20,578,854 | |
| | | | | |
| |
| | | | | | | 45,983,200 | |
| | | | | |
| |
| | | | Construction Services — 4.0% | | | | |
| | 566,666 | | D.R. Horton, Inc. | | | 17,011,313 | |
| | 600,000 | | Toll Brothers, Inc.* | | | 19,290,000 | |
| | | | | |
| |
| | | | | | | 36,301,313 | |
| | | | | |
| |
| | | | Consumer Financial Services — 2.9% | | | | |
| | 873,000 | | AmeriCredit Corp.* | | | 26,434,440 | |
| | 28,200 | | White River Capital, Inc.* | | | 422,295 | |
| | | | | |
| |
| | | | | | | 26,856,735 | |
| | | | | |
| |
| | | | Electric Utilities — 1.9% | | | | |
| | 1,000,000 | | The AES Corp.* | | | 16,970,000 | |
| | | | | |
| |
| | | | | | | | |
| | | | Insurance - Miscellaneous — 1.9% | | | | |
| | 50,000 | | Brown & Brown, Inc. | | | 1,561,500 | |
| | 393,500 | | Hilb Rogal and Hobbs Co. | | | 16,086,280 | |
| | | | | |
| |
| | | | | | | 17,647,780 | |
| | | | | |
| |
24
The FBR Funds
FBR Small Cap Fund
Portfolio of Investments (continued)
April 30, 2006
(unaudited)
|
| | | | | | VALUE | |
| | SHARES | | | | (NOTE 2) | |
|
| | | | Insurance - Property and Casualty — 10.3% | | | | |
| | 80 | | Berkshire Hathaway, Inc., Class B* | | $ | 236,160 | |
| | 12,700 | | Fairfax Financial Holdings Ltd. | | | 1,542,542 | |
| | 61,000 | | Investors Title Co. | | | 2,623,610 | |
| | 255,400 | | Markel Corp.* | | | 89,198,450 | |
| | | | | |
| |
| | | | | | | 93,600,762 | |
| | | | | |
| |
| | | | Office Equipment — 2.2% | | | | |
| | 542,700 | | Global Imaging Systems, Inc.* | | | 20,269,845 | |
| | | | | |
| |
| | | | | | | | |
| | | | Oil and Gas Operations — 2.6% | | | | |
| | 361,719 | | MarkWest Hydrocarbon, Inc. | | | 8,319,537 | |
| | 211,800 | | Penn Virginia Corp. | | | 15,308,904 | |
| | | | | |
| |
| | | | | | | 23,628,441 | |
| | | | | |
| |
| | | | Real Estate Operations — 0.3% | | | | |
| | 116,900 | | W.P. Carey & Co. LLC | | | 3,169,159 | |
| | | | | |
| |
| | | | | | | | |
| | | | Recreational Activities — 0.8% | | | | |
| | 603,800 | | Dover Motorsports, Inc. | | | 3,646,952 | |
| | 60,000 | | International Speedway Corp., Class A | | | 2,951,400 | |
| | 19,000 | | International Speedway Corp., Class B | | | 936,225 | |
| | | | | |
| |
| | | | | | | 7,534,577 | |
| | | | | |
| |
| | | | Retail - Specialty — 11.9% | | | | |
| | 3,445,336 | | 99 Cents Only Stores* | | | 41,102,858 | |
| | 107,900 | | Big 5 Sporting Goods Corp. | | | 1,999,387 | |
| | 1,500,000 | | CarMax, Inc.* | | | 52,965,001 | |
| | 356,508 | | O’Reilly Automotive, Inc.* | | | 12,078,491 | |
| | | | | |
| |
| | | | | | | 108,145,737 | |
| | | | | |
| |
| | | | Software and Programming — 0.1% | | | | |
| | 32,000 | | MICROS Systems, Inc.* | | | 1,337,600 | |
| | | | | |
| |
| | | | Transportation Services — 1.0% | | | | |
| | 464,997 | | Dynamex, Inc.* | | | 8,955,842 | |
| | | | | |
| |
| | | | Total Common Stocks (Cost $470,604,781) | | | 854,242,442 | |
| | | | | |
| |
25
The FBR Funds
FBR Small Cap Fund
Portfolio of Investments (continued)
April 30, 2006
(unaudited)
|
| | | | | | VALUE | |
| | SHARES | | | | (NOTE 2) | |
|
| | | | PREFERRED STOCK — 0.5% | | | | |
| | | | Insurance - Life — 0.5% | | | | |
| | 200,000 | | ING Groep N.V., 6.125% (Cost $5,000,000) | | $ | 4,616,000 | |
| | | | | |
| |
| | | | | | | | |
| PAR | | | | | | |
| | | | | | |
| | | | REPURCHASE AGREEMENTS — 6.0% | | | | |
| $ | 54,403,000 | | With Mizuho Securities, Inc. dated 4/28/06 at 4.62% to be repurchased at $54,423,945 | | | | |
| | | | on 5/1/06, collateralized by U.S. Treasury Bond, 7.25% due 5/15/06, value | | | | |
| | | | $29,028,639; U.S. Treasury Bond, 8.75% due 8/15/20, value $6,548,843; | | | | |
| | | | U.S. Treasury Note, 2.625% due 11/15/06, value $20,016,999 (Cost $54,403,000) | | | 54,403,000 | |
| | | | | |
| |
| | | | Total Investments — 100.3% (Cost $530,007,781) | | | 913,261,442 | |
| | | | | | | | |
| | | | Liabilities Less Other Assets — (0.3%) | | | (2,654,808 | ) |
| | | | | |
| |
| | | | | | | | |
| | | | Net Assets — 100.0% | | $ | 910,606,634 | |
| | | | | |
| |
|
| * | | Non-income producing security |
| † | | Affiliated issuer as defined in the Investment Company Act of 1940 (ownership of at least 5% of the outstanding voting securities of an issuer) |
Note: For presentation purposes, the Fund has grouped some of the industry categories. For purposes of categorizing securities for compliance with Section 8(b)(1) of the Investment Company Act of 1940, the Fund uses more specific industry classifications. |
The accompanying notes are an integral part of the financial statements.
26
The FBR Funds
FBR Small Cap Financial Fund
Management Overview
Portfolio Manager: David Ellison
How did the Fund perform?
For the six-month period ended April 30, 2006, the FBR Small Cap Financial Fund returned 10.70%. This compares to the Russell 2000 Index and the Lipper Financial Services Fund Index, which returned 18.93% and 13.34%, respectively, for the same period.
What factors contributed to the Fund’s performance?
The Fund underperformed the relevant indices for the six-months ended April 30, 2006. Being underweight in the less traditional and more diversified financial services companies, which performed better during this rising rate environment, detracted from Fund performance. I have always tended to overweight the more traditional bank and thrift companies, especially in this Fund, and it was not productive during this period. I will maintain the strategy of overweighting the Fund’s holdings in the bank and thrift business models because, over time, I expect them to deliver solid earnings growth, without as much volatility as the less traditional financial models.
What is the outlook for the Fund and the financial services sector?
A number of concerns surrounding the entire financial services industry has weighed on financial stock valuations over the last couple of years. These concerns include 1) rising short-term interest rates, 2) the flattening yield curve (the difference between long and short dated debt securities), 3) possible credit problems associated with a slow down or decline in the residential housing market, 4) pricing pressure in capital market activities, most noticeably on stock trading commission rates, 5) sluggish commercial loan demand, and finally 6) anemic merger and acquisition activity.
In spite of all these concerns, industry fundamentals remain favorable and the outlook is for conditions to remain so. The industry has known about, and consequently prepared for, the current rising rate environment and the potential credit problems based on previous cycles. Also, the regulators have been focused on these concerns and have pushed for conservative positioning in the industry relative to interest rates and credit behavior. I believe the financial services sector will do better relative to the market as these concerns are addressed or resolved by the companies, regulators, and the Federal Reserve.
I will continue to concentrate the Fund’s holdings in financial stocks that follow low risk business strategies and trade at below average peer valuations. This strategy has the intended effect of reducing potential downside performance associated with macro market changes like interest rates and credit. It will also provide the best opportunity for the Fund to perform well over the long term as these companies continue to deliver consistent earnings growth.
The opinions expressed in this commentary reflect those of the Portfolio Manager as of the date written. Any such opinions are subject to change based on market or other conditions. These opinions may not be relied upon as investment advice. Investment decisions for the FBR Funds are based on several factors, and may not be relied upon as an indication of trading intent on behalf of any FBR Fund. Security positions can and do change.
27
The FBR Funds
FBR Small Cap Financial Fund
Comparison of Changes in Value of $10,000 Investment in
Fund Shares(1)(2) vs. Various Indices(1)(3)
(unaudited)
| | Total Returns—For the Periods Ended April 30, 2006(4) | |
| | | | | | | | | | | | Annualized | |
| | | | | | | | Annualized | | Since | |
| | | | One Year | | Five Year | | Inception(5) | |
| | | |
| |
| |
| |
| | FBR Small Cap Financial Fund(1)(2) | | | 17.09 | % | | | 18.90 | % | | | 17.19 | % | |
| | Russell 2000 Index(1)(3) | | | 33.47 | % | | | 10.90 | % | | | 9.72 | % | |
| | Lipper Financial Services Fund Index(1)(3) | | | 22.96 | % | | | 8.43 | % | | | 11.14 | % | |
PAST PERFORMANCE IS NO GUARANTEE OF FUTURE RESULTS.
The performance data quoted represents past performance and the current performance may be lower or higher than the performance data quoted. The investment return and principal will fluctuate so that investors’ shares, when redeemed, may be worth more or less than their original cost. To obtain performance data current to the most recent month-end,
please call 888.200.4710 or visit www.fbrfunds.com.
|
| (1) | | The graph assumes a hypothetical $10,000 initial investment in the Fund and reflects the reinvestment of dividends and all Fund expenses. Investors should note that the Fund is a professionally managed mutual fund while the indices are unmanaged, do not incur expenses and are not available for investment. The performance of the indices includes reinvested dividends, and does not reflect sales charges or expenses, except for the Lipper Financial Services Fund Index which reflects fund expenses. |
| (2) | | FBR Fund Advisers, Inc. waived a portion of its advisory fees and agreed to contractually reimburse a portion of the Fund’s operating expenses, as necessary, to maintain existing expense limitations, as set forth in the notes to the financial statements. Total returns shown include fee waivers and expense reimbursements, if any; total returns would have been lower had there been no waiver of fees and/or reimbursement of expenses in excess of expense limitations. |
| (3) | | Russell 2000 Index is comprised of the smallest of the 2000 companies of the Russell 3000 Index, representing approximately 8% of the Russell 3000’s total market-capitalization. The Lipper Financial Services Fund Index is an equally weighted index of the largest thirty funds within the financial services fund classification as defined by Lipper Inc. The index is rebalanced quarterly. Lipper Analytical Services, Inc., is a nationally recognized organization that reports on mutual fund total return performance and calculates fund rankings. Each Lipper Average is based on a universe of funds with similar investment objectives. |
| (4) | | The total returns shown do not reflect the deduction of taxes that a shareholder would pay on fund distributions or the redemption of fund shares. |
| (5) | | For the period January 3, 1997 (commencement of investment operations) through April 30, 2006. Certain purchases made by shareholders within this period would have been subject to an initial maximum sales charge of up to 5.50%. As a result, total returns for such shareholders would have been lower. |
28
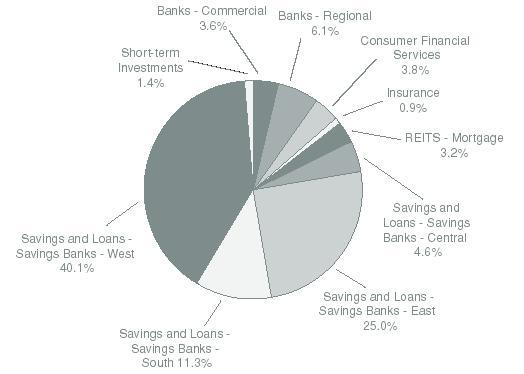
The FBR Funds
FBR Small Cap Financial Fund
Portfolio Summary
April 30, 2006
(unaudited)
The following chart provides a visual breakdown of the Fund by industry sectors. The underlying securities represent a percentage of the portfolio investments.
29
The FBR Funds
FBR Small Cap Financial Fund
Portfolio of Investments
April 30, 2006
(unaudited)
|
| | | | | | VALUE | |
| | SHARES | | | | (NOTE 2) | |
|
| | | | COMMON STOCKS — 98.9% | | | | |
| | | | Banks - Commercial — 3.6% | | | | |
| | 25,763 | | Beach First National Bancshares, Inc.* | | $ | 664,685 | |
| | 143,000 | | Provident Financial Services, Inc. | | | 2,609,750 | |
| | 269,157 | | Taylor Capital Group, Inc. | | | 10,497,123 | |
| | | | | |
| |
| | | | | | | 13,771,558 | |
| | | | | |
| |
| | | | Banks - Regional — 6.1% | | | | |
| | 692,895 | | Bank Mutual Corp. | | | 7,850,500 | |
| | 279,910 | | ITLA Capital Corp.† | | | 14,331,393 | |
| | 90,118 | | Partners Trust Financial Group, Inc. | | | 1,063,392 | |
| | | | | |
| |
| | | | | | | 23,245,285 | |
| | | | | |
| |
| | | | Consumer Financial Services — 3.8% | | | | |
| | 61,569 | | Advanta Corp., Class B | | | 2,349,473 | |
| | 135,000 | | AmeriCredit Corp.* | | | 4,087,800 | |
| | 217,800 | | ASTA Funding, Inc. | | | 7,912,674 | |
| | | | | |
| |
| | | | | | | 14,349,947 | |
| | | | | |
| |
| | | | Insurance - Life — 0.8% | | | | |
| | 60,000 | | StanCorp Financial Group, Inc. | | | 2,960,400 | |
| | | | | |
| |
| | | | Insurance - Property and Casualty — 0.1% | | | | |
| | 40,000 | | Affirmative Insurance Holdings, Inc. | | | 460,000 | |
| | | | | |
| |
| | | | REITs - Mortgage — 3.3% | | | | |
| | 65,000 | | Annaly Mortgage Management, Inc. | | | 875,550 | |
| | 230,000 | | Anworth Mortgage Asset Corp. | | | 1,856,100 | |
| | 155,600 | | Luminent Mortgage Capital, Inc. | | | 1,291,480 | |
| | 340,000 | | MFA Mortgage Investments, Inc. | | | 2,332,400 | |
| | 80,000 | | Opteum, Inc., Class A | | | 690,400 | |
| | 182,000 | | Thornburg Mortgage, Inc. | | | 5,261,620 | |
| | | | | |
| |
| | | | | | | 12,307,550 | |
| | | | | |
| |
| | | | Savings and Loans - Savings Banks - Central — 4.5% | | | | |
| | 100,200 | | Capitol Federal Financial | | | 3,376,740 | |
| | 120,000 | | Flagstar Bancorp, Inc. | | | 1,920,000 | |
| | 104,698 | | HMN Financial, Inc. | | | 3,483,302 | |
| | 184,679 | | MAF Bancorp, Inc. | | | 8,196,054l | |
| | | | | |
| |
| | | | | | | 16,976,096 | |
| | | | | |
| |
30
The FBR Funds
FBR Small Cap Financial Fund
Portfolio of Investments (continued)
April 30, 2006
(unaudited)
|
| | | | | | VALUE | |
| | SHARES | | | | (NOTE 2) | |
|
| | | | Savings and Loans - Savings Banks - East — 25.1% | | | | |
| | 195,837 | | Bancorp Rhode Island, Inc. | | $ | 6,854,295 | |
| | 566,497 | | Dime Community Bancshares, Inc. | | | 8,027,262 | |
| | 172,461 | | Flushing Financial Corp. | | | 2,919,765 | |
| | 35,740 | | Harleysville Savings Financial Corp. | | | 624,020 | |
| | 99,308 | | Hingham Institution for Savings | | | 3,904,791 | |
| | 2,343,156 | | Hudson City Bancorp, Inc. | | | 31,421,721 | |
| | 66,964 | | Independence Community Bank Corp. | | | 2,812,488 | |
| | 116,745 | | MASSBANK Corp. | | | 3,826,317 | |
| | 271,675 | | Parkvale Financial Corp. | | | 7,701,986 | |
| | 123,501 | | PennFed Financial Services, Inc. | | | 2,211,903 | |
| | 163,250 | | People’s Bank | | | 5,346,438 | |
| | 130,000 | | Sovereign Bancorp, Inc. | | | 2,882,100 | |
| | 89,987 | | TF Financial Corp. | | | 2,659,116 | |
| | 91,748 | | WSFS Financial Corp. | | | 5,773,702 | |
| | 223,418 | | Yardville National Bancorp | | | 8,076,561 | |
| | | | | |
| |
| | | | | | | 95,042,465 | |
| | | | | |
| |
| | | | Savings and Loans - Savings Banks - South — 11.4% | | | | |
| | 965,163 | | BankUnited Financial Corp., Class A | | | 29,620,852 | |
| | 636,393 | | Franklin Bank Corp.* | | | 12,352,388 | |
| | 43,886 | | Greenville First Bancshares, Inc.* | | | 976,464 | |
| | | | | |
| |
| | | | | | | 42,949,704 | |
| | | | | |
| |
| | | | Savings and Loans - Savings Banks - West — 40.2% | | | | |
| | 341,241 | | Banner Corp. | | | 12,755,589 | |
| | 67,000 | | Beverly Hills Bancorp, Inc. | | | 696,800 | |
| | 885,000 | | Commercial Capital Bancorp, Inc. | | | 13,867,950 | |
| | 363,900 | | Downey Financial Corp. | | | 26,120,742 | |
| | 515,000 | | FirstFed Financial Corp.* | | | 32,388,351 | |
| | 72,935 | | Harrington West Financial Group, Inc. | | | 1,198,322 | |
| | 259,668 | | Pacific Premier Bancorp, Inc.* | | | 3,025,132 | |
| | 385,600 | | PFF Bancorp, Inc. | | | 13,214,512 | |
| | 666,500 | | Sterling Financial Corp. | | | 21,427,975 | |
| | 1,144,734 | | Washington Federal, Inc. | | | 27,382,037 | |
| | | | | |
| |
| | | | | | | 152,077,410 | |
| | | | | |
| |
| | | | Total Common Stocks (Cost $266,444,440) | | | 374,140,415 | |
| | | | | |
| |
31
The FBR Funds
FBR Small Cap Financial Fund
Portfolio of Investments (continued)
April 30, 2006
(unaudited)
|
| | | | | | VALUE | |
| PAR | | | | (NOTE 2) | |
|
| | | | REPURCHASE AGREEMENTS — 1.4% | | | | |
| $ | 5,358,000 | | With Mizuho Securities, Inc. dated 4/28/06 at 4.62% to be repurchased at | | | | |
| | | | $5,360,063 on 5/1/06, collateralized by U.S. Treasury Bond, 7.25% due 5/15/06, | | | | |
| | | | value $2,858,950; U.S. Treasury Bond, 8.75% due 8/15/20, value $644,977; | | | | |
| | | | U.S. Treasury Note, 2.625% due 11/15/06, value $1,971,419 (Cost $5,358,000) | | $ | 5,358,000 | |
| | | | | |
| |
| | | | | | | | |
| | | | Total Investments — 100.3% | | | | |
| | | | (Cost $271,802,440) | | | 379,498,415 | |
| | | | | | | | |
| | | | Liabilities Less Other Assets — (0.3%) | | | (1,266,715 | ) |
| | | | | |
| |
| | | | | | | | |
| | | | Net Assets — 100.0% | | $ | 378,231,700 | |
| | | | | |
| |
|
| * | Non-income producing security |
| † | Affiliated issuer as defined in the Investment Company Act of 1940 (ownership of at least 5% of the outstanding voting securities of an issuer) |
The accompanying notes are an integral part of the financial statements.
32
| The FBR Funds |
|
| FBR Small Cap Technology Fund |
| Management Overview |
Portfolio Manager: Robert C. Barringer, CFA
How did the Fund perform?
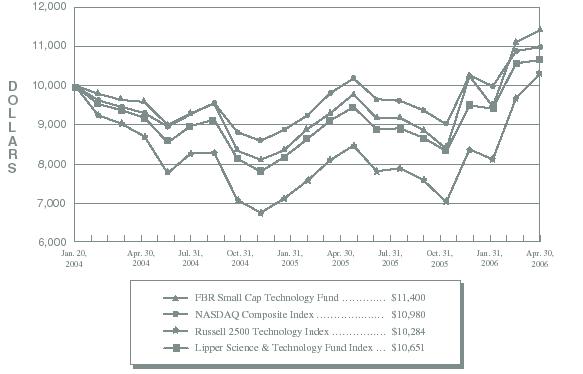
For the six-month period ended April 30, 2006, the FBR Small Cap Technology Fund appreciated 20.51%. The NASDAQ Composite Index, the Russell 2500 Technology Index and the Lipper Science and Technology Fund Index returned 10.02%, 26.85% and 13.22%, respectively, for the same period.
What factors contributed to the Fund’s performance?
As can be observed from the performance numbers above, smaller technology companies outperformed their larger peers during this period. The Fund was ahead of its general technology peers, although it lagged the smaller cap Russell 2500 Technology Index. The Fund tends to stay away from higher risk companies with inferior balance sheets and many companies with these characteristics outperformed during this period. Due to the more conservative approach we employ, the companies the Fund holds should do well in an up market, and should provide greater financial stability during a more difficult economic period.
During this period, the Fund was overweight in the semiconductor industry, which outperformed the technology group. I lowered the Fund’s exposure to the healthcare equipment and biotechnology industries, and increased the Fund’s exposure to the technology hardware industry, as I believed the risk/reward profile of the top companies in that sector was compelling. While the Fund did not invest in many of the higher risk profile companies that performed well, by making these adjustments to the portfolio, the Fund was able to take advantage of the favorable environment in the small-cap technology sector.
What is the outlook for the Fund and the technology sector?
I remain constructive on the long-term prospects of the technology sector and small-cap technology in particular. Generally, the small-cap technology group has been, and remains, less expensive, on a fundamental basis, relative to their more mature large-cap peers. Small-cap companies will always be more volatile as their stock prices and valuation metrics can rapidly change with market sentiment and business plan execution missteps.
My investment approach attempts to construct a diversified portfolio of smaller technology companies that have better than average balance sheets, are expanding their operating margins and, most importantly, can be acquired at a reasonable price. I feel that strict attention to valuation and the broad diversification across multiple sub-sectors mitigates some of the risks and volatility characteristics associated with investing in small-cap technology companies. Over time, I feel this strategy gives the Fund’s shareholders the opportunity to participate in the technological advances taking place today that will revolutionize tomorrow.
The opinions expressed in this commentary reflect those of the Portfolio Manager as of the date written. Any such opinions are subject to change based on market or other conditions. These opinions may not be relied upon as investment advice. Investment decisions for the FBR Funds are based on several factors, and may not be relied upon as an indication of trading intent on behalf of any FBR Fund. Security positions can and do change.33
| The FBR Funds |
|
| FBR Small Cap Technology Fund |
| |
| Comparison of Changes in Value of $10,000 Investment in |
| Fund Shares (1)(2) vs. Various Indices(1)(3) |
| (unaudited) |
| Total Returns—For the Periods Ended April 30, 2006(4) |
| | | One Year | | Since Inception(5) | |
| | |
| |
| |
| FBR Small Cap Technology Fund(1)(2) | | 36.04 | % | | 5.92 | % | |
| NASDAQ Composite Index(1)(3) | | 21.89 | % | | 4.19 | % | |
| Russell 2500 Technology Index(1)(3) | | 46.52 | % | | 1.24 | % | |
| Lipper Science & Technology Fund Index(1)(3) | | 28.04 | % | | 2.82 | % | |
PAST PERFORMANCE IS NO GUARANTEE OF FUTURE RESULTS.
The performance data quoted represents past performance and the current performance may be lower or higher than the performance data quoted. The investment return and principal will fluctuate so that investors’ shares, when redeemed, may be worth more or less than their original cost. To obtain performance data current to the most recent month-end,
please call 888.200.4710 or visit www.fbrfunds.com.
| (1) | | The graph assumes a hypothetical $10,000 initial investment in the Fund and reflects the reinvestment of dividends and all Fund expenses. Investors should note that the Fund is a professionally managed mutual fund while the indices are unmanaged, do not incur expenses and are not available for investment. The performance of the indices includes reinvested dividends, and does not reflect sales charges or expenses, except for the Lipper Science & Technology Fund Index which reflects fund expenses. |
| (2) | | FBR Fund Advisers, Inc. waived a portion of its advisory fees and agreed to contractually reimburse a portion of the Fund’s operating expenses, as necessary, to maintain existing expense limitations, as set forth in the notes to the financial statements. Total returns shown includes fee waivers and expense reim-bursements, if any; total returns would have been lower had there been no waiver of fees and/or reimbursement of expenses in excess of expense limitations. |
| (3) | | The NASDAQ Composite Index is a broad-based capitalization-weighted index of all NASDAQ National Market and Small Cap stocks. The Russell 2500 Technology Index is a capitalization-weighted index of companies that serve the electronics and computer industries or that manufacture products based on the latest applied science. The Lipper Science & Technology Fund Index is an equally weighted index of the largest thirty funds within the science and technology fund classification as defined by Lipper Inc. The index is rebalanced quarterly. Lipper Analytical Services, Inc., is a nationally recognized organization that reports on mutual fund total return performance and calculates fund rankings. Each Lipper Average is based on a universe of funds with similar investment objectives. |
| (4) | | The total returns shown do not reflect the deduction of taxes that a shareholder would pay on fund distributions or the redemption of fund shares. |
| (5) | | For the period January 20, 2004 (commencement of investment operations) through April 30, 2006. |
34
| The FBR Funds |
|
| FBR Small Cap Technology Fund |
| Portfolio Summary |
| April 30, 2006 |
| (unaudited) |
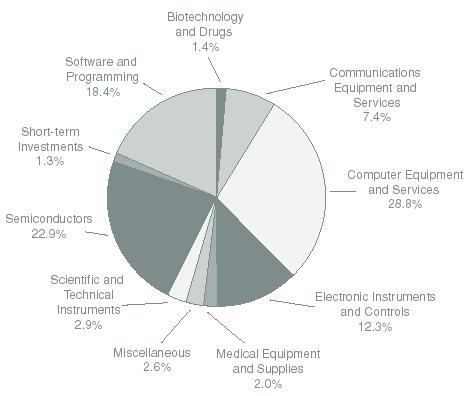
The following chart provides a visual breakdown of the Fund by industry sectors. The underlying securities represent a percentage of the portfolio investments.
35
| The FBR Funds |
|
| FBR Small Cap Technology Fund |
| Portfolio of Investments |
| April 30, 2006 |
| (unaudited) |
|
| SHARES | | | | VALUE
(NOTE 2) |
|
| | | COMMON STOCKS — 98.7% | | | |
| | | Biotechnology and Drugs — 1.4% | | | |
| 500 | | Biosite, Inc.* | | $ | 28,200 |
| 900 | | Par Pharmaceutical Companies, Inc.* | | | 23,175 |
| | | | |
|
| | | | | | 51,375 |
| | | | |
|
| | | Business Services — 0.7% | | | |
| 700 | | MAXIMUS, Inc. | | | 24,388 |
| | | | |
|
| | | Capital Goods - Miscellaneous — 0.8% | | | |
| 300 | | Fargo Electronics, Inc.* | | | 5,544 |
| 925 | | Intermec, Inc.* | | | 24,503 |
| | | | |
|
| | | | | | 30,047 |
| | | | |
|
| | | Chemical Manufacturing — 1.1% | | | |
| 1,200 | | Cabot Microelectronics Corp.* | | | 39,252 |
| | | | |
|
| | | Communications Equipment — 7.0% | | | |
| 3,600 | | Andrew Corp.* | | | 38,088 |
| 1,550 | | Arris Group, Inc.* | | | 18,368 |
| 7,200 | | Extreme Networks, Inc.* | | | 32,688 |
| 6,175 | | Foundry Networks, Inc.* | | | 87,746 |
| 5,650 | | McDATA Corp., Class A* | | | 27,290 |
| 1,100 | | NETGEAR, Inc.* | | | 24,695 |
| 900 | | Novatel Wireless, Inc.* | | | 9,054 |
| 975 | | Tekelec* | | | 13,923 |
| | | | |
|
| | | | | | 251,852 |
| | | | |
|
| | | Communications Services — 0.4% | | | |
| 2,750 | | @Road, Inc.* | | | 15,455 |
| | | | |
|
| | | Computer Hardware and Services — 8.4% | | | |
| 6,100 | | Ingram Micro, Inc., Class A* | | | 112,179 |
| 2,300 | | MIPS Technologies, Inc.* | | | 17,043 |
| 1,500 | | Packeteer, Inc.* | | | 19,590 |
| 2,250 | | Palm, Inc.* | | | 50,850 |
| 3,500 | | Perot Systems Corp., Class A* | | | 52,780 |
| 1,400 | | Tech Data Corp.* | | | 51,408 |
| | | | |
|
| | | | | | 303,850 |
| | | | |
|
36
| The FBR Funds |
|
| FBR Small Cap Technology Fund |
| Portfolio of Investments (continued) |
| April 30, 2006 |
| (unaudited) |
|
| SHARES | | | | VALUE
(NOTE 2) |
|
| | | Computer Networks — 6.8% | | | |
| 8,700 | | 3Com Corp.* | | $ | 46,893 |
| 3,175 | | Convergys Corp.* | | | 61,817 |
| 1,550 | | F5 Networks, Inc.* | | | 90,768 |
| 650 | | Intergraph Corp.* | | | 28,613 |
| 1,125 | | Sykes Enterprises, Inc.* | | | 18,214 |
| | | | |
|
| | | | | | 246,305 |
| | | | |
|
| | | Computer Peripherals — 3.2% | | | |
| 1,000 | | Avid Technology, Inc.* | | | 38,550 |
| 650 | | ScanSource, Inc.* | | | 40,690 |
| 3,550 | | Symbol Technologies, Inc. | | | 37,808 |
| | | | |
|
| | | | | | 117,048 |
| | | | |
|
| | | Computer Storage Devices — 10.2% | | | |
| 1,600 | | Advanced Digital Information Corp.* | | | 13,584 |
| 9,900 | | Brocade Communications Systems, Inc.* | | | 60,984 |
| 3,775 | | Emulex Corp.* | | | 68,516 |
| 1,000 | | Hutchinson Technology, Inc.* | | | 23,770 |
| 1,150 | | Imation Corp. | | | 48,300 |
| 850 | | Komag, Inc.* | | | 35,734 |
| 800 | | M-Systems Flash Disk Pioneers Ltd.* | | | 27,576 |
| 4,250 | | Western Digital Corp.* | | | 89,420 |
| | | | |
|
| | | | | | 367,884 |
| | | | |
|
| | | Electronic Instruments and Controls — 12.3% | | | |
| 800 | | Agilysys, Inc. | | | 11,584 |
| 2,675 | | American Power Conversion Corp. | | | 59,492 |
| 2,950 | | Arrow Electronics, Inc.* | | | 106,790 |
| 1,463 | | Benchmark Electronics, Inc.* | | | 39,926 |
| 1,800 | | Kopin Corp.* | | | 10,008 |
| 700 | | Park Electrochemical Corp. | | | 21,679 |
| 12,200 | | Sanmina - SCI Corp.* | | | 63,318 |
| 10,550 | | Solectron Corp.* | | | 42,200 |
| 1,300 | | SYNNEX Corp.* | | | 24,635 |
| 4,050 | | Vishay Intertechnology, Inc.* | | | 63,059 |
| | | | |
|
| | | | | | 442,691 |
| | | | |
|
| | | Medical Equipment and Supplies — 2.0% | | | |
| 800 | | Haemonetics Corp.* | | | 43,600 |
| 800 | | Merit Medical Systems, Inc.* | | | 9,352 |
37
| The FBR Funds |
|
| FBR Small Cap Technology Fund |
| Portfolio of Investments (continued) |
| April 30, 2006 |
| (unaudited) |
|
| SHARES | | | | | VALUE
(NOTE 2) |
|
| | | Medical Equipment and Supplies — 2.0% (continued) | | | |
| 850 | | Wright Medical Group, Inc.* | | $ | 19,950 |
| | | | |
|
| | | | | | 72,902 |
| | | | |
|
| | | Scientific and Technical Instruments — 2.9% | | | |
| 650 | | Analogic Corp | | | 41,009 |
| 1,000 | | Coherent, Inc.* | | | 37,010 |
| 500 | | OSI Systems, Inc.* | | | 9,530 |
| 400 | | Varian, Inc.* | | | 17,308 |
| | | | |
|
| | | | | | 104,857 |
| | | | |
|
| | | Semiconductors — 23.0% | | | |
| 698 | | Actel Corp.* | | | 11,217 |
| 14,275 | | Atmel Corp.* | | | 74,800 |
| 1,100 | | ATMI, Inc.* | | | 31,240 |
| 3,000 | | Axcelis Technologies, Inc.* | | | 17,670 |
| 2,050 | | Cirrus Logic, Inc.* | | | 19,373 |
| 600 | | Cymer, Inc.* | | | 31,014 |
| 4,005 | | Entegris, Inc.* | | | 40,771 |
| 1,100 | | Exar Corp.* | | | 15,939 |
| 1,200 | | Genesis Microchip, Inc.* | | | 18,864 |
| 2,125 | | International Rectifier Corp.* | | | 96,049 |
| 700 | | MEMC Electronic Materials, Inc.* | | | 28,420 |
| 1,775 | | MKS Instruments, Inc.* | | | 42,369 |
| 2,025 | | Novellus Systems, Inc.* | | | 50,018 |
| 1,325 | | OmniVision Technologies, Inc.* | | | 38,531 |
| 1,150 | | Photronics, Inc.* | | | 20,666 |
| 1,000 | | Semtech Corp.* | | | 18,750 |
| 2,600 | | Silicon Storage Technology, Inc.* | | | 11,882 |
| 2,875 | | Spansion, Inc., Class A* | | | 49,220 |
| 1,200 | | Standard Microsystems Corp.* | | | 27,960 |
| 5,925 | | Teradyne, Inc.* | | | 99,895 |
| 4,500 | | TriQuint Semiconductor, Inc.* | | | 24,435 |
| 1,700 | | Varian Semiconductor Equipment Associates, Inc.* | | | 55,675 |
| | | | |
|
| | | | | | 824,758 |
| | | | |
|
| | | Software and Programming — 18.5% | | | |
| 750 | | Altiris, Inc.* | | | 16,050 |
| 1,200 | | BEA Systems, Inc.* | | | 15,900 |
| 12,300 | | Compuware Corp.* | | | 94,464 |
38
| The FBR Funds |
|
| FBR Small Cap Technology Fund |
| Portfolio of Investments (continued) |
| April 30, 2006 |
| (unaudited) |
|
| SHARES | | | | VALUE
(NOTE 2) |
|
| | | Software and Programming — 18.5% (continued) | | | |
| 975 | | Covansys Corp.* | | $ | 16,965 |
| 1,825 | | FileNet Corp.* | | | 50,772 |
| 800 | | GSI Commerce, Inc.* | | | 13,992 |
| 1,700 | | Hyperion Solutions Corp.* | | | 52,054 |
| 900 | | InfoSpace, Inc.* | | | 22,977 |
| 1,400 | | Internet Security Systems, Inc.* | | | 31,416 |
| 1,200 | | JDA Software Group, Inc.* | | | 16,392 |
| 3,100 | | Lawson Software, Inc.* | | | 23,808 |
| 800 | | MRO Software, Inc.* | | | 15,216 |
| 13,300 | | Novell, Inc.* | | | 109,325 |
| 1,200 | | Progress Software Corp.* | | | 33,108 |
| 5,000 | | RealNetworks, Inc.* | | | 50,100 |
| 7,850 | | TIBCO Software, Inc.* | | | 67,667 |
| 1,000 | | Vignette Corp.* | | | 15,850 |
| 1,800 | | webMethods, Inc.* | | | 17,226 |
| | | | |
|
| | | | | | 663,282 |
| | | | |
|
| | | Total Common Stocks (Cost $3,370,953) | | | 3,555,946 |
| | | | |
|
| | | | | | |
PAR
| | | | | |
| | | REPURCHASE AGREEMENTS — 1.3% | | | |
| $46,000 | | With Mizuho Securities, Inc. dated 4/28/06 at 4.62% to be repurchased at $46,018
on 5/1/06, collateralized by U.S. Treasury Bond, 7.25% due 5/15/06, value
$24,545; U.S. Treasury Bond, 8.75% due 8/15/20, value $5,537;
U.S. Treasury Note, 2.625% due 11/15/06, value $16,925 (Cost $46,000) | | | 46,000 |
| | | | |
|
| | | | | | |
| | | Total Investments — 100.0% (Cost $3,416,953) | | | 3,601,946 |
| | | | | | |
| | | Liabilities Less Other Assets — N.M. | | | (396 | ) |
| | | | |
|
| | | | | | |
| | | Net Assets — 100.0% | | $ | 3,601,550 | |
| | | | |
|
| * | | Non-income producing security |
| N.M. | | Not Meaningful |
| | | |
| The accompanying notes are an integral part of the financial statements. |
39
The FBR Funds
FBR Gas Utility Index Fund
Management Overview
Portfolio Manager: Winsor Aylesworth
How did the Fund perform?
For the six-month period ended April 30, 2006, the FBR Gas Utility Index Fund appreciated 5.27%. This compares to the S&P5 00 Composite Index, the Lipper Utility Fund Index and the American Gas Association Stock Index (“AGA Stock Index”), which returned 9.64%, 7.20% and 5.72%, respectively, for the same period.
What factors contributed to the Fund’s performance?
The Fund tracked its benchmark index (the AGA Stock Index), but underperformed against the broader universe of utility funds represented by the Lipper Utility Index. This relative underperformance revolves around the definition of “utilities” as an investment category. This should remind investors of that famous quote “It all depends on what the definition of ‘is’ ... is”. In the broadest sense, the utility sector includes such categories as electric and gas utilities, which comprise 100% of the Fund, as well as water utilities, telephone utilities, and other telecommunication companies. For this six-month period, water and telecommunication companies outperformed the more traditional electric and gas utility companies, which led to the Fund’s underperformance versus this broader utility definition. We would expect that the phenomena of one sub-sector outperforming another will even out and that the Fund will compare more favorably against the broader defined benchmarks over time.
The economy and weather continue to be the largest external factors that influence the Fund’s returns. Over the last six months, the economy has generally been favorable with slow and steady growth. However, rising interest rates and historically high energy prices were a negative. The weather on the other hand was not favorable in many parts of the country. The warmer than normal winter temperatures, particularly in the northeast, depressed the overall commercial and residential demand for natural gas, which placed additional pressure on revenues.
What is the outlook for the Fund and the utility sector?
As I write this shareholder letter, the 2006 hurricane season looms on the horizon. We all hope and pray no one has to experience the likes of a ’Katrina’ or ’Rita’ this year. Obviously if we do, utilities directly impacted by such catastrophic events could be severely affected. As I mentioned in the annual report, weather always tends to revert to the norm or long-term averages. So even if we do have another year of unusual weather patterns and events, we remain steadfast in the belief that they would be more the exception than the norm.
If we were to foresee an end of rising interest rates, this should be a positive for the utility sector and the Fund. I suspect high or volatile energy costs will be with us for the foreseeable future. It is the volatility aspect of energy costs that creates the most problems
40
The FBR Funds
FBR Gas Utility Index Fund
Management Overview (continued)
as it makes planning business and operational decisions more difficult. How the U.S. economy as a whole handles these volatility issues will impact the Fund’s performance. We should all have faith that our economy is well diversified and will continue to grow over time, albeit at different rates. The companies owned by the Fund are all involved in the delivery of the energy that continues to fuel our growing economy. The FBR Gas Utility Index Fund continues to provide long-term investors with a solid alternative to traditional defensive investments (such as bonds) by providing the clear opportunity for capital appreciation and a healthy dividend component along the way.
The opinions expressed in this commentary reflect those of the Portfolio Manager as of the date written. Any such opinions are subject to change based on market or other conditions. These opinions may not be relied upon as investment advice. Investment decisions for the FBR Funds are based on several factors, and may not be relied upon as an indication of trading intent on behalf of any FBR Fund. Security positions can and do change.
41
The FBR Funds
FBR Gas Utility Index Fund
Comparison of Changes in Value of $10,000 Investment in
Fund Shares(1)(2) vs. Various Indices (1)(3)
(unaudited)

| Total Returns—For the Periods Ended April 30, 2006(4)(5) |
| | | | | | | | Annualized | | Annualized | |
| | | | One Year | | Five Year | | Ten Year | |
| | | |
| |
| |
| |
| | FBR Gas Utility Index Fund(1)(2) | | | 14.22 | % | | | 3.21 | % | | | 10.07 | % | |
| | S&P 500 Composite Index(1)(3) | | | 15.41 | % | | | 2.70 | % | | | 8.94 | % | |
| | A.G.A. Stock Index(1)(3) | | | 14.24 | % | | | 3.98 | % | | | 10.94 | % | |
| | Lipper Utility Fund Index(1)(3) | | | 17.11 | % | | | 2.41 | % | | | 8.45 | % | |
PAST PERFORMANCE IS NO GUARANTEE OF FUTURE RESULTS.
The performance data quoted represents past performance and the current performance may be lower or higher than the performance data quoted. The investment return and principal will fluctuate so that investors’ shares, when redeemed, may be worth more or less than their original cost. To obtain performance data current to the most recent month-end,
please call 888.200.4710 or visit www.fbrfunds.com.
| (1) | | The graph assumes a hypothetical $10,000 initial investment in the Fund and reflects the reinvestment of dividends and all Fund expenses. The indices are unmanaged, do not incur expenses and are not available for investment. The performance of the indices includes reinvested dividends, and does not reflect sales charges or expenses. |
| (2) | | FBR Fund Advisers, Inc. waived a portion of its advisory fees and agreed to contractually reimburse a portion of the Fund’s operating expenses, as necessary, to maintain existing expense limitations, as set forth in the notes to the financial statements. Total returns shown include fee waivers and expense reimbursements, if any; total returns would have been lower had there been no waiver of fees and/or reimbursement of expenses in excess of expense limitations. |
| (3) | | S&P 500 Composite Index is a capitalization-weighted index of 500 stocks. The index is designed to represent the broad domestic economy through changes in aggregate market value of 500 stocks representing all major industries. The A.G.A. Stock Index is a market capitalization weighted index, adjusted monthly, consisting of member companies of the American Gas Association. The Lipper Utility Fund Index is an equally weighted index of the largest ten funds within the utility fund classification as defined by the Lipper Inc. The index is rebalanced quarterly. Lipper Analytical Services, Inc., is a nationally recognized organization that reports on mutual fund total return performance and calculates fund rankings. Each Lipper Average is based on a universe of funds with similar objectives. |
| (4) | | The total returns shown do not reflect the deduction of taxes that a shareholder would pay on fund distributions or the redemption of fund shares. |
| (5) | | Effective April 1, 2003, the Fund changed its fiscal year-end from March 31 to October 31. |
42
The FBR Funds
FBR Gas Utility Index Fund
Portfolio Summary
April 30, 2006
(unaudited)
The following chart provides a visual breakdown of the Fund by industry sectors. The underlying securities represent a percentage of the portfolio investments.
43
The FBR Funds
FBR Gas Utility Index Fund
Portfolio of Investments
April 30, 2006
(unaudited)
|
| | | | | | | VALUE | | PERCENT OF | |
| | SHARES | | | | | (NOTE 2) | | NET ASSETS | |
|
| | | | COMMON STOCKS — 91.3% | | | | | | | |
| | 225,726 | | National Grid PLC ADR | | $ | 11,852,871 | | 4.6 | % | |
| | 393,210 | | Enbridge, Inc. | | | 11,729,454 | | 4.5 | | |
| | 401,387 | | Duke Energy Corp. | | | 11,688,389 | | 4.5 | | |
| | 392,800 | | TransCanada Corp. | | | 11,611,168 | | 4.5 | | |
| | 285,740 | | E.ON AG ADR | | | 11,598,187 | | 4.5 | | |
| | 283,800 | | KeySpan Corp. | | | 11,459,844 | | 4.4 | | |
| | 807,800 | | El Paso Corp. | | | 10,428,698 | | 4.0 | | |
| | 460,400 | | The Williams Companies, Inc. | | | 10,096,572 | | 3.9 | | |
| | 128,300 | | Dominion Resources, Inc. | | | 9,605,821 | | 3.7 | | |
| | 231,525 | | PG&E Corp. | | | 9,223,956 | | 3.6 | | |
| | 98,425 | | Questar Corp. | | | 7,878,921 | | 3.0 | | |
| | 361,950 | | NiSource, Inc. | | | 7,640,765 | | 2.9 | | |
| | 115,700 | | Public Service Enterprise Group, Inc. | | | 7,254,390 | | 2.8 | | |
| | 260,257 | | Southern Union Co. | | | 6,745,861 | | 2.6 | | |
| | 149,450 | | AGL Resources, Inc. | | | 5,287,541 | | 2.0 | | |
| | 195,050 | | Atmos Energy Corp. | | | 5,176,627 | | 2.0 | | |
| | 140,200 | | ONEOK, Inc. | | | 4,628,002 | | 1.8 | | |
| | 80,225 | | Exelon Corp. | | | 4,332,150 | | 1.7 | | |
| | 175,100 | | Piedmont Natural Gas Company, Inc. | | | 4,295,203 | | 1.7 | | |
| | 115,450 | | Equitable Resources, Inc. | | | 4,099,630 | | 1.6 | | |
| | 101,750 | | Nicor, Inc. | | | 4,030,318 | | 1.6 | | |
| | 92,175 | | Consolidated Edison, Inc. | | | 3,974,586 | | 1.5 | | |
| | 118,500 | | National Fuel Gas Co. | | | 3,940,125 | | 1.5 | | |
| | 112,900 | | WGL Holdings, Inc. | | | 3,321,518 | | 1.3 | | |
| | 268,700 | | CenterPoint Energy, Inc. | | | 3,229,774 | | 1.2 | | |
| | 132,650 | | Energy East Corp. | | | 3,204,824 | | 1.2 | | |
| | 115,405 | | Vectren Corp. | | | 3,083,622 | | 1.2 | | |
| | 79,075 | | Peoples Energy Corp. | | | 2,872,795 | | 1.1 | | |
| | 68,225 | | DTE Energy Co. | | | 2,782,216 | | 1.1 | | |
| | 96,750 | | Southwest Gas Corp. | | | 2,681,910 | | 1.0 | | |
| | 69,300 | | Northwest Natural Gas Co. | | | 2,393,622 | | 0.9 | | |
| | 67,625 | | Energen Corp. | | | 2,385,134 | | 0.9 | | |
| | 64,650 | | Southwestern Energy Co.* | | | 2,328,693 | | 0.9 | | |
| | 50,600 | | New Jersey Resources Corp. | | | 2,240,062 | | 0.9 | | |
| | 53,900 | | MDU Resources Group, Inc. | | | 1,980,825 | | 0.8 | | |
| | 104,350 | | Xcel Energy, Inc. | | | 1,965,954 | | 0.8 | | |
| | 46,325 | | Wisconsin Energy Corp. | | | 1,808,991 | | 0.7 | | |
| | 82,600 | | Puget Energy, Inc. | | | 1,715,602 | | 0.7 | | |
44
The FBR Funds
FBR Gas Utility Index Fund
Portfolio of Investments (continued)
April 30, 2006
(unaudited)
|
| | | | | | | VALUE | | PERCENT OF | |
| | SHARES | | | | | (NOTE 2) | | NET ASSETS | |
|
| | | | COMMON STOCKS — 91.3% (continued) | | | | | | | | |
| | 48,650 | | The Laclede Group, Inc. | | $ | 1,658,965 | | | 0.6 | % | |
| | 32,925 | | Ameren Corp. | | | 1,658,432 | | | 0.6 | | |
| | 60,410 | | South Jersey Industries, Inc. | | | 1,605,698 | | | 0.6 | | |
| | 28,750 | | Constellation Energy Group, Inc. | | | 1,578,950 | | | 0.6 | | |
| | 106,650 | | CMS Energy Corp.* | | | 1,420,578 | | | 0.5 | | |
| | 250,550 | | Aquila, Inc.* | | | 1,084,882 | | | 0.4 | | |
| | 45,625 | | UGI Corp. | | | 1,022,000 | | | 0.4 | | |
| | 27,416 | | NorthWestern Corp. | | | 963,124 | | | 0.4 | | |
| | 27,675 | | Alliant Energy Corp. | | | 884,493 | | | 0.3 | | |
| | 36,250 | | Northeast Utilities | | | 730,438 | | | 0.3 | | |
| | 25,500 | | NSTAR | | | 705,075 | | | 0.3 | | |
| | 12,480 | | WPS Resources Corp. | | | 623,875 | | | 0.2 | | |
| | 38,975 | | TECO Energy, Inc. | | | 622,821 | | | 0.2 | | |
| | 18,489 | | EnergySouth, Inc. | | | 596,270 | | | 0.2 | | |
| | 19,650 | | PPL Corp. | | | 570,636 | | | 0.2 | | |
| | 27,700 | | Cascade Natural Gas Corp. | | | 567,019 | | | 0.2 | | |
| | 17,875 | | PNM Resources, Inc. | | | 452,416 | | | 0.2 | | |
| | 21,475 | | Avista Corp. | | | 451,190 | | | 0.2 | | |
| | 82,325 | | SEMCO Energy, Inc.* | | | 444,555 | | | 0.2 | | |
| | 9,700 | | Cheniere Energy, Inc.* | | | 415,645 | | | 0.2 | | |
| | 8,450 | | CH Energy Group, Inc. | | | 399,516 | | | 0.2 | | |
| | 11,028 | | MGE Energy, Inc. | | | 351,793 | | | 0.1 | | |
| | 11,765 | | Chesapeake Utilities Corp. | | | 350,362 | | | 0.1 | | |
| | 14,716 | | Pepco Holdings, Inc. | | | 339,645 | | | 0.1 | | |
| | 4,300 | | Entergy Corp. | | | 300,742 | | | 0.1 | | |
| | 8,291 | | Delta Natural Gas Company, Inc. | | | 212,913 | | | 0.1 | | |
| | 14,825 | | Sierra Pacific Resources* | | | 209,329 | | | 0.1 | | |
| | 5,805 | | UniSource Energy Corp. | | | 175,601 | | | 0.1 | | |
| | 4,221 | | RGC Resources, Inc. | | | 108,184 | | | N.M. | | |
| | 1,875 | | Black Hills Corp. | | | 68,250 | | | N.M. | | |
| | 5,591 | | Energy West, Inc. | | | 55,630 | | | N.M. | | |
| | 1,000 | | ALLETE, Inc. | | | 46,770 | | | N.M. | | |
| | | | | |
| | |
| | |
| | | | Total Common Stocks (Cost $123,410,877) | | | 237,250,418 | | | 91.3 | | |
| | | | | |
| | |
| | |
45
The FBR Funds
FBR Gas Utility Index Fund
Portfolio of Investments (continued)
April 30, 2006
(unaudited)
|
| | | | | | | VALUE | | PERCENT OF | |
| | PAR | | | | | (NOTE 2) | | NET ASSETS | |
|
| | | | REPURCHASE AGREEMENTS — 8.2% | | | | | | | | |
| $ | 21,178,000 | | With Mizuho Securities, Inc. dated 4/28/06 at 4.62% to be | | | | | | | | |
| | | | repurchased at $21,186,154 on 5/1/06, collateralized by | | | | | | | | |
| | | | U.S. Treasury Bond, 7.25% due 5/15/06, value | | | | | | | | |
| | | | $11,300,269; U.S. Treasury Bond, 8.75% due 8/15/20, | | | | | | | | |
| | | | value $2,549,334; U.S. Treasury Note, 2.625% due | | | | | | | | |
| | | | 11/15/06, value $7,792,218 (Cost $21,178,000) | | $ | 21,178,000 | | | 8.2 | % | |
| | | | | |
| | |
| | |
| | | | | | | | | | | | |
| | | | Total Investments | | | | | | | | |
| | | | (Cost $144,588,877) | | | 258,428,418 | | | 99.5 | | |
| | | | | | | | | | | | |
| | | | Other Assets Less Liabilities | | | 1,339,312 | | | 0.5 | | |
| | | | | |
| | |
| | |
| | | | | | | | | | | | |
| | | | Net Assets | | $ | 259,767,730 | | | 100.0 | % | |
| | | | | |
| | |
| | |
|
| * | Non-income producing security |
| ADR | American Depositary Receipts |
| N.M. | Not Meaningful |
The accompanying notes are an integral part of the financial statements.
46
The FBR Funds
FBR Fund for Government Investors
Management Overview
Portfolio Manager: William B. Sanders, III
How did the Fund perform?
For the six month period ended April 30, 2006, the FBR Fund for Government Investors (“FGI”) appreciated 1.69%.
What factors contributed to the Fund’s performance?
The Federal Open Market Committee (the “Fed”) continued its tightening campaign and raised its target for the fed funds rate each of the four meetings held during the reporting period to 4.75%. From a historical perspective, we have not seen a fed funds rate near this level since the second quarter of 2001. Over the course of the reporting period, the Fund maintained its seasoned strategy of buying the highest quality short-term U.S. Government and Agency debt. As a direct result, FGI’s total return improved as its maturing assets were reinvested in those same high quality securities, but at higher rates.
What is the outlook for the Fund?
The Fed will continue to be vigilant in its fight to contain inflation. As key economic indicators are reported and interpreted by the Bernanke Fed, the future of telegraphed monetary tightening is uncertain. As a result, the capital markets and Fed watchers alike will be searching for the slightest indication that the Fed is indeed at the tail-end of the rate hike cycle. The Fed now has some “dry powder” in its monetary arsenal should the economy decelerate to the point it would require stimulus. As all this plays out, the Fund will continue to invest in the highest quality assets at the short end of the yield curve in an effort to preserve capital and provide liquidity. The performance of the Fund will remain linked to the movements of the Federal Funds target rate and consistent with our conservative investment style.
The opinions expressed in this commentary reflect those of the Portfolio Manager as of the date written. Any such opinions are subject to change based on market or other conditions. These opinions may not be relied upon as investment advice. Investment decisions for the FBR Funds are based on several factors, and may not be relied upon as an indication of trading intent on behalf of any FBR Fund. Security positions can and do change.
47
The FBR Funds
FBR Fund for Government Investors
Portfolio Summary
April 30, 2006
(unaudited)
The following chart provides a visual breakdown of the Fund by maturity schedule1. The underlying securities represent a percentage of the portfolio investments.
| 1 | The maturity date used for each security in the portfolio to determine the schedule is the shorter of the next interest rate reset date or the final maturity date. |
48
The FBR Funds
FBR Fund for Government Investors
Portfolio of Investments
April 30, 2006
(unaudited)
|
| | | | | | | | | MATURITY | | VALUE | |
| | PAR | | | | RATE | | DATE | | (NOTE 2) | |
|
| | | | U.S. GOVERNMENT AND AGENCY OBLIGATIONS — 90.7% | | | | | | | | | | | |
| | | | Federal National Mortgage Association — 18.3% | | | | | | | | | | | |
| $ | 10,000,000 | | Fannie Mae | | 2.25 | % | | | 5/26/06 | | | $ | 9,983,054 | |
| | 7,323,000 | | Fannie Mae | | 3.15 | | | | 6/30/06 | | | | 7,306,177 | |
| | 7,009,000 | | Fannie Mae | | 3.125 | | | | 7/15/06 | | | | 6,981,500 | |
| | 10,000,000 | | Fannie Mae Discount Note* | | 4.73 | | | | 6/21/06 | | | | 9,932,992 | |
| | 8,000,000 | | Fannie Mae Discount Note* | | 4.78 | | | | 7/5/06 | | | | 7,930,956 | |
| | | | | | | | | | | | |
| |
| | | | | | | | | | | | | | 42,134,679 | |
| | | | | | | | | | | | |
| |
| | | | Federal Agricultural Mortage Corporation — 3.0% | | | | | | | | | | | |
| | 7,000,000 | | Farmer Mac Discount Note* | | 4.53 | | | | 5/16/06 | | | | 6,986,787 | |
| | | | | | | | | | | | |
| |
| | | | Federal Home Loan Bank — 50.4% | | | | | | | | | | | |
| | 9,740,000 | | FHLB | | 3.625 | | | | 5/4/06 | | | | 9,739,372 | |
| | 4,360,000 | | FHLB | | 2.46 | | | | 5/10/06 | | | | 4,357,878 | |
| | 5,570,000 | | FHLB | | 1.875 | | | | 6/15/06 | | | | 5,554,157 | |
| | 10,000,000 | | FHLB | | 4.5 | | | | 6/16/06 | | | | 10,000,000 | |
| | 10,000,000 | | FHLB Discount Note* | | 4.55 | | | | 5/24/06 | | | | 9,970,931 | |
| | 18,000,000 | | FHLB Discount Note* | | 4.59 - 4.65 | | | | 5/31/06 | | | | 17,930,550 | |
| | 7,000,000 | | FHLB Discount Note* | | 4.71 | | | | 6/21/06 | | | | 6,953,293 | |
| | 8,000,000 | | FHLB Discount Note* | | 4.71 | | | | 6/23/06 | | | | 7,944,527 | |
| | 15,000,000 | | FHLB Discount Note* | | 4.845 | | | | 7/19/06 | | | | 14,840,519 | |
| | 10,000,000 | | FHLB Step Note^ | | 4.3 | | | | 5/9/06 | | | | 9,999,955 | |
| | 13,150,000 | | FHLB Step Note^ | | 4.3 | | | | 5/24/06 | | | | 13,150,000 | |
| | 6,000,000 | | FHLB Step Note^ | | 4.45 | | | | 7/13/06 | | | | 6,000,000 | |
| | | | | | | | | | | | |
| |
| | | | | | | | | | | | | | 116,441,182 | |
| | | | | | | | | | | | |
| |
| | | | Federal Home Loan Mortgage Corporation — 19.0% | | | | | | | | | | | |
| | 5,000,000 | | Freddie Mac | | 2.375 | | | | 5/19/06 | | | | 4,994,234 | |
| | 2,000,000 | | Freddie Mac | | 3.0 | | | | 5/26/06 | | | | 1,998,015 | |
| | 20,000,000 | | Freddie Mac Discount Note* | | 4.545 | | | | 5/22/06 | | | | 19,946,975 | |
| | 6,000,000 | | Freddie Mac Discount Note* | | 4.65 | | | | 6/6/06 | | | | 5,972,100 | |
| | 5,000,000 | | Freddie Mac Discount Note* | | 4.73 | | | | 6/7/06 | | | | 4,975,693 | |
| | 6,000,000 | | Freddie Mac Discount Note* | | 4.67 | | | | 6/20/06 | | | | 5,961,083 | |
| | | | | | | | | | | | |
| |
| | | | | | | | | | | | | | 43,848,100 | |
| | | | | | | | | | | | |
| |
| | | | Total Investments — 90.7% (Amortized Cost $209,410,748)† | | | | | | | | | | 209,410,748 | |
| | | | Other Assets Less Liabilities — 9.3% | | | | | | | | | | 21,555,707 | |
| | | | | | | | | | | | |
| |
| | | | Net Assets — 100.0% | | | | | | | | | $ | 230,966,455 | |
| | | | | | | | | | | | |
| |
| * | Interest rates for the discount notes represent the yield to maturity at the date of purchase. |
| ^ | A Step Note is a security with a predetermined schedule of interest or dividend rate changes. The maturity date shown is the next reset date or maturity date, whichever is shorter. |
| † | Same cost is used for federal income tax purposes. |
Weighted Average Maturity of Portfolio: 39 Days
The accompanying notes are an integral part of the financial statements.
49
The FBR Funds
Statements of Assets and Liabilities
April 30, 2006
(unaudited)
| | | | | | | | | FBR | | FBR |
| | | FBR | | Large Cap | | Large Cap |
| | | Pegasus FundTM | | Financial Fund | | Technology Fund |
| | |
| |
| |
|
| ASSETS | | | | | | | | | | | | | | | | | |
Investment Securities | | | | | | | | | | | | | | | | | |
Securities at Cost: | | | | | | | | | | | | | | | | | |
Unaffiliated Issuers | | | $ | 4,775,506 | | | | | $ | 23,228,441 | | | | | $ | 22,232,728 | |
Repurchase Agreements | | | | 325,000 | | | | | | 1,058,000 | | | | | | 706,000 | |
| | | |
| | | | |
| | | | |
| |
Total securities | | | $ | 5,100,506 | | | | | $ | 24,286,441 | | | | | $ | 22,938,728 | |
| | | |
| | | | |
| | | | |
| |
Securities at Value (Note 2): | | | | | | | | | | | | | | | | | |
Unaffiliated Issuers | | | $ | 5,083,917 | | | | | $ | 27,723,727 | | | | | $ | 24,197,609 | |
Repurchase Agreements | | | | 325,000 | | | | | | 1,058,000 | | | | | | 706,000 | |
| | | |
| | | | |
| | | | |
| |
Total securities | | | | 5,408,917 | | | | | | 28,781,727 | | | | | | 24,903,609 | |
Cash | | | | 512 | | | | | | 68 | | | | | | 916 | |
Receivable for Capital Shares Sold | | | | 1,593 | | | | | | 19,876 | | | | | | 12,188 | |
Receivable for Investment Securities Sold | | | | 799,340 | | | | | | — | | | | | | 113,555 | |
Dividends and Interest Receivable | | | | 3,715 | | | | | | 52,895 | | | | | | 23,900 | |
Receivable from Adviser | | | | 6,032 | | | | | | — | | | | | | — | |
Prepaid Expenses | | | | 1,853 | | | | | | 8,089 | | | | | | 9,544 | |
| | | |
| | | | |
| | | | |
| |
Total Assets | | | | 6,221,962 | | | | | | 28,862,655 | | | | | | 25,063,712 | |
| | | |
| | | | |
| | | | |
| |
| LIABILITIES | | | | | | | | | | | | | | | | | |
Payable for Capital Shares Redeemed | | | | 8,015 | | | | | | 28,636 | | | | | | 86,210 | |
Payable for Investment Securities Purchased | | | | 825,214 | | | | | | — | | | | | | 305,104 | |
Investment Advisory Fee Payable (Note 3) | | | | — | | | | | | 20,914 | | | | | | 10,459 | |
Administration Fee Payable (Note 3) | | | | 252 | | | | | | 1,394 | | | | | | 1,193 | |
Distribution Fees Payable (Note 3) | | | | 1,052 | | | | | | 5,809 | | | | | | 4,973 | |
Trustees’ Fees Payable | | | | 2,399 | | | | | | 2,399 | | | | | | 2,399 | |
Other Accrued Expenses | | | | 22,035 | | | | | | 30,249 | | | | | | 29,711 | |
| | | |
| | | | |
| | | | |
| |
Total Liabilities | | | | 858,967 | | | | | | 89,401 | | | | | | 440,049 | |
| | | |
| | | | |
| | | | |
| |
| NET ASSETS | | | $ | 5,362,995 | | | | | $ | 28,773,254 | | | | | $ | 24,623,663 | |
| | | |
| | | | |
| | | | |
| |
| Shares of Beneficial Interest Outstanding | | | | | | | | | | | | | | | | | |
(unlimited number of shares authorized, no par value) | | | | 468,362 | | | | | | 1,380,203 | | | | | | 2,035,919 | |
| | | |
| | | | |
| | | | |
| |
| Net Asset Value Per Share | | | $ | 11.45 | | | | | $ | 20.85 | | | | | $ | 12.09 | |
| | | |
| | | | |
| | | | |
| |
| Net Assets Consist of: | | | | | | | | | | | | | | | | | |
Paid-in capital | | | $ | 4,903,870 | | | | | $ | 23,576,979 | | | | | $ | 21,189,946 | |
Accumulated net investment income (loss) | | | | (2,932 | ) | | | | | 66,977 | | | | | | (79,019 | ) |
Accumulated net realized gain on investments | | | | 153,646 | | | | | | 634,012 | | | | | | 1,547,855 | |
Net unrealized appreciation on investments | | | | 308,411 | | | | | | 4,495,286 | | | | | | 1,964,881 | |
| | | |
| | | | |
| | | | |
| |
| NET ASSETS | | | $ | 5,362,995 | | | | | $ | 28,773,254 | | | | | $ | 24,623,663 | |
| | | |
| | | | |
| | | | |
| |
50
| The FBR Funds |
|
| Statements of Assets and Liabilities (continued) |
| April 30, 2006 |
| (unaudited) |
| | | | | | | FBR | | FBR |
| | | FBR | | Small Cap | | Small Cap |
| | | Small Cap Fund | | Financial Fund | | Technology Fund |
| | |
| |
| |
|
| ASSETS | | | | | | | | | | | | |
Investment Securities | | | | | | | | | | | | |
Securities at Cost: | | | | | | | | | | | | |
Unaffiliated Issuers | | $ | 471,092,814 | | | $ | 257,786,410 | | | $ | 3,370,953 | |
Affiliated Issuers | | | 4,511,967 | | | | 8,658,030 | | | | — | |
Repurchase Agreements | | | 54,403,000 | | | | 5,358,000 | | | | 46,000 | |
| | |
| | |
| | |
| |
Total securities | | $ | 530,007,781 | | | $ | 271,802,440 | | | $ | 3,416,953 | |
| | |
| | |
| | |
|
Securities at Value (Note 2): | | | | | | | | | | | | |
Unaffiliated Issuers | | $ | 827,630,282 | | | $ | 359,809,022 | | | $ | 3,555,946 | |
Affiliated Issuers | | | 31,228,160 | | | | 14,331,393 | | | | — | |
Repurchase Agreements | | | 54,403,000 | | | | 5,358,000 | | | | 46,000 | |
| | |
| | |
| | |
| |
Total securities | | | 913,261,442 | | | | 379,498,415 | | | | 3,601,946 | |
Cash | | | 140 | | | | 717 | | | | 105 | |
Receivable for Capital Shares Sold | | | 429,499 | | | | 132,108 | | | | 100 | |
Receivable for Investment Securities Sold | | | — | | | | — | | | | 50,636 | |
Dividends and Interest Receivable | | | 20,945 | | | | 208,212 | | | | 98 | |
Receivable from Adviser | | | — | | | | — | | | | 7,379 | |
Prepaid Expenses | | | 44,946 | | | | 29,371 | | | | 4,966 | |
| | |
| | |
| | |
| |
Total Assets | | | 913,756,972 | | | | 379,868,823 | | | | 3,665,230 | |
| | |
| | |
| | |
| |
| LIABILITIES | | | | | | | | | | | | |
Payable for Capital Shares Redeemed | | | 1,873,789 | | | | 348,255 | | | | 3,000 | |
Payable for Investment Securities Purchased | | | — | | | | 659,800 | | | | 35,362 | |
Investment Advisory Fee Payable (Note 3) | | | 672,967 | | | | 275,600 | | | | — | |
Administration Fee Payable (Note 3) | | | 44,863 | | | | 18,373 | | | | 175 | |
Distribution Fees Payable (Note 3) | | | 164,503 | | | | 76,555 | | | | 727 | |
Trustees’ Fees Payable | | | 2,399 | | | | 2,399 | | | | 2,399 | |
Other Accrued Expenses | | | 391,817 | | | | 256,141 | | | | 22,017 | |
| | |
| | |
| | |
| |
Total Liabilities | | | 3,150,338 | | | | 1,637,123 | | | | 63,680 | |
| | |
| | |
| | |
| |
| NET ASSETS | | $ | 910,606,634 | | | $ | 378,231,700 | | | $ | 3,601,550 | |
| | |
| | |
| | |
| |
| Shares of Beneficial Interest Outstanding | | | | | | | | | | | | |
(unlimited number of shares authorized, no par value) | | | 18,605,135 | | | | 11,676,109 | | | | 315,887 | |
| | |
| | |
| | |
| |
| Net Asset Value Per Share | | $ | 48.94 | | | $ | 32.39 | | | $ | 11.40 | |
| | |
| | |
| | |
| |
| Net Assets Consist of: | | | | | | | | | | | | |
Paid-in capital | | $ | 527,689,734 | | | $ | 248,574,520 | | | $ | 3,186,228 | |
Accumulated net investment loss | | | (4,161,042 | ) | | | (38,747 | ) | | | (20,245 | ) |
Accumulated net realized gain on investments | | | 3,824,281 | | | | 21,999,952 | | | | 250,574 | |
Net unrealized appreciation on investments | | | 383,253,661 | | | | 107,695,975 | | | | 184,993 | |
| | |
| | |
| | |
| |
| NET ASSETS | | $ | 910,606,634 | | | $ | 378,231,700 | | | $ | 3,601,550 | |
| | |
| | |
| | |
| |
51
| The FBR Funds |
|
| Statements of Assets and Liabilities (continued) |
| April 30, 2006 |
| (unaudited) |
| | | | | | | FBR |
| | | FBR | | Fund for |
| | | Gas Utility | | Government |
| | | Index Fund | | Investors |
| | |
| |
|
| ASSETS | | | | | | | | |
Investment Securities | | | | | | | | |
Securities at Cost*: | | | | | | | | |
Unaffiliated Issuers | | $ | 123,410,877 | | | $ | 209,410,748 | |
Repurchase Agreements | | | 21,178,000 | | | | — | |
| | |
| | |
| |
Total securities | | $ | 144,588,877 | | | $ | 209,410,748 | |
| | |
| | |
| |
Securities at Value (Note 2): | | | | | | | | |
Unaffiliated Issuers | | | 237,250,418 | | | | 209,410,748 | |
Repurchase Agreements | | | 21,178,000 | | | | — | |
| | |
| | |
| |
Total securities | | | 258,428,418 | | | | 209,410,748 | |
Cash | | | 613 | | | | 936 | |
Receivable for Capital Shares Sold | | | 69,860 | | | | — | |
Receivable for Investment Securities Sold | | | 1,235,510 | | | | 20,993,896 | |
Dividends and Interest Receivable | | | 473,408 | | | | 808,397 | |
Prepaid Expenses | | | 25,061 | | | | 18,625 | |
| | |
| | |
| |
Total Assets | | | 260,232,870 | | | | 231,232,602 | |
| | |
| | |
| |
| LIABILITIES | | | | | | | | |
Payable for Capital Shares Redeemed | | | 235,085 | | | | — | |
Dividends and Income Payable | | | — | | | | 15,885 | |
Investment Advisory Fee Payable (Note 3) | | | 85,664 | | | | 104,095 | |
Administration Fee Payable (Note 3) | | | 29,982 | | | | 12,491 | |
Trustees’ Fees Payable | | | 2,399 | | | | 2,399 | |
Other Accrued Expenses | | | 112,010 | | | | 131,277 | |
| | |
| | |
| |
Total Liabilities | | | 465,140 | | | | 266,147 | |
| | |
| | |
| |
| NET ASSETS | | $ | 259,767,730 | | | $ | 230,966,455 | |
| | |
| | |
| |
| Shares of Beneficial Interest Outstanding | | | | | | | | |
(unlimited number of shares authorized, no par value) | | | 14,574,364 | | | | 231,156,408 | |
| | |
| | |
| |
| Net Asset Value Per Share | | $ | 17.82 | | | $ | 1.00 | |
| | |
| | |
| |
| Net Assets Consist of: | | | | | | | | |
Paid-in capital | | $ | 164,455,171 | | | $ | 231,156,408 | |
Accumulated net investment income | | | 296,517 | | | | — | |
Accumulated net realized loss on investments | | | (18,823,499 | ) | | | (189,953 | ) |
Net unrealized appreciation on investments | | | 113,839,541 | | | | — | |
| | |
| | |
| |
| NET ASSETS | | $ | 259,767,730 | | | $ | 230,966,455 | |
| | |
| | |
| |
*For the FBR Fund for Government Investors, securities are reported at amortized cost.
| The accompanying notes are an integral part of the financial statements. |
| |
| 52 |
| The FBR Funds |
|
| Statements of Operations |
| For the Six Months Ended April 30, 2006 |
| (unaudited) |
| | | | | | | FBR | | FBR |
| | | FBR | | Large Cap | | Large Cap |
| | | Pegasus | | Financial | | Technology |
| | | FundTM1 | | Fund | | Fund |
| | |
| |
| |
|
| Investment Income | | | | | | | | | | | | |
Dividends2 | | $ | 20,334 | | | $ | 327,582 | | | $ | 91,027 | |
Interest | | | 8,590 | | | | 55,092 | | | | 22,749 | |
| | |
| | |
| | |
| |
Total Investment Income | | | 28,924 | | | | 382,674 | | | | 113,776 | |
| | |
| | |
| | |
| |
| Expenses | | | | | | | | | | | | |
Investment Advisory fees (Note 3) | | | 14,181 | | | | 128,499 | | | | 93,756 | |
Administration fees (Note 3) | | | 945 | | | | 8,566 | | | | 6,250 | |
Distribution fees (Note 3) | | | 3,939 | | | | 35,694 | | | | 26,043 | |
Professional fees | | | 18,296 | | | | 22,637 | | | | 20,637 | |
Custodian fees | | | 12,537 | | | | 9,652 | | | | 14,115 | |
Trustees’ fees | | | 5,199 | | | | 5,199 | | | | 5,199 | |
Compliance fees | | | 3,501 | | | | 5,209 | | | | 4,955 | |
Shareholder servicing fees | | | 3,102 | | | | 10,161 | | | | 12,171 | |
Registration fees | | | 2,154 | | | | 5,427 | | | | 6,103 | |
Accounting services fees | | | 1,692 | | | | 5,955 | | | | 4,827 | |
Transfer agent fees | | | 994 | | | | 12,535 | | | | 4,270 | |
Reports to shareholders | | | 799 | | | | 1,817 | | | | 1,638 | |
Insurance fees | | | 11 | | | | 316 | | | | 177 | |
Other expenses | | | 269 | | | | 386 | | | | 109 | |
| | |
| | |
| | |
| |
Total expenses before waivers and related | | | | | | | | | | | | |
reimbursements | | | 67,619 | | | | 252,053 | | | | 200,250 | |
Less waivers and related reimbursements | | | (36,894 | ) | | | — | | | | (7,455 | ) |
| | |
| | |
| | |
| |
Total expenses after waivers and related | | | | | | | | | | | | |
reimbursements | | | 30,725 | | | | 252,053 | | | | 192,795 | |
| | |
| | |
| | |
| |
Net Investment Income (Loss) | | | (1,801 | ) | | | 130,621 | | | | (79,019 | ) |
| | |
| | |
| | |
| |
| Net Realized and Unrealized Gain on Investments | | | | | | | | | | | | |
Net Realized Gain on Investment Transactions | | | 153,646 | | | | 952,946 | | | | 1,649,228 | |
Change in Net Unrealized Appreciation/Depreciation of | | | | | | | | | | | | |
Investments | | | 308,411 | | | | 1,631,373 | | | | 1,544,443 | |
| | |
| | |
| | |
| |
Net Gain on Investments | | | 462,057 | | | | 2,584,319 | | | | 3,193,671 | |
| | |
| | |
| | |
| |
| Net Increase in Net Assets Resulting from Operations | | $ | 460,256 | | | $ | 2,714,940 | | | $ | 3,114,652 | |
| | |
| | |
| | |
| |
| 1 | Represents the period from commencement of operations (November 15, 2005) through April 30, 2006. |
| 2 | Net of foreign taxes withheld of $492, $78 and $3,341 for the FBR Pegasus FundTM, FBR Large Cap Financial Fund and FBR Large Cap Technology Fund, respectively. |
53
| The FBR Funds |
|
| Statements of Operations (continued) |
| For the Six Months Ended April 30, 2006 |
| (unaudited) |
| | | | | | | FBR | | FBR |
| | | FBR | | Small Cap | | Small Cap |
| | | Small Cap | | Financial | | Technology |
| | | Fund | | Fund | | Fund |
| | |
| |
| |
|
| Investment Income | | | | | | | | | | | | |
Unaffiliated Dividends1 | | $ | 1,149,109 | | | $ | 3,167,441 | | | $ | 1,777 | |
Affiliated Dividends | | | — | | | | 41,987 | | | | — | |
Interest | | | 563,427 | | | | 656,007 | | | | 3,171 | |
| | |
| | |
| | |
| |
Total Investment Income | | | 1,712,536 | | | | 3,865,435 | | | | 4,948 | |
| | |
| | |
| | |
| |
| Expenses | | | | | | | | | | | | |
Investment Advisory fees (Note 3) | | | 3,772,813 | | | | 1,853,116 | | | | 11,618 | |
Administration fees (Note 3) | | | 251,516 | | | | 123,539 | | | | 774 | |
Distribution fees (Note 3) | | | 922,245 2 | | | | 514,754 | | | | 3,227 | |
Shareholder servicing fees | | | 452,970 | | | | 250,340 | | | | 4,711 | |
Accounting services fees | | | 150,404 | | | | 79,720 | | | | 2,090 | |
Transfer agent fees | | | 142,123 | | | | 121,295 | | | | 1,733 | |
Reports to shareholders | | | 46,987 | | | | 47,387 | | | | 821 | |
Custodian fees | | | 37,005 | | | | 29,479 | | | | 11,183 | |
Compliance fees | | | 27,446 | | | | 15,857 | | | | 4,524 | |
Professional fees | | | 22,887 | | | | 22,937 | | | | 19,397 | |
Registration fees | | | 12,038 | | | | 10,523 | | | | 3,904 | |
Insurance fees | | | 8,867 | | | | 4,973 | | | | 20 | |
Trustees’ fees | | | 5,199 | | | | 5,199 | | | | 5,199 | |
Other expenses | | | 21,078 | | | | 2,734 | | | | 113 | |
| | |
| | |
| | |
| |
Total expenses before waivers and related reimbursements | | | 5,873,578 | | | | 3,081,853 | | | | 69,314 | |
Less waivers and related reimbursements | | | — | | | | — | | | | (44,121 | ) |
| | |
| | |
| | |
| |
Total expenses after waivers and related reimbursements | | | 5,873,578 | | | | 3,081,853 | | | | 25,193 | |
| | |
| | |
| | |
| |
Net Investment Income (Loss) | | | (4,161,042 | ) | | | 783,582 | | | | (20,245 | ) |
| | |
| | |
| | |
| |
| Net Realized and Unrealized Gain on Investments | | | | | | | | | | | | |
Net Realized Gain on Investment Transactions: | | | | | | | | | | | | |
Unaffiliated Issuers | | | 4,040,317 | | | | 21,436,706 | | | | 262,769 | |
Affiliated Issuers | | | — | | | | 781,557 | | | | — | |
Change in Net Unrealized Appreciation/Depreciation of Investments | | | 175,775,356 | | | | 18,489,075 | | | | 200,254 | |
| | |
| | |
| | |
| |
Net Gain on Investments | | | 179,815,673 | | | | 40,707,338 | | | | 463,023 | |
| | |
| | |
| | |
| |
| Net Increase in Net Assets Resulting from Operations | | $ | 175,654,631 | | | $ | 41,490,920 | | | $ | 442,778 | |
| | |
| | |
| | |
| |
| 1 | Net of foreign taxes withheld of $12,180, $0 and $0 for the FBR Small Cap Fund, FBR Small Cap Financial Fund and FBR Small Cap Technology Fund, respectively. |
| 2 | Distribution fees are net waivers of $125,761. The Distributor has agreed to voluntarily waive a portion of the FBR Small Cap Fund’s distribution fees until such time as the Fund is reopened to new investors. Had the Distributor not waived any fees, the distribution expense would have been $1,048,006. |
54
| The FBR Funds |
|
| Statements of Operations (continued) |
| For the Six Months Ended April 30, 2006 |
| (unaudited) |
| | | | | | | FBR |
| | | FBR | | Fund for |
| | | Gas Utility | | Government |
| | | Index Fund | | Investors |
| | |
| |
|
| Investment Income | | | | | | | | |
Dividends1 | | $ | 4,288,525 | | | $ | — | |
Interest (Note 2) | | | 146,520 | | | | 5,137,709 | |
| | |
| | |
| |
Total Investment Income | | | 4,435,045 | | | | 5,137,709 | |
| | |
| | |
| |
| Expenses | | | | | | | | |
Investment Advisory fees (Note 3) | | | 552,871 | | | | 609,488 | |
Administration fees (Note 3) | | | 193,504 | | | | 73,137 | |
Transfer agent fees | | | 106,964 | | | | 195,415 | |
Shareholder servicing fees | | | 82,652 | | | | 12,337 | |
Accounting services fees | | | 49,437 | | | | 42,845 | |
Reports to shareholders | | | 30,910 | | | | 21,737 | |
Professional fees | | | 22,887 | | | | 22,837 | |
Custodian fees | | | 22,468 | | | | 13,981 | |
Compliance fees | | | 12,104 | | | | 10,984 | |
Registration fees | | | 6,987 | | | | 6,322 | |
Trustees’ fees | | | 5,199 | | | | 5,199 | |
Insurance fees | | | 3,064 | | | | 2,618 | |
Other expenses | | | 7,284 | | | | 3,404 | |
| | |
| | |
| |
Total expenses | | | 1,096,331 | | | | 1,020,304 | |
| | |
| | |
| |
Net Investment Income | | | 3,338,714 | | | | 4,117,405 | |
| | |
| | |
| |
| Net Realized and Unrealized Gain (Loss) on Investments | | | | | | | | |
Net Realized Gain (Loss) on Investment Transactions | | | 11,878,251 | | | | (23 | ) |
Change in Net Unrealized Appreciation/Depreciation of Investments | | | (1,042,011 | ) | | | — | |
| | |
| | |
| |
Net Gain (Loss) on Investments | | | 10,836,240 | | | | (23 | ) |
| | |
| | |
| |
| Net Increase in Net Assets Resulting from Operations | | $ | 14,174,954 | | | $ | 4,117,382 | |
| | |
| | |
| |
| 1 | Net of foreign taxes withheld of $67,483 and $0 for the FBR Gas Utility Index Fund and FBR Fund for Government Investors, respectively. |
| The accompanying notes are an integral part of the financial statements. |
| |
| 55 |
| The FBR Funds |
|
| Statements of Changes in Net Assets |
| | | FBR | | FBR Large Cap | | FBR Large Cap |
| | | Pegasus FundTM | | Financial Fund | | Technology Fund |
| | |
| |
| |
|
| | | | For the | | | For the | | | | | | For the | | | | |
| | | | Period | | | Six Months | | For the | | Six Months | | For the |
| | | | Ended | | | Ended | | Year | | Ended | | Year |
| | | | April 30, | | | April 30, | | Ended | | April 30, | | Ended |
| | | | 2006(A) | | | 2006 | | October 31, | | 2006 | | October 31, |
| | | | (unaudited) | | | (unaudited) | | 2005 | | (unaudited) | | 2005 |
| | | |
| | |
| |
| |
| |
|
| From Investment Activities | | | | | | | | | | | | | | | | | | | | | | |
Net Investment Income (Loss) | | | $ | (1,801 | ) | | | $ | 130,621 | | | $ | 188,656 | | | $ | (79,019 | ) | | $ | (73,240 | ) |
Net Realized Gain on | | | | | | | | | | | | | | | | | | | | | | |
Investment Transactions | | | | 153,646 | | | | | 952,946 | | | | 3,792,950 | | | | 1,649,228 | | | | 1,087,384 | |
Change in Net Unrealized | | | | | | | | | | | | | | | | | | | | | | |
Appreciation/Depreciation of Investments | | | | 308,411 | | | | | 1,631,373 | | | | (3,757,400 | ) | | | 1,544,443 | | | | 154,824 | |
| | | |
| | | |
| | |
| | |
| | |
| |
Net Increase in Net Assets | | | | | | | | | | | | | | | | | | | | | | |
Resulting from Operations | | | | 460,256 | | | | | 2,714,940 | | | | 224,206 | | | | 3,114,652 | | | | 1,168,968 | |
| | | |
| | | |
| | |
| | |
| | |
| |
| Distributions to Shareholders | | | | | | | | | | | | | | | | | | | | | | |
From Net Investment Income | | | | (1,131 | ) | | | | (231,629 | ) | | | (111,605 | ) | | | — | | | | — | |
From Net Realized Gain | | | | | | | | | | | | | | | | | | | | | | |
on Investments | | | | — | | | | | (3,691,189 | ) | | | (3,530,704 | ) | | | (932,291 | ) | | | (964,430 | ) |
| | | |
| | | |
| | |
| | |
| | |
| |
Total Distributions to Shareholders | | | | (1,131 | ) | | | | (3,922,818 | ) | | | (3,642,309 | ) | | | (932,291 | ) | | | (964,430 | ) |
| | | |
| | | |
| | |
| | |
| | |
| |
| From Share Transactions | | | | | | | | | | | | | | | | | | | | | | |
Net Proceeds from Sales of Shares | | | | 5,073,857 | | | | | 1,158,571 | | | | 5,740,994 | | | | 9,196,439 | | | | 9,338,571 | |
Reinvestment of Distributions | | | | 1,129 | | | | | 3,834,061 | | | | 3,514,554 | | | | 912,545 | | | | 955,283 | |
Cost of Shares Redeemed(B) | | | | (171,116 | ) | | | | (4,048,259 | ) | | | (7,184,823 | ) | | | (2,478,130 | ) | | | (2,295,680 | ) |
| | | |
| | | |
| | |
| | |
| | |
| |
Net Increase in Net Assets | | | | | | | | | | | | | | | | | | | | | | |
Resulting from Share Transactions | | | | 4,903,870 | | | | | 944,373 | | | | 2,070,725 | | | | 7,630,854 | | | | 7,998,174 | |
| | | |
| | | |
| | |
| | |
| | |
| |
Total Increase (Decrease) in Net Assets | | | | 5,362,995 | | | | | (263,505 | ) | | | (1,347,378 | ) | | | 9,813,215 | | | | 8,202,712 | |
Net Assets – Beginning of Period | | | | — | | | | | 29,036,759 | | | | 30,384,137 | | | | 14,810,448 | | | | 6,607,736 | |
| | | |
| | | |
| | |
| | |
| | |
| |
Net Assets – End of Period | | | $ | 5,362,995 | | | | $ | 28,773,254 | | | $ | 29,036,759 | | | $ | 24,623,663 | | | $ | 14,810,448 | |
| | | |
| | | |
| | |
| | |
| | |
| |
Accumulated Net Investment Income (Loss) | | | | (2,932 | ) | | | $ | 66,977 | | | $ | 167,985 | | | $ | (79,019 | ) | | $ | — | |
| Shares Issued and Redeemed | | | | | | | | | | | | | | | | | | | | | | |
Sold | | | | 484,153 | | | | | 56,460 | | | | 256,060 | | | | 798,781 | | | | 891,160 | |
Issued in Reinvestment of Distributions | | | | 110 | | | | | 190,616 | | | | 156,411 | | | | 82,211 | | | | 94,117 | |
Redeemed | | | | (15,901 | ) | | | | (196,234 | ) | | | (325,549 | ) | | | (213,539 | ) | | | (219,699 | ) |
| | | |
| | | |
| | |
| | |
| | |
| |
Net Increase in Shares | | | | 468,362 | | | | | 50,842 | | | | 86,922 | | | | 667,453 | | | | 765,578 | |
| | | |
| | | |
| | |
| | |
| | |
| |
| (A) | Represents the period from commencement of operations (November 15, 2005) through April 30, 2006. |
| (B) | The cost of shares redeemed is net of the 1% redemption fee on fund shares which have been held 90 days or less. For the period ended April 30, 2006, these fees were $734, $809 and $3,198 for FBR Pegasus FundTM, FBR Large Cap Financial Fund, and FBR Large Cap Technology Fund, respectively. For the year ended October 31, 2005, these fees were $5,664 and $3,490 for the FBR Large Cap Financial Fund and FBR Large Cap Technology Fund, respectively. |
56
The FBR Funds
Statements of Changes in Net Assets (continued)
| | | | | | | | | | | | | FBR Small Cap | | | FBR Small Cap | |
| | | | FBR Small Cap Fund | | Financial Fund | | | Technology Fund | |
| | | |
| |
| | |
| |
| | | | For the | | | | | | | | For the | | | | | | | | For the | | | | | |
| | | | Six Months | | | For the | | | Six Months | | | For the | | | Six Months | | | For the |
| | | | Ended | | | Year | | | Ended | | | Year | | | Ended | | | Year |
| | | | April 30, | | | Ended | | | April 30, | | | Ended | | | April 30, | | | Ended |
| | | | 2006 | | | October 31, | | | 2006 | | | October 31, | | | 2006 | | | October 31, |
| | | | (unaudited) | | | 2005 | | | (unaudited) | | | 2005 | | | (unaudited) | | | 2005 |
| | | |
| | |
| | |
| | |
| | |
| | |
|
| From Investment Activities | | | | | | | | | | | | | | | | | | | | | | | | | | | | | | |
Net Investment Income (Loss) | | | $ | (4,161,042 | ) | | | $ | (5,368,162 | ) | | | $ | 783,582 | | | | $ | 3,951,710 | | | | $ | (20,245 | ) | | | $ | (29,575 | ) |
Net Realized Gain on | | | | | | | | | | | | | | | | | | | | | | | | | | | | | | |
Investment Transactions from: | | | | | | | | | | | | | | | | | | | | | | | | | | | | | | |
Unaffiliated Issuers | | | | 4,040,317 | | | | | 16,780,143 | | | | | 21,436,706 | | | | | 47,073,636 | | | | | 262,769 | | | | | 144,518 | |
Affiliated Issuers | | | | — | | | | | 593,237 | | | | | 781,557 | | | | | 2,164,689 | | | | | — | | | | | — | |
Change in Net Unrealized | | | | | | | | | | | | | | | | | | | | | | | | | | | | | | |
Appreciation/Depreciation | | | | | | | | | | | | | | | | | | | | | | | | | | | | | | |
of Investments | | | | 175,775,356 | | | | | 60,327,673 | | | | | 18,489,075 | | | | | (39,705,446 | ) | | | | 200,254 | | | | | (13,158 | ) |
| | | |
| | | |
| | | |
| | | |
| | | |
| | | |
| |
Net Increase in Net Assets | | | | | | | | | | | | | | | | | | | | | | | | | | | | | | |
Resulting from Operations | | | | 175,654,631 | | | | | 72,332,891 | | | | | 41,490,920 | | | | | 13,484,589 | | | | | 442,778 | | | | | 101,785 | |
| | | |
| | | |
| | | |
| | | |
| | | |
| | | |
| |
| Distributions to Shareholders | | | | | | | | | | | | | | | | | | | | | | | | | | | | | | |
From Net Investment Income | | | | — | | | | | — | | | | | (2,080,797 | ) | | | | (3,545,129 | ) | | | | — | | | | | — | |
From Net Realized Gain | | | | | | | | | | | | | | | | | | | | | | | | | | | | | | |
on Investments | | | | (13,800,517 | ) | | | | (13,532,432 | ) | | | | (48,974,995 | ) | | | | (74,859,808 | ) | | | | — | | | | | — | |
| | | |
| | | |
| | | |
| | | |
| | | |
| | | |
| |
Total Distributions to | | | | | | | | | | | | | | | | | | | | | | | | | | | | | | |
Shareholders | | | | (13,800,517 | ) | | | | (13,532,432 | ) | | | | (51,055,792 | ) | | | | (78,404,937 | ) | | | | — | | | | | — | |
| | | |
| | | |
| | | |
| | | |
| | | |
| | | |
| |
| From Share Transactions | | | | | | | | | | | | | | | | | | | | | | | | | | | | | | |
Net Proceeds from Sales of Shares | | | | 91,436,322 | | | | | 372,773,336 | | | | | 32,964,029 | | | | | 230,368,255 | | | | | 1,731,653 | | | | | 1,661,709 | |
Reinvestment of Distributions | | | | 13,507,197 | | | | | 12,761,278 | | | | | 49,892,308 | | | | | 72,660,032 | | | | | — | | | | | — | |
Cost of Shares Redeemed (A) | | | | (162,049,076 | ) | | | | (463,973,882 | ) | | | | (158,392,973 | ) | | | | (369,400,035 | ) | | | | (331,517 | ) | | | | (1,444,969 | ) |
| | | |
| | | |
| | | |
| | | |
| | | |
| | | |
| |
Net Increase (Decrease) in Net Assets | | | | | | | | | | | | | | | | | | | | | | | | | | | | | | |
Resulting from Share | | | | | | | | | | | | | | | | | | | | | | | | | | | | | | |
Transactions | | | | (57,105,557 | ) | | | | (78,439,268 | ) | | | | (75,536,636 | ) | | | | (66,371,748 | ) | | | | 1,400,136 | | | | | 216,740 | |
| | | |
| | | |
| | | |
| | | |
| | | |
| | | |
| |
Total Increase (Decrease) in | | | | | | | | | | | | | | | | | | | | | | | | | | | | | | |
Net Assets | | | | 104,748,557 | | | | | (19,638,809 | ) | | | | (85,101,508 | ) | | | | (131,292,096 | ) | | | | 1,842,914 | | | | | 318,525 | |
Net Assets – Beginning of Period | | | | 805,858,077 | | | | | 825,496,886 | | | | | 463,333,208 | | | | | 594,625,304 | | | | | 1,758,636 | | | | | 1,440,111 | |
| | | |
| | | |
| | | |
| | | |
| | | |
| | | |
| |
Net Assets – End of Period | | | $ | 910,606,634 | | | | $ | 805,858,077 | | | | $ | 378,231,700 | | | | $ | 463,333,208 | | | | $ | 3,601,550 | | | | $ | 1,758,636 | |
| | | |
| | | |
| | | |
| | | |
| | | |
| | | |
| |
Accumulated Net Investment | | | | | | | | | | | | | | | | | | | | | | | | | | | | | | |
Income (Loss) | | | $ | (4,161,042 | ) | | | $ | — | | | | $ | (38,747 | ) | | | $ | 1,258,468 | | | | $ | (20,245 | ) | | | $ | — | |
| Shares Issued and Redeemed | | | | | | | | | | | | | | | | | | | | | | | | | | | | | | |
Sold | | | | 2,014,306 | | | | | 9,065,029 | | | | | 1,042,091 | | | | | 6,667,142 | | | | | 161,072 | | | | | 176,223 | |
Issued in Reinvestment | | | | | | | | | | | | | | | | | | | | | | | | | | | | | | |
of Distributions | | | | 321,447 | | | | | 313,867 | | | | | 1,638,584 | | | | | 2,125,106 | | | | | — | | | | | — | |
Redeemed | | | | (3,699,672 | ) | | | | (11,318,509 | ) | | | | (5,062,487 | ) | | | | (11,066,207 | ) | | | | (31,076 | ) | | | | (152,499 | ) |
| | | |
| | | |
| | | |
| | | |
| | | |
| | | |
| |
Net Increase (Decrease) in Shares | | | | (1,363,919 | ) | | | | (1,939,613 | ) | | | | (2,381,812 | ) | | | | (2,273,959 | ) | | | | 129,996 | | | | | 23,724 | |
| | | |
| | | |
| | | |
| | | |
| | | |
| | | | |
|
| (A) | The cost of shares redeemed is net of the 1% redemption fee on fund shares which have been held 90 days or less. For the six months ended April 30, 2006, these fees were $28,151, $27,266 and $1,238 for FBR Small Cap Fund, FBR Small Cap Financial Fund,and FBR Small Cap Technology Fund, respectively. For the year ended October 31, 2005, these fees were $178,577, $201,249 and $7,127 for FBR Small Cap Fund, FBR Small Cap Financial Fund, and FBR Small Cap Technology Fund, respectively. |
57
The FBR Funds
Statements of Changes in Net Assets (continued)
| | | | FBR Gas Utility | | | FBR Fund for |
| | | | Index Fund | | | Government Investors |
| | | |
| | |
|
| | | | For the | | | | | | | | For the | | | |
| | | | Six Months | | | For the | | | Six Months | | | For the |
| | | | Ended | | | Year | | | Ended | | | Year |
| | | | April 30, | | | Ended | | | April 30, | | | Ended |
| | | | 2006 | | | October 31, | | | 2006 | | | October 31, |
| | | | (unaudited) | | | 2005 | | | (unaudited) | | | 2005 |
| | | |
| | |
| | |
| | |
|
| From Investment Activities | | | | | | | | | | | | | | | | | | | | |
Net Investment Income | | | $ | 3,338,714 | | | | $ | 8,487,815 | | | | $ | 4,117,405 | | | | $ | 5,300,978 | |
Net Realized Gain (Loss) on Investment Transactions | | | | 11,878,251 | | | | | 6,544,433 | | | | | (23 | ) | | | | (970 | ) |
Change in Net Unrealized Appreciation/Depreciation of Investments | | | | (1,042,011 | ) | | | | 29,725,143 | | | | | — | | | | | — | |
| | | |
| | | |
| | | |
| | | |
| |
Net Increase in Net Assets Resulting from Operations | | | | 14,174,954 | | | | | 44,757,391 | | | | | 4,117,382 | | | | | 5,300,008 | |
| | | |
| | | |
| | | |
| | | |
| |
| Distributions to Shareholders | | | | | | | | | | | | | | | | | | | | |
From Net Investment Income | | | | (5,214,288 | ) | | | | (6,644,316 | ) | | | | (4,117,405 | ) | | | | (5,300,978 | ) |
| | | |
| | | |
| | | |
| | | |
| |
| From Share Transactions | | | | | | | | | | | | | | | | | | | | |
Net Proceeds from Sales of Shares | | | | 16,073,415 | | | | | 101,624,953 | | | | | 712,238,837 | | | | | 1,297,731,352 | |
Reinvestment of Distributions | | | | 4,808,515 | | | | | 6,155,740 | | | | | 4,014,707 | | | | | 5,142,132 | |
Cost of Shares Redeemed (A) | | | | (65,878,414 | ) | | | | (70,635,065 | ) | | | | (736,961,917 | ) | | | | (1,339,958,443 | ) |
| | | |
| | | |
| | | |
| | | |
| |
Net Increase (Decrease) in Net Assets Resulting from Share Transactions | | | | (44,996,484 | ) | | | | 37,145,628 | | | | | (20,708,373 | ) | | | | (37,084,959 | ) |
| | | |
| | | |
| | | |
| | | |
| |
Total Increase (Decrease) in Net Assets | | | | (36,035,818 | ) | | | | 75,258,703 | | | | | (20,708,396 | ) | | | | (37,085,929 | ) |
| Net Assets – Beginning of Period | | | | 295,803,548 | | | | | 220,544,845 | | | | | 251,674,851 | | | | | 288,760,780 | |
| | | |
| | | |
| | | |
| | | |
| |
| Net Assets – End of Period | | | $ | 259,767,730 | | | | $ | 295,803,548 | | | | $ | 230,966,455 | | | | $ | 251,674,851 | |
| | | |
| | | |
| | | |
| | | |
| |
| Accumulated Net Investment Income | | | $ | 296,517 | | | | $ | 2,172,091 | | | | $ | - | | | | $ | - | |
| Shares Issued and Redeemed | | | | | | | | | | | | | | | | | | | | |
Sold | | | | 915,268 | | | | | 6,017,006 | | | | | 712,238,837 | | | | | 1,297,731,352 | |
Issued in Reinvestment of Distributions | | | | 277,372 | | | | | 364,364 | | | | | 4,014,707 | | | | | 5,142,132 | |
Redeemed | | | | (3,765,988 | ) | | | | (4,265,038 | ) | | | | (736,961,917 | ) | | | | (1,339,958,443 | ) |
| | | |
| | | |
| | | |
| | | |
| |
Net Increase (Decrease) in Shares | | | | (2,573,348 | ) | | | | 2,116,332 | | | | | (20,708,373 | ) | | | | (37,084,959 | ) |
| | | |
| | | |
| | | |
| | | |
| |
|
| (A) | | The cost of shares redeemed is net of the 1% redemption fee on fund shares which have been held 90 days or less. For the FBR Gas Utility Index Fund, these fees for the six months ended April 30, 2006 and the year ended October 31, 2005 were $18,282 and $73,199, respectively. The FBR Fund for Government Investors does not charge a redemption fee. |
The accompanying notes are an integral part of the financial statements.
58
The FBR Funds
Financial Highlights
The following tables provide per share data for a share outstanding throughout each period for each Fund. Other data includes investment performance, ratios to average net assets and other supplemental information.
| | | FBR Pegasus FundTM |
| | |
|
| | | For the Period |
| | | Ended |
| | | April 30, 2006* |
| | | (unaudited) |
| | |
|
| Per Share Operating Performance: | | | | | | |
Net Asset Value – Beginning of Period | | | $ | 10.00 | | |
| | | |
| | |
Income (Loss) from Investment Operations: | | | | | | |
Net Investment Loss1,3 | | | | (0.00 | )2 | |
Net Realized and Unrealized Gain on Investments1,4 | | | | 1.45 | | |
| | | |
| | |
Total from Investment Operations | | | | 1.45 | | |
| | | |
| | |
Distributions to Shareholders: | | | | | | |
From Net Investment Income | | | | (0.00 | )2 | |
| | | |
| | |
Paid-in Capital from Redemption Fees | | | | 0.00 | 2 | |
| | | |
| | |
Net Increase in Net Asset Value | | | | 1.45 | | |
| | | |
| | |
Net Asset Value – End of Period | | | $ | 11.45 | | |
| | | |
| | |
| | | | | | | |
| Total Investment Return5 | | | | 14.55% | (A) | |
| Ratios to Average Net Assets: | | | | | | |
Expenses After Waivers and Related Reimbursements3 | | | | 1.93% | (B) | |
Expenses Before Waivers and Related Reimbursements | | | | 4.25% | (B) | |
Net Investment Loss After Waivers and Related Reimbursements3 | | | | (0.11)% | (B) | |
Net Investment Loss Before Waivers and Related Reimbursements | | | | (2.43)% | (B) | |
| Supplementary Data: | | | | | | |
Portfolio Turnover Rate | | | | 36% | (A) | |
Net Assets at End of Period (in thousands) | | | $ | 5,363 | | |
|
| * | | For the period November 15, 2005 (commencement of operations) to April 30, 2006. |
| 1 | | Calculated based on shares outstanding on the first and last day of the respective periods, except for dividends and distributions, if any, which are based on the actual shares outstanding on the dates of distributions. |
| 2 | | Less than $0.01 |
| 3 | | Reflects fees waived and reimbursed by FBR Fund Advisers, Inc. pursuant to a contractual expense limitation of 1.95%. |
| 4 | | The amounts shown for a share outstanding throughout the period may not be in accordance with the changes in the aggregate gains and losses on investments during the period because of the timing of sales and repurchases of Fund shares in relation to fluctuating net asset values during the period. |
| 5 | | Total investment return is calculated assuming a purchase of shares on the first day and a sale on the last day of each period reported and will include reinvestment of dividends and distributions, if any. |
| (A) | | Not Annualized |
| (B) | | Annualized |
59
The FBR Funds
Financial Highlights (continued)
| | | FBR Large Cap Financial Fund |
| | |
|
| | | For the | | | | | | | | | | | | | | | | | | | | | | | | | |
| | | Six Months | | | | | | | | | | | | | | | | | | | | | | | | | |
| | | Ended | | | | | | | | | | | | | | | | | | | | | | | | | |
| | | April 30, | | For the Years Ended October 31, |
| | | 2006 | |
|
| | | (unaudited) | | | 2005 | | | | | 2004 | | | | | 2003 | | | | | 2002 | | | | | 2001 | | |
| | |
| |
| | |
| | |
| | |
| | |
| |
| Per Share Operating Performance: | | | | | | | | | | | | | | | | | | | | | | | | | | | | | | | |
Net Asset Value – Beginning of Period | | | $ | 21.84 | | | | $ | 24.46 | | | | $ | 22.43 | | | | $ | 17.73 | | | | $ | 18.18 | | | | $ | 17.34 | | |
| | | |
| | | |
| | | |
| | | |
| | | |
| | | |
| | |
Income from Investment Operations: | | | | | | | | | | | | | | | | | | | | | | | | | | | | | | | |
Net Investment Income1,3 | | | | 0.08 | | | | | 0.13 | | | | | 0.08 | | | | | 0.10 | | | | | 0.07 | | | | | 0.06 | | |
| | | | | | | | | | | | | | | | | | | | | | | | | | | | | | | | |
Net Realized and Unrealized Gain on Investments1,4 | | | | 1.95 | | | | | 0.15 | | | | | 2.08 | | | | | 4.69 | | | | | 0.70 | | | | | 0.94 | | |
| | | |
| | | |
| | | |
| | | |
| | | |
| | | |
| | |
Total from Investment Operations | | | | 2.03 | | | | | 0.28 | | | | | 2.16 | | | | | 4.79 | | | | | 0.77 | | | | | 1.00 | | |
| | | |
| | | |
| | | |
| | | |
| | | |
| | | |
| | |
Distributions to Shareholders: | | | | | | | | | | | | | | | | | | | | | | | | | | | | | | | |
From Net Investment Income | | | | (0.16 | ) | | | | (0.08 | ) | | | | (0.07 | ) | | | | (0.09 | ) | | | | (0.08 | ) | | | | (0.16 | ) | |
From Net Realized Gain | | | | (2.86 | ) | | | | (2.82 | ) | | | | (0.08 | ) | | | | — | | | | | (1.15 | ) | | | | — | | |
| | | |
| | | |
| | | |
| | | |
| | | |
| | | |
| | |
Total Distributions | | | | (3.02 | ) | | | | (2.90 | ) | | | | (0.15 | ) | | | | (0.09 | ) | | | | (1.23 | ) | | | | (0.16 | ) | |
| | | |
| | | |
| | | |
| | | |
| | | |
| | | |
| | |
Paid-in Capital from Redemption Fees | | | | 0.00 | 2 | | | | 0.00 | 2 | | | | 0.02 | | | | | 0.00 | 2 | | | | 0.01 | | | | | — | | |
| | | |
| | | |
| | | |
| | | |
| | | |
| | | |
| | |
Net Increase (Decrease) in Net Asset Value | | | | (0.99 | ) | | | | (2.62 | ) | | | | 2.03 | | | | | 4.70 | | | | | (0.45 | ) | | | | 0.84 | | |
| | | |
| | | |
| | | |
| | | |
| | | |
| | | |
| | |
Net Asset Value – End of Period | | | $ | 20.85 | | | | $ | 21.84 | | | | $ | 24.46 | | | | $ | 22.43 | | | | $ | 17.73 | | | | $ | 18.18 | | |
| | | |
| | | |
| | | |
| | | |
| | | |
| | | |
| | |
| Total Investment Return5 | | | | 9.88% | (A) | | | | 0.86% | | | | | 9.76% | | | | | 27.13% | | | | | 4.11% | | | | | 5.72% | | |
| Ratios to Average Net Assets: | | | | | | | | | | | | | | | | | | | | | | | | | | | | | | | |
Expenses After Waivers3 | | | | 1.77% | (B) | | | | 1.95% | | | | | 1.91% | | | | | 1.92% | | | | | 1.95% | | | | | 1.89% | | |
Expenses Before Waivers | | | | 1.77% | (B) | | | | 1.96% | | | | | 1.94% | | | | | 1.98% | | | | | 2.03% | | | | | 1.90% | | |
Net Investment Income After Waivers3 | | | | 0.91% | (B) | | | | 0.62% | | | | | 0.28% | | | | | 0.53% | | | | | 0.36% | | | | | 0.32% | | |
Net Investment Income Before Waivers | | | | 0.91% | (B) | | | | 0.61% | | | | | 0.25% | | | | | 0.47% | | | | | 0.28% | | | | | 0.31% | | |
| Supplementary Data: | | | | | | | | | | | | | | | | | | | | | | | | | | | | | | | |
Portfolio Turnover Rate | | | | 22% | (A) | | | | 41% | | | | | 42% | | | | | 67% | | | | | 97% | | | | | 126% | | |
Net Assets at End of Period (in thousands) | | | $ | 28,773 | | | | $ | 29,037 | | | | $ | 30,384 | | | | $ | 35,459 | | | | $ | 26,541 | | | | $ | 25,577 | | |
| 1 | | Calculated based on shares outstanding on the first and last day of the respective periods, except for dividends and distributions, if any, which are based on the actual shares outstanding on the dates of distributions. |
| 2 | | Less than $0.01 |
| 3 | | Reflects fees waived by FBR Fund Advisers, Inc. pursuant to a contractual expense limitation of 1.95%. |
| 4 | | The amounts shown for a share outstanding throughout the respective periods may not be in accordance with the changes in the aggregate gains and losses on investments during the respective periods because of the timing of sales and repurchases of Fund shares in relation to fluctuating net asset values during the respective periods. |
| 5 | | Total investment return is calculated assuming a purchase of shares on the first day and a sale on the last day of each period reported and will include reinvestment of dividends and distributions, if any. |
| (A) | | Not Annualized |
| (B) | | Annualized |
60
| The FBR Funds |
|
| Financial Highlights (continued) |
| | FBR Large Cap Technology Fund |
| |
|
| | For the | | | | | | | | | | | | | | | | | | | | |
| | Six Months | | | | | | | | | | | | | | | | | For the |
| | Ended | | | For the Years Ended October 31, | | Period |
| | April 30, | | |
| | Ended |
| | 2006 | | | | | | | | | | | | | | | | | October 31, |
| | (unaudited) | | | 2005 | | | 2004 | | | 2003 | | 2002* |
| |
| | |
| | |
| | |
| |
|
Per Share Operating Performance: | | | | | | | | | | | | | | | | | | | | | | | | |
Net Asset Value – Beginning of Period | | $ | 10.82 | | | | $ | 10.96 | | | | $ | 11.03 | | | | $ | 7.19 | | | | $ | 10.00 | |
| | |
| | | |
| | | |
| | | |
| | | |
| |
Income (Loss) from Investment Operations: | | | | | | | | | | | | | | | | | | | | | | | | |
Net Investment Loss1,3 | | | (0.04 | ) | | | | (0.05 | ) | | | | (0.14 | ) | | | | (0.08 | ) | | | | (0.05 | ) |
Net Realized and Unrealized Gain (Loss) on Investments1,4 | | | 1.89 | | | | | 1.53 | | | | | 0.24 | | | | | 3.92 | | | | | (2.76 | ) |
| | |
| | | |
| | | |
| | | |
| | | |
| |
Total from Investment Operations | | | 1.85 | | | | | 1.48 | | | | | 0.10 | | | | | 3.84 | | | | | (2.81 | ) |
| | |
| | | |
| | | |
| | | |
| | | |
| |
Distributions to Shareholders: | | | | | | | | | | | | | | | | | | | | | | | | |
From Net Realized Gain | | | (0.58 | ) | | | | (1.62 | ) | | | | (0.20 | ) | | | | — | | | | | — | |
| | |
| | | |
| | | |
| | | |
| | | |
| |
Paid-in Capital from Redemption Fees | | | 0.00 | 2 | | | | 0.00 | 2 | | | | 0.03 | | | | | 0.00 | 2 | | | | 0.00 | 2 | |
| | |
| | | |
| | | |
| | | |
| | | |
| |
Net Increase (Decrease) in Net Asset Value | | | 1.27 | | | | | (0.14 | ) | | | | (0.07 | ) | | | | 3.84 | | | | | (2.81 | ) |
| | |
| | | |
| | | |
| | | |
| | | |
| |
Net Asset Value – End of Period | | $ | 12.09 | | | | $ | 10.82 | | | | $ | 10.96 | | | | $ | 11.03 | | | | $ | 7.19 | |
| | |
| | | |
| | | |
| | | |
| | | |
| |
Total Investment Return5 | | | 17.56% | (A) | | | | 14.51% | | | | | 1.17% | | | | | 53.41% | | | | | (28.10)% | (A) |
Ratios to Average Net Assets: | | | | | | | | | | | | | | | | | | | | | | | | |
Expenses After Waivers and Related Reimbursements3 | | | 1.85% | (B) | | | | 1.94% | | | | | 1.95% | | | | | 1.94% | | | | | 1.94% | (B) |
Expenses Before Waivers and Related Reimbursements | | | 1.92% | (B) | | | | 2.74% | | | | | 3.21% | | | | | 4.61% | | | | | 4.43% | (B) |
Net Investment Loss After Waivers and Related Reimbursements3 | | | (0.76)% | (B) | | | | (0.77)% | | | | | (1.23)% | | | | | (1.11)% | | | | | (1.37)% | (B) |
Net Investment Loss Before Waivers and Related Reimbursements | | | (0.83)% | (B) | | | | (1.57)% | | | | | (2.49)% | | | | | (3.78)% | | | | | (3.86)% | (B) |
Supplementary Data: | | | | | | | | | | | | | | | | | | | | | | | | |
Portfolio Turnover Rate | | | 57% | (A) | | | | 100% | | | | | 99% | | | | | 146% | | | | | 165% | (A) |
Net Assets at End of Period (in thousands) | | $ | 24,624 | | | | $ | 14,810 | | | | $ | 6,608 | | | | $ | 6,170 | | | | $ | 2,485 | |
|
| * | | From the period February 1, 2002 (commencement of operations) to October 31, 2002. |
| 1 | | Calculated based on shares outstanding on the first and last day of the respective periods, except for dividends and distributions, if any, which are based on the actual shares outstanding on the dates of distributions. |
| 2 | | Less than $0.01 |
| 3 | | Reflects fees waived by FBR Fund Advisers, Inc. pursuant to a contractual expense limitation of 1.95%. |
| 4 | | The amounts shown for a share outstanding throughout the respective periods may not be in accordance with the changes in the aggregate gains and losses on investments during the respective periods because of the timing of sales and repurchases of Fund shares in relation to fluctuating net asset values during the respective periods. |
| 5 | | Total investment return is calculated assuming a purchase of shares on the first day and a sale on the last day of each period reported and will include reinvestment of dividends and distributions, if any. |
| (A) | | Not Annualized |
| (B) | | Annualized |
61
| The FBR Funds |
|
| Financial Highlights (continued) |
| | FBR Small Cap Fund | |
| |
| |
| | For the | | | | | | | | | | | | | | | | | | | | | | | | | | |
| | Six Months | | | | | | | | | | | | | | | | | | | | | | | | | | |
| | Ended | | | | | | | | | | | | | | | | | | | | | | | | | | |
| | April 30, | | | For the Years Ended October 31, | |
| | | 2006 | | | |
| |
| | (unaudited) | | | 2005 | | | 2004 | | | 2003 | | | 2002 | | | 2001 | |
| |
| | |
| | |
| | |
| | |
| | |
| |
Per Share Operating Performance: | | | | | | | | | | | | | | | | | | | | | | | | | | | | | | |
Net Asset Value – Beginning of Period | | $ | 40.36 | | | | $ | 37.68 | | | | $ | 31.57 | | | | $ | 21.15 | | | | $ | 19.97 | | | | $ | 19.46 | | |
| | |
| | | |
| | | |
| | | |
| | | |
| | | |
| | |
Income (Loss) from Investment Operations: | | | | | | | | | | | | | | | | | | | | | | | | | | | | | | |
Net Investment Loss1,3 | | | (0.22 | ) | | | | (0.27 | ) | | | | (0.17 | ) | | | | (0.11 | ) | | | | (0.25 | ) | | | | (0.18 | ) | |
Net Realized and Unrealized Gain on Investments1,4 | | | 9.52 | | | | | 3.51 | | | | | 6.30 | | | | | 10.50 | | | | | 1.50 | | | | | 1.34 | | |
| | |
| | | |
| | | |
| | | |
| | | |
| | | |
| | |
Total from Investment Operations | | | 9.30 | | | | | 3.24 | | | | | 6.13 | | | | | 10.39 | | | | | 1.25 | | | | | 1.16 | | |
| | |
| | | |
| | | |
| | | |
| | | |
| | | |
| | |
Distributions to Shareholders: | | | | | | | | | | | | | | | | | | | | | | | | | | | | | | |
From Net Realized Gain | | | (0.72 | ) | | | | (0.57 | ) | | | | (0.03 | ) | | | | — | | | | | (0.17 | ) | | | | (0.65 | ) | |
| | |
| | | |
| | | |
| | | |
| | | |
| | | |
| | |
Paid-in Capital from Redemption Fees | | | 0.00 | 2 | | | | 0.01 | | | | | 0.01 | | | | | 0.03 | | | | | 0.10 | | | | | — | | |
| | |
| | | |
| | | |
| | | |
| | | |
| | | |
| | |
Net Increase in Net Asset Value | | | 8.58 | | | | | 2.68 | | | | | 6.11 | | | | | 10.42 | | | | | 1.18 | | | | | 0.51 | | |
| | |
| | | |
| | | |
| | | |
| | | |
| | | |
| | |
Net Asset Value – End of Period | | $ | 48.94 | | | | $ | 40.36 | | | | $ | 37.68 | | | | $ | 31.57 | | | | $ | 21.15 | | | | $ | 19.97 | | |
| | |
| | | |
| | | |
| | | |
| | | |
| | | |
| | |
Total Investment Return5 | | | 23.33% | (A) | | | | 8.63% | | | | | 19.46% | | | | | 49.27% | | | | | 6.76% | | | | | 6.87% | | |
Ratios to Average Net Assets: | | | | | | | | | | | | | | | | | | | | | | | | | | | | | | |
Expenses After Waivers3 | | | 1.40% | (B) | | | | 1.50% | | | | | 1.59% | | | | | 1.60% | | | | | 1.94% | | | | | 1.95% | | |
Expenses Before Waivers | | | 1.43% | (B) | | | | 1.53% | | | | | 1.59% | | | | | 1.60% | | | | | 2.07% | | | | | 2.37% | | |
Net Investment Loss After Waivers3 | | | (0.99)% | (B) | | | | (0.56)% | | | | | (0.75)% | | | | | (0.75)% | | | | | (1.39)% | | | | | (1.34)% | | |
Net Investment Loss Before Waivers | | | (1.02)% | (B) | | | | (0.59)% | | | | | (0.75)% | | | | | (0.75)% | | | | | (1.52)% | | | | | (1.76)% | | |
Supplementary Data: | | | | | | | | | | | | | | | | | | | | | | | | | | | | | | |
Portfolio Turnover Rate | | | 1% | (A) | | | | 20% | | | | | 19% | | | | | 16% | | | | | 13% | | | | | 26% | | |
Net Assets at End of Period (in thousands) | | $ | 910,607 | | | | $ | 805,858 | | | | $ | 825,497 | | | | $ | 343,824 | | | | $ | 28,803 | | | | $ | 16,571 | | |
|
| 1 | | Calculated based on shares outstanding on the first and last day of the respective periods,except for dividends and distributions,if any, which are based on the actual shares outstanding on the dates of distributions. | | |
| 2 | | Less than $0.01 | | |
| 3 | | Reflects fees waived by FBR Fund Advisers,Inc. pursuant to a contractual expense limitation of 1.95% and fees voluntarily waived by the Distributor in an amount attributable to marketing expenses for the Fund while closed to new investors. | | |
| 4 | | The amounts shown for a share outstanding throughout the respective periods may not be in accordance with the changes in the aggregate gains and losses on investments during the respective periods because of the timing of sales and repurchases of Fund shares in relation to fluctuating net asset values during the respective periods. | | |
| 5 | | Total investment return is calculated assuming a purchase of shares on the first day and a sale on the last day of each period reported and will include reinvestment of dividends and distributions, if any. | | |
| (A) | | Not Annualized | | |
| (B) | | Annualized | | |
62
| The FBR Funds |
|
| Financial Highlights (continued) |
| | | FBR Small Cap Financial Fund |
| |
| |
| | For the | | | | | | | | | | | | | | | | | | | | | | | | | | |
| | Six Months | | | | | | | | | | | | | | | | | | | | | | | | | | |
| | Ended | | | | | | | | | | | | | | | | | | | | | | | | | | |
| | April 30, | | | For the Years Ended October 31, |
| | | 2006 | | | |
| |
| | (unaudited) | | | | 2005 | | | | | 2004 | | | | | 2003 | | | | | | 2002 | | | | | 2001 | |
| |
| | | |
| | | | |
| | | | |
| | | | | |
| | | | |
| |
Per Share Operating Performance: | | | | | | | | | | | | | | | | | | | | | | | | | | | | | | |
Net Asset Value – Beginning of Period | | $ | 32.96 | | | | $ | 36.41 | | | | $ | 32.56 | | | | $ | 24.38 | | | | | $ | 20.53 | | | | $ | 16.03 | |
| | |
| | | |
| | | |
| | | |
| | | | |
| | | |
| |
Income from Investment Operations: | | | | | | | | | | | | | | | | | | | | | | | | | | | | | | |
Net Investment Income1,3 | | | 0.05 | | | | | 0.23 | | | | | 0.13 | | | | | 0.05 | | | | | | 0.15 | | | | | 0.42 | |
Net Realized and Unrealized Gain on Investments1,4 | | | 3.21 | | | | | 0.85 | | | | | 4.40 | | | | | 8.88 | | | | | | 4.35 | | | | | 4.18 | |
| | |
| | | |
| | | |
| | | |
| | | | |
| | | |
| |
Total from Investment Operations | | | 3.26 | | | | | 1.08 | | | | | 4.53 | | | | | 8.93 | | | | | | 4.50 | | | | | 4.60 | |
| | |
| | | |
| | | |
| | | |
| | | | |
| | | |
| |
Distributions to Shareholders: | | | | | | | | | | | | | | | | | | | | | | | | | | | | | | |
From Net Investment Income | | | (0.14 | ) | | | | (0.18 | ) | | | | (0.07 | ) | | | | (0.13 | ) | | | | | (0.47 | ) | | | | (0.10 | ) |
From Net Realized Gain | | | (3.69 | ) | | | | (4.36 | ) | | | | (0.65 | ) | | | | (0.64 | ) | | | | | (0.34 | ) | | | | — | |
| | |
| | | |
| | | |
| | | |
| | | | |
| | | |
| |
Total Distributions | | | (3.83 | ) | | | | (4.54 | ) | | | | (0.72 | ) | | | | (0.77 | ) | | | | | (0.81 | ) | | | | (0.10 | ) |
| | |
| | | |
| | | |
| | | |
| | | | |
| | | |
| |
Paid-in Capital from Redemption Fees | | | 0.00 | 2 | | | | 0.01 | | | | | 0.04 | | | | | 0.02 | | | | | | 0.16 | | | | | — | |
| | |
| | | |
| | | |
| | | |
| | | | |
| | | |
| |
Net Increase (Decrease) in Net Asset Value | | | (0.57 | ) | | | | (3.45 | ) | | | | 3.85 | | | | | 8.18 | | | | | | 3.85 | | | | | 4.50 | |
| | |
| | | |
| | | |
| | | |
| | | | |
| | | |
| |
Net Asset Value – End of Period | | $ | 32.39 | | | | $ | 32.96 | | | | $ | 36.41 | | | | $ | 32.56 | | | | | $ | 24.38 | | | | $ | 20.53 | |
| | |
| | | |
| | | |
| | | |
| | | | |
| | | |
| |
Total Investment Return5 | | | 10.70% | (A) | | | | 2.63% | | | | | 14.29% | | | | | 37.80% | | | | | | 23.37% | | | | | 28.85% | |
Ratios to Average Net Assets: | | | | | | | | | | | | | | | | | | | | | | | | | | | | | | |
Expenses After Waivers3 | | | 1.50% | (B) | | | | 1.55% | | | | | 1.59% | | | | | 1.57% | | | | | | 1.56% | | | | | 1.53% | |
Expenses Before Waivers | | | 1.50% | (B) | | | | 1.55% | | | | | 1.59% | | | | | 1.57% | | | | | | 1.56% | | | | | 1.53% | |
Net Investment Income After Waivers3 | | | 0.38% | (B) | | | | 0.69% | | | | | 0.40% | | | | | 0.26% | | | | | �� | 0.54% | | | | | 1.63% | |
Net Investment Income Before Waivers | | | 0.38% | (B) | | | | 0.69% | | | | | 0.40% | | | | | 0.26% | | | | | | 0.54% | | | | | 1.63% | |
Supplementary Data: | | | | | | | | | | | | | | | | | | | | | | | | | | | | | | |
Portfolio Turnover Rate | | | 3% | (A) | | | | 15% | | | | | 36% | | | | | 16% | | | | | | 44% | | | | | 68% | |
Net Assets at End of Period (in thousands) | | $ | 378,232 | | | | $ | 463,333 | | | | $ | 594,625 | | | | $ | 513,808 | | | | $ | | 319,762 | | | | $ | 125,372 | |
|
| 1 | | Calculated based on shares outstanding on the first and last day of the respective periods, except for dividends and distributions, if any, which are based on the actual shares outstanding on the dates of distributions. |
| 2 | | Less than $0.01 |
| 3 | | Reflects fees waived by FBR Fund Advisers, Inc. pursuant to a contractual expense limitation of 1.95%. |
| 4 | | The amounts shown for a share outstanding throughout the respective periods may not be in accordance with the changes in the aggregate gains and losses on investments during the respective periods because of the timing of sales and repurchases of Fund shares in relation to fluctuating net asset values during the respective periods. |
| 5 | | Total investment return is calculated assuming a purchase of shares on the first day and a sale on the last day of each period reported and will include reinvestment of dividends and distributions, if any. |
| (A) | | Not Annualized |
| (B) | | Annualized |
63
| The FBR Funds |
|
| Financial Highlights (continued) |
| | FBR Small Cap Technology Fund |
| |
|
| | For the | | | | | | | | | | | |
| | Six Months | | | | | | | | | | | |
| | Ended | | For the Year | For the Period |
| | April 30, | | Ended | Ended | |
| | 2006 | | October 31, | October 31, | |
| | (unaudited) | | 2005 | 2004* | |
| |
| |
|
| |
Per Share Operating Performance: | | | | | | | | | | | |
Net Asset Value – Beginning of Period | | $ | 9.46 | | | | $ | 8.88 | | | | $ | 10.00 | | |
| | |
| | | |
| | | |
| | |
Income (Loss) from Investment Operations: | | | | | | | | | | | | | | | |
Net Investment Loss1,3 | | | (0.06 | ) | | | | (0.16 | ) | | | | (0.11 | ) | |
| | | | | | | | | | | | | | | |
Net Realized and Unrealized Gain (Loss) on Investments1,4 | | | 2.00 | | | | | 0.70 | | | | | (1.06 | ) | |
| | |
| | | |
| | | |
| | |
Total from Investment Operations | | | 1.94 | | | | | 0.54 | | | | | (1.17 | ) | |
| | |
| | | |
| | | |
| | |
Paid-in Capital from Redemption Fees | | | 0.00 | 2 | | | | 0.04 | | | | | 0.05 | | |
| | |
| | | |
| | | |
| | |
Net Increase (Decrease) in Net Asset Value | | | 1.94 | | | | | 0.58 | | | | | (1.12 | ) | |
| | |
| | | |
| | | |
| | |
Net Asset Value – End of Period | | $ | 11.40 | | | | $ | 9.46 | | | | $ | 8.88 | | |
| | |
| | | |
| | | |
| | |
Total Investment Return5 | | | 20.51% | (A) | | | | 6.53% | | | | | (11.20)% | (A) | |
Ratios to Average Net Assets: | | | | | | | | | | | | | | | |
Expenses After Waivers and Related Reimbursements3 | | | 1.94% | (B) | | | | 1.95% | | | | | 1.95% | (B) | |
Expenses Before Waivers and Related Reimbursements | | | 5.35% | (B) | | | | 9.14% | | | | | 6.43% | (B) | |
Net Investment Loss After Waivers and Related Reimbursements3 | | | (1.56)% | (B) | | | | (1.68)% | | | | | (1.79)% | (B) | |
Net Investment Loss Before Waivers and Related Reimbursements | | | (4.97)% | (B) | | | | (8.87)% | | | | | (6.27)% | (B) | |
Supplementary Data: | | | | | | | | | | | | | | | |
Portfolio Turnover Rate | | | 93% | (A) | | | | 246% | | | | | 150% | (A) | |
Net Assets at End of Period (in thousands) | | $ | 3,602 | | | | $ | 1,759 | | | | $ | 1,440 | | |
|
| * | | For the period January 20, 2004 (commencement of operations) to October 31, 2004. |
| 1 | | Calculated based on shares outstanding on the first and last day of the respective periods, except for dividends and distributions, if any, which are based on the actual shares outstanding on the dates of distributions. |
| 2 | | Less than $0.01 |
| 3 | | Reflects fees waived by FBR Fund Advisers, Inc. pursuant to a contractual expense limitation of 1.95%. |
| 4 | | The amounts shown for a share outstanding throughout the respective periods may not be in accordance with the changes in the aggregate gains and losses on investments during the respective periods because of the timing of sales and repurchases of Fund shares in relation to fluctuating net asset values during the respective periods. |
| 5 | | Total investment return is calculated assuming a purchase of shares on the first day and a sale on the last day of each period reported and will include reinvestment of dividends and distributions, if any. |
| (A) | | Not Annualized |
| (B) | | Annualized |
64
The FBR Funds
Financial Highlights (continued)
| | | | FBR Gas Utility Index Fund |
| | | |
|
| | | | For the | | | | | | | | | | | | | | | | | | | | | | | | | | | | | | | | | | | | |
| | | | Six Months | | | | | | | | | | | | | | For the | | | | | | | | | | | | | | | | | | |
| | | | Ended | | For the Years Ended | | Period | | | | | | | | | | | | | | | | | | |
| | | | April 30, | | October 31, | | Ended | | For the Years Ended March 31, |
| | | | 2006 | |
| | October 31, | |
|
| | | | (unaudited) | | | 2005 | | | | 2004 | | | 2003* | | | 2003 | | | | 2002 | | | | 2001 | |
| | | |
| |
| | | |
| | |
| |
| | | |
| | | |
|
| Per Share Operating Performance: | | | | | | | | | | | | | | | | | | | | | | | | | | | | | | | | | | | | | | | | | | | |
Net Asset Value – Beginning of Period | | | | $ | 17.25 | | | | | $ | 14.67 | | | | | $ | 12.51 | | | | | $ | 10.41 | | | | | $ | 15.53 | | | | | $ | 19.42 | | | | | $ | 16.93 | | |
| | | | |
| | | | |
| | | | |
| | | | |
| | | | |
| | | | |
| | | | |
| | |
Income (Loss) from Investment Operations: | | | | | | | | | | | | | | | | | | | | | | | | | | | | | | | | | | | | | | | | | | | |
Net Investment Income1,3 | | | | | 0.22 | | | | | | 0.52 | | | | | | 0.38 | | | | | | 0.20 | | | | | | 0.43 | | | | | | 0.49 | | | | | | 0.52 | | |
Net Realized and Unrealized Gain (Loss) on Investments1,4 | | | | | 0.68 | | | | | | 2.47 | | | | | | 2.17 | | | | | | 2.08 | | | | | | (5.12 | ) | | | | | (1.86 | ) | | | | | 5.00 | | |
| | | | |
| | | | |
| | | | |
| | | | |
| | | | |
| | | | |
| | | | |
| | |
Total from Investment Operations | | | | | 0.90 | | | | | | 2.99 | | | | | | 2.55 | | | | | | 2.28 | | | | | | (4.69 | ) | | | | | (1.37 | ) | | | | | 5.52 | | |
| | | | |
| | | | |
| | | | |
| | | | |
| | | | |
| | | | |
| | | | |
| | |
Distributions to Shareholders: | | | | | | | | | | | | | | | | | | | | | | | | | | | | | | | | | | | | | | | | | | | |
From Net Investment Income | | | | | (0.33 | ) | | | | | (0.41 | ) | | | | | (0.39 | ) | | | | | (0.18 | ) | | | | | (0.43 | ) | | | | | (0.49 | ) | | | | | (0.52 | ) | |
From Net Realized Gain | | | | | — | | | | | | — | | | | | | — | | | | | | — | | | | | | — | | | | | | (2.03 | ) | | | | | (2.51 | ) | |
| | | | |
| | | | |
| | | | |
| | | | |
| | | | |
| | | | |
| | | | |
| | |
Total Distributions | | | | | (0.33 | ) | | | | | (0.41 | ) | | | | | (0.39 | ) | | | | | (0.18 | ) | | | | | (0.43 | ) | | | | | (2.52 | ) | | | | | (3.03 | ) | |
| | | | |
| | | | |
| | | | |
| | | | |
| | | | |
| | | | |
| | | | |
| | |
Paid-in Capital from Redemption Fees | | | | | 0.00 | 2 | | | | | 0.00 | 2 | | | | | 0.00 | 2 | | | | | 0.00 | 2 | | | | | — | | | | | | — | | | | | | — | | |
| | | | |
| | | | |
| | | | |
| | | | |
| | | | |
| | | | |
| | | | |
| | |
Net Increase (Decrease) in Net Asset Value | | | | | 0.57 | | | | | | 2.58 | | | | | | 2.16 | | | | | | 2.10 | | | | | | (5.12 | ) | | | | | (3.89 | ) | | | | | 2.49 | | |
| | | | |
| | | | |
| | | | |
| | | | |
| | | | |
| | | | |
| | | | |
| | |
Net Asset Value – End of Period | | | | $ | 17.82 | | | | | $ | 17.25 | | | | | $ | 14.67 | | | | | $ | 12.51 | | | | | $ | 10.41 | | | | | $ | 15.53 | | | | | $ | 19.42 | | |
| | | | |
| | | | |
| | | | |
| | | | |
| | | | |
| | | | |
| | | | |
| | |
| Total Investment Return5 | | | | | 5.27% | (A) | | | | | 20.48% | | | | | | 20.63% | | | | | | 21.98% | (A) | | | | | (30.40)% | | | | | | (5.90)% | | | | | | 32.88% | | |
| Ratios to Average Net Assets: | | | | | | | | | | | | | | | | | | | | | | | | | | | | | | | | | | | | | | | | | | | |
Expenses After Waivers3 | | | | | 0.79% | (B) | | | | | 0.80% | | | | | | 0.85% | | | | | | 0.85% | (B) | | | | | 0.85% | | | | | | 0.85% | | | | | | 0.85% | | |
Expenses Before Waivers | | | | | 0.79% | (B) | | | | | 0.80% | | | | | | 0.88% | | | | | | 0.87% | (B) | | | | | 0.86% | | | | | | 0.85% | | | | | | 0.85% | | |
Net Investment Income After Waivers3 | | | | | 2.42% | (B) | | | | | 3.18% | | | | | | 2.90% | | | | | | 3.02% | (B) | | | | | 3.58% | | | | | | 2.88% | | | | | | 2.77% | | |
Net Investment Income Before Waivers | | | | | 2.42% | (B) | | | | | 3.18% | | | | | | 2.87% | | | | | | 3.00% | (B) | | | | | 3.57% | | | | | | 2.88% | | | | | | 2.77% | | |
| Supplementary Data: | | | | | | | | | | | | | | | | | | | | | | | | | | | | | | | | | | | | | | | | | | | |
Portfolio Turnover Rate | | | | | 2% | (A) | | | | | 20% | | | | | | 34% | | | | | | 5% | (A) | | | | | 39% | | | | | | 29% | | | | | | 38% | | |
Net Assets at End of Period (in thousands) | | | | $ | 259,768 | | | | | $ | 295,804 | | | | | $ | 220,545 | | | | | $ | 184,818 | | | | | $ | 145,663 | | | | | $ | 224,681 | | | | | $ | 269,504 | | |
|
| * | | Effective April 1, 2003, the Fund’s fiscal year end was changed to October 31. |
| 1 | | Calculated based on shares outstanding on the first and last day of the respective periods, except for dividends and distributions, if any, which are based on the actual shares outstanding on the dates of distributions. |
| 2 | | Less than $0.01 |
| 3 | | Reflects fees waived by FBR Fund Advisers, Inc. pursuant to a contractual expense limitation of 0.85%. |
| 4 | | The amounts shown for a share outstanding throughout the respective periods may not be in accordance with the changes in the aggregate gains and losses on investments during the respective periods because of the timing of sales and repurchases of Fund shares in relation to fluctuating net asset values during the respective periods. |
| 5 | | Total investment return is calculated assuming a purchase of shares on the first day and a sale on the last day of each period reported and will include reinvestment of dividends and distributions, if any. |
| (A) | | Not Annualized |
| (B) | | Annualized |
65
The FBR Funds
Financial Highlights (continued)
| | | FBR Fund for Government Investors |
| | |
|
| | | For the | | | | | | | | | | | | | | | | | | | | | | | | | | | | | | | | | | | | |
| | | Six Months | | For the | | | For the | | | | | | | | | | | | | | | | | | | | | | | |
| | | Ended | | Year | | | Period | | | | | | | | | | | | | | | | | | | | | | | |
| | | April 30, | | Ended | | | Ended | | For the Years Ended December 31, |
| | | 2006 | | October 31, | | | October 31, | |
|
| | | (unaudited) | | 2005 | | | 2004* | | | 2003 | | | | 2002 | | | | 2001 | | | | 2000 |
| | |
| |
| | |
| |
| | |
| | | |
| | | |
|
| Per Share Operating Performance: | | | | | | | | | | | | | | | | | | | | | | | | | | | | | | | | | | | | | | | | | | |
Net Asset Value – Beginning of Period | | | $ | 1.00 | | | | | $ | 1.00 | | | | | | $ | 1.00 | | | | | $ | 1.00 | | | | | $ | 1.00 | | | | | $ | 1.00 | | | | | $ | 1.00 | |
| | | |
| | | | |
| | | | | |
| | | | |
| | | | |
| | | | |
| | | | |
| |
Income (Loss) from Investment Operations: | | | | | | | | | | | | | | | | | | | | | | | | | | | | | | | | | | | | | | | | | | |
Net Investment Income1,3 | | | | 0.02 | | | | | | 0.02 | | | | | | | 0.00 | 2 | | | | | 0.00 | 2 | | | | | 0.01 | | | | | | 0.03 | | | | | | 0.05 | |
Net Realized Loss on Investments1,4 | | | | (0.00 | )2 | | | | | (0.00 | )2 | | | | | | (0.00 | )2 | | | | | (0.00 | )2 | | | | | — | | | | | | — | | | | | | — | |
| | | |
| | | | |
| | | | | |
| | | | |
| | | | |
| | | | |
| | | | |
| |
Total From Investment Operations | | | | 0.02 | | | | | | 0.02 | | | | | | | 0.00 | 2 | | | | | 0.00 | 2 | | | | | 0.01 | | | | | | 0.03 | | | | | | 0.05 | |
| | | |
| | | | |
| | | | | |
| | | | |
| | | | |
| | | | |
| | | | |
| |
Distributions to Shareholders: | | | | | | | | | | | | | | | | | | | | | | | | | | | | | | | | | | | | | | | | | | |
From Net Investment Income | | | | (0.02 | ) | | | | | (0.02 | ) | | | | | | (0.00 | )2 | | | | | (0.00 | )2 | | | | | (0.01 | ) | | | | | (0.03 | ) | | | | | (0.05 | ) |
| | | |
| | | | |
| | | | | |
| | | | |
| | | | |
| | | | |
| | | | |
| |
Net Asset Value – End of Period | | | $ | 1.00 | | | | | $ | 1.00 | | | | | | $ | 1.00 | | | | | $ | 1.00 | | | | | $ | 1.00 | | | | | $ | 1.00 | | | | | $ | 1.00 | |
| | | |
| | | | |
| | | | | |
| | | | |
| | | | |
| | | | |
| | | | |
| |
| Total Investment Return5 | | | | 1.69% | (A) | | | | | 1.96% | | | | | | | 0.42% | (A) | | | | | 0.42% | | | | | | 1.03% | | | | | | 3.25% | | | | | | 5.27% | |
| Ratios to Average Net Assets: | | | | | | | | | | | | | | | | | | | | | | | | | | | | | | | | | | | | | | | | | | |
Expenses After Waivers3 | | | | 0.84% | (B) | | | | | 0.76% | | | | | | | 0.75% | (B) | | | | | 0.75% | | | | | | 0.75% | | | | | | 0.75% | | | | | | 0.75% | |
Expenses Before Waivers | | | | 0.84% | (B) | | | | | 0.86% | | | | | | | 0.85% | (B) | | | | | 0.82% | | | | | | 0.75% | | | | | | 0.75% | | | | | | 0.75% | |
Net Investment Income After Waivers3 | | | | 3.38% | (B) | | | | | 1.92% | | | | | | | 0.50% | (B) | | | | | 0.43% | | | | | | 1.03% | | | | | | 3.25% | | | | | | 5.17% | |
Net Investment Income Before Waivers | | | | 3.38% | (B) | | | | | 1.82% | | | | | | | 0.40% | (B) | | | | | 0.36% | | | | | | 1.03% | | | | | | 3.25% | | | | | | 5.17% | |
| Supplementary Data: | | | | | | | | | | | | | | | | | | | | | | | | | | | | | | | | | | | | | | | | | | |
Net Assets at End of Period (in thousands) | | | $ | 230,966 | | | | | $ | 251,675 | | | | | | $ | 288,761 | | | | | $ | 341,413 | | | | | $ | 454,247 | | | | | $ | 484,682 | | | | | $ | 555,711 | |
|
| * | | Effective March 1, 2004, the Fund’s fiscal year end changed to October 31. |
| 1 | | Calculated based on shares outstanding on the first and last day of the respective periods, except for dividends and distributions, if any, which are based on the actual shares outstanding on the dates of distributions. |
| 2 | | Less than $0.01 |
| 3 | | Prior to November 1, 2005, reflects fees waived by the Adviser pursuant to a contractual advisory fee waiver of 0.10%. |
| 4 | | The amounts shown for a share outstanding throughout the respective periods may not be in accordance with the changes in the aggregate gains and losses in investments during the respective periods because of the timing of sales and repurchases of Fund shares in relation to fluctuating net asset values during the respective periods. |
| 5 | | Total investment return is calculated assuming a purchase of shares on the first day and a sale on the last day of each period reported and will include reinvestment of dividends and distributions, if any. |
| (A) | | Not Annualized |
| (B) | | Annualized |
The accompanying notes are an integral part of the financial statements.
66
| The FBR Funds |
|
| Schedule of Shareholder Expenses |
| (unaudited) |
As a shareholder of the Funds, you incur two types of costs: (1) transaction costs, including reinvested dividends or other distributions; redemption fees; and exchange fees; and (2) ongoing costs, including investment advisory fees; distribution (12b-1) fees; and other Fund expenses. This example is intended to help you understand your ongoing costs (in dollars) of investing in the Funds and to compare these costs with the ongoing costs of investing in other mutual funds.
The example is based on an investment of $1,000 invested at the beginning of the period and held for the entire period (November 1, 2005 through April 30, 2006).
Actual Expenses
The first line of the table on the following page provides information about actual account values and actual expenses. You may use the information in this line, together with the amount you invested, to estimate the expenses that you paid over the period. Simply divide your account value by $1,000 (for example, an $8,600 account value divided by $1,000 = 8.6), then multiply the result by the number in the first line under the heading entitled “Expenses Paid During the Six Months Ended April 30, 2006” to estimate the expenses you paid on your account during this period.
Hypothetical Example for Comparison Purposes
The second line of the table on the following page provides information about hypothetical account values and hypothetical expenses based on the Funds’ actual expense ratio and an assumed rate of return of 5% per year before expenses, which is not the Funds’ actual return. The hypothetical account values and expenses may not be used to estimate the actual ending account balance or expenses you paid for the period. You may use this information to compare the ongoing costs of investing in the Funds and other funds. To do so, compare this 5% hypothetical example with the 5% hypothetical examples that appear in the shareholder reports of the other funds.
67
| The FBR Funds |
|
| Schedule of Shareholder Expenses (continued) |
| (unaudited) |
| | | | | | | | | Expenses Paid |
| | | Net Expense | | Beginning | | Ending | | During the |
| | | Ratio | | Account | | Account | | Six Months |
| | | Annualized | | Value | | Value | | Ended |
| | | April 30, 2006 | | November 1, 2005 | | April 30, 2006 | | April 30, 2006* |
| | |
| |
| |
| |
|
| Pegasus Fund** | | | | | | | | |
Actual | | 1.93% | | $1,000.00 | | $1,145.50 | | $9.47 |
Hypothetical | | 1.93 | | 1,000.00 | | 1,015.22 | | 9.64 |
| Large Cap Financial Fund | | | | | | | | |
Actual | | 1.77 | | 1,000.00 | | 1,098.80 | | 9.21 |
Hypothetical | | 1.77 | | 1,000.00 | | 1,016.02 | | 8.85 |
| Large Cap Technology Fund | | | | | | | | |
Actual | | 1.85 | | 1,000.00 | | 1,175.60 | | 9.98 |
Hypothetical | | 1.85 | | 1,000.00 | | 1,015.62 | | 9.25 |
| Small Cap Fund | | | | | | | | |
Actual | | 1.40 | | 1,000.00 | | 1,233.30 | | 7.75 |
Hypothetical | | 1.40 | | 1,000.00 | | 1,017.85 | | 7.00 |
| Small Cap Financial Fund | | | | | | | | |
Actual | | 1.50 | | 1,000.00 | | 1,107.00 | | 7.84 |
Hypothetical | | 1.50 | | 1,000.00 | | 1,017.36 | | 7.50 |
| Small Cap Technology Fund | | | | | | | | |
Actual | | 1.94 | | 1,000.00 | | 1,205.10 | | 10.61 |
Hypothetical | | 1.94 | | 1,000.00 | | 1,015.17 | | 9.69 |
| Gas Utility Index Fund | | | | | | | | |
Actual | | 0.79 | | 1,000.00 | | 1,052.70 | | 4.02 |
Hypothetical | | 0.79 | | 1,000.00 | | 1,020.88 | | 3.96 |
| Fund for Government Investors | | | | | | | | |
Actual | | 0.84 | | 1,000.00 | | 1,016.90 | | 4.20 |
Hypothetical | | 0.84 | | 1,000.00 | | 1,020.63 | | 4.21 |
| | | | | | | | | |
| | | | | | | | |
| * Expenses are equal to the Fund’s annualized expense ratio, multiplied by the average account value over the period, multiplied by the number of days in most recent fiscal half- year then divided by 365. |
| ** Represents the period from commencement of operations (November 15, 2005) through April 30, 2006. |
68
| The FBR Funds |
|
| Notes to Financial Statements |
| (unaudited) |
1. Organization
The FBR Funds (the “Trust”) is registered under the Investment Company Act of 1940, as amended, (“1940 Act”) as an open-end management investment company. The Trust was organized as a business trust under the laws of the State of Delaware on September 29, 2003. The Trust currently consists of eight series which represent interests in one of the following investment portfolios: FBR Pegasus FundTM (“Pegasus Fund”), FBR Large Cap Financial Fund (“Large Cap Financial Fund”), FBR Large Cap Technology Fund (“Large Cap Technology Fund”), FBR Small Cap Fund (“Small Cap Fund”), FBR Small Cap Financial Fund (“Small Cap Financial Fund”), FBR Small Cap Technology Fund (“Small Cap Technology Fund”), FBR Gas Utility Index Fund (“Gas Utility Index Fund”) and FBR Fund for Government Investors (“Money Market Fund”), (each a “Fund” and collectively, the “Funds”). The Trust is authorized to issue an unlimited number of shares of beneficial interest with no par value which may be issued in more than one class or series. Each Fund offers one class of shares, which is offered as no-load shares.
The Pegasus Fund, a non-diversified fund, intends to invest in the stocks of companies of any size without regard to market capitalization. The investment objective of the Fund is capital appreciation.
The Large Cap Financial Fund, a non-diversified fund, intends to invest at least 80% of its total assets in securities of large capitalization (“large-cap”) companies principally engaged in the business of financial services. The investment objective of the Fund is capital appreciation.
The Large Cap Technology Fund, a non-diversified fund, intends to invest at least 80% of its total assets in securities of large-cap companies that are principally engaged in the research, design, development, manufacturing or distributing products or services in the technology industry. The investment objective of the Fund is long-term capital appreciation.
The Small Cap Fund, a non-diversified fund, intends to invest at least 80% of its total assets in securities of small capitalization (“small-cap”) companies. The investment objective of the Fund is capital appreciation.
The Small Cap Financial Fund, a non-diversified fund, intends to invest at least 80% of its total assets in securities of small-cap companies principally engaged in the business of providing financial services to consumers and industry. The investment objective of the Fund is capital appreciation.
The Small Cap Technology Fund, a non-diversified fund, intends to invest at least 80% of its total assets in securities of small-cap companies that are principally engaged in the research, design, development, manufacturing or distributing products or services in the technology industry. The investment objective of the Fund is long-term capital appreciation.
The Gas Utility Index Fund, a diversified fund, intends to invest at least 85% of its net assets in the common stock of companies that have natural gas distribution and transmission operations. The investment objective of the Fund is income and capital appreciation.
69
| The FBR Funds |
|
| Notes to Financial Statements (continued) |
| (unaudited) |
The Money Market Fund, a diversified fund, intends to invest at least 95% of its total assets in fixed-rate and floating-rate short-term instruments issued or guaranteed by the U.S. Government, its agencies or instrumentalities and in repurchase agreements secured by such instruments. The investment objective of the Fund is current income consistent with liquidity and preservation of capital.
2. Significant Accounting Policies
The following is a summary of the Funds’ significant accounting policies:
Portfolio Valuation — The net asset value per share (“NAV”) of each Fund is determined as of the close of regular trading on the New York Stock Exchange (“NYSE”) (normally 4:00p.m., Eastern Time) on each business day that the exchange is open for trading. Each Fund’s securities are valued at the last sale price on the securities exchange or national securities market on which such securities are primarily traded. Securities that are quoted by NASDAQ are valued at the NASDAQ Official Closing Price. Securities not listed on an exchange or national securities market, or securities in which there were no transactions, are valued at the average of the most recent bid and ask prices, except in the case of open short positions where the ask price is used for valuation purposes. The bid price is used when no ask price is available. Short-term investments are carried at amortized cost, which approximates market value. Restricted securities, as well as securities or other assets for which market quotations are not readily available, or are not valued by a pricing service approved by the Funds’ Board of Trustees (the “Board”), are valued at fair value in good faith by, or at the direction of, the Board.
Share Valuation — The NAV of each Fund is calculated by dividing the sum of the value of the securities held by each Fund, plus cash or other assets, minus all liabilities (including estimated accrued expenses) by the total number of shares outstanding of each Fund, rounded to the nearest cent. Each Fund’s shares will not be priced on the days on which the NYSE is closed for trading. The offering and redemption price per share of each Fund is equal to each Fund’s NAV. The Funds, except for the Money Market Fund, charge a 1% redemption fee on shares redeemed or exchanged within 90 days of purchase. These fees are deducted from the redemption proceeds otherwise payable to the shareholder. The Funds will retain the fee charged as paid-in capital and such fees become part of that Fund’s daily NAV calculation.
Investment Income — Dividend income is recorded on the ex-dividend date. Interest income, which includes the amortization of premium and accretion of discount, if any, is recorded on an accrual basis.
Expenses — The Funds pay all operational expenses, which are either charged directly to a Fund for which the expense is attributable or are allocated proportionately among the Funds based on allocation methods approved by the Board.
Distributions to Shareholders — Each Fund, except the Gas Utility Index Fund and Money Market Fund, declares and pays any dividends from its net investment income, if any, annually. The Gas Utility Index Fund declares and pays any such dividends quarterly.
70
| The FBR Funds |
|
| Notes to Financial Statements (continued) |
| (unaudited) |
The Money Market Fund declares dividends each day the Fund is open for business and pays monthly. Distributions from net realized capital gains, if any, will be distributed at least annually for each Fund. Income and capital gain distributions are determined in accordance with U.S. federal income tax regulations.
Security Transactions — Security transactions are accounted for on the trade date. Securities sold are determined on a specific identification basis.
Estimates — The preparation of financial statements in accordance with U.S. generally accepted accounting principles requires management to make estimates and assumptions that may affect the reported amounts of assets and liabilities and disclosure of contingent assets and liabilities at the date of the financial statements and the reported amounts of income and expenses during the reporting period. Actual results could differ from those estimates.
Options — Each Fund, except the Gas Utility Index Fund and Money Market Fund, may buy and sell call and put options to hedge against changes in net asset value or to attempt to realize a greater current return. The risk associated with purchasing an option is that a Fund pays a premium whether or not the option is exercised. Additionally, a Fund bears the risk of loss of premium and change in market value should the counterparty not perform under the contract. Put and call options purchased are accounted for in the same manner as portfolio securities. The cost of securities acquired through the exercise of call options is increased by the premiums paid. The proceeds from securities sold through the exercise of put options are decreased by the premiums paid. When a Fund writes an option, an amount equal to the premium received by the Fund is recorded as a liability and is subsequently adjusted to the current market value of the option written. Premiums received from writing options which expire unexercised are recorded by a Fund on the expiration date as realized gains from options transactions.
The difference between the premium and the amount paid on effecting a closing purchase transaction, including brokerage commissions, is also treated as a realized gain, or if the premium is less than the amount paid for the closing purchase transaction, as a realized loss. If a call option is exercised, the premium is added to the proceeds from the sale of the underlying securities in determining whether a Fund has a realized gain or loss. If a put option is exercised, the premium reduces the cost basis of the securities purchased by a Fund. Each Fund’s use of written options involves, to varying degrees, elements of market risk in excess of the amount recognized in the Statement of Assets and Liabilities. The contract or notional amounts reflect the extent of a Fund’s involvement in these financial instruments. In writing an option, a Fund bears the market risk of an unfavorable change in the price of the security underlying the written option. Exercise of an option written by a Fund could result in a Fund selling or buying a security at a price different from the current market value. A Fund’s activities in written options are conducted through regulated exchanges, which do not result in counterparty credit risks. The Funds had no outstanding options at April 30, 2006.
Repurchase Agreements — The Pegasus Fund, Large Cap Financial Fund, Large Cap Technology Fund, Small Cap Fund, Small Cap Financial Fund, Small Cap Technology
71
| The FBR Funds |
|
| Notes to Financial Statements (continued) |
| (unaudited) |
Fund and Gas Utility Index Fund (collectively the “Equity Funds”) have agreed to purchase securities from financial institutions subject to the seller’s agreement to repurchase them at an agreed-upon time and price (“repurchase agreement”). The financial institutions with whom each Fund enters into repurchase agreements are banks and broker/dealers which the adviser considers creditworthy pursuant to criteria approved by the Board. The seller under a repurchase agreement will be required to maintain the value of the securities as collateral, subject to the agreement at not less than the repurchase price plus accrued interest. The adviser marks to market daily the value of the collateral, and, if necessary, requires the seller to maintain additional securities, to ensure that the value is not less than the repurchase price. Default by or bankruptcy of the seller would, however, expose each Fund to possible loss because of adverse market action or delays in connection with the disposition of the underlying securities.
Securities Lending — Each Fund may lend its portfolio securities to broker-dealers, banks or institutional borrowers of securities. Loans of securities are required at all times to be secured by collateral equal to at least 100% of the market value of the securities on loan. However, in the event of default or bankruptcy by the other party to the agreement, realization and/or retention of the collateral may be subject to legal proceedings. In the event that the borrower fails to return securities, and cash collateral being maintained by the borrower is insufficient to cover the value of loaned securities and provided such collateral insufficiency is not the result of investment losses, the lending agent has agreed to pay the amount of the shortfall to the Funds. The Funds had no securities on loan to brokers at April 30,2006.
Line of Credit — The Trust has a line of credit (“Credit Agreement”) with Custodial Trust Company (“CTC”) for temporary or emergency purposes. Under the Credit Agreement, CTC provides a line of credit in an amount up to the maximum amount permitted under the 1940 Act and each Fund’s prospectus. Pursuant to the Credit Agreement, each participating Fund is liable only for principal and interest payments related to borrowings made by that Fund. Borrowings under the Credit Agreement bear interest at 100 basis points (100 basis points = 1%) over the Fed Funds Rate, except for the Gas Utility Index Fund and the Money Market Fund, which bear interest at 100 basis points over the LIBOR (London Inter-Bank Offer Rate). The Funds had no borrowings outstanding at April 30, 2006.
Other — In the normal course of business, the Funds enter into contracts that contain a variety of representations and warranties and which provide general indemnifications. The Funds’ maximum exposure under these arrangements is unknown, as this would involve future claims that may be made against the Funds that have not yet occurred. However, based on experience, the Funds expect the risk of loss to be remote.
3. Transactions with Affiliates
Investment Adviser — FBR Fund Advisers, Inc. (“Fund Advisers”) serves as investment adviser to the Funds. For its advisory services, Fund Advisers receives a monthly fee at an annual rate of 0.90% of the average daily net assets of the Pegasus Fund, Large Cap Financial Fund, Large Cap Technology Fund, Small Cap Fund, Small Cap Financial Fund and Small Cap Technology Fund, and at an annual rate of 0.40% of the average daily net
72
| The FBR Funds |
|
| Notes to Financial Statements (continued) |
| (unaudited) |
assets of the Gas Utility Index Fund. The Money Market Fund pays a management fee at an annual rate based on the Fund’s average daily net assets of 0.50% on the first $500 million, 0.45% on the next $250 million, 0.40% on the next $250 million, and 0.35% on net assets over $1 billion.
Fund Advisers has contractually agreed to limit each Fund’s total operating expenses to 1.95% of each Fund’s average daily net assets, except for the Gas Utility Index Fund and Money Market Fund, which Fund Advisers has contractually agreed to limit total operating expenses to 0.85% and 1.00% of average daily net assets, respectively. Fund Advisers has agreed to maintain these limitations with regard to each Fund through November 1, 2006.
Fund Advisers has retained Akre Capital Management, LLC (“ACM”) as investment sub-adviser to the Small Cap Fund. In this capacity, subject to the supervision of Fund Advisers and the Board, ACM directs the investments of the Small Cap Fund’s assets, continually conducts investment research and supervision for the Small Cap Fund, and is responsible for the purchase and sale of the Small Cap Fund’s investments. For these services, Fund Advisers (and not the Fund) pays ACM a fee out of the Adviser’s advisory fee.
Administrator — Effective November 1, 2005, the Trust, on behalf of the Funds, entered into an Administration Agreement (“Agreement”) with Fund Advisers to provide day-to-day administrative services including monitoring portfolio compliance, determining compliance with provisions of the Internal Revenue Code, oversight of the service providers and preparing the Funds’ registration statements. Pursuant to the Agreement, Fund Advisers receives a fee of 0.06% on the first $2 billion of total average daily net assets of the Funds, 0.05% on the next $1 billion of total average daily net assets of the Funds and 0.035% on the Funds’ average daily net assets in excess of $3 billion. Fund Advisers also provides the Funds with office space, facilities and business equipment and generally administers the Funds’ business affairs and provides the services of executive and clerical personnel for administering the affairs of the Funds. Fund Advisers compensates all personnel, Officers, and Trustees of the Funds if such persons are employees of the Investment Adviser or Administrator. As of November 1, 2005, the Funds have contracted directly with a third party, Integrated Fund Services, Inc., for transfer agency and fund accounting services, and the Funds pay for all operating costs.
Plan of Distribution — The Trust, on behalf of each Fund, except the Gas Utility Index Fund and Money Market Fund, has adopted a Distribution Plan (the “Plan”) pursuant to Rule 12b-1 under the 1940 Act. Under the Plan, each Fund may pay FBR Investment Services, Inc. (the “Distributor”) a fee at an annual rate of up to 0.25% of each Fund’s average daily net assets. Fees paid to the Distributor under the Plan are payable without regard to actual expenses incurred. The Distributor has voluntarily agreed to waive a portion of the distribution fees payable by the Small Cap Fund in an amount attributable to marketing expenses for the Fund until such time as the Fund is reopened to new investors.
73
| The FBR Funds |
|
| Notes to Financial Statements (continued) |
| (unaudited) |
Brokerage Commissions — For the six months ended April 30, 2006, the Small Cap Financial Fund paid $13,504 in brokerage commissions from portfolio transactions to Friedman, Billings, Ramsey and Co., Inc. (FBR & Co.), an affiliate of Fund Advisers and the Distributor. No other Fund paid commissions to FBR & Co. during the period.
Trustees’ Fees — Each Trustee of the Trust who is not an employee of the Adviser or affiliate of the Adviser receives an annual retainer fee of $14,000 and an additional meeting fee of $2,250 for each quarterly meeting attended. In addition, each Trustee that serves on the Audit Committee or Nominating Committee receives a meeting fee of $1,000 for attendance at the meeting. If a Trustee participates by teleconference, the meeting fee is 50% of the respective meeting fee. The Chairman of the Board, an independent Trustee, receives an additional $1,000 for each meeting attended.
4. Investment Transactions
For the six months ended April 30, 2006, purchases and sales of investment securities (excluding short-term securities and U.S. government obligations) for each Fund were as follows:
| | | Purchases | | Sales |
| | |
| |
|
| Pegasus Fund | | $ | 5,797,570 | | $ | 1,175,711 |
| Large Cap Financial Fund | | | 10,935,031 | | | 5,776,104 |
| Large Cap Technology Fund | | | 17,857,503 | | | 11,452,584 |
| Small Cap Fund | | | 10,239,708 | | | 106,508,909 |
| Small Cap Financial Fund | | | 12,809,400 | | | 66,151,548 |
| Small Cap Technology Fund | | | 3,705,694 | | | 2,344,876 |
| Gas Utility Index Fund | | | 6,349,056 | | | 73,104,515 |
5. Federal Income Taxes
It is each Fund’s policy to comply with the special provisions of the Internal Revenue Code of 1986, as amended, applicable to regulated investment companies. As provided therein, in any fiscal year in which a Fund so qualifies and distributes at least 90% of its taxable net income, the Fund (but not the shareholders) will be relieved of federal income tax on the income distributed. Accordingly, no provision for income taxes has been made.
In order to avoid imposition of the excise tax applicable to regulated investment companies, it is also each Fund’s intention to declare and pay as dividends in each calendar year at least 98% of its net investment income (earned during the calendar year) and 98% of its net realized capital gains (earned during the twelve months ending October 31) plus undistributed amounts from prior years.
Income and capital gain distributions are determined in accordance with income tax regulations that may differ from accounting principles that are generally accepted in the United States of America. As a result, the character of tax-basis distributions and the composition of nets assets for tax purposes may differ from those reflected in the Funds’
74
| The FBR Funds |
|
| Notes to Financial Statements (continued) |
| (unaudited) |
financial statements. These book/tax differences may be temporary or permanent in nature. Reclassifications for these differences are made to components of capital. These reclassifications have no effect on net assets or net asset value per share. Tax-basis distributions and net asset balances are determined at the Funds’fiscal year-end.
Unused capital loss carryforwards as of October 31, 2005, were as follows:
| | | | | | Fund for |
| | | Gas Utility | | Government |
| | | Index Fund | | Investors |
| | |
| |
|
| October 31, 2011 | | $ | 17,046,614 | | $ | 23,854 |
| October 31, 2012 | | $ | 1,561,301 | | $ | 165,106 |
| October 31, 2013 | | $ | – | | $ | 970 |
The capital loss carryforwards may be utilized in the current and future years to offset net realized capital gains, if any, prior to distributing such gains to shareholders.
As of April 30, 2006, the Federal Tax cost of securities and the resulting net unrealized appreciation are as follows:
| | | | | Gross | | Gross | | | Net | |
| | | Federal | | Unrealized | | Unrealized | | | Unrealized | |
| | | Tax Cost | | Appreciation | | Depreciation | | | Appreciation | |
| | |
| |
| |
| | |
| |
| Pegasus Fund | | $ | 5,100,506 | | $ | 357,770 | | $ | (49,359 | ) | | $ | 308,411 | |
| Large Cap Financial Fund | | | 24,497,562 | | | 4,610,852 | | | (326,687 | ) | | | 4,284,165 | |
| Large Cap Technology Fund | | | 22,967,431 | | | 2,405,610 | | | (469,432 | ) | | | 1,936,178 | |
| Small Cap Fund | | | 530,007,781 | | | 392,587,073 | | | (9,333,412 | ) | | | 383,253,661 | |
| Small Cap Financial Fund | | | 272,064,286 | | | 113,219,594 | | | (5,785,465 | ) | | | 107,434,129 | |
| Small Cap Technology Fund | | | 3,419,835 | | | 260,431 | | | (78,320 | ) | | | 182,111 | |
| Gas Utility Index Fund | | | 155,380,190 | | | 107,628,468 | | | (4,580,240 | ) | | | 103,048,228 | |
| Fund for Government Investors | | | 209,410,748 | | | — | | | — | | | | — | |
6. Investments in Affiliates
Affiliated issuers, as defined by the 1940 Act, are those in which a Fund’s holdings represent 5% or more of the outstanding voting securities of the issuer. A summary of each Fund’s investments in affiliates, if any, for the six months ended April 30, 2006, is noted below:
| | | SHARE ACTIVITY | | | | | | | | | | |
| | |
| | | | | | | | | | |
| | | Balance | | | | | | Balance | | | Realized | | | | | Value | | Acquisition |
| Affiliate | | 10/31/05 | | Purchases | | Sales | | 4/30/06 | | | Gain | | | Dividends | | 4/30/06 | | Cost |
|
| FBR Small Cap Fund | | | | | | | | | | | | | | | | | | |
Monarch Casino & Resort, Inc. | | 992,000 | | — | | — | | 992,000 | | | — | | | — | | $31,228,160 | | $4,511,967 |
| FBR Small Cap Financial Fund | | | | | | | | | | | | | | | | | | |
ITLA Capital Corp. | | 301,902 | | 5,008 | | 27,000 | | 279,910 | | | $781,557 | | | $41,987 | | 14,331,393 | | 8,658,030 |
75
| The FBR Funds |
|
| Important Supplemental Information |
| (unaudited) |
Proxy Voting Guidelines
Fund Advisers is responsible for exercising the voting rights associated with the securities purchased and held by the Funds. A description of the policies and procedures Fund Advisers uses in fulfilling this responsibility is included in the Funds’ Statement of Additional Information and is available without charge, upon request, by calling 888.888.0025. The policies and procedures are also available on the Securities and Exchange Commission’s website at http://www.sec.gov. Information on how the Funds voted proxies relating to portfolio securities during the most recent 12 month period ended June 30 is available without charge, upon request, by calling 888.888.0025 and is also available on the SEC’s website at http://www.sec.gov.
Portfolio Holdings
The Funds file their complete schedule of holdings with the SEC for the first and third quarters of each fiscal year on Form N-Q. The Funds’ Form N-Q is available on the SEC’s website, beginning with the July 31, 2004 report, at http://www.sec.gov. You may review and make copies at the SEC’s Public Reference Room in Washington, D.C. You may also obtain copies after paying a duplicating fee by writing the SEC’s Public Reference Section, Washington, D.C. 20549-0102 or by electronic request to publicinfo@sec.gov. A copy of the quarterly holdings report is available, without charge, upon request, by calling 888.888.0025.
76
[THIS PAGE INTENTIONALLY LEFT BLANK]
[THIS PAGE INTENTIONALLY LEFT BLANK]
THE FBR FUNDS
888.888.0025
funds@fbr.com
www.fbrfunds.com
Investment Adviser and Administrator
FBR FUND ADVISERS, INC.
1001 NINETEENTH STREET NORTH
ARLINGTON, VIRGINIA 22209
Distributor
FBR INVESTMENT SERVICES, INC.
1001 NINETEENTH STREET NORTH
ARLINGTON, VIRGINIA 22209
Custodian
CARDINAL BANK
8270 GREENSBORO DRIVE
McLEAN, VIRGINIA 22102
Transfer Agent
INTEGRATED FUND SERVICES, INC.
P.O. BOX 5354
CINCINNATI, OHIO 45201
Independent Registered Public Accountants
TAIT, WELLER, AND BAKER LLP
1818 MARKET STREET
PHILADELPHIA, PENNSYLVANIA 19103
This report is not authorized
for distribution to prospective
investors unless it is preceded or
accompanied by a current prospectus.
ITEM 2. CODE OF ETHICS.
Not applicable for semi-annual reports.
ITEM 3. AUDIT COMMITTEE FINANCIAL EXPERT.
Not applicable for semi-annual reports.
ITEM 4. PRINCIPAL ACCOUNTANT FEES AND SERVICES.
Not applicable for semi-annual reports.
ITEM 5. AUDIT COMMITTEE OF LISTED REGISTRANTS.
Not applicable.
ITEM 6. SCHEDULE OF INVESTMENTS.
Contained in Item 1.
ITEM 7. DISCLOSURE OF PROXY VOTING POLICIES AND PROCEDURES FOR CLOSED-END MANAGEMENT INVESTMENT COMPANIES.
Not applicable.
ITEM 8. PORTFOLIO MANAGERS OF CLOSED-END MANAGEMENT INVESTMENT COMPANIES.
Not applicable.
ITEM 9. PURCHASES OF EQUITY SECURITIES BY CLOSED-END MANAGEMENT INVESTMENT COMPANY AND AFFILIATED PURCHASERS.
Not applicable.
ITEM 10. SUBMISSION OF MATTERS TO A VOTE OF SECURITY HOLDERS.
The Board of Trustees of the Trust has adopted Policies for Consideration of Board Member Candidates (the “Policies”). Generally, the Policies provide that, while the Nominating Committee (the “Committee”) is solely responsible for evaluating, selecting and nominating candidates to serve on the Board, the Committee may consider nominations from shareholders. Such nominations must be submitted by eligible shareholders and satisfy certain requirements as set forth in the Policies.
Among other requirements, each eligible shareholder may submit a candidate so long as it is received by the Committee within one year immediately preceding the Committee’s consideration of Board member candidates and such recommendation is delivered to the Trust’s Secretary, at 1001 Nineteenth Street North, Arlington, VA 22209. Additionally, any shareholder submitting a candidate must beneficially own securities of the Trust and must be eligible to vote both at the time of submission of the candidate and at the time of the Board member election. Such securities must continue to be held through the date of the meeting.
A shareholder’s submission to the Secretary of the Trust must include, among other information: (a) contact information for the nominating shareholder; (b) a certification from the nominating shareholder which provides the number of shares which the person or group has: (i) sole power to vote or direct the vote; (ii) shared power to vote or direct the vote; (iii) sole power to dispose or direct the disposition of such shares; and (iv) shared power to dispose or direct the disposition of such shares; (c) the candidate’s contact information and the number of applicable Trust shares owned by the candidate; (d) all information regarding the candidate that would be required to be disclosed in solicitations of proxies for elections of directors required by Regulation 14A under the Securities Exchange Act of 1934, as amended; and (e) a notarized letter executed by the candidate, stating his or her intention to serve as a candidate and be named in the Trust’s proxy statement, if so designated by the Committee and the Trust’s Board. It shall be in the Committee’s sole discretion whether to seek corrections of a deficient submission or to exclude a candidate for consideration.
For additional information, please contact the Trust at 888.888.0025.
ITEM 11. CONTROLS AND PROCEDURES.
| (a) | | Based upon their evaluation of the Registrant's disclosure controls and procedures as conducted within 90 days of the filing date of this Form N-CSR, the Registrant's PFO and PEO have concluded that those disclosure controls and procedures provide reasonable assurance that the material information required to be disclosed by the Registrant in this Form N-CSR has been recorded, processed, summarized and reported within the time periods specified in the Securities and Exchange Commission's rules and forms. |
| (b) | | There were no changes in the Registrant's internal controls over financial reporting as defined in Rule 30a-3(d) under the Act (17 CFR 270.30a-3(d)) that occurred during the second fiscal quarter of the period covered by this report that has materially affected, or is reasonably likely to materially affect, the Registrant’s internal control over financial reporting. |
ITEM 12. EXHIBITS.
File the exhibits listed below as part of this Form. Letter or number the exhibits in the sequence indicated.
| (a) | | (1) Not applicable. |
| | | (2) A separate certification for each principal executive officer and principal financial officer of the Registrant as required by Rule 30a-2(a) under the Act (17 CFR 270.30a-2): Attached herewith. |
| | | (3) Not applicable. |
| (b) | | (1) The certifications required by Rule 30a-2(b) of the Investment Company Act of 1940 and Section 906 of the Sarbanes-Oxley Act of 2002: Attached herewith. |
SIGNATURES
Pursuant to the requirements of the Securities Exchange Act of 1934 and the Investment Company Act of 1940, the registrant has duly caused this report to be signed on its behalf by the undersigned, thereunto duly authorized.
(Registrant) The FBR Funds
——————————————————————
| By (Signature and Title)* | | /s/ Susan L. Silva | | June 27, 2006 | |
| | |
| |
| | | Susan L. Silva | | Date | |
| | | Treasurer | | | |
| | | The FBR Funds | | | |
Pursuant to the requirements of the Securities Exchange Act of 1934 and the Investment Company Act of 1940, this report has been signed below by the following persons on behalf of the registrant and in the capacities and on the dates indicated.
| By (Signature and Title) | | /s/ David H. Ellison | | June 27, 2006 | |
| | |
| |
| | | David H. Ellison | | Date | |
| | | President | | | |
| | | The FBR Funds | | | |
| | | (Principal Executive Officer) | | | |
| By (Signature and Title) | | /s/ Susan L. Silva | | June 27, 2006 | |
| | |
| |
| | | Susan L. Silva | | Date | |
| | | Treasurer | | | |
| | | The FBR Funds | | | |
| | | (Principal Financial Officer and Accounting Officer) | |