UNITED STATES
SECURITIES AND EXCHANGE COMMISSION
Washington, D.C. 20549
FORM N-CSR
CERTIFIED SHAREHOLDER REPORT OF REGISTERED
MANAGEMENT INVESTMENT COMPANIES
Investment Company Act file number 811-21503
The FBR Funds
(Exact name of registrant as specified in charter)
1001 Nineteenth Street North
Arlington, VA 22209
(Address of principal executive offices) (Zip code)
Registrant’s telephone number, including area code: 703.469.1040
William Ginivan
General Counsel
FBR & Co.
Potomac Tower
1001 Nineteenth Street North
Arlington, VA 22209
(Name and address of agent for service)
Date of fiscal year end: October 31, 2011
Date of reporting period: April 30, 2011
ITEM 1. REPORT TO SHAREHOLDERS.

| THE FBR FUNDS |
| |
| |
| FBR Large Cap Fund |
| FBR Mid Cap Fund |
| FBR Small Cap Fund |
| FBR Focus Fund |
| FBR Large Cap Financial Fund |
| FBR Small Cap Financial Fund |
| FBR Technology Fund |
| FBR Gas Utility Index Fund |
| FBR Balanced Fund |
| FBR Core Bond Fund |
| |
| |
| Semi-Annual Report |
| April 30, 2011 |
[THIS PAGE INTENTIONALLY LEFT BLANK]
The FBR Funds
Semi-Annual Letter to Shareholders
Dear Shareholder:
U.S. equity markets performed well during the six-month period covered by this report, November 1, 2010 through April 30, 2011. The Dow Jones Industrial Average rose 16.7%. The S&P 500 gained 16.3%, and the smaller capitalization Russell 2000 Index rose 23.7%. In general, capital markets continue to recover from the lows of early March 2009 as recession and financial meltdown gripped the world. The Dow has gained 95% from its low in early March 2009 but is still 10% off its high of October 2007.
The investment roller coaster since late October 2007 was brought to you by an economy that was overleveraged to housing and consumption that was borrowed not earned. After much financial upset and government intervention, we have entered a period of healing that we believe will produce a better long term investment climate. We believe that this climate will be one with less leverage to rising asset prices and a renewed focus on business operation. We also believe that this climate will favor the better management teams who focus on operating their business and rely less on economic growth, rising asset prices or declining rates to cover suboptimal practices. In sum, we believe the U.S. economy is recovering from a debt hangover and that better conditions for investing and investment returns lie ahead.
As in prior years, what follows in this report is a commentary from each portfolio manager or team regarding performance for the period. It also includes their thoughts on the investment outlook, selected companies or industries. We believe the commentary from our fund managers is an important part of our communication to you. We encourage you to read the commentaries to gain a better understanding of the investment philosophy and stock selection process that is practiced.
All of us at The FBR Funds want to thank you for your continued support, and we look forward to serving your investment needs in the years ahead. As always, we welcome your questions and comments. You can reach us via e-mail at fbrfundsinfo@fbr.com or toll free at 888.200.4710. If you would like more timely updates, www.fbrfunds.com provides quarterly performance data as well as other important information.
Sincerely,
David H. Ellison
President, Chief Investment Officer and Trustee
The FBR Funds
Past performance is no guarantee of future results. The performance data quoted represents past performance and the current performance may be lower or higher than the performance data quoted. The investment return and principal will fluctuate so that investors’ shares, when redeemed, may be worth more or less than their original cost. The performance data does not reflect the deduction of taxes that a shareholder would pay on fund distributions or redemption fees. The Funds charge a redemption fee of 1.00% on shares redeemed or exchanged within 90 days; if reflected, the redemption fee would reduce the performance quoted. To obtain performance data current to the most recent month-end please call 888.200.4710.
2
Investors should consider the investment objectives, risks, charges and expenses carefully before investing. This and other important information can be found in the Funds’ prospectus. To obtain a free prospectus, please call 888.200.4710 or visit www.fbrfunds.com. Please read the prospectus carefully before investing.
The FBR Funds are distributed by FBR Investment Services, Inc., member FINRA/SIPC.
3
The FBR Funds
FBR Large Cap Fund
Management Overview
Portfolio Managers: Robert Barringer, CFA® and Ryan Kelley, CFA®
Over the previous six months, how did the Fund perform and what factors contributed to this performance?
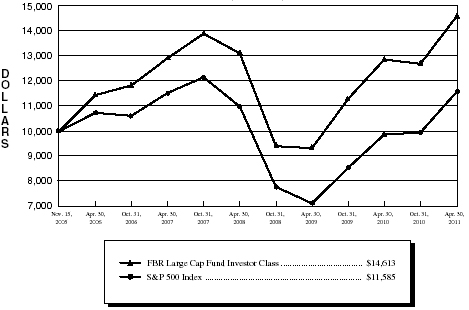
For the six-month period ended April 30, 2011, the Investor Class Shares of the FBR Large Cap Fund returned 14.94%. This compares to the S&P 500 Index and the Morningstar Large Blend Category average which over the same time period returned 16.36% and 15.82%, respectively.
The stock market continued to rise significantly during the past six months, with the S&P 500 Index returning over 16%. As of April 30, 2011, the S&P 500 Index has approximately doubled in value in a little over two years and was only about 12% lower than its all time high set in October of 2007. Many of the same themes have been helping the domestic equity market recovery, including an improving economic environment, continued government stimulus in various forms, and improving fundamentals of companies’ balance sheets, cost-structure, and profitability. During the past six months, the Energy Sector was the largest driver of the S&P 500 Index’s performance by a wide margin, while industrials and financials also contributed significantly due to their large relative weights as well as solid stock price appreciation.
Our Fund’s energy, industrial, and material stocks performed well over the past six months, as three of our top five best performing positions were energy companies. Compared to our benchmark, utilities and information technology stocks were our largest contributors on a relative basis. Additionally, we did not have any exposure to the Telecommunications Sector, which was the weakest performing sector of the S&P 500 Index.
Our relative performance was negatively affected by being somewhat underexposed to energy stocks versus our benchmark and slightly overexposed to financials. During a time period when the average energy stock was up 36% and energy stocks comprised 12% of the S&P 500 Index, being underweight by approximately 2% and owning energy stocks that only increased 32% on average caused a large part of our overall underperformance.
As we’ve discussed in previous letters, our funds have generally performed better than peers in difficult environments but may lag as stocks rise rapidly, due to our investment process and portfolio management style. We focus on high quality companies with strong balance sheets and consistent, high profitability, which means we may miss more volatile, cyclical stocks that soar during economic recoveries. As a result, we lagged our index by 1.4% and our peers by less than 1% during the past six months.
Portfolio managers’ comments on the Fund and the related investment outlook.
Our investment process is designed to create a diversified portfolio of investments in companies with less leveraged balance sheets and historically strong business models trading at attractive valuations. Our philosophy tends to produce less volatile returns over
4
The FBR Funds
FBR Large Cap Fund
Management Overview (continued)
a complete cycle, as is evidenced by our relative performance over the past three and five year periods. However, our investment discipline also means that we may lag our benchmark and peers as the stock market rises rapidly, as is evidenced over the past six months.
We continue to favor companies trading at attractive valuations that exhibit strong returns on equity with low volatility, low financial leverage and debt levels, good management teams, and compelling prospects of continued strong profitability. We continue to be fully invested, and the Fund is slightly overweight service-related technology and health care companies and underweight sectors more heavily dependent on robust consumer spending.
We envision the economy and therefore domestic equities will continue their longer-term recovery. Company earnings have been outperforming expectations for more than two years, while merger and acquisition activity is as strong as it has been since 2007. However, we also believe that risks to the improving economy remain, including high unemployment levels and continued weakness in the housing market, both of which may negatively affect consumer spending; hence, our current underexposure to consumer discretionary and consumer staples stocks.
The opinions expressed in this commentary reflect those of the Portfolio Managers as of the date written. Any such opinions are subject to change based on market or other conditions. These opinions may not be relied upon as investment advice. Investment decisions for The FBR Funds are based on several factors, and may not be relied upon as an indication of trading intent on behalf of any FBR Fund. Security positions can and do change.
5
The FBR Funds
FBR Large Cap Fund
Comparison of Changes in Value of $10,000 Investment in
Investor Class Shares(1)(2) vs. S&P 500 Index(1)(3)
(unaudited)
| Total Returns—For the Periods Ended April 30, 2011(4) |
| | | | | | | | | | Annualized
Since | |
| | | | | One Year | | Five Year | | Inception(5) | |
| | | | |
| |
| |
| |
| | FBR Large Cap Fund Investor Class(1)(2) | | | 13.38 | % | | 27.57 | % | | 7.20 | % | |
| | FBR Large Cap Fund Institutional Class(2)(6) | | | 13.66 | % | | 28.25 | % | | 7.31 | % | |
| | S&P 500 Index(1)(3) | | | 17.24 | % | | 7.75 | % | | 2.73 | % | |
| PAST PERFORMANCE IS NO GUARANTEE OF FUTURE RESULTS. |
| The performance data quoted represents past performance and the current performance may be lower or higher than the performance data quoted. The investment return and principal will fluctuate so that investors’ shares, when redeemed, may be worth more or less than their original cost. The performance data does not reflect the deduction of taxes that a shareholder would pay on Fund distributions or redemption fees. The Fund charges a redemption fee of 1.00% on shares redeemed or exchanged within 90 days; if reflected, the redemption fee would reduce the performance data quoted. To obtain performance data current to the most recent month-end, please call 888.200.4710. |
|
| (1) | | The graph assumes a hypothetical $10,000 initial investment in the Fund and reflects the reinvestment of dividends and all Fund expenses. Investors should note that the Fund is a professionally managed mutual fund while the index is unmanaged, does not incur expenses and is not available for investment. The performance of the index includes reinvested dividends, and does not reflect sales charges or expenses. |
| (2) | | FBR Fund Advisers, Inc. waived a portion of its advisory fees and agreed to contractually reimburse a portion of the Fund’s operating expenses, as necessary, to maintain existing expense limitations, as set forth in the notes to the financial statements. Total returns shown include fee waivers and expense reimbursements, if any; total returns would have been lower had there been no waiver of fees and/or reimbursement of expenses in excess of expense limitations. |
| (3) | | The S&P 500 Index is a capitalization-weighted index of 500 stocks. The index is designed to represent the broad domestic economy through changes in aggregate market value of 500 stocks representing all major industries. |
| (4) | | The total returns shown do not reflect the deduction of taxes that a shareholder would pay on fund distributions or the redemption of fund shares. |
| (5) | | For the period November 15, 2005 (commencement of operations) through April 30, 2011. |
| (6) | | Represents the performance of the Institutional Class shares after May 30, 2008 (inception of the share class) and Investor Class for periods prior to that date. |
6
The FBR Funds
FBR Large Cap Fund
Portfolio Summary
April 30, 2011
(unaudited)
The following provides a breakdown of the Fund by industry sectors. The underlying securities represent a percentage of the portfolio investments.
Industry Sector | | % of Total Investments |
| |
|
| Consumer, Non-cyclical | | | 19.8 | % |
| Technology | | | 18.6 | % |
| Financial | | | 16.7 | % |
| Energy | | | 10.9 | % |
| Industrial | | | 9.3 | % |
| Consumer, Cyclical | | | 8.4 | % |
| Communications | | | 5.1 | % |
| Basic Materials | | | 3.5 | % |
| Utilities | | | 1.5 | % |
| | | | | |
| Cash | | | 6.2 | % |
| | | | | |
7
The FBR Funds
FBR Large Cap Fund
Portfolio of Investments
April 30, 2011
(unaudited)
|
| | | | | | VALUE |
| | SHARES | | | | (NOTE 2) |
|
| | | | COMMON STOCKS — 97.1% | | | | |
| | | | Basic Materials — 3.6% | | | | |
| | 18,000 | | Freeport-McMoRan Copper & Gold, Inc. | | $ | 990,540 | |
| | 7,000 | | Newmont Mining Corp. | | | 410,270 | |
| | 10,600 | | Ternium SA ADR | | | 356,372 | |
| | | | | |
| |
| | | | | | | 1,757,182 | |
| | | | | |
| |
| | | | Communications — 5.3% | | | | |
| | 4,200 | | Akamai Technologies, Inc.* | | | 144,648 | |
| | 1,000 | | Amazon.com, Inc.* | | | 196,500 | |
| | 33,600 | | Cisco Systems, Inc. | | | 590,016 | |
| | 1,275 | | Google, Inc., Class A* | | | 693,727 | |
| | 6,500 | | Rackspace Hosting, Inc.* | | | 300,235 | |
| | 36,800 | | Yahoo!, Inc.* | | | 653,200 | |
| | | | | |
| |
| | | | | | | 2,578,326 | |
| | | | | |
| |
| | | | Consumer, Cyclical — 8.7% | | | | |
| | 12,900 | | Bed Bath & Beyond, Inc.* | | | 723,948 | |
| | 9,400 | | Coach, Inc. | | | 562,214 | |
| | 11,700 | | Genuine Parts Co. | | | 628,290 | |
| | 11,700 | | Kohl’s Corp. | | | 616,707 | |
| | 3,200 | | Lululemon Athletica, Inc.* | | | 320,096 | |
| | 15,325 | | The Gap, Inc. | | | 356,153 | |
| | 7,500 | | Tiffany & Co. | | | 520,800 | |
| | 3,500 | | W.W. Grainger, Inc. | | | 530,600 | |
| | | | | |
| |
| | | | | | | 4,258,808 | |
| | | | | |
| |
| | | | Consumer, Non-cyclical — 20.5% | | | | |
| | 8,640 | | Abbott Laboratories | | | 449,626 | |
| | 9,700 | | Automatic Data Processing, Inc. | | | 527,195 | |
| | 8,475 | | Baxter International, Inc. | | | 482,228 | |
| | 2,970 | | C.R. Bard, Inc. | | | 317,047 | |
| | 12,400 | | Forest Laboratories, Inc.* | | | 411,184 | |
| | 6,700 | | Gilead Sciences, Inc.* | | | 260,228 | |
| | 26,900 | | Hormel Foods Corp. | | | 791,129 | |
| | 8,500 | | Johnson & Johnson | | | 558,620 | |
| | 14,400 | | Merck & Company, Inc. | | | 517,680 | |
| | 12,000 | | Paychex, Inc. | | | 392,520 | |
8
The FBR Funds
FBR Large Cap Fund
Portfolio of Investments (continued)
April 30, 2011
(unaudited)
|
| | | | | | VALUE |
| | SHARES | | | | (NOTE 2) |
|
| | | | Consumer, Non-cyclical — 20.5% (continued) | | | | |
| | 6,800 | | PepsiCo, Inc. | | $ | 468,452 | |
| | 12,500 | | ResMed, Inc.* | | | 398,625 | |
| | 5,004 | | Smith & Nephew PLC ADR | | | 277,322 | |
| | 13,700 | | Stryker Corp. | | | 808,300 | |
| | 26,500 | | Sysco Corp. | | | 766,115 | |
| | 9,200 | | The Coca-Cola Co. | | | 620,632 | |
| | 7,800 | | The Estee Lauder Companies, Inc., Class A | | | 756,600 | |
| | 25,450 | | Unilever PLC ADR | | | 828,906 | |
| | 5,800 | | United Therapeutics Corp.* | | | 388,368 | |
| | | | | |
| |
| | | | | | | 10,020,777 | |
| | | | | |
| |
| | | | Energy — 11.3% | | | | |
| | 4,202 | | Apache Corp. | | | 560,421 | |
| | 12,600 | | Cabot Oil & Gas Corp. | | | 709,128 | |
| | 9,000 | | Hess Corp. | | | 773,640 | |
| | 14,700 | | Marathon Oil Corp. | | | 794,388 | |
| | 10,400 | | Murphy Oil Corp. | | | 805,792 | |
| | 30,800 | | Nexen, Inc. | | | 814,044 | |
| | 18,000 | | Petroleo Brasileiro SA ADR | | | 671,940 | |
| | 9,000 | | Rowan Companies, Inc.* | | | 375,300 | |
| | | | | |
| |
| | | | | | | 5,504,653 | |
| | | | | |
| |
| | | | Financial — 17.2% | | | | |
| | 111,300 | | Bank of America Corp. | | | 1,366,764 | |
| | 10,000 | | Capital One Financial Corp. | | | 547,300 | |
| | 200,000 | | Citigroup, Inc.* | | | 918,000 | |
| | 25,000 | | Discover Financial Services | | | 621,000 | |
| | 6,075 | | Franklin Resources, Inc. | | | 784,404 | |
| | 23,525 | | JPMorgan Chase & Co. | | | 1,073,446 | |
| | 44,200 | | KeyCorp | | | 383,214 | |
| | 13,000 | | Morgan Stanley | | | 339,950 | |
| | 5,500 | | Northern Trust Corp. | | | 274,945 | |
| | 10,100 | | Prudential Financial, Inc. | | | 640,542 | |
| | 17,075 | | T. Rowe Price Group, Inc. | | | 1,097,069 | |
| | 2,425 | | The Goldman Sachs Group, Inc. | | | 366,199 | |
| | | | | |
| |
| | | | | | | 8,412,833 | |
| | | | | |
| |
9
The FBR Funds
FBR Large Cap Fund
Portfolio of Investments (continued)
April 30, 2011
(unaudited)
|
| | | | | | VALUE |
| | SHARES | | | | (NOTE 2) |
|
| | | | Industrial — 9.6% | | | | |
| | 11,615 | | 3M Co. | | $ | 1,129,094 | |
| | 7,100 | | Cummins, Inc. | | | 853,278 | |
| | 11,000 | | Garmin Ltd.* | | | 376,530 | |
| | 400 | | Makita Corp. ADR | | | 18,720 | |
| | 16,000 | | Norfolk Southern Corp. | | | 1,194,880 | |
| | 13,700 | | PerkinElmer, Inc. | | | 387,299 | |
| | 6,950 | | Union Pacific Corp. | | | 719,117 | |
| | | | | |
| |
| | | | | | | 4,678,918 | |
| | | | | |
| |
| | | | Technology — 19.3% | | | | |
| | 4,425 | | Apple, Inc.* | | | 1,540,918 | |
| | 8,600 | | Canon, Inc. ADR | | | 405,662 | |
| | 8,000 | | Cerner Corp.* | | | 961,440 | |
| | 7,000 | | Check Point Software Technologies Ltd.* | | | 384,510 | |
| | 3,600 | | Citrix Systems, Inc.* | | | 303,624 | |
| | 36,000 | | Intel Corp. | | | 834,840 | |
| | 4,500 | | International Business Machines Corp. | | | 767,610 | |
| | 18,350 | | Microsoft Corp. | | | 477,467 | |
| | 11,000 | | NetApp, Inc.* | | | 571,780 | |
| | 25,500 | | Oracle Corp. | | | 919,275 | |
| | 8,000 | | Research In Motion Ltd.* | | | 389,200 | |
| | 7,000 | | Riverbed Technology, Inc.* | | | 245,980 | |
| | 1,800 | | salesforce.com, Inc.* | | | 249,480 | |
| | 8,200 | | SanDisk Corp.* | | | 402,948 | |
| | 8,750 | | SAP AG ADR | | | 564,637 | |
| | 10,100 | | Western Digital Corp.* | | | 401,980 | |
| | | | | |
| |
| | | | | | | 9,421,351 | |
| | | | | |
| |
| | | | Utilities — 1.6% | | | | |
| | 9,000 | | Exelon Corp. | | | 379,350 | |
| | 8,500 | | PG&E Corp. | | | 391,680 | |
| | | | | |
| |
| | | | | | | 771,030 | |
| | | | | |
| |
| | | | | | | | |
| | | | Total Common Stocks (Cost $40,788,243) | | | 47,403,878 | |
| | | | | |
| |
10
The FBR Funds
FBR Large Cap Fund
Portfolio of Investments (continued)
April 30, 2011
(unaudited)
|
| | | | | | | VALUE | |
| | SHARES | | | | | (NOTE 2) | |
|
| | | | SHORT-TERM INVESTMENT — 6.4% | | | | |
| | 3,118,067 | | JPMorgan 100% U.S. Treasury Securities Money Market Fund (Cost $3,118,067) | | $ | 3,118,067 | |
| | | | | |
| |
| | | | Total Investments — 103.5% (Cost $43,906,310) | | | 50,521,945 | |
| | | | | | | | |
| | | | Liabilities Less Other Assets — (3.5)% | | | (1,702,722 | ) |
| | | | | |
| |
| | | | | | | | |
| | | | Net Assets — 100.0% | | $ | 48,819,223 | |
| | | | | |
| |
|
| * | | Non-income producing security |
| ADR | | American Depositary Receipts |
| PLC | | Public Liability Company |
| | | |
| Note: | | For presentation purposes, the Fund has grouped some of the industry categories. For purposes of categorizing securities for compliance with Section 8(b)(1) of the Investment Company Act of 1940, the Fund uses more specific industry classifications. |
The accompanying notes are an integral part of the financial statements.
11
The FBR Funds
FBR Mid Cap Fund
Management Overview
Portfolio Manager: Ryan Kelley, CFA®
Over the previous six months, how did the Fund perform and what factors contributed to this performance?
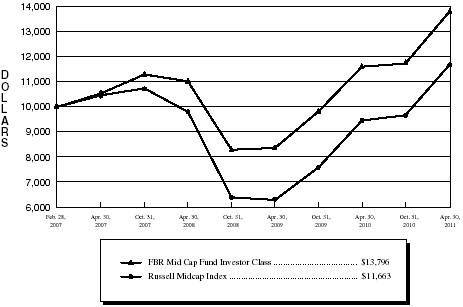
For the six-month period ended April 30, 2011, the Investor Class of the FBR Mid Cap Fund returned 17.54%. This compares to the Russell Midcap Index and the Morningstar Mid Cap Blend Category average which over the same time period returned 20.67% and 21.14%, respectively.
The stock market continued to rise significantly during the past six months, with the S&P 500 Index returning over 16%. Mid-cap stocks outpaced the broader market, as evidenced by the Russell Midcap Index’s 21% return. As of April 30, 2011, the Russell Midcap Index had returned a positive 6%, including dividends, since its prior all-time high set in July 2007, before the market downturn that began in the Fall of 2007.
Many of the same themes that have been helping the broader domestic equity market recovery have helped mid-cap stocks as well. These include an improving economic environment, continued government stimulus in various forms, and improving fundamentals of companies’ balance sheets, cost-structure, and profitability. While energy stocks were by far the largest contributor to the S&P 500 Index’s performance, the rally was more broadly based for mid-cap stocks, driven by strong contributions from consumer discretionary, financial, energy, and industrial stocks.
The Fund’s energy and consumer discretionary stocks performed well over the past six months, as four of the Fund’s top five best performing positions were in these sectors. Compared to the Fund’s benchmark, consumer discretionary stocks were the largest contributors on a relative basis, with our average consumer discretionary stock returning approximately 31% versus the benchmark’s 21% average.
Our relative performance was negatively affected by our financial and material stock investments. While we were slightly underweight financials as a sector, we tended to be more concentrated in depository institutions that did not perform well and hurt our relative performance. We were approximately equal-weighted in materials at 6% of the portfolio, but we missed certain stocks in the index that soared upwards of 50% in this six-month period.
As we’ve discussed in previous letters, our funds have generally performed better than peers in difficult environments but may lag as stocks rise rapidly, due to our investment process and portfolio management style. We focus on high quality companies with strong balance sheets and consistent, high profitability, which means we may miss more volatile, cyclical stocks that soar during economic recoveries. As a result, we lagged our index and our peers by approximately 3.1% and 3.6%, respectively.
12
The FBR Funds
FBR Mid Cap Fund
Management Overview (continued)
Portfolio managers’ comments on the Fund and the related investment outlook.
Our goal is to provide better than average risk-adjusted returns over a complete market cycle. We strive to participate in the upside while protecting against the downside. We continue to favor companies trading at attractive valuations that exhibit strong returns on equity with low volatility, low financial leverage and debt levels, good management teams, and compelling prospects of continued strong profitability.
Our investment process is designed to create a diversified portfolio of investments in companies with less leveraged balance sheets and historically strong business models trading at attractive valuations. Our philosophy tends to produce less volatile returns over a complete cycle, as is evidenced by our relative performance over the past three year period as well as inception-to-date (approximately 4 years). However, our investment discipline also means that we may lag our benchmark and peers as the stock market rises rapidly, as is evidenced over the past six months.
We continue to be fully invested, while targeting slight overweight positions in energy and material stocks and underweight positions in telecommunications and consumer stocks. We envision the economy and therefore domestic equities will continue their longer-term recovery. Company earnings have been outperforming expectations for more than two years, while merger and acquisition activity is as strong as it has been since 2007. However, we also believe that risks to the improving economy remain, including high unemployment levels and continued weakness in the housing market, both of which may negatively affect consumer spending; hence, our current underexposure to consumer discretionary and consumer staples stocks.
The opinions expressed in this commentary reflect those of the Portfolio Manager as of the date written. Any such opinions are subject to change based on market or other conditions. These opinions may not be relied upon as investment advice. Investment decisions for The FBR Funds are based on several factors, and may not be relied upon as an indication of trading intent on behalf of any FBR Fund. Security positions can and do change.
13
The FBR Funds
FBR Mid Cap Fund
Comparison of Changes in Value of $10,000 Investment in
Investor Class Shares(1)(2) vs. Russell Midcap Index(1)(3)
(unaudited)
Total Returns—For the Periods Ended April 30, 2011(4) |
| | | | | | | Annualized | |
| | | | | | | Since | |
| | | One Year | | Inception(5) | |
| | |
| |
| |
FBR Mid Cap Fund Investor Class(1)(2) | | | 18.79 | % | | | 8.03 | % | |
FBR Mid Cap Fund Institutional Class(2)(6) | | | 19.07 | % | | | 8.12 | % | |
Russell Midcap Index(1)(3) | | | 23.36 | % | | | 3.76 | % | |
| PAST PERFORMANCE IS NO GUARANTEE OF FUTURE RESULTS. |
| The performance data quoted represents past performance and the current performance may be lower or higher than the performance data quoted. The investment return and principal will fluctuate so that investors’ shares, when redeemed, may be worth more or less than their original cost. The performance data does not reflect the deduction of taxes that a shareholder would pay on Fund distributions or redemption fees. The Fund charges a redemption fee of 1.00% on shares redeemed or exchanged within 90 days; if reflected, the redemption fee would reduce the performance data quoted. To obtain performance data current to the most recent month-end, please call 888.200.4710. |
|
| (1) | | The graph assumes a hypothetical $10,000 initial investment in the Fund and reflects the reinvestment of dividends and all Fund expenses. Investors should note that the Fund is a professionally managed mutual fund while the index is unmanaged, does not incur expenses and is not available for investment. The performance of the index includes reinvested dividends, and does not reflect sales charges or expenses. |
| (2) | | FBR Fund Advisers, Inc. waived a portion of its advisory fees and agreed to contractually reimburse a portion of the Fund’s operating expenses, as necessary, to maintain existing expense limitations, as set forth in the notes to the financial statements. Total returns shown include fee waivers and expense reimbursements, if any; total returns would have been lower had there been no waiver of fees and/or reimbursement of expenses in excess of expense limitations. |
| (3) | | The Russell Midcap Index measures the performance of the 800 smallest companies in the Russell 1000 Index, which represents approximately 31% of the total market capitalization of the Russell 1000 Index. |
| (4) | | The total returns shown do not reflect the deduction of taxes that a shareholder would pay on fund distributions or the redemption of fund shares. |
| (5) | | For the period February 28, 2007 (commencement of operations) through April 30, 2011. |
| (6) | | Represents the performance of the Institutional Class shares after May 30, 2008 (inception of the share class) and Investor Class for periods prior to that date. |
14
The FBR Funds
FBR Mid Cap Fund
Portfolio Summary
April 30, 2011
(unaudited)
The following provides a breakdown of the Fund by industry sectors. The underlying securities represent a percentage of the portfolio investments.
Industry Sector | | % of Total Investments |
| |
|
| Financial | | | 17.4 | % |
| Consumer, Cyclical | | | 16.7 | % |
| Consumer, Non-cyclical | | | 15.7 | % |
| Industrial | | | 11.3 | % |
| Technology | | | 8.9 | % |
| Energy | | | 8.7 | % |
| Basic Materials | | | 5.6 | % |
| Utilities | | | 5.1 | % |
| Communications | | | 2.8 | % |
| | | | | |
| Cash | | | 7.8 | % |
15
The FBR Funds
FBR Mid Cap Fund
Portfolio of Investments
April 30, 2011
(unaudited)
|
| | | | | | VALUE |
| | SHARES | | | | (NOTE 2) |
|
| | | | COMMON STOCKS — 92.1% | | | | |
| | | | Basic Materials — 5.6% | | | | |
| | 9,800 | | Compania de Minas Buenaventura S.A.A. ADR | | $ | 408,366 | |
| | 6,075 | | Ecolab, Inc. | | | 320,517 | |
| | 8,000 | | Gold Fields Ltd. ADR | | | 142,720 | |
| | 4,934 | | Sigma-Aldrich Corp. | | | 348,242 | |
| | 11,800 | | Yamana Gold, Inc. | | | 149,978 | |
| | | | | |
| |
| | | | | | | 1,369,823 | |
| | | | | |
| |
| | | | Communications — 2.8% | | | | |
| | 3,097 | | FactSet Research Systems, Inc. | | | 338,843 | |
| | 10,450 | | Telephone and Data Systems, Inc. | | | 350,702 | |
| | | | | |
| |
| | | | | | | 689,545 | |
| | | | | |
| |
| | | | Consumer, Cyclical — 16.6% | | | | |
| | 6,115 | | Abercrombie & Fitch Co., Class A | | | 432,942 | |
| | 3,900 | | Bed Bath & Beyond, Inc.* | | | 218,868 | |
| | 9,080 | | Big Lots, Inc.* | | | 373,279 | |
| | 5,200 | | BJ’s Wholesale Club, Inc.* | | | 266,864 | |
| | 9,485 | | Copart, Inc.* | | | 430,335 | |
| | 1,600 | | Deckers Outdoor Corp.* | | | 135,776 | |
| | 3,400 | | Genuine Parts Co. | | | 182,580 | |
| | 2,700 | | Guess?, Inc. | | | 116,073 | |
| | 8,130 | | Magna International, Inc. | | | 416,663 | |
| | 12,824 | | Mattel, Inc. | | | 342,657 | |
| | 2,800 | | MSC Industrial Direct Company, Inc., Class A | | | 200,452 | |
| | 6,535 | | Tiffany& Co. | | | 453,790 | |
| | 3,079 | | V.F. Corp. | | | 309,624 | |
| | 3,700 | | Williams-Sonoma, Inc. | | | 160,617 | |
| | | | | |
| |
| | | | | | | 4,040,520 | |
| | | | | |
| |
| | | | Consumer, Non-cyclical — 15.7% | | | | |
| | 2,700 | | Brown-Forman Corp., Class B | | | 194,022 | |
| | 2,122 | | Bunge Ltd. | | | 160,084 | |
| | 2,446 | | C.R. Bard, Inc. | | | 261,110 | |
| | 2,600 | | Covance, Inc.* | | | 162,760 | |
| | 9,050 | | Endo Pharmaceuticals Holdings, Inc.* | | | 354,398 | |
| | 6,438 | | Forest Laboratories, Inc.* | | | 213,484 | |
16
The FBR Funds
FBR Mid Cap Fund
Portfolio of Investments (continued)
April 30, 2011
(unaudited)
|
| | | | | | VALUE |
| | SHARES | | | | (NOTE 2) |
|
| | | | Consumer, Non-cyclical — 15.7% (continued) | | | | |
| | 7,050 | | Hansen Natural Corp.* | | $ | 466,357 | |
| | 2,100 | | Humana, Inc.* | | | 159,852 | |
| | 6,995 | | Lincare Holdings, Inc. | | | 219,783 | |
| | 5,875 | | Paychex, Inc. | | | 192,171 | |
| | 16,850 | | SEI Investments Co. | | | 376,260 | |
| | 4,035 | | Techne Corp. | | | 313,560 | |
| | 2,600 | | Tupperware Brands Corp. | | | 165,542 | |
| | 13,275 | | Tyson Foods, Inc., Class A | | | 264,173 | |
| | 4,444 | | Varian Medical Systems, Inc.* | | | 311,969 | |
| | | | | |
| |
| | | | | | | 3,815,525 | |
| | | | | |
| |
| | | | Energy — 8.7% | | | | |
| | 4,685 | | Ensco International PLC ADR | | | 279,320 | |
| | 1,200 | | First Solar, Inc.* | | | 167,484 | |
| | 4,540 | | Helmerich & Payne, Inc. | | | 301,183 | |
| | 7,800 | | Nabors Industries Ltd.* | | | 238,992 | |
| | 2,925 | | Newfield Exploration Co.* | | | 207,090 | |
| | 4,625 | | Pioneer Natural Resources Co. | | | 472,814 | |
| | 5,800 | | Plains Exploration & Production Co.* | | | 220,632 | |
| | 5,550 | | Rowan Companies, Inc.* | | | 231,435 | |
| | | | | |
| |
| | | | | | | 2,118,950 | |
| | | | | |
| |
| | | | Financial — 17.4% | | | | |
| | 8,000 | | Aspen Insurance Holdings Ltd | | | 228,560 | |
| | 12,495 | | Capitol Federal Financial, Inc. | | | 141,443 | |
| | 8,575 | | Comerica, Inc. | | | 325,250 | |
| | 23,800 | | Fifth Third Bancorp | | | 315,826 | |
| | 28,125 | | Hudson City Bancorp, Inc. | | | 268,031 | |
| | 36,350 | | KeyCorp. | | | 315,155 | |
| | 3,746 | | M&T Bank Corp. | | | 331,034 | |
| | 8,185 | | New York Community Bancorp, Inc. | | | 135,871 | |
| | 10,250 | | People’s United Financial, Inc. | | | 140,323 | |
| | 8,700 | | Raymond James Financial, Inc. | | | 326,250 | |
| | 43,900 | | Regions Financial Corp. | | | 322,226 | |
| | 4,500 | | Reinsurance Group of America, Inc. | | | 284,850 | |
| | 6,821 | | T. Rowe Price Group, Inc. | | | 438,249 | |
17
The FBR Funds
FBR Mid Cap Fund
Portfolio of Investments (continued)
April 30, 2011
(unaudited)
|
| | | | | | VALUE |
| | SHARES | | | | (NOTE 2) |
|
| | | | Financial — 17.4% (continued) | | | | |
| | 8,900 | | W. R. Berkley Corp. | | $ | 290,229 | |
| | 14,300 | | Zions Bancorp | | | 349,635 | |
| | | | | |
| |
| | | | | | | 4,212,932 | |
| | | | | |
| |
| | | | Industrial — 11.3% | | | | |
| | 1,778 | | Cummins, Inc. | | | 213,680 | |
| | 6,625 | | Dolby Laboratories, Inc., Class A* | | | 331,647 | |
| | 6,075 | | FLIR Systems, Inc. | | | 213,962 | |
| | 5,700 | | Garmin Ltd.* | | | 195,111 | |
| | 6,200 | | Kansas City Southern* | | | 360,282 | |
| | 3,700 | | Kirby Corp.* | | | 210,086 | |
| | 7,295 | | Pall Corp. | | | 426,320 | |
| | 4,692 | | Roper Industries, Inc. | | | 405,811 | |
| | 7,500 | | Spirit AeroSystems Holdings, Inc., Class A* | | | 184,500 | |
| | 3,500 | | Tidewater, Inc. | | | 208,285 | |
| | | | | |
| |
| | | | | | | 2,749,684 | |
| | | | | |
| |
| | | | Technology — 8.9% | | | | |
| | 32,168 | | Activision Blizzard, Inc. | | | 366,393 | |
| | 9,503 | | Check Point Software Technologies Ltd.* | | | 522,000 | |
| | 4,900 | | Microchip Technology, Inc. | | | 201,096 | |
| | 3,400 | | SanDisk Corp.* | | | 167,076 | |
| | 15,500 | | Seagate Technology PLC | | | 273,110 | |
| | 30,900 | | Siliconware Precision Industries Co. ADR | | | 209,502 | |
| | 4,900 | | Western Digital Corp.* | | | 195,020 | |
| | 6,200 | | Xilinx, Inc. | | | 216,132 | |
| | | | | |
| |
| | | | | | | 2,150,329 | |
| | | | | |
| |
| | | | Utilities — 5.1% | | | | |
| | 8,600 | | Ameren Corp. | | | 252,066 | |
| | 4,677 | | Energen Corp. | | | 304,052 | |
| | 4,669 | | FirstEnergy Corp. | | | 186,573 | |
| | 8,100 | | NRG Energy, Inc.* | | | 196,020 | |
| | 10,650 | | Westar Energy, Inc. | | | 289,786 | |
| | | | | |
| |
| | | | | | | 1,228,497 | |
| | | | | |
| |
| | | | | | | | |
| | | | Total Common Stocks (Cost $18,104,182) | | | 22,375,805 | |
| | | | | |
| |
18
The FBR Funds
FBR Mid Cap Fund
Portfolio of Investments (continued)
April 30, 2011
(unaudited)
|
| | | | | | VALUE |
| | SHARES | | | | (NOTE 2) |
|
| | | | SHORT-TERM INVESTMENT — 7.8% | | | | |
| | 1,882,435 | | JPMorgan 100% U.S. Treasury Securities Money Market Fund (Cost $1,882,435) | | $ | 1,882,435 | |
| | | | | |
| |
| | | | | | | | |
| | | | Total Investments — 99.9% (Cost $19,986,617) | | | 24,258,240 | |
| | | | | | | | |
| | | | Other Assets Less Liabilities — 0.1% | | | 16,338 | |
| | | | | |
| |
| | | | | | | | |
| | | | Net Assets — 100.0% | | $ | 24,274,578 | |
| | | | | |
| |
|
| * | | Non-income producing security |
| ADR | | American Depositary Receipts |
| PLC | | Public Liability Company |
| Note: | | For presentation purposes, the Fund has grouped some of the industry categories. For purposes of categorizing securities for compliance with Section 8(b)(1) of the Investment Company Act of 1940, the Fund uses more specific industry classifications. |
The accompanying notes are an integral part of the financial statements.
19
The FBR Funds
FBR Small Cap Fund
Management Overview
Portfolio Manager: Robert Barringer, CFA®
Over the previous six months, how did the Fund perform and what factors contributed to this performance?
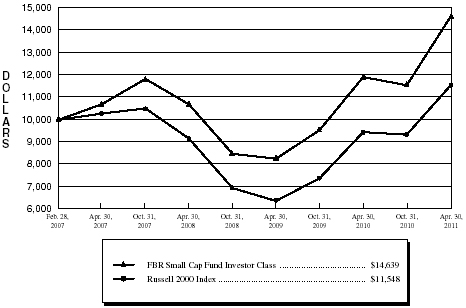
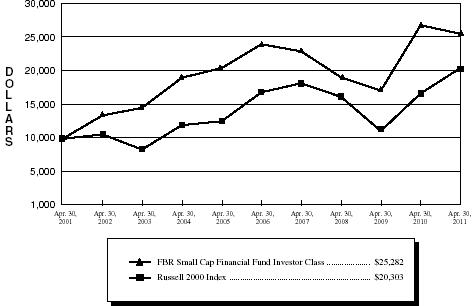
For the six-month period ended April 30, 2011, the Investor Class of the FBR Small Cap Fund returned 26.58%. This compares to the Russell 2000 Index and the Morningstar Small Growth Category, which returned 23.73% and 26.45% for the same period, respectively.
The three main areas of outperformance versus the Russell 2000 Index were in the consumer discretionary, energy and financial sectors. The outperformance came from individual stock selection within those sectors as opposed to an over or underweighting of those sectors. Top contributors were retailers The Buckle, Inc. and Deckers Outdoor Corp. which were up over 50% each as consumers kept up their spending during this time period, particularly with vendors that offer better quality, differentiated products.
Energy outperformance seemed to come also as a surprise to the market, with events in the Middle East and Libya, in particular, stoking fears of a lowering of supply and causing the price of oil to remain elevated. Key contributors to performance were Brigham Exploration Co. which was one of our largest holdings and was up over 70% and International Coal Group, Inc. which was up approximately 65% for the time period and was subsequently acquired for a large premium at the beginning of May.
Lastly, by far the largest contributor to performance in the financial group was Danvers Bancorp, Inc. which was one of our top positions. An acquisition by Peoples United Financial, Inc. at a premium of approximately 30% to the current stock price was announced in January. Banks underperformed during this time period, but our Danvers Bancorp, Inc. investment allowed us to buck that trend.
Portfolio manager comments on the Fund and the related investment outlook.
As we write this report, economic data that has been published recently points to a lull in the momentum that seemed to be building in the world and in the U.S. in particular. A pickup in economic growth that would solidify into an acceleration in employment growth which has been one of the remaining missing pieces in a sustainable economic recovery. Consistent and high employment growth has been elusive and the housing market has accordingly still been surprisingly soft. Many had hoped, as reflected in stock prices, that we would be further along in our economic recovery. However, it is still fragile.
Having said that, we are still very excited about the future prospects for this Fund and believe that we are well positioned to navigate whatever the future holds, given our confidence in our investment process. As mentioned above, we have been the beneficiary of a number of takeovers from large companies which were looking to grow their businesses in a slow growth environment. The companies we invest in are solid companies
20
The FBR Funds
FBR Small Cap Fund
Management Overview (continued)
| with good business prospects and healthy balance sheets and we believe our process allows us to identify those that will succeed on their own, but also that another company might find attractive as well, for the same reasons we like them. |
| |
| This past year in particular has clearly shown how much of the innovation in areas like technology has come from the smaller, more nimble companies, and many larger companies were leapfrogged in some areas. We are confident that innovation and investment opportunities will continue to present themselves in this area of the market. |
|
The opinions expressed in this commentary reflect those of the Portfolio Manager as of the date written. Any such opinions are subject to change based on market or other conditions. These opinions may not be relied upon as investment advice. Investment decisions for The FBR Funds are based on several factors, and may not be relied upon as an indication of trading intent on behalf of any FBR Fund. Security positions can and do change. |
21
The FBR Funds
FBR Small Cap Fund
Comparison of Changes in Value of $10,000 Investment in
Investor Class Shares(1)(2) vs. Russell 2000 Index(1)(3)
(unaudited)
Total Returns—For the Periods Ended April 30, 2011(4) | |
| | | | | | | Annualized | |
| | | | | | | Since | |
| | | One Year | | Inception(5) | |
| | |
| |
| |
FBR Small Cap Fund Investor Class(1)(2) | | | 22.63 | % | | | 9.58 | % | |
FBR Small Cap Fund Institutional Class(2)(6) | | | 23.00 | % | | | 9.72 | % | |
Russell 2000 Index(1)(3) | | | 22.20 | % | | | 3.51 | % | |
| PAST PERFORMANCE IS NO GUARANTEE OF FUTURE RESULTS. |
| The performance data quoted represents past performance and the current performance may be lower or higher than the performance data quoted. The investment return and principal will fluctuate so that investors’ shares, when redeemed, may be worth more or less than their original cost. The performance data does not reflect the deduction of taxes that a shareholder would pay on Fund distributions or redemption fees. The Fund charges a redemption fee of 1.00% on shares redeemed or exchanged within 90 days; if reflected, the redemption fee would reduce the performance data quoted. To obtain performance data current to the most recent month-end, please call 888.200.4710. |
|
| (1) | | The graph assumes a hypothetical $10,000 initial investment in the Fund and reflects the reinvestment of dividends and all Fund expenses. Investors should note that the Fund is a professionally managed mutual fund while the index is unmanaged, does not incur expenses and is not available for investment. The performance of the index includes reinvested dividends, and does not reflect sales charges or expenses. |
| (2) | | FBR Fund Advisers, Inc. waived a portion of its advisory fees and agreed to contractually reimburse a portion of the Fund’s operating expenses, as necessary, to maintain existing expense limitations, as set forth in the notes to the financial statements. Total returns shown include fee waivers and expense reimbursements, if any; total returns would have been lower had there been no waiver of fees and/or reimbursement of expenses in excess of expense limitations. |
| (3) | | The Russell 2000 Index is comprised of the smallest of the 2000 companies of the Russell 3000 Index, representing approximately 8% of the Russell 3000’s total market capitalization. |
| (4) | | The total returns shown do not reflect the deduction of taxes that a shareholder would pay on fund distributions or the redemption of fund shares. |
| (5) | | For the period February 28, 2007 (commencement of operations) through April 30, 2011. |
| (6) | | Represents the performance of the Institutional Class shares after May 30, 2008 (inception of the share class) and Investor Class for periods prior to that date. |
22
The FBR Funds
FBR Small Cap Fund
Portfolio Summary
April 30, 2011
(unaudited)
The following provides a breakdown of the Fund by industry sectors. The underlying securities represent a percentage of the portfolio investments.
Industry Sector | | % of Total Investments |
| |
|
| Consumer, Cyclical | | | 21.1 | % |
| Technology | | | 16.7 | % |
| Financial | | | 16.2 | % |
| Industrial | | | 12.5 | % |
| Consumer, Non-cyclical | | | 10.4 | % |
| Basic Materials | | | 9.0 | % |
| Energy | | | 8.5 | % |
| Communications | | | 2.6 | % |
| Utilities | | | 1.4 | % |
| | | | | |
| Cash | | | 1.6 | % |
23
The FBR Funds
FBR Small Cap Fund
Portfolio of Investments
April 30, 2011
(unaudited)
|
| | | | | | VALUE |
| | SHARES | | | | (NOTE 2) |
|
| | | | COMMON STOCKS — 97.2% | | | | |
| | | | Basic Materials — 8.9% | | | | |
| | 17,300 | | Harry Winston Diamond Corp.* | | $ | 295,138 | |
| | 34,000 | | Hecla Mining Co.* | | | 319,940 | |
| | 7,700 | | Innospec, Inc.* | | | 289,982 | |
| | 8,500 | | Kraton Performance Polymers, Inc.* | | | 392,360 | |
| | 2,884 | | NewMarket Corp. | | | 531,579 | |
| | 56,000 | | PolyOne Corp. | | | 810,880 | |
| | 10,750 | | Schnitzer Steel Industries, Inc., Class A | | | 667,252 | |
| | 2,800 | | Valhi, Inc. | | | 88,592 | |
| | 18,000 | | W.R. Grace & Co.* | | | 816,480 | |
| | | | | |
| |
| | | | | | | 4,212,203 | |
| | | | | |
| |
| | | | Communications — 2.6% | | | | |
| | 2,000 | | Acme Packet, Inc.* | | | 165,220 | |
| | 5,000 | | Aruba Networks, Inc.* | | | 179,650 | |
| | 3,600 | | Blue Coat Systems, Inc.* | | | 103,680 | |
| | 2,800 | | Finisar Corp.* | | | 78,652 | |
| | 5,500 | | Rackspace Hosting, Inc.* | | | 254,045 | |
| | 7,600 | | Sourcefire, Inc.* | | | 202,312 | |
| | 8,200 | | TIBCO Software, Inc.* | | | 245,918 | |
| | | | | |
| |
| | | | | | | 1,229,477 | |
| | | | | |
| |
| | | | Consumer, Cyclical — 20.8% | | | | |
| | 30,000 | | 99 Cents Only Stores* | | | 604,800 | |
| | 10,000 | | Aèropostale, Inc.* | | | 255,300 | |
| | 36,000 | | American Axle & Manufacturing Holdings, Inc.* | | | 460,800 | |
| | 18,900 | | American Eagle Outfitters, Inc. | | | 294,084 | |
| | 13,700 | | Ascena Retail Group, Inc.* | | | 428,673 | |
| | 15,500 | | Bally Technologies, Inc.* | | | 604,345 | |
| | 7,500 | | Big Lots, Inc.* | | | 308,325 | |
| | 18,400 | | BJ’s Wholesale Club, Inc.* | | | 944,288 | |
| | 13,000 | | Chico’s FAS, Inc. | | | 190,190 | |
| | 3,300 | | Deckers Outdoor Corp.* | | | 280,038 | |
| | 15,000 | | JetBlue Airways Corp.* | | | 84,900 | |
| | 2,375 | | Jos. A. Bank Clothiers, Inc.* | | | 124,498 | |
| | 15,000 | | Meritor, Inc.* | | | 258,150 | |
| | 29,500 | | Modine Manufacturing Co.* | | | 525,395 | |
24
The FBR Funds
FBR Small Cap Fund
Portfolio of Investments (continued)
April 30, 2011
(unaudited)
|
| | | | | | VALUE |
| | SHARES | | | | (NOTE 2) |
|
| | | | Consumer, Cyclical — 20.8% (continued) | | | | |
| | 3,200 | | MSC Industrial Direct Company, Inc., Class A | | $ | 229,088 | |
| | 9,754 | | Owens & Minor, Inc. | | | 336,025 | |
| | 24,000 | | Penn National Gaming, Inc.* | | | 960,240 | |
| | 10,000 | | Pier 1 Imports, Inc.* | | | 121,800 | |
| | 1,700 | | Polaris Industries, Inc. | | | 179,231 | |
| | 10,000 | | Saks, Inc.* | | | 119,600 | |
| | 4,600 | | Signet Jewelers Ltd.* | | | 201,250 | |
| | 4,000 | | Steven Madden Ltd.* | | | 212,600 | |
| | 5,600 | | The Buckle, Inc. | | | 254,744 | |
| | 5,000 | | The Children’s Place Retail Stores, Inc.* | | | 265,850 | |
| | 3,600 | | The Men’s Wearhouse, Inc. | | | 100,404 | |
| | 14,300 | | The Toro Co. | | | 971,113 | |
| | 36,000 | | US Airways Group, Inc.* | | | 327,240 | |
| | 5,000 | | Wolverine World Wide, Inc. | | | 198,400 | |
| | | | | |
| |
| | | | | | | 9,841,371 | |
| | | | | |
| |
| | | | Consumer, Non-cyclical — 10.3% | | | | |
| | 7,000 | | ABIOMED, Inc.* | | | 121,660 | |
| | 2,000 | | Amarin Corp. PLC ADR* | | | 32,000 | |
| | 20,000 | | AVANIR Pharmaceuticals, Inc., Class A* | | | 87,400 | |
| | 7,700 | | BioMarin Pharmaceutical, Inc.* | | | 207,053 | |
| | 6,100 | | Bruker Corp.* | | | 120,414 | |
| | 4,500 | | Catalyst Health Solutions, Inc.* | | | 268,020 | |
| | 10,000 | | Depomed, Inc.* | | | 88,300 | |
| | 4,000 | | Immunogen, Inc.* | | | 53,440 | |
| | 9,000 | | Impax Laboratories, Inc.* | | | 246,420 | |
| | 4,000 | | InterMune, Inc.* | | | 178,560 | |
| | 3,000 | | Jazz Pharmaceuticals, Inc.* | | | 95,730 | |
| | 4,000 | | MAKO Surgical Corp.* | | | 109,880 | |
| | 8,000 | | Optimer Pharmaceuticals, Inc.* | | | 101,040 | |
| | 10,000 | | Par Pharmaceutical Companies, Inc.* | | | 344,400 | |
| | 6,800 | | Pharmaceutical Product Development, Inc. | | | 209,780 | |
| | 16,200 | | Rollins, Inc. | | | 339,714 | |
| | 21,000 | | RSC Holdings, Inc.* | | | 276,570 | |
| | 4,500 | | Seattle Genetics, Inc.* | | | 74,745 | |
| | 9,150 | | Sirona Dental Systems, Inc.* | | | 522,191 | |
25
The FBR Funds
FBR Small Cap Fund
Portfolio of Investments (continued)
April 30, 2011
(unaudited)
|
| | | | | | VALUE |
| | SHARES | | | | (NOTE 2) |
|
| | | | Consumer, Non-cyclical — 10.3% (continued) | | | | |
| | 4,800 | | Sotheby’s | | $ | 242,496 | |
| | 5,400 | | SuccessFactors, Inc.* | | | 187,218 | |
| | 4,375 | | Techne Corp. | | | 339,981 | |
| | 2,000 | | Theravance, Inc.* | | | 55,500 | |
| | 4,285 | | Transcend Services, Inc.* | | | 103,397 | |
| | 2,000 | | ViroPharma, Inc.* | | | 38,580 | |
| | 7,110 | | Wright Express Corp.* | | | 400,506 | |
| | 2,000 | | XenoPort, Inc.* | | | 16,360 | |
| | | | | |
| |
| | | | | | | 4,861,355 | |
| | | | | |
| |
| | | | Energy — 8.4% | | | | |
| | 14,612 | | Atwood Oceanics, Inc.* | | | 656,517 | |
| | 21,900 | | Brigham Exploration Co.* | | | 734,307 | |
| | 27,000 | | Complete Production Services, Inc.* | | | 916,380 | |
| | 6,000 | | Energy XXI Bermuda Ltd.* | | | 217,500 | |
| | 48,000 | | International Coal Group, Inc.* | | | 529,440 | |
| | 20,200 | | Key Energy Services, Inc.* | | | 367,640 | |
| | 5,500 | | Oasis Petroleum, Inc.* | | | 169,015 | |
| | 7,900 | | Rosetta Resources, Inc.* | | | 362,847 | |
| | | | | |
| |
| | | | | | | 3,953,646 | |
| | | | | |
| |
| | | | Financial — 16.0% | | | | |
| | 30,000 | | Associated Banc-Corp | | | 438,000 | |
| | 36,000 | | Astoria Financial Corp. | | | 520,920 | |
| | 2,700 | | Bancorp Rhode Island, Inc. | | | 119,772 | |
| | 10,000 | | Berkshire Hills Bancorp, Inc. | | | 223,000 | |
| | 75,000 | | Brookline Bancorp, Inc. | | | 691,500 | |
| | 48,954 | | Capitol Federal Financial, Inc. | | | 554,159 | |
| | 38,500 | | CNO Financial Group, Inc.* | | | 310,310 | |
| | 4,000 | | Encore Capital Group, Inc.* | | | 119,760 | |
| | 8,170 | | Enterprise Bancorp, Inc. | | | 144,936 | |
| | 600 | | First Citizens BancShares, Inc., Class A | | | 120,006 | |
| | 48,253 | | First Horizon National Corp. | | | 528,370 | |
| | 62,000 | | Fulton Financial Corp. | | | 724,160 | |
| | 2,300 | | Hingham Institution for Savings | | | 121,670 | |
| | 35,000 | | Horace Mann Educators Corp. | | | 625,800 | |
| | 3,407 | | Investors Title Co. | | | 116,588 | |
26
The FBR Funds
FBR Small Cap Fund
Portfolio of Investments (continued)
April 30, 2011
(unaudited)
|
| | | | | | VALUE |
| | SHARES | | | | (NOTE 2) |
|
| | | | Financial — 16.0% (continued) | | | | |
| | 41,100 | | MGIC Investment Corp.* | | $ | 355,926 | |
| | 33,300 | | Sunstone Hotel Investors, Inc.* | | | 348,318 | |
| | 67,000 | | Susquehanna Bancshares, Inc. | | | 617,740 | |
| | 43,550 | | United Financial Bancorp, Inc. | | | 711,607 | |
| | 11,400 | | Washington Federal, Inc. | | | 183,426 | |
| | | | | |
| |
| | | | | | | 7,575,968 | |
| | | | | |
| |
| | | | Industrial — 12.3% | | | | |
| | 21,337 | | A.O. Smith Corp. | | | 938,188 | |
| | 7,100 | | Armstrong World Industries, Inc. | | | 317,725 | |
| | 8,000 | | Atlas Air Worldwide Holdings, Inc.* | | | 551,280 | |
| | 5,000 | | CLARCOR, Inc. | | | 225,950 | |
| | 9,800 | | Genesee & Wyoming, Inc., Class A* | | | 607,404 | |
| | 22,750 | | GrafTech International Ltd.* | | | 527,800 | |
| | 12,100 | | Heartland Express, Inc. | | | 208,725 | |
| | 9,000 | | Lennox International, Inc. | | | 437,490 | |
| | 8,200 | | PerkinElmer, Inc. | | | 231,814 | |
| | 4,000 | | Polypore International, Inc.* | | | 247,080 | |
| | 8,000 | | Roadrunner Transportation Systems, Inc.* | | | 112,720 | |
| | 3,000 | | Sauer-Danfoss, Inc.* | | | 177,030 | |
| | 10,000 | | Simpson Manufacturing Company, Inc. | | | 279,200 | |
| | 2,000 | | Sun Hydraulics Corp. | | | 92,980 | |
| | 8,200 | | Terex Corp.* | | | 285,196 | |
| | 22,250 | | Werner Enterprises, Inc. | | | 582,283 | |
| | | | | |
| |
| | | | | | | 5,822,865 | |
| | | | | |
| |
| | | | Technology — 16.5% | | | | |
| | 4,000 | | athenahealth, Inc.* | | | 184,920 | |
| | 62,100 | | Brocade Communications Systems, Inc.* | | | 388,125 | |
| | 11,000 | | Cirrus Logic, Inc.* | | | 182,160 | |
| | 10,000 | | CommVault Systems, Inc.* | | | 393,900 | |
| | 22,000 | | Compuware Corp.* | | | 249,260 | |
| | 3,000 | | Concur Technologies, Inc.* | | | 173,610 | |
| | 23,600 | | Emulex Corp.* | | | 228,684 | |
| | 7,200 | | Fortinet, Inc.* | | | 350,640 | |
| | 10,277 | | Jack Henry & Associates, Inc. | | | 349,110 | |
27
The FBR Funds
FBR Small Cap Fund
Portfolio of Investments (continued)
April 30, 2011
(unaudited)
|
| | | | | | VALUE |
| | SHARES | | | | (NOTE 2) |
|
| | | | Technology — 16.5% (continued) | | | | |
| | 3,900 | | Lexmark International, Inc., Class A* | | $ | 125,775 | |
| | 18,000 | | MedAssets, Inc.* | | | 288,360 | |
| | 16,000 | | Medidata Solutions, Inc.* | | | 410,720 | |
| | 14,000 | | Mellanox Technologies Ltd.* | | | 413,560 | |
| | 3,700 | | MicroStrategy, Inc., Class A* | | | 522,810 | |
| | 12,000 | | MIPS Technologies, Inc.* | | | 99,840 | |
| | 6,200 | | NetLogic Microsystems, Inc.* | | | 267,406 | |
| | 7,300 | | Netscout Systems, Inc.* | | | 186,807 | |
| | 8,000 | | NetSuite, Inc.* | | | 276,880 | |
| | 9,175 | | Open Text Corp.* | | | 561,510 | |
| | 20,575 | | QLogic Corp.* | | | 369,938 | |
| | 5,000 | | Quest Software, Inc.* | | | 128,800 | |
| | 11,400 | | RADWARE Ltd.* | | | 401,622 | |
| | 8,400 | | RightNow Technologies, Inc.* | | | 303,912 | |
| | 5,500 | | Solera Holdings, Inc. | | | 302,500 | |
| | 8,000 | | Synchronoss Technologies, Inc.* | | | 258,080 | |
| | 6,400 | | Taleo Corp., Class A* | | | 232,128 | |
| | 3,000 | | Veeco Instruments, Inc.* | | | 153,390 | |
| | | | | |
| |
| | | | | | | 7,804,447 | |
| | | | | |
| |
| | | | Utilities — 1.4% | | | | |
| | 26,400 | | Portland General Electric Co. | | | 658,944 | |
| | | | | |
| |
| |
| | | | Total Common Stocks (Cost $38,644,531) | | | 45,960,276 | |
| | | | | |
| |
| | | | | | | | |
|
| | NO. OF | | | | | | |
| | RIGHTS | | | | | | |
|
| | | | RIGHTS — NM | | | | |
| | 5,500 | | Clinical Data, Contingent Value Rights* | | | 5,225 | |
| | | | | |
| |
28
The FBR Funds
FBR Small Cap Fund
Portfolio of Investments (continued)
April 30, 2011
(unaudited)
|
| | | | | | VALUE |
| | SHARES | | | | (NOTE 2) |
|
| | | | SHORT-TERM INVESTMENT — 1.6% | | | | |
| | 745,724 | | JPMorgan 100% U.S. Treasury Securities Money Market Fund (Cost $745,724) | | $ | 745,724 | |
| | | | | |
| |
| | | | | | | | |
| | | | Total Investments — 98.8% (Cost $39,390,255) | | | 46,711,225 | |
| | | | | | | | |
| | | | Other Assets Less Liabilities — 1.2% | | | 565,273 | |
| | | | | |
| |
| | | | | | | | |
| | | | Net Assets — 100.0% | | $ | 47,276,498 | |
| | | | | |
| |
|
| * | | Non-income producing security |
| ADR | | American Depositary Receipts |
| PLC | | Public Liability Company |
| NM | | Not Meaningful |
| Note: | | For presentation purposes, the Fund has grouped some of the industry categories. For purposes of categorizing securities for compliance with Section 8(b)(1) of the Investment Company Act of 1940, the Fund uses more specific industry classifications. |
The accompanying notes are an integral part of the financial statements.
29
The FBR Funds
FBR Focus Fund
Management Overview
Portfolio Managers: David Rainey, CFA®, Brian Macauley, CFA® and Ira Rothberg, CFA®
Over the previous six months, how did the Fund perform and what factors contributed to this performance?
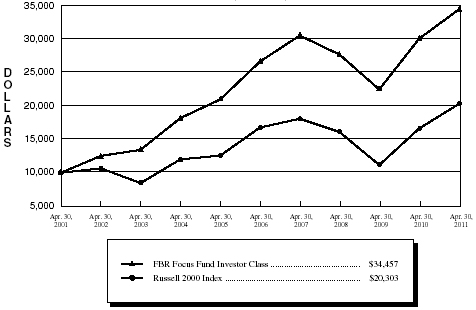
For the six-month period ended April 30, 2011, the Investor Class of the FBR Focus Fund returned 11.75% compared to 23.73% for the Russell 2000 Index and 16.36% for the S&P 500 Index.
The Fund’s return during the period was the result of improved business prospects for its key holdings, owed to a better overall economic outlook and company specific developments. Leading contributors to the Fund’s performance were 99 Cents Only Stores (NYSE Symbol: NDN), Markel Corp. (Nasdaq Symbol: MKL), Penn National Gaming, Inc. (Nasdaq Symbol: PENN), and CarMax, Inc. (NYSE Symbol: KMX). The leading detractor from the Fund’s performance was Lamar Advertising Co. (Nasdaq Symbol: LAMR).
We invest with a long-term time horizon and encourage shareholders to do the same. Despite the discussion of six-month results referenced above, we encourage investors to evaluate the Fund’s performance over three-, five-, and ten-year periods since shorter time frames can be influenced by many transitory issues unrelated to the intrinsic worth of the Fund’s holdings. Long-term performance metrics for the Fund can be found in the table below.
Portfolio managers’ comments on the Fund and the related investment outlook.
The Focus Fund has long employed a rather unconventional approach. Ostensibly, the Fund is distinguished by its concentrated portfolio, low turnover, and long-term performance. But under the surface, there are many important, but less obvious points of differentiation from the typical mutual fund. By way of a few recent investment decisions, we hope to illustrate for you some of these subtleties so that you can better appreciate our approach to managing the Fund.
During the last six months we have had two portfolio companies receive buyout offers from private equity firms (Dynamex, Inc. and 99 Cents Only Stores). We believed both of these offers substantially undervalued these companies shares so we made the necessary filings with the SEC to become an “activist” investor (13D filing status) in order to defend our shareholders’ rights and lobby for a more appropriate takeout price. Being an activist can be time consuming and potentially expensive, so it is not a decision to take lightly. However, in both circumstances we believed that we had a winning argument and very good chance to help increase the buyout price and generate an attractive return on our effort.
On April 11, 2011, The Wall Street Journal Online published an article about our 99 Cents Only Stores activity and observed that few mutual funds stage activist campaigns. This notion
30
The FBR Funds
FBR Focus Fund
Management Overview (continued)
was not evident to us prior to reading the article, but upon some reflection it makes sense. For the economics of activism to work there generally need to be three ingredients: 1) you need to have a firmly held view of the company’s value, 2) you need to be a large shareholder of the company (5%-plus), and 3) it needs to be an important enough position in your fund to warrant the effort. These ingredients are often present in our portfolio since our strategy revolves around getting to know a business very well, then making it an important, long-term investment in our portfolio when we see its stock price trading well below its intrinsic value. Since we frequently focus on small and mid-cap companies, a large position size for us often translates into a large percentage ownership in the target company. In contrast, the typical mutual fund in our peer group holds more than 100 stocks and sells those stocks about once a year making it far less likely that the three ingredients for activism will be present.
It is unusual that we have had these two activist experiences over the past six months, but the current environment is conducive to private equity and corporate buyer activity. We have never entered an investment with the intention of becoming an activist, but it is a valuable tool to have available if circumstances develop in such a way to warrant its use. We were pleased with the outcome of the Dynamex, Inc. buyout since the original proposed price was $21.25 per share and the deal closed 17% higher at a more appropriate price of $25.00 per share. We do not yet know the outcome of the buyout process at 99 Cents Only Stores, but believe that the current offer of $19.09 per share substantially undervalues the business.
Another distinguishing characteristic of the Fund is a willingness to look across the market capitalization spectrum in search of undervalued securities. Over the course of the last year, the Fund has established positions in companies with market capitalizations (at the time of purchase) ranging from $150 million (Diamond Hill Investment Group, Inc.) to $170 billion (Google, Inc.). This contrasts with many mutual funds that are pigeon holed into investing exclusively in one segment of the market capitalization range. Some mutual funds are even forced to sell their best small-cap stocks because they have appreciated into the mid-cap classification.
Because we are generally looking for growth companies, we have historically found more opportunity in the small and mid-capitalization space. We anticipate that this will continue to be the case. However, we think it is a mistake to ignore the important segment of the investable universe represented by large-cap stocks.
Despite its mega-cap status and approximately $30 billion in revenues, we believe that Google, Inc. can compound intrinsic value per share at a 15%-plus clip over at least the next five years. With a global search market share of approximately 65%, Google, Inc. is a toll gate on the growth of the Internet and the world’s information. While today less than 30% of the world’s population is accessing the Internet, we expect billions more to get online in the next few years. Two-thirds of the world’s population has a mobile phone and these users are quickly transitioning to web-enabled devices (smart phones). In the United
31
The FBR Funds
FBR Focus Fund
Management Overview (continued)
States, where 77% of the population is already online, the number of searches conducted last year grew at more than 20%. With its wide economic moat and rapid earnings growth, Google, Inc. as of April 30, 2011, trades at a modest 12.5x our estimate of forward twelve month economic earnings per share.
The Fund is also differentiated by its unique portfolio construction. We focus on holding about two dozen of the best investments that we can find from the universe of about 8,000 public companies. This leads us to heavy investment exposure in some sectors and little or no exposure in other sectors. For example, today we have exposure to just six of Morningstar’s twelve market sectors, and even then with very different weightings. This is a distinct contrast to most mutual funds that maintain generally balanced sector exposures and try to add value by selecting the best investment opportunities within all sectors. Most mutual funds take this approach because they are focused on relative, rather than absolute returns. We accept that our approach will inevitably lead to short-term periods of underperformance relative to our prospectus benchmark, but has allowed us to substantially outperform the market over longer periods of time.
Indeed, you may have noticed that the last six months has been a period of underperformance, albeit with a favorable absolute return of more than 11%. For historical perspective, consider that since the Fund’s inception 14 years ago, it has underperformed its benchmark in 7 of those 14 calendar years. But over the entire period the net result has been quite satisfactory at about 6 percentage points (600 basis points) of average annual outperformance.
Our view is that long-term performance is determined just as much by what we choose to avoid as by what we choose to own. For example, healthy skepticism and a disciplined valuation overlay enabled the Fund to largely avoid the destruction wrought upon the telecom-media-technology sector during the internet bubble collapse in 2000-2003, and also largely avoid direct exposure to the mortgage lending debacle that precipitated the Great Recession. We didn’t choose to own the hottest internet retailers or mortgage lenders like many of our more conventional peers, instead we avoided those industries altogether. We will continue to remain selective and disciplined in our security and sector exposure in our pursuit of creating long-term sustainable value for Fund shareholders.
The opinions expressed in this commentary reflect those of the Portfolio Managers as of the date written. Any such opinions are subject to change based on market or other conditions. These opinions may not be relied upon as investment advice. Investment decisions for The FBR Funds are based on several factors, and may not be relied upon as an indication of trading intent on behalf of any FBR Fund. Security positions can and do change.
32
The FBR Funds
FBR Focus Fund
Comparison of Changes in Value of $10,000 Investment in
Investor Class Shares(1)(2) vs. Russell 2000 Index(1)(3)
(unaudited)
| Total Returns—For the Periods Ended April 30, 2011(4) |
| | | | | One Year | | Five Year | | Ten Year |
| | | | |
| |
| |
|
| | FBR Focus Fund Investor Class(1)(2) | | | 14.57 | % | | 5.27 | % | | 13.17 | % |
| | FBR Focus Fund Institutional Class(2)(5) | | | 14.82 | % | | 5.50 | % | | 13.29 | % |
| | Russell 2000 Index(1)(3) | | | 22.20 | % | | 3.89 | % | | 7.34 | % |
| PAST PERFORMANCE IS NO GUARANTEE OF FUTURE RESULTS. |
| The performance data quoted represents past performance and the current performance may be lower or higher than the performance data quoted. The investment return and principal will fluctuate so that investors’ shares, when redeemed, may be worth more or less than their original cost. The performance data does not reflect the deduction of taxes that a shareholder would pay on Fund distributions or redemption fees. The Fund charges a redemption fee of 1.00% on shares redeemed or exchanged within 90 days; if reflected, the redemption fee would reduce the performance data quoted. To obtain performance data current to the most recent month-end, please call 888.200.4710. |
|
| (1) | | The graph assumes a hypothetical $10,000 initial investment in the Fund and reflects the reinvestment of dividends and all Fund expenses. Investors should note that the Fund is a professionally managed mutual fund while the index is unmanaged, does not incur expenses and is not available for investment. The performance of the index includes reinvested dividends, and does not reflect sales charges or expenses. |
| (2) | | FBR Fund Advisers, Inc. waived a portion of its advisory fees and agreed to contractually reimburse a portion of the Fund’s operating expenses, as necessary, to maintain existing expense limitations, as set forth in the notes to the financial statements. Total returns shown include fee waivers and expense reimbursements, if any; total returns would have been lower had there been no waiver of fees and/or reimbursement of expenses in excess of expense limitations. |
| (3) | | The Russell 2000 Index is comprised of the smallest of the 2000 companies of the Russell 3000 Index, representing approximately 8% of the Russell 3000’s total market capitalization. |
| (4) | | The total returns shown do not reflect the deduction of taxes that a shareholder would pay on fund distributions or the redemption of fund shares. |
| (5) | | Represents the performance of the Institutional Class shares after May 30, 2008 (inception of the share class) and Investor Class for periods prior to that date. |
33
The FBR Funds
FBR Focus Fund
Portfolio Summary
April 30, 2011
(unaudited)
The following provides a breakdown of the Fund by industry sectors. The underlying securities represent a percentage of the portfolio investments.
| Industry Sector | | | % of Total Investments |
| | |
|
| Retail | | | 30.2 | % |
| Entertainment | | | 18.0 | % |
| Insurance | | | 15.3 | % |
| Telecommunications | | | 12.1 | % |
| Advertising | | | 7.4 | % |
| Diversified Financial Services | | | 7.1 | % |
| Building Materials | | | 2.9 | % |
| Internet | | | 1.8 | % |
| Home Furnishings | | | 1.8 | % |
| Transportation | | | 0.2 | % |
| | | | | |
| Cash | | | 3.2 | % |
34
| The FBR Funds |
|
| FBR Focus Fund |
| Portfolio of Investments |
| April 30, 2011 |
| (unaudited) |
|
| | | | | VALUE |
| SHARES | | | | (NOTE 2) |
|
| | | COMMON STOCKS — 97.2% | | | |
| | | Advertising — 7.4% | | | |
| 1,771,440 | | Lamar Advertising Co., Class A* | | $ | 57,607,229 |
| | | | |
|
| | | | | | |
| | | Building Materials — 3.0% | | | |
| 825,000 | | Simpson Manufacturing Company, Inc. | | | 23,034,000 |
| | | | |
|
| | | | | | |
| | | Diversified Financial Services — 7.1% | | | |
| 94,910 | | Diamond Hill Investment Group, Inc. | | | 7,782,620 |
| 668,256 | | Encore Capital Group, Inc.* | | | 20,007,585 |
| 125,000 | | T. Rowe Price Group, Inc. | | | 8,031,250 |
| 912,000 | | The Charles Schwab Corp. | | | 16,698,720 |
| 173,137 | | White River Capital, Inc. | | | 3,126,854 |
| | | | |
|
| | | | | | 55,647,029 |
| | | | |
|
| | | Entertainment — 18.1% | | | |
| 1,549,000 | | Bally Technologies, Inc.* | | | 60,395,510 |
| 2,009,070 | | Penn National Gaming, Inc.* | | | 80,382,891 |
| | | | |
|
| | | | | | 140,778,401 |
| | | | |
|
| | | Home Furnishings — 1.8% | | | |
| 680,160 | | American Woodmark Corp. | | | 13,814,049 |
| | | | |
|
| | | | | | |
| | | Insurance — 15.4% | | | |
| 805,750 | | AON Corp. | | | 42,035,977 |
| 187,000 | | Markel Corp.* | | | 78,031,360 |
| | | | |
|
| | | | | | 120,067,337 |
| | | | |
|
| | | Internet — 1.8% | | | |
| 25,800 | | Google, Inc., Class A* | | | 14,037,780 |
| | | | |
|
| | | | | | |
| | | Retail — 30.3% | | | |
| 3,810,235 | | 99 Cents Only Stores*† | | | 76,814,338 |
| 2,297,088 | | CarMax, Inc.* | | | 79,708,954 |
| 1,352,076 | | O’Reilly Automotive, Inc.* | | | 79,853,608 |
| | | | |
|
| | | | | | 236,376,900 |
| | | | |
|
| | | Telecommunications — 12.1% | | | |
| 1,804,500 | | American Tower Corp., Class A* | | | 94,393,395 |
| | | | |
|
35
| The FBR Funds |
|
| FBR Focus Fund |
| Portfolio of Investments (continued) |
| April 30, 2011 |
| (unaudited) |
|
| | | | | VALUE |
| SHARES | | | | (NOTE 2) |
|
| | | Transportation — 0.2% | | | | |
| 104,200 | | Roadrunner Transportation Systems, Inc.* | | $ | 1,468,178 | |
| | | | |
| |
| | | | | | | |
| | | Total Common Stocks (Cost $383,640,236) | | | 757,224,298 | |
| | | | |
| |
| | | | | | | |
| | | SHORT-TERM INVESTMENT — 3.2% | | | | |
| 25,071,741 | | JPMorgan 100% U.S. Treasury Securities Money Market Fund (Cost $25,071,741) | | | 25,071,741 | |
| | | | |
| |
| | | | | | | |
| | | Total Investments — 100.4% (Cost $408,711,977) | | | 782,296,039 | |
| | | | | | | |
| | | Liabilities Less Other Assets — (0.4)% | | | (3,067,711 | ) |
| | | | |
| |
| | | | | | | |
| | | Net Assets — 100.0% | | $ | 779,228,328 | |
| | | | |
| |
|
| * | | Non-income producing security |
| † | | Affiliated issuer as defined in the Investment Company Act of 1940 (ownership of at least 5% of the outstanding voting securities of an issuer) |
| | | |
| Note: | | For presentation purposes, the Fund has grouped some of the industry categories. For purposes of categorizing securities for compliance with Section 8(b)(1) of the Investment Company Act of 1940, the Fund uses more specific industry classifications. |
The accompanying notes are an integral part of the financial statements.
36
| The FBR Funds |
|
| FBR Large Cap Financial Fund |
| Management Overview |
Portfolio Manager: David Ellison
Over the previous six months, how did the Fund perform and what factors contributed to this performance?
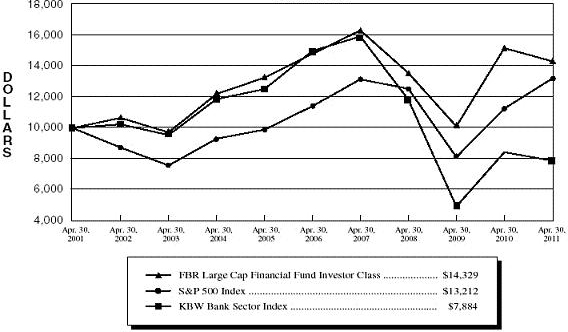
For the six-month period ended April 30, 2011, the Investor Class of the FBR Large Cap Financial Fund returned 9.39%. This compares to the S&P 500 Index, the KBW Bank Sector Index and the Morningstar Financial Category Average, which returned 16.36%, 13.97% and 12.85% for the same period, respectively.
The Fund continues to be conservatively positioned. The overweight in banks created most of the underperformance as continued worries over loan growth and loan quality outweighed the underlying improvement in balance sheets and earnings. The overweight in credit card companies helped performance as declining delinquencies fueled improved earnings. The underweight in consumer services hurt as investors favored these companies with little credit risk and loan growth concerns.
The Fund remains concentrated in domestic depository institutions. I believe these companies are well positioned to see much improved earnings as the economy improves. They are leveraged to improving real estate markets and a healthier consumer. These companies are also cheaper relative and historically to the other financial service groups.
Portfolio manager comments on the Fund and the related investment outlook.
The industry continues to struggle with numerous profit and growth headwinds. This is, I guess, a fancy way of saying there is still much work to be done before investors see (and buy) earnings they can believe and trust. These headwinds are primarily credit related. We all have heard them – housing prices falling and foreclosures rising, commercial real estate in trouble, loan demand weak, new financial regulations will be costly, Federal Reserve actions to keep interest low will reduce lending spreads and general uncertainty about what the long term impacts of Federal Reserve policy and related interventions will have. Finally, the economic recovery we saw develop in 2009 and the first half of 2010 has lost some steam and pushed back the time line for this industry to recover from what has turned out to be a severe credit cycle. Credit cycles are the biggest value creators and value destroyers for this industry and we are working our way through the latter today.
Now for some better news on financial stocks. Underneath all the macro concerns we have an industry that is working very hard to get better. I expect the work being done NOW will bear fruit over the next three to five years. This fruit will be in the form of reduced risk, reduced leverage and reduced complexity for both the balance sheet and income statement. This industry is cyclical and the difficult conditions of today will cycle into better ones over time.
37
| The FBR Funds |
|
| FBR Large Cap Financial Fund |
| Management Overview (continued) |
| It remains my goal to invest the Fund in companies that will benefit from the upset that has ensnarled an entire industry. I have been doing this for over 27 years and today’s investment environment is challenging. I remain mindful that investing is never always about making the most, but is always about preserving the most over the long run. |
| |
|
The opinions expressed in this commentary reflect those of the Portfolio Manager as of the date written. Any such opinions are subject to change based on market or other conditions. These opinions may not be relied upon as investment advice. Investment decisions for The FBR Funds are based on several factors, and may not be relied upon as an indication of trading intent on behalf of any FBR Fund. Security positions can and do change. |
38
| The FBR Funds |
|
| FBR Large Cap Financial Fund |
Comparison of Changes in Value of $10,000 Investment in
Investor Class Shares(1)(2) vs. Various Indices(1)(3)
(unaudited)
| | Total Returns—For the Periods Ended April 30, 2011(4) | |
| | | | | One Year | | Five Year | | Ten Year | |
| | | | |
| |
| |
| |
| | FBR Large Cap Financial Fund Investor Class(1)(2) | | | (5.63 | )% | | (0.66 | )% | | 3.66 | % | |
| | S&P 500 Index(1)(3) | | | 17.24 | % | | 2.95 | % | | 2.82 | % | |
| | KBW Bank Sector Index(1)(3) | | | (6.52 | )% | | (12.08 | )% | | (2.35 | )% | |
|
PAST PERFORMANCE IS NO GUARANTEE OF FUTURE RESULTS.
The performance data quoted represents past performance and the current performance may be lower or higher than the performance data quoted. The investment return and principal will fluctuate so that investors’ shares, when redeemed, may be worth more or less than their original cost. The performance data does not reflect the deduction of taxes that a shareholder would pay on Fund distributions or redemption fees. The Fund charges a redemption fee of 1.00% on shares redeemed or exchanged within 90 days; if reflected, the redemption fee would reduce the performance data quoted. To obtain performance data current to the most recent month-end, please call 888.200.4710.
|
| (1) | | The graph assumes a hypothetical $10,000 initial investment in the Fund and reflects the reinvestment of dividends and all Fund expenses. Investors should note that the Fund is a professionally managed mutual fund while the index is unmanaged, does not incur expenses and is not available for investment. The performance of the index includes reinvested dividends, and does not reflect sales charges or expenses. |
| (2) | | FBR Fund Advisers, Inc. waived a portion of its advisory fees and agreed to contractually reimburse a portion of the Fund’s operating expenses, as necessary, to maintain existing expense limitations, as set forth in the notes to the financial statements. Total returns shown include fee waivers and expense reimbursements, if any; total returns would have been lower had there been no waiver of fees and/or reimbursement of expenses in excess of expense limitations. |
| (3) | | The S&P 500 Index is a capitalization-weighted index of 500 stocks. The index is designed to represent the broad domestic ecomony through changes in aggregate market value of 500 stocks representing all major industries. The KBW Bank Sector Index is a capitalization-weighted index composed of 24 geographically diverse stocks representing national money center banks and leading regional institutions. The KBW Bank Sector Index is based on one-tenth the value of the Keefe, Bruyette & Woods Index. |
| (4) | | The total returns shown do not reflect the deduction of taxes that a shareholder would pay on fund distributions or the redemption of fund shares. |
39
| The FBR Funds |
|
| FBR Large Cap Financial Fund |
| Portfolio Summary |
| April 30, 2011 |
| (unaudited) |
The following provides a breakdown of the Fund by industry sectors. The underlying securities represent a percentage of the portfolio investments.
| Industry Sector | | | % of Total Investments |
| | |
|
| Banks | | | 78.0 | % |
| Diversified Financial Services | | | 8.0 | % |
| Commercial Services | | | 6.5 | % |
| Insurance | | | 2.4 | % |
| Real Estate Investment Trust (REIT) | | | 1.0 | % |
| | | | | |
| Cash | | | 4.1 | % |
40
| The FBR Funds |
|
| FBR Large Cap Financial Fund |
| Portfolio of Investments |
| April 30, 2011 |
| (unaudited) |
|
| | | | | | VALUE |
| SHARES | | | | | (NOTE 2) |
|
| | | COMMON STOCKS — 96.7% | | | |
| | | Banks — 78.6% | | | |
| 290,000 | | Bank of America Corp. | | $ | 3,561,200 |
| 35,000 | | Bank of New York Mellon Corp. | | | 1,013,600 |
| 55,000 | | BB&T Corp. | | | 1,480,600 |
| 75,000 | | Capital One Financial Corp. | | | 4,104,750 |
| 65,000 | | CIT Group, Inc.* | | | 2,759,900 |
| 900,000 | | Citigroup, Inc.* | | | 4,131,000 |
| 83,000 | | Comerica, Inc. | | | 3,148,190 |
| 225,000 | | Fifth Third Bancorp | | | 2,985,750 |
| 360,000 | | Huntington Bancshares, Inc. | | | 2,444,400 |
| 85,000 | | JPMorgan Chase & Co. | | | 3,878,550 |
| 340,000 | | KeyCorp | | | 2,947,800 |
| 106,000 | | Morgan Stanley | | | 2,771,900 |
| 370,000 | | Regions Financial Corp. | | | 2,715,800 |
| 95,000 | | SunTrust Banks, Inc. | | | 2,678,050 |
| 10,000 | | The Goldman Sachs Group, Inc. | | | 1,510,100 |
| 65,000 | | The PNC Financial Services Group, Inc. | | | 4,052,100 |
| 150,000 | | U.S. Bancorp | | | 3,873,000 |
| 132,000 | | Wells Fargo & Co. | | | 3,842,520 |
| 45,000 | | Zions Bancorp | | | 1,100,250 |
| | | | |
|
| | | | | | 54,999,460 |
| | | | |
|
| | | Commercial Services — 6.6% | | | |
| 6,000 | | MasterCard, Inc., Class A | | | 1,655,340 |
| 38,000 | | Visa, Inc., Class A | | | 2,968,560 |
| | | | |
|
| | | | | | 4,623,900 |
| | | | |
|
| | | Diversified Financial Services — 8.1% | | | |
| 50,000 | | American Express Co. | | | 2,454,000 |
| 5,000 | | BlackRock, Inc. | | | 979,700 |
| 90,000 | | Discover Financial Services | | | 2,235,600 |
| | | | |
|
| | | | | | 5,669,300 |
| | | | |
|
| | | Insurance — 2.4% | | | |
| 40,000 | | American International Group, Inc.* | | | 1,246,000 |
| 10,000 | | MetLife, Inc. | | | 467,900 |
| | | | |
|
| | | | | | 1,713,900 |
| | | | |
|
41
| The FBR Funds |
|
| FBR Large Cap Financial Fund |
| Portfolio of Investments (continued) |
| April 30, 2011 |
| (unaudited) |
|
| | | | | VALUE |
| SHARES | | | | (NOTE 2) |
|
| | | Real Estate Investment Trust (REIT) — 1.0% | | | | |
| 40,000 | | Annaly Capital Management, Inc. | | $ | 713,600 | |
| | | | |
| |
| | | | | | | |
| | | Total Common Stocks (Cost $64,689,763) | | | 67,720,160 | |
| | | | |
| |
| | | | | | | |
| | | SHORT-TERM INVESTMENT — 4.1% | | | | |
| 2,885,969 | | JPMorgan 100% U.S. Treasury Securities Money Market Fund (Cost $2,885,969) | | | 2,885,969 | |
| | | | |
| |
| | | | | | | |
| | | Total Investments — 100.8% (Cost $67,575,732) | | | 70,606,129 | |
| | | | | | | |
| | | Liabilities Less Other Assets — (0.8)% | | | (544,741 | ) |
| | | | |
| |
| | | | | | | |
| | | Net Assets — 100.0% | | $ | 70,061,388 | |
| | | | |
| |
|
| * | | Non-income producing security |
The accompanying notes are an integral part of the financial statements.
42
| The FBR Funds |
|
| FBR Small Cap Financial Fund |
| Management Overview |
Portfolio Manager: David Ellison
Over the previous six months, how did the Fund perform and what factors contributed to this performance?
For the six-month period ended April 30, 2011, the Investor Class of the FBR Small Cap Financial Fund returned 13.90%. This compares to the NASDAQ Bank Index and the Morningstar Financial Category Average which returned 13.18% and 12.85% for the same period, respectively. The Fund trailed the more broadly diversified Russell 2000 Index which retuned 23.73% for the period.
The Fund’s concentration in small banks created the favorable performance during the period. Investments in mortgage insurers and debit card providers hurt performance during the period. The Fund continues to be conservatively positioned with respect to cash levels and company selection. Reasons for this include the housing activity and employment growth. The economy has yet to show enough recovery energy to stabilize housing prices or improve home sale activity. There are also not any consistent signs of employment growth to drive new loan demand. As investors, we are in a “lonely vigil” waiting for conditions to improve and the stocks to respond to that improvement.
Portfolio manager comments on the Fund and the related investment outlook.
The industry continues to struggle with numerous profit and growth headwinds. This is, I guess, a fancy way of saying there is still much work to be done before investors see (and buy) earnings they can believe and trust. These headwinds are primarily credit related. We all have heard them – housing prices falling and foreclosures rising, commercial real estate in trouble, loan demand weak, new financial regulations will be costly, Federal Reserve actions to keep interest low will reduce lending spreads and general uncertainty about what the long term impacts of Federal Reserve policy and related interventions will have. Finally, the economic recovery we saw develop in 2009 and the first half of 2010 has lost some steam and pushed back the time line for this industry to recover from what has turned out to be a severe credit cycle. Credit cycles are the biggest value creators and value destroyers for this industry and we are working our way through the latter today.
Now for some better news on financial stocks. Underneath all the macro concerns we have an industry that is working very hard to get better. I expect the work being done NOW will bear fruit over the next three to five years. This fruit will be in the form of reduced risk, reduced leverage and reduced complexity for both the balance sheet and income statement. This industry is cyclical and the difficult conditions of today will cycle into better ones over time.
It remains my goal to invest the Fund in companies that will benefit from the upset that has ensnarled an entire industry. I have been doing this for over 27 years and today’s
43
| The FBR Funds |
|
| FBR Small Cap Financial Fund |
| Management Overview (continued) |
| investment environment is challenging. I remain mindful that investing is never always about making the most, but is always about preserving the most over the long run. |
| |
|
The opinions expressed in this commentary reflect those of the Portfolio Manager as of the date written. Any such opinions are subject to change based on market or other conditions. These opinions may not be relied upon as investment advice. Investment decisions for The FBR Funds are based on several factors, and may not be relied upon as an indication of trading intent on behalf of any FBR Fund. Security positions can and do change. |
44
| The FBR Funds |
|
| FBR Small Cap Financial Fund |
Comparison of Changes in Value of $10,000 Investment in
Investor Class Shares(1)(2) vs. Russell 2000 Index(1)(3)
(unaudited)
| | Total Returns—For the Periods Ended April 30, 2011(4) | |
| | | | | One Year | | Five Year | | Ten Year | |
| | | | |
| |
| |
| |
| | FBR Small Cap Financial Fund Investor Class(1)(2) | | | (4.68 | )% | | 1.25 | % | | 9.72 | % | |
| | FBR Small Cap Financial Fund Institutional Class(2)(5) | | | (4.62 | )% | | 1.39 | % | | 9.80 | % | |
| | Russell 2000 Index(1)(3) | | | 22.20 | % | | 3.89 | % | | 7.34 | % | |
|
PAST PERFORMANCE IS NO GUARANTEE OF FUTURE RESULTS.
The performance data quoted represents past performance and the current performance may be lower or higher than the performance data quoted. The investment return and principal will fluctuate so that investors’ shares, when redeemed, may be worth more or less than their original cost. The performance data does not reflect the deduction of taxes that a shareholder would pay on Fund distributions or redemption fees. The Fund charges a redemption fee of 1.00% on shares redeemed or exchanged within 90 days; if reflected, the redemption fee would reduce the performance data quoted. To obtain performance data current to the most recent month-end, please call 888.200.4710.
|
| (1) | | The graph assumes a hypothetical $10,000 initial investment in the Fund and reflects the reinvestment of dividends and all Fund expenses. Investors should note that the Fund is a professionally managed mutual fund while the index is unmanaged, does not incur expenses and is not available for investment. The performance of the index includes reinvested dividends, and does not reflect sales charges or expenses. |
| (2) | | FBR Fund Advisers, Inc. waived a portion of its advisory fees and agreed to contractually reimburse a portion of the Fund’s operating expenses, as necessary, to maintain existing expense limitations, as set forth in the notes to the financial statements. Total returns shown include fee waivers and expense reimbursements, if any; total returns would have been lower had there been no waiver of fees and/or reimbursement of expenses in excess of expense limitations. |
| (3) | | The Russell 2000 Index is comprised of the smallest of the 2000 companies of the Russell 3000 Index, representing approximately 8% of the Russell 3000’s total market capitalization. |
| (4) | | The total returns shown do not reflect the deduction of taxes that a shareholder would pay on fund distributions or the redemption of fund shares. |
| (5) | | Represents the performance of the Institutional Class shares after May 30, 2008 (inception of share class) and Investor Class for periods prior to that date. |
45
| The FBR Funds |
|
| FBR Small Cap Financial Fund |
| Portfolio Summary |
| April 30, 2011 |
| (unaudited) |
The following provides a breakdown of the Fund by industry sectors. The underlying securities represent a percentage of the portfolio investments.
| Industry Sector | | % of Total Investments |
| |
|
| Banks | | 36.0 | % |
| Savings & Loans | | 32.0 | % |
| Real Estate Investment Trust (REIT) | | 7.6 | % |
| Insurance | | 6.5 | % |
| Investment Companies | | 4.9 | % |
| Diversified Financial Services | | 4.8 | % |
| Home Builders | | 1.5 | % |
| Commercial Services | | 1.2 | % |
| | | | |
| Cash | | 5.5 | % |
46
| The FBR Funds |
|
| FBR Small Cap Financial Fund |
| Portfolio of Investments |
| April 30, 2011 |
| (unaudited) |
|
| | | | | VALUE |
| SHARES | | | | (NOTE 2) |
|
| | | COMMON STOCKS — 94.6% | | | | |
| | | Banks — 36.0% | | | | |
| 470,000 | | Associated Banc-Corp. | | $ | 6,862,000 | |
| 80,000 | | Bancorp Rhode Island, Inc. | | | 3,548,800 | |
| 2,400,000 | | Banner Corp. | | | 6,600,000 | |
| 230,000 | | Cathay General Bancorp | | | 3,921,500 | |
| 2,000,000 | | Citizens Republic Bancorp, Inc.* | | | 1,836,000 | |
| 20,000 | | Comerica, Inc. | | | 758,600 | |
| 160,000 | | East West Bancorp, Inc. | | | 3,380,800 | |
| 145,000 | | Fifth Third Bancorp | | | 1,924,150 | |
| 460,000 | | First Horizon National Corp. | | | 5,037,000 | |
| 560,000 | | Fulton Financial Corp. | | | 6,540,800 | |
| 195,000 | | Huntington Bancshares, Inc. | | | 1,324,050 | |
| 70,000 | | IBERIABANK Corp. | | | 4,200,700 | |
| 222,000 | | Independent Bank Corp. | | | 6,506,820 | |
| 190,000 | | KeyCorp | | | 1,647,300 | |
| 290,000 | | Nara Bancorp, Inc.* | | | 2,850,700 | |
| 660,000 | | National Penn Bancshares, Inc. | | | 5,418,600 | |
| 180,000 | | Oriental Financial Group, Inc. | | | 2,332,800 | |
| 1,000,000 | | Popular, Inc.* | | | 3,150,000 | |
| 427,000 | | State Bancorp, Inc. | | | 5,636,400 | |
| 325,000 | | Sterling Financial Corp.* | | | 5,733,000 | |
| 620,000 | | Susquehanna Bancshares, Inc. | | | 5,716,400 | |
| 2,100,000 | | Synovus Financial Corp. | | | 5,250,000 | |
| 170,000 | | TCF Financial Corp. | | | 2,650,300 | |
| 1,550,000 | | United Community Banks, Inc.* | | | 3,720,000 | |
| 150,000 | | Webster Financial Corp. | | | 3,228,000 | |
| 444,389 | | Wilshire Bancorp, Inc.* | | | 1,777,556 | |
| 70,000 | | Wintrust Financial Corp. | | | 2,358,300 | |
| 220,000 | | Zions Bancorp | | | 5,379,000 | |
| | | | |
| |
| | | | | | 109,289,576 | |
| | | | |
| |
| | | Commercial Services — 1.2% | | | | |
| 82,300 | | Green Dot Corp., Class A* | | | 3,552,068 | |
| | | | |
| |
47
| The FBR Funds |
|
| FBR Small Cap Financial Fund |
| Portfolio of Investments (continued) |
| April 30, 2011 |
| (unaudited) |
|
| | | | | VALUE |
| SHARES | | | | (NOTE 2) |
|
| | | Diversified Financial Services — 4.8% | | | | |
| 200,000 | | Doral Financial Corp.* | | $ | 300,000 | |
| 141,421 | | Encore Capital Group, Inc.* | | | 4,234,145 | |
| 310,000 | | Netspend Holdings, Inc.* | | | 3,599,100 | |
| 70,000 | | Portfolio Recovery Associates, Inc.* | | | 6,318,200 | |
| | | | |
| |
| | | | | | 14,451,445 | |
| | | | |
| |
| | | | | | | |
| | | Home Builders — 1.5% | | | | |
| 380,000 | | KB Home | | | 4,487,800 | |
| | | | |
| |
| | | | | | | |
| | | Insurance — 6.6% | | | | |
| 780,000 | | CNO Financial Group, Inc.* | | | 6,286,800 | |
| 30,000 | | MBIA, Inc.* | | | 309,600 | |
| 380,000 | | MGIC Investment Corp.* | | | 3,290,800 | |
| 1,025,000 | | Radian Group, Inc. | | | 6,078,250 | |
| 1,800,000 | | The PMI Group, Inc.* | | | 3,888,000 | |
| | | | |
| |
| | | | | | 19,853,450 | |
| | | | |
| |
| | | Investment Companies — 4.9% | | | | |
| 760,000 | | American Capital Ltd.* | | | 7,805,200 | |
| 700,000 | | KKR Financial Holdings LLC | | | 7,070,000 | |
| | | | |
| |
| | | | | | 14,875,200 | |
| | | | |
| |
| | | Real Estate Investment Trust (REIT) — 7.6% | | | | |
| 60,000 | | American Capital Agency Corp. | | | 1,746,600 | |
| 150,000 | | CommonWealth REIT | | | 4,108,500 | |
| 185,000 | | First Industrial Realty Trust, Inc.* | | | 2,316,200 | |
| 15,000 | | Hatteras Financial Corp. | | | 426,150 | |
| 1,290,000 | | NorthStar Realty Finance Corp. | | | 6,514,500 | |
| 130,000 | | PennyMac Mortgage Investment Trust | | | 2,381,600 | |
| 2,200,000 | | RAIT Financial Trust | | | 5,368,000 | |
| 10,000 | | Redwood Trust, Inc. | | | 158,300 | |
| | | | |
| |
| | | | | | 23,019,850 | |
| | | | |
| |
| | | Savings & Loans — 32.0% | | | | |
| 480,000 | | Astoria Financial Corp. | | | 6,945,600 | |
| 255,000 | | BankUnited, Inc. | | | 7,162,950 | |
| 470,000 | | Brookline Bancorp, Inc. | | | 4,333,400 | |
48
| The FBR Funds |
|
| FBR Small Cap Financial Fund |
| Portfolio of Investments (continued) |
| April 30, 2011 |
| (unaudited) |
|
| | | | | VALUE |
| SHARES | | | | (NOTE 2) |
|
| | | Savings & Loans — 32.0% (continued) | | | | |
| 510,000 | | Capitol Federal Financial, Inc. | | $ | 5,773,200 | |
| 160,000 | | Danvers Bancorp, Inc. | | | 3,608,000 | |
| 200,000 | | Dime Community Bancshares, Inc. | | | 3,092,000 | |
| 440,000 | | First Niagara Financial Group, Inc. | | | 6,336,000 | |
| 2,800,000 | | Flagstar Bancorp, Inc.* | | | 4,368,000 | |
| 490,000 | | Flushing Financial Corp. | | | 7,212,800 | |
| 94,331 | | Hingham Institution for Savings | | | 4,990,110 | |
| 35,000 | | Hudson City Bancorp, Inc. | | | 333,550 | |
| 540,000 | | Northwest Bancshares, Inc. | | | 6,798,600 | |
| 471,000 | | OceanFirst Financial Corp. | | | 6,829,500 | |
| 335,000 | | Provident Financial Services, Inc. | | | 4,864,200 | |
| 287,728 | | Territorial Bancorp, Inc. | | | 5,774,701 | |
| 410,000 | | TFS Financial Corp. | | | 4,460,800 | |
| 115,897 | | ViewPoint Financial Group | | | 1,431,328 | |
| 420,000 | | Washington Federal, Inc. | | | 6,757,800 | |
| 130,000 | | WSFS Financial Corp. | | | 5,846,100 | |
| | | | |
| |
| | | | | | 96,918,639 | |
| | | | |
| |
| | | | | | | |
| | | Total Common Stocks (Cost $252,082,956) | | | 286,448,028 | |
| | | | |
| |
| | | | | | | |
| | | SHORT-TERM INVESTMENT — 5.6% | | | | |
| 16,827,660 | | JPMorgan 100% U.S. Treasury Securities Money Market Fund (Cost $16,827,660) | | | 16,827,660 | |
| | | | |
| |
| | | | | | | |
| | | Total Investments — 100.2% (Cost $268,910,616) | | | 303,275,688 | |
| | | | | | | |
| | | Liabilities Less Other Assets — (0.2)% | | | (599,958 | ) |
| | | | |
| |
| | | | | | | |
| | | Net Assets — 100.0% | | $ | 302,675,730 | |
| | | | |
| |
|
| * | | Non-income producing security |
| LLC | | Limited Liability Company |
The accompanying notes are an integral part of the financial statements.
49
| The FBR Funds |
|
| FBR Technology Fund |
| Management Overview |
Portfolio Manager: David Ellison and Winsor Aylesworth
Over the previous six months, how did the Fund perform and what factors contributed to this performance?
For the six-month period ended April 30, 2011, the Investor Class of the FBR Technology Fund returned 12.64%. This compares to the S&P 500 Index, the NASDAQ Composite Index and the Morningstar Technology Category Average which returned 16.36%,14.60% and 16.05% for the same period respectively.
The Fund continued to provide a good return but fell short of its benchmarks. It is our opinion that this is a result of the market rewarding higher risk profiles in companies that the Fund would not routinely invest in. We continue to believe that the Fund’s investment philosophy of investing in only those technology firms that exhibit growing revenues, increasing tangible book value with minimal debt is the correct one for long term performance with minimal risk.
During the last six months, major contributors to the Fund’s performance were Baidu, Inc. (NASDAQ Symbol: BIDU), ARM Holdings PLC (NASDAQ Symbol: ARMH) and Altera Corp. (Nasdaq Symbol: ALTR). Baidu, Inc. is a Chinese internet search engine much in the model of Google, Inc. (“Google”). ARM Holdings PLC is a leading semiconductor intellectual property company based in the United Kingdom. It is a key player in mobile computing including tablet computers. Altera Corp. is a U.S. based company involved in the semiconductor industry by providing programmable logic solutions. For the six month period these three companies were up between 35 and 75%.
Significant detractors included Broadcom Corp. (“Broadcom”) (NASDAQ Symbol: BRCM), Akami Technologies, Inc. (“Akami”) (NASDAQ Symbol: AKAM) and Google (NASDAQ Symbol: GOOG). Broadcom designs, develops and provides semi-conductors for wireless communications. Akami provides services for improving internet and network performance while Google is the well known and widely held internet search engine. These three firms had period returns of between -10% and -33%. Both Akami and Broadcom had a slowdown in recent revenue growth while Google continues to grow but not at historic rates. We continue to own Google but recently sold our positions in Broadcom and Akami and redeployed the proceeds into companies that have better revenue growth prospects.
Although all these companies are leaders in their respective technologies, their performance demonstrates the importance of diversification in this sector. We try to minimize the firms that will have negative returns but through diversification and proper selection you have the chance to offset every disappointing result with a positive one.
Portfolio manager comments on the Fund and the related investment outlook.
Globally we believe there are many macro issues that cause concern. We have the advent of new democracies in the Middle East. Many European countries are having problems
50
| The FBR Funds |
|
| FBR Technology Fund |
| Management Overview (continued) |
with their debt with the Euro facing challenges. As we look to Asia, China continues to hold huge potential demand for products while Japan suffers through the worst natural disaster faced by the country since World War II.
We are very fortunate in the USA in that although not devoid of issues, we somehow seem to be capable of handling them. The biggest issue to growing our economy seems to be our national debt and the uncertainty on how we are going to handle that and such issues as social security and Medicare.
Solutions to all these issues involve technology. Economies throughout the world will invest in new technologies that will make them more efficient and competitive in the marketplace. As Japan rebuilds it will build new state of the art plants and housing to recover from their earthquake. Nuclear energy will require technology solutions for safety issues. Finally, consumers throughout the world will want the latest and newest consumer products which will feature technology.
We hope that this Fund continues to provide a good way to participate in technology companies that will grow with minimal risk. We will continue to offer a diversified portfolio of companies that have prospects for growing revenues and tangible book value with minimal debt. We remind investors that these types of companies generally command a price multiple premium and are subject to periods of price correction.
We continue to appreciate your support, we look confidently to the future.
|
The opinions expressed in this commentary reflect those of the Portfolio Managers as of the date written. Any such opinions are subject to change based on market or other conditions. These opinions may not be relied upon as investment advice. Investment decisions for The FBR Funds are based on several factors, and may not be relied upon as an indication of trading intent on behalf of any FBR Fund. Security positions can and do change. |
51
| The FBR Funds |
|
| FBR Technology Fund |
Comparison of Changes in Value of $10,000 Investment in
Investor Class Shares(1)(2) vs. Various Indices(1)(3)
(unaudited)
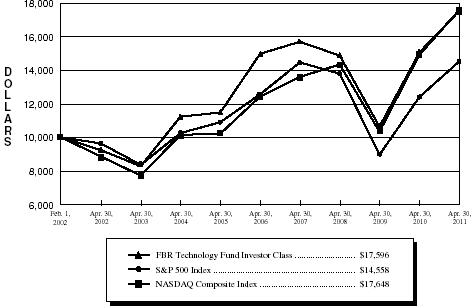
| | Total Returns—For the Periods Ended April 30, 2011(4) | |
| | | | | | | | | | | | |
| | | | | | | | | | Annualized
Since | |
| | | | | One Year | | Five Year | | Inception(5) | |
| | | | |
| |
| |
| |
| | FBR Technology Fund Investor Class(1)(2) | | | 16.56 | % | | 3.21 | % | | 6.31 | % | |
| | FBR Technology Fund Institutional Class(2)(6) | | | 16.73 | % | | 3.26 | % | | 6.33 | % | |
| | S&P 500 Index(1)(3) | | | 17.24 | % | | 2.95 | % | | 4.14 | % | |
| | NASDAQ Composite Index(1)(3) | | | 17.98 | % | | 7.22 | % | | 6.33 | % | |
|
PAST PERFORMANCE IS NO GUARANTEE OF FUTURE RESULTS.
The performance data quoted represents past performance and the current performance may be lower or higher than the performance data quoted. The investment return and principal will fluctuate so that investors’ shares, when redeemed, may be worth more or less than their original cost. The performance data does not reflect the deduction of taxes that a shareholder would pay on Fund distributions or redemption fees. The Fund charges a redemption fee of 1.00% on shares redeemed or exchanged within 90 days; if reflected, the redemption fee would reduce the performance data quoted. To obtain performance data current to the most recent month-end, please call 888.200.4710.
|
| (1) | | The graph assumes a hypothetical $10,000 initial investment in the Fund and reflects the reinvestment of dividends and all Fund expenses. Investors should note that the Fund is a professionally managed mutual fund while the indices are unmanaged, do not incur expenses and are not available for investment. The performance of the indices includes reinvested dividends, and does not reflect sales charges or expenses. |
| (2) | | FBR Fund Advisers, Inc. waived a portion of its advisory fees and agreed to contractually reimburse a portion of the Fund’s operating expenses, as necessary, to maintain existing expense limitations, as set forth in the notes to the financial statements. Total returns shown include fee waivers and expense reimbursements, if any; total returns would have been lower had there been no waiver of fees and/or reimbursement of expenses in excess of expense limitations. |
| (3) | | The S&P 500 Index is a capitalization-weighted index of 500 stocks. The index is designed to represent the broad domestic economy through changes in aggregate market value of 500 stocks representing all major industries. The NASDAQ Composite Index is a broad-based capitalization-weighted index of all NASDAQ National Market and Small Cap stocks. |
| (4) | | The total returns shown do not reflect the deduction of taxes that a shareholder would pay on fund distributions or the redemption of fund shares. |
| (5) | | For the period February 1, 2002 (commencement of operations) through April 30, 2011. |
| (6) | | Represents the performance of the Institutional Class shares after March 12, 2010 (inception of the share class) and Investor Class for periods prior to that date. |
52
| The FBR Funds |
|
| FBR Technology Fund |
| Portfolio Summary |
| April 30, 2011 |
| (unaudited) |
The following provides a breakdown of the Fund by industry sectors. The underlying securities represent a percentage of the portfolio investments.
| Industry Sector | | % of Total Investments |
| |
|
| Common Stocks | | 90.4 | % |
Semiconductors | | 24.0 | % |
Internet | | 22.7 | % |
Software | | 11.2 | % |
Computers | | 11.0 | % |
Telecommunications | | 7.0 | % |
Biotechnology | | 4.9 | % |
Energy-Alternate Sources | | 2.6 | % |
Healthcare-Products | | 2.5 | % |
Electronics | | 2.3 | % |
Electrical Components & Equipments | | 1.1 | % |
Commercial Services | | 1.1 | % |
| Investment Companies | | 5.8 | % |
| | | | |
| Cash | | 3.8 | % |
53
| The FBR Funds |
|
| FBR Technology Fund |
| Portfolio of Investments |
| April 30, 2011 |
| (unaudited) |
|
| | | | | VALUE |
| SHARES | | | | (NOTE 2) |
|
| | | COMMON STOCKS — 90.3% | | | | |
| | | Biotechnology — 5.0% | | | | |
| 800 | | Alexion Pharmaceuticals, Inc.* | | $ | 77,512 | |
| 4,550 | | Celgene Corp.* | | | 267,904 | |
| 1,700 | | Illumina, Inc.* | | | 120,666 | |
| | | | |
| |
| | | | | | 466,082 | |
| | | | |
| |
| | | Commercial Services — 1.1% | | | | |
| 650 | | HMS Holdings Corp.* | | | 51,162 | |
| 1,540 | | SuccessFactors, Inc.* | | | 53,392 | |
| | | | |
| |
| | | | | | 104,554 | |
| | | | |
| |
| | | Computers — 11.0% | | | | |
| 845 | | 3D Systems Corp.* | | | 35,253 | |
| 1,148 | | Apple, Inc.* | | | 399,768 | |
| 4,957 | | Cognizant Technology Solutions Corp., Class A* | | | 410,935 | |
| 1,330 | | Fortinet, Inc.* | | | 64,771 | |
| 2,425 | | Riverbed Technology, Inc.* | | | 85,215 | |
| 1,490 | | VanceInfo Technologies, Inc. ADR* | | | 47,918 | |
| | | | |
| |
| | | | | | 1,043,860 | |
| | | | |
| |
| | | Electrical Components & Equipments — 1.1% | | | | |
| 4,540 | | American Superconductor Corp.* | | | 53,799 | |
| 16,900 | | Satcon Technology Corp.* | | | 54,080 | |
| | | | |
| |
| | | | | | 107,879 | |
| | | | |
| |
| | | Electronics — 2.3% | | | | |
| 2,935 | | Amphenol Corp., Class A | | | 164,096 | |
| 2,850 | | TTM Technologies, Inc.* | | | 54,492 | |
| | | | |
| |
| | | | | | 218,588 | |
| | | | |
| |
| | | Energy-Alternate Sources — 2.6% | | | | |
| 1,450 | | First Solar, Inc.* | | | 202,376 | |
| 1,760 | | Trina Solar Ltd. ADR* | | | 50,142 | |
| | | | |
| |
| | | | | | 252,518 | |
| | | | |
| |
| | | Healthcare-Products — 2.5% | | | | |
| 690 | | Intuitive Surgical, Inc.* | | | 241,293 | |
| | | | |
| |
| | | | | | | |
| | | Internet — 22.7% | | | | |
| 3,505 | | Akamai Technologies, Inc.* | | | 120,712 | |
| 2,020 | | Amazon.com, Inc.* | | | 396,930 | |
54
| The FBR Funds |
|
| FBR Technology Fund |
| Portfolio of Investments (continued) |
| April 30, 2011 |
| (unaudited) |
| | | | | | | |
|
| | | | | VALUE |
| SHARES | | | | (NOTE 2) |
|
| | | Internet — 22.7% (continued) | | | | |
| 2,555 | | Baidu, Inc. ADR* | | $ | 379,469 | |
| 1,330 | | F5 Networks, Inc.* | | | 134,809 | |
| 750 | | Google, Inc., Class A* | | | 408,075 | |
| 700 | | MercadoLibre, Inc. | | | 63,980 | |
| 2,150 | | NetEase.com, Inc. ADR* | | | 105,952 | |
| 1,460 | | Qihoo 360 Technology Company Ltd. ADR* | | | 41,610 | |
| 14,081 | | Tencent Holdings Ltd. ADR | | | 401,309 | |
| 935 | | WebMD Health Corp.* | | | 54,108 | |
| 18,000 | | Zix Corp.* | | | 59,400 | |
| | | | |
| |
| | | | | | 2,166,354 | |
| | | | |
| |
| | | Semiconductors — 24.0% | | | | |
| 5,840 | | Altera Corp. | | | 284,407 | |
| 23,050 | | Applied Materials, Inc. | | | 361,655 | |
| 8,065 | | ARM Holdings PLC ADR | | | 253,724 | |
| 7,575 | | ASML Holding N.V. | | | 316,331 | |
| 4,410 | | Avago Technologies Ltd. | | | 147,559 | |
| 4,950 | | Broadcom Corp., Class A* | | | 174,141 | |
| 1,135 | | Cavium Networks, Inc.* | | | 53,595 | |
| 3,335 | | Cirrus Logic, Inc.* | | | 55,228 | |
| 810 | | Hittite Microwave Corp.* | | | 52,156 | |
| 2,060 | | Lam Research Corp.* | | | 99,519 | |
| 1,805 | | Microsemi Corp.* | | | 42,598 | |
| 6,500 | | MIPS Technologies, Inc.* | | | 54,080 | |
| 1,300 | | NetLogic Microsystems, Inc.* | | | 56,069 | |
| 1,610 | | Rovi Corp.* | | | 78,182 | |
| 1,900 | | Rubicon Technology, Inc.* | | | 54,169 | |
| 3,275 | | Skyworks Solutions, Inc.* | | | 103,032 | |
| 1,135 | | Varian Semiconductor Equipment Associates, Inc.* | | | 47,591 | |
| 1,100 | | Veeco Instruments, Inc.* | | | 56,243 | |
| | | | |
| |
| | | | | | 2,290,279 | |
| | | | |
| |
| | | Software — 11.1% | | | | |
| 1,495 | | ANSYS, Inc.* | | | 82,659 | |
| 1,135 | | athenahealth, Inc.* | | | 52,471 | |
| 1,723 | | Citrix Systems, Inc.* | | | 145,318 | |
| 2,950 | | hiSoft Technology International Ltd. ADR* | | | 55,047 | |
55
| The FBR Funds |
|
| FBR Technology Fund |
| Portfolio of Investments (continued) |
| April 30, 2011 |
| (unaudited) |
|
| | | | | VALUE |
| SHARES | | | | (NOTE 2) |
|
| | | Software — 11.1% (continued) | | | | |
| 1,540 | | Informatica Corp.* | | $ | 86,255 | |
| 1,795 | | QLIK Technologies, Inc.* | | | 57,548 | |
| 1,650 | | RealPage, Inc.* | | | 52,635 | |
| 3,115 | | Red Hat, Inc.* | | | 147,869 | |
| 4,045 | | VMware, Inc., Class A* | | | 386,014 | |
| | | | |
| |
| | | | | | 1,065,816 | |
| | | | |
| |
| | | Telecommunications — 6.9% | | | | |
| 1,175 | | Acme Packet, Inc.* | | | 97,067 | |
| 19,110 | | Corning, Inc. | | | 400,163 | |
| 1,700 | | EZchip Semiconductor Ltd.* | | | 54,383 | |
| 2,005 | | Finisar Corp.* | | | 56,320 | |
| 785 | | IPG Photonics Corp.* | | | 54,526 | |
| | | | |
| |
| | | | | | 662,459 | |
| | | | |
| |
| | | | | | | |
| | | Total Common Stocks (Cost $7,176,016) | | | 8,619,682 | |
| | | | |
| |
| | | | | | | |
| | | INVESTMENT COMPANIES — 5.8% | | | | |
| 3,740 | | First Trust Dow Jones Internet Index Fund | | | 140,998 | |
| 4,955 | | First Trust NASDAQ-100 Technology Index Fund | | | 137,600 | |
| 2,195 | | iShares S&P North American Technology-Software Index Fund | | | 141,490 | |
| 4,700 | | PowerShares Dynamic Networking Portfolio | | | 137,287 | |
| | | | |
| |
| | | | | | | |
| | | Total Investment Companies (Cost $511,296) | | | 557,375 | |
| | | | |
| |
| | | | | | | |
| | | SHORT-TERM INVESTMENT — 3.8% | | | | |
| 362,883 | | JPMorgan 100% U.S. Treasury Securities Money Market Fund (Cost $362,883) | | | 362,883 | |
| | | | |
| |
| | | | | | | |
| | | Total Investments — 99.9% (Cost $8,050,195) | | | 9,539,940 | |
| | | | | | | |
| | | Other Assets Less Liabilities — 0.1% | | | 11,530 | |
| | | | |
| |
| | | | | | | |
| | | Net Assets — 100.0% | | $ | 9,551,470 | |
| | | | |
| |
|
| * | | Non-income producing security |
| ADR | | American Depositary Receipts |
| PLC | | Public Liability Company |
The accompanying notes are an integral part of the financial statements.
56
| The FBR Funds |
|
| FBR Gas Utility Index Fund |
| Management Overview |
Portfolio Manager: Winsor Aylesworth
Over the previous six months, how did the Fund perform and what factors contributed to this performance?
For the six-months ended April 30, 2011, the Investor Class of the FBR Gas Utility Index Fund returned 17.04%. This compares to the S&P 500 Index, American Gas Association (AGA) Stock Index, and the Morningstar Utilities Category Average which returned 16.36%, 16.32% and 11.27% for the same period, respectively.
By any measure the Fund had a good six month period. It outperformed the AGA Stock Index, even without taking into account fund expenses. This is an unusual event as one would expect an index fund to slightly trail its benchmark by the expense ratio (35-37 basis points on a semi-annual basis) amount. The reason for this was due to the orderly disposition of the Fund’s E.ON AG (NYSE Symbol: EON) position during the period. This was one of the Fund’s largest positions and as a result of no longer being an AGA member, was no longer in the Index. The disposition took about 2 weeks during a time of rising prices. This technique tends to avoid influencing the market and hence resulted in some incremental positive returns to you, the shareholder.
The Fund also outperformed the overall market as represented by the S&P 500 Index and the Morningstar Utility Fund average. This can be attributed to the Fund’s emphasis on natural gas utilities which was in favor during the period as a result of ample gas supplies, low steady prices and the terrible earthquake disaster in Japan and its impact on the nuclear utility industry.
The Fund continued its history of quarterly distributions by paying $0.1170 and $0.1212 per share on 12/31/10 and 3/31/11 respectively. This was an 8.1% increase over the corresponding 6 month period ending 3/31/10.
For the six month period major contributors to the fund’s performance were El Paso Corp. (NYSE Symbol: EP), The Williams Companies, Inc. (NYSE Symbol: WMB), and ONEOK, Inc. (NYSE Symbol: OKE). All three companies are diversified and have an exploration and production (E&P) component. All three benefited from the exploration of various shale gas areas and the discoveries of new natural gas and petroleum deposits. Unlike the last reporting period, these contributors were major holdings of the Fund and amounted to more than 13% of the portfolio.
There were no significant detractors to performance this period as the investor interest in the sector positively influence most all of the Fund’s holdings.
Portfolio manager comments on the Fund and the related investment outlook.
As readers can summarize from the previous paragraphs, it is a good time for the sector (natural gas) the Fund invests in. Due to new discoveries of proven deposits, the United States now has over a 100 year supply of this valuable clean fuel. A result of having such an ample supply, pricing is historically low and stable which in turn leads to increase demand for this energy source in comparison to the alternatives of coal, oil, wind and
57
| The FBR Funds |
|
| FBR Gas Utility Index Fund |
| Management Overview (continued) |
solar. The unfortunate disaster in Japan has created additional hurdles for the advancement of the nuclear industry. The increased interest has created opportunities for new pipelines and storage facilities and new uses for the fuel such as transportation. In what was once thought of as a dream, the U.S. is now even in a position to be an energy exporter thru exporting liquid natural gas to countries where the demand and lack of supply has forced the price to be greater than twice of what it is domestically.
So what can go wrong with this picture? Two areas of possible concern might be safety and environmental issues. Either of these issues, if not properly handled, could result in increased regulation and costs. Natural gas is highly inflammable and subject to explosion if improperly handled. As pipelines age, they must be replaced and inspected to ensure against and to prevent disasters.
Many of the new gas deposits are being mined using a technology called fracking that has been used for many years. This process involves drilling down about a mile below the surface and injecting water and chemicals under high pressure which “fractures” the rock (generally shale) strata and releases gas. The increased use of this technique has resulted in a large amount of new discoveries and reserves. There are concerns that this process could potentially lead to water contamination and or the release of dangerous elements into the water supply. Due to the increase of using this technique in gas exploration and since it is loosely regulated; there is concern that a major accident in this area could cause long term damage to the industry. Many of the Fund’s companies recognize that they have responsibilities in this area to protect the public and their future. There is general consensus that there will become new best practice based regulations to minimize the risk and allow the industry to continue to flourish.
All energy producers remain subject to geo-political, economic and weather related issues. The advent of U.S. self-sufficiency in natural gas supply minimizes international politics. The U.S. economy appears to be stable and slightly improving. As I write this letter we are in the midst of a spring with above normal severe weather outbreaks (tornadoes). We are about to enter the 2011 hurricane season which we hope will not produce any “Katrina” like events. These weather events can have short term impacts on supply and/or demand but are not long lasting.
So in summary, the Fund is in an investment sector that has renewed investor interest and is comprised of companies that find, transport and distribute natural gas, a fuel that is abundant, within American political control, is clean and has an attractive stable price. We hope and expect the future to continue to be bright and rewards you and me as shareholders.
|
The opinions expressed in this commentary reflect those of the Portfolio Manager as of the date written. Any such opinions are subject to change based on market or other conditions. These opinions may not be relied upon as investment advice. Investment decisions for The FBR Funds are based on several factors, and may not be relied upon as an indication of trading intent on behalf of any FBR Fund. Security positions can and do change. |
58
| The FBR Funds |
|
| FBR Gas Utility Index Fund |
Comparison of Changes in Value of $10,000 Investment in
Investor Class Shares(1)(2) vs. Various Indices(1)(3)
(unaudited)
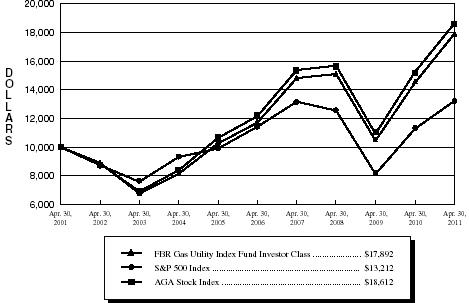
| | Total Returns—For the Periods Ended April 30, 2011(4)(5) | |
| | | | | One Year | | Five Year | | Ten Year | |
| | | | |
| |
| |
| |
| | FBR Gas Utility Index Fund Investor Class(1)(2) | | | 23.58 | % | | 8.85 | % | | 5.99 | % | |
| | S&P 500 Index(1)(3) | | | 17.24 | % | | 2.95 | % | | 2.82 | % | |
| | AGA Stock Index(1)(3) | | | 22.22 | % | | 8.90 | % | | 6.41 | % | |
|
PAST PERFORMANCE IS NO GUARANTEE OF FUTURE RESULTS.
The performance data quoted represents past performance and the current performance may be lower or higher than the performance data quoted. The investment return and principal will fluctuate so that investors’ shares, when redeemed, may be worth more or less than their original cost. The performance data does not reflect the deduction of taxes that a shareholder would pay on Fund distributions or redemption fees. The Fund charges a redemption fee of 1.00% on shares redeemed or exchanged within 90 days; if reflected, the redemption fee would reduce the performance data quoted. To obtain performance data current to the most recent month-end, please call 888.200.4710.
|
| (1) | | The graph assumes a hypothetical $10,000 initial investment in the Fund and reflects the reinvestment of dividends and all Fund expenses. Investors should note that the Fund is a professionally managed mutual fund while the indices are unmanaged, do not incur expenses and are not available for investment. The performance of the indices includes reinvested dividends, and does not reflect sales charges or expenses. |
| (2) | | FBR Fund Advisers, Inc. waived a portion of its advisory fees and agreed to contractually reimburse a portion of the Fund’s operating expenses, as necessary, to maintain existing expense limitations, as set forth in the notes to the financial statements. Total returns shown include fee waivers and expense reimbursements, if any; total returns would have been lower had there been no waiver of fees and/or reimbursement of expenses in excess of expense limitations. |
| (3) | | The S&P 500 Index is a capitalization-weighted index of 500 stocks. The index is designed to represent the broad domestic economy through changes in aggregate market value of 500 stocks representing all major industries. The AGA Stock Index is a market capitalization-weighted index, adjusted monthly, consisting of member companies of the American Gas Association. |
| (4) | | The total returns shown do not reflect the deduction of taxes that a shareholder would pay on fund distributions or the redemption of fund shares. |
| (5) | | Effective April 1, 2003, the Fund changed its fiscal year-end from March 31 to October 31. |
59
| The FBR Funds |
|
| FBR Gas Utility Index Fund |
| Portfolio Summary |
| April 30, 2011 |
| (unaudited) |
The following provides a breakdown of the Fund by industry sectors. The underlying securities represent a percentage of the portfolio investments.
| Industry Sector | | % of Total Investments |
| |
|
| Gas | | 40.7 | % |
| Pipelines | | 29.1 | % |
| Electric | | 26.0 | % |
| Oil & Gas | | 1.5 | % |
| | | | |
| Cash | | 2.7 | % |
60
| The FBR Funds |
|
| FBR Gas Utility Index Fund |
Portfolio of Investments
April 30, 2011
(unaudited) |
|
| | | | | | | | | VALUE | |
| SHARES | | | | | | | (NOTE 2) | |
|
| | | | | COMMON STOCKS — 97.8% | | | | | |
| | | | | Electric — 26.1% | | | | | |
| | 800 | | | ALLETE, Inc. | | | $ | 32,392 | |
| | 27,353 | | | Alliant Energy Corp. | | | | 1,081,538 | |
| | 38,090 | | | Ameren Corp. | | | | 1,116,418 | |
| | 30,230 | | | Avista Corp. | | | | 736,101 | |
| | 21,100 | | | Black Hills Corp. | | | | 733,225 | |
| | 8,825 | | | CH Energy Group, Inc. | | | | 473,197 | |
| | 203,668 | | | CMS Energy Corp. | | | | 4,032,626 | |
| | 126,870 | | | Consolidated Edison, Inc. | | | | 6,612,464 | |
| | 30,520 | | | Constellation Energy Group, Inc. | | | | 1,111,538 | |
| | 310,800 | | | Dominion Resources, Inc. | | | | 14,427,336 | |
| | 80,215 | | | DTE Energy Co. | | | | 4,053,264 | |
| | 110,712 | | | Duke Energy Corp. | | | | 2,064,779 | |
| | 3,675 | | | Entergy Corp. | | | | 256,221 | |
| | 81,575 | | | Exelon Corp. | | | | 3,438,386 | |
| | 74,521 | | | Integrys Energy Group, Inc. | | | | 3,901,920 | |
| | 183,925 | | | MDU Resources Group, Inc. | | | | 4,393,968 | |
| | 9,023 | | | MGE Energy, Inc. | | | | 379,056 | |
| | 32,875 | | | Northeast Utilities | | | | 1,170,350 | |
| | 17,604 | | | Pepco Holdings, Inc. | | | | 339,229 | |
| | 268,899 | | | PG&E Corp. | | | | 12,390,866 | |
| | 25,235 | | | PPL Corp. | | | | 692,196 | |
| | 278,025 | | | Public Service Enterprise Group, Inc. | | | | 8,944,064 | |
| | 69,290 | | | TECO Energy, Inc. | | | | 1,335,218 | |
| | 7,825 | | | The Empire District Electric Co. | | | | 175,593 | |
| | 61,204 | | | UIL Holdings Corp. | | | | 1,947,511 | |
| | 6,630 | | | UniSource Energy Corp. | | | | 246,172 | |
| | 14,383 | | | Unitil Corp. | | | | 363,315 | |
| | 61,760 | | | Wisconsin Energy Corp. | | | | 1,927,530 | |
| | 137,255 | | | Xcel Energy, Inc. | | | | 3,339,414 | |
| | | | | | | |
| |
| | | | | | | | | 81,715,887 | |
| | | | | | | |
| |
| | | | | Gas — 41.0% | | | | | |
| | 151,382 | | | AGL Resources, Inc. | | | | 6,283,867 | |
| | 222,391 | | | Atmos Energy Corp. | | | | 7,759,222 | |
| | 407,454 | | | CenterPoint Energy, Inc. | | | | 7,578,644 | |
| | 11,940 | | | Chesapeake Utilities Corp. | | | | 510,913 | |
61
| The FBR Funds |
|
| FBR Gas Utility Index Fund |
Portfolio of Investments (continued)
April 30, 2011
(unaudited) |
|
| | | | | | | | | VALUE | |
| SHARES | | | | | | | (NOTE 2) | |
|
| | | | | Gas — 41.0% (continued) | | | | | |
| | 5,302 | | | Corning Natural Gas Corp. | | | $ | 127,248 | |
| | 8,558 | | | Delta Natural Gas Company, Inc. | | | | 270,946 | |
| | 54,723 | | | Energen Corp. | | | | 3,557,542 | |
| | 10,118 | | | Gas Natural, Inc. | | | | 113,524 | |
| | 151,200 | | | National Fuel Gas Co. | | | | 11,082,960 | |
| | 299,885 | | | National Grid PLC ADR | | | | 15,393,096 | |
| | 83,742 | | | New Jersey Resources Corp. | | | | 3,666,225 | |
| | 115,750 | | | Nicor, Inc. | | | | 6,416,023 | |
| | 420,500 | | | NiSource, Inc. | | | | 8,178,725 | |
| | 69,725 | | | Northwest Natural Gas Co. | | | | 3,224,084 | |
| | 186,581 | | | Piedmont Natural Gas Company, Inc. | | | | 5,923,947 | |
| | 275,609 | | | Questar Corp. | | | | 4,842,450 | |
| | 6,201 | | | RGC Resources, Inc. | | | | 212,632 | |
| | 264,590 | | | Sempra Energy | | | | 14,578,909 | |
| | 59,185 | | | South Jersey Industries, Inc. | | | | 3,400,178 | |
| | 258,648 | | | Southern Union Co. | | | | 7,733,575 | |
| | 118,462 | | | Southwest Gas Corp. | | | | 4,711,234 | |
| | 59,050 | | | The Laclede Group, Inc. | | | | 2,265,749 | |
| | 90,875 | | | UGI Corp. | | | | 3,026,138 | |
| | 85,330 | | | Vectren Corp. | | | | 2,438,731 | |
| | 121,750 | | | WGL Holdings, Inc. | | | | 4,811,560 | |
| | | | | | | |
| |
| | | | | | | | | 128,108,122 | |
| | | | | | | |
| |
| | | | | Oil & Gas — 1.5% | | | | | |
| | 187,824 | | | Cheniere Energy, Inc.* | | | | 1,705,442 | |
| | 58,410 | | | EQT Corp. | | | | 3,072,950 | |
| | | | | | | |
| |
| | | | | | | | | 4,778,392 | |
| | | | | | | |
| |
| | | | | Pipelines — 29.2% | | | | | |
| | 801,402 | | | El Paso Corp. | | | | 15,555,212 | |
| | 234,392 | | | Enbridge, Inc. | | | | 15,195,633 | |
| | 206,600 | | | ONEOK, Inc. | | | | 14,449,604 | |
| | 528,943 | | | Spectra Energy Corp. | | | | 15,360,505 | |
| | 468,750 | | | The Williams Companies, Inc. | | | | 15,548,438 | |
| | 358,022 | | | TransCanada Corp. | | | | 15,373,465 | |
| | | | | | | |
| |
| | | | | | | | | 91,482,857 | |
| | | | | | | |
| |
| | | | | | | | | | |
| | | | | Total Common Stocks (Cost $164,514,648) | | | | 306,085,258 | |
| | | | | | | |
| |
62
| The FBR Funds |
|
| FBR Gas Utility Index Fund |
Portfolio of Investments (continued)
April 30, 2011
(unaudited) |
|
| | | | | | | | | VALUE | |
| SHARES | | | | | | | (NOTE 2) | |
|
| | | | | SHORT-TERM INVESTMENT — 2.7% | | | | | |
| | 8,552,284 | | | JPMorgan 100% U.S. Treasury Securities Money Market Fund (Cost $8,552,284) | | | $ | 8,552,284 | |
| | | | | | | |
| |
| | | | | | | | | | |
| | | | | Total Investments — 100.5% (Cost $173,066,932) | | | | 314,637,542 | |
| | | | | | | | | | |
| | | | | Liabilities Less Other Assets — (0.5)% | | | | (1,557,091 | ) |
| | | | | | | |
| |
| | | | | | | | | | |
| | | | | Net Assets — 100.0% | | | $ | 313,080,451 | |
| | | | | | | |
| |
|
| * | | Non-income producing security |
| ADR | | American Depositary Receipts |
| PLC | | Public Liability Company |
The accompanying notes are an integral part of the financial statements.
63
| The FBR Funds |
|
| FBR Balanced Fund |
| Management Overview |
For the six-months ended April 30, 2011, the Investor Class of the FBR Balanced Fund returned 10.36%. This compares to the S&P 500 Index and the Morningstar Moderate Allocation Category Average which returned 16.36% and 10.25% for the same period, respectively.
The London Company
Portfolio Managers: Stephen M. Goddard, CFA®, Jonathan T. Moody, CFA®, and J. Wade Stinnette, Jr., CFA®
What factors contributed to the performance of the equity portion of the FBR Balanced Fund?
Overall, investors continue to see improvement in the equity markets relative to the sharp declines experienced just a few years ago. However, smaller company stocks continue to provide market leadership relative to larger companies.
As the economic recovery starts to enter phase two, large cap stocks should start to perform better than smaller companies as they tend to be cheaper on many relative measures. In the earlier phase, investors experienced a junk rally where companies, particularly the ones most beaten down in 2008/2009 rebounded substantially. High beta stocks led the way. In fact, it was the top two quintiles that drove the market with returns exceeding 20%. Low beta stocks, such as those found in the Fund’s portfolio did not perform as well. We believe that low beta stocks may provide more appreciation potential as the recovery continues to take form.
Portfolio manager comments on the Fund and the related investment outlook.
Since the recovery started, growth stocks have been in favor relative to value stocks as the Russell 2000® Growth Index has outperformed the Russell 2000® Value Index. However, in the large cap arena, the outperformance was not as pronounced. As bottom-up, fundamental value managers, we favor companies with high margins, predictable cash flows, strong balance sheets and high barriers to entry.
As we discussed in previous shareholder materials, cash on corporate balance sheets is at a 50 year high. Over the past few years, operating expenses have been reduced, margins have been improved and cash has been stockpiled. Eventually, the cash will be spent on growth initiatives including acquisitions or returned to shareholders in the form of increased dividends. Companies that intend to grow by organic growth may be limited as consumer spending remains subdued. We believe that M&A activity will increase in a more meaningful way. Public companies are being purchased by private equity investors and larger companies are buying smaller firms. With cash so abundant, it is often easier to buy growth rather than build growth organically.
64
| The FBR Funds |
|
| FBR Balanced Fund |
| Management Overview (continued) |
Financial Counselors, Inc.
Portfolio Manager: Gary Cloud, CFA® and Peter Greig, CFA®
What factors contributed to the performance of the fixed income portion of the FBR Balanced Fund?
Interest rates continue to be low and consensus opinion is that the Fed will not raise interest rates in 2011. We do not see inflation as a critical concern in the near-term. We expect modest price increases as long as the housing market remains weak and unemployment remains relatively high. Our biggest concern is the unsustainable fiscal trajectory that the federal government is on, enabled by the Fed’s loose monetary policies. The deficit rate of 10% of GDP is unmanageable over an extended time when a 3% deficit amount is needed to maintain the status quo.
The government needs to take drastic action to assure the markets that it is serious about fiscal restraint. The consequences of investors losing confidence in America’s ability to control its debt could be disastrous for the economy and the bond markets. The recent experiences of several European countries should serve as a warning to the predicament that the U.S. could find itself in.
Portfolio manager comments on the Fund and related investment outlook.
We currently favor investment grade credit; particularly bonds issued by the financial sector, which we believe, present the most favorable valuations. Unlike government debt, the supply of corporate debt is somewhat weak. Overall, the portfolio is less exposed to increasing interest rates, which should contribute to capital preservation relative to the benchmark. Although we have an intuitive predicting as to the timing of rising rates, we are hedging our bets as to when the tightening will actually occur. We are waiting for further developments and are prepared to take action and adjust the portfolio based upon various economic scenarios.
The opinions expressed in this commentary reflect those of the Portfolio Managers as of the date written. Any such opinions are subject to change based on market or other conditions. These opinions may not be relied upon as investment advice. Investment decisions for The FBR Funds are based on several factors, and may not be relied upon as an indication of trading intent on behalf of any FBR Fund. Security positions can and do change.
65
| The FBR Funds |
|
| FBR Balanced Fund |
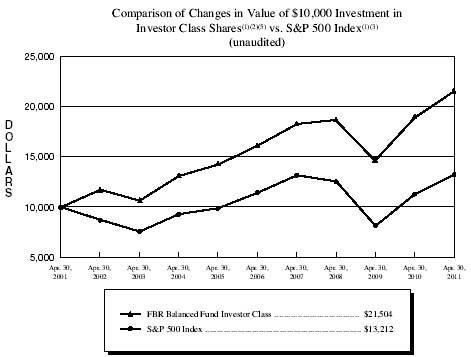
| | Total Returns—For the Periods Ended April 30, 2011(4) |
| | | | One Year | | Five Year | | Ten Year | |
| | | |
| |
| |
| |
| FBR Balanced Fund Investor Class(1)(2)(5) | | | 13.85 | % | | 5.94 | % | | 5.91 | % | |
| FBR Balanced Fund Institutional Class(2)(5) | | | 14.03 | % | | 6.20 | % | | 6.10 | % | |
| S&P 500 Index(1)(3) | | | 17.24 | % | | 2.95 | % | | 2.82 | % | |
PAST PERFORMANCE IS NO GUARANTEE OF FUTURE RESULTS.
The performance data quoted represents past performance and the current performance may be lower or higher than the performance data quoted. The investment return and principal will fluctuate so that investors’ shares, when redeemed, may be worth more or less than their original cost. The performance data does not reflect the deduction of taxes that a shareholder would pay on Fund distributions or redemption fees. The Fund charges a redemption fee of 1.00% on shares redeemed or exchanged within 90 days; if reflected, the redemption fee would reduce the performance data quoted. To obtain performance data current to the most recent month-end, please call 888.200.4710.
|
| (1) | | The graph assumes a hypothetical $10,000 initial investment in the Investor Class shares of the Fund and reflects the reinvestment of dividends and all Fund expenses. Investors should note that the Fund is a professionally managed mutual fund while the index is unmanaged, does not incur expenses and is not available for investment. The performance of the index includes reinvested dividends, and does not reflect sales charges or expenses. |
| (2) | | FBR Fund Advisers, Inc. and the Fund’s predecessor investment adviser each waived a portion of its advisory fees and agreed to contractually reimburse a portion of the Fund’s operating expenses, as necessary, to maintain existing expense limitations, as set forth in the notes to the financial statements. Total returns shown include fee waivers and expense reimbursements, if any; total returns would have been lower had there been no waiver of fees and/or reimbursement of expenses in excess of expense limitations. |
| (3) | | The S&P 500 Index is a capitalization-weighted index of 500 stocks. The index is designed to represent the broad domestic ecomony through changes in aggregate market value of 500 stocks representing all major industries. |
| (4) | | The total returns shown do not reflect the deduction of taxes that a shareholder would pay on fund distributions or the redemption of fund shares. |
| (5) | | The Fund is the investment successor to the AFBA 5Star Balanced Fund which commenced operations on June 3, 1997. On March 12, 2010, the AFBA 5Star Balanced Fund was reorganized into the Fund. The performance presented for the Investor Class of the Fund for the period prior to March 12, 2010 reflects the performance of the Advisor Class shares of the AFBA 5Star Balanced Fund and the performance presented for the Institutional Class of the Fund for the period prior to March 12, 2010 reflects the performance of the Class I shares of the AFBA 5Star Balanced Fund. The performance of the Advisor Class shares of the AFBA 5Star Balanced Fund for the period prior to September 24, 2001 includes the performance of the Class I shares of the AFBA 5Star Balanced Fund. |
66
| The FBR Funds |
|
| FBR Balanced Fund |
| Portfolio Summary |
| April 30, 2011 |
| (unaudited) |
The following provides a breakdown of the Fund by industry sectors. The underlying securities represent a percentage of the portfolio investments.
| Industry Sectors | | % of Total Investments |
| |
|
| Common Stocks | | 65.8 | % |
Consumer, Non-cyclical | | 21.0 | % |
Basic Materials | | 7.9 | % |
Technology | | 7.8 | % |
Energy | | 6.3 | % |
Financial | | 5.2 | % |
Industrial | | 4.9 | % |
Utilities | | 3.9 | % |
Consumer, Cyclical | | 3.1 | % |
Real Estate Investment Trust (REIT) | | 3.1 | % |
Communications | | 2.6 | % |
| Corporate Bonds | | 19.2 | % |
Financial | | 12.2 | % |
Communications | | 1.3 | % |
Consumer, Non-cyclical | | 1.3 | % |
Basic Materials | | 1.3 | % |
Consumer, Cyclical | | 1.2 | % |
Industrial | | 0.9 | % |
Miscellaneous | | 1.0 | % |
| U.S. Treasury Obligations | | 8.7 | % |
| Investment Companies | | 2.0 | % |
| U.S. Government Agency Obligations | | 2.9 | % |
| | | | |
| Cash | | 1.4 | % |
67
| The FBR Funds |
|
| FBR Balanced Fund |
| Portfolio of Investments |
| April 30, 2011 |
| (unaudited) |
|
| | | | | | | | | VALUE | |
| SHARES | | | | | | | (NOTE 2) | |
|
| | | | | COMMON STOCKS — 65.5% | | | | | |
| | | | | Basic Materials — 7.9% | | | | | |
| | 32,214 | | | Albemarle Corp. | | | $ | 2,272,698 | |
| | 54,280 | | | MeadWestvaco Corp. | | | | 1,828,693 | |
| | 16,941 | | | NewMarket Corp. | | | | 3,122,565 | |
| | | | | | | |
| |
| | | | | | | | | 7,223,956 | |
| | | | | | | |
| |
| | | | | Communications — 2.6% | | | | | |
| | 62,000 | | | Verizon Communications, Inc. | | | | 2,342,360 | |
| | | | | | | |
| |
| | | | | Consumer, Cyclical — 3.1% | | | | | |
| | 47,826 | | | Lowe’s Companies, Inc. | | | | 1,255,433 | |
| | 28,895 | | | Wal-Mart Stores, Inc. | | | | 1,588,647 | |
| | | | | | | |
| |
| | | | | | | | | 2,844,080 | |
| | | | | | | |
| |
| | | | | Consumer, Non-cyclical — 20.9% | | | | | |
| | 66,571 | | | Altria Group, Inc. | | | | 1,786,766 | |
| | 49,150 | | | Bristol-Myers Squibb Co. | | | | 1,381,115 | |
| | 11,071 | | | Brown-Forman Corp., Class B | | | | 795,562 | |
| | 54,700 | | | Corrections Corporation of America* | | | | 1,361,483 | |
| | 22,050 | | | Johnson & Johnson | | | | 1,449,126 | |
| | 17,639 | | | Lorillard, Inc. | | | | 1,878,553 | |
| | 83,000 | | | Pfizer, Inc. | | | | 1,739,680 | |
| | 18,354 | | | Philip Morris International, Inc. | | | | 1,274,502 | |
| | 41,367 | | | Reynolds American, Inc. | | | | 1,535,129 | |
| | 34,408 | | | The Coca-Cola Co. | | | | 2,321,164 | |
| | 32,499 | | | The Hershey Co. | | | | 1,875,517 | |
| | 22,358 | | | Visa, Inc., Class A | | | | 1,746,607 | |
| | | | | | | |
| |
| | | | | | | | | 19,145,204 | |
| | | | | | | |
| |
| | | | | Energy — 6.3% | | | | | |
| | 11,030 | | | BP PLC ADR | | | | 508,924 | |
| | 23,250 | | | Chevron Corp. | | | | 2,544,480 | |
| | 34,120 | | | ConocoPhillips | | | | 2,693,092 | |
| | | | | | | |
| |
| | | | | | | | | 5,746,496 | |
| | | | | | | |
| |
| | | | | Financial — 5.2% | | | | | |
| | 9,000 | | | Ares Capital Corp. | | | | 159,390 | |
| | 13,495 | | | Berkshire Hathaway, Inc., Class B* | | | | 1,124,133 | |
68
| The FBR Funds |
|
| FBR Balanced Fund |
| Portfolio of Investments (continued) |
| April 30, 2011 |
| (unaudited) |
|
| | | | | | | | | VALUE | |
| SHARES | | | | | | | (NOTE 2) | |
|
| | | | | Financial — 5.2% (continued) | | | | | |
| | 6,000 | | | Hercules Technology Growth Capital, Inc. | | | $ | 64,500 | |
| | 20,500 | | | MCG Capital Corp. | | | | 135,300 | |
| | 11,000 | | | NGP Capital Resources Co. | | | | 103,840 | |
| | 9,500 | | | PennantPark Investment Corp. | | | | 117,230 | |
| | 83,500 | | | Wells Fargo & Co. | | | | 2,430,685 | |
| | 1,600 | | | White Mountains Insurance Group Ltd. | | | | 572,016 | |
| | | | | | | |
| |
| | | | | | | | | 4,707,094 | |
| | | | | | | |
| |
| | | | | Industrial — 4.9% | | | | | |
| | 32,735 | | | Alexander & Baldwin, Inc. | | | | 1,725,135 | |
| | 16,000 | | | FedEx Corp. | | | | 1,530,720 | |
| | 12,949 | | | Martin Marietta Materials, Inc. | | | | 1,180,819 | |
| | | | | | | |
| |
| | | | | | | | | 4,436,674 | |
| | | | | | | |
| |
| | | | | Real Estate Investment Trust (REIT) — 3.0% | | | | | |
| | 5,500 | | | Apollo Commercial Real Estate Finance, Inc. | | | | 89,870 | |
| | 27,500 | | | Chimera Investment Corp. | | | | 111,375 | |
| | 35,000 | | | Hatteras Financial Corp. | | | | 994,350 | |
| | 60,599 | | | UDR, Inc. | | | | 1,568,908 | |
| | 1,500 | | | Winthrop Realty Trust | | | | 18,195 | |
| | | | | | | |
| |
| | | | | | | | | 2,782,698 | |
| | | | | | | |
| |
| | | | | Technology — 7.7% | | | | | |
| | 90,374 | | | Activision Blizzard, Inc. | | | | 1,029,360 | |
| | 98,800 | | | Intel Corp. | | | | 2,291,172 | |
| | 11,240 | | | International Business Machines Corp. | | | | 1,917,319 | |
| | 70,448 | | | Microsoft Corp. | | | | 1,833,057 | |
| | | | | | | |
| |
| | | | | | | | | 7,070,908 | |
| | | | | | | |
| |
| | | | | Utilities — 3.9% | | | | | |
| | 53,290 | | | Dominion Resources, Inc. | | | | 2,473,722 | |
| | 60,315 | | | Duke Energy Corp. | | | | 1,124,875 | |
| | | | | | | |
| |
| | | | | | | | | 3,598,597 | |
| | | | | | | |
| |
| | | | | | | | | | |
| | | | | Total Common Stocks (Cost $46,311,875) | | | | 59,898,067 | |
| | | | | | | |
| |
| | | | | PREFERRED STOCK — NM | | | | | |
| | 13,600 | | | Federal National Mortgage Association, Perpetual, Series S, 8.25%, due 12/31/15 (Cost 340,000)*(a) | | | | 27,744 | |
| | | | | | | |
| |
69
| The FBR Funds |
|
| FBR Balanced Fund |
| Portfolio of Investments (continued) |
| April 30, 2011 |
| (unaudited) |
|
| | | | | | | | | | MATURITY | | | VALUE | |
| PAR | | | | RATE | | | | DATE | | | (NOTE 2) | |
|
| | | | CORPORATE BONDS — 19.1% | | | | | | | | | | | |
| | | | Basic Materials — 1.3% | | | | | | | | | | | |
| $ | 350,000 | | Barrick Gold Financeco LLC | | 6.125 | % | | | 9/15/13 | | | $ | 389,016 | |
| | 250,000 | | BHP Billiton Finance USA Ltd. | | 6.750 | | | | 11/1/13 | | | | 282,652 | |
| | 315,000 | | EI du Pont de Nemours & Co. | | 4.750 | | | | 3/15/15 | | | | 345,970 | |
| | 150,000 | | International Paper Co. | | 9.375 | | | | 5/15/19 | | | | 195,808 | |
| | | | | | | | | | | | |
| |
| | | | | | | | | | | | | | 1,213,446 | |
| | | | | | | | | | | | |
| |
| | | | Communications — 1.3% | | | | | | | | | | | |
| | 300,000 | | Deutsche Telekom International Finance BV | | 5.875 | | | | 8/20/13 | | | | 329,858 | |
| | 300,000 | | Telefonica Emisiones SAU | | 5.877 | | | | 7/15/19 | | | | 321,198 | |
| | 350,000 | | Verizon Communications, Inc. | | 5.250 | | | | 4/15/13 | | | | 377,636 | |
| | 150,000 | | Verizon Communications, Inc. | | 8.750 | | | | 11/1/18 | | | | 194,804 | |
| | | | | | | | | | | | |
| |
| | | | | | | | | | | | | | 1,223,496 | |
| | | | | | | | | | | | |
| |
| | | | Consumer, Cyclical — 1.2% | | | | | | | | | | | |
| | 300,000 | | Best Buy Company, Inc. | | 6.750 | | | | 7/15/13 | | | | 328,703 | |
| | 150,000 | | Marriott International, Inc., Series J | | 5.625 | | | | 2/15/13 | | | | 160,717 | |
| | 300,000 | | Starbucks Corp. | | 6.250 | | | | 8/15/17 | | | | 343,352 | |
| | 200,000 | | The Home Depot, Inc. | | 5.400 | | | | 3/1/16 | | | | 223,740 | |
| | | | | | | | | | | | |
| |
| | | | | | | | | | | | | | 1,056,512 | |
| | | | | | | | | | | | |
| |
| | | | Consumer, Non-cyclical — 1.3% | | | | | | | | | | | |
| | 150,000 | | Anheuser-Busch InBev Worldwide, Inc. | | 7.750 | | | | 1/15/19 | | | | 188,363 | |
| | 350,000 | | Diageo Capital PLC | | 7.375 | | | | 1/15/14 | | | | 403,954 | |
| | 325,000 | | GlaxoSmithKline Capital, Inc. | | 4.850 | | | | 5/15/13 | | | | 350,477 | |
| | 250,000 | | UnitedHealth Group, Inc. | | 5.375 | | | | 3/15/16 | | | | 279,496 | |
| | | | | | | | | | | | |
| |
| | | | | | | | | | | | | | 1,222,290 | |
| | | | | | | | | | | | |
| |
| | | | Energy — 0.4% | | | | | | | | | | | |
| | 200,000 | | Devon Energy Corp. | | 5.625 | | | | 1/15/14 | | | | 222,157 | |
| | 150,000 | | Husky Energy, Inc. | | 5.900 | | | | 6/15/14 | | | | 166,899 | |
| | | | | | | | | | | | |
| |
| | | | | | | | | | | | | | 389,056 | |
| | | | | | | | | | | | |
| |
| | | | Financial — 12.1% | | | | | | | | | | | |
| | 250,000 | | Aflac, Inc. | | 8.500 | | | | 5/15/19 | | | | 306,336 | |
| | 60,000 | | American Express Credit Corp., Series C | | 7.300 | | | | 8/20/13 | | | | 67,443 | |
| | 300,000 | | Associates Corporation of North America | | 6.950 | | | | 11/1/18 | | | | 341,789 | |
| | 300,000 | | Barclays Bank PLC | | 5.125 | | | | 1/8/20 | | | | 309,201 | |
70
| The FBR Funds |
|
| FBR Balanced Fund |
| Portfolio of Investments (continued) |
| April 30, 2011 |
| (unaudited) |
|
| | | | | | | | | | MATURITY | | | VALUE | |
| PAR | | | | RATE | | | | DATE | | | (NOTE 2) | |
|
| | | | Financial — 12.1% (continued) | | | | | | | | | | | |
| $ | 79,000 | | Boston Properties LP | | 6.250 | % | | | 1/15/13 | | | $ | 85,442 | |
| | 325,000 | | Caterpillar Financial Services Corp. | | 4.900 | | | | 8/15/13 | | | | 351,597 | |
| | 705,000 | | Citigroup, Inc. | | 6.125 | | | | 11/21/17 | | | | 782,768 | |
| | 375,000 | | CME Group, Inc. | | 5.750 | | | | 2/15/14 | | | | 417,331 | |
| | 275,000 | | Credit Suisse USA, Inc. | | 5.125 | | | | 8/15/15 | | | | 301,879 | |
| | 275,000 | | Discover Financial Services | | 10.250 | | | | 7/15/19 | | | | 363,966 | |
| | 250,000 | | Fifth Third Bancorp | | 6.250 | | | | 5/1/13 | | | | 271,737 | |
| | 240,000 | | First Niagara Financial Group, Inc. | | 6.750 | | | | 3/19/20 | | | | 264,509 | |
| | 125,000 | | General Electric Capital Corp. | | 4.800 | | | | 5/1/13 | | | | 133,326 | |
| | 250,000 | | General Electric Capital Corp. | | 5.500 | | | | 6/4/14 | | | | 275,823 | |
| | 160,000 | | Jefferies Group, Inc. | | 8.500 | | | | 7/15/19 | | | | 192,189 | |
| | 346,000 | | JPMorgan Chase & Co. | | 5.750 | | | | 1/2/13 | | | | 371,819 | |
| | 300,000 | | KeyCorp | | 6.500 | | | | 5/14/13 | | | | 328,244 | |
| | 320,000 | | Lazard Group | | 6.850 | | | | 6/15/17 | | | | 352,461 | |
| | 300,000 | | Manulife Financial Corp. | | 3.400 | | | | 9/17/15 | | | | 306,789 | |
| | 230,000 | | Merrill Lynch & Company, Inc. | | 6.875 | | | | 4/25/18 | | | | 261,358 | |
| | 250,000 | | Merrill Lynch & Company, Inc., Series MTNC(a) | | 0.738 | | | | 1/15/15 | | | | 243,075 | |
| | 100,000 | | MetLife, Inc., Series A | | 6.817 | | | | 8/15/18 | | | | 117,772 | |
| | 250,000 | | Morgan Stanley | | 4.750 | | | | 4/1/14 | | | | 263,167 | |
| | 250,000 | | Morgan Stanley | | 6.625 | | | | 4/1/18 | | | | 279,487 | |
| | 350,000 | | New York Life Global Funding(b) | | 5.250 | | | | 10/16/12 | | | | 372,306 | |
| | 310,000 | | Prudential Financial, Inc. | | 5.500 | | | | 3/15/16 | | | | 335,796 | |
| | 285,000 | | Prudential Financial, Inc., Series MTNB | | 5.100 | | | | 9/20/14 | | | | 310,433 | |
| | 375,000 | | SunTrust Banks, Inc. | | 5.250 | | | | 11/5/12 | | | | 394,968 | |
| | 250,000 | | SunTrust Banks, Inc. | | 6.000 | | | | 9/11/17 | | | | 279,574 | |
| | 150,000 | | Swiss Re Solutions Holding Corp. | | 7.000 | | | | 2/15/26 | | | | 165,308 | |
| | 350,000 | | The Allstate Corp. | | 5.000 | | | | 8/15/14 | | | | 386,135 | |
| | 475,000 | | The Goldman Sachs Group, Inc. | | 5.375 | | | | 3/15/20 | | | | 494,844 | |
| | 300,000 | | The Hartford Financial Services Group, Inc. | | 5.375 | | | | 3/15/17 | | | | 316,334 | |
| | 300,000 | | Toyota Motor Credit Corp. | | 5.170 | | | | 1/11/12 | | | | 308,840 | |
| | 300,000 | | Wachovia Corp. | | 5.250 | | | | 8/1/14 | | | | 325,601 | |
| | 400,000 | | Wells Fargo & Co. | | 5.250 | | | | 10/23/12 | | | | 425,252 | |
| | | | | | | | | | | | |
| |
| | | | | | | | | | | | | | 11,104,899 | |
| | | | | | | | | | | | |
| |
71
| The FBR Funds |
|
| FBR Balanced Fund |
| Portfolio of Investments (continued) |
| April 30, 2011 |
| (unaudited) |
|
| | | | | | | | | | MATURITY | | | VALUE | |
| PAR | | | | RATE | | | | DATE | | | (NOTE 2) | |
|
| | | | Industrial — 0.9% | | | | | | | | | | | |
| $ | 300,000 | | FedEx Corp. | | 7.375 | % | | | 1/15/14 | | | $ | 341,929 | |
| | 220,000 | | The Boeing Co. | | 5.000 | | | | 3/15/14 | | | | 241,822 | |
| | 150,000 | | Tyco International Finance SA | | 8.500 | | | | 1/15/19 | | | | 191,782 | |
| | | | | | | | | | | | |
| |
| | | | | | | | | | | | | | 775,533 | |
| | | | | | | | | | | | |
| |
| | | | Technology — 0.2% | | | | | | | | | | | |
| | 150,000 | | Dell, Inc. | | 4.700 | | | | 4/15/13 | | | | 160,103 | |
| | | | | | | | | | | | |
| |
| | | | Utilities — 0.4% | | | | | | | | | | | |
| | 275,000 | | Sempra Energy | | 6.500 | | | | 6/1/16 | | | | 317,052 | |
| | | | | | | | | | | | |
| |
| |
| | | | Total Corporate Bonds (Cost $15,851,067) | | | | | | | | | | 17,462,387 | |
| | | | | | | | | | | | |
| |
| | | | U.S. GOVERNMENT AGENCY OBLIGATIONS — 2.9% | | | | | | | | | | | |
| | 344,651 | | Federal Home Loan Mortgage Corp. | | 5.000 | | | | 5/1/20 | | | | 371,276 | |
| | 634,602 | | Federal Home Loan Mortgage Corp. | | 5.500 | | | | 4/1/37 | | | | 687,634 | |
| | 600,000 | | Federal National Mortgage Association(c) | | 1.250 | | | | 12/30/15 | | | | 600,615 | |
| | 450,336 | | Federal National Mortgage Association | | 4.500 | | | | 8/1/20 | | | | 476,696 | |
| | 478,525 | | Federal National Mortgage Association | | 6.000 | | | | 10/1/37 | | | | 523,765 | |
| | | | | | | | | | | | |
| |
| | | | Total U.S. Government Agency Obligations | | | | | | | | | | | |
| | | | (Cost $2,503,543) | | | | | | | | | | 2,659,986 | |
| | | | | | | | | | | | |
| |
| | | | U.S. TREASURY OBLIGATIONS — 8.7% | | | | | | | | | | | |
| | 1,100,000 | | U.S. Treasury Bond | | 6.250 | | | | 8/15/23 | | | | 1,381,531 | |
| | 150,000 | | U.S. Treasury Bond | | 5.250 | | | | 2/15/29 | | | | 171,633 | |
| | 1,800,000 | | U.S. Treasury Bond | | 5.000 | | | | 5/15/37 | | | | 1,984,500 | |
| | 370,000 | | U.S. Treasury Note | | 4.500 | | | | 4/30/12 | | | | 385,566 | |
| | 270,000 | | U.S. Treasury Note | | 0.625 | | | | 7/31/12 | | | | 271,109 | |
| | 900,000 | | U.S. Treasury Note | | 1.250 | | | | 9/30/15 | | | | 882,212 | |
| | 400,000 | | U.S. Treasury Note | | 4.750 | | | | 8/15/17 | | | | 454,188 | |
| | 900,000 | | U.S. Treasury Note | | 1.875 | | | | 10/31/17 | | | | 864,070 | |
| | 200,000 | | U.S. Treasury Note | | 3.750 | | | | 11/15/18 | | | | 213,094 | |
| | 970,000 | | U.S. Treasury Note | | 3.500 | | | | 5/15/20 | | | | 995,691 | |
| | 150,000 | | U.S. Treasury Note | | 2.625 | | | | 8/15/20 | | | | 142,652 | |
| | 220,000 | | U.S. Treasury Note | | 2.625 | | | | 11/15/20 | | | | 208,175 | |
| | | | | | | | | | | | |
| |
| |
| | | | Total U.S. Treasury Obligations (Cost $8,060,154) | | | | | | | | | | 7,954,421 | |
| | | | | | | | | | | | |
| |
72
| The FBR Funds |
|
| FBR Balanced Fund |
| Portfolio of Investments (continued) |
| April 30, 2011 |
| (unaudited) |
|
| | | | | | | | | VALUE | |
| SHARES | | | | | | | (NOTE 2) | |
|
| | | | | INVESTMENT COMPANIES — 2.0% | | | | | |
| | 3,000 | | | BlackRock Credit Allocation Income Trust II, Inc. | | | $ | 30,240 | |
| | 8,000 | | | Calamos Convertible Opportunities and Income Fund | | | | 108,400 | |
| | 7,650 | | | iShares iBoxx $High Yield Corporate Bond Fund | | | | 710,303 | |
| | 8,000 | | | Morgan Stanley Emerging Markets Domestic Debt Fund, Inc. | | | | 139,200 | |
| | 16,000 | | | SPDR Barclays Capital High Yield Bond Fund | | | | 654,400 | |
| | 16,000 | | | Wells Fargo Advantage Income Opportunities Fund | | | | 166,080 | |
| | | | | | | |
| |
| |
| | | | | Total Investment Companies (Cost $1,713,961) | | | | 1,808,623 | |
| | | | | | | |
| |
| | | | | SHORT-TERM INVESTMENT — 1.4% | | | | | |
| | 1,311,860 | | | JPMorgan 100% U.S. Treasury Securities Money Market Fund (Cost $1,311,860) | | | | 1,311,860 | |
| | | | | | | |
| |
| | | | | | | | | | |
| | | | | Total Investments — 99.6% (Cost $76,092,460) | | | | 91,123,088 | |
| | | | | | | | | | |
| | | | | Other Assets Less Liabilities — 0.4% | | | | 350,283 | |
| | | | | | | |
| |
| |
| | | | | Net Assets — 100.0% | | | $ | 91,473,371 | |
| | | | | | | |
| |
|
| * | | Non-income producing security |
| (a) | | Variable/floating rate security |
| (b) | | This security is a restricted security under Rule 144A of the Securities Act of 1933. These securities may be resold in transactions exempt from registration, normally to qualified institutional buyers. As of April 30, 2011, the total amount of 144A securities was $372,306, or 0.4% of total net assets. |
| (c) | | Stepped coupon bond - the rate shown is the rate in effect on April 30, 2011. |
| ADR | | American Depositary Receipts |
| LLC | | Limited Liability Company |
| LP | | Limited Partnership |
| NM | | Not Meaningful |
| PLC | | Public Liability Company |
| | | |
| Note: | | For presentation purposes, the Fund has grouped some of the industry categories. For purposes of categorizing securities for compliance with Section 8(b)(1) of the Investment Company Act of 1940, the Fund uses more specific industry classifications. |
The accompanying notes are an integral part of the financial statements.
73
| The FBR Funds |
|
| FBR Core Bond Fund |
| Management Overview |
Portfolio Manager: Gary Cloud, CFA® and Peter Greig, CFA®, Financial Counselors, Inc.
Over the previous six months, how did the Fund perform and what factors contributed to this performance?
For the six-months ended April 30, 2011, the Investor Class of the FBR Core Bond Fund returned 0.15%. This compares to the Barclays Capital Intermediate U.S. Government/ Credit Index and the Morningstar Intermediate Term Bond Category Average which returned –0.47% and 0.92% for the same period, respectively.
Interest rates continue to be low and consensus opinion is that the Fed will not raise interest rates in 2011. We do not see inflation as a critical concern in the near-term. We expect modest price increases as long as the housing market remains weak and unemployment remains relatively high. Our biggest concern is the unsustainable fiscal trajectory that the federal government is on, enabled by the Fed’s loose monetary policies. The deficit rate of 10% of GDP is unmanageable over an extended time when a 3% deficit amount is needed to maintain the status quo.
The government needs to take drastic action to assure the markets that it is serious about fiscal restraint. The consequences of investors losing confidence in America’s ability to control its debt could be disastrous for the economy and the bond markets. The recent experiences of several European countries should serve as a warning to the predicament that the U.S. could find itself in.
Portfolio manager comments on the Fund and related investment outlook.
We currently favor investment grade credit; particularly bonds issued by the financial sector, which we believe, present the most favorable valuations. Unlike government debt, the supply of corporate debt is somewhat weak. Overall, the portfolio is less exposed to increasing interest rates, which should contribute to capital preservation relative to the benchmark. Although we have an intuitive predicting as to the timing of rising rates, we are hedging our bets as to when the tightening will actually occur. We are waiting for further developments and are prepared to take action and adjust the portfolio based upon various economic scenarios.
|
The opinions expressed in this commentary reflect those of the Portfolio Managers as of the date written. Any such opinions are subject to change based on market or other conditions. These opinions may not be relied upon as investment advice. Investment decisions for The FBR Funds are based on several factors, and may not be relied upon as an indication of trading intent on behalf of any FBR Fund. Security positions can and do change. |
74
| The FBR Funds |
|
| FBR Core Bond Fund |
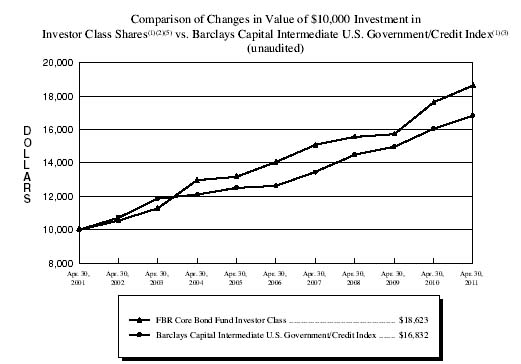
| | Total Returns—For the Periods Ended April 30, 2011(4) |
| | | | One Year | | Five Year | | Ten Year | |
| | | |
| |
| |
| |
| FBR Core Bond Fund Investor Class(1)(2)(5) | | | 5.69 | % | | 5.79 | % | | 6.50 | % | |
| FBR Core Bond Fund Institutional Class(2)(5) | | | 5.96 | % | | 6.05 | % | | 6.58 | % | |
| Barclays Capital Intermediate U.S. Government/Credit Index(1)(3) | | | 4.91 | % | | 5.91 | % | | 5.34 | % | |
PAST PERFORMANCE IS NO GUARANTEE OF FUTURE RESULTS.
The performance data quoted represents past performance and the current performance may be lower or higher than the performance data quoted. The investment return and principal will fluctuate so that investors’ shares, when redeemed, may be worth more or less than their original cost. The performance data does not reflect the deduction of taxes that a shareholder would pay on Fund distributions or redemption fees. The Fund charges a redemption fee of 1.00% on shares redeemed or exchanged within 90 days; if reflected, the redemption fee would reduce the performance data quoted. To obtain performance data current to the most recent month-end, please call 888.200.4710.
|
| (1) | | The graph assumes a hypothetical $10,000 initial investment in the Investor Class shares of the Fund and reflects the reinvestment of dividends and all Fund expenses. Investors should note that the Fund is a professionally managed mutual fund while the index is unmanaged, does not incur expenses and is not available for investment. The performance of the index includes reinvested dividends, and does not reflect sales charges or expenses. |
| (2) | | FBR Fund Advisers, Inc. and the Fund’s predecessor investment adviser each waived a portion of its advisory fees and agreed to contractually reimburse a portion of the Fund’s operating expenses, as necessary, to maintain existing expense limitations, as set forth in the notes to the financial statements. Total returns shown include fee waivers and expense reimbursements, if any; total returns would have been lower had there been no waiver of fees and/or reimbursement of expenses in excess of expense limitations. |
| (3) | | The Barclays Capital Intermediate U.S. Government/Credit Index measures performance of U.S. dollar denominated U.S. Treasuries, government-related and investment grade U.S. corporate securities that have a remaining maturity of greater than or equal to 1 year and less than 10 years. Securities have $250 million or more of outstanding face value and must be fixed rate and non-convertible. |
| (4) | | The total returns shown do not reflect the deduction of taxes that a shareholder would pay on fund distributions or the redemption of fund shares. |
| (5) | | The Fund is the investment successor to the AFBA 5Star Total Return Bond Fund which commenced investment operations on June 3, 1997. On March 12, 2010, the AFBA 5Star Total Return Bond Fund was reorganized into the Fund. The performance presented for the Investor Class of the Fund for the period prior to March 12, 2010 reflects the performance of the Advisor Class shares of the AFBA 5Star Total Return Bond Fund and the performance presented for the Institutional Class of the Fund for the period prior to March 12, 2010 reflects the performance of the Class I shares of the AFBA 5Star Total Return Bond Fund. The performance of the Advisor Class shares of the AFBA 5Star Total Return Bond Fund for the period prior to September 24, 2001 includes the performance of the Class I shares of the AFBA 5Star Total Return Bond Fund. |
75
| The FBR Funds |
|
| FBR Core Bond Fund |
| Portfolio Summary |
| April 30, 2011 |
| (unaudited) |
The following provides a breakdown of the Fund by industry sectors. The underlying securities represent a percentage of the portfolio investments.
| Industry Sector | | % of Total Investments |
| |
|
| Common Stocks | | 3.3 | % |
Financial | | 2.3 | % |
Real Estate Investment Trust (REIT) | | 1.0 | % |
| Corporate Bonds | | 54.8 | % |
Financial | | 32.1 | % |
Consumer, Cyclical | | 7.3 | % |
Communications | | 4.4 | % |
Basic Materials | | 3.0 | % |
Consumer, Non-cyclical | | 2.9 | % |
Industrial | | 2.8 | % |
Energy | | 1.2 | % |
Utilities | | 1.1 | % |
| U.S. Treasury Obligations | | 23.5 | % |
| Investment Companies | | 6.2 | % |
| U.S. Government Agency Obligations | | 9.7 | % |
| Convertible Preferred Stock | | 1.5 | % |
| Preferred Stock | | 0.1 | % |
| | | | |
| Cash | | 0.9 | % |
76
| The FBR Funds |
|
| FBR Core Bond Fund |
| Portfolio of Investments |
| April 30, 2011 |
| (unaudited) |
|
| | | | | | | | | VALUE | |
| SHARES | | | | | | | (NOTE 2) | |
|
| | | | | COMMON STOCKS — 3.2% | | | | | |
| | | | | Financial — 2.3% | | | | | |
| | 10,000 | | | Ares Capital Corp. | | | $ | 177,100 | |
| | 8,500 | | | Hercules Technology Growth Capital, Inc. | | | | 91,375 | |
| | 20,500 | | | MCG Capital Corp. | | | | 135,300 | |
| | 11,000 | | | NGP Capital Resources Co. | | | | 103,840 | |
| | 10,000 | | | PennantPark Investment Corp. | | | | 123,400 | |
| | | | | | | |
| |
| | | | | | | | | 631,015 | |
| | | | | | | |
| |
| | | | | Real Estate Investment Trust (REIT) — 0.9% | | | | | |
| | 5,500 | | | Apollo Commercial Real Estate Finance, Inc. | | | | 89,870 | |
| | 37,500 | | | Chimera Investment Corp. | | | | 151,875 | |
| | 1,500 | | | Winthrop Realty Trust | | | | 18,195 | |
| | | | | | | |
| |
| | | | | | | | | 259,940 | |
| | | | | | | |
| |
| |
| | | | | Total Common Stocks (Cost $821,670) | | | | 890,955 | |
| | | | | | | |
| |
| | | | | CONVERTIBLE PREFERRED STOCK — 1.5% | | | | | |
| | | | | Finance — 1.5% | | | | | |
| | 13,350 | | | Boston Private Capital Trust I, 4.88%, due 10/1/34 (Cost 638,782) | | | | 417,187 | |
| | | | | | | |
| |
| | | | | PREFERRED STOCK — 0.1% | | | | | |
| | 10,400 | | | Federal National Mortgage Association, Perpetual, Series S, 8.25%, due 12/31/15 (Cost 260,000)*(a) | | | | 21,216 | |
| | | | | | | |
| |
|
| | | | | | | | | | MATURITY | | | | |
| PAR | | | | RATE | | | | DATE | | | | |
|
| | | | CORPORATE BONDS — 54.4% | | | | | | | | | | | |
| | | | Basic Materials — 3.0% | | | | | | | | | | | |
| $ | 300,000 | | Barrick Gold Financeco LLC | | 6.125 | % | | | 9/15/13 | | | | 333,442 | |
| | 285,000 | | EI du Pont de Nemours & Co. | | 4.750 | | | | 3/15/15 | | | | 313,020 | |
| | 125,000 | | International Paper Co. | | 9.375 | | | | 5/15/19 | | | | 163,174 | |
| | | | | | | | | | | | |
| |
| | | | | | | | | | | | | | 809,636 | |
| | | | | | | | | | | | |
| |
| | | | Communications — 4.4% | | | | | | | | | | | |
| | 250,000 | | Comcast Corp. | | 6.500 | | | | 1/15/17 | | | | 289,538 | |
| | 275,000 | | Deutsche Telekom International Finance BV | | 5.875 | | | | 8/20/13 | | | | 302,370 | |
77
| The FBR Funds |
|
| FBR Core Bond Fund |
| Portfolio of Investments (continued) |
| April 30, 2011 |
| (unaudited) |
|
| | | | | | | | | | MATURITY | | | VALUE | |
| PAR | | | | RATE | | | | DATE | | | (NOTE 2) | |
|
| | | | Communications — 4.4% (continued) | | | | | | | | | | | |
| $ | 280,000 | | Rogers Communications, Inc. | | 7.500 | % | | | 3/15/15 | | | $ | 332,497 | |
| | 250,000 | | Telefonica Emisiones SAU | | 5.877 | | | | 7/15/19 | | | | 267,665 | |
| | | | | | | | | | | | |
| |
| | | | | | | | | | | | | | 1,192,070 | |
| | | | | | | | | | | | |
| |
| | | | Consumer, Cyclical — 7.3% | | | | | | | | | | | |
| | 275,000 | | Best Buy Company, Inc. | | 6.750 | | | | 7/15/13 | | | | 301,311 | |
| | 138,000 | | GameStop Corp. / GameStop, Inc. | | 8.000 | | | | 10/1/12 | | | | 141,105 | |
| | 150,000 | | Marriott International, Inc., Series J | | 5.625 | | | | 2/15/13 | | | | 160,717 | |
| | 325,000 | | Phillips-Van Heusen Corp. | | 7.750 | | | | 11/15/23 | | | | 357,247 | |
| | 575,000 | | Royal Caribbean Cruises Ltd. | | 7.500 | | | | 10/15/27 | | | | 576,438 | |
| | 275,000 | | Starbucks Corp. | | 6.250 | | | | 8/15/17 | | | | 314,739 | |
| | 120,000 | | The Home Depot, Inc. | | 5.400 | | | | 3/1/16 | | | | 134,244 | |
| | | | | | | | | | | | |
| |
| | | | | | | | | | | | | | 1,985,801 | |
| | | | | | | | | | | | |
| |
| | | | Consumer, Non-cyclical — 2.8% | | | | | | | | | | | |
| | 125,000 | | Anheuser-Busch InBev Worldwide, Inc. | | 7.750 | | | | 1/15/19 | | | | 156,969 | |
| | 250,000 | | Diageo Capital PLC | | 5.200 | | | | 1/30/13 | | | | 268,072 | |
| | 325,000 | | GlaxoSmithKline Capital, Inc. | | 4.850 | | | | 5/15/13 | | | | 350,477 | |
| | | | | | | | | | | | |
| |
| | | | | | | | | | | | | | 775,518 | |
| | | | | | | | | | | | |
| |
| | | | Energy — 1.2% | | | | | | | | | | | |
| | 175,000 | | Devon Energy Corp. | | 5.625 | | | | 1/15/14 | | �� | | 194,388 | |
| | 125,000 | | Husky Energy, Inc. | | 5.900 | | | | 6/15/14 | | | | 139,082 | |
| | | | | | | | | | | | |
| |
| | | | | | | | | | | | | | 333,470 | |
| | | | | | | | | | | | |
| |
| | | | Financial — 31.9% | | | | | | | | | | | |
| | 250,000 | | Aflac, Inc. | | 8.500 | | | | 5/15/19 | | | | 306,336 | |
| | 60,000 | | American Express Credit Corp., Series C | | 7.300 | | | | 8/20/13 | | | | 67,443 | |
| | 140,000 | | American Express Travel Related Services Company, Inc.(b) | | 5.250 | | | | 11/21/11 | | | | 143,497 | |
| | 250,000 | | Associates Corporation of North America | | 6.950 | | | | 11/1/18 | | | | 284,824 | |
| | 225,000 | | Barclays Bank PLC | | 5.125 | | | | 1/8/20 | | | | 231,901 | |
| | 200,000 | | Capital One Financial Corp. | | 6.750 | | | | 9/15/17 | | | | 234,476 | |
| | 325,000 | | Caterpillar Financial Services Corp. | | 4.900 | | | | 8/15/13 | | | | 351,597 | |
| | 250,000 | | Citigroup, Inc. | | 6.125 | | | | 11/21/17 | | | | 277,577 | |
| | 300,000 | | CME Group, Inc. | | 5.750 | | | | 2/15/14 | | | | 333,865 | |
| | 225,000 | | Credit Suisse USA, Inc. | | 5.125 | | | | 8/15/15 | | | | 246,992 | |
78
| The FBR Funds |
|
| FBR Core Bond Fund |
| Portfolio of Investments (continued) |
| April 30, 2011 |
| (unaudited) |
|
| | | | | | | | | | MATURITY | | | VALUE | |
| PAR | | | | RATE | | | | DATE | | | (NOTE 2) | |
|
| | | | Financial — 31.9% (continued) | | | | | | | | | | | |
| $ | 175,000 | | Discover Financial Services | | 10.250 | % | | | 7/15/19 | | | $ | 231,614 | |
| | 250,000 | | Fifth Third Bancorp | | 6.250 | | | | 5/1/13 | | | | 271,737 | |
| | 125,000 | | General Electric Capital Corp. | | 4.800 | | | | 5/1/13 | | | | 133,326 | |
| | 140,000 | | Jefferies Group, Inc. | | 8.500 | | | | 7/15/19 | | | | 168,166 | |
| | 235,000 | | JPMorgan Chase & Co. | | 5.375 | | | | 10/1/12 | | | | 249,434 | |
| | 300,000 | | KeyCorp | | 6.500 | | | | 5/14/13 | | | | 328,243 | |
| | 300,000 | | Lazard Group | | 6.850 | | | | 6/15/17 | | | | 330,432 | |
| | 300,000 | | Manulife Financial Corp. | | 3.400 | | | | 9/17/15 | | | | 306,789 | |
| | 170,000 | | Merrill Lynch & Company, Inc. | | 6.875 | | | | 4/25/18 | | | | 193,178 | |
| | 200,000 | | Merrill Lynch & Company, Inc., Series MTNC(a) | | 0.738 | | | | 1/15/15 | | | | 194,460 | |
| | 275,000 | | MetLife, Inc., Series A | | 6.817 | | | | 8/15/18 | | | | 323,874 | |
| | 250,000 | | Morgan Stanley | | 6.625 | | | | 4/1/18 | | | | 279,487 | |
| | 275,000 | | New York Life Global Funding(b) | | 5.250 | | | | 10/16/12 | | | | 292,526 | |
| | 288,000 | | Prudential Financial, Inc. | | 5.500 | | | | 3/15/16 | | | | 311,966 | |
| | 250,000 | | Prudential Financial, Inc., Series MTNB | | 5.100 | | | | 9/20/14 | | | | 272,310 | |
| | 215,000 | | SunTrust Banks, Inc. | | 5.250 | | | | 11/5/12 | | | | 226,448 | |
| | 300,000 | | SunTrust Banks, Inc. | | 6.000 | | | | 9/11/17 | | | | 335,489 | |
| | 125,000 | | Swiss Re Solutions Holding Corp. | | 7.000 | | | | 2/15/26 | | | | 137,757 | |
| | 270,000 | | The Allstate Corp. | | 5.000 | | | | 8/15/14 | | | | 297,876 | |
| | 500,000 | | The Goldman Sachs Group, Inc. | | 5.375 | | | | 3/15/20 | | | | 520,888 | |
| | 200,000 | | The Hartford Financial Services Group, Inc. | | 5.375 | | | | 3/15/17 | | | | 316,334 | |
| | 275,000 | | Toyota Motor Credit Corp. | | 5.170 | | | | 1/11/12 | | | | 283,103 | |
| | 200,000 | | Wachovia Corp. | | 5.250 | | | | 8/1/14 | | | | 217,067 | |
| | | | | | | | | | | | |
| |
| | | | | | | | | | | | | | 8,701,012 | |
| | | | | | | | | | | | |
| |
| | | | Industrial — 2.7% | | | | | | | | | | | |
| | 50,000 | | American Railcar Industries, Inc. | | 7.500 | | | | 3/1/14 | | | | 51,625 | |
| | 275,000 | | FedEx Corp. | | 7.375 | | | | 1/15/14 | | | | 313,435 | |
| | 200,000 | | The Boeing Co. | | 5.000 | | | | 3/15/14 | | | | 219,838 | |
| | 125,000 | | Tyco International Finance SA | | 8.500 | | | | 1/15/19 | | | | 159,819 | |
| | | | | | | | | | | | |
| |
| | | | | | | | | | | | | | 744,717 | |
| | | | | | | | | | | | |
| |
| | | | Utilities — 1.1% | | | | | | | | | | | |
| | 250,000 | | Sempra Energy | | 6.500 | | | | 6/1/16 | | | | 288,229 | |
| | | | | | | | | | | | |
| |
| |
| | | | Total Corporate Bonds (Cost $13,407,893) | | | | | | | | | | 14,830,453 | |
| | | | | | | | | | | | |
| |
79
| The FBR Funds |
|
| FBR Core Bond Fund |
| Portfolio of Investments (continued) |
| April 30, 2011 |
| (unaudited) |
|
| | | | | | | | | | MATURITY | | | VALUE | |
| PAR | | | | RATE | | | | DATE | | | (NOTE 2) | |
|
| | | | U.S. GOVERNMENT AGENCY OBLIGATIONS — 9.7% | | | | | | | | | | | |
| $ | 725,259 | | Federal Home Loan Mortgage Corp. | | 5.500 | % | | | 4/1/37 | | | $ | 785,867 | |
| | 600,000 | | Federal National Mortgage Association(c) | | 1.250 | | | | 12/30/15 | | | | 600,615 | |
| | 563,123 | | Federal National Mortgage Association | | 4.500 | | | | 8/1/20 | | | | 596,085 | |
| | 598,156 | | Federal National Mortgage Association | | 6.000 | | | | 10/1/37 | | | | 654,706 | |
| | | | | | | | | | | | |
| |
| |
| | | | Total U.S. Government Agency Obligations (Cost $2,478,407) | | | | | | | | | | 2,637,273 | |
| | | | | | | | | | | | |
| |
| | | | U.S. TREASURY OBLIGATIONS — 23.3% | | | | | | | | | | | |
| | 900,000 | | U.S. Treasury Bond | | 6.250 | | | | 8/15/23 | | | | 1,130,344 | |
| | 250,000 | | U.S. Treasury Bond | | 5.250 | | | | 2/15/29 | | | | 286,055 | |
| | 1,050,000 | | U.S. Treasury Bond | | 5.000 | | | | 5/15/37 | | | | 1,157,625 | |
| | 465,000 | | U.S. Treasury Note | | 4.500 | | | | 4/30/12 | | | | 484,563 | |
| | 850,000 | | U.S. Treasury Note | | 1.250 | | | | 9/30/15 | | | | 833,200 | |
| | 300,000 | | U.S. Treasury Note | | 4.750 | | | | 8/15/17 | | | | 340,641 | |
| | 650,000 | | U.S. Treasury Note | | 1.875 | | | | 10/31/17 | | | | 624,051 | |
| | 400,000 | | U.S. Treasury Note | | 3.750 | | | | 11/15/18 | | | | 426,187 | |
| | 550,000 | | U.S. Treasury Note | | 3.500 | | | | 5/15/20 | | | | 564,567 | |
| | 250,000 | | U.S. Treasury Note | | 2.625 | | | | 8/15/20 | | | | 237,754 | |
| | 275,000 | | U.S. Treasury Note | | 2.625 | | | | 11/15/20 | | | | 260,219 | |
| | | | | | | | | | | | |
| |
| |
| | | | Total U.S. Treasury Obligations (Cost $6,495,853) | | | | | | | | | | 6,345,206 | |
| | | | | | | | | | | | |
| |
|
| SHARES | | | | | | | |
|
| | | | INVESTMENT COMPANIES — 6.2% | | | | | |
| | 3,000 | | BlackRock Credit Allocation Income Trust II, Inc. | | | | 30,240 | |
| | 8,000 | | Calamos Convertible Opportunities and Income Fund | | | | 108,400 | |
| | 6,800 | | iShares iBoxx $High Yield Corporate Bond Fund | | | | 631,380 | |
| | 8,000 | | Morgan Stanley Emerging Markets Domestic Debt Fund, Inc. | | | | 139,200 | |
| | 15,000 | | SPDR Barclays Capital High Yield Bond Fund | | | | 613,500 | |
| | 16,000 | | Wells Fargo Advantage Income Opportunities Fund | | | | 166,080 | |
| | | | | | |
| |
| |
| | | | Total Investment Companies (Cost $1,604,346) | | | | 1,688,800 | |
| | | | | | |
| |
80
| The FBR Funds |
|
| FBR Core Bond Fund |
| Portfolio of Investments (continued) |
| April 30, 2011 |
| (unaudited) |
|
| | | | | | | | VALUE | |
| SHARES | | | | | | (NOTE 2) | |
|
| | | | SHORT-TERM INVESTMENT — 0.9% | | | | | |
| | 239,734 | | JPMorgan 100% U.S. Treasury Securities Money Market Fund (Cost $239,734) | | | $ | 239,734 | |
| | | | | | |
| |
| |
| | | | Total Investments — 99.3% (Cost $25,946,685) | | | | 27,070,824 | |
| | | | | | |
| |
| |
| | | | Other Assets Less Liabilities — 0.7% | | | | 187,096 | |
| | | | | | |
| |
| |
| | | | Net Assets — 100.0% | | | $ | 27,257,920 | |
| | | | | | |
| |
|
| * | | Non-income producing security |
| (a) | | Variable/floating rate security |
| (b) | | This security is a restricted security under Rule 144A of the Securities Act of 1933. These securities may be resold in transactions exempt from registration, normally to qualified institutional buyers. As of April 30, 2011, the total amount of 144A securities was $436,023, or 1.6% of total net assets. |
| (c) | | Stepped coupon bond - the rate shown is the rate in effect on April 30, 2011. |
| LLC | | Limited Liability Company |
| PLC | | Public Liability Company |
| | | |
| Note: | | For presentation purposes, the Fund has grouped some of the industry categories. For purposes of categorizing securities for compliance with Section 8(b)(1) of the Investment Company Act of 1940, the Fund uses more specific industry classifications. |
The accompanying notes are an integral part of the financial statements.
81
| The FBR Funds |
|
| Statements of Assets and Liabilities |
| April 30, 2011 |
| (unaudited) |
| | | FBR | | FBR | | FBR |
| | | Large Cap Fund | | Mid Cap Fund | | Small Cap Fund |
| | |
| |
| |
|
| ASSETS | | | | | | | | | | | | | | | |
Investment Securities at Cost | | | $ | 43,906,310 | | | | $ | 19,986,617 | | | | $ | 39,390,255 | |
| | | |
| | | |
| | | |
| |
Investment Securities at Value (Note 2) | | | $ | 50,521,945 | | | | $ | 24,258,240 | | | | $ | 46,711,225 | |
Receivable for Capital Shares Sold | | | | 3,127 | | | | | 32,762 | | | | | 16,629 | |
Receivable for Investment Securities Sold | | | | 937,707 | | | | | — | | | | | 1,859,458 | |
Dividends and Interest Receivable | | | | 28,928 | | | | | 15,704 | | | | | 14,204 | |
Receivable from Adviser | | | | 17,822 | | | | | 10,368 | | | | | 4,739 | |
Prepaid Expenses | | | | 11,845 | | | | | 13,589 | | | | | 17,137 | |
| | | |
| | | |
| | | |
| |
Total Assets | | | | 51,521,374 | | | | | 24,330,663 | | | | | 48,623,392 | |
| | | |
| | | |
| | | |
| |
| LIABILITIES | | | | | | | | | | | | | | | |
Payable for Investment Securities Purchased | | | | — | | | | | — | | | | | 234,433 | |
Payable for Capital Shares Redeemed | | | | 2,604,195 | | | | | — | | | | | 1,024,071 | |
Investment Advisory Fee Payable (Note 4) | | | | — | | | | | — | | | | | 36,344 | |
Administration Fee Payable (Note 4) | | | | 3,787 | | | | | 1,571 | | | | | 3,754 | |
Distribution and Service Fees Payable (Note 4) | | | | 3,754 | | | | | 1,832 | | | | | 6,366 | |
Other Accrued Expenses | | | | 90,415 | | | | | 52,682 | | | | | 41,926 | |
| | | |
| | | |
| | | |
| |
Total Liabilities | | | | 2,702,151 | | | | | 56,085 | | | | | 1,346,894 | |
| | | |
| | | |
| | | |
| |
| NET ASSETS | | | $ | 48,819,223 | | | | $ | 24,274,578 | | | | $ | 47,276,498 | |
| | | |
| | | |
| | | |
| |
| Net Assets Consist of: | | | | | | | | | | | | | | | |
Paid-in capital | | | $ | 51,388,099 | | | | $ | 23,947,600 | | | | $ | 50,211,237 | |
Accumulated net investment income (loss) | | | | 47,826 | | | | | 3,921 | | | | | (96,044 | ) |
Accumulated net realized loss on investments | | | | (9,232,337 | ) | | | | (3,948,566 | ) | | | | (10,159,665 | ) |
Net unrealized appreciation on investments | | | | 6,615,635 | | | | | 4,271,623 | | | | | 7,320,970 | |
| | | |
| | | |
| | | |
| |
| NET ASSETS | | | $ | 48,819,223 | | | | $ | 24,274,578 | | | | $ | 47,276,498 | |
| | | |
| | | |
| | | |
| |
| Pricing of Investor Class Shares | | | | | | | | | | | | | | | |
Net assets attributable to Investor Class shares | | | $ | 18,608,674 | | | | $ | 9,748,625 | | | | $ | 32,207,163 | |
Shares of Beneficial Interest Outstanding (unlimited number of shares authorized, no par value) | | | | 1,492,075 | | | | | 732,214 | | | | | 2,285,424 | |
| | | |
| | | |
| | | |
| |
Net Asset Value Per Share | | | $ | 12.47 | | | | $ | 13.31 | | | | $ | 14.09 | |
| | | |
| | | |
| | | |
| |
| Pricing of Institutional Class Shares | | | | | | | | | | | | | | | |
Net assets attributable to Institutional Class shares | | | $ | 30,210,549 | | | | $ | 14,525,953 | | | | $ | 15,069,335 | |
Shares of Beneficial Interest Outstanding (unlimited number of shares authorized, no par value) | | | | 2,799,768 | | | | | 1,259,049 | | | | | 1,187,375 | |
| | | |
| | | |
| | | |
| |
Net Asset Value Per Share | | | $ | 10.79 | | | | $ | 11.54 | | | | $ | 12.69 | |
| | | |
| | | |
| | | |
| |
82
| The FBR Funds |
|
| Statements of Assets and Liabilities (continued) |
| April 30, 2011 |
| (unaudited) |
| | | | | | | | FBR | | FBR |
| | | FBR | | Large Cap | | Small Cap |
| | | Focus Fund | | Financial Fund | | Financial Fund |
| | |
| |
| |
|
| ASSETS | | | | | | | | | | | | | | | |
Investment Securities | | | | | | | | | | | | | | | |
Securities at Cost: | | | | | | | | | | | | | | | |
Unaffiliated Issuers | | | $ | 370,602,191 | | | | $ | 67,575,732 | | | | $ | 268,910,616 | |
Affiliated Issuers | | | | 38,109,786 | | | | | — | | | | | — | |
| | | |
| | | |
| | | |
| |
Total Securities | | | $ | 408,711,977 | | | | $ | 67,575,732 | | | | $ | 268,910,616 | |
| | | |
| | | |
| | | |
| |
Securities at Value (Note 2): | | | | | | | | | | | | | | | |
Unaffiliated Issuers | | | $ | 705,481,701 | | | | $ | 70,606,129 | | | | $ | 303,275,688 | |
Affiliated Issuers | | | | 76,814,338 | | | | | — | | | | | — | |
| | | |
| | | |
| | | |
| |
Total Securities | | | | 782,296,039 | | | | | 70,606,129 | | | | | 303,275,688 | |
Cash | | | | — | | | | | 25,000 | | | | | — | |
Receivable for Capital Shares Sold | | | | 786,743 | | | | | 16,880 | | | | | 138,720 | |
Receivable for Investment Securities Sold | | | | — | | | | | 110,953 | | | | | 448,856 | |
Dividends and Interest Receivable | | | | 120,863 | | | | | 52,000 | | | | | 193,420 | |
Prepaid Expenses | | | | 20,361 | | | | | 10,125 | | | | | 28,042 | |
| | | |
| | | |
| | | |
| |
Total Assets | | | | 783,224,006 | | | | | 70,821,087 | | | | | 304,084,726 | |
| | | |
| | | |
| | | |
| |
| LIABILITIES | | | | | | | | | | | | | | | |
Payable for Capital Shares Redeemed | | | | 1,191,638 | | | | | 10,552 | | | | | 671,981 | |
Payable for Investment Securities Purchased | | | | 1,465,990 | | | | | 627,499 | | | | | 263,000 | |
Investment Advisory Fee Payable (Note 4) | | | | 571,740 | | | | | 52,441 | | | | | 224,914 | |
Administration Fee Payable (Note 4) | | | | 74,852 | | | | | 5,684 | | | | | 27,759 | |
Transfer Agent Fee Payable | | | | 301,588 | | | | | 13,543 | | | | | 79,904 | |
Distribution and Service Fees Payable (Note 4) | | | | 148,617 | | | | | 14,567 | | | | | 55,483 | |
Other Accrued Expenses | | | | 241,253 | | | | | 35,413 | | | | | 85,955 | |
| | | |
| | | |
| | | |
| |
Total Liabilities | | | | 3,995,678 | | | | | 759,699 | | | | | 1,408,996 | |
| | | |
| | | |
| | | |
| |
| NET ASSETS | | | $ | 779,228,328 | | | | $ | 70,061,388 | | | | $ | 302,675,730 | |
| | | |
| | | |
| | | |
| |
| Net Assets Consist of: | | | | | | | | | | | | | | | |
Paid-in capital | | | $ | 393,256,334 | | | | $ | 69,767,881 | | | | $ | 262,361,723 | |
Accumulated net investment income (loss) | | | | (28,837,919 | ) | | | | (96,631 | ) | | | | 364,607 | |
Accumulated net realized gain (loss) on investments and foreign currency transactions | | | | 41,225,851 | | | | | (2,640,259 | ) | | | | 5,584,328 | |
Net unrealized appreciation on investments | | | | 373,584,062 | | | | | 3,030,397 | | | | | 34,365,072 | |
| | | |
| | | |
| | | |
| |
| NET ASSETS | | | $ | 779,228,328 | | | | $ | 70,061,388 | | | | $ | 302,675,730 | |
| | | |
| | | |
| | | |
| |
| Pricing of Investor Class Shares | | | | | | | | | | | | | | | |
Net assets attributable to Investor Class shares | | | $ | 728,660,572 | | | | $ | 70,061,388 | | | | $ | 268,260,401 | |
Shares of Beneficial Interest Outstanding (unlimited number of shares authorized, no par value) | | | | 14,186,799 | | | | | 4,972,402 | | | | | 13,132,355 | |
| | | |
| | | |
| | | |
| |
Net Asset Value Per Share | | | $ | 51.36 | | | | $ | 14.09 | | | | $ | 20.43 | |
| | | |
| | | |
| | | |
| |
| Pricing of Institutional Class Shares | | | | | | | | | | | | | | | |
Net assets attributable to Institutional Class shares | | | $ | 50,567,756 | | | | $ | — | | | | $ | 34,415,329 | |
Shares of Beneficial Interest Outstanding (unlimited number of shares authorized, no par value) | | | | 981,594 | | | | | — | | | | | 2,632,193 | |
| | | |
| | | |
| | | |
| |
Net Asset Value Per Share | | | $ | 51.52 | | | | $ | — | | | | $ | 13.07 | |
| | | |
| | | |
| | | |
| |
83
| The FBR Funds |
|
| Statements of Assets and Liabilities (continued) |
| April 30, 2011 |
| (unaudited) |
| | | | | | | | FBR |
| | | FBR | | Gas Utility |
| | | Technology Fund | | Index Fund |
| | |
| |
|
| ASSETS | | | | | | | | | | |
Investment Securities at Cost | | | $ | 8,050,195 | | | | $ | 173,066,932 | |
| | | |
| | | |
| |
Investment Securities at Value (Note 2) | | | $ | 9,539,940 | | | | $ | 314,637,542 | |
Receivable for Capital Shares Sold | | | | 886 | | | | | 1,168,498 | |
Receivable for Investment Securities Sold | | | | 310,323 | | | | | 164,984 | |
Dividends and Interest Receivable | | | | 4,907 | | | | | 352,676 | |
Receivable from Adviser | | | | 2,532 | | | | | — | |
Prepaid Expenses | | | | 14,258 | | | | | 27,233 | |
| | | |
| | | |
| |
Total Assets | | | | 9,872,846 | | | | | 316,350,933 | |
| | | |
| | | |
| |
| LIABILITIES | | | | | | | | | | |
Payable for Capital Shares Redeemed | | | | 10,784 | | | | | 122,638 | |
Payable for Investment Securities Purchased | | | | 259,296 | | | | | 2,830,052 | |
Investment Advisory Fee Payable (Note 4) | | | | 8,574 | | | | | 96,519 | |
Administration Fee Payable (Note 4) | | | | 1,598 | | | | | 33,244 | |
Distribution and Service Fees Payable (Note 4) | | | | 1,655 | | | | | — | |
Other Accrued Expenses | | | | 39,469 | | | | | 188,029 | |
| | | |
| | | |
| |
Total Liabilities | | | | 321,376 | | | | | 3,270,482 | |
| | | |
| | | |
| |
| NET ASSETS | | | $ | 9,551,470 | | | | $ | 313,080,451 | |
| | | |
| | | |
| |
| Net Assets Consist of: | | | | | | | | | | |
Paid-in capital | | | $ | 10,794,603 | | | | $ | 183,271,606 | |
Accumulated net investment income (loss) | | | | (72,140 | ) | | | | 129,195 | |
Accumulated net realized loss on investments | | | | (2,660,738 | ) | | | | (11,890,960 | ) |
Net unrealized appreciation on investments | | | | 1,489,745 | | | | | 141,570,610 | |
| | | |
| | | |
| |
| NET ASSETS | | | $ | 9,551,470 | | | | $ | 313,080,451 | |
| | | |
| | | |
| |
| Pricing of Investor Class Shares | | | | | | | | | | |
Net assets attributable to Investor Class shares | | | $ | 8,116,355 | | | | $ | 313,080,451 | |
Shares of Beneficial Interest Outstanding (unlimited number of shares authorized, no par value) | | | | 655,066 | | | | | 15,371,961 | |
| | | |
| | | |
| |
Net Asset Value Per Share | | | $ | 12.39 | | | | $ | 20.37 | |
| | | |
| | | |
| |
| Pricing of Institutional Class Shares | | | | | | | | | | |
Net assets attributable to Institutional Class shares | | | $ | 1,435,115 | | | | $ | — | |
Shares of Beneficial Interest Outstanding (unlimited number of shares authorized, no par value) | | | | 115,580 | | | | | — | |
| | | |
| | | |
| |
Net Asset Value Per Share | | | $ | 12.42 | | | | $ | — | |
| | | |
| | | |
| |
84
| The FBR Funds |
|
| Statements of Assets and Liabilities (continued) |
| April 30, 2011 |
| (unaudited) |
| | | | | FBR |
| | | FBR | | Core Bond |
| | | Balanced Fund | | Fund |
| | |
| |
|
| ASSETS | | | | | | | | | | |
Investment Securities at Cost | | | $ | 76,092,460 | | | | $ | 25,946,685 | |
| | | |
| | | |
| |
Investment Securities at Value (Note 2) | | | $ | 91,123,088 | | | | $ | 27,070,824 | |
Receivable for Capital Shares Sold | | | | 35,569 | | | | | 20,948 | |
Dividends and Interest Receivable | | | | 456,484 | | | | | 296,427 | |
Prepaid Expenses | | | | 28,584 | | | | | 23,095 | |
| | | |
| | | |
| |
Total Assets | | | | 91,643,725 | | | | | 27,411,294 | |
| | | |
| | | |
| |
| LIABILITIES | | | | | | | | | | |
Payable for Capital Shares Redeemed | | | | 3,355 | | | | | 241 | |
Distribution Payable | | | | — | | | | | 81,704 | |
Investment Advisory Fee Payable (Note 4) | | | | 37,037 | | | | | 7,696 | |
Administration Fee Payable (Note 4) | | | | 11,039 | | | | | 3,787 | |
Distribution and Service Fees Payable (Note 4) | | | | 8,655 | | | | | 812 | |
Other Accrued Expenses | | | | 110,268 | | | | | 59,134 | |
| | | |
| | | |
| |
Total Liabilities | | | | 170,354 | | | | | 153,374 | |
| | | |
| | | |
| |
| NET ASSETS | | | $ | 91,473,371 | | | | $ | 27,257,920 | |
| | | |
| | | |
| |
| Net Assets Consist of: | | | | | | | | | | |
Paid-in capital | | | $ | 82,954,208 | | | | $ | 25,936,367 | |
Accumulated net investment income | | | | 96,897 | | | | | 3,868 | |
Accumulated net realized gain (loss) on investments | | | | (6,608,362 | ) | | | | 193,546 | |
Net unrealized appreciation on investments | | | | 15,030,628 | | | | | 1,124,139 | |
| | | |
| | | |
| |
| NET ASSETS | | | $ | 91,473,371 | | | | $ | 27,257,920 | |
| | | |
| | | |
| |
| Pricing of Investor Class Shares | | | | | | | | | | |
Net assets attributable to Investor Class shares | | | | 43,507,213 | | | | $ | 3,918,260 | |
Shares of Beneficial Interest Outstanding (unlimited number of shares authorized, no par value) | | | | 3,343,731 | | | | | 412,011 | |
| | | |
| | | |
| |
Net Asset Value Per Share | | | $ | 13.01 | | | | $ | 9.51 | |
| | | |
| | | |
| |
| Pricing of Institutional Class Shares | | | | | | | | | | |
Net assets attributable to Institutional Class shares | | | $ | 47,966,158 | | | | $ | 23,339,660 | |
Shares of Beneficial Interest Outstanding (unlimited number of shares authorized, no par value) | | | | 3,867,007 | | | | | 2,671,052 | |
| | | |
| | | |
| |
Net Asset Value Per Share | | | $ | 12.40 | | | | $ | 8.74 | |
| | | |
| | | |
| |
The accompanying notes are an integral part of the financial statements.
85
| The FBR Funds |
|
| Statements of Operations |
| For the Six Months Ended April 30, 2011 |
| (unaudited) |
| | | FBR | | FBR | | FBR |
| | | Large Cap Fund | | Mid Cap Fund | | Small Cap Fund |
| | |
| |
| |
|
| Investment Income | | | | | | | | | | | | | | | |
Dividends1 | | | $ | 381,409 | | | | $ | 158,725 | | | | $ | 332,937 | |
Interest | | | | — | | | | | 25 | | | | | — | |
| | | |
| | | |
| | | |
| |
Total Investment Income | | | | 381,409 | | | | | 158,750 | | | | | 332,937 | |
| | | |
| | | |
| | | |
| |
| Expenses | | | | | | | | | | | | | | | |
Investment Advisory fees (Note 4) | | | | 220,894 | | | | | 93,448 | | | | | 188,388 | |
Administration fees (Note 4) | | | | 13,928 | | | | | 5,818 | | | | | 12,446 | |
Distribution and Service fees – Investor Class (Note 4) | | | | 22,815 | | | | | 10,209 | | | | | 38,806 | |
Transfer agent fees – Investor Class | | | | 8,481 | | | | | 6,225 | | | | | 11,362 | |
Transfer agent fees – Institutional Class | | | | 14,130 | | | | | 1,373 | | | | | 1,947 | |
Registration fees – Investor Class | | | | 11,257 | | | | | 9,128 | | | | | 10,946 | |
Registration fees – Institutional Class | | | | 9,232 | | | | | 9,059 | | | | | 9,226 | |
Professional fees | | | | 18,538 | | | | | 18,432 | | | | | 9,552 | |
Shareholder administrative fees – Investor Class | | | | 12,223 | | | | | 7,930 | | | | | 15,950 | |
Shareholder administrative fees – Institutional Class | | | | 2,543 | | | | | 1,085 | | | | | 1,601 | |
Accounting services fees | | | | 7,117 | | | | | 3,810 | | | | | 6,295 | |
Trustees’ fees | | | | 7,030 | | | | | 7,029 | | | | | 7,025 | |
Compliance fees | | | | 6,142 | | | | | 5,313 | | | | | 5,363 | |
Insurance fees | | | | 5,173 | | | | | 2,147 | | | | | 1,292 | |
Reports to shareholders – Investor Class | | | | 1,983 | | | | | 1,236 | | | | | 2,806 | |
Reports to shareholders – Institutional Class | | | | 1,738 | | | | | 1,155 | | | | | 136 | |
Custodian fees | | | | 819 | | | | | 345 | | | | | 777 | |
Other expenses | | | | 3,041 | | | | | 1,407 | | | | | 1,650 | |
| | | |
| | | |
| | | |
| |
Total expenses before waivers and related reimbursements | | | | 367,084 | | | | | 185,149 | | | | | 325,568 | |
Less waivers and related reimbursements (Note 4) | | | | (98,694 | ) | | | | (60,529 | ) | | | | (35,118 | ) |
| | | |
| | | |
| | | |
| |
Total expenses after waivers and related reimbursements | | | | 268,390 | | | | | 124,620 | | | | | 290,450 | |
| | | |
| | | |
| | | |
| |
Net Investment Income | | | | 113,019 | | | | | 34,130 | | | | | 42,487 | |
| | | |
| | | |
| | | |
| |
| Net Realized and Unrealized Gain on Investments | | | | | | | | | | | | | | | |
Net Realized Gain on Investment Transactions | | | | 4,501,926 | | | | | 683,911 | | | | | 4,841,223 | |
Change in Net Unrealized Appreciation/Depreciation of Investments | | | | 2,280,404 | | | | | 2,624,368 | | | | | 4,884,928 | |
| | | |
| | | |
| | | |
| |
Net Gain on Investments | | | | 6,782,330 | | | | | 3,308,279 | | | | | 9,726,151 | |
| | | |
| | | |
| | | |
| |
| Net Increase in Net Assets Resulting from Operations | | | $ | 6,895,349 | | | | $ | 3,342,409 | | | | $ | 9,768,638 | |
| | | |
| | | |
| | | |
| |
|
| 1 | | Net of foreign taxes withheld of $941,$411 and $0 for the FBR Large Cap Fund, FBR Mid Cap Fund and FBR Small Cap Fund, respectively. |
86
| The FBR Funds |
|
| Statements of Operations (continued) |
| For the Six Months Ended April 30, 2011 |
| (unaudited) |
| | | | | | | | FBR | | FBR |
| | | | | | | | Large Cap | | Small Cap |
| | | FBR | | Financial | | Financial |
| | | Focus Fund | | Fund | | Fund |
| | |
| |
| |
|
| Investment Income | | | | | | | | | | | | | | | |
Dividends from Unaffiliated Issuers | | | $ | 2,206,595 | | | | $ | 379,627 | | | | $ | 2,848,032 | |
Interest | | | | 719 | | | | | 50 | | | | | 976 | |
| | | |
| | | |
| | | |
| |
Total Investment Income | | | | 2,207,314 | | | | | 379,677 | | | | | 2,849,008 | |
| | | |
| | | |
| | | |
| |
| Expenses | | | | | | | | | | | | | | | |
Investment Advisory fees (Note 4) | | | | 3,423,102 | | | | | 274,319 | | | | | 1,279,380 | |
Administration fees (Note 4) | | | | 220,113 | | | | | 17,695 | | | | | 89,201 | |
Distribution and Service fees – Investor Class (Note 4) | | | | 897,231 | | | | | 76,199 | | | | | 318,650 | |
Shareholder administrative fees – Investor Class | | | | 290,566 | | | | | 38,845 | | | | | 154,085 | |
Shareholder administrative fees – Institutional Class | | | | 9,918 | | | | | — | | | | | 16,795 | |
Transfer agent fees – Investor Class | | | | 201,636 | | | | | 5,695 | | | | | 42,859 | |
Transfer agent fees – Institutional Class | | | | 1,275 | | | | | — | | | | | 1,336 | |
Accounting services fees | | | | 99,275 | | | | | 7,230 | | | | | 39,912 | |
Insurance fees | | | | 75,292 | | | | | 3,703 | | | | | 26,261 | |
Reports to shareholders – Investor Class | | | | 52,493 | | | | | 3,733 | | | | | 21,712 | |
Reports to shareholders – Institutional Class | | | | — | | | | | — | | | | | 1,254 | |
Professional fees | | | | 38,793 | | | | | 19,209 | | | | | 27,304 | |
Registration fees – Investor Class | | | | 23,380 | | | | | 14,876 | | | | | 23,763 | |
Registration fees – Institutional Class | | | | 10,436 | | | | | — | | | | | 10,249 | |
Compliance fees | | | | 27,729 | | | | | 6,239 | | | | | 12,926 | |
Custodian fees | | | | 16,496 | | | | | 1,134 | | | | | 6,128 | |
Trustees’ fees | | | | 7,029 | | | | | 7,025 | | | | | 7,026 | |
Other expenses | | | | 7,641 | | | | | 1,431 | | | | | 1,969 | |
| | | |
| | | |
| | | |
| |
Total expenses | | | | 5,402,405 | | | | | 477,333 | | | | | 2,080,810 | |
| | | |
| | | |
| | | |
| |
Net Investment Income (Loss) | | | | (3,195,091 | ) | | | | (97,656 | ) | | | | 768,198 | |
| | | |
| | | |
| | | |
| |
| Net Realized and Unrealized Gain (Loss) on Investments | | | | | | | | | | | | | | | |
Net Realized Gain (Loss) on Investments Unaffiliated Issuers | | | | 15,865,505 | | | | | (137,317 | ) | | | | 8,860,651 | |
Change in Net Unrealized Appreciation/Depreciation of Investments | | | | 70,040,935 | | | | | 4,097,239 | | | | | 23,917,784 | |
| | | |
| | | |
| | | |
| |
Net Gain on Investments | | | | 85,906,440 | | | | | 3,959,922 | | | | | 32,778,435 | |
| | | |
| | | |
| | | |
| |
| Net Increase in Net Assets Resulting from Operations | | | $ | 82,711,349 | | | | $ | 3,862,266 | | | | $ | 33,546,633 | |
| | | |
| | | |
| | | |
| |
87
| The FBR Funds |
|
| Statements of Operations (continued) |
| For the Six Months Ended April 30, 2011 |
| (unaudited) |
| | | FBR | | FBR |
| | | Technology | | Gas Utility |
| | | Fund | | Index Fund |
| | |
| |
|
| Investment Income | | | | | | | | | | |
Dividends1 | | | $ | 23,824 | | | | $ | 4,444,836 | |
Interest (Note 2) | | | | 21 | | | | | 12 | |
| | | |
| | | |
| |
Total Investment Income | | | | 23,845 | | | | | 4,444,848 | |
| | | |
| | | |
| |
| Expenses | | | | | | | | | | |
Investment Advisory fees (Note 4) | | | | 45,464 | | | | | 525,527 | |
Administration fees (Note 4) | | | | 3,659 | | | | | 128,972 | |
Distribution and Service fees – Investor Class (Note 4) | | | | 10,261 | | | | | — | |
Registration fees – Investor Class | | | | 11,715 | | | | | 11,224 | |
Registration fees – Institutional Class | | | | 10,748 | | | | | — | |
Professional fees | | | | 20,059 | | | | | 26,051 | |
Transfer agent fees – Investor Class | | | | 7,365 | | | | | 79,901 | |
Transfer agent fees – Institutional Class | | | | 2,111 | | | | | — | |
Shareholder administrative fees – Investor Class | | | | 8,197 | | | | | 99,787 | |
Shareholder administrative fees – Institutional Class | | | | 598 | | | | | — | |
Trustees’ fees | | | | 7,025 | | | | | 7,026 | |
Compliance fees | | | | 5,193 | | | | | 11,615 | |
Accounting services fees | | | | 2,998 | | | | | 34,910 | |
Reports to shareholders – Investor Class | | | | 2,203 | | | | | 16,086 | |
Reports to shareholders – Institutional Class | | | | 416 | | | | | — | |
Insurance fees (Note 10) | | | | 2,074 | | | | | 22,726 | |
Custodian fees | | | | 165 | | | | | 5,729 | |
Other expenses | | | | 1,460 | | | | | 4,772 | |
| | | |
| | | |
| |
Total expenses before waivers and related reimbursements | | | | 141,711 | | | | | 974,326 | |
Less waivers and related reimbursements (Note 4) | | | | (45,726 | ) | | | | — | |
| | | |
| | | |
| |
Total expenses after waivers and related reimbursements | | | | 95,985 | | | | | 974,326 | |
| | | |
| | | |
| |
Net Investment Income (Loss) | | | | (72,140 | ) | | | | 3,470,522 | |
| | | |
| | | |
| |
| Net Realized and Unrealized Gain on Investments | | | | | | | | | | |
Net Realized Gain on Investment Transactions | | | | 898,262 | | | | | 3,472,606 | |
Change in Net Unrealized Appreciation/Depreciation of Investments | | | | 393,668 | | | | | 36,099,339 | |
| | | |
| | | |
| |
Net Gain on Investments | | | | 1,291,930 | | | | | 39,571,945 | |
| | | |
| | | |
| |
| Net Increase in Net Assets Resulting from Operations | | | $ | 1,219,790 | | | | $ | 43,042,467 | |
| | | |
| | | |
| |
|
| 1 | | Net of foreign taxes withheld of $0 and $73,202 for the FBR Technology Fund and FBR Gas Utility Index Fund, respectively. |
88
| The FBR Funds |
|
| Statements of Operations (continued) |
| For the Six Months Ended April 30, 2011 |
| (unaudited) |
| | | FBR | | FBR |
| | | Balanced | | Core Bond |
| | | Fund | | Fund |
| | |
| |
|
| Investment Income | | | | | | | | | | |
Dividends | | | $ | 945,030 | | | | $ | 132,167 | |
Interest | | | | 637,239 | | | | | 558,984 | |
| | | |
| | | |
| |
Total Investment Income | | | | 1,582,269 | | | | | 691,151 | |
| | | |
| | | |
| |
| Expenses | | | | | | | | | | |
Investment Advisory fees (Note 4) | | | | 339,795 | | | | | 109,107 | |
Administration fees (Note 4) | | | | 32,232 | | | | | 10,977 | |
Distribution and Service fees – Investor Class (Note 4) | | | | 51,714 | | | | | 5,181 | |
Transfer agent fees – Investor Class | | | | 46,791 | | | | | 6,378 | |
Transfer agent fees – Institutional Class | | | | 6,673 | | | | | 5,402 | |
Professional fees | | | | 46,098 | | | | | 50,252 | |
Registration fees – Investor Class | | | | 12,379 | | | | | 8,547 | |
Registration fees – Institutional Class | | | | 8,151 | | | | | 7,682 | |
Accounting services fees | | | | 15,874 | | | | | 7,921 | |
Shareholder administrative fees – Investor Class | | | | 14,521 | | | | | 5,698 | |
Shareholder administrative fees – Institutional Class | | | | 85 | | | | | 1,308 | |
Insurance fees | | | | 8,822 | | | | | 2,914 | |
Compliance fees | | | | 7,336 | | | | | 5,523 | |
Trustees’ fees | | | | 7,030 | | | | | 7,030 | |
Custodian fees | | | | 3,420 | | | | | 1,123 | |
Reports to shareholders – Investor Class | | | | 1,487 | | | | | 39 | |
Reports to shareholders – Institutional Class | | | | 1,424 | | | | | 857 | |
Other expenses | | | | 4,065 | | | | | 2,419 | |
| | | |
| | | |
| |
Total expenses before waivers and related reimbursements | | | | 607,897 | | | | | 238,358 | |
Less waivers and related reimbursements (Note 4) | | | | (135,474 | ) | | | | (90,016 | ) |
| | | |
| | | |
| |
Total expenses after waivers and related reimbursements | | | | 472,423 | | | | | 148,342 | |
| | | |
| | | |
| |
Net Investment Income | | | | 1,109,846 | | | | | 542,809 | |
| | | |
| | | |
| |
| Net Realized and Unrealized Gain (Loss) on Investments | | | | | | | | | | |
Net Realized Gain on Investment Transactions | | | | 1,471,258 | | | | | 278,101 | |
Change in Net Unrealized Appreciation/Depreciation of Investments | | | | 6,054,220 | | | | | (768,329 | ) |
| | | |
| | | |
| |
Net Gain (Loss) on Investments | | | | 7,525,478 | | | | | (490,228 | ) |
| | | |
| | | |
| |
| Net Increase in Net Assets Resulting from Operations | | | $ | 8,635,324 | | | | $ | 52,581 | |
| | | |
| | | |
| |
The accompanying notes are an integral part of the financial statements.
89
| The FBR Funds |
|
| Statements of Changes in Net Assets |
| | | FBR Large Cap Fund | | FBR Mid Cap Fund | | FBR Small Cap Fund |
| | |
| |
| |
|
| | | For the | | | | | | | For the | | | | For the | | | | | |
| | | Six Months | | For the | | Six Months | | For the | | Six Months | | For the |
| | | Ended | | Year | | Ended | | Year | | Ended | | Year |
| | | April 30, | | Ended | | April 30, | | Ended | | April 30, | | Ended |
| | | 2011 | | October 31, | | 2011 | | October 31, | | 2011 | | October 31, |
| | | (unaudited) | | 2010 | | (unaudited) | | 2010 | | (unaudited) | | 2010 |
| | |
| |
| |
| |
| |
| |
|
| From Investment Activities | | | | | | | | | | | | | | | | | | | | | | | | | | | | | | |
Net Investment Income | | | $ | 113,019 | | | | $ | 165,779 | | | | $ | 34,130 | | | | $ | 36,255 | | | | $ | 42,487 | | | | $ | 30,475 | |
Net Realized Gain on Investment Transactions | | | | 4,501,926 | | | | | 1,484,069 | | | | | 683,911 | | | | | 856,460 | | | | | 4,841,223 | | | | | 1,060,295 | |
Change in Net Unrealized Appreciation/Depreciation of Investments | | | | 2,280,404 | | | | | 287,938 | | | | | 2,624,368 | | | | | 450,331 | | | | | 4,884,928 | | | | | 3,646,786 | |
| | | |
| | | |
| | | |
| | | |
| | | |
| | | |
| |
Net Increase in Net Assets Resulting from Operations | | | | 6,895,349 | | | | | 1,937,786 | | | | | 3,342,409 | | | | | 1,343,046 | | | | | 9,768,638 | | | | | 4,737,556 | |
| | | |
| | | |
| | | |
| | | |
| | | |
| | | |
| |
| Distributions to Shareholders | | | | | | | | | | | | | | | | | | | | | | | | | | | | | | |
Distributions to Investor Class Shareholders: | | | | | | | | | | | | | | | | | | | | | | | | | | | | | | |
From Net Investment Income | | | | (52,145 | ) | | | | (93,740 | ) | | | | (17,685 | ) | | | | (26,340 | ) | | | | (106,555 | ) | | | | (34,316 | ) |
From Net Realized Gain on Investments | | | | — | | | | | — | | | | | — | | | | | — | | | | | — | | | | | (315,911 | ) |
Distributions to Institutional Class Shareholders: | | | | | | | | | | | | | | | | | | | | | | | | | | | | | | |
From Net Investment Income | | | | (150,922 | ) | | | | (818 | ) | | | | (35,878 | ) | | | | (451 | ) | | | | (35,059 | ) | | | | (629 | ) |
From Net Realized Gain on Investments | | | | — | | | | | — | | | | | — | | | | | — | | | | | — | | | | | (2,821 | ) |
| | | |
| | | |
| | | |
| | | |
| | | |
| | | |
| |
Total Distributions to Shareholders | | | | (203,067 | ) | | | | (94,558 | ) | | | | (53,563 | ) | | | | (26,791 | ) | | | | (141,614 | ) | | | | (353,677 | ) |
| | | |
| | | |
| | | |
| | | |
| | | |
| | | |
| |
| From Share Transactions | | | | | | | | | | | | | | | | | | | | | | | | | | | | | | |
Net Increase (Decrease) in Net Assets Resulting from Share Transactions | | | | (4,664,438 | ) | | | | 25,902,019 | | | | | 2,553,640 | | | | | 10,264,804 | | | | | 2,153,519 | | | | | 20,440,860 | |
| | | |
| | | |
| | | |
| | | |
| | | |
| | | |
| |
Total Increase in Net Assets | | | | 2,027,844 | | | | | 27,745,247 | | | | | 5,842,486 | | | | | 11,581,059 | | | | | 11,780,543 | | | | | 24,824,739 | |
| Net Assets – Beginning of Period | | | | 46,791,379 | | | | | 19,046,132 | | | | | 18,432,092 | | | | | 6,851,033 | | | | | 35,495,955 | | | | | 10,671,216 | |
| | | |
| | | |
| | | |
| | | |
| | | |
| | | |
| |
| Net Assets – End of Period | | | $ | 48,819,223 | | | | $ | 46,791,379 | | | | $ | 24,274,578 | | | | $ | 18,432,092 | | | | $ | 47,276,498 | | | | $ | 35,495,955 | |
| | | |
| | | |
| | | |
| | | |
| | | |
| | | |
| |
Accumulated Net Investment Income (Loss) | | | $ | 47,826 | | | | $ | 137,874 | | | | $ | 3,921 | | | | $ | 23,354 | | | | $ | (96,044 | ) | | | $ | 3,083 | |
| | | |
| | | |
| | | |
| | | |
| | | |
| | | |
| |
90
| The FBR Funds |
|
| Statements of Changes in Net Assets (continued) |
| | | | | FBR Large Cap | | FBR Small Cap |
| | | FBR Focus Fund | | Financial Fund | | Financial Fund |
| | |
| |
| |
|
| | | For the | | | | | | | For the | | | | For the | | | | | |
| | | Six Months | | For the | | Six Months | | For the | | Six Months | | For the |
| | | Ended | | Year | | Ended | | Year | | Ended | | Year |
| | | April 30, | | Ended | | April 30, | | Ended | | April 30, | | Ended |
| | | 2011 | | October 31, | | 2011 | | October 31, | | 2011 | | October 31, |
| | | (unaudited) | | 2010 | | (unaudited) | | 2010 | | (unaudited) | | 2010 |
| | |
| |
| |
| |
| |
| |
|
| From Investment Activities | | | | | | | | | | | | | | | | | | | | | | | | | | | | | | |
Net Investment Income (Loss) | | | $ | (3,195,091 | ) | | | $ | (9,379,242 | ) | | | $ | (97,656 | ) | | | $ | (304,291 | ) | | | $ | 768,198 | | | | $ | 919,314 | |
Net Realized Gain (Loss) on Investments and Foreign Currency Transactions Unaffiliated Issuers | | | | 15,865,505 | | | | | 32,448,092 | | | | | (137,317 | ) | | | | 4,174,856 | | | | | 8,860,651 | | | | | 10,863,874 | |
Affiliated Issuers | | | | — | | | | | 2,772,242 | | | | | — | | | | | — | | | | | — | | | | | — | |
Change in Net Unrealized Appreciation/Depreciation of Investments | | | | 70,040,935 | | | | | 146,676,963 | | | | | 4,097,239 | | | | | (5,180,152 | ) | | | | 23,917,784 | | | | | 1,210,218 | |
| | | |
| | | |
| | | |
| | | |
| | | |
| | | |
| |
Net Increase (Decrease) in Net Assets Resulting from Operations | | | | 82,711,349 | | | | | 172,518,055 | | | | | 3,862,266 | | | | | (1,309,587 | ) | | | | 33,546,633 | | | | | 12,993,406 | |
| | | |
| | | |
| | | |
| | | |
| | | |
| | | |
| |
| Distributions to Shareholders | | | | | | | | | | | | | | | | | | | | | | | | | | | | | | |
Distributions to Investor Class Shareholders: | | | | | | | | | | | | | | | | | | | | | | | | | | | | | | |
From Net Investment Income | | | | — | | | | | — | | | | | — | | | | | — | | | | | (725,603 | ) | | | | (717,201 | ) |
From Net Realized Gain on Investments | | | | (24,307,241 | ) | | | | — | | | | | — | | | | | — | | | | | (1,605,904 | ) | | | | — | |
Distributions to Institutional Class Shareholders: | | | | | | | | | | | | | | | | | | | | | | | | | | | | | | |
From Net Investment Income | | | | — | | | | | (282,300 | ) | | | | — | | | | | — | | | | | (256,185 | ) | | | | (148,737 | ) |
From Net Realized Gain on Investments | | | | (1,335,587 | ) | | | | — | | | | | — | | | | | — | | | | | (275,476 | ) | | | | — | |
Distributions to R1 Class Shareholders: | | | | | | | | | | | | | | | | | | | | | | | | | | | | | | |
From Net Investment Income | | | | — | | | | | (314 | ) | | | | — | | | | | — | | | | | — | | | | | (486 | ) |
| | | |
| | | |
| | | |
| | | |
| | | |
| | | |
| |
Total Distributions to Shareholders | | | | (25,642,828 | ) | | | | (282,614 | ) | | | | — | | | | | — | | | | | (2,863,168 | ) | | | | (866,424 | ) |
| | | |
| | | |
| | | |
| | | |
| | | |
| | | |
| |
| From Share Transactions | | | | | | | | | | | | | | | | | | | | | | | | | | | | | | |
Net Increase (Decrease) in Net Assets Resulting from Share Transactions | | | | 14,509,263 | | | | | (258,749,901 | ) | | | | 17,482,566 | | | | | 12,831,056 | | | | | 30,233,930 | | | | | 31,305,688 | |
| | | |
| | | |
| | | |
| | | |
| | | |
| | | |
| |
Total Increase (Decrease) in Net Assets | | | | 71,577,784 | | | | | (86,514,460 | ) | | | | 21,344,832 | | | | | 11,521,469 | | | | | 60,917,395 | | | | | 43,432,670 | |
| Net Assets – Beginning of Period | | | | 707,650,544 | | | | | 794,165,004 | | | | | 48,716,556 | | | | | 37,195,087 | | | | | 241,758,335 | | | | | 198,325,665 | |
| | | |
| | | |
| | | |
| | | |
| | | |
| | | |
| |
| Net Assets – End of Period | | | $ | 779,228,328 | | | | $ | 707,650,544 | | | | $ | 70,061,388 | | | | $ | 48,716,556 | | | | $ | 302,675,730 | | | | $ | 241,758,335 | |
| | | |
| | | |
| | | |
| | | |
| | | |
| | | |
| |
Accumulated Net Investment Income (Loss) | | | $ | (28,837,919 | ) | | | $ | — | | | | $ | (96,631 | ) | | | $ | 1,025 | | | | $ | 364,607 | | | | $ | 578,197 | |
| | | |
| | | |
| | | |
| | | |
| | | |
| | | |
| |
|
| 1 Effective after the close of business on October 22, 2010, R Class Shares merged into Investor Class (See Note 13). |
91
| The FBR Funds |
|
| Statements of Changes in Net Assets (continued) |
| | | FBR Technology Fund | | FBR Gas Utility Index Fund |
| | |
| |
|
| | | For the | | | | | | | For the | | | | | |
| | | Six Months | | For the | | Six Months | | For the |
| | | Ended | | Year | | Ended | | Year |
| | | April 30, | | Ended | | April 30, | | Ended |
| | | 2011 | | October 31, | | 2011 | | October 31, |
| | | (unaudited) | | 2010 | | (unaudited) | | 2010 |
| | |
| |
| |
| |
|
| From Investment Activities | | | | | | | | | | | | | | | | | | | | |
Net Investment Income (Loss) | | | $ | (72,140 | ) | | | $ | (136,272 | ) | | | $ | 3,470,522 | | | | $ | 7,779,537 | |
Net Realized Gain on Investment Transactions | | | | 898,262 | | | | | 1,562,671 | | | | | 3,472,606 | | | | | 2,250,847 | |
Change in Net Unrealized Appreciation/Depreciation of Investments | | | | 393,668 | | | | | 158,572 | | | | | 36,099,339 | | | | | 33,703,232 | |
| | | |
| | | |
| | | |
| | | |
| |
Net Increase in Net Assets Resulting from Operations | | | | 1,219,790 | | | | | 1,584,971 | | | | | 43,042,467 | | | | | 43,733,616 | |
| | | |
| | | |
| | | |
| | | |
| |
| Distributions to Shareholders | | | | | | | | | | | | | | | | | | | | |
Distributions to Investor Class Shareholders: | | | | | | | | | | | | | | | | | | | | |
From Net Investment Income | | | | — | | | | | — | | | | | (3,414,773 | ) | | | | (7,791,103 | ) |
From Net Realized Gain on Investments | | | | — | | | | | — | | | | | (2,818,013 | ) | | | | (248,764 | ) |
Distributions1 to R Class Shareholders: | | | | | | | | | | | | | | | | | | | | |
From Net Investment Income | | | | — | | | | | — | | | | | — | | | | | (9,158 | ) |
From Net Realized Gain on Investments | | | | — | | | | | — | | | | | — | | | | | (277 | ) |
| | | |
| | | |
| | | |
| | | |
| |
Total Distributions to Shareholders | | | | — | | | | | — | | | | | (6,232,786 | ) | | | | (8,049,302 | ) |
| | | |
| | | |
| | | |
| | | |
| |
| From Share Transactions | | | | | | | | | | | | | | | | | | | | |
Net Increase (Decrease) in Net Assets Resulting from Share Transactions | | | | (4,486,008 | ) | | | | 2,844,654 | | | | | 32,229,746 | | | | | 14,587,460 | |
| | | |
| | | |
| | | |
| | | |
| |
Total Increase (Decrease) in Net Assets | | | | (3,266,218 | ) | | | | 4,429,625 | | | | | 69,039,427 | | | | | 50,271,774 | |
| Net Assets – Beginning of Period | | | | 12,817,688 | | | | | 8,388,063 | | | | | 244,041,024 | | | | | 193,769,250 | |
| | | |
| | | |
| | | |
| | | |
| |
| Net Assets – End of Period | | | $ | 9,551,470 | | | | $ | 12,817,688 | | | | $ | 313,080,451 | | | | $ | 244,041,024 | |
| | | |
| | | |
| | | |
| | | |
| |
| Accumulated Net Investment Income (Loss) | | | $ | (72,140 | ) | | | $ | — | | | | $ | 129,195 | | | | $ | 73,446 | |
| | | |
| | | |
| | | |
| | | |
| |
|
| 1 | Effective after the close of business on October 22, 2010, R Class Shares merged into Investor Class (See Note 13). |
92
| The FBR Funds |
|
| Statements of Changes in Net Assets (continued) |
| | | FBR Balanced Fund | | | FBR Core Bond Fund | |
| | |
| | |
| |
| | | For the | | | For the | | | | | | | For the | | | For the | | | | | |
| | | Six Months | | | Period | | | For the | | | Six Months | | | Period | | | For the | |
| | | Ended | | | April 1, | | | Year | | | Ended | | | April 1, | | | Year | |
| | | April 30, | | | 2010 to | | | Ended | | | April 30, | | | 2010 to | | | Ended | |
| | | 2011 | | | October 31, | | | March 31, | | | 2011 | | | October 31, | | | March 31, | |
| | | (unaudited) | | | 20101 | | | 2010 | | | (unaudited) | | | 20101 | | | 2010 | |
| | |
| | |
| | |
| | |
| | |
| | |
| |
| From Investment Activities | | | | | | | | | | | | | | | | | | | | | | | | |
Net Investment Income | | $ | 1,109,846 | | | $ | 1,273,013 | | | $ | 2,197,290 | | | $ | 542,809 | | | $ | 739,060 | | | $ | 1,203,372 | |
Net Realized Gain (Loss) on | | | | | | | | | | | | | | | | | | | | | | | | |
Investment Transactions | | | 1,471,258 | | | | 1,513,933 | | | | (628,466 | ) | | | 278,101 | | | | 376,245 | | | | 176,611 | |
Change in Net Unrealized | | | | | | | | | | | | | | | | | | | | | | | | |
Appreciation/Depreciation of | | | | | | | | | | | | | | | | | | | | | | | | |
Investments | | | 6,054,220 | | | | 1,253,137 | | | | 20,623,773 | | | | (768,329 | ) | | | 857,643 | | | | 1,897,143 | |
| | |
| | |
| | |
| | |
| | |
| | |
| |
Net Increase in Net Assets | | | | | | | | | | | | | | | | | | | | | | | | |
Resulting from Operations | | | 8,635,324 | | | | 4,040,083 | | | | 22,192,597 | | | | 52,581 | | | | 1,972,948 | | | | 3,277,126 | |
| | |
| | |
| | |
| | |
| | |
| | |
| |
| Distributions to Shareholders | | | | | | | | | | | | | | | | | | | | | | | | |
Net Investment Income | | | | | | | | | | | | | | | | | | | | | | | | |
Investor Class (Advisor Class) | | | (498,424 | ) | | | (567,219 | ) | | | (733,712 | ) | | | (72,510 | ) | | | (102,123 | ) | | | (124,609 | ) |
Institutional Class | | | (609,263 | ) | | | (613,557 | ) | | | (1,172,404 | ) | | | (470,672 | ) | | | (636,626 | ) | | | (1,092,527 | ) |
Class B | | | — | | | | — | | | | (5,820 | ) | | | — | | | | — | | | | (13,698 | ) |
Class C | | | — | | | | — | | | | (394,015 | ) | | | — | | | | — | | | | (46,655 | ) |
Net Realized Gains From Investment | | | | | | | | | | | | | | | | | | | | | | | | |
Transactions | | | | | | | | | | | | | | | | | | | | | | | | |
Investor Class (Advisor Class) | | | — | | | | — | | | | — | | | | (67,867 | ) | | | — | | | | (17,570 | ) |
Institutional Class | | | — | | | | — | | | | — | | | | (403,399 | ) | | | — | | | | (128,515 | ) |
Class B | | | — | | | | — | | | | — | | | | — | | | | — | | | | — | |
Class C | | | — | | | | — | | | | — | | | | — | | | | — | | | | (7,920 | ) |
| | |
| | |
| | |
| | |
| | |
| | |
| |
Total Distributions to Shareholders | | | (1,107,687 | ) | | | (1,180,776 | ) | | | (2,305,951 | ) | | | (1,014,448 | ) | | | (738,749 | ) | | | (1,431,494 | ) |
| | |
| | |
| | |
| | |
| | |
| | |
| |
| From Share Transactions | | | | | | | | | | | | | | | | | | | | | | | | |
Net Increase (Decrease) in Net Assets | | | | | | | | | | | | | | | | | | | | | | | | |
Resulting from Share Transactions | | | 278,384 | | | | (5,403,744 | ) | | | 194,955 | | | | (472,583 | ) | | | (1,041,918 | ) | | | (52,730 | ) |
| | |
| | |
| | |
| | |
| | |
| | |
| |
Total Increase (Decrease) in | | | | | | | | | | | | | | | | | | | | | | | | |
Net Assets | | | 7,806,021 | | | | (2,544,437 | ) | | | 20,081,601 | | | | (1,434,450 | ) | | | 192,281 | | | | 1,792,902 | |
Net Assets – Beginning of Period | | | 83,667,350 | | | | 86,211,787 | | | | 66,130,186 | | | | 28,692,370 | | | | 28,500,089 | | | | 26,707,187 | |
| | |
| | |
| | |
| | |
| | |
| | |
| |
Net Assets – End of Period | | $ | 91,473,371 | | | $ | 83,667,350 | | | $ | 86,211,787 | | | $ | 27,257,920 | | | $ | 28,692,370 | | | $ | 28,500,089 | |
| | |
| | |
| | |
| | |
| | |
| | |
| |
Accumulated Net Investment | | | | | | | | | | | | | | | | | | | | | | | | |
Income (Loss) | | $ | 96,897 | | | $ | 95,782 | | | $ | — | | | $ | 3,868 | | | $ | 4,241 | | | $ | (89 | ) |
| | |
| | |
| | |
| | |
| | |
| | |
| |
|
| 1 The Fund changed its fiscal year end from March 31 to October 31. |
The accompanying notes are an integral part of the financial statements.
93
| The FBR Funds |
|
| Financial Highlights |
The following tables provide per share data for a share outstanding throughout each period for each Fund. Other data includes investment performance, ratios to average net assets and other supplemental information.
| | | FBR Large Cap Fund — Investor Class |
| | |
|
| | | For the | | | | | | | | | | | | | | | | | | | | | |
| | | Six Months | | | | | | | | | | | | | | | | | | | For the |
| | | Ended | | | | | | | | | | | | | | | | | | | Period |
| | | April 30, | | | For the Years Ended October 31, | | | Ended |
| | | 2011 | | |
| | | October 31, |
| | | (unaudited) | | | 2010 | | | 2009 | | | 2008 | | | 2007 | | | 2006* |
| | |
| | |
| | |
| | |
| | |
| | |
|
| Per Share Operating Performance: | | | | | | | | | | | | | | | | | | | | | | | | | |
Net Asset Value – Beginning of Period | | $ | 10.88 | | | | $ | 9.72 | | | $ | 8.14 | | | $ | 13.40 | | | $ | 11.84 | | | $ | 10.00 | |
| | |
| | | |
| | |
| | |
| | |
| | |
| |
Income (Loss) from Investment Operations: | | | | | | | | | | | | | | | | | | | | | | | | | |
Net Investment Income (Loss)1,2 | | | 0.01 | | | | | 0.04 | | | | 0.03 | | | | 0.08 | | | | (0.04 | ) | | | (0.01 | ) |
Net Realized and Unrealized Gain (Loss) | | | | | | | | | | | | | | | | | | | | | | | | | |
on Investments1,3 | | | 1.61 | | | | | 1.17 | | | | 1.60 | | | | (4.05 | ) | | | 2.05 | | | | 1.84 | |
| | |
| | | |
| | |
| | |
| | |
| | |
| |
Total from Investment Operations | | | 1.62 | | | | | 1.21 | | | | 1.63 | | | | (3.97 | ) | | | 2.01 | | | | 1.83 | |
| | |
| | | |
| | |
| | |
| | |
| | |
| |
Distributions to Shareholders: | | | | | | | | | | | | | | | | | | | | | | | | | |
From Net Investment Income | | | (0.03 | ) | | | | (0.05 | ) | | | (0.05 | ) | | | — | | | | — | | | | (0.00 | )5 |
From Net Realized Gain | | | — | | | | | — | | | | — | | | | (1.30 | ) | | | (0.45 | ) | | | — | |
| | |
| | | |
| | |
| | |
| | |
| | |
| |
Total Distributions | | | (0.03 | ) | | | | (0.05 | ) | | | (0.05 | ) | | | (1.30 | ) | | | (0.45 | ) | | | (0.00 | )5 |
| | |
| | | |
| | |
| | |
| | |
| | |
| |
Paid-in Capital from Redemption Fees4 | | | 0.00 | 5 | | | | 0.00 | 5 | | | 0.00 | 5 | | | 0.01 | | | | 0.00 | 5 | | | 0.01 | |
| | |
| | | |
| | |
| | |
| | |
| | |
| |
Net Increase (Decrease) in Net Asset Value | | | 1.59 | | | | | 1.16 | | | | 1.58 | | | | (5.26 | ) | | | 1.56 | | | | 1.84 | |
| | |
| | | |
| | |
| | |
| | |
| | |
| |
Net Asset Value – End of Period | | $ | 12.47 | | | | $ | 10.88 | | | $ | 9.72 | | | $ | 8.14 | | | $ | 13.40 | | | $ | 11.84 | |
| | |
| | | |
| | |
| | |
| | |
| | |
| |
| Total Investment Return6 | | | 14.94% | (A) | | | | 12.43% | | | | 20.12% | | | | (32.37)% | | | | 17.52% | | | | 18.45% | (A) |
| Ratios to Average Net Assets: | | | | | | | | | | | | | | | | | | | | | | | | | |
Expenses After Waivers and Related Reimbursements2,7 | | | 1.25% | (B) | | | | 1.25% | | | | 1.25% | | | | 1.71% | | | | 1.97% | | | | 1.94% | (B) |
Expenses Before Waivers and Related Reimbursements7 | | | 1.77% | (B) | | | | 1.84% | | | | 2.16% | | | | 2.55% | | | | 2.21% | | | | 2.74% | (B) |
Net Investment Income (Loss) After Waivers and | | | | | | | | | | | | | | | | | | | | | | | | | |
Related Reimbursements2 | | | 0.30% | (B) | | | | 0.39% | | | | 0.61% | | | | 0.51% | | | | (0.30)% | | | | (0.23)% | (B) |
Net Investment Loss Before Waivers and Related | | | | | | | | | | | | | | | | | | | | | | | | | |
Reimbursements | | | (0.22)% | (B) | | | | (0.20)% | | | | (0.30)% | | | | (0.33)% | | | | (0.54)% | | | | (1.03)% | (B) |
| Supplementary Data: | | | | | | | | | | | | | | | | | | | | | | | | | |
Portfolio Turnover Rate | | | 46% | (A) | | | | 86% | (C) | | | 60% | | | | 39% | | | | 108% | | | | 166% | (A) |
Net Assets at End of Period (in thousands) | | $ | 18,609 | | | | $ | 17,097 | | | $ | 18,947 | | | $ | 4,574 | | | $ | 13,037 | | | $ | 13,349 | |
|
| * | | Represents the period from commencement of operations (November 15, 2005) through October 31, 2006. |
| 1 | | Calculated based on shares outstanding on the first and last day of the respective periods, except for dividends and distributions, if any, which are based on the actual shares outstanding on the dates of distributions. |
| 2 | | Prior to May 30, 2008, reflects fees waived and reimbursed by FBR Fund Advisers, Inc. pursuant to a contractual expense limitation of 1.95% (excluding interest, taxes, brokerage commissions, dividend expenses, acquired fund fees and expenses, extraordinary legal expenses, or any other extraordinary expenses). As of May 30, 2008, reflects fees waived and reimbursed by FBR Fund Advisers, Inc. pursuant to a contractual expense limitation of 1.25% (excluding interest, taxes, brokerage commissions, dividend expenses, acquired fund fees and expenses, extraordinary legal expenses, or any other extraordinary expenses). |
| 3 | | The amounts shown for a share outstanding throughout the period may not be in accordance with the changes in the aggregate gains and losses on investments during the period because of the timing of sales and repurchases of Fund shares in relation to fluctuating net asset values during the period. |
| 4 | | Calculated based on average shares outstanding. |
| 5 | | Less than $0.01 |
| 6 | | Total investment return is calculated assuming a purchase of shares on the first day and a sale on the last day of each period reported and will include reinvestment of dividends and distributions, if any. |
| 7 | | Does not include expenses of the funds in which the Fund invests. |
| (A) | | Not Annualized |
| (B) | | Annualized |
| (C) | | Excludes merger activity |
94
| The FBR Funds |
|
| Financial Highlights (continued) |
| | | FBR Large Cap Fund — Institutional Class |
| | |
|
| | | For the | | | | | | | | | | | | |
| | | Six Months | | | | | | | | | | For the |
| | | Ended | | | | | | | | | | Period |
| | | April 30, | | For the Years Ended October 31, | | | Ended |
| | | 2011 | |
| | | October 31, |
| | | (unaudited) | | 2010 | | | 2009 | | | 2008* |
| | |
| |
| | |
| | |
|
| Per Share Operating Performance: | | | | | | | | | | | | | | | | |
Net Asset Value – Beginning of Period | | $ | 9.42 | | | $ | 8.42 | | | $ | 7.07 | | | $ | 10.00 | |
| | |
| | |
| | |
| | |
| |
Income (Loss) from Investment Operations: | | | | | | | | | | | | | | | | |
Net Investment Income1,2 | | | 0.03 | | | | 0.06 | | | | 0.07 | | | | 0.03 | |
Net Realized and Unrealized Gain (Loss) | | | | | | | | | | | | | | | | |
on Investments1,3 | | | 1.39 | | | | 1.01 | | | | 1.34 | | | | (2.96 | ) |
| | |
| | |
| | |
| | |
| |
Total from Investment Operations | | | 1.42 | | | | 1.07 | | | | 1.41 | | | | (2.93 | ) |
| | |
| | |
| | |
| | |
| |
Distributions to Shareholders: | | | | | | | | | | | | | | | | |
From Net Investment Income | | | (0.05 | ) | | | (0.07 | ) | | | (0.06 | ) | | | — | |
| | |
| | |
| | |
| | |
| |
Paid-in Capital from Redemption Fees4 | | | 0.00 | 5 | | | 0.00 | 5 | | | — | | | | — | |
| | |
| | |
| | |
| | |
| |
Net Increase (Decrease) in Net Asset Value | | | 1.37 | | | | 1.00 | | | | 1.35 | | | | (2.93 | ) |
| | |
| | |
| | |
| | |
| |
Net Asset Value – End of Period | | $ | 10.79 | | | $ | 9.42 | | | $ | 8.42 | | | $ | 7.07 | |
| | |
| | |
| | |
| | |
| |
| Total Investment Return6 | | | 15.11% | (A) | | | 12.71% | | | | 20.21% | | | | (29.30)% | (A) |
| Ratios to Average Net Assets: | | | | | | | | | | | | | | | | |
Expenses After Waivers and Related Reimbursements2,7 | | | 1.00% | (B) | | | 1.00% | | | | 1.00% | | | | 1.01% | (B) |
Expenses Before Waivers and Related Reimbursements7 | | | 1.33% | (B) | | | 1.49% | | | | 16.64% | | | | 4.11% | (B) |
Net Investment Income After Waivers and | | | | | | | | | | | | | | | | |
Related Reimbursements2 | | | 0.55% | (B) | | | 0.50% | | | | 1.05% | | | | 0.88% | (B) |
Net Investment Income (Loss) Before Waivers and | | | | | | | | | | | | | | | | |
Related Reimbursements | | | 0.22% | (B) | | | 0.01% | | | | (14.59)% | | | | (2.22)% | (B) |
| Supplementary Data: | | | | | | | | | | | | | | | | |
Portfolio Turnover Rate | | | 46% | (A) | | | 86% | (C) | | | 60% | | | | 39% | (A) |
Net Assets at End of Period (in thousands) | | $ | 30,211 | | | $ | 29,695 | | | $ | 99 | | | $ | 71 | |
|
| * | | Represents the period from inception of share class (May 30, 2008) through October 31, 2008. |
| 1 | | Calculated based on shares outstanding on the first and last day of the period, except for dividends and distributions, if any, which are based on the actual shares outstanding on the dates of distributions. |
| 2 | | Reflects fees waived and reimbursed by FBR Fund Advisers, Inc. pursuant to a contractual expense limitation of 1.00% (excluding interest, taxes, brokerage commissions, dividend expenses, acquired fund fees and expenses, extraordinary legal expenses, or any other extraordinary expenses). |
| 3 | | The amounts shown for a share outstanding throughout the period may not be in accordance with the changes in the aggregate gains and losses on investments during the period because of the timing of sales and repurchases of Fund shares in relation to fluctuating net asset values during the period. |
| 4 | | Calculated based on average shares outstanding. |
| 5 | | Less than $0.01 |
| 6 | | Total investment return is calculated assuming a purchase of shares on the first day and a sale on the last day of each period reported and will include reinvestment of dividends and distributions, if any. |
| 7 | | Does not include expenses of the funds in which the Fund invests. |
| (A) | | Not Annualized |
| (B) | | Annualized |
| (C) | | Excludes merger activity |
95
| The FBR Funds |
|
| Financial Highlights (continued) |
| | | FBR Mid Cap Fund — Investor Class |
| | |
|
| | | For the | | | | | | | | | | | | | | | | |
| | | Six Months | | | | | | | | | | | | | | For the |
| | | Ended | | | | | | | | | | | | | | Period |
| | | April 30, | | For the Years Ended October 31, | | | Ended |
| | | 2011 | |
| | | October 31, |
| | | (unaudited) | | 2010 | | | 2009 | | | 2008 | | | 2007* |
| | |
| |
| | |
| | |
| | |
|
| Per Share Operating Performance: | | | | | | | | | | | | | | | | | | | | |
Net Asset Value – Beginning of Period | | $ | 11.35 | | | $ | 9.53 | | | $ | 8.18 | | | $ | 11.30 | | | $ | 10.00 | |
| | |
| | |
| | |
| | |
| | |
| |
Income (Loss) from Investment Operations: | | | | | | | | | | | | | | | | | | | | |
Net Investment Income (Loss)1,2 | | | 0.02 | | | | 0.04 | | | | 0.04 | | | | (0.01 | ) | | | (0.02 | ) |
Net Realized and Unrealized Gain (Loss) | | | | | | | | | | | | | | | | | | | | |
on Investments1,3 | | | 1.96 | | | | 1.82 | | | | 1.43 | | | | (3.00 | ) | | | 1.32 | |
| | |
| | |
| | |
| | |
| | |
| |
Total from Investment Operations | | | 1.98 | | | | 1.86 | | | | 1.47 | | | | (3.01 | ) | | | 1.30 | |
| | |
| | |
| | |
| | |
| | |
| |
Distributions to Shareholders: | | | | | | | | | | | | | | | | | | | | |
From Net Investment Income | | | (0.03 | ) | | | (0.04 | ) | | | (0.01 | ) | | | — | | | | — | |
From Net Realized Gain | | | — | | | | — | | | | (0.12 | ) | | | (0.13 | ) | | | — | |
| | |
| | |
| | |
| | |
| | |
| |
Total Distributions | | | (0.03 | ) | | | (0.04 | ) | | | (0.13 | ) | | | (0.13 | ) | | | — | |
| | |
| | |
| | |
| | |
| | |
| |
Paid-in Capital from Redemption Fees4 | | | 0.01 | | | | 0.00 | 5 | | | 0.01 | | | | 0.02 | | | | 0.00 | 5 |
| | |
| | |
| | |
| | |
| | |
| |
Net Increase (Decrease) in Net Asset Value | | | 1.96 | | | | 1.82 | | | | 1.35 | | | | (3.12 | ) | | | 1.30 | |
| | |
| | |
| | |
| | |
| | |
| |
Net Asset Value - End of Period | | $ | 13.31 | | | $ | 11.35 | | | $ | 9.53 | | | $ | 8.18 | | | $ | 11.30 | |
| | |
| | |
| | |
| | |
| | |
| |
| Total Investment Return6 | | | 17.54% | (A) | | | 19.58% | | | | 18.51% | | | | (26.71)% | | | | 13.00% | (A) |
| Ratios to Average Net Assets: | | | | | | | | | | | | | | | | | | | | |
Expenses After Waivers and Related | | | | | | | | | | | | | | | | | | | | |
Reimbursements2,7 | | | 1.35% | (B) | | | 1.36% | | | | 1.35% | | | | 1.66% | | | | 1.95% | (B) |
Expenses Before Waivers and Related | | | | | | | | | | | | | | | | | | | | |
Reimbursements7 | | | 2.17% | (B) | | | 2.54% | | | | 2.95% | | | | 3.71% | | | | 4.17% | (B) |
Net Investment Income (Loss) After Waivers and | | | | | | | | | | | | | | | | | | | | |
Related Reimbursements2 | | | 0.18% | (B) | | | 0.24% | | | | 0.39% | | | | (0.13)% | | | | (0.36)% | (B) |
Net Investment Loss Before Waivers and Related | | | | | | | | | | | | | | | | | | | | |
Reimbursements | | | (0.65)% | (B) | | | (0.94)% | | | | (1.21)% | | | | (2.18)% | | | | (2.58)% | (B) |
| Supplementary Data: | | | | | | | | | | | | | | | | | | | | |
Portfolio Turnover Rate | | | 22% | (A) | | | 215% | (C) | | | 128% | | | | 93% | | | | 135% | (A) |
Net Assets at End of Period (in thousands) | | $ | 9,749 | | | $ | 6,776 | | | $ | 6,767 | | | $ | 4,108 | | | $ | 3,873 | |
|
| * | | Represents the period from commencement of operations (February 28, 2007) through October 31, 2007. |
| 1 | | Calculated based on shares outstanding on the first and last day of the respective periods, except for dividends and distributions, if any, which are based on the actual shares outstanding on the dates of distributions. |
| 2 | | Prior to May 30, 2008, reflects fees waived and reimbursed by FBR Fund Advisers, Inc. pursuant to a contractual expense limitation of 1.95% (excluding interest, taxes, brokerage commissions, dividend expenses, acquired fund fees and expenses, extraordinary legal expenses, or any other extraordinary expenses). As of May 30, 2008, reflects fees waived and reimbursed by FBR Fund Advisers, Inc. pursuant to a contractual expense limitation of 1.35% (excluding interest, taxes, brokerage commissions, dividend expenses, acquired fund fees and expenses, extraordinary legal expenses, or any other extraordinary expenses). |
| 3 | | The amounts shown for a share outstanding throughout the period may not be in accordance with the changes in the aggregate gains and losses on investments during the period because of the timing of sales and repurchases of Fund shares in relation to fluctuating net asset values during the period. |
| 4 | | Calculated based on average shares outstanding. |
| 5 | | Less than $0.01 |
| 6 | | Total investment return is calculated assuming a purchase of shares on the first day and a sale on the last day of each period reported and will include reinvestment of dividends and distributions, if any. |
| 7 | | Does not include expenses of the funds in which the Fund invests. |
| (A) | | Not Annualized |
| (B) | | Annualized |
| (C) | | Excludes merger activity |
96
| The FBR Funds |
|
| Financial Highlights (continued) |
| | | FBR Mid Cap Fund — Institutional Class |
| | |
|
| | | For the | | | | | | | | | | | | |
| | | Six Months | | | | | | | | | | For the |
| | | Ended | | | | | | | | | | Period |
| | | April 30, | | For the Years Ended October 31, | | | Ended |
| | | 2011 | |
| | | October 31, |
| | | (unaudited) | | 2010 | | | 2009 | | | 2008* |
| | |
| |
| | |
| | |
|
| Per Share Operating Performance: | | | | | | | | | | | | | | | | |
Net Asset Value – Beginning of Period | | $ | 9.84 | | | $ | 8.26 | | | $ | 7.11 | | | $ | 10.00 | |
| | |
| | |
| | |
| | |
| |
Income (Loss) from Investment Operations: | | | | | | | | | | | | | | | | |
Net Investment Income1,2 | | | 0.02 | | | | 0.03 | | | | 0.05 | | | | 0.02 | |
Net Realized and Unrealized Gain (Loss) on Investments1,3 | | | 1.71 | | | | 1.59 | | | | 1.25 | | | | (2.91 | ) |
| | |
| | |
| | |
| | |
| |
Total from Investment Operations | | | 1.73 | | | | 1.62 | | | | 1.30 | | | | (2.89 | ) |
| | |
| | |
| | |
| | |
| |
Distributions to Shareholders: | | | | | | | | | | | | | | | | |
From Net Investment Income | | | (0.03 | ) | | | (0.04 | ) | | | (0.03 | ) | | | — | |
From Net Realized Gain | | | — | | | | — | | | | (0.12 | ) | | | — | |
| | |
| | |
| | |
| | |
| |
Total Distributions | | | (0.03 | ) | | | (0.04 | ) | | | (0.15 | ) | | | — | |
| | |
| | |
| | |
| | |
| |
Paid-in Capital from Redemption Fees4 | | | 0.00 | 5 | | | 0.00 | 5 | | | — | | | | — | |
| | |
| | |
| | |
| | |
| |
Net Increase (Decrease) in Net Asset Value | | | 1.70 | | | | 1.58 | | | | 1.15 | | | | (2.89 | ) |
| | |
| | |
| | |
| | |
| |
Net Asset Value – End of Period | | $ | 11.54 | | | $ | 9.84 | | | $ | 8.26 | | | $ | 7.11 | |
| | |
| | |
| | |
| | |
| |
| Total Investment Return6 | | | 17.62% | (A) | | | 19.72% | | | | 18.78% | | | | (28.90)% | (A) |
| Ratios to Average Net Assets: | | | | | | | | | | | | | | | | |
Expenses After Waivers and Related Reimbursements2,7 | | | 1.10% | (B) | | | 1.11% | | | | 1.10% | | | | 1.10% | (B) |
Expenses Before Waivers and Related Reimbursements7 | | | 1.53% | (B) | | | 2.03% | | | | 16.91% | | | | 4.54% | (B) |
Net Investment Income After Waivers and Related Reimbursements2 | | | 0.43% | (B) | | | 0.26% | | | | 0.69% | | | | 0.47% | (B) |
Net Investment Income (Loss) Before Waivers and | | | | | | | | | | | | | | | | |
Related Reimbursements | | | 0.00% | (B),8 | | | (0.66)% | | | | (15.12)% | | | | (2.97)% | (B) |
| Supplementary Data: | | | | | | | | | | | | | | | | |
Portfolio Turnover Rate | | | 22% | (A) | | | 215% | (C) | | | 128% | | | | 93% | (A) |
Net Assets at End of Period (in thousands) | | $ | 14,526 | | | $ | 11,656 | | | $ | 84 | | | $ | 71 | |
|
| * | | Represents the period from inception of share class (May 30, 2008) through October 31, 2008. |
| 1 | | Calculated based on shares outstanding on the first and last day of the period, except for dividends and distributions, if any, which are based on the actual shares outstanding on the dates of distributions. |
| 2 | | Reflects fees waived and reimbursed by FBR Fund Advisers, Inc. pursuant to a contractual expense limitation of 1.10% (excluding interest, taxes, brokerage commissions, dividend expenses, acquired fund fees and expenses, extraordinary legal expenses, or any other extraordinary expenses). |
| 3 | | The amounts shown for a share outstanding throughout the period may not be in accordance with the changes in the aggregate gains and losses on investments during the period because of the timing of sales and repurchases of Fund shares in relation to fluctuating net asset values during the period. |
| 4 | | Calculated based on average shares outstanding. |
| 5 | | Less than $0.01 |
| 6 | | Total investment return is calculated assuming a purchase of shares on the first day and a sale on the last day of each period reported and will include reinvestment of dividends and distributions, if any. |
| 7 | | Does not include expenses of the funds in which the Fund invests. |
| 8 | | Less than 0.01% |
| (A) | | Not Annualized |
| (B) | | Annualized |
| (C) | | Excludes merger activity |
97
| The FBR Funds |
|
| Financial Highlights (continued) |
| | | FBR Small Cap Fund — Investor Class |
| | |
|
| | | For the | | | | | | | | | | | | | | | |
| | | Six Months | | | | | | | | | | | | | For the |
| | | Ended | | | | | | | | | | | | | Period |
| | | April 30, | | For the Years Ended October 31, | | | Ended |
| | | 2011 | |
| | | October 31, |
| | | (unaudited) | | 2010 | | | 2009 | | 2008 | | | 2007* |
| | |
| |
| | |
| |
| | |
|
| Per Share Operating Performance: | | | | | | | | | | | | | | | | | | | |
Net Asset Value – Beginning of Period | | $ | 11.17 | | | $ | 9.51 | | | $ | 8.44 | | $ | 11.85 | | | $ | 10.00 | |
| | |
| | |
| | |
| |
| | |
| |
Income (Loss) from Investment Operations: | | | | | | | | | | | | | | | | | | | |
Net Investment Income (Loss)1,2 | | | 0.01 | | | | 0.02 | | | | 0.01 | | | (0.03 | ) | | | (0.04 | ) |
Net Realized and Unrealized Gain (Loss) | | | | | | | | | | | | | | | | | | | |
on Investments1,3 | | | 2.95 | | | | 1.95 | | | | 1.04 | | | (3.35 | ) | | | 1.89 | |
Net Increase from Payments by Affiliates | | | — | | | | — | | | | 0.01 | | | — | | | | — | |
| | |
| | |
| | |
| |
| | |
| |
Total from Investment Operations | | | 2.96 | | | | 1.97 | | | | 1.06 | | | (3.38 | ) | | | 1.85 | |
| | |
| | |
| | |
| |
| | |
| |
Distributions to Shareholders: | | | | | | | | | | | | | | | | | | | |
From Net Investment Income | | | (0.04 | ) | | | (0.03 | ) | | | — | | | — | | | | — | |
From Net Realized Gains | | | — | | | | (0.28 | ) | | | — | | | (0.04 | ) | | | — | |
| | |
| | |
| | |
| |
| | |
| |
Total Distributions | | | (0.04 | ) | | | (0.31 | ) | | | — | | | (0.04 | ) | | | — | |
| | |
| | |
| | |
| |
| | |
| |
Paid-in Capital from Redemption Fees4 | | | 0.00 | 5 | | | 0.00 | 5 | | | 0.01 | | | 0.01 | | | | 0.00 | 5 |
| | |
| | |
| | |
| |
| | |
| |
Net Increase (Decrease) in Net Asset Value | | | 2.92 | | | | 1.66 | | | | 1.07 | | | (3.41 | ) | | | 1.85 | |
| | |
| | |
| | |
| |
| | |
| |
Net Asset Value – End of Period | | $ | 14.09 | | | $ | 11.17 | | | $ | 9.51 | | $ | 8.44 | | | $ | 11.85 | |
| | |
| | |
| | |
| |
| | |
| |
| Total Investment Return6 | | | 26.58% | (A) | | | 21.13% | | | | 12.68% | 7 | | (28.49)% | | | | 18.50% | (A) |
| Ratios to Average Net Assets: | | | | | | | | | | | | | | | | | | | |
Expenses After Waivers and Related Reimbursements2,8 | | | 1.45% | (B) | | | 1.45% | | | | 1.46% | | | 1.74% | | | | 1.95% | (B) |
Expenses Before Waivers and Related Reimbursements8 | | | 1.62% | (B) | | | 2.33% | | | | 2.73% | | | 3.55% | | | | 3.77% | (B) |
Net Investment Income (Loss) After Waivers and | | | | | | | | | | | | | | | | | | | |
Related Reimbursements2 | | | 0.15% | (B) | | | 0.18% | | | | 0.10% | | | (0.36)% | | | | (0.61)% | (B) |
Net Investment Loss Before Waivers and | | | | | | | | | | | | | | | | | | | |
Related Reimbursements | | | (0.03)% | (B) | | | (0.70)% | | | | (1.17)% | | | (2.17)% | | | | (2.43)% | (B) |
| Supplementary Data: | | | | | | | | | | | | | | | | | | | |
Portfolio Turnover Rate | | | 58% | (A) | | | 284% | (C) | | | 226% | | | 207% | | | | 107% | (A) |
Net Assets at End of Period (in thousands) | | $ | 32,207 | | | $ | 26,841 | | | $ | 10,585 | | $ | 3,998 | | | $ | 4,900 | |
|
| * | | Represents the period from commencement of operations (February 28, 2007) through October 31, 2007. |
| 1 | | Calculated based on shares outstanding on the first and last day of the respective periods, except for dividends and distributions, if any, which are based on the actual shares outstanding on the dates of distributions. |
| 2 | | Prior to May 30, 2008, reflects fees waived and reimbursed by FBR Fund Advisers, Inc. pursuant to a contractual expense limitation of 1.95% (excluding interest, taxes, brokerage commissions, dividend expenses, acquired fund fees and expenses, extraordinary legal expenses, or any other extraordinary expenses). As of May 30, 2008, reflects fees waived and reimbursed by FBR Fund Advisers, Inc. pursuant to a contractual expense limitation of 1.45% (excluding interest, taxes, brokerage commissions, dividend expenses, acquired fund fees and expenses, extraordinary legal expenses, or any other extraordinary expenses). |
| 3 | | The amounts shown for a share outstanding throughout the period may not be in accordance with the changes in the aggregate gains and losses on investments during the period because of the timing of sales and repurchases of Fund shares in relation to fluctuating net asset values during the period. |
| 4 | | Calculated based on average shares outstanding. |
| 5 | | Less than $0.01 |
| 6 | | Total investment return is calculated assuming a purchase of shares on the first day and a sale on the last day of each period reported and will include reinvestment of dividends and distributions, if any. |
| 7 | | The Fund’s total return consists of a voluntary reimbursement by the Adviser for a realized loss on a transaction not meeting the Fund’s investment guidelines. This item had an impact of 0.12%. If the Adviser had not made a capital contribution to the Fund, the total return would have been 12.56%. See Note 9. |
| 8 | | Does not include expenses of the funds in which the Fund invests. |
| (A) | | Not Annualized |
| (B) | | Annualized |
| (C) | | Excludes merger activity |
98
The FBR Funds
Financial Highlights (continued)
| | | FBR Small Cap Fund — Institutional Class |
| | |
|
| | | For the | | | | | | | | | | | | |
| | | Six Months | | | | | | | | | | For the |
| | | Ended | | | | | | | | | | Period |
| | | April 30, | | For the Years Ended October 31, | | | Ended |
| | | 2011 | |
| | | October 31, |
| | | (unaudited) | | 2010 | | | 2009 | | | 2008* |
| | |
| |
| | |
| | |
|
| Per Share Operating Performance: | | | | | | | | | | | | | | | | | |
Net Asset Value – Beginning of Period | | | $ | 10.04 | | | $ | 8.59 | | | $ | 7.62 | | | $ | 10.00 | |
| | | |
| | |
| | |
| | |
| |
Income (Loss) from Investment Operations: | | | | | | | | | | | | | | | | | |
Net Investment Income1,2 | | | | 0.02 | | | | 0.04 | | | | 0.03 | | | | 0.01 | |
Net Realized and Unrealized Gain (Loss) on Investments1,3 | | | | 2.68 | | | | 1.75 | | | | 0.93 | | | | (2.39 | ) |
Net Increase from Payments by Affiliates | | | | — | | | | — | | | | 0.01 | | | | — | |
| | | |
| | |
| | |
| | |
| |
Total from Investment Operations | | | | 2.70 | | | | 1.79 | | | | 0.97 | | | | (2.38 | ) |
| | | |
| | |
| | |
| | |
| |
Distributions to Shareholders: | | | | | | | | | | | | | | | | | |
From Net Investment Income | | | | (0.05 | ) | | | (0.06 | ) | | | — | | | | — | |
From Net Realized Gains | | | | — | | | | (0.28 | ) | | | — | | | | — | |
| | | |
| | |
| | |
| | |
| |
Total Distributions | | | | (0.05 | ) | | | (0.34 | ) | | | — | | | | — | |
| | | |
| | |
| | |
| | |
| |
Paid-in Capital from Redemption Fees4 | | | | 0.00 | 5 | | | 0.00 | 5 | | | — | | | | — | |
| | | |
| | |
| | |
| | |
| |
Net Increase (Decrease) in Net Asset Value | | | | 2.65 | | | | 1.45 | | | | 0.97 | | | | (2.38 | ) |
| | | |
| | |
| | |
| | |
| |
Net Asset Value – End of Period | | | $ | 12.69 | | | $ | 10.04 | | | $ | 8.59 | | | $ | 7.62 | |
| | | |
| | |
| | |
| | |
| |
| Total Investment Return6 | | | | 26.92% | (A) | | | 21.35% | | | | 12.73% | 7 | | | (23.80)% | (A) |
| Ratios to Average Net Assets: | | | | | | | | | | | | | | | | | |
Expenses After Waivers and Related Reimbursements2,8 | | | | 1.20% | (B) | | | 1.19% | | | | 1.20% | | | | 1.20% | (B) |
Expenses Before Waivers and Related Reimbursements8 | | | | 1.35% | (B) | | | 2.94% | | | | 16.22% | | | | 4.56% | (B) |
Net Investment Income After Waivers and Related Reimbursements2 | | | | 0.37% | (B) | | | 0.41% | | | | 0.44% | | | | 0.23% | (B) |
Net Investment Income (Loss) Before Waivers and Related Reimbursements | | | | 0.22% | (B) | | | (1.34)% | | | | (14.58)% | | | | (3.13)% | (B) |
| Supplementary Data: | | | | | | | | | | | | | | | | | |
Portfolio Turnover Rate | | | | 58% | (A) | | | 284% | (C) | | | 226% | | | | 207% | |
Net Assets at End of Period (in thousands) | | | $ | 15,069 | | | $ | 8,655 | | | $ | 86 | | | $ | 76 | |
| | | |
|
| * | | Represents the period from inception of share class (May 30, 2008) through October 31, 2008. |
| 1 | | Calculated based on shares outstanding on the first and last day of the period, except for dividends and distributions, if any, which are based on the actual shares outstanding on the dates of distributions. |
| 2 | | Reflects fees waived and reimbursed by FBR Fund Advisers, Inc. pursuant to a contractual expense limitation of 1.20% (excluding interest, taxes, brokerage commissions, dividend expenses, acquired fund fees and expenses, extraordinary legal expenses, or any other extraordinary expenses). |
| 3 | | The amounts shown for a share outstanding throughout the period may not be in accordance with the changes in the aggregate gains and losses on investments during the period because of the timing of sales and repurchases of Fund shares in relation to fluctuating net asset values during the period. |
| 4 | | Calculated based on average shares outstanding. |
| 5 | | Less than $0.01 |
| 6 | | Total investment return is calculated assuming a purchase of shares on the first day and a sale on the last day of each period reported and will include reinvestment of dividends and distributions, if any. |
| 7 | | The Fund’s total return consists of a voluntary reimbursement by the Adviser for a realized loss on a transaction not meeting the Fund’s investment guidelines. This item had an impact of 0.13%. If the Adviser had not made a capital contribution to the Fund, the total return would have been 12.60%. See Note 9. |
| 8 | | Does not include expenses of the funds in which the Fund invests. |
| (A) | | Not Annualized |
| (B) | | Annualized |
| (C) | | Excludes merger activity |
99
The FBR Funds
Financial Highlights (continued)
| | | FBR Focus Fund — Investor Class | |
| | |
| |
| | | For the | | | | | | | | | | | | | | | | | | | | |
| | | Six Months | | | | | | | | | | | | | | | | | | | | |
| | | Ended | | For the Years Ended October 31, | |
| | | April 30, 2011 | |
| |
| | | (unaudited) | | 2010 | | | 2009 | | | 2008 | | | 2007 | | | 2006 | |
| | |
| |
| | |
| | |
| | |
| | |
| |
| Per Share Operating Performance: | | | | | | | | | | | | | | | | | | | | | | | | | |
Net Asset Value – Beginning of Period | | | $ | 47.57 | | | $ | 37.56 | | | $ | 37.40 | | | $ | 57.97 | | | $ | 49.36 | | | $ | 40.36 | |
| | | |
| | |
| | |
| | |
| | |
| | |
| |
Income (Loss) from Investment Operations: | | | | | | | | | | | | | | | | | | | | | | | | | |
Net Investment Income (Loss)1,2 | | | | (1.90 | ) | | | (0.64 | ) | | | (0.42 | ) | | | (0.44 | ) | | | 0.08 | | | | (0.43 | ) |
Net Realized and Unrealized Gain (Loss) on Investments1,3 | | | | 7.41 | | | | 10.65 | | | | 5.76 | | | | (19.51 | ) | | | 8.63 | | | | 10.20 | |
| | | |
| | |
| | |
| | |
| | |
| | |
| |
Total from Investment Operations | | | | 5.51 | | | | 10.01 | | | | 5.34 | | | | (19.95 | ) | | | 8.71 | | | | 9.77 | |
| | | |
| | |
| | |
| | |
| | |
| | |
| |
Distributions to Shareholders: | | | | | | | | | | | | | | | | | | | | | | | | | |
From Net Investment Income | | | | — | | | | — | | | | — | | | | (0.12 | ) | | | — | | | | — | |
From Net Realized Gain | | | | (1.72 | ) | | | — | | | | (5.19 | ) | | | (0.51 | ) | | | (0.12 | ) | | | (0.77 | ) |
| | | |
| | |
| | |
| | |
| | |
| | |
| |
Total Distributions | | | | (1.72 | ) | | | — | | | | (5.19 | ) | | | (0.63 | ) | | | (0.12 | ) | | | (0.77 | ) |
| | | |
| | |
| | |
| | |
| | |
| | |
| |
Paid-in Capital from Redemption Fees4 | | | | 0.00 | 5 | | | 0.00 | 5 | | | 0.01 | | | | 0.01 | | | | 0.02 | | | | 0.00 | 5 |
| | | |
| | |
| | |
| | |
| | |
| | |
| |
Net Increase (Decrease) in Net Asset Value | | | | 3.79 | | | | 10.01 | | | | 0.16 | | | | (20.57 | ) | | | 8.61 | | | | 9.00 | |
| | | |
| | |
| | |
| | |
| | |
| | |
| |
Net Asset Value – End of Period | | | $ | 51.36 | | | $ | 47.57 | | | $ | 37.56 | | | $ | 37.40 | | | $ | 57.97 | | | $ | 49.36 | |
| | | |
| | |
| | |
| | |
| | |
| | |
| |
| Total Investment Return6 | | | | 11.75% | (A) | | | 26.65% | | | | 17.74% | | | | (34.73)% | | | | 17.72% | | | | 24.53% | |
| Ratios to Average Net Assets: | | | | | | | | | | | | | | | | | | | | | | | | | |
Expenses After Waivers2,7 | | | | 1.44% | (B) | | | 1.51% | | | | 1.43% | | | | 1.42% | | | | 1.40% | | | | 1.38% | |
Expenses Before Waivers7 | | | | 1.44% | (B) | | | 1.51% | | | | 1.43% | | | | 1.42% | | | | 1.40% | | | | 1.40% | |
Net Investment Income (Loss) After Waivers2 | | | | (0.86)% | (B) | | | (1.31)% | | | | (1.16)% | | | | (0.67)% | | | | 0.14% | | | | (0.94)% | |
Net Investment Income (Loss) Before Waivers | | | | (0.86)% | (B) | | | (1.31)% | | | | (1.16)% | | | | (0.67)% | | | | 0.14% | | | | (0.96)% | |
| Supplementary Data: | | | | | | | | | | | | | | | | | | | | | | | | | |
Portfolio Turnover Rate | | | | 5% | (A) | | | 5% | | | | 5% | | | | 17% | | | | 5% | | | | 3% | |
Net Assets at End of Period (in thousands) | | | $ | 728,661 | | | $ | 670,840 | | | $ | 759,774 | | | $ | 717,780 | | | $ | 1,556,339 | | | $ | 929,590 | |
| | | |
|
| 1 | | Calculated based on shares outstanding on the first and last day of the respective periods, except for dividends and distributions, if any, which are based on the actual shares outstanding on the dates of distributions. |
| 2 | | Reflects fees waived and reimbursed by FBR Fund Advisers, Inc. pursuant to a contractual expense limitation of 1.95% (excluding interest, taxes, brokerage commissions, dividend expenses, acquired fund fees and expenses, extraordinary legal expenses, or any other extraordinary expenses). |
| 3 | | The amounts shown for a share outstanding throughout the respective periods may not be in accordance with the changes in the aggregate gains and losses on investments during the respective periods because of the timing of sales and repurchases of Fund shares in relation to fluctuating net asset values during the respective periods. |
| 4 | | Calculated based on average shares outstanding. |
| 5 | | Less than $0.01 |
| 6 | | Total investment return is calculated assuming a purchase of shares on the first day and a sale on the last day of each period reported and will include reinvestment of dividends and distributions, if any. |
| 7 | | Does not include expenses of the funds in which the Fund invests. |
| (A) | | Not Annualized |
| (B) | | Annualized |
100
The FBR Funds
Financial Highlights (continued)
| | | FBR Focus Fund — Institutional Class | |
| | |
| |
| | | For the | | | | | | | | | | For the | |
| | | Six Months Ended | | For the Years Ended October 31, | | | Period Ended | |
| | | April 30, 2011 | |
| | | October 31, | |
| | | (unaudited) | | 2010* | | | 2009* | | | 2008*^ | |
| | |
| |
| | |
| | |
| |
| Per Share Operating Performance: | | | | | | | | | | | | | | | | | |
Net Asset Value – Beginning of Period | | | $ | 47.64 | | | $ | 37.84 | | | $ | 130.93 | | | $ | 180.00 | |
| | | |
| | |
| | |
| | |
| |
Income (Loss) from Investment Operations: | | | | | | | | | | | | | | | | | |
Net Investment Loss1 | | | | (1.90 | ) | | | (0.41 | ) | | | (0.25 | ) | | | (0.20 | ) |
Net Realized and Unrealized Gain (Loss) on Investments1,2 | | | | 7.50 | | | | 10.58 | | | | 0.59 | | | | (49.05 | ) |
| | | |
| | |
| | |
| | |
| |
Total from Investment Operations | | | | 5.60 | | | | 10.17 | | | | 0.34 | | | | (49.25 | ) |
| | | |
| | |
| | |
| | |
| |
Distributions to Shareholders: | | | | | | | | | | | | | | | | | |
From Net Investment Income | | | | — | | | | (0.37 | ) | | | — | | | | — | |
From Net Realized Gain | | | | (1.72 | ) | | | — | | | | (93.45 | ) | | | — | |
| | | |
| | |
| | |
| | |
| |
Paid-in Capital from Redemption Fees3 | | | | 0.00 | 4 | | | 0.00 | 4 | | | 0.02 | | | | 0.18 | |
| | | |
| | |
| | |
| | |
| |
Net Increase (Decrease) in Net Asset Value | | | | 3.88 | | | | 9.80 | | | | (93.09 | ) | | | (49.07 | ) |
| | | |
| | |
| | |
| | |
| |
Net Asset Value – End of Period | | | $ | 51.52 | | | $ | 47.64 | | | $ | 37.84 | | | $ | 130.93 | |
| | | |
| | |
| | |
| | |
| |
| Total Investment Return5 | | | | 11.78% | (A) | | | 27.32% | | | | 18.15% | | | | (27.30)% | (A) |
| Ratios to Average Net Assets: | | | | | | | | | | | | | | | | | |
Expenses After Waivers6 | | | | 1.13% | (B) | | | 1.26% | | | | 1.15% | | | | 1.05% | (B) |
Expenses Before Waivers6 | | | | 1.13% | (B) | | | 1.26% | | | | 1.15% | | | | 1.05% | (B) |
Net Investment Loss After Waivers | | | | (0.57)% | (B) | | | (1.06)% | | | | (0.88)% | | | | (0.70)% | (B) |
Net Investment Loss Before Waivers | | | | (0.57)% | (B) | | | (1.06)% | | | | (0.88)% | | | | (0.70)% | (B) |
| Supplementary Data: | | | | | | | | | | | | | | | | | |
Portfolio Turnover Rate | | | | 5% | (A) | | | 5% | | | | 5% | | | | 17% | (A) |
Net Assets at End of Period (in thousands) | | | $ | 50,568 | | | $ | 36,811 | | | $ | 34,225 | | | $ | 16,831 | |
| | | |
|
| * | | Per share amounts have been restated on a retroactive basis to reflect a 1:18 reverse stock split effective December 10, 2010. |
| ^ | | Represents the period from inception of share class (May 30, 2008) through October 31, 2008. |
| 1 | | Calculated based on shares outstanding on the first and last day of the period, except for dividends and distributions, if any, which are based on the actual shares outstanding on the dates of distributions. |
| 2 | | The amounts shown for a share outstanding throughout the period may not be in accordance with the changes in the aggregate gains and losses on investments during the period because of the timing of sales and repurchases of Fund shares in relation to fluctuating net asset values during the period. |
| 3 | | Calculated based on average shares outstanding. |
| 4 | | Less than $0.01 |
| 5 | | Total investment return is calculated assuming a purchase of shares on the first day and a sale on the last day of each period reported and will include reinvestment of dividends and distributions, if any. |
| 6 | | Does not include expenses of the funds in which the Fund invests. |
| (A) | | Not Annualized |
| (B) | | Annualized |
101
The FBR Funds
Financial Highlights (continued)
| | | FBR Large Cap Financial Fund — Investor Class | |
| | |
| |
| | | For the | | | | | | | | | | | | | | | | | | | | |
| | | Six Months | | | | | | | | | | | | | | | | | | | | |
| | | Ended | | For the Years Ended October 31, | |
| | | April 30, 2011 | |
| |
| | | (unaudited) | | 2010 | | | 2009 | | | 2008 | | | 2007 | | | 2006 | |
| | |
| |
| | |
| | |
| | |
| | |
| |
| Per Share Operating Performance: | | | | | | | | | | | | | | | | | | | | | | | | | |
Net Asset Value – Beginning of Period | | | $ | 12.88 | | | $ | 12.61 | | | $ | 11.14 | | | $ | 18.71 | | | $ | 21.67 | | | $ | 21.84 | |
| | | |
| | |
| | |
| | |
| | |
| | |
| |
Income (Loss) from Investment Operations: | | | | | | | | | | | | | | | | | | | | | | | | | |
Net Investment Income (Loss)1,2 | | | | (0.02 | ) | | | (0.08 | ) | | | 0.00 | 5 | | | 0.14 | | | | 0.14 | | | | 0.13 | |
Net Realized and Unrealized Gain (Loss) on Investments1,3 | | | | 1.23 | | | | 0.35 | | | | 1.58 | | | | (3.86 | ) | | | (0.97 | ) | | | 2.72 | |
| | | |
| | |
| | |
| | |
| | |
| | |
| |
Total from Investment Operations | | | | 1.21 | | | | 0.27 | | | | 1.58 | | | | (3.72 | ) | | | (0.83 | ) | | | 2.85 | |
| | | |
| | |
| | |
| | |
| | |
| | |
| |
Distributions to Shareholders: | | | | | | | | | | | | | | | | | | | | | | | | | |
From Net Investment Income | | | | — | | | | — | | | | (0.10 | ) | | | (0.18 | ) | | | (0.11 | ) | | | (0.16 | ) |
Distribution in Excess of Net Investment Income | | | | — | | | | — | | | | (0.02 | ) | | | — | | | | — | | | | — | |
From Net Realized Gain | | | | — | | | | — | | | | — | | | | (3.68 | ) | | | (2.02 | ) | | | (2.86 | ) |
| | | |
| | |
| | |
| | |
| | |
| | |
| |
Total Distributions | | | | — | | | | — | | | | (0.12 | ) | | | (3.86 | ) | | | (2.13 | ) | | | (3.02 | ) |
| | | |
| | |
| | |
| | |
| | |
| | |
| |
Paid-in Capital from Redemption Fees4 | | | | 0.00 | 5 | | | 0.00 | 5 | | | 0.01 | | | | 0.01 | | | | 0.00 | 5 | | | 0.00 | 5 |
| | | |
| | |
| | |
| | |
| | |
| | |
| |
Net Increase (Decrease) in Net Asset Value | | | | 1.21 | | | | 0.27 | | | | 1.47 | | | | (7.57 | ) | | | (2.96 | ) | | | (0.17 | ) |
| | | |
| | |
| | |
| | |
| | |
| | |
| |
Net Asset Value – End of Period | | | $ | 14.09 | | | $ | 12.88 | | | $ | 12.61 | | | $ | 11.14 | | | $ | 18.71 | | | $ | 21.67 | |
| | | |
| | |
| | |
| | |
| | |
| | |
| |
| Total Investment Return6 | | | | 9.39% | (A) | | | 2.14% | | | | 14.52% | | | | (23.76)% | | | | (4.59)% | | | | 14.21% | |
| Ratios to Average Net Assets: | | | | | | | | | | | | | | | | | | | | | | | | | |
Expenses After Waivers2,7 | | | | 1.56% | (B) | | | 1.78% | | | | 1.81% | | | | 1.88% | | | | 1.89% | | | | 1.83% | |
Expenses Before Waivers7 | | | | 1.56% | (B) | | | 1.78% | | | | 1.81% | | | | 2.01% | | | | 1.92% | | | | 1.84% | |
Net Investment Income (Loss) After Waivers2 | | | | (0.32)% | (B) | | | (0.73)% | | | | (0.08)% | | | | 1.63% | | | | 0.59% | | | | 0.68% | |
Net Investment Income (Loss) Before Waivers | | | | (0.32)% | (B) | | | (0.73)% | | | | (0.08)% | | | | 1.50% | | | | 0.56% | | | | 0.67% | |
| Supplementary Data: | | | | | | | | | | | | | | | | | | | | | | | | | |
Portfolio Turnover Rate | | | | 35% | (A) | | | 150% | | | | 220% | | | | 509% | | | | 95% | | | | 54% | |
Net Assets at End of Period (in thousands) | | | $ | 70,061 | | | $ | 48,717 | | | $ | 37,195 | | | $ | 24,272 | | | $ | 15,951 | | | $ | 26,313 | |
| | | |
|
| 1 | | Calculated based on shares outstanding on the first and last day of the respective periods, except for dividends and distributions, if any, which are based on the actual shares outstanding on the dates of distributions. |
| 2 | | Reflects fees waived by FBR Fund Advisers, Inc. pursuant to a contractual expense limitation of 1.95% (excluding interest, taxes, brokerage commissions, dividend expenses, acquired fund fees and expenses, extraordinary legal expenses, or any other extraordinary expenses) and effective May 30, 2008, the recoupment of certain previously waived fees. |
| 3 | | The amounts shown for a share outstanding throughout the respective periods may not be in accordance with the changes in the aggregate gains and losses on investments during the respective periods because of the timing of sales and repurchases of Fund shares in relation to fluctuating net asset values during the respective periods. |
| 4 | | Calculated based on average shares outstanding. |
| 5 | | Less than $0.01 |
| 6 | | Total investment return is calculated assuming a purchase of shares on the first day and a sale on the last day of each period reported and will include reinvestment of dividends and distributions, if any. |
| 7 | | Does not include expenses of the funds in which the Fund invests. |
| (A) | | Not Annualized |
| (B) | | Annualized |
102
The FBR Funds
Financial Highlights (continued)
| | | FBR Small Cap Financial Fund — Investor Class | |
| | |
| |
| | | For the | | | | | | | | | | | | | | | | | | | | |
| | | Six Months | | | | | | | | | | | | | | | | | | | | |
| | | Ended | | For the Years Ended October 31, | |
| | | April 30, 2011 | |
| |
| | | (unaudited) | | 2010 | | | 2009 | | | 2008 | | | 2007 | | | 2006 | |
| | |
| |
| | |
| | |
| | |
| | |
| |
| Per Share Operating Performance: | | | | | | | | | | | | | | | | | | | | | | | | | |
Net Asset Value – Beginning of Period | | | $ | 18.11 | | | $ | 15.91 | | | $ | 15.22 | | | $ | 23.18 | | | $ | 32.70 | | | $ | 32.96 | |
| | | |
| | |
| | |
| | |
| | |
| | |
| |
Income (Loss) from Investment Operations: | | | | | | | | | | | | | | | | | | | | | | | | | |
Net Investment Income1 | | | | 0.04 | | | | 0.08 | | | | 0.06 | | | | 0.24 | | | | 0.29 | | | | 0.14 | |
Net Realized and Unrealized Gain (Loss) on Investments1,2 | | | | 2.46 | | | | 2.17 | | | | 0.81 | | | | (1.69 | ) | | | (5.31 | ) | | | 3.44 | |
| | | |
| | |
| | |
| | |
| | |
| | |
| |
Total from Investment Operations | | | | 2.50 | | | | 2.25 | | | | 0.87 | | | | (1.45 | ) | | | (5.02 | ) | | | 3.58 | |
| | | |
| | |
| | |
| | |
| | |
| | |
| |
Distributions to Shareholders: | | | | | | | | | | | | | | | | | | | | | | | | | |
From Net Investment Income | | | | (0.06 | ) | | | (0.07 | ) | | | (0.19 | ) | | | (0.28 | ) | | | (0.15 | ) | | | (0.14 | ) |
From Net Realized Gain | | | | (0.13 | ) | | | — | | | | — | | | | (6.24 | ) | | | (4.35 | ) | | | (3.70 | ) |
| | | |
| | |
| | |
| | |
| | |
| | |
| |
Total Distributions | | | | (0.19 | ) | | | (0.07 | ) | | | (0.19 | ) | | | (6.52 | ) | | | (4.50 | ) | | | (3.84 | ) |
| | | |
| | |
| | |
| | |
| | |
| | |
| |
Paid-in Capital from Redemption Fees3 | | | | 0.01 | | | | 0.02 | | | | 0.01 | | | | 0.01 | | | | 0.00 | 4 | | | 0.00 | 4 |
| | | |
| | |
| | |
| | |
| | |
| | |
| |
Net Increase (Decrease) in Net Asset Value | | | | 2.32 | | | | 2.20 | | | | 0.69 | | | | (7.96 | ) | | | (9.52 | ) | | | (0.26 | ) |
| | | |
| | |
| | |
| | |
| | |
| | |
| |
Net Asset Value – End of Period | | | $ | 20.43 | | | $ | 18.11 | | | $ | 15.91 | | | $ | 15.22 | | | $ | 23.18 | | | $ | 32.70 | |
| | | |
| | |
| | |
| | |
| | |
| | |
| |
| Total Investment Return5 | | | | 13.90% | (A) | | | 14.27% | | | | 5.89% | | | | (6.76)% | | | | (18.02)% | | | | 11.81% | |
| Ratios to Average Net Assets: | | | | | | | | | | | | | | | | | | | | | | | | | |
Expenses After Waivers6 | | | | 1.49% | (B) | | | 1.51% | | | | 1.51% | | | | 1.49% | | | | 1.51% | | | | 1.46% | |
Expenses Before Waivers6 | | | | 1.49% | (B) | | | 1.51% | | | | 1.51% | | | | 1.49% | | | | 1.51% | | | | 1.46% | |
Net Investment Income After Waivers | | | | 0.55% | (B) | | | 0.35% | | | | 0.50% | | | | 1.48% | | | | 0.93% | | | | 0.45% | |
Net Investment Income Before Waivers | | | | 0.55% | (B) | | | 0.35% | | | | 0.50% | | | | 1.48% | | | | 0.93% | | | | 0.45% | |
| Supplementary Data: | | | | | | | | | | | | | | | | | | | | | | | | | |
Portfolio Turnover Rate | | | | 23% | (A) | | | 89% | | | | 118% | | | | 147% | | | | 13% | | | | 8% | |
Net Assets at End of Period (in thousands) | | | $ | 268,260 | | | $ | 216,747 | | | $ | 187,561 | | | $ | 181,803 | | | $ | 144,214 | | | $ | 346,155 | |
| | | |
|
| 1 | | Calculated based on shares outstanding on the first and last day of the respective periods, except for dividends and distributions, if any, which are based on the actual shares outstanding on the dates of distributions. |
| 2 | | The amounts shown for a share outstanding throughout the respective periods may not be in accordance with the changes in the aggregate gains and losses on investments during the respective periods because of the timing of sales and repurchases of Fund shares in relation to fluctuating net asset values during the respective periods. |
| 3 | | Calculated based on average shares outstanding. |
| 4 | | Less than $0.01 |
| 5 | | Total investment return is calculated assuming a purchase of shares on the first day and a sale on the last day of each period reported and will include reinvestment of dividends and distributions, if any. |
| 6 | | Does not include expenses of the funds in which the Fund invests. |
| (A) | | Not Annualized |
| (B) | | Annualized |
103
The FBR Funds
Financial Highlights (continued)
| | | | | | | | | | | | | | | | | | |
| | | FBR Small Cap Financial Fund — Institutional Class | |
| | |
| |
| | | For the | | | | | | | | | For the |
| | | Six Months Ended | | For the Years Ended October 31, | | Period Ended |
| | | April 30, 2011 | |
| | October 31, |
| | | (unaudited) | | 2010 | | | 2009 | | 2008* |
| | |
| |
| | |
| |
|
| Per Share Operating Performance: | | | | | | | | | | | | | | | | | |
Net Asset Value – Beginning of Period | | | $ | 11.70 | | | $ | 10.34 | | | $ | 9.96 | | | $ | 10.00 | |
| | | |
| | |
| | |
| |
| |
Income (Loss) from Investment Operations: | | | | | | | | | | | | | | | | |
Net Investment Income1,2 | | | | 0.11 | | | | 0.09 | | | | 0.19 | | | 0.02 | |
Net Realized and Unrealized Gain (Loss) on Investments1,3 | | | | 1.51 | | | | 1.40 | | | | 0.40 | | | (0.06 | ) |
| | | |
| | |
| | |
| |
| |
Total from Investment Operations | | | | 1.62 | | | | 1.49 | | | | 0.59 | | | (0.04 | ) |
| | | |
| | |
| | |
| |
| |
Distributions to Shareholders: | | | | | | | | | | | | | | | | |
From Net Investment Income | | | | (0.12 | ) | | | (0.13 | ) | | | (0.21 | ) | | — | |
From Net Realized Gain | | | | (0.13 | ) | | | — | | | | — | | | — | |
| | | |
| | |
| | |
| |
| |
Total Distributions | | | | (0.25 | ) | | | (0.13 | ) | | | (0.21 | ) | | — | |
| | | |
| | |
| | |
| |
| |
Paid-in Capital from Redemption Fees4 | | | | 0.00 | 5 | | | 0.00 | 5 | | | — | | | — | |
| | | |
| | |
| | |
| |
| |
Net Increase (Decrease) in Net Asset Value | | | | 1.37 | | | | 1.36 | | | | 0.38 | | | (0.04 | ) |
| | | |
| | |
| | |
| |
| |
Net Asset Value – End of Period | | | $ | 13.07 | | | $ | 11.70 | | | $ | 10.34 | | $ | 9.96 | |
| | | |
| | |
| | |
| |
| |
| Total Investment Return6 | | | | 13.97% | (A) | | | 14.52% | | | | 6.14% | | | (0.40)% | (A) |
| Ratios to Average Net Assets: | | | | | | | | | | | | | | | | |
Expenses After Waivers and Related Reimbursements2,7 | | | | 1.25% | (B) | | | 1.23% | | | | 1.56% | | | 1.31% | (B) |
Expenses Before Waivers and Related Reimbursements7 | | | | 1.25% | (B) | | | 1.23% | | | | 1.56% | | | 1.31% | (B) |
Net Investment Income After Waivers and Related Reimbursements2 | | | | 0.76% | (B) | | | 0.61% | | | | 0.04% | | | 1.49% | (B) |
Net Investment Income Before Waivers and Related Reimbursements | | | | 0.76% | (B) | | | 0.61% | | | | 0.04% | | | 1.49% | (B) |
| Supplementary Data: | | | | | | | | | | | | | | | | |
Portfolio Turnover Rate | | | | 23% | (A) | | | 89% | | | | 118% | | | 147% | (A) |
Net Assets at End of Period (in thousands) | | | $ | 34,415 | | | $ | 25,011 | | | $ | 10,638 | | $ | 3,952 | |
| | | | | | | | | | | | | | | | | |
| | | |
|
| * | | Represents the period from inception of share class (May 30, 2008) through October 31, 2008. |
| 1 | | Calculated based on shares outstanding on the first and last day of the period, except for dividends and distributions, if any, which are based on the actual shares outstanding on the dates of distributions. |
| 2 | | Reflects fees waived and reimbursed by FBR Fund Advisers, Inc. pursuant to a contractual expense limitation of 1.70% (excluding interest, taxes, brokerage commissions, dividend expenses, acquiured fund fees and expenses, extraordinary legal expenses, or any other extraordinary expenses and effective May 30, 2008, the recoupment of certain previously waived fees. |
| 3 | | The amounts shown for a share outstanding throughout the period may not be in accordance with the changes in the aggregate gains and losses on investments during the period because of the timing of sales and repurchases of Fund shares in relation to fluctuating net asset values during the period. |
| 4 | | Calculated based on average shares outstanding. |
| 5 | | Less than $0.01 |
| 6 | | Total investment return is calculated assuming a purchase of shares on the first day and a sale on the last day of each period reported and will include reinvestment of dividends and distributions, if any. |
| 7 | | Does not include expenses of the funds in which the Fund invests. |
| (A) | | Not Annualized |
| (B) | | Annualized |
104
The FBR Funds
Financial Highlights (continued)
| | | FBR Technology Fund — Investor Class | |
| | |
| |
| | | For the | | | | | | | | | | | | | | | | | | | | |
| | | Six Months | | | | | | | | | | | | | | | | | | | | |
| | | Ended | | For the Years Ended October 31, | |
| | | April 30, 2011 | |
| |
| | | (unaudited) | | 2010 | | | 2009 | | | 2008 | | | 2007 | | | 2006 | |
| | |
| |
| | |
| | |
| | |
| | |
| |
| Per Share Operating Performance: | | | | | | | | | | | | | | | | | | | | | | | | | |
Net Asset Value – Beginning of Period | | | $ | 11.00 | | | $ | 9.05 | | | $ | 6.96 | | | $ | 13.34 | | | $ | 11.97 | | | $ | 10.82 | |
| | | |
| | |
| | |
| | |
| | |
| | |
| |
Income (Loss) from Investment Operations: | | | | | | | | | | | | | | | | | | | | | | | | | |
Net Investment Loss1,2 | | | | (0.09 | ) | | | (0.14 | ) | | | (0.08 | ) | | | (0.12 | ) | | | (0.05 | ) | | | (0.04 | ) |
Net Realized and Unrealized Gain (Loss) on Investments1,3 | | | | 1.48 | | | | 2.08 | | | | 2.16 | | | | (5.03 | ) | | | 1.81 | | | | 1.77 | |
| | | |
| | |
| | |
| | |
| | |
| | |
| |
Total from Investment Operations | | | | 1.39 | | | | 1.94 | | | | 2.08 | | | | (5.15 | ) | | | 1.76 | | | | 1.73 | |
| | | |
| | |
| | |
| | |
| | |
| | |
| |
Distributions to Shareholders: | | | | | | | | | | | | | | | | | | | | | | | | | |
From Net Realized Gain | | | | — | | | | — | | | | — | | | | (1.23 | ) | | | (0.39 | ) | | | (0.58 | ) |
| | | |
| | |
| | |
| | |
| | |
| | |
| |
Paid-in Capital from Redemption Fees4 | | | | 0.00 | 5 | | | 0.01 | | | | 0.01 | | | | 0.00 | 5 | | | 0.00 | 5 | | | 0.00 | 5 |
| | | |
| | |
| | |
| | |
| | |
| | |
| |
Net Increase (Decrease) in Net Asset Value | | | | 1.39 | | | | 1.95 | | | | 2.09 | | | | (6.38 | ) | | | 1.37 | | | | 1.15 | |
| | | |
| | |
| | |
| | |
| | |
| | |
| |
Net Asset Value – End of Period | | | $ | 12.39 | | | $ | 11.00 | | | $ | 9.05 | | | $ | 6.96 | | | $ | 13.34 | | | $ | 11.97 | |
| | | |
| | |
| | |
| | |
| | |
| | |
| |
| Total Investment Return6 | | | | 12.64% | (A) | | | 21.55% | | | | 30.03% | | | | (42.30)% | | | | 15.18% | | | | 16.40% | |
| Ratios to Average Net Assets: | | | | | | | | | | | | | | | | | | | | | | | | | |
Expenses After Waivers and Related Reimbursements2,7 | | | | 1.95% | (B) | | | 1.95% | | | | 1.95% | | | | 1.84% | | | | 1.70% | | | | 1.87% | |
Expenses Before Waivers and Related Reimbursements7 | | | | 2.72% | (B) | | | 2.50% | | | | 3.00% | | | | 1.92% | | | | 1.70% | | | | 1.92% | |
Net Investment Loss After Waivers and Related Reimbursements2 | | | | (1.49)% | (B) | | | (1.10)% | | | | (1.05)% | | | | (0.60)% | | | | (0.41)% | | | | (0.60)% | |
Net Investment Loss Before Waivers and Related Reimbursements | | | | (2.27)% | (B) | | | (1.64)% | | | | (2.10)% | | | | (0.68)% | | | | (0.41)% | | | | (0.65)% | |
| Supplementary Data: | | | | | | | | | | | | | | | | | | | | | | | | | |
Portfolio Turnover Rate | | | | 44% | (A) | | | 353% | (C) | | | 211% | | | | 175% | | | | 229% | | | | 108% | |
Net Assets at End of Period (in thousands) | | | $ | 8,116 | | | $ | 8,207 | | | $ | 8,388 | | | $ | 7,689 | | | $ | 40,935 | | | $ | 39,407 | |
| | | |
|
| 1 | | Calculated based on shares outstanding on the first and last day of the respective periods, except for dividends and distributions, if any, which are based on the actual shares outstanding on the dates of distributions. |
| 2 | | Reflects fees waived and reimbursed by FBR Fund Advisers, Inc. pursuant to a contractual expense limitation of 1.95% (excluding interest, taxes, brokerage commissions, dividend expenses, acquired fund fees and expenses, extraordinary legal expenses, or any other extraordinary expenses) and effective May 30, 2008, the recoupment of certain previously waived fees. |
| 3 | | The amounts shown for a share outstanding throughout the respective periods may not be in accordance with the changes in the aggregate gains and losses on investments during the respective periods because of the timing of sales and repurchases of Fund shares in relation to fluctuating net asset values during the respective periods. |
| 4 | | Calculated based on average shares outstanding. |
| 5 | | Less than $0.01 |
| 6 | | Total investment return is calculated assuming a purchase of shares on the first day and a sale on the last day of each period reported and will include reinvestment of dividends and distributions, if any. |
| 7 | | Does not include expenses of the funds in which the Fund invests. |
| (A) | | Not Annualized |
| (B) | | Annualized |
| (C) | | Excludes merger activity |
105
The FBR Funds
Financial Highlights (continued)
| | FBR Technology Fund — Institutional Class |
| |
|
| | For the | | | | | |
| | Six Months | | | | | |
| | Ended | | For the |
| | April 30, 2011 | | Period Ended |
| | (unaudited) | | October 31, 2010* |
| |
| |
|
| Per Share Operating Performance: | | | | | | | | | |
Net Asset Value – Beginning of Period | | $ | 11.00 | | | | $ | 10.46 | |
| | |
| | |
| |
Income (Loss) from Investment Operations: | | | | | | | | |
Net Investment Loss1,2 | | | (0.09 | ) | | | (0.07) | |
Net Realized and Unrealized Gain on Investments1,3 | | | 1.51 | | | | 0.61 | |
| | |
| | |
| |
Total from Investment Operations | | | 1.42 | | | | 0.54 | |
| | |
| | |
| |
Paid-in Capital from Redemption Fees4 | | | 0.00 | 5 | | | 0.00 | 5 |
| | |
| | |
| |
Net Increase in Net Asset Value | | | 1.42 | | | | 0.54 | |
| | |
| | |
| |
Net Asset Value – End of Period | | $ | 12.42 | | | $ | 11.00 | |
| | |
| | |
| |
| Total Investment Return6 | | | 12.91% | (A) | | | 5.16% | (A) |
| Ratios to Average Net Assets: | | | | | | | | |
Expenses After Waivers and Related Reimbursements2,7 | | | 1.70% | (B) | | | 1.70% | (B) |
Expenses Before Waivers and Related Reimbursements7 | | | 3.19% | (B) | | | 2.34% | (B) |
Net Investment Loss After Waivers and Related Reimbursements2 | | | (1.16)% | (B) | | | (0.77)% | (B) |
Net Investment Loss Before Waivers and Related Reimbursements | | | (2.65)% | (B) | | | (1.41)% | (B) |
| Supplementary Data: | | | | | | | | |
Portfolio Turnover Rate | | | 44% | (A) | | | 353% | (C) |
Net Assets at End of Period (in thousands) | | $ | 1,435 | | | $ | 4,611 | |
| | | |
|
| * | | Represents the period from inception of share class (March 12, 2010) through October 31, 2010. |
| 1 | | Calculated based on shares outstanding on the first and last day of the respective periods, except for dividends and distributions, if any, which are based on the actual shares outstanding on the dates of distributions. |
| 2 | | Reflects fees waived and reimbursed by FBR Fund Advisers, Inc. pursuant to a contractual expense limitation of 1.70% (excluding interest, taxes, brokerage commissions, dividend expenses, acquired fund fees and expenses, extraordinary legal expenses, or any other extraordinary expenses) |
| 3 | | The amounts shown for a share outstanding throughout the respective periods may not be in accordance with the changes in the aggregate gains and losses on investments during the respective periods because of the timing of sales and repurchases of Fund shares in relation to fluctuating net asset values during the respective periods. |
| 4 | | Calculated based on average shares outstanding. |
| 5 | | Less than $0.01 |
| 6 | | Total investment return is calculated assuming a purchase of shares on the first day and a sale on the last day of each period reported and will include reinvestment of dividends and distributions, if any. |
| 7 | | Does not include expenses of the funds in which the Fund invests. |
| (A) | | Not Annualized |
| (B) | | Annualized |
| (C) | | Excludes merger activity |
106
The FBR Funds
Financial Highlights (continued)
| | FBR Gas Utility Index Fund — Investor Class |
| |
|
| | For the | | | | | | | | | | | | | | | | | | | | |
| | Six Months | | | | | | | | | | | | | | | | | | | | |
| | Ended | | For the Years Ended October 31, |
| | April 30, 2011 | |
|
| | (unaudited) | | 2010 | | | 2009 | | | 2008 | | | 2007 | | | 2006 | |
| |
| |
| | |
| | |
| | |
| | |
| |
| Per Share Operating Performance: | | | | | | | | | | | | | | | | | | | | | | | | |
Net Asset Value – Beginning of Period | | $ | 17.83 | | | $ | 15.13 | | | $ | 15.26 | | | $ | 23.14 | | | $ | 19.48 | | | $ | 17.25 | |
| | |
| | |
| | |
| | |
| | |
| | |
| |
Income (Loss) from Investment Operations: | | | | | | | | | | | | | | | | | | | | | | | | |
Net Investment Income1,2 | | | 0.24 | | | | 0.58 | | | | 0.49 | | | | 0.47 | | | | 0.47 | | | | 0.50 | |
Net Realized and Unrealized Gain (Loss) on Investments1,3 | | | 2.74 | | | | 2.72 | | | | 0.60 | | | | (6.13 | ) | | | 3.67 | | | | 2.34 | |
| | |
| | |
| | |
| | |
| | |
| | |
| |
Total from Investment Operations | | | 2.98 | | | | 3.30 | | | | 1.09 | | | | (5.66 | ) | | | 4.14 | | | | 2.84 | |
| | |
| | |
| | |
| | |
| | |
| | |
| |
Distributions to Shareholders: | | | | | | | | | | | | | | | | | | | | | | | | |
From Net Investment Income | | | (0.24 | ) | | | (0.58 | ) | | | (0.49 | ) | | | (0.47 | ) | | | (0.48 | ) | | | (0.61 | ) |
From Net Realized Gain | | | (0.20 | ) | | | (0.02 | ) | | | (0.74 | ) | | | (1.75 | ) | | | — | | | | — | |
| | |
| | |
| | |
| | |
| | |
| | |
| |
Total Distributions | | | (0.44 | ) | | | (0.60 | ) | | | (1.23 | ) | | | (2.22 | ) | | | (0.48 | ) | | | (0.61 | ) |
| | |
| | |
| | |
| | |
| | |
| | |
| |
Paid-in Capital from Redemption Fees4 | | | 0.00 | 5 | | | 0.00 | 5 | | | 0.01 | | | | 0.00 | 5 | | | 0.00 | 5 | | | 0.00 | 5 |
| | |
| | |
| | |
| | |
| | |
| | |
| |
Net Increase (Decrease) in Net Asset Value | | | 2.54 | | | | 2.70 | | | | (0.13 | ) | | | (7.88 | ) | | | 3.66 | | | | 2.23 | |
| | |
| | |
| | |
| | |
| | |
| | |
| |
Net Asset Value – End of Period | | $ | 20.37 | | | $ | 17.83 | | | $ | 15.13 | | | $ | 15.26 | | | $ | 23.14 | | | $ | 19.48 | |
| | |
| | |
| | |
| | |
| | |
| | |
| |
| Total Investment Return6 | | | 17.04% | (A) | | | 22.25% | | | | 8.18% | | | | (26.81)% | | | | 21.51% | | | | 16.84% | |
| Ratios to Average Net Assets: | | | | | | | | | | | | | | | | | | | | | | | | |
Expenses After Waivers2,7 | | | 0.74% | (B) | | | 0.76% | | | | 0.76% | | | | 0.70% | | | | 0.75% | | | | 0.80% | |
Expenses Before Waivers7 | | | 0.74% | (B) | | | 0.77% | | | | 0.76% | | | | 0.70% | | | | 0.75% | | | | 0.80% | |
Net Investment Income After Waivers2 | | | 2.64% | (B) | | | 3.51% | | | | 3.51% | | | | 2.39% | | | | 2.21% | | | | 2.69% | |
Net Investment Income Before Waivers | | | 2.64% | (B) | | | 3.50% | | | | 3.51% | | | | 2.39% | | | | 2.21% | | | | 2.69% | |
| Supplementary Data: | | | | | | | | | | | | | | | | | | | | | | | | |
Portfolio Turnover Rate | | | 10% | (A) | | | 16% | | | | 26% | | | | 27% | | | | 22% | | | | 16% | |
Net Assets at End of Period (in thousands) | | $ | 313,080 | | | $ | 244,041 | | | $ | 193,679 | | | $ | 198,569 | | | $ | 285,951 | | | $ | 270,031 | |
| | | |
|
| 1 | | Calculated based on shares outstanding on the first and last day of the respective periods, except for dividends and distributions, if any, which are based on the actual shares outstanding on the dates of distributions. |
| 2 | | Reflects fees waived by FBR Fund Advisers, Inc. pursuant to a contractual expense limitation of 0.85% (excluding interest, taxes, brokerage commissions, dividend expenses, acquired fund fees and expenses, extraordinary legal expenses, or any other extraordinary expenses) and effective May 30, 2008, the recoupment of certain previously waived fees. |
| 3 | | The amounts shown for a share outstanding throughout the respective periods may not be in accordance with the changes in the aggregate gains and losses on investments during the respective periods because of the timing of sales and repurchases of Fund shares in relation to fluctuating net asset values during the respective periods. |
| 4 | | Calculated based on average shares outstanding. |
| 5 | | Less than $0.01 |
| 6 | | Total investment return is calculated assuming a purchase of shares on the first day and a sale on the last day of each period reported and will include reinvestment of dividends and distributions, if any. |
| 7 | | Does not include expenses of the funds in which the Fund invests. |
| (A) | | Not Annualized |
| (B) | | Annualized |
107
The FBR Funds
Financial Highlights (continued)
| | | FBR Balanced Fund — Investor Class |
| | |
|
| | | | | | | | | | | | | | | | | | | | | | | | | | | | | | |
| | | For the | | | For the | | | | | | | | | | | | | | | | | | | | | |
| | | Six Months | | | Period | | | | | | | | | | | | | | | | | | | | |
| | | Ended | | | April 1, | | | | | | | | | | | | | | | | | | | | |
| | | April 30, | | | 2010 to | | | For the Years Ended March 31, |
| | | 2011 | | | October 31, | | |
|
| | | (unaudited) | | | 20104 | | | 2010 | | | | 2009 | | | | 2008 | | | | 2007 | | | | 2006 | |
| | |
| | |
| |
| |
| |
| |
| |
|
| Per Share Operating Performance: | | | | | | | | | | | | | | | | | | | | | | | | | | | | | |
Net Asset Value – Beginning of Period | | $ | 11.93 | | | | $ | 11.52 | | | $ | 8.92 | | | $ | 12.27 | | | $ | 14.48 | | | $ | 13.48 | | | $ | 12.58 | |
| | |
| | | |
| | |
| | |
| | |
| | |
| | |
| |
Income (Loss) from Investment Operations: | | | | | | | | | | | | | | | | | | | | | | | | | | | | | |
Net Investment Income | | | 0.15 | 2,3 | | | | 0.17 | 3,5 | | | 0.29 | 5 | | | 0.325 | | | | 0.39 | 5 | | | 0.36 | 5 | | | 0.37 | 5 |
Net Realized and Unrealized Gain (Loss) | | | | | | | | | | | | | | | | | | | | | | | | | | | | | |
on Investments1 | | | 1.08 | 2 | | | | 0.40 | 5 | | | 2.61 | 5 | | | (3.23) | 5 | | | 0.34 | 5 | | | 1.13 | 5 | | | 0.89 | 5 |
| | |
| | | |
| | |
| | |
| | |
| | |
| | |
| |
Total from Investment Operations | | | 1.23 | | | | | 0.57 | | | | 2.90 | | | | (2.91 | ) | | | 0.73 | | | | 1.49 | | | | 1.26 | |
| | |
| | | |
| | |
| | |
| | |
| | |
| | |
| |
Distributions to Shareholders: | | | | | | | | | | | | | | | | | | | | | | | | | | | | | |
From Net Investment Income | | | (0.15) | | | | | (0.16) | | | | (0.30) | | | | (0.25) | | | | (0.37) | | | | (0.33) | | | | (0.36) | |
From Net Realized Gain | | | — | | | | | — | | | | — | | | | (0.17) | | | | (2.57) | | | | (0.16) | | | | — | |
Return of Capital | | | — | | | | | — | | | | — | | | | (0.03) | | | | — | | | | — | | | | — | |
| | |
| | | |
| | |
| | |
| | |
| | |
| | |
| |
Total Distributions | | | (0.15) | | | | | (0.16) | | | | (0.30) | | | | (0.45) | | | | (2.94) | | | | (0.49) | | | | (0.36) | |
| | |
| | | |
| | |
| | |
| | |
| | |
| | |
| |
Paid-in Capital from Redemption Fees5 | | | 0.00 | 6 | | | | 0.00 | 6 | | | 0.00 | 6 | | | 0.01 | | | | — | | | | — | | | | — | |
| | |
| | | |
| | |
| | |
| | |
| | |
| | |
| |
Net Increase (Decrease) in Net Asset Value | | | 1.08 | | | | | 0.41 | | | | 2.60 | | | | (3.35 | ) | | | (2.21 | ) | | | 1.00 | | | | 0.90 | |
| | |
| | | |
| | |
| | |
| | |
| | |
| | |
| |
Net Asset Value – End of Period | | $ | 13.01 | | | | $ | 11.93 | | | $ | 11.52 | | | $ | 8.92 | | | $ | 12.27 | | | $ | 14.48 | | | $ | 13.48 | |
| | |
| | | |
| | |
| | |
| | |
| | |
| | |
| |
| Total Investment Return7 | | | 10.36% | (A) | | | | 5.04% | (A) | | | 32.76% | | | | (24.28)% | | | | 4.45% | | | | 11.19% | | | | 10.18% | |
| Ratios to Average Net Assets: | | | | | | | | | | | | | | | | | | | | | | | | | | | | | |
Expenses After Waivers and Related | | | | | | | | | | | | | | | | | | | | | | | | | | | | | |
Reimbursements8 | | | 1.24% | 3,(B) | | | | 1.24% | 3,(B) | | | 1.25% | | | | 1.32% | | | | 1.33% | | | | 1.33% | | | | 1.33% | |
Expenses Before Waivers and Related | | | | | | | | | | | | | | | | | | | | | | | | | | | | | |
Reimbursements8 | | | 1.71% | 3,(B) | | | | 1.60% | 3,(B) | | | 1.69% | | | | 1.84% | | | | 1.66% | | | | 1.51% | | | | 1.69% | |
Net Investment Income After Waivers and | | | | | | | | | | | | | | | | | | | | | | | | | | | | | |
Related Reimbursements | | | 2.49% | (B) | | | | 2.56% | (B) | | | 2.70% | | | | 3.03% | | | | 2.75% | | | | 2.52% | | | | 2.82% | |
Net Investment Income Before Waivers and | | | | | | | | | | | | | | | | | | | | | | | | | | | | | |
Related Reimbursements | | | 2.02% | (B) | | | | 2.21% | (B) | | | 2.26% | | | | 2.50% | | | | 2.42% | | | | 2.34% | | | | 2.46% | |
| Supplementary Data: | | | | | | | | | | | | | | | | | | | | | | | | | | | | | |
Portfolio Turnover Rate | | | 14% | (A) | | | | 27% | (A) | | | 26% | | | | 32% | | | | 110% | | | | 28% | | | | 18% | |
Net Assets at End of Period (in thousands) | | $ | 43,507 | | | | $ | 41,499 | | | $ | 46,809 | | | $ | 18,858 | | | $ | 21,700 | | | $ | 24,260 | | | $ | 13,413 | |
|
| 1 | | The amounts shown for a share outstanding throughout the period may not be in accordance with the changes in the aggregate gains and losses on investments during the period because of the timing of sales and repurchases of Fund shares in relation to fluctuating net asset values during the period. |
| 2 | | Calculated based on shares outstanding on the first and last day of the period, except for dividends and distributions, if any, which based on the actual shares outstanding on the dates of distributions. |
| 3 | | Reflects fees waived by FBR Fund Advisers, Inc. pursuant to a contractual expense limitation of 1.08% (excluding brokerage costs, interest, taxes, acquired fund fees and expenses, dividend expenses, 12b-1 fees and extraordinary expenses) and the recoupment of certain previously waived fees. Also reflects fees voluntarily waived by FBR Fund Advisers, Inc. to an expense limitation of 0.99% (excluding brokerage costs, interest, taxes, acquired fund fees and expenses, dividend expenses, 12b-1 fees and extraordinary expenses) and the recoupment of certain previously waived fees. |
| 4 | | The Fund changed its fiscal year end from March 31 to October 31. |
| 5 | | Calculated based on average shares outstanding. |
| 6 | | Less than $0.01 |
| 7 | | Total investment return is calculated assuming a purchase of shares on the first day and a sale on the last day of each period reported and will include reinvestment of dividends and distributions, if any. |
| 8 | | Does not include expenses of the funds in which the Fund invests. |
| (A) | | Not Annualized |
| (B) | | Annualized |
108
The FBR Funds
Financial Highlights (continued)
| | | FBR Balanced Fund — Institutional Class |
| | |
|
| | | For the | | | For the | | | | | | | | | | | | | | | | | | | | | |
| | | Six Months | | | Period | | | | | | | | | | | | | | | | | | | | |
| | | Ended | | | April 1, | | | | | | | | | | | | | | | | | | | | |
| | | April 30, | | | 2010 to | | | For the Years Ended March 31, |
| | | 2011 | | | October 31, | | |
|
| | | (unaudited) | | | 20104 | | | 2010 | | | | 2009 | | | | 2008 | | | | 2007 | | | | 2006 | |
| | |
| | |
| |
| |
| |
| |
| |
|
| Per Share Operating Performance: | | | | | | | | | | | | | | | | | | | | | | | | | | | | | |
Net Asset Value – Beginning of Period | | $ | 11.38 | | | | $ | 10.99 | | | $ | 8.52 | | | $ | 11.75 | | | $ | 13.98 | | | $ | 13.04 | | | $ | 12.19 | |
| | |
| | | |
| | |
| | |
| | |
| | |
| | |
| |
Income (Loss) from Investment Operations: | | | | | | | | | | | | | | | | | | | | | | | | | | | | | |
Net Investment Income | | | 0.16 | 2,3 | | | | 0.18 | 3,5 | | | 0.30 | 5 | | | 0.33 | 5 | | | 0.42 | 5 | | | 0.38 | 5 | | | 0.39 | 5 |
Net Realized and Unrealized Gain (Loss) | | | | | | | | | | | | | | | | | | | | | | | | | | | | | |
on Investments1 | | | 1.02 | 2 | | | | 0.38 | 5 | | | 2.50 | 5 | | | (3.10) | 5 | | | 0.33 | 5 | | | 1.10 | 5 | | | 0.86 | 5 |
| | |
| | | |
| | |
| | |
| | |
| | |
| | |
| |
Total from Investment Operations | | | 1.18 | | | | | 0.56 | | | | 2.80 | | | | (2.77) | | | | 0.75 | | | | 1.48 | | | | 1.25 | |
| | |
| | | |
| | |
| | |
| | |
| | |
| | |
| |
Distributions to Shareholders: | | | | | | | | | | | | | | | | | | | | | | | | | | | | | |
From Net Investment Income | | | (0.16 | ) | | | | (0.17 | ) | | | (0.33 | ) | | | (0.26 | ) | | | (0.41 | ) | | | (0.38 | ) | | | (0.40 | ) |
From Net Realized Gain | | | — | | | | | — | | | | — | | | | (0.17 | ) | | | (2.57 | ) | | | (0.16 | ) | | | — | |
Return of Capital | | | — | | | | | — | | | | — | | | | (0.04) | | | | — | | | | — | | | | — | |
| | |
| | | |
| | |
| | |
| | |
| | |
| | |
| |
Total Distributions | | | (0.16 | ) | | | | (0.17 | ) | | | (0.33 | ) | | | (0.47 | ) | | | (2.98 | ) | | | (0.54 | ) | | | (0.40 | ) |
| | |
| | | |
| | |
| | |
| | |
| | |
| | |
| |
Paid-in Capital from Redemption Fees5 | | | 0.00 | 6 | | | | 0.00 | 6 | | | 0.00 | 6 | | | 0.01 | | | | — | | | | — | | | | — | |
| | |
| | | |
| | |
| | |
| | |
| | |
| | |
| |
Net Increase (Decrease) in Net Asset Value | | | 1.02 | | | | | 0.39 | | | | 2.47 | | | | (3.23 | ) | | | (2.23 | ) | | | 0.94 | | | | 0.85 | |
| | |
| | | |
| | |
| | |
| | |
| | |
| | |
| |
Net Asset Value – End of Period | | $ | 12.40 | | | | $ | 11.38 | | | $ | 10.99 | | | $ | 8.52 | | | $ | 11.75 | | | $ | 13.98 | | | $ | 13.04 | |
| | |
| | | |
| | |
| | |
| | |
| | |
| | |
| |
| Total Investment Return7 | | | 10.47% | (A) | | | | 5.19% | (A) | | | 33.10% | | | | (24.13)% | | | | 4.75% | | | | 11.47% | | | | 10.42% | |
| Ratios to Average Net Assets: | | | | | | | | | | | | | | | | | | | | | | | | | | | | | |
Expenses After Waivers and Related | | | | | | | | | | | | | | | | | | | | | | | | | | | | | |
Reimbursements8 | | | 0.99% | 3,(B) | | | | 0.99% | 3,(B) | | | 0.99% | | | | 1.07% | | | | 1.08% | | | | 1.08% | | | | 1.08% | |
Expenses Before Waivers and Related | | | | | | | | | | | | | | | | | | | | | | | | | | | | | |
Reimbursements8 | | | 1.17% | 3,(B) | | | | 1.20% | 3,(B) | | | 1.43% | | | | 1.58% | | | | 1.41% | | | | 1.25% | | | | 1.45% | |
Net Investment Income After Waivers and | | | | | | | | | | | | | | | | | | | | | | | | | | | | | |
Related Reimbursements | | | 2.73% | (B) | | | | 2.82% | (B) | | | 3.01% | | | | 3.24% | | | | 3.00% | | | | 2.76% | | | | 3.06% | |
Net Investment Income Before Waivers and | | | | | | | | | | | | | | | | | | | | | | | | | | | | | |
Related Reimbursements | | | 2.55% | (B) | | | | 2.60% | (B) | | | 2.57% | | | | 2.73% | | | | 2.67% | | | | 2.59% | | | | 2.69% | |
| Supplementary Data: | | | | | | | | | | | | | | | | | | | | | | | | | | | | | |
Portfolio Turnover Rate | | | 14% | (A) | | | | 27% | (A) | | | 26% | | | | 32% | | | | 110% | | | | 28% | | | | 18% | |
Net Assets at End of Period (in thousands) | | $ | 47,966 | | | | $ | 42,169 | | | $ | 39,403 | | | $ | 31,127 | | | $ | 41,206 | | | $ | 47,390 | | | $ | 51,757 | |
|
| 1 | | The amounts shown for a share outstanding throughout the period may not be in accordance with the changes in the aggregate gains and losses on investments during the period because of the timing of sales and repurchases of Fund shares in relation to fluctuating net asset values during the period. |
| 2 | | Calculated based on shares outstanding on the first and last day of the period, except for dividends and distributions, if any, which based on the actual shares outstanding on the dates of distributions. |
| 3 | | Reflects fees waived by FBR Fund Advisers, Inc. pursuant to a contractual expense limitation of 1.08% (excluding brokerage costs, interest, taxes, acquired fund fees and expenses, dividend expenses, 12b-1 fees and extraordinary expenses) and the recoupment of certain previously waived fees. Also reflects fees voluntarily waived by FBR Fund Advisers, Inc. to an expense limitation of 0.99% (excluding brokerage costs, interest, taxes, acquired fund fees and expenses, dividend expenses, 12b-1 fees and extraordinary expenses) and the recoupment of certain previously waived fees. |
| 4 | | The Fund changed its fiscal year end from March 31 to October 31. |
| 5 | | Calculated based on average shares outstanding. |
| 6 | | Less than $0.01 |
| 7 | | Total investment return is calculated assuming a purchase of shares on the first day and a sale on the last day of each period reported and will include reinvestment of dividends and distributions, if any. |
| 8 | | Does not include expenses of the funds in which the Fund invests. |
| (A) | | Not Annualized |
| (B) | | Annualized |
109
The FBR Funds
Financial Highlights (continued)
| | | FBR Core Bond Fund — Investor Class |
| | |
|
| | | For the | | | For the | | | | | | | | | | | | | | | | | | | | | |
| | | Six Months | | | Period | | | | | | | | | | | | | | | | | | | | |
| | | Ended | | | April 1, | | | | | | | | | | | | | | | | | | | | |
| | | April 30, | | | 2010 to | | | For the Years Ended March 31, |
| | | 2011 | | | October 31, | | |
|
| | | (unaudited) | | | 20104 | | | 2010 | | | | 2009 | | | | 2008 | | | | 2007 | | | | 2006 | |
| | |
| | |
| |
| |
| |
| |
| |
|
| Per Share Operating Performance: | | | | | | | | | | | | | | | | | | | | | | | | | | | | | |
Net Asset Value – Beginning of Period | | $ | 9.82 | | | | $ | 9.39 | | | $ | 8.75 | | | $ | 9.16 | | | $ | 9.71 | | | $ | 9.77 | | | $ | 9.76 | |
| | |
| | | |
| | |
| | |
| | |
| | |
| | |
| |
Income (Loss) from Investment Operations: | | | | | | | | | | | | | | | | | | | | | | | | | | | | | |
Net Investment Income | | | 0.17 | 2,3 | | | | 0.23 | 3,5 | | | 0.38 | 5 | | | 0.35 | 5 | | | 0.42 | 5 | | | 0.50 | 5 | | | 0.43 | 5 |
Net Realized and Unrealized Gain (Loss) | | | | | | | | | | | | | | | | | | | | | | | | | | | | | |
on Investments1 | | | (0.16 | )2 | | | | 0.42 | 5 | | | 0.69 | 5 | | | (0.44 | )5 | | | — | 5 | | | 0.05 | 5 | | | 0.16 | 5 |
| | |
| | | |
| | |
| | |
| | |
| | |
| | |
| |
Total from Investment Operations | | | 0.01 | | | | | 0.65 | | | | 1.07 | | | | (0.09 | ) | | | 0.42 | | | | 0.55 | | | | 0.59 | |
| | |
| | | |
| | |
| | |
| | |
| | |
| | |
| |
Distributions to Shareholders: | | | | | | | | | | | | | | | | | | | | | | | | | | | | | |
From Net Investment Income | | | (0.17 | ) | | | | (0.22 | ) | | | (0.38 | ) | | | (0.32 | ) | | | (0.39 | ) | | | (0.51 | ) | | | (0.48 | ) |
From Net Realized Gain | | | (0.15 | ) | | | | — | | | | (0.05 | ) | | | — | | | | (0.58 | ) | | | (0.10 | ) | | | (0.10 | ) |
| | |
| | | |
| | |
| | |
| | |
| | |
| | |
| |
Total Distributions | | | (0.32 | ) | | | | (0.22 | ) | | | (0.43 | ) | | | (0.32 | ) | | | (0.97 | ) | | | (0.61 | ) | | | (0.58 | ) |
| | |
| | | |
| | |
| | |
| | |
| | |
| | |
| |
Paid-in Capital from Redemption Fees5 | | | 0.00 | 6 | | | | 0.00 | 6 | | | 0.00 | 6 | | | 0.00 | 6 | | | — | | | | — | | | | — | |
| | |
| | | |
| | |
| | |
| | |
| | |
| | |
| |
Net Increase (Decrease) in Net Asset Value | | | (0.31 | ) | | | | 0.43 | | | | 0.64 | | | | (0.41 | ) | | | (0.55 | ) | | | (0.06 | ) | | | 0.01 | |
| | |
| | | |
| | |
| | |
| | |
| | |
| | |
| |
Net Asset Value – End of Period | | $ | 9.51 | | | | $ | 9.82 | | | $ | 9.39 | | | $ | 8.75 | | | $ | 9.16 | | | $ | 9.71 | | | $ | 9.77 | |
| | |
| | | |
| | |
| | |
| | |
| | |
| | |
| |
| Total Investment Return7 | | | 0.15% | (A) | | | | 6.98% | (A) | | | 12.33% | | | | (0.93)% | | | | 4.48% | | | | 5.87% | | | | 6.22% | |
| Ratios to Average Net Assets: | | | | | | | | | | | | | | | | | | | | | | | | | | | | | |
Expenses After Waivers and Related | | | | | | | | | | | | | | | | | | | | | | | | | | | | | |
Reimbursements8 | | | 1.30% | 3,(B) | | | | 1.30% | 3,(B) | | | 1.31% | | | | 1.33% | | | | 1.33% | | | | 1.33% | | | | 1.33% | |
Expenses Before Waivers and Related | | | | | | | | | | | | | | | | | | | | | | | | | | | | | |
Reimbursements8 | | | 2.70% | 3,(B) | | | | 2.10% | 3,(B) | | | 1.93% | | | | 2.14% | | | | 2.19% | | | | 1.97% | | | | 2.09% | |
Net Investment Income After Waivers and | | | | | | | | | | | | | | | | | | | | | | | | | | | | | |
Related Reimbursements | | | 3.77% | (B) | | | | 4.17% | (B) | | | 4.11% | | | | 4.02% | | | | 4.40% | | | | 5.18% | | | | 4.41% | |
Net Investment Income Before Waivers and | | | | | | | | | | | | | | | | | | | | | | | | | | | | | |
Related Reimbursements | | | 2.37% | (B) | | | | 3.37% | (B) | | | 3.49% | | | | 3.21% | | | | 3.53% | | | | 4.54% | | | | 3.65% | |
| Supplementary Data: | | | | | | | | | | | | | | | | | | | | | | | | | | | | | |
Portfolio Turnover Rate | | | 27% | (A) | | | | 46% | (A) | | | 28 | % | | | 39% | | | | 102% | | | | 10% | | | | 28% | |
Net Assets at End of Period (in thousands) | | $ | 3,918 | | | | $ | 4,445 | | | $ | 4,615 | | | $ | 2,055 | | | $ | 2,030 | | | $ | 4,011 | | | $ | 7,563 | |
|
| 1 | | The amounts shown for a share outstanding throughout the period may not be in accordance with the changes in the aggregate gains and losses on investments during the period because of the timing of sales and repurchases of Fund shares in relation to fluctuating net asset values during the period. |
| 2 | | Calculated based on shares outstanding on the first and last day of the period, except for dividends and distributions, if any, which based on the actual shares outstanding on the dates of distributions. |
| 3 | | Reflects fees waived by FBR Fund Advisers, Inc. pursuant to a contractual expense limitation of 1.05% (excluding brokerage costs, interest, taxes, acquired fund fees and expenses, dividend expenses, 12b-1 fees and extraordinary expenses) and the recoupment of certain previously waived fees. |
| 4 | | The Fund changed its fiscal year end from March 31 to October 31. |
| 5 | | Calculated based on average shares outstanding. |
| 6 | | Less than $0.01 |
| 7 | | Total investment return is calculated assuming a purchase of shares on the first day and a sale on the last day of each period reported and will include reinvestment of dividends and distributions, if any. |
| 8 | | Does not include expenses of the funds in which the Fund invests. |
| (A) | | Not Annualized |
| (B) | | Annualized |
110
The FBR Funds
Financial Highlights (continued)
| | | FBR Core Bond Fund — Institutional Class |
| | |
|
| | | For the | | | For the | | | | | | | | | | | | | | | | | | | | | |
| | | Six Months | | | Period | | | | | | | | | | | | | | | | | | | | |
| | | Ended | | | April 1, | | | | | | | | | | | | | | | | | | | | |
| | | April 30, | | | 2010 to | | | For the Years Ended March 31, |
| | | 2011 | | | October 31, | | |
|
| | | (unaudited) | | | 20104 | | | 2010 | | | | 2009 | | | | 2008 | | | | 2007 | | | | 2006 | |
| | |
| | |
| |
| |
| |
| |
| |
|
| Per Share Operating Performance: | | | | | | | | | | | | | | | | | | | | | | | | | | | | | |
Net Asset Value – Beginning of Period | | $ | 9.05 | | | | $ | 8.67 | | | $ | 8.11 | | | $ | 8.52 | | | $ | 9.10 | | | $ | 9.15 | | | $ | 9.13 | |
| | |
| | | |
| | |
| | |
| | |
| | |
| | |
| |
Income (Loss) from Investment Operations: | | | | | | | | | | | | | | | | | | | | | | | | | | | | | |
Net Investment Income | | | 0.18 | 2,3 | | | | 0.23 | 3,5 | | | 0.37 | 5 | | | 0.35 | 5 | | | 0.39 | 5 | | | 0.49 | 5 | | | 0.45 | 5 |
Net Realized and Unrealized Gain (Loss) | | | | | | | | | | | | | | | | | | | | | | | | | | | | | |
on Investments1 | | | (0.16 | )2 | | | | 0.38 | 5 | | | 0.64 | 5 | | | (0.42 | )5 | | | 0.03 | 5 | | | 0.05 | 5 | | | 0.12 | 5 |
| | |
| | | |
| | |
| | |
| | |
| | |
| | |
| |
Total from Investment Operations | | | 0.02 | | | | | 0.61 | | | | 1.01 | | | | (0.07 | ) | | | 0.42 | | | | 0.54 | | | | 0.57 | |
| | |
| | | |
| | |
| | |
| | |
| | |
| | |
| |
Distributions to Shareholders: | | | | | | | | | | | | | | | | | | | | | | | | | | | | | |
From Net Investment Income | | | (0.18 | ) | | | | (0.23 | ) | | | (0.40 | ) | | | (0.34 | ) | | | (0.42 | ) | | | (0.49 | ) | | | (0.45 | ) |
From Net Realized Gain | | | (0.15 | ) | | | | — | | | | (0.05 | ) | | | — | | | | (0.58 | ) | | | (0.10 | ) | | | (0.10 | ) |
| | |
| | | |
| | |
| | |
| | |
| | |
| | |
| |
Total Distributions | | �� | (0.33 | ) | | | | (0.23 | ) | | | (0.45 | ) | | | (0.34 | ) | | | (1.00 | ) | | | (0.59 | ) | | | (0.55 | ) |
| | |
| | | |
| | |
| | |
| | |
| | |
| | |
| |
Paid-in Capital from Redemption Fees5 | | | 0.00 | 6 | | | | 0.00 | 6 | | | 0.00 | 6 | | | 0.00 | 6 | | | — | | | | — | | | | — | |
| | |
| | | |
| | |
| | |
| | |
| | |
| | |
| |
Net Increase (Decrease) in Net Asset Value | | | (0.31 | ) | | | | 0.38 | | | | 0.56 | | | | (0.41 | ) | | | (0.58 | ) | | | (0.05 | ) | | | 0.02 | |
| | |
| | | |
| | |
| | |
| | |
| | |
| | |
| |
Net Asset Value – End of Period | | $ | 8.74 | | | | $ | 9.05 | | | $ | 8.67 | | | $ | 8.11 | | | $ | 8.52 | | | $ | 9.10 | | | $ | 9.15 | |
| | |
| | | |
| | |
| | |
| | |
| | |
| | |
| |
| Total Investment Return7 | | | 0.29% | (A) | | | | 7.15% | (A) | | | 12.62% | | | | (0.74)% | | | | 4.78% | | | | 6.11% | | | | 6.47% | |
| Ratios to Average Net Assets: | | | | | | | | | | | | | | | | | | | | | | | | | | | | | |
Expenses After Waivers and Related | | | | | | | | | | | | | | | | | | | | | | | | | | | | | |
Reimbursements8 | | | 1.05% | 3,(B) | | | | 1.05% | 3,(B) | | | 1.06% | | | | 1.08% | | | | 1.08% | | | | 1.08% | | | | 1.08% | |
Expenses Before Waivers and Related | | | | | | | | | | | | | | | | | | | | | | | | | | | | | |
Reimbursements8 | | | 1.58% | 3,(B) | | | | 1.47% | 3,(B) | | | 1.69% | | | | 1.89% | | | | 1.94% | | | | 1.72% | | | | 1.79% | |
Net Investment Income After Waivers and | | | | | | | | | | | | | | | | | | | | | | | | | | | | | |
Related Reimbursements | | | 4.02% | (B) | | | | 4.41% | (B) | | | 4.37% | | | | 4.27% | | | | 4.46% | | | | 5.44% | | | | 4.95% | |
Net Investment Income Before Waivers and | | | | | | | | | | | | | | | | | | | | | | | | | | | | | |
Related Reimbursements | | | 3.49% | (B) | | | | 4.00% | (B) | | | 3.74% | | | | 3.46% | | | | 3.60% | | | | 4.80% | | | | 4.24% | |
| Supplementary Data: | | | | | | | | | | | | | | | | | | | | | | | | | | | | | |
Portfolio Turnover Rate | | | 27% | (A) | | | | 46% | (A) | | | 28% | | | | 39% | | | | 102% | | | | 10% | | | | 28% | |
Net Assets at End of Period (in thousands) | | $ | 23,340 | | | | $ | 24,248 | | | $ | 23,885 | | | $ | 22,053 | | | $ | 21,953 | | | $ | 13,234 | | | $ | 12,663 | |
|
| 1 | | The amounts shown for a share outstanding throughout the period may not be in accordance with the changes in the aggregate gains and losses on investments during the period because of the timing of sales and repurchases of Fund shares in relation to fluctuating net asset values during the period. |
| 2 | | Calculated based on shares outstanding on the first and last day of the period, except for dividends and distributions, if any, which based on the actual shares outstanding on the dates of distributions. |
| 3 | | Reflects fees waived by FBR Fund Advisers, Inc. pursuant to a contractual expense limitation of 1.05% (excluding brokerage costs, interest, taxes, acquired fund fees and expenses, dividend expenses, 12b-1 fees and extraordinary expenses) and the recoupment of certain previously waived fees. |
| 4 | | The Fund changed its fiscal year end from March 31 to October 31. |
| 5 | | Calculated based on average shares outstanding. |
| 6 | | Less than $0.01 |
| 7 | | Total investment return is calculated assuming a purchase of shares on the first day and a sale on the last day of each period reported and will include reinvestment of dividends and distributions, if any. |
| 8 | | Does not include expenses of the funds in which the Fund invests. |
| (A) | | Not Annualized |
| (B) | | Annualized |
111
The FBR Funds
Schedule of Shareholder Expenses
(unaudited)
As a shareholder of the Funds, you incur two types of costs: (1) transaction costs, including reinvested dividends or other distributions; redemption fees; and exchange fees; and (2) ongoing costs, including investment advisory fees; distribution (12b-1) fees; and other Fund expenses. This example is intended to help you understand your ongoing costs (in dollars) of investing in the Funds and to compare these costs with the ongoing costs of investing in other mutual funds.
The example is based on an investment of $1,000 invested at the beginning of the period and held for the entire period (November 1, 2010 through April 30, 2011).
Actual Expenses
The table on the following page provides information about actual account values and actual expenses. You may use the information in this line, together with the amount you invested, to estimate the expenses that you paid over the period. Simply divide your account value by $1,000 (for example, an $8,600 account value divided by $1,000 = 8.6), then multiply the result by the number in the first line under the heading entitled “Expenses Paid During the Six Months Ended April 30, 2011” to estimate the expenses you paid on your account during this period.
112
The FBR Funds
Schedule of Shareholder Expenses (continued)
(unaudited)
| | | | | | | | | | | | | | Expenses Paid |
| | Net Expense | | Beginning | | Ending | | During the |
| | Ratio | | Account | | Account | | Six Months |
| | Annualized | | Value | | Value | | Ended |
| | April 30, 2011 | | November 1, 2010 | | April 30, 2011 | | April 30, 2011* |
| |
| |
| |
| |
|
| Large Cap Fund | | | | | | | | | | | | | | | |
Investor Class | | 1.25 | % | | | $1,000.00 | | | | $1,149.40 | | | | $6.66 | |
Institutional Class | | 1.00 | | | | 1,000.00 | | | | 1,151.10 | | | | 5.33 | |
| Mid Cap Fund | | | | | | | | | | | | | | | |
Investor Class | | 1.35 | | | | 1,000.00 | | | | 1,175.40 | | | | 7.28 | |
Institutional Class | | 1.10 | | | | 1,000.00 | | | | 1,176.20 | | | | 5.94 | |
| Small Cap Fund | | | | | | | | | | | | | | | |
Investor Class | | 1.45 | | | | 1,000.00 | | | | 1,265.80 | | | | 8.15 | |
Institutional Class | | 1.20 | | | | 1,000.00 | | | | 1,269.20 | | | | 6.75 | |
| Focus Fund | | | | | | | | | | | | | | | |
Investor Class | | 1.44 | | | | 1,000.00 | | | | 1,117.50 | | | | 7.56 | |
Institutional Class | | 1.13 | | | | 1,000.00 | | | | 1,117.80 | | | | 5.93 | |
| Large Cap Financial Fund | | | | | | | | | | | | | | | |
Investor Class | | 1.56 | | | | 1,000.00 | | | | 1,093.90 | | | | 8.10 | |
| Small Cap Financial Fund | | | | | | | | | | | | | | | |
Investor Class | | 1.49 | | | | 1,000.00 | | | | 1,139.00 | | | | 7.90 | |
Institutional Class | | 1.25 | | | | 1,000.00 | | | | 1,139.70 | | | | 6.63 | |
| Technology Fund | | | | | | | | | | | | | | | |
Investor Class | | 1.95 | | | | 1,000.00 | | | | 1,126.40 | | | | 10.28 | |
Institutional Class | | 1.70 | | | | 1,000.00 | | | | 1,129.10 | | | | 8.97 | |
| Gas Utility Index Fund | | | | | | | | | | | | | | | |
Investor Class | | 0.74 | | | | 1,000.00 | | | | 1,170.40 | | | | 3.98 | |
| Balanced Fund | | | | | | | | | | | | | | | |
Investor Class | | 1.24 | | | | 1,000.00 | | | | 1,103.60 | | | | 6.47 | |
Institutional Class | | 0.99 | | | | 1,000.00 | | | | 1,104.70 | | | | 5.17 | |
| Core Bond Fund | | | | | | | | | | | | | | | |
Investor Class | | 1.30 | | | | 1,000.00 | | | | 1,001.50 | | | | 6.45 | |
Institutional Class | | 1.05 | | | | 1,000.00 | | | | 1,002.90 | | | | 5.21 | |
|
| * | | Expenses are equal to the Fund’s annualized expense ratio, multiplied by the average account value over the period, multiplied by the number of days in most recent fiscal half-year then divided by 365. |
113
The FBR Funds
Schedule of Shareholder Expenses (continued)
(unaudited)
Hypothetical Example for Comparison Purposes
The table on the following page provides information about hypothetical account values and hypothetical expenses based on the Funds’ actual expense ratio and an assumed rate of return of 5% per year before expenses, which is not the Funds’ actual return. The hypothetical account values and expenses may not be used to estimate the actual ending account balance or expenses you paid for the period. You may use this information to compare the ongoing costs of investing in the Funds and other funds. To do so, compare this 5% hypothetical example with the 5% hypothetical examples that appear in the shareholder reports of the other funds.
114
The FBR Funds
Schedule of Shareholder Expenses (continued)
(unaudited)
| | | | | | | | | | | | | | Expenses Paid |
| | Net Expense | | Beginning | | Ending | | During the |
| | Ratio | | Account | | Account | | Six Months |
| | Annualized | | Value | | Value | | Ended |
| | April 30, 2011 | | November 1, 2010 | | April 30, 2011 | | April 30, 2011* |
| |
| |
| |
| |
|
| Large Cap Fund | | | | | | | | | | | | | | | |
Investor Class | | 1.25 | % | | | $1,000.00 | | | | $1,018.61 | | | | $6.26 | |
Institutional Class | | 1.00 | | | | 1,000.00 | | | | 1,019.85 | | | | 5.01 | |
| Mid Cap Fund | | | | | | | | | | | | | | | |
Investor Class | | 1.35 | | | | 1,000.00 | | | | 1,018.10 | | | | 6.76 | |
Institutional Class | | 1.10 | | | | 1,000.00 | | | | 1,019.34 | | | | 5.51 | |
| Small Cap Fund | | | | | | | | | | | | | | | |
Investor Class | | 1.45 | | | | 1,000.00 | | | | 1,017.55 | | | | 7.25 | |
Institutional Class | | 1.20 | | | | 1,000.00 | | | | 1,018.84 | | | | 6.01 | |
| Focus Fund | | | | | | | | | | | | | | | |
Investor Class | | 1.44 | | | | 1,000.00 | | | | 1,017.66 | | | | 7.20 | |
Institutional Class | | 1.13 | | | | 1,000.00 | | | | 1,019.20 | | | | 5.66 | |
| Large Cap Financial Fund | | | | | | | | | | | | | | | |
Investor Class | | 1.56 | | | | 1,000.00 | | | | 1,017.06 | | | | 7.80 | |
| Small Cap Financial Fund | | | | | | | | | | | | | | | |
Investor Class | | 1.49 | | | | 1,000.00 | | | | 1,017.42 | | | | 7.45 | |
Institutional Class | | 1.25 | | | | 1,000.00 | | | | 1,018.61 | | | | 6.26 | |
| Technology Fund | | | | | | | | | | | | | | | |
Investor Class | | 1.95 | | | | 1,000.00 | | | | 1,015.13 | | | | 9.74 | |
Institutional Class | | 1.70 | | | | 1,000.00 | | | | 1,016.37 | | | | 8.50 | |
| Gas Utility Index Fund | | | | | | | | | | | | | | | |
Investor Class | | 0.74 | | | | 1,000.00 | | | | 1,021.13 | | | | 3.71 | |
| Balanced Fund | | | | | | | | | | | | | | | |
Investor Class | | 1.24 | | | | 1,000.00 | | | | 1,018.65 | | | | 6.21 | |
Institutional Class | | 0.99 | | | | 1,000.00 | | | | 1,019.89 | | | | 4.96 | |
| Core Bond Fund | | | | | | | | | | | | | | | |
Investor Class | | 1.30 | | | | 1,000.00 | | | | 1,018.36 | | | | 6.51 | |
Institutional Class | | 1.05 | | | | 1,000.00 | | | | 1,019.60 | | | | 5.26 | |
|
| * | | Expenses are equal to the Fund’s annualized expense ratio, multiplied by the average account value over the period, multiplied by the number of days in most recent fiscal half-year then divided by 365. |
115
| The FBR Funds |
|
| Notes to Financial Statements (unaudited) |
1. Organization
The FBR Funds (the “Trust”) is registered under the Investment Company Act of 1940, as amended (“1940 Act”), as an open-end management investment company. The Trust was organized as a statutory trust under the laws of the State of Delaware on September 29, 2003. The Trust currently consists of the following ten series: FBR Large Cap Fund (“Large Cap Fund”), FBR Mid Cap Fund (“Mid Cap Fund”), FBR Small Cap Fund (“Small Cap Fund”), FBR Focus Fund (“Focus Fund”), FBR Large Cap Financial Fund (“Large Cap Financial Fund”), FBR Small Cap Financial Fund (“Small Cap Financial Fund”), FBR Technology Fund (“Technology Fund”), FBR Gas Utility Index Fund (“Gas Utility Index Fund”), FBR Balanced Fund (“Balanced Fund”) and FBR Core Bond Fund (“Core Bond Fund”) (each a “Fund” and collectively, the “Funds”). The Trust is authorized to issue an unlimited number of shares of beneficial interest with no par value which may be issued in more than one class or series. The Institutional Class (formerly, I Class) shares are intended for institutional investors. In all Funds, except the Balanced Fund and Core Bond Fund, the initial class of shares is now referred to as Investor Class. The Institutional Class and Investor Class shares are currently offered.
The Large Cap Fund, a non-diversified fund, invests, under normal circumstances, at least 80% of its net assets plus the amount of any borrowings for investment purposes in securities of large capitalization (“large-cap”) companies. The investment objective of the Fund is capital appreciation.
The Mid Cap Fund, a non-diversified fund, invests, under normal circumstances, at least 80% of its net assets plus the amount of any borrowings for investment purposes in securities of mid capitalization (“mid-cap”) companies. The investment objective of the Fund is capital appreciation.
The Small Cap Fund, a non-diversified fund, invests, under normal circumstances, at least 80% of its net assets plus the amount of any borrowings for investment purposes in securities of small capitalization (“small-cap”) companies. The investment objective of the Fund is capital appreciation.
The Focus Fund, a non-diversified fund, invests, under normal circumstances, primarily in securities of companies traded in domestic markets. The investment objective of the Fund is capital appreciation.
The Large Cap Financial Fund, a non-diversified fund, invests, under normal circumstances, at least 80% of its net assets plus the amount of any borrowings for investment purposes in securities of large capitalization (“large-cap”) companies principally engaged in the business of financial services including, but not limited to, commercial banks, savings and loan associations, consumer and industrial finance companies, securities brokerage companies, insurance companies, real estate and leasing companies, holding companies for each of the foregoing types of business, or
116
| The FBR Funds |
|
| Notes to Financial Statements (continued) (unaudited) |
companies that combine some or all of these businesses. The investment objective of the Fund is capital appreciation.
The Small Cap Financial Fund, a non-diversified fund, invests, under normal circumstances, at least 80% of its net assets plus the amount of any borrowings for investment purposes in securities of small-cap companies principally engaged in the business of providing financial services to consumers and industry. The investment objective of the Fund is capital appreciation.
The Technology Fund, a non-diversified fund, invests, under normal circumstances, at least 80% of its net assets plus the amount of any borrowings for investment purposes in securities of companies that are principally engaged in the research, design, development, manufacturing or distributing products or services in the technology industry. The investment objective of the Fund is long-term capital appreciation.
The Gas Utility Index Fund, a non-diversified fund, invests, under normal circumstances, at least 85% of its net assets in the common stock of companies that have natural gas distribution and transmission operations. The investment objective of the Fund is income and capital appreciation.
The Balanced Fund, a diversified fund, invests in a blend of domestic common stocks, preferred stocks, convertible securities and core, high quality domestic corporate, agency and government bonds. The investment objective of the Fund is long-term capital growth and current income.
The Core Bond Fund, a diversified fund, invests, under normal circumstances, at least 80% of its net assets in fixed income securities, which include domestic investment grade corporate, agency and governmental bonds. The investment objective of the Fund is current income with capital growth as a secondary objective.
2. Significant Accounting Policies
The following is a summary of the Funds’ significant accounting policies:
Portfolio Valuation — The net asset value per share (“NAV”) of each Fund is determined as of the close of regular trading on the New York Stock Exchange (“NYSE”) (normally 4:00 p.m., Eastern Time) on each business day that the exchange is open for trading. Each Fund’s securities are valued at the last sale price on the securities exchange or national securities market on which such securities are primarily traded. Securities that are quoted by NASDAQ are valued at the NASDAQ Official Closing Price. Securities not listed on an exchange or national securities market, or securities in which there were no transactions, are valued at the average of the most recent bid and ask prices, except in the case of open short positions where the ask price is used for valuation purposes. The bid price is used when no ask price is available. Debt instruments and floating rate loans (other than short-term instruments), including restricted debt instruments, are generally valued at an evaluated or composite bid as
| The FBR Funds |
|
| Notes to Financial Statements (continued) (unaudited) |
provided by a third-party pricing service. Securities and other assets generally valued on the basis of information from a third-party pricing service may also be valued at a broker/dealer bid quotation. Values obtained from third-party pricing services can utilize both transaction data and market information such as yield, quality, coupon rate, maturity, type of issue, trading characteristics, and other market data. Short-term investments are carried at amortized cost, which approximates market value. Restricted securities, as well as securities or other assets for which market quotations are not readily available, or are not valued by a pricing service approved by the Funds’ Board of Trustees (the “Board”), are valued at fair value in good faith by, or at the direction of, the Board.
The Funds have adopted FASB 820 “Fair Value Measurements.” This standard establishes a single authoritative definition of fair value, sets out a framework for measuring fair value and requires additional disclosures about fair value measurements.
Fair Value Measurements applies to fair value measurements already required or permitted by existing standards. The changes to current generally accepted accounting principles (GAAP) from the application of this Statement relate to the definition of fair value, the methods used to measure fair value, and the expanded disclosures about fair value measurements. Various inputs are used in determining the value of the Funds investments. These inputs are summarized in the three broad levels listed below:
| | • | | Level 1 – Unadjusted quoted prices in active markets for identical assets or liabilities that the Fund has the ability to access. |
| | • | | Level 2 – Observable inputs other than quoted prices included in Level 1 that are observable for the asset or liability, either directly or indirectly. These inputs may include quoted prices for the identical instrument on an inactive market, prices for similar instruments, interest rates, prepayment speeds, credit risk curves, default rates and similar data. |
| | • | | Level 3 – Unobservable inputs for the asset or liability, to the extent observable inputs are not available, representing the Funds’ own assumptions about the assumptions a market participant would use in valuing the asset or liability, and would be based on the best information available. |
The inputs or methodology used for valuing securities are not necessarily an indication of the risk associated with investing in those securities. For example, securities maturing within 60 days of the filing are valued using amortized cost, in accordance with rules under the Investment Company Act of 1940. Generally, amortized cost approximates the current fair value of a security, but since the value is not obtained from a quoted price in an active market, such securities are reflected as Level 2.
| The FBR Funds |
|
| Notes to Financial Statements (continued) (unaudited) |
The following is a summary of the inputs used to value the Funds’ net assets as of April 30, 2011:
| | | | | | Level 2 | | Level 3 | | | |
| | | Level 1 | | Other Significant | | Significant | | | |
| | | Quoted | | Observable | | Unobservable | | | |
| | | Prices | | Inputs | | Inputs | | Total |
| | |
| |
| |
| |
|
| Large Cap Fund | | | | | | | | | | | | |
Common Stocks* | | $ | 47,403,878 | | $ | — | | $ | — | | $ | 47,403,878 |
Short-Term Investment | | | 3,118,067 | | | — | | | — | | | 3,118,067 |
| | |
| |
| |
| |
|
| Total | | | 50,521,945 | | | — | | | — | | | 50,521,945 |
| | |
| |
| |
| |
|
| Mid Cap Fund | | | | | | | | | | | | |
Common Stocks* | | | 22,375,805 | | | — | | | — | | | 22,375,805 |
Short-Term Investment | | | 1,882,435 | | | — | | | — | | | 1,882,435 |
| | |
| |
| |
| |
|
| Total | | | 24,258,240 | | | — | | | — | | | 24,258,240 |
| | |
| |
| |
| |
|
| Small Cap Fund | | | | | | | | | | | | |
Common Stocks* | | | 45,960,276 | | | — | | | — | | | 45,960,276 |
Rights | | | — | | | — | | | 5,225 | | | 5,225 |
Short-Term Investment | | | 745,724 | | | — | | | — | | | 745,724 |
| | |
| |
| |
| |
|
| Total | | | 46,706,000 | | | — | | | 5,225 | | | 46,711,225 |
| | |
| |
| |
| |
|
| Focus Fund | | | | | | | | | | | | |
Common Stocks* | | | 757,224,298 | | | — | | | — | | | 757,224,298 |
Short-Term Investment | | | 25,071,741 | | | — | | | — | | | 25,071,741 |
| | |
| |
| |
| |
|
| Total | | | 782,296,039 | | | — | | | — | | | 782,296,039 |
| | |
| |
| |
| |
|
| Large Cap Financial Fund | | | | | | | | | | | | |
Common Stocks* | | | 67,720,160 | | | — | | | — | | | 67,720,160 |
Short-Term Investment | | | 2,885,969 | | | — | | | — | | | 2,885,969 |
| | |
| |
| |
| |
|
| Total | | | 70,606,129 | | | — | | | — | | | 70,606,129 |
| | |
| |
| |
| |
|
| Small Cap Financial Fund | | | | | | | | | | | | |
Common Stocks* | | | 286,448,028 | | | — | | | — | | | 286,448,028 |
Short-Term Investment | | | 16,827,660 | | | — | | | — | | | 16,827,660 |
| | |
| |
| |
| |
|
| Total | | | 303,275,688 | | | — | | | — | | | 303,275,688 |
| | |
| |
| |
| |
|
| Technology Fund | | | | | | | | | | | | |
Common Stocks* | | | 8,619,682 | | | — | | | — | | | 8,619,682 |
Investment Companies | | | 557,375 | | | — | | | — | | | 557,375 |
Short-Term Investment | | | 362,883 | | | — | | | — | | | 362,883 |
| | |
| |
| |
| |
|
| Total | | | 9,539,940 | | | — | | | — | | | 9,539,940 |
| | |
| |
| |
| |
|
| Gas Utility Index Fund | | | | | | | | | | | | |
Common Stocks* | | | 306,085,258 | | | — | | | — | | | 306,085,258 |
Short-Term Investment | | | 8,552,284 | | | — | | | — | | | 8,552,284 |
| | |
| |
| |
| |
|
| Total | | | 314,637,542 | | | — | | | — | | | 314,637,542 |
| | |
| |
| |
| |
|
| The FBR Funds |
|
| Notes to Financial Statements (continued) (unaudited) |
| | | | | | Level 2 | | Level 3 | | | |
| | | Level 1 | | Other Significant | | Significant | | | |
| | | Quoted | | Observable | | Unobservable | | | |
| | | Prices | | Inputs | | Inputs | | Total |
| | |
| |
| |
| |
|
| Balanced Fund | | | | | | | | | | | | |
Common Stocks* | | $ | 59,898,067 | | $ | — | | $ | — | | $ | 59,898,067 |
Corporate Bonds | | | — | | | 17,462,387 | | | — | | | 17,462,387 |
Investment Companies | | | 1,808,623 | | | — | | | — | | | 1,808,623 |
Preferred Stocks | | | 27,744 | | | — | | | — | | | 27,744 |
Short-Term Investment | | | 1,311,860 | | | — | | | — | | | 1,311,860 |
U.S. Government Agency Obligations | | | — | | | 2,659,986 | | | — | | | 2,659,986 |
U.S. Treasury Obligations | | | — | | | 7,954,421 | | | — | | | 7,954,421 |
| | |
| |
| |
| |
|
| Total | | | 63,046,294 | | | 28,076,794 | | | — | | | 91,123,088 |
| | |
| |
| |
| |
|
| Core Bond Fund | | | | | | | | | | | | |
Common Stocks* | | | 890,955 | | | — | | | — | | | 890,955 |
Convertible Preferred Stocks | | | — | | | 417,187 | | | — | | | 417,187 |
Corporate Bonds | | | — | | | 14,830,453 | | | — | | | 14,830,453 |
Investment Companies | | | 1,688,800 | | | — | | | — | | | 1,688,800 |
Preferred Stocks | | | 21,216 | | | — | | | — | | | 21,216 |
Short-Term Investment | | | 239,734 | | | — | | | — | | | 239,734 |
U.S. Government Agency Obligations | | | — | | | 2,637,273 | | | — | | | 2,637,273 |
U.S. Treasury Obligations | | | — | | | 6,345,206 | | | — | | | 6,345,206 |
| | |
| |
| |
| |
|
| Total | | | 2,840,705 | | | 24,230,119 | | | — | | | 27,070,824 |
| | |
| |
| |
| |
|
|
| * | Please refer to portfolio of investment for industry classifications of common stocks. |
The following table reconciles the valuation of the Small Cap Fund’s Level 3 investment securities and related transactions during the six months ended April 30, 2011:
| Beginning value at 11/1/10 | | $ | — |
| Net purchases | | | — |
| Net realized loss | | | — |
| Net unrealized appreciation | | | 5,225 |
| Net transfers into Level 3 | | | — |
| | |
|
| Ending value at 4/30/11 | | | 5,225 |
| | |
|
| Market value at 4/30/11 | | | 5,225 |
| | |
|
| Net unrealized appreciation during the period on Level 3 securities held at 4/30/11 | | $ | 5,225 |
| | |
|
New Accounting Pronouncements — In January 2010, the Financial Accounting Standards Board (“FASB”) issued new guidance as an amendment to fair value measurements and disclosures. The new guidance adds new requirements for disclosure about transfers into and out of Level 1 and Level 2 fair value measurements and separate
| The FBR Funds |
|
| Notes to Financial Statements (continued) (unaudited) |
disclosures about purchases, sales, issuances, and settlements relating to Level 3 measurements. The guidance also clarifies existing fair value disclosures about the Level of disaggregation and about inputs and valuation techniques in Level 2 and Level 3 fair value measurements. The amendment is effective for interim and annual reporting periods beginning after December 15, 2009, except for Level 3 reconciliation disclosures which are effective for interim and annual periods beginning after December 15, 2010. There were no significant transfers into and out of Level 1 and Level 2 during the current period. The Funds do not expect the implications of this guidance to have a material impact on its financial statements.
Share Valuation — The NAV of each Fund is calculated by dividing the sum of the value of the securities held by each Fund, plus cash or other assets, minus all liabilities (including estimated accrued expenses) by the total number of shares outstanding of each Fund, rounded to the nearest cent. Each Fund’s shares will not be priced on the days on which the NYSE is closed for trading. The offering and redemption price per share of each Fund is equal to each Fund’s NAV. The Funds charge a 1% redemption fee on shares redeemed or exchanged within 90 days of purchase. These fees are deducted from the redemption proceeds otherwise payable to the shareholder. The Funds will retain the fee charged as paid-in capital and such fees become part of that Fund’s daily NAV calculation.
Investment Income — Dividend income is recorded on the ex-dividend date. Interest income, which includes the amortization of premium and accretion of discount, if any, is recorded on an accrual basis.
Expenses — The Funds pay all operational expenses, which are either charged directly to a Fund for which the expense is attributable or are allocated proportionately among the Funds based on allocation methods approved by the Board.
Dividends and Distributions to Shareholders — Each Fund, except the Gas Utility Index Fund, Balanced and Core Bond Fund, declares and pays any dividends from its net investment income, if any, annually. The Gas Utility Index Fund and Balanced Fund declare and pay any such dividends quarterly. The Core Bond Fund declares and pays net investment income, if any, monthly. Distributions from net realized capital gains, if any, will be distributed at least annually for each Fund. Income and capital gain distributions are determined in accordance with U.S. federal income tax regulations.
Allocations — Investment income earned, realized capital gains and losses, and unrealized appreciation and depreciation for the Funds are allocated daily to each class of shares based upon its proportionate share of total net assets of the Fund. Class specific expenses are charged directly to the class incurring the expense. Common expenses, which are not attributable to a specific class, are allocated daily to each class of shares based upon its proportionate share of total net assets of the Fund. Expenses not directly billed to a Fund are allocated proportionally among all Funds daily in relation to net assets of each Fund or another reasonable measure.
Security Transactions — Security transactions are accounted for on the trade date. Securities sold are determined on a specific identification basis.
| The FBR Funds |
|
| Notes to Financial Statements (continued) (unaudited) |
Estimates — The preparation of financial statements in accordance with U.S. generally accepted accounting principles requires management to make estimates and assumptions that may affect the reported amounts of assets and liabilities and disclosure of contingent assets and liabilities at the date of the financial statements and the reported amounts of income and expenses during the reporting period. Actual results could differ from those estimates.
Repurchase Agreements — The Funds have agreed to purchase securities from financial Institutions subject to the seller’s agreement to repurchase them at an agreed-upon time and price (“repurchase agreement”). The financial institutions with whom each Fund enters into repurchase agreements are banks and broker/dealers which the adviser considers creditworthy pursuant to criteria approved by the Board. The seller under a repurchase agreement will be required to maintain the value of the securities as collateral, subject to the agreement at not less than the repurchase price plus accrued interest. The adviser marks to market daily the value of the collateral, and, if necessary, requires the seller to maintain additional securities, to ensure that the value is not less than the repurchase price. Default by or bankruptcy of the seller would, however, expose each Fund to possible loss because of adverse market action or delays in connection with the disposition of the underlying securities.
3. Risk Factors
Equity Investments — Because each of the Funds invests in equity securities, fluctuations in the stock market in general, as well as in the value of particular equity securities held by a Fund, can affect the Fund’s performance. The value of equity securities will fluctuate due to many factors, including the past and predicted earnings of the issuer, the quality of the issuer’s management, general market conditions, forecasts for the issuer’s industry and the value of the issuer’s assets.
IPO Investments — IPO shares are subject to market risk and liquidity risk. The market value of IPO shares will fluctuate considerably due to facts such as the absence of a prior public market, unseasoned trading, the small number of shares available for trading and limited public information about the issuer. The purchase of IPO shares may involve high transaction costs. When a fund’s asset base is small, a significant portion of the fund’s performance could be attributable to investments in IPOs, because such investments would have a magnified impact on the fund.
Temporary Defensive Position — Each of the Funds may, from time to time, take temporary defensive positions in response to adverse market, economic, political or other conditions. To the extent the assets of a Fund are invested in temporary defensive positions, the Fund may not achieve its investment objective. For temporary defensive purposes, the Fund may invest in cash and/or short-term obligations.
Industry Concentration — Because of their narrow focus, the Large Cap Financial Fund and the Small Cap Financial Fund (“Financial Funds”), the Technology Fund and the Gas Utility Index Fund are tied closely to and affected by the financial services, technology, and natural gas distribution and transmission industries, respectively. The value of the
| The FBR Funds |
|
| Notes to Financial Statements (continued) (unaudited) |
Funds may be subject to greater volatility than funds with portfolios that are less concentrated.
Investments in Derivatives — Each Fund, except the Gas Utility Index Fund, Balanced Fund and Core Bond Fund, may engage in derivative instruments such as options, futures and forward foreign currency exchange contracts. Derivative instruments are instruments that derive their value from a different underlying security, index or financial indicator. A Fund may use derivatives for either hedging or non-hedging purposes, or for both purposes, including for purposes of enhancing return. Investing for non-hedging purposes may be considered speculative and involve additional risks.
Foreign Investments — Investing in foreign securities presents unique investment risks. The value of securities denominated in or indexed to foreign currencies, and of dividends and interest from such securities, can change significantly when foreign currencies strengthen or weaken relative to the U.S. dollar. Many foreign countries lack uniform accounting and disclosure standards comparable to those applicable to U.S. companies, and it may be more difficult to obtain reliable information regarding an issuer’s financial condition and operations. The Fund may invest in both sponsored and unsponsored ADRs which are receipts issued by a U.S. bank or trust company evidencing ownership of an indirect interest in underlying securities issued by a foreign issuer. In a sponsored ADR arrangement, the non-U.S. issuer assumes the obligation to pay some or all of the depositary’s transaction fees. Under an unsponsored ADR arrangement, the non-U.S. issuer assumes no obligations and the depositary’s transaction fees are paid directly by the ADR holders. Because unsponsored ADR arrangements are organized independently and without the cooperation of the issuer of the underlying securities, available information concerning the non-U.S. issuer may not be as current as for sponsored ADRs and voting rights with respect to the deposited securities are not passed through.
Debt Investments — The yields and principal values of debt securities will also fluctuate. Generally, values of debt securities change inversely with interest rates. That is, as interest rates go up, the values of debt securities tend to go down and vice versa. Furthermore, these fluctuations tend to increase as a bond’s maturity increases such that a longer term bond will increase or decrease more for a given change in interest rates than a shorter term bond.
High Yield Investments — The Funds may invest a small portion of their assets in lower-rated, high-yielding bonds (commonly known as “junk bonds”). These bonds have a greater degree of default risk than higher-rated bonds. Default risk is the possibility that the issuer of a debt security will fail to make timely payments of principal or interest to the Funds.
Mortgage-Backed and Asset-Backed Securities Investments — The Funds may invest in mortgage and asset-backed securities that are subject to prepayment risk, which is the risk that the borrower will prepay some or all of the principal owed to the issuer. If prepayment occurs, the Funds may have to replace the security by investing the proceeds in a less attractive security. This may reduce a Fund’s share price and income distribution.
| The FBR Funds |
|
| Notes to Financial Statements (continued) (unaudited) |
4. Transactions with Affiliates
Investment Adviser — FBR Fund Advisers, Inc. (“Fund Advisers”) serves as investment adviser to the Funds. For its advisory services, Fund Advisers receives a monthly fee at an annual rate of 0.90% of the average daily net assets of the Large Cap Fund, Mid Cap Fund, Small Cap Fund, Focus Fund, Large Cap Financial Fund, Small Cap Financial Fund, and Technology Fund, at an annual rate of 0.40% of the average daily net assets of the Gas Utility Index Fund, and at an annual rate of 0.80% of the average daily net assets of the Balanced Fund and Core Bond Fund.
Fund Advisers has contractually agreed to limit each class of shares of each Fund’s total operating expenses and to maintain these limitations with regard to each class of shares of each Fund through February 28, 2014. The following are the limits for the Funds, based on average daily net assets (excluding interest, taxes, brokerage commissions, dividend expenses, acquired fund fees and expenses, extraordinary legal expenses, or any other extraordinary expenses, and for the Balanced Fund and Core Bond Fund, also excluding 12b-1 fees):
| | | Investor Class | | Institutional Class | |
| | |
| |
| |
| Large Cap Fund | | 1.25 | % | | 1.00 | % | |
| Mid Cap Fund | | 1.35 | % | | 1.10 | % | |
| Small Cap Fund | | 1.45 | % | | 1.20 | % | |
| Focus Fund | | 1.95 | % | | 1.70 | % | |
| Large Cap Financial Fund | | 1.95 | % | | NA | | |
| Small Cap Financial Fund | | 1.95 | % | | 1.70 | % | |
| Technology Fund | | 1.95 | % | | 1.70 | % | |
| Gas Utility Index Fund | | 0.85 | % | | NA | | |
| Balanced Fund | | 1.08 | % | | 1.08 | % | |
| Core Bond Fund | | 1.05 | % | | 1.05 | % | |
In addition, with respect to the Balanced Fund, Fund Advisers has also agreed to voluntarily limit fees and/or pay expenses in amounts necessary in order to limit the total annual operating expenses of the Balanced Fund, after any such fee waivers and/or expense reimbursements, to 0.99% (excluding 12b-1 fees, brokerage costs, interest, taxes, acquired fund fees and expenses, dividend expenses, and extraordinary expenses such as litigation and merger or reorganization costs and other expenses not incurred in the ordinary course of such Fund’s business), for the period until March 12, 2012. Thereafter, Fund Advisers may either renew or terminate these voluntary arrangements at any time. The fee reductions and expenses reimbursed are reflected as a reduction of total expenses in the Statement of Operations.
Effective May 30, 2008, Fund Advisers may recoup any waived amount from a Fund pursuant to this agreement if such reimbursement does not cause the Fund to exceed existing expense limitations and the reimbursement is made within three years after the year in which the Adviser incurred the expense.
| The FBR Funds |
|
| Notes to Financial Statements (continued) (unaudited) |
As of April 30, 2011, the Funds had the following amounts (and year of expiration) subject to repayment to Fund Advisers:
| | | Year Fees | | Repayment | | | | |
| | | Waived | | Expires | | Balance |
| | |
| |
| |
|
| Large Cap Fund – Investor Class | | 2008 | | | 2011 | | $ | 42,645 | |
| | | 2009 | | | 2012 | | | 112,398 | |
| | | 2010 | | | 2013 | | | 113,013 | |
| | | 2011 | | | 2014 | | | 47,719 | |
| Large Cap Fund – Institutional Class | | 2008 | | | 2011 | | | 1,153 | |
| | | 2009 | | | 2012 | | | 11,563 | |
| | | 2010 | | | 2013 | | | 90,332 | |
| | | 2011 | | | 2014 | | | 50,975 | |
| Mid Cap Fund – Investor Class | | 2008 | | | 2011 | | | 37,881 | |
| | | 2009 | | | 2012 | | | 99,322 | |
| | | 2010 | | | 2013 | | | 88,626 | |
| | | 2011 | | | 2014 | | | 33,710 | |
| Mid Cap Fund – Institutional Class | | 2008 | | | 2011 | | | 1,295 | |
| | | 2009 | | | 2012 | | | 11,525 | |
| | | 2010 | | | 2013 | | | 64,899 | |
| | | 2011 | | | 2014 | | | 26,819 | |
| Small Cap Fund – Investor Class | | 2008 | | | 2011 | | | 36,709 | |
| | | 2009 | | | 2012 | | | 92,582 | |
| | | 2010 | | | 2013 | | | 120,555 | |
| | | 2011 | | | 2014 | | | 26,968 | |
| Small Cap Fund – Institutional Class | | 2008 | | | 2011 | | | 1,298 | |
| | | 2009 | | | 2012 | | | 11,387 | |
| | | 2010 | | | 2013 | | | 26,712 | |
| | | 2011 | | | 2014 | | | 8,150 | |
| Technology Fund – Investor Class | | 2008 | | | 2011 | | | 7,400 | |
| | | 2009 | | | 2012 | | | 72,289 | |
| | | 2010 | | | 2013 | | | 53,589 | |
| | | 2011 | | | 2014 | | | 31,746 | |
| Technology Fund – Institutional Class | | 2010 | | | 2013 | | | 23,699 | |
| | | 2011 | | | 2014 | | | 13,980 | |
| Gas Utility Index Fund – Investor Class | | 2010 | | | 2013 | | | 16,893 | |
| Balanced Fund | | 2008 | | | 2011 | | | 285,218 | |
| | | 2009 | | | 2012 | | | 387,497 | |
| | | 2010 | * | | 2013 | | | 356,740 | |
| | | 2010 | ** | | 2013 | | | 136,427 | |
| | | 2011 | | | 2014 | | | 135,474 | |
| Core Bond Fund | | 2008 | | | 2011 | | | 188,342 | |
| | | 2009 | | | 2012 | | | 210,127 | |
| | | 2010 | * | | 2013 | | | 177,887 | |
| | | 2010 | ** | | 2013 | | | 80,808 | |
| | | 2011 | | | 2014 | | | 90,016 | |
|
| * | Fund Advisers earned a total of $36,325 and $11,904 and of that they waived $7,103 and $2,441 in the Balanced and Core Bond Funds, respectively for the period from March 13, 2010 through March 31, 2010. |
| ** | For the seven months ended October 31, 2010. |
| The FBR Funds |
|
| Notes to Financial Statements (continued) (unaudited) |
During the six months ended April 30, 2011, the Large Cap Financial Fund – Investor Class and the Gas Utility Index Fund – Investor Class repaid Fund Advisers $104 and $78 for fees waived during the fiscal year ended October 31, 2009, respectively.
Fee reductions and expenses reimbursed are reflected as a reduction of total expenses in the Statement of Operations.
In connection with certain expense limitation arrangements between the Balanced Fund, Core Bond Fund and Fund Advisers, these Funds have agreed to pay Fund Advisers for certain amounts waived and/or reimbursed by AFBA pursuant to an expense limitation agreement, as assigned, provided that such repayment does not cause the total fund operating expenses for a Fund to exceed certain specified limits and the repayment is made within three years after the year in which AFBA incurred the expense.
Fund Advisers has entered into an investment sub-advisory agreement with Financial Counselors whereby it pays the sub-advisor 0.27% per annum of the assets it manages. Fund Advisers has also entered into an investment sub-advisory agreement with London Company whereby it pays the sub-advisor 0.33% per annum of the assets it manages.
The Funds are not responsible for paying the sub-advisory fee.
Administrator — JPMorgan Chase Bank N.A. (“JPMorgan”) serves as the administrator to the Funds and provides pursuant to an Administration Agreement (“Agreement”) day-to-day administrative services including monitoring portfolio compliance, determining compliance with provisions of the Internal Revenue Code and preparing the Funds’ registration statements. Pursuant to the Agreement, JPMorgan receives a monthly fee based on average daily net assets of the Trust.
Pursuant to the Administrative Services Agreement, Fund Advisers also provides administrative services to the Funds including oversight of service providers. For the period ended April 30, 2011, Fund Advisers received 0.04% of average daily net assets of the Trust. Prior to November 1, 2009, the Fund Advisers received 0.02% of average daily net assets of the Trust. Fund Advisers also provides the Funds with office space, facilities and business equipment and generally administers the Funds’ business affairs and provides the services of executive and clerical personnel for administering the affairs of the Funds. Fund Advisers compensates all personnel, Officers and Trustees of the Funds if such persons are employees of Fund Advisers. For the six months ended April 30, 2011, JPMorgan earned $161,931 and Fund Advisers earned $373,110 in administration fees.
Plan of Distribution — The Trust, on behalf of the Investor Class shares of each Fund, except the Gas Utility Index Fund, has adopted a Distribution Plan (the “Plan”) pursuant to Rule 12b-1 under the 1940 Act. Under the Plan, each Fund pays FBR Investment Services, Inc. (the “Distributor”) a fee at an annual rate of up to 0.25% of each Fund’s average daily net assets attributable to Investor Class shares. Fees paid to the Distributor under the Plan are payable without regard to actual expenses incurred.
Brokerage Commissions — For the six months ended April 30, 2011, the Small Cap Financial Fund and the Large Cap Financial Fund paid $13,000 and $1,250, respectively,
| The FBR Funds |
|
| Notes to Financial Statements (continued) (unaudited) |
in brokerage commissions from portfolio transactions to FBR Capital Markets & Co. (“FBR & Co.”), an affiliate of Fund Advisers and the Distributor. No other Fund paid commissions to FBR & Co. during the year.
Trustees’ Fees — Each Trustee of the Trust who is not an employee or affiliate of Fund Advisers receives an annual retainer fee of $25,000 and an additional meeting fee of $2,500 for each regular meeting attended. In addition, each Trustee that serves on the Audit Committee or Nominating Committee receives a meeting fee of $1,000 for attendance at the meeting. If a Trustee participates by teleconference, the meeting fee is $1,000. The Chairman of the Board, an independent Trustee, receives an additional $2,000 for each meeting attended, and the Audit Committee Chairman receives an additional $1,000 for each committee meeting attended.
5. Investment Transactions
For the six months ended April 30, 2011, purchases and sales of investment securities (excluding short-term securities) for each Fund were as follows:
| | | Purchases | | Sales |
| | |
| |
|
| | | | | | Investments | | | | | Investments |
| | | U.S. | | (non-U.S. | | U.S. | | (non-U.S. |
| | | Government | | Government | | Government | | Government |
| | | securities | | securities) | | securities | | securities) |
| | |
| |
| |
| |
|
| Large Cap Fund | | $ | — | | $ | 22,308,086 | | $ | — | | $ | 27,780,482 |
| Mid Cap Fund | | | — | | | 5,932,893 | | | — | | | 4,360,880 |
| Small Cap Fund | | | — | | | 25,015,970 | | | — | | | 23,828,977 |
| Focus Fund | | | — | | | 33,061,954 | | | — | | | 38,320,729 |
| Large Cap Financial Fund | | | — | | | 38,552,631 | | | — | | | 20,652,769 |
| Small Cap Financial Fund | | | — | | | 113,330,770 | | | — | | | 58,351,115 |
| Technology Fund | | | — | | | 4,357,934 | | | — | | | 7,619,266 |
| Gas Utility Fund | | | — | | | 50,846,762 | | | — | | | 25,538,599 |
| Balanced Fund | | | 5,463,593 | | | 6,562,045 | | | 3,290,169 | | | 8,323,964 |
| Core Bond Fund | | | 5,558,747 | | | 1,613,311 | | | 3,235,589 | | | 4,714,352 |
| The FBR Funds |
|
| Notes to Financial Statements (continued) (unaudited) |
6. Capital Share Transactions
| | | FBR Large Cap Fund | | | FBR Mid Cap Fund | | | FBR Small Cap Fund | |
| | |
| | |
| | |
| |
| | | For the | | | For the | | | For the | | | For the | | | For the | | | For the | |
| | | Six Months | | | Year | | | Six Months | | | Year | | | Six Months | | | Year | |
| | | Ended | | | Ended | | | Ended | | | Ended | | | Ended | | | Ended | |
| | | April 30, | | | October 31, | | | April 30, | | | October 31, | | | April 30, | | | October 31, | |
| | | 2011 | | | 2010 | | | 2011 | | | 2010 | | | 2011 | | | 2010 | |
| | |
| | |
| | |
| | |
| | |
| | |
| |
| Capital Transactions: | | | | | | | | | | | | | | | | | | | | | | | | |
| Investor Class | | | | | | | | | | | | | | | | | | | | | | | | |
Proceeds from Sale of Shares | | $ | 2,734,355 | | | $ | 7,328,586 | | | $ | 4,106,399 | | | $ | 2,685,688 | | | $ | 8,401,919 | | | $ | 3,925,758 | |
Reinvestment of Distributions | | | 49,420 | | | | 90,346 | | | | 16,440 | | | | 26,279 | | | | 97,256 | | | | 345,920 | |
Shares issued in connection with acquisition (Note 13) | | | — | | | | 1,621,780 | | | | — | | | | 3,045,738 | | | | — | | | | 14,556,430 | |
Cost of Shares Redeemed | | | (3,746,291 | ) | | | (12,614,455 | ) | | | (2,420,178 | ) | | | (6,568,277 | ) | | | (10,266,383 | ) | | | (5,996,292 | ) |
Redemption Fees | | | 169 | | | | 9,188 | | | | 10,302 | | | | 7,086 | | | | 3,952 | | | | 4,757 | |
| | |
| | |
| | |
| | |
| | |
| | |
| |
Investor Class Transactions | | $ | (962,347 | ) | | $ | (3,564,555 | ) | | $ | 1,712,963 | | | $ | (803,486 | ) | | $ | (1,763,256 | ) | | $ | 12,836,573 | |
| | |
| | |
| | |
| | |
| | |
| | |
| |
| Institutional Class | | | | | | | | | | | | | | | | | | | | | | | | |
Proceeds from Sale of Shares | | $ | 287,408 | | | $ | 475,689 | | | $ | 1,173,522 | | | $ | 266,105 | | | $ | 7,084,528 | | | $ | 514,320 | |
Reinvestment of Distributions | | | 38,467 | | | | 677 | | | | 6,088 | | | | 451 | | | | 14,633 | | | | 3,451 | |
Shares issued in connection with acquisition (Note 13) | | | — | | | | 30,273,086 | | | | — | | | | 11,321,429 | | | | — | | | | 7,405,298 | |
Cost of Shares Redeemed | | | (4,028,008 | ) | | | (1,283,059 | ) | | | (338,946 | ) | | | (519,721 | ) | | | (3,182,450 | ) | | | (319,530 | ) |
Redemption Fees | | | 42 | | | | 181 | | | | 13 | | | | 26 | | | | 64 | | | | 748 | |
| | |
| | |
| | |
| | |
| | |
| | |
| |
Institutional Class Transactions | | $ | (3,702,091 | ) | | $ | 29,466,574 | | | $ | 840,677 | | | $ | 11,068,290 | | | $ | 3,916,775 | | | $ | 7,604,287 | |
| | |
| | |
| | |
| | |
| | |
| | |
| |
| Net Increase (Decrease) from | | | | | | | | | | | | | | | | | | | | | | | | |
Capital Transactions | | $ | (4,664,438 | ) | | $ | 25,902,019 | | | $ | 2,553,640 | | | $ | 10,264,804 | | | $ | 2,153,519 | | | $ | 20,440,860 | |
| | |
| | |
| | |
| | |
| | |
| | |
| |
| Share Transactions: | | | | | | | | | | | | | | | | | | | | | | | | |
| Investor Class | | | | | | | | | | | | | | | | | | | | | | | | |
Sold | | | 233,218 | | | | 694,912 | | | | 325,845 | | | | 245,587 | | | | 658,268 | | | | 372,277 | |
Issued in Reinvestment of Distributions | | | 4,279 | | | | 8,654 | | | | 1,339 | | | | 2,559 | | | | 7,850 | | | | 34,573 | |
Shares issued in connection with acquisition (Note 13) | | | — | | | | 149,555 | | | | — | | | | 279,797 | | | | — | | | | 1,469,558 | |
Redeemed | | | (316,626 | ) | | | (1,232,179 | ) | | | (191,888 | ) | | | (640,740 | ) | | | (784,420 | ) | | | (585,767 | ) |
| | |
| | |
| | |
| | |
| | |
| | |
| |
Change in Investor Class Shares | | | (79,129 | ) | | | (379,058 | ) | | | 135,296 | | | | (112,797 | ) | | | (118,302 | ) | | | 1,290,641 | |
| | |
| | |
| | |
| | |
| | |
| | |
| |
| Institutional Class | | | | | | | | | | | | | | | | | | | | | | | | |
Sold | | | 28,141 | | | | 52,657 | | | | 106,132 | | | | 28,378 | | | | 595,609 | | | | 53,841 | |
Issued in Reinvestment of Distributions | | | 3,851 | | | | 75 | | | | 572 | | | | 51 | | | | 1,313 | | | | 382 | |
Shares issued in connection with acquisition (Note 13) | | | — | | | | 3,226,962 | | | | — | | | | 1,201,247 | | | | — | | | | 831,252 | |
Redeemed | | | (383,828 | ) | | | (139,807 | ) | | | (32,200 | ) | | | (55,355 | ) | | | (271,341 | ) | | | (33,681 | ) |
| | |
| | |
| | |
| | |
| | |
| | |
| |
Change in Institutional Class Shares | | | (351,836 | ) | | | 3,139,887 | | | | 74,504 | | | | 1,174,321 | | | | 325,581 | | | | 851,794 | |
| | |
| | |
| | |
| | |
| | |
| | |
| |
| Net Increase (Decrease) from | | | | | | | | | | | | | | | | | | | | | | | | |
Shares Transactions | | | (430,965 | ) | | | 2,760,829 | | | | 209,800 | | | | 1,061,524 | | | | 207,279 | | | | 2,142,435 | |
| | |
| | |
| | |
| | |
| | |
| | |
| |
| The FBR Funds |
|
| Notes to Financial Statements (continued) (unaudited) |
| | | | | | | | | | | FBR Large Cap | | | FBR Small Cap | |
| | | FBR Focus Fund | | | Financial Fund | | | Financial Fund | |
| | |
| | |
| | |
| |
| | | For the | | | For the | | | For the | | | For the | | | For the | | | For the | |
| | | Six Months | | | Year | | | Six Months | | | Year | | | Six Months | | | Year | |
| | | Ended | | | Ended | | | Ended | | | Ended | | | Ended | | | Ended | |
| | | April 30, | | | October 31, | | | April 30, | | | October 31, | | | April 30, | | | October 31, | |
| | | 2011 | | | 2010 | | | 2011 | | | 2010 | | | 2011 | | | 2010 | |
| | |
| | |
| | |
| | |
| | |
| | |
| |
| Capital Transactions: | | | | | | | | | | | | | | | | | | | | | | | | |
| Investor Class | | | | | | | | | | | | | | | | | | | | | | | | |
Proceeds from Sale of Shares | | $ | 81,014,968 | | | $ | 75,470,810 | | | $ | 25,709,410 | | | $ | 35,422,624 | | | $ | 79,758,900 | | | $ | 165,188,776 | |
Reinvestment of Distributions | | | 23,237,609 | | | | — | | | | — | | | | — | | | | 2,253,869 | | | | 703,797 | |
Cost of Shares Redeemed | | | (99,774,918 | ) | | | (329,622,691 | ) | | | (8,236,226 | ) | | | (22,600,491 | ) | | | (58,422,908 | ) | | | (148,830,452 | ) |
Redemption Fees | | | 42,406 | | | | 38,689 | | | | 9,382 | | | | 8,923 | | | | 74,265 | | | | 285,317 | |
| | |
| | |
| | |
| | |
| | |
| | |
| |
Investor Class Transactions | | $ | 4,520,065 | | | $ | (254,113,192 | ) | | $ | 17,482,566 | | | $ | 12,831,056 | | | $ | 23,664,126 | | | $ | 17,347,438 | |
| | |
| | |
| | |
| | |
| | |
| | |
| |
| Institutional Class | | | | | | | | | | | | | | | | | | | | | | | | |
Proceeds from Sale of Shares | | $ | 11,202,918 | | | $ | 11,535,684 | | | $ | — | | | $ | — | | | $ | 10,669,702 | | | $ | 17,573,779 | |
Reinvestment of Distributions | | | 1,290,549 | | | | 280,878 | | | | — | | | | — | | | | 503,727 | | | | 117,589 | |
Cost of Shares Redeemed | | | (2,506,088 | ) | | | (16,248,644 | ) | | | — | | | | — | | | | (4,604,530 | ) | | | (3,593,187 | ) |
Redemption Fees | | | 1,819 | | | | 613 | | | | — | | | | — | | | | 905 | | | | 6,071 | |
| | |
| | |
| | |
| | |
| | |
| | |
| |
Institutional Class Transactions | | $ | 9,989,198 | | | $ | (4,431,469 | ) | | $ | — | | | $ | — | | | $ | 6,569,804 | | | $ | 14,104,252 | |
| | |
| | |
| | |
| | |
| | |
| | |
| |
| R Class1 | | | | | | | | | | | | | | | | | | | | | | | | |
Proceeds from Sale of Shares | | $ | — | | | $ | 8,438 | | | $ | — | | | $ | — | | | $ | — | | | $ | 32,324 | |
Reinvestment of Distributions | | | — | | | | 314 | | | | — | | | | — | | | | — | | | | 486 | |
Cost of Shares Redeemed | | | — | | | | (214,467 | ) | | | — | | | | — | | | | — | | | | (178,883 | ) |
Redemption Fees | | | — | | | | 475 | | | | — | | | | — | | | | — | | | | 71 | |
| | |
| | |
| | |
| | |
| | |
| | |
| |
R Class Transactions | | $ | — | | | $ | (205,240 | ) | | $ | — | | | $ | — | | | $ | — | | | $ | (146,002 | ) |
| | |
| | |
| | |
| | |
| | |
| | |
| |
Net Increase (Decrease) from Capital Transactions | | $ | 14,509,263 | | | $ | (258,749,901 | ) | | $ | 17,482,566 | | | $ | 12,831,056 | | | $ | 30,233,930 | | | $ | 31,305,688 | |
| | |
| | |
| | |
| | |
| | |
| | |
| |
| Share Transactions: | | | | | | | | | | | | | | | | | | | | | | | | |
| Investor Class | | | | | | | | | | | | | | | | | | | | | | | | |
Sold | | | 1,614,650 | | | | 1,770,711 | | | | 1,787,924 | | | | 2,557,427 | | | | 4,014,218 | | | | 8,341,839 | |
Issued in Reinvestment of Distributions | | | 472,886 | | | | — | | | | — | | | | — | | | | 116,281 | | | | 41,158 | |
Redeemed | | | (2,002,719 | ) | | | (7,894,546 | ) | | | (598,577 | ) | | | (1,724,792 | ) | | | (2,969,123 | ) | | | (8,203,709 | ) |
| | |
| | |
| | |
| | |
| | |
| | |
| |
Change in Investor Class Shares | | | 84,817 | | | | (6,123,835 | ) | | | 1,189,347 | | | | 832,635 | | | | 1,161,376 | | | | 179,288 | |
| | |
| | |
| | |
| | |
| | |
| | |
| |
| Institutional Class | | | | | | | | | | | | | | | | | | | | | | | | |
Sold | | | 232,701 | | | | 4,845,377 | | | | — | | | | — | | | | 816,198 | | | | 1,407,327 | |
Issued in Reinvestment of Distributions | | | 26,215 | | | | 122,121 | | | | — | | | | — | | | | 40,227 | | | | 10,661 | |
Redeemed | | | (50,026 | ) | | | (7,337,675 | ) | | | — | | | | — | | | | (361,877 | ) | | | (309,180 | ) |
| | |
| | |
| | |
| | |
| | |
| | |
| |
Change in Institutional Class Shares2 | | | 208,890 | | | | (2,370,177 | ) | | | — | | | | — | | | | 494,548 | | | | 1,108,808 | |
| | |
| | |
| | |
| | |
| | |
| | |
| |
| R Class1 | | | | | | | | | | | | | | | | | | | | | | | | |
Sold | | | — | | | | 3,762 | | | | — | | | | — | | | | — | | | | 2,470 | |
Issued in Reinvestment of Distributions | | | — | | | | 141 | | | | — | | | | — | | | | — | | | | 44 | |
Redeemed | | | — | | | | (85,409 | ) | | | — | | | | — | | | | — | | | | (14,801 | ) |
| | |
| | |
| | |
| | |
| | |
| | |
| |
Change in R Class Shares | | | — | | | | (81,506 | ) | | | — | | | | — | | | | — | | | | (12,287 | ) |
| | |
| | |
| | |
| | |
| | |
| | |
| |
Net Increase (Decrease) from Shares Transactions | | | 293,707 | | | | (8,575,518 | ) | | | 1,189,347 | | | | 832,635 | | | | 1,655,924 | | | | 1,275,809 | |
| | |
| | |
| | |
| | |
| | |
| | |
| |
|
| 1 | As of the close of business on October 22, 2010, R Class Shares and dollars, as presented above, were converted to the Investor Class at the following rates: |
| Fund | | Shares | | Dollars |
| |
| |
|
| Focus | | 1,885 | | 88,385 |
| Small Cap Financial | | 728 | | 13,302 |
| 2 | Change in shares does not include reverse stock split effective December 10, 2010 of 13.2 million shares. |
| The FBR Funds |
|
| Notes to Financial Statements (continued) (unaudited) |
| | | | | | | | | | | FBR Gas Utility | |
| | | FBR Technology Fund | | | Index Fund | |
| | |
| | |
| |
| | | For the | | | For the | | | For the | | | For the | |
| | | Six Months | | | Year | | | Six Months | | | Year | |
| | | Ended | | | Ended | | | Ended | | | Ended | |
| | | April 30, | | | October 31, | | | April 30, | | | October 31, | |
| | | 2011 | | | 2010 | | | 2011 | | | 2010 | |
| | |
| | |
| | |
| | |
| |
| Capital Transactions: | | | | | | | | | | | | | | | | |
| Investor Class | | | | | | | | | | | | | | | | |
Proceeds from Sale of Shares | | $ | 657,479 | | | $ | 4,502,499 | | | $ | 42,311,295 | | | $ | 37,521,462 | |
Reinvestment of Distributions | | | — | | | | — | | | | 5,813,711 | | | | 7,473,451 | |
Shares issued in connection with acquisition (Note 13) | | | — | | | | 3,467,076 | | | | — | | | | — | |
Cost of Shares Redeemed | | | (1,740,757 | ) | | | (9,466,250 | ) | | | (15,895,260 | ) | | | (30,322,875 | ) |
Redemption Fees | | | — | | | | 9,864 | | | | — | | | | 18,301 | |
| | |
| | |
| | |
| | |
| |
Investor Class Transactions | | $ | (1,083,278 | ) | | $ | (1,486,811 | ) | | $ | 32,229,746 | | | $ | 14,690,339 | |
| | |
| | |
| | |
| | |
| |
| Institutional Class1 | | | | | | | | | | | | | | | | |
Proceeds from Sale of Shares | | $ | 101,570 | | | $ | 136,186 | | | $ | — | | | $ | — | |
Reinvestment of Distributions | | | — | | | | — | | | | — | | | | — | |
Cost of Shares Redeemed | | | (3,504,300 | ) | | | (1,835,881 | ) | | | — | | | | — | |
Shares issued in connection with acquisition (Note 13) | | | — | | | | 6,031,138 | | | | — | | | | — | |
Redemption Fees | | | — | | | | 22 | | | | — | | | | — | |
| | |
| | |
| | |
| | |
| |
Institutional Class Transactions | | $ | (3,402,730 | ) | | $ | 4,331,465 | | | $ | — | | | $ | — | |
| | |
| | |
| | |
| | |
| |
| R Class2 | | | | | | | | | | | | | | | | |
Proceeds from Sale of Shares | | $ | — | | | $ | — | | | $ | — | | | $ | 22,330 | |
Reinvestment of Distributions | | | — | | | | — | | | | — | | | | 9,429 | |
Cost of Shares Redeemed | | | — | | | | — | | | | — | | | | (134,638 | ) |
Redemption Fees | | | — | | | | — | | | | — | | | | — | |
| | |
| | |
| | |
| | |
| |
R Class Transactions | | $ | — | | | $ | — | | | $ | — | | | $ | (102,879 | ) |
| | |
| | |
| | |
| | |
| |
Net Increase (Decrease) from Capital Transactions | | $ | (4,486,008 | ) | | $ | 2,844,654 | | | $ | 32,229,746 | | | $ | 14,587,460 | |
| | |
| | |
| | |
| | |
| |
| Share Transactions: | | | | | | | | | | | | | | | | |
| Investor Class | | | | | | | | | | | | | | | | |
Sold | | | 57,078 | | | | 442,474 | | | | 2,221,223 | | | | 2,250,826 | |
Issued in Reinvestment of Distributions | | | — | | | | — | | | | 318,144 | | | | 459,731 | |
Shares issued in connection with acquisition (Note 13) | | | — | | | | 331,367 | | | | — | | | | — | |
Redeemed | | | (148,392 | ) | | | (954,032 | ) | | | (854,934 | ) | | | (1,822,655 | ) |
| | |
| | |
| | |
| | |
| |
Change in Investor Class Shares | | | (91,314 | ) | | | (180,191 | ) | | | 1,684,433 | | | | 887,902 | |
| | |
| | |
| | |
| | |
| |
| Institutional Class1 | | | | | | | | | | | | | | | | |
Sold | | | 6,923 | | | | 13,080 | | | | — | | | | — | |
Issued in Reinvestment of Distributions | | | — | | | | — | | | | — | | | | — | |
Shares issued in connection with acquisition (Note 13) | | | — | | | | 576,427 | | | | — | | | | — | |
Redeemed | | | (310,497 | ) | | | (170,353 | ) | | | — | | | | — | |
| | |
| | |
| | |
| | |
| |
Change in Institutional Class Shares | | | (303,574 | ) | | | 419,154 | | | | — | | | | — | |
| | |
| | |
| | |
| | |
| |
| R Class2 | | | | | | | | | | | | | | | | |
Sold | | | — | | | | — | | | | — | | | | 3,218 | |
Issued in Reinvestment of Distributions | | | — | | | | — | | | | — | | | | 1,438 | |
Redeemed | | | — | | | | — | | | | — | | | | (19,029 | ) |
| | |
| | |
| | |
| | |
| |
Change in R Class Shares | | | — | | | | — | | | | — | | | | (14,373 | ) |
| | |
| | |
| | |
| | |
| |
Net Increase (Decrease) from Shares Transactions | | | (394,888 | ) | | | 238,963 | | | | 1,684,433 | | | | 873,529 | |
| | |
| | |
| | |
| | |
| |
|
| 1 | Represents the period from commencement of operation (March 12, 2010) through October 31, 2010. |
| 2 | As of the close of business on October 22, 2010, R Class Shares and dollars, as presented above, were converted to the Investor Class at the following rates: |
| Fund | | Shares | | Dollars |
| |
| |
|
| Gas Utility Index | | 2,227 | | 39,647 |
The FBR Funds
Notes to Financial Statements (continued) (unaudited)
| | | FBR Balanced Fund | | | FBR Core Bond Fund | |
| | |
| | |
| |
| | | For the | | | For the Period | | | For the | | | For the | | | For the Period | | | For the | |
| | | Six Months | | | April 1, | | | Year | | | Six Months | | | April 1, | | | Year | |
| | | Ended | | | 2010 to | | | Ended | | | Ended | | | 2010 to | | | Ended | |
| | | April 30, | | | October 31, | | | March 31, | | | April 30, | | | October 31, | | | March 31, | |
| | | 2011 | | | 20101 | | | 2010 | | | 2011 | | | 20101 | | | 2010 | |
| | |
| | |
| | |
| | |
| | |
| | |
| |
| Capital Transactions: | | | | | | | | | | | | | | | | | | | | | | | | |
| Investor Class | | | | | | | | | | | | | | | | | | | | | | | | |
Proceeds from Sale of Shares | | $ | 4,457,992 | | | $ | 4,484,381 | | | $ | 32,146,517 | | | $ | 367,522 | | | $ | 513,557 | | | $ | 3,653,595 | |
Reinvestment of Dividends | | | 420,683 | | | | 521,342 | | | | 633,192 | | | | 124,932 | | | | 85,007 | | | | 104,494 | |
Cost of Shares Redeemed | | | (6,511,655 | ) | | | (11,758,359 | ) | | | (9,773,718 | ) | | | (878,148 | ) | | | (968,404 | ) | | | (1,905,453 | ) |
Redemption Fees | | | 2,491 | | | | 3,433 | | | | 4,218 | | | | 228 | | | | 473 | | | | 595 | |
| | |
| | |
| | |
| | |
| | |
| | |
| |
Investor Class Transactions | | $ | (1,630,489 | ) | | $ | (6,749,203 | ) | | $ | 23,010,209 | | | $ | (385,466 | ) | | $ | (369,367 | ) | | $ | 1,853,231 | |
| | |
| | |
| | |
| | |
| | |
| | |
| |
| Institutional Class | | | | | | | | | | | | | | | | | | | | | | | | |
Proceeds from Sale of Shares | | $ | 2,849,685 | | | $ | 2,541,008 | | | $ | 1,841,926 | | | $ | 105,387 | | | $ | 118,540 | | | $ | 519,301 | |
Reinvestment of Dividends | | | 283,844 | | | | 302,152 | | | | 570,113 | | | | 144,230 | | | | 118,753 | | | | 227,059 | |
Cost of Shares Redeemed | | | (1,224,670 | ) | | | (1,497,600 | ) | | | (3,125,016 | ) | | | (336,739 | ) | | | (909,769 | ) | | | (432,948 | ) |
Redemption Fees | | | 14 | | | | (101 | ) | | | 6,396 | | | | 5 | | | | (75 | ) | | | 75 | |
| | |
| | |
| | |
| | |
| | |
| | |
| |
Institutional Class Transactions | | $ | 1,908,873 | | | $ | 1,345,459 | | | $ | (706,581 | ) | | $ | (87,117 | ) | | $ | (672,551 | ) | | $ | 313,487 | |
| | |
| | |
| | |
| | |
| | |
| | |
| |
| Class B | | | | | | | | | | | | | | | | | | | | | | | | |
Proceeds from Sale of Shares | | $ | — | | | $ | — | | | $ | 1,514 | | | $ | — | | | $ | — | | | $ | — | |
Reinvestment of Dividends | | | — | | | | — | | | | 5,250 | | | | — | | | | — | | | | 7,850 | |
Cost of Shares Redeemed2 | | | — | | | | — | | | | (1,559,965 | ) | | | — | | | | — | | | | (1,345,474 | ) |
Redemption Fees | | | — | | | | — | | | | 30 | | | | — | | | | — | | | | — | |
| | |
| | |
| | |
| | |
| | |
| | |
| |
Class B Transactions | | $ | — | | | $ | — | | | $ | (1,553,171 | ) | | $ | — | | | $ | — | | | $ | (1,337,624 | ) |
| | |
| | |
| | |
| | |
| | |
| | |
| |
| Class C | | | | | | | | | | | | | | | | | | | | | | | | |
Proceeds from Sale of Shares | | $ | — | | | $ | — | | | $ | 5,316,509 | | | $ | — | | | $ | — | | | $ | 383,435 | |
Reinvestment of Dividends | | | — | | | | — | | | | 341,418 | | | | — | | | | — | | | | 41,953 | |
Cost of Shares Redeemed3 | | | — | | | | — | | | | (26,216,819 | ) | | | — | | | | — | | | | (1,307,212 | ) |
Redemption Fees | | | — | | | | — | | | | 3,390 | | | | — | | | | — | | | | — | |
| | |
| | |
| | |
| | |
| | |
| | |
| |
Class C Transactions | | $ | — | | | $ | — | | | $ | (20,555,502 | ) | | $ | — | | | $ | — | | | $ | (881,824 | ) |
| | |
| | |
| | |
| | |
| | |
| | |
| |
Net Increase (Decrease) from Capital Transactions | | $ | 278,384 | | | $ | (5,403,744 | ) | | $ | 194,955 | | | $ | (472,583 | ) | | $ | (1,041,918 | ) | | $ | (52,730 | ) |
| | |
| | |
| | |
| | |
| | |
| | |
| |
131
The FBR Funds
Notes to Financial Statements (continued) (unaudited)
| | | FBR Balanced Fund | | | FBR Core Bond Fund | |
| | |
| | |
| |
| | | For the | | | For the Period | | | For the | | | For the | | | For the Period | | | For the | |
| | | Six Months | | | April 1, | | | Year | | | Six Months | | | April 1, | | | Year | |
| | | Ended | | | 2010 to | | | Ended | | | Ended | | | 2010 to | | | Ended | |
| | | April 30, | | | October 31, | | | March 31, | | | April 30, | | | October 31, | | | March 31, | |
| | | 2011 | | | 20101 | | | 2010 | | | 2011 | | | 20101 | | | 2010 | |
| | |
| | |
| | |
| | |
| | |
| | |
| |
| Share Transactions: | | | | | | | | | | | | | | | | | | | | | | | | |
| Investor Class | | | | | | | | | | | | | | | | | | | | | | | | |
Sold | | | 361,240 | | | | 386,667 | | | | 2,792,865 | | | | 38,649 | | | | 53,515 | | | | 393,512 | |
Issued in Reinvestment of Distributions | | | 34,017 | | | | 46,160 | | | | 58,384 | | | | 13,287 | | | | 8,815 | | | | 11,269 | |
Redeemed | | | (530,524 | ) | | | (1,015,977 | ) | | | (904,179 | ) | | | (92,702 | ) | | | (101,005 | ) | | | (148,213 | ) |
| | |
| | |
| | |
| | |
| | |
| | |
| |
Investor Class Transactions | | | (135,267 | ) | | | (583,150 | ) | | | 1,947,070 | | | | (40,766 | ) | | | (38,675 | ) | | | 256,568 | |
| | |
| | |
| | |
| | |
| | |
| | |
| |
| Institutional Class | | | | | | | | | | | | | | | | | | | | | | | | |
Sold | | | 242,338 | | | | 226,162 | | | | 184,464 | | | | 12,059 | | | | 13,329 | | | | 60,904 | |
Issued in Reinvestment of Distributions | | | 24,068 | | | | 27,964 | | | | 55,198 | | | | 16,671 | | | | 13,358 | | | | 26,557 | |
Redeemed | | | (105,194 | ) | | | (134,274 | ) | | | (307,725 | ) | | | (38,174 | ) | | | (101,075 | ) | | | (50,693 | ) |
| | |
| | |
| | |
| | |
| | |
| | |
| |
Institutional Class Transactions | | | 161,212 | | | | 119,852 | | | | (68,063 | ) | | | (9,444 | ) | | | (74,388 | ) | | | 36,768 | |
| | |
| | |
| | |
| | |
| | |
| | |
| |
| Class B | | | | | | | | | | | | | | | | | | | | | | | | |
Sold | | | — | | | | — | | | | 163 | | | | — | | | | — | | | | — | |
Issued in Reinvestment of Distributions | | | — | | | | — | | | | 548 | | | | — | | | | — | | | | 891 | |
Redeemed2 | | | — | | | | — | | | | (123,582 | ) | | | — | | | | — | | | | (152,747 | ) |
| | |
| | |
| | |
| | |
| | |
| | |
| |
Class B Transactions | | | — | | | | — | | | | (122,871 | ) | | | — | | | | — | | | | (151,856 | ) |
| | |
| | |
| | |
| | |
| | |
| | |
| |
| Class C | | | | | | | | | | | | | | | | | | | | | | | | |
Sold | | | — | | | | — | | | | 527,911 | | | | — | | | | — | | | | 42,457 | |
Issued in Reinvestment of Distributions | | | — | | | | — | | | | 32,222 | | | | — | | | | — | | | | 4,689 | |
Redeemed3 | | | — | | | | — | | | | (2,280,810 | ) | | | — | | | | — | | | | (199,294 | ) |
| | |
| | |
| | |
| | |
| | |
| | |
| |
Class C Transactions | | | — | | | | — | | | | (1,720,677 | ) | | | — | | | | — | | | | (152,148 | ) |
| | |
| | |
| | |
| | |
| | |
| | |
| |
Net Increase (Decrease) from Shares Transactions | | | 25,945 | | | | (463,298 | ) | | | 35,459 | | | | (50,210 | ) | | | (113,063 | ) | | | (10,668 | ) |
| | |
| | |
| | |
| | |
| | |
| | |
| |
|
| 1 | | The Funds changed their fiscal year end from March 31 to October 31. |
| 2 | | As of the close of business on July 31, 2009, Class B Shares and dollars, as presented above, were converted to the Advisor Class (name changed to Investor Class) at the following rates: |
| Fund | | | Shares | | | Dollars |
| | |
| | |
|
| Balanced | | | 116,509 | | | 1,194,212 |
| Total Return Bond | | | 141,233 | | | 1,292,283 |
| 3 | | As of the close of business on March 12, 2010, Class C Shares and dollars, as presented above, were converted to the Investor Class at the following rates: |
| Fund | | | Shares | | | Dollars |
| | |
| | |
|
| Balanced | | | 1,752,189 | | | 20,027,830 |
| Total Return Bond | | | 157,483 | | | 1,482,408 |
132
The FBR Funds
Notes to Financial Statements (continued) (unaudited)
7. Federal Income Taxes
It is each Fund’s policy to continue to comply with the special provisions of the Internal Revenue Code that are applicable to regulated investment companies. As provided therein, in any fiscal year in which a Fund so qualifies and distributes at least 90% of its taxable net income, the Fund (but not the shareholders) will be relieved of federal income tax on the income distributed. Accordingly, no provision for income taxes has been made.
In order to avoid imposition of the excise tax applicable to regulated investment companies, it is also each Fund’s intention to declare and pay as dividends in each calendar year at least 98% of its net investment income (earned during the calendar year) and 98% of its net realized capital gains (earned during the twelve months ending October 31) plus undistributed amounts from prior years.
Income and capital gain distributions are determined in accordance with income tax regulations that may differ from accounting principles that are generally accepted in the United States of America. As a result, the character of tax-basis distributions and the composition of net assets for tax purposes may differ from those reflected in the Funds’ financial statements. These book/tax differences may be temporary or permanent in nature. Temporary differences are primarily the result of wash sales. Reclassifications for permanent differences are made to components of capital. These reclassifications have no effect on net assets or net asset value per share.
The tax character of distributions paid for each Fund’s tax year was as follows:
| | | | | | | | Long-Term | | Return of |
| | | Ordinary Income | | Capital Gains | | Capital |
| | |
| |
| |
|
| | | | Dollar | | | Dollar | | | Dollar | |
| | | | Amount | | | Amount | | | Amount | |
| | | |
| | |
| | |
| |
| Large Cap Fund | | | | | | | | | | | | | |
For the Year Ended October 31, 2010 | | | $ | 94,558 | | | $ | — | | | $ | — | |
For the Year Ended October 31, 2009 | | | | 38,623 | | | | — | | | | — | |
| Mid Cap Fund | | | | | | | | | | | | | |
For the Year Ended October 31, 2010 | | | | 26,791 | | | | — | | | | — | |
For the Year Ended October 31, 2009 | | | | 72,339 | | | | — | | | | — | |
| Small Cap Fund | | | | | | | | | | | | | |
For the Year Ended October 31, 2010 | | | | 353,677 | | | | — | | | | — | |
For the Year Ended October 31, 2009 | | | | — | | | | — | | | | — | |
| Focus Fund | | | | | | | | | | | | | |
For the Year Ended October 31, 2010 | | | | 282,614 | | | | — | | | | — | |
For the Year Ended October 31, 2009 | | | | — | | | | 106,380,482 | | | | — | |
| Large Cap Financial Fund | | | | | | | | | | | | | |
For the Year Ended October 31, 2010 | | | | — | | | | — | | | | — | |
For the Year Ended October 31, 2009 | | | | 243,517 | | | | — | | | | — | |
| Small Cap Financial Fund | | | | | | | | | | | | | |
For the Year Ended October 31, 2010 | | | | 866,424 | | | | — | | | | — | |
For the Year Ended October 31, 2009 | | | | 2,344,398 | | | | — | | | | — | |
133
The FBR Funds
Notes to Financial Statements (continued) (unaudited)
| | | | | | | | Long-Term | | Return of |
| | | Ordinary Income | | Capital Gains | | Capital |
| | |
| |
| |
|
| | | | Dollar | | | Dollar | | | Dollar | |
| | | | Amount | | | Amount | | | Amount | |
| | | |
| | |
| | |
| |
| Technology Fund | | | | | | | | | | | | | |
For the Year Ended October 31, 2010 | | | $ | — | | | $ | — | | | $ | — | |
For the Year Ended October 31, 2009 | | | | — | | | | — | | | | — | |
| Gas Utility Index Fund | | | | | | | | | | | | | |
For the Year Ended October 31, 2010 | | | | 7,800,261 | | | | 249,041 | | | | — | |
For the Year Ended October 31, 2009 | | | | 6,301,517 | | | | 9,585,471 | | | | — | |
| Balanced Fund | | | | | | | | | | | | | |
For the Period Ended October 31, 2010 | | | | 1,180,776 | | | | — | | | | — | |
For the Year Ended March 31, 2010 | | | | 2,305,981 | | | | — | | | | — | |
For the Year Ended March 31, 2009 | | | | 2,392,955 | | | | 495,704 | | | | 243,198 | |
| Core Bond Fund | | | | | | | | | | | | | |
For the Period Ended October 31, 2010 | | | | 738,749 | | | | — | | | | — | |
For the Year Ended March 31, 2010 | | | | 1,277,489 | | | | 154,005 | | | | — | |
For the Year Ended March 31, 2009 | | | | 1,037,660 | | | | — | | | | — | |
The following information is computed on a tax basis for each item:
| | | As of October 31, 2010 | |
| | |
| |
| | | | | | | | | | | | | | | | | | | Large Cap | |
| | | Large Cap | | | Mid Cap | | | Small Cap | | | Focus | | | Financial | |
| | | Fund | | | Fund | | | Fund | | | Fund | | | Fund | |
| | |
| | |
| | |
| | |
| | |
| |
| Tax cost of investment securities | | $ | 42,551,822 | | | $ | 18,728,450 | | | $ | 32,923,713 | | | $ | 405,200,861 | | | $ | 50,461,861 | |
| | |
| | |
| | |
| | |
| | |
| |
| Gross unrealized appreciation | | | 4,267,136 | | | | 1,493,243 | | | | 3,389,707 | | | | 314,922,365 | | | | 1,136,250 | |
| Gross unrealized depreciation | | | — | | | | — | | | | (1,083,589 | ) | | | (11,379,106 | ) | | | (3,532,632 | ) |
| | |
| | |
| | |
| | |
| | |
| |
| | | | | | | | | | | | | | | | | | | | | |
| Net unrealized appreciation (depreciation) | | | 4,267,136 | | | | 1,493,243 | | | | 2,306,118 | | | | 303,543,259 | | | | (2,396,382 | ) |
| Undistributed ordinary income | | | 137,874 | | | | 23,354 | | | | 10,212 | | | | — | | | | — | |
| Undistributed long-term capital gains | | | — | | | | — | | | | — | | | | 25,360,214 | | | | — | |
| Capital loss carryforward | | | (13,666,168 | ) | | | (4,478,465 | ) | | | (14,878,093 | ) | | | — | | | | (1,172,377 | ) |
| | |
| | |
| | |
| | |
| | |
| |
| Accumulated earnings (deficit) | | $ | (9,261,158 | ) | | $ | (2,961,868 | ) | | $ | (12,561,763 | ) | | $ | 328,903,473 | | | $ | (3,568,759 | ) |
| | |
| | |
| | |
| | |
| | |
| |
| | | As of October 31, 2010 | |
| | |
| |
| | | Small Cap | | | | | | | Gas Utility | | | | | | | | | | |
| | | Financial | | | Technology | | | Index | | | Balanced | | | Core Bond | |
| | | Fund | | | Fund | | | Fund | | | Fund | | | Fund | |
| | |
| | |
| | |
| | |
| | |
| |
| Tax cost of investment securities | | $ | 235,356,681 | | | $ | 11,550,070 | | | $ | 153,724,545 | | | $ | 74,590,517 | | | $ | 26,687,384 | |
| | |
| | |
| | |
| | |
| | |
| |
| Gross unrealized appreciation | | | 20,588,897 | | | | 976,715 | | | | 91,515,344 | | | | 11,443,673 | | | | 2,367,297 | |
| Gross unrealized depreciation | | | (13,425,996 | ) | | | (255,898 | ) | | | (1,407,612 | ) | | | (2,545,205 | ) | | | (559,458 | ) |
| | |
| | |
| | |
| | |
| | |
| |
| | | | | | | | | | | | | | | | | | | | | |
| Net unrealized appreciation | | | 7,162,901 | | | | 720,817 | | | | 90,107,732 | | | | 8,898,468 | | | | 1,807,839 | |
| Undistributed ordinary income | | | 2,467,641 | | | | — | | | | 279,208 | | | | 95,782 | | | | 27,666 | |
| Undistributed long-term capital gains | | | — | | | | — | | | | 2,612,224 | | | | — | | | | 447,915 | |
| Capital loss carryforward | | | — | | | | (3,183,740 | ) | | | — | | | | (8,002,724 | ) | | | — | |
| | |
| | |
| | |
| | |
| | |
| |
| Accumulated earnings (deficit) | | $ | 9,630,542 | | | $ | (2,462,923 | ) | | $ | 92,999,164 | | | $ | 991,526 | | | $ | 2,283,420 | |
| | |
| | |
| | |
| | |
| | |
| |
134
The FBR Funds
Notes to Financial Statements (continued) (unaudited)
Unused capital loss carryforwards as of October 31, 2010, were as follows:
| | | Amount | | | Expires October 31, |
| | |
| | |
|
| Large Cap Fund | | $ | 683,175 | | | 2015 |
| Large Cap Fund | | | 8,818,067 | | | 2016 |
| Large Cap Fund | | | 4,164,926 | | | 2017 |
| Mid Cap Fund | | | 958,128 | | | 2016 |
| Mid Cap Fund | | | 3,520,337 | | | 2017 |
| Small Cap Fund | | | 10,278,985 | | | 2016 |
| Small Cap Fund | | | 4,599,108 | | | 2017 |
| Large Cap Financial Fund | | | 10,229 | | | 2016 |
| Large Cap Financial Fund | | | 1,162,148 | | | 2017 |
| Technology Fund | | | 1,275,695 | | | 2016 |
| Technology Fund | | | 1,908,045 | | | 2017 |
| Balanced Fund | | | 3,245,429 | | | 2016 |
| Balanced Fund | | | 4,757,295 | | | 2017 |
During the year ended October 31, 2010, the Large Cap Fund, Mid Cap Fund, Small Cap Fund, Focus Fund, Large Cap Financial Fund, Small Cap Financial Fund and the Technology Fund utilized $1,461,832, $703,394, $1,065,369, $9,577,506, $2,235,403, $6,355,292, and $1,406,135 of capital loss carryforwards, respectively. During the period ended October 31, 2010, the Balanced Fund utilized $1,854,484 of capital loss carryforwards. The capital loss carryforwards may be utilized in future years to offset net realized capital gains, if any, prior to distributing such gains to shareholders.
8. Investments in Affiliates
Affiliated issuers, as defined by the 1940 Act, are those in which a Fund’s holdings represent 5% or more of the outstanding voting securities of the issuer. A summary of each Fund’s investments in affiliates, if any, for the six months ended April 30, 2011, is noted below:
| | | | SHARE ACTIVITY | | | | | | | | | | | | | | | | | | | |
| | | |
| | | | | | | | | | | | | | | | | | | |
| | | Balance | | | | | | | | Balance | | | Realized | | | | | | | Value | | | Acquisition |
| Affiliate | | 10/31/10 | | Purchases | | | Sales | | 4/30/11 | | | Gain (Loss) | | | Dividends | | | 04/30/11 | | | Cost |
|
| FBR Focus Fund | | | | | | | | | | | | | | | | | | | | | | | | | | | | |
99 Cents Only Stores | | | 3,810,235 | | | — | | | — | | | 3,810,235 | | | $ | — | | | $ | — | | | $ | 76,814,338 | | | $ | 38,109,786 |
9. Payment by Affiliate
During the fiscal year ended October 31, 2009, Fund Advisers voluntarily reimbursed the FBR Small Cap Fund $7,834, in connection with the Fund’s inadvertent investment in the shares of another investment company which was made by Fund Advisers in excess of applicable investment limitations. This reimbursement has been classified in the Fund’s Financial Highlights as “Net increase from payments by affiliates”.
135
The FBR Funds
Notes to Financial Statements (continued) (unaudited)
10. Commitments and Contingencies
In the normal course of business, the Funds enter into contracts that contain a variety of representations and warranties and which provide general indemnifications. The Funds’ maximum exposure under these arrangements is unknown, as this would involve future claims that may be made against the Funds that have not yet occurred. However, based on experience, the Funds expect the risk of loss to be remote.
11. Subsequent Events
ASC Topic 855, “Subsequent events” occurring after April 30, 2011 have been evaluated for potential impact to this report through the date the financial statements were issued. There were no subsequent events to report that would have a material impact on the Funds’ financial statements.
12. Acquisition and Reorganization
On March 12, 2010, the FBR Large Cap Fund acquired all of the assets and liabilities of AFBA 5Star Large Cap Growth Fund. The acquisition was accomplished by a tax-free exchange of 149,555 shares of Investor Class and 3,226,962 shares of I Class of the fund (valued at $31,894,866) for all of the assets and liabilities of AFBA 5Star Large Cap Growth Fund. The acquired fund then distributed the shares it received from the fund to its shareholders. AFBA 5Star Large Cap Growth Fund’s net assets on that date were $31,889,385 including $2,287,467 of unrealized appreciation, and $(14,814,733) of accumulated net realized loss on investments. The aggregate net assets of the fund after the acquisition were $51,870,712.
On March 12, 2010, the FBR Mid Cap Fund acquired all of the assets and liabilities of AFBA 5Star Mid Cap Fund. The acquisition was accomplished by a tax-free exchange of 279,797 shares of Investor Class and 1,201,247 shares of I Class of the fund (valued at $14,367,167) for all of the assets and liabilities of AFBA 5Star Mid Cap Fund. The acquired fund then distributed the shares it received from the fund to its shareholders. AFBA 5Star Mid Cap Fund’s net assets on that date were $14,367,167 including $673,442 of unrealized appreciation, and $(5,068,954) of accumulated net realized loss on investments. The aggregate net assets of the fund after the acquisition were $21,225,730.
On March 12, 2010, the FBR Small Cap Growth Fund, formerly, FBR Pegasus Small Cap Growth Fund acquired all of the assets and liabilities of AFBA 5Star Small Cap Fund. The acquisition was accomplished by a tax-free exchange of 1,199,929 shares of Investor Class and 860,878 shares of I Class of the fund (valued at $21,761,430) for all of the assets and liabilities of AFBA 5Star Small Cap Fund. The acquired fund then distributed the shares it received from the fund to its shareholders. AFBA 5Star Small Cap Fund’s net assets on that date were $21,761,430 including $703,098 of unrealized appreciation. The aggregate net assets of the fund after the acquisition were $29,221,690. Effective as of the close of business on August 27, 2010, the FBR Pegasus Small Cap Growth FundTM (the “Acquired Fund”) was reorganized into the FBR Small Cap Fund (the “Acquiring Fund”) in a transaction pursuant to which all of the assets of the Acquired fund were transferred to
136
The FBR Funds
Notes to Financial Statements (continued) (unaudited)
the Acquiring Fund and shareholders of the Acquired Fund became shareholders of the Acquiring Fund. Accordingly, as of the closing date, shares of the Acquired Fund were no longer offered or sold. FBR Pegasus Small Cap GrowthTM net assets on that date were $21,961,696 including ($1,858,984) of unrealized depreciation and ($15,943,462) accumulated net realized loss on investments. The aggregate net assets of the fund after the reorganization was $31,347,737.
On March 12, 2010, the FBR Technology Fund acquired all of the assets and liabilities of AFBA 5Star Science & Technology Fund. The acquisition was accomplished by a tax-free exchange of 331,367 shares of Investor Class and 576,427 shares of I Class of the fund (valued at $9,498,214) for all of the assets and liabilities of AFBA 5Star Science & Technology Fund. The acquired fund then distributed the shares it received from the fund to its shareholders. AFBA 5Star Science & Technology Fund’s net assets on that date were $9,498,214 including $58,764 of unrealized appreciation. The aggregate net assets of the fund after the acquisition were $20,831,958. Immediately following this acquisition, the FBR Technology Fund I Class shares commenced operations.
Effective as of the close of business on October 22, 2010, the R Class shares of the FBR Focus Fund, FBR Small Cap Financial Fund and FBR Gas Utility Index Fund were closed. Outstanding shares were exchanged for Investor Class shares of the same Fund having an aggregate net asset value equal to the aggregate net asset value of the R Class shares so exchanged.
137
The FBR Funds
Important Supplemental Information (unaudited)
Proxy Voting Guidelines
Fund Advisers is responsible for exercising the voting rights associated with the securities purchased and held by the Funds. A description of the policies and procedures Fund Advisers uses in fulfilling this responsibility is included in the Funds’ Statement of Additional Information and is available without charge, upon request, by calling 888.888.0025. The policies and procedures are also available on the Securities and Exchange Commission’s (“SEC”) website at http://www.sec.gov. Information on how the Funds voted proxies relating to portfolio securities during the most recent 12 month period ended June 30 is available without charge, upon request, by calling 888.888.0025 and is also available on the SEC’s website at http://www.sec.gov.
Portfolio Holdings
The Funds file their complete schedule of holdings with the SEC for the first and third quarters of each fiscal year on Form N-Q. The Funds’ Form N-Q is available on the SEC’s website at http://www.sec.gov. You may review and make copies at the SEC’s Public Reference Room in Washington, D.C. You may also obtain copies after paying a duplicating fee by writing the SEC’s Public Reference Section, Washington, D.C. 20549-0102 or by electronic request to publicinfo@sec.gov. Information on the operation of the Public Reference Room may be obtained by calling 800.SEC.0330. A copy of the quarterly holdings report is available, without charge, upon request, by calling 888.888.0025.
138
THE FBR FUNDS
888.888.0025
fbrfundsinfo@fbr.com
www.fbrfunds.com
Investment Adviser
FBR FUND ADVISERS, INC.
1001 NINETEENTH STREET NORTH
ARLINGTON, VIRGINIA 22209
Distributor
FBR INVESTMENT SERVICES, INC.
1001 NINETEENTH STREET NORTH
ARLINGTON, VIRGINIA 22209
Independent Registered Public Accounting Firm
TAIT, WELLER, AND BAKER LLP
1818 MARKET STREET
PHILADELPHIA, PENNSYLVANIA 19103
This report is not authorized
for distribution to prospective
investors unless it is preceded or
accompanied by a current prospectus.
ITEM 2. CODE OF ETHICS.
Not applicable for semiannual reports.
ITEM 3. AUDIT COMMITTEE FINANCIAL EXPERT.
Not applicable for semiannual reports.
ITEM 4. PRINCIPAL ACCOUNTANT FEES AND SERVICES.
Not applicable for semiannual reports.
ITEMS 5. AUDIT COMMITTEE OF LISTED REGISTRANTS.
Not applicable.
ITEM 6. SCHEDULE OF INVESTMENTS.
Contained in Item 1.
ITEM 7. DISCLOSURE OF PROXY VOTING POLICIES AND PROCEDURES FOR CLOSED-END MANAGEMENT INVESTMENT COMPANIES.
Not applicable.
ITEM 8. PORTFOLIO MANAGERS OF CLOSED-END MANAGEMENT INVESTMENT COMPANIES.
Not applicable.
ITEM 9. PURCHASES OF EQUITY SECURITIES BY CLOSED-END MANAGEMENT INVESTMENT COMPANY AND AFFLIIATED PURCHASERS.
Not applicable.
ITEM 10. SUBMISSION OF MATTERS TO A VOTE OF SECURITY HOLDERS.
There have been no material changes to the procedures by which shareholders may recommend nominees to the Board.
ITEM 11. CONTROLS AND PROCEDURES.
| (a) | | Based upon their evaluation of the Registrant’s disclosure controls and procedures as conducted within 90 days of the filing date of this Form N-CSR, the Registrant’s PFO and PEO have concluded that those disclosure controls and procedures provide reasonable assurance that the material information required to be disclosed by the Registrant in this Form N-CSR has been recorded, processed, summarized and reported within the time periods specified in the Securities and Exchange Commission’s rules and forms. |
| (b) | | There were no changes in the Registrant’s internal controls over financial reporting as defined in Rule 30a-3(d) under the Act (17 CFR 270.30a-3(d)) that occurred during the second fiscal half-year of the period covered by this report that has materially affected, or is reasonably likely to materially affect, the Registrant’s internal control over financial reporting. |
| ITEM 12. EXHIBITS. |
|
| File the exhibits listed below as part of this Form. Letter or number the exhibits in the sequence indicated. |
| (a) | | (1) Not applicable. |
| | | (2) A separate certification for each principal executive officer and principal financial officer of the Registrant as required by Rule 30a-2(a) under the Act (17 CFR 270.30a-2): Attached herewith. |
| | | (3) Not applicable. |
| (b) | | (1) The certifications required by Rule 30a-2(b) of the Investment Company Act of 1940 and Section 906 of the Sarbanes-Oxley Act of 2002: Attached herewith. |
SIGNATURES
Pursuant to the requirements of the Securities Exchange Act of 1934 and the Investment Company Act of 1940, the registrant has duly caused this report to be signed on its behalf by the undersigned, thereunto duly authorized.
| (Registrant) | | | The FBR Funds |
|
| By (Signature and Title)* | | | /s/ Kimberly J. Bradshaw | | June 27, 2011 |
| | | |
|
| | | | Kimberly J. Bradshaw | | Date |
| | | | Treasurer, Secretary and Principal Financial Officer | |
| | | | The FBR Funds | | |
Pursuant to the requirements of the Securities Exchange Act of 1934 and the Investment Company Act of 1940, this report has been signed below by the following persons on behalf of the registrant and in the capacities and on the dates indicated.
| By (Signature and Title) | | | /s/ David H. Ellison | | June 27, 2011 |
| | | |
|
| | | | David H. Ellison | | Date |
| | | | President and Principal Executive Officer | |
| | | | The FBR Funds | | |
| | | | | | |
| By (Signature and Title) | | | /s/ Kimberly J. Bradshaw | | June 27, 2011 |
| | | |
|
| | | | Kimberly J. Bradshaw | | Date |
| | | | Treasurer, Secretary and Principal Financial Officer | |
| | | | The FBR Funds | | |
| | | | | | |