| OMB APPROVAL |
OMB Number: 3235-0570 Expires: August 31, 2011 Estimated average burden hours per response: 18.9 |
UNITED STATES
SECURITIES AND EXCHANGE COMMISSION
Washington, D.C. 20549
FORM N-CSR
CERTIFIED SHAREHOLDER REPORT OF REGISTERED
MANAGEMENT INVESTMENT COMPANIES
Investment Company Act file number ___811-21531________
TFS Capital Investment Trust
(Exact name of registrant as specified in charter)
| 1800 Bayberry Court, Suite 103 Richmond, Virginia | 23226 |
| (Address of principal executive offices) | (Zip code) |
Wade R. Bridge, Esq.
Ultimus Fund Solutions, LLC 225 Pictoria Drive, Suite 450 Cincinnati, Ohio 4524
(Name and address of agent for service)
Registrant's telephone number, including area code: (804) 484-1401
Date of fiscal year end: October 31, 2009
Date of reporting period: October 31, 2009
Form N-CSR is to be used by management investment companies to file reports with the Commission not later than 10 days after the transmission to stockholders of any report that is required to be transmitted to stockholders under Rule 30e-1 under the Investment Company Act of 1940 (17 CFR 270.30e-1). The Commission may use the information provided on Form N-CSR in its regulatory, disclosure review, inspection, and policymaking roles.
A registrant is required to disclose the information specified by Form N-CSR, and the Commission will make this information public. A registrant is not required to respond to the collection of information contained in Form N-CSR unless the Form displays a currently valid Office of Management and Budget ("OMB") control number. Please direct comments concerning the accuracy of the information collection burden estimate and any suggestions for reducing the burden to Secretary, Securities and Exchange Commission, 450 Fifth Street, NW, Washington, DC 20549-0609. The OMB has reviewed this collection of information under the clearance requirements of 44 U.S.C. § 3507.
| Item 1. | Reports to Stockholders. |
ANNUAL REPORT
October 31, 2009
For more information or assistance in opening an account,
please call toll-free 1-888-534-2001.
December 15, 2009
Dear Shareholder,
Enclosed is the Annual Report to shareholders of the TFS Market Neutral Fund (ticker: TFSMX) and the TFS Small Cap Fund (ticker: TFSSX) for the fiscal year ended October 31, 2009. On behalf of the investment manager, TFS Capital LLC (“TFS”), I’d like to thank you for your investment.
We are pleased to announce that TFSMX’s strong performance earned it the 2009 Lipper Award in the Equity Market Neutral category. This marks the second consecutive year that TFSMX has won this award. The 2009 Lipper award is presented to the fund in the category with the best 3-year return for the period ended December 31, 2008. For this period TFSMX was ranked #1 out of 23 funds.1
TFSSX, which crossed the 3-year mark in March of 2009, has also established a very strong performance record. For example, TFSSX’s 1-year return for the year ended October 31, 2009, ranks in the top 2% of all funds in the Lipper Small-Cap Core category. Moreover, its 3-year return over the same period ranks in the top 3%.
Given its significant asset growth, the TFS Market Neutral Fund expects in the coming months to file a prospectus supplement to implement a “hard close” and cease its public offering of shares. This is a follow up to its “soft close” which took place on June 30, 2009. The intent of the hard close is to greatly limit the growth of the Fund. TFS believes that this action will assist the management team in its effort to maintain the Fund’s high standard of performance.
Although TFSMX is expected to implement a hard close, this action does not mean that TFS Capital intends to reduce its investment in strategy research and development. Rather, we continue to invest heavily in ongoing research as evidenced by our 2009 expenditures in this area which exceeded any prior year. Along those lines, TFS would like to announce the addition of Dr. Yan Liu as Co-Portfolio Manager to the Funds. Dr. Liu holds a Ph.D. in Economics and brings extensive experience in the quantitative analysis of equity securities.
It is notable that the TFS Small Cap Fund (ticker: TFSSX) will remain open to existing and new investors. This Fund provides investors with an opportunity to gain exposure to the experienced management team at TFS.
Below are performance highlights for the Funds.
TFS Market Neutral Fund (ticker: TFSMX)
| | 1 year return | 3 year return | 5 year return | Since Inception (9/7/2004) |
| TFS Market Neutral Fund | 14.86% | 8.11% | 9.16% | 9.47% |
| S&P 500 Index | 9.80% | -7.02% | 0.33% | 0.52% |
Average annual total returns for periods ended 10/31/2009
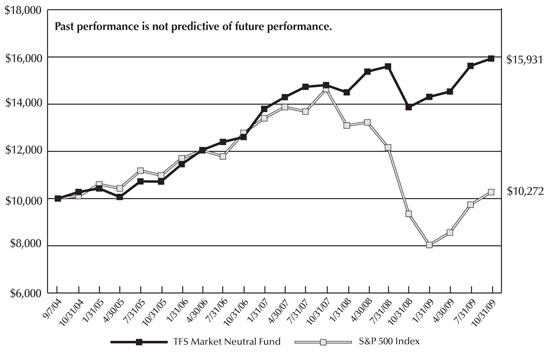
The TFS Market Neutral Fund rebounded well from the 2008 financial crisis. The liquidity crisis that caused forced selling in 2008 was believed to have had a significant adverse affect on the Fund. This activity in 2008 led the Fund into its largest peak-to-valley drawdown since inception. In the last twelve months, however, many of the price dislocations hampering the Fund have reversed. This shift has contributed to the Fund achieving a return in the latest fiscal year (14.86% return) that exceeds its long-term average annual return.
Overall, the Fund continues to perform extremely well relative to the broad equity markets. From inception through the fiscal year-end of October 31, 2009, TFSMX generated a 9.47% average annual return and an annualized standard deviation of 8.93%, whereas the S&P 500 Index generated a 0.52% average annual return and an annualized standard deviation of 23.70%. Therefore, from inception through October 31, 2009, TFSMX produced an annual return that was 8.95 percentage points higher than that of the S&P 500 Index while subjecting investors to only 38% of the volatility. Given a slightly positive market exposure (beta) since inception, the relatively flat growth of the overall U.S. equity market contributed very little to the Fund’s performance since inception. Consequently, most of the performance can be attributed to equity selection (alpha generation) by TFS. So, one can reasonably conclude that the models utilized by TFS to assist in picking stocks were generally successful at predicting the relative price movement of stocks within the Fund’s target universe.
The strategies used in managing TFSMX have resulted in the Fund having a low correlation to other asset classes. According to Modern Portfolio Theory, investors may benefit significantly by combining non-correlated investments. As such, we encourage investors to evaluate the impact that the inclusion of TFSMX would have on their portfolios. We believe TFSMX is best used as a component of a diversified portfolio of investments rather than a large holding for a given shareholder. We do not recommend allocating a high percentage of one’s assets to TFSMX given the risks inherent in the Fund. For your reference, below are the Fund’s correlations to several other asset classes.
| | | | |
| Index | | Correlation Since Inception | |
| S&P 500 Index | | | 0.51 | |
Russell 2000® Index | | | 0.47 | |
| MSCI EAFE Index | | | 0.47 | |
| Barclays Capital U.S. Aggregate Bond Index | | | -0.07 | |
| Wilshire REIT ETF Index | | | 0.35 | |
| Dow Jones Commodity Futures | | | 0.43 | |
Please note that we have developed an interactive “Asset Allocation Tool” on our web site. We encourage you to visit our web site to determine if an allocation to TFSMX may be appropriate for you.
TFS Small Cap Fund (ticker: TFSSX)
| | 1 year return | 3 year return | Since Inception (3/7/2006) |
| TFS Small Cap Fund | 37.41% | 0.58% | 2.59% |
| Russell 2000® Index | 6.46% | -8.51% | -5.26% |
Average annual total returns for periods ended 10/31/2009
Through October 31, 2009, TFSSX continued to achieve its objective of outperforming the Russell 2000® Index as measured by its performance since inception. From inception on March 7, 2006 through the recent fiscal year-end, it generated an average annual return of 2.59% versus -5.26% for the Russell 2000® Index. In the last Annual Report, we discussed the Fund’s underperformance relative to the Russell 2000® Index and indicated that we believed the Fund’s struggles were associated with last year’s financial crisis. Similar to TFSMX, since 2008 TFSSX has benefited greatly from liquidity being restored to the market as many price dislocations reversed course. This benefit can be observed in the 1-year return for the fiscal year ended October 31, 2009 in which the Fund outpaced the Russell 2000® Index by 30.95 percentage points. This significant outperformance was achieved despite the Fund having a lower average beta among its holdings than the Russell 2000® Index, which acted as a slight handicap.
For both Funds, there were no significant changes to the investing strategies during the period that impacted performance. As described in the prospectus, TFS develops quantitative models through rigorous historical analysis of the stock market. These models help TFS make objective decisions that we believe will lead to good performance.
Best regards,
Larry S. Eiben
Chief Operating Officer & Co-Portfolio Manager
TFS Capital LLC
| 1 | TFSMX was ranked #28 out of 46 funds using its 1-year return. |
Past performance is not predictive of future performance. Investment results and principal value will fluctuate so that shares, when redeemed, may be worth more or less than their original cost. Fee waivers have positively impacted each Fund’s performance over the relevant periods and without such waivers each Fund’s performance would have been lower. For each Fund’s current expense ratio information please see the Financial Highlights tables included in this Report. Current performance may be higher or lower than the performance data quoted. Performance data current to the most recent month-end are available at www.TFSCapital.com.
An investor should consider the investment objectives, risks, charges and expenses of the Funds carefully before investing. The Funds’ prospectus contains this and other important information. To obtain a copy of the TFS Funds’ prospectus please visit www.TFSCapital.com or call 1-888-534-2001 and a copy will be sent to you free of charge. Please read the prospectus carefully before you invest. The TFS Funds are distributed by Ultimus Fund Distributors, LLC.
TFS MARKET NEUTRAL FUND
PERFORMANCE INFORMATION (Unaudited)
Comparison of the Change in Value of a $10,000 Investment in the
TFS Market Neutral Fund versus the S&P 500 Index
Average Annual Total Returns(a)
For the periods ended October 31, 2009
| | 1 Year | 5 Years | Since Inception(b) |
TFS Market Neutral Fund | 14.86% | 9.16% | 9.47% |
| S&P 500 Index | 9.80% | 0.33% | 0.52% |
| (a) | The total returns shown do not reflect the deduction of taxes a shareholder would pay on Fund distributions or the redemption of Fund shares. |
(b) | Initial public offering of shares was September 7, 2004. |
TFS SMALL CAP FUND
PERFORMANCE INFORMATION (Unaudited)
Comparison of the Change in Value of a $10,000 Investment in the
TFS Small Cap Fund versus the Russell 2000 Index
Average Annual Total Returns(a)
For the periods ended October 31, 2009
| | 1 Year | Since Inception(b) |
TFS Small Cap Fund | 37.41% | 2.59% |
| Russell 2000 Index | 6.46% | -5.26% |
| (a) | The total returns shown do not reflect the deduction of taxes a shareholder would pay on Fund distributions or the redemption of Fund shares. |
| (b) | Initial public offering of shares was March 7, 2006. |
TFS MARKET NEUTRAL FUND
PORTFOLIO INFORMATION
October 31, 2009 (Unaudited)
TFS Market Neutral Fund vs S&P 500 Index
Net Sector Exposure*
| * | The net percentages for the TFS Market Neutral Fund are computed by taking the net dollar exposure, including short positions, and dividing by the net assets of the Fund. Consequently, the percentages are not likely to total to 100%. |
| Top 10 Long Equity Positions | | Top 10 Short Equity Positions |
| Security Description | % of Net Assets | | Security Description | % of Net Assets |
| Dynegy, Inc. | 0.69% | | Patterson-UTI Energy, Inc. | 0.45% |
| SIRIUS XM Radio, Inc. | 0.64% | | Hanesbrands, Inc. | 0.41% |
| Tenet Healthcare Corporation | 0.56% | | Park National Corporation | 0.37% |
| ON Semiconductor Corporation | 0.56% | | AK Steel Holding Corporation | 0.37% |
| Wendy’s/Arby’s Group, Inc. - Class A | 0.54% | | Compass Minerals International, Inc. | 0.36% |
| SUPERVALU, Inc. | 0.52% | | RadioShack Corporation | 0.35% |
| Brocade Communications Systems, Inc. | 0.50% | | Pool Corporation | 0.34% |
| 3Com Corporation | 0.47% | | Allegheny Technologies, Inc. | 0.34% |
| VeriFone Holdings, Inc. | 0.46% | | Realty Income Corporation | 0.34% |
| Synopsys, Inc. | 0.45% | | Tupperware Brands Corporation | 0.34% |
TFS SMALL CAP FUND
PORTFOLIO INFORMATION
October 31, 2009 (Unaudited)
TFS Small Cap Fund
Sector Allocation (% of Net Assets)
| Top 10 Equity Positions |
| Security Description | % of Net Assets |
| Spectrum Control, Inc. | 0.41% |
| Lender Processing Services, Inc. | 0.41% |
| GenCorp, Inc. | 0.40% |
| SIRIUS XM Radio, Inc. | 0.40% |
| FreightCar America, Inc. | 0.40% |
| American Greetings Corporation - Class A | 0.39% |
| Bally Technologies, Inc. | 0.38% |
| BioForm Medical, Inc. | 0.38% |
| Anixter International, Inc. | 0.38% |
| Kendle International, Inc. | 0.38% |
TFS MARKET NEUTRAL FUND
SUMMARY SCHEDULE OF INVESTMENTS*
October 31, 2009
| COMMON STOCKS — 85.1% | | Shares | | | Value | |
| Consumer Discretionary — 10.5% | | | | | | |
| Auto Components — 1.4% | | | | | | |
Other Auto Components (a) | | | | | $ | 11,177,798 | |
| | | | | | | | |
| Automobiles — 0.0% | | | | | | | |
Other Automobiles (a) | | | | | | 10,350 | |
| | | | | | | | |
| Distributors — 0.0% | | | | | | | |
Other Distributors (a) | | | | | | 22,726 | |
| | | | | | | | |
| Diversified Consumer Services — 0.4% | | | | | | | |
Other Diversified Consumer Services (a) | | | | | | 3,278,789 | |
| | | | | | | | |
| Hotels, Restaurants & Leisure — 1.8% | | | | | | | |
Wendy’s/Arby’s Group, Inc. - Class A (b) | | | 1,141,394 | | | | 4,508,506 | |
Wyndham Worldwide Corporation (b) | | | 181,300 | | | | 3,091,165 | |
Other Hotels, Restaurants & Leisure (a) | | | | | | | 7,390,988 | |
| | | | | | | | 14,990,659 | |
| Household Durables — 1.1% | | | | | | | | |
Other Household Durables (a) | | | | | | | 8,949,953 | |
| | | | | | | | | |
| Internet & Catalog Retail — 0.2% | | | | | | | | |
Other Internet & Catalog Retail (a) | | | | | | | 1,587,219 | |
| | | | | | | | | |
| Leisure Equipment & Products — 0.2% | | | | | | | | |
Other Leisure Equipment & Products (a) | | | | | | | 1,520,846 | |
| | | | | | | | | |
| Media — 2.2% | | | | | | | | |
CTC Media, Inc. (b) (c) | | | 182,481 | | | | 2,934,294 | |
SIRIUS XM Radio, Inc. (c) | | | 9,043,595 | | | | 5,299,547 | |
Other Media (a) | | | | | | | 10,131,819 | |
| | | | | | | | 18,365,660 | |
| Multi-Line Retail — 0.1% | | | | | | | | |
Other Multi-Line Retail (a) | | | | | | | 1,113,272 | |
| | | | | | | | | |
| Specialty Retail — 1.3% | | | | | | | | |
| American Eagle Outfitters, Inc. | | | 147,700 | | | | 2,583,273 | |
Other Specialty Retail (a) | | | | | | | 8,590,677 | |
| | | | | | | | 11,173,950 | |
| Textiles, Apparel & Luxury Goods — 1.8% | | | | | | | | |
Jones Apparel Group, Inc. (b) | | | 174,300 | | | | 3,118,227 | |
Other Textiles, Apparel & Luxury Goods (a) | | | | | | | 11,519,090 | |
| | | | | | | | 14,637,317 | |
| Consumer Staples — 3.0% | | | | | | | | |
| Beverages — 0.1% | | | | | | | | |
Other Beverages (a) | | | | | | | 774,115 | |
TFS MARKET NEUTRAL FUND
SUMMARY SCHEDULE OF INVESTMENTS (Continued)
| COMMON STOCKS — 85.1% (Continued) | | Shares | | | Value | |
| Consumer Staples — 3.0% (Continued) | | | | | | |
| Food & Staples Retailing — 1.1% | | | | | | |
SUPERVALU, Inc. (b) | | | 273,600 | | | $ | 4,342,032 | |
Other Food & Staples Retailing (a) | | | | | | | 5,108,357 | |
| | | | | | | | 9,450,389 | |
| Food Products — 1.1% | | | | | | | | |
Del Monte Foods Company (b) | | | 229,121 | | | | 2,474,507 | |
Other Food Products (a) | | | | | | | 6,770,244 | |
| | | | | | | | 9,244,751 | |
| Household Products — 0.0% | | | | | | | | |
Other Household Products (a) | | | | | | | 323,634 | |
| | | | | | | | | |
| Personal Products — 0.7% | | | | | | | | |
Other Personal Products (a) | | | | | | | 5,429,205 | |
| | | | | | | | | |
| Tobacco — 0.0% | | | | | | | | |
Other Tobacco (a) | | | | | | | 4,159 | |
| | | | | | | | | |
| Energy — 4.9% | | | | | | | | |
| Energy Equipment & Services — 1.6% | | | | | | | | |
Other Energy Equipment & Services (a) | | | | | | | 12,966,554 | |
| | | | | | | | | |
| Oil, Gas & Consumable Fuels — 3.3% | | | | | | | | |
Quicksilver Resources, Inc. (b) (c) | | | 193,100 | | | | 2,355,820 | |
Other Oil, Gas & Consumable Fuels (a) | | | | | | | 25,007,426 | |
| | | | | | | | 27,363,246 | |
| Financials — 11.7% | | | | | | | | |
| Capital Markets — 1.8% | | | | | | | | |
Ares Capital Corporation (b) | | | 258,849 | | | | 2,702,384 | |
E*TRADE Financial Corporation (b) (c) | | | 1,615,000 | | | | 2,357,900 | |
Other Capital Markets (a) | | | | | | | 10,048,415 | |
| | | | | | | | 15,108,699 | |
| Commercial Banks — 2.7% | | | | | | | | |
Boston Private Financial Holdings, Inc. (b) | | | 420,008 | | | | 2,499,048 | |
CapitalSource, Inc. (b) | | | 991,510 | | | | 3,529,776 | |
Other Commercial Banks (a) | | | | | | | 16,570,510 | |
| | | | | | | | 22,599,334 | |
| Consumer Finance — 0.4% | | | | | | | | |
Other Consumer Finance (a) | | | | | | | 3,017,964 | |
| | | | | | | | | |
| Diversified Financial Services — 0.3% | | | | | | | | |
Other Diversified Financial Services (a) | | | | | | | 2,760,122 | |
| | | | | | | | | |
| Insurance — 4.6% | | | | | | | | |
American Financial Group, Inc. (b) | | | 107,795 | | | | 2,651,757 | |
Other Insurance (a) | | | | | | | 35,297,726 | |
| | | | | | | | 37,949,483 | |
TFS MARKET NEUTRAL FUND
SUMMARY SCHEDULE OF INVESTMENTS (Continued)
| COMMON STOCKS — 85.1% (Continued) | | Shares | | | Value | |
| Financials — 11.7% (Continued) | | | | | | |
| Real Estate Investment Trusts — 1.4% | | | | | | |
Other Real Estate Investment Trusts (a) | | | | | $ | 11,306,568 | |
| | | | | | | | |
| Real Estate Management & Development — 0.0% | | | | | | | |
Other Real Estate Management & Development (a) | | | | | | 89,651 | |
| | | | | | | | |
| Thrifts & Mortgage Finance — 0.5% | | | | | | | |
Other Thrifts & Mortgage Finance (a) | | | | | | 4,340,226 | |
| | | | | | | | |
| Health Care — 11.4% | | | | | | | |
| Biotechnology — 2.4% | | | | | | | |
Amylin Pharmaceuticals, Inc. (c) | | | 297,500 | | | | 3,284,400 | |
PDL BioPharma, Inc. (b) | | | 401,799 | | | | 3,379,130 | |
Other Biotechnology (a) | | | | | | | 13,046,684 | |
| | | | | | | | 19,710,214 | |
| Health Care Equipment & Supplies — 2.0% | | | | | | | | |
Other Health Care Equipment & Supplies (a) | | | | | | | 16,859,151 | |
| | | | | | | | | |
| Health Care Providers & Services — 4.3% | | | | | | | | |
Coventry Health Care, Inc. (b) (c) | | | 133,000 | | | | 2,637,390 | |
MEDNAX, Inc. (b) (c) | | | 52,424 | | | | 2,721,854 | |
Tenet Healthcare Corporation (b) (c) | | | 902,541 | | | | 4,621,010 | |
Universal Health Services, Inc. - Class B (b) | | | 43,200 | | | | 2,404,080 | |
Other Health Care Providers & Services (a) | | | | | | | 22,999,465 | |
| | | | | | | | 35,383,799 | |
| Health Care Technology — 0.6% | | | | | | | | |
IMS Health, Inc. (b) | | | 223,800 | | | | 3,668,082 | |
Other Health Care Technology (a) | | | | | | | 1,293,815 | |
| | | | | | | | 4,961,897 | |
| Life Sciences Tools & Services — 1.5% | | | | | | | | |
Bruker Corporation (b) (c) | | | 298,028 | | | | 3,230,623 | |
Parexel International Corporation (b) (c) | | | 225,797 | | | | 2,826,978 | |
Other Life Sciences Tools & Services (a) | | | | | | | 6,240,626 | |
| | | | | | | | 12,298,227 | |
| Pharmaceuticals — 0.6% | | | | | | | | |
Other Pharmaceuticals (a) | | | | | | | 5,115,446 | |
| | | | | | | | | |
| Industrials — 13.4% | | | | | | | | |
| Aerospace & Defense — 1.3% | | | | | | | | |
Cubic Corporation (b) | | | 71,390 | | | | 2,477,947 | |
Other Aerospace & Defense (a) | | | | | | | 8,722,972 | |
| | | | | | | | 11,200,919 | |
| Air Freight & Logistics — 0.5% | | | | | | | | |
Other Air Freight & Logistics (a) | | | | | | | 4,354,040 | |
TFS MARKET NEUTRAL FUND
SUMMARY SCHEDULE OF INVESTMENTS (Continued)
| COMMON STOCKS — 85.1% (Continued) | | Shares | | | Value | |
| Industrials — 13.4% (Continued) | | | | | | |
| Airlines — 1.5% | | | | | | |
UAL Corporation (c) | | | 367,650 | | | $ | 2,393,401 | |
US Airways Group, Inc. (b) (c) | | | 1,077,696 | | | | 3,297,750 | |
Other Airlines (a) | | | | | | | 6,902,508 | |
| | | | | | | | 12,593,659 | |
| Building Products — 0.6% | | | | | | | | |
Other Building Products (a) | | | | | | | 5,324,955 | |
| | | | | | | | | |
| Commercial Services & Supplies — 1.1% | | | | | | | | |
Other Commercial Services & Supplies (a) | | | | | | | 8,991,152 | |
| | | | | | | | | |
| Construction & Engineering — 1.3% | | | | | | | | |
Shaw Group, Inc. (The) (b) (c) | | | 131,425 | | | | 3,372,366 | |
Other Construction & Engineering (a) | | | | | | | 7,029,354 | |
| | | | | | | | 10,401,720 | |
| Electrical Equipment — 1.3% | | | | | | | | |
Thomas & Betts Corporation (c) | | | 109,782 | | | | 3,755,642 | |
Other Electrical Equipment (a) | | | | | | | 7,421,353 | |
| | | | | | | | 11,176,995 | |
| Industrial Conglomerates — 0.2% | | | | | | | | |
Other Industrial Conglomerates (a) | | | | | | | 1,637,593 | |
| | | | | | | | | |
| Machinery — 3.3% | | | | | | | | |
Timken Company (b) | | | 127,880 | | | | 2,817,196 | |
Titan International, Inc. (b) | | | 313,912 | | | | 2,636,861 | |
Trinity Industries, Inc. (b) | | | 201,897 | | | | 3,408,021 | |
Other Machinery (a) | | | | | | | 18,094,779 | |
| | | | | | | | 26,956,857 | |
| Marine — 0.8% | | | | | | | | |
Other Marine (a) | | | | | | | 6,561,027 | |
| | | | | | | | | |
| Professional Services — 0.6% | | | | | | | | |
Other Professional Services (a) | | | | | | | 5,029,778 | |
| | | | | | | | | |
| Road & Rail — 0.5% | | | | | | | | |
Other Road & Rail (a) | | | | | | | 3,940,362 | |
| | | | | | | | | |
| Trading Companies & Distributors — 0.4% | | | | | | | | |
Other Trading Companies & Distributors (a) | | | | | | | 3,190,322 | |
| | | | | | | | | |
| Transportation Infrastructure — 0.0% | | | | | | | | |
Other Transportation Infrastructure (a) | | | | | | | 84,650 | |
TFS MARKET NEUTRAL FUND
SUMMARY SCHEDULE OF INVESTMENTS (Continued)
| COMMON STOCKS — 85.1% (Continued) | | Shares | | | Value | |
| Information Technology — 19.6% | | | | | | |
| Communications Equipment — 3.4% | | | | | | |
3Com Corporation (b) (c) | | | 765,548 | | | $ | 3,934,917 | |
Arris Group, Inc. (b) (c) | | | 259,800 | | | | 2,665,548 | |
Brocade Communications Systems, Inc. (b) (c) | | | 485,275 | | | | 4,163,659 | |
Other Communications Equipment (a) | | | | | | | 17,168,943 | |
| | | | | | | | 27,933,067 | |
| Computers & Peripherals — 0.5% | | | | | | | | |
Other Computers & Peripherals (a) | | | | | | | 4,296,281 | |
| | | | | | | | | |
| Electronic Equipment, Instruments & Components — 3.5% | | | | | | | | |
Anixter International, Inc. (b) (c) | | | 85,199 | | | | 3,565,578 | |
Arrow Electronics, Inc. (b) (c) | | | 123,600 | | | | 3,132,024 | |
Jabil Circuit, Inc. (b) | | | 222,427 | | | | 2,976,073 | |
Tech Data Corporation (b) (c) | | | 88,922 | | | | 3,417,272 | |
Vishay Intertechnology, Inc. (b) (c) | | | 498,764 | | | | 3,107,300 | |
Other Electronic Equipment, Instruments & Components (a) | | | | | | | 12,441,296 | |
| | | | | | | | 28,639,543 | |
| Internet Software & Services — 1.2% | | | | | | | | |
Other Internet Software & Services (a) | | | | | | | 10,286,460 | |
| | | | | | | | | |
| IT Services — 3.0% | | | | | | | | |
TeleTech Holdings, Inc. (b) (c) | | | 205,061 | | | | 3,668,541 | |
VeriFone Holdings, Inc. (b) (c) | | | 288,136 | | | | 3,832,209 | |
Other IT Services (a) | | | | | | | 17,525,370 | |
| | | | | | | | 25,026,120 | |
| Semiconductors & Semiconductor Equipment — 3.7% | | | | | | | | |
ON Semiconductor Corporation (c) | | | 689,600 | | | | 4,613,424 | |
Tessera Technologies, Inc. (b) (c) | | | 108,682 | | | | 2,402,959 | |
Other Semiconductors & Semiconductor Equipment (a) | | | | | | | 23,421,062 | |
| | | | | | | | 30,437,445 | |
| Software — 4.3% | | | | | | | | |
Synopsys, Inc. (b) (c) | | | 171,214 | | | | 3,766,708 | |
TIBCO Software, Inc. (b) (c) | | | 400,994 | | | | 3,508,698 | |
Other Software (a) | | | | | | | 28,091,425 | |
| | | | | | | | 35,366,831 | |
| Materials — 6.7% | | | | | | | | |
| Chemicals — 3.4% | | | | | | | | |
Ashland, Inc. (b) | | | 105,146 | | | | 3,631,743 | |
RPM International, Inc. (b) | | | 138,998 | | | | 2,449,145 | |
Solutia, Inc. (b) (c) | | | 295,756 | | | | 3,253,316 | |
Other Chemicals (a) | | | | | | | 18,629,396 | |
| | | | | | | | 27,963,600 | |
| Containers & Packaging — 1.3% | | | | | | | | |
Other Containers & Packaging (a) | | | | | | | 10,741,272 | |
| | | | | | | | | |
| Metals & Mining — 1.0% | | | | | | | | |
Other Metals & Mining (a) | | | | | | | 8,448,360 | |
TFS MARKET NEUTRAL FUND
SUMMARY SCHEDULE OF INVESTMENTS (Continued)
| COMMON STOCKS — 85.1% (Continued) | | Shares | | | Value | |
| Materials — 6.7% (Continued) | | | | | | |
| Paper & Forest Products — 1.0% | | | | | | |
Other Paper & Forest Products (a) | | | | | $ | 8,230,025 | |
| | | | | | | | |
| Telecommunication Services — 1.0% | | | | | | | |
| Diversified Telecommunication Services — 0.5% | | | | | | | |
Other Diversified Telecommunication Services (a) | | | | | | 3,986,635 | |
| | | | | | | | |
| Wireless Telecommunication Services — 0.5% | | | | | | | |
Other Wireless Telecommunication Services (a) | | | | | | 4,267,862 | |
| | | | | | | | |
| Utilities — 2.9% | | | | | | | |
| Electric Utilities — 0.3% | | | | | | | |
Other Electric Utilities (a) | | | | | | 2,468,114 | |
| | | | | | | | |
| Gas Utilities — 1.2% | | | | | | | |
AGL Resources, Inc. (b) | | | 80,352 | | | | 2,809,106 | |
Other Gas Utilities (a) | | | | | | | 7,311,216 | |
| | | | | | | | 10,120,322 | |
| Independent Power Producers & Energy Traders — 1.0% | | | | | | | | |
Dynegy, Inc. (c) | | | 2,874,525 | | | | 5,749,050 | |
Other Independent Power Producers & Energy Traders (a) | | | | | | | 2,044,443 | |
| | | | | | | | 7,793,493 | |
| Multi-Utilities — 0.4% | | | | | | | | |
Other Multi-Utilities (a) | | | | | | | 3,560,065 | |
| | | | | | | | | |
| Water Utilities — 0.0% | | | | | | | | |
Other Water Utilities (a) | | | | | | | 143,696 | |
| | | | | | | | | |
Total Common Stocks (Cost $669,733,452) | | | | | | $ | 705,038,593 | |
| | | | | | | | | |
| CLOSED-END FUNDS — 10.7% | | Shares | | | Value | |
Other Closed-End Funds (Cost $90,367,060) (a) | | | | | | $ | 88,383,154 | |
| | | | | | | | | |
| RIGHTS — 0.0% | | Shares | | | Value | |
Total Rights (Cost $0) (a)(e) | | | | | | $ | — | |
TFS MARKET NEUTRAL FUND
SUMMARY SCHEDULE OF INVESTMENTS (Continued)
| MONEY MARKET FUNDS — 3.0% | | Shares | | | Value | |
UMB Money Market Fiduciary, 0.05% (d) | | | | | | |
| (Cost $24,674,332) | | | 24,674,332 | | | $ | 24,674,332 | |
| | | | | | | | | |
Total Investments at Value — 98.8% (Cost $784,774,844) | | | | | | $ | 818,096,079 | |
| | | | | | | | | |
| Other Assets in Excess of Liabilities — 1.2% | | | | | | | 10,313,378 | |
| | | | | | | | | |
| Net Assets — 100.0% | | | | | | $ | 828,409,457 | |
| * | A complete Schedule of Investments is available without charge upon request by calling toll-free 1-888-534-2001 or on the SEC’s website at http://www.sec.gov. |
| (a) | Represents issuers not identified as a top 50 holding in terms of market value and issues or issuers not exceeding 1% of net assets individually or in the aggregate, respectively, as of October 31, 2009. |
| (b) | All or a portion of the shares have been committed as collateral for open short positions. |
| (c) | Non-income producing security. |
| (d) | Variable rate security. The rate shown is the 7-day effective yield as of October 31, 2009. |
| (e) | Fair value priced (Note 2). Fair valued securities totaled $0 at October 31, 2009, representing 0.0% of net assets. |
| See accompanying notes to financial statements. |
TFS MARKET NEUTRAL FUND
SCHEDULE OF SECURITIES SOLD SHORT
October 31, 2009
| COMMON STOCKS — 64.6% | | Shares | | | Value | |
| Consumer Discretionary — 14.3% | | | | | | |
| Auto Components — 0.5% | | | | | | |
Amerigon, Inc. (a) | | | 8,800 | | | $ | 56,584 | |
| ArvinMeritor, Inc. | | | 60,100 | | | | 469,381 | |
| BorgWarner, Inc. | | | 26,700 | | | | 809,544 | |
China Automotive Systems, Inc. (a) | | | 2,200 | | | | 22,792 | |
| Cooper Tire & Rubber Company | | | 31,197 | | | | 476,066 | |
Dorman Products, Inc. (a) | | | 4,000 | | | | 58,480 | |
Exide Technologies (a) | | | 300 | | | | 1,836 | |
Fuel Systems Solutions, Inc. (a) | | | 200 | | | | 6,548 | |
| Gentex Corporation | | | 11,400 | | | | 182,514 | |
| Modine Manufacturing Company | | | 3,800 | | | | 39,140 | |
Raser Technologies, Inc. (a) | | | 273,611 | | | | 322,861 | |
| Spartan Motors, Inc. | | | 77,837 | | | | 388,407 | |
| Standard Motor Products, Inc. | | | 100 | | | | 836 | |
Stoneridge, Inc. (a) | | | 19,600 | | | | 144,060 | |
| Superior Industries International, Inc. | | | 62,700 | | | | 832,656 | |
TRW Automotive Holdings Corporation (a) | | | 14,900 | | | | 233,185 | |
| WABCO Holdings, Inc. | | | 17,100 | | | | 405,612 | |
Wonder Auto Technology, Inc. (a) | | | 1,800 | | | | 23,292 | |
| | | | | | | | 4,473,794 | |
| Automobiles — 0.2% | | | | | | | | |
| Harley-Davidson, Inc. | | | 300 | | | | 7,476 | |
Winnebago Industries, Inc. (a) | | | 102,194 | | | | 1,175,231 | |
| | | | | | | | 1,182,707 | |
| Distributors — 0.0% | | | | | | | | |
Core-Mark Holding Company, Inc. (a) | | | 6,983 | | | | 191,125 | |
| | | | | | | | | |
| Diversified Consumer Services — 1.2% | | | | | | | | |
American Public Education, Inc. (a) | | | 32,224 | | | | 1,027,945 | |
Brink’s Home Security Holdings, Inc. (a) | | | 2,380 | | | | 73,732 | |
Capella Education Company (a) | | | 15,301 | | | | 1,054,239 | |
Career Education Corporation (a) | | | 58,071 | | | | 1,210,200 | |
ChinaCast Education Corporation (a) | | | 1,100 | | | | 6,842 | |
Coinstar, Inc. (a) | | | 28,300 | | | | 898,242 | |
Corinthian Colleges, Inc. (a) | | | 25,000 | | | | 396,500 | |
| DeVry, Inc. | | | 13,800 | | | | 763,002 | |
Grand Canyon Education, Inc. (a) | | | 99 | | | | 1,606 | |
Home Solutions of America, Inc. (a) | | | 95,563 | | | | 3,584 | |
| Jackson Hewitt Tax Service, Inc. | | | 119,750 | | | | 587,972 | |
K12, Inc. (a) | | | 48,300 | | | | 774,732 | |
Learning Tree International, Inc. (a) | | | 500 | | | | 5,440 | |
Pre-Paid Legal Services, Inc. (a) | | | 18,905 | | | | 747,504 | |
| Regis Corporation | | | 80,328 | | | | 1,304,527 | |
Spectrum Group International, Inc. (a) | | | 2,133 | | | | 5,439 | |
| Stewart Enterprises, Inc. - Class A | | | 121,348 | | | | 555,774 | |
Universal Technical Institute, Inc. (a) | | | 23,061 | | | | 414,867 | |
| Weight Watchers International, Inc. | | | 2,084 | | | | 55,247 | |
| | | | | | | | 9,887,394 | |
TFS MARKET NEUTRAL FUND
SCHEDULE OF SECURITIES SOLD SHORT (Continued)
| COMMON STOCKS — 64.6% (Continued) | | Shares | | | Value | |
| Consumer Discretionary — 14.3% (Continued) | | | | | | |
| Hotels, Restaurants & Leisure — 2.5% | | | | | | |
| Ambassadors Group, Inc. | | | 15,680 | | | $ | 199,293 | |
| Ameristar Casinos, Inc. | | | 10,400 | | | | 153,088 | |
BJ’s Restaurants, Inc. (a) | | | 100,148 | | | | 1,598,362 | |
Boyd Gaming Corporation (a) | | | 114,116 | | | | 839,894 | |
| Brinker International, Inc. | | | 300 | | | | 3,792 | |
Buffalo Wild Wings, Inc. (a) | | | 25,522 | | | | 1,046,657 | |
| Burger King Holdings, Inc. | | | 78,633 | | | | 1,349,342 | |
California Pizza Kitchen, Inc. (a) | | | 79,058 | | | | 1,026,964 | |
Caribou Coffee Company, Inc. (a) | | | 4,100 | | | | 33,579 | |
| Cedar Fair, L.P. | | | 600 | | | | 6,006 | |
Cheesecake Factory, Inc. (The) (a) | | | 19,000 | | | | 345,420 | |
| Choice Hotels International, Inc. | | | 8,800 | | | | 262,416 | |
| Cracker Barrel Old Country Store, Inc. | | | 4,100 | | | | 135,915 | |
DineEquity, Inc. (a) | | | 35,118 | | | | 743,097 | |
Interval Leisure Group, Inc. (a) | | | 400 | | | | 4,464 | |
Jamba, Inc. (a) | | | 143,344 | | | | 206,415 | |
Las Vegas Sands Corporation (a) | | | 1,900 | | | | 28,671 | |
MGM Mirage (a) | | | 6,500 | | | | 60,255 | |
Morgans Hotel Group Company (a) | | | 75,951 | | | | 252,157 | |
Multimedia Games, Inc. (a) | | | 400 | | | | 1,964 | |
O’Charley’s, Inc. (a) | | | 700 | | | | 4,907 | |
Orient-Express Hotels Ltd. - Class A (a) | | | 79,904 | | | | 687,174 | |
Panera Bread Company - Class A (a) | | | 25,559 | | | | 1,533,029 | |
Peet’s Coffee & Tea, Inc. (a) | | | 32,785 | | | | 1,114,690 | |
Pinnacle Entertainment, Inc. (a) | | | 13,869 | | | | 117,193 | |
Red Robin Gourmet Burgers, Inc. (a) | | | 53,637 | | | | 896,274 | |
Ruby Tuesday, Inc. (a) | | | 14,300 | | | | 95,238 | |
Scientific Games Corporation - Class A (a) | | | 1,400 | | | | 19,698 | |
Shuffle Master, Inc. (a) | | | 31,520 | | | | 246,171 | |
Sonic Corporation (a) | | | 157,200 | | | | 1,469,820 | |
Texas Roadhouse, Inc. (a) | | | 73,262 | | | | 693,791 | |
Universal Travel Group (a) | | | 6,300 | | | | 73,584 | |
Vail Resorts, Inc. (a) | | | 66,300 | | | | 2,283,372 | |
VCG Holding Corporation (a) | | | 13,691 | | | | 25,739 | |
WMS Industries, Inc. (a) | | | 59,600 | | | | 2,382,808 | |
| Wyndham Worldwide Corporation | | | 17,810 | | | | 303,661 | |
Wynn Resorts Ltd. (a) | | | 100 | | | | 5,422 | |
| | | | | | | | 20,250,322 | |
| Household Durables — 1.7% | | | | | | | | |
| Black & Decker Corporation (The) | | | 300 | | | | 14,166 | |
Brookfield Homes Corporation (a) | | | 42,761 | | | | 240,744 | |
Cavco Industries, Inc. (a) | | | 22,759 | | | | 691,874 | |
| CSS Industries, Inc. | | | 1,400 | | | | 28,420 | |
Deer Consumer Products, Inc. (a) | | | 2,600 | | | | 31,850 | |
| Ethan Allen Interiors, Inc. | | | 92,233 | | | | 1,149,223 | |
Furniture Brands International, Inc. (a) | | | 5,000 | | | | 21,250 | |
Hovnanian Enterprises, Inc. - Class A (a) | | | 280,365 | | | | 1,096,227 | |
iRobot Corporation (a) | | | 67,604 | | | | 903,865 | |
TFS MARKET NEUTRAL FUND
SCHEDULE OF SECURITIES SOLD SHORT (Continued)
| COMMON STOCKS — 64.6% (Continued) | | Shares | | | Value | |
| Consumer Discretionary — 14.3% (Continued) | | | | | | |
| Household Durables — 1.7% (Continued) | | | | | | |
| Jarden Corporation | | | 6,950 | | | $ | 190,361 | |
| KB Home | | | 300 | | | | 4,254 | |
Kid Brands, Inc. (a) | | | 700 | | | | 3,479 | |
| Leggett & Platt, Inc. | | | 68,100 | | | | 1,316,373 | |
M/I Homes, Inc. (a) | | | 38,264 | | | | 427,409 | |
| MDC Holdings, Inc. | | | 26,895 | | | | 877,315 | |
Meritage Homes Corporation (a) | | | 132,841 | | | | 2,423,020 | |
Mohawk Industries, Inc. (a) | | | 31,030 | | | | 1,329,015 | |
| National Presto Industries, Inc. | | | 2,748 | | | | 238,884 | |
| Ryland Group, Inc. (The) | | | 8,900 | | | | 165,095 | |
| Skyline Corporation | | | 2,272 | | | | 39,737 | |
| Tupperware Brands Corporation | | | 61,900 | | | | 2,786,738 | |
| | | | | | | | 13,979,299 | |
| Internet & Catalog Retail — 0.6% | | | | | | | | |
Amazon.com, Inc. (a) | | | 100 | | | | 11,881 | |
BIDZ.com, Inc. (a) | | | 1,202 | | | | 3,486 | |
HSN, Inc. (a) | | | 5,600 | | | | 83,664 | |
| NutriSystem, Inc. | | | 66,000 | | | | 1,420,320 | |
Orbitz Worldwide, Inc. (a) | | | 300 | | | | 1,569 | |
Overstock.com, Inc. (a) | | | 57,784 | | | | 808,976 | |
| PetMed Express, Inc. | | | 90,643 | | | | 1,422,189 | |
Shutterfly, Inc. (a) | | | 76,482 | | | | 1,078,396 | |
Ticketmaster Entertainment, Inc. (a) | | | 6,700 | | | | 64,655 | |
ValueVision Media, Inc. (a) | | | 59,144 | | | | 187,486 | |
| | | | | | | | 5,082,622 | |
| Leisure Equipment & Products — 0.5% | | | | | | | | |
| Brunswick Corporation | | | 6,400 | | | | 60,672 | |
| Callaway Golf Company | | | 74,300 | | | | 508,212 | |
JAKKS Pacific, Inc. (a) | | | 2,900 | | | | 41,267 | |
| Pool Corporation | | | 145,480 | | | | 2,848,498 | |
| Sturm Ruger & Company, Inc. | | | 20,001 | | | | 212,411 | |
| | | | | | | | 3,671,060 | |
| Media — 0.8% | | | | | | | | |
| Arbitron, Inc. | | | 43,530 | | | | 943,730 | |
| Cablevision Systems Corporation | | | 100 | | | | 2,296 | |
Central European Media Enterprises Ltd. (a) | | | 91,076 | | | | 2,289,651 | |
Charter Communications, Inc. - Class A (a) | | | 20,500 | | | | 433 | |
| Cinemark Holdings, Inc. | | | 47,631 | | | | 552,043 | |
CKX, Inc. (a) | | | 28,400 | | | | 181,760 | |
DISH Network Corporation - Class A (a) | | | 200 | | | | 3,480 | |
Dolan Media Company (a) | | | 1,200 | | | | 14,328 | |
DreamWorks Animation SKG, Inc. - Class A (a) | | | 24,100 | | | | 771,200 | |
| Gannett Company, Inc. | | | 13,200 | | | | 129,624 | |
Interpublic Group of Companies, Inc. (a) | | | 100 | | | | 602 | |
Liberty Global, Inc. (a) | | | 200 | | | | 4,116 | |
Liberty Global, Inc. - Class A (a) | | | 56,500 | | | | 1,159,945 | |
Liberty Media Corporation - Capital - Series A (a) | | | 17,500 | | | | 362,075 | |
Live Nation, Inc. (a) | | | 300 | | | | 1,998 | |
TFS MARKET NEUTRAL FUND
SCHEDULE OF SECURITIES SOLD SHORT (Continued)
| COMMON STOCKS — 64.6% (Continued) | | Shares | | | Value | |
| Consumer Discretionary — 14.3% (Continued) | | | | | | |
| Media — 0.8% (Continued) | | | | | | |
Martha Stewart Living Omnimedia, Inc. (a) | | | 5,300 | | | $ | 27,454 | |
| Media General, Inc. | | | 31,000 | | | | 256,990 | |
| New York Times Company (The) | | | 900 | | | | 7,173 | |
Outdoor Channel Holdings, Inc. (a) | | | 900 | | | | 6,228 | |
| Time Warner Cable, Inc. | | | 100 | | | | 3,944 | |
Warner Music Group Corporation (a) | | | 40,074 | | | | 230,826 | |
| | | | | | | | 6,949,896 | |
| Multi-Line Retail — 0.4% | | | | | | | | |
Big Lots, Inc. (a) | | | 60,700 | | | | 1,520,535 | |
| Bon-Ton Stores, Inc. (The) | | | 34,968 | | | | 323,454 | |
| Dillard’s, Inc. | | | 42,200 | | | | 574,764 | |
| Fred’s, Inc. | | | 77,271 | | | | 914,889 | |
Tuesday Morning Corporation (a) | | | 9,087 | | | | 29,351 | |
| | | | | | | | 3,362,993 | |
| Specialty Retail — 4.3% | | | | | | | | |
| Aaron’s, Inc. | | | 48,702 | | | | 1,219,985 | |
| Abercrombie & Fitch Company - Class A | | | 32,370 | | | | 1,062,383 | |
| American Eagle Outfitters, Inc. | | | 300 | | | | 5,247 | |
Asbury Automotive Group, Inc. (a) | | | 52,730 | | | | 513,590 | |
| Barnes & Noble, Inc. | | | 68,119 | | | | 1,131,457 | |
| bebe stores, Inc. | | | 140,218 | | | | 877,765 | |
Blockbuster, Inc. - Class A (a) | | | 100,400 | | | | 83,332 | |
| Brown Shoe Company, Inc. | | | 1,000 | | | | 10,370 | |
| Buckle, Inc. (The) | | | 50,386 | | | | 1,512,084 | |
Build-A-Bear Workshop, Inc. (a) | | | 400 | | | | 2,072 | |
Cabela’s, Inc. - Class A (a) | | | 70,676 | | | | 888,397 | |
Charming Shoppes, Inc. (a) | | | 188,709 | | | | 854,852 | |
Chico’s FAS, Inc. (a) | | | 68,300 | | | | 816,185 | |
Children’s Place Retail Stores, Inc. (The) (a) | | | 56 | | | | 1,761 | |
China Auto Logistics, Inc. (a) | | | 1,000 | | | | 4,120 | |
| Christopher & Banks Corporation | | | 100 | | | | 609 | |
Citi Trends, Inc. (a) | | | 18,076 | | | | 475,941 | |
Coldwater Creek, Inc. (a) | | | 70,000 | | | | 402,500 | |
Conn’s, Inc. (a) | | | 88,392 | | | | 557,754 | |
Dick’s Sporting Goods, Inc. (a) | | | 62,500 | | | | 1,418,125 | |
Dress Barn, Inc. (a) | | | 92,753 | | | | 1,674,192 | |
DSW, Inc. - Class A (a) | | | 73,316 | | | | 1,407,667 | |
| Foot Locker, Inc. | | | 47,000 | | | | 492,560 | |
GameStop Corporation - Class A (a) | | | 300 | | | | 7,287 | |
Gander Mountain Company (a) | | | 9,002 | | | | 44,920 | |
| Group 1 Automotive, Inc. | | | 70,416 | | | | 1,789,975 | |
| Guess?, Inc. | | | 9,300 | | | | 339,915 | |
Haverty Furniture Companies, Inc. (a) | | | 69,500 | | | | 841,645 | |
hhgregg, Inc. (a) | | | 60,419 | | | | 996,309 | |
Hibbett Sports, Inc. (a) | | | 56,075 | | | | 1,050,846 | |
Hot Topic, Inc. (a) | | | 73,600 | | | | 566,720 | |
Jo-Ann Stores, Inc. (a) | | | 51,573 | | | | 1,372,873 | |
| Limited Brands, Inc. | | | 200 | | | | 3,520 | |
TFS MARKET NEUTRAL FUND
SCHEDULE OF SECURITIES SOLD SHORT (Continued)
| COMMON STOCKS — 64.6% (Continued) | | Shares | | | Value | |
| Consumer Discretionary — 14.3% (Continued) | | | | | | |
| Specialty Retail — 4.3% (Continued) | | | | | | |
Lumber Liquidators, Inc. (a) | | | 55,372 | | | $ | 1,176,655 | |
New York & Company, Inc. (a) | | | 1,500 | | | | 6,600 | |
| Penske Auto Group, Inc. | | | 87,927 | | | | 1,376,937 | |
| PetSmart, Inc. | | | 98,200 | | | | 2,310,646 | |
Pier 1 Imports, Inc. (a) | | | 506,312 | | | | 1,782,218 | |
| RadioShack Corporation | | | 173,500 | | | | 2,930,415 | |
Shoe Carnival, Inc. (a) | | | 5,106 | | | | 76,641 | |
| Sonic Automotive, Inc. - Class A | | | 83,419 | | | | 745,766 | |
Stein Mart, Inc. (a) | | | 100 | | | | 950 | |
Systemax, Inc. (a) | | | 40,300 | | | | 543,244 | |
Tractor Supply Company (a) | | | 29,603 | | | | 1,323,254 | |
Tween Brands, Inc. (a) | | | 37,700 | | | | 319,696 | |
Urban Outfitters, Inc. (a) | | | 200 | | | | 6,276 | |
West Marine, Inc. (a) | | | 100 | | | | 762 | |
Zumiez, Inc. (a) | | | 64,311 | | | | 866,269 | |
| | | | | | | | 35,893,287 | |
| Textiles, Apparel & Luxury Goods — 1.6% | | | | | | | | |
Alpha Pro Tech Ltd. (a) | | | 6,100 | | | | 36,539 | |
Carter’s, Inc. (a) | | | 5,100 | | | | 120,360 | |
| Cherokee, Inc. | | | 33,325 | | | | 630,842 | |
| Columbia Sportswear Company | | | 41,900 | | | | 1,594,295 | |
Deckers Outdoor Corporation (a) | | | 14,500 | | | | 1,300,215 | |
Fossil, Inc. (a) | | | 6,900 | | | | 184,437 | |
Fuqi International, Inc. (a) | | | 19,400 | | | | 397,506 | |
G-III Apparel Group Ltd. (a) | | | 9,645 | | | | 154,416 | |
Gildan Activewear, Inc. (a) | | | 18,835 | | | | 333,945 | |
Hanesbrands, Inc. (a) | | | 157,086 | | | | 3,396,199 | |
Iconix Brand Group, Inc. (a) | | | 54,850 | | | | 639,551 | |
| Jones Apparel Group, Inc. | | | 82,900 | | | | 1,483,081 | |
| K-Swiss, Inc. - Class A | | | 95,561 | | | | 779,778 | |
| Liz Claiborne, Inc. | | | 8,200 | | | | 47,068 | |
| Movado Group, Inc. | | | 47,317 | | | | 495,882 | |
Skechers U.S.A., Inc. - Class A (a) | | | 3,300 | | | | 72,006 | |
Timberland Company (The) - Class A (a) | | | 23,300 | | | | 376,994 | |
Volcom, Inc. (a) | | | 53,212 | | | | 883,851 | |
Warnaco Group, Inc. (The) (a) | | | 16,471 | | | | 667,570 | |
| | | | | | | | 13,594,535 | |
| Consumer Staples — 3.5% | | | | | | | | |
| Beverages — 0.3% | | | | | | | | |
Boston Beer Company, Inc. - Class A (a) | | | 161 | | | | 6,118 | |
Central European Distribution Corporation (a) | | | 49,393 | | | | 1,536,616 | |
Constellation Brands, Inc. - Class A (a) | | | 34,900 | | | | 552,118 | |
Cott Corporation (a) | | | 6,900 | | | | 54,510 | |
Jones Soda Company (a) | | | 128,277 | | | | 100,056 | |
| | | | | | | | 2,249,418 | |
TFS MARKET NEUTRAL FUND
SCHEDULE OF SECURITIES SOLD SHORT (Continued)
| COMMON STOCKS — 64.6% (Continued) | | Shares | | | Value | |
| Consumer Staples — 3.5% (Continued) | | | | | | |
| Food & Staples Retailing — 0.7% | | | | | | |
Diedrich Coffee, Inc. (a) | | | 600 | | | $ | 13,080 | |
Great Atlantic & Pacific Tea Company, Inc. (The) (a) | | | 126,502 | | | | 1,253,635 | |
| Nash Finch Company | | | 16,757 | | | | 485,618 | |
Rite Aid Corporation (a) | | | 604,400 | | | | 779,676 | |
| Ruddick Corporation | | | 57,114 | | | | 1,526,086 | |
Susser Holdings Corporation (a) | | | 700 | | | | 8,323 | |
United Natural Foods, Inc. (a) | | | 44,997 | | | | 1,084,878 | |
Winn-Dixie Stores, Inc. (a) | | | 31,538 | | | | 349,756 | |
| | | | | | | | 5,501,052 | |
| Food Products — 1.5% | | | | | | | | |
AgFeed Industries, Inc. (a) | | | 5,000 | | | | 22,050 | |
American Dairy, Inc. (a) | | | 5,856 | | | | 169,473 | |
American Italian Pasta Company (a) | | | 9,200 | | | | 249,964 | |
| Cal-Maine Foods, Inc. | | | 68,900 | | | | 1,870,635 | |
Chiquita Brands International, Inc. (a) | | | 97,069 | | | | 1,571,547 | |
Dean Foods Company (a) | | | 20,600 | | | | 375,538 | |
| Diamond Foods, Inc. | | | 27,321 | | | | 823,728 | |
| Farmer Brothers Company | | | 3,133 | | | | 59,214 | |
| Flowers Foods, Inc. | | | 65,977 | | | | 1,541,223 | |
Fresh Del Monte Produce, Inc. (a) | | | 8,600 | | | | 186,706 | |
Hain Celestial Group, Inc. (The) (a) | | | 100 | | | | 1,754 | |
| Imperial Sugar Company | | | 5,000 | | | | 62,450 | |
Lifeway Foods, Inc. (a) | | | 3,389 | | | | 40,803 | |
| Sanderson Farms, Inc. | | | 1,700 | | | | 62,203 | |
Smithfield Foods, Inc. (a) | | | 155,900 | | | | 2,079,706 | |
Synutra International, Inc. (a) | | | 11,570 | | | | 139,997 | |
| Tootsie Roll Industries, Inc. | | | 37,558 | | | | 931,814 | |
Treehouse Foods, Inc. (a) | | | 46,600 | | | | 1,742,840 | |
| Tyson Foods, Inc. | | | 79,400 | | | | 994,088 | |
Zapata Corporation (a) | | | 256 | | | | 1,748 | |
| | | | | | | | 12,927,481 | |
| Personal Products — 0.7% | | | | | | | | |
American Oriental Bioengineering, Inc. (a) | | | 222,060 | | | | 879,358 | |
Bare Escentuals, Inc. (a) | | | 19,500 | | | | 246,285 | |
Chattem, Inc. (a) | | | 15,600 | | | | 988,572 | |
China Sky One Medical, Inc. (a) | | | 13,004 | | | | 154,357 | |
China-Biotics, Inc. (a) | | | 900 | | | | 10,440 | |
Elizabeth Arden, Inc. (a) | | | 2,200 | | | | 23,430 | |
Female Health Company (The) (a) | | | 900 | | | | 4,167 | |
| Herbalife Ltd. | | | 9,300 | | | | 312,945 | |
| Mannatech, Inc. | | | 72,468 | | | | 246,391 | |
| Mead Johnson Nutrition Company - Class A | | | 8,579 | | | | 360,661 | |
Medifast, Inc. (a) | | | 500 | | | | 11,010 | |
NBTY, Inc. (a) | | | 24,648 | | | | 897,434 | |
| Nu Skin Enterprises, Inc. | | | 200 | | | | 4,552 | |
Revlon, Inc. (a) | | | 13,100 | | | | 110,433 | |
USANA Health Sciences, Inc. (a) | | | 54,641 | | | | 1,574,754 | |
| | | | | | | | 5,824,789 | |
TFS MARKET NEUTRAL FUND
SCHEDULE OF SECURITIES SOLD SHORT (Continued)
| COMMON STOCKS — 64.6% (Continued) | | Shares | | | Value | |
| Consumer Staples — 3.5% (Continued) | | | | | | |
| Tobacco — 0.3% | | | | | | |
Alliance One International, Inc. (a) | | | 174,756 | | | $ | 770,674 | |
Star Scientific, Inc. (a) | | | 458 | | | | 385 | |
| Universal Corporation | | | 29,731 | | | | 1,236,512 | |
| Vector Group Ltd. | | | 50,432 | | | | 731,768 | |
| | | | | | | | 2,739,339 | |
| Energy — 5.0% | | | | | | | | |
| Energy Equipment & Services — 1.3% | | | | | | | | |
| Baker Hughes, Inc. | | | 600 | | | | 25,242 | |
Basic Energy Services, Inc. (a) | | | 3,800 | | | | 26,600 | |
Bronco Drilling Company, Inc. (a) | | | 3,000 | | | | 18,960 | |
| Carbo Ceramics, Inc. | | | 35,289 | | | | 2,060,525 | |
| Core Laboratories N.V. | | | 4,400 | | | | 458,920 | |
Dawson Geophysical Company (a) | | | 200 | | | | 4,830 | |
Dresser-Rand Group, Inc. (a) | | | 30,800 | | | | 907,676 | |
Exterran Holdings, Inc. (a) | | | 11,965 | | | | 244,445 | |
Global Industries Ltd. (a) | | | 19,854 | | | | 144,736 | |
| Gulf Island Fabrication, Inc. | | | 15,313 | | | | 292,784 | |
| Halliburton Company | | | 100 | | | | 2,921 | |
Helix Energy Solutions Group, Inc. (a) | | | 103,700 | | | | 1,423,801 | |
Hercules Offshore, Inc. (a) | | | 10,200 | | | | 52,326 | |
| Lufkin Industries, Inc. | | | 700 | | | | 39,935 | |
NATCO Group, Inc. (a) | | | 2,700 | | | | 117,666 | |
North American Energy Partners, Inc. (a) | | | 2,100 | | | | 11,907 | |
OYO Geospace Corporation (a) | | | 800 | | | | 21,000 | |
| Patterson-UTI Energy, Inc. | | | 237,200 | | | | 3,695,576 | |
| Precision Drilling Trust | | | 3,700 | | | | 24,235 | |
| RPC, Inc. | | | 2,100 | | | | 19,635 | |
Seahawk Drilling, Inc. (a) | | | 1,082 | | | | 29,214 | |
SulphCo, Inc. (a) | | | 279,872 | | | | 279,872 | |
Superior Well Services, Inc. (a) | | | 109,600 | | | | 1,162,856 | |
TETRA Technologies, Inc. (a) | | | 1,100 | | | | 10,406 | |
Trico Marine Services, Inc. (a) | | | 11,977 | | | | 73,060 | |
Union Drilling, Inc. (a) | | | 6,000 | | | | 45,840 | |
Unit Corporation (a) | | | 200 | | | | 7,816 | |
Weatherford International Ltd. (a) | | | 100 | | | | 1,753 | |
Willbros Group, Inc. (a) | | | 8,300 | | | | 109,062 | |
| | | | | | | | 11,313,599 | |
| Oil, Gas & Consumable Fuels — 3.7% | | | | | | | | |
Alpha Natural Resources, Inc. (a) | | | 34,940 | | | | 1,186,912 | |
Arena Resources, Inc. (a) | | | 23,400 | | | | 871,884 | |
| Atlas Pipeline Partners, L.P. | | | 9,200 | | | | 64,584 | |
| Berry Petroleum Company - Class A | | | 53,592 | | | | 1,359,093 | |
Bill Barrett Corporation (a) | | | 100 | | | | 3,098 | |
BPZ Resources, Inc. (a) | | | 100,862 | | | | 635,431 | |
Brigham Exploration Company (a) | | | 2,000 | | | | 19,000 | |
| Cabot Oil & Gas Corporation | | | 100 | | | | 3,847 | |
Carrizo Oil & Gas, Inc. (a) | | | 91,500 | | | | 2,120,970 | |
| Cheniere Energy Partners, L.P. | | | 600 | | | | 6,408 | |
TFS MARKET NEUTRAL FUND
SCHEDULE OF SECURITIES SOLD SHORT (Continued)
| COMMON STOCKS — 64.6% (Continued) | | Shares | | | Value | |
| Energy — 5.0% (Continued) | | | | | | |
| Oil, Gas & Consumable Fuels — 3.7% (Continued) | | | | | | |
Cheniere Energy, Inc. (a) | | | 303,188 | | | $ | 706,428 | |
Clayton Williams Energy, Inc. (a) | | | 700 | | | | 18,340 | |
Clean Energy Fuels Corporation (a) | | | 300 | | | | 3,480 | |
CNX Gas Corporation (a) | | | 100 | | | | 2,786 | |
Comstock Resources, Inc. (a) | | | 14,100 | | | | 579,369 | |
Concho Resources, Inc. (a) | | | 19,934 | | | | 759,685 | |
| Copano Energy, LLC | | | 18,496 | | | | 315,912 | |
| Cross Timbers Royalty Trust | | | 500 | | | | 16,020 | |
| Crosstex Energy, Inc. | | | 9,000 | | | | 50,580 | |
| Crosstex Energy, L.P. | | | 10,900 | | | | 63,656 | |
| DCP Midstream Partners, L.P. | | | 100 | | | | 2,579 | |
| Eagle Rock Energy Partners, L.P. | | | 13,300 | | | | 63,042 | |
| Enbridge Energy Partners, L.P. | | | 6,600 | | | | 306,768 | |
Encore Acquisition Company (a) | | | 18,523 | | | | 686,648 | |
| EOG Resources, Inc. | | | 100 | | | | 8,166 | |
Evergreen Energy, Inc. (a) | | | 306,822 | | | | 111,683 | |
| EXCO Resources, Inc. | | | 70,800 | | | | 1,105,896 | |
Forest Oil Corporation (a) | | | 14,500 | | | | 284,200 | |
| Frontier Oil Corporation | | | 84,367 | | | | 1,169,327 | |
| Frontline Ltd. | | | 44,348 | | | | 1,034,639 | |
| General Maritime Corporation | | | 103,896 | | | | 715,843 | |
GeoGlobal Resources, Inc. (a) | | | 17,923 | | | | 18,281 | |
GMX Resources, Inc. (a) | | | 52,893 | | | | 673,328 | |
Goodrich Petroleum Corporation (a) | | | 58,126 | | | | 1,492,094 | |
GreenHunter Energy, Inc. (a) | | | 1,400 | | | | 2,156 | |
Harvest Natural Resources, Inc. (a) | | | 52,151 | | | | 286,309 | |
| Holly Corporation | | | 10,500 | | | | 304,605 | |
| Hugoton Royalty Trust | | | 5,900 | | | | 96,170 | |
International Coal Group, Inc. (a) | | | 200 | | | | 818 | |
Isramco, Inc. (a) | | | 200 | | | | 16,568 | |
James River Coal Company (a) | | | 12,220 | | | | 232,058 | |
| Magellan Midstream Partners, L.P. | | | 583 | | | | 22,644 | |
| MarkWest Energy Partners, L.P. | | | 24,136 | | | | 579,505 | |
| Massey Energy Company | | | 300 | | | | 8,727 | |
McMoRan Exploration Company (a) | | | 800 | | | | 6,152 | |
| Natural Resource Partners, L.P. | | | 500 | | | | 10,945 | |
Newfield Exploration Company (a) | | | 200 | | | | 8,204 | |
| Nexen, Inc. | | | 400 | | | | 8,588 | |
| Nordic American Tanker Shipping Ltd. | | | 26,239 | | | | 742,564 | |
| NuStar Energy, L.P. | | | 13,415 | | | | 719,849 | |
| Overseas Shipholding Group, Inc. | | | 46,950 | | | | 1,842,787 | |
Pacific Ethanol, Inc. (a) | | | 137,669 | | | | 55,068 | |
Patriot Coal Corporation (a) | | | 4,600 | | | | 51,980 | |
| Peabody Energy Corporation | | | 400 | | | | 15,836 | |
| Pengrowth Energy Trust | | | 100 | | | | 920 | |
| Penn Virginia Corporation | | | 67,410 | | | | 1,365,052 | |
| Permian Basin Royalty Trust | | | 6,690 | | | | 86,167 | |
Petrohawk Energy Corporation (a) | | | 300 | | | | 7,056 | |
Petroleum Development Corporation (a) | | | 4,400 | | | | 73,480 | |
TFS MARKET NEUTRAL FUND
SCHEDULE OF SECURITIES SOLD SHORT (Continued)
| COMMON STOCKS — 64.6% (Continued) | | Shares | | | Value | |
| Energy — 5.0% (Continued) | | | | | | |
| Oil, Gas & Consumable Fuels — 3.7% (Continued) | | | | | | |
PetroQuest Energy, Inc. (a) | | | 800 | | | $ | 4,904 | |
Plains Exploration & Production Company (a) | | | 300 | | | | 7,950 | |
Quicksilver Resources, Inc. (a) | | | 58,500 | | | | 713,700 | |
Rex Energy Corporation (a) | | | 20,952 | | | | 169,502 | |
| San Juan Basin Royalty Trust | | | 2,300 | | | | 40,963 | |
SandRidge Energy, Inc. (a) | | | 2,600 | | | | 26,598 | |
Southwestern Energy Company (a) | | | 300 | | | | 13,074 | |
Stone Energy Corporation (a) | | | 5,300 | | | | 81,249 | |
| Suncor Energy, Inc. | | | 200 | | | | 6,604 | |
| Sunoco, Inc. | | | 5,000 | | | | 154,000 | |
Swift Energy Company (a) | | | 57,974 | | | | 1,227,889 | |
| Targa Resources Partners, L.P. | | | 4,400 | | | | 87,164 | |
| Teekay Corporation | | | 21,960 | | | | 455,670 | |
| Tesoro Corporation | | | 74,105 | | | | 1,047,845 | |
| Toreador Resources Corporation | | | 3,400 | | | | 29,002 | |
Tri-Valley Corporation (a) | | | 62,216 | | | | 149,318 | |
Uranerz Energy Corporation (a) | | | 6,740 | | | | 10,312 | |
Venoco, Inc. (a) | | | 22,200 | | | | 279,720 | |
Verenium Corporation (a) | | | 10,134 | | | | 38,610 | |
| W&T Offshore, Inc. | | | 4,100 | | | | 47,765 | |
Western Refining, Inc. (a) | | | 3,900 | | | | 21,879 | |
Whiting Petroleum Corporation (a) | | | 6,300 | | | | 355,320 | |
| Williams Partners, L.P. | | | 4,000 | | | | 102,000 | |
| World Fuel Services Corporation | | | 44,009 | | | | 2,237,858 | |
Zion Oil & Gas, Inc. (a) | | | 8,400 | | | | 56,532 | |
| | | | | | | | 30,369,613 | |
| Financials — 10.9% | | | | | | | | |
| Capital Markets — 1.0% | | | | | | | | |
| Allied Capital Corporation | | | 52,200 | | | | 162,864 | |
| Apollo Investment Corporation | | | 1,400 | | | | 12,600 | |
| Ares Capital Corporation | | | 100 | | | | 1,044 | |
| BlackRock Kelso Capital Corporation | | | 1,500 | | | | 10,965 | |
Broadpoint Gleacher Securities Group, Inc. (a) | | | 1,200 | | | | 7,644 | |
| Calamos Asset Management, Inc. | | | 600 | | | | 6,360 | |
| Eaton Vance Corporation | | | 42,000 | | | | 1,192,380 | |
| Epoch Holding Corporation | | | 300 | | | | 2,787 | |
| Federated Investors, Inc. | | | 37,947 | | | | 996,109 | |
Fortress Investment Group, LLC - Class A (a) | | | 5,000 | | | | 20,950 | |
| Greenhill & Company, Inc. | | | 13,000 | | | | 1,120,990 | |
Harris & Harris Group, Inc. (a) | | | 10,503 | | | | 45,058 | |
Investment Technology Group, Inc. (a) | | | 13,800 | | | | 297,666 | |
Knight Capital Group, Inc. (a) | | | 21,700 | | | | 365,645 | |
LaBranche & Company, Inc. (a) | | | 90,718 | | | | 250,382 | |
| Lazard Ltd. - Class A | | | 100 | | | | 3,775 | |
| Och-Ziff Capital Management Group, LLC | | | 9,200 | | | | 111,596 | |
| Oppenheimer Holdings, Inc. | | | 3,487 | | | | 88,918 | |
| optionsXpress Holdings, Inc. | | | 14,200 | | | | 221,946 | |
Penson Worldwide, Inc. (a) | | | 60,060 | | | | 585,585 | |
TFS MARKET NEUTRAL FUND
SCHEDULE OF SECURITIES SOLD SHORT (Continued)
| COMMON STOCKS — 64.6% (Continued) | | Shares | | | Value | |
| Financials — 10.9% (Continued) | | | | | | |
| Capital Markets — 1.0% (Continued) | | | | | | |
Piper Jaffray Companies, Inc. (a) | | | 13,075 | | | $ | 606,549 | |
| Prospect Capital Corporation | | | 15,700 | | | | 155,901 | |
Pzena Investment Management, Inc. (a) | | | 12,111 | | | | 89,379 | |
| Raymond James Financial, Inc. | | | 100 | | | | 2,361 | |
| Sanders Morris Harris Group, Inc. | | | 100 | | | | 581 | |
Stifel Financial Corporation (a) | | | 36,347 | | | | 1,888,590 | |
Thomas Weisel Partners Group, Inc. (a) | | | 1,200 | | | | 5,436 | |
TradeStation Group, Inc. (a) | | | 23,000 | | | | 177,560 | |
| | | | | | | | 8,431,621 | |
| Commercial Banks — 4.7% | | | | | | | | |
1st United Bancorp, Inc. (a) | | | 900 | | | | 5,076 | |
| American National Bankshares, Inc. | | | 198 | | | | 4,243 | |
| Associated Banc-Corp | | | 114,336 | | | | 1,464,644 | |
| BancorpSouth, Inc. | | | 35,641 | | | | 804,774 | |
| Bank of the Ozarks, Inc. | | | 10,660 | | | | 242,515 | |
BB&T Corporation (a) | | | 300 | | | | 7,173 | |
| Boston Private Financial Holdings, Inc. | | | 10,600 | | | | 63,070 | |
| Camden National Corporation | | | 3,466 | | | | 106,510 | |
| Capital City Bank Group, Inc. | | | 16,491 | | | | 193,604 | |
| Capitol Bancorp Ltd. | | | 10,654 | | | | 23,971 | |
| Cardinal Financial Corporation | | | 32,687 | | | | 266,399 | |
Cascade Bancorp, Inc. (a) | | | 47,384 | | | | 48,332 | |
| Chemical Financial Corporation | | | 34,036 | | | | 747,090 | |
| Citizens & Northern Corporation | | | 700 | | | | 8,526 | |
| City Bank | | | 13,068 | | | | 30,318 | |
| City National Corporation | | | 41,500 | | | | 1,563,305 | |
Colonial Bancgroup, Inc. (The) (a) | | | 108,955 | | | | 5,339 | |
| Columbia Banking Systems, Inc. | | | 900 | | | | 13,230 | |
| Cullen/Frost Bankers, Inc. | | | 14,365 | | | | 672,138 | |
| CVB Financial Corporation | | | 116,667 | | | | 934,503 | |
| East West Bancorp, Inc. | | | 800 | | | | 7,224 | |
| Farmers Capital Bank Corporation | | | 400 | | | | 4,448 | |
| Fifth Third Bancorp | | | 500 | | | | 4,470 | |
| First Busey Corporation | | | 48,419 | | | | 187,382 | |
| First Commonwealth Financial Corporation | | | 26,200 | | | | 137,550 | |
| First Financial Bancorporation | | | 11,434 | | | | 144,983 | |
| First Financial Bankshares, Inc. | | | 6,088 | | | | 294,964 | |
| First Financial Corporation | | | 1,108 | | | | 30,725 | |
First Horizon National Corporation (a) | | | 97,600 | | | | 1,154,608 | |
| First Midwest Bancorp, Inc. | | | 3,000 | | | | 31,200 | |
| First South Bancorp, Inc. | | | 5,455 | | | | 57,768 | |
| FNB Corporation | | | 72,686 | | | | 514,617 | |
Frontier Financial Corporation (a) | | | 88,593 | | | | 37,625 | |
| Fulton Financial Corporation | | | 66,185 | | | | 546,688 | |
| Glacier Bancorp, Inc. | | | 67,915 | | | | 889,007 | |
| Great Southern Bancorp, Inc. | | | 25,142 | | | | 576,255 | |
| Hancock Holding Company | | | 27,969 | | | | 1,014,436 | |
| Harleysville National Corporation | | | 87,784 | | | | 505,636 | |
TFS MARKET NEUTRAL FUND
SCHEDULE OF SECURITIES SOLD SHORT (Continued)
| COMMON STOCKS — 64.6% (Continued) | | Shares | | | Value | |
| Financials — 10.9% (Continued) | | | | | | |
| Commercial Banks — 4.7% (Continued) | | | | | | |
| IberiaBank Corporation | | | 27,468 | | | $ | 1,189,639 | |
| Lakeland Bancorp, Inc. | | | 100 | | | | 608 | |
| MainSource Financial Group, Inc. | | | 6,633 | | | | 38,670 | |
| Marshall & Ilsley Corporation | | | 1,100 | | | | 5,852 | |
| MB Financial, Inc. | | | 2,400 | | | | 42,912 | |
Metro Bancorp, Inc. (a) | | | 800 | | | | 9,464 | |
Midwest Bank Holdings, Inc. (a) | | | 5,300 | | | | 2,650 | |
| Nara Bancorp, Inc. | | | 2,000 | | | | 14,720 | |
| National Penn Bancshares, Inc. | | | 1,900 | | | | 10,678 | |
| NBT Bancorp, Inc. | | | 38,029 | | | | 829,032 | |
| Old Second Bancorp, Inc. | | | 38,424 | | | | 205,568 | |
| Oriental Financial Group, Inc. | | | 900 | | | | 9,585 | |
| Pacific Continental Corporation | | | 2,000 | | | | 21,800 | |
| PacWest Bancorp | | | 52,124 | | | | 885,066 | |
| Park National Corporation | | | 52,700 | | | | 3,060,816 | |
Pinnacle Financial Partners, Inc. (a) | | | 57,408 | | | | 729,082 | |
| PNC Bank Corporation | | | 900 | | | | 44,046 | |
| PrivateBancorp, Inc. | | | 83,776 | | | | 764,875 | |
| Prosperity Bancshares, Inc. | | | 29,500 | | | | 1,055,805 | |
| Regions Financial Corporation | | | 2,000 | | | | 9,680 | |
| Renasant Corporation | | | 12,792 | | | | 187,275 | |
| Republic Bancorp, Inc. - Class A | | | 1,099 | | | | 20,211 | |
| S&T Bancorp, Inc. | | | 64,626 | | | | 1,017,859 | |
| S.Y. Bancorp, Inc. | | | 4,230 | | | | 94,540 | |
| Sandy Spring Bancorp, Inc. | | | 45,091 | | | | 521,252 | |
| SCBT Financial Corporation | | | 9,408 | | | | 243,385 | |
Security Bank Corporation (a) | | | 32,973 | | | | 824 | |
| Southwest Bancorp, Inc. | | | 1,800 | | | | 17,712 | |
| StellarOne Corporation | | | 8,589 | | | | 91,129 | |
| Sterling Bancshares, Inc. | | | 700 | | | | 3,899 | |
| Suffolk Bancorp | | | 23,885 | | | | 667,825 | |
Sun Bancorp, Inc. (a) | | | 10,888 | | | | 44,205 | |
| Susquehanna Bancshares, Inc. | | | 192,706 | | | | 1,061,810 | |
SVB Financial Group (a) | | | 10,200 | | | | 420,750 | |
| Synovus Financial Corporation | | | 16,100 | | | | 35,742 | |
| TCF Financial Corporation | | | 107,310 | | | | 1,269,477 | |
Texas Capital Bancshares, Inc. (a) | | | 28,200 | | | | 410,874 | |
| Tompkins Financial Corporation | | | 6,546 | | | | 283,900 | |
| Towne Bank | | | 16,844 | | | | 194,380 | |
| Trustmark Corporation | | | 55,601 | | | | 1,053,639 | |
| UCBH Holdings, Inc. | | | 45,933 | | | | 45,014 | |
| Umpqua Holdings Corporation | | | 103,736 | | | | 1,028,024 | |
| Union Bankshares Corporation | | | 2,618 | | | | 32,254 | |
| United Bankshares, Inc. | | | 59,203 | | | | 1,056,774 | |
United Community Banks, Inc. (a) | | | 133,291 | | | | 541,161 | |
| United Security Bancshares, Inc./Georgia | | | 51 | | | | 1,056 | |
United Security Bancshares, Inc./Fresno, California (a) | | | 1,890 | | | | 4,725 | |
| Univest Corporation of Pennsylvania | | | 4,400 | | | | 84,612 | |
TFS MARKET NEUTRAL FUND
SCHEDULE OF SECURITIES SOLD SHORT (Continued)
| COMMON STOCKS — 64.6% (Continued) | | Shares | | | Value | |
| Financials — 10.9% (Continued) | | | | | | |
| Commercial Banks — 4.7% (Continued) | | | | | | |
| U.S. Bancorp | | | 100 | | | $ | 2,322 | |
| Valley National Bancorp | | | 86,502 | | | | 1,148,747 | |
| W Holding Company, Inc. | | | 6,898 | | | | 76,706 | |
| Webster Financial Corporation | | | 98,335 | | | | 1,112,169 | |
| Westamerica Bancorporation | | | 21,680 | | | | 1,036,304 | |
| Whitney Holding Corporation | | | 111,208 | | | | 893,000 | |
| Wilmington Trust Corporation | | | 61,500 | | | | 741,075 | |
| Wilshire Bancorp, Inc. | | | 41,305 | | | | 290,787 | |
| Zions Bancorporation | | | 55,700 | | | | 788,712 | |
| | | | | | | | 38,799,024 | |
| Consumer Finance — 0.2% | | | | | | | | |
| Capital One Financial Corporation | | | 200 | | | | 7,320 | |
| Cash America International, Inc. | | | 33,582 | | | | 1,016,191 | |
CompuCredit Holdings Corporation (a) | | | 65,321 | | | | 214,253 | |
Credit Acceptance Corporation (a) | | | 100 | | | | 3,437 | |
Dollar Financial Corporation (a) | | | 1,500 | | | | 28,155 | |
EZCORP, Inc. - Class A (a) | | | 6,500 | | | | 84,305 | |
SLM Corporation (a) | | | 800 | | | | 7,760 | |
World Acceptance Corporation (a) | | | 2,500 | | | | 62,725 | |
| | | | | | | | 1,424,146 | |
| Diversified Financial Services — 0.5% | | | | | | | | |
Asset Acceptance Capital Corporation (a) | | | 27,774 | | | | 201,917 | |
| Asta Funding, Inc. | | | 3,102 | | | | 20,256 | |
| Financial Federal Corporation | | | 35,570 | | | | 726,340 | |
Interactive Brokers Group, Inc. - Class A (a) | | | 27,878 | | | | 446,327 | |
| Life Partners Holdings, Inc. | | | 36,966 | | | | 628,052 | |
| Moody’s Corporation | | | 1,000 | | | | 23,680 | |
MSCI, Inc. (a) | | | 7,700 | | | | 234,080 | |
PHH Corporation (a) | | | 98,830 | | | | 1,597,093 | |
| | | | | | | | 3,877,745 | |
| Insurance — 0.9% | | | | | | | | |
| Aflac, Inc. | | | 200 | | | | 8,298 | |
American International Group, Inc. (a) | | | 3,000 | | | | 100,860 | |
| Assurant, Inc. | | | 16,600 | | | | 496,838 | |
Citizens, Inc. (a) | | | 200 | | | | 1,206 | |
| Endurance Specialty Holdings Ltd. | | | 33,285 | | | | 1,197,927 | |
| FBL Financial Group, Inc. - Class A | | | 1,000 | | | | 20,150 | |
First Acceptance Corporation (a) | | | 3,004 | | | | 6,609 | |
| First American Corporation | | | 27,892 | | | | 847,638 | |
Genworth Financial, Inc. (a) | | | 800 | | | | 8,496 | |
| Hanover Insurance Group, Inc. (The) | | | 23,599 | | | | 992,574 | |
| Hartford Financial Services Group, Inc. | | | 300 | | | | 7,356 | |
LandAmerica Financial Group, Inc. (a) | | | 92,077 | | | | 2,854 | |
| Lincoln National Corporation | | | 100 | | | | 2,383 | |
| Marsh & McLennan Companies, Inc. | | | 300 | | | | 7,038 | |
National Financial Partners Corporation (a) | | | 200 | | | | 1,630 | |
| National Interstate Corporation | | | 3,188 | | | | 57,735 | |
| NYMAGIC, INC. | | | 400 | | | | 5,716 | |
TFS MARKET NEUTRAL FUND
SCHEDULE OF SECURITIES SOLD SHORT (Continued)
| COMMON STOCKS — 64.6% (Continued) | | Shares | | | Value | |
| Financials — 10.9% (Continued) | | | | | | |
| Insurance — 0.9% (Continued) | | | | | | |
| Old Republic International Corporation | | | 21,800 | | | $ | 232,824 | |
PMA Capital Corporation (a) | | | 5,900 | | | | 28,202 | |
| Presidential Life Corporation | | | 2,500 | | | | 23,325 | |
| Principal Financial Group, Inc. | | | 300 | | | | 7,512 | |
| Protective Life Corporation | | | 8,175 | | | | 157,369 | |
| Prudential Financial, Inc. | | | 100 | | | | 4,523 | |
| Stewart Information Services Corporation | | | 600 | | | | 5,364 | |
| Torchmark Corporation | | | 43,800 | | | | 1,778,280 | |
United America Indemnity Ltd. - Class A (a) | | | 11,816 | | | | 82,830 | |
| United Fire & Casualty Company | | | 100 | | | | 1,748 | |
| Zenith National Insurance Corporation | | | 36,563 | | | | 1,043,142 | |
| | | | | | | | 7,130,427 | |
| Real Estate Investment Trusts — 2.5% | | | | | | | | |
Alesco Financial, Inc. (a) | | | 135,609 | | | | 101,707 | |
| Alexandria Real Estate Equities, Inc. | | | 19,800 | | | | 1,072,566 | |
| American Campus Communities, Inc. | | | 23,900 | | | | 645,778 | |
Anthracite Capital, Inc. (a) | | | 73,855 | | | | 53,176 | |
| Apartment Investment & Management Company | | | 1,800 | | | | 22,230 | |
| Arbor Realty Trust, Inc. | | | 71,908 | | | | 143,816 | |
Ashford Hospitality Trust (a) | | | 226,819 | | | | 870,985 | |
| Associated Estates Realty Corporation | | | 600 | | | | 5,472 | |
| BioMed Realty Trust, Inc. | | | 900 | | | | 12,213 | |
| Boston Properties, Inc. | | | 300 | | | | 18,231 | |
| BRE Properties, Inc. | | | 300 | | | | 8,169 | |
Capital Trust, Inc. (a) | | | 73,177 | | | | 143,427 | |
| CapLease, Inc. | | | 23,725 | | | | 81,377 | |
| Capstead Mortgage Corporation | | | 22,400 | | | | 294,784 | |
| Care Investment Trust, Inc. | | | 300 | | | | 2,403 | |
| CBL & Associates Properties, Inc. | | | 2,500 | | | | 20,400 | |
| Cedar Shopping Centers, Inc. | | | 3,900 | | | | 23,673 | |
| Developers Diversified Realty Corporation | | | 135,000 | | | | 1,159,650 | |
| Digital Realty Trust, Inc. | | | 23,200 | | | | 1,047,016 | |
| Douglas Emmett, Inc. | | | 32,100 | | | | 378,780 | |
| Duke Realty Corporation | | | 600 | | | | 6,744 | |
| Entertainment Properties Trust | | | 100 | | | | 3,402 | |
| Equity One, Inc. | | | 106,800 | | | | 1,593,456 | |
| Equity Residential | | | 300 | | | | 8,664 | |
| Essex Property Trust, Inc. | | | 12,300 | | | | 924,714 | |
| Federal Realty Investment Trust | | | 22,000 | | | | 1,298,660 | |
| First Industrial Realty Trust, Inc. | | | 8,800 | | | | 38,280 | |
| First Potomac Realty Trust | | | 100 | | | | 1,135 | |
| Hatteras Financial Corporation | | | 800 | | | | 22,480 | |
| HCP, Inc. | | | 100 | | | | 2,959 | |
| Healthcare Realty Trust, Inc. | | | 40,273 | | | | 838,886 | |
| Hospitality Properties Trust | | | 7,000 | | | | 135,170 | |
iStar Financial, Inc. (a) | | | 346,510 | | | | 724,206 | |
| Kilroy Realty Corporation | | | 100 | | | | 2,762 | |
| Kimco Realty Corporation | | | 2,900 | | | | 36,656 | |
| Lasalle Hotel Properties | | | 14,000 | | | | 240,240 | |
TFS MARKET NEUTRAL FUND
SCHEDULE OF SECURITIES SOLD SHORT (Continued)
| COMMON STOCKS — 64.6% (Continued) | | Shares | | | Value | |
| Financials — 10.9% (Continued) | | | | | | |
| Real Estate Investment Trusts — 2.5% (Continued) | | | | | | |
| Lexington Realty Trust | | | 2,989 | | | $ | 12,524 | |
| Mack-Cali Realty Corporation | | | 20,000 | | | | 619,000 | |
| MFA Financial, Inc. | | | 82,200 | | | | 609,924 | |
| Mid-America Apartment Communities, Inc. | | | 18,400 | | | | 806,288 | |
| NorthStar Realty Finance Corporation | | | 58,030 | | | | 204,846 | |
| Parkway Properties, Inc. | | | 900 | | | | 15,885 | |
| Pennsylvania Real Estate Investment Trust | | | 141,038 | | | | 1,033,808 | |
| Plum Creek Timber Company, Inc. | | | 300 | | | | 9,387 | |
| Post Properties, Inc. | | | 400 | | | | 6,596 | |
| Prologis | | | 1,900 | | | | 21,527 | |
| Ramco-Gershenson Properties Trust | | | 2,000 | | | | 17,680 | |
| Rayonier, Inc. | | | 8,600 | | | | 331,788 | |
| Realty Income Corporation | | | 121,337 | | | | 2,812,592 | |
| Regency Centers Corporation | | | 27,500 | | | | 922,625 | |
| Senior Housing Properties Trust | | | 25,500 | | | | 491,640 | |
| Simon Property Group, Inc. | | | 200 | | | | 13,578 | |
| Sun Communities, Inc. | | | 26,962 | | | | 470,217 | |
| Sunstone Hotel Investors, Inc. | | | 3,800 | | | | 28,690 | |
| Taubman Centers | | | 300 | | | | 9,153 | |
| UDR, Inc. | | | 1,800 | | | | 25,884 | |
| U-Store-It Trust | | | 2,800 | | | | 15,960 | |
| Vornado Realty Trust | | | 100 | | | | 5,956 | |
| Walter Investment Management Corporation | | | 14,941 | | | | 194,532 | |
| Weingarten Realty Investors | | | 300 | | | | 5,550 | |
| | | | | | | | 20,669,897 | |
| Real Estate Management & Development — 0.4% | | | | | | | | |
| Brookfield Properties Corporation | | | 1,500 | | | | 15,240 | |
CB Richard Ellis Group, Inc. - Class A (a) | | | 134,800 | | | | 1,395,180 | |
| Jones Lang Lasalle, Inc. | | | 18,700 | | | | 876,095 | |
| MI Developments, Inc. - Class A | | | 700 | | | | 9,940 | |
St. Joe Company (The) (a) | | | 59,567 | | | | 1,426,034 | |
| | | | | | | | 3,722,489 | |
| Thrifts & Mortgage Finance — 0.7% | | | | | | | | |
| Astoria Financial Corporation | | | 97,130 | | | | 969,357 | |
| Brookline Bancorp, Inc. | | | 22,355 | | | | 218,855 | |
Downey Financial Corporation (a) | | | 42,834 | | | | 2,142 | |
| First Financial Holdings, Inc. | | | 6,980 | | | | 94,160 | |
| First Niagra Financial Group, Inc. | | | 63,124 | | | | 810,512 | |
FirstFed Financial Corporation (a) | | | 23,697 | | | | 8,531 | |
Guaranty Financial Group, Inc. (a) | | | 62,759 | | | | 4,268 | |
MGIC Investment Corporation (a) | | | 77,500 | | | | 334,025 | |
| NASB Financial, Inc. | | | 441 | | | | 10,849 | |
| NewAlliance Bancshares, Inc. | | | 158,449 | | | | 1,755,615 | |
| OceanFirst Financial Corporation | | | 2,680 | | | | 25,460 | |
Ocwen Financial Corporation (a) | | | 1,000 | | | | 10,930 | |
| Oritani Financial Corporation | | | 200 | | | | 2,562 | |
| Provident Financial Services, Inc. | | | 900 | | | | 9,675 | |
| Provident New York Bancorp | | | 200 | | | | 1,706 | |
TFS MARKET NEUTRAL FUND
SCHEDULE OF SECURITIES SOLD SHORT (Continued)
| COMMON STOCKS — 64.6% (Continued) | | Shares | | | Value | |
| Financials — 10.9% (Continued) | | | | | | |
| Thrifts & Mortgage Finance — 0.7% (Continued) | | | | | | |
| Prudential Bancorp, Inc. of Pennsylvania | | | 166 | | | $ | 1,629 | |
| Radian Group, Inc. | | | 137,376 | | | | 795,407 | |
| Rockville Financial, Inc. | | | 2,842 | | | | 29,415 | |
| TFS Financial Corporation | | | 3,200 | | | | 37,312 | |
Tree.com, Inc. (a) | | | 900 | | | | 7,029 | |
Triad Guaranty, Inc. (a) | | | 22,450 | | | | 15,800 | |
| TrustCo Bank Corporation | | | 88,254 | | | | 525,111 | |
| ViewPoint Financial Group | | | 10,190 | | | | 136,546 | |
| WSFS Financial Corporation | | | 500 | | | | 13,800 | |
| | | | | | | | 5,820,696 | |
| Health Care — 9.0% | | | | | | | | |
| Biotechnology — 3.3% | | | | | | | | |
Abraxis BioScience, Inc. (a) | | | 1,700 | | | | 53,074 | |
Acorda Therapeutics, Inc. (a) | | | 47,649 | | | | 1,035,413 | |
Affymax, Inc. (a) | | | 1,600 | | | | 32,224 | |
Alexion Pharmaceuticals, Inc. (a) | | | 11,000 | | | | 488,510 | |
Alkermes, Inc. (a) | | | 26,800 | | | | 213,596 | |
Allos Therapeutics, Inc. (a) | | | 66,900 | | | | 377,985 | |
Alnylam Pharmaceuticals, Inc. (a) | | | 81,051 | | | | 1,381,109 | |
AMAG Pharmaceuticals, Inc. (a) | | | 56,522 | | | | 2,135,401 | |
Amicus Therapeutics, Inc. (a) | | | 13,330 | | | | 51,187 | |
Antigenics, Inc. (a) | | | 12,200 | | | | 12,200 | |
Array BioPharma, Inc. (a) | | | 226,079 | | | | 404,681 | |
AVI Biopharma, Inc. (a) | | | 26,900 | | | | 39,543 | |
BioCryst Pharmaceuticals, Inc. (a) | | | 70,669 | | | | 631,074 | |
BioMarin Pharmaceutical, Inc. (a) | | | 2,350 | | | | 36,566 | |
BioSante Pharmaceuticals, Inc. (a) | | | 18,808 | | | | 28,588 | |
Cell Therapeutics, Inc. (a) | | | 72,486 | | | | 68,862 | |
Celldex Therapeutics, Inc. (a) | | | 900 | | | | 3,924 | |
Clinical Data, Inc. (a) | | | 15,785 | | | | 249,087 | |
Cytori Therapeutics, Inc. (a) | | | 41,200 | | | | 135,548 | |
Dendreon Corporation (a) | | | 37,300 | | | | 942,571 | |
Dyax Corporation (a) | | | 89,061 | | | | 279,652 | |
Emergent BioSolutions, Inc. (a) | | | 500 | | | | 7,210 | |
Enzon Pharmaceuticals, Inc. (a) | | | 124,330 | | | | 1,043,129 | |
Facet Biotech Corporation (a) | | | 5,100 | | | | 87,363 | |
Genomic Health, Inc. (a) | | | 16,999 | | | | 315,671 | |
GenVec, Inc. (a) | | | 70,332 | | | | 52,749 | |
Geron Corporation (a) | | | 212,532 | | | | 1,298,570 | |
GTx, Inc. (a) | | | 99,402 | | | | 892,630 | |
Halozyme Therapeutics, Inc. (a) | | | 93,201 | | | | 564,798 | |
Human Genome Sciences, Inc. (a) | | | 1,000 | | | | 18,690 | |
Idenix Pharmaceuticals, Inc. (a) | | | 7,545 | | | | 16,750 | |
Idera Pharmaceuticals, Inc. (a) | | | 38,358 | | | | 204,832 | |
Immunomedics, Inc. (a) | | | 1,800 | | | | 6,408 | |
InterMune, Inc. (a) | | | 144,950 | | | | 1,750,996 | |
Introgen Therapeutics, Inc. (a) | | | 99,112 | | | | 1,487 | |
Isis Pharmaceuticals, Inc. (a) | | | 160,879 | | | | 2,038,337 | |
TFS MARKET NEUTRAL FUND
SCHEDULE OF SECURITIES SOLD SHORT (Continued)
| COMMON STOCKS — 64.6% (Continued) | | Shares | | | Value | |
| Health Care — 9.0% (Continued) | | | | | | |
| Biotechnology — 3.3% (Continued) | | | | | | |
Martek Biosciences Corporation (a) | | | 51,736 | | | $ | 929,179 | |
Maxygen, Inc. (a) | | | 1,700 | | | | 9,486 | |
Medivation, Inc. (a) | | | 50,797 | | | | 1,296,339 | |
Metabolix, Inc. (a) | | | 98,900 | | | | 1,002,846 | |
Micromet, Inc. (a) | | | 1,800 | | | | 9,198 | |
Momenta Pharmaceuticals, Inc. (a) | | | 87,788 | | | | 800,627 | |
Myriad Pharmaceuticals, Inc. (a) | | | 2,700 | | | | 14,904 | |
Nanosphere, Inc. (a) | | | 1,900 | | | | 12,692 | |
Neurocrine Biosciences, Inc. (a) | | | 143,289 | | | | 318,102 | |
Novavax, Inc. (a) | | | 99,000 | | | | 380,160 | |
NPS Pharmaceuticals, Inc. (a) | | | 61,329 | | | | 194,413 | |
Omeros Corporation (a) | | | 1,600 | | | | 8,640 | |
OncoGenex Pharmaceutical, Inc. (a) | | | 1,300 | | | | 37,843 | |
Oncothyreon, Inc. (a) | | | 6,600 | | | | 23,298 | |
Onyx Pharmaceuticals, Inc. (a) | | | 100 | | | | 2,660 | |
Orexigen Therapeutics, Inc. (a) | | | 500 | | | | 3,230 | |
Osiris Therapeutics, Inc. (a) | | | 76,179 | | | | 483,737 | |
Poniard Pharmaceuticals, Inc. (a) | | | 3,200 | | | | 20,960 | |
Progenics Pharmaceuticals, Inc. (a) | | | 45,985 | | | | 192,677 | |
Protalix BioTherapeutics, Inc. (a) | | | 2,300 | | | | 21,804 | |
Regeneron Pharmaceuticals, Inc. (a) | | | 2,300 | | | | 36,110 | |
Rigel Pharmaceuticals, Inc. (a) | | | 190,567 | | | | 1,221,534 | |
Seattle Genetics, Inc. (a) | | | 2,100 | | | | 19,068 | |
Sinovac Biotech Ltd. (a) | | | 300 | | | | 2,223 | |
Spectrum Pharmaceuticals, Inc. (a) | | | 900 | | | | 3,735 | |
StemCells, Inc. (a) | | | 314,434 | | | | 358,455 | |
Theravance, Inc. (a) | | | 69,037 | | | | 964,447 | |
United Therapeutics Corporation (a) | | | 35,679 | | | | 1,517,785 | |
ZymoGenetics, Inc. (a) | | | 28,393 | | | | 132,027 | |
| | | | | | | | 26,918,594 | |
| Health Care Equipment & Supplies — 1.9% | | | | | | | | |
Abaxis, Inc. (a) | | | 4,100 | | | | 93,562 | |
Abiomed, Inc. (a) | | | 95,859 | | | | 867,524 | |
Boston Scientific Corporation (a) | | | 3,000 | | | | 24,360 | |
Bovie Medical Corporation (a) | | | 5,530 | | | | 44,295 | |
Cantel Medical Corporation (a) | | | 600 | | | | 9,636 | |
Cardiovascular Systems, Inc. (a) | | | 900 | | | | 4,401 | |
Conceptus, Inc. (a) | | | 2,700 | | | | 47,358 | |
CryoLife, Inc. (a) | | | 9,300 | | | | 55,800 | |
Cyberonics, Inc. (a) | | | 54,538 | | | | 788,619 | |
Endologix, Inc. (a) | | | 200 | | | | 952 | |
ev3, Inc. (a) | | | 33,600 | | | | 395,808 | |
Exactech, Inc. (a) | | | 500 | | | | 7,500 | |
Gen-Probe, Inc. (a) | | | 20,800 | | | | 867,776 | |
Greatbatch, Inc. (a) | | | 57,089 | | | | 1,122,941 | |
Hansen Medical, Inc. (a) | | | 83,747 | | | | 214,392 | |
| Hill-Rom Holdings, Inc. | | | 7,647 | | | | 149,805 | |
ICU Medical, Inc. (a) | | | 16,478 | | | | 576,730 | |
IDEXX Laboratories, Inc. (a) | | | 27,300 | | | | 1,395,576 | |
TFS MARKET NEUTRAL FUND
SCHEDULE OF SECURITIES SOLD SHORT (Continued)
| COMMON STOCKS — 64.6% (Continued) | | Shares | | | Value | |
| Health Care — 9.0% (Continued) | | | | | | |
| Health Care Equipment & Supplies — 1.9% (Continued) | | | | | | |
Insulet Corporation (a) | | | 150,295 | | | $ | 1,668,274 | |
Integra LifeSciences Holdings Corporation (a) | | | 3,600 | | | | 109,944 | |
Masimo Corporation (a) | | | 33,200 | | | | 882,124 | |
| Meridian Bioscience, Inc. | | | 40,079 | | | | 889,353 | |
NeuroMetrix, Inc. (a) | | | 24,036 | | | | 62,494 | |
Palomar Medical Technologies, Inc. (a) | | | 4,800 | | | | 48,768 | |
Quidel Corporation (a) | | | 5,200 | | | | 74,360 | |
ResMed, Inc. (a) | | | 10,300 | | | | 506,863 | |
Sirona Dental Systems, Inc. (a) | | | 3,500 | | | | 94,185 | |
Somanetics Corporation (a) | | | 400 | | | | 5,980 | |
SonoSite, Inc. (a) | | | 24,558 | | | | 608,793 | |
Stereotaxis, Inc. (a) | | | 192,598 | | | | 695,279 | |
SurModics, Inc. (a) | | | 34,200 | | | | 875,862 | |
Symmetry Medical, Inc. (a) | | | 1,000 | | | | 8,000 | |
Syneron Medical Ltd. (a) | | | 900 | | | | 9,900 | |
Thoratec Corporation (a) | | | 29,318 | | | | 769,891 | |
| Utah Medical Products, Inc. | | | 100 | | | | 2,924 | |
Varian Medical Systems, Inc. (a) | | | 300 | | | | 12,294 | |
Volcano Corporation (a) | | | 62,705 | | | | 899,817 | |
| West Pharmaceutical Services, Inc. | | | 21,207 | | | | 837,040 | |
| | | | | | | | 15,729,180 | |
| Health Care Providers & Services — 1.8% | | | | | | | | |
Air Methods Corporation (a) | | | 5,621 | | | | 171,665 | |
Alliance Healthcare Services, Inc. (a) | | | 300 | | | | 1,632 | |
Allion Healthcare, Inc. (a) | | | 900 | | | | 5,796 | |
Almost Family, Inc. (a) | | | 1,800 | | | | 54,630 | |
Amedisys, Inc. (a) | | | 45,200 | | | | 1,798,508 | |
AMERIGROUP Corporation (a) | | | 9,900 | | | | 218,295 | |
AMN Healthcare Services, Inc. (a) | | | 4,800 | | | | 39,936 | |
Assisted Living Concepts, Inc. (a) | | | 300 | | | | 6,216 | |
Bio-Reference Labs, Inc. (a) | | | 29,380 | | | | 949,855 | |
BioScrip, Inc. (a) | | | 1,900 | | | | 14,326 | |
Cardionet, Inc. (a) | | | 33,700 | | | | 199,167 | |
Catalyst Health Solutions, Inc. (a) | | | 4,300 | | | | 134,891 | |
Community Health Systems, Inc. (a) | | | 14,888 | | | | 465,697 | |
Coventry Health Care, Inc. (a) | | | 200 | | | | 3,966 | |
Cross Country Healthcare, Inc. (a) | | | 900 | | | | 7,434 | |
Emeritus Corporation (a) | | | 46,427 | | | | 866,328 | |
Genoptix, Inc. (a) | | | 26,255 | | | | 913,412 | |
Health Net, Inc. (a) | | | 400 | | | | 5,964 | |
HealthSouth Corporation (a) | | | 81,876 | | | | 1,196,208 | |
Healthways, Inc. (a) | | | 23,480 | | | | 377,558 | |
HMS Holdings Corporation (a) | | | 22,300 | | | | 957,339 | |
Kindred Healthcare, Inc. (a) | | | 800 | | | | 11,760 | |
| Landauer, Inc. | | | 210 | | | | 10,876 | |
LCA-Vision, Inc. (a) | | | 40,223 | | | | 181,004 | |
LHC Group, Inc. (a) | | | 500 | | | | 13,955 | |
LifePoint Hospitals, Inc. (a) | | | 10,800 | | | | 305,964 | |
Magellan Health Services, Inc. (a) | | | 38,126 | | | | 1,224,988 | |
TFS MARKET NEUTRAL FUND
SCHEDULE OF SECURITIES SOLD SHORT (Continued)
| COMMON STOCKS — 64.6% (Continued) | | Shares | | | Value | |
| Health Care — 9.0% (Continued) | | | | | | |
| Health Care Providers & Services — 1.8% (Continued) | | | | | | |
MedCath Corporation (a) | | | 700 | | | $ | 5,747 | |
Molina Healthcare, Inc. (a) | | | 10,400 | | | | 194,688 | |
NightHawk Radiology Holdings, Inc. (a) | | | 300 | | | | 1,797 | |
| Omnicare, Inc. | | | 22,700 | | | | 491,909 | |
PharMerica Corporation (a) | | | 47,365 | | | | 730,842 | |
PSS World Medical, Inc. (a) | | | 55,000 | | | | 1,112,100 | |
Rural/Metro Corporation (a) | | | 1,400 | | | | 7,070 | |
Sharps Compliance Corporation (a) | | | 2,400 | | | | 21,264 | |
Skilled Healthcare Group, Inc. - Class A (a) | | | 1,100 | | | | 8,844 | |
Sun Healthcare Group, Inc. (a) | | | 700 | | | | 6,356 | |
Triple-S Management Corporation (a) | | | 19,823 | | | | 331,044 | |
| Universal Health Services, Inc. - Class B | | | 6,900 | | | | 383,985 | |
VCA Antech, Inc. (a) | | | 51,200 | | | | 1,219,584 | |
Virtual Radiologic Corporation (a) | | | 1,300 | | | | 16,705 | |
| | | | | | | | 14,669,305 | |
| Health Care Technology — 0.6% | | | | | | | | |
Allscripts-Misys Healthcare Solutions, Inc. (a) | | | 900 | | | | 17,550 | |
Amicas, Inc. (a) | | | 10,800 | | | | 34,020 | |
athenahealth, Inc. (a) | | | 18,441 | | | | 693,566 | |
| Computer Programs and Systems, Inc. | | | 49,807 | | | | 2,103,848 | |
Eclipsys Corporation (a) | | | 10,400 | | | | 195,000 | |
| IMS Health, Inc. | | | 500 | | | | 8,195 | |
MedAssets, Inc. (a) | | | 4,300 | | | | 94,342 | |
| Medquist, Inc. | | | 300 | | | | 1,734 | |
Phase Forward, Inc. (a) | | | 99,000 | | | | 1,297,890 | |
SXC Health Solutions Corporation (a) | | | 800 | | | | 36,544 | |
Transcend Services, Inc. (a) | | | 7,479 | | | | 136,492 | |
Vital Images, Inc. (a) | | | 22,221 | | | | 253,541 | |
| | | | | | | | 4,872,722 | |
| Life Sciences Tools & Services — 0.7% | | | | | | | | |
Affymetrix, Inc. (a) | | | 51,400 | | | | 268,822 | |
Albany Molecular Research, Inc. (a) | | | 900 | | | | 7,326 | |
Biodelivery Sciences International, Inc. (a) | | | 100 | | | | 398 | |
Covance, Inc. (a) | | | 25,900 | | | | 1,338,512 | |
Enzo Biochem, Inc. (a) | | | 8,992 | | | | 49,546 | |
eResearchTechnology, Inc. (a) | | | 300 | | | | 2,220 | |
Kendle International, Inc. (a) | | | 3,600 | | | | 60,768 | |
Life Sciences Research, Inc. (a) | | | 100 | | | | 843 | |
Luminex Corporation (a) | | | 53,808 | | | | 792,054 | |
MDS, Inc. (a) | | | 1,800 | | | | 14,346 | |
Parexel International Corporation (a) | | | 2,200 | | | | 27,544 | |
| PerkinElmer, Inc. | | | 38,200 | | | | 710,902 | |
| Pharmaceutical Product Development, Inc. | | | 66,900 | | | | 1,441,695 | |
Sequenom, Inc. (a) | | | 420,148 | | | | 1,159,608 | |
Varian, Inc. (a) | | | 2,600 | | | | 133,120 | |
| | | | | | | | 6,007,704 | |
TFS MARKET NEUTRAL FUND
SCHEDULE OF SECURITIES SOLD SHORT (Continued)
| COMMON STOCKS — 64.6% (Continued) | | Shares | | | Value | |
| Health Care — 9.0% (Continued) | | | | | | |
| Pharmaceuticals — 0.7% | | | | | | |
Acura Pharmaceuticals, Inc. (a) | | | 1,918 | | | $ | 7,940 | |
Ardea Biosciences, Inc. (a) | | | 600 | | | | 8,100 | |
| Biovail Corporation | | | 62,500 | | | | 841,250 | |
Cadence Pharmaceuticals, Inc. (a) | | | 49,823 | | | | 449,902 | |
Cypress Bioscience, Inc. (a) | | | 108,931 | | | | 668,836 | |
DepoMed, Inc. (a) | | | 16,189 | | | | 50,348 | |
ISTA Pharmaceuticals, Inc. (a) | | | 3,200 | | | | 11,712 | |
Javelin Pharmaceuticals, Inc. (a) | | | 82,274 | | | | 108,602 | |
Jazz Pharmaceuticals, Inc. (a) | | | 7,728 | | | | 48,532 | |
MAP Pharmaceuticals, Inc. (a) | | | 1,500 | | | | 12,330 | |
Medicines Company (The) (a) | | | 9,603 | | | | 69,045 | |
Nektar Therapeutics (a) | | | 63,207 | | | | 513,241 | |
Optimer Pharmaceuticals, Inc. (a) | | | 15,321 | | | | 177,111 | |
Pain Therapeutics, Inc. (a) | | | 1,100 | | | | 5,577 | |
POZEN, Inc. (a) | | | 112,873 | | | �� | 641,118 | |
Questcor Pharmaceuticals, Inc. (a) | | | 2,900 | | | | 13,166 | |
Valeant Pharmaceuticals International (a) | | | 53,617 | | | | 1,576,340 | |
ViroPharma, Inc. (a) | | | 3,000 | | | | 22,620 | |
XenoPort, Inc. (a) | | | 39,628 | | | | 662,184 | |
| | | | | | | | 5,887,954 | |
| Industrials — 9.4% | | | | | | | | |
| Aerospace & Defense — 0.8% | | | | | | | | |
AAR Corporation (a) | | | 45,543 | | | | 893,098 | |
AeroVironment, Inc. (a) | | | 100 | | | | 2,666 | |
Alliant Techsystems, Inc. (a) | | | 25,327 | | | | 1,969,934 | |
Ascent Solar Technologies, Inc. (a) | | | 14,600 | | | | 73,730 | |
BE Aerospace, Inc. (a) | | | 51,700 | | | | 916,641 | |
| Boeing Company (The) | | | 200 | | | | 9,560 | |
GeoEye, Inc. (a) | | | 80,016 | | | | 2,030,006 | |
| HEICO Corporation | | | 6,740 | | | | 256,322 | |
| Hi-Shear Technology Corporation | | | 3,200 | | | | 61,472 | |
Kratos Defense & Security Solutions, Inc. (a) | | | 6,800 | | | | 73,984 | |
Stanley, Inc. (a) | | | 100 | | | | 2,825 | |
Taser International, Inc. (a) | | | 146,653 | | | | 599,811 | |
| | | | | | | | 6,890,049 | |
| Air Freight & Logistics — 0.2% | | | | | | | | |
Dynamex, Inc. (a) | | | 4,687 | | | | 86,850 | |
| Forward Air Corporation | | | 61,879 | | | | 1,320,498 | |
Park-Ohio Holdings Corporation (a) | | | 3,800 | | | | 23,636 | |
| | | | | | | | 1,430,984 | |
| Airlines — 0.3% | | | | | | | | |
AirTran Holdings, Inc. (a) | | | 900 | | | | 3,807 | |
Alaska Air Group, Inc. (a) | | | 8,700 | | | | 223,764 | |
Allegiant Travel Company (a) | | | 51,690 | | | | 1,949,230 | |
AMR Corporation (a) | | | 17,400 | | | | 93,786 | |
Continental Airlines, Inc. - Class B (a) | | | 2,600 | | | | 29,900 | |
Delta Air Lines, Inc. (a) | | | 2,800 | | | | 19,992 | |
TFS MARKET NEUTRAL FUND
SCHEDULE OF SECURITIES SOLD SHORT (Continued)
| COMMON STOCKS — 64.6% (Continued) | | Shares | | | Value | |
| Industrials — 9.4% (Continued) | | | | | | |
| Airlines — 0.3% (Continued) | | | | | | |
Hawaiian Holdings, Inc. (a) | | | 43,200 | | | $ | 306,288 | |
Republic Airways Holdings, Inc. (a) | | | 3,300 | | | | 26,433 | |
| Southwest Airlines Company | | | 2,400 | | | | 20,160 | |
UAL Corporation (a) | | | 19,200 | | | | 124,992 | |
| | | | | | | | 2,798,352 | |
| Building Products — 0.8% | | | | | | | | |
| AAON, Inc. | | | 50,060 | | | | 901,580 | |
| American Woodmark Corporation | | | 33,795 | | | | 664,748 | |
| Apogee Enterprises, Inc. | | | 63,600 | | | | 842,064 | |
Builders FirstSource, Inc. (a) | | | 90,502 | | | | 352,053 | |
| Gilbraltar Industries, Inc. | | | 2,100 | | | | 22,722 | |
| Lennox International, Inc. | | | 8,100 | | | | 272,727 | |
| Masco Corporation | | | 200 | | | | 2,350 | |
NCI Building Systems, Inc. (a) | | | 12,500 | | | | 24,500 | |
| Simpson Manufacturing Company, Inc. | | | 38,500 | | | | 900,515 | |
Trex Company, Inc. (a) | | | 55,445 | | | | 882,130 | |
| Universal Forest Products, Inc. | | | 6,875 | | | | 245,300 | |
USG Corporation (a) | | | 124,849 | | | | 1,640,516 | |
| | | | | | | | 6,751,205 | |
| Commercial Services & Supplies — 0.7% | | | | | | | | |
| ABM Industries, Inc. | | | 47,943 | | | | 900,370 | |
ACCO Brands Corporation (a) | | | 1,600 | | | | 9,696 | |
American Reprographics Company (a) | | | 6,000 | | | | 36,000 | |
APAC Customer Services, Inc. (a) | | | 50,068 | | | | 322,939 | |
| Avery Dennison Corporation | | | 100 | | | | 3,565 | |
| Bowne & Company, Inc. | | | 1,600 | | | | 10,448 | |
| Brink’s Company (The) | | | 41,800 | | | | 991,914 | |
| Courier Corporation | | | 1,400 | | | | 20,762 | |
Document Security Systems, Inc. (a) | | | 25,493 | | | | 70,870 | |
| EnergySolutions, Inc. | | | 1,000 | | | | 8,340 | |
EnerNOC, Inc. (a) | | | 400 | | | | 11,492 | |
Fuel Tech, Inc. (a) | | | 77,644 | | | | 898,341 | |
| Herman Miller, Inc. | | | 200 | | | | 3,090 | |
| HNI Corporation | | | 4,963 | | | | 130,626 | |
InnerWorkings, Inc. (a) | | | 50,041 | | | | 257,711 | |
| Knoll, Inc. | | | 300 | | | | 2,940 | |
Metalico, Inc. (a) | | | 34,055 | | | | 137,582 | |
| Mine Safety Appliances Company | | | 1,400 | | | | 35,686 | |
Mobile Mini, Inc. (a) | | | 59,559 | | | | 863,605 | |
| Multi-Color Corporation | | | 4,100 | | | | 54,407 | |
Perma-Fix Environmental Services, Inc. (a) | | | 12,689 | | | | 29,946 | |
PRG-Schultz International, Inc. (a) | | | 400 | | | | 2,072 | |
| Schawk, Inc. | | | 1,300 | | | | 12,766 | |
| Steelcase, Inc. - Class A | | | 187,028 | | | | 1,079,152 | |
| Viad Corporation | | | 8,252 | | | | 144,410 | |
Waste Services, Inc. (a) | | | 300 | | | | 1,968 | |
| | | | | | | | 6,040,698 | |
TFS MARKET NEUTRAL FUND
SCHEDULE OF SECURITIES SOLD SHORT (Continued)
| COMMON STOCKS — 64.6% (Continued) | | Shares | | | Value | |
| Industrials — 9.4% (Continued) | | | | | | |
| Construction & Engineering — 0.5% | | | | | | |
Foster Wheeler AG (a) | | | 300 | | | $ | 8,397 | |
| Granite Construction, Inc. | | | 39,788 | | | | 1,136,345 | |
Insituform Technologies, Inc. - Class A (a) | | | 35,982 | | | | 762,818 | |
KHD Humboldt Wedag International Ltd. (a) | | | 300 | | | | 2,748 | |
MasTec, Inc. (a) | | | 600 | | | | 7,080 | |
Michael Baker Corporation (a) | | | 200 | | | | 7,140 | |
Tutor Perini Corporation (a) | | | 59,200 | | | | 1,044,880 | |
URS Corporation (a) | | | 19,732 | | | | 766,786 | |
| | | | | | | | 3,736,194 | |
| Electrical Equipment — 1.3% | | | | | | | | |
| A.O. Smith Corporation | | | 29,399 | | | | 1,165,082 | |
A123 Systems, Inc. (a) | | | 1,900 | | | | 37,354 | |
| Acuity Brands, Inc. | | | 58,046 | | | | 1,837,736 | |
Advanced Battery Technologies, Inc. (a) | | | 134,958 | | | | 453,459 | |
A-Power Energy Generation Systems Ltd. (a) | | | 7,200 | | | | 77,760 | |
| Belden, Inc. | | | 3,300 | | | | 75,735 | |
Broadwind Energy, Inc. (a) | | | 1,300 | | | | 7,592 | |
C&D Technologies, Inc. (a) | | | 78,943 | | | | 144,466 | |
Canadian Solar, Inc. (a) | | | 1,400 | | | | 20,412 | |
| Encore Wire Corporation | | | 40,328 | | | | 836,806 | |
Ener1, Inc. (a) | | | 77,600 | | | | 387,224 | |
Energy Conversion Devices, Inc. (a) | | | 92,378 | | | | 994,911 | |
Evergreen Solar, Inc. (a) | | | 471,040 | | | | 683,008 | |
First Solar, Inc. (a) | | | 400 | | | | 48,772 | |
FuelCell Energy, Inc. (a) | | | 19,400 | | | | 64,602 | |
GT Solar International, Inc. (a) | | | 75,463 | | | | 396,181 | |
Harbin Electric, Inc. (a) | | | 400 | | | | 6,372 | |
| Jinpan International Ltd. | | | 1,200 | | | | 36,432 | |
Lihua International, Inc. (a) | | | 3,200 | | | | 22,368 | |
Lime Energy Company (a) | | | 4,100 | | | | 26,035 | |
Medis Technologies Ltd. (a) | | | 63,019 | | | | 11,343 | |
Orion Energy Systems, Inc. (a) | | | 17,310 | | | | 65,951 | |
Polypore International, Inc. (a) | | | 43,646 | | | | 478,360 | |
Solarfun Power Holdings Company Ltd. - ADR (a) | | | 89,098 | | | | 423,216 | |
SunPower Corporation - Class A (a) | | | 66,980 | | | | 1,661,774 | |
SunPower Corporation - Class B (a) | | | 17,100 | | | | 370,386 | |
Thomas & Betts Corporation (a) | | | 10,300 | | | | 352,363 | |
Ultralife Corporation (a) | | | 36,299 | | | | 132,854 | |
UQM Technologies, Inc. (a) | | | 13,600 | | | | 63,920 | |
Valence Technology, Inc. (a) | | | 115,441 | | | | 148,919 | |
| | | | | | | | 11,031,393 | |
| Industrial Conglomerates — 0.0% | | | | | | | | |
| General Electric Company | | | 300 | | | | 4,278 | |
| Icahn Enterprises L.P. | | | 200 | | | | 7,710 | |
| Standex International Corporation | | | 500 | | | | 8,790 | |
| Textron, Inc. | | | 1,600 | | | | 28,448 | |
| | | | | | | | 49,226 | |
TFS MARKET NEUTRAL FUND
SCHEDULE OF SECURITIES SOLD SHORT (Continued)
| COMMON STOCKS — 64.6% (Continued) | | Shares | | | Value | |
| Industrials — 9.4% (Continued) | | | | | | |
| Machinery — 1.6% | | | | | | |
AGCO Corporation (a) | | | 12,900 | | | $ | 362,619 | |
| Albany International Corporation - Class A | | | 800 | | | | 13,328 | |
Altra Holdings, Inc. (a) | | | 300 | | | | 2,631 | |
| American Railcar Industries, Inc. | | | 200 | | | | 2,000 | |
Astec Industries, Inc. (a) | | | 45,736 | | | | 1,051,928 | |
Basin Water, Inc. (a) | | | 46,221 | | | | 837 | |
| Briggs & Stratton Corporation | | | 2,600 | | | | 48,620 | |
| Cascade Corporation | | | 100 | | | | 2,484 | |
| Caterpillar, Inc. | | | 200 | | | | 11,012 | |
Chart Industries, Inc. (a) | | | 16,497 | | | | 326,146 | |
China Fire & Security Group, Inc. (a) | | | 4,100 | | | | 58,302 | |
| China Yuchai International Ltd. | | | 1,300 | | | | 13,910 | |
CNH Global N.V. (a) | | | 1,700 | | | | 32,487 | |
Columbus McKinnon Corporation (a) | | | 25,483 | | | | 421,744 | |
| Crane Company | | | 100 | | | | 2,785 | |
Energy Recovery, Inc. (a) | | | 53,404 | | | | 297,994 | |
Enpro Industries, Inc. (a) | | | 9,473 | | | | 213,900 | |
ESCO Technologies, Inc. (a) | | | 29,150 | | | | 1,145,012 | |
| Federal Signal Corporation | | | 52,270 | | | | 320,938 | |
| Gorman-Rupp Company (The) | | | 30,391 | | | | 750,354 | |
| Graham Corporation | | | 17,055 | | | | 241,669 | |
| Harsco Corporation | | | 100 | | | | 3,149 | |
Hurco Companies, Inc. (a) | | | 3,676 | | | | 58,448 | |
Kadant. Inc. (a) | | | 3,000 | | | | 38,670 | |
| Kaydon Corporation | | | 16,291 | | | | 570,022 | |
| Lindsay Corporation | | | 500 | | | | 16,415 | |
Middleby Corporation (The) (a) | | | 20,945 | | | | 949,018 | |
| Mueller Water Products, Inc. - Class A | | | 2,900 | | | | 12,992 | |
| NACCO Industries, Inc. | | | 300 | | | | 17,880 | |
Navistar International Corporation (a) | | | 56,540 | | | | 1,873,736 | |
| Oshkosh Corporation | | | 11,800 | | | | 368,868 | |
| Pentair, Inc. | | | 5,900 | | | | 171,690 | |
PMFG, Inc. (a) | | | 2,500 | | | | 36,175 | |
| Robbins & Myers, Inc. | | | 1,900 | | | | 44,080 | |
| Sauer-Danfoss, Inc. | | | 9,300 | | | | 66,960 | |
SmartHeat, Inc. (a) | | | 28,540 | | | | 255,148 | |
| Snap-on, Inc. | | | 100 | | | | 3,653 | |
| SPX Corporation | | | 9,350 | | | | 493,493 | |
| Stanley Works (The) | | | 7,000 | | | | 316,610 | |
| Sun Hydraulics Corporation | | | 30,793 | | | | 586,914 | |
Tecumseh Products Company - Class A (a) | | | 5,100 | | | | 53,295 | |
| Tennant Company | | | 600 | | | | 15,996 | |
Terex Corporation (a) | | | 24,200 | | | | 489,324 | |
| Titan International, Inc. | | | 400 | | | | 3,360 | |
| Trinity Industries, Inc. | | | 34,900 | | | | 589,112 | |
| Twin Disc, Inc. | | | 2,400 | | | | 22,536 | |
| Wabtec Corporation | | | 16,400 | | | | 602,864 | |
| | | | | | | | 12,981,108 | |
TFS MARKET NEUTRAL FUND
SCHEDULE OF SECURITIES SOLD SHORT (Continued)
| COMMON STOCKS — 64.6% (Continued) | | Shares | | | Value | |
| Industrials — 9.4% (Continued) | | | | | | |
| Marine — 0.3% | | | | | | |
| Alexander & Baldwin, Inc. | | | 32,883 | | | $ | 948,017 | |
American Commercial Lines, Inc. (a) | | | 24,525 | | | | 526,061 | |
| Danaos Corporation | | | 3,600 | | | | 14,760 | |
| Excel Maritime Carriers Ltd. | | | 100,705 | | | | 567,976 | |
| | | | | | | | 2,056,814 | |
| Professional Services — 1.4% | | | | | | | | |
Acacia Research Corporation (a) | | | 25,765 | | | | 195,814 | |
| Administaff, Inc. | | | 66,469 | | | | 1,649,761 | |
| Barrett Business Services, Inc. | | | 1,049 | | | | 12,168 | |
COMSYS IT Partners, Inc. (a) | | | 6,544 | | | | 44,826 | |
| Corporate Executive Board Company (The) | | | 44,868 | | | | 1,077,281 | |
CoStar Group, Inc. (a) | | | 31,294 | | | | 1,214,833 | |
CRA International, Inc. (a) | | | 20,668 | | | | 511,533 | |
Exponent, Inc. (a) | | | 4,195 | | | | 109,112 | |
GP Strategies Corporation (a) | | | 14,142 | | | | 99,560 | |
| Heidrick & Struggles International, Inc. | | | 83,629 | | | | 2,288,089 | |
Hill International, Inc. (a) | | | 6,400 | | | | 43,008 | |
Huron Consulting Group, Inc. (a) | | | 9,000 | | | | 208,800 | |
Korn/Ferry International (a) | | | 500 | | | | 7,980 | |
MPS Group, Inc. (a) | | | 91,680 | | | | 1,239,514 | |
On Assignment, Inc. (a) | | | 1,600 | | | | 9,664 | |
Resources Connection, Inc. (a) | | | 40,271 | | | | 695,480 | |
School Specialty, Inc. (a) | | | 37,395 | | | | 832,039 | |
TrueBlue, Inc. (a) | | | 97,139 | | | | 1,175,382 | |
Volt Information Sciences, Inc. (a) | | | 700 | | | | 5,677 | |
| | | | | | | | 11,420,521 | |
| Road & Rail — 0.9% | | | | | | | | |
Avis Budget Group, Inc. (a) | | | 249,490 | | | | 2,095,716 | |
Celadon Group, Inc. (a) | | | 7,400 | | | | 72,224 | |
| Con-Way, Inc. | | | 42,881 | | | | 1,414,644 | |
Dollar Thrifty Automotive Group, Inc. (a) | | | 72,750 | | | | 1,346,603 | |
Kansas City Southern (a) | | | 33,700 | | | | 816,551 | |
| Knight Transportation, Inc. | | | 7,000 | | | | 112,280 | |
| Ryder System, Inc. | | | 200 | | | | 8,110 | |
Saia, Inc. (a) | | | 43,612 | | | | 639,352 | |
| Werner Enterprises, Inc. | | | 16,300 | | | | 305,625 | |
YRC Worldwide, Inc. (a) | | | 266,163 | | | | 971,495 | |
| | | | | | | | 7,782,600 | |
| Trading Companies & Distributors — 0.6% | | | | | | | | |
Beacon Roofing Supply, Inc. (a) | | | 62,807 | | | | 901,908 | |
| GATX Corporation | | | 84,266 | | | | 2,290,350 | |
| Houston Wire & Cable Company | | | 800 | | | | 9,672 | |
| Lawson Products, Inc. | | | 1,460 | | | | 22,703 | |
| MSC Industrial Direct Company, Inc. | | | 5,400 | | | | 232,470 | |
| TAL International Group, Inc. | | | 300 | | | | 3,558 | |
Titan Machinery, Inc. (a) | | | 43,012 | | | | 461,519 | |
| Watsco, Inc. | | | 19,348 | | | | 991,005 | |
WESCO International, Inc. (a) | | | 13,300 | | | | 339,948 | |
| | | | | | | | 5,253,133 | |
TFS MARKET NEUTRAL FUND
SCHEDULE OF SECURITIES SOLD SHORT (Continued)
| COMMON STOCKS — 64.6% (Continued) | | Shares | | | Value | |
| Industrials — 9.4% (Continued) | | | | | | |
| Transportation Infrastructure — 0.0% | | | | | | |
| Macquarie Infrastructure Company, LLC | | | 300 | | | $ | 2,421 | |
| | | | | | | | | |
| Information Technology — 7.7% | | | | | | | | |
| Communications Equipment — 0.6% | | | | | | | | |
Acme Packet, Inc. (a) | | | 300 | | | | 2,937 | |
| ADTRAN, Inc. | | | 59,058 | | | | 1,360,697 | |
Airvana, Inc. (a) | | | 10,200 | | | | 62,322 | |
Alvarion Ltd. (a) | | | 7,800 | | | | 30,654 | |
Aruba Networks, Inc. (a) | | | 16,500 | | | | 129,030 | |
Avocent Corporation (a) | | | 400 | | | | 9,948 | |
Brocade Communications Systems, Inc. (a) | | | 1,800 | | | | 15,444 | |
Cogo Group, Inc. (a) | | | 1,400 | | | | 7,854 | |
CommScope, Inc. (a) | | | 22,311 | | | | 602,843 | |
Comtech Telecommunications Corporation (a) | | | 1,000 | | | | 32,120 | |
DG FastChannel, Inc. (a) | | | 5,483 | | | | 114,979 | |
F5 Networks, Inc. (a) | | | 200 | | | | 8,978 | |
Harmonic, Inc. (a) | | | 7,400 | | | | 38,850 | |
Infinera Corporation (a) | | | 117,937 | | | | 876,272 | |
InterDigital, Inc. (a) | | | 800 | | | | 16,448 | |
Ixia (a) | | | 16,945 | | | | 112,684 | |
JDS Uniphase Corporation (a) | | | 18,200 | | | | 101,738 | |
Loral Space & Communications, Inc. (a) | | | 200 | | | | 5,284 | |
Network Equipment Technologies, Inc. (a) | | | 300 | | | | 990 | |
ParkerVision, Inc. (a) | | | 26,416 | | | | 73,172 | |
| Plantronics, Inc. | | | 9,100 | | | | 219,401 | |
Qiao Xing Mobile Communication Company Ltd. (a) | | | 400 | | | | 1,208 | |
Riverbed Technology, Inc. (a) | | | 200 | | | | 4,098 | |
ShoreTel, Inc. (a) | | | 800 | | | | 5,256 | |
Starent Networks Corporation (a) | | | 1,100 | | | | 37,114 | |
Telestone Technologies Corporation (a) | | | 1,100 | | | | 8,921 | |
Telkonet, Inc. (a) | | | 156,779 | | | | 54,873 | |
UTStarcom, Inc. (a) | | | 456,646 | | | | 826,529 | |
| | | | | | | | 4,760,644 | |
| Computers & Peripherals — 1.2% | | | | | | | | |
3PAR, Inc. (a) | | | 200 | | | | 1,882 | |
Avid Technology, Inc. (a) | | | 131,656 | | | | 1,662,815 | |
Dell, Inc. (a) | | | 300 | | | | 4,347 | |
Electronics for Imaging, Inc. (a) | | | 27,354 | | | | 318,948 | |
Hutchinson Technology, Inc. (a) | | | 2,100 | | | | 12,222 | |
| Imation Corporation | | | 101,656 | | | | 896,606 | |
Immersion Corporation (a) | | | 41,500 | | | | 152,305 | |
Intevac, Inc. (a) | | | 12,806 | | | | 130,621 | |
Lexmark International, Inc. - Class A (a) | | | 46,200 | | | | 1,178,100 | |
Logitech International S.A. (a) | | | 19,700 | | | | 334,900 | |
NCR Corporation (a) | | | 33,500 | | | | 340,025 | |
NetApp, Inc. (a) | | | 100 | | | | 2,705 | |
Netezza Corporation (a) | | | 125,780 | | | | 1,162,207 | |
QLogic Corporation (a) | | | 52,300 | | | | 917,342 | |
TFS MARKET NEUTRAL FUND
SCHEDULE OF SECURITIES SOLD SHORT (Continued)
| COMMON STOCKS — 64.6% (Continued) | | Shares | | | Value | |
| Information Technology — 7.7% (Continued) | | | | | | |
| Computers & Peripherals — 1.2% (Continued) | | | | | | |
Silicon Graphics International Corporation (a) | | | 2,200 | | | $ | 13,112 | |
STEC, Inc. (a) | | | 300 | | | | 6,396 | |
Stratasys, Inc. (a) | | | 66,927 | | | | 1,056,108 | |
Synaptics, Inc. (a) | | | 64,787 | | | | 1,457,708 | |
| | | | | | | | 9,648,349 | |
| Electronic Equipment, Instruments & Components — 1.2% | | | | | | | | |
| Agilysys, Inc. | | | 5,800 | | | | 27,318 | |
Arrow Electronics, Inc. (a) | | | 9,300 | | | | 235,662 | |
China Security & Surveillance Technology, Inc. (a) | | | 3,100 | | | | 16,213 | |
| Cognex Corporation | | | 56,151 | | | | 903,470 | |
Coherent, Inc. (a) | | | 25,991 | | | | 653,154 | |
| Daktronics, Inc. | | | 68,187 | | | | 512,766 | |
Dolby Laboratories, Inc. - Class A (a) | | | 3,300 | | | | 138,402 | |
DTS, Inc. (a) | | | 45,340 | | | | 1,280,855 | |
Echelon Corporation (a) | | | 39,339 | | | | 536,977 | |
FLIR Systems, Inc. (a) | | | 500 | | | | 13,905 | |
Ingram Micro, Inc. - Class A (a) | | | 26,600 | | | | 469,490 | |
Itron, Inc. (a) | | | 18,400 | | | | 1,104,736 | |
Littelfuse, Inc. (a) | | | 33,045 | | | | 910,720 | |
Maxwell Technologies, Inc. (a) | | | 12,384 | | | | 222,045 | |
Measurement Specialties, Inc. (a) | | | 1,600 | | | | 12,336 | |
| MTS Systems Corporation | | | 300 | | | | 7,950 | |
| Nam Tai Electronics, Inc. | | | 300 | | | | 1,665 | |
Plexus Corporation (a) | | | 3,600 | | | | 91,080 | |
RadiSys Corporation (a) | | | 8,000 | | | | 68,080 | |
Research Frontiers, Inc. (a) | | | 17,962 | | | | 65,022 | |
SYNNEX Corporation (a) | | | 33,690 | | | | 866,844 | |
Trimble Navigation Ltd. (a) | | | 13,400 | | | | 280,998 | |
Universal Display Corporation (a) | | | 106,400 | | | | 1,208,704 | |
X-Rite, Inc. (a) | | | 30,706 | | | | 61,412 | |
Zygo Corporation (a) | | | 9,958 | | | | 68,810 | |
| | | | | | | | 9,758,614 | |
| Internet Software & Services — 0.9% | | | | | | | | |
Constant Contact, Inc. (a) | | | 44,338 | | | | 734,681 | |
DealerTrack Holdings, Inc. (a) | | | 58,463 | | | | 963,470 | |
Dice Holdings, Inc. (a) | | | 200 | | | | 1,202 | |
Digital River, Inc. (a) | | | 3,600 | | | | 82,188 | |
DivX, Inc. (a) | | | 900 | | | | 4,329 | |
Equinix, Inc. (a) | | | 13,200 | | | | 1,126,224 | |
Innodata Isogen, Inc. (a) | | | 2,200 | | | | 14,256 | |
J2 Global Communications, Inc. (a) | | | 3,400 | | | | 69,530 | |
Knot, Inc. (The) (a) | | | 84,887 | | | | 905,744 | |
LoopNet, Inc. (a) | | | 85,593 | | | | 747,227 | |
| Marchex, Inc. - Class B | | | 2,000 | | | | 9,060 | |
ModusLink Global Solutions, Inc. (a) | | | 300 | | | | 2,466 | |
OpenTable, Inc. (a) | | | 261 | | | | 6,436 | |
Rackspace Hosting, Inc. (a) | | | 300 | | | | 5,025 | |
RADVision Ltd. (a) | | | 15,800 | | | | 97,486 | |
TFS MARKET NEUTRAL FUND
SCHEDULE OF SECURITIES SOLD SHORT (Continued)
| COMMON STOCKS — 64.6% (Continued) | | Shares | | | Value | |
| Information Technology — 7.7% (Continued) | | | | | | |
| Internet Software & Services — 0.9% (Continued) | | | | | | |
RealNetworks, Inc. (a) | | | 25,496 | | | $ | 91,021 | |
SAVVIS, Inc. (a) | | | 1,800 | | | | 26,622 | |
Sohu.com, Inc. (a) | | | 25,970 | | | | 1,443,932 | |
support.com, Inc. (a) | | | 24,224 | | | | 58,138 | |
Switch & Data Facilities Company, Inc. (a) | | | 500 | | | | 8,365 | |
Terremark Worldwide, Inc. (a) | | | 34,987 | | | | 223,567 | |
Travelzoo, Inc. (a) | | | 5,375 | | | | 74,283 | |
| United Online, Inc. | | | 4,500 | | | | 36,000 | |
Vocus, Inc. (a) | | | 20,565 | | | | 372,226 | |
WebMD Health Corporation (a) | | | 24,623 | | | | 838,659 | |
Yahoo, Inc. (a) | | | 100 | | | | 1,590 | |
| | | | | | | | 7,943,727 | |
| IT Services — 0.6% | | | | | | | | |
Alliance Data Systems Corporation (a) | | | 11,400 | | | | 626,772 | |
| Broadridge Financial Solutions, Inc. | | | 9,400 | | | | 195,614 | |
CyberSource Corporation (a) | | | 58,418 | | | | 956,887 | |
Euronet Worldwide, Inc. (a) | | | 4,815 | | | | 113,875 | |
ExlService Holdings, Inc. (a) | | | 800 | | | | 10,888 | |
| Heartland Payment Systems, Inc. | | | 400 | | | | 4,916 | |
Hewitt Associates, Inc. - Class A (a) | | | 9,400 | | | | 333,888 | |
InfoGROUP, Inc. (a) | | | 12,939 | | | | 84,880 | |
Integral Systems, Inc. (a) | | | 12,658 | | | | 106,327 | |
NCI, Inc. (a) | | | 10,027 | | | | 269,827 | |
Rightnow Technologies, Inc. (a) | | | 45,800 | | | | 698,908 | |
TeleTech Holdings, Inc. (a) | | | 11,929 | | | | 213,410 | |
Unisys Corporation (a) | | | 4,830 | | | | 140,746 | |
Wright Express Corporation (a) | | | 43,516 | | | | 1,214,531 | |
| | | | | | | | 4,971,469 | |
| Office Electronics — 0.0% | | | | | | | | |
| Xerox Corporation | | | 300 | | | | 2,256 | |
| | | | | | | | | |
| Semiconductors & Semiconductor Equipment — 1.6% | | | | | | | | |
Advanced Energy Industries, Inc. (a) | | | 31,847 | | | | 388,852 | |
Amkor Technology, Inc. (a) | | | 2,100 | | | | 11,571 | |
Brooks Automation, Inc. (a) | | | 73,184 | | | | 503,506 | |
Cree, Inc. (a) | | | 200 | | | | 8,420 | |
Cypress Semiconductor Corporation (a) | | | 95,400 | | | | 804,222 | |
DSP Group, Inc. (a) | | | 900 | | | | 5,202 | |
Exar Corporation (a) | | | 97,050 | | | | 669,645 | |
EZchip Semiconductor Ltd. (a) | | | 400 | | | | 4,788 | |
FormFactor, Inc. (a) | | | 46,330 | | | | 787,147 | |
| Intersil Corporation - Class A | | | 155,889 | | | | 1,956,407 | |
Kulicke & Soffa Industries, Inc. (a) | | | 261,107 | | | | 1,214,147 | |
Microsemi Corporation (a) | | | 1,000 | | | | 13,310 | |
MKS Instruments, Inc. (a) | | | 51,060 | | | | 798,578 | |
Monolithic Power Systems, Inc. (a) | | | 59,633 | | | | 1,192,064 | |
Rubicon Technology, Inc. (a) | | | 33,706 | | | | 509,635 | |
TFS MARKET NEUTRAL FUND
SCHEDULE OF SECURITIES SOLD SHORT (Continued)
| COMMON STOCKS — 64.6% (Continued) | | Shares | | | Value | |
| Information Technology — 7.7% (Continued) | | | | | | |
| Semiconductors & Semiconductor Equipment — 1.6% | | | | | | |
| (Continued) | | | | | | |
Rudolph Technologies, Inc. (a) | | | 4,400 | | | $ | 27,896 | |
Semtech Corporation (a) | | | 6,100 | | | | 94,367 | |
Sigma Designs, Inc. (a) | | | 66,745 | | | | 801,607 | |
Silicon Image, Inc. (a) | | | 335,424 | | | | 707,745 | |
Skyworks Solutions, Inc. (a) | | | 200 | | | | 2,086 | |
| STMicroelectronics N.V. | | | 100 | | | | 796 | |
Supertex, Inc. (a) | | | 22,700 | | | | 550,475 | |
Teradyne, Inc. (a) | | | 58,900 | | | | 492,993 | |
Tessera Technologies, Inc. (a) | | | 200 | | | | 4,422 | |
Trident Microsystems, Inc. (a) | | | 120,700 | | | | 226,916 | |
TriQuint Semiconductor, Inc. (a) | | | 4,800 | | | | 25,872 | |
UltraTech, Inc. (a) | | | 32,941 | | | | 425,598 | |
Varian Semiconductor Equipment Associates, Inc. (a) | | | 17,940 | | | | 509,316 | |
Veeco Instruments, Inc. (a) | | | 7,974 | | | | 194,167 | |
Verigy Ltd. (a) | | | 1,700 | | | | 16,728 | |
Virage Logic Corporation (a) | | | 500 | | | | 2,950 | |
| | | | | | | | 12,951,428 | |
| Software — 1.6% | | | | | | | | |
ACI Worldwide, Inc. (a) | | | 1,000 | | | | 16,090 | |
ANSYS, Inc. (a) | | | 23,289 | | | | 945,068 | |
ArcSight, Inc. (a) | | | 800 | | | | 19,776 | |
AsiaInfo Holdings, Inc. (a) | | | 600 | | | | 13,236 | |
Blackboard, Inc. (a) | | | 30,087 | | | | 1,067,186 | |
China TransInfo Technology Corporation (a) | | | 3,300 | | | | 23,001 | |
Chordiant Software, Inc. (a) | | | 16,060 | | | | 55,889 | |
ClickSoftware Technologies Ltd. (a) | | | 3,600 | | | | 18,576 | |
CommVault Systems, Inc. (a) | | | 3 | | | | 59 | |
Compuware Corporation (a) | | | 177,265 | | | | 1,251,491 | |
Concur Technologies, Inc. (a) | | | 32,100 | | | | 1,144,044 | |
DemandTec, Inc. (a) | | | 3,542 | | | | 31,134 | |
Electronic Arts, Inc. (a) | | | 1,000 | | | | 18,240 | |
| FactSet Research Systems, Inc. | | | 5,600 | | | | 358,680 | |
| Fair Isaac Corporation | | | 20,235 | | | | 411,377 | |
FalconStor Software, Inc. (a) | | | 11,078 | | | | 36,890 | |
GSE Systems, Inc. (a) | | | 200 | | | | 1,204 | |
Interactive Intelligence, Inc. (a) | | | 400 | | | | 6,708 | |
Kenexa Corporation (a) | | | 200 | | | | 2,520 | |
Lawson Software, Inc. (a) | | | 67,766 | | | | 427,603 | |
Manhattan Associates, Inc. (a) | | | 42,081 | | | | 965,759 | |
Midway Games, Inc. (a) | | | 51,015 | | | | 1,530 | |
Net 1 UEPS Technologies, Inc. (a) | | | 6,900 | | | | 120,681 | |
NetSuite, Inc. (a) | | | 24,181 | | | | 337,809 | |
Nuance Communications, Inc. (a) | | | 100 | | | | 1,311 | |
Parametric Technology Corporation (a) | | | 28,900 | | | | 430,899 | |
Quest Software, Inc. (a) | | | 5,000 | | | | 83,850 | |
Rosetta Stone, Inc. (a) | | | 4,000 | | | | 83,000 | |
Rovi Corporation (a) | | | 17,800 | | | | 490,390 | |
TFS MARKET NEUTRAL FUND
SCHEDULE OF SECURITIES SOLD SHORT (Continued)
| COMMON STOCKS — 64.6% (Continued) | | Shares | | | Value | |
| Information Technology — 7.7% (Continued) | | | | | | |
| Software — 1.6% (Continued) | | | | | | |
Scientific Learning Corporation (a) | | | 400 | | | $ | 2,020 | |
Shanda Interactive Entertainment Ltd. (a) | | | 19,000 | | | | 829,920 | |
Sonic Solutions, Inc. (a) | | | 27,372 | | | | 133,028 | |
Sourcefire, Inc. (a) | | | 300 | | | | 6,090 | |
SuccessFactors, Inc. (a) | | | 62,177 | | | | 950,686 | |
Sybase, Inc. (a) | | | 4,275 | | | | 169,119 | |
Symyx Technologies, Inc. (a) | | | 1,900 | | | | 11,153 | |
Take-Two Interactive Software, Inc. (a) | | | 188,175 | | | | 2,064,280 | |
THQ, Inc. (a) | | | 23,500 | | | | 122,905 | |
TiVo, Inc. (a) | | | 900 | | | | 9,792 | |
Tyler Technologies, Inc. (a) | | | 55,900 | | | | 1,063,218 | |
Vasco Data Security International, Inc. (a) | | | 3,100 | | | | 18,848 | |
| | | | | | | | 13,745,060 | |
| Materials — 3.4% | | | | | | | | |
| Chemicals — 0.7% | | | | | | | | |
| A. Schulman, Inc. | | | 16,352 | | | | 284,034 | |
| Airgas, Inc. | | | 10,300 | | | | 456,908 | |
Altair Nanotechnologies, Inc. (a) | | | 226,906 | | | | 231,444 | |
| American Vanguard Corporation | | | 34,198 | | | | 283,843 | |
| Cabot Corporation | | | 300 | | | | 6,579 | |
China Agritech, Inc. (a) | | | 300 | | | | 4,428 | |
| Cytec Industries, Inc. | | | 3,700 | | | | 122,729 | |
| Dow Chemical Company (The) | | | 100 | | | | 2,348 | |
| Ferro Corporation | | | 48,583 | | | | 297,814 | |
Georgia Gulf Corporation (a) | | | 1,500 | | | | 21,555 | |
| Hawkins, Inc. | | | 14,793 | | | | 310,949 | |
| Huntsman Corporation | | | 3,500 | | | | 27,825 | |
| Innophos Holdings, Inc. | | | 300 | | | | 5,805 | |
| KMG Chemicals, Inc. | | | 400 | | | | 4,920 | |
| Koppers Holdings, Inc. | | | 800 | | | | 20,896 | |
| NewMarket Corporation | | | 3,400 | | | | 317,900 | |
OMNOVA Solutions, Inc. (a) | | | 2,000 | | | | 12,820 | |
| Terra Industries, Inc. | | | 68,989 | | | | 2,191,781 | |
| Valhi, Inc. | | | 5,400 | | | | 50,706 | |
| Westlake Chemical Corporation | | | 897 | | | | 21,788 | |
Yongye International, Inc. (a) | | | 1,500 | | | | 13,095 | |
Zoltek Companies, Inc. (a) | | | 155,386 | | | | 1,384,489 | |
| | | | | | | | 6,074,656 | |
| Construction Materials — 0.3% | | | | | | | | |
| Eagle Materials, Inc. | | | 48,289 | | | | 1,199,982 | |
Headwaters, Inc. (a) | | | 177,310 | | | | 730,517 | |
| Martin Marietta Materials, Inc. | | | 4,300 | | | | 358,276 | |
United States Lime & Minerals, Inc. (a) | | | 1,909 | | | | 66,948 | |
| Vulcan Materials Company | | | 100 | | | | 4,603 | |
| | | | | | | | 2,360,326 | |
TFS MARKET NEUTRAL FUND
SCHEDULE OF SECURITIES SOLD SHORT (Continued)
| COMMON STOCKS — 64.6% (Continued) | | Shares | | | Value | |
| Materials — 3.4% (Continued) | | | | | | |
| Containers & Packaging — 0.7% | | | | | | |
AEP Industries, Inc. (a) | | | 300 | | | $ | 10,464 | |
| Bemis Company, Inc. | | | 600 | | | | 15,498 | |
BWAY Holding Company (a) | | | 200 | | | | 3,554 | |
| Greif, Inc. - Class A | | | 4,200 | | | | 224,784 | |
| Packaging Corporation of America | | | 9,758 | | | | 178,376 | |
Pactiv Corporation (a) | | | 94,033 | | | | 2,171,222 | |
| Rock-Tenn Company | | | 2,900 | | | | 127,020 | |
| Sealed Air Corporation | | | 42,189 | | | | 811,294 | |
| Silgan Holdings, Inc. | | | 47,306 | | | | 2,542,698 | |
| | | | | | | | 6,084,910 | |
| Metals & Mining — 1.6% | | | | | | | | |
| AK Steel Holding Corporation | | | 191,300 | | | | 3,035,931 | |
| Alcoa, Inc. | | | 300 | | | | 3,726 | |
| Allegheny Technologies, Inc. | | | 92,200 | | | | 2,845,292 | |
Allied Nevada Gold Corporation (a) | | | 28,508 | | | | 272,251 | |
| Amcol International Corporation | | | 24,188 | | | | 629,856 | |
Brush Engineered Materials, Inc. (a) | | | 5,600 | | | | 103,320 | |
China Precision Steel, Inc. (a) | | | 60,272 | | | | 133,804 | |
| Cliffs Natural Resources, Inc. | | | 100 | | | | 3,557 | |
| Compass Minerals International, Inc. | | | 48,200 | | | | 3,003,824 | |
Exeter Resource Corporation (a) | | | 1,900 | | | | 10,203 | |
Freeport-McMoRan Copper & Gold, Inc. (a) | | | 200 | | | | 14,672 | |
General Moly, Inc. (a) | | | 24,400 | | | | 53,680 | |
General Steel Holdings, Inc. (a) | | | 68,845 | | | | 256,103 | |
| Gerdau Ameristeel Corporation | | | 300 | | | | 2,040 | |
| IAMGOLD Corporation | | | 1,300 | | | | 17,095 | |
International Tower Hill Mines Ltd. (a) | | | 2,500 | | | | 11,775 | |
| Kinross Gold Corporation | | | 200 | | | | 3,716 | |
Northern Dynasty Minerals Ltd. (a) | | | 1,700 | | | | 11,016 | |
RTI International Metals, Inc. (a) | | | 35,500 | | | | 735,205 | |
| Schnitzer Steel Industries, Inc. - Class A | | | 35,581 | | | | 1,538,523 | |
Seabridge Gold, Inc (a) | | | 200 | | | | 4,016 | |
Silver Standard Resources, Inc. (a) | | | 996 | | | | 18,506 | |
Stillwater Mining Company (a) | | | 900 | | | | 5,580 | |
Teck Resources Ltd. (a) | | | 200 | | | | 5,784 | |
Thompson Creek Metals Company, Inc. (a) | | | 17,019 | | | | 173,253 | |
U.S. Energy Corporation (a) | | | 3,400 | | | | 17,884 | |
| Walter Energy, Inc. | | | 5,300 | | | | 310,050 | |
| Yamana Gold, Inc. | | | 400 | | | | 4,260 | |
| | | | | | | | 13,224,922 | |
| Paper & Forest Products — 0.1% | | | | | | | | |
AbitibiBowater, Inc. (a) | | | 70,886 | | | | 13,823 | |
| Deltic Timper Corporation | | | 6,882 | | | | 292,485 | |
Domtar Corporation (a) | | | 800 | | | | 33,512 | |
| Schweitzer-Mauduit International, Inc. | | | 300 | | | | 15,495 | |
| | | | | | | | 355,315 | |
TFS MARKET NEUTRAL FUND
SCHEDULE OF SECURITIES SOLD SHORT (Continued)
| COMMON STOCKS — 64.6% (Continued) | | Shares | | | Value | |
| Telecommunication Services — 0.7% | | | | | | |
| Diversified Telecommunication Services — 0.4% | | | | | | |
| Alaska Communications Systems Group, Inc. | | | 61,761 | | | $ | 480,500 | |
Cbeyond, Inc. (a) | | | 78,163 | | | | 1,043,476 | |
General Communication, Inc. (a) | | | 15,339 | | | | 94,335 | |
Global Crossing Ltd. (a) | | | 1,700 | | | | 19,380 | |
| Iowa Telecommunications Services, Inc. | | | 50,765 | | | | 597,504 | |
Iridium Communications, Inc. (a) | | | 1,200 | | | | 10,680 | |
Neutral Tandem, Inc. (a) | | | 11,100 | | | | 234,099 | |
Premiere Global Services, Inc. (a) | | | 40,729 | | | | 304,246 | |
SureWest Communications (a) | | | 800 | | | | 7,056 | |
tw telecom, inc. (a) | | | 40,600 | | | | 511,560 | |
| Windstream Corporation | | | 100 | | | | 964 | |
| | | | | | | | 3,303,800 | |
| Wireless Telecommunication Services — 0.3% | | | | | | | | |
American Tower Corporation (a) | | | 200 | | | | 7,364 | |
iPCS, Inc. (a) | | | 500 | | | | 11,935 | |
Leap Wireless International, Inc. (a) | | | 4,100 | | | | 54,202 | |
MetroPCS Communications, Inc. (a) | | | 8,800 | | | | 54,824 | |
| NTELOS Holdings Corporation | | | 34,100 | | | | 514,910 | |
SBA Communications Corporation - Class A (a) | | | 15,900 | | | | 448,539 | |
Syniverse Holdings, Inc. (a) | | | 48,858 | | | | 836,938 | |
| USA Mobility, Inc. | | | 17,700 | | | | 192,930 | |
| | | | | | | | 2,121,642 | |
| Utilities — 0.7% | | | | | | | | |
| Electric Utilities — 0.3% | | | | | | | | |
| Cleco Corporation | | | 38,801 | | | | 960,325 | |
| Hawaiian Electric Industries, Inc. | | | 70,510 | | | | 1,258,603 | |
| Unitil Corporation | | | 1,889 | | | | 39,083 | |
| | | | | | | | 2,258,011 | |
| Gas Utilities — 0.0% | | | | | | | | |
China Natural Gas, Inc. (a) | | | 6,200 | | | | 72,850 | |
| National Fuel Gas Company | | | 5,900 | | | | 267,506 | |
| Suburban Propane Partners, L.P. | | | 2,000 | | | | 86,040 | |
| | | | | | | | 426,396 | |
| Multi-Utilities — 0.2% | | | | | | | | |
| Black Hills Corporation | | | 37,403 | | | | 911,511 | |
| CMS Energy Corporation | | | 61,200 | | | | 813,960 | |
| | | | | | | | 1,725,471 | |
| Water Utilities — 0.2% | | | | | | | | |
| Aqua America, Inc. | | | 92,895 | | | | 1,435,228 | |
| Cascal N.V. | | | 4,400 | | | | 23,848 | |
| Southwest Water Company | | | 8,000 | | | | 44,560 | |
| | | | | | | | 1,503,636 | |
| | | | | | | | | |
Total Common Stocks (Proceeds $572,693,788) | | | | | | $ | 534,851,159 | |
TFS MARKET NEUTRAL FUND
SCHEDULE OF SECURITIES SOLD SHORT (Continued)
| CLOSED-END FUNDS — 0.0% | | Shares | | | Value | |
| Alpine Total Dynamic Dividend Fund | | | 1,715 | | | $ | 14,526 | |
| Federated Premier Municipal Income Fund | | | 900 | | | | 12,087 | |
| Flaherty & Crumrine/Claymore Preferred Securities Income Fund | | | 700 | | | | 8,659 | |
| Nicholas-Applegate Convertible & Income Fund | | | 1,100 | | | | 8,932 | |
Total Closed-End Funds (Proceeds $46,955) | | | | | | $ | 44,204 | |
| | | | | | | |
| RIGHTS — 0.0% | | Shares | | | Value | |
Zion Oil & Gas, Inc. (b) (Proceeds $6,209) | | | 1,541 | | | $ | 613 | |
| | | | | | | | | |
Total Securities Sold Short — 64.6% (Proceeds $572,746,952) | | | | | | $ | 534,895,976 | |
| ADR - American Depositary Receipt. |
| (a) | Non-income producing security. |
| (b) | Fair value priced and Level 2 security (Note 2). Other financial instruments that are fair valued at October 31, 2009 totaled $613, representing (0.0)% of net assets. |
| See accompanying notes to financial statements. |
TFS SMALL CAP FUND
SUMMARY SCHEDULE OF INVESTMENTS*
October 31, 2009
| COMMON STOCKS — 98.9% | | Shares | | | Value | |
| Consumer Discretionary — 14.4% | | | | | | |
| Auto Components — 1.1% | | | | | | |
Other Auto Components (a) | | | | | $ | 183,246 | |
| | | | | | | | |
| Distributors — 0.1% | | | | | | | |
Other Distributors (a) | | | | | | 20,246 | |
| | | | | | | | |
| Diversified Consumer Services — 0.6% | | | | | | | |
Other Diversified Consumer Services (a) | | | | | | 97,298 | |
| | | | | | | | |
| Hotels, Restaurants & Leisure — 2.6% | | | | | | | |
Bally Technologies, Inc. (b) | | | 1,600 | | | | 63,024 | |
Chipotle Mexican Grill, Inc. - Class A (b) | | | 700 | | | | 57,043 | |
Landry’s Restaurants, Inc. (b) | | | 5,200 | | | | 56,680 | |
Other Hotels, Restaurants & Leisure (a) | | | | | | | 263,218 | |
| | | | | | | | 439,965 | |
| Household Durables — 1.8% | | | | | | | | |
| American Greetings Corporation - Class A | | | 3,200 | | | | 65,088 | |
Helen of Troy Ltd. (b) | | | 2,200 | | | | 50,248 | |
Sealy Corporation (b) | | | 17,100 | | | | 49,590 | |
Other Household Durables (a) | | | | | | | 137,907 | |
| | | | | | | | 302,833 | |
| Internet & Catalog Retail — 0.2% | | | | | | | | |
Other Internet & Catalog Retail (a) | | | | | | | 33,704 | |
| | | | | | | | | |
| Leisure Equipment & Products — 0.3% | | | | | | | | |
Other Leisure Equipment & Products (a) | | | | | | | 51,747 | |
| | | | | | | | | |
| Media — 2.4% | | | | | | | | |
SIRIUS XM Radio, Inc. (b) | | | 113,970 | | | | 66,786 | |
Other Media (a) | | | | | | | 324,677 | |
| | | | | | | | 391,463 | |
| Multi-Line Retail — 0.7% | | | | | | | | |
| Dillard’s Inc. | | | 4,400 | | | | 59,928 | |
Other Multi-Line Retail (a) | | | | | | | 49,814 | |
| | | | | | | | 109,742 | |
| Specialty Retail — 1.9% | | | | | | | | |
J. Crew Group, Inc. (b) | | | 1,500 | | | | 61,170 | |
Ulta Salon, Cosmetics & Fragrance, Inc. (b) | | | 3,600 | | | | 54,504 | |
Other Specialty Retail (a) | | | | | | | 192,432 | |
| | | | | | | | 308,106 | |
| Textiles, Apparel & Luxury Goods — 2.7% | | | | | | | | |
| Jones Apparel Group, Inc. | | | 2,900 | | | | 51,881 | |
Perry Ellis International, Inc. (b) | | | 3,700 | | | | 50,579 | |
| UniFirst Corporation | | | 1,200 | | | | 50,520 | |
| Wolverine World Wide, Inc. | | | 2,100 | | | | 53,718 | |
Other Textiles, Apparel & Luxury Goods (a) | | | | | | | 247,783 | |
| | | | | | | | 454,481 | |
TFS SMALL CAP FUND
SUMMARY SCHEDULE OF INVESTMENTS (Continued)
| COMMON STOCKS — 98.9% (Continued) | | Shares | | | Value | |
| Consumer Staples — 3.1% | | | | | | |
| Food & Staples Retailing — 0.7% | | | | | | |
| Andersons, Inc. (The) | | | 1,600 | | | $ | 49,648 | |
Other Food & Staples Retailing (a) | | | | | | | 68,302 | |
| | | | | | | | 117,950 | |
| Food Products — 1.6% | | | | | | | | |
Other Food Products (a) | | | | | | | 265,951 | |
| | | | | | | | | |
| Personal Products — 0.8% | | | | | | | | |
Other Personal Products (a) | | | | | | | 125,289 | |
| | | | | | | | | |
| Energy — 5.7% | | | | | | | | |
| Energy Equipment & Services — 1.9% | | | | | | | | |
Other Energy Equipment & Services (a) | | | | | | | 322,898 | |
| | | | | | | | | |
| Oil, Gas & Consumable Fuels — 3.8% | | | | | | | | |
| Holly Corporation | | | 2,000 | | | | 58,020 | |
Other Oil, Gas & Consumable Fuels (a) | | | | | | | 564,240 | |
| | | | | | | | 622,260 | |
| Financials — 15.3% | | | | | | | | |
| Capital Markets — 2.3% | | | | | | | | |
Other Capital Markets (a) | | | | | | | 385,489 | |
| | | | | | | | | |
| Commercial Banks — 4.8% | | | | | | | | |
| Boston Private Financial Holdings, Inc. | | | 8,900 | | | | 52,955 | |
| CapitalSource, Inc. | | | 15,030 | | | | 53,507 | |
Other Commercial Banks (a) | | | | | | | 698,147 | |
| | | | | | | | 804,609 | |
| Consumer Finance — 0.8% | | | | | | | | |
Other Consumer Finance (a) | | | | | | | 129,409 | |
| | | | | | | | | |
| Diversified Financial Services — 0.2% | | | | | | | | |
Other Diversified Financial Services (a) | | | | | | | 30,690 | |
| | | | | | | | | |
| Insurance — 4.7% | | | | | | | | |
| Transatlantic Holdings, Inc. | | | 1,000 | | | | 50,500 | |
Other Insurance (a) | | | | | | | 731,907 | |
| | | | | | | | 782,407 | |
| Real Estate Investment Trusts — 1.4% | | | | | | | | |
Other Real Estate Investment Trusts (a) | | | | | | | 228,321 | |
| | | | | | | | | |
| Thrifts & Mortgage Finance — 1.1% | | | | | | | | |
Other Thrifts & Mortgage Finance (a) | | | | | | | 184,078 | |
| | | | | | | | | |
| Health Care — 14.8% | | | | | | | | |
| Biotechnology — 3.0% | | | | | | | | |
Targacept, Inc. (b) | | | 2,700 | | | | 50,625 | |
Other Biotechnology (a) | | | | | | | 445,021 | |
| | | | | | | | 495,646 | |
TFS SMALL CAP FUND
SUMMARY SCHEDULE OF INVESTMENTS (Continued)
| COMMON STOCKS — 98.9% (Continued) | | Shares | | | Value | |
| Health Care — 14.8% (Continued) | | | | | | |
| Health Care Equipment & Supplies — 2.9% | | | | | | |
| Cooper Companies, Inc. (The) | | | 2,200 | | | $ | 61,622 | |
Quidel Corporation (b) | | | 3,650 | | | | 52,195 | |
Other Health Care Equipment & Supplies (a) | | | | | | | 375,961 | |
| | | | | | | | 489,778 | |
| Health Care Providers & Services — 5.4% | | | | | | | | |
Amedysis, Inc. (b) | | | 1,400 | | | | 55,706 | |
AmSurg Corporation (b) | | | 2,500 | | | | 52,675 | |
Centene Corporation (b) | | | 3,300 | | | | 58,839 | |
Other Health Care Providers & Services (a) | | | | | | | 723,405 | |
| | | | | | | | 890,625 | |
| Health Care Technology — 0.6% | | | | | | | | |
| IMS Health, Inc. | | | 3,500 | | | | 57,365 | |
Other Health Care Technology (a) | | | | | | | 42,559 | |
| | | | | | | | 99,924 | |
| Life Sciences Tools & Services — 1.4% | | | | | | | | |
Bio-Rad Laboratories, Inc. - Class A (b) | | | 557 | | | | 49,790 | |
Kendle International, Inc. (b) | | | 3,700 | | | | 62,456 | |
Other Life Sciences Tools & Services (a) | | | | | | | 129,997 | |
| | | | | | | | 242,243 | |
| Pharmaceuticals — 1.5% | | | | | | | | |
BioForm Medical, Inc. (b) | | | 17,377 | | | | 62,905 | |
Other Pharmaceuticals (a) | | | | | | | 181,867 | |
| | | | | | | | 244,772 | |
| Industrials — 14.2% | | | | | | | | |
| Aerospace & Defense — 1.4% | | | | | | | | |
GenCorp, Inc. (b) | | | 9,000 | | | | 66,960 | |
Other Aerospace & Defense (a) | | | | | | | 158,145 | |
| | | | | | | | 225,105 | |
| Air Freight & Logistics — 0.6% | | | | | | | | |
Other Air Freight & Logistics (a) | | | | | | | 107,171 | |
| | | | | | | | | |
| Airlines — 0.5% | | | | | | | | |
Other Airlines (a) | | | | | | | 82,928 | |
| | | | | | | | | |
| Building Products — 0.6% | | | | | | | | |
Other Building Products (a) | | | | | | | 100,299 | |
| | | | | | | | | |
| Commercial Services & Supplies — 1.8% | | | | | | | | |
| Ennis, Inc. | | | 3,399 | | | | 51,495 | |
Team, Inc. (b) | | | 3,300 | | | | 53,559 | |
Waste Connections, Inc. (b) | | | 1,900 | | | | 59,717 | |
Other Commercial Services & Supplies (a) | | | | | | | 133,757 | |
| | | | | | | | 298,528 | |
| Construction & Engineering — 1.1% | | | | | | | | |
Other Construction & Engineering (a) | | | | | | | 186,664 | |
TFS SMALL CAP FUND
SUMMARY SCHEDULE OF INVESTMENTS (Continued)
| COMMON STOCKS — 98.9% (Continued) | | Shares | | | Value | |
| Industrials — 14.2% (Continued) | | | | | | |
| Electrical Equipment — 1.7% | | | | | | |
Thomas & Betts Corporation (b) | | | 1,600 | | | $ | 54,736 | |
Other Electrical Equipment (a) | | | | | | | 220,710 | |
| | | | | | | | 275,446 | |
| Industrial Conglomerates — 0.1% | | | | | | | | |
Other Industrial Conglomerates (a) | | | | | | | 21,096 | |
| | | | | | | | | |
| Machinery — 3.7% | | | | | | | | |
| FreightCar America, Inc. | | | 2,800 | | | | 66,024 | |
Other Machinery (a) | | | | | | | 551,751 | |
| | | | | | | | 617,775 | |
| Marine — 1.2% | | | | | | | | |
Other Marine (a) | | | | | | | 194,875 | |
| | | | | | | | | |
| Professional Services — 0.6% | | | | | | | | |
Other Professional Services (a) | | | | | | | 105,758 | |
| | | | | | | | | |
| Road & Rail — 0.1% | | | | | | | | |
Other Road & Rail (a) | | | | | | | 11,230 | |
| | | | | | | | | |
| Trading Companies & Distributors — 0.7% | | | | | | | | |
| Aceto Corporation | | | 9,068 | | | | 50,237 | |
Other Trading Companies & Distributors (a) | | | | | | | 68,542 | |
| | | | | | | | 118,779 | |
| Transportation Infrastructure — 0.1% | | | | | | | | |
Other Transportation Infrastructure (a) | | | | | | | 16,450 | |
| | | | | | | | | |
| Information Technology — 22.9% | | | | | | | | |
| Communications Equipment — 3.2% | | | | | | | | |
3Com Corporation (b) | | | 11,340 | | | | 58,288 | |
Tellabs, Inc. (b) | | | 8,700 | | | | 52,374 | |
Other Communications Equipment (a) | | | | | | | 425,364 | |
| | | | | | | | 536,026 | |
| Computers & Peripherals — 0.9% | | | | | | | | |
Other Computers & Peripherals (a) | | | | | | | 153,384 | |
| | | | | | | | | |
| Electronic Equipment, Instruments & Components — 4.2% | | | | | | | | |
Anixter International, Inc. (b) | | | 1,500 | | | | 62,775 | |
Spectrum Control, Inc. (b) | | | 8,100 | | | | 68,445 | |
Other Electronic Equipment, Instruments & Components (a) | | | | | | | 574,269 | |
| | | | | | | | 705,489 | |
| Internet Software & Services — 1.6% | | | | | | | | |
Other Internet Software & Services (a) | | | | | | | 259,432 | |
TFS SMALL CAP FUND
SUMMARY SCHEDULE OF INVESTMENTS (Continued)
| COMMON STOCKS — 98.9% (Continued) | | Shares | | | Value | |
| Information Technology — 22.9% (Continued) | | | | | | |
| IT Services — 2.9% | | | | | | |
| Lender Processing Services, Inc. | | | 1,700 | | | $ | 67,660 | |
VeriFone Holdings, Inc. (b) | | | 4,000 | | | | 53,200 | |
Other IT Services (a) | | | | | | | 360,012 | |
| | | | | | | | 480,872 | |
| Semiconductors & Semiconductor Equipment — 4.9% | | | | | | | | |
Pericom Semiconductor Corporation (b) | | | 6,063 | | | | 57,053 | |
PMC-Sierra, Inc. (b) | | | 6,400 | | | | 54,528 | |
Other Semiconductors & Semiconductor Equipment (a) | | | | | | | 696,408 | |
| | | | | | | | 807,989 | |
| Software — 5.2% | | | | | | | | |
Bottomline Technologies, Inc. (b) | | | 4,100 | | | | 60,188 | |
| FactSet Research Systems, Inc. | | | 900 | | | | 57,645 | |
| Jack Henry & Associates, Inc. | | | 2,200 | | | | 50,754 | |
Phoenix Technologies Ltd. (b) | | | 22,303 | | | | 52,189 | |
Sybase, Inc. (b) | | | 1,280 | | | | 50,637 | |
Synopsys, Inc. (b) | | | 2,500 | | | | 55,000 | |
Other Software (a) | | | | | | | 536,529 | |
| | | | | | | | 862,942 | |
| Materials — 6.1% | | | | | | | | |
| Chemicals — 2.7% | | | | | | | | |
Other Chemicals (a) | | | | | | | 454,211 | |
| | | | | | | | | |
| Containers & Packaging — 1.0% | | | | | | | | |
Other Containers & Packaging (a) | | | | | | | 166,760 | |
| | | | | | | | | |
| Metals & Mining — 1.4% | | | | | | | | |
Other Metals & Mining (a) | | | | | | | 226,623 | |
| | | | | | | | | |
| Paper & Forest Products — 1.0% | | | | | | | | |
Other Paper & Forest Products (a) | | | | | | | 171,938 | |
| | | | | | | | | |
| Telecommunication Services — 0.9% | | | | | | | | |
| Diversified Telecommunication Services — 0.5% | | | | | | | | |
Other Diversified Telecommunication Services (a) | | | | | | | 77,197 | |
| | | | | | | | | |
| Wireless Telecommunication Services — 0.4% | | | | | | | | |
Other Wireless Telecommunication Services (a) | | | | | | | 75,273 | |
| Utilities — 1.5% | | | | | | | | |
| Electric Utilities — 0.2% | | | | | | | | |
Other Electric Utilities (a) | | | | | | | 29,796 | |
| | | | | | | | | |
| Gas Utilities — 0.7% | | | | | | | | |
Other Gas Utilities (a) | | | | | | | 118,116 | |
TFS SMALL CAP FUND
SUMMARY SCHEDULE OF INVESTMENTS (Continued)
| COMMON STOCKS — 98.9% (Continued) | | Shares | | | Value | |
| Utilities — 1.5% (Continued) | | | | | | |
| Independent Power Producers & Energy Traders — 0.4% | | | | | | |
Other Independent Power Producers & Energy Traders (a) | | | | | $ | 58,243 | |
| | | | | | | | |
| Multi-Utilities — 0.2% | | | | | | | |
Other Multi-Utilities (a) | | | | | | 31,872 | |
| | | | | | | | |
| Water Utilities — 0.0% | | | | | | | |
Other Water Utilities (a) | | | | | | 1,545 | |
| | | | | | | | |
Total Common Stocks (Cost $16,537,009) | | | | | $ | 16,434,982 | |
| | | | | | | | |
| RIGHTS — 0.0% | | Shares | | | Value | |
Total Rights (Cost $0) (a)(d) | | | | | $ | — | |
| | | | | | | | |
| MONEY MARKET FUNDS — 0.3% | | Shares | | | Value | |
UMB Money Market Fiduciary, 0.05% (c) (Cost $58,594) | | | 58,594 | | | $ | 58,594 | |
| | | | | | | | | |
Total Investments at Value — 99.2% (Cost $16,595,603) | | | | | | $ | 16,493,576 | |
| | | | | | | | | |
| Other Assets in Excess of Liabilities — 0.8% | | | | | | | 129,488 | |
| | | | | | | | | |
| Net Assets — 100.0% | | | | | | $ | 16,623,064 | |
| * | A complete Schedule of Investments is available without charge upon request by calling toll-free 1-888-534-2001 or on the SEC’s website at http://www.sec.gov. |
| (a) | Represents issuers not identified as a top 50 holding in terms of market value and issues or issuers not exceeding 1% of net assets individually or in the aggregate, respectively, as of October 31, 2009. |
| (b) | Non-income producing security. |
| (c) | Variable rate security. The rate shown is the 7-day effective yield as of October 31, 2009. |
| (d) | Fair value priced (Note 2). Fair valued securities totaled $0 at October 31, 2009, representing 0.0% of net assets. |
| See accompanying notes to financial statements. |
TFS CAPITAL INVESTMENT TRUST
STATEMENTS OF ASSETS AND LIABILITIES
October 31, 2009
| | | TFS Market Neutral Fund | | | TFS Small Cap Fund | |
| ASSETS | | | | | | |
| Investments in securities: | | | | | | |
| At acquisition cost | | $ | 784,774,844 | | | $ | 16,595,603 | |
| At value (Note 2) | | $ | 818,096,079 | | | $ | 16,493,576 | |
| Deposits with brokers for securities sold short (Note 2) | | | 548,049,496 | | | | — | |
| Dividends and interest receivable | | | 270,113 | | | | 4,344 | |
| Receivable for investment securities sold | | | 119,134,047 | | | | 1,264,691 | |
| Receivable for capital shares sold | | | 1,902,205 | | | | 95,042 | |
| Other assets | | | 57,182 | | | | 16,190 | |
| TOTAL ASSETS | | | 1,487,509,122 | | | | 17,873,843 | |
| | | | | | | | | |
| LIABILITIES | | | | | | | | |
| Securities sold short, at value (Note 2) (proceeds $572,746,952) | | | 534,895,976 | | | | — | |
| Payable for investment securities purchased | | | 120,827,794 | | | | 1,225,449 | |
| Payable for capital shares redeemed | | | 1,016,600 | | | | 5,082 | |
| Dividends payable on securities sold short (Note 2) | | | 147,633 | | | | — | |
| Payable to Adviser (Note 4) | | | 1,612,255 | | | | 4,323 | |
| Payable to administrator (Note 4) | | | 98,100 | | | | 6,300 | |
| Other accrued expenses and liabilities | | | 501,307 | | | | 9,625 | |
| TOTAL LIABILITIES | | | 659,099,665 | | | | 1,250,779 | |
| | | | | | | | | |
| NET ASSETS | | $ | 828,409,457 | | | $ | 16,623,064 | |
| | | | | | | | | |
| Net assets consist of: | | | | | | | | |
| Paid-in capital | | $ | 793,512,831 | | | $ | 17,362,791 | |
| Accumulated net realized losses from security transactions | | | (36,275,585 | ) | | | (637,700 | ) |
| Net unrealized appreciation (depreciation) on: | | | | | | | | |
| Investments | | | 33,321,235 | | | | (102,027 | ) |
| Short positions | | | 37,850,976 | | | | — | |
| Net assets | | $ | 828,409,457 | | | $ | 16,623,064 | |
| | | | | | | | | |
| Shares of beneficial interest outstanding (unlimited number of shares authorized, no par value) | | | 55,531,973 | | | | 1,782,512 | |
| | | | | | | | | |
Net asset value, redemption price and offering price per share (a) (Note 2) | | $ | 14.92 | | | $ | 9.33 | |
| (a) | Redemption price may differ from the net asset value per share depending upon the length of time the shares are held (Note 2). |
| See accompanying notes to financial statements. |
TFS CAPITAL INVESTMENT TRUST
STATEMENTS OF OPERATIONS
For the Year Ended October 31, 2009
| | | TFS Market Neutral Fund | | | TFS Small Cap Fund | |
| INVESTMENT INCOME | | | | | | |
| Dividends | | $ | 13,451,453 | | | $ | 68,414 | |
| Foreign tax withholding | | | (2,297 | ) | | | (26 | ) |
| Interest | | | 66,729 | | | | 118 | |
| TOTAL INVESTMENT INCOME | | | 13,515,885 | | | | 68,506 | |
| | | | | | | | | |
| EXPENSES | | | | | | | | |
| Investment advisory fees (Note 4) | | | 12,890,976 | | | | 75,734 | |
| Brokerage expense on securities sold short (Note 2) | | | 7,722,392 | | | | — | |
| Dividend expense on securities sold short (Note 2) | | | 4,798,999 | | | | — | |
| Administration fees (Note 4) | | | 505,035 | | | | 24,200 | |
| Transfer agent fees (Note 4) | | | 299,071 | | | | 18,000 | |
| Accounting services fees (Note 4) | | | 192,165 | | | | 30,532 | |
| Custodian and bank service fees | | | 199,602 | | | | 21,282 | |
| Registration fees | | | 96,760 | | | | 19,508 | |
| Professional fees | | | 43,633 | | | | 28,265 | |
| Printing of shareholder reports | | | 67,616 | | | | 2,952 | |
| Postage and supplies | | | 54,625 | | | | 6,334 | |
| Compliance service fees and expenses (Note 4) | | | 24,765 | | | | 24,765 | |
| Pricing fees | | | 42,690 | | | | 5,969 | |
| Insurance expense | | | 29,704 | | | | 1,425 | |
| Trustees’ fees and expenses | | | 17,447 | | | | 17,447 | |
| Borrowing costs (Note 5) | | | 5,263 | | | | 293 | |
| Other expenses | | | 12,897 | | | | 6,374 | |
| TOTAL EXPENSES | | | 27,003,640 | | | | 283,080 | |
| Fees waived and expenses reimbursed by the Adviser (Note 4) | | | (167,067 | ) | | | (179,857 | ) |
| Plus previously waived investment advisory fees recovered by the Adviser (Note 4) | | | 11,929 | | | | — | |
| NET EXPENSES | | | 26,848,502 | | | | 103,223 | |
| | | | | | | | | |
| NET INVESTMENT LOSS | | | (13,332,617 | ) | | | (34,717 | ) |
| | | | | | | | | |
| REALIZED AND UNREALIZED GAINS (LOSSES) ON INVESTMENTS, SECURITIES SOLD SHORT AND FOREIGN CURRENCY | | | | | | | | |
| Net realized gains (losses) from: | | | | | | | | |
| Investments | | | 95,615,019 | | | | (527,001 | ) |
| Securities sold short | | | (101,104,859 | ) | | | (218 | ) |
| Foreign currency transactions | | | 2,046 | | | | — | |
| Net change in unrealized appreciation (depreciation) on: | | | | | | | | |
| Investments | | | 97,297,681 | | | | 1,407,015 | |
| Securities sold short | | | (1,580,141 | ) | | | — | |
| | | | | | | | | |
| NET REALIZED AND UNREALIZED GAINS ON INVESTMENTS | | | 90,229,746 | | | | 879,796 | |
| | | | | | | | | |
| NET INCREASE IN NET ASSETS FROM OPERATIONS | | $ | 76,897,129 | | | $ | 845,079 | |
See accompanying notes to financial statements.
TFS MARKET NEUTRAL FUND
STATEMENTS OF CHANGES IN NET ASSETS
| | | Year Ended October 31, 2009 | | | Four Months Ended October 31, 2008 (a) | | | Year Ended June 30, 2008 | |
| FROM OPERATIONS | | | | | | | | | |
| Net investment loss | | $ | (13,332,617 | ) | | $ | (2,645,461 | ) | | $ | (3,825,384 | ) |
| Net realized gains (losses) from: | | | | | | | | | | | | |
| Investments | | | 95,615,019 | | | | (28,429,068 | ) | | | (21,583,171 | ) |
| Short positions | | | (101,104,859 | ) | | | 17,317,074 | | | | 27,980,135 | |
| Foreign currency transactions | | | 2,046 | | | | — | | | | — | |
| Net change in unrealized appreciation (depreciation) on: | | | | | | | | | | | | |
| Investments | | | 97,297,681 | | | | (54,930,256 | ) | | | (20,608,839 | ) |
| Short positions | | | (1,580,141 | ) | | | 9,943,964 | | | | 27,060,992 | |
| Net increase (decrease) in net assets from operations | | | 76,897,129 | | | | (58,743,747 | ) | | | 9,023,733 | |
| | | | | | | | | | | | | |
| FROM DISTRIBUTIONS | | | | | | | | | | | | |
| Distributions from net investment income | | | — | | | | — | | | | (75,557 | ) |
| Distributions from net realized gains from security transactions | | | (7,411,156 | ) | | | — | | | | (4,093,514 | ) |
| Decrease in net assets from distributions to shareholders | | | (7,411,156 | ) | | | — | | | | (4,169,071 | ) |
| | | | | | | | | | | | | |
| FROM CAPITAL SHARE TRANSACTIONS | | | | | | | | | | | | |
| Proceeds from shares sold | | | 580,278,792 | | | | 237,571,341 | | | | 201,721,125 | |
| Net asset value of shares issued in reinvestment of distributions to shareholders | | | 6,647,525 | | | | — | | | | 3,396,677 | |
| Proceeds from redemption fees collected (Note 2) | | | 960,365 | | | | 541,934 | | | | 982,502 | |
| Payments for shares redeemed | | | (207,527,157 | ) | | | (72,044,321 | ) | | | (151,102,416 | ) |
| Net increase in net assets from capital share transactions | | | 380,359,525 | | | | 166,068,954 | | | | 55,997,888 | |
| | | | | | | | | | | | | |
| TOTAL INCREASE IN NET ASSETS | | | 449,845,498 | | | | 107,325,207 | | | | 59,852,550 | |
| | | | | | | | | | | | | |
| NET ASSETS | | | | | | | | | | | | |
| Beginning of period | | | 378,563,959 | | | | 271,238,752 | | | | 211,386,202 | |
| End of period | | $ | 828,409,457 | | | $ | 378,563,959 | | | $ | 271,238,752 | |
| | | | | | | | | | | | | |
| ACCUMULATED NET INVESTMENT INCOME | | $ | — | | | $ | — | | | $ | — | |
| | | | | | | | | | | | | |
| CAPITAL SHARE ACTIVITY | | | | | | | | | | | | |
| Shares sold | | | 41,291,307 | | | | 16,482,137 | | | | 13,716,056 | |
| Shares issued in reinvestment of distributions to shareholders | | | 529,683 | | | | — | | | | 239,540 | |
| Shares redeemed | | | (14,869,822 | ) | | | (5,299,283 | ) | | | (11,046,333 | ) |
| Net increase in shares outstanding | | | 26,951,168 | | | | 11,182,854 | | | | 2,909,263 | |
| Shares outstanding, beginning of period | | | 28,580,805 | | | | 17,397,951 | | | | 14,488,688 | |
| Shares outstanding, end of period | | | 55,531,973 | | | | 28,580,805 | | | | 17,397,951 | |
| (a) | Fund changed fiscal year end to October 31. |
| See accompanying notes to financial statements. |
TFS SMALL CAP FUND
STATEMENTS OF CHANGES IN NET ASSETS
| | | Year Ended October 31, 2009 | | | Four Months Ended October 31, 2008 (a) | | | Year Ended June 30, 2008 | |
| FROM OPERATIONS | | | | | | | | | |
| Net investment income (loss) | | $ | (34,717 | ) | | $ | 4,055 | | | $ | (87,752 | ) |
| Net realized losses from: | | | | | | | | | | | | |
| Investments | | | (527,001 | ) | | | (20,380 | ) | | | (78,473 | ) |
| Short positions | | | (218 | ) | | | — | | | | — | |
| Net change in unrealized appreciation (depreciation) on investments | | | 1,407,015 | | | | (1,151,693 | ) | | | (763,246 | ) |
| Net increase (decrease) in net assets from operations | | | 845,079 | | | | (1,168,018 | ) | | | (929,471 | ) |
| | | | | | | | | | | | | |
| FROM DISTRIBUTIONS | | | | | | | | | | | | |
| Distributions from net investment income | | | (4,055 | ) | | | — | | | | — | |
| Distributions from net realized gains from security transactions | | | — | | | | — | | | | (760,875 | ) |
| Decrease in net assets from distributions to shareholders | | | (4,055 | ) | | | — | | | | (760,875 | ) |
| | | | | | | | | | | | | |
| FROM CAPITAL SHARE TRANSACTIONS | | | | | | | | | | | | |
| Proceeds from shares sold | | | 14,594,124 | | | | 65,589 | | | | 270,485 | |
| Net asset value of shares issued in reinvestment of distributions to shareholders | | | 3,976 | | | | — | | | | 748,784 | |
| Proceeds from redemption fees collected (Note 2) | | | 10,459 | | | | 159 | | | | 1,951 | |
| Payments for shares redeemed | | | (1,879,603 | ) | | | (425,681 | ) | | | (387,376 | ) |
| Net increase (decrease) in net assets from capital share transactions | | | 12,728,956 | | | | (359,933 | ) | | | 633,844 | |
| | | | | | | | | | | | | |
| TOTAL INCREASE (DECREASE) IN NET ASSETS | | | 13,569,980 | | | | (1,527,951 | ) | | | (1,056,502 | ) |
| | | | | | | | | | | | | |
| NET ASSETS | | | | | | | | | | | | |
| Beginning of period | | | 3,053,084 | | | | 4,581,035 | | | | 5,637,537 | |
| End of period | | $ | 16,623,064 | | | $ | 3,053,084 | | | $ | 4,581,035 | |
| | | | | | | | | | | | | |
| ACCUMULATED NET INVESTMENT INCOME | | $ | — | | | $ | 4,055 | | | $ | — | |
| | | | | | | | | | | | | |
| CAPITAL SHARE ACTIVITY | | | | | | | | | | | | |
| Shares sold | | | 1,605,044 | | | | 9,051 | | | | 24,283 | |
| Shares issued in reinvestment of distributions to shareholders | | | 655 | | | | — | | | | 72,486 | |
| Shares redeemed | | | (272,096 | ) | | | (52,008 | ) | | | (35,844 | ) |
| Net increase (decrease) in shares outstanding | | | 1,333,603 | | | | (42,957 | ) | | | 60,925 | |
| Shares outstanding, beginning of period | | | 448,909 | | | | 491,866 | | | | 430,941 | |
| Shares outstanding, end of period | | | 1,782,512 | | | | 448,909 | | | | 491,866 | |
| (a) | Fund changed fiscal year end to October 31. |
| See accompanying notes to financial statements. |
TFS MARKET NEUTRAL FUND
FINANCIAL HIGHLIGHTS
Per share data for a share outstanding throughout each period: | | Year Ended October 31, 2009 | | | Four Months Ended October 31, 2008(b) | | | Year Ended June 30, 2008 | | | Year Ended June 30, 2007 | | | Year Ended June 30, 2006 | | | Period Ended June 30, 2005(a) | |
| Net asset value at beginning of period | | $ | 13.25 | | | $ | 15.59 | | | $ | 14.59 | | | $ | 12.44 | | | $ | 10.37 | | | $ | 10.00 | |
| | | | | | | | | | | | | | | | | | | | | | | | | |
| Income (loss) from investment operations: | | | | | | | | | | | | | | | | | | | | | | | | |
| Net investment income (loss) | | | (0.24 | ) | | | (0.09 | ) | | | (0.23 | ) | | | 0.01 | | | | (0.04 | ) | | | (0.11 | ) |
| Net realized and unrealized gains (losses) on investments | | | 2.13 | | | | (2.27 | ) | | | 1.56 | | | | 2.35 | | | | 2.12 | | | | 0.49 | |
| Total from investment operations | | | 1.89 | | | | (2.36 | ) | | | 1.33 | | | | 2.36 | | | | 2.08 | | | | 0.38 | |
| | | | | | | | | | | | | | | | | | | | | | | | | |
| Less distributions: | | | | | | | | | | | | | | | | | | | | | | | | |
| Distributions from net investment income | | | — | | | | — | | | | (0.01 | ) | | | — | | | | — | | | | — | |
| Distributions from net realized gains from security transactions | | | (0.25 | ) | | | — | | | | (0.40 | ) | | | (0.22 | ) | | | (0.01 | ) | | | — | |
| Distributions in excess of net realized gains (losses) from security transactions | | | — | | | | — | | | | — | | | | — | | | | — | | | | (0.01 | ) |
| Total distributions | | | (0.25 | ) | | | — | | | | (0.41 | ) | | | (0.22 | ) | | | (0.01 | ) | | | (0.01 | ) |
| | | | | | | | | | | | | | | | | | | | | | | | | |
| Proceeds from redemption fees collected (Note 2) | | | 0.03 | | | | 0.02 | | | | 0.08 | | | | 0.01 | | | | 0.00 | (c) | | | 0.00 | (c) |
| | | | | | | | | | | | | | | | | | | | | | | | | |
| Net asset value at end of period | | $ | 14.92 | | | $ | 13.25 | | | $ | 15.59 | | | $ | 14.59 | | | $ | 12.44 | | | $ | 10.37 | |
| | | | | | | | | | | | | | | | | | | | | | | | | |
Total return (d) | | | 14.86% | | | | (15.01% | )(e) | | | 9.93% | | | | 19.18% | | | | 20.04% | | | | 3.77% | (e) |
| | | | | | | | | | | | | | | | | | | | | | | | | |
| Ratios and supplemental data: | | | | | | | | | | | | | | | | | | | | | | | | |
| Net assets at end of period (000’s) | | $ | 828,409 | | | $ | 378,564 | | | $ | 271,239 | | | $ | 211,386 | | | $ | 22,478 | | | $ | 8,101 | |
| | | | | | | | | | | | | | | | | | | | | | | | | |
| Ratio of gross expenses to average net assets | | | 4.70% | | | | 4.60% | (h) | | | 4.05% | | | | 3.30% | | | | 5.10% | | | | 6.82% | (h) |
| | | | | | | | | | | | | | | | | | | | | | | | | |
Ratio of net expenses to average net assets (f) | | | 4.67% | | | | 4.55% | (h) | | | 3.94% | | | | 3.07% | | | | 3.21% | | | | 3.26% | (h) |
| | | | | | | | | | | | | | | | | | | | | | | | | |
Ratio of net expenses to average net assets excluding dividend expense (f) (g) | | | 3.84% | | | | 3.68% | (h) | | | 2.80% | | | | 2.48% | | | | 2.49% | | | | 2.49% | (h) |
| | | | | | | | | | | | | | | | | | | | | | | | | |
Ratio of net expenses to average net assets excluding dividend expense, borrowing costs and brokerage expense on securities sold short (f) (g) | | | 2.49% | | | | 2.49% | (h) | | | 2.50% | | | | 2.48% | | | | 2.49% | | | | 2.49% | (h) |
| | | | | | | | | | | | | | | | | | | | | | | | | |
| Ratio of net investment income (loss) to average net assets | | | (2.32% | ) | | | (2.24% | )(h) | | | (2.15% | ) | | | 0.09% | | | | (0.69% | ) | | | (1.77% | )(h) |
| | | | | | | | | | | | | | | | | | | | | | | | | |
| Portfolio turnover rate | | | 429% | | | | 204% | (e) | | | 536% | | | | 492% | | | | 398% | | | | 368% | (h) |
| (a) | Represents the period from the commencement of operations (September 7, 2004) through June 30, 2005. |
| (b) | Fund changed fiscal year end to October 31. |
| (c) | Amount rounds to less than $0.01 per share. |
| (d) | Total return is a measure of the change in value of an investment in the Fund over the period covered, which assumes any dividends or capital gains distributions are reinvested in shares of the Fund. The returns shown do not reflect the deduction of taxes a shareholder would pay on Fund distributions or the redemption of Fund shares. |
| (f) | Ratio was determined after advisory fee waivers and expense reimbursements. |
| (g) | Dividend expense, borrowing costs and brokerage expense on securities sold short totaled 2.18%, 2.06%(h), 1.44%, 0.59%, 0.72% and 0.77%(h) of average net assets for the periods ended October 31, 2009 and 2008 and June 30, 2008, 2007, 2006 and 2005, respectively. |
| See accompanying notes to financial statements. |
TFS SMALL CAP FUND
FINANCIAL HIGHLIGHTS
Per share data for a share outstanding throughout each period: | | Year Ended October 31, 2009 | | | Four Months Ended October 31, 2008(b) | | | Year Ended June 30, 2008 | | | Year Ended June 30, 2007 | | | Period Ended June 30, 2006(a) | |
| Net asset value at beginning of period | | $ | 6.80 | | | $ | 9.31 | | | $ | 13.08 | | | $ | 10.39 | | | $ | 10.00 | |
| | | | | | | | | | | | | | | | | | | | | |
| Income (loss) from investment operations: | | | | | | | | | | | | | | | | | | | | |
| Net investment income (loss) | | | (0.02 | ) | | | 0.01 | | | | (0.18 | ) | | | (0.07 | ) | | | (0.01 | ) |
| Net realized and unrealized gains (losses) on investments | | | 2.55 | | | | (2.52 | ) | | | (1.79 | ) | | | 2.76 | | | | 0.40 | |
| Total from investment operations | | | 2.53 | | | | (2.51 | ) | | | (1.97 | ) | | | 2.69 | | | | 0.39 | |
| | | | | | | | | | | | | | | | | | | | | |
| Less distributions: | | | | | | | | | | | | | | | | | | | | |
| Distributions from net investment income | | | (0.01 | ) | | | — | | | | — | | | | — | | | | — | |
| Distributions from net realized gains from security transactions | | | — | | | | — | | | | (1.80 | ) | | | (0.00 | )(c) | | | — | |
| Total distributions | | | (0.01 | ) | | | — | | | | (1.80 | ) | | | (0.00 | ) | | | — | |
| | | | | | | | | | | | | | | | | | | | | |
| Proceeds from redemption fees collected (Note 2) | | | 0.01 | | | | 0.00 | (c) | | | 0.00 | (c) | | | 0.00 | (c) | | | — | |
| | | | | | | | | | | | | | | | | | | | | |
| Net asset value at end of period | | $ | 9.33 | | | $ | 6.80 | | | $ | 9.31 | | | $ | 13.08 | | | $ | 10.39 | |
| | | | | | | | | | | | | | | | | | | | | |
Total return (d) | | | 37.41% | | | | (26.96% | )(e) | | | (16.40% | ) | | | 25.93% | | | | 3.90% | (e) |
| | | | | | | | | | | | | | | | | | | | | |
| Ratios and supplemental data: | | | | | | | | | | | | | | | | | | | | |
| Net assets at end of period (000’s) | | $ | 16,623 | | | $ | 3,053 | | | $ | 4,581 | | | $ | 5,638 | | | $ | 3,932 | |
| | | | | | | | | | | | | | | | | | | | | |
| Ratio of gross expenses to average net assets | | | 5.14% | | | | 4.44% | (g) | | | 5.57% | | | | 5.14% | | | | 8.18% | (g) |
| | | | | | | | | | | | | | | | | | | | | |
Ratio of net expenses to average net assets (f) | | | 1.88% | | | | 0.88% | (g) | | | 2.72% | | | | 2.03% | | | | 1.72% | (g) |
| | | | | | | | | | | | | | | | | | | | | |
Ratio of net expenses to average net assets excluding borrowing costs (f) | | | 1.87% | | | | 0.87% | (g) | | | 2.68% | | | | 2.03% | | | | 1.72% | (g) |
| | | | | | | | | | | | | | | | | | | | | |
| Ratio of net investment income (loss) to average net assets | | | (0.63% | ) | | | 0.28% | (g) | | | (1.76% | ) | | | (0.69% | ) | | | (0.69% | )(g) |
| | | | | | | | | | | | | | | | | | | | | |
| Portfolio turnover rate | | | 320% | | | | 123% | (e) | | | 269% | | | | 419% | | | | 184% | (g) |
| (a) | Represents the period from the commencement of operations (March 7, 2006) through June 30, 2006. |
| (b) | Fund changed fiscal year end to October 31. |
| (c) | Amount rounds to less than $0.01 per share. |
| (d) | Total return is a measure of the change in value of an investment in the Fund over the period covered, which assumes any dividends or capital gains distributions are reinvested in shares of the Fund. The returns shown do not reflect the deduction of taxes a shareholder would pay on Fund distributions or the redemption of Fund shares. |
| (f) | Ratio was determined after advisory fee waivers and expense reimbursements. |
| See accompanying notes to financial statements. |
TFS CAPITAL INVESTMENT TRUST
NOTES TO FINANCIAL STATEMENTS
October 31, 2009
1. Organization
The TFS Market Neutral Fund and the TFS Small Cap Fund (individually, a “Fund”, and collectively, the “Funds”) are each a diversified series of TFS Capital Investment Trust (the “Trust”), an open-end management investment company established as an Ohio business trust under a Declaration of Trust dated January 30, 2004. As part of the Trust’s organization, the TFS Market Neutral Fund issued in a private placement on June 28, 2004 10,000 shares of the Fund, at $10.00 per share, to TFS Capital LLC (the “Adviser”), the investment adviser to the Fund. The TFS Market Neutral Fund commenced operations on September 7, 2004. The TFS Small Cap Fund commenced operations on March 7, 2006.
The TFS Market Neutral Fund seeks to produce capital appreciation while having a low correlation to the U.S. equity market. For this purpose, the term “U.S. equity market” means the S&P 500 Index. In addition, the Fund seeks to produce lower volatility than would result from a long-only investment in the U.S. equity market. “Long-only” refers to a portfolio of common stocks that mimics the movement of the U.S. equity market, as opposed to one that attempts to hedge equity market risk through the use of short positions, equity options or futures contracts.
The TFS Small Cap Fund seeks long-term capital appreciation. In addition, the Fund seeks to outperform the Russell 2000® Index.
The TFS Market Neutral Fund is currently closed to new investors, except as described further in the Fund’s prospectus.
2. Significant Accounting Policies
The following is a summary of the Funds’ significant accounting policies:
Securities valuation – The Funds’ portfolio securities are valued at their value as of the close of the regular trading on the New York Stock Exchange (“NYSE”) (generally 4:00 p.m., Eastern time) on each business day the NYSE is open. Securities listed on the NYSE or other exchanges are valued on the basis of their last sale prices on the exchanges on which they are primarily traded. However, if the last sale price on the NYSE is different than the last sale price on any other exchange, the NYSE price will be used. If there are no sales on that day, the securities are valued at the mean of the most recent bid and ask prices on the NYSE or other primary exchange. Securities which are quoted by NASDAQ are valued at the NASDAQ Official Closing Price. If there are no sales on that day, the securities are valued at the mean between the closing bid and ask prices as reported by NASDAQ. Other assets and securities for which no quotations are readily available are valued at fair value as determined in good faith under the supervision of the Board of Trustees of the Trust. Such methods of fair valuation may include, but are not limited to: multiple of earnings, discount from market of a similar freely traded security, or a combination of these and other methods.
Accounting principles generally accepted in the United States of America (“GAAP”) establish a single authoritative definition of fair value, set out a framework for measuring fair value and require additional disclosures about fair value measurements.
Various inputs are used in determining the value of each of the Fund’s investments. These inputs are summarized in the three broad levels listed below:
• Level 1 – quoted prices in active markets for identical securities
• Level 2 – other significant observable inputs
• Level 3 – significant unobservable inputs
The inputs or methodologies used for valuing securities are not necessarily an indication of the risks associated with investing in those securities.
TFS CAPITAL INVESTMENT TRUST
NOTES TO FINANCIAL STATEMENTS (Continued)
The following is a summary of the inputs used to value the Funds’ investments and other financial instruments (short positions and rights) as of October 31, 2009:
| TFS Market Neutral Fund | | Investments in Securities | | | Other Financial Instruments | |
| Level 1 - Quoted prices | | $ | 818,096,079 | | | $ | (534,895,363 | ) |
| Level 2 - Other significant observable inputs | | | — | | | | (613 | ) |
| Level 3 - Significant unobservable inputs | | | — | | | | — | |
| Total | | $ | 818,096,079 | | | $ | (534,895,976 | ) |
| TFS Small Cap Fund | | Investments in Securities | |
| Level 1 - Quoted prices | | $ | 16,493,576 | |
| Level 2 - Other significant observable inputs | | | — | |
| Level 3 - Significant unobservable inputs | | | — | |
| Total | | $ | 16,493,576 | |
Refer to each Fund’s Schedule of Investments for a listing of the securities and other financial instruments (short positions) valued using Level 1 and Level 2 inputs by security type and industry type.
Share valuation – The net asset value per share of each Fund is calculated daily by dividing the total value of each Fund’s assets, less liabilities, by the number of shares outstanding. The offering price and redemption price per share of each Fund is equal to the net asset value per share, except that shares are subject to a redemption fee of 2% if redeemed within 90 days of the date of purchase. During the periods ended October 31, 2009, October 31, 2008 and June 30, 2008, proceeds from redemption fees totaled $960,365, $541,934 and $982,502, respectively, for the TFS Market Neutral Fund and $10,459, $159 and $1,951, respectively, for the TFS Small Cap Fund.
Investment income/expense – Dividend income/expense is recorded on the ex-dividend date. Interest income is accrued as earned.
Security transactions – Security transactions are accounted for on the trade date. Gains and losses on securities sold are determined on a specific identification basis.
Distributions to shareholders – Distributions to shareholders arising from net investment income and net realized capital gains, if any, are distributed at least once each year. The amount of distributions from net investment income and net realized gains are determined in accordance with federal income tax regulations, which may differ from GAAP. These “book/tax” differences are permanent in nature and are primarily due to differing treatments of net short-term gains. The tax character of distributions paid by the Funds during the periods ended October 31, 2009, October 31, 2008 and June 30, 2008 was as follows:
| | Period Ended | | Ordinary Income | | | Long-Term Capital Gains | | | Total Distributions | |
| TFS Market Neutral Fund | 10/31/2009 | | $ | 7,411,156 | | | $ | — | | | $ | 7,411,156 | |
| | 10/31/2008 | | $ | — | | | $ | — | | | $ | — | |
| | 6/30/2008 | | $ | 4,086,498 | | | $ | 82,573 | | | $ | 4,169,071 | |
| TFS Market Small Cap Fund | 10/31/2009 | | $ | 4,055 | | | $ | — | | | $ | 4,055 | |
| | 10/31/2008 | | $ | — | | | $ | — | | | $ | — | |
| | 6/30/2008 | | $ | 760,875 | | | $ | — | | | $ | 760,875 | |
TFS CAPITAL INVESTMENT TRUST
NOTES TO FINANCIAL STATEMENTS (Continued)
Short positions – The Funds may sell securities short. For financial statement purposes, an amount equal to the settlement amount is included in the Statements of Assets and Liabilities as an asset and an equivalent liability. The amount of the liability is subsequently marked-to-market to reflect the current value of the short position. Subsequent fluctuations in the market prices of securities sold, but not yet purchased, may require purchasing the securities at prices which may differ from the market value reflected on the Statements of Assets and Liabilities. The Funds are liable for any dividends payable on securities while those securities are in a short position and will also bear other costs, such as charges for the prime brokerage accounts, in connection with the short positions. These costs are reported as brokerage expenses on securities sold short in the Statements of Operations. As collateral for its short positions, the Funds are required under the Investment Company Act of 1940 to maintain assets consisting of cash, cash equivalents or liquid securities equal to the market value of the securities sold short. The amount of the collateral is required to be adjusted daily to reflect changes in the value of the securities sold short. TFS Market Neutral Fund engages in short selling as a principal investment strategy while the TFS Small Cap Fund does not. The TFS Small Cap Fund intends to limit its exposure to 5% of its net assets.
Estimates – The preparation of financial statements in conformity with GAAP requires management to make estimates and assumptions that affect the reported amounts of assets and liabilities and disclosures of contingent assets and liabilities at the date of the financial statements and the reported amounts of income and expenses during the reporting period. Actual results could differ from those estimates.
Common expenses – Common expenses of the Trust are allocated between the Funds based on the relative net assets of each Fund or the nature of the services performed and the relative applicability to each Fund.
Federal income tax – It is each Fund’s policy to comply with the special provisions of Subchapter M of the Internal Revenue Code applicable to regulated investment companies. As provided therein, in any fiscal year in which a Fund so qualifies and distributes at least 90% of its taxable net income, the Fund (but not the shareholders) will be relieved of federal income tax on the income distributed. Accordingly, no provision for income taxes has been made.
In order to avoid imposition of the excise tax applicable to regulated investment companies, it is also each Fund’s intention to declare as dividends in each calendar year at least 98% of its net investment income (earned during the calendar year) and 98% of its net realized capital gains (earned during the twelve months ended October 31) plus undistributed amounts from prior years.
The following information is computed on a tax basis for each item as of October 31, 2009:
| | | TFS Market Neutral Fund | | | TFS Small Cap Fund | |
| Tax cost of portfolio investments and securities sold short | | $ | 254,338,279 | | | $ | 16,713,626 | |
| Gross unrealized appreciation | | $ | 116,118,131 | | | $ | 1,057,133 | |
| Gross unrealized depreciation | | | (87,256,307 | ) | | | (1,277,183 | ) |
| Net unrealized appreciation (depreciation) | | | 28,861,824 | | | | (220,050 | ) |
| Undistributed ordinary income | | | 6,034,802 | | | | — | |
| Capital loss carryforwards | | | — | | | | (519,677 | ) |
| Total accumulated earnings (deficit) | | $ | 34,896,626 | | | $ | (739,727 | ) |
The difference between the federal income tax cost of portfolio of investments and securities sold short and the financial statement cost for the Funds is due to certain timing differences in the recognition of capital gains or losses under GAAP. These “book/tax” differences are temporary in nature and are primarily due to the tax deferral of losses on wash sales.
TFS CAPITAL INVESTMENT TRUST
NOTES TO FINANCIAL STATEMENTS (Continued)
For the year ended October 31, 2009, the TFS Market Neutral Fund utilized capital loss carryforwards of $141,401 to offset current year realized gains.
As of October 31, 2009, the TFS Small Cap Fund had capital loss carryforwards for federal income tax purposes of $519,677. These capital loss carryforwards, which may be utilized in future years to offset net realized capital gains, if any, prior to distribution to shareholders, which expire on the following dates:
| Expires | | TFS Small Cap Fund | |
| June 30, 2016 | | $ | 16,913 | |
| October 31, 2016 | | $ | 87,298 | |
| October 31, 2017 | | $ | 415,466 | |
For the year ended October 31, 2009, the TFS Market Neutral Fund reclassified $13,332,617 of net investment loss against accumulated net realized gains from security transactions. For the year ended October 31, 2009, the TFS Small Cap Fund reclassified $34,717 of net investment loss against paid-in capital. These reclassifications are reflected on the Statements of Assets and Liabilities. Such reclassifications, the result of permanent differences between the financial statement and income tax reporting requirements, have no effect on the Funds’ nets assets or net asset value per share.
The Funds recognize tax benefits or expenses of uncertain tax positions only when the position is “more likely than not” to be sustained assuming examination by tax authorities. Management has reviewed the tax positions taken on Federal income tax returns for all open tax periods (June 30, 2006 through October 31, 2009) of each Fund and has concluded that no provision for unrecognized tax benefits or expenses is required in these financial statements.
3. Investment Transactions
During the year ended October 31, 2009, cost of purchases and proceeds from sales of portfolio securities, other than short-term investments, U.S. government securities and short positions, amounted to $2,580,546,217 and $2,225,766,055, respectively, for the TFS Market Neutral Fund and $30,674,395 and $18,108,021, respectively, for the TFS Small Cap Fund.
4. Transactions with Affiliates
| INVESTMENT ADVISORY AGREEMENT |
Each Fund’s investments are managed by the Adviser pursuant to the terms of an Investment Advisory Agreement. The TFS Market Neutral Fund pays the Adviser an investment advisory fee, computed and accrued daily and paid monthly, at an annual rate of 2.25% of its average daily net assets. The TFS Small Cap Fund pays the Adviser an investment advisory fee, computed and accrued daily and paid monthly, at an annual rate of 1.25% of its average daily net assets (the “Base Fee”), which may be increased or decreased by as much as 1.25% if the Fund outperforms or underperforms its benchmark by at least 2.50%. The term “benchmark,” when used for the TFS Small Cap Fund’s investment advisory fee discussion, means the performance of the Russell 2000 Index plus 2.50%. The performance fee adjustment is calculated monthly by comparing the TFS Small Cap Fund’s performance to that of the benchmark over the performance period. The applicable performance period is a rolling twelve month period whereby the most recent calendar month is substituted for the earliest month as time passes. The performance fee adjustment will be applied to the average net assets of the Fund over the performance period. The Base Fee withrespect to the Fund will be increased by one basis point (0.01%) for every two basis points (0.02%) of outperformance, to a maximum fee of 2.50% per annum. However, if the Fund underperforms its
TFS CAPITAL INVESTMENT TRUST
NOTES TO FINANCIAL STATEMENTS (Continued)
benchmark the fee will be decreased one basis point (0.01%) for every two basis points (0.02%) of underperformance, to a minimum fee of 0.00% per annum. The Adviser may receive the performance fee adjustment for periods during which the Fund has negative investment performance. During the year ended October 31, 2009, investment advisory fees were increased $7,523 above the Base Fee pursuant to the performance fee adjustment.
The Adviser has contractually agreed to reduce its advisory fees and to absorb each Fund’s operating expenses (for the life of the Funds) to the extent necessary to limit each Fund’s aggregate annual ordinary operating expenses (which do not include brokerage costs, taxes, borrowing costs and extraordinary expenses) to 2.50% of the TFS Market Neutral Fund’s average daily net assets and 1.75% of the TFS Small Cap Fund’s average daily net assets. For the TFS Small Cap Fund, the expense cap is calculated prior to the performance fee adjustment. Therefore, it is possible that the TFS Small Cap Fund’s annual ordinary operating expenses could exceed the 1.75% cap. As a result of this agreement, during the year ended October 31, 2009, the Adviser reduced its investment advisory fees by $167,067 with respect to the TFS Market Neutral Fund, and waived all of its investment advisory fees of $75,734 and reimbursed $104,123 of other operating expenses with respect to the TFS Small Cap Fund.
Advisory fee reductions and expense reimbursements by the Adviser are subject to repayment by the respective Fund for a period of three years after such fees and expenses were incurred, provided that such repayments do not cause ordinary operating expenses to exceed the expense caps of 2.50% and 1.75%, respectively, for the TFS Market Neutral Fund and the TFS Small Cap Fund. During the year ended October 31, 2009, the Adviser recouped $11,929 of previous fee reductions from the TFS Market Neutral Fund. As of October 31, 2009, the Adviser may in the future recoup fee reductions and expense reimbursements totaling $533,727 and $468,998, respectively, from the TFS Market Neutral Fund and the TFS Small Cap Fund. The Adviser may recapture these amounts no later than the dates as stated below:
| | | June 30, 2010 | | | June 30, 2011 | | | October 31, 2011 | | | October 31, 2012 | |
| TFS Market Neutral Fund | | $ | 111,258 | | | $ | 194,726 | | | $ | 60,676 | | | $ | 167,067 | |
| TFS Small Cap Fund | | $ | 95,394 | | | $ | 142,256 | | | $ | 51,491 | | | $ | 179,857 | |
The President of the Trust is also a Principal of the Adviser.
| COMPLIANCE CONSULTING AGREEMENT |
Under the terms of the Compliance Consulting Agreement, Drake Compliance, LLC (“Drake”) provides ongoing regulatory compliance consulting, monitoring and reporting services for the Trust. In addition, a principal of Drake serves as the Trust’s Chief Compliance Officer. For these services, Drake receives $2,000 per month from each Fund. In addition, each Fund reimburses certain out-of-pocket expenses incurred by Drake, if any, including, but not limited to, postage and supplies and travel expenses.
Under the terms of an Administration Agreement, Ultimus Fund Solutions, LLC (“Ultimus”) supplies executive, administrative and regulatory services for the Funds. Ultimus supervises the preparation of tax returns, reports to shareholders of the Funds, reports to and filings with the Securities and Exchange Commission (the “SEC”) and state securities commissions and materials for meetings of the Board of Trustees. For these services, each Fund pays Ultimus a monthly fee at an annual rate of 0.15% of its average daily net assets up to $50 million, 0.125% of such assets between $50 million and $100 million, 0.10% of such assets between $100 million and $250 million, 0.075% of such assets between $250 million and $500 million, and 0.05% of such assets in excess of $500 million, subject to a minimum monthly fee of $2,000. Certain officers of the Trust are also officers of Ultimus.
TFS CAPITAL INVESTMENT TRUST
NOTES TO FINANCIAL STATEMENTS (Continued)
| ACCOUNTING SERVICES AGREEMENT |
Under the terms of an Accounting Services Agreement, Ultimus calculates the daily net asset value per share and maintains the financial books and records of each Fund. For the performance of these services, the TFS Market Neutral Fund pays Ultimus a monthly base fee of $4,000 per month plus an asset based fee of 0.005% of average gross daily assets. In addition, the Fund pays $1 per portfolio trade in excess of 1,000 portfolio trades per month. For the performance of these services, the TFS Small Cap Fund pays Ultimus a base fee of $2,500 per month plus an asset based fee of 0.01% of the first $500 million of average daily net assets and 0.005% of such assets in excess of $500 million. In addition, each Fund reimburses certain out-of-pocket expenses incurred by Ultimus in obtaining valuations of the Funds’ portfolio securities.
| TRANSFER AGENT AND SHAREHOLDER SERVICES AGREEMENT |
Under the terms of a Transfer Agent and Shareholder Services Agreement, Ultimus maintains the records of each shareholder’s account, answers shareholders’ inquiries concerning their accounts, processes purchases and redemptions of each Fund’s shares, acts as dividend and distribution disbursing agent and performs other shareholder service functions. Each Fund pays Ultimus a monthly fee for these services at an annual rate of $15 to $24 per shareholder account, depending on the nature of the account, subject to a $1,500 minimum monthly fee. Prior to September 1, 2009, each Fund paid Ultimus a monthly fee at an annual rate of $24 for all shareholder accounts, subject to a $1,500 minimum monthly fee. In addition, the Funds reimburse Ultimus for out-of-pocket expenses including, but not limited to, postage and supplies.
The Trust has entered into a Distribution Agreement with Ultimus Fund Distributors, LLC (the “Distributor”), pursuant to which the Distributor provides distribution services and serves as the principal underwriter to each Fund. The Distributor is a wholly-owned subsidiary of Ultimus. The Distributor’s fees are paid by the Adviser.
5. Borrowing Costs
During the year ended October 31, 2009, the TFS Market Neutral Fund and the TFS Small Cap Fund incurred $5,263 and $293 of borrowing costs, respectively. As of October 31, 2009, the Funds had no outstanding borrowings. The average outstanding borrowings for the year ended October 31, 2009 for the TFS Market Neutral Fund include 283 days of $0 borrowings and 270 days of $0 borrowings for the TFS Small Cap Fund. The average outstanding borrowing and average interest rate on borrowings during the year ended October 31, 2009 were as follows:
| | | Average Outstanding Borrowing | | | Average Interest Rate | |
| TFS Market Neutral Fund | | $ | 530,114 | | | | 1.10 | % |
| TFS Small Cap Fund | | $ | 12,958 | | | | 1.58 | % |
6. Contingencies and Commitments
The Funds indemnify the Trust’s officers and Trustees for certain liabilities that might arise from their performance of their duties to the Funds. Additionally, in the normal course of business the Funds enter into contracts that contain a variety of representations and warranties and which provide general indemnifications. The Funds’ maximum exposure under these arrangements is unknown, as this would involve future claims that may be made against the Funds that have not yet occurred. However, based on experience, the Funds expect the risk of loss to be remote.
TFS CAPITAL INVESTMENT TRUST
NOTES TO FINANCIAL STATEMENTS (Continued)
7. Subsequent Events
The Funds are required to recognize in the financial statements the effects of all subsequent events that provide additional evidence about conditions that existed as of the date of the Statements of Assets and Liabilities. For non-recognized subsequent events that must be disclosed to keep the financial statements from being misleading, the Funds are required to disclose the nature of the event as well as an estimate of its financial effect, or a statement that such an estimate cannot be made. In addition, GAAP requires the Funds to disclose the date through which subsequent events have been evaluated. Management has evaluated subsequent events through the issuance of these financial statements on December 23, 2009 and has noted no such events.
8. Recent Accounting Pronouncement
In June 2009, the Financial Accounting Standards Board (“FASB”) issued SFAS No. 168, “The FASB Accounting Standards CodificationTM and the Hierarchy of Generally Accepted Accounting Principles – a replacement of FASB Statement No. 162” (“SFAS 168”). SFAS 168 replaces SFAS No. 162, “The Hierarchy of Generally Accepted Accounting Principles” and establishes the “FASB Accounting Standards CodificationTM” (the “Codification”) as the source of authoritative accounting principles recognized by FASB to be applied by nongovernmental entities in the preparation of financial statements in conformity with GAAP. All guidance contained in the Codification carries an equal level of authority. The Codification supersedes all then-existing non-SEC accounting and reporting standards. All other non-grandfathered non-SEC accounting literature not included in the Codification have become non-authoritative. SFAS 168 is effective for financial statements issued for interim and annual periods ending after September 15, 2009 and therefore the Funds have adopted SFAS 168 with these financial statements. Management has evaluated this new pronouncement and has determined that it did not have a material impact on the determination or reporting of these financial statements.
TFS CAPITAL INVESTMENT TRUST
REPORT OF INDEPENDENT REGISTERED
PUBLIC ACCOUNTING FIRM
To the Shareholders and Board of Trustees of
TFS Capital Investment Trust
We have audited the accompanying statements of assets and liabilities, including the summary schedules of investments and schedule of securities sold short, of TFS Capital Investment Trust (the “Funds”), comprising TFS Market Neutral Fund and TFS Small Cap Fund, as of October 31, 2009, and the related statements of operations for the year then ended, and the statements of changes in net assets and the financial highlights for the periods presented. These financial statements and financial highlights are the responsibility of the Funds’ management. Our responsibility is to express an opinion on these financial statements and financial highlights based on our audits.
We conducted our audits in accordance with the standards of the Public Company Accounting Oversight Board (United States). Those standards require that we plan and perform the audit to obtain reasonable assurance about whether the financial statements and financial highlights are free of material misstatement. The Funds are not required to have, nor were we engaged to perform, an audit of their internal control over financial reporting. Our audits included consideration of internal control over financial reporting as a basis for designing audit procedures that are appropriate in the circumstances, but not for the purpose of expressing an opinion on the effectiveness of the Funds’ internal control over financial reporting. Accordingly, we express no such opinion. An audit also includes examining, on a test basis, evidence supporting the amounts and disclosures in the financial statements, assessing the accounting principles used and significant estimates made by management, as well as evaluating the overall financial statement presentation. Our procedures included confirmation of securities owned as of October 31, 2009, by correspondence with the custodian and brokers; where replies were not received from brokers, we performed other auditing procedures. We believe that our audits provide a reasonable basis for our opinion.
In our opinion, the financial statements and financial highlights referred to above present fairly, in all material respects, the financial position of each of the portfolios constituting the TFS Capital Investment Trust as of October 31, 2009, the results of their operations for the year then ended, and the changes in their net assets and the financial highlights for the periods presented, in conformity with accounting principles generally accepted in the United States of America.
DELOITTE & TOUCHE LLP
Cincinnati, Ohio
December 23, 2009
TFS CAPITAL INVESTMENT TRUST
ABOUT YOUR FUNDS’ EXPENSES (Unaudited)
We believe it is important for you to understand the impact of costs on your investment. As a shareholder of the Funds, you incur two types of costs: (1) transaction costs, including redemption fees; and (2) ongoing costs, including management fees and other Fund expenses. The following examples are intended to help you understand your ongoing costs (in dollars) of investing in the Funds and to compare these costs with the ongoing costs of investing in other mutual funds.
A mutual fund’s ongoing costs are expressed as a percentage of its average net assets. This figure is known as the expense ratio. The ongoing costs reflected in the table are based on an investment of $1,000 made at the beginning of the most recent semi-annual period and held until the end of the period (May 1, 2009 through October 31, 2009).
The table below illustrates each Fund’s ongoing costs in two ways:
Actual fund return – This section helps you to estimate the actual expenses that you paid over the period. The “Ending Account Value” shown is derived from each Fund’s actual return, and the third column shows the dollar amount of operating expenses that would have been paid by an investor who started with $1,000 in the Funds. You may use the information here, together with the amount you invested, to estimate the expenses that you paid over the period.
To do so, simply divide your account value by $1,000 (for example, an $8,600 account value divided by $1,000 = 8.6), then multiply the result by the number given for the Funds under the heading “Expenses Paid During Period.”
Hypothetical 5% return – This section is intended to help you compare each Fund’s ongoing costs with those of other mutual funds. It assumes that each Fund had an annual return of 5% before expenses during the period shown, but that the expense ratio is unchanged. In this case, because the return used is not the Fund’s actual return, the results do not apply to your investment. The example is useful in making comparisons because the SEC requires all mutual funds to calculate expenses based on a 5% return. You can assess each Fund’s ongoing costs by comparing this hypothetical example with the hypothetical examples that appear in shareholder reports of other funds.
Note that expenses shown in the table are meant to highlight and help you compare ongoing costs only. The Funds do not charge any sales loads. However, a redemption fee of 2% is applied on the sale of shares purchased within 180 days of the date of their purchase and does not apply to the redemption of shares acquired through reinvestment of dividends and other distributions. The calculations below assume no shares were bought or sold during the period. Your actual costs may have been higher or lower, depending on the amount of your investment and the timing of any purchases or redemptions.
More information about each Fund’s expenses, including annualized expense ratios, can be found in this report. For additional information on operating expenses and other shareholder costs, please refer to the Funds’ prospectus.
TFS CAPITAL INVESTMENT TRUST
ABOUT YOUR FUNDS’ EXPENSES (Unaudited) (Continued)
| | | Beginning Account Value May 1, 2009 | | | Ending Account Value Oct. 31, 2009 | | | Expenses Paid During Period* | |
| Based on Actual Fund Return | | $ | 1,000.00 | | | $ | 1,096.30 | | | $ | 26.26 | |
| Based on Hypothetical 5% Return (before expenses) | | $ | 1,000.00 | | | $ | 1,000.15 | | | $ | 25.06 | |
TFS Small Cap Fund
| | | Beginning Account Value May 1, 2009 | | | Ending Account Value Oct. 31, 2009 | | | Expenses Paid During Period* | |
| Based on Actual Fund Return | | $ | 1,000.00 | | | $ | 1,255.70 | | | $ | 12.74 | |
| Based on Hypothetical 5% Return (before expenses) | | $ | 1,000.00 | | | $ | 1,013.91 | | | $ | 11.37 | |
| * | Expenses are equal to the annualized expense ratio of 4.97% and 2.24%, respectively, for the TFS Market Neutral Fund and the TFS Small Cap Fund for the period, multiplied by the average account value over the period, multipled by 184/365 (to reflect the applicable period). |
OTHER INFORMATION (Unaudited)
A description of the policies and procedures that the Funds use to determine how to vote proxies relating to portfolio securities is available without charge upon request by calling toll-free 1-888-534-2001, or on the SEC’s website at http://www.sec.gov. Information regarding how the Funds voted proxies relating to portfolio securities during the most recent 12-month period ended June 30 is also available without charge upon request by calling toll-free 1-888-534-2001, or on the SEC’s website at http://www.sec.gov.
The Funds file a complete listing of portfolio holdings with the SEC as of the end of the first and third quarters of each fiscal year on Form N-Q. The filings are available upon request, by calling 1-888-534-2001. Furthermore, you may obtain copies of the filings on the SEC’s website at http://www.sec.gov. The Funds’ Forms N-Q may also be reviewed and copied at the SEC’s Public Reference Room in Washington, DC, and information on the operation of the Public Reference Room may be obtained by calling 1-800-SEC-0330.
FEDERAL TAX INFORMATION (Unaudited)
In accordance with federal tax requirements, the following provides shareholders with information concerning distributions from ordinary income made by the Funds during the fiscal year ended October 31, 2009. Certain dividends paid by the Funds may be subject to a maximum tax rate of 15%, as provided by the Jobs and Growth Tax Relief Reconciliation Act of 2003. The TFS Market Neutral Fund and TFS Small Cap Fund intend to designate up to a maximum amount of $7,411,156 and $4,055, respectively, as taxed at a maximum rate of 15%.
TFS CAPITAL INVESTMENT TRUST
BOARD OF TRUSTEES AND OFFICERS (Unaudited)
Overall responsibility for management of the Trust rests with its Trustees. The Trustees serve for terms of indefinite duration until death, resignation, retirement or removal from office. The Trustees, in turn, elect the officers of the Trust to actively supervise the Trust’s day-to-day operations. The officers have been elected for an annual term. Certain officers of the Trust also may serve as Trustees.
The Trust is managed by the Trustees in accordance with the laws of the State of Ohio governing business trusts. There are currently five Trustees, three of whom are not “interested persons” of the Trust within the meaning of that term under the Investment Company Act of 1940.
The Trustees and executive officers of the Trust, their addresses and their principal occupations during the past five (5) years are as follows:
Name, Address and Age | Length of Time Served | Position(s) Held with Trust | Principal Occupation(s) During Past 5 Years and Directorships of Public Companies** | Number of Portfolios in Fund Complex Overseen by Trustee |
| Interested Trustees: |
*Larry S. Eiben 1800 Bayberry Court, Suite 103 Richmond, Virginia 23226 Year of Birth: 1972 | Since January 2004 | Trustee and President | Chief Operating Officer and Chief Compliance Officer of TFS Capital LLC. | 2 |
*Thomas M. Frederick 121 Walnut Street, Suite 320 West Chester, Pennsylvania 19380 Year of Birth: 1972 | Since June 2004 | Trustee | Director of Business Development for TFS Capital LLC from July 2006 to present; Associate Director of Virginia Student Aid Foundation from February 2004 to July 2006. | 2 |
| Independent Trustees: |
Merle C. Hazelton 1800 Bayberry Court, Suite 103 Richmond, Virginia 23226 Year of Birth: 1962 | Since June 2004 | Trustee | Capital Markets - Assistant Controller of Genworth Financial, Inc. from July 2007 to present; Investments – Assistant Controller of Genworth Financial, Inc. from May 2005 to July 2007; Treasury - Controller of Genworth Financial, Inc. (insurance/ financial services firm) from February 2002 to May 2005. | 2 |
Mark J. Malone 1800 Bayberry Court, Suite 103 Richmond, Virginia 23226 Year of Birth: 1966 | Since June 2004 | Trustee | Director, Institutional Equities of Lazard Capital Markets from March 2008 to present; Managing Director of Institutional Sales of Morgan Keegan & Company, Inc. from April 2006 to March 2008; Director of Institutional Equities of Deutsche Bank Securities from June 1998 – May 2006. | 2 |
Brian O’Connell 1800 Bayberry Court, Suite 103 Richmond, Virginia 23226 Year of Birth: 1959 | Since June 2004 | Trustee | Independent writer/author. | 2 |
TFS CAPITAL INVESTMENT TRUST
BOARD OF TRUSTEES AND OFFICERS (Unaudited)
(Continued)
Name, Address and Age | Length of Time Served | Position(s) Held with Trust | Principal Occupation(s) During Past 5 Years |
| Executive Officers: | | | |
Robert G. Dorsey 225 Pictoria Drive, Suite 450 Cincinnati, Ohio 45246 Year of Birth: 1957 | Since June 2004 | Vice President | Managing Director of Ultimus Fund Solutions, LLC and Ultimus Fund Distributors, LLC. |
Mark J. Seger 225 Pictoria Drive, Suite 450 Cincinnati, Ohio 45246 Year of Birth: 1962 | Since June 2004 | Treasurer | Managing Director of Ultimus Fund Solutions, LLC and Ultimus Fund Distributors, LLC. |
John F. Splain 225 Pictoria Drive, Suite 450 Cincinnati, Ohio 45246 Year of Birth: 1956 | Since June 2004 | Secretary | Managing Director of Ultimus Fund Solutions, LLC and Ultimus Fund Distributors, LLC. |
David D. Jones 719 Sawdust Road, Suite 113 The Woodlands, TX 77380 Year of Birth: 1958 | Since December 2007 | Chief Compliance Officer | Managing Member of Drake Compliance, LLC; Attorney, David Jones & Assoc., P.C. (a law firm). |
| * | Larry S. Eiben and Thomas M. Frederick, as affiliated persons of TFS Capital LLC, the Trust’s investment adviser, are considered “interested persons” of the Trust within the meaning of Section 2(a)(19) of the Investment Company Act of 1940. |
| ** | None of the Trustees are directors of public companies. |
Additional information about members of the Board of Trustees and executive officers is available in the Statement of Additional Information (“SAI”). To obtain a free copy of the SAI, please call 1-888-534-2001.
TFS CAPITAL INVESTMENT TRUST
APPROVAL OF INVESTMENT ADVISORY AGREEMENTS
(Unaudited)
The Board of Trustees, including the Independent Trustees voting separately, have reviewed and approved the continuance of the Investment Advisory Agreements with the Adviser for the TFS Market Neutral Fund and the TFS Small Cap Fund. These approvals took place at an in-person meeting held on June 5, 2009, at which all of the Independent Trustees were present.
The Trustees were advised by independent counsel of their fiduciary obligations in approving the Investment Advisory Agreements and the Trustees requested such information from the Adviser as they deemed reasonably necessary to evaluate the terms of the Agreements and whether the Agreements continue to be in the best interests of the Funds and their shareholders. The Trustees reviewed: (i) the nature, extent and quality of the services provided by the Adviser; (ii) the investment performance of each Fund and the Adviser; (iii) the actual and projected costs of the services provided and the profits to be realized by the Adviser from its relationship with the Funds; and (iv) the extent to which economies of scale would be realized as the Funds grow and whether advisory fee levels reflect these economies of scale for the benefit of Fund shareholders. The Trustees reviewed the background, qualifications, education and experience of the Adviser’s investment and operational personnel. The Trustees also discussed and considered the quality of administrative and other services provided to the Trust, the Adviser’s compliance program, and the Adviser’s role in coordinating such services and programs. The Independent Trustees were advised by experienced independent counsel throughout the process. Prior to voting on the Investment Advisory Agreements, the Independent Trustees reviewed the Agreements with management and also met in a private session with counsel at which no representatives of the Adviser were present.
Below is a summary of the discussions and findings of the Trustees in regard to the approvals of the Investment Advisory Agreements.
| (i) | The nature, extent, and quality of the services provided by the Adviser. In this regard, the Independent Trustees reviewed the services being provided to the Funds by the Adviser. They discussed the responsibilities of the Adviser under the Investment Advisory Agreements and the Adviser’s compensation under the Agreements. The Independent Trustees reviewed the background and experience of the Adviser’s key investment and operating personnel. They noted the Adviser’s recent decision to add four experienced professionals to its team, thereby strengthening the Adviser’s analytical, programming and trading operations. The Independent Trustees considered the Adviser’s ongoing commitment to research and development. They also considered the steps taken by the Adviser to retain its key employees. After reviewing the foregoing information, the Independent Trustees concluded that the quality, extent and nature of the services provided by the Adviser were satisfactory for each Fund. |
| (ii) | The investment performance of the Funds and the Adviser. In this regard, the Independent Trustees compared the performance of the TFS Market Neutral Fund with the performance of the S&P 500 Index (the “Index”), the Fund’s primary benchmark, over various periods. The Independent Trustees noted that the TFS Market Neutral Fund outperformed the S&P 500 Index over both the one year period ended March 31, 2009 and for the period from the Fund’s inception until March 31, 2009, and it did so while experiencing substantially less volatility than the Index. The Independent Trustees also considered comparative performance statistics of the universe of funds categorized by Morningstar as “long short” funds, which is the category to which the TFS Market Neutral Fund has been assigned. The Independent Trustees noted that for the one year period ended March 31, 2009, the TFS Market Neutral Fund’s total return (-5.51%) was significantly better than the return of the average fund in the Morningstar “long short” category (-15.00%). They also noted that the Fund has a 5-star Morningstar rating overall and for three years. The Independent Trustees reviewed performanceinformation with respect to the Adviser’s other managed accounts with similar investment |
TFS CAPITAL INVESTMENT TRUST
APPROVAL OF INVESTMENT ADVISORY AGREEMENTS
(Unaudited) (Continued)
| | objectives, which indicated that the TFS Market Neutral Fund had performed in line with or better than such other accounts for the one year period ended March 31, 2009. They considered that, based on representations by the Adviser, those performance differences can be attributed mainly to the Fund being subject to stricter investment limitations and being managed more conservatively than such other accounts to achieve a less volatile return. The Independent Trustees noted that the TFS Market Neutral Fund’s more conservative investment approach proved beneficial during the past year’s market volatility. The Independent Trustees also considered the consistency of the Adviser’s management of the TFS Market Neutral Fund with the Fund’s investment objective and policies. After reviewing the foregoing information, the Independent Trustees concluded that the investment performance of the TFS Market Neutral Fund has been above average. |
| | The Independent Trustees reviewed the performance of the TFS Small Cap Fund and compared it to the performance of the Russell 2000 Index, the Fund’s primary benchmark, over various periods ended March 31, 2009. It was noted by the Independent Trustees that the TFS Small Cap Fund outperformed the Russell 2000 Index over both the one year and since inception periods ended March 31, 2009. The Independent Trustees also reviewed comparative performance statistics of the universe of funds categorized by Morningstar as “small cap blend” funds, which is the category to which the TFS Small Cap Fund has been assigned. The Independent Trustees noted that for the one year period ended March 31, 2009, the TFS Small Cap Fund’s -32.87% return was significantly better than the performance of the average fund in the Morningstar small cap blend category (-39.08%) over the same period. It was further noted that the TFS Small Cap Fund was in the top 5% of funds within the small cap blend category for both the one year and three year periods ended April 30, 2009. The Independent Trustees noted that the TFS Small Cap Fund has a 5-star Morningstar rating overall and for three years. They also reviewed performance information with respect to the Adviser’s other managed accounts but concluded that none of these other accounts provided a good comparison due to differences in investment objectives. The Independent Trustees considered the consistency of the Adviser’s management of the TFS Small Cap Fund with the Fund’s investment objective and policies. The Independent Trustees concluded that the investment performance of the TFS Small Cap Fund has been above average. |
| (iii) | The costs of the services to be provided and profits to be realized by the Adviser from its relationship with the Funds. In this regard, the Independent Trustees considered the Adviser’s staffing, personnel and operations; the financial condition of the Adviser and the level of commitment to the Funds by the principals of the Adviser; the asset levels of each Fund; and the overall expenses of each Fund. The Independent Trustees reviewed the rate of the advisory fees paid by the Funds under the Investment Advisory Agreements and compared them to average advisory fee ratios of similar mutual funds compiled from statistics reported by Morningstar. They also compared the total operating expense ratios of the Funds with average expense ratios of representative funds, focusing on other funds included in their respective Morningstar categories. It was noted by the Independent Trustees that the TFS Market Neutral Fund’s advisory fee of 2.25% and its overall expense ratio of 2.49% (which excludes dividend expenses, borrowing costs and brokerage expenses on securities sold short) were each higher than the average advisory fee (1.18%) and average expense ratio (2.10%) for Morningstar’s “long short” fund category. The Independent Trustees performed a similar comparison for the TFS Small Cap Fund, finding that the Fund’s advisory fee of 0.37% (adjusted based on the performance fee) and its overall expense ratio of 0.87% were each significantly lower than the average advisory fee (0.77%) and average expense ratio (1.41%) for Morningstar’s “small cap blend” fund category. The Independent Trustees noted that, with respect to the TFS Small Cap Fund, the results of this type of comparison may differ significantly each year due to the |
TFS CAPITAL INVESTMENT TRUST
APPROVAL OF INVESTMENT ADVISORY AGREEMENTS
(Unaudited) (Continued)
| | performance fee adjustment. The Independent Trustees further noted that during periods of underperformance the TFS Small Cap Fund’s advisory fee and overall expense ratio will likely be significantly less than the averages for its peer group and during periods of outperformance the TFS Small Cap Fund’s advisory fee and overall expense ratio will likely be significantly more than the averages for its peer group. The Independent Trustees also considered the Adviser’s analysis of its revenues and expenses with respect to its services provided to each Fund for periods ended March 31, 2009. It was noted by the Independent Trustees that the Adviser has reduced its advisory fees from the TFS Market Neutral Fund in order to maintain the 2.50% operating expense cap. The Independent Trustees noted that, despite the advisory fee reductions, the Adviser’s overall revenue and profits from managing the TFS Market Neutral Fund has increased significantly from prior years. The Independent Trustees considered the profitability of the Adviser and noted the costs associated with managing the Funds, research and development expenditures and retaining their investment professionals and hiring new personnel. The Independent Trustees also reviewed the revenue and expense information with respect to the TFS Small Cap Fund and it was noted that the Adviser has yet to recognize any profits with respect to its services to the Fund and, in fact, has yet to collect any advisory fees. The Independent Trustees noted that not only has the Adviser not collected any of its advisory fees since the inception of the TFS Small Cap Fund, it has also reimbursed a significant amount of other operating expenses of such Fund. The Independent Trustees reviewed the balance sheet of the Adviser as of March 31, 2009 and concluded that the Adviser has the necessary financial resources to serve as the Funds’ investment adviser. The Independent Trustees considered the “fallout benefits” to the Adviser, including the additional exposure the Adviser has received as a result of managing the Funds. After a full discussion and consideration of the foregoing, the Independent Trustees concluded that the fees paid by each Fund to the Adviser are reasonable. |
| (iv) | The extent to which economies of scale would be realized as a Fund grows and whether advisory fee levels reflect these economies of scale for the benefits of a Fund’s investors. The Independent Trustees considered the current net assets for each Fund as well as the expense cap arrangements between the Trust and the Adviser. The Independent Trustees noted that the TFS Market Neutral Fund has grown its assets to the point where the Adviser is close to collecting its full advisory fee from such Fund and, with respect to the TFS Small Cap Fund, the Adviser has not collected any of its advisory fees and continues to reimburse other expenses in order to limit such Fund’s overall expenses. The Independent Trustees concluded that, at the TFS Small Cap Fund’s current asset level, it would not be relevant to consider the extent to which economies of scale are being realized. The Independent Trustees noted that, as a result of the significant growth of assets in the TFS Market Neutral Fund, the extent to which economies of scale are being realized by shareholders should be considered. The Independent Trustees considered the Adviser’s past fee reductions and expense reimbursements, the Adviser’s ongoing commitment to hiring and maintaining top quality investment professionals and the Adviser’s continued investment in research and development. The Independent Trustees determined that it is not necessary or appropriate to introduce fee breakpoints at the present time for either Fund. The Independent Trustees noted, however, that to the extent that the TFS Market Neutral Fund continues to grow in assets, it may become necessary for the Adviser to consider adding fee breakpoints to such Fund’s Investment Advisory Agreement. |
In conclusion, the Trustees did not identify any single factor as all-important or controlling in their determination to approve the Investment Advisory Agreements. The Trustees, including all of the Independent Trustees, concluded that the terms of each Investment Advisory Agreement were fair and reasonable, that the Adviser’s fees were reasonable in light of the services provided to the Funds and the benefits received by the Adviser, and that continuance of the Investment Advisory Agreements is in the best interests of each Fund and its shareholders.
This page intentionally left blank.
As of the end of the period covered by this report, the registrant has adopted a code of ethics that applies to the registrant’s principal executive officer, principal financial officer, principal accounting officer or controller, or persons performing similar functions, regardless of whether these individuals are employed by the registrant or a third party. Pursuant to Item 12(a)(1), a copy of registrant’s code of ethics is filed as an exhibit to this Form N-CSR. During the period covered by this report, the code of ethics has not been amended, and the registrant has not granted any waivers, including implicit waivers, from the provisions of the code of ethics.
| Item 3. | Audit Committee Financial Expert. |
The registrant’s board of trustees has determined that the registrant has at least one audit committee financial expert serving on its audit committee. The name of the audit committee financial expert is Merle C. Hazelton. Mr. Hazelton is “independent” for purposes of this Item.
| Item 4. | Principal Accountant Fees and Services. |
| | (a) | Audit Fees. The aggregate fees billed for professional services rendered by the principal accountant for the audit of the registrant’s annual financial statements or for services that are normally provided by the accountant in connection with statutory and regulatory filings or engagements were $35,500 and $27,000 with respect to the registrant’s fiscal periods ended October 31, 2009 and 2008, respectively. |
| | (b) | Audit-Related Fees. No fees were billed in either of the last two fiscal periods for assurance and related services by the principal accountant that are reasonably related to the performance of the audit of the registrant’s financial statements and are not reported under paragraph (a) of this Item. |
| | (c) | Tax Fees. The aggregate fees billed for professional services rendered by the principal accountant for tax compliance, tax advice, and tax planning were $4,900 and 4,650 with respect to the registrant’s fiscal periods ended October 31, 2009 and 2008, respectively. The services comprising these fees are the preparation of the registrant’s federal income and excise tax returns. |
| | (d) | All Other Fees. No fees were billed in either of the last two fiscal periods for products and services provided by the principal accountant, other than the services reported in paragraphs (a) through (c) of this Item. |
| (e)(1) | The audit committee has not adopted pre-approval policies and procedures described in paragraph (c)(7) of Rule 2-01 of Regulation S-X. |
| (e)(2) | None of the services described in paragraph (b) through (d) of this Item were approved by the audit committee pursuant to paragraph (c)(7)(i)(C) of Rule 2-01 of Regulation S-X. |
| | (f) | Less than 50% of hours expended on the principal accountant’s engagement to audit the registrant’s financial statements for the most recent fiscal year were attributed to work performed by persons other than the principal accountant’s full-time, permanent employees. |
| (g) | With respect to the fiscal periods ended October 31, 2009 and 2008, aggregate non-audit fees of $4,900 and $4,650, respectively, were billed by the registrant’s principal accountant for services rendered to the registrant. No non-audit fees were billed in either of the last two fiscal periods by the registrant’s principal accountant for services rendered to the registrant’s investment adviser (not including any sub-adviser whose role is primarily portfolio management and is subcontracted with or overseen by another investment adviser), and any entity controlling, controlled by, or under common control with the adviser that provides ongoing services to the registrant. |
| | (h) | The principal accountant has not provided any non-audit services to the registrant’s investment adviser (not including any sub-adviser whose role is primarily portfolio management and is subcontracted with or overseen by another investment adviser), and any entity controlling, controlled by, or under common control with the investment adviser that provides ongoing services to the registrant. |
| Item 5. | Audit Committee of Listed Registrants. |
Not applicable
| Item 6. | Schedule of Investments. |
| | (a) | See Schedule I (Investment in securities of unaffiliated issuers) |
SCHEDULE I
| TFS MARKET NEUTRAL FUND | |
| SCHEDULE OF INVESTMENTS | |
| October 31, 2009 | |
| | |
| COMMON STOCKS - 85.1% | | Shares | | | Value | |
| Consumer Discretionary - 10.5% | |
| Auto Components - 1.4% | |
| American Axle & Manufacturing Holdings, Inc. | | | 3,400 | | | $ | 20,366 | |
| ArvinMeritor, Inc. | | | 56,000 | | | | 437,360 | |
China Automotive Systems, Inc. (a) | | | 32,550 | | | | 337,218 | |
Cooper Tire & Rubber Company (b) | | | 110,300 | | | | 1,683,178 | |
Dana Holding Corporation (a) (b) | | | 249,966 | | | | 1,414,808 | |
Drew Industries, Inc. (a) | | | 200 | | | | 3,828 | |
Federal-Mogul Corporation (a) | | | 9,200 | | | | 102,580 | |
Fuel Systems Solutions, Inc. (a) | | | 4,900 | | | | 160,426 | |
Goodyear Tire & Rubber Company (The) (a) | | | 300 | | | | 3,864 | |
Hawk Corporation - Class A (a) | | | 600 | | | | 8,352 | |
Modine Manufacturing Company (b) | | | 95,805 | | | | 986,791 | |
Raser Technologies, Inc. (a) | | | 47,085 | | | | 55,560 | |
SORL Auto Parts, Inc. (a) | | | 1,300 | | | | 8,229 | |
| Standard Motor Products, Inc. | | | 23,296 | | | | 194,755 | |
Stoneridge, Inc. (a) | | | 4,300 | | | | 31,605 | |
Tenneco, Inc. (a) (b) | | | 136,333 | | | | 1,856,855 | |
Tongxin International Ltd. (a) | | | 500 | | | | 4,445 | |
TRW Automotive Holdings Corporation (a) | | | 500 | | | | 7,825 | |
WABCO Holdings, Inc. (b) | | | 83,236 | | | | 1,974,358 | |
Westport Innovations, Inc. (a) | | | 1,700 | | | | 16,626 | |
Wonder Auto Technology, Inc. (a) (b) | | | 144,418 | | | | 1,868,769 | |
| | | | | | | | 11,177,798 | |
| Automobiles - 0.0% | |
Winnebago Industries, Inc. (a) | | | 900 | | | | 10,350 | |
| | | | | | | | | |
| Distributors - 0.0% | |
Audiovox Corporation (a) | | | 3,518 | | | | 22,726 | |
| | | | | | | | | |
| Diversified Consumer Services - 0.4% | |
American Public Education, Inc. (a) | | | 200 | | | | 6,380 | |
Coinstar, Inc. (a) | | | 9,300 | | | | 295,182 | |
Corinthian Colleges, Inc. (a) (b) | | | 87,191 | | | | 1,382,849 | |
Grand Canyon Education, Inc. (a) | | | 6,500 | | | | 105,430 | |
Hillenbrand, Inc. (b) | | | 74,093 | | | | 1,480,378 | |
| Service Corporation International | | | 200 | | | | 1,374 | |
Universal Technical Institute, Inc. (a) | | | 400 | | | | 7,196 | |
| | | | | | | | 3,278,789 | |
| Hotels, Restaurants & Leisure - 1.8% | |
| Ameristar Casinos, Inc. | | | 1,400 | | | | 20,608 | |
Bally Technologies, Inc. (a) | | | 16,600 | | | | 653,874 | |
Carrols Restaurant Group, Inc. (a) | | | 16,772 | | | | 108,850 | |
CEC Entertainment, Inc. (a) | | | 200 | | | | 5,842 | |
Chipotle Mexican Grill, Inc. - Class A (a) | | | 24,962 | | | | 2,034,154 | |
| Cracker Barrel Old Country Store, Inc. | | | 300 | | | | 9,945 | |
Denny's Corporation (a) | | | 149,400 | | | | 328,680 | |
DineEquity, Inc. (a) | | | 23,620 | | | | 499,799 | |
Einstein Noah Restaurant Group, Inc. (a) | | | 11,511 | | | | 149,873 | |
| Frisch's Restaurants, Inc. | | | 2,078 | | | | 48,729 | |
| TFS MARKET NEUTRAL FUND | |
| SCHEDULE OF INVESTMENTS (Continued) | |
| | |
| COMMON STOCKS - 85.1% (Continued) | | Shares | | | Value | |
| Consumer Discretionary - 10.5% (Continued) | |
| Hotels, Restaurants & Leisure - 1.8% (Continued) | |
| International Speedway Corporation - Class A | | | 35,838 | | | $ | 914,227 | |
Isle of Capri Casinos, Inc. (a) | | | 1,000 | | | | 7,750 | |
Jack in the Box, Inc. (a) | | | 17,300 | | | | 324,548 | |
Landry's Restaurants, Inc. (a) | | | 7,643 | | | | 83,309 | |
McCormick & Schmick's Seafood Restaurants, Inc. (a) | | | 900 | | | | 5,418 | |
Monarch Casino & Resort, Inc. (a) | | | 100 | | | | 694 | |
Multimedia Games, Inc. (a) | | | 20,015 | | | | 98,274 | |
Orient-Express Hotels Ltd. - Class A (a) | | | 400 | | | | 3,440 | |
Papa John's International, Inc. (a) (b) | | | 74,569 | | | | 1,677,803 | |
Penn National Gaming, Inc. (a) | | | 13,800 | | | | 346,794 | |
Red Robin Gourmet Burgers, Inc. (a) | | | 300 | | | | 5,013 | |
Royal Caribbean Cruises Ltd. (a) | | | 900 | | | | 18,207 | |
Shuffle Master, Inc. (a) | | | 1,500 | | | | 11,715 | |
| Speedway Motorsports, Inc. | | | 800 | | | | 10,832 | |
Starbucks Corporation (a) | | | 100 | | | | 1,898 | |
| Starwood Hotels & Resorts Worldwide, Inc. | | | 300 | | | | 8,718 | |
Wendy's/Arby's Group, Inc. - Class A (b) | | | 1,141,394 | | | | 4,508,506 | |
WMS Industries, Inc. (a) | | | 300 | | | | 11,994 | |
Wyndham Worldwide Corporation (b) | | | 181,300 | | | | 3,091,165 | |
| | | | | | | | 14,990,659 | |
| Household Durables - 1.1% | |
| American Greetings Corporation - Class A | | | 53,500 | | | | 1,088,190 | |
| D.R. Horton, Inc. | | | 87,700 | | | | 961,192 | |
Furniture Brands International, Inc. (a) | | | 87,779 | | | | 373,061 | |
| Garmin Ltd. | | | 300 | | | | 9,078 | |
Helen of Troy Ltd. (a) | | | 33,457 | | | | 764,158 | |
Hovnanian Enterprises, Inc. - Class A (a) | | | 70,744 | | | | 276,609 | |
Jarden Corporation (b) | | | 71,900 | | | | 1,969,341 | |
| La-Z-Boy, Inc. | | | 800 | | | | 5,680 | |
| Lennar Corporation - Class A | | | 28,000 | | | | 352,800 | |
| Lennar Corporation - Class B | | | 1,500 | | | | 14,505 | |
| Pulte Homes, Inc. | | | 37,600 | | | | 338,776 | |
| Ryland Group, Inc. (The) | | | 300 | | | | 5,565 | |
Standard Pacific Corporation (a) (b) | | | 408,298 | | | | 1,224,894 | |
Toll Brothers, Inc. (a) | | | 21,800 | | | | 377,576 | |
| Tupperware Corporation | | | 26,400 | | | | 1,188,528 | |
| | | | | | | | 8,949,953 | |
| Internet & Catalog Retail - 0.2% | |
Expedia, Inc. (a) | | | 300 | | | | 6,801 | |
Gaiam, Inc. - Class A (a) | | | 2,200 | | | | 14,366 | |
HSN, Inc. (a) | | | 55,666 | | | | 831,650 | |
Liberty Media Corporation - Interactive (a) | | | 1,100 | | | | 12,474 | |
| NutriSystem, Inc. | | | 21,340 | | | | 459,237 | |
Overstock.com, Inc. (a) | | | 2,400 | | | | 33,600 | |
Ticketmaster Entertainment, Inc. (a) | | | 23,740 | | | | 229,091 | |
| | | | | | | | 1,587,219 | |
| Leisure Equipment & Products - 0.2% | |
| Brunswick Corporation | | | 63,000 | | | | 597,240 | |
| Hasbro, Inc. | | | 300 | | | | 8,181 | |
| TFS MARKET NEUTRAL FUND | |
| SCHEDULE OF INVESTMENTS (Continued) | |
| | |
| COMMON STOCKS - 85.1% (Continued) | | Shares | | | Value | |
| Consumer Discretionary - 10.5% (Continued) | |
| Leisure Equipment & Products - 0.2% (Continued) | |
JAKKS Pacific, Inc. (a) | | | 1,500 | | | $ | 21,345 | |
| Pool Corporation | | | 26,600 | | | | 520,828 | |
RC2 Corporation (a) | | | 28,490 | | | | 372,080 | |
Steinway Musical Instruments, Inc. (a) | | | 100 | | | | 1,172 | |
| | | | | | | | 1,520,846 | |
| Media - 2.2% | |
| A.H. Belo Corporation - Class A | | | 48,100 | | | | 226,070 | |
| Arbitron, Inc. | | | 100 | | | | 2,168 | |
Carmike Cinemas, Inc. (a) | | | 4,585 | | | | 45,071 | |
| CBS Corporation - Class A | | | 800 | | | | 9,440 | |
| CBS Corporation - Class B | | | 500 | | | | 5,885 | |
Clear Channel Outdoor Holdings, Inc. (a) | | | 1,800 | | | | 12,276 | |
CTC Media, Inc. (a) (b) | | | 182,481 | | | | 2,934,294 | |
DISH Network Corporation - Class A (a) | | | 53,300 | | | | 927,420 | |
Dolan Media Company (a) | | | 25,400 | | | | 303,276 | |
DreamWorks Animation SKG, Inc. - Class A (a) (b) | | | 45,202 | | | | 1,446,464 | |
E.W. Scripps Company (The) - Class A (a) | | | 5,900 | | | | 37,524 | |
Entercom Communications Corporation (a) | | | 3,800 | | | | 26,904 | |
Fisher Communications, Inc. (a) | | | 1,200 | | | | 23,388 | |
| Gannett Company, Inc. | | | 2,800 | | | | 27,496 | |
| Harte-Hanks, Inc. | | | 45,519 | | | | 534,393 | |
Interactive Data Corporation (b) | | | 74,612 | | | | 1,962,296 | |
Knology, Inc. (a) | | | 3,700 | | | | 37,185 | |
Liberty Media Corporation - Capital - Series A (a) (b) | | | 78,609 | | | | 1,626,420 | |
Lions Gate Entertainment Corporation (a) | | | 1,400 | | | | 7,266 | |
Live Nation, Inc. (a) (b) | | | 233,737 | | | | 1,556,688 | |
LodgeNet Interactive Corporation (a) | | | 89,404 | | | | 433,609 | |
Marvel Entertainment, Inc. (a) | | | 300 | | | | 14,991 | |
| McClatchy Company - Class A | | | 111,400 | | | | 314,148 | |
MDC Partners, Inc. (a) | | | 2,200 | | | | 17,930 | |
Mediacom Communications Corporation (a) | | | 29,200 | | | | 139,576 | |
| New York Times Company (The) - Class A | | | 34,400 | | | | 274,168 | |
RCN Corporation (a) | | | 300 | | | | 2,502 | |
| Regal Entertainment Group | | | 6,100 | | | | 76,921 | |
SIRIUS XM Radio, Inc. (a) | | | 9,043,595 | | | | 5,299,547 | |
Valassis Communications, Inc. (a) | | | 1,600 | | | | 29,168 | |
| Virgin Media, Inc. | | | 800 | | | | 11,176 | |
| | | | | | | | 18,365,660 | |
| Multi-Line Retail - 0.1% | |
| Bon-Ton Stores, Inc. (The) | | | 1,000 | | | | 9,250 | |
| Dillard's, Inc. | | | 66,528 | | | | 906,111 | |
| Macy's, Inc. | | | 300 | | | | 5,271 | |
Retail Ventures, Inc. (a) | | | 30,053 | | | | 192,640 | |
| | | | | | | | 1,113,272 | |
| Specialty Retail - 1.3% | |
A.C. Moore Arts & Crafts, Inc. (a) | | | 1,100 | | | | 5,258 | |
| American Eagle Outfitters, Inc. | | | 147,700 | | | | 2,583,273 | |
| bebe stores, Inc. | | | 400 | | | | 2,504 | |
| Big 5 Sporting Goods Corporation | | | 300 | | | | 4,425 | |
| TFS MARKET NEUTRAL FUND | |
| SCHEDULE OF INVESTMENTS (Continued) | |
| | |
| COMMON STOCKS - 85.1% (Continued) | | Shares | | | Value | |
| Consumer Discretionary - 10.5% (Continued) | |
| Specialty Retail - 1.3% (Continued) | |
| Books-A-Million, Inc. | | | 5,600 | | | $ | 48,496 | |
CarMax, Inc. (a) | | | 100 | | | | 1,967 | |
| Cato Corporation (The) - Class A | | | 100 | | | | 1,971 | |
Charming Shoppes, Inc. (a) | | | 1,100 | | | | 4,983 | |
Coldwater Creek, Inc. (a) | | | 800 | | | | 4,600 | |
Conn's, Inc. (a) | | | 2,800 | | | | 17,668 | |
Destination Maternity Corporation (a) | | | 1,394 | | | | 27,950 | |
Dress Barn, Inc. (a) | | | 8,000 | | | | 144,400 | |
DSW, Inc. - Class A (a) | | | 6,000 | | | | 115,200 | |
| Finish Line, Inc. (The) - Class A | | | 1,600 | | | | 16,224 | |
| Gap, Inc. (The) | | | 300 | | | | 6,402 | |
Genesco, Inc. (a) | | | 500 | | | | 13,035 | |
| Guess?, Inc. | | | 200 | | | | 7,310 | |
Gymboree Corporation (The) (a) | | | 6,300 | | | | 268,191 | |
Haverty Furniture Companies, Inc. (a) | | | 300 | | | | 3,633 | |
Hot Topic, Inc. (a) | | | 25,100 | | | | 193,270 | |
Jo-Ann Stores, Inc. (a) | | | 300 | | | | 7,986 | |
Lithia Motors, Inc. (a) | | | 1,100 | | | | 9,174 | |
Lumber Liquidators, Inc. (a) | | | 200 | | | | 4,250 | |
MarineMax, Inc. (a) | | | 42,800 | | | | 291,468 | |
Midas, Inc. (a) | | | 1,900 | | | | 15,314 | |
| Monro Muffler Brake, Inc. | | | 300 | | | | 9,297 | |
New York & Company, Inc. (a) | | | 53,800 | | | | 236,720 | |
Office Depot, Inc. (a) | | | 4,100 | | | | 24,805 | |
OfficeMax, Inc. (a) | | | 194,604 | | | | 2,224,324 | |
Pacific Sunwear of California, Inc. (a) | | | 5,500 | | | | 33,220 | |
| Pep Boys - Manny, Moe & Jack | | | 39,669 | | | | 347,897 | |
Rent-A-Center, Inc. (a) | | | 2,900 | | | | 53,244 | |
Rex Stores Corporation (a) | | | 600 | | | | 7,410 | |
Select Comfort Corporation (a) | | | 2,100 | | | | 11,487 | |
Shoe Carnival, Inc. (a) | | | 700 | | | | 10,507 | |
Signet Jewelers Ltd. (a) (b) | | | 66,315 | | | | 1,671,801 | |
| Sonic Automotive, Inc. - Class A | | | 300 | | | | 2,682 | |
Stein Mart, Inc. (a) | | | 85,154 | | | | 808,963 | |
Systemax, Inc. (a) | | | 300 | | | | 4,044 | |
| Tiffany & Company | | | 300 | | | | 11,787 | |
TravelCenters of America LLC (a) | | | 700 | | | | 3,955 | |
Ulta Salon, Cosmetics & Fragrance, Inc. (a) | | | 95,299 | | | | 1,442,827 | |
West Marine, Inc. (a) | | | 13,480 | | | | 102,717 | |
| Williams-Sonoma, Inc. | | | 19,200 | | | | 360,576 | |
Zumiez, Inc. (a) | | | 500 | | | | 6,735 | |
| | | | | | | | 11,173,950 | |
| Textiles, Apparel & Luxury Goods - 1.8% | |
Carter's, Inc. (a) (b) | | | 51,760 | | | | 1,221,536 | |
CROCS, Inc. (a) | | | 96,100 | | | | 584,288 | |
Fossil, Inc. (a) (b) | | | 57,927 | | | | 1,548,389 | |
Gildan Activewear, Inc. - Class A (a) | | | 500 | | | | 8,865 | |
Jones Apparel Group, Inc. (b) | | | 174,300 | | | | 3,118,227 | |
| Kenneth Cole Productions, Inc. | | | 100 | | | | 951 | |
| TFS MARKET NEUTRAL FUND | |
| SCHEDULE OF INVESTMENTS (Continued) | |
| | |
| COMMON STOCKS - 85.1% (Continued) | | Shares | | | Value | |
| Consumer Discretionary - 10.5% (Continued) | |
| Textiles, Apparel & Luxury Goods - 1.8% (Continued) | |
| K-Swiss, Inc. - Class A | | | 200 | | | $ | 1,632 | |
| Liz Claiborne, Inc. | | | 131,429 | | | | 754,402 | |
Maidenform Brands, Inc. (a) | | | 19,300 | | | | 271,744 | |
| Oxford Industries, Inc. | | | 1,600 | | | | 30,960 | |
Perry Ellis International, Inc. (a) | | | 8,718 | | | | 119,175 | |
| Phillips-Van Heusen Corporation | | | 33,921 | | | | 1,361,928 | |
Quiksilver, Inc. (a) (b) | | | 648,300 | | | | 1,290,117 | |
Skechers U.S.A., Inc. - Class A (a) | | | 45,851 | | | | 1,000,469 | |
Steven Madden Ltd. (a) | | | 10,090 | | | | 408,645 | |
| UniFirst Corporation | | | 30,273 | | | | 1,274,493 | |
Volcom, Inc. (a) | | | 1,200 | | | | 19,932 | |
Warnaco Group, Inc. (The) (a) | | | 23,900 | | | | 968,667 | |
| Weyco Group, Inc. | | | 400 | | | | 8,920 | |
| Wolverine World Wide, Inc. | | | 25,175 | | | | 643,977 | |
| | | | | | | | 14,637,317 | |
| Consumer Staples - 3.0% | |
| Beverages - 0.1% | |
| Coca-Cola Bottling Company Consolidated | | | 1,391 | | | | 62,470 | |
Cott Corporation (a) | | | 21,900 | | | | 173,010 | |
Hansen Natural Corporation (a) | | | 14,900 | | | | 538,635 | |
| | | | | | | | 774,115 | |
| Food & Staples Retailing - 1.1% | |
| Andersons, Inc. (The) | | | 28,894 | | | | 896,581 | |
BJ's Wholesale Club, Inc. (a) | | | 13,700 | | | | 479,911 | |
Great Atlantic & Pacific Tea Company, Inc. (The) (a) | | | 3,100 | | | | 30,721 | |
| Nash Finch Company | | | 200 | | | | 5,796 | |
Pantry, Inc. (a) | | | 800 | | | | 11,288 | |
PriceSmart, Inc. (b) | | | 81,210 | | | | 1,567,353 | |
Rite Aid Corporation (a) | | | 1,556,304 | | | | 2,007,632 | |
| Spartan Stores, Inc. | | | 1,900 | | | | 26,904 | |
SUPERVALU, Inc. (b) | | | 273,600 | | | | 4,342,032 | |
Susser Holdings Corporation (a) | | | 6,102 | | | | 72,553 | |
Whole Foods Market, Inc. (a) | | | 300 | | | | 9,618 | |
| | | | | | | | 9,450,389 | |
| Food Products - 1.1% | |
AgFeed Industries, Inc. (a) | | | 28,773 | | | | 126,889 | |
| Alico, Inc. | | | 600 | | | | 17,448 | |
American Dairy, Inc. (a) | | | 500 | | | | 14,470 | |
| B&G Foods, Inc. | | | 50,200 | | | | 392,062 | |
Chiquita Brands International, Inc. (a) | | | 1,300 | | | | 21,047 | |
| Corn Products International, Inc. | | | 70,237 | | | | 1,979,279 | |
Cosan Ltd. - Class A (a) | | | 15,100 | | | | 100,566 | |
Darling International, Inc. (a) | | | 81,672 | | | | 567,620 | |
Del Monte Foods Company (b) | | | 229,121 | | | | 2,474,507 | |
Fresh Del Monte Produce, Inc. (a) (b) | | | 88,728 | | | | 1,926,285 | |
| Griffin Land & Nurseries, Inc. | | | 2,100 | | | | 62,349 | |
Hain Celestial Group, Inc. (The) (a) | | | 25,560 | | | | 448,322 | |
Reddy Ice Holdings, Inc (a) | | | 40,950 | | | | 161,752 | |
Sanderson Farms, Inc. (b) | | | 25,200 | | | | 922,068 | |
| TFS MARKET NEUTRAL FUND | |
| SCHEDULE OF INVESTMENTS (Continued) | |
| | |
| COMMON STOCKS - 85.1% (Continued) | | Shares | | | Value | |
| Consumer Staples - 3.0% (Continued) | |
| Food Products - 1.1% (Continued) | |
| Sara Lee Corporation | | | 500 | | | $ | 5,645 | |
Smart Balance, Inc. (a) | | | 1,400 | | | | 7,392 | |
Treehouse Foods, Inc. (a) | | | 100 | | | | 3,740 | |
Zhongpin, Inc. (a) | | | 1,000 | | | | 13,310 | |
| | | | | | | | 9,244,751 | |
| Household Products - 0.0% | |
| Church & Dwight Company, Inc. | | | 5,500 | | | | 312,840 | |
Oil-Dri Corporation of America (b) | | | 500 | | | | 7,645 | |
| WD-40 Company | | | 100 | | | | 3,149 | |
| | | | | | | | 323,634 | |
| Personal Products - 0.7% | |
Bare Escentuals, Inc. (a) (b) | | | 154,641 | | | | 1,953,116 | |
China Sky One Medical, Inc. (a) | | | 300 | | | | 3,561 | |
Female Health Company (The) (a) | | | 8,538 | | | | 39,531 | |
| Herbalife Ltd. | | | 19,192 | | | | 645,811 | |
| Inter Parfums, Inc. | | | 1,900 | | | | 23,332 | |
Medifast, Inc. (a) | | | 28,893 | | | | 636,224 | |
| Nu Skin Enterprises, Inc. - Class A | | | 29,831 | | | | 678,953 | |
Prestige Brands Holdings, Inc. (a) (b) | | | 208,035 | | | | 1,406,317 | |
| Schiff Nutrition International, Inc. | | | 1,600 | | | | 9,232 | |
Tiens Biotech Group (USA), Inc. (a) | | | 8,200 | | | | 33,128 | |
| | | | | | | | 5,429,205 | |
| Tobacco - 0.0% | |
| Universal Corporation | | | 100 | | | | 4,159 | |
| | | | | | | | | |
| Energy - 4.9% | |
| Energy Equipment & Services - 1.6% | |
Atwood Oceanics, Inc. (a) | | | 300 | | | | 10,647 | |
| BJ Services Company | | | 700 | | | | 13,440 | |
Cal Dive International, Inc. (a) (b) | | | 209,015 | | | | 1,605,235 | |
Cameron International Corporation (a) | | | 100 | | | | 3,697 | |
| Carbo Ceramics, Inc. | | | 100 | | | | 5,839 | |
Complete Production Services, Inc. (a) (b) | | | 243,930 | | | | 2,324,653 | |
Dril-Quip, Inc. (a) | | | 200 | | | | 9,718 | |
ENGlobal Corporation (a) | | | 23,008 | | | | 67,874 | |
| ENSCO International, Inc. | | | 100 | | | | 4,579 | |
Exterran Holdings, Inc. (a) | | | 1,000 | | | | 20,430 | |
| Exterran Partners, L.P. | | | 400 | | | | 7,652 | |
FMC Technologies, Inc. (a) | | | 100 | | | | 5,260 | |
Geokinetics, Inc. (a) | | | 10,848 | | | | 174,436 | |
Global Industries Ltd. (a) | | | 4,200 | | | | 30,618 | |
| Gulf Island Fabrication, Inc. | | | 1,500 | | | | 28,680 | |
Helix Energy Solutions Group, Inc. (a) | | | 1,100 | | | | 15,103 | |
Hercules Offshore, Inc. (a) | | | 55,900 | | | | 286,767 | |
Hornbeck Offshore Services, Inc. (a) | | | 800 | | | | 19,448 | |
ION Geophysical Corporation (a) (b) | | | 421,692 | | | | 1,615,080 | |
Key Energy Services, Inc. (a) | | | 700 | | | | 5,117 | |
| Lufkin Industries, Inc. | | | 400 | | | | 22,820 | |
| TFS MARKET NEUTRAL FUND | |
| SCHEDULE OF INVESTMENTS (Continued) | |
| | |
| COMMON STOCKS - 85.1% (Continued) | | Shares | | | Value | |
| Energy - 4.9% (Continued) | |
| Energy Equipment & Services - 1.6% (Continued) | |
Matrix Service Company (a) | | | 25,500 | | | $ | 226,185 | |
Nabors Industries Ltd. (a) | | | 200 | | | | 4,166 | |
NATCO Group, Inc. - Class A (a) | | | 400 | | | | 17,432 | |
National Oilwell Varco, Inc. (a) | | | 100 | | | | 4,099 | |
Natural Gas Services Group, Inc. (a) | | | 28,490 | | | | 480,626 | |
Oceaneering International, Inc. (a) (b) | | | 26,106 | | | | 1,334,017 | |
Oil States International, Inc. (a) (b) | | | 40,200 | | | | 1,384,488 | |
OYO Geospace Corporation (a) | | | 1,100 | | | | 28,875 | |
Parker Drilling Company (a) | | | 15,000 | | | | 78,000 | |
| Patterson-UTI Energy, Inc. | | | 300 | | | | 4,674 | |
PHI, Inc. (a) | | | 1,600 | | | | 27,488 | |
Pioneer Drilling Company (a) | | | 76,490 | | | | 511,718 | |
| Precision Drilling Trust | | | 26,700 | | | | 174,885 | |
Pride International, Inc. (a) | | | 500 | | | | 14,780 | |
| Rowan Companies, Inc. | | | 38,700 | | | | 899,775 | |
| Smith International, Inc. | | | 300 | | | | 8,319 | |
Superior Energy Services, Inc. (a) | | | 1,000 | | | | 21,610 | |
T-3 Energy Services, Inc. (a) | | | 11,581 | | | | 231,852 | |
Tesco Corporation (a) | | | 200 | | | | 1,736 | |
TETRA Technologies, Inc. (a) | | | 84,354 | | | | 797,989 | |
Union Drilling, Inc. (a) | | | 55,446 | | | | 423,607 | |
Willbros Group, Inc. (a) | | | 1,000 | | | | 13,140 | |
| | | | | | | | 12,966,554 | |
| Oil, Gas & Consumable Fuels - 3.3% | |
| Advantage Oil & Gas Ltd. | | | 13,100 | | | | 80,696 | |
| Alon USA Energy, Inc. | | | 70,923 | | | | 595,753 | |
Approach Resources, Inc. (a) | | | 67,874 | | | | 526,702 | |
| Arch Coal, Inc. | | | 700 | | | | 15,162 | |
| Atlas Energy, Inc. | | | 600 | | | | 15,708 | |
| Atlas Pipeline Partners, L.P. | | | 17,963 | | | | 126,100 | |
ATP Oil & Gas Corporation (a) | | | 18,300 | | | | 316,773 | |
| Baytex Energy Trust | | | 200 | | | | 4,892 | |
| Berry Petroleum Company - Class A | | | 400 | | | | 10,144 | |
BPZ Resources, Inc. (a) | | | 4,300 | | | | 27,090 | |
| Breitburn Energy Partners, L.P. | | | 3,200 | | | | 36,576 | |
| Calumet Specialty Products Partners, L.P. | | | 300 | | | | 4,776 | |
| Capital Product Partners, L.P. | | | 700 | | | | 6,440 | |
| Chesapeake Energy Corporation | | | 300 | | | | 7,350 | |
Concho Resources, Inc. (a) (b) | | | 39,557 | | | | 1,507,517 | |
Contango Oil & Gas Company (a) | | | 800 | | | | 38,120 | |
Continental Resources, Inc. (a) | | | 200 | | | | 7,442 | |
CVR Energy, Inc. (a) (b) | | | 196,243 | | | | 2,064,476 | |
| Delek US Holdings, Inc. | | | 62,327 | | | | 420,707 | |
| DHT Maritime, Inc. | | | 151,457 | | | | 517,983 | |
| Eagle Rock Energy Partners, L.P. | | | 3,800 | | | | 18,012 | |
| Encore Energy Partners, L.P. | | | 300 | | | | 5,400 | |
| EV Energy Partners, L.P. | | | 100 | | | | 2,508 | |
| EXCO Resources, Inc. | | | 1,400 | | | | 21,868 | |
| Frontier Oil Corporation | | | 32,600 | | | | 451,836 | |
| TFS MARKET NEUTRAL FUND | |
| SCHEDULE OF INVESTMENTS (Continued) | |
| | |
| COMMON STOCKS - 85.1% (Continued) | | Shares | | | Value | |
| Energy - 4.9% (Continued) | |
| Oil, Gas & Consumable Fuels - 3.3% (Continued) | |
| General Maritime Corporation | | | 49,633 | | | $ | 341,972 | |
GeoResources, Inc. (a) | | | 2,600 | | | | 28,834 | |
GMX Resources, Inc. (a) | | | 10,000 | | | | 127,300 | |
| Golar LNG Ltd. | | | 1,700 | | | | 20,502 | |
Gran Tierra Energy, Inc. (a) (b) | | | 273,341 | | | | 1,301,103 | |
Gulfport Energy Corporation (a) (b) | | | 182,829 | | | | 1,394,985 | |
| Harvest Energy Trust | | | 8,800 | | | | 80,080 | |
Harvest Natural Resources, Inc. (a) | | | 1,300 | | | | 7,137 | |
Holly Corporation (b) | | | 48,887 | | | | 1,418,212 | |
International Coal Group, Inc. (a) | | | 47,600 | | | | 194,684 | |
Interoil Corporation (a) | | | 200 | | | | 9,116 | |
| Knightsbridge Tankers Ltd. | | | 8,200 | | | | 103,648 | |
Mariner Energy, Inc. (a) | | | 300 | | | | 3,822 | |
| MarkWest Energy Partners, L.P. | | | 500 | | | | 12,005 | |
McMoRan Exploration Company (a) | | | 202,100 | | | | 1,554,149 | |
| MV Oil Trust | | | 500 | | | | 9,375 | |
Northern Oil and Gas, Inc. (a) | | | 1,200 | | | | 10,944 | |
Oilsands Quest, Inc. (a) | | | 109,000 | | | | 130,800 | |
| ONEOK Partners, L.P. | | | 1,700 | | | | 92,480 | |
| OSG America, L.P. | | | 2,500 | | | | 25,475 | |
| Overseas Shipholding Group, Inc. | | | 9,800 | | | | 384,650 | |
| Panhandle Oil & Gas, Inc. | | | 300 | | | | 5,898 | |
Patriot Coal Corporation (a) | | | 32,400 | | | | 366,120 | |
| Pengrowth Energy Trust | | | 76,800 | | | | 706,560 | |
| Penn Virginia GP Holdings, L.P. | | | 1,500 | | | | 19,485 | |
| Penn Virginia Resource Partners, L.P. | | | 400 | | | | 7,344 | |
| Penn West Energy Trust | | | 700 | | | | 11,515 | |
| Permian Basin Royalty Trust | | | 300 | | | | 3,864 | |
Petroleum Development Corporation (a) (b) | | | 116,888 | | | | 1,952,030 | |
PetroQuest Energy, Inc. (a) | | | 16,400 | | | | 100,532 | |
| Pioneer Natural Resources Company | | | 300 | | | | 12,333 | |
| Provident Energy Trust | | | 19,600 | | | | 120,932 | |
| Quicksilver Gas Services, L.P. | | | 700 | | | | 12,740 | |
Quicksilver Resources, Inc. (a) (b) | | | 193,100 | | | | 2,355,820 | |
| Regency Energy Partners, L.P. | | | 600 | | | | 11,742 | |
Rex Energy Corporation (a) | | | 3,100 | | | | 25,079 | |
Rosetta Resources, Inc. (a) | | | 23,600 | | | | 319,308 | |
| Ship Finance International Ltd. | | | 900 | | | | 10,233 | |
Southern Union Company (b) | | | 84,336 | | | | 1,650,456 | |
| St. Mary Land & Exploration Company | | | 400 | | | | 13,640 | |
| StealthGas, Inc. | | | 3,000 | | | | 19,260 | |
| Targa Resources Partners L.P. | | | 200 | | | | 3,962 | |
| Teekay Corporation | | | 7,307 | | | | 151,620 | |
| Teekay Offshore Partners, L.P. | | | 600 | | | | 9,762 | |
| Teekay Tankers Ltd. - Class A | | | 96,398 | | | | 780,824 | |
| Tesoro Corporation | | | 2,409 | | | | 34,063 | |
| Tsakos Energy Navigation Ltd. | | | 1,100 | | | | 17,072 | |
USEC, Inc. (a) (b) | | | 398,359 | | | | 1,537,666 | |
VAALCO Energy, Inc. (b) | | | 293,705 | | | | 1,251,183 | |
| TFS MARKET NEUTRAL FUND | |
| SCHEDULE OF INVESTMENTS (Continued) | |
| | |
| COMMON STOCKS - 85.1% (Continued) | | Shares | | | Value | |
| Energy - 4.9% (Continued) | |
| Oil, Gas & Consumable Fuels - 3.3% (Continued) | |
| Valero Energy Corporation | | | 300 | | | $ | 5,430 | |
Vanguard Natural Resources, LLC (a) | | | 300 | | | | 5,364 | |
Warren Resources, Inc. (a) | | | 29,400 | | | | 63,504 | |
Western Refining, Inc. (a) | | | 292,290 | | | | 1,639,747 | |
Whiting Petroleum Corporation (a) | | | 400 | | | | 22,560 | |
| Whiting USA Trust I | | | 1,400 | | | | 24,094 | |
| Williams Partners, L.P. | | | 400 | | | | 10,200 | |
| | | | | | | | 27,363,246 | |
| Financials - 11.7% | |
| Capital Markets - 1.8% | |
| AllianceBernstein Holding L.P. | | | 16,800 | | | | 453,264 | |
American Capital Ltd. (a) | | | 597,064 | | | | 1,600,132 | |
| Ameriprise Financial, Inc. | | | 400 | | | | 13,868 | |
Apollo Investment Corporation (b) | | | 139,805 | | | | 1,258,245 | |
Ares Capital Corporation (b) | | | 258,849 | | | | 2,702,384 | |
| BGC Partners, Inc. - Class A | | | 2,300 | | | | 11,109 | |
| BlackRock Kelso Capital Corporation | | | 6,510 | | | | 47,588 | |
| Blackstone Group L.P. (The) | | | 56,000 | | | | 751,520 | |
Broadpoint Gleacher Securities Group, Inc. (a) | | | 206,081 | | | | 1,312,736 | |
| Calamos Asset Management, Inc. - Class A | | | 13,200 | | | | 139,920 | |
| Capital Southwest Corporation | | | 300 | | | | 22,278 | |
| Duff & Phelps Corporation | | | 14,050 | | | | 241,519 | |
E*TRADE Financial Corporation (a) (b) | | | 1,615,000 | | | | 2,357,900 | |
| Evercore Partners, Inc. - Class A | | | 300 | | | | 9,792 | |
FBR Capital Markets Corporation (a) | | | 69,372 | | | | 423,169 | |
| Fifth Street Finance Corporation | | | 42,672 | | | | 419,466 | |
Fortress Investment Group, LLC (a) | | | 292,371 | | | | 1,225,034 | |
| GFI Group, Inc. | | | 87,949 | | | | 452,937 | |
| Gladstone Capital Corporation | | | 6,689 | | | | 54,917 | |
| Gladstone Investment Corporation | | | 1,900 | | | | 9,595 | |
| Janus Capital Group, Inc. | | | 1,400 | | | | 18,368 | |
Jefferies Group, Inc. (a) | | | 100 | | | | 2,610 | |
| JMP Group, Inc. | | | 300 | | | | 2,526 | |
KBW, Inc. (a) | | | 16,904 | | | | 473,312 | |
| Kohlberg Capital Corporation | | | 400 | | | | 2,124 | |
MCG Capital Corporation (a) | | | 106,459 | | | | 424,771 | |
| Och-Ziff Capital Management Group, LLC | | | 200 | | | | 2,426 | |
| PennantPark Investment Corporation | | | 32,893 | | | | 254,263 | |
Penson Worldwide, Inc. (a) | | | 500 | | | | 4,875 | |
Rodman & Renshaw Capital Group, Inc. (a) | | | 55,886 | | | | 239,192 | |
Safeguard Scientifics, Inc. (a) | | | 12,067 | | | | 117,533 | |
| Sanders Morris Harris Group, Inc. | | | 8,460 | | | | 49,153 | |
Stifel Financial Corporation (a) | | | 100 | | | | 5,196 | |
UBS AG - Regular Shares (a) | | | 300 | | | | 4,977 | |
| | | | | | | | 15,108,699 | |
| Commercial Banks - 2.7% | |
| 1st Source Corporation | | | 1,600 | | | | 23,712 | |
| Associated Banc-Corp | | | 700 | | | | 8,967 | |
| Auburn National Bancorporation, Inc. | | | 300 | | | | 5,868 | |
| TFS MARKET NEUTRAL FUND | |
| SCHEDULE OF INVESTMENTS (Continued) | |
| | |
| COMMON STOCKS - 85.1% (Continued) | | Shares | | | Value | |
| Financials - 11.7% (Continued) | |
| Commercial Banks - 2.7% (Continued) | |
| BancFirst Corporation | | | 1,100 | | | $ | 39,721 | |
| Banco Latinoamericano de Comercio Exterior, S.A. - Class E - ADR | | | 16,200 | | | | 228,582 | |
| Bancorp Rhode Island, Inc. | | | 200 | | | | 5,104 | |
Bancorp, Inc. (The) (a) | | | 2,100 | | | | 10,710 | |
| Bank of the Ozarks, Inc. | | | 100 | | | | 2,275 | |
BOK Financial Corporation (b) | | | 26,750 | | | | 1,149,448 | |
Boston Private Financial Holdings, Inc. (b) | | | 420,008 | | | | 2,499,048 | |
| Capital City Bank Group, Inc. | | | 2,600 | | | | 30,524 | |
CapitalSource, Inc. (b) | | | 991,510 | | | | 3,529,776 | |
Cathay General Bancorp (b) | | | 122,105 | | | | 1,078,187 | |
| CenterState Banks of Florida, Inc. | | | 1,200 | | | | 9,036 | |
| Chemical Financial Corporation | | | 900 | | | | 19,755 | |
| City Holding Company | | | 500 | | | | 15,285 | |
| CoBiz, Inc. | | | 16,691 | | | | 79,616 | |
| Comerica, Inc. | | | 600 | | | | 16,650 | |
Commerce Bancshares, Inc. (b) | | | 48,501 | | | | 1,860,498 | |
| Community Bank System, Inc. | | | 37,427 | | | | 696,516 | |
| Community Trust Bancorporation, Inc. | | | 3,380 | | | | 83,216 | |
| East West Bancorp, Inc. | | | 97,000 | | | | 875,910 | |
| F.N.B. Corporation | | | 3,200 | | | | 22,656 | |
| First Busey Corporation | | | 900 | | | | 3,483 | |
| First Community Bancshares, Inc. | | | 43,878 | | | | 510,740 | |
| First Financial Bancorporation | | | 4,500 | | | | 57,060 | |
| First Financial Corporation | | | 700 | | | | 19,411 | |
| First Merchants Corporation | | | 3,200 | | | | 19,584 | |
| First Midwest Bancorp, Inc. | | | 31,793 | | | | 330,647 | |
| First of Long Island Corporation (The) | | | 2,672 | | | | 64,582 | |
| Glacier Bancorp, Inc. | | | 1,600 | | | | 20,944 | |
| Hancock Holding Company | | | 300 | | | | 10,881 | |
| Harleysville National Corporation | | | 9,600 | | | | 55,296 | |
| Heartland Financial USA, Inc. | | | 2,734 | | | | 35,105 | |
Huntington Bancshares, Inc. (b) | | | 424,110 | | | | 1,615,859 | |
| Independent Bank Corporation | | | 13,112 | | | | 278,892 | |
Investors Bancorp, Inc. (a) | | | 300 | | | | 3,252 | |
| KeyCorp | | | 2,600 | | | | 14,014 | |
| Lakeland Bancorp, Inc. | | | 14,307 | | | | 86,987 | |
| MainSource Financial Group, Inc. | | | 1,500 | | | | 8,745 | |
Marshall & Ilsley Corporation (b) | | | 303,976 | | | | 1,617,152 | |
| Old National Bancorp | | | 30,100 | | | | 312,137 | |
| Oriental Financial Group, Inc. | | | 56,391 | | | | 600,564 | |
| Peoples Bancorp, Inc. | | | 6,845 | | | | 73,515 | |
Pinnacle Financial Partners, Inc. (a) | | | 27,600 | | | | 350,520 | |
| Popular, Inc. | | | 343,500 | | | | 741,960 | |
| Renasant Corporation | | | 700 | | | | 10,248 | |
| Republic Bancorp, Inc. - Class A | | | 900 | | | | 16,551 | |
Santander BanCorp (a) | | | 66,913 | | | | 769,500 | |
| SCBT Financial Corporation | | | 100 | | | | 2,587 | |
| Shore Bancshares, Inc. | | | 1,410 | | | | 22,997 | |
| TFS MARKET NEUTRAL FUND | |
| SCHEDULE OF INVESTMENTS (Continued) | |
| | |
| COMMON STOCKS - 85.1% (Continued) | | Shares | | | Value | |
| Financials - 11.7% (Continued) | |
| Commercial Banks - 2.7% (Continued) | |
| Smithtown Bancorp, Inc. | | | 1,500 | | | $ | 15,525 | |
| Southwest Bancorp, Inc. | | | 10,816 | | | | 106,429 | |
| StellarOne Corporation | | | 100 | | | | 1,061 | |
| Sterling Bancorp | | | 1,700 | | | | 11,441 | |
| SunTrust Banks, Inc. | | | 600 | | | | 11,466 | |
| Susquehanna Bancshares, Inc. | | | 500 | | | | 2,755 | |
SVB Financial Group (a) (b) | | | 32,300 | | | | 1,332,375 | |
| Synovus Financial Corporation | | | 76,900 | | | | 170,718 | |
| TCF Financial Corporation | | | 30,800 | | | | 364,364 | |
| Tompkins Financial Corporation | | | 100 | | | | 4,337 | |
| Tower Bancorporation, Inc. | | | 100 | | | | 2,256 | |
| Towne Bank | | | 1,700 | | | | 19,618 | |
| TriCo Bancshares | | | 900 | | | | 13,158 | |
| UMB Financial Corporation | | | 100 | | | | 3,977 | |
| Umpqua Holdings Corporation | | | 1,100 | | | | 10,901 | |
| Union Bankshares Corporation | | | 1,000 | | | | 12,320 | |
| United Bankshares, Inc. | | | 1,100 | | | | 19,635 | |
United Community Banks, Inc. (a) | | | 300 | | | | 1,218 | |
| Univest Corporation of Pennsylvania | | | 600 | | | | 11,538 | |
| Washington Trust Bancorp, Inc. | | | 100 | | | | 1,502 | |
| Webster Financial Corporation | | | 500 | | | | 5,655 | |
| WesBanco, Inc. | | | 1,400 | | | | 19,810 | |
| Westamerica Bancorporation | | | 600 | | | | 28,680 | |
Western Alliance Bancorp (a) | | | 37,257 | | | | 162,068 | |
| Whitney Holding Corporation | | | 200 | | | | 1,606 | |
| Wilshire Bancorp, Inc. | | | 1,900 | | | | 13,376 | |
| Zions Bancorporation | | | 21,700 | | | | 307,272 | |
| | | | | | | | 22,599,334 | |
| Consumer Finance - 0.4% | |
| American Express Company | | | 100 | | | | 3,484 | |
Cardtronics, Inc. (a) | | | 23,292 | | | | 231,756 | |
| Discover Financial Services, LLC | | | 300 | | | | 4,242 | |
EZCORP, Inc. - Class A (a) | | | 35,861 | | | | 465,117 | |
Nelnet, Inc. - Class A (a) (b) | | | 117,313 | | | | 1,645,901 | |
| Student Loan Corporation (The) | | | 300 | | | | 12,615 | |
World Acceptance Corporation (a) | | | 26,100 | | | | 654,849 | |
| | | | | | | | 3,017,964 | |
| Diversified Financial Services - 0.3% | |
| Asta Funding, Inc. | | | 2,400 | | | | 15,672 | |
| Bank of America Corporation | | | 2,600 | | | | 37,908 | |
| Citigroup, Inc. | | | 900 | | | | 3,681 | |
Compass Diversified Holdings, Inc. (b) | | | 166,615 | | | | 1,704,472 | |
Encore Capital Group, Inc. (a) | | | 1,200 | | | | 17,964 | |
KKR Financial Holdings, LLC (a) | | | 2,500 | | | | 11,450 | |
Leucadia National Corporation (a) | | | 300 | | | | 6,741 | |
| Life Partners Holdings, Inc. | | | 1,100 | | | | 18,689 | |
Nasdaq OMX Group, Inc. (The) (a) | | | 27,800 | | | | 502,068 | |
NewStar Financial, Inc. (a) | | | 11,506 | | | | 28,880 | |
| TFS MARKET NEUTRAL FUND | |
| SCHEDULE OF INVESTMENTS (Continued) | |
| | |
| COMMON STOCKS - 85.1% (Continued) | | Shares | | | Value | |
| Financials - 11.7% (Continued) | |
| Diversified Financial Services - 0.3% (Continued) | |
PHH Corporation (a) | | | 25,532 | | | $ | 412,597 | |
| | | | | | | | 2,760,122 | |
| Insurance - 4.6% | |
Allied World Assurance Company Holdings Ltd. (b) | | | 50,151 | | | | 2,244,759 | |
| Allstate Corporation (The) | | | 200 | | | | 5,914 | |
| American Equity Investment Life Holding Company | | | 400 | | | | 2,628 | |
American Financial Group, Inc. (b) | | | 107,795 | | | | 2,651,757 | |
| American National Insurance Company | | | 6,293 | | | | 525,402 | |
Argo Group International Holdings Ltd. (a) (b) | | | 37,282 | | | | 1,266,097 | |
Aspen Insurance Holdings Ltd. (b) | | | 59,496 | | | | 1,534,997 | |
| Assurant, Inc. | | | 800 | | | | 23,944 | |
| Assured Guaranty Ltd. | | | 136,517 | | | | 2,263,452 | |
CNA Financial Corporation (a) | | | 600 | | | | 13,062 | |
CNA Surety Corporation (a) (b) | | | 77,425 | | | | 1,119,565 | |
Conseco, Inc. (a) | | | 264,900 | | | | 1,380,129 | |
| Delphi Financial Group, Inc. - Class A | | | 77,254 | | | | 1,676,412 | |
eHealth, Inc. (a) | | | 1,400 | | | | 19,922 | |
Enstar Group Ltd. (a) | | | 300 | | | | 18,300 | |
Erie Indemnity Company - Class A (b) | | | 47,185 | | | | 1,663,271 | |
FBL Financial Group, Inc. - Class A (b) | | | 75,792 | | | | 1,527,209 | |
| Fidelity National Financial, Inc. - Class A | | | 55,700 | | | | 755,849 | |
| First American Corporation | | | 8,900 | | | | 270,471 | |
| First Mercury Financial Corporation | | | 17,312 | | | | 219,862 | |
| Flagstone Reinsurance Holdings Ltd. | | | 36,657 | | | | 401,394 | |
FPIC Insurance Group, Inc. (a) | | | 900 | | | | 30,447 | |
Hallmark Financial Services, Inc. (a) | | | 25,103 | | | | 192,540 | |
Horace Mann Educators Corporation (b) | | | 127,529 | | | | 1,585,185 | |
| Kansas City Life Insurance Company | | | 13,540 | | | | 363,414 | |
Maiden Holdings Ltd. (b) | | | 193,838 | | | | 1,343,297 | |
| Manulife Financial Corporation | | | 200 | | | | 3,718 | |
Max Capital Group Ltd. (b) | | | 60,052 | | | | 1,240,074 | |
Meadowbrook Insurance Group, Inc. (b) | | | 198,675 | | | | 1,337,083 | |
| Mercury General Corporation | | | 6,803 | | | | 248,037 | |
Navigators Group, Inc. (The) (a) (b) | | | 28,500 | | | | 1,512,495 | |
| OneBeacon Insurance Group Ltd. | | | 900 | | | | 10,728 | |
Platinum Underwriters Holdings Ltd. (b) | | | 45,420 | | | | 1,624,673 | |
Protective Life Corporation (b) | | | 84,600 | | | | 1,628,550 | |
| Reinsurance Group of America, Inc. | | | 19,000 | | | | 875,900 | |
SeaBright Insurance Holdings Ltd. (a) (b) | | | 106,457 | | | | 1,190,189 | |
| Selective Insurance Group, Inc. | | | 1,000 | | | | 15,320 | |
| StanCorp Financial Group, Inc. | | | 100 | | | | 3,671 | |
| State Auto Financial Corporation | | | 2,600 | | | | 42,276 | |
Transatlantic Holdings, Inc. (b) | | | 31,968 | | | | 1,614,384 | |
| United Fire & Casualty Company | | | 18,191 | | | | 317,979 | |
Unitrin, Inc. (b) | | | 119,806 | | | | 2,348,198 | |
| Universal Insurance Holdings, Inc. | | | 152,160 | | | | 807,970 | |
| Unum Group | | | 300 | | | | 5,985 | |
| XL Capital Ltd. - Class A | | | 1,400 | | | | 22,974 | |
| | | | | | | | 37,949,483 | |
| TFS MARKET NEUTRAL FUND | |
| SCHEDULE OF INVESTMENTS (Continued) | |
| | |
| COMMON STOCKS - 85.1% (Continued) | | Shares | | | Value | |
| Financials - 11.7% (Continued) | |
| Real Estate Investment Trusts - 1.4% | |
| Acadia Realty Trust | | | 100 | | | $ | 1,590 | |
| AMB Property Corporation | | | 200 | | | | 4,396 | |
Anworth Mortgage Asset Corporation (b) | | | 281,356 | | | | 2,006,068 | |
| Brandywine Realty Trust | | | 300 | | | | 2,868 | |
Capstead Mortgage Corporation (b) | | | 119,900 | | | | 1,577,884 | |
| Care Investment Trust, Inc. | | | 2,000 | | | | 16,020 | |
Chimera Investment Corporation (b) | | | 409,100 | | | | 1,427,759 | |
| Cogdell Spencer, Inc. | | | 3,100 | | | | 14,384 | |
| Colonial Properties Trust | | | 2,200 | | | | 23,166 | |
| Cousins Properties, Inc. | | | 49,900 | | | | 365,268 | |
DiamondRock Hospitality Company (a) | | | 500 | | | | 3,805 | |
DuPont Fabros Technology, Inc. (a) | | | 1,600 | | | | 24,128 | |
| Education Realty Trust, Inc. | | | 80,780 | | | | 404,708 | |
| First Potomac Realty Trust | | | 25,080 | | | | 284,658 | |
| Glimcher Realty Trust | | | 900 | | | | 2,430 | |
| Hatteras Financial Corporation | | | 1,600 | | | | 44,960 | |
| Hersha Hospitality Trust | | | 20,700 | | | | 52,992 | |
| Highwoods Properties, Inc. | | | 300 | | | | 8,256 | |
| Hospitality Properties Trust | | | 800 | | | | 15,448 | |
| HRPT Properties Trust | | | 4,000 | | | | 28,120 | |
| Inland Real Estate Corporation | | | 1,000 | | | | 8,580 | |
| Liberty Property Trust | | | 200 | | | | 5,874 | |
LTC Properties, Inc. (b) | | | 56,323 | | | | 1,337,671 | |
| Mack-Cali Realty Corporation | | | 300 | | | | 9,285 | |
MFA Financial, Inc. (b) | | | 198,009 | | | | 1,469,227 | |
| National Health Investors, Inc. | | | 8,492 | | | | 254,760 | |
| Pennsylvania Real Estate Investment Trust | | | 2,600 | | | | 19,058 | |
| PS Business Parks, Inc. | | | 12,154 | | | | 595,181 | |
| Regency Centers Corporation | | | 300 | | | | 10,065 | |
| Resource Capital Corporation | | | 7,000 | | | | 33,880 | |
| Saul Centers, Inc. | | | 15,575 | | | | 479,087 | |
| Senior Housing Properties Trust | | | 38,600 | | | | 744,208 | |
| Sun Communities, Inc. | | | 1,200 | | | | 20,928 | |
| Winthrop Realty Trust | | | 1,100 | | | | 9,856 | |
| | | | | | | | 11,306,568 | |
| Real Estate Management & Development - 0.0% | |
Avatar Holdings, Inc. (a) | | | 3,712 | | | | 60,506 | |
FirstService Corporation (a) | | | 600 | | | | 10,662 | |
Forestar Group, Inc. (a) | | | 300 | | | | 4,428 | |
| Jones Lang Lasalle, Inc. | | | 300 | | | | 14,055 | |
| | | | | | | | 89,651 | |
| Thrifts & Mortgage Finance - 0.5% | |
| Abington Bancorp, Inc. | | | 1,000 | | | | 6,860 | |
Arlington Asset Investment Corporation (a) | | | 700 | | | | 8,218 | |
| Astoria Financial Corporation | | | 1,700 | | | | 16,966 | |
| Bank Mutual Corporation | | | 400 | | | | 2,808 | |
| BankFinancial Corporation | | | 200 | | | | 1,888 | |
| Berkshire Hills Bancorp, Inc. | | | 500 | | | | 10,275 | |
| Capitol Federal Financial | | | 300 | | | | 9,099 | |
| TFS MARKET NEUTRAL FUND | |
| SCHEDULE OF INVESTMENTS (Continued) | |
| | |
| COMMON STOCKS - 85.1% (Continued) | | Shares | | | Value | |
| Financials - 11.7% (Continued) | |
| Thrifts & Mortgage Finance - 0.5% (Continued) | |
| Dime Community Bancshares, Inc. | | | 33,397 | | | $ | 367,033 | |
| Federal Agricultural Mortgage Corporation | | | 5,200 | | | | 41,756 | |
Federal National Mortgage Association (a) | | | 463,149 | | | | 500,201 | |
| First Defiance Financial Corporation | | | 800 | | | | 11,536 | |
| First Financial Holdings, Inc. | | | 1,100 | | | | 14,839 | |
| First Financial Northwest, Inc. | | | 200 | | | | 1,184 | |
| Flushing Financial Corporation | | | 19,658 | | | | 220,759 | |
| Hudson City Bancorp, Inc. | | | 200 | | | | 2,628 | |
MGIC Investment Corporation (a) | | | 204,497 | | | | 881,382 | |
| New York Community Bancorp, Inc. | | | 77,100 | | | | 831,909 | |
| NewAlliance Bancshares, Inc. | | | 300 | | | | 3,324 | |
| Northwest Bancorp, Inc. | | | 3,205 | | | | 70,510 | |
Ocwen Financial Corporation (a) (b) | | | 103,587 | | | | 1,132,206 | |
| Provident New York Bancorp | | | 13,133 | | | | 112,025 | |
| Radian Group, Inc. | | | 7,700 | | | | 44,583 | |
| Roma Financial Corporation | | | 1,252 | | | | 15,512 | |
| TrustCo Bank Corporation | | | 5,500 | | | | 32,725 | |
| | | | | | | | 4,340,226 | |
| Health Care - 11.4% | |
| Biotechnology - 2.4% | |
Abraxis BioScience, Inc. (a) | | | 8,146 | | | | 254,318 | |
Affymax, Inc. (a) | | | 200 | | | | 4,028 | |
Alkermes, Inc. (a) | | | 1,300 | | | | 10,361 | |
Allos Therapeutics, Inc. (a) | | | 130,600 | | | | 737,890 | |
Alnylam Pharmaceuticals, Inc. (a) | | | 300 | | | | 5,112 | |
AMAG Pharmaceuticals, Inc. (a) | | | 300 | | | | 11,334 | |
Amylin Pharmaceuticals, Inc. (a) | | | 297,500 | | | | 3,284,400 | |
BioCryst Pharmaceuticals, Inc. (a) | | | 78,000 | | | | 696,540 | |
BioMarin Pharmaceutical, Inc. (a) | | | 22,700 | | | | 353,212 | |
BioSpecifics Technologies Corporation (a) | | | 300 | | | | 9,150 | |
Celera Corporation (a) | | | 5,800 | | | | 35,902 | |
Cephalon, Inc. (a) | | | 7,100 | | | | 387,518 | |
Chelsea Therapeutics International, Inc. (a) | | | 300 | | | | 828 | |
Clinical Data, Inc. (a) | | | 900 | | | | 14,202 | |
Cubist Pharmaceuticals, Inc. (a) (b) | | | 95,800 | | | | 1,622,852 | |
Curis, Inc. (a) | | | 30,500 | | | | 60,695 | |
Cytokinetics, Inc. (a) | | | 39,525 | | | | 126,085 | |
Emergent BioSolutions, Inc. (a) | | | 51,966 | | | | 749,350 | |
Enzon Pharmaceuticals, Inc. (a) | | | 300 | | | | 2,517 | |
Exelixis, Inc. (a) | | | 95,800 | | | | 582,464 | |
Genomic Health, Inc. (a) | | | 100 | | | | 1,857 | |
Geron Corporation (a) | | | 100 | | | | 611 | |
Immunomedics, Inc. (a) | | | 96,525 | | | | 343,629 | |
Isis Pharmaceuticals, Inc. (a) | | | 22,500 | | | | 285,075 | |
Lexicon Pharmaceuticals, Inc. (a) | | | 47,432 | | | | 62,136 | |
Martek Biosciences Corporation (a) | | | 900 | | | | 16,164 | |
Myriad Genetics, Inc. (a) | | | 9,200 | | | | 223,376 | |
Nanosphere, Inc. (a) | | | 5,608 | | | | 37,461 | |
Novavax, Inc. (a) | | | 45,922 | | | | 176,340 | |
| TFS MARKET NEUTRAL FUND | |
| SCHEDULE OF INVESTMENTS (Continued) | |
| | |
| COMMON STOCKS - 85.1% (Continued) | | Shares | | | Value | |
| Health Care - 11.4% (Continued) | |
| Biotechnology - 2.4% (Continued) | |
Onyx Pharmaceuticals, Inc. (a) | | | 29,300 | | | $ | 779,380 | |
Opko Health, Inc. (a) | | | 15,500 | | | | 33,635 | |
OSI Pharmaceuticals, Inc. (a) | | | 9,700 | | | | 312,534 | |
PDL BioPharma, Inc. (b) | | | 401,799 | | | | 3,379,130 | |
Pharmasset, Inc. (a) | | | 600 | | | | 11,268 | |
Progenics Pharmaceuticals, Inc. (a) | | | 3,600 | | | | 15,084 | |
Protalix BioTherapeutics, Inc. (a) | | | 98,158 | | | | 930,538 | |
QLT, Inc. (a) | | | 4,100 | | | | 14,309 | |
Regeneron Pharmaceuticals, Inc. (a) | | | 12,600 | | | | 197,820 | |
Rigel Pharmaceuticals, Inc. (a) | | | 60,000 | | | | 384,600 | |
Savient Pharmaceuticals, Inc. (a) | | | 39,640 | | | | 499,464 | |
SciClone Pharmaceuticals, Inc. (a) | | | 43,500 | | | | 107,010 | |
Sinovac Biotech Ltd. (a) | | | 211,295 | | | | 1,565,696 | |
Spectrum Pharmaceuticals, Inc. (a) | | | 130,708 | | | | 542,438 | |
Targacept, Inc. (a) | | | 20,106 | | | | 376,988 | |
Transcept Pharmaceuticals, Inc. (a) | | | 2,700 | | | | 14,823 | |
Trubion Pharmaceuticals, Inc. (a) | | | 2,400 | | | | 10,464 | |
United Therapeutics Corporation (a) | | | 6,300 | | | | 268,002 | |
Vanda Pharmaceuticals, Inc. (a) | | | 14,000 | | | | 142,800 | |
Vical, Inc. (a) | | | 300 | | | | 924 | |
ZymoGenetics, Inc. (a) | | | 6,000 | | | | 27,900 | |
| | | | | | | | 19,710,214 | |
| Health Care Equipment & Supplies - 2.0% | |
Abaxis, Inc. (a) | | | 9,978 | | | | 227,698 | |
Abiomed, Inc. (a) | | | 2,700 | | | | 24,435 | |
Accuray, Inc. (a) | | | 700 | | | | 4,039 | |
Alphatec Holdings, Inc. (a) | | | 7,400 | | | | 35,372 | |
| Analogic Corporation | | | 100 | | | | 3,734 | |
AngioDynamics, Inc. (a) | | | 400 | | | | 6,040 | |
Aspect Medical Systems, Inc. (a) | | | 4,000 | | | | 47,920 | |
Conceptus, Inc. (a) | | | 14,502 | | | | 254,365 | |
Conmed Corporation (a) | | | 600 | | | | 12,714 | |
| Cooper Companies, Inc. (The) | | | 39,280 | | | | 1,100,233 | |
CryoLife, Inc. (a) | | | 86,077 | | | | 516,462 | |
Cynosure, Inc. - Class A (a) | | | 900 | | | | 9,018 | |
Delcath Systems, Inc. (a) | | | 4,000 | | | | 18,480 | |
DexCom, Inc. (a) | | | 1,000 | | | | 6,860 | |
Electro-Optical Sciences, Inc. (a) | | | 1,500 | | | | 15,090 | |
Endologix, Inc. (a) | | | 25,649 | | | | 122,089 | |
| Given Imaging Ltd. | | | 1,200 | | | | 17,088 | |
Heartware International, Inc. (a) | | | 400 | | | | 12,960 | |
| Hill-Rom Holdings, Inc. | | | 37,542 | | | | 735,448 | |
I-Flow Corporation (a) | | | 5,700 | | | | 71,934 | |
Immucor, Inc. (a) | | | 1,100 | | | | 19,668 | |
Integra LifeSciences Holdings Corporation (a) (b) | | | 58,174 | | | | 1,776,634 | |
Invacare Corporation (b) | | | 53,241 | | | | 1,194,196 | |
Inverness Medical Innovations, Inc. (a) (b) | | | 42,913 | | | | 1,631,123 | |
IRIS International, Inc. (a) | | | 700 | | | | 7,098 | |
Kensey Nash Corporation (a) | | | 6,353 | | | | 151,900 | |
| TFS MARKET NEUTRAL FUND | |
| SCHEDULE OF INVESTMENTS (Continued) | |
| | |
| COMMON STOCKS - 85.1% (Continued) | | Shares | | | Value | |
| Health Care - 11.4% (Continued) | |
| Health Care Equipment & Supplies - 2.0% (Continued) | |
Kinetic Concepts, Inc. (a) | | | 17,100 | | | $ | 567,549 | |
Medical Action Industries, Inc. (a) | | | 5,751 | | | | 62,916 | |
Micrus Endovascular Corporation (a) | | | 14,956 | | | | 176,780 | |
Natus Medical, Inc. (a) | | | 100 | | | | 1,389 | |
Neogen Corporation (a) | | | 8,600 | | | | 272,620 | |
NuVasive, Inc. (a) | | | 30,428 | | | | 1,104,232 | |
Quidel Corporation (a) | | | 78,169 | | | | 1,117,817 | |
Rochester Medical Corporation (a) | | | 900 | | | | 9,099 | |
Sirona Dental Systems, Inc. (a) (b) | | | 55,456 | | | | 1,492,321 | |
Spectranetics Corporation (a) | | | 1,700 | | | | 9,690 | |
SurModics, Inc. (a) | | | 300 | | | | 7,683 | |
Synovis Life Technologies, Inc. (a) | | | 16,011 | | | | 193,093 | |
Teleflex, Inc. (b) | | | 32,223 | | | | 1,603,094 | |
Thoratec Corporation (a) | | | 32,400 | | | | 850,824 | |
TomoTherapy, Inc. (a) | | | 51,172 | | | | 169,891 | |
Vascular Solutions, Inc. (a) | | | 8,359 | | | | 64,531 | |
Wright Medical Group, Inc. (a) (b) | | | 68,410 | | | | 1,111,662 | |
Zoll Medical Corporation (a) | | | 1,100 | | | | 21,362 | |
| | | | | | | | 16,859,151 | |
| Health Care Providers & Services - 4.3% | |
Air Methods Corporation (a) | | | 300 | | | | 9,162 | |
Alliance Imaging, Inc. (a) (b) | | | 313,555 | | | | 1,705,739 | |
Allion Healthcare, Inc. (a) | | | 5,401 | | | | 34,782 | |
Almost Family, Inc. (a) | | | 200 | | | | 6,070 | |
Amedysis, Inc. (a) | | | 48,339 | | | | 1,923,409 | |
American Dental Partners, Inc. (a) | | | 10,985 | | | | 130,612 | |
AMERIGROUP Corporation (a) | | | 500 | | | | 11,025 | |
AMN Healthcare Services, Inc. (a) (b) | | | 152,762 | | | | 1,270,980 | |
AmSurg Corporation (a) | | | 22,354 | | | | 470,999 | |
Brookdale Senior Living, Inc. (a) | | | 100 | | | | 1,684 | |
Centene Corporation (a) | | | 85,716 | | | | 1,528,316 | |
Chindex International, Inc. (a) | | | 32,518 | | | | 453,301 | |
Community Health Systems, Inc. (a) | | | 29,100 | | | | 910,248 | |
Continucare Corporation (a) | | | 20,355 | | | | 53,330 | |
Corvel Corporation (a) | | | 3,278 | | | | 93,423 | |
Coventry Health Care, Inc. (a) (b) | | | 133,000 | | | | 2,637,390 | |
Cross Country Healthcare, Inc. (a) | | | 53,006 | | | | 437,830 | |
Emergency Medical Services Corporation (a) | | | 200 | | | | 9,604 | |
Emeritus Corporation (a) | | | 2,200 | | | | 41,052 | |
Gentiva Health Services, Inc. (a) | | | 31,651 | | | | 759,624 | |
Hanger Orthopedic Group, Inc. (a) | | | 31,784 | | | | 439,890 | |
Health Management Associates, Inc. - Class A (a) (b) | | | 369,200 | | | | 2,252,120 | |
Health Net, Inc. (a) | | | 20,444 | | | | 304,820 | |
inVentiv Health, Inc. (a) (b) | | | 59,206 | | | | 1,005,318 | |
Kindred Healthcare, Inc. (a) | | | 24,144 | | | | 354,917 | |
LifePoint Hospitals, Inc. (a) | | | 200 | | | | 5,666 | |
Lincare Holdings, Inc. (a) | | | 7,600 | | | | 238,716 | |
Magellan Health Services, Inc. (a) | | | 100 | | | | 3,213 | |
MedCath Corporation (a) | | | 33,275 | | | | 273,188 | |
| TFS MARKET NEUTRAL FUND | |
| SCHEDULE OF INVESTMENTS (Continued) | |
| | |
| COMMON STOCKS - 85.1% (Continued) | | Shares | | | Value | |
| Health Care - 11.4% (Continued) | |
| Health Care Providers & Services - 4.3% (Continued) | |
MEDNAX, Inc. (a) (b) | | | 52,424 | | | $ | 2,721,854 | |
Molina Healthcare, Inc. (a) | | | 22,900 | | | | 428,688 | |
| National Healthcare Corporation | | | 300 | | | | 10,791 | |
| National Research Corporation | | | 114 | | | | 2,630 | |
NightHawk Radiology Holdings, Inc. (a) | | | 33,082 | | | | 198,161 | |
NovaMed, Inc. (a) | | | 3,250 | | | | 13,097 | |
Odyssey Healthcare, Inc. (a) | | | 46,271 | | | | 645,018 | |
Patterson Companies, Inc. (a) | | | 19,800 | | | | 505,494 | |
Provident Service Corporation (a) | | | 14,968 | | | | 186,501 | |
Psychiatric Solutions, Inc. (a) | | | 69,800 | | | | 1,440,672 | |
RehabCare Group, Inc. (a) (b) | | | 67,511 | | | | 1,265,831 | |
Res-Care, Inc. (a) | | | 19,591 | | | | 235,680 | |
Sun Healthcare Group, Inc. (a) (b) | | | 198,330 | | | | 1,800,836 | |
Sunrise Senior Living, Inc. (a) | | | 117,586 | | | | 489,158 | |
Tenet Healthcare Corporation (a) (b) | | | 902,541 | | | | 4,621,010 | |
U.S. Physical Therapy, Inc. (a) | | | 28,292 | | | | 397,220 | |
Universal American Corporation (a) | | | 65,065 | | | | 650,650 | |
Universal Health Services, Inc. - Class B (b) | | | 43,200 | | | | 2,404,080 | |
| | | | | | | | 35,383,799 | |
| Health Care Technology - 0.6% | |
athenahealth, Inc. (a) | | | 12,400 | | | | 466,364 | |
Eclipsys Corporation (a) | | | 43,500 | | | | 815,625 | |
IMS Health, Inc. (b) | | | 223,800 | | | | 3,668,082 | |
MedAssets, Inc. (a) | | | 300 | | | | 6,582 | |
Phase Forward, Inc. (a) | | | 400 | | | | 5,244 | |
| | | | | | | | 4,961,897 | |
| Life Sciences Tools & Services - 1.5% | |
Bio-Rad Laboratories, Inc. - Class A (a) (b) | | | 17,389 | | | | 1,554,403 | |
Bruker Corporation (a) (b) | | | 298,028 | | | | 3,230,623 | |
Cambrex Corporation (a) | | | 25,426 | | | | 152,556 | |
Charles River Laboratories International, Inc. (a) | | | 100 | | | | 3,652 | |
Covance, Inc. (a) | | | 7,992 | | | | 413,026 | |
Enzo Biochem, Inc. (a) | | | 2,600 | | | | 14,326 | |
eResearchTechnology, Inc. (a) | | | 171,790 | | | | 1,271,246 | |
Helicos BioSciences Corporation (a) | | | 319,276 | | | | 603,432 | |
Kendle International, Inc. (a) | | | 43,668 | | | | 737,116 | |
Life Sciences Research, Inc. (a) | | | 5,600 | | | | 47,208 | |
Luminex Corporation (a) | | | 500 | | | | 7,360 | |
Parexel International Corporation (a) (b) | | | 225,797 | | | | 2,826,978 | |
| Pharmaceutical Product Development, Inc. | | | 1,100 | | | | 23,705 | |
Sequenom, Inc. (a) | | | 511,810 | | | | 1,412,596 | |
| | | | | | | | 12,298,227 | |
| Pharmaceuticals - 0.6% | |
Ardea Biosciences, Inc. (a) | | | 15,235 | | | | 205,672 | |
AVANIR Pharmaceuticals, Inc. - Class A (a) | | | 95,200 | | | | 174,216 | |
Biodel, Inc. (a) | | | 1,000 | | | | 4,180 | |
BioForm Medical, Inc. (a) | | | 11,500 | | | | 41,630 | |
Caraco Pharmaceutical Laboratories Ltd. (a) | | | 60,022 | | | | 220,881 | |
Cornerstone Therapeutics, Inc. (a) | | | 8,200 | | | | 45,920 | |
| TFS MARKET NEUTRAL FUND | |
| SCHEDULE OF INVESTMENTS (Continued) | |
| | |
| COMMON STOCKS - 85.1% (Continued) | | Shares | | | Value | |
| Health Care - 11.4% (Continued) | |
| Pharmaceuticals - 0.6% (Continued) | |
Endo Pharmaceuticals Holdings, Inc. (a) (b) | | | 63,800 | | | $ | 1,429,120 | |
Hi-Tech Pharmacal Company, Inc. (a) | | | 600 | | | | 10,944 | |
Impax Laboratories, Inc. (a) | | | 1,200 | | | | 10,656 | |
Inspire Pharmaceuticals, Inc. (a) | | | 68,300 | | | | 305,301 | |
King Pharmaceuticals, Inc. (a) | | | 55,800 | | | | 565,254 | |
Lannett Company, Inc. (a) | | | 1,600 | | | | 10,752 | |
Medicines Company (The) (a) | | | 2,100 | | | | 15,099 | |
| Medicis Pharmaceutical Corporation | | | 100 | | | | 2,117 | |
Nektar Therapeutics (a) | | | 12,700 | | | | 103,124 | |
Obagi Medical Products, Inc. (a) | | | 2,800 | | | | 28,616 | |
Par Pharmaceutical Companies, Inc. (a) | | | 20,800 | | | | 436,176 | |
| Perrigo Company | | | 39,661 | | | | 1,474,993 | |
Repros Therapeutics, Inc. (a) | | | 15,400 | | | | 14,322 | |
SuperGen, Inc. (a) | | | 4,200 | | | | 9,828 | |
Warner Chilcott plc (a) | | | 300 | | | | 6,645 | |
| | | | | | | | 5,115,446 | |
| Industrials - 13.4% | |
| Aerospace & Defense - 1.3% | |
AAR Corporation (a) | | | 800 | | | | 15,688 | |
AerCap Holdings N.V. (a) | | | 300 | | | | 2,514 | |
AeroVironment, Inc. (a) | | | 700 | | | | 18,662 | |
Argon ST, Inc. (a) | | | 29,206 | | | | 543,231 | |
Astronics Corporation - Class B (a) | | | 7,212 | | | | 58,129 | |
Ceradyne, Inc. (a) | | | 4,000 | | | | 64,480 | |
Cubic Corporation (b) | | | 71,390 | | | | 2,477,947 | |
DigitalGlobe, Inc. (a) | | | 2,000 | | | | 44,660 | |
DynCorp International, Inc. - Class A (a) (b) | | | 126,863 | | | | 2,156,671 | |
Esterline Technologies Corporation (a) (b) | | | 49,403 | | | | 2,080,360 | |
GenCorp, Inc. (a) | | | 265,840 | | | | 1,977,850 | |
Hexcel Corporation (a) | | | 70,800 | | | | 778,800 | |
| Hi-Shear Technology Corporation | | | 1,500 | | | | 28,815 | |
Ladish Company, Inc. (a) | | | 9,622 | | | | 124,701 | |
LMI Aerospace, Inc. (a) | | | 1,600 | | | | 17,232 | |
MOOG, Inc. - Class A (a) | | | 600 | | | | 14,982 | |
Orbital Sciences Corporation (a) | | | 1,000 | | | | 12,880 | |
| Precision Castparts Corporation | | | 100 | | | | 9,553 | |
Spirit AeroSystems Holdings, Inc. (a) | | | 300 | | | | 4,776 | |
Taser International, Inc. (a) | | | 28,700 | | | | 117,383 | |
Teledyne Technologies, Inc. (a) | | | 18,731 | | | | 639,851 | |
| TransDigm Group, Inc. | | | 300 | | | | 11,754 | |
| | | | | | | | 11,200,919 | |
| Air Freight & Logistics - 0.5% | |
Air Transport Services Group, Inc. (a) | | | 130,060 | | | | 336,855 | |
Atlas Air Worldwide Holdings, Inc. (a) (b) | | | 79,526 | | | | 2,090,739 | |
Hub Group, Inc. - Class A (a) | | | 100 | | | | 2,486 | |
| Pacer International, Inc. | | | 21,400 | | | | 61,204 | |
UTI Worldwide, Inc. (b) | | | 149,379 | | | | 1,862,756 | |
| | | | | | | | 4,354,040 | |
| TFS MARKET NEUTRAL FUND | |
| SCHEDULE OF INVESTMENTS (Continued) | |
| | |
| COMMON STOCKS - 85.1% (Continued) | | Shares | | | Value | |
| Industrials - 13.4% (Continued) | |
| Airlines - 1.5% | |
AirTran Holdings, Inc. (a) | | | 161,100 | | | $ | 681,453 | |
AMR Corporation (a) (b) | | | 263,100 | | | | 1,418,109 | |
Copa Holdings, S.A. - Class A (b) | | | 50,417 | | | | 2,129,110 | |
JetBlue Airways Corporation (a) | | | 452,924 | | | | 2,246,503 | |
Pinnacle Airlines Corporation (a) | | | 2,800 | | | | 16,884 | |
Republic Airways Holdings, Inc. (a) | | | 50,370 | | | | 403,464 | |
| SkyWest, Inc. | | | 500 | | | | 6,985 | |
UAL Corporation (a) | | | 367,650 | | | | 2,393,401 | |
US Airways Group, Inc. (a) (b) | | | 1,077,696 | | | | 3,297,750 | |
| | | | | | | | 12,593,659 | |
| Building Products - 0.6% | |
| Ameron International Corporation | | | 18,092 | | | | 1,067,066 | |
Armstrong World Industries, Inc. (a) (b) | | | 36,219 | | | | 1,349,158 | |
| Insteel Industries, Inc. | | | 40,700 | | | | 452,584 | |
Owens Corning, Inc. (a) | | | 60,266 | | | | 1,332,481 | |
Quanex Building Products Corporation (b) | | | 75,326 | | | | 1,120,098 | |
| Universal Forest Products, Inc. | | | 100 | | | | 3,568 | |
| | | | | | | | 5,324,955 | |
| Commercial Services & Supplies - 1.1% | |
ACCO Brands Corporation (a) | | | 103,683 | | | | 628,319 | |
| American Ecology Corporation | | | 100 | | | | 1,662 | |
American Reprographics Company (a) (b) | | | 183,225 | | | | 1,099,350 | |
ATC Technology Corporation (a) | | | 12,178 | | | | 254,520 | |
Bowne & Company, Inc. (a) | | | 9,151 | | | | 59,756 | |
Cenveo, Inc. (a) | | | 2,900 | | | | 20,532 | |
Consolidated Graphics, Inc. (a) | | | 8,152 | | | | 163,529 | |
Cornell Companies, Inc. (a) | | | 8,750 | | | | 199,850 | |
Corrections Corporation of America (a) | | | 200 | | | | 4,788 | |
| Deluxe Corporation | | | 300 | | | | 4,269 | |
| EnergySolutions, Inc. | | | 124,690 | | | | 1,039,915 | |
| Ennis, Inc. | | | 9,181 | | | | 139,092 | |
Fuel Tech, Inc. (a) | | | 400 | | | | 4,628 | |
Geo Group, Inc. (The) (a) | | | 200 | | | | 4,230 | |
ICT Group, Inc. (a) | | | 1,700 | | | | 26,945 | |
Interface, Inc. - Class A (b) | | | 188,478 | | | | 1,462,589 | |
| Kimball International, Inc. - Class B | | | 8,500 | | | | 63,750 | |
M & F Worldwide Corporation (a) | | | 2,657 | | | | 56,541 | |
| R.R. Donnelley & Sons Company | | | 400 | | | | 8,032 | |
RINO International Corporation (a) | | | 200 | | | | 3,904 | |
| Schawk, Inc. | | | 1,600 | | | | 15,712 | |
| Standard Register Company (The) | | | 1,800 | | | | 8,586 | |
Team, Inc. (a) | | | 11,740 | | | | 190,540 | |
Tetra Tech, Inc. (a) (b) | | | 87,300 | | | | 2,246,229 | |
United Stationers, Inc. (a) | | | 100 | | | | 4,714 | |
Waste Connections, Inc. (a) | | | 40,699 | | | | 1,279,170 | |
| | | | | | | | 8,991,152 | |
| Construction & Engineering - 1.3% | |
AECOM Technology Corporation (a) | | | 31,180 | | | | 786,983 | |
| Chicago Bridge & Iron Company N.V. | | | 47,800 | | | | 899,118 | |
| TFS MARKET NEUTRAL FUND | |
| SCHEDULE OF INVESTMENTS (Continued) | |
| | |
| COMMON STOCKS - 85.1% (Continued) | | Shares | | | Value | |
| Industrials - 13.4% (Continued) | |
| Construction & Engineering - 1.3% (Continued) | |
Dycom Industries, Inc. (a) | | | 19,200 | | | $ | 189,696 | |
EMCOR Group, Inc. (a) | | | 74,500 | | | | 1,759,690 | |
| Granite Construction, Inc. | | | 1,200 | | | | 34,272 | |
| Great Lakes Dredge & Dock Company | | | 106,757 | | | | 654,420 | |
Insituform Technologies, Inc. - Class A (a) | | | 19,949 | | | | 422,919 | |
KHD Humboldt Wedag International Ltd. (a) | | | 8,460 | | | | 77,494 | |
Layne Christensen Company (a) | | | 900 | | | | 23,310 | |
MasTec, Inc. (a) | | | 10,000 | | | | 118,000 | |
Michael Baker Corporation (a) (b) | | | 44,136 | | | | 1,575,655 | |
MYR Group, Inc. (a) | | | 200 | | | | 3,436 | |
Northwest Pipe Company (a) | | | 100 | | | | 3,010 | |
Shaw Group, Inc. (The) (a) (b) | | | 131,425 | | | | 3,372,366 | |
Sterling Construction Company, Inc. (a) | | | 29,842 | | | | 481,351 | |
| | | | | | | | 10,401,720 | |
| Electrical Equipment - 1.3% | |
A123 Systems, Inc. (a) | | | 15,720 | | | | 309,055 | |
Advanced Battery Technologies, Inc. (a) | | | 96,370 | | | | 323,803 | |
A-Power Energy Generation Systems Ltd. (a) | | | 55,800 | | | | 602,640 | |
| Belden, Inc. | | | 400 | | | | 9,180 | |
Capstone Turbine Corporation (a) | | | 493,100 | | | | 576,927 | |
Ener1, Inc. (a) | | | 1,200 | | | | 5,988 | |
Energy Conversion Devices, Inc. (a) | | | 4,550 | | | | 49,004 | |
EnerSys, Inc. (a) | | | 73,000 | | | | 1,613,300 | |
Evergreen Solar, Inc. (a) | | | 235,231 | | | | 341,085 | |
| Franklin Electric Company, Inc. | | | 2,188 | | | | 59,689 | |
GrafTech International Ltd. (a) (b) | | | 88,100 | | | | 1,189,350 | |
Harbin Electric, Inc. (a) (b) | | | 99,773 | | | | 1,589,384 | |
II-VI, Inc. (a) | | | 200 | | | | 5,294 | |
| LSI Industries, Inc. | | | 600 | | | | 4,194 | |
Polypore International, Inc. (a) | | | 2,500 | | | | 27,400 | |
PowerSecure International, Inc. (a) | | | 1,200 | | | | 9,984 | |
SunPower Corporation - Class A (a) | | | 27,384 | | | | 679,397 | |
SunPower Corporation - Class B (a) | | | 400 | | | | 8,664 | |
Thomas & Betts Corporation (a) | | | 109,782 | | | | 3,755,642 | |
Ultralife Corporation (a) | | | 1,700 | | | | 6,222 | |
UQM Technologies, Inc. (a) | | | 200 | | | | 940 | |
Vicor Corporation (a) | | | 1,100 | | | | 7,502 | |
| Woodward Governor Company | | | 100 | | | | 2,351 | |
| | | | | | | | 11,176,995 | |
| Industrial Conglomerates - 0.2% | |
Carlisle Companies, Inc. (b) | | | 34,470 | | | | 1,069,949 | |
McDermott International, Inc. (a) | | | 300 | | | | 6,669 | |
| Otter Tail Corporation | | | 10,498 | | | | 244,183 | |
| Standex International Corporation | | | 18,020 | | | | 316,792 | |
| | | | | | | | 1,637,593 | |
| Machinery - 3.3% | |
3D Systems Corporation (a) | | | 800 | | | | 7,056 | |
| Actuant Corporation - Class A | | | 1,700 | | | | 26,537 | |
AGCO Corporation (a) | | | 100 | | | | 2,811 | |
| TFS MARKET NEUTRAL FUND | |
| SCHEDULE OF INVESTMENTS (Continued) | |
| | |
| COMMON STOCKS - 85.1% (Continued) | | Shares | | | Value | |
| Industrials - 13.4% (Continued) | |
| Machinery - 3.3% (Continued) | |
| Alamo Group, Inc. | | | 700 | | | $ | 9,590 | |
Altra Holdings, Inc. (a) (b) | | | 110,674 | | | | 970,611 | |
| American Railcar Industries, Inc. | | | 28,487 | | | | 284,870 | |
Ampco-Pittsburgh Corporation (b) | | | 46,139 | | | | 1,241,139 | |
Astec Industries, Inc. (a) | | | 200 | | | | 4,600 | |
| Barnes Group, Inc. | | | 800 | | | | 12,680 | |
| Briggs & Stratton Corporation | | | 890 | | | | 16,643 | |
| Cascade Corporation | | | 6,333 | | | | 157,312 | |
Chart Industries, Inc. (a) (b) | | | 105,389 | | | | 2,083,541 | |
| CIRCOR International, Inc. | | | 900 | | | | 24,525 | |
Colfax Corporation (a) (b) | | | 141,414 | | | | 1,538,584 | |
Commercial Vehicle Group, Inc. (a) | | | 2,400 | | | | 11,352 | |
| Dynamic Materials Corporation | | | 400 | | | | 7,712 | |
EnPro Industries, Inc. (a) | | | 100 | | | | 2,258 | |
| Federal Signal Corporation | | | 500 | | | | 3,070 | |
Force Protection, Inc. (a) | | | 2,300 | | | | 10,120 | |
| FreightCar America, Inc. | | | 39,003 | | | | 919,691 | |
| Gorman-Rupp Company (The) | | | 100 | | | | 2,469 | |
| Graham Corporation | | | 600 | | | | 8,502 | |
| Greenbrier Companies, Inc. (The) | | | 200 | | | | 1,776 | |
Harsco Corporation (b) | | | 46,313 | | | | 1,458,396 | |
Hurco Companies, Inc. (a) | | | 700 | | | | 11,130 | |
| Ingersoll-Rand PLC | | | 100 | | | | 3,159 | |
| John Bean Technologies Corporation | | | 600 | | | | 9,852 | |
| Kaydon Corporation | | | 13,300 | | | | 465,367 | |
K-Tron International, Inc. (a) | | | 200 | | | | 19,010 | |
| Lindsay Corporation | | | 17,200 | | | | 564,676 | |
| Met-Pro Corporation | | | 900 | | | | 8,280 | |
Miller Industries, Inc. (a) | | | 1,000 | | | | 10,050 | |
| Mueller Industries, Inc. | | | 36,474 | | | | 862,975 | |
Mueller Water Products, Inc. - Class A (b) | | | 313,605 | | | | 1,404,950 | |
| NACCO Industries, Inc. - Class A | | | 4,200 | | | | 250,320 | |
Navistar International Corporation (a) | | | 200 | | | | 6,628 | |
| Nordson Corporation | | | 946 | | | | 49,921 | |
| Oshkosh Corporation | | | 100 | | | | 3,126 | |
| Pall Corporation | | | 9,300 | | | | 295,182 | |
| Robbins & Myers, Inc. | | | 300 | | | | 6,960 | |
Sauer-Danfoss, Inc. (b) | | | 209,537 | | | | 1,508,666 | |
Snap-on, Inc. (b) | | | 27,805 | | | | 1,015,717 | |
SPX Corporation (b) | | | 28,600 | | | | 1,509,508 | |
| Tennant Company | | | 21,997 | | | | 586,440 | |
Timken Company (b) | | | 127,880 | | | | 2,817,196 | |
Titan International, Inc. (b) | | | 313,912 | | | | 2,636,861 | |
Trimas Corporation (a) | | | 4,300 | | | | 19,350 | |
Trinity Industries, Inc. (b) | | | 201,897 | | | | 3,408,021 | |
| Twin Disc, Inc. | | | 9,152 | | | | 85,937 | |
| Valmont Industries, Inc. | | | 100 | | | | 7,227 | |
| Wabtec Corporation | | | 300 | | | | 11,028 | |
| TFS MARKET NEUTRAL FUND | |
| SCHEDULE OF INVESTMENTS (Continued) | |
| | |
| COMMON STOCKS - 85.1% (Continued) | | Shares | | | Value | |
| Industrials - 13.4% (Continued) | |
| Machinery - 3.3% (Continued) | |
| Watts Water Technologies, Inc. - Class A | | | 20,300 | | | $ | 573,475 | |
| | | | | | | | 26,956,857 | |
| Marine - 0.8% | |
| Diana Shipping, Inc. | | | 19,400 | | | | 250,648 | |
DryShips, Inc. (a) | | | 3,200 | | | | 19,328 | |
| Eagle Bulk Shipping, Inc. | �� | | 216,958 | | | | 1,028,381 | |
| Euroseas Ltd. | | | 3,800 | | | | 14,896 | |
| Excel Maritime Carriers Ltd. | | | 193,431 | | | | 1,090,951 | |
| Genco Shipping & Trading Ltd. | | | 30,200 | | | | 600,678 | |
| Horizon Lines, Inc. | | | 600 | | | | 3,150 | |
International Shipholding Corporation (b) | | | 41,376 | | | | 1,371,614 | |
Kirby Coporation (a) | | | 17,343 | | | | 586,194 | |
| Navios Maritime Holdings, Inc. | | | 129,910 | | | | 593,689 | |
OceanFreight, Inc. (a) | | | 85,200 | | | | 81,792 | |
| Paragon Shipping, Inc. | | | 83,580 | | | | 341,006 | |
| Safe Bulkers, Inc. | | | 1,000 | | | | 6,960 | |
| Seaspan Corporation | | | 23,708 | | | | 205,311 | |
TBS International Ltd. (a) | | | 6,200 | | | | 51,026 | |
Ultrapetrol (Bahamas) Ltd. (a) | | | 64,368 | | | | 315,403 | |
| | | | | | | | 6,561,027 | |
| Professional Services - 0.6% | |
| CDI Corporation | | | 8,761 | | | | 106,709 | |
Comsys IT Partners, Inc. (a) | | | 300 | | | | 2,055 | |
| Diamond Management & Technology Consultants, Inc. | | | 2,000 | | | | 11,840 | |
First Advantage Corporation (a) | | | 31,775 | | | | 559,240 | |
FTI Consulting, Inc. (a) | | | 9,200 | | | | 375,452 | |
Hill International, Inc. (a) | | | 10,379 | | | | 69,747 | |
Kforce, Inc. (a) | | | 16,948 | | | | 198,800 | |
MPS Group, Inc. (a) | | | 400 | | | | 5,408 | |
Navigant Consulting, Inc. (a) | | | 500 | | | | 7,120 | |
Spherion Corporation (a) | | | 42,952 | | | | 212,612 | |
TrueBlue, Inc. (a) | | | 4,100 | | | | 49,610 | |
Volt Information Sciences, Inc. (a) | | | 113,379 | | | | 919,504 | |
| VSE Corporation | | | 12,411 | | | | 543,478 | |
Watson Wyatt Worldwide, Inc. (b) | | | 45,163 | | | | 1,968,203 | |
| | | | | | | | 5,029,778 | |
| Road & Rail - 0.5% | |
| Arkansas Best Corporation | | | 1,800 | | | | 46,476 | |
Avis Budget Group, Inc. (a) (b) | | | 247,691 | | | | 2,080,604 | |
Celadon Group, Inc. (a) | | | 1,400 | | | | 13,664 | |
| Con-Way, Inc. | | | 300 | | | | 9,897 | |
Hertz Global Holdings, Inc. (a) | | | 600 | | | | 5,586 | |
| Landstar System, Inc. | | | 6,800 | | | | 239,632 | |
Marten Transport Ltd. (a) (b) | | | 83,177 | | | | 1,458,925 | |
Old Dominion Freight Line, Inc. (a) | | | 500 | | | | 12,995 | |
Saia, Inc. (a) | | | 300 | | | | 4,398 | |
| Universal Truckload Services, Inc | | | 1,499 | | | | 24,644 | |
USA Truck, Inc. (a) | | | 3,801 | | | | 42,685 | |
| TFS MARKET NEUTRAL FUND | |
| SCHEDULE OF INVESTMENTS (Continued) | |
| | |
| COMMON STOCKS - 85.1% (Continued) | | Shares | | | Value | |
| Industrials - 13.4% (Continued) | |
| Road & Rail - 0.5% (Continued) | |
Vitran Corporation Inc. (a) | | | 100 | | | $ | 856 | |
| | | | | | | | 3,940,362 | |
| Trading Companies & Distributors - 0.4% | |
| Aceto Corporation | | | 102,022 | | | | 565,202 | |
Aircastle Ltd. (b) | | | 172,038 | | | | 1,362,541 | |
| Applied Industrial Technologies, Inc. | | | 2,100 | | | | 42,483 | |
Bluelinx Holdings, Inc. (a) | | | 1,100 | | | | 3,223 | |
DXP Enterprises, Inc. (a) | | | 3,400 | | | | 39,032 | |
| Houston Wire & Cable Company | | | 20,031 | | | | 242,175 | |
| Lawson Products, Inc. | | | 2,271 | | | | 35,314 | |
| Textainer Group Holdings Ltd. | | | 6,600 | | | | 99,396 | |
United Rentals, Inc. (a) | | | 84,400 | | | | 800,956 | |
| | | | | | | | 3,190,322 | |
| Transportation Infrastructure - 0.0% | |
| Aegean Marine Petroleum Network, Inc. | | | 2,900 | | | | 68,150 | |
CAI International, Inc. (a) | | | 2,200 | | | | 16,500 | |
| | | | | | | | 84,650 | |
| Information Technology - 19.6% | |
| Communications Equipment - 3.4% | |
3Com Corporation (a) (b) | | | 765,548 | | | | 3,934,917 | |
Acme Packet, Inc. (a) (b) | | | 167,269 | | | | 1,637,564 | |
ADC Telecommunications, Inc. (a) | | | 63,500 | | | | 412,115 | |
Anaren, Inc. (a) | | | 56,857 | | | | 831,249 | |
Arris Group, Inc. (a) (b) | | | 259,800 | | | | 2,665,548 | |
Aruba Networks, Inc. (a) | | | 77,050 | | | | 602,531 | |
Avocent Corporation (a) | | | 700 | | | | 17,409 | |
| Bel Fuse, Inc. - Class B | | | 10,936 | | | | 197,942 | |
BigBand Networks, Inc. (a) | | | 21,400 | | | | 79,180 | |
Blue Coat Systems, Inc. (a) | | | 900 | | | | 20,052 | |
Brocade Communications Systems, Inc. (a) (b) | | | 485,275 | | | | 4,163,659 | |
Ceragon Networks Ltd. (a) | | | 1,300 | | | | 11,596 | |
Ciena Corporation (a) | | | 30,500 | | | | 357,765 | |
CommScope, Inc. (a) (b) | | | 52,000 | | | | 1,405,040 | |
Comtech Telecommunications Corporation (a) | | | 3,800 | | | | 122,056 | |
DG FastChannel, Inc. (a) | | | 500 | | | | 10,485 | |
Digi International, Inc. (a) | | | 14,889 | | | | 118,368 | |
EchoStar Corporation - Class A (a) | | | 31,900 | | | | 579,304 | |
EMS Technologies, Inc. (a) | | | 900 | | | | 15,687 | |
Emulex Corporation (a) (b) | | | 159,025 | | | | 1,606,152 | |
Finisar Corporation (a) | | | 5,100 | | | | 37,995 | |
Harris Stratex Networks, Inc. - Class A (a) | | | 56,691 | | | | 357,153 | |
InterDigital, Inc. (a) | | | 43,600 | | | | 896,416 | |
JDS Uniphase Corporation (a) | | | 700 | | | | 3,913 | |
KVH Industries, Inc. (a) | | | 2,200 | | | | 23,100 | |
| Motorola, Inc. | | | 300 | | | | 2,571 | |
NETGEAR, Inc. (a) | | | 31,149 | | | | 567,846 | |
Oplink Communications, Inc. (a) | | | 57,508 | | | | 852,844 | |
Opnext, Inc. (a) (b) | | | 258,428 | | | | 635,733 | |
Polycom, Inc. (a) | | | 34,500 | | | | 740,715 | |
| TFS MARKET NEUTRAL FUND | |
| SCHEDULE OF INVESTMENTS (Continued) | |
| | |
| COMMON STOCKS - 85.1% (Continued) | | Shares | | | Value | |
| Information Technology - 19.6% (Continued) | |
| Communications Equipment - 3.4% (Continued) | |
Radware Ltd. (a) | | | 2,900 | | | $ | 33,553 | |
SeaChange International, Inc. (a) | | | 100 | | | | 677 | |
Sierra Wireless, Inc. (a) | | | 10,700 | | | | 96,407 | |
Sonus Networks, Inc. (a) | | | 287,108 | | | | 551,247 | |
Starent Networks Corporation (a) | | | 58,700 | | | | 1,980,538 | |
Tellabs, Inc. (a) (b) | | | 390,711 | | | | 2,352,080 | |
ViaSat, Inc. (a) | | | 400 | | | | 11,660 | |
| | | | | | | | 27,933,067 | |
| Computers & Peripherals - 0.5% | |
Adaptec, Inc. (a) | | | 200,718 | | | | 640,290 | |
Avid Technology, Inc. (a) | | | 1,200 | | | | 15,156 | |
Compellent Technologies, Inc. (a) | | | 900 | | | | 16,506 | |
Diebold, Inc. (b) | | | 69,206 | | | | 2,092,789 | |
Hypercom Corporation (a) | | | 115,516 | | | | 329,221 | |
| Imation Corporation | | | 1,100 | | | | 9,702 | |
Isilon Systems, Inc. (a) | | | 28,654 | | | | 150,434 | |
Lexmark International, Inc. - Class A (a) | | | 1,500 | | | | 38,250 | |
NCR Corporation (a) (b) | | | 71,032 | | | | 720,975 | |
QLogic Corporation (a) | | | 500 | | | | 8,770 | |
SanDisk Corporation (a) | | | 100 | | | | 2,048 | |
| Seagate Technology | | | 1,000 | | | | 13,950 | |
Silicon Graphics International Corporation (a) | | | 1,800 | | | | 10,728 | |
Stratasys, Inc. (a) | | | 500 | | | | 7,890 | |
Super Micro Computer, Inc. (a) | | | 23,241 | | | | 187,322 | |
Xyratex Ltd. (a) | | | 5,000 | | | | 52,250 | |
| | | | | | | | 4,296,281 | |
| Electronic Equipment, Instruments & Components - 3.5% | |
| Agilysys, Inc. | | | 46,078 | | | | 217,027 | |
Anixter International, Inc. (a) (b) | | | 85,199 | | | | 3,565,578 | |
Arrow Electronics, Inc. (a) (b) | | | 123,600 | | | | 3,132,024 | |
| AVX Corporation | | | 36,531 | | | | 413,531 | |
Brightpoint, Inc. (a) | | | 2,800 | | | | 20,636 | |
Celestica, Inc. (a) | | | 68,600 | | | | 569,380 | |
Cogent, Inc. (a) | | | 28,268 | | | | 272,786 | |
Comverge, Inc. (a) | | | 19,539 | | | | 222,940 | |
CPI International, Inc. (a) | | | 4,790 | | | | 47,421 | |
| CTS Corporation | | | 71,037 | | | | 636,492 | |
| Daktronics, Inc. | | | 2,900 | | | | 21,808 | |
Echelon Corporation (a) | | | 6,500 | | | | 88,725 | |
Flextronics International Ltd. (a) | | | 1,500 | | | | 9,720 | |
FLIR Systems, Inc. (a) | | | 41,400 | | | | 1,151,334 | |
Gerber Scientific, Inc. (a) | | | 27,974 | | | | 129,240 | |
Hollysys Automation Technologies Ltd. (a) | | | 2,100 | | | | 20,202 | |
Ingram Micro, Inc. - Class A (a) (b) | | | 128,630 | | | | 2,270,320 | |
Insight Enterprises, Inc. (a) | | | 91,460 | | | | 962,159 | |
IPG Photonics Corporation (a) | | | 100 | | | | 1,366 | |
Itron, Inc. (a) | | | 100 | | | | 6,004 | |
Jabil Circuit, Inc. (b) | | | 222,427 | | | | 2,976,073 | |
L-1 Identity Solutions, Inc. (a) | | | 5,600 | | | | 33,096 | |
| TFS MARKET NEUTRAL FUND | |
| SCHEDULE OF INVESTMENTS (Continued) | |
| | |
| COMMON STOCKS - 85.1% (Continued) | | Shares | | | Value | |
| Information Technology - 19.6% (Continued) | |
| Electronic Equipment, Instruments & Components - 3.5% (Continued) | |
Maxwell Technologies, Inc. (a) | | | 900 | | | $ | 16,137 | |
Mercury Computer Systems, Inc. (a) | | | 11,102 | | | | 118,791 | |
| Methode Electronics, Inc. | | | 17,425 | | | | 126,331 | |
Multi-Fineline Electronix, Inc. (a) (b) | | | 77,538 | | | | 2,112,911 | |
Newport Corporation (a) | | | 700 | | | | 5,208 | |
Sanmina-SCI Corporation (a) (b) | | | 118,475 | | | | 760,610 | |
SMART Modular Technologies (WWH), Inc. (a) | | | 97,064 | | | | 394,080 | |
Spectrum Control, Inc. (a) | | | 10,676 | | | | 90,212 | |
Tech Data Corporation (a) (b) | | | 88,922 | | | | 3,417,272 | |
Technitrol, Inc. (b) | | | 183,705 | | | | 1,431,062 | |
TTM Technologies, Inc. (a) | | | 28,689 | | | | 291,767 | |
Vishay Intertechnology, Inc. (a) (b) | | | 498,764 | | | | 3,107,300 | |
| | | | | | | | 28,639,543 | |
| Internet Software & Services - 1.2% | |
Akamai Technologies, Inc. (a) (b) | | | 76,400 | | | | 1,680,800 | |
Art Technology Group, Inc. (a) (b) | | | 469,828 | | | | 1,935,691 | |
comScore, Inc. (a) | | | 800 | | | | 12,264 | |
Dice Holdings, Inc. (a) | | | 41,746 | | | | 250,894 | |
Digital River, Inc. (a) | | | 25,000 | | | | 570,750 | |
Equinix, Inc. (a) | | | 3,300 | | | | 281,556 | |
GigaMedia Ltd. (a) | | | 171,552 | | | | 703,363 | |
IAC/InterActiveCorporation (a) | | | 50,200 | | | | 950,788 | |
Innodata Isogen, Inc. (a) | | | 50,250 | | | | 325,620 | |
Internet Capital Group, Inc. (a) | | | 300 | | | | 2,181 | |
KIT digital, Inc. (a) | | | 600 | | | | 5,814 | |
Knot, Inc. (The) (a) | | | 400 | | | | 4,268 | |
Limelight Networks, Inc. (a) | | | 33,162 | | | | 115,735 | |
LivePerson, Inc. (a) | | | 2,700 | | | | 13,581 | |
LogMeIn, Inc. (a) | | | 200 | | | | 4,020 | |
LoopNet, Inc. (a) | | | 800 | | | | 6,984 | |
Mercadolibre, Inc. (a) | | | 400 | | | | 14,316 | |
ModusLink Global Solutions, Inc. (a) | | | 30,270 | | | | 248,820 | |
| NIC, Inc. | | | 200 | | | | 1,752 | |
Open Text Corporation (a) | | | 34,100 | | | | 1,263,064 | |
RealNetworks, Inc. (a) | | | 11,000 | | | | 39,270 | |
SAVVIS, Inc. (a) (b) | | | 120,734 | | | | 1,785,656 | |
SINA Corporation (a) | | | 200 | | | | 7,478 | |
Terremark Worldwide, Inc. (a) | | | 2,100 | | | | 13,419 | |
ValueClick, Inc. (a) | | | 900 | | | | 8,856 | |
Vocus, Inc. (a) | | | 1,600 | | | | 28,960 | |
Web.com Group, Inc. (a) | | | 1,500 | | | | 10,560 | |
| | | | | | | | 10,286,460 | |
| IT Services - 3.0% | |
Alliance Data Systems Corporation (a) | | | 100 | | | | 5,498 | |
Broadridge Financial Solutions, Inc. (b) | | | 83,900 | | | | 1,745,959 | |
CGI Group, Inc. (a) | | | 400 | | | | 4,884 | |
China Information Security Technology, Inc. (a) | | | 79,757 | | | | 510,445 | |
CIBER, Inc. (a) | | | 51,800 | | | | 166,796 | |
Cognizant Technology Solutions Corporation - Class A (a) | | | 300 | | | | 11,595 | |
| TFS MARKET NEUTRAL FUND | |
| SCHEDULE OF INVESTMENTS (Continued) | |
| | |
| COMMON STOCKS - 85.1% (Continued) | | Shares | | | Value | |
| Information Technology - 19.6% (Continued) | |
| IT Services - 3.0% (Continued) | |
Computer Task Group, Inc. (a) | | | 600 | | | $ | 4,182 | |
Convergys Corporation (a) (b) | | | 209,896 | | | | 2,277,372 | |
CSG Systems International, Inc. (a) | | | 50,818 | | | | 830,366 | |
Dynamics Research Corporation (a) | | | 300 | | | | 3,843 | |
eLoyalty Corporation (a) | | | 1,371 | | | | 10,694 | |
ExlService Holdings, Inc. (a) | | | 400 | | | | 5,444 | |
Genpact Ltd. (a) (b) | | | 143,002 | | | | 1,703,154 | |
Global Cash Access Holdings, Inc. (a) | | | 600 | | | | 3,798 | |
Hewitt Associates, Inc. - Class A (a) (b) | | | 38,977 | | | | 1,384,463 | |
iGATE Corporation (b) | | | 155,172 | | | | 1,370,169 | |
Lender Processing Services, Inc. (b) | | | 48,300 | | | | 1,922,340 | |
Lionbridge Technologies, Inc. (a) | | | 31,305 | | | | 65,427 | |
Mantech International Corporation - Class A (a) | | | 21,237 | | | | 931,455 | |
Moneygram International, Inc. (a) | | | 32,541 | | | | 97,298 | |
NCI, Inc. - Class A (a) | | | 100 | | | | 2,691 | |
Ness Technologies, Inc. (a) (b) | | | 188,219 | | | | 1,240,363 | |
Online Resources Corporation (a) | | | 7,738 | | | | 40,624 | |
Perot Systems Corporation (a) | | | 1,300 | | | | 38,922 | |
Rightnow Technologies, Inc. (a) | | | 100 | | | | 1,526 | |
TeleTech Holdings, Inc. (a) (b) | | | 205,061 | | | | 3,668,541 | |
| Telvent Git, S.A. | | | 200 | | | | 5,750 | |
TNS, Inc. (a) (b) | | | 60,781 | | | | 1,717,671 | |
Unisys Corporation (a) | | | 17,300 | | | | 504,122 | |
VeriFone Holdings, Inc. (a) (b) | | | 288,136 | | | | 3,832,209 | |
Virtusa Corporation (a) (b) | | | 102,285 | | | | 918,519 | |
| | | | | | | | 25,026,120 | |
| Semiconductors & Semiconductor Equipment - 3.7% | |
Advanced Analogic Technologies, Inc. (a) | | | 45,003 | | | | 141,759 | |
Advanced Energy Industries, Inc. (a) | | | 1,400 | | | | 17,094 | |
Amkor Technology, Inc. (a) | | | 116,700 | | | | 643,017 | |
Applied Micro Circuits Corporation (a) (b) | | | 126,595 | | | | 989,973 | |
Atheros Communications, Inc. (a) (b) | | | 58,232 | | | | 1,433,672 | |
Atmel Corporation (a) (b) | | | 383,505 | | | | 1,426,639 | |
Brooks Automation, Inc. (a) | | | 1,500 | | | | 10,320 | |
CEVA, Inc. (a) | | | 1,000 | | | | 10,130 | |
Cirrus Logic, Inc. (a) | | | 133,821 | | | | 647,694 | |
| Cohu, Inc. | | | 200 | | | | 2,276 | |
Cymer, Inc. (a) (b) | | | 37,900 | | | | 1,297,696 | |
Cypress Semiconductor Corporation (a) | | | 52,300 | | | | 440,889 | |
Diodes, Inc. (a) | | | 300 | | | | 4,914 | |
DSP Group, Inc. (a) | | | 15,028 | | | | 86,862 | |
Entegris, Inc. (a) (b) | | | 308,975 | | | | 1,161,746 | |
Entropic Communications, Inc. (a) | | | 145,202 | | | | 381,881 | |
EZchip Semiconductor Ltd. (a) | | | 300 | | | | 3,591 | |
Fairchild Semiconductor International, Inc. (a) | | | 1,600 | | | | 11,968 | |
FormFactor, Inc. (a) | | | 62,800 | | | | 1,066,972 | |
Integrated Device Technology, Inc. (a) | | | 123,200 | | | | 724,416 | |
Intellon Corporation (a) | | | 72,020 | | | | 494,777 | |
IXYS Corporation (a) | | | 19,700 | | | | 131,990 | |
| TFS MARKET NEUTRAL FUND | |
| SCHEDULE OF INVESTMENTS (Continued) | |
| | |
| COMMON STOCKS - 85.1% (Continued) | | Share | | | Value | |
| Information Technology - 19.6% (Continued) | |
| Semiconductors & Semiconductor Equipment - 3.7% (Continued) | |
Kopin Corporation (a) | | | 49,300 | | | $ | 218,892 | |
Kulicke & Soffa Industries, Inc. (a) | | | 1,700 | | | | 7,905 | |
Lattice Semiconductor Corporation (a) | | | 240,292 | | | | 458,958 | |
LSI Corporation (a) | | | 264,300 | | | | 1,353,216 | |
Marvell Technology Group Ltd. (a) | | | 500 | | | | 6,860 | |
Mellanox Technologies Ltd. (a) | | | 200 | | | | 3,490 | |
MEMC Electronic Materials, Inc. (a) | | | 600 | | | | 7,452 | |
Micron Technology, Inc. (a) | | | 800 | | | | 5,432 | |
MKS Instruments, Inc. (a) | | | 200 | | | | 3,128 | |
Nanometrics, Inc. (a) | | | 3,400 | | | | 27,880 | |
NVE Corporation (a) | | | 15,047 | | | | 562,758 | |
NVIDIA Corporation (a) | | | 300 | | | | 3,588 | |
OmniVision Technologies, Inc. (a) | | | 55,900 | | | | 685,334 | |
ON Semiconductor Corporation (a) | | | 689,600 | | | | 4,613,424 | |
Pericom Semiconductor Corporation (a) | | | 4,672 | | | | 43,964 | |
PMC-Sierra, Inc. (a) | | | 268,600 | | | | 2,288,472 | |
RF Micro Devices, Inc. (a) | | | 303,500 | | | | 1,207,930 | |
Rubicon Technology, Inc. (a) | | | 400 | | | | 6,048 | |
Semitool, Inc. (a) | | | 22,100 | | | | 156,026 | |
Sigma Designs, Inc. (a) | | | 50,900 | | | | 611,309 | |
Silicon Storage Technology, Inc. (a) | | | 20,500 | | | | 41,615 | |
Skyworks Solutions, Inc. (a) | | | 208,700 | | | | 2,176,741 | |
Standard Microsystems Corporation (a) | | | 21,321 | | | | 410,642 | |
Supertex, Inc. (a) | | | 2,800 | | | | 67,900 | |
Techwell, Inc. (a) | | | 20,527 | | | | 213,070 | |
Teradyne, Inc. (a) | | | 100 | | | | 837 | |
Tessera Technologies, Inc. (a) (b) | | | 108,682 | | | | 2,402,959 | |
TriQuint Semiconductor, Inc. (a) | | | 28,600 | | | | 154,154 | |
Ultra Clean Holdings, Inc. (a) | | | 2,500 | | | | 13,775 | |
Ultratech, Inc. (a) | | | 1,100 | | | | 14,212 | |
Varian Semiconductor Equipment Associates, Inc. (a) | | | 21,300 | | | | 604,707 | |
Veeco Instruments, Inc. (a) | | | 600 | | | | 14,610 | |
Zoran Corporation (a) | | | 103,707 | | | | 919,881 | |
| | | | | | | | 30,437,445 | |
| Software - 4.3% | |
Actuate Corporation (a) | | | 42,894 | | | | 214,899 | |
ANSYS, Inc. (a) | | | 100 | | | | 4,058 | |
Ariba, Inc. (a) (b) | | | 166,300 | | | | 1,965,666 | |
AsiaInfo Holdings, Inc. (a) | | | 22,900 | | | | 505,174 | |
| Blackbaud, Inc. | | | 48,425 | | | | 1,074,551 | |
Bottomline Technologies, Inc. (a) | | | 34,880 | | | | 512,038 | |
Cadence Design Systems, Inc. (a) | | | 1,800 | | | | 10,998 | |
Compuware Corporation (a) | | | 64,122 | | | | 452,701 | |
Deltek, Inc. (a) | | | 68,971 | | | | 493,143 | |
Descartes Systems Group, Inc. (The) (a) | | | 2,200 | | | | 11,484 | |
Double-Take Software, Inc. (a) | | | 55,770 | | | | 516,988 | |
Ebix, Inc. (a) | | | 30,284 | | | | 1,865,494 | |
EPIQ Systems, Inc. (a) | | | 58,530 | | | | 738,063 | |
| FactSet Research Systems, Inc. | | | 20,590 | | | | 1,318,790 | |
| TFS MARKET NEUTRAL FUND | |
| SCHEDULE OF INVESTMENTS (Continued) | |
| | |
| COMMON STOCKS - 85.1% (Continued) | | Shares | | | Value | |
| Information Technology - 19.6% (Continued) | |
| Software - 4.3% (Continued) | |
| Fair Isaac Corporation | | | 300 | | | $ | 6,099 | |
Guidance Software, Inc. (a) | | | 500 | | | | 2,785 | |
i2 Technologies, Inc. (a) (b) | | | 98,333 | | | | 1,547,761 | |
Informatica Corporation (a) | | | 200 | | | | 4,246 | |
Interactive Intelligence, Inc. (a) | | | 13,527 | | | | 226,848 | |
| Jack Henry & Associates, Inc. | | | 25,275 | | | | 583,094 | |
JDA Software Group, Inc. (a) | | | 35,011 | | | | 694,618 | |
Kenexa Corporation (a) | | | 60,764 | | | | 765,626 | |
Manhattan Associates, Inc. (a) | | | 300 | | | | 6,885 | |
Mentor Graphics Corporation (a) | | | 300 | | | | 2,190 | |
MICROS Systems, Inc. (a) | | | 600 | | | | 16,152 | |
MicroStrategy, Inc. - Class A (a) | | | 1,000 | | | | 87,270 | |
Monotype Imaging Holdings, Inc. (a) | | | 53,913 | | | | 405,426 | |
Net 1 UEPS Technologies, Inc. (a) | | | 35,515 | | | | 621,157 | |
NetScout Systems, Inc. (a) (b) | | | 151,900 | | | | 1,866,851 | |
NetSuite, Inc. (a) | | | 100 | | | | 1,397 | |
Novell, Inc. (a) (b) | | | 375,719 | | | | 1,536,691 | |
| OPNET Technologies, Inc. | | | 200 | | | | 2,180 | |
Phoenix Technologies Ltd. (a) | | | 174,682 | | | | 408,756 | |
| QAD, Inc. | | | 1,700 | | | | 7,752 | |
Quest Software, Inc. (a) (b) | | | 97,714 | | | | 1,638,664 | |
Radiant Systems, Inc. (a) | | | 39,773 | | | | 391,366 | |
Red Hat, Inc. (a) | | | 100 | | | | 2,581 | |
Rosetta Stone, Inc. (a) | | | 1,400 | | | | 29,050 | |
S1 Corporation (a) (b) | | | 251,835 | | | | 1,511,010 | |
Salesforce.com, Inc. (a) | | | 300 | | | | 17,025 | |
SolarWinds, Inc. (a) | | | 8,700 | | | | 154,860 | |
| Solera Holdings, Inc. | | | 600 | | | | 19,332 | |
Sonic Solutions, Inc. (a) | | | 4,200 | | | | 20,412 | |
SonicWALL, Inc. (a) | | | 45,133 | | | | 358,356 | |
SuccessFactors, Inc. (a) | | | 1,000 | | | | 15,290 | |
Sybase, Inc. (a) | | | 44,012 | | | | 1,741,115 | |
Synopsys, Inc. (a) (b) | | | 171,214 | | | | 3,766,708 | |
Take-Two Interactive Software, Inc. (a) | | | 56,400 | | | | 618,708 | |
Taleo Corporation - Class A (a) | | | 43,434 | | | | 944,255 | |
TeleCommunication Systems, Inc. (a) | | | 68,323 | | | | 610,808 | |
TIBCO Software, Inc. (a) (b) | | | 400,994 | | | | 3,508,698 | |
TiVo, Inc. (a) | | | 127,200 | | | | 1,383,936 | |
Tyler Technologies, Inc. (a) | | | 200 | | | | 3,804 | |
VASCO Data Security International, Inc. (a) | | | 23,904 | | | | 145,336 | |
VMware, Inc. - Class A (a) | | | 200 | | | | 7,686 | |
| | | | | | | | 35,366,831 | |
| Materials - 6.7% | |
| Chemicals - 3.4% | |
| A. Schulman, Inc. | | | 300 | | | | 5,211 | |
| American Vanguard Corporation | | | 2,900 | | | | 24,070 | |
| Arch Chemicals, Inc. | | | 8,715 | | | | 241,318 | |
Ashland, Inc. (b) | | | 105,146 | | | | 3,631,743 | |
Cabot Corporation (b) | | | 101,887 | | | | 2,234,382 | |
| TFS MARKET NEUTRAL FUND | |
| SCHEDULE OF INVESTMENTS (Continued) | |
| | |
| COMMON STOCKS - 85.1% (Continued) | | Shares | | | Value | |
| Materials - 6.7% (Continued) | |
| Chemicals - 3.4% (Continued) | |
Calgon Carbon Corporation (a) | | | 300 | | | $ | 4,752 | |
China Green Agriculture, Inc. (a) | | | 400 | | | | 4,408 | |
Cytec Industries, Inc. (b) | | | 38,493 | | | | 1,276,813 | |
| Eastman Chemical Company | | | 9,200 | | | | 483,092 | |
| Ferro Corporation | | | 2,100 | | | | 12,873 | |
Georgia Gulf Corporation (a) | | | 600 | | | | 8,622 | |
| Hawkins, Inc. | | | 100 | | | | 2,102 | |
Huntsman Corporation (b) | | | 280,800 | | | | 2,232,360 | |
Innophos Holdings, Inc. (b) | | | 117,846 | | | | 2,280,320 | |
| Innospec, Inc. | | | 21,358 | | | | 252,452 | |
| International Flavors and Fragrances, Inc. | | | 14,141 | | | | 538,631 | |
Intrepid Potash, Inc. (a) | | | 100 | | | | 2,576 | |
Landec Corporation (a) | | | 200 | | | | 1,308 | |
LSB Industries, Inc. (a) (b) | | | 73,806 | | | | 915,194 | |
| Methanex Corporation | | | 300 | | | | 5,145 | |
| Nalco Holding Company | | | 10,600 | | | | 224,190 | |
| Olin Corporation | | | 300 | | | | 4,581 | |
OM Group, Inc. (a) | | | 800 | | | | 21,616 | |
OMNOVA Solutions, Inc. (a) (b) | | | 322,877 | | | | 2,069,642 | |
PolyOne Corporation (a) | | | 119,816 | | | | 668,573 | |
| Quaker Chemical Corporation | | | 27,114 | | | | 558,548 | |
Rockwood Holdings, Inc. (a) | | | 300 | | | | 5,964 | |
RPM International, Inc. (b) | | | 138,998 | | | | 2,449,145 | |
| Scotts Miracle-Gro Company (The) - Class A | | | 7,600 | | | | 308,712 | |
ShengdaTech, Inc. (a) | | | 300 | | | | 1,815 | |
Solutia, Inc. (a) (b) | | | 295,756 | | | | 3,253,316 | |
| Spartech Corporation | | | 300 | | | | 2,871 | |
Stepan Company (b) | | | 33,988 | | | | 1,945,473 | |
| Terra Industries, Inc. | | | 13,699 | | | | 435,217 | |
Valspar Corporation (The) (b) | | | 48,670 | | | | 1,234,758 | |
W.R. Grace & Company (a) | | | 28,406 | | | | 621,807 | |
| | | | | | | | 27,963,600 | |
| Containers & Packaging - 1.3% | |
AEP Industries, Inc. (a) | | | 16,928 | | | | 590,449 | |
Bemis Company, Inc. (b) | | | 89,300 | | | | 2,306,619 | |
Boise, Inc. (a) (b) | | | 315,444 | | | | 1,507,822 | |
BWAY Holding Company (a) (b) | | | 83,603 | | | | 1,485,625 | |
Graphic Packaging Holding Company (a) | | | 82,597 | | | | 189,147 | |
| Myers Industries, Inc. | | | 14,750 | | | | 129,358 | |
Packaging Corporation of America (b) | | | 93,023 | | | | 1,700,460 | |
Pactiv Corporation (a) | | | 14,100 | | | | 325,569 | |
Sonoco Products Company (b) | | | 60,642 | | | | 1,622,174 | |
| Temple-Inland, Inc. | | | 57,220 | | | | 884,049 | |
| | | | | | | | 10,741,272 | |
| Metals & Mining - 1.0% | |
| A.M. Castle & Company | | | 300 | | | | 3,381 | |
| AK Steel Holding Corporation | | | 500 | | | | 7,935 | |
| Allegheny Technologies, Inc. | | | 200 | | | | 6,172 | |
Brush Engineered Materials, Inc. (a) | | | 300 | | | | 5,535 | |
| TFS MARKET NEUTRAL FUND | |
| SCHEDULE OF INVESTMENTS (Continued) | |
| | |
| COMMON STOCKS - 85.1% (Continued) | | Shares | | | Value | |
| Materials - 6.7% (Continued) | |
| Metals & Mining - 1.0% (Continued) | |
| Carpenter Technology Corporation | | | 200 | | | $ | 4,206 | |
Coeur d'Alene Mines Corporation (a) | | | 1,200 | | | | 24,096 | |
| Commercial Metals Company | | | 37,700 | | | | 559,468 | |
Gammon Gold, Inc. (a) | | | 700 | | | | 5,698 | |
General Steel Holdings, Inc. (a) | | | 5,700 | | | | 21,204 | |
Golden Star Resources Ltd. (a) | | | 52,133 | | | | 160,048 | |
| Harry Winston Diamond Corporation | | | 300 | | | | 2,451 | |
Haynes International, Inc. (a) | | | 100 | | | | 2,832 | |
Ivanhoe Mines Ltd. (a) | | | 2,300 | | | | 24,771 | |
Jaguar Mining, Inc. (a) | | | 500 | | | | 4,205 | |
MAG Silver Corporation (a) | | | 1,500 | | | | 7,830 | |
| Mesabi Trust | | | 1,100 | | | | 11,011 | |
Minefinders Corporation Ltd. (a) | | | 7,300 | | | | 69,058 | |
North American Palladium Ltd. (a) | | | 88,963 | | | | 214,401 | |
NovaGold Resources, Inc. (a) | | | 275,952 | | | | 1,186,594 | |
Olympic Steel, Inc. (b) | | | 46,057 | | | | 1,165,242 | |
Pan American Silver Corporation (a) | | | 16,400 | | | | 343,088 | |
Puda Coal, Inc. (a) | | | 1,300 | | | | 8,957 | |
Reliance Steel & Aluminum Company (b) | | | 33,900 | | | | 1,236,672 | |
RTI International Metals, Inc. (a) | | | 1,400 | | | | 28,994 | |
Seabridge Gold, Inc. (a) | | | 14,500 | | | | 291,160 | |
Silver Standard Resources, Inc. (a) | | | 7,806 | | | | 145,036 | |
Silver Wheaton Corporation (a) | | | 1,400 | | | | 17,472 | |
| Silvercorp Metals, Inc. | | | 1,000 | | | | 5,180 | |
| Southern Copper Corporation | | | 200 | | | | 6,300 | |
Stillwater Mining Company (a) | | | 42,837 | | | | 265,589 | |
Sutor Technology Group Ltd. (a) | | | 29,918 | | | | 86,463 | |
Tanzanian Royalty Exploration Corporation (a) | | | 2,900 | | | | 8,497 | |
Thompson Creek Metals Company, Inc. (a) | | | 1,000 | | | | 10,180 | |
| Titanium Metals Corporation | | | 251,900 | | | | 2,166,340 | |
| United States Steel Corporation | | | 300 | | | | 10,347 | |
Universal Stainless & Alloy Products, Inc. (a) | | | 300 | | | | 4,527 | |
US Gold Corporation (a) | | | 119,100 | | | | 321,570 | |
| Walter Energy, Inc. | | | 100 | | | | 5,850 | |
| | | | | | | | 8,448,360 | |
| Paper & Forest Products - 1.0% | |
Buckeye Technologies, Inc. (a) (b) | | | 117,831 | | | | 1,055,766 | |
Clearwater Paper Corporation (a) (b) | | | 38,944 | | | | 1,762,995 | |
Domtar Corporation (a) (b) | | | 53,173 | | | | 2,227,417 | |
| International Paper Company | | | 100 | | | | 2,231 | |
KapStone Paper & Packaging Corporation (a) (b) | | | 158,780 | | | | 1,101,933 | |
Louisiana-Pacific Corporation (a) | | | 181,800 | | | | 954,450 | |
| MeadWestvaco Corporation | | | 300 | | | | 6,849 | |
| Neenah Paper, Inc. | | | 1,000 | | | | 10,350 | |
| P.H. Glatfelter Company | | | 13,200 | | | | 139,524 | |
| Schweitzer-Mauduit International, Inc. | | | 11,900 | | | | 614,635 | |
| Verso Paper Corporation | | | 23,700 | | | | 55,695 | |
| Wausau Paper Corporation | | | 34,000 | | | | 298,180 | |
| | | | | | | | 8,230,025 | |
| TFS MARKET NEUTRAL FUND | |
| SCHEDULE OF INVESTMENTS (Continued) | |
| | |
| COMMON STOCKS - 85.1% (Continued) | | Shares | | | Value | |
| Telecommunication Services - 1.0% | |
| Diversified Telecommunication Services - 0.5% | |
Atlantic Tele-Network, Inc. (b) | | | 32,037 | | | $ | 1,468,576 | |
Cbeyond, Inc. (a) | | | 400 | | | | 5,340 | |
Cincinnati Bell, Inc. (a) | | | 69,000 | | | | 212,520 | |
Clearwire Corporation (a) | | | 193,600 | | | | 1,211,936 | |
| Consolidated Communications Holdings, Inc. | | | 900 | | | | 12,438 | |
General Communication, Inc. - Class A (a) | | | 1,800 | | | | 11,070 | |
Global Crossing Ltd. (a) | | | 700 | | | | 7,980 | |
Neutral Tandem, Inc. (a) | | | 500 | | | | 10,545 | |
Premiere Global Services, Inc. (a) | | | 30,752 | | | | 229,717 | |
SureWest Communications (a) | | | 3,218 | | | | 28,383 | |
tw telecom, inc. (a) | | | 62,550 | | | | 788,130 | |
| | | | | | | | 3,986,635 | |
| Wireless Telecommunication Services - 0.5% | |
Centennial Communications Corporation (a) (b) | | | 231,921 | | | | 1,962,051 | |
Leap Wireless International, Inc. (a) | | | 40,300 | | | | 532,766 | |
MetroPCS Communications, Inc. (a) | | | 57,000 | | | | 355,110 | |
NII Holdings, Inc. (a) | | | 1,000 | | | | 26,930 | |
| NTELOS Holdings Corporation | | | 600 | | | | 9,060 | |
| Shenandoah Telecommunications Company | | | 13,189 | | | | 220,125 | |
| Telephone & Data Systems, Inc. - Special Shares | | | 100 | | | | 2,760 | |
Telephone & Data Systems, Inc. (b) | | | 39,131 | | | | 1,159,060 | |
| | | | | | | | 4,267,862 | |
| Utilities - 2.9% | |
| Electric Utilities - 0.3% | |
| Allegheny Energy, Inc. | | | 100 | | | | 2,282 | |
| Brookfield Infrastructure Partners, L.P. | | | 900 | | | | 13,050 | |
| Central Vermont Public Service Corporation | | | 2,200 | | | | 42,658 | |
El Paso Electric Company (a) | | | 39,612 | | | | 742,725 | |
| Great Plains Energy, Inc. | | | 200 | | | | 3,460 | |
| Hawaiian Electric Industries, Inc. | | | 600 | | | | 10,710 | |
NV Energy, Inc. (b) | | | 143,870 | | | | 1,648,750 | |
| Pepco Holdings, Inc. | | | 300 | | | | 4,479 | |
| | | | | | | | 2,468,114 | |
| Gas Utilities - 1.2% | |
AGL Resources, Inc. (b) | | | 80,352 | | | | 2,809,106 | |
Atmos Energy Corporation (b) | | | 69,974 | | | | 1,948,776 | |
Energen Corporation (b) | | | 44,150 | | | | 1,937,302 | |
| Ferrellgas Partners, L.P. | | | 300 | | | | 5,964 | |
Laclede Group, Inc. (The) (b) | | | 48,968 | | | | 1,503,807 | |
| Piedmont Natural Gas Company, Inc. | | | 200 | | | | 4,656 | |
UGI Corporation (b) | | | 80,013 | | | | 1,910,711 | |
| | | | | | | | 10,120,322 | |
| Independent Power Producers & Energy Traders - 1.0% | |
Calpine Corporation (a) | | | 600 | | | | 6,744 | |
| Constellation Energy Group, Inc. | | | 300 | | | | 9,276 | |
Dynegy, Inc. (a) | | | 2,874,525 | | | | 5,749,050 | |
RRI Energy, Inc. (a) | | | 384,900 | | | | 2,028,423 | |
| | | | | | | | 7,793,493 | |
| TFS MARKET NEUTRAL FUND | |
| SCHEDULE OF INVESTMENTS (Continued) | |
| | |
| COMMON STOCKS - 85.1% (Continued) | | Shares | | | Value | |
| Utilities - 2.9% (Continued) | |
| Multi-Utilities - 0.4% | |
Alliant Energy Corporation (b) | | | 60,577 | | | $ | 1,608,925 | |
| OGE Energy Corporation | | | 8,300 | | | | 275,726 | |
TECO Energy, Inc. (b) | | | 116,835 | | | | 1,675,414 | |
| | | | | | | | 3,560,065 | |
| Water Utilities - 0.0% | |
| Aqua America, Inc. | | | 8,300 | | | | 128,235 | |
| Consolidated Water Company, Inc. | | | 900 | | | | 13,284 | |
| SJW Corporation | | | 100 | | | | 2,177 | |
| | | | | | | | 143,696 | |
| | | | | | | | | |
Total Common Stocks (Cost $669,733,452) | | | $ | 705,038,593 | |
| | | | | | | | | |
| | | | | | | | | |
| CLOSED-END FUNDS - 10.7% | | Shares | | | Value | |
| Adams Express Company (The) | | | 89,160 | | | $ | 851,478 | |
| Advent/Claymore Enhanced Growth & Income Fund | | | 100 | | | | 1,048 | |
| Advent/Claymore Global Convertible Securities & Income Fund | | | 21,573 | | | | 157,914 | |
| Alliance California Municipal Income Fund, Inc. | | | 5,988 | | | | 75,928 | |
| Alliance New York Municipal Income Fund, Inc. | | | 3,823 | | | | 50,005 | |
| Alpine Global Premier Properties Fund | | | 263,050 | | | | 1,523,060 | |
| American Strategic Income Portfolio, Inc. | | | 8,600 | | | | 92,966 | |
| American Strategic Income Portfolio, Inc. II | | | 2,632 | | | | 26,320 | |
| American Strategic Income Portfolio, Inc. III | | | 25,512 | | | | 231,139 | |
| ASA Ltd. | | | 27,492 | | | | 2,003,617 | |
Asia Tigers Fund, Inc. (a) | | | 478 | | | | 8,604 | |
| Bancroft Fund Ltd. | | | 3,503 | | | | 49,638 | |
| BlackRock Apex Municipal Fund, Inc. | | | 100 | | | | 838 | |
| BlackRock California Insured Municipal Income Trust | | | 11,277 | | | | 143,895 | |
| BlackRock California Municipal Bond Trust | | | 4,427 | | | | 60,074 | |
| BlackRock California Municipal Income Trust | | | 3,039 | | | | 39,841 | |
| BlackRock California Municipal Income Trust II | | | 3,600 | | | | 46,476 | |
| BlackRock Core Bond Trust | | | 7,994 | | | | 94,329 | |
| BlackRock Corporate High Yield Fund V, Inc. | | | 11,700 | | | | 112,788 | |
| BlackRock Defined Opportunity Credit Trust | | | 100 | | | | 1,140 | |
| BlackRock Floating Rate Income Strategies Fund | | | 8,900 | | | | 110,271 | |
| BlackRock High Income Shares | | | 9,973 | | | | 17,553 | |
| BlackRock Income Trust | | | 138,717 | | | | 883,627 | |
| BlackRock Insured Municipal Income Investment Trust | | | 7,350 | | | | 95,550 | |
| BlackRock Limited Duration Income Trust | | | 52,850 | | | | 735,672 | |
| BlackRock Long-Term Municipal Advantage Trust | | | 9,079 | | | | 89,701 | |
| BlackRock Muni Intermediate Duration Fund, Inc. | | | 50,392 | | | | 652,576 | |
| BlackRock Muni New York Intermediate Duration Fund, Inc. | | | 10,740 | | | | 128,665 | |
| BlackRock MuniAssets Fund, Inc. | | | 2,200 | | | | 25,476 | |
| BlackRock Municipal Bond Investment Trust | | | 5,290 | | | | 69,246 | |
| BlackRock MuniEnhanced Fund, Inc. | | | 17,181 | | | | 168,374 | |
| BlackRock MuniHoldings California Insured Fund, Inc. | | | 73,022 | | | | 924,459 | |
| BlackRock MuniHoldings Insured Fund II, Inc. | | | 295 | | | | 3,640 | |
| BlackRock MuniHoldings Insured Investment Fund | | | 61,710 | | | | 792,356 | |
| TFS MARKET NEUTRAL FUND | |
| SCHEDULE OF INVESTMENTS (Continued) | |
| | |
| CLOSED-END FUNDS - 10.7% (Continued) | | Shares | | | Value | |
| BlackRock MuniHoldings New York Insured Fund, Inc. | | | 15,381 | | | $ | 200,876 | |
| BlackRock MuniYield California Fund, Inc. | | | 39,965 | | | | 516,747 | |
| BlackRock MuniYield California Insured Fund, Inc. | | | 85,105 | | | | 1,077,429 | |
| BlackRock MuniYield Insured Investment Fund | | | 20,805 | | | | 253,405 | |
| BlackRock MuniYield Investment Fund | | | 37,112 | | | | 453,138 | |
| BlackRock MuniYield Michigan Insured Fund II, Inc. | | | 16,786 | | | | 199,753 | |
| BlackRock MuniYield Michigan Insured Fund, Inc. | | | 26,123 | | | | 336,987 | |
| BlackRock MuniYield New York Insured Fund, Inc. | | | 86,314 | | | | 1,015,916 | |
| BlackRock MuniYield Pennsylvania Insured Fund | | | 17,917 | | | | 236,325 | |
| BlackRock MuniYield Quality Fund, Inc. | | | 4,730 | | | | 62,625 | |
| BlackRock New York Municipal Bond Trust | | | 400 | | | | 5,840 | |
| BlackRock Pennsylvania Strategic Municipal Trust | | | 3,131 | | | | 37,322 | |
| BlackRock Preferred & Corporate Income Strategies Fund, Inc. | | | 7,792 | | | | 64,206 | |
| BlackRock Preferred & Equity Advantage Trust | | | 136,817 | | | | 1,499,514 | |
| BlackRock Preferred Income Strategies Fund, Inc. | | | 100 | | | | 890 | |
| BlackRock Preferred Opportunity Trust | | | 100 | | | | 994 | |
| BlackRock S&P Quality Rankings Global Equity Managed Trust | | | 1,538 | | | | 17,749 | |
| BlackRock Senior High Income Fund, Inc. | | | 2,700 | | | | 8,883 | |
| BlackRock Strategic Bond Trust | | | 5,798 | | | | 65,633 | |
| BlackRock Strategic Dividend Achievers Trust | | | 58,658 | | | | 490,967 | |
| Blue Chip Value Fund, Inc. | | | 55,843 | | | | 159,711 | |
Boulder Growth & Income Fund, Inc. (a) | | | 48,612 | | | | 261,046 | |
Boulder Total Return Fund, Inc. (a) | | | 17,814 | | | | 214,124 | |
| Calamos Global Dynamic Income Fund | | | 34,347 | | | | 252,107 | |
| Calamos Strategic Total Return Fund | | | 132,040 | | | | 1,070,844 | |
| Central Europe & Russia Fund, Inc. (The) | | | 48,889 | | | | 1,549,781 | |
| Central Securities Corporation | | | 12,483 | | | | 213,334 | |
| Chartwell Dividend and Income Fund, Inc. | | | 10,900 | | | | 38,477 | |
| China Fund, Inc. | | | 100 | | | | 2,525 | |
| Claymore Dividend & Income Fund | | | 8,819 | | | | 125,671 | |
| Clough Global Equity Fund | | | 28,339 | | | | 371,808 | |
| Clough Global Opportunities Fund | | | 100 | | | | 1,200 | |
| Cohen & Steers Advantage Income Realty Fund, Inc. | | | 130,366 | | | | 683,118 | |
| Cohen & Steers Closed-End Opportunity Fund, Inc. | | | 100 | | | | 1,102 | |
| Cohen & Steers Dividend Majors Fund, Inc. | | | 42,515 | | | | 389,012 | |
| Cohen & Steers Premium Income Realty Fund, Inc. | | | 96,506 | | | | 460,334 | |
| Cohen & Steers Quality Income Realty Fund, Inc. | | | 125,151 | | | | 647,031 | |
| Cohen & Steers REIT and Preferred Income Fund, Inc. | | | 145,805 | | | | 1,316,619 | |
| Cohen & Steers REIT and Utility Income Fund, Inc. | | | 168,135 | | | | 1,501,446 | |
| Cohen & Steers Select Utility Fund, Inc. | | | 125,253 | | | | 1,658,350 | |
| Cohen & Steers Total Return Realty Fund, Inc. | | | 12,612 | | | | 107,076 | |
| Cohen & Steers Worldwide Realty Income Fund, Inc. | | | 19,918 | | | | 116,122 | |
| DCA Total Return Fund | | | 54,595 | | | | 108,098 | |
| DCW Total Return Fund | | | 20,600 | | | | 81,782 | |
| Delaware Enhanced Global Dividend and Income Fund | | | 4,500 | | | | 47,835 | |
| Delaware Investments Arizona Municipal Income Fund, Inc. | | | 3,527 | | | | 40,525 | |
| Delaware Investments Colorado Municipal Income Fund, Inc. | | | 856 | | | | 11,479 | |
| Delaware Investments Dividend & Income Fund, Inc. | | | 600 | | | | 3,810 | |
| Delaware Investments Global Dividend and Income Fund, Inc. | | | 2,779 | | | | 17,035 | |
| Delaware Investments Minnesota Municipal Income Fund II | | | 13,106 | | | | 160,155 | |
| Delaware Investments National Municipal Income Fund | | | 5,756 | | | | 69,705 | |
| TFS MARKET NEUTRAL FUND | |
| SCHEDULE OF INVESTMENTS (Continued) | |
| | |
| CLOSED-END FUNDS - 10.7% (Continued) | | Shares | | | Value | |
Denali Fund (The) (a) | | | 3,153 | | | $ | 41,840 | |
| Diamond Hill Financial Trends Fund, Inc. | | | 13,370 | | | | 100,542 | |
| Dreyfus Municipal Income, Inc. | | | 15,422 | | | | 128,311 | |
| Dreyfus Strategic Municipal Bond Fund | | | 98,557 | | | | 719,466 | |
| Dreyfus Strategic Municipals, Inc. | | | 83,348 | | | | 625,110 | |
| DTF Tax-Free Income, Inc. | | | 1,502 | | | | 21,178 | |
| DWS Dreman Value Income Edge Fund | | | 66,078 | | | | 726,197 | |
| DWS Global High Income Fund, Inc. | | | 17,628 | | | | 118,989 | |
DWS RREEF Real Estate Fund II, Inc. (a) | | | 12,550 | | | | 10,919 | |
DWS RREEF Real Estate Fund, Inc. (a) | | | 49,845 | | | | 153,024 | |
| DWS RREEF World Real Estate & Tactical Strategies Fund, Inc. | | | 17,623 | | | | 264,521 | |
| DWS Strategic Income Trust | | | 4,461 | | | | 48,803 | |
| Eaton Vance Floating-Rate Income Trust | | | 12,717 | | | | 159,090 | |
| Eaton Vance Limited Duration Income Fund | | | 18,623 | | | | 258,487 | |
| Eaton Vance Michigan Municipal Income Trust | | | 2,462 | | | | 29,913 | |
| Eaton Vance Ohio Municipal Income Trust | | | 1,047 | | | | 14,292 | |
| Eaton Vance Senior Income Trust | | | 35,535 | | | | 196,864 | |
| Eaton Vance Short Duration Diversified Income Fund | | | 36,753 | | | | 572,244 | |
| Eaton Vance Tax-Advantaged Dividend Income Fund | | | 2,700 | | | | 38,178 | |
| Eaton Vance Tax-Advantaged Global Dividend Opportunities Fund | | | 2,300 | | | | 40,388 | |
| Ellsworth Fund Ltd. | | | 12,157 | | | | 72,091 | |
| Emerging Markets Telecommunications Fund, Inc. | | | 20,200 | | | | 322,190 | |
Equus Total Return, Inc. (a) | | | 3,914 | | | | 13,856 | |
| European Equity Fund, Inc. (The) | | | 4,489 | | | | 29,852 | |
| Evergreen International Balanced Income Fund | | | 43,409 | | | | 600,781 | |
| Evergreen Multi-Sector Income Fund | | | 500 | | | | 6,860 | |
| First Israel Fund, Inc. | | | 100 | | | | 1,380 | |
| First Opportunity Fund, Inc. | | | 4,907 | | | | 30,963 | |
| First Trust Enhanced Equity Income Fund | | | 20,104 | | | | 200,437 | |
| First Trust Specialty Finance & Finance Opportunities Fund | | | 100 | | | | 520 | |
| First Trust Strategic High Income Fund | | | 3,863 | | | | 10,160 | |
| First Trust Strategic High Income Fund II | | | 19,392 | | | | 85,131 | |
| First Trust Strategic High Income Fund III | | | 100 | | | | 362 | |
| First Trust/FIDAC Mortgage Income Fund | | | 100 | | | | 1,791 | |
| First Trust/Four Corners Senior Floating Rate Income Fund | | | 5,770 | | | | 65,778 | |
| First Trust/Four Corners Senior Floating Rate Income Fund II | | | 92,601 | | | | 1,009,351 | |
| Fort Dearborn Income Securities, Inc. | | | 7,517 | | | | 108,019 | |
Foxby Corporation (a) | | | 400 | | | | 440 | |
| Franklin Templeton Limited Duration Income Trust | | | 27,676 | | | | 303,606 | |
| Franklin Universal Trust | | | 79,119 | | | | 409,836 | |
| Gabelli Dividend & Income Trust | | | 103,675 | | | | 1,235,806 | |
| Gabelli Global Deal Fund (The) | | | 16,188 | | | | 230,193 | |
| Gabelli Healthcare & WellnessRx Trust (The) | | | 13,530 | | | | 78,339 | |
| General American Investors Company, Inc. | | | 25,653 | | | | 573,088 | |
| Global High Income Fund, Inc. | | | 60,315 | | | | 693,623 | |
| Greater China Fund, Inc. | | | 100 | | | | 1,280 | |
H&Q Healthcare Investors (a) | | | 89,659 | | | | 968,317 | |
H&Q Life Sciences Investors (a) | | | 56,588 | | | | 482,696 | |
| Helios Advantage Income Fund, Inc. | | | 6,082 | | | | 38,561 | |
| Helios High Yield Fund | | | 3,413 | | | | 25,599 | |
| TFS MARKET NEUTRAL FUND | |
| SCHEDULE OF INVESTMENTS (Continued) | |
| | |
| CLOSED-END FUNDS - 10.7% (Continued) | | Shares | | | Value | |
| Helios Multi-Sector High Income Fund, Inc. | | | 106 | | | $ | 465 | |
| Highland Credit Strategies Fund | | | 181,508 | | | | 1,101,754 | |
India Fund, Inc. (a) | | | 70,852 | | | | 1,986,690 | |
| Indonesia Fund, Inc. | | | 41,423 | | | | 390,619 | |
| ING Clarion Global Real Estate Income Fund | | | 150,242 | | | | 871,404 | |
| Japan Equity Fund, Inc. (The) | | | 50,669 | | | | 258,412 | |
| Japan Smaller Capitalization Fund, Inc. | | | 126,943 | | | | 919,067 | |
| John Hancock Bank and Thrift Opportunity Fund | | | 65,063 | | | | 865,338 | |
| John Hancock Tax-Advantaged Global Shareholder Yield Fund | | | 4,800 | | | | 54,384 | |
| Korea Equity Fund, Inc. | | | 18,667 | | | | 156,243 | |
| Latin America Discovery Fund, Inc. | | | 100 | | | | 1,550 | |
| Latin America Equity Fund, Inc. | | | 2,710 | | | | 95,663 | |
| Lazard Global Total Return & Income Fund, Inc. | | | 1,702 | | | | 23,658 | |
| Lazard World Dividend & Income Fund, Inc. | | | 13,674 | | | | 140,842 | |
| Liberty All-Star Equity Fund | | | 324,639 | | | | 1,308,295 | |
| Liberty All-Star Growth Fund | | | 36,399 | | | | 110,653 | |
| LMP Capital and Income Fund, Inc. | | | 82,089 | | | | 771,637 | |
| LMP Corporate Loan Fund, Inc. | | | 7,528 | | | | 72,118 | |
| Macquarie Global Infrastructure Total Return Fund, Inc. | | | 68,511 | | | | 979,707 | |
| Macquarie/First Trust Global Infrastructure/Utilities Dividend & Income Fund | | | 22,935 | | | | 255,725 | |
| Madison Strategic Sector Premium Fund | | | 1,520 | | | | 17,298 | |
| Malaysia Fund, Inc. | | | 12,640 | | | | 94,168 | |
| Managed High Yield Plus Fund, Inc. | | | 24,127 | | | | 42,946 | |
| Mexico Equity and Income Fund, Inc. (The) | | | 7,277 | | | | 50,066 | |
| Mexico Fund, Inc. (The) | | | 10,600 | | | | 212,742 | |
| MFS Intermediate High Income Fund | | | 100 | | | | 236 | |
| MFS Multimarket Income Trust | | | 66,978 | | | | 405,887 | |
| MFS Special Value Trust | | | 4,854 | | | | 30,240 | |
| Montgomery Street Income Securities, Inc. | | | 7,524 | | | | 109,700 | |
Morgan Stanley Asia-Pacific Fund, Inc. (a) | | | 100 | | | | 1,420 | |
| Morgan Stanley California Insured Municipal Income Trust | | | 21,402 | | | | 270,735 | |
| Morgan Stanley California Quality Municipal Securities | | | 8,974 | | | | 106,611 | |
Morgan Stanley Eastern Europe Fund, Inc. (a) | | | 18,985 | | | | 275,662 | |
| Morgan Stanley Emerging Markets Debt Fund, Inc. | | | 13,500 | | | | 128,385 | |
| Morgan Stanley Emerging Markets Domestic Debt Fund, Inc. | | | 145,694 | | | | 2,003,293 | |
Morgan Stanley Emerging Markets Fund, Inc. (a) | | | 100 | | | | 1,289 | |
Morgan Stanley Frontier Emerging Markets Fund (a) | | | 7,200 | | | | 83,880 | |
| Morgan Stanley Global Opportunity Bond Fund, Inc. | | | 3,950 | | | | 25,596 | |
| Morgan Stanley Insured California Municipal Securities | | | 4,438 | | | | 58,005 | |
| Morgan Stanley Insured Municipal Bond Trust | | | 5,590 | | | | 71,832 | |
| Morgan Stanley Insured Municipal Income Trust | | | 22,078 | | | | 295,404 | |
| Morgan Stanley Insured Municipal Trust | | | 15,490 | | | | 199,666 | |
| Morgan Stanley Municipal Premium Income Trust | | | 13,258 | | | | 102,219 | |
| Morgan Stanley New York Quality Municipal Securities | | | 3,713 | | | | 48,195 | |
| Morgan Stanley Quality Municipal Income Trust | | | 18,553 | | | | 218,925 | |
| Morgan Stanley Quality Municipal Investment Trust | | | 29,752 | | | | 357,619 | |
| Neuberger Berman California Intermediate Municipal Fund, Inc. | | | 6,754 | | | | 89,423 | |
| Neuberger Berman High Yield Fund | | | 100 | | | | 1,088 | |
| Neuberger Berman Income Opportunity Fund, Inc. | | | 13,838 | | | | 80,952 | |
| Neuberger Berman Intermediate Municipal Fund, Inc. | | | 100 | | | | 1,301 | |
| TFS MARKET NEUTRAL FUND | |
| SCHEDULE OF INVESTMENTS (Continued) | |
| | |
| CLOSED-END FUNDS - 10.7% (Continued) | | Shares | | | Value | |
| Neuberger Berman New York Intermediate Municipal Fund, Inc. | | | 500 | | | $ | 6,440 | |
| Neuberger Berman Real Estate Securities Income Fund, Inc. | | | 136,951 | | | | 357,442 | |
| New Germany Fund, Inc. (The) | | | 4,800 | | | | 53,952 | |
| New Ireland Fund, Inc. (The) | | | 16,742 | | | | 118,701 | |
| NFJ Dividend, Interest & Premium Strategy Fund | | | 151,909 | | | | 2,003,680 | |
| Nicholas-Applegate Equity & Convertible Income Fund | | | 18,345 | | | | 274,808 | |
| Nuveen Arizona Dividend Advantage Municipal Fund 2 | | | 2,442 | | | | 31,526 | |
| Nuveen California Dividend Advantage Municipal Fund | | | 18,224 | | | | 225,066 | |
| Nuveen California Dividend Advantage Municipal Fund 2 | | | 500 | | | | 6,575 | |
| Nuveen California Dividend Advantage Municipal Fund 3 | | | 2,689 | | | | 32,618 | |
| Nuveen California Investment Quality Municipal Fund | | | 6,983 | | | | 88,684 | |
| Nuveen California Performance Plus Municipal Fund, Inc. | | | 5,772 | | | | 73,304 | |
| Nuveen California Premium Income Municipal Fund | | | 7,679 | | | | 92,686 | |
| Nuveen Core Equity Alpha Fund | | | 12,828 | | | | 137,260 | |
| Nuveen Diversified Dividend and Income Fund | | | 11,864 | | | | 106,420 | |
| Nuveen Dividend Advantage Municipal Fund | | | 38,073 | | | | 490,761 | |
| Nuveen Floating Rate Income Fund | | | 89,615 | | | | 814,600 | |
| Nuveen Floating Rate Income Opportunity Fund | | | 40,593 | | | | 366,961 | |
| Nuveen Georgia Dividend Advantage Municipal Fund 2 | | | 4,429 | | | | 57,090 | |
| Nuveen Georgia Premium Income Municipal Fund | | | 4,123 | | | | 53,228 | |
| Nuveen Global Value Opportunities Fund | | | 58,586 | | | | 911,598 | |
| Nuveen Insured California Premium Income Municipal Fund | | | 6,970 | | | | 91,656 | |
| Nuveen Insured California Premium Income Municipal Fund 2 | | | 13,326 | | | | 174,304 | |
| Nuveen Insured California Tax-Free Advantage Municipal Fund | | | 2,600 | | | | 33,748 | |
| Nuveen Insured Municipal Opportunity Fund, Inc. | | | 88,978 | | | | 1,154,934 | |
| Nuveen Insured New York Dividend Advantage Municipal Fund | | | 14,601 | | | | 192,733 | |
| Nuveen Insured New York Premium Income Municipal Fund | | | 14,557 | | | | 190,114 | |
| Nuveen Insured New York Tax Free Advantage Municipal Fund | | | 1,600 | | | | 21,312 | |
| Nuveen Insured Premium Income Municipal Fund 2 | | | 24,696 | | | | 292,895 | |
| Nuveen Insured Tax-Free Advantage Municipal Fund | | | 13,442 | | | | 181,601 | |
| Nuveen Investment Quality Municipal Fund, Inc. | | | 27,382 | | | | 358,978 | |
| Nuveen Maryland Dividend Advantage Municipal Fund | | | 5,071 | | | | 68,154 | |
| Nuveen Maryland Dividend Advantage Municipal Fund 2 | | | 200 | | | | 2,662 | |
| Nuveen Maryland Dividend Advantage Municipal Fund 3 | | | 6,446 | | | | 84,572 | |
| Nuveen Michigan Dividend Advantage Municipal Fund | | | 2,087 | | | | 25,691 | |
| Nuveen Michigan Premium Income Municipal Fund, Inc. | | | 7,461 | | | | 91,397 | |
| Nuveen Michigan Quality Income Municipal Fund, Inc. | | | 1,468 | | | | 18,761 | |
| Nuveen Multi-Currency Short-Term Government Income Fund | | | 109,358 | | | | 1,704,891 | |
| Nuveen Multi-Strategy Income and Growth Fund | | | 177,540 | | | | 1,180,641 | |
| Nuveen Multi-Strategy Income and Growth Fund 2 | | | 177,147 | | | | 1,240,029 | |
| Nuveen New Jersey Dividend Advantage Municipal Fund | | | 2,804 | | | | 35,723 | |
| Nuveen New Jersey Dividend Advantage Municipal Fund 2 | | | 980 | | | | 13,377 | |
| Nuveen New Jersey Investment Quality Municipal Fund, Inc. | | | 8,864 | | | | 114,877 | |
| Nuveen New Jersey Premium Income Municipal Fund, Inc. | | | 6,087 | | | | 81,627 | |
| Nuveen New York Dividend Advantage Municipal Fund | | | 4,090 | | | | 53,170 | |
| Nuveen New York Dividend Advantage Municipal Fund 2 | | | 2,780 | | | | 36,418 | |
| Nuveen New York Investment Quality Municipal Fund | | | 32,422 | | | | 429,267 | |
| Nuveen New York Performance Plus Municipal Fund, Inc. | | | 22,780 | | | | 313,908 | |
| Nuveen New York Quality Income Municipal Fund, Inc. | | | 35,265 | | | | 462,324 | |
| Nuveen New York Select Quality Municipal Fund, Inc. | | | 37,736 | | | | 497,738 | |
| Nuveen Ohio Dividend Advantage Municipal Fund | | | 4,303 | | | | 59,037 | |
| TFS MARKET NEUTRAL FUND | |
| SCHEDULE OF INVESTMENTS (Continued) | |
| | |
| CLOSED-END FUNDS - 10.7% (Continued) | | Shares | | | Value | |
| Nuveen Ohio Dividend Advantage Municipal Fund 2 | | | 2,529 | | | $ | 33,155 | |
| Nuveen Ohio Dividend Advantage Municipal Fund 3 | | | 489 | | | | 6,606 | |
| Nuveen Ohio Quality Income Municipal Fund | | | 8,219 | | | | 119,258 | |
| Nuveen Pennsylvania Dividend Advantage Municipal Fund | | | 4,700 | | | | 60,395 | |
| Nuveen Pennsylvania Dividend Advantage Municipal Fund 2 | | | 2,422 | | | | 31,050 | |
| Nuveen Pennsylvania Investment Quality Municipal Fund | | | 20,465 | | | | 261,543 | |
| Nuveen Pennsylvania Premium Income Municipal Fund 2 | | | 22,758 | | | | 278,558 | |
| Nuveen Premier Insured Municipal Income Fund, Inc. | | | 27,402 | | | | 358,966 | |
| Nuveen Premier Municipal Income Fund, Inc. | | | 26,007 | | | | 322,487 | |
| Nuveen Premium Income Municipal Fund | | | 1,900 | | | | 24,263 | |
| Nuveen Premium Income Municipal Fund 2 | | | 77,003 | | | | 1,002,581 | |
| Nuveen Premium Income Municipal Fund 4 | | | 4,257 | | | | 49,764 | |
| Nuveen Quality Income Municipal Fund | | | 900 | | | | 11,934 | |
| Nuveen Quality Preferred Income Fund 3 | | | 100 | | | | 660 | |
| Nuveen Tax-Advantaged Dividend Growth Fund | | | 39,310 | | | | 410,396 | |
| Nuveen Tax-Advantaged Floating Rate Fund | | | 12,023 | | | | 36,309 | |
| Nuveen Tax-Advantaged Total Return Strategy Fund | | | 24,178 | | | | 233,801 | |
| Old Mutual Claymore Long-Short Fund | | | 39,512 | | | | 302,267 | |
| Petroleum & Resources Corporation | | | 1,400 | | | | 33,068 | |
| Putnam High Income Securities Fund | | | 15,600 | | | | 102,180 | |
| Putnam Managed Municipal Income Trust | | | 17,478 | | | | 115,180 | |
RENN Global Entrepreneurs Fund (a) | | | 3,250 | | | | 8,515 | |
| RiverSource LaSalle International Real Estate Fund, Inc. | | | 29,882 | | | | 209,772 | |
| Rivus Bond Fund | | | 13,521 | | | | 218,770 | |
| RMR Asia Pacific Real Estate Fund | | | 4,474 | | | | 79,640 | |
| Royce Focus Trust, Inc. | | | 386 | | | | 2,142 | |
| Royce Micro-Cap Trust, Inc. | | | 67,261 | | | | 454,012 | |
| Royce Value Trust, Inc. | | | 181,227 | | | | 1,754,277 | |
| Source Capital, Inc. | | | 8,171 | | | | 320,712 | |
| Spain Fund, Inc. (The) | | | 2,200 | | | | 15,180 | |
| Strategic Global Income Fund, Inc. | | | 44,028 | | | | 439,840 | |
| SunAmerica Focused Alpha Large-Cap Fund, Inc. | | | 300 | | | | 3,549 | |
| Swiss Helvetia Fund, Inc. (The) | | | 23,559 | | | | 276,818 | |
| Taiwan Fund, Inc. | | | 3,982 | | | | 51,806 | |
Taiwan Greater China Fund (The) (a) | | | 1,500 | | | | 8,190 | |
| TCW Strategic Income Fund, Inc. | | | 11,367 | | | | 52,402 | |
| Templeton Emerging Markets Income Fund | | | 47,578 | | | | 624,223 | |
| Thai Capital Fund, Inc. (The) | | | 755 | | | | 7,074 | |
| Thai Fund, Inc. (The) | | | 60,009 | | | | 510,677 | |
| Tri-Continental Corporation | | | 82,886 | | | | 881,078 | |
| TS&W/Claymore Tax-Advantaged Balanced Fund | | | 10,643 | | | | 97,596 | |
Turkish Investment Fund, Inc. (The) (a) | | | 55,760 | | | | 669,120 | |
| Van Kampen Dynamic Credit Opportunities Fund | | | 182,837 | | | | 1,930,759 | |
| Van Kampen Ohio Quality Municipal Trust | | | 3,503 | | | | 49,883 | |
| Van Kampen Pennsylvania Value Municipal Income Trust | | | 21,182 | | | | 260,539 | |
| Van Kampen Select Sector Municipal Trust | | | 2,925 | | | | 31,707 | |
| Western Asset Emerging Markets Debt Fund, Inc. | | | 112,867 | | | | 1,835,217 | |
| Western Asset Emerging Markets Income Fund, Inc. | | | 73,963 | | | | 856,492 | |
| Western Asset Global High Income Fund, Inc. | | | 95,850 | | | | 968,085 | |
| Western Asset Inflation Management Fund, Inc. | | | 100 | | | | 1,599 | |
| Western Asset Municipal Partners Fund, Inc. | | | 5,708 | | | | 75,916 | |
| TFS MARKET NEUTRAL FUND | |
| SCHEDULE OF INVESTMENTS (Continued) | |
| | |
| CLOSED-END FUNDS - 10.7% (Continued) | | Shares | | | Value | |
| Western Asset Worldwide Income Fund, Inc. | | | 5,986 | | | $ | 71,533 | |
| Zweig Fund, Inc. (The) | | | 100 | | | | 310 | |
| Zweig Total Return Fund, Inc. (The) | | | 54,347 | | | | 198,367 | |
Total Closed-End Funds (Cost $90,367,060) | | | $ | 88,383,154 | |
| | | | | | | | | |
| RIGHTS - 0.0% | | Shares | | | Value | |
| Winthrop Realty Trust (Cost $0) | | | 2,354 | | | $ | – | |
| | | | | | | | | |
| MONEY MARKET FUNDS - 3.0% | | Shares | | | Value | |
UMB Money Market Fiduciary, 0.05% (c) (Cost $24,674,332) | | | 24,674,332 | | | $ | 24,674,332 | |
| | | | | | | | | |
Total Investments at Value - 98.8% (Cost $784,774,844) | | | $ | 818,096,079 | |
| | | | | | | | | |
| Other Assets in Excess of Liabilities – 1.2% | | | | 10,313,378 | |
| | | | | | | | | |
| Net Assets - 100.0% | | | $ | 828,409,457 | |
ADR - American Depositary Receipt.
| (a) | Non-income producing security. |
| (b) | All or a portion of the shares have been committed as collateral for open short positions. |
| (c) | Variable rate security. The rate shown is the 7-day effective yield as of October 31, 2009. |
| See accompanying notes to financial statements. |
| |
| TFS MARKET NEUTRAL FUND | |
| SCHEDULE OF SECURITIES SOLD SHORT | |
| October 31, 2009 | |
| | |
| COMMON STOCKS - 64.6% | | Shares | | | Value | |
| Consumer Discretionary - 14.3% | |
| Auto Components - 0.5% | |
Amerigon, Inc. (a) | | | 8,800 | | | $ | 56,584 | |
| ArvinMeritor, Inc. | | | 60,100 | | | | 469,381 | |
| BorgWarner, Inc. | | | 26,700 | | | | 809,544 | |
China Automotive Systems, Inc. (a) | | | 2,200 | | | | 22,792 | |
| Cooper Tire & Rubber Company | | | 31,197 | | | | 476,066 | |
Dorman Products, Inc. (a) | | | 4,000 | | | | 58,480 | |
Exide Technologies (a) | | | 300 | | | | 1,836 | |
Fuel Systems Solutions, Inc. (a) | | | 200 | | | | 6,548 | |
| Gentex Corporation | | | 11,400 | | | | 182,514 | |
| Modine Manufacturing Company | | | 3,800 | | | | 39,140 | |
Raser Technologies, Inc. (a) | | | 273,611 | | | | 322,861 | |
| Spartan Motors, Inc. | | | 77,837 | | | | 388,407 | |
| Standard Motor Products, Inc. | | | 100 | | | | 836 | |
Stoneridge, Inc. (a) | | | 19,600 | | | | 144,060 | |
| Superior Industries International, Inc. | | | 62,700 | | | | 832,656 | |
TRW Automotive Holdings Corporation (a) | | | 14,900 | | | | 233,185 | |
| WABCO Holdings, Inc. | | | 17,100 | | | | 405,612 | |
Wonder Auto Technology, Inc. (a) | | | 1,800 | | | | 23,292 | |
| | | | | | | | 4,473,794 | |
| Automobiles - 0.2% | |
| Harley-Davidson, Inc. | | | 300 | | | | 7,476 | |
Winnebago Industries, Inc. (a) | | | 102,194 | | | | 1,175,231 | |
| | | | | | | | 1,182,707 | |
| Distributors - 0.0% | |
Core-Mark Holding Company, Inc. (a) | | | 6,983 | | | | 191,125 | |
| | | | | | | | | |
| Diversified Consumer Services - 1.2% | |
American Public Education, Inc. (a) | | | 32,224 | | | | 1,027,945 | |
Brink's Home Security Holdings, Inc. (a) | | | 2,380 | | | | 73,732 | |
Capella Education Company (a) | | | 15,301 | | | | 1,054,239 | |
Career Education Corporation (a) | | | 58,071 | | | | 1,210,200 | |
ChinaCast Education Corporation (a) | | | 1,100 | | | | 6,842 | |
Coinstar, Inc. (a) | | | 28,300 | | | | 898,242 | |
Corinthian Colleges, Inc. (a) | | | 25,000 | | | | 396,500 | |
| DeVry, Inc. | | | 13,800 | | | | 763,002 | |
Grand Canyon Education, Inc. (a) | | | 99 | | | | 1,606 | |
Home Solutions of America, Inc. (a) | | | 95,563 | | | | 3,584 | |
| Jackson Hewitt Tax Service, Inc. | | | 119,750 | | | | 587,972 | |
K12, Inc. (a) | | | 48,300 | | | | 774,732 | |
Learning Tree International, Inc. (a) | | | 500 | | | | 5,440 | |
Pre-Paid Legal Services, Inc. (a) | | | 18,905 | | | | 747,504 | |
| Regis Corporation | | | 80,328 | | | | 1,304,527 | |
Spectrum Group International, Inc. (a) | | | 2,133 | | | | 5,439 | |
| Stewart Enterprises, Inc. - Class A | | | 121,348 | | | | 555,774 | |
Universal Technical Institute, Inc. (a) | | | 23,061 | | | | 414,867 | |
| Weight Watchers International, Inc. | | | 2,084 | | | | 55,247 | |
| | | | | | | | 9,887,394 | |
| TFS MARKET NEUTRAL FUND | |
| SCHEDULE OF SECURITIES SOLD SHORT (Continued) | |
| | |
| COMMON STOCKS - 64.6% (Continued) | | Shares | | | Value | |
| Consumer Discretionary - 14.3% (Continued) | |
| Hotels, Restaurants & Leisure - 2.5% | |
| Ambassadors Group, Inc. | | | 15,680 | | | $ | 199,293 | |
| Ameristar Casinos, Inc. | | | 10,400 | | | | 153,088 | |
BJ's Restaurants, Inc. (a) | | | 100,148 | | | | 1,598,362 | |
Boyd Gaming Corporation (a) | | | 114,116 | | | | 839,894 | |
| Brinker International, Inc. | | | 300 | | | | 3,792 | |
Buffalo Wild Wings, Inc. (a) | | | 25,522 | | | | 1,046,657 | |
| Burger King Holdings, Inc. | | | 78,633 | | | | 1,349,342 | |
California Pizza Kitchen, Inc. (a) | | | 79,058 | | | | 1,026,964 | |
Caribou Coffee Company, Inc. (a) | | | 4,100 | | | | 33,579 | |
| Cedar Fair, L.P. | | | 600 | | | | 6,006 | |
Cheesecake Factory, Inc. (The) (a) | | | 19,000 | | | | 345,420 | |
| Choice Hotels International, Inc. | | | 8,800 | | | | 262,416 | |
| Cracker Barrel Old Country Store, Inc. | | | 4,100 | | | | 135,915 | |
DineEquity, Inc. (a) | | | 35,118 | | | | 743,097 | |
Interval Leisure Group (a) | | | 400 | | | | 4,464 | |
Jamba, Inc. (a) | | | 143,344 | | | | 206,415 | |
Las Vegas Sands Corporation (a) | | | 1,900 | | | | 28,671 | |
MGM Mirage (a) | | | 6,500 | | | | 60,255 | |
Morgans Hotel Group Company (a) | | | 75,951 | | | | 252,157 | |
Multimedia Games, Inc. (a) | | | 400 | | | | 1,964 | |
O'Charley's, Inc. (a) | | | 700 | | | | 4,907 | |
Orient-Express Hotels Ltd. - Class A (a) | | | 79,904 | | | | 687,174 | |
Panera Bread Company - Class A (a) | | | 25,559 | | | | 1,533,029 | |
Peet's Coffee & Tea, Inc. (a) | | | 32,785 | | | | 1,114,690 | |
Pinnacle Entertainment, Inc. (a) | | | 13,869 | | | | 117,193 | |
Red Robin Gourmet Burgers, Inc. (a) | | | 53,637 | | | | 896,274 | |
Ruby Tuesday, Inc. (a) | | | 14,300 | | | | 95,238 | |
Scientific Games Corporation - Class A (a) | | | 1,400 | | | | 19,698 | |
Shuffle Master, Inc. (a) | | | 31,520 | | | | 246,171 | |
Sonic Corporation (a) | | | 157,200 | | | | 1,469,820 | |
Texas Roadhouse, Inc. (a) | | | 73,262 | | | | 693,791 | |
Universal Travel Group (a) | | | 6,300 | | | | 73,584 | |
Vail Resorts, Inc. (a) | | | 66,300 | | | | 2,283,372 | |
VCG Holding Corporation (a) | | | 13,691 | | | | 25,739 | |
WMS Industries, Inc. (a) | | | 59,600 | | | | 2,382,808 | |
| Wyndham Worldwide Corporation | | | 17,810 | | | | 303,661 | |
Wynn Resorts Ltd. (a) | | | 100 | | | | 5,422 | |
| | | | | | | | 20,250,322 | |
| Household Durables - 1.7% | |
| Black & Decker Corporation (The) | | | 300 | | | | 14,166 | |
Brookfield Homes Corporation (a) | | | 42,761 | | | | 240,744 | |
Cavco Industries, Inc. (a) | | | 22,759 | | | | 691,874 | |
| CSS Industries, Inc. | | | 1,400 | | | | 28,420 | |
Deer Consumer Products, Inc. (a) | | | 2,600 | | | | 31,850 | |
| Ethan Allen Interiors, Inc. | | | 92,233 | | | | 1,149,223 | |
Furniture Brands International, Inc. (a) | | | 5,000 | | | | 21,250 | |
Hovnanian Enterprises, Inc. - Class A (a) | | | 280,365 | | | | 1,096,227 | |
iRobot Corporation (a) | | | 67,604 | | | | 903,865 | |
| Jarden Corporation | | | 6,950 | | | | 190,361 | |
| TFS MARKET NEUTRAL FUND | |
| SCHEDULE OF SECURITIES SOLD SHORT (Continued) | |
| | |
| COMMON STOCKS - 64.6% (Continued) | | Shares | | | Value | |
| Consumer Discretionary - 14.3% (Continued) | |
| Household Durables - 1.7% (Continued) | |
| KB Home | | | 300 | | | $ | 4,254 | |
Kid Brands, Inc. (a) | | | 700 | | | | 3,479 | |
| Leggett & Platt, Inc. | | | 68,100 | | | | 1,316,373 | |
M/I Homes, Inc. (a) | | | 38,264 | | | | 427,409 | |
| MDC Holdings, Inc. | | | 26,895 | | | | 877,315 | |
Meritage Homes Corporation (a) | | | 132,841 | | | | 2,423,020 | |
Mohawk Industries, Inc. (a) | | | 31,030 | | | | 1,329,015 | |
| National Presto Industries, Inc. | | | 2,748 | | | | 238,884 | |
| Ryland Group, Inc. (The) | | | 8,900 | | | | 165,095 | |
| Skyline Corporation | | | 2,272 | | | | 39,737 | |
| Tupperware Corporation | | | 61,900 | | | | 2,786,738 | |
| | | | | | | | 13,979,299 | |
| Internet & Catalog Retail - 0.6% | |
Amazon.com, Inc. (a) | | | 100 | | | | 11,881 | |
BIDZ.com, Inc. (a) | | | 1,202 | | | | 3,486 | |
HSN, Inc. (a) | | | 5,600 | | | | 83,664 | |
| NutriSystem, Inc. | | | 66,000 | | | | 1,420,320 | |
Orbitz Worldwide, Inc. (a) | | | 300 | | | | 1,569 | |
Overstock.com, Inc. (a) | | | 57,784 | | | | 808,976 | |
| PetMed Express, Inc. | | | 90,643 | | | | 1,422,189 | |
Shutterfly, Inc. (a) | | | 76,482 | | | | 1,078,396 | |
Ticketmaster Entertainment, Inc. (a) | | | 6,700 | | | | 64,655 | |
ValueVision Media, Inc. (a) | | | 59,144 | | | | 187,486 | |
| | | | | | | | 5,082,622 | |
| Leisure Equipment & Products - 0.5% | |
| Brunswick Corporation | | | 6,400 | | | | 60,672 | |
| Callaway Golf Company | | | 74,300 | | | | 508,212 | |
JAKKS Pacific, Inc. (a) | | | 2,900 | | | | 41,267 | |
| Pool Corporation | | | 145,480 | | | | 2,848,498 | |
| Sturm Ruger & Company, Inc. | | | 20,001 | | | | 212,411 | |
| | | | | | | | 3,671,060 | |
| Media - 0.8% | |
| Arbitron, Inc. | | | 43,530 | | | | 943,730 | |
| Cablevision Systems Corporation | | | 100 | | | | 2,296 | |
Central European Media Enterprises Ltd. (a) | | | 91,076 | | | | 2,289,651 | |
Charter Communications, Inc. - Class A (a) | | | 20,500 | | | | 433 | |
| Cinemark Holdings, Inc. | | | 47,631 | | | | 552,043 | |
CKX, Inc. (a) | | | 28,400 | | | | 181,760 | |
DISH Network Corporation - Class A (a) | | | 200 | | | | 3,480 | |
Dolan Media Company (a) | | | 1,200 | | | | 14,328 | |
DreamWorks Animation SKG, Inc. - Class A (a) | | | 24,100 | | | | 771,200 | |
| Gannett Company, Inc. | | | 13,200 | | | | 129,624 | |
Interpublic Group of Companies, Inc. (a) | | | 100 | | | | 602 | |
Liberty Global, Inc. (a) | | | 200 | | | | 4,116 | |
Liberty Global, Inc. - Class A (a) | | | 56,500 | | | | 1,159,945 | |
Liberty Media Corporation - Capital - Series A (a) | | | 17,500 | | | | 362,075 | |
Live Nation, Inc. (a) | | | 300 | | | | 1,998 | |
Martha Stewart Living Omnimedia, Inc. (a) | | | 5,300 | | | | 27,454 | |
| Media General, Inc. | | | 31,000 | | | | 256,990 | |
| TFS MARKET NEUTRAL FUND | |
| SCHEDULE OF SECURITIES SOLD SHORT (Continued) | |
| | |
| COMMON STOCKS - 64.6% (Continued) | | Shares | | | Value | |
| Consumer Discretionary - 14.3% (Continued) | |
| Media - 0.8% (Continued) | |
| New York Times Company (The) | | | 900 | | | $ | 7,173 | |
Outdoor Channel Holding, Inc. (a) | | | 900 | | | | 6,228 | |
| Time Warner Cable, Inc. | | | 100 | | | | 3,944 | |
Warner Music Group Corporation (a) | | | 40,074 | | | | 230,826 | |
| | | | | | | | 6,949,896 | |
| Multi-Line Retail - 0.4% | |
Big Lots, Inc. (a) | | | 60,700 | | | | 1,520,535 | |
| Bon-Ton Stores, Inc. (The) | | | 34,968 | | | | 323,454 | |
| Dillard's, Inc. | | | 42,200 | | | | 574,764 | |
| Fred's, Inc. | | | 77,271 | | | | 914,889 | |
Tuesday Morning Corporation (a) | | | 9,087 | | | | 29,351 | |
| | | | | | | | 3,362,993 | |
| Specialty Retail - 4.3% | |
| Aaron's, Inc. | | | 48,702 | | | | 1,219,985 | |
| Abercrombie & Fitch Company - Class A | | | 32,370 | | | | 1,062,383 | |
| American Eagle Outfitters, Inc. | | | 300 | | | | 5,247 | |
Asbury Automotive Group, Inc. (a) | | | 52,730 | | | | 513,590 | |
| Barnes & Noble, Inc. | | | 68,119 | | | | 1,131,457 | |
| bebe stores, Inc. | | | 140,218 | | | | 877,765 | |
Blockbuster, Inc. - Class A (a) | | | 100,400 | | | | 83,332 | |
| Brown Shoe Company, Inc. | | | 1,000 | | | | 10,370 | |
| Buckle, Inc. (The) | | | 50,386 | | | | 1,512,084 | |
Build-A-Bear Workshop, Inc. (a) | | | 400 | | | | 2,072 | |
Cabela's, Inc. - Class A (a) | | | 70,676 | | | | 888,397 | |
Charming Shoppes, Inc. (a) | | | 188,709 | | | | 854,852 | |
Chico's FAS, Inc. (a) | | | 68,300 | | | | 816,185 | |
Children's Place Retail Stores, Inc. (The) (a) | | | 56 | | | | 1,761 | |
China Auto Logistics, Inc. (a) | | | 1,000 | | | | 4,120 | |
| Christopher & Banks Corporation | | | 100 | | | | 609 | |
Citi Trends, Inc. (a) | | | 18,076 | | | | 475,941 | |
Coldwater Creek, Inc. (a) | | | 70,000 | | | | 402,500 | |
Conn's, Inc. (a) | | | 88,392 | | | | 557,754 | |
Dick's Sporting Goods, Inc. (a) | | | 62,500 | | | | 1,418,125 | |
Dress Barn, Inc. (a) | | | 92,753 | | | | 1,674,192 | |
DSW, Inc. - Class A (a) | | | 73,316 | | | | 1,407,667 | |
| Foot Locker, Inc. | | | 47,000 | | | | 492,560 | |
GameStop Corporation - Class A (a) | | | 300 | | | | 7,287 | |
Gander Mountain Company (a) | | | 9,002 | | | | 44,920 | |
| Group 1 Automotive, Inc. | | | 70,416 | | | | 1,789,975 | |
| Guess?, Inc. | | | 9,300 | | | | 339,915 | |
Haverty Furniture Companies, Inc. (a) | | | 69,500 | | | | 841,645 | |
hhgregg, Inc. (a) | | | 60,419 | | | | 996,309 | |
Hibbett Sports, Inc. (a) | | | 56,075 | | | | 1,050,846 | |
Hot Topic, Inc. (a) | | | 73,600 | | | | 566,720 | |
Jo-Ann Stores, Inc. (a) | | | 51,573 | | | | 1,372,873 | |
| Limited Brands, Inc. | | | 200 | | | | 3,520 | |
Lumber Liquidators, Inc. (a) | | | 55,372 | | | | 1,176,655 | |
New York & Company, Inc. (a) | | | 1,500 | | | | 6,600 | |
| Penske Auto Group, Inc. | | | 87,927 | | | | 1,376,937 | |
| TFS MARKET NEUTRAL FUND | |
| SCHEDULE OF SECURITIES SOLD SHORT (Continued) | |
| | |
| COMMON STOCKS - 64.6% (Continued) | | Shares | | | Value | |
| Consumer Discretionary - 14.3% (Continued) | |
| Specialty Retail - 4.3% (Continued) | |
| PetSmart, Inc. | | | 98,200 | | | $ | 2,310,646 | |
Pier 1 Imports, Inc. (a) | | | 506,312 | | | | 1,782,218 | |
| RadioShack Corporation | | | 173,500 | | | | 2,930,415 | |
Shoe Carnival, Inc. (a) | | | 5,106 | | | | 76,641 | |
| Sonic Automotive, Inc. - Class A | | | 83,419 | | | | 745,766 | |
Stein Mart, Inc. (a) | | | 100 | | | | 950 | |
Systemax, Inc. (a) | | | 40,300 | | | | 543,244 | |
Tractor Supply Company (a) | | | 29,603 | | | | 1,323,254 | |
Tween Brands, Inc. (a) | | | 37,700 | | | | 319,696 | |
Urban Outfitters, Inc. (a) | | | 200 | | | | 6,276 | |
West Marine, Inc. (a) | | | 100 | | | | 762 | |
Zumiez, Inc. (a) | | | 64,311 | | | | 866,269 | |
| | | | | | | | 35,893,287 | |
| Textiles, Apparel & Luxury Goods - 1.6% | |
Alpha Pro Tech Ltd. (a) | | | 6,100 | | | | 36,539 | |
Carter's, Inc. (a) | | | 5,100 | | | | 120,360 | |
| Cherokee, Inc. | | | 33,325 | | | | 630,842 | |
| Columbia Sportswear Company | | | 41,900 | | | | 1,594,295 | |
Deckers Outdoor Corporation (a) | | | 14,500 | | | | 1,300,215 | |
Fossil, Inc. (a) | | | 6,900 | | | | 184,437 | |
Fuqi International, Inc. (a) | | | 19,400 | | | | 397,506 | |
G-III Apparel Group Ltd. (a) | | | 9,645 | | | | 154,416 | |
Gildan Activewear, Inc. (a) | | | 18,835 | | | | 333,945 | |
Hanesbrands, Inc. (a) | | | 157,086 | | | | 3,396,199 | |
Iconix Brand Group, Inc. (a) | | | 54,850 | | | | 639,551 | |
| Jones Apparel Group, Inc. | | | 82,900 | | | | 1,483,081 | |
| K-Swiss, Inc. - Class A | | | 95,561 | | | | 779,778 | |
| Liz Claiborne, Inc. | | | 8,200 | | | | 47,068 | |
| Movado Group, Inc. | | | 47,317 | | | | 495,882 | |
Skechers U.S.A., Inc. - Class A (a) | | | 3,300 | | | | 72,006 | |
Timberland Company (The) - Class A (a) | | | 23,300 | | | | 376,994 | |
Volcom, Inc. (a) | | | 53,212 | | | | 883,851 | |
Warnaco Group, Inc. (The) (a) | | | 16,471 | | | | 667,570 | |
| | | | | | | | 13,594,535 | |
| Consumer Staples - 3.5% | |
| Beverages - 0.3% | |
Boston Beer Company, Inc. - Class A (a) | | | 161 | | | | 6,118 | |
Central European Distribution Corporation (a) | | | 49,393 | | | | 1,536,616 | |
Constellation Brands, Inc. - Class A (a) | | | 34,900 | | | | 552,118 | |
Cott Corporation (a) | | | 6,900 | | | | 54,510 | |
Jones Soda Company (a) | | | 128,277 | | | | 100,056 | |
| | | | | | | | 2,249,418 | |
| Food & Staples Retailing - 0.7% | |
Diedrich Coffee, Inc. (a) | | | 600 | | | | 13,080 | |
Great Atlantic & Pacific Tea Company, Inc. (The) (a) | | | 126,502 | | | | 1,253,635 | |
| Nash Finch Company | | | 16,757 | | | | 485,618 | |
Rite Aid Corporation (a) | | | 604,400 | | | | 779,676 | |
| Ruddick Corporation | | | 57,114 | | | | 1,526,086 | |
Susser Holdings Corporation (a) | | | 700 | | | | 8,323 | |
| TFS MARKET NEUTRAL FUND | |
| SCHEDULE OF SECURITIES SOLD SHORT (Continued) | |
| | |
| COMMON STOCKS - 64.6% (Continued) | | Shares | | | Value | |
| Consumer Staples - 3.5% (Continued) | |
| Food & Staples Retailing - 0.7% (Continued) | |
United Natural Foods, Inc. (a) | | | 44,997 | | | $ | 1,084,878 | |
Winn-Dixie Stores, Inc. (a) | | | 31,538 | | | | 349,756 | |
| | | | | | | | 5,501,052 | |
| Food Products - 1.5% | |
AgFeed Industries, Inc. (a) | | | 5,000 | | | | 22,050 | |
American Dairy, Inc. (a) | | | 5,856 | | | | 169,473 | |
American Italian Pasta Company (a) | | | 9,200 | | | | 249,964 | |
| Cal-Maine Foods, Inc. | | | 68,900 | | | | 1,870,635 | |
Chiquita Brands International, Inc. (a) | | | 97,069 | | | | 1,571,547 | |
Dean Foods Company (a) | | | 20,600 | | | | 375,538 | |
| Diamond Foods, Inc. | | | 27,321 | | | | 823,728 | |
| Farmer Brothers Company | | | 3,133 | | | | 59,214 | |
| Flowers Foods, Inc. | | | 65,977 | | | | 1,541,223 | |
Fresh Del Monte Produce, Inc. (a) | | | 8,600 | | | | 186,706 | |
Hain Celestial Group, Inc. (The) (a) | | | 100 | | | | 1,754 | |
| Imperial Sugar Company | | | 5,000 | | | | 62,450 | |
Lifeway Foods, Inc. (a) | | | 3,389 | | | | 40,803 | |
| Sanderson Farms, Inc. | | | 1,700 | | | | 62,203 | |
Smithfield Foods, Inc. (a) | | | 155,900 | | | | 2,079,706 | |
Synutra International, Inc. (a) | | | 11,570 | | | | 139,997 | |
| Tootsie Roll Industries, Inc. | | | 37,558 | | | | 931,814 | |
Treehouse Foods, Inc. (a) | | | 46,600 | | | | 1,742,840 | |
| Tyson Foods, Inc. | | | 79,400 | | | | 994,088 | |
Zapata Corporation (a) | | | 256 | | | | 1,748 | |
| | | | | | | | 12,927,481 | |
| Personal Products - 0.7% | |
American Oriental Bioengineering, Inc. (a) | | | 222,060 | | | | 879,358 | |
Bare Escentuals, Inc. (a) | | | 19,500 | | | | 246,285 | |
Chattem, Inc. (a) | | | 15,600 | | | | 988,572 | |
China Sky One Medical, Inc. (a) | | | 13,004 | | | | 154,357 | |
China-Biotics, Inc. (a) | | | 900 | | | | 10,440 | |
Elizabeth Arden, Inc. (a) | | | 2,200 | | | | 23,430 | |
Female Health Company (The) (a) | | | 900 | | | | 4,167 | |
| Herbalife Ltd. | | | 9,300 | | | | 312,945 | |
| Mannatech, Inc. | | | 72,468 | | | | 246,391 | |
| Mead Johnson Nutrition Company - Class A | | | 8,579 | | | | 360,661 | |
Medifast, Inc. (a) | | | 500 | | | | 11,010 | |
NBTY, Inc. (a) | | | 24,648 | | | | 897,434 | |
| Nu Skin Enterprises, Inc. | | | 200 | | | | 4,552 | |
Revlon, Inc. (a) | | | 13,100 | | | | 110,433 | |
USANA Health Sciences, Inc. (a) | | | 54,641 | | | | 1,574,754 | |
| | | | | | | | 5,824,789 | |
| Tobacco - 0.3% | |
Alliance One International, Inc. (a) | | | 174,756 | | | | 770,674 | |
Star Scientific, Inc. (a) | | | 458 | | | | 385 | |
| Universal Corporation | | | 29,731 | | | | 1,236,512 | |
| Vector Group Ltd. | | | 50,432 | | | | 731,768 | |
| | | | | | | | 2,739,339 | |
| TFS MARKET NEUTRAL FUND | |
| SCHEDULE OF SECURITIES SOLD SHORT (Continued) | |
| | |
| COMMON STOCKS - 64.6% (Continued) | | Shares | | | Value | |
| Energy - 5.0% | |
| Energy Equipment & Services - 1.3% | |
| Baker Hughes, Inc. | | | 600 | | | $ | 25,242 | |
Basic Energy Services, Inc. (a) | | | 3,800 | | | | 26,600 | |
Bronco Drilling Company, Inc. (a) | | | 3,000 | | | | 18,960 | |
| Carbo Ceramics, Inc. | | | 35,289 | | | | 2,060,525 | |
| Core Laboratories N.V. | | | 4,400 | | | | 458,920 | |
Dawson Geophysical Company (a) | | | 200 | | | | 4,830 | |
Dresser-Rand Group, Inc. (a) | | | 30,800 | | | | 907,676 | |
Exterran Holdings, Inc. (a) | | | 11,965 | | | | 244,445 | |
Global Industries Ltd. (a) | | | 19,854 | | | | 144,736 | |
| Gulf Island Fabrication, Inc. | | | 15,313 | | | | 292,784 | |
| Halliburton Company | | | 100 | | | | 2,921 | |
Helix Energy Solutions Group, Inc. (a) | | | 103,700 | | | | 1,423,801 | |
Hercules Offshore, Inc. (a) | | | 10,200 | | | | 52,326 | |
| Lufkin Industries, Inc. | | | 700 | | | | 39,935 | |
NATCO Group, Inc. (a) | | | 2,700 | | | | 117,666 | |
North American Energy Partners, Inc. (a) | | | 2,100 | | | | 11,907 | |
OYO Geospace Corporation (a) | | | 800 | | | | 21,000 | |
| Patterson-UTI Energy, Inc. | | | 237,200 | | | | 3,695,576 | |
| Precision Drilling Trust | | | 3,700 | | | | 24,235 | |
| RPC, Inc. | | | 2,100 | | | | 19,635 | |
Seahawk Drilling, Inc. (a) | | | 1,082 | | | | 29,214 | |
SulphCo, Inc. (a) | | | 279,872 | | | | 279,872 | |
Superior Well Services, Inc. (a) | | | 109,600 | | | | 1,162,856 | |
TETRA Technologies, Inc. (a) | | | 1,100 | | | | 10,406 | |
Trico Marine Services, Inc. (a) | | | 11,977 | | | | 73,060 | |
Union Drilling, Inc. (a) | | | 6,000 | | | | 45,840 | |
Unit Corporation (a) | | | 200 | | | | 7,816 | |
Weatherford International Ltd. (a) | | | 100 | | | | 1,753 | |
Willbros Group, Inc. (a) | | | 8,300 | | | | 109,062 | |
| | | | | | | | 11,313,599 | |
| Oil, Gas & Consumable Fuels - 3.7% | |
Alpha Natural Resources, Inc. (a) | | | 34,940 | | | | 1,186,912 | |
Arena Resources, Inc. (a) | | | 23,400 | | | | 871,884 | |
| Atlas Pipeline Partners, L.P. | | | 9,200 | | | | 64,584 | |
| Berry Petroleum Company - Class A | | | 53,592 | | | | 1,359,093 | |
Bill Barrett Corporation (a) | | | 100 | | | | 3,098 | |
BPZ Resources, Inc. (a) | | | 100,862 | | | | 635,431 | |
Brigham Exploration Company (a) | | | 2,000 | | | | 19,000 | |
| Cabot Oil & Gas Corporation | | | 100 | | | | 3,847 | |
Carrizo Oil & Gas, Inc. (a) | | | 91,500 | | | | 2,120,970 | |
| Cheniere Energy Partners, L.P. | | | 600 | | | | 6,408 | |
Cheniere Energy, Inc. (a) | | | 303,188 | | | | 706,428 | |
Clayton Williams Energy, Inc. (a) | | | 700 | | | | 18,340 | |
Clean Energy Fuels Corporation (a) | | | 300 | | | | 3,480 | |
CNX Gas Corporation (a) | | | 100 | | | | 2,786 | |
Comstock Resources, Inc. (a) | | | 14,100 | | | | 579,369 | |
Concho Resources, Inc. (a) | | | 19,934 | | | | 759,685 | |
| Copano Energy, LLC | | | 18,496 | | | | 315,912 | |
| Cross Timbers Royalty Trust | | | 500 | | | | 16,020 | |
| TFS MARKET NEUTRAL FUND | |
| SCHEDULE OF SECURITIES SOLD SHORT (Continued) | |
| | |
| COMMON STOCKS - 64.6% (Continued) | | Shares | | | Value | |
| Energy - 5.0% (Continued) | |
| Oil, Gas & Consumable Fuels - 3.7% (Continued) | |
| Crosstex Energy, Inc. | | | 9,000 | | | $ | 50,580 | |
| Crosstex Energy, L.P. | | | 10,900 | | | | 63,656 | |
| DCP Midstream Partners, L.P. | | | 100 | | | | 2,579 | |
| Eagle Rock Energy Partners, L.P. | | | 13,300 | | | | 63,042 | |
| Enbridge Energy Partners, L.P. | | | 6,600 | | | | 306,768 | |
Encore Acquisition Company (a) | | | 18,523 | | | | 686,648 | |
| EOG Resources, Inc. | | | 100 | | | | 8,166 | |
Evergreen Energy, Inc. (a) | | | 306,822 | | | | 111,683 | |
| EXCO Resources, Inc. | | | 70,800 | | | | 1,105,896 | |
Forest Oil Corporation (a) | | | 14,500 | | | | 284,200 | |
| Frontier Oil Corporation | | | 84,367 | | | | 1,169,327 | |
| Frontline Ltd. | | | 44,348 | | | | 1,034,639 | |
| General Maritime Corporation | | | 103,896 | | | | 715,843 | |
GeoGlobal Resources, Inc. (a) | | | 17,923 | | | | 18,281 | |
GMX Resources, Inc. (a) | | | 52,893 | | | | 673,328 | |
Goodrich Petroleum Corporation (a) | | | 58,126 | | | | 1,492,094 | |
GreenHunter Energy, Inc. (a) | | | 1,400 | | | | 2,156 | |
Harvest Natural Resources, Inc. (a) | | | 52,151 | | | | 286,309 | |
| Holly Corporation | | | 10,500 | | | | 304,605 | |
| Hugoton Royalty Trust | | | 5,900 | | | | 96,170 | |
International Coal Group, Inc. (a) | | | 200 | | | | 818 | |
Isramco, Inc. (a) | | | 200 | | | | 16,568 | |
James River Coal Company (a) | | | 12,220 | | | | 232,058 | |
| Magellan Midstream Partners, L.P. | | | 583 | | | | 22,644 | |
| MarkWest Energy Partners, L.P. | | | 24,136 | | | | 579,505 | |
| Massey Energy Company | | | 300 | | | | 8,727 | |
McMoRan Exploration Company (a) | | | 800 | | | | 6,152 | |
| Natural Resource Partners, L.P. | | | 500 | | | | 10,945 | |
Newfield Exploration Company (a) | | | 200 | | | | 8,204 | |
| NEXEN, Inc. | | | 400 | | | | 8,588 | |
| Nordic American Tanker Shipping Ltd. | | | 26,239 | | | | 742,564 | |
| NuStar Energy, L.P. | | | 13,415 | | | | 719,849 | |
| Overseas Shipholding Group, Inc. | | | 46,950 | | | | 1,842,787 | |
Pacific Ethanol, Inc. (a) | | | 137,669 | | | | 55,068 | |
Patriot Coal Corporation (a) | | | 4,600 | | | | 51,980 | |
| Peabody Energy Corporation | | | 400 | | | | 15,836 | |
| Pengrowth Energy Trust | | | 100 | | | | 920 | |
| Penn Virginia Corporation | | | 67,410 | | | | 1,365,052 | |
| Permian Basin Royalty Trust | | | 6,690 | | | | 86,167 | |
Petrohawk Energy Corporation (a) | | | 300 | | | | 7,056 | |
Petroleum Development Corporation (a) | | | 4,400 | | | | 73,480 | |
PetroQuest Energy, Inc. (a) | | | 800 | | | | 4,904 | |
Plains Exploration & Production Company (a) | | | 300 | | | | 7,950 | |
Quicksilver Resources, Inc. (a) | | | 58,500 | | | | 713,700 | |
Rex Energy Corporation (a) | | | 20,952 | | | | 169,502 | |
| San Juan Basin Royalty Trust | | | 2,300 | | | | 40,963 | |
SandRidge Energy, Inc. (a) | | | 2,600 | | | | 26,598 | |
Southwestern Energy Company (a) | | | 300 | | | | 13,074 | |
Stone Energy Corporation (a) | | | 5,300 | | | | 81,249 | |
| TFS MARKET NEUTRAL FUND | |
| SCHEDULE OF SECURITIES SOLD SHORT (Continued) | |
| | |
| COMMON STOCKS - 64.6% (Continued) | | Shares | | | Value | |
| Energy - 5.0% (Continued) | |
| Oil, Gas & Consumable Fuels - 3.7% (Continued) | |
| Suncor Energy, Inc. | | | 200 | | | $ | 6,604 | |
| Sunoco, Inc. | | | 5,000 | | | | 154,000 | |
Swift Energy Company (a) | | | 57,974 | | | | 1,227,889 | |
| Targa Resources Partners, L.P. | | | 4,400 | | | | 87,164 | |
| Teekay Corporation | | | 21,960 | | | | 455,670 | |
| Tesoro Corporation | | | 74,105 | | | | 1,047,845 | |
| Toreador Resources Corporation | | | 3,400 | | | | 29,002 | |
Tri-Valley Corporation (a) | | | 62,216 | | | | 149,318 | |
Uranerz Energy Corporation (a) | | | 6,740 | | | | 10,312 | |
Venoco, Inc. (a) | | | 22,200 | | | | 279,720 | |
Verenium Corporation (a) | | | 10,134 | | | | 38,610 | |
| W&T Offshore, Inc. | | | 4,100 | | | | 47,765 | |
Western Refining, Inc. (a) | | | 3,900 | | | | 21,879 | |
Whiting Petroleum Corporation (a) | | | 6,300 | | | | 355,320 | |
| Williams Partners, L.P. | | | 4,000 | | | | 102,000 | |
| World Fuel Services Corporation | | | 44,009 | | | | 2,237,858 | |
Zion Oil & Gas, Inc. (a) | | | 8,400 | | | | 56,532 | |
| | | | | | | | 30,369,613 | |
| Financials - 10.9% | |
| Capital Markets - 1.0% | |
| Allied Capital Corporation | | | 52,200 | | | | 162,864 | |
| Apollo Investment Corporation | | | 1,400 | | | | 12,600 | |
| Ares Capital Corporation | | | 100 | | | | 1,044 | |
| BlackRock Kelso Capital Corporation | | | 1,500 | | | | 10,965 | |
Broadpoint Gleacher Securities Group, Inc. (a) | | | 1,200 | | | | 7,644 | |
| Calamos Asset Management, Inc. | | | 600 | | | | 6,360 | |
| Eaton Vance Corporation | | | 42,000 | | | | 1,192,380 | |
| Epoch Holding Corporation | | | 300 | | | | 2,787 | |
| Federated Investors, Inc. | | | 37,947 | | | | 996,109 | |
Fortress Investment Group, LLC - Class A (a) | | | 5,000 | | | | 20,950 | |
| Greenhill & Company, Inc. | | | 13,000 | | | | 1,120,990 | |
Harris & Harris Group, Inc. (a) | | | 10,503 | | | | 45,058 | |
Investment Technology Group, Inc. (a) | | | 13,800 | | | | 297,666 | |
Knight Capital Group, Inc. (a) | | | 21,700 | | | | 365,645 | |
LaBranche & Company, Inc. (a) | | | 90,718 | | | | 250,382 | |
| Lazard Ltd. - Class A | | | 100 | | | | 3,775 | |
| Och-Ziff Capital Management Group, LLC | | | 9,200 | | | | 111,596 | |
| Oppenheimer Holdings, Inc. | | | 3,487 | | | | 88,918 | |
| optionsXpress Holdings, Inc. | | | 14,200 | | | | 221,946 | |
Penson Worldwide, Inc. (a) | | | 60,060 | | | | 585,585 | |
Piper Jaffray Companies, Inc. (a) | | | 13,075 | | | | 606,549 | |
| Prospect Capital Corporation | | | 15,700 | | | | 155,901 | |
Pzena Investment Management, Inc. (a) | | | 12,111 | | | | 89,379 | |
| Raymond James Financial, Inc. | | | 100 | | | | 2,361 | |
| Sanders Morris Harris Group, Inc. | | | 100 | | | | 581 | |
Stifel Financial Corporation (a) | | | 36,347 | | | | 1,888,590 | |
Thomas Weisel Partners Group, Inc. (a) | | | 1,200 | | | | 5,436 | |
TradeStation Group, Inc. (a) | | | 23,000 | | | | 177,560 | |
| | | | | | | | 8,431,621 | |
| TFS MARKET NEUTRAL FUND | |
| SCHEDULE OF SECURITIES SOLD SHORT (Continued) | |
| | |
| COMMON STOCKS - 64.6% (Continued) | | Shares | | | Value | |
| Financials - 10.9% (Continued) | |
| Commercial Banks - 4.7% | |
1st United Bancorp, Inc. (a) | | | 900 | | | $ | 5,076 | |
| American National Bankshares, Inc. | | | 198 | | | | 4,243 | |
| Associated Banc-Corp | | | 114,336 | | | | 1,464,644 | |
| BancorpSouth, Inc. | | | 35,641 | | | | 804,774 | |
| Bank of the Ozarks, Inc. | | | 10,660 | | | | 242,515 | |
| BB&T Corporation | | | 300 | | | | 7,173 | |
| Boston Private Financial Holdings, Inc. | | | 10,600 | | | | 63,070 | |
| Camden National Corporation | | | 3,466 | | | | 106,510 | |
| Capital City Bank Group, Inc. | | | 16,491 | | | | 193,604 | |
| Capitol Bancorp Ltd. | | | 10,654 | | | | 23,971 | |
| Cardinal Financial Corporation | | | 32,687 | | | | 266,399 | |
Cascade Bancorp, Inc. (a) | | | 47,384 | | | | 48,332 | |
| Chemical Financial Corporation | | | 34,036 | | | | 747,090 | |
| Citizens & Northern Corporation | | | 700 | | | | 8,526 | |
| City Bank | | | 13,068 | | | | 30,318 | |
| City National Corporation | | | 41,500 | | | | 1,563,305 | |
Colonial Bancgroup, Inc. (The) (a) | | | 108,955 | | | | 5,339 | |
| Columbia Banking Systems, Inc. | | | 900 | | | | 13,230 | |
| Cullen/Frost Bankers, Inc. | | | 14,365 | | | | 672,138 | |
| CVB Financial Corporation | | | 116,667 | | | | 934,503 | |
| East West Bancorp, Inc. | | | 800 | | | | 7,224 | |
| Farmers Capital Bank Corporation | | | 400 | | | | 4,448 | |
| Fifth Third Bancorp | | | 500 | | | | 4,470 | |
| First Busey Corporation | | | 48,419 | | | | 187,382 | |
| First Commonwealth Financial Corporation | | | 26,200 | | | | 137,550 | |
| First Financial Bancorporation | | | 11,434 | | | | 144,983 | |
| First Financial Bankshares, Inc. | | | 6,088 | | | | 294,964 | |
| First Financial Corporation | | | 1,108 | | | | 30,725 | |
First Horizon National Corporation (a) | | | 97,600 | | | | 1,154,608 | |
| First Midwest Bancorp, Inc. | | | 3,000 | | | | 31,200 | |
| First South Bancorp, Inc. | | | 5,455 | | | | 57,768 | |
| FNB Corporation | | | 72,686 | | | | 514,617 | |
Frontier Financial Corporation (a) | | | 88,593 | | | | 37,625 | |
| Fulton Financial Corporation | | | 66,185 | | | | 546,688 | |
| Glacier Bancorp, Inc. | | | 67,915 | | | | 889,007 | |
| Great Southern Bancorp, Inc. | | | 25,142 | | | | 576,255 | |
| Hancock Holding Company | | | 27,969 | | | | 1,014,436 | |
| Harleysville National Corporation | | | 87,784 | | | | 505,636 | |
| IberiaBank Corporation | | | 27,468 | | | | 1,189,639 | |
| Lakeland Bancorp, Inc. | | | 100 | | | | 608 | |
| MainSource Financial Group, Inc. | | | 6,633 | | | | 38,670 | |
| Marshall & Ilsley Corporation | | | 1,100 | | | | 5,852 | |
| MB Financial, Inc. | | | 2,400 | | | | 42,912 | |
Metro Bancorp, Inc. (a) | | | 800 | | | | 9,464 | |
Midwest Bank Holdings, Inc. (a) | | | 5,300 | | | | 2,650 | |
| Nara Bancorp, Inc. | | | 2,000 | | | | 14,720 | |
| National Penn Bancshares, Inc. | | | 1,900 | | | | 10,678 | |
| NBT Bancorp, Inc. | | | 38,029 | | | | 829,032 | |
| Old Second Bancorp, Inc. | | | 38,424 | | | | 205,568 | |
| TFS MARKET NEUTRAL FUND | |
| SCHEDULE OF SECURITIES SOLD SHORT (Continued) | |
| | |
| COMMON STOCKS - 64.6% (Continued) | | Shares | | | Value | |
| Financials - 10.9% (Continued) | |
| Commercial Banks - 4.7% (Continued) | |
| Oriental Financial Group, Inc. | | | 900 | | | $ | 9,585 | |
| Pacific Continental Corporation | | | 2,000 | | | | 21,800 | |
| PacWest Bancorp | | | 52,124 | | | | 885,066 | |
| Park National Corporation | | | 52,700 | | | | 3,060,816 | |
Pinnacle Financial Partners, Inc. (a) | | | 57,408 | | | | 729,082 | |
| PNC Bank Corporation | | | 900 | | | | 44,046 | |
| PrivateBancorp, Inc. | | | 83,776 | | | | 764,875 | |
| Prosperity Bancshares, Inc. | | | 29,500 | | | | 1,055,805 | |
| Regions Financial Corporation | | | 2,000 | | | | 9,680 | |
| Renasant Corporation | | | 12,792 | | | | 187,275 | |
| Republic Bancorp, Inc. - Class A | | | 1,099 | | | | 20,211 | |
| S&T Bancorp, Inc. | | | 64,626 | | | | 1,017,859 | |
| S.Y. Bancorp, Inc. | | | 4,230 | | | | 94,540 | |
| Sandy Spring Bancorp, Inc. | | | 45,091 | | | | 521,252 | |
| SCBT Financial Corporation | | | 9,408 | | | | 243,385 | |
Security Bank Corporation (a) | | | 32,973 | | | | 824 | |
| Southwest Bancorp, Inc. | | | 1,800 | | | | 17,712 | |
| StellarOne Corporation | | | 8,589 | | | | 91,129 | |
| Sterling Bancshares, Inc. | | | 700 | | | | 3,899 | |
| Suffolk Bancorp | | | 23,885 | | | | 667,825 | |
Sun Bancorp, Inc. (a) | | | 10,888 | | | | 44,205 | |
| Susquehanna Bancshares, Inc. | | | 192,706 | | | | 1,061,810 | |
SVB Financial Group (a) | | | 10,200 | | | | 420,750 | |
| Synovus Financial Corporation | | | 16,100 | | | | 35,742 | |
| TCF Financial Corporation | | | 107,310 | | | | 1,269,477 | |
Texas Capital Bancshares, Inc. (a) | | | 28,200 | | | | 410,874 | |
| Tompkins Financial Corporation | | | 6,546 | | | | 283,900 | |
| Towne Bank | | | 16,844 | | | | 194,380 | |
| Trustmark Corporation | | | 55,601 | | | | 1,053,639 | |
| UCBH Holdings, Inc. | | | 45,933 | | | | 45,014 | |
| Umpqua Holdings Corporation | | | 103,736 | | | | 1,028,024 | |
| Union Bankshares Corporation | | | 2,618 | | | | 32,254 | |
| United Bankshares, Inc. | | | 59,203 | | | | 1,056,774 | |
United Community Banks, Inc. (a) | | | 133,291 | | | | 541,161 | |
| United Security Bancshares | | | 51 | | | | 1,056 | |
United Security Bancshares, Inc. (a) | | | 1,890 | | | | 4,725 | |
| Univest Corporation of Pennsylvania | | | 4,400 | | | | 84,612 | |
| US Bancorp | | | 100 | | | | 2,322 | |
| Valley National Bancorp | | | 86,502 | | | | 1,148,747 | |
| W Holding Company, Inc. | | | 6,898 | | | | 76,706 | |
| Webster Financial Corporation | | | 98,335 | | | | 1,112,169 | |
| Westamerica Bancorporation | | | 21,680 | | | | 1,036,304 | |
| Whitney Holding Corporation | | | 111,208 | | | | 893,000 | |
| Wilmington Trust Corporation | | | 61,500 | | | | 741,075 | |
| Wilshire Bancorp, Inc. | | | 41,305 | | | | 290,787 | |
| Zions Bancorporation | | | 55,700 | | | | 788,712 | |
| | | | | | | | 38,799,024 | |
| Consumer Finance - 0.2% | |
| Capital One Financial Corporation | | | 200 | | | | 7,320 | |
| TFS MARKET NEUTRAL FUND | |
| SCHEDULE OF SECURITIES SOLD SHORT (Continued) | |
| | |
| COMMON STOCKS - 64.6% (Continued) | | Shares | | | Value | |
| Financials - 10.9% (Continued) | |
| Consumer Finance - 0.2% (Continued) | |
| Cash America International, Inc. | | | 33,582 | | | $ | 1,016,191 | |
CompuCredit Holdings Corporation (a) | | | 65,321 | | | | 214,253 | |
Credit Acceptance Corporation (a) | | | 100 | | | | 3,437 | |
Dollar Financial Corporation (a) | | | 1,500 | | | | 28,155 | |
EZCORP, Inc. - Class A (a) | | | 6,500 | | | | 84,305 | |
SLM Corporation (a) | | | 800 | | | | 7,760 | |
World Acceptance Corporation (a) | | | 2,500 | | | | 62,725 | |
| | | | | | | | 1,424,146 | |
| Diversified Financial Services - 0.5% | |
Asset Acceptance Capital Corporation (a) | | | 27,774 | | | | 201,917 | |
| Asta Funding, Inc. | | | 3,102 | | | | 20,256 | |
| Financial Federal Corporation | | | 35,570 | | | | 726,340 | |
Interactive Brokers Group, Inc. - Class A (a) | | | 27,878 | | | | 446,327 | |
| Life Partners Holdings, Inc. | | | 36,966 | | | | 628,052 | |
| Moody's Corporation | | | 1,000 | | | | 23,680 | |
MSCI, Inc. (a) | | | 7,700 | | | | 234,080 | |
PHH Corporation (a) | | | 98,830 | | | | 1,597,093 | |
| | | | | | | | 3,877,745 | |
| Insurance - 0.9% | |
| AFLAC, Inc. | | | 200 | | | | 8,298 | |
American International Group, Inc. (a) | | | 3,000 | | | | 100,860 | |
| Assurant, Inc. | | | 16,600 | | | | 496,838 | |
Citizens, Inc. (a) | | | 200 | | | | 1,206 | |
| Endurance Specialty Holdings Ltd. | | | 33,285 | | | | 1,197,927 | |
| FBL Financial Group, Inc. - Class A | | | 1,000 | | | | 20,150 | |
First Acceptance Corporation (a) | | | 3,004 | | | | 6,609 | |
| First American Corporation | | | 27,892 | | | | 847,638 | |
Genworth Financial, Inc. (a) | | | 800 | | | | 8,496 | |
| Hanover Insurance Group, Inc. (The) | | | 23,599 | | | | 992,574 | |
| Hartford Financial Services Group, Inc. | | | 300 | | | | 7,356 | |
LandAmerica Financial Group, Inc. (a) | | | 92,077 | | | | 2,854 | |
| Lincoln National Corporation | | | 100 | | | | 2,383 | |
| Marsh & McLennan Companies, Inc. | | | 300 | | | | 7,038 | |
National Financial Partners Corporation (a) | | | 200 | | | | 1,630 | |
| National Interstate Corporation | | | 3,188 | | | | 57,735 | |
| NYMAGIC, INC. | | | 400 | | | | 5,716 | |
| Old Republic International Corporation | | | 21,800 | | | | 232,824 | |
PMA Capital Corporation (a) | | | 5,900 | | | | 28,202 | |
| Presidential Life Corporation | | | 2,500 | | | | 23,325 | |
| Principal Financial Group, Inc. | | | 300 | | | | 7,512 | |
| Protective Life Corporation | | | 8,175 | | | | 157,369 | |
| Prudential Financial, Inc. | | | 100 | | | | 4,523 | |
| Stewart Information Services Corporation | | | 600 | | | | 5,364 | |
| Torchmark Corporation | | | 43,800 | | | | 1,778,280 | |
United America Indemnity Ltd. - Class A (a) | | | 11,816 | | | | 82,830 | |
| United Fire & Casualty Company | | | 100 | | | | 1,748 | |
| Zenith National Insurance Corporation | | | 36,563 | | | | 1,043,142 | |
| | | | | | | | 7,130,427 | |
| TFS MARKET NEUTRAL FUND | |
| SCHEDULE OF SECURITIES SOLD SHORT (Continued) | |
| | |
| COMMON STOCKS - 64.6% (Continued) | | Shares | | | Value | |
| Financials - 10.9% (Continued) | |
| Real Estate Investment Trusts - 2.5% | |
Alesco Financial, Inc. (a) | | | 135,609 | | | $ | 101,707 | |
| Alexandria Real Estate Equities, Inc. | | | 19,800 | | | | 1,072,566 | |
| American Campus Communities, Inc. | | | 23,900 | | | | 645,778 | |
Anthracite Capital, Inc. (a) | | | 73,855 | | | | 53,176 | |
| Apartment Investment & Management Company | | | 1,800 | | | | 22,230 | |
| Arbor Realty Trust, Inc. | | | 71,908 | | | | 143,816 | |
Ashford Hospitality Trust (a) | | | 226,819 | | | | 870,985 | |
| Associated Estates Realty Corporation | | | 600 | | | | 5,472 | |
| BioMed Realty Trust, Inc. | | | 900 | | | | 12,213 | |
| Boston Properties, Inc. | | | 300 | | | | 18,231 | |
| BRE Properties, Inc. | | | 300 | | | | 8,169 | |
Capital Trust, Inc. (a) | | | 73,177 | | | | 143,427 | |
| CapLease, Inc. | | | 23,725 | | | | 81,377 | |
| Capstead Mortgage Corporation | | | 22,400 | | | | 294,784 | |
| Care Investment Trust, Inc. | | | 300 | | | | 2,403 | |
| CBL & Associates Properties, Inc. | | | 2,500 | | | | 20,400 | |
| Cedar Shopping Centers, Inc. | | | 3,900 | | | | 23,673 | |
| Developers Diversified Realty Corporation | | | 135,000 | | | | 1,159,650 | |
| Digital Realty Trust, Inc. | | | 23,200 | | | | 1,047,016 | |
| Douglas Emmett, Inc. | | | 32,100 | | | | 378,780 | |
| Duke Realty Corporation | | | 600 | | | | 6,744 | |
| Entertainment Properties Trust | | | 100 | | | | 3,402 | |
| Equity One, Inc. | | | 106,800 | | | | 1,593,456 | |
| Equity Residential | | | 300 | | | | 8,664 | |
| Essex Property Trust, Inc. | | | 12,300 | | | | 924,714 | |
| Federal Realty Investment Trust | | | 22,000 | | | | 1,298,660 | |
| First Industrial Realty Trust, Inc. | | | 8,800 | | | | 38,280 | |
| First Potomac Realty Trust | | | 100 | | | | 1,135 | |
| Hatteras Financial Corporation | | | 800 | | | | 22,480 | |
| HCP, Inc. | | | 100 | | | | 2,959 | |
| Healthcare Realty Trust, Inc. | | | 40,273 | | | | 838,886 | |
| Hospitality Properties Trust | | | 7,000 | | | | 135,170 | |
iStar Financial, Inc. (a) | | | 346,510 | | | | 724,206 | |
| Kilroy Realty Corporation | | | 100 | | | | 2,762 | |
| Kimco Realty Corporation | | | 2,900 | | | | 36,656 | |
| Lasalle Hotel Properties | | | 14,000 | | | | 240,240 | |
| Lexington Realty Trust | | | 2,989 | | | | 12,524 | |
| Mack-Cali Realty Corporation | | | 20,000 | | | | 619,000 | |
| MFA Financial, Inc. | | | 82,200 | | | | 609,924 | |
| Mid-America Apartment Communities, Inc. | | | 18,400 | | | | 806,288 | |
| NorthStar Realty Finance Corporation | | | 58,030 | | | | 204,846 | |
| Parkway Properties, Inc. | | | 900 | | | | 15,885 | |
| Pennsylvania Real Estate Investment Trust | | | 141,038 | | | | 1,033,808 | |
| Plum Creek Timber Company, Inc. | | | 300 | | | | 9,387 | |
| Post Properties, Inc. | | | 400 | | | | 6,596 | |
| Prologis | | | 1,900 | | | | 21,527 | |
| Ramco-Gershenson Properties Trust | | | 2,000 | | | | 17,680 | |
| Rayonier, Inc. | | | 8,600 | | | | 331,788 | |
| Realty Income Corporation | | | 121,337 | | | | 2,812,592 | |
| TFS MARKET NEUTRAL FUND | |
| SCHEDULE OF SECURITIES SOLD SHORT (Continued) | |
| | |
| COMMON STOCKS - 64.6% (Continued) | | Shares | | | Value | |
| Financials - 10.9% (Continued) | |
| Real Estate Investment Trusts - 2.5% (Continued) | |
| Regency Centers Corporation | | | 27,500 | | | $ | 922,625 | |
| Senior Housing Properties Trust | | | 25,500 | | | | 491,640 | |
| Simon Property Group, Inc. | | | 200 | | | | 13,578 | |
| Sun Communities, Inc. | | | 26,962 | | | | 470,217 | |
| Sunstone Hotel Investors, Inc. | | | 3,800 | | | | 28,690 | |
| Taubman Centers | | | 300 | | | | 9,153 | |
| UDR, Inc. | | | 1,800 | | | | 25,884 | |
| U-Store-It Trust | | | 2,800 | | | | 15,960 | |
| Vornado Realty Trust | | | 100 | | | | 5,956 | |
| Walter Investment Management Corporation | | | 14,941 | | | | 194,532 | |
| Weingarten Realty Investors | | | 300 | | | | 5,550 | |
| | | | | | | | 20,669,897 | |
| Real Estate Management & Development - 0.4% | |
| Brookfield Properties Corporation | | | 1,500 | | | | 15,240 | |
CB Richard Ellis Group, Inc. - Class A (a) | | | 134,800 | | | | 1,395,180 | |
| Jones Lang Lasalle, Inc. | | | 18,700 | | | | 876,095 | |
| MI Developments, Inc. - Class A | | | 700 | | | | 9,940 | |
St. Joe Company (The) (a) | | | 59,567 | | | | 1,426,034 | |
| | | | | | | | 3,722,489 | |
| Thrifts & Mortgage Finance - 0.7% | |
| Astoria Financial Corporation | | | 97,130 | | | | 969,357 | |
| Brookline Bancorp, Inc. | | | 22,355 | | | | 218,855 | |
Downey Financial Corporation (a) | | | 42,834 | | | | 2,142 | |
| First Financial Holdings, Inc. | | | 6,980 | | | | 94,160 | |
| First Niagra Financial Group, Inc. | | | 63,124 | | | | 810,512 | |
FirstFed Financial Corporation (a) | | | 23,697 | | | | 8,531 | |
Guaranty Financial Group, Inc. (a) | | | 62,759 | | | | 4,268 | |
MGIC Investment Corporation (a) | | | 77,500 | | | | 334,025 | |
| NASB Financial, Inc. | | | 441 | | | | 10,849 | |
| NewAlliance Bancshares, Inc. | | | 158,449 | | | | 1,755,615 | |
| OceanFirst Financial Corporation | | | 2,680 | | | | 25,460 | |
Ocwen Financial Corporation (a) | | | 1,000 | | | | 10,930 | |
| Oritani Financial Corporation | | | 200 | | | | 2,562 | |
| Provident Financial Services, Inc. | | | 900 | | | | 9,675 | |
| Provident New York Bancorp | | | 200 | | | | 1,706 | |
| Prudential Bancorp, Inc. of Pennsylvania | | | 166 | | | | 1,629 | |
| Radian Group, Inc. | | | 137,376 | | | | 795,407 | |
| Rockville Financial, Inc. | | | 2,842 | | | | 29,415 | |
| TFS Financial Corporation | | | 3,200 | | | | 37,312 | |
Tree.Com, Inc. (a) | | | 900 | | | | 7,029 | |
Triad Guaranty, Inc. (a) | | | 22,450 | | | | 15,800 | |
| TrustCo Bank Corporation | | | 88,254 | | | | 525,111 | |
| ViewPoint Financial Group | | | 10,190 | | | | 136,546 | |
| WSFS Financial Corporation | | | 500 | | | | 13,800 | |
| | | | | | | | 5,820,696 | |
| Health Care - 9.0% | |
| Biotechnology - 3.3% | |
Abraxis BioScience, Inc. (a) | | | 1,700 | | | | 53,074 | |
Acorda Therapeutics, Inc. (a) | | | 47,649 | | | | 1,035,413 | |
| TFS MARKET NEUTRAL FUND | |
| SCHEDULE OF SECURITIES SOLD SHORT (Continued) | |
| | |
| COMMON STOCKS - 64.6% (Continued) | | Shares | | | Value | |
| Health Care - 9.0% (Continued) | |
| Biotechnology - 3.3% (Continued) | |
Affymax, Inc. (a) | | | 1,600 | | | $ | 32,224 | |
Alexion Pharmaceuticals, Inc. (a) | | | 11,000 | | | | 488,510 | |
Alkermes, Inc. (a) | | | 26,800 | | | | 213,596 | |
Allos Therapeutics, Inc. (a) | | | 66,900 | | | | 377,985 | |
Alnylam Pharmaceuticals, Inc. (a) | | | 81,051 | | | | 1,381,109 | |
AMAG Pharmaceuticals, Inc. (a) | | | 56,522 | | | | 2,135,401 | |
Amicus Therapeutics, Inc. (a) | | | 13,330 | | | | 51,187 | |
Antigenics, Inc. (a) | | | 12,200 | | | | 12,200 | |
Array BioPharma, Inc. (a) | | | 226,079 | | | | 404,681 | |
Avi Biopharma, Inc. (a) | | | 26,900 | | | | 39,543 | |
BioCryst Pharmaceuticals, Inc. (a) | | | 70,669 | | | | 631,074 | |
BioMarin Pharmaceutical, Inc. (a) | | | 2,350 | | | | 36,566 | |
BioSante Pharmaceuticals, Inc. (a) | | | 18,808 | | | | 28,588 | |
Cell Therapeutics, Inc. (a) | | | 72,486 | | | | 68,862 | |
Celldex Therapeutics, Inc. (a) | | | 900 | | | | 3,924 | |
Clinical Data, Inc. (a) | | | 15,785 | | | | 249,087 | |
Cytori Therapeutics, Inc. (a) | | | 41,200 | | | | 135,548 | |
Dendreon Corporation (a) | | | 37,300 | | | | 942,571 | |
Dyax Corporation (a) | | | 89,061 | | | | 279,652 | |
Emergent BioSolutions, Inc. (a) | | | 500 | | | | 7,210 | |
Enzon Pharmaceuticals, Inc. (a) | | | 124,330 | | | | 1,043,129 | |
Facet Biotech Corporation (a) | | | 5,100 | | | | 87,363 | |
Genomic Health, Inc. (a) | | | 16,999 | | | | 315,671 | |
GenVec, Inc. (a) | | | 70,332 | | | | 52,749 | |
Geron Corporation (a) | | | 212,532 | | | | 1,298,570 | |
GTx, Inc. (a) | | | 99,402 | | | | 892,630 | |
Halozyme Therapeutics, Inc. (a) | | | 93,201 | | | | 564,798 | |
Human Genome Sciences, Inc. (a) | | | 1,000 | | | | 18,690 | |
Idenix Pharmaceuticals Inc (a) | | | 7,545 | | | | 16,750 | |
Idera Pharmaceuticals, Inc. (a) | | | 38,358 | | | | 204,832 | |
Immunomedics, Inc. (a) | | | 1,800 | | | | 6,408 | |
InterMune, Inc. (a) | | | 144,950 | | | | 1,750,996 | |
Introgen Therapeutics, Inc. (a) | | | 99,112 | | | | 1,487 | |
Isis Pharmaceuticals, Inc. (a) | | | 160,879 | | | | 2,038,337 | |
Martek Biosciences Corporation (a) | | | 51,736 | | | | 929,179 | |
Maxygen, Inc. (a) | | | 1,700 | | | | 9,486 | |
Medivation, Inc. (a) | | | 50,797 | | | | 1,296,339 | |
Metabolix, Inc. (a) | | | 98,900 | | | | 1,002,846 | |
Micromet, Inc. (a) | | | 1,800 | | | | 9,198 | |
Momenta Pharmaceuticals, Inc. (a) | | | 87,788 | | | | 800,627 | |
Myriad Pharmaceuticals, Inc. (a) | | | 2,700 | | | | 14,904 | |
Nanosphere, Inc. (a) | | | 1,900 | | | | 12,692 | |
Neurocrine Biosciences, Inc. (a) | | | 143,289 | | | | 318,102 | |
Novavax, Inc. (a) | | | 99,000 | | | | 380,160 | |
NPS Pharmaceuticals, Inc. (a) | | | 61,329 | | | | 194,413 | |
Omeros Corporation (a) | | | 1,600 | | | | 8,640 | |
OncoGenex Pharmaceutical, Inc. (a) | | | 1,300 | | | | 37,843 | |
Oncothyreon, Inc. (a) | | | 6,600 | | | | 23,298 | |
Onyx Pharmaceuticals, Inc. (a) | | | 100 | | | | 2,660 | |
| TFS MARKET NEUTRAL FUND | |
| SCHEDULE OF SECURITIES SOLD SHORT (Continued) | |
| | |
| COMMON STOCKS - 64.6% (Continued) | | Shares | | | Value | |
| Health Care - 9.0% (Continued) | |
| Biotechnology - 3.3% (Continued) | |
Orexigen Therapeutics, Inc. (a) | | | 500 | | | $ | 3,230 | |
Osiris Therapeutics, Inc. (a) | | | 76,179 | | | | 483,737 | |
Poniard Pharmaceuticals, Inc. (a) | | | 3,200 | | | | 20,960 | |
Progenics Pharmaceuticals, Inc. (a) | | | 45,985 | | | | 192,677 | |
Protalix BioTherapeutics, Inc. (a) | | | 2,300 | | | | 21,804 | |
Regeneron Pharmaceuticals, Inc. (a) | | | 2,300 | | | | 36,110 | |
Rigel Pharmaceuticals, Inc. (a) | | | 190,567 | | | | 1,221,534 | |
Seattle Genetics, Inc. (a) | | | 2,100 | | | | 19,068 | |
Sinovac Biotech Ltd. (a) | | | 300 | | | | 2,223 | |
Spectrum Pharmaceuticals, Inc. (a) | | | 900 | | | | 3,735 | |
StemCells, Inc. (a) | | | 314,434 | | | | 358,455 | |
Theravance, Inc. (a) | | | 69,037 | | | | 964,447 | |
United Therapeutics Corporation (a) | | | 35,679 | | | | 1,517,785 | |
ZymoGenetics, Inc. (a) | | | 28,393 | | | | 132,027 | |
| | | | | | | | 26,918,594 | |
| Health Care Equipment & Supplies - 1.9% | |
Abaxis, Inc. (a) | | | 4,100 | | | | 93,562 | |
Abiomed, Inc. (a) | | | 95,859 | | | | 867,524 | |
Boston Scientific Corporation (a) | | | 3,000 | | | | 24,360 | |
Bovie Medical Corporation (a) | | | 5,530 | | | | 44,295 | |
Cantel Medical Corporation (a) | | | 600 | | | | 9,636 | |
Cardiovascular Systems, Inc. (a) | | | 900 | | | | 4,401 | |
Conceptus, Inc. (a) | | | 2,700 | | | | 47,358 | |
CryoLife, Inc. (a) | | | 9,300 | | | | 55,800 | |
Cyberonics, Inc. (a) | | | 54,538 | | | | 788,619 | |
Endologix, Inc. (a) | | | 200 | | | | 952 | |
ev3, Inc. (a) | | | 33,600 | | | | 395,808 | |
Exactech, Inc. (a) | | | 500 | | | | 7,500 | |
Gen-Probe, Inc. (a) | | | 20,800 | | | | 867,776 | |
Greatbatch, Inc. (a) | | | 57,089 | | | | 1,122,941 | |
Hansen Medical, Inc. (a) | | | 83,747 | | | | 214,392 | |
| Hill-Rom Holdings, Inc. | | | 7,647 | | | | 149,805 | |
ICU Medical, Inc. (a) | | | 16,478 | | | | 576,730 | |
IDEXX Laboratories, Inc. (a) | | | 27,300 | | | | 1,395,576 | |
Insulet Corporation (a) | | | 150,295 | | | | 1,668,274 | |
Integra LifeSciences Holdings Corporation (a) | | | 3,600 | | | | 109,944 | |
Masimo Corporation (a) | | | 33,200 | | | | 882,124 | |
| Meridian Bioscience, Inc. | | | 40,079 | | | | 889,353 | |
NeuroMetrix, Inc. (a) | | | 24,036 | | | | 62,494 | |
Palomar Medical Technologies, Inc. (a) | | | 4,800 | | | | 48,768 | |
Quidel Corporation (a) | | | 5,200 | | | | 74,360 | |
ResMed, Inc. (a) | | | 10,300 | | | | 506,863 | |
Sirona Dental Systems, Inc. (a) | | | 3,500 | | | | 94,185 | |
Somanetics Corporation (a) | | | 400 | | | | 5,980 | |
SonoSite, Inc. (a) | | | 24,558 | | | | 608,793 | |
Stereotaxis, Inc. (a) | | | 192,598 | | | | 695,279 | |
SurModics, Inc. (a) | | | 34,200 | | | | 875,862 | |
Symmetry Medical, Inc. (a) | | | 1,000 | | | | 8,000 | |
Syneron Medical Ltd. (a) | | | 900 | | | | 9,900 | |
| TFS MARKET NEUTRAL FUND | |
| SCHEDULE OF SECURITIES SOLD SHORT (Continued) | |
| | |
| COMMON STOCKS - 64.6% (Continued) | | Shares | | | Value | |
| Health Care - 9.0% (Continued) | |
| Health Care Equipment & Supplies - 1.9% (Continued) | |
Thoratec Corporation (a) | | | 29,318 | | | $ | 769,891 | |
| Utah Medical Products, Inc. | | | 100 | | | | 2,924 | |
Varian Medical Systems, Inc. (a) | | | 300 | | | | 12,294 | |
Volcano Corporation (a) | | | 62,705 | | | | 899,817 | |
| West Pharmaceutical Services, Inc. | | | 21,207 | | | | 837,040 | |
| | | | | | | | 15,729,180 | |
| Health Care Providers & Services - 1.8% | |
Air Methods Corporation (a) | | | 5,621 | | | | 171,665 | |
Alliance Healthcare Services, Inc. (a) | | | 300 | | | | 1,632 | |
Allion Healthcare, Inc. (a) | | | 900 | | | | 5,796 | |
Almost Family, Inc. (a) | | | 1,800 | | | | 54,630 | |
Amedisys, Inc. (a) | | | 45,200 | | | | 1,798,508 | |
AMERIGROUP Corporation (a) | | | 9,900 | | | | 218,295 | |
AMN Healthcare Services, Inc. (a) | | | 4,800 | | | | 39,936 | |
Assisted Living Concepts, Inc. (a) | | | 300 | | | | 6,216 | |
Bio-Reference Labs, Inc. (a) | | | 29,380 | | | | 949,855 | |
BioScrip, Inc. (a) | | | 1,900 | | | | 14,326 | |
Cardionet, Inc. (a) | | | 33,700 | | | | 199,167 | |
Catalyst Health Solutions, Inc. (a) | | | 4,300 | | | | 134,891 | |
Community Health Systems, Inc. (a) | | | 14,888 | | | | 465,697 | |
Coventry Health Care, Inc. (a) | | | 200 | | | | 3,966 | |
Cross Country Healthcare, Inc. (a) | | | 900 | | | | 7,434 | |
Emeritus Corporation (a) | | | 46,427 | | | | 866,328 | |
Genoptix, Inc. (a) | | | 26,255 | | | | 913,412 | |
Health Net, Inc. (a) | | | 400 | | | | 5,964 | |
HealthSouth Corporation (a) | | | 81,876 | | | | 1,196,208 | |
Healthways, Inc. (a) | | | 23,480 | | | | 377,558 | |
HMS Holdings Corporation (a) | | | 22,300 | | | | 957,339 | |
Kindred Healthcare, Inc. (a) | | | 800 | | | | 11,760 | |
| Landauer, Inc. | | | 210 | | | | 10,876 | |
LCA-Vision, Inc. (a) | | | 40,223 | | | | 181,004 | |
LHC Group, Inc. (a) | | | 500 | | | | 13,955 | |
LifePoint Hospitals, Inc. (a) | | | 10,800 | | | | 305,964 | |
Magellan Health Services, Inc. (a) | | | 38,126 | | | | 1,224,988 | |
MedCath Corporation (a) | | | 700 | | | | 5,747 | |
Molina Healthcare, Inc. (a) | | | 10,400 | | | | 194,688 | |
NightHawk Radiology Holdings, Inc. (a) | | | 300 | | | | 1,797 | |
| Omnicare, Inc. | | | 22,700 | | | | 491,909 | |
PharMerica Corporation (a) | | | 47,365 | | | | 730,842 | |
PSS World Medical, Inc. (a) | | | 55,000 | | | | 1,112,100 | |
Rural/Metro Corporation (a) | | | 1,400 | | | | 7,070 | |
Sharps Compliance Corporation (a) | | | 2,400 | | | | 21,264 | |
Skilled Healthcare Group, Inc. - Class A (a) | | | 1,100 | | | | 8,844 | |
Sun Healthcare Group, Inc. (a) | | | 700 | | | | 6,356 | |
Triple-S Management Corporation (a) | | | 19,823 | | | | 331,044 | |
| Universal Health Services, Inc. - Class B | | | 6,900 | | | | 383,985 | |
VCA Antech, Inc. (a) | | | 51,200 | | | | 1,219,584 | |
Virtual Radiologic Corporation (a) | | | 1,300 | | | | 16,705 | |
| | | | | | | | 14,669,305 | |
| TFS MARKET NEUTRAL FUND | |
| SCHEDULE OF SECURITIES SOLD SHORT (Continued) | |
| | |
| COMMON STOCKS - 64.6% (Continued) | | Shares | | | Value | |
| Health Care - 9.0% (Continued) | |
| Health Care Technology - 0.6% | |
Allscripts-Misys Healthcare Solutions, Inc. (a) | | | 900 | | | $ | 17,550 | |
AMICAS, Inc. (a) | | | 10,800 | | | | 34,020 | |
athenahealth, Inc. (a) | | | 18,441 | | | | 693,566 | |
| Computer Programs and Systems, Inc. | | | 49,807 | | | | 2,103,848 | |
Eclipsys Corporation (a) | | | 10,400 | | | | 195,000 | |
| IMS Health, Inc. | | | 500 | | | | 8,195 | |
MedAssets, Inc. (a) | | | 4,300 | | | | 94,342 | |
| MedQuist, Inc. | | | 300 | | | | 1,734 | |
Phase Forward, Inc. (a) | | | 99,000 | | | | 1,297,890 | |
SXC Health Solutions Corporation (a) | | | 800 | | | | 36,544 | |
Transcend Services, Inc. (a) | | | 7,479 | | | | 136,492 | |
Vital Images, Inc. (a) | | | 22,221 | | | | 253,541 | |
| | | | | | | | 4,872,722 | |
| Life Sciences Tools & Services - 0.7% | |
Affymetrix, Inc. (a) | | | 51,400 | | | | 268,822 | |
Albany Molecular Research (a) | | | 900 | | | | 7,326 | |
Biodelivery Sciences International, Inc. (a) | | | 100 | | | | 398 | |
Covance, Inc. (a) | | | 25,900 | | | | 1,338,512 | |
Enzo Biochem, Inc. (a) | | | 8,992 | | | | 49,546 | |
eResearchTechnology, Inc. (a) | | | 300 | | | | 2,220 | |
Kendle International, Inc. (a) | | | 3,600 | | | | 60,768 | |
Life Sciences Research, Inc. (a) | | | 100 | | | | 843 | |
Luminex Corporation (a) | | | 53,808 | | | | 792,054 | |
MDS, Inc. (a) | | | 1,800 | | | | 14,346 | |
Parexel International Corporation (a) | | | 2,200 | | | | 27,544 | |
| PerkinElmer, Inc. | | | 38,200 | | | | 710,902 | |
| Pharmaceutical Product Development, Inc. | | | 66,900 | | | | 1,441,695 | |
Sequenom, Inc. (a) | | | 420,148 | | | | 1,159,608 | |
Varian, Inc. (a) | | | 2,600 | | | | 133,120 | |
| | | | | | | | 6,007,704 | |
| Pharmaceuticals - 0.7% | |
Acura Pharmaceuticals, Inc. (a) | | | 1,918 | | | | 7,940 | |
Ardea Biosciences, Inc. (a) | | | 600 | | | | 8,100 | |
| Biovail Corporation | | | 62,500 | | | | 841,250 | |
Cadence Pharmaceuticals, Inc. (a) | | | 49,823 | | | | 449,902 | |
Cypress Bioscience, Inc. (a) | | | 108,931 | | | | 668,836 | |
DepoMed, Inc. (a) | | | 16,189 | | | | 50,348 | |
ISTA Pharmaceuticals, Inc. (a) | | | 3,200 | | | | 11,712 | |
Javelin Pharmaceuticals, Inc. (a) | | | 82,274 | | | | 108,602 | |
Jazz Pharmaceuticals, Inc. (a) | | | 7,728 | | | | 48,532 | |
MAP Pharmaceuticals, Inc. (a) | | | 1,500 | | | | 12,330 | |
Medicines Company (The) (a) | | | 9,603 | | | | 69,045 | |
Nektar Therapeutics (a) | | | 63,207 | | | | 513,241 | |
Optimer Pharmaceuticals, Inc. (a) | | | 15,321 | | | | 177,111 | |
Pain Therapeutics, Inc. (a) | | | 1,100 | | | | 5,577 | |
POZEN, Inc. (a) | | | 112,873 | | | | 641,118 | |
Questcor Pharmaceuticals, Inc. (a) | | | 2,900 | | | | 13,166 | |
Valeant Pharmaceuticals International (a) | | | 53,617 | | | | 1,576,340 | |
ViroPharma, Inc. (a) | | | 3,000 | | | | 22,620 | |
| TFS MARKET NEUTRAL FUND | |
| SCHEDULE OF SECURITIES SOLD SHORT (Continued) | |
| | |
| COMMON STOCKS - 64.6% (Continued) | | Shares | | | Value | |
| Health Care - 9.0% (Continued) | |
| Pharmaceuticals - 0.7% (Continued) | |
XenoPort, Inc. (a) | | | 39,628 | | | $ | 662,184 | |
| | | | | | | | 5,887,954 | |
| Industrials - 9.4% | |
| Aerospace & Defense - 0.8% | |
AAR Corporation (a) | | | 45,543 | | | | 893,098 | |
AeroVironment, Inc. (a) | | | 100 | | | | 2,666 | |
Alliant Techsystems, Inc. (a) | | | 25,327 | | | | 1,969,934 | |
Ascent Solar Technologies, Inc. (a) | | | 14,600 | | | | 73,730 | |
BE Aerospace, Inc. (a) | | | 51,700 | | | | 916,641 | |
| Boeing Company (The) | | | 200 | | | | 9,560 | |
GeoEye, Inc. (a) | | | 80,016 | | | | 2,030,006 | |
| HEICO Corporation | | | 6,740 | | | | 256,322 | |
| Hi-Shear Technology Corporation | | | 3,200 | | | | 61,472 | |
Kratos Defense & Security Solutions, Inc. (a) | | | 6,800 | | | | 73,984 | |
Stanley, Inc. (a) | | | 100 | | | | 2,825 | |
Taser International, Inc. (a) | | | 146,653 | | | | 599,811 | |
| | | | | | | | 6,890,049 | |
| Air Freight & Logistics - 0.2% | |
Dynamex, Inc. (a) | | | 4,687 | | | | 86,850 | |
| Forward Air Corporation | | | 61,879 | | | | 1,320,498 | |
Park-Ohio Holdings Corporation (a) | | | 3,800 | | | | 23,636 | |
| | | | | | | | 1,430,984 | |
| Airlines - 0.3% | |
AirTran Holdings, Inc. (a) | | | 900 | | | | 3,807 | |
Alaska Air Group, Inc. (a) | | | 8,700 | | | | 223,764 | |
Allegiant Travel Company (a) | | | 51,690 | | | | 1,949,230 | |
AMR Corporation (a) | | | 17,400 | | | | 93,786 | |
Continental Airlines, Inc. - Class B (a) | | | 2,600 | | | | 29,900 | |
Delta Air Lines, Inc. (a) | | | 2,800 | | | | 19,992 | |
Hawaiian Holdings, Inc. (a) | | | 43,200 | | | | 306,288 | |
Republic Airways Holdings, Inc. (a) | | | 3,300 | | | | 26,433 | |
| Southwest Airlines Company | | | 2,400 | | | | 20,160 | |
UAL Corporation (a) | | | 19,200 | | | | 124,992 | |
| | | | | | | | 2,798,352 | |
| Building Products - 0.8% | |
| AAON, Inc. | | | 50,060 | | | | 901,580 | |
| American Woodmark Corporation | | | 33,795 | | | | 664,748 | |
| Apogee Enterprises, Inc. | | | 63,600 | | | | 842,064 | |
Builders FirstSource, Inc. (a) | | | 90,502 | | | | 352,053 | |
| Gilbraltar Industries, Inc. | | | 2,100 | | | | 22,722 | |
| Lennox International, Inc. | | | 8,100 | | | | 272,727 | |
| Masco Corporation | | | 200 | | | | 2,350 | |
NCI Building Systems, Inc. (a) | | | 12,500 | | | | 24,500 | |
| Simpson Manufacturing Company, Inc. | | | 38,500 | | | | 900,515 | |
Trex Company, Inc. (a) | | | 55,445 | | | | 882,130 | |
| Universal Forest Products, Inc. | | | 6,875 | | | | 245,300 | |
USG Corporation (a) | | | 124,849 | | | | 1,640,516 | |
| | | | | | | | 6,751,205 | |
| TFS MARKET NEUTRAL FUND | |
| SCHEDULE OF SECURITIES SOLD SHORT (Continued) | |
| | |
| COMMON STOCKS - 64.6% (Continued) | | Shares | | | Value | |
| Industrials - 9.4% (Continued) | |
| Commercial Services & Supplies - 0.7% | |
| ABM Industries, Inc. | | | 47,943 | | | $ | 900,370 | |
ACCO Brands Corporation (a) | | | 1,600 | | | | 9,696 | |
American Reprographics Company (a) | | | 6,000 | | | | 36,000 | |
APAC Customer Services, Inc. (a) | | | 50,068 | | | | 322,939 | |
| Avery Dennison Corporation | | | 100 | | | | 3,565 | |
Bowne & Company, Inc. (a) | | | 1,600 | | | | 10,448 | |
| Brink's Company (The) | | | 41,800 | | | | 991,914 | |
| Courier Corporation | | | 1,400 | | | | 20,762 | |
Document Security Systems, Inc. (a) | | | 25,493 | | | | 70,870 | |
| EnergySolutions, Inc. | | | 1,000 | | | | 8,340 | |
EnerNOC, Inc. (a) | | | 400 | | | | 11,492 | |
Fuel Tech, Inc. (a) | | | 77,644 | | | | 898,341 | |
| Herman Miller, Inc. | | | 200 | | | | 3,090 | |
| HNI Corporation | | | 4,963 | | | | 130,626 | |
InnerWorkings, Inc. (a) | | | 50,041 | | | | 257,711 | |
| Knoll, Inc. | | | 300 | | | | 2,940 | |
Metalico, Inc. (a) | | | 34,055 | | | | 137,582 | |
| Mine Safety Appliances Company | | | 1,400 | | | | 35,686 | |
Mobile Mini, Inc. (a) | | | 59,559 | | | | 863,605 | |
| Multi-Color Corporation | | | 4,100 | | | | 54,407 | |
Perma-Fix Environmental Services, Inc. (a) | | | 12,689 | | | | 29,946 | |
Prg-Schultz International, Inc. (a) | | | 400 | | | | 2,072 | |
| Schawk, Inc. | | | 1,300 | | | | 12,766 | |
| Steelcase, Inc. - Class A | | | 187,028 | | | | 1,079,152 | |
| Viad Corporation | | | 8,252 | | | | 144,410 | |
Waste Services, Inc. (a) | | | 300 | | | | 1,968 | |
| | | | | | | | 6,040,698 | |
| Construction & Engineering - 0.5% | |
Foster Wheeler AG (a) | | | 300 | | | | 8,397 | |
| Granite Construction, Inc. | | | 39,788 | | | | 1,136,345 | |
Insituform Technologies, Inc. - Class A (a) | | | 35,982 | | | | 762,818 | |
KHD Humboldt Wedag International Ltd. (a) | | | 300 | | | | 2,748 | |
MasTec, Inc. (a) | | | 600 | | | | 7,080 | |
Michael Baker Corporation (a) | | | 200 | | | | 7,140 | |
Tutor Perini Corporation (a) | | | 59,200 | | | | 1,044,880 | |
URS Corporation (a) | | | 19,732 | | | | 766,786 | |
| | | | | | | | 3,736,194 | |
| Electrical Equipment - 1.3% | |
| A.O. Smith Corporation | | | 29,399 | | | | 1,165,082 | |
A123 Systems, Inc. (a) | | | 1,900 | | | | 37,354 | |
| Acuity Brands, Inc. | | | 58,046 | | | | 1,837,736 | |
Advanced Battery Technologies, Inc. (a) | | | 134,958 | | | | 453,459 | |
A-Power Energy Generation Systems Ltd. (a) | | | 7,200 | | | | 77,760 | |
| Belden, Inc. | | | 3,300 | | | | 75,735 | |
Broadwind Energy, Inc. (a) | | | 1,300 | | | | 7,592 | |
C&D Technologies, Inc. (a) | | | 78,943 | | | | 144,466 | |
Canadian Solar, Inc. (a) | | | 1,400 | | | | 20,412 | |
| Encore Wire Corporation | | | 40,328 | | | | 836,806 | |
Ener1, Inc. (a) | | | 77,600 | | | | 387,224 | |
| TFS MARKET NEUTRAL FUND | |
| SCHEDULE OF SECURITIES SOLD SHORT (Continued) | |
| | |
| COMMON STOCKS - 64.6% (Continued) | | Shares | | | Value | |
| Industrials - 9.4% (Continued) | |
| Electrical Equipment - 1.3% (Continued) | |
Energy Conversion Devices, Inc. (a) | | | 92,378 | | | $ | 994,911 | |
Evergreen Solar, Inc. (a) | | | 471,040 | | | | 683,008 | |
First Solar, Inc. (a) | | | 400 | | | | 48,772 | |
FuelCell Energy, Inc. (a) | | | 19,400 | | | | 64,602 | |
GT Solar International, Inc. (a) | | | 75,463 | | | | 396,181 | |
Harbin Electric, Inc. (a) | | | 400 | | | | 6,372 | |
| Jinpan International Ltd. | | | 1,200 | | | | 36,432 | |
Lihua International, Inc (a) | | | 3,200 | | | | 22,368 | |
Lime Energy Company (a) | | | 4,100 | | | | 26,035 | |
Medis Technologies Ltd. (a) | | | 63,019 | | | | 11,343 | |
Orion Energy Systems, Inc. (a) | | | 17,310 | | | | 65,951 | |
Polypore International, Inc. (a) | | | 43,646 | | | | 478,360 | |
Solarfun Power Holdings Company Ltd. - ADR (a) | | | 89,098 | | | | 423,216 | |
SunPower Corporation - Class A (a) | | | 66,980 | | | | 1,661,774 | |
SunPower Corporation - Class B (a) | | | 17,100 | | | | 370,386 | |
Thomas & Betts Corporation (a) | | | 10,300 | | | | 352,363 | |
Ultralife Corporation (a) | | | 36,299 | | | | 132,854 | |
UQM Technologies, Inc. (a) | | | 13,600 | | | | 63,920 | |
Valence Technology, Inc. (a) | | | 115,441 | | | | 148,919 | |
| | | | | | | | 11,031,393 | |
| Industrial Conglomerates - 0.0% | |
| General Electric | | | 300 | | | | 4,278 | |
| Icahn Enterprises, L.P. | | | 200 | | | | 7,710 | |
| Standex International Corporation | | | 500 | | | | 8,790 | |
| Textron, Inc. | | | 1,600 | | | | 28,448 | |
| | | | | | | | 49,226 | |
| Machinery - 1.6% | |
AGCO Corporation (a) | | | 12,900 | | | | 362,619 | |
| Albany International Corporation - Class A | | | 800 | | | | 13,328 | |
Altra Holdings, Inc. (a) | | | 300 | | | | 2,631 | |
| American Railcar Industries, Inc. | | | 200 | | | | 2,000 | |
Astec Industries, Inc. (a) | | | 45,736 | | | | 1,051,928 | |
Basin Water, Inc. (a) | | | 46,221 | | | | 837 | |
| Briggs & Stratton Corporation | | | 2,600 | | | | 48,620 | |
| Cascade Corporation | | | 100 | | | | 2,484 | |
| Caterpillar, Inc. | | | 200 | | | | 11,012 | |
Chart Industries, Inc. (a) | | | 16,497 | | | | 326,146 | |
China Fire & Security Group, Inc. (a) | | | 4,100 | | | | 58,302 | |
| China Yuchai International Ltd. | | | 1,300 | | | | 13,910 | |
CNH Global N.V. (a) | | | 1,700 | | | | 32,487 | |
Columbus McKinnon Corporation (a) | | | 25,483 | | | | 421,744 | |
| Crane Company | | | 100 | | | | 2,785 | |
Energy Recovery, Inc. (a) | | | 53,404 | | | | 297,994 | |
EnPro Industries, Inc. (a) | | | 9,473 | | | | 213,900 | |
ESCO Technologies, Inc. (a) | | | 29,150 | | | | 1,145,012 | |
| Federal Signal Corporation | | | 52,270 | | | | 320,938 | |
| Gorman-Rupp Company (The) | | | 30,391 | | | | 750,354 | |
| Graham Corporation | | | 17,055 | | | | 241,669 | |
| Harsco Corporation | | | 100 | | | | 3,149 | |
| TFS MARKET NEUTRAL FUND | |
| SCHEDULE OF SECURITIES SOLD SHORT (Continued) | |
| | |
| COMMON STOCKS - 64.6% (Continued) | | Shares | | | Value | |
| Industrials - 9.4% (Continued) | |
| Machinery - 1.6% (Continued) | |
Hurco Companies, Inc. (a) | | | 3,676 | | | $ | 58,448 | |
Kadant. Inc. (a) | | | 3,000 | | | | 38,670 | |
| Kaydon Corporation | | | 16,291 | | | | 570,022 | |
| Lindsay Corporation | | | 500 | | | | 16,415 | |
Middleby Corporation (The) (a) | | | 20,945 | | | | 949,018 | |
| Mueller Water Products, Inc. - Class A | | | 2,900 | | | | 12,992 | |
| NACCO Industries, Inc. | | | 300 | | | | 17,880 | |
Navistar International Corporation (a) | | | 56,540 | | | | 1,873,736 | |
| Oshkosh Corporation | | | 11,800 | | | | 368,868 | |
| Pentair, Inc. | | | 5,900 | | | | 171,690 | |
PMFG, Inc. (a) | | | 2,500 | | | | 36,175 | |
| Robbins & Myers, Inc. | | | 1,900 | | | | 44,080 | |
| Sauer-Danfoss, Inc. | | | 9,300 | | | | 66,960 | |
SmartHeat, Inc. (a) | | | 28,540 | | | | 255,148 | |
| Snap-on, Inc. | | | 100 | | | | 3,653 | |
| SPX Corporation | | | 9,350 | | | | 493,493 | |
| Stanley Works (The) | | | 7,000 | | | | 316,610 | |
| Sun Hydraulics Corporation | | | 30,793 | | | | 586,914 | |
Tecumseh Products Company - Class A (a) | | | 5,100 | | | | 53,295 | |
| Tennant Company | | | 600 | | | | 15,996 | |
Terex Corporation (a) | | | 24,200 | | | | 489,324 | |
| Titan International, Inc. | | | 400 | | | | 3,360 | |
| Trinity Industries, Inc. | | | 34,900 | | | | 589,112 | |
| Twin Disc, Inc. | | | 2,400 | | | | 22,536 | |
| Wabtec Corporation | | | 16,400 | | | | 602,864 | |
| | | | | | | | 12,981,108 | |
| Marine - 0.3% | |
| Alexander & Baldwin, Inc. | | | 32,883 | | | | 948,017 | |
American Commercial Lines, Inc. (a) | | | 24,525 | | | | 526,061 | |
| Danaos Corporation | | | 3,600 | | | | 14,760 | |
| Excel Maritime Carriers Ltd. | | | 100,705 | | | | 567,976 | |
| | | | | | | | 2,056,814 | |
| Professional Services - 1.4% | |
Acacia Research Corporation (a) | | | 25,765 | | | | 195,814 | |
| Administaff, Inc. | | | 66,469 | | | | 1,649,761 | |
| Barrett Business Services, Inc. | | | 1,049 | | | | 12,168 | |
COMSYS IT Partners, Inc. (a) | | | 6,544 | | | | 44,826 | |
| Corporate Executive Board Company (The) | | | 44,868 | | | | 1,077,281 | |
CoStar Group, Inc. (a) | | | 31,294 | | | | 1,214,833 | |
CRA International, Inc. (a) | | | 20,668 | | | | 511,533 | |
Exponent, Inc. (a) | | | 4,195 | | | | 109,112 | |
GP Strategies Corporation (a) | | | 14,142 | | | | 99,560 | |
| Heidrick & Struggles International, Inc. | | | 83,629 | | | | 2,288,089 | |
Hill International, Inc. (a) | | | 6,400 | | | | 43,008 | |
Huron Consulting Group, Inc. (a) | | | 9,000 | | | | 208,800 | |
Korn/Ferry International (a) | | | 500 | | | | 7,980 | |
MPS Group, Inc. (a) | | | 91,680 | | | | 1,239,514 | |
On Assignment, Inc. (a) | | | 1,600 | | | | 9,664 | |
Resources Connection, Inc. (a) | | | 40,271 | | | | 695,480 | |
| TFS MARKET NEUTRAL FUND | |
| SCHEDULE OF SECURITIES SOLD SHORT (Continued) | |
| | |
| COMMON STOCKS - 64.6% (Continued) | | Shares | | | Value | |
| Industrials - 9.4% (Continued) | |
| Professional Services - 1.4% (Continued) | |
School Specialty, Inc. (a) | | | 37,395 | | | $ | 832,039 | |
TrueBlue, Inc. (a) | | | 97,139 | | | | 1,175,382 | |
Volt Information Sciences, Inc. (a) | | | 700 | | | | 5,677 | |
| | | | | | | | 11,420,521 | |
| Road & Rail - 0.9% | |
Avis Budget Group, Inc. (a) | | | 249,490 | | | | 2,095,716 | |
Celadon Group, Inc. (a) | | | 7,400 | | | | 72,224 | |
| Con-Way, Inc. | | | 42,881 | | | | 1,414,644 | |
Dollar Thrifty Automotive Group, Inc. (a) | | | 72,750 | | | | 1,346,603 | |
Kansas City Southern (a) | | | 33,700 | | | | 816,551 | |
| Knight Transportation, Inc. | | | 7,000 | | | | 112,280 | |
| Ryder System, Inc. | | | 200 | | | | 8,110 | |
Saia, Inc. (a) | | | 43,612 | | | | 639,352 | |
| Werner Enterprises, Inc. | | | 16,300 | | | | 305,625 | |
YRC Worldwide, Inc. (a) | | | 266,163 | | | | 971,495 | |
| | | | | | | | 7,782,600 | |
| Trading Companies & Distributors - 0.6% | |
Beacon Roofing Supply, Inc. (a) | | | 62,807 | | | | 901,908 | |
| GATX Corporation | | | 84,266 | | | | 2,290,350 | |
| Houston Wire & Cable Company | | | 800 | | | | 9,672 | |
| Lawson Products, Inc. | | | 1,460 | | | | 22,703 | |
| MSC Industrial Direct Company, Inc. | | | 5,400 | | | | 232,470 | |
| TAL International Group, Inc. | | | 300 | | | | 3,558 | |
Titan Machinery, Inc. (a) | | | 43,012 | | | | 461,519 | |
| Watsco, Inc. | | | 19,348 | | | | 991,005 | |
WESCO International, Inc. (a) | | | 13,300 | | | | 339,948 | |
| | | | | | | | 5,253,133 | |
| Transportation Infrastructure - 0.0% | |
| Macquarie Infrastructure Company, LLC | | | 300 | | | | 2,421 | |
| | | | | | | | | |
| Information Technology - 7.7% | |
| Communications Equipment - 0.6% | |
Acme Packet, Inc. (a) | | | 300 | | | | 2,937 | |
| ADTRAN, Inc. | | | 59,058 | | | | 1,360,697 | |
Airvana, Inc. (a) | | | 10,200 | | | | 62,322 | |
Alvarion Ltd. (a) | | | 7,800 | | | | 30,654 | |
Aruba Networks, Inc. (a) | | | 16,500 | | | | 129,030 | |
Avocent Corporation (a) | | | 400 | | | | 9,948 | |
Brocade Communications Systems, Inc. (a) | | | 1,800 | | | | 15,444 | |
Cogo Group, Inc. (a) | | | 1,400 | | | | 7,854 | |
CommScope, Inc. (a) | | | 22,311 | | | | 602,843 | |
Comtech Telecommunications Corporation (a) | | | 1,000 | | | | 32,120 | |
DG FastChannel, Inc. (a) | | | 5,483 | | | | 114,979 | |
F5 Networks, Inc. (a) | | | 200 | | | | 8,978 | |
Harmonic, Inc. (a) | | | 7,400 | | | | 38,850 | |
Infinera Corporation (a) | | | 117,937 | | | | 876,272 | |
InterDigital, Inc. (a) | | | 800 | | | | 16,448 | |
Ixia (a) | | | 16,945 | | | | 112,684 | |
| TFS MARKET NEUTRAL FUND | |
| SCHEDULE OF SECURITIES SOLD SHORT (Continued) | |
| | |
| COMMON STOCKS - 64.6% (Continued) | | Shares | | | Value | |
| Information Technology - 7.7% (Continued) | |
| Communications Equipment - 0.6% (Continued) | |
JDS Uniphase Corporation (a) | | | 18,200 | | �� | $ | 101,738 | |
Loral Space & Communications, Inc. (a) | | | 200 | | | | 5,284 | |
Network Equipment Technologies, Inc. (a) | | | 300 | | | | 990 | |
ParkerVision, Inc. (a) | | | 26,416 | | | | 73,172 | |
| Plantronics, Inc. | | | 9,100 | | | | 219,401 | |
Qiao Xing Mobile Communication Company Ltd. (a) | | | 400 | | | | 1,208 | |
Riverbed Technology, Inc. (a) | | | 200 | | | | 4,098 | |
ShoreTel, Inc. (a) | | | 800 | | | | 5,256 | |
Starent Networks Corporation (a) | | | 1,100 | | | | 37,114 | |
Telestone Technologies Corporation (a) | | | 1,100 | | | | 8,921 | |
Telkonet, Inc. (a) | | | 156,779 | | | | 54,873 | |
UTStarcom, Inc. (a) | | | 456,646 | | | | 826,529 | |
| | | | | | | | 4,760,644 | |
| Computers & Peripherals - 1.2% | |
3PAR, Inc. (a) | | | 200 | | | | 1,882 | |
Avid Technology, Inc. (a) | | | 131,656 | | | | 1,662,815 | |
Dell, Inc. (a) | | | 300 | | | | 4,347 | |
Electronics for Imaging, Inc. (a) | | | 27,354 | | | | 318,948 | |
Hutchinson Technology, Inc. (a) | | | 2,100 | | | | 12,222 | |
| Imation Corporation | | | 101,656 | | | | 896,606 | |
Immersion Corporation (a) | | | 41,500 | | | | 152,305 | |
Intevac, Inc. (a) | | | 12,806 | | | | 130,621 | |
Lexmark International, Inc. - Class A (a) | | | 46,200 | | | | 1,178,100 | |
Logitech International S.A. (a) | | | 19,700 | | | | 334,900 | |
NCR Corporation (a) | | | 33,500 | | | | 340,025 | |
NetApp, Inc. (a) | | | 100 | | | | 2,705 | |
Netezza Corporation (a) | | | 125,780 | | | | 1,162,207 | |
QLogic Corporation (a) | | | 52,300 | | | | 917,342 | |
Silicon Graphics International Corporation (a) | | | 2,200 | | | | 13,112 | |
STEC, Inc. (a) | | | 300 | | | | 6,396 | |
Stratasys, Inc. (a) | | | 66,927 | | | | 1,056,108 | |
Synaptics, Inc. (a) | | | 64,787 | | | | 1,457,708 | |
| | | | | | | | 9,648,349 | |
| Electronic Equipment, Instruments & Components - 1.2% | |
| Agilysys, Inc. | | | 5,800 | | | | 27,318 | |
Arrow Electronics, Inc. (a) | | | 9,300 | | | | 235,662 | |
China Security & Surveillance Technology, Inc. (a) | | | 3,100 | | | | 16,213 | |
| Cognex Corporation | | | 56,151 | | | | 903,470 | |
Coherent, Inc. (a) | | | 25,991 | | | | 653,154 | |
| Daktronics, Inc. | | | 68,187 | | | | 512,766 | |
Dolby Laboratories, Inc. - Class A (a) | | | 3,300 | | | | 138,402 | |
DTS, Inc. (a) | | | 45,340 | | | | 1,280,855 | |
Echelon Corporation (a) | | | 39,339 | | | | 536,977 | |
FLIR Systems, Inc. (a) | | | 500 | | | | 13,905 | |
Ingram Micro, Inc. - Class A (a) | | | 26,600 | | | | 469,490 | |
Itron, Inc. (a) | | | 18,400 | | | | 1,104,736 | |
Littelfuse, Inc. (a) | | | 33,045 | | | | 910,720 | |
Maxwell Technologies, Inc. (a) | | | 12,384 | | | | 222,045 | |
Measurement Specialties, Inc. (a) | | | 1,600 | | | | 12,336 | |
| TFS MARKET NEUTRAL FUND | |
| SCHEDULE OF SECURITIES SOLD SHORT (Continued) | |
| | |
| COMMON STOCKS - 64.6% (Continued) | | Shares | | | Value | |
| Information Technology - 7.7% (Continued) | |
| Electronic Equipment, Instruments & Components - 1.2% (Continued) | |
| MTS Systems Corporation | | | 300 | | | $ | 7,950 | |
| Nam Tai Electronics, Inc. | | | 300 | | | | 1,665 | |
Plexus Corporation (a) | | | 3,600 | | | | 91,080 | |
RadiSys Corporation (a) | | | 8,000 | | | | 68,080 | |
Research Frontiers, Inc. (a) | | | 17,962 | | | | 65,022 | |
SYNNEX Corporation (a) | | | 33,690 | | | | 866,844 | |
Trimble Navigation Ltd. (a) | | | 13,400 | | | | 280,998 | |
Universal Display Corporation (a) | | | 106,400 | | | | 1,208,704 | |
X-Rite, Inc. (a) | | | 30,706 | | | | 61,412 | |
Zygo Corporation (a) | | | 9,958 | | | | 68,810 | |
| | | | | | | | 9,758,614 | |
| Internet Software & Services - 0.9% | |
Constant Contact, Inc. (a) | | | 44,338 | | | | 734,681 | |
DealerTrack Holdings, Inc. (a) | | | 58,463 | | | | 963,470 | |
Dice Holdings, Inc. (a) | | | 200 | | | | 1,202 | |
Digital River, Inc. (a) | | | 3,600 | | | | 82,188 | |
DivX, Inc. (a) | | | 900 | | | | 4,329 | |
Equinix, Inc. (a) | | | 13,200 | | | | 1,126,224 | |
Innodata Isogen, Inc. (a) | | | 2,200 | | | | 14,256 | |
J2 Global Communications, Inc. (a) | | | 3,400 | | | | 69,530 | |
Knot, Inc. (The) (a) | | | 84,887 | | | | 905,744 | |
LoopNet, Inc. (a) | | | 85,593 | | | | 747,227 | |
| Marchex, Inc. - Class B | | | 2,000 | | | | 9,060 | |
ModusLink Global Solutions, Inc. (a) | | | 300 | | | | 2,466 | |
OpenTable, Inc. (a) | | | 261 | | | | 6,436 | |
Rackspace Hosting, Inc. (a) | | | 300 | | | | 5,025 | |
RADVision Ltd. (a) | | | 15,800 | | | | 97,486 | |
RealNetworks, Inc. (a) | | | 25,496 | | | | 91,021 | |
SAVVIS, Inc. (a) | | | 1,800 | | | | 26,622 | |
Sohu.com, Inc. (a) | | | 25,970 | | | | 1,443,932 | |
support.com, Inc. (a) | | | 24,224 | | | | 58,138 | |
Switch & Data Facilities Company, Inc. (a) | | | 500 | | | | 8,365 | |
Terremark Worldwide, Inc. (a) | | | 34,987 | | | | 223,567 | |
Travelzoo, Inc. (a) | | | 5,375 | | | | 74,283 | |
| United Online, Inc. | | | 4,500 | | | | 36,000 | |
Vocus, Inc. (a) | | | 20,565 | | | | 372,226 | |
WebMD Health Corporation (a) | | | 24,623 | | | | 838,659 | |
Yahoo, Inc. (a) | | | 100 | | | | 1,590 | |
| | | | | | | | 7,943,727 | |
| IT Services - 0.6% | |
Alliance Data Systems Corporation (a) | | | 11,400 | | | | 626,772 | |
| Broadridge Financial Solutions, Inc. | | | 9,400 | | | | 195,614 | |
CyberSource Corporation (a) | | | 58,418 | | | | 956,887 | |
Euronet Worldwide, Inc. (a) | | | 4,815 | | | | 113,875 | |
Exlservice Holdings, Inc. (a) | | | 800 | | | | 10,888 | |
| Heartland Payment Systems, Inc. | | | 400 | | | | 4,916 | |
Hewitt Associates, Inc. - Class A (a) | | | 9,400 | | | | 333,888 | |
InfoGROUP, Inc. (a) | | | 12,939 | | | | 84,880 | |
Integral Systems, Inc. (a) | | | 12,658 | | | | 106,327 | |
| TFS MARKET NEUTRAL FUND | |
| SCHEDULE OF SECURITIES SOLD SHORT (Continued) | |
| | |
| COMMON STOCKS - 64.6% (Continued) | | Shares | | | Value | |
| Information Technology - 7.7% (Continued) | |
| IT Services - 0.6% (Continued) | |
NCI, Inc. (a) | | | 10,027 | | | $ | 269,827 | |
Rightnow Technologies, Inc. (a) | | | 45,800 | | | | 698,908 | |
TeleTech Holdings, Inc. (a) | | | 11,929 | | | | 213,410 | |
Unisys Corporation (a) | | | 4,830 | | | | 140,746 | |
Wright Express Corporation (a) | | | 43,516 | | | | 1,214,531 | |
| | | | | | | | 4,971,469 | |
| Office Electronics - 0.0% | |
| Xerox Corporation | | | 300 | | | | 2,256 | |
| | | | | | | | | |
| Semiconductors & Semiconductor Equipment - 1.6% | |
Advanced Energy Industries, Inc. (a) | | | 31,847 | | | | 388,852 | |
Amkor Technology, Inc. (a) | | | 2,100 | | | | 11,571 | |
Brooks Automation, Inc. (a) | | | 73,184 | | | | 503,506 | |
Cree, Inc. (a) | | | 200 | | | | 8,420 | |
Cypress Semiconductor Corporation (a) | | | 95,400 | | | | 804,222 | |
DSP Group, Inc. (a) | | | 900 | | | | 5,202 | |
Exar Corporation (a) | | | 97,050 | | | | 669,645 | |
EZchip Semiconductor Ltd. (a) | | | 400 | | | | 4,788 | |
FormFactor, Inc. (a) | | | 46,330 | | | | 787,147 | |
| Intersil Corporation - Class A | | | 155,889 | | | | 1,956,407 | |
Kulicke & Soffa Industries, Inc. (a) | | | 261,107 | | | | 1,214,147 | |
Microsemi Corporation (a) | | | 1,000 | | | | 13,310 | |
MKS Instruments, Inc. (a) | | | 51,060 | | | | 798,578 | |
Monolithic Power Systems, Inc. (a) | | | 59,633 | | | | 1,192,064 | |
Rubicon Technology, Inc. (a) | | | 33,706 | | | | 509,635 | |
Rudolph Technologies, Inc. (a) | | | 4,400 | | | | 27,896 | |
Semtech Corporation (a) | | | 6,100 | | | | 94,367 | |
Sigma Designs, Inc. (a) | | | 66,745 | | | | 801,607 | |
Silicon Image, Inc. (a) | | | 335,424 | | | | 707,745 | |
Skyworks Solutions, Inc. (a) | | | 200 | | | | 2,086 | |
| STMicroelectronics N.V. | | | 100 | | | | 796 | |
Supertex, Inc. (a) | | | 22,700 | | | | 550,475 | |
Teradyne, Inc. (a) | | | 58,900 | | | | 492,993 | |
Tessera Technologies, Inc. (a) | | | 200 | | | | 4,422 | |
Trident Microsystems, Inc. (a) | | | 120,700 | | | | 226,916 | |
TriQuint Semiconductor, Inc. (a) | | | 4,800 | | | | 25,872 | |
UltraTech, Inc. (a) | | | 32,941 | | | | 425,598 | |
Varian Semiconductor Equipment Associates, Inc. (a) | | | 17,940 | | | | 509,316 | |
Veeco Instruments, Inc. (a) | | | 7,974 | | | | 194,167 | |
Verigy Ltd. (a) | | | 1,700 | | | | 16,728 | |
Virage Logic Corporation (a) | | | 500 | | | | 2,950 | |
| | | | | | | | 12,951,428 | |
| Software - 1.6% | |
ACI Worldwide, Inc. (a) | | | 1,000 | | | | 16,090 | |
ANSYS, Inc. (a) | | | 23,289 | | | | 945,068 | |
ArcSight, Inc. (a) | | | 800 | | | | 19,776 | |
AsiaInfo Holdings, Inc. (a) | | | 600 | | | | 13,236 | |
Blackboard, Inc. (a) | | | 30,087 | | | | 1,067,186 | |
China TransInfo Technology Corporation (a) | | | 3,300 | | | | 23,001 | |
| TFS MARKET NEUTRAL FUND | |
| SCHEDULE OF SECURITIES SOLD SHORT (Continued) | |
| | |
| COMMON STOCKS - 64.6% (Continued) | | Shares | | | Value | |
| Information Technology - 7.7% (Continued) | |
| Software - 1.6% (Continued) | |
Chordiant Software, Inc. (a) | | | 16,060 | | | $ | 55,889 | |
ClickSoftware Technologies Ltd. (a) | | | 3,600 | | | | 18,576 | |
CommVault Systems, Inc. (a) | | | 3 | | | | 59 | |
Compuware Corporation (a) | | | 177,265 | | | | 1,251,491 | |
Concur Technologies, Inc. (a) | | | 32,100 | | | | 1,144,044 | |
DemandTec, Inc. (a) | | | 3,542 | | | | 31,134 | |
Electronic Arts, Inc. (a) | | | 1,000 | | | | 18,240 | |
| FactSet Research Systems, Inc. | | | 5,600 | | | | 358,680 | |
| Fair Isaac Corporation | | | 20,235 | | | | 411,377 | |
FalconStor Software, Inc. (a) | | | 11,078 | | | | 36,890 | |
GSE Systems, Inc. (a) | | | 200 | | | | 1,204 | |
Interactive Intelligence, Inc. (a) | | | 400 | | | | 6,708 | |
Kenexa Corporation (a) | | | 200 | | | | 2,520 | |
Lawson Software, Inc. (a) | | | 67,766 | | | | 427,603 | |
Manhattan Associates, Inc. (a) | | | 42,081 | | | | 965,759 | |
Midway Games, Inc. (a) | | | 51,015 | | | | 1,530 | |
Net 1 UEPS Technologies, Inc. (a) | | | 6,900 | | | | 120,681 | |
NetSuite, Inc. (a) | | | 24,181 | | | | 337,809 | |
Nuance Communications, Inc. (a) | | | 100 | | | | 1,311 | |
Parametric Technology Corporation (a) | | | 28,900 | | | | 430,899 | |
Quest Software, Inc. (a) | | | 5,000 | | | | 83,850 | |
Rosetta Stone, Inc. (a) | | | 4,000 | | | | 83,000 | |
Rovi Corporation (a) | | | 17,800 | | | | 490,390 | |
Scientific Learning Corporation (a) | | | 400 | | | | 2,020 | |
Shanda Interactive Entertainment Ltd. (a) | | | 19,000 | | | | 829,920 | |
Sonic Solutions, Inc. (a) | | | 27,372 | | | | 133,028 | |
Sourcefire, Inc. (a) | | | 300 | | | | 6,090 | |
SuccessFactors, Inc. (a) | | | 62,177 | | | | 950,686 | |
Sybase, Inc. (a) | | | 4,275 | | | | 169,119 | |
Symyx Technologies, Inc. (a) | | | 1,900 | | | | 11,153 | |
Take-Two Interactive Software, Inc. (a) | | | 188,175 | | | | 2,064,280 | |
THQ, Inc. (a) | | | 23,500 | | | | 122,905 | |
TiVo, Inc. (a) | | | 900 | | | | 9,792 | |
Tyler Technologies, Inc. (a) | | | 55,900 | | | | 1,063,218 | |
Vasco Data Security International, Inc. (a) | | | 3,100 | | | | 18,848 | |
| | | | | | | | 13,745,060 | |
| Materials - 3.4% | |
| Chemicals - 0.7% | |
| A. Schulman, Inc. | | | 16,352 | | | | 284,034 | |
| Airgas, Inc. | | | 10,300 | | | | 456,908 | |
Altair Nanotechnologies, Inc. (a) | | | 226,906 | | | | 231,444 | |
| American Vanguard Corporation | | | 34,198 | | | | 283,843 | |
| Cabot Corporation | | | 300 | | | | 6,579 | |
China Agritech, Inc. (a) | | | 300 | | | | 4,428 | |
| Cytec Industries, Inc. | | | 3,700 | | | | 122,729 | |
| Dow Chemical Company (The) | | | 100 | | | | 2,348 | |
| Ferro Corporation | | | 48,583 | | | | 297,814 | |
Georgia Gulf Corporation (a) | | | 1,500 | | | | 21,555 | |
| Hawkins, Inc. | | | 14,793 | | | | 310,949 | |
| TFS MARKET NEUTRAL FUND | |
| SCHEDULE OF SECURITIES SOLD SHORT (Continued) | |
| | |
| COMMON STOCKS - 64.6% (Continued) | | Shares | | | Value | |
| Materials - 3.4% (Continued) | |
| Chemicals - 0.7% (Continued) | |
| Huntsman Corporation | | | 3,500 | | | $ | 27,825 | |
| Innophos Holdings, Inc. | | | 300 | | | | 5,805 | |
| KMG Chemicals, Inc. | | | 400 | | | | 4,920 | |
| Koppers Holdings, Inc. | | | 800 | | | | 20,896 | |
| NewMarket Corporation | | | 3,400 | | | | 317,900 | |
OMNOVA Solutions, Inc. (a) | | | 2,000 | | | | 12,820 | |
| Terra Industries, Inc. | | | 68,989 | | | | 2,191,781 | |
| Valhi, Inc. | | | 5,400 | | | | 50,706 | |
| Westlake Chemical Corporation | | | 897 | | | | 21,788 | |
Yongye International, Inc. (a) | | | 1,500 | | | | 13,095 | |
Zoltek Companies, Inc. (a) | | | 155,386 | | | | 1,384,489 | |
| | | | | | | | 6,074,656 | |
| Construction Materials - 0.3% | |
| Eagle Materials, Inc. | | | 48,289 | | | | 1,199,982 | |
Headwaters, Inc. (a) | | | 177,310 | | | | 730,517 | |
| Martin Marietta Materials, Inc. | | | 4,300 | | | | 358,276 | |
United States Lime & Minerals, Inc. (a) | | | 1,909 | | | | 66,948 | |
| Vulcan Materials Company | | | 100 | | | | 4,603 | |
| | | | | | | | 2,360,326 | |
| Containers & Packaging - 0.7% | |
AEP Industries, Inc. (a) | | | 300 | | | | 10,464 | |
| Bemis Company, Inc. | | | 600 | | | | 15,498 | |
BWAY Holding Company (a) | | | 200 | | | | 3,554 | |
| Greif, Inc. - Class A | | | 4,200 | | | | 224,784 | |
| Packaging Corporation of America | | | 9,758 | | | | 178,376 | |
Pactiv Corporation (a) | | | 94,033 | | | | 2,171,222 | |
| Rock-Tenn Company | | | 2,900 | | | | 127,020 | |
| Sealed Air Corporation | | | 42,189 | | | | 811,294 | |
| Silgan Holdings, Inc. | | | 47,306 | | | | 2,542,698 | |
| | | | | | | | 6,084,910 | |
| Metals & Mining - 1.6% | |
| AK Steel Holding Corporation | | | 191,300 | | | | 3,035,931 | |
| Alcoa, Inc. | | | 300 | | | | 3,726 | |
| Allegheny Technologies, Inc. | | | 92,200 | | | | 2,845,292 | |
Allied Nevada Gold Corporation (a) | | | 28,508 | | | | 272,251 | |
| Amcol International Corporation | | | 24,188 | | | | 629,856 | |
Brush Engineered Materials, Inc. (a) | | | 5,600 | | | | 103,320 | |
China Precision Steel, Inc. (a) | | | 60,272 | | | | 133,804 | |
| Cliffs Natural Resources, Inc. | | | 100 | | | | 3,557 | |
| Compass Minerals International, Inc. | | | 48,200 | | | | 3,003,824 | |
Exeter Resource Corporation (a) | | | 1,900 | | | | 10,203 | |
Freeport-McMoRan Copper & Gold, Inc. (a) | | | 200 | | | | 14,672 | |
General Moly, Inc. (a) | | | 24,400 | | | | 53,680 | |
General Steel Holdings, Inc. (a) | | | 68,845 | | | | 256,103 | |
| Gerdau Ameristeel Corporation | | | 300 | | | | 2,040 | |
| IAMGOLD Corporation | | | 1,300 | | | | 17,095 | |
International Tower Hill Mines Ltd. (a) | | | 2,500 | | | | 11,775 | |
| Kinross Gold Corporation | | | 200 | | | | 3,716 | |
Northern Dynasty Minerals Ltd. (a) | | | 1,700 | | | | 11,016 | |
| TFS MARKET NEUTRAL FUND | |
| SCHEDULE OF SECURITIES SOLD SHORT (Continued) | |
| | |
| COMMON STOCKS - 64.6% (Continued) | | Shares | | | Value | |
| Materials - 3.4% (Continued) | |
| Metals & Mining - 1.6% (Continued) | |
RTI International Metals, Inc. (a) | | | 35,500 | | | $ | 735,205 | |
| Schnitzer Steel Industries, Inc. - Class A | | | 35,581 | | | | 1,538,523 | |
Seabridge Gold, Inc (a) | | | 200 | | | | 4,016 | |
Silver Standard Resources, Inc. (a) | | | 996 | | | | 18,506 | |
Stillwater Mining Company (a) | | | 900 | | | | 5,580 | |
Teck Resources Ltd. (a) | | | 200 | | | | 5,784 | |
Thompson Creek Metals Company, Inc. (a) | | | 17,019 | | | | 173,253 | |
U.S. Energy Corporation (a) | | | 3,400 | | | | 17,884 | |
| Walter Energy, Inc. | | | 5,300 | | | | 310,050 | |
| Yamana Gold, Inc. | | | 400 | | | | 4,260 | |
| | | | | | | | 13,224,922 | |
| Paper & Forest Products - 0.1% | |
AbitibiBowater, Inc. (a) | | | 70,886 | | | | 13,823 | |
| Deltic Timper Corporation | | | 6,882 | | | | 292,485 | |
Domtar Corporation (a) | | | 800 | | | | 33,512 | |
| Schweitzer-Mauduit International, Inc. | | | 300 | | | | 15,495 | |
| | | | | | | | 355,315 | |
| Telecommunication Services - 0.7% | |
| Diversified Telecommunication Services - 0.4% | |
| Alaska Communications Systems Group, Inc. | | | 61,761 | | | | 480,500 | |
Cbeyond, Inc. (a) | | | 78,163 | | | | 1,043,476 | |
General Communication, Inc. (a) | | | 15,339 | | | | 94,335 | |
Global Crossing Ltd. (a) | | | 1,700 | | | | 19,380 | |
| Iowa Telecommunications Services, Inc. | | | 50,765 | | | | 597,504 | |
Iridium Communications, Inc. (a) | | | 1,200 | | | | 10,680 | |
Neutral Tandem, Inc. (a) | | | 11,100 | | | | 234,099 | |
Premiere Global Services, Inc. (a) | | | 40,729 | | | | 304,246 | |
SureWest Communications (a) | | | 800 | | | | 7,056 | |
tw telecom, inc. (a) | | | 40,600 | | | | 511,560 | |
| Windstream Corporation | | | 100 | | | | 964 | |
| | | | | | | | 3,303,800 | |
| Wireless Telecommunication Services - 0.3% | |
American Tower Corporation (a) | | | 200 | | | | 7,364 | |
iPCS, Inc. (a) | | | 500 | | | | 11,935 | |
Leap Wireless International, Inc. (a) | | | 4,100 | | | | 54,202 | |
MetroPCS Communications, Inc. (a) | | | 8,800 | | | | 54,824 | |
| NTELOS Holdings Corporation | | | 34,100 | | | | 514,910 | |
SBA Communications Corporation - Class A (a) | | | 15,900 | | | | 448,539 | |
Syniverse Holdings, Inc. (a) | | | 48,858 | | | | 836,938 | |
| USA Mobility, Inc. | | | 17,700 | | | | 192,930 | |
| | | | | | | | 2,121,642 | |
| Utilities - 0.7% | |
| Electric Utilities - 0.3% | |
| Cleco Corporation | | | 38,801 | | | | 960,325 | |
| Hawaiian Electric Industries, Inc. | | | 70,510 | | | | 1,258,603 | |
| Unitil Corporation | | | 1,889 | | | | 39,083 | |
| | | | | | | | 2,258,011 | |
| TFS MARKET NEUTRAL FUND | |
| SCHEDULE OF SECURITIES SOLD SHORT (Continued) | |
| | |
| COMMON STOCKS - 64.6% (Continued) | | Shares | | | Value | |
| Utilities - 0.7% (Continued) | |
| Gas Utilities - 0.0% | |
China Natural Gas, Inc. (a) | | | 6,200 | | | $ | 72,850 | |
| National Fuel Gas Company | | | 5,900 | | | | 267,506 | |
| Suburban Propane Partners, L.P. | | | 2,000 | | | | 86,040 | |
| | | | | | | | 426,396 | |
| Multi-Utilities - 0.2% | |
| Black Hills Corporation | | | 37,403 | | | | 911,511 | |
| CMS Energy Corporation | | | 61,200 | | | | 813,960 | |
| | | | | | | | 1,725,471 | |
| Water Utilities - 0.2% | |
| Aqua America, Inc. | | | 92,895 | | | | 1,435,228 | |
| Cascal N.V. | | | 4,400 | | | | 23,848 | |
| Southwest Water Company | | | 8,000 | | | | 44,560 | |
| | | | | | | | 1,503,636 | |
| | | | | | | | | |
Total Common Stocks (Proceeds $572,693,788) | | | $ | 534,851,159 | |
| | | | | | | | | |
| | | | | | | | | |
| RIGHTS - 0.0% | | Shares | | | Value | |
| Zion Oil & Gas, Inc. (Proceeds $6,209) | | | 1,541 | | | $ | 613 | |
| | | | | | | | | |
| CLOSED-END FUNDS - 0.0% | | Shares | | | Value | |
| Alpine Total Dynamic Dividend Fund | | | 1,715 | | | $ | 14,526 | |
| Federated Premier Municipal Income Fund | | | 900 | | | | 12,087 | |
| Flaherty & Crumrine/Claymore Preferred Securities Income Fund | | | 700 | | | | 8,659 | |
| Nicholas-Applegate Convertible & Income Fund | | | 1,100 | | | | 8,932 | |
Total Closed-End Funds (Proceeds $46,955) | | | $ | 44,204 | |
| | | | | | | | | |
Total Securities Sold Short - 64.6% (Proceeds $572,746,952) | | | $ | 534,895,976 | |
ADR - American Depositary Receipt.
| (a) | Non-income producing security. |
See accompanying notes to financial statements.
| TFS SMALL CAP FUND | |
| SCHEDULE OF INVESTMENTS | |
| October 31, 2009 | |
| | |
| COMMON STOCKS - 98.9% | | Shares | | | Value | |
| Consumer Discretionary - 14.4% | |
| Auto Components - 1.1% | |
China Automotive Systems, Inc. (a) | | | 1,900 | | | $ | 19,684 | |
| Cooper Tire & Rubber Company | | | 2,000 | | | | 30,520 | |
Dana Holding Corporation (a) | | | 7,800 | | | | 44,148 | |
Federal-Mogul Corporation (a) | | | 1,400 | | | | 15,610 | |
| Modine Manufacturing Company | | | 2,100 | | | | 21,630 | |
Tenneco, Inc. (a) | | | 800 | | | | 10,896 | |
| WABCO Holdings, Inc. | | | 900 | | | | 21,348 | |
Wonder Auto Technology, Inc. (a) | | | 1,500 | | | | 19,410 | |
| | | | | | | | 183,246 | |
| Distributors - 0.1% | |
Audiovox Corporation (a) | | | 3,134 | | | | 20,246 | |
| | | | | | | | | |
| Diversified Consumer Services - 0.6% | |
Corinthian Colleges, Inc. (a) | | | 2,600 | | | | 41,236 | |
Grand Canyon Education, Inc. (a) | | | 500 | | | | 8,110 | |
| Hillenbrand, Inc. | | | 2,400 | | | | 47,952 | |
| | | | | | | | 97,298 | |
| Hotels, Restaurants & Leisure - 2.6% | |
Bally Technologies, Inc. (a) | | | 1,600 | | | | 63,024 | |
Chipotle Mexican Grill, Inc. - Class A (a) | | | 700 | | | | 57,043 | |
Denny's Corporation (a) | | | 6,600 | | | | 14,520 | |
DineEquity, Inc. (a) | | | 2,100 | | | | 44,436 | |
Einstein Noah Restaurant Group, Inc. (a) | | | 1,296 | | | | 16,874 | |
| Frisch's Restaurants, Inc. | | | 411 | | | | 9,638 | |
| International Speedway Corporation - Class A | | | 1,900 | | | | 48,469 | |
Landry's Restaurants, Inc. (a) | | | 5,200 | | | | 56,680 | |
Multimedia Games, Inc. (a) | | | 9,000 | | | | 44,190 | |
Papa John's International, Inc. (a) | | | 900 | | | | 20,250 | |
Penn National Gaming, Inc. (a) | | | 200 | | | | 5,026 | |
| Wendy's/Arby's Group, Inc. - Class A | | | 9,100 | | | | 35,945 | |
| Wyndham Worldwide Corporation | | | 1,400 | | | | 23,870 | |
| | | | | | | | 439,965 | |
| Household Durables - 1.8% | |
| American Greetings Corporation - Class A | | | 3,200 | | | | 65,088 | |
Beazer Homes USA, Inc. (a) | | | 1,500 | | | | 6,585 | |
Furniture Brands International, Inc. (a) | | | 4,200 | | | | 17,850 | |
Helen of Troy Ltd. (a) | | | 2,200 | | | | 50,248 | |
Hovnanian Enterprises, Inc. - Class A (a) | | | 5,500 | | | | 21,505 | |
| Jarden Corporation | | | 700 | | | | 19,173 | |
| Lennar Corporation - Class A | | | 1,800 | | | | 22,680 | |
Sealy Corporation (a) | | | 17,100 | | | | 49,590 | |
Standard Pacific Corporation (a) | | | 6,200 | | | | 18,600 | |
| Tupperware Corporation | | | 700 | | | | 31,514 | |
| | | | | | | | 302,833 | |
| Internet & Catalog Retail - 0.2% | |
HSN, Inc. (a) | | | 1,600 | | | | 23,904 | |
| TFS SMALL CAP FUND | |
| SCHEDULE OF INVESTMENTS (Continued) | |
| | |
| COMMON STOCKS - 98.9% (Continued) | | Shares | | | Value | |
| Consumer Discretionary - 14.4% (Continued) | |
| Internet & Catalog Retail - 0.2% (Continued) | |
Overstock.com, Inc. (a) | | | 700 | | | $ | 9,800 | |
| | | | | | | | 33,704 | |
| Leisure Equipment & Products - 0.3% | |
| Brunswick Corporation | | | 2,290 | | | | 21,709 | |
RC2 Corporation (a) | | | 2,300 | | | | 30,038 | |
| | | | | | | | 51,747 | |
| Media - 2.4% | |
Carmike Cinemas, Inc. (a) | | | 1,400 | | | | 13,762 | |
CTC Media, Inc. (a) | | | 1,900 | | | | 30,552 | |
DreamWorks Animation SKG, Inc. - Class A (a) | | | 1,100 | | | | 35,200 | |
| Harte-Hanks, Inc. | | | 1,900 | | | | 22,306 | |
| Interactive Data Corporation | | | 1,700 | | | | 44,710 | |
Knology, Inc. (a) | | | 4,200 | | | | 42,210 | |
Liberty Media Corporation - Series A (a) | | | 1,200 | | | | 24,828 | |
Lions Gate Entertainment Corporation (a) | | | 1,200 | | | | 6,228 | |
Live Nation, Inc. (a) | | | 3,200 | | | | 21,312 | |
LodgeNet Interactive Corporation (a) | | | 9,873 | | | | 47,884 | |
Mediacom Communications Corporation (a) | | | 4,100 | | | | 19,598 | |
| Regal Entertainment Group | | | 300 | | | | 3,783 | |
SIRIUS XM Radio, Inc. (a) | | | 113,970 | | | | 66,786 | |
| Value Line, Inc. | | | 400 | | | | 12,304 | |
| | | | | | | | 391,463 | |
| Multi-Line Retail - 0.7% | |
| Dillard's, Inc. | | | 4,400 | | | | 59,928 | |
| Family Dollar Stores, Inc. | | | 200 | | | | 5,660 | |
Retail Ventures, Inc. (a) | | | 3,300 | | | | 21,153 | |
Saks, Inc. (a) | | | 4,100 | | | | 23,001 | |
| | | | | | | | 109,742 | |
| Specialty Retail - 1.9% | |
Conn's, Inc. (a) | | | 100 | | | | 631 | |
Destination Maternity Corporation (a) | | | 583 | | | | 11,689 | |
Dress Barn, Inc. (a) | | | 400 | | | | 7,220 | |
Hot Topic, Inc. (a) | | | 1,700 | | | | 13,090 | |
J Crew Group, Inc. (a) | | | 1,500 | | | | 61,170 | |
MarineMax, Inc. (a) | | | 2,800 | | | | 19,068 | |
New York & Company, Inc. (a) | | | 5,000 | | | | 22,000 | |
OfficeMax, Inc. (a) | | | 1,800 | | | | 20,574 | |
| Pep Boys - Manny, Moe & Jack | | | 5,300 | | | | 46,481 | |
Rent-A-Center, Inc. (a) | | | 100 | | | | 1,836 | |
Signet Jewelers Ltd. (a) | | | 700 | | | | 17,647 | |
Ulta Salon, Cosmetics & Fragrance, Inc. (a) | | | 3,600 | | | | 54,504 | |
West Marine, Inc. (a) | | | 2,500 | | | | 19,050 | |
| Williams-Sonoma, Inc. | | | 700 | | | | 13,146 | |
| | | | | | | | 308,106 | |
| Textiles, Apparel & Luxury Goods - 2.7% | |
CROCS, Inc. (a) | | | 6,200 | | | | 37,696 | |
Fossil, Inc. (a) | | | 800 | | | | 21,384 | |
| Jones Apparel Group, Inc. | | | 2,900 | | | | 51,881 | |
| TFS SMALL CAP FUND | |
| SCHEDULE OF INVESTMENTS (Continued) | |
| | |
| COMMON STOCKS - 98.9% (Continued) | | Shares | | | Value | |
| Consumer Discretionary - 14.4% (Continued) | |
| Textiles, Apparel & Luxury Goods - 2.7% (Continued) | |
| Liz Claiborne, Inc. | | | 7,600 | | | $ | 43,624 | |
Maidenform Brands, Inc. (a) | | | 1,500 | | | | 21,120 | |
Perry Ellis International, Inc. (a) | | | 3,700 | | | | 50,579 | |
Quiksilver, Inc. (a) | | | 22,500 | | | | 44,775 | |
Skechers U.S.A., Inc. - Class A (a) | | | 1,400 | | | | 30,548 | |
| UniFirst Corporation | | | 1,200 | | | | 50,520 | |
Warnaco Group, Inc. (The) (a) | | | 1,200 | | | | 48,636 | |
| Wolverine World Wide, Inc. | | | 2,100 | | | | 53,718 | |
| | | | | | | | 454,481 | |
| Consumer Staples - 3.1% | |
| Food & Staples Retailing - 0.7% | |
| Andersons, Inc. (The) | | | 1,600 | | | | 49,648 | |
BJ's Wholesale Club, Inc. (a) | | | 300 | | | | 10,509 | |
Rite Aid Corporation (a) | | | 7,300 | | | | 9,417 | |
| SUPERVALU, Inc. | | | 1,400 | | | | 22,218 | |
Susser Holdings Corporation (a) | | | 2,200 | | | | 26,158 | |
| | | | | | | | 117,950 | |
| Food Products - 1.6% | |
AgFeed Industries, Inc. (a) | | | 1,300 | | | | 5,733 | |
| B&G Foods, Inc. | | | 2,800 | | | | 21,868 | |
Chiquita Brands International, Inc. (a) | | | 1,200 | | | | 19,428 | |
| Corn Products International, Inc. | | | 1,705 | | | | 48,047 | |
Darling International, Inc. (a) | | | 3,300 | | | | 22,935 | |
| Del Monte Foods Company | | | 1,900 | | | | 20,520 | |
Fresh Del Monte Produce, Inc. (a) | | | 1,100 | | | | 23,881 | |
Hain Celestial Group, Inc. (The) (a) | | | 2,800 | | | | 49,112 | |
Reddy Ice Holdings, Inc (a) | | | 11,000 | | | | 43,450 | |
| Sanderson Farms, Inc. | | | 300 | | | | 10,977 | |
| | | | | | | | 265,951 | |
| Personal Products - 0.8% | |
Bare Escentuals, Inc. (a) | | | 2,200 | | | | 27,786 | |
Female Health Company (The) (a) | | | 4,799 | | | | 22,220 | |
| Nu Skin Enterprises, Inc. - Class A | | | 1,200 | | | | 27,312 | |
Prestige Brands Holdings, Inc. (a) | | | 4,800 | | | | 32,448 | |
Schiff Nutrition International, Inc. (a) | | | 1,477 | | | | 8,522 | |
Tiens Biotech Group (USA), Inc. (a) | | | 1,733 | | | | 7,001 | |
| | | | | | | | 125,289 | |
| Energy - 5.7% | |
| Energy Equipment & Services - 1.9% | |
Cal Dive International, Inc. (a) | | | 2,300 | | | | 17,664 | |
Geokinetics, Inc. (a) | | | 1,300 | | | | 20,904 | |
Hercules Offshore, Inc. (a) | | | 2,000 | | | | 10,260 | |
ION Geophysical Corporation (a) | | | 8,700 | | | | 33,321 | |
Matrix Service Company (a) | | | 2,800 | | | | 24,836 | |
Natural Gas Services Group, Inc. (a) | | | 1,400 | | | | 23,618 | |
Oceaneering International, Inc. (a) | | | 200 | | | | 10,220 | |
Oil States International, Inc. (a) | | | 800 | | | | 27,552 | |
Pioneer Drilling Company (a) | | | 4,900 | | | | 32,781 | |
| TFS SMALL CAP FUND | |
| SCHEDULE OF INVESTMENTS (Continued) | |
| | |
| COMMON STOCKS - 98.9% (Continued) | | Shares | | | Value | |
| Energy - 5.7% (Continued) | |
| Energy Equipment & Services - 1.9% (Continued) | |
| Precision Drilling Trust | | | 2,000 | | | $ | 13,100 | |
| Rowan Companies, Inc. | | | 700 | | | | 16,275 | |
T-3 Energy Services, Inc. (a) | | | 700 | | | | 14,014 | |
TETRA Technologies, Inc. (a) | | | 4,700 | | | | 44,462 | |
Union Drilling, Inc. (a) | | | 4,436 | | | | 33,891 | |
| | | | | | | | 322,898 | |
| Oil, Gas & Consumable Fuels - 3.8% | |
| Advantage Oil & Gas Ltd. | | | 2,800 | | | | 17,248 | |
| Alon USA Energy, Inc. | | | 2,100 | | | | 17,640 | |
Approach Resources, Inc. (a) | | | 2,101 | | | | 16,304 | |
| Atlas Energy, Inc. | | | 300 | | | | 7,854 | |
| Atlas Pipeline Partners, L.P. | | | 1,200 | | | | 8,424 | |
ATP Oil & Gas Corporation (a) | | | 400 | | | | 6,924 | |
Concho Resources, Inc. (a) | | | 600 | | | | 22,866 | |
Contango Oil & Gas Company (a) | | | 100 | | | | 4,765 | |
CVR Energy, Inc. (a) | | | 1,800 | | | | 18,936 | |
| Delek US Holdings, Inc. | | | 2,400 | | | | 16,200 | |
Denison Mines Corporation (a) | | | 8,000 | | | | 11,840 | |
| DHT Maritime, Inc. | | | 3,400 | | | | 11,628 | |
| Eagle Rock Energy Partners, L.P. | | | 700 | | | | 3,318 | |
| Frontier Oil Corporation | | | 600 | | | | 8,316 | |
Gran Tierra Energy, Inc. (a) | | | 4,700 | | | | 22,372 | |
Gulfport Energy Corporation (a) | | | 2,600 | | | | 19,838 | |
| Holly Corporation | | | 2,000 | | | | 58,020 | |
International Coal Group, Inc. (a) | | | 1,800 | | | | 7,362 | |
| Linn Energy, LLC | | | 200 | | | | 4,900 | |
McMoRan Exploration Company (a) | | | 1,500 | | | | 11,535 | |
Oilsands Quest, Inc. (a) | | | 10,760 | | | | 12,912 | |
Patriot Coal Corporation (a) | | | 600 | | | | 6,780 | |
| Pengrowth Energy Trust | | | 1,900 | | | | 17,480 | |
Petroleum Development Corporation (a) | | | 1,800 | | | | 30,060 | |
| Provident Energy Trust | | | 1,700 | | | | 10,489 | |
Quicksilver Resources, Inc. (a) | | | 3,800 | | | | 46,360 | |
| Southern Union Company | | | 1,800 | | | | 35,226 | |
Stone Energy Corporation (a) | | | 1,000 | | | | 15,330 | |
| Teekay Corporation | | | 1,300 | | | | 26,975 | |
| Teekay Tankers Ltd. - Class A | | | 2,668 | | | | 21,611 | |
USEC, Inc. (a) | | | 6,900 | | | | 26,634 | |
VAALCO Energy, Inc. (a) | | | 7,700 | | | | 32,802 | |
Warren Resources, Inc. (a) | | | 12,000 | | | | 25,920 | |
Western Refining, Inc. (a) | | | 3,100 | | | | 17,391 | |
| | | | | | | | 622,260 | |
| Financials - 15.3% | |
| Capital Markets - 2.3% | |
American Capital Ltd. (a) | | | 12,900 | | | | 34,572 | |
| Apollo Investment Corporation | | | 3,500 | | | | 31,500 | |
| Ares Capital Corporation | | | 2,000 | | | | 20,880 | |
| BlackRock Kelso Capital Corporation | | | 1,800 | | | | 13,158 | |
Broadpoint Gleacher Securities Group, Inc. (a) | | | 2,700 | | | | 17,199 | |
| TFS SMALL CAP FUND | |
| SCHEDULE OF INVESTMENTS (Continued) | |
| | |
| COMMON STOCKS - 98.9% (Continued) | | Shares | | | Value | |
| Financials - 15.3% (Continued) | |
| Capital Markets - 2.3% (Continued) | |
| Duff & Phelps Corporation | | | 800 | | | $ | 13,752 | |
E*TRADE Financial Corporation (a) | | | 21,500 | | | | 31,390 | |
FBR Capital Markets Corporation (a) | | | 4,900 | | | | 29,890 | |
| Fifth Street Finance Corporation | | | 1,400 | | | | 13,762 | |
Fortress Investment Group, LLC (a) | | | 6,500 | | | | 27,235 | |
| GFI Group, Inc. | | | 2,200 | | | | 11,330 | |
| Gladstone Capital Corporation | | | 2,700 | | | | 22,167 | |
KBW, Inc. (a) | | | 700 | | | | 19,600 | |
MCG Capital Corporation (a) | | | 4,334 | | | | 17,292 | |
MF Global Ltd. (a) | | | 200 | | | | 1,424 | |
| PennantPark Investment Corporation | | | 1,700 | | | | 13,141 | |
Rodman & Renshaw Capital Group, Inc. (a) | | | 6,700 | | | | 28,676 | |
Safeguard Scientifics, Inc. (a) | | | 2,404 | | | | 23,415 | |
| Sanders Morris Harris Group, Inc. | | | 2,600 | | | | 15,106 | |
| | | | | | | | 385,489 | |
| Commercial Banks - 4.8% | |
| Banco Latinoamericano de Comercio Exterior, S.A. - Class E - ADR | | | 1,800 | | | | 25,398 | |
| Boston Private Financial Holdings, Inc. | | | 8,900 | | | | 52,955 | |
| CapitalSource, Inc. | | | 15,030 | | | | 53,507 | |
| Cathay General Bancorp | | | 4,600 | | | | 40,618 | |
| CoBiz, Inc. | | | 3,300 | | | | 15,741 | |
| Commerce Bancshares, Inc. | | | 600 | | | | 23,016 | |
| Community Bank System, Inc. | | | 2,500 | | | | 46,525 | |
| Community Trust Bancorporation, Inc. | | | 822 | | | | 20,238 | |
| East West Bancorp, Inc. | | | 4,400 | | | | 39,732 | |
| First Bancorporation | | | 5,300 | | | | 10,017 | |
| First Busey Corporation | | | 4,274 | | | | 16,540 | |
| First Community Bancshares, Inc. | | | 3,057 | | | | 35,583 | |
| First Midwest Bancorp, Inc. | | | 1,900 | | | | 19,760 | |
| First of Long Island Corporation (The) | | | 500 | | | | 12,085 | |
| Heartland Financial USA, Inc. | | | 1,900 | | | | 24,396 | |
| Huntington Bancshares, Inc. | | | 4,500 | | | | 17,145 | |
| Independent Bank Corporation | | | 800 | | | | 17,016 | |
| Lakeland Bancorp, Inc. | | | 3,660 | | | | 22,253 | |
| Marshall & Ilsley Corporation | | | 6,500 | | | | 34,580 | |
| Oriental Financial Group, Inc. | | | 3,100 | | | | 33,015 | |
| Peoples Bancorp, Inc. | | | 2,894 | | | | 31,082 | |
Pinnacle Financial Partners, Inc. (a) | | | 3,100 | | | | 39,370 | |
| Popular, Inc. | | | 15,200 | | | | 32,832 | |
Santander BanCorp (a) | | | 1,700 | | | | 19,550 | |
| Shore Bancshares, Inc. | | | 1,000 | | | | 16,310 | |
| Southwest Bancorp, Inc. | | | 1,500 | | | | 14,760 | |
Sterling Financial Corporation (a) | | | 17,100 | | | | 13,680 | |
SVB Financial Group (a) | | | 1,200 | | | | 49,500 | |
Western Alliance Bancorp (a) | | | 6,300 | | | | 27,405 | |
| | | | | | | | 804,609 | |
| Consumer Finance - 0.8% | |
AmeriCredit Corporation (a) | | | 2,600 | | | | 45,890 | |
| TFS SMALL CAP FUND | |
| SCHEDULE OF INVESTMENTS (Continued) | |
| | |
| COMMON STOCKS - 98.9% (Continued) | | Shares | | | Value | |
| Financials - 15.3% (Continued) | |
| Consumer Finance - 0.8% (Continued) | |
Cardtronics, Inc. (a) | | | 3,800 | | | $ | 37,810 | |
EZCORP, Inc. - Class A (a) | | | 1,600 | | | | 20,752 | |
Nelnet, Inc. - Class A (a) | | | 1,600 | | | | 22,448 | |
World Acceptance Corporation (a) | | | 100 | | | | 2,509 | |
| | | | | | | | 129,409 | |
| Diversified Financial Services - 0.2% | |
| Compass Diversified Holdings, Inc. | | | 3,000 | | | | 30,690 | |
| | | | | | | | | |
| Insurance - 4.7% | |
| Allied World Assurance Company Holdings Ltd. | | | 1,100 | | | | 49,236 | |
| Ambac Financial Group, Inc. | | | 7,300 | | | | 8,395 | |
American Financial Group, Inc. (a) | | | 1,200 | | | | 29,520 | |
American Safety Insurance Holdings Ltd. (a) | | | 300 | | | | 4,446 | |
Argo Group International Holdings Ltd. (a) | | | 1,300 | | | | 44,148 | |
| Aspen Insurance Holdings Ltd. | | | 800 | | | | 20,640 | |
| Assured Guaranty Ltd. | | | 1,100 | | | | 18,238 | |
CNA Surety Corporation (a) | | | 2,198 | | | | 31,783 | |
Conseco, Inc. (a) | | | 5,700 | | | | 29,697 | |
| Delphi Financial Group, Inc. - Class A | | | 2,100 | | | | 45,570 | |
| Erie Indemnity Company - Class A | | | 200 | | | | 7,050 | |
| FBL Financial Group, Inc. - Class A | | | 1,900 | | | | 38,285 | |
| Fidelity National Financial, Inc. - Class A | | | 3,400 | | | | 46,138 | |
| Flagstone Reinsurance Holdings Ltd. | | | 3,200 | | | | 35,040 | |
Hallmark Financial Services, Inc. (a) | | | 3,300 | | | | 25,311 | |
| Horace Mann Educators Corporation | | | 1,500 | | | | 18,645 | |
| Kansas City Life Insurance Company | | | 685 | | | | 18,385 | |
| Maiden Holdings Ltd. | | | 2,000 | | | | 13,860 | |
| Max Capital Group Ltd. | | | 1,000 | | | | 20,650 | |
| Meadowbrook Insurance Group, Inc. | | | 4,800 | | | | 32,304 | |
| Platinum Underwriters Holdings Ltd. | | | 500 | | | | 17,885 | |
| Reinsurance Group of America, Inc. | | | 400 | | | | 18,440 | |
SeaBright Insurance Holdings Ltd. (a) | | | 3,180 | | | | 35,553 | |
| StanCorp Financial Group, Inc. | | | 700 | | | | 25,697 | |
| Transatlantic Holdings, Inc. | | | 1,000 | | | | 50,500 | |
| United Fire & Casualty Company | | | 1,500 | | | | 26,220 | |
| Unitrin, Inc. | | | 2,500 | | | | 49,000 | |
| Universal Insurance Holdings, Inc. | | | 4,100 | | | | 21,771 | |
| | | | | | | | 782,407 | |
| Real Estate Investment Trusts - 1.4% | |
| American Capital Agency Corporation | | | 600 | | | | 15,600 | |
| Anworth Mortgage Asset Corporation | | | 1,700 | | | | 12,121 | |
| Capstead Mortgage Corporation | | | 2,203 | | | | 28,992 | |
| Care Investment Trust, Inc. | | | 1,400 | | | | 11,214 | |
| Chimera Investment Corporation | | | 5,200 | | | | 18,148 | |
| Cousins Properties, Inc. | | | 900 | | | | 6,588 | |
| Education Realty Trust, Inc. | | | 5,600 | | | | 28,056 | |
| Hersha Hospitality Trust | | | 5,288 | | | | 13,537 | |
| LTC Properties, Inc. | | | 1,100 | | | | 26,125 | |
| MFA Financial, Inc. | | | 3,200 | | | | 23,744 | |
| TFS SMALL CAP FUND | |
| SCHEDULE OF INVESTMENTS (Continued) | |
| | |
| COMMON STOCKS - 98.9% (Continued) | | Shares | | | Value | |
| Financials - 15.3% (Continued) | |
| Real Estate Investment Trusts - 1.4% (Continued) | |
| PS Business Parks, Inc. | | | 400 | | | $ | 19,588 | |
| Saul Centers, Inc. | | | 800 | | | | 24,608 | |
| | | | | | | | 228,321 | |
| Thrifts & Mortgage Finance - 1.1% | |
| Dime Community Bancshares, Inc. | | | 3,600 | | | | 39,564 | |
| Federal Agricultural Mortgage Corporation | | | 1,900 | | | | 15,257 | |
| Flushing Financial Corporation | | | 1,500 | | | | 16,845 | |
MGIC Investment Corporation (a) | | | 1,400 | | | | 6,034 | |
| Northwest Bancorp, Inc. | | | 1,400 | | | | 30,800 | |
Ocwen Financial Corporation (a) | | | 2,200 | | | | 24,046 | |
| Provident New York Bancorp | | | 2,000 | | | | 17,060 | |
| Radian Group, Inc. | | | 1,400 | | | | 8,106 | |
| Roma Financial Corporation | | | 2,128 | | | | 26,366 | |
| | | | | | | | 184,078 | |
| Health Care - 14.8% | |
| Biotechnology - 3.0% | |
Abraxis BioScience, Inc. (a) | | | 900 | | | | 28,098 | |
Allos Therapeutics, Inc. (a) | | | 1,800 | | | | 10,170 | |
Amylin Pharmaceuticals, Inc. (a) | | | 3,790 | | | | 41,842 | |
Arena Pharmaceuticals, Inc. (a) | | | 2,000 | | | | 7,060 | |
BioCryst Pharmaceuticals, Inc. (a) | | | 2,900 | | | | 25,897 | |
Cubist Pharmaceuticals, Inc. (a) | | | 900 | | | | 15,246 | |
Cytokinetics, Inc. (a) | | | 6,600 | | | | 21,054 | |
Emergent BioSolutions, Inc. (a) | | | 1,200 | | | | 17,304 | |
Exelixis, Inc. (a) | | | 3,400 | | | | 20,672 | |
Geron Corporation (a) | | | 6,400 | | | | 39,104 | |
Immunomedics, Inc. (a) | | | 1,900 | | | | 6,764 | |
Isis Pharmaceuticals, Inc. (a) | | | 1,800 | | | | 22,806 | |
MannKind Corporation (a) | | | 1,970 | | | | 10,283 | |
Myriad Genetics, Inc. (a) | | | 600 | | | | 14,568 | |
Nanosphere, Inc. (a) | | | 1,699 | | | | 11,349 | |
NeurogesX, Inc. (a) | | | 2,500 | | | | 19,725 | |
Onyx Pharmaceuticals, Inc. (a) | | | 100 | | | | 2,660 | |
Protalix BioTherapeutics, Inc. (a) | | | 2,800 | | | | 26,544 | |
Rigel Pharmaceuticals, Inc. (a) | | | 1,200 | | | | 7,692 | |
Savient Pharmaceuticals, Inc. (a) | | | 800 | | | | 10,080 | |
Sinovac Biotech Ltd. (a) | | | 2,910 | | | | 21,563 | |
Spectrum Pharmaceuticals, Inc. (a) | | | 4,300 | | | | 17,845 | |
Targacept, Inc. (a) | | | 2,700 | | | | 50,625 | |
United Therapeutics Corporation (a) | | | 500 | | | | 21,270 | |
Vanda Pharmaceuticals, Inc. (a) | | | 1,900 | | | | 19,380 | |
ZymoGenetics, Inc. (a) | | | 1,300 | | | | 6,045 | |
| | | | | | | | 495,646 | |
| Health Care Equipment & Supplies - 2.9% | |
Abaxis, Inc. (a) | | | 700 | | | | 15,974 | |
Alphatec Holdings, Inc. (a) | | | 2,801 | | | | 13,389 | |
| Cooper Companies, Inc. (The) | | | 2,200 | | | | 61,622 | |
CryoLife, Inc. (a) | | | 2,500 | | | | 15,000 | |
Endologix, Inc. (a) | | | 4,500 | | | | 21,420 | |
| TFS SMALL CAP FUND | |
| SCHEDULE OF INVESTMENTS (Continued) | |
| | |
| COMMON STOCKS - 98.9% (Continued) | | Shares | | | Value | |
| Health Care - 14.8% (Continued) | |
| Health Care Equipment & Supplies - 2.9% (Continued) | |
Integra LifeSciences Holdings Corporation (a) | | | 600 | | | $ | 18,324 | |
| Invacare Corporation | | | 1,300 | | | | 29,159 | |
Inverness Medical Innovations, Inc. (a) | | | 1,300 | | | | 49,413 | |
Kensey Nash Corporation (a) | | | 1,401 | | | | 33,498 | |
Medical Action Industries, Inc. (a) | | | 1,700 | | | | 18,598 | |
NuVasive, Inc. (a) | | | 1,300 | | | | 47,177 | |
Quidel Corporation (a) | | | 3,650 | | | | 52,195 | |
Sirona Dental Systems, Inc. (a) | | | 1,100 | | | | 29,601 | |
Synovis Life Technologies, Inc. (a) | | | 1,900 | | | | 22,914 | |
| Teleflex, Inc. | | | 300 | | | | 14,925 | |
Thoratec Corporation (a) | | | 400 | | | | 10,504 | |
TomoTherapy, Inc. (a) | | | 4,500 | | | | 14,940 | |
Wright Medical Group, Inc. (a) | | | 1,300 | | | | 21,125 | |
| | | | | | | | 489,778 | |
| Health Care Providers & Services - 5.4% | |
Alliance Imaging, Inc. (a) | �� | | 4,200 | | | | 22,848 | |
Allion Healthcare, Inc. (a) | | | 2,600 | | | | 16,744 | |
Amedysis, Inc. (a) | | | 1,400 | | | | 55,706 | |
American Dental Partners, Inc. (a) | | | 1,800 | | | | 21,402 | |
AMN Healthcare Services, Inc. (a) | | | 2,200 | | | | 18,304 | |
AmSurg Corporation (a) | | | 2,500 | | | | 52,675 | |
Centene Corporation (a) | | | 3,300 | | | | 58,839 | |
Community Health Systems, Inc. (a) | | | 1,400 | | | | 43,792 | |
Continucare Corporation (a) | | | 7,506 | | | | 19,666 | |
Corvel Corporation (a) | | | 584 | | | | 16,644 | |
Coventry Health Care, Inc. (a) | | | 1,100 | | | | 21,813 | |
Cross Country Healthcare, Inc. (a) | | | 2,300 | | | | 18,998 | |
Emergency Medical Services Corporation (a) | | | 500 | | | | 24,010 | |
Hanger Orthopedic Group, Inc. (a) | | | 1,500 | | | | 20,760 | |
Health Management Associates, Inc. - Class A (a) | | | 3,400 | | | | 20,740 | |
Health Net, Inc. (a) | | | 1,200 | | | | 17,892 | |
inVentiv Health, Inc. (a) | | | 1,200 | | | | 20,376 | |
Lincare Holdings, Inc. (a) | | | 300 | | | | 9,423 | |
MedCath Corporation (a) | | | 1,730 | | | | 14,203 | |
MEDNAX, Inc. (a) | | | 400 | | | | 20,768 | |
Molina Healthcare, Inc. (a) | | | 1,100 | | | | 20,592 | |
| National Research Corporation | | | 984 | | | | 22,701 | |
NightHawk Radiology Holdings, Inc. (a) | | | 4,000 | | | | 23,960 | |
NovaMed, Inc. (a) | | | 2,406 | | | | 9,696 | |
Odyssey Healthcare, Inc. (a) | | | 1,600 | | | | 22,304 | |
| Omnicare, Inc. | | | 500 | | | | 10,835 | |
Provident Service Corporation (a) | | | 1,928 | | | | 24,023 | |
RehabCare Group, Inc. (a) | | | 900 | | | | 16,875 | |
Res-Care, Inc. (a) | | | 1,500 | | | | 18,045 | |
Sun Healthcare Group, Inc. (a) | | | 4,700 | | | | 42,676 | |
Sunrise Senior Living, Inc. (a) | | | 10,000 | | | | 41,600 | |
Tenet Healthcare Corporation (a) | | | 8,000 | | | | 40,960 | |
U.S. Physical Therapy, Inc. (a) | | | 2,203 | | | | 30,930 | |
Universal American Corporation (a) | | | 2,200 | | | | 22,000 | |
| TFS SMALL CAP FUND | |
| SCHEDULE OF INVESTMENTS (Continued) | |
| | |
| COMMON STOCKS - 98.9% (Continued) | | Shares | | | Value | |
| Health Care - 14.8% (Continued) | |
| Health Care Providers & Services - 5.4% (Continued) | |
| Universal Health Services, Inc. - Class B | | | 500 | | | $ | 27,825 | |
| | | | | | | | 890,625 | |
| Health Care Technology - 0.6% | |
athenahealth, Inc. (a) | | | 300 | | | | 11,283 | |
Eclipsys Corporation (a) | | | 1,200 | | | | 22,500 | |
| IMS Health, Inc. | | | 3,500 | | | | 57,365 | |
MedAssets, Inc. (a) | | | 400 | | | | 8,776 | |
| | | | | | | | 99,924 | |
| Life Sciences Tools & Services - 1.4% | |
Bio-Rad Laboratories, Inc. - Class A (a) | | | 557 | | | | 49,790 | |
Bruker Corporation (a) | | | 1,900 | | | | 20,596 | |
Cambrex Corporation (a) | | | 2,290 | | | | 13,740 | |
Covance, Inc. (a) | | | 900 | | | | 46,512 | |
Helicos BioSciences Corporation (a) | | | 9,700 | | | | 18,333 | |
Kendle International, Inc. (a) | | | 3,700 | | | | 62,456 | |
Parexel International Corporation (a) | | | 1,800 | | | | 22,536 | |
Sequenom, Inc. (a) | | | 3,000 | | | | 8,280 | |
| | | | | | | | 242,243 | |
| Pharmaceuticals - 1.5% | |
Ardea Biosciences, Inc. (a) | | | 900 | | | | 12,150 | |
BioForm Medical, Inc. (a) | | | 17,377 | | | | 62,905 | |
Caraco Pharmaceutical Laboratories Ltd. (a) | | | 3,400 | | | | 12,512 | |
Endo Pharmaceuticals Holdings, Inc. (a) | | | 1,000 | | | | 22,400 | |
Inspire Pharmaceuticals, Inc. (a) | | | 4,000 | | | | 17,880 | |
Lannett Company, Inc. (a) | | | 3,700 | | | | 24,864 | |
Matrixx Initiatives, Inc. (a) | | | 1,500 | | | | 6,750 | |
Medicines Company (The) (a) | | | 1,800 | | | | 12,942 | |
Nektar Therapeutics (a) | | | 800 | | | | 6,496 | |
Par Pharmaceutical Companies, Inc. (a) | | | 1,100 | | | | 23,067 | |
| Perrigo Company | | | 1,000 | | | | 37,190 | |
SuperGen, Inc. (a) | | | 2,400 | | | | 5,616 | |
| | | | | | | | 244,772 | |
| Industrials - 14.2% | |
| Aerospace & Defense - 1.4% | |
AeroVironment, Inc. (a) | | | 100 | | | | 2,666 | |
Ceradyne, Inc. (a) | | | 400 | | | | 6,448 | |
| Cubic Corporation | | | 400 | | | | 13,884 | |
DynCorp International, Inc. - Class A (a) | | | 1,800 | | | | 30,600 | |
Esterline Technologies Corporation (a) | | | 1,100 | | | | 46,321 | |
GenCorp, Inc. (a) | | | 9,000 | | | | 66,960 | |
Ladish Company, Inc. (a) | | | 1,400 | | | | 18,144 | |
Taser International, Inc. (a) | | | 9,800 | | | | 40,082 | |
| | | | | | | | 225,105 | |
| Air Freight & Logistics - 0.6% | |
Air Transport Services Group, Inc. (a) | | | 10,420 | | | | 26,988 | |
Atlas Air Worldwide Holdings, Inc. (a) | | | 1,100 | | | | 28,919 | |
| Pacer International, Inc. | | | 3,100 | | | | 8,866 | |
| TFS SMALL CAP FUND | |
| SCHEDULE OF INVESTMENTS (Continued) | |
| | |
| COMMON STOCKS - 98.9% (Continued) | | Shares | | | Value | |
| Industrials - 14.2% (Continued) | |
| Air Freight & Logistics - 0.6% (Continued) | |
| UTI Worldwide, Inc. | | | 3,400 | | | $ | 42,398 | |
| | | | | | | | 107,171 | |
| Airlines - 0.5% | |
AirTran Holdings, Inc. (a) | | | 4,500 | | | | 19,035 | |
| Copa Holdings, S.A. - Class A | | | 300 | | | | 12,669 | |
JetBlue Airways Corporation (a) | | | 8,600 | | | | 42,656 | |
US Airways Group, Inc. (a) | | | 2,800 | | | | 8,568 | |
| | | | | | | | 82,928 | |
| Building Products - 0.6% | |
| Insteel Industries, Inc. | | | 1,700 | | | | 18,904 | |
Owens Corning, Inc. (a) | | | 2,000 | | | | 44,220 | |
| Quanex Building Products Corporation | | | 2,500 | | | | 37,175 | |
| | | | | | | | 100,299 | |
| Commercial Services & Supplies - 1.8% | |
ACCO Brands Corporation (a) | | | 4,000 | | | | 24,240 | |
American Reprographics Company (a) | | | 1,300 | | | | 7,800 | |
ATC Technology Corporation (a) | | | 900 | | | | 18,810 | |
Cornell Companies, Inc. (a) | | | 1,400 | | | | 31,976 | |
Covanta Holding Corporation (a) | | | 300 | | | | 5,154 | |
| Ennis, Inc. | | | 3,399 | | | | 51,495 | |
| Interface, Inc. - Class A | | | 1,700 | | | | 13,192 | |
Team, Inc. (a) | | | 3,300 | | | | 53,559 | |
Tetra Tech, Inc. (a) | | | 900 | | | | 23,157 | |
United Stationers, Inc. (a) | | | 200 | | | | 9,428 | |
Waste Connections, Inc. (a) | | | 1,900 | | | | 59,717 | |
| | | | | | | | 298,528 | |
| Construction & Engineering - 1.1% | |
| Chicago Bridge & Iron Company N.V. | | | 1,300 | | | | 24,453 | |
EMCOR Group, Inc. (a) | | | 1,900 | | | | 44,878 | |
| Great Lakes Dredge & Dock Company | | | 3,400 | | | | 20,842 | |
Insituform Technologies, Inc. - Class A (a) | | | 500 | | | | 10,600 | |
MasTec, Inc. (a) | | | 600 | | | | 7,080 | |
Michael Baker Corporation (a) | | | 655 | | | | 23,383 | |
Shaw Group, Inc. (The) (a) | | | 400 | | | | 10,264 | |
Sterling Construction Company, Inc. (a) | | | 2,800 | | | | 45,164 | |
| | | | | | | | 186,664 | |
| Electrical Equipment - 1.7% | |
A123 Systems, Inc. (a) | | | 400 | | | | 7,864 | |
Advanced Battery Technologies, Inc. (a) | | | 12,600 | | | | 42,336 | |
Capstone Turbine Corporation (a) | | | 40,700 | | | | 47,619 | |
China BAK Battery, Inc. (a) | | | 2,100 | | | | 6,909 | |
EnerSys, Inc. (a) | | | 900 | | | | 19,890 | |
GrafTech International Ltd. (a) | | | 3,479 | | | | 46,967 | |
Harbin Electric, Inc. (a) | | | 1,100 | | | | 17,523 | |
LaBarge, Inc. (a) | | | 1,400 | | | | 15,540 | |
SunPower Corporation - Class A (a) | | | 400 | | | | 9,924 | |
Thomas & Betts Corporation (a) | | | 1,600 | | | | 54,736 | |
| TFS SMALL CAP FUND | |
| SCHEDULE OF INVESTMENTS (Continued) | |
| | |
| COMMON STOCKS - 98.9% (Continued) | | Shares | | | Value | |
| Industrials - 14.2% (Continued) | |
| Electrical Equipment - 1.7% (Continued) | |
Vicor Corporation (a) | | | 900 | | | $ | 6,138 | |
| | | | | | | | 275,446 | |
| Industrial Conglomerates - 0.1% | |
| Standex International Corporation | | | 1,200 | | | | 21,096 | |
| | | | | | | | | |
| Machinery - 3.7% | |
| Alamo Group, Inc. | | | 800 | | | | 10,960 | |
Altra Holdings, Inc. (a) | | | 1,400 | | | | 12,278 | |
| American Railcar Industries, Inc. | | | 2,200 | | | | 22,000 | |
| Ampco-Pittsburgh Corporation | | | 800 | | | | 21,520 | |
| Cascade Corporation | | | 1,800 | | | | 44,712 | |
Chart Industries, Inc. (a) | | | 1,700 | | | | 33,609 | |
Colfax Corporation (a) | | | 2,600 | | | | 28,288 | |
| FreightCar America, Inc. | | | 2,800 | | | | 66,024 | |
| Harsco Corporation | | | 400 | | | | 12,596 | |
| Kaydon Corporation | | | 300 | | | | 10,497 | |
| Lindsay Corporation | | | 600 | | | | 19,698 | |
| Mueller Industries, Inc. | | | 700 | | | | 16,562 | |
| Mueller Water Products, Inc. - Class A | | | 4,400 | | | | 19,712 | |
| NACCO Industries, Inc. - Class A | | | 400 | | | | 23,840 | |
| Nordson Corporation | | | 290 | | | | 15,303 | |
| Sauer-Danfoss, Inc. | | | 4,000 | | | | 28,800 | |
| Snap-on, Inc. | | | 800 | | | | 29,224 | |
| SPX Corporation | | | 600 | | | | 31,668 | |
| Timken Company | | | 1,400 | | | | 30,842 | |
| Titan International, Inc. | | | 5,600 | | | | 47,040 | |
| Trinity Industries, Inc. | | | 800 | | | | 13,504 | |
| Twin Disc, Inc. | | | 3,610 | | | | 33,898 | |
| Watts Water Technologies, Inc. - Class A | | | 1,600 | | | | 45,200 | |
| | | | | | | | 617,775 | |
| Marine - 1.2% | |
| Diana Shipping, Inc. | | | 700 | | | | 9,044 | |
| Eagle Bulk Shipping, Inc. | | | 8,700 | | | | 41,238 | |
| Excel Maritime Carriers Ltd. | | | 4,300 | | | | 24,252 | |
| International Shipholding Corporation | | | 400 | | | | 13,260 | |
Kirby Coporation (a) | | | 600 | | | | 20,280 | |
| Navios Maritime Holdings, Inc. | | | 7,500 | | | | 34,275 | |
OceanFreight, Inc. (a) | | | 3,100 | | | | 2,976 | |
| Paragon Shipping, Inc. | | | 6,500 | | | | 26,520 | |
Ultrapetrol (Bahamas) Ltd. (a) | | | 4,700 | | | | 23,030 | |
| | | | | | | | 194,875 | |
| Professional Services - 0.6% | |
| CDI Corporation | | | 1,500 | | | | 18,270 | |
First Advantage Corporation (a) | | | 700 | | | | 12,320 | |
FTI Consulting, Inc. (a) | | | 200 | | | | 8,162 | |
Kforce, Inc. (a) | | | 2,200 | | | | 25,806 | |
Spherion Corporation (a) | | | 3,900 | | | | 19,305 | |
| TFS SMALL CAP FUND | |
| SCHEDULE OF INVESTMENTS (Continued) | |
| | |
| COMMON STOCKS - 98.9% (Continued) | | Shares | | | Value | |
| Industrials - 14.2% (Continued) | |
| Professional Services - 0.6% (Continued) | |
| VSE Corporation | | | 500 | | | $ | 21,895 | |
| | | | | | | | 105,758 | |
| Road & Rail - 0.1% | |
USA Truck, Inc. (a) | | | 1,000 | | | | 11,230 | |
| | | | | | | | | |
| Trading Companies & Distributors - 0.7% | |
| Aceto Corporation | | | 9,068 | | | | 50,237 | |
| Aircastle Ltd. | | | 2,480 | | | | 19,641 | |
| Applied Industrial Technologies, Inc. | | | 100 | | | | 2,023 | |
| Houston Wire & Cable Company | | | 2,700 | | | | 32,643 | |
United Rentals, Inc. (a) | | | 1,500 | | | | 14,235 | |
| | | | | | | | 118,779 | |
| Transportation Infrastructure - 0.1% | |
| Aegean Marine Petroleum Network, Inc. | | | 700 | | | | 16,450 | |
| | | | | | | | | |
| Information Technology - 22.9% | |
| Communications Equipment - 3.2% | |
3Com Corporation (a) | | | 11,340 | | | | 58,288 | |
ADC Telecommunications, Inc. (a) | | | 6,900 | | | | 44,781 | |
Anaren, Inc. (a) | | | 2,300 | | | | 33,626 | |
Arris Group, Inc. (a) | | | 1,000 | | | | 10,260 | |
Aruba Networks, Inc. (a) | | | 5,700 | | | | 44,574 | |
| Bel Fuse, Inc. - Class B | | | 2,700 | | | | 48,870 | |
BigBand Networks, Inc. (a) | | | 3,700 | | | | 13,690 | |
Ciena Corporation (a) | | | 500 | | | | 5,865 | |
CommScope, Inc. (a) | | | 600 | | | | 16,212 | |
Digi International, Inc. (a) | | | 3,000 | | | | 23,850 | |
EchoStar Corporation - Class A (a) | �� | | 1,100 | | | | 19,976 | |
Emulex Corporation (a) | | | 2,900 | | | | 29,290 | |
InterDigital, Inc. (a) | | | 1,000 | | | | 20,560 | |
NETGEAR, Inc. (a) | | | 1,200 | | | | 21,876 | |
Oplink Communications, Inc. (a) | | | 1,900 | | | | 28,177 | |
Opnext, Inc. (a) | | | 4,400 | | | | 10,824 | |
Radware Ltd. (a) | | | 500 | | | | 5,785 | |
Sierra Wireless, Inc. (a) | | | 1,300 | | | | 11,713 | |
Sonus Networks, Inc. (a) | | | 13,184 | | | | 25,313 | |
Starent Networks Corporation (a) | | | 300 | | | | 10,122 | |
Tellabs, Inc. (a) | | | 8,700 | | | | 52,374 | |
| | | | | | | | 536,026 | |
| Computers & Peripherals - 0.9% | |
Adaptec, Inc. (a) | | | 12,000 | | | | 38,280 | |
| Diebold, Inc. | | | 1,100 | | | | 33,264 | |
Hypercom Corporation (a) | | | 7,600 | | | | 21,660 | |
Isilon Systems, Inc. (a) | | | 3,199 | | | | 16,795 | |
NCR Corporation (a) | | | 3,050 | | | | 30,957 | |
Novatel Wireless, Inc. (a) | | | 1,000 | | | | 8,920 | |
QLogic Corporation (a) | | | 200 | | | | 3,508 | |
| | | | | | | | 153,384 | |
| TFS SMALL CAP FUND | |
| SCHEDULE OF INVESTMENTS (Continued) | |
| | |
| COMMON STOCKS - 98.9% (Continued) | | Shares | | | Value | |
| Information Technology - 22.9% (Continued) | |
| Electronic Equipment, Instruments & Components - 4.2% | |
| Agilysys, Inc. | | | 2,800 | | | $ | 13,188 | |
Anixter International, Inc. (a) | | | 1,500 | | | | 62,775 | |
Arrow Electronics, Inc. (a) | | | 1,700 | | | | 43,078 | |
| AVX Corporation | | | 1,750 | | | | 19,810 | |
Celestica, Inc. (a) | | | 2,300 | | | | 19,090 | |
Cogent, Inc. (a) | | | 2,200 | | | | 21,230 | |
Comverge, Inc. (a) | | | 1,600 | | | | 18,256 | |
CPI International, Inc. (a) | | | 2,920 | | | | 28,908 | |
| CTS Corporation | | | 4,000 | | | | 35,840 | |
Echelon Corporation (a) | | | 500 | | | | 6,825 | |
Gerber Scientific, Inc. (a) | | | 6,885 | | | | 31,809 | |
Ingram Micro, Inc. - Class A (a) | | | 1,800 | | | | 31,770 | |
Insight Enterprises, Inc. (a) | | | 1,800 | | | | 18,936 | |
| Jabil Circuit, Inc. | | | 3,700 | | | | 49,506 | |
L-1 Identity Solutions, Inc. (a) | | | 1,200 | | | | 7,092 | |
Mercury Computer Systems, Inc. (a) | | | 1,106 | | | | 11,834 | |
| Methode Electronics, Inc. | | | 1,500 | | | | 10,875 | |
Multi-Fineline Electronix, Inc. (a) | | | 900 | | | | 24,525 | |
SMART Modular Technologies (WWH), Inc. (a) | | | 7,200 | | | | 29,232 | |
Spectrum Control, Inc. (a) | | | 8,100 | | | | 68,445 | |
Tech Data Corporation (a) | | | 1,200 | | | | 46,116 | |
| Technitrol, Inc. | | | 2,600 | | | | 20,254 | |
TTM Technologies, Inc. (a) | | | 4,300 | | | | 43,731 | |
Vishay Intertechnology, Inc. (a) | | | 6,800 | | | | 42,364 | |
| | | | | | | | 705,489 | |
| Internet Software & Services - 1.6% | |
Akamai Technologies, Inc. (a) | | | 700 | | | | 15,400 | |
Art Technology Group, Inc. (a) | | | 7,500 | | | | 30,900 | |
Dice Holdings, Inc. (a) | | | 2,500 | | | | 15,025 | |
Digital River, Inc. (a) | | | 300 | | | | 6,849 | |
GigaMedia Ltd. (a) | | | 7,850 | | | | 32,185 | |
IAC/InterActiveCorporation (a) | | | 1,500 | | | | 28,410 | |
InfoSpace, Inc. (a) | | | 5,630 | | | | 48,249 | |
Limelight Networks, Inc. (a) | | | 7,500 | | | | 26,175 | |
ModusLink Global Solutions, Inc. (a) | | | 2,100 | | | | 17,262 | |
Open Text Corporation (a) | | | 200 | | | | 7,408 | |
RealNetworks, Inc. (a) | | | 1,800 | | | | 6,426 | |
SAVVIS, Inc. (a) | | | 1,700 | | | | 25,143 | |
| | | | | | | | 259,432 | |
| IT Services - 2.9% | |
| Broadridge Financial Solutions, Inc. | | | 1,500 | | | | 31,215 | |
China Information Security Technology, Inc. (a) | | | 3,400 | | | | 21,760 | |
CIBER, Inc. (a) | | | 8,736 | | | | 28,130 | |
CSG Systems International, Inc. (a) | | | 2,820 | | | | 46,079 | |
eLoyalty Corporation (a) | | | 1,200 | | | | 9,360 | |
Genpact Ltd. (a) | | | 1,300 | | | | 15,483 | |
Hewitt Associates, Inc. - Class A (a) | | | 500 | | | | 17,760 | |
| iGATE Corporation | | | 2,000 | | | | 17,660 | |
| Lender Processing Services, Inc. | | | 1,700 | | | | 67,660 | |
| TFS SMALL CAP FUND | |
| SCHEDULE OF INVESTMENTS (Continued) | |
| | |
| COMMON STOCKS - 98.9% (Continued) | | Shares | | | Value | |
| Information Technology - 22.9% (Continued) | |
| IT Services - 2.9% (Continued) | |
Lionbridge Technologies, Inc. (a) | | | 9,200 | | | $ | 19,228 | |
Moneygram International, Inc. (a) | | | 8,200 | | | | 24,518 | |
Ness Technologies, Inc. (a) | | | 4,700 | | | | 30,973 | |
Online Resources Corporation (a) | | | 5,800 | | | | 30,450 | |
TeleTech Holdings, Inc. (a) | | | 1,600 | | | | 28,624 | |
TNS, Inc. (a) | | | 800 | | | | 22,608 | |
VeriFone Holdings, Inc. (a) | | | 4,000 | | | | 53,200 | |
Virtusa Corporation (a) | | | 1,800 | | | | 16,164 | |
| | | | | | | | 480,872 | |
| Semiconductors & Semiconductor Equipment - 4.9% | |
Advanced Analogic Technologies, Inc. (a) | | | 2,900 | | | | 9,135 | |
Amkor Technology, Inc. (a) | | | 5,800 | | | | 31,958 | |
Applied Micro Circuits Corporation (a) | | | 3,000 | | | | 23,460 | |
Atheros Communications, Inc. (a) | | | 900 | | | | 22,158 | |
Atmel Corporation (a) | | | 7,800 | | | | 29,016 | |
Cirrus Logic, Inc. (a) | | | 7,100 | | | | 34,364 | |
Cypress Semiconductor Corporation (a) | | | 800 | | | | 6,744 | |
DSP Group, Inc. (a) | | | 3,129 | | | | 18,085 | |
Entegris, Inc. (a) | | | 7,200 | | | | 27,072 | |
Entropic Communications, Inc. (a) | | | 5,700 | | | | 14,991 | |
FormFactor, Inc. (a) | | | 2,630 | | | | 44,684 | |
Integrated Device Technology, Inc. (a) | | | 5,300 | | | | 31,164 | |
Intellon Corporation (a) | | | 4,000 | | | | 27,480 | |
| Intersil Corporation - Class A | | | 790 | | | | 9,914 | |
| IXYS Corporation | | | 3,500 | | | | 23,450 | |
Kopin Corporation (a) | | | 5,400 | | | | 23,976 | |
Lattice Semiconductor Corporation (a) | | | 8,800 | | | | 16,808 | |
NVE Corporation (a) | | | 400 | | | | 14,960 | |
OmniVision Technologies, Inc. (a) | | | 3,100 | | | | 38,006 | |
Pericom Semiconductor Corporation (a) | | | 6,063 | | | | 57,053 | |
PMC-Sierra, Inc. (a) | | | 6,400 | | | | 54,528 | |
Rambus, Inc. (a) | | | 700 | | | | 11,200 | |
RF Micro Devices, Inc. (a) | | | 9,300 | | | | 37,014 | |
Semitool, Inc. (a) | | | 3,000 | | | | 21,180 | |
Sigma Designs, Inc. (a) | | | 1,500 | | | | 18,015 | |
Skyworks Solutions, Inc. (a) | | | 2,560 | | | | 26,701 | |
Standard Microsystems Corporation (a) | | | 700 | | | | 13,482 | |
Supertex, Inc. (a) | | | 400 | | | | 9,700 | |
Techwell, Inc. (a) | | | 2,200 | | | | 22,836 | |
Tessera Technologies, Inc. (a) | | | 800 | | | | 17,688 | |
TriQuint Semiconductor, Inc. (a) | | | 5,600 | | | | 30,184 | |
Varian Semiconductor Equipment Associates, Inc. (a) | | | 600 | | | | 17,034 | |
Zoran Corporation (a) | | | 2,700 | | | | 23,949 | |
| | | | | | | | 807,989 | |
| Software - 5.2% | |
Actuate Corporation (a) | | | 2,800 | | | | 14,028 | |
AsiaInfo Holdings, Inc. (a) | | | 1,300 | | | | 28,678 | |
| Blackbaud, Inc. | | | 800 | | | | 17,752 | |
Bottomline Technologies, Inc. (a) | | | 4,100 | | | | 60,188 | |
| TFS SMALL CAP FUND | |
| SCHEDULE OF INVESTMENTS (Continued) | |
| | |
| COMMON STOCKS - 98.9% (Continued) | | Shares | | | Value | |
| Information Technology - 22.9% (Continued) | |
| Software - 5.2% (Continued) | |
Compuware Corporation (a) | | | 500 | | | $ | 3,530 | |
Deltek, Inc. (a) | | | 3,300 | | | | 23,595 | |
Double-Take Software, Inc. (a) | | | 3,200 | | | | 29,664 | |
EPIQ Systems, Inc. (a) | | | 400 | | | | 5,044 | |
| FactSet Research Systems, Inc. | | | 900 | | | | 57,645 | |
i2 Technologies, Inc. (a) | | | 1,100 | | | | 17,314 | |
Interactive Intelligence, Inc. (a) | | | 2,300 | | | | 38,571 | |
| Jack Henry & Associates, Inc. | | | 2,200 | | | | 50,754 | |
Kenexa Corporation (a) | | | 1,500 | | | | 18,900 | |
MICROS Systems, Inc. (a) | | | 300 | | | | 8,076 | |
Monotype Imaging Holdings, Inc. (a) | | | 1,300 | | | | 9,776 | |
Net 1 UEPS Technologies, Inc. (a) | | | 2,600 | | | | 45,474 | |
NetScout Systems, Inc. (a) | | | 3,523 | | | | 43,298 | |
Novell, Inc. (a) | | | 8,300 | | | | 33,947 | |
Phoenix Technologies Ltd. (a) | | | 22,303 | | | | 52,189 | |
| QAD, Inc. | | | 1,700 | | | | 7,752 | |
Radiant Systems, Inc. (a) | | | 1,800 | | | | 17,712 | |
S1 Corporation (a) | | | 2,600 | | | | 15,600 | |
SolarWinds, Inc. (a) | | | 500 | | | | 8,900 | |
SonicWALL, Inc. (a) | | | 4,800 | | | | 38,112 | |
Sybase, Inc. (a) | | | 1,280 | | | | 50,637 | |
Synopsys, Inc. (a) | | | 2,500 | | | | 55,000 | |
Take-Two Interactive Software, Inc. (a) | | | 600 | | | | 6,582 | |
Taleo Corporation - Class A (a) | | | 1,100 | | | | 23,914 | |
TeleCommunication Systems, Inc. (a) | | | 3,300 | | | | 29,502 | |
TIBCO Software, Inc. (a) | | | 4,000 | | | | 35,000 | |
VASCO Data Security International, Inc. (a) | | | 2,600 | | | | 15,808 | |
| | | | | | | | 862,942 | |
| Materials - 6.1% | |
| Chemicals - 2.7% | |
| Ashland, Inc. | | | 800 | | | | 27,632 | |
| Cabot Corporation | | | 700 | | | | 15,351 | |
Calgon Carbon Corporation (a) | | | 500 | | | | 7,920 | |
| Cytec Industries, Inc. | | | 500 | | | | 16,585 | |
| Huntsman Corporation | | | 6,100 | | | | 48,495 | |
| Innophos Holdings, Inc. | | | 600 | | | | 11,610 | |
| Innospec, Inc. | | | 2,800 | | | | 33,096 | |
| International Flavors and Fragrances, Inc. | | | 700 | | | | 26,663 | |
LSB Industries, Inc. (a) | | | 1,600 | | | | 19,840 | |
| Methanex Corporation | | | 400 | | | | 6,860 | |
| Nalco Holding Company | | | 600 | | | | 12,690 | |
| Olin Corporation | | | 1,200 | | | | 18,324 | |
OMNOVA Solutions, Inc. (a) | | | 4,500 | | | | 28,845 | |
PolyOne Corporation (a) | | | 3,892 | | | | 21,718 | |
| Quaker Chemical Corporation | | | 1,000 | | | | 20,600 | |
| RPM International, Inc. | | | 1,400 | | | | 24,668 | |
Solutia, Inc. (a) | | | 2,200 | | | | 24,200 | |
| Stepan Company | | | 600 | | | | 34,344 | |
| Valspar Corporation (The) | | | 1,900 | | | | 48,203 | |
| TFS SMALL CAP FUND | |
| SCHEDULE OF INVESTMENTS (Continued) | |
| | |
| COMMON STOCKS - 98.8% (Continued) | | Shares | | | Value | |
| Materials - 6.1% (Continued) | |
| Chemicals - 2.7% (Continued) | |
W.R. Grace & Company (a) | | | 300 | | | $ | 6,567 | |
| | | | | | | | 454,211 | |
| Containers & Packaging - 1.0% | |
AEP Industries, Inc. (a) | | | 500 | | | | 17,440 | |
| Bemis Company, Inc. | | | 500 | | | | 12,915 | |
Boise, Inc. (a) | | | 6,300 | | | | 30,114 | |
BWAY Holding Company (a) | | | 800 | | | | 14,216 | |
Graphic Packaging Holding Company (a) | | | 11,900 | | | | 27,251 | |
| Myers Industries, Inc. | | | 2,100 | | | | 18,417 | |
| Packaging Corporation of America | | | 900 | | | | 16,452 | |
| Sonoco Products Company | | | 600 | | | | 16,050 | |
| Temple-Inland, Inc. | | | 900 | | | | 13,905 | |
| | | | | | | | 166,760 | |
| Metals & Mining - 1.4% | |
| Commercial Metals Company | | | 1,000 | | | | 14,840 | |
General Steel Holdings, Inc. (a) | | | 1,700 | | | | 6,324 | |
Golden Star Resources Ltd. (a) | | | 4,000 | | | | 12,280 | |
North American Palladium Ltd. (a) | | | 16,000 | | | | 38,560 | |
NovaGold Resources, Inc. (a) | | | 6,500 | | | | 27,950 | |
| Olympic Steel, Inc. | | | 500 | | | | 12,650 | |
| Reliance Steel & Aluminum Company | | | 800 | | | | 29,184 | |
| Royal Gold, Inc. | | | 300 | | | | 13,251 | |
Seabridge Gold, Inc. (a) | | | 1,200 | | | | 24,096 | |
Silver Standard Resources, Inc. (a) | | | 400 | | | | 7,432 | |
Stillwater Mining Company (a) | | | 900 | | | | 5,580 | |
Tanzanian Royalty Exploration Corporation (a) | | | 1,200 | | | | 3,516 | |
| Titanium Metals Corporation | | | 3,600 | | | | 30,960 | |
| | | | | | | | 226,623 | |
| Paper & Forest Products - 1.0% | |
Buckeye Technologies, Inc. (a) | | | 1,450 | | | | 12,992 | |
Clearwater Paper Corporation (a) | | | 800 | | | | 36,216 | |
Domtar Corporation (a) | | | 800 | | | | 33,512 | |
KapStone Paper & Packaging Corporation (a) | | | 2,800 | | | | 19,432 | |
Louisiana-Pacific Corporation (a) | | | 2,220 | | | | 11,655 | |
| P.H. Glatfelter Company | | | 1,600 | | | | 16,912 | |
| Verso Paper Corporation | | | 8,800 | | | | 20,680 | |
| Wausau Paper Corporation | | | 2,342 | | | | 20,539 | |
| | | | | | | | 171,938 | |
| Telecommunication Services - 0.9% | |
| Diversified Telecommunication Services - 0.5% | |
| Atlantic Tele-Network, Inc. | | | 275 | | | | 12,606 | |
Level 3 Communications, Inc. (a) | | | 10,000 | | | | 11,800 | |
PAETEC Holding Corporation (a) | | | 5,700 | | | | 18,468 | |
SureWest Communications (a) | | | 1,320 | | | | 11,643 | |
tw telecom, inc. (a) | | | 1,800 | | | | 22,680 | |
| | | | | | | | 77,197 | |
| Wireless Telecommunication Services - 0.4% | |
Leap Wireless International, Inc. (a) | | | 1,100 | | | | 14,542 | |
| TFS SMALL CAP FUND | |
| SCHEDULE OF INVESTMENTS (Continued) | |
| | |
| COMMON STOCKS - 98.9% (Continued) | | Shares | | | Value | |
| Telecommunication Services - 0.9% (Continued) | |
| Wireless Telecommunication Services - 0.4% (Continued) | |
MetroPCS Communications, Inc. (a) | | | 600 | | | $ | 3,738 | |
| Shenandoah Telecommunications Company | | | 700 | | | | 11,683 | |
| Telephone & Data Systems, Inc. | | | 700 | | | | 20,734 | |
Terrestar Corporation (a) | | | 19,200 | | | | 24,576 | |
| | | | | | | | 75,273 | |
| Utilities - 1.5% | |
| Electric Utilities - 0.2% | |
| NV Energy, Inc. | | | 2,600 | | | | 29,796 | |
| | | | | | | | | |
| Gas Utilities - 0.7% | |
| AGL Resources, Inc. | | | 601 | | | | 21,011 | |
| Atmos Energy Corporation | | | 800 | | | | 22,280 | |
| Energen Corporation | | | 500 | | | | 21,940 | |
| Laclede Group, Inc. (The) | | | 1,100 | | | | 33,781 | |
| UGI Corporation | | | 800 | | | | 19,104 | |
| | | | | | | | 118,116 | |
| Independent Power Producers & Energy Traders - 0.4% | |
Dynegy, Inc. (a) | | | 14,200 | | | | 28,400 | |
Mirant Corporation (a) | | | 1,230 | | | | 17,195 | |
RRI Energy, Inc. (a) | | | 2,400 | | | | 12,648 | |
| | | | | | | | 58,243 | |
| Multi-Utilities - 0.2% | |
| Alliant Energy Corporation | | | 1,200 | | | | 31,872 | |
| | | | | | | | | |
| Water Utilities - 0.0% | |
| Aqua America, Inc. | | | 100 | | | | 1,545 | |
| | | | | | | | | |
| | | | | | | | | |
Total Common Stocks (Cost $16,537,009) | | | $ | 16,434,982 | |
| | | | | | | | | |
| | | | | | | | | |
| RIGHTS - 0.0% | | Shares | | | Value | |
Winthrop Realty Trust (a) (Cost $0) | | | 742 | | | $ | – | |
| | | | | | | | | |
| MONEY MARKET FUNDS - 0.3% | | Shares | | | Value | |
UMB Money Market Fiduciary, 0.05% (b) (Cost $58,594) | | | 58,594 | | | $ | 58,594 | |
| | | | | | | | | |
Total Investments at Value - 99.2% (Cost $16,595,603) | | | $ | 16,493,576 | |
| | | | | | | | | |
| Other Assets in Excess of Liabilities - 0.8% | | | | 129,488 | |
| | | | | | | | | |
| Net Assets - 100.0% | | | $ | 16,623,064 | |
ADR - American Depositary Receipt.
| (a) | Non-income producing security. |
| (b) | Variable rate security. The rate shown is the 7-day effective yield as of October 31, 2009. |
See accompanying notes to financial statements.
REPORT OF INDEPENDENT REGISTERED PUBLIC ACCOUNTING FIRM ON
DETAILED SCHEDULES OF INVESTMENTS
To the Shareholders and Board of Trustees of
TFS Capital Investment Trust
We have audited, in accordance with the standards of the Public Company Accounting Oversight Board (United States), the financial statements of TFS Capital Investment Trust (the "Funds"), comprising TFS Market Neutral Fund and TFS Small Cap Fund, as of October 31, 2009, and for the year then ended and have issued our report thereon dated December 23, 2009 which report and financial statements are included in Item 1 of this Certified Shareholder Report on Form N-CSR. Our audits also included the Funds’ schedules of investments (the "Schedules") as of October 31, 2009 appearing in Item 6 of this Form N-CSR. These Schedules are the responsibility of the Funds’ management. Our responsibility is to express an opinion based on our audits. In our opinion, the Schedules referred to above, when considered in relation to the basic financial statements taken as a whole of the Funds referred to above, present fairly, in all material respects, the information set forth therein.
DELOITTE & TOUCHE LLP
Cincinnati, Ohio
December 23, 2009
| Item 7. | Disclosure of Proxy Voting Policies and Procedures for Closed-End Management Investment Companies. |
| Item 8. | Portfolio Managers of Closed-End Management Investment Companies. |
| Item 9. | Purchases of Equity Securities by Closed-End Management Investment Company and Affiliated Purchasers. |
| Item 10. | Submission of Matters to a Vote of Security Holders. |
The registrant has not adopted procedures by which shareholders may recommend nominees to the registrant’s board of trustees.
| Item 11. | Controls and Procedures. |
(a) Based on their evaluation of the registrant’s disclosure controls and procedures (as defined in Rule 30a-3(c) under the Investment Company Act of 1940) as of a date within 90 days of the filing date of this report, the registrant’s principal executive officer and principal financial officer have concluded that such disclosure controls and procedures are reasonably designed and are operating effectively to ensure that material information relating to the registrant, including its consolidated subsidiaries, is made known to them by others within those entities, particularly during the period in which this report is being prepared, and that the information required in filings on Form N-CSR is recorded, processed, summarized, and reported on a timely basis.
(b) There were no changes in the registrant’s internal control over financial reporting (as defined in Rule 30a-3(d) under the Investment Company Act of 1940) that occurred during the second fiscal quarter of the period covered by this report that have materially affected, or are reasonably likely to materially affect, the registrant’s internal control over financial reporting.
File the exhibits listed below as part of this Form. Letter or number the exhibits in the sequence indicated.
(a)(1) Any code of ethics, or amendment thereto, that is the subject of the disclosure required by Item 2, to the extent that the registrant intends to satisfy the Item 2 requirements through filing of an exhibit: Attached hereto
(a)(2) A separate certification for each principal executive officer and principal financial officer of the registrant as required by Rule 30a-2(a) under the Act (17 CFR 270.30a-2(a)): Attached hereto
(a)(3) Any written solicitation to purchase securities under Rule 23c-1 under the Act (17 CFR 270.23c-1) sent or given during the period covered by the report by or on behalf of the registrant to 10 or more persons: Not applicable
(b) Certifications required by Rule 30a-2(b) under the Act (17 CFR 270.30a-2(b)): Attached hereto
| Exhibit 99.CODE ETH | Code of Ethics |
| Exhibit 99.CERT | Certifications required by Rule 30a-2(a) under the Act |
| Exhibit 99.906CERT | Certifications required by Rule 30a-2(b) under the Act |
SIGNATURES
Pursuant to the requirements of the Securities Exchange Act of 1934 and the Investment Company Act of 1940, the registrant has duly caused this report to be signed on its behalf by the undersigned, thereunto duly authorized.
(Registrant) TFS Capital Investment Trust
| By (Signature and Title)* | /s/ Larry S, Eiben |
| | Larry S. Eiben, President |
Date December 29, 2009
Pursuant to the requirements of the Securities Exchange Act of 1934 and the Investment Company Act of 1940, this report has been signed below by the following persons on behalf of the registrant and in the capacities and on the dates indicated.
| By (Signature and Title)* | /s/ Larry S. Eiben |
| | Larry S. Eiben, President |
Date December 29, 2009
| By (Signature and Title)* | /s/ Mark J. Seger |
| | Mark J. Seger, Treasurer |
Date _ December 29, 2009
* Print the name and title of each signing officer under his or her signature.