| OMB APPROVAL |
OMB Number: 3235-0570 Expires: January 31, 2014 Estimated average burden hours per response: 20.6 |
UNITED STATES
SECURITIES AND EXCHANGE COMMISSION
Washington, D.C. 20549
FORM N-CSR
CERTIFIED SHAREHOLDER REPORT OF REGISTERED
MANAGEMENT INVESTMENT COMPANIES
Investment Company Act file number 811-21531
TFS Capital Investment Trust
(Exact name of registrant as specified in charter)
| 1800 Bayberry Court, Suite 103 Richmond, Virginia | 23226 |
| (Address of principal executive offices) | (Zip code) |
Wade R. Bridge, Esq.
Ultimus Fund Solutions, LLC 225 Pictoria Drive, Suite 450 Cincinnati, Ohio 45246
(Name and address of agent for service)
Registrant's telephone number, including area code: (804) 484-1401
Date of fiscal year end: October 31, 2011
Date of reporting period: October 31, 2011
Form N-CSR is to be used by management investment companies to file reports with the Commission not later than 10 days after the transmission to stockholders of any report that is required to be transmitted to stockholders under Rule 30e-1 under the Investment Company Act of 1940 (17 CFR 270.30e-1). The Commission may use the information provided on Form N-CSR in its regulatory, disclosure review, inspection, and policymaking roles.
A registrant is required to disclose the information specified by Form N-CSR, and the Commission will make this information public. A registrant is not required to respond to the collection of information contained in Form N-CSR unless the Form displays a currently valid Office of Management and Budget ("OMB") control number. Please direct comments concerning the accuracy of the information collection burden estimate and any suggestions for reducing the burden to Secretary, Securities and Exchange Commission, 450 Fifth Street, NW, Washington, DC 20549-0609. The OMB has reviewed this collection of information under the clearance requirements of 44 U.S.C. § 3507.
| Item 1. | Reports to Stockholders. |
ANNUAL REPORT
October 31, 2011
For more information or assistance in opening an account,
please call toll-free 1-888-534-2001.
December 20, 2011
Dear Shareholder,
Enclosed is the Annual Report to shareholders of the TFS Market Neutral Fund (ticker: TFSMX) and the TFS Small Cap Fund (ticker: TFSSX) for the fiscal year ended October 31, 2011. On behalf of the investment manager, TFS Capital LLC (“TFS Capital”), I’d like to thank you for your investment.
At this time, we are pleased to announce that the TFS Capital Investment Trust expects to launch a new fund on, or before, December 31, 2011. We at TFS Capital are very excited about the opportunity to manage this new fund and look forward to sharing detailed information about the fund once it is effective with the Securities and Exchange Commission. Please visit www.TFSCapital.com for information about the new fund.
Below are performance highlights for the Funds.
TFS Market Neutral Fund (ticker: TFSMX)
| | | | Since Inception (9/7/2004) |
| TFS Market Neutral Fund | 0.43% | 7.14% | 6.23% | 7.76% |
S&P 500® Index | 8.09% | 11.41% | 0.25% | 3.67% |
Average annual total returns for periods ended October 31, 2011
TFSMX did not perform favorably in the most recent fiscal year, generating negative “alpha,” in aggregate, over the period (i.e., the return that cannot be explained by the Fund’s market exposure). Although the models of the Adviser did generate positive alpha during much of the period, they produced substantial negative alpha in the months leading up to the end of the fiscal year. The Adviser believes that this recent period of poor performance may have been influenced by the turmoil in Europe which likely caused the recent market volatility and an increase in correlation among individual small-cap stocks. These conditions are believed to be adverse to alpha production by the Adviser by limiting the opportunity to add value through stock selection. In addition, a sudden spike in expenses related to securities sold short also adversely affected performance.
TFSMX’s performance over longer-term periods compares favorably to the overall U.S. equity market as measured by the S&P® 500 Index. From inception through October 31, 2011, TFSMX generated a 7.76% average annual return and had an annualized standard deviation of 8.59%, whereas the S&P® 500 Index generated a 3.67% average annual return and had an annualized standard deviation of 22.70%. Therefore, from inception through October 31, 2011, TFSMX produced an average annual return that was 4.09 percentage points above that of the S&P 500® Index while subjecting investors to only 37.8% of the volatility. Based on its trailing 5-year return through October 31, 2011, TFSMX was ranked #1 among 44 funds in Morningstar’s “Market Neutral” category and, for the same period, was ranked #1 among 36 funds in the Lipper “Equity Market Neutral” category.1
The broad U.S. equity market experienced a strong gain during the fiscal period of 8.09% but this had little impact on TFSMX given its ongoing hedge and corresponding low “beta” (i.e., market exposure) during the period. Similar to prior periods, TFSMX’s returns were largely driven by equity selection by the portfolio management team. In making these selections, the portfolio
management team continued to follow TFS Capital’s proprietary stock selection models. These models are designed to predict the future performance of individual stocks and closed-end-funds relative to the overall U.S. equity market.
The strategies used in managing TFSMX have resulted in the Fund having a low historical correlation to other asset classes. According to Modern Portfolio Theory, investors may benefit by combining non-correlated investments. For your reference, below are the Fund’s correlations to several other asset classes. It is notable that the Fund has seen a substantial rise in correlation to the equity indices, especially in recent months.
| Correlation Since Inception |
S&P 500® Index | 0.60 |
Russell 2000® Index | 0.58 |
| MSCI EAFE Index | 0.50 |
| Barclays Capital U.S. Agg. Bond Index | -0.15 |
| Wilshire REIT ETF Index | 0.42 |
| Dow Jones Commodity Futures | 0.44 |
As mentioned in our Semi-Annual Report letter, the TFS Market Neutral Fund is currently operating under a new policy for accepting additional investments (the “Subscription Policy”). Given its significant asset growth and the limited capacity of the Fund’s investment strategies, TFS Market Neutral Fund filed a prospectus supplement dated May 17, 2011 that describes the new Subscription Policy. The intent of the new Subscription Policy is to manage the growth of the Fund. TFS Capital believes that this action may assist the portfolio management team in its effort to maintain the Fund’s high standard of performance.
TFS Small Cap Fund (ticker: TFSSX)
| | | | | Since Inception (3/7/2006) |
| TFS Small Cap Fund | 6.68% | 23.47% | 6.86% | 7.48% |
Russell 2000® Index | 6.71% | 12.87% | 0.68% | 1.84% |
Average annual total returns for periods ended October 31, 2011
During the fiscal period, TFSSX underperformed its benchmark, the Russell 2000® Index. TFSSX’s returns were heavily impacted by the movement of the U.S. “small-cap” equity sector as evidenced by the narrow difference between the Fund and benchmark return (i.e., 6.68% versus 6.71%). Given its long-only mandate, the Fund will generally have a high correlation to U.S. small-cap equity market movements with any deviation attributable to TFS Capital’s equity selection. The models utilized by TFS Capital to select securities did not, net of Fund expenses, materially add or subtract alpha during the most recent fiscal year.
Over a longer-term period, TFSSX achieved its objective of outperforming the Russell 2000® Index. In fact, the Fund now has over a 5-year track record and achieved an average annual return since inception that is 5.64 percentage points higher than that of the Russell 2000® Index. Based on its trailing 5-year return through October 31, 2011, TFSSX was ranked #5 among 487 funds in Morningstar’s Small Blend category and, for the same period, was ranked #12 among 513 funds in the Lipper Small Cap Core category.2
Despite the Funds’ excellent long-term performance, we do not recommend allocating a high percentage of one’s assets to either Fund given the risks inherent in the Funds. Rather, we believe that they are best used as a component of a diversified portfolio of investments. If you have any questions about the Funds or TFS Capital, please contact us.
Best regards,
Larry S. Eiben
Chief Operating Officer & Co-Portfolio Manager
TFS Capital LLC
The performance data quoted represents past performance, which is not a guarantee of future results. Current performance may be lower or higher than the performance data quoted. The investment return and principal value of an investment in the Funds will fluctuate so that an investor’s shares, when redeemed, may be worth more or less than their original cost. The Funds charge a 2% redemption penalty on shares invested for less than 90 days. If shares are redeemed within the 90 day period, investment returns would be reduced from those shown above. Fee waivers and/or expense reimbursements by the Adviser have positively impacted the Funds’ performance. Without such waivers and/or reimbursements, performance would have been lower. An investor should consider the investment objectives, risks, charges and expenses of the Funds carefully before investing. To obtain a summary prospectus and/or prospectus, which each contain this and other important information, go to www.TFSCapital.com or call (888) 534-2001. Please read the summary prospectus and/or prospectus carefully before investing. The Funds may not be suitable for all investors.
| 1 | In the Lipper “Equity Market Neutral” category, TFSMX was ranked #1 out of 34 using its 5-year return and #6 out of 50 using its 3-year return. At 10/31/2011, Lipper did not make 1-year rankings available to the public. In the Morningstar “Market Neutral” category, TFSMX was ranked #1 out of 44 using its 5-year return, #2 out of 49 using its 3-year return and #48 out of 89 using its 1-year return. |
| | |
| 2 | In the Lipper, “Small Cap Core” category, TFSSX was ranked #12 out of 513 using its 5-year return and #12 out of 642 using its 3-year return. At 10/31/2011, Lipper did not make 1-year rankings available to the public. In the Morningstar “Small Blend” category, TFSSX was ranked #5 out of 487 using its 5-year return, #10 out of 573 using its 3-year return and #319 out of 651 using its 1-year return. |
Ranking information provided by Lipper and Morningstar for the periods ended October 31, 2011. TFSSX was assigned by Lipper to the Small-Cap Core category and by Morningstar to the Small Blend category. TFSMX was assigned by Lipper to the Equity Market Neutral category and by Morningstar to the Market Neutral category. The Funds are ranked based on total return and are ranked within a universe of funds with similar investment objectives. Rankings include the reinvestment of dividends and capital gains but exclude the effect of a fund’s sales load, if applicable. Fund rankings are calculated monthly by Lipper Analytical Services of New York and Morningstar, Inc. of Chicago. Lipper Inc. and Morningstar Inc. are nationally recognized organizations that rank the performance of mutual funds.
TFS MARKET NEUTRAL FUND PERFORMANCE INFORMATION (Unaudited) |
Comparison of the Change in Value of a $10,000 Investment in the
TFS Market Neutral Fund versus the S&P 500® Index
Average Annual Total Returns(a) For the periods ended October 31, 2011 |
| | 1 Year | 5 Years | Since Inception(b) |
| TFS Market Neutral Fund | 0.43% | 6.23% | 7.76% |
S&P 500® Index | 8.09% | 0.25% | 3.67% |
| (a) | The total returns shown do not reflect the deduction of taxes a shareholder would pay on Fund distributions or the redemption of Fund shares. |
| | |
| (b) | Initial public offering of shares was September 7, 2004. |
TFS SMALL CAP FUND PERFORMANCE INFORMATION (Unaudited) |
Comparison of the Change in Value of a $10,000 Investment in the
TFS Small Cap Fund versus the Russell 2000® Index
Average Annual Total Returns(a) For the periods ended October 31, 2011 |
| | 1 Year | 5 Years | Since Inception(b) |
| TFS Small Cap Fund | 6.68% | 6.86% | 7.48% |
Russell 2000® Index | 6.71% | 0.68% | 1.84% |
| (a) | The total returns shown do not reflect the deduction of taxes a shareholder would pay on Fund distributions or the redemption of Fund shares. |
| | |
| (b) | Initial public offering of shares was March 7, 2006. |
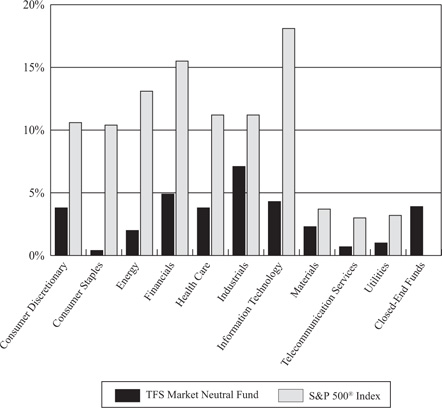
TFS MARKET NEUTRAL FUND PORTFOLIO INFORMATION October 31, 2011 (Unaudited) |
TFS Market Neutral Fund vs S&P 500® Index
Net Sector Exposure*
| * | The net percentages for the TFS Market Neutral Fund are computed by taking the net dollar exposure, including short positions, and dividing by the net assets of the Fund. Consequently, the percentages are not likely to total to 100%. |
Top 10 Long Equity Positions | | Top 10 Short Equity Positions |
| | | | |
| NetLogic Microsystems, Inc. | 0.70% | | Hollysys Automation Technologies Ltd. | 0.49% |
| Liz Claiborne, Inc. | 0.41% | | Travelzoo, Inc. | 0.48% |
| Ingram Micro, Inc. - Class A | 0.40% | | AVANIR Pharmaceuticals, Inc. - Class A | 0.47% |
| RightNow Technologies, Inc. | 0.40% | | Titan International, Inc. | 0.41% |
| Jazz Pharmaceuticals, Inc. | 0.37% | | Rubicon Technology, Inc. | 0.40% |
| Tech Data Corporation | 0.37% | | Education Management Corporation | 0.40% |
| Steel Dynamics, Inc. | 0.36% | | Bridgepoint Education, Inc. | 0.37% |
| Rockwood Holdings, Inc. | 0.36% | | LinkedIn Corporation - Class A | 0.36% |
| SEI Investments Company | 0.35% | | Oncothyreon, Inc. | 0.36% |
| Graco, Inc. | 0.33% | | AsiaInfo-Linkage, Inc. | 0.35% |
TFS SMALL CAP FUND PORTFOLIO INFORMATION October 31, 2011 (Unaudited) |
TFS Small Cap Fund
Sector Allocation (% of Net Assets)
|
| |
| Con-way, Inc. | 0.63% |
| TiVo, Inc. | 0.63% |
| W.R. Grace & Company | 0.59% |
| Thor Industries, Inc. | 0.58% |
| WebMD Health Corporation | 0.58% |
| Kennametal, Inc. | 0.56% |
| Huntsman Corporation | 0.56% |
| Robbins & Myers, Inc. | 0.56% |
| ADTRAN, Inc. | 0.55% |
| Actuant Corporation - Class A | 0.55% |
TFS MARKET NEUTRAL FUND SUMMARY SCHEDULE OF INVESTMENTS* October 31, 2011 |
| | | | | | |
| Consumer Discretionary — 12.6% | | | | | | |
| Auto Components — 1.4% | | | | | | |
Standard Motor Products, Inc. (a) | | | 284,571 | | | $ | 4,425,079 | |
Other Auto Components (b) | | | | | | | 20,595,840 | |
| | | | | | | | 25,020,919 | |
| Automobiles — 0.2% | | | | | | | | |
Other Automobiles (b) | | | | | | | 2,955,728 | |
| | | | | | | | | |
| Distributors — 0.2% | | | | | | | | |
Other Distributors (b) | | | | | | | 3,885,246 | |
| | | | | | | | | |
| Diversified Consumer Services — 0.8% | | | | | | | | |
Other Diversified Consumer Services (b) | | | | | | | 14,553,077 | |
| | | | | | | | | |
| Hotels, Restaurants & Leisure — 2.8% | | | | | | | | |
Buffalo Wild Wings, Inc. (a) (c) | | | 71,726 | | | | 4,749,696 | |
Other Hotels, Restaurants & Leisure (b) | | | | | | | 45,209,169 | |
| | | | | | | | 49,958,865 | |
| Household Durables — 0.7% | | | | | | | | |
Other Household Durables (b) | | | | | | | 13,011,129 | |
| | | | | | | | | |
| Internet & Catalog Retail — 0.2% | | | | | | | | |
Other Internet & Catalog Retail (b) | | | | | | | 2,967,754 | |
| | | | | | | | | |
| Leisure Equipment & Products — 0.7% | | | | | | | | |
Arctic Cat, Inc. (a) (c) | | | 191,134 | | | | 3,881,932 | |
Polaris Industries, Inc. (a) | | | 76,123 | | | | 4,821,631 | |
Other Leisure Equipment & Products (b) | | | | | | | 3,596,952 | |
| | | | | | | | 12,300,515 | |
| Media — 1.6% | | | | | | | | |
Other Media (b) | | | | | | | 27,638,609 | |
| | | | | | | | | |
| Multiline Retail — 0.3% | | | | | | | | |
Other Multiline Retail (b) | | | | | | | 4,770,523 | |
| | | | | | | | | |
| Specialty Retail — 2.1% | | | | | | | | |
Other Specialty Retail (b) | | | | | | | 36,981,188 | |
| | | | | | | | | |
| Textiles, Apparel & Luxury Goods — 1.6% | | | | | | | | |
Jones Group, Inc. (The) (a) | | | 389,282 | | | | 4,348,280 | |
Liz Claiborne, Inc. (a) (c) | | | 910,239 | | | | 7,291,014 | |
Skechers U.S.A., Inc. - Class A (a) (c) | | | 362,512 | | | | 5,169,421 | |
Other Textiles, Apparel & Luxury Goods (b) | | | | | | | 10,928,277 | |
| | | | | | | | 27,736,992 | |
| Consumer Staples — 2.4% | | | | | | | | |
| Beverages — 0.2% | | | | | | | | |
Other Beverages (b) | | | | | | | 4,305,852 | |
TFS MARKET NEUTRAL FUND SUMMARY SCHEDULE OF INVESTMENTS* (Continued) |
COMMON STOCKS — 92.6% (Continued) | | | | | | |
| Consumer Staples — 2.4% (Continued) | | | | | | |
| Food & Staples Retailing — 0.7% | | | | | | |
Other Food & Staples Retailing (b) | | | | | $ | 11,876,479 | |
| | | | | | | | |
| Food Products — 0.9% | | | | | | | |
Other Food Products (b) | | | | | | 15,520,126 | |
| | | | | | | | |
| Household Products — 0.1% | | | | | | | |
Other Household Products (b) | | | | | | 1,548,425 | |
| | | | | | | | |
| Personal Products — 0.5% | | | | | | | |
Other Personal Products (b) | | | | | | 8,247,970 | |
| | | | | | | | |
Tobacco — 0.0% (e) | | | | | | | |
Other Tobacco (b) | | | | | | 88,834 | |
| | | | | | | | |
| Energy — 6.4% | | | | | | | |
| Energy Equipment & Services — 2.1% | | | | | | | |
Basic Energy Services, Inc. (c) | | | 238,007 | | | | 4,365,048 | |
Other Energy Equipment & Services (b) | | | | | | | 32,956,493 | |
| | | | | | | | 37,321,541 | |
| Oil, Gas & Consumable Fuels — 4.3% | | | | | | | | |
Energy XXI (Bermuda) Ltd. (a) (c) | | | 142,048 | | | | 4,171,950 | |
Kodiak Oil & Gas Corporation (a) (c) | | | 767,252 | | | | 5,301,711 | |
Other Oil, Gas & Consumable Fuels (b) | | | | | | | 66,436,490 | |
| | | | | | | | 75,910,151 | |
| Financials — 15.7% | | | | | | | | |
| Capital Markets — 2.4% | | | | | | | | |
SEI Investments Company (a) | | | 381,408 | | | | 6,174,996 | |
Other Capital Markets (b) | | | | | | | 36,881,785 | |
| | | | | | | | 43,056,781 | |
| Commercial Banks — 3.5% | | | | | | | | |
Hancock Holding Company (a) | | | 156,757 | | | | 4,749,737 | |
Other Commercial Banks (b) | | | | | | | 56,771,352 | |
| | | | | | | | 61,521,089 | |
| Consumer Finance — 0.6% | | | | | | | | |
Other Consumer Finance (b) | | | | | | | 10,440,871 | |
| | | | | | | | | |
| Diversified Financial Services — 0.5% | | | | | | | | |
Other Diversified Financial Services (b) | | | | | | | 9,281,069 | |
| | | | | | | | | |
| Insurance — 3.0% | | | | | | | | |
Assured Guaranty Ltd. (a) | | | 387,263 | | | | 4,933,731 | |
Harleysville Group, Inc. (a) | | | 69,147 | | | | 4,063,078 | |
Other Insurance (b) | | | | | | | 42,912,711 | |
| | | | | | | | 51,909,520 | |
| Real Estate Investment Trusts (REIT) - 4.3% | | | | | | | | |
Other Real Estate Investment Trusts (REIT) (b) | | | | | | | 74,888,611 | |
TFS MARKET NEUTRAL FUND SUMMARY SCHEDULE OF INVESTMENTS* (Continued) |
COMMON STOCKS — 92.6% (Continued) | | | | | | |
| Financials — 15.7% (Continued) | | | | | | |
| Real Estate Management & Development — 0.4% | | | | | | |
Other Real Estate Management & Development (b) | | | | | $ | 6,698,723 | |
| | | | | | | | |
| Thrifts & Mortgage Finance — 1.0% | | | | | | | |
PMI Group, Inc. (The) (a) (c) (d) | | | 394,653 | | | | 123,132 | |
ViewPoint Financial Group (a) | | | 301,957 | | | | 3,886,187 | |
Other Thrifts & Mortgage Finance (b) | | | | | | | 14,278,327 | |
| | | | | | | | 18,287,646 | |
| Health Care — 12.7% | | | | | | | | |
| Biotechnology — 2.2% | | | | | | | | |
Other Biotechnology (b) | | | | | | | 39,460,242 | |
| | | | | | | | | |
| Health Care Equipment & Supplies — 3.3% | | | | | | | | |
Thoratec Corporation (a) (c) | | | 113,426 | | | | 4,141,183 | |
Other Health Care Equipment & Supplies (b) | | | | | | | 54,931,876 | |
| | | | | | | | 59,073,059 | |
| Health Care Providers & Services — 3.0% | | | | | | | | |
Molina Healthcare, Inc. (a) (c) | | | 202,660 | | | | 4,292,339 | |
Omnicare, Inc. | | | 148,103 | | | | 4,416,431 | |
Other Health Care Providers & Services (b) | | | | | | | 43,380,192 | |
| | | | | | | | 52,088,962 | |
| Health Care Technology — 1.2% | | | | | | | | |
athenahealth, Inc. (c) | | | 80,633 | | | | 4,266,292 | |
Other Health Care Technology (b) | | | | | | | 16,208,559 | |
| | | | | | | | 20,474,851 | |
| Life Sciences Tools & Services — 1.1% | | | | | | | | |
Other Life Sciences Tools & Services (b) | | | | | | | 20,077,726 | |
| | | | | | | | | |
| Pharmaceuticals — 1.9% | | | | | | | | |
Jazz Pharmaceuticals, Inc. (a) (c) | | | 168,354 | | | | 6,559,072 | |
Par Pharmaceutical Companies, Inc. (a) (c) | | | 138,357 | | | | 4,233,724 | |
Other Pharmaceuticals (b) | | | | | | | 22,256,055 | |
| | | | | | | | 33,048,851 | |
| Industrials — 16.8% | | | | | | | | |
| Aerospace & Defense — 1.2% | | | | | | | | |
Triumph Group, Inc. (a) | | | 70,664 | | | | 4,105,578 | |
Other Aerospace & Defense (b) | | | | | | | 17,972,772 | |
| | | | | | | | 22,078,350 | |
| Air Freight & Logistics — 0.7% | | | | | | | | |
Other Air Freight & Logistics (b) | | | | | | | 12,961,633 | |
| | | | | | | | | |
| Airlines — 0.9% | | | | | | | | |
Alaska Air Group, Inc. (a) (c) | | | 68,765 | | | | 4,574,935 | |
JetBlue Airways Corporation (a) (c) | | | 1,053,077 | | | | 4,717,785 | |
Other Airlines (b) | | | | | | | 6,032,599 | |
| | | | | | | | 15,325,319 | |
TFS MARKET NEUTRAL FUND SUMMARY SCHEDULE OF INVESTMENTS* (Continued) |
COMMON STOCKS — 92.6% (Continued) | | | | | | |
| Industrials — 16.8% (Continued) | | | | | | |
| Building Products — 0.8% | | | | | | |
Other Building Products (b) | | | | | $ | 13,757,893 | |
| | | | | | | | |
| Commercial Services & Supplies — 2.4% | | | | | | | |
Avery Dennison Corporation | | | 158,702 | | | | 4,221,473 | |
Other Commercial Services & Supplies (b) | | | | | | | 37,339,104 | |
| | | | | | | | 41,560,577 | |
| Construction & Engineering — 0.9% | | | | | | | | |
Chicago Bridge & Iron Company N.V. | | | 143,266 | | | | 5,240,670 | |
Other Construction & Engineering (b) | | | | | | | 10,011,883 | |
| | | | | | | | 15,252,553 | |
| Electrical Equipment — 1.0% | | | | | | | | |
Other Electrical Equipment (b) | | | | | | | 18,610,663 | |
| | | | | | | | | |
| Industrial Conglomerates — 0.4% | | | | | | | | |
Other Industrial Conglomerates (b) | | | | | | | 6,322,324 | |
| | | | | | | | | |
| Machinery — 4.3% | | | | | | | | |
Actuant Corporation - Class A (a) | | | 221,259 | | | | 4,978,328 | |
Graco, Inc. (a) | | | 136,463 | | | | 5,859,721 | |
WABCO Holdings, Inc. (a) (c) | | | 95,985 | | | | 4,819,407 | |
Wabtec Corporation (a) | | | 77,828 | | | | 5,228,485 | |
Other Machinery (b) | | | | | | | 54,894,425 | |
| | | | | | | | 75,780,366 | |
| Marine — 0.4% | | | | | | | | |
Other Marine (b) | | | | | | | 7,309,942 | |
| | | | | | | | | |
| Professional Services — 1.0% | | | | | | | | |
Other Professional Services (b) | | | | | | | 17,127,785 | |
| | | | | | | | | |
| Road & Rail — 2.1% | | | | | | | | |
Avis Budget Group, Inc. (a) (c) | | | 377,332 | | | | 5,320,381 | |
Con-way, Inc. (a) | | | 169,565 | | | | 4,997,081 | |
Knight Transportation, Inc. (a) | | | 304,261 | | | | 4,624,767 | |
Other Road & Rail (b) | | | | | | | 22,489,417 | |
| | | | | | | | 37,431,646 | |
| Trading Companies & Distributors — 0.6% | | | | | | | | |
Other Trading Companies & Distributors (b) | | | | | | | 11,075,799 | |
| | | | | | | | | |
| Transportation Infrastructure — 0.1% | | | | | | | | |
Other Transportation Infrastructure (b) | | | | | | | 1,481,353 | |
| | | | | | | | | |
| Information Technology — 16.9% | | | | | | | | |
| Communications Equipment — 2.1% | | | | | | | | |
ADTRAN, Inc. (a) | | | 143,376 | | | | 4,817,434 | |
Comtech Telecommunications Corporation (a) | | | 142,853 | | | | 4,729,863 | |
Riverbed Technology, Inc. (a) (c) | | | 163,849 | | | | 4,518,955 | |
Other Communications Equipment (b) | | | | | | | 23,335,184 | |
| | | | | | | | 37,401,436 | |
TFS MARKET NEUTRAL FUND SUMMARY SCHEDULE OF INVESTMENTS* (Continued) |
COMMON STOCKS — 92.6% (Continued) | | | | | | |
| Information Technology — 16.9% (Continued) | | | | | | |
| Computers & Peripherals — 0.8% | | | | | | |
Other Computers & Peripherals (b) | | | | | $ | 13,411,015 | |
| | | | | | | | |
| Electronic Equipment, Instruments & Components — 3.1% | | | | | | | |
Ingram Micro, Inc. - Class A (a) (c) | | | 396,952 | | | | 7,097,502 | |
Tech Data Corporation (a) (c) | | | 132,632 | | | | 6,522,842 | |
Other Electronic Equipment, Instruments & Components (b) | | | | | | | 41,535,140 | |
| | | | | | | | 55,155,484 | |
| Internet Software & Services — 2.1% | | | | | | | | |
RightNow Technologies, Inc. (a) (c) | | | 164,205 | | | | 7,062,457 | |
Other Internet Software & Services (b) | | | | | | | 29,757,660 | |
| | | | | | | | 36,820,117 | |
| IT Services — 2.1% | | | | | | | | |
NeuStar, Inc. - Class A (a) (c) | | | 176,238 | | | | 5,602,606 | |
Other IT Services (b) | | | | | | | 31,937,509 | |
| | | | | | | | 37,540,115 | |
| Office Electronics — 0.1% | | | | | | | | |
Other Office Electronics (b) | | | | | | | 770,018 | |
| | | | | | | | | |
| Semiconductors & Semiconductor Equipment — 3.7% | | | | | | | | |
Brooks Automation, Inc. (a) | | | 393,453 | | | | 4,111,584 | |
MEMC Electronic Materials, Inc. (a) (c) | | | 820,101 | | | | 4,912,405 | |
NetLogic Microsystems, Inc. (a) (c) | | | 252,378 | | | | 12,416,998 | |
Other Semiconductors & Semiconductor Equipment (b) | | | | | | | 43,422,573 | |
| | | | | | | | 64,863,560 | |
| Software — 2.9% | | | | | | | | |
CommVault Systems, Inc. (a) (c) | | | 129,881 | | | | 5,530,333 | |
SolarWinds, Inc. (a) (c) | | | 144,112 | | | | 4,159,072 | |
Other Software (b) | | | | | | | 41,652,271 | |
| | | | | | | | 51,341,676 | |
| Materials — 6.0% | | | | | | | | |
| Chemicals — 2.3% | | | | | | | | |
Rockwood Holdings, Inc. (a) (c) | | | 139,282 | | | | 6,412,543 | |
Valspar Corporation (The) (a) | | | 130,458 | | | | 4,549,070 | |
Other Chemicals (b) | | | | | | | 30,323,481 | |
| | | | | | | | 41,285,094 | |
Construction Materials — 0.0% (e) | | | | | | | | |
Other Construction Materials (b) | | | | | | | 65,271 | |
| | | | | | | | | |
| Containers & Packaging — 0.7% | | | | | | | | |
Other Containers & Packaging (b) | | | | | | | 11,691,387 | |
| | | | | | | | | |
| Metals & Mining — 2.7% | | | | | | | | |
Steel Dynamics, Inc. (a) | | | 513,689 | | | | 6,415,976 | |
Other Metals & Mining (b) | | | | | | | 41,855,514 | |
| | | | | | | | 48,271,490 | |
TFS MARKET NEUTRAL FUND SUMMARY SCHEDULE OF INVESTMENTS* (Continued) |
COMMON STOCKS — 92.6% (Continued) | | | | | | |
| Materials — 6.0% (Continued) | | | | | | |
| Paper & Forest Products — 0.3% | | | | | | |
Other Paper & Forest Products (b) | | | | | $ | 5,334,695 | |
| | | | | | | | |
| Telecommunication Services — 1.3% | | | | | | | |
| Diversified Telecommunication Services — 1.0% | | | | | | | |
PAETEC Holding Corporation (a) (c) | | | 854,537 | | | | 4,682,863 | |
Other Diversified Telecommunication Services (b) | | | | | | | 12,601,055 | |
| | | | | | | | 17,283,918 | |
| Wireless Telecommunication Services — 0.3% | | | | | | | | |
Other Wireless Telecommunication Services (b) | | | | | | | 4,995,284 | |
| | | | | | | | | |
| Utilities — 1.8% | | | | | | | | |
| Electric Utilities — 0.5% | | | | | | | | |
Other Electric Utilities (b) | | | | | | | 9,240,707 | |
| | | | | | | | | |
| Gas Utilities — 0.6% | | | | | | | | |
Southwest Gas Corporation (a) | | | 97,963 | | | | 3,867,579 | |
Other Gas Utilities (b) | | | | | | | 7,016,127 | |
| | | | | | | | 10,883,706 | |
| Independent Power Producers & Energy Traders — 0.1% | | | | | | | | |
Other Independent Power Producers & Energy Traders (b) | | | | | | | 1,782,324 | |
| | | | | | | | | |
| Multi-Utilities — 0.4% | | | | | | | | |
Other Multi-Utilities (b) | | | | | | | 7,304,009 | |
| | | | | | | | | |
| Water Utilities — 0.2% | | | | | | | | |
Other Water Utilities (b) | | | | | | | 3,401,815 | |
| | | | | | | | | |
Total Common Stocks (Cost $1,554,533,324) | | | | | | $ | 1,631,827,248 | |
| | | | | | |
Other Closed-End Funds (b) (Cost $67,273,863) | | | | | | $ | 69,536,407 | |
EXCHANGE-TRADED FUNDS — 0.0% (e) | | | | | | |
Other Exchange-Traded Funds (b) (Cost $2,126) | | | | | | $ | 2,308 | |
OPEN-END FUNDS — 0.0% (e) | | | | | | |
Other Open-End Funds (b) (Cost $885) | | | | | | $ | 1,002 | |
TFS MARKET NEUTRAL FUND SUMMARY SCHEDULE OF INVESTMENTS* (Continued) |
| | | | | | |
Other Rights (b) (Cost $0) | | | | | | $ | 10,057 | |
| | | | | | |
Magnum Hunter Resources Corporation (a) (d) (Cost $0) | | | 70 | | | $ | — | |
CORPORATE BONDS — 0.0% (e) | | | | | | |
Financials — 0.0% (e) | | | | | | |
Other Financials (b) (Cost $0) | | | | | | $ | 2,036 | |
| | | | | | | | | |
Total Investments at Value — 96.5% (Cost $1,621,810,198) | | | | | | $ | 1,701,379,058 | |
| | | | | | | | | |
Other Assets in Excess of Liabilities — 3.5% | | | | | | | 60,886,128 | |
| | | | | | | | | |
Net Assets — 100.0% | | | | | | $ | 1,762,265,186 | |
| * | A complete Schedule of Investments is available without charge upon request by calling toll-free 1-888-534-2001 or on the SEC’s website at http://www.sec.gov. |
| | |
| (a) | All or a portion of the shares have been committed as collateral for open short positions. |
| | |
| (b) | Represents securities at fair-value as of October 31, 2011 and 1) issuers not identified as a top 50 holding in terms of market value and 2) issues or issuers not exceeding 1% of net assets individually or in the aggregate, respectively, as of October 31, 2011. |
| | |
| (c) | Non-income producing security. |
| | |
| (d) | Securities fair-valued under supervision of the Board of Trustees totaled $123,132 at October 31, 2011, representing 0.0%(e) of net assets (Note 2). |
| | |
| (e) | Percentage rounds to less than 0.1%. |
| | |
| See accompanying notes to financial statements. |
TFS MARKET NEUTRAL FUND SCHEDULE OF SECURITIES SOLD SHORT October 31, 2011 |
| | | | | | |
| Consumer Discretionary — 8.8% | | | | | | |
| Auto Components — 0.4% | | | | | | |
Amerigon, Inc. | | | 28,047 | | | $ | 430,241 | |
China Automotive Systems, Inc. | | | 91,471 | | | | 482,052 | |
China XD Plastics Company Ltd. | | | 13,304 | | | | 58,006 | |
Cooper Tire & Rubber Company | | | 283,714 | | | | 4,065,622 | |
Goodyear Tire & Rubber Company (The) | | | 67,595 | | | | 970,664 | |
Quantum Fuel Systems Technologies Worldwide, Inc. | | | 253,837 | | | | 538,134 | |
Wonder Auto Technology, Inc. | | | 17,927 | | | | 19,540 | |
| | | | | | | | 6,564,259 | |
| Automobiles — 0.3% | | | | | | | | |
Kandi Technologies Corporation | | | 96,658 | | | | 244,545 | |
Tesla Motors, Inc. | | | 113,970 | | | | 3,347,299 | |
Winnebago Industries, Inc. | | | 187,052 | | | | 1,522,603 | |
| | | | | | | | 5,114,447 | |
Distributors — 0.0% (b) | | | | | | | | |
Core-Mark Holding Company, Inc. | | | 13,326 | | | | 446,288 | |
Pool Corporation | | | 65 | | | | 1,899 | |
Weyco Group, Inc. | | | 121 | | | | 2,868 | |
| | | | | | | | 451,055 | |
| Diversified Consumer Services — 1.4% | | | | | | | | |
American Public Education, Inc. | | | 6,989 | | | | 250,276 | |
Bridgepoint Education, Inc. | | | 298,330 | | | | 6,464,811 | |
Carriage Services, Inc. | | | 400 | | | | 2,384 | |
ChinaCast Education Corporation | | | 340,762 | | | | 1,369,863 | |
Collectors Universe, Inc. | | | 125 | | | | 1,933 | |
Corinthian Colleges, Inc. | | | 1,075,692 | | | | 2,054,572 | |
CPI Corporation | | | 5,636 | | | | 33,647 | |
DeVry, Inc. | | | 21 | | | | 791 | |
Education Management Corporation | | | 352,650 | | | | 7,003,629 | |
Matthews International Corporation - Class A | | | 3,819 | | | | 134,200 | |
Regis Corporation | | | 92,778 | | | | 1,517,848 | |
School Specialty, Inc. | | | 213,513 | | | | 1,633,374 | |
Stewart Enterprises, Inc. - Class A | | | 292,364 | | | | 1,882,824 | |
StoneMor Partners, L.P. | | | 100 | | | | 2,901 | |
Strayer Education, Inc. | | | 23,424 | | | | 1,995,959 | |
| | | | | | | | 24,349,012 | |
| Hotels, Restaurants & Leisure — 0.4% | | | | | | | | |
Asia Entertainment & Resources Ltd. | | | 7,572 | | | | 49,597 | |
Boyd Gaming Corporation | | | 309,032 | | | | 2,002,527 | |
Cheesecake Factory, Inc. (The) | | | 200 | | | | 5,598 | |
Denny's Corporation | | | 468,143 | | | | 1,685,315 | |
Dunkin' Brands Group, Inc. | | | 37,529 | | | | 1,092,469 | |
Gaylord Entertainment Company | | | 14,752 | | | | 345,049 | |
International Speedway Corporation - Class A | | | 58 | | | | 1,384 | |
Jamba, Inc. | | | 28,151 | | | | 47,857 | |
Morgans Hotel Group Company | | | 57,939 | | | | 377,183 | |
Multimedia Games Holding Company, Inc. | | | 691 | | | | 4,567 | |
O'Charley's, Inc. | | | 124,728 | | | | 774,561 | |
TFS MARKET NEUTRAL FUND SCHEDULE OF SECURITIES SOLD SHORT (Continued) |
COMMON STOCKS — 62.3% (Continued) | | | | | | |
| Consumer Discretionary — 8.8% (Continued) | | | | | | |
| Hotels, Restaurants & Leisure — 0.4% (Continued) | | | | | | |
Peet's Coffee & Tea, Inc. | | | 1,961 | | | $ | 124,955 | |
PokerTek, Inc. | | | 520 | | | | 458 | |
Red Lion Hotels Corporation | | | 200 | | | | 1,390 | |
Ruth's Hospitality Group, Inc. | | | 143,778 | | | | 678,632 | |
Shuffle Master, Inc. | | | 4 | | | | 42 | |
Speedway Motorsports, Inc. | | | 5,939 | | | | 77,207 | |
Star Buffet, Inc. | | | 600 | | | | 186 | |
Town Sports International Holdings, Inc. | | | 100 | | | | 868 | |
Universal Travel Group (a) | | | 238,516 | | | | 472,262 | |
| | | | | | | | 7,742,107 | |
| Household Durables — 1.6% | | | | | | | | |
American Greetings Corporation - Class A | | | 128,674 | | | | 2,060,071 | |
Beazer Homes USA, Inc. | | | 992,120 | | | | 2,133,058 | |
Cavco Industries, Inc. | | | 3,730 | | | | 167,962 | |
Comstock Homebuilding Companies, Inc. - Class A | | | 35,501 | | | | 41,536 | |
Deer Consumer Products, Inc. | | | 140,505 | | | | 709,550 | |
Ethan Allen Interiors, Inc. | | | 76,587 | | | | 1,516,423 | |
Flexsteel Industries, Inc. | | | 100 | | | | 1,425 | |
Furniture Brands International, Inc. | | | 1,958 | | | | 3,740 | |
Garmin Ltd. | | | 5,306 | | | | 182,473 | |
Hooker Furniture Corporation | | | 224 | | | | 2,173 | |
Hovnanian Enterprises, Inc. - Class A | | | 1,212,697 | | | | 1,746,284 | |
iRobot Corporation | | | 76,466 | | | | 2,589,139 | |
KB Home | | | 220,053 | | | | 1,533,769 | |
Lennar Corporation - Class A | | | 204,959 | | | | 3,390,022 | |
M/I Homes, Inc. | | | 6,079 | | | | 45,410 | |
Mad Catz Interactive, Inc. | | | 519,541 | | | | 432,778 | |
MDC Holdings, Inc. | | | 20,719 | | | | 464,106 | |
PulteGroup, Inc. | | | 661 | | | | 3,424 | |
Sealy Corporation | | | 320,239 | | | | 496,370 | |
Skullcandy, Inc. | | | 30,559 | | | | 481,304 | |
SodaStream International Ltd. | | | 37,000 | | | | 1,260,960 | |
Standard Pacific Corporation | | | 317,976 | | | | 966,647 | |
Toll Brothers, Inc. | | | 275,686 | | | | 4,807,964 | |
Universal Electronics, Inc. | | | 30,619 | | | | 569,207 | |
ZAGG, Inc. | | | 235,805 | | | | 3,181,009 | |
| | | | | | | | 28,786,804 | |
| Internet & Catalog Retail — 0.5% | | | | | | | | |
Blue Nile, Inc. | | | 11,174 | | | | 504,283 | |
E-Commerce China Dangdang, Inc. - ADR | | | 99,715 | | | | 695,014 | |
Gaiam, Inc. - Class A | | | 519 | | | | 2,008 | |
HomeAway, Inc. | | | 4,546 | | | | 150,245 | |
MakeMyTrip Ltd. | | | 29,570 | | | | 887,396 | |
NutriSystem, Inc. | | | 192,418 | | | | 2,378,286 | |
Overstock.com, Inc. | | | 85,927 | | | | 713,194 | |
PetMed Express, Inc. | | | 275,131 | | | | 2,743,056 | |
| | | | | | | | 8,073,482 | |
TFS MARKET NEUTRAL FUND SCHEDULE OF SECURITIES SOLD SHORT (Continued) |
COMMON STOCKS — 62.3% (Continued) | | | | | | |
| Consumer Discretionary — 8.8% (Continued) | | | | | | |
| Leisure Equipment & Products — 0.3% | | | | | | |
Callaway Golf Company | | | 469,903 | | | $ | 2,730,136 | |
JAKKS Pacific, Inc. | | | 90,877 | | | | 1,723,937 | |
Johnson Outdoors, Inc. | | | 77 | | | | 1,431 | |
Nautilus, Inc. | | | 1,102 | | | | 2,226 | |
Summer Infant, Inc. | | | 7 | | | | 55 | |
| | | | | | | | 4,457,785 | |
| Media — 1.0% | | | | | | | | |
AH Belo Corporation - Class A | | | 65 | | | | 325 | |
Atrinsic, Inc. | | | 87,591 | | | | 144,525 | |
Carmike Cinemas, Inc. | | | 28,640 | | | | 185,587 | |
China MediaExpress Holdings, Inc. | | | 146,250 | | | | 24,862 | |
China Yida Holding Company | | | 5,003 | | | | 15,009 | |
Clear Channel Outdoor Holdings, Inc. | | | 300 | | | | 3,300 | |
Cumulus Media, Inc. - Class A | | | 151,791 | | | | 456,891 | |
DG FastChannel, Inc. | | | 38,693 | | | | 721,238 | |
Entercom Communications Corporation - Class A | | | 182,743 | | | | 1,198,794 | |
Gannett Company, Inc. | | | 123,600 | | | | 1,444,884 | |
Harte-Hanks, Inc. | | | 1,000 | | | | 8,780 | |
Journal Communications, Inc. | | | 21,249 | | | | 82,021 | |
Lee Enterprises, Inc. | | | 125,766 | | | | 89,294 | |
Live Nation, Inc. | | | 970 | | | | 9,108 | |
LodgeNet Interactive Corporation | | | 31,165 | | | | 62,330 | |
Martha Stewart Living Omnimedia, Inc. - Class A | | | 32,374 | | | | 125,287 | |
McClatchy Company (The) - Class A | | | 877,867 | | | | 1,378,251 | |
Media General, Inc. - Class A | | | 167,618 | | | | 506,206 | |
Meredith Corporation | | | 92,725 | | | | 2,487,812 | |
Pandora Media, Inc. | | | 266,031 | | | | 4,203,290 | |
Radio One, Inc. - Class D | | | 4,231 | | | | 5,543 | |
ReachLocal, Inc. | | | 53,849 | | | | 539,028 | |
Scholastic Corporation | | | 66,106 | | | | 1,774,946 | |
SearchMedia Holdings Ltd. | | | 1,000 | | | | 1,210 | |
SPAR Group, Inc. | | | 500 | | | | 525 | |
SuperMedia, Inc. | | | 79,227 | | | | 137,063 | |
Valassis Communications, Inc. | | | 80,062 | | | | 1,563,611 | |
Viacom, Inc. - Class A | | | 4,097 | | | | 218,944 | |
Westwood One, Inc. - Class A | | | 1,286 | | | | 5,620 | |
| | | | | | | | 17,394,284 | |
| Multiline Retail — 0.2% | | | | | | | | |
Big Lots, Inc. | | | 9,665 | | | | 364,274 | |
Bon-Ton Stores, Inc. (The) | | | 88,228 | | | | 465,844 | |
Dillard's, Inc. - Class A | | | 1,545 | | | | 79,614 | |
Fred's, Inc. - Class A | | | 161,334 | | | | 1,966,661 | |
Tuesday Morning Corporation | | | 239,822 | | | | 868,156 | |
| | | | | | | | 3,744,549 | |
| Specialty Retail — 2.2% | | | | | | | | |
ANN, Inc. | | | 2,625 | | | | 69,930 | |
AutoChina International Ltd. | | | 881 | | | | 17,840 | |
AutoNation, Inc. | | | 1,200 | | | | 46,728 | |
TFS MARKET NEUTRAL FUND SCHEDULE OF SECURITIES SOLD SHORT (Continued) |
COMMON STOCKS — 62.3% (Continued) | | | | | | |
| Consumer Discretionary — 8.8% (Continued) | | | | | | |
| Specialty Retail — 2.2% (Continued) | | | | | | |
Barnes & Noble, Inc. | | | 30,726 | | | $ | 377,008 | |
Books-A-Million, Inc. | | | 8,500 | | | | 18,870 | |
Borders Group, Inc. | | | 21,200 | | | | 426 | |
Brown Shoe Company, Inc. | | | 218,418 | | | | 1,946,104 | |
Buckle, Inc. (The) | | | 22,852 | | | | 1,018,285 | |
Build-A-Bear Workshop, Inc. | | | 17,489 | | | | 114,553 | |
Cabela's, Inc. - Class A | | | 1,356 | | | | 33,792 | |
Cache, Inc. | | | 167 | | | | 878 | |
Casual Male Retail Group, Inc. | | | 2,281 | | | | 9,466 | |
Cato Corporation (The) - Class A | | | 52 | | | | 1,333 | |
Children's Place Retail Stores, Inc. (The) | | | 17,298 | | | | 812,141 | |
China Auto Logistics, Inc. | | | 2,600 | | | | 2,652 | |
Citi Trends, Inc. | | | 17,970 | | | | 222,648 | |
Collective Brands, Inc. | | | 207 | | | | 3,024 | |
Conn's, Inc. | | | 300,395 | | | | 2,766,638 | |
Cost Plus, Inc. | | | 228,224 | | | | 1,800,687 | |
Finish Line, Inc. (The) | | | 45 | | | | 905 | |
GameStop Corporation - Class A | | | 74 | | | | 1,892 | |
hhgregg, Inc. | | | 348,631 | | | | 4,445,045 | |
Hibbett Sports, Inc. | | | 99,217 | | | | 4,086,748 | |
Hot Topic, Inc. | | | 75,274 | | | | 569,071 | |
Jos. A. Bank Clothiers, Inc. | | | 22,222 | | | | 1,187,544 | |
Lithia Motors, Inc. | | | 18,047 | | | | 371,227 | |
Lumber Liquidators Holdings, Inc. | | | 155,208 | | | | 2,323,464 | |
MarineMax, Inc. | | | 143,867 | | | | 1,171,077 | |
Men's Warehouse, Inc. (The) | | | 154,590 | | | | 4,773,739 | |
OfficeMax, Inc. | | | 1,758 | | | | 9,001 | |
Pacific Sunwear of California, Inc. | | | 92,935 | | | | 116,169 | |
Penske Auto Group, Inc. | | | 8,051 | | | | 164,160 | |
Pep Boys - Manny Moe & Jack (The) | | | 144,978 | | | | 1,667,247 | |
rue21, inc. | | | 94,573 | | | | 2,519,425 | |
Stage Stores, Inc. | | | 111,728 | | | | 1,746,309 | |
Syms Corp | | | 160 | | | | 1,250 | |
Talbots, Inc. (The) | | | 1,329,655 | | | | 3,496,993 | |
Williams-Sonoma, Inc. | | | 1,700 | | | | 63,818 | |
Zale Corporation | | | 100 | | | | 369 | |
Zumiez, Inc. | | | 58,770 | | | | 1,337,018 | |
| | | | | | | | 39,315,474 | |
| Textiles, Apparel & Luxury Goods — 0.5% | | | | | | | | |
American Apparel, Inc. | | | 273,935 | | | | 238,323 | |
Carter's, Inc. | | | 39,834 | | | | 1,517,277 | |
Cherokee, Inc. | | | 8,242 | | | | 108,300 | |
Columbia Sportswear Company | | | 10,544 | | | | 566,635 | |
CROCS, Inc. | | | 1,713 | | | | 30,269 | |
Delta Apparel, Inc. | | | 211 | | | | 3,800 | |
DGSE Companies, Inc. | | | 1,145 | | | | 9,446 | |
Forward Industries, Inc. | | | 100 | | | | 202 | |
Hanesbrands, Inc. | | | 346 | | | | 9,124 | |
TFS MARKET NEUTRAL FUND SCHEDULE OF SECURITIES SOLD SHORT (Continued) |
COMMON STOCKS — 62.3% (Continued) | | | | | | |
| Consumer Discretionary — 8.8% (Continued) | | | | | | |
| Textiles, Apparel & Luxury Goods — 0.5% (Continued) | | | | | | |
Heelys, Inc. | | | 200 | | | $ | 398 | |
Joe's Jeans, Inc. | | | 100 | | | | 55 | |
Kingold Jewelry, Inc. | | | 649 | | | | 837 | |
K-Swiss, Inc. - Class A | | | 234,741 | | | | 1,056,334 | |
Movado Group, Inc. | | | 92,285 | | | | 1,543,928 | |
Perry Ellis International, Inc. | | | 6,747 | | | | 169,350 | |
R.G. Barry Corporation | | | 24 | | | | 267 | |
Under Armour, Inc. - Class A | | | 52,729 | | | | 4,450,855 | |
| | | | | | | | 9,705,400 | |
| Consumer Staples — 2.0% | | | | | | | | |
| Beverages — 0.3% | | | | | | | | |
China New Borun Corporation | | | 177,940 | | | | 774,039 | |
Heckmann Corporation | | | 575,235 | | | | 3,445,658 | |
MGP Ingredients, Inc. | | | 56 | | | | 367 | |
| | | | | | | | 4,220,064 | |
Food & Staples Retailing — 0.0% (b) | | | | | | | | |
Arden Group, Inc. - Class A | | | 39 | | | | 3,537 | |
Great Atlantic & Pacific Tea Company, Inc. (The) | | | 845,066 | | | | 137,746 | |
Ingles Markets, Inc. - Class A | | | 87 | | | | 1,314 | |
Pizza Inn Holdings, Inc. | | | 188 | | | | 827 | |
United Natural Foods, Inc. | | | 700 | | | | 25,557 | |
Village Super Market, Inc. - Class A | | | 25 | | | | 709 | |
| | | | | | | | 169,690 | |
| Food Products — 1.1% | | | | | | | | |
AgFeed Industries, Inc. | | | 160,993 | | | | 104,645 | |
Calavo Growers, Inc. | | | 120,582 | | | | 2,721,536 | |
Cal-Maine Foods, Inc. | | | 115,567 | | | | 3,850,692 | |
China Marine Food Group Ltd. | | | 61,176 | | | | 97,270 | |
Chiquita Brands International, Inc. | | | 975 | | | | 8,658 | |
Coffee Holding Company, Inc. | | | 47,046 | | | | 491,160 | |
Cosan Ltd. | | | 2,962 | | | | 35,544 | |
Dole Food Company, Inc. | | | 225,504 | | | | 2,385,832 | |
Farmer Brothers Company | | | 1,300 | | | | 7,605 | |
Feihe International, Inc. | | | 241,388 | | | | 1,296,254 | |
Flowers Foods, Inc. | | | 228,707 | | | | 4,617,594 | |
John B. Sanfilippo & Son, Inc. | | | 56 | | | | 482 | |
Lancaster Colony Corporation | | | 11,634 | | | | 773,894 | |
Le Gaga Holdings Ltd. | | | 1,599 | | | | 6,524 | |
Lifeway Foods, Inc. | | | 11,220 | | | | 118,259 | |
Limoneira Company | | | 284 | | | | 4,927 | |
Seneca Foods Corporation - Class A | | | 30 | | | | 632 | |
SkyPeople Fruit Juice, Inc. | | | 12,491 | | | | 24,857 | |
Tootsie Roll Industries, Inc. | | | 22,270 | | | | 551,628 | |
Yuhe International, Inc. | | | 109,183 | | | | 98,265 | |
Zhongpin, Inc. | | | 299,153 | | | | 2,761,182 | |
| | | | | | | | 19,957,440 | |
Household Products — 0.0% (b) | | | | | | | | |
Central Garden & Pet Company | | | 13,954 | | | | 120,702 | |
TFS MARKET NEUTRAL FUND SCHEDULE OF SECURITIES SOLD SHORT (Continued) |
COMMON STOCKS — 62.3% (Continued) | | | | | | |
| Consumer Staples — 2.0% (Continued) | | | | | | |
Household Products — 0.0% (b) (Continued) | | | | | | |
Spectrum Brands Holdings, Inc. | | | 300 | | | $ | 7,614 | |
WD-40 Company | | | 4,040 | | | | 177,841 | |
| | | | | | | | 306,157 | |
| Personal Products — 0.3% | | | | | | | | |
China Sky One Medical, Inc. | | | 195,854 | | | | 393,666 | |
China-Biotics, Inc. | | | 591,624 | | | | 307,644 | |
Medifast, Inc. | | | 43,106 | | | | 708,663 | |
Nature's Sunshine Products, Inc. | | | 74 | | | | 1,285 | |
Neptune Technologies & Bioressources, Inc. | | | 15,101 | | | | 41,679 | |
Synutra International, Inc. | | | 103,885 | | | | 690,835 | |
USANA Health Sciences, Inc. | | | 84,838 | | | | 2,935,395 | |
| | | | | | | | 5,079,167 | |
| Tobacco — 0.3% | | | | | | | | |
Alliance One International, Inc. | | | 403,416 | | | | 1,077,121 | |
Star Scientific, Inc. | | | 1,408,832 | | | | 4,085,613 | |
Universal Corporation | | | 18,547 | | | | 794,182 | |
| | | | | | | | 5,956,916 | |
| Energy — 4.4% | | | | | | | | |
| Energy Equipment & Services — 0.5% | | | | | | | | |
Dawson Geophysical Company | | | 12,478 | | | | 360,614 | |
Diamond Offshore Drilling, Inc. | | | 2,200 | | | | 144,188 | |
ENGlobal Corporation | | | 100 | | | | 261 | |
Exterran Holdings, Inc. | | | 148,310 | | | | 1,408,945 | |
Geokinetics, Inc. | | | 1,864 | | | | 6,095 | |
Global Industries Ltd. | | | 551 | | | | 4,380 | |
Gulf Island Fabrication, Inc. | | | 55 | | | | 1,532 | |
Hercules Offshore, Inc. | | | 229,885 | | | | 871,264 | |
ION Geophysical Corporation | | | 23,246 | | | | 177,135 | |
Natural Gas Services Group, Inc. | | | 54,306 | | | | 747,251 | |
PHI, Inc. | | | 1,551 | | | | 34,231 | |
Recon Technology Ltd. | | | 200 | | | | 166 | |
Seadrill Ltd. | | | 73,474 | | | | 2,434,194 | |
SulphCo, Inc. | | | 486,090 | | | | 1,750 | |
Superior Energy Services, Inc. | | | 110,803 | | | | 3,115,780 | |
TGC Industries, Inc. | | | 600 | | | | 3,348 | |
Tidewater, Inc. | | | 1,057 | | | | 52,036 | |
Willbros Group, Inc. | | | 246 | | | | 1,252 | |
| | | | | | | | 9,364,422 | |
| Oil, Gas & Consumable Fuels — 3.9% | | | | | | | | |
Abraxas Petroleum Corporation | | | 608,455 | | | | 2,372,974 | |
Amyris, Inc. | | | 44,369 | | | | 909,564 | |
Apco Oil and Gas International, Inc. | | | 1,276 | | | | 105,908 | |
ATP Oil & Gas Corporation | | | 126,481 | | | | 1,334,375 | |
BioFuel Energy Corporation | | | 246,628 | | | | 123,314 | |
Blue Dolphin Energy Company | | | 41,157 | | | | 138,288 | |
BMB Munai, Inc. | | | 148 | | | | 20 | |
BPZ Resources, Inc. | | | 1,167,792 | | | | 3,491,698 | |
Buckeye Partners, L.P. | | | 152 | | | | 10,268 | |
TFS MARKET NEUTRAL FUND SCHEDULE OF SECURITIES SOLD SHORT (Continued) |
COMMON STOCKS — 62.3% (Continued) | | | | | | |
| Energy — 4.4% (Continued) | | | | | | |
| Oil, Gas & Consumable Fuels — 3.9% (Continued) | | | | | | |
CAMAC Energy, Inc. | | | 22,976 | | | $ | 25,503 | |
Cano Petroleum, Inc. | | | 50,840 | | | | 6,614 | |
Capital Product Partners, L.P. | | | 16,219 | | | | 113,695 | |
Carrizo Oil & Gas, Inc. | | | 5,600 | | | | 152,320 | |
China Integrated Energy, Inc. | | | 491,150 | | | | 260,801 | |
China North East Petroleum Holdings Ltd. | | | 210,605 | | | | 566,527 | |
Clean Energy Fuels Corporation | | | 279,697 | | | | 3,306,019 | |
Comstock Resources, Inc. | | | 32,503 | | | | 592,855 | |
Constellation Energy Partners, LLC | | | 1,600 | | | | 4,304 | |
Contango Oil & Gas Company | | | 7,366 | | | | 473,928 | |
Cross Timbers Royalty Trust | | | 87 | | | | 4,089 | |
DCP Midstream Partners, L.P. | | | 1,100 | | | | 48,334 | |
Delek US Holdings, Inc. | | | 34,873 | | | | 504,961 | |
DHT Holdings, Inc. | | | 181,934 | | | | 291,094 | |
Dominion Resources Black Warrior Trust | | | 400 | | | | 3,796 | |
ECA Marcellus Trust I | | | 28,410 | | | | 783,548 | |
El Paso Pipeline Partners, L.P. | | | 100 | | | | 3,333 | |
Enbridge Energy Management, LLC | | | 34,252 | | | | 1,055,647 | |
Endeavour International Corporation | | | 344,744 | | | | 3,199,224 | |
Energy Partners Ltd. | | | 18,949 | | | | 271,729 | |
Energy Transfer Equity, L.P. | | | 3,080 | | | | 117,810 | |
Enterprise Products Partners, L.P. | | | 101 | | | | 4,528 | |
Evergreen Energy, Inc. | | | 172,973 | | | | 152,216 | |
Evolution Petroleum Corporation | | | 34,548 | | | | 238,727 | |
Frontline Ltd. | | | 38,700 | | | | 201,240 | |
FX Energy, Inc. | | | 279,836 | | | | 1,656,629 | |
General Maritime Corporation | | | 30,008 | | | | 7,802 | |
GeoGlobal Resources, Inc. | | | 294,532 | | | | 71,424 | |
GeoResources, Inc. | | | 100,617 | | | | 2,670,375 | |
Gevo, Inc. | | | 1,846 | | | | 13,716 | |
GMX Resources, Inc. | | | 100 | | | | 250 | |
Green Plains Renewable Energy, Inc. | | | 18,447 | | | | 192,956 | |
GreenHunter Energy, Inc. | | | 2,800 | | | | 1,896 | |
Gulfport Energy Corporation | | | 300 | | | | 9,342 | |
Harvest Natural Resources, Inc. | | | 299,747 | | | | 3,198,300 | |
Houston American Energy Corporation | | | 75,721 | | | | 1,185,791 | |
Hyperdynamics Corporation | | | 435,572 | | | | 2,134,303 | |
Inergy, L.P. | | | 1,400 | | | | 40,194 | |
InterOil Corporation | | | 19,007 | | | | 903,023 | |
Isramco, Inc. | | | 1,113 | | | | 94,416 | |
Kinder Morgan Management, LLC | | | 15,774 | | | | 1,044,893 | |
Kinder Morgan, Inc. | | | 29,538 | | | | 844,787 | |
KiOR, Inc. - Class A | | | 27,926 | | | | 461,617 | |
Knightsbridge Tankers Ltd. | | | 168,702 | | | | 2,847,690 | |
Kosmos Energy, LLC | | | 15,200 | | | | 235,600 | |
L & L Energy, Inc. | | | 490,656 | | | | 1,329,678 | |
Legacy Reserves, L.P. | | | 858 | | | | 25,285 | |
Longwei Petroleum Investment Holding Ltd. | | | 69,078 | | | | 83,584 | |
Lucas Energy, Inc. | | | 227,846 | | | | 389,617 | |
TFS MARKET NEUTRAL FUND SCHEDULE OF SECURITIES SOLD SHORT (Continued) |
COMMON STOCKS — 62.3% (Continued) | | | | | | |
| Energy — 4.4% (Continued) | | | | | | |
| Oil, Gas & Consumable Fuels — 3.9% (Continued) | | | | | | |
Magnum Hunter Resources Corporation | | | 426,380 | | | $ | 1,918,710 | |
MarkWest Energy Partners, L.P. | | | 300 | | | | 14,949 | |
Miller Energy Resources, Inc. | | | 554,795 | | | | 1,592,262 | |
MV Oil Trust | | | 9,270 | | | | 337,521 | |
New Concept Energy, Inc. | | | 11,200 | | | | 25,984 | |
Nordic American Tankers Ltd. | | | 210,725 | | | | 3,038,654 | |
NuStar GP Holdings, LLC | | | 200 | | | | 6,370 | |
Oiltanking Partners, L.P. | | | 100 | | | | 2,720 | |
ONEOK Partners, L.P. | | | 2,523 | | | | 126,150 | |
Overseas Shipholding Group, Inc. | | | 253,319 | | | | 3,161,421 | |
Pacific Ethanol, Inc. | | | 407,867 | | | | 187,619 | |
Panhandle Oil & Gas, Inc. | | | 100 | | | | 3,332 | |
Petroleum Development Corporation | | | 62,629 | | | | 1,635,243 | |
Provident Energy Ltd. | | | 300 | | | | 2,718 | |
Pyramid Oil Company | | | 40,471 | | | | 146,100 | |
Resolute Energy Corporation | | | 56,635 | | | | 736,255 | |
Rex Energy Corporation | | | 67,877 | | | | 1,050,736 | |
Rosetta Resources, Inc. | | | 2,600 | | | | 115,284 | |
Royale Energy, Inc. | | | 204,838 | | | | 637,046 | |
SandRidge Energy, Inc. | | | 31,125 | | | | 238,417 | |
SandRidge Mississippian Trust I | | | 17,049 | | | | 464,074 | |
Scorpio Tankers, Inc. | | | 2,282 | | | | 14,582 | |
Ship Finance International Ltd. | | | 2,087 | | | | 29,865 | |
Sino Clean Energy, Inc. | | | 88,671 | | | | 105,962 | |
Southern Union Company | | | 40,017 | | | | 1,681,915 | |
Spectra Energy Partners, L.P. | | | 11,602 | | | | 360,590 | |
Teekay Offshore Partners, L.P. | | | 693 | | | | 18,281 | |
Teekay Tankers Ltd. - Class A | | | 134,248 | | | | 663,185 | |
Tri-Valley Corporation | | | 561,372 | | | | 99,924 | |
Uranerz Energy Corporation | | | 469,929 | | | | 1,071,438 | |
Uranium Energy Corporation | | | 994,209 | | | | 3,340,542 | |
Uranium Resources, Inc. | | | 21,562 | | | | 25,874 | |
USEC, Inc. | | | 602,792 | | | | 1,265,863 | |
Vanguard Natural Resources, LLC | | | 13,056 | | | | 379,538 | |
Verenium Corporation | | | 82,517 | | | | 207,943 | |
Whiting USA Trust I | | | 55,782 | | | | 978,974 | |
Williams Partners, L.P. | | | 200 | | | | 11,866 | |
World Fuel Services Corporation | | | 32,320 | | | | 1,287,952 | |
Zion Oil & Gas, Inc. | | | 300,672 | | | | 874,956 | |
| | | | | | | | 68,173,234 | |
| Financials — 10.8% | | | | | | | | |
| Capital Markets — 1.8% | | | | | | | | |
AllianceBernstein Holding, L.P. | | | 178,202 | | | | 2,525,122 | |
Apollo Investment Corporation | | | 588,659 | | | | 4,874,097 | |
BGC Partners, Inc. - Class A | | | 172,075 | | | | 1,178,714 | |
CIFC Corporation | | | 600 | | | | 3,324 | |
Cowen Group, Inc. | | | 430,103 | | | | 1,169,880 | |
Duff & Phelps Corporation | | | 137,442 | | | | 1,744,139 | |
TFS MARKET NEUTRAL FUND SCHEDULE OF SECURITIES SOLD SHORT (Continued) |
COMMON STOCKS — 62.3% (Continued) | | | | | | |
| Financials — 10.8% (Continued) | | | | | | |
| Capital Markets — 1.8% (Continued) | | | | | | |
Eaton Vance Corporation | | | 2,400 | | | $ | 63,096 | |
Edelman Financial Group, Inc. | | | 179 | | | | 1,242 | |
FBR Capital Markets Corporation | | | 776 | | | | 1,614 | |
Federated Investors, Inc. - Class B | | | 303,911 | | | | 5,938,421 | |
Fifth Street Finance Corporation | | | 133,991 | | | | 1,321,151 | |
Financial Engines, Inc. | | | 162,030 | | | | 3,679,701 | |
FXCM, Inc. | | | 132,951 | | | | 1,528,937 | |
Gladstone Investment Corporation | | | 366 | | | | 2,741 | |
Greenhill & Company, Inc. | | | 3,987 | | | | 150,629 | |
Investors Capital Holdings Ltd. | | | 600 | | | | 2,820 | |
KBW, Inc. | | | 479 | | | | 6,783 | |
Main Street Capital Corporation | | | 44,795 | | | | 783,017 | |
Medley Capital Corporation | | | 784 | | | | 7,299 | |
MF Global Holdings Ltd. | | | 523,833 | | | | 628,600 | |
MVC Capital, Inc. | | | 3,093 | | | | 39,992 | |
Oppenheimer Holdings, Inc. | | | 189 | | | | 3,321 | |
Penson Worldwide, Inc. | | | 243,626 | | | | 299,660 | |
Piper Jaffray Companies, Inc. | | | 251 | | | | 5,211 | |
Prospect Capital Corporation | | | 452,687 | | | | 4,332,215 | |
Pzena Investment Management, Inc. - Class A | | | 1,392 | | | | 6,027 | |
Safeguard Scientifics, Inc. | | | 119,020 | | | | 2,012,628 | |
TICC Capital Corporation | | | 28 | | | | 249 | |
Tortoise Capital Resources Corporation | | | 48 | | | | 364 | |
U.S. Global Investors, Inc. | | | 271 | | | | 2,057 | |
Westwood Holdings Group, Inc. | | | 255 | | | | 9,343 | |
| | | | | | | | 32,322,394 | |
| Commercial Banks — 4.4% | | | | | | | | |
Alliance Financial Corporation | | | 3,248 | | | | 100,006 | |
American National Bankshares, Inc. | | | 214 | | | | 4,006 | |
Ameris Bancorp | | | 117,540 | | | | 1,181,277 | |
Ames National Corporation | | | 150 | | | | 2,763 | |
Arrow Financial Corporation | | | 23,355 | | | | 545,106 | |
BancTrust Financial Group, Inc. | | | 5,150 | | | | 8,394 | |
Bank of the Ozarks, Inc. | | | 63,275 | | | | 1,573,649 | |
Bridge Capital Holdings | | | 1,177 | | | | 12,982 | |
Britton & Koontz Capital Corporation | | | 50 | | | | 296 | |
Camden National Corporation | | | 3 | | | | 89 | |
Capital City Bank Group, Inc. | | | 52,728 | | | | 537,298 | |
Capitol Bancorp Ltd. | | | 40,199 | | | | 2,693 | |
Cascade Bancorp | | | 25,756 | | | | 136,249 | |
Center Bancorporation, Inc. | | | 5,260 | | | | 48,813 | |
CenterState Banks, Inc. | | | 117 | | | | 665 | |
Citizens Holding Company | | | 1,201 | | | | 21,468 | |
Citizens Republic Bancorp, Inc. | | | 10 | | | | 90 | |
City Bank | | | 13,668 | | | | 3,007 | |
City Holding Company | | | 81,133 | | | | 2,666,030 | |
City National Corporation | | | 97,935 | | | | 4,154,403 | |
CoBiz Financial, Inc. | | | 211,735 | | | | 1,122,196 | |
TFS MARKET NEUTRAL FUND SCHEDULE OF SECURITIES SOLD SHORT (Continued) |
COMMON STOCKS — 62.3% (Continued) | | | | | | |
| Financials — 10.8% (Continued) | | | | | | |
| Commercial Banks — 4.4% (Continued) | | | | | | |
Columbia Banking Systems, Inc. | | | 107,370 | | | $ | 2,047,546 | |
Community Bank System, Inc. | | | 122,014 | | | | 3,118,678 | |
Community Trust Bancorp, Inc. | | | 4,642 | | | | 131,508 | |
CVB Financial Corporation | | | 235,691 | | | | 2,288,560 | |
Dearborn Bancorp, Inc. | | | 136 | | | | 88 | |
Eagle Bancorp, Inc. | | | 3,390 | | | | 47,019 | |
First BanCorp (North Carolina) | | | 3,212 | | | | 40,728 | |
First BanCorp (Puerto Rico) | | | 274,982 | | | | 978,936 | |
First Bancorp, Inc. | | | 315 | | | | 4,533 | |
First Busey Corporation | | | 384,008 | | | | 1,958,441 | |
First Commonwealth Financial Corporation | | | 222,742 | | | | 1,026,841 | |
First Community Bancshares, Inc. | | | 217 | | | | 2,606 | |
First Financial Bankshares, Inc. | | | 116,585 | | | | 3,702,740 | |
First Horizon National Corporation | | | 8 | | | | 56 | |
First of Long Island Corporation (The) | | | 111 | | | | 2,836 | |
FirstMerit Corporation | | | 4,700 | | | | 65,847 | |
FNB Corporation | | | 255,702 | | | | 2,580,033 | |
Frontier Financial Corporation | | | 10,459 | | | | 575 | |
German American Bancorp, Inc. | | | 200 | | | | 3,474 | |
Great Southern Bancorp, Inc. | | | 37,480 | | | | 745,477 | |
Green Bankshares, Inc. | | | 81,194 | | | | 112,048 | |
Hampton Roads Bankshares, Inc. | | | 40,735 | | | | 178,827 | |
Heartland Financial USA, Inc. | | | 368 | | | | 5,752 | |
Heritage Financial Corporation | | | 24,574 | | | | 309,878 | |
IBERIABANK Corporation | | | 116,945 | | | | 6,048,395 | |
Independent Bank Corporation (Massachusetts) | | | 118,262 | | | | 3,065,351 | |
Independent Bank Corporation (Michigan) | | | 110,460 | | | | 189,991 | |
Lakeland Bancorp, Inc. | | | 78,215 | | | | 726,617 | |
Macatawa Bank Corporation | | | 75,547 | | | | 201,710 | |
MainSource Financial Group, Inc. | | | 791 | | | | 7,420 | |
Mercantile Bancorp, Inc. | | | 900 | | | | 450 | |
Mercantile Bank Corporation | | | 19,216 | | | | 175,442 | |
Merchants Bancshares, Inc. | | | 4 | | | | 114 | |
Nara Bancorp, Inc. | | | 486,853 | | | | 4,128,513 | |
National Bankshares, Inc. | | | 16,134 | | | | 450,945 | |
Old Second Bancorp, Inc. | | | 45,303 | | | | 58,894 | |
Oriental Financial Group, Inc. | | | 132,440 | | | | 1,402,540 | |
PAB Bankshares, Inc. | | | 4,809 | | | | 12 | |
Pacific Mercantile Bancorp | | | 1,019 | | | | 3,098 | |
PacWest Bancorp | | | 14,278 | | | | 251,864 | |
Park National Corporation | | | 52,031 | | | | 3,106,771 | |
Patriot National Bancorp | | | 994 | | | | 1,839 | |
Pinnacle Financial Partners, Inc. | | | 121,717 | | | | 1,826,972 | |
PremierWest Bancorp, Inc. | | | 15,074 | | | | 15,225 | |
Princeton National Bancorp, Inc. | | | 600 | | | | 1,350 | |
Prosperity Bancshares, Inc. | | | 35,770 | | | | 1,376,787 | |
Renasant Corporation | | | 108,045 | | | | 1,558,009 | |
Republic Bancorp, Inc. - Class A | | | 3,580 | | | | 72,817 | |
S&T Bancorp, Inc. | | | 115,807 | | | | 2,162,117 | |
TFS MARKET NEUTRAL FUND SCHEDULE OF SECURITIES SOLD SHORT (Continued) |
COMMON STOCKS — 62.3% (Continued) | | | | | | |
| Financials — 10.8% (Continued) | | | | | | |
| Commercial Banks — 4.4% (Continued) | | | | | | |
S.Y. Bancorp, Inc. | | | 43,136 | | | $ | 887,739 | |
Salisbury Bancorp, Inc. | | | 300 | | | | 6,900 | |
Sandy Spring Bancorp, Inc. | | | 228 | | | | 3,878 | |
SCBT Financial Corporation | | | 9,471 | | | | 279,679 | |
Seacoast Banking Corporation of Florida | | | 9,300 | | | | 13,857 | |
Security Bank Corporation | | | 32,973 | | | | — | |
Sierra Bancorp | | | 99 | | | | 1,083 | |
Simmons First National Corporation - Class A | | | 9,081 | | | | 235,743 | |
Southern Connecticut Bancorp, Inc. | | | 200 | | | | 466 | |
Southside Bancshares, Inc. | | | 57,432 | | | | 1,181,376 | |
State Bank Financial Corporation | | | 4,794 | | | | 69,225 | |
StellarOne Corporation | | | 1,100 | | | | 13,189 | |
Sterling Bancorp | | | 44,015 | | | | 363,124 | |
Suffolk Bancorp | | | 51 | | | | 434 | |
Superior Bancorp | | | 400 | | | | 1 | |
Susquehanna Bancshares, Inc. | | | 227 | | | | 1,648 | |
Taylor Capital Group, Inc. | | | 45,878 | | | | 426,207 | |
TCF Financial Corporation | | | 70,986 | | | | 755,291 | |
Texas Capital Bancshares, Inc. | | | 93,759 | | | | 2,625,252 | |
Tompkins Financial Corporation | | | 36,178 | | | | 1,426,499 | |
TowneBank | | | 158,538 | | | | 1,975,383 | |
Trico Bancshares | | | 46,202 | | | | 685,176 | |
UMB Financial Corporation | | | 9,551 | | | | 352,145 | |
United Bankshares, Inc. | | | 36,867 | | | | 875,223 | |
United Security Bancshares | | | 3,060 | | | | 8,537 | |
United Security Bancshares, Inc. | | | 18 | | | | 89 | |
Univest Corporation of Pennsylvania | | | 697 | | | | 10,601 | |
Valley National Bancorp | | | 103,617 | | | | 1,243,404 | |
VIST Financial Corporation | | | 200 | | | | 1,360 | |
Washington Banking Company | | | 500 | | | | 5,910 | |
Washington Trust Bancorp, Inc. | | | 5,323 | | | | 124,984 | |
Webster Financial Corporation | | | 128,601 | | | | 2,525,724 | |
Wells Fargo & Company | | | 1,600 | | | | 41,456 | |
West Bancorporation, Inc. | | | 300 | | | | 2,952 | |
Westamerica Bancorporation | | | 4,171 | | | | 186,944 | |
Wintrust Financial Corporation | | | 97,409 | | | | 2,813,172 | |
Zions Bancorporation | | | 100 | | | | 1,736 | |
| | | | | | | | 77,454,137 | |
| Consumer Finance — 0.1% | | | | | | | | |
CompuCredit Holdings Corporation | | | 77,709 | | | | 242,452 | |
EZCORP, Inc. - Class A | | | 1,380 | | | | 38,337 | |
First Marblehead Corporation (The) | | | 200 | | | | 192 | |
Green Dot Corporation - Class A | | | 2,802 | | | | 91,541 | |
World Acceptance Corporation | | | 11,979 | | | | 810,379 | |
| | | | | | | | 1,182,901 | |
| Diversified Financial Services — 0.5% | | | | | | | | |
ASTA Funding, Inc. | | | 800 | | | | 6,448 | |
Bank of America Corporation | | | 22,000 | | | | 150,260 | |
TFS MARKET NEUTRAL FUND SCHEDULE OF SECURITIES SOLD SHORT (Continued) |
COMMON STOCKS — 62.3% (Continued) | | | | | | |
| Financials — 10.8% (Continued) | | | | | | |
| Diversified Financial Services — 0.5% (Continued) | | | | | | |
Citigroup, Inc. | | | 4,900 | | | $ | 154,791 | |
Encore Capital Group, Inc. | | | 31,924 | | | | 864,821 | |
Life Partners Holdings, Inc. | | | 528,311 | | | | 3,629,497 | |
PHH Corporation | | | 49,516 | | | | 913,570 | |
Portfolio Recovery Associates, Inc. | | | 30,729 | | | | 2,155,332 | |
Sprott Resource Lending Corporation | | | 355 | | | | 518 | |
| | | | | | | | 7,875,237 | |
| Insurance — 1.4% | | | | | | | | |
Ambac Financial Group, Inc. | | | 89,956 | | | | 3,418 | |
American Equity Investment Life Holding Company | | | 11,211 | | | | 121,527 | |
Aspen Insurance Holdings Ltd. | | | 3,675 | | | | 97,351 | |
Axis Capital Holdings Ltd. | | | 548 | | | | 17,180 | |
Citizens, Inc. | | | 36,552 | | | | 286,568 | |
Crawford & Company - Class B | | | 524 | | | | 3,726 | |
eHealth, Inc. | | | 189,201 | | | | 2,809,635 | |
EMC Insurance Group, Inc. | | | 51 | | | | 991 | |
Enstar Group, Inc. (The) | | | 10 | | | | 920 | |
Flagstone Reinsurance Holdings, S.A. | | | 62,341 | | | | 529,275 | |
Gerova Financial Group Ltd. | | | 9,506 | | | | 760 | |
Greenlight Capital Re Ltd. - Class A | | | 181 | | | | 4,078 | |
HCC Insurance Holdings, Inc. | | | 23,306 | | | | 620,173 | |
Hilltop Holdings, Inc. | | | 218,692 | | | | 1,723,293 | |
Lincoln National Corporation | | | 1,600 | | | | 30,480 | |
Maiden Holdings Ltd. | | | 80,467 | | | | 655,806 | |
MBIA, Inc. | | | 659,690 | | | | 5,805,272 | |
Meadowbrook Insurance Group, Inc. | | | 670 | | | | 6,941 | |
MetLife, Inc. | | | 400 | | | | 14,064 | |
Montpelier Re Holdings Ltd. | | | 108,158 | | | | 1,892,765 | |
National Financial Partners Corporation | | | 260,900 | | | | 3,566,503 | |
National Interstate Corporation | | | 161 | | | | 4,282 | |
Navigators Group, Inc. (The) | | | 15,261 | | | | 696,207 | |
OneBeacon Insurance Group Ltd. - Class A | | | 6,966 | | | | 106,022 | |
Phoenix Companies, Inc. (The) | | | 50,800 | | | | 75,692 | |
RLI Corporation | | | 23,613 | | | | 1,660,938 | |
SeaBright Insurance Holdings, Inc. | | | 215 | | | | 1,544 | |
StanCorp Financial Group, Inc. | | | 19,585 | | | | 664,715 | |
State Auto Financial Corporation | | | 47 | | | | 625 | |
Stewart Information Services Corporation | | | 187,174 | | | | 1,879,227 | |
Tower Group, Inc. | | | 60,405 | | | | 1,433,411 | |
Willis Group Holdings plc | | | 6,069 | | | | 220,365 | |
| | | | | | | | 24,933,754 | |
| Real Estate Investment Trusts (REIT) — 1.5% | | | | | | | | |
Acadia Realty Trust | | | 4,535 | | | | 93,965 | |
Agree Realty Corporation | | | 89,422 | | | | 2,138,080 | |
American Capital Mortgage Investment Corporation | | | 21,260 | | | | 386,507 | |
ARMOUR Residential REIT, Inc. | | | 317,874 | | | | 2,272,799 | |
BRE Properties, Inc. | | | 152 | | | | 7,618 | |
Camden Property Trust | | | 100 | | | | 6,064 | |
TFS MARKET NEUTRAL FUND SCHEDULE OF SECURITIES SOLD SHORT (Continued) |
COMMON STOCKS — 62.3% (Continued) | | | | | | |
| Financials — 10.8% (Continued) | | | | | | |
| Real Estate Investment Trusts (REIT) — 1.5% (Continued) | | | | | | |
Campus Crest Communities, Inc. | | | 16,360 | | | $ | 186,995 | |
Capital Trust, Inc. - Class A | | | 24,468 | | | | 60,925 | |
CapLease, Inc. | | | 466 | | | | 1,822 | |
Chimera Investment Corporation | | | 200 | | | | 602 | |
Colony Financial, Inc. | | | 126,177 | | | | 1,851,017 | |
Cousins Properties, Inc. | | | 291 | | | | 1,909 | |
CYS Investments, Inc. | | | 57,305 | | | | 726,627 | |
DCT Industrial Trust, Inc. | | | 526,209 | | | | 2,609,997 | |
DuPont Fabros Technology, Inc. | | | 64,286 | | | | 1,336,506 | |
Dynex Capital, Inc. | | | 72,781 | | | | 637,562 | |
Entertainment Properties Trust | | | 983 | | | | 44,038 | |
Excel Trust, Inc. | | | 22,293 | | | | 234,299 | |
Franklin Street Properties Corporation | | | 104,070 | | | | 1,321,689 | |
Getty Realty Corporation | | | 29,339 | | | | 467,664 | |
Hatteras Financial Corporation | | | 2,000 | | | | 51,400 | |
Healthcare Realty Trust, Inc. | | | 2,900 | | | | 54,781 | |
Highwoods Properties, Inc. | | | 1,026 | | | | 31,785 | |
Hudson Pacific Properties, Inc. | | | 282 | | | | 3,767 | |
Investors Real Estate Trust | | | 82,955 | | | | 614,697 | |
Lexington Realty Trust | | | 615,760 | | | | 4,839,874 | |
Liberty Property Trust | | | 27,451 | | | | 878,432 | |
MPG Office Trust, Inc. | | | 44,286 | | | | 105,844 | |
National Retail Properties, Inc. | | | 19,890 | | | | 542,002 | |
Omega Healthcare Investors, Inc. | | | 2,979 | | | | 52,907 | |
Parkway Properties, Inc. | | | 141,133 | | | | 1,813,559 | |
RAIT Financial Trust | | | 181,108 | | | | 941,762 | |
Ramco-Gershenson Properties Trust | | | 190,528 | | | | 1,838,595 | |
Resource Capital Corporation | | | 75,188 | | | | 403,760 | |
Transcontinental Realty Investors, Inc. | | | 67 | | | | 121 | |
Two Harbors Investment Corporation | | | 629 | | | | 5,881 | |
Washington Real Estate Investment Trust | | | 11,045 | | | | 319,863 | |
| | | | | | | | 26,885,715 | |
| Real Estate Management & Development — 0.3% | | | | | | | | |
Avatar Holdings, Inc. | | | 216 | | | | 2,052 | |
China Housing & Land Development, Inc. | | | 171,004 | | | | 193,235 | |
Consolidated-Tomoka Land Company | | | 4,357 | | | | 130,492 | |
Forestar Group, Inc. | | | 5,563 | | | | 72,319 | |
Maui Land & Pineapple Company, Inc. | | | 800 | | | | 3,512 | |
St. Joe Company (The) | | | 395,530 | | | | 5,675,855 | |
| | | | | | | | 6,077,465 | |
| Thrifts & Mortgage Finance — 0.8% | | | | | | | | |
Anchor BanCorp Wisconsin, Inc. | | | 35,400 | | | | 18,068 | |
Apollo Residential Mortgage, Inc. | | | 40,305 | | | | 657,375 | |
BankAtlantic Bancorp, Inc. - Class A | | | 96,480 | | | | 228,658 | |
Berkshire Hills Bancorp, Inc. | | | 41,241 | | | | 825,645 | |
BofI Holding, Inc. | | | 22,221 | | | | 339,981 | |
Brookline Bancorp, Inc. | | | 431,796 | | | | 3,609,815 | |
Brooklyn Federal Bancorp, Inc. | | | 4,015 | | | | 3,132 | |
TFS MARKET NEUTRAL FUND SCHEDULE OF SECURITIES SOLD SHORT (Continued) |
COMMON STOCKS — 62.3% (Continued) | | | | | | |
| Financials — 10.8% (Continued) | | | | | | |
| Thrifts & Mortgage Finance — 0.8% (Continued) | | | | | | |
Capitol Federal Financial, Inc. | | | 36 | | | $ | 399 | |
Clifton Savings Bancorp, Inc. | | | 82 | | | | 835 | |
Dime Community Bancshares, Inc. | | | 15,669 | | | | 186,774 | |
ESSA Bancorp, Inc. | | | 7 | | | | 77 | |
First Federal Bancshares of Arkansas, Inc. | | | 4,628 | | | | 25,963 | |
FirstFed Financial Corporation | | | 23,697 | | | | 237 | |
Flushing Financial Corporation | | | 100 | | | | 1,226 | |
Freddie Mac | | | 94,749 | | | | 23,687 | |
Home Federal Bancorp, Inc. | | | 10 | | | | 100 | |
Impac Mortgage Holdings, Inc. | | | 148 | | | | 274 | |
MGIC Investment Corporation | | | 886,969 | | | | 2,359,338 | |
NASB Financial, Inc. | | | 4,380 | | | | 44,019 | |
OceanFirst Financial Corporation | | | 52 | | | | 678 | |
People's United Financial, Inc. | | | 8,939 | | | | 113,972 | |
PMI Group, Inc. (The) (a) | | | 7 | | | | 2 | |
Provident Financial Services, Inc. | | | 135,846 | | | | 1,759,206 | |
Provident New York Bancorp | | | 18,428 | | | | 128,075 | |
Radian Group, Inc. | | | 1,445,445 | | | | 3,396,796 | |
Rockville Financial, Inc. | | | 16,047 | | | | 161,272 | |
Roma Financial Corporation | | | 100 | | | | 967 | |
Territorial Bancorp, Inc. | | | 55 | | | | 1,081 | |
Tree.com, Inc. | | | 438 | | | | 2,365 | |
Triad Guaranty, Inc. | | | 9,250 | | | | 1,738 | |
TrustCo Bank Corporation | | | 54 | | | | 268 | |
Washington Federal, Inc. | | | 10,094 | | | | 137,783 | |
Westfield Financial, Inc. | | | 295 | | | | 2,097 | |
| | | | | | | | 14,031,903 | |
| Health Care — 8.9% | | | | | | | | |
| Biotechnology — 3.7% | | | | | | | | |
Aastrom Biosciences, Inc. | | | 256,307 | | | | 656,146 | |
Accentia Biopharmaceuticals, Inc. | | | 1,600 | | | | 576 | |
Acorda Therapeutics, Inc. | | | 7,526 | | | | 164,368 | |
ADVENTRX Pharmaceuticals, Inc. | | | 539,542 | | | | 598,892 | |
AEterna Zentaris, Inc. | | | 33,369 | | | | 56,394 | |
Agenus, Inc. | | | 208 | | | | 570 | |
Alnylam Pharmaceuticals, Inc. | | | 92,631 | | | | 752,164 | |
AMAG Pharmaceuticals, Inc. | | | 27,944 | | | | 394,290 | |
Amicus Therapeutics, Inc. | | | 7 | | | | 23 | |
Amylin Pharmaceuticals, Inc. | | | 942 | | | | 10,852 | |
ARCA biopharma, Inc. | | | 3,325 | | | | 3,791 | |
Ardea Biosciences, Inc. | | | 59,035 | | | | 1,175,387 | |
Arena Pharmaceuticals, Inc. | | | 200,779 | | | | 283,098 | |
Ariad Pharmaceuticals, Inc. | | | 137,515 | | | | 1,599,299 | |
AspenBio Pharma, Inc. | | | 226 | | | | 529 | |
AVEO Pharmaceuticals, Inc. | | | 38,175 | | | | 613,090 | |
BioCryst Pharmaceuticals, Inc. | | | 258,575 | | | | 793,825 | |
BioMimetic Therapeutics, Inc. | | | 673 | | | | 2,181 | |
BioSante Pharmaceuticals, Inc. | | | 2,058,579 | | | | 5,455,234 | |
TFS MARKET NEUTRAL FUND SCHEDULE OF SECURITIES SOLD SHORT (Continued) |
COMMON STOCKS — 62.3% (Continued) | | | | | | |
| Health Care — 8.9% (Continued) | | | | | | |
| Biotechnology — 3.7% (Continued) | | | | | | |
BioSpecifics Technologies Corporation | | | 184 | | | $ | 3,128 | |
BioTime, Inc. | | | 273,423 | | | | 1,233,138 | |
Cardium Therapeutics, Inc. | | | 100 | | | | 41 | |
Cell Therapeutics, Inc. | | | 1,086,499 | | | | 1,390,719 | |
CEL-SCI Corporation | | | 547,321 | | | | 197,090 | |
Celsion Corporation | | | 75,661 | | | | 249,681 | |
Chelsea Therapeutics International Ltd. | | | 447,378 | | | | 2,026,622 | |
China Biologic Products, Inc. | | | 59,596 | | | | 463,657 | |
Cleveland BioLabs, Inc. | | | 286,646 | | | | 851,339 | |
Curis, Inc. | | | 266,797 | | | | 981,813 | |
Cyclacel Pharmaceuticals, Inc. | | | 94,507 | | | | 57,649 | |
Cytori Therapeutics, Inc. | | | 982,382 | | | | 2,976,617 | |
CytRx Corporation | | | 14,079 | | | | 4,998 | |
DARA BioSciences, Inc. | | | 70,543 | | | | 105,109 | |
EntreMed, Inc. | | | 54 | | | | 94 | |
Enzon Pharmaceuticals, Inc. | | | 241,679 | | | | 1,776,341 | |
EpiCept Corporation | | | 103,115 | | | | 37,121 | |
Exact Sciences Corporation | | | 39,744 | | | | 315,965 | |
Exelixis, Inc. | | | 203,573 | | | | 1,573,619 | |
Galena Biopharma, Inc. | | | 267,220 | | | | 202,553 | |
Genomic Health, Inc. | | | 77,078 | | | | 1,649,469 | |
Hemispherx Biopharma, Inc. | | | 192,180 | | | | 52,311 | |
Human Genome Sciences, Inc. | | | 100 | | | | 1,026 | |
iBio, Inc. | | | 78,773 | | | | 159,121 | |
Idenix Pharmaceuticals, Inc. | | | 1,301 | | | | 7,806 | |
Immunomedics, Inc. | | | 3,012 | | | | 10,964 | |
Infinity Pharmaceuticals, Inc. | | | 27,807 | | | | 210,499 | |
Inovio Pharmaceuticals, Inc. | | | 5,426 | | | | 3,684 | |
Insmed, Inc. | | | 27,121 | | | | 95,737 | |
InterMune, Inc. | | | 3,414 | | | | 87,057 | |
Introgen Therapeutics, Inc. | | | 45,612 | | | | 114 | |
Ironwood Pharmaceuticals, Inc. | | | 7,061 | | | | 96,030 | |
Isis Pharmaceuticals, Inc. | | | 251,465 | | | | 2,084,645 | |
MannKind Corporation | | | 1,887,377 | | | | 5,888,616 | |
Marina Biotech, Inc. | | | 2,437,458 | | | | 390,237 | |
MediciNova, Inc. | | | 63,446 | | | | 133,237 | |
Medivation, Inc. | | | 18,568 | | | | 318,998 | |
Metabolix, Inc. | | | 561,873 | | | | 2,882,408 | |
Myrexis, Inc. | | | 939 | | | | 2,610 | |
Nanosphere, Inc. | | | 117 | | | | 177 | |
NanoViricides, Inc. | | | 100 | | | | 100 | |
Neuralstem, Inc. | | | 231,993 | | | | 306,231 | |
NeurogesX, Inc. | | | 128,288 | | | | 141,117 | |
Nymox Pharmaceutical Corporation | | | 124,609 | | | | 1,150,141 | |
Oncolytics Biotech, Inc. | | | 63,478 | | | | 298,347 | |
Oncothyreon, Inc. | | | 903,749 | | | | 6,290,093 | |
Onyx Pharmaceuticals, Inc. | | | 7,444 | | | | 304,683 | |
Opexa Therapeutics, Inc. | | | 138,446 | | | | 148,137 | |
Osiris Therapeutics, Inc. | | | 95,766 | | | | 513,306 | |
TFS MARKET NEUTRAL FUND SCHEDULE OF SECURITIES SOLD SHORT (Continued) |
COMMON STOCKS — 62.3% (Continued) | | | | | | |
| Health Care — 8.9% (Continued) | | | | | | |
| Biotechnology — 3.7% (Continued) | | | | | | |
OXiGENE, Inc. | | | 170,451 | | | $ | 281,244 | |
Oxygen Biotherapeutics, Inc. | | | 1,499 | | | | 3,298 | |
Pharmasset, Inc. | | | 432 | | | | 30,413 | |
PharmAthene, Inc. | | | 169,445 | | | | 288,057 | |
Pluristem Therapeutics, Inc. | | | 7,587 | | | | 18,892 | |
Poniard Pharmaceuticals, Inc. | | | 1,300 | | | | 195 | |
Progenics Pharmaceuticals, Inc. | | | 12,464 | | | | 81,888 | |
PROLOR Biotech, Inc. | | | 100,153 | | | | 442,676 | |
Raptor Pharmaceutical Corporation | | | 661,617 | | | | 3,268,388 | |
Rexahn Pharmaceuticals, Inc. | | | 49,836 | | | | 51,331 | |
Rigel Pharmaceuticals, Inc. | | | 64,864 | | | | 509,182 | |
Rosetta Genomics Ltd. | | | 1,100 | | | | 770 | |
Sangamo Biosciences, Inc. | | | 339,141 | | | | 1,125,948 | |
Savient Pharmaceuticals, Inc. | | | 1,047,861 | | | | 3,929,479 | |
SciClone Pharmaceuticals, Inc. | | | 68,250 | | | | 287,333 | |
Seattle Genetics, Inc. | | | 4,609 | | | | 101,398 | |
SIGA Technologies, Inc. | | | 159,719 | | | | 517,490 | |
StemCells, Inc. | | | 65 | | | | 136 | |
Sunesis Pharmaceuticals, Inc. | | | 177,995 | | | | 240,293 | |
Synta Pharmaceuticals Corporation | | | 1,413 | | | | 5,228 | |
Tengion, Inc. | | | 8,924 | | | | 4,551 | |
Theravance, Inc. | | | 50,659 | | | | 1,126,150 | |
Threshold Pharmaceuticals, Inc. | | | 244,569 | | | | 391,310 | |
XOMA Ltd. | | | 109,417 | | | | 180,538 | |
ZIOPHARM Oncology, Inc. | | | 404,261 | | | | 1,984,922 | |
| | | | | | | | 65,106,014 | |
| Health Care Equipment & Supplies — 2.2% | | | | | | | | |
Abaxis, Inc. | | | 86,807 | | | | 2,435,804 | |
ABIOMED, Inc. | | | 6,751 | | | | 101,670 | |
Alimera Sciences, Inc. | | | 212 | | | | 1,507 | |
Analogic Corporation | | | 27 | | | | 1,460 | |
Bacterin International Holdings, Inc. | | | 54,099 | | | | 179,068 | |
BioLase Technology, Inc. | | | 750,916 | | | | 2,733,334 | |
BSD Medical Corporation | | | 1,063,518 | | | | 3,031,026 | |
CONMED Corporation | | | 181 | | | | 4,755 | |
CryoPort, Inc. | | | 100 | | | | 104 | |
Cyberonics, Inc. | | | 60,543 | | | | 1,743,638 | |
D. Medical Industries Ltd. | | | 2,300 | | | | 5,060 | |
Delcath Systems, Inc. | | | 795,124 | | | | 2,878,349 | |
Derma Sciences, Inc. | | | 1,048 | | | | 8,751 | |
Dynatronics Corporation | | | 100 | | | | 73 | |
DynaVox, Inc. | | | 1,081 | | | | 3,654 | |
Exactech, Inc. | | | 109 | | | | 1,744 | |
Hansen Medical, Inc. | | | 329,968 | | | | 1,036,099 | |
HeartWare International, Inc. | | | 62,053 | | | | 4,215,260 | |
ICU Medical, Inc. | | | 51,224 | | | | 2,013,615 | |
Insulet Corporation | | | 47,830 | | | | 780,586 | |
Invacare Corporation | | | 9,479 | | | | 212,804 | |
TFS MARKET NEUTRAL FUND SCHEDULE OF SECURITIES SOLD SHORT (Continued) |
COMMON STOCKS — 62.3% (Continued) | | | | | | |
| Health Care — 8.9% (Continued) | | | | | | |
| Health Care Equipment & Supplies — 2.2% (Continued) | | | | | | |
IRIS International, Inc. | | | 329 | | | $ | 2,981 | |
Kensey Nash Corporation | | | 72,417 | | | | 1,946,569 | |
MAKO Surgical Corporation | | | 7,860 | | | | 302,217 | |
MELA Sciences, Inc. | | | 49,834 | | | | 286,047 | |
Meridian Bioscience, Inc. | | | 124,323 | | | | 2,265,165 | |
Neogen Corporation | | | 17,427 | | | | 673,554 | |
Neoprobe Corporation | | | 1,772,270 | | | | 5,033,247 | |
NxStage Medical, Inc. | | | 107,381 | | | | 2,468,689 | |
Quidel Corporation | | | 85,882 | | | | 1,533,853 | |
Rockwell Medical Technologies, Inc. | | | 49,761 | | | | 419,485 | |
Stereotaxis, Inc. | | | 190,674 | | | | 221,182 | |
Synergetics USA, Inc. | | | 1,400 | | | | 9,366 | |
Unilife Corporation | | | 291,310 | | | | 1,543,943 | |
Uroplasty, Inc. | | | 33,310 | | | | 150,228 | |
Winner Medical Group, Inc. | | | 9,246 | | | | 28,709 | |
World Heart Corporation | | | 1,600 | | | | 480 | |
| | | | | | | | 38,274,076 | |
| Health Care Providers & Services — 1.4% | | | | | | | | |
Accretive Health, Inc. | | | 207,761 | | | | 4,946,789 | |
Air Methods Corporation | | | 23,119 | | | | 1,868,478 | |
Amedisys, Inc. | | | 96,675 | | | | 1,269,343 | |
AMERIGROUP Corporation | | | 4,600 | | | | 255,898 | |
Bio-Reference Laboratories, Inc. | | | 185,568 | | | | 3,718,783 | |
Brookdale Senior Living, Inc. | | | 11,500 | | | | 190,670 | |
CardioNet, Inc. | | | 696 | | | | 1,970 | |
Centene Corporation | | | 993 | | | | 34,904 | |
Chindex International, Inc. | | | 2,344 | | | | 26,042 | |
Emeritus Corporation | | | 97,930 | | | | 1,734,340 | |
Health Net, Inc. | | | 101,072 | | | | 2,808,791 | |
HealthSouth Corporation | | | 2,801 | | | | 49,466 | |
IPC The Hospitalist Company, Inc. | | | 44,532 | | | | 1,867,227 | |
Kindred Healthcare, Inc. | | | 241,031 | | | | 2,808,011 | |
LCA-Vision, Inc. | | | 3,982 | | | | 12,862 | |
MWI Veterinary Supply, Inc. | | | 8,570 | | | | 647,035 | |
National Research Corporation | | | 100 | | | | 3,340 | |
Patterson Companies, Inc. | | | 1,500 | | | | 47,205 | |
PDI, Inc. | | | 71 | | | | 457 | |
Providence Service Corporation (The) | | | 3,419 | | | | 42,737 | |
PSS World Medical, Inc. | | | 62,625 | | | | 1,393,406 | |
Sunrise Senior Living, Inc. | | | 108,797 | | | | 598,383 | |
Vanguard Health Systems, Inc. | | | 700 | | | | 6,804 | |
| | | | | | | | 24,332,941 | |
Health Care Technology — 0.0% (b) | | | | | | | | |
Epocrates, Inc. | | | 615 | | | | 5,350 | |
iCad, Inc. | | | 400 | | | | 292 | |
Quality Systems, Inc. | | | 22,760 | | | | 885,592 | |
| | | | | | | | 891,234 | |
TFS MARKET NEUTRAL FUND SCHEDULE OF SECURITIES SOLD SHORT (Continued) |
COMMON STOCKS — 62.3% (Continued) | | | | | | |
| Health Care — 8.9% (Continued) | | | | | | |
| Life Sciences Tools & Services — 0.2% | | | | | | |
Accelr8 Technology Corporation | | | 511 | | | $ | 1,466 | |
Albany Molecular Research, Inc. | | | 497 | | | | 1,595 | |
Apricus Biosciences, Inc. | | | 330,211 | | | | 1,436,418 | |
Arrowhead Research Corporation | | | 119,992 | | | | 60,416 | |
Bioanalytical Systems, Inc. | | | 2,400 | | | | 3,240 | |
Bruker Corporation | | | 103,609 | | | | 1,495,078 | |
Cambrex Corporation | | | 32 | | | | 176 | |
Compugen Ltd. | | | 973 | | | | 4,087 | |
eResearchTechnology, Inc. | | | 67,168 | | | | 343,228 | |
Genetic Technologies Ltd. | | | 29,064 | | | | 120,616 | |
PURE Bioscience, Inc. | | | 274,490 | | | | 194,888 | |
Radient Pharmaceuticals Corporation | | | 46,192 | | | | 259 | |
| | | | | | | | 3,661,467 | |
| Pharmaceuticals — 1.4% | | | | | | | | |
Acura Pharmaceuticals, Inc. | | | 51,863 | | | | 230,272 | |
Adeona Pharmaceuticals, Inc. | | | 115,627 | | | | 68,220 | |
Ampio Pharmaceuticals, Inc. | | | 57,205 | | | | 406,728 | |
Aoxing Pharmaceutical Company, Inc. | | | 10,556 | | | | 4,434 | |
AVANIR Pharmaceuticals, Inc. - Class A | | | 2,784,947 | | | | 8,326,992 | |
Biodel, Inc. | | | 352,139 | | | | 285,233 | |
Biostar Pharmaceuticals, Inc. | | | 1,386 | | | | 1,178 | |
Cadence Pharmaceuticals, Inc. | | | 995,329 | | | | 5,802,768 | |
Cumberland Pharmaceuticals, Inc. | | | 536 | | | | 3,087 | |
DepoMed, Inc. | | | 24,782 | | | | 111,023 | |
Echo Therapeutics, Inc. | | | 1,000 | | | | 2,720 | |
Impax Laboratories, Inc. | | | 105,857 | | | | 2,001,756 | |
IntelliPharmaCeutics International, Inc. | | | 15,839 | | | | 45,141 | |
K-V Pharmaceutical Company - Class A | | | 251,317 | | | | 278,962 | |
Lannett Company, Inc. | | | 128,853 | | | | 527,009 | |
Nektar Therapeutics | | | 352,416 | | | | 1,910,095 | |
NeoStem, Inc. | | | 595,642 | | | | 399,080 | |
Obagi Medical Products, Inc. | | | 13,751 | | | | 129,809 | |
Oculus Innovative Sciences, Inc. | | | 85,412 | | | | 138,367 | |
Optimer Pharmaceuticals, Inc. | | | 2,556 | | | | 36,474 | |
Repros Therapeutics, Inc. | | | 124,915 | | | | 534,636 | |
Salix Pharmaceuticals Ltd. | | | 14,823 | | | | 507,762 | |
Skystar Bio-Pharmaceutical Company Ltd. | | | 3,733 | | | | 8,101 | |
Somaxon Pharmaceuticals, Inc. | | | 859,632 | | | | 833,843 | |
Ventrus BioSciences, Inc. | | | 6,063 | | | | 50,020 | |
ViroPharma, Inc. | | | 18,868 | | | | 381,888 | |
VIVUS, Inc. | | | 86,552 | | | | 816,185 | |
XenoPort, Inc. | | | 1,622 | | | | 9,894 | |
| | | | | | | | 23,851,677 | |
| Industrials — 9.7% | | | | | | | | |
| Aerospace & Defense — 1.0% | | | | | | | | |
AAR Corporation | | | 92,357 | | | | 1,840,675 | |
Aerovironment, Inc. | | | 24,120 | | | | 796,684 | |
Alliant Techsystems, Inc. | | | 28,768 | | | | 1,670,845 | |
TFS MARKET NEUTRAL FUND SCHEDULE OF SECURITIES SOLD SHORT (Continued) |
COMMON STOCKS — 62.3% (Continued) | | | | | | |
| Industrials — 9.7% (Continued) | | | | | | |
| Aerospace & Defense — 1.0% (Continued) | | | | | | |
American Science and Engineering, Inc. | | | 223 | | | $ | 15,169 | |
Arotech Corporation | | | 1,900 | | | | 2,945 | |
Ascent Solar Technologies, Inc. | | | 386,056 | | | | 312,705 | |
GenCorp, Inc. | | | 573,897 | | | | 2,789,139 | |
HEICO Corporation | | | 16,060 | | | | 915,741 | |
Huntington Ingalls Industries, Inc. | | | 8 | | | | 236 | |
Kratos Defense & Security Solutions, Inc. | | | 288,376 | | | | 1,825,420 | |
National Presto Industries, Inc. | | | 22,496 | | | | 2,148,368 | |
Spirit Aerosystems Holdings, Inc. - Class A | | | 201,793 | | | | 3,444,607 | |
Taser International, Inc. | | | 330,509 | | | | 1,642,630 | |
| | | | | | | | 17,405,164 | |
| Air Freight & Logistics — 0.2% | | | | | | | | |
Pacer International, Inc. | | | 552,441 | | | | 2,601,997 | |
| | | | | | | | | |
| Airlines — 0.4% | | | | | | | | |
Allegiant Travel Company | | | 7,095 | | | | 368,656 | |
AMR Corporation | | | 944,122 | | | | 2,483,041 | |
Delta Air Lines, Inc. | | | 700 | | | | 5,964 | |
LAN Airlines, S.A. - ADR | | | 20,081 | | | | 503,431 | |
Republic Airways Holdings, Inc. | | | 428,776 | | | | 1,114,817 | |
Southwest Airlines Company | | | 20 | | | | 171 | |
Spirit Airlines, Inc. | | | 500 | | | | 8,230 | |
US Airways Group, Inc. | | | 460,130 | | | | 2,654,950 | |
| | | | | | | | 7,139,260 | |
| Building Products — 0.7% | | | | | | | | |
AAON, Inc. | | | 111,732 | | | | 2,365,366 | |
Apogee Enterprises, Inc. | | | 50,054 | | | | 546,590 | |
Armstrong World Industries, Inc. | | | 3,638 | | | | 154,942 | |
Builders FirstSource, Inc. | | | 46,412 | | | | 75,652 | |
Griffon Corporation | | | 62,492 | | | | 591,799 | |
Insteel Industries, Inc. | | | 93,752 | | | | 966,583 | |
Masco Corporation | | | 69,500 | | | | 667,200 | |
Trex Company, Inc. | | | 169,626 | | | | 3,134,688 | |
Universal Forest Products, Inc. | | | 22,895 | | | | 642,663 | |
USG Corporation | | | 298,772 | | | | 2,766,629 | |
| | | | | | | | 11,912,112 | |
| Commercial Services & Supplies — 1.4% | | | | | | | | |
A.T. Cross Company - Class A | | | 871 | | | | 10,591 | |
ACCO Brands Corporation | | | 193,641 | | | | 1,330,314 | |
American Reprographics Company | | | 22,735 | | | | 90,713 | |
Cenveo, Inc. | | | 512,402 | | | | 1,921,507 | |
Clean Harbors, Inc. | | | 94,025 | | | | 5,478,837 | |
Courier Corporation | | | 400 | | | | 3,476 | |
Deluxe Corporation | | | 17,114 | | | | 404,233 | |
EnergySolutions, Inc. | | | 128,238 | | | | 483,457 | |
EnerNOC, Inc. | | | 188,095 | | | | 1,668,403 | |
Ennis, Inc. | | | 22,199 | | | | 324,771 | |
Heritage-Crystal Clean, Inc. | | | 400 | | | | 6,376 | |
TFS MARKET NEUTRAL FUND SCHEDULE OF SECURITIES SOLD SHORT (Continued) |
COMMON STOCKS — 62.3% (Continued) | | | | | | |
| Industrials — 9.7% (Continued) | | | | | | |
| Commercial Services & Supplies — 1.4% (Continued) | | | | | | |
Herman Miller, Inc. | | | 318 | | | $ | 6,567 | |
Higher One Holdings, Inc. | | | 12,395 | | | | 218,648 | |
HNI Corporation | | | 11,906 | | | | 286,339 | |
Industrial Services of America, Inc. | | | 21,962 | | | | 128,697 | |
Interface, Inc. | | | 372,951 | | | | 4,863,281 | |
Intersections, Inc. | | | 77,465 | | | | 1,308,384 | |
Kimball International, Inc. | | | 2,188 | | | | 12,318 | |
Mobile Mini, Inc. | | | 115,689 | | | | 2,098,598 | |
Quad/Graphics, Inc. | | | 71,244 | | | | 1,404,932 | |
R.R. Donnelley & Sons Company | | | 612 | | | | 9,976 | |
RINO International Corporation | | | 81,543 | | | | 4,893 | |
Swisher Hygiene, Inc. | | | 617,871 | | | | 2,693,917 | |
SYKES Enterprises, Inc. | | | 113 | | | | 1,800 | |
| | | | | | | | 24,761,028 | |
| Construction & Engineering — 0.4% | | | | | | | | |
AECOM Technology Corporation | | | 30,710 | | | | 642,453 | |
Aegion Corporation | | | 101,678 | | | | 1,503,818 | |
Granite Construction, Inc. | | | 77,282 | | | | 1,738,845 | |
Great Lakes Dredge & Dock Company | | | 263,827 | | | | 1,358,709 | |
India Globalization Capital, Inc. | | | 25,980 | | | | 9,353 | |
MasTec, Inc. | | | 6,333 | | | | 136,919 | |
Orion Marine Group, Inc. | | | 72,033 | | | | 489,104 | |
Primoris Services Corporation | | | 1,741 | | | | 22,668 | |
Sterling Construction Company, Inc. | | | 5 | | | | 62 | |
Tutor Perini Corporation | | | 45,232 | | | | 657,221 | |
| | | | | | | | 6,559,152 | |
| Electrical Equipment — 1.2% | | | | | | | | |
A123 Systems, Inc. | | | 1,340,428 | | | | 4,597,668 | |
Advanced Battery Technologies, Inc. | | | 579,689 | | | | 550,994 | |
Altair Nanotechnologies, Inc. | | | 371,076 | | | | 504,663 | |
American Superconductor Corporation | | | 581,720 | | | | 2,536,299 | |
AMETEK, Inc. | | | 1,100 | | | | 43,472 | |
Beacon Power Corporation | | | 57,124 | | | | 6,124 | |
Capstone Turbine Corporation | | | 1,166,926 | | | | 1,271,949 | |
China BAK Battery, Inc. | | | 387,297 | | | | 356,352 | |
China Electric Motor, Inc. | | | 1,771 | | | | 266 | |
China Technology Development Group Corporation | | | 2,500 | | | | 2,400 | |
Digital Power Corporation | | | 1,677 | | | | 3,103 | |
Encore Wire Corporation | | | 100,234 | | | | 2,664,220 | |
Ener1, Inc. | | | 818,039 | | | | 98,983 | |
Fushi Copperweld, Inc. | | | 405,258 | | | | 2,577,441 | |
General Cable Corporation | | | 9,668 | | | | 271,091 | |
Global Power Equipment Group, Inc. | | | 26,313 | | | | 697,558 | |
Hoku Corporation | | | 184,642 | | | | 278,809 | |
Hydrogenics Corporation | | | 3,215 | | | | 19,258 | |
Lihua International, Inc. | | | 476,597 | | | | 2,168,516 | |
Medis Technologies Ltd. | | | 22,419 | | | | 157 | |
New Energy Systems Group | | | 1,300 | | | | 2,314 | |
TFS MARKET NEUTRAL FUND SCHEDULE OF SECURITIES SOLD SHORT (Continued) |
COMMON STOCKS — 62.3% (Continued) | | | | | | |
| Industrials — 9.7% (Continued) | | | | | | |
| Electrical Equipment — 1.2% (Continued) | | | | | | |
Ocean Power Technologies, Inc. | | | 129,572 | | | $ | 488,486 | |
Plug Power, Inc. | | | 33,044 | | | | 74,679 | |
PowerSecure International, Inc. | | | 24,687 | | | | 104,920 | |
Satcon Technology Corporation | | | 1,002,543 | | | | 1,062,696 | |
Sensata Technologies Holding N.V. | | | 168 | | | | 5,030 | |
Ultralife Corporation | | | 6,004 | | | | 27,138 | |
Valence Technology, Inc. | | | 671,856 | | | | 644,310 | |
Valpey-Fisher Corporation | | | 100 | | | | 254 | |
Westinghouse Solar, Inc. | | | 31,444 | | | | 22,954 | |
ZBB Energy Corporation | | | 800 | | | | 608 | |
| | | | | | | | 21,082,712 | |
Industrial Conglomerates — 0.0% (b) | | | | | | | | |
General Electric Company | | | 1,100 | | | | 18,381 | |
| | | | | | | | | |
| Machinery — 2.1% | | | | | | | | |
3D Systems Corporation | | | 160,451 | | | | 2,610,538 | |
Albany International Corporation - Class A | | | 7,963 | | | | 179,884 | |
Art's-Way Manufacturing Company, Inc. | | | 3,205 | | | | 20,320 | |
Barnes Group, Inc. | | | 12,757 | | | | 296,855 | |
Briggs & Stratton Corporation | | | 182,349 | | | | 2,662,295 | |
China Fire & Security Group, Inc. | | | 190,583 | | | | 1,688,565 | |
China Valves Technology, Inc. | | | 266,568 | | | | 818,364 | |
CIRCOR International, Inc. | | | 15,306 | | | | 532,955 | |
Cleantech Solutions International, Inc. | | | 46,590 | | | | 20,034 | |
Colfax Corporation | | | 89,387 | | | | 2,257,916 | |
Commercial Vehicle Group, Inc. | | | 9,816 | | | | 108,270 | |
Energy Recovery, Inc. | | | 311,719 | | | | 956,977 | |
Federal Signal Corporation | | | 262,710 | | | | 1,239,991 | |
Flow International Corporation | | | 2,405 | | | | 6,229 | |
Gorman-Rupp Company (The) | | | 87 | | | | 2,338 | |
Harsco Corporation | | | 87,330 | | | | 2,012,956 | |
IDEX Corporation | | | 26 | | | | 922 | |
John Bean Technologies Corporation | | | 28,573 | | | | 461,168 | |
Kaydon Corporation | | | 10 | | | | 315 | |
Kennametal, Inc. | | | 26,038 | | | | 1,012,618 | |
Lindsay Corporation | | | 42,126 | | | | 2,447,521 | |
Manitowoc Company, Inc. (The) | | | 208,584 | | | | 2,311,111 | |
Meritor, Inc. | | | 102,578 | | | | 976,543 | |
Met-Pro Corporation | | | 245 | | | | 2,207 | |
Middleby Corporation (The) | | | 23,961 | | | | 2,019,433 | |
Mueller Industries, Inc. | | | 37,927 | | | | 1,534,147 | |
Oshkosh Corporation | | | 20,114 | | | | 419,578 | |
PMFG, Inc. | | | 59,915 | | | | 1,225,262 | |
Shengkai Innovations, Inc. | | | 139,249 | | | | 119,754 | |
Tecumseh Products Company - Class A | | | 585 | | | | 3,721 | |
Titan International, Inc. | | | 321,089 | | | | 7,224,503 | |
Trinity Industries, Inc. | | | 203 | | | | 5,536 | |
Twin Disc, Inc. | | | 1,105 | | | | 42,984 | |
TFS MARKET NEUTRAL FUND SCHEDULE OF SECURITIES SOLD SHORT (Continued) |
COMMON STOCKS — 62.3% (Continued) | | | | | | |
| Industrials — 9.7% (Continued) | | | | | | |
| Machinery — 2.1% (Continued) | | | | | | |
Wabash National Corporation | | | 360,957 | | | $ | 2,490,603 | |
| | | | | | | | 37,712,413 | |
| Marine — 0.3% | | | | | | | | |
Box Ships, Inc. | | | 6,995 | | | | 64,634 | |
Diana Containerships, Inc. | | | 31,352 | | | | 164,912 | |
Eagle Bulk Shipping, Inc. | | | 54,948 | | | | 85,169 | |
Excel Maritime Carriers Ltd. | | | 432,456 | | | | 1,228,175 | |
Genco Shipping & Trading Ltd. | | | 451,563 | | | | 4,064,067 | |
| | | | | | | | 5,606,957 | |
| Professional Services — 0.8% | | | | | | | | |
CBIZ, Inc. | | | 470,866 | | | | 2,980,582 | |
Corporate Executive Board Company (The) | | | 67,380 | | | | 2,465,434 | |
CoStar Group, Inc. | | | 17,787 | | | | 1,094,434 | |
Dolan Company (The) | | | 114,667 | | | | 1,003,336 | |
FTI Consulting, Inc. | | | 10,278 | | | | 405,056 | |
Hill International, Inc. | | | 1,110 | | | | 6,216 | |
Hudson Highland Group, Inc. | | | 65,195 | | | | 301,853 | |
Innovaro, Inc. | | | 8,192 | | | | 11,878 | |
Kelly Services, Inc. - Class A | | | 4,557 | | | | 74,507 | |
Kforce, Inc. | | | 67,239 | | | | 857,970 | |
Korn/Ferry International | | | 103,287 | | | | 1,649,493 | |
Lightbridge Corporation | | | 87,932 | | | | 219,830 | |
Odyssey Marine Exploration, Inc. | | | 746,463 | | | | 2,127,420 | |
Pendrell Corporation | | | 12,301 | | | | 30,507 | |
Resources Connection, Inc. | | | 10,902 | | | | 120,903 | |
Robert Half International, Inc. | | | 20,424 | | | | 539,806 | |
Spherix, Inc. | | | 1,601 | | | | 3,154 | |
Thomas Group, Inc. | | | 900 | | | | 162 | |
Towers Watson & Company - Class A | | | 1,200 | | | | 78,840 | |
Verisk Analytics, Inc. - Class A | | | 6,876 | | | | 241,691 | |
Volt Information Sciences, Inc. | | | 100 | | | | 630 | |
VSE Corporation | | | 256 | | | | 6,226 | |
| | | | | | | | 14,219,928 | |
| Road & Rail — 0.2% | | | | | | | | |
Patriot Transportation Holding, Inc. | | | 4 | | | | 92 | |
RailAmerica, Inc. | | | 18,300 | | | | 250,161 | |
Zipcar, Inc. | | | 198,751 | | | | 4,064,458 | |
| | | | | | | | 4,314,711 | |
| Trading Companies & Distributors — 1.0% | | | | | | | | |
Beacon Roofing Supply, Inc. | | | 216,757 | | | | 3,994,831 | |
BlueLinx Holdings, Inc. | | | 155 | | | | 245 | |
China Armco Metals, Inc. | | | 140,785 | | | | 50,683 | |
GATX Corporation | | | 68,191 | | | | 2,589,894 | |
Houston Wire & Cable Company | | | 148,619 | | | | 1,897,865 | |
Lawson Products, Inc. | | | 400 | | | | 6,668 | |
MSC Industrial Direct Company, Inc. | | | 500 | | | | 34,005 | |
Rush Enterprises, Inc. - Class A | | | 107,561 | | | | 2,075,927 | |
TAL International Group, Inc. | | | 7,696 | | | | 214,180 | |
TFS MARKET NEUTRAL FUND SCHEDULE OF SECURITIES SOLD SHORT (Continued) |
COMMON STOCKS — 62.3% (Continued) | | | | | | |
| Industrials — 9.7% (Continued) | | | | | | |
| Trading Companies & Distributors — 1.0% (Continued) | | | | | | |
Titan Machinery, Inc. | | | 33,112 | | | $ | 772,503 | |
Watsco, Inc. | | | 83,765 | | | | 5,164,950 | |
| | | | | | | | 16,801,751 | |
| Information Technology — 12.6% | | | | | | | | |
| Communications Equipment — 1.6% | | | | | | | | |
Arris Group, Inc. | | | 118,886 | | | | 1,279,213 | |
Aruba Networks, Inc. | | | 41,881 | | | | 992,161 | |
Bel Fuse, Inc. - Class B | | | 300 | | | | 5,364 | |
Blue Coat Systems, Inc. | | | 233,018 | | | | 3,751,590 | |
CIENA Corporation | | | 251,724 | | | | 3,317,722 | |
Cogo Group, Inc. | | | 2,321 | | | | 5,570 | |
Comverse Technology, Inc. | | | 23,200 | | | | 159,848 | |
Digi International, Inc. | | | 22,901 | | | | 292,904 | |
EMCORE Corporation | | | 93,512 | | | | 92,577 | |
Emulex Corporation | | | 237,145 | | | | 1,987,275 | |
Extreme Networks, Inc. | | | 662 | | | | 1,953 | |
Finisar Corporation | | | 8,560 | | | | 175,394 | |
Globecomm Systems, Inc. | | | 23,153 | | | | 314,649 | |
InterDigital, Inc. | | | 99,019 | | | | 4,302,376 | |
JDS Uniphase Corporation | | | 6,512 | | | | 78,144 | |
KVH Industries, Inc. | | | 44,433 | | | | 327,027 | |
Loral Space & Communications, Inc. | | | 12 | | | | 726 | |
Meru Networks, Inc. | | | 235,849 | | | | 1,280,660 | |
Network Equipment Technologies, Inc. | | | 246 | | | | 470 | |
Oclaro, Inc. | | | 125,049 | | | | 513,951 | |
Plantronics, Inc. | | | 41,056 | | | | 1,371,681 | |
Powerwave Technologies, Inc. | | | 1,532 | | | | 5,531 | |
Qiao Xing Mobile Communication Company Ltd. | | | 1,984 | | | | 2,063 | |
RIT Technologies Ltd. | | | 9,858 | | | | 39,334 | |
ShoreTel, Inc. | | | 9,849 | | | | 57,617 | |
Sonus Networks, Inc. | | | 605,662 | | | | 1,605,004 | |
Sycamore Networks, Inc. | | | 15,067 | | | | 289,588 | |
Symmetricom, Inc. | | | 9,869 | | | | 50,825 | |
Telestone Technologies Corporation | | | 567,319 | | | | 3,437,953 | |
ViaSat, Inc. | | | 24,360 | | | | 1,037,493 | |
Zoom Technologies, Inc. | | | 134,895 | | | | 276,535 | |
ZST Digital Networks, Inc. | | | 206,448 | | | | 431,476 | |
| | | | | | | | 27,484,674 | |
| Computers & Peripherals — 0.9% | | | | | | | | |
Avid Technology, Inc. | | | 153,653 | | | | 952,649 | |
Diebold, Inc. | | | 58,093 | | | | 1,875,242 | |
Fusion-io, Inc. | | | 5,106 | | | | 158,388 | |
Hauppauge Digital, Inc. | | | 69,638 | | | | 76,602 | |
iGo, Inc. | | | 15,315 | | | | 18,072 | |
Imation Corporation | | | 325,723 | | | | 2,188,858 | |
Immersion Corporation | | | 23,479 | | | | 161,301 | |
Intermec, Inc. | | | 43,048 | | | | 347,397 | |
Intevac, Inc. | | | 6,075 | | | | 48,904 | |
TFS MARKET NEUTRAL FUND SCHEDULE OF SECURITIES SOLD SHORT (Continued) |
COMMON STOCKS — 62.3% (Continued) | | | | | | |
| Information Technology — 12.6% (Continued) | | | | | | |
| Computers & Peripherals — 0.9% (Continued) | | | | | | |
Lexmark International, Inc. - Class A | | | 1,643 | | | $ | 52,083 | |
Logitech International S.A. | | | 17,316 | | | | 172,294 | |
Novatel Wireless, Inc. | | | 57,035 | | | | 226,429 | |
OCZ Technology Group, Inc. | | | 648,681 | | | | 4,586,175 | |
Rimage Corporation | | | 51 | | | | 566 | |
Silicon Graphics International Corporation | | | 146,940 | | | | 2,124,752 | |
Stratasys, Inc. | | | 71,084 | | | | 1,993,195 | |
Super Micro Computer, Inc. | | | 4,502 | | | | 72,032 | |
Synaptics, Inc. | | | 1,935 | | | | 65,384 | |
TransAct Technologies, Inc. | | | 100 | | | | 771 | |
USA Technologies, Inc. | | | 399,409 | | | | 583,137 | |
| | | | | | | | 15,704,231 | |
| Electronic Equipment, Instruments & Components — 1.5% | | | | | | | | |
Anixter International, Inc. | | | 570 | | | | 33,453 | |
Benchmark Electronics, Inc. | | | 657 | | | | 9,027 | |
CalAmp Corporation | | | 2,315 | | | | 8,542 | |
Clearfield, Inc. | | | 100 | | | | 522 | |
CTS Corporation | | | 341,450 | | | | 3,168,656 | |
Daktronics, Inc. | | | 623 | | | | 6,292 | |
DDi Corporation | | | 16,122 | | | | 148,161 | |
Digital Ally, Inc. | | | 4,700 | | | | 3,861 | |
Document Security Systems, Inc. | | | 600 | | | | 1,938 | |
DTS, Inc. | | | 61,907 | | | | 1,738,968 | |
Echelon Corporation | | | 280,664 | | | | 1,897,289 | |
Electro Rent Corporation | | | 6 | | | | 96 | |
FEI Company | | | 1,528 | | | | 60,753 | |
Hollysys Automation Technologies Ltd. | | | 989,607 | | | | 8,609,581 | |
Insight Enterprises, Inc. | | | 7,918 | | | | 133,814 | |
IPG Photonics Corporation | | | 67 | | | | 3,542 | |
Itron, Inc. | | | 200 | | | | 7,358 | |
Littelfuse, Inc. | | | 27,032 | | | | 1,323,487 | |
Maxwell Technologies, Inc. | | | 21,805 | | | | 435,446 | |
Mesa Laboratories, Inc. | | | 131 | | | | 4,878 | |
Methode Electronics, Inc. | | | 527 | | | | 4,896 | |
Microvision, Inc. | | | 949,504 | | | | 674,243 | |
Nam Tai Electronics, Inc. | | | 12,669 | | | | 60,811 | |
OSI Systems, Inc. | | | 42 | | | | 1,861 | |
Park Electrochemical Corporation | | | 704 | | | | 19,923 | |
Pinnacle Data Systems, Inc. | | | 100 | | | | 119 | |
Power-One, Inc. | | | 1,108,774 | | | | 5,488,431 | |
Pulse Electronics Corporation | | | 260,992 | | | | 921,302 | |
RadiSys Corporation | | | 14,372 | | | | 84,220 | |
Research Frontiers, Inc. | | | 70,876 | | | | 277,834 | |
ScanSource, Inc. | | | 52 | | | | 1,808 | |
SinoHub, Inc. | | | 43,908 | | | | 18,990 | |
SMTC Corporation | | | 187 | | | | 387 | |
Superconductor Technologies, Inc. | | | 170,081 | | | | 275,531 | |
SYNNEX Corporation | | | 52,801 | | | | 1,524,365 | |
TFS MARKET NEUTRAL FUND SCHEDULE OF SECURITIES SOLD SHORT (Continued) |
COMMON STOCKS — 62.3% (Continued) | | | | | | |
| Information Technology — 12.6% (Continued) | | | | | | |
| Electronic Equipment, Instruments & Components — 1.5% (Continued) | | | | | | |
Uni-Pixel, Inc. | | | 2,300 | | | $ | 13,685 | |
Vishay Intertechnology, Inc. | | | 3,900 | | | | 41,925 | |
Vishay Precision Group, Inc. | | | 14,846 | | | | 216,603 | |
| | | | | | | | 27,222,598 | |
| Internet Software & Services — 2.3% | | | | | | | | |
Active Network, Inc. (The) | | | 2,326 | | | | 31,262 | |
Ancestry.com, Inc. | | | 20,890 | | | | 475,665 | |
Autobytel, Inc. | | | 1,600 | | | | 1,440 | |
Bankrate, Inc. | | | 44,600 | | | | 868,362 | |
Carbonite, Inc. | | | 3,347 | | | | 42,239 | |
comScore, Inc. | | | 23,971 | | | | 506,028 | |
Constant Contact, Inc. | | | 101,375 | | | | 2,051,830 | |
DealerTrack Holdings, Inc. | | | 27 | | | | 586 | |
Demand Media, Inc. | | | 149,926 | | | | 1,044,984 | |
Digital River, Inc. | | | 13,337 | | | | 244,467 | |
EarthLink, Inc. | | | 385,520 | | | | 2,702,495 | |
Envestnet, Inc. | | | 3,141 | | | | 36,561 | |
FriendFinder Networks, Inc. | | | 1,100 | | | | 2,046 | |
HSW International, Inc. | | | 1,100 | | | | 3,267 | |
IAC/InterActiveCorporation | | | 1,890 | | | | 77,169 | |
KIT digital, Inc. | | | 342,013 | | | | 3,078,117 | |
LinkedIn Corporation - Class A | | | 71,097 | | | | 6,391,620 | |
Local.com Corporation | | | 253,953 | | | | 794,873 | |
LogMeIn, Inc. | | | 57,551 | | | | 2,340,599 | |
Marchex, Inc. - Class B | | | 63,066 | | | | 560,657 | |
MercadoLibre, Inc. | | | 400 | | | | 26,080 | |
ModusLink Global Solutions, Inc. | | | 47,557 | | | | 198,788 | |
Openwave Systems, Inc. | | | 2,427 | | | | 3,762 | |
Phoenix New Media Ltd. - ADR | | | 47,042 | | | | 244,618 | |
Qihoo 360 Technology Company Ltd. - ADR | | | 34,554 | | | | 698,336 | |
Quepasa Corporation | | | 434,166 | | | | 2,097,022 | |
Rediff.com India Ltd. - ADR | | | 80,503 | | | | 879,898 | |
Renren, Inc. | | | 103,662 | | | | 729,781 | |
Saba Software, Inc. | | | 13,443 | | | | 93,295 | |
Sify Technologies Ltd. - ADR | | | 129,591 | | | | 816,423 | |
Snap Interactive, Inc. | | | 7,235 | | | | 5,101 | |
Stamps.com, Inc. | | | 2,840 | | | | 92,470 | |
Support.com, Inc. | | | 302 | | | | 637 | |
TechTarget, Inc. | | | 110 | | | | 815 | |
Travelzoo, Inc. | | | 264,541 | | | | 8,428,276 | |
ValueClick, Inc. | | | 55,339 | | | | 973,966 | |
Vistaprint N.V. | | | 6,472 | | | | 226,002 | |
Vocus, Inc. | | | 100 | | | | 2,038 | |
Web.com Group, Inc. | | | 164,028 | | | | 1,584,511 | |
Zillow, Inc. | | | 49,955 | | | | 1,483,164 | |
Zix Corporation | | | 151,158 | | | | 374,872 | |
| | | | | | | | 40,214,122 | |
TFS MARKET NEUTRAL FUND SCHEDULE OF SECURITIES SOLD SHORT (Continued) |
COMMON STOCKS — 62.3% (Continued) | | | | | | |
| Information Technology — 12.6% (Continued) | | | | | | |
| IT Services — 0.6% | | | | | | |
Cardtronics, Inc. | | | 22,817 | | | $ | 568,828 | |
Cass Information Systems, Inc. | | | 1,063 | | | | 41,659 | |
China Information Technology, Inc. | | | 10 | | | | 10 | |
Computer Task Group, Inc. | | | 3,305 | | | | 42,205 | |
DJSP Enterprises, Inc. | | | 15,586 | | | | 1,403 | |
Echo Global Logistics, Inc. | | | 96,106 | | | | 1,483,877 | |
Euronet Worldwide, Inc. | | | 61,506 | | | | 1,191,371 | |
Global Payments, Inc. | | | 101,949 | | | | 4,681,498 | |
Hackett Group, Inc. (The) | | | 670 | | | | 2,767 | |
Heartland Payment Systems, Inc. | | | 65 | | | | 1,414 | |
Mattersight Corporation | | | 1,825 | | | | 9,216 | |
ServiceSource International, Inc. | | | 19,799 | | | | 263,525 | |
Stream Global Services, Inc. | | | 242 | | | | 757 | |
Telvent GIT, S.A. | | | 1,955 | | | | 77,007 | |
Unisys Corporation | | | 38,680 | | | | 1,005,293 | |
VeriFone Systems, Inc. | | | 1,131 | | | | 47,740 | |
Wright Express Corporation | | | 42,644 | | | | 1,999,151 | |
Yucheng Technologies Ltd. | | | 200 | | | | 498 | |
Zanett, Inc. | | | 12,650 | | | | 5,187 | |
| | | | | | | | 11,423,406 | |
| Semiconductors & Semiconductor Equipment — 2.8% | | | | | | | | |
Advanced Analogic Technologies, Inc. | | | 245 | | | | 1,068 | |
Aixtron SE - ADR | | | 33,886 | | | | 477,115 | |
Applied Micro Circuits Corporation | | | 6,342 | | | | 42,745 | |
ATMI, Inc. | | | 252 | | | | 5,141 | |
AuthenTec, Inc. | | | 118 | | | | 431 | |
Cabot Microelectronics Corporation | | | 88,749 | | | | 3,418,612 | |
Camtek Ltd. | | | 10,148 | | | | 22,529 | |
Canadian Solar, Inc. | | | 213,738 | | | | 737,396 | |
CEVA, Inc. | | | 42,301 | | | | 1,314,292 | |
ChipMOS TECHNOLOGIES (Bermuda) LTD. | | | 400 | | | | 2,000 | |
Cree, Inc. | | | 181,625 | | | | 4,838,490 | |
CSR plc | | | 1 | | | | 15 | |
Cypress Semiconductor Corporation | | | 2,700 | | | | 51,597 | |
DayStar Technologies, Inc. | | | 62,667 | | | | 12,596 | |
Diodes, Inc. | | | 4,445 | | | | 99,435 | |
Energy Conversion Devices, Inc. | | | 1,172,508 | | | | 574,529 | |
Entropic Communications, Inc. | | | 556,060 | | | | 3,236,269 | |
Evergreen Solar, Inc. | | | 114,139 | | | | 4,451 | |
FormFactor, Inc. | | | 48 | | | | 287 | |
FSI International, Inc. | | | 15,347 | | | | 37,907 | |
GSI Technology, Inc. | | | 624 | | | | 3,058 | |
Ikanos Communications, Inc. | | | 1,300 | | | | 1,378 | |
JinkoSolar Holding Company Ltd. - ADR | | | 103,541 | | | | 957,754 | |
Kopin Corporation | | | 400,188 | | | | 1,620,761 | |
LDK Solar Company Ltd. | | | 146,738 | | | | 607,495 | |
MEMC Electronic Materials, Inc. | | | 261 | | | | 1,563 | |
Micrel, Inc. | | | 64,104 | | | | 706,426 | |
TFS MARKET NEUTRAL FUND SCHEDULE OF SECURITIES SOLD SHORT (Continued) |
COMMON STOCKS — 62.3% (Continued) | | | | | | |
| Information Technology — 12.6% (Continued) | | | | | | |
| Semiconductors & Semiconductor Equipment — 2.8% (Continued) | | | | | | |
MIPS Technologies, Inc. | | | 204,932 | | | $ | 1,125,077 | |
MKS Instruments, Inc. | | | 959 | | | | 25,548 | |
MoSys, Inc. | | | 112,436 | | | | 435,127 | |
Novellus Systems, Inc. | | | 18,457 | | | | 637,689 | |
PDF Solutions, Inc. | | | 2,879 | | | | 14,884 | |
PLX Technology, Inc. | | | 142,891 | | | | 464,396 | |
Power Integrations, Inc. | | | 65,112 | | | | 2,319,941 | |
QuickLogic Corporation | | | 435 | | | | 1,336 | |
Rubicon Technology, Inc. | | | 681,258 | | | | 7,098,708 | |
Semtech Corporation | | | 2,574 | | | | 62,857 | |
Sigma Designs, Inc. | | | 208,039 | | | | 1,735,045 | |
Silicon Image, Inc. | | | 497 | | | | 3,201 | |
Silicon Laboratories, Inc. | | | 38,835 | | | | 1,660,196 | |
STR Holdings, Inc. | | | 359,086 | | | | 3,070,185 | |
SunPower Corporation - Class A | | | 549,185 | | | | 5,502,834 | |
SunPower Corporation - Class B | | | 15,117 | | | | 142,856 | |
Suntech Power Holdings Company Ltd. - ADR | | | 203,620 | | | | 557,919 | |
Teradyne, Inc. | | | 23,432 | | | | 335,546 | |
Tower Semiconductor Ltd. | | | 45,408 | | | | 35,886 | |
Transwitch Corporation | | | 20,965 | | | | 47,591 | |
TriQuint Semiconductor, Inc. | | | 255,029 | | | | 1,356,754 | |
Veeco Instruments, Inc. | | | 152,083 | | | | 4,059,095 | |
Vitesse Semiconductor Corporation | | | 300 | | | | 786 | |
| | | | | | | | 49,468,797 | |
| Software — 2.9% | | | | | | | | |
Accelrys, Inc. | | | 1,178 | | | | 7,810 | |
Advent Software, Inc. | | | 645 | | | | 17,673 | |
American Software, Inc. - Class A | | | 925 | | | | 7,233 | |
AsiaInfo-Linkage, Inc. | | | 608,378 | | | | 6,095,948 | |
Astea International, Inc. | | | 100 | | | | 309 | |
Authentidate Holding Corporation | | | 1,654 | | | | 1,125 | |
Callidus Software, Inc. | | | 195,355 | | | | 1,105,709 | |
China CGame, Inc. | | | 12,695 | | | | 2,666 | |
China TransInfo Technology Corporation | | | 105,160 | | | | 338,615 | |
Concur Technologies, Inc. | | | 68,177 | | | | 3,171,594 | |
CyberDefender Corporation | | | 11,408 | | | | 8,328 | |
DemandTec, Inc. | | | 102,819 | | | | 777,312 | |
Ebix, Inc. | | | 233,693 | | | | 3,998,487 | |
EPIQ Systems, Inc. | | | 65,853 | | | | 939,064 | |
ePlus, inc. | | | 100 | | | | 2,716 | |
FalconStor Software, Inc. | | | 2,760 | | | | 9,356 | |
Fundtech Ltd. | | | 100 | | | | 2,301 | |
Magic Software Enterprises Ltd. | | | 524,038 | | | | 2,672,594 | |
Majesco Entertainment Company | | | 77,989 | | | | 262,823 | |
MIND CTI Ltd. | | | 800 | | | | 1,568 | |
Motricity, Inc. | | | 174,777 | | | | 307,608 | |
Qlik Technologies, Inc. | | | 15,900 | | | | 454,263 | |
| RealD, Inc. | | | 499,791 | | | | 5,582,665 | |
TFS MARKET NEUTRAL FUND SCHEDULE OF SECURITIES SOLD SHORT (Continued) |
COMMON STOCKS — 62.3% (Continued) | | | | | | |
| Information Technology — 12.6% (Continued) | | | | | | |
| Software — 2.9% (Continued) | | | | | | |
RealPage, Inc. | | | 116,766 | | | $ | 3,076,784 | |
Rosetta Stone, Inc. | | | 292,645 | | | | 2,905,965 | |
Sky-Mobi Ltd. - ADR | | | 80,605 | | | | 466,703 | |
Sourcefire, Inc. | | | 10,086 | | | | 277,869 | |
SRS Labs, Inc. | | | 751 | | | | 5,280 | |
SuccessFactors, Inc. | | | 148,479 | | | | 3,964,389 | |
Synchronoss Technologies, Inc. | | | 82,678 | | | | 2,485,301 | |
Take-Two Interactive Software, Inc. | | | 127,265 | | | | 2,008,242 | |
TeleCommunication Systems, Inc. | | | 505,190 | | | | 1,667,127 | |
TeleNav, Inc. | | | 169,174 | | | | 1,449,821 | |
THQ, Inc. | | | 340,103 | | | | 724,419 | |
TigerLogic Corporation | | | 500 | | | | 1,185 | |
Ultimate Software Group, Inc. (The) | | | 21,143 | | | | 1,272,386 | |
VirnetX Holding Corporation | | | 52,872 | | | | 1,139,392 | |
Wave Systems Corporation - Class A | | | 737,222 | | | | 1,924,149 | |
Websense, Inc. | | | 104,945 | | | | 1,872,219 | |
| | | | | | | | 51,008,998 | |
| Materials — 3.7% | | | | | | | | |
| Chemicals — 1.2% | | | | | | | | |
ADA-ES, Inc. | | | 44,726 | | | | 683,413 | |
American Vanguard Corporation | | | 138,731 | | | | 1,716,102 | |
Ampal-American Israel Corporation - Class A | | | 2,031 | | | | 979 | |
Calgon Carbon Corporation | | | 98,947 | | | | 1,578,205 | |
Cereplast, Inc. | | | 97,734 | | | | 226,743 | |
China Agritech, Inc. | | | 85,645 | | | | 59,951 | |
China Gengsheng Minerals, Inc. | | | 63,249 | | | | 63,881 | |
China Green Agriculture, Inc. | | | 371,595 | | | | 1,501,244 | |
Clean Diesel Technologies, Inc. | | | 122,189 | | | | 427,662 | |
Converted Organics, Inc. | | | 1,622 | | | | 18 | |
CVR Partners, L.P. | | | 7,549 | | | | 189,857 | |
Ferro Corporation | | | 405,474 | | | | 2,623,417 | |
Flotek Industries, Inc. | | | 87,590 | | | | 651,670 | |
FutureFuel Corporation | | | 1,332 | | | | 15,052 | |
Georgia Gulf Corporation | | | 15,700 | | | | 284,170 | |
Gulf Resources, Inc. | | | 162,809 | | | | 384,229 | |
Hawkins, Inc. | | | 55,755 | | | | 2,134,301 | |
OMNOVA Solutions, Inc. | | | 535 | | | | 2,370 | |
Scotts Miracle-Gro Company (The) - Class A | | | 9,113 | | | | 442,072 | |
Senomyx, Inc. | | | 295,099 | | | | 1,345,651 | |
ShengdaTech, Inc. | | | 32,215 | | | | 1,450 | |
Yongye International, Inc. | | | 634,470 | | | | 3,197,729 | |
Zep, Inc. | | | 746 | | | | 11,369 | |
Zoltek Companies, Inc. | | | 433,240 | | | | 3,140,990 | |
| | | | | | | | 20,682,525 | |
| Construction Materials — 0.2% | | | | | | | | |
Eagle Materials, Inc. | | | 80,895 | | | | 1,664,819 | |
Martin Marietta Materials, Inc. | | | 18,226 | | | | 1,315,371 | |
Texas Industries, Inc. | | | 36,659 | | | | 1,099,770 | |
TFS MARKET NEUTRAL FUND SCHEDULE OF SECURITIES SOLD SHORT (Continued) |
COMMON STOCKS — 62.3% (Continued) | | | | | | |
| Materials — 3.7% (Continued) | | | | | | |
| Construction Materials — 0.2% (Continued) | | | | | | |
Vulcan Materials Company | | | 600 | | | $ | 18,774 | |
| | | | | | | | 4,098,734 | |
| Containers & Packaging — 0.1% | | | | | | | | |
AEP Industries, Inc. | | | 10 | | | | 270 | |
Graphic Packaging Holding Company | | | 219,738 | | | | 971,242 | |
| | | | | | | | 971,512 | |
| Metals & Mining — 1.9% | | | | | | | | |
A.M. Castle & Company | | | 373 | | | | 5,106 | |
AK Steel Holding Corporation | | | 300,618 | | | | 2,504,148 | |
AMCOL International Corporation | | | 117,362 | | | | 3,543,159 | |
Anooraq Resources Corporation | | | 201,165 | | | | 110,621 | |
Augusta Resource Corporation | | | 47,627 | | | | 181,935 | |
Avalon Rare Metals, Inc. | | | 153,308 | | | | 513,582 | |
China Direct Industries, Inc. | | | 17,830 | | | | 16,938 | |
China Gerui Advanced Materials Group Ltd. | | | 60,165 | | | | 150,413 | |
China Natural Resources, Inc. | | | 4,312 | | | | 40,964 | |
China Precision Steel, Inc. | | | 299,375 | | | | 149,688 | |
China Shen Zhou Mining & Resources, Inc. | | | 59,198 | | | | 107,740 | |
Crosshair Exploration & Mining Corporation | | | 271,904 | | | | 140,302 | |
General Moly, Inc. | | | 251,891 | | | | 866,505 | |
General Steel Holdings, Inc. | | | 103,057 | | | | 126,760 | |
Gold Reserve, Inc. | | | 153 | | | | 428 | |
Gold Resource Corporation | | | 142,453 | | | | 3,205,193 | |
Golden Minerals Company | | | 20,831 | | | | 146,025 | |
Great Northern Iron Ore Properties | | | 7,585 | | | | 790,736 | |
Great Panther Silver Ltd. | | | 510 | | | | 1,311 | |
Hecla Mining Company | | | 3,000 | | | | 18,810 | |
Horsehead Holding Corporation | | | 56,301 | | | | 488,693 | |
Ivanhoe Mines Ltd. | | | 105 | | | | 2,154 | |
Jaguar Mining, Inc. | | | 370,686 | | | | 1,927,567 | |
Kaiser Aluminum Corporation | | | 43,531 | | | | 2,022,450 | |
Kimber Resources, Inc. | | | 11,900 | | | | 16,303 | |
Midway Gold Corporation | | | 387,796 | | | | 814,372 | |
Olympic Steel, Inc. | | | 86,090 | | | | 1,760,540 | |
Paramount Gold and Silver Corporation | | | 275,751 | | | | 733,498 | |
Polymet Mining Corporation | | | 198,492 | | | | 267,964 | |
Puda Coal, Inc. | | | 61,600 | | | | 18,480 | |
Qiao Xing Universal Resources, Inc. | | | 25,117 | | | | 22,103 | |
Rare Element Resources Ltd. | | | 660,341 | | | | 4,312,027 | |
Revett Minerals, Inc. | | | 5,392 | | | | 22,700 | |
RTI International Metals, Inc. | | | 116,235 | | | | 3,067,442 | |
Silver Bull Resources, Inc. | | | 103,614 | | | | 68,385 | |
Silvercorp Metals, Inc. | | | 110,287 | | | | 1,042,212 | |
SinoCoking Coal and Coke Chemical Industries, Inc. | | | 86,511 | | | | 308,844 | |
SunCoke Energy, Inc. | | | 700 | | | | 8,834 | |
Tanzanian Royalty Exploration Corporation | | | 258,827 | | | | 999,072 | |
US Gold Corporation | | | 382,301 | | | | 1,735,647 | |
TFS MARKET NEUTRAL FUND SCHEDULE OF SECURITIES SOLD SHORT (Continued) |
COMMON STOCKS — 62.3% (Continued) | | | | | | |
| Materials — 3.7% (Continued) | | | | | | |
| Metals & Mining — 1.9% (Continued) | | | | | | |
Worthington Industries, Inc. | | | 86,412 | | | $ | 1,493,199 | |
| | | | | | | | 33,752,850 | |
| Paper & Forest Products — 0.3% | | | | | | | | |
AbitibiBowater, Inc. | | | 4,300 | | | | 73,100 | |
Clearwater Paper Corporation | | | 15,550 | | | | 515,172 | |
Deltic Timber Corporation | | | 2,172 | | | | 147,023 | |
Louisiana-Pacific Corporation | | | 260,056 | | | | 1,729,372 | |
Neenah Paper, Inc. | | | 9 | | | | 148 | |
Orient Paper, Inc. | | | 130,673 | | | | 321,456 | |
P.H. Glatfelter Company | | | 142,077 | | | | 2,131,155 | |
Wausau Paper Corporation | | | 45,271 | | | | 339,532 | |
| | | | | | | | 5,256,958 | |
| Telecommunication Services — 0.6% | | | | | | | | |
| Diversified Telecommunication Services — 0.5% | | | | | | | | |
Alaska Communications Systems Group, Inc. | | | 550,270 | | | | 3,890,409 | |
Atlantic Tele-Network, Inc. | | | 14,261 | | | | 541,205 | |
Boingo Wireless, Inc. | | | 432 | | | | 3,305 | |
CenturyLink, Inc. | | | 16 | | | | 564 | |
Cincinnati Bell, Inc. | | | 49,284 | | | | 158,695 | |
Cogent Communications Group, Inc. | | | 15,440 | | | | 247,812 | |
Consolidated Communications Holdings, Inc. | | | 18,076 | | | | 341,275 | |
Fairpoint Communications, Inc. | | | 168,763 | | | | 906,257 | |
Hawaiian Telcom Holdco, Inc. | | | 378 | | | | 5,579 | |
Iridium Communications, Inc. | | | 243,065 | | | | 1,545,893 | |
magicJack VocalTec Ltd. | | | 30,150 | | | | 744,705 | |
Radcom Ltd. | | | 52,881 | | | | 229,504 | |
Telecom Italia S.p.A. | | | 72 | | | | 895 | |
| | | | | | | | 8,616,098 | |
| Wireless Telecommunication Services — 0.1% | | | | | | | | |
Cellcom Israel Ltd. | | | 6,826 | | | | 150,445 | |
Clearwire Corporation - Class A | | | 121,113 | | | | 232,537 | |
Leap Wireless International, Inc. | | | 104,681 | | | | 727,533 | |
Shenandoah Telecommunications Company | | | 689 | | | | 9,343 | |
USA Mobility, Inc. | | | 85,003 | | | | 1,110,989 | |
| | | | | | | | 2,230,847 | |
| Utilities — 0.8% | | | | | | | | |
| Electric Utilities — 0.2% | | | | | | | | |
DPL, Inc. | | | 4,394 | | | | 133,358 | |
Empire District Electric Company (The) | | | 11,851 | | | | 236,664 | |
Hawaiian Electric Industries, Inc. | | | 11,666 | | | | 295,500 | |
ITC Holdings Corporation | | | 300 | | | | 21,804 | |
NV Energy, Inc. | | | 23,201 | | | | 372,144 | |
Otter Tail Corporation | | | 9,205 | | | | 178,669 | |
PNM Resources, Inc. | | | 400 | | | | 7,192 | |
Portland General Electric Company | | | 5,200 | | | | 127,608 | |
UIL Holdings Corporation | | | 25,473 | | | | 868,120 | |
Westar Energy, Inc. | | | 44,118 | | | | 1,202,657 | |
| | | | | | | | 3,443,716 | |
TFS MARKET NEUTRAL FUND SCHEDULE OF SECURITIES SOLD SHORT (Continued) |
COMMON STOCKS — 62.3% (Continued) | | | | | | |
| Utilities — 0.8% (Continued) | | | | | | |
| Gas Utilities — 0.2% | | | | | | |
AmeriGas Partners, L.P. | | | 190 | | | $ | 8,497 | |
China Natural Gas, Inc. (a) | | | 229,640 | | | | 175,675 | |
Ferrellgas Partners, L.P. | | | 1,042 | | | | 22,486 | |
New Jersey Resources Corporation | | | 24,011 | | | | 1,128,997 | |
Northwest Natural Gas Company | | | 35,065 | | | | 1,638,237 | |
Piedmont Natural Gas Company, Inc. | | | 11,620 | | | | 379,858 | |
WGL Holdings, Inc. | | | 4,425 | | | | 189,434 | |
| | | | | | | | 3,543,184 | |
| Independent Power Producers & Energy Traders — 0.1% | | | | | | | | |
American DG Energy, Inc. | | | 12,029 | | | | 17,923 | |
Atlantic Power Corporation | | | 5,319 | | | | 71,806 | |
Constellation Energy Group, Inc. | | | 1,200 | | | | 47,640 | |
Dynegy, Inc. | | | 129,322 | | | | 474,612 | |
U.S. Geothermal, Inc. | | | 184,350 | | | | 79,271 | |
| | | | | | | | 691,252 | |
| Multi-Utilities — 0.3% | | | | | | | | |
Black Hills Corporation | | | 75,085 | | | | 2,531,115 | |
CH Energy Group, Inc. | | | 32,993 | | | | 1,821,544 | |
MDU Resources Group, Inc. | | | 51,039 | | | | 1,051,914 | |
| | | | | | | | 5,404,573 | |
Water Utilities — 0.0% (b) | | | | | | | | |
Artesian Resources Corporation - Class A | | | 300 | | | | 5,460 | |
Cadiz, Inc. | | | 23,001 | | | | 221,039 | |
Connecticut Water Service, Inc. | | | 415 | | | | 11,097 | |
Middlesex Water Company | | | 5,182 | | | | 98,199 | |
SJW Corporation | | | 93 | | | | 2,165 | |
| | | | | | | | 337,960 | |
| | | | | | | | | |
Total Common Stocks (Proceeds $1,165,771,292) | | | | | | $ | 1,097,499,264 | |
CLOSED-END FUNDS — 0.0% (b) | | | | | | |
BlackRock International Growth and Income Trust | | | 5 | | | $ | 39 | |
Central GoldTrust | | | 1,249 | | | | 82,534 | |
Gabelli Convertible and Income Securities Fund, Inc. (The) | | | 100 | | | | 539 | |
Global High Income Fund, Inc. | | | 176 | | | | 2,207 | |
Nuveen Floating Rate Income Opportunity Fund | | | 44 | | | | 489 | |
PIMCO Global StocksPLUS & Income Fund | | | 48 | | | | 953 | |
Western Asset/Claymore Inflation-Linked Securities & Income Fund | | | 10 | | | | 128 | |
Total Closed-End Funds (Proceeds $91,404) | | | | | | $ | 86,889 | |
TFS MARKET NEUTRAL FUND SCHEDULE OF SECURITIES SOLD SHORT (Continued) |
EXCHANGE-TRADED FUNDS — 0.0% (b) | | | | | | |
Vanguard Extended Duration Treasury ETF | | | 300 | | | $ | 34,548 | |
WisdomTree Earnings 500 Fund | | | 165 | | | | 7,288 | |
Total Exchange-Traded Funds (Proceeds $40,831) | | | | | | $ | 41,836 | |
| | | | | | |
First BanCorp (Puerto Rico) (a) (Proceeds $0) | | | 358,191 | | | $ | — | |
| | | | | | |
American International Group, Inc. | | | 854 | | | $ | 5,987 | |
Magnum Hunter Resources Corporation (a) | | | 15,718 | | | | — | |
Zion Oil & Gas, Inc. | | | 44,348 | | | | 13,304 | |
Total Warrants (Proceeds $14,295) | | | | | | $ | 19,291 | |
| | | | | | | | | |
Total Securities Sold Short — 62.3% (Proceeds $1,165,917,822) | | | | | | $ | 1,097,647,280 | |
| ADR - American Depositary Receipt. |
| |
| (a) | Securities fair-valued under supervision of the Board of Trustees totaled ($647,939) at October 31, 2011, representing (0.0%)(b) of net assets (Note 2). |
| | |
| (b) | Percentage rounds to less than 0.1%. |
| | |
| See accompanying notes to financial statements. |
TFS SMALL CAP FUND SUMMARY SCHEDULE OF INVESTMENTS* October 31, 2011 |
| | | | | | |
| Consumer Discretionary — 16.0% | | | | | | |
| Auto Components — 1.0% | | | | | | |
Standard Motor Products, Inc. | | | 15,100 | | | $ | 234,805 | |
Other Auto Components (a) | | | | | | | 301,790 | |
| | | | | | | | 536,595 | |
| Automobiles — 0.6% | | | | | | | | |
Thor Industries, Inc. | | | 11,300 | | | | 298,772 | |
| | | | | | | | | |
| Distributors — 0.2% | | | | | | | | |
Other Distributors (a) | | | | | | | 86,024 | |
| | | | | | | | | |
| Diversified Consumer Services — 2.5% | | | | | | | | |
K12, Inc. (b) | | | 7,700 | | | | 269,885 | |
Sotheby's | | | 6,600 | | | | 232,452 | |
Other Diversified Consumer Services (a) | | | | | | | 781,595 | |
| | | | | | | | 1,283,932 | |
| Hotels, Restaurants & Leisure — 3.6% | | | | | | | | |
Papa John's International, Inc. (b) | | | 6,800 | | | | 229,568 | |
Other Hotels, Restaurants & Leisure (a) | | | | | | | 1,604,875 | |
| | | | | | | | 1,834,443 | |
| Household Durables — 0.8% | | | | | | | | |
Jarden Corporation | | | 8,200 | | | | 262,646 | |
Other Household Durables (a) | | | | | | | 157,680 | |
| | | | | | | | 420,326 | |
Internet & Catalog Retail — 0.0% (d) | | | | | | | | |
Other Internet & Catalog Retail (a) | | | | | | | 12,825 | |
| | | | | | | | | |
| Leisure Equipment & Products — 0.6% | | | | | | | | |
Other Leisure Equipment & Products (a) | | | | | | | 309,342 | |
| | | | | | | | | |
| Media — 1.2% | | | | | | | | |
Cinemark Holdings, Inc. | | | 13,000 | | | | 268,710 | |
Other Media (a) | | | | | | | 329,673 | |
| | | | | | | | 598,383 | |
| Multiline Retail — 0.4% | | | | | | | | |
Other Multiline Retail (a) | | | | | | | 207,152 | |
| | | | | | | | | |
| Specialty Retail — 4.3% | | | | | | | | |
bebe stores, inc. | | | 34,800 | | | | 249,864 | |
Other Specialty Retail (a) | | | | | | | 1,933,221 | |
| | | | | | | | 2,183,085 | |
| Textiles, Apparel & Luxury Goods — 0.8% | | | | | | | | |
Other Textiles, Apparel & Luxury Goods (a) | | | | | | | 429,428 | |
| | | | | | | | | |
| Consumer Staples — 3.8% | | | | | | | | |
| Beverages — 0.5% | | | | | | | | |
Other Beverages (a) | | | | | | | 236,112 | |
TFS SMALL CAP FUND SUMMARY SCHEDULE OF INVESTMENTS* (Continued) |
COMMON STOCKS — 100.2% (Continued) | | | | | | |
| Consumer Staples — 3.8% (Continued) | | | | | | |
| Food & Staples Retailing — 1.8% | | | | | | |
Susser Holdings Corporation (b) | | | 11,200 | | | $ | 245,952 | |
Other Food & Staples Retailing (a) | | | | | | | 653,558 | |
| | | | | | | | 899,510 | |
| Food Products — 1.1% | | | | | | | | |
Fresh Del Monte Produce, Inc. | | | 8,954 | | | | 227,969 | |
Other Food Products (a) | | | | | | | 361,150 | |
| | | | | | | | 589,119 | |
| Household Products — 0.2% | | | | | | | | |
Other Household Products (a) | | | | | | | 100,206 | |
| | | | | | | | | |
| Personal Products — 0.2% | | | | | | | | |
Other Personal Products (a) | | | | | | | 101,990 | |
| | | | | | | | | |
| Energy — 5.6% | | | | | | | | |
| Energy Equipment & Services — 1.6% | | | | | | | | |
Other Energy Equipment & Services (a) | | | | | | | 809,381 | |
| | | | | | | | | |
| Oil, Gas & Consumable Fuels — 4.0% | | | | | | | | |
Golar LNG Ltd. | | | 6,653 | | | | 268,981 | |
Other Oil, Gas & Consumable Fuels (a) | | | | | | | 1,774,407 | |
| | | | | | | | 2,043,388 | |
| Financials — 13.8% | | | | | | | | |
| Capital Markets — 2.2% | | | | | | | | |
Other Capital Markets (a) | | | | | | | 1,130,805 | |
| | | | | | | | | |
| Commercial Banks — 3.1% | | | | | | | | |
East West Bancorp, Inc. | | | 12,300 | | | | 239,481 | |
Fulton Financial Corporation | | | 28,700 | | | | 270,928 | |
Other Commercial Banks (a) | | | | | | | 1,077,541 | |
| | | | | | | | 1,587,950 | |
| Consumer Finance — 0.8% | | | | | | | | |
Other Consumer Finance (a) | | | | | | | 411,504 | |
| | | | | | | | | |
| Diversified Financial Services — 0.9% | | | | | | | | |
Other Diversified Financial Services (a) | | | | | | | 449,833 | |
| | | | | | | | | |
| Insurance — 2.8% | | | | | | | | |
Other Insurance (a) | | | | | | | 1,431,717 | |
| | | | | | | | | |
| Real Estate Investment Trusts (REIT) — 2.8% | | | | | | | | |
Other Real Estate Investment Trusts (REIT) (a) | | | | | | | 1,436,258 | |
| | | | | | | | | |
| Real Estate Management & Development — 0.3% | | | | | | | | |
Other Real Estate Management & Development (a) | | | | | | | 142,164 | |
| | | | | | | | | |
| Thrifts & Mortgage Finance — 0.9% | | | | | | | | |
Other Thrifts & Mortgage Finance (a) | | | | | | | 456,561 | |
TFS SMALL CAP FUND SUMMARY SCHEDULE OF INVESTMENTS* (Continued) |
COMMON STOCKS — 100.2% (Continued) | | | | | | |
| Health Care — 12.9% | | | | | | |
| Biotechnology — 0.9% | | | | | | |
Other Biotechnology (a) | | | | | $ | 484,878 | |
| | | | | | | | |
| Health Care Equipment & Supplies — 2.4% | | | | | | | |
RTI Biologics, Inc. (b) | | | 53,365 | | | | 240,142 | |
Other Health Care Equipment & Supplies (a) | | | | | | | 979,927 | |
| | | | | | | | 1,220,069 | |
| Health Care Providers & Services — 5.6% | | | | | | | | |
Chemed Corporation | | | 4,200 | | | | 249,312 | |
Health Management Associates, Inc. - Class A (b) | | | 28,600 | | | | 250,536 | |
LifePoint Hospitals, Inc. (b) | | | 7,000 | | | | 270,620 | |
Omnicare, Inc. | | | 9,200 | | | | 274,344 | |
Team Health Holdings, Inc. (b) | | | 11,926 | | | | 242,336 | |
Other Health Care Providers & Services (a) | | | | | | | 1,587,991 | |
| | | | | | | | 2,875,139 | |
| Health Care Technology — 0.9% | | | | | | | | |
Emdeon, Inc. - Class A (b) | | | 12,500 | | | | 237,125 | |
Other Health Care Technology (a) | | | | | | | 228,531 | |
| | | | | | | | 465,656 | |
| Life Sciences Tools & Services — 1.5% | | | | | | | | |
Charles River Laboratories International, Inc. (b) | | | 8,600 | | | | 277,608 | |
Covance, Inc. (b) | | | 5,300 | | | | 268,869 | |
Other Life Sciences Tools & Services (a) | | | | | | | 215,415 | |
| | | | | | | | 761,892 | |
| Pharmaceuticals — 1.6% | | | | | | | | |
Other Pharmaceuticals (a) | | | | | | | 817,366 | |
| | | | | | | | | |
| Industrials — 20.5% | | | | | | | | |
| Aerospace & Defense — 1.9% | | | | | | | | |
Other Aerospace & Defense (a) | | | | | | | 956,819 | |
| | | | | | | | | |
| Air Freight & Logistics — 1.0% | | | | | | | | |
Hub Group, Inc. - Class A (b) | | | 7,800 | | | | 243,828 | |
Other Air Freight & Logistics (a) | | | | | | | 286,790 | |
| | | | | | | | 530,618 | |
| Airlines — 0.5% | | | | | | | | |
Other Airlines (a) | | | | | | | 280,269 | |
| | | | | | | | | |
| Building Products — 1.3% | | | | | | | | |
Lennox International, Inc. | | | 7,700 | | | | 247,863 | |
Other Building Products (a) | | | | | | | 396,887 | |
| | | | | | | | 644,750 | |
| Commercial Services & Supplies — 3.5% | | | | | | | | |
Other Commercial Services & Supplies (a) | | | | | | | 1,799,243 | |
| | | | | | | | | |
| Construction & Engineering — 1.1% | | | | | | | | |
Chicago Bridge & Iron Company N.V. | | | 6,300 | | | | 230,454 | |
Other Construction & Engineering (a) | | | | | | | 359,044 | |
| | | | | | | | 589,498 | |
TFS SMALL CAP FUND SUMMARY SCHEDULE OF INVESTMENTS* (Continued) |
COMMON STOCKS — 100.2% (Continued) | | | | | | |
| Industrials — 20.5% (Continued) | | | | | | |
| Electrical Equipment — 0.3% | | | | | | |
Other Electrical Equipment (a) | | | | | $ | 136,338 | |
| | | | | | | | |
| Industrial Conglomerates — 0.5% | | | | | | | |
Other Industrial Conglomerates (a) | | | | | | 271,003 | |
| | | | | | | | |
| Machinery — 6.7% | | | | | | | |
Actuant Corporation - Class A | | | 12,500 | | | | 281,250 | |
Kennametal, Inc. | | | 7,400 | | | | 287,786 | |
Mueller Industries, Inc. | | | 6,000 | | | | 242,700 | |
Robbins & Myers, Inc. | | | 6,400 | | | | 286,016 | |
WABCO Holdings, Inc. (b) | | | 5,000 | | | | 251,050 | |
Other Machinery (a) | | | | | | | 2,060,801 | |
| | | | | | | | 3,409,603 | |
| Marine — 0.1% | | | | | | | | |
Other Marine (a) | | | | | | | 26,442 | |
| | | | | | | | | |
| Professional Services — 0.9% | | | | | | | | |
Other Professional Services (a) | | | | | | | 475,053 | |
| | | | | | | | | |
| Road & Rail — 2.3% | | | | | | | | |
Con-way, Inc. | | | 11,000 | | | | 324,170 | |
Ryder System, Inc. | | | 5,000 | | | | 254,700 | |
Other Road & Rail (a) | | | | | | | 616,473 | |
| | | | | | | | 1,195,343 | |
| Trading Companies & Distributors — 0.4% | | | | | | | | |
Other Trading Companies & Distributors (a) | | | | | | | 207,269 | |
| | | | | | | | | |
| Information Technology — 18.1% | | | | | | | | |
| Communications Equipment — 1.7% | | | | | | | | |
ADTRAN, Inc. | | | 8,400 | | | | 282,240 | |
Riverbed Technology, Inc. (b) | | | 8,100 | | | | 223,398 | |
Other Communications Equipment (a) | | | | | | | 388,988 | |
| | | | | | | | 894,626 | |
| Computers & Peripherals — 1.3% | | | | | | | | |
STEC, Inc. (b) | | | 21,100 | | | | 238,852 | |
Other Computers & Peripherals (a) | | | | | | | 453,484 | |
| | | | | | | | 692,336 | |
| Electronic Equipment, Instruments & Components — 3.4% | | | | | | | | |
Brightpoint, Inc. (b) | | | 27,300 | | | | 277,095 | |
Molex, Inc. | | | 9,400 | | | | 232,086 | |
Other Electronic Equipment, Instruments & Components (a) | | | | | | | 1,236,179 | |
| | | | | | | | 1,745,360 | |
| Internet Software & Services — 2.3% | | | | | | | | |
WebMD Health Corporation (b) | | | 8,300 | | | | 298,385 | |
Other Internet Software & Services (a) | | | | | | | 882,962 | |
| | | | | | | | 1,181,347 | |
TFS SMALL CAP FUND SUMMARY SCHEDULE OF INVESTMENTS* (Continued) |
COMMON STOCKS — 100.2% (Continued) | | | | | | |
| Information Technology — 18.1% (Continued) | | | | | | |
| IT Services — 3.3% | | | | | | |
Acxiom Corporation (b) | | | 19,100 | | | $ | 251,929 | |
DST Systems, Inc. | | | 4,600 | | | | 230,874 | |
NeuStar, Inc. - Class A (b) | | | 7,800 | | | | 247,962 | |
Other IT Services (a) | | | | | | | 973,532 | |
| | | | | | | | 1,704,297 | |
| Office Electronics — 0.2% | | | | | | | | |
Other Office Electronics (a) | | | | | | | 85,776 | |
| | | | | | | | | |
| Semiconductors & Semiconductor Equipment — 2.2% | | | | | | | | |
Kulicke & Soffa Industries, Inc. (b) | | | 23,100 | | | | 222,915 | |
Other Semiconductors & Semiconductor Equipment (a) | | | | | | | 891,202 | |
| | | | | | | | 1,114,117 | |
| Software — 3.7% | | | | | | | | |
CommVault Systems, Inc. (b) | | | 5,600 | | | | 238,448 | |
Quest Software, Inc. (b) | | | 15,000 | | | | 263,850 | |
S1 Corporation (b) | | | 23,900 | | | | 232,547 | |
TiVo, Inc. (b) | | | 29,600 | | | | 320,568 | |
Other Software (a) | | | | | | | 824,048 | |
| | | | | | | | 1,879,461 | |
| Materials — 7.2% | | | | | | | | |
| Chemicals — 3.1% | | | | | | | | |
Huntsman Corporation | | | 24,500 | | | | 287,630 | |
W.R. Grace & Company (b) | | | 7,200 | | | | 300,888 | |
Other Chemicals (a) | | | | | | | 978,275 | |
| | | | | | | | 1,566,793 | |
| Containers & Packaging — 1.6% | | | | | | | | |
Bemis Company, Inc. | | | 8,600 | | | | 241,746 | |
Other Containers & Packaging (a) | | | | | | | 589,972 | |
| | | | | | | | 831,718 | |
| Metals & Mining — 2.3% | | | | | | | | |
Schnitzer Steel Industries, Inc. - Class A | | | 5,700 | | | | 266,760 | |
Other Metals & Mining (a) | | | | | | | 924,170 | |
| | | | | | | | 1,190,930 | |
| Paper & Forest Products — 0.2% | | | | | | | | |
Other Paper & Forest Products (a) | | | | | | | 118,490 | |
| | | | | | | | | |
| Telecommunication Services — 1.1% | | | | | | | | |
| Diversified Telecommunication Services — 0.8% | | | | | | | | |
Other Diversified Telecommunication Services (a) | | | | | | | 430,238 | |
| | | | | | | | | |
| Wireless Telecommunication Services — 0.3% | | | | | | | | |
Other Wireless Telecommunication Services (a) | | | | | | | 130,204 | |
| | | | | | | | | |
| Utilities — 1.2% | | | | | | | | |
| Gas Utilities — 0.6% | | | | | | | | |
Other Gas Utilities (a) | | | | | | | 285,576 | |
TFS SMALL CAP FUND SUMMARY SCHEDULE OF INVESTMENTS* (Continued) |
COMMON STOCKS — 100.2% (Continued) | | | | | |
| Utilities — 1.2% (Continued) | | | | | |
| Independent Power Producers & Energy Traders — 0.2% | | | | | |
Other Independent Power Producers & Energy Traders (a) | | | | $ | 129,625 | |
| | | | | | | |
| Multi-Utilities — 0.4% | | | | | | |
Other Multi-Utilities (a) | | | | | 195,822 | |
| | | | | | | |
Water Utilities — 0.0% (d) | | | | | | |
Other Water Utilities (a) | | | | | 8,755 | |
| | | | | | | |
Total Common Stocks (Cost $47,786,668) | | | | $ | 51,359,524 | |
MONEY MARKET FUNDS — 0.1% | | | | | | |
UMB Money Market Fiduciary, 0.01% (c) (Cost $44,627) | | | 44,627 | | | $ | 44,627 | |
| | | | | | | | | |
Total Investments at Value — 100.3% (Cost $47,831,295) | | | | | | $ | 51,404,151 | |
| | | | | | | | | |
Liabilities in Excess of Other Assets — (0.3%) | | | | | | | (130,260 | ) |
| | | | | | | | | |
Net Assets — 100.0% | | | | | | $ | 51,273,891 | |
| * | A complete Schedule of Investments is available without charge upon request by calling toll-free 1-888-534-2001 or on the SEC’s website at http://www.sec.gov. |
| | |
| (a) | Represents issuers not identified as a top 50 holding in terms of market value and issues or issuers not exceeding 1% of net assets individually or in the aggregate, respectively, as of October 31, 2011. |
| | |
| (b) | Non-income producing security. |
| | |
| (c) | Variable rate security. The rate shown is the 7-day effective yield as of October 31, 2011. |
| | |
| (d) | Percentage rounds to less than 0.1%. |
| | |
| See accompanying notes to financial statements. |
TFS CAPITAL INVESTMENT TRUST STATEMENTS OF ASSETS AND LIABILITIES October 31, 2011 |
| | | | | | | |
| ASSETS | | | | | | |
| Investments in securities: | | | | | | |
At acquisition cost | | $ | 1,621,810,198 | | | $ | 47,831,295 | |
At value (Note 2) | | $ | 1,701,379,058 | | | $ | 51,404,151 | |
Deposits with brokers for securities sold short (Note 2) | | | 1,200,943,450 | | | | — | |
Dividends and interest receivable | | | 806,281 | | | | 15,415 | |
Receivable for investment securities sold | | | 178,402,230 | | | | 3,128,635 | |
Receivable for capital shares sold | | | 1,078,543 | | | | 46,234 | |
Other assets | | | 69,545 | | | | 11,241 | |
TOTAL ASSETS | | | 3,082,679,107 | | | | 54,605,676 | |
| | | | | | | | | |
| LIABILITIES | | | | | | | | |
Securities sold short, at value (Note 2)
(proceeds $1,165,917,822) | | | 1,097,647,280 | | | | — | |
Bank overdraft (Note 5) | | | 33,720,904 | | | | — | |
Payable for investment securities purchased | | | 178,580,902 | | | | 3,196,936 | |
Payable for capital shares redeemed | | | 919,223 | | | | 62,318 | |
Dividends payable on securities sold short (Note 2) | | | 295,863 | | | | — | |
Payable to Adviser (Note 4) | | | 3,354,022 | | | | 47,209 | |
Payable to administrator (Note 4) | | | 160,425 | | | | 10,430 | |
Accrued brokerage expense on securities sold short (Note 2) | | | 5,486,192 | | | | — | |
Other accrued expenses and liabilities | | | 249,110 | | | | 14,892 | |
TOTAL LIABILITIES | | | 1,320,413,921 | | | | 3,331,785 | |
| | | | | | | | | |
NET ASSETS | | $ | 1,762,265,186 | | | $ | 51,273,891 | |
| | | | | | | | | |
| Net assets consist of: | | | | | | | | |
Paid-in capital | | $ | 1,819,996,327 | | | $ | 48,141,181 | |
Accumulated net realized losses
from security transactions | | | (205,570,524 | ) | | | (440,146 | ) |
| Net unrealized appreciation (depreciation) on: | | | | | | | | |
Investments | | | 79,568,860 | | | | 3,572,856 | |
Short positions | | | 68,270,542 | | | | — | |
Translation of assets and liabilities in foreign currencies | | | (19 | ) | | | — | |
Net assets | | $ | 1,762,265,186 | | | $ | 51,273,891 | |
| | | | | | | | | |
Shares of beneficial interest outstanding
(unlimited number of shares authorized, no par value) | | | 122,325,300 | | | | 4,248,004 | |
| | | | | | | | | |
Net asset value, redemption price and offering
price per share (a) (Note 2) | | $ | 14.41 | | | $ | 12.07 | |
| (a) | Redemption price may differ from the net asset value per share depending upon the length of time the shares are held. |
| | |
| See accompanying notes to financial statements. |
TFS CAPITAL INVESTMENT TRUST STATEMENTS OF OPERATIONS For the Year Ended October 31, 2011 |
| | | | | | |
| INVESTMENT INCOME | | | | | | |
Dividends | | $ | 24,126,606 | | | $ | 687,246 | |
Foreign tax withholding | | | (53,491 | ) | | | (120 | ) |
Interest | | | 3,081 | | | | 62 | |
TOTAL INVESTMENT INCOME | | | 24,076,196 | | | | 687,188 | |
| | | | | | | | | |
| EXPENSES | | | | | | | | |
Brokerage expense on securities sold short (Note 2) | | | 76,259,387 | | | | — | |
Investment advisory fees (Note 4) | | | 34,856,303 | | | | 593,421 | |
Dividend expense on securities sold short (Note 2) | | | 11,460,810 | | | | — | |
Administration fees (Note 4) | | | 967,310 | | | | 68,276 | |
Accounting services fees (Note 4) | | | 666,671 | | | | 35,345 | |
Custodian fees | | | 618,573 | | | | 43,207 | |
Transfer agent fees (Note 4) | | | 298,319 | | | | 25,570 | |
Registration fees | | | 187,841 | | | | 28,446 | |
Pricing fees | | | 86,334 | | | | 11,371 | |
Professional fees | | | 66,874 | | | | 28,748 | |
Postage and supplies | | | 63,809 | | | | 6,469 | |
Trustees’ fees and expenses | | | 25,192 | | | | 25,192 | |
Compliance service fees and expenses (Note 4) | | | 28,163 | | | | 20,365 | |
Printing of shareholder reports | | | 35,899 | | | | 6,443 | |
Insurance expense | | | 37,779 | | | | 1,656 | |
Borrowing costs (Note 5) | | | 13,210 | | | | 365 | |
Other expenses | | | 22,440 | | | | 15,366 | |
TOTAL EXPENSES | | | 125,694,914 | | | | 910,240 | |
Investment advisory fee reductions (Note 4) | | | — | | | | (66,738 | ) |
Plus recovery by the Adviser of investment advisory
fee reductions in prior years (Note 4) | | | 275,149 | | | | — | |
NET EXPENSES | | | 125,970,063 | | | | 843,502 | |
| | | | | | | | | |
NET INVESTMENT LOSS | | | (101,893,867 | ) | | | (156,314 | ) |
| | | | | | | | | |
REALIZED AND UNREALIZED GAINS (LOSSES)
ON INVESTMENTS, SECURITIES SOLD SHORT
AND FOREIGN CURRENCY TRANSACTIONS | | | | | | | | |
| Net realized gains (losses) from: | | | | | | | | |
Investments | | | (57,639,740 | ) | | | (195,385 | ) |
Securities sold short | | | 32,458,231 | | | | 3,001 | |
Foreign currency transactions | | | (51,262 | ) | | | — | |
| Net change in unrealized appreciation (depreciation) on: | | | | | | | | |
Investments | | | 8,870,392 | | | | 674,114 | |
Securities sold short | | | 76,725,277 | | | | — | |
Foreign currency translation | | | (19 | ) | | | — | |
NET REALIZED AND UNREALIZED
GAINS ON INVESTMENTS | | | 60,362,879 | | | | 481,730 | |
NET INCREASE (DECREASE) IN NET ASSETS
FROM OPERATIONS | | $ | (41,530,988 | ) | | $ | 325,416 | |
| See accompanying notes to financial statements. |
TFS MARKET NEUTRAL FUND STATEMENTS OF CHANGES IN NET ASSETS |
| | | | | | | |
| FROM OPERATIONS | | | | | | |
Net investment loss | | $ | (101,893,867 | ) | | $ | (32,806,131 | ) |
| Net realized gains (losses) from: | | | | | | | | |
Investments | | | (57,639,740 | ) | | | 206,303,196 | |
Securities sold short | | | 32,458,231 | | | | (102,255,118 | ) |
Foreign currency transactions | | | (51,262 | ) | | | 2 | |
| Net change in unrealized appreciation (depreciation) on: | | | | | | | | |
Investments | | | 8,870,392 | | | | 37,377,233 | |
Securities sold short | | | 76,725,277 | | | | (46,305,711 | ) |
Foreign currency translation | | | (19 | ) | | | — | |
Net increase (decrease) in net assets from operations | | | (41,530,988 | ) | | | 62,313,471 | |
| | | | | | | | | |
| FROM DISTRIBUTIONS | | | | | | | | |
Distributions from net realized gains
from security transactions | | | (107,375,129 | ) | | | (6,035,121 | ) |
| | | | | | | | | |
| FROM CAPITAL SHARE TRANSACTIONS | | | | | | | | |
Proceeds from shares sold | | | 1,086,344,768 | | | | 487,596,827 | |
Net asset value of shares issued in reinvestment
of distributions to shareholders | | | 89,339,826 | | | | 5,396,118 | |
Proceeds from redemption fees collected (Note 2) | | | 170,403 | | | | 182,763 | |
Payments for shares redeemed | | | (406,903,124 | ) | | | (235,644,085 | ) |
Net increase in net assets from capital share transactions | | | 768,951,873 | | | | 257,531,623 | |
| | | | | | | | | |
TOTAL INCREASE IN NET ASSETS | | | 620,045,756 | | | | 313,809,973 | |
| | | | | | | | | |
| NET ASSETS | | | | | | | | |
Beginning of year | | | 1,142,219,430 | | | | 828,409,457 | |
End of year | | $ | 1,762,265,186 | | | $ | 1,142,219,430 | |
| | | | | | | | | |
ACCUMULATED NET INVESTMENT INCOME | | $ | — | | | $ | — | |
| | | | | | | | | |
| CAPITAL SHARE ACTIVITY | | | | | | | | |
Shares sold | | | 71,231,581 | | | | 31,680,817 | |
Shares issued in reinvestment of
distributions to shareholders | | | 6,085,819 | | | | 355,008 | |
Shares redeemed | | | (27,272,508 | ) | | | (15,287,390 | ) |
Net increase in shares outstanding | | | 50,044,892 | | | | 16,748,435 | |
Shares outstanding, beginning of year | | | 72,280,408 | | | | 55,531,973 | |
Shares outstanding, end of year | | | 122,325,300 | | | | 72,280,408 | |
| See accompanying notes to financial statements. |
TFS SMALL CAP FUND STATEMENTS OF CHANGES IN NET ASSETS |
| | | | | | |
| FROM OPERATIONS | | | | | | |
Net investment loss | | $ | (156,314 | ) | | $ | (189,625 | ) |
| Net realized gains (losses) from: | | | | | | | | |
Investments | | | (195,385 | ) | | | 2,817,536 | |
Securities sold short | | | 3,001 | | | | (2,732 | ) |
Net change in unrealized appreciation
(depreciation) on investments | | | 674,114 | | | | 3,000,769 | |
Net increase in net assets from operations | | | 325,416 | | | | 5,625,948 | |
| | | | | | | | | |
| FROM DISTRIBUTIONS | | | | | | | | |
Distributions from net realized gains
from security transactions | | | (2,235,241 | ) | | | — | |
| | | | | | | | | |
| FROM CAPITAL SHARE TRANSACTIONS | | | | | | | | |
Proceeds from shares sold | | | 34,491,562 | | | | 22,983,154 | |
Net asset value of shares issued in reinvestment
of distributions to shareholders | | | 2,062,420 | | | | — | |
Proceeds from redemption fees collected (Note 2) | | | 19,574 | | | | 21,157 | |
Payments for shares redeemed | | | (19,173,870 | ) | | | (9,469,293 | ) |
Net increase in net assets from capital share transactions | | | 17,399,686 | | | | 13,535,018 | |
| | | | | | | | | |
TOTAL INCREASE IN NET ASSETS | | | 15,489,861 | | | | 19,160,966 | |
| | | | | | | | | |
| NET ASSETS | | | | | | | | |
Beginning of year | | | 35,784,030 | | | | 16,623,064 | |
End of year | | $ | 51,273,891 | | | $ | 35,784,030 | |
| | | | | | | | | |
ACCUMULATED NET INVESTMENT INCOME | | $ | — | | | $ | — | |
| | | | | | | | | |
| CAPITAL SHARE ACTIVITY | | | | | | | | |
Shares sold | | | 2,672,521 | | | | 2,070,878 | |
Shares issued in reinvestment of
distributions to shareholders | | | 164,599 | | | | — | |
Shares redeemed | | | (1,576,877 | ) | | | (865,629 | ) |
Net increase in shares outstanding | | | 1,260,243 | | | | 1,205,249 | |
Shares outstanding, beginning of year | | | 2,987,761 | | | | 1,782,512 | |
Shares outstanding, end of year | | | 4,248,004 | | | | 2,987,761 | |
| See accompanying notes to financial statements. |
TFS MARKET NEUTRAL FUND FINANCIAL HIGHLIGHTS |
Per share data for a share outstanding throughout each period: | | | | | | | | | | | Four Months Ended October 31, 2008(a) | | | | | | | |
| Net asset value at beginning of period | | $ | 15.80 | | | $ | 14.92 | | | $ | 13.25 | | | $ | 15.59 | | | $ | 14.59 | | | $ | 12.44 | |
| | | | | | | | | | | | | | | | | | | | | | | | | |
| Income (loss) from investment operations: | | | | | | | | | | | | | | | | | | | | | | | | |
| Net investment income (loss) | | | (0.83 | ) | | | (0.45 | ) | | | (0.24 | ) | | | (0.09 | ) | | | (0.23 | ) | | | 0.01 | |
Net realized and unrealized gains
(losses) on investments | | | 0.93 | | | | 1.43 | | | | 2.13 | | | | (2.27 | ) | | | 1.56 | | | | 2.35 | |
| Total from investment operations | | | 0.10 | | | | 0.98 | | | | 1.89 | | | | (2.36 | ) | | | 1.33 | | | | 2.36 | |
| | | | | | | | | | | | | | | | | | | | | | | | | |
| Less distributions: | | | | | | | | | | | | | | | | | | | | | | | | |
Distributions from net
investment income | | | — | | | | — | | | | — | | | | — | | | | (0.01 | ) | | | — | |
Distributions from net realized gains
from security transactions | | | (1.49 | ) | | | (0.10 | ) | | | (0.25 | ) | | | — | | | | (0.40 | ) | | | (0.22 | ) |
Total distributions | | | (1.49 | ) | | | (0.10 | ) | | | (0.25 | ) | | | — | | | | (0.41 | ) | | | (0.22 | ) |
| | | | | | | | | | | | | | | | | | | | | | | | | |
Proceeds from redemption fees
collected (Note 2) | | | 0.00 | (b) | | | 0.00 | (b) | | | 0.03 | | | | 0.02 | | | | 0.08 | | | | 0.01 | |
| | | | | | | | | | | | | | | | | | | | | | | | | |
| Net asset value at end of period | | $ | 14.41 | | | $ | 15.80 | | | $ | 14.92 | | | $ | 13.25 | | | $ | 15.59 | | | $ | 14.59 | |
| | | | | | | | | | | | | | | | | | | | | | | | | |
Total return (c) | | | 0.43% | | | | 6.60% | | | | 14.86% | | | | (15.01% | )(d) | | | 9.93% | | | | 19.18% | |
| | | | | | | | | | | | | | | | | | | | | | | | | |
| Ratios and supplemental data: | | | | | | | | | | | | | | | | | | | | | | | | |
| Net assets at end of period (000’s) | | $ | 1,762,265 | | | $ | 1,142,219 | | | $ | 828,409 | | | $ | 378,564 | | | $ | 271,239 | | | $ | 211,386 | |
| | | | | | | | | | | | | | | | | | | | | | | | | |
Ratio of total expenses to
average net assets | | | 8.10% | | | | 4.52% | | | | 4.70% | | | | 4.60% | (g) | | | 4.05% | | | | 3.30% | |
| | | | | | | | | | | | | | | | | | | | | | | | | |
Ratio of net expenses to
average net assets | | | 8.12% | | | | 4.55% | | | | 4.67% | (e) | | | 4.55% | (e)(g) | | | 3.94% | (e) | | | 3.07% | (e) |
| | | | | | | | | | | | | | | | | | | | | | | | | |
Ratio of net expenses to average net
assets excluding dividend expense (f) | | | 7.38% | | | | 3.81% | | | | 3.84% | (e) | | | 3.68% | (e)(g) | | | 2.80% | (e) | | | 2.48% | (e) |
| | | | | | | | | | | | | | | | | | | | | | | | | |
Ratio of net expenses to average net
assets excluding dividend expense, borrowing costs and brokerage expense on securities sold short (f) | | | 2.47% | | | | 2.50% | | | | 2.49% | (e) | | | 2.49% | (e)(g) | | | 2.50% | (e) | | | 2.48% | (e) |
| | | | | | | | | | | | | | | | | | | | | | | | | |
Ratio of net investment income
(loss) to average net assets | | | (6.56% | ) | | | (3.16% | ) | | | (2.32% | ) | | | (2.24% | )(g) | | | (2.15% | ) | | | 0.09% | |
| | | | | | | | | | | | | | | | | | | | | | | | | |
| Portfolio turnover rate | | | 751% | | | | 703% | | | | 429% | | | | 204% | (d) | | | 536% | | | | 492% | |
| (a) | Fund changed fiscal year end to October 31. |
| | |
| (b) | Amount rounds to less than $0.01 per share. |
| | |
| (c) | Total return is a measure of the change in value of an investment in the Fund over the period covered, which assumes any dividends or capital gains distributions are reinvested in shares of the Fund. The returns shown do not reflect the deduction of taxes a shareholder would pay on Fund distributions or the redemption of Fund shares. |
| | |
| (d) | Not annualized. |
| | |
| (e) | Ratio was determined after advisory fee reductions and expense reimbursements (Note 4). |
| | |
| (f) | Dividend expense, borrowing costs and brokerage expense on securities sold short totaled 5.65%, 2.05%, 2.18%, 2.06%(g), 1.44% and 0.59% of average net assets for the periods ended October 31, 2011, 2010, 2009 and 2008 and June 30, 2008 and 2007, respectively. |
| | |
| (g) | Annualized. |
| | |
| See accompanying notes to financial statements. |
TFS SMALL CAP FUND FINANCIAL HIGHLIGHTS |
Per share data for a share outstanding throughout each period: | | | | | | | | | | | Four Months Ended October 31, 2008(a) | | | | | | | |
| Net asset value at beginning of period | | $ | 11.98 | | | $ | 9.33 | | | $ | 6.80 | | | $ | 9.31 | | | $ | 13.08 | | | $ | 10.39 | |
| | | | | | | | | | | | | | | | | | | | | | | | | |
| Income (loss) from investment operations: | | | | | | | | | | | | | | | | | | | | | | | | |
| Net investment income (loss) | | | (0.04 | ) | | | (0.06 | ) | | | (0.02 | ) | | | 0.01 | | | | (0.18 | ) | | | (0.07 | ) |
Net realized and unrealized gains
(losses) on investments | | | 0.87 | | | | 2.70 | | | | 2.55 | | | | (2.52 | ) | | | (1.79 | ) | | | 2.76 | |
| Total from investment operations | | | 0.83 | | | | 2.64 | | | | 2.53 | | | | (2.51 | ) | | | (1.97 | ) | | | 2.69 | |
| | | | | | | | | | | | | | | | | | | | | | | | | |
| Less distributions: | | | | | | | | | | | | | | | | | | | | | | | | |
Distributions from net
investment income | | | — | | | | — | | | | (0.01 | ) | | | — | | | | — | | | | — | |
Distributions from net realized gains
from security transactions | | | (0.74 | ) | | | — | | | | — | | | | — | | | | (1.80 | ) | | | (0.00 | )(b) |
Total distributions | | | (0.74 | ) | | | — | | | | (0.01 | ) | | | — | | | | (1.80 | ) | | | (0.00 | ) |
| | | | | | | | | | | | | | | | | | | | | | | | | |
Proceeds from redemption fees
collected (Note 2) | | | 0.00 | (b) | | | 0.01 | | | | 0.01 | | | | 0.00 | (b) | | | 0.00 | (b) | | | 0.00 | (b) |
| | | | | | | | | | | | | | | | | | | | | | | | | |
| Net asset value at end of period | | $ | 12.07 | | | $ | 11.98 | | | $ | 9.33 | | | $ | 6.80 | | | $ | 9.31 | | | $ | 13.08 | |
| | | | | | | | | | | | | | | | | | | | | | | | | |
Total return (c) | | | 6.68% | | | | 28.40% | | | | 37.41% | | | | (26.96% | )(d) | | | (16.40% | ) | | | 25.93% | |
| | | | | | | | | | | | | | | | | | | | | | | | | |
| Ratios and supplemental data: | | | | | | | | | | | | | | | | | | | | | | | | |
| Net assets at end of period (000’s) | | $ | 51,274 | | | $ | 35,784 | | | $ | 16,623 | | | $ | 3,053 | | | $ | 4,581 | | | $ | 5,638 | |
| | | | | | | | | | | | | | | | | | | | | | | | | |
Ratio of total expenses to
average net assets | | | 1.82% | | | | 2.31% | | | | 5.14% | | | | 4.44% | (e) | | | 5.57% | | | | 5.14% | |
| | | | | | | | | | | | | | | | | | | | | | | | | |
Ratio of net expenses to
average net assets (f) | | | 1.69% | | | | 1.78% | | | | 1.88% | | | | 0.88% | (e) | | | 2.72% | | | | 2.03% | |
| | | | | | | | | | | | | | | | | | | | | | | | | |
Ratio of net expenses to average net
assets excluding borrowing costs (f) | | | 1.68% | | | | 1.78% | | | | 1.87% | | | | 0.87% | (e) | | | 2.68% | | | | 2.03% | |
| | | | | | | | | | | | | | | | | | | | | | | | | |
Ratio of net investment income
(loss) to average net assets | | | (0.31% | ) | | | (0.70% | ) | | | (0.63% | ) | | | 0.28% | (e) | | | (1.76% | ) | | | (0.69% | ) |
| | | | | | | | | | | | | | | | | | | | | | | | | |
| Portfolio turnover rate | | | 525% | | | | 657% | | | | 320% | | | | 123% | (d) | | | 269% | | | | 419% | |
| (a) | Fund changed fiscal year end to October 31. |
| | |
| (b) | Amount rounds to less than $0.01 per share. |
| | |
| (c) | Total return is a measure of the change in value of an investment in the Fund over the period covered, which assumes any dividends or capital gains distributions are reinvested in shares of the Fund. The returns shown do not reflect the deduction of taxes a shareholder would pay on Fund distributions or the redemption of Fund shares. |
| | |
| (d) | Not annualized. |
| | |
| (e) | Annualized. |
| | |
| (f) | Ratio was determined after advisory fee reductions and expense reimbursements (Note 4). |
| | |
| See accompanying notes to financial statements. |
TFS CAPITAL INVESTMENT TRUST NOTES TO FINANCIAL STATEMENTS October 31, 2011 |
1. Organization
TFS Market Neutral Fund and TFS Small Cap Fund (individually, a “Fund”, and collectively, the “Funds”) are each a diversified series of TFS Capital Investment Trust (the “Trust”), an open-end management investment company established as an Ohio business trust under a Declaration of Trust dated January 30, 2004. As part of the Trust’s organization, TFS Market Neutral Fund issued in a private placement on June 28, 2004 10,000 shares of the Fund, at $10.00 per share, to TFS Capital LLC (the “Adviser”), the investment adviser to the Fund. TFS Market Neutral Fund commenced operations on September 7, 2004. TFS Small Cap Fund commenced operations on March 7, 2006.
TFS Market Neutral Fund seeks to produce capital appreciation while having a low correlation to the U.S. equity market, which the Adviser defines as the S&P 500® Index. In addition, the Fund seeks to produce lower volatility than the movement of the U.S. equity market.
TFS Small Cap Fund seeks long-term capital appreciation. In addition, the Fund seeks to outperform the Russell 2000® Index.
2. Significant Accounting Policies
The following is a summary of the Funds’ significant accounting policies. The policies are in conformity with accounting principles generally accepted in the United States of America (“GAAP”).
Securities valuation – The Funds’ portfolio securities are valued at their fair values as of the close of the regular trading on the New York Stock Exchange (“NYSE”) (generally 4:00 p.m., Eastern time) on each business day the NYSE is open. Securities listed on the NYSE or other exchanges are valued on the basis of their last sale prices on the exchanges on which they are primarily traded. If there are no sales on that day, the securities are valued at the mean of the most recent bid and ask prices on the NYSE or other primary exchange. Securities which are quoted by NASDAQ are valued at the NASDAQ Official Closing Price. If there are no sales on that day, the securities are valued at the mean between the closing bid and ask prices as reported by NASDAQ. Securities for which no quotations are readily available are valued at fair value as determined in good faith under the supervision of the Board of Trustees of the Trust and will be classified as Level 2 or 3 (see below) within the fair value hierarchy, depending on the inputs used.
GAAP establishes a single authoritative definition of fair value, sets out a framework for measuring fair value and requires additional disclosures about fair value measurements.
The Funds’ investments and securities sold short recorded at fair value have been categorized based upon a fair value hierarchy in accordance with the Financial Accounting Standards Board’s guidance on fair value measurement. The levels of the fair value hierarchy and their applicability to the Funds are described below:
| • | Level 1 inputs utilize quoted prices (unadjusted) in active markets for identical assets or liabilities at the reporting date. Level 1 assets and liabilities include common stocks, closed-end, open-end and exchange-traded funds, rights, warrants and cash equivalents. |
TFS CAPITAL INVESTMENT TRUST NOTES TO FINANCIAL STATEMENTS (Continued) |
| • | Level 2 inputs utilize inputs other than quoted prices included in Level 1 that are observable for the asset or liability, either directly or indirectly. Level 2 inputs include quoted prices for similar assets and liabilities in active markets and quoted prices for identical or similar assets or liabilities that are not active. Assets and liabilities included in this category generally include common stocks that trade infrequently or their trading has been temporarily halted and corporate bonds with values that are based on prices provided by an independent pricing service that utilizes various “other significant observable inputs” including bid and ask quotations, prices of similar securities and interest rates, among other factors. |
| • | Level 3 inputs are unobservable inputs for the asset or liability, and include situations where there is little, if any, market activity for the asset or liability. Assets and liabilities included in this category generally include common stocks that trade infrequently or their trading has been halted for an extended period of time. |
The inputs or methodologies used for valuing securities are not necessarily an indication of the risks associated with investing in those securities. The inputs used to measure fair value may fall into different levels of the fair value hierarchy. In such cases, for disclosure purposes, the level in the fair value hierarchy within which the fair value measurement falls in its entirety is determined based on the lowest level input that is significant to the fair value measurement. The Funds’ assessment of the significance of a particular input to the fair value measurement in its entirety requires judgment and considers factors specific to the asset or liability.
The availability of observable inputs can vary from product to product and is affected by a wide variety of factors, including, for example, the type of product, whether the product is new and not yet established in the marketplace, and other characteristics particular to the transaction. To the extent that valuation is based on models or inputs that are less observable or unobservable in the market, the determination of fair value requires more judgment. Accordingly, the degree of judgment exercised by the Funds in determining fair value is greatest for instruments categorized as Level 3.
The following is a summary of the inputs used to value the Funds’ investments and securities sold short as of October 31, 2011:
| | | | | | | | | | | | |
Common Stocks | | $ | 1,631,704,116 | | | $ | 123,132 | | | $ | — | | | $ | 1,631,827,248 | |
Common Stocks – Sold Short | | | (1,096,851,325 | ) | | | (2 | ) | | | (647,937 | ) | | | (1,097,499,264 | ) |
Closed-End Funds | | | 69,536,407 | | | | — | | | | — | | | | 69,536,407 | |
| Closed-End Funds – Sold Short | | | (86,889 | ) | | | — | | | | — | | | | (86,889 | ) |
Exchange-Traded Funds | | | 2,308 | | | | — | | | | — | | | | 2,308 | |
| Exchange-Traded Funds – Sold Short | | | (41,836 | ) | | | — | | | | — | | | | (41,836 | ) |
Open-End Funds | | | 1,002 | | | | — | | | | — | | | | 1,002 | |
Corporate Bonds | | | — | | | | 2,036 | | | | — | | | | 2,036 | |
Rights | | | 10,057 | | | | — | | | | — | | | | 10,057 | |
Rights – Sold Short | | | — | | | | — | | | | — | | | | — | |
Warrants | | | — | | | | — | | | | — | | | | — | |
Warrants – Sold Short | | | (19,291 | ) | | | — | | | | — | | | | (19,291 | ) |
Total | | $ | 604,254,549 | | | $ | 125,166 | | | $ | (647,937 | ) | | $ | 603,731,778 | |
TFS CAPITAL INVESTMENT TRUST NOTES TO FINANCIAL STATEMENTS (Continued) |
| | | | | | | | | | | | |
Common Stocks | | $ | 51,359,524 | | | $ | — | | | $ | — | | | $ | 51,359,524 | |
Money Market Funds | | | 44,627 | | | | — | | | | — | | | | 44,627 | |
Total | | $ | 51,404,151 | | | $ | — | | | $ | — | | | $ | 51,404,151 | |
Refer to each Fund’s Schedule of Investments and Schedule of Securities Sold Short, as applicable, for a listing of the securities valued using Level 1, Level 2 and Level 3 inputs by security type and industry type. During the year ended October 31, 2011, the Funds did not have any significant transfers in and out of any Level. There were no Level 3 securities or derivative instruments held by TFS Small Cap Fund during the year ended or as of October 31, 2011. It is the Funds’ policy to recognize transfers into and out of any Level at the end of the reporting period.
The following is a reconciliation of Level 3 investments held and securities sold short in TFS Market Neutral Fund for which significant unobservable inputs were used to determine fair value as of October 31, 2011. Because of the inherent uncertainty of valuation, this may differ from the values that would have been used had a ready market for the security existed and this difference could be material.
| | | Securities Sold Short | |
| Balance as of October 31, 2010 | | $ | — | |
| Transfers in and/or out of Level 3 | | | (647,937 | ) |
| Balance as of October 31, 2011 | | $ | (647,937 | ) |
Share valuation – The net asset value per share of each Fund is calculated daily by dividing the total value of its assets, less liabilities, by the number of shares outstanding. The offering price and redemption price per share of each Fund is equal to the net asset value per share, except that shares are subject to a redemption fee of 2% if redeemed within 90 days of the date of purchase. During the years ended October 31, 2011 and October 31, 2010, proceeds from redemption fees totaled $170,403 and $182,763, respectively, for TFS Market Neutral Fund and $19,574 and $21,157, respectively, for TFS Small Cap Fund.
Investment income (expense) – Dividend income (expense) is recorded on the ex-dividend date. Interest income is accrued as earned.
Security transactions – Security transactions are accounted for on the trade date. Gains and losses on securities sold are determined on a specific identification basis.
Distributions to shareholders – Distributions to shareholders arising from net investment income and net realized capital gains, if any, are distributed at least once each year. The amount of distributions from net investment income and net realized gains are determined in accordance with federal income tax regulations, which may differ from GAAP. These “book/tax” differences are permanent in nature and are primarily due to differing treatments of net short-term gains. The tax character of distributions paid by the Funds during the years ended October 31, 2011 and October 31, 2010 was as follows:
TFS CAPITAL INVESTMENT TRUST NOTES TO FINANCIAL STATEMENTS (Continued) |
| | | | | | | | | | |
| TFS Market Neutral Fund | 10/31/2011 | | $ | 87,395,252 | | | $ | 19,979,877 | | | $ | 107,375,129 | |
| | 10/31/2010 | | $ | 6,035,121 | | | $ | — | | | $ | 6,035,121 | |
| TFS Small Cap Fund | 10/31/2011 | | $ | 2,114,058 | | | $ | 121,183 | | | $ | 2,235,241 | |
| | 10/31/2010 | | $ | — | | | $ | — | | | $ | — | |
Short positions – The Funds may sell securities short. For financial statement purposes, an amount equal to the settlement amount is included in the Statements of Assets and Liabilities as an asset and an equivalent liability is then subsequently marked-to-market daily to reflect the current value of the short position. Subsequent fluctuations in the market prices of securities sold, but not yet purchased, may require purchasing the securities at prices which may differ from the market value reflected on the Statements of Assets and Liabilities. The Funds are liable for any dividends payable on securities while those securities are in a short position and will also bear other costs, such as charges for the prime brokerage accounts, in connection with the short positions. These costs are reported as brokerage expenses on securities sold short in the Statements of Operations. As collateral for its short positions, the Funds are required under the Investment Company Act of 1940 to maintain assets consisting of cash, cash equivalents or liquid securities equal to the market value of the securities sold short. The amount of the collateral is required to be adjusted daily to reflect changes in the value of the securities sold short. TFS Market Neutral Fund engages in short selling as a principal investment strategy while TFS Small Cap Fund does not. TFS Small Cap Fund currently intends to limit its exposure to short positions to 5% of its net assets.
Estimates – The preparation of financial statements in conformity with GAAP requires management to make estimates and assumptions that affect the reported amounts of assets and liabilities and disclosures of contingent assets and liabilities at the date of the financial statements and the reported amounts of income and expenses during the reporting period. Actual results could differ from those estimates.
Common expenses – Common expenses of the Trust are allocated between the Funds based on the relative net assets of each Fund or the nature of the services performed and the relative applicability to each Fund.
Federal income tax – It is each Fund’s policy to comply with the special provisions of Subchapter M of the Internal Revenue Code applicable to regulated investment companies. As provided therein, in any fiscal year in which a Fund so qualifies and distributes at least 90% of its taxable net income, the Fund (but not the shareholders) will be relieved of federal income tax on the income distributed. Accordingly, no provision for income taxes has been made.
In order to avoid imposition of the excise tax applicable to regulated investment companies, it is also each Fund’s intention to declare as dividends in each calendar year at least 98% of its ordinary income (net investment income and specified gains and losses) and 98.2% of its net realized capital gains plus undistributed amounts from prior years.
The following information is computed on a tax basis for each item as of October 31, 2011:
TFS CAPITAL INVESTMENT TRUST NOTES TO FINANCIAL STATEMENTS (Continued) |
| | | | | | |
| Tax cost of portfolio investments | | $ | 1,802,202,073 | | | $ | 48,391,260 | |
| Gross unrealized appreciation | | $ | 74,537,618 | | | $ | 4,169,501 | |
| Gross unrealized depreciation | | | (175,360,633 | ) | | | (1,156,610 | ) |
| Net unrealized appreciation (depreciation) on investments | | | (100,823,015 | ) | | | 3,012,891 | |
| Net unrealized appreciation on securities sold short | | | 14,402,350 | | | | — | |
| Net unrealized depreciation on translation of assets and liabilities in foreign currencies | | | (19 | ) | | | — | |
| Undistributed ordinary income | | | 23,395,817 | | | | — | |
| Undistributed long-term gains | | | 5,293,726 | | | | 119,819 | |
| Accumulated earnings (deficit) | | $ | (57,731,141 | ) | | $ | 3,132,710 | |
The difference between the federal income tax cost of portfolio of investments and the financial statement cost for each Fund is due to certain timing differences in the recognition of capital gains or losses under GAAP. These “book/tax” differences are temporary in nature and are primarily due to the tax deferral of losses on wash sales.
For the year ended October 31, 2011, TFS Market Neutral Fund reclassified $101,893,867 of net investment loss against accumulated net realized losses from security transactions and TFS Small Cap Fund reclassified $156,314 of net investment loss against paid-in capital on the Statements of Assets and Liabilities. Such reclassifications, the result of permanent differences between the financial statement and income tax reporting requirements, have no effect on the Funds’ net assets or net asset value per share.
The Funds recognize tax benefits or expenses of uncertain tax positions only when the position is “more likely than not” to be sustained assuming examination by tax authorities. Management has reviewed the tax positions taken on Federal income tax returns for all open tax periods (June 30, 2007 through October 31, 2011) of each Fund and has concluded that no provision for unrecognized tax benefits or expenses is required in these financial statements.
3. Investment Transactions
During the year ended October 31, 2011, cost of purchases and proceeds from sales of portfolio securities, other than short-term investments, U.S. government securities and short positions, amounted to $11,825,912,231 and $11,135,186,531, respectively, for TFS Market Neutral Fund and $275,026,471 and $259,607,284, respectively, for TFS Small Cap Fund.
4. Transactions with Affiliates
INVESTMENT ADVISORY AGREEMENT
Each Fund’s investments are managed by the Adviser pursuant to the terms of an Investment Advisory Agreement. TFS Market Neutral Fund pays the Adviser an investment advisory fee, computed and accrued daily and paid monthly, at an annual rate of 2.25% of its average daily net assets up to $1.75 billion and 2.15% of such assets above $1.75 billion. Prior to June 24, 2011, TFS Market Neutral Fund paid the Adviser at an annual rate of 2.25% of its average daily assets.
TFS CAPITAL INVESTMENT TRUST NOTES TO FINANCIAL STATEMENTS (Continued) |
Effective as of March 1, 2010, the Investment Advisory Agreement for TFS Small Cap Fund was amended to revise the investment advisory fee structure. The amended advisory fee for TFS Small Cap Fund is a fixed fee that is computed at the annual rate of 1.25% of its average daily net assets and replaced the previous performance fee structure. As part of the amendment to its Investment Advisory Agreement, TFS Small Cap Fund, for a transition period of 12 months beginning on March 1, 2010, paid the Adviser the lesser of the 1.25% fee (the “Fixed Fee”) or the Fixed Fee adjusted for the Fund’s performance relative to its benchmark, the Russell 2000® Index plus 2.50% (“Benchmark”), for the applicable performance period. The applicable performance period was a rolling twelve month period whereby the most recent calendar month was substituted for the earliest month as time passed. During periods where TFS Small Cap Fund outperformed the Benchmark for the relevant performance period, the Adviser was paid the Fixed Fee. During periods where TFS Small Cap Fund underperformed the Benchmark for the relevant performance period, the Fixed Fee was decreased by one basis point (0.01%) for every two basis points (0.02%) of such underperformance, to a minimum fee of 0.00% per annum. During the year ended October 31, 2011, investment advisory fees paid by TFS Small Cap Fund were decreased $31,744 below the Fixed Fee pursuant to the previous performance fee structure.
The Adviser has contractually agreed to reduce its advisory fees and to absorb each Fund’s operating expenses (for the life of the Funds) to the extent necessary to limit aggregate annual ordinary operating expenses (which do not include brokerage costs, taxes, borrowing costs such as interest and dividend expenses on securities sold short and extraordinary expenses) to 2.50% of TFS Market Neutral Fund’s average daily net assets and 1.75% of TFS Small Cap Fund’s average daily net assets. During the year ended October 31, 2011, the Adviser reduced its investment advisory fees by $66,738 with respect to TFS Small Cap Fund. There were no fee reductions by the Adviser for TFS Market Neutral Fund.
Advisory fee reductions and expense reimbursements by the Adviser are subject to repayment by the applicable Fund for a period of three years after such fees and expenses were incurred, provided that such repayments do not cause ordinary operating expenses to exceed the expense caps of 2.50% and 1.75%, respectively, for TFS Market Neutral Fund and TFS Small Cap Fund. During the year ended October 31, 2011, the Adviser recouped $275,149 of previous fee reductions from TFS Market Neutral Fund. As of October 31, 2011, the Adviser has recouped all previous fee reductions for TFS Market Neutral Fund. As of October 31, 2011, the Adviser may in the future recoup fee reductions and expense reimbursements totaling $390,062, from TFS Small Cap Fund. The Adviser may recapture these amounts no later than the dates as stated below:
| | | | | | | | | | |
TFS Small Cap Fund | | $ | 179,857 | | | $ | 143,467 | | | $ | 66,738 | |
The President of the Trust is also a Principal of the Adviser.
COMPLIANCE CONSULTING AGREEMENT
Under the terms of the Compliance Consulting Agreement, Drake Compliance, LLC (“Drake”) provides ongoing regulatory compliance consulting, monitoring and reporting services for the Trust. In addition, a principal of Drake serves as the Trust’s Chief Compliance Officer. For these services, Drake receives $4,000 per month from the Trust. In addition, each Fund reimburses certain out-of-pocket expenses incurred by Drake, if any, including, but not limited to, postage and supplies and travel expenses.
TFS CAPITAL INVESTMENT TRUST NOTES TO FINANCIAL STATEMENTS (Continued) |
ADMINISTRATION AGREEMENT
Under the terms of an Administration Agreement, Ultimus Fund Solutions, LLC (“Ultimus”) supplies executive, administrative and regulatory services for the Funds. Ultimus supervises the preparation of tax returns, reports to shareholders of the Funds, reports to and filings with the Securities and Exchange Commission (the “SEC”) and state securities commissions and materials for meetings of the Board of Trustees. For these services, each Fund pays Ultimus a monthly fee at an annual rate of 0.075% of its average daily net assets up to $500 million, 0.05% of such assets between $500 million and $2 billion, 0.04% of such assets between $2 billion and $3 billion, 0.03% of such assets between $3 billion and $5 billion, and 0.025% of such assets in excess of $5 billion, subject to a minimum monthly fee of $5,000. Prior to July 1, 2011, each Fund paid Ultimus a monthly fee at an annual rate of 0.15% of its average daily net assets up to $50 million, 0.125% of such assets between $50 million and $100 million, 0.10% of such assets between $100 million and $250 million, 0.075% of such assets between $250 million and $500 million, and 0.05% of such assets in excess of $500 million, subject to a minimum monthly fee of $2,000.Certain officers of the Trust are also officers of Ultimus.
ACCOUNTING SERVICES AGREEMENT
Under the terms of an Accounting Services Agreement, Ultimus calculates the daily net asset value per share and maintains the financial books and records of each Fund. For the performance of these services, TFS Market Neutral Fund pays Ultimus a monthly base fee of $4,000 per month plus an asset based fee of 0.005% of average daily gross assets. TFS Small Cap Fund pays Ultimus a base fee of $2,500 per month plus an asset based fee of 0.01% of the first $500 million of average daily net assets and 0.005% of such assets in excess of $500 million. In addition, each Fund pays a trade fee for trades in excess of 2,000 portfolio trades per month. Each Fund reimburses certain out-of-pocket expenses incurred by Ultimus in obtaining valuations of the Funds’ portfolio securities.
TRANSFER AGENT AND SHAREHOLDER SERVICES AGREEMENT
Under the terms of a Transfer Agent and Shareholder Services Agreement, Ultimus maintains the records of each shareholder’s account, answers shareholders’ inquiries concerning their accounts, processes purchases and redemptions of each Fund’s shares, acts as dividend and distribution disbursing agent and performs other shareholder service functions. Each Fund pays Ultimus a monthly fee for these services at an annual rate of $15 to $24 per shareholder account, depending on the nature of the account, subject to a $1,500 minimum monthly fee. In addition, the Funds reimburse Ultimus for out-of-pocket expenses including, but not limited to, postage and supplies.
DISTRIBUTION AGREEMENT
The Trust has entered into a Distribution Agreement with Ultimus Fund Distributors, LLC (the “Distributor”), pursuant to which the Distributor provides distribution services and serves as the principal underwriter to each Fund. The Distributor is a wholly-owned subsidiary of Ultimus. The Distributor’s fees are paid by the Adviser.
TFS CAPITAL INVESTMENT TRUST NOTES TO FINANCIAL STATEMENTS (Continued) |
5. Borrowing Costs
During the year ended October 31, 2011, TFS Market Neutral Fund and TFS Small Cap Fund incurred $13,210 and $365 of borrowing costs, respectively, with the Funds’ custodian bank. As of October 31, 2011, TFS Market Neutral Fund had outstanding borrowings (bank overdraft) of $33,720,904 and TFS Small Cap Fund had no outstanding borrowings. The average outstanding borrowings for the year ended October 31, 2011 include 304 days of $0 borrowings for TFS Market Neutral Fund and 337 days of $0 borrowings for TFS Small Cap Fund. The average outstanding borrowings and average interest rate on borrowings during the year ended October 31, 2011 were as follows:
| | Average Outstanding Borrowing | | | | |
| TFS Market Neutral Fund | | $ | 2,160,870 | | | | 1.55 | % |
| TFS Small Cap Fund | | $ | 23,485 | | | | 1.58 | % |
6. Contingencies and Commitments
The Funds indemnify the Trust’s officers and Trustees for certain liabilities that might arise from their performance of their duties to the Funds. Additionally, in the normal course of business the Funds enter into contracts that contain a variety of representations and warranties and which provide general indemnifications. The Funds’ maximum exposure under these arrangements is unknown, as this would involve future claims that may be made against the Funds that have not yet occurred. However, based on experience, the Funds expect the risk of loss to be remote.
7. Subsequent Events
The Funds are required to recognize in the financial statements the effects of all subsequent events that provide additional evidence about conditions that existed as of the date of the Statements of Assets and Liabilities. For non-recognized subsequent events that must be disclosed to keep the financial statements from being misleading, the Funds are required to disclose the nature of the event as well as an estimate of its financial effect, or a statement that such an estimate cannot be made. Management has evaluated subsequent events through the issuance of these financial statements and has noted no such events.
8. New Accounting Pronouncement
In May 2011, the Financial Accounting Standards Board issued Accounting Standards Update (“ASU”) No. 2011-04 “Amendments to Achieve Common Fair Value Measurement and Disclosure Requirements in U.S. GAAP and IFRSs.” ASU No. 2011-04 establishes common requirements for measuring fair value and for disclosing information about fair value measurements in accordance with GAAP and International Financial Reporting Standards. ASU No. 2011-04 is effective for interim and annual periods beginning after December 15, 2011 and is applied prospectively. Management is currently evaluating the impact ASU No. 2011-04 may have on financial statement disclosures.
TFS CAPITAL INVESTMENT TRUST REPORT OF INDEPENDENT REGISTERED PUBLIC ACCOUNTING FIRM |
To the Shareholders and Board of Trustees of
TFS Capital Investment Trust
We have audited the accompanying statements of assets and liabilities of TFS Capital Investment Trust, comprised of TFS Market Neutral Fund and TFS Small Cap Fund (the “Funds”), including the summary schedules of investments and schedule of securities sold short, as of October 31, 2011, and the related statements of operations for the year then ended, the statements of changes in net assets for each of the two years in the period then ended, and the financial highlights for the periods presented. These financial statements and financial highlights are the responsibility of the Funds’ management. Our responsibility is to express an opinion on these financial statements and financial highlights based on our audits.
We conducted our audits in accordance with the standards of the Public Company Accounting Oversight Board (United States). Those standards require that we plan and perform the audit to obtain reasonable assurance about whether the financial statements and financial highlights are free of material misstatement. The Funds are not required to have, nor were we engaged to perform, an audit of their internal control over financial reporting. Our audits included consideration of internal control over financial reporting as a basis for designing audit procedures that are appropriate in the circumstances, but not for the purpose of expressing an opinion on the effectiveness of the Funds’ internal control over financial reporting. Accordingly, we express no such opinion. An audit also includes examining, on a test basis, evidence supporting the amounts and disclosures in the financial statements, assessing the accounting principles used and significant estimates made by management, as well as evaluating the overall financial statement presentation. Our procedures included confirmation of securities owned as of October 31, 2011, by correspondence with the custodian and brokers; where replies were not received from brokers, we performed other auditing procedures. We believe that our audits provide a reasonable basis for our opinion.
In our opinion, the financial statements and financial highlights referred to above present fairly, in all material respects, the financial position of each of the Funds constituting the TFS Capital Investment Trust as of October 31, 2011, the results of their operations for the year then ended, the changes in their net assets for each of the two years in the period then ended, and the financial highlights for the periods presented, in conformity with accounting principles generally accepted in the United States of America.
McLean, Virginia
December 23, 2011
TFS CAPITAL INVESTMENT TRUST ABOUT YOUR FUNDS’ EXPENSES (Unaudited) |
We believe it is important for you to understand the impact of costs on your investment. As a shareholder of the Funds, you incur two types of costs: (1) transaction costs, including redemption fees; and (2) ongoing costs, including management fees and other Fund expenses. The following examples are intended to help you understand your ongoing costs (in dollars) of investing in the Funds and to compare these costs with the ongoing costs of investing in other mutual funds.
A mutual fund’s ongoing costs are expressed as a percentage of its average net assets. This figure is known as the expense ratio. The ongoing costs reflected in the table are based on an investment of $1,000 made at the beginning of the most recent semi-annual period and held until the end of the period (May 1, 2011 through October 31, 2011).
The table below illustrates each Fund’s ongoing costs in two ways:
Actual fund return – This section helps you to estimate the actual expenses that you paid over the period. The “Ending Account Value” shown is derived from each Fund’s actual return, and the third column shows the dollar amount of operating expenses that would have been paid by an investor who started with $1,000 in the Funds. You may use the information here, together with the amount you invested, to estimate the expenses that you paid over the period.
To do so, simply divide your account value by $1,000 (for example, an $8,600 account value divided by $1,000 = 8.6), then multiply the result by the number given for the Funds under the heading “Expenses Paid During Period.”
Hypothetical 5% return – This section is intended to help you compare each Fund’s ongoing costs with those of other mutual funds. It assumes that each Fund had an annual return of 5% before expenses during the period shown, but that the expense ratio is unchanged. In this case, because the return used is not each Fund’s actual return, the results do not apply to your investment. The example is useful in making comparisons because the SEC requires all mutual funds to calculate expenses based on a 5% return. You can assess each Fund’s ongoing costs by comparing this hypothetical example with the hypothetical examples that appear in shareholder reports of other funds.
Note that expenses shown in the table are meant to highlight and help you compare ongoing costs only. The Funds do not charge any sales loads. However, a redemption fee of 2% is applied on the sale of shares purchased within 90 days of the date of their purchase and does not apply to the redemption of shares acquired through reinvestment of dividends and other distributions. The calculations below assume no shares were bought or sold during the period. Your actual costs may have been higher or lower, depending on the amount of your investment and the timing of any purchases or redemptions.
More information about each Fund’s expenses, including annualized expense ratios, can be found in this report. For additional information on operating expenses and other shareholder costs, please refer to the Funds’ prospectus.
TFS CAPITAL INVESTMENT TRUST ABOUT YOUR FUNDS’ EXPENSES (Unaudited) (Continued) |
TFS Market Neutral Fund
| | Beginning Account Value May 1, 2011 | Ending Account Value October 31, 2011 | Expenses Paid During Period* |
| Based on Actual Fund Return | $1,000.00 | $926.10 | $45.68 |
| Based on Hypothetical 5% Return (before expenses) | $1,000.00 | $977.77 | $46.91 |
TFS Small Cap Fund
| | Beginning Account Value May 1, 2011 | Ending Account Value October 31, 2011 | Expenses Paid During Period* |
| Based on Actual Fund Return | $1,000.00 | $846.40 | $8.14 |
| Based on Hypothetical 5% Return (before expenses) | $1,000.00 | $1,016.38 | $8.89 |
| * | Expenses are equal to the annualized expense ratio of 9.41% and 1.75%, respectively, for TFS Market Neutral Fund and TFS Small Cap Fund for the period, multiplied by the average account value over the period, multiplied by 184/365 (to reflect the one-half year period). |
OTHER INFORMATION (Unaudited)
A description of the policies and procedures that the Funds use to determine how to vote proxies relating to portfolio securities is available without charge upon request by calling toll-free 1-888-534-2001, or on the SEC’s website at http://www.sec.gov. Information regarding how the Funds voted proxies relating to portfolio securities during the most recent 12-month period ended June 30 is also available without charge upon request by calling toll-free 1-888-534-2001, or on the SEC’s website at http://www.sec.gov.
The Funds file a complete listing of portfolio holdings with the SEC as of the end of the first and third quarters of each fiscal year on Form N-Q. The filings are available upon request, by calling 1-888-534-2001. Furthermore, you may obtain copies of the filings on the SEC’s website at http://www.sec.gov. The Funds’ Forms N-Q may also be reviewed and copied at the SEC’s Public Reference Room in Washington, DC, and information on the operation of the Public Reference Room may be obtained by calling 1-800-SEC-0330.
TFS CAPITAL INVESTMENT TRUST BOARD OF TRUSTEES AND OFFICERS (Unaudited) |
Overall responsibility for management of the Trust rests with its Trustees. The Trustees serve for terms of indefinite duration until death, resignation, retirement or removal from office. The Trustees, in turn, elect the officers of the Trust to actively supervise the Trust’s day-to-day operations. The officers have been elected for an annual term. Certain officers of the Trust also may serve as Trustees. The Trust is managed by the Trustees in accordance with the laws of the State of Ohio governing business trusts. There are currently six Trustees, four of whom are not “interested persons” of the Trust within the meaning of that term under the Investment Company Act of 1940. The Trustees and executive officers of the Trust, their addresses and their principal occupations during the past five (5) years are as follows:
Name, Address and Age | Length of Time Served | Position(s) Held with Trust | Principal Occupation(s) During Past 5 Years and Directorships of Public Companies ** | Number of Portfolios in Fund Complex Overseen by Trustee |
| Interested Trustees: | | | | |
*Larry S. Eiben 1800 Bayberry Court, Suite 103 Richmond, Virginia 23226 Year of Birth: 1972 | Since January 2004 | Trustee and President | Owner, Chief Operating Officer and Chief Compliance Officer of TFS Capital LLC. | 2 |
*Thomas M. Frederick 121 Walnut Street, Suite 320 West Chester, Pennsylvania 19380 Year of Birth: 1972 | Since June 2004 | Trustee | Director of Business Development for TFS Capital LLC from July 2006 to present. | 2 |
| Independent Trustees: | | | | |
Merle C. Hazelton 1800 Bayberry Court, Suite 103 Richmond, Virginia 23226 Year of Birth: 1962 | Since June 2004 | Trustee | Capital Markets – Assistant Controller of Genworth Financial, Inc. from July 2007 to present; Investments – Assistant Controller of Genworth Financial, Inc. from May 2005 to July 2007. | 2 |
Mark J. Malone 1800 Bayberry Court, Suite 103 Richmond, Virginia 23226 Year of Birth: 1966 | Since June 2004 | Trustee | Managing Director of Lazard Capital Markets from March 2008 to present; Managing Director of Institutional Sales of Morgan Keegan & Company, Inc. from April 2006 to March 2008. | 2 |
Brian O’Connell 1800 Bayberry Court, Suite 103 Richmond, Virginia 23226 Year of Birth: 1959 | Since June 2004 | Trustee | Independent writer/author. | 2 |
Gregory R. Owens 1800 Bayberry Court, Suite 103 Richmond, Virginia 23226 Year of Birth: 1966 | Since October 2011 | Trustee | Vice President of Finance of Capital One Financial Corporation from February 1996 to present. | 2 |
TFS CAPITAL INVESTMENT TRUST BOARD OF TRUSTEES AND OFFICERS (Unaudited) (Continued) |
Name, Address and Age | Length of Time Served | Position(s) Held with Trust | Principal Occupation(s) During Past 5 Years |
| Executive Officers: | | | |
Kevin Gates 1800 Bayberry Court, Suite 103 Richmond, Virginia 23226 Year of Birth: 1972 | Since October 2011 | Vice President | Owner and Co-Portfolio Manager of TFS Capital LLC. |
Richard Gates 1800 Bayberry Court, Suite 103 Richmond, Virginia 23226 Year of Birth: 1972 | Since October 2011 | Vice President | Owner and Co-Portfolio Manager of TFS Capital LLC. |
Robert G. Dorsey 225 Pictoria Drive, Suite 450 Cincinnati, Ohio 45246 Year of Birth: 1957 | Since June 2004 | Vice President | Managing Director of Ultimus Fund Solutions, LLC and Ultimus Fund Distributors, LLC. |
Mark J. Seger 225 Pictoria Drive, Suite 450 Cincinnati, Ohio 45246 Year of Birth: 1962 | Since June 2004 | Treasurer | Managing Director of Ultimus Fund Solutions, LLC and Ultimus Fund Distributors, LLC. |
Wade R. Bridge 225 Pictoria Drive, Suite 450 Cincinnati, Ohio 45246 Year of Birth: 1968 | Since June 2011 | Secretary | Director of Administration of Ultimus Fund Solutions, LLC and Ultimus Fund Distributors, LLC. |
David D. Jones 719 Sawdust Road, Suite 113 The Woodlands, TX 77380 Year of Birth: 1958 | Since December 2007 | Chief Compliance Officer | Managing Member of Drake Compliance, LLC; Attorney, David Jones & Assoc., P.C. (a law firm). |
| * | Larry S. Eiben and Thomas M. Frederick, as affiliated persons of TFS Capital LLC, the Trust’s investment adviser, are considered “interested persons” of the Trust within the meaning of Section 2(a)(19) of the Investment Company Act of 1940. |
| | |
| ** | None of the Trustees are directors of public companies. |
Additional information about members of the Board of Trustees and executive officers is available in the Statement of Additional Information (“SAI”). To obtain a free copy of the SAI, please call 1-888-534-2001.
TFS CAPITAL INVESTMENT TRUST
FEDERAL TAX INFORMATION (Unaudited)
In accordance with federal tax requirements, the following provides shareholders with information concerning distributions made by the Funds during the fiscal year ended October 31, 2011. Certain dividends paid the Funds may be subject to a maximum tax rate of 15%, as provided by the Jobs and Growth Tax Relief Reconciliation Act of 2003. TFS Market Neutral Fund and TFS Small Cap Fund intend to designate up to a maximum amount of $87,395,252 and $2,114,058, respectively, as taxed at a maximum rate of 15%. Additionally, TFS Market Neutral Fund and TFS Small Cap Fund intend to designate $19,979,877 and $121,183, respectively, as long-term gain distributions.
TFS CAPITAL INVESTMENT TRUST APPROVAL OF INVESTMENT ADVISORY AGREEMENTS (Unaudited) |
The Board of Trustees, including the Independent Trustees voting separately, have reviewed and approved the continuance of the Investment Advisory Agreements (the “Advisory Agreements”) with the Adviser for the TFS Market Neutral Fund and the TFS Small Cap Fund. These approvals took place at a Board meeting held on June 17, 2011, at which all of the Trustees were present in person.
The Trustees were advised by independent counsel of their fiduciary obligations in approving the Advisory Agreements and the Trustees requested such information from the Adviser as they deemed reasonably necessary to evaluate the terms of the Agreements and whether the Agreements continue to be in the best interests of the Funds and their shareholders. The Trustees reviewed: (i) the nature, extent and quality of the services provided by the Adviser; (ii) the investment performance of each Fund and the Adviser; (iii) the cost of the services provided and the profits realized by the Adviser from its relationship with the Funds and the financial strength of the Adviser; (iv) the extent to which economies of scale would be realized as the Funds grow larger; (v) whether advisory fee levels reflect these economies of scale for the benefit of Fund shareholders; (vi) comparisons of services rendered to and fees paid by the Funds with the services provided by and the fees paid to other investment advisers or the services provided to and the fees paid by other clients of the Adviser; and (vii) any ancillary benefits derived or to be derived by the Adviser from its relationship with the Funds. The Trustees reviewed the background, qualifications, education and experience of the Adviser’s investment and operational personnel. The Trustees also discussed and considered the quality of administrative and other services provided to the Trust, the Adviser’s compliance program, and the Adviser’s role in coordinating such services and programs. The Independent Trustees were provided with a list of intermediaries who are authorized to sell shares of the Funds and the fees paid by the Adviser to such intermediaries. The Independent Trustees were advised by experienced independent counsel throughout the process. Prior to voting on the Advisory Agreements, the Independent Trustees reviewed the Agreements with management and also met in a private session with counsel at which no representatives of the Adviser were present.
Below is a summary of the discussions and findings of the Trustees in regard to the approvals of the Advisory Agreements.
| (i) | The nature, extent, and quality of the services provided by the Adviser. In this regard, the Independent Trustees reviewed the services being provided to the Funds by the Adviser. They discussed the responsibilities of the Adviser under the Advisory Agreements and the Adviser’s compensation under the Advisory Agreements. The Independent Trustees reviewed the background and experience of the Adviser’s key investment and operating personnel. They considered the Adviser’s ongoing commitment to retain experienced personnel and noted that longevity of employment may facilitate consistency in the Funds’ performance and investment process. The Independent Trustees considered the Adviser’s ongoing commitment to expand its research capabilities and were mindful that continual analysis of investment opportunities and optimization of procedures is important to the Funds’ long-term success. After reviewing the foregoing information, the Independent Trustees concluded that the quality, extent and nature of the services provided by the Adviser to each Fund were satisfactory. |
TFS CAPITAL INVESTMENT TRUST APPROVAL OF INVESTMENT ADVISORY AGREEMENTS (Unaudited) (Continued) |
| (ii) | The investment performance of the Funds and Adviser. In this regard, the Independent Trustees compared the performance of the TFS Market Neutral Fund with the performance of the S&P 500® Index, the Fund’s primary benchmark, over various periods. It was noted by the Independent Trustees that the TFS Market Neutral Fund underperformed the S&P 500® Index for the one year period ended March 31, 2011. They discussed the TFS Market Neutral Fund’s shorter-term underperformance, finding that the Fund’s investment strategies are not designed to keep pace or outperform the S&P 500® Index during a period when the market enjoys a broad-based rally. The Independent Trustees further noted that the TFS Market Neutral Fund has significantly outperformed the S&P 500® Index over the three year, five year and since inception periods ended March 31, 2011. The Independent Trustees were also provided with comparative performance statistics of the universe of funds categorized by Morningstar as “long short and market neutral” funds. The Independent Trustees noted that for the one year period ended March 31, 2011, the TFS Market Neutral Fund’s total return (10.05%) was better than the return of the average fund in Morningstar’s long short and market neutral categories (1.97%). They also noted that the TFS Market Neutral Fund currently has a 5-star Morningstar overall rating. The Independent Trustees reviewed performance information with respect to the Adviser’s other managed accounts with similar investment objectives, which indicated that the TFS Market Neutral Fund trailed the performance of such other accounts for the one year period ended March 31, 2011. They considered that, based on representations by the Adviser, those performance differences can be attributed mainly to the TFS Market Neutral Fund being subject to stricter investment limitations and being managed more conservatively than such other accounts in order to achieve a less volatile return. The Independent Trustees also considered the consistency of the Adviser’s management of the TFS Market Neutral Fund with the Fund’s investment objective and policies. After considerable discussion, the Independent Trustees concluded that the overall investment performance of the TFS Market Neutral Fund has been above average. |
| | The Independent Trustees next reviewed the performance of the TFS Small Cap Fund, which was compared to the performance of the Russell 2000® Index, the Fund’s primary benchmark, over various periods ended March 31, 2011. It was noted by the Independent Trustees that the TFS Small Cap Fund outperformed the Russell 2000® Index over the one year, three year, five year and since inception periods ended March 31, 2011. The Independent Trustees were also provided with comparative performance statistics of the universe of funds categorized by Morningstar as “small cap blend” funds, which is the category to which the TFS Small Cap Fund has been assigned. The Independent Trustees noted that for the one year, three year and five year periods ended March 31, 2011, the TFS Small Cap Fund’s 28.24%, 17.42% and 10.42% returns, respectively, were higher than the performance of the average fund in the small cap blend category (25.29%, 8.14% and 3.21%, respectively) over the same periods. The Independent Trustees further noted that the TFS Small Cap Fund currently has a 5-star Morningstar overall rating. They also reviewed performance information with respect to the Adviser’s other managed accounts but concluded that none of these other accounts provided a good comparison due to differences in investment objectives. The Independent Trustees considered the consistency of the Adviser’s management of the TFS Small Cap Fund with the Fund’s investment objective and policies. After further discussion, the Independent Trustees concluded that the investment performance of the TFS Small Cap Fund has been above average. |
TFS CAPITAL INVESTMENT TRUST APPROVAL OF INVESTMENT ADVISORY AGREEMENTS (Unaudited) (Continued) |
| (iii) | The costs of the services to be provided and profits to be realized by the Adviser from its relationship with the Funds. In this regard, the Independent Trustees considered the Adviser’s staffing, personnel and operations; the financial condition of the Adviser and the level of commitment to the Funds by the principals of the Adviser; the asset levels of each Fund; and the overall expenses of each Fund. The Independent Trustees reviewed the rate of the advisory fees paid by the Funds under the Advisory Agreements and compared them to average advisory fee ratios of similar mutual funds compiled from statistics reported by Morningstar. They also compared the total operating expense ratios of the Funds with average expense ratios of representative funds in their respective Morningstar categories. It was noted by the Independent Trustees that the TFS Market Neutral Fund’s advisory fee of 2.28% and its overall expense ratio of 2.50% (which excludes dividend expenses, borrowing costs and brokerage expenses on securities sold short) were each higher than the average advisory fee (1.22%) and average expense ratio (2.03%) for Morningstar’s “long short and market neutral” fund categories. The Independent Trustees also considered the Adviser’s commitment to cap the TFS Market Neutral Fund’s ordinary operating expenses at 2.50% per annum. The Independent Trustees performed a similar comparison for the TFS Small Cap Fund, finding that the TFS Small Cap Fund’s advisory fee of 1.25% and its overall expense ratio of 1.78% were each higher than the average advisory fee (0.78%) and average expense ratio (1.38%) for Morningstar’s “small cap blend” fund category. They took into account the Adviser’s commitment to cap the TFS Small Cap Fund’s ordinary operating expenses at 1.75% per annum. The Independent Trustees also considered the Adviser’s analysis of its revenues and expenses with respect to its services provided to each Fund for periods ended March 31, 2011. It was noted by the Independent Trustees that the Adviser’s overall revenues and profits from managing the TFS Market Neutral Fund have increased significantly from prior years. They discussed the profitability of the Adviser and noted the costs associated with managing the Funds, especially in the areas of research and development and retention of its investment professionals and hiring new personnel. Next, the Independent Trustees reviewed the revenue and expense information with respect to the TFS Small Cap Fund. It was noted that since the inception of the TFS Small Cap Fund through March 31, 2009, the Adviser had not received any of its advisory fees and had also reimbursed a significant amount of other operating expenses of the Fund. They noted that during the 12 month period ended March 31, 2010 the Adviser began to receive a portion of its advisory fees and that has continued for the 12 month period ended March 31, 2011. The Independent Trustees further noted that the Adviser still is not receiving its full advisory fee from the TFS Small Cap Fund. The Independent Trustees reviewed the balance sheet of the Adviser as of March 31, 2011 and considered that the Adviser is entitled to receive a profit, in light of the high quality and scope of services that are provided to the Funds. The Independent Trustees further considered that the investment and research process utilized by the Adviser is broader and more sophisticated than the process used by most other investment companies as it involves frequent position rebalancing, the development of proprietary multiple trading models and the use of a team approach that involves many participants. They also considered the Adviser’s recommendation to add a fee breakpoint to the advisory fee structure for the TFS Market Neutral Fund. The Independent Trustees considered the “fallout benefits” to the Adviser, including the additional exposure the Adviser has received as a result of managing the Funds. After a full discussion and |
TFS CAPITAL INVESTMENT TRUST APPROVAL OF INVESTMENT ADVISORY AGREEMENTS (Unaudited) (Continued) |
consideration of the foregoing, the Independent Trustees concluded that the fees to be paid by each Fund to the Adviser are reasonable in light of the quality of the services received.
| (iv) | The extent to which economies of scale would be realized as a Fund grows and whether advisory fee levels reflect these economies of scale for the benefit of a Fund’s investors. The Independent Trustees considered the current net assets for each Fund and discussed the expense cap arrangements between the Trust and the Adviser. They noted that the TFS Market Neutral Fund’s assets have grown to the point where the Adviser is currently collecting its full advisory fee and is being reimbursed by the Fund for its prior fee reductions and expense reimbursements and, with respect to the TFS Small Cap Fund, assets have grown to the point where the Adviser is collecting approximately sixty percent of its 1.25% advisory fee. The Independent Trustees discussed the Adviser’s recommendation to add a fee breakpoint structure for the TFS Market Neutral Fund in order to allow shareholders to realize economy of scale benefits. The Independent Trustees discussed the fee breakpoint structure proposed by the Adviser and determined that given that the TFS Market Neutral Fund’s projected asset growth during the current annual period, the proposed structure is reasonable. The Independent Trustees concluded that the TFS Market Neutral Fund will pay an investment advisory fee computed at the annual rate of 2.25% on the first $1.75 billion of the Fund’s average daily net assets and 2.15% on assets over $1.75 billion. The Independent Trustees further concluded that, given the current asset levels in the TFS Small Cap Fund, it would not be relevant to consider the extent to which economies of scale are being realized and that it is not necessary or appropriate at this time to consider adding fee breakpoints to the advisory fee schedule for the TFS Small Cap Fund. |
In conclusion, the Trustees did not identify any single factor as all-important or controlling in their determination to approve the Advisory Agreements. The Trustees, including all of the Independent Trustees, concluded that the terms of each Advisory Agreement were fair and reasonable, that the Adviser’s fees were reasonable in light of the services provided to the Funds and the benefits received by the Adviser, and that continuance of the Advisory Agreements is in the best interests of each Fund and its shareholders.
This page intentionally left blank.
As of the end of the period covered by this report, the registrant has adopted a code of ethics that applies to the registrant’s principal executive officer, principal financial officer, principal accounting officer or controller, or persons performing similar functions, regardless of whether these individuals are employed by the registrant or a third party. Pursuant to Item 12(a)(1), a copy of registrant’s code of ethics is filed as an exhibit to this Form N-CSR. During the period covered by this report, the code of ethics has not been amended, and the registrant has not granted any waivers, including implicit waivers, from the provisions of the code of ethics.
| Item 3. | Audit Committee Financial Expert. |
The registrant’s board of trustees has determined that the registrant has at least one audit committee financial expert serving on its audit committee. The name of the audit committee financial expert is Merle C. Hazelton. Mr. Hazelton is “independent” for purposes of this Item.
| Item 4. | Principal Accountant Fees and Services. |
| | (a) | Audit Fees. The aggregate fees billed for professional services rendered by the principal accountant for the audit of the registrant’s annual financial statements or for services that are normally provided by the accountant in connection with statutory and regulatory filings or engagements were $42,000 and $39,000 with respect to the registrant’s fiscal periods ended October 31, 2011 and 2010, respectively. |
| | (b) | Audit-Related Fees. No fees were billed in either of the last two fiscal periods for assurance and related services by the principal accountant that are reasonably related to the performance of the audit of the registrant’s financial statements and are not reported under paragraph (a) of this Item. |
| | (c) | Tax Fees. The aggregate fees billed for professional services rendered by the principal accountant for tax compliance, tax advice, and tax planning were $5,250 and 5,000 with respect to the registrant’s fiscal periods ended October 31, 2011 and 2010, respectively. The services comprising these fees are the preparation of the registrant’s federal income and excise tax returns. |
| | (d) | All Other Fees. No fees were billed in either of the last two fiscal periods for products and services provided by the principal accountant, other than the services reported in paragraphs (a) through (c) of this Item. |
| | (e)(1) | The audit committee has not adopted pre-approval policies and procedures described in paragraph (c)(7) of Rule 2-01 of Regulation S-X. |
| | (e)(2) | None of the services described in paragraph (b) through (d) of this Item were approved by the audit committee pursuant to paragraph (c)(7)(i)(C) of Rule 2-01 of Regulation S-X. |
| | (f) | Less than 50% of hours expended on the principal accountant’s engagement to audit the registrant’s financial statements for the most recent fiscal year were attributed to work performed by persons other than the principal accountant’s full-time, permanent employees. |
| | (g) | With respect to the fiscal periods ended October 31, 2011 and 2010, aggregate non-audit fees of $5,250 and $5,000, respectively, were billed by the registrant’s principal accountant for services rendered to the registrant. No non-audit fees were billed in either of the last two fiscal periods by the registrant’s principal accountant for services rendered to the registrant’s investment adviser (not including any sub-adviser whose role is primarily portfolio management and is subcontracted with or overseen by another investment adviser), and any entity controlling, controlled by, or under common control with the adviser that provides ongoing services to the registrant. |
| | (h) | The principal accountant has not provided any non-audit services to the registrant’s investment adviser (not including any sub-adviser whose role is primarily portfolio management and is subcontracted with or overseen by another investment adviser), and any entity controlling, controlled by, or under common control with the investment adviser that provides ongoing services to the registrant. |
| Item 5. | Audit Committee of Listed Registrants. |
Not applicable
| Item 6. | Schedule of Investments. |
| | (a) | See Schedule I (Investments in securities of unaffiliated issuers) |
| TFS MARKET NEUTRAL FUND | |
| SCHEDULE OF INVESTMENTS | |
| October 31, 2011 | |
| | |
| COMMON STOCKS - 92.6% | | Shares | | | Value | |
| Consumer Discretionary - 12.6% | |
| Auto Components - 1.4% | |
American Axle & Manufacturing Holdings, Inc. (a) (b) | | | 65,096 | | | $ | 630,780 | |
| Autoliv, Inc. | | | 2,100 | | | | 121,317 | |
Ballard Power Systems, Inc. (a) (b) | | | 268,795 | | | | 403,193 | |
BorgWarner, Inc. (a) | | | 1,800 | | | | 137,682 | |
Dana Holding Corporation (a) | | | 87,959 | | | | 1,243,740 | |
Dorman Products, Inc. (a) | | | 28,384 | | | | 1,081,714 | |
Drew Industries, Inc. (b) | | | 44,745 | | | | 1,075,222 | |
Federal-Mogul Corporation (a) (b) | | | 179,094 | | | | 3,019,525 | |
Fuel Systems Solutions, Inc. (a) | | | 16,309 | | | | 380,652 | |
| Gentex Corporation | | | 5,700 | | | | 171,684 | |
Goodyear Tire & Rubber Company (The) (a) (b) | | | 175,796 | | | | 2,524,431 | |
| Magna International, Inc. - Class A | | | 3,700 | | | | 141,155 | |
Modine Manufacturing Company (a) (b) | | | 123,865 | | | | 1,309,253 | |
Motorcar Parts of America, Inc. (a) (b) | | | 29,804 | | | | 295,656 | |
| Shiloh Industries, Inc. | | | 3,588 | | | | 28,345 | |
SORL Auto Parts, Inc. (a) (b) | | | 96,269 | | | | 318,650 | |
Spartan Motors, Inc. (b) | | | 92,458 | | | | 453,044 | |
Standard Motor Products, Inc. (b) | | | 284,571 | | | | 4,425,079 | |
Stoneridge, Inc. (a) (b) | | | 165,821 | | | | 1,305,011 | |
Superior Industries International, Inc. (b) | | | 57,291 | | | | 1,047,853 | |
Tenneco, Inc. (a) (b) | | | 65,175 | | | | 2,132,526 | |
Tongxin International Ltd. (a) | | | 300 | | | | 128 | |
Tower International, Inc. (a) | | | 9,880 | | | | 121,623 | |
TRW Automotive Holdings Corporation (a) | | | 2,800 | | | | 117,880 | |
UQM Technologies, Inc. (a) | | | 42,618 | | | | 88,219 | |
Visteon Corporation (a) (b) | | | 43,987 | | | | 2,446,557 | |
| | | | | | | | 25,020,919 | |
| Automobiles - 0.2% | |
Thor Industries, Inc. (b) | | | 111,790 | | | | 2,955,728 | |
| | | | | | | | | |
| Distributors - 0.2% | |
Audiovox Corporation - Class A (a) (b) | | | 215,659 | | | | 1,533,336 | |
Core-Mark Holding Company, Inc. (a) | | | 1 | | | | 34 | |
| Genuine Parts Company | | | 2,108 | | | | 121,062 | |
LKQ Corporation (a) | | | 49,300 | | | | 1,438,574 | |
| Pool Corporation | | | 26,941 | | | | 787,216 | |
| Weyco Group, Inc. | | | 212 | | | | 5,024 | |
| | | | | | | | 3,885,246 | |
| Diversified Consumer Services - 0.8% | |
Archipelago Learning, Inc. (a) | | | 200 | | | | 2,038 | |
Ascent Capital Group, Inc. - Class A (a) (b) | | | 17,785 | | | | 809,040 | |
Cambium Learning Group, Inc. (a) | | | 1,206 | | | | 3,980 | |
Capella Education Company (a) | | | 14,385 | | | | 500,742 | |
Career Education Corporation (a) (b) | | | 86,310 | | | | 1,392,180 | |
| Carriage Services, Inc. | | | 400 | | | | 2,384 | |
China Education Alliance, Inc. (a) | | | 23,832 | | | | 45,042 | |
Coinstar, Inc. (a) (b) | | | 66,145 | | | | 3,157,762 | |
| Collectors Universe, Inc. | | | 7,933 | | | | 122,644 | |
| TFS MARKET NEUTRAL FUND | |
| SCHEDULE OF INVESTMENTS (Continued) | |
| | |
| COMMON STOCKS - 92.6% (Continued) | | Shares | | | Value | |
| Consumer Discretionary - 12.6% (Continued) | |
| Diversified Consumer Services - 0.8% (Continued) | |
DeVry, Inc. (b) | | | 47,864 | | | $ | 1,803,516 | |
Grand Canyon Education, Inc. (a) (b) | | | 144,872 | | | | 2,362,862 | |
Hillenbrand, Inc. (b) | | | 33,247 | | | | 701,844 | |
ITT Educational Services, Inc. (a) | | | 2,014 | | | | 124,787 | |
K12, Inc. (a) (b) | | | 48,036 | | | | 1,683,662 | |
Learning Tree International, Inc. (a) | | | 537 | | | | 4,269 | |
| Lincoln Educational Services Corporation | | | 34,220 | | | | 319,957 | |
| National American University Holdings, Inc. | | | 1,695 | | | | 11,984 | |
Steiner Leisure Ltd. (a) (b) | | | 19,083 | | | | 919,419 | |
| StoneMor Partners, L.P. | | | 4,600 | | | | 133,446 | |
Universal Technical Institute, Inc. (a) | | | 26,916 | | | | 384,361 | |
| Weight Watchers International, Inc. | | | 900 | | | | 67,158 | |
| | | | | | | | 14,553,077 | |
| Hotels, Restaurants & Leisure - 2.8% | |
AFC Enterprises, Inc. (a) (b) | | | 40,917 | | | | 560,972 | |
| Ambassadors Group, Inc. | | | 2,942 | | | | 14,592 | |
Ameristar Casinos, Inc. (b) | | | 180,032 | | | | 3,330,592 | |
Arcos Dorados Holdings, Inc. - Class A (b) | | | 6,210 | | | | 145,314 | |
Benihana, Inc. - Class A (a) | | | 9,102 | | | | 87,743 | |
Biglari Holdings, Inc. (a) (b) | | | 2,806 | | | | 968,407 | |
BJ's Restaurants, Inc. (a) (b) | | | 18,242 | | | | 965,549 | |
| Bob Evans Farms, Inc. | | | 5,700 | | | | 187,530 | |
Bravo Brio Restaurant Group, Inc. (a) (b) | | | 47,884 | | | | 930,386 | |
| Brinker International, Inc. | | | 900 | | | | 20,610 | |
Buffalo Wild Wings, Inc. (a) (b) | | | 71,726 | | | | 4,749,696 | |
Caribou Coffee Company, Inc. (a) (b) | | | 231,195 | | | | 3,155,812 | |
Carrols Restaurant Group, Inc. (a) (b) | | | 60,297 | | | | 563,174 | |
CEC Entertainment, Inc. (b) | | | 38,431 | | | | 1,215,188 | |
Cedar Fair, L.P. (b) | | | 28,799 | | | | 576,268 | |
| Choice Hotels International, Inc. | | | 3,226 | | | | 115,459 | |
Churchill Downs, Inc. (b) | | | 37,529 | | | | 1,804,019 | |
| Cracker Barrel Old Country Store, Inc. | | | 21,435 | | | | 908,630 | |
DineEquity, Inc. (a) | | | 10,083 | | | | 473,498 | |
Domino's Pizza, Inc. (a) | | | 3,549 | | | | 113,674 | |
| Einstein Noah Restaurant Group, Inc. | | | 34,897 | | | | 513,684 | |
| Frisch's Restaurants, Inc. | | | 692 | | | | 13,217 | |
Full House Resorts, Inc. (a) | | | 4,676 | | | | 13,467 | |
Hyatt Hotels Corporation - Class A (a) | | | 298 | | | | 11,083 | |
International Speedway Corporation - Class A (b) | | | 24,977 | | | | 595,951 | |
Interval Leisure Group, Inc. (a) (b) | | | 79,211 | | | | 1,093,904 | |
Isle of Capri Casinos, Inc. (a) (b) | | | 29,537 | | | | 160,681 | |
Jack in the Box, Inc. (a) (b) | | | 13,379 | | | | 275,340 | |
Kona Grill, Inc. (a) | | | 4,776 | | | | 27,510 | |
Krispy Kreme Doughnuts, Inc. (a) (b) | | | 127,220 | | | | 898,173 | |
Life Time Fitness, Inc. (a) (b) | | | 79,831 | | | | 3,443,111 | |
Luby's, Inc. (a) | | | 39,768 | | | | 192,079 | |
Marcus Corporation (b) | | | 174,041 | | | | 2,074,569 | |
McCormick & Schmick's Seafood Restaurants, Inc. (a) (b) | | | 77,876 | | | | 521,769 | |
| TFS MARKET NEUTRAL FUND | |
| SCHEDULE OF INVESTMENTS (Continued) | |
| | |
| COMMON STOCKS - 92.6% (Continued) | | Shares | | | Value | |
| Consumer Discretionary - 12.6% (Continued) | |
| Hotels, Restaurants & Leisure - 2.8% (Continued) | |
Morgans Hotel Group Company (a) | | | 850 | | | $ | 5,533 | |
Morton's Restaurant Group, Inc. (a) | | | 580 | | | | 2,830 | |
MTR Gaming Group, Inc. (a) | | | 100 | | | | 166 | |
Multimedia Games Holding Company, Inc. (a) | | | 69,977 | | | | 462,548 | |
Nevada Gold & Casinos, Inc. (a) | | | 100 | | | | 210 | |
Orient-Express Hotels Ltd. - Class A (a) (b) | | | 90,502 | | | | 771,982 | |
| P.F. Chang's China Bistro, Inc. | | | 3,620 | | | | 112,582 | |
Panera Bread Company - Class A (a) | | | 200 | | | | 26,738 | |
Papa John's International, Inc. (a) (b) | | | 75,889 | | | | 2,562,013 | |
Penn National Gaming, Inc. (a) (b) | | | 82,811 | | | | 2,981,196 | |
Pinnacle Entertainment, Inc. (a) | | | 15,611 | | | | 176,716 | |
Red Lion Hotels Corporation (a) | | | 113 | | | | 785 | |
Red Robin Gourmet Burgers, Inc. (a) (b) | | | 37,969 | | | | 951,883 | |
Rick's Cabaret International, Inc. (a) (b) | | | 27,325 | | | | 213,681 | |
| Royal Caribbean Cruises Ltd. | | | 271 | | | | 8,054 | |
Ruth's Hospitality Group, Inc. (a) | | | 1,958 | | | | 9,242 | |
Scientific Games Corporation (a) (b) | | | 335,624 | | | | 2,916,573 | |
Shuffle Master, Inc. (a) (b) | | | 178,516 | | | | 1,894,055 | |
| Six Flags Entertainment Corporation | | | 574 | | | | 20,607 | |
| Texas Roadhouse, Inc. | | | 13,206 | | | | 189,242 | |
Town Sports International Holdings, Inc. (a) (b) | | | 46,242 | | | | 401,381 | |
| Vail Resorts, Inc. | | | 4,300 | | | | 191,608 | |
Wendy's Company (The) (b) | | | 484,537 | | | | 2,451,757 | |
WMS Industries, Inc. (a) (b) | | | 131,713 | | | | 2,885,832 | |
| | | | | | | | 49,958,865 | |
| Household Durables - 0.7% | |
Blyth, Inc. (b) | | | 50,730 | | | | 2,832,256 | |
Brookfield Residential Properties, Inc. (a) | | | 34,731 | | | | 251,800 | |
Cavco Industries, Inc. (a) | | | 200 | | | | 9,006 | |
| CSS Industries, Inc. | | | 3,090 | | | | 65,137 | |
Furniture Brands International, Inc. (a) | | | 14,695 | | | | 28,068 | |
Helen of Troy Ltd. (a) (b) | | | 64,400 | | | | 1,863,092 | |
| Hooker Furniture Corporation | | | 5,795 | | | | 56,212 | |
Jarden Corporation (b) | | | 52,232 | | | | 1,672,991 | |
Kid Brands, Inc. (a) (b) | | | 9,127 | | | | 26,742 | |
| Koss Corporation | | | 200 | | | | 1,020 | |
La-Z-Boy, Inc. (a) | | | 71,819 | | | | 729,681 | |
Leggett & Platt, Inc. (b) | | | 64,206 | | | | 1,406,111 | |
| Lennar Corporation - Class A | | | 457 | | | | 7,559 | |
Libbey, Inc. (a) | | | 43,973 | | | | 556,698 | |
| Lifetime Brands, Inc. | | | 2,835 | | | | 34,672 | |
Meritage Homes Corporation (a) | | | 40,423 | | | | 717,508 | |
Mohawk Industries, Inc. (a) | | | 30,233 | | | | 1,591,767 | |
| Newell Rubbermaid, Inc. | | | 56,255 | | | | 832,574 | |
NIVS IntelliMedia Technology Group, Inc. (a) (b) | | | 242,917 | | | | 31,579 | |
PulteGroup, Inc. (a) | | | 23,983 | | | | 124,232 | |
| Skyline Corporation | | | 238 | | | | 1,609 | |
Stanley Furniture Company, Inc. (a) | | | 1,098 | | | | 3,393 | |
Tempur-Pedic International, Inc. (a) | | | 300 | | | | 20,418 | |
| TFS MARKET NEUTRAL FUND | |
| SCHEDULE OF INVESTMENTS (Continued) | |
| | |
| COMMON STOCKS - 92.6% (Continued) | | Shares | | | Value | |
| Consumer Discretionary - 12.6% (Continued) | |
| Household Durables - 0.7% (Continued) | |
| Tupperware Brands Corporation | | | 2,600 | | | $ | 147,004 | |
| | | | | | | | 13,011,129 | |
| Internet & Catalog Retail - 0.2% | |
1-800-FLOWERS.COM, Inc. - Class A (a) | | | 184,689 | | | | 526,363 | |
| Gaiam, Inc. - Class A | | | 2,363 | | | | 9,145 | |
Geeknet, Inc. (a) (b) | | | 19,795 | | | | 385,409 | |
| HSN, Inc. | | | 13,027 | | | | 464,673 | |
Liberty Interactive Corporation - Series A (a) (b) | | | 10,700 | | | | 175,801 | |
Orbitz Worldwide, Inc. (a) (b) | | | 447,853 | | | | 846,442 | |
Shutterfly, Inc. (a) | | | 1,297 | | | | 54,046 | |
U.S. Auto Parts Network, Inc. (a) | | | 1,572 | | | | 8,803 | |
ValueVision Media, Inc. (a) (b) | | | 94,171 | | | | 308,881 | |
Vitacost.com, Inc. (a) | | | 30,700 | | | | 188,191 | |
| | | | | | | | 2,967,754 | |
| Leisure Equipment & Products - 0.7% | |
Arctic Cat, Inc. (a) (b) | | | 191,134 | | | | 3,881,932 | |
Black Diamond, Inc. (a) | | | 1,211 | | | | 10,451 | |
| Hasbro, Inc. | | | 2,700 | | | | 102,762 | |
Johnson Outdoors, Inc. - Class A (a) | | | 77 | | | | 1,431 | |
LeapFrog Enterprises, Inc. (a) (b) | | | 530,717 | | | | 1,979,574 | |
Nautilus, Inc. (a) | | | 1,500 | | | | 3,030 | |
Polaris Industries, Inc. (b) | | | 76,123 | | | | 4,821,631 | |
Smith & Wesson Holding Corporation (a) (b) | | | 290,520 | | | | 859,939 | |
Steinway Musical Instruments, Inc. (a) | | | 15,153 | | | | 381,856 | |
| Sturm, Ruger & Company, Inc. | | | 8,450 | | | | 256,204 | |
Summer Infant, Inc. (a) | | | 218 | | | | 1,705 | |
| | | | | | | | 12,300,515 | |
| Media - 1.6% | |
| AH Belo Corporation - Class A | | | 1,832 | | | | 9,160 | |
AMC Networks, Inc. - Class A (a) | | | 5,261 | | | | 171,614 | |
Arbitron, Inc. (b) | | | 14,162 | | | | 562,656 | |
Ballantyne Strong, Inc. (a) | | | 35,602 | | | | 132,439 | |
| Belo Corporation - Class A | | | 102,672 | | | | 650,940 | |
| Cablevision Systems Corporation - Class A | | | 8,400 | | | | 121,548 | |
Carmike Cinemas, Inc. (a) | | | 109 | | | | 706 | |
Central European Media Enterprises Ltd. (a) | | | 41,192 | | | | 454,760 | |
Charter Communications, Inc. - Class A (a) | | | 2,300 | | | | 105,662 | |
Cinemark Holdings, Inc. (b) | | | 167,927 | | | �� | 3,471,051 | |
Clear Channel Outdoor Holdings, Inc. (a) | | | 9,263 | | | | 101,893 | |
Crown Media Holdings, Inc. - Class A (a) | | | 645 | | | | 1,019 | |
| CTC Media, Inc. | | | 64,912 | | | | 747,137 | |
Dex One Corporation (a) (b) | | | 97,777 | | | | 60,827 | |
Discovery Communications, Inc. - Class C (a) | | | 21,400 | | | | 846,798 | |
DISH Network Corporation - Class A (a) | | | 3,600 | | | | 87,012 | |
DreamWorks Animation SKG, Inc. - Class A (a) | | | 16,433 | | | | 304,832 | |
E.W. Scripps Company (The) - Class A (a) (b) | | | 236,927 | | | | 1,975,971 | |
Fisher Communications, Inc. (a) (b) | | | 12,609 | | | | 366,165 | |
Global Sources Ltd. (a) | | | 23,125 | | | | 168,581 | |
Gray Television, Inc. (a) | | | 33,558 | | | | 63,760 | |
| TFS MARKET NEUTRAL FUND | |
| SCHEDULE OF INVESTMENTS (Continued) | |
| | |
| COMMON STOCKS - 92.6% (Continued) | | Shares | | | Value | |
| Consumer Discretionary - 12.6% (Continued) | |
| Media - 1.6% (Continued) | |
| Harte-Hanks, Inc. | | | 44,831 | | | $ | 393,616 | |
| Insignia Systems, Inc. | | | 22,694 | | | | 46,977 | |
interclick, inc. (a) (b) | | | 109,921 | | | | 813,415 | |
| Interpublic Group of Companies, Inc. | | | 5,300 | | | | 50,244 | |
| John Wiley & Sons, Inc. - Class A | | | 13,030 | | | | 619,707 | |
Knology, Inc. (a) (b) | | | 55,541 | | | | 795,903 | |
Lamar Advertising Company - Class A (a) | | | 2,763 | | | | 62,140 | |
Liberty Media Corporation - Liberty Starz (a) | | | 2,994 | | | | 204,490 | |
LIN TV Corporation - Class A (a) (b) | | | 98,768 | | | | 308,156 | |
Lions Gate Entertainment Corporation (a) (b) | | | 398,765 | | | | 3,277,848 | |
Madison Square Garden Company (The) - Class A (a) | | | 57,620 | | | | 1,522,897 | |
MDC Partners, Inc. (b) | | | 16,106 | | | | 271,225 | |
| Morningstar, Inc. | | | 1,805 | | | | 106,441 | |
New York Times Company (The) - Class A (a) (b) | | | 223,211 | | | | 1,700,868 | |
Nexstar Broadcasting Group, Inc. (a) | | | 73,689 | | | | 670,570 | |
Outdoor Channel Holdings, Inc. (a) | | | 812 | | | | 6,066 | |
Radio One, Inc. - Class D (a) | | | 3,769 | | | | 4,937 | |
Reading International, Inc. (a) | | | 2,525 | | | | 10,454 | |
Regal Entertainment Group (b) | | | 164,079 | | | | 2,369,301 | |
Rentrak Corporation (a) | | | 22,390 | | | | 305,847 | |
Saga Communications, Inc. - Class A (a) | | | 130 | | | | 4,875 | |
Scripps Networks Interactive, Inc. - Class A (b) | | | 9,922 | | | | 421,487 | |
| Shaw Communications, Inc. - Class B | | | 30,030 | | | | 608,708 | |
Sinclair Broadcast Group, Inc. - Class A (b) | | | 83,863 | | | | 803,408 | |
Sirius XM Radio, Inc. (a) (b) | | | 575,377 | | | | 1,029,925 | |
Thomson Reuters Corporation (b) | | | 9,800 | | | | 290,766 | |
| Value Line, Inc. | | | 12 | | | | 151 | |
| World Wrestling Entertainment, Inc. | | | 50,776 | | | | 533,656 | |
| | | | | | | | 27,638,609 | |
| Multiline Retail - 0.3% | |
99¢ Only Stores (a) | | | 43,667 | | | | 951,941 | |
Dollar General Corporation (a) | | | 1,800 | | | | 71,388 | |
| Family Dollar Stores, Inc. | | | 1,600 | | | | 93,808 | |
Gordmans Stores, Inc. (a) (b) | | | 29,197 | | | | 408,174 | |
Saks, Inc. (a) (b) | | | 307,021 | | | | 3,245,212 | |
| | | | | | | | 4,770,523 | |
| Specialty Retail - 2.1% | |
| Aaron's, Inc. | | | 1,160 | | | | 31,042 | |
America's Car-Mart, Inc. (a) (b) | | | 35,176 | | | | 1,174,175 | |
ANN, Inc. (a) | | | 375 | | | | 9,990 | |
Asbury Automotive Group, Inc. (a) | | | 30,798 | | | | 574,383 | |
Ascena Retail Group, Inc. (a) | | | 5,400 | | | | 156,060 | |
Barnes & Noble, Inc. (a) | | | 703 | | | | 8,626 | |
bebe stores, inc. (b) | | | 479,884 | | | | 3,445,567 | |
Big 5 Sporting Goods Corporation (b) | | | 45,250 | | | | 349,782 | |
Body Central Corporation (a) (b) | | | 21,992 | | | | 461,832 | |
Borders Group, Inc. (a) | | | 2,400 | | | | 48 | |
Cache, Inc. (a) | | | 200 | | | | 1,052 | |
Casual Male Retail Group, Inc. (a) | | | 7,038 | | | | 29,208 | |
| TFS MARKET NEUTRAL FUND | |
| SCHEDULE OF INVESTMENTS (Continued) | |
| | |
| COMMON STOCKS - 92.6% (Continued) | | Shares | | | Value | |
| Consumer Discretionary - 12.6% (Continued) | |
| Specialty Retail - 2.1% (Continued) | |
| Cato Corporation (The) - Class A | | | 231 | | | $ | 5,920 | |
Charming Shoppes, Inc. (a) (b) | | | 513,100 | | | | 1,780,457 | |
| Chico's FAS, Inc. | | | 124,321 | | | | 1,536,607 | |
China Auto Logistics, Inc. (a) | | | 300 | | | | 306 | |
Christopher & Banks Corporation (b) | | | 186,981 | | | | 622,647 | |
Coldwater Creek, Inc. (a) (b) | | | 205,886 | | | | 216,180 | |
Destination Maternity Corporation (b) | | | 53,275 | | | | 882,767 | |
Dick's Sporting Goods, Inc. (a) | | | 500 | | | | 19,545 | |
Dreams, Inc. (a) | | | 2,997 | | | | 5,574 | |
| DSW, Inc. - Class A | | | 24,841 | | | | 1,300,178 | |
Express, Inc. (b) | | | 36,228 | | | | 818,390 | |
| Finish Line, Inc. (The) - Class A | | | 7,005 | | | | 140,800 | |
| Foot Locker, Inc. | | | 55,901 | | | | 1,221,996 | |
Francesca's Holdings Corporation (a) | | | 8,600 | | | | 220,762 | |
Genesco, Inc. (a) | | | 10,134 | | | | 597,298 | |
GNC Acquisition Holdings, Inc. - Class A (a) | | | 14,300 | | | | 353,925 | |
| Guess?, Inc. | | | 50,257 | | | | 1,657,978 | |
| Haverty Furniture Companies, Inc. | | | 12,974 | | | | 150,758 | |
Jos. A. Bank Clothiers, Inc. (a) | | | 121 | | | | 6,466 | |
Kirkland's, Inc. (a) | | | 8,174 | | | | 91,876 | |
| Lithia Motors, Inc. | | | 83 | | | | 1,707 | |
Midas, Inc. (a) | | | 6,302 | | | | 57,474 | |
| Monro Muffler Brake, Inc. | | | 7,741 | | | | 287,114 | |
New York & Company, Inc. (a) (b) | | | 274,866 | | | | 733,892 | |
Office Depot, Inc. (a) | | | 398,478 | | | | 912,515 | |
OfficeMax, Inc. (a) | | | 40,172 | | | | 205,681 | |
O'Reilly Automotive, Inc. (a) | | | 2,200 | | | | 167,310 | |
Pacific Sunwear of California, Inc. (a) | | | 400 | | | | 500 | |
| Penske Automotive Group, Inc. | | | 307 | | | | 6,260 | |
Pier 1 Imports, Inc. (a) | | | 36,526 | | | | 456,940 | |
| RadioShack Corporation | | | 245,315 | | | | 2,921,702 | |
| Rent-A-Center, Inc. | | | 919 | | | | 31,384 | |
Sally Beauty Holdings, Inc. (a) (b) | | | 76,631 | | | | 1,470,549 | |
Select Comfort Corporation (a) | | | 96,932 | | | | 2,013,278 | |
Shoe Carnival, Inc. (a) (b) | | | 71,598 | | | | 1,953,909 | |
| Signet Jewelers Ltd. | | | 41,607 | | | | 1,793,678 | |
Stein Mart, Inc. (b) | | | 132,827 | | | | 962,996 | |
Syms Corp (a) | | | 9,786 | | | | 76,429 | |
Systemax, Inc. (a) (b) | | | 8,698 | | | | 131,601 | |
Talbots, Inc. (The) (a) | | | 65 | | | | 171 | |
Teavana Holdings, Inc. (a) | | | 1,300 | | | | 29,718 | |
TravelCenters of America, Inc. (a) (b) | | | 191,636 | | | | 954,347 | |
Ulta Salon, Cosmetics & Fragrance, Inc. (a) | | | 4,900 | | | | 329,721 | |
Vitamin Shoppe, Inc. (a) (b) | | | 65,869 | | | | 2,483,920 | |
Wet Seal, Inc. (The) - Class A (a) | | | 126,453 | | | | 529,838 | |
| Winmark Corporation | | | 1,909 | | | | 94,744 | |
Zale Corporation (a) | | | 135,939 | | | | 501,615 | |
| | | | | | | | 36,981,188 | |
| TFS MARKET NEUTRAL FUND | |
| SCHEDULE OF INVESTMENTS (Continued) | |
| | |
| COMMON STOCKS - 92.6% (Continued) | | Shares | | | Value | |
| Consumer Discretionary - 12.6% (Continued) | |
| Textiles, Apparel & Luxury Goods - 1.6% | |
| Columbia Sportswear Company | | | 5,293 | | | $ | 284,446 | |
Culp, Inc. (a) | | | 12,367 | | | | 106,109 | |
Deckers Outdoor Corporation (a) | | | 780 | | | | 89,887 | |
Delta Apparel, Inc. (a) | | | 680 | | | | 12,247 | |
Fossil, Inc. (a) | | | 200 | | | | 20,732 | |
Fuqi International, Inc. (a) | | | 117,639 | | | | 242,336 | |
| Gildan Activewear, Inc. - Class A | | | 12,500 | | | | 322,250 | |
Hanesbrands, Inc. (a) | | | 3,254 | | | | 85,808 | |
Iconix Brand Group, Inc. (a) | | | 111,745 | | | | 2,005,823 | |
Joe's Jeans, Inc. (a) | | | 69,899 | | | | 38,444 | |
Jones Group, Inc. (The) (b) | | | 389,282 | | | | 4,348,280 | |
Kenneth Cole Productions, Inc. (a) | | | 8,038 | | | | 86,489 | |
| Lacrosse Footwear, Inc. | | | 55 | | | | 704 | |
Liz Claiborne, Inc. (a) (b) | | | 910,239 | | | | 7,291,014 | |
LJ International, Inc. (a) (b) | | | 67,792 | | | | 185,072 | |
Lululemon Athletica, Inc. (a) | | | 212 | | | | 11,974 | |
Maidenform Brands, Inc. (a) | | | 22,315 | | | | 548,503 | |
Oxford Industries, Inc. (b) | | | 37,596 | | | | 1,485,042 | |
| R.G. Barry Corporation | | | 384 | | | | 4,266 | |
Rocky Brands, Inc. (a) | | | 15,412 | | | | 163,367 | |
Skechers U.S.A., Inc. - Class A (a) (b) | | | 362,512 | | | | 5,169,421 | |
Steven Madden Ltd. (a) (b) | | | 43,110 | | | | 1,590,759 | |
True Religion Apparel, Inc. (a) | | | 21,616 | | | | 733,215 | |
Unifi, Inc. (a) (b) | | | 54,295 | | | | 420,786 | |
Warnaco Group, Inc. (The) (a) | | | 3,500 | | | | 171,850 | |
Wolverine World Wide, Inc. (b) | | | 61,117 | | | | 2,318,168 | |
| | | | | | | | 27,736,992 | |
| Consumer Staples - 2.4% | |
| Beverages - 0.2% | |
| Beam, Inc. | | | 1,000 | | | | 49,430 | |
Boston Beer Company, Inc. (The) - Class A (a) | | | 2,290 | | | | 202,619 | |
| Brown-Forman Corporation - Class B | | | 4,700 | | | | 351,231 | |
Coca-Cola Bottling Company Consolidated (b) | | | 36,388 | | | | 2,042,094 | |
Cott Corporation (a) (b) | | | 57,012 | | | | 403,645 | |
Craft Brewers Alliance, Inc. (a) | | | 22,797 | | | | 149,320 | |
| Dr Pepper Snapple Group, Inc. | | | 1,800 | | | | 67,410 | |
Jones Soda Company (a) | | | 80 | | | | 50 | |
| MGP Ingredients, Inc. | | | 400 | | | | 2,624 | |
| Molson Coors Brewing Company - Class B | | | 600 | | | | 25,404 | |
| National Beverage Corporation | | | 32,010 | | | | 541,609 | |
Primo Water Corporation (a) | | | 77,371 | | | | 470,416 | |
| | | | | | | | 4,305,852 | |
| Food & Staples Retailing - 0.7% | |
| Andersons, Inc. (The) | | | 13,410 | | | | 495,097 | |
| Arden Group, Inc. - Class A | | | 39 | | | | 3,538 | |
Casey's General Stores, Inc. (b) | | | 64,763 | | | | 3,209,007 | |
Chefs' Warehouse, Inc. (The) (a) | | | 8,302 | | | | 118,636 | |
Fresh Market, Inc. (The) (a) (b) | | | 19,973 | | | | 798,920 | |
Ingles Markets, Inc. - Class A (b) | | | 21,613 | | | | 326,356 | |
| TFS MARKET NEUTRAL FUND | |
| SCHEDULE OF INVESTMENTS (Continued) | |
| | |
| COMMON STOCKS - 92.6% (Continued) | | Shares | | | Value | |
| Consumer Staples - 2.4% (Continued) | |
| Food & Staples Retailing - 0.7% (Continued) | |
| Nash Finch Company | | | 18,647 | | | $ | 490,789 | |
Pantry, Inc. (The) (a) | | | 54,947 | | | | 776,950 | |
Pizza Inn Holdings, Inc. (a) | | | 300 | | | | 1,320 | |
| PriceSmart, Inc. | | | 230 | | | | 17,489 | |
Rite Aid Corporation (a) (b) | | | 688,417 | | | | 798,564 | |
Ruddick Corporation (b) | | | 38,177 | | | | 1,668,717 | |
| Spartan Stores, Inc. | | | 18,886 | | | | 323,328 | |
Susser Holdings Corporation (a) (b) | | | 128,552 | | | | 2,823,002 | |
| Sysco Corporation | | | 300 | | | | 8,316 | |
| Village Super Market, Inc. - Class A | | | 25 | | | | 709 | |
| Weis Markets, Inc. | | | 398 | | | | 15,741 | |
| | | | | | | | 11,876,479 | |
| Food Products - 0.9% | |
Adecoagro, S.A. (a) | | | 38,372 | | | | 372,976 | |
AgFeed Industries, Inc. (a) | | | 168 | | | | 109 | |
| B&G Foods, Inc. | | | 3,805 | | | | 80,742 | |
| Campbell Soup Company | | | 2,100 | | | | 69,825 | |
China Marine Food Group Ltd. (a) | | | 171 | | | | 272 | |
Chiquita Brands International, Inc. (a) | | | 8,260 | | | | 73,349 | |
| Corn Products International, Inc. | | | 21,898 | | | | 1,062,053 | |
Darling International, Inc. (a) (b) | | | 118,475 | | | | 1,661,020 | |
Dean Foods Company (a) (b) | | | 124,777 | | | | 1,212,832 | |
| Farmer Brothers Company | | | 1,560 | | | | 9,126 | |
Fresh Del Monte Produce, Inc. (b) | | | 92,527 | | | | 2,355,737 | |
Green Mountain Coffee Roasters, Inc. (a) | | | 2,300 | | | | 149,546 | |
| Griffin Land & Nurseries, Inc. | | | 100 | | | | 2,682 | |
Hain Celestial Group, Inc. (The) (a) | | | 4,886 | | | | 163,974 | |
Harbinger Group, Inc. (a) | | | 31,759 | | | | 163,241 | |
| Hormel Foods Corporation | | | 200 | | | | 5,894 | |
HQ Sustainable Maritime Industries, Inc. (a) | | | 1,421 | | | | 121 | |
| J & J Snack Foods Corporation | | | 6,442 | | | | 332,214 | |
| J.M. Smucker Company (The) | | | 600 | | | | 46,212 | |
| McCormick & Company, Inc. - Non-Voting Shares | | | 5,900 | | | | 286,504 | |
| Mead Johnson Nutrition Company | | | 1,500 | | | | 107,775 | |
Omega Protein Corporation (a) (b) | | | 42,260 | | | | 457,676 | |
Origin Agritech Ltd. (a) (b) | | | 133,792 | | | | 374,618 | |
Pilgrim's Pride Corporation (a) (b) | | | 496,391 | | | | 2,501,811 | |
Ralcorp Holdings, Inc. (a) | | | 3,700 | | | | 299,108 | |
Reddy Ice Holdings, Inc. (a) | | | 866 | | | | 961 | |
| Sara Lee Corporation | | | 3,600 | | | | 64,080 | |
Seneca Foods Corporation - Class A (a) | | | 12,363 | | | | 260,241 | |
Smart Balance, Inc. (a) (b) | | | 325,977 | | | | 2,135,149 | |
Smithfield Foods, Inc. (a) | | | 10,927 | | | | 249,791 | |
| Snyder's-Lance, Inc. | | | 4,484 | | | | 95,151 | |
SunOpta, Inc. (a) (b) | | | 108,555 | | | | 566,657 | |
TreeHouse Foods, Inc. (a) | | | 5,752 | | | | 352,828 | |
Westway Group, Inc. (a) | | | 1,317 | | | | 5,729 | |
Yuhe International, Inc. (a) | | | 136 | | | | 122 | |
| | | | | | | | 15,520,126 | |
| TFS MARKET NEUTRAL FUND | |
| SCHEDULE OF INVESTMENTS (Continued) | |
| | |
| COMMON STOCKS - 92.6% (Continued) | | Shares | | | Value | |
| Consumer Staples - 2.4% (Continued) | |
| Household Products - 0.1% | |
Central Garden & Pet Company - Class A (a) | | | 82,211 | | | $ | 722,635 | |
| Church & Dwight Company, Inc. | | | 3,059 | | | | 135,146 | |
Clorox Company (The) (b) | | | 5,201 | | | | 348,155 | |
Energizer Holdings, Inc. (a) | | | 1,100 | | | | 81,169 | |
| Oil-Dri Corporation of America | | | 200 | | | | 4,010 | |
Spectrum Brands Holdings, Inc. (a) | | | 9,866 | | | | 250,399 | |
| WD-40 Company | | | 157 | | | | 6,911 | |
| | | | | | | | 1,548,425 | |
| Personal Products - 0.5% | |
American Oriental Bioengineering, Inc. (a) | | | 175,553 | | | | 135,211 | |
Elizabeth Arden, Inc. (a) (b) | | | 65,474 | | | | 2,244,449 | |
| Herbalife Ltd. | | | 1,845 | | | | 115,054 | |
Inter Parfums, Inc. (b) | | | 22,697 | | | | 418,533 | |
Natural Alternatives International, Inc. (a) | | | 3,562 | | | | 21,728 | |
Nature's Sunshine Products, Inc. (a) | | | 22,325 | | | | 387,562 | |
Nu Skin Enterprises, Inc. - Class A (b) | | | 3,333 | | | | 168,417 | |
Nutraceutical International Corporation (a) | | | 225 | | | | 3,105 | |
Prestige Brands Holdings, Inc. (a) (b) | | | 93,988 | | | | 994,393 | |
| Reliv' International, Inc. | | | 1,800 | | | | 2,682 | |
Revlon, Inc. (a) (b) | | | 153,828 | | | | 2,265,886 | |
Schiff Nutrition International, Inc. (a) (b) | | | 122,009 | | | | 1,490,950 | |
| | | | | | | | 8,247,970 | |
Tobacco - 0.0% (d) | |
| Vector Group Ltd. | | | 5,056 | | | | 88,834 | |
| | | | | | | | | |
| Energy - 6.4% | |
| Energy Equipment & Services - 2.1% | |
Atwood Oceanics, Inc. (a) | | | 30,801 | | | | 1,316,435 | |
Basic Energy Services, Inc. (a) | | | 238,007 | | | | 4,365,048 | |
Bolt Technology Corporation (a) | | | 200 | | | | 2,016 | |
Bristow Group, Inc. (b) | | | 35,176 | | | | 1,751,061 | |
C&J Energy Services, Inc. (a) | | | 19,781 | | | | 333,508 | |
Cameron International Corporation (a) | | | 300 | | | | 14,742 | |
| CARBO Ceramics, Inc. | | | 300 | | | | 40,755 | |
| Compressco Partners, L.P. | | | 17 | | | | 276 | |
| Core Laboratories N.V. | | | 700 | | | | 75,782 | |
Dresser-Rand Group, Inc. (a) | | | 12,912 | | | | 624,941 | |
Dril-Quip, Inc. (a) | | | 1,513 | | | | 98,496 | |
ENGlobal Corporation (a) | | | 300 | | | | 783 | |
Exterran Partners, L.P. (b) | | | 18,484 | | | | 454,706 | |
FMC Technologies, Inc. (a) | | | 1,700 | | | | 76,194 | |
Geokinetics, Inc. (a) | | | 442 | | | | 1,445 | |
Global Geophysical Services, Inc. (a) (b) | | | 30,185 | | | | 287,965 | |
Global Industries Ltd. (a) (b) | | | 143,940 | | | | 1,144,323 | |
| Gulf Island Fabrication, Inc. | | | 32,042 | | | | 892,370 | |
Gulfmark Offshore, Inc. - Class A (a) (b) | | | 59,272 | | | | 2,465,122 | |
ION Geophysical Corporation (a) | | | 25,798 | | | | 196,581 | |
| Lufkin Industries, Inc. | | | 10,061 | | | | 594,504 | |
Matrix Service Company (a) (b) | | | 49,633 | | | | 527,102 | |
| TFS MARKET NEUTRAL FUND | |
| SCHEDULE OF INVESTMENTS (Continued) | |
| | |
| COMMON STOCKS - 92.6% (Continued) | | Shares | | | Value | |
| Energy - 6.4% (Continued) | |
| Energy Equipment & Services - 2.1% (Continued) | |
McDermott International, Inc. (a) (b) | | | 82,074 | | | $ | 901,172 | |
Mitcham Industries, Inc. (a) (b) | | | 76,648 | | | | 1,117,528 | |
Newpark Resources, Inc. (a) | | | 256,192 | | | | 2,287,795 | |
Noble Corporation (a) | | | 200 | | | | 7,188 | |
North American Energy Partners, Inc. (a) (b) | | | 173,773 | | | | 1,221,624 | |
Ocean Rig UDW, Inc. (a) | | | 14,775 | | | | 226,648 | |
Oil States International, Inc. (a) (b) | | | 29,990 | | | | 2,087,604 | |
OYO Geospace Corporation (a) (b) | | | 20,408 | | | | 1,603,661 | |
Parker Drilling Company (a) (b) | | | 203,085 | | | | 1,123,060 | |
| Patterson-UTI Energy, Inc. | | | 82,915 | | | | 1,684,833 | |
PHI, Inc. (a) | | | 12 | | | | 265 | |
Precision Drilling Corporation (a) | | | 14,400 | | | | 166,608 | |
RigNet, Inc. (a) | | | 1,893 | | | | 29,588 | |
| RPC, Inc. | | | 98,938 | | | | 1,837,279 | |
| Schlumberger Ltd. | | | 29,399 | | | | 2,159,945 | |
| SEACOR Holdings, Inc. | | | 15,146 | | | | 1,289,682 | |
TETRA Technologies, Inc. (a) | | | 70,505 | | | | 669,797 | |
TGC Industries, Inc. (a) (b) | | | 81,073 | | | | 452,387 | |
| Transocean Ltd. | | | 100 | | | | 5,715 | |
Union Drilling, Inc. (a) (b) | | | 78,791 | | | | 590,145 | |
Unit Corporation (a) (b) | | | 39,259 | | | | 1,926,047 | |
Vantage Drilling Company (a) (b) | | | 483,680 | | | | 657,805 | |
Willbros Group, Inc. (a) | | | 2,163 | | | | 11,010 | |
| | | | | | | | 37,321,541 | |
| Oil, Gas & Consumable Fuels - 4.3% | |
| Adams Resources & Energy, Inc. | | | 503 | | | | 11,921 | |
Advantage Oil & Gas Ltd. (a) (b) | | | 229,831 | | | | 1,213,508 | |
| Alliance Holdings GP, L.P. | | | 1,000 | | | | 48,400 | |
| Alliance Resource Partners, L.P. | | | 600 | | | | 45,558 | |
Alon USA Energy, Inc. (b) | | | 109,447 | | | | 831,797 | |
Andatee China Marine Fuel Services Corporation (a) | | | 213 | | | | 577 | |
Approach Resources, Inc. (a) | | | 1,669 | | | | 40,740 | |
| Arch Coal, Inc. | | | 30,257 | | | | 551,283 | |
| Atlas Energy, L.P. | | | 12,637 | | | | 299,876 | |
| Atlas Pipeline Partners, L.P. | | | 4,200 | | | | 146,160 | |
Baytex Energy Corporation (b) | | | 17,401 | | | | 924,863 | |
Bill Barrett Corporation (a) | | | 6,900 | | | | 287,040 | |
| BMB Munai, Inc. | | | 3,352 | | | | 449 | |
Boardwalk Pipeline Partners, L.P. (b) | | | 5,191 | | | | 148,359 | |
| BP Prudhoe Bay Royalty Trust | | | 392 | | | | 42,140 | |
BreitBurn Energy Partners, L.P. (b) | | | 75,257 | | | | 1,355,379 | |
Brigham Exploration Company (a) | | | 51,486 | | | | 1,874,863 | |
| Buckeye Partners, L.P. | | | 1,800 | | | | 121,590 | |
| Cabot Oil & Gas Corporation | | | 400 | | | | 31,088 | |
Callon Petroleum Company (a) (b) | | | 164,470 | | | | 774,654 | |
Calumet Specialty Products Partners, L.P. (b) | | | 34,718 | | | | 656,865 | |
| Cameco Corporation | | | 3,500 | | | | 75,005 | |
| Cheniere Energy Partners, L.P. | | | 27,247 | | | | 473,008 | |
| Chesapeake Midstream Partners, L.P. | | | 11,804 | | | | 311,744 | |
| TFS MARKET NEUTRAL FUND | |
| SCHEDULE OF INVESTMENTS (Continued) | |
| | |
| COMMON STOCKS - 92.6% (Continued) | | Shares | | | Value | |
| Energy - 6.4% (Continued) | |
| Oil, Gas & Consumable Fuels - 4.3% (Continued) | |
Clayton Williams Energy, Inc. (a) (b) | | | 38,751 | | | $ | 2,531,990 | |
Cloud Peak Energy, Inc. (a) | | | 62,237 | | | | 1,428,339 | |
Cobalt International Energy, Inc. (a) | | | 84,070 | | | | 867,602 | |
Concho Resources, Inc. (a) | | | 300 | | | | 28,416 | |
Constellation Energy Partners, LLC (a) | | | 2,050 | | | | 5,515 | |
Contango Oil & Gas Company (a) | | | 56 | | | | 3,603 | |
Crestwood Midstream Partners, L.P. (b) | | | 42,001 | | | | 1,242,390 | |
Crimson Exploration, Inc. (a) (b) | | | 118,334 | | | | 352,635 | |
| Cross Timbers Royalty Trust | | | 6,178 | | | | 290,366 | |
Crosstex Energy, Inc. (b) | | | 187,828 | | | | 2,447,399 | |
Crosstex Energy, L.P. (b) | | | 64,738 | | | | 1,034,513 | |
Delta Petroleum Corporation (a) | | | 52,938 | | | | 118,581 | |
Denbury Resources, Inc. (a) | | | 3,300 | | | | 51,810 | |
Dorchester Minerals, L.P. (b) | | | 44,157 | | | | 1,084,054 | |
Double Eagle Petroleum Company (a) | | | 28,851 | | | | 256,197 | |
Eagle Rock Energy Partners, L.P. (b) | | | 25,906 | | | | 259,578 | |
| El Paso Corporation | | | 9,000 | | | | 225,090 | |
| El Paso Pipeline Partners, L.P. | | | 2,400 | | | | 79,992 | |
Enbridge Energy Management, LLC (a) | | | 1 | | | | 31 | |
| Enbridge, Inc. | | | 3,899 | | | | 135,334 | |
Encore Energy Partners, L.P. (b) | | | 45,819 | | | | 990,149 | |
Energen Corporation (b) | | | 22,041 | | | | 1,081,331 | |
| Energy Transfer Partners, L.P. | | | 400 | | | | 18,688 | |
Energy XXI (Bermuda) Ltd. (a) (b) | | | 142,048 | | | | 4,171,950 | |
| Enterprise Products Partners, L.P. | | | 106 | | | | 4,752 | |
Equal Energy Ltd. (a) | | | 27,228 | | | | 152,477 | |
| EV Energy Partners, L.P. | | | 2,100 | | | | 156,303 | |
EXCO Resources, Inc. (b) | | | 28,656 | | | | 361,352 | |
Forest Oil Corporation (a) (b) | | | 141,168 | | | | 1,646,019 | |
Gastar Exploration Ltd. (a) | | | 7,860 | | | | 29,082 | |
| General Maritime Corporation | | | 61,692 | | | | 16,040 | |
| Genesis Energy, L.P. | | | 7,857 | | | | 207,346 | |
GeoMet, Inc. (a) | | | 1,636 | | | | 1,734 | |
Gevo, Inc. (a) | | | 758 | | | | 5,632 | |
Global Partners, L.P. (b) | | | 88,208 | | | | 1,885,005 | |
Golar LNG Ltd. (b) | | | 45,701 | | | | 1,847,691 | |
Golar LNG Partners, L.P. (b) | | | 45,996 | | | | 1,319,625 | |
Goodrich Petroleum Corporation (a) (b) | | | 40,626 | | | | 643,922 | |
Gran Tierra Energy, Inc. (a) | | | 27,820 | | | | 169,146 | |
Gulfport Energy Corporation (a) | | | 22,932 | | | | 714,103 | |
Holly Energy Partners, L.P. (b) | | | 15,289 | | | | 859,395 | |
| HollyFrontier Corporation | | | 946 | | | | 29,033 | |
Hugoton Royalty Trust (b) | | | 36,747 | | | | 798,145 | |
| Imperial Oil Ltd. | | | 3,800 | | | | 156,636 | |
Ivanhoe Energy, Inc. (a) (b) | | | 103,355 | | | | 130,227 | |
James River Coal Company (a) | | | 20,366 | | | | 210,788 | |
Kodiak Oil & Gas Corporation (a) (b) | | | 767,252 | | | | 5,301,711 | |
| Legacy Reserves, L.P. | | | 632 | | | | 18,625 | |
Lone Pine Resources, Inc. (a) (b) | | | 67,257 | | | | 506,445 | |