October 31, 2013
For more information or assistance in opening an account,
please call toll-free 1-888-534-2001.
December 16, 2013
Dear Shareholder,
Enclosed is the Annual Report to shareholders of the TFS Market Neutral Fund (ticker: TFSMX), the TFS Small Cap Fund (ticker: TFSSX) and the TFS Hedged Futures Fund (ticker: TFSHX) for the year ended October 31, 2013. On behalf of the investment manager, TFS Capital LLC (“TFS Capital”), I would like to thank you for your continued investment.
In October, TFS Capital announced that there will be a reduction in the advisory fee paid to TFS Capital for all three funds effective January 1, 2014. In addition, the maximum expense ratio of each fund will be reduced. TFS Capital believes these reductions (which are detailed in Note 9 to the financial statements) are in the best interests of the funds’ shareholders and consistent with industry demand for lower fees. TFS Capital believes the fee reductions strengthen the firm’s long-term value proposition.
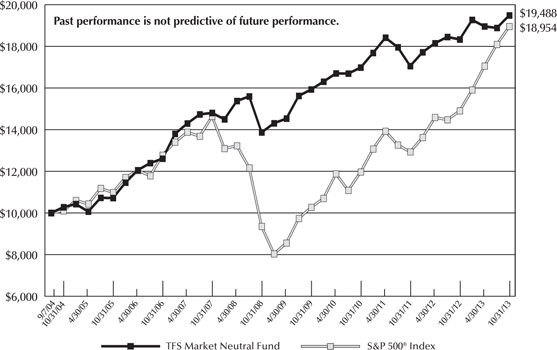
TFS Market Neutral Fund (ticker: TFSMX)
| | | | | Since Inception (9/7/2004) |
| TFS Market Neutral Fund | 6.30% | 4.69% | 7.04% | 7.57% |
S&P 500® Index | 27.18% | 16.56% | 15.17% | 7.24% |
Average annual total returns for periods ended October 31, 2013
TFSMX did not produce positive alpha (i.e., the return that cannot be explained by market exposure) in the current fiscal year. While the fund, with a beta in the 0.2-0.3 range, should not be expected to outperform the equity markets when they rise significantly, its return of 6.30% for the fiscal year is below expectations. The shortfall occurred primarily during the months of April and May; excluding those months, TFSMX produced small, but positive, alpha during the remainder of the period. During April and May, TFSMX lost more than 4% of its value, while the S&P 500® Index appreciated by more than 4%. Many of the fund’s short positions rose significantly more than the market, leading to the substantial loss. TFS Capital believes this period of underperformance in TFSMX may have been driven by a “short-squeeze” affecting the portfolio (i.e., a price dislocation that occurs when short positions in thinly traded securities are exited quickly resulting in a rise in price). While TFS Capital believes the impact from this market action may be temporary and could represent a buying opportunity, it is impossible to determine whether prices on certain short positions will improve (i.e., return to pre-short-squeeze levels). Since the end of May, TFSMX has recovered a small portion of the loss in alpha.
TFSMX’s performance over longer periods of time compares more favorably to the overall U.S. equity market as measured by the S&P 500® Index. From inception through October 31, 2013, TFSMX generated a 7.57% average annual return and had an annualized standard deviation of 7.98%, whereas the S&P 500® Index generated a 7.24% average annual return and had an annualized standard deviation of 21.07%. Therefore, during this time period, TFSMX produced an average annual return that was slightly ahead of the S&P 500® Index while subjecting investors to only 35.9% of the S&P 500® Index’s volatility. Based on its trailing 5-year return through October 31, 2013, TFSMX was ranked #5 among 41 funds in the Lipper “Equity Market Neutral” category.1
The strategies used in managing TFSMX have resulted in its returns having a low correlation to other asset classes. According to Modern Portfolio Theory, portfolios may benefit by combining non-correlated investments. For your reference, below are the TFS Market Neutral Fund’s correlations to several other asset classes since inception. It is notable that TFSMX’s correlation to the equity indices has increased in recent years.
| Correlation Since Inception |
S&P 500® Index | 0.61 |
Russell 2000® Index | 0.60 |
| MSCI EAFE Index | 0.50 |
| Barclays U.S. Aggregate Bond Index | -0.17 |
| Dow Jones REIT ETF Index | 0.43 |
| Dow Jones Commodity Futures | 0.44 |
The TFS Market Neutral Fund continues to operate under a subscription policy that limits additional shareholder investments. Given its investment strategies’ capacity limitations, this policy allows the TFS Market Neutral Fund to seek stability in its net assets and maintain control of its growth.
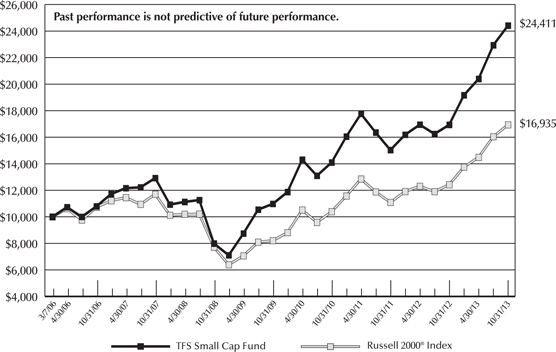
TFS Small Cap Fund (ticker: TFSSX)
| | | | | Since Inception (3/7/2006) |
| TFS Small Cap Fund | 44.15% | 20.09% | 25.03% | 12.37% |
Russell 2000® Index | 36.28% | 17.69% | 17.04% | 7.13% |
Average annual total returns for periods ended October 31, 2013
During the fiscal year, TFSSX outperformed its benchmark, the Russell 2000® Index. Given its “long-only” mandate, TFSSX is expected to have a high correlation to U.S. small-cap equity market movements with most of the performance deviation attributable to TFS Capital’s equity selection. All strategies contributed to the outperformance, and we are pleased that the fund added such significant alpha.
TFSSX also achieved its objective of outperforming the Russell 2000® Index over longer periods of time. In fact, it now has over a 7-year track record and has achieved an average annual return since inception that is 524 basis points higher than that of the Russell 2000® Index. Based on its trailing 5-year return through October 31, 2013, TFSSX was ranked #9 among 578 funds in the Lipper Small Cap Core category.2
TFS Hedged Futures Fund (ticker: TFSHX)
| | | Since Inception (12/29/2011) |
| TFS Hedged Futures Fund | -8.14% | 0.76% |
| S&P Diversified Trends Indicator | 4.53% | -4.95% |
S&P 500® Index | 27.18% | 22.24% |
Average annual total return for the periods ended October 31, 2013
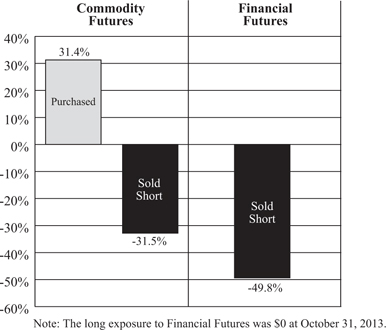
TFSHX, a hedged futures fund, was down 8.14% during the fiscal year. This loss was due primarily to losses in its commodities investments, as well as a smaller loss from financial futures. We are disappointed in this performance. We made some changes to the investment models in the fund in an effort to capture more of the opportunities we see in the market and realize greater risk-adjusted returns.
Like the TFS Market Neutral Fund, the TFS Hedged Futures Fund has demonstrated a low correlation to many market indices. This low correlation suggests the addition of the TFS Hedged Futures Fund may improve the risk-adjusted performance of many investment portfolios. The TFS Hedged Futures Fund has had a slightly negative correlation to the S&P Diversified Trends Indicator, which suggests that it may also have a low correlation to other managed-futures mutual funds that track this index. The TFS Hedged Futures Fund also has a low correlation to the TFS Market Neutral Fund which suggests that these two investments may complement each other in an investment portfolio. For your reference, below are the TFS Hedged Futures Fund’s correlations since inception to several other asset classes including the TFS Market Neutral Fund.
| Correlation Since Inception |
| TFS Market Neutral Fund (ticker: TFSMX) | 0.29 |
| S&P Diversified Trends Indicator | -0.09 |
S&P 500® Index | 0.24 |
Russell 2000® Index | 0.27 |
| S&P GSCI Index | 0.17 |
| Barclays U.S. Aggregate Bond Index | -0.10 |
As always, we do not recommend allocating a high percentage of one’s assets to any one investment fund managed by TFS Capital given the risks inherent in each product. Rather, we believe that they are best used as a component of a diversified portfolio of investments. If you have any questions regarding this material, please contact us.
Best regards,
Larry S. Eiben
Chief Operating Officer & Co-Portfolio Manager
TFS Capital LLC
The performance data quoted represents past performance, which is not a guarantee of future results. Current performance may be lower or higher than the performance data quoted. The investment return and principal value of an investment in the mutual funds discussed in this report (the “Funds”) will fluctuate so that an investor’s shares, when redeemed, may be worth more or less than their original cost. During the reporting period, the Funds charged a 2% redemption penalty on shares invested for less than 90 days. If shares were redeemed within the 90 day period, investment returns would have been reduced from those shown above. Fee reductions and/or expense reimbursements by the Adviser have positively impacted the Funds’ performance. Without such reductions and/or reimbursements, performance would have been lower. An investor should consider the investment objectives, risks, charges and expenses of the Funds carefully before investing. To obtain a summary prospectus and/or prospectus, which each contain this and other important information, go to www.TFSCapital.com or call (888) 534-2001. Please read the summary prospectus and/or prospectus carefully before investing. The Funds may not be suitable for all investors. Futures investing is speculative. Each Fund’s current NAV per share is available at www.TFSCapital.com.
| 1 | In the Lipper “Equity Market Neutral” category, TFSMX was ranked #5 out of 41 using its 5-year return and #6 out of 60 using its 3-year return. At 10/31/2013, Lipper did not make 1-year rankings available to the public. |
| 2 | In the Lipper “Small Cap Core” category, TFSSX was ranked #9 out of 578 using its 5-year return and #73 out of 637 using its 3-year return. At 10/31/2013, Lipper did not make 1-year rankings available to the public. |
Ranking information provided by Lipper for the periods ended October 31, 2013. TFSSX was assigned by Lipper to the Small-Cap Core category. TFSMX was assigned by Lipper to the Equity Market Neutral category. The Funds are ranked based on total return and are ranked within a universe of funds with similar investment objectives. Rankings include the reinvestment of dividends and capital gains but exclude the effect of a fund’s sales load, if applicable. Fund rankings are calculated monthly by Lipper Analytical Services of New York. Lipper Inc. is a nationally recognized organization that ranks the performance of mutual funds.
TFS MARKET NEUTRAL FUND
PERFORMANCE INFORMATION (Unaudited)
Comparison of the Change in Value of a $10,000 Investment in
TFS Market Neutral Fund versus the S&P 500® Index
Average Annual Total Returns(a) For the periods ended October 31, 2013 |
| | 1 Year | 5 Years | Since Inception(b) |
| TFS Market Neutral Fund | 6.30% | 7.04% | 7.57% |
S&P 500® Index | 27.18% | 15.17% | 7.24% |
| (a) | The total returns shown do not reflect the deduction of taxes a shareholder would pay on Fund distributions or the redemption of Fund shares. |
| (b) | Initial public offering of shares was September 7, 2004. |
TFS SMALL CAP FUND
PERFORMANCE INFORMATION (Unaudited)
Comparison of the Change in Value of a $10,000 Investment in
TFS Small Cap Fund versus the Russell 2000® Index
Average Annual Total Returns(a) For the periods ended October 31, 2013 |
| | 1 Year | 5 Years | Since Inception(b) |
| TFS Small Cap Fund | 44.15% | 25.03% | 12.37% |
Russell 2000® Index | 36.28% | 17.04% | 7.13% |
| (a) | The total returns shown do not reflect the deduction of taxes a shareholder would pay on Fund distributions or the redemption of Fund shares. |
| (b) | Initial public offering of shares was March 7, 2006. |
TFS HEDGED FUTURES FUND
PERFORMANCE INFORMATION (Unaudited)
Comparison of the Change in Value of a $10,000 Investment in
TFS Hedged Futures Fund versus the
S&P Diversified Trends Indicator and the S&P 500® Index
Average Annual Total Returns(a) For the periods ended October 31, 2013 |
| | 1 Year | Since Inception(b) |
| TFS Hedged Futures Fund | -8.14% | 0.76% |
| S&P Diversified Trends Indicator | 4.53% | -4.95% |
S&P 500® Index | 27.18% | 22.24% |
| (a) | The total returns shown do not reflect the deduction of taxes a shareholder would pay on Fund distributions or the redemption of Fund shares. |
| (b) | Initial public offering of shares was December 29, 2011. |
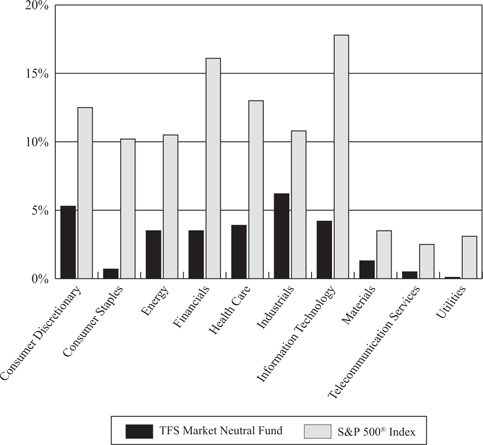
TFS MARKET NEUTRAL FUND
PORTFOLIO INFORMATION
October 31, 2013 (Unaudited)
Common Stocks vs.
the Standard & Poor's 500® Index Net Sector Exposure*
| * | The net percentages for TFS Market Neutral Fund are computed by taking the net dollar exposure, including short positions, and dividing by the net assets of the Fund. Consequently, the percentages will not total to 100%. |
Top 10 Long Common Stocks | | Top 10 Short Common Stocks |
| | | | |
| Penn Virginia Corporation | 0.70% | | Geospace Technologies Corporation | 0.57% |
| MAKO Surgical Corporation | 0.68% | | Walter Energy, Inc. | 0.48% |
| Carrizo Oil & Gas, Inc. | 0.57% | | Fusion-io, Inc. | 0.48% |
| Triangle Petroleum Corporation | 0.49% | | Dendreon Corporation | 0.45% |
| Stone Energy Corporation | 0.48% | | VirnetX Holding Corporation | 0.45% |
| Sanmina Corporation | 0.42% | | Ebix, Inc. | 0.43% |
| iGATE Corporation | 0.42% | | SunEdison, Inc. | 0.42% |
| Rosetta Resources, Inc. | 0.38% | | VeriFone Systems, Inc. | 0.40% |
| Mueller Water Products, Inc. - Class A | 0.37% | | Aéropostale, Inc. | 0.40% |
| Federal-Mogul Corporation | 0.35% | | Encore Capital Group, Inc. | 0.40% |
Please note that the Fund may hold securities other than common stocks.
TFS SMALL CAP FUND
PORTFOLIO INFORMATION
October 31, 2013 (Unaudited)
Sector Allocation (% of Net Assets)
|
| |
| ShoreTel, Inc. | 0.56% |
| iGATE Corporation | 0.56% |
| Triangle Petroleum Corporation | 0.52% |
| Federal-Mogul Corporation | 0.49% |
| Mueller Water Products, Inc. - Class A | 0.47% |
| Intersil Corporation - Class A | 0.47% |
| LifePoint Hospitals, Inc. | 0.47% |
| Lender Processing Services, Inc. | 0.47% |
| Winnebago Industries, Inc. | 0.46% |
| H.B. Fuller Company | 0.45% |
TFS HEDGED FUTURES FUND
PORTFOLIO INFORMATION
October 31, 2013 (Unaudited)
Exposure by Type of Futures Contract
(Value as a % of Net Assets)
Net Exposure by Type of Futures Contract (Net as a % of Net Assets) |
| Net Commodity Futures Exposure | -0.1% |
| Net Financial Futures Exposure | -49.8% |
TFS MARKET NEUTRAL FUND
SUMMARY SCHEDULE OF INVESTMENTS*
October 31, 2013
| | | | | | |
| Consumer Discretionary — 14.4% | | | | | | |
ANN, INC. (a) (b) | | | 123,988 | | | $ | 4,384,216 | |
Belo Corporation - Class A (b) | | | 382,485 | | | | 5,251,519 | |
Children's Place Retail Stores, Inc. (The) (a) (b) | | | 81,636 | | | | 4,456,509 | |
Digital Generation, Inc. (a) (b) | | | 364,961 | | | | 4,616,757 | |
Federal-Mogul Corporation (a) | | | 270,871 | | | | 5,550,147 | |
Guess?, Inc. (b) | | | 133,868 | | | | 4,183,375 | |
| Lithia Motors, Inc. | | | 73,683 | | | | 4,630,977 | |
Modine Manufacturing Company (a) (b) | | | 314,467 | | | | 4,188,700 | |
Sotheby's (b) | | | 87,125 | | | | 4,521,787 | |
Winnebago Industries, Inc. (a) | | | 174,005 | | | | 5,160,988 | |
Zale Corporation (a) (b) | | | 328,892 | | | | 5,140,582 | |
Other Consumer Discretionary (c) | | | | | | | 175,370,265 | |
| | | | | | | | 227,455,822 | |
| Consumer Staples — 2.8% | | | | | | | | |
Other Consumer Staples (c) | | | | | | | 43,863,818 | |
| | | | | | | | | |
| Energy — 9.8% | | | | | | | | |
Callon Petroleum Company (a) (b) | | | 727,013 | | | | 4,965,499 | |
Carrizo Oil & Gas, Inc. (a) (b) | | | 206,092 | | | | 9,035,073 | |
Hercules Offshore, Inc. (a) | | | 609,902 | | | | 4,147,334 | |
Matrix Service Company (a) | | | 199,172 | | | | 4,140,786 | |
Penn Virginia Corporation (a) (b) | | | 1,307,555 | | | | 11,127,293 | |
Rosetta Resources, Inc. (a) (b) | | | 99,538 | | | | 5,966,308 | |
Stone Energy Corporation (a) (b) | | | 216,291 | | | | 7,539,904 | |
Triangle Petroleum Corporation (a) (b) | | | 739,977 | | | | 7,821,557 | |
Other Energy (c) | | | | | | | 99,882,121 | |
| | | | | | | | 154,625,875 | |
| Financials — 12.6% | | | | | | | | |
CapLease, Inc. (b) | | | 640,320 | | | | 5,442,720 | |
Resource Capital Corporation (b) | | | 701,087 | | | | 4,311,685 | |
Symetra Financial Corporation (b) | | | 220,738 | | | | 4,134,423 | |
Other Financials (c) | | | | | | | 185,847,902 | |
| | | | | | | | 199,736,730 | |
| Health Care — 15.1% | | | | | | | | |
Affymetrix, Inc. (a) (b) | | | 648,446 | | | | 4,584,513 | |
AmSurg Corporation (a) (b) | | | 112,718 | | | | 4,834,475 | |
BioCryst Pharmaceuticals, Inc. (a) (b) | | | 830,816 | | | | 4,781,346 | |
Cambrex Corporation (a) | | | 249,236 | | | | 4,192,149 | |
Impax Laboratories, Inc. (a) (b) | | | 214,390 | | | | 4,343,541 | |
LifePoint Hospitals, Inc. (a) (b) | | | 86,016 | | | | 4,441,866 | |
Magellan Health Services, Inc. (a) (b) | | | 94,407 | | | | 5,541,691 | |
MAKO Surgical Corporation (a) (b) | | | 361,776 | | | | 10,784,543 | |
Medicines Company (The) (a) (b) | | | 131,823 | | | | 4,471,436 | |
TFS MARKET NEUTRAL FUND
SUMMARY SCHEDULE OF INVESTMENTS* (Continued)
COMMON STOCKS — 92.6% (Continued) | | | | | | |
| Health Care — 15.1% (Continued) | | | | | | |
VCA Antech, Inc. (a) (b) | | | 190,292 | | | $ | 5,413,807 | |
Other Health Care (c) | | | | | | | 185,977,437 | |
| | | | | | | | 239,366,804 | |
| Industrials — 13.5% | | | | | | | | |
Avis Budget Group, Inc. (a) (b) | | | 156,794 | | | | 4,912,356 | |
| EMCOR Group, Inc. | | | 129,739 | | | | 4,808,127 | |
| Manitowoc Company, Inc. (The) | | | 229,475 | | | | 4,465,584 | |
Mueller Water Products, Inc. - Class A (b) | | | 690,640 | | | | 5,918,785 | |
Orbital Sciences Corporation (a) | | | 181,553 | | | | 4,188,428 | |
Republic Airways Holdings, Inc. (a) (b) | | | 464,438 | | | | 5,471,079 | |
Ryder System, Inc. (b) | | | 71,157 | | | | 4,684,265 | |
Other Industrials (c) | | | | | | | 179,107,726 | |
| | | | | | | | 213,556,350 | |
| Information Technology — 16.3% | | | | | | | | |
Active Network, Inc. (The) (a) | | | 341,803 | | | | 4,935,635 | |
DST Systems, Inc. (b) | | | 49,972 | | | | 4,236,126 | |
Ellie Mae, Inc. (a) (b) | | | 187,365 | | | | 5,414,849 | |
iGATE Corporation (a) (b) | | | 207,124 | | | | 6,594,828 | |
Kulicke & Soffa Industries, Inc. (a) (b) | | | 402,587 | | | | 5,193,372 | |
Sanmina Corporation (a) (b) | | | 453,658 | | | | 6,605,260 | |
ShoreTel, Inc. (a) (b) | | | 655,742 | | | | 5,213,149 | |
TiVo, Inc. (a) (b) | | | 315,017 | | | | 4,186,576 | |
Other Information Technology (c) | | | | | | | 215,915,469 | |
| | | | | | | | 258,295,264 | |
| Materials — 5.4% | | | | | | | | |
Carpenter Technology Corporation (b) | | | 77,865 | | | | 4,619,730 | |
H.B. Fuller Company (b) | | | 115,663 | | | | 5,536,788 | |
Other Materials (c) | | | | | | | 76,325,882 | |
| | | | | | | | 86,482,400 | |
| Telecommunication Services — 1.4% | | | | | | | | |
Other Telecommunication Services (c) | | | | | | | 21,846,489 | |
| | | | | | | | | |
| Utilities — 1.3% | | | | | | | | |
Other Utilities (c) | | | | | | | 20,346,054 | |
| | | | | | | | | |
Total Common Stocks (Cost $1,284,089,511) | | | | | | $ | 1,465,575,606 | |
| | | | |
Other Preferred Stocks (Cost $2,593,825) (c) | | | $ | 2,679,032 | |
TFS MARKET NEUTRAL FUND
SUMMARY SCHEDULE OF INVESTMENTS* (Continued)
| | | | | | |
VelocityShares Daily Inverse VIX Short-Term ETN (a) | | | 258,300 | | | $ | 7,490,700 | |
Other Investments (c) | | | | | | | 66,125,486 | |
Total Other Investments (Cost $72,682,589) | | | | | | $ | 73,616,186 | |
CORPORATE BONDS — 0.0% (d) | | | | |
Financials — 0.0% (d) | | | | |
Other Financials (Cost $0) (c) | | | $ | 2,918 | |
MONEY MARKET FUNDS — 1.1% | | | | | | |
Federated Government Obligations Fund - Institutional Class, 0.01% (e) | | | 15,218,554 | | | $ | 15,218,554 | |
UMB Money Market Fiduciary, 0.01% (e) | | | 2,419,354 | | | | 2,419,354 | |
Total Money Market Funds (Cost $17,637,908) | | | | | | $ | 17,637,908 | |
| | | | | | | | | |
Total Investments at Value — 98.5% (Cost $1,377,003,833) | | | | | | $ | 1,559,511,650 | |
| | | | | | | | | |
| Other Assets in Excess of Liabilities — 1.5% | | | | | | | 23,285,065 | (f) |
| | | | | | | | | |
| Net Assets — 100.0% | | | | | | $ | 1,582,796,715 | |
| * | A complete Schedule of Investments is available without charge upon request by calling toll-free 1-888-534-2001 or on the SEC’s website at http://www.sec.gov. |
| (a) | Non-income producing security. |
| (b) | All or a portion of the shares have been committed as collateral for open short positions. |
| (c) | Represents issuers not identified as either a top 50 holding in terms of value and issues or issuers not exceeding 1% of net assets individually or in the aggregate, respectively, as of October 31, 2013. |
| (d) | Percentage rounds to less than 0.1%. |
| (e) | The rate shown is the 7-day effective yield as of October 31, 2013. |
| (f) | Includes cash held as margin deposits for open short positions. |
See accompanying notes to financial statements.
TFS MARKET NEUTRAL FUND
SCHEDULE OF SECURITIES SOLD SHORT
October 31, 2013
| | | | | | |
| Consumer Discretionary — 9.1% | | | | | | |
| Auto Components — 0.2% | | | | | | |
| American Axle & Manufacturing Holdings, Inc. | | | 6,286 | | | $ | 116,982 | |
| Ballard Power Systems, Inc. | | | 235,176 | | | | 322,191 | |
| China XD Plastics Company Ltd. | | | 103,237 | | | | 498,635 | |
| Dana Holding Corporation | | | 817 | | | | 16,013 | |
| Motorcar Parts of America, Inc. | | | 4,115 | | | | 56,293 | |
| Quantum Fuel Systems Technologies Worldwide, Inc. | | | 278,301 | | | | 1,327,496 | |
| SORL Auto Parts, Inc. | | | 44,089 | | | | 212,068 | |
| Standard Motor Products, Inc. | | | 1,593 | | | | 57,603 | |
| Tenneco Automotive, Inc. | | | 3,839 | | | | 203,736 | |
| | | | | | | | 2,811,017 | |
| Automobiles — 0.3% | | | | | | | | |
| Kandi Technologies Group, Inc. | | | 753,627 | | | | 4,936,257 | |
| Tesla Motors, Inc. | | | 1,716 | | | | 274,457 | |
| | | | | | | | 5,210,714 | |
Distributors — 0.0% (a) | | | | | | | | |
| China Metro-Rural Holdings Ltd. | | | 100 | | | | 110 | |
| | | | | | | | | |
| Diversified Consumer Services — 0.9% | | | | | | | | |
| Ascent Capital Group, Inc. | | | 660 | | | | 55,717 | |
| Bridgepoint Education, Inc. | | | 7,237 | | | | 141,845 | |
| Career Education Corporation | | | 5,302 | | | | 29,055 | |
| Collectors Universe, Inc. | | | 2,887 | | | | 48,069 | |
| Corinthian Colleges, Inc. | | | 725,419 | | | | 1,552,397 | |
| DeVry, Inc. | | | 2,987 | | | | 107,233 | |
| Education Management Corporation | | | 56,873 | | | | 870,157 | |
| ITT Educational Services, Inc. | | | 44,619 | | | | 1,790,114 | |
| K12, Inc. | | | 21,999 | | | | 402,142 | |
| LifeLock, Inc. | | | 10,300 | | | | 165,727 | |
| Matthews International Corporation - Class A | | | 16,358 | | | | 664,135 | |
| Outerwall, Inc. | | | 46,889 | | | | 3,046,847 | |
| Regis Corporation | | | 43,903 | | | | 636,594 | |
| Service Corporation International | | | 48,297 | | | | 869,829 | |
| StoneMor Partners, L.P. | | | 91,637 | | | | 2,405,471 | |
| Strayer Education, Inc. | | | 45,217 | | | | 1,787,428 | |
| | | | | | | | 14,572,760 | |
| Hotels, Restaurants & Leisure — 0.5% | | | | | | | | |
| Bally Technologies, Inc. | | | 13,078 | | | | 956,525 | |
| Buffalo Wild Wings, Inc. | | | 487 | | | | 69,436 | |
| Churchill Downs, Inc. | | | 7,111 | | | | 610,906 | |
| Empire Resorts, Inc. | | | 400 | | | | 2,456 | |
| Iao Kun Group Holding Company Ltd. | | | 41,287 | | | | 137,899 | |
| Interval Leisure Group, Inc. | | | 915 | | | | 22,207 | |
TFS MARKET NEUTRAL FUND
SCHEDULE OF SECURITIES SOLD SHORT (Continued)
COMMON STOCKS — 63.5% (Continued) | | | | | | |
| Consumer Discretionary — 9.1% (Continued) | | | | | | |
| Hotels, Restaurants & Leisure — 0.5% (Continued) | | | | | | |
| Life Time Fitness, Inc. | | | 16,704 | | | $ | 758,696 | |
| Morgans Hotel Group Company | | | 25,086 | | | | 179,616 | |
| Noodles & Company | | | 39,246 | | | | 1,718,582 | |
| PokerTek, Inc. | | | 1,884 | | | | 2,223 | |
| Red Lion Hotels Corporation | | | 12,215 | | | | 73,534 | |
| Red Robin Gourmet Burgers, Inc. | | | 299 | | | | 22,778 | |
| Ryman Hospitality Properties, Inc. | | | 24,056 | | | | 887,907 | |
| Six Flags Entertainment Corporation | | | 1,157 | | | | 43,515 | |
| Vail Resorts, Inc. | | | 34,165 | | | | 2,406,924 | |
| | | | | | | | 7,893,204 | |
| Household Durables — 1.9% | | | | | | | | |
| Beazer Homes USA, Inc. | | | 162,640 | | | | 2,955,169 | |
| Blyth, Inc. | | | 385,032 | | | | 5,317,292 | |
| Cavco Industries, Inc. | | | 3,530 | | | | 206,752 | |
| Comstock Homebuilding Companies, Inc. - Class A | | | 72,445 | | | | 148,512 | |
| Desarrolladora Homex S.A.B de C.V. - ADR | | | 36,260 | | | | 47,863 | |
| Dixie Group, Inc. (The) | | | 10,021 | | | | 126,265 | |
| Ethan Allen Interiors, Inc. | | | 34,651 | | | | 923,103 | |
| Hovnanian Enterprises, Inc. - Class A | | | 754,666 | | | | 3,818,610 | |
| KB Home | | | 263,066 | | | | 4,464,230 | |
| Location Based Technologies, Inc. | | | 95,655 | | | | 9,566 | |
| M/I Homes, Inc. | | | 70,313 | | | | 1,439,307 | |
| Mad Catz Interactive, Inc. | | | 483,035 | | | | 324,358 | |
| MDC Holdings, Inc. | | | 114,621 | | | | 3,345,787 | |
| Ryland Group, Inc. (The) | | | 108,067 | | | | 4,344,293 | |
| SodaStream International Ltd. | | | 38,692 | | | | 2,068,861 | |
| Tempur Sealy International, Inc. | | | 8,083 | | | | 309,983 | |
| William Lyon Homes - Class A | | | 16,367 | | | | 379,223 | |
| | | | | | | | 30,229,174 | |
| Internet & Catalog Retail — 0.3% | | | | | | | | |
| Blue Nile, Inc. | | | 37,491 | | | | 1,539,755 | |
| E-Commerce China Dangdang, Inc. - ADR | | | 68,164 | | | | 603,252 | |
| HomeAway, Inc. | | | 16,522 | | | | 489,877 | |
| Overstock.com, Inc. | | | 6,486 | | | | 151,967 | |
| PetMed Express, Inc. | | | 117,075 | | | | 1,737,393 | |
| ValueVision Media, Inc. | | | 36,848 | | | | 196,768 | |
| | | | | | | | 4,719,012 | |
| Leisure Equipment & Products — 0.5% | | | | | | | | |
| Black Diamond, Inc. | | | 27,986 | | | | 417,271 | |
| JAKKS Pacific, Inc. | | | 492,851 | | | | 3,173,961 | |
| LeapFrog Enterprises, Inc. | | | 116,200 | | | | 994,672 | |
| Smith & Wesson Holding Corporation | | | 122,489 | | | | 1,320,431 | |
| Sturm Ruger & Company, Inc. | | | 20,954 | | | | 1,370,601 | |
| | | | | | | | 7,276,936 | |
TFS MARKET NEUTRAL FUND
SCHEDULE OF SECURITIES SOLD SHORT (Continued)
COMMON STOCKS — 63.5% (Continued) | | | | | | |
| Consumer Discretionary — 9.1% (Continued) | | | | | | |
| Media — 1.1% | | | | | | |
| AirMedia Group, Inc. - ADR | | | 16,842 | | | $ | 28,463 | |
| Bona Film Group Ltd. - ADR | | | 9,458 | | | | 54,478 | |
| Central European Media Enterprises Ltd. | | | 72,460 | | | | 222,452 | |
| China Yida Holding Company | | | 1,551 | | | | 6,638 | |
| Clear Channel Outdoor Holdings, Inc. | | | 24,149 | | | | 205,267 | |
| Cumulus Media, Inc. - Class A | | | 313,271 | | | | 1,873,361 | |
| DreamWorks Animation SKG, Inc. - Class A | | | 68,523 | | | | 2,346,228 | |
| Gray Television, Inc. | | | 15,218 | | | | 128,592 | |
| Manchester United plc - Class A | | | 5,356 | | | | 87,303 | |
| McClatchy Company (The) - Class A | | | 300,014 | | | | 846,039 | |
| Media General, Inc. - Class A | | | 48,509 | | | | 707,261 | |
| Meredith Corporation | | | 58,988 | | | | 3,026,084 | |
| Nexstar Broadcasting Group, Inc. | | | 109,859 | | | | 4,876,641 | |
| ReachLocal, Inc. | | | 24,961 | | | | 306,771 | |
| Scholastic Corporation | | | 63,304 | | | | 1,816,192 | |
| Sinclair Broadcast Group, Inc. | | | 8,229 | | | | 263,822 | |
| SPAR Group, Inc. | | | 195 | | | | 380 | |
| Tiger Media, Inc. | | | 1,132 | | | | 1,528 | |
| Valassis Communications, Inc. | | | 41,892 | | | | 1,146,165 | |
| VisionChina Media, Inc. - ADR | | | 10,700 | | | | 75,328 | |
| | | | | | | | 18,018,993 | |
| Multiline Retail — 0.9% | | | | | | | | |
| Bon-Ton Stores, Inc. (The) | | | 92,588 | | | | 1,060,133 | |
| Dillard's, Inc. - Class A | | | 50,132 | | | | 4,109,821 | |
| Fred's, Inc. - Class A | | | 87,598 | | | | 1,419,088 | |
| J. C. Penney Company, Inc. | | | 632,253 | | | | 4,741,898 | |
| Sears Canada, Inc. | | | 7,343 | | | | 102,116 | |
| Sears Holdings Corporation | | | 43,954 | | | | 2,552,848 | |
| | | | | | | | 13,985,904 | |
| Specialty Retail — 2.1% | | | | | | | | |
| Abercrombie & Fitch Company - Class A | | | 106,029 | | | | 3,973,967 | |
| Aéropostale, Inc. | | | 673,907 | | | | 6,260,596 | |
| America's Car-Mart, Inc. | | | 11,273 | | | | 515,627 | |
AutoChina International Ltd. (b) | | | 143 | | | | 1,973 | |
| Barnes & Noble, Inc. | | | 139,325 | | | | 1,968,662 | |
| bebe stores, inc. | | | 12,624 | | | | 76,123 | |
| Books-A-Million, Inc. | | | 13,918 | | | | 34,934 | |
| Buckle, Inc. (The) | | | 16,907 | | | | 827,429 | |
| China Auto Logistics, Inc. | | | 1,926 | | | | 5,123 | |
| Coldwater Creek, Inc. | | | 31,901 | | | | 31,901 | |
| Conn's, Inc. | | | 53,651 | | | | 3,242,666 | |
| Destination XL Group, Inc. | | | 5,570 | | | | 38,712 | |
| Francesca's Holdings Corporation | | | 77,453 | | | | 1,393,379 | |
TFS MARKET NEUTRAL FUND
SCHEDULE OF SECURITIES SOLD SHORT (Continued)
COMMON STOCKS — 63.5% (Continued) | | | | | | |
| Consumer Discretionary — 9.1% (Continued) | | | | | | |
| Specialty Retail — 2.1% (Continued) | | | | | | |
| hhgregg, Inc. | | | 102,495 | | | $ | 1,589,697 | |
| Hibbett Sports, Inc. | | | 29,396 | | | | 1,714,669 | |
| Lentuo International, Inc. - ADR | | | 2,110 | | | | 6,794 | |
| Office Depot, Inc. | | | 317,491 | | | | 1,774,775 | |
| OfficeMax, Inc. | | | 60,785 | | | | 910,559 | |
| OSH 1 Liquidating Corporation | | | 11,183 | | | | 3,914 | |
| Pep Boys - Manny Moe & Jack (The) | | | 6,936 | | | | 89,752 | |
| Pier 1 Imports, Inc. | | | 206,942 | | | | 4,320,949 | |
| Rent-A-Center, Inc. | | | 23,906 | | | | 818,541 | |
| Restoration Hardware Holdings, Inc. | | | 1,171 | | | | 81,666 | |
| Select Comfort Corporation | | | 35,018 | | | | 641,530 | |
| Stage Stores, Inc. | | | 76,034 | | | | 1,570,102 | |
| Systemax, Inc. | | | 1,915 | | | | 18,193 | |
| Zumiez, Inc. | | | 50,991 | | | | 1,511,373 | |
| | | | | | | | 33,423,606 | |
| Textiles, Apparel & Luxury Goods — 0.4% | | | | | | | | |
| American Apparel, Inc. | | | 12,083 | | | | 16,191 | |
| Deckers Outdoor Corporation | | | 3,168 | | | | 218,054 | |
| DGSE Companies, Inc. | | | 2,185 | | | | 5,463 | |
| G-III Apparel Group Ltd. | | | 12,988 | | | | 736,679 | |
| Iconix Brand Group, Inc. | | | 13,675 | | | | 493,531 | |
| Kingold Jewelry, Inc. | | | 195,743 | | | | 395,401 | |
| Oxford Industries, Inc. | | | 1,160 | | | | 83,253 | |
| Vera Bradley, Inc. | | | 156,208 | | | | 3,460,007 | |
| | | | | | | | 5,408,579 | |
| Consumer Staples — 2.1% | | | | | | | | |
| Beverages — 0.1% | | | | | | | | |
| Primo Water Corporation | | | 177,933 | | | | 443,053 | |
| Reed's, Inc. | | | 89,069 | | | | 573,605 | |
| | | | | | | | 1,016,658 | |
| Food & Staples Retailing — 0.6% | | | | | | | | |
| China Jo-Jo Drugstores, Inc. | | | 395 | | | | 399 | |
| Crumbs Bake Shop, Inc. | | | 137 | | | | 178 | |
| Fairway Group Holdings Corporation | | | 11,332 | | | | 276,841 | |
| Nash Finch Company | | | 17,239 | | | | 483,726 | |
| Natural Grocers by Vitamin Cottage, Inc. | | | 22,531 | | | | 898,987 | |
| Pizza Inn Holdings, Inc. | | | 57,838 | | | | 473,693 | |
| Spartan Stores, Inc. | | | 24,975 | | | | 587,662 | |
| SUPERVALU, Inc. | | | 708,032 | | | | 4,977,465 | |
| Susser Holdings Corporation | | | 24,801 | | | | 1,360,087 | |
| | | | | | | | 9,059,038 | |
TFS MARKET NEUTRAL FUND
SCHEDULE OF SECURITIES SOLD SHORT (Continued)
COMMON STOCKS — 63.5% (Continued) | | | | | | |
| Consumer Staples — 2.1% (Continued) | | | | | | |
| Food Products — 0.7% | | | | | | |
| AgFeed Industries, Inc. | | | 146,948 | | | $ | 39,676 | |
| Annie's, Inc. | | | 48,548 | | | | 2,293,893 | |
| Boulder Brands, Inc. | | | 94,438 | | | | 1,547,839 | |
| Calavo Growers, Inc. | | | 27,166 | | | | 806,558 | |
| China Marine Food Group Ltd. | | | 95,426 | | | | 19,849 | |
| Coffee Holding Company, Inc. | | | 87,149 | | | | 465,376 | |
| Dean Foods Company | | | 155,808 | | | | 3,038,256 | |
| Diamond Foods, Inc. | | | 91,772 | | | | 2,240,154 | |
| Green Mountain Coffee Roasters, Inc. | | | 2,982 | | | | 187,299 | |
| Le Gaga Holdings Ltd. - ADR | | | 6,179 | | | | 22,183 | |
| S&W Seed Company | | | 4,952 | | | | 35,605 | |
| SkyPeople Fruit Juice, Inc. | | | 34,162 | | | | 65,591 | |
| | | | | | | | 10,762,279 | |
Household Products — 0.0% (a) | | | | | | | | |
| Central Garden & Pet Company - Class A | | | 13,376 | | | | 98,447 | |
| | | | | | | | | |
| Personal Products — 0.4% | | | | | | | | |
| China Sky One Medical, Inc. | | | 36,447 | | | | 8,747 | |
| China-Biotics, Inc. | | | 535,616 | | | | 1,365,821 | |
| Herbalife Ltd. | | | 25,182 | | | | 1,632,297 | |
| LifeVantage Corporation | | | 236,686 | | | | 518,342 | |
| Mannatech, Inc. | | | 2,247 | | | | 53,007 | |
| Medifast, Inc. | | | 43,853 | | | | 1,022,214 | |
| Synutra International, Inc. | | | 80,486 | | | | 549,719 | |
| USANA Health Sciences, Inc. | | | 19,585 | | | | 1,336,285 | |
| | | | | | | | 6,486,432 | |
| Tobacco — 0.3% | | | | | | | | |
| Star Scientific, Inc. | | | 1,026,502 | | | | 1,857,968 | |
| Universal Corporation | | | 53,321 | | | | 2,827,613 | |
| Vector Group Ltd. | | | 51,046 | | | | 825,414 | |
| | | | | | | | 5,510,995 | |
| Energy — 6.3% | | | | | | | | |
| Energy Equipment & Services — 1.3% | | | | | | | | |
| Cal Dive International, Inc. | | | 1,166,144 | | | | 2,297,304 | |
| CARBO Ceramics, Inc. | | | 35,110 | | | | 4,400,687 | |
| Exterran Holdings, Inc. | | | 1,387 | | | | 39,599 | |
| Forum Energy Technologies, Inc. | | | 7,815 | | | | 228,667 | |
| Geospace Technologies Corporation | | | 93,288 | | | | 9,088,117 | |
| McDermott International, Inc. | | | 27,123 | | | | 191,760 | |
| Patterson-UTI Energy, Inc. | | | 13,028 | | | | 316,059 | |
| Recon Technology Ltd. | | | 41,638 | | | | 186,538 | |
| RPC, Inc. | | | 5,980 | | | | 109,673 | |
| Tidewater, Inc. | | | 56,647 | | | | 3,411,282 | |
TFS MARKET NEUTRAL FUND
SCHEDULE OF SECURITIES SOLD SHORT (Continued)
COMMON STOCKS — 63.5% (Continued) | | | | | | |
| Energy — 6.3% (Continued) | | | | | | |
| Energy Equipment & Services — 1.3% (Continued) | | | | | | |
| Vantage Drilling Company | | | 170,920 | | | $ | 304,238 | |
| | | | | | | | 20,573,924 | |
| Oil, Gas & Consumable Fuels — 5.0% | | | | | | | | |
| Alliance Resource Partners, L.P. | | | 1,973 | | | | 149,770 | |
| Alon USA Energy, Inc. | | | 178,489 | | | | 2,156,147 | |
| Alpha Natural Resources, Inc. | | | 246,559 | | | | 1,725,913 | |
| Amyris, Inc. | | | 200,087 | | | | 504,219 | |
| Apco Oil and Gas International, Inc. | | | 1,828 | | | | 27,822 | |
| Arch Coal, Inc. | | | 86,527 | | | | 366,875 | |
| Berry Petroleum Company - Class A | | | 2,900 | | | | 138,475 | |
| Bill Barrett Corporation | | | 40,132 | | | | 1,110,452 | |
| BioFuel Energy Corporation | | | 109,169 | | | | 375,541 | |
| Blue Dolphin Energy Company | | | 38,398 | | | | 209,653 | |
| BPZ Resources, Inc. | | | 842,525 | | | | 1,693,475 | |
| BreitBurn Energy Partners, L.P. | | | 22,000 | | | | 422,840 | |
| CAMAC Energy, Inc. | | | 245,365 | | | | 244,138 | |
| Chesapeake Granite Wash Trust | | | 36,651 | | | | 449,341 | |
| China Integrated Energy, Inc. | | | 405,472 | | | | 223,010 | |
| Clean Energy Fuels Corporation | | | 175,509 | | | | 1,999,048 | |
| Comstock Resources, Inc. | | | 54,837 | | | | 938,261 | |
| Contango Oil & Gas Company | | | 26,295 | | | | 1,126,741 | |
| Crosstex Energy, L.P. | | | 5,533 | | | | 140,704 | |
| Cubic Energy, Inc. | | | 4,183 | | | | 1,590 | |
| Delek US Holdings, Inc. | | | 208,244 | | | | 5,320,634 | |
| Dominion Resources Black Warrior Trust | | | 1,278 | | | | 7,387 | |
| ECA Marcellus Trust I | | | 48,071 | | | | 481,671 | |
| Enbridge Energy Management, LLC | | | 58,549 | | | | 1,669,818 | |
| Endeavour International Corporation | | | 164,262 | | | | 975,716 | |
| Evolution Petroleum Corporation | | | 4,638 | | | | 55,934 | |
| EXCO Resources, Inc. | | | 246,281 | | | | 1,332,380 | |
| Frontline Ltd. | | | 1,470,440 | | | | 3,117,333 | |
| Gevo, Inc. | | | 234,631 | | | | 398,873 | |
| Global Partners, L.P. | | | 8,113 | | | | 289,634 | |
| GMX Resources, Inc. | | | 72,181 | | | | 9,384 | |
| Golar LNG Ltd. | | | 16,762 | | | | 622,373 | |
| GreenHunter Resources, Inc. | | | 78,321 | | | | 104,167 | |
| Halcon Resources Corporation | | | 235,527 | | | | 1,220,030 | |
| Harvest Natural Resources, Inc. | | | 317,596 | | | | 1,587,980 | |
| Houston American Energy Corporation | | | 39,340 | | | | 10,228 | |
| Hyperdynamics Corporation | | | 119,465 | | | | 431,269 | |
| InterOil Corporation | | | 19,078 | | | | 1,324,967 | |
| Isramco, Inc. | | | 2,362 | | | | 311,713 | |
| Ivanhoe Energy, Inc. | | | 4,600 | | | | 3,151 | |
| James River Coal Company | | | 2,228,219 | | | | 4,278,180 | |
TFS MARKET NEUTRAL FUND
SCHEDULE OF SECURITIES SOLD SHORT (Continued)
COMMON STOCKS — 63.5% (Continued) | | | | | | |
| Energy — 6.3% (Continued) | | | | | | |
| Oil, Gas & Consumable Fuels — 5.0% (Continued) | | | | | | |
| Kinder Morgan Management, LLC | | | 19,330 | | | $ | 1,455,902 | |
| KiOR, Inc. - Class A | | | 1,055,979 | | | | 2,460,431 | |
| L & L Energy, Inc. | | | 497,168 | | | | 705,979 | |
| LinnCo, LLC | | | 52,510 | | | | 1,548,520 | |
| Lucas Energy, Inc. | | | 373,047 | | | | 414,082 | |
| Midstates Petroleum Company, Inc. | | | 33,372 | | | | 188,218 | |
| Miller Energy Resources, Inc. | | | 490,141 | | | | 3,313,353 | |
| New Concept Energy, Inc. | | | 13,597 | | | | 22,027 | |
| Newfield Exploration Company | | | 19,684 | | | | 599,378 | |
| NGL Energy Partners, L.P. | | | 10,617 | | | | 334,011 | |
| Niska Gas Storage Partners, LLC | | | 18,126 | | | | 286,391 | |
| Nordic American Tankers Ltd. | | | 375,836 | | | | 3,066,822 | |
| North European Oil Royalty Trust | | | 10,200 | | | | 234,600 | |
| Northern Oil & Gas, Inc. | | | 20,056 | | | | 329,520 | |
| Nuverra Environmental Solutions, Inc. | | | 884,415 | | | | 2,157,973 | |
| Overseas Shipholding Group, Inc. | | | 526,119 | | | | 1,815,111 | |
| Oxford Resource Partners, L.P. | | | 189,133 | | | | 295,047 | |
| Pacific Coast Oil Trust | | | 8,046 | | | | 120,690 | |
| Pacific Ethanol, Inc. | | | 482,026 | | | | 1,764,215 | |
| Patriot Coal Corporation | | | 288,164 | | | | 36,597 | |
| PDC Energy, Inc. | | | 14,412 | | | | 977,278 | |
| PetroQuest Energy, Inc. | | | 49,065 | | | | 231,587 | |
| Pyramid Oil Company | | | 33,335 | | | | 176,676 | |
| Quicksilver Resources, Inc. | | | 65,629 | | | | 140,446 | |
| Rhino Resource Partners, L.P. | | | 13,818 | | | | 175,627 | |
| Royale Energy, Inc. | | | 196,705 | | | | 529,136 | |
| San Juan Basin Royalty Trust | | | 171,178 | | | | 2,694,342 | |
| SandRidge Energy, Inc. | | | 26,065 | | | | 165,252 | |
| SandRidge Mississippian Trust I | | | 45,880 | | | | 565,242 | |
| Sino Clean Energy, Inc. | | | 213,222 | | | | 36,248 | |
| Solazyme, Inc. | | | 499,382 | | | | 5,223,536 | |
| Spectra Energy Partners, L.P. | | | 4,852 | | | | 212,129 | |
| Summit Midstream Partners, L.P. | | | 777 | | | | 25,835 | |
| TC PipeLines, L.P. | | | 1,875 | | | | 95,644 | |
| Teekay Offshore Partners, L.P. | | | 7,530 | | | | 253,083 | |
| Teekay Tankers Ltd. - Class A | | | 277,461 | | | | 724,173 | |
| Ultra Petroleum Corporation | | | 26,276 | | | | 482,427 | |
| Uranerz Energy Corporation | | | 533,293 | | | | 490,630 | |
| Uranium Energy Corporation | | | 484,371 | | | | 852,493 | |
| Uranium Resources, Inc. | | | 157,024 | | | | 370,577 | |
| Ur-Energy, Inc. | | | 117,560 | | | | 123,438 | |
| USEC, Inc. | | | 58,548 | | | | 471,897 | |
| Verenium Corporation | | | 115,638 | | | | 461,396 | |
| Western Refining, Inc. | | | 26,263 | | | | 847,507 | |
TFS MARKET NEUTRAL FUND
SCHEDULE OF SECURITIES SOLD SHORT (Continued)
COMMON STOCKS — 63.5% (Continued) | | | | | | |
| Energy — 6.3% (Continued) | | | | | | |
| Oil, Gas & Consumable Fuels — 5.0% (Continued) | | | | | | |
| Whiting USA Trust I | | | 553,369 | | | $ | 2,905,187 | |
| World Fuel Services Corporation | | | 12,342 | | | | 470,847 | |
| Zion Oil & Gas, Inc. | | | 262,571 | | | | 430,616 | |
| | | | | | | | 78,838,953 | |
| Financials — 9.1% | | | | | | | | |
| Capital Markets — 1.5% | | | | | | | | |
| Apollo Investment Corporation | | | 312,856 | | | | 2,668,662 | |
| Calamos Asset Management, Inc. | | | 12,695 | | | | 124,665 | |
| Cohen & Steers, Inc. | | | 39,354 | | | | 1,509,619 | |
| Federated Investors, Inc. - Class B | | | 71,043 | | | | 1,926,686 | |
| Fidus Investment Corporation | | | 121,917 | | | | 2,476,134 | |
| Financial Engines, Inc. | | | 12,949 | | | | 723,461 | |
| Garrison Capital, Inc. | | | 21,311 | | | | 313,911 | |
| Gladstone Investment Corporation | | | 219,825 | | | | 1,554,163 | |
| Golub Capital BDC, Inc. | | | 106,911 | | | | 1,881,634 | |
| Hannon Armstrong Sustainable Infrastructure Capital, Inc. | | | 26,588 | | | | 325,703 | |
| Hercules Technology Growth Capital, Inc. | | | 71,951 | | | | 1,110,923 | |
| Horizon Technology Finance Corporation | | | 13,673 | | | | 184,312 | |
| INTL FCStone, Inc. | | | 51,236 | | | | 1,048,289 | |
| KCAP Financial, Inc. | | | 156,005 | | | | 1,315,122 | |
| Keating Capital, Inc. | | | 2,082 | | | | 14,491 | |
| Medley Capital Corporation | | | 19,493 | | | | 271,732 | |
| MVC Capital, Inc. | | | 10,675 | | | | 147,635 | |
| Noah Holdings Ltd. - ADR | | | 24,090 | | | | 464,696 | |
| Och-Ziff Capital Management Group, LLC | | | 50,083 | | | | 625,537 | |
| PennantPark Floating Rate Capital Ltd. | | | 28,718 | | | | 381,662 | |
| Prospect Capital Corporation | | | 107,917 | | | | 1,223,779 | |
| Rand Capital Corporation | | | 751 | | | | 2,140 | |
| Safeguard Scientifics, Inc. | | | 56,344 | | | | 983,203 | |
| Stifel Financial Corporation | | | 8,555 | | | | 350,327 | |
| TCP Capital Corporation | | | 13,928 | | | | 232,180 | |
| THL Credit, Inc. | | | 15,904 | | | | 258,440 | |
| TICC Capital Corporation | | | 157,401 | | | | 1,574,010 | |
| Triangle Capital Corporation | | | 12,112 | | | | 360,453 | |
| | | | | | | | 24,053,569 | |
| Commercial Banks — 3.3% | | | | | | | | |
| Ameris Bancorp | | | 30,895 | | | | 565,378 | |
| Arrow Financial Corporation | | | 26,523 | | | | 684,559 | |
| Athens Bancshares Corporation | | | 289 | | | | 5,216 | |
| Auburn National Bancorporation, Inc. | | | 25 | | | | 640 | |
| BancorpSouth, Inc. | | | 13,544 | | | | 299,322 | |
| Bank of Hawaii Corporation | | | 14,761 | | | | 855,843 | |
| Bank of the Ozarks, Inc. | | | 56,767 | | | | 2,808,831 | |
TFS MARKET NEUTRAL FUND
SCHEDULE OF SECURITIES SOLD SHORT (Continued)
COMMON STOCKS — 63.5% (Continued) | | | | | | |
| Financials — 9.1% (Continued) | | | | | | |
| Commercial Banks — 3.3% (Continued) | | | | | | |
| Banner Corporation | | | 21,726 | | | $ | 831,237 | |
| Capital City Bank Group, Inc. | | | 17,627 | | | | 216,812 | |
| Cardinal Financial Corporation | | | 13,234 | | | | 218,361 | |
| Cascade Bancorp | | | 25,281 | | | | 130,703 | |
| Cathay General Bancorp | | | 24,871 | | | | 612,573 | |
| Citizens Holding Company | | | 589 | | | | 11,262 | |
| City Bank | | | 12,333 | | | | 1,418 | |
| City Holding Company | | | 66,177 | | | | 3,011,053 | |
| Columbia Banking System, Inc. | | | 49,591 | | | | 1,273,993 | |
| Commerce Bancshares, Inc. | | | 4,685 | | | | 215,557 | |
| Community Bank System, Inc. | | | 48,794 | | | | 1,771,710 | |
| CommunityOne Bancorp | | | 15,963 | | | | 171,762 | |
| Customers Bancorp, Inc. | | | 16,587 | | | | 277,832 | |
| CVB Financial Corporation | | | 13,586 | | | | 197,540 | |
| DNB Financial Corporation | | | 10 | | | | 208 | |
| Farmers Capital Bank Corporation | | | 316 | | | | 6,491 | |
| Fauquier Bankshares, Inc. | | | 323 | | | | 4,425 | |
| Fidelity Southern Corporation | | | 10,603 | | | | 161,901 | |
| First Busey Corporation | | | 156,204 | | | | 807,575 | |
| First Community Corporation | | | 75 | | | | 786 | |
| First Financial Bancorporation | | | 54,750 | | | | 849,720 | |
| First Financial Bankshares, Inc. | | | 59,163 | | | | 3,639,116 | |
| First Merchants Corporation | | | 7,096 | | | | 133,405 | |
| FNB Corporation | | | 2,134 | | | | 26,696 | |
| Frontier Financial Corporation | | | 10,318 | | | | 1,032 | |
| Fulton Financial Corporation | | | 9,994 | | | | 122,027 | |
| Glacier Bancorp, Inc. | | | 50,735 | | | | 1,401,808 | |
| Glen Burnie Bancorp | | | 49 | | | | 584 | |
| Hampton Roads Bankshares, Inc. | | | 178,524 | | | | 251,719 | |
| Hancock Holding Company | | | 30,619 | | | | 1,003,691 | |
| Heartland Financial USA, Inc. | | | 2,048 | | | | 54,252 | |
| Independent Bank Corporation (Massachusetts) | | | 55,084 | | | | 1,976,414 | |
| Independent Bank Corporation (Michigan) | | | 43,320 | | | | 421,070 | |
| Intervest Bancshares Corporation - Class A | | | 11,918 | | | | 86,882 | |
| Lakeland Bancorp, Inc. | | | 33,657 | | | | 383,690 | |
| Macatawa Bank Corporation | | | 35,844 | | | | 175,994 | |
| National Bank Holdings Corporation | | | 6,169 | | | | 129,549 | |
| National Penn Bancshares, Inc. | | | 63,385 | | | | 657,302 | |
| Oak Valley Bancorp | | | 270 | | | | 2,201 | |
| OFG Bancorp | | | 66,426 | | | | 983,769 | |
| Old National Bancorp | | | 25,366 | | | | 368,822 | |
| Old Second Bancorp, Inc. | | | 68,547 | | | | 326,969 | |
| OptimumBank Holdings, Inc. | | | 1,136 | | | | 1,681 | |
TFS MARKET NEUTRAL FUND
SCHEDULE OF SECURITIES SOLD SHORT (Continued)
COMMON STOCKS — 63.5% (Continued) | | | | | | |
| Financials — 9.1% (Continued) | | | | | | |
| Commercial Banks — 3.3% (Continued) | | | | | | |
| Pacific Premier Bancorp, Inc. | | | 5,833 | | | $ | 81,137 | |
| PacWest Bancorp | | | 41,085 | | | | 1,563,284 | |
| Park National Corporation | | | 30,196 | | | | 2,392,127 | |
| Park Sterling Corporation | | | 26,509 | | | | 172,574 | |
| Patriot National Bancorp | | | 418 | | | | 506 | |
| Pinnacle Financial Partners, Inc. | | | 74,679 | | | | 2,315,049 | |
| Plumas Bancorp | | | 45 | | | | 288 | |
| Porter Bancorp, Inc. | | | 177 | | | | 198 | |
| Renasant Corporation | | | 67,423 | | | | 1,933,692 | |
| Republic Bancorp, Inc. - Class A | | | 25,920 | | | | 596,678 | |
| S&T Bancorp, Inc. | | | 7,105 | | | | 174,215 | |
| Southside Bancshares, Inc. | | | 83,168 | | | | 2,270,486 | |
| Southwest Bancorp, Inc. | | | 14,331 | | | | 229,439 | |
| State Bank Financial Corporation | | | 6,514 | | | | 111,129 | |
| Taylor Capital Group, Inc. | | | 59,033 | | | | 1,357,759 | |
| Texas Capital Bancshares, Inc. | | | 11,581 | | | | 602,791 | |
| TowneBank | | | 54,502 | | | | 793,549 | |
| Tristate Capital Holdings, Inc. | | | 1,519 | | | | 19,003 | |
| Two River Bancorp | | | 20 | | | | 150 | |
| Umpqua Holdings Corporation | | | 29,265 | | | | 479,068 | |
| Union First Market Bankshares Corporation | | | 23,923 | | | | 577,023 | |
| United Bancorp, Inc. | | | 539 | | | | 3,676 | |
| United Bankshares, Inc. | | | 108,538 | | | | 3,210,554 | |
| United Security Bancshares | | | 1,542 | | | | 7,923 | |
| Westamerica Bancorporation | | | 45,355 | | | | 2,334,875 | |
| Wintrust Financial Corporation | | | 47,364 | | | | 2,060,808 | |
| Yadkin Financial Corporation | | | 1,075 | | | | 17,652 | |
| | | | | | | | 51,447,014 | |
| Consumer Finance — 0.4% | | | | | | | | |
| Atlanticus Holdings Corporation | | | 106,479 | | | | 371,612 | |
| Encore Capital Group, Inc. | | | 127,994 | | | | 6,252,507 | |
| Green Dot Corporation - Class A | | | 12,087 | | | | 259,387 | |
| | | | | | | | 6,883,506 | |
| Diversified Financial Services — 0.1% | | | | | | | | |
| DJSP Enterprises, Inc. | | | 15,126 | | | | 2,118 | |
| Global Eagle Entertainment, Inc. | | | 19,502 | | | | 198,530 | |
| Life Partners Holdings, Inc. | | | 156,457 | | | | 316,043 | |
| Manhattan Bridge Capital, Inc. | | | 829 | | | | 1,865 | |
| MarketAxess Holdings, Inc. | | | 3,947 | | | | 257,463 | |
| | | | | | | | 776,019 | |
| Insurance — 0.9% | | | | | | | | |
| Arthur J. Gallagher & Company | | | 14,422 | | | | 684,324 | |
| Citizens, Inc. | | | 21,539 | | | | 180,928 | |
| CNA Financial Corporation | | | 2,682 | | | | 108,862 | |
TFS MARKET NEUTRAL FUND
SCHEDULE OF SECURITIES SOLD SHORT (Continued)
COMMON STOCKS — 63.5% (Continued) | | | | | | |
| Financials — 9.1% (Continued) | | | | | | |
| Insurance — 0.9% (Continued) | | | | | | |
| eHealth, Inc. | | | 8,789 | | | $ | 374,587 | |
| First American Financial Corporation | | | 56,860 | | | | 1,470,400 | |
| Greenlight Capital Re Ltd. - Class A | | | 36,451 | | | | 1,122,326 | |
| HCI Group, Inc. | | | 9,413 | | | | 413,607 | |
| Hilltop Holdings, Inc. | | | 44,803 | | | | 776,884 | |
| Kingsway Financial Services, Inc. | | | 2,403 | | | | 7,666 | |
| Meadowbrook Insurance Group, Inc. | | | 387,812 | | | | 2,575,072 | |
| Montpelier Re Holdings Ltd. | | | 45,005 | | | | 1,242,588 | |
| Phoenix Companies, Inc. (The) | | | 17,713 | | | | 683,190 | |
| Primerica, Inc. | | | 24,215 | | | | 1,040,034 | |
| StanCorp Financial Group, Inc. | | | 3,862 | | | | 227,472 | |
| Stewart Information Services Corporation | | | 73,767 | | | | 2,310,382 | |
| Tower Group International Ltd. | | | 103,279 | | | | 374,903 | |
| | | | | | | | 13,593,225 | |
| Real Estate Investment Trusts (REIT) — 1.7% | | | | | | | | |
| Agree Realty Corporation | | | 13,108 | | | | 413,820 | |
| American Residential Properties, Inc. | | | 34,892 | | | | 601,189 | |
| AmREIT, Inc. | | | 10,164 | | | | 178,886 | |
| Armada Hoffler Properties, Inc. | | | 26,801 | | | | 257,826 | |
| Associated Estates Realty Corporation | | | 55,680 | | | | 854,131 | |
| Campus Crest Communities, Inc. | | | 48,580 | | | | 486,286 | |
| Chambers Street Properties | | | 101,178 | | | | 943,991 | |
| Colony Financial, Inc. | | | 32,610 | | | | 659,700 | |
| CommonWealth REIT | | | 6,305 | | | | 153,653 | |
| CYS Investments, Inc. | | | 212,899 | | | | 1,807,513 | |
| DCT Industrial Trust, Inc. | | | 54,858 | | | | 425,149 | |
| DuPont Fabros Technology, Inc. | | | 34,038 | | | | 845,844 | |
| Education Realty Trust, Inc. | | | 15,065 | | | | 137,694 | |
| Equity Lifestyle Properties, Inc. | | | 9,765 | | | | 370,972 | |
| Equity One, Inc. | | | 6,464 | | | | 155,847 | |
| First Potomac Realty Trust | | | 43,351 | | | | 532,784 | |
| Geo Group, Inc. (The) | | | 6,548 | | | | 230,948 | |
| Getty Realty Corporation | | | 70,928 | | | | 1,360,399 | |
| Gladstone Commercial Corporation | | | 1,602 | | | | 30,278 | |
| Invesco Mortgage Capital, Inc. | | | 8,589 | | | | 132,700 | |
| iStar Financial, Inc. | | | 151,413 | | | | 1,912,346 | |
| JAVELIN Mortgage Investment Corporation | | | 32,659 | | | | 387,662 | |
| Liberty Property Trust | | | 1,602 | | | | 59,578 | |
| Monmouth Real Estate Investment Corporation - Class A | | | 24,618 | | | | 226,978 | |
| New Residential Investment Corporation | | | 11,665 | | | | 77,106 | |
| New York Mortgage Trust, Inc. | | | 14,868 | | | | 95,453 | |
| NorthStar Realty Finance Corporation | | | 52,383 | | | | 488,733 | |
TFS MARKET NEUTRAL FUND
SCHEDULE OF SECURITIES SOLD SHORT (Continued)
COMMON STOCKS — 63.5% (Continued) | | | | | | |
| Financials — 9.1% (Continued) | | | | | | |
| Real Estate Investment Trusts (REIT) — 1.7% (Continued) | | | | | | |
| Omega Healthcare Investors, Inc. | | | 53,446 | | | $ | 1,776,545 | |
| Parkway Properties, Inc. | | | 3,911 | | | | 70,828 | |
| PennyMac Mortgage Investment Trust | | | 8,243 | | | | 190,166 | |
| Preferred Apartment Communities, Inc. - Class A | | | 2,900 | | | | 24,012 | |
| Ramco-Gershenson Properties Trust | | | 19,890 | | | | 323,411 | |
| Redwood Trust, Inc. | | | 109,686 | | | | 1,921,699 | |
| Rouse Properties, Inc. | | | 118,326 | | | | 2,392,552 | |
| Sabra Health Care REIT, Inc. | | | 23,218 | | | | 624,564 | |
| Silver Bay Realty Trust Corporation | | | 17,962 | | | | 277,693 | |
| Spirit Realty Capital, Inc. | | | 60,877 | | | | 636,773 | |
| Walter Investment Management Corporation | | | 98,902 | | | | 3,735,529 | |
| Western Asset Mortgage Capital Corporation | | | 63,303 | | | | 1,019,811 | |
| Wheeler Real Estate Investment Trust, Inc. | | | 2,809 | | | | 11,798 | |
| | | | | | | | 26,832,847 | |
| Real Estate Management & Development — 0.3% | | | | | | | | |
| Alexander & Baldwin, Inc. | | | 3,013 | | | | 111,481 | |
| AV Homes, Inc. | | | 832 | | | | 15,891 | |
| Brookfield Property Partners, L.P. | | | 1,000 | | | | 19,260 | |
| China HGS Real Estate, Inc. | | | 4,201 | | | | 24,576 | |
| China Housing & Land Development, Inc. | | | 213,770 | | | | 575,041 | |
| Forest City Enterprises, Inc. | | | 139,761 | | | | 2,831,558 | |
| Gazit-Globe Ltd. | | | 1,213 | | | | 16,473 | |
| Kennedy-Wilson Holdings, Inc. | | | 44,876 | | | | 899,315 | |
| Mays (J.W.), Inc. | | | 125 | | | | 3,500 | |
| St. Joe Company (The) | | | 52,397 | | | | 978,252 | |
| | | | | | | | 5,475,347 | |
| Thrifts & Mortgage Finance — 0.9% | | | | | | | | |
| America First Tax Exempt Investors, L.P. | | | 10,633 | | | | 76,345 | |
| Astoria Financial Corporation | | | 37,732 | | | | 498,440 | |
| Banc of California, Inc. | | | 38,507 | | | | 543,334 | |
| BBX Capital Corporation - Class A | | | 24,803 | | | | 327,151 | |
| Beneficial Mutual Bancorp, Inc. | | | 48,826 | | | | 476,053 | |
| BofI Holding, Inc. | | | 2,698 | | | | 163,013 | |
| Brookline Bancorp, Inc. | | | 123,841 | | | | 1,098,470 | |
| Capitol Federal Financial, Inc. | | | 16,126 | | | | 204,316 | |
| CMS Bancorp, Inc. | | | 46 | | | | 371 | |
| First Federal Bancshares of Arkansas, Inc. | | | 5,667 | | | | 50,890 | |
| Five Oaks Investment Corporation | | | 14,164 | | | | 168,268 | |
| Freddie Mac | | | 50,442 | | | | 112,990 | |
| Greene County Bancorp, Inc. | | | 89 | | | | 2,174 | |
| Impac Mortgage Holdings, Inc. | | | 46,184 | | | | 314,051 | |
| NASB Financial, Inc. | | | 3,300 | | | | 84,975 | |
| Northfield Bancorp, Inc. | | | 13,151 | | | | 170,042 | |
TFS MARKET NEUTRAL FUND
SCHEDULE OF SECURITIES SOLD SHORT (Continued)
COMMON STOCKS — 63.5% (Continued) | | | | | | |
| Financials — 9.1% (Continued) | | | | | | |
| Thrifts & Mortgage Finance — 0.9% (Continued) | | | | | | |
| Oconee Federal Financial Corporation | | | 100 | | | $ | 1,650 | |
| PennyMac Financial Services, Inc. - Class A | | | 3,726 | | | | 59,989 | |
| Provident Financial Holdings, Inc. | | | 17,485 | | | | 265,073 | |
| Provident New York Bancorp | | | 207,909 | | | | 2,436,693 | |
| Radian Group, Inc. | | | 333,301 | | | | 4,856,196 | |
| Security National Financial Corporation - Class A | | | 88,662 | | | | 520,446 | |
| Tree.com, Inc. | | | 3,782 | | | | 111,607 | |
| TrustCo Bank Corporation | | | 269,187 | | | | 1,808,937 | |
| ViewPoint Financial Group, Inc. | | | 1,459 | | | | 31,821 | |
| | | | | | | | 14,383,295 | |
| Health Care — 11.2% | | | | | | | | |
| Biotechnology — 6.5% | | | | | | | | |
| Aastrom Biosciences, Inc. | | | 35,395 | | | | 141,580 | |
| ACADIA Pharmaceuticals, Inc. | | | 65,057 | | | | 1,478,746 | |
| Achillion Pharmaceuticals, Inc. | | | 150,691 | | | | 378,234 | |
| Aegerion Pharmaceuticals, Inc. | | | 6,548 | | | | 542,305 | |
| AEterna Zentaris, Inc. | | | 325,185 | | | | 439,000 | |
| Alnylam Pharmaceuticals, Inc. | | | 3,334 | | | | 192,072 | |
| Amarin Corporation plc - ADR | | | 919,383 | | | | 1,516,982 | |
| Anthera Pharmaceuticals, Inc. | | | 18,201 | | | | 57,515 | |
| ARCA Biopharma, Inc. | | | 341,488 | | | | 464,424 | |
| Arena Pharmaceuticals, Inc. | | | 80,919 | | | | 355,234 | |
| Ariad Pharmaceuticals, Inc. | | | 31,019 | | | | 68,242 | |
| Arrowhead Research Corporation | | | 52,664 | | | | 368,648 | |
| BioTime, Inc. | | | 259,137 | | | | 940,667 | |
| bluebird bio, Inc. | | | 10,566 | | | | 224,528 | |
| Cardium Therapeutics, Inc. | | | 15,545 | | | | 11,970 | |
| Catalyst Pharmaceutical Partners, Inc. | | | 281,358 | | | | 455,800 | |
| Cell Therapeutics, Inc. | | | 25,920 | | | | 45,619 | |
| Celldex Therapeutics, Inc. | | | 227,223 | | | | 5,205,679 | |
| Celsion Corporation | | | 563,445 | | | | 2,265,049 | |
| Cepheid | | | 25,602 | | | | 1,042,513 | |
| Chelsea Therapeutics International Ltd. | | | 386,078 | | | | 1,092,601 | |
| Cleveland BioLabs, Inc. | | | 282,604 | | | | 389,994 | |
| Coronado Biosciences, Inc. | | | 142,197 | | | | 237,469 | |
| Cubist Pharmaceuticals, Inc | | | 273,707 | | | | 528,255 | |
| Cyclacel Pharmaceuticals, Inc. | | | 34,204 | | | | 120,056 | |
| Cytori Therapeutics, Inc. | | | 110,201 | | | | 227,014 | |
| DARA BioSciences, Inc. | | | 594,711 | | | | 291,408 | |
| Dendreon Corporation | | | 2,776,373 | | | | 7,135,279 | |
| Discovery Laboratories, Inc. | | | 58,720 | | | | 120,963 | |
| Durata Therapeutics, Inc. | | | 71,202 | | | | 689,235 | |
| Dynavax Technologies Corporation | | | 119,493 | | | | 146,976 | |
TFS MARKET NEUTRAL FUND
SCHEDULE OF SECURITIES SOLD SHORT (Continued)
COMMON STOCKS — 63.5% (Continued) | | | | | | |
| Health Care — 11.2% (Continued) | | | | | | |
| Biotechnology — 6.5% (Continued) | | | | | | |
| Exelixis, Inc. | | | 634,567 | | | $ | 3,128,415 | |
| Fibrocell Science, Inc. | | | 64,609 | | | | 239,053 | |
| Galectin Therapeutics, Inc. | | | 213,775 | | | | 2,233,949 | |
| Galena Biopharma, Inc. | | | 2,271,732 | | | | 5,065,962 | |
| Genomic Health, Inc. | | | 4,978 | | | | 148,942 | |
| Geron Corporation | | | 91,827 | | | | 362,717 | |
| Horizon Pharma, Inc. | | | 190,320 | | | | 797,441 | |
| Hyperion Therapeutics, Inc. | | | 20,516 | | | | 410,936 | |
| iBio, Inc. | | | 205,076 | | | | 72,289 | |
| Idenix Pharmaceuticals, Inc. | | | 367,944 | | | | 1,210,536 | |
| Idera Pharmaceuticals, Inc. | | | 393,243 | | | | 723,567 | |
| ImmunoGen, Inc. | | | 11,751 | | | | 193,422 | |
| Immunomedics, Inc. | | | 218,791 | | | | 829,218 | |
| Infinity Pharmaceuticals, Inc. | | | 177,473 | | | | 2,404,759 | |
| Inovio Pharmaceuticals, Inc. | | | 814,597 | | | | 1,409,253 | |
| Insmed, Inc. | | | 101,709 | | | | 1,448,336 | |
| Insys Therapeutics, Inc. | | | 25,238 | | | | 1,006,744 | |
| InterMune, Inc. | | | 394,812 | | | | 5,562,901 | |
| Intrexon Corporation | | | 12,347 | | | | 261,756 | |
| Ironwood Pharmaceuticals, Inc. | | | 464,950 | | | | 4,468,170 | |
| IsoRay, Inc. | | | 299,790 | | | | 154,392 | |
| Keryx Biopharmaceuticals, Inc. | | | 103,055 | | | | 1,066,619 | |
| Kythera Biopharmaceuticals, Inc. | | | 7,287 | | | | 325,802 | |
| MannKind Corporation | | | 466,608 | | | | 2,281,713 | |
| Marina Biotech, Inc. | | | 244,030 | | | | 58,567 | |
| Mast Therapeutics, Inc. | | | 1,138,317 | | | | 557,775 | |
| Medgenics, Inc. | | | 125,667 | | | | 923,652 | |
| MediciNova, Inc. | | | 120,557 | | | | 297,776 | |
| MEI Pharma, Inc. | | | 103,114 | | | | 826,974 | |
| Metabolix, Inc. | | | 296,223 | | | | 325,845 | |
| MiMedx Group, Inc. | | | 451,087 | | | | 2,390,761 | |
| NanoViricides, Inc. | | | 105,221 | | | | 570,298 | |
| NeoStem, Inc. | | | 153,113 | | | | 973,799 | |
| Neuralstem, Inc. | | | 352,800 | | | | 786,744 | |
| Neurocrine Biosciences, Inc. | | | 9,210 | | | | 86,942 | |
| NewLink Genetics Corporation | | | 97,745 | | | | 1,637,229 | |
| Nymox Pharmaceutical Corporation | | | 86,485 | | | | 608,854 | |
| Omeros Corporation | | | 77,198 | | | | 771,980 | |
| Oncolytics Biotech, Inc. | | | 369,376 | | | | 982,540 | |
| Opexa Therapeutics, Inc. | | | 276,243 | | | | 511,050 | |
| OPKO Health, Inc. | | | 228,858 | | | | 2,293,161 | |
| Oragenics, Inc. | | | 2,139 | | | | 5,604 | |
| Orexigen Therapeutics, Inc. | | | 43,309 | | | | 211,348 | |
TFS MARKET NEUTRAL FUND
SCHEDULE OF SECURITIES SOLD SHORT (Continued)
COMMON STOCKS — 63.5% (Continued) | | | | | | |
| Health Care — 11.2% (Continued) | | | | | | |
| Biotechnology — 6.5% (Continued) | | | | | | |
| Organovo Holdings, Inc. | | | 170,603 | | | $ | 1,240,284 | |
| Osiris Therapeutics, Inc. | | | 50,844 | | | | 676,734 | |
| OXiGENE, Inc. | | | 30,225 | | | | 76,469 | |
| Oxygen Biotherapeutics, Inc. | | | 20,826 | | | | 63,103 | |
| Palatin Technologies, Inc. | | | 3,448 | | | | 2,000 | |
| Peregrine Pharmaceuticals, Inc. | | | 605,183 | | | | 780,686 | |
| PharmAthene, Inc. | | | 262,583 | | | | 538,295 | |
| Pluristem Therapeutics, Inc. | | | 169,230 | | | | 555,074 | |
| Prana Biotechnology Ltd. - ADR | | | 98,989 | | | | 446,440 | |
| Raptor Pharmaceutical Corporation | | | 76,674 | | | | 1,102,572 | |
| Repligen Corporation | | | 25,645 | | | | 280,556 | |
| Rexahn Pharmaceuticals, Inc. | | | 1,103,625 | | | | 455,797 | |
| Rosetta Genomics Ltd. | | | 159,480 | | | | 425,812 | |
| Sangamo BioSciences, Inc. | | | 51,299 | | | | 480,672 | |
| Sarepta Therapeutics, Inc. | | | 22,273 | | | | 867,311 | |
| Savient Pharmaceuticals, Inc. | | | 1,070,379 | | | | 46,562 | |
| SIGA Technologies, Inc. | | | 40,862 | | | | 140,157 | |
| Spectrum Pharmaceuticals, Inc. | | | 344,693 | | | | 2,960,913 | |
| StemCells, Inc. | | | 173,413 | | | | 230,639 | |
| Stemline Therapeutics, Inc. | | | 1,131 | | | | 31,476 | |
| Sunesis Pharmaceuticals, Inc. | | | 288,449 | | | | 1,445,130 | |
| Synageva BioPharma Corporation | | | 4,367 | | | | 221,844 | |
| Synergy Pharmaceuticals, Inc. | | | 135,330 | | | | 546,733 | |
| Synta Pharmaceuticals Corporation | | | 835,008 | | | | 3,790,936 | |
| Synthetic Biologics, Inc. | | | 80,610 | | | | 120,915 | |
| Tekmira Pharmaceuticals Corporation | | | 2,838 | | | | 25,400 | |
| TESARO, Inc. | | | 22,370 | | | | 861,245 | |
| TG Therapeutics, Inc. | | | 91,258 | | | | 329,441 | |
| Vanda Pharmaceuticals, Inc. | | | 239,415 | | | | 1,714,211 | |
| Venaxis, Inc. | | | 273,845 | | | | 503,875 | |
| Zalicus, Inc. | | | 1 | | | | 4 | |
| ZIOPHARM Oncology, Inc. | | | 1,312,395 | | | | 4,645,878 | |
| | | | | | | | 103,409,012 | |
| Health Care Equipment & Supplies — 2.3% | | | | | | | | |
| Abaxis, Inc. | | | 5,225 | | | | 186,689 | |
| Abiomed, Inc. | | | 92,012 | | | | 2,206,448 | |
| Accuray, Inc. | | | 225,333 | | | | 1,520,998 | |
| Antares Pharma, Inc. | | | 72,746 | | | | 290,984 | |
| Atossa Genetics, Inc. | | | 133,976 | | | | 235,798 | |
| Bacterin International Holdings, Inc. | | | 340,137 | | | | 201,735 | |
| BIOLASE, Inc. | | | 159,283 | | | | 297,859 | |
| BSD Medical Corporation | | | 828,821 | | | | 1,309,537 | |
| Cerus Corporation | | | 17,903 | | | | 112,968 | |
TFS MARKET NEUTRAL FUND
SCHEDULE OF SECURITIES SOLD SHORT (Continued)
COMMON STOCKS — 63.5% (Continued) | | | | | | |
| Health Care — 11.2% (Continued) | | | | | | |
| Health Care Equipment & Supplies — 2.3% (Continued) | | | | | | |
| Cyberonics, Inc. | | | 2,534 | | | $ | 146,364 | |
| Cynosure, Inc. | | | 43,798 | | | | 946,475 | |
| Delcath Systems, Inc. | | | 1,522,006 | | | | 499,218 | |
| Echo Therapeutics, Inc. | | | 91,640 | | | | 232,765 | |
| Fonar Corporation | | | 27,673 | | | | 301,359 | |
| GenMark Diagnostics, Inc. | | | 229,356 | | | | 2,775,208 | |
| Hansen Medical, Inc. | | | 62,107 | | | | 112,414 | |
| InspireMD, Inc. | | | 132,728 | | | | 374,293 | |
| Insulet Corporation | | | 7,870 | | | | 307,087 | |
| Integra LifeSciences Holdings Corporation | | | 6,176 | | | | 282,737 | |
| Masimo Corporation | | | 3,117 | | | | 79,857 | |
| MELA Sciences, Inc. | | | 631,264 | | | | 452,932 | |
| Meridian Bioscience, Inc. | | | 134,311 | | | | 3,320,168 | |
| Navidea Biopharmaceuticals, Inc. | | | 682,839 | | | | 1,365,678 | |
| NxStage Medical, Inc. | | | 9,117 | | | | 120,982 | |
| OraSure Technologies, Inc. | | | 87,527 | | | | 570,676 | |
| Quidel Corporation | | | 79,885 | | | | 1,973,159 | |
| ResMed, Inc. | | | 3,040 | | | | 157,290 | |
| Rockwell Medical, Inc. | | | 469,367 | | | | 5,407,108 | |
| Solta Medical, Inc. | | | 92,279 | | | | 170,716 | |
| Spectranetics Corporation (The) | | | 20,964 | | | | 437,938 | |
| Stereotaxis, Inc. | | | 362,797 | | | | 1,585,423 | |
| Synergetics USA, Inc. | | | 13,748 | | | | 57,192 | |
| TearLab Corporation | | | 346,400 | | | | 3,612,952 | |
| Unilife Corporation | | | 1,141,530 | | | | 3,458,836 | |
| Uroplasty, Inc. | | | 15,325 | | | | 46,435 | |
| Vermillion, Inc. | | | 12,777 | | | | 31,176 | |
| Volcano Corporation | | | 38,542 | | | | 738,850 | |
| Wright Medical Group, Inc. | | | 5,959 | | | | 161,906 | |
| | | | | | | | 36,090,210 | |
| Health Care Providers & Services — 0.9% | | | | | | | | |
| Acadia Healthcare Company, Inc. | | | 19,528 | | | | 846,734 | |
| Accretive Health, Inc. | | | 57,474 | | | | 474,735 | |
| Air Methods Corporation | | | 32,816 | | | | 1,434,715 | |
| Bio-Reference Laboratories, Inc. | | | 79,614 | | | �� | 2,580,290 | |
| Chemed Corporation | | | 23,602 | | | | 1,600,688 | |
| FAB Universal Corporation | | | 674,707 | | | | 4,230,413 | |
| Healthways, Inc. | | | 30,591 | | | | 294,591 | |
| IPC The Hospitalist Company, Inc. | | | 18,816 | | | | 1,030,929 | |
| Owens & Minor, Inc. | | | 26,127 | | | | 977,672 | |
| Patterson Companies, Inc. | | | 586 | | | | 24,911 | |
| Team Health Holdings, Inc. | | | 1,896 | | | | 82,362 | |
| Universal American Corporation | | | 49,721 | | | | 368,930 | |
TFS MARKET NEUTRAL FUND
SCHEDULE OF SECURITIES SOLD SHORT (Continued)
COMMON STOCKS — 63.5% (Continued) | | | | | | |
| Health Care — 11.2% (Continued) | | | | | | |
| Health Care Providers & Services — 0.9% (Continued) | | | | | | |
| USMD Holdings, Inc. | | | 435 | | | $ | 12,106 | |
| | | | | | | | 13,959,076 | |
| Health Care Technology — 0.2% | | | | | | | | |
| Allscripts Healthcare Solutions, Inc. | | | 206,086 | | | | 2,850,169 | |
| Computer Programs and Systems, Inc. | | | 361 | | | | 20,592 | |
| MGT Capital Investment, Inc. | | | 8,381 | | | | 24,305 | |
| Streamline Health Solutions, Inc. | | | 3,595 | | | | 29,299 | |
| | | | | | | | 2,924,365 | |
| Life Sciences Tools & Services — 0.3% | | | | | | | | |
| Accelerate Diagnostics, Inc. | | | 78,116 | | | | 1,001,447 | |
| Apricus Biosciences, Inc. | | | 279,454 | | | | 539,346 | |
| Bioanalytical Systems, Inc. | | | 6,029 | | | | 11,093 | |
| BioDelivery Sciences International, Inc. | | | 152,145 | | | | 798,761 | |
| CombiMatrix Corporation | | | 166,061 | | | | 459,989 | |
| Genetic Technologies Ltd. - ADR | | | 70,962 | | | | 134,828 | |
| Life Technologies Corporation | | | 2,587 | | | | 194,827 | |
| PURE Bioscience, Inc. | | | 59,879 | | | | 80,238 | |
| Sequenom, Inc. | | | 711,218 | | | | 1,365,539 | |
| | | | | | | | 4,586,068 | |
| Pharmaceuticals — 1.0% | | | | | | | | |
| AcelRx Pharmaceuticals, Inc. | | | 155,781 | | | | 1,046,848 | |
| Acura Pharmaceuticals, Inc. | | | 156,634 | | | | 266,278 | |
| Alexza Pharmaceuticals, Inc. | | | 298,969 | | | | 1,491,855 | |
| Ampio Pharmaceuticals, Inc. | | | 238,220 | | | | 2,105,865 | |
| ANI Pharmaceuticals, Inc. | | | 46,691 | | | | 478,583 | |
| Aoxing Pharmaceutical Company, Inc. | | | 11,481 | | | | 2,711 | |
| Aratana Therapeutics, Inc. | | | 6,249 | | | | 124,730 | |
| Auxilium Pharmaceuticals, Inc. | | | 16,490 | | | | 283,793 | |
| AVANIR Pharmaceuticals, Inc. - Class A | | | 72,663 | | | | 294,285 | |
| Cadence Pharmaceuticals, Inc. | | | 30,796 | | | | 151,824 | |
| Columbia Laboratories, Inc. | | | 38,680 | | | | 278,496 | |
| DURECT Corporation | | | 20,263 | | | | 30,394 | |
| Emisphere Technologies, Inc. | | | 4,999 | | | | 950 | |
| Endocyte, Inc. | | | 56,884 | | | | 593,300 | |
| GW Pharmaceuticals plc - ADR | | | 16,072 | | | | 487,946 | |
| IntelliPharmaCeutics International, Inc. | | | 61,706 | | | | 113,539 | |
| Jazz Pharmaceuticals plc | | | 2,194 | | | | 199,084 | |
| Novabay Pharmaceuticals, Inc. | | | 80,822 | | | | 134,164 | |
| NuPathe, Inc. | | | 210,804 | | | | 354,151 | |
| Oculus Innovative Sciences, Inc. | | | 1,767 | | | | 4,559 | |
| Pacira Pharmaceuticals, Inc. | | | 6,207 | | | | 313,516 | |
| Repros Therapeutics, Inc. | | | 132,176 | | | | 2,384,455 | |
| VIVUS, Inc. | | | 362,479 | | | | 3,403,678 | |
TFS MARKET NEUTRAL FUND
SCHEDULE OF SECURITIES SOLD SHORT (Continued)
COMMON STOCKS — 63.5% (Continued) | | | | | | |
| Health Care — 11.2% (Continued) | | | | | | |
| Pharmaceuticals — 1.0% (Continued) | | | | | | |
| XenoPort, Inc. | | | 144,854 | | | $ | 757,586 | |
| Zogenix, Inc. | | | 326,617 | | | | 956,988 | |
| | | | | | | | 16,259,578 | |
| Industrials — 7.4% | | | | | | | | |
| Aerospace & Defense — 0.9% | | | | | | | | |
| Ascent Solar Technologies, Inc. | | | 505,545 | | | | 475,212 | |
| Elbit Systems Ltd. | | | 24 | | | | 1,286 | |
| GenCorp, Inc. | | | 299,282 | | | | 5,027,937 | |
| Huntington Ingalls Industries, Inc. | | | 41,143 | | | | 2,943,782 | |
| KEYW Holding Corporation (The) | | | 227,686 | | | | 2,618,389 | |
| LMI Aerospace, Inc. | | | 69,326 | | | | 1,088,418 | |
| National Presto Industries, Inc. | | | 32,552 | | | | 2,296,544 | |
| Taser International, Inc. | | | 10,530 | | | | 187,118 | |
| | | | | | | | 14,638,686 | |
| Air Freight & Logistics — 0.2% | | | | | | | | |
| XPO Logistics, Inc. | | | 155,770 | | | | 3,143,439 | |
| | | | | | | | | |
Airlines — 0.0% (a) | | | | | | | | |
| AMR Corporation | | | 10,761 | | | | 79,094 | |
| Spirit Airlines, Inc. | | | 49 | | | | 2,114 | |
| US Airways Group, Inc. | | | 13,431 | | | | 295,079 | |
| | | | | | | | 376,287 | |
| Building Products — 0.1% | | | | | | | | |
| Builders FirstSource, Inc. | | | 25,197 | | | | 186,710 | |
| NCI Building Systems, Inc. | | | 126,630 | | | | 1,827,271 | |
| Nortek, Inc. | | | 1,393 | | | | 97,747 | |
| Ply Gem Holdings, Inc. | | | 2,066 | | | | 30,783 | |
| USG Corporation | | | 5,823 | | | | 159,026 | |
| | | | | | | | 2,301,537 | |
| Commercial Services & Supplies — 0.9% | | | | | | | | |
| ACCO Brands Corporation | | | 318,858 | | | | 1,865,319 | |
| Cenveo, Inc. | | | 468,533 | | | | 1,471,194 | |
| China Recycling Energy Corporation | | | 23,454 | | | | 70,128 | |
| Consolidated Graphics, Inc. | | | 1,034 | | | | 66,269 | |
| EnerNOC, Inc. | | | 4,852 | | | | 80,689 | |
| Healthcare Services Group, Inc. | | | 134,474 | | | | 3,683,243 | |
| Heritage-Crystal Clean, Inc. | | | 1,466 | | | | 25,904 | |
| Industrial Services of America, Inc. | | | 21,860 | | | | 50,278 | |
| InnerWorkings, Inc. | | | 175,536 | | | | 1,679,880 | |
| Intersections, Inc. | | | 60,248 | | | | 516,325 | |
| McGrath RentCorp | | | 5,306 | | | | 189,265 | |
| Mobile Mini, Inc. | | | 143 | | | | 5,165 | |
| Quad/Graphics, Inc. - Class A | | | 32,667 | | | | 1,140,732 | |
TFS MARKET NEUTRAL FUND
SCHEDULE OF SECURITIES SOLD SHORT (Continued)
COMMON STOCKS — 63.5% (Continued) | | | | | | |
| Industrials — 7.4% (Continued) | | | | | | |
| Commercial Services & Supplies — 0.9% (Continued) | | | | | | |
| RINO International Corporation | | | 67,543 | | | $ | 2,026 | |
| Standard Register Company (The) | | | 3,708 | | | | 31,518 | |
| Team, Inc. | | | 13,994 | | | | 521,836 | |
| United Stationers, Inc. | | | 44,696 | | | | 1,986,290 | |
| | | | | | | | 13,386,061 | |
| Construction & Engineering — 0.2% | | | | | | | | |
| Aegion Corporation | | | 28,799 | | | | 590,379 | |
| Ameresco, Inc. - Class A | | | 8,416 | | | | 88,031 | |
| Great Lakes Dredge & Dock Company | | | 65,341 | | | | 530,569 | |
| Layne Christensen Company | | | 31,127 | | | | 601,996 | |
| MasTec, Inc. | | | 32,849 | | | | 1,050,183 | |
| | | | | | | | 2,861,158 | |
| Electrical Equipment — 1.5% | | | | | | | | |
| Advanced Battery Technologies, Inc. | | | 596,378 | | | | 122,258 | |
| Altair Nanotechnologies, Inc. | | | 72,700 | | | | 338,055 | |
| Capstone Turbine Corporation | | | 685,947 | | | | 871,153 | |
| China BAK Battery, Inc. | | | 147,694 | | | | 305,727 | |
| China Ming Yang Wind Power Group Ltd. - ADR | | | 243,703 | | | | 604,383 | |
| Coleman Cable, Inc. | | | 14,420 | | | | 354,732 | |
| Digital Power Corporation | | | 712 | | | | 491 | |
| ECOtality, Inc. | | | 270,888 | | | | 14,086 | |
| Encore Wire Corporation | | | 21,055 | | | | 1,042,854 | |
| FuelCell Energy, Inc. | | | 167,557 | | | | 224,526 | |
| Generac Holdings, Inc. | | | 3,246 | | | | 160,190 | |
| General Cable Corporation | | | 14,694 | | | | 483,873 | |
| GrafTech International Ltd. | | | 273,599 | | | | 2,435,031 | |
| Highpower International, Inc. | | | 4,308 | | | | 12,235 | |
| Hydrogenics Corporation | | | 35,048 | | | | 427,936 | |
| Jinpan International Ltd. | | | 8,432 | | | | 51,604 | |
| New Energy Systems Group | | | 9,385 | | | | 1,314 | |
| Ocean Power Technologies, Inc. | | | 134,107 | | | | 315,151 | |
| Plug Power, Inc. | | | 855,346 | | | | 496,101 | |
| Power Solutions International, Inc. | | | 15,230 | | | | 887,300 | |
| PowerSecure International, Inc. | | | 91,162 | | | | 1,648,209 | |
| Real Goods Solar, Inc. - Class A | | | 1,582,086 | | | | 5,299,988 | |
| Regal-Beloit Corporation | | | 11,033 | | | | 809,050 | |
| Revolution Lighting Technologies, Inc. | | | 1,689,397 | | | | 5,051,297 | |
| SolarCity Corporation | | | 18,438 | | | | 982,377 | |
| Trina Solar Ltd. - ADR | | | 19,120 | | | | 280,490 | |
| Ultralife Corporation | | | 3,008 | | | | 11,731 | |
| Yingli Green Energy Holding Company Ltd. - ADR | | | 51,078 | | | | 306,468 | |
| | | | | | | | 23,538,610 | |
TFS MARKET NEUTRAL FUND
SCHEDULE OF SECURITIES SOLD SHORT (Continued)
COMMON STOCKS — 63.5% (Continued) | | | | | | |
| Industrials — 7.4% (Continued) | | | | | | |
Industrial Conglomerates — 0.0% (a) | | | | | | |
| Raven Industries, Inc. | | | 20,477 | | | $ | 683,113 | |
| | | | | | | | | |
| Machinery — 1.9% | | | | | | | | |
| American Railcar Industries, Inc. | | | 49,874 | | | | 2,042,839 | |
| Art's-Way Manufacturing Company, Inc. | | | 1,130 | | | | 6,317 | |
| Astec Industries, Inc. | | | 5,440 | | | | 183,926 | |
| Barnes Group, Inc. | | | 640 | | | | 22,746 | |
| Briggs & Stratton Corporation | | | 85,761 | | | | 1,572,857 | |
| China Valves Technology, Inc. | | | 253,770 | | | | 314,675 | |
| CLARCOR, Inc. | | | 32,919 | | | | 1,925,103 | |
| Cleantech Solutions International, Inc. | | | 85,593 | | | | 492,160 | |
| Douglas Dynamics, Inc. | | | 30,817 | | | | 467,494 | |
| EnPro Industries, Inc. | | | 18,984 | | | | 1,132,775 | |
| ESCO Technologies, Inc. | | | 14,285 | | | | 515,403 | |
| ExOne Company (The) | | | 57,449 | | | | 2,948,857 | |
| FreightCar America, Inc. | | | 66,605 | | | | 1,481,295 | |
| Gorman-Rupp Company (The) | | | 188 | | | | 7,659 | |
| Greenbrier Companies, Inc. (The) | | | 66,713 | | | | 1,770,563 | |
| Highway Holdings Ltd. | | | 370 | | | | 903 | |
| Lindsay Corporation | | | 67,485 | | | | 5,129,535 | |
| Navistar International Corporation | | | 119,341 | | | | 4,315,371 | |
| PMFG, Inc. | | | 9,803 | | | | 76,855 | |
| RBC Bearings, Inc. | | | 11,558 | | | | 795,075 | |
| SmartHeat, Inc. | | | 3,811 | | | | 1,334 | |
| Tecumseh Products Company - Class A | | | 329 | | | | 2,566 | |
| Terex Corporation | | | 5,592 | | | | 195,440 | |
| Twin Disc, Inc. | | | 14,889 | | | | 385,178 | |
| voxeljet AG - ADR | | | 3,960 | | | | 134,957 | |
| Wabash National Corporation | | | 64,579 | | | | 752,991 | |
| Westport Innovations, Inc. | | | 109,680 | | | | 2,569,802 | |
| Xerium Technologies, Inc. | | | 4,236 | | | | 50,790 | |
| | | | | | | | 29,295,466 | |
| Marine — 0.5% | | | | | | | | |
| Diana Containerships, Inc. | | | 118,879 | | | | 492,159 | |
| Eagle Bulk Shipping, Inc. | | | 361,537 | | | | 2,010,146 | |
| Excel Maritime Carriers Ltd. | | | 29,770 | | | | 7,148 | |
| FreeSeas, Inc. | | | 49,108 | | | | 18,170 | |
| Genco Shipping & Trading Ltd. | | | 1,388,395 | | | | 3,707,015 | |
| Navios Maritime Partners, L.P. | | | 51,846 | | | | 810,353 | |
| Seanergy Maritime Holdings Corporation | | | 2,089 | | | | 2,569 | |
| Seaspan Corporation | | | 1,721 | | | | 38,430 | |
| | | | | | | | 7,085,990 | |
TFS MARKET NEUTRAL FUND
SCHEDULE OF SECURITIES SOLD SHORT (Continued)
COMMON STOCKS — 63.5% (Continued) | | | | | | |
| Industrials — 7.4% (Continued) | | | | | | |
| Professional Services — 0.5% | | | | | | |
| Acacia Research Corporation | | | 139,916 | | | $ | 2,111,332 | |
| Advisory Board Company (The) | | | 15,336 | | | | 1,052,049 | |
| CBIZ, Inc. | | | 280,819 | | | | 2,291,483 | |
| Corporate Resource Services, Inc. | | | 14,263 | | | | 50,919 | |
| FTI Consulting, Inc. | | | 11,935 | | | | 484,322 | |
| Hudson Global, Inc. | | | 2,147 | | | | 6,978 | |
| Kelly Services, Inc. - Class A | | | 10,110 | | | | 210,895 | |
| Lightbridge Corporation | | | 123,341 | | | | 192,412 | |
| Mistras Group, Inc. | | | 27,247 | | | | 500,255 | |
| Odyssey Marine Exploration, Inc. | | | 728,101 | | | | 1,579,979 | |
| Spherix, Inc. | | | 9,589 | | | | 67,315 | |
| | | | | | | | 8,547,939 | |
| Road & Rail — 0.3% | | | | | | | | |
| Knight Transportation, Inc. | | | 46,142 | | | | 783,030 | |
| P.A.M. Transportation Services, Inc. | | | 1,877 | | | | 32,660 | |
| Student Transportation, Inc. | | | 64,204 | | | | 405,127 | |
| YRC Worldwide, Inc. - ADR | | | 339,678 | | | | 3,220,147 | |
| | | | | | | | 4,440,964 | |
| Trading Companies & Distributors — 0.4% | | | | | | | | |
| Armco Metals Holdings, Inc. | | | 142,384 | | | | 65,497 | |
| General Finance Corporation | | | 92 | | | | 534 | |
| Houston Wire & Cable Company | | | 7,560 | | | | 104,857 | |
| Kaman Corporation | | | 2,964 | | | | 110,202 | |
| Rush Enterprises, Inc. - Class A | | | 52,015 | | | | 1,488,669 | |
| Titan Machinery, Inc. | | | 174,903 | | | | 3,085,289 | |
| Watsco, Inc. | | | 12,769 | | | | 1,216,758 | |
| | | | | | | | 6,071,806 | |
Transportation Infrastructure — 0.0% (a) | | | | | | | | |
| Sino-Global Shipping America Ltd. | | | 8,240 | | | | 14,997 | |
| | | | | | | | | |
| Information Technology — 12.1% | | | | | | | | |
| Communications Equipment — 1.1% | | | | | | | | |
| Ambient Corporation | | | 2,690 | | | | 5,407 | |
| Aruba Networks, Inc. | | | 66,833 | | | | 1,253,787 | |
| Blackberry Ltd. | | | 51,874 | | | | 410,323 | |
| DragonWave, Inc. | | | 256,168 | | | | 368,882 | |
| EMCORE Corporation | | | 140,130 | | | | 746,893 | |
| Gilat Satellite Networks Ltd. | | | 4,682 | | | | 24,159 | |
| InterDigital, Inc. | | | 30,022 | | | | 1,163,353 | |
| Loral Space & Communications, Inc. | | | 5,147 | | | | 367,341 | |
| NETGEAR, Inc. | | | 329 | | | | 9,462 | |
| Oclaro, Inc. | | | 68,397 | | | | 139,530 | |
| ParkerVision, Inc. | | | 1,247,126 | | | | 3,417,125 | |
TFS MARKET NEUTRAL FUND
SCHEDULE OF SECURITIES SOLD SHORT (Continued)
COMMON STOCKS — 63.5% (Continued) | | | | | | |
| Information Technology — 12.1% (Continued) | | | | | | |
| Communications Equipment — 1.1% (Continued) | | | | | | |
| Procera Networks, Inc. | | | 270,642 | | | $ | 3,829,584 | |
| RIT Technologies Ltd. | | | 11,334 | | | | 27,202 | |
| Riverbed Technology, Inc. | | | 296,966 | | | | 4,401,036 | |
| Telestone Technologies Corporation | | | 454,003 | | | | 108,961 | |
| Ubiquiti Networks, Inc. | | | 46,557 | | | | 1,796,169 | |
| Zoom Technologies, Inc. | | | 180,953 | | | | 59,714 | |
| ZST Digital Networks, Inc. | | | 167,237 | | | | 292,665 | |
| | | | | | | | 18,421,593 | |
| Computers & Peripherals — 1.2% | | | | | | | | |
| 3D Systems Corporation | | | 25,044 | | | | 1,558,739 | |
| Avid Technology, Inc. | | | 83,075 | | | | 618,909 | |
| Diebold, Inc. | | | 85,078 | | | | 2,548,937 | |
| Fusion-io, Inc. | | | 704,600 | | | | 7,574,450 | |
| Hauppauge Digital, Inc. | | | 65,576 | | | | 23,148 | |
| Imation Corporation | | | 15,539 | | | | 72,256 | |
| Logitech International, S.A. | | | 255,343 | | | | 2,627,479 | |
| OCZ Technology Group, Inc. | | | 2,403,147 | | | | 2,667,493 | |
| SMART Technologies, Inc. - Class A | | | 79,415 | | | | 211,244 | |
| Synaptics, Inc. | | | 3,234 | | | | 150,381 | |
| USA Technologies, Inc. | | | 252,642 | | | | 482,546 | |
| Violin Memory, Inc. | | | 8,986 | | | | 59,757 | |
| | | | | | | | 18,595,339 | |
| Electronic Equipment, Instruments & Components — 1.1% | | | | | | | | |
| Audience, Inc. | | | 7,404 | | | | 84,554 | |
| ClearSign Combustion Corporation | | | 67,738 | | | | 510,744 | |
| Cognex Corporation | | | 35,283 | | | | 1,102,594 | |
| Coherent, Inc. | | | 2,154 | | | | 142,573 | |
| Digital Ally, Inc. | | | 42,784 | | | | 388,479 | |
| Document Security Systems, Inc. | | | 467,367 | | | | 542,146 | |
| DTS, Inc. | | | 73,555 | | | | 1,471,100 | |
| Electro Scientific Industries, Inc. | | | 13,952 | | | | 167,145 | |
| InvenSense, Inc. | | | 75,336 | | | | 1,272,425 | |
| IPG Photonics Corporation | | | 5,645 | | | | 374,094 | |
| Itron, Inc. | | | 19,609 | | | | 836,716 | |
| KEMET Corporation | | | 3,765 | | | | 21,348 | |
| Magal Security Systems Ltd. | | | 824 | | | | 2,727 | |
| Mercury Systems, Inc. | | | 42,485 | | | | 391,712 | |
| Microvision, Inc. | | | 297,259 | | | | 475,614 | |
| MTS Systems Corporation | | | 7,792 | | | | 508,973 | |
| National Instruments Corporation | | | 12,332 | | | | 358,245 | |
| Neonode, Inc. | | | 361,645 | | | | 1,956,499 | |
| Parametric Sound Corporation | | | 91,712 | | | | 1,374,763 | |
| RealD, Inc. | | | 194,126 | | | | 1,343,352 | |
TFS MARKET NEUTRAL FUND
SCHEDULE OF SECURITIES SOLD SHORT (Continued)
COMMON STOCKS — 63.5% (Continued) | | | | | | |
| Information Technology — 12.1% (Continued) | | | | | | |
| Electronic Equipment, Instruments & Components — 1.1% (Continued) | | | | | | |
| Research Frontiers, Inc. | | | 43,794 | | | $ | 211,087 | |
| Rofin-Sinar Technologies, Inc. | | | 674 | | | | 17,692 | |
| Speed Commerce, Inc. | | | 29,898 | | | | 109,726 | |
| Superconductor Technologies, Inc. - ADR | | | 68,381 | | | | 123,086 | |
| Taitron Components, Inc. - Class A | | | 115 | | | | 119 | |
| Uni-Pixel, Inc. | | | 191,053 | | | | 3,142,822 | |
| | | | | | | | 16,930,335 | |
| Internet Software & Services — 1.6% | | | | | | | | |
| 21Vianet Group, Inc. - ADR | | | 3,492 | | | | 62,856 | |
| Angie's List, Inc. | | | 131,197 | | | | 1,848,566 | |
| Bankrate, Inc. | | | 5,459 | | | | 91,930 | |
| Bazaarvoice, Inc. | | | 151,571 | | | | 1,421,736 | |
| Blucora, Inc. | | | 41,430 | | | | 978,991 | |
| Carbonite, Inc. | | | 29,695 | | | | 393,162 | |
| ChinaCache International Holdings Ltd. - ADR | | | 75,448 | | | | 515,310 | |
| Constant Contact, Inc. | | | 10,507 | | | | 272,236 | |
| Dice Holdings, Inc. | | | 91,911 | | | | 678,303 | |
| Digital River, Inc. | | | 3,534 | | | | 63,047 | |
| E2open, Inc. | | | 18,592 | | | | 418,320 | |
| Gogo, Inc. | | | 52,542 | | | | 979,383 | |
| Innodata, Inc. | | | 3,176 | | | | 7,622 | |
| Internap Network Services Corporation | | | 28,096 | | | | 204,258 | |
| Ku6 Media Company Ltd. - ADR | | | 59,621 | | | | 144,879 | |
| Liquidity Services, Inc. | | | 142,415 | | | | 3,718,456 | |
| LiveDeal, Inc. | | | 14,553 | | | | 43,368 | |
| Local Corporation | | | 237,218 | | | | 469,692 | |
| Marin Software, Inc. | | | 40,614 | | | | 470,716 | |
| MeetMe, Inc. | | | 632,119 | | | | 1,384,341 | |
| Millennial Media, Inc. | | | 33,532 | | | | 235,730 | |
| Monster Worldwide, Inc. | | | 161,618 | | | | 698,190 | |
| OpenTable, Inc. | | | 6,847 | | | | 475,730 | |
| Phoenix New Media Ltd. - ADR | | | 44,025 | | | | 395,345 | |
Piksel, Inc. - Series A-2 (b) | | | 346,880 | | | | — | |
| Points International Ltd. | | | 5,081 | | | | 108,022 | |
| Professional Diversity Network, Inc. | | | 90 | | | | 446 | |
| QuinStreet, Inc. | | | 7,772 | | | | 69,093 | |
| Rediff.com India Ltd. - ADR | | | 57,611 | | | | 135,962 | |
| Renren, Inc. - ADR | | | 26,178 | | | | 86,649 | |
| Responsys, Inc. | | | 10,354 | | | | 169,184 | |
| SciQuest, Inc. | | | 89,347 | | | | 1,951,338 | |
| Sify Technologies Ltd. - ADR | | | 4,877 | | | | 9,510 | |
| Sohu.com, Inc. | | | 3,178 | | | | 212,799 | |
TFS MARKET NEUTRAL FUND
SCHEDULE OF SECURITIES SOLD SHORT (Continued)
COMMON STOCKS — 63.5% (Continued) | | | | | | |
| Information Technology — 12.1% (Continued) | | | | | | |
| Internet Software & Services — 1.6% (Continued) | | | | | | |
| SouFun Holdings Ltd. - ADR | | | 8,775 | | | $ | 467,093 | |
| StarTek, Inc. | | | 3,124 | | | | 19,556 | |
| Trulia, Inc. | | | 5,889 | | | | 235,383 | |
| ValueClick, Inc. | | | 58,740 | | | | 1,128,395 | |
| Velti plc | | | 1,142,534 | | | | 308,141 | |
| Vistaprint N.V. | | | 59,162 | | | | 3,197,706 | |
| Vocus, Inc. | | | 142,098 | | | | 1,229,148 | |
| Web.com Group, Inc. | | | 3,412 | | | | 91,953 | |
| YY, Inc. - ADR | | | 14,957 | | | | 735,436 | |
| Zillow, Inc. | | | 2,539 | | | | 202,181 | |
| | | | | | | | 26,330,162 | |
| IT Services — 1.5% | | | | | | | | |
| Acorn Energy, Inc. | | | 183,727 | | | | 690,814 | |
| Bitauto Holdings Ltd. - ADR | | | 29,385 | | | | 720,226 | |
| Blackhawk Network Holdings, Inc. | | | 46,966 | | | | 1,073,643 | |
| Booz Allen Hamilton Holding Corporation | | | 1,323 | | | | 26,195 | |
| CACI International, Inc. | | | 34,493 | | | | 2,482,806 | |
| Cass Information Systems, Inc. | | | 6,844 | | | | 392,367 | |
| CGI Group, Inc. - Class A | | | 12,201 | | | | 409,466 | |
| China Information Technology, Inc. | | | 71,589 | | | | 327,162 | |
| CIBER, Inc. | | | 356,839 | | | | 1,159,727 | |
| Convergys Corporation | | | 8,118 | | | | 160,249 | |
| Forrester Research, Inc. | | | 7,431 | | | | 288,397 | |
| Heartland Payment Systems, Inc. | | | 60,324 | | | | 2,440,106 | |
| Helios and Matheson Analytics, Inc. | | | 1,378 | | | | 7,496 | |
| Higher One Holdings, Inc. | | | 404,170 | | | | 3,213,151 | |
| JetPay Corporation | | | 607 | | | | 1,542 | |
| Lionbridge Technologies, Inc. | | | 13,725 | | | | 59,841 | |
| ManTech International Corporation - Class A | | | 60,651 | | | | 1,694,589 | |
| QIWI plc - ADR | | | 6,233 | | | | 252,312 | |
| Unisys Corporation | | | 63,212 | | | | 1,665,636 | |
| VeriFone Systems, Inc. | | | 281,981 | | | | 6,389,689 | |
| WEX, Inc. | | | 3,560 | | | | 332,326 | |
| WPCS International, Inc. | | | 3,572 | | | | 7,144 | |
| | | | | | | | 23,794,884 | |
| Semiconductors & Semiconductor Equipment — 2.9% | | | | | | | | |
| Advanced Energy Industries, Inc. | | | 7,048 | | | | 147,162 | |
| Advanced Micro Devices, Inc. | | | 392,355 | | | | 1,310,466 | |
| Applied Micro Circuits Corporation | | | 282,693 | | | | 3,296,200 | |
| Cabot Microelectronics Corporation | | | 22,954 | | | | 938,589 | |
| Camtek Ltd. | | | 6,647 | | | | 12,164 | |
| China Sunergy Company Ltd. - ADR | | | 274,308 | | | | 2,024,393 | |
| CVD Equipment Corporation | | | 55,529 | | | | 621,925 | |
TFS MARKET NEUTRAL FUND
SCHEDULE OF SECURITIES SOLD SHORT (Continued)
COMMON STOCKS — 63.5% (Continued) | | | | | | |
| Information Technology — 12.1% (Continued) | | | | | | |
| Semiconductors & Semiconductor Equipment — 2.9% (Continued) | | | | | | |
| Cypress Semiconductor Corporation | | | 416,039 | | | $ | 3,860,842 | |
| Daqo New Energy Corporation - ADR | | | 14,216 | | | | 443,966 | |
| DayStar Technologies, Inc. | | | 11,915 | | | | 2,979 | |
| EZchip Semiconductor Ltd. | | | 11,225 | | | | 290,728 | |
| GT Advanced Technologies, Inc. | | | 159,393 | | | | 1,195,447 | |
| Hanwha SolarOne Company Ltd. - ADR | | | 102,091 | | | | 443,075 | |
| Himax Technologies, Inc. - ADR | | | 106,497 | | | | 1,031,956 | |
| JA Solar Holdings Company Ltd. - ADR | | | 19,974 | | | | 192,549 | |
| JinkoSolar Holding Company Ltd. - ADR | | | 23,431 | | | | 527,666 | |
| Kopin Corporation | | | 25,303 | | | | 92,862 | |
| LDK Solar Company Ltd. - ADR | | | 690,532 | | | | 932,218 | |
| Mindspeed Technologies, Inc. | | | 191,108 | | | | 552,302 | |
| MKS Instruments, Inc. | | | 44,318 | | | | 1,313,586 | |
| MoSys, Inc. | | | 25,786 | | | | 113,458 | |
| Nanometrics, Inc. | | | 42,903 | | | | 797,138 | |
| OmniVision Technologies, Inc. | | | 9,104 | | | | 127,547 | |
| Photronics, Inc. | | | 316,578 | | | | 2,659,255 | |
| Pixelworks, Inc. | | | 90,151 | | | | 408,384 | |
| QuickLogic Corporation | | | 232,617 | | | | 895,575 | |
| Rambus, Inc. | | | 34,065 | | | | 297,728 | |
| ReneSola Ltd. - ADR | | | 61,889 | | | | 269,217 | |
| Rubicon Technology, Inc. | | | 430,786 | | | | 3,704,760 | |
| Rudolph Technologies, Inc. | | | 194,052 | | | | 2,056,951 | |
| Spansion, Inc. | | | 64,294 | | | | 769,599 | |
| STR Holdings, Inc. | | | 17,422 | | | | 34,670 | |
| SunEdison, Inc. | | | 708,904 | | | | 6,592,807 | |
| SunPower Corporation | | | 89,850 | | | | 2,712,572 | |
| Suntech Power Holdings Company Ltd. - ADR | | | 169,397 | | | | 233,768 | |
| Tessera Technologies, Inc. | | | 109,398 | | | | 2,080,750 | |
| Tower Semiconductor Ltd. | | | 12,131 | | | | 58,229 | |
| Transwitch Corporation | | | 10,326 | | | | 2,117 | |
| Ultratech, Inc. | | | 107,015 | | | | 2,545,887 | |
| | | | | | | | 45,591,487 | |
| Software — 2.7% | | | | | | | | |
| ACI Worldwide, Inc. | | | 18,505 | | | | 1,019,996 | |
| Advent Software, Inc. | | | 12,103 | | | | 406,056 | |
| Allot Communications Ltd. | | | 14,575 | | | | 196,471 | |
| American Software, Inc. - Class A | | | 5,435 | | | | 47,556 | |
| AsiaInfo-Linkage, Inc. | | | 30,023 | | | | 348,267 | |
| Blackbaud, Inc. | | | 348 | | | | 12,528 | |
| BluePhoenix Solutions Ltd. | | | 1,006 | | | | 4,326 | |
| Bottomline Technologies, Inc. | | | 43,191 | | | | 1,357,061 | |
TFS MARKET NEUTRAL FUND
SCHEDULE OF SECURITIES SOLD SHORT (Continued)
COMMON STOCKS — 63.5% (Continued) | | | | | | |
| Information Technology — 12.1% (Continued) | | | | | | |
| Software — 2.7% (Continued) | | | | | | |
| BroadSoft, Inc. | | | 16,788 | | | $ | 549,303 | |
| Changyou.com Ltd. - ADR | | | 7,743 | | | | 214,946 | |
| Cyan, Inc. | | | 5,161 | | | | 24,308 | |
| Ebix, Inc. | | | 600,495 | | | | 6,833,633 | |
| Fleetmatics Group plc | | | 3,163 | | | | 100,425 | |
| Fortinet, Inc. | | | 224,215 | | | | 4,508,964 | |
| Future Healthcare of America | | | 50,776 | | | | 8,632 | |
| Glu Mobile, Inc. | | | 1,578,708 | | | | 5,367,607 | |
| Infoblox, Inc. | | | 6,863 | | | | 305,060 | |
| Jive Software, Inc. | | | 72,932 | | | | 794,230 | |
| Magic Software Enterprises Ltd. | | | 84,115 | | | | 519,831 | |
| Majesco Entertainment Company | | | 259,328 | | | | 157,308 | |
| Mitek Systems, Inc. | | | 377,211 | | | | 1,995,446 | |
| NQ Mobile, Inc. - ADR | | | 49,795 | | | | 717,048 | |
| Progress Software Corporation | | | 40,325 | | | | 1,046,837 | |
| PTC, Inc. | | | 2,635 | | | | 73,042 | |
| RealPage, Inc. | | | 10,465 | | | | 256,707 | |
| Rovi Corporation | | | 9,413 | | | | 157,762 | |
| Shanda Games Ltd. - ADR | | | 25,619 | | | | 113,236 | |
| Sky-mobi Ltd. - ADR | | | 85,190 | | | | 322,870 | |
| Tangoe, Inc. | | | 34,965 | | | | 667,832 | |
| Top Image Systems Ltd. | | | 14,796 | | | | 59,332 | |
| Trunkbow International Holdings Ltd. | | | 1,755 | | | | 1,895 | |
| Tyler Technologies, Inc. | | | 4,457 | | | | 431,037 | |
| VirnetX Holding Corporation | | | 325,664 | | | | 7,079,935 | |
| Voltari Corporation | | | 77,047 | | | | 365,973 | |
| Vringo, Inc. | | | 1,644,898 | | | | 4,638,612 | |
| Wave Systems Corporation - Class A | | | 227,745 | | | | 309,733 | |
| Zynga, Inc. - Class A | | | 401,137 | | | | 1,440,082 | |
| | | | | | | | 42,453,887 | |
| Materials — 4.1% | | | | | | | | |
| Chemicals — 1.1% | | | | | | | | |
| Advanced Emissions Solutions, Inc. | | | 1,473 | | | | 55,635 | |
| American Vanguard Corporation | | | 6,487 | | | | 169,311 | |
| China Gengsheng Minerals, Inc. | | | 71,852 | | | | 17,273 | |
| China Green Agriculture, Inc. | | | 129,983 | | | | 512,133 | |
| Clean Diesel Technologies, Inc. | | | 149,298 | | | | 207,524 | |
| Cytec Industries, Inc. | | | 52,124 | | | | 4,330,983 | |
| Flotek Industries, Inc. | | | 90,656 | | | | 1,938,225 | |
| Gulf Resources, Inc. | | | 291,862 | | | | 653,771 | |
| Hawkins, Inc. | | | 244 | | | | 8,787 | |
| Intrepid Potash, Inc. | | | 296,405 | | | | 4,401,614 | |
| Kronos Worldwide, Inc. | | | 36,776 | | | | 570,396 | |
TFS MARKET NEUTRAL FUND
SCHEDULE OF SECURITIES SOLD SHORT (Continued)
COMMON STOCKS — 63.5% (Continued) | | | | | | |
| Materials — 4.1% (Continued) | | | | | | |
| Chemicals — 1.1% (Continued) | | | | | | |
| OM Group, Inc. | | | 3,103 | | | $ | 105,502 | |
| PolyOne Corporation | | | 88,974 | | | | 2,695,912 | |
| Sensient Technologies Corporation | | | 2,105 | | | | 109,734 | |
| Tredegar Corporation | | | 24,456 | | | | 714,604 | |
| Valhi, Inc. | | | 1,302 | | | | 23,918 | |
| Zoltek Companies, Inc. | | | 68,897 | | | | 1,150,580 | |
| | | | | | | | 17,665,902 | |
Construction Materials — 0.0% (a) | | | | | | | | |
| Texas Industries, Inc. | | | 6,786 | | | | 364,408 | |
| US Concrete, Inc. | | | 3,320 | | | | 72,542 | |
| | | | | | | | 436,950 | |
| Metals & Mining — 2.6% | | | | | | | | |
| A.M. Castle & Company | | | 69,475 | | | | 994,187 | |
| AK Steel Holding Corporation | | | 1,285,635 | | | | 5,656,794 | |
| Allied Nevada Gold Corporation | | | 996,525 | | | | 4,065,822 | |
| AMCOL International Corporation | | | 56,938 | | | | 1,826,571 | |
| Atlatsa Resources Corporation | | | 186,712 | | | | 77,803 | |
| Avalon Rare Metals, Inc. | | | 251,247 | | | | 203,510 | |
| Avino Silver & Gold Mines Ltd. | | | 111 | | | | 128 | |
| China Gerui Advanced Materials Group Ltd. | | | 6,011 | | | | 8,716 | |
| China Natural Resources, Inc. | | | 4,498 | | | | 19,701 | |
| China Precision Steel, Inc. | | | 31,377 | | | | 38,908 | |
| China Shen Zhou Mining & Resources, Inc. | | | 123,871 | | | | 9,897 | |
| Coeur Mining, Inc. | | | 9,116 | | | | 111,306 | |
| Compass Minerals International, Inc. | | | 3,982 | | | | 296,540 | |
| Comstock Mining, Inc. | | | 29,554 | | | | 51,424 | |
| General Steel Holdings, Inc. | | | 116,261 | | | | 103,868 | |
| Gold Reserve, Inc. | | | 6,207 | | | | 21,452 | |
| Gold Resource Corporation | | | 1,039 | | | | 5,392 | |
| Golden Minerals Company | | | 45,566 | | | | 35,086 | |
| Golden Star Resources Ltd. | | | 597,268 | | | | 288,480 | |
| Great Northern Iron Ore Properties | | | 5,127 | | | | 362,223 | |
| Hecla Mining Company | | | 140,694 | | | | 438,965 | |
| Horsehead Holding Corporation | | | 176,008 | | | | 2,553,876 | |
| Jaguar Mining, Inc. | | | 680,115 | | | | 119,700 | |
| Kaiser Aluminum Corporation | | | 4,486 | | | | 302,581 | |
| Mesabi Trust | | | 15,544 | | | | 357,201 | |
| Midway Gold Corporation | | | 82,304 | | | | 77,366 | |
| Molycorp, Inc. | | | 849,192 | | | | 4,305,403 | |
| North American Palladium Ltd. | | | 447,498 | | | | 393,798 | |
| Olympic Steel, Inc. | | | 9,146 | | | | 250,326 | |
| Polymet Mining Corporation | | | 247,997 | | | | 189,718 | |
| Prospect Global Resources, Inc. | | | 23,828 | | | | 53,613 | |
TFS MARKET NEUTRAL FUND
SCHEDULE OF SECURITIES SOLD SHORT (Continued)
COMMON STOCKS — 63.5% (Continued) | | | | | | |
| Materials — 4.1% (Continued) | | | | | | |
| Metals & Mining — 2.6% (Continued) | | | | | | |
| Revett Minerals, Inc. | | | 1,200 | | | $ | 778 | |
| Royal Gold, Inc. | | | 13,956 | | | | 670,446 | |
| RTI International Metals, Inc. | | | 25,353 | | | | 859,467 | |
| Schnitzer Steel Industries, Inc. - Class A | | | 41,333 | | | | 1,200,310 | |
| Seabridge Gold, Inc. | | | 43,185 | | | | 408,098 | |
| Silver Bull Resources, Inc. | | | 153,453 | | | | 54,476 | |
| SinoCoking Coal and Coke Chemical Industries, Inc. | | | 133,689 | | | | 168,448 | |
| Stillwater Mining Company | | | 126,651 | | | | 1,381,762 | |
| Tahoe Resources, Inc. | | | 13,763 | | | | 263,562 | |
| Tanzanian Royalty Exploration Corporation | | | 239,499 | | | | 567,613 | |
| Thompson Creek Metals Company, Inc. | | | 504,810 | | | | 1,620,440 | |
| Turquoise Hill Resource Ltd. | | | 243,020 | | | | 1,171,356 | |
| United States Antimony Corporation | | | 72,799 | | | | 115,022 | |
| United States Steel Corporation | | | 49,275 | | | | 1,226,455 | |
| Universal Stainless & Alloy Products, Inc. | | | 6,711 | | | | 216,900 | |
| Walter Energy, Inc. | | | 480,408 | | | | 7,633,683 | |
| Western Copper and Gold Corporation | | | 3,015 | | | | 2,225 | |
| | | | | | | | 40,781,396 | |
| Paper & Forest Products — 0.4% | | | | | | | | |
| Domtar Corporation | | | 51,122 | | | | 4,330,545 | |
| Mercer International, Inc. | | | 17,128 | | | | 137,024 | |
| Orient Paper, Inc. | | | 172,604 | | | | 372,825 | |
| Resolute Forest Products, Inc. | | | 110,667 | | | | 1,769,565 | |
| Wausau Paper Corporation | | | 11,114 | | | | 130,034 | |
| | | | | | | | 6,739,993 | |
| Telecommunication Services — 0.9% | | | | | | | | |
| Diversified Telecommunication Services — 0.5% | | | | | | | | |
| 8x8, Inc. | | | 53,472 | | | | 612,789 | |
| Consolidated Communications Holdings, Inc. | | | 5,927 | | | | 110,420 | |
| Elephant Talk Communications Corporation | | | 442,776 | | | | 270,093 | |
| Fairpoint Communications, Inc. | | | 110,975 | | | | 1,036,507 | |
| Globalstar, Inc. | | | 29,902 | | | | 41,564 | |
| Hawaiian Telcom Holdco, Inc. | | | 6,380 | | | | 169,580 | |
| Iridium Communications, Inc. | | | 133,120 | | | | 802,714 | |
| magicJack VocalTec Ltd. | | | 375,909 | | | | 4,240,254 | |
| NTS, Inc. | | | 1,982 | | | | 3,865 | |
| Otelco, Inc. - Class A | | | 608 | | | | 4,955 | |
| Radcom Ltd. | | | 56,983 | | | | 253,574 | |
| Towerstream Corporation | | | 219,386 | | | | 526,526 | |
| | | | | | | | 8,072,841 | |
| Wireless Telecommunication Services — 0.4% | | | | | | | | |
| Boingo Wireless, Inc. | | | 59,869 | | | | 405,912 | |
| Leap Wireless International, Inc. | | | 269,710 | | | | 4,342,331 | |
TFS MARKET NEUTRAL FUND
SCHEDULE OF SECURITIES SOLD SHORT (Continued)
COMMON STOCKS — 63.5% (Continued) | | | | | | |
| Telecommunication Services — 0.9%(Continued) | | | | | | |
| Wireless Telecommunication Services — 0.4% (Continued) | | | | | | |
| NII Holdings, Inc. | | | 196,822 | | | $ | 677,068 | |
| NTELOS Holdings Corporation | | | 24,187 | | | | 460,521 | |
| USA Mobility, Inc. | | | 27,496 | | | | 410,240 | |
| | | | | | | | 6,296,072 | |
| Utilities — 1.2% | | | | | | | | |
| Electric Utilities — 0.3% | | | | | | | | |
| Empire District Electric Company (The) | | | 38,584 | | | | 867,754 | |
| IDACORP, Inc. | | | 806 | | | | 41,590 | |
| MGE Energy, Inc. | | | 208 | | | | 11,712 | |
| NRG Yield, Inc. - Class A | | | 8,721 | | | | 308,898 | |
| Otter Tail Corporation | | | 74,497 | | | | 2,222,246 | |
| Portland General Electric Company | | | 28,675 | | | | 822,972 | |
| | | | | | | | 4,275,172 | |
| Gas Utilities — 0.4% | | | | | | | | |
| AmeriGas Partners, L.P. | | | 5,264 | | | | 237,248 | |
| Atmos Energy Corporation | | | 6,999 | | | | 309,846 | |
| China Natural Gas, Inc. | | | 185,129 | | | | 101,821 | |
| Ferrellgas Partners, L.P. | | | 104,694 | | | | 2,393,305 | |
| Laclede Group, Inc. (The) | | | 6,042 | | | | 284,397 | |
| Northwest Natural Gas Company | | | 42,436 | | | | 1,842,995 | |
| Piedmont Natural Gas Company, Inc. | | | 22,006 | | | | 751,285 | |
| RGC Resources, Inc. | | | 48 | | | | 893 | |
| South Jersey Industries, Inc. | | | 13,132 | | | | 782,011 | |
| | | | | | | | 6,703,801 | |
| Independent Power Producers & Energy Traders — 0.3% | | | | | | | | |
| American DG Energy, Inc. | | | 30,879 | | | | 46,627 | |
| Atlantic Power Corporation | | | 552,863 | | | | 2,482,355 | |
| Dynegy, Inc. | | | 16,091 | | | | 312,648 | |
| Ormat Technologies, Inc. | | | 60,538 | | | | 1,578,226 | |
| U.S. Geothermal, Inc. | | | 240,378 | | | | 105,766 | |
| | | | | | | | 4,525,622 | |
| Multi-Utilities — 0.2% | | | | | | | | |
| Just Energy Group, Inc. | | | 435,158 | | | | 3,093,973 | |
| NorthWestern Corporation | | | 15,516 | | | | 711,254 | |
| | | | | | | | 3,805,227 | |
Water Utilities — 0.0% (a) | | | | | | | | |
| Consolidated Water Company Ltd. | | | 15,295 | | | | 230,037 | |
| | | | | | | | | |
Total Common Stocks (Proceeds $1,169,109,110) | | | | | | $ | 1,004,606,619 | |
TFS MARKET NEUTRAL FUND
SCHEDULE OF SECURITIES SOLD SHORT (Continued)
PREFERRED STOCKS — 0.0% (a) | | | | | | |
| Cabco Trust for J. C. Penney, 7.625% (Proceeds $93,092) | | | 4,878 | | | $ | 80,633 | |
OTHER INVESTMENTS — 14.3% | | | | | | |
| iPath S&P 500 VIX Mid-Term Futures ETN | | | 394,700 | | | $ | 7,128,282 | |
| iPath S&P 500 VIX Short-Term Futures ETN | | | 2,221,946 | | | | 28,729,762 | |
| SPDR S&P 500 ETF Trust | | | 180,100 | | | | 31,648,973 | |
| Vanguard S&P 500 ETF | | | 992,480 | | | | 159,670,182 | |
Total Other Investments (Proceeds $224,736,410) | | | | | | $ | 227,177,199 | |
| | | | | | |
| American International Group, Inc. | | | 854 | | | $ | 18,216 | |
Magnum Hunter Resources Corporation (b) | | | 15,689 | | | | — | |
Total Warrants (Proceeds $14,295) | | | | | | $ | 18,216 | |
| | | | | | | | | |
Total Securities Sold Short — 77.8% (Proceeds $1,393,952,907) | | | | | | $ | 1,231,882,667 | |
ADR - American Depositary Receipt.
| (a) | Percentage rounds to less than 0.1%. |
| (b) | Security value has been determined in good faith by the Board of Trustees. The total value of such securities is ($1,973) at October 31, 2013, representing (0.0%)(a) of net assets (Note 2). |
See accompanying notes to financial statements.
TFS MARKET NEUTRAL FUND
SCHEDULE OF OPEN WRITTEN OPTION CONTRACTS
October 31, 2013
| | | | | | | | | | | | | |
| Call Option Contracts | | | | | | | | | | | | | |
| Crude Oil Future 11/20/2013 | 11/15/2013 | | $ | 106.00 | | | | 1 | | | $ | 30 | | | $ | 290 | |
| iShares MSCI Emerging Market | 11/16/2013 | | | 45.00 | | | | 50 | | | | 300 | | | | 573 | |
| iShares MSCI Emerging Market | 11/16/2013 | | | 45.50 | | | | 325 | | | | 975 | | | | 1,776 | |
| SPDR S&P 500 ETF Trust | 11/16/2013 | | | 179.00 | | | | 100 | | | | 3,500 | | | | 3,046 | |
| SPDR S&P 500 ETF Trust | 11/16/2013 | | | 180.00 | | | | 175 | | | | 3,325 | | | | 3,756 | |
| SPDR S&P 500 ETF Trust | 11/16/2013 | | | 181.00 | | | | 100 | | | | 900 | | | | 1,247 | |
| | | | | | | | | | | | | 9,030 | | | | 10,688 | |
| Put Option Contracts | | | | | | | | | | | | | | | | | |
| Crude Oil Future 11/20/2013 | 11/15/2013 | | | 92.50 | | | | 1 | | | | 430 | | | | 320 | |
| iShares MSCI Emerging Market | 11/16/2013 | | | 40.00 | | | | 250 | | | | 2,500 | | | | 2,629 | |
| iShares MSCI Emerging Market | 11/16/2013 | | | 40.50 | | | | 125 | | | | 1,625 | | | | 1,725 | |
| SPDR S&P 500 ETF Trust | 11/16/2013 | | | 165.00 | | | | 150 | | | | 1,800 | | | | 4,720 | |
| SPDR S&P 500 ETF Trust | 11/16/2013 | | | 166.00 | | | | 75 | | | | 1,125 | | | | 2,810 | |
| SPDR S&P 500 ETF Trust | 11/16/2013 | | | 167.00 | | | | 150 | | | | 2,550 | | | | 6,669 | |
| | | | | | | | | | | | | 10,030 | | | | 18,873 | |
| | | | | | | | | | | | | | | | | | |
| Total Written Option Contracts | | | | | | | | | | | $ | 19,060 | | | $ | 29,561 | |
See accompanying notes to financial statements.
TFS SMALL CAP FUND
SUMMARY SCHEDULE OF INVESTMENTS*
October 31, 2013
| | | | | | |
| Consumer Discretionary — 15.1% | | | | | | |
Federal-Mogul Corporation (a) | | | 19,290 | | | $ | 395,252 | |
| Marcus Corporation | | | 16,439 | | | | 236,064 | |
| MDC Partners, Inc. | | | 9,564 | | | | 294,858 | |
Tower International, Inc. (a) | | | 13,146 | | | | 278,958 | |
Winnebago Industries, Inc. (a) | | | 12,480 | | | | 370,157 | |
Other Consumer Discretionary (b) | | | | | | | 10,653,198 | |
| | | | | | | | 12,228,487 | |
| Consumer Staples — 3.8% | | | | | | | | |
| Coca-Cola Bottling Company Consolidated | | | 3,826 | | | | 242,262 | |
Pantry, Inc. (The) (a) | | | 18,699 | | | | 250,380 | |
Other Consumer Staples (b) | | | | | | | 2,561,917 | |
| | | | | | | | 3,054,559 | |
| Energy — 7.7% | | | | | | | | |
Gastar Exploration Ltd. (a) | | | 64,311 | | | | 277,824 | |
Hercules Offshore, Inc. (a) | | | 44,056 | | | | 299,581 | |
Penn Virginia Corporation (a) | | | 30,928 | | | | 263,197 | |
Stone Energy Corporation (a) | | | 6,803 | | | | 237,153 | |
Triangle Petroleum Corporation (a) | | | 39,884 | | | | 421,574 | |
Other Energy (b) | | | | | | | 4,746,933 | |
| | | | | | | | 6,246,262 | |
| Financials — 16.9% | | | | | | | | |
| AMERISAFE, Inc. | | | 6,704 | | | | 258,104 | |
FBR & Company (a) | | | 10,497 | | | | 278,171 | |
Navigators Group, Inc. (The) (a) | | | 4,452 | | | | 250,380 | |
| Selective Insurance Group, Inc. | | | 10,091 | | | | 265,091 | |
| Sterling Bancorp | | | 16,555 | | | | 244,186 | |
Other Financials (b) | | | | | | | 12,387,603 | |
| | | | | | | | 13,683,535 | |
| Health Care — 14.7% | | | | | | | | |
AMN Healthcare Services, Inc. (a) | | | 21,443 | | | | 265,893 | |
AngioDynamics, Inc. (a) | | | 19,200 | | | | 301,824 | |
Cambrex Corporation (a) | | | 14,344 | | | | 241,266 | |
| Hi-Tech Pharmacal Company, Inc. | | | 7,830 | | | | 337,395 | |
Lannett Company, Inc. (a) | | | 11,790 | | | | 278,362 | |
LifePoint Hospitals, Inc. (a) | | | 7,351 | | | | 379,606 | |
Magellan Health Services, Inc. (a) | | | 6,165 | | | | 361,886 | |
Omnicell, Inc. (a) | | | 14,241 | | | | 328,540 | |
Prothena Corporation plc (a) | | | 10,092 | | | | 242,612 | |
Sagent Pharmaceuticals, Inc. (a) | | | 14,417 | | | | 312,705 | |
VCA Antech, Inc. (a) | | | 12,565 | | | | 357,474 | |
Other Health Care (b) | | | | | | | 8,476,512 | |
| | | | | | | | 11,884,075 | |
TFS SMALL CAP FUND
SUMMARY SCHEDULE OF INVESTMENTS* (Continued)
COMMON STOCKS — 98.2% (Continued) | | | | | | |
| Industrials — 15.2% | | | | | | |
ARC Document Solutions, Inc. (a) | | | 38,210 | | | $ | 238,430 | |
Dycom Industries, Inc. (a) | | | 12,111 | | | | 359,091 | |
| EMCOR Group, Inc. | | | 9,390 | | | | 347,993 | |
Furmanite Corporation (a) | | | 22,433 | | | | 252,371 | |
| Mueller Water Products, Inc. - Class A | | | 44,619 | | | | 382,385 | |
Patrick Industries, Inc. (a) | | | 8,332 | | | | 260,625 | |
Powell Industries, Inc. (a) | | | 4,217 | | | | 264,954 | |
| US Ecology, Inc. | | | 6,675 | | | | 237,296 | |
Other Industrials (b) | | | | | | | 9,984,606 | |
| | | | | | | | 12,327,751 | |
| Information Technology — 18.0% | | | | | | | | |
iGATE Corporation (a) | | | 14,214 | | | | 452,574 | |
Insight Enterprises, Inc. (a) | | | 12,111 | | | | 255,179 | |
| Intersil Corporation - Class A | | | 34,027 | | | | 379,741 | |
| Lender Processing Services, Inc. | | | 10,914 | | | | 376,751 | |
MoneyGram International, Inc. (a) | | | 12,649 | | | | 267,020 | |
PDF Solutions, Inc. (a) | | | 12,910 | | | | 296,543 | |
Perficient, Inc. (a) | | | 13,420 | | | | 242,768 | |
QLogic Corporation (a) | | | 19,259 | | | | 237,849 | |
ScanSource, Inc. (a) | | | 9,121 | | | | 350,794 | |
ShoreTel, Inc. (a) | | | 57,519 | | | | 457,276 | |
Verint Systems, Inc. (a) | | | 10,017 | | | | 365,821 | |
Other Information Technology (b) | | | | | | | 10,904,776 | |
| | | | | | | | 14,587,092 | |
| Materials — 4.3% | | | | | | | | |
| H.B. Fuller Company | | | 7,693 | | | | 368,264 | |
| Neenah Paper, Inc. | | | 6,966 | | | | 286,581 | |
| P.H. Glatfelter Company | | | 12,152 | | | | 318,383 | |
Other Materials (b) | | | | | | | 2,497,958 | |
| | | | | | | | 3,471,186 | |
| Telecommunication Services — 1.0% | | | | | | | | |
Other Telecommunication Services (b) | | | | | | | 838,382 | |
| | | | | | | | | |
| Utilities — 1.5% | | | | | | | | |
Other Utilities (b) | | | | | | | 1,214,901 | |
| | | | | | | | | |
Total Common Stocks (Cost $73,085,808) | | | | | | $ | 79,536,230 | |
| | | | |
Other Investments (Cost $169,210)(b) | | | $ | 162,471 | |
TFS SMALL CAP FUND
SUMMARY SCHEDULE OF INVESTMENTS* (Continued)
MONEY MARKET FUNDS — 1.1% | | | | | | |
UMB Money Market Fiduciary, 0.01% (c) (Cost $876,642) | | | 876,642 | | | $ | 876,642 | |
| | | | | | | | | |
Total Investments at Value — 99.5% (Cost $74,131,660) | | | | | | $ | 80,575,343 | |
| | | | | | | | | |
| Other Assets in Excess of Liabilities — 0.5% | | | | | | | 413,908 | |
| | | | | | | | | |
| Net Assets — 100.0% | | | | | | $ | 80,989,251 | |
| * | A complete Schedule of Investments is available without charge upon request by calling toll-free 1-888-534-2001 or on the SEC’s website at http://www.sec.gov. |
| (a) | Non-income producing security. |
| (b) | Represents issuers not identified as a top 50 holding in terms of market value and issues or issuers not exceeding 1% of net assets individually or in the aggregate, respectively, as of October 31, 2013. |
| (c) | The rate shown is the 7-day effective yield as of October 31, 2013. |
See accompanying notes to financial statements.
TFS HEDGED FUTURES FUND
SCHEDULE OF INVESTMENTS
October 31, 2013
U.S. TREASURY OBLIGATIONS (a) — 22.2% | | | | | | |
| U.S. Treasury Bills, | | | | | | |
| 0.020%, due 02/20/2014 | | $ | 3,750,000 | | | $ | 3,749,453 | |
| 0.006%, due 03/06/2014 | | | 5,250,000 | | | | 5,248,997 | |
| 0.086%, due 03/20/2014 | | | 3,150,000 | | | | 3,149,332 | |
| 0.050%, due 04/03/2014 | | | 3,000,000 | | | | 2,999,268 | |
Total U.S. Treasury Obligations (Cost $15,147,976) | | | | | | $ | 15,147,050 | |
MONEY MARKET FUNDS — 64.1% | | | | | | |
BlackRock Liquidity Funds TempFund Portfolio - Institutional Class, 0.03% (b) | | | 7,924,657 | | | $ | 7,924,657 | |
Fidelity Institutional Money Market Portfolio - Class I, 0.04% (b) | | | 17,426,623 | | | | 17,426,623 | |
Goldman Sachs Financial Square Money Market Fund - Institutional Class, 0.06% (b) | | | 8,426,250 | | | | 8,426,250 | |
Morgan Stanley Institutional Liquidity Funds - Money Market Portfolio - Institutional Class, 0.06% (b) | | | 772,690 | | | | 772,690 | |
PIMCO Money Market Fund - Institutional Class, 0.01% (b) | | | 770,967 | | | | 770,967 | |
Vanguard Prime Money Market Fund - Investor Shares, 0.01% (b) | | | 8,419,351 | | | | 8,419,351 | |
Total Money Market Funds (Cost $43,740,538) | | | | | | $ | 43,740,538 | |
| | | | | | | | | |
Total Investments at Value — 86.3% (Cost $58,888,514) | | | | | | $ | 58,887,588 | |
| | | | | | | | | |
| Other Assets in Excess of Liabilities — 13.7% | | | | | | | 9,362,000 | (c) |
| | | | | | | | | |
| Net Assets — 100.0% | | | | | | $ | 68,249,588 | |
| (a) | Rate shown is the annualized yield at time of purchase, not a coupon rate. |
| (b) | The rate shown is the 7-day effective yield as of October 31, 2013. |
| (c) | Includes cash held as margin deposits for futures contracts. |
See accompanying notes to financial statements.
TFS HEDGED FUTURES FUND
SCHEDULE OF FUTURES CONTRACTS
October 31, 2013
| | | | | | Aggregate Market Value of Contracts | | | Unrealized Appreciation (Depreciation) | |
| COMMODITY FUTURES | | | | | | | | | | |
| Butter Cash Future | 12/03/2013 | | | 2 | | | $ | 61,200 | | | $ | (550 | ) |
| Butter Cash Future | 02/04/2014 | | | 5 | | | | 149,500 | | | | 1,991 | |
| Class III Milk Future | 12/03/2013 | | | 8 | | | | 300,800 | | | | 14,498 | |
| Cocoa Future | 12/13/2013 | | | 36 | | | | 963,720 | | | | (753 | ) |
| Ethanol Future | 12/04/2013 | | | 41 | | | | 1,968,984 | | | | (34,707 | ) |
| Frozen Concentrate Orange Juice Future | 01/10/2014 | | | 56 | | | | 1,028,160 | | | | 9,972 | |
| Hard Red Winter Wheat Future | 12/13/2013 | | | 121 | | | | 4,480,025 | | | | (62,461 | ) |
| NY Harbor ULSD Future | 11/29/2013 | | | 5 | | | | 620,865 | | | | 9,077 | |
| Oats Future | 12/13/2013 | | | 136 | | | | 2,245,700 | | | | 49,861 | |
| Palladium Future | 12/27/2013 | | | 2 | | | | 147,600 | | | | (2,680 | ) |
| Platinum Future | 01/29/2014 | | | 5 | | | | 362,600 | | | | (6,857 | ) |
| Rough Rice Future | 01/14/2014 | | | 20 | | | | 604,200 | | | | (16,474 | ) |
| Soybean Future | 01/14/2014 | | | 13 | | | | 823,063 | | | | (13,797 | ) |
| Soybean Meal Future | 12/13/2013 | | | 135 | | | | 5,448,600 | | | | (122,372 | ) |
| Sugar No. 11 Future | 02/28/2014 | | | 108 | | | | 2,215,987 | | | | (17,009 | ) |
| | | | | | | | | | | | | | |
| Total Futures Contracts | | | | | | | $ | 21,421,004 | | | $ | (192,261 | ) |
See accompanying notes to financial statements.
TFS HEDGED FUTURES FUND
SCHEDULE OF FUTURES CONTRACTS SOLD SHORT
October 31, 2013
FUTURES CONTRACTS SOLD SHORT | | | | | | Aggregate Market Value of Contracts | | | Unrealized Appreciation (Depreciation) | |
| COMMODITY FUTURES | | | | | | | | | | |
| Butter Cash Future | 12/31/2013 | | | 1 | | | $ | 29,800 | | | $ | (653 | ) |
| Butter Cash Future | 03/04/2014 | | | 1 | | | | 30,000 | | | | (1,328 | ) |
| Class III Milk Future | 12/31/2013 | | | 15 | | | | 550,500 | | | | (8,461 | ) |
| Coffee Future | 12/18/2013 | | | 9 | | | | 355,725 | | | | 5,112 | |
| Copper Future | 12/27/2013 | | | 8 | | | | 659,500 | | | | (3,981 | ) |
| Corn Future | 12/13/2013 | | | 52 | | | | 1,113,450 | | | | 48,636 | |
| Cotton No. 2 Future | 12/06/2013 | | | 19 | | | | 733,210 | | | | 43,570 | |
| Crude Oil Future | 11/20/2013 | | | 1 | | | | 96,300 | | | | 3,488 | |
| Feeder Cattle Future | 11/21/2013 | | | 7 | | | | 575,312 | | | | 11,481 | |
| Feeder Cattle Future | 01/30/2014 | | | 10 | | | | 821,000 | | | | 12,522 | |
| Gasoline Future | 11/29/2013 | | | 1 | | | | 108,658 | | | | 103 | |
| Gold Future | 12/27/2013 | | | 3 | | | | 397,440 | | | | (547 | ) |
| Lean Hogs Future | 12/13/2013 | | | 36 | | | | 1,283,760 | | | | 14,291 | |
| Live Cattle Future | 12/31/2013 | | | 17 | | | | 904,230 | | | | (3,467 | ) |
| Lumber Future | 01/15/2014 | | | 58 | | | | 2,363,790 | | | | (96,388 | ) |
| Natural Gas Future | 11/26/2013 | | | 52 | | | | 1,864,200 | | | | 121,199 | |
| Natural Gas Future | 12/27/2013 | | | 9 | | | | 329,760 | | | | 25,069 | |
| Red Spring Wheat Future | 12/13/2013 | | | 45 | | | | 1,643,063 | | | | 14,792 | |
| Silver Future | 12/27/2013 | | | 4 | | | | 438,700 | | | | (4,384 | ) |
| Soybean Oil Future | 12/13/2013 | | | 173 | | | | 4,290,054 | | | | (14,582 | ) |
| Wheat Future | 12/13/2013 | | | 88 | | | | 2,937,000 | | | | 46,189 | |
| Total Commodity Futures | | | | | | | | 21,525,452 | | | | 212,661 | |
| | | | | | | | | | | | | | |
| FINANCIAL FUTURES | | | | | | | | | | | | | |
| CBOE Volatility Index (VIX) Future | 11/19/2013 | | | 195 | | | | 2,835,300 | | | | 266,940 | |
| CBOE Volatility Index (VIX) Future | 12/17/2013 | | | 211 | | | | 3,285,270 | | | | 213,637 | |
| E-Mini S&P 500 Future | 12/20/2013 | | | 318 | | | | 27,896,550 | | | | (653,339 | ) |
| Total Financial Futures | | | | | | | | 34,017,120 | | | | (172,762 | ) |
| | | | | | | | | | | | | | |
| Total Futures Contracts Sold Short | | | | | | | $ | 55,542,572 | | | $ | 39,899 | |
See accompanying notes to financial statements.
TFS CAPITAL INVESTMENT TRUST
STATEMENTS OF ASSETS AND LIABILITIES
October 31, 2013
| | | | | | | | | | |
| ASSETS | | | | | | | | | |
| Investments in securities: | | | | | | | | | |
| At acquisition cost | | $ | 1,377,003,833 | | | $ | 74,131,660 | | | $ | 58,888,514 | |
| At value (Note 2) | | $ | 1,559,511,650 | | | $ | 80,575,343 | | | $ | 58,887,588 | |
| Cash | | | 55 | | | | — | | | | 1,330,000 | |
| Deposits with brokers for short positions (Note 2) | | | 1,273,919,986 | | | | — | | | | — | |
| Margin deposits for futures contracts (Notes 2 and 5) | | | — | | | | — | | | | 8,351,718 | |
| Variation margin receivable (Notes 2 and 5) | | | — | | | | — | | | | 705,414 | |
Unrealized appreciation on forward currency
exchange contracts (Notes 2 and 5) | | | — | | | | — | | | | 107,151 | |
| Dividends and interest receivable | | | 603,981 | | | | 16,862 | | | | 1,597 | |
| Receivable for investment securities sold | | | 236,589,148 | | | | 10,012,586 | | | | — | |
| Receivable for capital shares sold | | | 1,259,767 | | | | 160,670 | | | | 53,073 | |
| Other assets | | | 42,989 | | | | 12,267 | | | | 13,568 | |
| TOTAL ASSETS | | | 3,071,927,576 | | | | 90,777,728 | | | | 69,450,109 | |
| | | | | | | | | | | | | |
| LIABILITIES | | | | | | | | | | | | |
Securities sold short, at value (Note 2)
(proceeds $1,393,952,907) | | | 1,231,882,667 | | | | — | | | | — | |
Written options, at value (Notes 2 and 5)
(proceeds $29,561) | | | 19,060 | | | | — | | | | — | |
| Variation margin payable (Notes 2 and 5) | | | — | | | | — | | | | 875,778 | |
Unrealized depreciation on forward currency
exchange contracts (Notes 2 and 5) | | | — | | | | — | | | | 12,817 | |
| Dividends payable on securities sold short (Note 2) | | | 290,646 | | | | — | | | | — | |
| Payable for investment securities purchased | | | 242,761,692 | | | | 9,584,687 | | | | — | |
| Payable for capital shares redeemed | | | 7,312,793 | | | | 83,209 | | | | 181,233 | |
| Payable to Adviser (Note 4) | | | 3,048,088 | | | | 91,740 | | | | 110,342 | |
| Payable to administrator (Note 4) | | | 160,450 | | | | 12,625 | | | | 12,425 | |
Accrued brokerage expense on securities
sold short (Note 2) | | | 3,561,237 | | | | — | | | | — | |
| Other accrued expenses and liabilities | | | 94,228 | | | | 16,216 | | | | 7,926 | |
| TOTAL LIABILITIES | | | 1,489,130,861 | | | | 9,788,477 | | | | 1,200,521 | |
| | | | | | | | | | | | | |
| NET ASSETS | | $ | 1,582,796,715 | | | $ | 80,989,251 | | | $ | 68,249,588 | |
| | | | | | | | | | | | | |
| Net assets consist of: | | | | | | | | | | | | |
| Paid-in capital | | $ | 1,443,115,523 | | | $ | 59,253,541 | | | $ | 75,902,995 | |
| Accumulated net investment income (loss) | | | 1,188,427 | | | | (46,834 | ) | | | (2,045,004 | ) |
Accumulated net realized gains (losses) from security
transactions and other financial instruments | | | (206,095,797 | ) | | | 15,338,861 | | | | (5,549,449 | ) |
| Net unrealized appreciation (depreciation) on: | | | | | | | | | | | | |
| Investments | | | 182,507,817 | | | | 6,443,683 | | | | (926 | ) |
| Short positions | | | 162,070,240 | | | | — | | | | — | |
| Option contracts | | | 10,501 | | | | — | | | | — | |
| Futures contracts | | | — | | | | — | | | | (152,362 | ) |
| Translation of assets and liabilities in foreign currencies | | | 4 | | | | — | | | | 94,334 | |
| Net assets | | $ | 1,582,796,715 | | | $ | 80,989,251 | | | $ | 68,249,588 | |
| | | | | | | | | | | | | |
Shares of beneficial interest outstanding (unlimited
number of shares authorized, no par value) | | | 97,753,884 | | | | 5,101,869 | | | | 6,870,670 | |
| | | | | | | | | | | | | |
Net asset value, redemption price and offering
price per share (a) (Note 2) | | $ | 16.19 | | | $ | 15.87 | | | $ | 9.93 | |
| * | Consolidated financial statement (Note 1). |
| (a) | Redemption price may differ from the net asset value per share depending upon the length of time the shares are held (Note 2). |
See accompanying notes to financial statements.
TFS CAPITAL INVESTMENT TRUST
STATEMENTS OF OPERATIONS
For the Year Ended October 31, 2013
| | | | | | | | | | |
| INVESTMENT INCOME | | | | | | | | | |
| Dividends | | $ | 36,092,929 | | | $ | 1,115,475 | | | $ | 57,323 | |
| Foreign tax withholding | | | (88,225 | ) | | | (426 | ) | | | — | |
| Interest | | | 1,448 | | | | 85 | | | | 19,642 | |
| TOTAL INVESTMENT INCOME | | | 36,006,152 | | | | 1,115,134 | | | | 76,965 | |
| | | | | | | | | | | | | |
| EXPENSES | | | | | | | | | | | | |
| Brokerage expense on securities sold short (Note 2) | | | 93,344,448 | | | | — | | | | — | |
| Investment advisory fees (Note 4) | | | 40,425,505 | | | | 769,199 | | | | 2,234,323 | |
| Dividend expense on securities sold short (Note 2) | | | 19,397,768 | | | | — | | | | — | |
| Administration fees (Note 4) | | | 1,025,165 | | | | 60,015 | | | | 84,169 | |
| Accounting services fees (Note 4) | | | 606,473 | | | | 43,955 | | | | 61,715 | |
| Custodian fees | | | 450,217 | | | | 52,371 | | | | 30,124 | |
| Transfer agent fees (Note 4) | | | 328,110 | | | | 32,811 | | | | 38,415 | |
| Professional fees | | | 89,198 | | | | 39,227 | | | | 51,578 | |
| Registration and filing fees | | | 62,540 | | | | 27,434 | | | | 55,396 | |
| Pricing fees | | | 105,687 | | | | 17,133 | | | | 2,038 | |
| Trustees’ fees and expenses (Note 4) | | | 28,513 | | | | 28,513 | | | | 28,513 | |
| Postage and supplies | | | 51,502 | | | | 6,912 | | | | 8,353 | |
| Compliance service fees and expenses (Note 4) | | | 40,171 | | | | 11,714 | | | | 12,594 | |
| Printing of shareholder reports | | | 34,959 | | | | 5,903 | | | | 7,135 | |
| Insurance expense | | | 37,928 | | | | 2,039 | | | | 2,057 | |
| Borrowing costs (Note 5) | | | 28,635 | | | | 1,089 | | | | — | |
| Other expenses | | | 27,125 | | | | 12,992 | | | | 11,996 | |
| TOTAL EXPENSES | | | 156,083,944 | | | | 1,111,307 | | | | 2,628,406 | |
| Investment advisory fee reductions (Note 4) | | | — | | | | (33,364 | ) | | | (58,934 | ) |
| NET EXPENSES | | | 156,083,944 | | | | 1,077,943 | | | | 2,569,472 | |
| NET INVESTMENT INCOME (LOSS) | | | (120,077,792 | ) | | | 37,191 | | | | (2,492,507 | ) |
| | | | | | | | | | | | | |
REALIZED AND UNREALIZED GAINS (LOSSES)
ON INVESTMENTS, SECURITIES SOLD
SHORT, OPTION AND FUTURES CONTRACTS
AND FOREIGN CURRENCY TRANSACTIONS | | | | | | | | | | | | |
| Net realized gains (losses) from: | | | | | | | | | | | | |
| Investments | | | 423,147,517 | | | | 16,812,788 | | | | 9,291 | |
| Securities sold short | | | (308,876,468 | ) | | | — | | | | — | |
| Option contracts | | | 860,815 | | | | — | | | | — | |
| Futures contracts | | | — | | | | — | | | | (5,414,738 | ) |
| Foreign currency transactions | | | 26,798 | | | | — | | | | (1,151,993 | ) |
| Net change in unrealized appreciation (depreciation) on: | | | | | | | | | | | | |
| Investments | | | 128,317,841 | | | | 5,193,135 | | | | (574 | ) |
| Securities sold short | | | (21,298,881 | ) | | | — | | | | — | |
| Option contracts | | | 10,501 | | | | — | | | | — | |
| Futures contracts | | | — | | | | — | | | | (395,828 | ) |
| Foreign currency translation | | | (36,928 | ) | | | — | | | | 94,334 | |
NET REALIZED AND UNREALIZED GAINS
(LOSSES) ON INVESTMENTS | | | 222,151,195 | | | | 22,005,923 | | | | (6,859,508 | ) |
NET INCREASE (DECREASE) IN NET ASSETS
FROM OPERATIONS | | $ | 102,073,403 | | | $ | 22,043,114 | | | $ | (9,352,015 | ) |
| * | Consolidated financial statement (Note 1). |
See accompanying notes to financial statements.
TFS MARKET NEUTRAL FUND
STATEMENTS OF CHANGES IN NET ASSETS
| | | | | | | |
| FROM OPERATIONS | | | | | | |
| Net investment loss | | $ | (120,077,792 | ) | | $ | (116,533,594 | ) |
| Net realized gains (losses) from: | | | | | | | | |
| Investments | | | 423,147,517 | | | | 214,856,225 | |
| Securities sold short | | | (308,876,468 | ) | | | (64,020,799 | ) |
| Option contracts | | | 860,815 | | | | — | |
| Foreign currency transactions | | | 26,798 | | | | (30,004 | ) |
| Net change in unrealized appreciation (depreciation) on: | | | | | | | | |
| Investments | | | 128,317,841 | | | | (25,378,884 | ) |
| Securities sold short | | | (21,298,881 | ) | | | 115,098,579 | |
| Option contracts | | | 10,501 | | | | — | |
| Foreign currency translation | | | (36,928 | ) | | | 36,951 | |
| Net increase in net assets from operations | | | 102,073,403 | | | | 124,028,474 | |
| | | | | | | | | |
| FROM DISTRIBUTIONS (Note 2) | | | | | | | | |
| Distributions from net realized gains from security transactions | | | — | | | | (28,690,939 | ) |
| | | | | | | | | |
| FROM CAPITAL SHARE TRANSACTIONS | | | | | | | | |
| Proceeds from shares sold | | | 480,118,243 | | | | 532,434,224 | |
Net asset value of shares issued in reinvestment of
distributions to shareholders | | | — | | | | 21,400,921 | |
| Proceeds from redemption fees collected (Note 2) | | | 170,982 | | | | 131,452 | |
| Payments for shares redeemed | | | (788,868,625 | ) | | | (622,266,606 | ) |
| Net decrease in net assets from capital share transactions | | | (308,579,400 | ) | | | (68,300,009 | ) |
| | | | | | | | | |
| TOTAL INCREASE (DECREASE) IN NET ASSETS | | | (206,505,997 | ) | | | 27,037,526 | |
| | | | | | | | | |
| NET ASSETS | | | | | | | | |
| Beginning of year | | | 1,789,302,712 | | | | 1,762,265,186 | |
| End of year | | $ | 1,582,796,715 | | | $ | 1,789,302,712 | |
| | | | | | | | | |
| ACCUMULATED NET INVESTMENT INCOME (LOSS) | | $ | 1,188,427 | | | $ | (14,140,543 | ) |
| | | | | | | | | |
| CAPITAL SHARE ACTIVITY | | | | | | | | |
| Shares sold | | | 30,497,892 | | | | 35,586,827 | |
| Shares issued in reinvestment of distributions to shareholders | | | — | | | | 1,500,766 | |
| Shares redeemed | | | (50,204,897 | ) | | | (41,952,004 | ) |
| Net decrease in shares outstanding | | | (19,707,005 | ) | | | (4,864,411 | ) |
| Shares outstanding, beginning of year | | | 117,460,889 | | | | 122,325,300 | |
| Shares outstanding, end of year | | | 97,753,884 | | | | 117,460,889 | |
See accompanying notes to financial statements.
TFS SMALL CAP FUND
STATEMENTS OF CHANGES IN NET ASSETS
| | | | | | | |
| FROM OPERATIONS | | | | | | |
| Net investment income (loss) | | $ | 37,191 | | | $ | (13,134 | ) |
| Net realized gains from investments | | | 16,812,788 | | | | 8,201,572 | |
| Net change in unrealized appreciation (depreciation) on investments | | | 5,193,135 | | | | (2,322,308 | ) |
| Net increase in net assets from operations | | | 22,043,114 | | | | 5,866,130 | |
| | | | | | | | | |
| FROM DISTRIBUTIONS (Note 2) | | | | | | | | |
| Distributions from net investment income | | | (312,976 | ) | | | — | |
| Distributions from net realized gains from security transactions | | | (8,873,127 | ) | | | (120,141 | ) |
| Decrease in net assets from distributions | | | (9,186,103 | ) | | | (120,141 | ) |
| | | | | | | | | |
| FROM CAPITAL SHARE TRANSACTIONS | | | | | | | | |
| Proceeds from shares sold | | | 29,460,786 | | | | 12,605,584 | |
Net asset value of shares issued in reinvestment of
distributions to shareholders | | | 7,904,955 | | | | 95,370 | |
| Proceeds from redemption fees collected (Note 2) | | | 7,160 | | | | 7,846 | |
| Payments for shares redeemed | | | (19,313,493 | ) | | | (19,655,848 | ) |
| Net increase (decrease) in net assets from capital share transactions | | | 18,059,408 | | | | (6,947,048 | ) |
| | | | | | | | | |
| TOTAL INCREASE (DECREASE) IN NET ASSETS | | | 30,916,419 | | | | (1,201,059 | ) |
| | | | | | | | | |
| NET ASSETS | | | | | | | | |
| Beginning of year | | | 50,072,832 | | | | 51,273,891 | |
| End of year | | $ | 80,989,251 | | | $ | 50,072,832 | |
| | | | | | | | | |
DISTRIBUTIONS IN EXCESS OF NET
INVESTMENT INCOME | | $ | (46,834 | ) | | $ | — | |
| | | | | | | | | |
| CAPITAL SHARE ACTIVITY | | | | | | | | |
| Shares sold | | | 2,133,863 | | | | 973,223 | |
| Shares issued in reinvestment of distributions to shareholders | | | 689,884 | | | | 7,934 | |
| Shares redeemed | | | (1,415,761 | ) | | | (1,535,278 | ) |
| Net increase (decrease) in shares outstanding | | | 1,407,986 | | | | (554,121 | ) |
| Shares outstanding, beginning of year | | | 3,693,883 | | | | 4,248,004 | |
| Shares outstanding, end of year | | | 5,101,869 | | | | 3,693,883 | |
See accompanying notes to financial statements.
TFS HEDGED FUTURES FUND
STATEMENTS OF CHANGES IN NET ASSETS*
| | | | | | Period Ended October 31, 2012(a) | |
| FROM OPERATIONS | | | | | | |
| Net investment loss | | $ | (2,492,507 | ) | | $ | (954,603 | ) |
| Net realized gains (losses) from: | | | | | | | | |
| Investments | | | 9,291 | | | | 670 | |
| Futures contracts | | | (5,414,738 | ) | | | 2,987,877 | |
| Foreign currency transactions | | | (1,151,993 | ) | | | — | |
| Net change in unrealized appreciation (depreciation) on: | | | | | | | | |
| Investments | | | (574 | ) | | | (352 | ) |
| Futures contracts | | | (395,828 | ) | | | 243,466 | |
| Foreign currency translation | | | 94,334 | | | | — | |
| Net increase (decrease) in net assets from operations | | | (9,352,015 | ) | | | 2,277,058 | |
| | | | | | | | | |
| FROM DISTRIBUTIONS (Note 2) | | | | | | | | |
| Distributions from net realized gains from security transactions | | | (2,570,373 | ) | | | — | |
| | | | | | | | | |
| FROM CAPITAL SHARE TRANSACTIONS | | | | | | | | |
| Proceeds from shares sold | | | 82,353,356 | | | | 115,630,089 | |
Net asset value of shares issued in reinvestment of
distributions to shareholders | | | 2,091,788 | | | | — | |
| Proceeds from redemption fees collected (Note 2) | | | 48,752 | | | | 5,865 | |
| Payments for shares redeemed | | | (117,862,869 | ) | | | (4,372,063 | ) |
| Net increase (decrease) in net assets from capital share transactions | | | (33,368,973 | ) | | | 111,263,891 | |
| | | | | | | | | |
| TOTAL INCREASE (DECREASE) IN NET ASSETS | | | (45,291,361 | ) | | | 113,540,949 | |
| | | | | | | | | |
| NET ASSETS | | | | | | | | |
| Beginning of period | | | 113,540,949 | | | | — | |
| End of period | | $ | 68,249,588 | | | $ | 113,540,949 | |
| | | | | | | | | |
| ACCUMULATED NET INVESTMENT LOSS | | $ | (2,045,004 | ) | | $ | (954,603 | ) |
| | | | | | | | | |
| CAPITAL SHARE ACTIVITY | | | | | | | | |
| Shares sold | | | 7,753,379 | | | | 10,688,187 | |
| Shares issued in reinvestment of distributions to shareholders | | | 192,969 | | | | — | |
| Shares redeemed | | | (11,358,461 | ) | | | (405,404 | ) |
| Net increase (decrease) in shares outstanding | | | (3,412,113 | ) | | | 10,282,783 | |
| Shares outstanding, beginning of period | | | 10,282,783 | | | | — | |
| Shares outstanding, end of period | | | 6,870,670 | | | | 10,282,783 | |
| * | Consolidated financial statements (Note 1). |
| (a) | Represents the period from commencement of operations (December 29, 2011) through October 31, 2012. |
See accompanying notes to financial statements.
TFS MARKET NEUTRAL FUND
FINANCIAL HIGHLIGHTS
Per share data for a share outstanding throughout each year: | | | | | | | | | | | | | | | |
| Net asset value at beginning of year | | $ | 15.23 | | | $ | 14.41 | | | $ | 15.80 | | | $ | 14.92 | | | $ | 13.25 | |
| | | | | | | | | | | | | | | | | | | | | |
| Income (loss) from investment operations: | | | | | | | | | | | | | | | | | | | | |
| Net investment loss | | | (1.25 | ) | | | (0.99 | ) | | | (0.83 | ) | | | (0.45 | ) | | | (0.24 | ) |
Net realized and unrealized gains
on investments | | | 2.21 | | | | 2.05 | | | | 0.93 | | | | 1.43 | | | | 2.13 | |
| Total from investment operations | | | 0.96 | | | | 1.06 | | | | 0.10 | | | | 0.98 | | | | 1.89 | |
| | | | | | | | | | | | | | | | | | | | | |
| Less distributions: | | | | | | | | | | | | | | | | | | | | |
Distributions from net realized gains
from security transactions | | | — | | | | (0.24 | ) | | | (1.49 | ) | | | (0.10 | ) | | | (0.25 | ) |
| | | | | | | | | | | | | | | | | | | | | |
| Proceeds from redemption fees collected (Note 2) | | | 0.00 | (a) | | | 0.00 | (a) | | | 0.00 | (a) | | | 0.00 | (a) | | | 0.03 | |
| | | | | | | | | | | | | | | | | | | | | |
| Net asset value at end of year | | $ | 16.19 | | | $ | 15.23 | | | $ | 14.41 | | | $ | 15.80 | | | $ | 14.92 | |
| | | | | | | | | | | | | | | | | | | | | |
Total return (b) | | | 6.30% | | | | 7.48% | | | | 0.43% | | | | 6.60% | | | | 14.86% | |
| | | | | | | | | | | | | | | | | | | | | |
| Ratios and supplemental data: | | | | | | | | | | | | | | | | | | | | |
| Net assets at end of year (000’s) | | $ | 1,582,797 | | | $ | 1,789,303 | | | $ | 1,762,265 | | | $ | 1,142,219 | | | $ | 828,409 | |
| | | | | | | | �� | | | | | | | | | | | | | |
| Ratio of total expenses to average net assets | | | 8.67% | | | | 8.63% | | | | 8.10% | | | | 4.52% | | | | 4.70% | |
| | | | | | | | | | | | | | | | | | | | | |
| Ratio of net expenses to average net assets | | | 8.67% | | | | 8.63% | | | | 8.12% | (c) | | | 4.55% | (c) | | | 4.67% | (d) |
| | | | | | | | | | | | | | | | | | | | | |
Ratio of net expenses to average net assets excluding dividend expense (e) | | | 7.59% | | | | 7.75% | | | | 7.38% | (c) | | | 3.81% | (c) | | | 3.84% | (d) |
| | | | | | | | | | | | | | | | | | | | | |
Ratio of net expenses to average net assets excluding dividend expense, borrowing costs and brokerage expense on securities sold short (e) | | | 2.41% | | | | 2.42% | | | | 2.47% | (c) | | | 2.50% | (c) | | | 2.49% | (d) |
| | | | | | | | | | | | | | | | | | | | | |
| Ratio of net investment loss to average net assets | | | (6.67% | ) | | | (6.73% | ) | | | (6.56% | ) | | | (3.16% | ) | | | (2.32% | ) |
| | | | | | | | | | | | | | | | | | | | | |
| Portfolio turnover rate | | | 552% | | | | 607% | | | | 751% | | | | 703% | | | | 429% | |
| (a) | Amount rounds to less than $0.01 per share. |
| (b) | Total return is a measure of the change in value of an investment in the Fund over the period covered, which assumes any dividends or capital gains distributions are reinvested in shares of the Fund. The returns shown do not reflect the deduction of taxes a shareholder would pay on Fund distributions or the redemption of Fund shares. |
| (c) | Includes recoupment by the Adviser of prior years’ advisory fee reductions and expense reimbursements (Note 4). |
| (d) | Ratio was determined after advisory fee reductions (Note 4). |
| (e) | Dividend expense, borrowing costs and brokerage expense on securities sold short totaled 6.26%, 6.21%, 5.65%, 2.05% and 2.18% of average net assets for the years ended October 31, 2013, 2012, 2011, 2010 and 2009, respectively. |
See accompanying notes to financial statements.
TFS SMALL CAP FUND
FINANCIAL HIGHLIGHTS
Per share data for a share outstanding throughout each year: | | | | | | | | | | | | | | | |
| Net asset value at beginning of year | | $ | 13.56 | | | $ | 12.07 | | | $ | 11.98 | | | $ | 9.33 | | | $ | 6.80 | |
| | | | | | | | | | | | | | | | | | | | | |
| Income (loss) from investment operations: | | | | | | | | | | | | | | | | | | | | |
| Net investment income (loss) | | | 0.02 | | | | (0.00 | )(a) | | | (0.04 | ) | | | (0.06 | ) | | | (0.02 | ) |
Net realized and unrealized gains
on investments | | | 4.92 | | | | 1.52 | | | | 0.87 | | | | 2.70 | | | | 2.55 | |
| Total from investment operations | | | 4.94 | | | | 1.52 | | | | 0.83 | | | | 2.64 | | | | 2.53 | |
| | | | | | | | | | | | | | | | | | | | | |
| Less distributions: | | | | | | | | | | | | | | | | | | | | |
| Distributions from net investment income | | | (0.07 | ) | | | — | | | | — | | | | — | | | | (0.01 | ) |
Distributions from net realized gains from
security transactions | | | (2.56 | ) | | | (0.03 | ) | | | (0.74 | ) | | | — | | | | — | |
| Total distributions | | | (2.63 | ) | | | (0.03 | ) | | | (0.74 | ) | | | — | | | | (0.01 | ) |
| | | | | | | | | | | | | | | | | | | | | |
| Proceeds from redemption fees collected (Note 2) | | | 0.00 | (a) | | | 0.00 | (a) | | | 0.00 | (a) | | | 0.01 | | | | 0.01 | |
| | | | | | | | | | | | | | | | | | | | | |
| Net asset value at end of year | | $ | 15.87 | | | $ | 13.56 | | | $ | 12.07 | | | $ | 11.98 | | | $ | 9.33 | |
| | | | | | | | | | | | | | | | | | | | | |
Total return (b) | | | 44.15% | | | | 12.62% | | | | 6.68% | | | | 28.40% | | | | 37.41% | |
| | | | | | | | | | | | | | | | | | | | | |
| Ratios and supplemental data: | | | | | | | | | | | | | | | | | | | | |
| Net assets at end of year (000’s) | | $ | 80,989 | | | $ | 50,073 | | | $ | 51,274 | | | $ | 35,784 | | | $ | 16,623 | |
| | | | | | | | | | | | | | | | | | | | | |
| Ratio of total expenses to average net assets | | | 1.80% | | | | 1.95% | | | | 1.82% | | | | 2.31% | | | | 5.14% | |
| | | | | | | | | | | | | | | | | | | | | |
Ratio of net expenses to average net assets (c) | | | 1.75% | | | | 1.75% | | | | 1.69% | | | | 1.78% | | | | 1.88% | |
| | | | | | | | | | | | | | | | | | | | | |
Ratio of net expenses to average net assets excluding borrowing costs (c) | | | 1.75% | | | | 1.75% | | | | 1.68% | | | | 1.78% | | | | 1.87% | |
| | | | | | | | | | | | | | | | | | | | | |
Ratio of net investment income (loss) to
average net assets | | | 0.06% | | | | (0.03% | ) | | | (0.31% | ) | | | (0.70% | ) | | | (0.63% | ) |
| | | | | | | | | | | | | | | | | | | | | |
| Portfolio turnover rate | | | 601% | | | | 557% | | | | 525% | | | | 657% | | | | 320% | |
| (a) | Amount rounds to less than $0.01 per share. |
| (b) | Total return is a measure of the change in value of an investment in the Fund over the period covered, which assumes any dividends or capital gains distributions are reinvested in shares of the Fund. The returns shown do not reflect the deduction of taxes a shareholder would pay on Fund distributions or the redemption of Fund shares. |
| (c) | Ratio was determined after advisory fee reductions and expense reimbursements (Note 4). |
See accompanying notes to financial statements.
TFS HEDGED FUTURES FUND
FINANCIAL HIGHLIGHTS*
Per share data for a share outstanding throughout each period: | | | | | Period Ended October 31, 2012(a) | |
| Net asset value at beginning of period | | $ | 11.04 | | | $ | 10.00 | |
| | | | | | | | | |
| Income (loss) from investment operations: | | | | | | | | |
| Net investment loss | | | (0.20 | ) | | | (0.09 | ) |
| Net realized and unrealized gains (losses) on investments | | | (0.68 | ) | | | 1.13 | |
| Total from investment operations | | | (0.88 | ) | | | 1.04 | |
| | | | | | | | | |
| Less distributions: | | | | | | | | |
| Distributions from net realized gains from security transactions | | | (0.23 | ) | | | — | |
| | | | | | | | | |
| Proceeds from redemption fees collected (Note 2) | | | 0.00 | (b) | | | 0.00 | (b) |
| | | | | | | | | |
| Net asset value at end of period | | $ | 9.93 | | | $ | 11.04 | |
| | | | | | | | | |
Total return (c) | | | (8.14% | ) | | | 10.40% | (d) |
| | | | | | | | | |
| Ratios and supplemental data: | | | | | | | | |
| Net assets at end of period (000’s) | | $ | 68,250 | | | $ | 113,541 | |
| | | | | | | | | |
| Ratio of total expenses to average net assets | | | 2.35% | | | | 2.51% | (e) |
| | | | | | | | | |
Ratio of net expenses to average net assets (f) | | | 2.30% | | | | 2.30% | (e) |
| | | | | | | | | |
| Ratio of net investment loss to average net assets | | | (2.23% | ) | | | (2.19% | )(e) |
| | | | | | | | | |
| Portfolio turnover rate | | | 0% | (g) | | | 0% | (g) |
| * | Consolidated financial statements (Note 1). |
| (a) | Represents the period from commencement of operations (December 29, 2011) through October 31, 2012. |
| (b) | Amount rounds to less than $0.01 per share. |
| (c) | Total return is a measure of the change in value of an investment in the Fund over the period covered, which assumes any dividends or capital gains distributions are reinvested in shares of the Fund. The returns shown do not reflect the deduction of taxes a shareholder would pay on Fund distributions or the redemption of Fund shares. |
| (f) | Ratio was determined after advisory fee reductions (Note 4). |
| (g) | All investments held are excluded from the calculation as they are considered to be short-term investments whose maturities or expiration dates at the time of acquisition were one year or less. |
See accompanying notes to financial statements.
TFS CAPITAL INVESTMENT TRUST
NOTES TO FINANCIAL STATEMENTS
October 31, 2013
1. Organization
TFS Market Neutral Fund, TFS Small Cap Fund and TFS Hedged Futures Fund (individually, a “Fund”, and collectively, the “Funds”) are each a series of TFS Capital Investment Trust (the “Trust”), an open-end management investment company established as an Ohio business trust under a Declaration of Trust dated January 30, 2004. TFS Market Neutral Fund commenced operations on September 7, 2004. TFS Small Cap Fund commenced operations on March 7, 2006. TFS Hedged Futures Fund commenced operations on December 29, 2011.
The consolidated financial statements of TFS Hedged Futures Fund include TFS Hedged Futures Strategy Offshore Fund Ltd. (the “Subsidiary”), a wholly-owned and controlled Cayman Islands subsidiary. TFS Hedged Futures Fund may invest up to 25% of its total assets in the Subsidiary. TFS Hedged Futures Fund purchases investments through the Subsidiary to provide exposure to the commodities futures market which otherwise may not be possible in a mutual fund structure. All inter-company accounts and transactions have been eliminated in consolidation for TFS Hedged Futures Fund. TFS Hedged Futures Fund and the Subsidiary each have a fiscal year end of October 31st for financial statement consolidation purposes and a nonconforming tax year end of December 31st and November 30th, respectively.
TFS Market Neutral Fund seeks to produce capital appreciation while having a low correlation to the U.S. equity market, which TFS Capital LLC (the “Adviser”) defines as the S&P 500® Index. In addition, the Fund seeks to produce lower volatility than the movement of the U.S. equity market.
TFS Small Cap Fund seeks long-term capital appreciation. In addition, the Fund seeks to outperform the Russell 2000® Index.
TFS Hedged Futures Fund seeks to achieve long-term capital appreciation.
2. Significant Accounting Policies
The following is a summary of the Funds’ significant accounting policies. The policies are in conformity with accounting principles generally accepted in the United States of America (“GAAP”).
Securities, options and futures valuation – The Funds’ portfolio securities are valued as of the close of regular trading on the New York Stock Exchange (“NYSE”) (generally 4:00 p.m., Eastern time) on each business day the NYSE is open. Securities listed on the NYSE or other exchanges are valued on the basis of their last sale prices on the exchanges on which they are primarily traded. If there are no sales on that day, the securities are valued at the closing bid price on the NYSE or other primary exchange for long positions and at the closing ask price for short positions for that day. Securities which are quoted by NASDAQ are valued at the NASDAQ Official Closing Price. If there are no sales on that day, the securities are valued at the mean between the closing bid and ask prices as reported by NASDAQ. Option contracts are valued at the closing price as quoted on the exchanges on which they are primarily traded. If no closing price is readily available at the time of valuation, the option will be valued at the closing bid price for that day. Futures contracts are generally valued at the last quoted sales price on the applicable valuation date. Futures contracts that trade on exchanges that close before 4:00 p.m. Eastern time
TFS CAPITAL INVESTMENT TRUST
NOTES TO FINANCIAL STATEMENTS (Continued)
are valued at the official settlement price of the primary exchange on which it is traded. Prices for these futures contracts are monitored daily by the Adviser until 4:00 p.m. Eastern time to determine if fair valuation is required. Other assets and securities for which no quotations are readily available are valued at fair value as determined in good faith under the supervision of the Board of Trustees of the Trust (the “Board”) and will be classified as Level 3 within the fair value hierarchy (see below).
GAAP establishes a single authoritative definition of fair value, sets out a framework for measuring fair value and requires additional disclosures about fair value measurements.
The Funds’ investments, securities sold short, and option and futures contracts have been categorized based upon a fair value hierarchy in accordance with the Financial Accounting Standards Board’s guidance on fair value measurement. The levels of the fair value hierarchy and their applicability to the Funds are described below:
| • | Level 1 inputs utilize quoted prices (unadjusted) in active markets for identical assets or liabilities at the reporting date. Level 1 assets and liabilities may include most common stocks, preferred stocks, closed-end funds, exchange-traded funds and notes, warrants, option contracts, futures contracts and money market funds. |
| • | Level 2 inputs utilize inputs other than quoted prices included in Level 1 that are observable for the asset or liability, either directly or indirectly. Level 2 inputs may include quoted prices for similar assets and liabilities in active markets and quoted prices for identical or similar assets or liabilities that are not active. Assets and liabilities included in this category may include common stocks and warrants that trade infrequently or their trading has been temporarily halted and U.S. treasury obligations and corporate bonds with values that are based on prices provided by an independent pricing service that utilizes various “other significant observable inputs” including bid and ask quotations, prices of similar securities and interest rates, among other factors. |
| • | Level 3 inputs are unobservable inputs for the asset or liability and include situations where there is little, if any, market activity for the asset or liability. |
The inputs or methodologies used for valuing securities are not necessarily an indication of the risks associated with investing in those securities. The inputs used to measure fair value may fall into different levels of the fair value hierarchy. In such cases, for disclosure purposes, the level in the fair value hierarchy within which the fair value measurement falls in its entirety is determined based on the lowest level input that is significant to the fair value measurement. The Funds’ assessment of the significance of a particular input to the fair value measurement in its entirety requires judgment and considers factors specific to the asset or liability.
The availability of observable inputs can vary from product to product and is affected by a wide variety of factors, including, for example, the type of product, whether the product is new and not yet established in the marketplace, and other characteristics particular to the transaction. To the extent that valuation is based on models or inputs that are less observable or unobservable in the market, the determination of fair value requires more judgment. Accordingly, the degree of judgment exercised by the Funds in determining fair value is greatest for instruments categorized as Level 3.
TFS CAPITAL INVESTMENT TRUST
NOTES TO FINANCIAL STATEMENTS (Continued)
The following is a summary of the inputs used to value the Funds’ investments, securities sold short and other financial instruments as of October 31, 2013:
| | | | | | | | | | | | |
| Investments in Securities: | |
| Common Stocks | | $ | 1,465,575,606 | | | $ | — | | | $ | — | | | $ | 1,465,575,606 | |
| Preferred Stocks | | | 2,679,032 | | | | — | | | | — | | | | 2,679,032 | |
| Other Investments | | | 73,616,186 | | | | — | | | | — | | | | 73,616,186 | |
| Corporate Bonds | | | — | | | | 2,918 | | | | — | | | | 2,918 | |
| Money Market Funds | | | 17,637,908 | | | | — | | | | — | | | | 17,637,908 | |
| Total | | $ | 1,559,508,732 | | | $ | 2,918 | | | $ | — | | | $ | 1,559,511,650 | |
| Other Financial Instruments: | |
| Common Stocks – Sold Short | | $ | (1,004,604,646 | ) | | $ | (1,973 | ) | | $ | — | | | $ | (1,004,606,619 | ) |
| Preferred Stocks – Sold Short | | | (80,633 | ) | | | — | | | | — | | | | (80,633 | ) |
| Other Investments – Sold Short | | | (227,177,199 | ) | | | — | | | | — | | | | (227,177,199 | ) |
| Warrants – Sold Short | | | (18,216 | ) | | | — | | | | — | | | | (18,216 | ) |
| Written Option Contracts | | | (19,060 | ) | | | — | | | | — | | | | (19,060 | ) |
| Total | | $ | (1,231,899,754 | ) | | $ | (1,973 | ) | | $ | — | | | $ | (1,231,901,727 | ) |
| | | | | | | | | | | | |
| Investments in Securities: | |
| Common Stocks | | $ | 79,536,230 | | | $ | — | | | $ | — | | | $ | 79,536,230 | |
| Other Investments | | | 162,471 | | | | — | | | | — | | | | 162,471 | |
| Money Market Funds | | | 876,642 | | | | — | | | | — | | | | 876,642 | |
| Total | | $ | 80,575,343 | | | $ | — | | | $ | — | | | $ | 80,575,343 | |
| | | | | | | | | | | | |
| Investments in Securities: | |
| U.S. Treasury Obligations | | $ | — | | | $ | 15,147,050 | | | $ | — | | | $ | 15,147,050 | |
| Money Market Funds | | | 43,740,538 | | | | — | | | | — | | | | 43,740,538 | |
| Total | | $ | 43,740,538 | | | $ | 15,147,050 | | | $ | — | | | $ | 58,887,588 | |
| | |
| Other Financial Instruments: | |
| Futures Contracts | | $ | (192,261 | ) | | $ | — | | | $ | — | | | $ | (192,261 | ) |
| Futures Contracts – Sold Short | | | 39,899 | | | | — | | | | — | | | | 39,899 | |
| Total | | $ | (152,362 | ) | | $ | — | | | $ | — | | | $ | (152,362 | ) |
Refer to each Fund’s Summary Schedule of Investments, Schedule of Securities Sold Short, Schedule of Open Written Option Contracts, Schedule of Futures Contracts and Schedule of Futures Contracts Sold Short, as applicable, for a listing of the securities by security type and industry type.
TFS CAPITAL INVESTMENT TRUST
NOTES TO FINANCIAL STATEMENTS (Continued)
It is the Funds’ policy to recognize transfers into and out of any Level at the end of the reporting period. As of October 31, 2013, TFS Small Cap Fund and TFS Hedged Futures Fund did not have any transfers in and out of any Level. Transfers that occurred between Level 1, Level 2 and Level 3 on October 31, 2013 for TFS Market Neutral Fund due to changes in the availability of quoted prices are as follows:
| | | Investments | | | Securities Sold Short | |
| Transfers from Level 2 to Level 1 | | $ | 306,412 | | | $ | (239,890 | ) |
| Transfers from Level 3 to Level 1 | | | — | | | | (14,544 | ) |
There were no transfers between Level 2 and Level 3 as of October 31, 2013 for TFS Market Neutral Fund. There were no Level 3 securities held in the Funds as of October 31, 2013.
The following is a reconciliation of Level 3 investments held and securities sold short in TFS Market Neutral Fund for which significant unobservable inputs were used to determine fair value between October 31, 2012 and October 31, 2013.
| | | Investments | |
| Balance as of October 31, 2012 | | $ | 1,747 | |
| Change in unrealized appreciation (depreciation) | | | 9,697 | |
| Sales | | | (240 | ) |
| Realized losses | | | (11,204 | ) |
| Balance as of October 31, 2013 | | $ | — | |
| | | Securities Sold Short | |
| Balance as of October 31, 2012 | | $ | (72,184 | ) |
| Change in unrealized appreciation (depreciation) | | | (489,112 | ) |
| Covers | | | 5,888 | |
| Realized gains | | | 540,864 | |
| Transfers in and/or out of Level 3 | | | 14,544 | |
| Balance as of October 31, 2013 | | $ | — | |
Share valuation – The net asset value per share of each Fund is calculated daily by dividing the total value of its assets, less liabilities, by the number of shares outstanding. The offering price and redemption price per share of each Fund is equal to the net asset value per share, except that shares are subject to a redemption fee of 2% if redeemed within 90 days of the date of purchase.
During the years ended October 31, 2013 and October 31, 2012, proceeds from redemption fees totaled $170,982 and $131,452, respectively, for TFS Market Neutral Fund, $7,160 and $7,846, respectively, for TFS Small Cap Fund and $48,752 and $5,865, respectively, for TFS Hedged Futures Fund.
TFS CAPITAL INVESTMENT TRUST
NOTES TO FINANCIAL STATEMENTS (Continued)
Investment income (expense) – Dividend income (expense) is recorded on the ex-dividend date. Interest income is accrued as earned. Discounts and premiums on fixed income securities are amortized using the interest method.
Security transactions – Security transactions are accounted for on the trade date. Gains and losses on securities sold are determined on a specific identification basis.
Distributions to shareholders – Distributions to shareholders arising from net investment income and net realized capital gains, if any, are distributed at least once each year. The amount of distributions from net investment income and net realized gains are determined in accordance with federal income tax regulations, which may differ from GAAP. These “book/tax” differences are permanent in nature and are primarily due to differing treatments of net short-term gains. The tax character of distributions paid by the Funds during the periods ended October 31, 2013 and October 31, 2012 was as follows:
| | | | | | | | | | | |
| TFS Market Neutral Fund | 10/31/2013 | | $ | — | | | $ | — | | | $ | — | |
| | 10/31/2012 | | $ | 23,397,213 | | | $ | 5,293,726 | | | $ | 28,690,939 | |
| TFS Small Cap Fund | 10/31/2013 | | $ | 8,620,933 | | | $ | 565,170 | | | $ | 9,186,103 | |
| | 10/31/2012 | | $ | 322 | | | $ | 119,819 | | | $ | 120,141 | |
| TFS Hedged Futures Fund | 10/31/2013 | | $ | 338,325 | | | $ | 2,232,048 | | | $ | 2,570,373 | |
| | 10/31/2012 | | $ | — | | | $ | — | | | $ | — | |
Short positions – The Funds may sell securities short. For financial statement purposes, an amount equal to the settlement amount is included in the Statements of Assets and Liabilities as an asset and an equivalent liability is then subsequently marked-to-market daily to reflect the current value of the short position. Subsequent fluctuations in the market prices of securities sold, but not yet purchased, may require purchasing the securities at prices which may differ from the market value reflected on the Statements of Assets and Liabilities. The Funds are liable for any dividends payable on securities while those securities are in a short position and will also bear other costs, such as charges for the prime brokerage accounts, in connection with the short positions. These costs are reported as brokerage expense on securities sold short in the Statements of Operations. As collateral for its short positions, the Funds are required under the Investment Company Act of 1940 (“1940 Act”) to maintain assets consisting of cash, cash equivalents or liquid securities equal to the market value of the securities sold short. The deposits with brokers for securities sold short are reported on the Statements of Assets and Liabilities. The amount of the collateral is required to be adjusted daily to reflect changes in the value of the securities sold short. TFS Market Neutral Fund and TFS Hedged Futures Fund both engage in short selling as a principal investment strategy while TFS Small Cap Fund does not. TFS Small Cap Fund currently intends to limit its exposure to short positions, if any, to 5% of its net assets.
TFS CAPITAL INVESTMENT TRUST
NOTES TO FINANCIAL STATEMENTS (Continued)
Option contracts – The Funds may use option contracts in any manner consistent with their investment objectives and as long as their use is consistent with relevant provisions of the 1940 Act. The Funds may use options for speculative investment purposes as well as for the purpose of seeking to reduce the overall investment risk that would otherwise be associated with the securities in which a Fund invests. When a Fund writes an option, an amount equal to the net premium (the premium less the commission) received by the Fund is recorded as a liability in the Fund’s Statement of Assets and Liabilities and is subsequently marked-to-market daily. Premiums received from writing options which expire are treated as realized gains. Premiums received from writing call options which are exercised increase the proceeds used to calculate the realized gain or loss on the sale of the security. Premiums received from writing put options which are exercised increase the basis of the security purchased. If a closing purchase transaction is used to terminate a Fund’s obligation on an option, a gain or loss will be realized, depending upon whether the price of the closing purchase transaction is more or less than the premium previously received on the option written.
Futures contracts – TFS Market Neutral Fund and TFS Hedged Futures Fund are subject to equity price risk, interest rate risk, foreign currency exchange rate risk, and commodity risk in the normal course of pursuing their investment objectives. The Funds may use futures contracts to gain exposure or to hedge against changes in the value of equities, interest rates, foreign currencies or commodities. A futures contract represents a commitment for the future purchase or sale of an asset at a specified price on a specified date. When the Fund purchases or sells a futures contract, no price is paid to or received by the Fund upon the purchase or sale of the futures contract. Instead, the Fund is required to deposit in a segregated asset account an amount of cash or qualifying securities currently ranging from 5% to 15% of the contract amount. This is called the “initial margin deposit.” Subsequent payments, known as “variation margin,” are made or received by the Fund each day, depending on the daily fluctuations in the fair value of the underlying asset. The Fund recognizes an unrealized gain or loss equal to the daily variation margin. If market conditions move unexpectedly, the Fund may not achieve the anticipated benefits of the futures contracts and may realize a loss. The margin deposits for futures contracts and the variation margin receivable and/or payable are reported on the Statements of Assets and Liabilities.
Estimates – The preparation of financial statements in conformity with GAAP requires management to make estimates and assumptions that affect the reported amounts of assets and liabilities and disclosures of contingent assets and liabilities as of the date of the financial statements and the reported amounts of income and expenses during the reporting period. Actual results could differ from those estimates.
Common expenses – Common expenses of the Trust are allocated between the Funds based on the relative net assets of each Fund or the nature of the services performed and the relative applicability to each Fund.
Foreign Currency Translation – Amounts denominated in or expected to settle in foreign currencies are translated into U.S. dollars based on exchange rates on the following basis:
| | A. | The value of investment securities and other assets and liabilities are translated at exchange rates as of the NYSE close each day. |
TFS CAPITAL INVESTMENT TRUST
NOTES TO FINANCIAL STATEMENTS (Continued)
| | B. | Purchases and sales of investment securities and income and expenses are translated at the rate of exchange prevailing on the respective date of such transactions. |
| | C. | The Funds do not isolate that portion of the results of operations caused by changes in foreign exchange rates on investments from those caused by changes in market prices of securities held. Such fluctuations are included with the net realized and unrealized gains or losses on investments. |
Reported net realized foreign exchange gains or losses arise from 1) purchases and sales of foreign currencies, 2) currency gains or losses realized between the trade and settlement dates on securities transactions and 3) the difference between the amounts of dividends, interest and foreign withholding taxes recorded on a Fund’s books and the U.S. dollar equivalent of the amounts actually received or paid. Reported net unrealized foreign exchange gains and losses arise from changes in the value of assets and liabilities that result from changes in exchange rates.
Forward Foreign Currency Exchange Contracts – TFS Market Neutral Fund may use forward foreign currency exchange contracts to hedge exposure to foreign currency. TFS Hedged Futures Fund may invest in currency forwards for speculative purposes. When the Adviser believes that the currency of a particular country may produce positive returns against the currency of another country, the Funds may purchase or sell currency forward contracts to gain exposure to the differential in currency returns. All foreign currency exchange contracts are “marked-to-market” daily at the applicable translation rates resulting in unrealized gains or losses. Realized and unrealized gains or losses from transactions in foreign currency exchange contracts will be included in the Fund’s Statement of Assets and Liabilities and Statement of Operations. Risks associated with these contracts include the potential inability of counterparties to meet the terms of their contracts and unanticipated movements in the value of a foreign currency relative to the U.S. dollar.
Federal income tax – The tax year end is October 31st for TFS Market Neutral Fund and TFS Small Cap Fund and December 31st for TFS Hedged Futures Fund. It is each Fund’s intention to qualify as a regulated investment company under the Internal Revenue Code of 1986 (the “Code”). Qualification generally will relieve the Funds of liability for federal income taxes to the extent 100% of their net investment income and net realized gains are distributed in accordance with the Code.
In order to avoid imposition of the excise tax applicable to regulated investment companies, it is also each Fund’s intention to declare as dividends in each calendar year at least 98% of its ordinary income (net investment income and specified gains and losses) and 98.2% of its net realized capital gains plus undistributed amounts from prior years.
TFS CAPITAL INVESTMENT TRUST
NOTES TO FINANCIAL STATEMENTS (Continued)
The following information is computed on a tax basis for each item as of October 31, 2013:
| | | | | | | | | | |
| Tax cost of portfolio investments | | $ | 1,465,958,914 | | | $ | 75,293,537 | | | $ | 58,888,514 | |
| Gross unrealized appreciation | | $ | 159,602,926 | | | $ | 7,185,747 | | | $ | 404 | |
| Gross unrealized depreciation | | | (66,050,190 | ) | | | (1,903,941 | ) | | | (1,330 | ) |
| Net unrealized appreciation (depreciation) on investments | | | 93,552,736 | | | | 5,281,806 | | | | (926 | ) |
| Net unrealized appreciation on securities sold short | | | (9,532,712 | ) | | | — | | | | — | |
| Net unrealized appreciation on written options | | | 10,351 | | | | — | | | | — | |
| Net unrealized appreciation on translation of assets and liabilities in foreign currencies | | | 4 | | | | — | | | | — | |
| Undistributed ordinary income | | | 11,048,618 | | | | 15,431,392 | | | | — | |
| Accumulated net investment loss | | | — | | | | — | | | | (3,110,297 | ) |
| Undistributed long-term gains | | | 44,602,195 | | | | 1,022,512 | | | | 180,107 | |
| Other gains (losses) | | | — | | | | — | | | | (4,722,291 | ) |
| Accumulated earnings (deficit) | | $ | 139,681,192 | | | $ | 21,735,710 | | | $ | (7,653,407 | ) |
As of October 31, 2013, the tax cost of securities sold short and written options is $1,222,349,955 and $29,411, respectively, for TFS Market Neutral Fund.
The difference between the federal income tax cost of portfolio investments and securities sold short and the financial statement cost for TFS Market Neutral Fund and TFS Small Cap Fund is due to certain timing differences in the recognition of capital gains or losses under GAAP. These “book/tax” differences are temporary in nature and are primarily due to the tax deferral of losses on wash sales. The tax cost of portfolio investments for TFS Hedged Futures Fund is equal to the financial statement cost disclosed.
For the year ended October 31, 2013, TFS Market Neutral Fund reclassified $26,798 of net realized gains from foreign currency transactions against accumulated net investment income, $135,379,964 of net investment loss against accumulated net realized gains from security transactions and $1,395 of accumulated net realized losses against paid-in capital on the Statement of Assets and Liabilities. For the year ended October 31, 2013, TFS Small Cap Fund reclassified $228,951 of accumulated net investment losses against accumulated net realized gains from security transactions on the Statement of Assets and Liabilities. For the tax year ended December 31, 2012, TFS Hedged Futures Fund reclassified $1,402,106 of accumulated net investment losses and $589,817 of accumulated net realized capital losses against paid-in capital on the Statement of Assets and Liabilities. For the year ended October 31, 2013, TFS Hedged Futures Fund reclassified $1,151,993 of net realized losses from foreign currency transactions against accumulated net investment loss on the Statement of Assets and Liabilities. Such reclassifications, the result of permanent differences between the financial statement and income tax reporting requirements, have no effect on the Funds’ net assets or net asset value per share.
TFS CAPITAL INVESTMENT TRUST
NOTES TO FINANCIAL STATEMENTS (Continued)
The Funds recognize tax benefits or expenses of uncertain tax positions only when the position is “more likely than not” to be sustained assuming examination by tax authorities. Management has reviewed the tax positions taken on federal income tax returns for all open tax periods (October 31, 2010 through October 31, 2013) of each Fund, as applicable, and has concluded that no provision for unrecognized tax benefits or expenses is required in these financial statements and does not expect this to change over the next twelve months. Each Fund identifies its major tax jurisdiction as U.S. Federal.
3. Investment Transactions
During the year ended October 31, 2013, cost of purchases and proceeds from sales of portfolio securities, other than short-term investments, U.S. government securities and short positions, amounted to $9,606,233,023 and $10,340,300,404, respectively, for TFS Market Neutral Fund, $373,509,089 and $365,572,155, respectively, for TFS Small Cap Fund and $0 and $0, respectively, for TFS Hedged Futures Fund.
4. Transactions with Related Parties
INVESTMENT ADVISORY AGREEMENT
Each Fund’s investments are managed by the Adviser pursuant to the terms of an Investment Advisory Agreement. TFS Market Neutral Fund pays the Adviser an investment advisory fee, computed and accrued daily and paid monthly, at an annual rate of 2.25% of its average daily net assets up to $1.75 billion and 2.15% of such assets above $1.75 billion. TFS Small Cap Fund and TFS Hedged Futures Fund pay the Adviser an investment advisory fee, computed and accrued daily and paid monthly, at an annual rate of 1.25% and 2.00%, respectively, of its average daily net assets.
The Adviser has contractually agreed to reduce its advisory fees and to absorb each Fund’s operating expenses (for the life of the Funds) to the extent necessary to limit aggregate annual ordinary operating expenses (which do not include brokerage costs, taxes, borrowing costs such as interest and dividend expenses on securities sold short and extraordinary expenses) to 2.50% of TFS Market Neutral Fund’s average daily net assets, 1.75% of TFS Small Cap Fund’s average daily net assets and 2.30% of TFS Hedged Futures Fund’s average daily net assets. During the year ended October 31, 2013, the Adviser reduced its investment advisory fees by $33,364 with respect to TFS Small Cap Fund and $58,934 with respect to TFS Hedged Futures Fund. There were no fee reductions by the Adviser for TFS Market Neutral Fund.
TFS CAPITAL INVESTMENT TRUST
NOTES TO FINANCIAL STATEMENTS (Continued)
Advisory fee reductions and expense reimbursements by the Adviser are subject to repayment by the applicable Fund for a period of three years after such fees and expenses were incurred, provided that such repayments do not cause ordinary operating expenses to exceed the expense caps of 2.50%, 1.75% and 2.30%, respectively, for TFS Market Neutral Fund, TFS Small Cap Fund and TFS Hedged Futures Fund. As of October 31, 2013, the Adviser has recouped all previous fee reductions for TFS Market Neutral Fund. As of October 31, 2013, the Adviser may in the future recoup fee reductions and expense reimbursements totaling $200,842 and $151,787, respectively, from TFS Small Cap Fund and TFS Hedged Futures Fund. The Adviser may recapture these amounts no later than the dates as stated below:
| | | | | | | | | | |
| TFS Small Cap Fund | | $ | 66,738 | | | $ | 100,740 | | | $ | 33,364 | |
| TFS Hedged Futures Fund | | $ | — | | | $ | 92,853 | | | $ | 58,934 | |
Certain Trustees and officers of the Trust are also officers of the Adviser.
AFFILIATED BROKER-DEALER
During the year ended October 31, 2013, TFS Hedged Futures Fund paid commissions of $157,306 to Interactive Brokers LLC (“IB”). Richard Gates, a principal of the Adviser and a Vice President of the Trust, serves as an independent Director of IB. Based on a factual determination by the Adviser that Mr. Gates does not have a controlling influence over IB’s management or policies, the Adviser does not believe that IB is an affiliate, or an affiliate of an affiliate, of the Trust. Nevertheless, the Adviser and the Trust have determined to subject any transactions between the Funds and IB to the same procedures that would be applicable if such transactions were subject to affiliated broker provisions of Section 17(e) of the 1940 Act and Rule 17e -1 thereunder.
COMPLIANCE CONSULTING AGREEMENT
Under the terms of a Compliance Consulting Agreement, Drake Compliance, LLC (“Drake”) provides ongoing regulatory compliance consulting, monitoring and reporting services for the Trust. In addition, a principal of Drake serves as the Trust’s Chief Compliance Officer. Drake receives $5,000 per month from the Trust, of which each Fund pays its proportionate share. In addition, each Fund reimburses certain out-of-pocket expenses incurred by Drake, if any, including, but not limited to, postage and supplies and travel expenses.
ADMINISTRATION AGREEMENT
Under the terms of an Administration Agreement, Ultimus Fund Solutions, LLC (“Ultimus”) supplies executive, administrative and regulatory services for the Funds. Ultimus supervises the preparation of tax returns, reports to shareholders of the Funds, reports to and filings with the Securities and Exchange Commission (the “SEC”) and state securities commissions and materials for meetings of the Board of Trustees. For these services, each Fund pays Ultimus a monthly fee at an annual rate of 0.075% of its average daily net assets up to $500 million, 0.05% of such assets between $500 million and $2 billion, 0.04% of such assets between $2 billion and $3 billion, 0.03% of such assets between $3 billion and $5 billion, and 0.025% of such assets in excess of $5 billion, subject to a minimum monthly fee of $5,000.
TFS CAPITAL INVESTMENT TRUST
NOTES TO FINANCIAL STATEMENTS (Continued)
ACCOUNTING SERVICES AGREEMENT
Under the terms of an Accounting Services Agreement, Ultimus calculates the daily net asset value per share and maintains the financial books and records of each Fund. For the performance of these services, TFS Market Neutral Fund pays Ultimus a monthly base fee of $4,000 per month plus an asset based fee of 0.005% of average daily gross assets. TFS Small Cap Fund and TFS Hedged Futures Fund each pay Ultimus a base fee of $2,500 per month plus an asset based fee of 0.01% of the first $500 million of average daily net assets and 0.005% of such assets in excess of $500 million. In addition, each Fund pays a trade fee for trades in excess of 2,000 portfolio trades per month. Each Fund reimburses certain out-of-pocket expenses incurred by Ultimus in obtaining valuations of its portfolio securities.
TRANSFER AGENT AND SHAREHOLDER SERVICES AGREEMENT
Under the terms of a Transfer Agent and Shareholder Services Agreement, Ultimus maintains the records of each shareholder’s account, answers shareholders’ inquiries concerning their accounts, processes purchases and redemptions of each Fund’s shares, acts as dividend and distribution disbursing agent and performs other shareholder service functions. Each Fund pays Ultimus a monthly fee for these services at an annual rate of $15 to $24 per shareholder account, depending on the nature of the account, subject to a $1,500 minimum monthly fee. In addition, the Funds reimburse Ultimus for out-of-pocket expenses including, but not limited to, postage and supplies.
DISTRIBUTION AGREEMENT
The Trust has entered into a Distribution Agreement with Ultimus Fund Distributors, LLC (the “Distributor”), pursuant to which the Distributor provides distribution services and serves as the principal underwriter to each Fund. The Distributor is a wholly-owned subsidiary of Ultimus. The Distributor’s fees are paid by the Adviser.
COMPENSATION OF TRUSTEES
Trustees and officers affiliated with the Adviser or Ultimus are not compensated by the Trust for their services. Each Trustee who is not an affiliated person of the Adviser or Ultimus receives from the Trust an annual retainer of $5,000, paid quarterly, a fee of $7,500 for attendance at each in-person meeting of the Board of Trustees, a fee of $2,500 for attendance at each telephonic regular meeting of the Board of Trustees and a fee of $1,500 for attendance at each telephonic special meeting of the Board of Trustees. The Chairman of the Audit Committee receives an additional fee of $1,000 for each Audit Committee meeting attended. The Trust reimburses each Trustee and officer for his or her travel and other expenses relating to attendance at Board or committee meetings.
TFS CAPITAL INVESTMENT TRUST
NOTES TO FINANCIAL STATEMENTS (Continued)
5. Derivatives Transactions
Transactions in option contracts written by TFS Market Neutral Fund during the year ended October 31, 2013 were as follows:
| | | | | | | |
| Options outstanding at beginning of year | | | — | | | $ | — | |
| Options written | | | 9,252 | | | | 1,243,011 | |
| Options cancelled in a closing purchase transaction | | | (2,700 | ) | | | (995,498 | ) |
| Options expired | | | (3,638 | ) | | | (106,855 | ) |
| Options exercised | | | (1,412 | ) | | | (111,097 | ) |
| Options outstanding at end of year | | | 1,502 | | | $ | 29,561 | |
The locations in the Statements of Assets and Liabilities of the derivative positions of TFS Market Neutral Fund and TFS Hedged Futures Fund as of October 31, 2013 are recorded in the following locations in the Statements of Assets and Liabilities:
Derivative Investment Type | |
| Call options written | Written options, at value |
| Put options written | Written options, at value |
| Futures contracts | Variation margin receivable (payable) |
| Forward foreign currency exchange contracts | Unrealized appreciation (depreciation) on forward currency exchange contracts |
The following tables set forth the values of derivative contracts of TFS Market Neutral Fund and TFS Hedged Futures Fund as of October 31, 2013:
| |
| | | | | Gross Notional Amount Outstanding October 31, 2013 | |
| | | | | | |
| Call options written | | $ | — | | | $ | (9,030 | ) | | $ | (8,193,826 | ) |
| Put options written | | | — | | | | (10,030 | ) | | | (8,193,826 | ) |
The average monthly notional amount of call options purchased, put options purchased, call options written and put options written during the year ended October 31, 2013 was $122,164, $389,331, $1,674,903 and $1,713,836, respectively, for TFS Market Neutral Fund.
TFS CAPITAL INVESTMENT TRUST
NOTES TO FINANCIAL STATEMENTS (Continued)
TFS Hedged Futures Fund Futures Contracts | |
| | | | | | | |
| | | | | | | | | | |
| Asset Derivatives | | | | | | | | | |
| Futures Contracts | | | | | | | | | |
| Commodity | | $ | 37,728 | | | $ | (214,467 | ) | | $ | (176,739 | ) |
| Financial | | | — | | | | — | | | | — | |
| Total Asset Derivatives | | $ | 37,728 | | | $ | (214,467 | ) | | $ | (176,739 | ) |
| | | | | | | | | | | | | |
| Liability Derivatives | | | | | | | | | | | | |
| Futures Contracts | | | | | | | | | | | | |
| Commodity | | | 187,108 | | | | (7,972 | ) | | | 179,136 | |
| Financial | | | 480,578 | | | | (653,339 | ) | | | (172,761 | ) |
| Total Liability Derivatives | | | 667,686 | | | | (661,311 | ) | | | 6,375 | |
| Total | | $ | 705,414 | | | $ | (875,778 | ) | | $ | (170,364 | ) |
TFS Hedged Futures Fund Forward Foreign Currency Exchange Contracts | |
| | | | | | | | | | | | | | | | Net Unrealized Appreciation (Depreciation) | |
| Asset Derivatives | |
| 11/7/2013 | 5,000,000 USD | 30,350,000 ARS | | $ | 5,000,000 | | | $ | 5,086,896 | | | $ | 86,896 | | | $ | — | | | $ | 86,896 | |
| 11/27/2013 | 1,750,000 USD | 10,762,500 ARS | | | 1,750,000 | | | | 1,756,533 | | | | 6,533 | | | | — | | | | 6,533 | |
| Total Contracts | | $ | 6,750,000 | | | $ | 6,843,429 | | | $ | 93,429 | | | $ | — | | | $ | 93,429 | |
| Liabilities Derivatives | |
| 11/8/2013 | 1,255,414 GBP | 2,000,000 USD | | | (2,000,000 | ) | | | (2,012,817 | ) | | | — | | | | (12,817 | ) | | | (12,817 | ) |
| 11/8/2013 | 37,878,000 CZK | 2,000,000 USD | | | (2,000,000 | ) | | | (1,993,923 | ) | | | 6,077 | | | | — | | | | 6,077 | |
| 11/13/2013 | 58,720,000 TWD | 2,000,000 USD | | | (2,000,000 | ) | | | (1,992,355 | ) | | | 7,645 | | | | — | | | | 7,645 | |
| Total Contracts | | $ | (6,000,000 | ) | | $ | (5,999,095 | ) | | $ | 13,722 | | | $ | (12,817 | ) | | $ | 905 | |
| Total | | $ | 750,000 | | | $ | 844,334 | | | $ | 107,151 | | | $ | (12,817 | ) | | $ | 94,334 | |
| GBP - British Pound Sterling |
TFS CAPITAL INVESTMENT TRUST
NOTES TO FINANCIAL STATEMENTS (Continued)
Transactions in derivative instruments for TFS Market Neutral Fund and TFS Hedged Futures Fund during the year ended October 31, 2013 are recorded in the following locations in the Statements of Operations:
Derivative Investment Type | |
| Call options purchased | Net realized gains (losses) from option contracts |
| | Net change in unrealized appreciation (depreciation) on option contracts |
| Put options purchased | Net realized gains (losses) from option contracts |
| | Net change in unrealized appreciation (depreciation) on option contracts |
| Call options written | Net realized gains (losses) from option contracts |
| | Net change in unrealized appreciation (depreciation) on option contracts |
| Put options written | Net realized gains (losses) from option contracts |
| | Net change in unrealized appreciation (depreciation) on option contracts |
| Futures contracts | Net realized gains (losses) from futures contracts |
| | Net change in unrealized appreciation (depreciation) on futures contracts |
| Forward foreign currency exchange contracts | Net realized gains (losses) from foreign currency transactions |
| | Net change in unrealized appreciation (depreciation) on foreign currency translation |
The following is a summary of net realized gains and net change in unrealized appreciation (depreciation) on derivative instruments for TFS Market Neutral Fund and TFS Hedged Futures Fund recognized in the Statements of Operations during the year ended October 31, 2013:
| | Net Realized Gains (Losses) | | | Net Change in Unrealized Appreciation (Depreciation) | |
| TFS Market Neutral Fund | | | | | | |
| Call options purchased | | $ | 389,384 | | | $ | — | |
| Put options purchased | | | — | | | | — | |
| Call options written | | | 15,517 | | | | 1,658 | |
| Put options written | | | 455,914 | | | | 8,843 | |
| Total | | $ | 860,815 | | | $ | 10,501 | |
TFS CAPITAL INVESTMENT TRUST
NOTES TO FINANCIAL STATEMENTS (Continued)
| | Net Realized Gains (Losses) | | | Net Change in Unrealized Appreciation (Depreciation) | |
| TFS Hedged Futures Fund | | | | | | | | |
| Futures contracts | | | | | | | | |
| Commodity | | $ | (4,374,852 | ) | | $ | 343,312 | |
| Currency | | | 3,014,014 | | | | 79,141 | |
| Financial | | | (4,053,900 | ) | | | (818,281 | ) |
| Total futures contracts | | | (5,414,738 | ) | | | (395,828 | ) |
| | | | | | | | | |
| Forward Foreign Currency Exchange Contracts | | | (1,151,993 | ) | | | 94,334 | |
| | | | | | | | | |
| Total | | $ | (6,566,731 | ) | | $ | (301,494 | ) |
TFS Small Cap Fund had no transactions in derivative instruments during the year ended October 31, 2013.
6. Investments in Other Investment Companies
In order to maintain sufficient liquidity to implement investment strategies, or for temporary defensive purposes, each Fund may invest a significant portion of its assets in shares of one or more money market mutual funds. An investment in a money market mutual fund is not insured or guaranteed by the Federal Deposit Insurance Corporation or any other governmental agency, entity or person. While investor losses in money market mutual funds have been rare, they have occurred. In addition, additional indirect expenses will be incurred due to acquired fund fees and other costs to the extent of the investment in shares of money market mutual funds. As of October 31, 2013, TFS Hedged Futures Fund had 64.1% of the value of its net assets invested in money market mutual funds registered under the 1940 Act. As of October 31, 2013, TFS Market Neutral Fund and TFS Small Cap Fund did not have a significant portion of their assets in shares of money market mutual funds.
7. Contingencies and Commitments
The Funds indemnify the Trust’s officers and Trustees for certain liabilities that might arise from their performance of their duties to the Funds. Additionally, in the normal course of business the Funds enter into contracts that contain a variety of representations and warranties and which provide general indemnifications. The Funds’ maximum exposure under these arrangements is unknown, as this would involve future claims that may be made against the Funds that have not yet occurred. However, based on experience, the Funds expect the risk of loss to be remote.
8. Recent Accounting Pronouncement
In December 2011, the Financial Accounting Standards Board (“FASB”) issued Accounting Standards Update (“ASU”) No. 2011-11, Balance Sheet (Topic 210): Disclosures about Offsetting Assets and Liabilities. The amendments in ASU No. 2011-11 enhance disclosures about offsetting
TFS CAPITAL INVESTMENT TRUST
NOTES TO FINANCIAL STATEMENTS (Continued)
of financial assets and liabilities to enable investors to understand the effect of these arrangements on a fund’s financial position. In January 2013, FASB issued ASU No. 2013-01, Balance Sheet (Topic 210): Clarifying the Scope of Disclosures about Offsetting Assets and Liabilities. The amendments in ASU No. 2013-01 clarify the intended scope of disclosures required by ASU No. 2011-11. These ASUs are effective for interim and annual reporting periods beginning on or after January 1, 2013. Management believes the adoption of these ASUs will not have a material impact on the financial statements.
9. Subsequent Events
The Funds are required to recognize in the financial statements the effects of all subsequent events that provide additional evidence about conditions that existed as of the date of the Statements of Assets and Liabilities. For non-recognized subsequent events that must be disclosed to keep the financial statements from being misleading, the Funds are required to disclose the nature of the event as well as an estimate of its financial effect, or a statement that such an estimate cannot be made. Management has evaluated subsequent events through the issuance of these financial statements and has noted no such events except as reflected in the following paragraphs:
The Board of Trustees of the Trust approved the discontinuance of the redemption fee for the Funds, effective January 1, 2014.
The Board of Trustees also approved the following reductions of each Fund’s investment advisory fees (hereafter referred to as “Management Fees”) and contractual annual fund operating expenses limitations, effective January 1, 2014:
|
| Current Management Fees: | 2.25% per annum |
| Management Fees Effective January 1, 2014: | 1.65% per annum |
| | |
| Current Contractual Fee Limitation: | 2.50% per annum |
| Contractual Expense Limitation Effective January 1, 2014: | 1.90% per annum |
| | |
|
| Current Management Fees: | 1.25% per annum |
| Management Fees Effective January 1, 2014: | 1.15% per annum |
| | |
| Current Contractual Fee Limitation: | 1.75% per annum |
| Contractual Expense Limitation Effective January 1, 2014: | 1.50% per annum |
| | |
|
| Current Management Fees: | 2.00% per annum |
| Management Fees Effective January 1, 2014: | 1.50% per annum |
| | |
| Current Contractual Fee Limitation: | 2.30% per annum |
| Contractual Expense Limitation Effective January 1, 2014: | 1.80% per annum |
TFS CAPITAL INVESTMENT TRUST
REPORT OF INDEPENDENT REGISTERED
PUBLIC ACCOUNTING FIRM
The Board of Trustees and Shareholders of
TFS Capital Investment Trust:
We have audited the accompanying statement of assets and liabilities of TFS Market Neutral Fund, TFS Small Cap Fund and TFS Hedged Futures Fund (collectively the “Funds”) each a series of the TFS Capital Investment Trust (the “Trust”), including the summary schedule of investments and summary of securities sold short for TFS Market Neutral Fund, the summary schedule of investments for TFS Small Cap Fund, and the schedule of investments, schedule of futures contracts, and schedule of futures contracts sold short for TFS Hedged Futures Fund, as of October 31, 2013, and the related statement of operations, the statement of changes in net assets, and the financial highlights for the year then ended. These financial statements and financial highlights are the responsibility of the Funds’ management. Our responsibility is to express an opinion on these financial statements and financial highlights based on our audits. The statements of changes in net assets and financial highlights presented herein for the years ended October 31, 2012 and prior were audited by another registered public accounting firm whose report dated December 24, 2012 expressed an unqualified opinion on those financial statements.
We conducted our audits in accordance with the standards of the Public Company Accounting Oversight Board (United States). Those standards require that we plan and perform the audits to obtain reasonable assurance about whether the financial statements and financial highlights are free of material misstatement. We were not engaged to perform an audit of the Funds’ internal control over financial reporting. Our audits included consideration of internal control over financial reporting as a basis for designing audit procedures that are appropriate in the circumstances, but not for the purpose of expressing an opinion on the effectiveness of the Funds’ internal control over financial reporting. Accordingly, we express no such opinion. An audit also includes examining, on a test basis, evidence supporting the amounts and disclosures in the financial statements and financial highlights, assessing the accounting principles used and significant estimates made by management, and evaluating the overall financial statement presentation. Our procedures included confirmation of securities owned as of October 31, 2013, by correspondence with the custodian and brokers or by other appropriate auditing procedures where replies from brokers were not received. We believe that our audits provide a reasonable basis for our opinion.
In our opinion, the financial statements and financial highlights referred to above present fairly, in all material respects, the financial positions of each of the Funds constituting TFS Capital Investment Trust at October 31, 2013, the results of their operations, the changes in their net assets, and the financial highlights for the year then ended, in conformity with U.S. generally accepted accounting principles.
Cincinnati, Ohio
December 27, 2013
TFS CAPITAL INVESTMENT TRUST
ABOUT YOUR FUNDS’ EXPENSES (Unaudited)
We believe it is important for you to understand the impact of costs on your investment. As a shareholder of the Funds, you incur two types of costs: (1) transaction costs, including redemption fees; and (2) ongoing costs, including management fees and other Fund expenses. The following examples are intended to help you understand your ongoing costs (in dollars) of investing in the Funds and to compare these costs with the ongoing costs of investing in other mutual funds.
A mutual fund’s ongoing costs are expressed as a percentage of its average net assets. This figure is known as the expense ratio. The ongoing costs reflected in the table are based on an investment of $1,000 made at the beginning of the most recent semi-annual period (May 1, 2013) and held until the end of the period (October 31, 2013).
The table below illustrates each Fund’s ongoing costs in two ways:
Actual fund return – This section helps you to estimate the actual expenses that you paid over the period. The “Ending Account Value” shown is derived from each Fund’s actual return, and the third column shows the dollar amount of operating expenses that would have been paid by an investor who started with $1,000 in the Funds. You may use the information here, together with the amount you invested, to estimate the expenses that you paid over the period.
To do so, simply divide your account value by $1,000 (for example, an $8,600 account value divided by $1,000 = 8.6), then multiply the result by the number given for the Funds under the heading “Expenses Paid During Period.”
Hypothetical 5% return – This section is intended to help you compare each Fund’s ongoing costs with those of other mutual funds. It assumes that each Fund had an annual return of 5% before expenses during the period shown, but that the expense ratio is unchanged. In this case, because the return used is not each Fund’s actual return, the results do not apply to your investment. The example is useful in making comparisons because the SEC requires all mutual funds to calculate expenses based on a 5% return. You can assess each Fund’s ongoing costs by comparing this hypothetical example with the hypothetical examples that appear in shareholder reports of other funds.
Note that expenses shown in the table are meant to highlight and help you compare ongoing costs only. The calculations below assume no shares were bought or sold during the period. Your actual costs may have been higher or lower, depending on the amount of your investment and the timing of any purchases or redemptions.
More information about each Fund’s expenses, including annualized expense ratios, can be found in this report. For additional information on operating expenses and other shareholder costs, please refer to each Fund’s summary prospectus.
TFS CAPITAL INVESTMENT TRUST
ABOUT YOUR FUNDS’ EXPENSES (Unaudited) (Continued)
| Beginning Account Value May 1, 2013 | Ending Account Value October 31, 2013 | Expenses Paid During Period* |
| Based on Actual Fund Return | $1,000.00 | $1,027.90 | $45.29 |
| Based on Hypothetical 5% Return (before expenses) | $1,000.00 | $980.54 | $44.23 |
| * | Expenses are equal to the annualized expense ratio of 8.86% for the period, multiplied by the average account value over the period, multiplied by 184/365 (to reflect the one-half year period). |
TFS Small Cap Fund
| Beginning Account Value May 1, 2013 | Ending Account Value October 31, 2013 | Expenses Paid During Period* |
| Based on Actual Fund Return | $1,000.00 | $1,196.80 | $9.69 |
| Based on Hypothetical 5% Return (before expenses) | $1,000.00 | $1,016.38 | $8.89 |
| * | Expenses are equal to the annualized expense ratio of 1.75% for the period, multiplied by the average account value over the period, multiplied by 184/365 (to reflect the one-half year period). |
TFS Hedged Futures Fund
| Beginning Account Value May 1, 2013 | Ending Account Value October 31, 2013 | Expenses Paid During Period* |
| Based on Actual Fund Return | $1,000.00 | $955.70 | $11.34 |
| Based on Hypothetical 5% Return (before expenses) | $1,000.00 | $1,013.61 | $11.67 |
| * | Expenses are equal to the annualized expense ratio of 2.30% for the period, multiplied by the average account value over the period, multiplied by 184/365 (to reflect the one-half year period). |
TFS CAPITAL INVESTMENT TRUST
OTHER INFORMATION (Unaudited)
A description of the policies and procedures that the Funds use to determine how to vote proxies relating to portfolio securities is available without charge upon request by calling toll-free 1-888-534-2001, or on the SEC’s website at http://www.sec.gov. Information regarding how the Funds voted proxies relating to portfolio securities during the most recent 12-month period ended June 30 is also available without charge upon request by calling toll-free 1-888-534-2001, or on the SEC’s website at http://www.sec.gov.
The Funds file a complete listing of portfolio holdings with the SEC as of the end of the first and third quarters of each fiscal year on Form N-Q. The filings are available upon request, by calling 1-888-534-2001. Furthermore, you may obtain copies of the filings on the SEC’s website at http://www.sec.gov. The Funds’ Forms N-Q may also be reviewed and copied at the SEC’s Public Reference Room in Washington, DC, and information on the operation of the Public Reference Room may be obtained by calling 1-800-SEC-0330.
The net asset value for TFS Hedged Futures Fund is published daily at the Funds’ website at http://www.tfscapital.com.
TFS CAPITAL INVESTMENT TRUST
BOARD OF TRUSTEES AND OFFICERS (Unaudited)
Overall responsibility for management of the Trust rests with its Trustees. The Trustees serve for terms of indefinite duration until death, resignation, retirement or removal from office. The Trustees, in turn, elect the officers of the Trust to actively supervise the Trust’s day-to-day operations. The officers have been elected for an annual term. Certain officers of the Trust also may serve as Trustees. The Trust is managed by the Trustees in accordance with the laws of the State of Ohio governing business trusts. There are currently five Trustees, three of whom are not “interested persons” of the Trust within the meaning of that term under the Investment Company Act of 1940. The Trustees and executive officers of the Trust, their addresses and their principal occupations during the past five (5) years are as follows:
Name, Address and Age | Length of Time Served | Position(s) Held with Trust | Principal Occupation(s) During Past 5 Years and Directorships of Public Companies ** | Number of Portfolios in Fund Complex Overseen by Trustee |
| Interested Trustees: | | | | |
*Larry S. Eiben 1800 Bayberry Court, Suite 103 Richmond, Virginia 23226 Year of Birth: 1972 | Since January 2004 | Trustee and President | Owner, Co-Portfolio Manager and Chief Operating Officer of TFS Capital LLC | 3 |
*Thomas M. Frederick 10 N. High Street, Suite 500 West Chester, Pennsylvania 19380 Year of Birth: 1972 | Since June 2004 | Trustee | Director of Business Development for TFS Capital LLC from July 2006 to present | 3 |
| Independent Trustees: | | | | |
Mark J. Malone 1800 Bayberry Court, Suite 103 Richmond, Virginia 23226 Year of Birth: 1966 | Since June 2004 | Trustee | Managing Director of Janney Capital Markets since December 2013; Managing Director of Lazard Capital Markets from March 2008 to December 2013 | 3 |
Brian O’Connell 1800 Bayberry Court, Suite 103 Richmond, Virginia 23226 Year of Birth: 1959 | Since June 2004 | Trustee | Independent writer/author | 3 |
Gregory R. Owens 1800 Bayberry Court, Suite 103 Richmond, Virginia 23226 Year of Birth: 1966 | Since October 2011 | Trustee | Vice President of Finance of Capital One Financial Corporation from February 1996 to present | 3 |
TFS CAPITAL INVESTMENT TRUST
BOARD OF TRUSTEES AND OFFICERS (Unaudited)
(Continued)
Name, Address and Age | Length of Time Served | Position(s) Held with Trust | Principal Occupation(s) During Past 5 Years |
| Executive Officers: | | | |
Kevin Gates 10 N. High Street, Suite 500 West Chester, Pennsylvania 19380 Year of Birth: 1972 | Since October 2011 | | Owner and Co-Portfolio Manager of TFS Capital LLC |
Richard Gates 10 N. High Street, Suite 500 West Chester, Pennsylvania 19380 Year of Birth: 1972 | Since October 2011 | Vice President | Owner and Co-Portfolio Manager of TFS Capital LLC |
Robert G. Dorsey 225 Pictoria Drive, Suite 450 Cincinnati, Ohio 45246 Year of Birth: 1957 | Since June 2004 | Vice President | Managing Director of Ultimus Fund Solutions, LLC and Ultimus Fund Distributors, LLC |
Mark J. Seger 225 Pictoria Drive, Suite 450 Cincinnati, Ohio 45246 Year of Birth: 1962 | Since June 2004 | Treasurer | Managing Director of Ultimus Fund Solutions, LLC and Ultimus Fund Distributors, LLC |
Wade R. Bridge 225 Pictoria Drive, Suite 450 Cincinnati, Ohio 45246 Year of Birth: 1968 | Since June 2011 | Secretary | Director of Administration of Ultimus Fund Solutions, LLC and Ultimus Fund Distributors, LLC |
David D. Jones 442 Fleming Street, Suite 7 Key West, Florida 33040 Year of Birth: 1957 | Since December 2007 | Chief Compliance Officer | Managing Member of Drake Compliance, LLC; Of Counsel to Kaplan Voekler Cunningham & Frank PLC (a law firm) |
| * | Larry S. Eiben and Thomas M. Frederick, as affiliated persons of TFS Capital LLC, the Trust’s investment adviser, are considered “interested persons” of the Trust within the meaning of Section 2(a)(19) of the Investment Company Act of 1940. |
| ** | None of the Trustees are directors of public companies. |
Additional information about members of the Board of Trustees and executive officers is available in the Statement of Additional Information (“SAI”). To obtain a free copy of the SAI, please call 1-888-534-2001.
TFS CAPITAL INVESTMENT TRUST
FEDERAL TAX INFORMATION (Unaudited)
In accordance with federal tax requirements, the following provides shareholders with information concerning distributions made by the Funds during the fiscal year ended October 31, 2013. Certain dividends paid by the Funds may be subject to a maximum tax rate of 15%, as provided by the Jobs and Growth Tax Relief Reconciliation Act of 2003. TFS Small Cap Fund and TFS Hedged Futures Fund intend to designate up to a maximum amount of $8,620,933 and $338,325, respectively, as taxed at a maximum rate of 15%. Additionally, TFS Small Cap Fund and TFS Hedged Futures Fund intend to designate $565,170 and $2,232,048, respectively, as long-term gain distributions.
CHANGE IN INDEPENDENT AUDITOR
On December 18, 2012, Deloitte & Touche LLP (“D&T”) was replaced as independent auditor of the Funds, and Ernst & Young LLP (“EY”) was selected as the Funds’ new independent auditor. The Funds’ selection of EY as its independent auditor was recommended and approved by the Trust’s Audit Committee and was ratified by the Trust’s Board of Trustees.
D&T’s reports on the Funds’ financial statements for the prior two fiscal years did not contain an adverse opinion or a disclaimer of opinion, and were not qualified or modified as to uncertainty, audit scope or accounting principles. During such fiscal years, and through the date of D&T’s replacement, there were no disagreements between the Trust and D&T on any matter of accounting principles or practices, financial statement disclosure, or auditing scope or procedures, which disagreements, if not resolved to the satisfaction of D&T, would have caused it to make reference to the subject matter of the disagreements in connection with its reports on the financial statements for such years. Prior to December 18, 2012, EY was not contacted during the prior two fiscal years regarding the application of accounting principles to any particular financial matter.
TFS CAPITAL INVESTMENT TRUST
APPROVAL OF INVESTMENT ADVISORY AGREEMENTS
(Unaudited)
The Board of Trustees, including the Independent Trustees voting separately, have reviewed and approved the continuance of the Investment Advisory Agreements (the “Advisory Agreements”) with the Adviser for TFS Market Neutral Fund, TFS Small Cap Fund and TFS Hedged Futures Fund. These approvals took place at a Board meeting held on June 17-18, 2013, at which all of the Independent Trustees were present in person.
The Trustees were advised by independent counsel of their fiduciary obligations in approving the Advisory Agreements and the Trustees requested such information from the Adviser as they deemed reasonably necessary to evaluate the terms of the Agreements and whether the Agreements continue to be in the best interests of the Funds and their shareholders. The Trustees reviewed: (i) the nature, extent and quality of the services provided by the Adviser; (ii) the investment performance of each Fund and the Adviser; (iii) the cost of the services provided and the profits realized by the Adviser and its affiliates from their relationships with the Funds and the financial strength of the Adviser; (iv) the extent to which economies of scale would be realized as the Funds grow larger; (v) whether advisory fee levels reflect these economies of scale for the benefit of Fund shareholders; (vi) comparisons of services rendered to and fees paid by the Funds with the services provided by and the fees paid to other investment advisers or the services provided to and the fees paid by other clients of the Adviser; and (vii) any ancillary benefits derived or to be derived by the Adviser from its relationship with the Funds. The Trustees reviewed the background, qualifications, education and experience of the Adviser’s investment and operational personnel, as well as staffing levels of the Adviser. The Trustees also discussed and considered the quality of administrative and other services provided to the Trust, the Adviser’s compliance program, and the Adviser’s role in coordinating such services and programs. The Independent Trustees were provided with a list of intermediaries who are authorized to sell shares of the Funds and the fees paid by the Adviser to such intermediaries since inception of each agreement. The Independent Trustees were advised by experienced independent counsel throughout the process. Prior to voting on the Advisory Agreements, the Independent Trustees reviewed the Agreements with management and also met in a private session with counsel at which no representatives of the Adviser were present.
Below is a summary of the discussions and findings of the Trustees in regard to the approvals of the Advisory Agreements.
| (i) | The nature, extent, and quality of the services provided by the Adviser. In this regard, the Independent Trustees reviewed the services being provided to the Funds by the Adviser. They discussed the responsibilities of the Adviser under the Advisory Agreements and the Adviser’s compensation under the Advisory Agreements. The Independent Trustees reviewed the background and experience of the Adviser’s key investment and operating personnel. They considered the Adviser’s ongoing commitment to retain experienced personnel and noted that longevity of employment may facilitate consistency in the Funds’ performance and investment process. The Independent Trustees considered the Adviser’s ongoing commitment to expand its research capabilities and were mindful that continual analysis of investment opportunities and optimization of procedures is important to the Funds’ long-term success. They discussed the Adviser’s registration with the Commodity Futures Trading Commission (“CFTC”) as a commodity pool operator and considered the contributions of the Adviser’s chief compliance officer in the CFTC registration process |
TFS CAPITAL INVESTMENT TRUST
APPROVAL OF INVESTMENT ADVISORY AGREEMENTS
(Unaudited) (Continued)
and her overall contributions to the operations of the Trust. After reviewing the foregoing information, the Independent Trustees concluded that the quality, extent and nature of the services provided by the Adviser to each Fund were satisfactory.
| (ii) | The investment performance of the Funds and Adviser. In this regard, the Independent Trustees compared the performance of the Market Neutral Fund with the performance of the S&P 500 Index, the Fund’s primary benchmark, over various periods. It was noted by the Independent Trustees that the Market Neutral Fund underperformed the S&P 500 Index for the one, three year and five year periods ended March 31, 2013. They discussed the Fund’s underperformance for those periods, finding that the Fund’s investment strategies are not designed to keep pace or outperform the S&P 500 Index during a period when the market enjoys a broad-based rally and/or when the market is favoring large capitalization companies. The Independent Trustees considered the Adviser’s comments regarding the Market Neutral Fund’s recent underperformance, noting that the Adviser believes the Fund’s short portfolio was impacted by a short squeeze in the market. The Independent Trustees also considered the Market Neutral Fund’s longer-term performance record, noting that the Market Neutral Fund has outperformed the S&P 500 Index over the since inception period ended March 31, 2013. They discussed the Market Neutral Fund’s average beta and compared it to the S&P 500 Index, noting that the Fund’s beta indicates that the Fund is generating returns with considerably less risk exposure than the S&P 500 Index. The Independent Trustees were also provided with comparative performance statistics of the universe of funds categorized by Morningstar as “market neutral” funds. The Independent Trustees noted that for the one year period ended March 31, 2013, the Market Neutral Fund’s return of 7.33% was considerably higher than the average return for the funds in Morningstar’s market neutral category (-0.37%) They also considered that for the three and five year periods ended March 31, 2013, the Market Neutral Fund’s total returns (5.15% and 5.34%, respectively) were better than the returns of the average fund in Morningstar’s market neutral category (0.65% and 0.46%, respectively). The Independent Trustees also considered the Adviser’s comments regarding the Market Neutral Fund’s underperformance relative to the benchmark for the year-to-date period ended May 31, 2013. They noted that the Market Neutral Fund’s recent underperformance has had a negative impact on its comparative statistics. The Independent Trustees further considered that as of May 31, 2013, the Fund had a 4-star Morningstar overall rating. The Independent Trustees reviewed performance information with respect to the Adviser’s other managed accounts, which indicated that the Market Neutral Fund trailed the performance of such other accounts for the one year period ended March 31, 2013. They considered that, based on representations by the Adviser, those performance differences can be attributed mainly to the Market Neutral Fund being subject to stricter investment limitations and being managed more conservatively than such other accounts in order to achieve a less volatile return. The Independent Trustees also considered the consistency of the Adviser’s management of the Market Neutral Fund with the Fund’s investment objective and policies. After considerable discussion, the Independent Trustees concluded that the overall investment performance of the Market Neutral Fund has been satisfactory. |
| | The Independent Trustees next reviewed the performance of the Small Cap Fund, which was compared to the performance of the Russell 2000 Index, the Fund’s primary benchmark, over various periods ended March 31, 2013. It was noted by the Independent Trustees that |
TFS CAPITAL INVESTMENT TRUST
APPROVAL OF INVESTMENT ADVISORY AGREEMENTS
(Unaudited) (Continued)
the Small Cap Fund outperformed the Russell 2000 Index for the one year, three year, five year and since inception periods ended March 31, 2013. The Independent Trustees were also provided with comparative performance statistics of the universe of funds categorized by Morningstar as “small cap blend” funds, which is the category to which the Small Cap Fund has been assigned. The Independent Trustees noted that for the one year, three year and five year periods ended March 31, 2013, the Small Cap Fund’s 20.10%, 14.83% and 13.83% returns, respectively, were higher than the performance of the average fund in the small cap blend category (15.66%, 13.28% and 7.69%, respectively) over the same periods. The Independent Trustees further considered that as of May 31, 2013, the Fund has a 4-star Morningstar overall rating. They also reviewed performance information with respect to the Adviser’s other managed accounts but concluded that none of these other accounts provided a good comparison due to differences in investment objectives. The Independent Trustees considered the consistency of the Adviser’s management of the Small Cap Fund with the Fund’s investment objective and policies. After further discussion, the Independent Trustees concluded that the investment performance of the Small Cap Fund has been above average.
| | The Independent Trustees next reviewed the performance of the Hedged Futures Fund, which was compared to the performance of the S&P DTI Index, the Fund’s primary benchmark, over various periods ended March 31, 2013. It was noted by the Independent Trustees that the Hedged Futures Fund outperformed the S&P DTI Index for the one year and since inception periods ended March 31, 2013. The Independent Trustees were also provided with comparative performance statistics of the universe of funds categorized by Morningstar as “managed futures” funds, which is the category to which the Hedged Futures Fund has been assigned. The Independent Trustees noted that for the one year period ended March 31, 2013, the Hedged Futures Fund’s -1.64% return was higher than the performance of the average fund in the managed futures category (-6.17%) over the same period. They also considered the Adviser’s comments regarding the Hedged Futures Fund’s underperformance relative to the benchmark and its peer group for the year-to-date period ended May 31, 2013. The Independent Trustees also reviewed performance information with respect to the Adviser’s other managed accounts but concluded that none of these other accounts provided a good comparison due to differences in investment objectives and policies. The Independent Trustees considered the consistency of the Adviser’s management of the Hedged Futures Fund with the Fund’s investment objective and policies. They also discussed the Hedged Futures Fund’s lack of correlation to the other funds in the managed futures category along with other broad based securities indices. After further discussion, the Independent Trustees concluded that the investment performance of the Hedged Futures Fund has been above average. |
| (iii) | The costs of the services to be provided and profits to be realized by the Adviser from its relationship with the Funds. In this regard, the Independent Trustees considered the Adviser’s staffing, personnel and operations; the financial condition of the Adviser and the level of commitment to the Funds by the principals of the Adviser; the asset levels of each Fund; and the overall expenses of each Fund. The Independent Trustees reviewed the rate of the advisory fees paid by the Funds under the Advisory Agreements and compared them to average advisory fee ratios of similar mutual funds compiled from statistics reported by Morningstar. They also compared the total operating expense ratios of the Funds with |
TFS CAPITAL INVESTMENT TRUST
APPROVAL OF INVESTMENT ADVISORY AGREEMENTS
(Unaudited) (Continued)
average expense ratios of representative funds in their respective Morningstar categories. It was noted by the Independent Trustees that the Market Neutral Fund’s advisory fee (2.25% on the first $1.75 billion in net assets and 2.15% on net assets above $1.75 billion) and its overall expense ratio of 2.50% (which excludes dividend expenses, borrowing costs and brokerage expenses on securities sold short) were each higher than the average advisory fee (1.21%) and average expense ratio (1.79%) for Morningstar’s market neutral category. The Independent Trustees also considered the Adviser’s commitment to cap the Market Neutral Fund’s ordinary operating expenses at 2.50% per annum for the life of the Fund. The Independent Trustees performed a similar comparison for the Small Cap Fund, finding that the Small Cap Fund’s advisory fee of 1.25% and its overall expense ratio of 1.75% were each higher than the average advisory fee (0.77%) and average expense ratio (1.32%) for Morningstar’s small cap blend category. They took into account the Adviser’s commitment to cap the Small Cap Fund’s ordinary operating expenses at 1.75% per annum for the life of the Fund. The Independent Trustees performed a similar comparison for the Hedged Futures Fund, finding that the Hedged Futures Fund’s advisory fee of 2.00% was higher than the average advisory fee (1.27%) for Morningstar’s managed futures category and that the Hedged Futures Fund’s overall expense ratio of 2.30% was lower than the average expense ratio (2.58%) for the managed futures category. They took into account the Adviser’s commitment to cap the Hedged Futures Fund’s ordinary operating expenses at 2.30% per annum for the life of the Fund. The Independent Trustees next considered the Adviser’s analysis of its revenues and expenses with respect to its services provided to each Fund for periods ended March 31, 2013. It was noted by the Independent Trustees that the Adviser’s overall revenues from managing the Funds have continued to increase. They discussed the profitability of the Adviser and noted the costs associated with managing the Funds, especially in the areas of research and development and retention of its investment professionals and hiring new personnel. The Independent Trustees also reviewed the revenue and expense information with respect to the Small Cap Fund. It was noted that since the inception of the Small Cap Fund through March 31, 2009, the Adviser had not received any of its advisory fees and had also reimbursed a significant amount of other operating expenses of the Fund. They noted that during the 12 month period ended March 31, 2010 the Adviser began to receive a portion of its advisory fees and that has continued to do so for last three annual periods ended March 31. The Independent Trustees considered that the Adviser still is not receiving its full advisory fee from the Small Cap Fund. The Independent Trustees reviewed the revenue and expense information with respect to the Hedged Futures Fund. It was noted that the Adviser has had to reduce its advisory fees to maintain the Hedged Futures Fund’s agreed upon expense ratio. The Independent Trustees considered that the amount of fee reductions required of the Adviser has fluctuated over the life of the Hedged Futures Fund. They noted that the Hedged Futures Fund’s net assets have been decreasing and as a result the Adviser’s fee reductions have increased. The Independent Trustees next reviewed the balance sheet of the Adviser as of March 31, 2013, and considered that the Adviser is entitled to receive a reasonable entrepreneurial profit, in light of the high quality and scope of services that are provided to the Funds. The Independent Trustees further considered that the investment and research process utilized by the Adviser is broader and more sophisticated than the process used by most other investment advisers as it involves frequent position rebalancing, the development of proprietary multiple trading models and the use of a team
TFS CAPITAL INVESTMENT TRUST
APPROVAL OF INVESTMENT ADVISORY AGREEMENTS
(Unaudited) (Continued)
approach that involves many participants. They also considered the Adviser’s efforts to improve economies of scale for the Funds as they grow in assets. The Independent Trustees considered the Market Neutral Fund’s continued operation under a subscription policy that is designed to control asset growth. The Independent Trustees considered the “fallout benefits” to the Adviser, including the additional exposure the Adviser has received as a result of managing the Funds, including the Adviser being named the 2012 Alternatives Fund Manager of the Year by Morningstar. After a thorough discussion and consideration of the foregoing, the Independent Trustees concluded that the fees to be paid by each Fund to the Adviser are reasonable in light of the quality of the services received.
| (iv) | The extent to which economies of scale would be realized as a Fund grows and whether advisory fee levels reflect these economies of scale for the benefit of a Fund’s investors. The Independent Trustees considered the current net assets for each Fund and discussed the expense cap arrangements between the Trust and the Adviser. They noted that the Market Neutral Fund’s assets continue to remain at a level where the Adviser collects its full advisory fee and that a breakpoint has been added to the advisory fee resulting in shareholders enjoying economies of scale. The Independent Trustees further noted that with respect to the Small Cap Fund, assets have grown to the point where the Adviser is currently receiving 1.08% as compared to its 1.25% advisory fee. They considered the Hedged Futures Fund’s advisory fees, noting that the Fund’s assets have grown to the point where the Adviser is currently receiving 1.96% as compared to its 2.00% advisory fee. The Independent Trustees also considered the increase in fee reductions required of the Adviser in 2013 due to the decline in net assets for the Hedged Futures Fund. The Independent Trustees also considered the Market Neutral Fund’s investment capacity limitations along with the Trust’s implementation of a subscription policy that controls the growth of the Fund. The Trustees discussed the Market Neutral Fund’s projected asset growth during the current annual period, concluding that the current fee breakpoint structure remains reasonable. The Independent Trustees concluded that, given the current asset levels in the Small Cap Fund and the Hedged Futures Fund, it would not be relevant to consider the extent to which economies of scale are being realized by each Fund and that it is not necessary or appropriate at this time to consider adding fee breakpoints to the advisory fee schedule for the Small Cap Fund or for the Hedged Futures Fund. |
In conclusion, the Trustees did not identify any single factor as all-important or controlling in their determination to approve the Advisory Agreements. The Trustees, including all of the Independent Trustees, concluded that the terms of each Advisory Agreement were fair and reasonable, that the Adviser’s fees were reasonable in light of the services provided to the Funds and the benefits received by the Adviser, and that continuance of the Advisory Agreements is in the best interests of each Fund and its shareholders.