Washington, D.C. 20549
Wade R. Bridge, Esq.
Form N-CSR is to be used by management investment companies to file reports with the Commission not later than 10 days after the transmission to stockholders of any report that is required to be transmitted to stockholders under Rule 30e-1 under the Investment Company Act of 1940 (17 CFR 270.30e-1). The Commission may use the information provided on Form N-CSR in its regulatory, disclosure review, inspection, and policymaking roles.
A registrant is required to disclose the information specified by Form N-CSR, and the Commission will make this information public. A registrant is not required to respond to the collection of information contained in Form N-CSR unless the Form displays a currently valid Office of Management and Budget ("OMB") control number. Please direct comments concerning the accuracy of the information collection burden estimate and any suggestions for reducing the burden to Secretary, Securities and Exchange Commission, 450 Fifth Street, NW, Washington, DC 20549-0609. The OMB has reviewed this collection of information under the clearance requirements of 44 U.S.C. § 3507.
October 31, 2010
For more information or assistance in opening an account,
please call toll-free 1-888-534-2001.
December 17, 2010
Dear Shareholder,
Enclosed is the Annual Report to shareholders of the TFS Market Neutral Fund (ticker: TFSMX) and the TFS Small Cap Fund (ticker: TFSSX) for the fiscal year ended October 31, 2010. On behalf of the investment manager, TFS Capital LLC (“TFS Capital”), I’d like to thank you for your investment.
At this time, TFS Capital would like to report that the TFS Market Neutral Fund will be returning to a “soft close” status effective January 10, 2011. A “soft close” means that TFSMX will be open for additional investment by all current investors and financial advisers that have previously allocated client assets to the Fund. The TFS Capital research team believes it has been successful in uncovering additional investment strategies that will permit the Fund to increase its current asset level.
As you may recall, the Fund implemented a “hard close” in January of 2010 in an effort to greatly limit Fund growth. The “hard close” was successful as the Fund maintained a narrow asset range since the close of between $1.0 to $1.2 billion. Please note that TFS Capital may recommend that the Fund revert back to a “hard close” in the future. Given the rising demand for “market-neutral-equity” strategies in mutual funds, a shift back to a hard close could occur quickly.
TFS Capital invested heavily in 2010 to strengthen its operations. Notably, the firm now has relationships with three separate brokerage firms to minimize its dependence on any one firm. Moreover, it has continued to automate trading, through enhancements in its proprietary trading software, which enables it to capitalize more quickly on perceived inefficiencies. TFS Capital’s infrastructure enhancements enabled it to trade more than 2 billion shares, representing greater than $22 billion in value, on behalf of the Funds during the fiscal year.
It is notable that the TFS Small Cap Fund remains open to existing and new investors. This Fund provides investors with another way to gain exposure to the management team at TFS Capital.
Below are performance highlights for the Funds.
TFS Market Neutral Fund (ticker: TFSMX)
| | | | Since Inception (9/7/2004) |
| TFS Market Neutral Fund | 6.60% | 4.68% | 9.64% | 9.00% |
| S&P 500 Index | 16.52% | -6.49% | 1.73% | 2.97% |
Average annual total returns for periods ended October 31, 2010
TFSMX’s performance over longer-term periods compares favorably to the overall U.S. equity market as measured by the S&P 500 Index. From inception through October 31, 2010, TFSMX generated a 9.00% average annual return and had an annualized standard deviation of 8.58%, whereas the S&P 500 Index generated a 2.97% average annual return and had an annualized standard deviation of 22.90%. Therefore, from inception through October 31, 2010, TFSMX produced an average annual return that was 6.03 percentage points above that of the S&P 500 Index while subjecting investors to only 37.5% of the volatility. At the end of October 2010, the trailing 5-year return placed TFSMX as the top performing fund in the Lipper “Market Neutral” category.1
During the period, TFSMX’s returns were largely driven by equity selection by the portfolio management team. In making these selections, the portfolio management team continued to follow TFS Capital’s proprietary stock selection models. These models are designed to predict the future performance of individual stocks relative to the overall U.S. equity market.
The broad U.S. equity market experienced a large gain during the fiscal period of 16.52% but this had little impact on TFSMX given its ongoing hedge and corresponding low “beta” (i.e., market exposure) during the period. The positive “alpha” production by the Fund during the period (i.e., return that cannot be explained by the Fund’s market exposure), provides evidence of good stock selection decisions by the portfolio management team.
The strategies used in managing TFSMX have resulted in the Fund having a low correlation to other asset classes. According to Modern Portfolio Theory, investors may benefit by combining non-correlated investments. For your reference, below are the Fund’s correlations to several other asset classes.
| Correlation Since Inception |
| S&P 500 Index | 0.55 |
Russell 2000® Index | 0.52 |
| MSCI EAFE Index | 0.48 |
| Barclays Capital U.S. Agg. Bond Index | -0.11 |
| Wilshire REIT ETF Index | 0.39 |
| Dow Jones Commodity Futures | 0.44 |
Earlier his year, Morningstar created a new fund category (“Market Neutral”) and added the TFS Market Neutral Fund to it. TFSMX had previously been placed in Morningstar’s “Long-Short” category. TFS Capital sees this new category as a positive shift for the Fund given that, with an average beta below 0.2 and a relatively “static” hedge, it is, in our opinion, more appropriately placed in this category for comparison purposes. This category is populated with other mutual funds like TFSMX (i.e., funds with a low beta that generate the vast majority of their return stream from alpha).
On December 12, 2010, TFSMX paid its annual capital gains distribution. The distribution of $1.486 per share was higher than in past years and higher than is expected on average. The distribution, on a percentage basis, actually exceeded the Fund’s gain for the year. This situation is not unexpected given the high portfolio turnover of the Fund and the lower-than-expected distributions from prior years. Generally speaking, TFSMX is not expected to be a tax efficient fund and one may expect that a large percentage of any appreciation of fund value will be distributed annually in the form of capital gains.
TFS Small Cap Fund (ticker: TFSSX)
| | | | Since Inception (3/7/2006) |
| TFS Small Cap Fund | 28.40% | 2.94% | 7.66% |
Russell 2000® Index | 26.58% | -3.91% | 0.83% |
Average annual total returns for periods ended October 31, 2010
As evidenced by the return figures above, TFSSX has continued to achieve its objective of outperforming the Russell 2000® Index. In fact, the Fund now has over a 4-year track record and has achieved an average annual return that is 6.83 percentage points higher than that of the Russell 2000® Index. On a cumulative basis since inception, TFSSX generated a 40.96% total return compared to 4.00% total return for the Russell 2000® Index. At the end of October 2010, the trailing 3-year return placed TFSSX in the top 2% of the Lipper “Small Cap Core” category.1
During the period, TFSSX’s returns were largely driven by the favorable market conditions overall. That is, the broad U.S. equity market and, more specifically, the “small cap” segment experienced large gains. Given its long-only mandate, the Fund will generally correlate to U.S. small-cap equity market movements with some deviation attributable to TFS Capital’s equity selection.
Despite the Funds’ excellent performance, we do not recommend allocating a high percentage of one’s assets to either Fund given the risks inherent in the Funds. Rather, we believe that they are best used as a component of a diversified portfolio of investments. If you have any questions about the Funds or TFS Capital, please contact us.
Best regards,
Larry S. Eiben
Chief Operating Officer & Co-Portfolio Manager
TFS Capital LLC
The performance data quoted represents past performance, which is not a guarantee of future results. Current performance may be lower or higher than the performance data quoted. The investment return and principal value of an investment in the Funds will fluctuate so that an investor’s shares, when redeemed, may be worth more or less than their original cost. The Funds charge a 2% redemption penalty on shares invested for less than 90 days. If shares are redeemed within the 90 day period, investment returns would be reduced from those shown above. Fee waivers and/or expense reimbursements by the Adviser have positively impacted the Funds’ performance. Without such waivers and/or reimbursements, performance would have been lower. An investor should consider the investment objectives, risks, charges and expenses of the Funds carefully before investing. To obtain a summary prospectus and/or prospectus, which each contain this and other important information, go to www.TFSCapital.com or call (888) 534-2001. Please read the summary prospectus and/or prospectus carefully before investing. The Funds may not be suitable for all investors.
| 1 | TFSMX was ranked #1 out of 31 in the Lipper “Market Neutral” category using its 5-year return. TFSMX was ranked #1 out of 45 in the Lipper “Market Neutral” category using its 5-year return. TFSMX was ranked #9 out of 69 in the Lipper “Market Neutral” category using its 1-year return. TFSSX was ranked #7 out of 684 in the Lipper “Small Cap Core” category using its 3-year return. TFSSX was ranked #364 out of 778 in the Lipper “Small Cap Core” category using its 1-year return. |
Ranking information provided by Lipper for the periods ended October 31, 2010. TFSSX was assigned by Lipper to the Small-Cap Core category. TFSMX was assigned by Lipper to the Market Neutral category. The Funds are ranked based on total return and are ranked within a universe of funds with similar investment objectives. Rankings include the reinvestment of dividends and capital gains but exclude the effect of a fund’s sales load, if applicable. Fund rankings are calculated monthly by Lipper Analytical Services of New York. Lipper Inc. is a nationally recognized organization that ranks the performance of mutual funds.
TFS MARKET NEUTRAL FUND PERFORMANCE INFORMATION (Unaudited) |
Comparison of the Change in Value of a $10,000 Investment in the
TFS Market Neutral Fund versus the S&P 500 Index
Average Annual Total Returns(a) For the periods ended October 31, 2010 |
| | 1 Year | 5 Years | Since Inception(b) |
| TFS Market Neutral Fund | 6.60% | 9.64% | 9.00% |
| S&P 500 Index | 16.52% | 1.73% | 2.97% |
| (a) | The total returns shown do not reflect the deduction of taxes a shareholder would pay on Fund distributions or the redemption of Fund shares. |
| | |
| (b) | Initial public offering of shares was September 7, 2004. |
TFS SMALL CAP FUND PERFORMANCE INFORMATION (Unaudited) |
Comparison of the Change in Value of a $10,000 Investment in the
TFS Small Cap Fund versus the Russell 2000 Index
Average Annual Total Returns(a) For the periods ended October 31, 2010 |
| | 1 Year | Since Inception(b) |
| TFS Small Cap Fund | 28.40% | 7.66% |
| Russell 2000 Index | 26.58% | 0.83% |
| (a) | The total returns shown do not reflect the deduction of taxes a shareholder would pay on Fund distributions or the redemption of Fund shares. |
| | |
| (b) | Initial public offering of shares was March 7, 2006. |
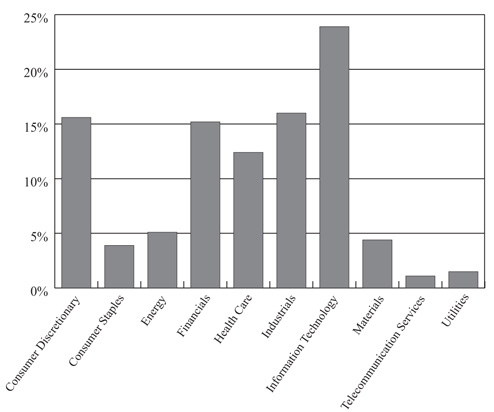
TFS MARKET NEUTRAL FUND PORTFOLIO INFORMATION October 31, 2010 (Unaudited) |
TFS Market Neutral Fund vs S&P 500 Index
Net Sector Exposure*
| * | The net percentages for the TFS Market Neutral Fund are computed by taking the net dollar exposure, including short positions, and dividing by the net assets of the Fund. Consequently, the percentages are not likely to total to 100%. |
Top 10 Long Equity Positions | | Top 10 Short Equity Positions |
| | | | |
| King Pharmaceuticals, Inc. | 0.47% | | Great Atlantic & Pacific Tea Company, Inc. (The) | 0.46% |
| BE Aerospace, Inc. | 0.47% | | iStar Financial, Inc. | 0.45% |
| United Rentals, Inc. | 0.43% | | Texas Industries, Inc. | 0.41% |
| SUPERVALU, Inc. | 0.41% | | WESCO International, Inc. | 0.35% |
| Corn Products International, Inc. | 0.40% | | MELA Sciences, Inc. | 0.35% |
| Alliance Data Systems Corporation | 0.40% | | AMR Corporation | 0.34% |
| Sonus Networks, Inc. | 0.40% | | Allegiant Travel Company | 0.34% |
| Cinemark Holdings, Inc. | 0.39% | | Granite Construction, Inc. | 0.32% |
| Cardtronics, Inc. | 0.39% | | Global Payments, Inc. | 0.31% |
| Lattice Semiconductor Corporation | 0.39% | | PHH Corporation | 0.31% |
TFS SMALL CAP FUND PORTFOLIO INFORMATION October 31, 2010 (Unaudited) |
TFS Small Cap Fund
Sector Allocation (% of Net Assets)
|
| |
| Sotheby's | 0.53% |
| ON Semiconductor Corporation | 0.48% |
| Ariad Pharmaceuticals, Inc. | 0.47% |
| ITT Educational Services, Inc. | 0.47% |
| Veeco Instruments, Inc. | 0.47% |
| Cypress Semiconductor Corporation | 0.46% |
| Blue Coat Systems, Inc. | 0.46% |
| SUPERVALU, Inc. | 0.45% |
| Dorman Products, Inc. | 0.45% |
| Websense, Inc. | 0.45% |
TFS MARKET NEUTRAL FUND SUMMARY SCHEDULE OF INVESTMENTS* October 31, 2010 |
| | | | | | |
| Consumer Discretionary — 12.1% | | | | | | |
| Auto Components — 1.1% | | | | | | |
Other Auto Components (a) | | | | | $ | 12,331,483 | |
| | | | | | | | |
| Automobiles — 0.1% | | | | | | | |
Other Automobiles (a) | | | | | | 1,173,498 | |
| | | | | | | | |
| Distributors — 0.0% | | | | | | | |
Other Distributors (a) | | | | | | 14,358 | |
| | | | | | | | |
| Diversified Consumer Services — 0.6% | | | | | | | |
Other Diversified Consumer Services (a) | | | | | | 7,328,636 | |
| | | | | | | | |
| Hotels, Restaurants & Leisure — 2.7% | | | | | | | |
Penn National Gaming, Inc. (b) (c) | | | 123,200 | | | | 4,097,632 | |
Other Hotels, Restaurants & Leisure (a) | | | | | | | 26,535,016 | |
| | | | | | | | 30,632,648 | |
| Household Durables — 1.3% | | | | | | | | |
Harman International Industries, Inc. (b) (c) | | | 113,400 | | | | 3,804,570 | |
Other Household Durables (a) | | | | | | | 11,455,140 | |
| | | | | | | | 15,259,710 | |
| Internet & Catalog Retail — 0.2% | | | | | | | | |
Other Internet & Catalog Retail (a) | | | | | | | 1,958,118 | |
| | | | | | | | | |
| Leisure Equipment & Products — 0.2% | | | | | | | | |
Other Leisure Equipment & Products (a) | | | | | | | 2,562,319 | |
| | | | | | | | | |
| Media — 1.9% | | | | | | | | |
Cinemark Holdings, Inc. (c) | | | 256,183 | | | | 4,496,012 | |
Other Media (a) | | | | | | | 16,890,421 | |
| | | | | | | | 21,386,433 | |
| Multiline Retail — 0.6% | | | | | | | | |
Retail Ventures, Inc. (b) (c) | | | 312,943 | | | | 4,252,896 | |
Other Multiline Retail (a) | | | | | | | 2,023,666 | |
| | | | | | | | 6,276,562 | |
| Specialty Retail — 2.5% | | | | | | | | |
Other Specialty Retail (a) | | | | | | | 28,749,196 | |
| | | | | | | | | |
| Textiles, Apparel & Luxury Goods — 0.9% | | | | | | | | |
Other Textiles, Apparel & Luxury Goods (a) | | | | | | | 10,655,550 | |
| | | | | | | | | |
| Consumer Staples — 3.5% | | | | | | | | |
| Beverages — 0.5% | | | | | | | | |
Constellation Brands, Inc. - Class A (b) (c) | | | 191,300 | | | | 3,774,349 | |
Other Beverages (a) | | | | | | | 2,011,810 | |
| | | | | | | | 5,786,159 | |
TFS MARKET NEUTRAL FUND SUMMARY SCHEDULE OF INVESTMENTS (Continued) |
COMMON STOCKS — 89.1% (Continued) | | | | | | |
| Consumer Staples — 3.5% (Continued) | | | | | | |
| Food & Staples Retailing — 1.0% | | | | | | |
SUPERVALU, Inc. (c) | | | 435,140 | | | $ | 4,695,161 | |
Other Food & Staples Retailing (a) | | | | | | | 6,243,420 | |
| | | | | | | | 10,938,581 | |
| Food Products — 1.2% | | | | | | | | |
Corn Products International, Inc. (c) | | | 108,605 | | | | 4,621,143 | |
Other Food Products (a) | | | | | | | 9,376,627 | |
| | | | | | | | 13,997,770 | |
| Household Products — 0.2% | | | | | | | | |
Other Household Products (a) | | | | | | | 2,129,115 | |
| | | | | | | | | |
| Personal Products — 0.6% | | | | | | | | |
Other Personal Products (a) | | | | | | | 7,223,456 | |
| | | | | | | | | |
| Tobacco — 0.0% | | | | | | | | |
Other Tobacco (a) | | | | | | | 220,029 | |
| | | | | | | | | |
| Energy — 7.0% | | | | | | | | |
| Energy Equipment & Services — 2.2% | | | | | | | | |
Dresser-Rand Group, Inc. (b) (c) | | | 116,000 | | | | 3,969,520 | |
Superior Energy Services, Inc. (b) (c) | | | 150,312 | | | | 4,151,617 | |
Other Energy Equipment & Services (a) | | | | | | | 16,691,717 | |
| | | | | | | | 24,812,854 | |
| Oil, Gas & Consumable Fuels — 4.8% | | | | | | | | |
Other Oil, Gas & Consumable Fuels (a) | | | | | | | 54,702,811 | |
| | | | | | | | | |
| Financials — 14.8% | | | | | | | | |
| Capital Markets — 1.9% | | | | | | | | |
BlackRock Kelso Capital Corporation (c) | | | 305,970 | | | | 3,585,968 | |
E*TRADE Financial Corporation (b) (c) | | | 271,633 | | | | 3,884,352 | |
Other Capital Markets (a) | | | | | | | 14,437,291 | |
| | | | | | | | 21,907,611 | |
| Commercial Banks — 2.0% | | | | | | | | |
CapitalSource, Inc. (c) | | | 540,329 | | | | 3,301,410 | |
East West Bancorp, Inc. (c) | | | 210,869 | | | | 3,717,620 | |
Fulton Financial Corporation (c) | | | 361,520 | | | | 3,376,597 | |
Other Commercial Banks (a) | | | | | | | 12,680,958 | |
| | | | | | | | 23,076,585 | |
| Consumer Finance — 0.8% | | | | | | | | |
Cardtronics, Inc. (b) (c) | | | 262,872 | | | | 4,455,680 | |
Other Consumer Finance (a) | | | | | | | 4,824,225 | |
| | | | | | | | 9,279,905 | |
| Diversified Financial Services — 0.5% | | | | | | | | |
Other Diversified Financial Services (a) | | | | | | | 5,761,066 | |
| | | | | | | | | |
| Insurance — 4.1% | | | | | | | | |
American Financial Group, Inc. (c) | | | 112,795 | | | | 3,449,271 | |
TFS MARKET NEUTRAL FUND SUMMARY SCHEDULE OF INVESTMENTS (Continued) |
COMMON STOCKS — 89.1% (Continued) | | | | | | |
| Financials — 14.8% (Continued) | | | | | | |
| Insurance — 4.1% (Continued) | | | | | | |
Aspen Insurance Holdings Ltd. (c) | | | 136,866 | | | $ | 3,882,888 | |
Other Insurance (a) | | | | | | | 38,782,187 | |
| | | | | | | | 46,114,346 | |
| Real Estate Investment Trusts — 4.7% | | | | | | | | |
Hospitality Properties Trust (c) | | | 193,740 | | | | 4,419,209 | |
Mack-Cali Realty Corporation (c) | | | 106,100 | | | | 3,562,838 | |
Saul Centers, Inc. (c) | | | 77,753 | | | | 3,318,498 | |
Senior Housing Properties Trust (c) | | | 152,800 | | | | 3,650,392 | |
Other Real Estate Investment Trusts (a) | | | | | | | 38,736,518 | |
| | | | | | | | 53,687,455 | |
| Real Estate Management & Development — 0.2% | | | | | | | | |
Other Real Estate Management & Development (a) | | | | | | | 2,350,176 | |
| | | | | | | | | |
| Thrifts & Mortgage Finance — 0.6% | | | | | | | | |
Other Thrifts & Mortgage Finance (a) | | | | | | | 6,797,154 | |
| | | | | | | | | |
| Health Care — 9.9% | | | | | | | | |
| Biotechnology — 1.7% | | | | | | | | |
Other Biotechnology (a) | | | | | | | 19,054,598 | |
| | | | | | | | | |
| Health Care Equipment & Supplies — 1.8% | | | | | | | | |
Teleflex, Inc. (c) | | | 62,438 | | | | 3,480,918 | |
Other Health Care Equipment & Supplies (a) | | | | | | | 16,737,621 | |
| | | | | | | | 20,218,539 | |
| Health Care Providers & Services — 3.2% | | | | | | | | |
Coventry Health Care, Inc. (b) (c) | | | 161,900 | | | | 3,791,698 | |
Health Net, Inc. (b) (c) | | | 141,317 | | | | 3,800,014 | |
Other Health Care Providers & Services (a) | | | | | | | 28,907,653 | |
| | | | | | | | 36,499,365 | |
| Health Care Technology — 0.6% | | | | | | | | |
SXC Health Solutions Corporation (b) (c) | | | 92,700 | | | | 3,611,592 | |
Other Health Care Technology (a) | | | | | | | 3,279,109 | |
| | | | | | | | 6,890,701 | |
| Life Sciences Tools & Services — 0.9% | | | | | | | | |
PerkinElmer, Inc. (c) | | | 159,944 | | | | 3,750,687 | |
Other Life Sciences Tools & Services (a) | | | | | | | 6,845,995 | |
| | | | | | | | 10,596,682 | |
| Pharmaceuticals — 1.7% | | | | | | | | |
King Pharmaceuticals, Inc. (b) (c) | | | 380,090 | | | | 5,374,473 | |
Other Pharmaceuticals (a) | | | | | | | 13,994,774 | |
| | | | | | | | 19,369,247 | |
| Industrials — 15.4% | | | | | | | | |
| Aerospace & Defense — 1.7% | | | | | | | | |
BE Aerospace, Inc. (b) (c) | | | 145,700 | | | | 5,355,932 | |
TransDigm Group, Inc. (b) (c) | | | 63,560 | | | | 4,212,121 | |
Other Aerospace & Defense (a) | | | | | | | 10,476,468 | |
| | | | | | | | 20,044,521 | |
TFS MARKET NEUTRAL FUND SUMMARY SCHEDULE OF INVESTMENTS (Continued) |
COMMON STOCKS — 89.1% (Continued) | | | | | | |
| Industrials — 15.4% (Continued) | | | | | | |
| Air Freight & Logistics — 0.4% | | | | | | |
Other Air Freight & Logistics (a) | | | | | $ | 4,420,356 | |
| | | | | | | | |
| Airlines — 0.4% | | | | | | | |
Other Airlines (a) | | | | | | 4,585,425 | |
| | | | | | | | |
| Building Products — 0.2% | | | | | | | |
Other Building Products (a) | | | | | | 2,470,686 | |
| | | | | | | | |
| Commercial Services & Supplies — 1.3% | | | | | | | |
Other Commercial Services & Supplies (a) | | | | | | 14,618,932 | |
| | | | | | | | |
| Construction & Engineering — 1.8% | | | | | | | |
Great Lakes Dredge & Dock Corporation (c) | | | 609,407 | | | | 3,772,230 | |
Other Construction & Engineering (a) | | | | | | | 16,895,410 | |
| | | | | | | | 20,667,640 | |
| Electrical Equipment — 1.3% | | | | | | | | |
Hubbell, Inc. - Class B (c) | | | 70,322 | | | | 3,798,794 | |
Thomas & Betts Corporation (b) (c) | | | 83,000 | | | | 3,614,650 | |
Other Electrical Equipment (a) | | | | | | | 7,904,912 | |
| | | | | | | | 15,318,356 | |
| Industrial Conglomerates — 0.2% | | | | | | | | |
Other Industrial Conglomerates (a) | | | | | | | 1,874,149 | |
| | | | | | | | | |
| Machinery — 4.2% | | | | | | | | |
Navistar International Corporation (b) (c) | | | 86,300 | | | | 4,157,934 | |
Sauer-Danfoss, Inc. (b) (c) | | | 183,729 | | | | 4,062,248 | |
WABCO Holdings, Inc. (b) (c) | | | 88,696 | | | | 4,117,268 | |
Other Machinery (a) | | | | | | | 35,876,684 | |
| | | | | | | | 48,214,134 | |
| Marine — 0.9% | | | | | | | | |
Other Marine (a) | | | | | | | 9,848,096 | |
| | | | | | | | | |
| Professional Services — 0.7% | | | | | | | | |
Other Professional Services (a) | | | | | | | 7,838,580 | |
| | | | | | | | | |
| Road & Rail — 0.8% | | | | | | | | |
Ryder System, Inc. | | | 78,900 | | | | 3,451,875 | |
Other Road & Rail (a) | | | | | | | 6,348,128 | |
| | | | | | | | 9,800,003 | |
| Trading Companies & Distributors — 1.3% | | | | | | | | |
Aircastle Ltd. (c) | | | 461,880 | | | | 4,253,915 | |
United Rentals, Inc. (b) (c) | | | 260,700 | | | | 4,898,553 | |
Other Trading Companies & Distributors (a) | | | | | | | 5,768,366 | |
| | | | | | | | 14,920,834 | |
| Transportation Infrastructure — 0.2% | | | | | | | | |
Other Transportation Infrastructure (a) | | | | | | | 1,867,980 | |
TFS MARKET NEUTRAL FUND SUMMARY SCHEDULE OF INVESTMENTS (Continued) |
COMMON STOCKS — 89.1% (Continued) | | | | | | |
| Information Technology — 18.2% | | | | | | |
| Communications Equipment — 2.7% | | | | | | |
Sonus Networks, Inc. (b) (c) | | | 1,480,083 | | | $ | 4,603,058 | |
Other Communications Equipment (a) | | | | | | | 26,387,723 | |
| | | | | | | | 30,990,781 | |
| Computers & Peripherals — 1.2% | | | | | | | | |
Other Computers & Peripherals (a) | | | | | | | 12,961,515 | |
| | | | | | | | | |
| Electronic Equipment, Instruments & Components — 3.1% | | | | | | | | |
Arrow Electronics, Inc. (b) (c) | | | 111,700 | | | | 3,307,437 | |
Cogent, Inc. (b) | | | 317,520 | | | | 3,340,310 | |
Other Electronic Equipment, Instruments & Components (a) | | | | | | | 28,355,491 | |
| | | | | | | | 35,003,238 | |
| Internet Software & Services — 1.1% | | | | | | | | |
Other Internet Software & Services (a) | | | | | | | 12,892,187 | |
| | | | | | | | | |
| IT Services — 2.2% | | | | | | | | |
Alliance Data Systems Corporation (b) (c) | | | 76,006 | | | | 4,615,084 | |
iGATE Corporation (c) | | | 161,027 | | | | 3,291,392 | |
Other IT Services (a) | | | | | | | 17,597,156 | |
| | | | | | | | 25,503,632 | |
| Office Electronics — 0.0% | | | | | | | | |
Other Office Electronics (a) | | | | | | | 252,356 | |
| | | | | | | | | |
| Semiconductors & Semiconductor Equipment — 5.5% | | | | | | | | |
Fairchild Semiconductor International, Inc. (b) (c) | | | 322,100 | | | | 3,630,067 | |
Lattice Semiconductor Corporation (b) (c) | | | 914,817 | | | | 4,446,011 | |
Other Semiconductors & Semiconductor Equipment (a) | | | | | | | 54,506,777 | |
| | | | | | | | 62,582,855 | |
| Software — 2.4% | | | | | | | | |
Other Software (a) | | | | | | | 27,583,432 | |
| | | | | | | | | |
| Materials — 5.8% | | | | | | | | |
| Chemicals — 2.8% | | | | | | | | |
Cabot Corporation (c) | | | 110,200 | | | | 3,749,004 | |
Cytec Industries, Inc. (c) | | | 71,993 | | | | 3,565,093 | |
Other Chemicals (a) | | | | | | | 24,490,886 | |
| | | | | | | | 31,804,983 | |
| Construction Materials — 0.0% | | | | | | | | |
Other Construction Materials (a) | | | | | | | 64,384 | |
| | | | | | | | | |
| Containers & Packaging — 0.6% | | | | | | | | |
Packaging Corporation of America (c) | | | 137,866 | | | | 3,368,066 | |
Other Containers & Packaging (a) | | | | | | | 3,616,546 | |
| | | | | | | | 6,984,612 | |
| Metals & Mining — 2.3% | | | | | | | | |
Other Metals & Mining (a) | | | | | | | 26,231,641 | |
| | | | | | | | | |
| Paper & Forest Products — 0.1% | | | | | | | | |
Other Paper & Forest Products (a) | | | | | | | 1,280,694 | |
TFS MARKET NEUTRAL FUND SUMMARY SCHEDULE OF INVESTMENTS (Continued) |
COMMON STOCKS — 89.1% (Continued) | | | | | | |
| Telecommunication Services — 0.7% | | | | | | |
| Diversified Telecommunication Services — 0.5% | | | | | | |
Other Diversified Telecommunication Services (a) | | | | | $ | 5,416,147 | |
| | | | | | | | |
| Wireless Telecommunication Services — 0.2% | | | | | | | |
Other Wireless Telecommunication Services (a) | | | | | | 2,434,070 | |
| | | | | | | | |
| Utilities — 1.7% | | | | | | | |
| Electric Utilities — 0.6% | | | | | | | |
Other Electric Utilities (a) | | | | | | 7,116,820 | |
| | | | | | | | |
| Gas Utilities — 0.9% | | | | | | | |
AGL Resources, Inc. (c) | | | 93,752 | | | | 3,680,703 | |
UGI Corporation (c) | | | 123,913 | | | | 3,728,542 | |
Other Gas Utilities (a) | | | | | | | 2,232,914 | |
| | | | | | | | 9,642,159 | |
| Independent Power Producers & Energy Traders — 0.0% | | | | | | | | |
Other Independent Power Producers & Energy Traders (a) | | | | | | | 476,351 | |
| | | | | | | | | |
| Multi-Utilities — 0.1% | | | | | | | | |
Other Multi-Utilities (a) | | | | | | | 1,311,897 | |
| | | | | | | | | |
| Water Utilities — 0.1% | | | | | | | | |
Other Water Utilities (a) | | | | | | | 1,086,562 | |
| | | | | | | | | |
Total Common Stocks (Cost $947,935,809) | | | | | | $ | 1,017,852,724 | |
| | | | |
Other Closed-End Funds (Cost $40,736,777) (a) | | | $ | 41,055,193 | |
EXCHANGE-TRADED FUNDS — 0.1% | | | | |
Other Exchange-Traded Funds (Cost $739,151) (a) | | | $ | 725,199 | |
| | | | |
Other Rights (Cost $64,169) (a) (e) | | | $ | 541,256 | |
| | | | |
Other Warrants (Cost $0) (a) | | | $ | 2 | |
TFS MARKET NEUTRAL FUND SUMMARY SCHEDULE OF INVESTMENTS (Continued) |
MONEY MARKET FUNDS — 7.6% | | | | | | |
UMB Money Market Fiduciary, 0.02% (d) (Cost $86,302,892) | | | 86,302,892 | | | $ | 86,302,892 | |
| | | | | | | | | |
Total Investments at Value — 100.4% (Cost $1,075,778,798) | | | | | | $ | 1,146,477,266 | |
| | | | | | | | | |
Liabilities in Excess of Other Assets — (0.4%) | | | | | | | (4,257,836 | ) |
| | | | | | | | | |
Net Assets — 100.0% | | | | | | $ | 1,142,219,430 | |
| * | A complete Schedule of Investments is available without charge upon request by calling toll-free 1-888-534-2001 or on the SEC’s website at http://www.sec.gov. |
| | |
| (a) | Represents issuers not identified as a top 50 holding in terms of market value and issues or issuers not exceeding 1% of net assets individually or in the aggregate, respectively, as of October 31, 2010. |
| | |
| (b) | Non-income producing security. |
| | |
| (c) | All or a portion of the shares have been committed as collateral for open short positions. |
| | |
| (d) | Variable rate security. The rate shown is the 7-day effective yield as of October 31, 2010. |
| | |
| (e) | Fair value priced (Note 2). Fair valued securities totaled $541,256 at October 31, 2010, representing 0.0% of net assets. |
| | |
| See accompanying notes to financial statements. |
TFS MARKET NEUTRAL FUND SCHEDULE OF SECURITIES SOLD SHORT October 31, 2010 |
| | | | | | |
| Consumer Discretionary — 10.1% | | | | | | |
| Auto Components — 0.0% | | | | | | |
Cooper Tire & Rubber Company | | | 6,801 | | | $ | 133,368 | |
Goodyear Tire & Rubber Company (The) (a) | | | 38,500 | | | | 393,470 | |
Icahn Enterprises, L.P. | | | 570 | | | | 19,722 | |
Johnson Controls, Inc. | | | 1,300 | | | | 45,656 | |
| | | | | | | | 592,216 | |
| Automobiles — 0.1% | | | | | | | | |
Ford Motor Company (a) | | | 6,100 | | | | 86,193 | |
Harley-Davidson, Inc. | | | 700 | | | | 21,476 | |
Kandi Technologies Corporation (a) | | | 6,300 | | | | 35,406 | |
Tesla Motors, Inc. (a) | | | 58,790 | | | | 1,283,974 | |
| | | | | | | | 1,427,049 | |
| Distributors — 0.1% | | | | | | | | |
Audiovox Corporation - Class A (a) | | | 12,514 | | | | 81,091 | |
Core-Mark Holding Company, Inc. (a) | | | 18,562 | | | | 612,546 | |
LKQ Corporation (a) | | | 620 | | | | 13,479 | |
| | | | | | | | 707,116 | |
| Diversified Consumer Services — 1.0% | | | | | | | | |
American Public Education, Inc. (a) | | | 6,209 | | | | 173,604 | |
Apollo Group, Inc. - Class A (a) | | | 2,700 | | | | 101,196 | |
Bridgepoint Education, Inc. (a) | | | 89,946 | | | | 1,280,831 | |
Capella Education Company (a) | | | 50,769 | | | | 2,783,664 | |
Career Education Corporation (a) | | | 4,300 | | | | 75,422 | |
Coinstar, Inc. (a) | | | 3,100 | | | | 178,498 | |
Corinthian Colleges, Inc. (a) | | | 93,500 | | | | 488,070 | |
DeVry, Inc. | | | 8,200 | | | | 392,452 | |
Education Management Corporation (a) | | | 120,578 | | | | 1,446,936 | |
Grand Canyon Education, Inc. (a) | | | 205 | | | | 3,856 | |
H&R Block, Inc. | | | 29,400 | | | | 346,626 | |
Learning Tree International, Inc. (a) | | | 5,878 | | | | 57,016 | |
Lincoln Educational Services Corporation (a) | | | 700 | | | | 8,722 | |
Sotheby's | | | 7,600 | | | | 333,184 | |
Stewart Enterprises, Inc. - Class A | | | 345,385 | | | | 1,920,341 | |
Strayer Education, Inc. | | | 17,000 | | | | 2,377,110 | |
| | | | | | | | 11,967,528 | |
| Hotels, Restaurants & Leisure — 0.9% | | | | | | | | |
Ambassadors Group, Inc. | | | 525 | | | | 5,822 | |
Bally Technologies, Inc. (a) | | | 2,400 | | | | 86,592 | |
Biglari Holdings, Inc. (a) | | | 481 | | | | 160,361 | |
Bluegreen Corporation (a) | | | 110 | | | | 355 | |
Buffalo Wild Wings, Inc. (a) | | | 2,700 | | | | 126,981 | |
Cheesecake Factory, Inc. (The) (a) | | | 600 | | | | 17,472 | |
Chipotle Mexican Grill, Inc. (a) | | | 200 | | | | 42,042 | |
Cracker Barrel Old Country Store, Inc. | | | 5,020 | | | | 270,528 | |
Darden Restaurants, Inc. | | | 400 | | | | 18,284 | |
DineEquity, Inc. (a) | | | 12,300 | | | | 546,735 | |
Gaylord Entertainment Company (a) | | | 35,170 | | | | 1,172,568 | |
TFS MARKET NEUTRAL FUND SCHEDULE OF SECURITIES SOLD SHORT (Continued) |
COMMON STOCKS — 60.2% (Continued) | | | | | | |
| Consumer Discretionary — 10.1% (Continued) | | | | | | |
| Hotels, Restaurants & Leisure — 0.9% (Continued) | | | | | | |
Hyatt Hotels Corporation - Class A (a) | | | 2,900 | | | $ | 116,870 | |
International Speedway Corporation - Class A | | | 34,963 | | | | 798,555 | |
Jack in the Box, Inc. (a) | | | 1,200 | | | | 27,792 | |
Las Vegas Sands Corporation (a) | | | 3,400 | | | | 155,992 | |
Marriott International, Inc. - Class A | | | 100 | | | | 3,705 | |
McDonald's Corporation | | | 300 | | | | 23,331 | |
MGM Resorts International (a) | | | 4,100 | | | | 44,813 | |
Morgans Hotel Group Company (a) | | | 159,525 | | | | 1,287,367 | |
Panera Bread Company - Class A (a) | | | 1,700 | | | | 152,167 | |
Peet's Coffee & Tea, Inc. (a) | | | 66,062 | | | | 2,526,871 | |
Red Robin Gourmet Burgers, Inc. (a) | | | 6,094 | | | | 123,708 | |
Six Flags Entertainment Corporation (a) | | | 3,513 | | | | 180,147 | |
Speedway Motorsports, Inc. | | | 7,700 | | | | 117,810 | |
Starwood Hotels & Resorts Worldwide, Inc. | | | 400 | | | | 21,656 | |
Texas Roadhouse, Inc. (a) | | | 58,192 | | | | 893,829 | |
Town Sports International Holdings, Inc. (a) | | | 400 | | | | 1,200 | |
Universal Travel Group (a) | | | 24,600 | | | | 137,760 | |
Vail Resorts, Inc. (a) | | | 8,600 | | | | 348,816 | |
WMS Industries, Inc. (a) | | | 9,900 | | | | 431,937 | |
Wyndham Worldwide Corporation | | | 560 | | | | 16,100 | |
| | | | | | | | 9,858,166 | |
| Household Durables — 1.3% | | | | | | | | |
American Greetings Corporation - Class A | | | 99,528 | | | | 1,927,857 | |
Beazer Homes USA, Inc. (a) | | | 45,300 | | | | 183,918 | |
Blyth, Inc. | | | 3,469 | | | | 139,176 | |
Brookfield Homes Corporation (a) | | | 14,430 | | | | 120,346 | |
Cavco Industries, Inc. (a) | | | 19,645 | | | | 622,550 | |
Comstock Homebuilding Companies, Inc. - Class A (a) | | | 2,103 | | | | 2,419 | |
CSS Industries, Inc. | | | 2 | | | | 34 | |
D.R. Horton, Inc. | | | 13,100 | | | | 136,764 | |
Deer Consumer Products, Inc. (a) | | | 38,300 | | | | 438,535 | |
Ethan Allen Interiors, Inc. | | | 55,882 | | | | 847,730 | |
Flexsteel Industries, Inc. | | | 1,700 | | | | 25,704 | |
Hooker Furniture Corporation | | | 4,004 | | | | 42,322 | |
Hovnanian Enterprises, Inc. - Class A (a) | | | 179,295 | | | | 638,290 | |
iRobot Corporation (a) | | | 26,953 | | | | 562,779 | |
KB Home | | | 267,700 | | | | 2,813,527 | |
La-Z-Boy, Inc. (a) | | | 95,700 | | | | 743,589 | |
Lennar Corporation - Class A | | | 228,100 | | | | 3,309,731 | |
Libbey, Inc. (a) | | | 13,846 | | | | 184,013 | |
Lifetime Brands, Inc. (a) | | | 701 | | | | 9,001 | |
Meritage Homes Corporation (a) | | | 8,000 | | | | 146,480 | |
Mohawk Industries, Inc. (a) | | | 6,766 | | | | 387,962 | |
National Presto Industries, Inc. | | | 600 | | | | 67,158 | |
Pulte Homes, Inc. (a) | | | 28,199 | | | | 221,362 | |
Ryland Group, Inc. (The) | | | 24,120 | | | | 361,318 | |
Sealy Corporation (a) | | | 286,073 | | | | 752,372 | |
Stanley Black & Decker, Inc. | | | 400 | | | | 24,788 | |
TFS MARKET NEUTRAL FUND SCHEDULE OF SECURITIES SOLD SHORT (Continued) |
COMMON STOCKS — 60.2% (Continued) | | | | | | |
| Consumer Discretionary — 10.1% (Continued) | | | | | | |
| Household Durables — 1.3% (Continued) | | | | | | |
Tempur-Pedic International, Inc. (a) | | | 1,640 | | | $ | 56,580 | |
Whirlpool Corporation | | | 600 | | | | 45,498 | |
| | | | | | | | 14,811,803 | |
| Internet & Catalog Retail — 1.0% | | | | | | | | |
1-800-FLOWERS.COM, Inc. (a) | | | 51,535 | | | | 92,763 | |
Amazon.com, Inc. (a) | | | 600 | | | | 99,084 | |
Blue Nile, Inc. (a) | | | 71,779 | | | | 3,057,786 | |
Gaiam, Inc. - Class A | | | 20 | | | | 141 | |
HSN, Inc. (a) | | | 237 | | | | 7,096 | |
Liberty Media Corporation - Interactive - Series A (a) | | | 13,700 | | | | 202,212 | |
NetFlix, Inc. (a) | | | 1,400 | | | | 242,900 | |
NutriSystem, Inc. | | | 116,046 | | | | 2,218,800 | |
Overstock.com, Inc. (a) | | | 108,927 | | | | 1,460,711 | |
PetMed Express, Inc. | | | 193,745 | | | | 2,993,360 | |
priceline.com, Inc. (a) | | | 200 | | | | 75,362 | |
Shutterfly, Inc. (a) | | | 35,443 | | | | 1,066,834 | |
SinoCoking Coal and Coke Chemical Industries, Inc. (a) | | | 14,566 | | | | 117,693 | |
ValueVision Media, Inc. (a) | | | 400 | | | | 948 | |
| | | | | | | | 11,635,690 | |
| Leisure Equipment & Products — 0.9% | | | | | | | | |
Arctic Cat, Inc. (a) | | | 20,317 | | | | 270,419 | |
Brunswick Corporation | | | 82,570 | | | | 1,306,257 | |
Callaway Golf Company | | | 169,420 | | | | 1,165,610 | |
JAKKS Pacific, Inc. (a) | | | 60,267 | | | | 1,136,033 | |
Polaris Industries, Inc. | | | 23,700 | | | | 1,684,833 | |
Pool Corporation | | | 116,625 | | | | 2,348,828 | |
Smith & Wesson Holding Corporation (a) | | | 107,075 | | | | 401,531 | |
Steinway Musical Instruments, Inc. (a) | | | 100 | | | | 1,701 | |
Sturm Ruger & Company, Inc. | | | 95,552 | | | | 1,496,344 | |
Summer Infant, Inc. (a) | | | 11,169 | | | | 89,352 | |
| | | | | | | | 9,900,908 | |
| Media — 1.1% | | | | | | | | |
A.H. Belo Corporation (a) | | | 21,764 | | | | 158,224 | |
Arbitron, Inc. | | | 39,300 | | | | 995,076 | |
Ascent Media Corporation (a) | | | 386 | | | | 10,515 | |
China MediaExpress Holdings, Inc. (a) | | | 125,079 | | | | 1,933,721 | |
China Yida Holding Company (a) | | | 100 | | | | 1,063 | |
Dex One Corporation (a) | | | 6,600 | | | | 46,266 | |
DIRECTV (a) | | | 400 | | | | 17,384 | |
DISH Network Corporation - Class A (a) | | | 2,600 | | | | 51,636 | |
E.W. Scripps Company - Class A (a) | | | 33,401 | | | | 291,925 | |
Emmis Communications Corporation - Class A (a) | | | 600 | | | | 515 | |
Entercom Communications Corporation - Class A (a) | | | 40,467 | | | | 337,899 | |
Gannett Company, Inc. | | | 24,836 | | | | 294,307 | |
Harte-Hanks, Inc. | | | 1,100 | | | | 13,288 | |
IMAX Corporation (a) | | | 600 | | | | 12,990 | |
Interpublic Group of Companies, Inc. (The) (a) | | | 13,960 | | | | 144,486 | |
Martha Stewart Living Omnimedia, Inc. - Class A (a) | | | 230,064 | | | | 1,003,079 | |
TFS MARKET NEUTRAL FUND SCHEDULE OF SECURITIES SOLD SHORT (Continued) |
COMMON STOCKS — 60.2% (Continued) | | | | | | |
| Consumer Discretionary — 10.1% (Continued) | | | | | | |
| Media — 1.1% (Continued) | | | | | | |
McClatchy Company (The) - Class A (a) | | | 365,575 | | | $ | 1,008,987 | |
McGraw-Hill Companies, Inc. (The) | | | 400 | | | | 15,060 | |
Media General, Inc. (a) | | | 111,386 | | | | 613,737 | |
Meredith Corporation | | | 1,800 | | | | 61,110 | |
Morningstar, Inc. (a) | | | 2,530 | | | | 123,515 | |
New York Times Company (The) (a) | | | 33,347 | | | | 255,771 | |
Radio One, Inc. - Class D (a) | | | 20,000 | | | | 23,200 | |
Rentrak Corporation (a) | | | 11 | | | | 299 | |
Scholastic Corporation | | | 113,121 | | | | 3,331,413 | |
Spanish Broadcasting System, Inc. (a) | | | 1,500 | | | | 1,110 | |
SuperMedia, Inc. (a) | | | 18,512 | | | | 121,809 | |
Time Warner Cable, Inc. | | | 100 | | | | 5,787 | |
Viacom, Inc. - Class A | | | 27,374 | | | | 1,170,786 | |
Viacom, Inc. - Class B | | | 100 | | | | 3,859 | |
Washington Post Company (The) - Class B | | | 100 | | | | 40,215 | |
World Wrestling Entertainment, Inc. - Class A | | | 2,400 | | | | 33,216 | |
| | | | | | | | 12,122,248 | |
| Multiline Retail — 0.3% | | | | | | | | |
Big Lots, Inc. (a) | | | 7,600 | | | | 238,412 | |
Dillard's, Inc. - Class A | | | 5,295 | | | | 135,076 | |
Dollar Tree, Inc. (a) | | | 400 | | | | 20,524 | |
Fred's, Inc. - Class A | | | 42,831 | | | | 513,115 | |
J.C. Penney Company, Inc. | | | 1,600 | | | | 49,888 | |
Kohl's Corporation (a) | | | 400 | | | | 20,480 | |
Nordstrom, Inc. | | | 2,300 | | | | 88,573 | |
Sears Holdings Corporation (a) | | | 31,000 | | | | 2,231,380 | |
| | | | | | | | 3,297,448 | |
| Specialty Retail — 2.1% | | | | | | | | |
A.C. Moore Arts & Crafts, Inc. (a) | | | 600 | | | | 1,350 | |
Aaron's, Inc. | | | 13,210 | | | | 249,141 | |
Abercrombie & Fitch Company - Class A | | | 3,300 | | | | 141,438 | |
Aéropostale, Inc. (a) | | | 5,700 | | | | 138,966 | |
American Eagle Outfitters, Inc. | | | 6,000 | | | | 96,060 | |
AnnTaylor Stores Corporation (a) | | | 11,100 | | | | 258,630 | |
AutoNation, Inc. (a) | | | 300 | | | | 6,966 | |
AutoZone, Inc. (a) | | | 200 | | | | 47,526 | |
Barnes & Noble, Inc. | | | 175,370 | | | | 2,627,043 | |
Bed Bath & Beyond, Inc. (a) | | | 100 | | | | 4,390 | |
Best Buy Company, Inc. | | | 3,100 | | | | 133,238 | |
Blockbuster, Inc. - Class A (a) | | | 100,400 | | | | 4,418 | |
Brown Shoe Company, Inc. | | | 14,739 | | | | 173,183 | |
Buckle, Inc. (The) | | | 99,986 | | | | 2,908,593 | |
Build-A-Bear Workshop, Inc. (a) | | | 1,839 | | | | 12,928 | |
Cabela's, Inc. - Class A (a) | | | 69,836 | | | | 1,294,759 | |
Cache, Inc. (a) | | | 167 | | | | 833 | |
Citi Trends, Inc. (a) | | | 44,502 | | | | 933,652 | |
Collective Brands, Inc. (a) | | | 39,100 | | | | 599,403 | |
Conn's, Inc. (a) | | | 250,888 | | | | 1,103,907 | |
TFS MARKET NEUTRAL FUND SCHEDULE OF SECURITIES SOLD SHORT (Continued) |
COMMON STOCKS — 60.2% (Continued) | | | | | | |
| Consumer Discretionary — 10.1% (Continued) | | | | | | |
| Specialty Retail — 2.1% (Continued) | | | | | | |
Dick's Sporting Goods, Inc. (a) | | | 4,700 | | | $ | 135,454 | |
DSW, Inc. - Class A (a) | | | 48,300 | | | | 1,606,941 | |
Foot Locker, Inc. | | | 44,500 | | | | 708,885 | |
GameStop Corporation - Class A (a) | | | 1,600 | | | | 31,456 | |
Genesco, Inc. (a) | | | 22,837 | | | | 748,140 | |
Group 1 Automotive, Inc. (a) | | | 1,631 | | | | 57,509 | |
Guess?, Inc. | | | 6,900 | | | | 268,548 | |
Hastings Entertainment, Inc. (a) | | | 100 | | | | 664 | |
Haverty Furniture Companies, Inc. (a) | | | 98,012 | | | | 1,047,748 | |
hhgregg, Inc. (a) | | | 70,578 | | | | 1,626,117 | |
Hibbett Sports, Inc. (a) | | | 18,300 | | | | 493,185 | |
J. Crew Group, Inc. (a) | | | 7,800 | | | | 249,522 | |
Limited Brands, Inc. | | | 300 | | | | 8,817 | |
Lowe's Companies, Inc. | | | 700 | | | | 14,931 | |
Lumber Liquidators Holdings, Inc. (a) | | | 83,918 | | | | 2,020,746 | |
MarineMax, Inc. (a) | | | 37,332 | | | | 279,243 | |
Midas, Inc. (a) | | | 1,159 | | | | 8,530 | |
Monro Muffler Brake, Inc. | | | 100 | | | | 4,774 | |
OfficeMax, Inc. (a) | | | 10,180 | | | | 180,186 | |
Penske Auto Group, Inc. (a) | | | 600 | | | | 8,070 | |
Pep Boys - Manny Moe & Jack (The) | | | 858 | | | | 10,030 | |
PetSmart, Inc. | | | 500 | | | | 18,715 | |
Rent-A-Center, Inc. | | | 2,500 | | | | 62,850 | |
Rue21, Inc. (a) | | | 3,900 | | | | 103,818 | |
Sonic Automotive, Inc. - Class A (a) | | | 105,999 | | | | 1,157,509 | |
Syms Corporation (a) | | | 1,300 | | | | 9,477 | |
Talbots, Inc. (The) (a) | | | 37,241 | | | | 364,217 | |
TJX Companies, Inc. | | | 100 | | | | 4,589 | |
Ulta Salon Cosmetics & Fragrance, Inc. (a) | | | 70,100 | | | | 2,151,369 | |
Urban Outfitters, Inc. (a) | | | 100 | | | | 3,077 | |
Vitamin Shoppe, Inc. (a) | | | 4,249 | | | | 118,165 | |
West Marine, Inc. (a) | | | 8 | | | | 79 | |
Williams-Sonoma, Inc. | | | 12,420 | | | | 402,035 | |
Winmark Corporation | | | 603 | | | | 19,851 | |
Zale Corporation (a) | | | 100 | | | | 256 | |
| | | | | | | | 24,661,927 | |
| Textiles, Apparel & Luxury Goods — 1.3% | | | | | | | | |
Columbia Sportswear Company | | | 46,415 | | | | 2,425,184 | |
Culp, Inc. (a) | | | 7,681 | | | | 77,885 | |
Deckers Outdoor Corporation (a) | | | 400 | | | | 23,240 | |
DGSE Companies, Inc. (a) | | | 400 | | | | 1,620 | |
Fuqi International, Inc. (a) | | | 128,213 | | | | 950,058 | |
G-III Apparel Group Ltd. (a) | | | 29,255 | | | | 772,332 | |
Hanesbrands, Inc. (a) | | | 3,100 | | | | 76,880 | |
Iconix Brand Group, Inc. (a) | | | 34,500 | | | | 603,750 | |
Joe's Jeans, Inc. (a) | | | 85,700 | | | | 132,835 | |
Jones Group, Inc. (The) | | | 149,900 | | | | 2,167,554 | |
K-Swiss, Inc. - Class A (a) | | | 17,957 | | | | 218,357 | |
TFS MARKET NEUTRAL FUND SCHEDULE OF SECURITIES SOLD SHORT (Continued) |
COMMON STOCKS — 60.2% (Continued) | | | | | | |
| Consumer Discretionary — 10.1% (Continued) | | | | | | |
| Textiles, Apparel & Luxury Goods — 1.3% (Continued) | | | | | | |
lululemon athletica, Inc. (a) | | | 8,000 | | | $ | 354,560 | |
Movado Group, Inc. (a) | | | 9,328 | | | | 104,847 | |
Phillips-Van Heusen Corporation | | | 1,400 | | | | 85,876 | |
R.G. Barry Corporation | | | 8,022 | | | | 82,948 | |
Rocky Brands, Inc. (a) | | | 100 | | | | 917 | |
Skechers U.S.A., Inc. - Class A (a) | | | 2,300 | | | | 44,712 | |
Steven Madden Ltd. (a) | | | 1,300 | | | | 54,990 | |
True Religion Apparel, Inc. (a) | | | 109,154 | | | | 2,232,199 | |
Under Armour, Inc. - Class A (a) | | | 47,883 | | | | 2,235,178 | |
Volcom, Inc. (a) | | | 114,751 | | | | 1,970,275 | |
| | | | | | | | 14,616,197 | |
| Consumer Staples — 2.8% | | | | | | | | |
| Beverages — 0.1% | | | | | | | | |
Boston Beer Company, Inc. - Class A (a) | | | 200 | | | | 14,318 | |
China New Borun Corporation (a) | | | 8,370 | | | | 122,453 | |
Coca-Cola Company (The) | | | 400 | | | | 24,528 | |
Coca-Cola Enterprises, Inc. | | | 24,800 | | | | 595,448 | |
Hansen Natural Corporation (a) | | | 500 | | | | 25,605 | |
Molson Coors Brewing Company - Class B | | | 200 | | | | 9,446 | |
| | | | | | | | 791,798 | |
| Food & Staples Retailing — 0.7% | | | | | | | | |
Costco Wholesale Corporation | | | 400 | | | | 25,108 | |
Great Atlantic & Pacific Tea Company, Inc. (The) (a) | | | 1,524,602 | | | | 5,244,631 | |
Kroger Company (The) | | | 400 | | | | 8,800 | |
Nash Finch Company | | | 29,266 | | | | 1,226,246 | |
QKL Stores, Inc. (a) | | | 200 | | | | 1,086 | |
Ruddick Corporation | | | 22,500 | | | | 785,250 | |
Spartan Stores, Inc. | | | 20,107 | | | | 300,600 | |
Sysco Corporation | | | 100 | | | | 2,946 | |
United Natural Foods, Inc. (a) | | | 9,200 | | | | 328,992 | |
Walgreen Company | | | 10,300 | | | | 348,964 | |
Wal-Mart Stores, Inc. | | | 400 | | | | 21,668 | |
Weis Markets, Inc. | | | 7,271 | | | | 283,278 | |
Winn-Dixie Stores, Inc. (a) | | | 1,692 | | | | 11,336 | |
| | | | | | | | 8,588,905 | |
| Food Products — 1.4% | | | | | | | | |
American Dairy, Inc. (a) | | | 74,227 | | | | 754,888 | |
American Lorain Corporation (a) | | | 300 | | | | 915 | |
Calavo Growers, Inc. | | | 21,672 | | | | 475,267 | |
Cal-Maine Foods, Inc. | | | 86,689 | | | | 2,511,380 | |
China Marine Food Group Ltd. (a) | | | 23,804 | | | | 138,539 | |
Chiquita Brands International, Inc. (a) | | | 120,610 | | | | 1,600,495 | |
ConAgra Foods, Inc. | | | 100 | | | | 2,249 | |
Dean Foods Company (a) | | | 1,500 | | | | 15,600 | |
Diamond Foods, Inc. | | | 41,746 | | | | 1,845,173 | |
Dole Food Company, Inc. (a) | | | 186,246 | | | | 1,717,188 | |
Flowers Foods, Inc. | | | 74,136 | | | | 1,888,985 | |
General Mills, Inc. | | | 600 | | | | 22,524 | |
TFS MARKET NEUTRAL FUND SCHEDULE OF SECURITIES SOLD SHORT (Continued) |
COMMON STOCKS — 60.2% (Continued) | | | | | | |
| Consumer Staples — 2.8% (Continued) | | | | | | |
| Food Products — 1.4% (Continued) | | | | | | |
Green Mountain Coffee Roasters, Inc. (a) | | | 1,200 | | | $ | 39,588 | |
Hain Celestial Group, Inc. (The) (a) | | | 1,000 | | | | 24,730 | |
Harbinger Group, Inc. (a) | | | 200 | | | | 1,032 | |
Hershey Company (The) | | | 400 | | | | 19,796 | |
Imperial Sugar Company | | | 8,123 | | | | 103,162 | |
Kellogg Company | | | 300 | | | | 15,078 | |
Kraft Foods, Inc. - Class A | | | 400 | | | | 12,908 | |
Lancaster Colony Corporation | | | 10,969 | | | | 547,134 | |
Reddy Ice Holdings, Inc. (a) | | | 600 | | | | 2,094 | |
Sara Lee Corporation | | | 100 | | | | 1,433 | |
Seneca Foods Corporation - Class A (a) | | | 3,300 | | | | 76,230 | |
Smart Balance, Inc. (a) | | | 39,523 | | | | 140,702 | |
Tootsie Roll Industries, Inc. | | | 58,299 | | | | 1,530,349 | |
TreeHouse Foods, Inc. (a) | | | 26,200 | | | | 1,223,540 | |
Tyson Foods, Inc. | | | 514 | | | | 7,993 | |
Yuhe International, Inc. (a) | | | 19,390 | | | | 155,508 | |
Zhongpin, Inc. (a) | | | 36,500 | | | | 738,030 | |
| | | | | | | | 15,612,510 | |
| Household Products — 0.0% | | | | | | | | |
Central Garden & Pet Company - Class A (a) | | | 6,500 | | | | 67,925 | |
Clorox Company | | | 100 | | | | 6,655 | |
Colgate-Palmolive Company | | | 400 | | | | 30,848 | |
Energizer Holdings, Inc. (a) | | | 500 | | | | 37,390 | |
Kimberly Clark Corporation | | | 200 | | | | 12,668 | |
| | | | | | | | 155,486 | |
| Personal Products — 0.3% | | | | | | | | |
Avon Products, Inc. | | | 400 | | | | 12,180 | |
China Sky One Medical, Inc. (a) | | | 130,291 | | | | 1,186,951 | |
China-Biotics, Inc. (a) | | | 165,373 | | | | 2,073,777 | |
Estée Lauder Companies, Inc. (The) - Class A | | | 400 | | | | 28,468 | |
Medifast, Inc. (a) | | | 7,110 | | | | 169,787 | |
Schiff Nutrition International, Inc. (a) | | | 24,158 | | | | 195,197 | |
USANA Health Sciences, Inc. (a) | | | 4,354 | | | | 191,228 | |
| | | | | | | | 3,857,588 | |
| Tobacco — 0.3% | | | | | | | | |
Alliance One International, Inc. (a) | | | 14,565 | | | | 64,377 | |
Altria Group, Inc. | | | 100 | | | | 2,542 | |
Philip Morris International, Inc. | | | 400 | | | | 23,400 | |
Star Scientific, Inc. (a) | | | 329,792 | | | | 659,584 | |
Universal Corporation | | | 64,500 | | | | 2,672,880 | |
| | | | | | | | 3,422,783 | |
| Energy — 4.4% | | | | | | | | |
| Energy Equipment & Services — 1.0% | | | | | | | | |
Baker Hughes, Inc. | | | 2,600 | | | | 120,458 | |
Bolt Technology Corporation (a) | | | 355 | | | | 3,944 | |
Bristow Group, Inc. (a) | | | 23,500 | | | | 911,330 | |
Bronco Drilling Company, Inc. (a) | | | 21,548 | | | | 90,933 | |
Cameron International Corporation (a) | | | 400 | | | | 17,500 | |
TFS MARKET NEUTRAL FUND SCHEDULE OF SECURITIES SOLD SHORT (Continued) |
COMMON STOCKS — 60.2% (Continued) | | | | | | |
| Energy — 4.4% (Continued) | | | | | | |
| Energy Equipment & Services — 1.0% (Continued) | | | | | | |
Dawson Geophysical Company (a) | | | 23,717 | | | $ | 589,130 | |
ENGlobal Corporation (a) | | | 400 | | | | 1,156 | |
Exterran Holdings, Inc. (a) | | | 41,420 | | | | 1,042,541 | |
FMC Technologies, Inc. (a) | | | 400 | | | | 28,840 | |
Geokinetics, Inc. (a) | | | 7,180 | | | | 48,968 | |
Gulfmark Offshore, Inc. - Class A (a) | | | 6,018 | | | | 178,193 | |
Halliburton Company | | | 841 | | | | 26,794 | |
Helmerich & Payne, Inc. | | | 1,082 | | | | 46,288 | |
Hercules Offshore, Inc. (a) | | | 108,098 | | | | 255,111 | |
Hornbeck Offshore Services, Inc. (a) | | | 44,780 | | | | 995,907 | |
Key Energy Services, Inc. (a) | | | 8,100 | | | | 79,785 | |
Matrix Service Company (a) | | | 6,344 | | | | 57,603 | |
Natural Gas Services Group, Inc. (a) | | | 2,645 | | | | 41,659 | |
Newpark Resources, Inc. (a) | | | 379,034 | | | | 2,228,720 | |
PHI, Inc. (a) | | | 3,165 | | | | 55,293 | |
Royale Energy, Inc. (a) | | | 1,600 | | | | 3,232 | |
Seahawk Drilling, Inc. (a) | | | 118,351 | | | | 1,192,978 | |
SulphCo, Inc. (a) | | | 255,735 | | | | 63,934 | |
Tesco Corporation (a) | | | 16,300 | | | | 206,358 | |
Tidewater, Inc. | | | 65,205 | | | | 3,007,907 | |
| | | | | | | | 11,294,562 | |
| Oil, Gas & Consumable Fuels — 3.4% | | | | | | | | |
Alliance Holdings GP, L.P. | | | 400 | | | | 16,604 | |
Alliance Resource Partners, L.P. | | | 2,569 | | | | 151,160 | |
Alpha Natural Resources, Inc. (a) | | | 900 | | | | 40,653 | |
American Oil & Gas, Inc. (a) | | | 107,978 | | | | 932,930 | |
Anadarko Petroleum Corporation | | | 1,200 | | | | 73,884 | |
Apache Corporation | | | 400 | | | | 40,408 | |
Arch Coal, Inc. | | | 500 | | | | 12,295 | |
ATP Oil & Gas Corporation (a) | | | 81,530 | | | | 1,170,771 | |
BP Prudhoe Bay Royalty Trust | | | 1,408 | | | | 144,757 | |
BPZ Resources, Inc. (a) | | | 418,182 | | | | 1,555,637 | |
Callon Petroleum Company (a) | | | 28,652 | | | | 141,254 | |
Carrizo Oil & Gas, Inc. (a) | | | 68,500 | | | | 1,617,970 | |
Cheniere Energy Partners, L.P. | | | 6,200 | | | | 118,916 | |
Cheniere Energy, Inc. (a) | | | 286,885 | | | | 940,983 | |
Chesapeake Energy Corporation | | | 300 | | | | 6,510 | |
Chevron Corporation | | | 100 | | | | 8,261 | |
China Integrated Energy, Inc. (a) | | | 55,912 | | | | 463,511 | |
Cimarex Energy Company | | | 100 | | | | 7,675 | |
Clean Energy Fuels Corporation (a) | | | 148,647 | | | | 2,158,354 | |
Cloud Peak Energy, Inc. (a) | | | 8,723 | | | | 151,519 | |
Comstock Resources, Inc. (a) | | | 25,438 | | | | 568,539 | |
CONSOL Energy, Inc. | | | 700 | | | | 25,732 | |
Copano Energy, LLC | | | 2,700 | | | | 75,492 | |
Crosstex Energy, Inc. | | | 4 | | | | 32 | |
Crosstex Energy, L.P. | | | 51,023 | | | | 713,812 | |
DCP Midstream Partners, L.P. | | | 12,041 | | | | 429,623 | |
TFS MARKET NEUTRAL FUND SCHEDULE OF SECURITIES SOLD SHORT (Continued) |
COMMON STOCKS — 60.2% (Continued) | | | | | | |
| Energy — 4.4% (Continued) | | | | | | |
| Oil, Gas & Consumable Fuels — 3.4% (Continued) | | | | | | |
Devon Energy Corporation | | | 100 | | | $ | 6,502 | |
DHT Holdings, Inc. | | | 99,610 | | | | 428,323 | |
El Paso Corporation | | | 50 | | | | 663 | |
Enbridge Energy Management, LLC (a) | | | 4,904 | | | | 292,671 | |
Endeavour International Corporation (a) | | | 54,211 | | | | 74,811 | |
Energy Partners Ltd. (a) | | | 28,500 | | | | 318,345 | |
Enterprise GP Holdings, L.P. | | | 700 | | | | 44,800 | |
EOG Resources, Inc. | | | 100 | | | | 9,572 | |
EQT Corporation | | | 1,100 | | | | 41,184 | |
Equal Energy Ltd. (a) | | | 200 | | | | 976 | |
Forest Oil Corporation (a) | | | 5,720 | | | | 175,776 | |
GeoGlobal Resources, Inc. (a) | | | 22,523 | | | | 18,014 | |
GMX Resources, Inc. (a) | | | 204,378 | | | | 915,613 | |
Golar LNG Ltd. | | | 13,445 | | | | 178,281 | |
Goodrich Petroleum Corporation (a) | | | 5,316 | | | | 72,510 | |
Green Plains Renewable Energy, Inc. (a) | | | 23,596 | | | | 262,388 | |
GreenHunter Energy, Inc. (a) | | | 1,400 | | | | 1,204 | |
Houston American Energy Corporation | | | 159,742 | | | | 2,244,375 | |
Hyperdynamics Corporation (a) | | | 41,749 | | | | 102,285 | |
Inergy Holdings, L.P. | | | 575 | | | | 17,365 | |
Inergy, L.P. | | | 5,100 | | | | 200,226 | |
Isramco, Inc. (a) | | | 100 | | | | 5,730 | |
James River Coal Company (a) | | | 34,414 | | | | 595,706 | |
Kinder Morgan Management, LLC (a) | | | 15,421 | | | | 951,029 | |
K-Sea Transportation Partners, L.P. | | | 2,142 | | | | 8,547 | |
L & L Energy, Inc. (a) | | | 84,096 | | | | 687,064 | |
Linn Energy, LLC | | | 500 | | | | 17,490 | |
Lucas Energy, Inc. (a) | | | 5,400 | | | | 10,962 | |
Magellan Petroleum Corporation (a) | | | 400 | | | | 812 | |
Magnum Hunter Resources Corporation (a) | | | 35,109 | | | | 167,821 | |
Mariner Energy, Inc. (a) | | | 200 | | | | 4,984 | |
MarkWest Energy Partners, L.P. | | | 10,000 | | | | 381,200 | |
Massey Energy Company | | | 8,305 | | | | 349,391 | |
Miller Petroleum, Inc. (a) | | | 200,106 | | | | 1,100,583 | |
Natural Resource Partners, L.P. | | | 1,200 | | | | 34,800 | |
Nordic American Tanker Shipping Ltd. | | | 44,000 | | | | 1,145,320 | |
NuStar Energy, L.P. | | | 795 | | | | 50,085 | |
Occidental Petroleum Corporation | | | 100 | | | | 7,863 | |
Overseas Shipholding Group, Inc. | | | 11,800 | | | | 394,474 | |
Panhandle Oil & Gas, Inc. | | | 17 | | | | 420 | |
Patriot Coal Corporation (a) | | | 49,800 | | | | 671,802 | |
Penn Virginia Corporation | | | 138,416 | | | | 2,051,325 | |
Penn Virginia Resource Partners, L.P. | | | 27,341 | | | | 736,840 | |
Petrohawk Energy Corporation (a) | | | 15,700 | | | | 267,057 | |
PetroQuest Energy, Inc. (a) | | | 58,137 | | | | 324,404 | |
Pioneer Natural Resources Company | | | 600 | | | | 41,880 | |
Provident Energy Trust | | | 2,000 | | | | 15,360 | |
Range Resources Corporation | | | 100 | | | | 3,739 | |
TFS MARKET NEUTRAL FUND SCHEDULE OF SECURITIES SOLD SHORT (Continued) |
COMMON STOCKS — 60.2% (Continued) | | | | | | |
| Energy — 4.4% (Continued) | | | | | | |
| Oil, Gas & Consumable Fuels — 3.4% (Continued) | | | | | | |
Rentech, Inc. (a) | | | 76,911 | | | $ | 91,524 | |
Resolute Energy Corporation (a) | | | 46,200 | | | | 554,862 | |
Rex Energy Corporation (a) | | | 152,002 | | | | 1,872,665 | |
SandRidge Energy, Inc. (a) | | | 186,245 | | | | 1,018,760 | |
Scorpio Tankers, Inc. (a) | | | 4,393 | | | | 51,310 | |
Ship Finance International Ltd. | | | 9,700 | | | | 195,067 | |
Southwestern Energy Company (a) | | | 200 | | | | 6,770 | |
Spectra Energy Corporation | | | 100 | | | | 2,377 | |
Swift Energy Company (a) | | | 55,900 | | | | 1,780,415 | |
TC PipeLines, L.P. | | | 2,432 | | | | 119,776 | |
Teekay LNG Partners, L.P. | | | 6,700 | | | | 230,078 | |
Tesoro Corporation | | | 3,500 | | | | 45,360 | |
TransAtlantic Petroleum Ltd. (a) | | | 15,428 | | | | 47,055 | |
TransCanada Corporation | | | 700 | | | | 25,865 | |
Tri-Valley Corporation (a) | | | 62,216 | | | | 45,356 | |
Uranerz Energy Corporation (a) | | | 1,000 | | | | 2,240 | |
Uranium Energy Corporation (a) | | | 69,898 | | | | 270,505 | |
USEC, Inc. (a) | | | 382,830 | | | | 2,055,797 | |
Venoco, Inc. (a) | | | 4,025 | | | | 62,307 | |
Verenium Corporation (a) | | | 28,634 | | | | 109,668 | |
W&T Offshore, Inc. | | | 92,630 | | | | 1,007,814 | |
Western Refining, Inc. (a) | | | 234,581 | | | | 1,559,964 | |
Whiting Petroleum Corporation (a) | | | 500 | | | | 50,220 | |
Whiting USA Trust I | | | 5,346 | | | | 123,279 | |
Williams Companies, Inc. | | | 900 | | | | 19,368 | |
Williams Partners, L.P. | | | 100 | | | | 4,410 | |
World Fuel Services Corporation | | | 2,640 | | | | 74,527 | |
Zion Oil & Gas, Inc. (a) | | | 29,020 | | | | 151,775 | |
| | | | | | | | 38,578,968 | |
| Financials — 10.3% | | | | | | | | |
| Capital Markets — 0.9% | | | | | | | | |
AllianceBernstein Holding, L.P. | | | 6,701 | | | | 163,504 | |
Apollo Investment Corporation | | | 617 | | | | 6,781 | |
Arlington Asset Investment Corporation | | | 11,874 | | | | 281,295 | |
BGC Partners, Inc. - Class A | | | 85,859 | | | | 595,861 | |
BlackRock, Inc. - Class A | | | 600 | | | | 102,594 | |
Blackstone Group, L.P. (The) | | | 10,500 | | | | 141,540 | |
Deutsche Bank AG | | | 3,794 | | | | 219,597 | |
Duff & Phelps Corporation | | | 1,376 | | | | 19,181 | |
Eaton Vance Corporation | | | 11,700 | | | | 336,609 | |
Evercore Partners, Inc. - Class A | | | 1,300 | | | | 39,468 | |
FBR Capital Markets Corporation (a) | | | 77,358 | | | | 273,847 | |
Federated Investors, Inc. - Class B | | | 6,075 | | | | 151,328 | |
Franklin Resources, Inc. | | | 400 | | | | 45,880 | |
Gladstone Capital Corporation | | | 22,267 | | | | 255,403 | |
Goldman Sachs Group, Inc. (The) | | | 600 | | | | 96,570 | |
Greenhill & Company, Inc. | | | 14,300 | | | | 1,110,681 | |
Janus Capital Group, Inc. | | | 299,380 | | | | 3,161,453 | |
TFS MARKET NEUTRAL FUND SCHEDULE OF SECURITIES SOLD SHORT (Continued) |
COMMON STOCKS — 60.2% (Continued) | | | | | | |
| Financials — 10.3% (Continued) | | | | | | |
| Capital Markets — 0.9% (Continued) | | | | | | |
JMP Group, Inc. | | | 411 | | | $ | 2,733 | |
KBW, Inc. | | | 2,719 | | | | 68,791 | |
Knight Capital Group, Inc. (a) | | | 103,659 | | | | 1,350,677 | |
Morgan Stanley | | | 400 | | | | 9,948 | |
Oppenheimer Holdings, Inc. | | | 1,184 | | | | 30,133 | |
Penson Worldwide, Inc. (a) | | | 153,550 | | | | 790,783 | |
Raymond James Financial, Inc. | | | 1,000 | | | | 28,220 | |
Rodman & Renshaw Capital Group, Inc. (a) | | | 300 | | | | 861 | |
Sanders Morris Harris Group, Inc. | | | 4,683 | | | | 27,161 | |
SEI Investments Company | | | 18,800 | | | | 416,420 | |
State Street Corporation | | | 500 | | | | 20,880 | |
Stifel Financial Corporation (a) | | | 1,400 | | | | 66,346 | |
SWS Group, Inc. | | | 20,635 | | | | 141,762 | |
U.S. Global Investors, Inc. | | | 19,672 | | | | 155,606 | |
| | | | | | | | 10,111,913 | |
| Commercial Banks — 4.9% | | | | | | | | |
1st Source Corporation | | | 3,700 | | | | 65,379 | |
Ameris Bancorp (a) | | | 1,314 | | | | 12,181 | |
Arrow Financial Corporation | | | 572 | | | | 13,951 | |
Associated Banc-Corp | | | 39,860 | | | | 505,026 | |
Auburn National Bancorporation, Inc. | | | 200 | | | | 4,112 | |
BancFirst Corporation | | | 3,349 | | | | 137,644 | |
Bancorp, Inc. (The) (a) | | | 2,100 | | | | 15,729 | |
BancorpSouth, Inc. | | | 136,163 | | | | 1,795,990 | |
BancTrust Financial Group, Inc. (a) | | | 800 | | | | 2,336 | |
Bank of the Ozarks, Inc. | | | 49,699 | | | | 1,889,059 | |
Bar Harbor Bankshares | | | 100 | | | | 2,719 | |
Bridge Bancorp, Inc. | | | 1,000 | | | | 23,280 | |
Capital City Bank Group, Inc. | | | 18,648 | | | | 222,844 | |
Capitol Bancorp Ltd. (a) | | | 12,354 | | | | 14,084 | |
Cascade Bancorp, Inc. (a) | | | 43,934 | | | | 23,285 | |
Cathay General Bancorp | | | 83,322 | | | | 1,133,179 | |
CenterState Banks, Inc. | | | 1,009 | | | | 7,467 | |
Central Pacific Financial Corporation (a) | | | 1,000 | | | | 1,520 | |
Chemical Financial Corporation | | | 4,880 | | | | 98,966 | |
Citizens Holding Company | | | 301 | | | | 5,620 | |
City Bank (a) | | | 13,068 | | | | 1,568 | |
City Holding Company | | | 85,739 | | | | 2,717,926 | |
City National Corporation | | | 4,403 | | | | 227,063 | |
CoBiz Financial, Inc. | | | 113,043 | | | | 547,128 | |
Colonial Bancgroup, Inc. (The) (a) | | | 108,955 | | | | 1,416 | |
Columbia Banking Systems, Inc. | | | 73,008 | | | | 1,329,476 | |
Community Bank System, Inc. | | | 100,362 | | | | 2,345,460 | |
Community Trust Bancorp, Inc. | | | 557 | | | | 15,212 | |
Cullen/Frost Bankers, Inc. | | | 1,400 | | | | 73,416 | |
CVB Financial Corporation | | | 364,789 | | | | 2,776,044 | |
Danvers Bancorp, Inc. | | | 1,280 | | | | 19,238 | |
Eagle Bancorp, Inc. (a) | | | 2,621 | | | | 32,396 | |
TFS MARKET NEUTRAL FUND SCHEDULE OF SECURITIES SOLD SHORT (Continued) |
COMMON STOCKS — 60.2% (Continued) | | | | | | |
| Financials — 10.3% (Continued) | | | | | | |
| Commercial Banks — 4.9% (Continued) | | | | | | |
First BanCorp (North Carolina) | | | 8,718 | | | $ | 116,734 | |
First BanCorp (Puerto Rico) (a) | | | 1,600 | | | | 488 | |
First Busey Corporation | | | 114,625 | | | | 531,860 | |
First Commonwealth Financial Corporation | | | 86,720 | | | | 504,710 | |
First Financial Bankshares, Inc. | | | 34,041 | | | | 1,608,778 | |
First Horizon National Corporation (a) | | | 84,501 | | | | 852,613 | |
First South Bancorp, Inc. | | | 4,887 | | | | 49,065 | |
FNB Corporation | | | 118,841 | | | | 1,010,148 | |
Frontier Financial Corporation (a) | | | 8,859 | | | | 1,081 | |
Glacier Bancorp, Inc. | | | 86,300 | | | | 1,121,900 | |
Great Southern Bancorp, Inc. | | | 15,525 | | | | 349,157 | |
Green Bankshares, Inc. (a) | | | 16,753 | | | | 64,667 | |
Hanmi Financial Corporation (a) | | | 229,587 | | | | 268,617 | |
Independent Bank Corporation | | | 73,218 | | | | 1,719,891 | |
International Bancshares Corporation | | | 121,694 | | | | 2,084,618 | |
Lakeland Bancorp, Inc. | | | 23,362 | | | | 216,566 | |
Lakeland Financial Corporation | | | 313 | | | | 5,944 | |
Macatawa Bank Corporation (a) | | | 707 | | | | 1,329 | |
Marshall & Ilsley Corporation | | | 5,800 | | | | 34,278 | |
National Penn Bancshares, Inc. | | | 220,520 | | | | 1,431,175 | |
Old Second Bancorp, Inc. | | | 44,084 | | | | 86,845 | |
Oriental Financial Group, Inc. | | | 5,800 | | | | 76,734 | |
Pacific Capital Bancorp (a) | | | 200 | | | | 128 | |
PacWest Bancorp | | | 82,141 | | | | 1,431,718 | |
Park National Corporation | | | 45,397 | | | | 2,966,694 | |
Penns Woods Bancorp, Inc. | | | 83 | | | | 2,735 | |
Pinnacle Financial Partners, Inc. (a) | | | 154,548 | | | | 1,763,393 | |
Popular, Inc. (a) | | | 51,600 | | | | 140,868 | |
Premierwest Bancorp, Inc. (a) | | | 68,742 | | | | 27,098 | |
Regions Financial Corporation | | | 800 | | | | 5,040 | |
Renasant Corporation | | | 58,860 | | | | 962,361 | |
Republic Bancorp, Inc. - Class A | | | 3,742 | | | | 76,486 | |
S&T Bancorp, Inc. | | | 109,109 | | | | 2,138,536 | |
S.Y. Bancorp, Inc. | | | 4,780 | | | | 117,110 | |
Sandy Spring Bancorp, Inc. | | | 13,279 | | | | 231,055 | |
SCBT Financial Corporation | | | 4,667 | | | | 142,483 | |
Seacoast Banking Corporation of Florida (a) | | | 790 | | | | 987 | |
Security Bank Corporation (a) | | | 32,973 | | | | — | |
Sierra Bancorp | | | 1,300 | | | | 13,533 | |
Simmons First National Coporation - Class A | | | 2,078 | | | | 56,501 | |
Southern Connecticut Bancorp, Inc. (a) | | | 200 | | | | 1,190 | |
Southside Bancshares, Inc. | | | 11,183 | | | | 210,352 | |
Sterling Bancorp | | | 3,200 | | | | 30,048 | |
Suffolk Bancorp | | | 25,908 | | | | 671,017 | |
SunTrust Banks, Inc. | | | 300 | | | | 7,506 | |
Synovus Financial Corporation | | | 49,600 | | | | 107,136 | |
Taylor Capital Group, Inc. (a) | | | 35,736 | | | | 430,976 | |
TCF Financial Corporation | | | 103,100 | | | | 1,356,796 | |
TFS MARKET NEUTRAL FUND SCHEDULE OF SECURITIES SOLD SHORT (Continued) |
COMMON STOCKS — 60.2% (Continued) | | | | | | |
| Financials — 10.3% (Continued) | | | | | | |
| Commercial Banks — 4.9% (Continued) | | | | | | |
Texas Capital Bancshares, Inc. (a) | | | 195,872 | | | $ | 3,555,077 | |
Tompkins Financial Corporation | | | 7,466 | | | | 288,188 | |
Tower Bancorp, Inc. | | | 4,200 | | | | 90,804 | |
Towne Bank | | | 76,804 | | | | 1,113,658 | |
Trico Bancshares | | | 6,839 | | | | 106,620 | |
Trustmark Corporation | | | 7,852 | | | | 173,451 | |
U.S. Bancorp | | | 1,700 | | | | 41,106 | |
UMB Financial Corporation | | | 700 | | | | 25,942 | |
Union First Market Bankshares Corporation | | | 500 | | | | 6,430 | |
United Bankshares, Inc. | | | 106,659 | | | | 2,849,928 | |
United Security Bancshares | | | 1,018 | | | | 9,366 | |
United Security Bancshares, Inc. (a) | | | 2,315 | | | | 11,343 | |
Univest Corporation of Pennsylvania | | | 2,337 | | | | 44,076 | |
Valley National Bancorp | | | 21,200 | | | | 282,808 | |
Washington Trust Bancorp, Inc. | | | 4,112 | | | | 82,610 | |
Webster Financial Corporation | | | 46,400 | | | | 794,368 | |
WesBanco, Inc. | | | 5,253 | | | | 87,252 | |
West Coast Bancorp (a) | | | 34,785 | | | | 91,484 | |
Westamerica Bancorporation | | | 41,751 | | | | 2,088,385 | |
Western Alliance Bancorporation (a) | | | 260,267 | | | | 1,572,013 | |
Whitney Holding Corporation | | | 54,796 | | | | 453,711 | |
Wilmington Trust Corporation | | | 9,900 | | | | 70,389 | |
Wilshire Bancorp, Inc. | | | 186,800 | | | | 1,253,428 | |
Zions Bancorporation | | | 12,600 | | | | 260,316 | |
| | | | | | | | 56,442,412 | |
| Consumer Finance — 0.3% | | | | | | | | |
Advance America, Cash Advance Centers, Inc. | | | 28,872 | | | | 144,071 | |
American Express Company | | | 200 | | | | 8,292 | |
Cash America International, Inc. | | | 8,089 | | | | 284,975 | |
CompuCredit Holdings Corporation (a) | | | 42,574 | | | | 239,692 | |
First Marblehead Corporation (The) (a) | | | 19,313 | | | | 43,068 | |
Green Dot Corporation - Class A (a) | | | 1,100 | | | | 55,880 | |
SLM Corporation (a) | | | 100 | | | | 1,190 | |
World Acceptance Corporation (a) | | | 57,337 | | | | 2,474,092 | |
| | | | | | | | 3,251,260 | |
| Diversified Financial Services — 0.7% | | | | | | | | |
CBOE Holdings, Inc. | | | 24,013 | | | | 576,552 | |
IntercontinentalExchange, Inc. (a) | | | 100 | | | | 11,487 | |
JPMorgan Chase & Company | | | 100 | | | | 3,763 | |
Life Partners Holdings, Inc. | | | 164,522 | | | | 3,053,528 | |
Moody's Corporation | | | 2,700 | | | | 73,062 | |
NASDAQ OMX Group, Inc. (The) (a) | | | 2,020 | | | | 42,461 | |
NewStar Financial, Inc. (a) | | | 10,574 | | | | 80,468 | |
PHH Corporation (a) | | | 184,500 | | | | 3,555,315 | |
Portfolio Recovery Associates, Inc. (a) | | | 7,525 | | | | 504,551 | |
Primus Guaranty Ltd. (a) | | | 1,700 | | | | 8,449 | |
| | | | | | | | 7,909,636 | |
TFS MARKET NEUTRAL FUND SCHEDULE OF SECURITIES SOLD SHORT (Continued) |
COMMON STOCKS — 60.2% (Continued) | | | | | | |
| Financials — 10.3% (Continued) | | | | | | |
| Insurance — 0.7% | | | | | | |
American Equity Investment Life Holding Company | | | 31,500 | | | $ | 341,775 | |
American International Group, Inc. (a) | | | 39,300 | | | | 1,650,993 | |
AMERISAFE, Inc. (a) | | | 2,490 | | | | 47,534 | |
AmTrust Financial Services, Inc. | | | 22,240 | | | | 332,933 | |
Assured Guaranty Ltd. | | | 1,100 | | | | 20,955 | |
Berkshire Hathaway, Inc. - Class B (a) | | | 100 | | | | 7,956 | |
Citizens, Inc. (a) | | | 50 | | | | 346 | |
Crawford & Company - Class B (a) | | | 2,482 | | | | 6,354 | |
Donegal Group, Inc. - Class A | | | 100 | | | | 1,385 | |
eHealth, Inc. (a) | | | 52,157 | | | | 704,641 | |
Fidelity National Financial, Inc. - Class A | | | 6,300 | | | | 84,357 | |
First American Financial Corporation | | | 75,112 | | | | 1,054,572 | |
FPIC Insurance Group, Inc. (a) | | | 1,342 | | | | 47,534 | |
Gerova Financial Group Ltd. (a) | | | 800 | | | | 4,560 | |
Lincoln National Corporation | | | 300 | | | | 7,344 | |
Marsh & McLennan Companies, Inc. | | | 100 | | | | 2,498 | |
Mercer Insurance Group, Inc. | | | 680 | | | | 12,478 | |
Montpelier Re Holdings Ltd. | | | 7,800 | | | | 142,896 | |
National Financial Partners Corporation (a) | | | 6,600 | | | | 91,080 | |
Old Republic International Corporation | | | 22,240 | | | | 293,568 | |
Primerica, Inc. | | | 7,593 | | | | 160,364 | |
RLI Corporation | | | 13,456 | | | | 772,644 | |
StanCorp Financial Group, Inc. | | | 6,400 | | | | 274,560 | |
Stewart Information Services Corporation | | | 154,477 | | | | 1,671,441 | |
Tower Group, Inc. | | | 16,708 | | | | 405,670 | |
W.R. Berkley Corporation | | | 800 | | | | 22,016 | |
Wesco Financial Corporation | | | 159 | | | | 57,781 | |
| | | | | | | | 8,220,235 | |
| Real Estate Investment Trusts — 2.2% | | | | | | | | |
Alexandria Real Estate Equities, Inc. | | | 3,280 | | | | 241,014 | |
AMB Property Corporation | | | 1,200 | | | | 33,828 | |
American Campus Communities, Inc. | | | 6,000 | | | | 189,780 | |
American Capital Agency Corporation | | | 3,400 | | | | 97,648 | |
Ashford Hospitality Trust (a) | | | 91,771 | | | | 931,476 | |
Capital Trust, Inc. - Class A (a) | | | 78,877 | | | | 115,160 | |
CapLease, Inc. | | | 245,573 | | | | 1,439,058 | |
Capstead Mortgage Corporation | | | 9,090 | | | | 103,626 | |
CBL & Associates Properties, Inc. | | | 102,500 | | | | 1,607,200 | |
Colony Financial, Inc. | | | 4,200 | | | | 79,632 | |
Corporate Office Properties Trust | | | 8,500 | | | | 301,665 | |
Cousins Properties, Inc. | | | 4,420 | | | | 32,752 | |
DCT Industrial Trust, Inc. | | | 127,400 | | | | 638,274 | |
Developers Diversified Realty Corporation | | | 32,037 | | | | 413,277 | |
Douglas Emmett, Inc. | | | 2,900 | | | | 52,026 | |
Dupont Fabros Technology, Inc. | | | 30,600 | | | | 768,060 | |
Education Realty Trust, Inc. | | | 142,942 | | | | 1,072,065 | |
Entertainment Properties Trust | | | 27,800 | | | | 1,285,194 | |
Equity Lifestyle Properties, Inc. | | | 1,900 | | | | 108,148 | |
TFS MARKET NEUTRAL FUND SCHEDULE OF SECURITIES SOLD SHORT (Continued) |
COMMON STOCKS — 60.2% (Continued) | | | | | | |
| Financials — 10.3% (Continued) | | | | | | |
| Real Estate Investment Trusts — 2.2% (Continued) | | | | | | |
Essex Property Trust, Inc. | | | 1,900 | | | $ | 214,624 | |
First Industrial Realty Trust, Inc. (a) | | | 63,329 | | | | 464,202 | |
Franklin Street Properties Corporation | | | 6,200 | | | | 82,770 | |
Hatteras Financial Corporation | | | 8,300 | | | | 243,024 | |
iStar Financial, Inc. (a) | | | 1,119,662 | | | | 5,116,855 | |
Lexington Realty Trust | | | 119,575 | | | | 930,294 | |
Liberty Property Trust | | | 1,000 | | | | 33,460 | |
Medical Properties Trust, Inc. | | | 8,338 | | | | 93,302 | |
National Retail Properties, Inc. | | | 35,000 | | | | 948,500 | |
Nationwide Health Properties, Inc. | | | 700 | | | | 28,581 | |
New York Mortgage Trust, Inc. | | | 100 | | | | 636 | |
Omega Healthcare Investors, Inc. | | | 6,700 | | | | 154,100 | |
Parkway Properties, Inc. | | | 65,653 | | | | 1,021,561 | |
Pennsylvania Real Estate Investment Trust | | | 45,363 | | | | 647,330 | |
PennyMac Mortgage Investment Trust | | | 12,769 | | | | 220,393 | |
Post Properties, Inc. | | | 20,655 | | | | 628,738 | |
Potlatch Corporation | | | 1,100 | | | | 37,455 | |
Redwood Trust, Inc. | | | 51,706 | | | | 733,191 | |
Strategic Hotels & Resorts, Inc. (a) | | | 1 | | | | 5 | |
Sun Communities, Inc. | | | 72,930 | | | | 2,378,247 | |
Sunstone Hotel Investors, Inc. (a) | | | 21,400 | | | | 232,190 | |
Tanger Factory Outlet Centers, Inc. | | | 2,000 | | | | 95,840 | |
Taubman Centers, Inc. | | | 1,400 | | | | 64,988 | |
Terreno Realty Corporation (a) | | | 1,400 | | | | 25,368 | |
UMH Properties, Inc. | | | 73 | | | | 773 | |
Walter Investment Management Corporation | | | 3,180 | | | | 58,258 | |
Washington Real Estate Investment Trust | | | 2,000 | | | | 64,060 | |
Weingarten Realty Investors | | | 44,788 | | | | 1,080,734 | |
| | | | | | | | 25,109,362 | |
| Real Estate Management & Development — 0.2% | | | | | | | | |
China Housing & Land Development, Inc. (a) | | | 34,400 | | | | 82,216 | |
Forest City Enterprises, Inc. (a) | | | 600 | | | | 8,754 | |
Jones Lang LaSalle, Inc. | | | 3,446 | | | | 268,995 | |
Kennedy-Wilson Holdings, Inc. (a) | | | 1,563 | | | | 16,677 | |
St. Joe Company (The) (a) | | | 100,667 | | | | 2,032,467 | |
| | | | | | | | 2,409,109 | |
| Thrifts & Mortgage Finance — 0.4% | | | | | | | | |
Astoria Financial Corporation | | | 17,000 | | | | 211,140 | |
Bank Mutual Corporation | | | 13 | | | | 63 | |
BankAtlantic Bancorp, Inc. (a) | | | 62,296 | | | | 56,378 | |
Berkshire Hills Bancorporation, Inc. | | | 7,108 | | | | 137,469 | |
BofI Holding, Inc. (a) | | | 32,074 | | | | 412,472 | |
Dime Community Bancshares, Inc. | | | 9,386 | | | | 136,942 | |
ESSA Bancorp, Inc. | | | 7 | | | | 88 | |
Federal Agricultural Mortgage Corporation - Class C | | | 55,237 | | | | 650,139 | |
First Niagara Financial Group, Inc. | | | 7,006 | | | | 83,021 | |
First PacTrust Bancorp, Inc. | | | 3,500 | | | | 40,250 | |
FirstFed Financial Corporation (a) | | | 23,697 | | | | 237 | |
TFS MARKET NEUTRAL FUND SCHEDULE OF SECURITIES SOLD SHORT (Continued) |
COMMON STOCKS — 60.2% (Continued) | | | | | | |
| Financials — 10.3% (Continued) | | | | | | |
| Thrifts & Mortgage Finance — 0.4% (Continued) | | | | | | |
Guaranty Financial Group, Inc. (a) | | | 62,759 | | | $ | 627 | |
MGIC Investment Corporation (a) | | | 35,780 | | | | 315,580 | |
NASB Financial, Inc. | | | 300 | | | | 4,974 | |
New York Community Bancorp, Inc. | | | 400 | | | | 6,772 | |
Ocwen Financial Corporation (a) | | | 22,073 | | | | 190,490 | |
Provident Financial Services, Inc. | | | 16,081 | | | | 203,264 | |
Roma Financial Corporation | | | 100 | | | | 991 | |
Territorial Bancorp, Inc. | | | 600 | | | | 10,182 | |
Triad Guaranty, Inc. (a) | | | 9,250 | | | | 2,220 | |
TrustCo Bank Corporation | | | 325,526 | | | | 1,754,585 | |
Waterstone Financial, Inc. (a) | | | 187 | | | | 699 | |
Westfield Financial, Inc. | | | 2,653 | | | | 22,418 | |
| | | | | | | | 4,241,001 | |
| Health Care — 7.5% | | | | | | | | |
| Biotechnology — 2.2% | | | | | | | | |
Accentia Biopharmaceuticals, Inc. (a) | | | 900 | | | | 1,287 | |
Achillion Pharmaceuticals, Inc. (a) | | | 6,500 | | | | 18,590 | |
Acorda Therapeutics, Inc. (a) | | | 52,200 | | | | 1,411,488 | |
ADVENTRX Pharmaceuticals, Inc. (a) | | | 6,400 | | | | 13,504 | |
Allos Therapeutics, Inc. (a) | | | 321,341 | | | | 1,278,937 | |
Alnylam Pharmaceuticals, Inc. (a) | | | 80,743 | | | | 1,060,963 | |
Amgen, Inc. (a) | | | 100 | | | | 5,719 | |
Amylin Pharmaceuticals, Inc. (a) | | | 3,190 | | | | 41,566 | |
Anadys Pharmaceuticals, Inc. (a) | | | 1,700 | | | | 2,465 | |
ARCA biopharma, Inc. (a) | | | 1,600 | | | | 6,224 | |
Arena Pharmaceuticals, Inc. (a) | | | 528,246 | | | | 871,606 | |
AspenBio Pharma, Inc. (a) | | | 2,227 | | | | 1,514 | |
AVI BioPharma, Inc. (a) | | | 63,898 | | | | 135,464 | |
BioCryst Pharmaceuticals, Inc. (a) | | | 61,070 | | | | 302,907 | |
Biogen Idec, Inc. (a) | | | 700 | | | | 43,897 | |
BioMarin Pharmaceutical, Inc. (a) | | | 43,400 | | | | 1,135,344 | |
BioSante Pharmaceuticals, Inc. (a) | | | 54,308 | | | | 81,462 | |
BioSpecifics Technologies Corporation (a) | | | 584 | | | | 16,060 | |
BioTime, Inc. (a) | | | 111,999 | | | | 671,994 | |
Celgene Corporation (a) | | | 400 | | | | 24,828 | |
Cell Therapeutics, Inc. (a) | | | 524,206 | | | | 197,101 | |
CEL-SCI Corporation (a) | | | 21,600 | | | | 14,835 | |
Cephalon, Inc. (a) | | | 400 | | | | 26,576 | |
Chelsea Therapeutics International Ltd. (a) | | | 25,233 | | | | 128,688 | |
China Biologic Products, Inc. (a) | | | 6,433 | | | | 62,979 | |
Clinical Data, Inc. (a) | | | 2,737 | | | | 51,976 | |
Codexis, Inc. (a) | | | 300 | | | | 3,072 | |
Cyclacel Pharmaceuticals, Inc. (a) | | | 700 | | | | 1,148 | |
Cytori Therapeutics, Inc. (a) | | | 155,886 | | | | 757,606 | |
CytRx Corporation (a) | | | 3,500 | | | | 3,024 | |
DARA BioSciences, Inc. (a) | | | 600 | | | | 1,398 | |
Dendreon Corporation (a) | | | 1,300 | | | | 47,450 | |
Exact Sciences Corporation (a) | | | 26,740 | | | | 183,436 | |
TFS MARKET NEUTRAL FUND SCHEDULE OF SECURITIES SOLD SHORT (Continued) |
COMMON STOCKS — 60.2% (Continued) | | | | | | |
| Health Care — 7.5% (Continued) | | | | | | |
| Biotechnology — 2.2% (Continued) | | | | | | |
Genomic Health, Inc. (a) | | | 9,584 | | | $ | 135,709 | |
GenVec, Inc. (a) | | | 70,332 | | | | 40,793 | |
GTx, Inc. (a) | | | 244,074 | | | | 683,407 | |
Hemispherx Biopharma, Inc. (a) | | | 41,460 | | | | 21,456 | |
Human Genome Sciences, Inc. (a) | | | 1,000 | | | | 26,880 | |
ImmunoGen, Inc. (a) | | | 2,300 | | | | 18,906 | |
Immunomedics, Inc. (a) | | | 99,703 | | | | 391,833 | |
Incyte Corporation (a) | | | 33,612 | | | | 559,976 | |
Insmed, Inc. (a) | | | 4,880 | | | | 3,558 | |
Introgen Therapeutics, Inc. (a) | | | 45,612 | | | | 114 | |
Isis Pharmaceuticals, Inc. (a) | | | 61,417 | | | | 561,351 | |
Keryx Biopharmaceuticals, Inc. (a) | | | 95,600 | | | | 493,296 | |
Ligand Pharmaceuticals, Inc. - Class B (a) | | | 200 | | | | 324 | |
MannKind Corporation (a) | | | 250,133 | | | | 1,595,849 | |
Marina Biotech, Inc. (a) | | | 2,100 | | | | 4,389 | |
Martek Biosciences Corporation (a) | | | 8,091 | | | | 177,597 | |
Medivation, Inc. (a) | | | 71,207 | | | | 822,441 | |
Metabolix, Inc. (a) | | | 226,715 | | | | 3,164,941 | |
Momenta Pharmaceuticals, Inc. (a) | | | 53,487 | | | | 893,768 | |
Myriad Genetics, Inc. (a) | | | 14,300 | | | | 284,999 | |
Nabi Biopharmaceuticals (a) | | | 77,277 | | | | 379,430 | |
Neuralstem, Inc. (a) | | | 14,309 | | | | 31,909 | |
NeurogesX, Inc. (a) | | | 12,682 | | | | 88,394 | |
Novavax, Inc. (a) | | | 315,477 | | | | 766,609 | |
Nymox Pharmaceutical Corporation (a) | | | 1,800 | | | | 7,560 | |
Omeros Corporation (a) | | | 12,275 | | | | 98,445 | |
OncoGenex Pharmaceuticals, Inc. (a) | | | 17,397 | | | | 274,699 | |
Oncothyreon, Inc. (a) | | | 6,700 | | | | 23,048 | |
Opexa Therapeutics, Inc. (a) | | | 2,800 | | | | 4,228 | |
Orexigen Therapeutics, Inc. (a) | | | 223,058 | | | | 1,179,977 | |
Osiris Therapeutics, Inc. (a) | | | 4,969 | | | | 36,522 | |
Pharmacyclics, Inc. (a) | | | 154,500 | | | | 945,540 | |
Poniard Pharmaceuticals, Inc. (a) | | | 1,448 | | | | 771 | |
Progenics Pharmaceuticals, Inc. (a) | | | 27,583 | | | | 129,640 | |
PROLOR Biotech, Inc. (a) | | | 9,168 | | | | 55,100 | |
Protalix BioTherapeutics, Inc. (a) | | | 7,751 | | | | 74,875 | |
Rexahn Pharmaceuticals, Inc. (a) | | | 22,636 | | | | 25,126 | |
Rigel Pharmaceuticals, Inc. (a) | | | 11,425 | | | | 94,942 | |
RXi Pharmaceuticals Corporation (a) | | | 20,330 | | | | 67,902 | |
Savient Pharmaceuticals, Inc. (a) | | | 20,800 | | | | 258,128 | |
SIGA Technologies, Inc. (a) | | | 6,340 | | | | 84,005 | |
Spectrum Pharmaceuticals, Inc. (a) | | | 239,529 | | | | 1,017,998 | |
StemCells, Inc. (a) | | | 371 | | | | 330 | |
Synta Pharmaceuticals Corporation (a) | | | 3,003 | | | | 11,111 | |
Theravance, Inc. (a) | | | 9,600 | | | | 195,648 | |
Vanda Pharmaceuticals, Inc. (a) | | | 58,191 | | | | 425,376 | |
Vertex Pharmaceuticals, Inc. (a) | | | 600 | | | | 22,998 | |
TFS MARKET NEUTRAL FUND SCHEDULE OF SECURITIES SOLD SHORT (Continued) |
COMMON STOCKS — 60.2% (Continued) | | | | | | |
| Health Care — 7.5% (Continued) | | | | | | |
| Biotechnology — 2.2% (Continued) | | | | | | |
ZIOPHARM Oncology, Inc. (a) | | | 25,158 | | | $ | 108,431 | |
| | | | | | | | 24,895,437 | |
| Health Care Equipment & Supplies — 2.6% | | | | | | | | |
Abaxis, Inc. (a) | | | 7,096 | | | | 170,375 | |
Abiomed, Inc. (a) | | | 154,094 | | | | 1,588,709 | |
Alere, Inc. (a) | | | 51,240 | | | | 1,514,142 | |
Alimera Sciences, Inc. (a) | | | 187 | | | | 2,010 | |
ArthroCare Corporation (a) | | | 4,646 | | | | 126,743 | |
Baxter International, Inc. | | | 400 | | | | 20,360 | |
Becton, Dickinson and Company | | | 400 | | | | 30,208 | |
Boston Scientific Corporation (a) | | | 21,917 | | | | 139,830 | |
BSD Medical Corporation (a) | | | 89,638 | | | | 425,781 | |
CareFusion Corporation (a) | | | 1,400 | | | | 33,796 | |
Cerus Corporation (a) | | | 94,935 | | | | 312,336 | |
Conceptus, Inc. (a) | | | 89,129 | | | | 1,266,523 | |
CONMED Corporation (a) | | | 5,200 | | | | 114,452 | |
Cooper Companies, Inc. (The) | | | 15,700 | | | | 774,638 | |
Cutera, Inc. (a) | | | 200 | | | | 1,446 | |
Delcath Systems, Inc. (a) | | | 140,700 | | | | 1,194,543 | |
Edwards Lifesciences Corporation (a) | | | 1,000 | | | | 63,910 | |
Greatbatch, Inc. (a) | | | 68,020 | | | | 1,479,435 | |
Haemonetics Corporation (a) | | | 10,000 | | | | 546,500 | |
Hill-Rom Holdings, Inc. | | | 3,000 | | | | 116,250 | |
Hospira, Inc. (a) | | | 400 | | | | 23,792 | |
ICU Medical, Inc. (a) | | | 41,805 | | | | 1,525,882 | |
Insulet Corporation (a) | | | 95,195 | | | | 1,518,360 | |
Integra LifeSciences Holdings Corporation (a) | | | 1,400 | | | | 60,228 | |
Intuitive Surgical, Inc. (a) | | | 100 | | | | 26,295 | |
Invacare Corporation | | | 48,829 | | | | 1,318,383 | |
Kensey Nash Corporation (a) | | | 57,804 | | | | 1,558,396 | |
Kinetic Concepts, Inc. (a) | | | 5,100 | | | | 193,953 | |
MAKO Surgical Corporation (a) | | | 174,761 | | | | 1,883,924 | |
Masimo Corporation (a) | | | 45,100 | | | | 1,360,667 | |
MELA Sciences, Inc. (a) | | | 526,754 | | | | 3,961,190 | |
Meridian Bioscience, Inc. | | | 38,500 | | | | 881,265 | |
NuVasive, Inc. (a) | | | 19,300 | | | | 505,660 | |
OraSure Technologies, Inc. (a) | | | 23,491 | | | | 95,608 | |
Quidel Corporation (a) | | | 172,551 | | | | 1,994,690 | |
ResMed, Inc. (a) | | | 200 | | | | 6,374 | |
Rockwell Medical Technologies, Inc. (a) | | | 2,107 | | | | 17,952 | |
SonoSite, Inc. (a) | | | 3,009 | | | | 93,791 | |
Spectranetics Corporation (The) (a) | | | 47 | | | | 221 | |
Stereotaxis, Inc. (a) | | | 403,716 | | | | 1,594,678 | |
STERIS Corporation | | | 5,059 | | | | 173,119 | |
SurModics, Inc. (a) | | | 25,266 | | | | 302,181 | |
Syneron Medical Ltd. (a) | | | 1,300 | | | | 13,689 | |
Synovis Life Technologies, Inc. (a) | | | 427 | | | | 6,405 | |
Thoratec Corporation (a) | | | 4,400 | | | | 143,616 | |
TFS MARKET NEUTRAL FUND SCHEDULE OF SECURITIES SOLD SHORT (Continued) |
COMMON STOCKS — 60.2% (Continued) | | | | | | |
| Health Care — 7.5% (Continued) | | | | | | |
| Health Care Equipment & Supplies — 2.6% (Continued) | | | | | | |
Unilife Corporation (a) | | | 2,086 | | | $ | 11,932 | |
Uroplasty, Inc. (a) | | | 500 | | | | 2,325 | |
Varian Medical Systems, Inc. (a) | | | 200 | | | | 12,644 | |
West Pharmaceutical Services, Inc. | | | 20,403 | | | | 728,183 | |
Zimmer Holdings, Inc. (a) | | | 400 | | | | 18,976 | |
| | | | | | | | 29,956,366 | |
| Health Care Providers & Services — 1.3% | | | | | | | | |
Air Methods Corporation (a) | | | 33,554 | | | | 1,372,359 | |
Amedisys, Inc. (a) | | | 33,420 | | | | 850,873 | |
American Dental Partners, Inc. (a) | | | 800 | | | | 9,328 | |
AMERIGROUP Corporation (a) | | | 11,400 | | | | 475,722 | |
Bio-Reference Laboratories, Inc. (a) | | | 64,974 | | | | 1,400,839 | |
BioScrip, Inc. (a) | | | 13,528 | | | | 76,163 | |
Brookdale Senior Living, Inc. (a) | | | 7,200 | | | | 135,216 | |
Chemed Corporation | | | 900 | | | | 53,046 | |
CIGNA Corporation | | | 400 | | | | 14,076 | |
Emeritus Corporation (a) | | | 127,054 | | | | 2,369,557 | |
Express Scripts, Inc. (a) | | | 400 | | | | 19,408 | |
Gentiva Health Services, Inc. (a) | | | 3,600 | | | | 83,808 | |
HealthSouth Corporation (a) | | | 88,021 | | | | 1,592,300 | |
Henry Schein, Inc. (a) | | | 100 | | | | 5,615 | |
HMS Holdings Corporation (a) | | | 4,500 | | | | 270,495 | |
Humana, Inc. (a) | | | 500 | | | | 29,145 | |
IPC The Hospitalist Company, Inc. (a) | | | 3,008 | | | | 96,346 | |
Kindred Healthcare, Inc. (a) | | | 1,809 | | | | 24,819 | |
Laboratory Corporation of America Holdings (a) | | | 100 | | | | 8,132 | |
Landauer, Inc. | | | 1,500 | | | | 91,635 | |
LHC Group, Inc. (a) | | | 14,400 | | | | 387,360 | |
Lincare Holdings, Inc. | | | 100 | | | | 2,622 | |
Magellan Health Services, Inc. (a) | | | 670 | | | | 32,160 | |
Medco Health Solutions, Inc. (a) | | | 700 | | | | 36,771 | |
Mednax, Inc. (a) | | | 6,780 | | | | 401,444 | |
MWI Veterinary Supply, Inc. (a) | | | 7,499 | | | | 428,943 | |
Omnicare, Inc. | | | 1,800 | | | | 43,416 | |
Patterson Companies, Inc. | | | 7,800 | | | | 215,670 | |
Prospect Medical Holdings, Inc. (a) | | | 6,583 | | | | 55,561 | |
PSS World Medical, Inc. (a) | | | 55,012 | | | | 1,299,934 | |
Quest Diagnostics, Inc. | | | 400 | | | | 19,656 | |
Select Medical Holdings Corporation (a) | | | 14,251 | | | | 106,597 | |
Sharps Compliance Corporation (a) | | | 4,100 | | | | 18,245 | |
Skilled Healthcare Group, Inc. - Class A (a) | | | 13,774 | | | | 51,652 | |
UnitedHealth Group, Inc. | | | 400 | | | | 14,420 | |
Universal American Corporation (a) | | | 9,600 | | | | 154,368 | |
WellCare Health Plans, Inc. (a) | | | 84,601 | | | | 2,350,216 | |
| | | | | | | | 14,597,917 | |
| Health Care Technology — 0.3% | | | | | | | | |
athenahealth, Inc. (a) | | | 36,339 | | | | 1,452,470 | |
iCad, Inc. (a) | | | 400 | | | | 584 | |
TFS MARKET NEUTRAL FUND SCHEDULE OF SECURITIES SOLD SHORT (Continued) |
COMMON STOCKS — 60.2% (Continued) | | | | | | |
| Health Care — 7.5% (Continued) | | | | | | |
| Health Care Technology — 0.3% (Continued) | | | | | | |
MedAssets, Inc. (a) | | | 1,400 | | | $ | 25,956 | |
MedQuist, Inc. (a) | | | 14,372 | | | | 121,874 | |
Quality Systems, Inc. | | | 27,703 | | | | 1,780,195 | |
| | | | | | | | 3,381,079 | |
| Life Sciences Tools & Services — 0.1% | | | | | | | | |
Affymetrix, Inc. (a) | | | 2,200 | | | | 9,856 | |
Albany Molecular Research, Inc. (a) | | | 5,112 | | | | 32,717 | |
Apricus Biosciences, Inc. (a) | | | 6,600 | | | | 11,682 | |
Arrowhead Research Corporation (a) | | | 13,984 | | | | 13,822 | |
Caliper Life Sciences, Inc. (a) | | | 4,186 | | | | 18,837 | |
Compugen Ltd. (a) | | | 100 | | | | 462 | |
Covance, Inc. (a) | | | 5,200 | | | | 244,348 | |
eResearchTechnology, Inc. (a) | | | 13 | | | | 99 | |
Furiex Pharmaceuticals, Inc. (a) | | | 358 | | | | 4,120 | |
Life Technologies Corporation (a) | | | 400 | | | | 20,072 | |
Mettler-Toledo International, Inc. (a) | | | 700 | | | | 91,392 | |
Sequenom, Inc. (a) | | | 204,574 | | | | 1,299,045 | |
| | | | | | | | 1,746,452 | |
| Pharmaceuticals — 1.0% | | | | | | | | |
Abbott Laboratories | | | 400 | | | | 20,528 | |
Acura Pharmaceuticals, Inc. (a) | | | 4,424 | | | | 11,591 | |
Adolor Corporation (a) | | | 400 | | | | 496 | |
Alexza Pharmaceuticals, Inc. (a) | | | 137,838 | | | | 143,352 | |
Angiotech Pharmaceuticals, Inc. (a) | | | 1,331 | | | | 675 | |
Aoxing Pharmaceutical Company, Inc. (a) | | | 5,277 | | | | 13,351 | |
Ardea Biosciences, Inc. (a) | | | 66,640 | | | | 1,420,765 | |
Auxilium Pharmaceuticals, Inc. (a) | | | 77,312 | | | | 1,913,472 | |
AVANIR Pharmaceuticals, Inc. - Class A (a) | | | 236,940 | | | | 575,764 | |
Biodel, Inc. (a) | | | 71,219 | | | | 257,101 | |
BioMimetic Therapeutics, Inc. (a) | | | 71,641 | | | | 812,409 | |
BMP Sunstone Corporation (a) | | | 9,400 | | | | 92,496 | |
Bristol-Myers Squibb Company | | | 400 | | | | 10,760 | |
Cadence Pharmaceuticals, Inc. (a) | | | 220,779 | | | | 1,960,518 | |
Eli Lilly & Company | | | 400 | | | | 14,080 | |
Generex Biotechnology Corporation (a) | | | 61,100 | | | | 20,774 | |
Hi-Tech Pharmacal Company, Inc. (a) | | | 16,000 | | | | 346,080 | |
Jiangbo Pharmaceuticals, Inc. (a) | | | 1,269 | | | | 8,502 | |
Johnson & Johnson | | | 400 | | | | 25,468 | |
Merck & Company, Inc. | | | 400 | | | | 14,512 | |
Nektar Therapeutics (a) | | | 55,200 | | | | 804,264 | |
NeoStem, Inc. (a) | | | 19,715 | | | | 37,064 | |
Oculus Innovative Sciences, Inc. (a) | | | 4,900 | | | | 7,595 | |
Optimer Pharmaceuticals, Inc. (a) | | | 62,651 | | | | 588,293 | |
Pain Therapeutics, Inc. (a) | | | 4,809 | | | | 36,933 | |
Perrigo Company | | | 400 | | | | 26,352 | |
Pfizer, Inc. | | | 1,400 | | | | 24,360 | |
Questcor Pharmaceuticals, Inc. (a) | | | 10,205 | | | | 125,215 | |
Raptor Pharmaceutical Corporation (a) | | | 11,114 | | | | 37,343 | |
TFS MARKET NEUTRAL FUND SCHEDULE OF SECURITIES SOLD SHORT (Continued) |
COMMON STOCKS — 60.2% (Continued) | | | | | | |
| Health Care — 7.5% (Continued) | | | | | | |
| Pharmaceuticals — 1.0% (Continued) | | | | | | |
Salix Pharmaceuticals Ltd. (a) | | | 10,966 | | | $ | 414,844 | |
Somaxon Pharmaceuticals, Inc. (a) | | | 229,209 | | | | 641,785 | |
VIVUS, Inc. (a) | | | 15,880 | | | | 122,911 | |
XenoPort, Inc. (a) | | | 107,155 | | | | 830,451 | |
| | | | | | | | 11,360,104 | |
| Industrials — 9.0% | | | | | | | | |
| Aerospace & Defense — 0.4% | | | | | | | | |
AeroVironment, Inc. (a) | | | 24,125 | | | | 565,973 | |
American Science & Engineering, Inc. | | | 1,667 | | | | 137,277 | |
Applied Energetics, Inc. (a) | | | 13,332 | | | | 13,865 | |
Arotech Corporation (a) | | | 1,100 | | | | 2,134 | |
Ascent Solar Technologies, Inc. (a) | | | 37,009 | | | | 161,729 | |
Curtiss-Wright Corporation | | | 13 | | | | 401 | |
DigitalGlobe, Inc. (a) | | | 573 | | | | 18,709 | |
GenCorp, Inc. (a) | | | 134,964 | | | | 657,275 | |
HEICO Corporation | | | 28,415 | | | | 1,414,499 | |
Herley Industries, Inc. (a) | | | 1,895 | | | | 31,476 | |
Precision Castparts Corporation | | | 400 | | | | 54,632 | |
Taser International, Inc. (a) | | | 359,873 | | | | 1,425,097 | |
| | | | | | | | 4,483,067 | |
| Air Freight & Logistics — 0.2% | | | | | | | | |
Atlas Air Worldwide Holdings, Inc. (a) | | | 4,408 | | | | 230,362 | |
FedEx Corporation | | | 400 | | | | 35,088 | |
Hub Group, Inc. (a) | | | 2,888 | | | | 93,773 | |
Pacer International, Inc. (a) | | | 93,452 | | | | 520,528 | |
United Parcel Service, Inc. - Class B | | | 300 | | | | 20,202 | |
UTi Worldwide, Inc. | | | 66,900 | | | | 1,285,818 | |
| | | | | | | | 2,185,771 | |
| Airlines — 1.0% | | | | | | | | |
Allegiant Travel Company (a) | | | 83,144 | | | | 3,915,251 | |
AMR Corporation (a) | | | 497,060 | | | | 3,916,833 | |
Delta Air Lines, Inc. (a) | | | 10,300 | | | | 143,067 | |
JetBlue Airways Corporation (a) | | | 174,481 | | | | 1,217,877 | |
Pinnacle Airlines Corporation (a) | | | 1,582 | | | | 9,112 | |
Republic Airways Holdings, Inc. (a) | | | 156,948 | | | | 1,458,047 | |
United Continental Holdings, Inc. (a) | | | 28,125 | | | | 816,750 | |
| | | | | | | | 11,476,937 | |
| Building Products — 0.7% | | | | | | | | |
A.O. Smith Corporation | | | 44,600 | | | | 2,498,938 | |
AAON, Inc. | | | 73,299 | | | | 1,799,490 | |
American Woodmark Corporation | | | 22,760 | | | | 402,852 | |
Apogee Enterprises, Inc. | | | 55,081 | | | | 577,800 | |
Builders FirstSource, Inc. (a) | | | 231,377 | | | | 467,381 | |
Insteel Industries, Inc. | | | 34,203 | | | | 293,804 | |
Owens Corning, Inc. (a) | | | 14,420 | | | | 389,917 | |
Simpson Manufacturing Company, Inc. | | | 2,100 | | | | 55,818 | |
Trex Company, Inc. (a) | | | 101,528 | | | | 1,822,428 | |
| | | | | | | | 8,308,428 | |
TFS MARKET NEUTRAL FUND SCHEDULE OF SECURITIES SOLD SHORT (Continued) |
COMMON STOCKS — 60.2% (Continued) | | | | | | |
| Industrials — 9.0% (Continued) | | | | | | |
| Commercial Services & Supplies — 1.5% | | | | | | |
ABM Industries, Inc. | | | 126,677 | | | $ | 2,856,566 | |
ACCO Brands Corporation (a) | | | 26,100 | | | | 162,603 | |
Avery Dennison Corporation | | | 1,200 | | | | 43,620 | |
Bowne & Company, Inc. | | | 149,122 | | | | 1,692,535 | |
Cintas Corporation | | | 1,000 | | | | 27,470 | |
EnerNOC, Inc. (a) | | | 45,435 | | | | 1,366,230 | |
Healthcare Services Group, Inc. | | | 24,100 | | | | 579,123 | |
Herman Miller, Inc. | | | 74,000 | | | | 1,423,020 | |
HNI Corporation | | | 65,491 | | | | 1,615,008 | |
Industrial Services of America, Inc. (a) | | | 33,551 | | | | 512,324 | |
InnerWorkings, Inc. (a) | | | 196,576 | | | | 1,350,477 | |
Interface, Inc. | | | 12,173 | | | | 175,170 | |
McGrath RentCorp | | | 3,792 | | | | 95,976 | |
Mine Safety Appliances Company | | | 38,290 | | | | 1,078,246 | |
Mobile Mini, Inc. (a) | | | 111,061 | | | | 1,935,793 | |
Perma-Fix Environmental Services, Inc. (a) | | | 147 | | | | 247 | |
R.R. Donnelley & Sons Company | | | 19,271 | | | | 355,550 | |
RINO International Corporation (a) | | | 63,313 | | | | 1,161,160 | |
Ritchie Bros. Auctioneers, Inc. | | | 700 | | | | 14,826 | |
Standard Parking Corporation (a) | | | 400 | | | | 6,836 | |
Steelcase, Inc. - Class A | | | 32,300 | | | | 271,643 | |
| | | | | | | | 16,724,423 | |
| Construction & Engineering — 0.5% | | | | | | | | |
Comfort Systems USA, Inc. | | | 32,330 | | | | 370,179 | |
EMCOR Group, Inc. (a) | | | 6,200 | | | | 160,270 | |
Granite Construction, Inc. | | | 149,086 | | | | 3,604,899 | |
Insituform Technologies, Inc. - Class A (a) | | | 50,712 | | | | 1,095,379 | |
MYR Group, Inc. (a) | | | 5,400 | | | | 84,186 | |
Northwest Pipe Company (a) | | | 8,056 | | | | 151,614 | |
Orion Marine Group, Inc. (a) | | | 29,847 | | | | 373,386 | |
Pike Electric Corporation (a) | | | 31,897 | | | | 241,141 | |
| | | | | | | | 6,081,054 | |
| Electrical Equipment — 0.9% | | | | | | | | |
A123 Systems, Inc. (a) | | | 85,892 | | | | 834,870 | |
Acuity Brands, Inc. | | | 8,200 | | | | 410,574 | |
A-Power Energy Generation Systems Ltd. (a) | | | 19,200 | | | | 137,088 | |
Baldor Electric Company | | | 5,472 | | | | 229,933 | |
Belden, Inc. | | | 4,000 | | | | 111,600 | |
Capstone Turbine Corporation (a) | | | 1,500 | | | | 1,125 | |
China BAK Battery, Inc. (a) | | | 157,830 | | | | 301,455 | |
Encore Wire Corporation | | | 101,406 | | | | 2,105,188 | |
Ener1, Inc. (a) | | | 629,339 | | | | 2,278,207 | |
EnerSys, Inc. (a) | | | 26,600 | | | | 701,176 | |
GrafTech International Ltd. (a) | | | 22,300 | | | | 367,281 | |
Harbin Electric, Inc. (a) | | | 57,370 | | | | 1,236,897 | |
Hoku Corporation (a) | | | 16,317 | | | | 45,688 | |
Hubbell, Inc. - Class B | | | 600 | | | | 32,412 | |
II-VI, Inc. (a) | | | 9,996 | | | | 393,243 | |
TFS MARKET NEUTRAL FUND SCHEDULE OF SECURITIES SOLD SHORT (Continued) | |
COMMON STOCKS — 60.2% (Continued) | | | | | | |
| Industrials — 9.0% (Continued) | | | | | | |
| Electrical Equipment — 0.9% (Continued) | | | | | | |
LGL Group, Inc. (a) | | | 230 | | | $ | 5,971 | |
Medis Technologies Ltd. (a) | | | 20,819 | | | | 458 | |
Nexxus Lighting, Inc. (a) | | | 300 | | | | 795 | |
Ocean Power Technologies, Inc. (a) | | | 4,100 | | | | 26,814 | |
PowerSecure International, Inc. (a) | | | 57,175 | | | | 538,017 | |
Satcon Technology Corporation (a) | | | 154,199 | | | | 619,880 | |
Ultralife Corporation (a) | | | 400 | | | | 2,100 | |
UQM Technologies, Inc. (a) | | | 28,039 | | | | 66,172 | |
Valence Technology, Inc. (a) | | | 128,120 | | | | 163,994 | |
Woodward Governor Company | | | 638 | | | | 19,995 | |
| | | | | | | | 10,630,933 | |
| Industrial Conglomerates — 0.0% | | | | | | | | |
United Capital Corporation (a) | | | 170 | | | | 4,597 | |
| | | | | | | | | |
| Machinery — 2.3% | | | | | | | | |
Actuant Corporation - Class A | | | 600 | | | | 13,482 | |
Albany International Corporation - Class A | | | 22,500 | | | | 459,000 | |
ArvinMeritor, Inc. (a) | | | 7,200 | | | | 119,376 | |
Astec Industries, Inc. (a) | | | 49,210 | | | | 1,450,219 | |
Badger Meter, Inc. | | | 39,793 | | | | 1,652,603 | |
Briggs & Stratton Corporation | | | 116,090 | | | | 2,043,184 | |
Bucyrus International, Inc. - Class A | | | 500 | | | | 34,080 | |
China Fire & Security Group, Inc. (a) | | | 97,518 | | | | 774,293 | |
China Valves Technology, Inc. (a) | | | 201,230 | | | | 1,754,726 | |
CLARCOR, Inc. | | | 700 | | | | 27,762 | |
Cummins, Inc. | | | 200 | | | | 17,620 | |
Donaldson Company, Inc. | | | 2,820 | | | | 137,390 | |
Energy Recovery, Inc. (a) | | | 252,216 | | | | 897,889 | |
EnPro Industries, Inc. (a) | | | 13,700 | | | | 481,418 | |
Flow International Corporation (a) | | | 400 | | | | 1,056 | |
FreightCar America, Inc. | | | 69,450 | | | | 1,837,647 | |
Gorman-Rupp Company (The) | | | 48,952 | | | | 1,459,749 | |
Graco, Inc. | | | 78,800 | | | | 2,711,508 | |
Lincoln Electric Holdings, Inc. | | | 7,800 | | | | 466,128 | |
Met-Pro Corporation | | | 46 | | | | 519 | |
Middleby Corporation (The) (a) | | | 16,605 | | | | 1,239,729 | |
Nordson Corporation | | | 900 | | | | 70,218 | |
Oshkosh Corporation (a) | | | 6,000 | | | | 177,060 | |
PACCAR, Inc. | | | 100 | | | | 5,126 | |
PMFG, Inc. (a) | | | 2,315 | | | | 36,230 | |
Sun Hydraulics Corporation | | | 21,360 | | | | 663,655 | |
Terex Corporation (a) | | | 150,800 | | | | 3,385,460 | |
Toro Company (The) | | | 23,644 | | | | 1,342,034 | |
Valmont Industries, Inc. | | | 2,100 | | | | 165,585 | |
Wabash National Corporation (a) | | | 83,300 | | | | 671,398 | |
Watts Water Technologies, Inc. - Class A | | | 960 | | | | 33,763 | |
Westinghouse Air Brake Technologies Corporation | | | 44,443 | | | | 2,081,710 | |
| | | | | | | | 26,211,617 | |
TFS MARKET NEUTRAL FUND SCHEDULE OF SECURITIES SOLD SHORT (Continued) |
COMMON STOCKS — 60.2% (Continued) | | | | | | |
| Industrials — 9.0% (Continued) | | | | | | |
| Marine — 0.3% | | | | | | |
Alexander & Baldwin, Inc. | | | 7,720 | | | $ | 265,800 | |
American Commercial Lines, Inc. (a) | | | 11,432 | | | | 378,971 | |
Eagle Bulk Shipping, Inc. (a) | | | 26,700 | | | | 136,971 | |
Excel Maritime Carriers Ltd. (a) | | | 166,057 | | | | 966,452 | |
Kirby Corporation (a) | | | 41,955 | | | | 1,803,645 | |
| | | | | | | | 3,551,839 | |
| Professional Services — 0.3% | | | | | | | | |
Advisory Board Company (The) (a) | | | 4,267 | | | | 199,738 | |
CBIZ, Inc. (a) | | | 15,534 | | | | 91,961 | |
CoStar Group, Inc. (a) | | | 19,294 | | | | 958,140 | |
CRA International, Inc. (a) | | | 1,400 | | | | 26,110 | |
Equifax, Inc. | | | 2,020 | | | | 66,923 | |
FTI Consulting, Inc. (a) | | | 8,925 | | | | 316,481 | |
Kelly Services, Inc. - Class A (a) | | | 28,705 | | | | 426,269 | |
Lightbridge Corporation (a) | | | 10,443 | | | | 58,063 | |
Manpower, Inc. | | | 800 | | | | 43,784 | |
Odyssey Marine Exploration, Inc. (a) | | | 1,000 | | | | 2,220 | |
Resources Connection, Inc. | | | 17,876 | | | | 289,412 | |
Robert Half International, Inc. | | | 4,900 | | | | 132,839 | |
School Specialty, Inc. (a) | | | 33,399 | | | | 447,547 | |
Verisk Analytics, Inc. - Class A (a) | | | 2,500 | | | | 74,525 | |
| | | | | | | | 3,134,012 | |
| Road & Rail — 0.1% | | | | | | | | |
Con-Way, Inc. | | | 11,300 | | | | 373,013 | |
CSX Corporation | | | 100 | | | | 6,145 | |
Dollar Thrifty Automotive Group, Inc. (a) | | | 700 | | | | 32,480 | |
Genesee & Wyoming, Inc. (a) | | | 2,400 | | | | 110,952 | |
Hertz Global Holdings, Inc. (a) | | | 3,328 | | | | 37,673 | |
Old Dominion Freight Line, Inc. (a) | | | 14,800 | | | | 415,140 | |
Quality Distribution, Inc. (a) | | | 4,500 | | | | 32,175 | |
| | | | | | | | 1,007,578 | |
| Trading Companies & Distributors — 0.8% | | | | | | | | |
Applied Industrial Technologies, Inc. | | | 400 | | | | 12,164 | |
BlueLinx Holdings, Inc. (a) | | | 155 | | | | 488 | |
China Armco Metals, Inc. (a) | | | 2,300 | | | | 8,579 | |
GATX Corporation | | | 52,600 | | | | 1,665,316 | |
Houston Wire & Cable Company | | | 128,041 | | | | 1,476,313 | |
MSC Industrial Direct Company, Inc. | | | 4,700 | | | | 267,618 | |
Rush Enterprises, Inc. - Class A (a) | | | 46,083 | | | | 732,259 | |
Titan Machinery, Inc. (a) | | | 52,313 | | | | 1,016,965 | |
Watsco, Inc. | | | 1,000 | | | | 55,970 | |
WESCO International, Inc. (a) | | | 93,600 | | | | 4,007,952 | |
| | | | | | | | 9,243,624 | |
| Information Technology — 10.6% | | | | | | | | |
| Communications Equipment — 1.3% | | | | | | | | |
Acme Packet, Inc. (a) | | | 7,200 | | | | 284,760 | |
ADTRAN, Inc. | | | 74,900 | | | | 2,417,023 | |
Arris Group, Inc. (a) | | | 25,835 | | | | 240,524 | |
TFS MARKET NEUTRAL FUND SCHEDULE OF SECURITIES SOLD SHORT (Continued) |
COMMON STOCKS — 60.2% (Continued) | | | | | | |
| Information Technology — 10.6% (Continued) | | | | | | |
| Communications Equipment — 1.3% (Continued) | | | | | | |
Aruba Networks, Inc. (a) | | | 8,100 | | | $ | 177,471 | |
AudioCodes Ltd. (a) | | | 16,155 | | | | 80,613 | |
Aviat Networks, Inc. (a) | | | 224,612 | | | | 1,021,985 | |
BigBand Networks, Inc. (a) | | | 24,418 | | | | 72,522 | |
CIENA Corporation (a) | | | 211,600 | | | | 2,939,124 | |
CommScope, Inc. (a) | | | 2,700 | | | | 85,482 | |
DG FastChannel, Inc. (a) | | | 45,274 | | | | 1,066,203 | |
F5 Networks, Inc. (a) | | | 1,100 | | | | 129,470 | |
Globecomm Systems, Inc. (a) | | | 361 | | | | 3,231 | |
InterDigital, Inc. (a) | | | 79,220 | | | | 2,659,415 | |
Meru Networks, Inc. (a) | | | 28,074 | | | | 425,602 | |
Mitel Networks Corporation (a) | | | 200 | | | | 1,328 | |
Motorola, Inc. (a) | | | 1,400 | | | | 11,410 | |
Opnext, Inc. (a) | | | 1,500 | | | | 2,265 | |
Polycom, Inc. (a) | | | 4,100 | | | | 138,498 | |
Powerwave Technologies, Inc. (a) | | | 272,278 | | | | 593,566 | |
QUALCOMM, Inc. | | | 600 | | | | 27,078 | |
Riverbed Technology, Inc. (a) | | | 6,200 | | | | 356,748 | |
Symmetricom, Inc. (a) | | | 28,805 | | | | 179,455 | |
Telestone Technologies Corporation (a) | | | 85,800 | | | | 1,005,576 | |
UTStarcom, Inc. (a) | | | 343,710 | | | | 694,294 | |
| | | | | | | | 14,613,643 | |
| Computers & Peripherals — 0.7% | | | | | | | | |
Apple, Inc. (a) | | | 200 | | | | 60,174 | |
Avid Technology, Inc. (a) | | | 159,192 | | | | 2,009,003 | |
Dell, Inc. (a) | | | 20,400 | | | | 293,352 | |
Hutchinson Technology, Inc. (a) | | | 138,596 | | | | 472,612 | |
Imation Corporation (a) | | | 32,748 | | | | 318,966 | |
Intermec, Inc. (a) | | | 1,541 | | | | 17,953 | |
Intevac, Inc. (a) | | | 7,722 | | | | 77,992 | |
Lexmark International, Inc. - Class A (a) | | | 600 | | | | 22,818 | |
NCR Corporation (a) | | | 8,480 | | | | 116,346 | |
NetApp, Inc. (a) | | | 800 | | | | 42,600 | |
Quantum Corporation (a) | | | 276 | | | | 933 | |
Rimage Corporation (a) | | | 100 | | | | 1,483 | |
Silicon Graphics International Corporation (a) | | | 100 | | | | 757 | |
SMART Technologies, Inc. - Class A (a) | | | 8,400 | | | | 109,116 | |
STEC, Inc. (a) | | | 15,004 | | | | 234,062 | |
Stratasys, Inc. (a) | | | 30,107 | | | | 942,951 | |
Synaptics, Inc. (a) | | | 125,313 | | | | 3,374,679 | |
Western Digital Corporation (a) | | | 7,300 | | | | 233,746 | |
| | | | | | | | 8,329,543 | |
| Electronic Equipment, Instruments & Components — 1.5% | | | | | | | | |
Advanced Photonix, Inc. - Class A (a) | | | 400 | | | | 396 | |
Agilent Technologies, Inc. (a) | | | 600 | | | | 20,880 | |
Anixter International, Inc. (a) | | | 25,452 | | | | 1,366,518 | |
Avnet, Inc. (a) | | | 1,600 | | | | 47,648 | |
Brightpoint, Inc. (a) | | | 1,800 | | | | 13,482 | |
TFS MARKET NEUTRAL FUND SCHEDULE OF SECURITIES SOLD SHORT (Continued) |
COMMON STOCKS — 60.2% (Continued) | | | | | | |
| Information Technology — 10.6% (Continued) | | | | | | |
| Electronic Equipment, Instruments & Components — 1.5% (Continued) | | | | | | |
Comverge, Inc. (a) | | | 93,435 | | | $ | 714,778 | |
Daktronics, Inc. | | | 62,378 | | | | 681,168 | |
Digital Ally, Inc. (a) | | | 4,000 | | | | 7,560 | |
Dolby Laboratories, Inc. - Class A (a) | | | 6,700 | | | | 413,256 | |
DTS, Inc. (a) | | | 48,634 | | | | 1,935,633 | |
Echelon Corporation (a) | | | 87,087 | | | | 685,375 | |
Electro Rent Corporation | | | 363 | | | | 5,394 | |
FARO Technologies, Inc. (a) | | | 4,364 | | | | 105,347 | |
FLIR Systems, Inc. (a) | | | 3,100 | | | | 86,304 | |
Funtalk China Holdings Ltd. (a) | | | 3,621 | | | | 23,899 | |
Gerber Scientific, Inc. (a) | | | 400 | | | | 2,676 | |
L-1 Identity Solutions, Inc. (a) | | | 20,668 | | | | 243,676 | |
Maxwell Technologies, Inc. (a) | | | 113,581 | | | | 1,842,284 | |
Methode Electronics, Inc. | | | 30,618 | | | | 284,441 | |
Microvision, Inc. (a) | | | 887,757 | | | | 1,819,902 | |
MTS Systems Corporation | | | 24,443 | | | | 800,997 | |
Plexus Corporation (a) | | | 2,273 | | | | 68,985 | |
RadiSys Corporation (a) | | | 86,549 | | | | 845,584 | |
Research Frontiers, Inc. (a) | | | 21,262 | | | | 87,174 | |
Sanmina-SCI Corporation (a) | | | 182,800 | | | | 2,409,304 | |
SMTC Corporation (a) | | | 200 | | | | 764 | |
Superconductor Technologies, Inc. (a) | | | 2,400 | | | | 4,008 | |
SYNNEX Corporation (a) | | | 29,810 | | | | 865,682 | |
Tech Data Corporation (a) | | | 1,026 | | | | 44,108 | |
Technitrol, Inc. | | | 168,476 | | | | 774,989 | |
TTM Technologies, Inc. (a) | | | 14,503 | | | | 151,991 | |
Universal Display Corporation (a) | | | 16,900 | | | | 423,176 | |
| | | | | | | | 16,777,379 | |
| Internet Software & Services — 2.0% | | | | | | | | |
Akamai Technologies, Inc. (a) | | | 800 | | | | 41,336 | |
Archipelago Learning, Inc. (a) | | | 4,611 | | | | 48,738 | |
Art Technology Group, Inc. (a) | | | 177,272 | | | | 742,770 | |
BroadVision, Inc. (a) | | | 100 | | | | 1,116 | |
Constant Contact, Inc. (a) | | | 110,947 | | | | 2,551,781 | |
DealerTrack Holdings, Inc. (a) | | | 111,628 | | | | 2,156,653 | |
Digital River, Inc. (a) | | | 45,400 | | | | 1,691,604 | |
EarthLink, Inc. | | | 142,641 | | | | 1,282,343 | |
eBay, Inc. (a) | | | 1,700 | | | | 50,677 | |
Equinix, Inc. (a) | | | 1,300 | | | | 109,512 | |
GSI Commerce, Inc. (a) | | | 80,578 | | | | 1,967,715 | |
HSW International, Inc. (a) | | | 500 | | | | 3,205 | |
iPass, Inc. (a) | | | 354 | | | | 407 | |
j2 Global Communications, Inc. (a) | | | 88,237 | | | | 2,325,045 | |
KIT digital, Inc. (a) | | | 143,769 | | | | 1,979,699 | |
Knot, Inc. (The) (a) | | | 31,944 | | | | 288,774 | |
Local.com Corporation (a) | | | 76,384 | | | | 316,230 | |
LogMeIn, Inc. (a) | | | 10,974 | | | | 435,997 | |
TFS MARKET NEUTRAL FUND SCHEDULE OF SECURITIES SOLD SHORT (Continued) |
COMMON STOCKS — 60.2% (Continued) | | | | | | |
| Information Technology — 10.6% (Continued) | | | | | | |
| Internet Software & Services — 2.0% (Continued) | | | | | | |
LoopNet, Inc. (a) | | | 27,540 | | | $ | 290,547 | |
MercadoLibre, Inc. (a) | | | 800 | | | | 52,904 | |
ModusLink Global Solutions, Inc. (a) | | | 19,660 | | | | 130,346 | |
Move, Inc. (a) | | | 88,148 | | | | 208,029 | |
NIC, Inc. (a) | | | 200 | | | | 1,736 | |
OpenTable, Inc. (a) | | | 6,278 | | | | 385,155 | |
QuinStreet, Inc. (a) | | | 67,212 | | | | 1,043,802 | |
Rackspace Hosting, Inc. (a) | | | 97,300 | | | | 2,428,608 | |
SAVVIS, Inc. (a) | | | 12,816 | | | | 307,456 | |
Sohu.com, Inc. (a) | | | 1,100 | | | | 81,950 | |
Support.com, Inc. (a) | | | 75,678 | | | | 429,094 | |
TechTarget, Inc. (a) | | | 751 | | | | 3,935 | |
Terremark Worldwide, Inc. (a) | | | 163,065 | | | | 1,629,019 | |
Vocus, Inc. (a) | | | 3,320 | | | | 73,538 | |
WebMD Health Corporation (a) | | | 4,900 | | | | 256,172 | |
Yahoo, Inc. (a) | | | 5,600 | | | | 92,456 | |
| | | | | | | | 23,408,349 | |
| IT Services — 0.7% | | | | | | | | |
CIBER, Inc. (a) | | | 45,376 | | | | 166,530 | |
Cognizant Technology Solutions Corporation (a) | | | 400 | | | | 26,076 | |
DJSP Enterprises, Inc. (a) | | | 7,386 | | | | 7,386 | |
Dynamics Research Corporation (a) | | | 100 | | | | 1,130 | |
Echo Global Logistics, Inc. (a) | | | 33,703 | | | | 478,583 | |
Euronet Worldwide, Inc. (a) | | | 76,060 | | | | 1,373,644 | |
Fidelity National Information Services, Inc. | | | 100 | | | | 2,710 | |
Global Payments, Inc. | | | 91,300 | | | | 3,557,048 | |
Heartland Payment Systems, Inc. | | | 92,322 | | | | 1,318,358 | |
Integral Systems, Inc. (a) | | | 91 | | | | 773 | |
Mantech International Corporation - Class A (a) | | | 11,047 | | | | 433,153 | |
MasterCard, Inc. - Class A | | | 100 | | | | 24,006 | |
Ness Technologies, Inc. (a) | | | 25,500 | | | | 122,910 | |
SAIC, Inc. (a) | | | 200 | | | | 3,108 | |
Stream Global Services, Inc. (a) | | | 1,107 | | | | 4,162 | |
Visa, Inc. - Class A | | | 800 | | | | 62,536 | |
Wright Express Corporation (a) | | | 16,440 | | | | 619,952 | |
Zanett, Inc. (a) | | | 2,800 | | | | 4,144 | |
| | | | | | | | 8,206,209 | |
| Office Electronics — 0.0% | | | | | | | | |
Xerox Corporation | | | 1,100 | | | | 12,870 | |
| | | | | | | | | |
| Semiconductors & Semiconductor Equipment — 1.9% | | | | | | | | |
Advanced Analogic Technologies, Inc. (a) | | | 37,010 | | | | 139,158 | |
Advanced Micro Devices, Inc. (a) | | | 28,700 | | | | 210,371 | |
Aixtron AG | | | 8,400 | | | | 273,168 | |
Analog Devices, Inc. | | | 100 | | | | 3,367 | |
Atheros Communications, Inc. (a) | | | 4,000 | | | | 124,160 | |
AXT, Inc. (a) | | | 25,100 | | | | 207,075 | |
Cabot Microelectronics Corporation (a) | | | 60,839 | | | | 2,350,210 | |
TFS MARKET NEUTRAL FUND SCHEDULE OF SECURITIES SOLD SHORT (Continued) |
COMMON STOCKS — 60.2% (Continued) | | | | | | |
| Information Technology — 10.6% (Continued) | | | | | | |
| Semiconductors & Semiconductor Equipment — 1.9% (Continued) | | | | | | |
Cavium Networks, Inc. (a) | | | 45,000 | | | $ | 1,434,150 | |
Cree, Inc. (a) | | | 400 | | | | 20,516 | |
Cymer, Inc. (a) | | | 8,017 | | | | 296,228 | |
DayStar Technologies, Inc. (a) | | | 6,400 | | | | 12,544 | |
Energy Conversion Devices, Inc. (a) | | | 474,788 | | | | 2,141,294 | |
Evergreen Solar, Inc. (a) | | | 18,600 | | | | 17,298 | |
FormFactor, Inc. (a) | | | 26,100 | | | | 253,953 | |
Hittite Microwave Corporation (a) | | | 9,400 | | | | 485,698 | |
Ikanos Communications, Inc. (a) | | | 105 | | | | 120 | |
Intersil Corporation - Class A | | | 35,100 | | | | 459,459 | |
Kopin Corporation (a) | | | 106,800 | | | | 406,908 | |
Maxim Integrated Products, Inc. | | | 200 | | | | 4,332 | |
MaxLinear, Inc. - Class A (a) | | | 26,600 | | | | 277,704 | |
Micrel, Inc. | | | 86,500 | | | | 1,030,215 | |
Micron Technology, Inc. (a) | | | 3,000 | | | | 24,810 | |
Mindspeed Technologies, Inc. (a) | | | 33,300 | | | | 245,754 | |
Monolithic Power Systems, Inc. (a) | | | 32,745 | | | | 526,212 | |
MoSys, Inc. (a) | | | 1,800 | | | | 8,514 | |
National Semiconductor Corporation | | | 21,500 | | | | 294,550 | |
NetLogic Microsystems, Inc. (a) | | | 48,582 | | | | 1,460,375 | |
NVE Corporation (a) | | | 2,900 | | | | 139,577 | |
NVIDIA Corporation (a) | | | 16,900 | | | | 203,307 | |
NXP Semiconductors N.V. (a) | | | 31,800 | | | | 419,442 | |
ON Semiconductor Corporation (a) | | | 5,900 | | | | 45,253 | |
PLX Technology, Inc. (a) | | | 1,100 | | | | 3,916 | |
Power Integrations, Inc. | | | 46,417 | | | | 1,585,605 | |
Sigma Designs, Inc. (a) | | | 171,927 | | | | 1,961,687 | |
Silicon Laboratories, Inc. (a) | | | 68,000 | | | | 2,713,200 | |
Skyworks Solutions, Inc. (a) | | | 12,400 | | | | 284,084 | |
Standard Microsystems Corporation (a) | | | 17,990 | | | | 434,279 | |
SunPower Corporation - Class A (a) | | | 18,800 | | | | 256,432 | |
SunPower Corporation - Class B (a) | | | 21,264 | | | | 280,685 | |
Ultra Clean Holdings, Inc. (a) | | | 29 | | | | 218 | |
Veeco Instruments, Inc. (a) | | | 7,900 | | | | 330,615 | |
| | | | | | | | 21,366,443 | |
| Software — 2.5% | | | | | | | | |
Activision Blizzard, Inc. | | | 300 | | | | 3,441 | |
Adobe Systems, Inc. (a) | | | 600 | | | | 16,890 | |
Advent Software, Inc. (a) | | | 39,056 | | | | 2,098,088 | |
AsiaInfo Linkage, Inc. (a) | | | 8,485 | | | | 188,537 | |
Blackbaud, Inc. | | | 47,212 | | | | 1,198,713 | |
Blackboard, Inc. (a) | | | 27,837 | | | | 1,161,916 | |
Citrix Systems, Inc. (a) | | | 600 | | | | 38,442 | |
CommVault Systems, Inc. (a) | | | 3,400 | | | | 98,362 | |
Convio, Inc. (a) | | | 200 | | | | 1,794 | |
Ebix, Inc. (a) | | | 70,400 | | | | 1,738,880 | |
Electronic Arts, Inc. (a) | | | 400 | | | | 6,340 | |
TFS MARKET NEUTRAL FUND SCHEDULE OF SECURITIES SOLD SHORT (Continued) |
COMMON STOCKS — 60.2% (Continued) | | | | | | |
| Information Technology — 10.6% (Continued) | | | | | | |
| Software — 2.5% (Continued) | | | | | | |
Fair Isaac Corporation | | | 135,882 | | | $ | 3,266,603 | |
Informatica Corporation (a) | | | 8,300 | | | | 337,727 | |
Intuit, Inc. (a) | | | 600 | | | | 28,800 | |
Lawson Software, Inc. (a) | | | 316,470 | | | | 2,816,583 | |
Manhattan Associates, Inc. (a) | | | 26,544 | | | | 817,024 | |
MicroStrategy, Inc. - Class A (a) | | | 600 | | | | 54,378 | |
Motricity, Inc. (a) | | | 2,450 | | | | 53,827 | |
NetSuite, Inc. (a) | | | 61,230 | | | | 1,253,990 | |
Parametric Technology Corporation (a) | | | 4,000 | | | | 85,880 | |
Pegasystems, Inc. | | | 34,360 | | | | 929,438 | |
Quest Software, Inc. (a) | | | 7,200 | | | | 188,424 | |
RealD, Inc. (a) | | | 7,100 | | | | 148,532 | |
RealPage, Inc. (a) | | | 1,100 | | | | 25,388 | |
Renaissance Learning, Inc. | | | 6,151 | | | | 85,930 | |
Rosetta Stone, Inc. (a) | | | 33,453 | | | | 774,437 | |
salesforce.com, inc. (a) | | | 400 | | | | 46,428 | |
Shanda Interactive Entertainment Ltd. (a) | | | 24,700 | | | | 998,127 | |
Solarwinds, Inc. (a) | | | 8,200 | | | | 148,830 | |
Sonic Solutions, Inc. (a) | | | 101,034 | | | | 1,209,377 | |
SuccessFactors, Inc. (a) | | | 43,200 | | | | 1,171,584 | |
Symantec Corporation (a) | | | 3,500 | | | | 56,630 | |
TeleCommunication Systems, Inc. (a) | | | 25,052 | | | | 135,531 | |
THQ, Inc. (a) | | | 295,110 | | | | 1,180,440 | |
TiVo, Inc. (a) | | | 20,569 | | | | 229,139 | |
Tyler Technologies, Inc. (a) | | | 68,619 | | | | 1,400,514 | |
Ultimate Software Group, Inc. (The) (a) | | | 39,505 | | | | 1,634,717 | |
VASCO Data Security International, Inc. (a) | | | 59,546 | | | | 475,773 | |
VirnetX Holding Corporation (a) | | | 74,606 | | | | 1,383,941 | |
VMware, Inc. - Class A (a) | | | 400 | | | | 30,584 | |
Wave Systems Corporation - Class A (a) | | | 245,784 | | | | 580,050 | |
| | | | | | | | 28,100,029 | |
| Materials — 3.6% | | | | | | | | |
| Chemicals — 1.5% | | | | | | | | |
ADA-ES, Inc. (a) | | | 1,600 | | | | 9,504 | |
Air Products and Chemicals, Inc. | | | 100 | | | | 8,497 | |
Airgas, Inc. | | | 400 | | | | 28,372 | |
Albemarle Corporation | | | 1,200 | | | | 60,156 | |
Altair Nanotechnologies, Inc. (a) | | | 168,552 | | | | 92,299 | |
American Vanguard Corporation | | | 78,491 | | | | 578,479 | |
Ashland, Inc. | | | 2,100 | | | | 108,423 | |
Balchem Corporation | | | 20,248 | | | | 618,779 | |
Calgon Carbon Corporation (a) | | | 14,557 | | | | 218,500 | |
China Agritech, Inc. (a) | | | 119,454 | | | | 1,534,984 | |
China Green Agriculture, Inc. (a) | | | 343,797 | | | | 2,526,908 | |
Hawkins, Inc. | | | 39,404 | | | | 1,414,603 | |
International Flavors & Fragrances, Inc. | | | 8,000 | | | | 401,280 | |
Kronos Worldwide, Inc. (a) | | | 1,724 | | | | 69,736 | |
Mosaic Company (The) | | | 900 | | | | 65,844 | |
TFS MARKET NEUTRAL FUND SCHEDULE OF SECURITIES SOLD SHORT (Continued) |
COMMON STOCKS — 60.2% (Continued) | | | | | | |
| Materials — 3.6% (Continued) | | | | | | |
| Chemicals — 1.5% (Continued) | | | | | | |
NewMarket Corporation | | | 1,130 | | | $ | 133,928 | |
Olin Corporation | | | 20,416 | | | | 408,116 | |
Sensient Technologies Corporation | | | 38,700 | | | | 1,250,397 | |
ShengdaTech, Inc. (a) | | | 47,871 | | | | 303,023 | |
Sherwin-Williams Company (The) | | | 300 | | | | 21,891 | |
Stepan Company | | | 32,441 | | | | 2,187,821 | |
STR Holdings, Inc. (a) | | | 48,861 | | | | 1,214,196 | |
Valhi, Inc. | | | 4,886 | | | | 98,599 | |
W.R. Grace & Company (a) | | | 6,700 | | | | 214,802 | |
Westlake Chemical Corporation | | | 5,324 | | | | 170,155 | |
Yongye International, Inc. (a) | | | 22,558 | | | | 180,238 | |
ZAGG, Inc. (a) | | | 29,552 | | | | 245,282 | |
Zoltek Companies, Inc. (a) | | | 236,636 | | | | 2,271,706 | |
| | | | | | | | 16,436,518 | |
| Construction Materials — 0.6% | | | | | | | | |
China Advanced Construction Materials Group, Inc. (a) | | | 200 | | | | 958 | |
Eagle Materials, Inc. | | | 87,381 | | | | 2,049,958 | |
Headwaters, Inc. (a) | | | 151,391 | | | | 514,730 | |
Texas Industries, Inc. | | | 136,849 | | | | 4,676,130 | |
| | | | | | | | 7,241,776 | |
| Containers & Packaging — 0.0% | | | | | | | | |
Boise, Inc. (a) | | | 3,593 | | | | 26,049 | |
Graphic Packaging Holding Company (a) | | | 32,800 | | | | 120,048 | |
Myers Industries, Inc. | | | 62 | | | | 548 | |
Owens-Illinois, Inc. (a) | | | 600 | | | | 16,818 | |
Temple-Inland, Inc. | | | 4,600 | | | | 95,312 | |
| | | | | | | | 258,775 | |
| Metals & Mining — 1.2% | | | | | | | | |
A.M. Castle & Company (a) | | | 29 | | | | 447 | |
AK Steel Holding Corporation | | | 171,900 | | | | 2,164,221 | |
Alcoa, Inc. | | | 8,800 | | | | 115,544 | |
AMCOL International Corporation | | | 69,593 | | | | 1,930,510 | |
Brigus Gold Corporation (a) | | | 2,656 | | | | 4,196 | |
Brush Engineered Materials, Inc. (a) | | | 30,999 | | | | 1,027,617 | |
Century Aluminum Company (a) | | | 13,800 | | | | 186,576 | |
China Direct Industries, Inc. (a) | | | 37,300 | | | | 53,339 | |
China Gerui Advanced Materials Group Ltd. (a) | | | 600 | | | | 3,750 | |
China Natural Resources, Inc. (a) | | | 21 | | | | 255 | |
Cliffs Natural Resources, Inc. | | | 600 | | | | 39,120 | |
Commercial Metals Company | | | 2,500 | | | | 34,700 | |
Compass Minerals International, Inc. | | | 2,699 | | | | 212,870 | |
Entrée Gold, Inc. (a) | | | 1,000 | | | | 2,590 | |
General Steel Holdings, Inc. (a) | | | 166,281 | | | | 493,854 | |
Gold Resource Corporation (a) | | | 3,537 | | | | 74,631 | |
Great Basin Gold Ltd. (a) | | | 97,841 | | | | 274,933 | |
Gulf Resources, Inc. (a) | | | 62,384 | | | | 524,026 | |
Jaguar Mining, Inc. (a) | | | 129,612 | | | | 838,590 | |
Kaiser Aluminum Corporation | | | 4,394 | | | | 197,686 | |
TFS MARKET NEUTRAL FUND SCHEDULE OF SECURITIES SOLD SHORT (Continued) |
COMMON STOCKS — 60.2% (Continued) | | | | | | |
| Materials — 3.6% (Continued) | | | | | | |
| Metals & Mining — 1.2% (Continued) | | | | | | |
Mesabi Trust | | | 20,197 | | | $ | 836,762 | |
Newmont Mining Corporation | | | 300 | | | | 18,261 | |
Olympic Steel, Inc. | | | 52,080 | | | | 1,167,634 | |
Rare Element Resources Ltd. (a) | | | 10,000 | | | | 113,600 | |
Schnitzer Steel Industries, Inc. - Class A | | | 2,000 | | | | 103,380 | |
Seabridge Gold, Inc. (a) | | | 15,500 | | | | 423,615 | |
Taseko Mines Ltd. (a) | | | 6,647 | | | | 42,075 | |
Timberline Resources Corporation (a) | | | 600 | | | | 708 | |
U.S. Energy Corporation (a) | | | 10,565 | | | | 55,361 | |
United States Steel Corporation | | | 500 | | | | 21,395 | |
Walter Energy, Inc. | | | 600 | | | | 52,776 | |
WHX Corporation (a) | | | 5,187 | | | | 52,492 | |
Worthington Industries, Inc. | | | 178,900 | | | | 2,755,060 | |
| | | | | | | | 13,822,574 | |
| Paper & Forest Products — 0.3% | | | | | | | | |
Deltic Timber Corporation | | | 27,836 | | | | 1,299,384 | |
Domtar Corporation | | | 100 | | | | 7,936 | |
International Paper Company | | | 1,900 | | | | 48,032 | |
KapStone Paper and Packaging Corporation (a) | | | 2,300 | | | | 29,440 | |
MeadWestvaco Corporation | | | 1,660 | | | | 42,712 | |
Mercer International, Inc. (a) | | | 48,185 | | | | 255,381 | |
Orient Paper, Inc. (a) | | | 46,531 | | | | 253,594 | |
P.H. Glatfelter Company | | | 20,600 | | | | 256,264 | |
Schweitzer-Mauduit International, Inc. | | | 6,497 | | | | 416,977 | |
Verso Paper Corporation (a) | | | 254 | | | | 930 | |
Wausau Paper Corporation (a) | | | 34,635 | | | | 292,319 | |
| | | | | | | | 2,902,969 | |
| Telecommunication Services — 0.7% | | | | | | | | |
| Diversified Telecommunication Services — 0.6% | | | | | | | | |
AboveNet, Inc. (a) | | | 100 | | | | 5,689 | |
Alaska Communications Systems Group, Inc. | | | 59,255 | | | | 594,328 | |
AT&T, Inc. | | | 400 | | | | 11,400 | |
Cbeyond, Inc. (a) | | | 84,260 | | | | 1,141,723 | |
Cincinnati Bell, Inc. (a) | | | 64,347 | | | | 157,650 | |
Cogent Communications Group, Inc. (a) | | | 57,692 | | | | 625,958 | |
HickoryTech Corporation | | | 1,631 | | | | 14,842 | |
IDT Corporation - Class B (a) | | | 31,447 | | | | 461,642 | |
Iridium Communications, Inc. (a) | | | 194,120 | | | | 1,601,490 | |
Neutral Tandem, Inc. (a) | | | 1,400 | | | | 20,468 | |
PAETEC Holding Corporation (a) | | | 32,229 | | | | 136,006 | |
Premiere Global Services, Inc. (a) | | | 53,220 | | | | 363,493 | |
Qwest Communications International, Inc. | | | 900 | | | | 5,940 | |
Radcom Ltd. (a) | | | 1,400 | | | | 15,120 | |
tw telecom, inc. (a) | | | 54,062 | | | | 994,741 | |
Verizon Communications, Inc. | | | 400 | | | | 12,988 | |
VocalTec Communications Ltd. (a) | | | 12,074 | | | | 402,185 | |
| | | | | | | | 6,565,663 | |
TFS MARKET NEUTRAL FUND SCHEDULE OF SECURITIES SOLD SHORT (Continued) |
COMMON STOCKS — 60.2% (Continued) | | | | | | |
| Telecommunication Services — 0.7% (Continued) | | | | | | |
| Wireless Telecommunication Services — 0.1% | | | | | | |
Clearwire Corporation - Class A (a) | | | 78 | | | $ | 553 | |
Fibertower Corporation (a) | | | 114,879 | | | | 516,956 | |
Leap Wireless International, Inc. (a) | | | 27,300 | | | | 311,493 | |
Shenandoah Telecommunications Company | | | 4,177 | | | | 76,230 | |
Telephone and Data Systems, Inc. | | | 2,200 | | | | 76,626 | |
USA Mobility, Inc. | | | 16,481 | | | | 277,375 | |
| | | | | | | | 1,259,233 | |
| Utilities — 1.2% | | | | | | | | |
| Electric Utilities — 0.4% | | | | | | | | |
Brookfield Infrastructure Partners, L.P. | | | 4,500 | | | | 95,175 | |
DPL, Inc. | | | 100 | | | | 2,610 | |
Duke Energy Corporation | | | 200 | | | | 3,642 | |
Empire District Electric Company (The) | | | 2,600 | | | | 54,704 | |
Exelon Corporation | | | 400 | | | | 16,328 | |
FirstEnergy Corporation | | | 240 | | | | 8,717 | |
Great Plains Energy, Inc. | | | 2,100 | | | | 39,963 | |
MGE Energy, Inc. | | | 9,443 | | | | 382,913 | |
Otter Tail Corporation | | | 17,100 | | | | 350,892 | |
Pepco Holdings, Inc. | | | 100 | | | | 1,926 | |
Pinnacle West Capital Corporation | | | 5,500 | | | | 226,380 | |
PNM Resources, Inc. | | | 79,800 | | | | 940,842 | |
PPL Corporation | | | 400 | | | | 10,760 | |
Unitil Corporation | | | 37,458 | | | | 813,588 | |
Westar Energy, Inc. | | | 62,300 | | | | 1,576,190 | |
| | | | | | | | 4,524,630 | |
| Gas Utilities — 0.6% | | | | | | | | |
China Natural Gas, Inc. (a) | | | 156,097 | | | | 963,118 | |
New Jersey Resources Corporation | | | 100 | | | | 4,049 | |
Nicor, Inc. | | | 1,160 | | | | 55,251 | |
Northwest Natural Gas Company | | | 26,534 | | | | 1,307,861 | |
Piedmont Natural Gas, Inc. | | | 38,400 | | | | 1,132,416 | |
South Jersey Industries, Inc. | | | 44,810 | | | | 2,256,631 | |
Star Gas Partners, L.P. | | | 600 | | | | 2,958 | |
WGL Holdings, Inc. | | | 37,423 | | | | 1,442,657 | |
| | | | | | | | 7,164,941 | |
| Independent Power Producers & Energy Traders — 0.1% | | | | | | | | |
AES Corporation (The) (a) | | | 200 | | | | 2,388 | |
American DG Energy, Inc. (a) | | | 600 | | | | 1,908 | |
Dynegy, Inc. (a) | | | 123,200 | | | | 571,648 | |
Mirant Corporation (a) | | | 10,900 | | | | 115,649 | |
Ormat Technologies, Inc. | | | 205 | | | | 5,845 | |
Raser Technologies, Inc. (a) | | | 315,711 | | | | 59,606 | |
U.S. Geothermal, Inc. (a) | | | 1,500 | | | | 1,278 | |
| | | | | | | | 758,322 | |
| Multi-Utilities — 0.1% | | | | | | | | |
Black Hills Corporation | | | 22,803 | | | | 726,048 | |
CH Energy Group, Inc. | | | 1,110 | | | | 50,449 | |
Sempra Energy | | | 200 | | | | 10,696 | |
TFS MARKET NEUTRAL FUND SCHEDULE OF SECURITIES SOLD SHORT (Continued) |
COMMON STOCKS — 60.2% (Continued) | | | | | | |
| Utilities — 1.2% (Continued) | | | | | | |
| Multi-Utilities — 0.1% (Continued) | | | | | | |
Wisconsin Energy Corporation | | | 800 | | | $ | 47,632 | |
| | | | | | | | 834,825 | |
| Water Utilities — 0.0% | | | | | | | | |
American Water Works Company, Inc. | | | 2,140 | | | | 51,103 | |
Aqua America, Inc. | | | 28,375 | | | | 610,914 | |
Cadiz, Inc. (a) | | | 2,623 | | | | 28,512 | |
York Water Company | | | 1,912 | | | | 30,267 | |
| | | | | | | | 720,796 | |
| | | | | | | | | |
Total Common Stocks (Proceeds $679,457,226) | | | | | | $ | 687,882,546 | |
EXCHANGE-TRADED FUNDS — 0.0% | | | | | | |
First Trust NASDAQ-100 Equal Weighted Index Fund | | | 1,000 | | | $ | 22,600 | |
ProShares UltraPro QQQ (a) | | | 740 | | | | 96,696 | |
| | | | | | | | | |
Total Exchange-Traded Funds (Proceeds $87,935) | | | | | | $ | 119,296 | |
| | | | | | |
Zion Oil & Gas, Inc. (a) (b) (Proceeds $2,148) | | | 4,870 | | | $ | 202 | |
| | | | | | | | | |
Total Securities Sold Short — 60.2% (Proceeds $679,547,309) | | | | | | $ | 688,002,044 | |
| (a) | Security did not pay a dividend during the year. Therefore, no dividend expense was incurred on the security. |
| | |
| (b) | Fair Value priced (Note 2). Fair valued securities totaled $202 at October 31, 2010, representing (0.0%) of net assets. |
| | |
| See accompanying notes to financial statements. |
TFS SMALL CAP FUND SUMMARY SCHEDULE OF INVESTMENTS* October 31, 2010 |
| | | | | | |
| Consumer Discretionary — 15.6% | | | | | | |
| Auto Components — 1.1% | | | | | | |
Dorman Products, Inc. (a) | | | 4,415 | | | $ | 161,103 | |
Other Auto Components (b) | | | | | | | 240,390 | |
| | | | | | | | 401,493 | |
| Automobiles — 0.3% | | | | | | | | |
Other Automobiles (b) | | | | | | | 103,917 | |
| | | | | | | | | |
| Diversified Consumer Services — 2.2% | | | | | | | | |
ITT Educational Services, Inc. (a) | | | 2,600 | | | | 167,778 | |
Sotheby's | | | 4,300 | | | | 188,512 | |
Other Diversified Consumer Services (b) | | | | | | | 436,585 | |
| | | | | | | | 792,875 | |
| Hotels, Restaurants & Leisure — 3.3% | | | | | | | | |
Life Time Fitness, Inc. (a) | | | 4,200 | | | | 151,746 | |
Other Hotels, Restaurants & Leisure (b) | | | | | | | 1,019,616 | |
| | | | | | | | 1,171,362 | |
| Household Durables — 1.3% | | | | | | | | |
Other Household Durables (b) | | | | | | | 455,458 | |
| | | | | | | | | |
| Internet & Catalog Retail — 0.2% | | | | | | | | |
Other Internet & Catalog Retail (b) | | | | | | | 86,105 | |
| | | | | | | | | |
| Leisure Equipment & Products — 0.5% | | | | | | | | |
Other Leisure Equipment & Products (b) | | | | | | | 171,584 | |
| | | | | | | | | |
| Media — 1.8% | | | | | | | | |
DreamWorks Animation SKG, Inc. - Class A (a) | | | 4,200 | | | | 148,260 | |
Other Media (b) | | | | | | | 503,311 | |
| | | | | | | | 651,571 | |
| Multiline Retail — 0.4% | | | | | | | | |
Other Multiline Retail (b) | | | | | | | 138,886 | |
| | | | | | | | | |
| Specialty Retail — 3.3% | | | | | | | | |
Charming Shoppes, Inc. (a) | | | 43,100 | | | | 150,419 | |
Select Comfort Corporation (a) | | | 18,100 | | | | 150,411 | |
Other Specialty Retail (b) | | | | | | | 884,154 | |
| | | | | | | | 1,184,984 | |
Textiles, Apparel & Luxury Goods — 1.2% | | | | | | | | |
Other Textiles, Apparel & Luxury Goods (b) | | | | | | | 437,093 | |
| | | | | | | | | |
| Consumer Staples — 3.9% | | | | | | | | |
| Beverages — 0.7% | | | | | | | | |
Other Beverages (b) | | | | | | | 250,710 | |
| | | | | | | | | |
| Food & Staples Retailing — 1.7% | | | | | | | | |
SUPERVALU, Inc. | | | 15,000 | | | | 161,850 | |
Other Food & Staples Retailing (b) | | | | | | | 457,103 | |
| | | | | | | | 618,953 | |
TFS SMALL CAP FUND SUMMARY SCHEDULE OF INVESTMENTS (Continued) |
COMMON STOCKS — 99.1% (Continued) | | | | | | |
| Consumer Staples — 3.9% (Continued) | | | | | | |
| Food Products — 1.2% | | | | | | |
Other Food Products (b) | | | | | $ | 426,129 | |
| | | | | | | | |
| Personal Products — 0.3% | | | | | | | |
Other Personal Products (b) | | | | | | 98,900 | |
| | | | | | | | |
| Energy — 5.1% | | | | | | | |
| Energy Equipment & Services — 2.0% | | | | | | | |
Allis-Chalmers Energy, Inc. (a) | | | 30,600 | | | | 157,284 | |
Other Energy Equipment & Services (b) | | | | | | | 564,500 | |
| | | | | | | | 721,784 | |
| Oil, Gas & Consumable Fuels — 3.1% | | | | | | | | |
Berry Petroleum Company - Class A | | | 4,300 | | | | 147,103 | |
Stone Energy Corporation (a) | | | 9,400 | | | | 146,922 | |
Other Oil, Gas & Consumable Fuels (b) | | | | | | | 798,204 | |
| | | | | | | | 1,092,229 | |
| Financials — 15.2% | | | | | | | | |
| Capital Markets — 1.9% | | | | | | | | |
Other Capital Markets (b) | | | | | | | 667,964 | |
| | | | | | | | | |
| Commercial Banks — 1.7% | | | | | | | | |
Other Commercial Banks (b) | | | | | | | 615,012 | |
| | | | | | | | | |
| Consumer Finance — 1.9% | | | | | | | | |
Cardtronics, Inc. (a) | | | 8,500 | | | | 144,075 | |
Cash America International, Inc. | | | 4,300 | | | | 151,489 | |
First Cash Financial Services, Inc. (a) | | | 5,100 | | | | 148,257 | |
Other Consumer Finance (b) | | | | | | | 225,464 | |
| | | | | | | | 669,285 | |
| Diversified Financial Services — 0.9% | | | | | | | | |
MarketAxess Holdings, Inc. | | | 8,300 | | | | 150,811 | |
Other Diversified Financial Services (b) | | | | | | | 180,597 | |
| | | | | | | | 331,408 | |
| Insurance — 4.6% | | | | | | | | |
Other Insurance (b) | | | | | | | 1,657,669 | |
| | | | | | | | | |
| Real Estate Investment Trusts — 3.6% | | | | | | | | |
Hersha Hospitality Trust | | | 24,446 | | | | 149,121 | |
Other Real Estate Investment Trusts (b) | | | | | | | 1,117,879 | |
| | | | | | | | 1,267,000 | |
| Thrifts & Mortgage Finance — 0.6% | | | | | | | | |
Other Thrifts & Mortgage Finance (b) | | | | | | | 220,476 | |
| | | | | | | | | |
| Health Care — 12.4% | | | | | | | | |
| Biotechnology — 1.9% | | | | | | | | |
Ariad Pharmaceuticals, Inc. (a) | | | 45,800 | | | | 168,544 | |
Other Biotechnology (b) | | | | | | | 521,390 | |
| | | | | | | | 689,934 | |
TFS SMALL CAP FUND SUMMARY SCHEDULE OF INVESTMENTS (Continued) |
COMMON STOCKS — 99.1% (Continued) | | | | | | |
| Health Care — 12.4% (Continued) | | | | | | |
| Health Care Equipment & Supplies — 0.7% | | | | | | |
Other Health Care Equipment & Supplies (b) | | | | | $ | 257,186 | |
| | | | | | | | |
| Health Care Providers & Services — 6.8% | | | | | | | |
Five Star Quality Care, Inc. (a) | | | 28,590 | | | | 155,244 | |
Healthways, Inc. (a) | | | 14,600 | | | | 153,008 | |
Psychiatric Solutions, Inc. (a) | | | 4,500 | | | | 151,650 | |
Sun Healthcare Group, Inc. (a) | | | 15,735 | | | | 149,640 | |
Other Health Care Providers & Services (b) | | | | | | | 1,810,870 | |
| | | | | | | | 2,420,412 | |
| Health Care Technology — 0.5% | | | | | | | | |
Other Health Care Technology (b) | | | | | | | 170,981 | |
| | | | | | | | | |
| Life Sciences Tools & Services — 0.6% | | | | | | | | |
Other Life Sciences Tools & Services (b) | | | | | | | 224,760 | |
| | | | | | | | | |
| Pharmaceuticals — 1.9% | | | | | | | | |
Impax Laboratories, Inc. (a) | | | 7,900 | | | | 148,836 | |
Other Pharmaceuticals (b) | | | | | | | 511,021 | |
| | | | | | | | 659,857 | |
| Industrials — 16.0% | | | | | | | | |
| Aerospace & Defense — 2.2% | | | | | | | | |
BE Aerospace, Inc. (a) | | | 4,200 | | | | 154,392 | |
Orbital Sciences Corporation (a) | | | 9,200 | | | | 149,408 | |
Other Aerospace & Defense (b) | | | | | | | 470,782 | |
| | | | | | | | 774,582 | |
| Air Freight & Logistics — 0.7% | | | | | | | | |
Forward Air Corporation | | | 5,500 | | | | 147,840 | |
Other Air Freight & Logistics (b) | | | | | | | 94,500 | |
| | | | | | | | 242,340 | |
| Airlines — 1.1% | | | | | | | | |
Hawaiian Holdings, Inc. (a) | | | 19,790 | | | | 144,863 | |
Other Airlines (b) | | | | | | | 246,680 | |
| | | | | | | | 391,543 | |
| Building Products — 0.8% | | | | | | | | |
Universal Forest Products, Inc. | | | 5,000 | | | | 150,700 | |
Other Building Products (b) | | | | | | | 152,865 | |
| | | | | | | | 303,565 | |
| Commercial Services & Supplies — 1.0% | | | | | | | | |
Other Commercial Services & Supplies (b) | | | | | | | 344,231 | |
| | | | | | | | | |
| Construction & Engineering — 1.6% | | | | | | | | |
Great Lakes Dredge & Dock Corporation | | | 23,678 | | | | 146,567 | |
Other Construction & Engineering (b) | | | | | | | 441,148 | |
| | | | | | | | 587,715 | |
| Electrical Equipment — 0.8% | | | | | | | | |
Polypore International, Inc. (a) | | | 4,500 | | | | 149,715 | |
Other Electrical Equipment (b) | | | | | | | 152,479 | |
| | | | | | | | 302,194 | |
TFS SMALL CAP FUND SUMMARY SCHEDULE OF INVESTMENTS (Continued) |
COMMON STOCKS — 99.1% (Continued) | | | | | | |
| Industrials — 16.0% (Continued) | | | | | | |
| Industrial Conglomerates — 0.2% | | | | | | |
Other Industrial Conglomerates (b) | | | | | $ | 70,140 | |
| | | | | | | | |
| Machinery — 4.0% | | | | | | | |
Trimas Corporation (a) | | | 9,356 | | | | 148,106 | |
Twin Disc, Inc. | | | 7,312 | | | | 148,872 | |
Other Machinery (b) | | | | | | | 1,131,489 | |
| | | | | | | | 1,428,467 | |
| Marine — 0.6% | | | | | | | | |
Other Marine (b) | | | | | | | 202,231 | |
| | | | | | | | | |
| Professional Services — 0.7% | | | | | | | | |
Acacia Research Corporation (a) | | | 5,900 | | | | 157,058 | |
Other Professional Services (b) | | | | | | | 75,486 | |
| | | | | | | | 232,544 | |
| Road & Rail — 1.2% | | | | | | | | |
Ryder System, Inc. | | | 3,400 | | | | 148,750 | |
Other Road & Rail (b) | | | | | | | 294,039 | |
| | | | | | | | 442,789 | |
| Trading Companies & Distributors — 1.1% | | | | | | | | |
United Rentals, Inc. (a) | | | 8,000 | | | | 150,320 | |
Other Trading Companies & Distributors (b) | | | | | | | 261,031 | |
| | | | | | | | 411,351 | |
| Information Technology — 23.9% | | | | | | | | |
| Communications Equipment — 2.6% | | | | | | | | |
Blue Coat Systems, Inc. (a) | | | 6,100 | | | | 164,517 | |
Other Communications Equipment (b) | | | | | | | 773,632 | |
| | | | | | | | 938,149 | |
| Computers & Peripherals — 2.2% | | | | | | | | |
Compellent Technologies, Inc. (a) | | | 6,200 | | | | 156,674 | |
Isilon Systems, Inc. (a) | | | 5,200 | | | | 148,044 | |
Other Computers & Peripherals (b) | | | | | | | 468,639 | |
| | | | | | | | 773,357 | |
| Electronic Equipment, Instruments & Components — 4.3% | | | | | | | | |
Other Electronic Equipment, Instruments & Components (b) | | | | | | | 1,550,693 | |
| | | | | | | | | |
| Internet Software & Services — 1.3% | | | | | | | | |
Other Internet Software & Services (b) | | | | | | | 470,351 | |
| | | | | | | | | |
| IT Services — 3.0% | | | | | | | | |
Alliance Data Systems Corporation (a) | | | 2,400 | | | | 145,728 | |
Other IT Services (b) | | | | | | | 906,684 | |
| | | | | | | | 1,052,412 | |
| Office Electronics — 0.2% | | | | | | | | |
Other Office Electronics (b) | | | | | | | 78,716 | |
| | | | | | | | | |
| Semiconductors & Semiconductor Equipment — 7.2% | | | | | | | | |
ATMI, Inc. (a) | | | 9,000 | | | | 159,030 | |
TFS SMALL CAP FUND SUMMARY SCHEDULE OF INVESTMENTS (Continued) |
COMMON STOCKS — 99.1% (Continued) | | | | | | |
| Information Technology — 23.9% (Continued) | | | | | | |
| Semiconductors & Semiconductor Equipment — 7.2% (Continued) | | | | | | |
Cypress Semiconductor Corporation (a) | | | 11,700 | | | $ | 164,970 | |
Entegris, Inc. (a) | | | 24,800 | | | | 148,304 | |
Fairchild Semiconductor International, Inc. (a) | | | 14,000 | | | | 157,780 | |
MIPS Technologies, Inc. (a) | | | 9,800 | | | | 144,060 | |
ON Semiconductor Corporation (a) | | | 22,300 | | | | 171,041 | |
Veeco Instruments, Inc. (a) | | | 4,000 | | | | 167,400 | |
Other Semiconductors & Semiconductor Equipment (b) | | | | | | | 1,466,802 | |
| | | | | | | | 2,579,387 | |
| Software — 3.1% | | | | | | | | |
Websense, Inc. (a) | | | 8,000 | | | | 160,960 | |
Other Software (b) | | | | | | | 939,487 | |
| | | | | | | | 1,100,447 | |
| Materials — 4.4% | | | | | | | | |
| Chemicals — 2.1% | | | | | | | | |
Ferro Corporation (a) | | | 10,800 | | | | 148,176 | |
Rockwood Holdings, Inc. (a) | | | 4,400 | | | | 149,248 | |
Other Chemicals (b) | | | | | | | 445,909 | |
| | | | | | | | 743,333 | |
| Construction Materials — 0.0% | | | | | | | | |
Other Construction Materials (b) | | | | | | | 6,966 | |
| | | | | | | | | |
| Containers & Packaging — 0.5% | | | | | | | | |
Other Containers & Packaging (b) | | | | | | | 188,623 | |
| | | | | | | | | |
| Metals & Mining — 0.7% | | | | | | | | |
Other Metals & Mining (b) | | | | | | | 251,390 | |
| | | | | | | | | |
| Paper & Forest Products — 1.1% | | | | | | | | |
Clearwater Paper Corporation (a) | | | 1,900 | | | | 153,425 | |
Domtar Corporation | | | 2,000 | | | | 158,720 | |
Other Paper & Forest Products (b) | | | | | | | 88,920 | |
| | | | | | | | 401,065 | |
| Telecommunication Services — 1.1% | | | | | | | | |
| Diversified Telecommunication Services — 0.7% | | | | | | | | |
Other Diversified Telecommunication Services (b) | | | | | | | 273,402 | |
| | | | | | | | | |
| Wireless Telecommunication Services — 0.4% | | | | | | | | |
Other Wireless Telecommunication Services (b) | | | | | | | 135,309 | |
| | | | | | | | | |
| Utilities — 1.5% | | | | | | | | |
| Electric Utilities — 0.6% | | | | | | | | |
Other Electric Utilities (b) | | | | | | | 212,250 | |
| | | | | | | | | |
| Gas Utilities — 0.9% | | | | | | | | |
Other Gas Utilities (b) | | | | | | | 332,871 | |
| | | | | | | | | |
Total Common Stocks (Cost $32,579,648) | | | | | | $ | 35,478,390 | |
TFS SMALL CAP FUND SUMMARY SCHEDULE OF INVESTMENTS (Continued) |
MONEY MARKET FUNDS — 1.0% | | | | | | |
UMB Money Market Fiduciary, 0.02% (c) (Cost $344,184) | | | 344,184 | | | $ | 344,184 | |
| | | | | | | | | |
Total Investments at Value — 100.1% (Cost $32,923,832) | | | | | | $ | 35,822,574 | |
| | | | | | | | | |
| Liabilities in Excess of Other Assets — (0.1%) | | | | | | | (38,544 | ) |
| | | | | | | | | |
Net Assets — 100.0% | | | | | | $ | 35,784,030 | |
| * | A complete Schedule of Investments is available without charge upon request by calling toll-free 1-888-534-2001 or on the SEC’s website at http://www.sec.gov. |
| | |
| (a) | Non-income producing security. |
| | |
| (b) | Represents issuers not identified as a top 50 holding in terms of market value and issues or issuers not exceeding 1% of net assets individually or in the aggregate, respectively, as of October 31, 2010. |
| | |
| (c) | Variable rate security. The rate shown is the 7-day effective yield as of October 31, 2010. |
| | |
| See accompanying notes to financial statements. |
TFS CAPITAL INVESTMENT TRUST STATEMENTS OF ASSETS AND LIABILITIES October 31, 2010 |
| | | | | | | |
| ASSETS | | | | | | |
| Investments in securities: | | | | | | |
At acquisition cost | | $ | 1,075,778,798 | | | $ | 32,923,832 | |
At value (Note 2) | | $ | 1,146,477,266 | | | $ | 35,822,574 | |
Deposits with brokers for securities sold short (Note 2) | | | 683,261,980 | | | | — | |
Dividends and interest receivable | | | 577,227 | | | | 13,949 | |
Receivable for investment securities sold | | | 235,202,261 | | | | 3,805,788 | |
Receivable for capital shares sold | | | 610,503 | | | | 26,605 | |
Other assets | | | 46,442 | | | | 11,665 | |
TOTAL ASSETS | | | 2,066,175,679 | | | | 39,680,581 | |
| | | | | | | | | |
| LIABILITIES | | | | | | | | |
Securities sold short, at value (Note 2)
(proceeds $679,547,309) | | | 688,002,044 | | | | — | |
Payable for investment securities purchased | | | 230,269,097 | | | | 3,847,391 | |
Payable for capital shares redeemed | | | 1,533,142 | | | | 3,242 | |
Dividends payable on securities sold short (Note 2) | | | 265,769 | | | | — | |
Payable to Adviser (Note 4) | | | 2,126,755 | | | | 23,643 | |
Payable to administrator (Note 4) | | | 152,900 | | | | 8,700 | |
Other accrued expenses and liabilities | | | 1,606,542 | | | | 13,575 | |
TOTAL LIABILITIES | | | 923,956,249 | | | | 3,896,551 | |
| | | | | | | | | |
NET ASSETS | | $ | 1,142,219,430 | | | $ | 35,784,030 | |
| | | | | | | | | |
| Net assets consist of: | | | | | | | | |
Paid-in capital | | $ | 1,051,044,454 | | | $ | 30,897,809 | |
Accumulated net realized gains from security transactions | | | 28,931,243 | | | | 1,987,479 | |
| Net unrealized appreciation (depreciation) on: | | | | | | | | |
Investments | | | 70,698,468 | | | | 2,898,742 | |
Short positions | | | (8,454,735 | ) | | | — | |
Net assets | | $ | 1,142,219,430 | | | $ | 35,784,030 | |
| | | | | | | | | |
Shares of beneficial interest outstanding (unlimited
number of shares authorized, no par value) | | | 72,280,408 | | | | 2,987,761 | |
| | | | | | | | | |
Net asset value, redemption price and offering
price per share (a) (Note 2) | | $ | 15.80 | | | $ | 11.98 | |
| (a) | Redemption price may differ from the net asset value per share depending upon the length of time the shares are held (Note 2). |
| | |
| See accompanying notes to financial statements. |
TFS CAPITAL INVESTMENT TRUST STATEMENTS OF OPERATIONS For the Year Ended October 31, 2010 |
| | | | | | | |
| INVESTMENT INCOME | | | | | | |
Dividends | | $ | 14,204,630 | | | $ | 294,231 | |
Foreign tax withholding | | | (13,321 | ) | | | (112 | ) |
Interest | | | 204,124 | | | | 147 | |
TOTAL INVESTMENT INCOME | | | 14,395,433 | | | | 294,266 | |
| | | | | | | | | |
| EXPENSES | | | | | | | | |
Investment advisory fees (Note 4) | | | 23,330,828 | | | | 347,939 | |
Brokerage expense on securities sold short (Note 2) | | | 13,568,445 | | | | — | |
Dividend expense on securities sold short (Note 2) | | | 7,696,975 | | | | — | |
Administration fees (Note 4) | | | 743,804 | | | | 40,725 | |
Accounting services fees (Note 4) | | | 450,663 | | | | 32,768 | |
Custodian fees | | | 418,364 | | | | 42,064 | |
Transfer agent fees (Note 4) | | | 273,451 | | | | 18,000 | |
Registration fees | | | 116,916 | | | | 32,182 | |
Pricing fees | | | 70,442 | | | | 14,074 | |
Professional fees | | | 51,212 | | | | 26,732 | |
Postage and supplies | | | 59,204 | | | | 5,855 | |
Printing of shareholder reports | | | 48,926 | | | | 5,508 | |
Compliance service fees and expenses (Note 4) | | | 24,385 | | | | 24,385 | |
Trustees’ fees and expenses | | | 23,157 | | | | 23,157 | |
Insurance expense | | | 34,807 | | | | 1,552 | |
Borrowing costs (Note 5) | | | 13,005 | | | | 333 | |
Other expenses | | | 18,401 | | | | 12,084 | |
TOTAL EXPENSES | | | 46,942,985 | | | | 627,358 | |
Investment advisory fee reductions (Note 4) | | | — | | | | (143,467 | ) |
Plus recovery by the Adviser of investment advisory
fee reductions in prior years (Note 4) | | | 258,579 | | | | — | |
NET EXPENSES | | | 47,201,564 | | | | 483,891 | |
| | | | | | | | | |
NET INVESTMENT LOSS | | | (32,806,131 | ) | | | (189,625 | ) |
| | | | | | | | | |
REALIZED AND UNREALIZED GAINS (LOSSES)
ON INVESTMENTS, SECURITIES SOLD SHORT
AND FOREIGN CURRENCY | | | | | | | | |
| Net realized gains (losses) from: | | | | | | | | |
Investments | | | 206,303,196 | | | | 2,817,536 | |
Securities sold short | | | (102,255,118 | ) | | | (2,732 | ) |
Foreign currency transactions | | | 2 | | | | — | |
| Net change in unrealized appreciation (depreciation) on: | | | | | | | | |
Investments | | | 37,377,233 | | | | 3,000,769 | |
Securities sold short | | | (46,305,711 | ) | | | — | |
| | | | | | | | | |
NET REALIZED AND UNREALIZED
GAINS ON INVESTMENTS | | | 95,119,602 | | | | 5,815,573 | |
| | | | | | | | | |
NET INCREASE IN NET ASSETS
FROM OPERATIONS | | $ | 62,313,471 | | | $ | 5,625,948 | |
| See accompanying notes to financial statements. |
TFS MARKET NEUTRAL FUND STATEMENTS OF CHANGES IN NET ASSETS |
| | | | | | | |
| FROM OPERATIONS | | | | | | |
Net investment loss | | $ | (32,806,131 | ) | | $ | (13,332,617 | ) |
| Net realized gains (losses) from: | | | | | | | | |
Investments | | | 206,303,196 | | | | 95,615,019 | |
Short positions | | | (102,255,118 | ) | | | (101,104,859 | ) |
Foreign currency transactions | | | 2 | | | | 2,046 | |
| Net change in unrealized appreciation (depreciation) on: | | | | | | | | |
Investments | | | 37,377,233 | | | | 97,297,681 | |
Short positions | | | (46,305,711 | ) | | | (1,580,141 | ) |
Net increase in net assets from operations | | | 62,313,471 | | | | 76,897,129 | |
| | | | | | | | | |
| FROM DISTRIBUTIONS | | | | | | | | |
Distributions from net realized gains
from security transactions | | | (6,035,121 | ) | | | (7,411,156 | ) |
| | | | | | | | | |
| FROM CAPITAL SHARE TRANSACTIONS | | | | | | | | |
Proceeds from shares sold | | | 487,596,827 | | | | 580,278,792 | |
Net asset value of shares issued in reinvestment
of distributions to shareholders | | | 5,396,118 | | | | 6,647,525 | |
Proceeds from redemption fees collected (Note 2) | | | 182,763 | | | | 960,365 | |
Payments for shares redeemed | | | (235,644,085 | ) | | | (207,527,157 | ) |
Net increase in net assets from capital share transactions | | | 257,531,623 | | | | 380,359,525 | |
| | | | | | | | | |
TOTAL INCREASE IN NET ASSETS | | | 313,809,973 | | | | 449,845,498 | |
| | | | | | | | | |
| NET ASSETS | | | | | | | | |
Beginning of year | | | 828,409,457 | | | | 378,563,959 | |
End of year | | $ | 1,142,219,430 | | | $ | 828,409,457 | |
| | | | | | | | | |
ACCUMULATED NET INVESTMENT INCOME | | $ | — | | | $ | — | |
| | | | | | | | | |
| CAPITAL SHARE ACTIVITY | | | | | | | | |
Shares sold | | | 31,680,817 | | | | 41,291,307 | |
Shares issued in reinvestment of
distributions to shareholders | | | 355,008 | | | | 529,683 | |
Shares redeemed | | | (15,287,390 | ) | | | (14,869,822 | ) |
Net increase in shares outstanding | | | 16,748,435 | | | | 26,951,168 | |
Shares outstanding, beginning of year | | | 55,531,973 | | | | 28,580,805 | |
Shares outstanding, end of year | | | 72,280,408 | | | | 55,531,973 | |
| See accompanying notes to financial statements. |
TFS SMALL CAP FUND STATEMENTS OF CHANGES IN NET ASSETS |
| | | | | | | |
| FROM OPERATIONS | | | | | | |
Net investment loss | | $ | (189,625 | ) | | $ | (34,717 | ) |
| Net realized gains (losses) from: | | | | | | | | |
Investments | | | 2,817,536 | | | | (527,001 | ) |
Short positions | | | (2,732 | ) | | | (218 | ) |
Net change in unrealized appreciation (depreciation) on investments | | | 3,000,769 | | | | 1,407,015 | |
Net increase in net assets from operations | | | 5,625,948 | | | | 845,079 | |
| | | | | | | | | |
| FROM DISTRIBUTIONS | | | | | | | | |
Distributions from net investment income | | | — | | | | (4,055 | ) |
| | | | | | | | | |
| FROM CAPITAL SHARE TRANSACTIONS | | | | | | | | |
Proceeds from shares sold | | | 22,983,154 | | | | 14,594,124 | |
Net asset value of shares issued in reinvestment
of distributions to shareholders | | | — | | | | 3,976 | |
Proceeds from redemption fees collected (Note 2) | | | 21,157 | | | | 10,459 | |
Payments for shares redeemed | | | (9,469,293 | ) | | | (1,879,603 | ) |
Net increase in net assets from capital share transactions | | | 13,535,018 | | | | 12,728,956 | |
| | | | | | | | | |
TOTAL INCREASE IN NET ASSETS | | | 19,160,966 | | | | 13,569,980 | |
| | | | | | | | | |
| NET ASSETS | | | | | | | | |
Beginning of year | | | 16,623,064 | | | | 3,053,084 | |
End of year | | $ | 35,784,030 | | | $ | 16,623,064 | |
| | | | | | | | | |
ACCUMULATED NET INVESTMENT INCOME | | $ | — | | | $ | — | |
| | | | | | | | | |
| CAPITAL SHARE ACTIVITY | | | | | | | | |
Shares sold | | | 2,070,878 | | | | 1,605,044 | |
Shares issued in reinvestment of
distributions to shareholders | | | — | | | | 655 | |
Shares redeemed | | | (865,629 | ) | | | (272,096 | ) |
Net increase in shares outstanding | | | 1,205,249 | | | | 1,333,603 | |
Shares outstanding, beginning of year | | | 1,782,512 | | | | 448,909 | |
Shares outstanding, end of year | | | 2,987,761 | | | | 1,782,512 | |
| See accompanying notes to financial statements. |
TFS MARKET NEUTRAL FUND FINANCIAL HIGHLIGHTS |
Per share data for a share outstanding throughout each period: | | Year Ended October 31, 2010 | | | Year Ended October 31, 2009 | | | Four Months Ended October 31, 2008(a) | | | | | | | | | | |
| Net asset value at beginning of period | | $ | 14.92 | | | $ | 13.25 | | | $ | 15.59 | | | $ | 14.59 | | | $ | 12.44 | | | $ | 10.37 | |
| | | | | | | | | | | | | | | | | | | | | | | | | |
| Income (loss) from investment operations: | | | | | | | | | | | | | | | | | | | | | | | | |
| Net investment income (loss) | | | (0.45 | ) | | | (0.24 | ) | | | (0.09 | ) | | | (0.23 | ) | | | 0.01 | | | | (0.04 | ) |
Net realized and unrealized gains
(losses) on investments | | | 1.43 | | | | 2.13 | | | | (2.27 | ) | | | 1.56 | | | | 2.35 | | | | 2.12 | |
| Total from investment operations | | | 0.98 | | | | 1.89 | | | | (2.36 | ) | | | 1.33 | | | | 2.36 | | | | 2.08 | |
| | | | | | | | | | | | | | | | | | | | | | | | | |
| Less distributions: | | | | | | | | | | | | | | | | | | | | | | | | |
Distributions from net
investment income | | | — | | | | — | | | | — | | | | (0.01 | ) | | | — | | | | — | |
Distributions from net realized gains
from security transactions | | | (0.10 | ) | | | (0.25 | ) | | | — | | | | (0.40 | ) | | | (0.22 | ) | | | (0.01 | ) |
Total distributions | | | (0.10 | ) | | | (0.25 | ) | | | — | | | | (0.41 | ) | | | (0.22 | ) | | | (0.01 | ) |
| | | | | | | | | | | | | | | | | | | | | | | | | |
Proceeds from redemption fees
collected (Note 2) | | | 0.00 | (b) | | | 0.03 | | | | 0.02 | | | | 0.08 | | | | 0.01 | | | | 0.00 | (b) |
| | | | | | | | | | | | | | | | | | | | | | | | | |
| Net asset value at end of period | | $ | 15.80 | | | $ | 14.92 | | | $ | 13.25 | | | $ | 15.59 | | | $ | 14.59 | | | $ | 12.44 | |
| | | | | | | | | | | | | | | | | | | | | | | | | |
Total return (c) | | | 6.60% | | | | 14.86% | | | | (15.01% | )(d) | | | 9.93% | | | | 19.18% | | | | 20.04% | |
| | | | | | | | | | | | | | | | | | | | | | | | | |
| Ratios and supplemental data: | | | | | | | | | | | | | | | | | | | | | | | | |
| Net assets at end of period (000’s) | | $ | 1,142,219 | | | $ | 828,409 | | | $ | 378,564 | | | $ | 271,239 | | | $ | 211,386 | | | $ | 22,478 | |
| | | | | | | | | | | | | | | | | | | | | | | | | |
Ratio of total expenses to
average net assets | | | 4.52% | | | | 4.70% | | | | 4.60% | (g) | | | 4.05% | | | | 3.30% | | | | 5.10% | |
| | | | | | | | | | | | | | | | | | | | | | | | | |
Ratio of net expenses to
average net assets (e) | | | 4.55% | | | | 4.67% | | | | 4.55% | (g) | | | 3.94% | | | | 3.07% | | | | 3.21% | |
| | | | | | | | | | | | | | | | | | | | | | | | | |
Ratio of net expenses to
average net assets excluding
dividend expense (e) (f) | | | 3.81% | | | | 3.84% | | | | 3.68% | (g) | | | 2.80% | | | | 2.48% | | | | 2.49% | |
| | | | | | | | | | | | | | | | | | | | | | | | | |
Ratio of net expenses to average net assets
excluding dividend expense, borrowing
costs and brokerage expense on
securities sold short (e) (f) | | | 2.50% | | | | 2.49% | | | | 2.49% | (g) | | | 2.50% | | | | 2.48% | | | | 2.49% | |
| | | | | | | | | | | | | | | | | | | | | | | | | |
Ratio of net investment income
(loss) to average net assets | | | (3.16% | ) | | | (2.32% | ) | | | (2.24% | )(g) | | | (2.15% | ) | | | 0.09% | | | | (0.69% | ) |
| | | | | | | | | | | | | | | | | | | | | | | | | |
| Portfolio turnover rate | | | 703% | | | | 429% | | | | 204% | (d) | | | 536% | | | | 492% | | | | 398% | |
| (a) | Fund changed fiscal year end to October 31. |
| | |
| (b) | Amount rounds to less than $0.01 per share. |
| | |
| (c) | Total return is a measure of the change in value of an investment in the Fund over the period covered, which assumes any dividends or capital gains distributions are reinvested in shares of the Fund. The returns shown do not reflect the deduction of taxes a shareholder would pay on Fund distributions or the redemption of Fund shares. |
| | |
| (d) | Not annualized. |
| | |
| (e) | Ratio was determined after advisory fee reductions and expense reimbursements (Note 4). |
| | |
| (f) | Dividend expense, borrowing costs and brokerage expense on securities sold short totaled 2.05%, 2.18%, 2.06%(g), 1.44%, 0.59% and 0.72% of average net assets for the periods ended October 31, 2010, 2009 and 2008 and June 30, 2008, 2007 and 2006, respectively. |
| | |
| (g) | Annualized. |
| | |
| See accompanying notes to financial statements. |
TFS SMALL CAP FUND FINANCIAL HIGHLIGHTS |
Per share data for a share outstanding throughout each period: | | Year Ended October 31, 2010 | | | Year Ended October 31, 2009 | | | Four Months Ended October 31, 2008(b) | | | | | | | | | Period Ended June 30, 2006(a) | |
| Net asset value at beginning of period | | $ | 9.33 | | | $ | 6.80 | | | $ | 9.31 | | | $ | 13.08 | | | $ | 10.39 | | | $ | 10.00 | |
| | | | | | | | | | | | | | | | | | | | | | | | | |
| Income (loss) from investment operations: | | | | | | | | | | | | | | | | | | | | | | | | |
| Net investment income (loss) | | | (0.06 | ) | | | (0.02 | ) | | | 0.01 | | | | (0.18 | ) | | | (0.07 | ) | | | (0.01 | ) |
Net realized and unrealized gains
(losses) on investments | | | 2.70 | | | | 2.55 | | | | (2.52 | ) | | | (1.79 | ) | | | 2.76 | | | | 0.40 | |
| Total from investment operations | | | 2.64 | | | | 2.53 | | | | (2.51 | ) | | | (1.97 | ) | | | 2.69 | | | | 0.39 | |
| | | | | | | | | | | | | | | | | | | | | | | | | |
| Less distributions: | | | | | | | | | | | | | | | | | | | | | | | | |
Distributions from net
investment income | | | — | | | | (0.01 | ) | | | — | | | | — | | | | — | | | | — | |
Distributions from net realized gains
from security transactions | | | — | | | | — | | | | — | | | | (1.80 | ) | | | (0.00 | )(c) | | | — | |
Total distributions | | | — | | | | (0.01 | ) | | | — | | | | (1.80 | ) | | | (0.00 | ) | | | — | |
| | | | | | | | | | | | | | | | | | | | | | | | | |
Proceeds from redemption fees
collected (Note 2) | | | 0.01 | | | | 0.01 | | | | 0.00 | (c) | | | 0.00 | (c) | | | 0.00 | (c) | | | — | |
| | | | | | | | | | | | | | | | | | | | | | | | | |
| Net asset value at end of period | | $ | 11.98 | | | $ | 9.33 | | | $ | 6.80 | | | $ | 9.31 | | | $ | 13.08 | | | $ | 10.39 | |
| | | | | | | | | | | | | | | | | | | | | | | | | |
Total return (d) | | | 28.40% | | | | 37.41% | | | | (26.96% | )(e) | | | (16.40% | ) | | | 25.93% | | | | 3.90% | (e) |
| | | | | | | | | | | | | | | | | | | | | | | | | |
| Ratios and supplemental data: | | | | | | | | | | | | | | | | | | | | | | | | |
| Net assets at end of period (000’s) | | $ | 35,784 | | | $ | 16,623 | | | $ | 3,053 | | | $ | 4,581 | | | $ | 5,638 | | | $ | 3,932 | |
| | | | | | | | | | | | | | | | | | | | | | | | | |
Ratio of total expenses to
average net assets | | | 2.31% | | | | 5.14% | | | | 4.44% | (g) | | | 5.57% | | | | 5.14% | | | | 8.18% | (g) |
| | | | | | | | | | | | | | | | | | | | | | | | | |
Ratio of net expenses to
average net assets (f) | | | 1.78% | | | | 1.88% | | | | 0.88% | (g) | | | 2.72% | | | | 2.03% | | | | 1.72% | (g) |
| | | | | | | | | | | | | | | | | | | | | | | | | |
Ratio of net expenses to average net
assets excluding borrowing costs (f) | | | 1.78% | | | | 1.87% | | | | 0.87% | (g) | | | 2.68% | | | | 2.03% | | | | 1.72% | (g) |
| | | | | | | | | | | | | | | | | | | | | | | | | |
Ratio of net investment income
(loss) to average net assets | | | (0.70% | ) | | | (0.63% | ) | | | 0.28% | (g) | | | (1.76% | ) | | | (0.69% | ) | | | (0.69% | )(g) |
| | | | | | | | | | | | | | | | | | | | | | | | | |
| Portfolio turnover rate | | | 657% | | | | 320% | | | | 123% | (e) | | | 269% | | | | 419% | | | | 184% | (g) |
| (a) | Represents the period from the commencement of operations (March 7, 2006) through June 30, 2006. |
| | |
| (b) | Fund changed fiscal year end to October 31. |
| | |
| (c) | Amount rounds to less than $0.01 per share. |
| | |
| (d) | Total return is a measure of the change in value of an investment in the Fund over the period covered, which assumes any dividends or capital gains distributions are reinvested in shares of the Fund. The returns shown do not reflect the deduction of taxes a shareholder would pay on Fund distributions or the redemption of Fund shares. |
| | |
| (e) | Not annualized. |
| | |
| (f) | Ratio was determined after advisory fee reductions and expense reimbursements (Note 4). |
| | |
| (g) | Annualized. |
| | |
| See accompanying notes to financial statements. |
TFS CAPITAL INVESTMENT TRUST NOTES TO FINANCIAL STATEMENTS October 31, 2010 |
1. Organization
The TFS Market Neutral Fund and the TFS Small Cap Fund (individually, a “Fund”, and collectively, the “Funds”) are each a diversified series of TFS Capital Investment Trust (the “Trust”), an open-end management investment company established as an Ohio business trust under a Declaration of Trust dated January 30, 2004. As part of the Trust’s organization, the TFS Market Neutral Fund issued in a private placement on June 28, 2004 10,000 shares of the Fund, at $10.00 per share, to TFS Capital LLC (the “Adviser”), the investment adviser to the Fund. The TFS Market Neutral Fund commenced operations on September 7, 2004. The TFS Small Cap Fund commenced operations on March 7, 2006.
The TFS Market Neutral Fund seeks to produce capital appreciation while having a low correlation to the U.S. equity market, which the Adviser defines as the S&P 500 Index. In addition, the Fund seeks to produce lower volatility than the movement of the U.S. equity market.
The TFS Small Cap Fund seeks long-term capital appreciation. In addition, the Fund seeks to outperform the Russell 2000® Index.
2. Significant Accounting Policies
The following is a summary of the Funds’ significant accounting policies:
Securities valuation – The Funds’ portfolio securities are valued at their fair values as of the close of the regular trading on the New York Stock Exchange (“NYSE”) (generally 4:00 p.m., Eastern time) on each business day the NYSE is open. Securities listed on the NYSE or other exchanges are valued on the basis of their last sale prices on the exchanges on which they are primarily traded. If there are no sales on that day, the securities are valued at the mean of the most recent bid and ask prices on the NYSE or other primary exchange. Securities which are quoted by NASDAQ are valued at the NASDAQ Official Closing Price. If there are no sales on that day, the securities are valued at the mean between the closing bid and ask prices as reported by NASDAQ. Other assets and securities for which no quotations are re adily available are valued at fair value as determined in good faith under the supervision of the Board of Trustees of the Trust and will be classified as Level 2 or 3 within the fair value hierarchy, depending on the inputs used. Such methods of fair valuation may include, but are not limited to: multiple of earnings, discount from market of a similar freely traded security, or a combination of these and other methods.
Accounting principles generally accepted in the United States of America (“GAAP”) establish a single authoritative definition of fair value, set out a framework for measuring fair value and require additional disclosures about fair value measurements.
Various inputs are used in determining the value of each Fund’s investments. These inputs are summarized in the three broad levels listed below:
| • | Level 1 – quoted prices in active markets for identical securities |
| • | Level 2 – other significant observable inputs |
| • | Level 3 – significant unobservable inputs |
The inputs or methodologies used for valuing securities are not necessarily an indication of the risks associated with investing in those securities. The inputs used to measure fair value may fall into different levels of the fair value hierarchy. In such cases, for disclosure purposes, the level in
TFS CAPITAL INVESTMENT TRUST NOTES TO FINANCIAL STATEMENTS (Continued) |
the fair value hierarchy within which the fair value measurement falls in its entirety is determined based on the lowest level input that is significant to the fair value measurement.
The following is a summary of the inputs used to value the Funds’ investments and securities sold short as of October 31, 2010:
| | | | | | | | | | | | |
Common Stocks | | $ | 1,017,852,724 | | | $ | — | | | $ | — | | | $ | 1,017,852,724 | |
Common Stocks – Sold Short | | | (687,882,546 | ) | | | — | | | | — | | | | (687,882,546 | ) |
Closed-End Funds | | | 41,055,193 | | | | — | | | | — | | | | 41,055,193 | |
Exchange-Traded Funds | | | 725,199 | | | | — | | | | — | | | | 725,199 | |
| Exchange-Traded Funds – Sold Short | | | (119,296 | ) | | | — | | | | — | | | | (119,296 | ) |
Rights | | | — | | | | 541,256 | | | | — | | | | 541,256 | |
Rights – Sold Short | | | — | | | | (202 | ) | | | — | | | | (202 | ) |
Warrants | | | 2 | | | | — | | | | — | | | | 2 | |
Money Market Funds | | | 86,302,892 | | | | — | | | | — | | | | 86,302,892 | |
Total | | $ | 457,934,168 | | | $ | 541,054 | | | $ | — | | | $ | 458,475,222 | |
| | | | | | | | | | | | |
Common Stocks | | $ | 35,478,390 | | | $ | — | | | $ | — | | | $ | 35,478,390 | |
Money Market Funds | | | 344,184 | | | | — | | | | — | | | | 344,184 | |
Total | | $ | 35,822,574 | | | $ | — | | | $ | — | | | $ | 35,822,574 | |
Refer to each Fund’s Schedule of Investments and Schedule of Securities Sold Short, as applicable, for a listing of the securities valued using Level 1 inputs by security type and industry type. During the year ended October 31, 2010, the Funds did not have any significant transfers in and out of Level 1 or Level 2. There were no Level 3 securities or derivative instruments held by the Funds during the year ended or as of October 31, 2010.
Share valuation – The net asset value per share of each Fund is calculated daily by dividing the total value of its assets, less liabilities, by the number of shares outstanding. The offering price and redemption price per share of each Fund is equal to the net asset value per share, except that shares are subject to a redemption fee of 2% if redeemed within 90 days of the date of purchase. During the years ended October 31, 2010 and 2009, proceeds from redemption fees totaled $182,763 and $960,365, respectively, for the TFS Market Neutral Fund and $21,157 and $10,459, respectively, for the TFS Small Cap Fund.
Investment income/expense – Dividend income/expense is recorded on the ex-dividend date. Interest income is accrued as earned.
Security transactions – Security transactions are accounted for on the trade date. Gains and losses on securities sold are determined on a specific identification basis.
Distributions to shareholders – Distributions to shareholders arising from net investment income and net realized capital gains, if any, are distributed at least once each year. The amount of distributions from net investment income and net realized gains are determined in accordance with federal income tax regulations, which may differ from GAAP. These “book/tax” differences
TFS CAPITAL INVESTMENT TRUST NOTES TO FINANCIAL STATEMENTS (Continued) |
are permanent in nature and are primarily due to differing treatments of net short-term gains. The tax character of distributions paid by the Funds during the years ended October 31, 2010 and 2009 was as follows:
| | | | | | | |
| TFS Market Neutral Fund | 10/31/2010 | | $ | 6,035,121 | | | $ | 6,035,121 | |
| | 10/31/2009 | | $ | 7,411,156 | | | $ | 7,411,156 | |
| TFS Small Cap Fund | 10/31/2010 | | $ | — | | | $ | — | |
| | 10/31/2009 | | $ | 4,055 | | | $ | 4,055 | |
Short positions – The Funds may sell securities short. For financial statement purposes, an amount equal to the settlement amount is included in the Statements of Assets and Liabilities as an asset and an equivalent liability is then subsequently marked-to-market daily to reflect the current value of the short position. Subsequent fluctuations in the market prices of securities sold, but not yet purchased, may require purchasing the securities at prices which may differ from the market value reflected on the Statements of Assets and Liabilities. The Funds are liable for any dividends payable on securities while those securities are in a short position and will also bear other costs, such as charges for the prime brokerage accounts, in connection with the short positions. These costs are reported as brokerage expenses on securitie s sold short in the Statements of Operations. As collateral for its short positions, the Funds are required under the Investment Company Act of 1940 to maintain assets consisting of cash, cash equivalents or liquid securities equal to the market value of the securities sold short. The amount of the collateral is required to be adjusted daily to reflect changes in the value of the securities sold short. TFS Market Neutral Fund engages in short selling as a principal investment strategy while the TFS Small Cap Fund does not. The TFS Small Cap Fund currently intends to limit its exposure to short positions to 5% of its net assets.
Estimates – The preparation of financial statements in conformity with GAAP requires management to make estimates and assumptions that affect the reported amounts of assets and liabilities and disclosures of contingent assets and liabilities at the date of the financial statements and the reported amounts of income and expenses during the reporting period. Actual results could differ from those estimates.
Common expenses – Common expenses of the Trust are allocated between the Funds based on the relative net assets of each Fund or the nature of the services performed and the relative applicability to each Fund.
Federal income tax – It is each Fund’s policy to comply with the special provisions of Subchapter M of the Internal Revenue Code applicable to regulated investment companies. As provided therein, in any fiscal year in which a Fund so qualifies and distributes at least 90% of its taxable net income, the Fund (but not the shareholders) will be relieved of federal income tax on the income distributed. Accordingly, no provision for income taxes has been made.
In order to avoid imposition of the excise tax applicable to regulated investment companies, it is also each Fund’s intention to declare as dividends in each calendar year at least 98% of its net investment income (earned during the calendar year) and 98% of its net realized capital
TFS CAPITAL INVESTMENT TRUST NOTES TO FINANCIAL STATEMENTS (Continued) |
gains (earned during the twelve months ended October 31) plus undistributed amounts from prior years.
The following information is computed on a tax basis for each item as of October 31, 2010:
| | | | | | |
| Tax cost of portfolio investments and securities sold short | | $ | 474,671,415 | | | $ | 33,171,474 | |
| Gross unrealized appreciation | | $ | 88,233,194 | | | $ | 3,038,057 | |
| Gross unrealized depreciation | | | (104,429,387 | ) | | | (386,957 | ) |
| Net unrealized appreciation | | | (16,196,193 | ) | | | 2,651,100 | |
| Undistributed ordinary income | | | 87,391,292 | | | | 2,114,058 | |
| Undistributed long-term gains | | | 19,979,877 | | | | 121,063 | |
| Total accumulated earnings | | $ | 91,174,976 | | | $ | 4,886,221 | |
The difference between the federal income tax cost of portfolio of investments and securities sold short and the financial statement cost for each Fund is due to certain timing differences in the recognition of capital gains or losses under GAAP. These “book/tax” differences are temporary in nature and are primarily due to the tax deferral of losses on wash sales.
For the year ended October 31, 2010, the TFS Market Neutral Fund and the TFS Small Cap Fund reclassified $32,806,131 and $189,625, respectively, of accumulated net realized gains from security transactions against net investment loss. These reclassifications are reflected on the Statements of Assets and Liabilities. Such reclassifications, the result of permanent differences between the financial statement and income tax reporting requirements, have no effect on the Funds’ net assets or net asset value per share.
During the year ended October 31, 2010, the TFS Small Cap Fund utilized capital loss carryforwards of $519,677 to offset current year realized gains.
The Funds recognize tax benefits or expenses of uncertain tax positions only when the position is “more likely than not” to be sustained assuming examination by tax authorities. Management has reviewed the tax positions taken on Federal income tax returns for all open tax periods (June 30, 2007 through October 31, 2010) of each Fund and has concluded that no provision for unrecognized tax benefits or expenses is required in these financial statements.
3. Investment Transactions
During the year ended October 31, 2010, cost of purchases and proceeds from sales of portfolio securities, other than short-term investments, U.S. government securities and short positions, amounted to $6,824,052,080 and $6,787,873,400, respectively, for the TFS Market Neutral Fund and $186,699,829 and $173,474,620, respectively, for the TFS Small Cap Fund.
TFS CAPITAL INVESTMENT TRUST NOTES TO FINANCIAL STATEMENTS (Continued) |
4. Transactions with Affiliates
INVESTMENT ADVISORY AGREEMENT
Each Fund’s investments are managed by the Adviser pursuant to the terms of an Investment Advisory Agreement. The TFS Market Neutral Fund pays the Adviser an investment advisory fee, computed and accrued daily and paid monthly, at an annual rate of 2.25% of its average daily net assets. Effective as of March 1, 2010, the Investment Advisory Agreement for the TFS Small Cap Fund was amended to revise the investment advisory fee structure. The amended advisory fee for the TFS Small Cap Fund is a fixed fee that is computed at the annual rate of 1.25% of its average daily net assets and replaces the previous performance fee structure.
As part of the amendment to its Investment Advisory Agreement, the TFS Small Cap Fund, for a transition period of 12 months beginning on March 1, 2010, will pay the Adviser the lesser of the 1.25% fee (the “Fixed Fee”) or the Fixed Fee adjusted for the Fund’s performance relative to its benchmark, the Russell 2000 Index plus 2.50% (“Benchmark”), for the applicable performance period. The applicable performance period is a rolling twelve month period whereby the most recent calendar month is substituted for the earliest month as time passes. During periods where the TFS Small Cap Fund outperforms the Benchmark for the relevant performance period, the Adviser will be paid the Fixed Fee. During periods where the TFS Small Cap Fund underperforms the Benchmark for the relevant performance period, the Fixed Fee will be decreased by one basis point (0.01%) for every two basis points (0.02%) of such underperformance, to a minimum fee of 0.00% per annum. As a result, effective March 1, 2010, the maximum fee that the Adviser will receive from the TFS Small Cap Fund is 1.25% per annum of average daily net assets. During the year ended October 31, 2010, investment advisory fees paid by the TFS Small Cap Fund were increased $43,188 above the Fixed Fee pursuant to the performance fee adjustment that was in place prior to March 1, 2010. Since March 1, 2010, investment advisory fees paid by the TFS Small Cap Fund were decreased $34,235 below the Fixed Fee pursuant to the amended investment advisory fee structure.
The Adviser has contractually agreed to reduce its advisory fees and to absorb each Fund’s operating expenses (for the life of the Funds) to the extent necessary to limit aggregate annual ordinary operating expenses (which do not include brokerage costs, taxes, borrowing costs such as interest and dividend expenses on securities sold short and extraordinary expenses) to 2.50% of the TFS Market Neutral Fund’s average daily net assets and 1.75% of the TFS Small Cap Fund’s average daily net assets. Prior to March 1, 2010, the TFS Small Cap Fund’s expense cap was calculated prior to the performance fee adjustment, if any. Therefore, it was possible that the TFS Small Cap Fund’s annual ordinary operating expenses could exceed the 1.75% cap. As a result of this agreement, during the year ended October 31, 2010, the Adviser reduced its investment advisory fees by $143,467 with respect to the TFS Small Cap Fund. There were no fee reductions by the Adviser for the TFS Market Neutral Fund Fund.
Advisory fee reductions and expense reimbursements by the Adviser are subject to repayment by the applicable Fund for a period of three years after such fees and expenses were incurred, provided that such repayments do not cause ordinary operating expenses to exceed the expense caps of 2.50% and 1.75%, respectively, for the TFS Market Neutral Fund and the TFS Small Cap Fund. During the year ended October 31, 2010, the Adviser recouped $258,579 of previous fee reductions from the TFS Market Neutral Fund. As of October 31, 2010, the Adviser may in the future recoup fee reductions and expense reimbursements totaling $275,149 and $474,977,
TFS CAPITAL INVESTMENT TRUST NOTES TO FINANCIAL STATEMENTS (Continued) |
respectively, from the TFS Market Neutral Fund and the TFS Small Cap Fund. The Adviser may recapture these amounts no later than the dates as stated below:
| | | | | | | | | | | | | |
| TFS Market Neutral Fund | | $ | 47,406 | | | $ | 60,676 | | | $ | 167,067 | | | $ | — | |
| TFS Small Cap Fund | | $ | 100,162 | | | $ | 51,491 | | | $ | 179,857 | | | $ | 143,467 | |
The President of the Trust is also a Principal of the Adviser.
COMPLIANCE CONSULTING AGREEMENT
Under the terms of the Compliance Consulting Agreement, Drake Compliance, LLC (“Drake”) provides ongoing regulatory compliance consulting, monitoring and reporting services for the Trust. In addition, a principal of Drake serves as the Trust’s Chief Compliance Officer. For these services, Drake receives $2,000 per month from each Fund. In addition, each Fund reimburses certain out-of-pocket expenses incurred by Drake, if any, including, but not limited to, postage and supplies and travel expenses.
ADMINISTRATION AGREEMENT
Under the terms of an Administration Agreement, Ultimus Fund Solutions, LLC (“Ultimus”) supplies executive, administrative and regulatory services for the Funds. Ultimus supervises the preparation of tax returns, reports to shareholders of the Funds, reports to and filings with the Securities and Exchange Commission (the “SEC”) and state securities commissions and materials for meetings of the Board of Trustees. For these services, each Fund pays Ultimus a monthly fee at an annual rate of 0.15% of its average daily net assets up to $50 million, 0.125% of such assets between $50 million and $100 million, 0.10% of such assets between $100 million and $250 million, 0.075% of such assets between $250 million and $500 million, and 0.05% of such assets in excess of $500 million, subject to a minimum monthly fee of $2, 000. Certain officers of the Trust are also officers of Ultimus.
ACCOUNTING SERVICES AGREEMENT
Under the terms of an Accounting Services Agreement, Ultimus calculates the daily net asset value per share and maintains the financial books and records of each Fund. For the performance of these services, the TFS Market Neutral Fund pays Ultimus a monthly base fee of $4,000 per month plus an asset based fee of 0.005% of average gross daily assets. In addition, the Fund pays $1 per portfolio trade in excess of 1,000 portfolio trades per month. For the performance of these services, the TFS Small Cap Fund pays Ultimus a base fee of $2,500 per month plus an asset based fee of 0.01% of the first $500 million of average daily net assets and 0.005% of such assets in excess of $500 million. In addition, each Fund reimburses certain out-of-pocket expenses incurred by Ultimus in obtaining valuations of the Funds’ portfolio securities.
TRANSFER AGENT AND SHAREHOLDER SERVICES AGREEMENT
Under the terms of a Transfer Agent and Shareholder Services Agreement, Ultimus maintains the records of each shareholder’s account, answers shareholders’ inquiries concerning their accounts, processes purchases and redemptions of each Fund’s shares, acts as dividend and distribution disbursing agent and performs other shareholder service functions. Each Fund pays Ultimus a monthly fee for these services at an annual rate of $15 to $24 per shareholder account, depending on the nature of the account, subject to a $1,500 minimum monthly fee. In addition, the Funds reimburse Ultimus for out-of-pocket expenses including, but not limited to, postage and supplies.
TFS CAPITAL INVESTMENT TRUST NOTES TO FINANCIAL STATEMENTS (Continued) |
DISTRIBUTION AGREEMENT
The Trust has entered into a Distribution Agreement with Ultimus Fund Distributors, LLC (the “Distributor”), pursuant to which the Distributor provides distribution services and serves as the principal underwriter to each Fund. The Distributor is a wholly-owned subsidiary of Ultimus. The Distributor’s fees are paid by the Adviser.
5. Borrowing Costs
During the year ended October 31, 2010, the TFS Market Neutral Fund and the TFS Small Cap Fund incurred $13,005 and $333 of borrowing costs, respectively. As of October 31, 2010, the Funds had no outstanding borrowings. The average outstanding borrowings for the year ended October 31, 2010 for the TFS Market Neutral Fund include 260 days of $0 borrowings and 331 days of $0 borrowings for the TFS Small Cap Fund. The average outstanding borrowings and average interest rate on borrowings during the year ended October 31, 2010 were as follows:
| Average Outstanding Borrowing | |
| TFS Market Neutral Fund | $1,056,610 | 1.21% |
| TFS Small Cap Fund | $21,950 | 1.58% |
6. Contingencies and Commitments
The Funds indemnify the Trust’s officers and Trustees for certain liabilities that might arise from their performance of their duties to the Funds. Additionally, in the normal course of business the Funds enter into contracts that contain a variety of representations and warranties and which provide general indemnifications. The Funds’ maximum exposure under these arrangements is unknown, as this would involve future claims that may be made against the Funds that have not yet occurred. However, based on experience, the Funds expect the risk of loss to be remote.
7. Subsequent Events
The Funds are required to recognize in the financial statements the effects of all subsequent events that provide additional evidence about conditions that existed as of the date of the Statements of Assets and Liabilities. For non-recognized subsequent events that must be disclosed to keep the financial statements from being misleading, the Funds are required to disclose the nature of the event as well as an estimate of its financial effect, or a statement that such an estimate cannot be made. Management has evaluated subsequent events through the issuance of these financial statements and has noted no such events.
TFS CAPITAL INVESTMENT TRUST NOTES TO FINANCIAL STATEMENTS (Continued) |
8. Recent Accounting Pronouncement
In January 2010, the Financial Accounting Standards Board (“FASB”) issued Accounting Standards Update (“ASU”) No. 2010-06 “Improving Disclosures about Fair Value Measurements.” ASU No. 2010-06 amends FASB Accounting Standards Codification Topic 820, Fair Value Measurements and Disclosures, to require additional disclosures regarding fair value measurements. Certain disclosures required by ASU No. 2010-06 are effective for interim and annual reporting periods beginning after December 15, 2009 and others for fiscal years beginning after December 15, 2010 and for interim periods within those fiscal years. Management is currently evaluating the impact ASU No. 2010-06 will have on the Funds’ financial statement disclosures.
TFS CAPITAL INVESTMENT TRUST REPORT OF INDEPENDENT REGISTERED PUBLIC ACCOUNTING FIRM |
To the Shareholders and Board of Trustees of
TFS Capital Investment Trust
We have audited the accompanying statements of assets and liabilities, including the summary schedules of investments and schedule of securities sold short, of TFS Capital Investment Trust (the “Funds”), comprised of TFS Market Neutral Fund and TFS Small Cap Fund, as of October 31, 2010, and the related statements of operations for the year then ended, the statements of changes in net assets for each of the two years in the period then ended, and the financial highlights for the periods presented. These financial statements and financial highlights are the responsibility of the Funds’ management. Our responsibility is to express an opinion on these financial statements and financial highlights based on our audits.
We conducted our audits in accordance with the standards of the Public Company Accounting Oversight Board (United States). Those standards require that we plan and perform the audit to obtain reasonable assurance about whether the financial statements and financial highlights are free of material misstatement. The Funds are not required to have, nor were we engaged to perform, an audit of their internal control over financial reporting. Our audits included consideration of internal control over financial reporting as a basis for designing audit procedures that are appropriate in the circumstances, but not for the purpose of expressing an opinion on the effectiveness of the Funds’ internal control over financial reporting. Accordingly, we express no such opinion. An audit also includes examining, on a test basis, evidence supporti ng the amounts and disclosures in the financial statements, assessing the accounting principles used and significant estimates made by management, as well as evaluating the overall financial statement presentation. Our procedures included confirmation of securities owned as of October 31, 2010, by correspondence with the custodian and brokers; where replies were not received from brokers, we performed other auditing procedures. We believe that our audits provide a reasonable basis for our opinion.
In our opinion, the financial statements and financial highlights referred to above present fairly, in all material respects, the financial position of each of the portfolios constituting the TFS Capital Investment Trust as of October 31, 2010, the results of their operations for the year then ended, the changes in their net assets for each of the two years in the period then ended, and the financial highlights for the periods presented, in conformity with accounting principles generally accepted in the United States of America.
Deloitte & Touche LLP
Cincinnati, Ohio
December 28, 2010
TFS CAPITAL INVESTMENT TRUST ABOUT YOUR FUNDS’ EXPENSES (Unaudited) |
We believe it is important for you to understand the impact of costs on your investment. As a shareholder of the Funds, you incur two types of costs: (1) transaction costs, including redemption fees; and (2) ongoing costs, including management fees and other Fund expenses. The following examples are intended to help you understand your ongoing costs (in dollars) of investing in the Funds and to compare these costs with the ongoing costs of investing in other mutual funds.
A mutual fund’s ongoing costs are expressed as a percentage of its average net assets. This figure is known as the expense ratio. The ongoing costs reflected in the table are based on an investment of $1,000 made at the beginning of the most recent semi-annual period and held until the end of the period (May 1, 2010 through October 31, 2010).
The table below illustrates each Fund’s ongoing costs in two ways:
Actual fund return – This section helps you to estimate the actual expenses that you paid over the period. The “Ending Account Value” shown is derived from each Fund’s actual return, and the third column shows the dollar amount of operating expenses that would have been paid by an investor who started with $1,000 in the Funds. You may use the information here, together with the amount you invested, to estimate the expenses that you paid over the period.
To do so, simply divide your account value by $1,000 (for example, an $8,600 account value divided by $1,000 = 8.6), then multiply the result by the number given for the Funds under the heading “Expenses Paid During Period.”
Hypothetical 5% return – This section is intended to help you compare each Fund’s ongoing costs with those of other mutual funds. It assumes that each Fund had an annual return of 5% before expenses during the period shown, but that the expense ratio is unchanged. In this case, because the return used is not each Fund’s actual return, the results do not apply to your investment. The example is useful in making comparisons because the SEC requires all mutual funds to calculate expenses based on a 5% return. You can assess each Fund’s ongoing costs by comparing this hypothetical example with the hypothetical examples that appear in shareholder reports of other funds.
Note that expenses shown in the table are meant to highlight and help you compare ongoing costs only. The Funds do not charge any sales loads. However, a redemption fee of 2% is applied on the sale of shares purchased within 180 days of the date of their purchase and does not apply to the redemption of shares acquired through reinvestment of dividends and other distributions. The calculations below assume no shares were bought or sold during the period. Your actual costs may have been higher or lower, depending on the amount of your investment and the timing of any purchases or redemptions.
More information about each Fund’s expenses, including annualized expense ratios, can be found in this report. For additional information on operating expenses and other shareholder costs, please refer to the Funds’ prospectus.
TFS CAPITAL INVESTMENT TRUST ABOUT YOUR FUNDS’ EXPENSES (Unaudited) (Continued) |
TFS Market Neutral Fund
| | Beginning Account Value May 1, 2010 | Ending Account Value October 31, 2010 | Expenses Paid During Period* |
| Based on Actual Fund Return | $1,000.00 | $1,016.70 | $24.15 |
| Based on Hypothetical 5% Return (before expenses) | $1,000.00 | $1,001.26 | $23.96 |
TFS Small Cap Fund
| | Beginning Account Value May 1, 2010 | Ending Account Value October 31, 2010 | Expenses Paid During Period* |
| Based on Actual Fund Return | $1,000.00 | $985.20 | $7.66 |
| Based on Hypothetical 5% Return (before expenses) | $1,000.00 | $1,017.49 | $7.78 |
| * | Expenses are equal to the annualized expense ratio of 4.75% and 1.53%, respectively, for the TFS Market Neutral Fund and the TFS Small Cap Fund for the period, multiplied by the average account value over the period, multiplied by 184/365 (to reflect the one-half year period). |
OTHER INFORMATION (Unaudited)
A description of the policies and procedures that the Funds use to determine how to vote proxies relating to portfolio securities is available without charge upon request by calling toll-free 1-888-534-2001, or on the SEC’s website at http://www.sec.gov. Information regarding how the Funds voted proxies relating to portfolio securities during the most recent 12-month period ended June 30 is also available without charge upon request by calling toll-free 1-888-534-2001, or on the SEC’s website at http://www.sec.gov.
The Funds file a complete listing of portfolio holdings with the SEC as of the end of the first and third quarters of each fiscal year on Form N-Q. The filings are available upon request, by calling 1-888-534-2001. Furthermore, you may obtain copies of the filings on the SEC’s website at http://www.sec.gov. The Funds’ Forms N-Q may also be reviewed and copied at the SEC’s Public Reference Room in Washington, DC, and information on the operation of the Public Reference Room may be obtained by calling 1-800-SEC-0330.
FEDERAL TAX INFORMATION (Unaudited)
In accordance with federal tax requirements, the following provides shareholders with information concerning distributions from ordinary income made by the Funds during the fiscal year ended October 31, 2010. Certain dividends paid by the Funds may be subject to a maximum tax rate of 15%, as provided by the Jobs and Growth Tax Relief Reconciliation Act of 2003. The TFS Market Neutral Fund intends to designate up to a maximum amount of $6,035,121 as taxed at a maximum rate of 15%.
TFS CAPITAL INVESTMENT TRUST BOARD OF TRUSTEES AND OFFICERS (Unaudited) |
Overall responsibility for management of the Trust rests with its Trustees. The Trustees serve for terms of indefinite duration until death, resignation, retirement or removal from office. The Trustees, in turn, elect the officers of the Trust to actively supervise the Trust’s day-to-day operations. The officers have been elected for an annual term. Certain officers of the Trust also may serve as Trustees. The Trust is managed by the Trustees in accordance with the laws of the State of Ohio governing business trusts. There are currently five Trustees, three of whom are not “interested persons” of the Trust within the meaning of that term under the Investment Company Act of 1940. The Trustees and executive officers of the Trust, their addresses and their principal occupations during the past five (5) years are as follo ws:
Name, Address and Age | Length of Time Served | Position(s) Held with Trust | Principal Occupation(s) During Past 5 Years and Directorships of Public Companies ** | Number of Portfolios in Fund Complex Overseen by Trustee |
| Interested Trustees: | | | | |
*Larry S. Eiben 1800 Bayberry Court, Suite 103 Richmond, Virginia 23226 Year of Birth: 1972 | Since January 2004 | Trustee and President | Chief Operating Officer and Chief Compliance Officer of TFS Capital LLC. | 2 |
*Thomas M. Frederick 121 Walnut Street, Suite 320 West Chester, Pennsylvania 19380 Year of Birth: 1972 | Since June 2004 | Trustee | Director of Business Development for TFS Capital LLC from July 2006 to present; Associate Director of Virginia Student Aid Foundation from February 2004 to July 2006. | 2 |
| Independent Trustees: | | | | |
Merle C. Hazelton 1800 Bayberry Court, Suite 103 Richmond, Virginia 23226 Year of Birth: 1962 | Since June 2004 | Trustee | Capital Markets – Assistant Controller of Genworth Financial, Inc. from July 2007 to present; Investments – Assistant Controller of Genworth Financial, Inc. from May 2005 to July 2007. | 2 |
Mark J. Malone 1800 Bayberry Court, Suite 103 Richmond, Virginia 23226 Year of Birth: 1966 | Since June 2004 | Trustee | Managing Director of Lazard Capital Markets from March 2008 to present; Managing Director of Institutional Sales of Morgan Keegan & Company, Inc. from April 2006 to March 2008; Director of Institutional Equities of Deutsche Bank Securities from June 1998 to May 2006. | 2 |
Brian O’Connell 1800 Bayberry Court, Suite 103 Richmond, Virginia 23226 Year of Birth: 1959 | Since June 2004 | Trustee | Independent writer/author. | 2 |
TFS CAPITAL INVESTMENT TRUST BOARD OF TRUSTEES AND OFFICERS (Unaudited) (Continued) |
Name, Address and Age | Length of Time Served | Position(s) Held with Trust | Principal Occupation(s) During Past 5 Years |
| Executive Officers: | | | |
Robert G. Dorsey 225 Pictoria Drive, Suite 450 Cincinnati, Ohio 45246 Year of Birth: 1957 | Since June 2004 | Vice President | Managing Director of Ultimus Fund Solutions, LLC and Ultimus Fund Distributors, LLC. |
Mark J. Seger 225 Pictoria Drive, Suite 450 Cincinnati, Ohio 45246 Year of Birth: 1962 | Since June 2004 | Treasurer | Managing Director of Ultimus Fund Solutions, LLC and Ultimus Fund Distributors, LLC. |
John F. Splain 225 Pictoria Drive, Suite 450 Cincinnati, Ohio 45246 Year of Birth: 1956 | Since June 2004 | Secretary | Managing Director of Ultimus Fund Solutions, LLC and Ultimus Fund Distributors, LLC. |
David D. Jones 719 Sawdust Road, Suite 113 The Woodlands, TX 77380 Year of Birth: 1958 | Since December 2007 | Chief Compliance Officer | Managing Member of Drake Compliance, LLC; Attorney, David Jones & Assoc., P.C. (a law firm). |
| * | Larry S. Eiben and Thomas M. Frederick, as affiliated persons of TFS Capital LLC, the Trust’s investment adviser, are considered “interested persons” of the Trust within the meaning of Section 2(a)(19) of the Investment Company Act of 1940. |
| ** | None of the Trustees are directors of public companies. |
Additional information about members of the Board of Trustees and executive officers is available in the Statement of Additional Information (“SAI”). To obtain a free copy of the SAI, please call 1-888-534-2001.
TFS CAPITAL INVESTMENT TRUST APPROVAL OF INVESTMENT ADVISORY AGREEMENTS (Unaudited) |
The Board of Trustees, including the Independent Trustees voting separately, have reviewed and approved the continuance of the Investment Advisory Agreements (the “Advisory Agreements”) with the Adviser for the TFS Market Neutral Fund and the TFS Small Cap Fund. These approvals took place at a Board meeting held on May 27, 2010, at which all of the Trustees were present in person.
The Trustees were advised by independent counsel of their fiduciary obligations in approving the Advisory Agreements and the Trustees requested such information from the Adviser as they deemed reasonably necessary to evaluate the terms of the Agreements and whether the Agreements continue to be in the best interests of the Funds and their shareholders. The Trustees reviewed: (i) the nature, extent and quality of the services provided by the Adviser; (ii) the investment performance of each Fund and the Adviser; (iii) the cost of the services provided and the profits realized by the Adviser from its relationship with the Funds and the financial strength of the Adviser; (iv) the extent to which economies of scale would be realized as the Funds grow larger; (v) whether advisory fee levels reflect these economies of scale for the benefit of Fund shareholders; (vi) comparisons of services rendered to and fees paid by the Funds with the services provided by and the fees paid to other investment advisers or the services provided to and the fees paid by other clients of the Adviser; and (vii) any ancillary benefits derived or to be derived by the Adviser from its relationship with the Funds. The Trustees reviewed the background, qualifications, education and experience of the Adviser’s investment and operational personnel. The Trustees also discussed and considered the quality of administrative and other services provided to the Trust, the Adviser’s compliance program, and the Adviser’s role in coordinating such services and programs. The Independent Trustees were advised by experienced independent counsel throughout the process. Prior to voting on the Advisory Agreements, the Independent Trustees reviewed the Agreements with management and also met in a private session with counsel at which no representatives of the Adviser were present.
Below is a summary of the discussions and findings of the Trustees in regard to the approvals of the Advisory Agreements.
| (i) | The nature, extent, and quality of the services provided by the Adviser. In this regard, the Independent Trustees reviewed the services being provided to the Funds by the Adviser. They discussed the responsibilities of the Adviser under the Advisory Agreements and the Adviser’s compensation under the Advisory Agreements. The Independent Trustees reviewed the background and experience of the Adviser’s key investment and operating personnel. They noted the Adviser’s continued commitment to add experienced professionals to its team to further strengthen its operations and the Adviser’s ongoing commitment to research and development. The Independent Trustees also discussed the steps taken by the Adviser to retain its key employees. After reviewing th e foregoing information, the Independent Trustees concluded that the quality, extent and nature of the services provided by the Adviser to each Fund were satisfactory. |
| (ii) | The investment performance of the Funds and Adviser. In this regard, the Independent Trustees compared the performance of the TFS Market Neutral Fund with the performance of the S&P 500 Index, the Fund’s primary benchmark, over various periods. It was noted by the Independent Trustees that the TFS Market Neutral Fund underperformed the S&P 500 Index for the one year period ended March 31, 2010. They discussed the Fund’s underperformance, finding that the Fund’s investment strategies are not designed to keep |
TFS CAPITAL INVESTMENT TRUST APPROVAL OF INVESTMENT ADVISORY AGREEMENTS (Unaudited) (Continued) |
pace with or outperform the S&P 500 Index during a period when the market enjoys a broad-based rally. The Independent Trustees further noted that the TFS Market Neutral Fund has significantly outperformed the S&P 500 Index over the three year, five year and since inception periods ended March 31, 2010. The Independent Trustees also reviewed comparative performance statistics of the universe of funds categorized by Morningstar as “long short” funds, which is the category to which the TFS Market Neutral Fund has been assigned. The Independent Trustees noted that for the one year period ended March 31, 2010, the TFS Market Neutral Fund’s total return (18.10%) was better than the return of the average fund in the Morningstar “long short” category (16.10%). They also noted that the Fund currently has a 5-star Morningstar rating. The Independent Trustees reviewed performance information with respect to the Adviser’s other managed accounts with similar investment objectives, which indicated that the TFS Market Neutral Fund trailed the performance of such other accounts for the one year period ended March 31, 2010. They considered that, based on representations by the Adviser, those performance differences can be attributed mainly to the Fund being subject to stricter investment limitations and being managed more conservatively than such other accounts in order to achieve a less volatile return. The Independent Trustees also considered the consistency of the Adviser’s management of the TFS Market Neutral Fund with the Fund’s investment objective and policies. After considerable discussion, the Independent Trustees concluded that the investment performance of the TFS Market Neutral Fund has been above average.
The Independent Trustees next reviewed the performance of the TFS Small Cap Fund, which was compared to the performance of the Russell 2000 Index, the Fund’s primary benchmark, over various periods ended March 31, 2010. It was noted by the Independent Trustees that the TFS Small Cap Fund outperformed the Russell 2000 Index over the one year, three year and since inception periods ended March 31, 2010. The Independent Trustees reviewed comparative performance statistics of the universe of funds categorized by Morningstar as “small cap blend” funds, which is the category to which the TFS Small Cap Fund has been assigned. The Independent Trustees noted that for the one year and three year periods ended March 31, 2010, the TFS Small Cap Fund’s 88.07% and 4.60% returns, respectively, were significantly higher t han the performance of the average fund in the Morningstar “small cap blend” category (65.47% and -4.30%, respectively) over the same periods. The Independent Trustees further noted that the TFS Small Cap Fund currently has a 5-star Morningstar rating. They also reviewed performance information with respect to the Adviser’s other managed accounts but concluded that none of these other accounts provided a good comparison due to differences in investment objectives. The Independent Trustees considered the consistency of the Adviser’s management of the TFS Small Cap Fund with the Fund’s investment objective and policies. After further discussion, the Independent Trustees concluded that the investment performance of the TFS Small Cap Fund has been above average.
| (iii) | The costs of the services to be provided and profits to be realized by the Adviser from its relationship with the Funds. In this regard, the Independent Trustees considered the Adviser’s staffing, personnel and operations; the financial condition of the Adviser and the level of commitment to the Funds by the principals of the Adviser; the asset levels of each Fund; and the overall expenses of each Fund. The Independent Trustees reviewed the rate of the advisory fees paid by the Funds under the Advisory Agreements and compared them |
TFS CAPITAL INVESTMENT TRUST APPROVAL OF INVESTMENT ADVISORY AGREEMENTS (Unaudited) (Continued) |
to average advisory fee ratios of similar mutual funds compiled from statistics reported by Morningstar. They also compared the total operating expense ratios of the Funds with average expense ratios of representative funds in their respective Morningstar categories. It was noted by the Independent Trustees that the TFS Market Neutral Fund’s advisory fee of 2.25% and its overall expense ratio of 2.49% (which excludes dividend expenses, borrowing costs and brokerage expenses on securities sold short) were each higher than the average advisory fee (1.20%) and average expense ratio (2.09%) for Morningstar’s “long short” fund category. The Independent Trustees performed a similar comparison for the TFS Small Cap Fund, finding that the Fund’s advisory fee of 1.25% and its overall expense ratio of 1.87% we re each higher than the average advisory fee (0.79%) and average expense ratio (1.42%) for Morningstar’s “small cap blend” fund category. The Independent Trustees took into account shareholders’ recent approval of the new fixed-fee structure for the TFS Small Cap Fund and the Adviser’s commitment to cap the Fund’s ordinary operating expenses at 1.75% per annum. The Independent Trustees also considered the Adviser’s analysis of its revenues and expenses with respect to its services provided to each Fund for periods ended March 31, 2010. It was noted by the Independent Trustees that the Adviser has been required to reduce its advisory fees from the TFS Market Neutral Fund in order to maintain the 2.50% operating expense cap. The Independent Trustees noted that, despite these advisory fee reductions, the Adviser’s overall revenues and profits from managing the TFS Market Neutral Fund have increased significantly from prior years. They discussed the profitability o f the Adviser and noted the costs associated with managing the Funds, especially in the areas of research and development and retention of its investment professionals and hiring new personnel. The Independent Trustees reviewed the revenue and expense information with respect to the TFS Small Cap Fund and it was noted that during the last fiscal year the Adviser began to receive a portion of its advisory fees with respect to its services to the Fund. It was further noted that, prior to the most recently completed fiscal year, the Adviser had not received any of its advisory fees since the inception of the TFS Small Cap Fund and it had also reimbursed a significant amount of other operating expenses of the Fund. The Independent Trustees reviewed the balance sheet of the Adviser as of March 31, 2010 and concluded that the Adviser has adequate financial resources to serve as the Funds’ investment adviser. The Independent Trustees considered the “fallout benefits” to the Adviser, including the additional exposure the Adviser has received as a result of managing the Funds. After a full discussion and consideration of the foregoing, the Independent Trustees concluded that the fees paid by each Fund to the Adviser are reasonable in light of the quality of the services received.
| (iv) | The extent to which economies of scale would be realized as a Fund grows and whether advisory fee levels reflect these economies of scale for the benefit of a Fund’s investors. The Independent Trustees considered the current net assets for each Fund and discussed the expense cap arrangements between the Trust and the Adviser. They noted that the TFS Market Neutral Fund has grown its assets to the point where the Adviser is currently collecting its full advisory fee and is being reimbursed by the Fund for a portion of prior fee reductions and expense reimbursements and, with respect to the TFS Small Cap Fund, the Adviser has begun to collect a portion of its advisory fees. The Independent Trustees concluded that, at the TFS Small Cap Fund’s current asset level, it would not be relevant to consider the extent to which economies of scale a re being realized and that it is not necessary |
TFS CAPITAL INVESTMENT TRUST APPROVAL OF INVESTMENT ADVISORY AGREEMENTS (Unaudited) (Continued) |
or appropriate at this time to consider adding fee breakpoints to the advisory fee schedule for the TFS Small Cap Fund. The Independent Trustees next discussed whether or not it is appropriate to add breakpoints to the TFS Market Neutral Fund’s advisory fee schedule at this time. They noted that, as a result of the significant growth of assets in the TFS Market Neutral Fund, the extent to which economies of scale are being realized by shareholders should be considered. The Independent Trustees discussed the Adviser’s past fee reductions and expense reimbursements, the Adviser’s ongoing commitment to hiring and maintaining top quality investment professionals and the Adviser’s significant investment in research and development. The Independent Trustees considered various fee schedules that might be implemen ted on behalf of the TFS Market Neutral Fund, including recommendations from the Adviser. They discussed the likelihood that the Adviser would recommend the TFS Market Neutral Fund reopen to new investors, focusing on the Adviser’s efforts to develop new investment strategies that might allow for the Fund to be reopened and the expense the Adviser would incur in developing the strategies. After considerable discussion regarding adding breakpoints to the TFS Market Neutral Fund’s fee schedule and considering factors such as the Adviser just recently earning its full fee, the Fund commencing recoupment of fee reductions and expense reimbursements and the closing of the Fund to new investors, the Independent Trustees concluded that it is not necessary or appropriate to introduce fee breakpoints at the present time. The Independent Trustees noted, however, that they will continue to monitor this situation and may determine in the future that fee breakpoints are appropriate.
In conclusion, the Trustees did not identify any single factor as all-important or controlling in their determination to approve the Advisory Agreements. The Trustees, including all of the Independent Trustees, concluded that the terms of each Advisory Agreement were fair and reasonable, that the Adviser’s fees were reasonable in light of the services provided to the Funds and the benefits received by the Adviser, and that continuance of the Advisory Agreements is in the best interests of each Fund and its shareholders.
This page intentionally left blank.
As of the end of the period covered by this report, the registrant has adopted a code of ethics that applies to the registrant’s principal executive officer, principal financial officer, principal accounting officer or controller, or persons performing similar functions, regardless of whether these individuals are employed by the registrant or a third party. Pursuant to Item 12(a)(1), a copy of registrant’s code of ethics is filed as an exhibit to this Form N-CSR. During the period covered by this report, the code of ethics has not been amended, and the registrant has not granted any waivers, including implicit waivers, from the provisions of the code of ethics.
The registrant’s board of trustees has determined that the registrant has at least one audit committee financial expert serving on its audit committee. The name of the audit committee financial expert is Merle C. Hazelton. Mr. Hazelton is “independent” for purposes of this Item.
The registrant has not adopted procedures by which shareholders may recommend nominees to the registrant’s board of trustees.
(a) Based on their evaluation of the registrant’s disclosure controls and procedures (as defined in Rule 30a-3(c) under the Investment Company Act of 1940) as of a date within 90 days of the filing date of this report, the registrant’s principal executive officer and principal financial officer have concluded that such disclosure controls and procedures are reasonably designed and are operating effectively to ensure that material information relating to the registrant, including its consolidated subsidiaries, is made known to them by others within those entities, particularly during the period in which this report is being prepared, and that the information required in filings on Form N-CSR is recorded, processed, summarized, and reported on a timely basis.
(b) There were no changes in the registrant’s internal control over financial reporting (as defined in Rule 30a-3(d) under the Investment Company Act of 1940) that occurred during the second fiscal quarter of the period covered by this report that have materially affected, or are reasonably likely to materially affect, the registrant’s internal control over financial reporting.
File the exhibits listed below as part of this Form. Letter or number the exhibits in the sequence indicated.
(a)(1) Any code of ethics, or amendment thereto, that is the subject of the disclosure required by Item 2, to the extent that the registrant intends to satisfy the Item 2 requirements through filing of an exhibit: Attached hereto
(a)(2) A separate certification for each principal executive officer and principal financial officer of the registrant as required by Rule 30a-2(a) under the Act (17 CFR 270.30a-2(a)): Attached hereto
(a)(3) Any written solicitation to purchase securities under Rule 23c-1 under the Act (17 CFR 270.23c-1) sent or given during the period covered by the report by or on behalf of the registrant to 10 or more persons: Not applicable
(b) Certifications required by Rule 30a-2(b) under the Act (17 CFR 270.30a-2(b)): Attached hereto
Pursuant to the requirements of the Securities Exchange Act of 1934 and the Investment Company Act of 1940, the registrant has duly caused this report to be signed on its behalf by the undersigned, thereunto duly authorized.
Pursuant to the requirements of the Securities Exchange Act of 1934 and the Investment Company Act of 1940, this report has been signed below by the following persons on behalf of the registrant and in the capacities and on the dates indicated.