MicroCap Opportunities Fund
Ultra MicroCap Fund
Low Priced Stock Fund
Annual Report
October 31, 2016

The PERRITT MICROCAP OPPORTUNITIES FUND will, under normal circumstances, invest at least 80% of its net assets in a diversified portfolio of common stocks of United States companies that at the time of initial purchase have a market capitalization (equity market value) that is below $500 million (referred to as “micro-cap” companies). The Fund seeks to invest in micro-cap companies that have demonstrated above-average growth in revenues and/or earnings, possess relatively low levels of long-term debt, have a high percentage of their shares owned by company management, and possess modest price-to-sales ratios and price-to-earnings ratios that are below their long-term annual growth rate. At times, the Fund may also invest in “special situations” such as companies that possess valuable patents, companies undergoing restructuring, and companies involved in large share repurchase programs. Investors should expect the Fund to contain a mix of both value-priced and growth stocks.
The PERRITT ULTRA MICROCAP FUND will, under normal circumstances, invest at least 80% of its net assets in a diversified portfolio of common stocks of United States companies that at the time of initial purchase have a market capitalization (equity market value) that is below $300 million (referred to as “micro-cap” companies). The Fund seeks to invest in micro-cap companies that have a high percentage of their shares owned by company management, possess relatively low levels of long-term debt, have a potential for above average growth in revenues and/or earnings, and possess reasonable valuations based on the ratios of price-to-sales, price-to-earnings, and price-to-book values. The micro-cap companies in which the Fund may invest include “early stage” companies, which are companies that are in a relatively early stage of development with market capitalizations that are below $50 million. At times, the Fund may also invest in unseasoned companies, companies that are undergoing corporate restructuring, initial public offerings, and companies believed to possess undervalued assets.
The PERRITT LOW PRICED STOCK FUND will, under normal circumstances, invest at least 80% of its net assets in a diversified portfolio of low priced common stocks of United States companies that at the time of initial purchase have a market capitalization (equity market value) that is below $3 billion. Low priced stocks are those that are trading at or below $15 per share at the time of initial purchase. Subsequent to the initial purchase, the Fund may purchase such securities at a price above $15 per share. The Fund’s strategy is based on the premise that low priced stocks offer growth potential because these stocks have limited broker research coverage, the companies’ prospects are misunderstood by most investors, and some investors mistakenly believe stocks trading below $15 per share are more “speculative” than those trading at higher levels and therefore avoid low priced stocks. The Fund will invest in “growth” stocks, “value” stocks, or a combination of both. Given the market capitalization restrictions, the Fund will normally invest in securities issued by small-cap companies, including some micro-cap companies. However, micro-cap companies will only make up a small portion of the Fund’s portfolio. Micro-cap companies represent the smallest sector of public companies based on market capitalization. At times, the Fund’s portfolio may contain the shares of unseasoned companies, companies that are undergoing corporate restructuring, initial public offerings, and companies believed to possess undervalued assets.
Annual Report
October 31, 2016
| From the Desk of Michael Corbett, President and CIO | 2 |
| | |
| Perritt MicroCap Opportunities Fund | |
| From the Portfolio Managers | 4 |
| Performance | 8 |
| Ten Largest Common Stock Holdings | 10 |
| Allocation of Portfolio Investments | 11 |
| | |
| Perritt Ultra MicroCap Fund | |
| From the Portfolio Managers | 12 |
| Performance | 16 |
| Ten Largest Common Stock Holdings | 18 |
| Allocation of Portfolio Investments | 19 |
| | |
| Perritt Low Priced Stock Fund | |
| From the Portfolio Managers | 20 |
| Performance | 24 |
| Ten Largest Common Stock Holdings | 26 |
| Allocation of Portfolio Investments | 27 |
| | |
| Perritt Funds | |
| Schedules of Investments | 28 |
| Statements of Assets and Liabilities | 37 |
| Statements of Operations | 38 |
| Statements of Changes in Net Assets | 39 |
| Financial Highlights | 42 |
| Notes to Financial Statements | 45 |
| Report of the Independent Registered Public Accounting Firm | 54 |
| Expense Example | 55 |
| Directors and Officers | 57 |
| Information | 60 |
Perritt Funds, Inc.
| From the Desk of Michael Corbett, President and CIO |
Michael Corbett,
President and CIO
The past year marked a big change for small/micro-cap stocks. As we have discussed several times in the past few years, small/micro-cap stocks have been in a stealth bear market. A stealth bear market occurs when the average stock price is down more than 20%, but the indexes, such as the Russell 2000 Index and the Russell Microcap Index are not down 20% from peak levels. The Russell 2000 Index and the Russell Microcap Index both joined the bear market. As of February 11, 2016, the Russell 2000 Index declined nearly 26% from its peak in June 2015, and the Russell Microcap Index lost nearly 29% from its peak in June 2015.
Now that it appears small/micro-cap stocks have entered a new bull market, maybe we can finally put the bear market discussions behind us. From the February 11, 2016 through October 31, 2016, the Russell 2000 Index climbed 24.92%, and the Russell Microcap Index rose by 24.18% in that same period. These impressive gains did not come without increased volatility. These indexes experienced several daily moves of more than one percent, as well as several weekly and monthly moves of more than 5%. The thing that impressed us the most was the resilience the market showed during the past seven months. The markets shook off several poor economic reports, such as the poor jobs report in May. Additionally, when the United Kingdom voted on June 23, 2016 to exit the European Union,(now known as Brexit), the market initially sold off but once again, the markets showed resilience and rallied nicely in the next few months.
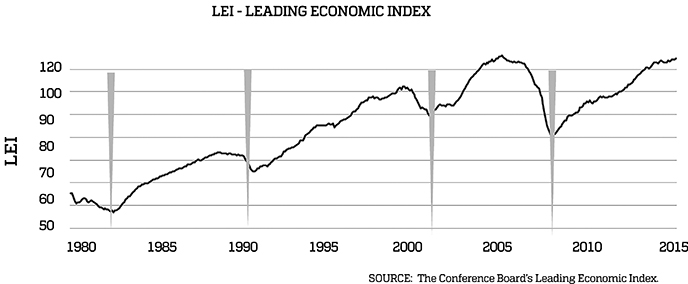
Perhaps the most interesting news of the year happened eight days after our fiscal year ended; Donald Trump’s surprise victory on November 8, 2016. Donald Trump’s election as president of the United States and the Republicans’ sweep of control in the legislation caught the financial world off guard. So, what does a Trump presidency mean for the markets and the economy? The implications of how a Trump win plays out in the markets are not entirely obvious. Trump has not been overly detailed on his economic policies and there is always a transition from campaign rhetoric to actual policy. However, it does seem clear that there will be a push for fewer regulations and lower taxes. In our opinion, these two potential changes in policy were the major reasons the markets reversed in under 24 hours. If you were watching closely, you probably noticed the Dow Jones Industrial Average futures were down nearly 800 points once it appeared Trump could win. However, the Dow quickly reversed, and in less than two weeks the index rallied by more than 10% from that low on election day. While the political situation is certainly one of the factors we use to evaluate investments, it is not the only factor, nor is it the most important. We also evaluate such factors as corporate profits, monetary and fiscal policy, currencies, and a host of various economic indicators. One of our favorite indicators is the Leading Economic Index (LEI). The LEI was developed by the Conference Board, and the index is published monthly. The index is made up of 10 economic components, whose changes tend to precede changes in the overall economy. Some of the components include consumer sentiment, new building permits, average hours worked and new orders for capital goods. This index has done a great job of predicting recessions. For example, this index last peaked in late 2006 and early 2007, and turned down throughout 2007. While the index did not predict the degree of the great recession of 2008/2009, it certainly gave us an indication that a recession was coming. Today, the index just returned to the 2007 peak, but history shows us that the index has always moved higher
Perritt Funds, Inc.
before another downturn in the economy. In fact, economic expansion has typically lasted another 4 to 8 years after this index tops its previous peak. If we believe in the LEI’s previous predicting power, it appears that the next economic downturn is not in the near term and may be at least another four years out. Therefore, we may finally get a great economic recovery after the great recession we all lived through in 2008/09.
Please refer to the Schedule of Investments in the report for more complete information regarding Funds’ holdings. Fund holdings and sector allocations are subject to change and should not be considered a recommendation to buy or sell any security.
Mutual fund investing involves risk. Principal loss is possible. The Funds invest in smaller companies, which involve additional risks such as limited liquidity and greater volatility. The Funds invest in micro cap companies which tend to perform poorly during times of economic stress. The Ultra MicroCap Fund and Low Priced Stock Fund may invest in early stage companies which tend to be more volatile and somewhat more speculative than investments in more established companies. Low Priced stocks are generally more volatile than higher priced securities.
The Perritt Funds are distributed by Quasar Distributors, LLC.
Dow Jones Industrial Average Index is a price-weighted average of 30 significant stocks traded on the New York Stock Exchange and the NASDAQ. It is not possible to invest directly in an index.
Perritt MicroCap Opportunities Fund
| Portfolio Managers’ Message |
| | | | |
| |  | |
| | | | |
| Michael Corbett, | | George Metrou, | |
| Portfolio Manager | | Portfolio Manager | |
The Perritt Microcap Opportunities Fund posted a gain of 6.85% during the fiscal year ended October 31, 2016, which exceeded the 1.53% gain for the Russell Microcap Index and 4.11% gain for the Russell 2000 Index. The Fund’s longer-term performance results, as well as the benchmark’s performance, can be found later in this report.
Our due diligence process leads us to focus on businesses with high returns on capital, robust free cash flow generation, and solid balance sheets. Businesses that meet our quality standards have intrinsic value, often well above the prevailing market price. The understanding that we own and invest in high quality businesses is a crucial factor in our ability to have conviction in our positions. This conviction provides us an invaluable advantage during periods of volatility.
During the period, we continued to strategically reduce the number of names in the portfolio. We began the period with 101 positions in the Fund and ended the period with 86 positions. The majority of this reduction took place during the first half of the fiscal year as we concentrated the portfolio in the highest conviction names during the market stress. Though a reduction of a net 14 positions, we were still adding new securities as well as increasing our positions in existing holdings. At present, we believe the number of positions in the portfolio is appropriate.
Ten new positions were added during the period. They were Birner Dental Management Services Inc. (BDMS), First Internet Bancorp (INBK), Graham Corp. (GHM), Huttig Building Products Inc. (HBP), Innerworkings Inc. (INWK), Kadant Inc. (KAI), Libby Inc. (LBY), Radiant Logistics, Inc. (RLGT), Tactile Systems Technology, Inc. (TCMD), and Team Inc. (TISI). Each of these companies generates free cash flow, has a solid balance sheet, and earns an above average return on capital. Furthermore, the average market capitalization of the names added was $245 million with an average of only 2 Wall Street analysts covering the companies. Two positions have no coverage at all. These points on size and coverage speak to our dedication to remain true to our micro-cap space, investing in undiscovered and under researched securities.
During the period, we liquidated 24 positions. Four positions were sold after receiving a valid buyout offer: Epiq Systems, Inc. (EPIQ), Liberator Medical Holdings, Inc. (LBMH), Integrated Silicon Solutions Inc. (ISSI), and SL Industries Inc. (SLI). A fifth buyout occurred during the period when Team Inc. (TISI) offered to acquire the shares of Furmanite Corp. (FRM) in an all-stock transaction, however we have retained the shares of TISI acquired through this buyout.
Five companies were sold after reaching our price targets or becoming too large in terms of market capitalization: AEP Industries Group (AEPI), Baldwin & Lyons (BWINB), Ennis Inc. (EBF), Monmouth Realty (MNR), Physicians Realty Trust (DOC), and Universal Electronics Inc. (UEIC). The
Perritt MicroCap Opportunities Fund
remaining nineteen positions removed from the portfolio were sold after a downgrade in our view of the price appreciation potential of the security or to rotate capital to higher conviction ideas.
As of October 31, 2016, the Fund’s portfolio was comprised of 86 common stocks. The Fund’s 10 largest holdings and detailed descriptions can be found later in this report. Based on our earnings estimates, the Fund’s portfolio is trading at approximately 18.6 times 2016 earnings. Stocks in the portfolio are priced at a median 1.0 times revenue and the median price to book value is 1.9x. Lastly, the median market capitalization is approximately $295 million.
On November 18th, the Fund paid a capital gain distribution of $3.29 per share. This is the fourth distribution made by the Fund in the previous nine years. We believe this reflects our commitment to managing the portfolio in a tax-conscious manner. The capital gain distribution is not reflected in the financials of this annual report because it was completed in fiscal 2017, but distributed in calendar year 2016. Please review your statement for the full details of the capital gain distribution.
We are encouraged by the current composition of the portfolio. The Fund’s companies have a median revenue growth rate of 7%, return on invested capital of 11%, free cash flow margin of 6%, and trade at 1.0x revenue. This compares to a median revenue growth of 3%, return on invested capital of 4%, free cash flow margins of 2%, and a valuation of 1.4x revenue for the broader micro-cap market as measured by the Russell Microcap Index. The bottom line is that our portfolio has grown faster, has offered more profitability, has generated more cash, and has been cheaper than the broader micro-cap market. This may serve the Fund’s shareholders well in the future.
I want to thank my fellow shareholders for their continued support and confidence in the Perritt Capital Management team. We remain dedicated to investing in high quality micro-cap companies at attractive valuations. If you have any questions or comments about this report or your investment in the Perritt MicroCap Opportunities Fund, please call us toll-free at (800) 331-8936 or visit our website at www.perrittcap.com. Please refer to the prospectus for information about the Fund’s investment objectives and strategies.
 |
| |
| George Metrou |
| Portfolio Manager |
Perritt MicroCap Opportunities Fund
Past performance does not guarantee future results.
Opinions expressed are subject to change at any time, are not guaranteed and should not be considered investment advice.
Russell Microcap Index is a capitalization weighted index of 2,000 small cap and micro cap stocks that captures the smallest 1,000 companies in the Russell 2000, plus 1,000 smaller U.S.-based listed stocks.
Russell 2000 Index is an index measuring the performance approximately 2,000 small-cap companies in the Russell 3000 Index, which is made up of 3,000 of the biggest U.S. stocks. The Russell 2000 serves as a benchmark for small-cap stocks in the United States.
Return on Invested Capital is a fundamental method of determining a company’s financial performance. It is used to measure how well a company is investing its capital.
Free Cash Flow is a measure of financial performance calculated as operating cash flow minus capital expenditures. Free cash flow (FCF) represents the cash that a company is able to generate after laying out the money required to maintain or expand its asset base.
Any tax or legal information provided is a summary of our understanding and interpretation of some of the current income tax regulations. Investors must consult their tax advisor or legal counsel for advice and information concerning their particular situation. Neither the Fund nor any of its representatives may give legal or tax advice.
(This Page Intentionally Left Blank.)
Perritt MicroCap Opportunities Fund
| Performance* (Unaudited) | October 31, 2016 |
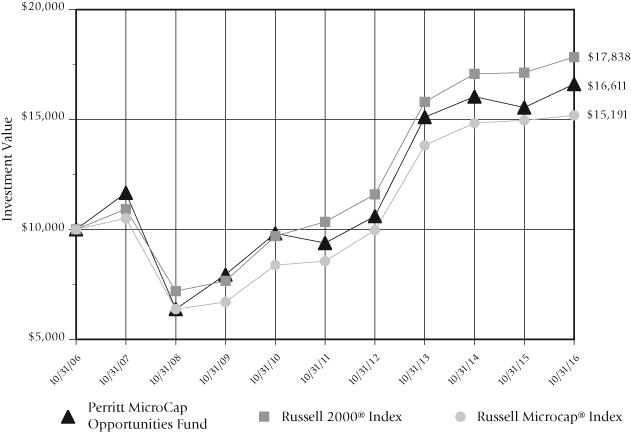
Perritt MicroCap Opportunities Fund versus
Russell 2000® Index and Russell Microcap® Index
There are several ways to evaluate a fund’s historical performance. You can look at the total percentage change in value, the average annual percentage change, or the growth of a hypothetical $10,000 investment. Each performance figure includes changes in a fund’s share price, plus reinvestment of any dividends (or income) and capital gains (the profits the fund earns when it sells stocks that have grown in value).
Cumulative total returns reflect the Fund’s actual performance over a set period. For example, if you invested $1,000 in a fund that had a 5% return over one year, you would end up with $1,050. You can compare the Fund’s returns to the Russell 2000® Index, which reflects a popular measure of the stock performance of small companies, and the Russell Microcap® Index, which measures the performance of the micro-cap segment of the U.S. equity market.
Average annual total returns take the Fund’s actual (or cumulative) return and show you what would have happened if the Fund had performed at a constant rate each year.
| * | The graph illustrates the performance of a hypothetical $10,000 investment made in the period presented. Assumes reinvestment of dividends and capital gains, but does not reflect the effect of any applicable sales charge or redemption fees or the deduction of taxes that a shareholder would pay on the Fund’s distributions or the redemption of the Fund shares. The graph does not imply any future performance. |
Perritt MicroCap Opportunities Fund
| Performance* (Unaudited)(Continued) | October 31, 2016 |
| Cumulative Total Returns* |
| Periods ended October 31, 2016 (Unaudited) |
| | Past | Past | Past | Past | Past | Past |
| | 1 Year | 3 Years | 5 Years | 10 Years | 15 Years | 25 Years |
| | | | | | | |
| Perritt MicroCap | | | | | | |
| Opportunities Fund | 6.85% | 9.96% | 77.05% | 66.11% | 340.37% | 970.84% |
| | | | | | | |
| Russell 2000¨ Index | 4.11% | 12.89% | 72.43% | 78.38% | 239.77% | 809.33% |
| (reflects no deduction | | | | | | |
| for fees and expenses) | | | | | | |
| | | | | | | |
| Russell Microcap¨ Index | 1.53% | 9.89% | 77.58% | 51.91% | 218.93% | N/A |
| (reflects no deduction | | | | | | |
| for fees and expenses) | | | | | | |
| Average Annual Total Returns* |
| Periods ended October 31, 2016 (Unaudited) |
| | Past | Past | Past | Past | Past | Past |
| | 1 Year | 3 Years | 5 Years | 10 Years | 15 Years | 25 Years |
| | | | | | | |
| Perritt MicroCap | | | | | | |
| Opportunities Fund | 6.85% | 3.21% | 12.10% | 5.21% | 10.39% | 9.95% |
| | | | | | | |
| Russell 2000¨ Index | 4.11% | 4.12% | 11.51% | 5.96% | 8.50% | 9.23% |
| (reflects no deduction | | | | | | |
| for fees and expenses) | | | | | | |
| | | | | | | |
| Russell Microcap¨ Index | 1.53% | 3.19% | 12.17% | 4.27% | 8.04% | N/A |
| (reflects no deduction | | | | | | |
| for fees and expenses) | | | | | | |
The Perritt MicroCap Opportunities Fund’s annualized expense ratio for the year ended October 31, 2015, as stated in the statutory prospectus, was 1.22%. The Fund imposes a 2% redemption fee on shares held for 90 days or less. Performance data does not reflect the redemption fee. If reflected, total returns would be reduced.
Performance data quoted represents past performance; past performance does not guarantee future results. The investment return and principal value of an investment will fluctuate so that an investor’s shares, when redeemed, may be worth more or less than their original cost. Current performance of the Fund may be lower or higher than the performance quoted. Performance data current to the most recent month end is available by calling 800-331-8936.
| * | The tables do not reflect the deduction of taxes that a shareholder would pay on the Fund’s distributions or the redemption of Fund shares. |
Perritt MicroCap Opportunities Fund
| Ten Largest Common Stock Holdings (Unaudited) |
Hudson Technologies Inc. (HDSN) provides innovative services to the recurring problems within the refrigeration industry. Its products and services include refrigerant sales, refrigerant management services, reclamation of refrigerants and system decontamination to remove moisture, oils, and other pollutants.
AXT Inc. (AXTI) is a developer and producer of compound and single element semiconductor substrates known as wafers, which are made from gallium and arsenic (GaAs). AXT manufactures its semiconductor substrates using its proprietary vertical gradient freeze technology.
Tristate Capital Holdings, Inc. (TSC) is a bank holding company headquartered in Pittsburgh, providing commercial banking, private banking and investment management services to middle-market companies, institutional clients, and high-net-worth individuals.
Atlas Financial Holdings, Inc. (AFH) engages in the underwriting of commercial automobile insurance policies, focusing on the ‘light’ commercial automobile sector. This sector includes taxi cabs, non-emergency para-transit, limousine, livery, and business autos.
Farmer Brothers Co. (FARM) engages in the manufacture, wholesale, and distribution of coffee, tea, and culinary products in the United States. The company is a direct distributor of coffee to restaurants, hotels, casinos, offices, convenience stores, healthcare facilities, and other foodservice providers.
Addus Homecare Corporation (ADUS) is a provider of home and community-based personal care services, which are provided primarily in the home, and is focused on the dual eligible (Medicare/Medicaid) population. Addus provides these services on a long-term, continuous basis, with an average duration of over 20 months per consumer.
Triumph Bancorp Inc. (TBK) is a financial holding company. Triumph through its bank subsidiary, TBK Bank, offers banking services, as well as commercial finance products to businesses that require specialized financial solutions. The company operates through four segments: Banking, Factoring, Asset Management and Corporate.
KMG Chemicals Ins. (KMG) manufactures, formulates and globally distributes specialty chemicals. The company operates businesses selling electronic chemicals, industrial wood treating chemicals, and industrial valve lubricants and sealants.
American Software Inc. (AMSW.A) develops, markets and supports a portfolio of software and services that delivers enterprise management, supply chain and retail planning solutions to the marketplace. The company operates in three segments: Supply Chain Management (SCM), Enterprise Resource Planning (ERP), and Information Technology (IT) Consulting.
Perritt MicroCap Opportunities Fund
| Ten Largest Common Stock Holdings (Unaudited) (Continued) |
Miller Industries Inc. (MLR) engages in the manufacture and sale of towing and recovery equipment. It offers wreckers, such as conventional tow trucks and recovery vehicles. The company also provides transport trailers for moving multiple vehicles, auto auctions, car dealerships, leasing companies, and other similar applications.
Fund holdings and/or sector allocations are subject to change at any time and
are not recommendations to buy or sell any security.
Please refer to the Schedule of Investments in this report for a complete list of Fund holdings.
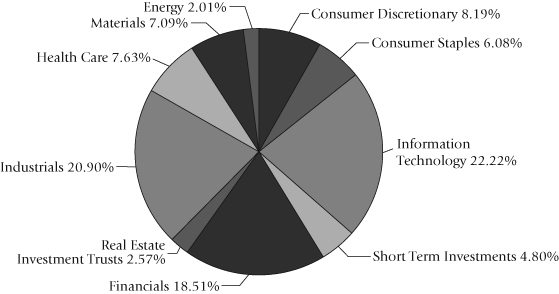
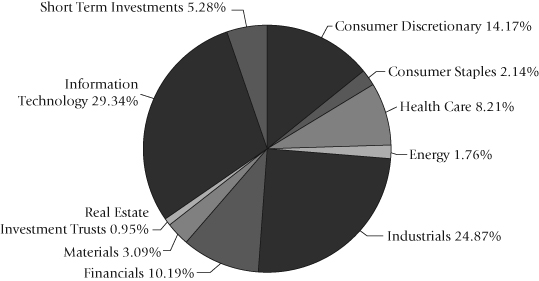
| Allocation of Portfolio Investments (Unaudited) | October 31, 2016 |
The sector classifications represented in the graph above and industry classifications represented in the Schedule of Investments are in accordance with Global Industry Classification Standard (GICS®), which was developed by and/or is the exclusive property of MSCI, Inc. and Standard & Poor Financial Services LLC. Percentages are based on total investments, at value.
| Note: | For presentation purposes, the Fund has grouped some of the industry categories. For purposes of categorizing securities for compliance with section 8(b)(1) of the Investment Company Act of 1940, the Fund uses more specific industry classifications. |
Perritt Ultra MicroCap Fund
| Portfolio Managers’ Message |
| |  | |
| | | | |
| Michael Corbett, | | Matthew Brackmann, | |
| Portfolio Manager | | Portfolio Manager | |
The Perritt Ultra MicroCap Fund had a positive return of 9.11% for fiscal year 2016. This performance compares favorably to the positive 4.11% return for the Russell 2000 and the positive 1.53% return for the Russell Microcap Index. The complete performance for the fund and its benchmarks can be found on page 17.
During the fiscal year, the Fund has seen its strongest performance from its investments in the industrial and Information Technology sectors. Some of the top performers from the industrial sector include Gencore Industries (GENC), a heavy machinery manufacturer that was up 87.5% and DLH Holdings (DLHC), a provider of healthcare, logistical & technical services to various government entities that returned 81.3%. We also saw strong performance from our holding in Hudson Technologies (HDSN) which returned 77.84% during the past year. Hudson is a high conviction name due to their position as a provider of reclaimed refrigerants to industrial users. Recent EPA and Global mandates have required the cessation of manufacturing certain refrigerants, such as R-22. Hudson may stand to benefit as end users will be forced to purchase recycled materials. We remain positive on this name going forward and it remains as one of our top holdings. In the Information Technology sector, we saw the best performance in this sector from PCM, Inc. (PCMI), which was up 128% during the past year. PCM is a technology solutions provider & distributor of electronic equipment to small, medium and enterprise level businesses.
Since the period ending April 30th, the Fund has liquidated 12 investments from the portfolio. Two of these, Dawson Geophysical (DWSN) and LGI Homes (LGIH), were sold because each investment reached our valuation and price targets. Four companies, MeetMe (MEET), Air Gains (AIRG), Digital Turbine (APPS) & Stanley Furniture (STLY) were sold for tax efficiency reasons. The remaining six companies were eliminated due to weak results or material downgrades in the outlook for the company. The proceeds of these investments were replaced with 13 new companies that we believe will help contribute to the future performance of the Fund. Some of these investments include Global Self Storage (SELF), a newly debuted REIT in the self-storage market, IntriCon Inc. (IIN), which is a manufacturer of components for medical devices and is in the process of moving into the discounted hearing aid space, and Kewaunee Scientific Corp. (KEQU) which manufactures and distributes various furniture and related items for laboratory and healthcare environments.
As of October 31, 2016, the Fund holds the common stock of 91 companies which remains in line with the 90 names we held six months ago. We intend to keep the number of names in the portfolio around 90 names, and continue with our strategy of concentrating on higher quality and higher conviction names. Based on our earnings estimates, the Fund’s portfolio is trading at 13.5 times forward earnings. The median price to sales ratio is 0.9, the
Perritt Ultra MicroCap Fund
median price to book ratio is 1.7, the trailing 12-month price-earnings ratio is 19.5, and the median market cap is approximately $77 million. The Fund’s largest holdings and detailed descriptions can be found on page 18.
The Fund continues to actively underweight the Healthcare sector with an exposure of 7.34% versus 19.57% for the Russell Microcap Index. The Healthcare sector has companies within Pharmaceuticals, Life Sciences & Biotech businesses. Many of the companies in these sub-sectors have very little in the way of tangible assets, cash flow generation, profitability and many times revenue. These companies are exposed to a high degree of regulatory uncertainty due to the Food and Drug Administration (FDA) approval process as well as congressional scrutiny due to drug pricing. While the recent election results have lessened the risk of some regulatory risk in this space in regards to pricing, it does not remove the risks inherent in the FDA approval process. These factors eliminate them from eligibility for investment due to our criteria and screening process. The portfolio will remain underweight in this segment going forward due to our continued reliance on the valuation and stock picking criteria. The portfolio is also underweight in the Financial sector and are overweight in both Industrial and Information Technology names.
The Ultra MicroCap Fund tends to have investments that fly under the radar screen of most investors. The micro-cap universe, particularly those stocks with sub-$100 million market capitalizations, are often ignored by investors for an extended period. Therefore, the potential rewards can take longer to achieve, but can be swift. As fellow shareholders, we exit this fiscal year pleased with our performance relative to our index and remain focused on the long-term picture both for the individual companies within the portfolio as well as the portfolio as a whole. We remain confident that looking out at the long-term potential for our holdings based on sound fundamentals rather than focusing on short-term fluctuations in the market is in the best interest of our shareholders.
We want to thank our fellow shareholders for their continued support and confidence in the Perritt Capital Management team. Each member of our investment committee as well as many other employees have made continued investment in this Fund for the past 10 years and remain shareholders alongside all of you. If you have any questions or comments about this report or your investment in the Perritt Ultra MicroCap Fund, please call us toll-free at (800) 331-8936 or visit our web site at www.perrittcap.com. Please refer to the prospectus for information about the Fund’s investment objectives and strategies.
Matthew Brackmann
Portfolio Manager
Perritt Ultra MicroCap Fund
Past performance does not guarantee future results.
Opinions expressed are subject to change at any time, are not guaranteed and should not be considered investment advice.
Russell Microcap Index is a capitalization weighted index of 2,000 small cap and micro cap stocks that captures the smallest 1,000 companies in the Russell 2000, plus 1,000 smaller U.S.-based listed stocks.
Russell 2000 Index is an index measuring the performance approximately 2,000 small-cap companies in the Russell 3000 Index, which is made up of 3,000 of the biggest U.S. stocks. The Russell 2000 serves as a benchmark for small-cap stocks in the United States.
Cash flow is the net amount of cash and cash-equivalents moving into and out of a business. Positive cash flow indicates that a company’s liquid assets are increasing, enabling it to settle debts, reinvest in its business, return money to shareholders, pay expenses and provide a buffer against future financial challenges. Negative cash flow indicates that a company’s liquid assets are decreasing.
P/E (Price-to-Earnings) is a ratio for valuing a company that measures its current share price relative to its per-share earnings.
Price-to-Book (P/B) is a ratio used to compare a stock’s market value to its book value. It is calculated by dividing the current closing price of the stock by the latest quarter’s book value per share.
Price-to-Sales (P/S) is a valuation ratio that compares a company’s stock price to its revenues. The price-to-sales ratio is an indicator of the value placed on each dollar of a company’s sales or revenues.
(This Page Intentionally Left Blank.)
Perritt Ultra MicroCap Fund
| Performance* (Unaudited) | October 31, 2016 |
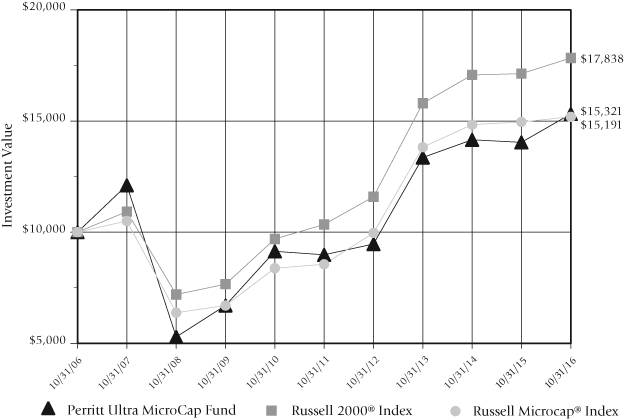
Perritt Ultra MicroCap Fund versus
Russell 2000® Index and Russell Microcap® Index
There are several ways to evaluate a fund’s historical performance. You can look at the total percentage change in value, the average annual percentage change, or the growth of a hypothetical $10,000 investment. Each performance figure includes changes in a fund’s share price, plus reinvestment of any dividends (or income) and capital gains (the profits the fund earns when it sells stocks that have grown in value).
Cumulative total returns reflect the Fund’s actual performance over a set period. For example, if you invested $1,000 in a fund that had a 5% return over one year, you would end up with $1,050. You can compare the Fund’s returns to the Russell 2000® Index, which reflects a popular measure of the stock performance of small companies, and the Russell Microcap® Index, which measures the performance of the micro-cap segment of the U.S. equity market.
Average annual total returns take the Fund’s actual (or cumulative) return and show you what would have happened if the Fund had performed at a constant rate each year.
| * | The graph illustrates the performance of a hypothetical $10,000 investment made in the period presented. Assumes reinvestment of dividends and capital gains, but does not reflect the effect of any applicable sales charge or redemption fees or the deduction of taxes that a shareholder would pay on the Fund’s distributions or the redemption of Fund shares. The graph does not imply any future performance. |
Perritt Ultra MicroCap Fund
| Performance* (Unaudited) (Continued) | October 31, 2016 |
| Cumulative Total Returns** |
| Periods ended October 31, 2016 (Unaudited) |
| | Past | Past | Past | Past | Since |
| | 1 Year | 3 Years | 5 Years | 10 Years | Inception* |
| | | | | | |
| Perritt Ultra | | | | | |
| MicroCap Fund | 9.11% | 14.66% | 70.58% | 53.21% | 124.31% |
| | | | | | |
| Russell 2000¨ Index | 4.11% | 12.89% | 72.43% | 78.38% | 157.66% |
| (reflects no deduction | | | | | |
| for fees and expenses) | | | | | |
| | | | | | |
| Russell Microcap¨ Index | 1.53% | 9.89% | 77.58% | 51.91% | 111.51% |
| (reflects no deduction | | | | | |
| for fees and expenses) | | | | | |
| Average Annual Total Returns** |
| Periods ended October 31, 2016 (Unaudited) |
| | Past | Past | Past | Past | Since |
| | 1 Year | 3 Years | 5 Years | 10 Years | Inception* |
| | | | | | |
| Perritt Ultra | | | | | |
| MicroCap Fund | 9.11% | 4.67% | 11.27% | 4.36% | 6.86% |
| | | | | | |
| Russell 2000¨ Index | 4.11% | 4.12% | 11.51% | 5.96% | 8.09% |
| (reflects no deduction | | | | | |
| for fees and expenses) | | | | | |
| | | | | | |
| Russell Microcap¨ Index | 1.53% | 3.19% | 12.17% | 4.27% | 6.35% |
| (reflects no deduction | | | | | |
| for fees and expenses) | | | | | |
The Perritt Ultra MicroCap Fund’s annualized expense ratio for the year ended October 31, 2015, as stated in the statutory prospectus, was 1.76%. The Fund imposes a 2% redemption fee on shares held for 90 days or less. Performance data does not reflect the redemption fee. If reflected, total returns would be reduced.
Performance data quoted represents past performance; past performance does not guarantee future results. The investment return and principal value of an investment will fluctuate so that an investor’s shares, when redeemed, may be worth more or less than their original cost. Current performance of the Fund may be lower or higher than the performance quoted. Performance data current to the most recent month end is available by calling 800-331-8936.
| * | | The since inception date is August 30, 2004. |
| | | |
| ** | | The tables do not reflect the deduction of taxes that a shareholder would pay on the Fund’s distributions or the redemption of Fund shares. |
Perritt Ultra MicroCap Fund
| Ten Largest Common Stock Holdings (Unaudited) |
AXT Inc. (AXTI) is a developer and producer of compound and single element semiconductor substrates known as wafers, which are made from gallium and arsenic (GaAs). AXT manufactures its semiconductor substrates using its proprietary vertical gradient freeze technology.
DLH Holdings Coro. (DLHC) provides healthcare, logistics, and technical services, and solutions to the Federal Government agencies including the Department of Veteran Affairs, the Department of Defense, and other government clients.
Hudson Technologies Inc. (HDSN) provides innovative services to the recurring problems within the refrigeration industry. Its products and services include refrigerant sales, refrigerant management services, reclamation of refrigerants, and system decontamination to remove moisture, oils and other pollutants.
PCM, Inc. (PCMI) operates as a multi-vendor provider of technology products and solutions, and consumer products primarily in the United States and Canada. The company also provides value-added services, such as custom configured systems, software licensing, image management, asset tagging, and asset disposal services, IT management, and related services.
Gencor Industries Inc. (GENC) designs, manufactures, and sells machinery and related equipment used for the production of asphalt and highway construction materials. The company’s products include asphalt plants, combustion systems and fluid heat transfer systems. The company’s products are manufactured in two facilities in the United States.
Ballantyne Strong, Inc. (BTN) is a holding company. The company operates through two segments: Cinema and Digital Media. Its Cinema operations include the sale of digital projection equipment, screens, and sound systems. Its Digital Media operations include the delivery of end-to-end digital signage solutions, and management and service of digital signage and digital cinema equipment.
DSP Group Inc. (DSPG) provides wireless chipset solutions for converged communications, delivering system solutions that combine semiconductors, and software with reference designs. Its products enable converged voice, audio and data connectivity across diverse consumer products, ranging from cordless and VOIP phones to home gateways and connected multimedia screens.
Willdan Group, Inc. (WLDN) is a holding company. Willdan provides professional technical and consulting services to utilities, private and public agencies at all levels of government, primarily in California and New York. It operates through four segments: Energy Efficiency Services, Engineering Services, Public Finance Services, and Homeland Security Services.
Galaxy Gaming, Inc. (GLXZ) is engaged in designing, developing, manufacturing and acquiring casino table games and associated technology, platforms and systems for the global gaming industry. The company markets its products to land-based, riverboat and cruise ship gaming establishments and Internet gaming companies.
Perritt Ultra MicroCap Fund
| Ten Largest Common Stock Holdings (Unaudited) (Continued) |
iPass Inc. (IPAS) is a provider of global mobile connectivity, offering simple, secure, always-on Wi-Fi access on mobile devices. Built on a software-as-a-service (SaaS) platform, the iPass cloud-based service keeps its customers connected by providing unlimited Wi-Fi connectivity on unlimited devices.
Fund holdings and/or sector allocations are subject to change at any time and
are not recommendations to buy or sell any security.
Please refer to the Schedule of Investments in this report for a complete list of Fund holdings.
| Allocation of Portfolio Investments (Unaudited) | October 31, 2016 |
The sector classifications represented in the graph above and industry classifications represented in the Schedule of Investments are in accordance with Global Industry Classification Standard (GICS®), which was developed by and/or is the exclusive property of MSCI, Inc. and Standard & Poor Financial Services LLC. Percentages are based on total investments, at value.
| Note: | For presentation purposes, the Fund has grouped some of the industry categories. For purposes of categorizing securities for compliance with section 8(b)(1) of the Investment Company Act of 1940, the Fund uses more specific industry classifications. |
Perritt Low Priced Stock Fund
| Portfolio Managers’ Message |
| |  | |
| | | | |
| Michael Corbett, | | Brian Gillespie, | |
| Portfolio Manager | | Portfolio Manager | |
The Perritt Low Priced Stock Fund produced a positive performance year, but the return lagged that of the Index. The Fund gained 1.04% for the one-year period ended October 31, 2016 versus the 4.11% gain for the Russell 2000 Index. More detailed performance results for the Fund, as well as the results for the Russell 2000 Index can be viewed on page 25. We continue to focus on the long-term prospects of the stocks in our portfolio.
Before discussing the portfolio, we would like to point out that the turnover ratio for the Fund was once again elevated above our desired level. The ratio for the most recent year was above 62%, which was below last year’s ratio of above 76%, but still above our stated goal of below 50%. Like last year, the ratio was elevated because of our attempts to limit our capital gains payout for the year. We were successful once again in our endeavor. Thus, we did not pay out any distribution of any kind for the year. This strategy has been used each of the last two years to help the Fund be more tax-conscious in future years.
As of October 31, 2016, the Fund’s portfolio was comprised of 62 common stocks. The Fund’s 10 largest holdings and detailed descriptions can be found on page 26. Based on our earnings estimate, the Fund’s portfolio is trading at just above 14 times next year’s earnings. The median price/revenues for the portfolio is roughly 1.5 times and the median market capitalization is approximately $685 million.
As far as sectors go within the Perritt Low Priced Fund, Information Technology was a big contributor to performance, up nearly 15% in the past year. Our names in the Consumer Discretionary sector were up 7.0% and contributed to performance as well. Energy and Materials were the biggest detractors from the Fund’s performance during the past twelve months.
As we have mentioned before, sector weightings are a function of where we see the best valuations and growth prospects. Information Technology and Industrials continue to represent two of our largest weightings. Information Technology represented 23.5% of our Fund compared to a 17.9% weighting in the Russell 2000 Index. Our overweight to this sector relative to the benchmark, as well as the performance of our names within the sector was a driver of performance in the fiscal year. Industrials was also an overweight compared to the Index. Industrials accounted for 20.0% of our Fund in the period compared to 13.1% in the Russell 2000 index. Unfortunately, our overweight did not help our performance as our Industrial investments declined 1.7% compared to a gain of 7.2%. Within Information Technology, we found attractive opportunities in the semiconductor space as well as in the electronic equipment area. In the Industrials sector, our allocation to Commercial Services and Supplies was a detractor to our performance. We did benefit from an underweight in Healthcare. We had an allocation of 10.6% to Healthcare compared to the Index weight of
Perritt Low Priced Stock Fund
14.4%. The Healthcare companies within the Russell 2000 declined 7.5% over the past twelve months. Our Healthcare investments gained 1.3% in the period due in part to our underweight of Biotechnology companies. We continue to avoid this area for the most part due to valuations and uncertainties surrounding receiving FDA approval.
Turning to a couple of individual names, one of our best performers was Orbotech Ltd. (ORBK). This company is a leading supplier of inspection and test/repair equipment to the Printed Circuit Board (PCB) and Flat Panel Display (FPD) industries. Shares of ORBK have gained 65% in the past twelve months as the company continues to benefit from the increasing complexity and functionality of electronics. Increased capacity in organic light-emitting diode (OLED) as a result of the growth in wearable devices and flexible displays should benefit the company in the future. Another solid performer for us was Gencor Industries Inc. (GENC), which is a leading manufacturer of asphalt plants, soil remediation plants, combustion systems and heat transfer systems to the road and highway construction industry. Shares in the company have surged 87% in the past year. The company’s stock benefited from the 5-year $305 billion highway bill signed into law in late 2015.
We had a few of our holdings contribute negatively to our performance. Holdings during the period, such as Ardmore Shipping Corporation (ASC), a provider of seaborne transportation of petroleum products and chemicals through product and chemical tankers worldwide, and TRC Companies (TRR), a provider of engineering, consulting, and construction management services in the United States, did not perform up to our expectations. Therefore, both positions were subsequently sold. We will continue to seek out companies that possess strong financials, such as strong cash flows and solid balance sheets. We were pleased with our results over the fiscal year and we will continue to examine our current positions and new opportunities to ensure the Low Priced Stock Fund continues to be successful.
If you have any questions or comments about this report or your investment in the Perritt Low Priced Stock Fund, please call us toll-free at (800) 331-8936 or visit our website at www.perrittcap.com. Please refer to the prospectus for information about the Fund’s investment objectives and strategies.
 |
| |
| Brian Gillespie |
| Portfolio Manager |
Perritt Low Priced Stock Fund
Past performance does not guarantee future results.
Opinions expressed are subject to change at any time, are not guaranteed and should not be considered investment advice.
Turnover ratio is the percentage of investment’s holdings that have been replaced in a given year.
Russell Microcap Index is a capitalization weighted index of 2,000 small cap and micro cap stocks that captures the smallest 1,000 companies in the Russell 2000, plus 1,000 smaller U.S.-based listed stocks.
Russell 2000 Index is an index measuring the performance approximately 2,000 small-cap companies in the Russell 3000 Index, which is made up of 3,000 of the biggest U.S. stocks. The Russell 2000 serves as a benchmark for small-cap stocks in the United States.
(This Page Intentionally Left Blank.)
Perritt Low Priced Stock Fund
| Performance* (Unaudited) | October 31, 2016 |
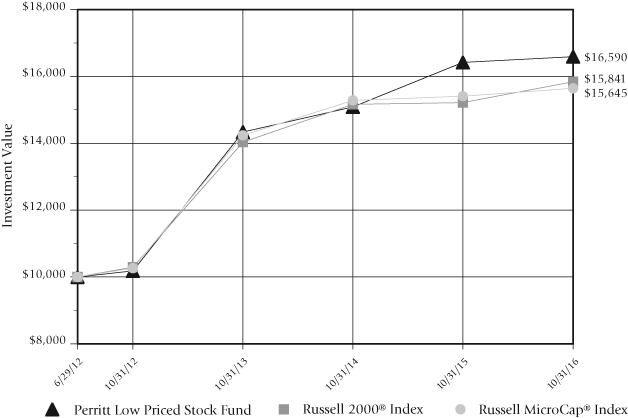
Perritt Low Priced Stock Fund** versus
Russell 2000® Index and Russell Microcap® Index
There are several ways to evaluate a fund’s historical performance. You can look at the total percentage change in value, the average annual percentage change, or the growth of a hypothetical $10,000 investment. Each performance figure includes changes in a fund’s share price, plus reinvestment of any dividends (or income) and capital gains (the profits the fund earns when it sells stocks that have grown in value).
Cumulative total returns reflect the Fund’s actual performance over a set period. For example, if you invested $1,000 in a fund that had a 5% return over one year, you would end up with $1,050. You can compare the Fund’s returns to the Russell 2000® Index, which reflects a popular measure of the stock performance of small companies, and the Russell Microcap® Index, which measures the performance of the micro-cap segment of the U.S. equity market.
Average annual total returns take the Fund’s actual (or cumulative) return and show you what would have happened if the Fund had performed at a constant rate each year.
| * | | The graph illustrates the performance of a hypothetical $10,000 investment made in the Fund at inception (June 29, 2012) of the Fund’s predecessor account through October 31, 2016. Assumes reinvestment of dividends and capital gains, but does not reflect the effect of any applicable sales charge or redemption fees or the deduction of taxes that a shareholder would pay on the Fund’s distributions or the redemption of Fund shares. The graph does not imply any future performance. |
| | | |
| ** | | June 29, 2012 is the inception date of the Fund’s predecessor account. The Fund commenced operations on February 28, 2014. The investment policies, objectives, guidelines and restrictions of the Fund are in all material respects equivalent to those of the predecessor account. |
Perritt Low Priced Stock Fund
| Performance* (Unaudited) (Continued) | October 31, 2016 |
| Cumulative Total Returns** |
| Periods ended October 31, 2016 (Unaudited) |
| | Past | Past | Since |
| | 1 Year | 3 Years* | Inception* |
| | | | |
| Perritt Low Priced Stock Fund | 1.04% | 15.72% | 65.90% |
| | | | |
| Russell 2000® Index | 4.11% | 12.89% | 58.41% |
| (reflects no deduction for fees and expenses) | | | |
| | | | |
| Russell Microcap® Index | 1.53% | 9.89% | 56.45% |
| (reflects no deduction for fees and expenses) | | | |
| Average Annual Total Returns** |
| Periods ended October 31, 2016 (Unaudited) |
| | Past | Past | Since |
| | 1 Year | 3 Years* | Inception* |
| | | | |
| Perritt Low Priced Stock Fund | 1.04% | 4.99% | 12.38% |
| | | | |
| Russell 2000® Index | 4.11% | 4.12% | 11.19% |
| (reflects no deduction for fees and expenses) | | | |
| | | | |
| Russell Microcap® Index | 1.53% | 3.19% | 10.87% |
| (reflects no deduction for fees and expenses) | | | |
The Perritt Low Priced Stock Fund’s annualized net expense ratio, as stated in the statutory prospectus, dated October 31, 2015, was 1.41%. The Fund imposes a 2% redemption fee on shares held for 90 days or less. Performance data does not reflect the redemption fee. If reflected, total returns would be reduced.
Performance data quoted represents past performance; past performance does not guarantee future results. The investment return and principal value of an investment will fluctuate so that an investor’s shares, when redeemed, may be worth more or less than their original cost. Current performance of the Fund may be lower or higher than the performance quoted. Performance data current to the most recent month end is available by calling 800-331-8936.
| * | | The Fund is the successor to a separately managed account. Immediately prior to the Fund commencing operations on February 28, 2014, the predecessor account transferred its assets to the Fund in exchange for the Fund’s shares. The investment policies, objectives, guidelines and restrictions of the Fund are in all material respects equivalent to those of the predecessor. In addition, the predecessor’s portfolio managers are the current portfolio managers of the Fund. As a mutual fund registered under the Investment Company Act of 1940 (the “1940 Act”), the Fund is subject to certain restrictions under the 1940 Act and the Internal Revenue Code to which the predecessor was not subject. Had the predecessor been registered under the 1940 Act and been subject to the provisions of the 1940 Act and the Internal Revenue Code, its investment performance may have been adversely affected. The performance was achieved by the predecessor when Fund assets were relatively small; the same strategies may not be available, and similar performance may not be achieved, when the Fund’s assets are larger. The performance shown includes an annual management fee of 1.00% and does not include any expenses paid by the predecessor’s investment advisor. |
| | | |
| | | The since inception date is June 29, 2012, the date of inception of the Fund’s predecessor account. The past performance of the Fund and its predecessor account (before and after taxes) is not necessarily an indication of how the Fund will perform in the future. |
| | | |
| ** | | The tables do not reflect the deduction of taxes that a shareholder would pay on the Fund’s distributions or the redemption of Fund shares. |
Perritt Low Priced Stock Fund
| Ten Largest Common Stock Holdings (Unaudited) |
Orbotech LTD (ORBK) provides yield-enhancing and process-enabling solutions for printed circuit boards (PCBs), liquid crystal displays (LCDs), and semiconductor devices in North America and internationally. It operates through three segments: Production Solutions for the Electronics Industry, Recognition Software, and Solar Energy.
Investors Bancorp Inc. (ISBC) operates as a holding company that provides various banking products and services for businesses and individuals in the United States. It offers deposit products, such as savings, checking, and money market accounts, as well as certificates of deposit.
Globus Medical, Inc. (GMED) is focused on developing products for patients with musculoskeletal disorders. Globus operates in two categories; The Innovative Fusion category products include fusion products to treat spinal disorders for the entire spine. The Disruptive Technologies category provides material improvements to fusion procedures, such as minimally invasive surgical techniques and motion preservation technologies.
Nautilus Inc. (NLS) is a consumer fitness products company that operates through two segments: The Direct segment offers products directly to consumers through television advertising, catalogs, and the Internet. The Retail segment offers its products through a network of independent retail companies with stores and Websites located in the United States and internationally.
Fox Factory Holding Corp (FOXF) designs and manufactures high-performance ride dynamics products primarily for bicycles, side-by-side vehicles, on-road and off-road vehicles and trucks, all-terrain vehicles, snowmobiles, specialty vehicles and applications, and motorcycles.
F.N.B. Corporation (FNB) is a financial holding company that provides various financial services to consumers, corporations, governments, and small to medium-sized businesses primarily in Pennsylvania, eastern Ohio, and northern West Virginia. F.N.B operates through four segments: Community Banking, Wealth Management, Insurance, and Consumer Finance.
Photronics Inc. (PLAB) offers services across the full spectrum of integrated chip (IC) production and flat panel display (FPD) technologies by manufacturing photomasks using electron beam or optical (laser-based) systems. The company primarily sells its products to leading semiconductor and FPD manufacturers.
Atlas Financial Holdings, Inc. (AFH) engages in the underwriting of commercial automobile insurance policies, focusing on the ‘light’ commercial automobile sector. This sector includes taxi cabs, non-emergency para-transit, limousine, livery and business autos.
Gencor Industries Inc. (GENC) designs, manufactures, and sells machinery and related equipment used for the production of asphalt and highway construction materials. The company’s products include asphalt plants, combustion systems and fluid heat transfer systems. The company’s products are manufactured in two facilities in the United States.
Perritt Low Priced Stock Fund
| Ten Largest Common Stock Holdings (Unaudited) (Continued) |
CryoLife Inc. (CRY) is a medical device manufacturing and distribution company that processes and distributes implantable human tissues for use in cardiac and vascular surgeries. It offers surgical sealants and hemostats, including BioGlue Surgical Adhesive, an agent for cross-linking proteins for cardiac, vascular, pulmonary, and general surgical applications.
Fund holdings and/or sector allocations are subject to change at any time and
are not recommendations to buy or sell any security.
Please refer to the Schedule of Investments in this report for a complete list of Fund holdings.
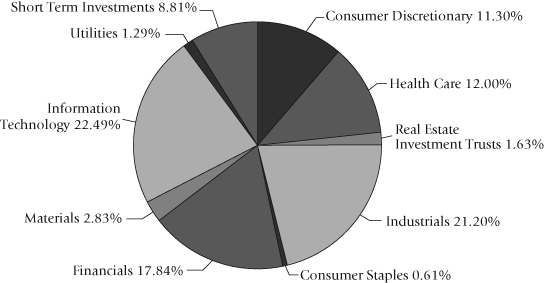
| Allocation of Portfolio Investments (Unaudited) | October 31, 2016 |
The sector classifications represented in the graph above and industry classifications represented in the Schedule of Investments are in accordance with Global Industry Classification Standard (GICS®), which was developed by and/or is the exclusive property of MSCI, Inc. and Standard & Poor Financial Services LLC. Percentages are based on total investments, at value.
| Note: | For presentation purposes, the Fund has grouped some of the industry categories. For purposes of categorizing securities for compliance with section 8(b)(1) of the Investment Company Act of 1940, the Fund uses more specific industry classifications. |
Perritt MicroCap Opportunities Fund
| Schedule of Investments | October 31, 2016 |
| Shares | | COMMON STOCKS – 95.33% | | Value | |
| | |
| Aerospace & Defense – 0.92% | |
| | 358,787 | | CPI Aerostructures, | | | |
| | | | Inc.(a) | | $ | 2,421,812 | |
| | | | | | | 2,421,812 | |
| | |
| Auto Parts & Equipment – 3.85% | |
| | 220,570 | | Miller Industries, Inc. | | | 4,841,512 | |
| | 125,000 | | Motorcar Parts | | | | |
| | | | of America, Inc. | | | | |
| | | | (Acquired 9/10/2012 | | | | |
| | | | through 8/27/2014, | | | | |
| | | | Cost $1,052,127)(a)(b) | | | 3,280,000 | |
| | 10,000 | | Motorcar Parts | | | | |
| | | | of America, Inc. | | | 262,400 | |
| | 115,000 | | Stoneridge, Inc.(a) | | | 1,704,300 | |
| | | | | | | 10,088,212 | |
| | |
| Building Materials – 3.35% | |
| | 150,000 | | Global Brass & Copper | | | | |
| | | | Holdings, Inc. | | | 4,305,000 | |
| | 316,934 | | Huttig Building | | | | |
| | | | Products, Inc.(a) | | | 1,530,791 | |
| | 300,000 | | PGT, Inc.(a) | | | 2,940,000 | |
| | | | | | | 8,775,791 | |
| | |
| Business Services – 5.62% | |
| | 270,217 | | Datalink Corp.(a) | | | 2,561,657 | |
| | 134,567 | | GP Strategies Corp.(a) | | | 3,478,557 | |
| | 661,000 | | Innodata Isogen, Inc.(a) | | | 1,619,450 | |
| | 221,100 | | PCM, Inc.(a) | | | 4,687,320 | |
| | 305,200 | | Systemax, Inc. | | | 2,395,820 | |
| | | | | | | 14,742,804 | |
| | |
| Chemical & Related Products – 5.81% | |
| | 104,644 | | Aceto Corp. | | | 1,918,124 | |
| | 183,722 | | KMG Chemicals, Inc. | | | 4,986,215 | |
| | 202,000 | | Northern Technologies | | | | |
| | | | International Corp.(a) | | | 2,807,800 | |
| | 417,238 | | OMNOVA | | | | |
| | | | Solutions, Inc.(a) | | | 3,171,009 | |
| | 229,054 | | Trecora Resources(a) | | | 2,347,804 | |
| | | | | | | 15,230,952 | |
| | |
| Commercial Banks – 8.97% | |
| | 125,900 | | Bankwell Financial | | | | |
| | | | Group, Inc. | | | 3,104,694 | |
| | 112,000 | | Berkshire Hills | | | | |
| | | | Bancorp, Inc. | | | 3,309,600 | |
| | 135,000 | | First Internet Bancorp | | | 3,543,750 | |
| | 413,526 | | TriState Capital | | | | |
| | | | Holdings, Inc.(a) | | | 7,298,734 | |
| | 272,980 | | Triumph | | | | |
| | | | Bancorp, Inc.(a) | | | 5,077,428 | |
| | 67,800 | | Veritex Holdings, Inc.(a) | | | 1,195,314 | |
| | | | | | | 23,529,520 | |
| | |
| Commercial Services & Supplies – 0.67% | |
| | 200,000 | | InnerWorkings, Inc.(a) | | | 1,762,000 | |
| | | | | | | 1,762,000 | |
| | |
| Construction & Engineering – 3.53% | |
| | 58,000 | | Comfort Systems | | | | |
| | | | USA, Inc. | | | 1,673,300 | |
| | 965,232 | | Hill International, | | | | |
| | | | Inc.(a) | | | 3,716,143 | |
| | 125,532 | | Team, Inc.(a) | | | 3,860,109 | |
| | | | | | | 9,249,552 | |
| | |
| Consumer Products – Manufacturing – 3.70% | |
| | 125,000 | | Cherokee, Inc.(a) | | | 1,175,000 | |
| | 114,000 | | Delta Apparel, Inc.(a) | | | 1,881,000 | |
| | 16,609 | | Flexsteel | | | | |
| | | | Industries, Inc. | | | 695,917 | |
| | 56,818 | | Libbey, Inc. | | | 909,656 | |
| | 96,326 | | Orchids Paper | | | | |
| | | | Products Co. | | | 2,471,725 | |
| | 144,764 | | Superior Uniform | | | | |
| | | | Group, Inc. | | | 2,575,352 | |
| | | | | | | 9,708,650 | |
| | |
| Consumer Services – 0.57% | |
| | 260,000 | | DHI Group, Inc.(a) | | | 1,482,000 | |
| | | | | | | 1,482,000 | |
| | |
| Electronic Equipment & Instruments – 0.84% | |
| | 92,415 | | Bel Fuse, Inc. – Class B | | | 2,204,098 | |
| | | | | | | 2,204,098 | |
| | |
| Energy & Related Services – 2.01% | |
| | 180,643 | | Matrix Service Co.(a) | | | 3,197,381 | |
| | 133,744 | | PHI, Inc.(a) | | | 2,083,732 | |
| | | | | | | 5,281,113 | |
| | |
| Financial Services – 4.39% | |
| | 444,000 | | Cowen Group, | | | | |
| | | | Inc. – Class A(a) | | | 1,443,000 | |
| | 182,600 | | FBR & Co. | | | 2,538,140 | |
| | 96,728 | | Hennessy | | | | |
| | | | Advisors, Inc. | | | 2,793,505 | |
| | | | | | | | |
The accompanying notes to financial statements are an integral part of this schedule.
Perritt MicroCap Opportunities Fund
| Schedule of Investments (Continued) | October 31, 2016 |
| Shares | | | | Value | |
| | |
| Financial Services (Continued) | |
| | 115,821 | | Oppenheimer Holdings, | | | |
| | | | Inc. – Class A | | $ | 1,621,494 | |
| | 270,606 | | Silvercrest Asset | | | | |
| | | | Management Group, | | | | |
| | | | Inc. – Class A | | | 3,125,499 | |
| | | | | | | 11,521,638 | |
| | |
| Food – 5.14% | |
| | 321,872 | | Crimson Wine | | | | |
| | | | Group Ltd.(a) | | | 2,996,628 | |
| | 170,162 | | Farmer Brothers Co.(a) | | | 5,564,297 | |
| | 33,300 | | John B. Sanfilippo | | | | |
| | | | & Son, Inc. | | | 1,687,644 | |
| | 245,000 | | Landec Corp.(a) | | | 3,246,250 | |
| | | | | | | 13,494,819 | |
| | |
| Health Care Providers & Services – 0.99% | |
| | 140,000 | | The Ensign | | | | |
| | | | Group, Inc. | | | 2,585,800 | |
| | | | | | | 2,585,800 | |
| | |
| Industrial Goods – 4.18% | |
| | 1,400,000 | | Hudson | | | | |
| | | | Technologies, Inc.(a) | | | 8,540,000 | |
| | 100,000 | | Schnitzer Steel Industries, | | | | |
| | | | Inc. – Class A | | | 2,415,000 | |
| | | | | | | 10,955,000 | |
| | |
| Insurance – 5.17% | |
| | 418,397 | | Atlas Financial | | | | |
| | | | Holdings, Inc.(a) | | | 7,175,508 | |
| | 90,000 | | EMC Insurance | | | | |
| | | | Group, Inc. | | | 2,191,500 | |
| | 289,648 | | United Insurance | | | | |
| | | | Holdings Corp. | | | 4,199,896 | |
| | | | | | | 13,566,904 | |
| | |
| Leisure – 1.76% | |
| | 728,641 | | Century Casinos, | | | | |
| | | | Inc.(a) | | | 4,619,584 | |
| | | | | | | 4,619,584 | |
| | |
| Machinery Manufacturing – 1.31% | |
| | 100,000 | | Graham Corp. | | | 1,785,000 | |
| | 32,110 | | Kadant, Inc. | | | 1,658,482 | |
| | | | | | | 3,443,482 | |
| | |
| Medical Supplies & Services – 5.92% | |
| | 219,037 | | Addus HomeCare | | | | |
| | | | Corp.(a) | | | 5,541,636 | |
| | 35,820 | | Birner Dental | | | | |
| | | | Management | | | | |
| | | | Services, Inc. | | | 656,581 | |
| | 140,712 | | CryoLife, Inc. | | | 2,392,104 | |
| | 100,000 | | Exactech, Inc.(a) | | | 2,415,000 | |
| | 374,000 | | Syneron Medical Ltd.(a) | | | 2,805,000 | |
| | 96,771 | | Tactile Systems | | | | |
| | | | Technology, Inc.(a) | | | 1,719,137 | |
| | | | | | | 15,529,458 | |
| | |
| Real Estate Investment Trusts – 2.57% | |
| | 201,185 | | City Office Real | | | | |
| | | | Estate Investment | | | | |
| | | | Trust, Inc. | | | 2,526,884 | |
| | 115,000 | | Community Healthcare | | | | |
| | | | Trust, Inc. | | | 2,573,700 | |
| | 80,000 | | UMH Properties, Inc. | | | 969,600 | |
| | 50,000 | | Whitestone Real Estate | | | | |
| | | | Investment Trust | | | 665,000 | |
| | | | | | | 6,735,184 | |
| | |
| Retail – 1.68% | |
| | 175,000 | | Kirkland’s, Inc.(a) | | | 2,136,750 | |
| | 89,360 | | Weyco Group, Inc. | | | 2,261,702 | |
| | | | | | | 4,398,452 | |
| | |
| Semiconductor Related Products – 8.38% | |
| | 1,441,731 | | AXT, Inc.(a) | | | 7,424,915 | |
| | 351,000 | | DSP Group, Inc.(a) | | | 3,825,900 | |
| | 161,111 | | PDF Solutions, Inc.(a) | | | 3,181,942 | |
| | 415,000 | | Photronics, Inc.(a) | | | 4,025,500 | |
| | 195,000 | | Rudolph | | | | |
| | | | Technologies, Inc.(a) | | | 3,529,500 | |
| | | | | | | 21,987,757 | |
| | |
| Software – 5.20% | |
| | 472,000 | | American Software, | | | | |
| | | | Inc. – Class A | | | 4,922,960 | |
| | 1,967,092 | | iPass, Inc.(a) | | | 3,501,424 | |
| | 100,000 | | VASCO Data Security | | | | |
| | | | International, Inc.(a) | | | 1,375,000 | |
| | 942,493 | | Zix Corp.(a) | | | 3,835,946 | |
| | | | | | | 13,635,330 | |
| | |
| Specialty Manufacturing – 5.67% | |
| | 224,947 | | CECO | | | | |
| | | | Environmental Corp. | | | 2,226,975 | |
| | 166,339 | | Core Molding | | | | |
| | | | Technologies, Inc.(a) | | | 2,897,625 | |
The accompanying notes to financial statements are an integral part of this schedule.
Perritt MicroCap Opportunities Fund
| Schedule of Investments (Continued) | October 31, 2016 |
| Shares | | | | Value | |
| | |
| Specialty Manufacturing (Continued) | |
| | 99,500 | | Federal Signal Corp. | | $ | 1,221,860 | |
| | 295,482 | | KVH Industries, Inc.(a) | | | 2,349,082 | |
| | 297,969 | | LSI Industries, Inc. | | | 2,562,533 | |
| | 217,830 | | Manitex | | | | |
| | | | International, Inc.(a) | | | 1,208,957 | |
| | 100,000 | | Sparton Corp.(a) | | | 2,393,000 | |
| | | | | | | 14,860,032 | |
| | |
| Telecommunications – 2.08% | |
| | 1,039,548 | | Ceragon | | | | |
| | | | Networks Ltd.(a) | | | 2,671,638 | |
| | 550,000 | | PC-Tel, Inc. | | | 2,794,000 | |
| | | | | | | 5,465,638 | |
| | |
| Transportation – 1.05% | |
| | 1,103,769 | | Radiant Logistics, Inc.(a) | | | 2,759,422 | |
| | | | | | | 2,759,422 | |
| | | | TOTAL COMMON | | | | |
| | | | STOCKS | | | | |
| | | | (Cost $182,958,114) | | $ | 250,035,004 | |
| | | | | | | | |
| Contracts | | WARRANTS – 0.00% | | | |
| | |
| Insurance – 0.00% | |
| | | | Emergent Capital, | | | | |
| | | | Inc. Warrant; | | | | |
| | 38,106 | | Expiration: 10/06/2019, | | | | |
| | | | Exercise Price | | | | |
| | | | $10.75(a)(c) | | $ | — | |
| | | | TOTAL WARRANTS | | | | |
| | | | (Cost $0) | | $ | — | |
| | | | | | | | |
| | | | SHORT-TERM | | | | |
| | | | INVESTMENTS – 4.81% | | | | |
| | 12,606,512 | | Invesco Short Term | | | | |
| | | | Investments Government | | | | |
| | | | & Agency Portfolio – | | | | |
| | | | Class I, 0.29%(d) | | $ | 12,606,512 | |
| | | | TOTAL SHORT-TERM | | | | |
| | | | INVESTMENTS | | | | |
| | | | (Cost $12,606,512) | | $ | 12,606,512 | |
| | | | Total Investments | | | | |
| | | | (Cost $195,564,626) – | | | | |
| | | | 100.14% | | $ | 262,641,516 | |
| | | | Liabilities in | | | | |
| | | | Excess of Other | | | | |
| | | | Assets – (0.14)% | | | (373,905 | ) |
| | | | TOTAL NET ASSETS – | | | | |
| | | | 100.00% | | $ | 262,267,611 | |
Percentages are stated as a percent of net assets.
(a) | Non-income producing security. |
| | |
(b) | Security was purchased in a transaction exempt from registration in the U.S. under the Securities Act of 1933 (the “Act”) and, unless registered under the Act, may only be sold pursuant to exemption from registration and, in the case of a Rule 144A offering under the Act, may only be sold to “qualified institutional buyers.” The value of this security is $3,280,000 or 1.25% of the Fund’s net assets. This security is deemed to be liquid. |
| | |
(c) | The price for this security was derived from an estimate of fair value using methods approved by the Fund’s Board of Directors. This security represents $0 or 0.00% of the Fund’s net assets. This security is classified as Level 2 and is deemed to be illiquid. |
| | |
(d) | Variable rate security; the rate shown is the effective rate as of October 31, 2016. |
The industry classifications listed above are in accordance with Global Industry Classification Standard (GICS®), which was developed by and/or is the exclusive property of MSCI, Inc. and Standard & Poor Financial Services LLC (“S&P”).
The accompanying notes to financial statements are an integral part of this schedule.
Perritt Ultra MicroCap Fund
| Schedule of Investments | October 31, 2016 |
| Shares | | COMMON STOCKS – 94.30% | | Value | |
| | |
| Aerospace & Defense – 1.31% | |
| | 48,294 | | Air Industries | | | |
| | | | Group, Inc. | | $ | 168,546 | |
| | 80,000 | | CPI Aerostructures, | | | | |
| | | | Inc.(a) | | | 540,000 | |
| | | | | | | 708,546 | |
| | |
| Air Transport – 0.56% | |
| | 34,047 | | AeroCentury Corp.(a) | | | 304,720 | |
| | | | | | | 304,720 | |
| | |
| Auto Parts & Equipment – 2.50% | |
| | 50,000 | | Supreme Industries, | | | | |
| | | | Inc. – Class A | | | 609,500 | |
| | 60,000 | | Unique | | | | |
| | | | Fabricating, Inc. | | | 749,400 | |
| | | | | | | 1,358,900 | |
| | |
| Building Materials – 1.03% | |
| | 119,778 | | Empire Resources, Inc. | | | 559,363 | |
| | | | | | | 559,363 | |
| | |
| Business Services – 13.66% | |
| | 625,547 | | Auxilio, Inc.(a) | | | 506,693 | |
| | 50,000 | | BG Staffing, Inc. | | | 713,000 | |
| | 288,291 | | DLH Holdings Corp.(a) | | | 1,470,284 | |
| | 150,000 | | Information Services | | | | |
| | | | Group, Inc.(a) | | | 592,500 | |
| | 205,500 | | Innodata Isogen, Inc.(a) | | | 503,475 | |
| | 236,199 | | Intrusion, Inc.(a)(c) | | | 118,100 | |
| | 57,000 | | PCM, Inc.(a) | | | 1,208,400 | |
| | 1,837,300 | | Quadrant 4 | | | | |
| | | | System Corp.(a) | | | 385,833 | |
| | 125,000 | | SITO Mobile Ltd.(a) | | | 600,000 | |
| | 52,147 | | Transcat, Inc.(a) | | | 547,543 | |
| | 125,000 | | USA Technologies, | | | | |
| | | | Inc.(a) | | | 562,500 | |
| | 508,900 | | WidePoint Corp.(a) | | | 213,738 | |
| | | | | | | 7,422,066 | |
| | |
| Chemical & Related Products – 1.98% | |
| | 320,000 | | Flexible Solutions | | | | |
| | | | International, Inc.(a) | | | 576,000 | |
| | 36,000 | | Northern Technologies | | | | |
| | | | International Corp.(a) | | | 500,400 | |
| | | | | | | 1,076,400 | |
| | |
| Computer and Electronic | |
| Product Manufacturing – 0.47% | |
| | 68,356 | | Dynatronics Corp.(a) | | | 177,726 | |
| | 194,000 | | Singing Machine Co., | | | | |
| | | | Inc.(a) | | | 77,600 | |
| | | | | | | 255,326 | |
| | |
| Computers & Electronics – 1.65% | |
| | 81,000 | | Concurrent | | | | |
| | | | Computer Corp. | | | 500,580 | |
| | 56,500 | | Napco Security | | | | |
| | | | Technologies, Inc.(a) | | | 395,500 | |
| | | | | | | 896,080 | |
| | |
| Construction & Engineering – 6.32% | |
| | 97,500 | | Gencor Industries, | | | | |
| | | | Inc.(a) | | | 1,179,750 | |
| | 150,000 | | Hill International, | | | | |
| | | | Inc.(a) | | | 577,500 | |
| | 25,000 | | NV5 Global, Inc.(a) | | | 715,000 | |
| | 60,000 | | Willdan Group, Inc.(a) | | | 963,600 | |
| | | | | | | 3,435,850 | |
| | |
| Consumer Goods – 1.03% | |
| | 50,000 | | MCBC Holdings, Inc. | | | 557,000 | |
| | | | | | | 557,000 | |
| | |
| Consumer Products – Distributing – 2.50% | |
| | 310,000 | | FitLife Brands, Inc.(a) | | | 558,000 | |
| | 260,000 | | US Auto Parts | | | | |
| | | | Network, Inc.(a) | | | 798,200 | |
| | | | | | | 1,356,200 | |
| | |
| Consumer Products – Manufacturing – 2.42% | |
| | 42,070 | | Cherokee, Inc.(a) | | | 395,458 | |
| | 50,000 | | Crown Crafts, Inc. | | | 482,500 | |
| | 45,000 | | Hardinge, Inc. | | | 436,500 | |
| | | | | | | 1,314,458 | |
| | |
| Consumer Services – 1.74% | |
| | 85,000 | | Xcel Brands, Inc.(a) | | | 425,000 | |
| | 80,000 | | ZAGG, Inc.(a) | | | 520,000 | |
| | | | | | | 945,000 | |
| | |
| Electronic Equipment & Instruments – 1.63% | |
| | 200,000 | | Iteris, Inc.(a) | | | 682,000 | |
| | 50,000 | | Ultralife Corp.(a) | | | 205,000 | |
| | | | | | | 887,000 | |
| | |
| Energy & Related Services – 1.36% | |
| | 95,000 | | DHT Holdings, Inc. | | | 386,650 | |
The accompanying notes to financial statements are an integral part of this schedule.
Perritt Ultra MicroCap Fund
| Schedule of Investments (Continued) | October 31, 2016 |
| Shares | | | | Value | |
| | |
| Energy & Related Services – 1.36% (Continued) | |
| | 119,206 | | Mitcham | | | |
| | | | Industries, Inc.(a) | | $ | 352,850 | |
| | | | | | | 739,500 | |
| | |
| Environmental Services – 0.59% | |
| | 250,000 | | Fuel Tech, Inc.(a) | | | 321,250 | |
| | | | | | | 321,250 | |
| | |
| Financial Services – 7.49% | |
| | 90,000 | | AMREP Corp.(a) | | | 664,200 | |
| | 25,000 | | First Internet Bancorp | | | 656,250 | |
| | 24,000 | | Hennessy Advisors, Inc. | | | 693,120 | |
| | 50,000 | | HopFed Bancorp, Inc. | | | 569,000 | |
| | 20,000 | | Pacific Premier | | | | |
| | | | Bancorp, Inc.(a) | | | 517,000 | |
| | 52,000 | | Silvercrest Asset | | | | |
| | | | Management Group, | | | | |
| | | | Inc. – Class A | | | 600,600 | |
| | 350,347 | | TheStreet, Inc. | | | 367,864 | |
| | | | | | | 4,068,034 | |
| | |
| Food – 1.11% | |
| | 5,000 | | John B. Sanfilippo | | | | |
| | | | & Son, Inc. | | | 253,400 | |
| | 42,691 | | Willamette Valley | | | | |
| | | | Vineyards, Inc.(a) | | | 347,932 | |
| | | | | | | 601,332 | |
| | |
| Health Care Providers & Services – 0.19% | |
| | 100,000 | | Celsion Corp.(a) | | | 105,000 | |
| | | | | | | 105,000 | |
| | |
| Industrial Goods – 2.47% | |
| | 219,900 | | Hudson | | | | |
| | | | Technologies, Inc.(a) | | | 1,341,390 | |
| | | | | | | 1,341,390 | |
| | |
| Insurance – 3.89% | |
| | 50,000 | | Atlas Financial | | | | |
| | | | Holdings, Inc.(a) | | | 857,500 | |
| | 72,900 | | Kingstone | | | | |
| | | | Companies, Inc. | | | 750,870 | |
| | 35,000 | | United Insurance | | | | |
| | | | Holdings Corp. | | | 507,500 | |
| | | | | | | 2,115,870 | |
| | |
| Leisure – 3.30% | |
| | 97,322 | | Century Casinos, Inc.(a) | | | 617,022 | |
| | 1,771,000 | | Galaxy Gaming, Inc.(a) | | | 920,920 | |
| | 150,000 | | Nevada Gold | | | | |
| | | | & Casinos, Inc.(a) | | | 255,000 | |
| | | | | | | 1,792,942 | |
| | |
| Medical Supplies & Services – 6.46% | |
| | 27,000 | | Addus | | | | |
| | | | HomeCare Corp.(a) | | | 683,100 | |
| | 3,500 | | Birner Dental Management | | | | |
| | | | Services, Inc. | | | 64,155 | |
| | 50,000 | | Cutera, Inc.(a) | | | 655,000 | |
| | 180,440 | | First Choice Healthcare | | | | |
| | | | Solutions, Inc.(a) | | | 196,679 | |
| | 213,334 | | Hooper Holmes, Inc.(a) | | | 192,001 | |
| | 115,000 | | IntriCon Corp.(a) | | | 695,750 | |
| | 70,000 | | MGC Diagnostics | | | | |
| | | | Corp.(a) | | | 528,500 | |
| | 80,000 | | Sensus Healthcare, Inc.(a) | | | 495,600 | |
| | | | | | | 3,510,785 | |
| | |
| Motion Pictures – 1.97% | |
| | 157,677 | | Ballantyne | | | | |
| | | | Strong, Inc.(a) | | | 1,072,203 | |
| | | | | | | 1,072,203 | |
| | |
| Pharmaceuticals – 0.85% | |
| | 82,629 | | ImmuCell Corp.(a) | | | 461,896 | |
| | | | | | | 461,896 | |
| | |
| Real Estate Investment Trusts – 0.94% | |
| | 100,000 | | Global Self | | | | |
| | | | Storage, Inc. | | | 512,000 | |
| | | | | | | 512,000 | |
| | |
| Retail – 0.41% | |
| | 176,000 | | Christopher & | | | | |
| | | | Banks Corp.(a) | | | 225,280 | |
| | | | | | | 225,280 | |
| | |
| Semiconductor Related Products – 6.92% | |
| | 290,000 | | AXT, Inc.(a) | | | 1,493,500 | |
| | 97,500 | | DSP Group, Inc.(a) | | | 1,062,750 | |
| | 105,400 | | inTEST Corp.(a) | | | 437,410 | |
| | 90,000 | | Ultra Clean | | | | |
| | | | Holdings, Inc.(a) | | | 765,000 | |
| | | | | | | 3,758,660 | |
| | |
| Software – 6.80% | |
| | 128,800 | | ARI Network | | | | |
| | | | Services, Inc.(a) | | | 640,136 | |
| | 126,883 | | Asure Software, Inc.(a) | | | 839,966 | |
The accompanying notes to financial statements are an integral part of this schedule.
Perritt Ultra MicroCap Fund
| Schedule of Investments (Continued) | October 31, 2016 |
| Shares | | | Value | |
| | |
| Software (Continued) | |
| | | 67,000 | | BSQUARE Corp.(a) | | $ | 278,050 | |
| | | 75,000 | | Evolving Systems, Inc. | | | 318,750 | |
| | | 200,000 | | GlobalSCAPE, Inc. | | | 728,000 | |
| | | 500,000 | | iPass, Inc.(a) | | | 890,000 | |
| | | | | | | | 3,694,902 | |
| | |
| Specialty Manufacturing – 9.35% | |
| | | 35,000 | | Aspen Aerogels, Inc.(a) | | | 215,950 | |
| | | 93,500 | | CTI Industries Corp.(a) | | | 579,700 | |
| | | 187,835 | | Data I/O Corp.(a) | | | 777,637 | |
| | | 25,000 | | Hurco | | | | |
| | | | | Companies, Inc. | | | 655,000 | |
| | | 14,500 | | Kewaunee | | | | |
| | | | | Scientific Corp. | | | 319,725 | |
| | | 55,000 | | KVH Industries, Inc.(a) | | | 437,250 | |
| | | 170,000 | | Orbit | | | | |
| | | | | International Corp.(a) | | | 637,500 | |
| | | 163,229 | | Pioneer Power | | | | |
| | | | | Solutions, Inc.(a) | | | 856,952 | |
| | | 50,000 | | Tecnoglass, Inc. | | | 599,500 | |
| | | | | | | | 5,079,214 | |
| | |
| Telecommunications – 1.40% | |
| | | 100,000 | | Ceragon | | | | |
| | | | | Networks Ltd.(a) | | | 257,000 | |
| | | 660,000 | | Mobivity Holdings Corp. | | | | |
| | | | | (Acquired 03/11/2014, | | | | |
| | | | | Cost $660,000)(a)(b) | | | 504,900 | |
| | | | | | | | 761,900 | |
| | | | | TOTAL COMMON | | | | |
| | | | | STOCKS | | | | |
| | | | | (Cost $42,767,141) | | $ | 51,239,067 | |
| | | | | | | | | |
| Contracts | | WARRANTS – 0.11% | | |
| | |
| Medical Supplies & Services – 0.11% | |
| | | | | Sensus Healthcare, Inc. | | | | |
| | | 50,000 | | Expiration: 06/08/2019, | | | | |
| | | | | Exercise Price $6.75(a)(c) | | $ | 60,000 | |
| | | | | | | | | |
| | |
| Telecommunications – 0.00% | |
| | | | | Mobivity Holdings Corp. | | | | |
| | | 165,000 | | Expiration: 03/11/2019, | | | | |
| | | | | Exercise Price $1.20 | | | | |
| | | | | (Acquired 03/11/2014, | | | | |
| | | | | Cost $0)(a)(b)(c) | | | 0 | |
| | | | | TOTAL WARRANTS | | | | |
| | | | | (Cost $23,476) | | $ | 60,000 | |
| | | | | | | | | |
| Shares | | SHORT-TERM | | |
| | | | | INVESTMENTS – 5.26% | | | | |
| | | 2,859,138 | | Invesco Short Term | | | | |
| | | | | Investments Government | | | | |
| | | | | & Agency Portfolio – | | | | |
| | | | | Class I, 0.29%(d) | | $ | 2,859,138 | |
| | | | | | | | | |
| | | | | TOTAL SHORT-TERM | | | | |
| | | | | INVESTMENTS | | | | |
| | | | | (Cost $2,859,138) | | $ | 2,859,138 | |
| | | | | | | | | |
| | | | | Total Investments | | | | |
| | | | | (Cost $45,649,755) – | | | | |
| | | | | 99.67% | | $ | 54,158,205 | |
| | | | | Other Assets in Excess | | | | |
| | | | | of Liabilities – 0.33% | | | 178,190 | |
| | | | | TOTAL NET ASSETS – | | | | |
| | | | | 100.00% | | $ | 54,336,395 | |
Percentages are stated as a percent of net assets.
(a) | Non-income producing security. |
| | |
(b) | Securities were purchased in a transaction exempt from registration in the U.S. under the Securities Act of 1933 (the “Act”) or were acquired in a private placement and, unless registered under the Act, may only be sold pursuant to exemption from registration and, in the case of a Rule 144A offering under the Act, may only be sold to “qualified institutional buyers.” The values of these securities total $504,900 or 0.93% of the Fund’s net assets. These securities were classified as Level 2 and, with the exception of Mobivity Holdings Corp. Warrant (“Mobivity Warrant”), are deemed to be liquid. Mobivity Warrant is considered to be illiquid. |
| | |
(c) | The price for these securities was derived from an estimate of fair value using methods approved by the Fund’s Board of Directors. These securities represent $178,100 or 0.33% of the Fund’s net assets. These securities were classified as Level 2 and, with the exception of Mobivity Holdings Corp. Warrant (“Mobivity Warrant”), are deemed to be liquid. Mobivity Warrant is considered to be illiquid. |
| | |
(d) | Variable rate security; the rate shown is the effective rate as of October 31, 2016. |
The industry classifications listed above are in accordance with Global Industry Classification Standard (GICS®), which was developed by and/or is the exclusive property of MSCI, Inc. and Standard & Poor Financial Services LLC (“S&P”).
The accompanying notes to financial statements are an integral part of this schedule.
Perritt Low Priced Stock Fund
| Schedule of Investments (Continued) | October 31, 2016 |
| Shares | | COMMON STOCKS – 91.89% | | Value | |
| | |
| Administrative and Support Services – 1.89% | |
| | 6,200 | | Kforce, Inc. | | $ | 107,570 | |
| | | | | | | 107,570 | |
| | |
| Air Transportation – 3.57% | |
| | 2,000 | | Hawaiian Holdings, | | | | |
| | | | Inc.(a) | | | 90,050 | |
| | 6,500 | | JetBlue Airways | | | | |
| | | | Corp.(a) | | | 113,620 | |
| | | | | | | 203,670 | |
| | |
| Auto Parts & Equipment – 1.48% | |
| | 2,100 | | Miller Industries, Inc. | | | 46,095 | |
| | 3,500 | | Modine | | | | |
| | | | Manufacturing Co.(a) | | | 38,325 | |
| | | | | | | 84,420 | |
| | |
| Automobile Manufacturers – 1.64% | |
| | 3,300 | | Winnebago | | | | |
| | | | Industries, Inc. | | | 93,225 | |
| | | | | | | 93,225 | |
| | |
| Beverage and Tobacco | |
| Product Manufacturing – 0.62% | |
| | 1,000 | | MGP Ingredients, Inc. | | | 35,210 | |
| | | | | | | 35,210 | |
| | |
| Biotechnology – 0.23% | |
| | 1,900 | | Trinity Biotech | | | | |
| | | | Plc – ADR(a) | | | 12,958 | |
| | | | | | | 12,958 | |
| | |
| Building Products – 6.21% | |
| | 12,000 | | Builders | | | | |
| | | | FirstSource, Inc.(a) | | | 116,040 | |
| | 7,100 | | NCI Building | | | | |
| | | | Systems, Inc.(a) | | | 102,240 | |
| | 5,400 | | USG Corp.(a) | | | 135,972 | |
| | | | | | | 354,252 | |
| | |
| Business Services – 2.08% | |
| | 4,300 | | Graphic Packaging | | | | |
| | | | Holding Co. | | | 53,750 | |
| | 10,300 | | Information Services | | | | |
| | | | Group, Inc.(a) | | | 40,685 | |
| | 1,800 | | Steelcase, Inc. | | | 24,030 | |
| | | | | | | 118,465 | |
| | |
| Commercial Banks – 13.23% | |
| | 11,300 | | FNB Corp. | | | 147,691 | |
| | 8,800 | | Hallmark Financial | | | | |
| | | | Services, Inc.(a) | | | 91,168 | |
| | 13,800 | | Investors Bancorp, Inc. | | | 169,188 | |
| | 7,800 | | Meridian Bancorp, Inc. | | | 124,410 | |
| | 1,500 | | TowneBank | | | 37,200 | |
| | 1,400 | | Triumph | | | | |
| | | | Bancorp, Inc.(a) | | | 26,040 | |
| | 14,600 | | United Community | | | | |
| | | | Financial Corp. | | | 107,310 | |
| | 2,900 | | Veritex Holdings, Inc.(a) | | | 51,127 | |
| | | | | | | 754,134 | |
| | |
| Commercial Services & Supplies – 1.98% | |
| | 2,700 | | ACCO Brands Corp.(a) | | | 29,970 | |
| | 8,500 | | RPX Corp.(a) | | | 82,960 | |
| | | | | | | 112,930 | |
| | |
| Communications Equipment – 2.05% | |
| | 2,400 | | CalAmp Corp.(a) | | | 31,008 | |
| | 7,900 | | ClearOne, Inc. | | | 85,715 | |
| | | | | | | 116,723 | |
| | |
| Computers & Electronics – 2.20% | |
| | 11,850 | | Brocade Communications | | | | |
| | | | Systems, Inc. | | | 125,610 | |
| | | | | | | 125,610 | |
| | |
| Construction & Engineering – 3.40% | |
| | 11,800 | | Gencor | | | | |
| | | | Industries, Inc.(a) | | | 142,780 | |
| | 3,400 | | IES Holdings, Inc.(a) | | | 50,830 | |
| | | | | | | 193,610 | |
| | |
| Electronic Equipment & Instruments – 4.17% | |
| | 7,100 | | Orbotech Ltd.(a) | | | 194,540 | |
| | 3,300 | | TTM Technologies, | | | | |
| | | | Inc.(a) | | | 43,395 | |
| | | | | | | 237,935 | |
| | |
| Financial Services – 0.90% | |
| | 4,000 | | Janus Capital | | | | |
| | | | Group, Inc. | | | 51,280 | |
| | | | | | | 51,280 | |
| | |
| Health Care Providers & Services – 1.57% | |
| | 6,900 | | Select Medical | | | | |
| | | | Holdings Corp(a) | | | 89,700 | |
| | | | | | | 89,700 | |
| | |
| Healthcare Equipment – 2.72% | |
| | 7,000 | | Globus Medical, Inc.(a) | | | 154,910 | |
| | | | | | | 154,910 | |
The accompanying notes to financial statements are an integral part of this schedule.
Perritt Low Priced Stock Fund
| Schedule of Investments (Continued) | October 31, 2016 |
| Shares | | | | Value | |
| | |
| Household Durables – 1.79% | |
| | 7,200 | | Lifetime Brands, Inc. | | $ | 101,880 | |
| | | | | | | 101,880 | |
| | |
| Insurance – 3.85% | |
| | 8,400 | | Atlas Financial | | | | |
| | | | Holdings, Inc.(a) | | | 144,060 | |
| | 5,000 | | CNO Financial | | | | |
| | | | Group, Inc. | | | 75,400 | |
| | | | | | | 219,460 | |
| | |
| IT Consulting – 1.66% | |
| | 5,100 | | Perficient, Inc.(a) | | | 94,911 | |
| | | | | | | 94,911 | |
| | |
| Leisure – 4.66% | |
| | 5,300 | | Marine Products Corp. | | | 49,555 | |
| | 8,600 | | Nautilus, Inc.(a) | | | 151,360 | |
| | 4,900 | | Reading | | | | |
| | | | International, Inc.(a) | | | 64,631 | |
| | | | | | | 265,546 | |
| | |
| Machinery Manufacturing – 3.58% | |
| | 9,300 | | Nova Measuring | | | | |
| | | | Instruments Ltd.(a) | | | 111,321 | |
| | 5,300 | | Novanta, Inc.(a) | | | 92,485 | |
| | | | | | | 203,806 | |
| | |
| Medical Supplies & Services – 6.22% | |
| | 2,100 | | AMN Healthcare | | | | |
| | | | Services, Inc.(a) | | | 68,880 | |
| | 8,000 | | CryoLife, Inc. | | | 136,000 | |
| | 23,600 | | Digirad Corp. | | | 103,840 | |
| | 2,100 | | Merit Medical | | | | |
| | | | Systems, Inc.(a) | | | 46,095 | |
| | | | | | | 354,815 | |
| | |
| Pharmaceuticals – 1.34% | |
| | 1,900 | | Cambrex Corp.(a) | | | 76,570 | |
| | | | | | | 76,570 | |
| | |
| Real Estate Investment Trusts – 1.64% | |
| | 6,700 | | Medical Properties | | | | |
| | | | Trust, Inc. | | | 93,398 | |
| | | | | | | 93,398 | |
| | |
| Semiconductor Related Products – 4.96% | |
| | 5,000 | | Entegris, Inc.(a) | | | 79,500 | |
| | 2,200 | | Kulicke & Soffa | | | | |
| | | | Industries, Inc.(a) | | | 29,128 | |
| | 2,100 | | NeoPhotonics Corp.(a) | | | 29,400 | |
| | 14,900 | | Photronics, Inc.(a) | | | 144,530 | |
| | | | | | | 282,558 | |
| | |
| Software – 3.33% | |
| | 11,700 | | American | | | | |
| | | | Software, Inc. | | | 122,031 | |
| | 3,500 | | TechTarget, Inc. – | | | | |
| | | | Class A(a) | | | 28,280 | |
| | 9,700 | | Zix Corp.(a) | | | 39,479 | |
| | | | | | | 189,790 | |
| | |
| Specialty Chemicals – 1.91% | |
| | 8,400 | | Ferro Corp.(a) | | | 108,864 | |
| | | | | | | 108,864 | |
| | |
| Specialty Manufacturing – 5.71% | |
| | 5,200 | | Federal Signal Corp. | | | 63,856 | |
| | 6,900 | | Fox Factory | | | | |
| | | | Holding Corp.(a) | | | 149,730 | |
| | 4,500 | | Mueller Water | | | | |
| | | | Products, Inc. | | | 55,440 | |
| | 5,000 | | Wabash National | | | | |
| | | | Corp.(a) | | | 56,250 | |
| | | | | | | 325,276 | |
| | |
| Utilities – 1.30% | |
| | 7,800 | | Star Gas Partners LP | | | 74,100 | |
| | | | | | | 74,100 | |
| | | | TOTAL COMMON | | | | |
| | | | STOCKS | | | | |
| | | | (Cost $4,943,518) | | $ | 5,237,576 | |
The accompanying notes to financial statements are an integral part of this schedule.
Perritt Low Priced Stock Fund
| Schedule of Investments (Continued) | October 31, 2016 |
| Shares | | SHORT-TERM | | Value | |
| | | INVESTMENTS – 8.88% | | | |
| | 506,237 | | Invesco Short Term | | | |
| | | | Investments Government | | | |
| | | | & Agency Portfolio – | | | |
| | | | Class I, 0.29%(b) | | $ | 506,237 | |
| | | | | | | | |
| | | | TOTAL SHORT-TERM | | | | |
| | | | INVESTMENTS | | | | |
| | | | (Cost $506,237) | | $ | 506,237 | |
| | | | | | | | |
| | | | Total Investments | | | | |
| | | | (Cost $5,449,755) – | | | | |
| | | | 100.77% | | $ | 5,743,813 | |
| | | | Liabilities in | | | | |
| | | | Excess of Other | | | | |
| | | | Assets – (0.77)% | | | (43,713 | ) |
| | | | TOTAL NET ASSETS – | | | | |
| | | | 100.00% | | $ | 5,700,100 | |
Percentages are stated as a percent of net assets.
| ADR | American Depository Receipt |
| | |
(a) | Non-income producing security. |
| | |
(b) | Variable rate security; the rate shown is the effective rate as of October 31, 2016. |
The industry classifications listed above are in accordance with Global Industry Classification Standard (GICS®), which was developed by and/or is the exclusive property of MSCI, Inc. and Standard & Poor Financial Services LLC (“S&P”).
The accompanying notes to financial statements are an integral part of this schedule.
Perritt Funds, Inc.
| Statements of Assets and Liabilities |
October 31, 2016
| | | Perritt MicroCap | | | Perritt Ultra | | | Perritt Low | |
| | | Opportunities Fund | | | MicroCap Fund | | | Priced Stock Fund | |
| Assets: | | | | | | | | | |
| Investments at value | | $ | 262,641,516 | | | $ | 54,158,205 | | | $ | 5,743,813 | |
| Receivable for investments sold | | | 238,788 | | | | 329,871 | | | | — | |
| Dividends and interest receivable | | | 21,769 | | | | 18,165 | | | | 1,672 | |
| Prepaid expenses | | | 11,581 | | | | 10,933 | | | | 1,346 | |
| Receivable for fund shares issued | | | 54,254 | | | | 32,341 | | | | 92 | |
| Total Assets | | | 262,967,908 | | | | 54,549,515 | | | | 5,746,923 | |
| | | | | | | | | | | | | |
| Liabilities: | | | | | | | | | | | | |
| Payable for investments purchased | | | 65,822 | | | | 37,130 | | | | 16,988 | |
| Payable for fund shares purchased | | | 274,579 | | | | 46,936 | | | | — | |
| Payable to Officer & directors | | | 23,254 | | | | 23,254 | | | | — | |
| Payable to Advisor | | | 230,101 | | | | 58,687 | | | | 64 | |
| Accrued expenses & other liabilities | | | 106,541 | | | | 47,113 | | | | 29,771 | |
| Total Liabilities | | | 700,297 | | | | 213,120 | | | | 46,823 | |
| Net Assets | | $ | 262,267,611 | | | $ | 54,336,395 | | | $ | 5,700,100 | |
| | | | | | | | | | | | | |
| Net Assets Consist of: | | | | | | | | | | | | |
| Capital Stock | | $ | 169,646,710 | | | $ | 43,246,130 | | | $ | 5,578,271 | |
| Accumulated net | | | | | | | | | | | | |
| investment gain/(loss) | | | 648,016 | | | | — | | | | (12,968 | ) |
| Accumulated undistributed net realized | | | | | | | | | | | | |
| income/(loss) on investments sold | | | 24,895,995 | | | | 2,581,815 | | | | (159,261 | ) |
| Net unrealized appreciation | | | | | | | | | | | | |
| on investments | | | 67,076,890 | | | | 8,508,450 | | | | 294,058 | |
| Total Net Assets | | $ | 262,267,611 | | | $ | 54,336,395 | | | $ | 5,700,100 | |
| Capital Stock, $0.0001 par value | | | | | | | | | | | | |
| Authorized | | | 100,000,000 | | | | 100,000,000 | | | | 100,000,000 | |
| Outstanding | | | 7,672,207 | | | | 3,514,592 | | | | 366,505 | |
| Net Assets | | $ | 262,267,611 | | | $ | 54,336,395 | | | $ | 5,700,100 | |
| Net asset value and | | | | | | | | | | | | |
| offering price per share | | $ | 34.18 | | | $ | 15.46 | | | $ | 15.55 | |
| Cost of Investments | | $ | 195,564,626 | | | $ | 45,649,755 | | | $ | 5,449,755 | |
The accompanying notes to financial statements are an integral part of these statements.
Perritt Funds, Inc.
For the Years Ended October 31, 2016
| | | Perritt MicroCap | | | Perritt Ultra | | | Perritt Low | |
| | | Opportunities Fund | | | MicroCap Fund | | | Priced Stock Fund | |
| Investment Income: | | | | | | | | | |
| Dividend Income | | $ | 4,758,427 | | | $ | 1,186,364 | | | $ | 58,005 | |
| Less: Foreign taxes withheld | | | | | | | | | | | | |
| and issuance fees | | | — | | | | — | | | | (100 | ) |
| Interest income | | | 19,433 | | | | 5,429 | | | | 1,340 | |
| Total investment income | | | 4,777,860 | | | | 1,191,793 | | | | 59,245 | |
| | | | | | | | | | | | | |
| Expenses: | | | | | | | | | | | | |
| Investment advisory fee | | | 2,901,471 | | | | 664,074 | | | | 53,174 | |
| Shareholder servicing | | | 251,130 | | | | 72,795 | | | | 26,245 | |
| Administration fee | | | 138,845 | | | | 34,549 | | | | 10,093 | |
| Fund accounting expenses | | | 89,566 | | | | 20,323 | | | | 4,568 | |
| Officer & directors’ fees & expenses | | | 73,574 | | | | 73,574 | | | | 17,250 | |
| Professional fees | | | 32,201 | | | | 32,019 | | | | 28,477 | |
| Federal & state registration fees | | | 30,396 | | | | 24,354 | | | | 24,843 | |
| Printing & Mailing fees | | | 23,925 | | | | 5,961 | | | | 3,038 | |
| Custodian fees | | | 19,055 | | | | 6,763 | | | | 2,469 | |
| Other expense | | | 19,203 | | | | 4,608 | | | | 2,824 | |
| Interest expense | | | 2,210 | | | | 154 | | | | — | |
| Total expenses | | | 3,581,576 | | | | 939,174 | | | | 172,981 | |
| Less contractual waiver | | | — | | | | — | | | | (81,819 | ) |
| Less voluntary waiver | | | — | | | | — | | | | (17,250 | ) |
| Total expenses net of waivers | | | 3,581,576 | | | | 939,174 | | | | 73,912 | |
| Net investment income/(loss) | | | 1,196,284 | | | | 252,619 | | | | (14,667 | ) |
| | | | | | | | | | | | | |
| Realized and Unrealized | | | | | | | | | | | | |
| Gain on Investments: | | | | | | | | | | | | |
| Net realized gain/(loss) | | | | | | | | | | | | |
| on investments | | | 24,942,608 | | | | 2,738,172 | | | | (2,687 | ) |
| Change in unrealized appreciation/ | | | | | | | | | | | | |
| (depreciation) on investments | | | (13,260,520 | ) | | | 1,533,943 | | | | 85,475 | |
| Net realized and unrealized | | | | | | | | | | | | |
| gain on investments | | | 11,682,088 | | | | 4,272,115 | | | | 82,788 | |
| Net increase in net assets | | | | | | | | | | | | |
| resulting from operations | | $ | 12,878,372 | | | $ | 4,524,734 | | | $ | 68,121 | |
The accompanying notes to financial statements are an integral part of these statements.
Perritt MicroCap Opportunities Fund
| Statements of Changes in Net Assets |
| | | For the | | | For the | |
| | | Year Ended | | | Year Ended | |
| | | October 31, 2016 | | | October 31, 2015 | |
| Operations: | | | | | | |
| Net investment income | | $ | 1,196,284 | | | $ | 522,087 | |
| Net realized gain on investments | | | 24,942,608 | | | | 6,081,565 | |
| Net unrealized depreciation on investments | | | (13,260,520 | ) | | | (20,834,810 | ) |
| Net increase/(decrease) in net assets | | | | | | | | |
| resulting from operations | | | 12,878,372 | | | | (14,231,158 | ) |
| | | | | | | | | |
| Dividends and Distributions to Shareholders: | | | | | | | | |
| Net realized gains | | | (6,027,092 | ) | | | (31,028,153 | ) |
| Total dividends and distributions | | | (6,027,092 | ) | | | (31,028,153 | ) |
| | | | | | | | | |
| Capital Share Transactions: | | | | | | | | |
| Proceeds from shares issued | | | 17,649,843 | | | | 44,631,301 | |
| Reinvestment of distributions | | | 5,597,737 | | | | 28,912,587 | |
| Cost of shares redeemed | | | (140,602,491 | ) | | | (118,258,647 | ) |
| Redemption fees | | | 3,662 | | | | 25,540 | |
| Net decrease in net assets | | | | | | | | |
| from capital share transactions | | | (117,351,249 | ) | | | (44,689,219 | ) |
| Total Decrease in Net Assets | | | (110,499,969 | ) | | | (89,948,530 | ) |
| Net Assets | | | | | | | | |
| Beginning of the period | | | 372,767,580 | | | | 462,716,110 | |
| End of the period | | $ | 262,267,611 | | | $ | 372,767,580 | |
| Accumulated net investment income/(loss) | | $ | 648,016 | | | $ | (548,268 | ) |
| | | | | | | | | |
| Capital Share Transactions: | | | | | | | | |
| Shares sold | | | 558,788 | | | | 1,327,427 | |
| Shares issued on reinvestment of distributions | | | 175,039 | | | | 872,437 | |
| Shares redeemed | | | (4,525,350 | ) | | | (3,588,849 | ) |
| Net decrease from capital share transactions | | | (3,791,523 | ) | | | (1,388,985 | ) |
The accompanying notes to financial statements are an integral part of this statement.
Perritt Ultra MicroCap Fund
| Statements of Changes in Net Assets |
| | | For the | | | For the | |
| | | Year Ended | | | Year Ended | |
| | | October 31, 2016 | | | October 31, 2015 | |
| Operations: | | | | | | |
| Net investment income/(loss) | | $ | 252,619 | | | $ | (278,487 | ) |
| Net realized gain on investments | | | 2,738,172 | | | | 860,911 | |
| Net unrealized appreciation/(depreciation) on investments | | | 1,533,943 | | | | (1,103,581 | ) |
| Net increase/(decrease) in net assets | | | | | | | | |
| resulting from operations | | | 4,524,734 | | | | (521,157 | ) |
| | | | | | | | | |
| Dividends and Distributions to Shareholders: | | | | | | | | |
| Net realized gains | | | (866,370 | ) | | | (9,199,946 | ) |
| Total dividends and distributions | | | (866,370 | ) | | | (9,199,946 | ) |
| | | | | | | | | |
| Capital Share Transactions: | | | | | | | | |
| Proceeds from shares issued | | | 6,812,555 | | | | 15,901,676 | |
| Reinvestment of distributions | | | 816,702 | | | | 8,580,440 | |
| Cost of shares redeemed | | | (17,008,387 | ) | | | (22,320,922 | ) |
| Redemption fees | | | 3,747 | | | | 42,748 | |
| Net increase/(decrease) in net assets | | | | | | | | |
| from capital share transactions | | | (9,375,383 | ) | | | 2,203,942 | |
| Total Decrease in Net Assets | | | (5,717,019 | ) | | | (7,517,161 | ) |
| Net Assets | | | | | | | | |
| Beginning of the period | | | 60,053,414 | | | | 67,570,575 | |
| End of the period | | $ | 54,336,395 | | | $ | 60,053,414 | |
| Accumulated net investment loss | | $ | — | | | $ | (391,657 | ) |
| | | | | | | | | |
| Capital Share Transactions: | | | | | | | | |
| Shares sold | | | 474,399 | | | | 1,081,853 | |
| Shares issued on reinvestment of distributions | | | 58,336 | | | | 590,127 | |
| Shares redeemed | | | (1,192,850 | ) | | | (1,522,319 | ) |
| Net increase/(decrease) from capital share transactions | | | (660,115 | ) | | | 149,661 | |
The accompanying notes to financial statements are an integral part of this statement.
Perritt Low Priced Stock Fund
| Statements of Changes in Net Assets |
| | | For the | | | For the | |
| | | Year Ended | | | Year Ended | |
| | | October 31, 2016 | | | October 31, 2015 | |
| Operations: | | | | | | |
| Net investment loss | | $ | (14,667 | ) | | $ | (2,360 | ) |
| Net realized loss on investments | | | (2,687 | ) | | | (50,903 | ) |
| Net increase in unrealized appreciation on investments | | | 85,475 | | | | 155,499 | |
| Net increase in net assets resulting from operations | | | 68,121 | | | | 102,236 | |
| | | | | | | | | |
| Capital Share Transactions: | | | | | | | | |
| Proceeds from shares issued | | | 1,698,859 | | | | 2,995,885 | |
| Cost of shares redeemed | | | (679,718 | ) | | | (575,980 | ) |
| Redemption fees | | | 541 | | | | 604 | |
| Net increase in net assets | | | | | | | | |
| from capital share transactions | | | 1,019,682 | | | | 2,420,509 | |
| Total Increase in Net Assets | | | 1,087,803 | | | | 2,522,745 | |
| Net Assets | | | | | | | | |
| Beginning of the period | | | 4,612,297 | | | | 2,089,552 | |
| End of the period | | $ | 5,700,100 | | | $ | 4,612,297 | |
| Accumulated net investment loss | | $ | (12,968 | ) | | $ | (794 | ) |
| | | | | | | | | |
| Capital Share Transactions: | | | | | | | | |
| Shares sold | | | 112,864 | | | | 190,087 | |
| Shares redeemed | | | (46,121 | ) | | | (37,977 | ) |
| Net increase from capital share transactions | | | 66,743 | | | | 152,110 | |
The accompanying notes to financial statements are an integral part of this statement.
Perritt MicroCap Opportunities Fund
For a Fund share outstanding throughout the year
| | | For the Years Ended October 31, | |
| | | 2016 | | | 2015 | | | 2014 | | | 2013 | | | 2012 | |
| Net asset value, beginning of year | | $ | 32.52 | | | $ | 36.00 | | | $ | 37.38 | | | $ | 26.47 | | | $ | 23.43 | |
| Income/(loss) from investment operations: | | | | | | | | | | | | | | | | | | | | |
Net investment income/(loss)2 | | | 0.13 | | | | 0.04 | | | | (0.18 | ) | | | (0.06 | ) | | | 0.10 | |
| Net realized and unrealized | | | | | | | | | | | | | | | | | | | | |
| gain/(loss) on investments | | | 2.06 | | | | (1.10 | ) | | | 2.29 | | | | 11.21 | | | | 2.94 | |
| Total from investment operations | | | 2.19 | | | | (1.06 | ) | | | 2.11 | | | | 11.15 | | | | 3.04 | |
| Less dividends and distributions: | | | | | | | | | | | | | | | | | | | | |
| From net investment income | | | — | | | | — | | | | — | | | | (0.24 | ) | | | — | |
| Distributions from net realized gains | | | (0.53 | ) | | | (2.42 | ) | | | (3.49 | ) | | | — | | | | — | |
| Total dividends and distributions | | | (0.53 | ) | | | (2.42 | ) | | | (3.49 | ) | | | (0.24 | ) | | | — | |
Redemption fees2,3 | | | — | | | | — | | | | — | | | | — | | | | — | |
| Net asset value, end of year | | $ | 34.18 | | | $ | 32.52 | | | $ | 36.00 | | | $ | 37.38 | | | $ | 26.47 | |
Total return1 | | | 6.85 | % | | | (3.07 | )% | | | 6.17 | % | | | 42.46 | % | | | 12.97 | % |
| Supplemental data and ratios: | | | | | | | | | | | | | | | | | | | | |
| Net assets, end of year (in thousands) | | $ | 262,268 | | | $ | 372,768 | | | $ | 462,716 | | | $ | 463,469 | | | $ | 308,241 | |
| Ratio of net expenses to average net assets | | | 1.23 | % | | | 1.21 | % | | | 1.19 | % | | | 1.22 | % | | | 1.26 | % |
| Ratio of net investment income/(loss) | | | | | | | | | | | | | | | | | | | | |
| to average net assets | | | 0.41 | % | | | 0.12 | % | | | (0.51 | %) | | | (0.20 | %) | | | 0.38 | % |
| Portfolio turnover rate | | | 6.2 | % | | | 20.7 | % | | | 29.1 | % | | | 41.4 | % | | | 14.0 | % |
1 | Total return reflects reinvested dividends but does not reflect the impact of taxes. |
2 | Net investment income (loss) and redemption fees per share has been calculated based on average shares outstanding during the period. |
3 | Amount is less than $0.01 per share. |
The accompanying notes to financial statements are an integral part of this schedule.
Perritt Ultra MicroCap Fund
For a Fund share outstanding throughout the year
| | | For the Years Ended October 31, | |
| | | 2016 | | | 2015 | | | 2014 | | | 2013 | | | 2012 | |
| Net asset value, beginning of year | | $ | 14.39 | | | $ | 16.79 | | | $ | 16.23 | | | $ | 11.50 | | | $ | 10.90 | |
| Income/(loss) from investment operations: | | | | | | | | | | | | | | | | | | | | |
Net investment income/(loss)2 | | | 0.07 | | | | (0.06 | ) | | | (0.19 | ) | | | (0.15 | ) | | | (0.06 | ) |
| Net realized and unrealized | | | | | | | | | | | | | | | | | | | | |
| gain/(loss) on investments | | | 1.22 | | | | (0.06 | ) | | | 1.12 | | | | 4.88 | | | | 0.66 | |
| Total from investment operations | | | 1.29 | | | | (0.12 | ) | | | 0.93 | | | | 4.73 | | | | 0.60 | |
| Less dividends and distributions: | | | | | | | | | | | | | | | | | | | | |
| Distributions from net realized gains | | | (0.22 | ) | | | (2.29 | ) | | | (0.39 | ) | | | — | | | | — | |
| Total dividends and distributions | | | (0.22 | ) | | | (2.29 | ) | | | (0.39 | ) | | | — | | | | — | |
Redemption fees2 | | | — | 3 | | | 0.01 | | | | 0.02 | | | | — | 3 | | | — | 3 |
| Net asset value, end of year | | $ | 15.46 | | | $ | 14.39 | | | $ | 16.79 | | | $ | 16.23 | | | $ | 11.50 | |
Total return1 | | | 9.11 | % | | | (0.82 | %) | | | 5.96 | % | | | 41.13 | % | | | 5.50 | % |
| Supplemental data and ratios: | | | | | | | | | | | | | | | | | | | | |
| Net assets, end of year (in thousands) | | $ | 54,336 | | | $ | 60,053 | | | $ | 67,571 | | | $ | 82,000 | | | $ | 48,577 | |
| Ratio of net expenses to average net assets | | | 1.77 | % | | | 1.75 | % | | | 1.56 | % | | | 1.75 | % | | | 1.85 | % |
| Ratio of net investment loss | | | | | | | | | | | | | | | | | | | | |
| to average net assets | | | 0.48 | % | | | (0.43 | %) | | | (1.06 | %) | | | (1.14 | %) | | | (0.56 | %) |
| Portfolio turnover rate | | | 18.1 | % | | | 30.1 | % | | | 64.2 | % | | | 33.9 | % | | | 14.6 | % |
1 | Total return reflects reinvested dividends but does not reflect the impact of taxes. |
2 | Net investment income (loss) and redemption fees per share has been calculated based on average shares outstanding during the period. |
3 | Amount is less than $0.01 per share. |
The accompanying notes to financial statements are an integral part of this schedule.
Perritt Low Priced Stock Fund
For a Fund share outstanding throughout the year/period
| | | | | | | | | For the | |
| | | | | | | | | Period From | |
| | | | | | | | | February 28, 20144 | |
| | | For the | | | to | |
| | | Years Ended October 31, | | | October 31, | |
| | | 2016 | | | 2015 | | | 2014 | |
| Net asset value, beginning of year/period | | $ | 15.39 | | | $ | 14.15 | | | $ | 15.00 | |
| Income/(loss) from investment operations: | | | | | | | | | | | | |
Net investment loss2 | | | (0.04 | ) | | | (0.01 | ) | | | (0.06 | ) |
| Net realized and unrealized loss on investments | | | 0.20 | | | | 1.25 | | | | (0.79 | ) |
| Total from investment operations | | | 0.16 | | | | 1.24 | | | | (0.85 | ) |
Redemption fees2,3 | | | — | | | | — | | | | — | |
| Net asset value, end of year/period | | $ | 15.55 | | | $ | 15.39 | | | $ | 14.15 | |
Total return1,7 | | | 1.04 | % | | | 8.76 | % | | | (5.67 | %)5 |
| Supplemental data and ratios: | | | | | | | | | | | | |
| Net assets, end of year/period (in thousands) | | $ | 5,700 | | | $ | 4,612 | | | $ | 2,090 | |
| Ratio of net expenses to average net assets | | | 1.39 | % | | | 1.49 | %8 | | | 1.50 | %6 |
| Ratio of net investment loss to average net assets | | | (0.28 | %) | | | (0.08 | %) | | | (0.67 | %)6 |
| Ratio of expenses (prior to reimbursement) | | | | | | | | | | | | |
| to average net assets | | | 3.25 | % | | | 4.90 | % | | | 7.15 | %6 |
| Ratio of net investment loss | | | | | | | | | | | | |
| (prior to reimbursement) to average net assets | | | (2.14 | %) | | | (3.49 | %) | | | (6.32 | %)6 |
| Portfolio turnover rate | | | 62.7 | % | | | 76.6 | % | | | 49.0 | %7 |
| 1 | Total return reflects reinvested dividends but does not reflect the impact of taxes. |
2 | Net investment income (loss) and redemption fees per share has been calculated based on average shares outstanding during the period. |
3 | Amount is less than $0.01 per share. |
4 | Commencement of operations. |
5 | The total return figure is the since inception return for the Fund which commenced operations on February 28, 2014. |
6 | Annualized for periods less than one year. |
7 | Not annualized for periods less than one year. |
8 | Effective October 1, 2015, the Advisor expense limit was reduced from 1.50% to 1.39%. See Note 4. |
The accompanying notes to financial statements are an integral part of this schedule.
Perritt Funds, Inc.
| Notes to Financial Statements |
October 31, 2016
| 1. | Organization |
| | | |
| | | Perritt Funds, Inc. (the “Corporation”) was organized on March 19, 2004 as a Maryland corporation and is registered under the Investment Company Act of 1940, as amended (the “1940 Act”), as an open-end investment company, with each series below being a diversified fund. The Corporation currently consists of the following series: Perritt MicroCap Opportunities Fund (“MicroCap Fund”), Perritt Ultra MicroCap Fund (“Ultra MicroCap Fund”) and Perritt Low Priced Stock Fund (“Low Priced Stock Fund”) (each, a “Fund,” and collectively, the “Funds”). Perritt MicroCap Opportunities Fund, Inc., the predecessor to the MicroCap Fund, commenced operations on April 11, 1988. As part of a plan of reorganization, on February 28, 2013, Perritt MicroCap Opportunities Fund, Inc. merged into the MicroCap Fund, a series within the Corporation. The Perritt Low Priced Stock Fund commenced operations on February 28, 2014. The MicroCap Fund’s investment objective is to invest in mainly common stocks of companies with market capitalizations that are below $500 million at the time of the initial purchase. The Ultra MicroCap Fund’s investment objective is to invest in mainly common stocks of companies with market capitalizations that are below $300 million at the time of the initial purchase. The Low Priced Stock Fund’s investment objective is to invest mainly in common stocks of companies with market capitalization that are below $3 billion and traded at or below $15 per share at the time of initial purchase. The Funds are each an investment company and accordingly follow the investment company accounting and reporting guidance of the Financial Accounting Standards Board (“FASB”) Accounting Standards Codification topic 946 “Financial Services – Investment Companies.” |
| | |
| 2. | Summary of Significant Accounting Policies |
| | | |
| | a. | Exchange-listed securities are generally valued at the last sales price reported by the principal security exchange on which the security is traded, or if no sale is reported, the mean between the latest bid and ask price unless the Funds’ investment advisor believes that the mean does not represent a fair value, in which case the securities are fair valued as set forth below. Securities listed on NASDAQ are valued at the NASDAQ Official Closing Price. Demand notes, commercial paper, U.S. Treasury Bills and warrants are stated at fair value using market prices if available, or a pricing service when such prices are believed to reflect fair value. Securities for which market quotations are not readily available are valued at their fair value as determined in good faith by the Funds’ advisor under procedures established by and under the supervision of the Board of Directors of the Funds. The Funds’ fair value procedures allow for the use of certain methods performed by the Funds’ advisor to value those securities for which market quotations are not readily available, at a price that a Fund might reasonably expect to receive upon a sale of such securities. For example, these methods may be based on a multiple of earnings, or a discount from market of a similar freely traded security, or a yield to maturity with respect to debt issues, or a combination of these and other methods. |
| | | |
| | b. | Net realized gains and losses on securities are computed using the first-in, first-out method. |
Perritt Funds, Inc.
| Notes to Financial Statements (Continued) |
| | c. | Dividend income is recognized on the ex-dividend date, and interest income is recognized on the accrual basis. Withholding taxes on foreign dividends and capital gains, which are included as a component of net investment income and realized gain (loss) on investments, respectively, have been provided for in accordance with the Funds’ understanding of the applicable country’s tax rules and rates. Discounts and premiums on securities purchased are amortized over the life of the respective securities. Distributions received from real estate investment trusts (“REITs”) are classified as investment income or realized gains based on the U.S. income tax characteristics of the distribution. Return of capital distributions received from REIT securities and partnerships are recorded as an adjustment to the cost of the security and thus may impact unrealized or realized gains or losses on the security. Investment and shareholder transactions are recorded on the trade date. |
| | | |
| | d. | Each Fund is charged for those expenses that are directly attributable to it. Expenses that are not readily identifiable to a specific Fund are generally allocated among the Funds in proportion to the relative net assets of the Funds. |
| | | |
| | e. | Provision has not been made for federal income tax since the Funds have each elected to be taxed as a “regulated investment company” and intend to distribute substantially all income to their shareholders and otherwise comply with the provisions of the Internal Revenue Code applicable to regulated investment companies. |
| | | |
| | f. | The preparation of financial statements in conformity with accounting principles generally accepted in the United States of America (“GAAP”) requires management to make estimates and assumptions that affect the reported amounts of assets and liabilities and disclosure of contingent assets and liabilities at the date of the financial statements and reported amounts of increases and decreases in net assets from operations during the reporting period. Actual results could differ from those estimates. |
| | | |
| | | In preparing these financial statements, the Funds have evaluated events and transactions for potential recognition or disclosure through the date the financial statements were issued. |
| | | |
| | g. | Dividends from net investment income and net realized capital gains, if any, are declared and paid annually. Distributions to shareholders are recorded on the ex-dividend date. The Funds may periodically make reclassifications among certain of their capital accounts as a result of the timing and characterization of certain income and realized gain distributions determined annually in accordance with federal tax regulations which may differ from GAAP. The MicroCap Fund did not have any permanent book to tax adjustments for the year ended October 31, 2016. The Ultra MicroCap Fund has reclassified the components of its capital accounts for the year ended October 31, 2016 by increasing paid-in capital by $5,846, decreasing accumulated net investment loss by $139,038 and decreasing accumulated net realized gain by $144,884. The Low Priced Stock Fund has reclassified the components of its capital accounts for the year ended October 31, 2016 by decreasing accumulated net investment loss by $2,493 and increasing accumulated net realized loss by $2,493. |
| | | |
| | h. | As of and during the year ended October 31, 2016, the Funds did not have a liability for any unrecognized tax benefits. The Funds recognize interest and penalties, if any, related to unrecognized tax benefits as income tax expense on the Statements of |
Perritt Funds, Inc.
| Notes to Financial Statements (Continued) |
| | | Operations. During the year ended October 31, 2016, the Funds did not incur any interest or penalties. The Funds are not subject to examination by U.S. federal tax authorities for any tax years before 2013. |
| | |
| 3. | Security Valuation |
| | | |
| | GAAP establishes an authoritative definition of fair value and sets out a hierarchy for measuring fair value. GAAP also requires additional disclosures about the various inputs used to develop the measurements of fair value. These inputs are summarized in the three broad levels listed below: |
| | | • Level 1 – | Quoted prices in active markets for identical securities. |
| | | • Level 2 – | Other significant observable inputs (including quoted prices for similar securities or the identical security on an inactive market, interest rates, prepayment speeds, credit risk, etc.). |
| | | • Level 3 – | Significant unobservable inputs (including the Funds’ own assumptions in determining the fair value of investments). |
| | The inputs or methodology used for valuing securities are not necessarily an indication of the risk associated with investing in those securities. The following is a summary of the inputs used to value the Funds’ net assets as of October 31, 2016: |
Perritt MicroCap Opportunities Fund
| | Description | | Level 1 | | | Level 2 | | | Level 3 | | | Total | |
| | Investments in Securities | | | | | | | | | | | | |
| | Common Stocks | | | | | | | | | | | | |
| | Consumer Discretionary | | $ | 21,501,660 | | | $ | — | | | $ | — | | | $ | 21,501,660 | |
| | Consumer Staples | | | 15,966,545 | | | | — | | | | — | | | | 15,966,545 | |
| | Energy | | | 5,281,113 | | | | — | | | | — | | | | 5,281,113 | |
| | Financials | | | 48,618,062 | | | | — | | | | — | | | | 48,618,062 | |
| | Health Care | | | 19,376,801 | | | | 656,581 | | | | — | | | | 20,033,382 | |
| | Industrials | | | 52,463,641 | | | | 2,421,812 | | | | — | | | | 54,885,453 | |
| | Information Technology | | | 58,388,152 | | | | — | | | | — | | | | 58,388,152 | |
| | Materials | | | 18,625,453 | | | | — | | | | — | | | | 18,625,453 | |
| | Real Estate Investment Trusts | | | 6,735,184 | | | | — | | | | — | | | | 6,735,184 | |
| | Total Common Stocks | | | 246,956,611 | | | | 3,078,393 | | | | — | | | | 250,035,004 | |
| | Warrants | | | | | | | | | | | | | | | | |
| | Financials | | | — | | | | 0 | | | | — | | | | — | |
| | Total Warrants | | | — | | | | — | | | | — | | | | — | |
| | Short Term Investments | | | 12,606,512 | | | | — | | | | — | | | | 12,606,512 | |
| | Total Investments | | | | | | | | | | | | | | | | |
| | in Securities | | $ | 259,563,123 | | | $ | 3,078,393 | | | $ | — | | | $ | 262,641,516 | |
Perritt Funds, Inc.
| Notes to Financial Statements (Continued) |
| | Perritt Ultra MicroCap Fund | | | | | | | | | | | | |
| | | | | | | | | | | | | | |
| | Description | | Level 1 | | | Level 2 | | | Level 3 | | | Total | |
| | Investments in Securities | | | | | | | | | | | | |
| | Common Stocks | | | | | | | | | | | | |
| | Consumer Discretionary | | $ | 7,675,283 | | | $ | — | | | $ | — | | | $ | 7,675,283 | |
| | Consumer Staples | | | 1,159,332 | | | | — | | | | — | | | | 1,159,332 | |
| | Energy | | | 955,450 | | | | — | | | | — | | | | 955,450 | |
| | Financials | | | 5,519,704 | | | | — | | | | — | | | | 5,519,704 | |
| | Health Care | | | 3,826,320 | | | | 559,755 | | | | — | | | | 4,386,075 | |
| | Industrials | | | 12,621,879 | | | | 844,721 | | | | — | | | | 13,466,600 | |
| | Information Technology | | | 15,265,724 | | | | 622,999 | | | | — | | | | 15,888,723 | |
| | Materials | | | 1,675,900 | | | | — | | | | — | | | | 1,675,900 | |
| | Real Estate Investment Trusts | | | 512,000 | | | | — | | | | — | | | | 512,000 | |
| | Total Common Stocks | | | 49,211,592 | | | | 2,027,475 | | | | — | | | | 51,239,067 | |
| | Warrants | | | | | | | | | | | | | | | | |
| | Health Care | | | — | | | | 60,000 | | | | — | | | | 60,000 | |
| | Information Technology | | | — | | | | 0 | | | | — | | | | — | |
| | Total Warrants | | | — | | | | 60,000 | | | | — | | | | 60,000 | |
| | Short Term Investments | | | 2,859,138 | | | | — | | | | — | | | | 2,859,138 | |
| | Total Investments | | | | | | | | | | | | | | | | |
| | in Securities | | $ | 52,070,730 | | | $ | 2,087,475 | | | $ | — | | | $ | 54,158,205 | |
| | | | | | | | | | | | | | | | | | |
| | Perritt Low Priced Stock Fund | | | | | | | | | | | | | | | | |
| | | | | | | | | | | | | | | | | | |
| | Description | | Level 1 | | | Level 2 | | | Level 3 | | | Total | |
| | Investments in Securities | | | | | | | | | | | | | | | | |
| | Common Stocks | | | | | | | | | | | | | | | | |
| | Consumer Discretionary | | $ | 648,706 | | | $ | — | | | $ | — | | | $ | 648,706 | |
| | Consumer Staples | | | 35,210 | | | | — | | | | — | | | | 35,210 | |
| | Financials | | | 1,024,874 | | | | — | | | | — | | | | 1,024,874 | |
| | Health Care | | | 688,953 | | | | — | | | | — | | | | 688,953 | |
| | Industrials | | | 1,217,703 | | | | — | | | | — | | | | 1,217,703 | |
| | Information Technology | | | 1,292,018 | | | | — | | | | — | | | | 1,292,018 | |
| | Materials | | | 162,614 | | | | — | | | | — | | | | 162,614 | |
| | Real Estate Investment Trusts | | | 93,398 | | | | — | | | | — | | | | 93,398 | |
| | Utilities | | | 74,100 | | | | — | | | | — | | | | 74,100 | |
| | Total Common Stocks | | | 5,237,576 | | | | — | | | | — | | | | 5,237,576 | |
| | Short Term Investments | | | 506,237 | | | | — | | | | — | | | | 506,237 | |
| | Total Investments | | | | | | | | | | | | | | | | |
| | in Securities | | $ | 5,743,813 | | | $ | — | | | $ | — | | | $ | 5,743,813 | |
Please refer to the Schedules of Investments for additional information regarding the composition of the amounts listed above.
Perritt Funds, Inc.
| Notes to Financial Statements (Continued) |
| | Below are the transfers into or out of Levels 1 and 2 for the Funds. It is the Funds’ policy to record transfers using fair values measured at the end of the reporting period. |
| | | | MicroCap | | | Ultra MicroCap | |
| | | | Fund | | | Fund | |
| | Transfers into Level 1 | | $ | — | | | $ | 2,551,866 | |
| | Transfers out of Level 1 | | | (2,421,812 | ) | | | (1,026,975 | ) |
| | Net Transfers into/(out of) Level 1 | | $ | (2,421,812 | ) | | $ | 1,524,891 | |
| | Transfers into Level 2 | | $ | 2,421,812 | | | $ | 1,026,975 | |
| | Transfers out of Level 2 | | | — | | | | (2,551,866 | ) |
| | Net Transfers into/(out of) Level 2 | | $ | 2,421,812 | | | $ | (1,524,891 | ) |
| | There were no transfers into or out of Levels 1 or 2 during the year ended October 31, 2016 for the Low Priced Stock Fund. |
| | |
| | The securities transferred from Level 1 to Level 2 were transferred due to those securities not trading on the last day of the reporting period. The securities transferred from Level 2 to Level 1 were due to an increase of observable market data from an increase in market activity. |
| | |
| | At the beginning and during the year ended October 31, 2016, the MicroCap Fund, the Ultra MicroCap Fund, and the Low Priced Stock Fund did not hold any Level 3 securities. |
| | |
| 4. | Investment Advisory Agreement |
| | |
| | For each Fund, the Corporation entered into an investment advisory agreement (collectively, the “Agreements”) with Perritt Capital Management, Inc. (the “Advisor”), with whom certain officers and directors of the Corporation are affiliated, to furnish investment advisory services to the Funds. Under the terms of the Agreements, the MicroCap Fund and the Low Priced Stock Fund pay the Advisor a monthly fee at the annual rate of 1% of each Fund’s daily average net assets, and the Ultra MicroCap Fund pays the Advisor a monthly fee equal to 1.25% of its daily average net assets less than or equal to $100 million; 1.00% with respect to daily average net assets in excess of $100 million and less than or equal to $200 million; and 0.50% with respect to daily average net assets in excess of $200 million. At October 31, 2016, the MicroCap Fund, Ultra MicroCap Fund and Low Priced Stock Fund had fees due to the Advisor of $230,101, $58,687 and $64, respectively. For the year ended October 31, 2016, the MicroCap Fund, Ultra MicroCap Fund and Low Priced Stock Fund had incurred advisory fees of $2,901,471, $664,074 and $53,174, respectively. |
| | |
| | With regards to the Low Priced Stock Fund, the Advisor has agreed to waive fees and/or reimburse operating expenses (other than interest, brokerage commissions, dividend expense on short sales, taxes, extraordinary expenses and acquired fund fees and expenses) so that total annual operating expenses are not expected to exceed 1.39% of the average daily net assets. This arrangement cannot be terminated prior to February 28, 2018 without the consent of the Board of Directors. The Advisor is permitted to recapture amounts waived and/or reimbursed within three years after the fiscal year in which the Advisor earned the fee or incurred the expense if the total annual operating expenses have fallen to a level below the limit described above. Additionally, the Advisor has voluntarily waived any salaries and fees of all officers and directors of the Low Priced Stock Fund |
Perritt Funds, Inc.
| Notes to Financial Statements (Continued) |
| | during the year. The salaries and fees waived by the Advisor for the year ended October 31, 2016 were $17,250 and are not eligible for recapture. Voluntary expense waivers may be discontinued at any time. |
| | |
| | For the year ended October 31, 2016, the Advisor waived expenses and/or reimbursed the Low Priced Stock Fund $81,819 which is eligible for recapture through October 31, 2019. $87,508 is eligible for recapture through October 31, 2018. $71,859 is eligible for recapture through October 31, 2017. |
| | |
| | The Advisor manages the Funds’ investments subject to the supervision of the Funds’ Board of Directors. The Advisor is responsible for investment decisions and supplies investment research and portfolio management. Under the Agreements, the Advisor, at its own expense and without reimbursement from the Funds, will furnish office space and all necessary office facilities, equipment and personnel for making the investment decisions necessary for managing the Funds and maintaining their organization, will pay the salaries and fees of all officers and directors of the Funds (except the Chief Compliance Officer’s salary and the fees paid to disinterested directors) and will bear all sales and promotional expenses of the Funds. |
| | |
| | The officers of the Funds are affiliated with the Advisor. Such officers, with the exception of the Chief Compliance Officer, receive no compensation from the Funds or the Advisor for serving their respective roles. The Funds pay the salary associated with the office of the Chief Compliance Officer. Such fees are included on the Statements of Operations. |
| | |
| | The Funds may reimburse the Advisor for fees paid to intermediaries such as banks, broker-dealers, financial advisors or other financial institutions for sub-transfer agency, sub-administration and other services provided to investors whose shares of record are held in omnibus, other group accounts, retirement plans or accounts traded through registered securities clearing agents. These fees are fees that the Funds are obligated to pay to such intermediaries, and the fees may vary based on, for example, the nature of services provided. The fees paid to such intermediaries by the Funds are only a portion of the full fee that is paid to the intermediaries, and the Advisor is obligated to pay the remaining amount. In determining the portion of the fees paid to the intermediaries that the Funds are obligated to pay, the Funds have used the “avoided cost” method, which is one of several permissible methods to determine the fees are reasonable. Based on this method, the Funds’ Board of Directors determines a fee per sub-account that it believes approximates the transfer agency fee that would otherwise have been payable by the Funds if such intermediaries did not maintain the sub-account. These amounts are included within shareholder servicing fees on the Statements of Operations. |
| | |
| 5. | Investment Transactions |
| | |
| | Purchases and sales of securities, excluding short-term investments, for the year ended October 31, 2016, were as follows: |
| | | | Purchases | | | Sales | |
| | | | U.S. | | | | | | U.S. | | | | |
| | | | Governments | | | Other | | | Governments | | | Other | |
| | MicroCap Fund | | $ | — | | | $ | 17,644,792 | | | $ | — | | | $ | 140,742,000 | |
| | Ultra MicroCap Fund | | $ | — | | | $ | 9,354,594 | | | $ | — | | | $ | 20,831,886 | |
| | Low Priced Stock Fund | | $ | — | | | $ | 3,976,911 | | | $ | — | | | $ | 3,098,705 | |
Perritt Funds, Inc.
| Notes to Financial Statements (Continued) |
| 6. | Federal Income Tax Matters |
| | |
| | As of October 31, 2016, the components of distributable earnings on a tax basis were as follows: |
| | | | MicroCap | | | Ultra MicroCap | | | Low Priced | |
| | | | Fund | | | Fund | | | Stock Fund | |
| | Cost of investments for tax purposes | | $ | 195,611,218 | | | $ | 45,655,023 | | | $ | 5,477,879 | |
| | Gross tax unrealized appreciation | | | 81,194,150 | | | | 14,398,915 | | | | 564,466 | |
| | Gross tax unrealized depreciation | | | (14,163,852 | ) | | | (5,895,733 | ) | | | (298,532 | ) |
| | Net unrealized appreciation | | | | | | | | | | | | |
| | on investments | | | 67,030,298 | | | | 8,503,182 | | | | 265,934 | |
| | Distributable ordinary income | | | 803,439 | | | | 75,493 | | | | — | |
| | Distributable long-term capital gains | | | 24,787,164 | | | | 2,511,590 | | | | — | |
| | Total distributable earnings | | | 25,590,603 | | | | 2,587,083 | | | | — | |
| | Other accumulated losses | | | — | | | | — | | | | (144,105 | ) |
| | Total accumulated earnings | | $ | 92,620,901 | | | $ | 11,090,265 | | | $ | 121,829 | |
| | The difference between book and tax basis distributable earnings is primarily related to the deferral of losses on wash sales. |
| | |
| | At October 31, 2016, the Low Priced Stock Fund deferred, on a tax basis, post-October and late year ordinary losses of $12,968. |
| | |
| | The tax composition of distributions paid during the periods ended October 31, 2016 and 2015 were as follows: |
| | | | Ordinary Income | | | Long-term Capital Gains | |
| | | | 2016 | | | 2015 | | | 2016 | | | 2015 | |
| | MicroCap Fund | | $ | — | | | $ | — | | | $ | 6,027,092 | | | $ | 31,028,153 | |
| | Ultra MicroCap Fund | | | — | | | | — | | | | 866,370 | | | | 9,199,946 | |
| | Low Priced Stock Fund | | | — | | | | — | | | | — | | | | — | |
| | The Fund designated as long-term capital gain dividend, pursuant to Internal Revenue Code Section 852(b)(3), the amount necessary to reduce the earnings and profits of the Fund related to net capital gain to zero for the tax year ended October 31, 2016. |
| | |
| | On November 18, 2016, the MicroCap Fund paid short-term capital gains distributions of $0.02051 per share, and the Ultra MicroCap paid short-term capital gains distributions of $0.02136 per share. In addition, the MicroCap Fund paid long-term capital gains distributions of $3.26969 per share, and the Ultra MicroCap Fund paid long-term capital gains distributions of $0.71032 per share. The Low Priced Stock Fund did not have a distribution. |
| | |
| | As of October 31, 2016, the Low Priced Stock Fund had short-term capital losses of $131,137, which have no expiration date. |
| | |
| 7. | Restricted Securities |
| | |
| | The Funds may own investment securities which are unregistered and thus restricted as to resale. These securities are valued by each Fund after giving due consideration to |
Perritt Funds, Inc.
| Notes to Financial Statements (Continued) |
| | pertinent factors including recent private sales, market conditions and the issuer’s financial performance. Where future disposition of these securities requires registration under the Securities Act of 1933, each Fund has the right to include these securities in such registration, generally without cost to the Fund. The Funds have no right to require registration of the unregistered securities they hold. At October 31, 2016, the MicroCap Fund and Ultra MicroCap Fund held restricted securities with an aggregate value of $3,280,000 and $504,900, which accounted for 1.25% and 0.93%, respectively, of each Fund’s net assets. These restricted securities are deemed to be liquid with the exception of Mobivity Holdings Corp. warrant in the Ultra MicroCap Fund. The Mobivity Holdings Corp. warrant is considered to be illiquid. During the year ended October 31, 2016, the Low Priced Stock Fund did not hold any restricted securities. |
| | |
| 8. | Guarantees and Indemnifications |
| | |
| | Under the Funds’ organizational documents, their officers and directors are indemnified by the Funds against certain liabilities arising out of the performance of their duties to the Funds. Additionally, in the normal course of business, the Funds enter into contracts with service providers that contain general indemnification clauses. The Funds’ maximum exposure under these arrangements is unknown as this would involve future claims that may be made against the Funds that have not yet occurred. Currently, the Funds expect the risk of loss to be remote. |
| | |
| 9. | Line of Credit Arrangement |
| | |
| | The MicroCap Fund and Ultra MicroCap Fund are each party to uncommitted line of credit arrangements with U.S. Bank, N.A. with an expiration date of December 12, 2016, under which the MicroCap Fund may borrow up to $18,000,000 and the Ultra MicroCap Fund may borrow up to $6,000,000, subject to certain restrictions and covenants. Interest is charged on borrowings at the prevailing Prime Rate. The Funds have borrowed under these arrangements from time to time to increase the efficiency of cash flow management. At the beginning of the year, the prime rate was at 3.25% and was increased to 3.50% on December 17, 2015. For the fiscal year ended October 31, 2016, the MicroCap Fund had average borrowings of $1,136,450 and the weighted average interest rate on the line of credit borrowings was 3.50% which occurred between February 1, 2016 and April 3, 2016. The Ultra MicroCap Fund had average borrowings of $570,000 and the weighted average interest rate on the line of credit borrowings was 3.25% which occurred between November 13, 2015 and November 15, 2015. On February 2, 2016, the MicroCap Fund had borrowings of $2,245,000, which represents the largest borrowing amount during the year. On November 13, 2015, the Ultra MicroCap Fund had borrowings of $570,000, which represents the largest borrowing amount during the year. At October 31, 2016, the MicroCap Fund and Ultra MicroCap Fund had no outstanding borrowings on the lines of credit. Subsequent to October 31, 2016, the line of credit arrangements for the MicroCap Fund and the Ultra MicroCap Fund were renewed through December 11, 2017. As of October 31, 2016, the Low Priced Stock Fund does not have a line of credit arrangement. |
Perritt Funds, Inc.
| Notes to Financial Statements (Continued) |
| 10. | Redemption Fee |
| | |
| | The Funds charge a 2% redemption fee to those who buy and sell shares within 90 calendar days or less. The redemption fee is retained for the benefit of long-term shareholders, and recorded as additional capital in the Statements of Changes in Net Assets. |
| | |
| 11. | Transactions with Affiliates |
| | |
| | The following issuer was affiliated with the Funds, as the Funds held 5% or more of the outstanding voting securities of the issuer during the period from November 1, 2015 through October 31, 2016. No issuers were affiliated with the MicroCap Opportunities Fund and the Low Priced Stock Fund during the year ended October 31, 2016. See Section (2)(a)(3) of the Investment Company Act of 1940. |
Perritt Ultra MicroCap Fund
| | | Share Balance At | | | | | | | | | Share Balance At | | | Dividend | | | Value At | |
| Issuer Name | | November 1, 2015 | | | Additions | | | Reductions | | | October 31, 2016 | | | Income | | | October 31, 2016 | |
| CTI Industries | | | | | | | | | | | | | | | | | | |
Corp.1 | | | 183,400 | | | | — | | | | 89,900 | | | | 93,500 | | | $ | — | | | $ | 579,700 | |
| | | | | | | | | | | | | | | | | | | $ | — | | | $ | 579,700 | |
1 | Issuer was not an affiliate as of October 31, 2016. |
| | The Funds are permitted to purchase or sell securities from or to each other under specified conditions outlined in procedures adopted by the Board of Directors. The procedures have been designed to ensure that any purchase or sale of securities by a Fund from or to another Fund complies with Rule 17a-7 of the Investment Company Act of 1940. For the fiscal year ended October 31, 2016, the MicroCap Fund and Ultra MicroCap Fund engaged in one purchase and sale of a security pursuant to Rule 17a-7 of the Investment Company Act of 1940. The Low Priced Stock Fund did not engage in any 17a-7 transactions. |
Perritt Funds, Inc.
| Report of Independent Registered Public Accounting Firm |
To the Shareholders and Board of Directors of
Perritt Funds, Inc.
We have audited the accompanying statements of assets and liabilities, including the schedules of investments, of Perritt Funds, Inc., comprising Perritt Ultra MicroCap Fund, Perritt MicroCap Opportunities Fund, and Perritt Low Priced Stock Fund (the “Funds”), as of October 31, 2016, and the related statements of operations for the year then ended, the statements of changes in net assets for each of the two years in the period then ended, and the financial highlights for each of the periods indicated in the period then ended. These financial statements and financial highlights are the responsibility of the Funds’ management. Our responsibility is to express an opinion on these financial statements and financial highlights based on our audits.
We conducted our audits in accordance with the standards of the Public Company Accounting Oversight Board (United States). Those standards require that we plan and perform the audit to obtain reasonable assurance about whether the financial statements and financial highlights are free of material misstatement. An audit includes examining, on a test basis, evidence supporting the amounts and disclosures in the financial statements. Our procedures included confirmation of securities owned as of October 31, 2016, by correspondence with the custodian and brokers, or by other appropriate auditing procedures where replies from brokers were not received. An audit also includes assessing the accounting principles used and significant estimates made by management, as well as evaluating the overall financial statement presentation. We believe that our audits provide a reasonable basis for our opinion.
In our opinion, the financial statements and financial highlights referred to above present fairly, in all material respects, the financial position of each of the Funds constituting Perritt Funds, Inc., as of October 31, 2016, the results of their operations for the year then ended, the changes in their net assets for each of the two years in the period then ended, and the financial highlights for each of the periods indicated in the period then ended, in conformity with accounting principles generally accepted in the United States of America.
COHEN & COMPANY, LTD.
Cleveland, Ohio
December 19, 2016
Perritt Funds, Inc.
| Expense Example (Unaudited) | October 31, 2016 |
As a shareholder of the Funds, you incur two types of costs: (1) transaction costs, including sales charges (loads) on purchase payments, reinvested dividends, or other distributions; redemption fees (the Funds impose a 2.00% redemption fee on shares held for 90 calendar days or less after purchase); and exchange fees; and (2) ongoing costs, including management fees; distribution and/or service fees; and other Fund expenses. This example is intended to help you understand your ongoing costs (in dollars) of investing in the Fund and to compare these costs with the ongoing costs of investing in other mutual funds. The example is based on an investment of $1,000 invested at the beginning of the period and held for the entire period (May 1, 2016 – October 31, 2016).
Actual Expenses
The first line of the table below provides information about actual account values and actual expenses. Although the Funds charge no sales load or transaction fees (other than a 2.00% redemption fee for shares held for 90 calendar days or less after purchase), you will be assessed fees for outgoing wire transfers, returned checks and stop payment orders at prevailing rates charged by U.S. Bancorp Fund Services, LLC, the Funds transfer agent. If you request that a redemption be made by wire transfer, currently a $15.00 fee is charged by the Funds transfer agent. You will be charged a transaction fee equal to 2.00% of the net amount of the redemption if you redeem your shares within 90 calendar days of purchase. IRA accounts will be charged a $15.00 annual maintenance fee. There is a $25 IRA distribution and transfer out fee, unless set up automatically. Please see IRA Account Agreement for additional fees related to IRA accounts. To the extent the Fund invests in shares of other investment companies as part of its investment strategy, you will indirectly bear your proportionate share of any fees and expenses charged by the underlying funds in which the Fund invests in addition to the expenses of the Fund. Actual expenses of the underlying funds are expected to vary among the various underlying funds. These expenses are not included in the example below. The example below includes, but is not limited to, management fees, shareholder servicing fees, fund accounting, custody and transfer agent fees. However, the example below does not include portfolio trading commissions and related expenses, interest expense and other extraordinary expenses as determined under accounting principles generally accepted in the United States of America. You may use the information in this line, together with the amount you invested, to estimate the expenses that you paid over the period. Simply divide your account value by $1,000 (for example, an $8,600 account value divided by $1,000 = 8.6), then multiply the result by the number in the first line under the heading entitled “Expenses Paid During Period” to estimate the expenses you paid on your account during this period.
Hypothetical Example for Comparison Purposes
The second line of the table below provides information about hypothetical account values and hypothetical expenses based on the Fund’s actual expense ratio and an assumed rate of return of 5% per year before expenses, which is not the Fund’s actual return. The hypothetical account values and expenses may not be used to estimate the actual ending account balance or expenses you paid for the period. You may use this information to compare the ongoing costs of investing in the Fund and other funds. To do so, compare this 5% hypothetical example with the 5% hypothetical examples that appear in the shareholder reports of the other funds.
Perritt Funds, Inc.
| Expense Example (Unaudited) (Continued) | October 31, 2016 |
Please note that the expenses shown in the table are meant to highlight your ongoing costs only and do not reflect any transactional costs, such as sales charges (loads), redemption fees, or exchange fees. Therefore, the second line of the table is useful in comparing ongoing costs only, and will not help you determine the relative total costs of owning different funds. In addition, if these transactional costs were included, your costs would have been higher.
| | Beginning | Ending | Expenses Paid |
| | Account Value | Account Value | During Period |
| | 5/1/16 | 10/31/16 | 5/1/16 – 10/31/161 |
| Actual | | | |
| Perritt MicroCap Opportunities | $1,000.00 | $1,091.70 | $6.41 |
| Perritt Ultra MicroCap Fund | $1,000.00 | $1,088.70 | $9.08 |
| Perritt Low Priced Stock Fund | $1,000.00 | $1,021.00 | $7.06 |
| | | | |
| Hypothetical | | | |
| Perritt MicroCap Opportunities | $1,000.00 | $1,019.00 | $6.19 |
| Perritt Ultra MicroCap Fund | $1,000.00 | $1,016.44 | $8.77 |
| Perritt Low Priced Stock Fund | $1,000.00 | $1,018.15 | $7.05 |
1 | Expenses are equal to the Fund’s annualized expense ratio of 1.22% for the MicroCap Opportunities Fund, 1.73% for the Ultra MicroCap Fund and 1.39% for the Low Priced Stock Fund for the six-month period, multiplied by the average account value over the period, multiplied by 184/366 (to reflect the one-half year period). |
Perritt Funds, Inc.
| Directors and Officers (Unaudited) |
The Funds are governed by a Board of Directors that meets regularly to review investments, performance, expenses, and other business matters, and is responsible for protecting the interests of shareholders. The majority of the Funds’ directors are independent of Perritt Capital Management, Inc. The Board of Directors elects the Funds’ officers. The name, address, age and principal occupations for the past five years of the directors and officers are listed below, along with the number of portfolios in the Fund complex overseen by each director. During the past five years none of the directors has served as a director of a public company or a mutual fund other than Perritt MicroCap Opportunities, Inc. and Perritt Funds, Inc. The business address of each director and officer is 300 South Wacker Drive, Suite 2880, Chicago, IL 60606. For additional information about the directors, please call 1-800-331-8936 and request a Statement of Additional Information (SAI) or visit www.perrittcap.com. One will be mailed to you free of charge.
| | Position(s) Held | | | |
| | with Fund and | | | Other |
| | Number of | | | Directorships |
| | Portfolios in | | | Held by |
| Name, | Fund Complex | Term of Office | Principal | Director |
| Address, | Overseen | and Length of | Occupation(s) | during the |
and Age | by Director | Time Served | during Past 5 Years | Past 5 Years |
| | | | | |
| Independent Directors of the Fund | | | | |
| | | | | |
| Dianne C. Click | Director | Indefinite, until | Ms. Click is a licensed Real | Perritt |
| Age: 54 | | successor | Estate Broker in the State | MicroCap |
| | Portfolios in | elected; 20 years, | of Montana. She has been | Opportunities |
| | Fund Complex | Perritt MicroCap | a partner and a principal | Fund, Inc. |
| | Overseen: 3 | Opportunities | owner of a real estate sales | |
| | | Fund; 12 years, | company, Bozeman Broker | |
| | | Perritt Ultra | Group, since April 2004. | |
| | | MicroCap Fund; | She has been licensed | |
| | | and since | in the state of Montana | |
| | | inception, | since 1995. | |
| | | Perritt Low Priced | | |
| | | Stock Fund | | |
| | | | | |
| David S. Maglich | Director | Indefinite, until | Mr. Maglich is a Shareholder | Perritt |
| Age: 59 | | successor | with the law firm of Fergeson, | MicroCap |
| | Portfolios in | elected; 27 years, | Skipper, et. al. in Sarasota, | Opportunities |
| | Fund Complex | Perritt MicroCap | Florida and has been | Fund, Inc. |
| | Overseen: 3 | Opportunities | employed with such firm | |
| | | Fund; 12 years, | since April 1989. | |
| | | Perritt Ultra | | |
| | | MicroCap Fund; | | |
| | | and since | | |
| | | inception, | | |
| | | Perritt Low Priced | | |
| | | Stock Fund | | |
Perritt Funds, Inc.
| Directors and Officers (Unaudited) (Continued) |
| | Position(s) Held | | | |
| | with Fund and | | | Other |
| | Number of | | | Directorships |
| | Portfolios in | | | Held by |
| Name, | Fund Complex | Term of Office | Principal | Director |
| Address, | Overseen | and Length of | Occupation(s) | during the |
and Age | by Director | Time Served | during Past 5 Years | Past 5 Years |
| | | | | |
| Inside Director of the Fund | | | | |
| | | | | |
| Michael J. | | | | |
Corbett(1) | President | One-year term | Mr. Corbett has been | Perritt |
| Age: 51 | | as President; | President of the Perritt | MicroCap |
| | Portfolios in | As Director, | MicroCap Opportunities | Opportunities |
| | Fund Complex | indefinite until | Fund since November | Fund, Inc. |
| | Overseen: 3 | successor | 1999 and President of the | |
| | | elected; | Perritt Ultra MicroCap Fund | |
| | | Director since | since August 2004. He has | |
| | | October 5, 2010; | served as President of the | |
| | | 16 years as | Advisor since October 5, | |
| | | President of | 2010, and previously served | |
| | | Perritt MicroCap | as Vice President of the | |
| | | Opportunities | Advisor from February | |
| | | Fund; 11 years | 1997 until October 5, 2010. | |
| | | as President of | Mr. Corbett began his | |
| | | Perritt Ultra | tenure with Perritt Capital | |
| | | MicroCap Fund; | Management in 1990 as a | |
| | | and since | research analyst. He assumed | |
| | | inception, | portfolio management | |
| | | Perritt Low Priced | responsibilities in 1996 | |
| | | Stock Fund | and now serves as portfolio | |
| | | | manager for both funds. | |
Perritt Funds, Inc.
| Directors and Officers (Unaudited) (Continued) |
| | Position(s) Held | | | |
| | with Fund and | | | Other |
| | Number of | | | Directorships |
| | Portfolios in | | | Held by |
| Name, | Fund Complex | Term of Office | Principal | Director |
| Address, | Overseen | and Length of | Occupation(s) | during the |
and Age | by Director | Time Served | during Past 5 Years | Past 5 Years |
| | | | | |
| Officers of the Fund other than Mr. Corbett | | | | |
| | | | | |
| Mark Buh | Vice President | One-year term | Mr. Buh has been Vice | N/A |
| Age: 54 | and Treasurer | 3 years | President and Treasurer of the | |
| | | | Funds and Chief Financial | |
| | | | Officer of the Advisor since | |
| | | | February 2012. He has over | |
| | | | 25 years experience in corporate | |
| | | | accounting, finance, administration, | |
| | | | planning and business development. | |
| | | | His previous experience includes | |
| | | | tenures at Ernst and Young and | |
| | | | CenturyLink Communications. | |
| Lynn E. | | | | |
| Burmeister | Vice President, | One-year term | Mrs. Burmeister has been the | N/A |
| Age: 57 | Chief | 5 years | Chief Compliance Officer | |
| | Compliance | | since May 1, 2010, and | |
| | Officer and | | oversees all compliance | |
| | Secretary | | matters for the funds and the | |
| | | | advisor. She also coordinates | |
| | | | the administration of the Funds | |
| | | | and is a liaison with the firm’s | |
| | | | corporate counsel. Mrs. | |
| | | | Burmeister has worked in the | |
| | | | financial industry since 1980. | |
| | | | Her previous experience | |
| | | | includes work at Harris | |
| | | | Associates, Gofen & Glossberg | |
| | | | and Optimum Investments. | |
(1) | Mr. Corbett is an interested person of the Funds based upon his position with the Advisor. |
Perritt Funds
The Funds file their complete schedule of portfolio holdings with the Securities and Exchange Commission for the first and third quarters of each fiscal year on Form N-Q. The Funds’ Forms N-Q are available on the Securities and Exchange Commission’s website at http://www.sec.gov and may be reviewed and copied at the Commission’s Public Reference Room in Washington, D.C. Information on the operation of the Public Reference Room may be obtained by calling 1-800-SEC-0330. The Funds’ latest Forms N-Q are also available without charge upon request by calling 1-800-331-8936.
A description of the policies and procedures that the Funds use to determine how to vote proxies relating to portfolio securities is available without charge, upon request, by calling the Advisor at 1-800-331-8936 and on the Securities and Exchange Commission’s website at http://www.sec.gov.
Information regarding how the Funds voted proxies relating to portfolio securities during the most recent 12-month period ended June 30 is available without charge, upon request, by calling 1-800-331-8936 and on the Securities and Exchange Commission’s website at http://www.sec.gov.
Household Delivery of Shareholder Documents: To reduce expenses, the Funds may mail only one copy of the Funds’ prospectus, SAI and each annual and semi-annual report to those addresses shared by two or more accounts. If you wish to receive individual copies of these documents, please call the Funds at 1-800-331-8936 or contact your financial institution. You will begin receiving individual copies thirty days after receiving your request.
Electronic Delivery of Shareholder Documents: You may choose to receive the Funds’ prospectus and annual and semi-annual reports electronically. To sign up for electronic delivery, visit www.icsdelivery.com and select the first letter of your brokerage firm’s name. Then, select your brokerage institution from the list that follows, fill out the appropriate information and provide an e-mail address where you would like your information sent. If your brokerage firm is not listed, electronic delivery may not be available. Please contact your brokerage firm or financial advisor.
Tax Notice
For the year end October 31, 2016, the Perritt MicroCap Opportunities Fund, the Perritt Ultra MicroCap Fund and the Perritt Low Priced Stock Fund did not pay any interest related dividends under the Internal Revenue Code Section 87(k)(1)(c). Additionally, for the year ended October 31, 2016, 0%, 0% and 0% of the distributions paid by the Perritt MicroCap Opportunities Fund, the Perritt Ultra MicroCap Fund and the Perritt Low Priced Stock Fund were designated as short-term capital gain distributions designated under the Internal Revenue Code Section 871(k)(2)(c).
The percentage of dividend income distributed for the year ended October 31, 2016, which is designated as qualified dividend income under the Jobs and Growth Tax Relief Reconciliation Act of 2003, is 0%, 0% and 0% for the Perritt MicroCap Opportunities Fund, the Perritt Ultra MicroCap Fund and the Perritt Low Priced Stock Fund, respectively. Of the dividends paid by the Perritt MicroCap Opportunities Fund, the Perritt Ultra MicroCap Fund and the Perritt Low Priced Stock Fund, 0%, 0% and 0%, respectively, qualify for the corporate dividends received deduction.
Privacy Policy
We collect the following nonpublic personal information about you:
| | • | Information we receive from you on or in applications or other forms, including but not limited to, your name, address, phone number, and social security number; and |
| | | |
| | • | Information about your transactions with us, our affiliates or others, including but not limited to, your account number and balance, parties to transactions, cost basis information and other financial information. |
We do not disclose any nonpublic personal information about our current or former shareholders to nonaffiliated third parties, except as permitted by law. For example, we are permitted by law to disclose all the information we collect to our transfer agent to process your transactions. Furthermore, we restrict access to your nonpublic personal information to those persons who require such information to provide products or services to you. We maintain physical, electronic, and procedural safeguards through our transfer agent, U.S. Bancorp Fund Services, LLC, that comply with federal standards to guard your nonpublic personal information.
In the event that you hold shares of the Funds through a financial intermediary, including, but not limited to, a broker-dealer, bank or trust company, the privacy policy of your financial intermediary would govern how your nonpublic personal information would be shared with nonaffiliated third parties.
| | |
| | Investment Advisor |
| | Perritt Capital Management, Inc. |
| | 300 South Wacker Drive, Suite 2880 |
| | Chicago, IL 60606-6703 |
| | 800-331-8936 |
| | |
| | Independent Registered |
| | Public Accounting Firm |
| | Cohen & Company, Ltd. |
| | 1350 Euclid Avenue, Suite 800 |
| | Cleveland, OH 44115 |
| | |
| | Legal Counsel |
| | Foley & Lardner LLP |
| | 777 East Wisconsin Avenue |
| | Milwaukee, WI 53202 |
| | |
| | Custodian |
| | U.S. Bank, NA |
| | 1555 North River Center Drive, Suite 302 |
| | Milwaukee, WI 53212 |
| | |
| | Transfer Agent |
| | and Dividend Disbursing Agent |
| | U.S. Bancorp Fund Services, LLC |
| | P.O. Box 701 |
| | Milwaukee, WI 53201-0701 |
| | |
| | Distributor |
| | Quasar Distributors, LLC |
| | 615 East Michigan Street |
| | Milwaukee, WI 53202 |
| | |
| | For assistance with your existing account, call our Shareholder Service Center at 1-800-332-3133. |
| | |
| | The Funds’ Statements of Additional Information contain information about the Funds’ directors and are available without charge upon request by calling 1-800-332-3133. |
MicroCap Opportunities Fund
Ultra MicroCap Fund
Low Priced Stock Fund
Minimum Initial Investment $1,000
IRA Minimum Initial Investment $250
Dividend Reinvestment Plan
Systematic Withdrawal Plan
Automatic Investment Plan
Retirement Plans Including:
| • | IRA | • | Roth IRA |
| • | SEP-IRA | • | Coverdell Education |
| • | Simple IRA | | Savings Account |
2% redemption fee imposed for shares
held ninety (90) calendar days or less.
This report is authorized for distribution
only to shareholders and others who have
received a copy of the prospectus of the
Perritt MicroCap Opportunities Fund,
the Perritt Ultra MicroCap Fund and/or
the Perritt Low Priced Stock Fund.
300 S. Wacker Drive • Suite 2880 • Chicago, IL 60606-6703
Tel 312-669-1650 • 800-331-8936 • Fax: 312-669-1235
E-mail: info@PerrittCap.com
Web Site: www.perrittcap.com
Item 2. Code of Ethics.
The registrant has adopted a code of ethics that applies to the registrant’s principal executive officer and principal financial officer. The registrant has not made any amendments to its code of ethics during the period covered by this report. The registrant has not granted any waivers from any provisions of the code of ethics during the period covered by this report. Incorporated by reference to the registrant’s Form N-CSR filed January 8, 2010.
Item 3. Audit Committee Financial Expert.
The registrant’s board of directors has determined that the registrant does not have an audit committee financial expert serving on its board of directors, which functions as the registrant’s audit committee since the registrant does not have a separate audit committee.
The board of directors has determined that the members of the board of directors have sufficient background, experience and financial knowledge to fulfill their responsibilities and obligations to the registrant and its shareholders. Accordingly, the board of directors has determined that the search for, and possible appointment of, a person who would satisfy the definition of an audit committee financial expert is not necessary.
Item 4. Principal Accountant Fees and Services.
The registrant has engaged its principal accountant, Cohen Fund Audit Services, Ltd., to perform audit services, audit-related services, and tax services during the past fiscal year. “Audit services” refer to performing an audit of the registrant's annual financial statements or services that are normally provided by the accountant in connection with statutory and regulatory filings or engagements for the fiscal year. “Audit-related services” refer to the assurance and related services by the principal accountant that are reasonably related to the performance of the audit. “Tax services” refer to professional services rendered by the principal accountant for tax compliance, tax advice, and tax planning. The following table details the aggregate fees billed or expected to be billed for each of the last two fiscal years for audit fees, audit-related fees, tax fees and other fees by the principal accountant.
| | FYE 10/31/2016 | FYE 10/31/2015 |
| Audit Fees | $40,500 | $39,000 |
| Audit-Related Fees | $0 | $0 |
| Tax Fees | $9,000 | $9,000 |
| All Other Fees | $0 | $0 |
The percentage of fees billed by Cohen Fund Audit Services, Ltd. for the fiscal years ended October 31, 2016 and October 31, 2015, respectively, applicable to non-audit services pursuant to a waiver of the pre-approval requirement was as follows:
| | FYE 10/31/2016 | FYE 10/31/2015 |
| Audit-Related Fees | 0% | 0% |
| Tax Fees | 0% | 0% |
| All Other Fees | 0% | 0% |
All of the principal accountant’s hours spent on auditing the registrant’s financial statements were attributed to work performed by full‑time permanent employees of the principal accountant. The following table indicates the non-audit fees billed or expected to be billed by the registrant’s accountants for services to the registrant and to the registrant’s investment adviser or Service Affiliates (as defined below) for the last two years.
| Non-Audit Related Fees | FYE 10/31/2016 | FYE 10/31/2015 |
| Registrant | $0 | $0 |
| Registrant’s Investment Adviser | $0 | $0 |
Because the registrant’s accountants have not rendered any non-audit services during the last two fiscal years to the registrant’s investment adviser, or any entity controlling, controlled by or under common control with the investment adviser that provides ongoing services to the registrant (together with the registrant’s investment adviser, “Service Affiliates”) that were not pre-approved pursuant to paragraph (c)(7)(ii) of Rule 2-01 of Regulation S-X, the registrant’s board of directors has not considered whether the provision of such services to the registrant’s investment adviser or the Service Affiliates is compatible with maintaining the independence of the registrant’s accountant.
Item 5. Audit Committee of Listed Registrants.
Not applicable to registrants who are not listed issuers (as defined in Rule 10A-3 under the Securities Exchange Act of 1934).
Item 6. Investments.
(a). Schedule of Investments is included as part of the report to shareholders filed under Item 1 of this Form.
(b). Not applicable.
Item 7. Disclosure of Proxy Voting Policies and Procedures for Closed-End Management Investment Companies.
Not applicable to open-end investment companies.
Item 8. Portfolio Managers of Closed-End Management Investment Companies.
Not applicable to open-end investment companies.
Item 9. Purchases of Equity Securities by Closed‑End Management Investment Company and Affiliated Purchasers.
Not applicable to open-end investment companies.
Item 10. Submission of Matters to a Vote of Security Holders.
There have been no material changes to the procedures by which shareholders may recommend nominees to the registrant’s board of directors.
Item 11. Controls and Procedures.
The Registrant’s President and Treasurer have reviewed the Registrant's disclosure controls and procedures (as defined in Rule 30a-3(c) under the Investment Company Act of 1940 (the “Act”)) as of a date within 90 days of the filing of this report, as required by Rule 30a-3(b) under the Act and Rules 13a-15(b) or 15d‑15(b) under the Securities Exchange Act of 1934. Based on their review, such officers have concluded that the disclosure controls and procedures are effective in ensuring that information required to be disclosed in this report is appropriately recorded, processed, summarized and reported and made known to them by others within the Registrant and by the Registrant’s service provider.
There were no changes in the Registrant's internal control over financial reporting (as defined in Rule 30a-3(d) under the Act) that occurred during the second fiscal quarter of the period covered by this report that has materially affected, or is reasonably likely to materially affect, the Registrant's internal control over financial reporting.
Item 12. Exhibits.
| (a) | (1) Any code of ethics or amendment thereto, that is the subject of the disclosure required by Item 2, to the extent that the registrant intends to satisfy Item 2 requirements through filing an exhibit. Incorporated by reference to the registrant’s Form N-CSR filed January 8, 2010. |
(2) A separate certification for each principal executive and principal financial officer pursuant to Section 302 of the Sarbanes-Oxley Act of 2002. Filed herewith.
(3) Any written solicitation to purchase securities under Rule 23c‑1 under the Act sent or given during the period covered by the report by or on behalf of the registrant to 10 or more persons. Not applicable to open-end investment companies.
| (b) | Certifications pursuant to Section 906 of the Sarbanes‑Oxley Act of 2002. Furnished herewith. |
SIGNATURES
Pursuant to the requirements of the Securities Exchange Act of 1934 and the Investment Company Act of 1940, the registrant has duly caused this report to be signed on its behalf by the undersigned, thereunto duly authorized.
(Registrant) Perritt Funds, Inc.
By (Signature and Title)* /s/ Michael J. Corbett
Michael J. Corbett, President
Date December 29, 2016
Pursuant to the requirements of the Securities Exchange Act of 1934 and the Investment Company Act of 1940, this report has been signed below by the following persons on behalf of the registrant and in the capacities and on the dates indicated.
By (Signature and Title)* /s/ Michael J. Corbett
Michael J. Corbett, President
Date December 29, 2016
By (Signature and Title)* /s/ Mark J. Buh
Mark J. Buh, Treasurer/Principal Financial Officer
Date December 29, 2016
* Print the name and title of each signing officer under his or her signature.