UNITED STATES
SECURITIES AND EXCHANGE COMMISSION
Washington, D.C. 20549
SECURITIES AND EXCHANGE COMMISSION
Washington, D.C. 20549
FORM N-CSR
CERTIFIED SHAREHOLDER REPORT OF REGISTERED
MANAGEMENT INVESTMENT COMPANIES
Investment Company Act file number 811-21556
Perritt Funds, Inc.
(Exact name of registrant as specified in charter)
(Exact name of registrant as specified in charter)
300 South Wacker Drive, Suite 600, Chicago, IL 60606
(Address of principal executive offices) (Zip code)
(Address of principal executive offices) (Zip code)
Michael J. Corbett, 300 South Wacker Drive, Suite 600, Chicago, IL 60606
(Name and address of agent for service)
(Name and address of agent for service)
1-312-669-1650
Registrant's telephone number, including area code
Date of fiscal year end: October 31, 2018
Date of reporting period: October 31, 2018
Item 1. Reports to Stockholders.
MicroCap Opportunities Fund
Ultra MicroCap Fund
Low Priced Stock Fund
Annual Report
October 31, 2018

The PERRITT MICROCAP OPPORTUNITIES FUND will, under normal circumstances, invest at least 80% of its net assets in a diversified portfolio of common stocks of United States companies that at the time of initial purchase have a market capitalization (equity market value) that is below $500 million (referred to as “micro-cap” companies). The Fund seeks to invest in micro-cap companies that have demonstrated above-average growth in revenues and/or earnings, possess relatively low levels of long-term debt, have a high percentage of their shares owned by company management, and possess modest price-to-sales ratios and price-to-earnings ratios that are below their long-term annual growth rate. At times, the Fund may also invest in “special situations” such as companies that possess valuable patents, companies undergoing restructuring, and companies involved in large share repurchase programs. Investors should expect the Fund to contain a mix of both value-priced and growth stocks.
The PERRITT ULTRA MICROCAP FUND will, under normal circumstances, invest at least 80% of its net assets in a diversified portfolio of common stocks of United States companies that at the time of initial purchase have a market capitalization (equity market value) that is below $300 million (referred to as “micro-cap” companies). The Fund seeks to invest in micro-cap companies that have a high percentage of their shares owned by company management, possess relatively low levels of long-term debt, have a potential for above average growth in revenues and/or earnings, and possess reasonable valuations based on the ratios of price-to-sales, price-to-earnings, and price-to-book values. The micro-cap companies in which the Fund may invest include “early stage” companies, which are companies that are in a relatively early stage of development with market capitalizations that are below $50 million. At times, the Fund may also invest in unseasoned companies, companies that are undergoing corporate restructuring, initial public offerings, and companies believed to possess undervalued assets.
The PERRITT LOW PRICED STOCK FUND will, under normal circumstances, invest at least 80% of its net assets in a diversified portfolio of low priced common stocks of United States companies that at the time of initial purchase have a market capitalization (equity market value) that is below $3 billion. Low priced stocks are those that are trading at or below $15 per share at the time of initial purchase. Subsequent to the initial purchase, the Fund may purchase such securities at a price above $15 per share. The Fund’s strategy is based on the premise that low priced stocks offer growth potential because these stocks have limited broker research coverage, the companies’ prospects are misunderstood by most investors, and some investors mistakenly believe stocks trading below $15 per share are more “speculative” than those trading at higher levels and therefore avoid low priced stocks. The Fund will invest in “growth” stocks, “value” stocks, or a combination of both. Given the market capitalization restrictions, the Fund will normally invest in securities issued by small-cap companies, including some micro-cap companies. However, micro-cap companies will only make up a small portion of the Fund’s portfolio. Micro-cap companies represent the smallest sector of public companies based on market capitalization. At times, the Fund’s portfolio may contain the shares of unseasoned companies, companies that are undergoing corporate restructuring, initial public offerings, and companies believed to possess undervalued assets.
| Table of Contents |
Annual Report
October 31, 2018
| From the Desk of Michael Corbett, President and CIO | 2 |
| Perritt MicroCap Opportunities Fund | |
| From the Portfolio Managers | 3 |
| Performance | 6 |
| Ten Largest Common Stock Holdings | 8 |
| Allocation of Portfolio Investments | 9 |
| Perritt Ultra MicroCap Fund | |
| From the Portfolio Managers | 10 |
| Performance | 14 |
| Ten Largest Common Stock Holdings | 16 |
| Allocation of Portfolio Investments | 17 |
| Perritt Low Priced Stock Fund | |
| From the Portfolio Manager | 18 |
| Performance | 22 |
| Ten Largest Common Stock Holdings | 24 |
| Allocation of Portfolio Investments | 25 |
| Perritt Funds | |
| Schedules of Investments | 26 |
| Statements of Assets and Liabilities | 36 |
| Statements of Operations | 37 |
| Statements of Changes in Net Assets | 38 |
| Financial Highlights | 41 |
| Notes to Financial Statements | 44 |
| Report of the Independent Registered Public Accounting Firm | 53 |
| Expense Example | 54 |
| Directors and Officers | 56 |
| Information | 60 |
1
Perritt Funds, Inc.
| From the Desk of Michael Corbett, President and CIO |

Michael Corbett,
President and CIO
Dr. Gerald W. Perritt
“We are sad to report the loss of our founder, friend, teacher and mentor. Dr. Perritt was a pioneer in the mutual fund industry. He was one of the first in the industry to track performance and industry dynamics, and to champion mutual funds as an investment option. He launched The Mutual Fund Letter in 1981, a monthly newsletter tracking the mutual fund industry. Dr. Perritt’s flagship newsletter was Investment Horizons where he recommended micro-cap stocks. He also created the Perritt MicroCap Opportunities Fund, one of the first micro-cap mutual funds, in 1988,” stated Michael Corbett, the current CEO of Perritt Capital Management.
Dr. Perritt was a prolific writer, sharing his insights and expertise through newsletters and several books, including Small Stocks, Big Profits, Mutual Funds Made Easy, and Expanding Your Investment Horizons. He was also a columnist for Forbes Magazine. Dr. Perritt was frequently quoted in such publications as the Wall Street Journal and Barron’s Magazine. He was always generous to share his wisdom, knowledge and experience with his staff, grooming successful investors.
Teaching was a passion for Dr. Perritt. He taught and mentored many throughout his illustrious career. He served as a professor at several prestigious universities, including Ball State University, Babson College, University of Miami and DePaul University.
Michael Corbett added, “Our thoughts and prayers are with Dr. Perritt’s family and loved ones.”

2
Perritt MicroCap Opportunities Fund
| Portfolio Managers’ Message |
Michael Corbett,
Portfolio Manager
The Perritt MicroCap Opportunities Fund posted a loss of 5.89% for the 12 months ended October 31, 2018, which compares to a 1.43% gain for the Russell Microcap® Index and 1.85% gain for the Russell 2000® Index. The Fund’s longer-term performance results, as well as the benchmark’s performance, can be found later in this report. While recent performance is disappointing, we have not seen this level of opportunity in many years. In addition to the description of the top 10 holdings on the following pages, we have decided to include details of some unique holdings. We think these descriptions will give a better understanding of why we are excited about the current investment opportunities.
DLH Holdings Corp. (DLHC) provides healthcare and social services in the United States. It offers defense and veterans’ health solutions, including case management, physical and behavioral health examinations, and medical administration and logistics services. In the past three years, DLHC has more than doubled their revenue and EBITDA is up nearly fourfold. Despite these impressive results, DLHC’s stock has made a roundtrip back the same level is was three years ago. Our discussions with management give us confidence that growth will continue. Based on our estimates, DLHC’s stock currently trades at less than 0.3 of future revenue and less than 3 times EBITDA. We compared DLHC to several other health care services companies, one of which is United Health (UNH). UNH is a health care service company that is worth nearly $300 billion and has more than $200 billion in revenue. UNH trades at more than 12 times future EBITDA. While it is hard to believe DLHC should trade at such a rich valuation of UNH, we believe DLHC shares are incredibly attractive at these levels.
Infrastructure and Energy Alternatives (IEA) provides engineering, procurement, and construction services for the renewable energy, traditional power, and civil infrastructure industries in the United States. It offers design, site development, construction, installation, and restoration of infrastructure services. Recent results showed that IEA’s backlog is in excess of $1.8 billion. Given our 2019 estimates for revenue and cash flow, IEA is one of the most reasonable priced stocks in our portfolio. Revenue should grow by more than 70% next year to nearly $1.5 billion and EBITDA should climb more than two-fold to more than $140 million. With an estimated enterprise value of less than $400 million, IEA shares trade at less than one-third of revenue and less than 3 times EBITDA.
Northern Technologies International Corporation (NTIC) develops leading corrosion inhibiting products and services, as well as bio-based and biodegradable polymer compounds. They recently invested $3.5 million in developing new corrosion solutions and bioplastic products. ZERUST is sprayed on metal components to prevent damage to the appearance and the mechanical performance often realizing a savings of 15-35% of the cost. Nature-Tec produces bioplastic solutions such as plastic bags for shipping and resin for straws to reduce carbon dioxide emissions and provide sustainable products. NTIC has grown sales by more than 15% per year from 2010 – 2017 and sales year-to-date in 2018 are up 30% to a record level. NTIC China and
3
Perritt MicroCap Opportunities Fund
Nature-Tec recorded sales growth of 73.1% and 48.2% respectively. They are expected to be key contributors to fiscal 2019 and beyond. The company has no debt, and recently started paying a dividend, which we expect several increases in the future.
Miller Industries, Inc. (MLR) is the industry leader in the manufacturing and sale of towing and recovery equipment. Plant expansion and consolidation in North America is complete and growth is steady in the single digits. The true revenue generator is overseas with MLR’s French subsidiary. Growth in the first half of the year was 80%. MLR is contemplating adding more capacity there and has a strong balance sheet to do so with virtually no debt. Over the last 4 years they have grown revenues 50% and doubled earnings. The valuation is very reasonable at less 0.4 times revenue, 6.2 times EBITDA, a price earnings ratio under 10 and a 2.6% dividend yield.
Silvercrest Asset Management Group (SAMG) a wealth management firm, provides financial advisory and related family office services in the United States. The company serves ultra-high net worth individuals and families, as well as their trusts; endowments; foundations; and other institutional investors. It also manages funds of funds and other investment funds. We believe SAMG is one of the most attractively priced asset management stocks in the public market today. The company has more than $21 billion in assets under management and its shares trade for less than $100 million enterprise value. Revenues have been growing at a 10% clip and shares trade for less than 4 times EV/EBITDA. We compare this company to several other asset managers, but the closest comparison is Focus Financial (FOCS). We believe FOCS is a high-quality company, but its shares trade at nearly three times the valuation of SAMG. In other words, SAMG’s stock would have to triple its stock price to be valued at the same level as FOCS.
We are encouraged by the current composition of the portfolio. The Fund’s companies trade at a median price to revenue 0.9, which is about half that of the Russell Microcap® Index. We estimate that earnings will grow by more than 20% next year and the portfolio’s forward price earnings ratio is a little above 13 times. We can’t quote a price earnings ratio for the Russell Microcap® Index because more than 900 of the 1550 companies in the Index are not profitable. The remaining 650 profitable companies in the Index have a median price earnings ratio of approximately 18, which is more expensive that our portfolio. The bottom line is that we believe our portfolio is higher quality than that of the Russell Microcap Index.
I want to thank my fellow shareholders for their continued support and confidence in the Perritt Capital Management team. We remain dedicated to investing in high quality micro-cap companies at attractive valuations. If you have any questions or comments about this report or your investment in the Perritt MicroCap Opportunities Fund, please call us toll-free at (800) 331-8936 or visit our website at www.perrittcap.com. Please refer to the prospectus for information about the Fund’s investment objectives and strategies.

Michael Corbett
Portfolio Manager
4
Perritt MicroCap Opportunities Fund
Mutual fund investing involves risk. Principal loss is possible. The Funds invest in smaller companies, which involve additional risks, such as limited liquidity and greater volatility. The Funds invest in micro-cap companies which tend to perform poorly during times of economic stress.
Past performance does not guarantee future results.
Opinions expressed are subject to change at any time, are not guaranteed and should not be considered investment advice.
Russell Microcap® Index is a capitalization weighted index of 2,000 small cap and micro cap stocks that captures the smallest 1,000 companies in the Russell 2000, plus 1,000 smaller U.S.-based listed stocks.
Russell 2000® Index is an index measuring the performance approximately 2,000 small-cap companies in the Russell 3000 Index, which is made up of 3,000 of the biggest U.S. stocks. The Russell 2000 serves as a benchmark for small-cap stocks in the United States.
EV/EBITDA is the enterprise value to EBITDA or earnings before interest, taxes, depreciation, and amortization. The EV equals market capitalization + preferred shares + minority interest + debt - total cash divided by EBITDA.
Forward Price Earnings Ratio (Forward P/E) is a quantification of the ratio of price-to-earnings using forecasted earnings for the P/E calculation.
5
Perritt MicroCap Opportunities Fund
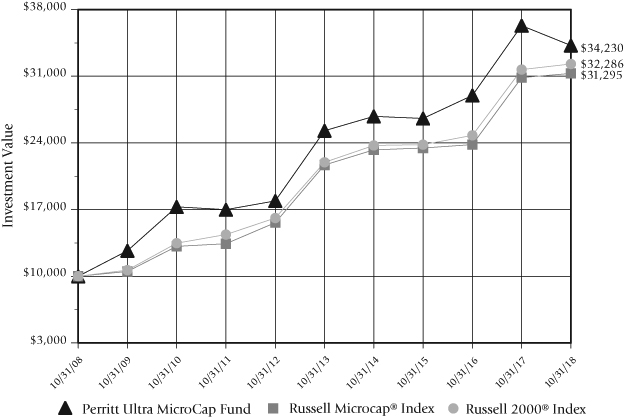
| Performance* (Unaudited) | October 31, 2018 |
Perritt MicroCap Opportunities Fund versus
Russell Microcap® Index and Russell 2000® Index

There are several ways to evaluate a fund’s historical performance. You can look at the total percentage change in value, the average annual percentage change, or the growth of a hypothetical $10,000 investment. Each performance figure includes changes in a fund’s share price, plus reinvestment of any dividends (or income) and capital gains (the profits the fund earns when it sells stocks that have grown in value).
Cumulative total returns reflect the Fund’s actual performance over a set period. For example, if you invested $1,000 in a fund that had a 5% return over one year, you would end up with $1,050. You can compare the Fund’s returns to the Russell 2000® Index, which reflects a popular measure of the stock performance of small companies, and the Russell Microcap® Index, which measures the performance of the micro-cap segment of the U.S. equity market.
Average annual total returns take the Fund’s actual (or cumulative) return and show you what would have happened if the Fund had performed at a constant rate each year.
| * | The graph illustrates the performance of a hypothetical $10,000 investment made in the period presented. Assumes reinvestment of dividends and capital gains, but does not reflect the effect of any applicable sales charge or redemption fees or the deduction of taxes that a shareholder would pay on the Fund’s distributions or the redemption of the Fund shares. The graph does not imply any future performance. It is not possible to invest directly in an index. |
6
Perritt MicroCap Opportunities Fund
| Performance (Unaudited) (Continued) | October 31, 2018 |
| Average Annual Total Returns* | |
| Periods ended October 31, 2018 (Unaudited) |
| Past | Past | Past | Past | |
| 1 Year | 5 Years | 10 Years | 25 Years | |
| Perritt MicroCap Opportunities Fund | (5.89)% | 5.15% | 11.78% | 10.03% |
| Russell Microcap Index | 1.43% | 7.62% | 12.08% | N/A |
| (reflects no deduction for fees and expenses) | ||||
| Russell 2000 index | 1.85% | 8.01% | 12.44% | 8.76% |
| (reflects no deduction for fees and expenses) |
Performance data quoted represents past performance; past performance does not guarantee future results. The investment return and principal value of an investment will fluctuate so that an investor’s shares, when redeemed, may be worth more or less than their original cost. Current performance of the Fund may be lower or higher than the performance quoted. Performance data current to the most recent month end is available by calling 800-331-8936.
| * | The tables do not reflect the deduction of taxes that a shareholder would pay on the Fund’s distributions or the redemption of Fund shares. |
7
Perritt MicroCap Opportunities Fund
| Ten Largest Common Stock Holdings (Unaudited) |
Northern Technology International Corp. (NTIC) develops and markets rust and corrosion inhibiting products and services to automotive, electronics, electrical mechanical, military, retail consumer, and oil and gas markets.
Ooma, Inc. (OOMA) provides communications solutions and other connected services to small business, home, and mobile users in the United States and Canadian markets.
BlueLinx Holdings, Inc. (BXC), together with its subsidiaries, distributes building and industrial products in the United States. It distributes products in two principal categories, structural products and specialty products.
Photronics, Inc. (PLAB), together with its subsidiaries, manufactures and sells photomasks in the United States, Taiwan, Korea, Europe, and internationally. The company offers photomasks, which are high precision photographic quartz plates containing microscopic images of electronic circuits for use in the manufacture of semiconductors and flat panel displays.
Miller Industries, Inc. (MLR) engages in the manufacture and sale of towing and recovery equipment. It offers wreckers, such as conventional tow trucks and recovery vehicles. The company also provides transport trailers for moving multiple vehicles, auto auctions, car dealerships, leasing companies, and other similar applications.
Silvercrest Asset Management Group, Inc. – Class A (SAMG) is a wealth management firm that provides financial advisory and related family office services in the United States. The company serves ultra-high net worth individuals and families, as well as their trusts; endowments; foundations; and other institutional investors. It also manages funds of funds and other investment funds.
Bankwell Financial Group, Inc. (BWFG) operates as the bank holding company for Bankwell Bank, it provides a range of banking services to commercial and consumer customers in Connecticut.
Primo Water Corp. (PRMW), together with its subsidiaries, provides multi-gallon purified bottled water, self-service refill water, and water dispensers in the United States and Canada. It operates in three segments: Refill, Exchange, and Dispensers.
Radiant Logistics, Inc. (RLGT) operates as a third-party logistics and multi-modal transportation services company primarily in the United States and Canada. The company offers domestic and international air and ocean freight forwarding services; and freight brokerage services, including truckload, less than truckload, and intermodal services.
PCM, Inc. (PCMI) through its subsidiaries, operates as a multi-vendor provider of technology products and solutions in the United States and Europe. It primarily sells device products, servers, storage products, network products, printers, and related accessories and devices.
Fund holdings and/or sector allocations are subject to change at any time and
are not recommendations to buy or sell any security.
Please refer to the Schedule of Investments in this report for a complete list of Fund holdings.
8
Perritt MicroCap Opportunities Fund
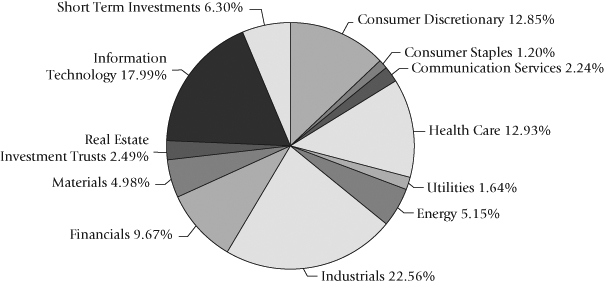
| Allocation of Portfolio Investments (Unaudited) | October 31, 2018 |

The sector classifications represented in the graph above and industry classifications represented in the Schedule of Investments are in accordance with Global Industry Classification Standard (GICS®), which was developed by and/or is the exclusive property of MSCI, Inc. and Standard & Poor Financial Services LLC. Percentages are based on total investments, at value.
| Note: | For presentation purposes, the Fund has grouped some of the industry categories. For purposes of categorizing securities for compliance with section 8(b)(1) of the Investment Company Act of 1940, the Fund uses more specific industry classifications. |
9
Perritt Ultra MicroCap Fund
| Portfolio Managers’ Message |
|  |
| Michael Corbett, | Matthew Brackmann, |
| Portfolio Manager | Portfolio Manager |
The Perritt Ultra MicroCap posted a 5.22% loss for the second half of the 2018 fiscal year as of October 31, compared to a loss of 2.44% for the Russell Microcap® Index during the same period. For the entire fiscal year the Perritt Ultra MicroCap had a loss of 5.73% compared to a gain of 1.43% for the Russell Microcap® Index. The Fund’s longer-term performance, as well as that of its index, can be found on page 14. As shareholders ourselves, we share in the disappointment over the years results. However, we are also excited for the future as we see value opportunities in names that have quite frankly been ignored by the marketplace. To illustrate this point, we have selected a handful of names to highlight and demonstrate our outlook going forward.
Cynergistek, Inc. (CTEK) is a provider of managed print and cybersecurity services to hospital chains and healthcare providers across much of the U.S. The company came to be through the merging of two firms that served the same healthcare space independently in managed print and cybersecurity but shared very little in terms of their customer base. We have always viewed this as a good opportunity for them to cross sell their services across their current customer portfolio as well as to continue to grow organically. As one would expect given the number of high-profile data breaches that have been in the news the last few years, cybersecurity is a growing area of demand within the healthcare space. This is made even more important by hospitals need to secure any digital data regarding their patients to abide by HIPAA laws. CTEK currently trades at an Enterprise Value to Revenue (EV/Rev) of .9x. Other names in the cybersecurity and cloud space usually trade at multiples of revenue. FireEye, a cybersecurity software provider trades at 4.5x EV/REV and loses money every quarter. CTEK on the other hand has been profitable six out of their last eight quarters. Due to this disconnect in value, our outlook going forward for CTEK remains very positive.
Galaxy Gaming, Inc. (GLXZ) is a gaming company that designs, develops, manufactures, markets, and licenses proprietary casino gaming tables both in the United States and overseas. Over the past couple of years, there have been several positive developments that have led to some success for the company including the appointment of a new professional management team, a renegotiation of their debt lowering their interest rate by several percentage points and approval to sell their products into the Nevada gaming market. These developments coupled with our discussion with management have led us to believe that they’re trading at forward EV/EBITDA of (EBITDA is Earnings before Interest, Taxes, Depreciation and Amortization) of about 9x and an EV/REV of about 3x. The last two companies acquired in this space were purchased at multiples in the range of 4-5x revenue and 12-16x EBITDA. When we look at these historical metrics versus Galaxy’s current metrics we remain confident that the stock continues to have significant upside despite having traded sideways this year.
10
Perritt Ultra MicroCap Fund
First Internet Bancorp (INBK) is a bank holding company that operates and internet based bank offering commercial and retail banking services via their website, www.firstib.com. By operating under an asset light internet banking model INBK is able to offer their customer more attractive rates on their accounts than a conventional brick and mortar bank due to the savings that come with business model. The company consistently posts double digit revenue growth rates each year and as they scale up should be able to leverage their existing infrastructure to growth rates of return at a higher pace than traditional banks as they do not need to open new branches. They are currently trading at only .9x their price to tangible book value. A larger player in the space, Axos Financial, currently trades at a multiple of 2.0x. While they have better rates of return due to their size, we believe that as INBK scales up they will be able to grow their multiples and get to the level of the larger players in the space. Due to this we view INBK as an attractive investment at these levels.
As of October 31, 2018, the Fund holds the common stock of 84 companies which is the same number of companies we reported in our semi-annual report. We still intend to keep the number of names in the portfolio around this number and continue with our strategy of concentrating on high quality and higher conviction names. Based on our earnings estimates, the Fund’s portfolio is trading at a 17.0x forward price to earnings. The median price to sales ratio is 0.97x, the median price to book is 1.54x, and price to trailing twelve month’s earnings of 19.43x. The median market cap for the fund is at $85.7 million. The compares to the Russell Microcap metrics of a price to earnings of 1.97x, a price to book of 1.68x and a trailing P/E of 17.93x. It is interesting to note that the P/E number for the Index only includes profitable companies, and of the 1550 names that constitute the index only 616 of those are profitable.
We want to genuinely thank our fellow shareholders for their continued support and confidence in the Perritt Capital Management team. Each member of our investment committee, as well as many other employees have made continued investment in this Fund for over 10 years and remain shareholders alongside all of you. If you have any questions or comments about this report or your investment in the Perritt Ultra MicroCap Fund, please call us toll-free at (800) 331-8936 or visit our web site at www.perrittcap.com. Please refer to the prospectus for information about the Fund’s investment objectives and strategies.

Matthew Brackmann
Portfolio Manager
11
Perritt Ultra MicroCap Fund
Mutual fund investing involves risk. Principal loss is possible. The Funds invest in smaller companies, which involve additional risks, such as limited liquidity and greater volatility. The Funds invest in micro-cap companies which tend to perform poorly during times of economic stress.
Past performance does not guarantee future results.
Opinions expressed are subject to change at any time, are not guaranteed and should not be considered investment advice.
Russell Microcap® Index is a capitalization weighted index of 2,000 small cap and micro cap stocks that captures the smallest 1,000 companies in the Russell 2000, plus 1,000 smaller U.S.-based listed stocks.
Russell 2000® Index is an index measuring the performance approximately 2,000 small-cap companies in the Russell 3000 Index, which is made up of 3,000 of the biggest U.S. stocks. The Russell 2000 serves as a benchmark for small-cap stocks in the United States.
Enterprise Value to Revenue (EV/Rev) multiple is a valuation metric used to value a business by dividing its enterprise value (equity plus debt minus cash) by its annual revenue.
EV/EBITDA is the enterprise value to EBITDA or earnings before interest, taxes, depreciation, and amortization. The EV equals market capitalization + preferred shares + minority interest + debt - total cash divided by EBITDA.
Forward Price Earnings Ratio (Forward P/E) is a quantification of the ratio of price-to-earnings using forecasted earnings for the P/E calculation.
Trailing P/E is calculated by dividing the current market value, or share price, by the earnings per share over the previous 12 months.
Price to Book Ratio (P/B) is a financial ratio used to compare a company’s current market price to its book value.
Price to Sales Ratio (P/S) is a valuation metric for stocks. It is calculated by dividing the company’s market cap by the revenue in the most recent year; or, equivalently, divide the per-share stock price by the per-share revenue.
12
(This Page Intentionally Left Blank.)
13
Perritt Ultra MicroCap Fund
| Performance* (Unaudited) | October 31, 2018 |
Perritt Ultra MicroCap Fund versus
Russell Microcap® Index and Russell 2000® Index
There are several ways to evaluate a fund’s historical performance. You can look at the total percentage change in value, the average annual percentage change, or the growth of a hypothetical $10,000 investment. Each performance figure includes changes in a fund’s share price, plus reinvestment of any dividends (or income) and capital gains (the profits the fund earns when it sells stocks that have grown in value).
Cumulative total returns reflect the Fund’s actual performance over a set period. For example, if you invested $1,000 in a fund that had a 5% return over one year, you would end up with $1,050. You can compare the Fund’s returns to the Russell 2000® Index, which reflects a popular measure of the stock performance of small companies, and the Russell Microcap® Index, which measures the performance of the micro-cap segment of the U.S. equity market.
Average annual total returns take the Fund’s actual (or cumulative) return and show you what would have happened if the Fund had performed at a constant rate each year.
| * | The graph illustrates the performance of a hypothetical $10,000 investment made in the period presented. Assumes reinvestment of dividends and capital gains, but does not reflect the effect of any applicable sales charge or redemption fees or the deduction of taxes that a shareholder would pay on the Fund’s distributions or the redemption of Fund shares. The graph does not imply any future performance. It is not possible to invest directly in an index. |
14
Perritt Ultra MicroCap Fund
| Performance (Unaudited) (Continued) | October 31, 2018 |
| Average Annual Total Returns* | |
| Periods ended October 31, 2018 (Unaudited) |
| Past | Past | Past | |
| 1 Year | 5 Years | 10 Years | |
| Perritt Ultra MicroCap Fund | (5.73)% | 6.25% | 13.09% |
| Russell Microcap Index | 1.43% | 7.62% | 12.08% |
| (reflects no deduction for fees and expenses) | |||
| Russell 2000 Index | 1.85% | 8.01% | 12.44% |
| (reflects no deduction for fees and expenses) |
Performance data quoted represents past performance; past performance does not guarantee future results. The investment return and principal value of an investment will fluctuate so that an investor’s shares, when redeemed, may be worth more or less than their original cost. Current performance of the Fund may be lower or higher than the performance quoted. Performance data current to the most recent month end is available by calling 800-331-8936.
| * | The tables do not reflect the deduction of taxes that a shareholder would pay on the Fund’s distributions or the redemption of Fund shares. |
15
Perritt Ultra MicroCap Fund
| Ten Largest Common Stock Holdings (Unaudited) |
Galaxy Gaming, Inc. (GLXZ) is a gaming company that designs, develops, manufactures, markets, acquires, and licenses proprietary casino table games and associated technology, platforms, and systems for the gaming industry.
CynergisTek, Inc. (CTEK) provides outsourced document solutions, IT consulting data security, and managed print services primarily to the healthcare industry in the United States. The company offers Incident Response, Vendor Security Management, and Patient Privacy Monitoring Service, as well as Compliance Assist Partner Program.
DLH Holdings Corp. (DLHC) provides healthcare, logistics, and technical services and solutions to Federal Government agencies including the Department of Veteran Affairs, the Department of Defense, and other government clients.
PCM, Inc. (PCMI) through its subsidiaries, operates as a multi-vendor provider of technology products and solutions in the United States and Europe. It primarily sells device products, servers, storage products, network products, printers, and related accessories and devices.
Sensus Healthcare, Inc. (STRS) manufactures and markets superficial radiation therapy devices to healthcare providers worldwide. It offers SRT-100, a photon X-ray low energy superficial radiotherapy system that provides patients an alternative to surgery for treating non-melanoma skin cancers; and SRT-100 Vision, which provides the user with a superficial radiation therapy-tailored treatment planning application that integrates the embedded high frequency ultrasound imaging module, volumetric tumor analysis, beam margins planning, and dosimetry parameters.
ImmuCell Corp. (ICCC), an animal health company, develops, acquires, manufactures, and sells products that enhance the health and productivity of dairy and beef cattle in the United States and internationally. The company primarily offers First Defense, an orally delivered scours preventive product for newborn calves.
Northern Technology International Corp. (NTIC) develops and markets rust and corrosion inhibiting products and services to automotive, electronics, electrical mechanical, military, retail consumer, and oil and gas markets.
Information Services Group, Inc. (III) operates as a technology research and advisory company in the Americas, Europe, and the Asia Pacific. The company offers digital transformation services, including automation, cloud, and data analytics; sourcing advisory; managed governance and risk; network carrier; technology strategy and operations design; change management; and market intelligence and technology research and analysis services.
Sachem Capital Corp. (SACH) operates as a real estate finance company and engages in originating, underwriting, funding, servicing, and managing a portfolio of short-term loans secured by first mortgage liens on real property located primarily in Connecticut.
Global Water Resources, Inc. (GWRS), a water resource management company, owns, operates, and manages regulated water, waste water, and recycled water utilities primarily in metropolitan Phoenix, Arizona.
Fund holdings and/or sector allocations are subject to change at any time and
are not recommendations to buy or sell any security.
Please refer to the Schedule of Investments in this report for a complete list of Fund holdings.
16
Perritt Ultra MicroCap Fund
| Allocation of Portfolio Investments (Unaudited) | October 31, 2018 |
| Note: | For presentation purposes, the Fund has grouped some of the industry categories. For purposes of categorizing securities for compliance with section 8(b)(1) of the Investment Company Act of 1940, the Fund uses more specific industry classifications. |
17
Perritt Low Priced Stock Fund
| Portfolio Manager’s Message |
Michael Corbett,
Portfolio Manager
We are certainly disappointed with the absolute and relative performance for the Perritt Low Priced Stock Fund this past year. We remain extremely excited about the prospects for the Fund’s holdings. That is why we have decided to provide an expanded detail of some of the most interesting and largest holdings in this report. The Fund’s performance results and historic performance can be found on the pages later in this report.
Callaway Golf (ELY) together with its subsidiaries, designs, manufactures, and sells golf clubs, golf balls, golf bags, and other golf-related accessories in the United States and internationally. The company operates through three segments: Golf Clubs; Golf Balls; and Gear and Accessories. It offers drivers, fairway woods, hybrids, irons, wedges, and putters. The company has a number one or two market shares in most categories. The hidden gem in Callaway’s bag is their 15% ownership of Topgolf. Topgolf is a private company that offers one of the fastest growing retail concepts in the world. There are more than 60 locations worldwide that offer competitive golf games and an impressive food and drink menu. We expect Topgolf to double its footprint in the next couple of years and take the company public.
Glu Mobile Inc. (GLUU) develops, publishes, and markets a portfolio of free-to-play mobile games for the users of smartphones and tablet devices. The company publishes titles in four genres, including home décor, sports and action, fashion and celebrity, and time management. Online games have become the new big sports for younger people. There were more than 60 million people watching the 2017 League of World Video Game Final, which is half the amount of people watching the Super Bowl each year. This is a huge growth industry, and GLUU is well positioned to participate in that growth. We expect revenue and profits to grow well in the double digits in the next several years.
Immersion Corporation (IMMR) develops and licenses haptic technologies, with 3000+ issued and pending patents, which allow people to use their sense of touch when they engage with various digital products. This is used with mobile devices, gaming, auto and other sectors. Their haptics are in approximately 7% of all automobiles, but after signing a recent series of deals, they will have 50% coverage with $1 to $6 of content per car. Recent license agreements have included Apple, Fitbit, and Sony and pending litigation against Samsung and Motorola looks very favorable. Earnings can be lumpy due to less fixed fees and more license sales. There is anticipation of a $50 million settlement with Samsung which would be about 17% of IMMR’s enterprise value. IMMR trades at 3.1x EBITDA, has a 13% free cash flow yield, and zero debt. This company could have explosive growth as more devices migrate to “touch”.
KEMET Corporation (KEM) manufactures and sells passive electronic components under the KEMET brand worldwide. The company operates in three segments: Solid Capacitors, Film and Electrolytic; and Electro-Magnetic, Sensors, and Actuators. The company recently completed an agreement with 2 customers where 27 billion pieces or 37% of all KEMET annual MLCC capacity are sold through fiscal 2021. This recurring revenue stream has been unattainable in their industry thus far and
18
Perritt Low Priced Stock Fund
requires a high level of confidence and trust between the parties. Despite the fact that the company has grown revenue in excess of 20% annualized in the past three years and future growth looks promising, the company’s stock trades at less than 1 times revenue and less than 6 times earnings.
McEwen Mining (MUX) engages in the exploration, development, production, and sale of gold and silver. The company owns 100% interests in the El Gallo 1 mine and El Gallo 2 project in the state of Sinaloa, Mexico; and the Black Fox Complex, Buffalo Ankerite, Fuller, Davidson Tisdale, and Black Fox North properties in Canada. McEwen Mining was founded by Robert McEwen who was also founder and former Chairman and CEO of Goldcorp, which is one of the largest gold producers in the world. Under McEwen leadership, he consolidated five companies to form Goldcorp in the 1990s. During his leadership from 1993 to 2005, Goldcorp’s stock rose by nearly 20-fold. Mr. McEwen receives $1 in salary, no bonus and no options, but owns 24% of MUX. We are excited to be a fellow shareholder with Mr. McEwen!
Tecnoglass (TGLS) through its subsidiaries, manufactures and sells architectural glass, windows, and associated aluminum products for the global commercial and residential construction industries in North, Central, and South America. It offers soft coat, laminated/thermo-laminated, thermo-acoustic, tempered, silk-screened, curved, and digital print glass. In the past five years, the company has grown revenue by more than 13% annually and EBITDA has grown by nearly 20% in that same period. The company’s shares trade at a reasonable 1.4 times revenue and a little more than 6 times EBITDA. The company pays an above average dividend with a current yield in excess of 6%. Given the fact that management recently raised guidance, we believe the dividend is solid and future increases in the dividend are likely.
While there is not enough room to discuss all the Fund’s holdings in this report, we are equally excited about all the holdings in this portfolio. Here are some summary statistics for the entire portfolio. Based on our earnings estimate, the Fund’s portfolio trades at less than 11 times 2019 earnings. The median price to revenue is slightly less than 0.9 times. These valuations compare to the Russell 2000® Index’s median price earnings ratio of 14.2 and a median price to revenue of 2.1 times. In addition, there are nearly one-third of the companies in the Index that are not profitable. More than 90% of the companies in the Perritt Low Priced Stock Fund are profitable.
Thank you for entrusting your investment with us. The Perritt Capital Management team continues to show their commitment to the Fund’s success with their own personal investment. As a fellow shareholder and the largest shareholder, I am committed to the success of this fund. If you have any questions or comments about this report or your investment in the Perritt Low Priced Stock Fund, please call us toll-free at (800) 331-8936 or visit our website at www.perrittcap.com. Please refer to the prospectus for information about the Fund’s investment objectives and strategies.
Michael Corbett
Portfolio Manager
19
Perritt Low Priced Stock Fund
Past performance does not guarantee future results.
Earnings Growth is not a measure of the Fund’s future performance.
Opinions expressed are subject to change at any time, are not guaranteed, and should not be considered investment advice.
The Russell 2000® Index consists of the smallest 2000 companies in a group of 3000 companies in the Russell 3000 as ranked by market cap.
Free Cash Flow is the cash a company produces through its operation, less the cost of expenditures on assets. It is the cash left over after a company pays for its operating expenses and capital expenditures.
Median Price to Revenue Ratio is a valuation that compares a company’s stock price to its revenue. It is an indicator of the value placed on each dollar of a company’s sales or revenues.
It is not possible to invest directly in an index.
Please refer to the Schedule of Investments in the report for more complete information regarding Fund holdings. Fund holdings and sector allocations are subject to change and should not be considered a recommendation to buy or sell any security.
Mutual fund investing involves risk. Principal loss is possible. The Funds invest in smaller companies, which involve additional risks, such as limited liquidity and greater volatility. The Funds invest in micro-cap companies which tend to perform poorly during times of economic stress. The Low Priced Stock Fund may invest in early stage companies which tend to be more volatile and somewhat more speculative than investments in more established companies. Low Priced stocks are generally more volatile than higher priced securities.
The annual report must be preceded or accompanied by a prospectus. One cannot invest directly in an index.
The Perritt Funds are distributed by Quasar Distributors, LLC.
20
(This Page Intentionally Left Blank.)
21
Perritt Low Priced Stock Fund
| Performance* (Unaudited) | October 31, 2018 |
Perritt Low Priced Stock Fund** versus
Russell 2000® Index and Russell Microcap® Index
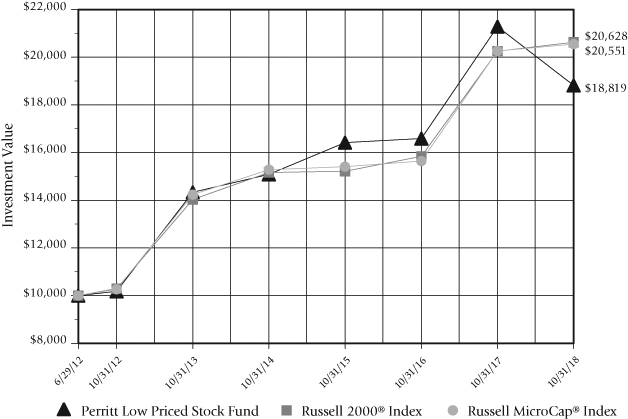
There are several ways to evaluate a fund’s historical performance. You can look at the total percentage change in value, the average annual percentage change, or the growth of a hypothetical $10,000 investment. Each performance figure includes changes in a fund’s share price, plus reinvestment of any dividends (or income) and capital gains (the profits the fund earns when it sells stocks that have grown in value).
Cumulative total returns reflect the Fund’s actual performance over a set period. For example, if you invested $1,000 in a fund that had a 5% return over one year, you would end up with $1,050. You can compare the Fund’s returns to the Russell 2000® Index, which reflects a popular measure of the stock performance of small companies, and the Russell Microcap® Index, which measures the performance of the micro-cap segment of the U.S. equity market.
Average annual total returns take the Fund’s actual (or cumulative) return and show you what would have happened if the Fund had performed at a constant rate each year.
| * | The graph illustrates the performance of a hypothetical $10,000 investment made in the Fund at inception (June 29, 2012) of the Fund’s predecessor account through October 31, 2018. Assumes reinvestment of dividends and capital gains, but does not reflect the effect of any applicable sales charge or redemption fees or the deduction of taxes that a shareholder would pay on the Fund’s distributions or the redemption of Fund shares. The graph does not imply any future performance. In the absence of fee waivers and reimbursements, when they are necessary to keep expenses at the expense cap, total returns would be reduced. It is not possible to invest directly in an index. | |
| ** | June 29, 2012 is the inception date of the Fund’s predecessor account. The Fund commenced operations on February 28, 2014. The investment policies, objectives, guidelines and restrictions of the Fund are in all material respects equivalent to those of the predecessor account. |
22
Perritt Low Priced Stock Fund
| Performance (Unaudited) (Continued) | October 31, 2018 |
| Average Annual Total Returns** | |
| Periods ended October 31, 2018 (Unaudited) |
| Past | Past | Since | |
| 1 Year | 5 Years | Inception* | |
| Perritt Low Priced Stock Fund | (11.57)% | 5.59% | 10.49% |
| Russell 2000 index | 1.85% | 8.01% | 12.10% |
| (reflects no deduction for fees and expenses) | |||
| Russell Microcap Index | 1.43% | 7.62% | 12.04% |
| (reflects no deduction for fees and expenses) |
Performance data quoted represents past performance; past performance does not guarantee future results. The investment return and principal value of an investment will fluctuate so that an investor’s shares, when redeemed, may be worth more or less than their original cost. Current performance of the Fund may be lower or higher than the performance quoted. Performance data current to the most recent month end is available by calling 800-331-8936.
| * | The Fund is the successor to a separately managed account. Immediately prior to the Fund commencing operations on February 28, 2014, the predecessor account transferred its assets to the Fund in exchange for the Fund’s shares. The investment policies, objectives, guidelines and restrictions of the Fund are in all material respects equivalent to those of the predecessor. In addition, the predecessor’s portfolio managers are the current portfolio managers of the Fund. As a mutual fund registered under the Investment Company Act of 1940 (the “1940 Act”), the Fund is subject to certain restrictions under the 1940 Act and the Internal Revenue Code to which the predecessor was not subject. Had the predecessor been registered under the 1940 Act and been subject to the provisions of the 1940 Act and the Internal Revenue Code, its investment performance may have been adversely affected. The performance was achieved by the predecessor when Fund assets were relatively small; the same strategies may not be available, and similar performance may not be achieved, when the Fund’s assets are larger. The performance shown includes an annual management fee of 1.00% and does not include any expenses paid by the predecessor’s investment advisor. | |
| The since inception date is June 29, 2012, the date of inception of the Fund’s predecessor account. The past performance of the Fund and its predecessor account (before and after taxes) is not necessarily an indication of how the Fund will perform in the future. | ||
| ** | The tables do not reflect the deduction of taxes that a shareholder would pay on the Fund’s distributions or the redemption of Fund shares. |
23
Perritt Low Priced Stock Fund
| Ten Largest Common Stock Holdings (Unaudited) |
Infrastructure & Energy Alternatives, Inc. (IEA) provides engineering, procurement, and construction services for the renewable energy, traditional power, and civil infrastructure industries in the United States. It offers design, site development, construction, installation, and restoration of infrastructure services.
Photronics, Inc. (PLAB), together with its subsidiaries, manufactures and sells photomasks in the United States, Taiwan, Korea, Europe, and internationally. The company offers photomasks, which are high precision photographic quartz plates containing microscopic images of electronic circuits for use in the manufacture of semiconductors and flat panel displays.
AMC Entertainment Holdings, Inc. (AMC), through its subsidiaries, operates in the theatrical exhibition business. The company owns, operates, or has interests in theatres.
Electro Scientific Industries, Inc. (ESIO), together with its subsidiaries, supplies laser-based microfabrication solutions for the microtechnology industry worldwide. The company provides printed circuit board laser drilling products, including laser via drilling systems for electrical interconnect applications, semiconductor manufacturing products, component test products, and industrial machining products.
Primo Water Corp. (PRMW), together with its subsidiaries, provides multi-gallon purified bottled water, self-service refill water, and water dispensers in the United States and Canada. It operates in three segments: Refill, Exchange, and Dispensers.
Carrizo Oil & Gas, Inc. (CRZO), together with its subsidiaries, engages in the exploration, development, and production of crude oil, natural gas liquids, and gas from resource plays primarily in the United States.
Mercer International, Inc. (MERC), together with its subsidiaries, manufactures and sells northern bleached softwood Kraft (NBSK) pulp in the United States, Europe, Asia, and internationally. The company operates in two segments, Pulp and Wood Products.
Information Services Group, Inc. (III) operates as a technology research and advisory company in the Americas, Europe, and the Asia Pacific. The company offers digital transformation services, including automation, cloud, and data analytics; sourcing advisory; managed governance and risk; network carrier; technology strategy and operations design; change management; and market intelligence and technology research and analysis services.
CNO Financial Group, Inc. (CMO) develops, markets and administers health insurance, annuity, individual life insurance and other insurance products. The Company’s segments include Bankers Life, Washington National and Colonial Penn.
Tower International, Inc. (TWRS) manufactures and sells engineered automotive structural metal components and assemblies primarily for original equipment manufacturers. It operates in two segments, North America and Europe.
Fund holdings and/or sector allocations are subject to change at any time and
are not recommendations to buy or sell any security.
Please refer to the Schedule of Investments in this report for a complete list of Fund holdings.
24
Perritt Low Priced Stock Fund
| Allocation of Portfolio Investments (Unaudited) | October 31, 2018 |
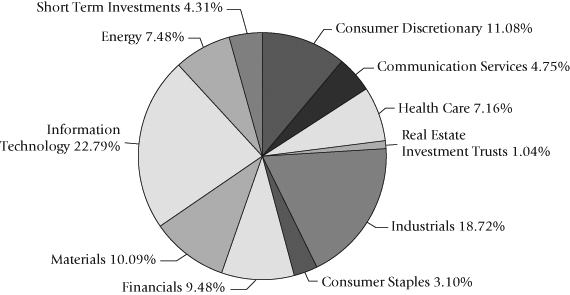
| Note: | For presentation purposes, the Fund has grouped some of the industry categories. For purposes of categorizing securities for compliance with section 8(b)(1) of the Investment Company Act of 1940, the Fund uses more specific industry classifications. |
25
Perritt MicroCap Opportunities Fund
| Schedule of Investments | October 31, 2018 |
| Shares | COMMON STOCKS – 99.36% | Value | |||||
| Aerospace & Defense – 1.68% | |||||||
| 397,172 | CPI Aerostructures, | ||||||
Inc.(a) | $ | 2,700,770 | |||||
| 2,700,770 | |||||||
| Auto Parts & Equipment – 5.02% | |||||||
| 162,271 | Miller Industries, Inc. | 3,922,090 | |||||
| 125,000 | Motorcar Parts | ||||||
of America, Inc.(a)(b) | 2,647,500 | ||||||
| 10,500 | Motorcar Parts | ||||||
of America, Inc.(a) | 222,390 | ||||||
| 50,000 | Stoneridge, Inc.(a) | 1,270,500 | |||||
| 8,062,480 | |||||||
| Automotive Retail – 0.73% | |||||||
| 193,651 | Lazydays Holdings, | ||||||
Inc.(a) | 1,175,462 | ||||||
| 1,175,462 | |||||||
| Building Materials – 7.07% | |||||||
| 180,000 | BlueLinx | ||||||
Holdings, Inc.(a) | 4,239,000 | ||||||
| 94,452 | Global Brass & Copper | ||||||
| Holdings, Inc. | 2,986,572 | ||||||
| 471,677 | Huttig Building | ||||||
Products, Inc.(a) | 1,759,355 | ||||||
| 23,454 | Insteel Industries, Inc. | 612,619 | |||||
| 87,400 | PGT Innovations, Inc.(a) | 1,770,724 | |||||
| 11,368,270 | |||||||
| Business Services – 5.78% | |||||||
| 125,200 | CynergisTek, Inc.(a) | 500,800 | |||||
| 144,261 | DLH Holdings Corp.(a) | 771,075 | |||||
| 115,000 | GP Strategies Corp.(a) | 1,680,150 | |||||
| 120,175 | Information Services | ||||||
Group, Inc.(a) | 493,919 | ||||||
| 171,383 | PCM, Inc.(a) | 3,233,997 | |||||
| 368,969 | PFSweb, Inc.(a) | 2,615,990 | |||||
| 9,295,931 | |||||||
| Chemical & Related Products – 8.70% | |||||||
| 20,000 | KMG Chemicals, Inc. | 1,500,400 | |||||
| 204,165 | Northern Technologies | ||||||
| International Corp. | 6,604,738 | ||||||
| 375,652 | OMNOVA | ||||||
Solutions, Inc.(a) | 2,776,068 | ||||||
| 287,266 | Trecora Resources(a) | 3,102,473 | |||||
| 13,983,679 | |||||||
| Commercial Banks – 7.23% | |||||||
| 125,900 | Bankwell Financial | ||||||
| Group, Inc. | 3,817,288 | ||||||
| 87,691 | Berkshire Hills | ||||||
| Bancorp, Inc. | 2,926,249 | ||||||
| 25,000 | Bridgewater | ||||||
Bancshares, Inc.(a) | 277,500 | ||||||
| 50,000 | Esquire Financial | ||||||
Holdings, Inc.(a) | 1,199,000 | ||||||
| 54,185 | Triumph | ||||||
Bancorp, Inc.(a) | 1,943,074 | ||||||
| 61,240 | Veritex Holdings, Inc.(a) | 1,442,815 | |||||
| 11,605,926 | |||||||
| Commercial Services – 1.02% | |||||||
| 65,000 | TriState Capital | ||||||
Holdings, Inc.(a) | 1,639,300 | ||||||
| 1,639,300 | |||||||
| Construction & Engineering – 5.30% | |||||||
| 30,000 | Comfort Systems | ||||||
| USA, Inc. | 1,604,400 | ||||||
| 739,500 | Hill International, | ||||||
Inc.(a) | 2,085,390 | ||||||
| 132,776 | IES Holdings, Inc.(a) | 2,355,446 | |||||
| 260,700 | Limbach | ||||||
Holdings, Inc.(a) | 2,474,043 | ||||||
| 8,519,279 | |||||||
| Consumer Products – | |||||||
| Manufacturing – 2.02% | |||||||
| 114,000 | Delta Apparel, Inc.(a) | 2,173,980 | |||||
| 62,041 | Superior Group | ||||||
| of Cos., Inc. | 1,078,893 | ||||||
| 3,252,873 | |||||||
| Consumer Services – 2.95% | |||||||
| 207,583 | Primo Water Corp.(a) | 3,460,409 | |||||
| 105,869 | ZAGG, Inc.(a) | 1,282,073 | |||||
| 4,742,482 | |||||||
| Data Processing, Hosting | |||||||
| and Related Services – 4.48% | |||||||
| 450,175 | Limelight | ||||||
Networks, Inc.(a) | 1,814,205 | ||||||
| 357,663 | Ooma, Inc.(a) | 5,379,252 | |||||
| 7,193,457 | |||||||
The accompanying notes to financial statements are an integral part of this schedule.
26
Perritt MicroCap Opportunities Fund
| Schedule of Investments (Continued) | October 31, 2018 |
| Shares | Value | ||||||
| Electronic Equipment & Instruments – 1.69% | |||||||
| 123,728 | Bel Fuse, Inc. – Class B | $ | 2,722,016 | ||||
| 2,722,016 | |||||||
| Energy & Related Services – 1.14% | |||||||
| 90,000 | Matrix Service Co.(a) | 1,829,700 | |||||
| 1,829,700 | |||||||
| Engineering & Construction – 0.84% | |||||||
| 135,200 | Infrastructure & Energy | ||||||
Alternatives, Inc.(a) | 1,352,000 | ||||||
| 1,352,000 | |||||||
| Financial Services – 6.92% | |||||||
| 123,800 | First Internet Bancorp | 3,190,326 | |||||
| 145,092 | Hennessy Advisors, Inc. | 1,797,690 | |||||
| 53,009 | Northeast Bancorp | 997,099 | |||||
| 40,950 | Oppenheimer Holdings, | ||||||
| Inc. – Class A | 1,259,622 | ||||||
| 270,006 | Silvercrest Asset | ||||||
| Management Group, | |||||||
| Inc. – Class A | 3,882,686 | ||||||
| 11,127,423 | |||||||
| Food – 3.99% | |||||||
| 101,533 | Crimson Wine | ||||||
Group Ltd.(a) | 868,107 | ||||||
| 116,981 | Farmer Brothers Co.(a) | 2,820,412 | |||||
| 198,500 | Landec Corp.(a) | 2,717,465 | |||||
| 6,405,984 | |||||||
| Gold – 0.20% | |||||||
| 75,000 | Gold Resource Corp. | 324,750 | |||||
| 324,750 | |||||||
| Home Builder – 0.59% | |||||||
| 100,000 | Green Brick | ||||||
Partners, Inc.(a) | 940,000 | ||||||
| 940,000 | |||||||
| Industrial Goods – 0.97% | |||||||
| 736,740 | Hudson Technologies, | ||||||
Inc.(a) | 610,537 | ||||||
| 35,000 | Schnitzer Steel Industries, | ||||||
| Inc. – Class A | 941,500 | ||||||
| 1,552,037 | |||||||
| Insurance – 2.45% | |||||||
| 240,000 | Atlas Financial | ||||||
Holdings, Inc.(a) | 2,306,400 | ||||||
| 83,049 | United Insurance | ||||||
| Holdings Corp. | 1,637,726 | ||||||
| 3,944,126 | |||||||
| Leisure – 0.78% | |||||||
| 200,000 | Century Casinos, | ||||||
Inc.(a) | 1,248,000 | ||||||
| 1,248,000 | |||||||
| Machinery Manufacturing – 1.51% | |||||||
| 98,700 | Graham Corp. | 2,429,007 | |||||
| 2,429,007 | |||||||
| Medical Supplies & Services – 0.81% | |||||||
| 20,000 | Addus HomeCare | ||||||
Corp.(a) | 1,310,000 | ||||||
| 1,310,000 | |||||||
| Private Equity & Venture Capital – 0.26% | |||||||
| 73,206 | BBX Capital Corp. – | ||||||
| Class A | 428,255 | ||||||
| 428,255 | |||||||
| Real Estate Investment Trusts – 4.56% | |||||||
| 169,799 | City Office Real Estate | ||||||
| Investment Trust, Inc. | 1,871,185 | ||||||
| 90,000 | Community Healthcare | ||||||
| Trust, Inc. | 2,674,800 | ||||||
| 75,000 | Exantas Capital Corp. | 850,500 | |||||
| 210,000 | Global Medical | ||||||
| REIT, Inc. | 1,923,600 | ||||||
| 7,320,085 | |||||||
| Retail – 1.20% | |||||||
| 150,000 | Kirkland’s, Inc.(a) | 1,516,500 | |||||
| 250,100 | Pier 1 Imports, Inc. | 397,659 | |||||
| 1,914,159 | |||||||
| Semiconductor Related Products – 5.39% | |||||||
| 286,367 | AXT, Inc.(a) | 1,887,159 | |||||
| 138,327 | DSP Group, Inc.(a) | 1,691,739 | |||||
| 415,000 | Photronics, Inc.(a) | 4,042,100 | |||||
| 50,000 | Rudolph Technologies, | ||||||
Inc.(a) | 1,039,500 | ||||||
| 8,660,498 | |||||||
| Software – 4.50% | |||||||
| 190,700 | American Software, | ||||||
| Inc. – Class A | 2,194,957 | ||||||
| 200,000 | Asure Software, Inc.(a) | 2,228,000 | |||||
The accompanying notes to financial statements are an integral part of this schedule.
27
Perritt MicroCap Opportunities Fund
| Schedule of Investments (Continued) | October 31, 2018 |
| Shares | Value | ||||||
| Software (Continued) | |||||||
| 418,000 | Zix Corp.(a) | $ | 2,817,320 | ||||
| 7,240,277 | |||||||
| Specialty Manufacturing – 4.39% | |||||||
| 82,500 | Federal Signal Corp. | 1,814,175 | |||||
| 386,196 | LSI Industries, Inc. | 1,668,367 | |||||
| 188,733 | Manitex International, | ||||||
Inc.(a) | 1,611,780 | ||||||
| 86,001 | Sparton Corp.(a) | 1,064,692 | |||||
| 46,900 | Twin Disc, Inc.(a) | 897,197 | |||||
| 7,056,211 | |||||||
| Telecommunications – 3.09% | |||||||
| 740,000 | Ceragon Networks | ||||||
Ltd.(a)(e) | 2,464,200 | ||||||
| 79,652 | Digi International, | ||||||
Inc.(a) | 923,963 | ||||||
| 355,000 | PC-Tel, Inc. | 1,569,100 | |||||
| 4,957,263 | |||||||
| Transportation – 2.10% | |||||||
| 620,000 | Radiant Logistics, | ||||||
Inc.(a) | 3,372,800 | ||||||
| 3,372,800 | |||||||
| TOTAL COMMON | |||||||
| STOCKS | |||||||
| (Cost $118,039,235) | $ | 159,674,500 | |||||
| Contracts | WARRANTS – 0.05% | Value | |||||
| Engineering & Construction – 0.05% | |||||||
| Infrastructure & Energy | |||||||
| Alternatives, Inc. Warrant; | |||||||
| 46,400 | Expiration: 05/20/2021,(a) | ||||||
| $ | 72,384 | ||||||
| Insurance – 0.00% | |||||||
| Emergent Capital, | |||||||
| Inc. Warrant; | |||||||
| 38,106 | Expiration: 10/06/2019, | ||||||
Exercise Price $10.75(a)(c) | |||||||
| — | |||||||
| TOTAL WARRANTS | |||||||
| (Cost $65,747) | $ | 72,384 | |||||
| Shares | SHORT-TERM | Value | |||||
| INVESTMENTS – 1.11% | |||||||
| Money Market Funds – 1.11% | |||||||
| 1,786,501 | First American Government | ||||||
| Obligations Fund | |||||||
Class X 2.09%(d) | $ | 1,786,501 | |||||
| TOTAL SHORT-TERM | |||||||
| INVESTMENTS | |||||||
| (Cost $1,786,501) | $ | 1,786,501 | |||||
| Total Investments | |||||||
| (Cost $119,891,483) – | |||||||
| 100.52% | $ | 161,533,385 | |||||
| Liabilities in | |||||||
| Excess of Other | |||||||
| Assets – (0.52)% | (835,425 | ) | |||||
| TOTAL NET ASSETS – | |||||||
| 100.00% | $ | 160,697,960 | |||||
Percentages are stated as a percent of net assets.
(a) | Non-income producing security. |
(b) | Security was purchased in a transaction exempt from registration in the U.S. under the Securities Act of 1933 (the “Act”) and, unless registered under the Act, may only be sold pursuant to exemption from registration and, in the case of a Rule 144A offering under the Act, may only be sold to “qualified institutional buyers.” The value of this security is $2,647,500 or 1.65% of the Fund’s net assets. This security is deemed to be liquid. |
(c) | The price for this security was derived from an estimate of fair value using methods approved by the Fund’s Board of Directors. This security represents $0 or 0.00% of the Fund’s net assets. This security is classified as Level 2 and is deemed to be illiquid. |
(d) | Variable rate security; the rate shown is the seven-day yield rate as of October 31, 2018. |
(e) | Foreign issued security. |
The accompanying notes to financial statements are an integral part of this schedule.
28
Perritt Ultra MicroCap Fund
| Schedule of Investments | October 31, 2018 |
| Shares | COMMON STOCKS – 93.84% | Value | |||||
| Aerospace & Defense – 0.95% | |||||||
| 85,000 | CPI Aerostructures, | ||||||
Inc.(a) | $ | 578,000 | |||||
| 578,000 | |||||||
| Air Transport – 1.29% | |||||||
| 54,886 | AeroCentury Corp.(a) | 789,810 | |||||
| 789,810 | |||||||
| Auto Parts & Equipment – 1.05% | |||||||
| 90,000 | Unique | ||||||
| Fabricating, Inc. | 639,000 | ||||||
| 639,000 | |||||||
| Business Services – 12.91% | |||||||
| 35,000 | BG Staffing, Inc. | 904,400 | |||||
| 350,000 | CynergisTek, Inc.(a) | 1,399,999 | |||||
| 244,300 | DLH Holdings Corp.(a) | 1,305,783 | |||||
| 275,000 | Information Services | ||||||
Group, Inc.(a) | 1,130,250 | ||||||
| 65,000 | PCM, Inc.(a) | 1,226,550 | |||||
| 45,475 | Transcat, Inc.(a) | 941,787 | |||||
| 105,000 | USA Technologies, | ||||||
Inc.(a) | 609,000 | ||||||
| 701,005 | WidePoint Corp.(a) | 364,523 | |||||
| 7,882,292 | |||||||
| Chemical & Related Products – 1.91% | |||||||
| 36,000 | Northern Technologies | ||||||
| International Corp. | 1,164,600 | ||||||
| 1,164,600 | |||||||
| Chemical Manufacturing – 1.29% | |||||||
| 200,000 | Intrepid Potash, Inc.(a) | 790,000 | |||||
| 790,000 | |||||||
| Computer & Electronic | |||||||
| Product Manufacturing – 2.78% | |||||||
| 200,000 | Dynatronics Corp.(a) | 530,000 | |||||
| 250,000 | Luna Innovations, Inc.(a) | 815,000 | |||||
| 1,000,000 | Singing Machine | ||||||
Co., Inc.(a) | 350,000 | ||||||
| 1,695,000 | |||||||
| Computers & Electronics – 0.81% | |||||||
| 35,000 | Napco Security | ||||||
Technologies, Inc.(a) | 492,450 | ||||||
| 492,450 | |||||||
| Construction & Engineering – 3.06% | |||||||
| 65,353 | Gencor Industries, | ||||||
Inc.(a) | 743,717 | ||||||
| 150,000 | Hill International, | ||||||
Inc.(a) | 423,000 | ||||||
| 9,000 | NV5 Global, Inc.(a) | 702,630 | |||||
| 1,869,347 | |||||||
| Consumer Goods – 0.97% | |||||||
| 20,000 | MCBC Holdings, | ||||||
Inc.(a) | 593,600 | ||||||
| 593,600 | |||||||
| Consumer Products ��� Distributing – 0.78% | |||||||
| 400,000 | US Auto Parts Network, | ||||||
Inc.(a) | 476,000 | ||||||
| 476,000 | |||||||
| Consumer Services – 0.99% | |||||||
| 50,000 | ZAGG, Inc.(a) | 605,500 | |||||
| 605,500 | |||||||
| Diversified Financials – 1.40% | |||||||
| 100,000 | Safeguard Scientifics, | ||||||
Inc.(a) | 855,000 | ||||||
| 855,000 | |||||||
| Electronic Equipment & Instruments – 1.06% | |||||||
| 150,000 | Iteris, Inc.(a) | 648,000 | |||||
| 648,000 | |||||||
| Energy & Related Services – 3.24% | |||||||
| 145,000 | DHT Holdings, Inc.(e) | 729,350 | |||||
| 30,000 | Matrix Service Co.(a) | 609,900 | |||||
| 160,000 | Mitcham Industries, | ||||||
Inc.(a) | 640,000 | ||||||
| 1,979,250 | |||||||
| Engineering & Construction – 1.72% | |||||||
| 62,500 | Infrastructure & Energy | ||||||
Alternatives, Inc.(a) | 625,000 | ||||||
| 100,000 | SG Blocks, Inc.(a) | 422,000 | |||||
| 1,047,000 | |||||||
| Environmental Services – 1.90% | |||||||
| 250,000 | Fuel Tech, Inc.(a) | 300,000 | |||||
| 377,500 | Quest Resource | ||||||
Holding Corp.(a) | 860,700 | ||||||
| 1,160,700 | |||||||
| Financial Holding Company – 0.63% | |||||||
| 100,000 | CCUR Holdings, Inc. | 383,000 | |||||
| 383,000 | |||||||
The accompanying notes to financial statements are an integral part of this schedule.
29
Perritt Ultra MicroCap Fund
| Schedule of Investments (Continued) | October 31, 2018 |
| Shares | Value | ||||||
| Financial Services – 5.42% | |||||||
| 65,000 | AMREP Corp.(a) | $ | 432,900 | ||||
| 35,000 | First Internet Bancorp | 901,950 | |||||
| 36,000 | Hennessy Advisors, Inc. | 446,040 | |||||
| 50,000 | HopFed Bancorp, Inc. | 767,500 | |||||
| 52,500 | Silvercrest Asset Management | ||||||
| Group, Inc. – Class A | 754,950 | ||||||
| 3,303,340 | |||||||
| Food – 0.49% | |||||||
| 40,000 | Willamette Valley | ||||||
Vineyards, Inc.(a) | 296,000 | ||||||
| 296,000 | |||||||
| Health Care – 0.75% | |||||||
| 113,250 | Rockwell Medical | ||||||
Technologies, Inc.(a) | 462,060 | ||||||
| 462,060 | |||||||
| Insurance – 1.92% | |||||||
| 50,000 | Atlas Financial | ||||||
Holdings, Inc.(a) | 480,500 | ||||||
| 35,000 | United Insurance | ||||||
| Holdings Corp. | 690,200 | ||||||
| 1,170,700 | |||||||
| Leisure – 3.97% | |||||||
| 97,322 | Century Casinos, Inc.(a) | 607,289 | |||||
| 1,534,599 | Galaxy Gaming, Inc.(a) | 1,810,827 | |||||
| 2,418,116 | |||||||
| Machinery Manufacturing – 0.90% | |||||||
| 170,000 | ASV Holdings, Inc.(a) | 547,400 | |||||
| 547,400 | |||||||
| Medical Supplies & Services – 8.01% | |||||||
| 6,000 | Addus HomeCare | ||||||
Corp.(a) | 393,000 | ||||||
| 51,549 | Birner Dental Management | ||||||
Services, Inc.(a) | 515,490 | ||||||
| 659,000 | First Choice Healthcare | ||||||
Solutions, Inc.(a) | 652,410 | ||||||
| 66,000 | Lakeland | ||||||
Industries, Inc.(a) | 867,240 | ||||||
| 400,000 | Nobilis Health Corp.(a) | 286,960 | |||||
| 200,000 | Sensus Healthcare, | ||||||
Inc.(a) | 1,195,000 | ||||||
| 41,665 | Taylor Devices, Inc.(a) | 487,480 | |||||
| 250,000 | Titan Medical, Inc.(a)(e) | 492,500 | |||||
| 4,890,080 | |||||||
| Merchant Wholesalers, | |||||||
| Nondurable Goods – 0.72% | |||||||
| 688,450 | Innovative Food | ||||||
Holdings, Inc.(a) | 441,296 | ||||||
| 441,296 | |||||||
| Motion Pictures – 0.66% | |||||||
| 100,000 | Ballantyne | ||||||
Strong, Inc.(a) | 404,000 | ||||||
| 404,000 | |||||||
| Oil & Gas Services – 0.75% | |||||||
| 200,000 | Profire Energy, Inc.(a) | 456,000 | |||||
| 456,000 | |||||||
| Pharmaceuticals – 1.91% | |||||||
| 154,300 | ImmuCell Corp.(a) | 1,166,508 | |||||
| 1,166,508 | |||||||
| Professional, Scientific, | |||||||
| and Technical Services – 1.95% | |||||||
| 350,000 | CUI Global, Inc.(a) | 595,000 | |||||
| 300,000 | Sigma Labs, Inc.(a) | 591,000 | |||||
| 1,186,000 | |||||||
| Real Estate Investment Trusts – 2.50% | |||||||
| 170,000 | Global Self | ||||||
| Storage, Inc. | 686,800 | ||||||
| 60,000 | Plymouth Industrial | ||||||
| REIT, Inc. | 840,000 | ||||||
| 1,526,800 | |||||||
| Retail – 2.56% | |||||||
| 80,000 | Build-A-Bear | ||||||
Workshop, Inc.(a) | 684,800 | ||||||
| 240,000 | OurPet’s Co.(a) | 176,520 | |||||
| 150,000 | TravelCenters of | ||||||
America, LLC(a) | 699,000 | ||||||
| 1,560,320 | |||||||
| Semiconductor Related Products – 2.52% | |||||||
| 82,181 | AXT, Inc.(a) | 541,573 | |||||
| 50,000 | DSP Group, Inc.(a) | 611,500 | |||||
| 65,457 | GSI Technology, Inc.(a) | 386,851 | |||||
| 1,539,924 | |||||||
| Software – 4.28% | |||||||
| 80,000 | Asure Software, Inc.(a) | 891,200 | |||||
| 264,175 | Evolving Systems, Inc.(a) | 494,007 | |||||
| 117,500 | Finjan Holdings, Inc.(a) | 427,700 | |||||
| 200,000 | GlobalSCAPE, Inc. | 802,000 | |||||
| 2,614,907 | |||||||
The accompanying notes to financial statements are an integral part of this schedule.
30
Perritt Ultra MicroCap Fund
| Schedule of Investments (Continued) | October 31, 2018 |
| Shares | Value | ||||||
| Specialty Finance – 1.68% | |||||||
| 250,000 | Sachem Capital Corp. | $ | 1,025,000 | ||||
| 1,025,000 | |||||||
| Specialty Manufacturing – 11.04% | |||||||
| 200,000 | Aspen Aerogels, Inc.(a) | 716,000 | |||||
| 40,064 | Continental Materials | ||||||
Corp.(a) | 621,192 | ||||||
| 93,500 | CTI Industries Corp.(a) | 359,040 | |||||
| 120,000 | Data I/O Corp.(a) | 598,800 | |||||
| 12,500 | Hurco Companies, Inc. | 509,250 | |||||
| 28,863 | Kewaunee | ||||||
| Scientific Corp. | 825,482 | ||||||
| 88,467 | Pioneer Power Solutions, | ||||||
Inc.(a) | 442,335 | ||||||
| 170,000 | Polar Power, Inc.(a) | 967,300 | |||||
| 50,000 | �� | Sparton Corp.(a) | 619,000 | ||||
| 80,000 | Tecnoglass, Inc.(e) | 632,800 | |||||
| 13,336 | UFP | ||||||
Technologies, Inc.(a) | 460,359 | ||||||
| 6,751,558 | |||||||
| Telecommunications – 1.43% | |||||||
| 500,000 | Mobivity Holdings | ||||||
Corp.(a) | 875,000 | ||||||
| 875,000 | |||||||
| Utilities – 1.64% | |||||||
| 90,000 | Global Water | ||||||
| Resources, Inc. | 1,002,600 | ||||||
| 1,002,600 | |||||||
| TOTAL COMMON | |||||||
| STOCKS | |||||||
| (Cost $50,655,181) | $ | 57,286,158 | |||||
| Contracts | WARRANTS – 0.15% | Value | |||||
| Medical Supplies & Services – 0.00% | |||||||
| Titan Medical, Inc., Warrant: | |||||||
| 250,000 | Expiration: 08/10/2023, | ||||||
Exercise Price $3.20(a)(c) | $ | — | |||||
| Telecommunications – 0.15% | |||||||
| Mobivity Holdings | |||||||
| Corp. Warrant: | |||||||
| 165,000 | Expiration: 03/11/2019, | ||||||
Exercise Price $1.20(a)(b)(c) | 90,750 | ||||||
| TOTAL WARRANTS | |||||||
| (Cost $85,000) | $ | 90,750 | |||||
| Shares | SHORT-TERM | Value | |||||
| INVESTMENTS – 6.32% | |||||||
| Money Market Funds – 6.32% | |||||||
| 3,857,014 | First American Government | ||||||
| Obligations Fund | |||||||
Class X 2.09%(d) | $ | 3,857,014 | |||||
| TOTAL SHORT-TERM | |||||||
| INVESTMENTS | |||||||
| (Cost $3,857,014) | $ | 3,857,014 | |||||
| Total Investments | |||||||
| (Cost $54,597,195) – | |||||||
| 100.31% | $ | 61,233,922 | |||||
| Liabilities in Excess of | |||||||
| Other Assets – (0.31)% | (191,569 | ) | |||||
| TOTAL NET ASSETS – | |||||||
| 100.00% | $ | 61,042,353 | |||||
Percentages are stated as a percent of net assets.
(a) | Non-income producing security. |
(b) | Security was purchased in a transaction exempt from registration in the U.S. under the Securities Act of 1933 (the “Act”) and, unless registered under the Act, may only be sold to “qualified institutional buyers.” The value of this security is $90,750 or 0.15% of the Fund’s Net Assets. |
(c) | The price for this security was derived from an estimate of fair value using methods approved by the Fund’s Board of Directors. This security represents $90,750 or 0.15% of the Fund’s net assets. This security was classified as Level 2 and is considered to be illiquid. |
(d) | Variable rate security; the rate shown is the seven-day yield rate as of October 31, 2018. |
(e) | Foreign issued security. |
The accompanying notes to financial statements are an integral part of this schedule.
31
Perritt Low Priced Stock Fund
| Schedule of Investments | October 31, 2018 |
| Shares | COMMON STOCKS – 95.40% | Value | |||||
| Administrative & Support Services – 0.86% | |||||||
| 2,000 | Kforce, Inc. | $ | 61,640 | ||||
| 61,640 | |||||||
| Air Transportation – 0.96% | |||||||
| 2,000 | Hawaiian | ||||||
| Holdings, Inc. | 69,220 | ||||||
| 69,220 | |||||||
| Auto Parts & Equipment – 6.01% | |||||||
| 8,000 | Commercial Vehicle | ||||||
Group, Inc.(a) | 53,520 | ||||||
| 4,000 | Miller Industries, Inc. | 96,680 | |||||
| 8,000 | Modine | ||||||
Manufacturing Co.(a) | 104,080 | ||||||
| 6,000 | Superior Industries | ||||||
| International, Inc. | 58,980 | ||||||
| 4,000 | Tower International, Inc. | 118,760 | |||||
| 432,020 | |||||||
| Automobile Manufacturers – 0.77% | |||||||
| 2,000 | Winnebago | ||||||
| Industries, Inc. | 55,120 | ||||||
| 55,120 | |||||||
| Biotechnology – 1.91% | |||||||
| 7,000 | Innoviva, Inc.(a) | 97,720 | |||||
| 4,000 | Osiris | ||||||
Therapeutics, Inc.(a) | 39,120 | ||||||
| 136,840 | |||||||
| Building Material, Garden | |||||||
| Equipment & Supplies Dealers – 0.93% | |||||||
| 4,000 | BMC Stock | ||||||
Holdings, Inc.(a) | 66,960 | ||||||
| 66,960 | |||||||
| Building Products – 1.21% | |||||||
| 7,000 | Builders | ||||||
FirstSource, Inc.(a) | 86,660 | ||||||
| 86,660 | |||||||
| Business Services – 6.31% | |||||||
| 2,000 | Cardlytics, Inc.(a) | 42,320 | |||||
| 3,000 | Cision Ltd.(a) | 44,370 | |||||
| 2,000 | Darling | ||||||
Ingredients, Inc.(a) | 41,320 | ||||||
| 29,515 | Information Services | ||||||
Group, Inc.(a) | 121,307 | ||||||
| 19,000 | MobileIron, Inc.(a) | 91,865 | |||||
| 8,000 | New Media Investment | ||||||
| Group, Inc. | 112,400 | ||||||
| 453,582 | |||||||
| Chemical & Related Products – 1.44% | |||||||
| 14,000 | OMNOVA | ||||||
Solutions, Inc.(a) | 103,460 | ||||||
| 103,460 | |||||||
| Commercial Banks – 0.95% | |||||||
| 2,900 | Veritex Holdings, Inc.(a) | 68,324 | |||||
| 68,324 | |||||||
| Commercial Services & Supplies – 1.82% | |||||||
| 8,100 | ACCO Brands Corp. | 65,367 | |||||
| 20,000 | Groupon, Inc.(a) | 65,400 | |||||
| 130,767 | |||||||
| Computer & Electronic Product | |||||||
| Manufacturing – 2.02% | |||||||
| 5,000 | Electro Scientific | ||||||
Industries, Inc.(a) | 145,000 | ||||||
| 145,000 | |||||||
| Construction & Engineering – 5.72% | |||||||
| 9,000 | Gencor Industries, | ||||||
Inc.(a) | 102,420 | ||||||
| 20,000 | Hill International, | ||||||
Inc.(a) | 56,400 | ||||||
| 5,000 | IES Holdings, Inc.(a) | 88,700 | |||||
| 9,000 | Sterling Construction | ||||||
Co, Inc.(a) | 102,240 | ||||||
| 4,000 | Tutor Perini Corp.(a) | 62,000 | |||||
| 411,760 | |||||||
| Consumer Services – 3.03% | |||||||
| 8,000 | Primo Water Corp.(a) | 133,360 | |||||
| 7,000 | ZAGG, Inc.(a) | 84,770 | |||||
| 218,130 | |||||||
| Credit Intermediation & | |||||||
| Related Activities – 2.43% | |||||||
| 7,000 | FNB Corp. | 82,810 | |||||
| 10,000 | United Community | ||||||
| Financial Corp. | 91,500 | ||||||
| 174,310 | |||||||
| Data Processing, Hosting | |||||||
| and Related Services – 1.12% | |||||||
| 20,000 | Limelight Networks, | ||||||
Inc.(a) | 80,600 | ||||||
| 80,600 | |||||||
| Electronic Equipment & Instruments – 1.30% | |||||||
| 8,000 | TTM Technologies, | ||||||
Inc.(a) | 93,600 | ||||||
| 93,600 | |||||||
The accompanying notes to financial statements are an integral part of this schedule.
32
Perritt Low Priced Stock Fund
| Schedule of Investments (Continued) | October 31, 2018 |
| Shares | Value | ||||||
| Electronic Manufacturing Services – 0.91% | |||||||
| 3,000 | KEMET Corp.(a) | $ | 65,340 | ||||
| 65,340 | |||||||
| Energy & Related Services – 0.91% | |||||||
| 8,000 | Newpark | ||||||
Resources, Inc.(a) | 65,680 | ||||||
| 65,680 | |||||||
| Engineering & Construction – 2.23% | |||||||
| 16,000 | Infrastructure & Energy | ||||||
Alternatives, Inc.(a) | 160,000 | ||||||
| 160,000 | |||||||
| Engines & Turbines – 1.05% | |||||||
| 3,000 | TPI Composites, Inc.(a) | 75,780 | |||||
| 75,780 | |||||||
| Financial Services – 1.93% | |||||||
| 2,000 | Axos Financial, Inc.(a) | 60,720 | |||||
| 4,000 | EZCORP, Inc. – | ||||||
Class A(a) | 39,760 | ||||||
| 5,000 | Victory Capital | ||||||
| Holdings, Inc. – | |||||||
Class A(a) | 39,000 | ||||||
| 139,480 | |||||||
| Gold – 2.28% | |||||||
| 5,400 | Kirkland Lake | ||||||
Gold Ltd.(c) | 105,624 | ||||||
| 30,000 | McEwen Mining, Inc.(c) | 58,800 | |||||
| 164,424 | |||||||
| Health Care – 0.57% | |||||||
| 10,000 | Rockwell | ||||||
Medical, Inc.(a) | 40,800 | ||||||
| 40,800 | |||||||
| Health Care Providers & Services – 1.38% | |||||||
| 6,000 | Select Medical | ||||||
Holdings Corp.(a) | 99,480 | ||||||
| 99,480 | |||||||
| Health Care Services – 1.44% | |||||||
| 7,000 | RadNet, Inc.(a) | 103,600 | |||||
| 103,600 | |||||||
| Home Builder – 1.11% | |||||||
| 8,500 | Green Brick | ||||||
Partners, Inc.(a) | 79,900 | ||||||
| 79,900 | |||||||
| Insurance – 1.66% | |||||||
| 6,300 | CNO Financial | ||||||
| Group, Inc. | 119,070 | ||||||
| 119,070 | |||||||
| Integrated Mining & Precious Metals – 0.82% | |||||||
| 15,000 | Hudbay | ||||||
Minerals, Inc.(c) | 58,650 | ||||||
| 58,650 | |||||||
| Internet Software & Services – 1.43% | |||||||
| 3,000 | Carbonite, Inc.(a) | 102,630 | |||||
| 102,630 | |||||||
| Investment Banking & Brokerage – 1.35% | |||||||
| 35,000 | Ladenburg | ||||||
| Thalmann Financial | |||||||
| Services, Inc. | 96,950 | ||||||
| 96,950 | |||||||
| Leisure – 1.58% | |||||||
| 2,000 | Callaway Golf Co. | 42,800 | |||||
| 10,000 | Glu Mobile, Inc.(a) | 70,500 | |||||
| 113,300 | |||||||
| Machinery Manufacturing – 0.94% | |||||||
| 3,000 | Nova Measuring | ||||||
Instruments Ltd.(a)(c) | 67,680 | ||||||
| 67,680 | |||||||
| Medical Supplies & Services – 0.70% | |||||||
| 1,000 | AMN Healthcare | ||||||
Services, Inc.(a) | 50,620 | ||||||
| 50,620 | |||||||
| Movies & Entertainment – 1.61% | |||||||
| 6,000 | AMC Entertainment | ||||||
| Holdings, Inc. – | |||||||
| Class A | 115,560 | ||||||
| 115,560 | |||||||
| Oil & Gas – 3.43% | |||||||
| 7,500 | Callon | ||||||
Petroleum Co.(a) | 74,775 | ||||||
| 10,000 | Denbury | ||||||
Resources, Inc.(a) | 34,500 | ||||||
| 5,358 | Goodrich | ||||||
Petroleum Corp.(a) | 80,745 | ||||||
| 8,000 | SRC Energy, Inc.(a) | 56,640 | |||||
| 246,660 | |||||||
The accompanying notes to financial statements are an integral part of this schedule.
33
Perritt Low Priced Stock Fund
| Schedule of Investments (Continued) | October 31, 2018 |
| Shares | Value | ||||||
| Oil & Gas – Exploration & Production – 1.78% | |||||||
| 7,000 | Carrizo Oil | ||||||
& Gas, Inc.(a) | $ | 127,470 | |||||
| 127,470 | |||||||
| Paper Products – 1.69% | |||||||
| 8,000 | Mercer | ||||||
International, Inc.(c) | 121,680 | ||||||
| 121,680 | |||||||
| Pharmaceuticals – 1.14% | |||||||
| 7,000 | Corcept | ||||||
Therapeutics, Inc.(a) | 82,250 | ||||||
| 82,250 | |||||||
| Real Estate Investment Trusts – 1.03% | |||||||
| 5,000 | Medical Properties | ||||||
| Trust, Inc. | 74,300 | ||||||
| 74,300 | |||||||
| Regional Banks – 1.13% | |||||||
| 5,000 | First Foundation, Inc.(a) | 81,050 | |||||
| 81,050 | |||||||
| Retail – 1.29% | |||||||
| 20,000 | TravelCenters | ||||||
of America, LLC(a) | 93,200 | ||||||
| 93,200 | |||||||
| Semiconductor Equipment – 2.67% | |||||||
| 5,000 | Cohu, Inc. | 104,000 | |||||
| 5,000 | Ichor Holdings Ltd.(a) | 88,750 | |||||
| 192,750 | |||||||
| Semiconductor Related Products – 4.23% | |||||||
| 1,500 | Entegris, Inc. | 39,810 | |||||
| 4,000 | Kulicke & Soffa | ||||||
Industries, Inc.(c) | 81,320 | ||||||
| 16,000 | Photronics, Inc.(a) | 155,840 | |||||
| 2,500 | Ultra Clean | ||||||
Holdings, Inc.(a) | 26,300 | ||||||
| 303,270 | |||||||
| Semiconductors – 1.36% | |||||||
| 3,500 | SMART Global | ||||||
Holdings, Inc. (a) | 98,035 | ||||||
| 98,035 | |||||||
| Silver – 1.00% | |||||||
| 15,000 | Coeur Mining, Inc.(a) | 71,700 | |||||
| 71,700 | |||||||
| Software – 0.91% | |||||||
| 9,700 | Zix Corp.(a) | 65,378 | |||||
| 65,378 | |||||||
| Specialty Chemicals – 1.18% | |||||||
| 5,000 | Ferro Corp.(a) | 84,700 | |||||
| 84,700 | |||||||
| Specialty Manufacturing – 6.95% | |||||||
| 4,000 | Control4 Corp.(a) | 111,680 | |||||
| 5,000 | Immersion Corp.(a) | 50,050 | |||||
| 5,029 | McDermott | ||||||
International, Inc.(a) | 38,874 | ||||||
| 5,000 | Natural Alternatives | ||||||
International, Inc.(a) | 47,400 | ||||||
| 6,000 | Select Energy Services, | ||||||
Inc. – Class A(a) | 57,360 | ||||||
| 15,000 | Tecnoglass, Inc.(c) | 118,650 | |||||
| 5,000 | Wabash National | ||||||
| Corp. | 75,500 | ||||||
| 499,514 | |||||||
| Specialty Stores – 1.27% | |||||||
| 4,000 | MarineMax, Inc.(a) | 91,040 | |||||
| 91,040 | |||||||
| Trucking – 0.59% | |||||||
| 7,000 | Daseke, Inc.(a) | 42,560 | |||||
| 42,560 | |||||||
| Water Transportation – 1.06% | |||||||
| 10,000 | Golden Ocean | ||||||
Group Ltd.(c) | 76,100 | ||||||
| 76,100 | |||||||
| TOTAL COMMON | |||||||
| STOCKS | |||||||
| (Cost $6,893,932) | $ | 6,858,594 | |||||
The accompanying notes to financial statements are an integral part of this schedule.
34
Perritt Low Priced Stock Fund
| Schedule of Investments (Continued) | October 31, 2018 |
| Shares | SHORT-TERM | Value | |||||
| INVESTMENTS – 4.30% | |||||||
| Money Market Funds – 4.30% | |||||||
| 309,453 | First American | ||||||
| Government Obligations | |||||||
Fund 2.09%(b) | $ | 309,453 | |||||
| TOTAL SHORT-TERM | |||||||
| INVESTMENTS | |||||||
| (Cost $309,453) | $ | 309,453 | |||||
| Total Investments | |||||||
(Cost $7,203,385) – 99.70% | |||||||
| $ | 7,168,047 | ||||||
| Other Assets in Excess of | |||||||
| Liabilities – 0.30% | 21,919 | ||||||
| TOTAL NET ASSETS – | |||||||
| 100.00% | $ | 7,189,966 | |||||
Percentages are stated as a percent of net assets.
(a) | Non-income producing security. |
(b) | Variable rate security; the rate shown is the seven-day yield rate as of October 31, 2018. |
(c) | Foreign Issued Security. |
The accompanying notes to financial statements are an integral part of this schedule.
35
Perritt Funds, Inc.
| Statements of Assets and Liabilities |
October 31, 2018
| Perritt MicroCap | Perritt Ultra | Perritt Low | ||||||||||
| Opportunities Fund | MicroCap Fund | Priced Stock Fund | ||||||||||
| Assets: | ||||||||||||
| Investments at value | $ | 161,533,385 | $ | 61,233,922 | $ | 7,168,047 | ||||||
| Receivable for investments sold | — | 215,780 | 39,026 | |||||||||
| Dividends and interest receivable | 11,740 | 51,767 | 3,193 | |||||||||
| Prepaid expenses | 15,509 | 12,340 | 6,587 | |||||||||
| Receivable for fund shares issued | 42,981 | 17,630 | 110 | |||||||||
| Total Assets | 161,603,615 | 61,531,439 | 7,216,963 | |||||||||
| Liabilities: | ||||||||||||
| Payable for investments purchased | 334,905 | 298,367 | — | |||||||||
| Payable for fund shares purchased | 320,235 | 47,177 | 201 | |||||||||
| Payable to Officer & directors | 23,346 | 28,790 | — | |||||||||
| Payable to Advisor | 142,936 | 67,155 | 876 | |||||||||
| Payable to Custodian | 2,150 | 1,199 | 227 | |||||||||
| Accrued expenses & other liabilities | 82,083 | 46,398 | 25,693 | |||||||||
| Total Liabilities | 905,655 | 489,086 | 26,997 | |||||||||
| Net Assets | $ | 160,697,960 | $ | 61,042,353 | $ | 7,189,966 | ||||||
| Net Assets Consist of: | ||||||||||||
| Capital Stock | $ | 100,964,556 | $ | 50,179,303 | $ | 6,870,977 | ||||||
| Total Distributable Earnings | 59,733,404 | 10,863,050 | 318,989 | |||||||||
| Total Net Assets | $ | 160,697,960 | $ | 61,042,353 | $ | 7,189,966 | ||||||
| Capital Stock, $0.0001 par value | ||||||||||||
| Authorized | 100,000,000 | 100,000,000 | 100,000,000 | |||||||||
| Outstanding | 5,705,136 | 3,908,565 | 430,474 | |||||||||
| Net Assets | $ | 160,697,960 | $ | 61,042,353 | $ | 7,189,966 | ||||||
| Net asset value and | ||||||||||||
| offering price per share | $ | 28.17 | $ | 15.62 | $ | 16.70 | ||||||
| Cost of Investments | $ | 119,891,483 | $ | 54,597,195 | $ | 7,203,385 | ||||||
The accompanying notes to financial statements are an integral part of these statements.
36
Perritt Funds, Inc.
| Statements of Operations |
For the Year Ended October 31, 2018
| Perritt MicroCap | Perritt Ultra | Perritt Low | ||||||||||
| Opportunities Fund | MicroCap Fund | Priced Stock Fund | ||||||||||
| Investment Income: | ||||||||||||
| Dividend income | $ | 1,156,757 | $ | 432,638 | $ | 85,114 | ||||||
| Less: Foreign taxes withheld | ||||||||||||
| and issuance fees | — | — | (86 | ) | ||||||||
| Interest income | 61,860 | 52,603 | 3,383 | |||||||||
| Total investment income | 1,218,617 | 485,241 | 88,411 | |||||||||
| Expenses: | ||||||||||||
| Investment advisory fee | 1,878,610 | 841,042 | 82,898 | |||||||||
| Shareholder servicing | 170,419 | 86,699 | 28,296 | |||||||||
| Administration fee | 98,525 | 40,499 | 11,172 | |||||||||
| Fund accounting expenses | 77,297 | 31,939 | 7,679 | |||||||||
| Officer & directors’ fees & expenses | 73,000 | 73,000 | 17,875 | |||||||||
| Professional fees | 29,417 | 28,803 | 25,742 | |||||||||
| Federal & state registration fees | 27,306 | 24,447 | 23,214 | |||||||||
| Printing & mailing fees | 22,027 | 11,863 | 5,576 | |||||||||
| Custodian fees | 13,471 | 7,425 | 1,362 | |||||||||
| Other expense | 15,985 | 5,342 | 2,801 | |||||||||
| Total expenses | 2,406,057 | 1,151,059 | 205,990 | |||||||||
| Less contractual waiver | — | — | (73,512 | ) | ||||||||
| Less voluntary waiver | — | — | (17,875 | ) | ||||||||
| Total expenses net of waivers | 2,406,057 | 1,151,059 | 115,228 | |||||||||
| Net investment loss | (1,187,440 | ) | (665,818 | ) | (26,817 | ) | ||||||
| Realized and Unrealized | ||||||||||||
| Loss on Investments: | ||||||||||||
| Net realized gain on investments | 25,482,610 | 5,565,825 | 439,584 | |||||||||
| Change in unrealized | ||||||||||||
| depreciation on investments | (34,849,446 | ) | (8,601,323 | ) | (1,387,312 | ) | ||||||
| Net realized and unrealized | ||||||||||||
| loss on investments | (9,366,836 | ) | (3,035,498 | ) | (947,728 | ) | ||||||
| Net decrease in net assets | ||||||||||||
| resulting from operations | $ | (10,554,276 | ) | $ | (3,701,316 | ) | $ | (974,545 | ) | |||
The accompanying notes to financial statements are an integral part of these statements.
37
Perritt MicroCap Opportunities Fund
| Statements of Changes in Net Assets |
| For the | For the | |||||||
| Year Ended | Year Ended | |||||||
| October 31, 2018 | October 31, 2017 | |||||||
| Operations: | ||||||||
| Net investment loss | $ | (1,187,440 | ) | $ | (1,062,704 | ) | ||
| Net realized gain on investments | 25,482,610 | 46,860,920 | ||||||
| Net change in unrealized | ||||||||
| appreciation/(depreciation) on investments | (34,849,446 | ) | 9,414,458 | |||||
| Net increase/(decrease) in net assets resulting from operations | (10,554,276 | ) | 55,212,674 | |||||
| Dividends and Distributions to Shareholders: | ||||||||
| Distributable earnings | (45,812,458 | ) | (25,557,267 | ) | ||||
| Total dividends and distributions | (45,812,458 | ) | (25,557,267 | )1 | ||||
| Capital Share Transactions: | ||||||||
| Proceeds from shares issued | 17,671,873 | 21,713,650 | ||||||
| Reinvestment of distributions | 43,395,030 | 24,470,175 | ||||||
| Cost of shares redeemed | (69,454,780 | ) | (112,669,167 | ) | ||||
| Redemption fees | 7,884 | 7,011 | ||||||
| Net decrease in net assets | ||||||||
| from capital share transactions | (8,379,993 | ) | (66,478,331 | ) | ||||
| Total Decrease in Net Assets | (64,746,727 | ) | (36,822,924 | ) | ||||
| Net Assets | ||||||||
| Beginning of the period | 225,444,687 | 262,267,611 | ||||||
| End of the period | $ | 160,697,960 | $ | 225,444,687 | 2 | |||
| Capital Share Transactions: | ||||||||
| Shares sold | 575,324 | 609,471 | ||||||
| Shares issued on reinvestment of distributions | 1,480,953 | 720,748 | ||||||
| Shares redeemed | (2,192,697 | ) | (3,160,870 | ) | ||||
| Net decrease from capital share transactions | (136,420 | ) | (1,830,651 | ) | ||||
1 | Includes net investment income distributions of $614,595 and net realized gain distributions of $24,942,672. |
2 | Includes accumulated undistributed net investment income of $0. |
The accompanying notes to financial statements are an integral part of this statement.
38
Perritt Ultra MicroCap Fund
| Statements of Changes in Net Assets |
| For the | For the | |||||||
| Year Ended | Year Ended | |||||||
| October 31, 2018 | October 31, 2017 | |||||||
| Operations: | ||||||||
| Net investment loss | $ | (665,818 | ) | $ | (661,843 | ) | ||
| Net realized gain on investments | 5,565,825 | 7,563,499 | ||||||
| Net change in unrealized | ||||||||
| appreciation/(depreciation) on investments | (8,601,323 | ) | 6,729,600 | |||||
| Net increase/(decrease) in net assets resulting from operations | (3,701,316 | ) | 13,631,256 | |||||
| Dividends and Distributions to Shareholders: | ||||||||
| Distributable earnings | (7,255,839 | ) | (2,587,145 | ) | ||||
| Total dividends and distributions | (7,255,839 | ) | (2,587,145 | )1 | ||||
| Capital Share Transactions: | ||||||||
| Proceeds from shares issued | 6,142,650 | 15,342,310 | ||||||
| Reinvestment of distributions | 6,905,064 | 2,426,585 | ||||||
| Cost of shares redeemed | (10,685,608 | ) | (13,525,515 | ) | ||||
| Redemption fees | 1,418 | 12,098 | ||||||
| Net increase in net assets | ||||||||
| from capital share transactions | 2,363,524 | 4,255,478 | ||||||
| Total Increase/(Decrease) in Net Assets | (8,593,631 | ) | 15,299,589 | |||||
| Net Assets | ||||||||
| Beginning of the period | 69,635,984 | 54,336,395 | ||||||
| End of the period | $ | 61,042,353 | $ | 69,635,984 | 2 | |||
| Capital Share Transactions: | ||||||||
| Shares sold | 364,474 | 912,976 | ||||||
| Shares issued on reinvestment of distributions | 415,217 | 157,163 | ||||||
| Shares redeemed | (636,397 | ) | (819,460 | ) | ||||
| Net increase from capital share transactions | 143,294 | 250,679 | ||||||
1 | Includes net realized gain distributions of $2,587,145. |
2 | Includes accumulated undistributed net investment loss of $(364,335). |
The accompanying notes to financial statements are an integral part of this statement.
39
Perritt Low Priced Stock Fund
| Statements of Changes in Net Assets |
| For the | For the | |||||||
| Year Ended | Year Ended | |||||||
| October 31, 2018 | October 31, 2017 | |||||||
| Operations: | ||||||||
| Net investment loss | $ | (26,817 | ) | $ | (40,126 | ) | ||
| Net realized gain on investments | 439,584 | 602,089 | ||||||
| Net change in unrealized | ||||||||
| appreciation/(depreciation) on investments | (1,387,312 | ) | 1,057,916 | |||||
| Net increase/(decrease) in net assets resulting from operations | (974,545 | ) | 1,619,879 | |||||
| Dividends and Distributions to Shareholders: | ||||||||
| Distributable earnings | (401,664 | ) | — | |||||
| Total dividends and distributions | (401,664 | ) | — | |||||
| Capital Share Transactions: | ||||||||
| Proceeds from shares issued | 2,119,151 | 2,202,538 | ||||||
| Reinvestment of distributions | 400,458 | — | ||||||
| Cost of shares redeemed | (1,109,561 | ) | (2,367,256 | ) | ||||
| Redemption fees | 521 | 345 | ||||||
| Net increase/(decrease) in net assets | ||||||||
| from capital share transactions | 1,410,569 | (164,373 | ) | |||||
| Total Increase in Net Assets | 34,360 | 1,455,506 | ||||||
| Net Assets | ||||||||
| Beginning of the period | 7,155,606 | 5,700,100 | ||||||
| End of the period | $ | 7,189,966 | $ | 7,155,606 | 1 | |||
| Capital Share Transactions: | ||||||||
| Shares Sold | 108,959 | 123,609 | ||||||
| Shares issued on reinvestment of distributions | 20,986 | |||||||
| Shares redeemed | (58,133 | ) | (131,452 | ) | ||||
| Net increase/(decrease) from capital share transactions | 71,812 | (7,843 | ) | |||||
1 | Includes accumulated undistributed net investment income of $0. |
The accompanying notes to financial statements are an integral part of this statement.
40
Perritt MicroCap Opportunities Fund
| Financial Highlights |
For a Fund share outstanding throughout the year
| For the Years Ended October 31, | ||||||||||||||||||||
| 2018 | 2017 | 2016 | 2015 | 2014 | ||||||||||||||||
| Net asset value, beginning of year | $ | 38.59 | $ | 34.18 | $ | 32.52 | $ | 36.00 | $ | 37.38 | ||||||||||
| Income/(loss) from investment operations: | ||||||||||||||||||||
Net investment income/(loss)2 | (0.20 | ) | (0.15 | ) | 0.13 | 0.04 | (0.18 | ) | ||||||||||||
| Net realized and unrealized | ||||||||||||||||||||
| gain/(loss) on investments | (1.83 | ) | 7.94 | 2.06 | (1.10 | ) | 2.29 | |||||||||||||
| Total from investment operations | (2.03 | ) | 7.79 | 2.19 | (1.06 | ) | 2.11 | |||||||||||||
| Less dividends and distributions: | ||||||||||||||||||||
| From net investment income | — | (0.09 | ) | — | — | — | ||||||||||||||
| From net realized gains | (8.39 | ) | (3.29 | ) | (0.53 | ) | (2.42 | ) | (3.49 | ) | ||||||||||
| Total dividends and distributions | (8.39 | ) | (3.38 | ) | (0.53 | ) | (2.42 | ) | (3.49 | ) | ||||||||||
Redemption fees2,3 | — | — | — | — | — | |||||||||||||||
| Net asset value, end of year | $ | 28.17 | $ | 38.59 | $ | 34.18 | $ | 32.52 | $ | 36.00 | ||||||||||
Total return1 | (5.89 | %) | 24.20 | % | 6.85 | % | (3.07 | %) | 6.17 | % | ||||||||||
| Supplemental data and ratios: | ||||||||||||||||||||
| Net assets, end of year (in thousands) | $ | 160,698 | $ | 225,445 | $ | 262,268 | $ | 372,768 | $ | 462,716 | ||||||||||
| Ratio of net expenses to average net assets | 1.28 | % | 1.23 | % | 1.23 | % | 1.21 | % | 1.19 | % | ||||||||||
| Ratio of net investment income/(loss) | ||||||||||||||||||||
| to average net assets | (0.63 | %) | (0.41 | %) | 0.41 | % | 0.12 | % | (0.51 | %) | ||||||||||
| Portfolio turnover rate | 14.0 | % | 18.0 | % | 6.2 | % | 20.7 | % | 29.1 | % | ||||||||||
1 | Total return reflects reinvested dividends but does not reflect the impact of taxes. |
2 | Net investment income (loss) and redemption fees per share has been calculated based on average shares outstanding during the period. |
3 | Amount is less than $0.01 per share. |
The accompanying notes to financial statements are an integral part of this schedule.
41
Perritt Ultra MicroCap Fund
| Financial Highlights |
For a Fund share outstanding throughout the year
| For the Years Ended October 31, | ||||||||||||||||||||
| 2018 | 2017 | 2016 | 2015 | 2014 | ||||||||||||||||
| Net asset value, beginning of year | $ | 18.49 | $ | 15.46 | $ | 14.39 | $ | 16.79 | $ | 16.23 | ||||||||||
| Income/(loss) from investment operations: | ||||||||||||||||||||
Net investment income/(loss)2 | (0.17 | ) | (0.18 | ) | 0.07 | (0.06 | ) | (0.19 | ) | |||||||||||
| Net realized and unrealized | ||||||||||||||||||||
| gain/(loss) on investments | (0.77 | ) | 3.94 | 1.22 | (0.06 | ) | 1.12 | |||||||||||||
| Total from investment operations | (0.94 | ) | 3.76 | 1.29 | (0.12 | ) | 0.93 | |||||||||||||
| Less dividends and distributions: | ||||||||||||||||||||
| From net realized gains | (1.93 | ) | (0.73 | ) | (0.22 | ) | (2.29 | ) | (0.39 | ) | ||||||||||
| Total dividends and distributions | (1.93 | ) | (0.73 | ) | (0.22 | ) | (2.29 | ) | (0.39 | ) | ||||||||||
Redemption fees2 | — | 3 | — | 3 | — | 3 | 0.01 | 0.02 | ||||||||||||
| Net asset value, end of year | $ | 15.62 | $ | 18.49 | $ | 15.46 | $ | 14.39 | $ | 16.79 | ||||||||||
Total return1 | (5.73 | %) | 25.27 | % | 9.11 | % | (0.82 | %) | 5.96 | % | ||||||||||
| Supplemental data and ratios: | ||||||||||||||||||||
| Net assets, end of year (in thousands) | $ | 61,042 | $ | 69,636 | $ | 54,336 | $ | 60,053 | $ | 67,571 | ||||||||||
| Ratio of net expenses to average net assets | 1.71 | % | 1.70 | % | 1.77 | % | 1.75 | % | 1.56 | % | ||||||||||
| Ratio of net investment income/(loss) | ||||||||||||||||||||
| to average net assets | (0.99 | %) | (1.07 | %) | 0.48 | % | (0.43 | %) | (1.06 | %) | ||||||||||
| Portfolio turnover rate | 28.4 | % | 43.0 | % | 18.1 | % | 30.1 | % | 64.2 | % | ||||||||||
1 | Total return reflects reinvested dividends but does not reflect the impact of taxes. |
2 | Net investment income (loss) and redemption fees per share has been calculated based on average shares outstanding during the period. |
3 | Amount is less than $0.01 per share. |
The accompanying notes to financial statements are an integral part of this schedule.
42
Perritt Low Priced Stock Fund
| Financial Highlights |
For a Fund share outstanding throughout the year/period
| For the | ||||||||||||||||||||
| Period From | ||||||||||||||||||||
February 28, 20144 | ||||||||||||||||||||
| For the Years Ended October 31, | to October 31, | |||||||||||||||||||
| 2018 | 2017 | 2016 | 2015 | 2014 | ||||||||||||||||
| Net asset value, | ||||||||||||||||||||
| beginning of year/period | $ | 19.95 | $ | 15.55 | $ | 15.39 | $ | 14.15 | $ | 15.00 | ||||||||||
| Income/(loss) from investment operations: | ||||||||||||||||||||
Net investment loss2 | (0.06 | ) | (0.11 | ) | (0.04 | ) | (0.01 | ) | (0.06 | ) | ||||||||||
| Net realized and unrealized | ||||||||||||||||||||
| gain (loss) on investments | (2.10 | ) | 4.51 | 0.20 | 1.25 | (0.79 | ) | |||||||||||||
| Total from investment operations | (2.16 | ) | 4.40 | 0.16 | 1.24 | (0.85 | ) | |||||||||||||
| Less dividends and distributions: | ||||||||||||||||||||
| From net realized gains | (1.09 | ) | — | — | — | — | ||||||||||||||
| Total dividends and distributions | (1.09 | ) | — | — | — | — | ||||||||||||||
Redemption fees2,3 | — | — | — | — | — | |||||||||||||||
| Net asset value, end of year/period | $ | 16.70 | $ | 19.95 | $ | 15.55 | $ | 15.39 | $ | 14.15 | ||||||||||
Total return1,7 | (11.57 | %) | 28.28 | % | 1.04 | % | 8.76 | % | (5.67 | %)6 | ||||||||||
| Supplemental data and ratios: | ||||||||||||||||||||
| Net assets, end of | ||||||||||||||||||||
| year/period (in thousands) | $ | 7,190 | $ | 7,156 | $ | 5,700 | $ | 4,612 | $ | 2,090 | ||||||||||
| Ratio of net expenses | ||||||||||||||||||||
| to average net assets | 1.39 | % | 1.39 | % | 1.39 | % | 1.49 | %7 | 1.50 | %5 | ||||||||||
| Ratio of net investment loss | ||||||||||||||||||||
| to average net assets | (0.32 | %) | (0.61 | %) | (0.28 | %) | (0.08 | %) | (0.67 | %)5 | ||||||||||
| Ratio of expenses (prior to | ||||||||||||||||||||
| reimbursement) to average net assets | 2.48 | % | 2.65 | % | 3.25 | % | 4.90 | % | 7.15 | %5 | ||||||||||
| Ratio of net investment loss (prior to | ||||||||||||||||||||
| reimbursement) to average net assets | (1.42 | %) | (1.87 | %) | (2.14 | %) | (3.49 | %) | (6.32 | %)5 | ||||||||||
| Portfolio turnover rate | 60.5 | % | 75.0 | % | 62.7 | % | 76.6 | % | 49.0 | %6 | ||||||||||
1 | Total return reflects reinvested dividends but does not reflect the impact of taxes. |
2 | Net investment income (loss) and redemption fees per share has been calculated based on average shares outstanding during the period. |
3 | Amount is less than $0.01 per share. |
4 | Commencement of operations. |
5 | Annualized for periods less than one year. |
6 | Not annualized for periods less than one year. |
7 | Effective October 1, 2015, the Advisor expense limit was reduced from 1.50% to 1.39%. See Note 4. |
The accompanying notes to financial statements are an integral part of this schedule.
43
Perritt Funds, Inc.
| Notes to Financial Statements |
October 31, 2018
| 1. | Organization |
| Perritt Funds, Inc. (the “Corporation”) was organized on March 19, 2004 as a Maryland corporation and is registered under the Investment Company Act of 1940, as amended (the “1940 Act”), as an open-end investment company, with each series below being a diversified fund. The Corporation currently consists of the following series: Perritt MicroCap Opportunities Fund (“MicroCap Fund”), Perritt Ultra MicroCap Fund (“Ultra MicroCap Fund”) and Perritt Low Priced Stock Fund (“Low Priced Stock Fund”) (each, a “Fund,” and collectively, the “Funds”). Perritt MicroCap Opportunities Fund, Inc., the predecessor to the MicroCap Fund, commenced operations on April 11, 1988. As part of a plan of reorganization, on February 28, 2013, Perritt MicroCap Opportunities Fund, Inc. merged into the MicroCap Fund, a series within the Corporation. The Ultra MicroCap Fund commenced operations on August 30, 2004. The Low Priced Stock Fund commenced operations on February 28, 2014. The MicroCap Fund’s investment objective is to invest in mainly common stocks of companies with market capitalizations that are below $500 million at the time of the initial purchase. The Ultra MicroCap Fund’s investment objective is to invest in mainly common stocks of companies with market capitalizations that are below $300 million at the time of the initial purchase. The Low Priced Stock Fund’s investment objective is to invest mainly in common stocks of companies with market capitalization that are below $3 billion and traded at or below $15 per share at the time of initial purchase. The Funds are each an investment company and accordingly follow the investment company accounting and reporting guidance of the Financial Accounting Standards Board (“FASB”) Accounting Standards Codification Topic 946 “Financial Services – Investment Companies.” | |
| 2. | Summary of Significant Accounting Policies |
| a. | Exchange-listed securities are generally valued at the last sales price reported by the principal security exchange on which the security is traded, or if no sale is reported, the mean between the latest bid and ask price unless the Funds’ investment advisor believes that the mean does not represent a fair value, in which case the securities are fair valued as set forth below. Securities listed on NASDAQ are valued at the NASDAQ Official Closing Price. Demand notes, commercial paper, U.S. Treasury Bills and warrants are stated at fair value using market prices if available, or a pricing service when such prices are believed to reflect fair value. Money Market Funds are valued at net asset value. Securities for which market quotations are not readily available are valued at their fair value as determined in good faith by the Funds’ advisor under procedures established by and under the supervision of the Board of Directors of the Funds. The Funds’ fair value procedures allow for the use of certain methods performed by the Funds’ advisor to value those securities for which market quotations are not readily available, at a price that a Fund might reasonably expect to receive upon a sale of such securities. For example, these methods may be based on a multiple of earnings, or a discount from market of a similar freely traded security, or a yield to maturity with respect to debt issues, or a combination of these and other methods. | |
| b. | Net realized gains and losses on securities are computed using the first-in, first-out method. |
44
Perritt Funds, Inc.
| Notes to Financial Statements (Continued) |
| c. | Dividend income is recognized on the ex-dividend date, and interest income is recognized on the accrual basis. Withholding taxes on foreign dividends and capital gains, which are included as a component of net investment income and realized gain (loss) on investments, respectively, have been provided for in accordance with the Funds’ understanding of the applicable country’s tax rules and rates. Discounts and premiums on securities purchased are amortized over the life of the respective securities using the interest method. Distributions received from real estate investment trusts (“REITs”) are classified as investment income or realized gains based on the U.S. income tax characteristics of the distribution. Return of capital distributions received from REIT securities and partnerships are recorded as an adjustment to the cost of the security and thus may impact unrealized or realized gains or losses on the security. Investment and shareholder transactions are recorded on the trade date. | |
| d. | Each Fund is charged for those expenses that are directly attributable to it. Expenses that are not readily identifiable to a specific Fund are generally allocated among the Funds in proportion to the relative net assets of the Funds. | |
| e. | Provision has not been made for federal income tax since the Funds have each elected to be taxed as a “regulated investment company” and intend to distribute substantially all income to their shareholders and otherwise comply with the provisions of the Internal Revenue Code applicable to regulated investment companies. | |
| f. | The preparation of financial statements in conformity with accounting principles generally accepted in the United States of America (“GAAP”) requires management to make estimates and assumptions that affect the reported amounts of assets and liabilities and disclosure of contingent assets and liabilities at the date of the financial statements and reported amounts of increases and decreases in net assets from operations during the reporting period. Actual results could differ from those estimates. | |
| In preparing these financial statements, the Funds have evaluated events and transactions for potential recognition or disclosure through the date the financial statements were issued. | ||
| g. | Dividends from net investment income and net realized capital gains, if any, are declared and paid annually. Distributions to shareholders are recorded on the ex-dividend date. The Funds may periodically make reclassifications among certain of their capital accounts as a result of the timing and characterization of certain income and realized gain distributions, including reclassifying net operating loss, as determined annually in accordance with federal tax regulations which may differ from GAAP. The MicroCap Fund has reclassified the components of its capital accounts for the year ended October 31, 2018 by increasing paid-in capital by $6,156,976 and decreasing distributable earnings by $6,156,976. The Ultra MicroCap Fund has reclassified the components of its capital accounts for the year ended October 31, 2018 by increasing paid-in capital by $314,171 and decreasing distributable earnings by $314,171. The Low Priced Stock Fund has reclassified the components of its capital accounts for the year ended October 31, 2018 by increasing paid-in capital by $46,510 and decreasing distributable earnings by $46,510. These adjustments were due to the use of equalization. Each Fund may utilize earnings and profit distributed to shareholders on redemption of shares as part of the dividends paid deduction. |
45
Perritt Funds, Inc.
| Notes to Financial Statements (Continued) |
| h. | As of and during the year ended October 31, 2018, the Funds did not have a liability for any unrecognized tax benefits. The Funds recognize interest and penalties, if any, related to unrecognized tax benefits as income tax expense on the Statements of Operations. During the year ended October 31, 2018, the Funds did not incur any interest or penalties. The Funds are not subject to examination by U.S. federal tax authorities for any tax years before 2015. |
| 3. | Security Valuation |
| GAAP establishes an authoritative definition of fair value and sets out a hierarchy for measuring fair value. GAAP also requires additional disclosures about the various inputs used to develop the measurements of fair value. These inputs are summarized in the three broad levels listed below: |
| • Level 1 – | Quoted prices in active markets for identical securities. | |
| • Level 2 – | Other significant observable inputs (including quoted prices for similar securities or the identical security on an inactive market, interest rates, prepayment speeds, credit risk, etc.). | |
| • Level 3 – | Significant unobservable inputs (including the Funds’ own assumptions in determining the fair value of investments). |
| The inputs or methodology used for valuing securities are not necessarily an indication of the risk associated with investing in those securities. The following is a summary of the inputs used to value the Funds’ net assets as of October 31, 2018: |
| MicroCap Opportunities Fund | |||||||||||||||||
Description | Level 1 | Level 2 | Level 3 | Total | |||||||||||||
| Investments in Securities | |||||||||||||||||
| Common Stocks | |||||||||||||||||
| Communication Services | $ | 5,379,252 | $ | — | $ | — | $ | 5,379,252 | |||||||||
| Consumer Discretionary | 14,381,212 | — | — | 14,381,212 | |||||||||||||
| Consumer Staples | 9,866,393 | — | — | 9,866,393 | |||||||||||||
| Energy | 1,829,700 | — | — | 1,829,700 | |||||||||||||
| Financial | 29,167,275 | — | — | 29,167,275 | |||||||||||||
| Health Care | 1,810,800 | — | — | 1,810,800 | |||||||||||||
| Industrials | 43,782,188 | — | — | 43,782,188 | |||||||||||||
| Information Technology | 31,738,166 | — | — | 31,738,166 | |||||||||||||
| Materials | 15,249,929 | — | — | 15,249,929 | |||||||||||||
| Real Estate Investment Trusts | 6,469,585 | — | — | 6,469,585 | |||||||||||||
| Total Common Stocks | 159,674,500 | — | — | 159,674,500 | |||||||||||||
| Warrants | |||||||||||||||||
| Industrials | 72,384 | — | — | 72,384 | |||||||||||||
| Financial | — | 0 | — | — | |||||||||||||
| Total Warrants | 72,384 | — | — | 72,384 | |||||||||||||
| Short-Term Investments | 1,786,501 | — | — | 1,786,501 | |||||||||||||
| Total Investments | |||||||||||||||||
| in Securities | $ | 161,533,385 | $ | — | $ | — | $ | 161,533,385 | |||||||||
46
Perritt Funds, Inc.
| Notes to Financial Statements (Continued) |
| Ultra MicroCap Fund | |||||||||||||||||
Description | Level 1 | Level 2 | Level 3 | Total | |||||||||||||
| Investments in Securities | |||||||||||||||||
| Common Stocks | |||||||||||||||||
| Communication Services | $ | 1,279,000 | $ | — | $ | — | $ | 1,279,000 | |||||||||
| Consumer Discretionary | 7,868,816 | — | — | 7,868,816 | |||||||||||||
| Consumer Staples | 737,296 | — | — | 737,296 | |||||||||||||
| Energy | 3,151,250 | — | — | 3,151,250 | |||||||||||||
| Financial | 5,921,140 | — | — | 5,921,140 | |||||||||||||
| Health Care | 7,919,408 | — | — | 7,919,408 | |||||||||||||
| Industrials | 13,193,493 | 621,192 | — | 13,814,685 | |||||||||||||
| Information Technology | 10,634,404 | 383,000 | — | 11,017,404 | |||||||||||||
| Materials | 3,047,759 | — | — | 3,047,759 | |||||||||||||
| Real Estate Investment Trusts | 1,526,800 | — | — | 1,526,800 | |||||||||||||
| Utilities | 1,002,600 | — | — | 1,002,600 | |||||||||||||
| Total Common Stocks | 56,281,966 | 1,004,192 | — | 57,286,158 | |||||||||||||
| Warrants | |||||||||||||||||
| Communication Services | — | 90,750 | — | 90,750 | |||||||||||||
| Health Care | — | 0 | — | — | |||||||||||||
| Total Warrants | — | 90,750 | — | 90,750 | |||||||||||||
| Short-Term Investments | 3,857,014 | — | — | 3,857,014 | |||||||||||||
| Total Investments | |||||||||||||||||
| in Securities | $ | 60,138,980 | $ | 1,094,942 | $ | — | $ | 61,233,922 | |||||||||
| Low Priced Stock Fund | |||||||||||||||||
Description | Level 1 | Level 2 | Level 3 | Total | |||||||||||||
| Investments in Securities | |||||||||||||||||
| Common Stocks | |||||||||||||||||
| Communication Services | $ | 340,780 | $ | — | $ | — | $ | 340,780 | |||||||||
| Consumer Discretionary | 794,050 | — | — | 794,050 | |||||||||||||
| Consumer Staples | 222,080 | — | — | 222,080 | |||||||||||||
| Energy | 536,044 | — | — | 536,044 | |||||||||||||
| Financial | 679,184 | — | — | 679,184 | |||||||||||||
| Health Care | 513,590 | — | — | 513,590 | |||||||||||||
| Industrials | 1,341,747 | — | — | 1,341,747 | |||||||||||||
| Information Technology | 1,633,555 | — | — | 1,633,555 | |||||||||||||
| Materials | 723,264 | — | — | 723,264 | |||||||||||||
| Real Estate Investment Trusts | 74,300 | — | — | 74,300 | |||||||||||||
| Total Common Stocks | 6,858,594 | — | — | 6,858,594 | |||||||||||||
| Short-Term Investments | 309,453 | — | — | 309,453 | |||||||||||||
| Total Investments | |||||||||||||||||
| in Securities | $ | 7,168,047 | $ | — | $ | — | $ | 7,168,047 | |||||||||
Please refer to the Schedules of Investments for additional information regarding the composition of the amounts listed above.
47
Perritt Funds, Inc.
| Notes to Financial Statements (Continued) |
| At the beginning and during the twelve months ended October 31, 2018, the MicroCap Fund, the Ultra MicroCap Fund, and the Low Priced Stock Fund did not hold any Level 3 securities. | |
| 4. | Investment Advisory Agreement |
| For each Fund, the Corporation entered into an investment advisory agreement (collectively, the “Agreements”) with Perritt Capital Management, Inc. (the “Advisor”), with whom certain officers and directors of the Corporation are affiliated, to furnish investment advisory services to the Funds. Under the terms of the Agreements, the MicroCap Fund and the Low Priced Stock Fund pay the Advisor a monthly fee at the annual rate of 1% of each Fund’s daily average net assets, and the Ultra MicroCap Fund pays the Advisor a monthly fee equal to 1.25% of its daily average net assets less than or equal to $100 million; 1.00% with respect to daily average net assets in excess of $100 million and less than or equal to $200 million; and 0.50% with respect to daily average net assets in excess of $200 million. At October 31, 2018, the MicroCap Fund, Ultra MicroCap Fund and Low Priced Stock Fund had fees due to the Advisor of $142,936, $67,155 and $876, respectively. For the year ended October 31, 2018, the MicroCap Fund, Ultra MicroCap Fund and Low Priced Stock Fund had incurred advisory fees of $1,878,610, $841,042 and $82,898, respectively. | |
| With regards to the Low Priced Stock Fund, the Advisor has agreed to waive fees and/or reimburse operating expenses (other than interest, brokerage commissions, dividend expense on short sales, taxes, extraordinary expenses and acquired fund fees and expenses) so that total annual operating expenses are not expected to exceed 1.39% of the average daily net assets. This arrangement cannot be terminated prior to February 28, 2019 without the consent of the Board of Directors. The Advisor is permitted to recapture amounts waived and/or reimbursed within three years after the fiscal year in which the Advisor earned the fee or incurred the expense if the total annual operating expenses have fallen to a level below the limit described above. Additionally, the Advisor has voluntarily waived any salaries and fees of all officers and directors of the Low Priced Stock Fund during the year. The salaries and fees waived by the Advisor for the year ended October 31, 2018 were $17,875 and are not eligible for recapture. Voluntary expense waivers may be discontinued at any time. | |
| For the year ended October 31, 2018, the Advisor waived expenses and/or reimbursed the Low Priced Stock Fund $73,512 which is eligible for recapture through October 31, 2021. $66,290 is eligible for recapture through October 31, 2020. $81,819 is eligible for recapture through October 31, 2019. | |
| The Advisor manages the Funds’ investments subject to the supervision of the Funds’ Board of Directors. The Advisor is responsible for investment decisions and supplies investment research and portfolio management. Under the Agreements, the Advisor, at its own expense and without reimbursement from the Funds, will furnish office space and all necessary office facilities, equipment and personnel for making the investment decisions necessary for managing the Funds and maintaining their organization, will pay the salaries and fees of all officers and directors of the Funds (except the Chief Compliance Officer’s salary and the fees paid to disinterested directors) and will bear all sales and promotional expenses of the Funds. |
48
Perritt Funds, Inc.
| Notes to Financial Statements (Continued) |
| The officers of the Funds are affiliated with the Advisor. Such officers, with the exception of the Chief Compliance Officer, receive no compensation from the Funds or the Advisor for serving their respective roles. The Funds pay the salary associated with the office of the Chief Compliance Officer. Such fees are included on the Statements of Operations within officer & directors’ fees & expenses. | |
| The Funds may reimburse the Advisor for fees paid to intermediaries such as banks, broker-dealers, financial advisors or other financial institutions for sub-transfer agency, sub-administration and other services provided to investors whose shares of record are held in omnibus, other group accounts, retirement plans or accounts traded through registered securities clearing agents. These fees are fees that the Funds are obligated to pay to such intermediaries, and the fees may vary based on, for example, the nature of services provided. The fees paid to such intermediaries by the Funds are only a portion of the full fee that is paid to the intermediaries, and the Advisor is obligated to pay the remaining amount. In determining the portion of the fees paid to the intermediaries that the Funds are obligated to pay, the Funds have used the “avoided cost” method, which is one of several permissible methods to determine the fees are reasonable. Based on this method, the Funds’ Board of Directors determines a fee per sub-account that it believes approximates the transfer agency fee that would otherwise have been payable by the Funds if such intermediaries did not maintain the sub-account. These amounts are included within shareholder servicing fees on the Statements of Operations. | |
| 5. | Investment Transactions |
| Purchases and sales of securities, excluding short-term investments, for the year ended October 31, 2018, were as follows: |
| Purchases | Sales | ||||||||||||||||
| U.S. | U.S. | ||||||||||||||||
| Governments | Other | Governments | Other | ||||||||||||||
| MicroCap Fund | $ | — | $ | 25,807,089 | $ | — | $ | 73,223,066 | |||||||||
| Ultra MicroCap Fund | $ | — | $ | 18,088,164 | $ | — | $ | 25,380,913 | |||||||||
| Low Priced Stock Fund | $ | — | $ | 5,745,804 | $ | — | $ | 4,804,301 | |||||||||
| 6. | Federal Income Tax Matters |
| As of October 31, 2018, the components of distributable earnings on a tax basis were as follows: |
| MicroCap | Ultra MicroCap | Low Priced | |||||||||||
| Fund | Fund | Stock Fund | |||||||||||
| Cost of investments for tax purposes | $ | 119,938,074 | $ | 54,624,465 | $ | 7,213,179 | |||||||
| Gross tax unrealized appreciation | 51,542,532 | 13,833,476 | 767,704 | ||||||||||
| Gross tax unrealized depreciation | (9,947,222 | ) | (7,224,019 | ) | (812,836 | ) | |||||||
| Net unrealized appreciation | |||||||||||||
| on investments | 41,595,310 | 6,609,457 | (45,132 | ) | |||||||||
| Distributable ordinary income | 4,203,696 | 396,483 | — | ||||||||||
| Distributable long-term capital gains | 13,934,398 | 3,857,110 | 389,445 | ||||||||||
| Other accumulated losses | — | — | (25,324 | ) | |||||||||
| Total distributable earnings | $ | 59,733,404 | $ | 10,863,050 | $ | 318,989 | |||||||
49
Perritt Funds, Inc.
| Notes to Financial Statements (Continued) |
| The difference between book and tax basis distributable earnings is primarily related to the deferral of losses on wash sales. | |
| At October 31, 2018, the Low Priced Stock Fund deferred, on a tax basis, late year ordinary losses of $25,324. None of the Funds had post-October losses. | |
| The tax composition of distributions paid during the years ended October 31, 2018 and 2017 were as follows: |
| Ordinary Income | Long-term Capital Gains | ||||||||||||||||
| 2018 | 2017 | 2018 | 2017 | ||||||||||||||
| MicroCap Fund | $ | 2,046,810 | $ | 770,079 | $ | 43,765,648 | $ | 24,787,188 | |||||||||
| Ultra MicroCap Fund | — | 75,527 | 7,255,839 | 2,511,618 | |||||||||||||
| Low Priced Stock Fund | 5,714 | — | 395,950 | — | |||||||||||||
| The Funds designated as long-term capital gain dividend, pursuant to Internal Revenue Code Section 852(b)(3), the amount necessary to reduce the earnings and profits of the Funds related to net capital gain to zero for the tax year ended October 31, 2018. | |
| On November 14, 2018, the MicroCap Fund paid long-term capital gains distributions of $2.47662 per share, the Ultra MicroCap Fund paid long-term capital gains distributions of $0.99088 per share and the Low Priced Stock Fund paid long-term capital gains distributions of $0.95557 per share. | |
| 7. | Restricted Securities |
| The Funds may own investment securities which are unregistered and thus restricted as to resale. These securities are valued by each Fund after giving due consideration to pertinent factors including recent private sales, market conditions and the issuer’s financial performance. Where future disposition of these securities requires registration under the Securities Act of 1933, each Fund has the right to include these securities in such registration, generally without cost to the Fund. The Funds have no right to require registration of the unregistered securities they hold. At October 31, 2018, the MicroCap Fund and Ultra MicroCap Fund held restricted securities with an aggregate value of $2,647,500 and $90,750, which accounted for 1.65% and 0.15%, respectively, of each Fund’s net assets. These restricted securities are deemed to be liquid with the exception of Mobivity Holdings Corp. warrant in the Ultra MicroCap Fund. The Mobivity Holdings Corp. warrant is considered to be illiquid. During the year ended October 31, 2018, the Low Priced Stock Fund did not hold any restricted securities. | |
| 8. | Guarantees and Indemnifications |
| Under the Funds’ organizational documents, their officers and directors are indemnified by the Funds against certain liabilities arising out of the performance of their duties to the Funds. Additionally, in the normal course of business, the Funds enter into contracts with service providers that contain general indemnification clauses. The Funds’ maximum exposure under these arrangements is unknown as this would involve future claims that may be made against the Funds that have not yet occurred. Currently, the Funds expect the risk of loss to be remote. |
50
Perritt Funds, Inc.
| Notes to Financial Statements (Continued) |
| 9. | Line of Credit Arrangement |
| The MicroCap Fund and Ultra MicroCap Fund are each party to uncommitted line of credit arrangements with U.S. Bank, N.A. with an expiration date of December 10, 2018, under which the MicroCap Fund may borrow up to $10,000,000 and the Ultra MicroCap Fund may borrow up to $6,000,000, subject to certain restrictions and covenants. Upon renewal, the MicroCap Fund may borrow up to $8,000,000 and the Ultra MicroCap Fund may borrow up to $6,000,000 with an expiration date of December 9, 2019. Interest is charged on borrowings at the prevailing Prime Rate which was 5.25% as of October 31, 2018. The Funds have borrowed under these arrangements from time to time to increase the efficiency of cash flow management. For the year ended October 31, 2018, the MicroCap Fund had average borrowings of $700,000 and the weighted average interest rate on the line of credit borrowings was 4.47%. From December 29-31, 2017, the MicroCap Fund had borrowings of $999,000, which represents the largest borrowing amount during the year ended October 31, 2018. As of October 31, 2018, the MicroCap Fund and Ultra MicroCap Fund had no outstanding borrowings on the lines of credit. As of October 31, 2018, the Low Priced Stock Fund does not have a line of credit arrangement. Interest charged on the borrowings is recorded as other expense in the Statements of Operations. | |
| 10. | Redemption Fee |
| The Funds charge a 2% redemption fee to those who buy and sell shares within 90 calendar days or less. The redemption fee is retained for the benefit of long-term shareholders, and recorded as additional capital in the Statements of Changes in Net Assets. | |
| 11. | Transactions with Affiliates |
| During the year ended October 31, 2018, Perritt Ultra MicroCap Fund held Sigma Lab, Inc. which was considered affiliated, as it held 5% or more at the outstanding voting securities of the issuer. As of October 31, 2018, this issuer was not affiliated. | |
| The Funds are permitted to purchase or sell securities from or to each other under specified conditions outlined in procedures adopted by the Board of Directors. The procedures have been designed to ensure that any purchase or sale of securities by a Fund from or to another Fund complies with Rule 17a-7 of the 1940 Act. For the year ended October 31, 2018, the MicroCap Fund, Ultra MicroCap Fund and Low Priced Stock Fund engaged in two, one and one securities transactions pursuant to Rule 17a-7 of the 1940 Act, respectively. | |
| 12. | Beneficial Ownership |
| The beneficial ownership, either directly or indirectly, of more than 25% of voting securities of a fund creates a presumption of control of that fund, under Section 2(a)(9) of the 1940 Act. As of October 31, 2018, the Funds had omnibus shareholder accounts (comprised of a group of individual shareholders), which amounted to more than 25% of the total shares outstanding of the respective Fund. There were no individual shareholders of record who owned more than 5% of the outstanding shares of beneficial interest of a Fund or Class of shares of a Fund. Shareholders with a controlling interest could affect the outcome of proxy voting or direction of management of a Fund. |
51
Perritt Funds, Inc.
| Notes to Financial Statements (Continued) |
| 13. | New Accounting Pronouncements |
| In August 2018, FASB issued Accounting Standards Update 2018-13, Fair Value Measurement (Topic 820): Disclosure Framework – Changes to the Disclosure Requirements for Fair Value Measurement (“ASU 2018-13”). The primary focus of ASU 2018-13 is to improve the effectiveness of the disclosure requirements for fair value measurements. The changes affect all companies that are required to include fair value measurement disclosures. In general, the amendments in ASU 2018-13 are effective for all entities for fiscal years and interim periods within those fiscal years, beginning after December 15, 2019. An entity is permitted to early adopt the removed or modified disclosures upon the issuance of ASU 2018-13 and may delay adoption of the additional disclosures, which are required for public companies only, until their effective date. Management has evaluated ASU 2018-13 and has adopted the Framework. |
52
Perritt Funds, Inc.
| Report of Independent Registered Public Accounting Firm |
To the Shareholders and Board of Directors of
Perritt Funds, Inc.
Opinion on the Financial Statements
We have audited the accompanying statements of assets and liabilities, including the schedules of investments, of Perritt Funds, Inc., comprising Perritt MicroCap Opportunities Fund, Perritt Ultra MicroCap Fund, and Perritt Low Priced Stock Fund (the “Funds”) as of October 31, 2018, and the related statements of operations for the year then ended, the statements of changes in net assets for each of the two years in the period then ended, including the related notes, and the financial highlights for each of the periods presented in the period then ended (collectively referred to as the “financial statements”). In our opinion, the financial statements present fairly, in all material respects, the financial position of each of the Funds as of October 31, 2018, the results of their operations for the year then ended, the changes in their net assets for each of the two years in the period then ended, and the financial highlights for each of the periods presented in the period then ended, in conformity with accounting principles generally accepted in the United States of America.
Basis for Opinion
These financial statements are the responsibility of the Funds’ management. Our responsibility is to express an opinion on the Funds’ financial statements based on our audits. We are a public accounting firm registered with the Public Company Accounting Oversight Board (United States) (“PCAOB”) and are required to be independent with respect to the Funds in accordance with the U.S. federal securities laws and the applicable rules and regulations of the Securities and Exchange Commission and the PCAOB.
We conducted our audits in accordance with the standards of the PCAOB. Those standards require that we plan and perform the audit to obtain reasonable assurance about whether the financial statements are free of material misstatement, whether due to error or fraud.
Our audits included performing procedures to assess the risks of material misstatement of the financial statements, whether due to error or fraud, and performing procedures that respond to those risks. Such procedures included examining, on a test basis, evidence regarding the amounts and disclosures in the financial statements. Our procedures included confirmation of securities owned as of October 31, 2018, by correspondence with the custodian and brokers or by other appropriate auditing procedures where replies from brokers were not received. Our audits also included evaluating the accounting principles used and significant estimates made by management, as well as evaluating the overall presentation of the financial statements. We believe that our audits provide a reasonable basis for our opinion.
We have served as the Funds’ auditor since 2009.
/s/ Cohen & Company, LTD.
Milwaukee, Wisconsin
December 19, 2018
53
Perritt Funds, Inc.
| Expense Example (Unaudited) | October 31, 2018 |
As a shareholder of the Funds, you incur two types of costs: (1) transaction costs, including sales charges (loads) on purchase payments, reinvested dividends, or other distributions; redemption fees (the Funds impose a 2.00% redemption fee on shares held for 90 calendar days or less after purchase); and exchange fees; and (2) ongoing costs, including management fees; distribution and/or service fees; and other Fund expenses. This example is intended to help you understand your ongoing costs (in dollars) of investing in the Fund and to compare these costs with the ongoing costs of investing in other mutual funds. The example is based on an investment of $1,000 invested at the beginning of the period and held for the entire period (May 1, 2018 – October 31, 2018).
Actual Expenses
The first line of the table below provides information about actual account values and actual expenses. Although the Funds charge no sales load or transaction fees (other than a 2.00% redemption fee for shares held for 90 calendar days or less after purchase), you will be assessed fees for outgoing wire transfers, returned checks and stop payment orders at prevailing rates charged by U.S. Bancorp Fund Services, LLC, the Funds transfer agent. If you request that a redemption be made by wire transfer, currently a $15.00 fee is charged by the Funds transfer agent. You will be charged a transaction fee equal to 2.00% of the net amount of the redemption if you redeem your shares within 90 calendar days of purchase. IRA accounts will be charged a $15.00 annual maintenance fee. There is a $25 IRA distribution and transfer out fee, unless set up automatically. Please see IRA Account Agreement for additional fees related to IRA accounts. To the extent the Fund invests in shares of other investment companies as part of its investment strategy, you will indirectly bear your proportionate share of any fees and expenses charged by the underlying funds in which the Fund invests in addition to the expenses of the Fund. Actual expenses of the underlying funds are expected to vary among the various underlying funds. These expenses are not included in the example below. The example below includes, but is not limited to, management fees, shareholder servicing fees, fund accounting, custody and transfer agent fees. However, the example below does not include portfolio trading commissions and related expenses, interest expense and other extraordinary expenses as determined under accounting principles generally accepted in the United States of America. You may use the information in this line, together with the amount you invested, to estimate the expenses that you paid over the period. Simply divide your account value by $1,000 (for example, an $8,600 account value divided by $1,000 = 8.6), then multiply the result by the number in the first line under the heading entitled “Expenses Paid During Period” to estimate the expenses you paid on your account during this period.
Hypothetical Example for Comparison Purposes
The second line of the table below provides information about hypothetical account values and hypothetical expenses based on the Fund’s actual expense ratio and an assumed rate of return of 5% per year before expenses, which is not the Fund’s actual return. The hypothetical account values and expenses may not be used to estimate the actual ending account balance or expenses you paid for the period. You may use this information to compare the ongoing costs of investing in the Fund and other funds. To do so, compare this 5% hypothetical example with the 5% hypothetical examples that appear in the shareholder reports of the other funds.
54
Perritt Funds, Inc.
| Expense Example (Unaudited) (Continued) | October 31, 2018 |
Please note that the expenses shown in the table are meant to highlight your ongoing costs only and do not reflect any transactional costs, such as sales charges (loads), redemption fees, or exchange fees. Therefore, the second line of the table is useful in comparing ongoing costs only, and will not help you determine the relative total costs of owning different funds. In addition, if these transactional costs were included, your costs would have been higher.
| Beginning | Ending | Expenses Paid | |
| Account Value | Account Value | During Period | |
| 5/1/18 | 10/31/18 | 5/1/18 – 10/31/181 | |
| Actual | |||
| Perritt MicroCap Opportunities | $1,000.00 | $ 921.50 | $6.11 |
| Perritt Ultra MicroCap Fund | $1,000.00 | $ 947.80 | $8.41 |
| Perritt Low Priced Stock Fund | $1,000.00 | $ 882.70 | $6.60 |
| Hypothetical | |||
| Perritt MicroCap Opportunities | $1,000.00 | $1,018.85 | $6.42 |
| Perritt Ultra MicroCap Fund | $1,000.00 | $1,016.57 | $8.71 |
| Perritt Low Priced Stock Fund | $1,000.00 | $1,018.20 | $7.07 |
1 | Expenses (net of waiver, if applicable) are equal to the Fund’s annualized expense ratio of 1.26% for the MicroCap Opportunities Fund, 1.71% for the Ultra MicroCap Fund and 1.39% for the Low Priced Stock Fund for the six-month period, multiplied by the average account value over the period, multiplied by 184/365 (to reflect the one-half year period). |
55
Perritt Funds, Inc.
| Directors and Officers (Unaudited) |
The Board is responsible for the overall management of the Funds. This includes establishing the Funds’ policies, approval of all significant agreements between the Funds and persons or companies providing services to the Funds, and the general supervision and review of the Funds’ investment activities. As a Maryland corporation, the day-to-day operations of the Funds are delegated to the officers of the Funds, subject to the investment objectives and policies of the Funds and to general supervision by the Board.
Management Information
The name, age (as of the date of this SAI), address, principal occupations during the past five years, and other information with respect to each of the Directors are set forth in the following tables, along with information for the officers of the Funds. The information is provided as of the date of this SAI.
| Position(s) Held | ||||
| with Funds and | Other | |||
| Number of | Directorships | |||
| Portfolios in | Held by | |||
| Name, | Fund Complex | Term of Office | Principal | Director |
| Address, | Overseen | and Length of | Occupation(s) | during the |
and Age | by Director | Time Served | during Past 5 Years | Past 5 Years |
| “Disinterested” Directors of the Funds | ||||
| Dianne C. Click | Director | Indefinite, until | Ms. Click is a licensed Real | Perritt |
| Age: 56 | successor | Estate Broker in the State | MicroCap | |
| 300 South | Portfolios in | elected | of Montana. She has been | Opportunities |
| Wacker Drive, | Fund Complex | a partner and a principal | Fund, Inc. | |
| Suite 600 | Overseen: 3 | Director | owner of a real estate sales | (1994–2013) |
| Chicago, IL | since 2004 | company, Bozeman Broker | ||
| 60606 | Group, since 2004. She has | |||
| been licensed in the state | ||||
| of Montana since 1995. | ||||
| David S. Maglich | Director | Indefinite, until | Mr. Maglich is a Shareholder | Perritt |
| Age: 61 | successor | with the law firm of Fergeson, | MicroCap | |
| 300 South | Portfolios in | elected | Skipper et. al. in Sarasota, | Opportunities |
| Wacker Drive, | Fund Complex | Florida and has been | Fund, Inc. | |
| Suite 600 | Overseen: 3 | Director | employed with such firm | (1987–2013) |
| Chicago, IL | since 2004 | since 1989. | ||
| 60606 | ||||
56
Perritt Funds, Inc.
| Directors and Officers (Unaudited) (Continued) |
| Position(s) Held | ||||
| with Funds and | Other | |||
| Number of | Directorships | |||
| Portfolios in | Held by | |||
| Name, | Fund Complex | Term of Office | Principal | Director |
| Address, | Overseen | and Length of | Occupation(s) | during the |
and Age | by Director | Time Served | during Past 5 Years | Past 5 Years |
| “Interested” Director of the Funds | ||||
| Michael J. | President | One-year term | Mr. Corbett was President | Perritt |
Corbett(1) | as President | of the Perritt MicroCap | MicroCap | |
| Age: 53 | Portfolios in | Opportunities Fund, Inc. | Opportunities | |
| 300 South | Fund Complex | As Director, | (1999–2013) and President | Fund, Inc. |
| Wacker Drive, | Overseen: 3 | indefinite, | of the Perritt Funds, Inc. | (2010–2013) |
| Suite 600 | until successor | since 2004. He has served | ||
| Chicago, IL | elected | as President of the Adviser | ||
| 60606 | since 2010, and previously | |||
| Director | served as Vice President of | |||
| since 2010 | the Adviser from 1997 until | |||
| 2010. Mr. Corbett began his | ||||
| President | tenure with Perritt Capital | |||
| since 2004 | Management in 1990 as a | |||
| research analyst. He assumed | ||||
| portfolio management | ||||
| responsibilities in 1996 and | ||||
| now serves as portfolio | ||||
| manager for the Funds. | ||||
____________
(1) | Mr. Corbett is an interested person of the Funds based upon his position with the Adviser. |
57
Perritt Funds, Inc.
| Directors and Officers (Unaudited) (Continued) |
| Position(s) Held | ||||
| with Funds and | Other | |||
| Number of | Directorships | |||
| Portfolios in | Held by | |||
| Name, | Fund Complex | Term of Office | Principal | Director |
| Address, | Overseen | and Length of | Occupation(s) | during the |
and Age | by Director | Time Served | during Past 5 Years | Past 5 Years |
| Officers of the Funds Other Than Mr. Corbett | ||||
| Mark Buh | Vice President | One-year term | Mr. Buh has been Vice | N/A |
| Age: 57 | and Treasurer | Since 2012 | President and Treasurer of | |
| 300 South | the Funds and Chief Financial | |||
| Wacker Drive, | Officer of the Adviser since | |||
| Suite 600 | 2012. He has over 25 years | |||
| Chicago, IL | of experience in corporate | |||
| 60606 | accounting, administration, | |||
| planning and business | ||||
| development. His previous | ||||
| experience includes tenures | ||||
| at Ernst and Young and | ||||
| CenturyLink | ||||
| Communications. | ||||
| Lynn E. | Vice President, | One-year term | Mrs. Burmeister has been | N/A |
| Burmeister | Chief | the Chief Compliance | ||
| Age: 59 | Compliance | Chief | Officer since May 1, 2010, | |
| 300 South | Officer and | Compliance | and oversees all compliance | |
| Wacker Drive, | Secretary | Officer | matters for the Funds and the | |
| Suite 600 | Since 2010 | Adviser. She also coordinates | ||
| Chicago, IL | the administration of the | |||
| 60606 | Secretary | Funds and is a liaison with | ||
| Since 2015 | the firm’s corporate counsel. | |||
| Mrs. Burmeister has worked | ||||
| in the financial industry | ||||
| since 1980. Her previous | ||||
| experience includes work at | ||||
| Harris Associates, Gofen & | ||||
| Glossberg and Optimum | ||||
| Investments. | ||||
Qualification of Directors
Michael J. Corbett has been the President and a portfolio manager of the MicroCap Fund (including the Predecessor MicroCap Fund) since 1996, a portfolio manager of the Ultra MicroCap Fund since its inception in 2004, and a portfolio manager of the Low Priced Stock Fund since its inception in 2014. His experience and skills as a portfolio manager, as well as his familiarity with the investment strategies utilized by the Adviser and with the Funds’ portfolios, led to the conclusion that he should serve as a director. Dianne C. Click’s experience as a partner and principal owner of a real estate sales company has provided her
58
Perritt Funds, Inc.
| Directors and Officers (Unaudited) (Continued) |
with a firm understanding of financial statements and the issues that confront businesses, enabling her to provide the Board of Directors valuable input and oversight. As a partner in a law firm, David S. Maglich has extensive experience working with regulated industries, and a deep understanding of financial statements, making him a valuable source of information and insight. Each of Ms. Click and Mr. Maglich take a conservative and thoughtful approach to addressing issues facing the Funds. These combinations of skills and attributes led to the conclusion that each of Ms. Click and Mr. Maglich should serve as a director.
Board Leadership Structure
The Board has general oversight responsibility with respect to the operation of the Funds. The Board has engaged the Adviser to manage the Funds and is responsible for overseeing the Adviser and other service providers to the Funds in accordance with the provisions of the 1940 Act and other applicable laws.
The Board does not have a Chairman of the Board. As President of the Funds, Mr. Corbett is the presiding officer at all meetings of the Board. The Board does not have a lead independent director. The Board has determined that its leadership structure is appropriate because it has been in place for many years and during that time the Funds have delivered positive returns for their investors.
59
Perritt Funds
The Funds file their complete schedule of portfolio holdings with the Securities and Exchange Commission for the first and third quarters of each fiscal year on Form N-Q. The Funds’ Forms N-Q are available on the Securities and Exchange Commission’s website at http://www.sec.gov. The Funds’ latest Forms N-Q are also available without charge upon request by calling 1-800-331-8936.
A description of the policies and procedures that the Funds use to determine how to vote proxies relating to portfolio securities is available without charge, upon request, by calling the Advisor at 1-800-331-8936 and on the Securities and Exchange Commission’s website at http://www.sec.gov.
Information regarding how the Funds voted proxies relating to portfolio securities during the most recent 12-month period ended June 30 is available without charge, upon request, by calling 1-800-331-8936 and on the Securities and Exchange Commission’s website at http://www.sec.gov.
Household Delivery of Shareholder Documents: To reduce expenses, the Funds may mail only one copy of the Funds’ prospectus, SAI and each annual and semi-annual report to those addresses shared by two or more accounts. If you wish to receive individual copies of these documents, please call the Funds at 1-800-331-8936 or contact your financial institution. You will begin receiving individual copies thirty days after receiving your request.
Electronic Delivery of Shareholder Documents: You may choose to receive the Funds’ prospectus and annual and semi-annual reports electronically. To sign up for electronic delivery, visit www.icsdelivery.com and select the first letter of your brokerage firm’s name. Then, select your brokerage institution from the list that follows, fill out the appropriate information and provide an e-mail address where you would like your information sent. If your brokerage firm is not listed, electronic delivery may not be available. Please contact your brokerage firm or financial advisor.
Tax Notice
For the year end October 31, 2018, the Perritt MicroCap Opportunities Fund, the Perritt Ultra MicroCap Fund and the Perritt Low Priced Stock Fund did not pay any interest related dividends under the Internal Revenue Code Section 87(k)(1)(c). Additionally, for the year ended October 31, 2018, 100.00%, 0.00% and 100.00% of the distributions paid by the Perritt MicroCap Opportunities Fund, the Perritt Ultra MicroCap Fund and the Perritt Low Priced Stock Fund were designated as short-term capital gain distributions designated under the Internal Revenue Code Section 871(k)(2)(c).
The percentage of dividend income distributed for the year ended October 31, 2018, which is designated as qualified dividend income under the Jobs and Growth Tax Relief Reconciliation Act of 2003, is 89.52%, 0.00% and 100.00% for the Perritt MicroCap Opportunities Fund, the Perritt Ultra MicroCap Fund and the Perritt Low Priced Stock Fund, respectively. Of the dividends paid by the Perritt MicroCap Opportunities Fund, the Perritt Ultra MicroCap Fund and the Perritt Low Priced Stock Fund, 89.52%, 0.00% and 100.00%, respectively, qualify for the corporate dividends received deduction.
60
Privacy Policy
We collect the following nonpublic personal information about you:
| • | Information we receive from you on or in applications or other forms, including but not limited to, your name, address, phone number, and social security number; and | |
| • | Information about your transactions with us, our affiliates or others, including but not limited to, your account number and balance, parties to transactions, cost basis information and other financial information. |
We do not disclose any nonpublic personal information about our current or former shareholders to nonaffiliated third parties, except as permitted by law. For example, we are permitted by law to disclose all the information we collect to our transfer agent to process your transactions. Furthermore, we restrict access to your nonpublic personal information to those persons who require such information to provide products or services to you. We maintain physical, electronic, and procedural safeguards through our transfer agent, U.S. Bancorp Fund Services, LLC, that comply with federal standards to guard your nonpublic personal information.
In the event that you hold shares of the Funds through a financial intermediary, including, but not limited to, a broker-dealer, bank or trust company, the privacy policy of your financial intermediary would govern how your nonpublic personal information would be shared with nonaffiliated third parties.
61
Investment Advisor
Perritt Capital Management, Inc.
300 South Wacker Drive, Suite 600
Chicago, IL 60606-6703
800-331-8936
Independent Registered
Public Accounting Firm
Cohen & Company, Ltd.
342 North Water Street, Suite 830
Milwaukee, WI 53202
Legal Counsel
Foley & Lardner LLP
777 East Wisconsin Avenue
Milwaukee, WI 53202
Custodian
U.S. Bank, NA
1555 North River Center Drive, Suite 302
Milwaukee, WI 53212
Transfer Agent
and Dividend Disbursing Agent
U.S. Bancorp Fund Services, LLC,
doing business as U.S. Bank Global Fund Services
P.O. Box 701
Milwaukee, WI 53201-0701
Distributor
Quasar Distributors, LLC
777 East Wisconsin Avenue
Milwaukee, WI 53202
For assistance with your existing account, call our
Shareholder Service Center at 1-800-332-3133.
The Funds’ Statements of Additional Information
contain information about the Funds’ directors and are
available without charge upon request by calling
1-800-332-3133.
(This Page Intentionally Left Blank.)
MicroCap Opportunities Fund – PRCGX
Ultra MicroCap Fund – PREOX
Low Priced Stock Fund – PLOWX
Minimum Initial Investment $1,000
IRA Minimum Initial Investment $250
Dividend Reinvestment Plan
Systematic Withdrawal Plan
Automatic Investment Plan
Retirement Plans Including:
| • | IRA | • | Roth IRA |
| • | SEP-IRA | • | Coverdell Education |
| • | Simple IRA | Savings Account |
2% redemption fee imposed for shares
held ninety (90) calendar days or less.
This report is authorized for distribution
only to shareholders and others who have
received a copy of the prospectus of the
Perritt MicroCap Opportunities Fund,
the Perritt Ultra MicroCap Fund and/or
the Perritt Low Priced Stock Fund.
300 S. Wacker Drive • Suite 600 • Chicago, IL 60606-6703
Tel 312-669-1650 • 800-331-8936 • Fax: 312-669-1235
E-mail: info@PerrittCap.com
Web Site: www.perrittcap.com
Item 2. Code of Ethics.
The registrant has adopted a code of ethics that applies to the registrant’s principal executive officer and principal financial officer. The registrant has not made any amendments to its code of ethics during the period covered by this report. The registrant has not granted any waivers from any provisions of the code of ethics during the period covered by this report. Incorporated by reference to the registrant’s Form N-CSR filed January 8, 2010.
Item 3. Audit Committee Financial Expert.
The registrant’s board of directors has determined that the registrant does not have an audit committee financial expert serving on its board of directors, which functions as the registrant’s audit committee since the registrant does not have a separate audit committee.
The board of directors has determined that the members of the board of directors have sufficient background, experience and financial knowledge to fulfill their responsibilities and obligations to the registrant and its shareholders. Accordingly, the board of directors has determined that the search for, and possible appointment of, a person who would satisfy the definition of an audit committee financial expert is not necessary.
Item 4. Principal Accountant Fees and Services.
The registrant has engaged its principal accountant, Cohen & Company, Ltd., to perform audit services, audit-related services, and tax services during the past fiscal year. “Audit services” refer to performing an audit of the registrant's annual financial statements or services that are normally provided by the accountant in connection with statutory and regulatory filings or engagements for the fiscal year. “Audit-related services” refer to the assurance and related services by the principal accountant that are reasonably related to the performance of the audit. “Tax services” refer to professional services rendered by the principal accountant for tax compliance, tax advice, and tax planning. The following table details the aggregate fees billed or expected to be billed for each of the last two fiscal years for audit fees, audit-related fees, tax fees and other fees by the principal accountant.
| FYE 10/31/2018 | FYE 10/31/2017 | |
| Audit Fees | $40,500 | $40,500 |
| Audit-Related Fees | $0 | $0 |
| Tax Fees | $9,000 | $9,000 |
| All Other Fees | $0 | $0 |
The percentage of fees billed by Cohen & Company, Ltd. for the fiscal years ended October 31, 2018 and October 31, 2017, respectively, applicable to non-audit services pursuant to a waiver of the pre-approval requirement was as follows:
| FYE 10/31/2018 | FYE 10/31/2017 | |
| Audit-Related Fees | 0% | 0% |
| Tax Fees | 0% | 0% |
| All Other Fees | 0% | 0% |
All of the principal accountant’s hours spent on auditing the registrant’s financial statements were attributed to work performed by full‑time permanent employees of the principal accountant. The following table indicates the non-audit fees billed or expected to be billed by the registrant’s accountants for services to the registrant and to the registrant’s investment adviser or Service Affiliates (as defined below) for the last two years.
| Non-Audit Related Fees | FYE 10/31/2018 | FYE 10/31/2017 |
| Registrant | $0 | $0 |
| Registrant’s Investment Adviser | $0 | $0 |
Because the registrant’s accountants have not rendered any non-audit services during the last two fiscal years to the registrant’s investment adviser, or any entity controlling, controlled by or under common control with the investment adviser that provides ongoing services to the registrant (together with the registrant’s investment adviser, “Service Affiliates”) that were not pre-approved pursuant to paragraph (c)(7)(ii) of Rule 2-01 of Regulation S-X, the registrant’s board of directors has not considered whether the provision of such services to the registrant’s investment adviser or the Service Affiliates is compatible with maintaining the independence of the registrant’s accountant.
Item 5. Audit Committee of Listed Registrants.
Not applicable to registrants who are not listed issuers (as defined in Rule 10A-3 under the Securities Exchange Act of 1934).
Item 6. Investments.
(a). Schedule of Investments is included as part of the report to shareholders filed under Item 1 of this Form.
(b). Not applicable.
Item 7. Disclosure of Proxy Voting Policies and Procedures for Closed-End Management Investment Companies.
Not applicable to open-end investment companies.
Item 8. Portfolio Managers of Closed-End Management Investment Companies.
Not applicable to open-end investment companies.
Item 9. Purchases of Equity Securities by Closed‑End Management Investment Company and Affiliated Purchasers.
Not applicable to open-end investment companies.
Item 10. Submission of Matters to a Vote of Security Holders.
There have been no material changes to the procedures by which shareholders may recommend nominees to the registrant’s board of directors.
Item 11. Controls and Procedures.
The Registrant’s President and Treasurer have reviewed the Registrant's disclosure controls and procedures (as defined in Rule 30a-3(c) under the Investment Company Act of 1940 (the “Act”)) as of a date within 90 days of the filing of this report, as required by Rule 30a-3(b) under the Act and Rules 13a-15(b) or 15d‑15(b) under the Securities Exchange Act of 1934. Based on their review, such officers have concluded that the disclosure controls and procedures are effective in ensuring that information required to be disclosed in this report is appropriately recorded, processed, summarized and reported and made known to them by others within the Registrant and by the Registrant’s service provider.
There were no changes in the Registrant's internal control over financial reporting (as defined in Rule 30a-3(d) under the Act) that occurred during the second fiscal quarter of the period covered by this report that has materially affected, or is reasonably likely to materially affect, the Registrant's internal control over financial reporting.
Item 12. Disclosure of Securities Lending Activities for Closed-End Management Investment Companies.
Not applicable to open-end investment companies.
Item 13. Exhibits.
| (a) | (1) Any code of ethics or amendment thereto, that is the subject of the disclosure required by Item 2, to the extent that the registrant intends to satisfy Item 2 requirements through filing an exhibit. Incorporated by reference to the registrant’s Form N-CSR filed January 8, 2010. |
(2) A separate certification for each principal executive and principal financial officer pursuant to Section 302 of the Sarbanes-Oxley Act of 2002. Filed herewith.
(3) Any written solicitation to purchase securities under Rule 23c‑1 under the Act sent or given during the period covered by the report by or on behalf of the registrant to 10 or more persons. Not applicable to open-end investment companies.
| (b) | Certifications pursuant to Section 906 of the Sarbanes‑Oxley Act of 2002. Furnished herewith. |
SIGNATURES
Pursuant to the requirements of the Securities Exchange Act of 1934 and the Investment Company Act of 1940, the registrant has duly caused this report to be signed on its behalf by the undersigned, thereunto duly authorized.
(Registrant) Perritt Funds, Inc.
By (Signature and Title)* /s/Michael J. Corbett
Michael J. Corbett, President
Date December 27, 2018
Pursuant to the requirements of the Securities Exchange Act of 1934 and the Investment Company Act of 1940, this report has been signed below by the following persons on behalf of the registrant and in the capacities and on the dates indicated.
By (Signature and Title)* /s/Michael J. Corbett
Michael J. Corbett, President
Date December 27, 2018
By (Signature and Title)* /s/Mark J. Buh
Mark J. Buh, Treasurer/Principal Financial Officer
Date December 27, 2018
* Print the name and title of each signing officer under his or her signature.