MicroCap Opportunities Fund
Ultra MicroCap Fund
Low Priced Stock Fund
Annual Report
October 31, 2017

The PERRITT MICROCAP OPPORTUNITIES FUND will, under normal circumstances, invest at least 80% of its net assets in a diversified portfolio of common stocks of United States companies that at the time of initial purchase have a market capitalization (equity market value) that is below $500 million (referred to as “micro-cap” companies). The Fund seeks to invest in micro-cap companies that have demonstrated above-average growth in revenues and/or earnings, possess relatively low levels of long-term debt, have a high percentage of their shares owned by company management, and possess modest price-to-sales ratios and price-to-earnings ratios that are below their long-term annual growth rate. At times, the Fund may also invest in “special situations” such as companies that possess valuable patents, companies undergoing restructuring, and companies involved in large share repurchase programs. Investors should expect the Fund to contain a mix of both value-priced and growth stocks.
The PERRITT ULTRA MICROCAP FUND will, under normal circumstances, invest at least 80% of its net assets in a diversified portfolio of common stocks of United States companies that at the time of initial purchase have a market capitalization (equity market value) that is below $300 million (referred to as “micro-cap” companies). The Fund seeks to invest in micro-cap companies that have a high percentage of their shares owned by company management, possess relatively low levels of long-term debt, have a potential for above average growth in revenues and/or earnings, and possess reasonable valuations based on the ratios of price-to-sales, price-to-earnings, and price-to-book values. The micro-cap companies in which the Fund may invest include “early stage” companies, which are companies that are in a relatively early stage of development with market capitalizations that are below $50 million. At times, the Fund may also invest in unseasoned companies, companies that are undergoing corporate restructuring, initial public offerings, and companies believed to possess undervalued assets.
The PERRITT LOW PRICED STOCK FUND will, under normal circumstances, invest at least 80% of its net assets in a diversified portfolio of low priced common stocks of United States companies that at the time of initial purchase have a market capitalization (equity market value) that is below $3 billion. Low priced stocks are those that are trading at or below $15 per share at the time of initial purchase. Subsequent to the initial purchase, the Fund may purchase such securities at a price above $15 per share. The Fund’s strategy is based on the premise that low priced stocks offer growth potential because these stocks have limited broker research coverage, the companies’ prospects are misunderstood by most investors, and some investors mistakenly believe stocks trading below $15 per share are more “speculative” than those trading at higher levels and therefore avoid low priced stocks. The Fund will invest in “growth” stocks, “value” stocks, or a combination of both. Given the market capitalization restrictions, the Fund will normally invest in securities issued by small-cap companies, including some micro-cap companies. However, micro-cap companies will only make up a small portion of the Fund’s portfolio. Micro-cap companies represent the smallest sector of public companies based on market capitalization. At times, the Fund’s portfolio may contain the shares of unseasoned companies, companies that are undergoing corporate restructuring, initial public offerings, and companies believed to possess undervalued assets.
Annual Report
October 31, 2017
| From the Desk of Michael Corbett, President and CIO | 2 |
| | |
| Perritt MicroCap Opportunities Fund | |
| From the Portfolio Managers | 5 |
| Performance | 8 |
| Ten Largest Common Stock Holdings | 10 |
| Allocation of Portfolio Investments | 11 |
| | |
| Perritt Ultra MicroCap Fund | |
| From the Portfolio Managers | 12 |
| Performance | 16 |
| Ten Largest Common Stock Holdings | 18 |
| Allocation of Portfolio Investments | 19 |
| | |
| Perritt Low Priced Stock Fund | |
| From the Portfolio Manager | 20 |
| Performance | 22 |
| Ten Largest Common Stock Holdings | 24 |
| Allocation of Portfolio Investments | 25 |
| | |
| Perritt Funds | |
| Schedules of Investments | 26 |
| Statements of Assets and Liabilities | 35 |
| Statements of Operations | 36 |
| Statements of Changes in Net Assets | 37 |
| Financial Highlights | 40 |
| Notes to Financial Statements | 43 |
| Report of the Independent Registered Public Accounting Firm | 52 |
| Expense Example | 53 |
| Directors and Officers | 55 |
| Information | 58 |
Perritt Funds, Inc.
| From the Desk of Michael Corbett, President and CIO |
Michael Corbett,
President and CIO
All equity markets produced solid gains during the past 12 months ending October 31, 2017. As measured by the S&P 500 Index, large-cap stocks rose 23.63%. Smaller stocks outperformed large stocks during that same period. The Russell 2000 index rose 27.85% and the Russell Microcap Index was up 29.53%. We are not surprised by these gains. In fact, we have remained positive since small stocks hit a bear market bottom a little more than 20 months ago. Since the bear market low on February 11, 2016, the Russell 2000 Index and Russell Microcap Index have each gained more than 31%. Due to several macro factors, we remain confident about the future for stocks, which we will outline later in this message. The big surprise to us, though, is that the recent gains in the markets have been without volatility or even a modest correction.
Each of the major stock market averages have not experienced a modest 5% correction in the past year. The worst decline this year for S&P 500 Index was 2.8% from March 1, 2017 through April 13, 2017. Since 1929, the S&P 500 Index on average has dropped 5% three times a year, and declined 10% or more about once a year. We are now nearly a year without a 5% correction, which is the longest such streak in 26 years. Given this historical perspective, the stock market does seem overdue for a correction.
While a correction may well be in our future, a true bear market (20% decline) is unlikely to occur without a recession. None of the typical recession indicators seem imminent, and global economic fundamentals are strong. We are in the middle of a global economic growth recovery which has provided strong support for market gains. For the first time since 2007, all 45 economies tracked by the OECD (Organization for Economic Co-operation and Development) Composite Leading Indicators Index have positive GDP growth for the year. Furthermore, despite minor interest rate increases in the U.S., global central bank policies remain very accommodating with low interest rates around the world.
In addition to the positives in the global markets, the Trump Administration’s pro-growth agenda is still a possibility. The pro-growth agenda includes slashing onerous regulations that have stifled business, a proposed $1 trillion infrastructure spending scheduled for 2018, a significant increase in military budget, as well as individual and corporate tax cuts. The current plan calls for reducing corporate taxes from 35% to as low as 20%. While it seems unlikely that congress will agree to that degree of tax cut, any cut would be welcomed by the equity markets.
What would concern us in the near term? There are several indicators we review regularly to give us hope or concern about the near term for equity markets. One of those indicators is our conversation with management teams. Most of conversations and observations with management teams have been more upbeat than negative. Another indicator is the Leading Economic Indicators (LEI). The LEI rose 1.2% in November, the largest increase since November 2013. So, we see no concern from the LEI. And yet another indicator we watch closely is sentiment. Consumer sentiment has been climbing lately and remains at near term highs. However, investor sentiment remains subdued. On a sentiment basis, we would be more concerned about the markets if investor sentiment was at new highs.
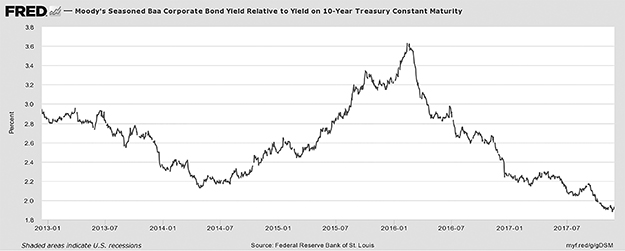
The one indicator that is of some concern is corporate debt. American corporations have been borrowing money at a rapid clip over the last several years, bringing total corporate
Perritt Funds, Inc.
debt to $8.7 trillion, its highest level relative to U.S. GDP (45%) since the financial crisis. In just two years, corporations have added $1 trillion of new debt, which is the equivalent of a borrowing stampede. The demand for corporate bonds has also been like a stampede. The chart below shows the spread between corporate bond yields and U.S. Treasuries. This risk premium for owning corporate bonds over U.S. Treasuries is at historic lows, which does concern us.
The Spread Between Corporate Bond Yields and the 10-Year U.S. Treasury is < 2%
As of 11/27/17
There will always be some indicators that concern us, but we have not seen enough evidence to put caution in our forecast. Until we see a deterioration in the LEI or excessive investor optimism, we remain optimistic about the near-term future for stock prices.
Past performance does not guarantee future results.
S&P 500 Index is an American stock market index based on the market capitalizations of 500 large companies having common stock listed on the NYSE or NASDAQ.
Russell Microcap Index is a capitalization weighted index of 2,000 small cap and micro cap stocks that captures the smallest 1,000 companies in the Russell 2000, plus 1,000 smaller U.S.-based listed stocks.
Russell 2000 Index is an index measuring the performance approximately 2,000 small-cap companies in the Russell 3000 Index, which is made up of 3,000 of the biggest U.S. stocks. The Russell 2000 serves as a benchmark for small-cap stocks in the United States.
One cannot invest directly in an index.
The Organization for Economic Co-operation and Development (OECD) is an intergovernmental economic organization with 35 member countries, founded in 1960 to stimulate economic progress and world trade.
Leading Economic Indicators (LEI) are measurable economic factors that change before the economy starts to follow a particular pattern or trend. Leading indicators are used to predict changes in the economy, but they are not always accurate.
Gross Domestic Product (GDP) is the broadest quantitative measure of a nation’s total economic activity. GDP represents the monetary value of all goods and services produced within a nation’s geographic borders over a specified period of time.
Perritt Funds, Inc.
Moody’s Seasoned Baa Corporate Bond Yield is a corporate yield of a Moody’s Graded Bond. A Seasoned Baa Corporate Bond of 30 years is the yield return of bonds graded Baa by Moody’s with a maturity of 30 years.
Yield on 10 year Treasury Constant Maturity is an index published by the Federal Reserve Board based on the average yield of a range of Treasury securities, all adjusted to the equivalent of a 10-year maturity. Yields on Treasury securities at constant maturity are determined by the U.S. Treasury from the daily yield curve.
Perritt MicroCap Opportunities Fund
| Portfolio Managers’ Message |
 | |  |
| Michael Corbett, | | George Metrou, |
| Portfolio Manager | | Portfolio Manager |
The Perritt MicroCap Opportunities Fund posted a gain of +24.2% during the fiscal year ended October 31, 2017, compared to a +29.5% gain for the Russell Microcap Index and +27.9% gain for the Russell 2000 Index. The Fund’s longer-term performance results, as well as the benchmarks’ performance, can be found later in this report.
We focus on managing a portfolio of microcap equities. In this pursuit, we perform bottom up due-diligence on companies, attempt to value the securities of these companies, and actively engage in security selection to build a portfolio. Our due diligence process leads us to focus on businesses with high returns on capital, robust free cash flow generation, solid balance sheets, and a competitive advantage.
We are confident that businesses with these attributes generate value over time. When valued appropriately, and purchased at a price below intrinsic value, we believe an investor can capture an above market rate of return. We also believe that in the long run, an active and diligent based approach is the best path for consistent return generation. Unfortunately, the path to the “long run” is not always linear.
While pleased with the absolute return of the portfolio this year at +24.2%, we also find ourselves feeling a bit of Déjà vu at the markets willingness to again reward low quality, money losing businesses with aggressive valuations. Many of the hottest areas of the market, with above average returns were found in sectors our process leads us to avoid. These areas include: 1) biotech and pharmaceuticals where binary outcomes with low success rates often prevail, 2) software and technology companies with some unproven business models and suspect profit capability, and 3) medical device companies, where some valuations are not driven not by cash flows, but by forward revenue growth projections.
We have experienced markets like this as recently as 2014 and 2015, and believe today, as we did then, that these trends are not durable. Price meets value in the long run. So, we focus on value, and where value can be found, not on the hot price action.
During the year, we made significant strides in upgrading the quality of the portfolio. We began the period with 86 positions and ended the period with 83 positions. While the net reduction represents only three positions, it belies the substantial amount of rotation that took place during the year. In gross terms, we added sixteen new positions to the portfolio, and eliminated nineteen. We view this balance as a signal we have found the appropriate size portfolio, in terms of number of positions.
Within the sixteen names added to the portfolio, we were able to find new opportunities in various sectors. We added five positions in Industrials, three in each the Consumer and Financials sectors, two in Technology, and single positions in the Energy, Real Estate, and Healthcare sectors. Each of the companies added adhere to our disciplined focus on companies who can generate free cash flow, have a solid balance sheet, and have earned a strong return on capital.
Perritt MicroCap Opportunities Fund
The average market capitalization of the positions added was $273 million. The average number of Wall Street analysts covering the companies was two. Two of the companies have no analyst coverage at all. These data points on size and coverage speak to our dedication to remain true to our microcap space, investing in undiscovered and under researched securities. Sticking to our process has yielded promising initial results from the new additions to the portfolio.
Historically, our decision to exit a position is driven by three primary causes: 1) companies receive an offer to be bought out (M&A), 2) securities achieve our price targets, or 3) disappointing results or a change in our thesis. This year was no exception, and we had roughly equal amounts of each type of liquidation. Five positions were sold after receiving a valid buyout offer: Datalink Corp. (DTLK), Exactech Inc. (EXAC), FBR & Co. (FBRC), Sparton Corp. (SPA), and Syneron Medical Ltd. (ELOS).
Six securities were sold after reaching our price target: CryoLife Inc. (CRY), Flexsteel Industries Inc. (FLXS), John B Sanfilippo & Sons Inc. (JBSS), Tactile Systems Technology Inc. (TCMD), UMH Properties Inc. (UMH), and VASCO Data Security Int’l Inc. (VDSI). The remaining eight positions removed from the portfolio were sold after a downgrade in our view of the price appreciation potential of the security or to rotate capital to higher conviction ideas.
As of October 31, 2017, the Fund’s portfolio was comprised of 83 common stocks. The Fund’s 10 largest holdings and detailed descriptions can be found later in this report. Based on our earnings estimates, the Fund’s portfolio is trading at approximately 22.2 times 2017 earnings. Stocks in the portfolio are priced at a median 1.0 times revenue and the median price to book value is 1.8x. Lastly, the median market capitalization is approximately $317 million.
On November 17th, the Fund paid a capital gain distribution of $8.07 per share. The capital gain distribution is not reflected in the financials of this annual report because it was completed in fiscal 2018, but distributed in calendar year 2017. Please review your statement for the full details of the capital gain distribution.
I want to thank my fellow shareholders for their continued support and confidence in the Perritt Capital Management team. If you have any questions or comments about this report or your investment in the Perritt MicroCap Opportunities Fund, please call us toll-free at (800)331-8936 or visit our web site at www.perrittcap.com. Please refer to the prospectus for information about the Fund’s investment objectives and strategies.
George Metrou
Portfolio Manager
Perritt MicroCap Opportunities Fund
Mutual fund investing involves risk. Principal loss is possible. The Funds invest in smaller companies, which involve additional risks, such as limited liquidity and greater volatility. The Funds invest in micro-cap companies which tend to perform poorly during times of economic stress.
Past performance does not guarantee future results.
Opinions expressed are subject to change at any time, are not guaranteed and should not be considered investment advice.
Russell Microcap Index is a capitalization weighted index of 2,000 small cap and micro cap stocks that captures the smallest 1,000 companies in the Russell 2000, plus 1,000 smaller U.S.-based listed stocks.
Russell 2000 Index is an index measuring the performance approximately 2,000 small-cap companies in the Russell 3000 Index, which is made up of 3,000 of the biggest U.S. stocks. The Russell 2000 serves as a benchmark for small-cap stocks in the United States.
Return on Equity is a measure of profitability that calculates how many dollars of profit a company generates with each dollar of shareholders’ equity.
Return on Invested Capital is a fundamental method of determining a company’s financial performance. It is used to measure how well a company is investing its capital.
Free Cash Flow is a measure of financial performance calculated as operating cash flow minus capital expenditures. Free cash flow (FCF) represents the cash that a company is able to generate after laying out the money required to maintain or expand its asset base.
Price to Book is a ratio used to compare a stock’s market value to its book value. It is calculated by dividing the current closing price of the stock by the latest quarter’s book value per share.
Tangible Book Value is the total net asset value of a company (book value) minus intangible assets and goodwill.
Perritt MicroCap Opportunities Fund
| Performance* (Unaudited) | October 31, 2017 |
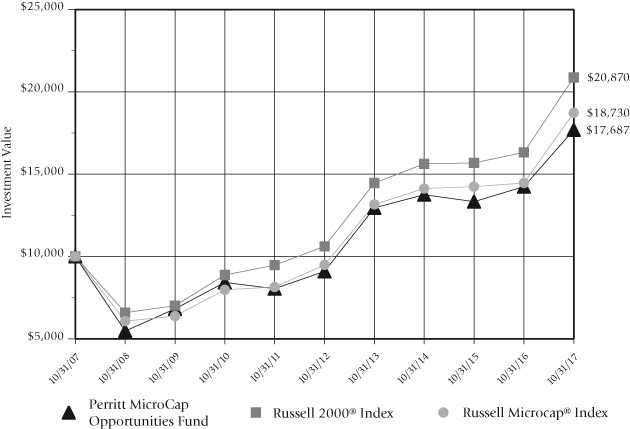
Perritt MicroCap Opportunities Fund versus
Russell 2000® Index and Russell Microcap® Index
There are several ways to evaluate a fund’s historical performance. You can look at the total percentage change in value, the average annual percentage change, or the growth of a hypothetical $10,000 investment. Each performance figure includes changes in a fund’s share price, plus reinvestment of any dividends (or income) and capital gains (the profits the fund earns when it sells stocks that have grown in value).
Cumulative total returns reflect the Fund’s actual performance over a set period. For example, if you invested $1,000 in a fund that had a 5% return over one year, you would end up with $1,050. You can compare the Fund’s returns to the Russell 2000® Index, which reflects a popular measure of the stock performance of small companies, and the Russell Microcap® Index, which measures the performance of the micro-cap segment of the U.S. equity market.
Average annual total returns take the Fund’s actual (or cumulative) return and show you what would have happened if the Fund had performed at a constant rate each year.
| * | The graph illustrates the performance of a hypothetical $10,000 investment made in the period presented. Assumes reinvestment of dividends and capital gains, but does not reflect the effect of any applicable sales charge or redemption fees or the deduction of taxes that a shareholder would pay on the Fund’s distributions or the redemption of the Fund shares. The graph does not imply any future performance. |
Perritt MicroCap Opportunities Fund
| Performance (Unaudited) (Continued) | October 31, 2017 |
| Cumulative Total Returns* | | | | | | |
| Periods ended October 31, 2017 (Unaudited) | | | | | | |
| | Past | Past | Past | Past | Past | Past |
| | 1 Year | 3 Years | 5 Years | 10 Years | 15 Years | 25 Years |
| Perritt MicroCap | | | | | | |
| Opportunities Fund | 24.20% | 28.63% | 94.55% | 76.87% | 436.53% | 1208.15% |
| | | | | | | |
| Russell 2000 index | 27.85% | 33.55% | 96.69% | 108.70% | 391.22% | 961.79% |
| (reflects no deduction | | | | | | |
| for fees and expenses) | | | | | | |
| | | | | | | |
| Russell Microcap Index | 29.53% | 32.60% | 97.43% | 87.30% | 351.92% | N/A |
| (reflects no deduction | | | | | | |
| for fees and expenses) | | | | | | |
| | | | | | | |
| Average Annual Total Returns* | | | | | | |
| Periods ended October 31, 2017 (Unaudited) | | | | | | |
| | Past | Past | Past | Past | Past | Past |
| | 1 Year | 3 Years | 5 Years | 10 Years | 15 Years | 25 Years |
| Perritt MicroCap | | | | | | |
| Opportunities Fund | 24.20% | 8.75% | 14.24% | 5.87% | 11.85% | 10.83% |
| | | | | | | |
| Russell 2000 index | 27.85% | 10.12% | 14.49% | 7.63% | 11.19% | 9.91% |
| (reflects no deduction | | | | | | |
| for fees and expenses) | | | | | | |
| | | | | | | |
| Russell Microcap Index | 29.53% | 9.86% | 14.57% | 6.48% | 10.58% | N/A |
| (reflects no deduction | | | | | | |
| for fees and expenses) | | | | | | |
The Perritt MicroCap Opportunities Fund’s annualized expense ratio for the year ended October 31, 2016, as stated in the statutory prospectus, was 1.23%. The Fund imposes a 2% redemption fee on shares held for 90 days or less. Performance data does not reflect the redemption fee. If reflected, total returns would be reduced.
Performance data quoted represents past performance; past performance does not guarantee future results. The investment return and principal value of an investment will fluctuate so that an investor’s shares, when redeemed, may be worth more or less than their original cost. Current performance of the Fund may be lower or higher than the performance quoted. Performance data current to the most recent month end is available by calling 800-331-8936.
| * | The tables do not reflect the deduction of taxes that a shareholder would pay on the Fund’s distributions or the redemption of Fund shares. |
Perritt MicroCap Opportunities Fund
| Ten Largest Common Stock Holdings (Unaudited) |
Atlas Financial Holdings, Inc. (AFH) engages in the underwriting of commercial automobile insurance policies, focusing on the ‘light’ commercial automobile sector. This sector includes taxi cabs, nonemergency para-transit, limousine, livery, and business autos.
Century Casinos, Inc. (CNTY) operates as a casino entertainment company worldwide. The company develops and operates gaming establishments, as well as related lodging, restaurant, horse racing, and entertainment facilities.
First Internet Bancorp (INBK) operates as a bank holding company for First Internet Bank of Indiana that provides commercial and retail banking products and services through its website, firstib.com.
Addus HomeCare Corporation (ADUS) is a provider of home and community-based personal care services, which are provided primarily in the home, and is focused on the dual eligible (Medicare/Medicaid) population. Addus provides these services on a long-term, continuous basis, with an average duration of over 20 months per consumer.
Miller Industries, Inc. (MLR) engages in the manufacture and sale of towing and recovery equipment. It offers wreckers, such as conventional tow trucks and recovery vehicles. The company also provides transport trailers for moving multiple vehicles, auto auctions, car dealerships, leasing companies, and other similar applications.
Hill International, Inc. (HIL) provides project and construction management, and other consulting services primarily for the buildings, transportation, environmental, energy, and industrial markets.
OMNOVA Solutions Inc. (OMN) provides emulsion polymers, specialty chemicals, and engineered surfaces for various commercial, industrial, and residential end uses in the United States, Europe, and Asia. Omnova operates in two segments, Performance Chemicals and Engineered Surfaces.
Bankwell Financial Group, Inc. (BWFG) operates as the bank holding company for Bankwell Bank, it provides a range of banking services to commercial and consumer customers in Connecticut.
Global Brass and Copper Holdings, Inc. (BRSS) converts, fabricates, processes, and distributes non-ferrous products in the United States, the Asia Pacific, and Mexico. Its products are used in the building and housing, automotive, electronics/electrical components, munitions, coinage, and industrial machinery and equipment markets.
Silvercrest Asset Management Group Inc. (SAMG) is a wealth management firm that provides financial advisory and related family office services in the United States. The company serves ultra-high net worth individuals and families, as well as their trusts; endowments; foundations; and other institutional investors. It also manages funds of funds and other investment funds.
Fund holdings and/or sector allocations are subject to change at any time and
are not recommendations to buy or sell any security.
Please refer to the Schedule of Investments in this report for a complete list of Fund holdings.
Perritt MicroCap Opportunities Fund
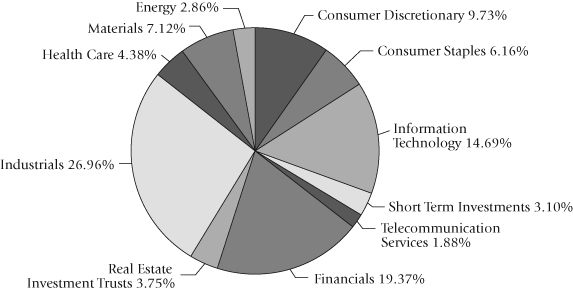
| Allocation of Portfolio Investments (Unaudited) | October 31, 2017 |
The sector classifications represented in the graph above and industry classifications represented in
the Schedule of Investments are in accordance with Global Industry Classification Standard
(GICS®), which was developed by and/or is the exclusive property of MSCI, Inc. and Standard &
Poor Financial Services LLC. Percentages are based on total investments, at value.
| Note: | For presentation purposes, the Fund has grouped some of the industry categories. For purposes of categorizing securities for compliance with section 8(b)(1) of the Investment Company Act of 1940, the Fund uses more specific industry classifications. |
Perritt Ultra MicroCap Fund
| Portfolio Managers’ Message |
| |  |
| Michael Corbett, | | Matthew Brackmann, |
| Portfolio Manager | | Portfolio Manager |
The Perritt Ultra MicroCap Fund had a positive return of 25.27% for the fiscal year ending October 31, 2017. This compares unfavorably to the Russell Microcap Index benchmark of 29.53%. The Fund performance for the second half of the fiscal year returned a positive 12.33%, which does compare favorably to the 9.44% return for the Russell Microcap Index. The complete performance for the Fund and its benchmarks can be found later in this report.
During the fiscal year, the Fund has seen its strongest performance from its investments in the information technology and industrial spaces. Some of the top performers in the information technology space were Ultra Clean Technologies (UCTT), a semi-conductor capital equipment manufacturer which returned 261.5% and Data I/O Corp (DAIO), a manufacturer of automatic programming devices which returned 207.7%. We also saw strong performance from industrial holdings, such as NV5 Global (NVEE), a construction & engineering contractor that returned 103.2%. We also had several successes in the machinery & equipment manufacturing space, including Hardinge Inc. (HDNG), Hurco Companies (HURC), Supreme Industries (STS) and Gencor Industries (GENC). These names cumulatively added 5.1% to the Fund’s performance. While we sold out of Supreme Industries over the course of the year, the others remain as holdings in the portfolio.
Since our semi-annual report for the period ending April 30, 2017, the Fund has liquidated 10 investments. One of these, ARI Network Services (ARIS) was sold because of the company receiving a valid buyout offer. Six companies, Supreme Industries, KVH Industries (KVHI), Orbit International (ORBT), Sito Mobile (SITO), Intricon (IIN) & Ultra Clean Technologies (UCTT) were sold due to the companies reaching our valuation targets. The remaining three companies were eliminated due to weak results or material downgrades in the outlook for the company, as well as for tax efficiency purposes. These were replaced with new additions that we believe will help contribute to the future performance of the Fund. These include Layne Christenson (LAYN), a contractor in the water management and drilling for the water, mineral & energy space, OurPet’s Company (OPCO), a designer, producer and distributor of pet products & Lakeland Industries (LAKE), a manufacturer of various safety garments and accessories.
As of October 31, 2017, the Fund holds the common stock of 87 companies which is greater than the 85 names we held at the time of our semi-annual report, April 30, 2017. We intend to keep the number of names in the portfolio around this number and continue with our strategy of concentrating on higher quality and higher conviction names. Based on our earnings estimates, the Fund’s portfolio is trading at 17.2 times forward earnings. The median price to sales ratio is 1.14x, the median price to book ratio is 2.03, the trailing twelve-month price earnings ratio is 21.9x and the median market cap is unchanged at
Perritt Ultra MicroCap Fund
$90 million. The Fund’s largest holdings and detailed descriptions can be found later in this report.
In terms of allocations to individual sectors, the Fund continues to maintain large underweights in both the financial and healthcare sectors. While we have closed the gaps on both over the course of the last year, we continue to avoid certain regional banks and biotech stocks in each respective sector due to valuations, risk exposure, and liquidity reasons and will continue to utilize the stock picking criteria we have relied on the past 29 years. Despite our aversion to those sub-sectors, we have found some opportunities for investments in specialty finance companies, healthcare services, and medical devices and continue to look for opportunities in those areas. We maintain over-weight allocations to consumer discretionary, industrial, and information technology names while the remaining sectors remain even-weight with the index.
The Ultra Microcap Fund tends to have investments that fly under the radar screen of most investors. The microcap universe, particularly those stocks with market capitalizations below $100 million, are often ignored by investors for an extended period. Therefore, the potential rewards can take longer to achieve, but can be swift. As fellow shareholders, we exit this fiscal year pleased with our performance relative to our index and remain focused on the long-term picture both for the individual companies within the portfolio, as well as the portfolio as a whole. We remain confident that looking out at the long-term potential for our holdings based on sound fundamentals rather than focusing on short- term fluctuations in the market is in the best interest of our shareholders. As always, we would like to remind investors that the rewards of microcap investing may not be consistent in the short run, but can have the potential to be rewarding in a full market cycle.
We want to thank our fellow shareholders for their continued support and confidence in the Perritt Capital Management team. Each member of our investment committee, as well as many other employees have made continued investment in this Fund for over 10 years and remain shareholders alongside all of you. If you have any questions or comments about this report or your investment in the Perritt Ultra MicroCap Fund, please call us toll- free at (800) 331-8936 or visit our web site at www.perrittcap.com. Please refer to the prospectus for information about the Fund’s investment objectives and strategies.
Matthew Brackmann
Portfolio Manager
Perritt Ultra MicroCap Fund
Past performance does not guarantee future results.
Opinions expressed are subject to change at any time, are not guaranteed and should not be considered investment advice.
Russell Microcap Index is a capitalization weighted index of 2,000 small cap and micro cap stocks that captures the smallest 1,000 companies in the Russell 2000, plus 1,000 smaller U.S.-based listed stocks.
Russell 2000 Index is an index measuring the performance approximately 2,000 small-cap companies in the Russell 3000 Index, which is made up of 3,000 of the biggest U.S. stocks. The Russell 2000 serves as a benchmark for small-cap stocks in the United States.
Cash flow is the net amount of cash and cash-equivalents moving into and out of a business. Positive cash flow indicates that a company’s liquid assets are increasing, enabling it to settle debts, reinvest in its business, return money to shareholders, pay expenses and provide a buffer against future financial challenges. Negative cash flow indicates that a company’s liquid assets are decreasing.
Price-to-Book (P/B) is a ratio used to compare a stock’s market value to its book value. It is calculated by dividing the current closing price of the stock by the latest quarter’s book value per share.
Price-to-Sales (P/S) is a valuation ratio that compares a company’s stock price to its revenues. The price-to-sales ratio is an indicator of the value placed on each dollar of a company’s sales or revenues.
Price-to-Earnings (P/E) is the ratio for valuing a company that measures its current share price relative to its per share earnings.
Trailing Price-to Earnings (P/E) is calculated by taking the current stock price and dividing it by the trailing earnings per share (EPS) for the past 12 months.
(This Page Intentionally Left Blank.)
Perritt Ultra MicroCap Fund
| Performance* (Unaudited) | October 31, 2017 |
Perritt Ultra MicroCap Fund versus
Russell 2000® Index and Russell Microcap® Index
There are several ways to evaluate a fund’s historical performance. You can look at the total percentage change in value, the average annual percentage change, or the growth of a hypothetical $10,000 investment. Each performance figure includes changes in a fund’s share price, plus reinvestment of any dividends (or income) and capital gains (the profits the fund earns when it sells stocks that have grown in value).
Cumulative total returns reflect the Fund’s actual performance over a set period. For example, if you invested $1,000 in a fund that had a 5% return over one year, you would end up with $1,050. You can compare the Fund’s returns to the Russell 2000® Index, which reflects a popular measure of the stock performance of small companies, and the Russell Microcap® Index, which measures the performance of the micro-cap segment of the U.S. equity market.
Average annual total returns take the Fund’s actual (or cumulative) return and show you what would have happened if the Fund had performed at a constant rate each year.
| * | The graph illustrates the performance of a hypothetical $10,000 investment made in the period presented. Assumes reinvestment of dividends and capital gains, but does not reflect the effect of any applicable sales charge or redemption fees or the deduction of taxes that a shareholder would pay on the Fund’s distributions or the redemption of Fund shares. The graph does not imply any future performance. |
Perritt Ultra MicroCap Fund
| Performance (Unaudited) (Continued) | October 31, 2017 |
| Cumulative Total Returns** | | | | | |
| Periods ended October 31, 2017 (Unaudited) | | | | | |
| | Past | Past | Past | Past | Since |
| | 1 Year | 3 Years | 5 Years | 10 Years | Inception* |
| Perritt Ultra | | | | | |
| MicroCap Fund | 25.27% | 35.55% | 102.71% | 58.44% | 180.99% |
| | | | | | |
| Russell 2000 Index | 27.85% | 33.55% | 96.69% | 108.70% | 229.41% |
| (reflects no deduction | | | | | |
| for fees and expenses) | | | | | |
| | | | | | |
| Russell Microcap Index | 29.53% | 32.60% | 97.43% | 87.30% | 173.94% |
| (reflects no deduction | | | | | |
| for fees and expenses) | | | | | |
| | | | | | |
| Average Annual Total Returns** | | | | | |
| Periods ended October 31, 2017 (Unaudited) | | | | | |
| | Past | Past | Past | Past | Since |
| | 1 Year | 3 Years | 5 Years | 10 Years | Inception* |
| Perritt Ultra | | | | | |
| MicroCap Fund | 25.27% | 10.67% | 15.18% | 4.71% | 8.16% |
| | | | | | |
| Russell 2000 Index | 27.85% | 10.12% | 14.49% | 7.63% | 9.47% |
| (reflects no deduction | | | | | |
| for fees and expenses) | | | | | |
| | | | | | |
| Russell Microcap Index | 29.53% | 9.86% | 14.57% | 6.48% | 7.95% |
| (reflects no deduction | | | | | |
| for fees and expenses) | | | | | |
The Perritt Ultra MicroCap Fund’s annualized expense ratio for the year ended October 31, 2016, as stated in the statutory prospectus, was 1.78%. The Fund imposes a 2% redemption fee on shares held for 90 days or less. Performance data does not reflect the redemption fee. If reflected, total returns would be reduced.
Performance data quoted represents past performance; past performance does not guarantee future results. The investment return and principal value of an investment will fluctuate so that an investor’s shares, when redeemed, may be worth more or less than their original cost. Current performance of the Fund may be lower or higher than the performance quoted. Performance data current to the most recent month end is available by calling 800-331-8936.
| * | | The since inception date is August 30, 2004. |
| ** | | The tables do not reflect the deduction of taxes that a shareholder would pay on the Fund’s distributions or the redemption of Fund shares. |
Perritt Ultra MicroCap Fund
| Ten Largest Common Stock Holdings (Unaudited) |
Galaxy Gaming, Inc. (GLXZ) is a gaming company that designs, develops, manufactures, markets, acquires, and licenses proprietary casino table games and associated technology, platforms, and systems for the gaming industry.
Data I/O Corporation (DAIO) designs, manufactures, and sells programming systems for electronic device manufacturers worldwide. Its programming system products are used to program integrated circuits (ICs) with the specific data necessary for the ICs. The company also provides hardware support, system installation and repair, and device programming services.
ZAGG Inc. (ZAGG) together with its subsidiaries, designs, manufactures, and distributes mobile tech accessories for smartphones and tablets in the United States, Europe, and internationally.
Gencor Industries, Inc. (GENC) designs, manufactures, and sells machinery and related equipment used to produce asphalt and highway construction materials. The company’s products include asphalt plants, combustion systems, and fluid heat transfer systems, which are manufactured in two facilities in the United States.
DLH Holdings Corp. (DLHC) provides healthcare, logistics, and technical services and solutions to Federal Government agencies including the Department of Veteran Affairs, the Department of Defense, and other government clients.
First Internet Bancorp (INBK) operates as a bank holding company for First Internet Bank of Indiana that provides commercial and retail banking products and services through its website, firstib.com.
Safeguard Scientifics, Inc. (SFE) is a private equity and venture capital firm specializing in expansion financings, growth capital, management buyouts, recapitalizations, industry consolidations, corporate spinouts, growth stage, and early stage financings in Fintech sector.
Cutera, Inc. (CUTR) designs, develops, manufactures, markets, and services laser and other energy based aesthetics systems. It offers a laser system for tattoo removal, and treatment of benign pigmented lesions; hair removal solutions for various skin types; and a high-powered radio frequency platform for deep tissue heating.
Asure Software, Inc. (ASUR) provides cloud-based software-as-a-service (SaaS) time and labor management, and workspace management solutions worldwide. The company offers a suite of solutions to help clients optimize and manage their mobile workforces and their global workspaces.
Matrix Service Company (MTRX) provides engineering, fabrication, construction, and maintenance services primarily to the oil, gas, power, petrochemical, industrial, agricultural, and mining and minerals markets in the United States, Canada, and internationally.
Fund holdings and/or sector allocations are subject to change at any time and
are not recommendations to buy or sell any security.
Please refer to the Schedule of Investments in this report for a complete list of Fund holdings.
Perritt Ultra MicroCap Fund
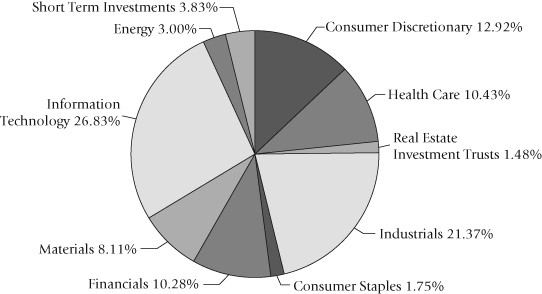
| Allocation of Portfolio Investments (Unaudited) | October 31, 2017 |
The sector classifications represented in the graph above and industry classifications represented in
the Schedule of Investments are in accordance with Global Industry Classification Standard
(GICS®), which was developed by and/or is the exclusive property of MSCI, Inc. and Standard &
Poor Financial Services LLC. Percentages are based on total investments, at value.
| Note: | For presentation purposes, the Fund has grouped some of the industry categories. For purposes of categorizing securities for compliance with section 8(b)(1) of the Investment Company Act of 1940, the Fund uses more specific industry classifications. |
Perritt Low Priced Stock Fund
| Portfolio Manager’s Message |
Michael Corbett,
Portfolio Manager
The Perritt Low Priced Stock Fund produced strong performance during the fiscal year ended October 31, 2017. The Fund gained 28.28% versus a 27.85% gain for the benchmark Russell 2000 Index. The Perritt Low Priced Stock Fund has now officially been around for more than three years. More detailed performance results for the Fund for the past year and three years, as well as the results for the Russell 2000 index can be found later in this report.
We attribute the Fund’s competitive performance mostly due to stock selection. As might be expected, most of the stocks in the portfolio rose during the past twelve months. However, there were a few stellar performers. Nova Measuring Instruments (NVMI) was the best performer, climbing more than 160% during the past 12 months. Nova Measuring, which sells process control systems used in semiconductor industry, consistently raised guidance in the past year, and management is forecasting another record year in 2018. We also had three other stocks that climbed near or more than 100% during the past 12 months: Entegris (ENTG), Fox Factory Holding (FOXF), and Wabash National (WNC). ENTG and FOXF both grew their businesses at impressive rates, and managements expect more of the same next year. WNC is more of a turnaround, and they made a very large acquisition this past year. We expect WNC to realize some gratifying synergies from their acquisition, and solid performance next year.
We did turn the portfolio over a great deal in the past year. Our objective was to increase the Fund’s investments in high quality companies with stronger earnings growth. During the past year, we sold 32 names from the portfolio, but added 49 new names. We sold several companies, such as Marine Products (MPX) and Merit Medical (MMSI), because their valuations were too rich, particularly relative to their growth rates. Most of the other companies liquidated were due to disappointing earnings growth prospects. The net result is that we believe the portfolio is packed with companies that have the potential to offer stronger earnings growth. On an industry basis, we significantly reduced our weight in financial services and increased our weight in information technology and materials. We also initiated a couple investments within the energy services. Another reason to turn the portfolio over was to increase the average company size in the portfolio. The net result is that the average market capitalization increased from $685 million a year ago to nearly $1 billion today (10/31/17).
As of October 31, 2017, the Fund’s portfolio was comprised of 79 common stocks. The Fund’s 10 largest holdings and detailed description can be found later in this report. Based on our earnings estimate, the Fund’s portfolio trades at 15.6 times 2018 earnings. The median price to revenue is slightly less than 1.4 times and the median market capitalization is approximately $955 million. Lastly, we estimate that earnings growth should be very robust for our companies in 2018. On a median basis, we estimate that earnings growth will
Perritt Low Priced Stock Fund
be about 19% in 2018. However, we have weighted the Fund’s portfolio toward stronger earnings growth investments, which means that on that basis we are looking for growth closer to 40%.
We are pleased with the results over the past year, which also came without much volatility. While predicting the future is very difficult, it seems likely to us that volatility may increase in the future. We remain confident with our investment approach and discipline, and believe our process will seek to offer solid results in the future.
Thank you for entrusting your investment with us. The Perritt Capital Management team continue to show their commitment to the Fund’s success with their own personal investment. As a fellow shareholder and the largest shareholder, I am committed to the success of this fund. If you have any questions or comments about this report or your investment in the Perritt Low Priced Stock Fund, please call us toll-free at (800) 331-8936 or visit our website at www.perrittcap.com. Please refer to the prospectus for information about the Fund’s investment objectives and strategies.
Michael Corbett
Portfolio Manager
Past performance does not guarantee future results.
Earnings Growth is not a measure of the Fund’s future performance.
Opinions expressed are subject to change at any time, are not guaranteed, and should not be considered investment advice.
The Russell 2000 Index consists of the smallest 2000 companies in a group of 3000 companies in the Russell 3000 as ranked by market cap.
Turnover represents the percentage of the portfolio that is sold in a particular time period.
Price to Revenue compares a company’s stock price to its revenues, which is an indicator of the value placed on each dollar of a company’s sales or revenues.
Please refer to the Schedule of Investments in the report for more complete information regarding Fund holdings. Fund holdings and sector allocations are subject to change and should not be considered a recommendation to buy or sell any security.
Mutual fund investing involves risk. Principal loss is possible. The Funds invest in smaller companies, which involve additional risks, such as limited liquidity and greater volatility. The Funds invest in micro-cap companies which tend to perform poorly during times of economic stress. The Low Priced Stock Fund may invest in early stage companies which tend to be more volatile and somewhat more speculative than investments in more established companies. Low Priced stocks are generally more volatile than higher priced securities.
The annual report must be preceded or accompanied by a prospectus. One cannot invest directly in an index.
The Perritt Funds are distributed by Quasar Distributors, LLC.
Perritt Low Priced Stock Fund
| Performance* (Unaudited) | October 31, 2017 |
Perritt Low Priced Stock Fund** versus
Russell 2000® Index and Russell Microcap® Index
There are several ways to evaluate a fund’s historical performance. You can look at the total percentage change in value, the average annual percentage change, or the growth of a hypothetical $10,000 investment. Each performance figure includes changes in a fund’s share price, plus reinvestment of any dividends (or income) and capital gains (the profits the fund earns when it sells stocks that have grown in value).
Cumulative total returns reflect the Fund’s actual performance over a set period. For example, if you invested $1,000 in a fund that had a 5% return over one year, you would end up with $1,050. You can compare the Fund’s returns to the Russell 2000® Index, which reflects a popular measure of the stock performance of small companies, and the Russell Microcap® Index, which measures the performance of the micro-cap segment of the U.S. equity market.
Average annual total returns take the Fund’s actual (or cumulative) return and show you what would have happened if the Fund had performed at a constant rate each year.
| * | | The graph illustrates the performance of a hypothetical $10,000 investment made in the Fund at inception (June 29, 2012) of the Fund’s predecessor account through October 31, 2017. Assumes reinvestment of dividends and capital gains, but does not reflect the effect of any applicable sales charge or redemption fees or the deduction of taxes that a shareholder would pay on the Fund’s distributions or the redemption of Fund shares. The graph does not imply any future performance. |
| ** | | June 29, 2012 is the inception date of the Fund’s predecessor account. The Fund commenced operations on February 28, 2014. The investment policies, objectives, guidelines and restrictions of the Fund are in all material respects equivalent to those of the predecessor account. |
Perritt Low Priced Stock Fund
| Performance (Unaudited) (Continued) | October 31, 2017 |
| Cumulative Total Returns** | | | |
| Periods ended October 31, 2017 (Unaudited) | | | |
| | Past | Past | Since |
| | 1 Year | 3 Years | Inception* |
| Perritt Low Priced Stock Fund | 28.28% | 41.06% | 33.07% |
| | | | |
| Russell 2000 index | 27.85% | 33.55% | 33.66% |
| (reflects no deduction for fees and expenses) | | | |
| | | | |
| Russell Microcap Index | 29.53% | 32.60% | 26.27% |
| (reflects no deduction for fees and expenses) | | | |
| | | | |
| Average Annual Total Returns** | | | |
| Periods ended October 31, 2017 (Unaudited) | | | |
| | Past | Past | Since |
| | 1 Year | 3 Years | Inception* |
| Perritt Low Priced Stock Fund | 28.28% | 12.15% | 15.20% |
| | | | |
| Russell 2000 index | 27.85% | 10.12% | 14.14% |
| (reflects no deduction for fees and expenses) | | | |
| | | | |
| Russell Microcap Index | 29.53% | 9.86% | 14.15% |
| (reflects no deduction for fees and expenses) | | | |
The Perritt Low Priced Stock Fund’s annualized net expense ratio, as stated in the statutory prospectus, dated October 31, 2016, was 1.40%. The Fund imposes a 2% redemption fee on shares held for 90 days or less. Performance data does not reflect the redemption fee. If reflected, total returns would be reduced.
Performance data quoted represents past performance; past performance does not guarantee future results. The investment return and principal value of an investment will fluctuate so that an investor’s shares, when redeemed, may be worth more or less than their original cost. Current performance of the Fund may be lower or higher than the performance quoted. Performance data current to the most recent month end is available by calling 800-331-8936.
| * | | The Fund is the successor to a separately managed account. Immediately prior to the Fund commencing operations on February 28, 2014, the predecessor account transferred its assets to the Fund in exchange for the Fund’s shares. The investment policies, objectives, guidelines and restrictions of the Fund are in all material respects equivalent to those of the predecessor. In addition, the predecessor’s portfolio managers are the current portfolio managers of the Fund. As a mutual fund registered under the Investment Company Act of 1940 (the “1940 Act”), the Fund is subject to certain restrictions under the 1940 Act and the Internal Revenue Code to which the predecessor was not subject. Had the predecessor been registered under the 1940 Act and been subject to the provisions of the 1940 Act and the Internal Revenue Code, its investment performance may have been adversely affected. The performance was achieved by the predecessor when Fund assets were relatively small; the same strategies may not be available, and similar performance may not be achieved, when the Fund’s assets are larger. The performance shown includes an annual management fee of 1.00% and does not include any expenses paid by the predecessor’s investment advisor. |
| | | The since inception date is June 29, 2012, the date of inception of the Fund’s predecessor account. The past performance of the Fund and its predecessor account (before and after taxes) is not necessarily an indication of how the Fund will perform in the future. |
| ** | | The tables do not reflect the deduction of taxes that a shareholder would pay on the Fund’s distributions or the redemption of Fund shares. |
Perritt Low Priced Stock Fund
| Ten Largest Common Stock Holdings (Unaudited) |
Builders FirstSource, Inc. (BLDR) manufactures and supplies building materials, manufactured components, and construction services to professional contractors, sub-contractors, and consumers in the United States. Its products include lumber and lumber sheet goods; windows, interior and exterior door units, as well as interior trims and custom products.
Ferro Corporation (FOE) produces specialty materials in the United States and internationally. It offers frits, porcelain, and other glass enamels, glazes, stains, decorating colors, pigments, inks, polishing materials, dielectrics, electronic glasses, and other specialty coatings. Its products are used in appliances, automobiles, building and renovation, electronics, household furnishings, industrial products, and packaging.
Modine Manufacturing Company (MOD) develops, manufactures, and markets engineered heat transfer systems and heat transfer components for use in on- and off-highway original equipment manufacturer vehicular applications. The company operates through Americas, Europe, Asia, and Building HVAC segments.
Gencor Industries, Inc. (GENC) designs, manufactures, and sells machinery and related equipment used to produce asphalt and highway construction materials. The company’s products include asphalt plants, combustion systems, and fluid heat transfer systems, which are manufactured in two facilities in the United States.
New Media Investment Group Inc. (NEWM) invests in, owns, and operates local media assets in the United States. The company’s principal products include newspapers, yellow page directories and Propel digital marketing and business services.
AMN Healthcare Services, Inc. (AMN) provides healthcare workforce solutions and staffing services in the United States. The company operates through three segments: Nurse and Allied Solutions, Locum Tenens Solutions, and Other Workforce Solutions.
CNO Financial Group, Inc. (CNO), develops, markets and administers health insurance, annuity, individual life insurance and other insurance products. The Company's segments include Bankers Life, Washington National and Colonial Penn.
Kforce Inc. (KFRC) provides professional and technical specialty staffing services and solutions through three segments: Technology (Tech), Finance and Accounting (FA), and Government Solutions (GS). They serve clients in industries primarily in financial services, communications, insurance services, government sectors, and healthcare.
Kulicke and Soffa Industries, Inc. (KLIC) designs, manufactures, and sells capital equipment and expendable tools to assemble semiconductor devices. It operates in two segments, Equipment and Expendable Tools.
Orbotech Ltd. (ORBK) provides yield-enhancing and process-enabling solutions for printed circuit boards (PCBs), liquid crystal displays (LCDs), and semiconductor devices in North America and internationally. It operates through three segments: Product Solutions for the Electronics Industry, Recognition Software, and Solar Energy.
Fund holdings and/or sector allocations are subject to change at any time and
are not recommendations to buy or sell any security.
Please refer to the Schedule of Investments in this report for a complete list of Fund holdings.
Perritt Low Priced Stock Fund
| Allocation of Portfolio Investments (Unaudited) | October 31, 2017 |
The sector classifications represented in the graph above and industry classifications represented in
the Schedule of Investments are in accordance with Global Industry Classification Standard
(GICS®), which was developed by and/or is the exclusive property of MSCI, Inc. and Standard &
Poor Financial Services LLC. Percentages are based on total investments, at value.
| Note: | For presentation purposes, the Fund has grouped some of the industry categories. For purposes of categorizing securities for compliance with section 8(b)(1) of the Investment Company Act of 1940, the Fund uses more specific industry classifications. |
Perritt MicroCap Opportunities Fund
| Schedule of Investments | October 31, 2017 |
| Shares | | COMMON STOCKS – 96.31% | | Value | |
| Administrative and Support Services – 0.38% | | | |
| | 40,462 | | Kforce, Inc. | | $ | 847,679 | |
| | | | | | | 847,679 | |
| Aerospace & Defense – 1.65% | | | | |
| | 398,891 | | CPI Aerostructures, | | | | |
| | | | Inc.(a) | | | 3,729,631 | |
| | | | | | | 3,729,631 | |
| Auto Parts & Equipment – 4.75% | | | | |
| | 167,771 | | Miller Industries, Inc. | | | 4,739,531 | |
| | 125,000 | | Motorcar Parts | | | | |
| | | | of America, Inc.(a)(b) | | | 3,613,750 | |
| | 10,500 | | Motorcar Parts | | | | |
| | | | of America, Inc.(a) | | | 303,555 | |
| | 90,000 | | Stoneridge, Inc.(a) | | | 2,046,600 | |
| | | | | | | 10,703,436 | |
| Building Materials – 6.30% | | | | |
| | 425,000 | | BlueLinx | | | | |
| | | | Holdings, Inc.(a) | | | 3,706,000 | |
| | 130,000 | | Global Brass & Copper | | | | |
| | | | Holdings, Inc. | | | 4,550,000 | |
| | 471,677 | | Huttig Building | | | | |
| | | | Products, Inc.(a) | | | 3,169,669 | |
| | 47,454 | | Insteel Industries, Inc. | | | 1,212,450 | |
| | 110,800 | | PGT Innovations, Inc.(a) | | | 1,562,280 | |
| | | | | | | 14,200,399 | |
| Business Services – 4.48% | | | | |
| | 107,642 | | GP Strategies Corp.(a) | | | 3,127,000 | |
| | 163,263 | | Innodata Isogen, Inc.(a) | | | 212,242 | |
| | 171,383 | | PCM, Inc.(a) | | | 2,407,931 | |
| | 405,469 | | PFSweb, Inc.(a) | | | 3,365,393 | |
| | 35,000 | | Systemax, Inc. | | | 999,250 | |
| | | | | | | 10,111,816 | |
| Chemical & Related Products – 6.11% | | | | |
| | 104,644 | | Aceto Corp. | | | 1,053,765 | |
| | 22,506 | | KMG Chemicals, Inc. | | | 1,240,756 | |
| | 204,165 | | Northern Technologies | | | | |
| | | | International Corp.(a) | | | 3,378,931 | |
| | 417,238 | | OMNOVA | | | | |
| | | | Solutions, Inc.(a) | | | 4,610,480 | |
| | 287,266 | | Trecora Resources(a) | | | 3,490,282 | |
| | | | | | | 13,774,214 | |
| Commercial Banks – 6.91% | | | | |
| | 125,900 | | Bankwell Financial | | | | |
| | | | Group, Inc. | | | 4,607,940 | |
| | 112,000 | | Berkshire Hills | | | | |
| | | | Bancorp, Inc. | | | 4,289,600 | |
| | 75,000 | | Esquire Financial | | | | |
| | | | Holdings, Inc.(a) | | | 1,253,250 | |
| | 117,141 | | Triumph | | | | |
| | | | Bancorp, Inc.(a) | | | 3,631,371 | |
| | 68,590 | | Veritex Holdings, Inc.(a) | | | 1,808,032 | |
| | | | | | | 15,590,193 | |
| Commercial Services – 0.65% | | | | |
| | 65,000 | | TriState Capital | | | | |
| | | | Holdings, Inc.(a) | | | 1,472,250 | |
| | | | | | | 1,472,250 | |
| Commercial Services & Supplies – 1.19% | | | | |
| | 247,500 | | InnerWorkings, | | | | |
| | | | Inc.(a) | | | 2,692,800 | |
| | | | | | | 2,692,800 | |
| Construction & Engineering – 6.08% | | | | |
| | 58,000 | | Comfort Systems | | | | |
| | | | USA, Inc. | | | 2,569,400 | |
| | 889,832 | | Hill International, | | | | |
| | | | Inc.(a) | | | 4,716,110 | |
| | 132,776 | | IES Holdings, | | | | |
| | | | Inc.(a) | | | 2,482,911 | |
| | 281,700 | | Limbach | | | | |
| | | | Holdings, Inc.(a) | | | 3,943,800 | |
| | | | | | | 13,712,221 | |
| Consumer Products – | | | | |
| Manufacturing – 2.55% | | | | |
| | 114,000 | | Delta Apparel, Inc.(a) | | | 2,386,020 | |
| | 130,181 | | Orchids Paper | | | | |
| | | | Products Co. | | | 1,598,623 | |
| | 74,764 | | Superior Uniform | | | | |
| | | | Group, Inc. | | | 1,754,711 | |
| | | | | | | 5,739,354 | |
| Consumer Services – 0.85% | | | | |
| | 173,583 | | Primo Water Corp.(a) | | | 1,911,149 | |
| | | | | | | 1,911,149 | |
| Data Processing, Hosting | | | | |
| and Related Services – 1.86% | | | | |
| | 400,000 | | Ooma, Inc.(a) | | | 4,200,000 | |
| | | | | | | 4,200,000 | |
The accompanying notes to financial statements are an integral part of this schedule.
Perritt MicroCap Opportunities Fund
| Schedule of Investments (Continued) | October 31, 2017 |
| Shares | | | | Value | |
| Electronic Equipment & Instruments – 1.51% | | | |
| | 105,297 | | Bel Fuse, Inc. – Class B | | $ | 3,406,358 | |
| | | | | | | 3,406,358 | |
| Energy & Related Services – 2.31% | | | | |
| | 279,658 | | Matrix Service Co.(a) | | | 3,943,178 | |
| | 108,744 | | PHI, Inc.(a) | | | 1,271,217 | |
| | | | | | | 5,214,395 | |
| Financial Services – 6.83% | | | | |
| | 50,000 | | Cowen, Inc.(a) | | | 750,000 | |
| | 135,000 | | First Internet Bancorp | | | 5,089,500 | |
| | 145,092 | | Hennessy Advisors, Inc. | | | 2,396,920 | |
| | 53,124 | | Northeast Bancorp | | | 1,367,943 | |
| | 63,027 | | Oppenheimer Holdings, | | | | |
| | | | Inc. – Class A | | | 1,370,837 | |
| | 270,606 | | Silvercrest Asset | | | | |
| | | | Management Group, | | | | |
| | | | Inc. – Class A | | | 4,410,878 | |
| | | | | | | 15,386,078 | |
| Food – 4.57% | | | | |
| | 171,270 | | Crimson Wine | | | | |
| | | | Group Ltd.(a) | | | 1,738,390 | |
| | 116,981 | | Farmer Brothers Co.(a) | | | 3,971,505 | |
| | 198,500 | | Landec Corp.(a) | | | 2,630,125 | |
| | 89,726 | | Omega Protein Corp. | | | 1,964,999 | |
| | | | | | | 10,305,019 | |
| Health Care Providers & Services – 1.40% | | | | |
| | 136,400 | | The Ensign Group, Inc. | | | 3,148,112 | |
| | | | | | | 3,148,112 | |
| Industrial Goods – 2.25% | | | | |
| | 560,000 | | Hudson Technologies, | | | | |
| | | | Inc.(a) | | | 3,315,200 | |
| | 60,000 | | Schnitzer Steel Industries, | | | | |
| | | | Inc. – Class A | | | 1,767,000 | |
| | | | | | | 5,082,200 | |
| Insurance – 4.41% | | | | |
| | 298,826 | | Atlas Financial | | | | |
| | | | Holdings, Inc.(a)(e) | | | 5,901,814 | |
| | 64,565 | | EMC Insurance | | | | |
| | | | Group, Inc. | | | 1,902,085 | |
| | 134,767 | | United Insurance | | | | |
| | | | Holdings Corp. | | | 2,121,233 | |
| | | | | | | 9,925,132 | |
| Leisure – 2.57% | | | | |
| | 703,550 | | Century Casinos, Inc.(a) | | | 5,804,287 | |
| | | | | | | 5,804,287 | |
| Machinery Manufacturing – 1.29% | | | | |
| | 102,600 | | Graham Corp. | | | 1,977,102 | |
| | 8,150 | | Kadant, Inc. | | | 925,840 | |
| | | | | | | 2,902,942 | |
| Medical Supplies & Services – 2.49% | | | | |
| | 135,683 | | Addus HomeCare | | | | |
| | | | Corp.(a) | | | 4,884,588 | |
| | 40,000 | | OrthoPediatrics | | | | |
| | | | Corp.(a) | | | 730,400 | |
| | | | | | | 5,614,988 | |
| Real Estate Investment Trusts – 4.17% | | | | |
| | 250,000 | | City Office REIT, Inc. | | | 3,260,000 | |
| | 115,000 | | Community Healthcare | | | | |
| | | | Trust, Inc. | | | 3,154,450 | |
| | 232,515 | | Global Medical | | | | |
| | | | REIT, Inc. | | | 1,967,077 | |
| | 100,000 | | Resource Capital Corp. | | | 1,026,000 | |
| | | | | | | 9,407,527 | |
| Retail – 1.53% | | | | |
| | 175,000 | | Kirkland’s, Inc.(a) | | | 2,047,500 | |
| | 51,403 | | Weyco Group, Inc. | | | 1,397,648 | |
| | | | | | | 3,445,148 | |
| Security Manufacturing – 1.09% | | | | |
| | 150,602 | | Horizon | | | | |
| | | | Global Corp.(a) | | | 2,444,270 | |
| | | | | | | 2,444,270 | |
| Semiconductor Related Products – 5.69% | | | | |
| | 286,367 | | AXT, Inc.(a) | | | 2,663,213 | |
| | 128,327 | | DSP Group, Inc.(a) | | | 1,719,582 | |
| | 171,111 | | PDF Solutions, Inc.(a) | | | 2,506,776 | |
| | 415,000 | | Photronics, Inc.(a) | | | 4,025,500 | |
| | 69,000 | | Rudolph Technologies, | | | | |
| | | | Inc.(a) | | | 1,914,750 | |
| | | | | | | 12,829,821 | |
| Software – 2.03% | | | | |
| | 250,000 | | American Software, | | | | |
| | | | Inc. – Class A | | | 3,102,500 | |
| | 300,000 | | Zix Corp.(a) | | | 1,455,000 | |
| | | | | | | 4,557,500 | |
| Specialty Manufacturing – 4.89% | | | | |
| | 268,663 | | Aspen Aerogels, Inc.(a) | | | 1,203,610 | |
| | 226,797 | | CECO Environmental | | | | |
| | | | Corp. | | | 1,989,010 | |
| | 63,141 | | Core Molding | | | | |
| | | | Technologies, Inc. | | | 1,465,502 | |
The accompanying notes to financial statements are an integral part of this schedule.
Perritt MicroCap Opportunities Fund
| Schedule of Investments (Continued) | October 31, 2017 |
| Shares | | | | Value | |
| Specialty Manufacturing (Continued) | | | |
| | 99,500 | | Federal Signal Corp. | | $ | 2,124,325 | |
| | 327,696 | | LSI Industries, Inc. | | | 2,277,487 | |
| | 217,830 | | Manitex International, | | | | |
| | | | Inc.(a) | | | 1,977,896 | |
| | | | | | | 11,037,830 | |
| Telecommunications – 2.29% | | | | |
| | 700,000 | | Ceragon Networks | | | | |
| | | | Ltd.(a)(e) | | | 1,505,000 | |
| | 548,800 | | PC-Tel, Inc. | | | 3,649,520 | |
| | | | | | | 5,154,520 | |
| Transportation – 1.23% | | | | |
| | 568,891 | | Radiant | | | | |
| | | | Logistics, Inc.(a) | | | 2,776,188 | |
| | | | | | | 2,776,188 | |
| | | | TOTAL COMMON | | | | |
| | | | STOCKS | | | | |
| | | | (Cost $140,636,109) | | $ | 217,127,457 | |
| | | | | | | | |
| Contracts | | WARRANTS – 0.00% | | Value | |
| Insurance – 0.00% | | | | |
| | | | Emergent Capital, | | | | |
| | | | Inc. Warrant; | | | | |
| | 38,106 | | Expiration: 10/06/2019, | | | | |
| | | | Exercise Price | | | | |
| | | | $10.75(a)(c) | | $ | — | |
| | | | TOTAL WARRANTS | | | | |
| | | | (Cost $0) | | $ | — | |
| | | | | | | | |
| Shares | | SHORT-TERM | | Value | |
| | | | INVESTMENTS – 3.08% | | | | |
| | 6,942,638 | | Invesco Short Term | | | | |
| | | | Investments Government | | | | |
| | | | & Agency Portfolio – | | | | |
| | | | Class I 0.94%(d) | | $ | 6,942,638 | |
| | | | TOTAL SHORT-TERM | | | | |
| | | | INVESTMENTS | | | | |
| | | | (Cost $6,942,638) | | $ | 6,942,638 | |
| | | | Total Investments | | | | |
| | | | (Cost $147,578,747) – | | | | |
| | | | 99.39% | | $ | 224,070,095 | |
| | | | Other Assets in | | | | |
| | | | Excess of | | | | |
| | | | Liabilities – 0.61% | | | 1,374,592 | |
| | | | TOTAL NET ASSETS – | | | | |
| | | | 100.00% | | $ | 225,444,687 | |
Percentages are stated as a percent of net assets.
(a) | Non-income producing security. |
(b) | Security was purchased in a transaction exempt from registration in the U.S. under the Securities Act of 1933 (the “Act”) and, unless registered under the Act, may only be sold pursuant to exemption from registration and, in the case of a Rule 144A offering under the Act, may only be sold to “qualified institutional buyers.” The value of this security is $3,613,750 or 1.60% of the Fund’s net assets. This security is deemed to be liquid. |
(c) | The price for this security was derived from an estimate of fair value using methods approved by the Fund’s Board of Directors. This security represents $0 or 0.00% of the Fund’s net assets. This security is classified as Level 2 and is deemed to be illiquid. |
(d) | Variable rate security; the rate shown is the effective rate as of October 31, 2017. |
(e) | Foreign issued security. |
The industry classifications listed above are in accordance with Global Industry Classification Standard (GICS®), which was developed by and/or is the exclusive property of MSCI, Inc. and Standard & Poor Financial Services LLC (“S&P”).
The accompanying notes to financial statements are an integral part of this schedule.
Perritt Ultra MicroCap Fund
| Schedule of Investments | October 31, 2017 |
| Shares | | COMMON STOCKS – 97.27% | | Value | |
| Aerospace & Defense – 0.81% | | | |
| | 60,000 | | CPI Aerostructures, | | | |
| | | | Inc.(a) | | $ | 561,000 | |
| | | | | | | 561,000 | |
| Air Transport – 1.07% | | | | |
| | 53,077 | | AeroCentury Corp.(a) | | | 745,732 | |
| | | | | | | 745,732 | |
| Auto Parts & Equipment – 0.74% | | | | |
| | 60,000 | | Unique | | | | |
| | | | Fabricating, Inc. | | | 514,800 | |
| | | | | | | 514,800 | |
| Business Services – 11.04% | | | | |
| | 50,000 | | BG Staffing, Inc. | | | 844,000 | |
| | 350,000 | | CynergisTek, Inc.(a) | | | 1,035,999 | |
| | 244,300 | | DLH Holdings Corp(a) | | | 1,492,673 | |
| | 275,000 | | Information Services | | | | |
| | | | Group, Inc.(a) | | | 1,122,000 | |
| | 205,500 | | Innodata Isogen, Inc.(a) | | | 267,150 | |
| | 80,000 | | PCM, Inc.(a) | | | 1,124,000 | |
| | 50,000 | | Transcat, Inc.(a) | | | 635,000 | |
| | 125,000 | | USA Technologies, | | | | |
| | | | Inc.(a) | | | 793,750 | |
| | 701,005 | | WidePoint Corp.(a) | | | 371,533 | |
| | | | | | | 7,686,105 | |
| Chemical & Related Products – 1.72% | | | | |
| | 320,000 | | Flexible Solutions | | | | |
| | | | International, Inc.(a) | | | 604,800 | |
| | 36,000 | | Northern Technologies | | | | |
| | | | International Corp.(a) | | | 595,800 | |
| | | | | | | 1,200,600 | |
| Chemical Manufacturing – 1.16% | | | | |
| | 200,000 | | Intrepid Potash, Inc.(a) | | | 804,000 | |
| | | | | | | 804,000 | |
| Computer & Electronic | | | | |
| Product Manufacturing – 3.60% | | | | |
| | 200,000 | | Dynatronics Corp.(a) | | | 490,000 | |
| | 940,000 | | Singing Machine | | | | |
| | | | Co., Inc.(a) | | | 394,800 | |
| | 450,000 | | Luna Innovations, Inc.(a) | | | 706,500 | |
| | 83,348 | | PAR Technology Corp.(a) | | | 911,827 | |
| | | | | | | 2,503,127 | |
| Computers & Electronics – 1.13% | | | | |
| | 70,000 | | Concurrent | | | | |
| | | | Computer Corp. | | | 429,800 | |
| | 35,000 | | Napco Security | | | | |
| | | | Technologies, Inc.(a) | | | 355,250 | |
| | | | | | | 785,050 | |
| Construction & Engineering – 6.11% | | | | |
| | 83,254 | | Gencor Industries, | | | | |
| | | | Inc.(a) | | | 1,506,897 | |
| | 150,000 | | Hill International, | | | | |
| | | | Inc.(a) | | | 795,000 | |
| | 82,000 | | Layne Christensen | | | | |
| | | | Co.(a) | | | 1,083,220 | |
| | 15,000 | | NV5 Global, Inc.(a) | | | 871,500 | |
| | | | | | | 4,256,617 | |
| Consumer Goods – 1.15% | | | | |
| | 35,000 | | MCBC Holdings, Inc.(a) | | | 800,450 | |
| | | | | | | 800,450 | |
| Consumer Products – Distributing – 1.10% | | | | |
| | 300,000 | | US Auto Parts | | | | |
| | | | Network, Inc.(a) | | | 768,000 | |
| | | | | | | 768,000 | |
| Consumer Products – Manufacturing – 1.36% | | | | |
| | 47,070 | | Cherokee, Inc.(a) | | | 105,907 | |
| | 51,095 | | Hardinge, Inc. | | | 845,111 | |
| | | | | | | 951,018 | |
| Consumer Services – 3.79% | | | | |
| | 175,000 | | Meet Group, Inc.(a) | | | 593,250 | |
| | 150,000 | | Xcel Brands, Inc.(a) | | | 480,000 | |
| | 100,000 | | ZAGG, Inc.(a) | | | 1,565,000 | |
| | | | | | | 2,638,250 | |
| Diversified Financials – 1.82% | | | | |
| | 90,000 | | Safeguard Scientifics, | | | | |
| | | | Inc.(a) | | | 1,269,000 | |
| | | | | | | 1,269,000 | |
| Electronic Equipment & Instruments – 0.89% | | | | |
| | 90,000 | | Iteris, Inc.(a) | | | 621,900 | |
| | | | | | | 621,900 | |
| Energy & Related Services – 3.01% | | | | |
| | 145,000 | | DHT Holdings, Inc.(e) | | | 571,300 | |
| | 80,000 | | Matrix Service Co.(a) | | | 1,128,000 | |
| | 121,000 | | Mitcham Industries, | | | | |
| | | | Inc.(a) | | | 394,460 | |
| | | | | | | 2,093,760 | |
The accompanying notes to financial statements are an integral part of this schedule.
Perritt Ultra MicroCap Fund
| Schedule of Investments (Continued) | October 31, 2017 |
| Shares | | | | Value | |
| Financial Services – 6.42% | | | |
| | 65,000 | | AMREP Corp.(a) | | $ | 462,150 | |
| | 35,000 | | First Internet Bancorp | | | 1,319,500 | |
| | 36,000 | | Hennessy Advisors, Inc. | | | 594,720 | |
| | 50,000 | | HopFed Bancorp, Inc. | | | 720,500 | |
| | 52,500 | | Silvercrest Asset Management | | | | |
| | | | Group, Inc. – Class A | | | 855,750 | |
| | 200,000 | | US Global Investors, Inc. | | | 522,000 | |
| | | | | | | 4,474,620 | |
| Food – 0.52% | | | | |
| | 42,400 | | Willamette Valley | | | | |
| | | | Vineyards, Inc.(a) | | | 362,944 | |
| | | | | | | 362,944 | |
| Health Care – 1.07% | | | | |
| | 122,917 | | Rockwell Medical | | | | |
| | | | Technologies, Inc.(a) | | | 744,877 | |
| | | | | | | 744,877 | |
| Industrial Goods – 1.19% | | | | |
| | 139,900 | | Hudson Technologies, | | | | |
| | | | Inc.(a) | | | 828,208 | |
| | | | | | | 828,208 | |
| Insurance – 2.91% | | | | |
| | 50,000 | | Atlas Financial | | | | |
| | | | Holdings, Inc.(a)(e) | | | 987,500 | |
| | 30,000 | | Kingstone | | | | |
| | | | Companies, Inc. | | | 486,000 | |
| | 35,000 | | United Insurance | | | | |
| | | | Holdings Corp. | | | 550,900 | |
| | | | | | | 2,024,400 | |
| Leisure – 3.73% | | | | |
| | 97,322 | | Century Casinos, Inc.(a) | | | 802,907 | |
| | 1,534,599 | | Galaxy Gaming, Inc.(a) | | | 1,795,481 | |
| | | | | | | 2,598,388 | |
| Medical Supplies & Services – 8.30% | | | | |
| | 24,500 | | Addus HomeCare | | | | |
| | | | Corp.(a) | | | 882,000 | |
| | 75,049 | | Birner Dental Management | | | | |
| | | | Services, Inc.(a) | | | 322,711 | |
| | 30,000 | | Cutera, Inc.(a) | | | 1,179,000 | |
| | 609,000 | | First Choice Healthcare | | | | |
| | | | Solutions, Inc.(a) | | | 621,058 | |
| | 498,001 | | Hooper Holmes, Inc.(a) | | | 239,040 | |
| | 50,000 | | Lakeland Industries, Inc.(a) | | | 792,500 | |
| | 70,000 | | MGC Diagnostics Corp. | | | 595,700 | |
| | 200,000 | | Sensus Healthcare, | | | | |
| | | | Inc.(a) | | | 1,150,000 | |
| | | | | | | 5,782,009 | |
| Motion Pictures – 0.91% | | | | |
| | 100,000 | | Ballantyne | | | | |
| | | | Strong, Inc.(a) | | | 636,660 | |
| | | | | | | 636,660 | |
| Oil & Gas Services – 1.32% | | | | |
| | 500,000 | | Profire Energy, Inc.(a) | | | 920,000 | |
| | | | | | | 920,000 | |
| Pharmaceuticals – 1.48% | | | | |
| | 134,300 | | ImmuCell Corp.(a) | | | 1,032,767 | |
| | | | | | | 1,032,767 | |
| Professional, Scientific, | | | | |
| and Technical Services – 4.47% | | | | |
| | 135,000 | | AutoWeb, Inc.(a) | | | 934,200 | |
| | 350,000 | | CUI Global, Inc.(a) | | | 1,088,500 | |
| | 550,000 | | FORM Holdings | | | | |
| | | | Corp.(a) | | | 671,000 | |
| | 249,640 | | Sigma Labs, Inc.(a)(d) | | | 414,402 | |
| | | | | | | 3,108,102 | |
| Real Estate Investment Trusts – 2.33% | | | | |
| | 164,199 | | Global Self Storage, Inc. | | | 766,809 | |
| | 200,000 | | Sachem Capital Corp. | | | 858,000 | |
| | | | | | | 1,624,809 | |
| Retail – 2.90% | | | | |
| | 125,000 | | Build-A-Bear | | | | |
| | | | Workshop, Inc.(a) | | | 975,000 | |
| | 500,000 | | Christopher & | | | | |
| | | | Banks Corp.(a) | | | 590,000 | |
| | 280,000 | | OurPet’s Co.(a) | | | 450,800 | |
| | | | | | | 2,015,800 | |
| Semiconductor Related Products – 1.87% | | | | |
| | 82,181 | | AXT, Inc.(a) | | | 764,283 | |
| | 40,000 | | DSP Group, Inc.(a) | | | 536,000 | |
| | | | | | | 1,300,283 | |
| Software – 4.72% | | | | |
| | 100,000 | | Asure Software, Inc.(a) | | | 1,128,000 | |
| | 100,000 | | BSQUARE Corp.(a) | | | 535,000 | |
| | 175,000 | | Evolving Systems, Inc.(a) | | | 805,000 | |
| | 200,000 | | GlobalSCAPE, Inc. | | | 810,000 | |
| | | | | | | 3,278,000 | |
The accompanying notes to financial statements are an integral part of this schedule.
Perritt Ultra MicroCap Fund
| Schedule of Investments (Continued) | October 31, 2017 |
| Shares | | | | Value | |
| Specialty Manufacturing – 11.55% | | | |
| | 150,000 | | Aspen Aerogels, Inc.(a) | | $ | 672,000 | |
| | 37,240 | | Continental | | | | |
| | | | Materials Corp.(a) | | | 716,870 | |
| | 93,500 | | CTI Industries Corp.(a) | | | 362,313 | |
| | 140,000 | | Data I/O Corp.(a) | | | 1,783,600 | |
| | 25,000 | | Hurco Companies, Inc. | | | 1,118,750 | |
| | 31,749 | | Kewaunee Scientific Corp. | | | 904,847 | |
| | 135,000 | | Pioneer Power | | | | |
| | | | Solutions, Inc.(a) | | | 1,032,750 | |
| | 170,000 | | Polar Power, Inc.(a) | | | 895,900 | |
| | 80,000 | | Tecnoglass, Inc.(e) | | | 559,200 | |
| | | | | | | 8,046,230 | |
| Telecommunications – 1.08% | | | | |
| | 629,074 | | Mobivity Holdings | | | | |
| | | | Corp.(a) | | | 754,889 | |
| | | | | | | 754,889 | |
| | | | TOTAL COMMON | | | | |
| | | | STOCKS | | | | |
| | | | (Cost $52,532,745) | | $ | 67,732,395 | |
| | | | | | | | |
| Contracts | | WARRANTS – 0.06% | | Value | |
| Professional, Scientific, and | | | | |
| Technical Services – 0.06% | | | | |
| | | | Sigma Labs, Inc. | | | | |
| | 80,000 | | Expiration: 02/15/2022, | | | | |
| | | | Exercise Price $4.00(a) | | $ | 39,200 | |
| | | | | |
| Telecommunications – 0.00% | | | | |
| | | | Mobivity Holdings Corp. | | | | |
| | 165,000 | | Expiration: | | | | |
| | | | 03/11/2019, | | | | |
| | | | Exercise Price $1.20(a)(b) | | | 0 | |
| | | | TOTAL WARRANTS | | | | |
| | | | (Cost $800) | | $ | 39,200 | |
| | | | | | | | |
| Shares | | SHORT-TERM | | Value | |
| | | | INVESTMENTS – 2.79% | | | | |
| | 1,945,900 | | Invesco Short Term | | | | |
| | | | Investments Government | | | | |
| | | | & Agency Portfolio – | | | | |
| | | | Class I 0.94%(c) | | $ | 1,945,900 | |
| | | | TOTAL SHORT-TERM | | | | |
| | | | INVESTMENTS | | | | |
| | | | (Cost $1,945,900) | | $ | 1,945,900 | |
| | | | Total Investments | | | | |
| | | | (Cost $54,479,445) – | | | | |
| | | | 100.12% | | $ | 69,717,495 | |
| | | | Liabilities in Excess of | | | | |
| | | | Other Assets – (0.12)% | | | (81,511 | ) |
| | | | TOTAL NET ASSETS – | | | | |
| | | | 100.00% | | $ | 69,635,984 | |
Percentages are stated as a percent of net assets.
(a) | Non-income producing security. |
(b) | The price for this security was derived from an estimate of fair market value using methods approved by the Fund’s Board of Directors. This security represents $0 or 0.00% of the Fund’s net assets. This security was classified as Level 2 and is considered to be illiquid. |
(c) | Variable rate security; the rate shown is the effective rate as of October 31, 2017. |
(d) | Affiliated issuer. See Note 11 of the Notes to Financial Statements. |
(e) | Foreign issued security. |
The industry classifications listed above are in accordance with Global Industry Classification Standard (GICS®), which was developed by and/or is the exclusive property of MSCI, Inc. and Standard & Poor Financial Services LLC (“S&P”).
The accompanying notes to financial statements are an integral part of this schedule.
Perritt Low Priced Stock Fund
| Schedule of Investments | October 31, 2017 |
| Shares | | COMMON STOCKS – 96.10% | | Value | |
| Administrative and Support Services – 2.08% | | | |
| | 7,100 | | Kforce, Inc. | | $ | 148,745 | |
| | | | | | | 148,745 | |
| Air Transportation – 1.41% | | | | |
| | 3,000 | | Hawaiian Holdings, | | | | |
| | | | Inc.(a) | | | 100,500 | |
| | | | | | | 100,500 | |
| Auto Parts & Equipment – 4.42% | | | | |
| | 2,500 | | Miller Industries, Inc. | | | 70,625 | |
| | 8,000 | | Modine | | | | |
| | | | Manufacturing Co.(a) | | | 168,400 | |
| | 2,500 | | Tower International, Inc. | | | 76,000 | |
| | | | | | | 315,025 | |
| Automobile Manufacturers – 1.37% | | | | |
| | 2,000 | | Winnebago | | | | |
| | | | Industries, Inc. | | | 98,300 | |
| | | | | | | 98,300 | |
| Biotechnology – 1.20% | | | | |
| | 7,000 | | Innoviva, Inc.(a) | | | 85,680 | |
| | | | | | | 85,680 | |
| Building Products – 3.76% | | | | |
| | 10,700 | | Builders | | | | |
| | | | FirstSource, Inc.(a) | | | 192,814 | |
| | 2,200 | | USG Corp.(a) | | | 75,526 | |
| | | | | | | 268,340 | |
| Business Services – 4.19% | | | | |
| | 2,000 | | Darling Ingredients, | | | | |
| | | | Inc.(a) | | | 36,500 | |
| | 25,515 | | Information Services | | | | |
| | | | Group, Inc.(a) | | | 104,101 | |
| | 10,000 | | New Media Investment | | | | |
| | | | Group, Inc. | | | 159,700 | |
| | | | | | | 300,301 | |
| Chemical & Related Products – 2.26% | | | | |
| | 4,000 | | Aceto Corp. | | | 40,280 | |
| | 11,000 | | OMNOVA | | | | |
| | | | Solutions, Inc.(a) | | | 121,550 | |
| | | | | | | 161,830 | |
| Commercial Banks – 1.07% | | | | |
| | 2,900 | | Veritex Holdings, | | | | |
| | | | Inc.(a) | | | 76,444 | |
| | | | | | | 76,444 | |
| Commercial Services & Supplies – 2.73% | | | | |
| | 10,000 | | ACCO Brands Corp.(a) | | | 130,500 | |
| | 6,000 | | InnerWorkings, Inc.(a) | | | 65,280 | |
| | | | | | | 195,780 | |
| Communications Equipment – 2.35% | | | | |
| | 9,000 | | Extreme Networks, | | | | |
| | | | Inc.(a) | | | 108,000 | |
| | 7,000 | | Mitel Networks | | | | |
| | | | Corp.(a)(c) | | | 60,130 | |
| | | | | | | 168,130 | |
| Construction & Engineering – 5.85% | | | | |
| | 4,000 | | Chicago Bridge & | | | | |
| | | | Iron Co. N.V.(c) | | | 55,760 | |
| | 9,000 | | Gencor Industries, | | | | |
| | | | Inc.(a) | | | 162,900 | |
| | 20,000 | | Hill International, | | | | |
| | | | Inc.(a) | | | 106,000 | |
| | 5,000 | | IES Holdings, | | | | |
| | | | Inc.(a) | | | 93,500 | |
| | | | | | | 418,160 | |
| Consumer Services – 2.10% | | | | |
| | 8,000 | | Primo Water Corp.(a) | | | 88,080 | |
| | 4,000 | | ZAGG, Inc.(a) | | | 62,600 | |
| | | | | | | 150,680 | |
| Credit Intermediation | | | | |
| and Related Activities – 4.14% | | | | |
| | 7,000 | | FNB Corp. | | | 94,430 | |
| | 6,000 | | Investors Bancorp, Inc. | | | 82,500 | |
| | 13,000 | | United Community | | | | |
| | | | Financial Corp. | | | 119,990 | |
| | | | | | | 296,920 | |
| Electronic Equipment & Instruments – 3.64% | | | | |
| | 3,000 | | Orbotech Ltd.(a)(c) | | | 134,160 | |
| | 8,000 | | TTM Technologies, | | | | |
| | | | Inc.(a) | | | 126,241 | |
| | | | | | | 260,401 | |
| Electronic Manufacturing Services – 1.44% | | | | |
| | 4,000 | | KEMET Corp.(a) | | | 102,760 | |
| | | | | | | 102,760 | |
| Energy & Related Services – 2.15% | | | | |
| | 10,000 | | McDermott International, | | | | |
| | | | Inc.(a)(c) | | | 66,200 | |
The accompanying notes to financial statements are an integral part of this schedule.
Perritt Low Priced Stock Fund
| Schedule of Investments (Continued) | October 31, 2017 |
| Shares | | | | Value | |
| Energy & Related Services (Continued) | | | |
| | 10,000 | | Newpark Resources, | | | |
| | | | Inc.(a) | | $ | 87,500 | |
| | | | | | | 153,700 | |
| Fabricated Metal Product Manufacturing – 1.11% | | | | |
| | 5,000 | | NCI Building Systems, | | | | |
| | | | Inc.(a) | | | 79,750 | |
| | | | | | | 79,750 | |
| Financial Services – 1.66% | | | | |
| | 3,000 | | B of I Holding, Inc.(a) | | | 80,700 | |
| | 1,000 | | First Internet Bancorp | | | 37,700 | |
| | | | | | | 118,400 | |
| Gold – 1.12% | | | | |
| | 3,500 | | Kirkland Lake | | | | |
| | | | Gold Ltd.(c) | | | 41,195 | |
| | 20,000 | | McEwen Mining, Inc. | | | 38,800 | |
| | | | | | | 79,995 | |
| Health Care – 0.85% | | | | |
| | 10,000 | | Rockwell Medical, | | | | |
| | | | Inc.(a) | | | 60,600 | |
| | | | | | | 60,600 | |
| Health Care Equipment – 1.33% | | | | |
| | 3,000 | | Globus Medical, Inc.(a) | | | 95,610 | |
| | | | | | | 95,610 | |
| Health Care Providers & Services – 1.04% | | | | |
| | 3,900 | | Select Medical Holdings | | | | |
| | | | Corp.(a) | | | 74,685 | |
| | | | | | | 74,685 | |
| Health Care Services – 1.53% | | | | |
| | 8,000 | | Cross Country Healthcare, | | | | |
| | | | Inc.(a) | | | 109,200 | |
| | | | | | | 109,200 | |
| Hotels, Resorts & Cruise Lines – 0.43% | | | | |
| | 3,000 | | Playa Hotels & | | | | |
| | | | Resorts N.V.(a)(c) | | | 30,990 | |
| | | | | | | 30,990 | |
| Household Durables – 1.04% | | | | |
| | 4,000 | | Lifetime Brands, Inc. | | | 74,600 | |
| | | | | | | 74,600 | |
| Industrial Goods – 1.24% | | | | |
| | 15,000 | | Hudson Technologies, | | | | |
| | | | Inc.(a) | | | 88,800 | |
| | | | | | | 88,800 | |
| Insurance – 2.11% | | | | |
| | 6,300 | | CNO Financial Group, | | | | |
| | | | Inc. | | | 151,011 | |
| | | | | | | 151,011 | |
| Internet Software & Services – 1.27% | | | | |
| | 4,000 | | Carbonite, Inc.(a) | | | 90,800 | |
| | | | | | | 90,800 | |
| IT Consulting – 1.09% | | | | |
| | 4,000 | | Perficient, Inc.(a) | | | 77,800 | |
| | | | | | | 77,800 | |
| Leisure – 1.43% | | | | |
| | 3,000 | | Nautilus, Inc.(a) | | | 39,000 | |
| | 4,000 | | Reading International, | | | | |
| | | | Inc.(a) | | | 62,600 | |
| | | | | | | 101,600 | |
| Machinery Manufacturing – 1.31% | | | | |
| | 3,000 | | Nova Measuring | | | | |
| | | | Instruments Ltd.(a)(c) | | | 93,780 | |
| | | | | | | 93,780 | |
| Medical Supplies & Services – 2.20% | | | | |
| | 3,600 | | AMN Healthcare | | | | |
| | | | Services, Inc.(a) | | | 158,040 | |
| | | | | | | 158,040 | |
| Movies & Entertainment – 0.87% | | | | |
| | 4,500 | | AMC Entertainment | | | | |
| | | | Holdings, Inc. | | | 62,550 | |
| | | | | | | 62,550 | |
| Oil & Gas Equipment & Services – 0.85% | | | | |
| | 2,000 | | US Silica Holdings, Inc. | | | 61,020 | |
| | | | | | | 61,020 | |
| Paper Products – 1.03% | | | | |
| | 5,000 | | Mercer International, | | | | |
| | | | Inc. | | | 73,500 | |
| | | | | | | 73,500 | |
| Pharmaceuticals – 1.70% | | | | |
| | 1,900 | | Cambrex Corp.(a) | | | 82,175 | |
| | 2,000 | | Corcept Therapeutics, | | | | |
| | | | Inc.(a) | | | 39,380 | |
| | | | | | | 121,555 | |
| Real Estate Investment Trusts – 1.48% | | | | |
| | 8,000 | | Medical Properties | | | | |
| | | | Trust, Inc. | | | 105,840 | |
| | | | | | | 105,840 | |
The accompanying notes to financial statements are an integral part of this schedule.
Perritt Low Priced Stock Fund
| Schedule of Investments (Continued) | October 31, 2017 |
| Shares | | | | Value | |
| Regional Banks – 1.29% | | | |
| | 5,000 | | First Foundation, | | | |
| | | | Inc.(a) | | $ | 92,550 | |
| | | | | | | 92,550 | |
| Research & Consulting Services – 0.31% | | | | |
| | 5,000 | | Acacia Research | | | | |
| | | | Corp.(a) | | | 22,500 | |
| | | | | | | 22,500 | |
| Semiconductor Equipment – 3.69% | | | | |
| | 5,000 | | Cohu, Inc. | | | 129,000 | |
| | 4,000 | | FormFactor, Inc.(a) | | | 72,800 | |
| | 2,000 | | Ichor Holdings Ltd(a)(c) | | | 62,380 | |
| | | | | | | 264,180 | |
| Semiconductor Related Products – 6.23% | | | | |
| | 3,000 | | Entegris, Inc.(a) | | | 98,250 | |
| | 6,000 | | Kulicke & Soffa | | | | |
| | | | Industries, Inc.(a) | | | 135,900 | |
| | 12,000 | | Oclaro, Inc.(a) | | | 99,240 | |
| | 11,600 | | Photronics, Inc.(a) | | | 112,520 | |
| | | | | | | 445,910 | |
| Semiconductors – 1.32% | | | | |
| | 3,000 | | SMART Global | | | | |
| | | | Holdings, Inc.(a)(c) | | | 94,110 | |
| | | | | | | 94,110 | |
| Silver – 0.42% | | | | |
| | 4,000 | | Coeur Mining, Inc.(a) | | | 30,360 | |
| | | | | | | 30,360 | |
| Software – 2.39% | | | | |
| | 10,000 | | American Software, Inc. | | | 124,100 | |
| | 9,700 | | Zix Corp.(a) | | | 47,045 | |
| | | | | | | 171,145 | |
| Specialty Chemicals – 2.66% | | | | |
| | 8,000 | | Ferro Corp.(a) | | | 190,560 | |
| | | | | | | 190,560 | |
| Specialty Manufacturing – 3.46% | | | | |
| | 1,000 | | Fox Factory | | | | |
| | | | Holding Corp.(a) | | | 42,550 | |
| | 4,500 | | Mueller Water | | | | |
| | | | Products, Inc. | | | 53,730 | |
| | 12,000 | | Tecnoglass, Inc.(c) | | | 83,880 | |
| | 3,000 | | Wabash National Corp. | | | 67,500 | |
| | | | | | | 247,660 | |
| Specialty Stores – 0.65% | | | | |
| | 2,500 | | MarineMax, Inc.(a) | | | 46,375 | |
| | | | | | | 46,375 | |
| Telecommunications – 0.64% | | | | |
| | 2,000 | | CalAmp Corp.(a) | | | 45,460 | |
| | | | | | | 45,460 | |
| Trucking – 0.19% | | | | |
| | 1,000 | | Daseke, Inc.(a) | | | 13,830 | |
| | | | | | | 13,830 | |
| | | | TOTAL COMMON | | | | |
| | | | STOCKS | | | | |
| | | | (Cost $5,524,488) | | $ | 6,876,462 | |
| | | | | | | | |
| Shares | | SHORT-TERM | | Value | |
| | | | INVESTMENTS – 3.83% | | | | |
| | 274,050 | | Invesco Short Term | | | | |
| | | | Investments Government | | | | |
| | | | & Agency Portfolio – | | | | |
| | | | Class I 0.94%(b) | | $ | 274,050 | |
| | | | TOTAL SHORT-TERM | | | | |
| | | | INVESTMENTS | | | | |
| | | | (Cost $274,050) | | $ | 274,050 | |
| | | | Total Investments | | | | |
| | | | (Cost $5,798,538) – | | | | |
| | | | 99.93% | | | 7,150,512 | |
| | | | Other Assets in Excess | | | | |
| | | | of Liabilities – 0.07% | | | 5,094 | |
| | | | TOTAL NET ASSETS – | | | | |
| | | | 100.00% | | $ | 7,155,606 | |
Percentages are stated as a percent of net assets.
ADR American Depositary Receipt
(a) | Non-income producing security. |
(b) | Variable rate security; the rate shown is the effective rate as of October 31, 2017. |
(c) | Foreign issued security. |
The industry classifications listed above are in accordance with Global Industry Classification Standard (GICS®), which was developed by and/or is the exclusive property of MSCI, Inc. and Standard & Poor Financial Services LLC (“S&P”).
The accompanying notes to financial statements are an integral part of this schedule.
Perritt Funds, Inc.
| Statements of Assets and Liabilities |
October 31, 2017
| | | Perritt MicroCap | | | Perritt Ultra | | | Perritt Low | |
| | | Opportunities Fund | | | MicroCap Fund | | | Priced Stock Fund | |
| Assets: | | | | | | | | | |
| Investments in unaffiliated securities, | | | | | | | | | |
| at value | | $ | 224,070,095 | | | $ | 69,303,093 | | | $ | 7,150,512 | |
| Investments in affiliated securities, | | | | | | | | | | | | |
| at value | | | — | | | | 414,402 | | | | — | |
| Receivable for investments sold | | | 2,830,039 | | | | — | | | | 35,410 | |
| Dividends and interest receivable | | | 14,755 | | | | 2,873 | | | | 578 | |
| Prepaid expenses | | | 15,992 | | | | 12,487 | | | | 6,267 | |
| Receivable for fund shares issued | | | 17,116 | | | | 140,988 | | | | 70,096 | |
| Total Assets | | | 226,947,997 | | | | 69,873,843 | | | | 7,262,863 | |
| Liabilities: | | | | | | | | | | | | |
| Payable for investments purchased | | | 849,860 | | | | 86,497 | | | | 76,178 | |
| Payable for fund shares purchased | | | 347,616 | | | | 7,628 | | | | 2,600 | |
| Payable to Officer & directors | | | 26,118 | | | | 28,615 | | | | — | |
| Payable to Advisor | | | 192,073 | | | | 74,288 | | | | 5,422 | |
| Accrued expenses & other liabilities | | | 87,643 | | | | 40,831 | | | | 23,057 | |
| Total Liabilities | | | 1,503,310 | | | | 237,859 | | | | 107,257 | |
| Net Assets | | $ | 225,444,687 | | | $ | 69,635,984 | | | $ | 7,155,606 | |
| Net Assets Consist of: | | | | | | | | | | | | |
| Capital Stock | | $ | 103,187,573 | | | $ | 47,501,608 | | | $ | 5,413,898 | |
| Accumulated net | | | | | | | | | | | | |
| investment income (loss) | | | — | | | | (364,335 | ) | | | — | |
| Accumulated undistributed net realized | | | | | | | | | | | | |
| gain on investments sold | | | 45,765,766 | | | | 7,260,661 | | | | 389,734 | |
| Net unrealized appreciation | | | | | | | | | | | | |
| on investments | | | 76,491,348 | | | | 15,238,050 | | | | 1,351,974 | |
| Total Net Assets | | $ | 225,444,687 | | | $ | 69,635,984 | | | $ | 7,155,606 | |
| Capital Stock, $0.0001 par value | | | | | | | | | | | | |
| Authorized | | | 100,000,000 | | | | 100,000,000 | | | | 100,000,000 | |
| Outstanding | | | 5,841,556 | | | | 3,765,271 | | | | 358,662 | |
| Net Assets | | $ | 225,444,687 | | | $ | 69,635,984 | | | $ | 7,155,606 | |
| Net asset value and | | | | | | | | | | | | |
| offering price per share | | $ | 38.59 | | | $ | 18.49 | | | $ | 19.95 | |
| Cost of Unaffiliated Securities | | $ | 147,578,747 | | | $ | 53,680,697 | | | $ | 5,798,538 | |
| Cost of Affiliated Securities | | | — | | | | 798,748 | | | | — | |
The accompanying notes to financial statements are an integral part of these statements.
Perritt Funds, Inc.
For the Year Ended October 31, 2017
| | | Perritt MicroCap | | | Perritt Ultra | | | Perritt Low | |
| | | Opportunities Fund | | | MicroCap Fund | | | Priced Stock Fund | |
| Investment Income: | | | | | | | | | |
| Dividend Income from | | | | | | | | | |
| Unaffiliated Securities | | $ | 2,017,886 | | | $ | 372,372 | | | $ | 49,891 | |
| Less: Foreign taxes withheld | | | | | | | | | | | | |
| and issuance fees | | | — | | | | — | | | | (2 | ) |
| Interest income | | | 83,479 | | | | 21,192 | | | | 1,835 | |
| Total investment income | | | 2,101,365 | | | | 393,564 | | | | 51,724 | |
| Expenses: | | | | | | | | | | | | |
| Investment advisory fee | | | 2,566,328 | | | | 774,816 | | | | 66,079 | |
| Shareholder servicing | | | 201,472 | | | | 76,189 | | | | 27,282 | |
| Administration fee | | | 122,401 | | | | 29,510 | | | | 6,099 | |
| Fund accounting expenses | | | 86,023 | | | | 22,926 | | | | 5,201 | |
| Officer & directors’ fees & expenses | | | 75,000 | | | | 75,000 | | | | 17,250 | |
| Professional fees | | | 29,248 | | | | 28,316 | | | | 25,296 | |
| Federal & state registration fees | | | 17,020 | | | | 23,092 | | | | 16,847 | |
| Printing & mailing fees | | | 29,665 | | | | 13,183 | | | | 6,825 | |
| Custodian fees | | | 17,089 | | | | 7,633 | | | | 2,273 | |
| Other expense | | | 19,823 | | | | 4,742 | | | | 2,238 | |
| Total expenses | | | 3,164,069 | | | | 1,055,407 | | | | 175,390 | |
| Less contractual waiver | | | — | | | | — | | | | (66,290 | ) |
| Less voluntary waiver | | | — | | | | — | | | | (17,250 | ) |
| Total expenses net of waivers | | | 3,164,069 | | | | 1,055,407 | | | | 91,850 | |
| Net investment loss | | | (1,062,704 | ) | | | (661,843 | ) | | | (40,126 | ) |
| | | | | | | | | | | | | |
| Realized and Unrealized | | | | | | | | | | | | |
| Gain on Investments: | | | | | | | | | | | | |
| Net realized gain on securities on: | | | | | | | | | | | | |
| Unaffiliated securities | | | 46,860,920 | | | | 7,563,499 | | | | 602,089 | |
| Affiliated securities | | | — | | | | — | | | | — | |
| Net change in unrealized appreciation | | | | | | | | | | | | |
| on investments of: | | | | | | | | | | | | |
| Unaffiliated securities | | | 9,414,458 | | | | 7,113,946 | | | | 1,057,916 | |
| Affiliated securities | | | — | | | | (384,346 | ) | | | — | |
| Net realized and unrealized | | | | | | | | | | | | |
| gain on investments | | | 56,275,378 | | | | 14,293,099 | | | | 1,660,005 | |
| Net increase in net assets | | | | | | | | | | | | |
| resulting from operations | | $ | 55,212,674 | | | $ | 13,631,256 | | | $ | 1,619,879 | |
The accompanying notes to financial statements are an integral part of these statements.
Perritt MicroCap Opportunities Fund
| Statements of Changes in Net Assets |
| | | For the | | | For the | |
| | | Year Ended | | | Year Ended | |
| | | October 31, 2017 | | | October 31, 2016 | |
| Operations: | | | | | | |
| Net investment income/(loss) | | $ | (1,062,704 | ) | | $ | 1,196,284 | |
| Net realized gain on investments | | | 46,860,920 | | | | 24,942,608 | |
| Net increase/decrease in unrealized | | | | | | | | |
| appreciation/(depreciation) on investments | | | 9,414,458 | | | | (13,260,520 | ) |
| Net increase in net assets resulting from operations | | | 55,212,674 | | | | 12,878,372 | |
| Dividends and Distributions to Shareholders: | | | | | | | | |
| Net investment income | | | (614,595 | ) | | | — | |
| Net realized gains | | | (24,942,672 | ) | | | (6,027,092 | ) |
| Total dividends and distributions | | | (25,557,267 | ) | | | (6,027,092 | ) |
| Capital Share Transactions: | | | | | | | | |
| Proceeds from shares issued | | | 21,713,650 | | | | 17,649,843 | |
| Reinvestment of distributions | | | 24,470,175 | | | | 5,597,737 | |
| Cost of shares redeemed | | | (112,669,167 | ) | | | (140,602,491 | ) |
| Redemption fees | | | 7,011 | | | | 3,662 | |
| Net decrease in net assets | | | | | | | | |
| from capital share transactions | | | (66,478,331 | ) | | | (117,351,249 | ) |
| Total Decrease in Net Assets | | | (36,822,924 | ) | | | (110,499,969 | ) |
| Net Assets | | | | | | | | |
| Beginning of the period | | | 262,267,611 | | | | 372,767,580 | |
| End of the period | | $ | 225,444,687 | | | $ | 262,267,611 | |
| Accumulated net investment income | | $ | — | | | $ | 648,016 | |
| Capital Share Transactions: | | | | | | | | |
| Shares sold | | | 609,471 | | | | 558,788 | |
| Shares issued on reinvestment of distributions | | | 720,748 | | | | 175,039 | |
| Shares redeemed | | | (3,160,870 | ) | | | (4,525,350 | ) |
| Net decrease from capital share transactions | | | (1,830,651 | ) | | | (3,791,523 | ) |
The accompanying notes to financial statements are an integral part of this statement.
Perritt Ultra MicroCap Fund
| Statements of Changes in Net Assets |
| | | For the | | | For the | |
| | | Year Ended | | | Year Ended | |
| | | October 31, 2017 | | | October 31, 2016 | |
| Operations: | | | | | | |
| Net investment income/(loss) | | $ | (661,843 | ) | | $ | 252,619 | |
| Net realized gain on investments | | | 7,563,499 | | | | 2,738,172 | |
| Net increase in unrealized | | | | | | | | |
| appreciation on investments | | | 6,729,600 | | | | 1,533,943 | |
| Net increase in net assets resulting from operations | | | 13,631,256 | | | | 4,524,734 | |
| Dividends and Distributions to Shareholders: | | | | | | | | |
| Net realized gains | | | (2,587,145 | ) | | | (866,370 | ) |
| Total dividends and distributions | | | (2,587,145 | ) | | | (866,370 | ) |
| Capital Share Transactions: | | | | | | | | |
| Proceeds from shares issued | | | 15,342,310 | | | | 6,812,555 | |
| Reinvestment of distributions | | | 2,426,585 | | | | 816,702 | |
| Cost of shares redeemed | | | (13,525,515 | ) | | | (17,008,387 | ) |
| Redemption fees | | | 12,098 | | | | 3,747 | |
| Net increase/(decrease) in net assets | | | | | | | | |
| from capital share transactions | | | 4,255,478 | | | | (9,375,383 | ) |
| Total Increase/(Decrease) in Net Assets | | | 15,299,589 | | | | (5,717,019 | ) |
| Net Assets | | | | | | | | |
| Beginning of the period | | | 54,336,395 | | | | 60,053,414 | |
| End of the period | | $ | 69,635,984 | | | $ | 54,336,395 | |
| Accumulated net investment loss | | $ | (364,335 | ) | | $ | — | |
| Capital Share Transactions: | | | | | | | | |
| Shares sold | | | 912,976 | | | | 474,399 | |
| Shares issued on reinvestment of distributions | | | 157,163 | | | | 58,336 | |
| Shares redeemed | | | (819,460 | ) | | | (1,192,850 | ) |
| Net increase/(decrease) from capital share transactions | | | 250,679 | | | | (660,115 | ) |
The accompanying notes to financial statements are an integral part of this statement.
Perritt Low Priced Stock Fund
| Statements of Changes in Net Assets |
| | | For the | | | For the | |
| | | Year Ended | | | Year Ended | |
| | | October 31, 2017 | | | October 31, 2016 | |
| Operations: | | | | | | |
| Net investment loss | | $ | (40,126 | ) | | $ | (14,667 | ) |
| Net realized gain/(loss) on investments | | | 602,089 | | | | (2,687 | ) |
| Net increase in unrealized appreciation on investments | | | 1,057,916 | | | | 85,475 | |
| Net increase in net assets resulting from operations | | | 1,619,879 | | | | 68,121 | |
| Capital Share Transactions: | | | | | | | | |
| Proceeds from shares issued | | | 2,202,538 | | | | 1,698,859 | |
| Cost of shares redeemed | | | (2,367,256 | ) | | | (679,718 | ) |
| Redemption fees | | | 345 | | | | 541 | |
| Net increase/(decrease) in net assets | | | | | | | | |
| from capital share transactions | | | (164,373 | ) | | | 1,019,682 | |
| Total Increase in Net Assets | | | 1,455,506 | | | | 1,087,803 | |
| Net Assets | | | | | | | | |
| Beginning of the period | | | 5,700,100 | | | | 4,612,297 | |
| End of the period | | $ | 7,155,606 | | | $ | 5,700,100 | |
| Accumulated net investment loss | | $ | — | | | $ | (12,968 | ) |
| Capital Share Transactions: | | | | | | | | |
| Shares sold | | | 123,609 | | | | 112,864 | |
| Shares redeemed | | | (131,452 | ) | | | (46,121 | ) |
| Net increase/(decrease) from capital share transactions | | | (7,843 | ) | | | 66,743 | |
The accompanying notes to financial statements are an integral part of this statement.
Perritt MicroCap Opportunities Fund
For a Fund share outstanding throughout the year
| | | For the Years Ended October 31, | |
| | | 2017 | | | 2016 | | | 2015 | | | 2014 | | | 2013 | |
| Net asset value, beginning of year | | $ | 34.18 | | | $ | 32.52 | | | $ | 36.00 | | | $ | 37.38 | | | $ | 26.47 | |
| Income/(loss) from investment operations: | | | | | | | | | | | | | | | | | | | | |
Net investment income/(loss)2 | | | (0.15 | ) | | | 0.13 | | | | 0.04 | | | | (0.18 | ) | | | (0.06 | ) |
| Net realized and unrealized | | | | | | | | | | | | | | | | | | | | |
| gain/(loss) on investments | | | 7.94 | | | | 2.06 | | | | (1.10 | ) | | | 2.29 | | | | 11.21 | |
| Total from investment operations | | | 7.79 | | | | 2.19 | | | | (1.06 | ) | | | 2.11 | | | | 11.15 | |
| Less dividends and distributions: | | | | | | | | | | | | | | | | | | | | |
| From net investment income | | | (0.09 | ) | | | — | | | | — | | | | — | | | | (0.24 | ) |
| Distributions from net realized gains | | | (3.29 | ) | | | (0.53 | ) | | | (2.42 | ) | | | (3.49 | ) | | | — | |
| Total dividends and distributions | | | (3.38 | ) | | | (0.53 | ) | | | (2.42 | ) | | | (3.49 | ) | | | (0.24 | ) |
Redemption fees2,3 | | | — | | | | — | | | | — | | | | — | | | | — | |
| Net asset value, end of year | | $ | 38.59 | | | $ | 34.18 | | | $ | 32.52 | | | $ | 36.00 | | | $ | 37.38 | |
Total return1 | | | 24.20 | % | | | 6.85 | % | | | (3.07 | )% | | | 6.17 | % | | | 42.46 | % |
| Supplemental data and ratios: | | | | | | | | | | | | | | | | | | | | |
| Net assets, end of year (in thousands) | | $ | 225,445 | | | $ | 262,268 | | | $ | 372,768 | | | $ | 462,716 | | | $ | 463,469 | |
| Ratio of net expenses to average net assets | | | 1.23 | % | | | 1.23 | % | | | 1.21 | % | | | 1.19 | % | | | 1.22 | % |
| Ratio of net investment income/(loss) | | | | | | | | | | | | | | | | | | | | |
| to average net assets | | | (0.41 | %) | | | 0.41 | % | | | 0.12 | % | | | (0.51 | %) | | | (0.20 | %) |
| Portfolio turnover rate | | | 18.0 | % | | | 6.2 | % | | | 20.7 | % | | | 29.1 | % | | | 41.4 | % |
1 | Total return reflects reinvested dividends but does not reflect the impact of taxes. |
2 | Net investment income (loss) and redemption fees per share has been calculated based on average shares outstanding during the period. |
3 | Amount is less than $0.01 per share. |
The accompanying notes to financial statements are an integral part of this schedule.
Perritt Ultra MicroCap Fund
For a Fund share outstanding throughout the year
| | | For the Years Ended October 31, | |
| | | 2017 | | | 2016 | | | 2015 | | | 2014 | | | 2013 | |
| Net asset value, beginning of year | | $ | 15.46 | | | $ | 14.39 | | | $ | 16.79 | | | $ | 16.23 | | | $ | 11.50 | |
| Income/(loss) from investment operations: | | | | | | | | | | | | | | | | | | | | |
Net investment income/(loss)2 | | | (0.18 | ) | | | 0.07 | | | | (0.06 | ) | | | (0.19 | ) | | | (0.15 | ) |
| Net realized and unrealized | | | | | | | | | | | | | | | | | | | | |
| gain/(loss) on investments | | | 3.94 | | | | 1.22 | | | | (0.06 | ) | | | 1.12 | | | | 4.88 | |
| Total from investment operations | | | 3.76 | | | | 1.29 | | | | (0.12 | ) | | | 0.93 | | | | 4.73 | |
| Less dividends and distributions: | | | | | | | | | | | | | | | | | | | | |
| Distributions from net realized gains | | | (0.73 | ) | | | (0.22 | ) | | | (2.29 | ) | | | (0.39 | ) | | | — | |
| Total dividends and distributions | | | (0.73 | ) | | | (0.22 | ) | | | (2.29 | ) | | | (0.39 | ) | | | — | |
Redemption fees2 | | | — | 3 | | | — | 3 | | | 0.01 | | | | 0.02 | | | | — | 3 |
| Net asset value, end of year | | $ | 18.49 | | | $ | 15.46 | | | $ | 14.39 | | | $ | 16.79 | | | $ | 16.23 | |
Total return1 | | | 25.27 | % | | | 9.11 | % | | | (0.82 | %) | | | 5.96 | % | | | 41.13 | % |
| Supplemental data and ratios: | | | | | | | | | | | | | | | | | | | | |
| Net assets, end of year (in thousands) | | $ | 69,636 | | | $ | 54,336 | | | $ | 60,053 | | | $ | 67,571 | | | $ | 82,000 | |
| Ratio of net expenses to average net assets | | | 1.70 | % | | | 1.77 | % | | | 1.75 | % | | | 1.56 | % | | | 1.75 | % |
| Ratio of net investment income/(loss) | | | | | | | | | | | | | | | | | | | | |
| to average net assets | | | (1.07 | %) | | | 0.48 | % | | | (0.43 | %) | | | (1.06 | %) | | | (1.14 | %) |
| Portfolio turnover rate | | | 43.0 | % | | | 18.1 | % | | | 30.1 | % | | | 64.2 | % | | | 33.9 | % |
1 | Total return reflects reinvested dividends but does not reflect the impact of taxes. |
2 | Net investment income (loss) and redemption fees per share has been calculated based on average shares outstanding during the period. |
3 | Amount is less than $0.01 per share. |
The accompanying notes to financial statements are an integral part of this schedule.
Perritt Low Priced Stock Fund
For a Fund share outstanding throughout the year/period
| | | | | | | | | | | | For the | |
| | | | | | | | | | | | Period From | |
| | | | | | | | | | | | February 28, 20144 | |
| | | For the Years Ended October 31, | | | to October 31, | |
| | | 2017 | | | 2016 | | | 2015 | | | 2014 | |
| Net asset value, beginning of year/period | | $ | 15.55 | | | $ | 15.39 | | | $ | 14.15 | | | $ | 15.00 | |
| Income/(loss) from investment operations: | | | | | | | | | | | | | | | | |
Net investment loss2 | | | (0.11 | ) | | | (0.04 | ) | | | (0.01 | ) | | | (0.06 | ) |
| Net realized and unrealized | | | | | | | | | | | | | | | | |
| gain (loss) on investments | | | 4.51 | | | | 0.20 | | | | 1.25 | | | | (0.79 | ) |
| Total from investment operations | | | 4.40 | | | | 0.16 | | | | 1.24 | | | | (0.85 | ) |
Redemption fees2,3 | | | — | | | | — | | | | — | | | | — | |
| Net asset value, end of year/period | | $ | 19.95 | | | $ | 15.55 | | | $ | 15.39 | | | $ | 14.15 | |
Total return1,7 | | | 28.28 | % | | | 1.04 | % | | | 8.76 | % | | | (5.67 | %) |
| Supplemental data and ratios: | | | | | | | | | | | | | | | | |
| Net assets, end of year/period | | | | | | | | | | | | | | | | |
| (in thousands) | | $ | 7,156 | | | $ | 5,700 | | | $ | 4,612 | | | $ | 2,090 | |
| Ratio of net expenses | | | | | | | | | | | | | | | | |
| to average net assets | | | 1.39 | % | | | 1.39 | % | | | 1.49 | %7 | | | 1.50 | %5 |
| Ratio of net investment loss | | | | | | | | | | | | | | | | |
| to average net assets | | | (0.61 | %) | | | (0.28 | %) | | | (0.08 | %) | | | (0.67 | %)5 |
| Ratio of expenses (prior to | | | | | | | | | | | | | | | | |
| reimbursement) to average net assets | | | 2.65 | % | | | 3.25 | % | | | 4.90 | % | | | 7.15 | %5 |
| Ratio of net investment loss (prior to | | | | | | | | | | | | | | | | |
| reimbursement) to average net assets | | | (1.87 | %) | | | (2.14 | %) | | | (3.49 | %) | | | (6.32 | %)5 |
| Portfolio turnover rate | | | 75.0 | % | | | 62.7 | % | | | 76.6 | % | | | 49.0 | %6 |
1 | Total return reflects reinvested dividends but does not reflect the impact of taxes. |
2 | Net investment income (loss) and redemption fees per share has been calculated based on average shares outstanding during the period. |
3 | Amount is less than $0.01 per share. |
4 | Commencement of operations. |
5 | Annualized for periods less than one year. |
6 | Not annualized for periods less than one year. |
7 | Effective October 1, 2015, the Advisor expense limit was reduced from 1.50% to 1.39%. See Note 4. |
The accompanying notes to financial statements are an integral part of this schedule.
Perritt Funds, Inc.
| Notes to Financial Statements |
October 31, 2017
| 1. | Organization |
| | Perritt Funds, Inc. (the “Corporation”) was organized on March 19, 2004 as a Maryland corporation and is registered under the Investment Company Act of 1940, as amended (the “1940 Act”), as an open-end investment company, with each series below being a diversified fund. The Corporation currently consists of the following series: Perritt MicroCap Opportunities Fund (“MicroCap Fund”), Perritt Ultra MicroCap Fund (“Ultra MicroCap Fund”) and Perritt Low Priced Stock Fund (“Low Priced Stock Fund”) (each, a “Fund,” and collectively, the “Funds”). Perritt MicroCap Opportunities Fund, Inc., the predecessor to the MicroCap Fund, commenced operations on April 11, 1988. As part of a plan of reorganization, on February 28, 2013, Perritt MicroCap Opportunities Fund, Inc. merged into the MicroCap Fund, a series within the Corporation. The Perritt Low Priced Stock Fund commenced operations on February 28, 2014. The MicroCap Fund’s investment objective is to invest in mainly common stocks of companies with market capitalizations that are below $500 million at the time of the initial purchase. The Ultra MicroCap Fund’s investment objective is to invest in mainly common stocks of companies with market capitalizations that are below $300 million at the time of the initial purchase. The Low Priced Stock Fund’s investment objective is to invest mainly in common stocks of companies with market capitalization that are below $3 billion and traded at or below $15 per share at the time of initial purchase. The Funds are each an investment company and accordingly follow the investment company accounting and reporting guidance of the Financial Accounting Standards Board (“FASB”) Accounting Standards Codification Topic 946 “Financial Services – Investment Companies.” |
| 2. | Summary of Significant Accounting Policies |
| | a. | Exchange-listed securities are generally valued at the last sales price reported by the principal security exchange on which the security is traded, or if no sale is reported, the mean between the latest bid and ask price unless the Funds’ investment advisor believes that the mean does not represent a fair value, in which case the securities are fair valued as set forth below. Securities listed on NASDAQ are valued at the NASDAQ Official Closing Price. Demand notes, commercial paper, U.S. Treasury Bills and warrants are stated at fair value using market prices if available, or a pricing service when such prices are believed to reflect fair value. Money market funds are valued at net asset value. Securities for which market quotations are not readily available are valued at their fair value as determined in good faith by the Funds’ advisor under procedures established by and under the supervision of the Board of Directors of the Funds. The Funds’ fair value procedures allow for the use of certain methods performed by the Funds’ advisor to value those securities for which market quotations are not readily available, at a price that a Fund might reasonably expect to receive upon a sale of such securities. For example, these methods may be based on a multiple of earnings, or a discount from market of a similar freely traded security, or a yield to maturity with respect to debt issues, or a combination of these and other methods. |
| | b. | Net realized gains and losses on securities are computed using the first-in, first-out method. |
Perritt Funds, Inc.
| Notes to Financial Statements (Continued) |
| | c. | Dividend income is recognized on the ex-dividend date, and interest income is recognized on the accrual basis. Withholding taxes on foreign dividends and capital gains, which are included as a component of net investment income and realized gain (loss) on investments, respectively, have been provided for in accordance with the Funds’ understanding of the applicable country’s tax rules and rates. Discounts and premiums on securities purchased are amortized over the life of the respective securities using the interest method. Distributions received from real estate investment trusts (“REITs”) are classified as investment income or realized gains based on the U.S. income tax characteristics of the distribution. Return of capital distributions received from REIT securities and partnerships are recorded as an adjustment to the cost of the security and thus may impact unrealized or realized gains or losses on the security. Investment and shareholder transactions are recorded on the trade date. |
| | d. | Each Fund is charged for those expenses that are directly attributable to it. Expenses that are not readily identifiable to a specific Fund are generally allocated among the Funds in proportion to the relative net assets of the Funds. |
| | e. | Provision has not been made for federal income tax since the Funds have each elected to be taxed as a “regulated investment company” and intend to distribute substantially all income to their shareholders and otherwise comply with the provisions of the Internal Revenue Code applicable to regulated investment companies. |
| | f. | The preparation of financial statements in conformity with accounting principles generally accepted in the United States of America (“GAAP”) requires management to make estimates and assumptions that affect the reported amounts of assets and liabilities and disclosure of contingent assets and liabilities at the date of the financial statements and reported amounts of increases and decreases in net assets from operations during the reporting period. Actual results could differ from those estimates. |
| | | In preparing these financial statements, the Funds have evaluated events and transactions for potential recognition or disclosure through the date the financial statements were issued. |
| | g. | Dividends from net investment income and net realized capital gains, if any, are declared and paid annually. Distributions to shareholders are recorded on the ex-dividend date. The Funds may periodically make reclassifications among certain of their capital accounts as a result of the timing and characterization of certain income and realized gain distributions, including reclassifying net operating losses, as determined annually in accordance with federal tax regulations which may differ from GAAP. The MicroCap Fund has reclassified the components of its capital accounts for the year ended October 31, 2017, by increasing paid-in capital by $19,194, decreasing accumulated net investment loss by $1,029,283 and decreasing accumulated net realized gain by $1,048,477. The Ultra MicroCap Fund has reclassified the components of its capital accounts for the year ended October 31, 2017, by decreasing accumulated net investment loss by $297,508 and decreasing accumulated net realized gain by $297,508. The Low Priced Stock Fund has reclassified the components of its capital accounts for the year ended October 31, 2017 by decreasing accumulated net investment loss by $53,094 and increasing accumulated net realized loss by $53,094. |
Perritt Funds, Inc.
| Notes to Financial Statements (Continued) |
| | h. | As of and during the year ended October 31, 2017, the Funds did not have a liability for any unrecognized tax benefits. The Funds recognize interest and penalties, if any, related to unrecognized tax benefits as income tax expense on the Statements of Operations. During the year ended October 31, 2017, the Funds did not incur any interest or penalties. The Funds are not subject to examination by U.S. federal tax authorities for any tax years before 2014. |
| 3. | Security Valuation |
| | GAAP establishes an authoritative definition of fair value and sets out a hierarchy for measuring fair value. GAAP also requires additional disclosures about the various inputs used to develop the measurements of fair value. These inputs are summarized in the three broad levels listed below: |
| | • Level 1 – | Quoted prices in active markets for identical securities. |
| | • Level 2 – | Other significant observable inputs (including quoted prices for similar securities or the identical security on an inactive market, interest rates, prepayment speeds, credit risk, etc.). |
| | • Level 3 – | Significant unobservable inputs (including the Funds’ own assumptions in determining the fair value of investments). |
| | The inputs or methodology used for valuing securities are not necessarily an indication of the risk associated with investing in those securities. The following is a summary of the inputs used to value the Funds’ net assets as of October 31, 2017: |
| | Perritt MicroCap Opportunities Fund |
| | Description | | Level 1 | | | Level 2 | | | Level 3 | | | Total | |
| | Investments in Securities | | | | | | | | | | | | |
| | Common Stocks | | | | | | | | | | | | |
| | Consumer Discretionary | | $ | 21,798,342 | | | $ | — | | | $ | — | | | $ | 21,798,342 | |
| | Consumer Staples | | | 13,814,791 | | | | — | | | | — | | | | 13,814,791 | |
| | Energy | | | 6,418,005 | | | | — | | | | — | | | | 6,418,005 | |
| | Financial | | | 43,399,652 | | | | — | | | | — | | | | 43,399,652 | |
| | Health Care | | | 9,816,865 | | | | — | | | | — | | | | 9,816,865 | |
| | Industrials | | | 60,412,309 | | | | — | | | | — | | | | 60,412,309 | |
| | Information Technology | | | 32,933,015 | | | | — | | | | — | | | | 32,933,015 | |
| | Materials | | | 15,952,951 | | | | — | | | | — | | | | 15,952,951 | |
| | Real Estate Investment Trusts | | | 8,381,527 | | | | — | | | | — | | | | 8,381,527 | |
| | Telecommunication Services | | | 4,200,000 | | | | — | | | | — | | | | 4,200,000 | |
| | Total Common Stocks | | | 217,127,457 | | | | — | | | | — | | | | 217,127,457 | |
| | Warrants | | | | | | | | | | | | | | | | |
| | Financial | | | — | | | | 0 | | | | — | | | | — | |
| | Total Warrants | | | — | | | | — | | | | — | | | | — | |
| | Short-Term Investments | | | 6,942,638 | | | | — | | | | — | | | | 6,942,638 | |
| | Total Investments | | | | | | | | | | | | | | | | |
| | in Securities | | $ | 224,070,095 | | | $ | — | | | $ | — | | | $ | 224,070,095 | |
Perritt Funds, Inc.
| Notes to Financial Statements (Continued) |
| | Perritt Ultra MicroCap Fund | | | | | | | | | | | | |
| | | | | | | | | | | | | | |
| | Description | | Level 1 | | | Level 2 | | | Level 3 | | | Total | |
| | Investments in Securities | | | | | | | | | | | | |
| | Common Stocks | | | | | | | | | | | | |
| | Consumer Discretionary | | $ | 10,672,304 | | | $ | 362,313 | | | $ | — | | | $ | 11,034,617 | |
| | Consumer Staples | | | 362,944 | | | | — | | | | — | | | | 362,944 | |
| | Energy | | | 3,685,760 | | | | — | | | | — | | | | 3,685,760 | |
| | Financial | | | 8,163,870 | | | | — | | | | — | | | | 8,163,870 | |
| | Health Care | | | 9,197,999 | | | | — | | | | — | | | | 9,197,999 | |
| | Industrials | | | 13,354,264 | | | | 1,494,900 | | | | — | | | | 14,849,164 | |
| | Information Technology | | | 17,107,432 | | | | — | | | | — | | | | 17,107,432 | |
| | Materials | | | 2,563,800 | | | | — | | | | — | | | | 2,563,800 | |
| | Real Estate Investment Trusts | | | 766,809 | | | | — | | | | — | | | | 766,809 | |
| | Total Common Stocks | | | 65,875,182 | | | | 1,857,213 | | | | — | | | | 67,732,395 | |
| | Warrants | | | | | | | | | | | | | | | | |
| | Industrials | | | — | | | | 39,200 | | | | — | | | | 39,200 | |
| | Information Technology | | | — | | | | 0 | | | | — | | | | — | |
| | Total Warrants | | | — | | | | 39,200 | | | | — | | | | 39,200 | |
| | Short-Term Investments | | | 1,945,900 | | | | — | | | | — | | | | 1,945,900 | |
| | Total Investments | | | | | | | | | | | | | | | | |
| | in Securities | | $ | 67,821,082 | | | $ | 1,896,413 | | | $ | — | | | $ | 69,717,495 | |
| | | | | | | | | | | | | | | | | | |
| | Perritt Low Priced Stock Fund | | | | | | | | | | | | | | | | |
| | | | | | | | | | | | | | | | | | |
| | Description | | Level 1 | | | Level 2 | | | Level 3 | | | Total | |
| | Investments in Securities | | | | | | | | | | | | | | | | |
| | Common Stocks | | | | | | | | | | | | | | | | |
| | Consumer Discretionary | | $ | 923,665 | | | $ | — | | | $ | — | | | $ | 923,665 | |
| | Consumer Staples | | | 124,580 | | | | — | | | | — | | | | 124,580 | |
| | Energy | | | 214,720 | | | | — | | | | — | | | | 214,720 | |
| | Financial | | | 735,325 | | | | — | | | | — | | | | 735,325 | |
| | Health Care | | | 745,650 | | | | — | | | | — | | | | 745,650 | |
| | Industrials | | | 1,528,260 | | | | — | | | | — | | | | 1,528,260 | |
| | Information Technology | | | 1,918,577 | | | | — | | | | — | | | | 1,918,577 | |
| | Materials | | | 579,845 | | | | — | | | | — | | | | 579,845 | |
| | Real Estate Investment Trusts | | | 105,840 | | | | — | | | | — | | | | 105,840 | |
| | Total Common Stocks | | | 6,876,462 | | | | — | | | | — | | | | 6,876,462 | |
| | Short-Term Investments | | | 274,050 | | | | — | | | | — | | | | 274,050 | |
| | Total Investments | | | | | | | | | | | | | | | | |
| | in Securities | | $ | 7,150,512 | | | $ | — | | | $ | — | | | $ | 7,150,512 | |
| | Please refer to the Schedules of Investments for additional information regarding the composition of the amounts listed above. |
Perritt Funds, Inc.
| Notes to Financial Statements (Continued) |
| | Below are the transfers into or out of Levels 1 and 2 for the Funds using market values measured at the end of the reporting periods: |
| | | | MicroCap | | | Ultra MicroCap | |
| | | | Fund | | | Fund | |
| | Transfers into Level 1 | | $ | 3,729,631 | | | $ | 3,534,331 | |
| | Transfers out of Level 1 | | | — | | | | (1,857,213 | ) |
| | Net Transfers into/(out of) Level 1 | | $ | 3,729,631 | | | $ | 1,677,118 | |
| | Transfers into Level 2 | | | — | | | $ | 1,857,213 | |
| | Transfers out of Level 2 | | | (3,729,631 | ) | | | (3,534,331 | ) |
| | Net Transfers into/(out of) Level 2 | | $ | (3,729,631 | ) | | $ | (1,677,118 | ) |
| | There were no transfers into or out of Levels 1 or 2 during the twelve months ended October 31, 2017 for Low Priced Stock Fund. |
| | The securities transferred from Level 1 to Level 2 due to securities not trading on the last day of the reporting period. |
| | The securities transferred from Level 2 to Level 1 due to an increase of observable market data from an increase in market activity. |
| | At the beginning and during the twelve months ended October 31, 2017, the MicroCap Fund, the Ultra MicroCap Fund, and the Low Priced Stock Fund did not hold any Level 3 securities. |
| 4. | Investment Advisory Agreement |
| | For each Fund, the Corporation entered into an investment advisory agreement (collectively, the “Agreements”) with Perritt Capital Management, Inc. (the “Advisor”), with whom certain officers and directors of the Corporation are affiliated, to furnish investment advisory services to the Funds. Under the terms of the Agreements, the MicroCap Fund and the Low Priced Stock Fund pay the Advisor a monthly fee at the annual rate of 1% of each Fund’s daily average net assets, and the Ultra MicroCap Fund pays the Advisor a monthly fee equal to 1.25% of its daily average net assets less than or equal to $100 million; 1.00% with respect to daily average net assets in excess of $100 million and less than or equal to $200 million; and 0.50% with respect to daily average net assets in excess of $200 million. At October 31, 2017, the MicroCap Fund, Ultra MicroCap Fund and Low Priced Stock Fund had fees due to the Advisor of $192,073, $74,288 and $5,422, respectively. For the year ended October 31, 2017, the MicroCap Fund, Ultra MicroCap Fund and Low Priced Stock Fund had incurred advisory fees of $2,566,328, $774,816 and $66,079, respectively. |
| | With regards to the Low Priced Stock Fund, the Advisor has agreed to waive fees and/or reimburse operating expenses (other than interest, brokerage commissions, dividend expense on short sales, taxes, extraordinary expenses and acquired fund fees and expenses) so that total annual operating expenses are not expected to exceed 1.39% of the daily average net assets. This arrangement cannot be terminated prior to February 28, 2018 without the consent of the Board of Directors. The Advisor is permitted to recapture amounts waived and/or reimbursed within three years after the fiscal year in |
Perritt Funds, Inc.
| Notes to Financial Statements (Continued) |
| | which the Advisor earned the fee or incurred the expense if the total annual operating expenses have fallen to a level below the limit described above. Additionally, the Advisor has voluntarily waived any salaries and fees of all officers and directors of the Low Priced Stock Fund during the year. The salaries and fees waived by the Advisor for the year ended October 31, 2017 were $17,250 and are not eligible for recapture. Voluntary expense waivers may be discontinued at any time. |
| | For the year ended October 31, 2017, the Advisor waived expenses and/or reimbursed the Low Priced Stock Fund $66,290 which is eligible for recapture through October 31, 2020. $81,819 is eligible for recapture through October 31, 2019. $87,508 is eligible for recapture through October 31, 2018. |
| | The Advisor manages the Funds’ investments subject to the supervision of the Funds’ Board of Directors. The Advisor is responsible for investment decisions and supplies investment research and portfolio management. Under the Agreements, the Advisor, at its own expense and without reimbursement from the Funds, will furnish office space and all necessary office facilities, equipment and personnel for making the investment decisions necessary for managing the Funds and maintaining their organization, will pay the salaries and fees of all officers and directors of the Funds (except the Chief Compliance Officer’s salary and the fees paid to disinterested directors) and will bear all sales and promotional expenses of the Funds. |
| | The officers of the Funds are affiliated with the Advisor. Such officers, with the exception of the Chief Compliance Officer, receive no compensation from the Funds or the Advisor for serving their respective roles. The Funds pay the salary associated with the office of the Chief Compliance Officer. Such fees are included on the Statements of Operations within officer & directors’ fees & expenses. |
| | The Funds may reimburse the Advisor for fees paid to intermediaries such as banks, broker-dealers, financial advisors or other financial institutions for sub-transfer agency, sub-administration and other services provided to investors whose shares of record are held in omnibus, other group accounts, retirement plans or accounts traded through registered securities clearing agents. These fees are fees that the Funds are obligated to pay to such intermediaries, and the fees may vary based on, for example, the nature of services provided. The fees paid to such intermediaries by the Funds are only a portion of the full fee that is paid to the intermediaries, and the Advisor is obligated to pay the remaining amount. In determining the portion of the fees paid to the intermediaries that the Funds are obligated to pay, the Funds have used the “avoided cost” method, which is one of several permissible methods to determine the fees are reasonable. Based on this method, the Funds’ Board of Directors determines a fee per sub-account that it believes approximates the transfer agency fee that would otherwise have been payable by the Funds if such intermediaries did not maintain the sub-account. These amounts are included within shareholder servicing fees on the Statements of Operations. |
Perritt Funds, Inc.
| Notes to Financial Statements (Continued) |
| 5. | Investment Transactions |
| | Purchases and sales of securities, excluding short-term investments, for the year ended October 31, 2017, were as follows: |
| | | | Purchases | | | Sales | |
| | | | U.S. | | | | | | U.S. | | | | |
| | | | Governments | | | Other | | | Governments | | | Other | |
| | MicroCap Fund | | $ | — | | | $ | 43,721,237 | | | $ | — | | | $ | 132,444,177 | |
| | Ultra MicroCap Fund | | $ | — | | | $ | 27,686,932 | | | $ | — | | | $ | 25,427,680 | |
| | Low Priced Stock Fund | | $ | — | | | $ | 4,718,618 | | | $ | — | | | $ | 4,735,343 | |
| 6. | Federal Income Tax Matters |
| | As of October 31, 2017, the components of distributable earnings on a tax basis were as follows: |
| | | | MicroCap | | | Ultra MicroCap | | | Low Priced | |
| | | | Fund | | | Fund | | | Stock Fund | |
| | Cost of investments for tax purposes | | $ | 147,625,339 | | | $ | 54,482,074 | | | $ | 5,810,467 | |
| | Gross tax unrealized appreciation | | | 80,614,011 | | | | 21,502,761 | | | | 1,524,157 | |
| | Gross tax unrealized depreciation | | | (4,169,255 | ) | | | (6,267,340 | ) | | | (184,112 | ) |
| | Net unrealized appreciation | | | | | | | | | | | | |
| | on investments | | | 76,444,756 | | | | 15,235,421 | | | | 1,340,045 | |
| | Distributable ordinary income | | | 2,046,759 | | | | — | | | | 5,713 | |
| | Distributable long-term capital gains | | | 43,765,599 | | | | 7,263,290 | | | | 395,950 | |
| | Total distributable earnings | | | 45,812,358 | | | | 7,263,290 | | | | 401,663 | |
| | Other accumulated losses | | | — | | | | (364,335 | ) | | | — | |
| | Total accumulated earnings | | $ | 122,257,114 | | | $ | 22,134,376 | | | $ | 1,741,708 | |
| | The difference between book and tax basis distributable earnings is primarily related to the deferral of losses on wash sales. |
| | At October 31, 2017, the Low Priced Stock Fund utilized short-term capital losses of $130,745. |
| | At October 31, 2017, the Ultra MicroCap Fund deferred, on a tax basis, post-October and late year ordinary losses of $364,335. |
| | The tax composition of distributions paid during the periods ended October 31, 2017 and 2016 were as follows: |
| | | | Ordinary Income | | | Long-term Capital Gains | |
| | | | 2017 | | | 2016 | | | 2017 | | | 2016 | |
| | MicroCap Fund | | $ | 770,079 | | | $ | — | | | $ | 24,787,188 | | | $ | 6,027,092 | |
| | Ultra MicroCap Fund | | | 75,527 | | | | — | | | | 2,511,618 | | | | 866,370 | |
| | Low Priced Stock Fund | | | — | | | | — | | | | — | | | | — | |
| | The Funds designated as long-term capital gain dividend, pursuant to Internal Revenue Code Section 852(b)(3), the amount necessary to reduce the earnings and profits of the Funds related to net capital gain to zero for the tax year ended October 31, 2017. |
Perritt Funds, Inc.
| Notes to Financial Statements (Continued) |
| | On November 17, 2017, the MicroCap Fund paid long-term capital gains distributions of $8.06541 per share, the Ultra MicroCap Fund paid long-term capital gains distributions of $1.92699 per share, and the Low Priced Stock Fund paid long-term capital gains distributions of $1.07162 per share. |
| 7. | Restricted Securities |
| | The Funds may own investment securities which are unregistered and thus restricted as to resale. These securities are valued by each Fund after giving due consideration to pertinent factors including recent private sales, market conditions and the issuer’s financial performance. Where future disposition of these securities requires registration under the Securities Act of 1933, each Fund has the right to include these securities in such registration, generally without cost to the Fund. The Funds have no right to require registration of the unregistered securities they hold. At October 31, 2017, the MicroCap Fund held restricted securities with an aggregate value of $3,613,750 which accounted for 1.60% of the MicroCap Fund’s net assets. These restricted securities are deemed to be liquid. During the year ended October 31, 2017, the Ultra MicroCap Fund and the Low Priced Stock Fund did not hold any restricted securities. |
| 8. | Guarantees and Indemnifications |
| | Under the Funds’ organizational documents, their officers and directors are indemnified by the Funds against certain liabilities arising out of the performance of their duties to the Funds. Additionally, in the normal course of business, the Funds enter into contracts with service providers that contain general indemnification clauses. The Funds’ maximum exposure under these arrangements is unknown as this would involve future claims that may be made against the Funds that have not yet occurred. Currently, the Funds expect the risk of loss to be remote. |
| 9. | Line of Credit Arrangement |
| | The MicroCap Fund and Ultra MicroCap Fund are each party to uncommitted line of credit arrangements with U.S. Bank, N.A. with an expiration date of December 11, 2017, under which the MicroCap Fund may borrow up to $18,000,000 and the Ultra MicroCap Fund may borrow up to $6,000,000, subject to certain restrictions and covenants. Interest is charged on borrowings at the prevailing Prime Rate. The Funds have borrowed under these arrangements from time to time to increase the efficiency of cash flow management. During the year ended October 31, 2017, the MicroCap Fund and Ultra MicroCap Fund had no outstanding borrowings on the lines of credit. As of October 31, 2017, the Low Priced Stock Fund does not have a line of credit arrangement. Subsequent to year end, the Ultra MicroCap Fund renewed its line of credit arrangement with an updated borrowing limit of $10,000,000 and the MircoCap Fund renewed its line of credit arrangement with no change to the borrowing limit. Both line of credit arrangements have an expiration date of December 11, 2018. |
Perritt Funds, Inc.
| Notes to Financial Statements (Continued) |
| 10. | Redemption Fee |
| | The Funds charge a 2% redemption fee to those who buy and sell shares within 90 calendar days or less. The redemption fee is retained for the benefit of long-term shareholders, and recorded as additional capital in the Statements of Changes in Net Assets. |
| 11. | Transactions with Affiliates |
| | The following issuer was affiliated with the Funds, as the Funds held 5% or more of the outstanding voting securities of the issuer during the period from November 1, 2016 through October 31, 2017. No issuers were affiliated with the MicroCap Opportunities Fund and the Low Priced Stock Fund during the year ended October 31, 2017. See Section (2)(a)(3) of the Investment Company Act of 1940. |
| Perritt Ultra MicroCap Fund | | | | | |
| | | | | | |
| | Share | | | Share | Net | | Net | Value |
| | Balance At | | | Balance At | Change in | | Realized | At |
| | November 1, | | | October 31, | Unrealized | Dividend | Gains | October 31, |
| Issuer Name | 2016 | Additions | Reductions | 2017 | (Depreciation) | Income | (Losses) | 2017 |
| Sigma Lab, | | | | | | | | |
| Inc. | — | 249,640 | — | 249,640 | $(384,346) | $ — | $ — | $414,402 |
| | During the year ended October 31, 2017, Perritt Ultra MicroCap Fund held Dynatronics Corp. and Hooper Holmes, Inc., each of which were considered issuers affiliated with the Fund. As of October 31, 2017, these issuers were not affiliates. |
| | The Funds are permitted to purchase or sell securities from or to each other under specified conditions outlined in procedures adopted by the Board of Directors. The procedures have been designed to ensure that any purchase or sale of securities by a Fund from or to another Fund complies with Rule 17a-7 of the Investment Company Act of 1940. For the year ended October 31, 2017, the MicroCap Fund and Ultra MicroCap Fund engaged in two securities transactions pursuant to Rule 17a-7 of the Investment Company Act of 1940. The Low Priced Stock Fund did not engage in any 17a-7 transactions. |
Perritt Funds, Inc.
| Report of Independent Registered Public Accounting Firm |
To the Shareholders and Board of Directors of
Perritt Funds, Inc.
We have audited the accompanying statements of assets and liabilities, including the schedules of investments, of Perritt Funds, Inc., comprising Perritt MicroCap Opportunities Fund, Perritt Ultra MicroCap Fund, and Perritt Low Priced Stock Fund (the “Funds”), as of October 31, 2017, and the related statements of operations for the year then ended, the statements of changes in net assets for each of the two years in the period then ended, and the financial highlights for each of the periods presented in the period then ended. These financial statements and financial highlights are the responsibility of the Funds’ management. Our responsibility is to express an opinion on these financial statements and financial highlights based on our audits.
We conducted our audits in accordance with the standards of the Public Company Accounting Oversight Board (United States). Those standards require that we plan and perform the audit to obtain reasonable assurance about whether the financial statements and financial highlights are free of material misstatement. An audit includes examining, on a test basis, evidence supporting the amounts and disclosures in the financial statements. Our procedures included confirmation of securities owned as of October 31, 2017, by correspondence with the custodian and brokers or by other appropriate auditing procedures where replies from brokers were not received. An audit also includes assessing the accounting principles used and significant estimates made by management, as well as evaluating the overall financial statement presentation. We believe that our audits provide a reasonable basis for our opinion.
In our opinion, the financial statements and financial highlights referred to above present fairly, in all material respects, the financial position of each of the Funds constituting Perritt Funds, Inc., as of October 31, 2017, the results of their operations for the year then ended, the changes in their net assets for each of the two years in the period then ended, and the financial highlights for each of the periods presented in the period then ended, in conformity with accounting principles generally accepted in the United States of America.
COHEN & COMPANY, LTD.
Cleveland, Ohio
December 15, 2017
Perritt Funds, Inc.
| Expense Example (Unaudited) | October 31, 2017 |
As a shareholder of the Funds, you incur two types of costs: (1) transaction costs, including sales charges (loads) on purchase payments, reinvested dividends, or other distributions; redemption fees (the Funds impose a 2.00% redemption fee on shares held for 90 calendar days or less after purchase); and exchange fees; and (2) ongoing costs, including management fees; distribution and/or service fees; and other Fund expenses. This example is intended to help you understand your ongoing costs (in dollars) of investing in the Fund and to compare these costs with the ongoing costs of investing in other mutual funds. The example is based on an investment of $1,000 invested at the beginning of the period and held for the entire period (May 1, 2017 – October 31, 2017).
Actual Expenses
The first line of the table below provides information about actual account values and actual expenses. Although the Funds charge no sales load or transaction fees (other than a 2.00% redemption fee for shares held for 90 calendar days or less after purchase), you will be assessed fees for outgoing wire transfers, returned checks and stop payment orders at prevailing rates charged by U.S. Bancorp Fund Services, LLC, the Funds transfer agent. If you request that a redemption be made by wire transfer, currently a $15.00 fee is charged by the Funds transfer agent. You will be charged a transaction fee equal to 2.00% of the net amount of the redemption if you redeem your shares within 90 calendar days of purchase. IRA accounts will be charged a $15.00 annual maintenance fee. There is a $25 IRA distribution and transfer out fee, unless set up automatically. Please see IRA Account Agreement for additional fees related to IRA accounts. To the extent the Fund invests in shares of other investment companies as part of its investment strategy, you will indirectly bear your proportionate share of any fees and expenses charged by the underlying funds in which the Fund invests in addition to the expenses of the Fund. Actual expenses of the underlying funds are expected to vary among the various underlying funds. These expenses are not included in the example below. The example below includes, but is not limited to, management fees, shareholder servicing fees, fund accounting, custody and transfer agent fees. However, the example below does not include portfolio trading commissions and related expenses, interest expense and other extraordinary expenses as determined under accounting principles generally accepted in the United States of America. You may use the information in this line, together with the amount you invested, to estimate the expenses that you paid over the period. Simply divide your account value by $1,000 (for example, an $8,600 account value divided by $1,000 = 8.6), then multiply the result by the number in the first line under the heading entitled “Expenses Paid During Period” to estimate the expenses you paid on your account during this period.
Hypothetical Example for Comparison Purposes
The second line of the table below provides information about hypothetical account values and hypothetical expenses based on the Fund’s actual expense ratio and an assumed rate of return of 5% per year before expenses, which is not the Fund’s actual return. The hypothetical account values and expenses may not be used to estimate the actual ending account balance or expenses you paid for the period. You may use this information to compare the ongoing costs of investing in the Fund and other funds. To do so, compare this 5% hypothetical example with the 5% hypothetical examples that appear in the shareholder reports of the other funds.
Perritt Funds, Inc.
| Expense Example (Unaudited) (Continued) | October 31, 2017 |
Please note that the expenses shown in the table are meant to highlight your ongoing costs only and do not reflect any transactional costs, such as sales charges (loads), redemption fees, or exchange fees. Therefore, the second line of the table is useful in comparing ongoing costs only, and will not help you determine the relative total costs of owning different funds. In addition, if these transactional costs were included, your costs would have been higher.
| | Beginning | Ending | Expenses Paid |
| | Account Value | Account Value | During Period |
| | 5/1/17 | 10/31/17 | 5/1/17 – 10/31/171 |
| Actual | | | |
| Perritt MicroCap Opportunities | $1,000.00 | $1,074.90 | $6.49 |
| Perritt Ultra MicroCap Fund | $1,000.00 | $1,123.30 | $9.15 |
| Perritt Low Priced Stock Fund | $1,000.00 | $1,077.80 | $7.28 |
| | | | |
| Hypothetical | | | |
| Perritt MicroCap Opportunities | $1,000.00 | $1,018.95 | $6.31 |
| Perritt Ultra MicroCap Fund | $1,000.00 | $1,016.59 | $8.69 |
| Perritt Low Priced Stock Fund | $1,000.00 | $1,018.20 | $7.07 |
1 | Expenses are equal to the Fund’s annualized expense ratio of 1.24% for the MicroCap Opportunities Fund, 1.71% for the Ultra MicroCap Fund and 1.39% for the Low Priced Stock Fund for the six-month period, multiplied by the average account value over the period, multiplied by 184/365 (to reflect the one-half year period). |
Perritt Funds, Inc.
| Directors and Officers (Unaudited) |
The Funds are governed by a Board of Directors that meets regularly to review investments, performance, expenses, and other business matters, and is responsible for protecting the interests of shareholders. The majority of the Funds’ directors are independent of Perritt Capital Management, Inc. The Board of Directors elects the Funds’ officers. The name, address, age and principal occupations for the past five years of the directors and officers are listed below, along with the number of portfolios in the Fund complex overseen by each director. During the past five years none of the directors has served as a director of a public company or a mutual fund other than Perritt MicroCap Opportunities, Inc. and Perritt Funds, Inc. The business address of each director and officer is 300 South Wacker Drive, Suite 2880, Chicago, IL 60606. For additional information about the directors, please call 1-800-331-8936 and request a Statement of Additional Information (SAI) or visit www.perrittcap.com. One will be mailed to you free of charge.
| | Position(s) Held | | | |
| | with Funds and | | | Other |
| | Number of | | | Directorships |
| | Portfolios in | | | Held by |
| Name, | Fund Complex | Term of Office | Principal | Director |
| Address, | Overseen | and Length of | Occupation(s) | during the |
and Age | by Director | Time Served | during Past 5 Years | Past 5 Years |
| | | |
| “Disinterested” Directors of the Funds | | |
| | | | | |
| Dianne C. Click | Director | Indefinite, until | Ms. Click is a licensed Real | Perritt |
| Age: 55 | | successor | Estate Broker in the State | MicroCap |
| 300 South | Portfolios in | elected; 21 years, | of Montana. She has been | Opportunities |
| Wacker Drive, | Fund Complex | Perritt MicroCap | a partner and a principal | Fund, Inc. |
| Suite 2880 | Overseen: 3 | Opportunities | owner of a real estate sales | |
| Chicago, IL | | Fund; 13 years, | company, Bozeman Broker | |
| 60606 | | and since | Group, since 2004. | |
| | | inception, Perritt | She has been licensed in | |
| | | Low Priced | the state of Montana | |
| | | Stock Fund | since 1995. | |
| | | | | |
| | | Director since | | |
| | | 2004 | | |
| | | | | |
| David S. Maglich | Director | Indefinite, until | Mr. Maglich is a Shareholder | Perritt |
| Age: 60 | | successor | with the law firm of Fergeson, | MicroCap |
| 300 South | Portfolios in | elected; 28 years, | Skipper et. al. in Sarasota, | Opportunities |
| Wacker Drive, | Fund Complex | Perritt MicroCap | Florida and has been | Fund, Inc. |
| Suite 2880 | Overseen: 3 | Opportunities | employed with such firm | |
| Chicago, IL | | Fund; 13 years, | since 1989. | |
| 60606 | | and since | | |
| | | inception, Perritt | | |
| | | Low Priced | | |
| | | Stock Fund | | |
| | | | | |
| | | Director since | | |
| | | 2004 | | |
Perritt Funds, Inc.
| Directors and Officers (Unaudited) (Continued) |
| | Position(s) Held | | | |
| | with Funds and | | | Other |
| | Number of | | | Directorships |
| | Portfolios in | | | Held by |
| Name, | Fund Complex | Term of Office | Principal | Director |
| Address, | Overseen | and Length of | Occupation(s) | during the |
and Age | by Director | Time Served | during Past 5 Years | Past 5 Years |
| | | |
| “Interested” Director of the Funds | | |
| | | | | |
| Michael J. | | | | |
Corbett(1) | President | One-year term | Mr. Corbett was President | Perritt |
| Age: 52 | Portfolios in | as President; | of the Perritt MicroCap | MicroCap |
| 300 South | Fund Complex | As Director, | Opportunities Fund, Inc. | Opportunities |
| Wacker Drive, | Overseen: 3 | indefinite, until | since November 1999 | Fund, Inc. |
| Suite 2880 | | successor | and President of the | |
| Chicago, IL | | elected; | Perritt Funds, Inc. since | |
| 60606 | | Director since | August 2004. He has | |
| | | October 5, 2010; | served as President of | |
| | | 16 years as | the Adviser since | |
| | | President of | October 5, 2010, and | |
| | | Perritt MicroCap | previously served as | |
| | | Opportunities | Vice President of the | |
| | | Fund; 11 years | Adviser from February | |
| | | as President of | 1997 until October 5, | |
| | | Perritt Ultra | 2010. Mr. Corbett began | |
| | | MicroCap Fund; | his tenure with Perritt | |
| | | and since | Capital Management in | |
| | | inception, | 1990 as a research analyst. | |
| | | Perritt Low Priced | He assumed portfolio | |
| | | Stock Fund | management | |
| | | | responsibilities in 1996 | |
| | | | and now serves as portfolio | |
| | | | manager for the Funds. | |
(1) | Mr. Corbett is an interested person of the Funds based upon his position with the Adviser. |
Perritt Funds, Inc.
| Directors and Officers (Unaudited) (Continued) |
| | Position(s) Held | | | |
| | with Funds and | | | Other |
| | Number of | | | Directorships |
| | Portfolios in | | | Held by |
| Name, | Fund Complex | Term of Office | Principal | Director |
| Address, | Overseen | and Length of | Occupation(s) | during the |
and Age | by Director | Time Served | during Past 5 Years | Past 5 Years |
| | |
| Officers of the Funds Other Than Mr. Corbett | |
| | | | | |
| Mark Buh | Vice President | One-year term | Mr. Buh has been Vice | N/A |
| Age: 55 | and Treasurer | since 2012 | President and Treasurer of | |
| 300 South | | | the Funds and Chief Financial | |
| Wacker Drive, | | | Officer of the Adviser since | |
| Suite 2880 | | | February 2012. He has over | |
| Chicago, IL | | | 25 years of experience in | |
| 60606 | | | corporate accounting, | |
| | | | administration, planning | |
| | | | and business development. | |
| | | | His previous experience | |
| | | | includes tenures at | |
| | | | Ernst and Young and | |
| | | | CenturyLink | |
| | | | Communications. | |
| | | | | |
| Lynn E. | | | | |
| Burmeister | Vice President, | One-year term | Mrs. Burmeister has been | N/A |
| Age: 58 | Chief | | the Chief Compliance | |
| 300 South | Compliance | Chief | Officer since May 1, 2010, and | |
| Wacker Drive, | Officer and | Compliance | oversees all compliance | |
| Suite 2880 | Secretary | Officer | matters for the Funds and the | |
| Chicago, IL | | since 2010 | Adviser. She also coordinates | |
| 60606 | | | the administration of the | |
| | | Secretary | Funds and is a liaison with | |
| | | since 2015 | the firm’s corporate counsel. | |
| | | | Mrs. Burmeister has worked | |
| | | | in the financial industry | |
| | | | since 1980. Her previous | |
| | | | experience includes work at | |
| | | | Harris Associates, Gofen & | |
| | | | Glossberg and Optimum | |
| | | | Investments. | |
Perritt Funds
The Funds file their complete schedule of portfolio holdings with the Securities and Exchange Commission for the first and third quarters of each fiscal year on Form N-Q. The Funds’ Forms N-Q are available on the Securities and Exchange Commission’s website at http://www.sec.gov and may be reviewed and copied at the Commission’s Public Reference Room in Washington, D.C. Information on the operation of the Public Reference Room may be obtained by calling 1-800-SEC-0330. The Funds’ latest Forms N-Q are also available without charge upon request by calling 1-800-331-8936.
A description of the policies and procedures that the Funds use to determine how to vote proxies relating to portfolio securities is available without charge, upon request, by calling the Advisor at 1-800-331-8936 and on the Securities and Exchange Commission’s website at http://www.sec.gov.
Information regarding how the Funds voted proxies relating to portfolio securities during the most recent 12-month period ended June 30 is available without charge, upon request, by calling 1-800-331-8936 and on the Securities and Exchange Commission’s website at http://www.sec.gov.
Household Delivery of Shareholder Documents: To reduce expenses, the Funds may mail only one copy of the Funds’ prospectus, SAI and each annual and semi-annual report to those addresses shared by two or more accounts. If you wish to receive individual copies of these documents, please call the Funds at 1-800-331-8936 or contact your financial institution. You will begin receiving individual copies thirty days after receiving your request.
Electronic Delivery of Shareholder Documents: You may choose to receive the Funds’ prospectus and annual and semi-annual reports electronically. To sign up for electronic delivery, visit www.icsdelivery.com and select the first letter of your brokerage firm’s name. Then, select your brokerage institution from the list that follows, fill out the appropriate information and provide an e-mail address where you would like your information sent. If your brokerage firm is not listed, electronic delivery may not be available. Please contact your brokerage firm or financial advisor.
Tax Notice
For the year end October 31, 2017, the Perritt MicroCap Opportunities Fund, the Perritt Ultra MicroCap Fund and the Perritt Low Priced Stock Fund did not pay any interest related dividends under the Internal Revenue Code Section 87(k)(1)(c). Additionally, for the year ended October 31, 2017, 100.00%, 20.19% and 0.00% of the distributions paid by the Perritt MicroCap Opportunities Fund, the Perritt Ultra MicroCap Fund and the Perritt Low Priced Stock Fund were designated as short-term capital gain distributions designated under the Internal Revenue Code Section 871(k)(2)(c).
The percentage of dividend income distributed for the year ended October 31, 2017, which is designated as qualified dividend income under the Jobs and Growth Tax Relief Reconciliation Act of 2003, is 0.05%, 0.05% and 0.00% for the Perritt MicroCap Opportunities Fund, the Perritt Ultra MicroCap Fund and the Perritt Low Priced Stock Fund, respectively. Of the dividends paid by the Perritt MicroCap Opportunities Fund, the Perritt Ultra MicroCap Fund and the Perritt Low Priced Stock Fund, 0.05%, 0.05% and 0.00%, respectively, qualify for the corporate dividends received deduction.
Privacy Policy
We collect the following nonpublic personal information about you:
| | • | Information we receive from you on or in applications or other forms, including but not limited to, your name, address, phone number, and social security number; and |
| | • | Information about your transactions with us, our affiliates or others, including but not limited to, your account number and balance, parties to transactions, cost basis information and other financial information. |
We do not disclose any nonpublic personal information about our current or former shareholders to nonaffiliated third parties, except as permitted by law. For example, we are permitted by law to disclose all the information we collect to our transfer agent to process your transactions. Furthermore, we restrict access to your nonpublic personal information to those persons who require such information to provide products or services to you. We maintain physical, electronic, and procedural safeguards through our transfer agent, U.S. Bancorp Fund Services, LLC, that comply with federal standards to guard your nonpublic personal information.
In the event that you hold shares of the Funds through a financial intermediary, including, but not limited to, a broker-dealer, bank or trust company, the privacy policy of your financial intermediary would govern how your nonpublic personal information would be shared with nonaffiliated third parties.
Investment Advisor
Perritt Capital Management, Inc.
300 South Wacker Drive, Suite 2880
Chicago, IL 60606-6703
800-331-8936
Independent Registered
Public Accounting Firm
Cohen & Company, Ltd.
1350 Euclid Avenue, Suite 800
Cleveland, OH 44115
Legal Counsel
Foley & Lardner LLP
777 East Wisconsin Avenue
Milwaukee, WI 53202
Custodian
U.S. Bank, NA
1555 North River Center Drive, Suite 302
Milwaukee, WI 53212
Transfer Agent
and Dividend Disbursing Agent
U.S. Bancorp Fund Services, LLC
P.O. Box 701
Milwaukee, WI 53201-0701
Distributor
Quasar Distributors, LLC
777 East Wisconsin Avenue
Milwaukee, WI 53202
For assistance with your existing account, call our
Shareholder Service Center at 1-800-332-3133.
The Funds’ Statements of Additional Information
contain information about the Funds’ directors and are
available without charge upon request by calling
1-800-332-3133.
MicroCap Opportunities Fund – PRCGX
Ultra MicroCap Fund – PREOX
Low Priced Stock Fund – PLOWX
Minimum Initial Investment $1,000
IRA Minimum Initial Investment $250
Dividend Reinvestment Plan
Systematic Withdrawal Plan
Automatic Investment Plan
Retirement Plans Including:
| • | IRA | • | Roth IRA |
| • | SEP-IRA | • | Coverdell Education |
| • | Simple IRA | | Savings Account |
2% redemption fee imposed for shares
held ninety (90) calendar days or less.
This report is authorized for distribution
only to shareholders and others who have
received a copy of the prospectus of the
Perritt MicroCap Opportunities Fund,
the Perritt Ultra MicroCap Fund and/or
the Perritt Low Priced Stock Fund.
300 S. Wacker Drive • Suite 2880 • Chicago, IL 60606-6703
Tel 312-669-1650 • 800-331-8936 • Fax: 312-669-1235
E-mail: info@PerrittCap.com
Web Site: www.perrittcap.com
Item 2. Code of Ethics.
The registrant has adopted a code of ethics that applies to the registrant’s principal executive officer and principal financial officer. The registrant has not made any amendments to its code of ethics during the period covered by this report. The registrant has not granted any waivers from any provisions of the code of ethics during the period covered by this report. Incorporated by reference to the registrant’s Form N-CSR filed January 8, 2010.
Item 3. Audit Committee Financial Expert.
The registrant’s board of directors has determined that the registrant does not have an audit committee financial expert serving on its board of directors, which functions as the registrant’s audit committee since the registrant does not have a separate audit committee.
The board of directors has determined that the members of the board of directors have sufficient background, experience and financial knowledge to fulfill their responsibilities and obligations to the registrant and its shareholders. Accordingly, the board of directors has determined that the search for, and possible appointment of, a person who would satisfy the definition of an audit committee financial expert is not necessary.
Item 4. Principal Accountant Fees and Services.
The registrant has engaged its principal accountant, Cohen & Company, Ltd., to perform audit services, audit-related services, and tax services during the past fiscal year. “Audit services” refer to performing an audit of the registrant's annual financial statements or services that are normally provided by the accountant in connection with statutory and regulatory filings or engagements for the fiscal year. “Audit-related services” refer to the assurance and related services by the principal accountant that are reasonably related to the performance of the audit. “Tax services” refer to professional services rendered by the principal accountant for tax compliance, tax advice, and tax planning. The following table details the aggregate fees billed or expected to be billed for each of the last two fiscal years for audit fees, audit-related fees, tax fees and other fees by the principal accountant.
| | FYE 10/31/2017 | FYE 10/31/2016 |
| Audit Fees | $40,500 | $40,500 |
| Audit-Related Fees | $0 | $0 |
| Tax Fees | $9,000 | $9,000 |
| All Other Fees | $0 | $0 |
The percentage of fees billed by Cohen & Company, Ltd. for the fiscal years ended October 31, 2017 and October 31, 2016, respectively, applicable to non-audit services pursuant to a waiver of the pre-approval requirement was as follows:
| | FYE 10/31/2017 | FYE 10/31/2016 |
| Audit-Related Fees | 0% | 0% |
| Tax Fees | 0% | 0% |
| All Other Fees | 0% | 0% |
All of the principal accountant’s hours spent on auditing the registrant’s financial statements were attributed to work performed by full‑time permanent employees of the principal accountant. The following table indicates the non-audit fees billed or expected to be billed by the registrant’s accountants for services to the registrant and to the registrant’s investment adviser or Service Affiliates (as defined below) for the last two years.
| Non-Audit Related Fees | FYE 10/31/2017 | FYE 10/31/2016 |
| Registrant | $0 | $0 |
| Registrant’s Investment Adviser | $0 | $0 |
Because the registrant’s accountants have not rendered any non-audit services during the last two fiscal years to the registrant’s investment adviser, or any entity controlling, controlled by or under common control with the investment adviser that provides ongoing services to the registrant (together with the registrant’s investment adviser, “Service Affiliates”) that were not pre-approved pursuant to paragraph (c)(7)(ii) of Rule 2-01 of Regulation S-X, the registrant’s board of directors has not considered whether the provision of such services to the registrant’s investment adviser or the Service Affiliates is compatible with maintaining the independence of the registrant’s accountant.
Item 5. Audit Committee of Listed Registrants.
Not applicable to registrants who are not listed issuers (as defined in Rule 10A-3 under the Securities Exchange Act of 1934).
Item 6. Investments.
(a). Schedule of Investments is included as part of the report to shareholders filed under Item 1 of this Form.
(b). Not applicable.
Item 7. Disclosure of Proxy Voting Policies and Procedures for Closed-End Management Investment Companies.
Not applicable to open-end investment companies.
Item 8. Portfolio Managers of Closed-End Management Investment Companies.
Not applicable to open-end investment companies.
Item 9. Purchases of Equity Securities by Closed‑End Management Investment Company and Affiliated Purchasers.
Not applicable to open-end investment companies.
Item 10. Submission of Matters to a Vote of Security Holders.
There have been no material changes to the procedures by which shareholders may recommend nominees to the registrant’s board of directors.
Item 11. Controls and Procedures.
The Registrant’s President and Treasurer have reviewed the Registrant's disclosure controls and procedures (as defined in Rule 30a-3(c) under the Investment Company Act of 1940 (the “Act”)) as of a date within 90 days of the filing of this report, as required by Rule 30a-3(b) under the Act and Rules 13a-15(b) or 15d‑15(b) under the Securities Exchange Act of 1934. Based on their review, such officers have concluded that the disclosure controls and procedures are effective in ensuring that information required to be disclosed in this report is appropriately recorded, processed, summarized and reported and made known to them by others within the Registrant and by the Registrant’s service provider.
There were no changes in the Registrant's internal control over financial reporting (as defined in Rule 30a-3(d) under the Act) that occurred during the second fiscal quarter of the period covered by this report that has materially affected, or is reasonably likely to materially affect, the Registrant's internal control over financial reporting.
Item 12. Exhibits.
| (a) | (1) Any code of ethics or amendment thereto, that is the subject of the disclosure required by Item 2, to the extent that the registrant intends to satisfy Item 2 requirements through filing an exhibit. Incorporated by reference to the registrant’s Form N-CSR filed January 8, 2010. |
(2) A separate certification for each principal executive and principal financial officer pursuant to Section 302 of the Sarbanes-Oxley Act of 2002. Filed herewith.
(3) Any written solicitation to purchase securities under Rule 23c‑1 under the Act sent or given during the period covered by the report by or on behalf of the registrant to 10 or more persons. Not applicable to open-end investment companies.
| (b) | Certifications pursuant to Section 906 of the Sarbanes‑Oxley Act of 2002. Furnished herewith. |
SIGNATURES
Pursuant to the requirements of the Securities Exchange Act of 1934 and the Investment Company Act of 1940, the registrant has duly caused this report to be signed on its behalf by the undersigned, thereunto duly authorized.
(Registrant) Perritt Funds, Inc.
By (Signature and Title)* /s/Michael J. Corbett
Michael J. Corbett, President
Date December 20, 2017
Pursuant to the requirements of the Securities Exchange Act of 1934 and the Investment Company Act of 1940, this report has been signed below by the following persons on behalf of the registrant and in the capacities and on the dates indicated.
By (Signature and Title)* /s/Michael J. Corbett
Michael J. Corbett, President
Date December 20, 2017
By (Signature and Title)* /s/Mark J. Buh
Mark J. Buh, Treasurer/Principal Financial Officer
Date December 20, 2017
* Print the name and title of each signing officer under his or her signature.