MicroCap Opportunities Fund
Ultra MicroCap Fund
Annual Report
October 31, 2020
Beginning on January 1, 2021, as permitted by regulations adopted by the U.S. Securities and Exchange Commission, paper copies of the Funds’ shareholder reports will no longer be sent by mail, unless you specifically request paper copies of the reports from the Fund or from your financial intermediary, such as a broker-dealer or bank. Instead, the reports will be made available on the Fund’s website, www.perrittcap.com, and you will be notified by mail each time a report is posted and provided with a website link to access the report.
If you already elected to receive shareholder reports electronically, you will not be affected by this change and you need not take any action. You may elect to receive shareholder reports and other communications from the Fund electronically by contacting your financial intermediary, such as a broker-dealer or bank, or, if you are a direct investor, by calling the Fund toll-free at 1-800-332-3133 or by sending an e-mail request to info@perrittcap.com.
You may elect to receive all future reports in paper free of charge. If you invest through a financial intermediary, you can contact your financial intermediary to request that you continue to receive paper copies of your shareholder reports. If you invest directly with the Funds, you can call the Funds toll-free at 1-800-332-3133 or send an e-mail request to info@perrittcap.com to let the Fund know you wish to continue receiving paper copies of your shareholder reports. Your election to receive reports in paper will apply to all Funds held in your account if you invest through your financial intermediary.

The PERRITT MICROCAP OPPORTUNITIES FUND will, under normal circumstances, invest at least 80% of its net assets in a diversified portfolio of common stocks of United States companies that at the time of initial purchase have a market capitalization (equity market value) that is below $500 million (referred to as “micro-cap” companies). The Fund seeks to invest in micro-cap companies that have demonstrated above-average growth in revenues and/or earnings, possess relatively low levels of long-term debt, have a high percentage of their shares owned by company management, and possess modest price-to-sales ratios and price-to-earnings ratios that are below their long-term annual growth rate. At times, the Fund may also invest in “special situations” such as companies that possess valuable patents, companies undergoing restructuring, and companies involved in large share repurchase programs. Investors should expect the Fund to contain a mix of both value-priced and growth stocks.
The PERRITT ULTRA MICROCAP FUND will, under normal circumstances, invest at least 80% of its net assets in a diversified portfolio of common stocks of United States companies that at the time of initial purchase have a market capitalization (equity market value) that is below $300 million (referred to as “micro-cap” companies). The Fund seeks to invest in micro-cap companies that have a high percentage of their shares owned by company management, possess relatively low levels of long-term debt, have a potential for above average growth in revenues and/or earnings, and possess reasonable valuations based on the ratios of price-to-sales, price-to-earnings, and price-to-book values. The micro-cap companies in which the Fund may invest include “early stage” companies, which are companies that are in a relatively early stage of development with market capitalizations that are below $50 million. At times, the Fund may also invest in unseasoned companies, companies that are undergoing corporate restructuring, initial public offerings, and companies believed to possess undervalued assets.
Annual Report
October 31, 2020
| Perritt MicroCap Opportunities Fund | |
| From the Portfolio Managers | 2 |
| Performance | 6 |
| Ten Largest Common Stock Holdings | 8 |
| Allocation of Portfolio Investments | 9 |
| | |
| Perritt Ultra MicroCap Fund | |
| From the Portfolio Managers | 10 |
| Performance | 14 |
| Ten Largest Common Stock Holdings | 16 |
| Allocation of Portfolio Investments | 17 |
| | |
| Perritt Funds | |
| Schedules of Investments | 18 |
| Statements of Assets and Liabilities | 24 |
| Statements of Operations | 25 |
| Statements of Changes in Net Assets | 26 |
| Financial Highlights | 28 |
| Notes to Financial Statements | 30 |
| Report of the Independent Registered Public Accounting Firm | 39 |
| Expense Example | 40 |
| Directors and Officers | 42 |
| Information | 45 |
Perritt MicroCap Opportunities Fund
| Portfolio Manager’s Message |
Michael Corbett,
Portfolio Manager
In a year challenged by a global pandemic, economic shutdowns, and a highly charged presidential election, it is not surprising the stock market experienced extreme volatility. This increased volatility is a big reason the Perritt MicroCap Opportunities Fund had another disappointing year. While we are certainly disappointed in the recent results, we continue to have great faith in our portfolio of companies. I will cover the Fund’s results and highlight our reasons for optimism later in this letter, but I will first address more macro issues.
The real surprise to us in this marketplace was the resilience of the equity markets, particularly larger companies. Heading into this pandemic, larger companies traded at premium valuations to smaller companies. That premium widened further during this pandemic period. According to Leuthold Research, the average micro-cap company now (10/31/20) trades at less 12 times 2021 earnings versus 22 times earnings for that of larger-cap companies. A period of uncertainty, such as we have experienced in the past year does explain investors’ hesitation to invest in smaller companies. Certainly, the pandemic is a horrible thing, but it should not last forever, and the economic recovery should eventually occur. The clarity of the presidential race, news of highly effective COVID-19 vaccine trials, and hope for the inevitable reopening of our economy should bode well for the economy and smaller companies.
During the past year, the Perritt MicroCap Opportunities Fund lost 12.46% which compares to a gain of 3.14% for the Russell Microcap Index. The performance difference can mostly be explained by the Fund’s lack of investments in healthcare. Healthcare stocks within the Russell Microcap Index rose 38% during the past 12 months. We remain severely underweight in healthcare stocks to the index since valuations remain very rich, and most healthcare companies are not profitable. Profitability or near-term profitability remains a requirement for us to make an investment. We also have a big overweight in industrial and material industries, which underperformed the index during the past year. As was said earlier, we believe reopening of the economy will eventually occur and our investments in economically sensitive industries will pay big dividends. We are currently overweight, or as some call it an active weight in economic industries, such as industrial, information technology and materials by more than 40%.
During the past year, we sold 27 companies from the portfolio. Four companies were sold after receiving acquisition offers: Hema Corporation, Omnova Solutions, GlobalSCAPE and Primo Water. Six companies were sold after reaching their long-term price targets. The remaining 17 companies were sold due to poor long-term outlooks for their businesses. Some of those sales were done to make room for more attractive investments. We purchased 24 new companies in the past year, all from different industries, but the bulk of them were from business services and information technology.
One of the more exciting additions was Intrusion (INTZ). INTZ develops and supports entity identification, high speed data mining within the cybersecurity space. The company’s products; Shield, Savant and TraceCop are currently being used and tested by several companies and government agencies. It appears the marketplace has
Perritt MicroCap Opportunities Fund
high praise for their products and could see widespread acceptance in the market soon. INTZ stock has more than doubled since our initial purchase less than six months ago. Despite business success and long-term strength, several of our current investments have not received the same respect INTZ stock has recently experienced. Here are some examples.
One of the portfolio’s largest holdings, Northern Technologies (NTIC) develops, and markets rust and corrosion inhibiting products, as well as biobased compostable polymer resin compounds and finished products. The company’s corrosion products are marketed under the ZERUST brand and compostable products are marketed under the Natur-Tec brand. During the past 10 years, the company has increased revenue by nearly five-fold. While revenue slipped slightly this year due to the pandemic, business has already started to improve. Despite this long-term success and industry acceptance of their products, the company’s stock is up only modestly in the past 10 years and down more than 30% in the past year. We continue to have high confidence in NTIC prospects.
Another one of the portfolio’s largest holding, Legacy Housing (LEGH) builds, sells, and finances manufactured homes and tiny houses primarily in the southern United States. LEGH was added to the portfolio about two years ago. Not only has the company’s business been strong in the past two years, but it has also remained strong throughout this pandemic period. Despite double digit revenue growth each year and continued strength in their business, the company’s stock is approximately flat in the past two years and down nearly 15% in the past year. We believe this stock is misunderstood and very attractively priced.
As of October 31, 2020, the Fund’s portfolio contained the common stocks of 91 companies. The Fund’s 10 largest holdings and detailed descriptions can be found the following pages of this report. Based on our earnings estimates, the Fund’s portfolio is trading at approximately 14 times our 2021 earnings estimate. Stocks in the portfolio are priced at slightly less than 1.2 times average revenue and the median market capitalization is approximately $165 million. Finally, the average stock in the Fund is trading at 1.4 times book value and less than 10 times Enterprise Value to EBITDA (earnings before interest taxes depreciation and amortization). The valuation characteristics for the MicroCap Opportunities Fund are significantly less than the Fund’s benchmark Russell Microcap Index. The Russell Microcap Index is priced at 1.8 times revenue, 16 times earnings and nearly 1.7 times book value. Lastly, it is important to note than more than 50% of the companies within the Russell Microcap Index are not profitable, which compares to only 20% for the Perritt MicroCap Opportunities Fund.
I want to thank my fellow shareholders for their continued support and confidence in the Perritt Capital Management team. I have been a shareholder of the Fund for 30 years and have nearly half of my liquid investments in the Perritt Funds. The Perritt team remains dedicated to investing in high quality micro-cap companies at attractive valuations. If you have any questions or comments about this report or your investment in the Perritt MicroCap Opportunities Fund, please call us toll-free at (800) 331-8936 or visit our web site at www.perrittcap.com. Please refer to the prospectus for information about the Fund’s investment objectives and strategies.
Michael Corbett
President
Perritt MicroCap Opportunities Fund
Mutual fund investing involves risk. Principal loss is possible. The Funds invest in smaller companies, which involve additional risks, such as limited liquidity and greater volatility. The Funds invest in micro-cap companies which tend to perform poorly during times of economic stress.
Past performance does not guarantee future results.
Earnings Growth is not a measure of the Fund’s future performance.
Opinions expressed are subject to change at any time, are not guaranteed and should not be considered investment advice.
Please refer to the Schedule of Investments in the report for more complete information regarding Fund holdings. Fund holdings and sector allocations are subject to change and should not be considered a recommendation to buy or sell any security.
Russell Microcap Index is a capitalization weighted index of 2,000 small cap and micro-cap stocks that captures the smallest 1,000 companies in the Russell 2000, plus 1,000 smaller U.S.-based listed stocks.
One cannot invest directly in an index.
Cash flow is the net amount of cash and cash-equivalents moving into and out of a business. Positive cash flow indicates that a company’s liquid assets are increasing, enabling it to settle debts, reinvest in its business, return money to shareholders, pay expenses and provide a buffer against future financial challenges. Negative cash flow indicates that a company’s liquid assets are decreasing.
Book Value is the net asset value of a company calculated as total assets minus intangible assets (patents, goodwill) and liabilities.
Enterprise Value is a measure of a company’s total value, often used as a more comprehensive alternative to equity market capitalization. EV includes in its calculation the market capitalization of a company but also short-term and long-term debt as well as any cash on the company’s balance sheet.
Enterprise value to EBITDA Equals market capitalization + preferred shares + minority interest + debt - total cash divided by EBITDA.
The annual report must be preceded or accompanied by a prospectus.
The Perritt Funds are distributed by Quasar Distributors, LLC.
(This Page Intentionally Left Blank.)
Perritt MicroCap Opportunities Fund
| Performance* (Unaudited) | October 31, 2020
|
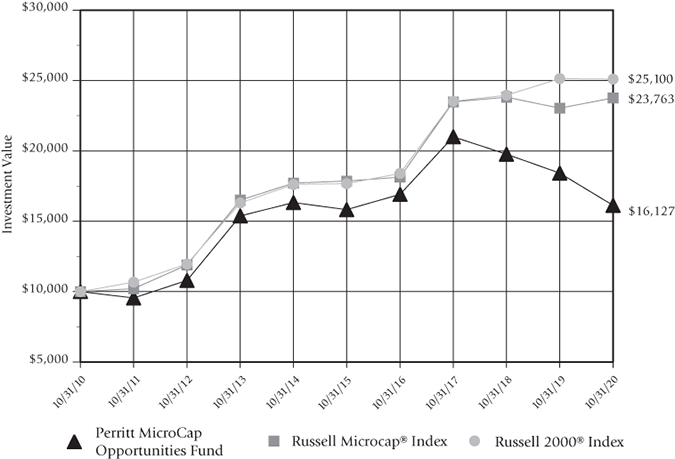
Perritt MicroCap Opportunities Fund versus
Russell Microcap® Index and Russell 2000® Index
There are several ways to evaluate a fund’s historical performance. You can look at the total percentage change in value, the average annual percentage change, or the growth of a hypothetical $10,000 investment. Each performance figure includes changes in a fund’s share price, plus reinvestment of any dividends (or income) and capital gains (the profits the fund earns when it sells stocks that have grown in value).
Cumulative total returns reflect the Fund’s actual performance over a set period. For example, if you invested $1,000 in a fund that had a 5% return over one year, you would end up with $1,050. You can compare the Fund’s returns to the Russell 2000® Index, which reflects a popular measure of the stock performance of small companies, and the Russell Microcap® Index, which measures the performance of the micro-cap segment of the U.S. equity market.
Average annual total returns take the Fund’s actual (or cumulative) return and show you what would have happened if the Fund had performed at a constant rate each year.
| * | The graph illustrates the performance of a hypothetical $10,000 investment made in the period presented. Assumes reinvestment of dividends and capital gains, but does not reflect the effect of any applicable sales charge or redemption fees or the deduction of taxes that a shareholder would pay on the Fund’s distributions or the redemption of the Fund shares. The graph does not imply any future performance. It is not possible to invest directly in an index. |
Perritt MicroCap Opportunities Fund
| Performance (Unaudited) (Continued) | October 31, 2020
|
| Average Annual Total Returns* |
| Year ended October 31, 2020 (Unaudited) |
| | Past | Past | Past | Past | Past |
| | 1 Year | 5 Years | 10 Years | 15 Years | 25 Years |
| Perritt MicroCap Opportunities Fund | (12.46)% | 0.38% | 4.90% | 4.02% | 8.19% |
| | | | | | |
Russell Microcap® Index | 3.14% | 5.88% | 9.04% | 5.80% | n/a |
| (reflects no deduction | | | | | |
| for fees and expenses) | | | | | |
| | | | | | |
Russell 2000® Index | (0.14)% | 7.27% | 9.64% | 7.40% | 8.25% |
| (reflects no deduction | | | | | |
| for fees and expenses) | | | | | |
Performance data quoted represents past performance; past performance does not guarantee future results. The investment return and principal value of an investment will fluctuate so that an investor’s shares, when redeemed, may be worth more or less than their original cost. Current performance of the Fund may be lower or higher than the performance quoted. Performance data current to the most recent month end is available by calling 800-331-8936.
| * | The tables do not reflect the deduction of taxes that a shareholder would pay on the Fund’s distributions or the redemption of Fund shares. |
Perritt MicroCap Opportunities Fund
| Ten Largest Common Stock Holdings (Unaudited) |
Silvercrest Asset Management Group Inc. (SAMG) is a wealth management firm that provides financial advisory and related family office services in the United States. The company serves ultra-high net worth individuals and families, as well as their trusts; endowments; foundations; and other institutional investors. It also manages funds of funds and other investment funds.
DLH Holdings Corp. (DLHC) provides healthcare and social services in the United States. It offers defense and veterans’ health solutions, including case management, physical and behavioral health examinations, and medical administration and logistics services.
IES Holdings, Inc. (IESC) engages in communications, commercial and industrial, infrastructure solutions, and residential businesses in the United States.
Radiant Logistics, Inc. (RLGT) operates as a third-party logistics and multi-modal transportation services company primarily in the United States and Canada. The company offers domestic and international air and ocean freight forwarding services; and freight brokerage services, including truckload, less than truckload, and intermodal services.
Shyft Group, Inc. (SHYF) through its subsidiary Spartan Motors USA, Inc., manufactures and assembles specialty vehicles for the commercial vehicle and recreational vehicle industries in the United States and internationally. It operates through two segments, Fleet Vehicles and Services (FVS), and Specialty Chassis and Vehicles (SCV).
Northern Technologies International, Corp. (NTIC) develops and markets rust and corrosion inhibiting products and services to automotive, electronics, electrical mechanical, military, retail consumer, and oil and gas markets.
Miller Industries, Inc. (MLR) engages in the manufacture and sale of towing and recovery equipment. It offers wreckers, such as conventional tow trucks and recovery vehicles. The company also provides transport trailers for moving multiple vehicles, auto auctions, car dealerships, leasing companies, and other similar applications.
U.S. Global Investors, Inc. (GROW) is a publicly owned investment manager. The firm primarily provides its services to investment companies. It also provides its services to pooled investment vehicles. The firm manages equity and fixed income mutual funds, hedge funds and exchange traded funds. It also invests in the public equity and fixed income markets across the globe.
Legacy Housing Corp. (LEGH) builds, sells, and finances manufactured homes and tiny houses primarily in the southern United States. The company manufactures and provides for the transport of mobile homes; and offers wholesale financing to dealers and mobile home parks, as well as a range of homes.
Turtle Beach Corp. (HEAR) operates as an audio technology company. It develops, commercializes, and markets gaming headset solutions for various platforms, including video game and entertainment consoles, handheld consoles, personal computers, and mobile and tablet devices under the Turtle Beach brand.
Fund holdings and/or sector allocations are subject to change at any time and
are not recommendations to buy or sell any security.
Please refer to the Schedule of Investments in this report for a complete list of Fund holdings.
Perritt MicroCap Opportunities Fund
| Allocation of Portfolio Investments (Unaudited) | October 31, 2020
|
The sector classifications represented in the graph above and industry classifications represented in
the Schedule of Investments are in accordance with Global Industry Classification Standard
(GICS®), which was developed by and/or is the exclusive property of MSCI, Inc. and Standard &
Poor Financial Services LLC. Percentages are based on total investments, at value.
| Note: | For presentation purposes, the Fund has grouped some of the industry categories. For purposes of categorizing securities for compliance with section 8(b)(1) of the Investment Company Act of 1940, the Fund uses more specific industry classifications. |
Perritt Ultra MicroCap Fund
| Portfolio Managers’ Message |
 |  |
| Michael Corbett, | Matthew Brackmann, |
| Portfolio Manager | Portfolio Manager |
The Perritt Ultra MicroCap Fund underperformed the Russell Microcap Index for the fiscal year 2020. The year started off with a continued dominance of the larger market cap companies within the Russell Microcap index. This began to shift early as we entered January and continued as the COVID-19 pandemic spread over the next few months. In our previous report, we had expressed some optimism that the dominance of the larger market cap companies in the index was abating. The six-month period from May through October saw positive performance across most industries and market cap ranges. However, given that the breadth of the recovery was spread across the entire index, the smaller market cap ranges that make up the Ultra’s investable universe did not outperform the larger constituents. Rather they performed in line with them, not making up any of the differential to the larger-cap companies. Within the Perritt Ultra MicroCap portfolio, several holdings in the healthcare space had negative returns. This hurt overall performance versus the index on a relative basis. The details of this underperformance will be addressed later in this letter.
As the COVID pandemic and related lifestyle changes have continued to permeate almost every aspect of our daily lives’, we have continued to keep in close contact with management teams across our portfolios to remain informed as to how they are adapting to this new environment. During the period, we attended several virtual conferences, had innumerable conference calls with various key decision makers and continuously monitored developments across the portfolio. While some of the holdings in the portfolio have experienced temporary disruptions to their business models, most have seen their businesses recover and are excited about their prospects going into 2021. April and May represented the worst of the decrease in activity for our companies with incremental improvements each month since then. Absent another full lock down, most investment professionals expect this improvement to continue. We will continue to stay in close contact and based on management’s feedback share in the optimism that 2021 will be a continuation of this recovery.
For fiscal year 2020, the Ultra MicroCap had a net loss of 9.75%, lagging the Russell Microcap Index’s positive gain of 3.14%. The second half of fiscal year 2020 saw the Ultra Microcap had a positive net return of 10.33% versus 19.00% for the Russell Microcap Index. The Fund’s longer-term performance, as well as that of its index, can be found later in this report. As we addressed earlier in the letter, the primary driver of this underperformance during the year came from holdings in the healthcare sector. The Fund’s holdings within the healthcare space had an average loss of 34.34% for the year versus an average gain of 38.58%. For some of the portfolio holdings, the focus on COVID by both regulatory organizations and healthcare providers proved to be detrimental to their business. These delays in regulatory approvals and longer lead times to sign new contracts have not impaired these companies’ future. We remain cautiously
Perritt Ultra MicroCap Fund
optimistic for these companies as we view their potential as being pushed out several quarters by COVID. A couple of investments had company specific events that negatively impacted their businesses and subsequently their stock’s performance. Consequently, we sold these companies from the portfolio. Fortunately, several holdings in several sectors including real estate, financials, information technology and consumer staples have contributed positively to the Fund’s performance.
Since our last update, we have sold five positions and added eleven. Four were sold due to declining fundamentals. We sold a fifth holding, GlobalSCAPE, Inc. after receiving a buyout offer. The portfolio additions were drawn from several industries and include a mix of investments we have owned in the past, mostly due to the fact their prices have come down to attractive valuations. A couple of highlights include Fathom Holdings, a cloud-based real estate brokerage and service firm that had their IPO this summer, as well as Transact Technologies, a name we have known for many years that recently announced a partnership with Apple to sell their software on iPads to restaurants for food safety and inventory control. Transact is a great example of a company that we had known prior to the pandemic that came down in price and presented an attractive entry point.
As of October 31, 2020, the Fund holds 69 companies which is higher than the last report. While this number remains slightly below the optimal number of names for the portfolio, we are pleased to have increased the number of holdings over the period. We continue to monitor several names on various watchlists and look for new opportunities with attractive valuations.
Regarding current portfolio valuations, based on our earnings estimates, the Fund’s portfolio is trading at a 15.2 forward price to earnings. The median price to sales ratio is 1.3, the median price to book is 1.4 and price to trailing twelve month’s earnings of 27.7. The median market cap for the Fund is at $80.3 million. By comparison, the Russell Microcap index has a price to sales ratio of 1.8, a price to book ratio of nearly 1.7 and a trailing twelve-month price earnings ratio of 16.2. The median market cap for the index is $203 million. We would like to point out the difference in market cap exposure between the two names as this illustrates the different focus of the two products as the Ultra MicroCap remains committed to investing in the smallest segment of the microcap space.
We want to genuinely thank our fellow shareholders for their continued support and confidence in the Perritt Capital Management team. Each member of our investment committee and many other employees have made continued investments in this Fund over the years and remain shareholders alongside all of you. We also wish you and your loved ones well in this difficult environment, and we wish you continued good health. If you have any questions or comments about this report or your investment in the Perritt Ultra MicroCap Fund, please call us toll free at (800)331-8936 or visit our web site at www.perrittcap.com. Please refer to the prospectus for information about the Fund’s investment objectives and strategies.
Matt Brackmann
Portfolio Manager
Perritt Ultra MicroCap Fund
Mutual fund investing involves risk. Principal loss is possible. The Funds invest in smaller companies, which involve additional risks, such as limited liquidity and greater volatility. The Funds invest in micro-cap companies which tend to perform poorly during times of economic stress.
Past performance does not guarantee future results.
Earnings Growth is not a measure of the Fund’s future performance. Opinions expressed are subject to change at any time, are not guaranteed and should not be considered investment advice.
Please refer to the Schedule of Investments in the report for more complete information regarding Fund holdings. Fund holdings and sector allocations are subject to change and should not be considered a recommendation to buy or sell any security.
Russell Microcap Index is a capitalization weighted index of 2,000 small cap and micro-cap stocks that captures the smallest 1,000 companies in the Russell 2000, plus 1,000 smaller U.S.-based listed stocks.
Price-to-Book (P/B) is a ratio used to compare a stock’s market value to its book value. It is calculated by dividing the current closing price of the stock by the latest quarter’s book value per share.
Price-to-Sales (P/S) is a valuation ratio that compares a company’s stock price to its revenues. The price-to-sales ratio is an indicator of the value placed on each dollar of a company’s sales or revenues.
Trailing Price-to Earnings (P/E) is calculated by taking the current stock price and dividing it by the trailing earnings per share (EPS) for the past 12 months.
Forward price-to-earnings (forward P/E) is a version of the ratio of price-to-earnings (P/E) that uses forecasted earnings for the P/E calculation. The forecasted earnings used in the formula typically uses either projected earnings for the following 12 months or for the next full-year fiscal (FY) period.
The annual report must be preceded or accompanied by a prospectus. One cannot invest directly in an index.
The Perritt Funds are distributed by Quasar Distributors, LLC.
(This Page Intentionally Left Blank.)
Perritt Ultra MicroCap Fund
| Performance* (Unaudited) | October 31, 2020
|
Perritt Ultra MicroCap Fund versus
Russell Microcap® Index and Russell 2000® Index
There are several ways to evaluate a fund’s historical performance. You can look at the total percentage change in value, the average annual percentage change, or the growth of a hypothetical $10,000 investment. Each performance figure includes changes in a fund’s share price, plus reinvestment of any dividends (or income) and capital gains (the profits the fund earns when it sells stocks that have grown in value).
Cumulative total returns reflect the Fund’s actual performance over a set period. For example, if you invested $1,000 in a fund that had a 5% return over one year, you would end up with $1,050. You can compare the Fund’s returns to the Russell 2000® Index, which reflects a popular measure of the stock performance of small companies, and the Russell Microcap® Index, which measures the performance of the micro-cap segment of the U.S. equity market.
Average annual total returns take the Fund’s actual (or cumulative) return and show you what would have happened if the Fund had performed at a constant rate each year.
| * | The graph illustrates the performance of a hypothetical $10,000 investment made in the period presented. Assumes reinvestment of dividends and capital gains, but does not reflect the effect of any applicable sales charge or redemption fees or the deduction of taxes that a shareholder would pay on the Fund’s distributions or the redemption of Fund shares. The graph does not imply any future performance. It is not possible to invest directly in an index. |
Perritt Ultra MicroCap Fund
| Performance (Unaudited) (Continued) | October 31, 2020
|
| Average Annual Total Returns* |
| Year ended October 31, 2020 (Unaudited) |
| | Past 1 | Past | Past | Past |
| | Year | 5 Years | 10 Years | 15 Years |
| Perritt Ultra MicroCap Fund | (9.75)% | 0.57% | 4.68% | 3.89% |
| | | | | |
Russell Microcap® Index | 3.14% | 5.88% | 9.04% | 5.80% |
| (reflects no deduction for fees and expenses) | | | | |
| | | | | |
Russell 2000® Index | (0.14)% | 7.27% | 9.64% | 7.40% |
| (reflects no deduction for fees and expenses) | | | | |
Performance data quoted represents past performance; past performance does not guarantee future results. The investment return and principal value of an investment will fluctuate so that an investor’s shares, when redeemed, may be worth more or less than their original cost. Current performance of the Fund may be lower or higher than the performance quoted. Performance data current to the most recent month end is available by calling 800-331-8936.
| * | The tables do not reflect the deduction of taxes that a shareholder would pay on the Fund’s distributions or the redemption of Fund shares. |
Perritt Ultra MicroCap Fund
| Ten Largest Common Stock Holdings (Unaudited) |
DLH Holdings Corp. (DLHC) provides healthcare, logistics, and technical services and solutions to Federal Government agencies including the Department of Veteran Affairs, the Department of Defense, and other government clients.
Fathom Holdings, Inc. (FTHM) provides cloud-based real estate brokerage services in the South, Atlantic, Southwest, and Western parts of the United States. It offers access to various properties for sale or lease through its website, www.FathomRealty.com to buyers, sellers, landlords, and tenants.
Transcat, Inc. (TRNS) provides calibration and laboratory instrument services in North America and internationally. It operates in two segments, Service and Distribution.
Issuer Direct Corp. (ISDR) provides shareholder communications and compliance platforms, technologies, and services in North America and Europe.
Luna Innovations Inc. (LUNA) develops, manufactures, and markets fiber optic sensing, and test and measurement products worldwide. It operates in two segments, Products and Licensing, and Technology Development.
Immucell Corp. (ICCC) an animal health company, acquires, develops, manufactures, and sells products that enhance the health and productivity of dairy and beef cattle in the United States and international.
Northern Technology International, Corp. (NTIC) develops and markets rust and corrosion inhibiting products and services to automotive, electronics, electrical mechanical, military, retail consumer, and oil and gas markets.
Galaxy Gaming, Inc. (GLXZ) is a gaming company that designs, develops, manufactures, markets, acquires, and licenses proprietary casino table games and associated technology, platforms, and systems for the gaming industry.
Quest Resource Holding Corp. (QRHC) through its subsidiaries, provides solutions for the reuse, recycling, and disposal of various waste streams and recyclables in the United States.
PCTEL, Inc. (PCTI), together with its subsidiaries, delivers performance critical telecom solutions in the Asia Pacific, Europe, the Middle East, Africa, and the Americas. The company designs and manufactures precision antennas, which are used primarily in small cells, enterprise Wi-Fi access points, fleet management and transit systems, and in equipment and devices for the Industrial Internet of Things.
Fund holdings and/or sector allocations are subject to change at any time and
are not recommendations to buy or sell any security.
Please refer to the Schedule of Investments in this report for a complete list of Fund holdings.
Perritt Ultra MicroCap Fund
| Allocation of Portfolio Investments (Unaudited) | October 31, 2020
|
The sector classifications represented in the graph above and industry classifications represented in
the Schedule of Investments are in accordance with Global Industry Classification Standard
(GICS®), which was developed by and/or is the exclusive property of MSCI, Inc. and Standard &
Poor Financial Services LLC. Percentages are based on total investments, at value.
| Note: | For presentation purposes, the Fund has grouped some of the industry categories. For purposes of categorizing securities for compliance with section 8(b)(1) of the Investment Company Act of 1940, the Fund uses more specific industry classifications. |
Perritt MicroCap Opportunities Fund
| Schedule of Investments | October 31, 2020
|
| Shares | | COMMON STOCKS – 100.03% | | Value | |
| Administrative and | | | |
| Support Services – 0.88% | | | |
| | 45,050 | | Hudson Global, Inc.(a) | | $ | 464,015 | |
| | | | | | | 464,015 | |
| Aerospace & Defense – 0.47% | | | | |
| | 56,816 | | CPI Aerostructures, Inc.(a) | | | 129,541 | |
| | 123,000 | | GSE Systems, Inc.(a) | | | 120,565 | |
| | | | | | | 250,106 | |
| Auto Parts & Equipment – 4.14% | | | | |
| | 58,000 | | Miller Industries, Inc. | | | 1,736,520 | |
| | 40,000 | | Motorcar Parts of | | | | |
| | | | America, Inc.(a) | | | 589,200 | |
| | | | | | | 2,325,720 | |
| Biotechnology – 1.43% | | | | |
| | 7,000 | | BioSpecifics Technologies | | | | |
| | | | Corp.(a) | | | 616,700 | |
| | 20,000 | | Opiant Pharmaceuticals, | | | | |
| | | | Inc.(a) | | | 137,800 | |
| | | | | | | 754,500 | |
| Building Materials – 3.06% | | | | |
| | 24,000 | | BlueLinx | | | | |
| | | | Holdings, Inc.(a) | | | 527,520 | |
| | 32,000 | | PGT Innovations, Inc.(a) | | | 530,560 | |
| | 123,434 | | Tecnoglass, Inc.(c) | | | 556,687 | |
| | | | | | | 1,614,767 | |
| Business Services – 9.75% | | | | |
| | 25,386 | | BG Staffing, Inc. | | | 202,326 | |
| | 150,422 | | CynergisTek, Inc.(a) | | | 222,625 | |
| | 283,399 | | DLH Holdings Corp.(a) | | | 2,539,255 | |
| | 66,514 | | GP Strategies Corp.(a) | | | 641,860 | |
| | 212,706 | | Information Services | | | | |
| | | | Group, Inc.(a) | | | 436,047 | |
| | 83,000 | | Intrusion, Inc.(a) | | | 839,130 | |
| | 41,558 | | PFSweb, Inc.(a) | | | 257,660 | |
| | | | | | | 5,138,903 | |
| Chemical & Related Products – 4.67% | | | | |
| | 44,500 | | Chembio | | | | |
| | | | Diagnostics, Inc.(a) | | | 210,930 | |
| | 258,730 | | Northern Technologies | | | | |
| | | | International Corp.(a) | | | 2,072,427 | |
| | 30,012 | | Trecora Resources(a) | | | 177,671 | |
| | | | | | | 2,461,028 | |
| Chemical Manufacturing – 0.15% | | | | |
| | 125,000 | | Assertio | | | | |
| | | | Holdings, Inc.(a) | | | 77,500 | |
| | | | | | | 77,500 | |
| Commercial Banks – 0.87% | | | | |
| | 7,000 | | Bankwell Financial | | | | |
| | | | Group, Inc. | | | 115,500 | |
| | 22,000 | | Esquire Financial | | | | |
| | | | Holdings, Inc.(a) | | | 342,980 | |
| | | | | | | 458,480 | |
| Commercial Services – 1.10% | | | | |
| | 46,000 | | TriState Capital | | | | |
| | | | Holdings, Inc.(a) | | | 579,140 | |
| | | | | | | 579,140 | |
| Computer and Electronic | | | | |
| Product Manufacturing – 2.07% | | | | |
| | 80,000 | | Coda Octopus | | | | |
| | | | Group, Inc.(a) | | | 441,600 | |
| | 65,000 | | Magal Security | | | | |
| | | | Systems Ltd.(a)(c) | | | 246,350 | |
| | 50,000 | | Powerfleet, Inc.(a) | | | 302,500 | |
| | 14,000 | | TransAct Technologies, | | | | |
| | | | Inc.(a) | | | 100,100 | |
| | | | | | | 1,090,550 | |
| Construction & Engineering – 6.16% | | | | |
| | 48,241 | | Gencor Industries, | | | | |
| | | | Inc.(a) | | | 557,666 | |
| | 115,943 | | Hill International, | | | | |
| | | | Inc.(a) | | | 153,045 | |
| | 79,500 | | IES Holdings, Inc.(a) | | | 2,537,640 | |
| | | | | | | 3,248,351 | |
| Consumer Goods – 1.71% | | | | |
| | 50,000 | | Turtle Beach Corp.(a) | | | 901,000 | |
| | | | | | | 901,000 | |
| Consumer Products – | | | | |
| Manufacturing – 1.59% | | | | |
| | 29,000 | | Delta Apparel, Inc.(a) | | | 482,850 | |
| | 16,353 | | Superior Group of | | | | |
| | | | Cos., Inc. | | | 353,552 | |
| | | | | | | 836,402 | |
| Consumer Services – 0.26% | | | | |
| | 80,000 | | DHI Group, Inc.(a) | | | 135,200 | |
| | | | | | | 135,200 | |
The accompanying notes to financial statements are an integral part of this schedule.
Perritt MicroCap Opportunities Fund
| Schedule of Investments (Continued) | October 31, 2020
|
| Shares | | | | Value | |
| Data Processing, Hosting | | | |
| and Related Services – 1.22% | | | |
| | 82,000 | | Limelight Networks, | | | |
| | | | Inc.(a) | | $ | 289,460 | |
| | 25,000 | | Ooma, Inc.(a) | | | 352,750 | |
| | | | | | | 642,210 | |
| Educational Services – 0.55% | | | | |
| | 24,110 | | Lincoln Educational | | | | |
| | | | Services Corp.(a) | | | 112,594 | |
| | 38,434 | | Universal Technical | | | | |
| | | | Institute, Inc.(a) | | | 176,412 | |
| | | | | | | 289,006 | |
| Electronic Equipment | | | | |
| & Instruments – 2.85% | | | | |
| | 29,500 | | Bel Fuse, Inc. – Class B | | | 345,445 | |
| | 93,789 | | Identiv, Inc.(a) | | | 612,442 | |
| | 129,500 | | Richardson | | | | |
| | | | Electronics Ltd. | | | 546,490 | |
| | | | | | | 1,504,377 | |
| Electronics and Appliance Stores – 0.61% | | | | |
| | 40,000 | | Mohawk Group | | | | |
| | | | Holdings, Inc.(a) | | | 321,600 | |
| | | | | | | 321,600 | |
| Engineering & Construction – 0.84% | | | | |
| | 65,458 | | Infrastructure & Energy | | | | |
| | | | Alternatives, Inc.(a) | | | 443,805 | |
| | | | | | | 443,805 | |
| Financial Services – 9.60% | | | | |
| | 33,000 | | First Internet Bancorp | | | 710,160 | |
| | 39,000 | | Hennessy Advisors, Inc. | | | 314,730 | |
| | 235,368 | | Silvercrest Asset | | | | |
| | | | Management Group, | | | | |
| | | | Inc. – Class A | | | 2,657,305 | |
| | 537,957 | | U.S. Global Investors, | | | | |
| | | | Inc. – Class A | | | 1,382,549 | |
| | | | | | | 5,064,744 | |
| Food – 1.00% | | | | |
| | 55,000 | | Landec Corp.(a) | | | 528,550 | |
| | | | | | | 528,550 | |
| Gold – 2.96% | | | | |
| | 135,000 | | Fortuna Silver Mines, | | | | |
| | | | Inc.(a)(c) | | | 893,700 | |
| | 145,000 | | Gold Resource Corp. | | | 397,300 | |
| | 280,000 | | McEwen Mining, | | | | |
| | | | Inc.(a)(c) | | | 271,992 | |
| | | | | | | 1,562,992 | |
| Healthcare Services – 1.17% | | | | |
| | 20,000 | | InfuSystem Holdings, | | | | |
| | | | Inc.(a) | | | 246,400 | |
| | 89,095 | | Trxade Group, Inc.(a) | | | 372,417 | |
| | | | | | | 618,817 | |
| Home Builder – 1.10% | | | | |
| | 32,500 | | Green Brick Partners, | | | | |
| | | | Inc.(a) | | | 581,425 | |
| | | | | | | 581,425 | |
| Housing – 2.55% | | | | |
| | 99,000 | | Legacy Housing | | | | |
| | | | Corp.(a) | | | 1,347,390 | |
| | | | | | | 1,347,390 | |
| Leisure – 1.24% | | | | |
| | 84,000 | | Century Casinos, | | | | |
| | | | Inc.(a) | | | 395,640 | |
| | 180,000 | | Galaxy Gaming, Inc.(a) | | | 178,200 | |
| | 50,000 | | Super League | | | | |
| | | | Gaming, Inc.(a) | | | 83,000 | |
| | | | | | | 656,840 | |
| Machinery Manufacturing – 1.44% | | | | |
| | 40,000 | | Graham Corp. | | | 528,000 | |
| | 200,000 | | TechPrecision Corp.(a) | | | 232,000 | |
| | | | | | | 760,000 | |
| Medical Supplies & Services – 0.55% | | | | |
| | 3,000 | | Addus HomeCare | | | | |
| | | | Corp.(a) | | | 292,710 | |
| | | | | | | 292,710 | |
| Merchant Wholesalers, | | | | |
| Nondurable Goods – 0.75% | | | | |
| | 170,000 | | NewAge, Inc.(a) | | | 397,800 | |
| | | | | | | 397,800 | |
| Miscellaneous Manufacturing – 0.16% | | | | |
| | 10,000 | | Electromed, Inc.(a) | | | 83,100 | |
| | | | | | | 83,100 | |
| Motion Pictures and Sound | | | | |
| Recording Industries – 1.11% | | | | |
| | 469,405 | | WildBrain Ltd.(c) | | | 588,493 | |
| | | | | | | 588,493 | |
| Oil & Gas – 0.40% | | | | |
| | 96,500 | | Evolution Petroleum | | | | |
| | | | Corp. | | | 213,265 | |
| | | | | | | 213,265 | |
The accompanying notes to financial statements are an integral part of this schedule.
Perritt MicroCap Opportunities Fund
| Schedule of Investments (Continued) | October 31, 2020
|
| Shares | | | | Value | |
| Oil & Gas Services – 0.89% | | | |
| | 150,000 | | Energy Fuels | | | |
| | | | Inc/Canada(a)(c) | | $ | 226,500 | |
| | 371,895 | | Profire Energy, Inc.(a) | | | 242,104 | |
| | | | | | | 468,604 | |
| Professional, Scientific, and | | | | |
| Technical Services – 0.62% | | | | |
| | 8,000 | | CRA International, Inc. | | | 327,600 | |
| | | | | | | 327,600 | |
| Publishing Industries | | | | |
| (except Internet) – 0.90% | | | | |
| | 30,000 | | eGain Corp.(a) | | | 475,500 | |
| | | | | | | 475,500 | |
| Securities, Commodity Contracts, and | | | | |
| Other Financial Investments and | | | | |
| Related Activities – 1.24% | | | | |
| | 22,000 | | Sprott, Inc.(c) | | | 656,700 | |
| | | | | | | 656,700 | |
| Semiconductor Related Products – 3.66% | | | | |
| | 115,000 | | AXT, Inc.(a) | | | 684,250 | |
| | 65,000 | | DSP Group, Inc.(a) | | | 856,050 | |
| | 40,000 | | Photronics, Inc.(a) | | | 390,000 | |
| | | | | | | 1,930,300 | |
| Software – 5.33% | | | | |
| | 55,000 | | American Software, | | | | |
| | | | Inc. – Class A(a) | | | 807,400 | |
| | 100,000 | | Asure Software, Inc.(a) | | | 707,000 | |
| | 111,000 | | Immersion Corp.(a) | | | 683,760 | |
| | 100,000 | | Zix Corp.(a) | | | 613,000 | |
| | | | | | | 2,811,160 | |
| Specialty Manufacturing – 4.37% | | | | |
| | 20,000 | | Federal Signal Corp. | | | 573,600 | |
| | 26,445 | | LB Foster Co. – Class A(a) | | | 358,594 | |
| | 56,000 | | LSI Industries, Inc. | | | 383,040 | |
| | 83,564 | | Manitex International, | | | | |
| | | | Inc.(a) | | | 343,448 | |
| | 24,000 | | Northwest Pipe Co.(a) | | | 643,200 | |
| | | | | | | 2,301,882 | |
| Support Activities for Mining – 0.24% | | | | |
| | 50,000 | | Alexco Resource Corp.(a)(c) | | | 124,500 | |
| | | | | | | 124,500 | |
| Telecommunications – 3.40% | | | | |
| | 255,000 | | Ceragon Networks, | | | | |
| | | | Ltd.(a)(c) | | | 563,550 | |
| | 34,000 | | Digi International, | | | | |
| | | | Inc.(a) | | | 500,820 | |
| | 143,000 | | PC-Tel, Inc. | | | 729,300 | |
| | | | | | | 1,793,670 | |
| Transportation – 4.55% | | | | |
| | 466,666 | | Radiant Logistics, | | | | |
| | | | Inc.(a) | | | 2,398,663 | |
| | | | | | | 2,398,663 | |
| Transportation Equipment | | | | |
| Manufacturing – 4.05% | | | | |
| | 110,749 | | Shyft Group Inc | | | 2,138,563 | |
| | | | | | | 2,138,563 | |
| Utilities – 0.83% | | | | |
| | 50,000 | | Pure Cycle Corp.(a) | | | 440,000 | |
| | | | | | | 440,000 | |
| Waste Management & | | | | |
| Remediation Services – 1.27% | | | | |
| | 98,229 | | Perma-Fix Environmental | | | | |
| | | | Services, Inc.(a) | | | 672,869 | |
| | | | | | | 672,869 | |
| | | | TOTAL COMMON | | | | |
| | | | STOCKS | | | | |
| | | | (Cost $43,765,860) | | $ | 52,772,797 | |
| | | | | | | | |
| SHORT-TERM | | | | |
| INVESTMENTS – 0.13% | | | | |
| | | | | |
| Money Market Funds – 0.13% | | | | |
| | 66,963 | | First American Government | | | | |
| | | | Obligations Fund, | | | | |
| | | | Class X, 0.046%(b) | | $ | 66,963 | |
| | | | TOTAL SHORT-TERM | | | | |
| | | | INVESTMENTS | | | | |
| | | | (Cost $66,963) | | $ | 66,963 | |
| | | | Total Investments | | | | |
| | | | (Cost $43,832,823) – | | | | |
| | | | 100.16% | | $ | 52,839,760 | |
| | | | Liabilities in Excess of | | | | |
| | | | Other Assets – | | | | |
| | | | (0.16)% | | | (84,111 | ) |
| | | | TOTAL NET ASSETS – | | | | |
| | | | 100.00% | | $ | 52,755,649 | |
Percentages are stated as a percent of net assets.
(a) | Non-income producing security. |
(b) | The rate shown is the seven-day yield as of October 31, 2020. |
(c) | Foreign issued security. |
The accompanying notes to financial statements are an integral part of this schedule.
Perritt Ultra MicroCap Fund
| Schedule of Investments | October 31, 2020
|
| Shares | | COMMON STOCKS – 97.86% | | Value | |
| Administrative and | | | |
| Support Services – 1.12% | | | |
| | 12,548 | | Hudson Global, Inc.(a) | | $ | 129,245 | |
| | | | | | | 129,245 | |
| Aerospace & Defense – 0.79% | | | | |
| | 40,000 | | CPI Aerostructures, | | | | |
| | | | Inc.(a) | | | 91,200 | |
| | | | | | | 91,200 | |
| Auto Parts & Equipment – 1.01% | | | | |
| | 20,000 | | Commercial Vehicle | | | | |
| | | | Group, Inc.(a) | | | 117,000 | |
| | | | | | | 117,000 | |
| Biotechnology – 0.57% | | | | |
| | 9,500 | | Opiant Pharmaceuticals, | | | | |
| | | | Inc.(a) | | | 65,455 | |
| | | | | | | 65,455 | |
| Building Materials – 1.75% | | | | |
| | 45,000 | | Tecnoglass, Inc.(d) | | | 202,950 | |
| | | | | | | 202,950 | |
| Business Services – 20.31% | | | | |
| | 12,500 | | BG Staffing, Inc. | | | 99,625 | |
| | 96,000 | | CynergisTek, Inc.(a) | | | 142,080 | |
| | 70,000 | | DLH Holdings Corp.(a) | | | 627,200 | |
| | 63,138 | | Information Services | | | | |
| | | | Group, Inc.(a) | | | 129,433 | |
| | 17,500 | | Intrusion, Inc.(a) | | | 176,925 | |
| | 15,000 | | Issuer Direct Corp.(a) | | | 301,200 | |
| | 60,000 | | Medicine Man | | | | |
| | | | Technologies, Inc.(a) | | | 66,000 | |
| | 100,000 | | Support.com, Inc. | | | 231,000 | |
| | 12,000 | | Transcat, Inc.(a) | | | 370,920 | |
| | 25,000 | | USA Technologies, | | | | |
| | | | Inc.(a) | | | 207,750 | |
| | | | | | | 2,352,133 | |
| Chemical & Related Products – 2.39% | | | | |
| | 34,500 | | Northern Technologies | | | | |
| | | | International Corp.(a) | | | 276,345 | |
| | | | | | | 276,345 | |
| Computer & Electronic | | | | |
| Product Manufacturing – 3.77% | | | | |
| | 50,000 | | PC-Tel, Inc. | | | 255,000 | |
| | 700,000 | | Singing Machine | | | | |
| | | | Co., Inc.(a)(b)(e) | | | 182,000 | |
| | | | | | | 437,000 | |
| Computer and Electronic | | | | |
| Product Manufacturing – 6.89% | | | | |
| | 14,000 | | Airgain, Inc.(a) | | | 193,480 | |
| | 47,500 | | Luna Innovations, | | | | |
| | | | Inc.(a) | | | 299,725 | |
| | 52,600 | | One Stop Systems, | | | | |
| | | | Inc.(a) | | | 117,824 | |
| | 50,000 | | Orbital Energy Group, | | | | |
| | | | Inc.(a) | | | 36,550 | |
| | 21,000 | | TransAct Technologies, | | | | |
| | | | Inc.(a) | | | 150,150 | |
| | | | | | | 797,729 | |
| Computers & Electronics – 2.08% | | | | |
| | 10,000 | | Napco Security | | | | |
| | | | Technologies, Inc.(a) | | | 241,200 | |
| | | | | | | 241,200 | |
| Construction & Engineering – 1.50% | | | | |
| | 15,000 | | Gencor Industries, | | | | |
| | | | Inc.(a) | | | 173,400 | |
| | | | | | | 173,400 | |
| Consumer Goods – 3.51% | | | | |
| | 28,000 | | Jerash Holdings | | | | |
| | | | US, Inc. | | | 133,000 | |
| | 12,000 | | Natural Alternatives | | | | |
| | | | International, Inc.(a) | | | 92,880 | |
| | 10,000 | | Turtle Beach Corp.(a) | | | 180,200 | |
| | | | | | | 406,080 | |
| Consumer Services – 1.00% | | | | |
| | 35,000 | | DHI Group, Inc.(a) | | | 59,150 | |
| | 20,000 | | ZAGG, Inc.(a) | | | 57,000 | |
| | | | | | | 116,150 | |
| Diversified Financials – 1.01% | | | | |
| | 20,000 | | Safeguard Scientifics, | | | | |
| | | | Inc. | | | 116,400 | |
| | | | | | | 116,400 | |
| Electronic Equipment & | | | | |
| Instruments – 2.72% | | | | |
| | 31,000 | | Identiv, Inc.(a) | | | 202,430 | |
| | 30,000 | | Iteris, Inc.(a) | | | 113,100 | |
| | | | | | | 315,530 | |
| Environmental Services – 2.25% | | | | |
| | 140,000 | | Quest Resource Holding | | | | |
| | | | Corp.(a) | | | 260,400 | |
| | | | | | | 260,400 | |
The accompanying notes to financial statements are an integral part of this schedule.
Perritt Ultra MicroCap Fund
| Schedule of Investments (Continued) | October 31, 2020
|
| Shares | | | | Value | |
| Financial Holding Company – 0.95% | | | |
| | 36,759 | | CCUR Holdings, Inc. | | $ | 110,277 | |
| | | | | | | 110,277 | |
| Financial Services – 2.93% | | | | |
| | 17,500 | | Hennessy Advisors, Inc. | | | 141,225 | |
| | 17,500 | | Silvercrest Asset | | | | |
| | | | Management Group, | | | | |
| | | | Inc. – Class A | | | 97,575 | |
| | | | | | | 338,800 | |
| Health Care – 0.44% | | | | |
| | 60,000 | | Rockwell Medical | | | | |
| | | | Technologies, Inc.(a) | | | 51,144 | |
| | | | | | | 51,144 | |
| Healthcare Services – 1.08% | | | | |
| | 30,000 | | Trxade Group, Inc.(a) | | | 125,400 | |
| | | | | | | 125,400 | |
| Leisure – 3.57% | | | | |
| | 30,000 | | Century Casinos, Inc.(a) | | | 141,300 | |
| | 275,000 | | Galaxy Gaming, Inc.(a) | | | 272,250 | |
| | | | | | | 413,550 | |
| Machinery Manufacturing – 1.07% | | | | |
| | 5,000 | | GRAHAM Corp. | | | 66,000 | |
| | 50,000 | | TechPrecision Corp.(a) | | | 58,000 | |
| | | | | | | 124,000 | |
| Medical Supplies & Services – 5.07% | | | | |
| | 25,000 | | Biomerica, Inc.(a) | | | 136,500 | |
| | 75,000 | | Check Cap, Ltd.(a)(d) | | | 23,040 | |
| | 9,000 | | Lakeland Industries, | | | | |
| | | | Inc.(a) | | | 194,130 | |
| | 25,000 | | Sensus Healthcare, | | | | |
| | | | Inc.(a) | | | 62,000 | |
| | 18,500 | | Taylor Devices, Inc.(a) | | | 171,125 | |
| | | | | | | 586,795 | |
| Merchant Wholesalers, | | | | |
| Nondurable Goods – 1.41% | | | | |
| | 70,000 | | NewAge, Inc.(a) | | | 163,800 | |
| | | | | | | 163,800 | |
| Miscellaneous Manufacturing – 0.84% | | | | |
| | 22,500 | | Myomo, Inc.(a) | | | 97,650 | |
| | | | | | | 97,650 | |
| Oil & Gas Services – 0.79% | | | | |
| | 140,010 | | Profire Energy, Inc.(a) | | | 91,147 | |
| | | | | | | 91,147 | |
| Pharmaceuticals – 2.52% | | | | |
| | 55,000 | | ImmuCell Corp.(a) | | | 292,050 | |
| | | | | | | 292,050 | |
| Primary Metal Manufacturing – 0.90% | | | | |
| | 24,000 | | Ampco-Pittsburgh | | | | |
| | | | Corp.(a) | | | 104,400 | |
| | | | | | | 104,400 | |
| Professional, Scientific, and | | | | |
| Technical Services – 1.50% | | | | |
| | 25,000 | | Perion Network | | | | |
| | | | Ltd.(a)(d) | | | 173,375 | |
| | | | | | | 173,375 | |
| Real Estate – 3.64% | | | | |
| | 22,500 | | Fathom Holdings, | | | | |
| | | | Inc.(a) | | | 422,100 | |
| | | | | | | 422,100 | |
| Real Estate Investment Trusts – 2.06% | | | | |
| | 25,495 | | Global Self Storage, | | | | |
| | | | Inc. | | | 100,705 | |
| | 35,000 | | Sachem Capital Corp. | | | 138,250 | |
| | | | | | | 238,955 | |
| Semiconductor Related Products – 4.30% | | | | |
| | 40,000 | | AXT, Inc.(a) | | | 238,000 | |
| | 14,000 | | DSP Group, Inc.(a) | | | 184,380 | |
| | 16,252 | | inTEST Corp.(a) | | | 75,734 | |
| | | | | | | 498,114 | |
| Software – 2.66% | | | | |
| | 30,000 | | Asure Software, Inc.(a) | | | 212,100 | |
| | 40,000 | | NetSol Technologies, | | | | |
| | | | Inc.(a) | | | 96,400 | |
| | | | | | | 308,500 | |
| Specialty Manufacturing – 6.24% | | | | |
| | 50,000 | | Data I/O Corp.(a) | | | 170,500 | |
| | 17,500 | | GSI Technology, Inc.(a) | | | 106,925 | |
| | 29,998 | | Gulf Island | | | | |
| | | | Fabrication, Inc.(a) | | | 97,793 | |
| | 70,000 | | MIND Technology, | | | | |
| | | | Inc.(a) | | | 143,500 | |
| | 5,500 | | UFP Technologies, | | | | |
| | | | Inc.(a) | | | 203,830 | |
| | | | | | | 722,548 | |
The accompanying notes to financial statements are an integral part of this schedule.
Perritt Ultra MicroCap Fund
| Schedule of Investments (Continued) | October 31, 2020
|
| Shares | | | | Value | |
| Telecommunications – 1.39% | | | |
| | 175,000 | | Mobivity Holdings | | | |
| | | | Corp.(a)(b) | | $ | 161,000 | |
| | | | | | | 161,000 | |
| Utilities – 1.83% | | | | |
| | 20,000 | | Global Water Resources, | | | | |
| | | | Inc. | | | 212,000 | |
| | | | | | | 212,000 | |
| | | | TOTAL COMMON | | | | |
| | | | STOCKS | | | | |
| | | | (Cost $11,221,572) | | $ | 11,333,822 | |
| | | | | | | | |
| Contracts | | WARRANTS – 0.08% | | | | |
| Medical Supplies & Services – 0.00% | | | | |
| | | | Titan Medical, Inc. | | | | |
| | 250,000 | | Expiration: 08/10/2023, | | | | |
| | | | Exercise Price $3.20(a)(b)(e) | | | | |
| | | | | $ | 0 | |
| | | | | |
| Primary Metal Manufacturing – 0.08% | | | | |
| | | | Ampco-Pittsburgh Corp. | | | | |
| | 15,000 | | Expiration: 08/01/2025, | | | | |
| | | | Exercise Price $5.75(a) | | | | |
| | | | | | 8,926 | |
| | | | TOTAL WARRANTS | | | | |
| | | | (Cost $85,000) | | $ | 8,926 | |
| | | | | | | | |
| | | | SHORT-TERM | | | | |
| | | | INVESTMENTS – 2.27% | | | | |
| | | | | |
| Money Market Funds – 2.27% | | | | |
| | 263,072 | | First American Government | | | | |
| | | | Obligations Fund, 0.046%(c) | | | | |
| | | | | $ | 263,072 | |
| | | | TOTAL SHORT-TERM | | | | |
| | | | INVESTMENTS | | | | |
| | | | (Cost $263,072) | | $ | 263,072 | |
| | | | Total Investments | | | | |
| | | | (Cost $11,569,644) – | | | | |
| | | | 100.21% | | $ | 11,605,820 | |
| | | | Liabilities in Excess | | | | |
| | | | of Other | | | | |
| | | | Assets – (0.21)% | | | (24,146 | ) |
| | | | TOTAL NET ASSETS – | | | | |
| | | | 100.00% | | $ | 11,581,674 | |
Percentages are stated as a percent of net assets.
(a) | Non-income producing security. |
(b) | The prices for these securities were derived from estimates of fair value using methods approved by the Fund’s Board of Directors. These securities represent $343,000 of value or 2.96% of net assets. |
(c) | The rate shown is the seven-day yield as of October 31, 2020. |
(d) | Foreign issued security. |
(e) | These securities are deemed to be illiquid. These securities represent $182,000 of value or 1.57% of net assets. |
The accompanying notes to financial statements are an integral part of this schedule.
Perritt Funds, Inc.
| Statements of Assets and Liabilities |
October 31, 2020
| | | Perritt MicroCap | | | Perritt Ultra | |
| | | Opportunities Fund | | | MicroCap Fund | |
| Assets: | | | | | | |
| Investments at value | | $ | 52,839,760 | | | $ | 11,605,820 | |
| Receivable for investments sold | | | 64,426 | | | | — | |
| Receivable for fund shares issued | | | 22,823 | | | | 16,350 | |
| Dividends and interest receivable | | | 8 | | | | 4,213 | |
| Prepaid expenses | | | 13,678 | | | | 10,086 | |
| Total Assets | | | 52,940,695 | | | | 11,636,469 | |
| Liabilities: | | | | | | | | |
| Payable for fund shares purchased | | | 68,731 | | | | — | |
| Payable to Officer | | | 681 | | | | 681 | |
| Payable to Advisor | | | 47,645 | | | | 12,956 | |
| Payable to Custodian | | | 3,036 | | | | 1,658 | |
| Accrued audit expense | | | 22,423 | | | | 17,361 | |
| Other accrued expenses & liabilities | | | 42,530 | | | | 22,139 | |
| Total Liabilities | | | 185,046 | | | | 54,795 | |
| Net Assets | | $ | 52,755,649 | | | $ | 11,581,674 | |
| Net Assets Consist of: | | | | | | | | |
| Capital Stock | | $ | 44,456,612 | | | $ | 13,145,068 | |
| Total Distributable Earnings/(Losses) | | | 8,299,037 | | | | (1,563,394 | ) |
| Total Net Assets | | $ | 52,755,649 | | | $ | 11,581,674 | |
| Capital Stock, $0.0001 par value | | | | | | | | |
| Authorized | | | 100,000,000 | | | | 100,000,000 | |
| Outstanding | | | 2,704,656 | | | | 1,003,371 | |
| Net Assets | | $ | 52,755,649 | | | $ | 11,581,674 | |
| Net asset value and offering price per share | | $ | 19.51 | | | $ | 11.54 | |
| Cost of Investments | | $ | 43,832,823 | | | $ | 11,569,644 | |
The accompanying notes to financial statements are an integral part of these statements.
Perritt Funds, Inc.
For the Year Ended October 31, 2020
| | | Perritt MicroCap | | | Perritt Ultra | |
| | | Opportunities Fund | | | MicroCap Fund | |
| Investment Income: | | | | | | |
| Dividend Income (net of $734 and $0 foreign | | | | | | |
| withholding tax and issuance fees) | | $ | 620,847 | | | $ | 284,297 | |
| Interest income | | | 15,385 | | | | 5,767 | |
| Total investment income | | | 636,232 | | | | 290,064 | |
| Expenses: | | | | | | | | |
| Investment advisory fee | | | 696,996 | | | | 206,481 | |
| Shareholder servicing | | | 129,031 | | | | 54,912 | |
| Administration fee | | | 94,062 | | | | 31,689 | |
| Fund accounting expenses | | | 60,174 | | | | 17,361 | |
| Officer & directors’ fees & expenses | | | 53,000 | | | | 50,883 | |
| Professional fees | | | 44,408 | | | | 37,100 | |
| Federal & state registration fees | | | 31,007 | | | | 24,675 | |
| Other expense | | | 17,030 | | | | 8,592 | |
| Custodian fees | | | 12,913 | | | | 5,656 | |
| Printing & mailing fees | | | 7,691 | | | | 4,961 | |
| Total expenses | | | 1,146,312 | | | | 442,310 | |
| Net investment loss | | | (510,080 | ) | | | (152,246 | ) |
| | | | | | | | | |
| Realized and Unrealized Gain (Loss) on Investments: | | | | | | | | |
| Net realized gain (loss) on investments | | | 1,646,827 | | | | (1,147,634 | ) |
| Net change in unrealized depreciation on investments | | | (15,762,510 | ) | | | (1,333,569 | ) |
| Net realized and unrealized loss on investments | | | (14,115,683 | ) | | | (2,481,203 | ) |
| Net decrease in net assets resulting from operations | | $ | (14,625,763 | ) | | $ | (2,633,449 | ) |
The accompanying notes to financial statements are an integral part of these statements.
Perritt MicroCap Opportunities Fund
| Statements of Changes in Net Assets |
| | | For the | | | For the | |
| | | Year Ended | | | Year Ended | |
| | | October 31, 2020 | | | October 31, 2019 | |
| Operations: | | | | | | |
| Net investment loss | | $ | (510,080 | ) | | $ | (633,786 | ) |
| Net realized gain on investments | | | 1,646,827 | | | | 5,453,377 | |
| Net change in unrealized depreciation on investments | | | (15,762,510 | ) | | | (16,914,277 | ) |
| Net decrease in net assets resulting from operations | | | (14,625,763 | ) | | | (12,094,686 | ) |
| Dividends and Distributions to Shareholders: | | | | | | | | |
| Distributable Earnings | | | (3,593,867 | ) | | | (18,138,199 | ) |
| Total dividends and distributions | | | (3,593,867 | ) | | | (18,138,199 | ) |
| Capital Share Transactions: | | | | | | | | |
| Proceeds from shares issued | | | 3,364,259 | | | | 21,918,304 | 1 |
| Reinvestment of distributions | | | 3,508,721 | | | | 17,256,354 | |
| Cost of shares redeemed | | | (43,781,601 | ) | | | (61,772,857 | ) |
| Redemption fees | | | 9,268 | | | | 7,758 | |
| Net decrease in net assets | | | | | | | | |
| from capital share transactions | | | (36,899,353 | ) | | | (22,590,443 | ) |
| Total Decrease in Net Assets | | | (55,118,983 | ) | | | (52,823,328 | ) |
| Net Assets | | | | | | | | |
| Beginning of the year | | | 107,874,632 | | | | 160,697,960 | |
| End of the year | | $ | 52,755,649 | | | $ | 107,874,632 | |
| Capital Share Transactions: | | | | | | | | |
| Shares sold | | | 183,094 | | | | 916,801 | 1 |
| Shares issued on reinvestment of distributions | | | 163,424 | | | | 713,425 | |
| Shares redeemed | | | (2,307,998 | ) | | | (2,669,226 | ) |
| Net decrease from capital share transactions | | | (1,961,480 | ) | | | (1,039,000 | ) |
1 | Includes 212,431 shares valued at $5,434,552 for all 347,735 of the shares outstanding of the Perritt Low Priced Stock Fund on February 22, 2019. See Note 13 for additional detail. |
The accompanying notes to financial statements are an integral part of this statement.
Perritt Ultra MicroCap Fund
| Statements of Changes in Net Assets |
| | | For the | | | For the | |
| | | Year Ended | | | Year Ended | |
| | | October 31, 2020 | | | October 31, 2019 | |
| Operations: | | | | | | |
| Net investment loss | | $ | (152,246 | ) | | $ | (405,697 | ) |
| Net realized gain (loss) on investments | | | (1,147,634 | ) | | | 52,203 | |
| Net change in unrealized depreciation on investments | | | (1,333,569 | ) | | | (5,266,983 | ) |
| Net decrease in net assets resulting from operations | | | (2,633,449 | ) | | | (5,620,477 | ) |
| Dividends and Distributions to Shareholders: | | | | | | | | |
| Distributable earnings | | | (17,594 | ) | | | (4,253,625 | ) |
| Return of capital | | | (34,626 | ) | | | — | |
| Total dividends and distributions | | | (52,220 | ) | | | (4,253,625 | ) |
| Capital Share Transactions: | | | | | | | | |
| Proceeds from shares issued | | | 776,958 | | | | 3,712,481 | |
| Reinvestment of distributions | | | 50,759 | | | | 4,056,631 | |
| Cost of shares redeemed | | | (20,714,603 | ) | | | (24,785,948 | ) |
| Redemption fees | | | 150 | | | | 2,664 | |
| Net decrease in net assets | | | | | | | | |
| from capital share transactions | | | (19,886,736 | ) | | | (17,014,172 | ) |
| Total Decrease in Net Assets | | | (22,572,405 | ) | | | (26,888,274 | ) |
| Net Assets | | | | | | | | |
| Beginning of the year | | | 34,154,079 | | | | 61,042,353 | |
| End of the year | | $ | 11,581,674 | | | $ | 34,154,079 | |
| Capital Share Transactions: | | | | | | | | |
| Shares sold | | | 64,582 | | | | 265,911 | |
| Shares issued on reinvestment of distributions | | | 4,028 | | | | 289,968 | |
| Shares redeemed | | | (1,731,047 | ) | | | (1,798,636 | ) |
| Net decrease from capital share transactions | | | (1,662,437 | ) | | | (1,242,757 | ) |
The accompanying notes to financial statements are an integral part of this statement.
Perritt MicroCap Opportunities Fund
For a Fund share outstanding throughout the year
| | | For the Years Ended October 31, | |
| | | 2020 | | | 2019 | | | 2018 | | | 2017 | | | 2016 | |
| Net asset value, beginning of year | | $ | 23.12 | | | $ | 28.17 | | | $ | 38.59 | | | $ | 34.18 | | | $ | 32.52 | |
| Income/(loss) from investment operations: | | | | | | | | | | | | | | | | | | | | |
Net investment income (loss)2 | | | (0.15 | ) | | | (0.11 | ) | | | (0.20 | ) | | | (0.15 | ) | | | 0.13 | |
| Net realized and unrealized | | | | | | | | | | | | | | | | | | | | |
| gain (loss) on investments | | | (2.66 | ) | | | (1.74 | ) | | | (1.83 | ) | | | 7.94 | | | | 2.06 | |
| Total from investment operations | | | (2.81 | ) | | | (1.85 | ) | | | (2.03 | ) | | | 7.79 | | | | 2.19 | |
| Less dividends and distributions: | | | | | | | | | | | | | | | | | | | | |
| From net investment income | | | — | | | | — | | | | — | | | | (0.09 | ) | | | — | |
| From net realized gains | | | (0.80 | ) | | | (3.20 | ) | | | (8.39 | ) | | | (3.29 | ) | | | (0.53 | ) |
| Total dividends and distributions | | | (0.80 | ) | | | (3.20 | ) | | | (8.39 | ) | | | (3.38 | ) | | | (0.53 | ) |
Redemption fees2,3 | | | 0.00 | | | | 0.00 | | | | 0.00 | | | | 0.00 | | | | 0.00 | |
| Net asset value, end of year | | $ | 19.51 | | | $ | 23.12 | | | $ | 28.17 | | | $ | 38.59 | | | $ | 34.18 | |
Total return1 | | | (12.46 | %) | | | (6.80 | %) | | | (5.89 | %) | | | 24.20 | % | | | 6.85 | % |
| Supplemental data and ratios: | | | | | | | | | | | | | | | | | | | | |
| Net assets, end of year (in thousands) | | $ | 52,756 | | | $ | 107,875 | | | $ | 160,698 | | | $ | 225,445 | | | $ | 262,268 | |
| Ratio of net expenses to average net assets | | | 1.64 | % | | | 1.38 | % | | | 1.28 | % | | | 1.23 | % | | | 1.23 | % |
| Ratio of net investment income (loss) | | | | | | | | | | | | | | | | | | | | |
| to average net assets | | | (0.73 | %) | | | (0.48 | %) | | | (0.63 | %) | | | (0.41 | %) | | | 0.41 | % |
| Portfolio turnover rate | | | 19.1 | % | | | 22.1 | % | | | 14.0 | % | | | 18.0 | % | | | 6.2 | % |
1 | Total return reflects reinvested dividends but does not reflect the impact of taxes. |
2 | Net investment income (loss) and redemption fees per share has been calculated based on average shares outstanding during the year. |
3 | Amount is less than $0.01 per share. |
The accompanying notes to financial statements are an integral part of this schedule.
Perritt Ultra MicroCap Fund
For a Fund share outstanding throughout the year
| | | For the Years Ended October 31, | |
| | | 2020 | | | 2019 | | | 2018 | | | 2017 | | | 2016 | |
| Net asset value, beginning of year | | $ | 12.81 | | | $ | 15.62 | | | $ | 18.49 | | | $ | 15.46 | | | $ | 14.39 | |
| Income/(loss) from investment operations: | | | | | | | | | | | | | | | | | | | | |
Net investment income (loss)2 | | | (0.11 | ) | | | (0.12 | ) | | | (0.17 | ) | | | (0.18 | ) | | | 0.07 | |
| Net realized and unrealized | | | | | | | | | | | | | | | | | | | | |
| gain (loss) on investments | | | (1.14 | ) | | | (1.60 | ) | | | (0.77 | ) | | | 3.94 | | | | 1.22 | |
| Total from investment operations | | | (1.25 | ) | | | (1.72 | ) | | | (0.94 | ) | | | 3.76 | | | | 1.29 | |
| Less dividends and distributions: | | | | | | | | | | | | | | | | | | | | |
| From net realized gains | | | (0.01 | ) | | | (1.09 | ) | | | (1.93 | ) | | | (0.73 | ) | | | (0.22 | ) |
| From return of capital | | | (0.01 | ) | | | — | | | | — | | | | — | | | | — | |
| Total dividends and distributions | | | (0.02 | ) | | | (1.09 | ) | | | (1.93 | ) | | | (0.73 | ) | | | (0.22 | ) |
Redemption fees2,3 | | | 0.00 | | | | 0.00 | | | | 0.00 | | | | 0.00 | | | | 0.00 | |
| Net asset value, end of year | | $ | 11.54 | | | $ | 12.81 | | | $ | 15.62 | | | $ | 18.49 | | | $ | 15.46 | |
Total return1 | | | (9.75 | %) | | | (11.54 | %) | | | (5.73 | %) | | | 25.27 | % | | | 9.11 | % |
| Supplemental data and ratios: | | | | | | | | | | | | | | | | | | | | |
| Net assets, end of year (in thousands) | | $ | 11,582 | | | $ | 34,154 | | | $ | 61,042 | | | $ | 69,636 | | | $ | 54,336 | |
| Ratio of net expenses to average net assets | | | 2.68 | % | | | 1.83 | % | | | 1.71 | % | | | 1.70 | % | | | 1.77 | % |
| Ratio of net investment income (loss) | | | | | | | | | | | | | | | | | | | | |
| to average net assets | | | (0.92 | %) | | | (0.85 | %) | | | (0.99 | %) | | | (1.07 | %) | | | 0.48 | % |
| Portfolio turnover rate | | | 14.3 | % | | | 13.3 | % | | | 28.4 | % | | | 43.0 | % | | | 18.1 | % |
1 | Total return reflects reinvested dividends but does not reflect the impact of taxes. |
2 | Net investment income (loss) and redemption fees per share has been calculated based on average shares outstanding during the year. |
3 | Amount is less than $0.01 per share. |
The accompanying notes to financial statements are an integral part of this schedule.
Perritt Funds, Inc.
| Notes to Financial Statements |
October 31, 2020
| 1. | Organization |
| | |
| | Perritt Funds, Inc. (the “Corporation”) was organized on March 19, 2004 as a Maryland corporation and is registered under the Investment Company Act of 1940, as amended (the “1940 Act”), as an open-end investment company, with each series below being a diversified fund. The Corporation currently consists of the following series: Perritt MicroCap Opportunities Fund (“MicroCap Fund”) and Perritt Ultra MicroCap Fund (“Ultra MicroCap Fund”) (each, a “Fund,” and collectively, the “Funds”). Perritt MicroCap Opportunities Fund, Inc., the predecessor to the MicroCap Fund, commenced operations on April 11, 1988. As part of a plan of reorganization, on February 28, 2013, Perritt MicroCap Opportunities Fund, Inc. merged into the MicroCap Fund, a series within the Corporation. The Ultra MicroCap Fund commenced operations on August 30, 2004. The MicroCap Fund’s investment objective is to invest in mainly common stocks of companies with market capitalizations that are below $500 million at the time of the initial purchase. The Ultra MicroCap Fund’s investment objective is to invest in mainly common stocks of companies with market capitalizations that are below $300 million at the time of the initial purchase. The Funds are each an investment company and accordingly follow the investment company accounting and reporting guidance of the Financial Accounting Standards Board (“FASB”) Accounting Standards Codification Topic 946 “Financial Services – Investment Companies.” |
| | |
| 2. | Summary of Significant Accounting Policies |
| | a. | Exchange-listed securities are generally valued at the last sales price reported by the principal security exchange on which the security is traded, or if no sale is reported, the mean between the latest bid and ask price unless the Funds’ investment advisor believes that the mean does not represent a fair value, in which case the securities are fair valued as set forth below. Securities listed on NASDAQ are valued at the NASDAQ Official Closing Price. Demand notes, commercial paper, U.S. Treasury Bills and warrants are stated at fair value using market prices if available, or a pricing service when such prices are believed to reflect fair value. Money Market Funds are valued at amortized cost. Securities for which market quotations are not readily available are valued at their fair value as determined in good faith by the Funds’ advisor under procedures established by and under the supervision of the Board of Directors of the Funds. The Funds’ fair value procedures allow for the use of certain methods performed by the Funds’ advisor to value those securities for which market quotations are not readily available, at a price that a Fund might reasonably expect to receive upon a sale of such securities. For example, these methods may be based on a multiple of earnings, or a discount from market of a similar freely traded security, or a yield to maturity with respect to debt issues, or a combination of these and other methods. |
| | | |
| | b. | Net realized gains and losses on securities are computed using the first-in, first-out method. |
| | | |
| | c. | Dividend income is recognized on the ex-dividend date, and interest income is recognized on the accrual basis. Withholding taxes on foreign dividends and capital gains, which are included as a component of net investment income and realized gain |
Perritt Funds, Inc.
| Notes to Financial Statements (Continued) |
| | | (loss) on investments, respectively, have been provided for in accordance with the Funds’ understanding of the applicable country’s tax rules and rates. Discounts and premiums on securities purchased are amortized over the life of the respective securities using the interest method. Distributions received from real estate investment trusts (“REITs”) are classified as investment income or realized gains based on the U.S. income tax characteristics of the distribution. Return of capital distributions received from REIT securities and partnerships are recorded as an adjustment to the cost of the security and thus may impact unrealized or realized gains or losses on the security. Investment and shareholder transactions are recorded on the trade date. |
| | | |
| | d. | Each Fund is charged for those expenses that are directly attributable to it. Expenses that are not readily identifiable to a specific Fund are generally allocated among the Funds in proportion to the relative net assets of the Funds. |
| | | |
| | e. | Provision has not been made for federal income tax since the Funds have each elected to be taxed as a “regulated investment company” and intend to distribute substantially all income to their shareholders and otherwise comply with the provisions of the Internal Revenue Code applicable to regulated investment companies. |
| | | |
| | f. | The preparation of financial statements in conformity with accounting principles generally accepted in the United States of America (“GAAP”) requires management to make estimates and assumptions that affect the reported amounts of assets and liabilities and disclosure of contingent assets and liabilities at the date of the financial statements and reported amounts of increases and decreases in net assets from operations during the reporting period. Actual results could differ from those estimates. |
| | | |
| | | In preparing these financial statements, the Funds have evaluated events and transactions for potential recognition or disclosure through the date the financial statements were issued. |
| | | |
| | g. | Dividends from net investment income and net realized capital gains, if any, are declared and paid annually. Distributions to shareholders are recorded on the ex-dividend date. Each Fund may utilize earnings and profit distributed to shareholders on redemption of shares as part of the dividends paid deduction. The Funds may periodically make reclassifications among certain of their capital accounts as a result of the timing and characterization of certain income and realized gain distributions, including reclassifying net operating loss, as determined annually in accordance with federal tax regulations which may differ from GAAP. The MicroCap Fund has reclassified the components of its capital accounts for the year ended October 31, 2020 by increasing paid-in capital by $610,931 and decreasing distributable earnings/(losses) by $610,931. The Ultra Microcap Fund has reclassified the components of its capital accounts for the year ended October 31, 2020 by decreasing paid-in capital by $61,300 and increasing distributable earnings/(losses) by $61,300. These adjustments were primarily due to the utilization of earnings and profits distributed to shareholders on redemptions of shares and the write off of net operating losses. |
| | | |
| | h. | As of and during the year ended October 31, 2020, the Funds did not have a liability for any unrecognized tax benefits. The Funds recognize interest and penalties, if any, |
Perritt Funds, Inc.
| Notes to Financial Statements (Continued) |
| | | related to unrecognized tax benefits as income tax expense on the Statements of Operations. During the year ended October 31, 2020, the Funds did not incur any interest or penalties. The Funds are not subject to examination by U.S. federal tax authorities for any tax years before 2017. |
| 3. | Security Valuation |
| | |
| | GAAP establishes an authoritative definition of fair value and sets out a hierarchy for measuring fair value. GAAP also requires additional disclosures about the various inputs used to develop the measurements of fair value. These inputs are summarized in the three broad levels listed below: |
| | • Level 1 – | Quoted prices in active markets for identical securities that the Funds have the ability to access. |
| | | |
| | • Level 2 – | Other significant observable inputs (including quoted prices for similar securities or the identical security on an inactive market, interest rates, prepayment speeds, credit risk, etc.). |
| | | |
| | • Level 3 – | Significant unobservable inputs (including the Funds’ own assumptions in determining the fair value of investments). |
| | The inputs or methodology used for valuing securities are not necessarily an indication of the risk associated with investing in those securities. The following is a summary of the inputs used to value the Funds’ net assets as of October 31, 2020: |
| | |
| | Perritt MicroCap Opportunities Fund |
| | Description | | Level 1 | | | Level 2 | | | Level 3 | | | Total | |
| | Investments in Securities | | | | | | | | | | | | |
| | Common Stocks | | | | | | | | | | | | |
| | Communication Services | | $ | 1,159,443 | | | $ | — | | | $ | — | | | $ | 1,159,443 | |
| | Consumer Discretionary | | | 5,812,280 | | | | — | | | | — | | | | 5,812,280 | |
| | Consumer Staples | | | 926,350 | | | | — | | | | — | | | | 926,350 | |
| | Energy | | | 681,868 | | | | — | | | | — | | | | 681,868 | |
| | Financial | | | 6,759,064 | | | | — | | | | — | | | | 6,759,064 | |
| | Health Care | | | 1,887,765 | | | | — | | | | — | | | | 1,887,765 | |
| | Industrials | | | 19,187,830 | | | | — | | | | — | | | | 19,187,830 | |
| | Information Technology | | | 11,548,419 | | | | — | | | | — | | | | 11,548,419 | |
| | Materials | | | 4,369,778 | | | | — | | | | — | | | | 4,369,778 | |
| | Utilities | | | 440,000 | | | | — | | | | — | | | | 440,000 | |
| | Total Common Stocks | | | 52,772,797 | | | | — | | | | — | | | | 52,772,797 | |
| | Short-Term Investments | | | 66,963 | | | | — | | | | — | | | | 66,963 | |
| | Total Investments | | | | | | | | | | | | | | | | |
| | in Securities | | $ | 52,839,760 | | | $ | — | | | $ | — | | | $ | 52,839,760 | |
Perritt Funds, Inc.
| Notes to Financial Statements (Continued) |
| | Perritt Ultra MicroCap Fund | | | | | | | | | | | | |
| | | | | | | | | | | | | | |
| | Description | | Level 1 | | | Level 2 | | | Level 3 | | | Total | |
| | Investments in Securities | | | | | | | | | | | | |
| | Common Stocks | | | | | | | | | | | | |
| | Communication Services | | $ | 232,525 | | | $ | 161,000 | | | $ | — | | | $ | 393,525 | |
| | Consumer Discretionary | | | 1,103,280 | | | | 182,000 | | | | — | | | | 1,285,280 | |
| | Consumer Staples | | | 256,680 | | | | — | | | | — | | | | 256,680 | |
| | Energy | | | 332,440 | | | | — | | | | — | | | | 332,440 | |
| | Financial | | | 703,727 | | | | — | | | | — | | | | 703,727 | |
| | Health Care | | | 935,919 | | | | — | | | | — | | | | 935,919 | |
| | Industrials | | | 2,164,115 | | | | — | | | | — | | | | 2,164,115 | |
| | Information Technology | | | 3,739,806 | | | | — | | | | — | | | | 3,739,806 | |
| | Materials | | | 787,525 | | | | — | | | | — | | | | 787,525 | |
| | Real Estate Investment Trusts | | | 522,805 | | | | — | | | | — | | | | 522,805 | |
| | Utilities | | | 212,000 | | | | — | | | | — | | | | 212,000 | |
| | Total Common Stocks | | | 10,990,822 | | | | 343,000 | | | | — | | | | 11,333,822 | |
| | Warrants | | | | | | | | | | | | | | | | |
| | Health Care | | | — | | | | 0 | | | | — | | | | 0 | |
| | Materials | | | 8,926 | | | | — | | | | — | | | | 8,926 | |
| | Total Warrants | | | 8,926 | | | | — | | | | — | | | | 8,926 | |
| | Short-Term Investments | | | 263,072 | | | | — | | | | — | | | | 263,072 | |
| | Total Investments | | | | | | | | | | | | | | | | |
| | in Securities | | $ | 11,262,820 | | | $ | 343,000 | | | $ | — | | | $ | 11,605,820 | |
| | Please refer to the Schedule of Investments for additional information regarding the composition of the amounts listed above. |
| | |
| | During the year ended October 31, 2020, the MicroCap Fund and the Ultra MicroCap Fund did not hold any Level 3 securities. |
| | |
| 4. | Investment Advisory Agreement |
| | |
| | For each Fund, the Corporation entered into an investment advisory agreement (collectively, the “Agreements”) with Perritt Capital Management, Inc. (the “Advisor”), with whom certain officers and directors of the Corporation are affiliated, to furnish investment advisory services to the Funds. Under the terms of the Agreements, the MicroCap Fund pays the Advisor a monthly fee at the annual rate of 1.00% of the Fund’s daily average net assets, and the Ultra MicroCap Fund pays the Advisor a monthly fee equal to 1.25% of its daily average net assets less than or equal to $100 million; 1.00% with respect to daily average net assets in excess of $100 million and less than or equal to $200 million; and 0.50% with respect to daily average net assets in excess of $200 million. At October, 2020, the MicroCap Fund and Ultra MicroCap Fund had fees due to the Advisor of $47,645 and $12,956, respectively. For the year ended October 31, 2020, the MicroCap Fund and Ultra MicroCap Fund had incurred advisory fees of $696,996 and $206,481, respectively. |
Perritt Funds, Inc.
| Notes to Financial Statements (Continued) |
| | The Advisor manages the Funds’ investments subject to the supervision of the Funds’ Board of Directors. The Advisor is responsible for investment decisions and supplies investment research and portfolio management. Under the Agreements, the Advisor, at its own expense and without reimbursement from the Funds, will furnish office space and all necessary office facilities, equipment and personnel for making the investment decisions necessary for managing the Funds and maintaining their organization, will pay the salaries and fees of all officers and directors of the Funds (except the Chief Compliance Officer’s salary and the fees paid to disinterested directors) and will bear all sales and promotional expenses of the Funds. |
| | |
| | The officers of the Funds are affiliated with the Advisor. Such officers, with the exception of the Chief Compliance Officer, receive no compensation from the Funds or the Advisor for serving their respective roles. The Funds pay the salary associated with the office of the Chief Compliance Officer. Such fees are included on the Statements of Operations within officer & directors’ fees & expenses. |
| | |
| | The Funds reimbursed the Advisor for fees paid to financial intermediaries such as banks, broker-dealers, financial advisors or other financial institutions for sub-transfer agency, sub-administration and other services that the financial intermediaries provided to their clients, who are beneficial owners of shares of the Funds. The financial intermediaries are the record owners of the Funds on the Funds’ records through omnibus accounts, other group accounts, retirement plans or accounts traded through registered securities clearing agents. These fees are fees that the Funds are obligated to pay to such intermediaries, and the fees may vary based on, for example, the nature of services provided. The fees paid to such intermediaries by the Funds are only a portion of the full fee that is paid to the intermediaries, and the Advisor is obligated to pay the remaining amount. In determining the portion of the fees paid to the intermediaries that the Funds are obligated to pay, the Funds have used the “avoided cost” method, which is one of several permissible methods to determine the fees are reasonable. Based on this method, the Funds’ Board of Directors determines a fee per sub-account that it believes approximates the transfer agency fee that would otherwise have been payable by the Funds if such intermediaries did not maintain the sub-account. These amounts are included within shareholder servicing fees on the Statements of Operations. |
| | |
| 5. | Investment Transactions |
| | |
| | Purchases and sales of securities, excluding short-term investments, for the year ended October 31, 2020, were as follows: |
| | | | Purchases | | | Sales | |
| | | | U.S. | | | | | | U.S. | | | | |
| | | | Governments | | | Other | | | Governments | | | Other | |
| | MicroCap Fund | | $ | — | | | $ | 13,238,582 | | | $ | — | | | $ | 54,006,650 | |
| | Ultra MicroCap Fund | | $ | — | | | $ | 2,355,008 | | | $ | — | | | $ | 21,713,825 | |
Perritt Funds, Inc.
| Notes to Financial Statements (Continued) |
| 6. | Federal Income Tax Matters |
| | |
| | As of October 31, 2020, the components of distributable earnings on a tax basis were as follows: |
| | | | MicroCap | | | Ultra MicroCap | |
| | | | Fund | | | Fund | |
| | Cost of investments for tax purposes | | $ | 43,971,097 | | | $ | 11,569,644 | |
| | Gross tax unrealized appreciation | | | 15,608,716 | | | | 3,010,023 | |
| | Gross tax unrealized depreciation | | | (6,740,054 | ) | | | (2,973,847 | ) |
| | Net unrealized appreciation | | | | | | | | |
| | on investments | | | 8,868,662 | | | | 36,176 | |
| | Other accumulated losses | | | (569,625 | ) | | | (1,599,570 | ) |
| | Total Distributable Earnings/(Losses) | | $ | 8,299,037 | | | $ | (1,563,394 | ) |
| | The difference between book and tax basis distributable earnings is primarily related to the deferral of losses on wash sales. |
| | |
| | A regulated investment company may elect for any taxable year to treat any portion of any qualified late year loss as arising on the first day of the next taxable year. Qualified late year losses are ordinary losses which occur during the portion of the Fund's taxable year subsequent to December 31. |
| | |
| | At October 31, 2020, the following Funds deferred, on a tax basis, late year ordinary losses of: MicroCap Fund had $567,909 in losses and Ultra MicroCap Fund had $459,274 in losses. The MicroCap Fund has an outstanding short term capital loss carryover of $1,716 to utilize. The Ultra MicroCap Fund has an outstanding long term capital loss carryover of $1,140,295 to utilize. The MicroCap Fund utilized $135,971 in capital loss carryover in the current year. |
| | |
| | The tax composition of distributions paid during the periods ended October 31, 2020 and 2019 were as follows: |
| | | | Ordinary | | | | | | | | | Return of | |
| | | | Income | | | Long-term Capital Gains | | | Capital | |
| | | | 2020 | | | 2019 | | | 2020 | | | 2019 | | | 2020 | | | 2019 | |
| | MicroCap Fund | | $ | — | | | $ | 4,228,890 | | | $ | 3,593,867 | | | $ | 13,909,309 | | | $ | — | | | $ | — | |
| | Ultra MicroCap Fund | | | — | | | | 407,328 | | | | 17,594 | | | | 3,846,297 | | | | 34,626 | | | | — | |
| | The Funds designated as long-term capital gain dividend, pursuant to Internal Revenue Code Section 852(b)(3), the amount necessary to reduce the earnings and profits of the Funds related to net capital gain to zero for the tax year ended October 31, 2020. |
| | |
| 7. | Restricted Securities |
| | |
| | The Funds may own investment securities which are unregistered and thus restricted as to resale. These securities are valued by each Fund after giving due consideration to pertinent factors including recent private sales, market conditions and the issuer’s financial performance. Where future disposition of these securities requires registration under the Securities Act of 1933, each Fund has the right to include these securities in |
Perritt Funds, Inc.
| Notes to Financial Statements (Continued) |
| | such registration, generally without cost to the Fund. The Funds have no right to require registration of the unregistered securities they hold. At October 31, 2020, the Funds did not hold any restricted securities. |
| | |
| 8. | Guarantees and Indemnifications |
| | |
| | Under the Funds’ organizational documents, their officers and directors are indemnified by the Funds against certain liabilities arising out of the performance of their duties to the Funds. Additionally, in the normal course of business, the Funds enter into contracts with service providers that contain general indemnification clauses. The Funds’ maximum exposure under these arrangements is unknown as this would involve future claims that may be made against the Funds that have not yet occurred. Currently, the Funds expect the risk of loss to be remote. |
| | |
| 9. | Line of Credit Arrangement |
| | |
| | The MicroCap Fund and Ultra MicroCap Fund are each party to uncommitted line of credit arrangements with U.S. Bank, N.A. with an expiration date of December 7, 2020, under which the MicroCap Fund may borrow up to $5,000,000 and the Ultra MicroCap Fund may borrow up to $3,000,000, subject to certain restrictions and covenants. Interest is charged on borrowings at the prevailing Prime Rate which was 3.25% as of October 31, 2020. The Funds have borrowed under these arrangements from time to time to increase the efficiency of cash flow management. For the year ended October 31, 2020, the MicroCap Fund had average borrowings of $453,679 and the weighted average interest rate on the line of credit borrowings was 3.68%. The Ultra MicroCap Fund had average borrowings of $320,667 and the weighted average interest rate on the line of credit borrowings was 3.95%. On March 10, 2020, the MicroCap Fund had borrowings of $1,890,000 and on March 31, 2020, the Ultra MicroCap Fund had borrowings of $1,440,000, which represent the largest borrowing amounts during the year ended October 31, 2020. As of October 31, 2020, the MicroCap Fund and Ultra MicroCap Fund had no outstanding borrowings on the lines of credit. Interest charged on the borrowings is recorded as other expense in the Statements of Operations. Subsequent to year end, the MicroCap Fund and Ultra MicroCap Fund renewed their line of credit arrangements with an updated borrowing limits of $2,500,000 and $2,000,000, respectively. Both line of credit agreements have an expiration date of December 6, 2021. |
| | |
| 10. | Redemption Fee |
| | |
| | The Funds charge a 2.00% redemption fee to those who buy and sell shares within 90 calendar days or less. The redemption fee is retained for the benefit of long-term shareholders, and recorded as additional capital in the Statements of Changes in Net Assets. |
| | |
| 11. | Transactions with Affiliates |
| | |
| | During the year ended October 31, 2020, MicroCap Fund and Ultra MicroCap Fund did not hold any securities that were considered affiliated. |
| | |
| | The Funds are permitted to purchase or sell securities from or to each other under specified conditions outlined in procedures adopted by the Board of Directors. The procedures have been designed to ensure that any purchase or sale of securities by a Fund |
Perritt Funds, Inc.
| Notes to Financial Statements (Continued) |
| | from or to another Fund complies with Rule 17a-7 of the 1940 Act. For the year ended October 31, 2020, the MicroCap Fund and Ultra MicroCap Fund engaged in 12 securities transactions pursuant to Rule 17a-7 of the 1940 Act. |
| | |
| 12. | Beneficial Ownership |
| | |
| | The beneficial ownership, either directly or indirectly, of more than 25% of voting securities of a fund creates a presumption of control of that fund, under Section 2(a)(9) of the 1940 Act. As of October 31, 2020, the Funds had omnibus shareholder accounts (comprised of a group of individual shareholders), which amounted to more than 25% of the total shares outstanding of the respective Fund. There were no individual shareholders of record who owned more than 5% of the outstanding shares of beneficial interest of a Fund or Class of shares of a Fund. Shareholders with a controlling interest could affect the outcome of proxy voting or direction of management of a Fund. |
| | |
| 13. | Reorganization |
| | |
| | After the close of business on February 22, 2019, the MicroCap Fund acquired all the net assets of the Perritt Low Priced Stock Fund (“Low Priced Fund”), pursuant to a Plan of Reorganization approved by the Fund’s Board of Directors on January 4, 2019. The purpose of the transaction was to combine two funds managed by the Advisor with comparable investment objectives and strategies. The cost and value of the investments of Low Priced Fund pre-merger were $5,393,454 and $5,435,276, respectively. The acquisition was accomplished by a tax-free exchange of 212,431 shares of MicroCap Fund (valued at $5,434,552) for all 347,735 of the shares outstanding of the Low Priced Fund after close of business on February 22, 2019. For financial reporting purposes, assets received, and shares issued by MicroCap Fund were recorded at fair value; however, the cost basis of the investments received from Low Priced Fund was carried forward to align ongoing reporting of MicroCap Fund’s realized and unrealized gains and losses with amounts distributable to shareholders for tax purposes. Low Priced Fund’s net assets at that date ($5,434,552), including $41,822 of unrealized appreciation, were combined with those of MicroCap Fund. The aggregate net assets of MicroCap Fund immediately before and after the acquisition were $149,526,231 and $154,960,783, respectively. Because the combined investment portfolios have been managed as a single integrated portfolio since the acquisition was completed, it is not practicable to separate the amounts of revenue and earnings of Low Priced Fund that have been included in MicroCap Fund’s Statements of Operations since February 22, 2019. All costs associated with the Plan of Reorganization were paid by the Advisor. |
| | |
| | Assuming the acquisition had been completed on November 1, 2018, the beginning of the annual reporting period of the MicroCap Fund, MicroCap Fund’s pro forma results of operations for the year ended October 31, 2019, are as follows: |
| | Net Investment Income | | $ | (642,518 | ) |
| | Net realized gain on investments | | | 5,222,540 | |
| | Net increase in net assets resulting from operations | | | (12,257,095 | ) |
Perritt Funds, Inc.
| Notes to Financial Statements (Continued) |
| 14. | Liquidity Risk Management (Unaudited) |
| | |
| | On July 1, 2020, the Directors of the Perritt MicroCap Opportunities Fund and the Perritt Ultra MicroCap Fund, the series of Perritt Funds, Inc., reviewed and considered a written report prepared by the program administrator of the Funds’ Liquidity Risk Management Program (the “Program”), the Fund’s Liquidity Risk Management Committee (the “Program Administrator”), which addressed the operation of the Program and assessed the Program’s adequacy and effectiveness of implementation. In considering the report, the Directors noted that the Program Administrator has determined that the Fund primarily holds assets that are highly liquid investments, and thus relies on the exclusion from the requirements to determine and review a highly liquid investment minimum and to adopt shortfall policies and procedures. They then confirmed with the Program Administrator that no material changes were made to the Program, and reviewed all of the material features of the Program to ensure that they understand how the Program is designed to assess and manage the risk that the Fund could not meet requests to redeem shares issued by the Fund without significant dilution of remaining investors in the Fund. Following this review and discussion, the Directors determined that they believe the disclosures in the report, taken as a whole, provide the information necessary for the Directors to effectively assess the Program and its implementation, and that they are comfortable with the report’s conclusion that the Program is reasonably designed to assess and manage the Fund’s liquidity risk, and that the Program has operated as intended during the past year. |
| | |
| 15. | Coronavirus (COVID-19) Pandemic |
| | |
| | The global outbreak of COVID-19 (commonly referred to as “coronavirus”) has disrupted economic markets and the prolonged economic impact is uncertain. The ultimate economic fallout from the pandemic, and the long-term impact on economies, markets, industries and individual issuers, are not known. The operational and financial performance of the issuers of securities in which the Funds invest depends on future developments, including the duration and spread of the outbreak, and such uncertainty may in turn adversely affect the value and liquidity of the Funds’ investments, impair the Funds’ ability to satisfy redemption requests, and negatively impact the Funds’ performance. |
Perritt Funds, Inc.
| Report of Independent Registered Public Accounting Firm |
To the Shareholders and Board of Directors of
Perritt Funds, Inc.
Opinion on the Financial Statements
We have audited the accompanying statements of assets and liabilities, including the schedules of investments, of Perritt Funds, Inc. comprising Perritt MicroCap Opportunities Fund and Perritt Ultra MicroCap Fund (the “Funds”) as of October 31, 2020, the related statements of operations for the year then ended, the statements of changes in net assets for each of the two years in the period then ended, including the related notes, and the financial highlights for each of the five years in the period then ended (collectively referred to as the “financial statements”). In our opinion, the financial statements present fairly, in all material respects, the financial position of each of the Funds as of October 31, 2020, the results of their operations for the year then ended, the changes in their net assets for each of the two years in the period then ended, and the financial highlights for each of the five years in the period then ended, in conformity with accounting principles generally accepted in the United States of America.
Basis for Opinion
These financial statements are the responsibility of the Funds’ management. Our responsibility is to express an opinion on the Funds’ financial statements based on our audits. We are a public accounting firm registered with the Public Company Accounting Oversight Board (United States) (“PCAOB”) and are required to be independent with respect to the Funds in accordance with the U.S. federal securities laws and the applicable rules and regulations of the Securities and Exchange Commission and the PCAOB.
We conducted our audits in accordance with the standards of the PCAOB. Those standards require that we plan and perform the audit to obtain reasonable assurance about whether the financial statements are free of material misstatement whether due to error or fraud.
Our audits included performing procedures to assess the risks of material misstatement of the financial statements, whether due to error or fraud, and performing procedures that respond to those risks. Such procedures included examining, on a test basis, evidence regarding the amounts and disclosures in the financial statements. Our procedures included confirmation of securities owned as of October 31, 2020, by correspondence with the custodian and brokers. Our audits also included evaluating the accounting principles used and significant estimates made by management, as well as evaluating the overall presentation of the financial statements. We believe that our audits provide a reasonable basis for our opinion.
We have served as the Funds’ auditor since 2009.
COHEN & COMPANY, LTD.
Chicago, Illinois
December 18, 2020
Perritt Funds, Inc.
| Expense Example (Unaudited) | October 31, 2020
|
As a shareholder of the Funds, you incur two types of costs: (1) transaction costs, including sales charges (loads) on purchase payments, reinvested dividends, or other distributions; redemption fees (the Funds impose a 2.00% redemption fee on shares held for 90 calendar days or less after purchase); and exchange fees; and (2) ongoing costs, including management fees; distribution and/or service fees; and other Fund expenses. This example is intended to help you understand your ongoing costs (in dollars) of investing in the Fund and to compare these costs with the ongoing costs of investing in other mutual funds. The example is based on an investment of $1,000 invested at the beginning of the period and held for the entire period (May 1, 2020 – October 31, 2020).
Actual Expenses
The first line of the table below provides information about actual account values and actual expenses. Although the Funds charge no sales load or transaction fees (other than a 2.00% redemption fee for shares held for 90 calendar days or less after purchase), you will be assessed fees for outgoing wire transfers, returned checks and stop payment orders at prevailing rates charged by U.S. Bancorp Fund Services, LLC, the Funds transfer agent. If you request that a redemption be made by wire transfer, currently a $15.00 fee is charged by the Funds transfer agent. You will be charged a transaction fee equal to 2.00% of the net amount of the redemption if you redeem your shares within 90 calendar days of purchase. IRA accounts will be charged a $15.00 annual maintenance fee. There is a $25 IRA distribution and transfer out fee, unless set up automatically. Please see IRA Account Agreement for additional fees related to IRA accounts. To the extent the Fund invests in shares of other investment companies as part of its investment strategy, you will indirectly bear your proportionate share of any fees and expenses charged by the underlying funds in which the Fund invests in addition to the expenses of the Fund. Actual expenses of the underlying funds are expected to vary among the various underlying funds. These expenses are not included in the example below. The example below includes, but is not limited to, management fees, shareholder servicing fees, fund accounting, custody and transfer agent fees. However, the example below does not include portfolio trading commissions and related expenses, interest expense and other extraordinary expenses as determined under accounting principles generally accepted in the United States of America. You may use the information in this line, together with the amount you invested, to estimate the expenses that you paid over the period. Simply divide your account value by $1,000 (for example, an $8,600 account value divided by $1,000 = 8.6), then multiply the result by the number in the first line under the heading entitled “Expenses Paid During Period” to estimate the expenses you paid on your account during this period.
Hypothetical Example for Comparison Purposes
The second line of the table below provides information about hypothetical account values and hypothetical expenses based on the Fund’s actual expense ratio and an assumed rate of return of 5% per year before expenses, which is not the Fund’s actual return. The hypothetical account values and expenses may not be used to estimate the actual ending account balance or expenses you paid for the period. You may use this information to compare the ongoing costs of investing in the Fund and other funds. To do so, compare this 5% hypothetical example with the 5% hypothetical examples that appear in the shareholder reports of the other funds.
Perritt Funds, Inc.
| Expense Example (Unaudited) (Continued) | October 31, 2020
|
Please note that the expenses shown in the table are meant to highlight your ongoing costs only and do not reflect any transactional costs, such as sales charges (loads), redemption fees, or exchange fees. Therefore, the second line of the table is useful in comparing ongoing costs only, and will not help you determine the relative total costs of owning different funds. In addition, if these transactional costs were included, your costs would have been higher.
| | Beginning | Ending | Expenses Paid |
| | Account Value | Account Value | During Period |
| | 5/1/20 | 10/31/20 | 5/1/20 – 10/31/201 |
| Actual | | | |
| Perritt MicroCap Opportunities | $1,000.00 | $1,167.60 | $ 9.65 |
| Perritt Ultra MicroCap Fund | $1,000.00 | $1,103.30 | $16.04 |
| | | | |
| Hypothetical | | | |
| Perritt MicroCap Opportunities | $1,000.00 | $1,016.10 | $ 8.97 |
| Perritt Ultra MicroCap Fund | $1,000.00 | $1,009.75 | $15.32 |
1 | Expenses are equal to the Fund’s annualized expense ratio of 1.69% for the MicroCap Opportunities Fund and 3.05% for the Ultra MicroCap Fund for the six-month period, multiplied by the average account value over the period, multiplied by 183/366 (to reflect the one-half year period). |
Perritt Funds, Inc.
| Directors and Officers (Unaudited) |
The name, age, address, principal occupations during the past five years, and other information with respect to each of the Directors are set forth in the following tables, along with information for the officers of the Funds.
| | Position(s) Held | | | |
| | with Funds and | | | Other |
| | Number of | | | Directorships |
| | Portfolios in | | | Held by |
| Name, | Fund Complex | Term of Office | Principal | Director |
| Address, | Overseen | and Length of | Occupation(s) | during the |
and Age | by Director | Time Served | during Past 5 Years | Past 5 Years |
| | |
| “Disinterested” Directors of the Funds | |
| | | | | |
| Dianne C. Click | Director | Indefinite, until | Ms. Click is a licensed Real | Perritt |
| Year of | | successor | Estate Broker in the State | MicroCap |
| Birth: 1962 | Portfolios in | elected | of Montana. She has been | Opportunities |
| 300 South | Fund Complex | | a partner and a principal | Fund, Inc. |
| Wacker Drive, | Overseen: 2 | Director | owner of a real estate sales | (1994–2013) |
| Suite 600 | | since 2004 | company, Bozeman Broker | |
| Chicago, IL | | | Group, since 2004. She has | |
| 60606 | | | been licensed in the state | |
| | | | of Montana since 1995. | |
| | | | | |
| David S. Maglich | Director | Indefinite, until | Mr. Maglich is a Shareholder | Perritt |
| Year of | | successor | with the law firm of Fergeson, | MicroCap |
| Birth: 1957 | Portfolios in | elected | Skipper et. al. in Sarasota, | Opportunities |
| 300 South | Fund Complex | | Florida and has been | Fund, Inc. |
| Wacker Drive, | Overseen: 2 | Director | employed with such firm | (1987–2013) |
| Suite 600 | | since 2004 | since 1989. | |
| Chicago, IL | | | | |
| 60606 | | | | |
Perritt Funds, Inc.
| Directors and Officers (Unaudited) (Continued) |
| | Position(s) Held | | | |
| | with Funds and | | | Other |
| | Number of | | | Directorships |
| | Portfolios in | | | Held by |
| Name, | Fund Complex | Term of Office | Principal | Director |
| Address, | Overseen | and Length of | Occupation(s) | during the |
and Age | by Director | Time Served | during Past 5 Years | Past 5 Years |
| | |
| “Interested” Director of the Funds | |
| | | | | |
| Michael J. | President | One-year term | Mr. Corbett was President | Perritt |
Corbett(1) | | as President | of the Perritt MicroCap | MicroCap |
| Year of | Portfolios in | | Opportunities Fund, Inc. | Opportunities |
| Birth: 1965 | Fund Complex | As Director, | (1999–2013) and President | Fund, Inc. |
| 300 South | Overseen: 2 | indefinite, | of the Perritt Funds, Inc. | (2010–2013) |
| Wacker Drive, | | until successor | since 2004. He has served | |
| Suite 600 | | elected | as President of the Adviser | |
| Chicago, IL | | | since 2010, and previously | |
| 60606 | | Director | served as Vice President of | |
| | | since 2010 | the Adviser from 1997 until | |
| | | | 2010. Mr. Corbett began his | |
| | | President | tenure with Perritt Capital | |
| | | since 2004 | Management in 1990 as a | |
| | | | research analyst. He assumed | |
| | | | portfolio management | |
| | | | responsibilities in 1996 and | |
| | | | now serves as portfolio | |
| | | | manager for the Funds. | |
____________
(1) | Mr. Corbett is an interested person of the Funds based upon his position with the Adviser. |
Perritt Funds, Inc.
| Directors and Officers (Unaudited) (Continued) |
| | Position(s) Held | | | |
| | with Funds and | | | Other |
| | Number of | | | Directorships |
| | Portfolios in | | | Held by |
| Name, | Fund Complex | Term of Office | Principal | Director |
| Address, | Overseen | and Length of | Occupation(s) | during the |
and Age | by Director | Time Served | during Past 5 Years | Past 5 Years |
| | |
| Officers of the Funds Other Than Mr. Corbett | |
| | | | | |
| Mark Buh | Vice President | One-year term | Mr. Buh has been Vice | N/A |
| Year of | and Treasurer | Since 2012 | President and Treasurer of | |
| Birth: 1961 | | | the Funds and Chief Financial | |
| 300 South | | | Officer of the Adviser since | |
| Wacker Drive, | | | 2012. He has over 25 years | |
| Suite 600 | | | of experience in corporate | |
| Chicago, IL | | | accounting, administration, | |
| 60606 | | | planning and business | |
| | | | development. His previous | |
| | | | experience includes tenures | |
| | | | at Ernst and Young and | |
| | | | CenturyLink | |
| | | | Communications. | |
| | | | | |
| Lynn E. | Vice President, | One-year term | Mrs. Burmeister has been | N/A |
| Burmeister | Chief | | the Chief Compliance | |
| Year of | Compliance | Chief | Officer since May 1, 2010, | |
| Birth: 1959 | Officer and | Compliance | and oversees all compliance | |
| 300 South | Secretary | Officer | matters for the Funds and the | |
| Wacker Drive, | | Since 2010 | Adviser. She also coordinates | |
| Suite 600 | | | the administration of the | |
| Chicago, IL | | Secretary | Funds and is a liaison with | |
| 60606 | | Since 2015 | the firm’s corporate counsel. | |
| | | | Mrs. Burmeister has worked | |
| | | | in the financial industry | |
| | | | since 1980. Her previous | |
| | | | experience includes work at | |
| | | | Harris Associates, Gofen & | |
| | | | Glossberg and Optimum | |
| | | | Investments. | |
Perritt Funds
The Statement of Additional Information (SAI) includes additional information about the Funds’ directors and is available, without charge, upon request, by calling 1-800-331-8936.
The Funds file their complete schedule of portfolio holdings with the Commission for the first and third quarters of each fiscal year as an exhibit to its reports on Form N-PORT. The Funds’ Form N-PORT reports are available on the Commission’s website at http://www.sec.gov
A description of the policies and procedures that the Funds use to determine how to vote proxies relating to portfolio securities is available without charge, upon request, by calling the Advisor at 1-800-331-8936 and on the Securities and Exchange Commission’s website at http://www.sec.gov.
Information regarding how the Funds voted proxies relating to portfolio securities during the most recent 12-month period ended June 30 is available without charge, upon request, by calling 1-800-331-8936 and on the Securities and Exchange Commission’s website at http://www.sec.gov.
Household Delivery of Shareholder Documents: To reduce expenses, the Funds may mail only one copy of the Funds’ prospectus, SAI and each annual and semi-annual report to those addresses shared by two or more accounts. If you wish to receive individual copies of these documents, please call the Funds at 1-800-331-8936 or contact your financial institution. You will begin receiving individual copies thirty days after receiving your request.
Electronic Delivery of Shareholder Documents: You may choose to receive the Funds’ prospectus and annual and semi-annual reports electronically. To sign up for electronic delivery, visit www.icsdelivery.com and select the first letter of your brokerage firm’s name. Then, select your brokerage institution from the list that follows, fill out the appropriate information and provide an e-mail address where you would like your information sent. If your brokerage firm is not listed, electronic delivery may not be available. Please contact your brokerage firm or financial advisor.
Privacy Policy
We collect the following nonpublic personal information about you:
| | • | Information we receive from you on or in applications or other forms, including but not limited to, your name, address, phone number, and social security number; and |
| | | |
| | • | Information about your transactions with us, our affiliates or others, including but not limited to, your account number and balance, parties to transactions, cost basis information and other financial information. |
We do not disclose any nonpublic personal information about our current or former shareholders to nonaffiliated third parties, except as permitted by law. For example, we are permitted by law to disclose all the information we collect to our transfer agent to process your transactions. Furthermore, we restrict access to your nonpublic personal information to those persons who require such information to provide products or services to you. We maintain physical, electronic, and procedural safeguards through our transfer agent, U.S. Bank Global Fund Services, that comply with federal standards to guard your nonpublic personal information.
In the event that you hold shares of the Funds through a financial intermediary, including, but not limited to, a broker-dealer, bank or trust company, the privacy policy of your financial intermediary would govern how your nonpublic personal information would be shared with nonaffiliated third parties.
| | Investment Advisor | |
| | Perritt Capital Management, Inc. | |
| | 300 South Wacker Drive, Suite 600 | |
| | Chicago, IL 60606-6703 | |
| | 800-331-8936 | |
| | | |
| | Independent Registered | |
| | Public Accounting Firm | |
| | Cohen & Company, Ltd. | |
| | 151 North Franklin Street, Suite 575 | |
| | Chicago, IL 60606 | |
| | | |
| | Legal Counsel | |
| | Foley & Lardner LLP | |
| | 777 East Wisconsin Avenue | |
| | Milwaukee, WI 53202 | |
| | | |
| | Custodian | |
| | U.S. Bank, NA | |
| | 1555 North River Center Drive, Suite 302 | |
| | Milwaukee, WI 53212 | |
| | | |
| | Transfer Agent | |
| | and Dividend Disbursing Agent | |
| | U.S. Bancorp Fund Services, LLC, | |
| | doing business as U.S. Bank Global Fund Services | |
| | P.O. Box 701 | |
| | Milwaukee, WI 53201-0701 | |
| | | |
| | Distributor | |
| | Quasar Distributors, LLC | |
| | 111 East Kilbourn Avenue, Suite 2200 | |
| | Milwaukee, WI 53202 | |
| | | |
| | | |
| | For assistance with your existing account, call our | |
| | Shareholder Service Center at 1-800-332-3133. | |
| | | |
| | The Funds’ Statements of Additional Information | |
| | contain information about the Funds’ directors and are | |
| | available without charge upon request by calling | |
| | 1-800-332-3133. | |
(This Page Intentionally Left Blank.)
MicroCap Opportunities Fund – PRCGX
Ultra MicroCap Fund – PREOX
Minimum Initial Investment $1,000
IRA Minimum Initial Investment $250
Dividend Reinvestment Plan
Systematic Withdrawal Plan
Automatic Investment Plan
Retirement Plans Including:
| • | IRA | • | Roth IRA |
| • | SEP-IRA | • | Coverdell Education |
| • | Simple IRA | | Savings Account |
2% redemption fee imposed for shares
held ninety (90) calendar days or less.
This report is authorized for distribution
only to shareholders and others who have
received a copy of the prospectus of the
Perritt MicroCap Opportunities Fund
and/or the Perritt Ultra MicroCap Fund.
300 S. Wacker Drive • Suite 600 • Chicago, IL 60606-6703
Tel 312-669-1650 • 800-331-8936 • Fax: 312-669-1235
E-mail: info@PerrittCap.com
Web Site: www.perrittcap.com
Item 2. Code of Ethics.
The registrant has adopted a code of ethics that applies to the registrant’s principal executive officer and principal financial officer. The registrant has not made any amendments to its code of ethics during the period covered by this report. The registrant has not granted any waivers from any provisions of the code of ethics during the period covered by this report. Incorporated by reference to the registrant’s Form N-CSR filed January 8, 2010.
Item 3. Audit Committee Financial Expert.
The registrant’s board of directors has determined that the registrant does not have an audit committee financial expert serving on its board of directors, which functions as the registrant’s audit committee since the registrant does not have a separate audit committee.
The board of directors has determined that the members of the board of directors have sufficient background, experience and financial knowledge to fulfill their responsibilities and obligations to the registrant and its shareholders. Accordingly, the board of directors has determined that the search for, and possible appointment of, a person who would satisfy the definition of an audit committee financial expert is not necessary.
Item 4. Principal Accountant Fees and Services.
The registrant has engaged its principal accountant, Cohen & Company, Ltd., to perform audit services, audit-related services, and tax services during the past fiscal year. “Audit services” refer to performing an audit of the registrant's annual financial statements or services that are normally provided by the accountant in connection with statutory and regulatory filings or engagements for the fiscal year. “Audit-related services” refer to the assurance and related services by the principal accountant that are reasonably related to the performance of the audit. “Tax services” refer to professional services rendered by the principal accountant for tax compliance, tax advice, and tax planning. The following table details the aggregate fees billed or expected to be billed for each of the last two fiscal years for audit fees, audit-related fees, tax fees and other fees by the principal accountant.
| | FYE 10/31/2020 | FYE 10/31/2019 |
Audit Fees | $28,000 | $28,000 |
Audit-Related Fees | $0 | $0 |
Tax Fees | $7,000 | $7,000 |
All Other Fees | $0 | $0 |
The percentage of fees billed by Cohen & Company, Ltd. for the fiscal years ended October 31, 2020 and October 31, 2019, respectively, applicable to non-audit services pursuant to a waiver of the pre-approval requirement was as follows:
| | FYE 10/31/2020 | FYE 10/31/2019 |
Audit-Related Fees | 0% | 0% |
Tax Fees | 0% | 0% |
All Other Fees | 0% | 0% |
All of the principal accountant’s hours spent on auditing the registrant’s financial statements were attributed to work performed by full‑time permanent employees of the principal accountant. The following table indicates the non-audit fees billed or expected to be billed by the registrant’s accountants for services to the registrant and to the registrant’s investment adviser or Service Affiliates (as defined below) for the last two years.
Non-Audit Related Fees | FYE 10/31/2020 | FYE 10/31/2019 |
Registrant | $0 | $0 |
Registrant’s Investment Adviser | $0 | $0 |
Because the registrant’s accountants have not rendered any non-audit services during the last two fiscal years to the registrant’s investment adviser, or any entity controlling, controlled by or under common control with the investment adviser that provides ongoing services to the registrant (together with the registrant’s investment adviser, “Service Affiliates”) that were not pre-approved pursuant to paragraph (c)(7)(ii) of Rule 2-01 of Regulation S-X, the registrant’s board of directors has not considered whether the provision of such services to the registrant’s investment adviser or the Service Affiliates is compatible with maintaining the independence of the registrant’s accountant.
Item 5. Audit Committee of Listed Registrants.
Not applicable to registrants who are not listed issuers (as defined in Rule 10A-3 under the Securities Exchange Act of 1934).
Item 6. Investments.
(a). Schedule of Investments is included as part of the report to shareholders filed under Item 1 of this Form.
(b). Not applicable.
Item 7. Disclosure of Proxy Voting Policies and Procedures for Closed-End Management Investment Companies.
Not applicable to open-end investment companies.
Item 8. Portfolio Managers of Closed-End Management Investment Companies.
Not applicable to open-end investment companies.
Item 9. Purchases of Equity Securities by Closed‑End Management Investment Company and Affiliated Purchasers.
Not applicable to open-end investment companies.
Item 10. Submission of Matters to a Vote of Security Holders.
There have been no material changes to the procedures by which shareholders may recommend nominees to the registrant’s board of directors.
Item 11. Controls and Procedures.
The Registrant’s President and Treasurer have reviewed the Registrant's disclosure controls and procedures (as defined in Rule 30a-3(c) under the Investment Company Act of 1940 (the “Act”)) as of a date within 90 days of the filing of this report, as required by Rule 30a-3(b) under the Act and Rules 13a-15(b) or 15d‑15(b) under the Securities Exchange Act of 1934. Based on their review, such officers have concluded that the disclosure controls and procedures are effective in ensuring that information required to be disclosed in this report is appropriately recorded, processed, summarized and reported and made known to them by others within the Registrant and by the Registrant’s service provider.
There were no changes in the Registrant's internal control over financial reporting (as defined in Rule 30a-3(d) under the Act) that occurred during the second fiscal quarter of the period covered by this report that has materially affected, or is reasonably likely to materially affect, the Registrant's internal control over financial reporting.
Item 12. Disclosure of Securities Lending Activities for Closed-End Management Investment Companies.
Not applicable to open-end investment companies.
Item 13. Exhibits.
(3) Any written solicitation to purchase securities under Rule 23c‑1 under the Act sent or given during the period covered by the report by or on behalf of the registrant to 10 or more persons. Not applicable to open-end investment companies.
SIGNATURES
Pursuant to the requirements of the Securities Exchange Act of 1934 and the Investment Company Act of 1940, the registrant has duly caused this report to be signed on its behalf by the undersigned, thereunto duly authorized.
(Registrant) Perritt Funds, Inc.
By (Signature and Title)* /s/Michael J. Corbett
Michael J. Corbett, President
Date December 21, 2020
Pursuant to the requirements of the Securities Exchange Act of 1934 and the Investment Company Act of 1940, this report has been signed below by the following persons on behalf of the registrant and in the capacities and on the dates indicated.
By (Signature and Title)* /s/Michael J. Corbett
Michael J. Corbett, President
Date December 21, 2020
By (Signature and Title)* /s/Mark J. Buh
Mark J. Buh, Treasurer/Principal Financial Officer
Date December 21, 2020
* Print the name and title of each signing officer under his or her signature.