UNITED STATES
SECURITIES AND EXCHANGE COMMISSION
Washington, D.C. 20549
Form N-CSR
CERTIFIED SHAREHOLDER REPORT OF REGISTERED
MANAGEMENT INVESTMENT COMPANIES
Investment Company Act File Number: 811-21574
Eaton Vance Floating-Rate Income Trust
(Exact Name of Registrant as Specified in Charter)
Two International Place, Boston, Massachusetts 02110
(Address of Principal Executive Offices)
Maureen A. Gemma
Two International Place, Boston, Massachusetts 02110
(Name and Address of Agent for Services)
(617) 482-8260
(Registrant’s Telephone Number)
May 31
Date of Fiscal Year End
November 30, 2020
Date of Reporting Period
| Item 1. | Reports to Stockholders |

Eaton Vance
Floating-Rate Income Trust (EFT)
Semiannual Report
November 30, 2020

Commodity Futures Trading Commission Registration. The Commodity Futures Trading Commission (“CFTC”) has adopted regulations that subject registered investment companies and advisers to regulation by the CFTC if a fund invests more than a prescribed level of its assets in certain CFTC-regulated instruments (including futures, certain options and swap agreements) or markets itself as providing investment exposure to such instruments. The investment adviser has claimed an exclusion from the definition of “commodity pool operator” under the Commodity Exchange Act with respect to its management of the Fund. Accordingly, neither the Fund nor the adviser with respect to the operation of the Fund is subject to CFTC regulation. Because of its management of other strategies, the Fund’s adviser is registered with the CFTC as a commodity pool operator. The adviser is also registered as a commodity trading advisor.
Fund shares are not insured by the FDIC and are not deposits or other obligations of, or guaranteed by, any depository institution. Shares are subject to investment risks, including possible loss of principal invested.
Semiannual Report November 30, 2020
Eaton Vance
Floating-Rate Income Trust
Eaton Vance
Floating-Rate Income Trust
November 30, 2020
Performance1,2
Portfolio Managers Ralph H. Hinckley, CFA, Andrew N. Sveen, CFA, Catherine C. McDermott, William E. Holt, CFA and Daniel P. McElaney, CFA
| | | | | | | | | | | | | | | | | | | | |
| % Average Annual Total Returns | | Inception Date | | | Six Months | | | One Year | | | Five Years | | | Ten Years | |
| | | | | |
Fund at NAV | | | 06/29/2004 | | | | 12.13 | % | | | 2.64 | % | | | 6.33 | % | | | 5.74 | % |
Fund at Market Price | | | — | | | | 20.46 | | | | 6.43 | | | | 6.66 | | | | 4.44 | |
|
| |
| | | | | |
S&P/LSTA Leveraged Loan Index | | | — | | | | 7.88 | % | | | 3.38 | % | | | 4.73 | % | | | 4.31 | % |
| | | | | |
| % Premium/Discount to NAV3 | | | | | | | | | | | | | | | |
| | | | | |
| | | | | | | | | | | | | | | | | | | –7.33 | % |
| | | | | |
| Distributions4 | | | | | | | | | | | | | | | |
| | | | | |
Total Distributions per share for the period | | | | | | | | | | | | | | | | | | $ | 0.358 | |
Distribution Rate at NAV | | | | | | | | | | | | | | | | | | | 5.07 | % |
Distribution Rate at Market Price | | | | | | | | | | | | | | | | | | | 5.48 | |
| | | | | |
| % Total Leverage5 | | | | | | | | | | | | | | | |
| | | | | |
Borrowings | | | | | | | | | | | | | | | | | | | 28.24 | % |
Variable Rate Term Preferred Shares (VRTP Shares) | | | | | | | | | | | | | | | | | | | 8.89 | |
See Endnotes and Additional Disclosures in this report.
Past performance is no guarantee of future results. Returns are historical and are calculated net of management fees and other expenses by determining the percentage change in net asset value (NAV) or market price (as applicable) with all distributions reinvested in accordance with the Fund’s Dividend Reinvestment Plan. Performance at market price will differ from performance at NAV due to variations in the Fund’s market price versus NAV, which may reflect factors such as fluctuations in supply and demand for Fund shares, changes in Fund distributions, shifting market expectations for the Fund’s future returns and distribution rates, and other considerations affecting the trading prices of closed-end funds. Investment return and principal value will fluctuate so that shares, when sold, may be worth more or less than their original cost. Performance for periods less than or equal to one year is cumulative. Performance is for the stated time period only; due to market volatility, current Fund performance may be lower or higher than the quoted return. For performance as of the most recent month-end, please refer to eatonvance.com.
Eaton Vance
Floating-Rate Income Trust
November 30, 2020
Fund Profile
Top 10 Issuers (% of total investments)6
| | | | |
TransDigm, Inc. | | | 1.2 | % |
| |
Hyland Software, Inc. | | | 1.1 | |
| |
UPC Broadband Holding B.V. | | | 0.9 | |
| |
Asurion, LLC | | | 0.8 | |
| |
Virgin Media SFA Finance Limited | | | 0.8 | |
| |
CenturyLink, Inc. | | | 0.8 | |
| |
Informatica, LLC | | | 0.8 | |
| |
Uber Technologies | | | 0.8 | |
| |
Ziggo B.V. | | | 0.7 | |
| |
MA FinanceCo., LLC | | | 0.7 | |
| |
Total | | | 8.6 | % |
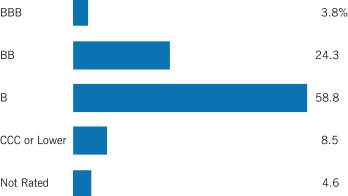
Credit Quality (% of bonds, loans and asset-backed securities)7
Top 10 Sectors (% of total investments)6
| | | | |
Electronics/Electrical | | | 16.1 | % |
| |
Health Care | | | 8.2 | |
| |
Business Equipment and Services | | | 7.9 | |
| |
Industrial Equipment | | | 4.6 | |
| |
Drugs | | | 4.3 | |
| |
Chemicals and Plastics | | | 4.2 | |
| |
Insurance | | | 4.1 | |
| |
Leisure Goods/Activities/Movies | | | 3.9 | |
| |
Telecommunications | | | 3.9 | |
| |
Cable and Satellite Television | | | 3.6 | |
| |
Total | | | 60.8 | % |
See Endnotes and Additional Disclosures in this report.
Eaton Vance
Floating-Rate Income Trust
November 30, 2020
Endnotes and Additional Disclosures
| 1 | S&P/LSTA Leveraged Loan Index is an unmanaged index of the institutional leveraged loan market. S&P/LSTA Leveraged Loan indices are a product of S&P Dow Jones Indices LLC (“S&P DJI”) and have been licensed for use. S&P® is a registered trademark of S&P DJI; Dow Jones® is a registered trademark of Dow Jones Trademark Holdings LLC (“Dow Jones”); LSTA is a trademark of Loan Syndications and Trading Association, Inc. S&P DJI, Dow Jones, their respective affiliates and their third party licensors do not sponsor, endorse, sell or promote the Fund, will not have any liability with respect thereto and do not have any liability for any errors, omissions, or interruptions of the S&P Dow Jones Indices. Unless otherwise stated, index returns do not reflect the effect of any applicable sales charges, commissions, expenses, taxes or leverage, as applicable. It is not possible to invest directly in an index. |
| 2 | Performance results reflect the effects of leverage. Included in the average annual total return at NAV for the ten-year period is the impact of the 2013 tender and repurchase of a portion of the Fund’s Auction Preferred Shares (APS) at 98% of the Fund’s APS per share liquidation preference. Had this transaction not occurred, the total return at NAV would be lower for the Fund. The Fund’s performance for certain periods reflects the effects of expense reductions. Absent these reductions, performance would have been lower. |
| 3 | The shares of the Fund often trade at a discount or premium to their net asset value. The discount or premium may vary over time and may be higher or lower than what is quoted in this report. For up-to-date premium/discount information, please refer to https://funds.eatonvance.com/closed-end-fund-prices.php. |
| 4 | The Distribution Rate is based on the Fund’s last regular distribution per share in the period (annualized) divided by the Fund’s NAV or market price at the end of the period. The Fund’s distributions may be comprised of amounts characterized for federal income tax purposes as qualified and non-qualified ordinary dividends, capital gains and nondividend distributions, also known as return of capital. For additional information about nondividend distributions, please refer to Eaton Vance Closed-End Fund Distribution Notices (19a) posted on our website, eatonvance.com. The Fund will determine the federal income tax character of distributions paid to a shareholder after the end of the calendar year. This is reported on the IRS form 1099-DIV and provided to the shareholder shortly after each year-end. For information about the tax character of distributions made in prior calendar years, please refer to Performance-Tax Character of Distributions on the Fund’s webpage available at eatonvance. com. The Fund’s distributions are determined by the investment adviser based on its current assessment of the Fund’s long-term return potential. Fund distributions may be affected by numerous factors including changes in Fund performance, the cost of financing for leverage, portfolio holdings, realized and projected returns, and other factors. As portfolio and market conditions change, the rate of distributions paid by the Fund could change. |
| 5 | Leverage represents the liquidation value of the Fund’s VRTP Shares and borrowings outstanding as a percentage of Fund net assets applicable to common shares plus VRTP Shares and borrowings outstanding. Use of leverage creates an opportunity for income, but creates risks including greater price volatility. The cost of leverage rises and falls with changes in short-term interest rates. The Fund may be |
| | required to maintain prescribed asset coverage for its leverage and may be required to reduce its leverage at an inopportune time. |
| 6 | Excludes cash and cash equivalents. |
| 7 | Credit ratings are categorized using S&P Global Ratings (“S&P”). Ratings, which are subject to change, apply to the creditworthiness of the issuers of the underlying securities and not to the Fund or its shares. Credit ratings measure the quality of a bond based on the issuer’s creditworthiness, with ratings ranging from AAA, being the highest, to D, being the lowest based on S&P’s measures. Ratings of BBB or higher by S&P are considered to be investment-grade quality. Credit ratings are based largely on the ratings agency’s analysis at the time of rating. The rating assigned to any particular security is not necessarily a reflection of the issuer’s current financial condition and does not necessarily reflect its assessment of the volatility of a security’s market value or of the liquidity of an investment in the security. Holdings designated as “Not Rated” (if any) are not rated by S&P. |
| | Fund profile subject to change due to active management. |
Important Notice to Shareholders
On August 13, 2020, the Board of Trustees of the Fund amended and restated the Fund’s By-Laws (the “Amended and Restated By-Laws”). The Amended and Restated By-Laws include provisions (the “Control Share Provisions”) pursuant to which, in summary, a shareholder who obtains beneficial ownership of Fund shares in a “Control Share Acquisition” may exercise voting rights with respect to such shares only to the extent the authorization of such voting rights is approved by other shareholders of the Fund. The Control Share Provisions are primarily intended to protect the interests of the Fund and its shareholders by limiting the risk that the Fund will become subject to undue influence by opportunistic hedge funds or other activist investors. The Control Share Provisions do not eliminate voting rights for shares acquired in Control Share Acquisitions, but rather, they entrust the Fund’s other “non-interested” shareholders with determining whether to approve the authorization of voting rights for such shares. Subject to various conditions and exceptions, the Amended and Restated By-Laws define a “Control Share Acquisition” to include an acquisition of Fund shares that, but for the Control Share Provisions, would give the beneficial owner, upon the acquisition of such shares, the ability to exercise voting power in the election of Fund Trustees in any of the following ranges: (i) one-tenth or more, but less than one-fifth of all voting power; (ii) one-fifth or more, but less than one-third of all voting power; (iii) one-third or more, but less than a majority of all voting power; or (iv) a majority or more of all voting power. Share acquisitions prior to August 13, 2020 are excluded from the definition of Control Share Acquisition. This discussion is only a high-level summary of certain aspects of the Control Share Provisions, and is qualified in its entirety by reference to the full Amended and Restated By-Laws. The Amended and Restated By-Laws were filed by the Fund on Form 8-K with the Securities and Exchange Commission and are available at sec.gov.
Eaton Vance
Floating-Rate Income Trust
November 30, 2020
Portfolio of Investments (Unaudited)
| | | | | | | | | | |
| Asset-Backed Securities — 6.4% | |
| Security | | | | Principal
Amount
(000’s omitted) | | | Value | |
| | | |
| Allegany Park CLO, Ltd. | | | | | | | | |
| | | |
Series 2019-1A, Class E, 6.993%, (3 mo. USD LIBOR + 6.78%), 1/20/33(1)(2) | | | | $ | 850 | | | $ | 847,382 | |
| | | |
| Ares LII CLO, Ltd. | | | | | | | | |
| | | |
Series 2019-52A, Class E, 6.766%, (3 mo. USD LIBOR + 6.55%), 4/22/31(1)(2) | | | | | 500 | | | | 484,428 | |
| | | |
| Ares XXXIIR CLO, Ltd. | | | | | | | | |
| | | |
Series 2014-32RA, Class D, 6.071%, (3 mo. USD LIBOR + 5.85%), 5/15/30(1)(2) | | | | | 2,000 | | | | 1,856,454 | |
| | | |
| Ares XXXIV CLO, Ltd. | | | | | | | | |
| | | |
Series 2015-2A, Class ER, 7.068%, (3 mo. USD LIBOR + 6.85%), 4/17/33(1)(2) | | | | | 1,300 | | | | 1,278,361 | |
| | | |
| Bardot CLO, Ltd. | | | | | | | | |
| | | |
Series 2019-2A, Class E, 7.166%, (3 mo. USD LIBOR + 6.95%), 10/22/32(1)(2) | | | | | 1,000 | | | | 1,001,023 | |
| | | |
| Benefit Street Partners CLO XIX, Ltd. | | | | | | | | |
| | | |
Series 2019-19A, Class E, 7.257%, (3 mo. USD LIBOR + 7.02%), 1/15/33(1)(2) | | | | | 750 | | | | 751,595 | |
| | | |
| Benefit Street Partners CLO XVII, Ltd. | | | | | | | | |
| | | |
Series 2019-17A, Class E, 6.837%, (3 mo. USD LIBOR + 6.60%), 7/15/32(1)(2) | | | | | 1,000 | | | | 978,878 | |
| | | |
| Benefit Street Partners CLO XVIII, Ltd. | | | | | | | | |
| | | |
Series 2019-18A, Class E, 7.137%, (3 mo. USD LIBOR + 6.90%), 10/15/32(1)(2) | | | | | 1,000 | | | | 989,073 | |
| | | |
| BlueMountain CLO XXV, Ltd. | | | | | | | | |
| | | |
Series 2019-25A, Class E, 6.937%, (3 mo. USD LIBOR + 6.70%), 7/15/32(1)(2) | | | | | 1,000 | | | | 992,775 | |
| | | |
| BlueMountain CLO XXVI, Ltd. | | | | | | | | |
| | | |
Series 2019-26A, Class E, 7.918%, (3 mo. USD LIBOR + 7.70%), 10/20/32(1)(2) | | | | | 1,500 | | | | 1,504,882 | |
| | | |
| Canyon Capital CLO, Ltd. | | | | | | | | |
| | | |
Series 2019-2A, Class E, 7.387%, (3 mo. USD LIBOR + 7.15%), 10/15/32(1)(2) | | | | | 400 | | | | 402,584 | |
| | | |
| Carlyle Global Market Strategies CLO, Ltd. | | | | | | | | |
| | | |
Series 2012-3A, Class DR2, 6.724%, (3 mo. USD LIBOR + 6.50%), 1/14/32(1)(2) | | | | | 1,200 | | | | 1,010,923 | |
| | | |
Series 2015-5A, Class DR, 6.918%, (3 mo. USD LIBOR + 6.70%), 1/20/32(1)(2) | | | | | 500 | | | | 439,028 | |
| | | |
| Cedar Funding X CLO, Ltd. | | | | | | | | |
| | | |
Series 2019-10A, Class E, 7.218%, (3 mo. USD LIBOR + 7.00%), 10/20/32(1)(2) | | | | | 1,000 | | | | 1,006,344 | |
| | | |
| Dryden Senior Loan Fund | | | | | | | | |
| | | |
Series 2015-40A, Class ER, 5.971%, (3 mo. USD LIBOR + 5.75%), 8/15/31(1)(2) | | | | | 1,000 | | | | 927,894 | |
| | | |
| Fort Washington CLO, Ltd. | | | | | | | | |
| | | |
Series 2019-1A, Class E, 7.468%, (3 mo. USD LIBOR + 7.25%), 10/20/32(1)(2) | | | | | 1,000 | | | | 957,511 | |
| | | | | | | | | | |
| Security | | | | Principal
Amount
(000’s omitted) | | | Value | |
| | | |
| Galaxy XV CLO, Ltd. | | | | | | | | |
| | | |
Series 2013-15A, Class ER, 6.882%, (3 mo. USD LIBOR + 6.65%), 10/15/30(1)(2) | | | | $ | 1,000 | | | $ | 925,500 | |
| | | |
| Galaxy XXI CLO, Ltd. | | | | | | | | |
| | | |
Series 2015-21A, Class ER, 5.468%, (3 mo. USD LIBOR + 5.25%), 4/20/31(1)(2) | | | | | 1,000 | | | | 884,953 | |
| | | |
| Galaxy XXV CLO, Ltd. | | | | | | | | |
| | | |
Series 2018-25A, Class E, 6.165%, (3 mo. USD LIBOR + 5.95%), 10/25/31(1)(2) | | | | | 250 | | | | 230,614 | |
| | | |
| Golub Capital Partners CLO 23M, Ltd. | | | | | | | | |
| | | |
Series 2015-23A, Class ER, 5.968%, (3 mo. USD LIBOR + 5.75%), 1/20/31(1)(2) | | | | | 1,200 | | | | 1,027,664 | |
| | | |
| Harriman Park CLO, Ltd. | | | | | | | | |
| | | |
Series 2020-1A, Class E, 7.128%, (3 mo. USD LIBOR + 6.91%), 4/20/31(1)(2) | | | | | 1,100 | | | | 1,101,471 | |
| | | |
| Kayne CLO 5, Ltd. | | | | | | | | |
| | | |
Series 2019-5A, Class E, 6.915%, (3 mo. USD LIBOR + 6.70%), 7/24/32(1)(2) | | | | | 1,000 | | | | 998,540 | |
| | | |
| Kayne CLO 7, Ltd. | | | | | | | | |
| | | |
Series 2020-7A, Class E, 6.718%, (3 mo. USD LIBOR + 6.50%), 4/17/33(1)(2) | | | | | 1,275 | | | | 1,271,269 | |
| | | |
| Madison Park Funding XXXVI, Ltd. | | | | | | | | |
| | | |
Series 2019-36A, Class E, 7.487%, (3 mo. USD LIBOR + 7.25%), 1/15/33(1)(2) | | | | | 500 | | | | 501,479 | |
| | | |
| Madison Park Funding XXXVII, Ltd. | | | | | | | | |
| | | |
Series 2019-37A, Class E, 6.787%, (3 mo. USD LIBOR + 6.55%), 7/15/32(1)(2) | | | | | 1,000 | | | | 986,120 | |
| | | |
| Neuberger Berman Loan Advisers CLO 31, Ltd. | | | | | | | | |
| | | |
Series 2019-31A, Class E, 6.968%, (3 mo. USD LIBOR + 6.75%), 4/20/31(1)(2) | | | | | 600 | | | | 605,094 | |
| | | |
| Neuberger Berman Loan Advisers CLO 33, Ltd. | | | | | | | | |
| | | |
Series 2019-33A, Class E, 7.03%, (3 mo. USD LIBOR + 6.80%), 10/16/32(1)(2) | | | | | 1,000 | | | | 1,002,059 | |
| | | |
| Oaktree CLO, Ltd. | | | | | | | | |
| | | |
Series 2019-3A, Class E, 6.988%, (3 mo. USD LIBOR + 6.77%), 7/20/31(1)(2) | | | | | 1,000 | | | | 916,319 | |
| | | |
| Palmer Square CLO, Ltd. | | | | | | | | |
| | | |
Series 2013-2A, Class DRR, 6.068%, (3 mo. USD LIBOR + 5.85%), 10/17/31(1)(2) | | | | | 900 | | | | 840,336 | |
| | | |
Series 2019-1A, Class D, 7.221%, (3 mo. USD LIBOR + 7.00%), 11/14/32(1)(2) | | | | | 1,000 | | | | 1,003,131 | |
| | | |
| Regatta XII Funding, Ltd. | | | | | | | | |
| | | |
Series 2019-1A, Class E, 7.087%, (3 mo. USD LIBOR + 6.85%), 10/15/32(1)(2) | | | | | 500 | | | | 501,153 | |
| | | |
| Regatta XIV Funding, Ltd. | | | | | | | | |
| | | |
Series 2018-3A, Class E, 6.165%, (3 mo. USD LIBOR + 5.95%), 10/25/31(1)(2) | | | | | 700 | | | | 643,834 | |
| | | |
| Regatta XVI Funding, Ltd. | | | | | | | | |
| | | |
Series 2019-2A, Class E, 7.237%, (3 mo. USD LIBOR + 7.00%), 1/15/33(1)(2) | | | | | 750 | | | | 756,746 | |
| | | | |
| | 5 | | See Notes to Financial Statements. |
Eaton Vance
Floating-Rate Income Trust
November 30, 2020
Portfolio of Investments (Unaudited) — continued
| | | | | | | | | | | | |
| Security | | | | | Principal
Amount
(000’s omitted) | | | Value | |
| | | |
| Southwick Park CLO, LLC | | | | | | | | | |
| | | |
Series 2019-4A, Class E, 6.918%, (3 mo. USD LIBOR + 6.70%), 7/20/32(1)(2) | | | | | | $ | 2,000 | | | $ | 1,995,602 | |
| | | |
| Vibrant CLO X, Ltd. | | | | | | | | | |
| | | |
Series 2018-10A, Class D, 6.408%, (3 mo. USD LIBOR + 6.19%),
10/20/31(1)(2) | | | | | | | 850 | | | | 716,013 | |
| | | |
| Vibrant CLO XI, Ltd. | | | | | | | | | |
| | | |
Series 2019-11A, Class D, 6.988%, (3 mo. USD LIBOR + 6.77%),
7/20/32(1)(2) | | | | | | | 1,000 | | | | 911,149 | |
| | | |
| Voya CLO, Ltd. | | | | | | | | | |
| | | |
Series 2013-1A, Class DR, 6.717%, (3 mo. USD LIBOR + 6.48%),
10/15/30(1)(2) | | | | | | | 2,000 | | | | 1,723,544 | |
| | | |
| Wellfleet CLO, Ltd. | | | | | | | | | |
| | | |
Series 2020-1A, Class D, 7.477%, (3 mo. USD LIBOR + 7.24%), 4/15/33(1)(2) | | | | | | | 1,300 | | | | 1,270,567 | |
| | | |
Total Asset-Backed Securities
(identified cost $37,403,488) | | | | | | | | | | $ | 36,242,292 | |
| | | |
| Closed-End Funds — 1.7% | | | | | | | | | | | | |
| Security | | | | | Shares | | | Value | |
| | | |
BlackRock Floating Rate Income Strategies Fund, Inc. | | | | | | | 111,292 | | | $ | 1,341,069 | |
| | | |
Invesco Senior Income Trust | | | | | | | 402,161 | | | | 1,596,579 | |
| | | |
Nuveen Credit Strategies Income Fund | | | | | | | 406,731 | | | | 2,558,338 | |
| | | |
Nuveen Floating Rate Income Fund | | | | | | | 164,907 | | | | 1,414,902 | |
| | | |
Nuveen Floating Rate Income Opportunity Fund | | | | | | | 115,017 | | | | 970,743 | |
| | | |
Voya Prime Rate Trust | | | | | | | 441,753 | | | | 1,974,636 | |
| | | |
Total Closed-End Funds
(identified cost $12,900,108) | | | | | | | | | | $ | 9,856,267 | |
| | | |
| Common Stocks — 2.1% | | | | | | | | | | | | |
| Security | | | | | Shares | | | Value | |
| | | |
| Aerospace and Defense — 0.2% | | | | | | | | | |
| | | |
IAP Global Services, LLC(3)(4)(5) | | | | | | | 58 | | | $ | 865,178 | |
| |
| | | | $ | 865,178 | |
| | | |
| Automotive — 0.0%(6) | | | | | | | | | |
| | | |
Dayco Products, LLC(4)(5) | | | | | | | 20,780 | | | $ | 155,850 | |
| |
| | | | $ | 155,850 | |
| | | |
| Business Equipment and Services — 0.0%(6) | | | | | | | | | |
| | | |
Crossmark Holdings, Inc.(4)(5) | | | | | | | 3,740 | | | $ | 215,050 | |
| |
| | | | $ | 215,050 | |
| | | | | | | | | | | | |
| Security | | | | | Shares | | | Value | |
| | | |
| Chemicals and Plastics — 0.1% | | | | | | | | | |
| | | |
Hexion Holdings Corp., Class B(4)(5) | | | | | | | 40,989 | | | $ | 506,829 | |
| |
| | | | $ | 506,829 | |
| | | |
| Containers and Glass Products — 0.0%(6) | | | | | | | | | |
| | | |
LG Newco Holdco, Inc.(4)(5) | | | | | | | 26,953 | | | $ | 40,430 | |
| |
| | | | $ | 40,430 | |
| | | |
| Electronics / Electrical — 0.5% | | | | | | | | | |
| | | |
Answers Corp.(3)(4)(5) | | | | | | | 96,908 | | | $ | 56,207 | |
| | | |
Software Luxembourg Holding S.A.(4)(5) | | | | | | | 13,976 | | | | 2,795,200 | |
| |
| | | | $ | 2,851,407 | |
| | | |
| Health Care — 0.2% | | | | | | | | | |
| | | |
Akorn Holding Company, LLC, Class A(4)(5) | | | | | | | 73,582 | | | $ | 974,961 | |
| |
| | | | $ | 974,961 | |
| | | |
| Nonferrous Metals / Minerals — 0.0%(6) | | | | | | | | | |
| | | |
ACNR Holdings, Inc., Class A(4)(5) | | | | | | | 3,482 | | | $ | 26,115 | |
| |
| | | | $ | 26,115 | |
| | | |
| Oil and Gas — 0.2% | | | | | | | | | |
| | | |
AFG Holdings, Inc.(3)(4)(5) | | | | | | | 30,640 | | | $ | 572,049 | |
| | | |
Fieldwood Energy, Inc.(4)(5) | | | | | | | 19,189 | | | | 1,919 | |
| | | |
McDermott International, Ltd.(4)(5) | | | | | | | 162,147 | | | | 179,983 | |
| | | |
Nine Point Energy Holdings, Inc.(3)(5)(7) | | | | | | | 758 | | | | 0 | |
| | | |
RDV Resources, Inc., Class A(3)(4)(5) | | | | | | | 30,849 | | | | 0 | |
| | | |
Samson Resources II, LLC, Class A(3)(4) | | | | | | | 46,484 | | | | 302,146 | |
| | | |
Sunrise Oil & Gas, Inc., Class A(4)(5) | | | | | | | 13,157 | | | | 92,099 | |
| |
| | | | $ | 1,148,196 | |
| | | |
| Publishing — 0.5% | | | | | | | | | |
| | | |
ION Media Networks, Inc.(3)(4)(5) | | | | | | | 4,429 | | | $ | 2,924,336 | |
| | | |
Tweddle Group, Inc.(3)(4)(5) | | | | | | | 1,944 | | | | 3,966 | |
| |
| | | | $ | 2,928,302 | |
| | | |
| Radio and Television — 0.2% | | | | | | | | | |
| | | |
Clear Channel Outdoor Holdings, Inc.(4)(5) | | | | | | | 86,335 | | | $ | 130,366 | |
| | | |
Cumulus Media, Inc., Class A(4)(5) | | | | | | | 42,499 | | | | 372,716 | |
| | | |
iHeartMedia, Inc., Class A(4)(5) | | | | | | | 36,714 | | | | 438,916 | |
| |
| | | | $ | 941,998 | |
| | | |
| Retailers (Except Food and Drug) — 0.0%(6) | | | | | | | | | |
| | | |
David’s Bridal, LLC(3)(4)(5) | | | | | | | 23,371 | | | $ | 163,597 | |
| |
| | | | $ | 163,597 | |
| | | | |
| | 6 | | See Notes to Financial Statements. |
Eaton Vance
Floating-Rate Income Trust
November 30, 2020
Portfolio of Investments (Unaudited) — continued
| | | | | | | | | | | | |
| Security | | | | | Shares | | | Value | |
| | | |
| Utilities — 0.2% | | | | | | | | | |
| | | |
Longview Intermediate Holdings, LLC, Class A(3)(4)(5) | | | | | | | 101,172 | | | $ | 817,469 | |
| |
| | | | $ | 817,469 | |
| | | |
Total Common Stocks
(identified cost $11,340,974) | | | | | | | | | | $ | 11,635,382 | |
|
| Convertible Preferred Stocks — 0.0% | |
| Security | | | | | Shares | | | Value | |
| | | |
| Oil and Gas — 0.0% | | | | | | | | | |
| | |
Nine Point Energy Holdings, Inc., Series A, 12.00%(3)(5)(7) | | | | 14 | | | $ | 0 | |
| | | |
Total Convertible Preferred Stocks
(identified cost $14,000) | | | | | | | | | | $ | 0 | |
|
| Corporate Bonds & Notes — 4.8% | |
| Security | | | | | Principal
Amount
(000’s omitted) | | | Value | |
| | | |
| Aerospace and Defense — 0.1% | | | | | | | | | |
| | | |
| TransDigm, Inc. | | | | | | | | | |
| | | |
6.50%, 7/15/24 | | | | | | $ | 520 | | | $ | 528,775 | |
| | | |
7.50%, 3/15/27 | | | | | | | 282 | | | | 302,217 | |
| |
| | | | $ | 830,992 | |
| | | |
| Automotive — 0.1% | | | | | | | | | |
| | | |
| Ford Motor Co. | | | | | | | | | |
| | | |
9.00%, 4/22/25 | | | | | | $ | 150 | | | $ | 182,477 | |
| | | |
4.75%, 1/15/43 | | | | | | | 250 | | | | 246,356 | |
| | | |
| Navistar International Corp. | | | | | | | | | |
| | | |
6.625%, 11/1/25(1) | | | | | | | 322 | | | | 337,440 | |
| |
| | | | $ | 766,273 | |
| | | |
| Building and Development — 0.2% | | | | | | | | | |
| | | |
| Builders FirstSource, Inc. | | | | | | | | | |
| | | |
5.00%, 3/1/30(1) | | | | | | $ | 123 | | | $ | 132,686 | |
| | | |
| Hillman Group, Inc. (The) | | | | | | | | | |
| | | |
6.375%, 7/15/22(1) | | | | | | | 37 | | | | 36,851 | |
| | | |
| Standard Industries, Inc. | | | | | | | | | |
| | | |
5.00%, 2/15/27(1) | | | | | | | 677 | | | | 711,273 | |
| | | |
| TRI Pointe Group, Inc./TRI Pointe Homes, Inc. | | | | | | | | | |
| | | |
5.875%, 6/15/24 | | | | | | | 8 | | | | 8,755 | |
| |
| | | | $ | 889,565 | |
| | | | | | | | | | |
| Security | | | | Principal
Amount
(000’s omitted) | | | Value | |
| |
| Business Equipment and Services — 0.6% | | | | |
| | | |
| EIG Investors Corp. | | | | | | | | |
| | | |
10.875%, 2/1/24 | | | | $ | 958 | | | $ | 999,793 | |
| | | |
GEMS MENASA Cayman, Ltd./GEMS
Education Delaware, LLC | | | | | | | | |
| | | |
7.125%, 7/31/26(1) | | | | | 258 | | | | 262,193 | |
| | | |
Prime Security Services Borrower,
LLC/Prime Finance, Inc. | | | | | | | | |
| | | |
5.25%, 4/15/24(1) | | | | | 750 | | | | 795,938 | |
| | | |
5.75%, 4/15/26(1) | | | | | 750 | | | | 814,687 | |
| | | |
| ServiceMaster Co., LLC (The) | | | | | | | | |
| | | |
7.45%, 8/15/27 | | | | | 427 | | | | 487,766 | |
| |
| | | | $ | 3,360,377 | |
| | | |
| Cable and Satellite Television — 0.3% | | | | | | | | |
| | | |
| Altice France S.A. | | | | | | | | |
| | | |
8.125%, 2/1/27(1) | | | | $ | 677 | | | $ | 746,321 | |
| | | |
| CCO Holdings, LLC/CCO Holdings Capital Corp. | | | | | | | | |
| | | |
5.75%, 2/15/26(1) | | | | | 32 | | | | 33,212 | |
| | | |
4.25%, 2/1/31(1) | | | | | 229 | | | | 237,851 | |
| | | |
| CSC Holdings, LLC | | | | | | | | |
| | | |
5.875%, 9/15/22 | | | | | 15 | | | | 15,984 | |
| | | |
5.25%, 6/1/24 | | | | | 10 | | | | 10,844 | |
| | | |
5.75%, 1/15/30(1) | | | | | 550 | | | | 594,135 | |
| | | |
4.125%, 12/1/30(1) | | | | | 200 | | | | 207,160 | |
| | | |
| DISH DBS Corp. | | | | | | | | |
| | | |
6.75%, 6/1/21 | | | | | 14 | | | | 14,319 | |
| | | |
5.875%, 11/15/24 | | | | | 5 | | | | 5,325 | |
| | | |
| TEGNA, Inc. | | | | | | | | |
| | | |
5.00%, 9/15/29 | | | | | 56 | | | | 58,957 | |
| |
| | | | $ | 1,924,108 | |
| | | |
| Conglomerates — 0.0%(6) | | | | | | | | |
| | | |
| Spectrum Brands, Inc. | | | | | | | | |
| | | |
5.75%, 7/15/25 | | | | $ | 75 | | | $ | 77,545 | |
| | | |
5.00%, 10/1/29(1) | | | | | 21 | | | | 22,733 | |
| |
| | | | $ | 100,278 | |
|
| Containers and Glass Products — 0.0%(6) | |
| | | |
Ardagh Packaging Finance PLC/Ardagh
Holdings USA, Inc. | | | | | | | | |
| | | |
4.125%, 8/15/26(1) | | | | $ | 200 | | | $ | 207,750 | |
| |
| | | | $ | 207,750 | |
| | | | |
| | 7 | | See Notes to Financial Statements. |
Eaton Vance
Floating-Rate Income Trust
November 30, 2020
Portfolio of Investments (Unaudited) — continued
| | | | | | | | | | |
| Security | | | | Principal
Amount
(000’s omitted) | | | Value | |
| | | |
| Distribution & Wholesale — 0.0%(6) | | | | | | | | |
| | | |
| Performance Food Group, Inc. | | | | | | | | |
| | | |
5.50%, 10/15/27(1) | | | | $ | 68 | | | $ | 72,459 | |
| |
| | | | $ | 72,459 | |
|
| Drugs — 0.2% | |
| | | |
| AdaptHealth, LLC | | | | | | | | |
| | | |
6.125%, 8/1/28(1) | | | | $ | 125 | | | $ | 135,000 | |
| | | |
| Bausch Health Americas, Inc. | | | | | | | | |
| | | |
8.50%, 1/31/27(1) | | | | | 146 | | | | 160,807 | |
|
| Bausch Health Companies, Inc. | |
| | | |
7.00%, 1/15/28(1) | | | | | 752 | | | | 811,077 | |
| |
| | | | $ | 1,106,884 | |
|
| Ecological Services and Equipment — 0.1% | |
| | | |
| GFL Environmental, Inc. | | | | | | | | |
| | | |
8.50%, 5/1/27(1) | | | | $ | 575 | | | $ | 636,453 | |
| |
| | | | $ | 636,453 | |
|
| Electronics / Electrical — 0.0%(6) | |
| | | |
| Sensata Technologies, Inc. | | | | | | | | |
| | | |
4.375%, 2/15/30(1) | | | | $ | 45 | | | $ | 48,234 | |
| |
| | | | $ | 48,234 | |
|
| Financial Intermediaries — 0.2% | |
| | | |
| Ford Motor Credit Co., LLC | | | | | | | | |
| | | |
5.125%, 6/16/25 | | | | $ | 500 | | | $ | 540,475 | |
| | | |
Icahn Enterprises, L.P./Icahn Enterprises
Finance Corp. | | | | | | | | |
| | | |
6.25%, 2/1/22 | | | | | 18 | | | | 18,142 | |
| | | |
6.25%, 5/15/26 | | | | | 677 | | | | 709,008 | |
| | | |
| JPMorgan Chase & Co. | | | | | | | | |
| | | |
Series S, 6.75% to 2/1/24 (8)(9) | | | | | 80 | | | | 89,374 | |
| |
| | | | $ | 1,356,999 | |
|
| Food Products — 0.2% | |
| | | |
| Del Monte Foods, Inc. | | | | | | | | |
| | | |
11.875%, 5/15/25(1) | | | | $ | 1,075 | | | $ | 1,176,453 | |
| | | |
JBS USA LUX S.A./JBS USA Food Co./JBS
USA Finance, Inc. | | | | | | | | |
| | | |
5.50%, 1/15/30(1) | | | | | 156 | | | | 175,555 | |
| |
| | | | $ | 1,352,008 | |
| | | | | | | | | | |
| Security | | | | Principal
Amount
(000’s omitted) | | | Value | |
|
| Food / Drug Retailers — 0.2% | |
| | | |
| Fresh Market, Inc. (The) | | | | | | | | |
| | | |
9.75%, 5/1/23(1) | | | | $ | 1,300 | | | $ | 1,276,437 | |
| |
| | | | $ | 1,276,437 | |
|
| Health Care — 0.2% | |
| | | |
| Centene Corp. | | | | | | | | |
| | | |
3.375%, 2/15/30 | | | | $ | 114 | | | $ | 119,664 | |
| | | |
| HCA, Inc. | | | | | | | | |
| | | |
5.875%, 2/15/26 | | | | | 18 | | | | 20,745 | |
| | | |
| MPH Acquisition Holdings, LLC | | | | | | | | |
| | | |
5.75%, 11/1/28(1) | | | | | 286 | | | | 280,637 | |
| | | |
| Syneos Health, Inc. | | | | | | | | |
| | | |
3.625%, 1/15/29(1) | | | | | 172 | | | | 173,613 | |
| | | |
| Tenet Healthcare Corp. | | | | | | | | |
| | | |
6.75%, 6/15/23 | | | | | 244 | | | | 262,666 | |
| |
| | | | $ | 857,325 | |
| |
| Insurance — 0.2% | | | | |
| | | |
| AssuredPartners, Inc. | | | | | | | | |
| | | |
7.00%, 8/15/25(1) | | | | $ | 958 | | | $ | 992,119 | |
| |
| | | | $ | 992,119 | |
|
| Internet Software & Services — 0.1% | |
| | | |
| Netflix, Inc. | | | | | | | | |
| | | |
5.375%, 11/15/29(1) | | | | $ | 240 | | | $ | 286,872 | |
| | | |
| Riverbed Technology, Inc. | | | | | | | | |
| | | |
8.875%, 3/1/23(1) | | | | | 27 | | | | 18,900 | |
| |
| | | | $ | 305,772 | |
|
| Leisure Goods / Activities / Movies — 0.2% | |
| | | |
| Viking Cruises, Ltd. | | | | | | | | |
| | | |
6.25%, 5/15/25(1) | | | | $ | 45 | | | $ | 43,364 | |
| | | |
5.875%, 9/15/27(1) | | | | | 858 | | | | 814,564 | |
| |
| | | | $ | 857,928 | |
|
| Lodging and Casinos — 0.4% | |
| | | |
| Caesars Resort Collection, LLC/CRC Finco, Inc. | | | | | | | | |
| | | |
5.25%, 10/15/25(1) | | | | $ | 677 | | | $ | 677,890 | |
| | | |
| ESH Hospitality, Inc. | | | | | | | | |
| | | |
5.25%, 5/1/25(1) | | | | | 22 | | | | 22,583 | |
| | | |
MGM Growth Properties Operating
Partnership, L.P./MGP Finance Co-Issuer, Inc. | | | | | | | | |
| | | |
5.625%, 5/1/24 | | | | | 15 | | | | 16,116 | |
| | | | |
| | 8 | | See Notes to Financial Statements. |
Eaton Vance
Floating-Rate Income Trust
November 30, 2020
Portfolio of Investments (Unaudited) — continued
| | | | | | | | | | |
| Security | | | | Principal
Amount
(000’s omitted) | | | Value | |
|
| Lodging and Casinos (continued) | |
| | | |
| MGM Resorts International | | | | | | | | |
| | | |
7.75%, 3/15/22 | | | | $ | 18 | | | $ | 19,252 | |
| | | |
Stars Group Holdings B.V./Stars Group US
Co-Borrower, LLC | | | | | | | | |
| | | |
7.00%, 7/15/26(1) | | | | | 958 | | | | 1,014,881 | |
| | | |
Wynn Las Vegas, LLC/Wynn Las Vegas
Capital Corp. | | | | | | | | |
| | | |
5.25%, 5/15/27(1) | | | | | 273 | | | | 276,242 | |
| |
| | | | $ | 2,026,964 | |
|
| Metals / Mining — 0.2% | |
| | | |
| Cleveland-Cliffs, Inc. | | | | | | | | |
| | | |
6.75%, 3/15/26(1) | | | | $ | 1,006 | | | $ | 1,086,480 | |
| |
| | | | $ | 1,086,480 | |
|
| Nonferrous Metals / Minerals — 0.0%(6) | |
| | | |
| New Gold, Inc. | | | | | | | | |
| | | |
6.375%, 5/15/25(1) | | | | $ | 49 | | | $ | 51,184 | |
| |
| | | | $ | 51,184 | |
|
| Oil and Gas — 0.4% | |
| | | |
| Centennial Resource Production, LLC | | | | | | | | |
| | | |
6.875%, 4/1/27(1) | | | | $ | 958 | | | $ | 529,683 | |
| | | |
| Energy Transfer Operating, L.P. | | | | | | | | |
| | | |
5.875%, 1/15/24 | | | | | 35 | | | | 38,874 | |
| | | |
| Neptune Energy Bondco PLC | | | | | | | | |
| | | |
6.625%, 5/15/25(1) | | | | | 1,065 | | | | 1,014,413 | |
| | | |
| Newfield Exploration Co. | | | | | | | | |
| | | |
5.625%, 7/1/24 | | | | | 92 | | | | 97,764 | |
|
| Occidental Petroleum Corp. | |
| | | |
6.625%, 9/1/30 | | | | | 229 | | | | 239,520 | |
| | | |
| Seven Generations Energy, Ltd. | | | | | | | | |
| | | |
6.75%, 5/1/23(1) | | | | | 30 | | | | 30,169 | |
| | | |
6.875%, 6/30/23(1) | | | | | 15 | | | | 15,130 | |
| | | |
| Tervita Corp. | | | | | | | | |
| | | |
11.00%, 12/1/25(1) | | | | | 229 | | | | 238,208 | |
| |
| | | | $ | 2,203,761 | |
|
| Packaging & Containers — 0.1% | |
| | | |
| ARD Finance S.A. | | | | | | | | |
| | | |
6.50%, (6.50% cash or 7.25% PIK), 6/30/27(1)(10) | | | | $ | 333 | | | $ | 351,315 | |
| |
| | | | $ | 351,315 | |
| | | | | | | | | | |
| Security | | | | Principal
Amount
(000’s omitted) | | | Value | |
|
| Radio and Television — 0.2% | |
| | | |
Diamond Sports Group, LLC/Diamond
Sports Finance Co. | | | | | | | | |
| | | |
5.375%, 8/15/26(1) | | | | $ | 115 | | | $ | 89,341 | |
| | | |
| iHeartCommunications, Inc. | | | | | | | | |
| | | |
6.375%, 5/1/26 | | | | | 208 | | | | 220,219 | |
| | | |
8.375%, 5/1/27 | | | | | 376 | | | | 400,537 | |
| | | |
| Nielsen Co. Luxembourg S.a.r.l. (The) | | | | | | | | |
| | | |
5.50%, 10/1/21(1) | | | | | 8 | | | | 7,982 | |
| | | |
| Sirius XM Radio, Inc. | | | | | | | | |
| | | |
4.125%, 7/1/30(1) | | | | | 91 | | | | 95,459 | |
| | | |
| Terrier Media Buyer, Inc. | | | | | | | | |
| | | |
8.875%, 12/15/27(1) | | | | | 313 | | | | 338,627 | |
| |
| | | | $ | 1,152,165 | |
|
| Real Estate Investment Trusts (REITs) — 0.1% | |
| | | |
| Service Properties Trust | | | | | | | | |
| | | |
3.95%, 1/15/28 | | | | $ | 458 | | | $ | 413,059 | |
| |
| | | | $ | 413,059 | |
|
| Steel — 0.2% | |
| | | |
| Allegheny Technologies, Inc. | | | | | | | | |
| | | |
7.875%, 8/15/23 | | | | $ | 1,065 | | | $ | 1,155,637 | |
| |
| | | | $ | 1,155,637 | |
|
| Surface Transport — 0.0%(6) | |
| | | |
| XPO Logistics, Inc. | | | | | | | | |
| | | |
6.50%, 6/15/22(1) | | | | $ | 56 | | | $ | 56,158 | |
| |
| | | | $ | 56,158 | |
|
| Telecommunications — 0.3% | |
| | | |
| CenturyLink, Inc. | | | | | | | | |
| | | |
6.75%, 12/1/23 | | | | $ | 40 | | | $ | 44,437 | |
| | | |
| Connect Finco S.a.r.l./Connect US Finco, LLC | | | | | | | | |
| | | |
6.75%, 10/1/26(1) | | | | | 250 | | | | 259,462 | |
| | | |
Digicel International Finance, Ltd./Digicel
Holdings Bermuda, Ltd. | | | | | | | | |
| | | |
8.75%, 5/25/24(1) | | | | | 600 | | | | 612,750 | |
| | | |
| Level 3 Financing, Inc. | | | | | | | | |
| | | |
5.375%, 1/15/24 | | | | | 25 | | | | 25,266 | |
| | | |
| Sprint Communications, Inc. | | | | | | | | |
| | | |
6.00%, 11/15/22 | | | | | 3 | | | | 3,233 | |
| | | |
| Sprint Corp. | | | | | | | | |
| | | |
7.25%, 9/15/21 | | | | | 230 | | | | 239,775 | |
| | | |
7.625%, 2/15/25 | | | | | 250 | | | | 299,844 | |
| | | | |
| | 9 | | See Notes to Financial Statements. |
Eaton Vance
Floating-Rate Income Trust
November 30, 2020
Portfolio of Investments (Unaudited) — continued
| | | | | | | | | | | | |
| Security | | | | | Principal
Amount
(000’s omitted) | | | Value | |
|
| Telecommunications (continued) | |
| | | |
| T-Mobile USA, Inc. | | | | | | | | | |
| | | |
6.50%, 1/15/26 | | | | | | $ | 110 | | | $ | 114,449 | |
| |
| | | | $ | 1,599,216 | |
|
| Utilities — 0.0%(6) | |
| | | |
Vistra Operations Co., LLC | | | | | | | | | | | | |
| | | |
5.00%, 7/31/27(1) | | | | | | $ | 201 | | | $ | 212,778 | |
| | | |
4.30%, 7/15/29(1) | | | | | | | 32 | | | | 35,849 | |
| |
| | | | $ | 248,627 | |
| | |
Total Corporate Bonds & Notes
(identified cost $26,855,784) | | | | | | | $ | 27,286,527 | |
| | | |
| Preferred Stocks — 0.1% | | | | | | | | | | | | |
| Security | | | | | Shares | | | Value | |
| |
| Containers and Glass Products — 0.0%(6) | | | | |
| | | |
LG Newco Holdco, Inc.(4)(5) | | | | | | | 4,079 | | | $ | 209,028 | |
| | | |
| | | | | | | | | | | $ | 209,028 | |
| |
| Financial Services — 0.0%(6) | | | | |
| | | |
DBI Investors, Inc., Series A-1(3)(4)(5) | | | | | | | 1,113 | | | $ | 89,407 | |
| | | |
| | | | | | | | | | | $ | 89,407 | |
| |
| Nonferrous Metals / Minerals — 0.0%(6) | | | | |
| | | |
ACNR Holdings, Inc., 15.00% (PIK)(4)(5) | | | | | | | 1,645 | | | $ | 53,463 | |
| | | |
| | | | | | | | | | | $ | 53,463 | |
| |
| Retailers (Except Food and Drug) — 0.1% | | | | |
| | | |
David’s Bridal, LLC, Series A,
8.00% (PIK)(3)(4)(5) | | | | | | | 655 | | | $ | 52,400 | |
| | | |
David’s Bridal, LLC, Series B,
10.00% (PIK)(3)(4)(5) | | | | | | | 2,667 | | | | 215,920 | |
| | | |
| | | | | | | | | | | $ | 268,320 | |
| | |
Total Preferred Stocks
(identified cost $430,046) | | | | | | | $ | 620,218 | |
| | | | | | | | | | |
| Senior Floating-Rate Loans — 146.4%(11) | | | | | |
| Borrower/Tranche Description | | | | Principal
Amount*
(000’s omitted) | | | Value | |
| | | |
| Aerospace and Defense — 3.3% | | | | | | | | |
| | | |
| Aernnova Aerospace S.A.U. | | | | | | | | |
| | | |
Term Loan, 3.00%, (3 mo. EURIBOR + 3.00%), Maturing February 22, 2027 | | EUR | | | 107 | | | $ | 117,421 | |
| | | |
Term Loan, 3.00%, (3 mo. EURIBOR + 3.00%), Maturing February 26, 2027 | | EUR | | | 418 | | | | 457,943 | |
|
| AI Convoy (Luxembourg) S.a.r.l. | |
| | | |
Term Loan, 3.75%, (6 mo. EURIBOR + 3.75%), Maturing January 17, 2027 | | EUR | | | 450 | | | | 536,671 | |
| | | |
Term Loan, 4.50%, (USD LIBOR + 3.50%, Floor 1.00%), Maturing January 17, 2027(12) | | | | | 746 | | | | 745,317 | |
| | | |
| Dynasty Acquisition Co., Inc. | | | | | | | | |
| | | |
Term Loan, 3.72%, (3 mo. USD LIBOR + 3.50%), Maturing April 6, 2026 | | | | | 1,060 | | | | 990,292 | |
| | | |
Term Loan, 3.72%, (3 mo. USD LIBOR + 3.50%), Maturing April 6, 2026 | | | | | 1,971 | | | | 1,841,295 | |
| | | |
| IAP Worldwide Services, Inc. | | | | | | | | |
| | | |
Revolving Loan, 1.38%, (3 mo. USD LIBOR + 5.50%, Floor 1.50%), Maturing July 19, 2021(13) | | | | | 325 | | | | 321,082 | |
| | | |
Term Loan - Second Lien, 8.00%, (3 mo. USD LIBOR + 6.50%, Floor 1.50%), Maturing July 18, 2021(3) | | | | | 422 | | | | 335,059 | |
| | | |
| Spirit Aerosystems, Inc. | | | | | | | | |
| | | |
Term Loan, 6.00%, (1 mo. USD LIBOR + 5.25%, Floor 0.75%), Maturing January 30, 2025 | | | | | 450 | | | | 455,344 | |
| | | |
| TransDigm, Inc. | | | | | | | | |
| | | |
Term Loan, 2.40%, (1 mo. USD LIBOR + 2.25%), Maturing August 22, 2024 | | | | | 2,805 | | | | 2,727,714 | |
| | | |
Term Loan, 2.40%, (1 mo. USD LIBOR + 2.25%), Maturing December 9, 2025 | | | | | 7,738 | | | | 7,517,700 | |
| | | |
| WP CPP Holdings, LLC | | | | | | | | |
| | | |
Term Loan, 4.75%, (USD LIBOR + 3.75%, Floor 1.00%), Maturing April 30, 2025(12) | | | | | 2,801 | | | | 2,632,596 | |
| |
| | | | $ | 18,678,434 | |
| | | |
| Air Transport — 1.5% | | | | | | | | |
| | | |
| Delta Air Lines, Inc. | | | | | | | | |
| | | |
Term Loan, 5.75%, (3 mo. USD LIBOR + 4.75%, Floor 1.00%), Maturing April 29, 2023 | | | | | 2,120 | | | $ | 2,143,534 | |
| | | |
| JetBlue Airways Corporation | | | | | | | | |
| | | |
Term Loan, 6.25%, (3 mo. USD LIBOR + 5.25%, Floor 1.00%), Maturing June 17, 2024 | | | | | 3,219 | | | | 3,280,280 | |
| | | |
| Mileage Plus Holdings, LLC | | | | | | | | |
| | | |
Term Loan, 6.25%, (3 mo. USD LIBOR + 5.25%, Floor 1.00%), Maturing June 25, 2027 | | | | | 800 | | | | 826,760 | |
| | | | |
| | 10 | | See Notes to Financial Statements. |
Eaton Vance
Floating-Rate Income Trust
November 30, 2020
Portfolio of Investments (Unaudited) — continued
| | | | | | | | | | |
| Borrower/Tranche Description | | | | Principal
Amount*
(000’s omitted) | | | Value | |
| | | |
| Air Transport (continued) | | | | | | | | |
| | | |
| SkyMiles IP, Ltd. | | | | | | | | |
| | | |
Term Loan, 4.75%, (3 mo. USD LIBOR + 3.75%, Floor 1.00%), Maturing October 20, 2027 | | | | | 2,200 | | | $ | 2,254,314 | |
| |
| | | | $ | 8,504,888 | |
| | | |
| Automotive — 4.2% | | | | | | | | |
| | | |
| Adient US, LLC | | | | | | | | |
| | | |
Term Loan, 4.41%, (USD LIBOR + 4.25%), Maturing May 6, 2024(12) | | | | | 1,506 | | | $ | 1,505,130 | |
| | | |
| American Axle and Manufacturing, Inc. | | | | | | | | |
| | | |
Term Loan, 3.00%, (1 mo. USD LIBOR + 2.25%, Floor 0.75%), Maturing April 6, 2024 | | | | | 3,344 | | | | 3,288,069 | |
| | | |
| Autokiniton US Holdings, Inc. | | | | | | | | |
| | | |
Term Loan, 6.52%, (1 mo. USD LIBOR + 6.38%), Maturing May 22, 2025 | | | | | 855 | | | | 851,036 | |
| | | |
| Bright Bidco B.V. | | | | | | | | |
| | | |
Term Loan, 4.50%, (6 mo. USD LIBOR + 3.50%, Floor 1.00%), Maturing June 30, 2024 | | | | | 1,646 | | | | 918,618 | |
| | | |
| Chassix, Inc. | | | | | | | | |
| | | |
Term Loan, 6.50%, (USD LIBOR + 5.50%, Floor 1.00%), Maturing November 15, 2023(12) | | | | | 1,459 | | | | 1,378,519 | |
| | | |
| Clarios Global L.P. | | | | | | | | |
| | | |
Term Loan, 3.65%, (1 mo. USD LIBOR + 3.50%), Maturing April 30, 2026 | | | | | 3,694 | | | | 3,661,819 | |
| | | |
| Dayco Products, LLC | | | | | | | | |
| | | |
Term Loan, 4.48%, (3 mo. USD LIBOR + 4.25%), Maturing May 19, 2023 | | | | | 1,086 | | | | 749,986 | |
| | | |
| Garrett LX III S.a.r.l. | | | | | | | | |
| | | |
Term Loan, 3.75%, (1 mo. EURIBOR + 3.75%), Maturing September 27, 2025 | | EUR | | | 389 | | | | 451,104 | |
| | | |
Term Loan, 5.75%, (USD Prime + 2.50%), Maturing September 27, 2025 | | | | | 270 | | | | 263,996 | |
|
| Garrett Motion, Inc. | |
| | | |
DIP Loan, 5.50%, (1 mo. USD LIBOR + 4.50%, Floor 1.00%), Maturing March 15, 2021 | | | | | 154 | | | | 154,966 | |
| | | |
| IAA, Inc. | | | | | | | | |
| | | |
Term Loan, 2.44%, (1 mo. USD LIBOR + 2.25%), Maturing June 28, 2026 | | | | | 605 | | | | 599,396 | |
| | | |
| Les Schwab Tire Centers | | | | | | | | |
| | | |
Term Loan, 4.25%, (3 mo. USD LIBOR + 3.50%, Floor 0.75%), Maturing November 2, 2027 | | | | | 2,850 | | | | 2,828,625 | |
| | | |
| Tenneco, Inc. | | | | | | | | |
| | | |
Term Loan, 3.15%, (1 mo. USD LIBOR + 3.00%), Maturing October 1, 2025 | | | | | 3,758 | | | | 3,642,972 | |
| | | |
| Thor Industries, Inc. | | | | | | | | |
| | | |
Term Loan, 3.94%, (1 mo. USD LIBOR + 3.75%), Maturing February 1, 2026 | | | | | 1,101 | | | | 1,098,075 | |
| | | | | | | | | | |
| Borrower/Tranche Description | | | | Principal
Amount*
(000’s omitted) | | | Value | |
| | | |
| Automotive (continued) | | | | | | | | |
| | | |
| TI Group Automotive Systems, LLC | | | | | | | | |
| | | |
Term Loan, 4.50%, (3 mo. EURIBOR + 3.75%, Floor 0.75%), Maturing December 16, 2024 | | EUR | | | 857 | | | $ | 1,032,797 | |
| | | |
Term Loan, 4.50%, (3 mo. USD LIBOR + 3.75%, Floor 0.75%), Maturing December 16, 2024 | | | | | 1,151 | | | | 1,147,980 | |
| |
| | | | $ | 23,573,088 | |
| | | |
| Beverage and Tobacco — 0.2% | | | | | | | | |
| | | |
| Arterra Wines Canada, Inc. | | | | | | | | |
| | | |
Term Loan, Maturing November 18, 2027(14) | | | | | 1,100 | | | $ | 1,101,787 | |
| |
| | | | $ | 1,101,787 | |
|
| Brokerage / Securities Dealers / Investment Houses — 0.6% | |
| | | |
| Advisor Group, Inc. | | | | | | | | |
| | | |
Term Loan, 5.15%, (1 mo. USD LIBOR + 5.00%), Maturing July 31, 2026 | | | | | 3,456 | | | $ | 3,341,870 | |
| |
| | | | $ | 3,341,870 | |
|
| Building and Development — 5.4% | |
| | | |
| ACProducts, Inc. | | | | | | | | |
| | | |
Term Loan, 7.50%, (6 mo. USD LIBOR + 6.50%, Floor 1.00%), Maturing August 18, 2025 | | | | | 444 | | | $ | 455,207 | |
| | | |
| Advanced Drainage Systems, Inc. | | | | | | | | |
| | | |
Term Loan, 2.44%, (1 mo. USD LIBOR + 2.25%), Maturing July 31, 2026 | | | | | 272 | | | | 271,330 | |
| | | |
| American Builders & Contractors Supply Co., Inc. | | | | | | | | |
| | | |
Term Loan, 2.15%, (1 mo. USD LIBOR + 2.00%), Maturing January 15, 2027 | | | | | 2,500 | | | | 2,457,762 | |
| | | |
| American Residential Services, LLC | | | | | | | | |
| | | |
Term Loan, 4.25%, (3 mo. USD LIBOR + 3.50%, Floor 0.75%), Maturing October 15, 2027 | | | | | 625 | | | | 621,484 | |
| | | |
| APi Group DE, Inc. | | | | | | | | |
| | | |
Term Loan, 2.65%, (1 mo. USD LIBOR + 2.50%), Maturing October 1, 2026 | | | | | 1,538 | | | | 1,516,501 | |
| | | |
Term Loan, 2.90%, (1 mo. USD LIBOR + 2.75%), Maturing October 1, 2026 | | | | | 325 | | | | 319,719 | |
| | | |
| Beacon Roofing Supply, Inc. | | | | | | | | |
| | | |
Term Loan, 2.40%, (1 mo. USD LIBOR + 2.25%), Maturing January 2, 2025 | | | | | 609 | | | | 597,283 | |
| | | |
| Brookfield Property REIT, Inc. | | | | | | | | |
| | | |
Term Loan, 2.65%, (1 mo. USD LIBOR + 2.50%), Maturing August 27, 2025 | | | | | 1,004 | | | | 930,418 | |
| | | |
| Core & Main L.P. | | | | | | | | |
| | | |
Term Loan, 3.75%, (3 mo. USD LIBOR + 2.75%, Floor 1.00%), Maturing August 1, 2024 | | | | | 1,170 | | | | 1,157,844 | |
| | | | |
| | 11 | | See Notes to Financial Statements. |
Eaton Vance
Floating-Rate Income Trust
November 30, 2020
Portfolio of Investments (Unaudited) — continued
| | | | | | | | | | |
| Borrower/Tranche Description | | | | Principal
Amount*
(000’s omitted) | | | Value | |
|
| Building and Development (continued) | |
| | | |
| Cornerstone Building Brands, Inc. | | | | | | | | |
| | | |
Term Loan, 3.88%, (1 mo. USD LIBOR + 3.75%), Maturing April 12, 2025 | | | | | 808 | | | $ | 804,416 | |
| | | |
| CP Atlas Buyer, Inc. | | | | | | | | |
| | | |
Term Loan, 5.25%, (3 mo. USD LIBOR + 4.50%, Floor 0.75%), Maturing November 23, 2027 | | | | | 319 | | | | 318,830 | |
| | | |
Term Loan, 5.25%, (3 mo. USD LIBOR + 4.50%, Floor 0.75%), Maturing November 23, 2027 | | | | | 956 | | | | 956,489 | |
| | | |
| CPG International, Inc. | | | | | | | | |
| | | |
Term Loan, 4.75%, (12 mo. USD LIBOR + 3.75%, Floor 1.00%), Maturing May 5, 2024 | | | | | 1,146 | | | | 1,146,857 | |
| | | |
| Cushman & Wakefield U.S. Borrower, LLC | | | | | | | | |
| | | |
Term Loan, 2.90%, (1 mo. USD LIBOR + 2.75%), Maturing August 21, 2025 | | | | | 5,846 | | | | 5,681,821 | |
| | | |
| LSF11 Skyscraper Holdco S.a.r.l. | | | | | | | | |
| | | |
Term Loan, 4.50%, (1 mo. EURIBOR + 4.50%), Maturing September 29, 2027 | | EUR | | | 575 | | | | 682,460 | |
| | | |
Term Loan, 4.50%, (1 mo. EURIBOR + 4.50%), Maturing September 29, 2027 | | EUR | | | 1,075 | | | | 1,287,581 | |
| | | |
Term Loan, 5.67%, (1 mo. USD LIBOR + 5.50%), Maturing September 29, 2027 | | | | | 699 | | | | 701,224 | |
| | | |
| Quikrete Holdings, Inc. | | | | | | | | |
| | | |
Term Loan, 2.65%, (1 mo. USD LIBOR + 2.50%), Maturing February 1, 2027 | | | | | 2,222 | | | | 2,193,593 | |
| | | |
| RE/MAX International, Inc. | | | | | | | | |
| | | |
Term Loan, 3.50%, (3 mo. USD LIBOR + 2.75%, Floor 0.75%), Maturing December 15, 2023 | | | | | 2,038 | | | | 2,037,534 | |
| | | |
| Realogy Group, LLC | | | | | | | | |
| | | |
Term Loan, 3.00%, (1 mo. USD LIBOR + 2.25%, Floor 0.75%), Maturing February 8, 2025 | | | | | 888 | | | | 865,956 | |
| | | |
| Werner FinCo L.P. | | | | | | | | |
| | | |
Term Loan, 5.00%, (1 mo. USD LIBOR + 4.00%, Floor 1.00%), Maturing July 24, 2024 | | | | | 1,116 | | | | 1,116,229 | |
| | | |
| White Cap Buyer, LLC | | | | | | | | |
| | | |
Term Loan, 4.50%, (6 mo. USD LIBOR + 4.00%, Floor 0.50%), Maturing October 19, 2027 | | | | | 2,375 | | | | 2,358,035 | |
| | | |
| WireCo WorldGroup, Inc. | | | | | | | | |
| | | |
Term Loan, 6.00%, (6 mo. USD LIBOR + 5.00%, Floor 1.00%), Maturing September 30, 2023 | | | | | 940 | | | | 860,111 | |
| | | |
Term Loan - Second Lien, 10.00%, (6 mo. USD LIBOR + 9.00%, Floor 1.00%), Maturing September 30, 2024 | | | | | 1,300 | | | | 1,059,500 | |
| |
| | | | $ | 30,398,184 | |
|
| Business Equipment and Services — 12.3% | |
| | | |
| Adevinta ASA | | | | | | | | |
| | | |
Term Loan, Maturing October 23, 2027(14) | | | | | 325 | | | $ | 325,000 | |
| | | |
Term Loan, Maturing October 23, 2027(14) | | EUR | | | 1,250 | | | | 1,497,187 | |
| | | | | | | | | | |
| Borrower/Tranche Description | | | | Principal
Amount*
(000’s omitted) | | | Value | |
|
| Business Equipment and Services (continued) | |
| | | |
| Adtalem Global Education, Inc. | | | | | | | | |
| | | |
Term Loan, 3.15%, (1 mo. USD LIBOR + 3.00%), Maturing April 11, 2025 | | | | | 415 | | | $ | 411,802 | |
| | | |
| Airbnb, Inc. | | | | | | | | |
| | | |
Term Loan, 8.50%, (1 mo. USD LIBOR + 7.50%, Floor 1.00%), Maturing April 17, 2025 | | | | | 848 | | | | 919,944 | |
| | | |
| AlixPartners, LLP | | | | | | | | |
| | | |
Term Loan, 2.65%, (1 mo. USD LIBOR + 2.50%), Maturing April 4, 2024 | | | | | 2,318 | | | | 2,276,823 | |
| | | |
Term Loan, 3.25%, (3 mo. EURIBOR + 3.25%), Maturing April 4, 2024 | | EUR | | | 788 | | | | 940,162 | |
| | | |
| Allied Universal Holdco, LLC | | | | | | | | |
| | | |
Term Loan, 4.40%, (1 mo. USD LIBOR + 4.25%), Maturing July 10, 2026 | | | | | 3,577 | | | | 3,559,121 | |
| | | |
| Amentum Government Services Holdings, LLC | | | | | | | | |
| | | |
Term Loan, 3.65%, (1 mo. USD LIBOR + 3.50%), Maturing February 1, 2027 | | | | | 1,022 | | | | 1,007,101 | |
| | | |
| AppLovin Corporation | | | | | | | | |
| | | |
Term Loan, 3.65%, (1 mo. USD LIBOR + 3.50%), Maturing August 15, 2025 | | | | | 3,836 | | | | 3,822,347 | |
| | | |
Term Loan, 4.15%, (1 mo. USD LIBOR + 4.00%), Maturing August 15, 2025 | | | | | 697 | | | | 694,904 | |
| | | |
| Asplundh Tree Expert, LLC | | | | | | | | |
| | | |
Term Loan, 2.64%, (1 mo. USD LIBOR + 2.50%), Maturing September 7, 2027 | | | | | 1,250 | | | | 1,252,790 | |
|
| Belfor Holdings, Inc. | |
| | | |
Term Loan, 4.15%, (1 mo. USD LIBOR + 4.00%), Maturing April 6, 2026 | | | | | 568 | | | | 569,232 | |
| | | |
| BidFair MergeRight, Inc. | | | | | | | | |
| | | |
Term Loan, 6.50%, (1 mo. USD LIBOR + 5.50%, Floor 1.00%), Maturing January 15, 2027 | | | | | 668 | | | | 667,770 | |
| | | |
| Bracket Intermediate Holding Corp. | | | | | | | | |
| | | |
Term Loan, 4.48%, (3 mo. USD LIBOR + 4.25%), Maturing September 5, 2025 | | | | | 931 | | | | 921,690 | |
| | | |
| Brand Energy & Infrastructure Services, Inc. | | | | | | | | |
| | | |
Term Loan, 5.25%, (3 mo. USD LIBOR + 4.25%, Floor 1.00%), Maturing June 21, 2024 | | | | | 1,676 | | | | 1,616,585 | |
| | | |
| Camelot U.S. Acquisition 1 Co. | | | | | | | | |
| | | |
Term Loan, 4.00%, (1 mo. USD LIBOR + 3.00%, Floor 1.00%), Maturing October 30, 2026 | | | | | 1,225 | | | | 1,222,320 | |
| | | |
| Cardtronics USA, Inc. | | | | | | | | |
| | | |
Term Loan, 5.00%, (1 mo. USD LIBOR + 4.00%, Floor 1.00%), Maturing June 29, 2027 | | | | | 599 | | | | 600,295 | |
| | | |
| CCC Information Services, Inc. | | | | | | | | |
| | | |
Term Loan, 4.00%, (1 mo. USD LIBOR + 3.00%, Floor 1.00%), Maturing April 29, 2024 | | | | | 3,126 | | | | 3,114,510 | |
| | | | |
| | 12 | | See Notes to Financial Statements. |
Eaton Vance
Floating-Rate Income Trust
November 30, 2020
Portfolio of Investments (Unaudited) — continued
| | | | | | | | | | |
| Borrower/Tranche Description | | | | Principal
Amount*
(000’s omitted) | | | Value | |
|
| Business Equipment and Services (continued) | |
| | | |
| Ceridian HCM Holding, Inc. | | | | | | | | |
| | | |
Term Loan, 2.60%, (1 week USD LIBOR + 2.50%), Maturing April 30, 2025 | | | | | 1,047 | | | $ | 1,027,661 | |
| | | |
| CM Acquisition Co. | | | | | | | | |
| | | |
Term Loan, 11.00%, (3 mo. USD LIBOR + 10.00%, Floor 1.00%), Maturing July 26, 2023 | | | | | 200 | | | | 185,417 | |
| | | |
| Deerfield Dakota Holding, LLC | | | | | | | | |
| | | |
Term Loan, 4.75%, (1 mo. USD LIBOR + 3.75%, Floor 1.00%), Maturing April 9, 2027 | | | | | 2,219 | | | | 2,216,663 | |
| | | |
| EAB Global, Inc. | | | | | | | | |
| | | |
Term Loan, 4.75%, (USD LIBOR + 3.75%, Floor 1.00%), Maturing November 15, 2024(12) | | | | | 1,365 | | | | 1,345,662 | |
| | | |
| EIG Investors Corp. | | | | | | | | |
| | | |
Term Loan, 4.75%, (USD LIBOR + 3.75%, Floor 1.00%), Maturing February 9, 2023(12) | | | | | 4,042 | | | | 4,043,729 | |
| | | |
| Garda World Security Corporation | | | | | | | | |
| | | |
Term Loan, 4.91%, (1 mo. USD LIBOR + 4.75%), Maturing October 30, 2026 | | | | | 1,426 | | | | 1,425,066 | |
| | | |
| Greeneden U.S. Holdings II, LLC | | | | | | | | |
| | | |
Term Loan, Maturing October 8,
2027(14) | | | | | 925 | | | | 922,919 | |
| | | |
| IG Investment Holdings, LLC | | | | | | | | |
| | | |
Term Loan, 5.00%, (3 mo. USD LIBOR + 4.00%, Floor 1.00%), Maturing May 23, 2025 | | | | | 2,595 | | | | 2,569,988 | |
| | | |
| Illuminate Buyer, LLC | | | | | | | | |
| | | |
Term Loan, 4.15%, (1 mo. USD LIBOR + 4.00%), Maturing June 16, 2027 | | | | | 850 | | | | 849,292 | |
| | | |
| IRI Holdings, Inc. | | | | | | | | |
| | | |
Term Loan, 4.40%, (1 mo. USD LIBOR + 4.25%), Maturing December 1, 2025 | | | | | 2,211 | | | | 2,184,834 | |
| | | |
| Iron Mountain, Inc. | | | | | | | | |
| | | |
Term Loan, 1.90%, (1 mo. USD LIBOR + 1.75%), Maturing January 2, 2026 | | | | | 902 | | | | 886,092 | |
| | | |
| KAR Auction Services, Inc. | | | | | | | | |
| | | |
Term Loan, 2.44%, (1 mo. USD LIBOR + 2.25%), Maturing September 19, 2026 | | | | | 668 | | | | 654,467 | |
| | | |
| KUEHG Corp. | | | | | | | | |
| | | |
Term Loan, 4.75%, (3 mo. USD LIBOR + 3.75%, Floor 1.00%), Maturing February 21, 2025 | | | | | 2,719 | | | | 2,599,770 | |
| | | |
Term Loan - Second Lien, 9.25%, (3 mo. USD LIBOR + 8.25%, Floor 1.00%), Maturing August 22, 2025 | | | | | 425 | | | | 395,250 | |
| | | |
| LGC Group Holdings, Ltd. | | | | | | | | |
| | | |
Term Loan, 3.25%, (1 mo. EURIBOR + 3.25%), Maturing April 21, 2027 | | EUR | | | 500 | | | | 589,343 | |
| | | |
| Loire Finco Luxembourg S.a.r.l. | | | | | | | | |
| | | |
Term Loan, 3.65%, (1 mo. USD LIBOR + 3.50%), Maturing April 21, 2027 | | | | | 374 | | | | 365,646 | |
| | | | | | | | | | |
| Borrower/Tranche Description | | | | Principal
Amount*
(000’s omitted) | | | Value | |
|
| Business Equipment and Services (continued) | |
| | | |
| Monitronics International, Inc. | | | | | | | | |
| | | |
Term Loan, 7.75%, (1 mo. USD LIBOR + 6.50%, Floor 1.25%), Maturing March 29, 2024 | | | | | 1,591 | | | $ | 1,415,985 | |
|
| Northstar Group Services, Inc. | |
| | | |
Term Loan, 6.50%, (1 mo. USD LIBOR + 5.50%, Floor 1.00%), Maturing November 9, 2026 | | | | | 1,400 | | | | 1,375,500 | |
| | | |
| PGX Holdings, Inc. | | | | | | | | |
| | | |
Term Loan, 10.50%, (12 mo. USD LIBOR + 9.50%, Floor 1.00%), 6.25% cash, 4.25 PIK, Maturing September 29, 2023 | | | | | 1,148 | | | | 1,079,096 | |
| | | |
| Pre-Paid Legal Services, Inc. | | | | | | | | |
| | | |
Term Loan, 3.40%, (1 mo. USD LIBOR + 3.25%), Maturing May 1, 2025 | | | | | 412 | | | | 402,360 | |
| | | |
| Prime Security Services Borrower, LLC | | | | | | | | |
| | | |
Term Loan, 4.25%, (USD LIBOR + 3.25%, Floor 1.00%), Maturing September 23, 2026(12) | | | | | 2,386 | | | | 2,376,896 | |
| | | |
| Red Ventures, LLC | | | | | | | | |
| | | |
Term Loan, 2.65%, (1 mo. USD LIBOR + 2.50%), Maturing November 8, 2024 | | | | | 1,486 | | | | 1,442,579 | |
| | | |
| Rockwood Service Corporation | | | | | | | | |
| | | |
Term Loan, 4.40%, (1 mo. USD LIBOR + 4.25%), Maturing January 23, 2027 | | | | | 498 | | | | 496,567 | |
| | | |
| Sabre GLBL, Inc. | | | | | | | | |
| | | |
Term Loan, 2.15%, (1 mo. USD LIBOR + 2.00%), Maturing February 22, 2024 | | | | | 1,021 | | | | 976,078 | |
| | | |
| SMG US Midco 2, Inc. | | | | | | | | |
| | | |
Term Loan, 2.69%, (USD LIBOR + 2.50%), Maturing January 23, 2025(12) | | | | | 244 | | | | 224,280 | |
| | | |
| Speedster Bidco GmbH | | | | | | | | |
| | | |
Term Loan, 3.25%, (6 mo. EURIBOR + 3.25%), Maturing March 31, 2027 | | EUR | | | 2,325 | | | | 2,749,607 | |
| | | |
| Spin Holdco, Inc. | | | | | | | | |
| | | |
Term Loan, 4.25%, (3 mo. USD LIBOR + 3.25%, Floor 1.00%), Maturing November 14, 2022 | | | | | 3,749 | | | | 3,704,891 | |
| | | |
| Techem Verwaltungsgesellschaft 675 mbH | | | | | | | | |
| | | |
Term Loan, 2.63%, (6 mo. EURIBOR + 2.63%), Maturing July 15, 2025 | | EUR | | | 801 | | | | 948,541 | |
| | | |
| Tempo Acquisition, LLC | | | | | | | | |
| | | |
Term Loan, 3.75%, (1 mo. USD LIBOR + 3.25%, Floor 0.50%), Maturing November 2, 2026 | | | | | 1,665 | | | | 1,640,451 | |
| | | |
| Vestcom Parent Holdings, Inc. | | | | | | | | |
| | | |
Term Loan, 5.00%, (1 mo. USD LIBOR + 4.00%, Floor 1.00%), Maturing December 19, 2023 | | | | | 553 | | | | 542,482 | |
| | | |
| WASH Multifamily Laundry Systems, LLC | | | | | | | | |
| | | |
Term Loan, 4.25%, (1 mo. USD LIBOR + 3.25%, Floor 1.00%), Maturing May 14, 2022 | | | | | 262 | | | | 259,752 | |
| | | | |
| | 13 | | See Notes to Financial Statements. |
Eaton Vance
Floating-Rate Income Trust
November 30, 2020
Portfolio of Investments (Unaudited) — continued
| | | | | | | | | | |
| Borrower/Tranche Description | | | | Principal
Amount*
(000’s omitted) | | | Value | |
|
| Business Equipment and Services (continued) | |
| | | |
| West Corporation | | | | | | | | |
| | | |
Term Loan, 4.50%, (USD LIBOR + 3.50%, Floor 1.00%), Maturing October 10, 2024(12) | | | | | 342 | | | $ | 324,805 | |
| | | |
Term Loan, 5.00%, (USD LIBOR + 4.00%, Floor 1.00%), Maturing October 10, 2024(12) | | | | | 1,143 | | | | 1,090,246 | |
| | | |
| Zephyr Bidco Limited | | | | | | | | |
| | | |
Term Loan, 4.29%, (1 mo. GBP LIBOR + 4.25%), Maturing July 23, 2025 | | GBP | | | 775 | | | | 1,019,243 | |
| |
| | | | $ | 69,750,741 | |
|
| Cable and Satellite Television — 5.6% | |
| | | |
| Altice France S.A. | | | | | | | | |
| | | |
Term Loan, 3.83%, (1 mo. USD LIBOR + 3.69%), Maturing January 31, 2026 | | | | | 782 | | | $ | 772,873 | |
| | | |
Term Loan, 4.24%, (3 mo. USD LIBOR + 4.00%), Maturing August 14, 2026 | | | | | 1,236 | | | | 1,226,810 | |
| | | |
| CSC Holdings, LLC | | | | | | | | |
| | | |
Term Loan, 2.39%, (1 mo. USD LIBOR + 2.25%), Maturing July 17, 2025 | | | | | 3,686 | | | | 3,602,002 | |
| | | |
Term Loan, 2.64%, (1 mo. USD LIBOR + 2.50%), Maturing April 15, 2027 | | | | | 1,348 | | | | 1,322,080 | |
| | | |
| Numericable Group S.A. | | | | | | | | |
| | | |
Term Loan, 2.90%, (1 mo. USD LIBOR + 2.75%), Maturing July 31, 2025 | | | | | 1,954 | | | | 1,903,644 | |
| | | |
Term Loan, 3.00%, (3 mo. EURIBOR + 3.00%), Maturing July 31, 2025 | | EUR | | | 483 | | | | 568,850 | |
| | | |
| Telenet Financing USD, LLC | | | | | | | | |
| | | |
Term Loan, 2.14%, (1 mo. USD LIBOR + 2.00%), Maturing April 30, 2028 | | | | | 4,075 | | | | 4,004,005 | |
|
| UPC Broadband Holding B.V. | |
| | |
Term Loan, 2.39%, (1 mo. USD LIBOR + 2.25%), Maturing April 30, 2028 | | | 900 | | | | 880,875 | |
| | | |
Term Loan, 2.50%, (6 mo. EURIBOR + 2.50%), Maturing April 30, 2029 | | EUR | | | 775 | | | | 920,125 | |
| | | |
Term Loan, 3.50%, (2 mo. EURIBOR + 3.50%), Maturing January 31, 2029 | | EUR | | | 888 | | | | 1,065,139 | |
| | | |
Term Loan, 3.50%, (2 mo. EURIBOR + 3.50%), Maturing January 31, 2029 | | EUR | | | 888 | | | | 1,065,139 | |
| | |
Term Loan, 3.67%, (2 mo. USD LIBOR + 3.50%), Maturing January 31, 2029 | | | 2,050 | | | | 2,034,412 | |
| | |
Term Loan, 3.67%, (2 mo. USD LIBOR + 3.50%), Maturing January 31, 2029 | | | 2,050 | | | | 2,034,412 | |
| | | |
| Virgin Media Bristol, LLC | | | | | | | | |
| | |
Term Loan, 2.64%, (1 mo. USD LIBOR + 2.50%), Maturing January 31, 2028 | | | 4,625 | | | | 4,543,198 | |
| | |
Term Loan, Maturing January 31, 2029(14) | | | 1,275 | | | | 1,267,669 | |
| | | | | | | | | | |
| Borrower/Tranche Description | | | | Principal
Amount*
(000’s omitted) | | | Value | |
|
| Cable and Satellite Television (continued) | |
| | | |
| Virgin Media SFA Finance Limited | | | | | | | | |
| | | |
Term Loan, 2.50%, (6 mo. EURIBOR + 2.50%), Maturing January 31, 2029 | | EUR | | | 1,325 | | | $ | 1,577,366 | |
| | | |
| Ziggo B.V. | | | | | | | | |
| | | |
Term Loan, 3.00%, (6 mo. EURIBOR + 3.00%), Maturing January 31, 2029 | | EUR | | | 2,425 | | | | 2,893,794 | |
| |
| | | | $ | 31,682,393 | |
|
| Chemicals and Plastics — 6.8% | |
| | | |
| Alpha 3 B.V. | | | | | | | | |
| | | |
Term Loan, 4.00%, (3 mo. USD LIBOR + 3.00%, Floor 1.00%), Maturing January 31, 2024 | | | | | 1,318 | | | $ | 1,310,606 | |
| | | |
| Aruba Investments, Inc. | | | | | | | | |
| | | |
Term Loan, Maturing October 28,
2027(14) | | EUR | | | 525 | | | | 627,029 | |
| | |
Term Loan, Maturing October 28, 2027(14) | | | 800 | | | | 798,000 | |
| | | |
| Axalta Coating Systems US Holdings, Inc. | | | | | | | | |
| | | |
Term Loan, 1.97%, (3 mo. USD LIBOR + 1.75%), Maturing June 1, 2024 | | | | | 2,310 | | | | 2,273,153 | |
| | | |
| Charter NEX US, Inc. | | | | | | | | |
| | | |
Term Loan, Maturing November 24, 2027(14) | | | | | 500 | | | | 500,729 | |
| | | |
| Chemours Company (The) | | | | | | | | |
| | | |
Term Loan, 2.50%, (3 mo. EURIBOR + 2.00%, Floor 0.50%), Maturing April 3, 2025 | | EUR | | | 631 | | | | 742,138 | |
| | | |
| Emerald Performance Materials, LLC | | | | | | | | |
| | | |
Term Loan, 5.00%, (1 mo. USD LIBOR + 4.00%, Floor 1.00%), Maturing August 12, 2025 | | | | | 395 | | | | 395,109 | |
| | | |
| Ferro Corporation | | | | | | | | |
| | |
Term Loan, 2.47%, (3 mo. USD LIBOR + 2.25%), Maturing February 14, 2024 | | | 350 | | | | 345,403 | |
| | |
Term Loan, 2.47%, (3 mo. USD LIBOR + 2.25%), Maturing February 14, 2024 | | | 357 | | | | 352,912 | |
| | |
Term Loan, 2.47%, (3 mo. USD LIBOR + 2.25%), Maturing February 14, 2024 | | | 434 | | | | 429,103 | |
| | | |
| Flint Group GmbH | | | | | | | | |
| | | |
Term Loan, 6.00%, (USD LIBOR + 5.00%, Floor 1.00%), 5.25% cash, 0.75% PIK, Maturing September 21, 2023(12) | | | | | 157 | | | | 144,901 | |
| | | |
| Flint Group US, LLC | | | | | | | | |
| | | |
Term Loan, 6.00%, (USD LIBOR + 5.00%, Floor 1.00%), 5.25% cash, 0.75% PIK, Maturing September 21, 2023(12) | | | | | 949 | | | | 876,532 | |
| | | |
| Gemini HDPE, LLC | | | | | | | | |
| | | |
Term Loan, 2.72%, (3 mo. USD LIBOR + 2.50%), Maturing August 7, 2024 | | | | | 2,142 | | | | 2,109,900 | |
| | | |
| H.B. Fuller Company | | | | | | | | |
| | | |
Term Loan, 2.15%, (1 mo. USD LIBOR + 2.00%), Maturing October 20, 2024 | | | | | 1,177 | | | | 1,163,207 | |
| | | | |
| | 14 | | See Notes to Financial Statements. |
Eaton Vance
Floating-Rate Income Trust
November 30, 2020
Portfolio of Investments (Unaudited) — continued
| | | | | | | | | | |
| Borrower/Tranche Description | | | | Principal
Amount*
(000’s omitted) | | | Value | |
|
| Chemicals and Plastics (continued) | |
| | | |
| Hexion, Inc. | | | | | | | | |
| | |
Term Loan, 3.73%, (3 mo. USD LIBOR + 3.50%), Maturing July 1, 2026 | | | 765 | | | $ | 761,486 | |
| | | |
Term Loan, 4.00%, (3 mo. EURIBOR + 4.00%), Maturing July 1, 2026 | | EUR | | | 1,600 | | | | 1,908,561 | |
| | | |
| INEOS Enterprises Holdings II Limited | | | | | | | | |
| | | |
Term Loan, 4.25%, (3 mo. EURIBOR + 3.25%, Floor 1.00%), Maturing August 28, 2026 | | EUR | | | 200 | | | | 237,825 | |
|
| INEOS Enterprises Holdings US Finco, LLC | |
| | | |
Term Loan, 4.50%, (3 mo. USD LIBOR + 3.50%, Floor 1.00%), Maturing August 28, 2026 | | | | | 224 | | | | 222,661 | |
| | | |
| INEOS Finance PLC | | | | | | | | |
| | | |
Term Loan, 2.50%, (1 mo. EURIBOR + 2.00%, Floor 0.50%), Maturing April 1, 2024 | | EUR | | | 3,185 | | | | 3,749,290 | |
| | | |
| Messer Industries GmbH | | | | | | | | |
| | | |
Term Loan, 2.72%, (3 mo. USD LIBOR + 2.50%), Maturing March 1, 2026 | | | | | 1,527 | | | | 1,507,530 | |
| | | |
| Minerals Technologies, Inc. | | | | | | | | |
| | | |
Term Loan, 3.00%, (USD LIBOR + 2.25%, Floor 0.75%), Maturing February 14, 2024(12) | | | | | 886 | | | | 885,641 | |
| | | |
| Momentive Performance Materials, Inc. | | | | | | | | |
| | | |
Term Loan, 3.40%, (1 mo. USD LIBOR + 3.25%), Maturing May 15, 2024 | | | | | 469 | | | | 455,577 | |
| | | |
| Orion Engineered Carbons GmbH | | | | | | | | |
| | | |
Term Loan, 2.22%, (3 mo. USD LIBOR + 2.00%), Maturing July 25, 2024 | | | | | 1,128 | | | | 1,115,082 | |
| | | |
Term Loan, 2.25%, (3 mo. EURIBOR + 2.25%), Maturing July 25, 2024 | | EUR | | | 808 | | | | 962,673 | |
| | | |
| PMHC II, Inc. | | | | | | | | |
| | | |
Term Loan, 4.50%, (12 mo. USD LIBOR + 3.50%, Floor 1.00%), Maturing March 31, 2025 | | | | | 1,677 | | | | 1,573,399 | |
| | | |
| PQ Corporation | | | | | | | | |
| | | |
Term Loan, 2.46%, (3 mo. USD LIBOR + 2.25%), Maturing February 7, 2027 | | | | | 2,349 | | | | 2,303,102 | |
| | | |
Term Loan, 4.00%, (3 mo. USD LIBOR + 3.00%, Floor 1.00%), Maturing February 7, 2027 | | | | | 2,020 | | | | 2,019,938 | |
| | | |
| Pregis TopCo Corporation | | | | | | | | |
| | | |
Term Loan, 3.90%, (1 mo. USD LIBOR + 3.75%), Maturing July 31, 2026 | | | | | 670 | | | | 662,261 | |
| | | |
| Rohm Holding GmbH | | | | | | | | |
| | | |
Term Loan, 5.32%, (6 mo. USD LIBOR + 5.00%), Maturing July 31, 2026 | | | | | 397 | | | | 385,579 | |
| | | |
| Starfruit Finco B.V. | | | | | | | | |
| | | |
Term Loan, 3.14%, (1 mo. USD LIBOR + 3.00%), Maturing October 1, 2025 | | | | | 1,494 | | | | 1,469,659 | |
| | | |
Term Loan, 3.25%, (1 mo. EURIBOR + 3.25%), Maturing October 1, 2025 | | EUR | | | 448 | | | | 533,430 | |
| | | | | | | | | | |
| Borrower/Tranche Description | | | | Principal
Amount*
(000’s omitted) | | | Value | |
|
| Chemicals and Plastics (continued) | |
| | | |
| Tronox Finance, LLC | | | | | | | | |
| | | |
Term Loan, 3.18%, (USD LIBOR + 3.00%), Maturing September 23, 2024(12) | | | | | 3,120 | | | $ | 3,086,750 | |
| | | |
| Univar, Inc. | | | | | | | | |
| | | |
Term Loan, 2.40%, (1 mo. USD LIBOR + 2.25%), Maturing July 1, 2024 | | | | | 1,953 | | | | 1,933,998 | |
| | | |
| Venator Materials Corporation | | | | | | | | |
| | | |
Term Loan, 3.15%, (1 mo. USD LIBOR + 3.00%), Maturing August 8, 2024 | | | | | 412 | | | | 400,398 | |
| |
| | | | $ | 38,243,562 | |
|
| Conglomerates — 0.0%(6) | |
| | | |
| Penn Engineering & Manufacturing Corp. | | | | | | | | |
| | | |
Term Loan, 3.75%, (1 mo. USD LIBOR + 2.75%, Floor 1.00%), Maturing June 27, 2024 | | | | | 199 | | | $ | 198,964 | |
| |
| | | | $ | 198,964 | |
|
| Containers and Glass Products — 3.1% | |
| | | |
| Berry Global, Inc. | | | | | | | | |
| | | |
Term Loan, 2.13%, (1 mo. USD LIBOR + 2.00%), Maturing July 1, 2026 | | | | | 1,012 | | | $ | 996,182 | |
| | | |
| BWAY Holding Company | | | | | | | | |
| | | |
Term Loan, 3.48%, (3 mo. USD LIBOR + 3.25%), Maturing April 3, 2024 | | | | | 2,502 | | | | 2,389,454 | |
| | | |
| Flex Acquisition Company, Inc. | | | | | | | | |
| | | |
Term Loan, 4.00%, (USD LIBOR + 3.00%, Floor 1.00%), Maturing December 29, 2023(12) | | | | | 3,479 | | | | 3,438,935 | |
| | | |
Term Loan, 3.23%, (3 mo. USD LIBOR + 3.00%), Maturing June 29, 2025 | | | | | 1,515 | | | | 1,481,400 | |
| | | |
| Libbey Glass, Inc. | | | | | | | | |
| | | |
Term Loan, 9.00%, (6 mo. USD LIBOR + 8.00%, Floor 1.00%), Maturing November 12, 2025 | | | | | 799 | | | | 767,052 | |
|
| Reynolds Consumer Products, Inc. | |
| | | |
Term Loan, 1.90%, (1 mo. USD LIBOR + 1.75%), Maturing February 4, 2027 | | | | | 1,371 | | | | 1,356,718 | |
| | | |
| Reynolds Group Holdings, Inc. | | | | | | | | |
| | | |
Term Loan, 2.90%, (1 mo. USD LIBOR + 2.75%), Maturing February 5, 2023 | | | | | 2,146 | | | | 2,122,941 | |
| | | |
Term Loan, 3.40%, (1 mo. USD LIBOR + 3.25%), Maturing February 5, 2026 | | | | | 1,550 | | | | 1,526,943 | |
| | | |
| Ring Container Technologies Group, LLC | | | | | | | | |
| | | |
Term Loan, 2.90%, (1 mo. USD LIBOR + 2.75%), Maturing October 31, 2024 | | | | | 899 | | | | 881,264 | |
| | | |
| Trident TPI Holdings, Inc. | | | | | | | | |
| | | |
Term Loan, 3.25%, (3 mo. EURIBOR + 3.25%), Maturing October 17, 2024 | | EUR | | | 1,337 | | | | 1,571,139 | |
| | | | |
| | 15 | | See Notes to Financial Statements. |
Eaton Vance
Floating-Rate Income Trust
November 30, 2020
Portfolio of Investments (Unaudited) — continued
| | | | | | | | | | |
| Borrower/Tranche Description | | | | Principal
Amount*
(000’s omitted) | | | Value | |
|
| Containers and Glass Products (continued) | |
| | | |
| Trident TPI Holdings, Inc. (continued) | | | | | | | | |
| | | |
Term Loan, 4.00%, (3 mo. USD LIBOR + 3.00%, Floor 1.00%), Maturing October 17, 2024 | | | | | 755 | | | $ | 743,227 | |
| |
| | | | $ | 17,275,255 | |
|
| Cosmetics / Toiletries — 0.7% | |
| | | |
| Kronos Acquisition Holdings, Inc. | | | | | | | | |
| | | |
Term Loan, 5.00%, (1 mo. USD LIBOR + 4.00%, Floor 1.00%), Maturing May 15, 2023 | | | | | 3,813 | | | $ | 3,811,338 | |
| |
| | | | $ | 3,811,338 | |
|
| Drugs — 6.8% | |
| | | |
| Aenova Holding GmbH | | | | | | | | |
| | | |
Term Loan, 5.00%, (6 mo. EURIBOR + 5.00%), Maturing March 6, 2025 | | EUR | | | 200 | | | $ | 239,862 | |
| | | |
| Akorn, Inc. | | | | | | | | |
| | | |
Term Loan, 8.50%, (3 mo. USD LIBOR + 7.50%, Floor 1.00%), Maturing October 1, 2025 | | | | | 864 | | | | 870,062 | |
| | | |
| Albany Molecular Research, Inc. | | | | | | | | |
| | | |
Term Loan, 4.25%, (USD LIBOR + 3.25%, Floor 1.00%), Maturing August 30, 2024(12) | | | | | 825 | | | | 823,263 | |
| | | |
Term Loan, 4.50%, (3 mo. USD LIBOR + 3.50%, Floor 1.00%), Maturing August 30, 2024 | | | | | 275 | | | | 275,573 | |
| | | |
| Alkermes, Inc. | | | | | | | | |
| | | |
Term Loan, 2.40%, (1 mo. USD LIBOR + 2.25%), Maturing March 27, 2023 | | | | | 394 | | | | 391,636 | |
| | | |
| Amneal Pharmaceuticals, LLC | | | | | | | | |
| | | |
Term Loan, 3.69%, (1 mo. USD LIBOR + 3.50%), Maturing May 4, 2025 | | | | | 3,714 | | | | 3,605,697 | |
| | | |
| Arbor Pharmaceuticals, Inc. | | | | | | | | |
| | | |
Term Loan, 6.00%, (3 mo. USD LIBOR + 5.00%, Floor 1.00%), Maturing July 5, 2023 | | | | | 1,760 | | | | 1,610,580 | |
| | | |
| Bausch Health Companies, Inc. | | | | | | | | |
| | | |
Term Loan, 3.14%, (1 mo. USD LIBOR + 3.00%), Maturing June 2, 2025 | | | | | 5,247 | | | | 5,192,023 | |
| | | |
| Cambrex Corporation | | | | | | | | |
| | | |
Term Loan, Maturing December 4, 2026(14) | | | | | 325 | | | | 326,016 | |
| | | |
| Catalent Pharma Solutions, Inc. | | | | | | | | |
| | | |
Term Loan, 3.25%, (1 mo. USD LIBOR + 2.25%, Floor 1.00%), Maturing May 18, 2026 | | | | | 862 | | | | 863,491 | |
| | | |
| Elanco Animal Health Incorporated | | | | | | | | |
| | | |
Term Loan, 1.90%, (1 mo. USD LIBOR + 1.75%), Maturing August 1, 2027 | | | | | 640 | | | | 631,032 | |
| | | |
| Endo Luxembourg Finance Company I S.a.r.l. | | | | | | | | |
| | | |
Term Loan, 5.00%, (3 mo. USD LIBOR + 4.25%, Floor 0.75%), Maturing April 29, 2024 | | | | | 5,509 | | | | 5,364,800 | |
| | | | | | | | | | |
| Borrower/Tranche Description | | | | Principal
Amount*
(000’s omitted) | | | Value | |
|
| Drugs (continued) | |
| | | |
| Grifols Worldwide Operations USA, Inc. | | | | | | | | |
| | | |
Term Loan, 2.10%, (1 week USD LIBOR + 2.00%), Maturing November 15, 2027 | | | | | 2,538 | | | $ | 2,503,333 | |
| | | |
| Horizon Therapeutics USA, Inc. | | | | | | | | |
| | | |
Term Loan, 2.19%, (1 mo. USD LIBOR + 2.00%), Maturing May 22, 2026 | | | | | 2,196 | | | | 2,177,549 | |
| | | |
| Jaguar Holding Company II | | | | | | | | |
| | | |
Term Loan, 3.50%, (1 mo. USD LIBOR + 2.50%, Floor 1.00%), Maturing August 18, 2022 | | | | | 5,899 | | | | 5,895,559 | |
| | | |
| Mallinckrodt International Finance S.A. | | | | | | | | |
| | | |
Term Loan, 5.50%, (3 mo. USD LIBOR + 4.75%, Floor 0.75%), Maturing September 24, 2024 | | | | | 2,910 | | | | 2,736,030 | |
| | | |
Term Loan, 5.75%, (6 mo. USD LIBOR + 5.00%, Floor 0.75%), Maturing February 24, 2025 | | | | | 3,282 | | | | 3,079,158 | |
| | | |
| Nidda Healthcare Holding AG | | | | | | | | |
| | | |
Term Loan, 3.50%, (3 mo. EURIBOR + 3.50%), Maturing August 21, 2026 | | EUR | | | 625 | | | | 738,542 | |
| | | |
| Packaging Coordinators Midco, Inc. | | | | | | | | |
| | | |
Term Loan, Maturing September 25, 2027(14) | | | | | 1,250 | | | | 1,242,188 | |
| |
| | | | $ | 38,566,394 | |
|
| Ecological Services and Equipment — 0.5% | |
| | | |
| EnergySolutions, LLC | | | | | | | | |
| | | |
Term Loan, 4.75%, (3 mo. USD LIBOR + 3.75%, Floor 1.00%), Maturing May 9, 2025 | | | | | 1,960 | | | $ | 1,927,093 | |
| | | |
| Patriot Container Corp. | | | | | | | | |
| | | |
Term Loan, 4.50%, (1 mo. USD LIBOR + 3.50%, Floor 1.00%), Maturing March 20, 2025 | | | | | 146 | | | | 143,142 | |
| | | |
| TruGreen Limited Partnership | | | | | | | | |
| | | |
Term Loan, 4.75%, (1 mo. USD LIBOR + 4.00%, Floor 0.75%), Maturing November 2, 2027 | | | | | 650 | | | | 649,187 | |
| | | |
| US Ecology Holdings, Inc. | | | | | | | | |
| | | |
Term Loan, 2.65%, (1 mo. USD LIBOR + 2.50%), Maturing November 1, 2026 | | | | | 273 | | | | 271,232 | |
| |
| | | | $ | 2,990,654 | |
|
| Electronics / Electrical — 25.8% | |
| | | |
| Allegro Microsystems, Inc. | | | | | | | | |
| | | |
Term Loan, 4.50%, (1 mo. USD LIBOR + 4.00%, Floor 0.50%), Maturing September 30, 2027 | | | | | 48 | | | $ | 48,017 | |
| | | |
| Applied Systems, Inc. | | | | | | | | |
| | | |
Term Loan - Second Lien, 8.00%, (3 mo. USD LIBOR + 7.00%, Floor 1.00%), Maturing September 19, 2025 | | | | | 2,700 | | | | 2,715,749 | |
| | | | |
| | 16 | | See Notes to Financial Statements. |
Eaton Vance
Floating-Rate Income Trust
November 30, 2020
Portfolio of Investments (Unaudited) — continued
| | | | | | | | | | |
| Borrower/Tranche Description | | | | Principal
Amount*
(000’s omitted) | | | Value | |
|
| Electronics / Electrical (continued) | |
| | | |
| Aptean, Inc. | | | | | | | | |
| | | |
Term Loan, 4.40%, (1 mo. USD LIBOR + 4.25%), Maturing April 23, 2026 | | | | | 765 | | | $ | 748,314 | |
| | | |
Term Loan - Second Lien, 8.65%, (1 mo. USD LIBOR + 8.50%), Maturing April 23, 2027 | | | | | 1,525 | | | | 1,569,378 | |
| | | |
| AQA Acquisition Holding, Inc. | | | | | | | | |
| | | |
Term Loan, Maturing November 19, 2027(14) | | | | | 975 | | | | 973,172 | |
| | | |
| Astra Acquisition Corp. | | | | | | | | |
| | | |
Term Loan, 6.50%, (1 mo. USD LIBOR + 5.50%, Floor 1.00%), Maturing March 1, 2027 | | | | | 871 | | | | 872,802 | |
| | | |
| Avast Software B.V. | | | | | | | | |
| | | |
Term Loan, 3.25%, (3 mo. USD LIBOR + 2.25%, Floor 1.00%), Maturing September 29, 2023 | | | | | 206 | | | | 205,355 | |
| | | |
| Banff Merger Sub, Inc. | | | | | | | | |
| | | |
Term Loan, 4.40%, (1 mo. USD LIBOR + 4.25%), Maturing October 2, 2025 | | | | | 4,138 | | | | 4,098,070 | |
| | | |
Term Loan, 4.75%, (3 mo. EURIBOR + 4.75%), Maturing October 2, 2025 | | EUR | | | 295 | | | | 353,288 | |
| | | |
| Barracuda Networks, Inc. | | | | | | | | |
| | | |
Term Loan - Second Lien, 7.50%, (3 mo. USD LIBOR + 6.75%, Floor 0.75%), Maturing October 30, 2028 | | | | | 450 | | | | 454,500 | |
| | | |
| Buzz Merger Sub, Ltd. | | | | | | | | |
| | | |
Term Loan, 2.90%, (1 mo. USD LIBOR + 2.75%), Maturing January 29, 2027 | | | | | 597 | | | | 590,284 | |
| | | |
Term Loan, 3.75%, (1 mo. USD LIBOR + 3.25%, Floor 0.50%), Maturing January 29, 2027 | | | | | 250 | | | | 249,688 | |
| | | |
| Cambium Learning Group, Inc. | | | | | | | | |
| | | |
Term Loan, 4.72%, (2 mo. USD LIBOR + 4.50%), Maturing December 18, 2025 | | | | | 975 | | | | 959,460 | |
| | | |
| Castle US Holding Corporation | | | | | | | | |
| | | |
Term Loan, 3.97%, (3 mo. USD LIBOR + 3.75%), Maturing January 29, 2027 | | | | | 1,077 | | | | 1,042,645 | |
|
| CDW, LLC | |
| | | |
Term Loan, 1.90%, (1 mo. USD LIBOR + 1.75%), Maturing October 13, 2026 | | | | | 1,336 | | | | 1,338,133 | |
| | | |
| Celestica, Inc. | | | | | | | | |
| | | |
Term Loan, 2.64%, (1 mo. USD LIBOR + 2.50%), Maturing June 27, 2025 | | | | | 263 | | | | 260,859 | |
| | | |
| CentralSquare Technologies, LLC | | | | | | | | |
| | | |
Term Loan, 3.90%, (1 mo. USD LIBOR + 3.75%), Maturing August 29, 2025 | | | | | 909 | | | | 843,492 | |
| | | |
| Cohu, Inc. | | | | | | | | |
| | | |
Term Loan, 3.15%, (1 mo. USD LIBOR + 3.00%), Maturing October 1, 2025 | | | | | 808 | | | | 796,271 | |
| | | |
| CommScope, Inc. | | | | | | | | |
| | | |
Term Loan, 3.40%, (1 mo. USD LIBOR + 3.25%), Maturing April 6, 2026 | | | | | 1,832 | | | | 1,805,335 | |
| | | | | | | | | | |
| Borrower/Tranche Description | | | | Principal
Amount*
(000’s omitted) | | | Value | |
|
| Electronics / Electrical (continued) | |
| | | |
| Cornerstone OnDemand, Inc. | | | | | | | | |
| | | |
Term Loan, 4.40%, (1 mo. USD LIBOR + 4.25%), Maturing April 22, 2027 | | | | | 1,734 | | | $ | 1,735,531 | |
| | | |
| CPI International, Inc. | | | | | | | | |
| | | |
Term Loan, 4.50%, (1 mo. USD LIBOR + 3.50%, Floor 1.00%), Maturing July 26, 2024 | | | | | 660 | | | | 647,081 | |
| | | |
| E2open, LLC | | | | | | | | |
| | | |
Term Loan, Maturing October 29, 2027(14) | | | | | 975 | | | | 969,516 | |
| | | |
| ECI Macola Max Holdings, LLC | | | | | | | | |
| | | |
Term Loan, 4.50%, (3 mo. USD LIBOR + 3.75%, Floor 0.75%), Maturing November 9, 2027 | | | | | 1,225 | | | | 1,216,769 | |
| | | |
| Electro Rent Corporation | | | | | | | | |
| | | |
Term Loan, 6.00%, (3 mo. USD LIBOR + 5.00%, Floor 1.00%), Maturing January 31, 2024 | | | | | 1,745 | | | | 1,738,607 | |
| | | |
| Epicor Software Corporation | | | | | | | | |
| | | |
Term Loan, 5.25%, (1 mo. USD LIBOR + 4.25%, Floor 1.00%), Maturing July 30, 2027 | | | | | 5,157 | | | | 5,169,915 | |
| | | |
Term Loan - Second Lien, 8.75%, (1 mo. USD LIBOR + 7.75%, Floor 1.00%), Maturing July 31, 2028 | | | | | 925 | | | | 957,375 | |
| | | |
| EXC Holdings III Corp. | | | | | | | | |
| | | |
Term Loan, 4.50%, (3 mo. USD LIBOR + 3.50%, Floor 1.00%), Maturing December 2, 2024 | | | | | 1,655 | | | | 1,636,065 | |
| | | |
| Finastra USA, Inc. | | | | | | | | |
| | | |
Term Loan, 4.50%, (6 mo. USD LIBOR + 3.50%, Floor 1.00%), Maturing June 13, 2024 | | | | | 5,724 | | | | 5,559,023 | |
| | | |
| Fiserv Investment Solutions, Inc. | | | | | | | | |
| | | |
Term Loan, 4.97%, (3 mo. USD LIBOR + 4.75%), Maturing February 18, 2027 | | | | | 599 | | | | 597,752 | |
| | | |
| GlobalLogic Holdings, Inc. | | | | | | | | |
| | | |
Term Loan, 2.90%, (1 mo. USD LIBOR + 2.75%), Maturing August 1, 2025 | | | | | 451 | | | | 445,211 | |
| | | |
Term Loan, 4.50%, (1 mo. USD LIBOR + 3.75%, Floor 0.75%), Maturing September 14, 2027 | | | | | 825 | | | | 826,031 | |
| | | |
| Go Daddy Operating Company, LLC | | | | | | | | |
| | | |
Term Loan, 2.65%, (1 mo. USD LIBOR + 2.50%), Maturing August 10, 2027 | | | | | 1,222 | | | | 1,217,482 | |
| | | |
| Hyland Software, Inc. | | | | | | | | |
| | | |
Term Loan, 4.25%, (1 mo. USD LIBOR + 3.50%, Floor 0.75%), Maturing July 1, 2024 | | | | | 6,462 | | | | 6,450,186 | |
| | | |
Term Loan - Second Lien, 7.75%, (1 mo. USD LIBOR + 7.00%, Floor 0.75%), Maturing July 7, 2025 | | | | | 3,806 | | | | 3,829,788 | |
| | | |
| Imperva, Inc. | | | | | | | | |
| | | |
Term Loan, 5.00%, (3 mo. USD LIBOR + 4.00%, Floor 1.00%), Maturing January 12, 2026 | | | | | 650 | | | | 645,938 | |
| | | |
| Imprivata, Inc. | | | | | | | | |
| | | |
Term Loan, Maturing November 24, 2027(14) | | | | | 1,300 | | | | 1,295,125 | |
| | | | |
| | 17 | | See Notes to Financial Statements. |
Eaton Vance
Floating-Rate Income Trust
November 30, 2020
Portfolio of Investments (Unaudited) — continued
| | | | | | | | | | |
| Borrower/Tranche Description | | | | Principal
Amount*
(000’s omitted) | | | Value | |
|
| Electronics / Electrical (continued) | |
| | | |
| Infoblox, Inc. | | | | | | | | |
| | | |
Term Loan, 6.75%, (USD Prime + 3.50%), Maturing November 7, 2023 | | | | | 1,534 | | | $ | 1,534,390 | |
| | | |
Term Loan, Maturing October 7,
2027(14) | | | | | 1,575 | | | | 1,567,125 | |
| | | |
Term Loan - Second Lien, Maturing October 6, 2028(14) | | | | | 2,250 | | | | 2,238,750 | |
| | | |
| Informatica, LLC | | | | | | | | |
| | | |
Term Loan, 3.25%, (3 mo. EURIBOR + 3.25%), Maturing February 25, 2027 | | EUR | | | 299 | | | | 353,306 | |
| | | |
Term Loan, 3.40%, (1 mo. USD LIBOR + 3.25%), Maturing February 25, 2027 | | | | | 6,443 | | | | 6,350,012 | |
| | | |
Term Loan - Second Lien, 7.13%, Maturing February 25, 2025(15) | | | | | 550 | | | | 561,000 | |
| | | |
| Ivanti Software, Inc. | | | | | | | | |
| | | |
Term Loan, Maturing November 20, 2027(14) | | | | | 1,470 | | | | 1,458,225 | |
| | | |
Term Loan, Maturing November 22, 2027(14) | | | | | 564 | | | | 558,986 | |
| | | |
Term Loan, Maturing November 22, 2027(14) | | | | | 841 | | | | 834,429 | |
| | | |
| LogMeIn, Inc. | | | | | | | | |
| | | |
Term Loan, 4.89%, (1 mo. USD LIBOR + 4.75%), Maturing August 31, 2027 | | | | | 1,625 | | | | 1,609,004 | |
| | | |
| MA FinanceCo., LLC | | | | | | | | |
| | | |
Term Loan, 2.65%, (1 mo. USD LIBOR + 2.50%), Maturing June 21, 2024 | | | | | 506 | | | | 493,185 | |
| | | |
Term Loan, 4.50%, (3 mo. EURIBOR + 4.50%), Maturing June 5, 2025 | | EUR | | | 745 | | | | 895,159 | |
| | | |
Term Loan, 5.25%, (3 mo. USD LIBOR + 4.25%, Floor 1.00%), Maturing June 5, 2025 | | | | | 1,888 | | | | 1,895,206 | |
| | | |
| MACOM Technology Solutions Holdings, Inc. | | | | | | | | |
| | | |
Term Loan, 2.40%, (1 mo. USD LIBOR + 2.25%), Maturing May 17, 2024 | | | | | 1,264 | | | | 1,234,207 | |
| | | |
| Marcel LUX IV S.a.r.l. | | | | | | | | |
| | | |
Term Loan, Maturing September 22, 2027(14) | | | | | 500 | | | | 498,750 | |
| | | |
| MaxLinear, Inc. | | | | | | | | |
| | | |
Term Loan, 4.40%, (1 mo. USD LIBOR + 4.25%), Maturing July 31, 2023 | | | | | 1,375 | | | | 1,373,281 | |
| | | |
| Milano Acquisition Corp. | | | | | | | | |
| | | |
Term Loan, 4.75%, (3 mo. USD LIBOR + 4.00%, Floor 0.75%), Maturing October 1, 2027 | | | | | 3,100 | | | | 3,079,332 | |
| | | |
| Mirion Technologies, Inc. | | | | | | | | |
| | | |
Term Loan, 4.27%, (6 mo. USD LIBOR + 4.00%), Maturing March 6, 2026 | | | | | 1,368 | | | | 1,362,741 | |
| | | |
| MKS Instruments, Inc. | | | | | | | | |
| | | |
Term Loan, 1.90%, (1 mo. USD LIBOR + 1.75%), Maturing February 2, 2026 | | | | | 330 | | | | 327,273 | |
| | | |
| MTS Systems Corporation | | | | | | | | |
| | | |
Term Loan, 4.00%, (1 mo. USD LIBOR + 3.25%, Floor 0.75%), Maturing July 5, 2023 | | | | | 524 | | | | 522,516 | |
| | | | | | | | | | |
| Borrower/Tranche Description | | | | Principal
Amount*
(000’s omitted) | | | Value | |
|
| Electronics / Electrical (continued) | |
| | | |
| NCR Corporation | | | | | | | | |
| | | |
Term Loan, 2.65%, (1 mo. USD LIBOR + 2.50%), Maturing August 28, 2026 | | | | | 1,561 | | | $ | 1,543,180 | |
| | | |
| Recorded Books, Inc. | | | | | | | | |
| | | |
Term Loan, 4.40%, (1 mo. USD LIBOR + 4.25%), Maturing August 29, 2025 | | | | | 873 | | | | 855,245 | |
| | | |
Term Loan, 4.75%, (1 mo. USD LIBOR + 4.25%, Floor 0.50%), Maturing August 29, 2025 | | | | | 1,650 | | | | 1,631,438 | |
| | | |
| Redstone Buyer, LLC | | | | | | | | |
| | | |
Term Loan, 6.00%, (2 mo. USD LIBOR + 5.00%, Floor 1.00%), Maturing September 1, 2027 | | | | | 2,845 | | | | 2,843,222 | |
| | | |
| Refinitiv US Holdings, Inc. | | | | | | | | |
| | | |
Term Loan, 3.40%, (1 mo. USD LIBOR + 3.25%), Maturing October 1, 2025 | | | | | 1,675 | | | | 1,665,804 | |
| | | |
| Renaissance Holding Corp. | | | | | | | | |
| | | |
Term Loan - Second Lien, 7.15%, (1 mo. USD LIBOR + 7.00%), Maturing May 29, 2026 | | | | | 200 | | | | 195,333 | |
| | | |
| Seattle Spinco, Inc. | | | | | | | | |
| | | |
Term Loan, 2.65%, (1 mo. USD LIBOR + 2.50%), Maturing June 21, 2024 | | | | | 3,415 | | | | 3,330,599 | |
| | | |
| SkillSoft Corporation | | | | | | | | |
| | | |
Term Loan, 8.50%, (1 mo. USD LIBOR + 7.50%, Floor 1.00%), Maturing December 27, 2024 | | | | | 452 | | | | 455,040 | |
| | | |
Term Loan - Second Lien, 8.50%, (1 mo. USD LIBOR + 7.50%, Floor 1.00%), Maturing April 27, 2025 | | | | | 1,492 | | | | 1,484,792 | |
| | | |
| SolarWinds Holdings, Inc. | | | | | | | | |
| | | |
Term Loan, 2.90%, (1 mo. USD LIBOR + 2.75%), Maturing February 5, 2024 | | | | | 3,411 | | | | 3,373,504 | |
| | | |
| Solera, LLC | | | | | | | | |
| | | |
Term Loan, 2.90%, (1 mo. USD LIBOR + 2.75%), Maturing March 3, 2023 | | | | | 2,787 | | | | 2,754,728 | |
| | | |
| Sophia L.P. | | | | | | | | |
| | | |
Term Loan, 4.50%, (3 mo. USD LIBOR + 3.75%, Floor 0.75%), Maturing October 7, 2027 | | | | | 450 | | | | 447,656 | |
|
| Sparta Systems, Inc. | |
| | | |
Term Loan, 4.50%, (3 mo. USD LIBOR + 3.50%, Floor 1.00%), Maturing August 21, 2024 | | | | | 2,400 | | | | 2,286,067 | |
| | | |
| SS&C Technologies Holdings Europe S.a.r.l. | | | | | | | | |
| | | |
Term Loan, 1.90%, (1 mo. USD LIBOR + 1.75%), Maturing April 16, 2025 | | | | | 702 | | | | 692,639 | |
| | | |
| SS&C Technologies, Inc. | | | | | | | | |
| | | |
Term Loan, 1.90%, (1 mo. USD LIBOR + 1.75%), Maturing April 16, 2025 | | | | | 926 | | | | 914,534 | |
| | | |
| STG-Fairway Holdings, LLC | | | | | | | | |
| | | |
Term Loan, 3.40%, (1 mo. USD LIBOR + 3.25%), Maturing January 31, 2027 | | | | | 3,446 | | | | 3,371,404 | |
| | | | |
| | 18 | | See Notes to Financial Statements. |
Eaton Vance
Floating-Rate Income Trust
November 30, 2020
Portfolio of Investments (Unaudited) — continued
| | | | | | | | | | |
| Borrower/Tranche Description | | | | Principal
Amount*
(000’s omitted) | | | Value | |
|
| Electronics / Electrical (continued) | |
| | | |
| SurveyMonkey, Inc. | | | | | | | | |
| | | |
Term Loan, 3.85%, (1 week USD LIBOR + 3.75%), Maturing October 10, 2025 | | | | | 1,042 | | | $ | 1,029,041 | |
| | | |
| Switch, Ltd. | | | | | | | | |
| | | |
Term Loan, 2.40%, (1 mo. USD LIBOR + 2.25%), Maturing June 27, 2024 | | | | | 183 | | | | 183,333 | |
| | | |
| Symplr Software, Inc. | | | | | | | | |
| | | |
Term Loan, Maturing November 23, 2027(14) | | | | | 875 | | | | 866,250 | |
| | | |
| Syncsort Incorporated | | | | | | | | |
| | | |
Term Loan, 6.48%, (3 mo. USD LIBOR + 6.25%), Maturing August 16, 2024 | | | | | 2,547 | | | | 2,508,573 | |
| | | |
| Tech Data Corporation | | | | | | | | |
| | | |
Term Loan, 3.65%, (1 mo. USD LIBOR + 3.50%), Maturing June 30, 2025 | | | | | 1,200 | | | | 1,202,063 | |
| | | |
| Tibco Software, Inc. | | | | | | | | |
| | | |
Term Loan, 3.90%, (1 mo. USD LIBOR + 3.75%), Maturing June 30, 2026 | | | | | 5,346 | | | | 5,251,131 | |
| | | |
Term Loan - Second Lien, 7.40%, (1 mo. USD LIBOR + 7.25%), Maturing March 3, 2028 | | | | | 1,350 | | | | 1,362,656 | |
| | | |
| TTM Technologies, Inc. | | | | | | | | |
| | | |
Term Loan, 2.65%, (1 mo. USD LIBOR + 2.50%), Maturing September 28, 2024 | | | | | 150 | | | | 148,312 | |
| | | |
| Uber Technologies, Inc. | | | | | | | | |
| | | |
Term Loan, 3.65%, (1 mo. USD LIBOR + 3.50%), Maturing July 13, 2023 | | | | | 4,228 | | | | 4,214,837 | |
| | | |
Term Loan, 5.00%, (1 mo. USD LIBOR + 4.00%, Floor 1.00%), Maturing April 4, 2025 | | | | | 2,717 | | | | 2,722,058 | |
| | | |
| Ultimate Software Group, Inc. (The) | | | | | | | | |
| | | |
Term Loan, 3.90%, (1 mo. USD LIBOR + 3.75%), Maturing May 4, 2026 | | | | | 1,757 | | | | 1,749,362 | |
| | | |
Term Loan, 4.75%, (3 mo. USD LIBOR + 4.00%, Floor 0.75%), Maturing May 4, 2026 | | | | | 4,275 | | | | 4,288,624 | |
| | | |
Term Loan - Second Lien, 7.50%, (3 mo. USD LIBOR + 6.75%, Floor 0.75%), Maturing May 3, 2027 | | | | | 275 | | | | 281,531 | |
| | | |
| Ultra Clean Holdings, Inc. | | | | | | | | |
| | | |
Term Loan, 4.65%, (1 mo. USD LIBOR + 4.50%), Maturing August 27, 2025 | | | | | 775 | | | | 775,268 | |
| | | |
| Valkyr Purchaser, LLC | | | | | | | | |
| | | |
Term Loan, 4.75%, (3 mo. USD LIBOR + 4.00%, Floor 0.75%), Maturing October 29, 2027 | | | | | 800 | | | | 794,000 | |
| | | |
| Verifone Systems, Inc. | | | | | | | | |
| | | |
Term Loan, 4.22%, (3 mo. USD LIBOR + 4.00%), Maturing August 20, 2025 | | | | | 1,251 | | | | 1,190,586 | |
| | | |
| Veritas US, Inc. | | | | | | | | |
| | | |
Term Loan, 6.50%, (3 mo. USD LIBOR + 5.50%, Floor 1.00%), Maturing September 1, 2025 | | | | | 2,750 | | | | 2,720,781 | |
| | | |
Term Loan, Maturing September 1, 2025(14) | | EUR | | | 373 | | | | 446,512 | |
| | | | | | | | | | |
| Borrower/Tranche Description | | | | Principal
Amount*
(000’s omitted) | | | Value | |
|
| Electronics / Electrical (continued) | |
| | | |
| VS Buyer, LLC | | | | | | | | |
| | | |
Term Loan, 3.40%, (1 mo. USD LIBOR + 3.25%), Maturing February 28, 2027 | | | | | 1,244 | | | $ | 1,232,867 | |
| | | |
| Vungle, Inc. | | | | | | | | |
| | | |
Term Loan, 5.65%, (1 mo. USD LIBOR + 5.50%), Maturing September 30, 2026 | | | | | 718 | | | | 718,647 | |
| | | |
| Western Digital Corporation | | | | | | | | |
| | | |
Term Loan, 1.90%, (1 mo. USD LIBOR + 1.75%), Maturing April 29, 2023 | | | | | 966 | | | | 964,626 | |
| |
| | | | $ | 146,105,327 | |
| | |
| Equipment Leasing — 0.7% | | | | | | |
| | | |
| Avolon TLB Borrower 1 (US), LLC | | | | | | | | |
| | | |
Term Loan, Maturing December 31, 2027(14) | | | | | 2,025 | | | $ | 2,017,827 | |
| | | |
| Boels Topholding B.V. | | | | | | | | |
| | | |
Term Loan, 4.00%, (3 mo. EURIBOR + 4.00%), Maturing February 6, 2027 | | EUR | | | 600 | | | | 717,947 | |
| | | |
| Fly Funding II S.a.r.l. | | | | | | | | |
| | | |
Term Loan, 6.24%, (3 mo. USD LIBOR + 6.00%), Maturing October 8, 2025 | | | | | 1,325 | | | | 1,281,938 | |
| |
| | | | $ | 4,017,712 | |
| | |
| Financial Intermediaries — 3.7% | | | | | | |
| | | |
| Apollo Commercial Real Estate Finance, Inc. | | | | | | | | |
| | | |
Term Loan, 2.90%, (1 mo. USD LIBOR + 2.75%), Maturing May 15, 2026 | | | | | 469 | | | $ | 447,955 | |
| | | |
| Aretec Group, Inc. | | | | | | | | |
| | | |
Term Loan, 4.40%, (1 mo. USD LIBOR + 4.25%), Maturing October 1, 2025 | | | | | 5,075 | | | | 4,863,613 | |
| | | |
| Citco Funding, LLC | | | | | | | | |
| | | |
Term Loan, 2.77%, (6 mo. USD LIBOR + 2.50%), Maturing September 28, 2023 | | | | | 2,777 | | | | 2,700,695 | |
| | | |
| Claros Mortgage Trust, Inc. | | | | | | | | |
| | | |
Term Loan, 3.38%, (1 mo. USD LIBOR + 3.25%), Maturing August 9, 2026 | | | | | 617 | | | | 606,728 | |
| | | |
| Ditech Holding Corporation | | | | | | | | |
| | | |
Term Loan, 0.00%, Maturing June 30, 2022(16) | | | | | 2,592 | | | | 822,957 | |
| | | |
| EIG Management Company, LLC | | | | | | | | |
| | | |
Term Loan, 4.50%, (1 mo. USD LIBOR + 3.75%, Floor 0.75%), Maturing February 22, 2025 | | | | | 268 | | | | 267,455 | |
| | | |
| Evergood 4 ApS | | | | | | | | |
| | | |
Term Loan, 3.75%, (3 mo. EURIBOR + 3.75%), Maturing February 6, 2025 | | EUR | | | 750 | | | | 896,455 | |
| | | |
| Focus Financial Partners, LLC | | | | | | | | |
| | | |
Term Loan, 2.15%, (1 mo. USD LIBOR + 2.00%), Maturing July 3, 2024 | | | | | 3,041 | | | | 2,994,354 | |
| | | | |
| | 19 | | See Notes to Financial Statements. |
Eaton Vance
Floating-Rate Income Trust
November 30, 2020
Portfolio of Investments (Unaudited) — continued
| | | | | | | | | | |
| Borrower/Tranche Description | | | | Principal
Amount*
(000’s omitted) | | | Value | |
| | |
| Financial Intermediaries (continued) | | | | | | |
| | | |
| Franklin Square Holdings L.P. | | | | | | | | |
| | | |
Term Loan, 2.44%, (1 mo. USD LIBOR + 2.25%), Maturing August 1, 2025 | | | | | 563 | | | $ | 552,229 | |
| | | |
| Greenhill & Co., Inc. | | | | | | | | |
| | | |
Term Loan, 3.39%, (1 mo. USD LIBOR + 3.25%), Maturing April 12, 2024 | | | | | 1,087 | | | | 1,076,006 | |
| | | |
| GreenSky Holdings, LLC | | | | | | | | |
| | | |
Term Loan, 3.44%, (1 mo. USD LIBOR + 3.25%), Maturing March 31, 2025 | | | | | 1,463 | | | | 1,418,625 | |
| | | |
Term Loan, 5.50%, (1 mo. USD LIBOR + 4.50%, Floor 1.00%), Maturing March 29, 2025 | | | | | 499 | | | | 490,022 | |
| | | |
| Harbourvest Partners, LLC | | | | | | | | |
| | | |
Term Loan, 2.39%, (1 mo. USD LIBOR + 2.25%), Maturing March 3, 2025 | | | | | 27 | | | | 26,567 | |
| | | |
| LPL Holdings, Inc. | | | | | | | | |
| | | |
Term Loan, 1.89%, (1 mo. USD LIBOR + 1.75%), Maturing November 12, 2026 | | | | | 1,489 | | | | 1,467,349 | |
| | | |
| Starwood Property Trust, Inc. | | | | | | | | |
| | | |
Term Loan, 2.65%, (1 mo. USD LIBOR + 2.50%), Maturing July 27, 2026 | | | | | 545 | | | | 534,971 | |
| | | |
| Victory Capital Holdings, Inc. | | | | | | | | |
| | | |
Term Loan, 2.73%, (3 mo. USD LIBOR + 2.50%), Maturing July 1, 2026 | | | | | 1,160 | | | | 1,148,806 | |
| | | |
| Virtus Investment Partners, Inc. | | | | | | | | |
| | | |
Term Loan, 3.00%, (3 mo. USD LIBOR + 2.25%, Floor 0.75%), Maturing June 1, 2024 | | | | | 441 | | | | 440,226 | |
| |
| | | | $ | 20,755,013 | |
| | |
| Food Products — 3.9% | | | | | | |
| | | |
| Alphabet Holding Company, Inc. | | | | | | | | |
| | | |
Term Loan, 3.65%, (1 mo. USD LIBOR + 3.50%), Maturing September 26, 2024 | | | | | 2,522 | | | $ | 2,474,037 | |
| | | |
| Atkins Nutritionals Holdings II, Inc. | | | | | | | | |
| | | |
Term Loan, 4.75%, (1 mo. USD LIBOR + 3.75%, Floor 1.00%), Maturing July 7, 2024 | | | | | 355 | | | | 355,953 | |
|
| B&G Foods, Inc. | |
| | | |
Term Loan, 2.65%, (1 mo. USD LIBOR + 2.50%), Maturing October 10, 2026 | | | | | 227 | | | | 226,773 | |
| | | |
| Badger Buyer Corp. | | | | | | | | |
| | | |
Term Loan, 4.50%, (1 mo. USD LIBOR + 3.50%, Floor 1.00%), Maturing September 30, 2024 | | | | | 364 | | | | 345,108 | |
| | | |
| CHG PPC Parent, LLC | | | | | | | | |
| | | |
Term Loan, 2.90%, (1 mo. USD LIBOR + 2.75%), Maturing March 31, 2025 | | | | | 513 | | | | 505,169 | |
| | | |
Term Loan, 3.50%, (1 mo. EURIBOR + 3.50%), Maturing March 31, 2025 | | EUR | | | 3,125 | | | | 3,690,381 | |
| | | | | | | | | | |
| Borrower/Tranche Description | | | | Principal
Amount*
(000’s omitted) | | | Value | |
| | |
| Food Products (continued) | | | | | | |
| | | |
| Froneri International, Ltd. | | | | | | | | |
| | | |
Term Loan, 2.40%, (1 mo. USD LIBOR + 2.25%), Maturing January 31, 2027 | | | | | 2,195 | | | $ | 2,146,324 | |
| | | |
Term Loan, 2.63%, (1 mo. EURIBOR + 2.63%), Maturing January 31, 2027 | | EUR | | | 1,300 | | | | 1,533,083 | |
| | | |
| H Food Holdings, LLC | | | | | | | | |
| | | |
Term Loan, 3.83%, (1 mo. USD LIBOR + 3.69%), Maturing May 23, 2025 | | | | | 1,740 | | | | 1,709,163 | |
| | | |
Term Loan, 4.15%, (1 mo. USD LIBOR + 4.00%), Maturing May 23, 2025 | | | | | 491 | | | | 484,342 | |
| | | |
| HLF Financing S.a.r.l. | | | | | | | | |
| | | |
Term Loan, 2.90%, (1 mo. USD LIBOR + 2.75%), Maturing August 18, 2025 | | | | | 805 | | | | 802,119 | |
| | | |
| Jacobs Douwe Egberts International B.V. | | | | | | | | |
| | | |
Term Loan, 2.19%, (1 mo. USD LIBOR + 2.00%), Maturing November 1, 2025 | | | | | 1,512 | | | | 1,507,838 | |
| | | |
Term Loan, 2.25%, (3 mo. EURIBOR + 1.75%, Floor 0.50%), Maturing November 1, 2025 | | EUR | | | 285 | | | | 341,483 | |
| | | |
| JBS USA Lux S.A. | | | | | | | | |
| | | |
Term Loan, 2.15%, (1 mo. USD LIBOR + 2.00%), Maturing May 1, 2026 | | | | | 4,383 | | | | 4,330,024 | |
| | | |
| Nomad Foods Europe Midco Limited | | | | | | | | |
| | | |
Term Loan, 2.39%, (1 mo. USD LIBOR + 2.25%), Maturing May 15, 2024 | | | | | 1,267 | | | | 1,249,405 | |
| | | |
| Shearer’s Foods, Inc. | | | | | | | | |
| | | |
Term Loan, 4.75%, (3 mo. USD LIBOR + 4.00%, Floor 0.75%), Maturing September 23, 2027 | | | | | 450 | | | | 449,672 | |
| |
| | | | $ | 22,150,874 | |
| | |
| Food Service — 2.1% | | | | | | |
| | | |
| 1011778 B.C. Unlimited Liability Company | | | | | | | | |
| | | |
Term Loan, 1.90%, (1 mo. USD LIBOR + 1.75%), Maturing November 19, 2026 | | | | | 4,888 | | | $ | 4,764,986 | |
| | | |
| IRB Holding Corp. | | | | | | | | |
| | | |
Term Loan, 3.75%, (USD LIBOR + 2.75%, Floor 1.00%), Maturing February 5, 2025(12) | | | | | 2,527 | | | | 2,488,024 | |
| | | |
Term Loan, Maturing November 18, 2027(14) | | | | | 2,100 | | | | 2,079,876 | |
| | | |
| Restaurant Technologies, Inc. | | | | | | | | |
| | | |
Term Loan, 3.40%, (1 mo. USD LIBOR + 3.25%), Maturing October 1, 2025 | | | | | 171 | | | | 166,358 | |
| | | |
| US Foods, Inc. | | | | | | | | |
| | | |
Term Loan, 1.90%, (1 mo. USD LIBOR + 1.75%), Maturing June 27, 2023 | | | | | 877 | | | | 852,979 | |
| | | |
Term Loan, 2.15%, (1 mo. USD LIBOR + 2.00%), Maturing September 13, 2026 | | | | | 1,757 | | | | 1,698,491 | |
| |
| | | | $ | 12,050,714 | |
| | | | |
| | 20 | | See Notes to Financial Statements. |
Eaton Vance
Floating-Rate Income Trust
November 30, 2020
Portfolio of Investments (Unaudited) — continued
| | | | | | | | | | |
| Borrower/Tranche Description | | | | Principal
Amount*
(000’s omitted) | | | Value | |
| | |
| Food / Drug Retailers — 0.3% | | | | | | |
| | | |
| BW Gas & Convenience Holdings, LLC | | | | | | | | |
| | | |
Term Loan, 6.40%, (1 mo. USD LIBOR + 6.25%), Maturing November 18, 2024 | | | | | 502 | | | $ | 503,085 | |
| | | |
| L1R HB Finance Limited | | | | | | | | |
| | | |
Term Loan, 4.25%, (6 mo. EURIBOR + 4.25%), Maturing August 9, 2024 | | EUR | | | 450 | | | | 475,796 | |
| | | |
Term Loan, 5.55%, (6 mo. GBP LIBOR + 5.25%), Maturing September 2, 2024 | | GBP | | | 450 | | | | 527,009 | |
| |
| | | | $ | 1,505,890 | |
| | |
| Forest Products — 0.2% | | | | | | |
| | | |
| Neenah, Inc. | | | | | | | | |
| | | |
Term Loan, 5.00%, (3 mo. USD LIBOR + 4.00%, Floor 1.00%), Maturing June 25, 2027 | | | | | 998 | | | $ | 1,021,191 | |
| |
| | | | $ | 1,021,191 | |
| | |
| Health Care — 13.0% | | | | | | |
| | | |
| Accelerated Health Systems, LLC | | | | | | | | |
| | | |
Term Loan, 3.65%, (1 mo. USD LIBOR + 3.50%), Maturing October 31, 2025 | | | | | 565 | | | $ | 550,461 | |
| | | |
| ADMI Corp. | | | | | | | | |
| | | |
Term Loan, 2.90%, (1 mo. USD LIBOR + 2.75%), Maturing April 30, 2025 | | | | | 1,809 | | | | 1,747,589 | |
| | | |
| Alliance Healthcare Services, Inc. | | | | | | | | |
| | | |
Term Loan, 5.50%, (1 mo. USD LIBOR + 4.50%, Floor 1.00%), Maturing October 24, 2023 | | | | | 794 | | | | 721,403 | |
| | | |
Term Loan - Second Lien, 12.00%, (1 mo. USD LIBOR + 11.00%, Floor 1.00%), Maturing April 24, 2024 | | | | | 530 | | | | 247,551 | |
| | | |
| athenahealth, Inc. | | | | | | | | |
| | | |
Term Loan, 4.75%, (3 mo. USD LIBOR + 4.50%), Maturing February 11, 2026 | | | | | 1,995 | | | | 1,987,145 | |
| | | |
| Avantor Funding, Inc. | | | | | | | | |
| | | |
Term Loan, 3.25%, (1 mo. USD LIBOR + 2.25%, Floor 1.00%), Maturing November 21, 2024 | | | | | 414 | | | | 413,788 | |
| | | |
Term Loan, 3.50%, (1 mo. USD LIBOR + 2.50%, Floor 1.00%), Maturing November 8, 2027 | | | | | 450 | | | | 450,656 | |
| | | |
| BioClinica Holding I L.P. | | | | | | | | |
| | | |
Term Loan, 5.25%, (1 mo. USD LIBOR + 4.25%, Floor 1.00%), Maturing October 20, 2023 | | | | | 1,494 | | | | 1,478,867 | |
| | | |
| BW NHHC Holdco, Inc. | | | | | | | | |
| | | |
Term Loan, 5.22%, (3 mo. USD LIBOR + 5.00%), Maturing May 15, 2025 | | | | | 2,511 | | | | 2,201,332 | |
| | | |
| CeramTec AcquiCo GmbH | | | | | | | | |
| | | |
Term Loan, 2.50%, (1 mo. EURIBOR + 2.50%), Maturing March 7, 2025 | | EUR | | | 903 | | | | 1,062,367 | |
| | | | | | | | | | |
| Borrower/Tranche Description | | | | Principal
Amount*
(000’s omitted) | | | Value | |
| | |
| Health Care (continued) | | | | | | |
| | | |
| Certara L.P. | | | | | | | | |
| | | |
Term Loan, 3.72%, (3 mo. USD LIBOR + 3.50%), Maturing August 15, 2024 | | | | | 967 | | | $ | 959,832 | |
| | | |
| Change Healthcare Holdings, LLC | | | | | | | | |
| | | |
Term Loan, 3.50%, (USD LIBOR + 2.50%, Floor 1.00%), Maturing March 1, 2024(12) | | | | | 5,041 | | | | 5,000,575 | |
| | | |
| CHG Healthcare Services, Inc. | | | | | | | | |
| | | |
Term Loan, 4.00%, (6 mo. USD LIBOR + 3.00%, Floor 1.00%), Maturing June 7, 2023 | | | | | 3,448 | | | | 3,406,083 | |
| | | |
| CryoLife, Inc. | | | | | | | | |
| | | |
Term Loan, 4.25%, (3 mo. USD LIBOR + 3.25%, Floor 1.00%), Maturing December 1, 2024 | | | | | 511 | | | | 507,371 | |
| | | |
| Dedalus Finance GmbH | | | | | | | | |
| | | |
Term Loan, 4.50%, (6 mo. EURIBOR + 4.50%), Maturing May 4, 2027 | | EUR | | | 825 | | | | 989,022 | |
| | | |
Term Loan, Maturing August 16, 2027(14) | | EUR | | | 1,200 | | | | 1,438,578 | |
| | | |
| Ensemble RCM, LLC | | | | | | | | |
| | | |
Term Loan, 3.96%, (3 mo. USD LIBOR + 3.75%), Maturing August 3, 2026 | | | | | 520 | | | | 518,126 | |
| | | |
| Envision Healthcare Corporation | | | | | | | | |
| | | |
Term Loan, 3.90%, (1 mo. USD LIBOR + 3.75%), Maturing October 10, 2025 | | | | | 6,073 | | | | 4,997,027 | |
| | | |
| Gentiva Health Services, Inc. | | | | | | | | |
| | | |
Term Loan, 3.44%, (1 mo. USD LIBOR + 3.25%), Maturing July 2, 2025 | | | | | 2,382 | | | | 2,372,540 | |
| | | |
| GHX Ultimate Parent Corporation | | | | | | | | |
| | | |
Term Loan, 4.25%, (3 mo. USD LIBOR + 3.25%, Floor 1.00%), Maturing June 28, 2024 | | | | | 970 | | | | 954,188 | |
| | | |
| Greatbatch, Ltd. | | | | | | | | |
| | | |
Term Loan, 3.50%, (1 mo. USD LIBOR + 2.50%, Floor 1.00%), Maturing October 27, 2022 | | | | | 1,502 | | | | 1,500,615 | |
|
| Hanger, Inc. | |
| | | |
Term Loan, 3.65%, (1 mo. USD LIBOR + 3.50%), Maturing March 6, 2025 | | | | | 1,121 | | | | 1,118,097 | |
| | | |
| Inovalon Holdings, Inc. | | | | | | | | |
| | | |
Term Loan, 3.19%, (1 mo. USD LIBOR + 3.00%), Maturing April 2, 2025 | | | | | 1,251 | | | | 1,235,113 | |
| | | |
| IQVIA, Inc. | | | | | | | | |
| | | |
Term Loan, 1.90%, (1 mo. USD LIBOR + 1.75%), Maturing March 7, 2024 | | | | | 551 | | | | 545,036 | |
| | | |
Term Loan, 1.90%, (1 mo. USD LIBOR + 1.75%), Maturing January 17, 2025 | | | | | 970 | | | | 960,199 | |
| | | |
| Medical Solutions, LLC | | | | | | | | |
| | | |
Term Loan, 5.50%, (6 mo. USD LIBOR + 4.50%, Floor 1.00%), Maturing June 14, 2024 | | | | | 1,620 | | | | 1,595,380 | |
| | | |
| MPH Acquisition Holdings, LLC | | | | | | | | |
| | | |
Term Loan, 3.75%, (3 mo. USD LIBOR + 2.75%, Floor 1.00%), Maturing June 7, 2023 | | | | | 2,862 | | | | 2,827,636 | |
| | | | |
| | 21 | | See Notes to Financial Statements. |
Eaton Vance
Floating-Rate Income Trust
November 30, 2020
Portfolio of Investments (Unaudited) — continued
| | | | | | | | | | |
| Borrower/Tranche Description | | | | Principal
Amount*
(000’s omitted) | | | Value | |
| | |
| Health Care (continued) | | | | | | |
| | | |
| National Mentor Holdings, Inc. | | | | | | | | |
| | | |
Term Loan, 4.40%, (1 mo. USD LIBOR + 4.25%), Maturing March 9, 2026 | | | | | 30 | | | $ | 29,976 | |
| | | |
Term Loan, 4.40%, (1 mo. USD LIBOR + 4.25%), Maturing March 9, 2026 | | | | | 661 | | | | 656,704 | |
| | |
Term Loan, Maturing March 9, 2026(14) | | | 10 | | | | 10,152 | |
| | |
Term Loan, Maturing March 9, 2026(14) | | | 265 | | | | 263,007 | |
| | | |
| Navicure, Inc. | | | | | | | | |
| | | |
Term Loan, 4.15%, (1 mo. USD LIBOR + 4.00%), Maturing October 22, 2026 | | | | | 1,020 | | | | 1,005,852 | |
| | |
Term Loan, 4.75%, (1 mo. USD LIBOR + 4.00%, Floor 0.75%), Maturing October 22, 2026 | | | 550 | | | | 549,313 | |
| | | |
| One Call Corporation | | | | | | | | |
| | | |
Term Loan, 6.25%, (3 mo. USD LIBOR + 5.25%, Floor 1.00%), Maturing November 25, 2022 | | | | | 2,056 | | | | 1,967,590 | |
| | | |
| Ortho-Clinical Diagnostics S.A. | | | | | | | | |
| | | |
Term Loan, 3.39%, (1 mo. USD LIBOR + 3.25%), Maturing June 30, 2025 | | | | | 4,900 | | | | 4,809,808 | |
| | | |
Term Loan, 3.50%, (3 mo. EURIBOR + 3.50%), Maturing June 30, 2025 | | EUR | | | 423 | | | | 495,599 | |
| | | |
| Parexel International Corporation | | | | | | | | |
| | | |
Term Loan, 2.90%, (1 mo. USD LIBOR + 2.75%), Maturing September 27, 2024 | | | | | 1,610 | | | | 1,578,151 | |
| | | |
| Phoenix Guarantor, Inc. | | | | | | | | |
| | | |
Term Loan, 3.40%, (1 mo. USD LIBOR + 3.25%), Maturing March 5, 2026 | | | | | 1,950 | | | | 1,927,226 | |
| | |
Term Loan, 4.25%, (1 mo. USD LIBOR + 3.75%, Floor 0.50%), Maturing March 5, 2026 | | | 625 | | | | 621,484 | |
| | | |
| Radiology Partners, Inc | | | | | | | | |
| | | |
Term Loan, 4.80%, (USD LIBOR + 4.25%), Maturing July 9, 2025(12) | | | | | 2,555 | | | | 2,471,273 | |
| | | |
| RadNet, Inc. | | | | | | | | |
| | | |
Term Loan, 4.75%, (3 mo. USD LIBOR + 3.75%, Floor 1.00%), Maturing June 30, 2023 | | | | | 1,584 | | | | 1,580,938 | |
| | | |
| Select Medical Corporation | | | | | | | | |
| | | |
Term Loan, 2.78%, (6 mo. USD LIBOR + 2.50%), Maturing March 6, 2025 | | | | | 2,709 | | | | 2,665,751 | |
| | | |
| Sound Inpatient Physicians | | | | | | | | |
| | | |
Term Loan, 2.90%, (1 mo. USD LIBOR + 2.75%), Maturing June 27, 2025 | | | | | 489 | | | | 483,313 | |
| | | |
| Surgery Center Holdings, Inc. | | | | | | | | |
| | | |
Term Loan, 4.25%, (1 mo. USD LIBOR + 3.25%, Floor 1.00%), Maturing September 3, 2024 | | | | | 3,430 | | | | 3,366,736 | |
| | | |
| Synlab Bondco Plc | | | | | | | | |
| | | |
Term Loan, Maturing July 31, 2027(14) | | EUR | | | 325 | | | | 386,707 | |
| | | |
| Team Health Holdings, Inc. | | | | | | | | |
| | | |
Term Loan, 3.75%, (1 mo. USD LIBOR + 2.75%, Floor 1.00%), Maturing February 6, 2024 | | | | | 1,992 | | | | 1,753,212 | |
| | | | | | | | | | |
| Borrower/Tranche Description | | | | Principal
Amount*
(000’s omitted) | | | Value | |
| | |
| Health Care (continued) | | | | | | |
| | | |
| Tecomet, Inc. | | | | | | | | |
| | | |
Term Loan, 4.50%, (3 mo. USD LIBOR + 3.50%, Floor 1.00%), Maturing May 1, 2024 | | | | | 1,120 | | | $ | 1,090,636 | |
| | | |
| U.S. Anesthesia Partners, Inc. | | | | | | | | |
| | | |
Term Loan, 4.00%, (6 mo. USD LIBOR + 3.00%, Floor 1.00%), Maturing June 23, 2024 | | | | | 2,623 | | | | 2,544,908 | |
| | | |
| Verscend Holding Corp. | | | | | | | | |
| | | |
Term Loan, 4.65%, (1 mo. USD LIBOR + 4.50%), Maturing August 27, 2025 | | | | | 799 | | | | 798,239 | |
|
| Viant Medical Holdings, Inc. | |
| | | |
Term Loan, 3.90%, (1 mo. USD LIBOR + 3.75%), Maturing July 2, 2025 | | | | | 490 | | | | 458,640 | |
| | | |
| Wink Holdco, Inc. | | | | | | | | |
| | | |
Term Loan, 4.00%, (1 mo. USD LIBOR + 3.00%, Floor 1.00%), Maturing December 2, 2024 | | | | | 486 | | | | 486,174 | |
| |
| | | | $ | 73,787,966 | |
| | |
| Home Furnishings — 0.8% | | | | | | |
| | | |
| Serta Simmons Bedding, LLC | | | | | | | | |
| | | |
Term Loan, 8.50%, (1 mo. USD LIBOR + 7.50%, Floor 1.00%), Maturing August 10, 2023 | | | | | 1,174 | | | $ | 1,182,863 | |
| | | |
Term Loan - Second Lien, 8.50%, (1 mo. USD LIBOR + 7.50%, Floor 1.00%), Maturing August 10, 2023 | | | | | 3,883 | | | | 3,517,338 | |
| |
| | | | $ | 4,700,201 | |
| | |
| Industrial Equipment — 7.5% | | | | | | |
| | | |
| AI Alpine AT Bidco GmbH | | | | | | | | |
| | | |
Term Loan, 3.23%, (USD LIBOR + 3.00%), Maturing October 31, 2025(12) | | | | | 246 | | | $ | 229,966 | |
| | | |
| Alliance Laundry Systems, LLC | | | | | | | | |
| | | |
Term Loan, 4.25%, (3 mo. USD LIBOR + 3.50%, Floor 0.75%), Maturing October 8, 2027 | | | | | 1,225 | | | | 1,224,107 | |
| | | |
| Altra Industrial Motion Corp. | | | | | | | | |
| | | |
Term Loan, 2.15%, (1 mo. USD LIBOR + 2.00%), Maturing October 1, 2025 | | | | | 633 | | | | 626,112 | |
| | | |
| Apex Tool Group, LLC | | | | | | | | |
| | | |
Term Loan, 6.50%, (1 mo. USD LIBOR + 5.25%, Floor 1.25%), Maturing August 1, 2024 | | | | | 2,971 | | | | 2,909,459 | |
| | | |
| CFS Brands, LLC | | | | | | | | |
| | | |
Term Loan, 4.00%, (6 mo. USD LIBOR + 3.00%, Floor 1.00%), Maturing March 20, 2025 | | | | | 269 | | | | 245,027 | |
| | | |
| CPM Holdings, Inc. | | | | | | | | |
| | | |
Term Loan, 3.90%, (1 mo. USD LIBOR + 3.75%), Maturing November 17, 2025 | | | | | 2,214 | | | | 2,121,065 | |
| | | | |
| | 22 | | See Notes to Financial Statements. |
Eaton Vance
Floating-Rate Income Trust
November 30, 2020
Portfolio of Investments (Unaudited) — continued
| | | | | | | | | | |
| Borrower/Tranche Description | | | | Principal
Amount*
(000’s omitted) | | | Value | |
| | |
| Industrial Equipment (continued) | | | | | | |
| | | |
| Delachaux Group S.A. | | | | | | | | |
| | | |
Term Loan, 3.75%, (6 mo. EURIBOR + 3.75%), Maturing April 16, 2026 | | EUR | | | 400 | | | $ | 475,152 | |
| | | |
Term Loan, 4.74%, (6 mo. USD LIBOR + 4.50%), Maturing April 16, 2026 | | | | | 470 | | | | 452,028 | |
| | | |
| DexKo Global, Inc. | | | | | | | | |
| | | |
Term Loan, 3.75%, (3 mo. EURIBOR + 3.75%), Maturing July 24, 2024 | | EUR | | | 322 | | | | 381,755 | |
| | | |
Term Loan, 3.75%, (3 mo. EURIBOR + 3.75%), Maturing July 24, 2024 | | EUR | | | 805 | | | | 954,392 | |
| | | |
Term Loan, 4.50%, (1 mo. USD LIBOR + 3.50%, Floor 1.00%), Maturing July 24, 2024 | | | | | 895 | | | | 883,072 | |
| | | |
| DXP Enterprises, Inc. | | | | | | | | |
| | | |
Term Loan, 5.75%, (1 mo. USD LIBOR + 4.75%, Floor 1.00%), Maturing August 29, 2023 | | | | | 479 | | | | 468,930 | |
| | | |
| Dynacast International, LLC | | | | | | | | |
| | | |
Term Loan, 4.25%, (3 mo. USD LIBOR + 3.25%, Floor 1.00%), Maturing January 28, 2022 | | | | | 1,288 | | | | 1,223,635 | |
| | | |
| Engineered Machinery Holdings, Inc. | | | | | | | | |
| | | |
Term Loan, 4.00%, (3 mo. USD LIBOR + 3.00%, Floor 1.00%), Maturing July 19, 2024 | | | | | 1,801 | | | | 1,775,448 | |
| | | |
Term Loan, 5.25%, (3 mo. USD LIBOR + 4.25%, Floor 1.00%), Maturing July 19, 2024 | | | | | 319 | | | | 318,381 | |
| | | |
| EWT Holdings III Corp. | | | | | | | | |
| | | |
Term Loan, 2.90%, (1 mo. USD LIBOR + 2.75%), Maturing December 20, 2024 | | | | | 1,870 | | | | 1,855,502 | |
| | | |
| Filtration Group Corporation | | | | | | | | |
| | | |
Term Loan, 3.15%, (1 mo. USD LIBOR + 3.00%), Maturing March 29, 2025 | | | | | 1,665 | | | | 1,633,899 | |
| | | |
Term Loan, 3.50%, (3 mo. EURIBOR + 3.50%), Maturing March 29, 2025 | | EUR | | | 390 | | | | 461,257 | |
| | | |
Term Loan, 4.50%, (1 mo. USD LIBOR + 3.75%, Floor 0.75%), Maturing March 29, 2025 | | | | | 400 | | | | 399,458 | |
| | | |
| Gardner Denver, Inc. | | | | | | | | |
| | | |
Term Loan, 1.90%, (1 mo. USD LIBOR + 1.75%), Maturing March 1, 2027 | | | | | 1,297 | | | | 1,276,588 | |
| | | |
Term Loan, 2.00%, (1 mo. EURIBOR + 2.00%), Maturing March 1, 2027 | | EUR | | | 421 | | | | 501,606 | |
| | | |
| Gates Global, LLC | | | | | | | | |
| | | |
Term Loan, 3.00%, (3 mo. EURIBOR + 3.00%), Maturing April 1, 2024 | | EUR | | | 917 | | | | 1,085,740 | |
| | | |
Term Loan, 3.75%, (1 mo. USD LIBOR + 2.75%, Floor 1.00%), Maturing April 1, 2024 | | | | | 4,557 | | | | 4,524,702 | |
| | | |
| Hayward Industries, Inc. | | | | | | | | |
| | | |
Term Loan, 3.65%, (1 mo. USD LIBOR + 3.50%), Maturing August 5, 2024 | | | | | 478 | | | | 470,496 | |
| | | |
Term Loan, 4.50%, (1 mo. USD LIBOR + 3.75%, Floor 0.75%), Maturing August 4, 2026 | | | | | 725 | | | | 713,219 | |
| | | | | | | | | | |
| Borrower/Tranche Description | | | | Principal
Amount*
(000’s omitted) | | | Value | |
| | |
| Industrial Equipment (continued) | | | | | | |
| | | |
| Ingersoll-Rand Services Company | | | | | | | | |
| | | |
Term Loan, 1.90%, (1 mo. USD LIBOR + 1.75%), Maturing March 1, 2027 | | | | | 1,418 | | | $ | 1,395,847 | |
| | | |
| LTI Holdings, Inc. | | | | | | | | |
| | | |
Term Loan, 3.65%, (1 mo. USD LIBOR + 3.50%), Maturing September 6, 2025 | | | | | 1,582 | | | | 1,504,936 | |
| | | |
Term Loan, 4.90%, (1 mo. USD LIBOR + 4.75%), Maturing July 24, 2026 | | | | | 198 | | | | 189,173 | |
| | | |
| Pro Mach Group, Inc. | | | | | | | | |
| | |
Term Loan, 3.50%, Maturing March 7, 2025(13) | | | 229 | | | | 237,134 | |
| | | |
Term Loan, 4.50%, (USD LIBOR + 3.50%, Floor 1.00%), Maturing March 7, 2025(12) | | | | | 694 | | | | 679,221 | |
| | | |
| Quimper AB | | | | | | | | |
| | | |
Term Loan, 4.00%, (3 mo. EURIBOR + 4.00%), Maturing February 13, 2026 | | EUR | | | 1,900 | | | | 2,278,634 | |
| | | |
| Robertshaw US Holding Corp. | | | | | | | | |
| | | |
Term Loan, 4.50%, (1 mo. USD LIBOR + 3.50%, Floor 1.00%), Maturing February 28, 2025 | | | | | 1,048 | | | | 984,910 | |
| | | |
| Thermon Industries, Inc. | | | | | | | | |
| | | |
Term Loan, 4.75%, (1 mo. USD LIBOR + 3.75%, Floor 1.00%), Maturing October 30, 2024 | | | | | 279 | | | | 277,904 | |
| | | |
| Titan Acquisition Limited | | | | | | | | |
| | | |
Term Loan, 3.36%, (3 mo. USD LIBOR + 3.00%), Maturing March 28, 2025 | | | | | 3,092 | | | | 2,984,375 | |
| | | |
| Vertical Midco GmbH | | | | | | | | |
| | | |
Term Loan, 4.57%, (6 mo. USD LIBOR + 4.25%), Maturing July 30, 2027 | | | | | 1,350 | | | | 1,348,523 | |
| | | |
| Welbilt, Inc. | | | | | | | | |
| | | |
Term Loan, 2.65%, (1 mo. USD LIBOR + 2.50%), Maturing October 23, 2025 | | | | | 3,484 | | | | 3,303,026 | |
| |
| | | | $ | 42,394,679 | |
| | |
| Insurance — 6.6% | | | | | | |
| | | |
| Alliant Holdings Intermediate, LLC | | | | | | | | |
| | | |
Term Loan, 3.40%, (1 mo. USD LIBOR + 3.25%), Maturing May 9, 2025 | | | | | 2,525 | | | $ | 2,468,656 | |
| | | |
Term Loan, 3.40%, (1 mo. USD LIBOR + 3.25%), Maturing May 9, 2025 | | | | | 469 | | | | 458,618 | |
| | | |
Term Loan, 4.25%, (1 mo. USD LIBOR + 3.75%, Floor 0.50%), Maturing October 8, 2027 | | | | | 475 | | | | 473,738 | |
| | | |
| AmWINS Group, Inc. | | | | | | | | |
| | | |
Term Loan, 3.75%, (1 mo. USD LIBOR + 2.75%, Floor 1.00%), Maturing January 25, 2024 | | | | | 5,273 | | | | 5,263,186 | |
| | | |
| AssuredPartners Capital, Inc. | | | | | | | | |
| | | |
Term Loan, 5.50%, (1 mo. USD LIBOR + 4.50%, Floor 1.00%), Maturing February 12, 2027 | | | | | 498 | | | | 498,495 | |
| | | | |
| | 23 | | See Notes to Financial Statements. |
Eaton Vance
Floating-Rate Income Trust
November 30, 2020
Portfolio of Investments (Unaudited) — continued
| | | | | | | | | | |
| Borrower/Tranche Description | | | | Principal
Amount*
(000’s omitted) | | | Value | |
| | |
| Insurance (continued) | | | | | | |
| | | |
| AssuredPartners, Inc. | | | | | | | | |
| | | |
Term Loan, 3.65%, (1 mo. USD LIBOR + 3.50%), Maturing February 12, 2027 | | | | | 1,489 | | | $ | 1,461,368 | |
| | | |
| Asurion, LLC | | | | | | | | |
| | | |
Term Loan, 3.15%, (1 mo. USD LIBOR + 3.00%), Maturing August 4, 2022 | | | | | 1,249 | | | | 1,245,257 | |
| | | |
Term Loan, 3.15%, (1 mo. USD LIBOR + 3.00%), Maturing November 3, 2023 | | | | | 2,264 | | | | 2,245,623 | |
| | | |
Term Loan - Second Lien, 6.65%, (1 mo. USD LIBOR + 6.50%), Maturing August 4, 2025 | | | | | 3,945 | | | | 3,980,471 | |
| | | |
| Financiere CEP S.A.S. | | | | | | | | |
| | | |
Term Loan, 4.75%, (3 mo. EURIBOR + 4.75%), Maturing June 3, 2027 | | EUR | | | 550 | | | | 661,644 | |
| | | |
| FrontDoor, Inc. | | | | | | | | |
| | | |
Term Loan, 2.69%, (1 mo. USD LIBOR + 2.50%), Maturing August 16, 2025 | | | | | 490 | | | | 487,550 | |
|
| Hub International Limited | |
| | | |
Term Loan, 2.96%, (3 mo. USD LIBOR + 2.75%), Maturing April 25, 2025 | | | | | 4,436 | | | | 4,335,021 | |
| | | |
Term Loan, 5.00%, (3 mo. USD LIBOR + 4.00%, Floor 1.00%), Maturing April 25, 2025 | | | | | 1,886 | | | | 1,891,643 | |
| | | |
| NFP Corp. | | | | | | | | |
| | | |
Term Loan, 3.40%, (1 mo. USD LIBOR + 3.25%), Maturing February 15, 2027 | | | | | 3,694 | | | | 3,600,428 | |
| | | |
| Ryan Specialty Group, LLC | | | | | | | | |
| | | |
Term Loan, 4.00%, (1 mo. USD LIBOR + 3.25%, Floor 0.75%), Maturing September 1, 2027 | | | | | 1,925 | | | | 1,921,791 | |
| | | |
| Sedgwick Claims Management Services, Inc. | | | | | | | | |
| | | |
Term Loan, 3.40%, (1 mo. USD LIBOR + 3.25%), Maturing December 31, 2025 | | | | | 1,253 | | | | 1,225,480 | |
| | | |
| USI, Inc. | | | | | | | | |
| | | |
Term Loan, 3.22%, (3 mo. USD LIBOR + 3.00%), Maturing May 16, 2024 | | | | | 3,596 | | | | 3,526,687 | |
| | | |
Term Loan, 4.22%, (3 mo. USD LIBOR + 4.00%), Maturing December 2, 2026 | | | | | 1,464 | | | | 1,460,827 | |
| |
| | | | $ | 37,206,483 | |
|
| Leisure Goods / Activities / Movies — 6.3% | |
| | | |
| Amer Sports Oyj | | | | | | | | |
| | | |
Term Loan, 4.50%, (6 mo. EURIBOR + 4.50%), Maturing March 30, 2026 | | EUR | | | 3,625 | | | $ | 4,134,905 | |
| | | |
| Ancestry.com Operations, Inc. | | | | | | | | |
| | | |
Term Loan, 4.15%, (1 mo. USD LIBOR + 4.00%), Maturing August 27, 2026 | | | | | 3,333 | | | | 3,333,444 | |
| | | |
| Bombardier Recreational Products, Inc. | | | | | | | | |
| | | |
Term Loan, 2.15%, (1 mo. USD LIBOR + 2.00%), Maturing May 24, 2027 | | | | | 4,694 | | | | 4,570,199 | |
| | | | | | | | | | |
| Borrower/Tranche Description | | | | Principal
Amount*
(000’s omitted) | | | Value | |
|
| Leisure Goods / Activities / Movies (continued) | |
| | | |
Bombardier Recreational Products, Inc.
(continued) | | | | | | | | |
| | | |
Term Loan, 6.00%, (3 mo. USD LIBOR + 5.00%, Floor 1.00%), Maturing May 24, 2027 | | | | | 698 | | | $ | 710,120 | |
| | | |
| Carnival Corporation | | | | | | | | |
| | | |
Term Loan, 8.50%, (1 mo. USD LIBOR + 7.50%, Floor 1.00%), Maturing June 30, 2025 | | | | | 1,397 | | | | 1,447,123 | |
| | | |
| ClubCorp Holdings, Inc. | | | | | | | | |
| | | |
Term Loan, 2.97%, (3 mo. USD LIBOR + 2.75%), Maturing September 18, 2024 | | | | | 2,387 | | | | 2,143,914 | |
| | | |
| Crown Finance US, Inc. | | | | | | | | |
| | | |
Term Loan, 2.63%, (6 mo. EURIBOR + 2.63%), Maturing February 28, 2025 | | EUR | | | 290 | | | | 271,693 | |
| | | |
Term Loan, 2.77%, (6 mo. USD LIBOR + 2.50%), Maturing February 28, 2025 | | | | | 1,761 | | | | 1,359,000 | |
| | | |
Term Loan, 3.02%, (6 mo. USD LIBOR + 2.75%), Maturing September 30, 2026 | | | | | 1,535 | | | | 1,171,015 | |
| | | |
| Delta 2 (LUX) S.a.r.l. | | | | | | | | |
| | | |
Term Loan, 3.50%, (1 mo. USD LIBOR + 2.50%, Floor 1.00%), Maturing February 1, 2024 | | | | | 1,530 | | | | 1,495,167 | |
| | | |
| Etraveli Holding AB | | | | | | | | |
| | | |
Term Loan, 4.50%, (6 mo. EURIBOR + 4.50%), Maturing August 2, 2024 | | EUR | | | 950 | | | | 1,014,221 | |
| | | |
| Lindblad Expeditions, Inc. | | | | | | | | |
| | | |
Term Loan, 5.50%, (1 mo. USD LIBOR + 4.75%, Floor 0.75%), 4.25% cash, 1.25% PIK, Maturing March 27, 2025 | | | | | 340 | | | | 319,807 | |
| | | |
Term Loan, 5.50%, (1 mo. USD LIBOR + 4.75%, Floor 0.75%), 4.25% cash, 1.25% PIK, Maturing March 27, 2025 | | | | | 1,361 | | | | 1,279,230 | |
| | | |
| Match Group, Inc. | | | | | | | | |
| | | |
Term Loan, 1.96%, (3 mo. USD LIBOR + 1.75%), Maturing February 13, 2027 | | | | | 775 | | | | 765,636 | |
| | | |
| Playtika Holding Corp. | | | | | | | | |
| | | |
Term Loan, 7.00%, (6 mo. USD LIBOR + 6.00%, Floor 1.00%), Maturing December 10, 2024 | | | | | 3,417 | | | | 3,439,297 | |
| | | |
| SeaWorld Parks & Entertainment, Inc. | | | | | | | | |
| | | |
Term Loan, 3.75%, (1 mo. USD LIBOR + 3.00%, Floor 0.75%), Maturing March 31, 2024 | | | | | 1,909 | | | | 1,829,621 | |
| | | |
| SRAM, LLC | | | | | | | | |
| | | |
Term Loan, 3.75%, (USD LIBOR + 2.75%, Floor 1.00%), Maturing March 15, 2024(12) | | | | | 1,116 | | | | 1,114,463 | |
|
| Steinway Musical Instruments, Inc. | |
| | | |
Term Loan, 4.75%, (1 mo. USD LIBOR + 3.75%, Floor 1.00%), Maturing February 14, 2025 | | | | | 514 | | | | 498,433 | |
| | | |
| Travel Leaders Group, LLC | | | | | | | | |
| | | |
Term Loan, 4.15%, (1 mo. USD LIBOR + 4.00%), Maturing January 25, 2024 | | | | | 1,726 | | | | 1,568,127 | |
| | | | |
| | 24 | | See Notes to Financial Statements. |
Eaton Vance
Floating-Rate Income Trust
November 30, 2020
Portfolio of Investments (Unaudited) — continued
| | | | | | | | | | |
| Borrower/Tranche Description | | | | Principal
Amount*
(000’s omitted) | | | Value | |
|
| Leisure Goods / Activities / Movies (continued) | |
| | | |
| UFC Holdings, LLC | | | | | | | | |
| | | |
Term Loan, 4.25%, (6 mo. USD LIBOR + 3.25%, Floor 1.00%), Maturing April 29, 2026 | | | | | 224 | | | $ | 222,193 | |
| | | |
Term Loan, 4.25%, (6 mo. USD LIBOR + 3.25%, Floor 1.00%), Maturing April 29, 2026 | | | | | 2,301 | | | | 2,283,575 | |
| | | |
| Vue International Bidco PLC | | | | | | | | |
| | | |
Term Loan, 4.75%, (6 mo. EURIBOR + 4.75%), Maturing July 3, 2026 | | EUR | | | 678 | | | | 707,063 | |
| |
| | | | $ | 35,678,246 | |
| | | |
| Lodging and Casinos — 3.6% | | | | | | | | |
| | | |
| Aristocrat Technologies, Inc. | | | | | | | | |
| | | |
Term Loan, 1.96%, (3 mo. USD LIBOR + 1.75%), Maturing October 19, 2024 | | | | | 1,040 | | | $ | 1,016,240 | |
| | | |
| Azelis Finance S.A. | | | | | | | | |
| | | |
Term Loan, 3.50%, (6 mo. EURIBOR + 3.50%), Maturing November 10, 2025 | | EUR | | | 2,000 | | | | 2,378,033 | |
| | | |
| Boyd Gaming Corporation | | | | | | | | |
| | | |
Term Loan, 2.35%, (1 week USD LIBOR + 2.25%), Maturing September 15, 2023 | | | | | 678 | | | | 669,765 | |
| | | |
| CityCenter Holdings, LLC | | | | | | | | |
| | | |
Term Loan, 3.00%, (1 mo. USD LIBOR + 2.25%, Floor 0.75%), Maturing April 18, 2024 | | | | | 2,761 | | | | 2,670,664 | |
| | | |
| Golden Nugget, Inc. | | | | | | | | |
| | | |
Term Loan, 3.25%, (2 mo. USD LIBOR + 2.50%, Floor 0.75%), Maturing October 4, 2023 | | | | | 4,968 | | | | 4,738,291 | |
| | | |
| GVC Holdings (Gibraltar) Limited | | | | | | | | |
| | | |
Term Loan, 3.25%, (3 mo. USD LIBOR + 2.25%, Floor 1.00%), Maturing March 29, 2024 | | | | | 1,170 | | | | 1,158,300 | |
| | | |
| GVC Holdings PLC | | | | | | | | |
| | | |
Term Loan, 2.50%, (3 mo. EURIBOR + 2.50%), Maturing March 29, 2024 | | EUR | | | 1,875 | | | | 2,234,917 | |
| | | |
| Playa Resorts Holding B.V. | | | | | | | | |
| | | |
Term Loan, 3.75%, (1 mo. USD LIBOR + 2.75%, Floor 1.00%), Maturing April 29, 2024 | | | | | 2,569 | | | | 2,365,001 | |
| | | |
| Sportradar Capital S.a.r.l. | | | | | | | | |
| | | |
Term Loan, Maturing October 27, 2027(14) | | EUR | | | 550 | | | | 658,528 | |
| | | |
| Stars Group Holdings B.V. (The) | | | | | | | | |
| | | |
Term Loan, 3.72%, (3 mo. USD LIBOR + 3.50%), Maturing July 10, 2025 | | | | | 1,783 | | | | 1,788,493 | |
| | | |
Term Loan, 3.75%, (3 mo. EURIBOR + 3.75%), Maturing July 10, 2025 | | EUR | | | 597 | | | | 716,426 | |
| |
| | | | $ | 20,394,658 | |
| | | | | | | | | | |
| Borrower/Tranche Description | | | | Principal
Amount*
(000’s omitted) | | | Value | |
| | | |
| Nonferrous Metals / Minerals — 0.5% | | | | | | | | |
| | | |
| American Consolidated Natural Resources, Inc. | | | | | | | | |
| | | |
Term Loan, 14.00%, (3 mo. USD LIBOR + 13.00%, Floor 1.00%), Maturing September 16, 2025 | | | | | 673 | | | $ | 605,900 | |
| | | |
| CD&R Hydra Buyer, Inc. | | | | | | | | |
| | | |
Term Loan, 7.50%, (0.00% cash, 7.50% PIK), Maturing August 15, 2021(3)(15) | | | | | 163 | | | | 130,106 | |
| | | |
| Noranda Aluminum Acquisition Corporation | | | | | | | | |
| | | |
Term Loan, 0.00%, Maturing February 28, 2021(16) | | | | | 942 | | | | 84,776 | |
| | | |
| Oxbow Carbon, LLC | | | | | | | | |
| | | |
Term Loan, 5.00%, (1 mo. USD LIBOR + 4.25%, Floor 0.75%), Maturing October 13, 2025 | | | | | 775 | | | | 773,062 | |
| | | |
| Rain Carbon GmbH | | | | | | | | |
| | | |
Term Loan, 3.00%, (3 mo. EURIBOR + 3.00%), Maturing January 16, 2025 | | EUR | | | 1,025 | | | | 1,176,822 | |
| |
| | | | $ | 2,770,666 | |
| | | |
| Oil and Gas — 4.1% | | | | | | | | |
| | | |
| Ameriforge Group, Inc. | | | | | | | | �� |
| | | |
Term Loan, 14.00%, (3 mo. USD LIBOR + 13.00%, Floor 1.00%), 9.00% cash, 5.00% PIK, Maturing June 8, 2022 | | | | | 767 | | | $ | 671,181 | |
| | | |
| Apergy Corporation | | | | | | | | |
| | | |
Term Loan, 2.69%, (1 mo. USD LIBOR + 2.50%), Maturing May 9, 2025 | | | | | 172 | | | | 168,396 | |
| | | |
Term Loan, 6.00%, (3 mo. USD LIBOR + 5.00%, Floor 1.00%), Maturing May 28, 2027 | | | | | 222 | | | | 224,687 | |
| | | |
| Blackstone CQP Holdco L.P. | | | | | | | | |
| | | |
Term Loan, 3.73%, (3 mo. USD LIBOR + 3.50%), Maturing September 30, 2024 | | | | | 1,037 | | | | 1,027,154 | |
| | | |
| Buckeye Partners L.P. | | | | | | | | |
| | | |
Term Loan, 2.90%, (1 mo. USD LIBOR + 2.75%), Maturing November 1, 2026 | | | | | 1,343 | | | | 1,332,127 | |
| | | |
| Centurion Pipeline Company, LLC | | | | | | | | |
| | | |
Term Loan, 4.15%, (1 mo. USD LIBOR + 4.00%), Maturing September 28, 2025 | | | | | 250 | | | | 247,188 | |
| | | |
Term Loan, 3.40%, (1 mo. USD LIBOR + 3.25%), Maturing September 29, 2025 | | | | | 270 | | | | 267,317 | |
| | | |
| CITGO Holding, Inc. | | | | | | | | |
| | | |
Term Loan, 8.00%, (6 mo. USD LIBOR + 7.00%, Floor 1.00%), Maturing August 1, 2023 | | | | | 2,093 | | | | 1,834,560 | |
| | | |
| CITGO Petroleum Corporation | | | | | | | | |
| | | |
Term Loan, 7.25%, (6 mo. USD LIBOR + 6.25%, Floor 1.00%), Maturing March 28, 2024 | | | | | 4,156 | | | | 3,984,714 | |
| | | | |
| | 25 | | See Notes to Financial Statements. |
Eaton Vance
Floating-Rate Income Trust
November 30, 2020
Portfolio of Investments (Unaudited) — continued
| | | | | | | | | | |
| Borrower/Tranche Description | | | | Principal
Amount*
(000’s omitted) | | | Value | |
| | | |
| Oil and Gas (continued) | | | | | | | | |
| | | |
| Delek US Holdings, Inc. | | | | | | | | |
| | | |
Term Loan, 2.40%, (1 mo. USD LIBOR + 2.25%), Maturing March 31, 2025 | | | | | 1,379 | | | $ | 1,297,389 | |
| | | |
Term Loan, 6.50%, (1 mo. USD LIBOR + 5.50%, Floor 1.00%), Maturing March 31, 2025 | | | | | 597 | | | | 588,791 | |
| | | |
| Fieldwood Energy, LLC | | | | | | | | |
| | | |
DIP Loan, 3.68%, (1 mo. USD LIBOR + 8.75%, Floor 1.00%), Maturing August 4, 2021(13) | | | | | 410 | | | | 408,906 | |
| | | |
Term Loan, 0.00%, Maturing April 11, 2022(16) | | | | | 2,775 | | | | 624,333 | |
| | | |
| Lealand Finance Company B.V. | | | | | | | | |
| | | |
Term Loan, 4.15%, (1 mo. USD LIBOR + 4.00%), 1.15% cash, 3.00% PIK, Maturing June 30, 2025 | | | | | 369 | | | | 251,548 | |
| | | |
| Matador Bidco S.a.r.l. | | | | | | | | |
| | | |
Term Loan, 4.90%, (1 mo. USD LIBOR + 4.75%), Maturing October 15, 2026 | | | | | 4,084 | | | | 4,002,785 | |
| | | |
| McDermott Technology Americas, Inc. | | | | | | | | |
| | | |
Term Loan, 3.15%, (1 mo. USD LIBOR + 3.00%), Maturing June 30, 2024 | | | | | 26 | | | | 22,310 | |
| | | |
| Prairie ECI Acquiror L.P. | | | | | | | | |
| | | |
Term Loan, 4.90%, (1 mo. USD LIBOR + 4.75%), Maturing March 11, 2026 | | | | | 2,871 | | | | 2,699,812 | |
| | | |
| PSC Industrial Holdings Corp. | | | | | | | | |
| | | |
Term Loan, 4.75%, (1 mo. USD LIBOR + 3.75%, Floor 1.00%), Maturing October 11, 2024 | | | | | 1,871 | | | | 1,800,660 | |
| | | |
| RDV Resources Properties, LLC | | | | | | | | |
| | | |
Term Loan, 15.50%, (1 mo. USD LIBOR + 14.50%, Floor 1.00%), Maturing March 29, 2024(3) | | | | | 509 | | | | 334,549 | |
| | | |
| Sunrise Oil & Gas Properties, LLC | | | | | | | | |
| | | |
Term Loan, 8.00%, (1 mo. USD LIBOR + 7.00%, Floor 1.00%), Maturing January 17, 2023 | | | | | 88 | | | | 79,235 | |
| | | |
Term Loan - Second Lien, 8.00%, (1 mo. USD LIBOR + 7.00%, Floor 1.00%), Maturing January 17, 2023 | | | | | 90 | | | | 70,581 | |
| | | |
Term Loan - Third Lien, 8.00%, (1 mo. USD LIBOR + 7.00%, Floor 1.00%), Maturing January 17, 2023 | | | | | 104 | | | | 52,457 | |
| | | |
| UGI Energy Services, LLC | | | | | | | | |
| | | |
Term Loan, 3.90%, (1 mo. USD LIBOR + 3.75%), Maturing August 13, 2026 | | | | | 1,086 | | | | 1,087,608 | |
| |
| | | | $ | 23,078,288 | |
| | | |
| Publishing — 1.2% | | | | | | | | |
| | | |
| Alchemy Copyrights, LLC | | | | | | | | |
| | | |
Term Loan, 4.00%, (1 mo. USD LIBOR + 3.25%, Floor 0.75%), Maturing August 16, 2027 | | | | | 525 | | | $ | 525,656 | |
| | | | | | | | | | |
| Borrower/Tranche Description | | | | Principal
Amount*
(000’s omitted) | | | Value | |
| | | |
| Publishing (continued) | | | | | | | | |
| | | |
| Ascend Learning, LLC | | | | | | | | |
| | | |
Term Loan, 4.00%, (1 mo. USD LIBOR + 3.00%, Floor 1.00%), Maturing July 12, 2024 | | | | | 1,188 | | | $ | 1,175,625 | |
| | | |
Term Loan, 4.75%, (1 mo. USD LIBOR + 3.75%, Floor 1.00%), Maturing July 12, 2024 | | | | | 425 | | | | 425,133 | |
| | | |
| Getty Images, Inc. | | | | | | | | |
| | | |
Term Loan, 4.69%, (1 mo. USD LIBOR + 4.50%), Maturing February 19, 2026 | | | | | 1,725 | | | | 1,670,533 | |
| | | |
| LSC Communications, Inc. | | | | | | | | |
| | | |
Term Loan, 0.00%, Maturing September 30, 2022(16) | | | | | 784 | | | | 128,373 | |
| | | |
| Nielsen Finance, LLC | | | | | | | | |
| | | |
Term Loan, 4.75%, (1 mo. USD LIBOR + 3.75%, Floor 1.00%), Maturing June 4, 2025 | | | | | 846 | | | | 849,345 | |
| | | |
| ProQuest, LLC | | | | | | | | |
| | | |
Term Loan, 3.65%, (1 mo. USD LIBOR + 3.50%), Maturing October 23, 2026 | | | | | 1,581 | | | | 1,572,150 | |
| | | |
| Tweddle Group, Inc. | | | | | | | | |
| | | |
Term Loan, 5.50%, (1 mo. USD LIBOR + 4.50%, Floor 1.00%), Maturing September 17, 2023 | | | | | 206 | | | | 188,779 | |
| |
| | | | $ | 6,535,594 | |
| | | |
| Radio and Television — 3.2% | | | | | | | | |
| | | |
| Cumulus Media New Holdings, Inc. | | | | | | | | |
| | | |
Term Loan, 4.75%, (6 mo. USD LIBOR + 3.75%, Floor 1.00%), Maturing March 31, 2026 | | | | | 516 | | | $ | 498,799 | |
| | | |
| Diamond Sports Group, LLC | | | | | | | | |
| | | |
Term Loan, 3.40%, (1 mo. USD LIBOR + 3.25%), Maturing August 24, 2026 | | | | | 3,168 | | | | 2,676,960 | |
| | | |
| Entercom Media Corp. | | | | | | | | |
| | | |
Term Loan, 2.64%, (1 mo. USD LIBOR + 2.50%), Maturing November 18, 2024 | | | | | 928 | | | | 900,549 | |
| | | |
| Entravision Communications Corporation | | | | | | | | |
| | | |
Term Loan, 2.90%, (1 mo. USD LIBOR + 2.75%), Maturing November 29, 2024 | | | | | 846 | | | | 816,258 | |
| | | |
| Gray Television, Inc. | | | | | | | | |
| | | |
Term Loan, 2.40%, (1 mo. USD LIBOR + 2.25%), Maturing February 7, 2024 | | | | | 255 | | | | 251,215 | |
| | | |
Term Loan, 2.65%, (1 mo. USD LIBOR + 2.50%), Maturing January 2, 2026 | | | | | 637 | | | | 629,118 | |
| | | |
| Hubbard Radio, LLC | | | | | | | | |
| | | |
Term Loan, 5.25%, (6 mo. USD LIBOR + 4.25%, Floor 1.00%), Maturing March 28, 2025 | | | | | 784 | | | | 760,930 | |
| | | |
| iHeartCommunications, Inc. | | | | | | | | |
| | | |
Term Loan, 3.15%, (1 mo. USD LIBOR + 3.00%), Maturing May 1, 2026 | | | | | 1,911 | | | | 1,850,460 | |
| | | |
Term Loan, 4.75%, (1 mo. USD LIBOR + 4.00%, Floor 0.75%), Maturing May 1, 2026 | | | | | 424 | | | | 419,963 | |
| | | | |
| | 26 | | See Notes to Financial Statements. |
Eaton Vance
Floating-Rate Income Trust
November 30, 2020
Portfolio of Investments (Unaudited) — continued
| | | | | | | | | | |
| Borrower/Tranche Description | | | | Principal
Amount*
(000’s omitted) | | | Value | |
| | | |
| Radio and Television (continued) | | | | | | | | |
| | | |
| Nexstar Broadcasting, Inc. | | | | | | | | |
| | | |
Term Loan, 2.40%, (1 mo. USD LIBOR + 2.25%), Maturing January 17, 2024 | | | | | 1,386 | | | $ | 1,368,390 | |
| | | |
Term Loan, 2.90%, (1 mo. USD LIBOR + 2.75%), Maturing September 18, 2026 | | | | | 453 | | | | 448,534 | |
| | | |
| Sinclair Television Group, Inc. | | | | | | | | |
| | | |
Term Loan, 2.40%, (1 mo. USD LIBOR + 2.25%), Maturing January 3, 2024 | | | | | 533 | | | | 521,531 | |
| | | |
Term Loan, 2.65%, (1 mo. USD LIBOR + 2.50%), Maturing September 30, 2026 | | | | | 668 | | | | 654,606 | |
| | | |
| Terrier Media Buyer, Inc. | | | | | | | | |
| | | |
Term Loan, 4.40%, (1 mo. USD LIBOR + 4.25%), Maturing December 17, 2026 | | | | | 2,632 | | | | 2,602,381 | |
| | | |
| Univision Communications, Inc. | | | | | | | | |
| | | |
Term Loan, 4.75%, (1 mo. USD LIBOR + 3.75%, Floor 1.00%), Maturing March 15, 2026 | | | | | 3,485 | | | | 3,458,705 | |
| |
| | | | $ | 17,858,399 | |
| | | |
| Retailers (Except Food and Drug) — 2.9% | | | | | | | | |
| | | |
| Apro, LLC | | | | | | | | |
| | | |
Term Loan, 5.00%, (3 mo. USD LIBOR + 4.00%, Floor 1.00%), Maturing November 14, 2026 | | | | | 670 | | | $ | 669,473 | |
| | | |
| Ascena Retail Group, Inc. | | | | | | | | |
| | | |
DIP Loan, 12.75%, (1 mo. USD LIBOR + 11.75%, Floor 1.00%), Maturing March 16, 2021 | | | | | 685 | | | | 761,711 | |
| | | |
Term Loan, 0.00%, Maturing August 21, 2022(16) | | | | | 1,978 | | | | 629,333 | |
| | | |
| Bass Pro Group, LLC | | | | | | | | |
| | | |
Term Loan, 5.75%, (3 mo. USD LIBOR + 5.00%, Floor 0.75%), Maturing September 25, 2024 | | | | | 2,974 | | | | 2,978,794 | |
| | | |
| BJ’s Wholesale Club, Inc. | | | | | | | | |
| | | |
Term Loan, 2.14%, (1 mo. USD LIBOR + 2.00%), Maturing February 3, 2024 | | | | | 520 | | | | 518,803 | |
| | | |
| Coinamatic Canada, Inc. | | | | | | | | |
| | | |
Term Loan, 4.25%, (1 mo. USD LIBOR + 3.25%, Floor 1.00%), Maturing May 14, 2022 | | | | | 46 | | | | 45,490 | |
| | | |
| CNT Holdings I Corp. | | | | | | | | |
| | | |
Term Loan, 4.50%, (6 mo. USD LIBOR + 3.75%, Floor 0.75%), Maturing November 8, 2027 | | | | | 775 | | | | 770,338 | |
| | | |
| David’s Bridal, Inc. | | | | | | | | |
| | | |
Term Loan, 11.00%, (3 mo. USD LIBOR + 10.00%, Floor 1.00%), 6.00% cash, 5.00% PIK, Maturing June 23, 2023 | | | | | 298 | | | | 279,039 | |
| | | |
Term Loan, 7.00%, (3 mo. USD LIBOR + 6.00%, Floor 1.00%), Maturing June 30, 2023 | | | | | 349 | | | | 290,291 | |
| | | |
| Harbor Freight Tools USA, Inc. | | | | | | | | |
| | | |
Term Loan, 4.00%, (1 mo. USD LIBOR + 3.25%, Floor 0.75%), Maturing October 19, 2027 | | | | | 1,600 | | | | 1,591,858 | |
| | | | | | | | | | |
| Borrower/Tranche Description | | | | Principal
Amount*
(000’s omitted) | | | Value | |
| | | |
| Retailers (Except Food and Drug) (continued) | | | | | | | | |
| | | |
| Hoya Midco, LLC | | | | | | | | |
| | | |
Term Loan, 4.50%, (6 mo. USD LIBOR + 3.50%, Floor 1.00%), Maturing June 30, 2024 | | | | | 2,058 | | | $ | 1,883,124 | |
| | | |
| LSF9 Atlantis Holdings, LLC | | | | | | | | |
| | | |
Term Loan, 7.00%, (1 mo. USD LIBOR + 6.00%, Floor 1.00%), Maturing May 1, 2023 | | | | | 1,004 | | | | 992,771 | |
| | | |
| Mattress Firm, Inc. | | | | | | | | |
| | | |
Term Loan, Maturing November 24,
2027(14) | | | | | 925 | | | | 920,375 | |
| | | |
| PetSmart, Inc. | | | | | | | | |
| | | |
Term Loan, 4.50%, (6 mo. USD LIBOR + 3.50%, Floor 1.00%), Maturing March 11, 2022 | | | | | 3,613 | | | | 3,600,493 | |
| | | |
| PFS Holding Corporation | | | | | | | | |
| | | |
Term Loan, 0.00%, Maturing January 31, 2021(3)(16) | | | | | 2,332 | | | | 0 | |
| | | |
| Pier 1 Imports (U.S.), Inc. | | | | | | | | |
| | | |
Term Loan, 0.00%, Maturing April 30,
2021(16) | | | | | 455 | | | | 284,176 | |
| |
| | | | $ | 16,216,069 | |
| | | |
| Steel — 1.0% | | | | | | | | |
| | | |
| Atkore International, Inc. | | | | | | | | |
| | | |
Term Loan, 3.75%, (3 mo. USD LIBOR + 2.75%, Floor 1.00%), Maturing December 22, 2023 | | | | | 1,258 | | | $ | 1,256,564 | |
| | | |
| GrafTech Finance, Inc. | | | | | | | | |
| | | |
Term Loan, 4.50%, (1 mo. USD LIBOR + 3.50%, Floor 1.00%), Maturing February 12, 2025 | | | | | 2,153 | | | | 2,143,483 | |
| | | |
| Neenah Foundry Company | | | | | | | | |
| | | |
Term Loan, 10.07%, (2 mo. USD LIBOR + 9.00%), Maturing December 13, 2022 | | | | | 710 | | | | 621,378 | |
| | | |
| Phoenix Services International, LLC | | | | | | | | |
| | | |
Term Loan, 4.75%, (1 mo. USD LIBOR + 3.75%, Floor 1.00%), Maturing March 1, 2025 | | | | | 878 | | | | 859,402 | |
|
| Zekelman Industries, Inc. | |
| | | |
Term Loan, 2.15%, (1 mo. USD LIBOR + 2.00%), Maturing January 24, 2027 | | | | | 1,070 | | | | 1,052,021 | |
| |
| | | | $ | 5,932,848 | |
| | | |
| Surface Transport — 0.5% | | | | | | | | |
| | | |
| Hertz Corporation (The) | | | | | | | | |
| | | |
DIP Loan, 4.62%, (USD Prime + 6.25%), Maturing December 31, 2020(13) | | | | | 917 | | | $ | 945,283 | |
| | | |
Term Loan, 3.50%, (1 mo. USD LIBOR + 2.75%, Floor 0.75%), Maturing June 30, 2023 | | | | | 1,078 | | | | 1,050,363 | |
| | | |
| Kenan Advantage Group, Inc. | | | | | | | | |
| | | |
Term Loan, 4.00%, (1 mo. USD LIBOR + 3.00%, Floor 1.00%), Maturing July 31, 2022 | | | | | 117 | | | | 113,953 | |
| | | |
Term Loan, 4.00%, (1 mo. USD LIBOR + 3.00%, Floor 1.00%), Maturing July 31, 2022 | | | | | 383 | | | | 374,729 | |
| | | | |
| | 27 | | See Notes to Financial Statements. |
Eaton Vance
Floating-Rate Income Trust
November 30, 2020
Portfolio of Investments (Unaudited) — continued
| | | | | | | | | | |
| Borrower/Tranche Description | | | | Principal
Amount*
(000’s omitted) | | | Value | |
| | | |
| Surface Transport (continued) | | | | | | | | |
| | | |
| XPO Logistics, Inc. | | | | | | | | |
| | | |
Term Loan, 2.15%, (1 mo. USD LIBOR + 2.00%), Maturing February 24, 2025 | | | | | 650 | | | $ | 644,312 | |
| |
| | | | $ | 3,128,640 | |
| | | |
| Telecommunications — 6.2% | | | | | | | | |
| | | |
| Cablevision Lightpath, LLC | | | | | | | | |
| | | |
Term Loan, Maturing September 15, 2027(14) | | | | | 400 | | | $ | 398,417 | |
| | | |
| CenturyLink, Inc. | | | | | | | | |
| | | |
Term Loan, 2.40%, (1 mo. USD LIBOR + 2.25%), Maturing March 15, 2027 | | | | | 7,444 | | | | 7,294,413 | |
| | | |
| Colorado Buyer, Inc. | | | | | | | | |
| | | |
Term Loan, 4.00%, (6 mo. USD LIBOR + 3.00%, Floor 1.00%), Maturing May 1, 2024 | | | | | 1,649 | | | | 1,529,801 | |
| | | |
| Digicel International Finance Limited | | | | | | | | |
| | | |
Term Loan, 3.51%, (6 mo. USD LIBOR + 3.25%), Maturing May 28, 2024 | | | | | 1,770 | | | | 1,572,214 | |
| | | |
| eircom Finco S.a.r.l. | | | | | | | | |
| | | |
Term Loan, 2.75%, (1 mo. EURIBOR + 2.75%), Maturing May 15, 2026 | | EUR | | | 1,706 | | | | 2,035,741 | |
| | | |
| Gamma Infrastructure III B.V. | | | | | | | | |
| | | |
Term Loan, 3.50%, (6 mo. EURIBOR + 3.50%), Maturing January 9, 2025 | | EUR | | | 1,650 | | | | 1,935,399 | |
| | | |
| Global Eagle Entertainment, Inc. | | | | | | | | |
| | | |
DIP Loan, 11.25%, (1 mo. USD LIBOR + 10.00%, Floor 1.25%), Maturing January 22, 2021 | | | | | 408 | | | | 403,958 | |
| | | |
Term Loan, 0.00%, Maturing January 6, 2023(16) | | | | | 2,743 | | | | 2,073,179 | |
| | | |
| Intelsat Jackson Holdings S.A. | | | | | | | | |
| | | |
DIP Loan, 5.78%, (USD LIBOR + 5.50%, Floor 1.00%), Maturing July 13, 2022(12)(13) | | | | | 1,037 | | | | 1,061,543 | |
| | | |
Term Loan, 8.00%, (USD Prime + 4.75%), Maturing November 27, 2023 | | | | | 1,900 | | | | 1,924,343 | |
| | | |
Term Loan, 8.75%, (USD Prime + 5.50%), Maturing January 2, 2024 | | | | | 1,600 | | | | 1,624,000 | |
| | | |
| IPC Corp. | | | | | | | | |
| | | |
Term Loan, 5.50%, (3 mo. USD LIBOR + 4.50%, Floor 1.00%), Maturing August 6, 2021(3) | | | | | 1,230 | | | | 886,271 | |
| | | |
| Onvoy, LLC | | | | | | | | |
| | | |
Term Loan, 5.50%, (1 mo. USD LIBOR + 4.50%, Floor 1.00%), Maturing February 10, 2024 | | | | | 1,737 | | | | 1,689,233 | |
| | | |
| Plantronics, Inc. | | | | | | | | |
| | | |
Term Loan, 2.65%, (1 mo. USD LIBOR + 2.50%), Maturing July 2, 2025 | | | | | 1,327 | | | | 1,284,935 | |
| | | |
| Syniverse Holdings, Inc. | | | | | | | | |
| | | |
Term Loan, 6.00%, (3 mo. USD LIBOR + 5.00%, Floor 1.00%), Maturing March 9, 2023 | | | | | 1,024 | | | | 892,795 | |
| | | | | | | | | | | | |
| Borrower/Tranche Description | | | | | Principal
Amount*
(000’s omitted) | | | Value | |
| | | |
| Telecommunications (continued) | | | | | | | | | |
| | | |
| Telesat Canada | | | | | | | | | |
| | | |
Term Loan, 2.90%, (1 mo. USD LIBOR + 2.75%), Maturing December 7, 2026 | | | | | | | 1,439 | | | $ | 1,407,943 | |
| | | |
| Zayo Group Holdings, Inc. | | | | | | | | | |
| | | |
Term Loan, 3.15%, (1 mo. USD LIBOR + 3.00%), Maturing March 9, 2027 | | | | | | | 2,637 | | | | 2,594,892 | |
| | | |
Term Loan, 3.25%, (1 mo. EURIBOR + 3.25%), Maturing March 9, 2027 | | | EUR | | | | 448 | | | | 534,210 | |
|
| Ziggo Financing Partnership | |
| | | |
Term Loan, 2.64%, (1 mo. USD LIBOR + 2.50%), Maturing April 30, 2028 | | | | | | | 3,825 | | | | 3,748,840 | |
| |
| | | | $ | 34,892,127 | |
| | | |
| Utilities — 1.3% | | | | | | | | | |
| | | |
| Brookfield WEC Holdings, Inc. | | | | | | | | | |
| | | |
Term Loan, 3.75%, (1 mo. USD LIBOR + 3.00%, Floor 0.75%), Maturing August 1, 2025 | | | | | | | 1,688 | | | $ | 1,672,921 | |
| | | |
| Calpine Construction Finance Company L.P. | | | | | | | | | |
| | | |
Term Loan, 2.15%, (1 mo. USD LIBOR + 2.00%), Maturing January 15, 2025 | | | | | | | 941 | | | | 928,730 | |
| | | |
| Calpine Corporation | | | | | | | | | |
| | | |
Term Loan, 2.40%, (1 mo. USD LIBOR + 2.25%), Maturing January 15, 2024 | | | | | | | 3,340 | | | | 3,319,821 | |
| | | |
Term Loan, 2.40%, (1 mo. USD LIBOR + 2.25%), Maturing April 5, 2026 | | | | | | | 938 | | | | 930,972 | |
| | | |
| Longview Power, LLC | | | | | | | | | |
| | | |
Term Loan, 11.50%, (3 mo. USD LIBOR + 10.00%, Floor 1.50%), Maturing July 30, 2025(3) | | | | | | | 404 | | | | 322,940 | |
| | | |
| USIC Holdings, Inc. | | | | | | | | | |
| | | |
Term Loan, 4.00%, (1 mo. USD LIBOR + 3.00%, Floor 1.00%), Maturing December 8, 2023 | | | | | | | 195 | | | | 192,907 | |
| |
| | | | $ | 7,368,291 | |
| | | |
Total Senior Floating-Rate Loans
(identified cost $844,895,437) | | | | | | | | | | $ | 827,667,428 | |
| | | |
| Warrants — 0.0%(6) | | | | | | | | | | | | |
| Security | | | | | Shares | | | Value | |
| | | |
| Health Care — 0.0%(6) | | | | | | | | | |
| | | |
THAIHOT Investment Company US Limited, Exp. 10/13/27(3)(4)(5) | | | | | | | 24 | | | $ | 7,159 | |
| | | |
THAIHOT Investment Company US Limited, Exp. 10/13/27(3)(4)(5) | | | | | | | 175 | | | | 52,197 | |
| | | | |
| | 28 | | See Notes to Financial Statements. |
Eaton Vance
Floating-Rate Income Trust
November 30, 2020
Portfolio of Investments (Unaudited) — continued
| | | | | | | | | | | | |
| Security | | | | | Shares | | | Value | |
| | | |
| Health Care (continued) | | | | | | | | | |
| | | |
THAIHOT Investment Company US Limited, Exp. 10/13/27, (Contingent
Warrants)(3)(4)(5) | | | | | | | 11,110 | | | $ | 0 | |
| |
| | | | $ | 59,356 | |
| | | |
| Retailers (Except Food and Drug) — 0.0% | | | | | | | | | |
| | | |
David’s Bridal, LLC, Exp. 11/26/22(3)(4)(5) | | | | | | | 4,543 | | | $ | 0 | |
| |
| | | | $ | 0 | |
| | | |
Total Warrants
(identified cost $0) | | | | | | | | | | $ | 59,356 | |
| | | |
| Miscellaneous — 0.0%(6) | | | | | | | | | | | | |
| Security | | | | | Shares | | | Value | |
| | | |
| Oil and Gas — 0.0%(6) | | | | | | | | | |
| | | |
Paragon Offshore Finance Company,
Class A(4)(5) | | | | | | | 1,707 | | | $ | 512 | |
| | | |
Paragon Offshore Finance Company,
Class B(4)(5) | | | | | | | 854 | | | | 10,462 | |
| | | |
Total Miscellaneous
(identified cost $18,573) | | | | | | | | | | $ | 10,974 | |
|
| Short-Term Investments — 2.1% | |
| Description | | | | | Units | | | Value | |
| | | |
Eaton Vance Cash Reserves Fund, LLC, 0.10%(17) | | | | | | | 11,721,058 | | | $ | 11,721,058 | |
| | | |
Total Short-Term Investments
(identified cost $11,721,058) | | | | | | | | | | $ | 11,721,058 | |
| | | |
Total Investments — 163.6%
(identified cost $945,579,468) | | | | | | | | | | $ | 925,099,502 | |
| |
Less Unfunded Loan Commitments — (0.4)% | | | $ | (1,928,228 | ) |
| | | |
Net Investments — 163.2%
(identified cost $943,651,240) | | | | | | | | | | $ | 923,171,274 | |
| |
Notes Payable — (44.9)% | | | $ | (254,000,000 | ) |
| |
Variable Rate Term Preferred Shares, at Liquidation Value (net of unamortized deferred debt issuance costs) — (14.1)% | | | $ | (79,898,063 | ) |
| |
Other Assets, Less Liabilities — (4.2)% | | | $ | (23,712,131 | ) |
| |
Net Assets Applicable to Common Shares — 100.0% | | | $ | 565,561,080 | |
The percentage shown for each investment category in the Portfolio of Investments is based on net assets applicable to common shares.
| | * | In U.S. dollars unless otherwise indicated. |
| | (1) | Security exempt from registration under Rule 144A of the Securities Act of 1933, as amended. These securities may be sold in certain transactions in reliance on an exemption from registration (normally to qualified institutional buyers). At November 30, 2020, the aggregate value of these securities is $55,501,650 or 9.8% of the Fund’s net assets applicable to common shares. |
| | (2) | Variable rate security. The stated interest rate represents the rate in effect at November 30, 2020. |
| | (3) | For fair value measurement disclosure purposes, security is categorized as Level 3 (see Note 11). |
| | (4) | Security was acquired in connection with a restructuring of a Senior Loan and may be subject to restrictions on resale. |
| | (5) | Non-income producing security. |
| | (6) | Amount is less than 0.05%. |
| | (7) | Restricted security (see Note 7). |
| | (8) | Security converts to variable rate after the indicated fixed-rate coupon period. |
| | (9) | Perpetual security with no stated maturity date but may be subject to calls by the issuer. |
| (10) | Represents a payment-in-kind security which may pay interest in additional principal at the issuer’s discretion. |
| (11) | Senior floating-rate loans (Senior Loans) often require prepayments from excess cash flows or permit the borrowers to repay at their election. The degree to which borrowers repay, whether as a contractual requirement or at their election, cannot be predicted with accuracy. As a result, the actual remaining maturity may be substantially less than the stated maturities shown. However, Senior Loans will typically have an expected average life of approximately two to four years. Senior Loans typically have rates of interest which are redetermined periodically by reference to a base lending rate, plus a spread. These base lending rates are primarily the London Interbank Offered Rate (“LIBOR”) and secondarily, the prime rate offered by one or more major United States banks (the “Prime Rate”). Base lending rates may be subject to a floor, or a minimum rate. Senior Loans are generally subject to contractual restrictions that must be satisfied before they can be bought or sold. |
| (12) | The stated interest rate represents the weighted average interest rate at November 30, 2020 of contracts within the senior loan facility. Interest rates on contracts are primarily redetermined either weekly, monthly or quarterly by reference to the indicated base lending rate and spread and the reset period. |
| (13) | Unfunded or partially unfunded loan commitments. The stated interest rate reflects the weighted average of the reference rate and spread for the funded portion, if any, and the commitment fees on the portion of the loan that is unfunded. At November 30, 2020, the total value of unfunded loan commitments is $1,961,568. See Note 1F for description. |
| (14) | This Senior Loan will settle after November 30, 2020, at which time the interest rate will be determined. |
| (16) | Issuer is in default with respect to interest and/or principal payments. For a variable rate security, interest rate has been adjusted to reflect non-accrual status. |
| (17) | Affiliated investment company, available to Eaton Vance portfolios and funds, which invests in high quality, U.S. dollar denominated money market instruments. The rate shown is the annualized seven-day yield as of November 30, 2020. |
| | | | |
| | 29 | | See Notes to Financial Statements. |
Eaton Vance
Floating-Rate Income Trust
November 30, 2020
Portfolio of Investments (Unaudited) — continued
| | | | | | | | | | | | | | | | | | | | | | | | |
| Forward Foreign Currency Exchange Contracts | |
| Currency Purchased | | | Currency Sold | | | Counterparty | | Settlement
Date | | | Unrealized
Appreciation | | | Unrealized
(Depreciation) | |
| | | | | | | |
| USD | | | 19,558,223 | | | EUR | | | 16,779,950 | | | Standard Chartered Bank | | | 12/2/20 | | | $ | — | | | $ | (457,749 | ) |
| | | | | | | |
| USD | | | 1,266,729 | | | EUR | | | 1,075,000 | | | State Street Bank and Trust Company | | | 12/2/20 | | | | — | | | | (15,585 | ) |
| | | | | | | |
| USD | | | 21,382,682 | | | EUR | | | 17,854,950 | | | Standard Chartered Bank | | | 1/5/21 | | | | 59,455 | | | | — | |
| | | | | | | |
| USD | | | 20,596,018 | | | EUR | | | 17,490,568 | | | Goldman Sachs International | | | 1/29/21 | | | | — | | | | (303,337 | ) |
| | | | | | | |
| USD | | | 2,075,826 | | | EUR | | | 1,743,802 | | | HSBC Bank USA, N.A. | | | 1/29/21 | | | | — | | | | (7,830 | ) |
| | | | | | | |
| USD | | | 1,281,081 | | | EUR | | | 1,069,500 | | | State Street Bank and Trust Company | | | 1/29/21 | | | | 3,143 | | | | — | |
| | | | | | | |
| USD | | | 20,769,594 | | | EUR | | | 17,446,916 | | | HSBC Bank USA, N.A. | | | 2/26/21 | | | | — | | | | (90,396 | ) |
| | | | | | | |
| USD | | | 1,560,635 | | | GBP | | | 1,168,034 | | | State Street Bank and Trust Company | | | 2/26/21 | | | | 2,119 | | | | — | |
| | |
| | | | $ | 64,717 | | | $ | (874,897 | ) |
Abbreviations:
| | | | |
| DIP | | – | | Debtor In Possession |
| | |
| EURIBOR | | – | | Euro Interbank Offered Rate |
| | |
| LIBOR | | – | | London Interbank Offered Rate |
| | |
| PIK | | – | | Payment In Kind |
Currency Abbreviations:
| | | | |
| EUR | | – | | Euro |
| | |
| GBP | | – | | British Pound Sterling |
| | |
| USD | | – | | United States Dollar |
| | | | |
| | 30 | | See Notes to Financial Statements. |
Eaton Vance
Floating-Rate Income Trust
November 30, 2020
Statement of Assets and Liabilities (Unaudited)
| | | | |
| Assets | | November 30, 2020 | |
| |
Unaffiliated investments, at value (identified cost, $931,930,182) | | $ | 911,450,216 | |
| |
Affiliated investment, at value (identified cost, $11,721,058) | | | 11,721,058 | |
| |
Cash | | | 3,384,261 | |
| |
Deposits for derivatives collateral — forward foreign currency exchange contracts | | | 720,000 | |
| |
Foreign currency, at value (identified cost, $633,570) | | | 631,797 | |
| |
Interest and dividends receivable | | | 3,176,591 | |
| |
Dividends receivable from affiliated investment | | | 674 | |
| |
Receivable for investments sold | | | 396,274 | |
| |
Receivable for open forward foreign currency exchange contracts | | | 64,717 | |
| |
Prepaid upfront fees and other fees on notes payable and variable rate term preferred shares | | | 242,560 | |
| |
Prepaid expenses | | | 35,512 | |
| |
Total assets | | $ | 931,823,660 | |
|
| Liabilities | |
| |
Notes payable | | $ | 254,000,000 | |
| |
Variable rate term preferred shares, at liquidation value (net of unamortized deferred debt issuance costs of $101,937) | | | 79,898,063 | |
| |
Payable for investments purchased | | | 30,195,884 | |
| |
Payable for open forward foreign currency exchange contracts | | | 874,897 | |
| |
Payable to affiliates: | | | | |
| |
Investment adviser fee | | | 543,685 | |
| |
Trustees’ fees | | | 7,526 | |
| |
Interest expense and fees payable | | | 487,444 | |
| |
Accrued expenses | | | 255,081 | |
| |
Total liabilities | | $ | 366,262,580 | |
| |
Net assets applicable to common shares | | $ | 565,561,080 | |
|
| Sources of Net Assets | |
| |
Common shares, $0.01 par value, unlimited number of shares authorized, 39,863,690 shares issued and outstanding | | $ | 398,637 | |
| |
Additional paid-in capital | | | 624,388,144 | |
| |
Accumulated loss | | | (59,225,701 | ) |
| |
Net assets applicable to common shares | | $ | 565,561,080 | |
| |
| Net Asset Value Per Common Share | | | | |
| |
($565,561,080 ÷ 39,863,690 common shares issued and outstanding) | | $ | 14.19 | |
| | | | |
| | 31 | | See Notes to Financial Statements. |
Eaton Vance
Floating-Rate Income Trust
November 30, 2020
Statement of Operations (Unaudited)
| | | | |
| Investment Income | | Six Months Ended November 30, 2020 | |
| |
Interest and other income | | $ | 19,933,077 | |
| |
Dividends | | | 416,745 | |
| |
Dividends from affiliated investment | | | 7,687 | |
| |
Total investment income | | $ | 20,357,509 | |
| |
| Expenses | | | | |
| |
Investment adviser fee | | $ | 3,182,258 | |
| |
Trustees’ fees and expenses | | | 22,020 | |
| |
Custodian fee | | | 102,171 | |
| |
Transfer and dividend disbursing agent fees | | | 10,189 | |
| |
Legal and accounting services | | | 129,577 | |
| |
Printing and postage | | | 35,904 | |
| |
Interest expense and fees | | | 2,584,779 | |
| |
Miscellaneous | | | 58,115 | |
| |
Total expenses | | $ | 6,125,013 | |
| |
Net investment income | | $ | 14,232,496 | |
| |
| Realized and Unrealized Gain (Loss) | | | | |
| |
Net realized gain (loss) — | | | | |
| |
Investment transactions | | $ | (11,241,159 | ) |
| |
Investment transactions — affiliated investment | | | 155 | |
| |
Foreign currency transactions | | | (13,429 | ) |
| |
Forward foreign currency exchange contracts | | | (4,027,187 | ) |
| |
Net realized loss | | $ | (15,281,620 | ) |
| |
Change in unrealized appreciation (depreciation) — | | | | |
| |
Investments | | $ | 61,480,116 | |
| |
Investments — affiliated investment | | | 710 | |
| |
Foreign currency | | | (92,817 | ) |
| |
Forward foreign currency exchange contracts | | | 28,813 | |
| |
Net change in unrealized appreciation (depreciation) | | $ | 61,416,822 | |
| |
Net realized and unrealized gain | | $ | 46,135,202 | |
| |
Net increase in net assets from operations | | $ | 60,367,698 | |
| | | | |
| | 32 | | See Notes to Financial Statements. |
Eaton Vance
Floating-Rate Income Trust
November 30, 2020
Statements of Changes in Net Assets
| | | | | | | | |
| Increase (Decrease) in Net Assets | | Six Months Ended November 30, 2020
(Unaudited) | | | Year Ended May 31, 2020 | |
| | |
From operations — | | | | | | | | |
| | |
Net investment income | | $ | 14,232,496 | | | $ | 33,594,529 | |
| | |
Net realized loss | | | (15,281,620 | ) | | | (20,580,181 | ) |
| | |
Net change in unrealized appreciation (depreciation) | | | 61,416,822 | | | | (59,806,577 | ) |
| | |
Net increase (decrease) in net assets from operations | | $ | 60,367,698 | | | $ | (46,792,229 | ) |
| | |
Distributions to common shareholders | | $ | (14,271,201 | ) | | $ | (40,150,709 | ) |
| | |
Net increase (decrease) in net assets | | $ | 46,096,497 | | | $ | (86,942,938 | ) |
|
| Net Assets Applicable to Common Shares | |
| | |
At beginning of period | | $ | 519,464,583 | | | $ | 606,407,521 | |
| | |
At end of period | | $ | 565,561,080 | | | $ | 519,464,583 | |
| | | | |
| | 33 | | See Notes to Financial Statements. |
Eaton Vance
Floating-Rate Income Trust
November 30, 2020
Statement of Cash Flows (Unaudited)
| | | | |
| Cash Flows From Operating Activities | | Six Months Ended November 30, 2020 | |
| |
Net increase in net assets from operations | | $ | 60,367,698 | |
| |
Adjustments to reconcile net increase in net assets from operations to net cash used in operating activities: | | | | |
| |
Investments purchased | | | (134,072,434 | ) |
| |
Investments sold and principal repayments | | | 79,831,690 | |
| |
Increase in short-term investments, net | | | (4,624,577 | ) |
| |
Net amortization/accretion of premium (discount) | | | (1,653,635 | ) |
| |
Amortization of deferred debt issuance costs on variable rate term preferred shares | | | 16,101 | |
| |
Amortization of prepaid upfront fees and other fees on notes payable and variable rate term preferred shares | | | 344,833 | |
| |
Decrease in interest and dividends receivable | | | 327,817 | |
| |
Decrease in dividends receivable from affiliated investment | | | 839 | |
| |
Increase in receivable for open forward foreign currency exchange contracts | | | (32,734 | ) |
| |
Decrease in prepaid expenses | | | 15,213 | |
| |
Decrease in cash collateral due to broker | | | (120,000 | ) |
| |
Increase in payable for open forward foreign currency exchange contracts | | | 3,921 | |
| |
Increase in payable to affiliate for investment adviser fee | | | 56,242 | |
| |
Increase in payable to affiliate for Trustees’ fees | | | 2 | |
| |
Decrease in interest expense and fees payable | | | (248,191 | ) |
| |
Decrease in accrued expenses | | | (137,005 | ) |
| |
Increase in unfunded loan commitments | | | 1,635,508 | |
| |
Net change in unrealized (appreciation) depreciation from investments | | | (61,480,826 | ) |
| |
Net realized loss from investments | | | 11,241,004 | |
| |
Net cash used in operating activities | | $ | (48,528,534 | ) |
| |
| Cash Flows From Financing Activities | | | | |
| |
Cash distributions paid to common shareholders | | $ | (14,271,201 | ) |
| |
Proceeds from notes payable | | | 69,000,000 | |
| |
Repayments of notes payable | | | (5,000,000 | ) |
| |
Net cash provided by financing activities | | $ | 49,728,799 | |
| |
Net increase in cash and restricted cash* | | $ | 1,200,265 | |
| |
Cash and restricted cash at beginning of period (including foreign currency) | | $ | 3,535,793 | |
| |
Cash and restricted cash at end of period (including foreign currency) | | $ | 4,736,058 | |
| |
| Supplemental disclosure of cash flow information: | | | | |
| |
Cash paid for interest and fees on borrowings and variable rate term preferred shares | | $ | 2,472,036 | |
| * | Includes net change in unrealized appreciation (depreciation) on foreign currency of $(1,723). |
The following table provides a reconciliation of cash and restricted cash reported within the Statement of Assets and Liabilities that sum to the total of such amounts shown on the Statement of Cash Flows.
| | | | |
| | | November 30, 2020 | |
| |
Cash | | $ | 3,384,261 | |
| |
Deposit for derivatives collateral — forward foreign currency exchange contracts | | | 720,000 | |
| |
Foreign currency | | | 631,797 | |
| |
Total cash and restricted cash as shown on the Statement of Cash Flows | | $ | 4,736,058 | |
| | | | |
| | 34 | | See Notes to Financial Statements. |
Eaton Vance
Floating-Rate Income Trust
November 30, 2020
Financial Highlights
Selected data for a common share outstanding during the periods stated
| | | | | | | | | | | | | | | | | | | | | | | | |
| | |
| | | Six Months Ended
November 30, 2020
(Unaudited) | | | Year Ended May 31, | |
| | | 2020 | | | 2019 | | | 2018 | | | 2017 | | | 2016 | |
| | | | | | | |
Net asset value — Beginning of period (Common shares) | | $ | 13.030 | | | $ | 15.210 | | | $ | 15.610 | | | $ | 15.570 | | | $ | 14.680 | | | $ | 15.640 | |
| | | | | | |
| Income (Loss) From Operations | | | | | | | | | | | | | | | | | | | | | | | | |
| | | | | | |
Net investment income(1) | | $ | 0.357 | | | $ | 0.843 | | | $ | 0.847 | | | $ | 0.792 | | | $ | 0.864 | | | $ | 0.908 | |
| | | | | | |
Net realized and unrealized gain (loss) | | | 1.161 | | | | (2.016 | ) | | | (0.373 | ) | | | 0.076 | | | | 0.899 | | | | (0.964 | ) |
| | | | | | |
Total income (loss) from operations | | $ | 1.518 | | | $ | (1.173 | ) | | $ | 0.474 | | | $ | 0.868 | | | $ | 1.763 | | | $ | (0.056 | ) |
| | | | | | |
| Less Distributions to Common Shareholders | | | | | | | | | | | | | | | | | | | | | | | | |
| | | | | | |
From net investment income | | $ | (0.358 | ) | | $ | (1.007 | ) | | $ | (0.874 | ) | | $ | (0.828 | ) | | $ | (0.873 | ) | | $ | (0.904 | ) |
| | | | | | |
Total distributions to common shareholders | | $ | (0.358 | ) | | $ | (1.007 | ) | | $ | (0.874 | ) | | $ | (0.828 | ) | | $ | (0.873 | ) | | $ | (0.904 | ) |
| | | | | | |
Net asset value — End of period (Common shares) | | $ | 14.190 | | | $ | 13.030 | | | $ | 15.210 | | | $ | 15.610 | | | $ | 15.570 | | | $ | 14.680 | |
| | | | | | |
Market value — End of period (Common shares) | | $ | 13.150 | | | $ | 11.240 | | | $ | 13.480 | | | $ | 14.850 | | | $ | 15.150 | | | $ | 13.560 | |
| | | | | | |
Total Investment Return on Net Asset Value(2) | | | 12.13 | %(3) | | | (7.36 | )% | | | 3.77 | % | | | 6.03 | % | | | 12.65 | % | | | 0.46 | % |
| | | | | | |
Total Investment Return on Market Value(2) | | | 20.46 | %(3) | | | (9.83 | )% | | | (3.32 | )% | | | 3.67 | % | | | 18.58 | % | | | 1.14 | % |
| | | | |
| | 35 | | See Notes to Financial Statements. |
Eaton Vance
Floating-Rate Income Trust
November 30, 2020
Financial Highlights — continued
Selected data for a common share outstanding during the periods stated
| | | | | | | | | | | | | | | | | | | | | | | | |
| | |
| | | Six Months Ended
November 30, 2020
(Unaudited) | | | Year Ended May 31, | |
| Ratios/Supplemental Data | | 2020 | | | 2019 | | | 2018 | | | 2017 | | | 2016 | |
| | | | | | | |
Net assets applicable to common shares, end of period (000’s omitted) | | $ | 565,561 | | | $ | 519,465 | | | $ | 606,408 | | | $ | 622,241 | | | $ | 620,772 | | | $ | 585,101 | |
| | | | | | |
Ratios (as a percentage of average daily net assets applicable to common shares):† | | | | | | | | | | | | | | | | | | | | | | | | |
| | | | | | |
Expenses excluding interest and fees(4) | | | 1.30 | %(5) | | | 1.26 | % | | | 1.28 | % | | | 1.28 | % | | | 1.32 | % | | | 1.36 | % |
| | | | | | |
Interest and fee expense(6) | | | 0.94 | %(5) | | | 1.79 | % | | | 2.00 | % | | | 1.52 | % | | | 1.16 | % | | | 0.93 | % |
| | | | | | |
Total expenses(4) | | | 2.24 | %(5) | | | 3.05 | % | | | 3.28 | % | | | 2.80 | % | | | 2.48 | % | | | 2.29 | % |
| | | | | | |
Net investment income | | | 5.20 | %(5) | | | 5.85 | % | | | 5.49 | % | | | 5.09 | % | | | 5.68 | % | | | 6.22 | % |
| | | | | | |
Portfolio Turnover | | | 8 | %(3) | | | 34 | % | | | 24 | % | | | 34 | % | | | 47 | % | | | 29 | % |
| | | | | | |
Senior Securities: | | | | | | | | | | | | | | | | | | | | | | | | |
| | | | | | |
Total notes payable outstanding (in 000’s) | | $ | 254,000 | | | $ | 190,000 | | | $ | 248,000 | | | $ | 254,000 | | | $ | 246,000 | | | $ | 232,000 | |
| | | | | | |
Asset coverage per $1,000 of notes payable(7) | | $ | 3,542 | | | $ | 4,155 | | | $ | 3,768 | | | $ | 3,765 | | | $ | 3,849 | | | $ | 3,867 | |
| | | | | | |
Total preferred shares outstanding | | | 800 | | | | 800 | | | | 800 | | | | 800 | | | | 800 | | | | 800 | |
| | | | | | |
Asset coverage per preferred share(8) | | $ | 269,330 | | | $ | 292,394 | | | $ | 284,880 | | | $ | 286,300 | | | $ | 290,421 | | | $ | 287,532 | |
| | | | | | |
Involuntary liquidation preference per preferred share(9) | | $ | 100,000 | | | $ | 100,000 | | | $ | 100,000 | | | $ | 100,000 | | | $ | 100,000 | | | $ | 100,000 | |
| | | | | | |
Approximate market value per preferred share(9) | | $ | 100,000 | | | $ | 100,000 | | | $ | 100,000 | | | $ | 100,000 | | | $ | 100,000 | | | $ | 100,000 | |
| (1) | Computed using average common shares outstanding. |
| (2) | Returns are historical and are calculated by determining the percentage change in net asset value or market value with all distributions reinvested. Distributions are assumed to be reinvested at prices obtained under the Trust’s dividend reinvestment plan. |
| (4) | Excludes the effect of custody fee credits, if any, of less than 0.005%. Effective September 1, 2015, custody fee credits, which were earned on cash deposit balances, were discontinued by the custodian. |
| (6) | Interest and fee expense relates to variable rate term preferred shares (see Note 2) and the notes payable (see Note 9). |
| (7) | Calculated by subtracting the Trust’s total liabilities (not including the notes payable and preferred shares) from the Trust’s total assets, and dividing the result by the notes payable balance in thousands. |
| (8) | Calculated by subtracting the Trust’s total liabilities (not including the notes payable and preferred shares) from the Trust’s total assets, dividing the result by the sum of the value of the notes payable and liquidation value of the preferred shares, and multiplying the result by the liquidation value of one preferred share. Such amount equates to 269%, 292%, 285%, 286%, 290% and 288% at November 30, 2020 and May 31, 2020, 2019, 2018, 2017 and 2016, respectively. |
| (9) | Plus accumulated and unpaid dividends. |
| † | Ratios based on net assets applicable to common shares plus preferred shares and borrowings are presented below. Ratios exclude the effect of custody fee credits, if any. Ratios for periods less than one year are annualized. |
| | | | | | | | | | | | | | | | | | | | | | | | |
| | |
| | | Six Months Ended
November 30, 2020
(Unaudited) | | | Year Ended May 31, | |
| | | 2020 | | | 2019 | | | 2018 | | | 2017 | | | 2016 | |
| | | | | | | |
Expenses excluding interest and fees | | | 0.83 | % | | | 0.81 | % | | | 0.83 | % | | | 0.83 | % | | | 0.86 | % | | | 0.86 | % |
| | | | | | |
Interest and fee expense | | | 0.61 | % | | | 1.16 | % | | | 1.31 | % | | | 1.00 | % | | | 0.76 | % | | | 0.58 | % |
| | | | | | |
Total expenses | | | 1.44 | % | | | 1.97 | % | | | 2.14 | % | | | 1.83 | % | | | 1.62 | % | | | 1.44 | % |
| | | | | | |
Net investment income | | | 3.35 | % | | | 3.79 | % | | | 3.58 | % | | | 3.33 | % | | | 3.72 | % | | | 3.90 | % |
| | | | |
| | 36 | | See Notes to Financial Statements. |
Eaton Vance
Floating-Rate Income Trust
November 30, 2020
Notes to Financial Statements (Unaudited)
1 Significant Accounting Policies
Eaton Vance Floating-Rate Income Trust (the Trust) is a Massachusetts business trust registered under the Investment Company Act of 1940, as amended (the 1940 Act), as a diversified, closed-end management investment company. The Trust’s investment objective is to provide a high level of current income. The Trust will, as a secondary objective, also seek preservation of capital to the extent consistent with its primary goal of high current income.
The following is a summary of significant accounting policies of the Trust. The policies are in conformity with accounting principles generally accepted in the United States of America (U.S. GAAP). The Trust is an investment company and follows accounting and reporting guidance in the Financial Accounting Standards Board (FASB) Accounting Standards Codification Topic 946.
A Investment Valuation — The following methodologies are used to determine the market value or fair value of investments.
Senior Floating-Rate Loans. Interests in senior floating-rate loans (Senior Loans) for which reliable market quotations are readily available are valued generally at the average mean of bid and ask quotations obtained from a third party pricing service. Other Senior Loans are valued at fair value by the investment adviser under procedures approved by the Trustees. In fair valuing a Senior Loan, the investment adviser utilizes one or more of the valuation techniques described in (i) through (iii) below to assess the likelihood that the borrower will make a full repayment of the loan underlying such Senior Loan relative to yields on other Senior Loans issued by companies of comparable credit quality. If the investment adviser believes that there is a reasonable likelihood of full repayment, the investment adviser will determine fair value using a matrix pricing approach that considers the yield on the Senior Loan. If the investment adviser believes there is not a reasonable likelihood of full repayment, the investment adviser will determine fair value using analyses that include, but are not limited to: (i) a comparison of the value of the borrower’s outstanding equity and debt to that of comparable public companies; (ii) a discounted cash flow analysis; or (iii) when the investment adviser believes it is likely that a borrower will be liquidated or sold, an analysis of the terms of such liquidation or sale. In certain cases, the investment adviser will use a combination of analytical methods to determine fair value, such as when only a portion of a borrower’s assets are likely to be sold. In conducting its assessment and analyses for purposes of determining fair value of a Senior Loan, the investment adviser will use its discretion and judgment in considering and appraising relevant factors. Fair value determinations are made by the portfolio managers of the Trust based on information available to such managers. The portfolio managers of other funds managed by the investment adviser that invest in Senior Loans may not possess the same information about a Senior Loan borrower as the portfolio managers of the Trust. At times, the fair value of a Senior Loan determined by the portfolio managers of other funds managed by the investment adviser that invest in Senior Loans may vary from the fair value of the same Senior Loan determined by the portfolio managers of the Trust. The fair value of each Senior Loan is periodically reviewed and approved by the investment adviser’s Valuation Committee and by the Trustees based upon procedures approved by the Trustees. Junior Loans (i.e., subordinated loans and second lien loans) are valued in the same manner as Senior Loans.
Debt Obligations. Debt obligations are generally valued on the basis of valuations provided by third party pricing services, as derived from such services’ pricing models. Inputs to the models may include, but are not limited to, reported trades, executable bid and ask prices, broker/dealer quotations, prices or yields of securities with similar characteristics, interest rates, anticipated prepayments, benchmark curves or information pertaining to the issuer, as well as industry and economic events. The pricing services may use a matrix approach, which considers information regarding securities with similar characteristics to determine the valuation for a security. Short-term debt obligations purchased with a remaining maturity of sixty days or less for which a valuation from a third party pricing service is not readily available may be valued at amortized cost, which approximates fair value.
Equity Securities. Equity securities listed on a U.S. securities exchange generally are valued at the last sale or closing price on the day of valuation or, if no sales took place on such date, at the mean between the closing bid and ask prices on the exchange where such securities are principally traded. Equity securities listed on the NASDAQ Global or Global Select Market generally are valued at the NASDAQ official closing price. Unlisted or listed securities for which closing sales prices or closing quotations are not available are valued at the mean between the latest available bid and ask prices or, in the case of preferred equity securities that are not listed or traded in the over-the-counter market, by a third party pricing service that uses various techniques that consider factors including, but not limited to, prices or yields of securities with similar characteristics, benchmark yields, broker/dealer quotes, quotes of underlying common stock, issuer spreads, as well as industry and economic events.
Derivatives. Forward foreign currency exchange contracts are generally valued at the mean of the average bid and average ask prices that are reported by currency dealers to a third party pricing service at the valuation time. Such third party pricing service valuations are supplied for specific settlement periods and the Trust’s forward foreign currency exchange contracts are valued at an interpolated rate between the closest preceding and subsequent settlement period reported by the third party pricing service.
Foreign Securities and Currencies. Foreign securities and currencies are valued in U.S. dollars, based on foreign currency exchange rate quotations supplied by a third party pricing service. The pricing service uses a proprietary model to determine the exchange rate. Inputs to the model include reported trades and implied bid/ask spreads.
Affiliated Fund. The Trust may invest in Eaton Vance Cash Reserves Fund, LLC (Cash Reserves Fund), an affiliated investment company managed by Eaton Vance Management (EVM). While Cash Reserves Fund is not a registered money market mutual fund, it conducts all of its investment activities in accordance with the requirements of Rule 2a-7 under the 1940 Act. Investments in Cash Reserves Fund are valued at the closing net asset value per unit on the valuation day. Cash Reserves Fund generally values its investment securities based on available market quotations provided by a third party pricing service.
Fair Valuation. Investments for which valuations or market quotations are not readily available or are deemed unreliable are valued at fair value using methods determined in good faith by or at the direction of the Trustees of the Trust in a manner that most fairly reflects the security’s “fair value”, which is the amount that the Trust might reasonably expect to receive for the security upon its current sale in the ordinary course. Each such determination is based
Eaton Vance
Floating-Rate Income Trust
November 30, 2020
Notes to Financial Statements (Unaudited) — continued
on a consideration of relevant factors, which are likely to vary from one pricing context to another. These factors may include, but are not limited to, the type of security, the existence of any contractual restrictions on the security’s disposition, the price and extent of public trading in similar securities of the issuer or of comparable companies or entities, quotations or relevant information obtained from broker/dealers or other market participants, information obtained from the issuer, analysts, and/or the appropriate stock exchange (for exchange-traded securities), an analysis of the company’s or entity’s financial statements, and an evaluation of the forces that influence the issuer and the market(s) in which the security is purchased and sold.
B Investment Transactions — Investment transactions for financial statement purposes are accounted for on a trade date basis. Realized gains and losses on investments sold are determined on the basis of identified cost.
C Income — Interest income is recorded on the basis of interest accrued, adjusted for amortization of premium or accretion of discount. Fees associated with loan amendments are recognized immediately. Dividend income is recorded on the ex-dividend date for dividends received in cash and/or securities. Distributions from investment companies are recorded as dividend income, capital gains or return of capital based on the nature of the distribution.
D Federal Taxes — The Trust’s policy is to comply with the provisions of the Internal Revenue Code applicable to regulated investment companies and to distribute to shareholders each year substantially all of its net investment income, and all or substantially all of its net realized capital gains. Accordingly, no provision for federal income or excise tax is necessary.
As of November 30, 2020, the Trust had no uncertain tax positions that would require financial statement recognition, de-recognition, or disclosure. The Trust files a U.S. federal income tax return annually after its fiscal year-end, which is subject to examination by the Internal Revenue Service for a period of three years from the date of filing.
E Foreign Currency Translation — Investment valuations, other assets, and liabilities initially expressed in foreign currencies are translated each business day into U.S. dollars based upon current exchange rates. Purchases and sales of foreign investment securities and income and expenses denominated in foreign currencies are translated into U.S. dollars based upon currency exchange rates in effect on the respective dates of such transactions. Recognized gains or losses on investment transactions attributable to changes in foreign currency exchange rates are recorded for financial statement purposes as net realized gains and losses on investments. That portion of unrealized gains and losses on investments that results from fluctuations in foreign currency exchange rates is not separately disclosed.
F Unfunded Loan Commitments — The Trust may enter into certain loan agreements all or a portion of which may be unfunded. The Trust is obligated to fund these commitments at the borrower’s discretion. These commitments are disclosed in the accompanying Portfolio of Investments. At November 30, 2020, the Trust had sufficient cash and/or securities to cover these commitments.
G Use of Estimates — The preparation of the financial statements in conformity with U.S. GAAP requires management to make estimates and assumptions that affect the reported amounts of assets and liabilities at the date of the financial statements and the reported amounts of income and expense during the reporting period. Actual results could differ from those estimates.
H Indemnifications — Under the Trust’s organizational documents, its officers and Trustees may be indemnified against certain liabilities and expenses arising out of the performance of their duties to the Trust. Under Massachusetts law, if certain conditions prevail, shareholders of a Massachusetts business trust (such as the Trust) could be deemed to have personal liability for the obligations of the Trust. However, the Trust’s Declaration of Trust contains an express disclaimer of liability on the part of Trust shareholders and the By-laws provide that the Trust shall assume, upon request by the shareholder, the defense on behalf of any Trust shareholders. Moreover, the By-laws also provide for indemnification out of Trust property of any shareholder held personally liable solely by reason of being or having been a shareholder for all loss or expense arising from such liability. Additionally, in the normal course of business, the Trust enters into agreements with service providers that may contain indemnification clauses. The Trust’s maximum exposure under these arrangements is unknown as this would involve future claims that may be made against the Trust that have not yet occurred.
I Forward Foreign Currency Exchange Contracts — The Trust may enter into forward foreign currency exchange contracts for the purchase or sale of a specific foreign currency at a fixed price on a future date. The forward foreign currency exchange contracts are adjusted by the daily exchange rate of the underlying currency and any gains or losses are recorded as unrealized until such time as the contracts have been closed. Risks may arise upon entering these contracts from the potential inability of counterparties to meet the terms of their contracts and from movements in the value of a foreign currency relative to the U.S. dollar.
J Interim Financial Statements — The interim financial statements relating to November 30, 2020 and for the six months then ended have not been audited by an independent registered public accounting firm, but in the opinion of the Trust’s management, reflect all adjustments, consisting only of normal recurring adjustments, necessary for the fair presentation of the financial statements.
2 Variable Rate Term Preferred Shares
Variable rate term preferred shares are a form of preferred shares that represent stock of the Trust. They have a par value of $0.01 per share and a liquidation preference of $100,000 per share.
Eaton Vance
Floating-Rate Income Trust
November 30, 2020
Notes to Financial Statements (Unaudited) — continued
On December 18, 2012, the Trust issued 800 shares of Series C-1 Variable Rate Term Preferred Shares (Series C-1 VRTP Shares) in a private offering to a commercial paper conduit sponsored by a large financial institution. The Trust used the net proceeds from the issuance to enter into a series of transactions which resulted in a redemption and/or repurchase of its Auction Preferred Shares.
On September 30, 2016, the Series C-1 VRTP Shares were transferred to another large financial institution (the Assignee) as permitted by the Trust’s By-laws. The transferred Series C-1 VRTP Shares were then exchanged for an equal number of Series L-2 Variable Rate Term Preferred Shares (Series L-2 VRTP Shares), and the mandatory redemption date was extended to three years from the date of transfer. Effective January 24, 2019, the mandatory redemption date of the Series L-2 VRTP Shares was extended to January 24, 2024. Dividends on the Series L-2 VRTP Shares are determined each day based on a spread of 1.75% to three-month LIBOR. Such spread is determined based on the current credit rating of the Series L-2 VRTP Shares, which is provided by Moody’s Investors Service.
The Series L-2 VRTP Shares are redeemable at the option of the Trust at a redemption price equal to $100,000 per share, plus accumulated and unpaid dividends, on any business day and solely for the purpose of reducing the leverage of the Trust. The Series L-2 VRTP Shares are also subject to mandatory redemption at a redemption price equal to $100,000 per share, plus accumulated and unpaid dividends, if the Trust is in default for an extended period on its asset maintenance or leverage ratio requirements with respect to the Series L-2 VRTP Shares. Six months prior to the mandatory redemption date, the Trust is required to segregate in a liquidity account with its custodian investments equal to 110% of the Series L-2 VRTP Shares’ redemption price, and over the six-month period execute a series of liquidation transactions to assure sufficient liquidity to redeem the Series L-2 VRTP Shares. The holders of the Series L-2 VRTP Shares, voting as a class, are entitled to elect two Trustees of the Trust. If the dividends on the Series L-2 VRTP Shares remain unpaid in an amount equal to two full years’ dividends, the holders of the Series L-2 VRTP Shares as a class have the right to elect a majority of the Board of Trustees.
For financial reporting purposes, the liquidation value of the Series L-2 VRTP Shares (net of unamortized deferred debt issuance costs) is presented as a liability on the Statement of Assets and Liabilities and unpaid dividends are included in interest expense and fees payable. Dividends accrued on Series L-2 VRTP Shares are treated as interest payments for financial reporting purposes and are included in interest expense and fees on the Statement of Operations.
In connection with the transfer of the Series C-1 VRTP Shares to the Assignee on September 30, 2016, the Trust paid an upfront fee of $400,000 and debt issuance costs of $458,267. The Trust paid additional debt issuance costs of $52,580 in connection with the extension of the mandatory redemption date of the Series L-2 VRTP Shares. These amounts are being amortized to interest expense and fees through January 24, 2024. The unamortized amount of the debt issuance costs as of November 30, 2020 is presented as a reduction of the liability for variable rate term preferred shares on the Statement of Assets and Liabilities.
The carrying amount of the Series L-2 VRTP Shares at November 30, 2020 represents its liquidation value, which approximates fair value. If measured at fair value, the Series L-2 VRTP Shares would have been considered as Level 2 in the fair value hierarchy (see Note 11) at November 30, 2020. The average liquidation preference of the Series L-2 VRTP Shares during the six months ended November 30, 2020 was $80,000,000.
3 Distributions to Shareholders and Income Tax Information
The Trust intends to make monthly distributions of net investment income to common shareholders, after payment of any dividends on any outstanding variable rate term preferred shares. In addition, at least annually, the Trust intends to distribute all or substantially all of its net realized capital gains. Distributions to common shareholders are recorded on the ex-dividend date. Dividends to variable rate term preferred shareholders are accrued daily and payable quarterly. The dividend rate on the Series L-2 VRTP Shares at November 30, 2020 was 1.97%. The amount of dividends accrued and the average annual dividend rate of the Series L-2 VRTP Shares during the six months ended November 30, 2020 were $897,641 and 2.24%, respectively.
Distributions to shareholders are determined in accordance with income tax regulations, which may differ from U.S. GAAP. As required by U.S. GAAP, only distributions in excess of tax basis earnings and profits are reported in the financial statements as a return of capital. Permanent differences between book and tax accounting relating to distributions are reclassified to paid-in capital. For tax purposes, distributions from short-term capital gains are considered to be from ordinary income.
At May 31, 2020, the Trust, for federal income tax purposes, had deferred capital losses of $25,388,745 which would reduce its taxable income arising from future net realized gains on investment transactions, if any, to the extent permitted by the Internal Revenue Code, and thus would reduce the amount of distributions to shareholders, which would otherwise be necessary to relieve the Trust of any liability for federal income or excise tax. The deferred capital losses are treated as arising on the first day of the Trust’s next taxable year and retain the same short-term or long-term character as when originally deferred. Of the deferred capital losses at May 31, 2020, $6,321,084 are short-term and $19,067,661 are long-term.
Eaton Vance
Floating-Rate Income Trust
November 30, 2020
Notes to Financial Statements (Unaudited) — continued
The cost and unrealized appreciation (depreciation) of investments, including open derivative contracts, of the Trust at November 30, 2020, as determined on a federal income tax basis, were as follows:
| | | | |
| |
Aggregate cost | | $ | 944,685,595 | |
| |
Gross unrealized appreciation | | $ | 13,749,030 | |
| |
Gross unrealized depreciation | | | (36,073,531 | ) |
| |
Net unrealized depreciation | | $ | (22,324,501 | ) |
4 Investment Adviser Fee and Other Transactions with Affiliates
The investment adviser fee is earned by EVM, a wholly-owned subsidiary of Eaton Vance Corp., as compensation for management and investment advisory services rendered to the Trust. The fee is computed at an annual rate of 0.75% of the Trust’s average daily gross assets and is payable monthly. Gross assets as referred to herein represent net assets plus obligations attributable to investment leverage. For the six months ended November 30, 2020, the Trust’s investment adviser fee amounted to $3,182,258. The Trust invests its cash in Cash Reserves Fund. EVM does not currently receive a fee for advisory services provided to Cash Reserves Fund. EVM also serves as administrator of the Trust, but receives no compensation.
Trustees and officers of the Trust who are members of EVM’s organization receive remuneration for their services to the Trust out of the investment adviser fee. Trustees of the Trust who are not affiliated with EVM may elect to defer receipt of all or a percentage of their annual fees in accordance with the terms of the Trustees Deferred Compensation Plan. For the six months ended November 30, 2020, no significant amounts have been deferred. Certain officers and Trustees of the Trust are officers of EVM.
5 Purchases and Sales of Investments
Purchases and sales of investments, other than short-term obligations and including maturities, paydowns and principal repayments on Senior Loans, aggregated $146,218,107 and $71,903,805, respectively, for the six months ended November 30, 2020.
6 Common Shares of Beneficial Interest and Shelf Offering
The Trust may issue common shares pursuant to its dividend reinvestment plan. There were no common shares issued by the Trust for the six months ended November 30, 2020 and the year ended May 31, 2020.
In November 2013, the Board of Trustees initially approved a share repurchase program for the Trust. Pursuant to the reauthorization of the share repurchase program by the Board of Trustees in March 2019, the Trust is authorized to repurchase up to 10% of its common shares outstanding as of the last day of the prior calendar year at market prices when shares are trading at a discount to net asset value. The share repurchase program does not obligate the Trust to purchase a specific amount of shares. There were no repurchases of common shares by the Trust for the six months ended November 30, 2020 and the year ended May 31, 2020.
Pursuant to a registration statement filed with the SEC, the Trust is authorized to issue up to an additional 5,495,789 common shares through an equity shelf offering program (the “shelf offering”). Under the shelf offering, the Trust, subject to market conditions, may raise additional capital from time to time and in varying amounts and offering methods at a net price at or above the Trust’s net asset value per common share. During the six months ended November 30, 2020 and the year ended May 31, 2020, there were no shares sold by the Trust pursuant to its shelf offering.
According to filings made on Schedule 13D and 13G pursuant to Sections 13(d) and 13(g) of the Securities Exchange Act of 1934, as amended, one entity and one individual affiliated with such entity together owned 13.1% of the Trust’s common shares.
Eaton Vance
Floating-Rate Income Trust
November 30, 2020
Notes to Financial Statements (Unaudited) — continued
7 Restricted Securities
At November 30, 2020, the Trust owned the following securities which were restricted as to public resale and not registered under the Securities Act of 1933 (excluding Rule 144A securities). The Trust has various registration rights (exercisable under a variety of circumstances) with respect to these securities. The value of these securities is determined based on valuations provided by brokers when available, or if not available, they are valued at fair value using methods determined in good faith by or at the direction of the Trustees.
| | | | | | | | | | | | | | | | |
| Description | | Date of
Acquisition | | | Shares | | | Cost | | | Value | |
| | | | |
Common Stocks | | | | | | | | | | | | | | | | |
| | | | |
Nine Point Energy Holdings, Inc. | |
| 7/15/14,
10/21/14 |
| | | 758 | | | $ | 34,724 | | | $ | 0 | |
| | | | |
Convertible Preferred Stocks | | | | | | | | | | | | | | | | |
| | | | |
Nine Point Energy Holdings, Inc., Series A, 12.00% | | | 5/26/17 | | | | 14 | | | $ | 14,000 | | | $ | 0 | |
| | | | |
Total Restricted Securities | | | | | | | | | | $ | 48,724 | | | $ | 0 | |
8 Financial Instruments
The Trust may trade in financial instruments with off-balance sheet risk in the normal course of its investing activities. These financial instruments may include forward foreign currency exchange contracts and may involve, to a varying degree, elements of risk in excess of the amounts recognized for financial statement purposes. The notional or contractual amounts of these instruments represent the investment the Trust has in particular classes of financial instruments and do not necessarily represent the amounts potentially subject to risk. The measurement of the risks associated with these instruments is meaningful only when all related and offsetting transactions are considered. A summary of obligations under these financial instruments at November 30, 2020 is included in the Portfolio of Investments. At November 30, 2020, the Trust had sufficient cash and/or securities to cover commitments under these contracts.
The Trust is subject to foreign exchange risk in the normal course of pursuing its investment objectives. Because the Trust holds foreign currency denominated investments, the value of these investments and related receivables and payables may change due to future changes in foreign currency exchange rates. To hedge against this risk, the Trust enters into forward foreign currency exchange contracts.
The Trust enters into forward foreign currency exchange contracts that may contain provisions whereby the counterparty may terminate the contract under certain conditions, including but not limited to a decline in the Trust’s net assets below a certain level over a certain period of time, which would trigger a payment by the Trust for those derivatives in a liability position. At November 30, 2020, the fair value of derivatives with credit-related contingent features in a net liability position was $874,897. The aggregate fair value of assets pledged as collateral by the Trust for such liability was $720,000 at November 30, 2020.
The over-the-counter (OTC) derivatives in which the Trust invests are subject to the risk that the counterparty to the contract fails to perform its obligations under the contract. To mitigate this risk, the Trust has entered into an International Swaps and Derivatives Association, Inc. Master Agreement (“ISDA Master Agreement”) or similar agreement with substantially all its derivative counterparties. An ISDA Master Agreement is a bilateral agreement between the Trust and a counterparty that governs certain OTC derivatives and typically contains, among other things, set-off provisions in the event of a default and/or termination event as defined under the relevant ISDA Master Agreement. Under an ISDA Master Agreement, the Trust may, under certain circumstances, offset with the counterparty certain derivative financial instruments’ payables and/or receivables with collateral held and/or posted and create one single net payment. The provisions of the ISDA Master Agreement typically permit a single net payment in the event of default including the bankruptcy or insolvency of the counterparty. However, bankruptcy or insolvency laws of a particular jurisdiction may impose restrictions on or prohibitions against the right of offset in bankruptcy or insolvency. Certain ISDA Master Agreements allow counterparties to OTC derivatives to terminate derivative contracts prior to maturity in the event the Trust’s net assets decline by a stated percentage or the Trust fails to meet the terms of its ISDA Master Agreements, which would cause the counterparty to accelerate payment by the Trust of any net liability owed to it.
The collateral requirements for derivatives traded under an ISDA Master Agreement are governed by a Credit Support Annex to the ISDA Master Agreement. Collateral requirements are determined at the close of business each day and are typically based on changes in market values for each transaction under an ISDA Master Agreement and netted into one amount for such agreement. Generally, the amount of collateral due from or to a counterparty is subject to a minimum transfer threshold amount before a transfer is required, which may vary by counterparty. Collateral pledged for the benefit of the Trust and/or counterparty is held in segregated accounts by the Trust’s custodian and cannot be sold, re-pledged, assigned or otherwise used while pledged. The portion of such collateral representing cash, if any, is reflected as deposits for derivatives collateral and, in the case of cash pledged by a counterparty for the benefit of the Trust, a corresponding liability on the Statement of Assets and Liabilities. Securities pledged by the Trust as collateral, if any, are identified as such in the Portfolio of Investments.
Eaton Vance
Floating-Rate Income Trust
November 30, 2020
Notes to Financial Statements (Unaudited) — continued
The fair value of open derivative instruments (not considered to be hedging instruments for accounting disclosure purposes) and whose primary underlying risk exposure is foreign exchange risk at November 30, 2020 was as follows:
| | | | | | | | |
| | | Fair Value | |
| Derivative | | Asset Derivative(1) | | | Liability Derivative(2) | |
| | |
Forward foreign currency exchange contracts | | $ | 64,717 | | | $ | (874,897 | ) |
| (1) | Statement of Assets and Liabilities location: Receivable for open forward foreign currency exchange contracts. |
| (2) | Statement of Assets and Liabilities location: Payable for open forward foreign currency exchange contracts. |
The Trust’s derivative assets and liabilities at fair value by type, which are reported gross in the Statement of Assets and Liabilities, are presented in the table above. The following tables present the Trust’s derivative assets and liabilities by counterparty, net of amounts available for offset under a master netting agreement and net of the related collateral received by the Trust for such assets and pledged by the Trust for such liabilities as of November 30, 2020.
| | | | | | | | | | | | | | | | | | | | |
| Counterparty | | Derivative
Assets Subject to
Master Netting
Agreement | | | Derivatives
Available
for Offset | | | Non-cash
Collateral
Received(a) | | | Cash
Collateral
Received(a) | | | Net Amount
of Derivative
Assets(b) | |
| | | | | |
Standard Chartered Bank | | $ | 59,455 | | | $ | (59,455 | ) | | $ | — | | | $ | — | | | $ | — | |
| | | | | |
State Street Bank and Trust Company | | | 5,262 | | | | (5,262 | ) | | | — | | | | — | | | | — | |
| | | | | |
| | | $ | 64,717 | | | $ | (64,717 | ) | | $ | — | | | $ | — | | | $ | — | |
| | | | | |
| Counterparty | | Derivative
Liabilities Subject to
Master Netting
Agreement | | | Derivatives
Available
for Offset | | | Non-cash
Collateral
Pledged(a) | | | Cash
Collateral
Pledged(a) | | | Net Amount
of Derivative
Liabilities(c) | |
| | | | | |
Goldman Sachs International | | $ | (303,337 | ) | | $ | — | | | $ | — | | | $ | 290,000 | | | $ | (13,337 | ) |
| | | | | |
HSBC Bank USA, N.A. | | | (98,226 | ) | | | — | | | | — | | | | 98,226 | | | | — | |
| | | | | |
Standard Chartered Bank | | | (457,749 | ) | | | 59,455 | | | | — | | | | 280,000 | | | | (118,294 | ) |
| | | | | |
State Street Bank and Trust Company | | | (15,585 | ) | | | 5,262 | | | | — | | | | — | | | | (10,323 | ) |
| | | | | |
| | | $ | (874,897 | ) | | $ | 64,717 | | | $ | — | | | $ | 668,226 | | | $ | (141,954 | ) |
| (a) | In some instances, the total collateral received and/or pledged may be more than the amount shown due to overcollateralization. |
| (b) | Net amount represents the net amount due from the counterparty in the event of default. |
| (c) | Net amount represents the net amount payable to the counterparty in the event of default. |
The effect of derivative instruments (not considered to be hedging instruments for accounting disclosure purposes) on the Statement of Operations and whose primary underlying risk exposure is foreign exchange risk for the six months ended November 30, 2020 was as follows:
| | | | | | | | |
| Derivative | | Realized Gain (Loss)
on Derivatives Recognized
in Income(1) | | | Change in Unrealized
Appreciation (Depreciation) on
Derivatives Recognized in Income(2) | |
| | |
Forward foreign currency exchange contracts | | $ | (4,027,187 | ) | | $ | 28,813 | |
| (1) | Statement of Operations location: Net realized gain (loss) – Forward foreign currency exchange contracts. |
| (2) | Statement of Operations location: Change in unrealized appreciation (depreciation) – Forward foreign currency exchange contracts. |
Eaton Vance
Floating-Rate Income Trust
November 30, 2020
Notes to Financial Statements (Unaudited) — continued
The average notional amount of forward foreign currency exchange contracts (based on the absolute value of notional amounts of currency purchased and currency sold) outstanding during the six months ended November 30, 2020, which is indicative of the volume of this derivative type, was approximately $76,058,000.
9 Revolving Credit and Security Agreement
The Trust has entered into a Revolving Credit and Security Agreement, as amended (the Agreement) with conduit lenders and a bank to borrow up to $290 million. Borrowings under the Agreement are secured by the assets of the Trust. Interest is charged at a rate above the conduits’ commercial paper issuance rate and is payable monthly. Under the terms of the Agreement, in effect through March 8, 2021, the Trust also pays a program fee of 0.85% per annum on its outstanding borrowings to administer the facility and a liquidity fee of 0.15% (0.25% if the outstanding loan amount is less than or equal to 60% of the total facility size) per annum on the unused portion of the total commitment under the Agreement. Program and liquidity fees for the six months ended November 30, 2020 totaled $1,005,501 and are included in interest expense and fees on the Statement of Operations. In connection with the renewal of the Agreement on March 9, 2020, the Trust paid upfront fees of $290,000 and, shortly thereafter on March 20, 2020, the Trust paid waiver fees of $362,500 in connection with a reduction of Trust net asset value during the month of March 2020 due to market volatility; these aggregate upfront and waiver fees are being amortized to interest expense through March 8, 2021. The unamortized balance at November 30, 2020 is approximately $185,000 and is included in prepaid upfront fees and other fees on notes payable and variable rate term preferred shares on the Statement of Assets and Liabilities. At November 30, 2020, the Trust had borrowings outstanding under the Agreement of $254,000,000 at an interest rate of 0.21%. Based on the short-term nature of the borrowings under the Agreement and the variable interest rate, the carrying amount of the borrowings at November 30, 2020 approximated its fair value. If measured at fair value, borrowings under the Agreement would have been considered as Level 2 in the fair value hierarchy (see Note 11) at November 30, 2020. For the six months ended November 30, 2020, the average borrowings under the Agreement and the average annual interest rate (excluding fees) were $220,770,492 and 0.28%, respectively.
10 Investments in Affiliated Funds
At November 30, 2020, the value of the Trust’s investment in affiliated funds was $11,721,058, which represents 2.1% of the Trust’s net assets applicable to common shares. Transactions in affiliated funds by the Trust for the six months ended November 30, 2020 were as follows:
| | | | | | | | | | | | | | | | | | | | | | | | | | | | | | | | |
| Name of affiliated fund | | Value,
beginning
of period | | | Purchases | | | Sales
proceeds | | | Net
realized
gain (loss) | | | Change in
unrealized
appreciation
(depreciation) | | | Value, end
of period | | | Dividend
income | | | Units, end
of period | |
|
Short-Term Investments | |
| | | | | | | | |
Eaton Vance Cash Reserves Fund, LLC | | $ | 7,095,616 | | | $ | 116,088,243 | | | $ | (111,463,666 | ) | | $ | 155 | | | $ | 710 | | | $ | 11,721,058 | | | $ | 7,687 | | | | 11,721,058 | |
11 Fair Value Measurements
Under generally accepted accounting principles for fair value measurements, a three-tier hierarchy to prioritize the assumptions, referred to as inputs, is used in valuation techniques to measure fair value. The three-tier hierarchy of inputs is summarized in the three broad levels listed below.
| • | | Level 1 – quoted prices in active markets for identical investments |
| • | | Level 2 – other significant observable inputs (including quoted prices for similar investments, interest rates, prepayment speeds, credit risk, etc.) |
| • | | Level 3 – significant unobservable inputs (including a fund’s own assumptions in determining the fair value of investments) |
In cases where the inputs used to measure fair value fall in different levels of the fair value hierarchy, the level disclosed is determined based on the lowest level input that is significant to the fair value measurement in its entirety. The inputs or methodology used for valuing securities are not necessarily an indication of the risk associated with investing in those securities.
Eaton Vance
Floating-Rate Income Trust
November 30, 2020
Notes to Financial Statements (Unaudited) — continued
At November 30, 2020, the hierarchy of inputs used in valuing the Trust’s investments and open derivative instruments, which are carried at value, were as follows:
| | | | | | | | | | | | | | | | |
| Asset Description | | Level 1 | | | Level 2 | | | Level 3* | | | Total | |
| | | | |
Asset-Backed Securities | | $ | — | | | $ | 36,242,292 | | | $ | — | | | $ | 36,242,292 | |
| | | | |
Closed-End Funds | | | 9,856,267 | | | | — | | | | — | | | | 9,856,267 | |
| | | | |
Common Stocks | | | 1,669,240 | | | | 4,261,194 | | | | 5,704,948 | | | | 11,635,382 | |
| | | | |
Convertible Preferred Stocks | | | — | | | | — | | | | 0 | | | | 0 | |
| | | | |
Corporate Bonds & Notes | | | — | | | | 27,286,527 | | | | — | | | | 27,286,527 | |
| | | | |
Preferred Stocks | | | 209,028 | | | | 53,463 | | | | 357,727 | | | | 620,218 | |
| | | | |
Senior Floating-Rate Loans (Less Unfunded Loan Commitments) | | | — | | | | 823,730,275 | | | | 2,008,925 | | | | 825,739,200 | |
| | | | |
Warrants | | | — | | | | — | | | | 59,356 | | | | 59,356 | |
| | | | |
Miscellaneous | | | — | | | | 10,974 | | | | — | | | | 10,974 | |
| | | | |
Short-Term Investments | | | — | | | | 11,721,058 | | | | — | | | | 11,721,058 | |
| | | | |
Total Investments | | $ | 11,734,535 | | | $ | 903,305,783 | | | $ | 8,130,956 | | | $ | 923,171,274 | |
| | | | |
Forward Foreign Currency Exchange Contracts | | $ | — | | | $ | 64,717 | | | $ | — | | | $ | 64,717 | |
| | | | |
Total | | $ | 11,734,535 | | | $ | 903,370,500 | | | $ | 8,130,956 | | | $ | 923,235,991 | |
| | | |
Liability Description | | | | | | | | | | | | | |
| | | | |
Forward Foreign Currency Exchange Contracts | | $ | — | | | $ | (874,897 | ) | | $ | — | | | $ | (874,897 | ) |
| | | | |
Total | | $ | — | | | $ | (874,897 | ) | | $ | — | | | $ | (874,897 | ) |
| * | None of the unobservable inputs for Level 3 assets, individually or collectively, had a material impact on the Trust. |
Level 3 investments at the beginning and/or end of the period in relation to net assets were not significant and accordingly, a reconciliation of Level 3 assets for the six months ended November 30, 2020 is not presented.
12 Risks and Uncertainties
Risks Associated with Foreign Investments
Investing in securities issued by companies whose principal business activities are outside the United States may involve significant risks not present in domestic investments. For example, there is generally less publicly available information about foreign companies, particularly those not subject to the disclosure and reporting requirements of the U.S. securities laws. Certain foreign issuers are generally not bound by uniform accounting, auditing, and financial reporting requirements and standards of practice comparable to those applicable to domestic issuers. Investments in foreign securities also involve the risk of possible adverse changes in investment or exchange control regulations, expropriation or confiscatory taxation, limitation on the removal of funds or other assets of the Trust, political or financial instability or diplomatic and other developments which could affect such investments. Foreign securities markets, while growing in volume and sophistication, are generally not as developed as those in the United States, and securities of some foreign issuers (particularly those located in developing countries) may be less liquid and more volatile than securities of comparable U.S. companies. In general, there is less overall governmental supervision and regulation of foreign securities markets, broker/dealers and issuers than in the United States.
Credit Risk
The Trust invests primarily in below investment grade floating-rate loans, which are considered speculative because of the credit risk of their issuers. Changes in economic conditions or other circumstances are more likely to reduce the capacity of issuers of these securities to make principal and interest payments. Such companies are more likely to default on their payments of interest and principal owed than issuers of investment grade bonds. An economic downturn generally leads to a higher non-payment rate, and a loan or other debt obligation may lose significant value before a default occurs. Lower rated investments also may be subject to greater price volatility than higher rated investments. Moreover, the specific collateral used to secure a loan may decline in value or become illiquid, which would adversely affect the loan’s value.
Eaton Vance
Floating-Rate Income Trust
November 30, 2020
Notes to Financial Statements (Unaudited) — continued
Pandemic Risk
An outbreak of respiratory disease caused by a novel coronavirus was first detected in China in December 2019 and subsequently spread internationally. This coronavirus has resulted in closing borders, enhanced health screenings, changes to healthcare service preparation and delivery, quarantines, cancellations, disruptions to supply chains and customer activity, as well as general concern and uncertainty. Health crises caused by outbreaks, such as the coronavirus outbreak, may exacerbate other pre-existing political, social and economic risks and disrupt normal market conditions and operations. The impact of this outbreak has negatively affected the worldwide economy, the economies of individual countries, individual companies, and the market in general, and may continue to do so in significant and unforeseen ways, as may other epidemics and pandemics that may arise in the future. Any such impact could adversely affect the Trust’s performance, or the performance of the securities in which the Trust invests.
13 Additional Information
On August 27, 2020, the Trust’s Board of Trustees (the “Board”) received a shareholder demand letter from counsel to Saba Capital Master Fund, Ltd., a hedge fund (“Saba”). Saba also filed claims against the Trust in a lawsuit in Suffolk County Superior Court in Massachusetts asserting breach of contract and fiduciary duty by the Trust and certain of its affiliates, the Trust’s adviser, and the Board, following the recent implementation by the Trust of by-law amendments that (i) require trustee nominees in contested elections to obtain affirmative votes of a majority of eligible shares in order to be elected and (ii) establish certain requirements related to shares obtained in “control share” acquisitions. With respect to the Trust, Saba seeks rescission of these by-law provisions and certain related relief. As of the date these financial statements were issued, the court has not ruled on these matters.
On October 8, 2020, Morgan Stanley and Eaton Vance Corp. (“Eaton Vance”) announced that they had entered into a definitive agreement under which Morgan Stanley would acquire Eaton Vance. Under the Investment Company Act of 1940, as amended, consummation of this transaction may be deemed to result in the automatic termination of an Eaton Vance Fund’s investment advisory agreement, and, where applicable, any related sub-advisory agreement. On November 10, 2020, the Trust’s Board approved a new investment advisory agreement. Shareholders of record of the Trust at the close of business on October 29, 2020 who have voting power with respect to such shares are entitled to be present and vote at a joint special meeting of shareholders and at any adjournments or postponements thereof. The joint special meeting of shareholders was held on January 12, 2021 and adjourned to February 5, 2021 with respect to the Trust.
Eaton Vance
Floating-Rate Income Trust
November 30, 2020
Board of Trustees’ Contract Approval
Overview of the Contract Review Process
Even though the following description of the Board’s (as defined below) consideration of investment advisory agreements covers multiple funds, for purposes of this shareholder report, the description is only relevant as to Eaton Vance Floating-Rate Income Trust.
At a meeting held on November 10, 2020 (the “November Meeting”), the Board of Trustees (each, a “Board” and, collectively, the “Board”) of each closed-end Fund (each, a “Fund” and, collectively, the “Funds”(1)) managed by Eaton Vance Management (“Eaton Vance”), including a majority of the Board members (the “Independent Trustees”) who are not “interested persons” (as defined in the Investment Company Act of 1940 (the “1940 Act”)) of the Funds or Eaton Vance, voted to approve a new investment advisory agreement between each Fund and Eaton Vance, each of which is intended to go into effect upon the completion of the Transaction (as defined below) (each, a “New Agreement” and, collectively, the “New Agreements”). The Board’s evaluative process is more fully described below. In voting its approval of the New Agreements at the November Meeting, the Board relied on an order issued by the Securities and Exchange Commission in response to the impacts of the COVID-19 pandemic that provided temporary relief from the in-person meeting requirements under Section 15 of the 1940 Act.
In voting its approval of the New Agreements, the Board of each Fund relied upon the recommendation of its Contract Review Committee, which is a committee comprised exclusively of Independent Trustees. Prior to and during meetings leading up to the November Meeting, the Contract Review Committee reviewed and discussed information furnished by Eaton Vance and Morgan Stanley, as requested by the Independent Trustees, that the Contract Review Committee considered reasonably necessary to evaluate the terms of the New Agreements and to form its recommendations. Such information included, among other things, the terms and anticipated impacts of Morgan Stanley’s pending acquisition of Eaton Vance Corp. (the “Transaction”) on the Funds and their shareholders. In addition to considering information furnished specifically to evaluate the impact of the Transaction on the Funds and their respective shareholders, the Board and its Contract Review Committee also considered information furnished for prior meetings of the Board and its committees, including, but not limited to, information provided in connection with the annual contract review process for the Funds, which most recently culminated in April 2020 (the “2020 Annual Approval Process”).
The Board of each Fund, including the Independent Trustees, concluded that the applicable New Agreement, including the fees payable thereunder, was fair and reasonable, and it voted to approve the New Agreement and to recommend that shareholders do so as well.
Shortly after the announcement of the Transaction, the Board, including all of the Independent Trustees, met with senior representatives from Eaton Vance and Morgan Stanley at its meeting held on October 13, 2020 to discuss certain aspects of the Transaction and the expected impacts of the Transaction on the Funds and their shareholders. As part of the Board’s evaluation process, counsel to the Independent Trustees, on behalf of the Contract Review Committee, requested additional information to assist the Independent Trustees in their evaluation of the New Agreements and the implications of the Transaction, as well as other contractual arrangements that may be affected by the Transaction. The Contract Review Committee considered information furnished by Eaton Vance and Morgan Stanley and their respective affiliates during meetings on November 5, 2020 and November 10, 2020.
The Contract Review Committee again met with senior representatives of Eaton Vance and Morgan Stanley at its meeting on November 10, 2020, to further discuss the approval of the New Agreements. The representatives from Eaton Vance and Morgan Stanley each made presentations to, and responded to questions from, the Independent Trustees. The Contract Review Committee considered Eaton Vance’s and Morgan Stanley’s responses related to the Transaction and specifically to the Funds, as well as information received in connection with the 2020 Annual Approval Process, with respect to its evaluation of the New Agreements. Among other information, the Board considered:
Information about the Transaction and its Terms
| | • | | Information about the material terms and conditions, and expected impact, of the Transaction that relate to the Funds, including the expected impact on the businesses conducted by Eaton Vance with respect to the Funds; |
| | • | | Information about the advantages of the Transaction as they relate to the Funds and their shareholders; |
| | • | | A commitment that the Funds would not bear any expenses, directly or indirectly, in connection with the Transaction, including with respect to the solicitation of shareholder approval of the New Agreements; |
| | • | | A commitment that, for a period of three years after the Closing, at least 75% of each Fund’s Board members must not be “interested persons” (as defined in the 1940 Act) of the investment adviser (or predecessor investment adviser, if applicable) pursuant to Section 15(f)(1)(A) of the 1940 Act; |
| | • | | A commitment that Morgan Stanley would use its reasonable best efforts to ensure that it did not impose any “unfair burden” (as that term is used in section 15(f)(1)(B) of the 1940 Act) on the Funds as a result of the Transaction; |
| | • | | Information with respect to the potential impact of the Transaction on personnel and/or other resources of Eaton Vance and its affiliates, as well as any expected changes to compensation, including any retention-based compensation intended to incentivize key personnel at Eaton Vance and its affiliates; |
| | • | | Information regarding any changes that are expected with respect to the Funds’ slate of officers as a result of the Transaction; |
Information about Morgan Stanley
| | • | | Information about Morgan Stanley’s overall business, including information about the advisory, brokerage and related businesses that Morgan Stanley operates; |
| (1) | References to the Funds do not include Eaton Vance Floating-Rate Income Plus Fund. |
Eaton Vance
Floating-Rate Income Trust
November 30, 2020
Board of Trustees’ Contract Approval — continued
| | • | | Information about Morgan Stanley’s financial condition, including its access to capital and other resources required to support the investment advisory businesses related to the Funds; |
| | • | | Information on how the Funds are expected to fit within Morgan Stanley’s overall business strategy, and any changes that Morgan Stanley contemplates implementing to the Funds in the short- or long-term following the closing of the Transaction (the |
| | • | | Information regarding risk management functions at Morgan Stanley and its affiliates, including how existing risk management protocols and procedures may impact the Funds and/or the businesses of Eaton Vance and its affiliates as they relate to the Funds; |
| | • | | Information on the anticipated benefits of the Transaction to the Funds with respect to potential additional distribution capabilities and the ability to access new markets and customer segments through Morgan Stanley’s distribution network, including, in particular, its institutional client base; |
| | • | | Information regarding the financial condition and reputation of Morgan Stanley, its worldwide presence, experience as a fund sponsor and manager, commitment to maintain a high level of cooperation with, and support to, the Funds, strong client service capabilities, and relationships in the asset management industry; |
Information about the New Agreements
| | • | | A representation that, after the Closing, all of the Funds will continue to be advised by Eaton Vance, and will continue under the “Eaton Vance” brand; |
| | • | | Information regarding the terms of the New Agreements, including certain changes as compared to the current investment advisory agreement between each Fund and Eaton Vance (collectively, the “Current Agreements”); |
| | • | | Information confirming that the fee rates payable under the New Agreements are not changed as compared to the Current Agreements; |
| | • | | A representation that the New Agreements will not cause any diminution in the nature, extent and quality of services provided by Eaton Vance to the Funds and their respective shareholders, including with respect to compliance and other non-advisory services; |
Information about Fund Performance, Fees and Expenses
| | • | | A report from an independent data provider comparing the investment performance of each Fund (including, as relevant, total return data, income data, Sharpe ratios and information ratios) to the investment performance of comparable funds and, as applicable, benchmark indices, over various time periods as of the 2020 Annual Approval Process, as well as performance information as of a more recent date; |
| | • | | A report from an independent data provider comparing each Fund’s total expense ratio (and its components) to those of comparable funds as of the 2020 Annual Approval Process, as well as fee and expense information as of a more recent date; |
| | • | | In certain instances, data regarding investment performance relative to customized groups of peer funds and blended indices identified by Eaton Vance in consultation with the Portfolio Management Committee of the Board as of the 2020 Annual Approval Process, as well as corresponding performance information as of a more recent date; |
| | • | | Comparative information concerning the fees charged and services provided by Eaton Vance to each Fund in managing other accounts (which may include other mutual funds, collective investment funds and institutional accounts) using investment strategies and techniques similar to those used in managing such Fund(s), if any; |
| | • | | Profitability analyses of Eaton Vance with respect to each of the Funds as of the 2020 Annual Approval Process, as well as information regarding the impact of the Transaction on profitability; |
Information about Portfolio Management and Trading
| | • | | Descriptions of the investment management services currently provided and expected to be provided to each Fund after the Closing, as well as each of the Funds’ investment strategies and policies; |
| | • | | The procedures and processes used to determine the fair value of Fund assets, when necessary, and actions taken to monitor and test the effectiveness of such procedures and processes; |
| | • | | Information regarding any contemplated changes to the policies and practices of Eaton Vance with respect to trading, including their processes for seeking best execution of portfolio transactions; |
| | • | | Information regarding the impact on trading and access to capital markets associated with the Funds’ post-Closing affiliations with Morgan Stanley and its affiliates, including potential restrictions with respect to the Funds’ ability to execute portfolio transactions with Morgan Stanley and its affiliates; |
Information about Eaton Vance
| | • | | Information about the financial results and condition of Eaton Vance since the culmination of the 2020 Annual Approval Process and any material changes in financial condition that are reasonably expected to occur before and after the Closing; |
| | • | | Confirmation that there are no immediately contemplated post-Closing changes to the individual investment professionals whose responsibilities include portfolio management and investment research for the Funds, and, for portfolio managers and certain other investment professionals, information relating to their responsibilities with respect to managing other mutual funds and investment accounts, as applicable post-Closing; |
| | • | | The Code of Ethics of Eaton Vance and its affiliates, together with information relating to compliance with, and the administration of, such codes; |
| | • | | Policies and procedures relating to proxy voting and the handling of corporate actions and class actions; |
Eaton Vance
Floating-Rate Income Trust
November 30, 2020
Board of Trustees’ Contract Approval — continued
| | • | | Information concerning the resources devoted to compliance efforts undertaken by Eaton Vance and its affiliates, including descriptions of their various compliance programs and their record of compliance; |
| | • | | Information concerning the business continuity and disaster recovery plans of Eaton Vance and its affiliates; |
Other Relevant Information
| | • | | Information concerning the nature, cost and character of the administrative and other non-investment advisory services provided by Eaton Vance and its affiliates; |
| | • | | Information concerning oversight of the relationship with the custodian, subcustodians and fund accountants by Eaton Vance and/or administrator to each of the Funds; |
| | • | | Information concerning the benefits of the closed-end fund structure, as well as, where relevant, the closed-end fund’s market prices, trading volume data, distribution rates and other relevant matters; |
| | • | | Confirmation that Eaton Vance intends to continue to manage the Funds in a manner materially consistent with each Fund’s current investment objective(s) and principal investment strategies; |
| | • | | Information regarding Morgan Stanley’s commitment to maintaining competitive compensation arrangements to attract and retain highly qualified personnel; |
| | • | | Confirmation that Eaton Vance and Morgan Stanley will continue to keep the Board apprised of developments as the Transaction progresses and prior to and, as applicable, following the Closing; |
| | • | | Confirmation that the current senior management team at Eaton Vance has indicated its strong support of the Transaction; and |
| | • | | Information regarding the fact that Morgan Stanley and Eaton Vance Corp. will each derive benefits from the Transaction and that, as a result, they have a financial interest in the matters that were being considered. |
As indicated above, the Board and its Contract Review Committee also considered information received at its regularly scheduled meetings throughout the year, which included information from portfolio managers and other investment professionals of Eaton Vance regarding investment and performance matters, and considered various investment and trading strategies used in pursuing the Funds’ investment objectives. The Board also received information regarding risk management techniques employed in connection with the management of the Funds. The Board and its committees evaluated issues pertaining to industry and regulatory developments, compliance procedures, fund governance and other issues with respect to the Funds, and received reports and participated in presentations provided by Eaton Vance and its affiliates with respect to such matters.
The Contract Review Committee was advised throughout the evaluation process by Goodwin Procter LLP, independent legal counsel for the Independent Trustees. The members of the Contract Review Committee, with the advice of such counsel, exercised their own business judgment in determining the material factors to be considered in evaluating the New Agreements and the weight to be given to each such factor. The conclusions reached with respect to the New Agreements were based on a comprehensive evaluation of all the information provided and not any single factor. Moreover, each Independent Trustee may have placed varying emphasis on particular factors in reaching conclusions with respect to the New Agreements.
Nature, Extent and Quality of Services
In considering whether to approve the New Agreements, the Board evaluated the nature, extent and quality of services currently provided to each Fund by Eaton Vance under the Current Agreements. In evaluating the nature, extent and quality of services to be provided by Eaton Vance under the New Agreements, the Board considered, among other information, the expected impact, if any, of the Transaction on the operations, facilities, organization and personnel of Eaton Vance, and that Morgan Stanley and Eaton Vance have advised the Board that, following the Closing, there is not expected to be any diminution in the nature, extent and quality of services provided by Eaton Vance to the Funds and their shareholders, including compliance and other non-advisory services, and that there are not expected to be any changes in portfolio management personnel as a result of the Transaction.
The Board also considered the financial resources of Morgan Stanley and Eaton Vance and the importance of having a Fund manager with, or with access to, significant organizational and financial resources. The Board considered the benefits to the Funds of being part of a larger combined organization with greater financial resources following the Closing, particularly during periods of market disruptions and volatility. In this regard, the Board considered information provided by Morgan Stanley regarding its business and operating structure, scale of operation, leadership and reputation, distribution capabilities and financial condition, as well as information on how the Funds are expected to fit within Morgan Stanley’s overall business strategy and any changes that Morgan Stanley contemplates in the short- or long-term following the Closing. The Board also noted Morgan Stanley’s and Eaton Vance’s commitment to keep the Board apprised of developments with respect to its long-term integration plans for Eaton Vance and existing Morgan Stanley affiliates and their respective personnel.
The Board considered Eaton Vance’s management capabilities, investment processes and investment performance in light of the types of investments held by each Fund, including the education, experience and number of investment professionals and other personnel who provide portfolio management, investment research, and similar services to each Fund. In particular, the Board considered the abilities and experience of Eaton Vance’s investment professionals in implementing each Fund’s investment strategies. The Board also took into account the resources dedicated to portfolio management and other services, the compensation methods of Eaton Vance and other factors, including the reputation and resources of Eaton Vance to recruit and retain highly qualified research, advisory and supervisory investment professionals. With respect to the recruitment and retention of key personnel, the Board
Eaton Vance
Floating-Rate Income Trust
November 30, 2020
Board of Trustees’ Contract Approval — continued
noted information from Morgan Stanley and Eaton Vance regarding the benefits of joining Morgan Stanley. In addition, the Board considered the time and attention devoted to the Funds by senior management, as well as the infrastructure, operational capabilities and support staff in place to assist in the portfolio management and operations of the Funds, including the provision of administrative services. With respect to the foregoing, the Board also considered information from Eaton Vance and Morgan Stanley regarding the anticipated impact of the Transaction on such matters. The Board also considered the business-related and other risks to which Eaton Vance or its affiliates may be subject in managing the Funds and in connection with the Transaction. The Board considered the deep experience of Eaton Vance and its affiliates with managing and operating funds organized as exchange-listed closed-end funds, such as the Funds. In this regard, the Board considered, among other things, Eaton Vance’s and its affiliates’ experience with implementing leverage arrangements, monitoring and assessing trading price discounts and premiums and adhering to the requirements of securities exchanges.
The Board considered the compliance programs of Eaton Vance and relevant affiliates thereof. The Board considered compliance and reporting matters regarding, among other things, personal trading by investment professionals, disclosure of portfolio holdings, late trading, frequent trading, portfolio valuation, business continuity and the allocation of investment opportunities. The Board also considered the responses of Eaton Vance and its affiliates to requests in recent years from regulatory authorities, such as the Securities and Exchange Commission and the Financial Industry Regulatory Authority. The Board also considered certain information relating to the compliance record of Morgan Stanley and its affiliates, including information requests in recent years from regulatory authorities. With respect to the foregoing, including the compliance programs of Eaton Vance, the Board noted information regarding the impact of the Transaction, as well as Eaton Vance’s and Morgan Stanley’s commitment to keep the Board apprised of developments with respect to its long-term integration plans for Eaton Vance and existing Morgan Stanley affiliates and their respective personnel.
The Board considered other administrative services provided and to be provided or overseen by Eaton Vance and its affiliates, including transfer agency and accounting services. The Board evaluated the benefits to shareholders of investing in a fund that is a part of a large fund complex offering exposure to a variety of asset classes and investment disciplines. The Board noted information that the Transaction was not expected to have any material impact on such matters in the near-term.
In evaluating the nature, extent and quality of the services to be provided under the New Agreements, the Board also considered investment performance information provided for each Fund in connection with the 2020 Annual Approval Process, as well as information provided as of a more recent date. In this regard, the Board compared each Fund’s investment performance to that of comparable funds identified by an independent data provider (the peer group), as well as appropriate benchmark indices and, for certain Funds, a custom peer group of similarly managed funds. The Board also considered, where applicable, Fund-specific performance explanations based on criteria established by the Board in connection with the 2020 Annual Approval Process and, where applicable, performance explanations as of a more recent date. In addition to the foregoing information, it was also noted that the Board has received and discussed with management information throughout the year at periodic intervals comparing each Fund’s performance against applicable benchmark indices and peer groups. In addition, the Board considered each Fund’s performance in light of overall financial market conditions. Where a Fund’s relative underperformance to its peers was significant during one or more specified periods, the Board noted the explanations from Eaton Vance concerning the Fund’s relative performance versus the peer group.
After consideration of the foregoing factors, among others, and based on their review of the materials provided and the assurances received from, and recommendations of, Eaton Vance and Morgan Stanley, the Board determined that the Transaction was not expected to adversely affect the nature, extent and quality of services provided to the Funds by Eaton Vance and its affiliates and that the Transaction was not expected to have an adverse effect on the ability of Eaton Vance and its affiliates to provide those services. The Board concluded that the nature, extent and quality of services expected to be provided by Eaton Vance, taken as a whole, are appropriate and expected to be consistent with the terms of the New Agreements.
Management Fees and Expenses
The Board considered contractual fee rates payable by each Fund for advisory and administrative services (referred to collectively as “management fees”) in connection with the 2020 Annual Approval Process, as well as information provided as of a more recent date. As part of its review, the Board considered each Fund’s management fees and total expense ratio over various periods, as compared to those of comparable funds, before and after giving effect to any undertaking to waive fees or reimburse expenses.
The Board also considered factors, and, where applicable, certain Fund-specific factors, that had an impact on a Fund’s total expense ratio relative to comparable funds, as identified by Eaton Vance in response to inquiries from the Contract Review Committee. The Board considered that the New Agreement does not change a Fund’s management fee rate or the computation method for calculating such fees, including any separately executed permanent contractual management fee reduction currently in place for the Fund.
The Board also received and considered, where applicable, information about the services offered and the fee rates charged by Eaton Vance to other types of accounts with investment objectives and strategies that are substantially similar to and/or managed in a similar investment style as a Fund. In this regard, the Board received information about the differences in the nature and scope of services Eaton Vance provides to the Funds as compared to other types of accounts and the material differences in compliance, reporting and other legal burdens and risks to Eaton Vance as between each Fund and other types of accounts.
Eaton Vance
Floating-Rate Income Trust
November 30, 2020
Board of Trustees’ Contract Approval — continued
After considering the foregoing information, and in light of the nature, extent and quality of the services expected to be provided by Eaton Vance, the Board concluded that the management fees charged for advisory and related services are reasonable with respect to its approval of the New Agreements.
Profitability and “Fall-Out” Benefits
During the 2020 Annual Approval Process, the Board considered the level of profits realized by Eaton Vance and relevant affiliates thereof in providing investment advisory and administrative services to the Funds and to all Eaton Vance funds as a group. The Board considered the level of profits realized without regard to marketing support or other payments by Eaton Vance and its affiliates to third parties in respect of distribution or other services. In light of the foregoing factors and the nature, extent and quality of the services rendered, the profits realized by Eaton Vance and its affiliates were not deemed to be excessive by the Board.
The Board noted that Morgan Stanley and Eaton Vance are expected to realize, over time, cost savings from the Transaction based on eliminating duplicate corporate overhead expenses. The Board considered, however, information from Eaton Vance and Morgan Stanley that such cost savings are not expected to be realized immediately upon the Closing and that, accordingly, there are currently no specific expected changes in the levels of profitability associated with the advisory and other services provided to the Funds that are contemplated as a result of the Transaction. The Board noted that it will continue to receive information regarding profitability during its annual contract review processes, including the extent to which cost savings and/or other efficiencies result in changes to profitability levels.
The Board also considered direct or indirect fall-out benefits received by Eaton Vance and its affiliates in connection with their respective relationships with the Funds, including the benefits of research services that may be available to Eaton Vance and its affiliates as a result of securities transactions effected for the Funds and other investment advisory clients. In evaluating the fall-out benefits to be received by Eaton Vance and its affiliates under the New Agreements, the Board considered whether the Transaction would have an impact on the fall-out benefits currently realized by Eaton Vance and its affiliates in connection with services provided pursuant to the Current Agreements.
The Board of each Fund considered that Morgan Stanley may derive reputational and other benefits from its ability to use the names of Eaton Vance and its affiliates in connection with operating and marketing the Funds. The Board considered that the Transaction, if completed, would significantly increase Morgan Stanley’s assets under management and expand Morgan Stanley’s investment capabilities.
Economies of Scale
The Board also considered the extent to which Eaton Vance and its affiliates, on the one hand, and the Funds, on the other hand, can expect to realize benefits from economies of scale as the assets of the Funds increase. The Board acknowledged the difficulty in accurately measuring the benefits resulting from economies of scale, if any, with respect to the management of any specific Fund or group of funds. As part of the 2020 Annual Approval Process, the Board reviewed data summarizing the increases and decreases in the assets of the Funds and of all Eaton Vance funds as a group over various time periods, and evaluated the extent to which the total expense ratio of each Fund and the profitability of Eaton Vance and its affiliates may have been affected by such increases or decreases.
The Board noted that Morgan Stanley and Eaton Vance are expected to benefit from possible growth of the Funds resulting from enhanced distribution capabilities, including with respect to the Funds’ potential access to Morgan Stanley’s institutional client base. Based upon the foregoing, the Board concluded that the Funds currently share in the benefits from economies of scale, if any, when they are realized by Eaton Vance, and that the Transaction is not expected to impede a Fund from continuing to benefit from any future economies of scale realized by Eaton Vance. The Board also considered the fact that the Funds are not continuously offered in the same manner as an open-end fund and that the Funds’ assets may not increase materially in the foreseeable future.
Conclusion
Based on its consideration of the foregoing, and such other information it deemed relevant, including the factors and conclusions described above, the Contract Review Committee recommended to the Board approval of the New Agreements. Based on the recommendation of the Contract Review Committee, the Board, including a majority of the Independent Trustees, unanimously voted to approve the New Agreements for the Funds and recommended that shareholders approve the New Agreements.
Eaton Vance
Floating-Rate Income Trust
November 30, 2020
Officers and Trustees
Officers
Eric A. Stein
President
Deidre E. Walsh
Vice President
Maureen A. Gemma
Secretary and Chief Legal Officer
James F. Kirchner
Treasurer
Richard F. Froio
Chief Compliance Officer
Trustees
William H. Park
Chairperson
Thomas E. Faust Jr.*
Mark R. Fetting
Cynthia E. Frost
George J. Gorman
Valerie A. Mosley
Helen Frame Peters
Keith Quinton
Marcus L. Smith
Susan J. Sutherland
Scott E. Wennerholm
Eaton Vance Funds
IMPORTANT NOTICES
Privacy. The Eaton Vance organization is committed to ensuring your financial privacy. Each entity listed below has adopted privacy policy and procedures (“Privacy Program”) Eaton Vance believes is reasonably designed to protect your personal information and to govern when and with whom Eaton Vance may share your personal information.
| • | | At the time of opening an account, Eaton Vance generally requires you to provide us with certain information such as name, address, social security number, tax status, account numbers, and account balances. This information is necessary for us to both open an account for you and to allow us to satisfy legal requirements such as applicable anti-money laundering reviews and know-your-customer requirements. |
| • | | On an ongoing basis, in the normal course of servicing your account, Eaton Vance may share your information with unaffiliated third parties that perform various services for Eaton Vance and/or your account. These third parties include transfer agents, custodians, broker/dealers and our professional advisers including auditors, accountants, and legal counsel. Eaton Vance may share your personal information with our affiliates. Eaton Vance may also share your information as required or permitted by applicable law. |
| • | | We have adopted a Privacy Program we believe is reasonably designed to protect the confidentiality of your personal information and to prevent unauthorized access to your information. |
| • | | We reserve the right to change our Privacy Program at any time upon proper notification to you. You may want to review our Privacy Program periodically for changes by accessing the link on our homepage: www.eatonvance.com. |
Our pledge of protecting your personal information applies to the following entities within the Eaton Vance organization: the Eaton Vance Family of Funds, Eaton Vance Management, Eaton Vance WaterOak Advisors, Eaton Vance Distributors, Inc., Eaton Vance Trust Company, Eaton Vance Management (International) Limited, Eaton Vance Advisers International Ltd., Eaton Vance Global Advisors Limited, Eaton Vance Management’s Real Estate Investment Group, Boston Management and Research, Calvert Research and Management, and Calvert Funds. This notice supersedes all previously issued privacy disclosures. For more information about Eaton Vance’s Privacy Program or about how your personal information may be used, please call 1-800-262-1122.
Delivery of Shareholder Documents. The Securities and Exchange Commission (SEC) permits funds to deliver only one copy of shareholder documents, including prospectuses, proxy statements and shareholder reports, to fund investors with multiple accounts at the same residential or post office box address. This practice is often called “householding” and it helps eliminate duplicate mailings to shareholders. American Stock Transfer & Trust Company, LLC (“AST”), the closed-end funds transfer agent, or your financial intermediary, may household the mailing of your documents indefinitely unless you instruct AST, or your financial intermediary, otherwise. If you would prefer that your Eaton Vance documents not be householded, please contact AST or your financial intermediary. Your instructions that householding not apply to delivery of your Eaton Vance documents will typically be effective within 30 days of receipt by AST or your financial intermediary.
Portfolio Holdings. Each Eaton Vance Fund and its underlying Portfolio(s) (if applicable) files a schedule of portfolio holdings on Part F to Form N-PORT with the SEC. Certain information filed on Form N-PORT may be viewed on the Eaton Vance website at www.eatonvance.com, by calling Eaton Vance at 1-800-262-1122 or in the EDGAR database on the SEC’s website at www.sec.gov.
Proxy Voting. From time to time, funds are required to vote proxies related to the securities held by the funds. The Eaton Vance Funds or their underlying Portfolios (if applicable) vote proxies according to a set of policies and procedures approved by the Funds’ and Portfolios’ Boards. You may obtain a description of these policies and procedures and information on how the Funds or Portfolios voted proxies relating to portfolio securities during the most recent 12-month period ended June 30, without charge, upon request, by calling 1-800-262-1122 and by accessing the SEC’s website at www.sec.gov.
Share Repurchase Program. The Fund’s Board of Trustees has approved a share repurchase program authorizing the Fund to repurchase up to 10% of its common shares outstanding as of the last day of the prior calendar year in open-market transactions at a discount to net asset value. The repurchase program does not obligate the Fund to purchase a specific amount of shares. The Fund’s repurchase activity, including the number of shares purchased, average price and average discount to net asset value, is disclosed in the Fund’s annual and semi-annual reports to shareholders.
Additional Notice to Shareholders. If applicable, a Fund may also redeem or purchase its outstanding preferred shares in order to maintain compliance with regulatory requirements, borrowing or rating agency requirements or for other purposes as it deems appropriate or necessary.
Closed-End Fund Information. Eaton Vance closed-end funds make fund performance data and certain information about portfolio characteristics available on the Eaton Vance website shortly after the end of each month. Other information about the funds is available on the website. The funds’ net asset value per share is readily accessible on the Eaton Vance website. Portfolio holdings for the most recent month-end are also posted to the website approximately 30 days following the end of the month. This information is available at www.eatonvance.com on the fund information pages under “Individual Investors — Closed-End Funds”.
Investment Adviser and Administrator
Eaton Vance Management
Two International Place
Boston, MA 02110
Custodian
State Street Bank and Trust Company
State Street Financial Center, One Lincoln Street
Boston, MA 02111
Transfer Agent
American Stock Transfer & Trust Company, LLC
6201 15th Avenue
Brooklyn, NY 11219
Fund Offices
Two International Place
Boston, MA 02110

7739 11.30.20
Not required in this filing.
| Item 3. | Audit Committee Financial Expert |
Not required in this filing.
| Item 4. | Principal Accountant Fees and Services |
Not required in this filing.
| Item 5. | Audit Committee of Listed Registrants |
Not required in this filing.
| Item 6. | Schedule of Investments |
Please see schedule of investments contained in the Report to Stockholders included under Item 1 of this Form N-CSR.
| Item 7. | Disclosure of Proxy Voting Policies and Procedures for Closed-End Management Investment Companies |
Not required in this filing.
| Item 8. | Portfolio Managers of Closed-End Management Investment Companies |
Not required in this filing.
| Item 9. | Purchases of Equity Securities by Closed-End Management Investment Company and Affiliated Purchasers |
Not applicable.
| Item 10. | Submission of Matters to a Vote of Security Holders |
No material changes.
| Item 11. | Controls and Procedures |
(a) It is the conclusion of the registrant’s principal executive officer and principal financial officer that the effectiveness of the registrant’s current disclosure controls and procedures (such disclosure controls and procedures having been evaluated within 90 days of the date of this filing) provide reasonable assurance that the information required to be disclosed by the registrant has been recorded, processed, summarized and reported within the time period specified in the Commission’s rules and forms and that the information required to be disclosed by the registrant has been accumulated and communicated to the registrant’s principal executive officer and principal financial officer in order to allow timely decisions regarding required disclosure.
(b) There have been no changes in the registrant’s internal controls over financial reporting during the period covered by this report that has materially affected, or is reasonably likely to materially affect, the registrant’s internal control over financial reporting.
| Item 12. | Disclosure of Securities Lending Activities for Closed-End Management Investment Companies |
No activity to report for the registrant’s most recent fiscal year end.
Signatures
Pursuant to the requirements of the Securities Exchange Act of 1934 and the Investment Company Act of 1940, the registrant has duly caused this report to be signed on its behalf by the undersigned, thereunto duly authorized.
| | |
| Eaton Vance Floating-Rate Income Trust |
| |
| By: | | /s/ Eric A. Stein |
| | Eric A. Stein |
| | President |
| |
| Date: | | January 25, 2021 |
Pursuant to the requirements of the Securities Exchange Act of 1934 and the Investment Company Act of 1940, this report has been signed below by the following persons on behalf of the registrant and in the capacities and on the dates indicated.
| | |
| By: | | /s/ James F. Kirchner |
| | James F. Kirchner |
| | Treasurer |
| |
| Date: | | January 25, 2021 |
| |
| By: | | /s/ Eric A. Stein |
| | Eric A. Stein |
| | President |
| |
| Date: | | January 25, 2021 |