UNITED STATES
SECURITIES AND EXCHANGE COMMISSION
Washington, D.C. 20549
Form N-CSR
CERTIFIED SHAREHOLDER REPORT OF REGISTERED
MANAGEMENT INVESTMENT COMPANIES
Investment Company Act File Number: 811-21574
Eaton Vance Floating-Rate Income Trust
(Exact Name of Registrant as Specified in Charter)
Two International Place, Boston, Massachusetts 02110
(Address of Principal Executive Offices)
Deidre E. Walsh
Two International Place, Boston, Massachusetts 02110
(Name and Address of Agent for Services)
(617) 482-8260
(Registrant’s Telephone Number)
May 31
Date of Fiscal Year End
November 30, 2021
Date of Reporting Period
Item 1. Reports to Stockholders

Eaton Vance
Floating-Rate Income Trust (EFT)
Semiannual Report
November 30, 2021

Commodity Futures Trading Commission Registration. The Commodity Futures Trading Commission (“CFTC”) has adopted regulations that subject registered investment companies and advisers to regulation by the CFTC if a fund invests more than a prescribed level of its assets in certain CFTC-regulated instruments (including futures, certain options and swap agreements) or markets itself as providing investment exposure to such instruments. The investment adviser has claimed an exclusion from the definition of “commodity pool operator” under the Commodity Exchange Act with respect to its management of the Fund. Accordingly, neither the Fund nor the adviser with respect to the operation of the Fund is subject to CFTC regulation. Because of its management of other strategies, the Fund’s adviser is registered with the CFTC as a commodity pool operator. The adviser is also registered as a commodity trading advisor.
Fund shares are not insured by the FDIC and are not deposits or other obligations of, or guaranteed by, any depository institution. Shares are subject to investment risks, including possible loss of principal invested.
Semiannual Report November 30, 2021
Eaton Vance
Floating-Rate Income Trust
Eaton Vance
Floating-Rate Income Trust
November 30, 2021
Performance1,2
Portfolio Manager(s) Ralph H. Hinckley, CFA, Andrew N. Sveen, CFA, Catherine C. McDermott, William E. Holt, CFA and Daniel P. McElaney, CFA
| | | | | | | | | | | | | | | | | | | | |
| % Average Annual Total Returns | | Inception Date | | | Six Months | | | One Year | | | Five Years | | | Ten Years | |
| | | | | |
Fund at NAV | | | 06/29/2004 | | | | 2.19 | % | | | 7.77 | % | | | 5.37 | % | | | 6.08 | % |
Fund at Market Price | | | — | | | | 6.58 | | | | 18.88 | | | | 6.51 | | | | 6.72 | |
|
| |
| | | | | |
S&P/LSTA Leveraged Loan Index | | | — | | | | 1.59 | % | | | 5.94 | % | | | 4.38 | % | | | 4.67 | % |
| | | | | |
| % Premium/Discount to NAV3 | | | | | | | | | | | | | | | |
| | | | | |
| | | | | | | | | | | | | | | | | | | 2.22 | % |
| | | | | |
| Distributions4 | | | | | | | | | | | | | | | |
| | | | | |
Total Distributions per share for the period | | | | | | | | | | | | | | | | | | $ | 0.465 | |
Distribution Rate at NAV | | | | | | | | | | | | | | | | | | | 6.45 | % |
Distribution Rate at Market Price | | | | | | | | | | | | | | | | | | | 6.31 | |
| | | | | |
| % Total Leverage5 | | | | | | | | | | | | | | | |
| | | | | |
Borrowings | | | | | | | | | | | | | | | | | | | 21.98 | % |
Variable Rate Term Preferred Shares (VRTP Shares) | | | | | | | | | | | | | | | | | | | 12.56 | |
See Endnotes and Additional Disclosures in this report.
Past performance is no guarantee of future results. Returns are historical and are calculated net of management fees and other expenses by determining the percentage change in net asset value (NAV) or market price (as applicable) with all distributions reinvested in accordance with the Fund’s Dividend Reinvestment Plan. Performance at market price will differ from performance at NAV due to variations in the Fund’s market price versus NAV, which may reflect factors such as fluctuations in supply and demand for Fund shares, changes in Fund distributions, shifting market expectations for the Fund’s future returns and distribution rates, and other considerations affecting the trading prices of closed-end funds. Investment return and principal value will fluctuate so that shares, when sold, may be worth more or less than their original cost. Performance for periods less than or equal to one year is cumulative. Performance is for the stated time period only; due to market volatility, current Fund performance may be lower or higher than the quoted return. For performance as of the most recent month-end, please refer to eatonvance.com.
Eaton Vance
Floating-Rate Income Trust
November 30, 2021
Fund Profile
Top 10 Issuers (% of total investments)6
| | | | |
| |
Ultimate Software Group, Inc. (The) | | | 1.0 | % |
| |
CITGO Petroleum Corporation | | | 1.0 | |
| |
MA FinanceCo., LLC | | | 0.9 | |
| |
Uber Technologies, Inc. | | | 0.9 | |
| |
Magenta Buyer, LLC | | | 0.9 | |
| |
Virgin Media SFA Finance, Limited | | | 0.9 | |
| |
Intelsat Jackson Holdings S.A. | | | 0.8 | |
| |
Finastra USA, Inc. | | | 0.8 | |
| |
Mallinckrodt International Finance S.A. | | | 0.7 | |
| |
Banff Merger Sub, Inc. | | | 0.7 | |
| |
Total | | | 8.6 | % |
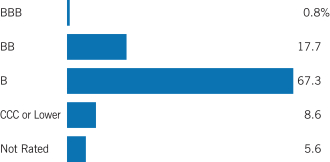
Credit Quality (% of bonds, loans and asset-backed securities)7
Top 10 Sectors (% of total investments)6
| | | | |
| |
Electronics/Electrical | | | 20.6 | % |
| |
Business Equipment and Services | | | 11.5 | |
| |
Health Care | | | 7.7 | |
| |
Automotive | | | 4.5 | |
| |
Industrial Equipment | | | 4.5 | |
| |
Chemicals and Plastics | | | 4.1 | |
| |
Building and Development | | | 3.4 | |
| |
Oil and Gas | | | 3.1 | |
| |
Leisure Goods/Activities/Movies | | | 3.1 | |
| |
Insurance | | | 2.7 | |
| |
Total | | | 65.2 | % |
See Endnotes and Additional Disclosures in this report.
Eaton Vance
Floating-Rate Income Trust
November 30, 2021
Endnotes and Additional Disclosures
| 1 | S&P/LSTA Leveraged Loan Index is an unmanaged index of the institutional leveraged loan market. S&P/LSTA Leveraged Loan indices are a product of S&P Dow Jones Indices LLC (“S&P DJI”) and have been licensed for use. S&P® is a registered trademark of S&P DJI; Dow Jones® is a registered trademark of Dow Jones Trademark Holdings LLC (“Dow Jones”); LSTA is a trademark of Loan Syndications and Trading Association, Inc. S&P DJI, Dow Jones, their respective affiliates and their third party licensors do not sponsor, endorse, sell or promote the Fund, will not have any liability with respect thereto and do not have any liability for any errors, omissions, or interruptions of the S&P Dow Jones Indices. Unless otherwise stated, index returns do not reflect the effect of any applicable sales charges, commissions, expenses, taxes or leverage, as applicable. It is not possible to invest directly in an index. |
| 2 | Performance results reflect the effects of leverage. Included in the average annual total return at NAV for the ten year period is the impact of the 2013 tender and repurchase of a portion of the Fund’s Auction Preferred Shares (APS) at 98% of the Fund’s APS per share liquidation preference. Had this transaction not occurred, the total return at NAV would be lower for the Fund. The Fund’s performance for certain periods reflects the effects of expense reductions. Absent these reductions, performance would have been lower. |
| 3 | The shares of the Fund often trade at a discount or premium to their net asset value. The discount or premium may vary over time and may be higher or lower than what is quoted in this report. For up-to-date premium/discount information, please refer to https://funds.eatonvance.com/closed-end-fund-prices.php. |
| 4 | The Distribution Rate is based on the Fund’s last regular distribution per share in the period (annualized) divided by the Fund’s NAV or market price at the end of the period. The Fund’s distributions may be comprised of amounts characterized for federal income tax purposes as qualified and non-qualified ordinary dividends, capital gains and nondividend distributions, also known as return of capital. For additional information about nondividend distributions, please refer to Eaton Vance Closed-End Fund Distribution Notices (19a) posted on our website, eatonvance.com. The Fund will determine the federal income tax character of distributions paid to a shareholder after the end of the calendar year. This is reported on the IRS form 1099-DIV and provided to the shareholder shortly after each year-end. For information about the tax character of distributions made in prior calendar years, please refer to Performance-Tax Character of Distributions on the Fund’s webpage available at eatonvance. com. The Fund’s distributions are determined by the investment adviser based on its current assessment of the Fund’s long-term return potential. Fund distributions may be affected by numerous factors including changes in Fund performance, the cost of financing for leverage, portfolio holdings, realized and projected returns, and other factors. As portfolio and market conditions change, the rate of distributions paid by the Fund could change. |
| 5 | Leverage represents the liquidation value of the Fund’s VRTP Shares and borrowings outstanding as a percentage of Fund net assets applicable to common shares plus VRTP Shares and borrowings outstanding. Use of leverage creates an opportunity for income, but creates risks including greater price volatility. The cost of leverage rises and falls with changes in short-term interest rates. The Fund may be required to maintain prescribed asset coverage for its leverage and may be required to reduce its leverage at an inopportune time. |
| 6 | Excludes cash and cash equivalents. |
| 7 | Credit ratings are categorized using S&P Global Ratings (“S&P”). Ratings, which are subject to change, apply to the creditworthiness of the issuers of the underlying securities and not to the Fund or its shares. Credit ratings measure the quality of a bond based on the issuer’s creditworthiness, with ratings ranging from AAA, being the highest, to D, being the lowest based on S&P’s measures. Ratings of BBB or higher by S&P are considered to be investment-grade quality. Credit ratings are based largely on the ratings agency’s analysis at the time of rating. The rating assigned to any particular security is not necessarily a reflection of the issuer’s current financial condition and does not necessarily reflect its assessment of the volatility of a security’s market value or of the liquidity of an investment in the security. Holdings designated as “Not Rated” (if any) are not rated by S&P. |
| | Fund profile subject to change due to active management. |
Eaton Vance
Floating-Rate Income Trust
November 30, 2021
Portfolio of Investments (Unaudited)
| | | | | | | | | | |
| Asset-Backed Securities — 6.2% | |
| Security | | | | Principal
Amount
(000’s omitted) | | | Value | |
| | | |
Allegany Park CLO, Ltd., Series 2019-1A, Class E, 6.907%, (3 mo. USD LIBOR + 6.78%), 1/20/33(1)(2) | | | | $ | 850 | | | $ | 850,972 | |
| | | |
Ares XXXIIR CLO, Ltd., Series 2014-32RA, Class D, 6.006%, (3 mo. USD LIBOR + 5.85%), 5/15/30(1)(2) | | | | | 2,000 | | | | 1,948,140 | |
| | | |
Ares XXXIV CLO, Ltd., Series 2015-2A, Class ER, 6.972%, (3 mo. USD LIBOR + 6.85%), 4/17/33(1)(2) | | | | | 1,300 | | | | 1,284,577 | |
| | | |
Benefit Street Partners CLO XIX, Ltd., Series 2019-19A, Class E, 7.144%, (3 mo. USD LIBOR + 7.02%), 1/15/33(1)(2) | | | | | 750 | | | | 742,429 | |
| | | |
Benefit Street Partners CLO XVIII, Ltd., Series 2019-18A, Class ER, 6.869%, (3 mo. USD LIBOR + 6.75%), 10/15/34(1)(2) | | | | | 1,000 | | | | 992,137 | |
| | | |
BlueMountain CLO XXVI, Ltd., Series 2019-26A, Class ER, 7.255%, (3 mo. USD LIBOR + 7.13%), 10/20/34(1)(2) | | | | | 1,500 | | | | 1,486,602 | |
| | | |
Canyon Capital CLO, Ltd., Series 2019-2A, Class ER, 6.874%, (3 mo. USD LIBOR + 6.75%), 10/15/34(1)(2) | | | | | 400 | | | | 400,200 | |
|
| Carlyle Global Market Strategies CLO, Ltd.: | |
| | | |
Series 2012-3A, Class DR2, 6.627%, (3 mo. USD LIBOR + 6.50%),
1/14/32(1)(2) | | | | | 1,200 | | | | 1,120,356 | |
| | | |
Series 2015-5A, Class DR, 6.832%, (3 mo. USD LIBOR + 6.70%),
1/20/32(1)(2) | | | | | 500 | | | | 473,754 | |
| | | |
Cedar Funding X CLO, Ltd., Series 2019-10A, Class ER, 6.632%, (3 mo. USD LIBOR + 6.50%), 10/20/32(1)(2) | | | | | 1,000 | | | | 990,324 | |
| | | |
Galaxy XV CLO, Ltd., Series 2013-15A, Class ER, 6.769%, (3 mo. USD LIBOR + 6.65%), 10/15/30(1)(2) | | | | | 1,000 | | | | 976,594 | |
| | | |
Galaxy XXI CLO, Ltd., Series 2015-21A, Class ER, 5.382%, (3 mo. USD LIBOR + 5.25%), 4/20/31(1)(2) | | | | | 1,000 | | | | 953,011 | |
| | | |
Galaxy XXV CLO, Ltd., Series 2018-25A, Class E, 6.074%, (3 mo. USD LIBOR + 5.95%), 10/25/31(1)(2) | | | | | 250 | | | | 241,868 | |
| | | |
Golub Capital Partners CLO 23M, Ltd., Series 2015-23A, Class ER, 5.882%, (3 mo. USD LIBOR + 5.75%), 1/20/31(1)(2) | | | | | 1,200 | | | | 1,083,086 | |
| | | |
Kayne CLO 5, Ltd., Series 2019-5A, Class E, 6.824%, (3 mo. USD LIBOR + 6.70%), 7/24/32(1)(2) | | | | | 1,000 | | | | 1,000,499 | |
| | | |
Kayne CLO 7, Ltd., Series 2020-7A, Class E, 6.622%, (3 mo. USD LIBOR + 6.50%), 4/17/33(1)(2) | | | | | 1,275 | | | | 1,275,886 | |
| | | |
Madison Park Funding XXXVI, Ltd., Series 2019-36A, Class E, 7.374%, (3 mo. USD LIBOR + 7.25%), 1/15/33(1)(2) | | | | | 500 | | | | 500,133 | |
| | | | | | | | | | | | |
| Security | | | | | Principal
Amount
(000’s omitted) | | | Value | |
|
| Palmer Square CLO, Ltd.: | |
| | | |
Series 2013-2A, Class DRR, 5.972%, (3 mo. USD LIBOR + 5.85%), 10/17/31(1)(2) | | | | | | $ | 900 | | | $ | 880,162 | |
| | | |
Series 2019-1A, Class D, 7.156%, (3 mo. USD LIBOR + 7.00%), 11/14/32(1)(2) | | | | | | | 1,000 | | | | 1,000,005 | |
| | | |
Series 2019-1A, Class DR, (3 mo. USD LIBOR + 6.50%), 11/14/34(1)(3) | | | | | | | 1,000 | | | | 1,000,000 | |
| | | |
Regatta XIV Funding, Ltd., Series 2018-3A, Class E, 6.074%, (3 mo. USD LIBOR + 5.95%), 10/25/31(1)(2) | | | | | | | 700 | | | | 668,565 | |
| | | |
Regatta XVI Funding, Ltd., Series 2019-2A, Class E, 7.124%, (3 mo. USD LIBOR + 7.00%), 1/15/33(1)(2) | | | | | | | 750 | | | | 750,152 | |
| | | |
Vibrant CLO X, Ltd., Series 2018-10A, Class D, 6.322%, (3 mo. USD LIBOR + 6.19%), 10/20/31(1)(2) | | | | | | | 850 | | | | 783,034 | |
| | | |
Vibrant CLO XI, Ltd., Series 2019-11A, Class D, 6.902%, (3 mo. USD LIBOR + 6.77%), 7/20/32(1)(2) | | | | | | | 1,000 | | | | 958,017 | |
| | | |
Voya CLO, Ltd., Series 2013-1A, Class DR, 6.604%, (3 mo. USD LIBOR + 6.48%), 10/15/30(1)(2) | | | | | | | 2,000 | | | | 1,841,514 | |
| | | |
Wellfleet CLO, Ltd., Series 2020-1A, Class D, 7.364%, (3 mo. USD LIBOR + 7.24%), 4/15/33(1)(2) | | | | | | | 1,300 | | | | 1,301,058 | |
| |
Total Asset-Backed Securities
(identified cost $25,923,943) | | | $ | 25,503,075 | |
|
| Closed-End Funds — 2.1% | |
| Security | | | | | Shares | | | Value | |
| | | |
BlackRock Floating Rate Income Strategies Fund, Inc. | | | | | | | 111,292 | | | $ | 1,512,458 | |
| | | |
Invesco Senior Income Trust | | | | | | | 402,161 | | | | 1,797,660 | |
| | | |
Nuveen Credit Strategies Income Fund | | | | | | | 406,731 | | | | 2,647,819 | |
| | | |
Nuveen Floating Rate Income Fund | | | | | | | 164,907 | | | | 1,691,946 | |
| | | |
Nuveen Floating Rate Income Opportunity Fund | | | | | | | 115,017 | | | | 1,153,620 | |
| |
Total Closed-End Funds
(identified cost $9,825,290) | | | $ | 8,803,503 | |
|
| Common Stocks — 1.2% | |
| Security | | | | | Shares | | | Value | |
| | | |
| Aerospace and Defense — 0.1% | | | | | | | | | |
| | | |
IAP Global Services, LLC(4)(5)(6) | | | | | | | 58 | | | $ | 288,477 | |
| | | |
| | | | | | | | | | | $ | 288,477 | |
|
| Electronics / Electrical — 0.1% | |
| | | |
Skillsoft Corp.(4)(5)(6)(7) | | | | | | | 56,469 | | | $ | 661,435 | |
| | | |
| | | | | | | | | | | $ | 661,435 | |
| | | | |
| | 5 | | See Notes to Financial Statements. |
Eaton Vance
Floating-Rate Income Trust
November 30, 2021
Portfolio of Investments (Unaudited) — continued
| | | | | | | | | | | | |
| Security | | | | | Shares | | | Value | |
|
| Oil and Gas — 0.3% | |
| | | |
Nine Point Energy Holdings, Inc.(4)(5)(7) | | | | | | | 758 | | | $ | 0 | |
| | | |
QuarterNorth Energy, Inc.(5)(6) | | | | | | | 13,251 | | | | 1,371,479 | |
| | | |
| | | | | | | | | | | $ | 1,371,479 | |
|
| Radio and Television — 0.4% | |
| | | |
Clear Channel Outdoor Holdings, Inc.(5)(6) | | | | | | | 86,335 | | | $ | 265,048 | |
| | | |
Cumulus Media, Inc., Class A(5)(6) | | | | | | | 42,499 | | | | 517,213 | |
| | | |
iHeartMedia, Inc., Class A(5)(6) | | | | | | | 36,714 | | | | 719,962 | |
| | | |
| | | | | | | | | | | $ | 1,502,223 | |
|
| Retailers (Except Food and Drug) — 0.1% | |
| | | |
Phillips Pet Holding Corp.(4)(5)(6) | | | | | | | 613 | | | $ | 239,872 | |
| | | |
| | | | | | | | | | | $ | 239,872 | |
|
| Telecommunications — 0.2% | |
| | | |
GEE Acquisition Holdings Corp.(4)(5)(6) | | | | | | | 46,236 | | | $ | 1,006,095 | |
| | | |
| | | | | | | | | | | $ | 1,006,095 | |
| |
Total Common Stocks
(identified cost $4,938,418) | | | $ | 5,069,581 | |
|
| Convertible Preferred Stocks — 0.0% | |
| Security | | | | | Shares | | | Value | |
|
| Oil and Gas — 0.0% | |
| | | |
Nine Point Energy Holdings, Inc., Series A, 12.00%(4)(5)(7) | | | | | | | 14 | | | $ | 0 | |
| |
Total Convertible Preferred Stocks
(identified cost $14,000) | | | $ | 0 | |
|
| Corporate Bonds — 1.3% | |
| Security | | | | | Principal
Amount
(000’s omitted) | | | Value | |
|
| Business Equipment and Services — 0.4% | |
| | |
Prime Security Services Borrower, LLC/Prime Finance, Inc.: | | | | | | | | | |
| | | |
5.25%, 4/15/24(1) | | | | | | $ | 750 | | | $ | 787,245 | |
| | | |
5.75%, 4/15/26(1) | | | | | | | 750 | | | | 794,835 | |
| | | |
| | | | | | | | | | | $ | 1,582,080 | |
|
| Food Products — 0.3% | |
| | | |
Del Monte Foods, Inc., 11.875%, 5/15/25(1) | | | | | | $ | 1,075 | | | $ | 1,191,390 | |
| | | |
| | | | | | | | | | | $ | 1,191,390 | |
| | | | | | | | | | | | |
| Security | | | | | Principal
Amount
(000’s omitted) | | | Value | |
|
| Radio and Television — 0.5% | |
| | | |
Diamond Sports Group, LLC/Diamond Sports Finance Co., 5.375%, 8/15/26(1) | | | | | | $ | 3,160 | | | $ | 1,405,995 | |
|
| iHeartCommunications, Inc.: | |
| | | |
6.375%, 5/1/26 | | | | | | | 208 | | | | 215,312 | |
| | | |
8.375%, 5/1/27 | | | | | | | 376 | | | | 396,495 | |
| | | |
| | | | | | | | | | | $ | 2,017,802 | |
|
| Telecommunications — 0.1% | |
| | | |
Digicel International Finance, Ltd./Digicel International Holdings, Ltd., 8.75%, 5/25/24(1) | | | | | | $ | 600 | | | $ | 617,118 | |
| | | |
| | | | | | | | | | | $ | 617,118 | |
| | | |
Total Corporate Bonds
(identified cost $6,345,176) | | | | | | | | | | $ | 5,408,390 | |
|
| Senior Floating-Rate Loans — 142.3%(8) | |
| Borrower/Description | | | | | Principal
Amount*
(000’s omitted) | | | Value | |
|
| Aerospace and Defense — 2.8% | |
| | | |
Aernnova Aerospace S.A.U.: | | | | | | | | | | | | |
| | | |
Term Loan, 3.00%, (3 mo. EURIBOR + 3.00%), 2/22/27 | | | EUR | | | | 107 | | | $ | 114,752 | |
| | | |
Term Loan, 3.00%, (3 mo. EURIBOR + 3.00%), 2/26/27 | | | EUR | | | | 418 | | | | 447,532 | |
| | | |
AI Convoy (Luxembourg) S.a.r.l.: | | | | | | | | | | | | |
| | | |
Term Loan, 3.50%, (6 mo. EURIBOR + 3.50%), 1/18/27 | | | EUR | | | | 450 | | | | 507,475 | |
| | | |
Term Loan, 4.50%, (3 mo. USD LIBOR + 3.50%, Floor 1.00%), 1/17/27 | | | | | | | 1,745 | | | | 1,746,953 | |
| | | |
Dynasty Acquisition Co., Inc.: | | | | | | | | | | | | |
| | | |
Term Loan, 3.632%, (3 mo. USD LIBOR + 3.50%), 4/6/26 | | | | | | | 1,049 | | | | 1,020,733 | |
| | | |
Term Loan, 3.632%, (3 mo. USD LIBOR + 3.50%), 4/6/26 | | | | | | | 1,951 | | | | 1,897,895 | |
| | | |
IAP Worldwide Services, Inc.: | | | | | | | | | | | | |
| | | |
Revolving Loan, 0.75%, 7/18/23(9) | | | | | | | 325 | | | | 326,448 | |
| | | |
Term Loan - Second Lien, 8.00%, (3 mo. USD LIBOR + 6.50%, Floor 1.50%), 7/18/23(4) | | | | | | | 417 | | | | 340,070 | |
| | | |
KKR Apple Bidco, LLC, Term Loan, 3.50%, (1 mo. USD LIBOR + 3.00%, Floor 0.50%), 9/22/28 | | | | | | | 1,650 | | | | 1,637,831 | |
| | | |
Spirit Aerosystems, Inc., Term Loan, 4.25%, (1 mo. USD LIBOR + 3.75%, Floor 0.50%), 1/15/25 | | | | | | | 572 | | | | 571,982 | |
| | | |
WP CPP Holdings, LLC, Term Loan, 4.75%, (USD LIBOR + 3.75%, Floor 1.00%), 4/30/25(10) | | | | | | | 3,299 | | | | 3,179,876 | |
| | | |
| | | | | | | | | | | $ | 11,791,547 | |
| | | | |
| | 6 | | See Notes to Financial Statements. |
Eaton Vance
Floating-Rate Income Trust
November 30, 2021
Portfolio of Investments (Unaudited) — continued
| | | | | | | | | | | | |
| Borrower/Description | | | | | Principal
Amount*
(000’s omitted) | | | Value | |
|
| Air Transport — 2.7% | |
| | | |
AAdvantage Loyalty IP, Ltd., Term Loan, 5.50%, (3 mo. USD LIBOR + 4.75%, Floor 0.75%), 4/20/28 | | | | | | | 3,050 | | | $ | 3,141,500 | |
| | | |
Air Canada, Term Loan, 4.25%, (6 mo. USD LIBOR + 3.50%, Floor 0.75%), 8/11/28 | | | | | | | 2,000 | | | | 1,987,500 | |
| | | |
Brown Group Holding, LLC, Term Loan, 3.25%, (3 mo. USD LIBOR + 2.75%, Floor 0.50%), 6/7/28 | | | | | | | 2,221 | | | | 2,206,966 | |
| | | |
Mileage Plus Holdings, LLC, Term Loan, 6.25%, (3 mo. USD LIBOR + 5.25%, Floor 1.00%), 6/21/27 | | | | | | | 800 | | | | 838,429 | |
| | | |
United Airlines, Inc., Term Loan, 4.50%, (3 mo. USD LIBOR + 3.75%, Floor 0.75%), 4/21/28 | | | | | | | 3,142 | | | | 3,140,141 | |
| | | |
| | | | | | | | | | | $ | 11,314,536 | |
|
| Automotive — 7.0% | |
| | | |
Adient US, LLC, Term Loan, 3.59%, (1 mo. USD LIBOR + 3.50%), 4/8/28 | | | | | | | 2,047 | | | $ | 2,043,217 | |
| | | |
Autokiniton US Holdings, Inc., Term Loan, 5.00%, (12 mo. USD LIBOR + 4.50%, Floor 0.50%), 4/6/28 | | | | | | | 3,320 | | | | 3,319,402 | |
| | | |
Belron Finance US, LLC, Term Loan, 3.25%, (3 mo. USD LIBOR + 2.75%, Floor 0.50%), 4/13/28 | | | | | | | 995 | | | | 990,025 | |
| | | |
Bright Bidco B.V., Term Loan, 4.50%, (6 mo. USD LIBOR + 3.50%, Floor 1.00%), 6/30/24 | | | | | | | 1,629 | | | | 1,261,161 | |
| | | |
Chassix, Inc., Term Loan, 6.50%, (USD LIBOR + 5.50%, Floor 1.00%), 11/15/23(10) | | | | | | | 1,444 | | | | 1,334,266 | |
| | | |
Clarios Global, L.P.: | | | | | | | | | | | | |
| | | |
Term Loan, 3.25%, (1 mo. EURIBOR + 3.25%), 4/30/26 | | | EUR | | | | 1,000 | | | | 1,129,342 | |
| | | |
Term Loan, 3.34%, (1 mo. USD LIBOR + 3.25%), 4/30/26 | | | | | | | 3,042 | | | | 3,011,257 | |
| | | |
Dayco Products, LLC, Term Loan, 4.425%, (3 mo. USD LIBOR + 4.25%), 5/19/23 | | | | | | | 1,074 | | | | 1,050,202 | |
| | | |
Garrett LX I S.a.r.l., Term Loan, 3.75%, (3 mo. USD LIBOR + 3.25%, Floor 0.50%), 4/30/28 | | | | | | | 775 | | | | 767,250 | |
| | | |
Gates Global, LLC, Term Loan, 3.25%, (1 mo. USD LIBOR + 2.50%, Floor 0.75%), 3/31/27 | | | | | | | 2,643 | | | | 2,626,490 | |
| | | |
Les Schwab Tire Centers, Term Loan, 4.00%, (3 mo. USD LIBOR + 3.25%, Floor 0.75%), 11/2/27 | | | | | | | 4,325 | | | | 4,322,153 | |
| | | |
MajorDrive Holdings IV, LLC, Term Loan, 4.50%, (3 mo. USD LIBOR + 4.00%, Floor 0.50%), 5/12/28 | | | | | | | 673 | | | | 672,261 | |
| | | |
Tenneco, Inc., Term Loan, 3.09%, (1 mo. USD LIBOR + 3.00%), 10/1/25 | | | | | | | 3,000 | | | | 2,946,564 | |
| | | |
Thor Industries, Inc., Term Loan, 3.125%, (1 mo. USD LIBOR + 3.00%), 2/1/26 | | | | | | | 1,101 | | | | 1,101,860 | |
| | | |
Truck Hero, Inc., Term Loan, 4.00%, (1 mo. USD LIBOR + 3.25%, Floor 0.75%), 1/31/28 | | | | | | | 1,746 | | | | 1,735,140 | |
| | | |
Wheel Pros, LLC, Term Loan, 5.25%, (1 mo. USD LIBOR + 4.50%, Floor 0.75%), 5/11/28 | | | | | | | 1,025 | | | | 1,020,982 | |
| | | |
| | | | | | | | | | | $ | 29,331,572 | |
| | | | | | | | | | | | |
| Borrower/Description | | | | | Principal
Amount*
(000’s omitted) | | | Value | |
|
| Beverage and Tobacco — 1.1% | |
| | | |
Arterra Wines Canada, Inc., Term Loan, 4.25%, (3 mo. USD LIBOR + 3.50%, Floor 0.75%), 11/24/27 | | | | | | | 1,092 | | | $ | 1,089,703 | |
| | | |
City Brewing Company, LLC, Term Loan, 4.25%, (3 mo. USD LIBOR + 3.50%, Floor 0.75%), 4/5/28 | | | | | | | 925 | | | | 915,364 | |
| | | |
Triton Water Holdings, Inc., Term Loan, 4.00%, (3 mo. USD LIBOR + 3.50%, Floor 0.50%), 3/31/28 | | | | | | | 2,494 | | | | 2,485,735 | |
| | | |
| | | | | | | | | | | $ | 4,490,802 | |
|
| Brokerage / Securities Dealers / Investment Houses — 0.9% | |
| | | |
Advisor Group, Inc., Term Loan, 4.59%, (1 mo. USD LIBOR + 4.50%), 7/31/26 | | | | | | | 2,404 | | | $ | 2,403,447 | |
| | | |
Hudson River Trading, LLC, Term Loan, 3.09%, (1 mo. USD LIBOR + 3.00%), 3/20/28 | | | | | | | 1,509 | | | | 1,495,979 | |
| | | |
| | | | | | | | | | | $ | 3,899,426 | |
|
| Building and Development — 5.3% | |
| | | |
Aegion Corporation, Term Loan, 5.50%, (3 mo. USD LIBOR + 4.75%, Floor 0.75%), 5/17/28 | | | | | | | 550 | | | $ | 555,672 | |
| | | |
AllSpring Buyer, LLC, Term Loan, 11/1/28(11) | | | | | | | 1,353 | | | | 1,352,315 | |
| | | |
American Residential Services, LLC, Term Loan, 4.25%, (3 mo. USD LIBOR + 3.50%, Floor 0.75%), 10/15/27 | | | | | | | 620 | | | | 620,312 | |
| | | |
Cornerstone Building Brands, Inc., Term Loan, 3.75%, (1 mo. USD LIBOR + 3.25%, Floor 0.50%), 4/12/28 | | | | | | | 2,445 | | | | 2,442,499 | |
| | | |
CP Atlas Buyer, Inc., Term Loan, 4.25%, (1 mo. USD LIBOR + 3.75%, Floor 0.50%), 11/23/27 | | | | | | | 1,519 | | | | 1,507,131 | |
| | | |
MI Windows and Doors, LLC, Term Loan, 4.50%, (1 mo. USD LIBOR + 3.75%, Floor 0.75%), 12/18/27 | | | | | | | 2,491 | | | | 2,490,602 | |
| | | |
Northstar Group Services, Inc., Term Loan, 6.50%, (1 mo. USD LIBOR + 5.50%, Floor 1.00%), 11/12/26 | | | | | | | 1,574 | | | | 1,579,652 | |
| | | |
Park River Holdings, Inc., Term Loan, 4.00%, (3 mo. USD LIBOR + 3.25%, Floor 0.75%), 12/28/27 | | | | | | | 721 | | | | 716,358 | |
| |
| Patagonia Bidco Limited: | | | | |
| | | |
Term Loan, 4.797%, (SONIA + 4.75%), 3/5/29 | | | GBP | | | | 1,142 | | | | 1,511,932 | |
| | | |
Term Loan, 3/5/29(11) | | | GBP | | | | 208 | | | | 274,897 | |
| | | |
Quikrete Holdings, Inc., Term Loan, 6/11/28(11) | | | | | | | 2,500 | | | | 2,488,195 | |
| | | |
SRS Distribution, Inc., Term Loan, 4.25%, (6 mo. USD LIBOR + 3.75%, Floor 0.50%), 6/2/28 | | | | | | | 1,172 | | | | 1,171,574 | |
| | | |
Standard Industries, Inc., Term Loan, 3.00%, (3 mo. USD LIBOR + 2.50%, Floor 0.50%), 9/22/28 | | | | | | | 1,500 | | | | 1,497,657 | |
| | | |
Werner FinCo L.P., Term Loan, 5.00%, (3 mo. USD LIBOR + 4.00%, Floor 1.00%), 7/24/24 | | | | | | | 1,105 | | | | 1,103,341 | |
| | | |
White Cap Buyer, LLC, Term Loan, 4.50%, (1 mo. USD LIBOR + 4.00%, Floor 0.50%), 10/19/27 | | | | | | | 2,351 | | | | 2,346,841 | |
| | | | |
| | 7 | | See Notes to Financial Statements. |
Eaton Vance
Floating-Rate Income Trust
November 30, 2021
Portfolio of Investments (Unaudited) — continued
| | | | | | | | | | | | |
| Borrower/Description | | | | | Principal
Amount*
(000’s omitted) | | | Value | |
|
| Building and Development (continued) | |
| | | |
WireCo WorldGroup, Inc., Term Loan, 4.75%, (6 mo. USD LIBOR + 4.25%, Floor 0.50%), 10/27/28 | | | | | | | 450 | | | $ | 448,312 | |
| | | |
| | | | | | | | | | | $ | 22,107,290 | |
|
| Business Equipment and Services — 17.5% | |
| | | |
AlixPartners, LLP, Term Loan, 3.25%, (3 mo. EURIBOR + 3.25%), 2/4/28 | | | EUR | | | | 522 | | | $ | 591,130 | |
| | | |
Allied Universal Holdco, LLC, Term Loan, 4.25%, (3 mo. USD LIBOR + 3.75%, Floor 0.50%), 5/12/28 | | | | | | | 3,559 | | | | 3,533,848 | |
|
| AppLovin Corporation: | |
| | | |
Term Loan, 3.34%, (1 mo. USD LIBOR + 3.25%), 8/15/25 | | | | | | | 2,194 | | | | 2,186,130 | |
| | | |
Term Loan, 3.50%, (1 mo. USD LIBOR + 3.00%, Floor 0.50%), 10/25/28 | | | | | | | 1,300 | | | | 1,293,906 | |
| | | |
Belfor Holdings, Inc., Term Loan, 3.84%, (1 mo. USD LIBOR + 3.75%), 4/6/26 | | | | | | | 562 | | | | 562,765 | |
| | | |
Blitz 20-487 GmbH, Term Loan, 3.50%, (3 mo. EURIBOR + 3.50%), 4/28/28 | | | EUR | | | | 825 | | | | 932,458 | |
| | | |
Bracket Intermediate Holding Corp., Term Loan, 4.377%, (3 mo. USD LIBOR + 4.25%), 9/5/25 | | | | | | | 922 | | | | 922,076 | |
| | | |
Brand Energy & Infrastructure Services, Inc., Term Loan, 5.25%, (3 mo. USD LIBOR + 4.25%, Floor 1.00%), 6/21/24 | | | | | | | 1,658 | | | | 1,635,410 | |
| | | |
Camelot U.S. Acquisition 1 Co., Term Loan, 4.00%, (1 mo. USD LIBOR + 3.00%, Floor 1.00%), 10/30/26 | | | | | | | 2,712 | | | | 2,708,993 | |
| | | |
Ceridian HCM Holding, Inc., Term Loan, 2.578%, (1 week USD LIBOR + 2.50%), 4/30/25 | | | | | | | 1,037 | | | | 1,019,118 | |
| | | |
Deerfield Dakota Holding, LLC, Term Loan, 4.75%, (1 mo. USD LIBOR + 3.75%, Floor 1.00%), 4/9/27 | | | | | | | 2,197 | | | | 2,196,845 | |
| | | |
Employbridge, LLC, Term Loan, 5.50%, (3 mo. USD LIBOR + 4.75%, Floor 0.75%), 7/14/28 | | | | | | | 1,550 | | | | 1,535,227 | |
| | | |
Endure Digital, Inc., Term Loan, 4.25%, (6 mo. USD LIBOR + 3.50%, Floor 0.75%), 2/10/28 | | | | | | | 3,342 | | | | 3,305,599 | |
| | | |
Foundational Education Group, Inc., Term Loan, 4.75%, (6 mo. USD LIBOR + 4.25%, Floor 0.50%), 8/31/28 | | | | | | | 1,475 | | | | 1,471,312 | |
| | | |
Garda World Security Corporation, Term Loan, 4.35%, (1 mo. USD LIBOR + 4.25%), 10/30/26 | | | | | | | 2,426 | | | | 2,427,177 | |
| | | |
Grab Holdings, Inc., Term Loan, 5.50%, (1 mo. USD LIBOR + 4.50%, Floor 1.00%), 1/29/26 | | | | | | | 2,512 | | | | 2,540,639 | |
| | | |
Greeneden U.S. Holdings II, LLC, Term Loan, 4.75%, (1 mo. USD LIBOR + 4.00%, Floor 0.75%), 12/1/27 | | | | | | | 2,414 | | | | 2,417,613 | |
|
| Hillman Group, Inc. (The): | |
| | | |
Term Loan, 2.79%, (1 mo. USD LIBOR + 2.75%, Floor 0.50%), 7/14/28(9) | | | | | | | 84 | | | | 84,124 | |
| | | |
Term Loan, 3.25%, (1 mo. USD LIBOR + 2.75%, Floor 0.50%), 7/14/28 | | | | | | | 352 | | | | 351,220 | |
| | | | | | | | | | |
| Borrower/Description | | | | Principal
Amount*
(000’s omitted) | | | Value | |
|
| Business Equipment and Services (continued) | |
|
| Indy US Bidco, LLC: | |
| | | |
Term Loan, 3.84%, (1 mo. USD LIBOR + 3.75%), 3/5/28 | | | | | 796 | | | $ | 795,752 | |
| | | |
Term Loan, 3.75%, (1 mo. EURIBOR + 3.75%), 3/6/28 | | EUR | | | 623 | | | | 706,991 | |
| | | |
Intrado Corporation, Term Loan, 5.00%, (3 mo. USD LIBOR + 4.00%, Floor 1.00%), 10/10/24 | | | | | 1,011 | | | | 965,403 | |
| | | |
IRI Holdings, Inc., Term Loan, 4.34%, (1 mo. USD LIBOR + 4.25%), 12/1/25 | | | | | 2,643 | | | | 2,643,205 | |
|
| Ivanti Software, Inc.: | |
| | | |
Term Loan, 4.75%, (3 mo. USD LIBOR + 4.00%, Floor 0.75%), 12/1/27 | | | | | 796 | | | | 789,532 | |
| | | |
Term Loan, 5.75%, (3 mo. USD LIBOR + 4.75%, Floor 1.00%), 12/1/27 | | | | | 2,886 | | | | 2,869,269 | |
| | | |
KAR Auction Services, Inc., Term Loan, 2.375%, (1 mo. USD LIBOR + 2.25%), 9/19/26 | | | | | 662 | | | | 643,309 | |
|
| KUEHG Corp.: | |
| | | |
Term Loan, 4.75%, (3 mo. USD LIBOR + 3.75%, Floor 1.00%), 2/21/25 | | | | | 2,692 | | | | 2,644,501 | |
| | | |
Term Loan - Second Lien, 9.25%, (3 mo. USD LIBOR + 8.25%, Floor 1.00%), 8/22/25 | | | | | 425 | | | | 423,229 | |
| | | |
LGC Group Holdings, Ltd., Term Loan, 3.00%, (1 mo. EURIBOR + 3.00%), 4/21/27 | | EUR | | | 500 | | | | 556,379 | |
| | | |
Loire Finco Luxembourg S.a.r.l., Term Loan, 3.34%, (1 mo. USD LIBOR + 3.25%), 4/21/27 | | | | | 370 | | | | 363,161 | |
| | | |
Magnite, Inc., Term Loan, 5.75%, (6 mo. USD LIBOR + 5.00%, Floor 0.75%), 4/28/28 | | | | | 773 | | | | 771,130 | |
| | | |
MedAssets Software Intermediate Holdings, Inc., Term Loan, 4.50%, (3 mo. USD LIBOR + 3.75%, Floor 0.75%), 1/28/28 | | | | | 499 | | | | 499,436 | |
| | | |
Monitronics International, Inc., Term Loan, 7.75%, (1 mo. USD LIBOR + 6.50%, Floor 1.25%), 3/29/24 | | | | | 1,575 | | | | 1,555,237 | |
| | | |
NAB Holdings, LLC, Term Loan, 3.50%, (SOFR + 3.00%, Floor 0.50%), 11/23/28 | | | | | 675 | | | | 671,344 | |
| | | |
Packaging Coordinators Midco, Inc., Term Loan, 4.25%, (3 mo. USD LIBOR + 3.50%, Floor 0.75%), 11/30/27 | | | | | 1,494 | | | | 1,491,727 | |
| | | |
PECF USS Intermediate Holding III Corporation, Term Loan, 11/4/28(11) | | | | | 550 | | | | 550,344 | |
| | | |
Pike Corporation, Term Loan, 3.10%, (1 mo. USD LIBOR + 3.00%), 1/21/28 | | | | | 503 | | | | 501,312 | |
| | | |
Prime Security Services Borrower, LLC, Term Loan, 3.50%, (USD LIBOR + 2.75%, Floor 0.75%), 9/23/26(10) | | | | | 2,143 | | | | 2,135,709 | |
|
| Sabre GLBL, Inc.: | |
| | | |
Term Loan, 2.09%, (1 mo. USD LIBOR + 2.00%), 2/22/24 | | | | | 1,011 | | | | 995,392 | |
| | | | |
| | 8 | | See Notes to Financial Statements. |
Eaton Vance
Floating-Rate Income Trust
November 30, 2021
Portfolio of Investments (Unaudited) — continued
| | | | | | | | | | | | |
| Borrower/Description | | | | | Principal
Amount*
(000’s omitted) | | | Value | |
|
| Business Equipment and Services (continued) | |
|
| Sabre GLBL, Inc.: (continued) | |
| | | |
Term Loan, 4.00%, (1 mo. USD LIBOR + 3.50%, Floor 0.50%), 12/17/27 | | | | | | | 961 | | | $ | 953,971 | |
| | | |
Term Loan, 4.00%, (1 mo. USD LIBOR + 3.50%, Floor 0.50%), 12/17/27 | | | | | | | 1,532 | | | | 1,520,687 | |
| | | |
SITEL Worldwide Corporation, Term Loan, 4.25%, (1 mo. USD LIBOR + 3.75%, Floor 0.50%), 8/28/28 | | | | | | | 2,334 | | | | 2,329,081 | |
| | | |
Skopima Merger Sub, Inc., Term Loan, 4.50%, (1 mo. USD LIBOR + 4.00%, Floor 0.50%), 5/12/28 | | | | | | | 1,575 | | | | 1,563,433 | |
| | | |
SMG US Midco 2, Inc., Term Loan, 2.618%, (USD LIBOR + 2.50%), 1/23/25(10) | | | | | | | 241 | | | | 234,388 | |
| | | |
Sotheby’s, Term Loan, 5.00%, (3 mo. USD LIBOR + 4.50%, Floor 0.50%), 1/15/27 | | | | | | | 463 | | | | 464,574 | |
| | | |
Spin Holdco, Inc., Term Loan, 4.75%, (3 mo. USD LIBOR + 4.00%, Floor 0.75%), 3/4/28 | | | | | | | 4,652 | | | | 4,663,575 | |
| | | |
Techem Verwaltungsgesellschaft 675 mbH, Term Loan, 2.375%, (6 mo. EURIBOR + 2.375%), 7/15/25 | | | EUR | | | | 801 | | | | 890,074 | |
| | | |
Tempo Acquisition, LLC, Term Loan, 3.75%, (1 mo. USD LIBOR + 3.25%, Floor 0.50%), 11/2/26 | | | | | | | 1,649 | | | | 1,650,588 | |
| | | |
TK Elevator Topco GmbH, Term Loan, 7/29/27(11) | | | EUR | | | | 525 | | | | 592,479 | |
| | | |
TPG VIII Elf Purchaser, LLC, Term Loan, 11/6/28(11) | | | | | | | 350 | | | | 348,687 | |
|
| Trans Union, LLC: | |
| | | |
Term Loan, 12/1/28(11) | | | | | | | 1,800 | | | | 1,791,751 | |
| | | |
Term Loan - Second Lien, 12/3/29(11) | | | | | | | 325 | | | | 325,000 | |
| | | |
West Corporation, Term Loan, 4.50%, (3 mo. USD LIBOR + 3.50%, Floor 1.00%), 10/10/24 | | | | | | | 303 | | | | 287,675 | |
| | | |
Zephyr Bidco Limited, Term Loan, 4.813%, (1 mo. GBP LIBOR + 4.75%), 7/23/25 | | | GBP | | | | 775 | | | | 1,023,142 | |
| | | |
| | | | | | | | | | | $ | 72,927,057 | |
|
| Cable and Satellite Television — 3.6% | |
|
| Altice France S.A.: | |
| | | |
Term Loan, 3.811%, (3 mo. USD LIBOR + 3.69%), 1/31/26 | | | | | | | 2,270 | | | $ | 2,251,464 | |
| | | |
Term Loan, 4.118%, (2 mo. USD LIBOR + 4.00%), 8/14/26 | | | | | | | 1,722 | | | | 1,711,687 | |
| | | |
Numericable Group S.A., Term Loan, 3.00%, (3 mo. EURIBOR + 3.00%), 7/31/25 | | | EUR | | | | 478 | | | | 530,770 | |
| |
UPC Broadband Holding B.V.: | | | | | |
| | | |
Term Loan, 2.339%, (1 mo. USD LIBOR + 2.25%), 4/30/28 | | | | | | | 900 | | | | 886,388 | |
| | | |
Term Loan, 2.50%, (6 mo. EURIBOR + 2.50%), 4/30/29 | | | EUR | | | | 775 | | | | 865,195 | |
| | | |
UPC Financing Partnership, Term Loan, 3.089%, (1 mo. USD LIBOR + 3.00%), 1/31/29 | | | | | | | 3,000 | | | | 2,979,687 | |
| | | | | | | | | | | | |
| Borrower/Description | | | | | Principal
Amount*
(000’s omitted) | | | Value | |
|
| Cable and Satellite Television (continued) | |
| | | |
Virgin Media Bristol, LLC, Term Loan, 3.339%, (1 mo. USD LIBOR + 3.25%), 1/31/29 | | | | | | | 5,775 | | | $ | 5,764,172 | |
| | | |
| | | | | | | | | | | $ | 14,989,363 | |
|
| Chemicals and Plastics — 6.4% | |
|
| Aruba Investments, Inc.: | |
| | | |
Term Loan, 4.00%, (6 mo. EURIBOR + 4.00%), 11/24/27 | | | EUR | | | | 522 | | | $ | 593,907 | |
| | | |
Term Loan, 4.75%, (6 mo. USD LIBOR + 4.00%, Floor 0.75%), 11/24/27 | | | | | | | 796 | | | | 796,000 | |
| | | |
Atotech B.V., Term Loan, 2.50%, (3 mo. EURIBOR + 2.50%), 3/18/28 | | | EUR | | | | 375 | | | | 425,288 | |
| | | |
Charter NEX US, Inc., Term Loan, 4.50%, (1 mo. USD LIBOR + 3.75%, Floor 0.75%), 12/1/27 | | | | | | | 496 | | | | 497,008 | |
| | | |
Chemours Company (The), Term Loan, 2.50%, (3 mo. EURIBOR + 2.00%, Floor 0.50%), 4/3/25 | | | EUR | | | | 625 | | | | 701,360 | |
| | | |
CPC Acquisition Corp., Term Loan, 4.50%, (3 mo. USD LIBOR + 3.75%, Floor 0.75%), 12/29/27 | | | | | | | 821 | | | | 818,310 | |
| |
| Ferro Corporation: | | | | |
| | | |
Term Loan, 2.382%, (3 mo. USD LIBOR + 2.25%), 2/14/24 | | | | | | | 134 | | | | 133,836 | |
| | | |
Term Loan, 2.382%, (3 mo. USD LIBOR + 2.25%), 2/14/24 | | | | | | | 137 | | | | 136,746 | |
| | | |
Term Loan, 2.382%, (3 mo. USD LIBOR + 2.25%), 2/14/24 | | | | | | | 166 | | | | 166,268 | |
| | | |
Flint Group GmbH, Term Loan, 6.00%, (3 mo. USD LIBOR + 5.00%, Floor 1.00%), 5.25% cash, 0.75% PIK, 9/21/23 | | | | | | | 156 | | | | 155,506 | |
| | | |
Flint Group US, LLC, Term Loan, 6.00%, (3 mo. USD LIBOR + 5.00%, Floor 1.00%), 5.25% cash, 0.75% PIK, 9/21/23 | | | | | | | 946 | | | | 940,687 | |
| | | |
Gemini HDPE, LLC, Term Loan, 3.50%, (3 mo. USD LIBOR + 3.00%, Floor 0.50%), 12/31/27 | | | | | | | 798 | | | | 797,125 | |
| | | |
Groupe Solmax, Inc., Term Loan, 5.50%, (2 mo. USD LIBOR + 4.75%, Floor 0.75%), 5/29/28 | | | | | | | 1,546 | | | | 1,543,226 | |
| | | |
Hexion, Inc., Term Loan, 3.64%, (3 mo. USD LIBOR + 3.50%), 7/1/26 | | | | | | | 758 | | | | 758,509 | |
| | | |
Illuminate Buyer, LLC, Term Loan, 3.59%, (1 mo. USD LIBOR + 3.50%), 6/30/27 | | | | | | | 1,803 | | | | 1,789,917 | |
| | | |
INEOS Enterprises Holdings II Limited, Term Loan, 3.25%, (3 mo. EURIBOR + 3.25%), 8/31/26 | | | EUR | | | | 200 | | | | 226,643 | |
| | | |
INEOS Enterprises Holdings US Finco, LLC, Term Loan, 4.50%, (3 mo. USD LIBOR + 3.50%, Floor 1.00%), 8/28/26 | | | | | | | 221 | | | | 221,479 | |
| |
| INEOS Finance PLC: | | | | |
| | | |
Term Loan, 11/4/28(11) | | | EUR | | | | 625 | | | | 708,636 | |
| | | |
Term Loan, 2.50%, (1 mo. EURIBOR + 2.00%, Floor 0.50%), 4/1/24 | | | EUR | | | | 4 | | | | 4,345 | |
| | | | |
| | 9 | | See Notes to Financial Statements. |
Eaton Vance
Floating-Rate Income Trust
November 30, 2021
Portfolio of Investments (Unaudited) — continued
| | | | | | | | | | | | |
| Borrower/Description | | | | | Principal
Amount*
(000’s omitted) | | | Value | |
|
| Chemicals and Plastics (continued) | |
| | | |
INEOS Styrolution US Holding, LLC, Term Loan, 3.25%, (1 mo. USD LIBOR + 2.75%, Floor 0.50%), 1/29/26 | | | | | | | 1,995 | | | $ | 1,991,259 | |
| | | |
INEOS US Finance, LLC, Term Loan, 11/8/28(11) | | | | | | | 525 | | | | 523,250 | |
| |
| Kraton Polymers, LLC: | | | | |
| | | |
Term Loan, 11/18/28(11) | | | EUR | | | | 300 | | | | 340,655 | |
| | | |
Term Loan, 11/18/28(11) | | | | | | | 400 | | | | 400,125 | |
| | | |
Lonza Group AG, Term Loan, 4.75%, (6 mo. USD LIBOR + 4.00%, Floor 0.75%), 7/3/28 | | | | | | | 2,494 | | | | 2,493,750 | |
| | | |
LSF11 Skyscraper Holdco S.a.r.l., Term Loan, 4.25%, (3 mo. USD LIBOR + 3.75%, Floor 0.50%), 9/29/27 | | | | | | | 672 | | | | 670,790 | |
| | | |
Momentive Performance Materials, Inc., Term Loan, 3.35%, (1 mo. USD LIBOR + 3.25%), 5/15/24 | | | | | | | 464 | | | | 463,732 | |
| | | |
Orion Engineered Carbons GmbH, Term Loan, 2.75%, (3 mo. USD LIBOR + 2.25%, Floor 0.50%), 9/24/28 | | | | | | | 325 | | | | 326,625 | |
| | | |
PMHC II, Inc., Term Loan, 4.50%, (3 mo. USD LIBOR + 3.50%, Floor 1.00%), 3/31/25 | | | | | | | 1,660 | | | | 1,651,998 | |
| | | |
Pregis TopCo Corporation, Term Loan, 4.09%, (1 mo. USD LIBOR + 4.00%), 7/31/26 | | | | | | | 663 | | | | 662,911 | |
| |
| Pretium PKG Holdings, Inc.: | | | | |
| | | |
Term Loan, 4.50%, (6 mo. USD LIBOR + 4.00%, Floor 0.50%), 10/2/28 | | | | | | | 525 | | | | 524,016 | |
| | | |
Term Loan - Second Lien, 7.25%, (6 mo. USD LIBOR + 6.75%, Floor 0.50%), 10/1/29 | | | | | | | 300 | | | | 302,062 | |
| | | |
Rohm Holding GmbH, Term Loan, 4.904%, (6 mo. USD LIBOR + 4.75%), 7/31/26 | | | | | | | 1,490 | | | | 1,486,458 | |
| | | |
Starfruit Finco B.V., Term Loan, 3.25%, (1 mo. EURIBOR + 3.25%), 10/1/25 | | | EUR | | | | 448 | | | | 502,616 | |
| | | |
Venator Materials Corporation, Term Loan, 3.09%, (1 mo. USD LIBOR + 3.00%), 8/8/24 | | | | | | | 408 | | | | 405,280 | |
| | | |
W.R. Grace & Co. Conn., Term Loan, 4.25%, (3 mo. USD LIBOR + 3.75%, Floor 0.50%), 9/22/28 | | | | | | | 2,475 | | | | 2,472,421 | |
| | | |
| | | | | | | | | | | $ | 26,632,744 | |
|
| Conglomerates — 0.0%(12) | |
| | | |
Penn Engineering & Manufacturing Corp., Term Loan, 3.50%, (3 mo. USD LIBOR + 2.50%, Floor 1.00%), 6/27/24 | | | | | | | 183 | | | $ | 182,424 | |
| | | |
| | | | | | | | | | | $ | 182,424 | |
|
| Containers and Glass Products — 2.8% | |
| | | |
Berlin Packaging, LLC, Term Loan, 4.25%, (USD LIBOR + 3.75%, Floor 0.50%), 3/11/28(10) | | | | | | | 725 | | | $ | 721,647 | |
| | | |
BWAY Holding Company, Term Loan, 3.337%, (1 mo. USD LIBOR + 3.25%), 4/3/24 | | | | | | | 2,476 | | | | 2,427,920 | |
| | | | | | | | | | | | |
| Borrower/Description | | | | | Principal
Amount*
(000’s omitted) | | | Value | |
|
| Containers and Glass Products (continued) | |
| | | |
Flex Acquisition Company, Inc., Term Loan, 4.00%, (3 mo. USD LIBOR + 3.50%, Floor 0.50%), 2/23/28 | | | | | | | 3,441 | | | $ | 3,419,845 | |
| | | |
Libbey Glass, Inc., Term Loan, 5.00%, (1 mo. USD LIBOR + 4.00%, Floor 1.00%), 11/13/25 | | | | | | | 849 | | | | 882,543 | |
| | | |
Proampac PG Borrower, LLC, Term Loan, 4.50%, (3 mo. USD LIBOR + 3.75%, Floor 0.75%), 11/3/25 | | | | | | | 623 | | | | 622,408 | |
| | | |
Reynolds Group Holdings, Inc., Term Loan, 4.00%, (1 mo. USD LIBOR + 3.50%, Floor 0.50%), 9/20/28 | | | | | | | 2,350 | | | | 2,342,167 | |
| | | |
TricorBraun Holdings, Inc., Term Loan, 3.75%, (1 mo. USD LIBOR + 3.25%, Floor 0.50%), 3/3/28 | | | | | | | 674 | | | | 666,950 | |
| | | |
Trident TPI Holdings, Inc., Term Loan, 4.25%, (3 mo. USD LIBOR + 3.25%, Floor 1.00%), 10/17/24 | | | | | | | 747 | | | | 745,689 | |
| | | |
| | | | | | | | | | | $ | 11,829,169 | |
|
| Cosmetics / Toiletries — 0.3% | |
| | | |
Kronos Acquisition Holdings, Inc., Term Loan, 4.25%, (3 mo. USD LIBOR + 3.75%, Floor 0.50%), 12/22/26 | | | | | | | 1,414 | | | $ | 1,371,176 | |
| | | |
| | | | | | | | | | | $ | 1,371,176 | |
|
| Drugs — 4.0% | |
| | | |
Akorn, Inc., Term Loan, 8.50%, (3 mo. USD LIBOR + 7.50%, Floor 1.00%), 10/1/25 | | | | | | | 864 | | | $ | 872,943 | |
| | | |
Alkermes, Inc., Term Loan, 3.00%, (3 mo. USD LIBOR + 2.50%, Floor 0.50%), 3/12/26 | | | | | | | 391 | | | | 386,726 | |
| | | |
Amneal Pharmaceuticals, LLC, Term Loan, 3.625%, (1 mo. USD LIBOR + 3.50%), 5/4/25 | | | | | | | 1,836 | | | | 1,807,632 | |
| | | |
Bausch Health Companies, Inc., Term Loan, 3.09%, (1 mo. USD LIBOR + 3.00%), 6/2/25 | | | | | | | 2,200 | | | | 2,183,500 | |
| | | |
Cambrex Corporation, Term Loan, 4.25%, (1 mo. USD LIBOR + 3.50%, Floor 0.75%), 12/4/26 | | | | | | | 323 | | | | 322,260 | |
| | | |
Curia Global, Inc., Term Loan, 4.50%, (USD LIBOR + 3.75%, Floor 0.75%), 8/30/26(10) | | | | | | | 1,987 | | | | 1,986,947 | |
| | | |
Elanco Animal Health Incorporated, Term Loan, 1.836%, (1 mo. USD LIBOR + 1.75%), 8/1/27 | | | | | | | 633 | | | | 623,332 | |
| | | |
Jazz Financing Lux S.a.r.l., Term Loan, 4.00%, (1 mo. USD LIBOR + 3.50%, Floor 0.50%), 5/5/28 | | | | | | | 2,494 | | | | 2,491,802 | |
| |
| Mallinckrodt International Finance S.A.: | | | | |
| | | |
Term Loan, 6.00%, (3 mo. USD LIBOR + 5.25%, Floor 0.75%), 9/24/24 | | | | | | | 2,127 | | | | 1,993,673 | |
| | | |
Term Loan, 6.25%, (3 mo. USD LIBOR + 5.50%, Floor 0.75%), 2/24/25 | | | | | | | 3,053 | | | | 2,862,317 | |
| | | |
Nidda Healthcare Holding AG, Term Loan, 3.50%, (3 mo. EURIBOR + 3.50%), 8/21/26 | | | EUR | | | | 625 | | | | 702,611 | |
| | | | |
| | 10 | | See Notes to Financial Statements. |
Eaton Vance
Floating-Rate Income Trust
November 30, 2021
Portfolio of Investments (Unaudited) — continued
| | | | | | | | | | | | |
| Borrower/Description | | | | | Principal
Amount*
(000’s omitted) | | | Value | |
|
| Drugs (continued) | |
| | | |
Pearl Intermediate Parent, LLC, Term Loan - Second Lien, 2/13/26(11) | | | | | | | 175 | | | $ | 175,656 | |
| | | |
PharmaZell GmbH, Term Loan, 6/11/27(11) | | | EUR | | | | 125 | | | | 142,028 | |
| | | |
| | | | | | | | | | | $ | 16,551,427 | |
|
| Ecological Services and Equipment — 1.0% | |
| | | |
EnergySolutions, LLC, Term Loan, 4.75%, (3 mo. USD LIBOR + 3.75%, Floor 1.00%), 5/9/25 | | | | | | | 1,844 | | | $ | 1,841,417 | |
| | | |
GFL Environmental, Inc., Term Loan, 3.50%, (3 mo. USD LIBOR + 3.00%, Floor 0.50%), 5/30/25 | | | | | | | 50 | | | | 49,677 | |
| | | |
TruGreen Limited Partnership, Term Loan, 4.75%, (1 mo. USD LIBOR + 4.00%, Floor 0.75%), 11/2/27 | | | | | | | 2,141 | | | | 2,145,906 | |
| | | |
US Ecology Holdings, Inc., Term Loan, 2.59%, (1 mo. USD LIBOR + 2.50%), 11/1/26 | | | | | | | 270 | | | | 269,794 | |
| | | |
| | | | | | | | | | | $ | 4,306,794 | |
|
| Electronics / Electrical — 32.0% | |
| | | |
Allegro Microsystems, Inc., Term Loan, 4.25%, (3 mo. USD LIBOR + 3.75%, Floor 0.50%), 9/30/27 | | | | | | | 48 | | | $ | 48,077 | |
| | | |
Applied Systems, Inc., Term Loan - Second Lien, 6.25%, (3 mo. USD LIBOR + 5.50%, Floor 0.75%), 9/19/25 | | | | | | | 2,671 | | | | 2,700,887 | |
| | | |
Aptean, Inc., Term Loan, 4.342%, (1 mo. USD LIBOR + 4.25%), 4/23/26 | | | | | | | 2,100 | | | | 2,090,812 | |
| | | |
AQA Acquisition Holding, Inc., Term Loan, 4.75%, (3 mo. USD LIBOR + 4.25%, Floor 0.50%), 3/3/28 | | | | | | | 973 | | | | 973,170 | |
| |
| Astra Acquisition Corp.: | | | | |
| | | |
Term Loan, 5.75%, (1 mo. USD LIBOR + 5.25%, Floor 0.50%), 10/25/28 | | | | | | | 1,575 | | | | 1,537,594 | |
| | | |
Term Loan - Second Lien, 9.625%, (1 mo. USD LIBOR + 8.875%, Floor 0.75%), 10/22/29 | | | | | | | 1,450 | | | | 1,431,875 | |
| |
| Banff Merger Sub, Inc.: | | | | |
| | | |
Term Loan, 3.882%, (3 mo. USD LIBOR + 3.75%), 10/2/25 | | | | | | | 3,748 | | | | 3,713,335 | |
| | | |
Term Loan, 4.00%, (3 mo. EURIBOR + 4.00%), 10/2/25 | | | EUR | | | | 292 | | | | 331,802 | |
| | | |
Term Loan - Second Lien, 6.00%, (3 mo. USD LIBOR + 5.50%, Floor 0.50%), 2/27/26 | | | | | | | 775 | | | | 784,494 | |
| | | |
Barracuda Networks, Inc., Term Loan - Second Lien, 7.50%, (3 mo. USD LIBOR + 6.75%, Floor 0.75%), 10/30/28 | | | | | | | 450 | | | | 455,813 | |
| |
| Brooks Automation, Inc.: | | | | |
| | | |
Term Loan, 11/17/28(11) | | | | | | | 1,100 | | | | 1,095,187 | |
| | | |
Term Loan - Second Lien, 11/4/29(11) | | | | | | | 475 | | | | 477,969 | |
| | | | | | | | | | |
| Borrower/Description | | | | Principal
Amount*
(000’s omitted) | | | Value | |
|
| Electronics / Electrical (continued) | |
| |
| Buzz Merger Sub, Ltd.: | | | | |
| | | |
Term Loan, 2.84%, (1 mo. USD LIBOR + 2.75%), 1/29/27 | | | | | 591 | | | $ | 586,568 | |
| | | |
Term Loan, 3.75%, (1 mo. USD LIBOR + 3.25%, Floor 0.50%), 1/29/27 | | | | | 67 | | | | 66,932 | |
| | | |
Celestica, Inc., Term Loan, 2.592%, (1 mo. USD LIBOR + 2.50%), 6/27/25 | | | | | 218 | | | | 217,228 | |
| | | |
CentralSquare Technologies, LLC, Term Loan, 3.882%, (3 mo. USD LIBOR + 3.75%), 8/29/25 | | | | | 900 | | | | 847,838 | |
| | | |
Chamberlain Group, Inc., Term Loan, 4.00%, (1 mo. USD LIBOR + 3.50%, Floor 0.50%), 11/3/28 | | | | | 1,350 | | | | 1,344,094 | |
| |
| Cloudera, Inc.: | | | | |
| | | |
Term Loan, 4.25%, (1 mo. USD LIBOR + 3.75%, Floor 0.50%), 10/8/28 | | | | | 2,400 | | | | 2,386,500 | |
| | | |
Term Loan - Second Lien, 6.50%, (1 mo. USD LIBOR + 6.00%, Floor 0.50%), 10/8/29 | | | | | 650 | | | | 651,625 | |
| | | |
Cohu, Inc., Term Loan, 3.09%, (1 mo. USD LIBOR + 3.00%), 10/1/25 | | | | | 272 | | | | 270,702 | |
| | | |
Concorde Midco, Ltd., Term Loan, 4.00%, (6 mo. EURIBOR + 4.00%), 3/1/28 | | EUR | | | 575 | | | | 654,146 | |
| | | |
ConnectWise, LLC, Term Loan, 4.00%, (3 mo. USD LIBOR + 3.50%, Floor 0.50%), 9/29/28 | | | | | 2,000 | | | | 1,988,438 | |
| | | |
Constant Contact, Inc., Term Loan, 4.75%, (6 mo. USD LIBOR + 4.00%, Floor 0.75%), 2/10/28 | | | | | 2,046 | | | | 2,041,484 | |
| | | |
Cornerstone OnDemand, Inc., Term Loan, 4.25%, (6 mo. USD LIBOR + 3.75%, Floor 0.50%), 10/16/28 | | | | | 1,175 | | | | 1,171,084 | |
| | | |
CPI International, Inc., Term Loan, 4.50%, (1 mo. USD LIBOR + 3.50%, Floor 1.00%), 7/26/24 | | | | | 660 | | | | 660,003 | |
| | | |
Creation Technologies, Inc., Term Loan, 6.00%, (3 mo. USD LIBOR + 5.50%, Floor 0.50%), 10/5/28 | | | | | 850 | | | | 851,062 | |
| |
| Delta TopCo, Inc.: | | | | |
| | | |
Term Loan, 4.50%, (3 mo. USD LIBOR + 3.75%, Floor 0.75%), 12/1/27 | | | | | 1,559 | | | | 1,556,636 | |
| | | |
Term Loan - Second Lien, 8.00%, (6 mo. USD LIBOR + 7.25%, Floor 0.75%), 12/1/28 | | | | | 2,250 | | | | 2,280,235 | |
| | | |
DG Investment Intermediate Holdings 2, Inc., Term Loan, 4.50%, (1 mo. USD LIBOR + 3.75%, Floor 0.75%), 3/31/28 | | | | | 998 | | | | 995,247 | |
| | | |
E2open, LLC, Term Loan, 4.00%, (3 mo. USD LIBOR + 3.50%, Floor 0.50%), 2/4/28 | | | | | 970 | | | | 970,329 | |
| | | |
ECI Macola Max Holding, LLC, Term Loan, 4.50%, (3 mo. USD LIBOR + 3.75%, Floor 0.75%), 11/9/27 | | | | | 1,415 | | | | 1,417,079 | |
| | | |
Electro Rent Corporation, Term Loan, 6.00%, (3 mo. USD LIBOR + 5.00%, Floor 1.00%), 1/31/24 | | | | | 1,727 | | | | 1,729,538 | |
| | | | |
| | 11 | | See Notes to Financial Statements. |
Eaton Vance
Floating-Rate Income Trust
November 30, 2021
Portfolio of Investments (Unaudited) — continued
| | | | | | | | | | |
| Borrower/Description | | | | Principal
Amount*
(000’s omitted) | | | Value | |
|
| Electronics / Electrical (continued) | |
| |
| Epicor Software Corporation: | | | | |
| | | |
Term Loan, 4.00%, (1 mo. USD LIBOR + 3.25%, Floor 0.75%), 7/30/27 | | | | | 2,512 | | | $ | 2,504,502 | |
| | | |
Term Loan - Second Lien, 8.75%, (1 mo. USD LIBOR + 7.75%, Floor 1.00%), 7/31/28 | | | | | 925 | | | | 949,281 | |
| | | |
EXC Holdings III Corp., Term Loan, 4.50%, (3 mo. USD LIBOR + 3.50%, Floor 1.00%), 12/2/24 | | | | | 1,638 | | | | 1,635,618 | |
| | | |
Finastra USA, Inc., Term Loan, 4.50%, (6 mo. USD LIBOR + 3.50%, Floor 1.00%), 6/13/24 | | | | | 4,966 | | | | 4,924,868 | |
| | | |
Gainwell Acquisition Corp., Term Loan, 4.75%, (3 mo. USD LIBOR + 4.00%, Floor 0.75%), 10/1/27 | | | | | 4,305 | | | | 4,307,255 | |
| | | |
Hyland Software, Inc., Term Loan - Second Lien, 7.00%, (1 mo. USD LIBOR + 6.25%, Floor 0.75%), 7/7/25 | | | | | 3,806 | | | | 3,856,745 | |
| | | |
Imperva, Inc., Term Loan, 5.00%, (3 mo. USD LIBOR + 4.00%, Floor 1.00%), 1/12/26 | | | | | 2,389 | | | | 2,385,719 | |
| | | |
Imprivata, Inc., Term Loan, 4.00%, (3 mo. USD LIBOR + 3.50%, Floor 0.50%), 12/1/27 | | | | | 1,000 | | | | 1,000,469 | |
| | | |
Informatica, LLC, Term Loan, 2.875%, (1 mo. USD LIBOR + 2.75%), 10/27/28 | | | | | 2,325 | | | | 2,314,345 | |
| | | |
LogMeIn, Inc., Term Loan, 4.839%, (1 mo. USD LIBOR + 4.75%), 8/31/27 | | | | | 2,035 | | | | 2,025,724 | |
| |
| MA FinanceCo., LLC: | | | | |
| | | |
Term Loan, 2.84%, (1 mo. USD LIBOR + 2.75%), 6/21/24 | | | | | 451 | | | | 446,910 | |
| | | |
Term Loan, 4.50%, (3 mo. EURIBOR + 4.50%), 6/5/25 | | EUR | | | 727 | | | | 833,008 | |
| | | |
Term Loan, 5.25%, (3 mo. USD LIBOR + 4.25%, Floor 1.00%), 6/5/25 | | | | | 1,841 | | | | 1,865,166 | |
| |
| Magenta Buyer, LLC: | | | | |
| | | |
Term Loan, 5.75%, (3 mo. USD LIBOR + 5.00%, Floor 0.75%), 7/27/28 | | | | | 4,650 | | | | 4,639,342 | |
| | | |
Term Loan - Second Lien, 9.00%, (3 mo. USD LIBOR + 8.25%, Floor 0.75%), 7/27/29 | | | | | 1,250 | | | | 1,239,062 | |
| | | |
Marcel LUX IV S.a.r.l., Term Loan, 4.75%, (1 mo. USD LIBOR + 4.00%, Floor 0.75%), 12/31/27 | | | | | 112 | | | | 111,653 | |
| | | |
Mavenir Systems, Inc., Term Loan, 5.25%, (3 mo. USD LIBOR + 4.75%, Floor 0.50%), 8/18/28 | | | | | 325 | | | | 326,219 | |
| | | |
MH Sub I, LLC, Term Loan, 9/13/24(11) | | | | | 350 | | | | 348,994 | |
| | | |
Mirion Technologies, Inc., Term Loan, 3.25%, (2 mo. USD LIBOR + 2.75%, Floor 0.50%), 10/20/28 | | | | | 625 | | | | 621,484 | |
| | | |
MKS Instruments, Inc., Term Loan, 10/21/28(11) | | EUR | | | 350 | | | | 396,935 | |
| | | |
Panther Commercial Holdings L.P., Term Loan, 5.00%, (3 mo. USD LIBOR + 4.50%, Floor 0.50%), 1/7/28 | | | | | 998 | | | | 999,851 | |
| | | |
PointClickCare Technologies, Inc., Term Loan, 3.75%, (3 mo. USD LIBOR + 3.00%, Floor 0.75%), 12/29/27 | | | | | 672 | | | | 670,366 | |
| | | | | | | | | | |
| Borrower/Description | | | | Principal
Amount*
(000’s omitted) | | | Value | |
|
| Electronics / Electrical (continued) | |
| | | |
Polaris Newco, LLC, Term Loan, 4.50%, (6 mo. USD LIBOR + 4.00%, Floor 0.50%), 6/2/28 | | | | | 2,900 | | | $ | 2,895,340 | |
| | | |
Poseidon Intermediate, LLC, Term Loan, 4.09%, (1 mo. USD LIBOR + 4.00%), 8/18/25 | | | | | 199 | | | | 199,992 | |
| | | |
Proofpoint, Inc., Term Loan, 3.75%, (3 mo. USD LIBOR + 3.25%, Floor 0.50%), 8/31/28 | | | | | 3,000 | | | | 2,975,625 | |
| | | |
Rackspace Technology Global, Inc., Term Loan, 2/15/28(11) | | | | | 2,000 | | | | 1,974,376 | |
| | | |
RealPage, Inc., Term Loan, 3.75%, (1 mo. USD LIBOR + 3.25%, Floor 0.50%), 4/24/28 | | | | | 4,425 | | | | 4,391,020 | |
| | | |
Recorded Books, Inc., Term Loan, 4.089%, (1 mo. USD LIBOR + 4.00%), 8/29/25 | | | | | 2,520 | | | | 2,517,374 | |
| | | |
Redstone Holdco 2 L.P., Term Loan, 5.50%, (3 mo. USD LIBOR + 4.75%, Floor 0.75%), 4/27/28 | | | | | 2,450 | | | | 2,326,478 | |
| | | |
Renaissance Holding Corp., Term Loan - Second Lien, 7.09%, (1 mo. USD LIBOR + 7.00%), 5/29/26 | | | | | 200 | | | | 201,225 | |
| | | |
Riverbed Technology, Inc., Term Loan - Second Lien, 12.00%, (1 mo. USD LIBOR + 11.00%, Floor 1.00%), 7.50% cash, 4.50% PIK, 12/31/26 | | | | | 24 | | | | 6,657 | |
| | | |
Seattle Spinco, Inc., Term Loan, 2.84%, (1 mo. USD LIBOR + 2.75%), 6/21/24 | | | | | 3,049 | | | | 3,018,090 | |
| | | |
Sophia L.P., Term Loan, 4.00%, (3 mo. USD LIBOR + 3.50%, Floor 0.50%), 10/7/27 | | | | | 4,237 | | | | 4,237,077 | |
| |
| Sovos Compliance, LLC: | | | | |
| | | |
Term Loan, 2.25%, 8/11/28(9) | | | | | 92 | | | | 92,555 | |
| | | |
Term Loan, 5.00%, (3 mo. USD LIBOR + 4.50%, Floor 0.50%), 8/11/28 | | | | | 533 | | | | 535,960 | |
| | | |
SurveyMonkey, Inc., Term Loan, 3.83%, (1 week USD LIBOR + 3.75%), 10/10/25 | | | | | 1,031 | | | | 1,028,210 | |
| | | |
Symplr Software, Inc., Term Loan, 5.25%, (3 mo. USD LIBOR + 4.50%, Floor 0.75%), 12/22/27 | | | | | 871 | | | | 872,802 | |
| |
| Tibco Software, Inc.: | | | | |
| | | |
Term Loan, 6/30/26(11) | | | | | 675 | | | | 667,723 | |
| | | |
Term Loan, 3.85%, (1 mo. USD LIBOR + 3.75%), 6/30/26 | | | | | 2,619 | | | | 2,588,779 | |
| | | |
Term Loan - Second Lien, 7.35%, (1 mo. USD LIBOR + 7.25%), 3/3/28 | | | | | 1,350 | | | | 1,355,569 | |
| | | |
TTM Technologies, Inc., Term Loan, 2.586%, (1 mo. USD LIBOR + 2.50%), 9/28/24 | | | | | 150 | | | | 149,654 | |
| | | |
Turing Midco, LLC, Term Loan, 3.50%, (1 mo. USD LIBOR + 3.00%, Floor 0.50%), 3/23/28 | | | | | 340 | | | | 338,625 | |
| |
| Uber Technologies, Inc.: | | | | |
| | | |
Term Loan, 3.59%, (1 mo. USD LIBOR + 3.50%), 4/4/25 | | | | | 6,124 | | | | 6,110,992 | |
| | | |
Term Loan, 3.59%, (1 mo. USD LIBOR + 3.50%), 2/25/27 | | | | | 5 | | | | 5,278 | |
| | | | |
| | 12 | | See Notes to Financial Statements. |
Eaton Vance
Floating-Rate Income Trust
November 30, 2021
Portfolio of Investments (Unaudited) — continued
| | | | | | | | | | | | |
| Borrower/Description | | | | | Principal
Amount*
(000’s omitted) | | | Value | |
|
| Electronics / Electrical (continued) | |
| |
| Ultimate Software Group, Inc. (The): | | | | |
| | | |
Term Loan, 3.84%, (1 mo. USD LIBOR + 3.75%), 5/4/26 | | | | | | | 1,726 | | | $ | 1,719,127 | |
| | | |
Term Loan, 4.00%, (3 mo. USD LIBOR + 3.25%, Floor 0.75%), 5/4/26 | | | | | | | 4,580 | | | | 4,563,246 | |
| | | |
Term Loan - Second Lien, 7.50%, (3 mo. USD LIBOR + 6.75%, Floor 0.75%), 5/3/27 | | | | | | | 275 | | | | 278,781 | |
| | | |
Ultra Clean Holdings, Inc., Term Loan, 3.84%, (1 mo. USD LIBOR + 3.75%), 8/27/25 | | | | | | | 1,276 | | | | 1,278,540 | |
| | | |
Valkyr Purchaser, LLC, Term Loan, 4.75%, (3 mo. USD LIBOR + 4.00%, Floor 0.75%), 11/5/27 | | | | | | | 796 | | | | 795,503 | |
| | | |
Verifone Systems, Inc., Term Loan, 4.178%, (3 mo. USD LIBOR + 4.00%), 8/20/25 | | | | | | | 1,238 | | | | 1,210,786 | |
| |
| Verisure Holding AB: | | | | |
| | | |
Term Loan, 3.25%, (3 mo. EURIBOR + 3.25%), 7/20/26 | | | EUR | | | | 325 | | | | 366,663 | |
| | | |
Term Loan, 3.25%, (3 mo. EURIBOR + 3.25%), 3/27/28 | | | EUR | | | | 850 | | | | 958,161 | |
| |
| Veritas US, Inc.: | | | | |
| | | |
Term Loan, 5.75%, (3 mo. EURIBOR + 4.75%, Floor 1.00%), 9/1/25 | | | EUR | | | | 369 | | | | 420,981 | |
| | | |
Term Loan, 6.00%, (3 mo. USD LIBOR + 5.00%, Floor 1.00%), 9/1/25 | | | | | | | 2,723 | | | | 2,715,179 | |
| | | |
Vision Solutions, Inc., Term Loan, 4.75%, (3 mo. USD LIBOR + 4.00%, Floor 0.75%), 4/24/28 | | | | | | | 2,500 | | | | 2,500,780 | |
| | | |
VS Buyer, LLC, Term Loan, 3.09%, (1 mo. USD LIBOR + 3.00%), 2/28/27 | | | | | | | 1,231 | | | | 1,228,172 | |
| | | |
| | | | | | | | | | | $ | 133,256,619 | |
|
| Equipment Leasing — 0.5% | |
| | | |
Boels Topholding B.V., Term Loan, 3.25%, (3 mo. EURIBOR + 3.25%), 2/6/27 | | | EUR | | | | 600 | | | $ | 679,822 | |
| | | |
Fly Funding II S.a.r.l., Term Loan, 7.00%, (3 mo. USD LIBOR + 6.00%, Floor 1.00%), 10/8/25 | | | | | | | 1,259 | | | | 1,259,537 | |
| | | |
| | | | | | | | | | | $ | 1,939,359 | |
|
| Financial Intermediaries — 3.8% | |
| | | |
Aretec Group, Inc., Term Loan, 4.34%, (1 mo. USD LIBOR + 4.25%), 10/1/25 | | | | | | | 3,507 | | | $ | 3,503,499 | |
| | | |
CoreLogic, Inc., Term Loan, 4.00%, (1 mo. USD LIBOR + 3.50%, Floor 0.50%), 6/2/28 | | | | | | | 3,138 | | | | 3,122,791 | |
| | | |
Edelman Financial Center, LLC, Term Loan, 4.25%, (1 mo. USD LIBOR + 3.50%, Floor 0.75%), 4/7/28 | | | | | | | 2,546 | | | | 2,536,577 | |
| | | |
EIG Management Company, LLC, Term Loan, 4.50%, (1 mo. USD LIBOR + 3.75%, Floor 0.75%), 2/22/25 | | | | | | | 265 | | | | 265,154 | |
| | | | | | | | | | | | |
| Borrower/Description | | | | | Principal
Amount*
(000’s omitted) | | | Value | |
|
| Financial Intermediaries (continued) | |
| |
| Focus Financial Partners, LLC: | | | | |
| | | |
Term Loan, 2.50%, 6/24/28(9) | | | | | | | 281 | | | $ | 278,906 | |
| | | |
Term Loan, 3.00%, (1 mo. USD LIBOR + 2.50%, Floor 0.50%), 7/1/28 | | | | | | | 1,216 | | | | 1,205,573 | |
| | | |
Greenhill & Co., Inc., Term Loan, 3.34%, (1 mo. USD LIBOR + 3.25%), 4/12/24 | | | | | | | 493 | | | | 493,224 | |
| |
| GreenSky Holdings, LLC: | | | | |
| | | |
Term Loan, 3.375%, (1 mo. USD LIBOR + 3.25%), 3/31/25 | | | | | | | 1,448 | | | | 1,443,881 | |
| | | |
Term Loan, 5.50%, (1 mo. USD LIBOR + 4.50%, Floor 1.00%), 3/29/25 | | | | | | | 494 | | | | 492,516 | |
| |
| Mariner Wealth Advisors, LLC: | | | | |
| | | |
Term Loan, 8/18/28(11) | | | | | | | 125 | | | | 124,062 | |
| | | |
Term Loan, 0.00%, 8/18/28(9) | | | | | | | 53 | | | | 52,727 | |
| | | |
Term Loan, 3.75%, (3 mo. USD LIBOR + 3.25%, Floor 0.50%), 8/18/28 | | | | | | | 1,247 | | | | 1,237,524 | |
| | | |
Victory Capital Holdings, Inc., Term Loan, 2.377%,
(3 mo. USD LIBOR + 2.25%), 7/1/26 | | | | | | | 935 | | | | 925,560 | |
| | | |
| | | | | | | | | | | $ | 15,681,994 | |
|
| Food Products — 1.0% | |
| | | |
8th Avenue Food & Provisions, Inc., Term Loan, 5.50%, (1 mo. USD LIBOR + 4.75%, Floor 0.75%), 10/1/25 | | | | | | | 500 | | | $ | 498,125 | |
| | | |
Alltech, Inc., Term Loan, 4.50%, (1 mo. USD LIBOR + 4.00%, Floor 0.50%), 10/13/28 | | | | | | | 425 | | | | 426,063 | |
| | | |
Badger Buyer Corp., Term Loan, 4.50%, (1 mo. USD LIBOR + 3.50%, Floor 1.00%), 9/30/24 | | | | | | | 360 | | | | 347,400 | |
| | | |
HLF Financing S.a.r.l., Term Loan, 2.59%, (1 mo. USD LIBOR + 2.50%), 8/18/25 | | | | | | | 731 | | | | 722,648 | |
| | | |
Monogram Food Solutions, LLC, Term Loan, 4.50%, (1 mo. USD LIBOR + 4.00%, Floor 0.50%), 8/28/28 | | | | | | | 450 | | | | 450,000 | |
| | | |
Shearer’s Foods, Inc., Term Loan, 4.25%, (3 mo. USD LIBOR + 3.50%, Floor 0.75%), 9/23/27 | | | | | | | 446 | | | | 443,281 | |
| | | |
Simply Good Foods USA, Inc., Term Loan, 4.75%, (1 mo. USD LIBOR + 3.75%, Floor 1.00%), 7/7/24 | | | | | | | 263 | | | | 264,174 | |
| | | |
United Petfood Group B.V., Term Loan, 3.25%, (6 mo. EURIBOR + 3.25%), 4/23/28 | | | EUR | | | | 775 | | | | 873,709 | |
| | | |
UTZ Quality Foods, LLC, Term Loan, 3.09%, (1 mo. USD LIBOR + 3.00%), 1/20/28 | | | | | | | 174 | | | | 173,284 | |
| | | |
| | | | | | | | | | | $ | 4,198,684 | |
|
| Food Service — 1.2% | |
| |
| Ai Aqua Merger Sub, Inc.: | | | | |
| | | |
Term Loan, 7/31/28(11) | | | | | | | 244 | | | $ | 244,495 | |
| | | |
Term Loan, 7/31/28(11) | | | | | | | 1,956 | | | | 1,955,963 | |
| | | | |
| | 13 | | See Notes to Financial Statements. |
Eaton Vance
Floating-Rate Income Trust
November 30, 2021
Portfolio of Investments (Unaudited) — continued
| | | | | | | | | | | | |
| Borrower/Description | | | | | Principal
Amount*
(000’s omitted) | | | Value | |
|
| Food Service (continued) | |
| | | |
IRB Holding Corp., Term Loan, 4.25%, (3 mo. USD LIBOR + 3.25%, Floor 1.00%), 12/15/27 | | | | | | | 2,084 | | | $ | 2,078,518 | |
| | | |
Sovos Brands Intermediate, Inc., Term Loan, 4.50%, (3 mo. USD LIBOR + 3.75%, Floor 0.75%), 6/8/28 | | | | | | | 601 | | | | 600,875 | |
| | | |
| | | | | | | | | | | $ | 4,879,851 | |
|
| Food / Drug Retailers — 0.2% | |
| |
| L1R HB Finance Limited: | | | | |
| | | |
Term Loan, 4.25%, (3 mo. EURIBOR + 4.25%), 9/2/24 | | | EUR | | | | 450 | | | $ | 479,572 | |
| | | |
Term Loan, 5.326%, (3 mo. GBP LIBOR + 5.25%), 9/2/24 | | | GBP | | | | 450 | | | | 554,163 | |
| | | |
| | | | | | | | | | | $ | 1,033,735 | |
|
| Forest Products — 0.3% | |
| | | |
Journey Personal Care Corp., Term Loan, 5.00%, (3 mo. USD LIBOR + 4.25%, Floor 0.75%), 3/1/28 | | | | | | | 1,272 | | | $ | 1,267,574 | |
| | | |
| | | | | | | | | | | $ | 1,267,574 | |
|
| Health Care — 12.0% | |
| | | |
Accelerated Health Systems, LLC, Term Loan, 3.592%, (1 mo. USD LIBOR + 3.50%), 10/31/25 | | | | | | | 559 | | | $ | 558,489 | |
| | | |
AEA International Holdings (Lux) S.a.r.l., Term Loan, 4.25%, (3 mo. USD LIBOR + 3.75%, Floor 0.50%), 9/7/28 | | | | | | | 900 | | | | 902,250 | |
| | | |
athenahealth, Inc., Term Loan, 4.399%, (USD LIBOR + 4.25%), 2/11/26(10) | | | | | | | 4,123 | | | | 4,126,728 | |
| | | |
Bayou Intermediate II, LLC, Term Loan, 5.25%, (3 mo. USD LIBOR + 4.50%, Floor 0.75%), 8/2/28 | | | | | | | 875 | | | | 878,281 | |
| | | |
Biogroup-LCD, Term Loan, 3.50%, (6 mo. EURIBOR + 3.50%), 1/28/28 | | | EUR | | | | 250 | | | | 282,029 | |
| | | |
BW NHHC Holdco, Inc., Term Loan, 5.16%, (3 mo. USD LIBOR + 5.00%), 5/15/25 | | | | | | | 2,485 | | | | 2,183,860 | |
| | | |
Cano Health, LLC, Term Loan, 5.25%, (3 mo. USD LIBOR + 4.50%, Floor 0.75%), 11/23/27 | | | | | | | 1,537 | | | | 1,540,618 | |
| | | |
CCRR Parent, Inc., Term Loan, 4.50%, (3 mo. USD LIBOR + 3.75%, Floor 0.75%), 3/6/28 | | | | | | | 522 | | | | 524,824 | |
| | | |
Cerba Healthcare S.A.S., Term Loan, 3.75%, (1 mo. EURIBOR + 3.75%), 6/30/28 | | | EUR | | | | 450 | | | | 510,522 | |
| | | |
Certara L.P., Term Loan, 3.59%, (1 mo. USD LIBOR + 3.50%), 8/15/26 | | | | | | | 960 | | | | 960,879 | |
| | | |
CHG Healthcare Services, Inc., Term Loan, 4.00%, (3 mo. USD LIBOR + 3.50%, Floor 0.50%), 9/29/28 | | | | | | | 950 | | | | 947,116 | |
| | | |
CryoLife, Inc., Term Loan, 4.50%, (3 mo. USD LIBOR + 3.50%, Floor 1.00%), 6/1/27 | | | | | | | 505 | | | | 505,944 | |
| | | | | | | | | | |
| Borrower/Description | | | | Principal
Amount*
(000’s omitted) | | | Value | |
|
| Health Care (continued) | |
| | | |
Electron BidCo, Inc., Term Loan, 3.75%, (3 mo. USD LIBOR + 3.25%, Floor 0.50%), 11/1/28 | | | | | 700 | | | $ | 697,812 | |
| | | |
Envision Healthcare Corporation, Term Loan, 3.84%, (1 mo. USD LIBOR + 3.75%), 10/10/25 | | | | | 3,019 | | | | 2,277,072 | |
| | | |
eResearchTechnology, Inc., Term Loan, 5.50%, (1 mo. USD LIBOR + 4.50%, Floor 1.00%), 2/4/27 | | | | | 348 | | | | 348,672 | |
| | | |
GHX Ultimate Parent Corporation, Term Loan, 4.25%, (3 mo. USD LIBOR + 3.25%, Floor 1.00%), 6/28/24 | | | | | 960 | | | | 958,122 | |
| | | |
Hanger, Inc., Term Loan, 3.59%, (1 mo. USD LIBOR + 3.50%), 3/6/25 | | | | | 1,110 | | | | 1,109,287 | |
| | | |
IQVIA, Inc., Term Loan, 1.84%, (1 mo. USD LIBOR + 1.75%), 3/7/24 | | | | | 524 | | | | 522,425 | |
| | | |
IVC Acquisition Ltd., Term Loan, 2/13/26(11) | | EUR | | | 1,350 | | | | 1,532,184 | |
| | | |
LSCS Holdings, Inc., Term Loan, 11/23/28(11) | | | | | 650 | | | | 649,729 | |
| | | |
MDVIP, Inc., Term Loan, 4.25%, (3 mo. USD LIBOR + 3.75%, Floor 0.50%), 10/16/28 | | | | | 250 | | | | 249,792 | |
| |
| Medical Solutions, LLC: | | | | |
| | | |
Term Loan, 0.00%, 11/1/28(9) | | | | | 204 | | | | 203,312 | |
| | | |
Term Loan, 4.00%, (3 mo. USD LIBOR + 3.50%, Floor 0.50%), 11/1/28 | | | | | 1,071 | | | | 1,067,385 | |
| | | |
Midwest Physician Administrative Services, LLC, Term Loan, 4.00%, (3 mo. USD LIBOR + 3.25%, Floor 0.75%), 3/12/28 | | | | | 572 | | | | 569,622 | |
| |
| National Mentor Holdings, Inc.: | | | | |
| | | |
Term Loan, 3.75%, 3/2/28(9) | | | | | 97 | | | | 95,369 | |
| | | |
Term Loan, 4.50%, (3 mo. USD LIBOR + 3.75%, Floor 0.75%), 3/2/28 | | | | | 65 | | | | 64,701 | |
| | | |
Term Loan, 4.50%, (USD LIBOR + 3.75%, Floor 0.75%), 3/2/28(10) | | | | | 2,074 | | | | 2,049,466 | |
| | | |
Navicure, Inc., Term Loan, 4.09%, (1 mo. USD LIBOR + 4.00%), 10/22/26 | | | | | 1,576 | | | | 1,576,492 | |
| | | |
Option Care Health, Inc., Term Loan, 3.25%, (1 mo. USD LIBOR + 2.75%, Floor 0.50%), 10/27/28 | | | | | 375 | | | | 374,531 | |
| | | |
Ortho-Clinical Diagnostics S.A., Term Loan, 3.50%, (3 mo. EURIBOR + 3.50%), 6/30/25 | | EUR | | | 388 | | | | 440,785 | |
| | | |
Pacific Dental Services, LLC, Term Loan, 4.00%, (1 mo. USD LIBOR + 3.25%, Floor 0.75%), 5/5/28 | | | | | 599 | | | | 597,876 | |
| | | |
PetVet Care Centers, LLC, Term Loan, 4.25%, (1 mo. USD LIBOR + 3.50%, Floor 0.75%), 2/14/25 | | | | | 348 | | | | 347,900 | |
| |
| Phoenix Guarantor, Inc.: | | | | |
| | | |
Term Loan, 3.342%, (1 mo. USD LIBOR + 3.25%), 3/5/26 | | | | | 2,992 | | | | 2,962,462 | |
| | | |
Term Loan, 3.589%, (1 mo. USD LIBOR + 3.50%), 3/5/26 | | | | | 1,546 | | | | 1,530,654 | |
| | | |
Project Ruby Ultimate Parent Corp., Term Loan, 4.00%, (1 mo. USD LIBOR + 3.25%, Floor 0.75%), 3/3/28 | | | | | 1,244 | | | | 1,236,365 | |
| | | | |
| | 14 | | See Notes to Financial Statements. |
Eaton Vance
Floating-Rate Income Trust
November 30, 2021
Portfolio of Investments (Unaudited) — continued
| | | | | | | | | | | | |
| Borrower/Description | | | | | Principal
Amount*
(000’s omitted) | | | Value | |
|
| Health Care (continued) | |
| | | |
Radiology Partners, Inc., Term Loan, 4.339%, (1 mo. USD LIBOR + 4.25%), 7/9/25 | | | | | | | 2,555 | | | $ | 2,523,181 | |
| | | |
Sotera Health Holdings, LLC, Term Loan, 3.25%, (3 mo. USD LIBOR + 2.75%, Floor 0.50%), 12/11/26 | | | | | | | 675 | | | | 672,679 | |
| | | |
Sound Inpatient Physicians, Term Loan, 2.84%, (1 mo. USD LIBOR + 2.75%), 6/27/25 | | | | | | | 484 | | | | 480,928 | |
| | | |
Sunshine Luxembourg VII S.a.r.l., Term Loan, 4.50%, (3 mo. USD LIBOR + 3.75%, Floor 0.75%), 10/1/26 | | | | | | | 1,244 | | | | 1,242,351 | |
| | | |
Surgery Center Holdings, Inc., Term Loan, 4.50%, (1 mo. USD LIBOR + 3.75%, Floor 0.75%), 8/31/26 | | | | | | | 2,519 | | | | 2,513,249 | |
| | | |
Synlab Bondco PLC, Term Loan, 2.50%, (6 mo. EURIBOR + 2.50%), 7/1/27 | | | EUR | | | | 325 | | | | 365,884 | |
| | | |
Team Health Holdings, Inc., Term Loan, 3.75%, (1 mo. USD LIBOR + 2.75%, Floor 1.00%), 2/6/24 | | | | | | | 1,972 | | | | 1,880,453 | |
| | | |
U.S. Anesthesia Partners, Inc., Term Loan, 4.75%, (6 mo. USD LIBOR + 4.25%, Floor 0.50%), 10/1/28 | | | | | | | 1,775 | | | | 1,766,569 | |
| | | |
US Radiology Specialists, Inc., Term Loan, 6.25%, (3 mo. USD LIBOR + 5.50%, Floor 0.75%), 12/10/27 | | | | | | | 893 | | | | 894,590 | |
| | | |
Verscend Holding Corp., Term Loan, 4.09%, (1 mo. USD LIBOR + 4.00%), 8/27/25 | | | | | | | 1,591 | | | | 1,591,258 | |
| | | |
WP CityMD Bidco, LLC, Term Loan, 11/18/28(11) | | | | | | | 575 | | | | 573,922 | |
| | | |
| | | | | | | | | | | $ | 49,888,619 | |
|
| Home Furnishings — 2.2% | |
| | | |
ACProducts, Inc., Term Loan, 4.75%, (3 mo. USD LIBOR + 4.25%, Floor 0.50%), 5/17/28 | | | | | | | 2,120 | | | $ | 2,104,320 | |
| | | |
Conair Holdings, LLC, Term Loan, 4.25%, (3 mo. USD LIBOR + 3.75%, Floor 0.50%), 5/17/28 | | | | | | | 2,200 | | | | 2,196,907 | |
| | | |
Mattress Firm, Inc., Term Loan, 5.00%, (12 mo. USD LIBOR + 4.25%, Floor 0.75%), 9/25/28 | | | | | | | 1,075 | | | | 1,065,191 | |
| |
| Serta Simmons Bedding, LLC: | | | | |
| | | |
Term Loan, 8.50%, (1 mo. USD LIBOR + 7.50%, Floor 1.00%), 8/10/23 | | | | | | | 1,162 | | | | 1,173,910 | |
| | | |
Term Loan - Second Lien, 8.50%, (1 mo. USD LIBOR + 7.50%, Floor 1.00%), 8/10/23 | | | | | | | 2,687 | | | | 2,521,993 | |
| | | |
| | | | | | | | | | | $ | 9,062,321 | |
|
| Industrial Equipment — 7.0% | |
| | | |
Albion Financing 3 S.a.r.l., Term Loan, 5.75%, (3 mo. USD LIBOR + 5.25%, Floor 0.50%), 8/17/26 | | | | | | | 1,375 | | | $ | 1,362,109 | |
| | | |
Alliance Laundry Systems, LLC, Term Loan, 4.25%, (3 mo. USD LIBOR + 3.50%, Floor 0.75%), 10/8/27 | | | | | | | 2,200 | | | | 2,201,129 | |
| | | | | | | | | | |
| Borrower/Description | | | | Principal
Amount*
(000’s omitted) | | | Value | |
|
| Industrial Equipment (continued) | |
| | | |
American Trailer World Corp., Term Loan, 4.50%, (1 mo. USD LIBOR + 3.75%, Floor 0.75%), 3/3/28 | | | | | 648 | | | $ | 643,512 | |
| | | |
Apex Tool Group, LLC, Term Loan, 6.75%, (1 mo. USD LIBOR + 5.50%, Floor 1.25%), 8/1/24 | | | | | 2,894 | | | | 2,876,522 | |
| |
| Delachaux Group S.A.: | | | | |
| | | |
Term Loan, 3.75%, (3 mo. EURIBOR + 3.75%), 4/16/26 | | EUR | | | 394 | | | | 447,109 | |
| | | |
Term Loan, 4.629%, (3 mo. USD LIBOR + 4.50%), 4/16/26 | | | | | 466 | | | | 465,791 | |
| |
| DexKo Global, Inc.: | | | | |
| | | |
Term Loan, 0.00%, 10/4/28(9) | | EUR | | | 74 | | | | 84,107 | |
| | | |
Term Loan, 2.757%, (1 mo. USD LIBOR + 3.75%, Floor 1.00%), 10/4/28(9) | | | | | 112 | | | | 111,300 | |
| | | |
Term Loan, 4.00%, (3 mo. EURIBOR + 4.00%), 9/22/28 | | EUR | | | 240 | | | | 271,828 | |
| | | |
Term Loan, 4.00%, (3 mo. EURIBOR + 4.00%), 9/22/28 | | EUR | | | 461 | | | | 522,718 | |
| | | |
Term Loan, 4.25%, (3 mo. USD LIBOR + 3.75%, Floor 0.50%), 10/4/28 | | | | | 588 | | | | 584,325 | |
| | | |
DXP Enterprises, Inc., Term Loan, 5.75%, (1 mo. USD LIBOR + 4.75%, Floor 1.00%), 12/16/27 | | | | | 670 | | | | 668,263 | |
| | | |
Dynacast International, LLC, Term Loan, 10.25%, (3 mo. USD LIBOR + 9.25%, Floor 1.00%), 10/22/25 | | | | | 370 | | | | 375,170 | |
| | | |
Engineered Machinery Holdings, Inc., Term Loan, 4.50%, (3 mo. USD LIBOR + 3.75%, Floor 0.75%), 5/19/28 | | | | | 2,815 | | | | 2,815,730 | |
| |
| Filtration Group Corporation: | | | | |
| | | |
Term Loan, 3.50%, (3 mo. EURIBOR + 3.50%), 3/29/25 | | EUR | | | 386 | | | | 437,478 | |
| | | |
Term Loan, 4.00%, (1 mo. USD LIBOR + 3.50%, Floor 0.50%), 10/21/28 | | | | | 650 | | | | 647,563 | |
| | | |
Gardner Denver, Inc., Term Loan, 1.84%, (1 mo. USD LIBOR + 1.75%), 3/1/27 | | | | | 1,284 | | | | 1,268,157 | |
| | | |
GrafTech Finance, Inc., Term Loan, 3.50%, (1 mo. USD LIBOR + 3.00%, Floor 0.50%), 2/12/25 | | | | | 1,873 | | | | 1,876,522 | |
| | | |
Granite Holdings US Acquisition Co., Term Loan, 4.132%, (3 mo. USD LIBOR + 4.00%), 9/30/26 | | | | | 1,416 | | | | 1,408,232 | |
| | | |
Ingersoll-Rand Services Company, Term Loan, 1.84%, (1 mo. USD LIBOR + 1.75%), 3/1/27 | | | | | 1,404 | | | | 1,386,629 | |
| |
| LTI Holdings, Inc.: | | | | |
| | | |
Term Loan, 4.84%, (1 mo. USD LIBOR + 4.75%), 7/24/26 | | | | | 225 | | | | 223,418 | |
| | | |
Term Loan, 4.84%, (1 mo. USD LIBOR + 4.75%), 7/24/26 | | | | | 374 | | | | 371,432 | |
| | | |
Madison IAQ, LLC, Term Loan, 3.75%, (6 mo. USD LIBOR + 3.25%, Floor 0.50%), 6/21/28 | | | | | 2,494 | | | | 2,477,124 | |
| | | | |
| | 15 | | See Notes to Financial Statements. |
Eaton Vance
Floating-Rate Income Trust
November 30, 2021
Portfolio of Investments (Unaudited) — continued
| | | | | | | | | | | | |
| Borrower/Description | | | | | Principal
Amount*
(000’s omitted) | | | Value | |
|
| Industrial Equipment (continued) | |
| | | |
Robertshaw US Holding Corp., Term Loan, 4.50%, (USD LIBOR + 3.50%, Floor 1.00%), 2/28/25(10) | | | | | | | 1,037 | | | $ | 986,803 | |
| | | |
Tiger Acquisition, LLC, Term Loan, 3.75%, (3 mo. USD LIBOR + 3.25%, Floor 0.50%), 6/1/28 | | | | | | | 599 | | | | 594,635 | |
| | | |
Titan Acquisition Limited, Term Loan, 3.167%, (3 mo. USD LIBOR + 3.00%), 3/28/25 | | | | | | | 2,000 | | | | 1,958,334 | |
| | | |
Vertical US Newco, Inc., Term Loan, 4.00%, (6 mo. USD LIBOR + 3.50%, Floor 0.50%), 7/30/27 | | | | | | | 1,337 | | | | 1,334,212 | |
| | | |
Zephyr German BidCo GmbH, Term Loan, 3.75%, (1 mo. EURIBOR + 3.75%), 3/10/28 | | | EUR | | | | 650 | | | | 738,029 | |
| | | |
| | | | | | | | | | | $ | 29,138,181 | |
|
| Insurance — 4.2% | |
| |
| AssuredPartners, Inc.: | | | | |
| | | |
Term Loan, 3.59%, (1 mo. USD LIBOR + 3.50%), 2/12/27 | | | | | | | 1,396 | | | $ | 1,378,991 | |
| | | |
Term Loan, 4.00%, (1 mo. USD LIBOR + 3.50%, Floor 0.50%), 2/12/27 | | | | | | | 1,397 | | | | 1,388,354 | |
| |
| Asurion, LLC: | | | | |
| | | |
Term Loan, 3.215%, (1 mo. USD LIBOR + 3.125%), 11/3/23 | | | | | | | 1,236 | | | | 1,232,761 | |
| | | |
Term Loan, 3.34%, (1 mo. USD LIBOR + 3.25%), 12/23/26 | | | | | | | 1,330 | | | | 1,311,871 | |
| | | |
Term Loan - Second Lien, 5.34%, (1 mo. USD LIBOR + 5.25%), 1/31/28 | | | | | | | 2,070 | | | | 2,055,510 | |
| | | |
Financiere CEP S.A.S., Term Loan, 4.00%, (1 mo. EURIBOR + 4.00%), 6/18/27 | | | EUR | | | | 550 | | | | 625,626 | |
| | | |
Hub International Limited, Term Loan, 4.00%, (3 mo. USD LIBOR + 3.25%, Floor 0.75%), 4/25/25 | | | | | | | 2,992 | | | | 2,983,111 | |
| | | |
NFP Corp., Term Loan, 3.34%, (1 mo. USD LIBOR + 3.25%), 2/15/27 | | | | | | | 2,194 | | | | 2,159,113 | |
| | | |
Ryan Specialty Group, LLC, Term Loan, 3.75%, (1 mo. USD LIBOR + 3.00%, Floor 0.75%), 9/1/27 | | | | | | | 2,992 | | | | 2,988,703 | |
| | | |
Sedgwick Claims Management Services, Inc., Term Loan, 3.34%, (1 mo. USD LIBOR + 3.25%), 12/31/25 | | | | | | | 1,247 | | | | 1,224,067 | |
| | | |
| | | | | | | | | | | $ | 17,348,107 | |
|
| Leisure Goods / Activities / Movies — 4.8% | |
| | | |
Amer Sports Oyj, Term Loan, 4.50%, (6 mo. EURIBOR + 4.50%), 3/30/26 | | | EUR | | | | 1,813 | | | $ | 2,055,985 | |
| |
| Carnival Corporation: | | | | |
| | | |
Term Loan, 3.75%, (3 mo. USD LIBOR + 3.00%, Floor 0.75%), 6/30/25 | | | | | | | 1,383 | | | | 1,365,219 | |
| | | |
Term Loan, 4.00%, (6 mo. USD LIBOR + 3.25%, Floor 0.75%), 10/18/28 | | | | | | | 2,350 | | | | 2,320,625 | |
| | | | | | | | | | | | |
| Borrower/Description | | | | | Principal
Amount*
(000’s omitted) | | | Value | |
|
| Leisure Goods / Activities / Movies (continued) | |
| | | |
City Football Group Limited, Term Loan, 4.00%, (6 mo. USD LIBOR + 3.50%, Floor 0.50%), 7/21/28 | | | | | | | 1,000 | | | $ | 995,000 | |
| | | |
ClubCorp Holdings, Inc., Term Loan, 2.882%, (3 mo. USD LIBOR + 2.75%), 9/18/24 | | | | | | | 1,496 | | | | 1,443,740 | |
| |
| Crown Finance US, Inc.: | | | | |
| | | |
Term Loan, 3.50%, (6 mo. USD LIBOR + 2.50%, Floor 1.00%), 2/28/25 | | | | | | | 2,110 | | | | 1,713,215 | |
| | | |
Term Loan, 3.75%, (1 mo. USD LIBOR + 2.75%, Floor 1.00%), 9/30/26 | | | | | | | 1,523 | | | | 1,222,839 | |
| | | |
Term Loan, 15.25%, (7.00% cash, 8.25% PIK), 5/23/24(13) | | | | | | | 516 | | | | 620,448 | |
| | | |
Fender Musical Instruments Corporation, Term Loan, 12/1/28(11) | | | | | | | 275 | | | | 274,656 | |
| |
| Lindblad Expeditions, Inc.: | | | | |
| | | |
Term Loan, 6.00%, (1 mo. USD LIBOR + 5.25%, Floor 0.75%), 4.75% cash, 1.25% PIK, 3/27/25 | | | | | | | 341 | | | | 327,424 | |
| | | |
Term Loan, 6.00%, (1 mo. USD LIBOR + 5.25%, Floor 0.75%), 4.75% cash, 1.25% PIK, 3/27/25 | | | | | | | 1,364 | | | | 1,309,698 | |
| | | |
Match Group, Inc., Term Loan, 1.908%, (3 mo. USD LIBOR + 1.75%), 2/13/27 | | | | | | | 775 | | | | 761,922 | |
| | | |
Sandy BidCo B.V., Term Loan, 6/12/28(11) | | | EUR | | | | 950 | | | | 1,078,742 | |
| | | |
SeaWorld Parks & Entertainment, Inc., Term Loan, 3.50%, (1 mo. USD LIBOR + 3.00%, Floor 0.50%), 8/25/28 | | | | | | | 775 | | | | 772,739 | |
| | | |
Steinway Musical Instruments, Inc., Term Loan, 4.75%, (1 mo. USD LIBOR + 3.75%, Floor 1.00%), 2/14/25 | | | | | | | 71 | | | | 70,246 | |
| | | |
Travel Leaders Group, LLC, Term Loan, 4.09%, (1 mo. USD LIBOR + 4.00%), 1/25/24 | | | | | | | 1,708 | | | | 1,605,458 | |
| | | |
UFC Holdings, LLC, Term Loan, 3.50%, (6 mo. USD LIBOR + 2.75%, Floor 0.75%), 4/29/26 | | | | | | | 1,197 | | | | 1,182,533 | |
| | | |
Vue International Bidco PLC, Term Loan, 4.75%, (6 mo. EURIBOR + 4.75%), 7/3/26 | | | EUR | | | | 678 | | | | 712,612 | |
| | | |
| | | | | | | | | | | $ | 19,833,101 | |
|
| Lodging and Casinos — 1.3% | |
| | | |
Boyd Gaming Corporation, Term Loan, 2.328%, (1 week USD LIBOR + 2.25%), 9/15/23 | | | | | | | 667 | | | $ | 666,426 | |
| | | |
Oravel Stays Singapore Pte. Ltd., Term Loan, 9.00%, (3 mo. USD LIBOR + 8.25%, Floor 0.75%), 6/23/26 | | | | | | | 648 | | | | 688,898 | |
| | | |
Playa Resorts Holding B.V., Term Loan, 3.75%, (1 mo. USD LIBOR + 2.75%, Floor 1.00%), 4/29/24 | | | | | | | 1,123 | | | | 1,088,752 | |
| | | |
Raptor Acquisition Corp., Term Loan, 4.75%, (3 mo. USD LIBOR + 4.00%, Floor 0.75%), 11/1/26 | | | | | | | 1,525 | | | | 1,525,000 | |
| | | |
Sportradar Capital S.a.r.l., Term Loan, 3.50%, (6 mo. EURIBOR + 3.50%), 11/22/27 | | | EUR | | | | 550 | | | | 623,755 | |
| | | | |
| | 16 | | See Notes to Financial Statements. |
Eaton Vance
Floating-Rate Income Trust
November 30, 2021
Portfolio of Investments (Unaudited) — continued
| | | | | | | | | | | | |
| Borrower/Description | | | | | Principal
Amount*
(000’s omitted) | | | Value | |
|
| Lodging and Casinos (continued) | |
| | | |
Twin River Worldwide Holdings, Inc., Term Loan, 3.75%, (6 mo. USD LIBOR + 3.25%, Floor 0.50%), 10/2/28 | | | | | | | 1,000 | | | $ | 996,250 | |
| | | |
| | | | | | | | | | | $ | 5,589,081 | |
|
| Nonferrous Metals / Minerals — 0.2% | |
| | | |
Oxbow Carbon, LLC, Term Loan, 5.00%, (1 mo. USD LIBOR + 4.25%, Floor 0.75%), 10/13/25 | | | | | | | 736 | | | $ | 739,471 | |
| | | |
| | | | | | | | | | | $ | 739,471 | |
|
| Oil and Gas — 4.3% | |
| | | |
Ameriforge Group, Inc., Term Loan, 12.574%, (1 mo. USD LIBOR + 13.00%, Floor 1.00%), 12/31/23(9) | | | | | | | 105 | | | $ | 52,039 | |
| | | |
Apergy Corporation, Term Loan, 2.625%, (1 mo. USD LIBOR + 2.50%), 5/9/25 | | | | | | | 127 | | | | 126,137 | |
| | | |
Centurion Pipeline Company, LLC: | | | | | | | | | | | | |
| | | |
Term Loan, 3.34%, (1 mo. USD LIBOR + 3.25%), 9/29/25 | | | | | | | 267 | | | | 264,763 | |
| | | |
Term Loan, 4.09%, (1 mo. USD LIBOR + 4.00%), 9/28/25 | | | | | | | 248 | | | | 245,024 | |
| | | |
CITGO Holding, Inc., Term Loan, 8.00%, (3 mo. USD LIBOR + 7.00%, Floor 1.00%), 8/1/23 | | | | | | | 2,072 | | | | 2,062,452 | |
| | | |
CITGO Petroleum Corporation, Term Loan, 7.25%, (3 mo. USD LIBOR + 6.25%, Floor 1.00%), 3/28/24 | | | | | | | 4,114 | | | | 4,125,962 | |
| | | |
CQP Holdco L.P., Term Loan, 4.25%, (3 mo. USD LIBOR + 3.75%, Floor 0.50%), 6/5/28 | | | | | | | 1,973 | | | | 1,968,454 | |
| | | |
Delek US Holdings, Inc., Term Loan, 6.50%, (1 mo. USD LIBOR + 5.50%, Floor 1.00%), 3/31/25 | | | | | | | 591 | | | | 593,216 | |
| | | |
Freeport LNG Investments, LLLP, Term Loan, 11/17/28(11) | | | | | | | 600 | | | | 594,937 | |
| | | |
Matador Bidco S.a.r.l., Term Loan, 4.84%, (1 mo. USD LIBOR + 4.75%), 10/15/26 | | | | | | | 4,043 | | | | 4,049,741 | |
| | | |
Oryx Midstream Services Permian Basin, LLC, Term Loan, 3.75%, (3 mo. USD LIBOR + 3.25%, Floor 0.50%), 10/5/28 | | | | | | | 725 | | | | 719,109 | |
| | | |
Prairie ECI Acquiror L.P., Term Loan, 4.84%, (1 mo. USD LIBOR + 4.75%), 3/11/26 | | | | | | | 521 | | | | 503,627 | |
| | | |
QuarterNorth Energy Holding, Inc., Term Loan - Second Lien, 9.00%, (3 mo. USD LIBOR + 8.00%, Floor 1.00%), 8/27/26 | | | | | | | 783 | | | | 787,797 | |
| | | |
UGI Energy Services, LLC, Term Loan, 3.84%, (1 mo. USD LIBOR + 3.75%), 8/13/26 | | | | | | | 1,995 | | | | 1,999,885 | |
| | | |
| | | | | | | | | | | $ | 18,093,143 | |
| | | | | | | | | | | | |
| Borrower/Description | | | | | Principal
Amount*
(000’s omitted) | | | Value | |
|
| Publishing — 2.0% | |
| | | |
Adevinta ASA: | | | | | | | | | | | | |
| | | |
Term Loan, 3.25%, (3 mo. EURIBOR + 3.25%), 6/26/28 | | | EUR | | | | 1,250 | | | $ | 1,419,018 | |
| | | |
Term Loan, 3.75%, (3 mo. USD LIBOR + 3.00%, Floor 0.75%), 6/26/28 | | | | | | | 324 | | | | 324,035 | |
| | | |
Alchemy Copyrights, LLC, Term Loan, 3.50%, (1 mo. USD LIBOR + 3.00%, Floor 0.50%), 3/10/28 | | | | | | | 520 | | | | 517,811 | |
| | | |
Ascend Learning, LLC: | | | | | | | | | | | | |
| | | |
Term Loan, 11/18/28(11) | | | | | | | 575 | | | | 572,215 | |
| | | |
Term Loan, 4.00%, (1 mo. USD LIBOR + 3.00%, Floor 1.00%), 7/12/24 | | | | | | | 2,672 | | | | 2,675,027 | |
| | | |
Term Loan, 4.75%, (1 mo. USD LIBOR + 3.75%, Floor 1.00%), 7/12/24 | | | | | | | 421 | | | | 421,434 | |
| | | |
Getty Images, Inc., Term Loan, 4.625%, (1 mo. USD LIBOR + 4.50%), 2/19/26 | | | | | | | 1,707 | | | | 1,705,279 | |
| | | |
LABL, Inc., Term Loan, 5.50%, (1 mo. USD LIBOR + 5.00%, Floor 0.50%), 10/29/28 | | | | | | | 625 | | | | 622,812 | |
| | | |
| | | | | | | | | | | $ | 8,257,631 | |
|
| Radio and Television — 1.5% | |
| | | |
Gray Television, Inc.: | | | | | | | | | | | | |
| | | |
Term Loan, 12/1/28(11) | | | | | | | 850 | | | $ | 845,325 | |
| | | |
Term Loan, 2.336%, (1 mo. USD LIBOR + 2.25%), 2/7/24 | | | | | | | 255 | | | | 253,328 | |
| | | |
Term Loan, 2.586%, (1 mo. USD LIBOR + 2.50%), 1/2/26 | | | | | | | 637 | | | | 630,701 | |
| | | |
Hubbard Radio, LLC, Term Loan, 5.25%, (1 mo. USD LIBOR + 4.25%, Floor 1.00%), 3/28/25 | | | | | | | 728 | | | | 728,180 | |
| | | |
Nexstar Broadcasting, Inc., Term Loan, 2.586%, (1 mo. USD LIBOR + 2.50%), 9/18/26 | | | | | | | 453 | | | | 451,903 | |
| | | |
Sinclair Television Group, Inc.: | | | | | | | | | | | | |
| | | |
Term Loan, 2.60%, (1 mo. USD LIBOR + 2.50%), 9/30/26 | | | | | | | 662 | | | | 643,970 | |
| | | |
Term Loan, 3.10%, (1 mo. USD LIBOR + 3.00%), 4/1/28 | | | | | | | 451 | | | | 440,816 | |
| | | |
Univision Communications, Inc., Term Loan, 4.00%, (1 mo. USD LIBOR + 3.25%, Floor 0.75%), 3/15/26 | | | | | | | 2,195 | | | | 2,191,757 | |
| | | |
| | | | | | | | | | | $ | 6,185,980 | |
|
| Retailers (Except Food and Drug) — 2.9% | |
| | | |
CNT Holdings I Corp., Term Loan, 4.50%, (6 mo. USD LIBOR + 3.75%, Floor 0.75%), 11/8/27 | | | | | | | 771 | | | $ | 770,161 | |
| | | |
Gloves Buyer, Inc., Term Loan, 4.50%, (1 mo. USD LIBOR + 3.75%, Floor 0.75%), 12/29/27 | | | | | | | 597 | | | | 595,507 | |
| | | |
Great Outdoors Group, LLC, Term Loan, 4.50%, (1 mo. USD LIBOR + 3.75%, Floor 0.75%), 3/6/28 | | | | | | | 2,928 | | | | 2,925,129 | |
| | | | |
| | 17 | | See Notes to Financial Statements. |
Eaton Vance
Floating-Rate Income Trust
November 30, 2021
Portfolio of Investments (Unaudited) — continued
| | | | | | | | | | | | |
| Borrower/Description | | | | | Principal
Amount*
(000’s omitted) | | | Value | |
|
| Retailers (Except Food and Drug) (continued) | |
| | | |
Harbor Freight Tools USA, Inc., Term Loan, 3.25%, (1 mo. USD LIBOR + 2.75%, Floor 0.50%), 10/19/27 | | | | | | | 2,743 | | | $ | 2,723,071 | |
| | | |
Hoya Midco, LLC, Term Loan, 4.50%, (1 mo. USD LIBOR + 3.50%, Floor 1.00%), 6/30/24 | | | | | | | 1,545 | | | | 1,544,458 | |
| | | |
PetSmart, Inc., Term Loan, 4.50%, (3 mo. USD LIBOR + 3.75%, Floor 0.75%), 2/11/28 | | | | | | | 3,267 | | | | 3,267,629 | |
| | | |
Phillips Feed Service, Inc., Term Loan, 8.00%, (3 mo. USD LIBOR + 7.00%, Floor 1.00%), 11/13/24(4) | | | | | | | 114 | | | | 90,983 | |
| | | |
| | | | | | | | | | | $ | 11,916,938 | |
|
| Steel — 0.5% | |
| | | |
Phoenix Services International, LLC, Term Loan, 4.75%, (1 mo. USD LIBOR + 3.75%, Floor 1.00%), 3/1/25 | | | | | | | 869 | | | $ | 860,901 | |
| | | |
TMS International Corp., Term Loan, 3.75%, (USD LIBOR + 2.75%, Floor 1.00%), 8/14/24(10) | | | | | | | 273 | | | | 272,596 | |
| | | |
Zekelman Industries, Inc., Term Loan, 2.089%, (1 mo. USD LIBOR + 2.00%), 1/24/27 | | | | | | | 1,044 | | | | 1,033,929 | |
| | | |
| | | | | | | | | | | $ | 2,167,426 | |
|
| Surface Transport — 1.2% | |
| | | |
Kenan Advantage Group, Inc., Term Loan, 4.50%, (1 mo. USD LIBOR + 3.75%, Floor 0.75%), 3/24/26 | | | | | | | 2,631 | | | $ | 2,630,542 | |
| | | |
PODS, LLC, Term Loan, 3.75%, (1 mo. USD LIBOR + 3.00%, Floor 0.75%), 3/31/28 | | | | | | | 2,494 | | | | 2,480,877 | |
| | | |
| | | | | | | | | | | $ | 5,111,419 | |
|
| Telecommunications — 3.0% | |
| | | |
Avaya, Inc., Term Loan, 4.089%, (1 mo. USD LIBOR + 4.00%), 12/15/27 | | | | | | | 225 | | | $ | 224,684 | |
| | | |
Cincinnati Bell, Inc., Term Loan, 11/22/28(11) | | | | | | | 350 | | | | 349,891 | |
| | | |
Digicel International Finance Limited, Term Loan, 3.50%, (6 mo. USD LIBOR + 3.25%), 5/28/24 | | | | | | | 1,752 | | | | 1,712,596 | |
| | | |
GEE Holdings 2, LLC: | | | | | | | | | | | | |
| | | |
Term Loan, 9.00%, (3 mo. USD LIBOR + 8.00%, Floor 1.00%), 3/24/25 | | | | | | | 408 | | | | 403,958 | |
| | | |
Term Loan - Second Lien, 9.25%, (3 mo. USD LIBOR + 8.25%, Floor 1.00%), 2.50% cash, 6.75% PIK, 3/23/26 | | | | | | | 813 | | | | 723,889 | |
| | | |
Intelsat Jackson Holdings S.A.: | | | | | | | | | | | | |
| | | |
DIP Loan, 5.392%, (3 mo. USD LIBOR + 4.75%, Floor 1.00%), 10/13/22(9) | | | | | | | 1,425 | | | | 1,432,125 | |
| | | |
Term Loan, 8.00%, (USD Prime + 4.75%), 11/27/23 | | | | | | | 1,900 | | | | 1,911,480 | |
| | | |
Term Loan, 8.75%, (USD Prime + 5.50%), 1/2/24 | | | | | | | 1,600 | | | | 1,612,000 | |
| | | | | | | | | | | | |
| Borrower/Description | | | | | Principal
Amount*
(000’s omitted) | | | Value | |
|
| Telecommunications (continued) | |
| | | |
Onvoy, LLC, Term Loan, 5.50%, (3 mo. USD LIBOR + 4.50%, Floor 1.00%), 2/10/24 | | | | | | | 1,637 | | | $ | 1,637,352 | |
| | | |
Syniverse Holdings, Inc., Term Loan, 6.00%, (3 mo. USD LIBOR + 5.00%, Floor 1.00%), 3/9/23 | | | | | | | 1,013 | | | | 1,011,033 | |
| | | |
Zayo Group Holdings, Inc., Term Loan, 3.25%, (1 mo. EURIBOR + 3.25%), 3/9/27 | | | EUR | | | | 1,443 | | | | 1,622,059 | |
| | | |
| | | | | | | | | | | $ | 12,641,067 | |
|
| Utilities — 0.8% | |
| | | |
Calpine Construction Finance Company L.P., Term Loan, 2.09%, (1 mo. USD LIBOR + 2.00%), 1/15/25 | | | | | | | 932 | | | $ | 921,660 | |
| | | |
USIC Holdings, Inc., Term Loan, 4.25%, (1 mo. USD LIBOR + 3.50%, Floor 0.75%), 5/12/28 | | | | | | | 2,400 | | | | 2,390,251 | |
| | | |
| | | | | | | | | | | $ | 3,311,911 | |
| |
Total Senior Floating-Rate Loans
(identified cost $595,118,648) | | | $ | 593,267,539 | |
|
| Warrants — 0.2% | |
| Security | | | | | Shares | | | Value | |
|
| Leisure Goods / Activities / Movies — 0.0%(12) | |
| | | |
Cineworld Group PLC, Exp. 11/23/25(5)(6) | | | | | | | 154,246 | | | $ | 11,303 | |
| | | |
| | | | | | | | | | | $ | 11,303 | |
|
| Oil and Gas — 0.2% | |
| | | |
QuarterNorth Energy, Inc., Exp. 8/27/28(5)(6) | | | | | | | 8,300 | | | $ | 859,050 | |
| | | |
| | | | | | | | | | | $ | 859,050 | |
|
| Retailers (Except Food and Drug) — 0.0% | |
| | | |
David’s Bridal, LLC, Exp.
11/26/22(4)(5)(6) | | | | | | | 4,543 | | | $ | 0 | |
| | | |
| | | | | | | | | | | $ | 0 | |
| |
Total Warrants
(identified cost $0) | | | $ | 870,353 | |
| | | | |
| | 18 | | See Notes to Financial Statements. |
Eaton Vance
Floating-Rate Income Trust
November 30, 2021
Portfolio of Investments (Unaudited) — continued
| | | | | | | | | | |
| Short-Term Investments — 2.8% | |
| Description | | | | Units | | | Value | |
| | | |
Eaton Vance Cash Reserves Fund, LLC, 0.08%(14) | | | | | 11,615,330 | | | $ | 11,614,168 | |
| |
Total Short-Term Investments
(identified cost $11,614,419) | | | $ | 11,614,168 | |
| |
Total Investments — 156.1%
(identified cost $653,779,894) | | | $ | 650,536,609 | |
| |
Less Unfunded Loan Commitments — (0.4)% | | | $ | (1,501,215 | ) |
| |
Net Investments — 155.7%
(identified cost $652,278,679) | | | $ | 649,035,394 | |
| |
Notes Payable — (33.6)% | | | $ | (140,000,000 | ) |
| |
Variable Rate Term Preferred Shares, at Liquidation Value
(net of unamortized deferred debt issuance costs) — (19.2)% | | | $ | (79,930,183 | ) |
| |
Other Assets, Less Liabilities — (2.9)% | | | $ | (12,236,805 | ) |
| |
Net Assets Applicable to Common Shares — 100.0% | | | $ | 416,868,406 | |
The percentage shown for each investment category in the Portfolio of Investments is based on net assets applicable to common shares.
| | * | In U.S. dollars unless otherwise indicated. |
| | (1) | Security exempt from registration under Rule 144A of the Securities Act of 1933, as amended. These securities may be sold in certain transactions in reliance on an exemption from registration (normally to qualified institutional buyers). At November 30, 2021, the aggregate value of these securities is $30,299,658 or 7.3% of the Trust’s net assets applicable to common shares. |
| | (2) | Variable rate security. The stated interest rate represents the rate in effect at November 30, 2021. |
| | (3) | When-issued, variable rate security whose interest rate will be determined after November 30, 2021. |
| | (4) | For fair value measurement disclosure purposes, security is categorized as Level 3 (see Note 11). |
| | (5) | Non-income producing security. |
| | (6) | Security was acquired in connection with a restructuring of a Senior Loan and may be subject to restrictions on resale. |
| | (7) | Restricted security (see Note 7). |
| | (8) | Senior floating-rate loans (Senior Loans) often require prepayments from excess cash flows or permit the borrowers to repay at their election. The degree to which borrowers repay, whether as a contractual requirement or at their election, cannot be predicted with accuracy. As a result, the actual remaining maturity may be substantially less than the stated maturities shown. However, Senior Loans will typically have an expected average life of approximately two to four years. Senior Loans typically have rates of interest which are redetermined periodically by reference to a base lending rate, plus a spread. These base lending rates are primarily the London Interbank Offered Rate (“LIBOR”) and secondarily, the prime rate offered by one or more major United States banks (the “Prime Rate”). Base lending rates may be subject to a floor, or a minimum rate. Senior Loans are generally subject to contractual restrictions that must be satisfied before they can be bought or sold. |
| | (9) | Unfunded or partially unfunded loan commitments. The stated interest rate reflects the weighted average of the reference rate and spread for the funded portion, if any, and the commitment fees on the portion of the loan that is unfunded. At November 30, 2021, the total value of unfunded loan commitments is $1,504,485. See Note 1F for description. |
| (10) | The stated interest rate represents the weighted average interest rate at November 30, 2021 of contracts within the senior loan facility. Interest rates on contracts are primarily redetermined either weekly, monthly or quarterly by reference to the indicated base lending rate and spread and the reset period. |
| (11) | This Senior Loan will settle after November 30, 2021, at which time the interest rate will be determined. |
| (12) | Amount is less than 0.05%. |
| (14) | Affiliated investment company, available to Eaton Vance portfolios and funds, which invests in high quality, U.S. dollar denominated money market instruments. The rate shown is the annualized seven-day yield as of November 30, 2021. |
| | | | | | | | | | | | | | | | | | | | | | | | |
| Forward Foreign Currency Exchange Contracts | |
| | | | | |
| Currency Purchased | | | Currency Sold | | | Counterparty | | Settlement
Date | | | Unrealized
Appreciation | | | Unrealized
(Depreciation) | |
| | | | | | | |
| USD | | | 21,615,182 | | | EUR | | | 18,667,559 | | | Standard Chartered Bank | | | 12/2/21 | | | $ | 444,292 | | | $ | — | |
| | | | | | | |
| USD | | | 806,766 | | | EUR | | | 697,311 | | | HSBC Bank USA, N.A. | | | 12/30/21 | | | | 14,967 | | | | — | |
| | | | | | | |
| USD | | | 317,401 | | | EUR | | | 273,227 | | | State Street Bank and Trust Company | | | 12/30/21 | | | | 7,150 | | | | — | |
| | | | | | | |
| USD | | | 476,022 | | | EUR | | | 409,840 | | | State Street Bank and Trust Company | | | 12/30/21 | | | | 10,646 | | | | — | |
| | | | | | | |
| USD | | | 882,317 | | | EUR | | | 759,700 | | | State Street Bank and Trust Company | | | 12/30/21 | | | | 19,673 | | | | — | |
| | | | | | | |
| USD | | | 12,328,796 | | | EUR | | | 10,878,144 | | | State Street Bank and Trust Company | | | 1/31/22 | | | | — | | | | (33,592 | ) |
| | | | | | | |
| USD | | | 1,526,840 | | | GBP | | | 1,130,885 | | | HSBC Bank USA, N.A. | | | 1/31/22 | | | | 21,524 | | | | — | |
| | | | | | | |
| USD | | | 852,742 | | | GBP | | | 620,588 | | | State Street Bank and Trust Company | | | 1/31/22 | | | | 26,680 | | | | — | |
| | | | | | | |
| USD | | | 867,877 | | | GBP | | | 631,713 | | | State Street Bank and Trust Company | | | 1/31/22 | | | | 27,007 | | | | — | |
| | | | | | | |
| | | | | | | | | | | | | | | | | | | $ | 571,939 | | | $ | (33,592 | ) |
| | | | |
| | 19 | | See Notes to Financial Statements. |
Eaton Vance
Floating-Rate Income Trust
November 30, 2021
Portfolio of Investments (Unaudited) — continued
Abbreviations:
| | | | |
| | |
| DIP | | – | | Debtor In Possession |
| | |
| EURIBOR | | – | | Euro Interbank Offered Rate |
| | |
| LIBOR | | – | | London Interbank Offered Rate |
| | |
| PIK | | – | | Payment In Kind |
| | |
| SOFR | | – | | Secured Overnight Financing Rate |
| | |
| SONIA | | – | | Sterling Overnight Interbank Average |
Currency Abbreviations:
| | | | |
| | |
| EUR | | – | | Euro |
| | |
| GBP | | – | | British Pound Sterling |
| | |
| USD | | – | | United States Dollar |
| | | | |
| | 20 | | See Notes to Financial Statements. |
Eaton Vance
Floating-Rate Income Trust
November 30, 2021
Statement of Assets and Liabilities (Unaudited)
| | | | |
| Assets | | November 30, 2021 | |
| |
Unaffiliated investments, at value (identified cost, $640,664,260) | | $ | 637,421,226 | |
| |
Affiliated investment, at value (identified cost, $11,614,419) | | | 11,614,168 | |
| |
Cash | | | 1,945,818 | |
| |
Deposits for derivatives collateral — forward foreign currency exchange contracts | | | 600,000 | |
| |
Foreign currency, at value (identified cost, $8,910,303) | | | 8,976,872 | |
| |
Interest and dividends receivable | | | 2,418,511 | |
| |
Dividends receivable from affiliated investment | | | 798 | |
| |
Receivable for investments sold | | | 5,146,547 | |
| |
Receivable for Trust shares sold | | | 12,950 | |
| |
Receivable for open forward foreign currency exchange contracts | | | 571,939 | |
| |
Receivable from the transfer agent | | | 86,333 | |
| |
Prepaid upfront fees on notes payable and variable rate term preferred shares | | | 180,100 | |
| |
Prepaid expenses | | | 10,911 | |
| |
Total assets | | $ | 668,986,173 | |
|
| Liabilities | |
| |
Notes payable | | $ | 140,000,000 | |
| |
Variable rate term preferred shares, at liquidation value (net of unamortized deferred debt issuance costs of $69,817) | | | 79,930,183 | |
| |
Cash collateral due to broker | | | 600,000 | |
| |
Payable for investments purchased | | | 29,488,350 | |
| |
Payable for when-issued securities | | | 1,000,000 | |
| |
Payable for open forward foreign currency exchange contracts | | | 33,592 | |
| |
Payable to affiliates: | | | | |
| |
Investment adviser fee | | | 390,408 | |
| |
Trustees’ fees | | | 7,101 | |
| |
Interest expense and fees payable | | | 386,640 | |
| |
Accrued expenses | | | 281,493 | |
| |
Total liabilities | | $ | 252,117,767 | |
| |
Net assets applicable to common shares | | $ | 416,868,406 | |
|
| Sources of Net Assets | |
| |
Common shares, $0.01 par value, unlimited number of shares authorized, 28,908,641 shares issued and outstanding | | $ | 289,086 | |
| |
Additional paid-in capital | | | 467,826,234 | |
| |
Accumulated loss | | | (51,246,914 | ) |
| |
Net assets applicable to common shares | | $ | 416,868,406 | |
| |
| Net Asset Value Per Common Share | | | | |
| |
($416,868,406 ÷ 28,908,641 common shares issued and outstanding) | | $ | 14.42 | |
| | | | |
| | 21 | | See Notes to Financial Statements. |
Eaton Vance
Floating-Rate Income Trust
November 30, 2021
Statement of Operations (Unaudited)
| | | | |
| Investment Income | | Six Months Ended November 30, 2021 | |
| |
Interest and other income | | $ | 14,950,590 | |
| |
Dividends | | | 301,985 | |
| |
Dividends from affiliated investment | | | 8,700 | |
| |
Total investment income | | $ | 15,261,275 | |
| |
| Expenses | | | | |
| |
Investment adviser fee | | $ | 2,513,942 | |
| |
Trustees’ fees and expenses | | | 21,120 | |
| |
Custodian fee | | | 87,536 | |
| |
Transfer and dividend disbursing agent fees | | | 9,260 | |
| |
Legal and accounting services | | | 88,134 | |
| |
Printing and postage | | | 8,766 | |
| |
Interest expense and fees | | | 1,870,260 | |
| |
Miscellaneous | | | 50,807 | |
| |
Total expenses | | $ | 4,649,825 | |
| |
Net investment income | | $ | 10,611,450 | |
| |
| Realized and Unrealized Gain (Loss) | | | | |
| |
Net realized gain (loss) — | | | | |
| |
Investment transactions | | $ | 179,731 | |
| |
Investment transactions — affiliated investment | | | (899 | ) |
| |
Foreign currency transactions | | | (681,974 | ) |
| |
Forward foreign currency exchange contracts | | | 2,124,667 | |
| |
Net realized gain | | $ | 1,621,525 | |
| |
Change in unrealized appreciation (depreciation) — | | | | |
| |
Investments | | $ | (6,699,908 | ) |
| |
Investments — affiliated investment | | | (251 | ) |
| |
Foreign currency | | | 229,869 | |
| |
Forward foreign currency exchange contracts | | | 2,175,255 | |
| |
Net change in unrealized appreciation (depreciation) | | $ | (4,295,035 | ) |
| |
Net realized and unrealized loss | | $ | (2,673,510 | ) |
| |
Net increase in net assets from operations | | $ | 7,937,940 | |
| | | | |
| | 22 | | See Notes to Financial Statements. |
Eaton Vance
Floating-Rate Income Trust
November 30, 2021
Statements of Changes in Net Assets
| | | | | | | | |
| Increase (Decrease) in Net Assets | | Six Months Ended November 30, 2021
(Unaudited) | | | Year Ended
May 31, 2021 | |
| | |
From operations — | | | | | | | | |
| | |
Net investment income | | $ | 10,611,450 | | | $ | 28,607,220 | |
| | |
Net realized gain (loss) | | | 1,621,525 | | | | (22,957,216 | ) |
| | |
Net change in unrealized appreciation (depreciation) | | | (4,295,035 | ) | | | 84,695,789 | |
| | |
Net increase in net assets from operations | | $ | 7,937,940 | | | $ | 90,345,793 | |
| | |
Distributions to common shareholders | | $ | (15,038,734 | )* | | $ | (29,220,085 | ) |
| | |
Capital share transactions — | | | | | | | | |
| | |
Proceeds from shelf offering, net of offering costs (see Note 6) | | $ | 8,719,533 | | | $ | — | |
| | |
Reinvestment of distributions to common shareholders | | | 413,743 | | | | — | |
| | |
Cost of shares repurchased in tender offer (see Note 6) | | | (165,754,367 | ) | | | — | |
| | |
Net decrease in net assets from capital share transactions | | $ | (156,621,091 | ) | | $ | — | |
| | |
Net increase (decrease) in net assets | | $ | (163,721,885 | ) | | $ | 61,125,708 | |
|
| Net Assets Applicable to Common Shares | |
| | |
At beginning of period | | $ | 580,590,291 | | | $ | 519,464,583 | |
| | |
At end of period | | $ | 416,868,406 | | | $ | 580,590,291 | |
| * | A portion of the distributions may be deemed a tax return of capital at year-end. See Note 3. |
| | | | |
| | 23 | | See Notes to Financial Statements. |
Eaton Vance
Floating-Rate Income Trust
November 30, 2021
Statement of Cash Flows (Unaudited)
| | | | |
| Cash Flows From Operating Activities | | Six Months Ended November 30, 2021 | |
| |
Net increase in net assets from operations | | $ | 7,937,940 | |
|
Adjustments to reconcile net increase in net assets from operations to net cash provided by operating activities: | |
| |
Investments purchased | | | (281,297,852 | ) |
| |
Investments sold and principal repayments | | | 555,856,472 | |
| |
Increase in short-term investments, net | | | (5,340,770 | ) |
| |
Net amortization/accretion of premium (discount) | | | (309,566 | ) |
| |
Amortization of deferred debt issuance costs on variable rate term preferred shares | | | 16,104 | |
| |
Amortization of prepaid upfront fees on notes payable and variable rate term preferred shares | | | 203,829 | |
| |
Decrease in interest and dividends receivable | | | 1,181,301 | |
| |
Increase in dividends receivable from affiliated investment | | | (265 | ) |
| |
Increase in receivable for open forward foreign currency exchange contracts | | | (466,528 | ) |
| |
Increase in receivable from the transfer agent | | | (86,333 | ) |
| |
Decrease in prepaid expenses | | | 9,471 | |
| |
Increase in cash collateral due to broker | | | 600,000 | |
| |
Decrease in payable for open forward foreign currency exchange contracts | | | (1,708,727 | ) |
| |
Decrease in payable to affiliate for investment adviser fee | | | (1,331,129 | ) |
| |
Decrease in payable to affiliate for Trustees’ fees | | | (391 | ) |
| |
Decrease in interest expense and fees payable | | | (100,151 | ) |
| |
Decrease in accrued expenses | | | (19,278 | ) |
| |
Decrease in unfunded loan commitments | | | (300,891 | ) |
| |
Net change in unrealized (appreciation) depreciation from investments | | | 6,700,159 | |
| |
Net realized gain from investments | | | (178,832 | ) |
| |
Net cash provided by operating activities | | $ | 281,364,563 | |
| |
| Cash Flows From Financing Activities | | | | |
| |
Cash distributions paid to common shareholders | | $ | (14,624,991 | ) |
| |
Proceeds from shelf offering, net of offering costs | | | 8,706,583 | |
| |
Repurchases of common shares in tender offer | | | (165,754,367 | ) |
| |
Proceeds from notes payable | | | 155,000,000 | |
| |
Repayments of notes payable | | | (265,000,000 | ) |
| |
Net cash used in financing activities | | $ | (281,672,775 | ) |
| |
Net decrease in cash and restricted cash* | | $ | (308,212 | ) |
| |
Cash and restricted cash at beginning of period (including foreign currency) | | $ | 11,830,902 | |
| |
Cash and restricted cash at end of period (including foreign currency) | | $ | 11,522,690 | |
|
| Supplemental disclosure of cash flow information: | |
| |
Noncash financing activities not included herein consist of: | | | | |
| |
Reinvestment of dividends and distributions | | $ | 413,743 | |
| |
Cash paid for interest and fees on borrowings and variable rate term preferred shares | | | 1,750,478 | |
| * | Includes net change in unrealized appreciation (depreciation) on foreign currency of $42,761. |
| | | | |
| | 24 | | See Notes to Financial Statements. |
Eaton Vance
Floating-Rate Income Trust
November 30, 2021
Statement of Cash Flows (Unaudited) — continued
The following table provides a reconciliation of cash and restricted cash reported within the Statement of Assets and Liabilities that sum to the total of such amounts shown on the Statement of Cash Flows.
| | | | |
| | | November 30, 2021 | |
| |
Cash | | $ | 1,945,818 | |
| |
Deposit for derivatives collateral — forward foreign currency exchange contracts | | | 600,000 | |
| |
Foreign currency | | | 8,976,872 | |
| |
Total cash and restricted cash as shown on the Statement of Cash Flows | | $ | 11,522,690 | |
| | | | |
| | 25 | | See Notes to Financial Statements. |
Eaton Vance
Floating-Rate Income Trust
November 30, 2021
Financial Highlights
Selected data for a common share outstanding during the periods stated
| | | | | | | | | | | | | | | | | | | | | | | | |
| | |
| | | Six Months Ended
November 30, 2021
(Unaudited) | | | Year Ended May 31, | |
| | | 2021 | | | 2020 | | | 2019 | | | 2018 | | | 2017 | |
| | | | | | | |
Net asset value — Beginning of period (Common shares) | | $ | 14.560 | | | $ | 13.030 | | | $ | 15.210 | | | $ | 15.610 | | | $ | 15.570 | | | $ | 14.680 | |
| | | | | | |
| Income (Loss) From Operations | | | | | | | | | | | | | | | | | | | | | | | | |
| | | | | | |
Net investment income(1) | | $ | 0.328 | | | $ | 0.718 | | | $ | 0.843 | | | $ | 0.847 | | | $ | 0.792 | | | $ | 0.864 | |
| | | | | | |
Net realized and unrealized gain (loss) | | | (0.061 | ) | | | 1.545 | | | | (2.016 | ) | | | (0.373 | ) | | | 0.076 | | | | 0.899 | |
| | | | | | |
Total income (loss) from operations | | $ | 0.267 | | | $ | 2.263 | | | $ | (1.173 | ) | | $ | 0.474 | | | $ | 0.868 | | | $ | 1.763 | |
| | | | | | |
| Less Distributions to Common Shareholders | | | | | | | | | | | | | | | | | | | | | | | | |
| | | | | | |
From net investment income | | $ | (0.465 | )* | | $ | (0.733 | ) | | $ | (1.007 | ) | | $ | (0.874 | ) | | $ | (0.828 | ) | | $ | (0.873 | ) |
| | | | | | |
Total distributions to common shareholders | | $ | (0.465 | ) | | $ | (0.733 | ) | | $ | (1.007 | ) | | $ | (0.874 | ) | | $ | (0.828 | ) | | $ | (0.873 | ) |
| | | | | | |
Premium from common shares sold through shelf offering (see Note 6)(1) | | $ | 0.006 | | | $ | — | | | $ | — | | | $ | — | | | $ | — | | | $ | — | |
| | | | | | |
Discount on tender offer (see Note 6)(1) | | $ | 0.052 | | | $ | — | | | $ | — | | | $ | — | | | $ | — | | | $ | — | |
| | | | | | |
Net asset value — End of period (Common shares) | | $ | 14.420 | | | $ | 14.560 | | | $ | 13.030 | | | $ | 15.210 | | | $ | 15.610 | | | $ | 15.570 | |
| | | | | | |
Market value — End of period (Common shares) | | $ | 14.740 | | | $ | 14.280 | | | $ | 11.240 | | | $ | 13.480 | | | $ | 14.850 | | | $ | 15.150 | |
| | | | | | |
Total Investment Return on Net Asset Value(2) | | | 2.19 | %(3) | | | 18.25 | % | | | (7.36 | )% | | | 3.77 | % | | | 6.03 | % | | | 12.65 | % |
| | | | | | |
Total Investment Return on Market Value(2) | | | 6.58 | %(3) | | | 34.36 | % | | | (9.83 | )% | | | (3.32 | )% | | | 3.67 | % | | | 18.58 | % |
| * | A portion of the distributions may be deemed a tax return of capital at year-end. See Note 3. |
| | | | |
| | 26 | | See Notes to Financial Statements. |
Eaton Vance
Floating-Rate Income Trust
November 30, 2021
Financial Highlights — continued
Selected data for a common share outstanding during the periods stated
| | | | | | | | | | | | | | | | | | | | | | | | |
| | |
| | | Six Months Ended
November 30, 2021
(Unaudited) | | | Year Ended May 31, | |
| Ratios/Supplemental Data | | 2021 | | | 2020 | | | 2019 | | | 2018 | | | 2017 | |
| | | | | | | |
Net assets applicable to common shares, end of period (000’s omitted) | | $ | 416,868 | | | $ | 580,590 | | | $ | 519,465 | | | $ | 606,408 | | | $ | 622,241 | | | $ | 620,772 | |
| | | | | | |
Ratios (as a percentage of average daily net assets applicable to common shares):† | | | | | | | | | | | | | | | | | | | | | | | | |
| | | | | | |
Expenses excluding interest and fees | | | 1.18 | %(4) | | | 1.33 | % | | | 1.26 | % | | | 1.28 | % | | | 1.28 | % | | | 1.32 | % |
| | | | | | |
Interest and fee expense(5) | | | 0.79 | %(4) | | | 0.91 | % | | | 1.79 | % | | | 2.00 | % | | | 1.52 | % | | | 1.16 | % |
| | | | | | |
Total expenses | | | 1.97 | %(4) | | | 2.24 | % | | | 3.05 | % | | | 3.28 | % | | | 2.80 | % | | | 2.48 | % |
| | | | | | |
Net investment income | | | 4.49 | %(4) | | | 5.08 | % | | | 5.85 | % | | | 5.49 | % | | | 5.09 | % | | | 5.68 | % |
| | | | | | |
Portfolio Turnover | | | 44 | %(3) | | | 32 | % | | | 34 | % | | | 24 | % | | | 34 | % | | | 47 | % |
| | | | | | |
Senior Securities: | | | | | | | | | | | | | | | | | | | | | | | | |
| | | | | | |
Total notes payable outstanding (in 000’s) | | $ | 140,000 | | | $ | 250,000 | | | $ | 190,000 | | | $ | 248,000 | | | $ | 254,000 | | | $ | 246,000 | |
| | | | | | |
Asset coverage per $1,000 of notes payable(6) | | $ | 4,549 | | | $ | 3,642 | | | $ | 4,155 | | | $ | 3,768 | | | $ | 3,765 | | | $ | 3,849 | |
| | | | | | |
Total preferred shares outstanding | | | 800 | | | | 800 | | | | 800 | | | | 800 | | | | 800 | | | | 800 | |
| | | | | | |
Asset coverage per preferred share(7) | | $ | 289,486 | | | $ | 275,936 | | | $ | 292,394 | | | $ | 284,880 | | | $ | 286,300 | | | $ | 290,421 | |
| | | | | | |
Involuntary liquidation preference per preferred share(8) | | $ | 100,000 | | | $ | 100,000 | | | $ | 100,000 | | | $ | 100,000 | | | $ | 100,000 | | | $ | 100,000 | |
| | | | | | |
Approximate market value per preferred share(8) | | $ | 100,000 | | | $ | 100,000 | | | $ | 100,000 | | | $ | 100,000 | | | $ | 100,000 | | | $ | 100,000 | |
| (1) | Computed using average common shares outstanding. |
| (2) | Returns are historical and are calculated by determining the percentage change in net asset value or market value with all distributions reinvested. Distributions are assumed to be reinvested at prices obtained under the Trust’s dividend reinvestment plan. |
| (5) | Interest and fee expense relates to variable rate term preferred shares (see Note 2) and the notes payable (see Note 9). |
| (6) | Calculated by subtracting the Trust’s total liabilities (not including the notes payable and preferred shares) from the Trust’s total assets, and dividing the result by the notes payable balance in thousands. |
| (7) | Calculated by subtracting the Trust’s total liabilities (not including the notes payable and preferred shares) from the Trust’s total assets, dividing the result by the sum of the value of the notes payable and liquidation value of the preferred shares, and multiplying the result by the liquidation value of one preferred share. Such amount equates to 289%, 276%, 292%, 285%, 286% and 290% at November 30, 2021 and May 31, 2021, 2020, 2019, 2018 and 2017, respectively. |
| (8) | Plus accumulated and unpaid dividends. |
| † | Ratios based on net assets applicable to common shares plus preferred shares and borrowings are presented below. Ratios for periods less than one year are annualized. |
| | | | | | | | | | | | | | | | | | | | | | |
| | | Six Months Ended
November 30, 2021
(Unaudited) | | Year Ended May 31, | |
| | | 2021 | | | 2020 | | | 2019 | | | 2018 | | | 2017 | |
| | | | | | | |
Expenses excluding interest and fees | | 0.83% | | | 0.85 | % | | | 0.81 | % | | | 0.83 | % | | | 0.83 | % | | | 0.86 | % |
| | | | | | |
Interest and fee expense | | 0.56% | | | 0.58 | % | | | 1.16 | % | | | 1.31 | % | | | 1.00 | % | | | 0.76 | % |
| | | | | | |
Total expenses | | 1.39% | | | 1.43 | % | | | 1.97 | % | | | 2.14 | % | | | 1.83 | % | | | 1.62 | % |
| | | | | | |
Net investment income | | 3.17% | | | 3.25 | % | | | 3.79 | % | | | 3.58 | % | | | 3.33 | % | | | 3.72 | % |
| | | | |
| | 27 | | See Notes to Financial Statements. |
Eaton Vance
Floating-Rate Income Trust
November 30, 2021
Notes to Financial Statements (Unaudited)
1 Significant Accounting Policies
Eaton Vance Floating-Rate Income Trust (the Trust) is a Massachusetts business trust registered under the Investment Company Act of 1940, as amended (the 1940 Act), as a diversified, closed-end management investment company. The Trust’s investment objective is to provide a high level of current income. The Trust will, as a secondary objective, also seek preservation of capital to the extent consistent with its primary goal of high current income.
The following is a summary of significant accounting policies of the Trust. The policies are in conformity with accounting principles generally accepted in the United States of America (U.S. GAAP). The Trust is an investment company and follows accounting and reporting guidance in the Financial Accounting Standards Board (FASB) Accounting Standards Codification Topic 946.
A Investment Valuation — The following methodologies are used to determine the market value or fair value of investments.
Senior Floating-Rate Loans. Interests in senior floating-rate loans (Senior Loans) for which reliable market quotations are readily available are valued generally at the average mean of bid and ask quotations obtained from a third party pricing service. Other Senior Loans are valued at fair value by the investment adviser under procedures approved by the Trustees. In fair valuing a Senior Loan, the investment adviser utilizes one or more of the valuation techniques described in (i) through (iii) below to assess the likelihood that the borrower will make a full repayment of the loan underlying such Senior Loan relative to yields on other Senior Loans issued by companies of comparable credit quality. If the investment adviser believes that there is a reasonable likelihood of full repayment, the investment adviser will determine fair value using a matrix pricing approach that considers the yield on the Senior Loan. If the investment adviser believes there is not a reasonable likelihood of full repayment, the investment adviser will determine fair value using analyses that include, but are not limited to: (i) a comparison of the value of the borrower’s outstanding equity and debt to that of comparable public companies; (ii) a discounted cash flow analysis; or (iii) when the investment adviser believes it is likely that a borrower will be liquidated or sold, an analysis of the terms of such liquidation or sale. In certain cases, the investment adviser will use a combination of analytical methods to determine fair value, such as when only a portion of a borrower’s assets are likely to be sold. In conducting its assessment and analyses for purposes of determining fair value of a Senior Loan, the investment adviser will use its discretion and judgment in considering and appraising relevant factors. Fair value determinations are made by the portfolio managers of the Trust based on information available to such managers. The portfolio managers of other funds managed by the investment adviser that invest in Senior Loans may not possess the same information about a Senior Loan borrower as the portfolio managers of the Trust. At times, the fair value of a Senior Loan determined by the portfolio managers of other funds managed by the investment adviser that invest in Senior Loans may vary from the fair value of the same Senior Loan determined by the portfolio managers of the Trust. The fair value of each Senior Loan is periodically reviewed and approved by the investment adviser’s Valuation Committee and by the Trustees based upon procedures approved by the Trustees. Junior Loans (i.e., subordinated loans and second lien loans) are valued in the same manner as Senior Loans.
Debt Obligations. Debt obligations are generally valued on the basis of valuations provided by third party pricing services, as derived from such services’ pricing models. Inputs to the models may include, but are not limited to, reported trades, executable bid and ask prices, broker/dealer quotations, prices or yields of securities with similar characteristics, interest rates, anticipated prepayments, benchmark curves or information pertaining to the issuer, as well as industry and economic events. The pricing services may use a matrix approach, which considers information regarding securities with similar characteristics to determine the valuation for a security. Short-term debt obligations purchased with a remaining maturity of sixty days or less for which a valuation from a third party pricing service is not readily available may be valued at amortized cost, which approximates fair value.
Equity Securities. Equity securities listed on a U.S. securities exchange generally are valued at the last sale or closing price on the day of valuation or, if no sales took place on such date, at the mean between the closing bid and ask prices on the exchange where such securities are principally traded. Equity securities listed on the NASDAQ National Market System are valued at the NASDAQ official closing price. Unlisted or listed securities for which closing sales prices or closing quotations are not available are valued at the mean between the latest available bid and ask prices or, in the case of preferred equity securities that are not listed or traded in the over-the-counter market, by a third party pricing service that uses various techniques that consider factors including, but not limited to, prices or yields of securities with similar characteristics, benchmark yields, broker/dealer quotes, quotes of underlying common stock, issuer spreads, as well as industry and economic events.
Derivatives. Forward foreign currency exchange contracts are generally valued at the mean of the average bid and average ask prices that are reported by currency dealers to a third party pricing service at the valuation time. Such third party pricing service valuations are supplied for specific settlement periods and the Trust’s forward foreign currency exchange contracts are valued at an interpolated rate between the closest preceding and subsequent settlement period reported by the third party pricing service.
Foreign Securities and Currencies. Foreign securities and currencies are valued in U.S. dollars, based on foreign currency exchange rate quotations supplied by a third party pricing service. The pricing service uses a proprietary model to determine the exchange rate. Inputs to the model include reported trades and implied bid/ask spreads.
Affiliated Fund. The Trust may invest in Eaton Vance Cash Reserves Fund, LLC (Cash Reserves Fund), an affiliated investment company managed by Eaton Vance Management (EVM). While Cash Reserves Fund is not a registered money market mutual fund, it conducts all of its investment activities in accordance with the requirements of Rule 2a-7 under the 1940 Act. Investments in Cash Reserves Fund are valued at the closing net asset value per unit on the valuation day. Cash Reserves Fund generally values its investment securities based on available market quotations provided by a third party pricing service.
Fair Valuation. Investments for which valuations or market quotations are not readily available or are deemed unreliable are valued at fair value using methods determined in good faith by or at the direction of the Trustees of the Trust in a manner that most fairly reflects the security’s “fair value”, which is the amount that the Trust might reasonably expect to receive for the security upon its current sale in the ordinary course. Each such determination is based
Eaton Vance
Floating-Rate Income Trust
November 30, 2021
Notes to Financial Statements (Unaudited) — continued
on a consideration of relevant factors, which are likely to vary from one pricing context to another. These factors may include, but are not limited to, the type of security, the existence of any contractual restrictions on the security’s disposition, the price and extent of public trading in similar securities of the issuer or of comparable companies or entities, quotations or relevant information obtained from broker/dealers or other market participants, information obtained from the issuer, analysts, and/or the appropriate stock exchange (for exchange-traded securities), an analysis of the company’s or entity’s financial statements, and an evaluation of the forces that influence the issuer and the market(s) in which the security is purchased and sold.
B Investment Transactions — Investment transactions for financial statement purposes are accounted for on a trade date basis. Realized gains and losses on investments sold are determined on the basis of identified cost.
C Income — Interest income is recorded on the basis of interest accrued, adjusted for amortization of premium or accretion of discount. Fees associated with loan amendments are recognized immediately. Dividend income is recorded on the ex-dividend date for dividends received in cash and/or securities. Distributions from investment companies are recorded as dividend income, capital gains or return of capital based on the nature of the distribution.
D Federal Taxes — The Trust’s policy is to comply with the provisions of the Internal Revenue Code applicable to regulated investment companies and to distribute to shareholders each year substantially all of its net investment income, and all or substantially all of its net realized capital gains. Accordingly, no provision for federal income or excise tax is necessary.
As of November 30, 2021, the Trust had no uncertain tax positions that would require financial statement recognition, de-recognition, or disclosure. The Trust files a U.S. federal income tax return annually after its fiscal year-end, which is subject to examination by the Internal Revenue Service for a period of three years from the date of filing.
E Foreign Currency Translation — Investment valuations, other assets, and liabilities initially expressed in foreign currencies are translated each business day into U.S. dollars based upon current exchange rates. Purchases and sales of foreign investment securities and income and expenses denominated in foreign currencies are translated into U.S. dollars based upon currency exchange rates in effect on the respective dates of such transactions. Recognized gains or losses on investment transactions attributable to changes in foreign currency exchange rates are recorded for financial statement purposes as net realized gains and losses on investments. That portion of unrealized gains and losses on investments that results from fluctuations in foreign currency exchange rates is not separately disclosed.
F Unfunded Loan Commitments — The Trust may enter into certain loan agreements all or a portion of which may be unfunded. The Trust is obligated to fund these commitments at the borrower’s discretion. These commitments are disclosed in the accompanying Portfolio of Investments. At November 30, 2021, the Trust had sufficient cash and/or securities to cover these commitments.
G Use of Estimates — The preparation of the financial statements in conformity with U.S. GAAP requires management to make estimates and assumptions that affect the reported amounts of assets and liabilities at the date of the financial statements and the reported amounts of income and expense during the reporting period. Actual results could differ from those estimates.
H Indemnifications — Under the Trust’s organizational documents, its officers and Trustees may be indemnified against certain liabilities and expenses arising out of the performance of their duties to the Trust. Under Massachusetts law, if certain conditions prevail, shareholders of a Massachusetts business trust (such as the Trust) could be deemed to have personal liability for the obligations of the Trust. However, the Trust’s Declaration of Trust contains an express disclaimer of liability on the part of Trust shareholders and the By-laws provide that the Trust shall assume, upon request by the shareholder, the defense on behalf of any Trust shareholders. Moreover, the By-laws also provide for indemnification out of Trust property of any shareholder held personally liable solely by reason of being or having been a shareholder for all loss or expense arising from such liability. Additionally, in the normal course of business, the Trust enters into agreements with service providers that may contain indemnification clauses. The Trust’s maximum exposure under these arrangements is unknown as this would involve future claims that may be made against the Trust that have not yet occurred.
I Forward Foreign Currency Exchange Contracts — The Trust may enter into forward foreign currency exchange contracts for the purchase or sale of a specific foreign currency at a fixed price on a future date. The forward foreign currency exchange contracts are adjusted by the daily exchange rate of the underlying currency and any gains or losses are recorded as unrealized until such time as the contracts have been closed. Risks may arise upon entering these contracts from the potential inability of counterparties to meet the terms of their contracts and from movements in the value of a foreign currency relative to the U.S. dollar.
J When-Issued Securities and Delayed Delivery Transactions — The Trust may purchase securities on a delayed delivery or when-issued basis. Payment and delivery may take place after the customary settlement period for that security. At the time the transaction is negotiated, the price of the security that will be delivered is fixed. The Trust maintains cash and/or security positions for these commitments such that sufficient liquid assets will be available to make payments upon settlement. Securities purchased on a delayed delivery or when-issued basis are marked-to-market daily and begin earning interest on settlement date. Such security purchases are subject to the risk that when delivered they will be worth less than the agreed upon payment price. Losses may also arise if the counterparty does not perform under the contract.
K Interim Financial Statements — The interim financial statements relating to November 30, 2021 and for the six months then ended have not been audited by an independent registered public accounting firm, but in the opinion of the Trust’s management, reflect all adjustments, consisting only of normal recurring adjustments, necessary for the fair presentation of the financial statements.
Eaton Vance
Floating-Rate Income Trust
November 30, 2021
Notes to Financial Statements (Unaudited) — continued
2 Variable Rate Term Preferred Shares
Variable rate term preferred shares are a form of preferred shares that represent stock of the Trust. They have a par value of $0.01 per share and a liquidation preference of $100,000 per share.
On December 18, 2012, the Trust issued 800 shares of Series C-1 Variable Rate Term Preferred Shares (Series C-1 VRTP Shares) in a private offering to a commercial paper conduit sponsored by a large financial institution. The Trust used the net proceeds from the issuance to enter into a series of transactions which resulted in a redemption and/or repurchase of its Auction Preferred Shares.
On September 30, 2016, the Series C-1 VRTP Shares were transferred to another large financial institution (the Assignee) as permitted by the Trust’s By-laws. The transferred Series C-1 VRTP Shares were then exchanged for an equal number of Series L-2 Variable Rate Term Preferred Shares (Series L-2 VRTP Shares), and the mandatory redemption date was extended to three years from the date of transfer. Effective January 24, 2019, the mandatory redemption date of the Series L-2 VRTP Shares was extended to January 24, 2024. Dividends on the Series L-2 VRTP Shares are determined each day based on a spread of 1.75% to three-month LIBOR. Such spread is determined based on the current credit rating of the Series L-2 VRTP Shares, which is provided by Moody’s Investors Service.
The Series L-2 VRTP Shares are redeemable at the option of the Trust at a redemption price equal to $100,000 per share, plus accumulated and unpaid dividends, on any business day and solely for the purpose of reducing the leverage of the Trust. The Series L-2 VRTP Shares are also subject to mandatory redemption at a redemption price equal to $100,000 per share, plus accumulated and unpaid dividends, if the Trust is in default for an extended period on its asset maintenance or leverage ratio requirements with respect to the Series L-2 VRTP Shares. Six months prior to the mandatory redemption date, the Trust is required to segregate in a liquidity account with its custodian investments equal to 110% of the Series L-2 VRTP Shares’ redemption price, and over the six-month period execute a series of liquidation transactions to assure sufficient liquidity to redeem the Series L-2 VRTP Shares. The holders of the Series L-2 VRTP Shares, voting as a class, are entitled to elect two Trustees of the Trust. If the dividends on the Series L-2 VRTP Shares remain unpaid in an amount equal to two full years’ dividends, the holders of the Series L-2 VRTP Shares as a class have the right to elect a majority of the Board of Trustees.
For financial reporting purposes, the liquidation value of the Series L-2 VRTP Shares (net of unamortized deferred debt issuance costs) is presented as a liability on the Statement of Assets and Liabilities and unpaid dividends are included in interest expense and fees payable. Dividends accrued on Series L-2 VRTP Shares are treated as interest payments for financial reporting purposes and are included in interest expense and fees on the Statement of Operations.
In connection with the transfer of the Series C-1 VRTP Shares to the Assignee on September 30, 2016, the Trust paid an upfront fee of $400,000 and debt issuance costs of $458,267. The Trust paid additional debt issuance costs of $52,580 in connection with the extension of the mandatory redemption date of the Series L-2 VRTP Shares. These amounts are being amortized to interest expense and fees through January 24, 2024. The unamortized amount of the debt issuance costs as of November 30, 2021 is presented as a reduction of the liability for variable rate term preferred shares on the Statement of Assets and Liabilities.
The carrying amount of the Series L-2 VRTP Shares at November 30, 2021 represents its liquidation value, which approximates fair value. If measured at fair value, the Series L-2 VRTP Shares would have been considered as Level 2 in the fair value hierarchy (see Note 11) at November 30, 2021. The average liquidation preference of the Series L-2 VRTP Shares during the six months ended November 30, 2021 was $80,000,000.
3 Distributions to Shareholders and Income Tax Information
The Trust intends to make monthly distributions of net investment income to common shareholders, after payment of any dividends on any outstanding variable rate term preferred shares. In addition, at least annually, the Trust intends to distribute all or substantially all of its net realized capital gains. Distributions to common shareholders are recorded on the ex-dividend date. Dividends to variable rate term preferred shareholders are accrued daily and payable quarterly. The dividend rate on the Series L-2 VRTP Shares at November 30, 2021 was 1.90%. The amount of dividends accrued and the average annual dividend rate of the Series L-2 VRTP Shares during the six months ended November 30, 2021 were $777,532 and 1.94%, respectively.
Distributions to shareholders are determined in accordance with income tax regulations, which may differ from U.S. GAAP. As required by U.S. GAAP, only distributions in excess of tax basis earnings and profits are reported in the financial statements as a return of capital. Permanent differences between book and tax accounting relating to distributions are reclassified to paid-in capital. For tax purposes, distributions from short-term capital gains are considered to be from ordinary income.
Distributions in any year may include a return of capital component. For the six months ended November 30, 2021, the amount of distributions estimated to be a tax return of capital was approximately $2,090,000. The final determination of tax characteristics of the Trust’s distributions will occur at the end of the year, at which time it will be reported to the shareholders.
At May 31, 2021, the Trust, for federal income tax purposes, had deferred capital losses of $44,744,452 which would reduce its taxable income arising from future net realized gains on investment transactions, if any, to the extent permitted by the Internal Revenue Code, and thus would reduce the amount of distributions to shareholders, which would otherwise be necessary to relieve the Trust of any liability for federal income or excise tax. The deferred
Eaton Vance
Floating-Rate Income Trust
November 30, 2021
Notes to Financial Statements (Unaudited) — continued
capital losses are treated as arising on the first day of the Trust’s next taxable year and retain the same short-term or long-term character as when originally deferred. Of the deferred capital losses at May 31, 2021, $5,304,684 are short-term and $39,439,768 are long-term.
The cost and unrealized appreciation (depreciation) of investments, including open derivative contracts, of the Trust at November 30, 2021, as determined on a federal income tax basis, were as follows:
| | | | |
| |
Aggregate cost | | $ | 652,131,335 | |
| |
Gross unrealized appreciation | | $ | 5,719,890 | |
| |
Gross unrealized depreciation | | | (8,277,484 | ) |
| |
Net unrealized depreciation | | $ | (2,557,594 | ) |
4 Investment Adviser Fee and Other Transactions with Affiliates
The investment adviser fee is earned by EVM as compensation for investment advisory services rendered to the Trust. The investment adviser fee is computed at an annual rate of 0.75% of the Trust’s average daily gross assets and is payable monthly. Gross assets means total assets of the Trust, including any form of investment leverage, minus all accrued expenses incurred in the normal course of operations, but not excluding any liabilities or obligations attributable to investment leverage obtained through (i) indebtedness of any type (including, without limitation, borrowing through a credit facility or the issuance of debt securities), (ii) the issuance of preferred stock or other similar preference securities, (iii) the reinvestment of collateral received for securities loaned in accordance with the Trust’s investment objectives and policies, and/or (iv) any other means. Accrued expenses includes other liabilities other than indebtedness attributable to leverage. For the six months ended November 30, 2021, the Trust’s investment adviser fee amounted to $2,513,942. The Trust may invest its cash in Cash Reserves Fund. EVM does not currently receive a fee for advisory services provided to Cash Reserves Fund. EVM also serves as administrator of the Trust, but receives no compensation.
Trustees and officers of the Trust who are members of EVM’s organization receive remuneration for their services to the Trust out of the investment adviser fee. Trustees of the Trust who are not affiliated with EVM may elect to defer receipt of all or a percentage of their annual fees in accordance with the terms of the Trustees Deferred Compensation Plan. For the six months ended November 30, 2021, no significant amounts have been deferred. Certain officers and Trustees of the Trust are officers of EVM.
During the six months ended November 30, 2021, EVM reimbursed the Trust $3,991 for a net realized loss due to a trading error. The amount of the reimbursement had an impact on total return of less than 0.01%.
5 Purchases and Sales of Investments
Purchases and sales of investments, other than short-term obligations and including maturities, paydowns and principal repayments on Senior Loans, aggregated $287,923,668 and $553,474,440, respectively, for the six months ended November 30, 2021.
6 Common Shares of Beneficial Interest and Shelf Offering
The Trust may issue common shares pursuant to its dividend reinvestment plan. Common shares issued by the Trust pursuant to its dividend reinvestment plan for the six months ended November 30, 2021 were 28,505. There were no common shares issued by the Trust for the year ended May 31, 2021.
As announced on March 16, 2021, and further updated on May 12, 2021, the Trust’s Board of Trustees authorized an initial conditional cash tender offer (the “Initial Tender Offer”) by the Trust for up to 50% of its outstanding common shares at a price per share equal to 99% of the Trust’s net asset value (“NAV”) per share as of the close of regular trading on the New York Stock Exchange on the date the tender offer expires. On June 29, 2021, the Trust commenced a cash tender offer for up to 19,931,845 of its outstanding common shares. The tender offer expired at 5:00 P.M. Eastern Time on July 30, 2021. The number of shares properly tendered was 11,568,482. The purchase price of the properly tendered shares was equal to $14.3281 per share for an aggregate purchase price of $165,754,367.
In addition to the Initial Tender Offer, the Trust announced on May 12, 2021 that it will conduct cash tender offers in the fourth quarter of each of 2022, 2023 and 2024 (each, a “Conditional Tender Offer”) for up to 10% of the Trust’s then-outstanding common shares if, from January to August of the relevant year, the Trust’s shares trade at an average daily discount to NAV of more than 10%, based upon the Trust’s volume-weighted average market price and NAV on each business day during the period. If triggered, common shares tendered and accepted in a Conditional Tender Offer would be repurchased at a price per share equal to 98% of the Trust’s NAV as of the close of regular trading on the New York Stock Exchange on the date such Conditional Tender Offer expires.
Eaton Vance
Floating-Rate Income Trust
November 30, 2021
Notes to Financial Statements (Unaudited) — continued
Pursuant to a registration statement filed with the SEC, the Trust is authorized to issue up to an additional 5,495,789 common shares through an equity shelf offering program (the “shelf offering”). Under the shelf offering, the Trust, subject to market conditions, may raise additional capital from time to time and in varying amounts and offering methods at a net price at or above the Trust’s net asset value per common share. During the six months ended November 30, 2021, the Trust sold 584,928 common shares and received proceeds (net of offering costs) of $8,719,533 through its shelf offering. The net proceeds in excess of the net asset value of the shares sold were $193,880 for the six months ended November 30, 2021. Offering costs (other than the applicable sales commissions) incurred in connection with the shelf offering were borne directly by EVM. Eaton Vance Distributors, Inc. (EVD), an affiliate of EVM, is the distributor of the Trust’s shares and is entitled to receive a sales commission from the Trust of 1.00% of the gross sales price per share, a portion of which is re-allowed to sales agents. The Trust was informed that the sales commissions retained by EVD during the six months ended November 30, 2021 were $17,615. During the year ended May 31, 2021, there were no shares sold by the Trust pursuant to its shelf offering.
In November 2013, the Board of Trustees initially approved a share repurchase program for the Trust. Pursuant to the reauthorization of the share repurchase program by the Board of Trustees in March 2019, the Trust is authorized to repurchase up to 10% of its common shares outstanding as of the last day of the prior calendar year at market prices when shares are trading at a discount to net asset value. The share repurchase program does not obligate the Trust to purchase a specific amount of shares. There were no repurchases of common shares by the Trust for the six months ended November 30, 2021 and the year ended May 31, 2021.
7 Restricted Securities
At November 30, 2021, the Trust owned the following securities (representing 0.2% of net assets applicable to common shares) which were restricted as to public resale and not registered under the Securities Act of 1933 (excluding Rule 144A securities). The Trust has various registration rights (exercisable under a variety of circumstances) with respect to these securities. The value of these securities is determined based on valuations provided by brokers when available, or if not available, they are valued at fair value using methods determined in good faith by or at the direction of the Trustees.
| | | | | | | | | | | | | | | | |
| Description | | Date of Acquisition | | | Shares | | | Cost | | | Value | |
| | | | |
Common Stocks | | | | | | | | | | | | | | | | |
| | | | |
Nine Point Energy Holdings, Inc. | | | 7/15/14, 10/21/14 | | | | 758 | | | $ | 34,724 | | | $ | 0 | |
| | | | |
Skillsoft Corp. | | | 6/23/21 | | | | 56,469 | | | | 564,688 | | | | 661,435 | |
| | | | |
Convertible Preferred Stocks | | | | | | | | | | | | | | | | |
| | | | |
Nine Point Energy Holdings, Inc., Series A, 12.00% | | | 5/26/17 | | | | 14 | | | | 14,000 | | | | 0 | |
| | | | |
Total Restricted Securities | | | | | | | | | | $ | 613,412 | | | $ | 661,435 | |
8 Financial Instruments
The Trust may trade in financial instruments with off-balance sheet risk in the normal course of its investing activities. These financial instruments may include forward foreign currency exchange contracts and may involve, to a varying degree, elements of risk in excess of the amounts recognized for financial statement purposes. The notional or contractual amounts of these instruments represent the investment the Trust has in particular classes of financial instruments and do not necessarily represent the amounts potentially subject to risk. The measurement of the risks associated with these instruments is meaningful only when all related and offsetting transactions are considered. A summary of obligations under these financial instruments at November 30, 2021 is included in the Portfolio of Investments. At November 30, 2021, the Trust had sufficient cash and/or securities to cover commitments under these contracts.
The Trust is subject to foreign exchange risk in the normal course of pursuing its investment objectives. Because the Trust holds foreign currency denominated investments, the value of these investments and related receivables and payables may change due to future changes in foreign currency exchange rates. To hedge against this risk, the Trust enters into forward foreign currency exchange contracts.
The Trust enters into forward foreign currency exchange contracts that may contain provisions whereby the counterparty may terminate the contract under certain conditions, including but not limited to a decline in the Trust’s net assets below a certain level over a certain period of time, which would trigger a payment by the Trust for those derivatives in a liability position. At November 30, 2021, the fair value of derivatives with credit-related contingent features in a net liability position was $33,592. At November 30, 2021, there were no assets pledged by the Trust for such liability.
The over-the-counter (OTC) derivatives in which the Trust invests are subject to the risk that the counterparty to the contract fails to perform its obligations under the contract. To mitigate this risk, the Trust has entered into an International Swaps and Derivatives Association, Inc. Master Agreement (“ISDA Master Agreement”) or similar agreement with substantially all its derivative counterparties. An ISDA Master Agreement is a bilateral agreement between the Trust and a counterparty that governs certain OTC derivatives and typically contains, among other things, set-off provisions in the event of a default and/or termination event as defined under the relevant ISDA Master Agreement. Under an ISDA Master Agreement, the Trust may, under certain
Eaton Vance
Floating-Rate Income Trust
November 30, 2021
Notes to Financial Statements (Unaudited) — continued
circumstances, offset with the counterparty certain derivative financial instruments’ payables and/or receivables with collateral held and/or posted and create one single net payment. The provisions of the ISDA Master Agreement typically permit a single net payment in the event of default including the bankruptcy or insolvency of the counterparty. However, bankruptcy or insolvency laws of a particular jurisdiction may impose restrictions on or prohibitions against the right of offset in bankruptcy or insolvency. Certain ISDA Master Agreements allow counterparties to OTC derivatives to terminate derivative contracts prior to maturity in the event the Trust’s net assets decline by a stated percentage or the Trust fails to meet the terms of its ISDA Master Agreements, which would cause the counterparty to accelerate payment by the Trust of any net liability owed to it.
The collateral requirements for derivatives traded under an ISDA Master Agreement are governed by a Credit Support Annex to the ISDA Master Agreement. Collateral requirements are determined at the close of business each day and are typically based on changes in market values for each transaction under an ISDA Master Agreement and netted into one amount for such agreement. Generally, the amount of collateral due from or to a counterparty is subject to a minimum transfer threshold amount before a transfer is required, which may vary by counterparty. Collateral pledged for the benefit of the Trust and/or counterparty is held in segregated accounts by the Trust’s custodian and cannot be sold, re-pledged, assigned or otherwise used while pledged. The portion of such collateral representing cash, if any, is reflected as deposits for derivatives collateral and, in the case of cash pledged by a counterparty for the benefit of the Trust, a corresponding liability on the Statement of Assets and Liabilities. Securities pledged by the Trust as collateral, if any, are identified as such in the Portfolio of Investments. The carrying amount of the liability for cash collateral due to broker at November 30, 2021 approximated its fair value. If measured at fair value, such liability would have been considered as Level 2 in the fair value hierarchy (see Note 11) at November 30, 2021.
The fair value of open derivative instruments (not considered to be hedging instruments for accounting disclosure purposes) and whose primary underlying risk exposure is foreign exchange risk at November 30, 2021 was as follows:
| | | | | | | | |
| | | Fair Value | |
| Derivative | | Asset Derivative(1) | | | Liability Derivative(2) | |
| | |
Forward foreign currency exchange contracts | | $ | 571,939 | | | $ | (33,592 | ) |
| (1) | Statement of Assets and Liabilities location: Receivable for open forward foreign currency exchange contracts. |
| (2) | Statement of Assets and Liabilities location: Payable for open forward foreign currency exchange contracts. |
The Trust’s derivative assets and liabilities at fair value by type, which are reported gross in the Statement of Assets and Liabilities, are presented in the table above. The following tables present the Trust’s derivative assets and liabilities by counterparty, net of amounts available for offset under a master netting agreement and net of the related collateral received by the Trust for such assets and pledged by the Trust for such liabilities as of November 30, 2021.
| | | | | | | | | | | | | | | | | | | | |
| Counterparty | | Derivative Assets
Subject to
Master Netting
Agreement | | | Derivatives
Available
for Offset | | | Non-cash
Collateral
Received(a) | | | Cash
Collateral
Received(a) | | | Net Amount
of Derivative
Assets(b) | |
| | | | | |
HSBC Bank USA, N.A. | | $ | 36,491 | | | $ | — | | | $ | (36,491 | ) | | $ | — | | | $ | — | |
| | | | | |
Standard Chartered Bank | | | 444,292 | | | | — | | | | — | | | | (444,292 | ) | | | — | |
| | | | | |
State Street Bank and Trust Company | | | 91,156 | | | | (33,592 | ) | | | — | | | | — | | | | 57,564 | |
| | | | | |
| | | $ | 571,939 | | | $ | (33,592 | ) | | $ | (36,491 | ) | | $ | (444,292 | ) | | $ | 57,564 | |
| | | | | |
| Counterparty | | Derivative Liabilities
Subject to
Master Netting
Agreement | | | Derivatives
Available
for Offset | | | Non-cash
Collateral
Pledged(a) | | | Cash
Collateral
Pledged(a) | | | Net Amount
of Derivative
Liabilities(c) | |
| | | | | |
State Street Bank and Trust Company | | $ | (33,592 | ) | | $ | 33,592 | | | $ | — | | | $ | — | | | $ | — | |
| (a) | In some instances, the total collateral received and/or pledged may be more than the amount shown due to overcollateralization. |
| (b) | Net amount represents the net amount due from the counterparty in the event of default. |
| (c) | Net amount represents the net amount payable to the counterparty in the event of default. |
Eaton Vance
Floating-Rate Income Trust
November 30, 2021
Notes to Financial Statements (Unaudited) — continued
The effect of derivative instruments (not considered to be hedging instruments for accounting disclosure purposes) on the Statement of Operations and whose primary underlying risk exposure is foreign exchange risk for the six months ended November 30, 2021 was as follows:
| | | | | | | | |
| Derivative | | Realized Gain (Loss)
on Derivatives Recognized
in Income(1) | | | Change in Unrealized
Appreciation (Depreciation) on
Derivatives Recognized in Income(2) | |
| | |
Forward foreign currency exchange contracts | | $ | 2,124,667 | | | $ | 2,175,255 | |
| (1) | Statement of Operations location: Net realized gain (loss) – Forward foreign currency exchange contracts. |
| (2) | Statement of Operations location: Change in unrealized appreciation (depreciation) – Forward foreign currency exchange contracts. |
The average notional amount of forward foreign currency exchange contracts (based on the absolute value of notional amounts of currency purchased and currency sold) outstanding during the six months ended November 30, 2021, which is indicative of the volume of this derivative type, was approximately $80,445,000.
9 Revolving Credit and Security Agreement
The Trust has entered into a Revolving Credit and Security Agreement, as amended (the Agreement) with conduit lenders and a bank to borrow up to $210 million ($290 million prior to September 29, 2021). Borrowings under the Agreement are secured by the assets of the Trust. Interest is charged at a rate above the conduits’ commercial paper issuance rate and is payable monthly. Under the terms of the Agreement, in effect through March 7, 2022, the Trust also pays a program fee of 0.90% per annum on its outstanding borrowings to administer the facility and a liquidity fee of 0.15% (0.25% if the outstanding loan amount is less than or equal to 60% of the total facility size) per annum on the unused portion of the total commitment under the Agreement. Program and liquidity fees for the six months ended November 30, 2021 totaled $711,861 and are included in interest expense and fees on the Statement of Operations. In connection with the renewal of the Agreement on March 8, 2021, the Trust paid an upfront fee of $435,000, which is being amortized to interest expense over a period of one year through March 7, 2022. The unamortized balance at November 30, 2021 is approximately $141,000 and is included in prepaid upfront fees on notes payable and variable rate term preferred shares on the Statement of Assets and Liabilities. At November 30, 2021, the Trust had borrowings outstanding under the Agreement of $140,000,000 at an interest rate of 0.15%. Based on the short-term nature of the borrowings under the Agreement and the variable interest rate, the carrying amount of the borrowings at November 30, 2021 approximated its fair value. If measured at fair value, borrowings under the Agreement would have been considered as Level 2 in the fair value hierarchy (see Note 11) at November 30, 2021. For the six months ended November 30, 2021, the average borrowings under the Agreement and the average annual interest rate (excluding fees) were $115,546,448 and 0.14%, respectively.
10 Investments in Affiliated Funds
At November 30, 2021, the value of the Trust’s investment in affiliated funds was $11,614,168, which represents 2.8% of the Trust’s net assets applicable to common shares. Transactions in affiliated funds by the Trust for the six months ended November 30, 2021 were as follows:
| | | | | | | | | | | | | | | | | | | | | | | | | | | | | | | | |
| Name | | Value,
beginning
of period | | | Purchases | | | Sales
proceeds | | | Net
realized
gain (loss) | | | Change in
unrealized
appreciation
(depreciation) | | | Value, end
of period | | | Dividend
income | | | Units, end
of period | |
| | | | | | | | |
Short-Term Investments | | | | | | | | | | | | | | | | | | | | | | | | | | | | | | | | |
| | | | | | | | |
Eaton Vance Cash Reserves Fund, LLC | | $ | 6,274,548 | | | $ | 384,186,194 | | | $ | (378,845,424 | ) | | $ | (899 | ) | | $ | (251 | ) | | $ | 11,614,168 | | | $ | 8,700 | | | | 11,615,330 | |
Eaton Vance
Floating-Rate Income Trust
November 30, 2021
Notes to Financial Statements (Unaudited) — continued
11 Fair Value Measurements
Under generally accepted accounting principles for fair value measurements, a three-tier hierarchy to prioritize the assumptions, referred to as inputs, is used in valuation techniques to measure fair value. The three-tier hierarchy of inputs is summarized in the three broad levels listed below.
| • | | Level 1 – quoted prices in active markets for identical investments |
| • | | Level 2 – other significant observable inputs (including quoted prices for similar investments, interest rates, prepayment speeds, credit risk, etc.) |
| • | | Level 3 – significant unobservable inputs (including a fund’s own assumptions in determining the fair value of investments) |
In cases where the inputs used to measure fair value fall in different levels of the fair value hierarchy, the level disclosed is determined based on the lowest level input that is significant to the fair value measurement in its entirety. The inputs or methodology used for valuing securities are not necessarily an indication of the risk associated with investing in those securities.
At November 30, 2021, the hierarchy of inputs used in valuing the Trust’s investments and open derivative instruments, which are carried at value, were as follows:
| | | | | | | | | | | | | | | | |
| Asset Description | | Level 1 | | | Level 2 | | | Level 3* | | | Total | |
| | | | |
Asset-Backed Securities | | $ | — | | | $ | 25,503,075 | | | $ | — | | | $ | 25,503,075 | |
| | | | |
Closed-End Funds | | | 8,803,503 | | | | — | | | | — | | | | 8,803,503 | |
| | | | |
Common Stocks | | | 1,502,223 | | | | 1,371,479 | | | | 2,195,879 | | | | 5,069,581 | |
| | | | |
Convertible Preferred Stocks | | | — | | | | — | | | | 0 | | | | 0 | |
| | | | |
Corporate Bonds | | | — | | | | 5,408,390 | | | | — | | | | 5,408,390 | |
| | | | |
Senior Floating-Rate Loans (Less Unfunded Loan Commitments) | | | — | | | | 591,335,271 | | | | 431,053 | | | | 591,766,324 | |
| | | | |
Warrants | | | — | | | | 870,353 | | | | 0 | | | | 870,353 | |
| | | | |
Short-Term Investments | | | — | | | | 11,614,168 | | | | — | | | | 11,614,168 | |
| | | | |
Total Investments | | $ | 10,305,726 | | | $ | 636,102,736 | | | $ | 2,626,932 | | | $ | 649,035,394 | |
| | | | |
Forward Foreign Currency Exchange Contracts | | $ | — | | | $ | 571,939 | | | $ | — | | | $ | 571,939 | |
| | | | |
Total | | $ | 10,305,726 | | | $ | 636,674,675 | | | $ | 2,626,932 | | | $ | 649,607,333 | |
| | | | |
Liability Description | | | | | | | | | | | | | | | | |
| | | | |
Forward Foreign Currency Exchange Contracts | | $ | — | | | $ | (33,592 | ) | | $ | — | | | $ | (33,592 | ) |
| | | | |
Total | | $ | — | | | $ | (33,592 | ) | | $ | — | | | $ | (33,592 | ) |
| * | None of the unobservable inputs for Level 3 assets, individually or collectively, had a material impact on the Trust. |
Level 3 investments at the beginning and/or end of the period in relation to net assets were not significant and accordingly, a reconciliation of Level 3 assets for the six months ended November 30, 2021 is not presented.
12 Risks and Uncertainties
Risks Associated with Foreign Investments
Foreign investments can be adversely affected by political, economic and market developments abroad, including the imposition of economic and other sanctions by the United States or another country. There may be less publicly available information about foreign issuers because they may not be subject to reporting practices, requirements or regulations comparable to those to which United States companies are subject. Foreign markets may be smaller, less liquid and more volatile than the major markets in the United States. Trading in foreign markets typically involves higher expense than trading in the United States. The Trust may have difficulties enforcing its legal or contractual rights in a foreign country. Securities that trade or are denominated in currencies other than the U.S. dollar may be adversely affected by fluctuations in currency exchange rates.
Credit Risk
The Trust invests primarily in below investment grade floating-rate loans, which are considered speculative because of the credit risk of their issuers. Changes in economic conditions or other circumstances are more likely to reduce the capacity of issuers of these securities to make principal and interest payments. Such companies are more likely to default on their payments of interest and principal owed than issuers of investment grade bonds. An
Eaton Vance
Floating-Rate Income Trust
November 30, 2021
Notes to Financial Statements (Unaudited) — continued
economic downturn generally leads to a higher non-payment rate, and a loan or other debt obligation may lose significant value before a default occurs. Lower rated investments also may be subject to greater price volatility than higher rated investments. Moreover, the specific collateral used to secure a loan may decline in value or become illiquid, which would adversely affect the loan’s value.
LIBOR Transition Risk
Certain instruments held by the Trust may pay an interest rate based on the London Interbank Offered Rate (“LIBOR”), which is the average offered rate for various maturities of short-term loans between certain major international banks. LIBOR is used throughout global banking and financial industries to determine interest rates for a variety of financial instruments (such as debt instruments and derivatives) and borrowing arrangements. The ICE Benchmark Administration Limited, the administrator of LIBOR, is expected to cease publishing certain LIBOR settings on December 31, 2021, and the remaining LIBOR settings on June 30, 2023. Although the transition process away from LIBOR has become increasingly well-defined in advance of the anticipated discontinuation, the impact on certain debt securities, derivatives and other financial instruments that utilize LIBOR remains uncertain. The phase-out of LIBOR may result in, among other things, increased volatility or illiquidity in markets for instruments based on LIBOR and changes in the value of such instruments.
Pandemic Risk
An outbreak of respiratory disease caused by a novel coronavirus was first detected in China in late 2019 and subsequently spread internationally. This coronavirus has resulted in closing borders, enhanced health screenings, changes to healthcare service preparation and delivery, quarantines, cancellations, disruptions to supply chains and customer activity, as well as general concern and uncertainty. Health crises caused by outbreaks, such as the coronavirus outbreak, may exacerbate other pre-existing political, social and economic risks and disrupt normal market conditions and operations. The impact of this outbreak has negatively affected the worldwide economy, the economies of individual countries, individual companies, and the market in general, and may continue to do so in significant and unforeseen ways, as may other epidemics and pandemics that may arise in the future. Any such impact could adversely affect the Trust’s performance, or the performance of the securities in which the Trust invests.
13 Additional Information
On August 27, 2020, the Trust’s Board of Trustees (the “Board”) received a shareholder demand letter from counsel to Saba Capital Master Fund, Ltd., a hedge fund (“Saba”). Saba also filed claims against the Trust in a lawsuit in Suffolk County Superior Court in Massachusetts asserting breach of contract and fiduciary duty by the Trust and certain of its affiliates, the Trust’s adviser, and the Board, following the implementation by the Trust of by-law amendments that (i) require trustee nominees in contested elections to obtain affirmative votes of a majority of eligible shares in order to be elected and (ii) establish certain requirements related to shares obtained in “control share” acquisitions. With respect to the Trust, Saba seeks rescission of these bylaw provisions and certain related relief. On March 31, 2021, the court allowed in part and denied in part a motion to dismiss Saba’s claims.
Eaton Vance
Floating-Rate Income Trust
November 30, 2021
Officers and Trustees
Officers
Eric A. Stein
President
Deidre E. Walsh
Vice President and Chief Legal Officer
James F. Kirchner
Treasurer
Kimberly M. Roessiger
Secretary
Richard F. Froio
Chief Compliance Officer
Trustees
George J. Gorman
Chairperson
Thomas E. Faust Jr.*
Mark R. Fetting
Cynthia E. Frost
Valerie A. Mosley
William H. Park
Helen Frame Peters
Keith Quinton
Marcus L. Smith
Susan J. Sutherland
Scott E. Wennerholm
Eaton Vance Funds
| | |
| Privacy Notice | | April 2021 |
| | |
| |
| FACTS | | WHAT DOES EATON VANCE DO WITH YOUR
PERSONAL INFORMATION? |
| | | |
| |
| | |
| Why? | | Financial companies choose how they share your personal information. Federal law gives consumers the right to limit some but not all sharing. Federal law also requires us to tell you how we collect, share, and protect your personal information. Please read this notice carefully to understand what we do. |
| | |
| | | |
| What? | | The types of personal information we collect and share depend on the product or service you have with us. This information can include: ∎ Social Security number and income ∎ investment experience and risk tolerance ∎ checking account number and wire transfer instructions |
| | |
| | | |
| How? | | All financial companies need to share customers’ personal information to run their everyday business. In the section below, we list the reasons financial companies can share their customers’ personal information; the reasons Eaton Vance chooses to share; and whether you can limit this sharing. |
| | |
| | | |
| | | | |
Reasons we can share your
personal information | | Does Eaton Vance share? | | Can you limit this sharing? |
| For our everyday business purposes — such as to process your transactions, maintain your account(s), respond to court orders and legal investigations, or report to credit bureaus | | Yes | | No |
| For our marketing purposes — to offer our products and services to you | | Yes | | No |
| For joint marketing with other financial companies | | No | | We don’t share |
| For our investment management affiliates’ everyday business purposes — information about your transactions, experiences, and creditworthiness | | Yes | | Yes |
| For our affiliates’ everyday business purposes — information about your transactions and experiences | | Yes | | No |
| For our affiliates’ everyday business purposes — information about your creditworthiness | | No | | We don’t share |
| For our investment management affiliates to market to you | | Yes | | Yes |
| For our affiliates to market to you | | No | | We don’t share |
| For nonaffiliates to market to you | | No | | We don’t share |
| | |
| To limit our sharing | | Call toll-free 1-800-262-1122 or email: EVPrivacy@eatonvance.com Please note: If you are a new customer, we can begin sharing your information 30 days from the date we sent this notice. When you are no longer our customer, we continue to share your information as described in this notice. However, you can contact us at any time to limit our sharing. |
| | |
| | | |
| | |
| Questions? | | Call toll-free 1-800-262-1122 or email: EVPrivacy@eatonvance.com |
| | |
| | | |
Eaton Vance Funds
| | |
| Privacy Notice — continued | | April 2021 |
| | |
| Who we are |
| Who is providing this notice? | | Eaton Vance Management, Eaton Vance Distributors, Inc., Eaton Vance Trust Company, Eaton Vance Management (International) Limited, Eaton Vance Advisers International Ltd., Eaton Vance Global Advisors Limited, Eaton Vance Management’s Real Estate Investment Group, Boston Management and Research, Calvert Research and Management, Eaton Vance and Calvert Fund Families and our investment advisory affiliates (“Eaton Vance”) (see Investment Management Affiliates definition below) |
| What we do |
| How does Eaton Vance protect my personal information? | | To protect your personal information from unauthorized access and use, we use security measures that comply with federal law. These measures include computer safeguards and secured files and buildings. We have policies governing the proper handling of customer information by personnel and requiring third parties that provide support to adhere to appropriate security standards with respect to such information. |
| How does Eaton Vance collect my personal information? | | We collect your personal information, for example, when you ∎ open an account or make deposits or withdrawals from your account ∎ buy securities from us or make a wire transfer ∎ give us your contact information We also collect your personal information from others, such as credit bureaus, affiliates, or other companies. |
| Why can’t I limit all sharing? | | Federal law gives you the right to limit only ∎ sharing for affiliates’ everyday business purposes — information about your creditworthiness ∎ affiliates from using your information to market to you ∎ sharing for nonaffiliates to market to you State laws and individual companies may give you additional rights to limit sharing. See below for more on your rights under state law. |
| Definitions |
| Investment Management Affiliates | | Eaton Vance Investment Management Affiliates include registered investment advisers, registered broker-dealers, and registered and unregistered funds. Investment Management Affiliates does not include entities associated with Morgan Stanley Wealth Management, such as Morgan Stanley Smith Barney LLC and Morgan Stanley & Co. |
| Affiliates | | Companies related by common ownership or control. They can be financial and nonfinancial companies. ∎ Our affiliates include companies with a Morgan Stanley name and financial companies such as Morgan Stanley Smith Barney LLC and Morgan Stanley & Co. |
| Nonaffiliates | | Companies not related by common ownership or control. They can be financial and nonfinancial companies. ∎ Eaton Vance does not share with nonaffiliates so they can market to you. |
| Joint marketing | | A formal agreement between nonaffiliated financial companies that together market financial products or services to you. ∎ Eaton Vance doesn’t jointly market. |
| Other important information |
Vermont: Except as permitted by law, we will not share personal information we collect about Vermont residents with Nonaffiliates unless you provide us with your written consent to share such information. California: Except as permitted by law, we will not share personal information we collect about California residents with Nonaffiliates and we will limit sharing such personal information with our Affiliates to comply with California privacy laws that apply to us. |
Eaton Vance Funds
IMPORTANT NOTICES
Delivery of Shareholder Documents. The Securities and Exchange Commission (SEC) permits funds to deliver only one copy of shareholder documents, including prospectuses, proxy statements and shareholder reports, to fund investors with multiple accounts at the same residential or post office box address. This practice is often called “householding” and it helps eliminate duplicate mailings to shareholders. American Stock Transfer & Trust Company, LLC (“AST”), the closed-end funds transfer agent, or your financial intermediary, may household the mailing of your documents indefinitely unless you instruct AST, or your financial intermediary, otherwise. If you would prefer that your Eaton Vance documents not be householded, please contact AST or your financial intermediary. Your instructions that householding not apply to delivery of your Eaton Vance documents will typically be effective within 30 days of receipt by AST or your financial intermediary.
Portfolio Holdings. Each Eaton Vance Fund and its underlying Portfolio(s) (if applicable) files a schedule of portfolio holdings on Part F to Form N-PORT with the SEC. Certain information filed on Form N-PORT may be viewed on the Eaton Vance website at www.eatonvance.com, by calling Eaton Vance at 1-800-262-1122 or in the EDGAR database on the SEC’s website at www.sec.gov.
Proxy Voting. From time to time, funds are required to vote proxies related to the securities held by the funds. The Eaton Vance Funds or their underlying Portfolios (if applicable) vote proxies according to a set of policies and procedures approved by the Funds’ and Portfolios’ Boards. You may obtain a description of these policies and procedures and information on how the Funds or Portfolios voted proxies relating to portfolio securities during the most recent 12-month period ended June 30, without charge, upon request, by calling 1-800-262-1122 and by accessing the SEC’s website at www.sec.gov.
Share Repurchase Program. The Fund’s Board of Trustees has approved a share repurchase program authorizing the Fund to repurchase up to 10% of its common shares outstanding as of the last day of the prior calendar year in open-market transactions at a discount to net asset value. The repurchase program does not obligate the Fund to purchase a specific amount of shares. The Fund’s repurchase activity, including the number of shares purchased, average price and average discount to net asset value, is disclosed in the Fund’s annual and semi-annual reports to shareholders.
Additional Notice to Shareholders. If applicable, a Fund may also redeem or purchase its outstanding preferred shares in order to maintain compliance with regulatory requirements, borrowing or rating agency requirements or for other purposes as it deems appropriate or necessary.
Closed-End Fund Information. Eaton Vance closed-end funds make fund performance data and certain information about portfolio characteristics available on the Eaton Vance website shortly after the end of each month. Other information about the funds is available on the website. The funds’ net asset value per share is readily accessible on the Eaton Vance website. Portfolio holdings for the most recent month-end are also posted to the website approximately 30 days following the end of the month. This information is available at www.eatonvance.com on the fund information pages under “Closed-End Funds and Term Trusts”.
Investment Adviser and Administrator
Eaton Vance Management
Two International Place
Boston, MA 02110
Custodian
State Street Bank and Trust Company
State Street Financial Center, One Lincoln Street
Boston, MA 02111
Transfer Agent
American Stock Transfer & Trust Company, LLC
6201 15th Avenue
Brooklyn, NY 11219
Fund Offices
Two International Place
Boston, MA 02110
7739 11.30.21
Item 2. Code of Ethics
Not required in this filing.
Item 3. Audit Committee Financial Expert
Not required in this filing.
Item 4. Principal Accountant Fees and Services
Not required in this filing.
Item 5. Audit Committee of Listed Registrants
Not required in this filing.
Item 6. Schedule of Investments
Please see schedule of investments contained in the Report to Stockholders included under Item 1 of this Form N-CSR.
Item 7. Disclosure of Proxy Voting Policies and Procedures for Closed-End Management Investment Companies
Not required in this filing.
Item 8. Portfolio Managers of Closed-End Management Investment Companies
Not required in this filing.
Item 9. Purchases of Equity Securities by Closed-End Management Investment Company and Affiliated Purchasers
Not applicable.
Item 10. Submission of Matters to a Vote of Security Holders
No material changes.
Item 11. Controls and Procedures
(a) It is the conclusion of the registrant’s principal executive officer and principal financial officer that the effectiveness of the registrant’s current disclosure controls and procedures (such disclosure controls and procedures having been evaluated within 90 days of the date of this filing) provide reasonable assurance that the information required to be disclosed by the registrant has been recorded, processed, summarized and reported within the time period specified in the Commission’s rules and forms and that the information required to be disclosed by the registrant has been accumulated and communicated to the registrant’s principal executive officer and principal financial officer in order to allow timely decisions regarding required disclosure.
(b) There have been no changes in the registrant’s internal controls over financial reporting during the period covered by this report that has materially affected, or is reasonably likely to materially affect, the registrant’s internal control over financial reporting.
Item 12. Disclosure of Securities Lending Activities for Closed-End Management Investment Companies
No activity to report for the registrant’s most recent fiscal year end.
Item 13. Exhibits
Signatures
Pursuant to the requirements of the Securities Exchange Act of 1934 and the Investment Company Act of 1940, the registrant has duly caused this report to be signed on its behalf by the undersigned, thereunto duly authorized.
Eaton Vance Floating-Rate Income Trust
| | |
| By: | | /s/ Eric A. Stein |
| | Eric A. Stein |
| | President |
Date: January 19, 2022
Pursuant to the requirements of the Securities Exchange Act of 1934 and the Investment Company Act of 1940, this report has been signed below by the following persons on behalf of the registrant and in the capacities and on the dates indicated.
| | |
| By: | | /s/ James F. Kirchner |
| | James F. Kirchner |
| | Treasurer |
Date: January 19, 2022
| | |
| By: | | /s/ Eric A. Stein |
| | Eric A. Stein |
| | President |
Date: January 19, 2022