UNITED STATES
SECURITIES AND EXCHANGE COMMISSION
Washington, D.C. 20549
FORM N-CSR
CERTIFIED SHAREHOLDER REPORT OF REGISTERED
MANAGEMENT INVESTMENT COMPANIES
| Investment Company Act file number | 811-21591 | |||||
| AMERICAN CENTURY ASSET ALLOCATION PORTFOLIOS, INC. | ||||||
| (Exact name of registrant as specified in charter) | ||||||
| 4500 MAIN STREET, KANSAS CITY, MISSOURI | 64111 | |||||
| (Address of principal executive offices) | (Zip Code) | |||||
CHARLES A. ETHERINGTON 4500 MAIN STREET, KANSAS CITY, MISSOURI 64111 | ||||||
| (Name and address of agent for service) | ||||||
| Registrant’s telephone number, including area code: | 816-531-5575 | |||||
| Date of fiscal year end: | 07-31 | |||||
| Date of reporting period: | 07-31-2015 | |||||
ITEM 1. REPORTS TO STOCKHOLDERS.
| ANNUAL REPORT | JULY 31, 2015 |


One Choice Portfolio®: Very Conservative
One Choice Portfolio®: Conservative
One Choice Portfolio®: Moderate
One Choice Portfolio®: Aggressive
One Choice Portfolio®: Very Aggressive
| Table of Contents |
| President’s Letter | 2 | |
| Performance | 3 | |
| Portfolio Commentary | ||
| Portfolio Characteristics | ||
| Shareholder Fee Examples | ||
| Schedules of Investments | ||
| Statements of Assets and Liabilities | ||
| Statements of Operations | ||
| Statements of Changes in Net Assets | ||
| Notes to Financial Statements | ||
| Financial Highlights | ||
| Report of Independent Registered Public Accounting Firm | ||
| Management | ||
| Approval of Management Agreement | ||
| Additional Information | ||
Any opinions expressed in this report reflect those of the author as of the date of the report, and do not necessarily represent the opinions of American Century Investments® or any other person in the American Century Investments organization. Any such opinions are subject to change at any time based upon market or other conditions and American Century Investments disclaims any responsibility to update such opinions. These opinions may not be relied upon as investment advice and, because investment decisions made by American Century Investments funds are based on numerous factors, may not be relied upon as an indication of trading intent on behalf of any American Century Investments fund. Security examples are used for representational purposes only and are not intended as recommendations to purchase or sell securities. Performance information for comparative indices and securities is provided to American Century Investments by third party vendors. To the best of American Century Investments’ knowledge, such information is accurate at the time of printing.
| President’s Letter |
 | Dear Investor: Thank you for reviewing this annual report for the 12 months ended July 31, 2015. It provides investment performance and portfolio information for the reporting period, plus longer-term historical performance data. Annual reports remain important vehicles for conveying information about fund returns, including market and economic factors that affected performance during the reporting period. For additional, updated investment and market insights, we encourage you to visit our website, americancentury.com. |
| Jonathan Thomas | |
Global Divergence Helped Trigger Market Volatility
“Global divergence” between the U.S. and the rest of the world emerged as a prevalent theme during the reporting period. This theme embraced not only the relatively stronger economic growth enjoyed by the U.S. compared with most of the world, but also the related contrast between the U.S. Federal Reserve’s unwinding of monetary stimulus compared with the continuation and expansion of stimulus by other major central banks. These central bank moves helped trigger big swings in market returns.
In October 2014, the U.S. Federal Reserve ended its latest bond-buying program (quantitative easing, QE). But while QE was ending in the U.S., other major central banks were starting or increasing QE as their economies faltered. This divergence helped fuel increased demand for the U.S. dollar and U.S. dollar-denominated assets, and put downward pressure on commodities prices, most notably oil. Low inflation also prevailed, after crude oil prices plunged amid muted demand for commodities in general. In this environment, the U.S. dollar, U.S. stocks, and longer-maturity U.S. Treasuries generally benefited from “flight to quality” capital flows, reinforced by geopolitical and financial turmoil, particularly in Russia/Ukraine, Greece, China, and the Middle East.
We expect more monetary policy divergence between the U.S. and other major developed economies in the coming months, accompanied by continued market volatility. This could present both challenges and opportunities for active investment managers. Upward pressures on inflation and interest rates could develop as the massive amount of global monetary stimulus in progress takes hold and economies improve. In this environment, we continue to believe in a disciplined, diversified, long-term investment approach, using professionally managed stock and bond portfolios to meet financial goals. We appreciate your continued trust in us.
Sincerely,

Jonathan Thomas
President and Chief Executive Officer
American Century Investments
2
| Performance |
| Total Returns as of July 31, 2015 | ||||||
| Average Annual Returns | ||||||
Ticker Symbol | 1 year | 5 years | 10 years | Since Inception | Inception Date | |
| One Choice Portfolio: Very Conservative | ||||||
| Investor Class | AONIX | 2.07% | 5.16% | 4.58% | 4.73% | 9/30/04 |
| R Class | AORHX | — | — | — | -1.13%(1) | 3/20/15 |
| One Choice Portfolio: Conservative | ||||||
| Investor Class | AOCIX | 4.09% | 7.87% | 5.72% | 6.02% | 9/30/04 |
| R Class | AORSX | — | — | — | -1.06%(1) | 3/20/15 |
| One Choice Portfolio: Moderate | ||||||
| Investor Class | AOMIX | 5.66% | 9.94% | 6.56% | 7.13% | 9/30/04 |
| R Class | AORMX | — | — | — | -0.92%(1) | 3/20/15 |
| One Choice Portfolio: Aggressive | ||||||
| Investor Class | AOGIX | 7.44% | 11.62% | 7.17% | 7.86% | 9/30/04 |
| R Class | AORYX | — | — | — | -0.82%(1) | 3/20/15 |
| One Choice Portfolio: Very Aggressive | ||||||
| Investor Class | AOVIX | 8.87% | 13.16% | 7.32% | 8.19% | 9/30/04 |
| R Class | AORVX | — | — | — | -0.81%(1) | 3/20/15 |
| Russell 3000 Index | — | 11.28% | 16.34% | 7.89% | 8.63% | — |
Barclays U.S. Aggregate Bond Index | — | 2.82% | 3.27% | 4.60% | 4.48% | — |
| (1) | Total returns for periods less than one year are not annualized. |
The Russell 3000 Index represents approximately 98% of the investable U.S. equity market and provides a broad measure of equity performance. The Barclays U.S. Aggregate Bond Index represents the U.S. investment-grade fixed-rate bond market and provides a broad measure of bond market performance. Performance for these indices is provided for reference only. Neither index is intended to represent the composition of the portfolio, which invests in a mix of equity and fixed-income securities. (See the Schedule of Investments for each portfolio’s asset allocations as of the date of this report.)
Data presented reflect past performance. Past performance is no guarantee of future
results. Current performance may be higher or lower than the performance shown.
Investment return and principal value will fluctuate, and redemption value may be more or
less than original cost. Data assumes reinvestment of dividends and capital gains, and
none of the charts reflect the deduction of taxes that a shareholder would pay on fund
distributions or the redemption of fund shares. To obtain performance data current to the
most recent month end, please call 1-800-345-2021 or visit americancentury.com. For
additional information about the funds, please consult the prospectus.
3
| Growth of $10,000 Over 10 Years of One Choice Portfolio: Very Conservative |
| $10,000 investment made July 31, 2005 |
| Performance for other share classes will vary due to differences in fee structure. |
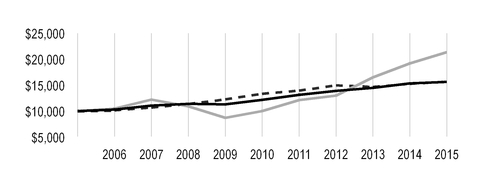
| Value on July 31, 2015 | |
| Investor Class — $15,653 | |
| Russell 3000 Index — $21,386 | |
| Barclays U.S. Aggregate Bond Index — $15,688 | |
| Growth of $10,000 Over 10 Years of One Choice Portfolio: Conservative |
| $10,000 investment made July 31, 2005 |
| Performance for other share classes will vary due to differences in fee structure. |
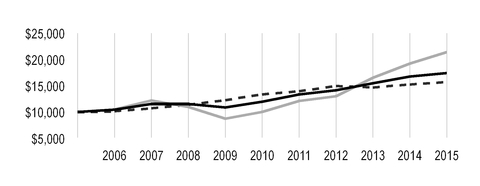
| Value on July 31, 2015 | |
| Investor Class — $17,440 | |
| Russell 3000 Index — $21,386 | |
| Barclays U.S. Aggregate Bond Index — $15,688 | |
Data presented reflect past performance. Past performance is no guarantee of future
results. Current performance may be higher or lower than the performance shown.
Investment return and principal value will fluctuate, and redemption value may be more or
less than original cost. Data assumes reinvestment of dividends and capital gains, and
none of the charts reflect the deduction of taxes that a shareholder would pay on fund
distributions or the redemption of fund shares. To obtain performance data current to the
most recent month end, please call 1-800-345-2021 or visit americancentury.com. For
additional information about the funds, please consult the prospectus.
4
| Growth of $10,000 Over 10 Years of One Choice Portfolio: Moderate |
| $10,000 investment made July 31, 2005 |
| Performance for other share classes will vary due to differences in fee structure. |
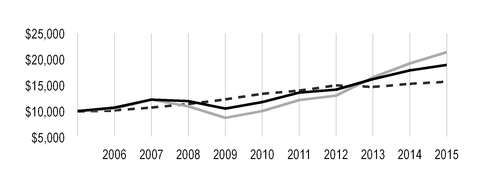
| Value on July 31, 2015 | |
| Investor Class — $18,887 | |
| Russell 3000 Index — $21,386 | |
| Barclays U.S. Aggregate Bond Index — $15,688 | |
| Growth of $10,000 Over 10 Years of One Choice Portfolio: Aggressive |
| $10,000 investment made July 31, 2005 |
| Performance for other share classes will vary due to differences in fee structure. |
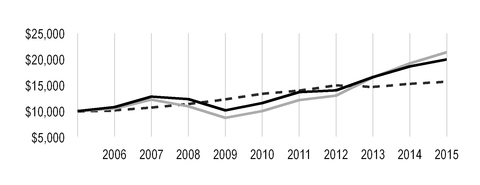
| Value on July 31, 2015 | |
| Investor Class — $19,988 | |
| Russell 3000 Index — $21,386 | |
| Barclays U.S. Aggregate Bond Index — $15,688 | |
Data presented reflect past performance. Past performance is no guarantee of future
results. Current performance may be higher or lower than the performance shown.
Investment return and principal value will fluctuate, and redemption value may be more or
less than original cost. Data assumes reinvestment of dividends and capital gains, and
none of the charts reflect the deduction of taxes that a shareholder would pay on fund
distributions or the redemption of fund shares. To obtain performance data current to the
most recent month end, please call 1-800-345-2021 or visit americancentury.com. For
additional information about the funds, please consult the prospectus.
5
| Growth of $10,000 Over 10 Years of One Choice Portfolio: Very Aggressive |
| $10,000 investment made July 31, 2005 |
| Performance for other share classes will vary due to differences in fee structure. |

| Value on July 31, 2015 | |
| Investor Class — $20,270 | |
| Russell 3000 Index — $21,386 | |
| Barclays U.S. Aggregate Bond Index — $15,688 | |
| Total Annual Fund Operating Expenses | ||
| Investor Class | R Class | |
| One Choice Portfolio: Very Conservative | 0.66% | 1.16% |
| One Choice Portfolio: Conservative | 0.75% | 1.25% |
| One Choice Portfolio: Moderate | 0.86% | 1.36% |
| One Choice Portfolio: Aggressive | 0.96% | 1.46% |
| One Choice Portfolio: Very Aggressive | 1.02% | 1.52% |
The total annual fund operating expenses shown is as stated in the fund’s prospectus current as of the date of this report. The prospectus may vary from the expense ratio shown elsewhere in this report because it is based on a different time period, includes acquired fund fees and expenses, and, if applicable, does not include fee waivers or expense reimbursements.
Data presented reflect past performance. Past performance is no guarantee of future
results. Current performance may be higher or lower than the performance shown.
Investment return and principal value will fluctuate, and redemption value may be more or
less than original cost. Data assumes reinvestment of dividends and capital gains, and
none of the charts reflect the deduction of taxes that a shareholder would pay on fund
distributions or the redemption of fund shares. To obtain performance data current to the
most recent month end, please call 1-800-345-2021 or visit americancentury.com. For
additional information about the funds, please consult the prospectus.
6
| Portfolio Commentary |
Portfolio Managers: Scott Wittman, Rich Weiss, Scott Wilson, Radu Gabudean, and David MacEwen
Performance Summary
Each of the five One Choice® Target Risk Portfolios advanced for the fiscal year ended July 31, 2015, with returns ranging from 2.07%* for One Choice Portfolio: Very Conservative to 8.87% for One Choice Portfolio: Very Aggressive (see pages 3-6 for more detailed performance information). Returns for the 12-month period were driven primarily by strong performance of U.S.-based equities, which outperformed their non-U.S. counterparts
Because of the Portfolios’ strategic exposure to a variety of asset classes, a review of the financial markets helps explain much of their performance.
Market Overview
Global equities endured substantial volatility during the fiscal year as markets contended with concerns about the pace and breadth of global growth, falling energy and commodity prices, and currency volatility as the U.S. dollar strengthened relative to most global currencies. Geopolitical instability also dominated headlines and unsettled markets, from unrest in the Middle East and conflict between Russia and Ukraine, to worries about Greece’s ability to repay its debts and the long-term sustainability of the European Union. Monetary policy divergence of global central banks was another key theme as the U.S. Federal Reserve’s (the Fed) quantitative easing (QE) program came to an end and the likelihood of impending interest rate hikes increased. Meanwhile, the European Central Bank (ECB) instituted a long-awaited QE program and central banks throughout Asia maintained aggressive stimulus policies. Overall, U.S. equities dominated returns, although outperformance was somewhat concentrated during the first half of the period. Non-U.S. equities took over leadership during the second half, but were unable to match the rally seen in U.S. stocks. Broad U.S. indices reached record levels during the period, bolstered by ongoing, if uneven, economic growth with declines in unemployment and gains in employment growth, improving consumer confidence, a strong housing market, and a pick-up in nonresidential construction. Outside of the U.S., while the ECB’s stimulative monetary policies bolstered markets and the European economy showed true signs of recovery, worries persisted about slowing growth and financial market instability in China and deflationary pressures in Japan. Growth equities led value stocks across all market capitalizations both in the U.S. and globally. Non-U.S. developed markets ended the period flat, while emerging markets declined, pressured by stressed commodity prices and currency weakness.
Fixed-income returns around the globe varied during the 12-month period as bond yields fluctuated in response to global economic and monetary policy divergence. After declines in the first part of the fiscal year, U.S. bonds generally rallied on subdued inflation and heightened demand. Commodity and oil price weakness and persistently low inflation led longer-duration bonds to outperform those with shorter durations, with long-term U.S. Treasury securities producing especially strong gains. These forces also led inflation-protected securities to decline and finish the period as some of the worst performers. High-yield bonds struggled during the first half of the fiscal year, but regained leadership later in the period, benefiting from investors’ heightened risk appetite. Non-U.S. bonds generally fell, impacted in large part by currency volatility and regional political and economic instability.
| * | All fund returns referenced in this commentary are for Investor Class shares. Performance for other share classes will vary due to differences in fee structure; when Investor Class performance exceeds that of the fund's benchmark, other share classes may not. See page 3 for returns for all share classes. |
7
Portfolio Performance
Each One Choice Target Risk Portfolio is a “fund of funds” that invests in other American Century Investments mutual funds to achieve its investment objective and target asset allocation. (See page 10 for the specific underlying fund allocations for each Portfolio.)
The Portfolios’ U.S. equity funds generated positive performance for the 12-month period, with Heritage Fund (mid-cap growth) producing the largest absolute gains and outperforming its underlying fund benchmark. Growth Fund and Real Estate Fund also advanced substantially, contributing to overall results. Although International Growth Fund (not held by Very Conservative Portfolio) advanced more modestly than many U.S.-based funds, strong security selection in the fund produced considerable outperformance relative to its underlying fund benchmark and contributed to results across the Portfolios that held it. Similarly, despite declining on an absolute basis, Emerging Markets Fund (not held by Very Conservative and Conservative Portfolios) strongly outperformed its underlying benchmark. Other funds that notably outperformed their underlying benchmarks included Mid Cap Value Fund and Large Company Value Fund. Stock selection in the disciplined equity funds was less successful, with Equity Growth Fund, NT International Value Fund (not held by Very Conservative Portfolio), and Core Equity Plus Fund underperforming their underlying benchmarks and weighing on results. Growth Fund was also unable to match the return of its benchmark due to stock selection.
Performance of the Portfolios’ fixed-income segments varied, with Diversified Bond Fund producing the strongest absolute returns. In contrast, International Bond Fund (not held by Aggressive or Very Aggressive Portfolios), which is un-hedged, declined during the year as the U.S. dollar appreciated relative to most global currencies. Funds designed to protect against inflation, such as Short Duration Inflation Protection Bond Fund (held only by Very Conservative Portfolio) and Inflation-Adjusted Bond Fund (not held by Very Aggressive Portfolio), declined. However, performance relative to underlying fund benchmarks was positive in Short Duration Inflation Protection Bond Fund, Short Duration Fund, and International Bond Fund. Inflation-Adjusted Bond Fund, High-Yield Fund, and Diversified Bond Fund underperformed their underlying fund benchmarks.
Portfolio Strategy
Each Portfolio has a “neutral” asset mix (the target allocations for stocks, bonds, and cash- equivalent investments) that remains fixed over time. In March 2015, we made enhancements to the Portfolios’ neutral asset mixes by adding NT Disciplined Growth Fund, Global Bond Fund and, except for Very Conservative Portfolio, NT International Value Fund, NT International Small-Mid Cap Fund, and NT Global Real Estate Fund (replacing U.S. Real Estate Fund in all Portfolios aside from Very Conservative). With the exception of Very Aggressive Portfolio, there were no changes in the overall target equity, fixed-income, and cash allocations, which set each Portfolio’s broad risk/return profile. In Very Aggressive Portfolio, equity exposure moved from a strategic allocation of 96% to the top of its allowed operating range at 100% equity. These enhancements were designed to align Portfolios with future growth opportunities outside of the U.S., broaden the fixed-income allocation to hedge interest rate and currency risks, and help manage volatility while optimizing return potential.
Our management approach involves making modest tactical adjustments to each Portfolio’s actual asset mix to add value and improve the Portfolios’ ability to meet their investment objectives. During the second half of the period we increased our overweight exposure to equities, with a corresponding decrease to Diversified Bond Fund (not held by Very Aggressive Portfolio) within the fixed-income segment weighting, while remaining underweight to cash. On balance, this positioning was beneficial as equities outperformed bonds. In equities, we maintained, though reduced, a slight overweight position in Growth Fund and Heritage Fund and removed the underweight position in Large Company Value Fund. Overall, the overweight to growth stocks benefited the Portfolios’ results given the strong outperformance of growth stocks relative to value. A tactical increase in non-U.S. equity funds (in all Portfolios except Very Conservative) instituted in May pressured returns as non-U.S. stocks trailed U.S. equities during that time period. An overweight
8
position in High-Yield Fund (held only by Moderate and Aggressive Portfolios) and underweight in Diversified Bond Fund hurt results, particularly during the first half of the reporting period. In Very Conservative Portfolio, a long-term tactical allocation out of cash and into Short Duration Inflation Protection Bond Fund detracted from results.
In the last month of the reporting period we enacted several additional tactical allocation shifts. We further reduced exposure to U.S.-based growth equities and slightly increased our allocation to U.S.-based value equities to end the period with marginal overweights to both. In Very Aggressive Portfolio, we moved to an underweight position in U.S. equities overall, by initiating an underweight in Growth Fund and retaining the underweight in Large Company Value Fund. We remained overweight to International Growth Fund and NT International Value Fund, which accounted for the non-U.S. equity overweight in that Portfolio. In Very Conservative Portfolio, we retained somewhat larger overweight positions in both Growth Fund and Large Company Value Fund, relative to other Portfolios, and decreased the magnitude of the underweight position in Diversified Bond Fund.
A Look Ahead
We believe that although global economic activity appears to have diminished in breadth, it remains on track for slow yet steady growth. Divergence in global monetary policy is likely to remain a top story in the near future. We see an increasing likelihood that the Fed will raise short-term interest rates before 2015 is out, reflecting the evident improvement in employment, wages, consumer confidence, and financial markets in recent years. The European economy seems to have turned a corner and has begun producing sustainable growth, as evidenced by its fourth-consecutive quarter of expansion. The ECB’s quantitative easing program is likely to support further economic growth, bolster financials markets, and boost investor confidence by increasing the money supply, improving access to credit, and weakening the euro. Meanwhile, the Japanese government’s stimulative policies have weakened the yen, benefiting manufacturers and exporters, including automakers, machinery firms, and technology companies. However, deflationary pressures continue to hamper the consumer-oriented and domestically focused sectors of the economy. In our opinion, a leading risk to global recovery is decelerating growth in China, which accounts for more than 16% of global gross domestic product. Although the government continues to implement aggressive steps to stimulate the economy and support financials markets, the country’s struggles with overinvestment and a build-up in inventories, softening corporate earnings, and falling consumer confidence are unlikely to be resolved in short order. Therefore, we think the combined forces of sluggish and uneven growth, stressed commodities prices, the strong dollar and a looming interest rate increase in the U.S. are likely to continue to lead to heightened levels of market volatility.
Given this backdrop, we continue to favor equities over bonds and cash-equivalent investments. While we maintain an overweight to equities, we have reduced its magnitude slightly as we think bond yields are becoming increasingly attractive at the margin. Within equities, after a long-running overweight to growth stocks during a period when growth strongly outperformed value, we are moving to a more neutral stance. Likewise, we remain neutral in terms of market capitalization and are marginally biased to U.S. equities as compared to non-U.S. in all Portfolios aside from Very Aggressive.
Our fixed-income positioning reflects our expectation that economic conditions in the U.S. will meet the necessary targets for the Fed to raise interest rates. We therefore remain underweight to U.S. Treasuries and government agencies in favor of higher-yielding corporate- and mortgage-backed securities. We believe that high-yield corporate bonds remain attractive, and remain overweight to that segment (for those Portfolios whose mandates allow exposure to these instruments).
9
| Portfolio Characteristics |
Underlying Fund Allocations(1) as a % of net assets as of July 31, 2015 | |||||
One Choice Portfolio: Very Conservative | One Choice Portfolio: Conservative | One Choice Portfolio: Moderate | One Choice Portfolio: Aggressive | One Choice Portfolio: Very Aggressive | |
| Equity | |||||
| Core Equity Plus Fund | 1.0% | 2.0% | 4.0% | 4.6% | 4.8% |
| Equity Growth Fund | 3.5% | 6.6% | 10.6% | 9.6% | 11.8% |
| Growth Fund | 3.4% | 5.7% | 8.0% | 11.6% | 13.2% |
| Heritage Fund | 2.2% | 4.2% | 6.0% | 8.3% | 9.1% |
| Large Company Value Fund | 7.7% | 7.1% | 8.6% | 9.6% | 10.5% |
| Mid Cap Value Fund | 5.5% | 6.1% | 5.7% | 5.8% | 7.9% |
| NT Disciplined Growth Fund | 1.0% | 1.5% | 2.0% | 3.1% | 4.1% |
| Real Estate Fund | 2.0% | — | — | — | — |
| Small Company Fund | 1.0% | 1.5% | 1.9% | 2.3% | 6.4% |
| Emerging Markets Fund | — | — | 3.8% | 6.1% | 7.1% |
| International Growth Fund | — | 6.1% | 7.0% | 9.0% | 10.6% |
| NT Global Real Estate Fund | — | 2.0% | 1.9% | 3.0% | 3.0% |
| NT International Small-Mid Cap Fund | — | 1.0% | 1.6% | 2.1% | 3.0% |
| NT International Value Fund | — | 3.9% | 5.5% | 6.3% | 8.5% |
| Total Equity | 27.3% | 47.7% | 66.6% | 81.4% | 100.0% |
| Fixed Income | |||||
| Diversified Bond Fund | 25.0% | 23.1% | 12.8% | 5.3% | — |
| High-Yield Fund | — | — | 4.0% | 6.0% | — |
| Inflation-Adjusted Bond Fund | 10.0% | 9.0% | 5.9% | 4.0% | — |
| Short Duration Fund | 7.0% | — | — | — | — |
| Short Duration Inflation Protection Bond Fund | 7.9% | — | — | — | — |
| Global Bond Fund | 7.9% | 7.0% | 4.9% | 3.0% | — |
| International Bond Fund | 8.0% | 6.5% | 2.0% | — | — |
| Total Fixed Income | 65.8% | 45.6% | 29.6% | 18.3% | — |
| Prime Money Market Fund | 6.9% | 6.7% | 3.8% | 0.3% | — |
| Other Assets and Liabilities | —(2) | —(2) | —(2) | —(2) | —(2) |
| (1) | Underlying fund investments represent Investor Class. |
| (2) | Category is less than 0.05% of total net assets. |
10
| Shareholder Fee Examples |
Fund shareholders may incur two types of costs: (1) transaction costs, including sales charges (loads) on purchase payments and redemption/exchange fees; and (2) ongoing costs, including management fees; distribution and service (12b-1) fees; and other fund expenses. This example is intended to help you understand your ongoing costs (in dollars) of investing in your fund and to compare these costs with the ongoing cost of investing in other mutual funds. As a shareholder in the underlying American Century Investments funds, your fund will indirectly bear its pro rata share of the expenses incurred by the underlying funds. These expenses are not included in the fund’s annualized expense ratio or the expenses paid during the period. These expenses are, however, included in the effective expenses paid during the period.
The example is based on an investment of $1,000 made at the beginning of the period and held for the entire period from February 1, 2015 to July 31, 2015 (except as noted).
Actual Expenses
The table provides information about actual account values and actual expenses for each class. You may use the information, together with the amount you invested, to estimate the expenses that you paid over the period. First, identify the share class you own. Then simply divide your account value by $1,000 (for example, an $8,600 account value divided by $1,000 = 8.6), then multiply the result by the number under the heading “Expenses Paid During Period” to estimate the expenses you paid on your account during this period.
If you hold Investor Class shares of any American Century Investments fund, or Institutional Class shares of the American Century Diversified Bond Fund, in an American Century Investments account (i.e., not a financial intermediary or retirement plan account), American Century Investments may charge you a $12.50 semiannual account maintenance fee if the value of those shares is less than $10,000. We will redeem shares automatically in one of your accounts to pay the $12.50 fee. In determining your total eligible investment amount, we will include your investments in all personal accounts (including American Century Investments Brokerage accounts) registered under your Social Security number. Personal accounts include individual accounts, joint accounts, UGMA/UTMA accounts, personal trusts, Coverdell Education Savings Accounts and IRAs (including traditional, Roth, Rollover, SEP-, SARSEP- and SIMPLE-IRAs), and certain other retirement accounts. If you have only business, business retirement, employer-sponsored or American Century Investments Brokerage accounts, you are currently not subject to this fee. If you are subject to the Account Maintenance Fee, your account value could be reduced by the fee amount.
Hypothetical Example for Comparison Purposes
The table also provides information about hypothetical account values and hypothetical expenses based on the actual expense ratio of each class of your fund and an assumed rate of return of 5% per year before expenses, which is not the actual return of a fund’s share class. The hypothetical account values and expenses may not be used to estimate the actual ending account balance or expenses you paid for the period. You may use this information to compare the ongoing costs of investing in your fund and other funds. To do so, compare this 5% hypothetical example with the 5% hypothetical examples that appear in the shareholder reports of the other funds.
Please note that the expenses shown in the table are meant to highlight your ongoing costs only and do not reflect any transactional costs, such as sales charges (loads) or redemption/exchange fees. Therefore, the table is useful in comparing ongoing costs only, and will not help you determine the relative total costs of owning different funds. In addition, if these transactional costs were included, your costs would have been higher.
11
| Beginning Account Value 2/1/15 | Ending Account Value 7/31/15 | Expenses Paid During Period(1) 2/1/15 - 7/31/15 | Annualized Expense Ratio(1) | Effective Expenses Paid During Period(2) 2/1/15 - 7/31/15 | Effective Annualized Expense Ratio(2) | |
| One Choice Portfolio: Very Conservative | ||||||
| Actual | ||||||
| Investor Class | $1,000 | $1,000.60 | $0.00 | 0.00%(3) | $3.42 | 0.69% |
| R Class | $1,000 | $988.70(4) | $1.83(5) | 0.50% | $4.34(5) | 1.19% |
| Hypothetical | ||||||
| Investor Class | $1,000 | $1,024.80 | $0.00 | 0.00%(3) | $3.46 | 0.69% |
| R Class | $1,000 | $1,022.32(6) | $2.51(6) | 0.50% | $5.96(6) | 1.19% |
| One Choice Portfolio: Conservative | ||||||
| Actual | ||||||
| Investor Class | $1,000 | $1,015.90 | $0.00 | 0.00%(3) | $3.90 | 0.78% |
| R Class | $1,000 | $989.40(4) | $1.83(5) | 0.50% | $4.67(5) | 1.28% |
| Hypothetical | ||||||
| Investor Class | $1,000 | $1,024.80 | $0.00 | 0.00%(3) | $3.91 | 0.78% |
| R Class | $1,000 | $1,022.32(6) | $2.51(6) | 0.50% | $6.41(6) | 1.28% |
| One Choice Portfolio: Moderate | ||||||
| Actual | ||||||
| Investor Class | $1,000 | $1,030.90 | $0.00 | 0.00%(3) | $4.48 | 0.89% |
| R Class | $1,000 | $990.80(4) | $1.83(5) | 0.50% | $5.08(5) | 1.39% |
| Hypothetical | ||||||
| Investor Class | $1,000 | $1,024.80 | $0.00 | 0.00%(3) | $4.46 | 0.89% |
| R Class | $1,000 | $1,022.32(6) | $2.51(6) | 0.50% | $6.95(6) | 1.39% |
| (1) | Expenses are equal to the class's annualized expense ratio listed in the table above, multiplied by the average account value over the period, multiplied by 181, the number of days in the most recent fiscal half-year, divided by 365, to reflect the one-half year period. The fees and expenses of the underlying American Century Investments funds in which the fund invests are not included in the class's annualized expense ratio. |
| (2) | Effective expenses reflect the sum of expenses borne directly by the class plus the fund's pro rata share of the weighted average expense ratio of the underlying funds in which it invests. The effective annualized expense ratio combines the class's annualized expense ratio and the annualized weighted average expense ratio of the underlying funds. The annualized weighted average expense ratio of the underlying funds for the one-half year period reflects the actual expense ratio of each underlying fund from its most recent shareholder report, annualized and weighted for the fund's relative average investment therein during the period. |
| (3) | Other expenses, which include directors' fees and expenses, did not exceed 0.005%. |
| (4) | Ending account value based on actual return from March 20, 2015 (commencement of sale) through July 31, 2015. |
| (5) | Expenses are equal to the class's annualized expense ratio listed in the table above, multiplied by the average account value over the period, multiplied by 134, the number of days in the period from March 20, 2015 (commencement of sale) through July 31, 2015, divided by 365, to reflect the period. Had the class been available for the full period, the expenses paid during the period would have been higher. |
| (6) | Ending account value and expenses paid during the period assumes the class had been available throughout the entire period and are calculated using the class's annualized expense ratio listed in the table above. |
12
| Beginning Account Value 2/1/15 | Ending Account Value 7/31/15 | Expenses Paid During Period(1) 2/1/15 - 7/31/15 | Annualized Expense Ratio(1) | Effective Expenses Paid During Period(2) 2/1/15 - 7/31/15 | Effective Annualized Expense Ratio(2) | |
| One Choice Portfolio: Aggressive | ||||||
| Actual | ||||||
| Investor Class | $1,000 | $1,044.50 | $0.00 | 0.00%(3) | $5.02 | 0.99% |
| R Class | $1,000 | $991.80(4) | $1.83(5) | 0.50% | $5.45(5) | 1.49% |
| Hypothetical | ||||||
| Investor Class | $1,000 | $1,024.80 | $0.00 | 0.00%(3) | $4.96 | 0.99% |
| R Class | $1,000 | $1,022.32(6) | $2.51(6) | 0.50% | $7.45(6) | 1.49% |
| One Choice Portfolio: Very Aggressive | ||||||
| Actual | ||||||
| Investor Class | $1,000 | $1,057.20 | $0.00 | 0.00%(3) | $5.36 | 1.05% |
| R Class | $1,000 | $991.90(4) | $1.83(5) | 0.50% | $5.67(5) | 1.55% |
| Hypothetical | ||||||
| Investor Class | $1,000 | $1,024.80 | $0.00 | 0.00%(3) | $5.26 | 1.05% |
| R Class | $1,000 | $1,022.32(6) | $2.51(6) | 0.50% | $7.75(6) | 1.55% |
| (1) | Expenses are equal to the class's annualized expense ratio listed in the table above, multiplied by the average account value over the period, multiplied by 181, the number of days in the most recent fiscal half-year, divided by 365, to reflect the one-half year period. The fees and expenses of the underlying American Century Investments funds in which the fund invests are not included in the class's annualized expense ratio. |
| (2) | Effective expenses reflect the sum of expenses borne directly by the class plus the fund's pro rata share of the weighted average expense ratio of the underlying funds in which it invests. The effective annualized expense ratio combines the class's annualized expense ratio and the annualized weighted average expense ratio of the underlying funds. The annualized weighted average expense ratio of the underlying funds for the one-half year period reflects the actual expense ratio of each underlying fund from its most recent shareholder report, annualized and weighted for the fund's relative average investment therein during the period. |
| (3) | Other expenses, which include directors' fees and expenses, did not exceed 0.005%. |
| (4) | Ending account value based on actual return from March 20, 2015 (commencement of sale) through July 31, 2015. |
| (5) | Expenses are equal to the class's annualized expense ratio listed in the table above, multiplied by the average account value over the period, multiplied by 134, the number of days in the period from March 20, 2015 (commencement of sale) through July 31, 2015, divided by 365, to reflect the period. Had the class been available for the full period, the expenses paid during the period would have been higher. |
| (6) | Ending account value and expenses paid during the period assumes the class had been available throughout the entire period and are calculated using the class's annualized expense ratio listed in the table above. |
13
| Schedules of Investments |
JULY 31, 2015
One Choice Portfolio: Very Conservative
| Shares | Value | |||
MUTUAL FUNDS(1) — 100.0% | ||||
| Domestic Fixed Income Funds — 49.9% | ||||
| Diversified Bond Fund Investor Class | 8,826,843 | $ | 95,506,436 | |
| Inflation-Adjusted Bond Fund Investor Class | 3,276,482 | 38,072,716 | ||
| Short Duration Fund Investor Class | 2,575,005 | 26,522,548 | ||
| Short Duration Inflation Protection Bond Fund Investor Class | 3,015,923 | 30,340,189 | ||
| 190,441,889 | ||||
| Domestic Equity Funds — 27.3% | ||||
| Core Equity Plus Fund Investor Class | 266,847 | 3,775,892 | ||
| Equity Growth Fund Investor Class | 432,016 | 13,362,266 | ||
| Growth Fund Investor Class | 422,813 | 12,963,439 | ||
| Heritage Fund Investor Class | 324,210 | 8,325,709 | ||
| Large Company Value Fund Investor Class | 3,244,569 | 29,622,911 | ||
| Mid Cap Value Fund Investor Class | 1,272,204 | 21,054,978 | ||
NT Disciplined Growth Fund Investor Class(2) | 374,781 | 3,770,299 | ||
| Real Estate Fund Investor Class | 256,142 | 7,522,879 | ||
| Small Company Fund Investor Class | 277,483 | 3,757,119 | ||
| 104,155,492 | ||||
| International Fixed Income Funds — 15.9% | ||||
| Global Bond Fund Investor Class | 3,094,321 | 30,386,234 | ||
| International Bond Fund Investor Class | 2,474,260 | 30,433,400 | ||
| 60,819,634 | ||||
| Money Market Funds — 6.9% | ||||
| Prime Money Market Fund Investor Class | 26,496,802 | 26,496,802 | ||
TOTAL INVESTMENT SECURITIES — 100.0% (Cost $348,721,105) | 381,913,817 | |||
OTHER ASSETS AND LIABILITIES† | (185) | |||
| TOTAL NET ASSETS — 100.0% | $ | 381,913,632 | ||
| NOTES TO SCHEDULE OF INVESTMENTS |
| † | Category is less than 0.05% of total net assets. |
| (1) | Investments are funds within the American Century Investments family of funds and are considered affiliated funds. |
| (2) | Non-income producing. |
See Notes to Financial Statements.
14
JULY 31, 2015
One Choice Portfolio: Conservative
| Shares | Value | |||
MUTUAL FUNDS(1) — 100.0% | ||||
| Domestic Equity Funds — 34.7% | ||||
| Core Equity Plus Fund Investor Class | 1,458,630 | $ | 20,639,612 | |
| Equity Growth Fund Investor Class | 2,170,836 | 67,143,972 | ||
| Growth Fund Investor Class | 1,913,530 | 58,668,843 | ||
| Heritage Fund Investor Class | 1,687,099 | 43,324,692 | ||
| Large Company Value Fund Investor Class | 7,951,117 | 72,593,695 | ||
| Mid Cap Value Fund Investor Class | 3,777,507 | 62,517,733 | ||
NT Disciplined Growth Fund Investor Class(2) | 1,558,264 | 15,676,134 | ||
| Small Company Fund Investor Class | 1,117,535 | 15,131,424 | ||
| 355,696,105 | ||||
| Domestic Fixed Income Funds — 32.1% | ||||
| Diversified Bond Fund Investor Class | 21,957,599 | 237,581,216 | ||
| Inflation-Adjusted Bond Fund Investor Class | 7,923,664 | 92,072,978 | ||
| 329,654,194 | ||||
| International Fixed Income Funds — 13.5% | ||||
| Global Bond Fund Investor Class | 7,350,780 | 72,184,655 | ||
| International Bond Fund Investor Class | 5,369,452 | 66,044,263 | ||
| 138,228,918 | ||||
| International Equity Funds — 13.0% | ||||
| International Growth Fund Investor Class | 4,791,757 | 62,244,919 | ||
NT Global Real Estate Fund Investor Class(2) | 2,119,095 | 20,343,314 | ||
NT International Small-Mid Cap Fund Investor Class(2) | 991,682 | 10,491,999 | ||
NT International Value Fund Investor Class(2) | 4,077,467 | 40,611,572 | ||
| 133,691,804 | ||||
| Money Market Funds — 6.7% | ||||
| Prime Money Market Fund Investor Class | 68,845,655 | 68,845,655 | ||
TOTAL INVESTMENT SECURITIES — 100.0% (Cost $910,964,582) | 1,026,116,676 | |||
OTHER ASSETS AND LIABILITIES† | (202) | |||
| TOTAL NET ASSETS — 100.0% | $ | 1,026,116,474 | ||
| NOTES TO SCHEDULE OF INVESTMENTS |
| † | Category is less than 0.05% of total net assets. |
| (1) | Investments are funds within the American Century Investments family of funds and are considered affiliated funds. |
| (2) | Non-income producing. |
See Notes to Financial Statements.
15
JULY 31, 2015
One Choice Portfolio: Moderate
| Shares | Value | |||
MUTUAL FUNDS(1) — 100.0% | ||||
| Domestic Equity Funds — 46.8% | ||||
| Core Equity Plus Fund Investor Class | 4,609,243 | $ | 65,220,788 | |
| Equity Growth Fund Investor Class | 5,601,358 | 173,250,010 | ||
| Growth Fund Investor Class | 4,245,708 | 130,173,417 | ||
| Heritage Fund Investor Class | 3,798,721 | 97,551,161 | ||
| Large Company Value Fund Investor Class | 15,389,104 | 140,502,518 | ||
| Mid Cap Value Fund Investor Class | 5,563,633 | 92,078,132 | ||
NT Disciplined Growth Fund Investor Class(2) | 3,254,726 | 32,742,545 | ||
| Small Company Fund Investor Class | 2,343,469 | 31,730,571 | ||
| 763,249,142 | ||||
| Domestic Fixed Income Funds — 22.7% | ||||
| Diversified Bond Fund Investor Class | 19,335,508 | 209,210,200 | ||
| High-Yield Fund Investor Class | 11,290,761 | 65,034,786 | ||
| Inflation-Adjusted Bond Fund Investor Class | 8,355,162 | 97,086,977 | ||
| 371,331,963 | ||||
| International Equity Funds — 19.8% | ||||
| Emerging Markets Fund Investor Class | 7,152,953 | 62,230,687 | ||
| International Growth Fund Investor Class | 8,798,821 | 114,296,683 | ||
NT Global Real Estate Fund Investor Class(2) | 3,273,208 | 31,422,793 | ||
NT International Small-Mid Cap Fund Investor Class(2) | 2,441,045 | 25,826,252 | ||
NT International Value Fund Investor Class(2) | 8,912,153 | 88,765,041 | ||
| 322,541,456 | ||||
| International Fixed Income Funds — 6.9% | ||||
| Global Bond Fund Investor Class | 8,217,930 | 80,700,068 | ||
| International Bond Fund Investor Class | 2,584,403 | 31,788,152 | ||
| 112,488,220 | ||||
| Money Market Funds — 3.8% | ||||
| Prime Money Market Fund Investor Class | 62,203,336 | 62,203,336 | ||
TOTAL INVESTMENT SECURITIES — 100.0% (Cost $1,373,844,550) | 1,631,814,117 | |||
OTHER ASSETS AND LIABILITIES† | (745) | |||
| TOTAL NET ASSETS — 100.0% | $ | 1,631,813,372 | ||
| NOTES TO SCHEDULE OF INVESTMENTS |
| † | Category is less than 0.05% of total net assets. |
| (1) | Investments are funds within the American Century Investments family of funds and are considered affiliated funds. |
| (2) | Non-income producing. |
See Notes to Financial Statements.
16
JULY 31, 2015
One Choice Portfolio: Aggressive
| Shares | Value | |||
MUTUAL FUNDS(1) — 100.0% | ||||
| Domestic Equity Funds — 54.9% | ||||
| Core Equity Plus Fund Investor Class | 3,586,812 | $ | 50,753,394 | |
| Equity Growth Fund Investor Class | 3,407,007 | 105,378,735 | ||
| Growth Fund Investor Class | 4,151,872 | 127,296,401 | ||
| Heritage Fund Investor Class | 3,569,693 | 91,669,705 | ||
| Large Company Value Fund Investor Class | 11,556,413 | 105,510,055 | ||
| Mid Cap Value Fund Investor Class | 3,834,737 | 63,464,904 | ||
NT Disciplined Growth Fund Investor Class(2) | 3,394,728 | 34,150,967 | ||
| Small Company Fund Investor Class | 1,833,021 | 24,819,101 | ||
| 603,043,262 | ||||
| International Equity Funds — 26.5% | ||||
| Emerging Markets Fund Investor Class | 7,756,538 | 67,481,883 | ||
| International Growth Fund Investor Class | 7,632,883 | 99,151,152 | ||
NT Global Real Estate Fund Investor Class(2) | 3,394,728 | 32,589,392 | ||
NT International Small-Mid Cap Fund Investor Class(2) | 2,161,977 | 22,873,713 | ||
NT International Value Fund Investor Class(2) | 6,990,140 | 69,621,791 | ||
| 291,717,931 | ||||
| Domestic Fixed Income Funds — 15.3% | ||||
| Diversified Bond Fund Investor Class | 5,335,167 | 57,726,506 | ||
| High-Yield Fund Investor Class | 11,459,985 | 66,009,514 | ||
| Inflation-Adjusted Bond Fund Investor Class | 3,816,966 | 44,353,140 | ||
| 168,089,160 | ||||
| International Fixed Income Funds — 3.0% | ||||
| Global Bond Fund Investor Class | 3,401,531 | 33,403,038 | ||
| Money Market Funds — 0.3% | ||||
| Prime Money Market Fund Investor Class | 2,829,059 | 2,829,059 | ||
TOTAL INVESTMENT SECURITIES — 100.0% (Cost $897,046,014) | 1,099,082,450 | |||
OTHER ASSETS AND LIABILITIES† | (624) | |||
| TOTAL NET ASSETS — 100.0% | $ | 1,099,081,826 | ||
| NOTES TO SCHEDULE OF INVESTMENTS |
| † | Category is less than 0.05% of total net assets. |
| (1) | Investments are funds within the American Century Investments family of funds and are considered affiliated funds. |
| (2) | Non-income producing. |
See Notes to Financial Statements.
17
JULY 31, 2015
One Choice Portfolio: Very Aggressive
| Shares | Value | |||
MUTUAL FUNDS(1) — 100.0% | ||||
| Domestic Equity Funds — 67.8% | ||||
| Core Equity Plus Fund Investor Class | 909,894 | $ | 12,875,007 | |
| Equity Growth Fund Investor Class | 1,022,159 | 31,615,392 | ||
| Growth Fund Investor Class | 1,161,659 | 35,616,478 | ||
| Heritage Fund Investor Class | 947,521 | 24,332,337 | ||
| Large Company Value Fund Investor Class | 3,095,485 | 28,261,774 | ||
| Mid Cap Value Fund Investor Class | 1,288,767 | 21,329,092 | ||
NT Disciplined Growth Fund Investor Class(2) | 1,088,142 | 10,946,709 | ||
| Small Company Fund Investor Class | 1,274,352 | 17,254,727 | ||
| 182,231,516 | ||||
| International Equity Funds — 32.2% | ||||
| Emerging Markets Fund Investor Class | 2,192,522 | 19,074,942 | ||
| International Growth Fund Investor Class | 2,197,340 | 28,543,448 | ||
NT Global Real Estate Fund Investor Class(2) | 848,043 | 8,141,211 | ||
NT International Small-Mid Cap Fund Investor Class(2) | 765,515 | 8,099,144 | ||
NT International Value Fund Investor Class(2) | 2,280,306 | 22,711,848 | ||
| 86,570,593 | ||||
TOTAL INVESTMENT SECURITIES — 100.0% (Cost $198,246,359) | 268,802,109 | |||
OTHER ASSETS AND LIABILITIES† | 1 | |||
| TOTAL NET ASSETS — 100.0% | $ | 268,802,110 | ||
| NOTES TO SCHEDULE OF INVESTMENTS |
| † | Category is less than 0.05% of total net assets. |
| (1) | Investments are funds within the American Century Investments family of funds and are considered affiliated funds. |
| (2) | Non-income producing. |
See Notes to Financial Statements.
18
| Statements of Assets and Liabilities |
| JULY 31, 2015 | |||||||||
| One Choice Portfolio: Very Conservative | One Choice Portfolio: Conservative | One Choice Portfolio: Moderate | |||||||
| Assets | |||||||||
| Investment securities in affiliates, at value (cost of $348,721,105, $910,964,582 and $1,373,844,550, respectively) | $ | 381,913,817 | $ | 1,026,116,676 | $ | 1,631,814,117 | |||
| Cash | 10 | 7,510 | 11 | ||||||
| Receivable for investments sold | — | — | 377,993 | ||||||
| Receivable for capital shares sold | 570,328 | 791,295 | 713,716 | ||||||
| Distributions receivable from affiliates | 213,047 | 452,980 | 704,999 | ||||||
| 382,697,202 | 1,027,368,461 | 1,633,610,836 | |||||||
| Liabilities | |||||||||
| Payable for investments purchased | 399,821 | 593,698 | 705,745 | ||||||
| Payable for capital shares redeemed | 383,738 | 658,279 | 1,091,708 | ||||||
| Distribution and service fees payable | 11 | 10 | 11 | ||||||
| 783,570 | 1,251,987 | 1,797,464 | |||||||
| Net Assets | $ | 381,913,632 | $ | 1,026,116,474 | $ | 1,631,813,372 | |||
| Net Assets Consist of: | |||||||||
| Capital (par value and paid-in surplus) | $ | 349,454,782 | $ | 878,667,243 | $ | 1,321,620,735 | |||
| Undistributed net investment income | — | 329,484 | 494,271 | ||||||
| Accumulated undistributed net realized gain (loss) | (733,862 | ) | 31,967,653 | 51,728,799 | |||||
| Net unrealized appreciation | 33,192,712 | 115,152,094 | 257,969,567 | ||||||
| $ | 381,913,632 | $ | 1,026,116,474 | $ | 1,631,813,372 | ||||
| Fund/Class | Net Assets | Shares Outstanding | Net Asset Value Per Share | ||
| One Choice Portfolio: Very Conservative | |||||
| Investor Class, $0.01 Par Value | $381,888,911 | 32,311,316 | $11.82 | ||
| R Class, $0.01 Par Value | $24,721 | 2,091 | $11.82 | ||
| One Choice Portfolio: Conservative | |||||
| Investor Class, $0.01 Par Value | $1,026,091,138 | 75,140,557 | $13.66 | ||
| R Class, $0.01 Par Value | $25,336 | 1,856 | $13.65 | ||
| One Choice Portfolio: Moderate | |||||
| Investor Class, $0.01 Par Value | $1,631,785,022 | 105,407,706 | $15.48 | ||
| R Class, $0.01 Par Value | $28,350 | 1,832 | $15.47 | ||
See Notes to Financial Statements.
19
| JULY 31, 2015 | ||||||
| One Choice Portfolio: Aggressive | One Choice Portfolio: Very Aggressive | |||||
| Assets | ||||||
| Investment securities in affiliates, at value (cost of $897,046,014 and $198,246,359, respectively) | $ | 1,099,082,450 | $ | 268,802,109 | ||
| Cash | 10 | 11 | ||||
| Receivable for capital shares sold | 549,774 | 69,327 | ||||
| Distributions receivable from affiliates | 420,831 | — | ||||
| 1,100,053,065 | 268,871,447 | |||||
| Liabilities | ||||||
| Payable for investments purchased | 590,595 | 42,300 | ||||
| Payable for capital shares redeemed | 380,633 | 27,026 | ||||
| Distribution and service fees payable | 11 | 11 | ||||
| 971,239 | 69,337 | |||||
| Net Assets | $ | 1,099,081,826 | $ | 268,802,110 | ||
| Net Assets Consist of: | ||||||
| Capital (par value and paid-in surplus) | $ | 820,444,917 | $ | 179,917,429 | ||
| Undistributed net investment income | 4,255,122 | 2,117,122 | ||||
| Undistributed net realized gain | 72,345,351 | 16,211,809 | ||||
| Net unrealized appreciation | 202,036,436 | 70,555,750 | ||||
| $ | 1,099,081,826 | $ | 268,802,110 | |||
| Fund/Class | Net Assets | Shares Outstanding | Net Asset Value Per Share | ||
| One Choice Portfolio: Aggressive | |||||
| Investor Class, $0.01 Par Value | $1,099,056,516 | 65,022,493 | $16.90 | ||
| R Class, $0.01 Par Value | $25,310 | 1,500 | $16.87 | ||
| One Choice Portfolio: Very Aggressive | |||||
| Investor Class, $0.01 Par Value | $268,771,799 | 14,552,645 | $18.47 | ||
| R Class, $0.01 Par Value | $30,311 | 1,644 | $18.44 | ||
See Notes to Financial Statements.
20
| Statements of Operations |
| YEAR ENDED JULY 31, 2015 | |||||||||
| One Choice Portfolio: Very Conservative | One Choice Portfolio: Conservative | One Choice Portfolio: Moderate | |||||||
| Investment Income (Loss) | |||||||||
| Income from Affiliates: | |||||||||
| Income distributions from underlying funds | $ | 6,432,487 | $ | 17,777,398 | $ | 29,831,750 | |||
| Expenses: | |||||||||
| Distribution and service fees - R Class | 45 | 44 | 46 | ||||||
| Directors' fees and expenses | 12,751 | 34,385 | 53,441 | ||||||
| 12,796 | 34,429 | 53,487 | |||||||
| Net investment income (loss) | 6,419,691 | 17,742,969 | 29,778,263 | ||||||
| Realized and Unrealized Gain (Loss) on Affiliates | |||||||||
| Net realized gain (loss) on: | |||||||||
| Sale of investments in underlying funds | 734,554 | 17,759,499 | 17,568,827 | ||||||
Capital gain distributions received from underlying funds | 7,438,781 | 34,531,621 | 79,410,983 | ||||||
| 8,173,335 | 52,291,120 | 96,979,810 | |||||||
| Change in net unrealized appreciation (depreciation) on investments in underlying funds | (6,585,682 | ) | (31,364,391 | ) | (43,056,343 | ) | |||
| Net realized and unrealized gain (loss) on affiliates | 1,587,653 | 20,926,729 | 53,923,467 | ||||||
| Net Increase (Decrease) in Net Assets Resulting from Operations | $ | 8,007,344 | $ | 38,669,698 | $ | 83,701,730 | |||
See Notes to Financial Statements.
21
| YEAR ENDED JULY 31, 2015 | ||||||
| One Choice Portfolio: Aggressive | One Choice Portfolio: Very Aggressive | |||||
| Investment Income (Loss) | ||||||
| Income from Affiliates: | ||||||
| Income distributions from underlying funds | $ | 20,357,167 | $ | 4,800,283 | ||
| Expenses: | ||||||
| Distribution and service fees - R Class | 45 | 46 | ||||
| Directors' fees and expenses | 37,372 | 9,606 | ||||
| 37,417 | 9,652 | |||||
| Net investment income (loss) | 20,319,750 | 4,790,631 | ||||
| Realized and Unrealized Gain (Loss) on Affiliates | ||||||
| Net realized gain (loss) on: | ||||||
| Sale of investments in underlying funds | 26,473,055 | 13,484,260 | ||||
| Capital gain distributions received from underlying funds | 77,162,022 | 24,069,499 | ||||
| 103,635,077 | 37,553,759 | |||||
| Change in net unrealized appreciation (depreciation) on investments in underlying funds | (46,585,601 | ) | (18,516,001 | ) | ||
| Net realized and unrealized gain (loss) on affiliates | 57,049,476 | 19,037,758 | ||||
| Net Increase (Decrease) in Net Assets Resulting from Operations | $ | 77,369,226 | $ | 23,828,389 | ||
See Notes to Financial Statements.
22
| Statements of Changes in Net Assets |
| YEARS ENDED JULY 31, 2015 AND JULY 31, 2014 | ||||||||||||
One Choice Portfolio: Very Conservative | One Choice Portfolio: Conservative | |||||||||||
| Increase (Decrease) in Net Assets | July 31, 2015 | July 31, 2014 | July 31, 2015 | July 31, 2014 | ||||||||
| Operations | ||||||||||||
| Net investment income (loss) | $ | 6,419,691 | $ | 6,030,028 | $ | 17,742,969 | $ | 15,468,968 | ||||
| Net realized gain (loss) | 8,173,335 | 5,688,818 | 52,291,120 | 12,803,779 | ||||||||
| Change in net unrealized appreciation (depreciation) | (6,585,682 | ) | 8,441,215 | (31,364,391 | ) | 39,257,283 | ||||||
| Net increase (decrease) in net assets resulting from operations | 8,007,344 | 20,160,061 | 38,669,698 | 67,530,030 | ||||||||
| Distributions to Shareholders | ||||||||||||
| From net investment income: | ||||||||||||
| Investor Class | (6,257,908 | ) | (5,977,895 | ) | (18,048,067 | ) | (15,269,425 | ) | ||||
| R Class | (32 | ) | — | (25 | ) | — | ||||||
| From net realized gains: | ||||||||||||
| Investor Class | (5,178,987 | ) | (2,884,902 | ) | (8,617,670 | ) | — | |||||
| Decrease in net assets from distributions | (11,436,927 | ) | (8,862,797 | ) | (26,665,762 | ) | (15,269,425 | ) | ||||
| Capital Share Transactions | ||||||||||||
| Net increase (decrease) in net assets from capital share transactions (Note 5) | 30,178,175 | (7,758,764 | ) | 86,157,307 | 129,568,515 | |||||||
| Net increase (decrease) in net assets | 26,748,592 | 3,538,500 | 98,161,243 | 181,829,120 | ||||||||
| Net Assets | ||||||||||||
| Beginning of period | 355,165,040 | 351,626,540 | 927,955,231 | 746,126,111 | ||||||||
| End of period | $ | 381,913,632 | $ | 355,165,040 | $ | 1,026,116,474 | $ | 927,955,231 | ||||
| Undistributed net investment income | — | $ | 35,221 | $ | 329,484 | $ | 692,736 | |||||
See Notes to Financial Statements.
23
| YEARS ENDED JULY 31, 2015 AND JULY 31, 2014 | ||||||||||||
| One Choice Portfolio: Moderate | One Choice Portfolio: Aggressive | |||||||||||
| Increase (Decrease) in Net Assets | July 31, 2015 | July 31, 2014 | July 31, 2015 | July 31, 2014 | ||||||||
| Operations | ||||||||||||
| Net investment income (loss) | $ | 29,778,263 | $ | 24,255,233 | $ | 20,319,750 | $ | 16,880,763 | ||||
| Net realized gain (loss) | 96,979,810 | 26,265,708 | 103,635,077 | 26,721,028 | ||||||||
| Change in net unrealized appreciation (depreciation) | (43,056,343 | ) | 76,131,071 | (46,585,601 | ) | 63,651,077 | ||||||
| Net increase (decrease) in net assets resulting from operations | 83,701,730 | 126,652,012 | 77,369,226 | 107,252,868 | ||||||||
| Distributions to Shareholders | ||||||||||||
| From net investment income: | ||||||||||||
| Investor Class | (30,074,942 | ) | (24,018,441 | ) | (23,614,774 | ) | (14,880,948 | ) | ||||
| R Class | (27 | ) | — | — | — | |||||||
| From net realized gains: | ||||||||||||
| Investor Class | (2,093,099 | ) | — | (14,398,255 | ) | — | ||||||
| Decrease in net assets from distributions | (32,168,068 | ) | (24,018,441 | ) | (38,013,029 | ) | (14,880,948 | ) | ||||
| Capital Share Transactions | ||||||||||||
| Net increase (decrease) in net assets from capital share transactions (Note 5) | 137,690,228 | 206,387,298 | 31,540,414 | 82,905,900 | ||||||||
| Net increase (decrease) in net assets | 189,223,890 | 309,020,869 | 70,896,611 | 175,277,820 | ||||||||
| Net Assets | ||||||||||||
| Beginning of period | 1,442,589,482 | 1,133,568,613 | 1,028,185,215 | 852,907,395 | ||||||||
| End of period | $ | 1,631,813,372 | $ | 1,442,589,482 | $ | 1,099,081,826 | $ | 1,028,185,215 | ||||
| Undistributed net investment income | $ | 494,271 | $ | 920,550 | $ | 4,255,122 | $ | 7,550,146 | ||||
See Notes to Financial Statements.
24
| YEARS ENDED JULY 31, 2015 AND JULY 31, 2014 | ||||||
One Choice Portfolio: Very Aggressive | ||||||
| Increase (Decrease) in Net Assets | July 31, 2015 | July 31, 2014 | ||||
| Operations | ||||||
| Net investment income (loss) | $ | 4,790,631 | $ | 3,739,849 | ||
| Net realized gain (loss) | 37,553,759 | 8,815,662 | ||||
| Change in net unrealized appreciation (depreciation) | (18,516,001 | ) | 20,587,527 | |||
| Net increase (decrease) in net assets resulting from operations | 23,828,389 | 33,143,038 | ||||
| Distributions to Shareholders | ||||||
| From net investment income: | ||||||
| Investor Class | (5,097,597 | ) | (2,298,997 | ) | ||
| Capital Share Transactions | ||||||
| Net increase (decrease) in net assets from capital share transactions (Note 5) | (17,465,348 | ) | 2,063,291 | |||
| Net increase (decrease) in net assets | 1,265,444 | 32,907,332 | ||||
| Net Assets | ||||||
| Beginning of period | 267,536,666 | 234,629,334 | ||||
| End of period | $ | 268,802,110 | $ | 267,536,666 | ||
| Undistributed net investment income | $ | 2,117,122 | $ | 2,908,624 | ||
See Notes to Financial Statements.
25
| Notes to Financial Statements |
JULY 31, 2015
1. Organization
American Century Asset Allocation Portfolios, Inc. (the corporation) is registered under the Investment Company Act of 1940, as amended (the 1940 Act), as an open-end management investment company and is organized as a Maryland corporation. One Choice Portfolio: Very Conservative, One Choice Portfolio: Conservative, One Choice Portfolio: Moderate, One Choice Portfolio: Aggressive and One Choice Portfolio: Very Aggressive (collectively, the funds) are five funds in a series issued by the corporation. The funds operate as “funds of funds,” meaning substantially all of the funds’ assets will be invested in other American Century Investments mutual funds (the underlying funds). Each fund’s assets are allocated among underlying funds that represent major asset classes, including equity securities (stocks), fixed-income securities (bonds) and cash-equivalent instruments (money markets). The funds are diversified as defined under the 1940 Act. The funds will assume the risks associated with their underlying funds. Additional information and attributes of each underlying fund are available at americancentury.com. Each fund's investment objective is to seek the highest total return consistent with its asset mix.
The funds offer the Investor Class and the R Class, which have different fees and expenses. The difference in the fee structures between the classes is the result of their separate arrangements for shareholder and distribution services. It is not the result of any difference in advisory or custodial fees or other expenses related to the management of the funds' assets, which do not vary by class. Sale of the R Class commenced on March 20, 2015.
2. Significant Accounting Policies
The following is a summary of significant accounting policies consistently followed by the funds in preparation of their financial statements. Each fund is an investment company and follows accounting and reporting guidance in accordance with accounting principles generally accepted in the United States of America. This may require management to make certain estimates and assumptions at the date of the financial statements. Actual results could differ from these estimates. Management evaluated the impact of events or transactions occurring through the date the financial statements were issued that would merit recognition or disclosure.
Investment Valuations — The funds determine the fair value of their investments and compute their net asset value per share at the close of regular trading (usually 4 p.m. Eastern time) on the New York Stock Exchange (NYSE) on each day the NYSE is open. The Board of Directors has adopted valuation policies and procedures to guide the investment advisor in the funds' investment valuation process and to provide methodologies for the oversight of the funds' pricing function. Investments in the underlying funds are valued at their reported net asset value.
Security Transactions — Security transactions are accounted for as of the trade date. Net realized gains and losses are determined on the identified cost basis, which is also used for federal income tax purposes.
Investment Income — Income and capital gain distributions, if any, from the underlying funds are recorded as of the ex-dividend date. Long-term capital gain distributions, if any, from the underlying funds are a component of net realized gain (loss).
Expenses — The expenses included in the accompanying financial statements reflect the expenses of each fund and do not include any expenses associated with the underlying funds.
Income Tax Status — It is each fund’s policy to distribute substantially all net investment income and net realized gains to shareholders and to otherwise qualify as a regulated investment company under provisions of the Internal Revenue Code. Accordingly, no provision has been made for income taxes. The funds file U.S. federal, state, local and non-U.S. tax returns as applicable. The funds' tax returns are subject to examination by the relevant taxing authority until expiration of the applicable statute of limitations, which is generally three years from the date of filing but can be longer in certain jurisdictions. At this time, management believes there are no uncertain tax positions which, based on their technical merit, would not be sustained upon examination and for which it is reasonably possible that the total amounts of unrecognized tax benefits will significantly change in the next twelve months.
26
Multiple Class — All shares of each fund represent an equal pro rata interest in the net assets of the class to which such shares belong, and have identical voting, dividend, liquidation and other rights and the same terms and conditions, except for class specific expenses and exclusive rights to vote on matters affecting only individual classes. Income, non-class specific expenses, and realized and unrealized capital gains and losses of the funds are allocated to each class of shares based on their relative net assets.
Distributions to Shareholders — Distributions from net investment income, if any, are generally declared and paid quarterly for One Choice Portfolio: Very Conservative, One Choice Portfolio: Conservative and One Choice Portfolio: Moderate. Distributions from net investment income, if any, are generally declared and paid annually for One Choice Portfolio: Aggressive and One Choice Portfolio: Very Aggressive. Distributions from net realized gains, if any, are generally declared and paid annually for all funds. Each fund may elect to treat a portion of its payment to a redeeming shareholder, which represents the pro rata share of undistributed net investment income and net realized gains, as a distribution for federal income tax purposes (tax equalization).
Indemnifications — Under the corporation’s organizational documents, its officers and directors are indemnified against certain liabilities arising out of the performance of their duties to the funds. In addition, in the normal course of business, the funds enter into contracts that provide general indemnifications. The maximum exposure under these arrangements is unknown as this would involve future claims that may be made against a fund. The risk of material loss from such claims is considered by management to be remote.
3. Fees and Transactions with Related Parties
Certain officers and directors of the corporation are also officers and/or directors of American Century Companies, Inc. (ACC). The corporation’s investment advisor, American Century Investment Management, Inc. (ACIM), the corporation's distributor, American Century Investment Services, Inc. (ACIS), and the corporation’s transfer agent, American Century Services, LLC, are wholly owned, directly or indirectly, by ACC. ACIM serves as the investment advisor for the underlying funds.
Administrative Fees — The corporation's investment advisor, ACIM, does not receive an administrative fee for services provided to the funds.
Distribution and Service Fees — The Board of Directors has adopted a separate Master Distribution and Individual Shareholder Services Plan for the R Class (the plan), pursuant to Rule 12b-1 of the 1940 Act. The plan provides that the R Class will pay ACIS an annual distribution and service fee of 0.50%. The fee is computed and accrued daily based on class's daily net assets and paid monthly in arrears. The fee is used to pay financial intermediaries for distribution and individual shareholder services. Fees incurred under the plan during the year ended July 31, 2015 are detailed in the Statement of Operations.
Directors' Fees and Expenses — The Board of Directors is responsible for overseeing the investment advisor’s management and operations of the funds. The directors receive detailed information about the funds and their investment advisor regularly throughout the year, and meet at least quarterly with management of the investment advisor to review reports about fund operations. The funds' officers do not receive compensation from the funds.
Acquired Fund Fees and Expenses — Each fund will indirectly realize its pro rata share of the fees and expenses of the underlying funds in which it invests. These fees and expenses are already reflected in the valuation of the underlying funds.
4. Investment Transactions
Investment transactions for the year ended July 31, 2015 were as follows:
One Choice Portfolio: Very Conservative | One Choice Portfolio: Conservative | One Choice Portfolio: Moderate | One Choice Portfolio: Aggressive | One Choice Portfolio: Very Aggressive | |||||||||||
| Purchases | $ | 120,453,525 | $ | 331,162,284 | $ | 528,239,672 | $ | 402,890,731 | $ | 122,394,925 | |||||
| Sales | $ | 87,853,680 | $ | 219,392,607 | $ | 313,527,615 | $ | 311,871,016 | $ | 116,097,742 | |||||
27
5. Capital Share Transactions
The corporation is authorized to issue 4,000,000,000 shares. Transactions in shares of the funds were as follows:
Year ended July 31, 2015(1) | Year ended July 31, 2014 | |||||||||
| Shares | Amount | Shares | Amount | |||||||
| One Choice Portfolio: Very Conservative | ||||||||||
| Investor Class | ||||||||||
| Sold | 11,915,396 | $ | 141,636,212 | 7,832,402 | $ | 91,897,942 | ||||
| Issued in reinvestment of distributions | 941,468 | 11,167,371 | 742,348 | 8,651,237 | ||||||
| Redeemed | (10,287,876 | ) | (122,650,440 | ) | (9,257,466 | ) | (108,307,943 | ) | ||
| 2,568,988 | 30,153,143 | (682,716 | ) | (7,758,764 | ) | |||||
| R Class | N/A | |||||||||
| Sold | 2,088 | 25,000 | ||||||||
| Issued in reinvestment of distributions | 3 | 32 | ||||||||
| 2,091 | 25,032 | |||||||||
| Net increase (decrease) | 2,571,079 | $ | 30,178,175 | (682,716 | ) | $ | (7,758,764 | ) | ||
| One Choice Portfolio: Conservative | ||||||||||
| Investor Class | ||||||||||
| Sold | 19,285,302 | $ | 262,828,525 | 19,381,020 | $ | 253,758,564 | ||||
| Issued in reinvestment of distributions | 1,924,989 | 26,156,687 | 1,139,728 | 14,973,084 | ||||||
| Redeemed | (14,886,646 | ) | (202,853,530 | ) | (10,643,243 | ) | (139,163,133 | ) | ||
| 6,323,645 | 86,131,682 | 9,877,505 | 129,568,515 | |||||||
| R Class | N/A | |||||||||
| Sold | 1,854 | 25,600 | ||||||||
| Issued in reinvestment of distributions | 2 | 25 | ||||||||
| 1,856 | 25,625 | |||||||||
| Net increase (decrease) | 6,325,501 | $ | 86,157,307 | 9,877,505 | $ | 129,568,515 | ||||
| One Choice Portfolio: Moderate | ||||||||||
| Investor Class | ||||||||||
| Sold | 23,115,876 | $ | 354,389,468 | 25,608,183 | $ | 371,485,435 | ||||
| Issued in reinvestment of distributions | 2,070,549 | 31,669,725 | 1,624,838 | 23,668,750 | ||||||
| Redeemed | (16,208,233 | ) | (248,397,576 | ) | (13,026,618 | ) | (188,766,887 | ) | ||
| 8,978,192 | 137,661,617 | 14,206,403 | 206,387,298 | |||||||
| R Class | N/A | |||||||||
| Sold | 1,830 | 28,584 | ||||||||
| Issued in reinvestment of distributions | 2 | 27 | ||||||||
| 1,832 | 28,611 | |||||||||
| Net increase (decrease) | 8,980,024 | $ | 137,690,228 | 14,206,403 | $ | 206,387,298 | ||||
| One Choice Portfolio: Aggressive | ||||||||||
| Investor Class | ||||||||||
| Sold | 11,763,689 | $ | 196,349,221 | 13,749,731 | $ | 215,763,985 | ||||
| Issued in reinvestment of distributions | 2,299,528 | 37,689,248 | 941,037 | 14,764,862 | ||||||
| Redeemed | (12,137,997 | ) | (202,523,573 | ) | (9,414,416 | ) | (147,622,947 | ) | ||
| 1,925,220 | 31,514,896 | 5,276,352 | 82,905,900 | |||||||
| R Class | N/A | |||||||||
| Sold | 1,500 | 25,518 | ||||||||
| Net increase (decrease) | 1,926,720 | $ | 31,540,414 | 5,276,352 | $ | 82,905,900 | ||||
| (1) | March 20, 2015 (commencement of sale) through July 31, 2015 for the R Class. |
28
Year ended July 31, 2015(1) | Year ended July 31, 2014 | |||||||||
| Shares | Amount | Shares | Amount | |||||||
| One Choice Portfolio: Very Aggressive | ||||||||||
| Investor Class | ||||||||||
| Sold | 2,600,213 | $ | 46,873,852 | 2,726,163 | $ | 44,771,752 | ||||
| Issued in reinvestment of distributions | 282,905 | 5,044,201 | 136,965 | 2,279,082 | ||||||
| Redeemed | (3,814,711 | ) | (69,413,906 | ) | (2,716,235 | ) | (44,987,543 | ) | ||
| (931,593 | ) | (17,495,853 | ) | 146,893 | 2,063,291 | |||||
| R Class | N/A | |||||||||
| Sold | 1,644 | 30,505 | ||||||||
| Net increase (decrease) | (929,949 | ) | $ | (17,465,348 | ) | 146,893 | $ | 2,063,291 | ||
| (1) | March 20, 2015 (commencement of sale) through July 31, 2015 for the R Class. |
6. Affiliated Fund Transactions
A summary of transactions for each underlying fund for the year ended July 31, 2015 follows:
Fund/ Underlying Fund(1) | Beginning Value | Purchase Cost | Sales Cost | Realized Gain (Loss) | Distributions Received(2) | Ending Value | ||||||||||||
| One Choice Portfolio: Very Conservative | ||||||||||||||||||
| Diversified Bond Fund | $ | 110,765,956 | $ | 19,608,679 | $ | 35,825,891 | $ | (288,609 | ) | $ | 2,408,193 | $ | 95,506,436 | |||||
| Inflation-Adjusted Bond Fund | 35,625,413 | 6,281,432 | 2,990,788 | (315,920 | ) | 363,956 | 38,072,716 | |||||||||||
| Short Duration Fund | 25,022,560 | 3,520,870 | 1,960,847 | (39,110 | ) | 479,098 | 26,522,548 | |||||||||||
| Short Duration Inflation Protection Bond Fund | 28,559,396 | 4,626,979 | 2,090,233 | (69,972 | ) | 259,591 | 30,340,189 | |||||||||||
| Core Equity Plus Fund | 3,521,896 | 948,324 | 492,770 | 6,920 | 505,247 | 3,775,892 | ||||||||||||
| Equity Growth Fund | 13,998,043 | 4,593,120 | 4,513,040 | 279,881 | 1,808,646 | 13,362,266 | ||||||||||||
| Growth Fund | 15,763,310 | 6,507,009 | 8,259,609 | (54,774 | ) | 3,457,381 | 12,963,439 | |||||||||||
| Heritage Fund | 8,770,710 | 2,584,991 | 3,296,096 | 6,615 | 1,360,058 | 8,325,709 | ||||||||||||
| Large Company Value Fund | 24,517,470 | 13,949,686 | 8,804,134 | 2,070,752 | 300,607 | 29,622,911 | ||||||||||||
| Mid Cap Value Fund | 17,593,261 | 7,652,110 | 3,881,295 | 139,433 | 1,945,946 | 21,054,978 | ||||||||||||
NT Disciplined Growth Fund(3) | — | 3,790,652 | 43,134 | (129 | ) | — | 3,770,299 | |||||||||||
| Real Estate Fund | 7,047,738 | 1,170,528 | 1,102,665 | 294,862 | 140,164 | 7,522,879 | ||||||||||||
| Small Company Fund | 3,461,240 | 607,863 | 583,319 | 119,269 | 2,756 | 3,757,119 | ||||||||||||
| Global Bond Fund | — | 31,037,326 | 178,589 | (4,593 | ) | — | 30,386,234 | |||||||||||
| International Bond Fund | 35,508,854 | 10,219,955 | 11,230,264 | (1,410,071 | ) | 837,027 | 30,433,400 | |||||||||||
| Prime Money Market Fund | 25,009,253 | 3,354,001 | 1,866,452 | — | 2,598 | 26,496,802 | ||||||||||||
| $ | 355,165,100 | $ | 120,453,525 | $ | 87,119,126 | $ | 734,554 | $ | 13,871,268 | $ | 381,913,817 | |||||||
| (1) | Underlying fund investments represent Investor Class. |
| (2) | Distributions received includes distributions from net investment income and from capital gains, if any. |
| (3) | Non-income producing. |
29
Fund/ Underlying Fund(1) | Beginning Value | Purchase Cost | Sales Cost | Realized Gain (Loss) | Distributions Received(2) | Ending Value | ||||||||||||
| One Choice Portfolio: Conservative | ||||||||||||||||||
| Core Equity Plus Fund | $ | 18,144,640 | $ | 3,875,689 | $ | 374,417 | $ | (26,898 | ) | $ | 2,480,062 | $ | 20,639,612 | |||||
| Equity Growth Fund | 63,717,139 | 12,389,701 | 6,378,155 | (66,496 | ) | 8,313,315 | 67,143,972 | |||||||||||
| Growth Fund | 61,042,304 | 16,151,550 | 15,031,029 | (1,326,339 | ) | 13,605,400 | 58,668,843 | |||||||||||
| Heritage Fund | 45,074,146 | 9,019,669 | 11,916,427 | (288,497 | ) | 7,043,715 | 43,324,692 | |||||||||||
| Large Company Value Fund | 91,624,838 | 20,488,838 | 34,829,929 | 11,347,129 | 1,052,085 | 72,593,695 | ||||||||||||
| Mid Cap Value Fund | 61,779,238 | 11,262,919 | 9,264,830 | 114,183 | 6,840,969 | 62,517,733 | ||||||||||||
NT Disciplined Growth Fund(3) | — | 15,708,941 | 126,302 | (379 | ) | — | 15,676,134 | |||||||||||
| Real Estate Fund | 18,960,665 | 545,387 | 10,979,286 | 11,557,218 | 306,535 | — | ||||||||||||
| Small Company Fund | 18,268,387 | 14,130 | 3,954,429 | 723,343 | 14,130 | 15,131,424 | ||||||||||||
| Diversified Bond Fund | 271,136,927 | 38,701,215 | 74,492,979 | (932,860 | ) | 6,057,652 | 237,581,216 | |||||||||||
| Inflation-Adjusted Bond Fund | 83,247,371 | 13,326,008 | 1,988,701 | (283,754 | ) | 873,712 | 92,072,978 | |||||||||||
| Global Bond Fund | — | 73,721,851 | 367,913 | (8,383 | ) | — | 72,184,655 | |||||||||||
| International Bond Fund | 73,829,863 | 20,295,173 | 19,056,486 | (2,606,058 | ) | 1,758,402 | 66,044,263 | |||||||||||
| International Growth Fund | 54,408,587 | 16,221,291 | 7,518,146 | (476,474 | ) | 3,956,066 | 62,244,919 | |||||||||||
NT Global Real Estate Fund(3) | — | 21,177,520 | — | — | — | 20,343,314 | ||||||||||||
NT International Small-Mid Cap Fund(3) | — | 10,472,627 | 555,804 | 26,448 | — | 10,491,999 | ||||||||||||
NT International Value Fund(3) | — | 41,196,158 | 332,527 | 7,316 | — | 40,611,572 | ||||||||||||
| Prime Money Market Fund | 66,717,786 | 6,593,617 | 4,465,748 | — | 6,976 | 68,845,655 | ||||||||||||
| $ | 927,951,891 | $ | 331,162,284 | $ | 201,633,108 | $ | 17,759,499 | $ | 52,309,019 | $ | 1,026,116,676 | |||||||
| (1) | Underlying fund investments represent Investor Class. |
| (2) | Distributions received includes distributions from net investment income and from capital gains, if any. |
| (3) | Non-income producing. |
30
Fund/ Underlying Fund(1) | Beginning Value | Purchase Cost | Sales Cost | Realized Gain (Loss) | Distributions Received(2) | Ending Value | ||||||||||||
| One Choice Portfolio: Moderate | ||||||||||||||||||
| Core Equity Plus Fund | $ | 56,295,319 | $ | 12,039,424 | — | — | $ | 7,575,321 | $ | 65,220,788 | ||||||||
| Equity Growth Fund | 170,685,667 | 31,930,258 | $ | 22,532,602 | $ | 5,956 | 21,725,029 | 173,250,010 | ||||||||||
| Growth Fund | 142,424,837 | 34,074,674 | 37,558,227 | (2,092,769 | ) | 30,837,655 | 130,173,417 | |||||||||||
| Heritage Fund | 113,704,991 | 19,960,492 | 37,252,398 | 1,014,344 | 17,220,638 | 97,551,161 | ||||||||||||
| Large Company Value Fund | 120,611,539 | 27,177,808 | 14,502,247 | 1,213,039 | 1,513,279 | 140,502,518 | ||||||||||||
| Mid Cap Value Fund | 78,440,517 | 15,217,564 | — | — | 8,529,084 | 92,078,132 | ||||||||||||
NT Disciplined Growth Fund(3) | — | 32,547,262 | — | — | — | 32,742,545 | ||||||||||||
| Real Estate Fund | 29,372,016 | 575,214 | 14,881,127 | 19,667,141 | 475,635 | — | ||||||||||||
| Small Company Fund | 32,671,509 | 24,151 | 3,263,911 | 572,648 | 24,151 | 31,730,571 | ||||||||||||
| Diversified Bond Fund | 249,445,157 | 37,899,533 | 80,002,269 | (451,169 | ) | 5,409,575 | 209,210,200 | |||||||||||
| High-Yield Fund | 57,339,983 | 11,640,734 | 23,766 | (1,436 | ) | 3,815,175 | 65,034,786 | |||||||||||
| Inflation-Adjusted Bond Fund | 86,791,505 | 13,191,120 | 25,414 | (3,290 | ) | 899,423 | 97,086,977 | |||||||||||
| Emerging Markets Fund | 56,986,291 | 10,052,824 | 1,905,265 | 42,821 | 46,977 | 62,230,687 | ||||||||||||
| International Growth Fund | 142,386,077 | 36,730,394 | 60,094,231 | (179,162 | ) | 10,157,331 | 114,296,683 | |||||||||||
NT Global Real Estate Fund(3) | — | 32,720,618 | — | — | — | 31,422,793 | ||||||||||||
NT International Small-Mid Cap Fund(3) | — | 24,410,446 | — | — | — | 25,826,252 | ||||||||||||
NT International Value Fund(3) | — | 89,478,269 | 277,404 | 6,935 | — | 88,765,041 | ||||||||||||
| Global Bond Fund | — | 82,003,505 | — | — | — | 80,700,068 | ||||||||||||
| International Bond Fund | 42,676,358 | 11,415,824 | 17,935,895 | (2,226,231 | ) | 1,007,237 | 31,788,152 | |||||||||||
| Prime Money Market Fund | 62,757,810 | 5,149,558 | 5,704,032 | — | 6,223 | 62,203,336 | ||||||||||||
| $ | 1,442,589,576 | $ | 528,239,672 | $ | 295,958,788 | $ | 17,568,827 | $ | 109,242,733 | $ | 1,631,814,117 | |||||||
| (1) | Underlying fund investments represent Investor Class. |
| (2) | Distributions received includes distributions from net investment income and from capital gains, if any. |
| (3) | Non-income producing. |
31
Fund/ Underlying Fund(1) | Beginning Value | Purchase Cost | Sales Cost | Realized Gain (Loss) | Distributions Received(2) | Ending Value | ||||||||||||
| One Choice Portfolio: Aggressive | ||||||||||||||||||
| Core Equity Plus Fund | $ | 47,297,592 | $ | 8,455,262 | $ | 2,393,634 | $ | 216,099 | $ | 6,026,788 | $ | 50,753,394 | ||||||
| Equity Growth Fund | 104,297,632 | 18,026,724 | 12,612,601 | 446,880 | 12,668,535 | 105,378,735 | ||||||||||||
| Growth Fund | 165,392,952 | 39,924,319 | 62,640,447 | 2,491,040 | 35,411,182 | 127,296,401 | ||||||||||||
| Heritage Fund | 142,204,401 | 26,156,550 | 69,471,053 | 9,493,457 | 21,549,627 | 91,669,705 | ||||||||||||
| Large Company Value Fund | 78,554,335 | 24,984,065 | 3,026,036 | 274,371 | 1,009,148 | 105,510,055 | ||||||||||||
| Mid Cap Value Fund | 49,857,115 | 18,512,858 | 3,727,884 | 156,632 | 5,268,755 | 63,464,904 | ||||||||||||
NT Disciplined Growth Fund(3) | — | 33,947,283 | — | — | — | 34,150,967 | ||||||||||||
| Real Estate Fund | 22,248,520 | 445,122 | 13,345,290 | 12,503,472 | 331,492 | — | ||||||||||||
| Small Company Fund | 24,963,171 | 98,737 | 2,095,285 | 348,244 | 18,886 | 24,819,101 | ||||||||||||
| Emerging Markets Fund | 68,801,045 | 9,946,964 | 7,833,546 | 394,289 | 52,303 | 67,481,883 | ||||||||||||
| International Growth Fund | 124,214,250 | 28,810,637 | 49,047,838 | 516,032 | 8,886,768 | 99,151,152 | ||||||||||||
NT Global Real Estate Fund(3) | — | 33,947,283 | — | — | — | 32,589,392 | ||||||||||||
NT International Small-Mid Cap Fund(3) | — | 22,631,522 | 1,011,756 | 48,249 | — | 22,873,713 | ||||||||||||
NT International Value Fund(3) | — | 70,910,538 | 939,773 | 24,278 | — | 69,621,791 | ||||||||||||
| Diversified Bond Fund | 96,025,988 | 13,176,455 | 52,350,305 | (183,440 | ) | 1,887,006 | 57,726,506 | |||||||||||
| High-Yield Fund | 58,650,614 | 13,323,199 | 1,999,267 | (135,498 | ) | 3,987,487 | 66,009,514 | |||||||||||
| Inflation-Adjusted Bond Fund | 40,890,681 | 5,645,608 | 954,998 | (121,050 | ) | 420,890 | 44,353,140 | |||||||||||
| Global Bond Fund | — | 33,947,283 | — | — | — | 33,403,038 | ||||||||||||
| Prime Money Market Fund | 4,776,985 | 322 | 1,948,248 | — | 322 | 2,829,059 | ||||||||||||
| $ | 1,028,175,281 | $ | 402,890,731 | $ | 285,397,961 | $ | 26,473,055 | $ | 97,519,189 | $ | 1,099,082,450 | |||||||
| (1) | Underlying fund investments represent Investor Class. |
| (2) | Distributions received includes distributions from net investment income and from capital gains, if any. |
| (3) | Non-income producing. |
32
Fund/ Underlying Fund(1) | Beginning Value | Purchase Cost | Sales Cost | Realized Gain (Loss) | Distributions Received(2) | Ending Value | ||||||||||||
| One Choice Portfolio: Very Aggressive | ||||||||||||||||||
| Core Equity Plus Fund | $ | 12,810,914 | $ | 2,361,994 | $ | 1,571,440 | $ | 48,500 | $ | 1,659,594 | $ | 12,875,007 | ||||||
| Equity Growth Fund | 34,841,972 | 5,980,032 | 7,476,738 | 427,552 | 4,280,633 | 31,615,392 | ||||||||||||
| Growth Fund | 52,891,878 | 12,831,591 | 24,093,607 | 1,903,146 | 11,054,801 | 35,616,478 | ||||||||||||
| Heritage Fund | 45,931,900 | 8,316,685 | 25,310,231 | 5,244,799 | 6,777,309 | 24,332,337 | ||||||||||||
| Large Company Value Fund | 25,502,726 | 5,262,614 | 4,161,517 | 142,823 | 318,262 | 28,261,774 | ||||||||||||
| Mid Cap Value Fund | 16,216,543 | 8,210,107 | 2,706,893 | 45,445 | 1,730,797 | 21,329,092 | ||||||||||||
NT Disciplined Growth Fund(3) | — | 11,736,883 | 856,700 | (5,285 | ) | — | 10,946,709 | |||||||||||
| Real Estate Fund | 5,475,859 | 763,133 | 2,995,139 | 4,062,648 | 83,752 | — | ||||||||||||
| Small Company Fund | 6,732,986 | 12,178,295 | 1,968,554 | 21,211 | 5,224 | 17,254,727 | ||||||||||||
| Emerging Markets Fund | 20,182,212 | 4,002,507 | 4,055,336 | 162,200 | 15,658 | 19,074,942 | ||||||||||||
| International Growth Fund | 40,898,971 | 8,195,270 | 18,059,367 | 956,033 | 2,864,738 | 28,543,448 | ||||||||||||
NT Global Real Estate Fund(3) | — | 8,775,210 | 298,672 | (11,877 | ) | — | 8,141,211 | |||||||||||
NT International Small-Mid Cap Fund(3) | — | 8,732,686 | 1,077,112 | 52,346 | — | 8,099,144 | ||||||||||||
NT International Value Fund(3) | — | 24,286,558 | 1,489,088 | 12,933 | — | 22,711,848 | ||||||||||||
| Diversified Bond Fund | 5,260,574 | 761,316 | 5,702,912 | 421,786 | 78,967 | — | ||||||||||||
| Prime Money Market Fund | 790,132 | 44 | 790,176 | — | 47 | — | ||||||||||||
| $ | 267,536,667 | $ | 122,394,925 | $ | 102,613,482 | $ | 13,484,260 | $ | 28,869,782 | $ | 268,802,109 | |||||||
| (1) | Underlying fund investments represent Investor Class. |
| (2) | Distributions received includes distributions from net investment income and from capital gains, if any. |
| (3) | Non-income producing. |
7. Investments in Underlying Funds
The funds do not invest in the underlying funds for the purpose of exercising management or control; however, investments by the funds within their investment strategies may represent a significant portion of the underlying funds’ net assets. As of July 31, 2015, One Choice Portfolio: Moderate and One Choice Portfolio: Aggressive owned 38% and 30%, respectively, of the shares of Core Equity Plus Fund.
8. Fair Value Measurements
The funds’ investments valuation process is based on several considerations and may use multiple inputs to determine the fair value of the investments held by the funds. In conformity with accounting principles generally accepted in the United States of America, the inputs used to determine a valuation are classified into three broad levels.
| • | Level 1 valuation inputs consist of unadjusted quoted prices in an active market for identical investments. |
| • | Level 2 valuation inputs consist of direct or indirect observable market data (including quoted prices for comparable investments, evaluations of subsequent market events, interest rates, prepayment speeds, credit risk, etc.). These inputs also consist of quoted prices for identical investments initially expressed in local currencies that are adjusted through translation into U.S. dollars. |
| • | Level 3 valuation inputs consist of unobservable data (including a fund’s own assumptions). |
The level classification is based on the lowest level input that is significant to the fair valuation measurement. The valuation inputs are not necessarily an indication of the risks associated with investing in these securities or other financial instruments. There were no significant transfers between levels during the period.
As of period end, the funds’ investment securities were classified as Level 1. The Schedules of Investments provide additional information on the funds’ portfolio holdings.
33
9. Federal Tax Information
The tax character of distributions paid during the years ended July 31, 2015 and July 31, 2014 were as follows:
| 2015 | 2014 | |||||||||||
| Distributions Paid From: | Distributions Paid From: | |||||||||||
| Ordinary Income | Long-term capital gains | Ordinary Income | Long-term capital gains | |||||||||
| One Choice Portfolio: Very Conservative | $ | 6,628,992 | $ | 4,807,935 | $ | 6,426,657 | $ | 2,436,140 | ||||
| One Choice Portfolio: Conservative | $ | 18,106,221 | $ | 8,559,541 | $ | 15,269,425 | — | |||||
| One Choice Portfolio: Moderate | $ | 30,204,542 | $ | 1,963,526 | $ | 24,018,441 | — | |||||
| One Choice Portfolio: Aggressive | $ | 24,107,514 | $ | 13,905,515 | $ | 14,880,948 | — | |||||
| One Choice Portfolio: Very Aggressive | $ | 5,097,597 | — | $ | 2,298,997 | — | ||||||
The book-basis character of distributions made during the year from net investment income or net realized gains may differ from their ultimate characterization for federal income tax purposes. These differences reflect the differing character of certain income items and net realized gains and losses for financial statement and tax purposes, and may result in reclassification among certain capital accounts on the financial statements.
The reclassifications, which are primarily due to tax equalization and dividend redesignations, were as follows:
One Choice Portfolio: Very Conservative | One Choice Portfolio: Conservative | One Choice Portfolio: Moderate | One Choice Portfolio: Aggressive | One Choice Portfolio: Very Aggressive | |||||||||
| Capital paid in | $ | 1,315,807 | — | — | — | $ | 4,697,806 | ||||||
| Undistributed net investment income | $ | (196,972 | ) | $ | (58,129 | ) | $ | (129,573 | ) | — | $ | (484,536 | ) |
| Accumulated undistributed net realized gain (loss) | $ | (1,118,835 | ) | $ | 58,129 | $ | 129,573 | — | $ | (4,213,270 | ) | ||
As of July 31, 2015, the federal tax cost of investments and the components of distributable earnings on a tax-basis were as follows
One Choice Portfolio: Very Conservative | One Choice Portfolio: Conservative | One Choice Portfolio: Moderate | |||||||
| Federal tax cost of investments | $ | 356,990,696 | $ | 929,280,452 | $ | 1,415,406,139 | |||
| Gross tax appreciation of investments | $ | 32,114,638 | $ | 110,148,988 | $ | 228,905,750 | |||
| Gross tax depreciation of investments | (7,191,517 | ) | (13,312,764 | ) | (12,497,772 | ) | |||
| Net tax appreciation (depreciation) of investments | $ | 24,923,121 | $ | 96,836,224 | $ | 216,407,978 | |||
| Undistributed ordinary income | $ | 54,482 | $ | 329,484 | $ | 494,271 | |||
| Accumulated long-term gains | $ | 7,481,247 | $ | 50,283,523 | $ | 93,290,388 | |||
| One Choice Portfolio: Aggressive | One Choice Portfolio: Very Aggressive | |||||
| Federal tax cost of investments | $ | 924,353,712 | $ | 211,284,830 | ||
| Gross tax appreciation of investments | $ | 181,712,379 | $ | 58,015,102 | ||
| Gross tax depreciation of investments | (6,983,641 | ) | (497,823 | ) | ||
| Net tax appreciation (depreciation) of investments | $ | 174,728,738 | $ | 57,517,279 | ||
| Undistributed ordinary income | $ | 8,573,035 | $ | 2,117,122 | ||
| Accumulated long-term gains | $ | 95,335,136 | $ | 29,250,280 | ||
The difference between book-basis and tax-basis unrealized appreciation (depreciation) is attributable primarily to the tax deferral of losses on wash sales.
34
| Financial Highlights |
| For a Share Outstanding Throughout the Years Ended July 31 (except as noted) | |||||||||||||||
| Per-Share Data | Ratios and Supplemental Data | ||||||||||||||
| Income From Investment Operations: | Distributions From: | Ratio to Average Net Assets of: | |||||||||||||
Net Asset Value, Beginning of Period | Net Investment Income (Loss)(1) | Net Realized and Unrealized Gain (Loss) | Total From Investment Operations | Net Investment Income | Net Realized Gains | Total Distributions | Net Asset Value, End of Period | Total Return(2) | Operating Expenses(3) | Net Investment Income (Loss) | Portfolio Turnover Rate | Net Assets, End of Period (in thousands) | |||
| One Choice Portfolio: Very Conservative | |||||||||||||||
| Investor Class | |||||||||||||||
| 2015 | $11.94 | 0.21 | 0.03 | 0.24 | (0.20) | (0.16) | (0.36) | $11.82 | 2.07% | 0.00%(4) | 1.73% | 24% | $381,889 | ||
| 2014 | $11.56 | 0.20 | 0.48 | 0.68 | (0.20) | (0.10) | (0.30) | $11.94 | 5.99% | 0.00%(4) | 1.74% | 12% | $355,165 | ||
| 2013 | $11.38 | 0.20 | 0.26 | 0.46 | (0.20) | (0.08) | (0.28) | $11.56 | 4.04% | 0.00%(4) | 1.75% | 28% | $351,627 | ||
| 2012 | $11.02 | 0.24 | 0.37 | 0.61 | (0.24) | (0.01) | (0.25) | $11.38 | 5.66% | 0.00%(4) | 2.14% | 13% | $295,065 | ||
| 2011 | $10.41 | 0.23 | 0.61 | 0.84 | (0.23) | — | (0.23) | $11.02 | 8.16% | 0.00%(4) | 2.15% | 17% | $206,540 | ||
| R Class | |||||||||||||||
2015(5) | $11.97 | 0.02 | (0.15) | (0.13) | (0.02) | — | (0.02) | $11.82 | (1.13)% | 0.50%(6) | 0.40%(6) | 24%(7) | $25 | ||
| One Choice Portfolio: Conservative | |||||||||||||||
| Investor Class | |||||||||||||||
| 2015 | $13.48 | 0.24 | 0.31 | 0.55 | (0.25) | (0.12) | (0.37) | $13.66 | 4.09% | 0.00%(4) | 1.77% | 22% | $1,026,091 | ||
| 2014 | $12.66 | 0.24 | 0.82 | 1.06 | (0.24) | — | (0.24) | $13.48 | 8.43% | 0.00%(4) | 1.85% | 2% | $927,955 | ||
| 2013 | $11.79 | 0.23 | 0.87 | 1.10 | (0.23) | — | (0.23) | $12.66 | 9.42% | 0.00%(4) | 1.86% | 3% | $746,126 | ||
| 2012 | $11.41 | 0.25 | 0.39 | 0.64 | (0.26) | — | (0.26) | $11.79 | 5.71% | 0.00%(4) | 2.24% | 12% | $573,351 | ||
| 2011 | $10.42 | 0.24 | 0.99 | 1.23 | (0.24) | — | (0.24) | $11.41 | 11.90% | 0.00%(4) | 2.16% | 10% | $466,326 | ||
| R Class | |||||||||||||||
2015(5) | $13.81 | 0.01 | (0.16) | (0.15) | (0.01) | — | (0.01) | $13.65 | (1.06)% | 0.50%(6) | 0.28%(6) | 22%(7) | $25 | ||
35
| For a Share Outstanding Throughout the Years Ended July 31 (except as noted) | |||||||||||||||
| Per-Share Data | Ratios and Supplemental Data | ||||||||||||||
| Income From Investment Operations: | Distributions From: | Ratio to Average Net Assets of: | |||||||||||||
Net Asset Value, Beginning of Period | Net Investment Income (Loss)(1) | Net Realized and Unrealized Gain (Loss) | Total From Investment Operations | Net Investment Income | Net Realized Gains | Total Distributions | Net Asset Value, End of Period | Total Return(2) | Operating Expenses(3) | Net Investment Income (Loss) | Portfolio Turnover Rate | Net Assets, End of Period (in thousands) | |||
| One Choice Portfolio: Moderate | |||||||||||||||
| Investor Class | |||||||||||||||
| 2015 | $14.96 | 0.29 | 0.55 | 0.84 | (0.30) | (0.02) | (0.32) | $15.48 | 5.66% | 0.00%(4) | 1.91% | 20% | $1,631,785 | ||
| 2014 | $13.79 | 0.27 | 1.17 | 1.44 | (0.27) | — | (0.27) | $14.96 | 10.51% | 0.00%(4) | 1.88% | 3% | $1,442,589 | ||
| 2013 | $12.27 | 0.24 | 1.52 | 1.76 | (0.24) | — | (0.24) | $13.79 | 14.48% | 0.00%(4) | 1.81% | 3% | $1,133,569 | ||
| 2012 | $12.01 | 0.23 | 0.26 | 0.49 | (0.23) | — | (0.23) | $12.27 | 4.21% | 0.00%(4) | 1.95% | 16% | $869,723 | ||
| 2011 | $10.60 | 0.21 | 1.41 | 1.62 | (0.21) | — | (0.21) | $12.01 | 15.35% | 0.00%(4) | 1.80% | 11% | $803,485 | ||
| R Class | |||||||||||||||
2015(5) | $15.63 | 0.02 | (0.16) | (0.14) | (0.02) | — | (0.02) | $15.47 | (0.92)% | 0.50%(6) | 0.28%(6) | 20%(7) | $28 | ||
| One Choice Portfolio: Aggressive | |||||||||||||||
| Investor Class | |||||||||||||||
| 2015 | $16.30 | 0.31 | 0.89 | 1.20 | (0.37) | (0.23) | (0.60) | $16.90 | 7.44% | 0.00%(4) | 1.87% | 29% | $1,099,057 | ||
| 2014 | $14.75 | 0.28 | 1.52 | 1.80 | (0.25) | — | (0.25) | $16.30 | 12.26% | 0.00%(4) | 1.77% | 5% | $1,028,185 | ||
| 2013 | $12.68 | 0.23 | 2.05 | 2.28 | (0.21) | — | (0.21) | $14.75 | 18.15% | 0.00%(4) | 1.67% | 5% | $852,907 | ||
| 2012 | $12.58 | 0.20 | 0.10 | 0.30 | (0.20) | — | (0.20) | $12.68 | 2.50% | 0.00%(4) | 1.65% | 14% | $566,200 | ||
| 2011 | $10.75 | 0.18 | 1.82 | 2.00 | (0.17) | — | (0.17) | $12.58 | 18.67% | 0.00%(4) | 1.48% | 11% | $523,231 | ||
| R Class | |||||||||||||||
2015(5) | $17.01 | 0.01 | (0.15) | (0.14) | — | — | — | $16.87 | (0.82)% | 0.50%(6) | 0.23%(6) | 29%(7) | $25 | ||
36
| For a Share Outstanding Throughout the Years Ended July 31 (except as noted) | |||||||||||||||
| Per-Share Data | Ratios and Supplemental Data | ||||||||||||||
| Income From Investment Operations: | Distributions From: | Ratio to Average Net Assets of: | |||||||||||||
Net Asset Value, Beginning of Period | Net Investment Income (Loss)(1) | Net Realized and Unrealized Gain (Loss) | Total From Investment Operations | Net Investment Income | Net Realized Gains | Total Distributions | Net Asset Value, End of Period | Total Return(2) | Operating Expenses(3) | Net Investment Income (Loss) | Portfolio Turnover Rate | Net Assets, End of Period (in thousands) | |||
| One Choice Portfolio: Very Aggressive | |||||||||||||||
| Investor Class | |||||||||||||||
| 2015 | $17.28 | 0.31 | 1.21 | 1.52 | (0.33) | — | (0.33) | $18.47 | 8.87% | 0.00%(4) | 1.72% | 42% | $268,772 | ||
| 2014 | $15.30 | 0.24 | 1.89 | 2.13 | (0.15) | — | (0.15) | $17.28 | 13.94% | 0.00%(4) | 1.45% | 8% | $267,537 | ||
| 2013 | $12.62 | 0.18 | 2.63 | 2.81 | (0.13) | — | (0.13) | $15.30 | 22.42% | 0.00%(4) | 1.29% | 16% | $234,629 | ||
| 2012 | $12.62 | 0.12 | —(8) | 0.12 | (0.12) | — | (0.12) | $12.62 | 1.05% | 0.00%(4) | 1.02% | 13% | $193,193 | ||
| 2011 | $10.52 | 0.11 | 2.09 | 2.20 | (0.10) | — | (0.10) | $12.62 | 20.97% | 0.00%(4) | 0.87% | 18% | $203,114 | ||
| R Class | |||||||||||||||
2015(5) | $18.59 | (0.01) | (0.14) | (0.15) | — | — | — | $18.44 | (0.81)% | 0.50%(6) | (0.18)%(6) | 42%(7) | $30 | ||
| Notes to Financial Highlights |
| (1) | Computed using average shares outstanding throughout the period. |
| (2) | Total returns are calculated based on the net asset value of the last business day. Total returns for periods less than one year are not annualized. |
| (3) | Ratio of operating expenses to average net assets does not include any fees and expenses of the underlying funds. |
| (4) | Ratio was less than 0.005%. |
| (5) | March 20, 2015 (commencement of sale) through July 31, 2015. |
| (6) | Annualized. |
| (7) | Portfolio turnover is calculated at the fund level. Percentage indicated was calculated for the year ended July 31, 2015. |
| (8) | Per-share amount was less than $0.005. |
See Notes to Financial Statements.
37
| Report of Independent Registered Public Accounting Firm |
To the Board of Directors and Shareholders of American Century Asset Allocation Portfolios, Inc.:
We have audited the accompanying statements of assets and liabilities, including the schedules of investments, of One Choice Portfolio: Very Conservative, One Choice Portfolio: Conservative, One Choice Portfolio: Moderate, One Choice Portfolio: Aggressive, and One Choice Portfolio: Very Aggressive, five of the portfolios constituting American Century Asset Allocation Portfolios, Inc. (the “Funds”), as of July 31, 2015, and the related statements of operations for the year then ended, the statements of changes in net assets for each of the two years in the period then ended, and the financial highlights for each of the five years in the period then ended. These financial statements and financial highlights are the responsibility of the Funds’ management. Our responsibility is to express an opinion on these financial statements and financial highlights based on our audits.
We conducted our audits in accordance with the standards of the Public Company Accounting Oversight Board (United States). Those standards require that we plan and perform the audit to obtain reasonable assurance about whether the financial statements and financial highlights are free of material misstatement. The Funds are not required to have, nor were we engaged to perform, an audit of their internal control over financial reporting. Our audits included consideration of internal control over financial reporting as a basis for designing audit procedures that are appropriate in the circumstances, but not for the purpose of expressing an opinion on the effectiveness of the Funds' internal control over financial reporting. Accordingly, we express no such opinion. An audit also includes examining, on a test basis, evidence supporting the amounts and disclosures in the financial statements, assessing the accounting principles used and significant estimates made by management, as well as evaluating the overall financial statement presentation. Our procedures included confirmation of securities owned as of July 31, 2015, by correspondence with the transfer agent. We believe that our audits provide a reasonable basis for our opinion.
In our opinion, the financial statements and financial highlights referred to above present fairly, in all material respects, the financial position of each of the respective Funds as of July 31, 2015, the results of their operations for the year then ended, the changes in their net assets for each of the two years in the period then ended, and the financial highlights for each of the five years in the period then ended, in conformity with accounting principles generally accepted in the United States of America.
DELOITTE & TOUCHE LLP
Kansas City, Missouri
September 17, 2015
38
| Management |
The Board of Directors
The individuals listed below serve as directors of the funds. Each director will continue to serve in this capacity until death, retirement, resignation or removal from office. The board has adopted a mandatory retirement age for directors who are not “interested persons,” as that term is defined in the Investment Company Act (independent directors). Independent directors shall retire by December 31 of the year in which they reach their 75th birthday.
Mr. Thomas is an “interested person” because he currently serves as President and Chief Executive Officer of American Century Companies, Inc. (ACC), the parent company of American Century Investment Management, Inc. (ACIM or the advisor). Mr. Fink is treated as an “interested person” because of his recent employment with ACC and American Century Services, LLC (ACS). The other directors (more than three-fourths of the total number) are independent. They are not employees, directors or officers of, and have no financial interest in, ACC or any of its wholly owned, direct or indirect, subsidiaries, including ACIM, American Century Investment Services, Inc. (ACIS) and ACS, and they do not have any other affiliations, positions or relationships that would cause them to be considered “interested persons” under the Investment Company Act. The directors serve in this capacity for seven (in the case of Mr. Thomas, 15) registered investment companies in the American Century Investments family of funds.
The following table presents additional information about the directors. The mailing address for each director is 4500 Main Street, Kansas City, Missouri 64111.
Name (Year of Birth) | Position(s) Held with Funds | Length of Time Served | Principal Occupation(s) During Past 5 Years | Number of American Century Portfolios Overseen by Director | Other Directorships Held During Past 5 Years |
| Independent Directors | |||||
| Thomas A. Brown (1940) | Director | Since 1980 | Managing Member, Associated Investments, LLC (real estate investment company) | 78 | None |
| Andrea C. Hall (1945) | Director | Since 1997 | Retired | 78 | None |
| Jan M. Lewis (1957) | Director | Since 2011 | Retired; President and Chief Executive Officer, Catholic Charities of Northeast Kansas (human services organization) (2006 to 2013) | 78 | None |
| James A. Olson (1942) | Director and Chairman of the Board | Since 2007 (Chairman since 2014) | Member, Plaza Belmont LLC (private equity fund manager) | 78 | Saia, Inc. (2002 to 2012) and EPR Properties (2003 to 2013) |
| M. Jeannine Strandjord (1945) | Director | Since 1994 | Retired | 78 | Euronet Worldwide Inc.; MGP Ingredients, Inc.; Charming Shoppes, Inc. (2006 to 2010); and DST Systems Inc. (1996 to 2012) |
39
| Name (Year of Birth) | Position(s) Held with Funds | Length of Time Served | Principal Occupation(s) During Past 5 Years | Number of American Century Portfolios Overseen by Director | Other Directorships Held During Past 5 Years |
| Independent Directors | |||||
| John R. Whitten (1946) | Director | Since 2008 | Retired | 78 | Rudolph Technologies, Inc. |
| Stephen E. Yates (1948) | Director | Since 2012 | Retired; Executive Vice President, Technology & Operations, KeyCorp. (computer services) (2004 to 2010) | 78 | Applied Industrial Technologies, Inc. (2001 to 2010) |
| Interested Directors | |||||
| Barry Fink (1955) | Director | Since 2012 | Retired; Executive Vice President, ACC (September 2007 to February 2013); President, ACS (October 2007 to February 2013); Chief Operating Officer, ACC (September 2007 to November 2012) | 78 | None |
| Jonathan S. Thomas (1963) | Director and President | Since 2007 | President and Chief Executive Officer, ACC (March 2007 to present). Also serves as Chief Executive Officer, ACS; Executive Vice President, ACIM; Director, ACC, ACIM and other ACC subsidiaries | 124 | BioMed Valley Discoveries, Inc. |
The Statement of Additional Information has additional information about the funds' directors and is available without charge, upon request, by calling 1-800-345-2021.
40
Officers
The following table presents certain information about the executive officers of the funds. Each officer serves as an officer for each of the 15 investment companies in the American Century family of funds, unless otherwise noted. No officer is compensated for his or her service as an officer of the funds. The listed officers are interested persons of the funds and are appointed or re-appointed on an annual basis. The mailing address for each officer listed below is 4500 Main Street, Kansas City, Missouri 64111.
Name (Year of Birth) | Offices with the Funds | Principal Occupation(s) During the Past Five Years |
| Jonathan S. Thomas (1963) | Director and President since 2007 | President and Chief Executive Officer, ACC (March 2007 to present). Also serves as Chief Executive Officer, ACS; Executive Vice President, ACIM; Director, ACC, ACIM and other ACC subsidiaries |
| Amy D. Shelton (1964) | Chief Compliance Officer and Vice President since 2014 | Chief Compliance Officer, American Century funds, (March 2014 to present); Chief Compliance Officer, ACIM (February 2014 to present); Chief Compliance Officer, ACIS (October 2009 to present); Vice President, Client Interactions and Marketing, ACIS (February 2013 to January 2014); Director, Client Interactions and Marketing, ACIS (June 2007 to January 2013). Also serves as Vice President, ACIS |
| Charles A. Etherington (1957) | General Counsel since 2007 and Senior Vice President since 2006 | Attorney, ACC (February 1994 to present); Vice President, ACC (November 2005 to present); General Counsel, ACC (March 2007 to present). Also serves as General Counsel, ACIM, ACS, ACIS and other ACC subsidiaries; and Senior Vice President, ACIM and ACS |
| C. Jean Wade (1964) | Vice President, Treasurer and Chief Financial Officer since 2012 | Vice President, ACS (February 2000 to present) |
| Robert J. Leach (1966) | Vice President since 2006 and Assistant Treasurer since 2012 | Vice President, ACS (February 2000 to present) |
| David H. Reinmiller (1963) | Vice President since 2000 | Attorney, ACC (January 1994 to present); Associate General Counsel, ACC (January 2001 to present). Also serves as Vice President, ACIM and ACS |
| Ward D. Stauffer (1960) | Secretary since 2005 | Attorney, ACC (June 2003 to present) |
41
| Approval of Management Agreement |
At a meeting held on June 30, 2015, the Funds’ Board of Directors unanimously approved the renewal of the management agreement pursuant to which American Century Investment Management, Inc. (the “Advisor”) acts as the investment advisor for the Funds. Under Section
15(c) of the Investment Company Act, contracts for investment advisory services are required to be reviewed, evaluated, and approved by a majority of a funds’ directors (the “Directors”), including a majority of the independent Directors, each year.
Prior to its consideration of the renewal of the management agreement, the Directors requested and reviewed extensive data and information compiled by the Advisor and certain independent providers of evaluation data concerning the Funds and the services provided to the Funds by the Advisor. This review was in addition to the oversight and evaluation undertaken by the Board and its committees on a continuous basis and the information received was supplemental to the extensive information that the Board and its committees receive and consider throughout the year.
In connection with its consideration of the renewal of the management agreement, the Board’s review and evaluation of the services provided by the Advisor included, but was not limited to, the following:
| • | the nature, extent, and quality of investment management, shareholder services, and other services provided by the Advisor to each Fund; |
| • | the wide range of other programs and services the Advisor provides to each Fund and its shareholders on a routine and non-routine basis; |
| • | each Fund’s investment performance compared to appropriate benchmarks and/or a peer group of other mutual funds with similar investment objectives and strategies; |
| • | the cost of owning each Fund compared to the cost of owning similar funds; |
| • | the Advisor’s compliance policies, procedures, and regulatory experience; |
| • | financial data showing the cost of services provided to each Fund, the profitability of each Fund to the Advisor, and the overall profitability of the Advisor; |
| • | possible economies of scale associated with the Advisor’s management of the Funds and other accounts under its management; |
| • | data comparing services provided and charges to other investment management clients of the Advisor; |
| • | acquired fund fees and expenses; |
| • | payments to intermediaries by each Fund and the Advisor; and |
| • | any collateral benefits derived by the Advisor from the management of the Funds. |
In keeping with their practice, the Directors held two in-person meetings and one telephonic meeting to review and discuss the information provided. The independent Directors also had the benefit of the advice of their independent counsel throughout the process.
Factors Considered
The Directors considered all of the information provided by the Advisor, the independent data providers, and independent counsel, and evaluated such information for each Fund. In connection with their review, the Directors did not identify any single factor as being all-important or controlling, and each Director may have attributed different levels of importance to different factors. In deciding to renew the management agreement, the Board based its decision on a number of factors, including the following:
Nature, Extent and Quality of Services - Generally. Under the management agreement, the Advisor is responsible for providing or arranging for all services necessary for the operation of each Fund. The Board noted that under the management agreement, the Advisor provides or arranges at its own expense a wide variety of services including:
42
| • | constructing and designing each Fund |
| • | portfolio research and security selection |
| • | initial capitalization/funding |
| • | securities trading |
| • | Fund administration |
| • | custody of Fund assets |
| • | daily valuation of each Fund’s portfolio |
| • | shareholder servicing and transfer agency, including shareholder confirmations, recordkeeping, and communications |
| • | legal services (except the independent Directors’ counsel) |
| • | regulatory and portfolio compliance |
| • | financial reporting |
| • | marketing and distribution (except Rule 12b-1 plans) |
The Board noted that many of these services have expanded over time both in terms of quantity and complexity in response to shareholder demands, competition in the industry, changing distribution channels, and the changing regulatory environment.
Investment Management Services. The nature of the investment management services provided to the Funds is quite complex and allows fund shareholders access to professional money management, instant diversification of their investments within an asset class, the opportunity to easily diversify among asset classes by investing in or exchanging among various American Century Investments funds, and liquidity. In evaluating investment performance, the Board expects the Advisor to manage each Fund in accordance with its investment objectives and approved strategies. Further, the Directors recognize that the Advisor has an obligation to monitor trading activities, and in particular to seek the best execution of fund trades, and to evaluate the use of and payment for research. In providing these services, the Advisor utilizes teams of investment professionals (portfolio managers, analysts, research assistants, and securities traders) who require extensive information technology, research, training, compliance, and other systems to conduct their business. The Board, directly and through its Fund Performance Review Committee, regularly reviews investment performance information for each Fund, together with comparative information for appropriate benchmarks and/or peer groups of similarly-managed funds, over different time horizons. The Directors also review detailed performance information during the management agreement approval process. If performance concerns are identified with respect to a fund, the Fund receives special reviews until performance improves, during which the Board discusses with the Advisor the reasons for such results (e.g., market conditions, security selection) and any efforts being undertaken to improve performance. The performance for each Fund was above its respective benchmark for the one-, three-, five-, and ten-year periods reviewed by the Board. Taking all of these factors into consideration, the Board found the investment management services provided to each Fund by the Advisor to be satisfactory and consistent with the management agreement.
Shareholder and Other Services. Under the management agreement, the Advisor provides the Funds with a comprehensive package of transfer agency, shareholder, and other services. The Board, directly and through various committees of the Board, regularly reviews reports and evaluations of such services at its regular meetings. These reports include, but are not limited to, information regarding the operational efficiency and accuracy of the shareholder and transfer agency services provided, staffing levels, shareholder satisfaction (as measured by external as well as internal sources), technology support, new products and services offered to fund shareholders, securities trading activities, portfolio valuation services, auditing services, and legal and operational compliance activities. The Board particularly noted the Advisor’s continual efforts to maintain effective business continuity plans and to address cybersecurity threats. Certain aspects of shareholder and transfer agency service level efficiency and the quality of securities trading activities are measured by independent third party providers and are presented in comparison to other fund groups not managed by the Advisor. The Board found the services provided by the Advisor to the Funds under the management agreement to be competitive and of high quality.
43
Costs of Services and Profitability. The Advisor provides detailed information concerning its cost of providing various services to the Funds, its profitability in managing each Fund (pre- and post- distribution), its overall profitability, and its financial condition. The Directors have reviewed with the Advisor the methodology used to prepare this financial information. This information is considered in evaluating the Advisor’s financial condition, its ability to continue to provide services to the Funds, and the reasonableness of the current management agreement. The Board concluded that the Advisor’s profits were reasonable in light of the services provided to the Funds.
Ethics. The Board generally considers the Advisor’s commitment to providing quality services to shareholders and to conducting its business ethically. They noted that the Advisor’s practices generally meet or exceed industry best practices.
Economies of Scale. The Board also reviewed information provided by the Advisor regarding the possible existence of economies of scale in connection with the management of each Fund. The Board concluded that economies of scale are difficult to measure and predict with precision, especially on a fund-by-fund basis. The Board concluded that the Advisor is appropriately sharing economies of scale through its competitive fee structure, offering competitive fees from fund inception, and through reinvestment in its business to provide shareholders additional content and services.
Comparison to Other Funds’ Fees. The Funds invest their non-cash assets entirely in other American Century Investments funds. The Funds do not pay an investment advisory fee to the Advisor. Rather, each Fund indirectly bears its pro rata share of the expenses incurred by the underlying funds. Each of the underlying funds pay the Advisor a single, all-inclusive (or unified) management fee for providing all services necessary for the management and operation of the fund, other than brokerage expenses, taxes, interest, extraordinary expenses, and the fees and expenses of the fund’s independent directors (including their independent legal counsel), as well as expenses incurred in connection with the provision of shareholder services and distribution services under a plan adopted pursuant to Rule 12b-1 under the 1940 Act. The Board concluded that the underlying fund expenses incurred by each Fund were reasonable in light of the services provided to each Fund.
Comparison to Fees and Services Provided to Other Clients of the Advisor. The Directors also requested and received information from the Advisor concerning the nature of the services, fees, costs, and profitability of its advisory services to advisory clients other than the Funds. They observed that these varying types of client accounts require different services and involve different regulatory and entrepreneurial risks than the management of each Fund. The Board analyzed this information and concluded that the fees charged and services provided to the Funds were reasonable by comparison.
Payments to Intermediaries. The Directors also requested and received a description of payments made to intermediaries by each Fund and the Advisor. These payments include various payments made by each Fund or the Advisor to different types of intermediaries and recordkeepers for distribution and service activities provided for each Fund. The Board reviewed such information and found the payments to be reasonable in scope and purpose.
Collateral or “Fall-Out” Benefits Derived by the Advisor. The Board considered the existence of collateral benefits the Advisor may receive as a result of its relationship with the Funds. They concluded that the Advisor’s primary business is managing mutual funds and it generally does not use fund or shareholder information to generate profits in other lines of business, and therefore does not derive any significant collateral benefits from them. The Board noted that additional assets from other clients may offer the Advisor some benefit from increased leverage with service providers and counterparties. Additionally, the Advisor receives proprietary research from broker-dealers that execute fund portfolio transactions, which the Board concluded is likely to benefit other clients of the Advisor as well as fund shareholders. The Board also determined that the Advisor is
44
able to provide investment management services to certain clients other than the Funds, at least in part, due to its existing infrastructure built to serve the fund complex.
Existing Relationship. The Board also considered whether there was any reason for not continuing the existing arrangement with the Advisor. In this regard, the Board was mindful of the potential disruptions of the Funds’ operations and various risks, uncertainties, and other effects that could occur as a result of a decision not to continue such relationship. In particular, the Board recognized that most shareholders have invested in the Funds on the strength of the Advisor’s industry standing and reputation and in the expectation that the Advisor will have a continuing role in providing advisory services to each Fund.
Conclusion of the Directors. As a result of this process, the Board, including all of the independent Directors, taking into account all of the factors discussed above and the information provided by the Advisor and others in connection with its review and throughout the year, determined that the management agreement between the Funds and the Advisor is fair and reasonable in light of the services provided and should be renewed.
45
| Additional Information |
Retirement Account Information
As required by law, distributions you receive from certain IRAs are subject to federal income tax withholding, unless you elect not to have withholding apply. Tax will be withheld on the total amount withdrawn even though you may be receiving amounts that are not subject to withholding, such as nondeductible contributions. In such case, excess amounts of withholding could occur. You may adjust your withholding election so that a greater or lesser amount will be withheld.
If you don’t want us to withhold on this amount, you must notify us to not withhold the federal income tax. You may notify us in writing or in certain situations by telephone or through other electronic means. For systematic withdrawals, your withholding election will remain in effect until revoked or changed by filing a new election. You have the right to revoke your election at any time.
Remember, even if you elect not to have income tax withheld, you are liable for paying income tax on the taxable portion of your withdrawal. If you elect not to have income tax withheld or you don’t have enough income tax withheld, you may be responsible for payment of estimated tax. You may incur penalties under the estimated tax rules if your withholding and estimated tax payments are not sufficient. You can reduce or defer the income tax on a distribution by directly or indirectly rolling such distribution over to another IRA or eligible plan. You should consult your tax advisor for additional information.
State tax will be withheld if, at the time of your distribution, your address is within one of the mandatory withholding states and you have federal income tax withheld (or as otherwise required by state law). State taxes will be withheld from your distribution in accordance with the respective state rules.
Distributions you receive from 403(b), 457 and qualified plans are subject to special tax and withholding rules. Your plan administrator or plan sponsor is required to provide you with a special tax notice explaining those rules at the time you request a distribution. If applicable, federal and/or state taxes may be withheld from your distribution amount.
Proxy Voting Policies
A description of the policies that the funds’ investment advisor uses in exercising the voting rights associated with the securities purchased and/or held by the funds is available without charge, upon request, by calling 1-800-345-2021. It is also available on the “About Us” page of American Century Investments’ website at americancentury.com and on the Securities and Exchange Commission’s
website at sec.gov. Information regarding how the investment advisor voted proxies relating to portfolio securities during the most recent 12-month period ended June 30 is available on the “About Us” page at americancentury.com. It is also available at sec.gov.
Quarterly Portfolio Disclosure
The funds file their complete schedule of portfolio holdings with the Securities and Exchange Commission (SEC) for the first and third quarters of each fiscal year on Form N-Q. The funds’ Forms N-Q are available on the SEC’s website at sec.gov, and may be reviewed and copied at the SEC’s Public Reference Room in Washington, DC. Information on the operation of the Public Reference Room may be obtained by calling 1-800-SEC-0330. The funds also make their complete
schedule of portfolio holdings for the most recent quarter of their fiscal year available on their website at americancentury.com and, upon request, by calling 1-800-345-2021.
46
Other Tax Information
The following information is provided pursuant to provisions of the Internal Revenue Code.
The funds hereby designate up to the maximum amount allowable as qualified dividend income for the fiscal year ended July 31, 2015.
For corporate taxpayers, the funds hereby designate the following, or up to the maximum amount allowable, of ordinary income distributions paid during the fiscal year ended July 31, 2015 as qualified for the corporate dividends received deduction.
One Choice Portfolio: Very Conservative | One Choice Portfolio: Conservative | One Choice Portfolio: Moderate | One Choice Portfolio: Aggressive | One Choice Portfolio: Very Aggressive |
| $1,180,750 | $4,673,621 | $9,331,257 | $6,885,563 | $3,357,209 |
The funds hereby designate the following as qualified short-term capital gain distributions for purposes of Internal Revenue Code Section 871 for the fiscal year ended July 31, 2015.
One Choice Portfolio: Very Conservative | One Choice Portfolio: Conservative | One Choice Portfolio: Moderate | One Choice Portfolio: Aggressive | One Choice Portfolio: Very Aggressive |
| $770,761 | — | — | $492,740 | — |
The funds hereby designate the following, or up to the maximum amount allowable, as long-term capital gain distributions for the fiscal year ended July 31, 2015.
One Choice Portfolio: Very Conservative | One Choice Portfolio: Conservative | One Choice Portfolio: Moderate | One Choice Portfolio: Aggressive | One Choice Portfolio: Very Aggressive |
| $5,527,061 | $8,559,541 | $1,963,526 | $13,905,515 | $4,213,270 |
For the fiscal year ended July 31, 2015, the funds intend to pass through to shareholders the following foreign source income and foreign taxes paid, or up to the maximum amount allowable, as a foreign tax credit.
| Foreign Tax Credit | Foreign Source Income | |||||||
| Amount | Per Outstanding Share | Amount | Per Outstanding Share | |||||
| One Choice Portfolio: Very Conservative | — | — | — | — | ||||
| One Choice Portfolio: Conservative | $ | 75,504 | 0.0010 | $ | 367,029 | 0.0049 | ||
| One Choice Portfolio: Moderate | $ | 193,836 | 0.0018 | $ | 942,252 | 0.0089 | ||
| One Choice Portfolio: Aggressive | $ | 169,598 | 0.0026 | $ | 824,427 | 0.0127 | ||
| One Choice Portfolio: Very Aggressive | $ | 54,725 | 0.0038 | $ | 266,023 | 0.0183 | ||
The funds utilized the following earnings and profits distributed to shareholders on redemption of shares as part of the dividends paid deduction (tax equalization).
One Choice Portfolio: Very Conservative | One Choice Portfolio: Conservative | One Choice Portfolio: Moderate | One Choice Portfolio: Aggressive | One Choice Portfolio: Very Aggressive |
| $1,315,807 | — | — | — | $4,697,806 |
47
| Notes |
48
| ||
| Contact Us | americancentury.com | |
| Automated Information Line | 1-800-345-8765 | |
| Investor Services Representative | 1-800-345-2021 or 816-531-5575 | |
| Investors Using Advisors | 1-800-378-9878 | |
| Business, Not-For-Profit, Employer-Sponsored Retirement Plans | 1-800-345-3533 | |
| Banks and Trust Companies, Broker-Dealers, Financial Professionals, Insurance Companies | 1-800-345-6488 | |
| Telecommunications Relay Services for the Deaf | 711 | |
| American Century Asset Allocation Portfolios, Inc. | ||
Investment Advisor: American Century Investment Management, Inc. Kansas City, Missouri | ||
| This report and the statements it contains are submitted for the general information of our shareholders. The report is not authorized for distribution to prospective investors unless preceded or accompanied by an effective prospectus. | ||
©2015 American Century Proprietary Holdings, Inc. All rights reserved. CL-ANN-86671 1509 | ||
| ANNUAL REPORT | JULY 31, 2015 |
One Choice® In Retirement Portfolio
One Choice® 2020 Portfolio
One Choice® 2025 Portfolio
One Choice® 2030 Portfolio
One Choice® 2035 Portfolio
One Choice® 2040 Portfolio
One Choice® 2045 Portfolio
One Choice® 2050 Portfolio
One Choice® 2055 Portfolio
| Table of Contents |
| President’s Letter | ||
| Performance | 3 | |
| Portfolio Commentary | ||
| Portfolio Characteristics | ||
| Shareholder Fee Examples | ||
| Schedules of Investments | ||
| Statements of Assets and Liabilities | ||
| Statements of Operations | ||
| Statements of Changes in Net Assets | ||
| Notes to Financial Statements | ||
| Financial Highlights | ||
| Report of Independent Registered Public Accounting Firm | ||
| Management | ||
| Approval of Management Agreements | ||
| Additional Information | ||
Any opinions expressed in this report reflect those of the author as of the date of the report, and do not necessarily represent the opinions of American Century Investments® or any other person in the American Century Investments organization. Any such opinions are subject to change at any time based upon market or other conditions and American Century Investments disclaims any responsibility to update such opinions. These opinions may not be relied upon as investment advice and, because investment decisions made by American Century Investments funds are based on numerous factors, may not be relied upon as an indication of trading intent on behalf of any American Century Investments fund. Security examples are used for representational purposes only and are not intended as recommendations to purchase or sell securities. Performance information for comparative indices and securities is provided to American Century Investments by third party vendors. To the best of American Century Investments’ knowledge, such information is accurate at the time of printing.
| President’s Letter |
| Dear Investor: Thank you for reviewing this annual report for the 12 months ended July 31, 2015. It provides investment performance and portfolio information for the reporting period, plus longer-term historical performance data. Annual reports remain important vehicles for conveying information about fund returns, including market and economic factors that affected performance during the reporting period. For additional, updated investment and market insights, we encourage you to visit our website, americancentury.com. |
| Jonathan Thomas | |
Global Divergence Helped Trigger Market Volatility
“Global divergence” between the U.S. and the rest of the world emerged as a prevalent theme during the reporting period. This theme embraced not only the relatively stronger economic growth enjoyed by the U.S. compared with most of the world, but also the related contrast between the U.S. Federal Reserve’s unwinding of monetary stimulus compared with the continuation and expansion of stimulus by other major central banks. These central bank moves helped trigger big swings in market returns.
In October 2014, the U.S. Federal Reserve ended its latest bond-buying program (quantitative easing, QE). But while QE was ending in the U.S., other major central banks were starting or increasing QE as their economies faltered. This divergence helped fuel increased demand for the U.S. dollar and U.S. dollar-denominated assets, and put downward pressure on commodities prices, most notably oil. Low inflation also prevailed, after crude oil prices plunged amid muted demand for commodities in general. In this environment, the U.S. dollar, U.S. stocks, and longer-maturity U.S. Treasuries generally benefited from “flight to quality” capital flows, reinforced by geopolitical and financial turmoil, particularly in Russia/Ukraine, Greece, China, and the Middle East.
We expect more monetary policy divergence between the U.S. and other major developed economies in the coming months, accompanied by continued market volatility. This could present both challenges and opportunities for active investment managers. Upward pressures on inflation and interest rates could develop as the massive amount of global monetary stimulus in progress takes hold and economies improve. In this environment, we continue to believe in a disciplined, diversified, long-term investment approach, using professionally managed stock and bond portfolios to meet financial goals. We appreciate your continued trust in us.
Sincerely,
Jonathan Thomas
President and Chief Executive Officer
American Century Investments
2
| Performance |
| Total Returns as of July 31, 2015 | ||||||
| Average Annual Returns | ||||||
Ticker Symbol | 1 year | 5 years | 10 years | Since Inception | Inception Date | |
| One Choice In Retirement Portfolio | ||||||
| Investor Class | ARTOX | 3.66% | 7.88% | 5.55% | 5.83% | 8/31/04 |
| S&P Target Date Retirement Income Index | — | 3.27% | 5.90% | 4.57% | 4.87% | — |
| Institutional Class | ATTIX | 3.79% | 8.10% | 5.76% | 6.04% | 8/31/04 |
A Class(1) | ARTAX | 8/31/04 | ||||
| No sales charge* | 3.39% | 7.61% | 5.29% | 5.57% | ||
| With sales charge* | -2.52% | 6.34% | 4.67% | 4.99% | ||
| C Class | ATTCX | 2.59% | 6.82% | — | 6.57% | 3/1/10 |
| R Class | ARSRX | 3.13% | 7.34% | 5.02% | 5.29% | 8/31/04 |
| * | Sales charges include initial sales charges and contingent deferred sales charges (CDSCs), as applicable. A Class shares have a 5.75% maximum initial sales charge and may be subject to a maximum CDSC of 1.00%. C Class shares redeemed within 12 months of purchase are subject to a maximum CDSC of 1.00%. The SEC requires that mutual funds provide performance information net of maximum sales charges in all cases where charges could be applied. |
| (1) | Prior to March 1, 2010, the A Class was referred to as the Advisor Class and did not have a front-end sales charge. Performance prior to that date has been adjusted to reflect this charge. |
A One Choice Target Date Portfolio's target date is the approximate year when investors plan to retire or start withdrawing their money. The principal value of the investment is not guaranteed at any time, including at the target date.
Data presented reflect past performance. Past performance is no guarantee of future
results. Current performance may be higher or lower than the performance shown.
Investment return and principal value will fluctuate, and redemption value may be more or
less than original cost. Data assumes reinvestment of dividends and capital gains, and
none of the charts reflect the deduction of taxes that a shareholder would pay on fund
distributions or the redemption of fund shares. To obtain performance data current to the
most recent month end, please call 1-800-345-2021 or visit americancentury.com. For
additional information about the funds, please consult the prospectus.
3
| Total Returns as of July 31, 2015 | |||||
| Average Annual Returns | |||||
Ticker Symbol | 1 year | 5 years | Since Inception | Inception Date | |
| One Choice 2020 Portfolio | |||||
| Investor Class | ARBVX | 4.14% | 8.68% | 5.38% | 5/30/08 |
| S&P Target Date To 2020 Index | — | 3.87% | 7.69% | 4.69% | — |
| Institutional Class | ARBSX | 4.35% | 8.89% | 5.59% | 5/30/08 |
A Class(1) | ARBMX | 5/30/08 | |||
| No sales charge* | 3.97% | 8.42% | 5.12% | ||
| With sales charge* | -2.04% | 7.14% | 4.26% | ||
| C Class | ARNCX | 3.09% | 7.61% | 7.31% | 3/1/10 |
| R Class | ARBRX | 3.62% | 8.14% | 4.85% | 5/30/08 |
| * | Sales charges include initial sales charges and contingent deferred sales charges (CDSCs), as applicable. A Class shares have a 5.75% maximum initial sales charge and may be subject to a maximum CDSC of 1.00%. C Class shares redeemed within 12 months of purchase are subject to a maximum CDSC of 1.00%. The SEC requires that mutual funds provide performance information net of maximum sales charges in all cases where charges could be applied. |
| (1) | Prior to March 1, 2010, the A Class was referred to as the Advisor Class and did not have a front-end sales charge. Performance prior to that date has been adjusted to reflect this charge. |
A One Choice Target Date Portfolio's target date is the approximate year when investors plan to retire or start withdrawing their money. The principal value of the investment is not guaranteed at any time, including at the target date.
Data presented reflect past performance. Past performance is no guarantee of future
results. Current performance may be higher or lower than the performance shown.
Investment return and principal value will fluctuate, and redemption value may be more or
less than original cost. Data assumes reinvestment of dividends and capital gains, and
none of the charts reflect the deduction of taxes that a shareholder would pay on fund
distributions or the redemption of fund shares. To obtain performance data current to the
most recent month end, please call 1-800-345-2021 or visit americancentury.com. For
additional information about the funds, please consult the prospectus.
4
| Total Returns as of July 31, 2015 | ||||||
| Average Annual Returns | ||||||
Ticker Symbol | 1 year | 5 years | 10 years | Since Inception | Inception Date | |
| One Choice 2025 Portfolio | ||||||
| Investor Class | ARWIX | 4.62% | 9.26% | 6.16% | 6.87% | 8/31/04 |
| S&P Target Date To 2025 Index | — | 4.17% | 8.49% | N/A(1) | N/A(1) | — |
| S&P Target Date 2025 Index | — | 5.04% | 9.78% | 5.96% | 6.66% | — |
| Institutional Class | ARWFX | 4.90% | 9.49% | 6.38% | 7.08% | 8/31/04 |
A Class(2) | ARWAX | 8/31/04 | ||||
| No sales charge* | 4.36% | 8.98% | 5.90% | 6.60% | ||
| With sales charge* | -1.66% | 7.69% | 5.28% | 6.03% | ||
| C Class | ARWCX | 3.64% | 8.18% | — | 7.83% | 3/1/10 |
| R Class | ARWRX | 4.17% | 8.72% | 5.63% | 6.34% | 8/31/04 |
| * | Sales charges include initial sales charges and contingent deferred sales charges (CDSCs), as applicable. A Class shares have a 5.75% maximum initial sales charge and may be subject to a maximum CDSC of 1.00%. C Class shares redeemed within 12 months of purchase are subject to a maximum CDSC of 1.00%. The SEC requires that mutual funds provide performance information net of maximum sales charges in all cases where charges could be applied. |
| (1) | Benchmark data first available May 2007. |
| (2) | Prior to March 1, 2010, the A Class was referred to as the Advisor Class and did not have a front-end sales charge. Performance prior to that date has been adjusted to reflect this charge. |
A One Choice Target Date Portfolio's target date is the approximate year when investors plan to retire or start withdrawing their money. The principal value of the investment is not guaranteed at any time, including at the target date.
Data presented reflect past performance. Past performance is no guarantee of future
results. Current performance may be higher or lower than the performance shown.
Investment return and principal value will fluctuate, and redemption value may be more or
less than original cost. Data assumes reinvestment of dividends and capital gains, and
none of the charts reflect the deduction of taxes that a shareholder would pay on fund
distributions or the redemption of fund shares. To obtain performance data current to the
most recent month end, please call 1-800-345-2021 or visit americancentury.com. For
additional information about the funds, please consult the prospectus.
5
| Total Returns as of July 31, 2015 | |||||
| Average Annual Returns | |||||
Ticker Symbol | 1 year | 5 years | Since Inception | Inception Date | |
| One Choice 2030 Portfolio | |||||
| Investor Class | ARCVX | 5.43% | 9.93% | 5.58% | 5/30/08 |
| S&P Target Date To 2030 Index | — | 4.44% | 9.25% | 4.85% | — |
| Institutional Class | ARCSX | 5.73% | 10.14% | 5.78% | 5/30/08 |
A Class(1) | ARCMX | 5/30/08 | |||
| No sales charge* | 5.18% | 9.65% | 5.30% | ||
| With sales charge* | -0.89% | 8.37% | 4.43% | ||
| C Class | ARWOX | 4.46% | 8.83% | 8.39% | 3/1/10 |
| R Class | ARCRX | 4.99% | 9.38% | 5.05% | 5/30/08 |
| * | Sales charges include initial sales charges and contingent deferred sales charges (CDSCs), as applicable. A Class shares have a 5.75% maximum initial sales charge and may be subject to a maximum CDSC of 1.00%. C Class shares redeemed within 12 months of purchase are subject to a maximum CDSC of 1.00%. The SEC requires that mutual funds provide performance information net of maximum sales charges in all cases where charges could be applied. |
| (1) | Prior to March 1, 2010, the A Class was referred to as the Advisor Class and did not have a front-end sales charge. Performance prior to that date has been adjusted to reflect this charge. |
A One Choice Target Date Portfolio's target date is the approximate year when investors plan to retire or start withdrawing their money. The principal value of the investment is not guaranteed at any time, including at the target date.
Data presented reflect past performance. Past performance is no guarantee of future
results. Current performance may be higher or lower than the performance shown.
Investment return and principal value will fluctuate, and redemption value may be more or
less than original cost. Data assumes reinvestment of dividends and capital gains, and
none of the charts reflect the deduction of taxes that a shareholder would pay on fund
distributions or the redemption of fund shares. To obtain performance data current to the
most recent month end, please call 1-800-345-2021 or visit americancentury.com. For
additional information about the funds, please consult the prospectus.
6
| Total Returns as of July 31, 2015 | ||||||
| Average Annual Returns | ||||||
Ticker Symbol | 1 year | 5 years | 10 years | Since Inception | Inception Date | |
| One Choice 2035 Portfolio | ||||||
| Investor Class | ARYIX | 6.25% | 10.70% | 6.62% | 7.47% | 8/31/04 |
| S&P Target Date To 2035 Index | — | 4.64% | 9.91% | N/A(1) | N/A(1) | — |
| S&P Target Date 2035 Index | — | 5.62% | 10.97% | 6.18% | 6.99% | — |
| Institutional Class | ARLIX | 6.52% | 10.94% | 6.83% | 7.69% | 8/31/04 |
A Class(2) | ARYAX | 8/31/04 | ||||
| No sales charge* | 5.98% | 10.44% | 6.34% | 7.21% | ||
| With sales charge* | -0.11% | 9.15% | 5.71% | 6.63% | ||
| C Class | ARLCX | 5.25% | 9.61% | — | 9.08% | 3/1/10 |
| R Class | ARYRX | 5.71% | 10.15% | 6.08% | 6.94% | 8/31/04 |
| * | Sales charges include initial sales charges and contingent deferred sales charges (CDSCs), as applicable. A Class shares have a 5.75% maximum initial sales charge and may be subject to a maximum CDSC of 1.00%. C Class shares redeemed within 12 months of purchase are subject to a maximum CDSC of 1.00%. The SEC requires that mutual funds provide performance information net of maximum sales charges in all cases where charges could be applied. |
| (1) | Benchmark data first available May 2007. |
| (2) | Prior to March 1, 2010, the A Class was referred to as the Advisor Class and did not have a front-end sales charge. Performance prior to that date has been adjusted to reflect this charge. |
A One Choice Target Date Portfolio's target date is the approximate year when investors plan to retire or start withdrawing their money. The principal value of the investment is not guaranteed at any time, including at the target date.
Data presented reflect past performance. Past performance is no guarantee of future
results. Current performance may be higher or lower than the performance shown.
Investment return and principal value will fluctuate, and redemption value may be more or
less than original cost. Data assumes reinvestment of dividends and capital gains, and
none of the charts reflect the deduction of taxes that a shareholder would pay on fund
distributions or the redemption of fund shares. To obtain performance data current to the
most recent month end, please call 1-800-345-2021 or visit americancentury.com. For
additional information about the funds, please consult the prospectus.
7
| Total Returns as of July 31, 2015 | |||||
| Average Annual Returns | |||||
Ticker Symbol | 1 year | 5 years | Since Inception | Inception Date | |
| One Choice 2040 Portfolio | |||||
| Investor Class | ARDVX | 6.84% | 11.44% | 6.16% | 5/30/08 |
| S&P Target Date To 2040 Index | — | 4.79% | 10.49% | 5.02% | — |
| Institutional Class | ARDSX | 7.05% | 11.65% | 6.36% | 5/30/08 |
A Class(1) | ARDMX | 5/30/08 | |||
| No sales charge* | 6.57% | 11.15% | 5.89% | ||
| With sales charge* | 0.47% | 9.85% | 5.02% | ||
| C Class | ARNOX | 5.77% | 10.32% | 9.68% | 3/1/10 |
| R Class | ARDRX | 6.31% | 10.89% | 5.63% | 5/30/08 |
| * | Sales charges include initial sales charges and contingent deferred sales charges (CDSCs), as applicable. A Class shares have a 5.75% maximum initial sales charge and may be subject to a maximum CDSC of 1.00%. C Class shares redeemed within 12 months of purchase are subject to a maximum CDSC of 1.00%. The SEC requires that mutual funds provide performance information net of maximum sales charges in all cases where charges could be applied. |
| (1) | Prior to March 1, 2010, the A Class was referred to as the Advisor Class and did not have a front-end sales charge. Performance prior to that date has been adjusted to reflect this charge. |
A One Choice Target Date Portfolio's target date is the approximate year when investors plan to retire or start withdrawing their money. The principal value of the investment is not guaranteed at any time, including at the target date.
Data presented reflect past performance. Past performance is no guarantee of future
results. Current performance may be higher or lower than the performance shown.
Investment return and principal value will fluctuate, and redemption value may be more or
less than original cost. Data assumes reinvestment of dividends and capital gains, and
none of the charts reflect the deduction of taxes that a shareholder would pay on fund
distributions or the redemption of fund shares. To obtain performance data current to the
most recent month end, please call 1-800-345-2021 or visit americancentury.com. For
additional information about the funds, please consult the prospectus.
8
| Total Returns as of July 31, 2015 | ||||||
| Average Annual Returns | ||||||
Ticker Symbol | 1 year | 5 years | 10 years | Since Inception | Inception Date | |
| One Choice 2045 Portfolio | ||||||
| Investor Class | AROIX | 7.22% | 11.89% | 6.98% | 7.90% | 8/31/04 |
| S&P Target Date To 2045 Index | — | 4.91% | 11.01% | N/A(1) | N/A(1) | — |
S&P Target Date 2040 Index(2) | — | 5.78% | 11.35% | 6.28% | 7.13% | — |
| Institutional Class | AOOIX | 7.50% | 12.11% | 7.19% | 8.12% | 8/31/04 |
A Class(3) | AROAX | 8/31/04 | ||||
| No sales charge* | 6.96% | 11.61% | 6.71% | 7.63% | ||
| With sales charge* | 0.79% | 10.29% | 6.08% | 7.05% | ||
| C Class | AROCX | 6.21% | 10.76% | — | 10.11% | 3/1/10 |
| R Class | ARORX | 6.75% | 11.33% | 6.45% | 7.37% | 8/31/04 |
| * | Sales charges include initial sales charges and contingent deferred sales charges (CDSCs), as applicable. A Class shares have a 5.75% maximum initial sales charge and may be subject to a maximum CDSC of 1.00%. C Class shares redeemed within 12 months of purchase are subject to a maximum CDSC of 1.00%. The SEC requires that mutual funds provide performance information net of maximum sales charges in all cases where charges could be applied. |
| (1) | Benchmark data first available May 2007. |
| (2) | There is not an S&P Target Date 2045 (or longer) Index with history to cover the performance period since the fund's inception. The fund's investment advisor believes the S&P Target Date 2040 Index is a reasonable proxy for comparison purposes. |
| (3) | Prior to March 1, 2010, the A Class was referred to as the Advisor Class and did not have a front-end sales charge. Performance prior to that date has been adjusted to reflect this charge. |
A One Choice Target Date Portfolio's target date is the approximate year when investors plan to retire or start withdrawing their money. The principal value of the investment is not guaranteed at any time, including at the target date.
Data presented reflect past performance. Past performance is no guarantee of future
results. Current performance may be higher or lower than the performance shown.
Investment return and principal value will fluctuate, and redemption value may be more or
less than original cost. Data assumes reinvestment of dividends and capital gains, and
none of the charts reflect the deduction of taxes that a shareholder would pay on fund
distributions or the redemption of fund shares. To obtain performance data current to the
most recent month end, please call 1-800-345-2021 or visit americancentury.com. For
additional information about the funds, please consult the prospectus.
9
| Total Returns as of July 31, 2015 | |||||
| Average Annual Returns | |||||
Ticker Symbol | 1 year | 5 years | Since Inception | Inception Date | |
| One Choice 2050 Portfolio | |||||
| Investor Class | ARFVX | 7.37% | 12.12% | 6.09% | 5/30/08 |
| S&P Target Date To 2050 Index | — | 5.00% | 11.32% | 5.34% | — |
| Institutional Class | ARFSX | 7.58% | 12.35% | 6.31% | 5/30/08 |
A Class(1) | ARFMX | 5/30/08 | |||
| No sales charge* | 7.11% | 11.84% | 5.83% | ||
| With sales charge* | 0.97% | 10.53% | 4.96% | ||
| C Class | ARFDX | 6.30% | 10.99% | 10.28% | 3/1/10 |
| R Class | ARFWX | 6.84% | 11.55% | 5.56% | 5/30/08 |
| * | Sales charges include initial sales charges and contingent deferred sales charges (CDSCs), as applicable. A Class shares have a 5.75% maximum initial sales charge and may be subject to a maximum CDSC of 1.00%. C Class shares redeemed within 12 months of purchase are subject to a maximum CDSC of 1.00%. The SEC requires that mutual funds provide performance information net of maximum sales charges in all cases where charges could be applied. |
| (1) | Prior to March 1, 2010, the A Class was referred to as the Advisor Class and did not have a front-end sales charge. Performance prior to that date has been adjusted to reflect this charge. |
A One Choice Target Date Portfolio's target date is the approximate year when investors plan to retire or start withdrawing their money. The principal value of the investment is not guaranteed at any time, including at the target date.
Data presented reflect past performance. Past performance is no guarantee of future
results. Current performance may be higher or lower than the performance shown.
Investment return and principal value will fluctuate, and redemption value may be more or
less than original cost. Data assumes reinvestment of dividends and capital gains, and
none of the charts reflect the deduction of taxes that a shareholder would pay on fund
distributions or the redemption of fund shares. To obtain performance data current to the
most recent month end, please call 1-800-345-2021 or visit americancentury.com. For
additional information about the funds, please consult the prospectus.
10
| Total Returns as of July 31, 2015 | ||||
| Average Annual Returns | ||||
Ticker Symbol | 1 year | Since Inception | Inception Date | |
| One Choice 2055 Portfolio | ||||
| Investor Class | AREVX | 7.56% | 9.77% | 3/31/11 |
| S&P Target Date To 2055+ Index | — | 5.11% | 8.78% | — |
| Institutional Class | ARENX | 7.78% | 9.98% | 3/31/11 |
| A Class | AREMX | 3/31/11 | ||
| No sales charge* | 7.31% | 9.48% | ||
| With sales charge* | 1.17% | 7.99% | ||
| C Class | AREFX | 6.51% | 8.67% | 3/31/11 |
| R Class | AREOX | 7.11% | 9.24% | 3/31/11 |
| * | Sales charges include initial sales charges and contingent deferred sales charges (CDSCs), as applicable. A Class shares have a 5.75% maximum initial sales charge and may be subject to a maximum CDSC of 1.00%. C Class shares redeemed within 12 months of purchase are subject to a maximum CDSC of 1.00%. The SEC requires that mutual funds provide performance information net of maximum sales charges in all cases where charges could be applied. |
A One Choice Target Date Portfolio's target date is the approximate year when investors plan to retire or start withdrawing their money. The principal value of the investment is not guaranteed at any time, including at the target date.
Data presented reflect past performance. Past performance is no guarantee of future
results. Current performance may be higher or lower than the performance shown.
Investment return and principal value will fluctuate, and redemption value may be more or
less than original cost. Data assumes reinvestment of dividends and capital gains, and
none of the charts reflect the deduction of taxes that a shareholder would pay on fund
distributions or the redemption of fund shares. To obtain performance data current to the
most recent month end, please call 1-800-345-2021 or visit americancentury.com. For
additional information about the funds, please consult the prospectus.
11
| Growth of $10,000 Over 10 Years of One Choice In Retirement Portfolio — Investor Class |
| $10,000 investment made July 31, 2005 |
| Performance for other share classes will vary due to differences in fee structure. |
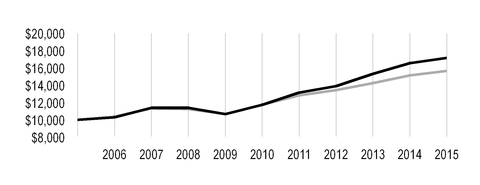
| Value on July 31, 2015 | |
| Investor Class — $17,164 | |
| S&P Target Date Retirement Income Index — $15,640 | |
A One Choice Target Date Portfolio's target date is the approximate year when investors plan to retire or start withdrawing their money. The principal value of the investment is not guaranteed at any time, including at the target date.
Data presented reflect past performance. Past performance is no guarantee of future
results. Current performance may be higher or lower than the performance shown.
Investment return and principal value will fluctuate, and redemption value may be more or
less than original cost. Data assumes reinvestment of dividends and capital gains, and
none of the charts reflect the deduction of taxes that a shareholder would pay on fund
distributions or the redemption of fund shares. To obtain performance data current to the
most recent month end, please call 1-800-345-2021 or visit americancentury.com. For
additional information about the funds, please consult the prospectus.
12
| Growth of $10,000 Over Life of One Choice 2020 Portfolio — Investor Class |
| $10,000 investment made May 30, 2008 |
| Performance for other share classes will vary due to differences in fee structure. |
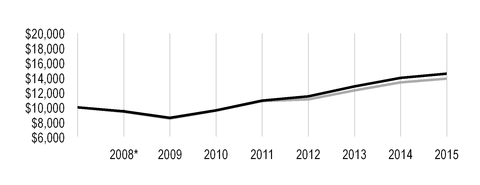
| Value on July 31, 2015 | |
| Investor Class — $14,567 | |
| S&P Target Date To 2020 Index — $13,888 | |
*From May 30, 2008, the Investor Class’s inception date. Not annualized.
A One Choice Target Date Portfolio's target date is the approximate year when investors plan to retire or start withdrawing their money. The principal value of the investment is not guaranteed at any time, including at the target date.
Data presented reflect past performance. Past performance is no guarantee of future
results. Current performance may be higher or lower than the performance shown.
Investment return and principal value will fluctuate, and redemption value may be more or
less than original cost. Data assumes reinvestment of dividends and capital gains, and
none of the charts reflect the deduction of taxes that a shareholder would pay on fund
distributions or the redemption of fund shares. To obtain performance data current to the
most recent month end, please call 1-800-345-2021 or visit americancentury.com. For
additional information about the funds, please consult the prospectus.
13
| Growth of $10,000 Over 10 Years of One Choice 2025 Portfolio — Investor Class* |
| $10,000 investment made July 31, 2005 |
| Performance for other share classes will vary due to differences in fee structure. |
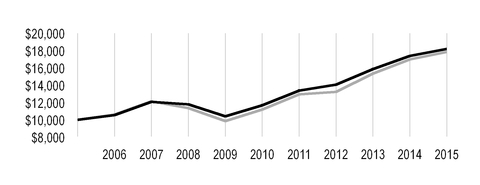
| Value on July 31, 2015 | |
| Investor Class — $18,191 | |
| S&P Target Date 2025 Index — $17,835 | |
* Since S&P Target Date To 2025 Index return data is only available from May 2007, it is not included in the
line chart.
A One Choice Target Date Portfolio's target date is the approximate year when investors plan to retire or start withdrawing their money. The principal value of the investment is not guaranteed at any time, including at the target date.
Data presented reflect past performance. Past performance is no guarantee of future
results. Current performance may be higher or lower than the performance shown.
Investment return and principal value will fluctuate, and redemption value may be more or
less than original cost. Data assumes reinvestment of dividends and capital gains, and
none of the charts reflect the deduction of taxes that a shareholder would pay on fund
distributions or the redemption of fund shares. To obtain performance data current to the
most recent month end, please call 1-800-345-2021 or visit americancentury.com. For
additional information about the funds, please consult the prospectus.
14
| Growth of $10,000 Over Life of One Choice 2030 Portfolio — Investor Class |
| $10,000 investment made May 30, 2008 |
| Performance for other share classes will vary due to differences in fee structure. |
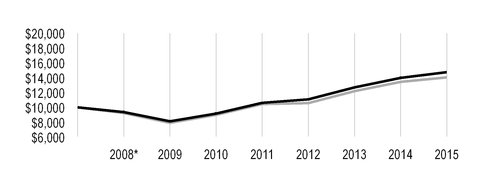
| Value on July 31, 2015 | |
| Investor Class — $14,757 | |
| S&P Target Date To 2030 Index — $14,039 | |
*From May 30, 2008, the Investor Class’s inception date. Not annualized.
A One Choice Target Date Portfolio's target date is the approximate year when investors plan to retire or start withdrawing their money. The principal value of the investment is not guaranteed at any time, including at the target date.
Data presented reflect past performance. Past performance is no guarantee of future
results. Current performance may be higher or lower than the performance shown.
Investment return and principal value will fluctuate, and redemption value may be more or
less than original cost. Data assumes reinvestment of dividends and capital gains, and
none of the charts reflect the deduction of taxes that a shareholder would pay on fund
distributions or the redemption of fund shares. To obtain performance data current to the
most recent month end, please call 1-800-345-2021 or visit americancentury.com. For
additional information about the funds, please consult the prospectus.
15
| Growth of $10,000 Over 10 Years of One Choice 2035 Portfolio — Investor Class* |
| $10,000 investment made July 31, 2005 |
| Performance for other share classes will vary due to differences in fee structure. |
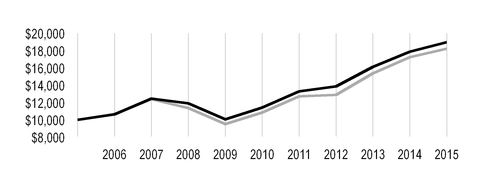
| Value on July 31, 2015 | |
| Investor Class — $18,984 | |
| S&P Target Date 2035 Index — $18,216 | |
* Since S&P Target Date To 2035 Index return data is only available from May 2007, it is not included in the
line chart.
A One Choice Target Date Portfolio's target date is the approximate year when investors plan to retire or start withdrawing their money. The principal value of the investment is not guaranteed at any time, including at the target date.
Data presented reflect past performance. Past performance is no guarantee of future
results. Current performance may be higher or lower than the performance shown.
Investment return and principal value will fluctuate, and redemption value may be more or
less than original cost. Data assumes reinvestment of dividends and capital gains, and
none of the charts reflect the deduction of taxes that a shareholder would pay on fund
distributions or the redemption of fund shares. To obtain performance data current to the
most recent month end, please call 1-800-345-2021 or visit americancentury.com. For
additional information about the funds, please consult the prospectus.
16
| Growth of $10,000 Over Life of One Choice 2040 Portfolio — Investor Class |
| $10,000 investment made May 30, 2008 |
| Performance for other share classes will vary due to differences in fee structure. |
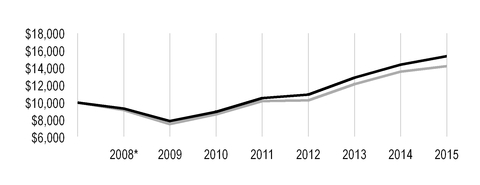
| Value on July 31, 2015 | |
| Investor Class — $15,352 | |
| S&P Target Date To 2040 Index — $14,209 | |
*From May 30, 2008, the Investor Class’s inception date. Not annualized.
A One Choice Target Date Portfolio's target date is the approximate year when investors plan to retire or start withdrawing their money. The principal value of the investment is not guaranteed at any time, including at the target date.
Data presented reflect past performance. Past performance is no guarantee of future
results. Current performance may be higher or lower than the performance shown.
Investment return and principal value will fluctuate, and redemption value may be more or
less than original cost. Data assumes reinvestment of dividends and capital gains, and
none of the charts reflect the deduction of taxes that a shareholder would pay on fund
distributions or the redemption of fund shares. To obtain performance data current to the
most recent month end, please call 1-800-345-2021 or visit americancentury.com. For
additional information about the funds, please consult the prospectus.
17
| Growth of $10,000 Over 10 Years of One Choice 2045 Portfolio — Investor Class* |
| $10,000 investment made July 31, 2005 |
| Performance for other share classes will vary due to differences in fee structure. |
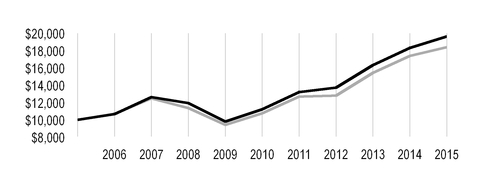
| Value on July 31, 2015 | |
| Investor Class — $19,640 | |
| S&P Target Date 2040 Index** — $18,385 | |
* Since S&P Target Date To 2045 Index return data is only available from May 2007, it is not included in the
line chart.
** There is not an S&P Target Date 2045 (or longer) Index with history to cover the performance period since
the fund's inception. The fund's investment advisor believes the S&P Target Date 2040 Index is a
reasonable proxy for comparison purposes.
A One Choice Target Date Portfolio's target date is the approximate year when investors plan to retire or start withdrawing their money. The principal value of the investment is not guaranteed at any time, including at the target date.
Data presented reflect past performance. Past performance is no guarantee of future
results. Current performance may be higher or lower than the performance shown.
Investment return and principal value will fluctuate, and redemption value may be more or
less than original cost. Data assumes reinvestment of dividends and capital gains, and
none of the charts reflect the deduction of taxes that a shareholder would pay on fund
distributions or the redemption of fund shares. To obtain performance data current to the
most recent month end, please call 1-800-345-2021 or visit americancentury.com. For
additional information about the funds, please consult the prospectus.
18
| Growth of $10,000 Over Life of One Choice 2050 Portfolio — Investor Class |
| $10,000 investment made May 30, 2008 |
| Performance for other share classes will vary due to differences in fee structure. |
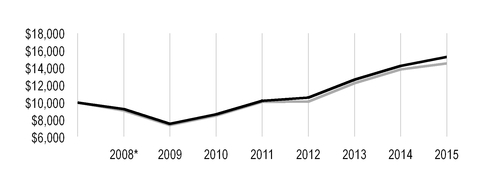
| Value on July 31, 2015 | |
| Investor Class — $15,283 | |
| S&P Target Date To 2050 Index — $14,522 | |
*From May 30, 2008, the Investor Class’s inception date. Not annualized.
A One Choice Target Date Portfolio's target date is the approximate year when investors plan to retire or start withdrawing their money. The principal value of the investment is not guaranteed at any time, including at the target date.
Data presented reflect past performance. Past performance is no guarantee of future
results. Current performance may be higher or lower than the performance shown.
Investment return and principal value will fluctuate, and redemption value may be more or
less than original cost. Data assumes reinvestment of dividends and capital gains, and
none of the charts reflect the deduction of taxes that a shareholder would pay on fund
distributions or the redemption of fund shares. To obtain performance data current to the
most recent month end, please call 1-800-345-2021 or visit americancentury.com. For
additional information about the funds, please consult the prospectus.
19
| Growth of $10,000 Over Life of One Choice 2055 Portfolio — Investor Class |
| $10,000 investment made March 31, 2011 |
| Performance for other share classes will vary due to differences in fee structure. |
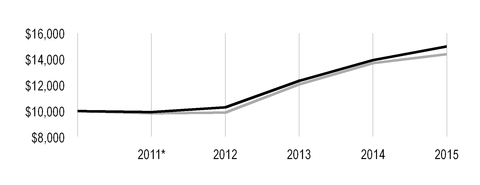
| Value on July 31, 2015 | |
| Investor Class — $14,981 | |
| S&P Target Date To 2055+ Index — $14,400 | |
*From March 31, 2011, the Investor Class’s inception date. Not annualized.
| Total Annual Fund Operating Expenses | |||||
| Investor Class | Institutional Class | A Class | C Class | R Class | |
| One Choice In Retirement Portfolio | 0.76% | 0.56% | 1.01% | 1.76% | 1.26% |
| One Choice 2020 Portfolio | 0.79% | 0.59% | 1.04% | 1.79% | 1.29% |
| One Choice 2025 Portfolio | 0.82% | 0.62% | 1.07% | 1.82% | 1.32% |
| One Choice 2030 Portfolio | 0.84% | 0.64% | 1.09% | 1.84% | 1.34% |
| One Choice 2035 Portfolio | 0.87% | 0.67% | 1.12% | 1.87% | 1.37% |
| One Choice 2040 Portfolio | 0.90% | 0.70% | 1.15% | 1.90% | 1.40% |
| One Choice 2045 Portfolio | 0.94% | 0.74% | 1.19% | 1.94% | 1.44% |
| One Choice 2050 Portfolio | 0.95% | 0.75% | 1.20% | 1.95% | 1.45% |
| One Choice 2055 Portfolio | 0.96% | 0.76% | 1.21% | 1.96% | 1.46% |
The total annual fund operating expenses shown is as stated in the fund’s prospectus current as of the date of this report. The prospectus may vary from the expense ratio shown elsewhere in this report because it is based on a different time period, includes acquired fund fees and expenses, and, if applicable, does not include fee waivers or expense reimbursements.
A One Choice Target Date Portfolio's target date is the approximate year when investors plan to retire or start withdrawing their money. The principal value of the investment is not guaranteed at any time, including at the target date.
Data presented reflect past performance. Past performance is no guarantee of future
results. Current performance may be higher or lower than the performance shown.
Investment return and principal value will fluctuate, and redemption value may be more or
less than original cost. Data assumes reinvestment of dividends and capital gains, and
none of the charts reflect the deduction of taxes that a shareholder would pay on fund
distributions or the redemption of fund shares. To obtain performance data current to the
most recent month end, please call 1-800-345-2021 or visit americancentury.com. For
additional information about the funds, please consult the prospectus.
20
| Portfolio Commentary |
Portfolio Managers: Scott Wittman, Rich Weiss, Scott Wilson, Radu Gabudean, and David MacEwen
The One Choice 2015 Portfolio was combined into the One Choice In Retirement Portfolio on March 27, 2015.
In March 2015, we made enhancements to the Portfolios’ underlying asset mixes by adding NT Disciplined Growth Fund, NT International Value Fund, NT International Small-Mid Cap Fund (except for In Retirement Portfolio), NT Global Real Estate Fund (replacing U.S. Real Estate Fund), and Global Bond Fund. There were no changes in the overall target equity, fixed-income, and cash allocations, which set each Portfolio’s broad risk/return profile. The enhancements were designed to align Portfolios with future growth opportunities, broaden the fixed-income allocation to hedge interest rate and currency risks, and help manage volatility while optimizing return potential.
Performance Summary
Each of the nine One Choice® Target Date Portfolios advanced for the fiscal year ended July 31, 2015, with returns ranging from 7.56%* for the One Choice 2055 Portfolio to 3.66% for the One Choice In Retirement Portfolio (see pages 3-20 for more detailed performance information). Returns for the 12-month period were driven primarily by strong performance of U.S.-based equities, which outperformed their non-U.S. counterparts.
Because of the Portfolios’ strategic exposure to a variety of asset classes, a review of the financial markets helps explain much of their performance.
Market Overview
Global equities endured substantial volatility during the fiscal year as markets contended with concerns about the pace and breadth of global growth, falling energy and commodity prices, and currency volatility as the U.S. dollar strengthened relative to most global currencies. Geopolitical instability also dominated headlines and unsettled markets, from unrest in the Middle East and conflict between Russia and Ukraine, to worries about Greece’s ability to repay its debts and the long-term sustainability of the European Union. Monetary policy divergence of global central banks was another key theme as the U.S. Federal Reserve’s (the Fed) quantitative easing (QE) program came to an end and the likelihood of impending interest rate hikes increased. Meanwhile, the European Central Bank (ECB) instituted a long-awaited QE program and central banks throughout Asia maintained aggressive stimulus policies. Overall, U.S. equities dominated returns, although outperformance was somewhat concentrated during the first half of the period. Non-U.S. equities took over leadership during the second half, but were unable to match the rally seen in U.S. stocks. Broad U.S. indices reached record levels during the period, bolstered by ongoing, if uneven, economic growth with declines in unemployment and gains in employment growth, improving consumer confidence, a strong housing market, and a pick-up in nonresidential construction. Outside of the U.S., while the ECB’s stimulative monetary policies bolstered markets and the European economy showed true signs of recovery, worries persisted about slowing growth and financial market instability in China and deflationary pressures in Japan. Growth equities led value stocks across all market capitalizations both in the U.S. and globally. Non-U.S. developed markets ended the period flat, while emerging markets declined, pressured by stressed commodity prices and currency weakness.
| * | All fund returns referenced in this commentary are for Investor Class shares. Performance for other share classes will vary due to differences in fee structure; when Investor Class performance exceeds that of the fund's benchmark, other share classes may not. See pages 3-11 for returns for all share classes. |
21
Fixed-income returns around the globe varied during the 12-month period as bond yields fluctuated in response to global economic and monetary policy divergence. After declines in the first part of the fiscal year, U.S. bonds generally rallied on subdued inflation and heightened demand. Commodity and oil price weakness and persistently low inflation led longer-duration bonds to outperform those with shorter durations, with long-term U.S. Treasury securities producing especially strong gains. These forces also led inflation-protected securities to decline and finish the period as some of the worst performers. High-yield bonds struggled during the first half of the fiscal year, but regained leadership later in the period, benefiting from investors’ heightened risk appetite. Non-U.S. bonds generally fell, impacted in large part by currency volatility and regional political and economic instability.
Fund Information
Each One Choice Target Date Portfolio is a “fund of funds” that invests in other American Century Investments mutual funds to achieve its investment objective and target asset allocation. (See pages 24-25 for the specific underlying fund allocations for each Portfolio.) A Portfolio’s target date is the approximate year when investors plan to retire and likely would stop making new investments in the fund. The principal value of the investment is not guaranteed at any time, including at the target date. One Choice In Retirement Portfolio is generally intended for investors near, at, or in retirement. There is no guarantee that an investment in any of the funds will provide adequate income at or through an investor’s retirement.
Each target-dated Portfolio seeks the highest total return consistent with its asset mix. Over time, the asset mix and weightings are adjusted to be more conservative. In general, as the target year approaches, each Portfolio’s allocation becomes more conservative by decreasing the allocation to stock funds and increasing the allocation to bond and money market funds. By the time each Portfolio reaches its target date, its target asset mix will become fixed and match that of One Choice In Retirement Portfolio, which seeks current income and capital appreciation.
Portfolio Performance
The Portfolios’ U.S. equity funds generated positive performance for the 12-month period, with NT Heritage Fund (mid-cap growth) and NT Growth Fund producing the largest absolute gains. NT Small Company Fund also advanced substantially, and was a top absolute performer. Although NT International Growth Fund advanced more modestly than many U.S.-based funds, strong security selection in the fund produced considerable outperformance relative to its underlying fund benchmark and contributed to results across all Portfolios. Similarly, despite declining on an absolute basis, NT Emerging Markets Fund (not held by the In Retirement Portfolio) strongly outperformed its underlying benchmark. Other funds that outperformed their underlying benchmarks included NT Mid Cap Value Fund and NT Large Company Value Fund. Stock selection in the disciplined equity funds was less successful, with NT Core Equity Plus Fund and NT Equity Growth Fund underperforming their underlying benchmarks. NT Growth Fund was also unable to match the return of its benchmark due to stock selection.
Performance of the Portfolios’ fixed-income segments varied, with NT Diversified Bond Fund producing the strongest absolute returns and contributing to results across all Portfolios. In contrast, International Bond Fund (held by Portfolios at or approaching retirement), which is un-hedged, declined during the year as the U.S. dollar appreciated relative to most global currencies. Funds designed to protect against inflation—Short Duration Inflation Protection Bond Fund (not held by Portfolios further from retirement) and Inflation-Adjusted Bond Fund—declined. However, performance relative to underlying fund benchmarks was positive in Short Duration Inflation Protection Bond Fund, International Bond Fund, and NT Diversified Bond Fund, while the remaining fixed-income funds underperformed their underlying fund benchmarks.
22
A Look Ahead
We believe that although global economic activity appears to have diminished in breadth, it remains on track for slow yet steady growth. Divergence in global monetary policy is likely to remain a top story in the near future. We see an increasing likelihood that the Fed will raise short-term interest rates before 2015 is out, reflecting the evident improvement in employment, wages, consumer confidence, and financial markets in recent years. The European economy seems to have turned a corner and has begun producing sustainable growth, as evidenced by its fourth-consecutive quarter of expansion. The ECB’s quantitative easing program is likely to support further economic growth, bolster financials markets, and boost investor confidence by increasing the money supply, improving access to credit, and weakening the euro. Meanwhile, the Japanese government’s stimulative policies have weakened the yen, benefiting manufacturers and exporters, including automakers, machinery firms, and technology companies. However, deflationary pressures continue to hamper the consumer-oriented and domestically focused sectors of the economy. In our opinion, a leading risk to global recovery is decelerating growth in China, which accounts for more than 16% of global gross domestic product. Although the government continues to implement aggressive steps to stimulate the economy and support financials markets, the country’s struggles with overinvestment and a build-up in inventories, softening corporate earnings, and falling consumer confidence are unlikely to be resolved in short order. Therefore, we think the combined forces of sluggish and uneven growth, stressed commodities prices, the strong dollar and a looming interest rate increase in the U.S. are likely to continue to lead to heightened levels of market volatility.
23
| Portfolio Characteristics |
Underlying Fund Allocations(1) as a % of net assets as of July 31, 2015 | |||||
One Choice In Retirement Portfolio | One Choice 2020 Portfolio | One Choice 2025 Portfolio | One Choice 2030 Portfolio | One Choice 2035 Portfolio | |
| Equity | |||||
| NT Core Equity Plus Fund | 3.0% | 3.0% | 3.0% | 3.1% | 3.2% |
| NT Disciplined Growth Fund | 1.5% | 1.8% | 2.2% | 2.6% | 3.0% |
| NT Equity Growth Fund | 10.0% | 9.7% | 9.3% | 9.2% | 9.2% |
| NT Growth Fund | 4.5% | 5.3% | 6.0% | 7.2% | 8.9% |
| NT Heritage Fund | 2.2% | 3.1% | 4.1% | 4.4% | 4.8% |
| NT Large Company Value Fund | 9.5% | 9.6% | 9.7% | 10.2% | 10.6% |
| NT Mid Cap Value Fund | 4.5% | 5.1% | 5.9% | 6.0% | 6.0% |
| NT Small Company Fund | 2.0% | 1.8% | 1.7% | 2.4% | 3.1% |
| NT Emerging Markets Fund | — | 1.0% | 2.1% | 2.7% | 3.1% |
| NT Global Real Estate Fund | 1.0% | 1.2% | 1.5% | 1.7% | 2.0% |
| NT International Growth Fund | 4.5% | 4.8% | 5.0% | 5.8% | 6.5% |
| NT International Small-Mid Cap Fund | — | 0.3% | 0.6% | 0.9% | 1.2% |
| NT International Value Fund | 2.3% | 2.8% | 3.4% | 4.0% | 4.7% |
| Total Equity | 45.0% | 49.5% | 54.5% | 60.2% | 66.3% |
| Fixed Income | |||||
| High-Yield Fund | 3.8% | 3.7% | 3.5% | 3.2% | 2.8% |
| Inflation-Adjusted Bond Fund | 1.5% | 2.7% | 3.9% | 4.8% | 5.4% |
| NT Diversified Bond Fund | 21.6% | 20.8% | 19.9% | 17.8% | 15.4% |
| Short Duration Inflation Protection Bond Fund | 6.1% | 4.6% | 3.1% | 1.6% | 0.3% |
| Global Bond Fund | 7.0% | 6.4% | 5.9% | 5.2% | 4.6% |
| International Bond Fund | 5.0% | 4.6% | 4.0% | 2.2% | 0.2% |
| Total Fixed Income | 45.0% | 42.8% | 40.3% | 34.8% | 28.7% |
| Premium Money Market Fund | 10.0% | 7.7% | 5.2% | 5.0% | 5.0% |
| Other Assets and Liabilities | —(2) | —(2) | —(2) | —(2) | —(2) |
| (1) | Underlying fund investments represent Institutional Class, except Premium Money Market Fund Investor Class. |
| (2) | Category is less than 0.05% of total net assets. |
24
Underlying Fund Allocations(1) as a % of net assets as of July 31, 2015 | ||||
| One Choice 2040 Portfolio | One Choice 2045 Portfolio | One Choice 2050 Portfolio | One Choice 2055 Portfolio | |
| Equity | ||||
| NT Core Equity Plus Fund | 3.5% | 4.1% | 4.5% | 4.5% |
| NT Disciplined Growth Fund | 3.1% | 3.3% | 3.4% | 3.5% |
| NT Equity Growth Fund | 9.9% | 10.2% | 10.2% | 10.7% |
| NT Growth Fund | 9.7% | 10.5% | 10.7% | 11.0% |
| NT Heritage Fund | 5.6% | 6.5% | 6.5% | 6.8% |
| NT Large Company Value Fund | 11.9% | 13.1% | 13.7% | 14.2% |
| NT Mid Cap Value Fund | 6.4% | 7.0% | 6.9% | 6.8% |
| NT Small Company Fund | 3.1% | 3.0% | 3.3% | 3.9% |
| NT Emerging Markets Fund | 4.2% | 5.0% | 5.9% | 6.5% |
| NT Global Real Estate Fund | 2.2% | 2.5% | 2.7% | 3.0% |
| NT International Growth Fund | 6.7% | 6.9% | 6.7% | 6.0% |
| NT International Small-Mid Cap Fund | 1.5% | 1.9% | 2.1% | 2.5% |
| NT International Value Fund | 4.9% | 5.1% | 5.3% | 5.5% |
| Total Equity | 72.7% | 79.1% | 81.9% | 84.9% |
| Fixed Income | ||||
| High-Yield Fund | 2.4% | 2.0% | 1.8% | 1.5% |
| Inflation-Adjusted Bond Fund | 4.9% | 4.1% | 3.5% | 3.0% |
| NT Diversified Bond Fund | 13.1% | 10.7% | 9.4% | 7.6% |
| Global Bond Fund | 4.2% | 3.8% | 3.4% | 3.0% |
| Total Fixed Income | 24.6% | 20.6% | 18.1% | 15.1% |
| Premium Money Market Fund | 2.7% | 0.3% | — | — |
| Other Assets and Liabilities | —(2) | —(2) | —(2) | —(2) |
| (1) | Underlying fund investments represent Institutional Class, except Premium Money Market Fund Investor Class. |
| (2) | Category is less than 0.05% of total net assets. |
25
| Shareholder Fee Examples |
Fund shareholders may incur two types of costs: (1) transaction costs, including sales charges (loads) on purchase payments and redemption/exchange fees; and (2) ongoing costs, including management fees; distribution and service (12b-1) fees; and other fund expenses. This example is intended to help you understand your ongoing costs (in dollars) of investing in your fund and to compare these costs with the ongoing cost of investing in other mutual funds. As a shareholder in the underlying American Century Investments funds, your fund will indirectly bear its pro rata share of the expenses incurred by the underlying funds. These expenses are not included in the fund’s annualized expense ratio or the expenses paid during the period. These expenses are, however, included in the effective expenses paid during the period.
The example is based on an investment of $1,000 made at the beginning of the period and held for the entire period from February 1, 2015 to July 31, 2015.
Actual Expenses
The table provides information about actual account values and actual expenses for each class. You may use the information, together with the amount you invested, to estimate the expenses that you paid over the period. First, identify the share class you own. Then simply divide your account value by $1,000 (for example, an $8,600 account value divided by $1,000 = 8.6), then multiply the result by the number under the heading “Expenses Paid During Period” to estimate the expenses you paid on your account during this period.
If you hold Investor Class shares of any American Century Investments fund, or Institutional Class shares of the American Century Diversified Bond Fund, in an American Century Investments account (i.e., not a financial intermediary or retirement plan account), American Century Investments may charge you a $12.50 semiannual account maintenance fee if the value of those shares is less than $10,000. We will redeem shares automatically in one of your accounts to pay the $12.50 fee. In determining your total eligible investment amount, we will include your investments in all personal accounts (including American Century Investments Brokerage accounts) registered under your Social Security number. Personal accounts include individual accounts, joint accounts, UGMA/UTMA accounts, personal trusts, Coverdell Education Savings Accounts and IRAs (including traditional, Roth, Rollover, SEP-, SARSEP- and SIMPLE-IRAs), and certain other retirement accounts. If you have only business, business retirement, employer-sponsored or American Century Investments Brokerage accounts, you are currently not subject to this fee. If you are subject to the Account Maintenance Fee, your account value could be reduced by the fee amount.
Hypothetical Example for Comparison Purposes
The table also provides information about hypothetical account values and hypothetical expenses based on the actual expense ratio of each class of your fund and an assumed rate of return of 5% per year before expenses, which is not the actual return of a fund’s share class. The hypothetical account values and expenses may not be used to estimate the actual ending account balance or expenses you paid for the period. You may use this information to compare the ongoing costs of investing in your fund and other funds. To do so, compare this 5% hypothetical example with the 5% hypothetical examples that appear in the shareholder reports of the other funds.
Please note that the expenses shown in the table are meant to highlight your ongoing costs only and do not reflect any transactional costs, such as sales charges (loads) or redemption/exchange fees. Therefore, the table is useful in comparing ongoing costs only, and will not help you determine the relative total costs of owning different funds. In addition, if these transactional costs were included, your costs would have been higher.
26
| Beginning Account Value 2/1/15 | Ending Account Value 7/31/15 | Expenses Paid During Period(1)2/1/15 - 7/31/15 | Annualized Expense Ratio(1) | Effective Expenses Paid During Period(2) 2/1/15 - 7/31/15 | Effective Annualized Expense Ratio(2) | |
| One Choice In Retirement Portfolio | ||||||
| Actual | ||||||
| Investor Class | $1,000 | $1,016.90 | $1.00 | 0.20% | $3.95 | 0.79% |
| Institutional Class | $1,000 | $1,017.00 | $0.00 | 0.00%(3) | $2.95 | 0.59% |
| A Class | $1,000 | $1,015.60 | $2.25 | 0.45% | $5.20 | 1.04% |
| C Class | $1,000 | $1,011.80 | $5.99 | 1.20% | $8.93 | 1.79% |
| R Class | $1,000 | $1,013.60 | $3.49 | 0.70% | $6.44 | 1.29% |
| Hypothetical | ||||||
| Investor Class | $1,000 | $1,023.80 | $1.00 | 0.20% | $3.96 | 0.79% |
| Institutional Class | $1,000 | $1,024.80 | $0.00 | 0.00%(3) | $2.96 | 0.59% |
| A Class | $1,000 | $1,022.56 | $2.26 | 0.45% | $5.21 | 1.04% |
| C Class | $1,000 | $1,018.84 | $6.01 | 1.20% | $8.95 | 1.79% |
| R Class | $1,000 | $1,021.32 | $3.51 | 0.70% | $6.46 | 1.29% |
| One Choice 2020 Portfolio | ||||||
| Actual | ||||||
| Investor Class | $1,000 | $1,019.10 | $1.00 | 0.20% | $4.01 | 0.80% |
| Institutional Class | $1,000 | $1,020.70 | $0.00 | 0.00%(3) | $3.01 | 0.60% |
| A Class | $1,000 | $1,018.20 | $2.25 | 0.45% | $5.25 | 1.05% |
| C Class | $1,000 | $1,014.10 | $5.99 | 1.20% | $8.99 | 1.80% |
| R Class | $1,000 | $1,016.60 | $3.50 | 0.70% | $6.50 | 1.30% |
| Hypothetical | ||||||
| Investor Class | $1,000 | $1,023.80 | $1.00 | 0.20% | $4.01 | 0.80% |
| Institutional Class | $1,000 | $1,024.80 | $0.00 | 0.00%(3) | $3.01 | 0.60% |
| A Class | $1,000 | $1,022.56 | $2.26 | 0.45% | $5.26 | 1.05% |
| C Class | $1,000 | $1,018.84 | $6.01 | 1.20% | $9.00 | 1.80% |
| R Class | $1,000 | $1,021.32 | $3.51 | 0.70% | $6.51 | 1.30% |
| (1) | Expenses are equal to the class's annualized expense ratio listed in the table above, multiplied by the average account value over the period, multiplied by 181, the number of days in the most recent fiscal half-year, divided by 365, to reflect the one-half year period. The fees and expenses of the underlying American Century Investments funds in which the fund invests are not included in the class's annualized expense ratio. |
| (2) | Effective expenses reflect the sum of expenses borne directly by the class plus the fund's pro rata share of the weighted average expense ratio of the underlying funds in which it invests. The effective annualized expense ratio combines the class's annualized expense ratio and the annualized weighted average expense ratio of the underlying funds. The annualized weighted average expense ratio of the underlying funds for the one-half year period reflects the actual expense ratio of each underlying fund from its most recent shareholder report, annualized and weighted for the fund's relative average investment therein during the period. |
| (3) | Other expenses, which include directors' fees and expenses, did not exceed 0.005%. |
27
| Beginning Account Value 2/1/15 | Ending Account Value 7/31/15 | Expenses Paid During Period(1)2/1/15 - 7/31/15 | Annualized Expense Ratio(1) | Effective Expenses Paid During Period(2) 2/1/15 - 7/31/15 | Effective Annualized Expense Ratio(2) | |
| One Choice 2025 Portfolio | ||||||
| Actual | ||||||
| Investor Class | $1,000 | $1,022.40 | $1.00 | 0.20% | $4.16 | 0.83% |
| Institutional Class | $1,000 | $1,023.80 | $0.00 | 0.00%(3) | $3.16 | 0.63% |
| A Class | $1,000 | $1,021.00 | $2.25 | 0.45% | $5.41 | 1.08% |
| C Class | $1,000 | $1,017.40 | $6.00 | 1.20% | $9.15 | 1.83% |
| R Class | $1,000 | $1,019.60 | $3.51 | 0.70% | $6.66 | 1.33% |
| Hypothetical | ||||||
| Investor Class | $1,000 | $1,023.80 | $1.00 | 0.20% | $4.16 | 0.83% |
| Institutional Class | $1,000 | $1,024.80 | $0.00 | 0.00%(3) | $3.16 | 0.63% |
| A Class | $1,000 | $1,022.56 | $2.26 | 0.45% | $5.41 | 1.08% |
| C Class | $1,000 | $1,018.84 | $6.01 | 1.20% | $9.15 | 1.83% |
| R Class | $1,000 | $1,021.32 | $3.51 | 0.70% | $6.66 | 1.33% |
| One Choice 2030 Portfolio | ||||||
| Actual | ||||||
| Investor Class | $1,000 | $1,026.90 | $1.01 | 0.20% | $4.32 | 0.86% |
| Institutional Class | $1,000 | $1,028.60 | $0.00 | 0.00%(3) | $3.32 | 0.66% |
| A Class | $1,000 | $1,026.20 | $2.26 | 0.45% | $5.58 | 1.11% |
| C Class | $1,000 | $1,022.80 | $6.02 | 1.20% | $9.33 | 1.86% |
| R Class | $1,000 | $1,025.30 | $3.52 | 0.70% | $6.83 | 1.36% |
| Hypothetical | ||||||
| Investor Class | $1,000 | $1,023.80 | $1.00 | 0.20% | $4.31 | 0.86% |
| Institutional Class | $1,000 | $1,024.80 | $0.00 | 0.00%(3) | $3.31 | 0.66% |
| A Class | $1,000 | $1,022.56 | $2.26 | 0.45% | $5.56 | 1.11% |
| C Class | $1,000 | $1,018.84 | $6.01 | 1.20% | $9.30 | 1.86% |
| R Class | $1,000 | $1,021.32 | $3.51 | 0.70% | $6.81 | 1.36% |
| (1) | Expenses are equal to the class's annualized expense ratio listed in the table above, multiplied by the average account value over the period, multiplied by 181, the number of days in the most recent fiscal half-year, divided by 365, to reflect the one-half year period. The fees and expenses of the underlying American Century Investments funds in which the fund invests are not included in the class's annualized expense ratio. |
| (2) | Effective expenses reflect the sum of expenses borne directly by the class plus the fund's pro rata share of the weighted average expense ratio of the underlying funds in which it invests. The effective annualized expense ratio combines the class's annualized expense ratio and the annualized weighted average expense ratio of the underlying funds. The annualized weighted average expense ratio of the underlying funds for the one-half year period reflects the actual expense ratio of each underlying fund from its most recent shareholder report, annualized and weighted for the fund's relative average investment therein during the period. |
| (3) | Other expenses, which include directors' fees and expenses, did not exceed 0.005%. |
28
| Beginning Account Value 2/1/15 | Ending Account Value 7/31/15 | Expenses Paid During Period(1)2/1/15 - 7/31/15 | Annualized Expense Ratio(1) | Effective Expenses Paid During Period(2) 2/1/15 - 7/31/15 | Effective Annualized Expense Ratio(2) | |
| One Choice 2035 Portfolio | ||||||
| Actual | ||||||
| Investor Class | $1,000 | $1,032.60 | $1.01 | 0.20% | $4.43 | 0.88% |
| Institutional Class | $1,000 | $1,033.20 | $0.00 | 0.00%(3) | $3.43 | 0.68% |
| A Class | $1,000 | $1,031.30 | $2.27 | 0.45% | $5.69 | 1.13% |
| C Class | $1,000 | $1,027.40 | $6.03 | 1.20% | $9.45 | 1.88% |
| R Class | $1,000 | $1,030.00 | $3.52 | 0.70% | $6.95 | 1.38% |
| Hypothetical | ||||||
| Investor Class | $1,000 | $1,023.80 | $1.00 | 0.20% | $4.41 | 0.88% |
| Institutional Class | $1,000 | $1,024.80 | $0.00 | 0.00%(3) | $3.41 | 0.68% |
| A Class | $1,000 | $1,022.56 | $2.26 | 0.45% | $5.66 | 1.13% |
| C Class | $1,000 | $1,018.84 | $6.01 | 1.20% | $9.39 | 1.88% |
| R Class | $1,000 | $1,021.32 | $3.51 | 0.70% | $6.90 | 1.38% |
| One Choice 2040 Portfolio | ||||||
| Actual | ||||||
| Investor Class | $1,000 | $1,036.30 | $1.01 | 0.20% | $4.59 | 0.91% |
| Institutional Class | $1,000 | $1,037.10 | $0.00 | 0.00%(3) | $3.59 | 0.71% |
| A Class | $1,000 | $1,035.50 | $2.27 | 0.45% | $5.85 | 1.16% |
| C Class | $1,000 | $1,030.70 | $6.04 | 1.20% | $9.62 | 1.91% |
| R Class | $1,000 | $1,033.90 | $3.53 | 0.70% | $7.11 | 1.41% |
| Hypothetical | ||||||
| Investor Class | $1,000 | $1,023.80 | $1.00 | 0.20% | $4.56 | 0.91% |
| Institutional Class | $1,000 | $1,024.80 | $0.00 | 0.00%(3) | $3.56 | 0.71% |
| A Class | $1,000 | $1,022.56 | $2.26 | 0.45% | $5.81 | 1.16% |
| C Class | $1,000 | $1,018.84 | $6.01 | 1.20% | $9.54 | 1.91% |
| R Class | $1,000 | $1,021.32 | $3.51 | 0.70% | $7.05 | 1.41% |
| (1) | Expenses are equal to the class's annualized expense ratio listed in the table above, multiplied by the average account value over the period, multiplied by 181, the number of days in the most recent fiscal half-year, divided by 365, to reflect the one-half year period. The fees and expenses of the underlying American Century Investments funds in which the fund invests are not included in the class's annualized expense ratio. |
| (2) | Effective expenses reflect the sum of expenses borne directly by the class plus the fund's pro rata share of the weighted average expense ratio of the underlying funds in which it invests. The effective annualized expense ratio combines the class's annualized expense ratio and the annualized weighted average expense ratio of the underlying funds. The annualized weighted average expense ratio of the underlying funds for the one-half year period reflects the actual expense ratio of each underlying fund from its most recent shareholder report, annualized and weighted for the fund's relative average investment therein during the period. |
| (3) | Other expenses, which include directors' fees and expenses, did not exceed 0.005%. |
29
| Beginning Account Value 2/1/15 | Ending Account Value 7/31/15 | Expenses Paid During Period(1)2/1/15 - 7/31/15 | Annualized Expense Ratio(1) | Effective Expenses Paid During Period(2) 2/1/15 - 7/31/15 | Effective Annualized Expense Ratio(2) | |
| One Choice 2045 Portfolio | ||||||
| Actual | ||||||
| Investor Class | $1,000 | $1,040.20 | $1.01 | 0.20% | $4.81 | 0.95% |
| Institutional Class | $1,000 | $1,041.40 | $0.00 | 0.00%(3) | $3.80 | 0.75% |
| A Class | $1,000 | $1,038.90 | $2.27 | 0.45% | $6.07 | 1.20% |
| C Class | $1,000 | $1,035.10 | $6.06 | 1.20% | $9.84 | 1.95% |
| R Class | $1,000 | $1,037.70 | $3.54 | 0.70% | $7.33 | 1.45% |
| Hypothetical | ||||||
| Investor Class | $1,000 | $1,023.80 | $1.00 | 0.20% | $4.76 | 0.95% |
| Institutional Class | $1,000 | $1,024.80 | $0.00 | 0.00%(3) | $3.76 | 0.75% |
| A Class | $1,000 | $1,022.56 | $2.26 | 0.45% | $6.01 | 1.20% |
| C Class | $1,000 | $1,018.84 | $6.01 | 1.20% | $9.74 | 1.95% |
| R Class | $1,000 | $1,021.32 | $3.51 | 0.70% | $7.25 | 1.45% |
| One Choice 2050 Portfolio | ||||||
| Actual | ||||||
| Investor Class | $1,000 | $1,041.80 | $1.01 | 0.20% | $4.91 | 0.97% |
| Institutional Class | $1,000 | $1,042.60 | $0.00 | 0.00%(3) | $3.90 | 0.77% |
| A Class | $1,000 | $1,040.30 | $2.28 | 0.45% | $6.17 | 1.22% |
| C Class | $1,000 | $1,036.20 | $6.06 | 1.20% | $9.95 | 1.97% |
| R Class | $1,000 | $1,038.70 | $3.54 | 0.70% | $7.43 | 1.47% |
| Hypothetical | ||||||
| Investor Class | $1,000 | $1,023.80 | $1.00 | 0.20% | $4.86 | 0.97% |
| Institutional Class | $1,000 | $1,024.80 | $0.00 | 0.00%(3) | $3.86 | 0.77% |
| A Class | $1,000 | $1,022.56 | $2.26 | 0.45% | $6.11 | 1.22% |
| C Class | $1,000 | $1,018.84 | $6.01 | 1.20% | $9.84 | 1.97% |
| R Class | $1,000 | $1,021.32 | $3.51 | 0.70% | $7.35 | 1.47% |
| (1) | Expenses are equal to the class's annualized expense ratio listed in the table above, multiplied by the average account value over the period, multiplied by 181, the number of days in the most recent fiscal half-year, divided by 365, to reflect the one-half year period. The fees and expenses of the underlying American Century Investments funds in which the fund invests are not included in the class's annualized expense ratio. |
| (2) | Effective expenses reflect the sum of expenses borne directly by the class plus the fund's pro rata share of the weighted average expense ratio of the underlying funds in which it invests. The effective annualized expense ratio combines the class's annualized expense ratio and the annualized weighted average expense ratio of the underlying funds. The annualized weighted average expense ratio of the underlying funds for the one-half year period reflects the actual expense ratio of each underlying fund from its most recent shareholder report, annualized and weighted for the fund's relative average investment therein during the period. |
| (3) | Other expenses, which include directors' fees and expenses, did not exceed 0.005%. |
30
| Beginning Account Value 2/1/15 | Ending Account Value 7/31/15 | Expenses Paid During Period(1)2/1/15 - 7/31/15 | Annualized Expense Ratio(1) | Effective Expenses Paid During Period(2) 2/1/15 - 7/31/15 | Effective Annualized Expense Ratio(2) | |
| One Choice 2055 Portfolio | ||||||
| Actual | ||||||
| Investor Class | $1,000 | $1,042.60 | $1.01 | 0.20% | $4.91 | 0.97% |
| Institutional Class | $1,000 | $1,044.10 | $0.00 | 0.00%(3) | $3.90 | 0.77% |
| A Class | $1,000 | $1,041.10 | $2.28 | 0.45% | $6.17 | 1.22% |
| C Class | $1,000 | $1,037.30 | $6.06 | 1.20% | $9.95 | 1.97% |
| R Class | $1,000 | $1,041.10 | $3.54 | 0.70% | $7.44 | 1.47% |
| Hypothetical | ||||||
| Investor Class | $1,000 | $1,023.80 | $1.00 | 0.20% | $4.86 | 0.97% |
| Institutional Class | $1,000 | $1,024.80 | $0.00 | 0.00%(3) | $3.86 | 0.77% |
| A Class | $1,000 | $1,022.56 | $2.26 | 0.45% | $6.11 | 1.22% |
| C Class | $1,000 | $1,018.84 | $6.01 | 1.20% | $9.84 | 1.97% |
| R Class | $1,000 | $1,021.32 | $3.51 | 0.70% | $7.35 | 1.47% |
| (1) | Expenses are equal to the class's annualized expense ratio listed in the table above, multiplied by the average account value over the period, multiplied by 181, the number of days in the most recent fiscal half-year, divided by 365, to reflect the one-half year period. The fees and expenses of the underlying American Century Investments funds in which the fund invests are not included in the class's annualized expense ratio. |
| (2) | Effective expenses reflect the sum of expenses borne directly by the class plus the fund's pro rata share of the weighted average expense ratio of the underlying funds in which it invests. The effective annualized expense ratio combines the class's annualized expense ratio and the annualized weighted average expense ratio of the underlying funds. The annualized weighted average expense ratio of the underlying funds for the one-half year period reflects the actual expense ratio of each underlying fund from its most recent shareholder report, annualized and weighted for the fund's relative average investment therein during the period. |
| (3) | Other expenses, which include directors' fees and expenses, did not exceed 0.005%. |
31
| Schedules of Investments |
JULY 31, 2015
One Choice In Retirement Portfolio
| Shares | Value | |||
MUTUAL FUNDS(1) — 100.0% | ||||
| Domestic Equity Funds — 37.2% | ||||
| NT Core Equity Plus Fund Institutional Class | 4,057,962 | $ | 59,733,204 | |
NT Disciplined Growth Fund Institutional Class(2) | 2,964,794 | 29,825,831 | ||
| NT Equity Growth Fund Institutional Class | 15,934,088 | 198,379,399 | ||
| NT Growth Fund Institutional Class | 5,728,941 | 89,428,772 | ||
| NT Heritage Fund Institutional Class | 3,134,305 | 44,663,841 | ||
| NT Large Company Value Fund Institutional Class | 15,125,109 | 187,853,852 | ||
| NT Mid Cap Value Fund Institutional Class | 7,052,929 | 89,572,202 | ||
| NT Small Company Fund Institutional Class | 3,958,692 | 39,745,272 | ||
| 739,202,373 | ||||
| Domestic Fixed Income Funds — 33.0% | ||||
| High-Yield Fund Institutional Class | 13,092,660 | 75,413,721 | ||
| Inflation-Adjusted Bond Fund Institutional Class | 2,590,159 | 30,071,749 | ||
| NT Diversified Bond Fund Institutional Class | 39,676,000 | 430,087,844 | ||
| Short Duration Inflation Protection Bond Fund Institutional Class | 11,977,094 | 121,327,958 | ||
| 656,901,272 | ||||
| International Fixed Income Funds — 12.0% | ||||
| Global Bond Fund Institutional Class | 14,166,520 | 139,256,889 | ||
| International Bond Fund Institutional Class | 8,094,951 | 99,567,891 | ||
| 238,824,780 | ||||
| Money Market Funds — 10.0% | ||||
| Premium Money Market Fund Investor Class | 198,538,100 | 198,538,100 | ||
| International Equity Funds — 7.8% | ||||
NT Global Real Estate Fund Institutional Class(2) | 2,074,244 | 19,933,487 | ||
| NT International Growth Fund Institutional Class | 7,792,415 | 90,158,246 | ||
NT International Value Fund Institutional Class(2) | 4,503,057 | 44,895,479 | ||
| 154,987,212 | ||||
TOTAL INVESTMENT SECURITIES — 100.0% (Cost $1,802,829,576) | 1,988,453,737 | |||
OTHER ASSETS AND LIABILITIES† | 69,709 | |||
| TOTAL NET ASSETS — 100.0% | $ | 1,988,523,446 | ||
| NOTES TO SCHEDULE OF INVESTMENTS |
| † | Category is less than 0.05% of total net assets. |
| (1) | Investments are funds within the American Century Investments family of funds and are considered affiliated funds. |
| (2) | Non-income producing. |
See Notes to Financial Statements.
32
JULY 31, 2015
One Choice 2020 Portfolio
| Shares | Value | |||
MUTUAL FUNDS(1) — 100.0% | ||||
| Domestic Equity Funds — 39.4% | ||||
| NT Core Equity Plus Fund Institutional Class | 3,517,574 | $ | 51,778,691 | |
NT Disciplined Growth Fund Institutional Class(2) | 3,160,450 | 31,794,123 | ||
| NT Equity Growth Fund Institutional Class | 13,501,207 | 168,090,023 | ||
| NT Growth Fund Institutional Class | 5,831,647 | 91,032,007 | ||
| NT Heritage Fund Institutional Class | 3,706,374 | 52,815,824 | ||
| NT Large Company Value Fund Institutional Class | 13,310,575 | 165,317,337 | ||
| NT Mid Cap Value Fund Institutional Class | 6,963,076 | 88,431,067 | ||
| NT Small Company Fund Institutional Class | 3,062,873 | 30,751,249 | ||
| 680,010,321 | ||||
| Domestic Fixed Income Funds — 31.8% | ||||
| High-Yield Fund Institutional Class | 11,080,414 | 63,823,182 | ||
| Inflation-Adjusted Bond Fund Institutional Class | 4,069,459 | 47,246,424 | ||
| NT Diversified Bond Fund Institutional Class | 33,105,443 | 358,863,003 | ||
| Short Duration Inflation Protection Bond Fund Institutional Class | 7,900,118 | 80,028,196 | ||
| 549,960,805 | ||||
| International Fixed Income Funds — 11.0% | ||||
| Global Bond Fund Institutional Class | 11,325,764 | 111,332,264 | ||
| International Bond Fund Institutional Class | 6,402,141 | 78,746,336 | ||
| 190,078,600 | ||||
| International Equity Funds — 10.1% | ||||
| NT Emerging Markets Fund Institutional Class | 1,661,324 | 17,327,605 | ||
NT Global Real Estate Fund Institutional Class(2) | 2,219,720 | 21,331,504 | ||
| NT International Growth Fund Institutional Class | 7,058,969 | 81,672,277 | ||
NT International Small-Mid Cap Fund Institutional Class(2) | 477,972 | 5,056,947 | ||
NT International Value Fund Institutional Class(2) | 4,907,562 | 48,928,397 | ||
| 174,316,730 | ||||
| Money Market Funds — 7.7% | ||||
| Premium Money Market Fund Investor Class | 133,711,822 | 133,711,822 | ||
TOTAL INVESTMENT SECURITIES — 100.0% (Cost $1,570,900,487) | 1,728,078,278 | |||
OTHER ASSETS AND LIABILITIES† | (6,030) | |||
| TOTAL NET ASSETS — 100.0% | $ | 1,728,072,248 | ||
| NOTES TO SCHEDULE OF INVESTMENTS |
| † | Category is less than 0.05% of total net assets. |
| (1) | Investments are funds within the American Century Investments family of funds and are considered affiliated funds. |
| (2) | Non-income producing. |
See Notes to Financial Statements.
33
JULY 31, 2015
One Choice 2025 Portfolio
| Shares | Value | |||
MUTUAL FUNDS(1) — 100.0% | ||||
| Domestic Equity Funds — 41.9% | ||||
| NT Core Equity Plus Fund Institutional Class | 5,331,992 | $ | 78,486,923 | |
NT Disciplined Growth Fund Institutional Class(2) | 5,816,341 | 58,512,394 | ||
| NT Equity Growth Fund Institutional Class | 19,518,994 | 243,011,480 | ||
| NT Growth Fund Institutional Class | 10,038,811 | 156,705,841 | ||
| NT Heritage Fund Institutional Class | 7,458,589 | 106,284,897 | ||
| NT Large Company Value Fund Institutional Class | 20,427,336 | 253,707,512 | ||
| NT Mid Cap Value Fund Institutional Class | 12,148,547 | 154,286,546 | ||
| NT Small Company Fund Institutional Class | 4,572,447 | 45,907,369 | ||
| 1,096,902,962 | ||||
| Domestic Fixed Income Funds — 30.4% | ||||
| High-Yield Fund Institutional Class | 15,900,644 | 91,587,711 | ||
| Inflation-Adjusted Bond Fund Institutional Class | 8,912,830 | 103,477,958 | ||
| NT Diversified Bond Fund Institutional Class | 47,997,391 | 520,291,717 | ||
| Short Duration Inflation Protection Bond Fund Institutional Class | 7,919,508 | 80,224,618 | ||
| 795,582,004 | ||||
| International Equity Funds — 12.6% | ||||
| NT Emerging Markets Fund Institutional Class | 5,300,007 | 55,279,068 | ||
NT Global Real Estate Fund Institutional Class(2) | 4,047,720 | 38,898,586 | ||
| NT International Growth Fund Institutional Class | 11,206,273 | 129,656,582 | ||
NT International Small-Mid Cap Fund Institutional Class(2) | 1,498,798 | 15,857,286 | ||
NT International Value Fund Institutional Class(2) | 9,028,401 | 90,013,155 | ||
| 329,704,677 | ||||
| International Fixed Income Funds — 9.9% | ||||
| Global Bond Fund Institutional Class | 15,594,516 | 153,294,094 | ||
| International Bond Fund Institutional Class | 8,629,480 | 106,142,609 | ||
| 259,436,703 | ||||
| Money Market Funds — 5.2% | ||||
| Premium Money Market Fund Investor Class | 136,831,487 | 136,831,487 | ||
TOTAL INVESTMENT SECURITIES — 100.0% (Cost $2,284,453,448) | 2,618,457,833 | |||
OTHER ASSETS AND LIABILITIES† | 947,024 | |||
| TOTAL NET ASSETS — 100.0% | $ | 2,619,404,857 | ||
| NOTES TO SCHEDULE OF INVESTMENTS |
| † | Category is less than 0.05% of total net assets. |
| (1) | Investments are funds within the American Century Investments family of funds and are considered affiliated funds. |
| (2) | Non-income producing. |
See Notes to Financial Statements.
34
JULY 31, 2015
One Choice 2030 Portfolio
| Shares | Value | |||
MUTUAL FUNDS(1) — 100.0% | ||||
| Domestic Equity Funds — 45.1% | ||||
| NT Core Equity Plus Fund Institutional Class | 3,656,824 | $ | 53,828,448 | |
NT Disciplined Growth Fund Institutional Class(2) | 4,466,659 | 44,934,594 | ||
| NT Equity Growth Fund Institutional Class | 12,827,991 | 159,708,482 | ||
| NT Growth Fund Institutional Class | 8,025,187 | 125,273,174 | ||
| NT Heritage Fund Institutional Class | 5,279,201 | 75,228,613 | ||
| NT Large Company Value Fund Institutional Class | 14,235,504 | 176,804,958 | ||
| NT Mid Cap Value Fund Institutional Class | 8,207,521 | 104,235,520 | ||
| NT Small Company Fund Institutional Class | 4,065,380 | 40,816,418 | ||
| 780,830,207 | ||||
| Domestic Fixed Income Funds — 27.4% | ||||
| High-Yield Fund Institutional Class | 9,610,410 | 55,355,964 | ||
| Inflation-Adjusted Bond Fund Institutional Class | 7,185,761 | 83,426,680 | ||
| NT Diversified Bond Fund Institutional Class | 28,309,528 | 306,875,287 | ||
| Short Duration Inflation Protection Bond Fund Institutional Class | 2,707,973 | 27,431,766 | ||
| 473,089,697 | ||||
| International Equity Funds — 15.1% | ||||
| NT Emerging Markets Fund Institutional Class | 4,384,915 | 45,734,668 | ||
NT Global Real Estate Fund Institutional Class(2) | 3,115,849 | 29,943,305 | ||
| NT International Growth Fund Institutional Class | 8,602,365 | 99,529,358 | ||
NT International Small-Mid Cap Fund Institutional Class(2) | 1,516,650 | 16,046,153 | ||
NT International Value Fund Institutional Class(2) | 7,013,569 | 69,925,278 | ||
| 261,178,762 | ||||
| International Fixed Income Funds — 7.4% | ||||
| Global Bond Fund Institutional Class | 9,193,804 | 90,375,097 | ||
| International Bond Fund Institutional Class | 3,098,846 | 38,115,811 | ||
| 128,490,908 | ||||
| Money Market Funds — 5.0% | ||||
| Premium Money Market Fund Investor Class | 86,395,934 | 86,395,934 | ||
TOTAL INVESTMENT SECURITIES — 100.0% (Cost $1,559,874,493) | 1,729,985,508 | |||
OTHER ASSETS AND LIABILITIES† | 24,143 | |||
| TOTAL NET ASSETS — 100.0% | $ | 1,730,009,651 | ||
| NOTES TO SCHEDULE OF INVESTMENTS |
| † | Category is less than 0.05% of total net assets. |
| (1) | Investments are funds within the American Century Investments family of funds and are considered affiliated funds. |
| (2) | Non-income producing. |
See Notes to Financial Statements.
35
JULY 31, 2015
One Choice 2035 Portfolio
| Shares | Value | |||
MUTUAL FUNDS(1) — 100.0% | ||||
| Domestic Equity Funds — 48.8% | ||||
| NT Core Equity Plus Fund Institutional Class | 4,585,490 | $ | 67,498,413 | |
NT Disciplined Growth Fund Institutional Class(2) | 6,165,660 | 62,026,540 | ||
| NT Equity Growth Fund Institutional Class | 15,322,990 | 190,771,220 | ||
| NT Growth Fund Institutional Class | 11,841,617 | 184,847,637 | ||
| NT Heritage Fund Institutional Class | 6,903,989 | 98,381,838 | ||
| NT Large Company Value Fund Institutional Class | 17,613,812 | 218,763,549 | ||
| NT Mid Cap Value Fund Institutional Class | 9,771,858 | 124,102,598 | ||
| NT Small Company Fund Institutional Class | 6,326,616 | 63,519,225 | ||
| 1,009,911,020 | ||||
| Domestic Fixed Income Funds — 23.9% | ||||
| High-Yield Fund Institutional Class | 10,196,041 | 58,729,196 | ||
| Inflation-Adjusted Bond Fund Institutional Class | 9,636,830 | 111,883,593 | ||
| NT Diversified Bond Fund Institutional Class | 29,294,563 | 317,553,060 | ||
| Short Duration Inflation Protection Bond Fund Institutional Class | 672,468 | 6,812,096 | ||
| 494,977,945 | ||||
| International Equity Funds — 17.5% | ||||
| NT Emerging Markets Fund Institutional Class | 6,217,728 | 64,850,899 | ||
NT Global Real Estate Fund Institutional Class(2) | 4,301,109 | 41,333,660 | ||
| NT International Growth Fund Institutional Class | 11,604,948 | 134,269,245 | ||
NT International Small-Mid Cap Fund Institutional Class(2) | 2,402,124 | 25,414,468 | ||
NT International Value Fund Institutional Class(2) | 9,633,807 | 96,049,054 | ||
| 361,917,326 | ||||
| Money Market Funds — 5.0% | ||||
| Premium Money Market Fund Investor Class | 103,488,350 | 103,488,350 | ||
| International Fixed Income Funds — 4.8% | ||||
| Global Bond Fund Institutional Class | 9,720,346 | 95,551,004 | ||
| International Bond Fund Institutional Class | 335,433 | 4,125,821 | ||
| 99,676,825 | ||||
TOTAL INVESTMENT SECURITIES — 100.0% (Cost $1,788,012,525) | 2,069,971,466 | |||
OTHER ASSETS AND LIABILITIES† | 31,628 | |||
| TOTAL NET ASSETS — 100.0% | $ | 2,070,003,094 | ||
| NOTES TO SCHEDULE OF INVESTMENTS |
| † | Category is less than 0.05% of total net assets. |
| (1) | Investments are funds within the American Century Investments family of funds and are considered affiliated funds. |
| (2) | Non-income producing. |
See Notes to Financial Statements.
36
JULY 31, 2015
One Choice 2040 Portfolio
| Shares | Value | |||
MUTUAL FUNDS(1) — 100.0% | ||||
| Domestic Equity Funds — 53.2% | ||||
| NT Core Equity Plus Fund Institutional Class | 3,088,783 | $ | 45,466,882 | |
NT Disciplined Growth Fund Institutional Class(2) | 4,060,308 | 40,846,699 | ||
| NT Equity Growth Fund Institutional Class | 10,339,137 | 128,722,250 | ||
| NT Growth Fund Institutional Class | 8,112,307 | 126,633,113 | ||
| NT Heritage Fund Institutional Class | 5,068,594 | 72,227,459 | ||
| NT Large Company Value Fund Institutional Class | 12,424,422 | 154,311,327 | ||
| NT Mid Cap Value Fund Institutional Class | 6,590,565 | 83,700,170 | ||
| NT Small Company Fund Institutional Class | 4,036,200 | 40,523,447 | ||
| 692,431,347 | ||||
| Domestic Fixed Income Funds — 20.4% | ||||
| High-Yield Fund Institutional Class | 5,485,405 | 31,595,930 | ||
| Inflation-Adjusted Bond Fund Institutional Class | 5,519,352 | 64,079,672 | ||
| NT Diversified Bond Fund Institutional Class | 15,708,746 | 170,282,807 | ||
| 265,958,409 | ||||
| International Equity Funds — 19.5% | ||||
| NT Emerging Markets Fund Institutional Class | 5,253,824 | 54,797,379 | ||
NT Global Real Estate Fund Institutional Class(2) | 3,025,848 | 29,078,399 | ||
| NT International Growth Fund Institutional Class | 7,512,383 | 86,918,273 | ||
NT International Small-Mid Cap Fund Institutional Class(2) | 1,884,679 | 19,939,905 | ||
NT International Value Fund Institutional Class(2) | 6,371,686 | 63,525,705 | ||
| 254,259,661 | ||||
| International Fixed Income Funds — 4.2% | ||||
| Global Bond Fund Institutional Class | 5,563,102 | 54,685,296 | ||
| Money Market Funds — 2.7% | ||||
| Premium Money Market Fund Investor Class | 35,565,915 | 35,565,915 | ||
TOTAL INVESTMENT SECURITIES — 100.0% (Cost $1,169,693,077) | 1,302,900,628 | |||
OTHER ASSETS AND LIABILITIES† | 19,258 | |||
| TOTAL NET ASSETS — 100.0% | $ | 1,302,919,886 | ||
| NOTES TO SCHEDULE OF INVESTMENTS |
| † | Category is less than 0.05% of total net assets. |
| (1) | Investments are funds within the American Century Investments family of funds and are considered affiliated funds. |
| (2) | Non-income producing. |
See Notes to Financial Statements.
37
JULY 31, 2015
One Choice 2045 Portfolio
| Shares | Value | |||
MUTUAL FUNDS(1) — 100.0% | ||||
| Domestic Equity Funds — 57.7% | ||||
| NT Core Equity Plus Fund Institutional Class | 4,182,564 | $ | 61,567,343 | |
NT Disciplined Growth Fund Institutional Class(2) | 4,818,729 | 48,476,415 | ||
| NT Equity Growth Fund Institutional Class | 12,218,598 | 152,121,546 | ||
| NT Growth Fund Institutional Class | 10,005,408 | 156,184,411 | ||
| NT Heritage Fund Institutional Class | 6,787,924 | 96,727,920 | ||
| NT Large Company Value Fund Institutional Class | 15,635,900 | 194,197,872 | ||
| NT Mid Cap Value Fund Institutional Class | 8,229,216 | 104,511,046 | ||
| NT Small Company Fund Institutional Class | 4,370,506 | 43,879,877 | ||
| 857,666,430 | ||||
| International Equity Funds — 21.4% | ||||
| NT Emerging Markets Fund Institutional Class | 7,170,249 | 74,785,693 | ||
NT Global Real Estate Fund Institutional Class(2) | 3,878,360 | 37,271,039 | ||
| NT International Growth Fund Institutional Class | 8,933,830 | 103,364,416 | ||
NT International Small-Mid Cap Fund Institutional Class(2) | 2,613,207 | 27,647,725 | ||
NT International Value Fund Institutional Class(2) | 7,568,985 | 75,462,779 | ||
| 318,531,652 | ||||
| Domestic Fixed Income Funds — 16.8% | ||||
| High-Yield Fund Institutional Class | 5,198,060 | 29,940,828 | ||
| Inflation-Adjusted Bond Fund Institutional Class | 5,209,673 | 60,484,301 | ||
| NT Diversified Bond Fund Institutional Class | 14,635,385 | 158,647,574 | ||
| 249,072,703 | ||||
| International Fixed Income Funds — 3.8% | ||||
| Global Bond Fund Institutional Class | 5,728,960 | 56,315,680 | ||
| Money Market Funds — 0.3% | ||||
| Premium Money Market Fund Investor Class | 3,714,267 | 3,714,267 | ||
TOTAL INVESTMENT SECURITIES — 100.0% (Cost $1,279,837,243) | 1,485,300,732 | |||
OTHER ASSETS AND LIABILITIES† | 9,861 | |||
| TOTAL NET ASSETS — 100.0% | $ | 1,485,310,593 | ||
| NOTES TO SCHEDULE OF INVESTMENTS |
| † | Category is less than 0.05% of total net assets. |
| (1) | Investments are funds within the American Century Investments family of funds and are considered affiliated funds. |
| (2) | Non-income producing. |
See Notes to Financial Statements.
38
JULY 31, 2015
One Choice 2050 Portfolio
| Shares | Value | |||
MUTUAL FUNDS(1) — 100.0% | ||||
| Domestic Equity Funds — 59.2% | ||||
| NT Core Equity Plus Fund Institutional Class | 2,302,152 | $ | 33,887,672 | |
NT Disciplined Growth Fund Institutional Class(2) | 2,535,999 | 25,512,151 | ||
| NT Equity Growth Fund Institutional Class | 6,200,971 | 77,202,083 | ||
| NT Growth Fund Institutional Class | 5,172,071 | 80,736,033 | ||
| NT Heritage Fund Institutional Class | 3,455,856 | 49,245,955 | ||
| NT Large Company Value Fund Institutional Class | 8,272,939 | 102,749,901 | ||
| NT Mid Cap Value Fund Institutional Class | 4,076,452 | 51,770,946 | ||
| NT Small Company Fund Institutional Class | 2,509,092 | 25,191,285 | ||
| 446,296,026 | ||||
| International Equity Funds — 22.7% | ||||
| NT Emerging Markets Fund Institutional Class | 4,237,669 | 44,198,890 | ||
NT Global Real Estate Fund Institutional Class(2) | 2,136,402 | 20,530,826 | ||
| NT International Growth Fund Institutional Class | 4,339,939 | 50,213,090 | ||
NT International Small-Mid Cap Fund Institutional Class(2) | 1,530,480 | 16,192,474 | ||
NT International Value Fund Institutional Class(2) | 4,001,711 | 39,897,061 | ||
| 171,032,341 | ||||
| Domestic Fixed Income Funds — 14.7% | ||||
| High-Yield Fund Institutional Class | 2,312,678 | 13,321,023 | ||
| Inflation-Adjusted Bond Fund Institutional Class | 2,300,342 | 26,706,973 | ||
| NT Diversified Bond Fund Institutional Class | 6,485,724 | 70,305,247 | ||
| 110,333,243 | ||||
| International Fixed Income Funds — 3.4% | ||||
| Global Bond Fund Institutional Class | 2,621,758 | 25,771,878 | ||
TOTAL INVESTMENT SECURITIES — 100.0% (Cost $682,914,884) | 753,433,488 | |||
OTHER ASSETS AND LIABILITIES† | 6,580 | |||
| TOTAL NET ASSETS — 100.0% | $ | 753,440,068 | ||
| NOTES TO SCHEDULE OF INVESTMENTS |
| † | Category is less than 0.05% of total net assets. |
| (1) | Investments are funds within the American Century Investments family of funds and are considered affiliated funds. |
| (2) | Non-income producing. |
See Notes to Financial Statements.
39
JULY 31, 2015
One Choice 2055 Portfolio
| Shares | Value | |||
MUTUAL FUNDS(1) — 100.0% | ||||
| Domestic Equity Funds — 61.4% | ||||
| NT Core Equity Plus Fund Institutional Class | 725,944 | $ | 10,685,895 | |
NT Disciplined Growth Fund Institutional Class(2) | 820,633 | 8,255,572 | ||
| NT Equity Growth Fund Institutional Class | 2,038,266 | 25,376,410 | ||
| NT Growth Fund Institutional Class | 1,667,164 | 26,024,433 | ||
| NT Heritage Fund Institutional Class | 1,121,716 | 15,984,450 | ||
| NT Large Company Value Fund Institutional Class | 2,695,728 | 33,480,938 | ||
| NT Mid Cap Value Fund Institutional Class | 1,262,713 | 16,036,456 | ||
| NT Small Company Fund Institutional Class | 910,516 | 9,141,578 | ||
| 144,985,732 | ||||
| International Equity Funds — 23.5% | ||||
| NT Emerging Markets Fund Institutional Class | 1,471,112 | 15,343,694 | ||
NT Global Real Estate Fund Institutional Class(2) | 734,231 | 7,055,957 | ||
| NT International Growth Fund Institutional Class | 1,232,407 | 14,258,947 | ||
NT International Small-Mid Cap Fund Institutional Class(2) | 549,145 | 5,809,954 | ||
NT International Value Fund Institutional Class(2) | 1,296,761 | 12,928,711 | ||
| 55,397,263 | ||||
| Domestic Fixed Income Funds — 12.1% | ||||
| High-Yield Fund Institutional Class | 618,673 | 3,563,558 | ||
| Inflation-Adjusted Bond Fund Institutional Class | 610,396 | 7,086,698 | ||
| NT Diversified Bond Fund Institutional Class | 1,653,508 | 17,924,026 | ||
| 28,574,282 | ||||
| International Fixed Income Funds — 3.0% | ||||
| Global Bond Fund Institutional Class | 729,082 | 7,166,872 | ||
TOTAL INVESTMENT SECURITIES — 100.0% (Cost $226,748,670) | 236,124,149 | |||
OTHER ASSETS AND LIABILITIES† | 5,442 | |||
| TOTAL NET ASSETS — 100.0% | $ | 236,129,591 | ||
| NOTES TO SCHEDULE OF INVESTMENTS |
| † | Category is less than 0.05% of total net assets. |
| (1) | Investments are funds within the American Century Investments family of funds and are considered affiliated funds. |
| (2) | Non-income producing. |
See Notes to Financial Statements.
40
| Statements of Assets and Liabilities |
| JULY 31, 2015 | |||||||||
One Choice In Retirement Portfolio | One Choice 2020 Portfolio | One Choice 2025 Portfolio | |||||||
| Assets | |||||||||
| Investment securities in affiliates, at value (cost of $1,802,829,576, $1,570,900,487 and $2,284,453,448, respectively) | $ | 1,988,453,737 | $ | 1,728,078,278 | $ | 2,618,457,833 | |||
| Cash | 443,242 | 352,698 | 529,716 | ||||||
| Receivable for capital shares sold | 13,494,149 | 15,649,300 | 10,591,558 | ||||||
| Distributions receivable from affiliates | 1,157,150 | 962,283 | 1,395,389 | ||||||
| 2,003,548,278 | 1,745,042,559 | 2,630,974,496 | |||||||
| Liabilities | |||||||||
| Payable for investments purchased | 8,309,787 | 9,009,299 | 6,033,121 | ||||||
| Payable for capital shares redeemed | 6,257,059 | 7,609,241 | 4,989,071 | ||||||
| Accrued administrative fees | 255,707 | 194,500 | 319,447 | ||||||
| Distribution and service fees payable | 202,279 | 157,271 | 228,000 | ||||||
| 15,024,832 | 16,970,311 | 11,569,639 | |||||||
| Net Assets | $ | 1,988,523,446 | $ | 1,728,072,248 | $ | 2,619,404,857 | |||
| Net Assets Consist of: | |||||||||
| Capital (par value and paid-in surplus) | $ | 1,824,960,071 | $ | 1,513,234,846 | $ | 2,196,446,636 | |||
| Undistributed net investment income | 802,762 | 6,660,069 | 9,884,158 | ||||||
| Accumulated undistributed net realized gain (loss) | (22,863,548 | ) | 50,999,542 | 79,069,678 | |||||
| Net unrealized appreciation | 185,624,161 | 157,177,791 | 334,004,385 | ||||||
| $ | 1,988,523,446 | $ | 1,728,072,248 | $ | 2,619,404,857 | ||||
| Fund/Class | Net Assets | Shares Outstanding | Net Asset Value Per Share | |||
| One Choice In Retirement Portfolio | ||||||
| Investor Class, $0.01 Par Value | $822,617,771 | 65,193,991 | $12.62 | |||
| Institutional Class, $0.01 Par Value | $485,416,423 | 38,456,195 | $12.62 | |||
| A Class, $0.01 Par Value | $428,049,523 | 33,915,854 | $12.62* | |||
| C Class, $0.01 Par Value | $7,721,460 | 613,121 | $12.59 | |||
| R Class, $0.01 Par Value | $244,718,269 | 19,416,033 | $12.60 | |||
| One Choice 2020 Portfolio | ||||||
| Investor Class, $0.01 Par Value | $611,535,895 | 49,703,359 | $12.30 | |||
| Institutional Class, $0.01 Par Value | $579,652,749 | 47,074,828 | $12.31 | |||
| A Class, $0.01 Par Value | $357,729,606 | 29,130,515 | $12.28* | |||
| C Class, $0.01 Par Value | $11,578,154 | 944,040 | $12.26 | |||
| R Class, $0.01 Par Value | $167,575,844 | 13,663,879 | $12.26 | |||
| One Choice 2025 Portfolio | ||||||
| Investor Class, $0.01 Par Value | $1,075,027,985 | 73,508,076 | $14.62 | |||
| Institutional Class, $0.01 Par Value | $729,071,348 | 49,806,783 | $14.64 | |||
| A Class, $0.01 Par Value | $568,433,789 | 38,921,430 | $14.60* | |||
| C Class, $0.01 Par Value | $7,658,336 | 525,362 | $14.58 | |||
| R Class, $0.01 Par Value | $239,213,399 | 16,404,918 | $14.58 | |||
| * | Maximum offering price $13.39, $13.03 and $15.49 (net asset value divided by 0.9425) for One Choice In Retirement Portfolio, One Choice 2020 Portfolio and One Choice 2025 Portfolio, respectively. |
See Notes to Financial Statements.
41
| JULY 31, 2015 | |||||||||
One Choice 2030 Portfolio | One Choice 2035 Portfolio | One Choice 2040 Portfolio | |||||||
| Assets | |||||||||
| Investment securities in affiliates, at value (cost of $1,559,874,493, $1,788,012,525 and $1,169,693,077, respectively) | $ | 1,729,985,508 | $ | 2,069,971,466 | $ | 1,302,900,628 | |||
| Cash | 344,552 | 432,061 | 249,309 | ||||||
| Receivable for investments sold | — | — | 419,652 | ||||||
| Receivable for capital shares sold | 8,461,184 | 6,441,020 | 5,729,572 | ||||||
| Distributions receivable from affiliates | 831,271 | 867,357 | 463,892 | ||||||
| 1,739,622,515 | 2,077,711,904 | 1,309,763,053 | |||||||
| Liabilities | |||||||||
| Payable for investments purchased | 1,143,277 | 1,503,056 | 464,173 | ||||||
| Payable for capital shares redeemed | 8,113,501 | 5,759,233 | 6,121,323 | ||||||
| Accrued administrative fees | 195,749 | 256,166 | 146,245 | ||||||
| Distribution and service fees payable | 160,337 | 190,355 | 111,426 | ||||||
| 9,612,864 | 7,708,810 | 6,843,167 | |||||||
| Net Assets | $ | 1,730,009,651 | $ | 2,070,003,094 | $ | 1,302,919,886 | |||
| Net Assets Consist of: | |||||||||
| Capital (par value and paid-in surplus) | $ | 1,489,744,596 | $ | 1,696,886,851 | $ | 1,109,494,360 | |||
| Undistributed net investment income | 6,020,965 | 6,546,610 | 3,864,164 | ||||||
| Undistributed net realized gain | 64,133,075 | 84,610,692 | 56,353,811 | ||||||
| Net unrealized appreciation | 170,111,015 | 281,958,941 | 133,207,551 | ||||||
| $ | 1,730,009,651 | $ | 2,070,003,094 | $ | 1,302,919,886 | ||||
| Fund/Class | Net Assets | Shares Outstanding | Net Asset Value Per Share | |||
| One Choice 2030 Portfolio | ||||||
| Investor Class, $0.01 Par Value | $590,896,450 | 46,960,543 | $12.58 | |||
| Institutional Class, $0.01 Par Value | $574,390,036 | 45,623,888 | $12.59 | |||
| A Class, $0.01 Par Value | $385,874,252 | 30,743,880 | $12.55* | |||
| C Class, $0.01 Par Value | $5,628,326 | 448,901 | $12.54 | |||
| R Class, $0.01 Par Value | $173,220,587 | 13,814,473 | $12.54 | |||
| One Choice 2035 Portfolio | ||||||
| Investor Class, $0.01 Par Value | $839,654,579 | 53,033,601 | $15.83 | |||
| Institutional Class, $0.01 Par Value | $556,384,159 | 35,082,846 | $15.86 | |||
| A Class, $0.01 Par Value | $460,605,112 | 29,129,419 | $15.81* | |||
| C Class, $0.01 Par Value | $6,586,508 | 417,666 | $15.77 | |||
| R Class, $0.01 Par Value | $206,772,736 | 13,092,470 | $15.79 | |||
| One Choice 2040 Portfolio | ||||||
| Investor Class, $0.01 Par Value | $472,334,546 | 35,952,630 | $13.14 | |||
| Institutional Class, $0.01 Par Value | $437,728,442 | 33,289,027 | $13.15 | |||
| A Class, $0.01 Par Value | $267,038,118 | 20,357,233 | $13.12* | |||
| C Class, $0.01 Par Value | $3,158,121 | 241,426 | $13.08 | |||
| R Class, $0.01 Par Value | $122,660,659 | 9,366,251 | $13.10 | |||
| * | Maximum offering price $13.32, $16.77 and $13.92 (net asset value divided by 0.9425) for One Choice 2030 Portfolio, One Choice 2035 Portfolio and One Choice 2040 Portfolio, respectively. |
See Notes to Financial Statements.
42
| JULY 31, 2015 | |||||||||
One Choice 2045 Portfolio | One Choice 2050 Portfolio | One Choice 2055 Portfolio | |||||||
| Assets | |||||||||
| Investment securities in affiliates, at value (cost of $1,279,837,243, $682,914,884 and $226,748,670, respectively) | $ | 1,485,300,732 | $ | 753,433,488 | $ | 236,124,149 | |||
| Cash | 289,845 | 141,122 | 43,995 | ||||||
| Receivable for investments sold | 2,806,560 | — | — | ||||||
| Receivable for capital shares sold | 2,666,536 | 3,239,987 | 928,771 | ||||||
| Distributions receivable from affiliates | 435,598 | 191,980 | 49,494 | ||||||
| 1,491,499,271 | 757,006,577 | 237,146,409 | |||||||
| Liabilities | |||||||||
| Payable for investments purchased | 435,865 | 1,039,774 | 331,696 | ||||||
| Payable for capital shares redeemed | 5,453,262 | 2,380,872 | 639,634 | ||||||
| Accrued administrative fees | 177,215 | 83,373 | 23,875 | ||||||
| Distribution and service fees payable | 122,336 | 62,490 | 21,613 | ||||||
| 6,188,678 | 3,566,509 | 1,016,818 | |||||||
| Net Assets | $ | 1,485,310,593 | $ | 753,440,068 | $ | 236,129,591 | |||
| Net Assets Consist of: | |||||||||
| Capital (par value and paid-in surplus) | $ | 1,208,831,756 | $ | 647,189,940 | $ | 218,427,886 | |||
| Undistributed net investment income | 4,031,434 | 1,873,490 | 500,988 | ||||||
| Undistributed net realized gain | 66,983,914 | 33,858,034 | 7,825,238 | ||||||
| Net unrealized appreciation | 205,463,489 | 70,518,604 | 9,375,479 | ||||||
| $ | 1,485,310,593 | $ | 753,440,068 | $ | 236,129,591 | ||||
| Fund/Class | Net Assets | Shares Outstanding | Net Asset Value Per Share | |||
| One Choice 2045 Portfolio | ||||||
| Investor Class, $0.01 Par Value | $608,153,876 | 36,702,710 | $16.57 | |||
| Institutional Class, $0.01 Par Value | $437,726,328 | 26,375,534 | $16.60 | |||
| A Class, $0.01 Par Value | $306,434,831 | 18,525,812 | $16.54* | |||
| C Class, $0.01 Par Value | $2,458,800 | 148,947 | $16.51 | |||
| R Class, $0.01 Par Value | $130,536,758 | 7,898,459 | $16.53 | |||
| One Choice 2050 Portfolio | ||||||
| Investor Class, $0.01 Par Value | $268,547,848 | 20,348,964 | $13.20 | |||
| Institutional Class, $0.01 Par Value | $257,920,541 | 19,510,365 | $13.22 | |||
| A Class, $0.01 Par Value | $162,011,455 | 12,295,427 | $13.18* | |||
| C Class, $0.01 Par Value | $2,196,778 | 167,011 | $13.15 | |||
| R Class, $0.01 Par Value | $62,763,446 | 4,768,046 | $13.16 | |||
| One Choice 2055 Portfolio | ||||||
| Investor Class, $0.01 Par Value | $66,162,540 | 4,821,585 | $13.72 | |||
| Institutional Class, $0.01 Par Value | $92,653,430 | 6,746,646 | $13.73 | |||
| A Class, $0.01 Par Value | $51,889,208 | 3,789,134 | $13.69* | |||
| C Class, $0.01 Par Value | $557,337 | 40,849 | $13.64 | |||
| R Class, $0.01 Par Value | $24,867,076 | 1,817,031 | $13.69 | |||
| * | Maximum offering price $17.55, $13.98 and $14.53 (net asset value divided by 0.9425) for One Choice 2045 Portfolio, One Choice 2050 Portfolio and One Choice 2055 Portfolio, respectively. |
See Notes to Financial Statements.
43
| Statements of Operations |
| YEAR ENDED JULY 31, 2015 | |||||||||
One Choice In Retirement Portfolio | One Choice 2020 Portfolio | One Choice 2025 Portfolio | |||||||
| Investment Income (Loss) | |||||||||
| Income from Affiliates: | |||||||||
| Income distributions from underlying funds | $ | 20,185,908 | $ | 34,724,267 | $ | 54,678,490 | |||
| Expenses: | |||||||||
| Administrative fees: | |||||||||
| Investor Class | 930,524 | 1,167,616 | 2,104,796 | ||||||
| A Class | 486,928 | 691,060 | 1,090,581 | ||||||
| C Class | 8,702 | 23,461 | 15,385 | ||||||
| R Class | 322,107 | 310,200 | 459,637 | ||||||
| Distribution and service fees: | |||||||||
| A Class | 608,659 | 863,826 | 1,363,226 | ||||||
| C Class | 43,508 | 117,303 | 76,928 | ||||||
| R Class | 805,266 | 775,501 | 1,149,095 | ||||||
| Directors' fees and expenses | 31,137 | 51,662 | 80,786 | ||||||
| 3,236,831 | 4,000,629 | 6,340,434 | |||||||
| Net investment income (loss) | 16,949,077 | 30,723,638 | 48,338,056 | ||||||
| Realized and Unrealized Gain (Loss) on Affiliates | |||||||||
| Net realized gain (loss) on: | |||||||||
| Sale of investments in underlying funds | 1,291,456 | 7,802,711 | 29,204,731 | ||||||
| Capital gain distributions received from underlying funds | 21,421,865 | 49,099,769 | 83,235,540 | ||||||
| 22,713,321 | 56,902,480 | 112,440,271 | |||||||
| Change in net unrealized appreciation (depreciation) on investments in underlying funds | (15,394,485 | ) | (29,289,826 | ) | (57,670,276 | ) | |||
| Net realized and unrealized gain (loss) on affiliates | 7,318,836 | 27,612,654 | 54,769,995 | ||||||
| Net Increase (Decrease) in Net Assets Resulting from Operations | $ | 24,267,913 | $ | 58,336,292 | $ | 103,108,051 | |||
See Notes to Financial Statements.
44
| YEAR ENDED JULY 31, 2015 | |||||||||
| One Choice 2030 Portfolio | One Choice 2035 Portfolio | One Choice 2040 Portfolio | |||||||
| Investment Income (Loss) | |||||||||
| Income from Affiliates: | |||||||||
| Income distributions from underlying funds | $ | 33,910,222 | $ | 41,837,834 | $ | 25,546,861 | |||
| Expenses: | |||||||||
| Administrative fees: | |||||||||
| Investor Class | 1,110,071 | 1,626,403 | 867,397 | ||||||
| A Class | 740,795 | 886,960 | 500,969 | ||||||
| C Class | 10,243 | 11,447 | 6,443 | ||||||
| R Class | 314,198 | 395,844 | 223,910 | ||||||
| Distribution and service fees: | |||||||||
| A Class | 925,993 | 1,108,699 | 626,210 | ||||||
| C Class | 51,218 | 57,235 | 32,212 | ||||||
| R Class | 785,495 | 989,609 | 559,775 | ||||||
| Directors' fees and expenses | 51,132 | 63,666 | 38,082 | ||||||
| 3,989,145 | 5,139,863 | 2,854,998 | |||||||
| Net investment income (loss) | 29,921,077 | 36,697,971 | 22,691,863 | ||||||
| Realized and Unrealized Gain (Loss) on Affiliates | |||||||||
| Net realized gain (loss) on: | |||||||||
| Sale of investments in underlying funds | 12,325,153 | 27,130,497 | 7,983,154 | ||||||
| Capital gain distributions received from underlying funds | 57,900,047 | 79,927,614 | 51,463,859 | ||||||
| 70,225,200 | 107,058,111 | 59,447,013 | |||||||
| Change in net unrealized appreciation (depreciation) on investments in underlying funds | (24,454,278 | ) | (34,923,732 | ) | (12,280,750 | ) | |||
| Net realized and unrealized gain (loss) on affiliates | 45,770,922 | 72,134,379 | 47,166,263 | ||||||
| Net Increase (Decrease) in Net Assets Resulting from Operations | $ | 75,691,999 | $ | 108,832,350 | $ | 69,858,126 | |||
See Notes to Financial Statements.
45
| YEAR ENDED JULY 31, 2015 | |||||||||
| One Choice 2045 Portfolio | One Choice 2050 Portfolio | One Choice 2055 Portfolio | |||||||
| Investment Income (Loss) | |||||||||
| Income from Affiliates: | |||||||||
| Income distributions from underlying funds | $ | 30,951,434 | $ | 14,461,120 | $ | 3,723,406 | |||
| Expenses: | |||||||||
| Administrative fees: | |||||||||
| Investor Class | 1,152,791 | 486,925 | 100,157 | ||||||
| A Class | 585,544 | 293,093 | 83,890 | ||||||
| C Class | 4,376 | 4,438 | 1,010 | ||||||
| R Class | 258,018 | 113,276 | 39,691 | ||||||
| Distribution and service fees: | |||||||||
| A Class | 731,931 | 366,366 | 104,863 | ||||||
| C Class | 21,882 | 22,188 | 5,048 | ||||||
| R Class | 645,044 | 283,190 | 99,227 | ||||||
| Directors' fees and expenses | 45,627 | 21,551 | 5,694 | ||||||
| 3,445,213 | 1,591,027 | 439,580 | |||||||
| Net investment income (loss) | 27,506,221 | 12,870,093 | 3,283,826 | ||||||
| Realized and Unrealized Gain (Loss) on Affiliates | |||||||||
| Net realized gain (loss) on: | |||||||||
| Sale of investments in underlying funds | 16,425,042 | 3,670,820 | (45,787 | ) | |||||
| Capital gain distributions received from underlying funds | 66,694,957 | 31,902,915 | 8,239,181 | ||||||
| 83,119,999 | 35,573,735 | 8,193,394 | |||||||
| Change in net unrealized appreciation (depreciation) on investments in underlying funds | (21,040,888 | ) | (6,085,460 | ) | (471,405 | ) | |||
| Net realized and unrealized gain (loss) on affiliates | 62,079,111 | 29,488,275 | 7,721,989 | ||||||
| Net Increase (Decrease) in Net Assets Resulting from Operations | $ | 89,585,332 | $ | 42,358,368 | $ | 11,005,815 | |||
See Notes to Financial Statements.
46
| Statements of Changes in Net Assets |
| YEARS ENDED JULY 31, 2015 AND JULY 31, 2014 | ||||||||||||
| One Choice In Retirement Portfolio | One Choice 2020 Portfolio | |||||||||||
| Increase (Decrease) in Net Assets | July 31, 2015 | July 31, 2014 | July 31, 2015 | July 31, 2014 | ||||||||
| Operations | ||||||||||||
| Net investment income (loss) | $ | 16,949,077 | $ | 11,271,704 | $ | 30,723,638 | $ | 24,914,074 | ||||
| Net realized gain (loss) | 22,713,321 | 9,124,706 | 56,902,480 | 20,528,706 | ||||||||
| Change in net unrealized appreciation (depreciation) | (15,394,485 | ) | 22,567,777 | (29,289,826 | ) | 54,975,502 | ||||||
| Net increase (decrease) in net assets resulting from operations | 24,267,913 | 42,964,187 | 58,336,292 | 100,418,282 | ||||||||
| Distributions to Shareholders | ||||||||||||
| From net investment income: | ||||||||||||
| Investor Class | (8,278,509 | ) | (4,974,928 | ) | (12,352,256 | ) | (9,819,267 | ) | ||||
| Institutional Class | (5,038,644 | ) | (2,595,030 | ) | (9,406,680 | ) | (5,571,254 | ) | ||||
| A Class | (3,747,083 | ) | (2,369,527 | ) | (6,389,870 | ) | (5,275,285 | ) | ||||
| C Class | (39,543 | ) | (27,803 | ) | (136,434 | ) | (78,383 | ) | ||||
| R Class | (2,349,792 | ) | (1,221,450 | ) | (2,510,233 | ) | (1,788,806 | ) | ||||
| From net realized gains: | ||||||||||||
| Investor Class | (12,996,429 | ) | (2,288,831 | ) | (8,843,300 | ) | (3,573,259 | ) | ||||
| Institutional Class | (7,599,042 | ) | (1,087,473 | ) | (6,157,505 | ) | (1,840,144 | ) | ||||
| A Class | (6,589,671 | ) | (1,247,654 | ) | (5,183,223 | ) | (2,197,614 | ) | ||||
| C Class | (114,443 | ) | (20,733 | ) | (184,038 | ) | (57,872 | ) | ||||
| R Class | (5,489,818 | ) | (721,985 | ) | (2,348,635 | ) | (871,830 | ) | ||||
| Decrease in net assets from distributions | (52,242,974 | ) | (16,555,414 | ) | (53,512,174 | ) | (31,073,714 | ) | ||||
| Capital Share Transactions | ||||||||||||
| Net increase (decrease) in net assets from capital share transactions (Note 5) | 1,387,527,297 | 111,785,577 | 378,199,710 | 301,710,872 | ||||||||
| Net increase (decrease) in net assets | 1,359,552,236 | 138,194,350 | 383,023,828 | 371,055,440 | ||||||||
| Net Assets | ||||||||||||
| Beginning of period | 628,971,210 | 490,776,860 | 1,345,048,420 | 973,992,980 | ||||||||
| End of period | $ | 1,988,523,446 | $ | 628,971,210 | $ | 1,728,072,248 | $ | 1,345,048,420 | ||||
| Undistributed net investment income | $ | 802,762 | $ | — | $ | 6,660,069 | $ | 6,731,904 | ||||
See Notes to Financial Statements.
47
| YEARS ENDED JULY 31, 2015 AND JULY 31, 2014 | ||||||||||||
| One Choice 2025 Portfolio | One Choice 2030 Portfolio | |||||||||||
| Increase (Decrease) in Net Assets | July 31, 2015 | July 31, 2014 | July 31, 2015 | July 31, 2014 | ||||||||
| Operations | ||||||||||||
| Net investment income (loss) | $ | 48,338,056 | $ | 42,845,053 | $ | 29,921,077 | $ | 25,257,541 | ||||
| Net realized gain (loss) | 112,440,271 | 42,795,699 | 70,225,200 | 26,549,841 | ||||||||
| Change in net unrealized appreciation (depreciation) | (57,670,276 | ) | 92,519,980 | (24,454,278 | ) | 56,111,490 | ||||||
| Net increase (decrease) in net assets resulting from operations | 103,108,051 | 178,160,732 | 75,691,999 | 107,918,872 | ||||||||
| Distributions to Shareholders | ||||||||||||
| From net investment income: | ||||||||||||
| Investor Class | (22,521,580 | ) | (19,077,703 | ) | (11,527,431 | ) | (9,330,847 | ) | ||||
| Institutional Class | (12,088,557 | ) | (8,115,728 | ) | (9,190,911 | ) | (5,817,356 | ) | ||||
| A Class | (10,418,808 | ) | (9,556,205 | ) | (6,745,489 | ) | (5,667,872 | ) | ||||
| C Class | (90,627 | ) | (72,908 | ) | (54,556 | ) | (42,914 | ) | ||||
| R Class | (3,786,705 | ) | (3,061,379 | ) | (2,516,296 | ) | (1,893,572 | ) | ||||
| From net realized gains: | ||||||||||||
| Investor Class | (20,138,492 | ) | (8,772,450 | ) | (10,815,442 | ) | (3,426,979 | ) | ||||
| Institutional Class | (9,890,637 | ) | (3,406,146 | ) | (7,873,516 | ) | (1,946,819 | ) | ||||
| A Class | (10,542,107 | ) | (4,992,585 | ) | (7,184,678 | ) | (2,370,992 | ) | ||||
| C Class | (151,236 | ) | (64,317 | ) | (97,635 | ) | (30,719 | ) | ||||
| R Class | (4,410,237 | ) | (1,850,724 | ) | (3,097,726 | ) | (919,508 | ) | ||||
| Decrease in net assets from distributions | (94,038,986 | ) | (58,970,145 | ) | (59,103,680 | ) | (31,447,578 | ) | ||||
| Capital Share Transactions | ||||||||||||
| Net increase (decrease) in net assets from capital share transactions (Note 5) | 448,053,159 | 298,336,311 | 385,425,967 | 343,921,171 | ||||||||
| Net increase (decrease) in net assets | 457,122,224 | 417,526,898 | 402,014,286 | 420,392,465 | ||||||||
| Net Assets | ||||||||||||
| Beginning of period | 2,162,282,633 | 1,744,755,735 | 1,327,995,365 | 907,602,900 | ||||||||
| End of period | $ | 2,619,404,857 | $ | 2,162,282,633 | $ | 1,730,009,651 | $ | 1,327,995,365 | ||||
| Undistributed net investment income | $ | 9,884,158 | $ | 10,452,379 | $ | 6,020,965 | $ | 6,134,571 | ||||
See Notes to Financial Statements.
48
| YEARS ENDED JULY 31, 2015 AND JULY 31, 2014 | ||||||||||||
| One Choice 2035 Portfolio | One Choice 2040 Portfolio | |||||||||||
| Increase (Decrease) in Net Assets | July 31, 2015 | July 31, 2014 | July 31, 2015 | July 31, 2014 | ||||||||
| Operations | ||||||||||||
| Net investment income (loss) | $ | 36,697,971 | $ | 34,247,740 | $ | 22,691,863 | $ | 19,175,979 | ||||
| Net realized gain (loss) | 107,058,111 | 41,724,936 | 59,447,013 | 23,800,299 | ||||||||
| Change in net unrealized appreciation (depreciation) | (34,923,732 | ) | 77,422,009 | (12,280,750 | ) | 44,741,982 | ||||||
| Net increase (decrease) in net assets resulting from operations | 108,832,350 | 153,394,685 | 69,858,126 | 87,718,260 | ||||||||
| Distributions to Shareholders | ||||||||||||
| From net investment income: | ||||||||||||
| Investor Class | (17,069,090 | ) | (14,670,259 | ) | (9,017,197 | ) | (7,497,230 | ) | ||||
| Institutional Class | (8,933,739 | ) | (6,523,160 | ) | (7,299,870 | ) | (4,691,093 | ) | ||||
| A Class | (8,314,219 | ) | (7,837,370 | ) | (4,642,592 | ) | (4,005,418 | ) | ||||
| C Class | (62,683 | ) | (46,280 | ) | (37,054 | ) | (32,701 | ) | ||||
| R Class | (3,192,145 | ) | (2,755,398 | ) | (1,818,551 | ) | (1,266,851 | ) | ||||
| From net realized gains: | ||||||||||||
| Investor Class | (19,055,364 | ) | (6,508,455 | ) | (9,445,838 | ) | (2,650,070 | ) | ||||
| Institutional Class | (9,111,372 | ) | (2,649,867 | ) | (6,987,452 | ) | (1,518,621 | ) | ||||
| A Class | (10,524,767 | ) | (3,929,247 | ) | (5,512,609 | ) | (1,599,221 | ) | ||||
| C Class | (132,715 | ) | (38,067 | ) | (73,397 | ) | (21,371 | ) | ||||
| R Class | (4,665,723 | ) | (1,587,929 | ) | (2,492,089 | ) | (581,086 | ) | ||||
| Decrease in net assets from distributions | (81,061,817 | ) | (46,546,032 | ) | (47,326,649 | ) | (23,863,662 | ) | ||||
| Capital Share Transactions | ||||||||||||
| Net increase (decrease) in net assets from capital share transactions (Note 5) | 351,330,616 | 273,030,474 | 315,884,884 | 266,700,967 | ||||||||
| Net increase (decrease) in net assets | 379,101,149 | 379,879,127 | 338,416,361 | 330,555,565 | ||||||||
| Net Assets | ||||||||||||
| Beginning of period | 1,690,901,945 | 1,311,022,818 | 964,503,525 | 633,947,960 | ||||||||
| End of period | $ | 2,070,003,094 | $ | 1,690,901,945 | $ | 1,302,919,886 | $ | 964,503,525 | ||||
| Undistributed net investment income | $ | 6,546,610 | $ | 7,420,515 | $ | 3,864,164 | $ | 3,987,565 | ||||
See Notes to Financial Statements.
49
| YEARS ENDED JULY 31, 2015 AND JULY 31, 2014 | ||||||||||||
| One Choice 2045 Portfolio | One Choice 2050 Portfolio | |||||||||||
| Increase (Decrease) in Net Assets | July 31, 2015 | July 31, 2014 | July 31, 2015 | July 31, 2014 | ||||||||
| Operations | ||||||||||||
| Net investment income (loss) | $ | 27,506,221 | $ | 24,519,396 | $ | 12,870,093 | $ | 10,073,276 | ||||
| Net realized gain (loss) | 83,119,999 | 32,079,858 | 35,573,735 | 13,081,175 | ||||||||
| Change in net unrealized appreciation (depreciation) | (21,040,888 | ) | 62,485,120 | (6,085,460 | ) | 26,753,615 | ||||||
| Net increase (decrease) in net assets resulting from operations | 89,585,332 | 119,084,374 | 42,358,368 | 49,908,066 | ||||||||
| Distributions to Shareholders | ||||||||||||
| From net investment income: | ||||||||||||
| Investor Class | (12,417,396 | ) | (10,137,498 | ) | (4,991,296 | ) | (3,796,951 | ) | ||||
| Institutional Class | (7,762,124 | ) | (5,633,312 | ) | (4,239,248 | ) | (2,661,091 | ) | ||||
| A Class | (5,699,040 | ) | (5,408,579 | ) | (2,692,104 | ) | (2,176,551 | ) | ||||
| C Class | (24,550 | ) | (18,397 | ) | (24,454 | ) | (28,338 | ) | ||||
| R Class | (2,186,794 | ) | (1,836,633 | ) | (902,027 | ) | (687,986 | ) | ||||
| From net realized gains: | ||||||||||||
| Investor Class | (14,310,333 | ) | (4,326,674 | ) | (5,158,427 | ) | (1,370,673 | ) | ||||
| Institutional Class | (8,195,367 | ) | (2,208,806 | ) | (4,002,833 | ) | (881,545 | ) | ||||
| A Class | (7,415,660 | ) | (2,594,509 | ) | (3,154,095 | ) | (885,230 | ) | ||||
| C Class | (52,135 | ) | (14,063 | ) | (47,826 | ) | (18,564 | ) | ||||
| R Class | (3,267,257 | ) | (1,006,054 | ) | (1,219,857 | ) | (320,242 | ) | ||||
| Decrease in net assets from distributions | (61,330,656 | ) | (33,184,525 | ) | (26,432,167 | ) | (12,827,171 | ) | ||||
| Capital Share Transactions | ||||||||||||
| Net increase (decrease) in net assets from capital share transactions (Note 5) | 248,473,490 | 246,605,584 | 205,592,971 | 157,882,377 | ||||||||
| Net increase (decrease) in net assets | 276,728,166 | 332,505,433 | 221,519,172 | 194,963,272 | ||||||||
| Net Assets | ||||||||||||
| Beginning of period | 1,208,582,427 | 876,076,994 | 531,920,896 | 336,957,624 | ||||||||
| End of period | $ | 1,485,310,593 | $ | 1,208,582,427 | $ | 753,440,068 | $ | 531,920,896 | ||||
| Undistributed net investment income | $ | 4,031,434 | $ | 4,615,117 | $ | 1,873,490 | $ | 1,852,526 | ||||
See Notes to Financial Statements.
50
| YEARS ENDED JULY 31, 2015 AND JULY 31, 2014 | ||||||
| One Choice 2055 Portfolio | ||||||
| Increase (Decrease) in Net Assets | July 31, 2015 | July 31, 2014 | ||||
| Operations | ||||||
| Net investment income (loss) | $ | 3,283,826 | $ | 1,790,387 | ||
| Net realized gain (loss) | 8,193,394 | 2,193,768 | ||||
| Change in net unrealized appreciation (depreciation) | (471,405 | ) | 5,249,341 | |||
| Net increase (decrease) in net assets resulting from operations | 11,005,815 | 9,233,496 | ||||
| Distributions to Shareholders | ||||||
| From net investment income: | ||||||
| Investor Class | (920,151 | ) | (527,130 | ) | ||
| Institutional Class | (1,225,516 | ) | (459,579 | ) | ||
| A Class | (707,023 | ) | (404,300 | ) | ||
| C Class | (4,711 | ) | (3,431 | ) | ||
| R Class | (287,640 | ) | (162,114 | ) | ||
| From net realized gains: | ||||||
| Investor Class | (680,925 | ) | (107,031 | ) | ||
| Institutional Class | (824,828 | ) | (85,305 | ) | ||
| A Class | (597,342 | ) | (93,019 | ) | ||
| C Class | (6,929 | ) | (1,313 | ) | ||
| R Class | (283,137 | ) | (43,026 | ) | ||
| Decrease in net assets from distributions | (5,538,202 | ) | (1,886,248 | ) | ||
| Capital Share Transactions | ||||||
Net increase (decrease) in net assets from capital share transactions (Note 5) | 107,943,826 | 68,124,691 | ||||
| Net increase (decrease) in net assets | 113,411,439 | 75,471,939 | ||||
| Net Assets | ||||||
| Beginning of period | 122,718,152 | 47,246,213 | ||||
| End of period | $ | 236,129,591 | $ | 122,718,152 | ||
| Undistributed net investment income | $ | 500,988 | $ | 362,203 | ||
See Notes to Financial Statements.
51
| Notes to Financial Statements |
JULY 31, 2015
1. Organization
American Century Asset Allocation Portfolios, Inc. (the corporation) is registered under the Investment Company Act of 1940, as amended (the 1940 Act), as an open-end management investment company and is organized as a Maryland corporation. One Choice In Retirement Portfolio, One Choice 2020 Portfolio, One Choice 2025 Portfolio, One Choice 2030 Portfolio, One Choice 2035 Portfolio, One Choice 2040 Portfolio, One Choice 2045 Portfolio, One Choice 2050 Portfolio and One Choice 2055 Portfolio (collectively, the funds) are nine funds in a series issued by the corporation. The funds operate as “funds of funds,” meaning substantially all of the funds’ assets will be invested in other American Century Investments mutual funds (the underlying funds). Each fund’s assets are allocated among underlying funds that represent major asset classes, including equity securities (stocks), fixed-income securities (bonds) and cash-equivalent instruments (money markets). The underlying funds do not invest in securities issued by companies assigned the Global Industry Classification Standard for the tobacco industry. The funds are diversified as defined under the 1940 Act. The funds will assume the risks associated with their underlying funds. Additional information and attributes of each underlying fund are available at americancentury.com. The investment objective of One Choice In Retirement Portfolio is to seek current income. Capital appreciation is a secondary objective. The investment objective of each of the eight target date One Choice Portfolios is to seek the highest total return consistent with its asset mix. When a fund reaches its most conservative planned target asset allocation, which is expected to occur on approximately November 30 of the year before the target date, its target allocation will become fixed and will match that of One Choice In Retirement Portfolio.
The funds offer the Investor Class, the Institutional Class, the A Class, the C Class and the R Class. The A Class may incur an initial sales charge. The A Class and C Class may be subject to a contingent deferred sales charge. The share classes differ principally in their respective sales charges and distribution and shareholder servicing expenses and arrangements. The Institutional Class is made available to institutional shareholders or through financial intermediaries whose clients do not require the same level of shareholder and administrative services as shareholders of other classes. As a result, the Institutional Class is not charged an administrative fee.
2. Significant Accounting Policies
The following is a summary of significant accounting policies consistently followed by the funds in preparation of their financial statements. Each fund is an investment company and follows accounting and reporting guidance in accordance with accounting principles generally accepted in the United States of America. This may require management to make certain estimates and assumptions at the date of the financial statements. Actual results could differ from these estimates. Management evaluated the impact of events or transactions occurring through the date the financial statements were issued that would merit recognition or disclosure.
Investment Valuations — The funds determine the fair value of their investments and compute their net asset value per share at the close of regular trading (usually 4 p.m. Eastern time) on the New York Stock Exchange (NYSE) on each day the NYSE is open. The Board of Directors has adopted valuation policies and procedures to guide the investment advisor in the funds' investment valuation process and to provide methodologies for the oversight of the funds' pricing function. Investments in the underlying funds are valued at their reported net asset value.
Security Transactions — Security transactions are accounted for as of the trade date. Net realized gains and losses are determined on the identified cost basis, which is also used for federal income tax purposes.
Investment Income — Income and capital gain distributions, if any, from the underlying funds are recorded as of the ex-dividend date. Long-term capital gain distributions, if any, from the underlying funds are a component of net realized gain (loss).
Expenses — The expenses included in the accompanying financial statements reflect the expenses of each fund and do not include any expenses associated with the underlying funds.
52
Income Tax Status — It is each fund’s policy to distribute substantially all net investment income and net realized gains to shareholders and to otherwise qualify as a regulated investment company under provisions of the Internal Revenue Code. Accordingly, no provision has been made for income taxes. The funds file U.S. federal, state, local and non-U.S. tax returns as applicable. The funds' tax returns are subject to examination by the relevant taxing authority until expiration of the applicable statute of limitations, which is generally three years from the date of filing but can be longer in certain jurisdictions. At this time, management believes there are no uncertain tax positions which, based on their technical merit, would not be sustained upon examination and for which it is reasonably possible that the total amounts of unrecognized tax benefits will significantly change in the next twelve months.
Multiple Class — All shares of each fund represent an equal pro rata interest in the net assets of the class to which such shares belong, and have identical voting, dividend, liquidation and other rights and the same terms and conditions, except for class specific expenses and exclusive rights to vote on matters affecting only individual classes. Income, non-class specific expenses, and realized and unrealized capital gains and losses of the funds are allocated to each class of shares based on their relative net assets.
Distributions to Shareholders — Distributions from net investment income, if any, are generally declared and paid quarterly for One Choice In Retirement Portfolio. Distributions from net investment income, if any, are generally declared and paid annually for the eight target date One Choice Portfolios. Distributions from net realized gains, if any, are generally declared and paid annually for all funds.
Indemnifications — Under the corporation’s organizational documents, its officers and directors are indemnified against certain liabilities arising out of the performance of their duties to the funds. In addition, in the normal course of business, the funds enter into contracts that provide general indemnifications. The maximum exposure under these arrangements is unknown as this would involve future claims that may be made against a fund. The risk of material loss from such claims is considered by management to be remote.
3. Fees and Transactions with Related Parties
Certain officers and directors of the corporation are also officers and/or directors of American Century Companies, Inc. (ACC). The corporation’s investment advisor, American Century Investment Management, Inc. (ACIM), the corporation's distributor, American Century Investment Services, Inc. (ACIS), and the corporation’s transfer agent, American Century Services, LLC, are wholly owned, directly or indirectly, by ACC. ACIM serves as the investment advisor for the underlying funds.
Administrative Fees — The corporation has entered into an agreement with ACIM, under which ACIM provides the funds with shareholder services in exchange for an administrative fee (the fee). The fee is computed and accrued daily based on each class’s daily net assets and paid monthly in arrears. The rate of the fee for the Investor Class, A Class, C Class and R Class is 0.20%. There is no administrative fee for the Institutional Class. Fees incurred under the agreement during the year ended July 31, 2015 are detailed in the Statement of Operations.
Distribution and Service Fees — The Board of Directors has adopted a separate Master Distribution and Individual Shareholder Services Plan for each of the A Class, C Class and R Class (collectively the plans), pursuant to Rule 12b-1 of the 1940 Act. The plans provide that the A Class will pay ACIS an annual distribution and service fee of 0.25%. The plans provide that the C Class will pay ACIS an annual distribution and service fee of 1.00%, of which 0.25% is paid for individual shareholder services and 0.75% is paid for distribution services. The plans provide that the R Class will pay ACIS an annual distribution and service fee of 0.50%. The fees are computed and accrued daily based on each class’s daily net assets and paid monthly in arrears. These fees are used to pay financial intermediaries for distribution and individual shareholder services. Fees incurred under the plans during the year ended July 31, 2015 are detailed in the Statements of Operations.
Directors' Fees and Expenses — The Board of Directors is responsible for overseeing the investment advisor’s management and operations of the funds. The directors receive detailed information about the funds and their investment advisor regularly throughout the year, and meet at least quarterly with management of the investment advisor to review reports about fund operations. The funds' officers do not receive compensation from the funds.
Acquired Fund Fees and Expenses — Each fund will indirectly realize its pro rata share of the fees and expenses of the underlying funds in which it invests. These fees and expenses are already reflected in the valuation of the underlying funds.
53
4. Investment Transactions
Investment transactions for the year ended July 31, 2015 were as follows:
| One Choice In Retirement Portfolio | One Choice 2020 Portfolio | One Choice 2025 Portfolio | One Choice 2030 Portfolio | One Choice 2035 Portfolio | |||||||||||
| Purchases | $ | 542,814,460 | $ | 696,884,750 | $ | 956,923,272 | $ | 719,647,169 | $ | 809,917,849 | |||||
| Sales | $ | 201,695,129 | $ | 292,366,876 | $ | 472,301,211 | $ | 305,525,110 | $ | 423,052,333 | |||||
| One Choice 2040 Portfolio | One Choice 2045 Portfolio | One Choice 2050 Portfolio | One Choice 2055 Portfolio | |||||||||
| Purchases | $ | 571,559,546 | $ | 592,399,239 | $ | 360,991,785 | $ | 155,270,094 | ||||
| Sales | $ | 228,872,330 | $ | 311,062,864 | $ | 137,062,782 | $ | 41,346,705 | ||||
54
5. Capital Share Transactions
The corporation is authorized to issue 4,000,000,000 shares. Transactions in shares of the funds were as follows:
| Year ended July 31, 2015 | Year ended July 31, 2014 | |||||||||
| Shares | Amount | Shares | Amount | |||||||
| One Choice In Retirement Portfolio | ||||||||||
| Investor Class | ||||||||||
| Sold | 17,213,862 | $ | 221,160,056 | 9,344,734 | $ | 118,858,225 | ||||
Issued in connection with reorganization (Note 10) | 38,767,212 | 490,224,856 | — | — | ||||||
| Issued in reinvestment of distributions | 1,633,545 | 20,973,245 | 565,559 | 7,164,226 | ||||||
| Redeemed | (12,016,598 | ) | (153,949,116 | ) | (6,871,661 | ) | (87,661,948 | ) | ||
| 45,598,021 | 578,409,041 | 3,038,632 | 38,360,503 | |||||||
| Institutional Class | ||||||||||
| Sold | 18,960,260 | 242,784,308 | 4,962,217 | 63,382,965 | ||||||
Issued in connection with reorganization (Note 10) | 15,752,681 | 199,204,707 | — | — | ||||||
| Issued in reinvestment of distributions | 962,851 | 12,361,297 | 284,671 | 3,607,197 | ||||||
| Redeemed | (7,231,026 | ) | (92,616,001 | ) | (3,631,594 | ) | (46,185,156 | ) | ||
| 28,444,766 | 361,734,311 | 1,615,294 | 20,805,006 | |||||||
| A Class | ||||||||||
| Sold | 13,081,287 | 167,909,620 | 5,457,025 | 69,464,024 | ||||||
Issued in connection with reorganization (Note 10) | 16,935,741 | 214,308,053 | — | — | ||||||
| Issued in reinvestment of distributions | 743,527 | 9,552,136 | 261,841 | 3,314,578 | ||||||
| Redeemed | (7,593,284 | ) | (97,782,607 | ) | (4,599,854 | ) | (58,418,609 | ) | ||
| 23,167,271 | 293,987,202 | 1,119,012 | 14,359,993 | |||||||
| C Class | ||||||||||
| Sold | 92,973 | 1,189,600 | 128,031 | 1,619,511 | ||||||
Issued in connection with reorganization (Note 10) | 418,218 | 5,283,721 | — | — | ||||||
| Issued in reinvestment of distributions | 11,987 | 153,874 | 3,835 | 48,536 | ||||||
| Redeemed | (108,132 | ) | (1,378,450 | ) | (44,116 | ) | (558,381 | ) | ||
| 415,046 | 5,248,745 | 87,750 | 1,109,666 | |||||||
| R Class | ||||||||||
| Sold | 4,893,972 | 63,225,281 | 4,619,094 | 58,836,138 | ||||||
Issued in connection with reorganization (Note 10) | 9,766,945 | 123,418,300 | — | — | ||||||
| Issued in reinvestment of distributions | 598,120 | 7,680,888 | 149,406 | 1,890,232 | ||||||
| Redeemed | (3,605,660 | ) | (46,176,471 | ) | (1,853,280 | ) | (23,575,961 | ) | ||
| 11,653,377 | 148,147,998 | 2,915,220 | 37,150,409 | |||||||
| Net increase (decrease) | 109,278,481 | $ | 1,387,527,297 | 8,775,908 | $ | 111,785,577 | ||||
55
| Year ended July 31, 2015 | Year ended July 31, 2014 | |||||||||
| Shares | Amount | Shares | Amount | |||||||
| One Choice 2020 Portfolio | ||||||||||
| Investor Class | ||||||||||
| Sold | 14,280,676 | $ | 175,926,540 | 21,043,779 | $ | 249,994,003 | ||||
| Issued in reinvestment of distributions | 1,733,039 | 21,125,745 | 1,134,503 | 13,375,788 | ||||||
| Redeemed | (11,106,583 | ) | (136,839,437 | ) | (10,595,751 | ) | (127,015,531 | ) | ||
| 4,907,132 | 60,212,848 | 11,582,531 | 136,354,260 | |||||||
| Institutional Class | ||||||||||
| Sold | 28,856,375 | 355,949,709 | 12,653,625 | 151,264,000 | ||||||
| Issued in reinvestment of distributions | 1,274,866 | 15,527,868 | 628,617 | 7,411,398 | ||||||
| Redeemed | (8,353,262 | ) | (102,935,651 | ) | (6,267,991 | ) | (74,770,003 | ) | ||
| 21,777,979 | 268,541,926 | 7,014,251 | 83,905,395 | |||||||
| A Class | ||||||||||
| Sold | 8,393,327 | 103,181,602 | 9,817,108 | 116,375,892 | ||||||
| Issued in reinvestment of distributions | 908,384 | 11,064,112 | 604,367 | 7,125,492 | ||||||
| Redeemed | (7,483,026 | ) | (91,992,350 | ) | (6,509,238 | ) | (77,630,489 | ) | ||
| 1,818,685 | 22,253,364 | 3,912,237 | 45,870,895 | |||||||
| C Class | ||||||||||
| Sold | 201,888 | 2,490,419 | 478,240 | 5,663,540 | ||||||
| Issued in reinvestment of distributions | 26,108 | 319,042 | 11,419 | 134,968 | ||||||
| Redeemed | (163,308 | ) | (2,008,971 | ) | (141,207 | ) | (1,657,561 | ) | ||
| 64,688 | 800,490 | 348,452 | 4,140,947 | |||||||
| R Class | ||||||||||
| Sold | 4,699,903 | 57,844,285 | 5,622,646 | 66,724,197 | ||||||
| Issued in reinvestment of distributions | 388,598 | 4,733,123 | 218,800 | 2,579,646 | ||||||
| Redeemed | (2,944,639 | ) | (36,186,326 | ) | (3,193,423 | ) | (37,864,468 | ) | ||
| 2,143,862 | 26,391,082 | 2,648,023 | 31,439,375 | |||||||
| Net increase (decrease) | 30,712,346 | $ | 378,199,710 | 25,505,494 | $ | 301,710,872 | ||||
56
| Year ended July 31, 2015 | Year ended July 31, 2014 | |||||||||
| Shares | Amount | Shares | Amount | |||||||
| One Choice 2025 Portfolio | ||||||||||
| Investor Class | ||||||||||
| Sold | 15,982,482 | $ | 233,800,121 | 19,149,017 | $ | 270,574,750 | ||||
| Issued in reinvestment of distributions | 2,922,755 | 42,204,586 | 1,963,505 | 27,489,062 | ||||||
| Redeemed | (13,526,685 | ) | (198,262,902 | ) | (11,905,716 | ) | (168,899,498 | ) | ||
| 5,378,552 | 77,741,805 | 9,206,806 | 129,164,314 | |||||||
| Institutional Class | ||||||||||
| Sold | 27,274,426 | 400,047,373 | 12,189,454 | 172,967,274 | ||||||
| Issued in reinvestment of distributions | 1,489,458 | 21,507,780 | 804,901 | 11,260,566 | ||||||
| Redeemed | (8,065,557 | ) | (118,097,955 | ) | (5,602,048 | ) | (79,677,701 | ) | ||
| 20,698,327 | 303,457,198 | 7,392,307 | 104,550,139 | |||||||
| A Class | ||||||||||
| Sold | 13,216,694 | 193,358,730 | 11,840,877 | 167,296,312 | ||||||
| Issued in reinvestment of distributions | 1,348,142 | 19,467,175 | 951,631 | 13,322,832 | ||||||
| Redeemed | (11,947,133 | ) | (174,734,711 | ) | (10,101,771 | ) | (142,980,875 | ) | ||
| 2,617,703 | 38,091,194 | 2,690,737 | 37,638,269 | |||||||
| C Class | ||||||||||
| Sold | 134,770 | 1,977,888 | 110,203 | 1,557,112 | ||||||
| Issued in reinvestment of distributions | 16,703 | 241,863 | 9,756 | 136,882 | ||||||
| Redeemed | (118,393 | ) | (1,732,147 | ) | (79,808 | ) | (1,136,207 | ) | ||
| 33,080 | 487,604 | 40,151 | 557,787 | |||||||
| R Class | ||||||||||
| Sold | 5,531,354 | 80,852,800 | 5,637,303 | 79,620,796 | ||||||
| Issued in reinvestment of distributions | 537,074 | 7,755,353 | 327,815 | 4,589,412 | ||||||
| Redeemed | (4,126,096 | ) | (60,332,795 | ) | (4,099,280 | ) | (57,784,406 | ) | ||
| 1,942,332 | 28,275,358 | 1,865,838 | 26,425,802 | |||||||
| Net increase (decrease) | 30,669,994 | $ | 448,053,159 | 21,195,839 | $ | 298,336,311 | ||||
57
| Year ended July 31, 2015 | Year ended July 31, 2014 | |||||||||
| Shares | Amount | Shares | Amount | |||||||
| One Choice 2030 Portfolio | ||||||||||
| Investor Class | ||||||||||
| Sold | 12,342,855 | $ | 154,898,255 | 20,426,845 | $ | 245,871,448 | ||||
| Issued in reinvestment of distributions | 1,802,338 | 22,312,945 | 1,066,114 | 12,740,058 | ||||||
| Redeemed | (8,377,028 | ) | (105,463,245 | ) | (8,995,021 | ) | (109,551,889 | ) | ||
| 5,768,165 | 71,747,955 | 12,497,938 | 149,059,617 | |||||||
| Institutional Class | ||||||||||
| Sold | 26,403,324 | 332,313,496 | 12,448,367 | 150,487,344 | ||||||
| Issued in reinvestment of distributions | 1,369,619 | 16,942,184 | 649,722 | 7,764,175 | ||||||
| Redeemed | (7,929,515 | ) | (99,577,803 | ) | (4,749,313 | ) | (57,207,774 | ) | ||
| 19,843,428 | 249,677,877 | 8,348,776 | 101,043,745 | |||||||
| A Class | ||||||||||
| Sold | 8,621,434 | 107,989,095 | 11,037,047 | 132,555,936 | ||||||
| Issued in reinvestment of distributions | 1,066,619 | 13,183,409 | 638,448 | 7,623,066 | ||||||
| Redeemed | (7,604,709 | ) | (95,248,054 | ) | (5,832,605 | ) | (70,195,184 | ) | ||
| 2,083,344 | 25,924,450 | 5,842,890 | 69,983,818 | |||||||
| C Class | ||||||||||
| Sold | 124,316 | 1,558,209 | 147,541 | 1,775,111 | ||||||
| Issued in reinvestment of distributions | 12,242 | 151,803 | 6,091 | 72,962 | ||||||
| Redeemed | (46,704 | ) | (585,833 | ) | (89,873 | ) | (1,082,908 | ) | ||
| 89,854 | 1,124,179 | 63,759 | 765,165 | |||||||
| R Class | ||||||||||
| Sold | 5,221,381 | 65,515,655 | 5,417,624 | 65,180,130 | ||||||
| Issued in reinvestment of distributions | 442,326 | 5,471,578 | 227,857 | 2,722,894 | ||||||
| Redeemed | (2,720,916 | ) | (34,035,727 | ) | (3,748,744 | ) | (44,834,198 | ) | ||
| 2,942,791 | 36,951,506 | 1,896,737 | 23,068,826 | |||||||
| Net increase (decrease) | 30,727,582 | $ | 385,425,967 | 28,650,100 | $ | 343,921,171 | ||||
58
| Year ended July 31, 2015 | Year ended July 31, 2014 | |||||||||
| Shares | Amount | Shares | Amount | |||||||
| One Choice 2035 Portfolio | ||||||||||
| Investor Class | ||||||||||
| Sold | 12,171,906 | $ | 191,758,316 | 15,419,113 | $ | 232,617,825 | ||||
| Issued in reinvestment of distributions | 2,307,787 | 35,793,777 | 1,399,130 | 20,958,959 | ||||||
| Redeemed | (9,912,501 | ) | (156,679,334 | ) | (7,817,703 | ) | (118,549,367 | ) | ||
| 4,567,192 | 70,872,759 | 9,000,540 | 135,027,417 | |||||||
| Institutional Class | ||||||||||
| Sold | 19,527,225 | 309,062,135 | 8,121,478 | 122,982,998 | ||||||
| Issued in reinvestment of distributions | 1,118,352 | 17,356,824 | 584,736 | 8,765,198 | ||||||
| Redeemed | (6,239,004 | ) | (98,411,697 | ) | (4,217,689 | ) | (64,009,875 | ) | ||
| 14,406,573 | 228,007,262 | 4,488,525 | 67,738,321 | |||||||
| A Class | ||||||||||
| Sold | 9,416,842 | 148,486,107 | 9,699,553 | 146,439,953 | ||||||
| Issued in reinvestment of distributions | 1,122,939 | 17,416,778 | 724,693 | 10,855,896 | ||||||
| Redeemed | (8,706,317 | ) | (137,135,114 | ) | (7,722,319 | ) | (116,439,152 | ) | ||
| 1,833,464 | 28,767,771 | 2,701,927 | 40,856,697 | |||||||
| C Class | ||||||||||
| Sold | 186,377 | 2,948,377 | 82,321 | 1,235,451 | ||||||
| Issued in reinvestment of distributions | 12,574 | 195,398 | 5,614 | 84,263 | ||||||
| Redeemed | (76,543 | ) | (1,202,927 | ) | (39,674 | ) | (599,902 | ) | ||
| 122,408 | 1,940,848 | 48,261 | 719,812 | |||||||
| R Class | ||||||||||
| Sold | 4,473,556 | 70,511,806 | 4,642,119 | 69,941,532 | ||||||
| Issued in reinvestment of distributions | 482,651 | 7,490,741 | 271,934 | 4,076,289 | ||||||
| Redeemed | (3,570,822 | ) | (56,260,571 | ) | (3,007,224 | ) | (45,329,594 | ) | ||
| 1,385,385 | 21,741,976 | 1,906,829 | 28,688,227 | |||||||
| Net increase (decrease) | 22,315,022 | $ | 351,330,616 | 18,146,082 | $ | 273,030,474 | ||||
59
| Year ended July 31, 2015 | Year ended July 31, 2014 | |||||||||
| Shares | Amount | Shares | Amount | |||||||
| One Choice 2040 Portfolio | ||||||||||
| Investor Class | ||||||||||
| Sold | 10,078,550 | $ | 131,538,110 | 16,128,053 | $ | 199,593,668 | ||||
| Issued in reinvestment of distributions | 1,435,726 | 18,449,075 | 822,511 | 10,141,566 | ||||||
| Redeemed | (6,055,910 | ) | (79,239,135 | ) | (6,192,967 | ) | (77,605,817 | ) | ||
| 5,458,366 | 70,748,050 | 10,757,597 | 132,129,417 | |||||||
| Institutional Class | ||||||||||
| Sold | 18,025,517 | 236,358,055 | 8,529,888 | 106,206,558 | ||||||
| Issued in reinvestment of distributions | 1,109,702 | 14,259,665 | 503,626 | 6,209,714 | ||||||
| Redeemed | (4,794,660 | ) | (62,615,500 | ) | (3,291,797 | ) | (40,954,069 | ) | ||
| 14,340,559 | 188,002,220 | 5,741,717 | 71,462,203 | |||||||
| A Class | ||||||||||
| Sold | 6,382,928 | 83,276,597 | 6,395,153 | 79,076,614 | ||||||
| Issued in reinvestment of distributions | 746,460 | 9,592,013 | 428,583 | 5,284,424 | ||||||
| Redeemed | (4,742,076 | ) | (61,744,765 | ) | (3,704,038 | ) | (46,020,542 | ) | ||
| 2,387,312 | 31,123,845 | 3,119,698 | 38,340,496 | |||||||
| C Class | ||||||||||
| Sold | 66,097 | 861,355 | 104,517 | 1,268,123 | ||||||
| Issued in reinvestment of distributions | 8,582 | 110,451 | 4,337 | 53,557 | ||||||
| Redeemed | (62,786 | ) | (822,235 | ) | (52,725 | ) | (657,995 | ) | ||
| 11,893 | 149,571 | 56,129 | 663,685 | |||||||
| R Class | ||||||||||
| Sold | 3,716,455 | 48,500,389 | 3,939,129 | 49,045,510 | ||||||
| Issued in reinvestment of distributions | 323,310 | 4,154,537 | 143,522 | 1,769,619 | ||||||
| Redeemed | (2,058,328 | ) | (26,793,728 | ) | (2,164,678 | ) | (26,709,963 | ) | ||
| 1,981,437 | 25,861,198 | 1,917,973 | 24,105,166 | |||||||
| Net increase (decrease) | 24,179,567 | $ | 315,884,884 | 21,593,114 | $ | 266,700,967 | ||||
60
| Year ended July 31, 2015 | Year ended July 31, 2014 | |||||||||
| Shares | Amount | Shares | Amount | |||||||
| One Choice 2045 Portfolio | ||||||||||
| Investor Class | ||||||||||
| Sold | 9,660,379 | $ | 158,867,725 | 12,757,406 | $ | 199,150,063 | ||||
| Issued in reinvestment of distributions | 1,632,508 | 26,413,979 | 920,996 | 14,293,859 | ||||||
| Redeemed | (6,894,964 | ) | (113,809,339 | ) | (5,199,876 | ) | (81,631,937 | ) | ||
| 4,397,923 | 71,472,365 | 8,478,526 | 131,811,985 | |||||||
| Institutional Class | ||||||||||
| Sold | 12,614,302 | 208,794,613 | 6,832,555 | 107,208,682 | ||||||
| Issued in reinvestment of distributions | 956,596 | 15,487,287 | 493,000 | 7,651,352 | ||||||
| Redeemed | (4,545,571 | ) | (74,791,278 | ) | (3,130,252 | ) | (49,271,979 | ) | ||
| 9,025,327 | 149,490,622 | 4,195,303 | 65,588,055 | |||||||
| A Class | ||||||||||
| Sold | 6,000,030 | 98,735,500 | 6,789,524 | 106,051,418 | ||||||
| Issued in reinvestment of distributions | 757,645 | 12,258,689 | 477,700 | 7,409,128 | ||||||
| Redeemed | (5,751,918 | ) | (94,387,834 | ) | (5,261,700 | ) | (82,176,375 | ) | ||
| 1,005,757 | 16,606,355 | 2,005,524 | 31,284,171 | |||||||
| C Class | ||||||||||
| Sold | 60,771 | 1,002,020 | 54,678 | 854,187 | ||||||
| Issued in reinvestment of distributions | 4,657 | 75,539 | 2,058 | 31,996 | ||||||
| Redeemed | (39,859 | ) | (659,134 | ) | (15,472 | ) | (239,838 | ) | ||
| 25,569 | 418,425 | 41,264 | 646,345 | |||||||
| R Class | ||||||||||
| Sold | 2,927,240 | 48,182,396 | 3,021,482 | 47,239,450 | ||||||
| Issued in reinvestment of distributions | 324,338 | 5,251,030 | 175,396 | 2,722,141 | ||||||
| Redeemed | (2,611,853 | ) | (42,947,703 | ) | (2,106,163 | ) | (32,686,563 | ) | ||
| 639,725 | 10,485,723 | 1,090,715 | 17,275,028 | |||||||
| Net increase (decrease) | 15,094,301 | $ | 248,473,490 | 15,811,332 | $ | 246,605,584 | ||||
61
| Year ended July 31, 2015 | Year ended July 31, 2014 | |||||||||
| Shares | Amount | Shares | Amount | |||||||
| One Choice 2050 Portfolio | ||||||||||
| Investor Class | ||||||||||
| Sold | 7,231,609 | $ | 94,412,951 | 9,404,702 | $ | 116,239,147 | ||||
| Issued in reinvestment of distributions | 787,594 | 10,144,207 | 420,182 | 5,164,040 | ||||||
| Redeemed | (4,393,486 | ) | (57,584,351 | ) | (2,943,037 | ) | (36,769,630 | ) | ||
| 3,625,717 | 46,972,807 | 6,881,847 | 84,633,557 | |||||||
| Institutional Class | ||||||||||
| Sold | 11,948,412 | 157,520,174 | 4,866,275 | 60,431,530 | ||||||
| Issued in reinvestment of distributions | 639,417 | 8,242,081 | 288,019 | 3,542,636 | ||||||
| Redeemed | (3,617,765 | ) | (47,416,705 | ) | (2,710,942 | ) | (33,404,590 | ) | ||
| 8,970,064 | 118,345,550 | 2,443,352 | 30,569,576 | |||||||
| A Class | ||||||||||
| Sold | 4,538,845 | 59,389,523 | 4,631,989 | 57,192,282 | ||||||
| Issued in reinvestment of distributions | 437,490 | 5,634,876 | 240,168 | 2,951,668 | ||||||
| Redeemed | (2,949,894 | ) | (38,468,312 | ) | (2,347,231 | ) | (29,010,901 | ) | ||
| 2,026,441 | 26,556,087 | 2,524,926 | 31,133,049 | |||||||
| C Class | ||||||||||
| Sold | 59,780 | 779,607 | 62,496 | 752,682 | ||||||
| Issued in reinvestment of distributions | 5,594 | 72,280 | 3,754 | 46,249 | ||||||
| Redeemed | (53,229 | ) | (697,097 | ) | (60,393 | ) | (743,139 | ) | ||
| 12,145 | 154,790 | 5,857 | 55,792 | |||||||
| R Class | ||||||||||
| Sold | 2,118,190 | 27,698,775 | 2,018,802 | 24,925,113 | ||||||
| Issued in reinvestment of distributions | 159,263 | 2,052,906 | 79,614 | 978,460 | ||||||
| Redeemed | (1,237,820 | ) | (16,187,944 | ) | (1,171,991 | ) | (14,413,170 | ) | ||
| 1,039,633 | 13,563,737 | 926,425 | 11,490,403 | |||||||
| Net increase (decrease) | 15,674,000 | $ | 205,592,971 | 12,782,407 | $ | 157,882,377 | ||||
62
| Year ended July 31, 2015 | Year ended July 31, 2014 | |||||||||
| Shares | Amount | Shares | Amount | |||||||
| One Choice 2055 Portfolio | ||||||||||
| Investor Class | ||||||||||
| Sold | 3,066,992 | $ | 41,712,511 | 2,022,537 | $ | 25,759,894 | ||||
| Issued in reinvestment of distributions | 119,545 | 1,600,714 | 50,208 | 634,132 | ||||||
| Redeemed | (889,005 | ) | (12,092,296 | ) | (793,062 | ) | (10,112,243 | ) | ||
| 2,297,532 | 31,220,929 | 1,279,683 | 16,281,783 | |||||||
| Institutional Class | ||||||||||
| Sold | 4,756,279 | 64,859,274 | 2,980,841 | 38,058,501 | ||||||
| Issued in reinvestment of distributions | 153,125 | 2,050,344 | 43,142 | 544,884 | ||||||
| Redeemed | (1,424,936 | ) | (19,297,793 | ) | (671,823 | ) | (8,635,793 | ) | ||
| 3,484,468 | 47,611,825 | 2,352,160 | 29,967,592 | |||||||
| A Class | ||||||||||
| Sold | 2,265,221 | 30,702,476 | 1,570,011 | 19,921,268 | ||||||
| Issued in reinvestment of distributions | 93,074 | 1,245,329 | 38,909 | 491,428 | ||||||
| Redeemed | (979,181 | ) | (13,234,447 | ) | (377,223 | ) | (4,797,626 | ) | ||
| 1,379,114 | 18,713,358 | 1,231,697 | 15,615,070 | |||||||
| C Class | ||||||||||
| Sold | 17,482 | 236,514 | 18,650 | 236,856 | ||||||
| Issued in reinvestment of distributions | 869 | 11,640 | 376 | 4,744 | ||||||
| Redeemed | (10,083 | ) | (136,673 | ) | (4,431 | ) | (56,507 | ) | ||
| 8,268 | 111,481 | 14,595 | 185,093 | |||||||
| R Class | ||||||||||
| Sold | 1,164,264 | 15,811,677 | 732,757 | 9,301,944 | ||||||
| Issued in reinvestment of distributions | 41,365 | 554,281 | 16,044 | 202,791 | ||||||
| Redeemed | (450,762 | ) | (6,079,725 | ) | (269,107 | ) | (3,429,582 | ) | ||
| 754,867 | 10,286,233 | 479,694 | 6,075,153 | |||||||
| Net increase (decrease) | 7,924,249 | $ | 107,943,826 | 5,357,829 | $ | 68,124,691 | ||||
63
6. Affiliated Fund Transactions
A summary of transactions for each underlying fund for the year ended July 31, 2015 follows:
Fund/Underlying Fund(1) | Beginning Value | Purchase Cost | Sales Cost | Realized Gain (Loss) | Distributions Received(2) | Ending Value(3) | ||||||||||||
| One Choice In Retirement Portfolio | ||||||||||||||||||
| NT Core Equity Plus Fund | $ | 18,748,506 | $ | 13,893,725 | $ | 3,653,987 | $ | (26,156 | ) | $ | 2,487,623 | $ | 59,733,204 | |||||
NT Disciplined Growth Fund(4) | — | 15,289,011 | 1,489,658 | (11,670 | ) | — | 29,825,831 | |||||||||||
| NT Equity Growth Fund | 61,996,124 | 50,883,293 | 17,981,868 | (9,565 | ) | 7,874,548 | 198,379,399 | |||||||||||
| NT Growth Fund | 40,407,511 | 26,183,550 | 24,373,692 | 658,866 | 6,382,966 | 89,428,772 | ||||||||||||
| NT Heritage Fund | 15,558,098 | 8,158,741 | 4,813,865 | 251,954 | 776,222 | 44,663,841 | ||||||||||||
| NT Large Company Value Fund | 68,182,408 | 49,563,563 | 28,505,614 | 106,306 | 6,790,591 | 187,853,852 | ||||||||||||
| NT Mid Cap Value Fund | 24,995,101 | 23,038,024 | 4,129,490 | (37,064 | ) | 3,230,587 | 89,572,202 | |||||||||||
| NT Small Company Fund | 12,384,609 | 9,133,436 | 1,886,859 | (53,069 | ) | 1,658,801 | 39,745,272 | |||||||||||
| Real Estate Fund | 6,333,427 | 936,236 | 4,513,496 | 3,770,175 | 112,036 | — | ||||||||||||
| High-Yield Fund | 24,038,749 | 16,523,411 | 1,531,027 | (78,992 | ) | 2,575,207 | 75,413,721 | |||||||||||
| Inflation-Adjusted Bond Fund | 9,514,071 | 6,043,017 | 352,736 | (8,418 | ) | 191,543 | 30,071,749 | |||||||||||
| NT Diversified Bond Fund | 168,937,152 | 100,346,208 | 58,881,086 | (331,536 | ) | 6,625,540 | 430,087,844 | |||||||||||
| Short Duration Inflation Protection Bond Fund | 38,843,486 | 22,035,319 | 1,615,957 | (40,964 | ) | 399,910 | 121,327,958 | |||||||||||
| Global Bond Fund | — | 71,793,917 | 2,789,513 | (68,266 | ) | — | 139,256,889 | |||||||||||
| International Bond Fund | 44,288,846 | 30,803,110 | 21,164,292 | (2,649,704 | ) | 1,147,583 | 99,567,891 | |||||||||||
| Premium Money Market Fund | 63,596,470 | 35,895,280 | 4,270,513 | — | 11,329 | 198,538,100 | ||||||||||||
NT Global Real Estate Fund(4) | — | 10,990,842 | 553,889 | (28,761 | ) | — | 19,933,487 | |||||||||||
| NT International Growth Fund | 31,157,092 | 25,756,485 | 14,682,918 | (146,228 | ) | 1,343,287 | 90,158,246 | |||||||||||
NT International Value Fund(4) | — | 25,547,292 | 3,213,213 | (5,452 | ) | — | 44,895,479 | |||||||||||
| $ | 628,981,650 | $ | 542,814,460 | $ | 200,403,673 | $ | 1,291,456 | $ | 41,607,773 | $ | 1,988,453,737 | |||||||
| (1) | Underlying fund investments represent Institutional Class, except Premium Money Market Fund Investor Class. |
| (2) | Distributions received includes distributions from net investment income and from capital gains, if any. |
| (3) | Ending value may include underlying fund investments transferred as a result of an agreement and plan of reorganization. (Note 10) |
| (4) | Non-income producing. |
64
Fund/Underlying Fund(1) | Beginning Value | Purchase Cost | Sales Cost | Realized Gain (Loss) | Distributions Received(2) | Ending Value | ||||||||||||
| One Choice 2020 Portfolio | ||||||||||||||||||
| NT Core Equity Plus Fund | $ | 40,177,487 | $ | 13,998,371 | $ | 706,664 | $ | 26,627 | $ | 4,963,523 | $ | 51,778,691 | ||||||
NT Disciplined Growth Fund(3) | — | 31,577,083 | — | — | — | 31,794,123 | ||||||||||||
| NT Equity Growth Fund | 128,117,838 | 50,421,726 | 7,067,719 | (87,033 | ) | 15,388,643 | 168,090,023 | |||||||||||
| NT Growth Fund | 105,009,877 | 34,590,540 | 44,729,937 | 2,434,963 | 16,156,718 | 91,032,007 | ||||||||||||
| NT Heritage Fund | 48,498,511 | 9,388,656 | 10,125,176 | 965,475 | 2,315,379 | 52,815,824 | ||||||||||||
| NT Large Company Value Fund | 149,517,346 | 53,492,648 | 36,234,407 | 789,049 | 13,744,359 | 165,317,337 | ||||||||||||
| NT Mid Cap Value Fund | 65,528,416 | 28,121,504 | 3,495,432 | 181,813 | 7,597,723 | 88,431,067 | ||||||||||||
| NT Small Company Fund | 26,466,705 | 9,018,000 | 4,215,954 | (86,361 | ) | 3,498,685 | 30,751,249 | |||||||||||
| Real Estate Fund | 17,329,947 | 2,786,286 | 14,453,607 | 8,366,886 | 297,870 | — | ||||||||||||
| High-Yield Fund | 49,149,604 | 18,715,065 | 526,113 | (20,749 | ) | 3,562,454 | 63,823,182 | |||||||||||
| Inflation-Adjusted Bond Fund | 40,427,949 | 9,883,450 | 1,775,912 | (59,637 | ) | 501,368 | 47,246,424 | |||||||||||
| NT Diversified Bond Fund | 345,201,698 | 112,506,283 | 100,396,139 | (534,560 | ) | 9,749,845 | 358,863,003 | |||||||||||
| Short Duration Inflation Protection Bond Fund | 58,114,015 | 23,617,496 | 28,429 | (962 | ) | 627,075 | 80,028,196 | |||||||||||
| Global Bond Fund | — | 113,095,851 | 86,416 | (1,811 | ) | — | 111,332,264 | |||||||||||
| International Bond Fund | 79,380,924 | 37,680,123 | 29,400,822 | (3,993,484 | ) | 2,094,370 | 78,746,336 | |||||||||||
| NT Emerging Markets Fund | 15,298,669 | 4,594,243 | 1,644,442 | 159,559 | 31,091 | 17,327,605 | ||||||||||||
NT Global Real Estate Fund(3) | — | 22,136,896 | — | — | — | 21,331,504 | ||||||||||||
| NT International Growth Fund | 78,592,061 | 30,605,489 | 28,349,795 | (357,200 | ) | 3,283,408 | 81,672,277 | |||||||||||
NT International Small-Mid Cap Fund(3) | — | 4,913,994 | 135,220 | 6,731 | — | 5,056,947 | ||||||||||||
NT International Value Fund(3) | — | 50,252,161 | 1,178,446 | 13,405 | — | 48,928,397 | ||||||||||||
| Premium Money Market Fund | 98,236,472 | 35,488,885 | 13,535 | — | 11,525 | 133,711,822 | ||||||||||||
| $ | 1,345,047,519 | $ | 696,884,750 | $ | 284,564,165 | $ | 7,802,711 | $ | 83,824,036 | $ | 1,728,078,278 | |||||||
| (1) | Underlying fund investments represent Institutional Class, except Premium Money Market Fund Investor Class. |
| (2) | Distributions received includes distributions from net investment income and from capital gains, if any. |
| (3) | Non-income producing. |
65
Fund/Underlying Fund(1) | Beginning Value | Purchase Cost | Sales Cost | Realized Gain (Loss) | Distributions Received(2) | Ending Value | ||||||||||||
| One Choice 2025 Portfolio | ||||||||||||||||||
| NT Core Equity Plus Fund | $ | 64,788,224 | $ | 17,798,850 | $ | 1,302,338 | $ | 150,663 | $ | 7,866,155 | $ | 78,486,923 | ||||||
NT Disciplined Growth Fund(3) | — | 58,107,131 | — | — | — | 58,512,394 | ||||||||||||
| NT Equity Growth Fund | 198,686,047 | 63,104,903 | 13,325,722 | 269,094 | 23,109,169 | 243,011,480 | ||||||||||||
| NT Growth Fund | 193,046,477 | 49,340,747 | 74,901,267 | 8,168,347 | 28,904,864 | 156,705,841 | ||||||||||||
| NT Heritage Fund | 96,791,367 | 14,744,061 | 15,578,364 | 1,743,483 | 4,712,466 | 106,284,897 | ||||||||||||
| NT Large Company Value Fund | 243,996,009 | 70,729,534 | 57,829,228 | 1,972,670 | 21,862,018 | 253,707,512 | ||||||||||||
| NT Mid Cap Value Fund | 118,876,688 | 42,370,133 | 3,855,184 | 50,084 | 13,977,627 | 154,286,546 | ||||||||||||
| NT Small Company Fund | 50,761,373 | 11,017,429 | 14,091,082 | 831,852 | 6,276,001 | 45,907,369 | ||||||||||||
| Real Estate Fund | 33,383,373 | 2,165,169 | 21,075,487 | 19,625,310 | 566,671 | — | ||||||||||||
| High-Yield Fund | 74,501,593 | 23,694,206 | 1,435,625 | (54,725 | ) | 5,252,052 | 91,587,711 | |||||||||||
| Inflation-Adjusted Bond Fund | 89,337,982 | 18,866,855 | 1,885,359 | (123,669 | ) | 1,116,197 | 103,477,958 | |||||||||||
| NT Diversified Bond Fund | 530,428,369 | 132,655,664 | 145,447,292 | (812,912 | ) | 14,680,244 | 520,291,717 | |||||||||||
| Short Duration Inflation Protection Bond Fund | 60,015,491 | 21,940,009 | — | — | 649,524 | 80,224,618 | ||||||||||||
| NT Emerging Markets Fund | 48,717,391 | 14,158,524 | 4,960,039 | 216,756 | 108,710 | 55,279,068 | ||||||||||||
NT Global Real Estate Fund(3) | — | 40,587,098 | 204,040 | (204 | ) | — | 38,898,586 | |||||||||||
| NT International Growth Fund | 147,439,152 | 37,341,654 | 54,075,246 | 1,027,183 | 6,106,240 | 129,656,582 | ||||||||||||
NT International Small-Mid Cap Fund(3) | — | 15,326,100 | 340,102 | 19,894 | — | 15,857,286 | ||||||||||||
NT International Value Fund(3) | — | 92,963,639 | 2,665,318 | 22,414 | — | 90,013,155 | ||||||||||||
| Global Bond Fund | — | 156,291,504 | 681,569 | (15,482 | ) | — | 153,294,094 | |||||||||||
| International Bond Fund | 102,694,541 | 45,320,939 | 29,038,342 | (3,886,027 | ) | 2,714,019 | 106,142,609 | |||||||||||
| Premium Money Market Fund | 108,837,240 | 28,399,123 | 404,876 | — | 12,073 | 136,831,487 | ||||||||||||
| $ | 2,162,301,317 | $ | 956,923,272 | $ | 443,096,480 | $ | 29,204,731 | $ | 137,914,030 | $ | 2,618,457,833 | |||||||
| (1) | Underlying fund investments represent Institutional Class, except Premium Money Market Fund Investor Class. |
| (2) | Distributions received includes distributions from net investment income and from capital gains, if any. |
| (3) | Non-income producing. |
66
Fund/Underlying Fund(1) | Beginning Value | Purchase Cost | Sales Cost | Realized Gain (Loss) | Distributions Received(2) | Ending Value | ||||||||||||
| One Choice 2030 Portfolio | ||||||||||||||||||
| NT Core Equity Plus Fund | $ | 42,740,078 | $ | 14,625,463 | $ | 1,759,582 | $ | (62,286 | ) | $ | 5,335,410 | $ | 53,828,448 | |||||
NT Disciplined Growth Fund(3) | — | 44,616,170 | — | — | — | 44,934,594 | ||||||||||||
| NT Equity Growth Fund | 121,713,108 | 44,786,649 | 3,474,483 | (81,372 | ) | 14,521,737 | 159,708,482 | |||||||||||
| NT Growth Fund | 141,632,611 | 45,846,465 | 57,595,906 | 2,652,254 | 21,826,739 | 125,273,174 | ||||||||||||
| NT Heritage Fund | 65,961,559 | 13,701,730 | 12,142,137 | 729,885 | 3,287,868 | 75,228,613 | ||||||||||||
| NT Large Company Value Fund | 156,423,602 | 54,222,954 | 32,359,940 | 654,530 | 14,314,698 | 176,804,958 | ||||||||||||
| NT Mid Cap Value Fund | 69,560,002 | 38,223,890 | 1,599,982 | (23,136 | ) | 8,383,993 | 104,235,520 | |||||||||||
| NT Small Company Fund | 44,093,587 | 11,630,264 | 14,087,954 | 15,999 | 5,705,132 | 40,816,418 | ||||||||||||
| Real Estate Fund | 23,797,679 | 3,105,717 | 20,006,977 | 10,659,491 | 413,150 | — | ||||||||||||
| High-Yield Fund | 41,126,774 | 17,938,782 | 689,333 | (19,319 | ) | 3,014,639 | 55,355,964 | |||||||||||
| Inflation-Adjusted Bond Fund | 66,134,501 | 20,856,962 | 1,492,376 | (169,892 | ) | 859,892 | 83,426,680 | |||||||||||
| NT Diversified Bond Fund | 293,062,384 | 101,496,371 | 89,044,498 | (473,273 | ) | 8,347,458 | 306,875,287 | |||||||||||
| Short Duration Inflation Protection Bond Fund | 17,700,128 | 10,275,425 | 17,818 | (119 | ) | 200,065 | 27,431,766 | |||||||||||
| NT Emerging Markets Fund | 36,675,822 | 13,493,035 | 2,305,558 | 84,446 | 86,037 | 45,734,668 | ||||||||||||
NT Global Real Estate Fund(3) | — | 31,110,058 | 31,267 | (31 | ) | — | 29,943,305 | |||||||||||
| NT International Growth Fund | 110,306,314 | 35,713,355 | 47,378,816 | (748,073 | ) | 4,685,139 | 99,529,358 | |||||||||||
NT International Small-Mid Cap Fund(3) | — | 15,163,780 | — | — | — | 16,046,153 | ||||||||||||
NT International Value Fund(3) | — | 71,099,692 | 948,836 | 1,608 | — | 69,925,278 | ||||||||||||
| Global Bond Fund | — | 91,835,187 | 108,104 | (2,266 | ) | — | 90,375,097 | |||||||||||
| International Bond Fund | 29,946,471 | 19,915,422 | 7,444,572 | (893,293 | ) | 820,724 | 38,115,811 | |||||||||||
| Premium Money Market Fund | 67,117,954 | 19,989,798 | 711,818 | — | 7,588 | 86,395,934 | ||||||||||||
| $ | 1,327,992,574 | $ | 719,647,169 | $ | 293,199,957 | $ | 12,325,153 | $ | 91,810,269 | $ | 1,729,985,508 | |||||||
| (1) | Underlying fund investments represent Institutional Class, except Premium Money Market Fund Investor Class. |
| (2) | Distributions received includes distributions from net investment income and from capital gains, if any. |
| (3) | Non-income producing. |
67
Fund/Underlying Fund(1) | Beginning Value | Purchase Cost | Sales Cost | Realized Gain (Loss) | Distributions Received(2) | Ending Value | ||||||||||||
| One Choice 2035 Portfolio | ||||||||||||||||||
| NT Core Equity Plus Fund | $ | 54,745,212 | $ | 15,739,125 | $ | 663,650 | $ | 1,604 | $ | 6,694,095 | $ | 67,498,413 | ||||||
NT Disciplined Growth Fund(3) | — | 61,594,629 | — | — | — | 62,026,540 | ||||||||||||
| NT Equity Growth Fund | 157,669,676 | 44,436,250 | 6,946,514 | 210,009 | 18,165,820 | 190,771,220 | ||||||||||||
| NT Growth Fund | 212,029,145 | 58,519,541 | 77,784,140 | 4,853,488 | 32,527,468 | 184,847,637 | ||||||||||||
| NT Heritage Fund | 90,400,282 | 12,483,004 | 14,005,792 | 1,636,494 | 4,312,541 | 98,381,838 | ||||||||||||
| NT Large Company Value Fund | 211,996,402 | 57,956,931 | 48,598,988 | 1,382,249 | 19,078,432 | 218,763,549 | ||||||||||||
| NT Mid Cap Value Fund | 90,912,502 | 38,171,238 | 2,393,613 | 203,336 | 10,515,130 | 124,102,598 | ||||||||||||
| NT Small Company Fund | 70,704,075 | 19,539,692 | 24,930,447 | 535,817 | 9,312,575 | 63,519,225 | ||||||||||||
| Real Estate Fund | 34,358,220 | 3,463,476 | 25,158,358 | 18,035,966 | 593,320 | — | ||||||||||||
| High-Yield Fund | 46,363,256 | 16,849,683 | 1,206,794 | (50,047 | ) | 3,313,416 | 58,729,196 | |||||||||||
| Inflation-Adjusted Bond Fund | 92,478,146 | 24,825,042 | 2,607,265 | (278,288 | ) | 1,180,731 | 111,883,593 | |||||||||||
| NT Diversified Bond Fund | 329,838,678 | 96,289,028 | 110,205,386 | (395,833 | ) | 9,155,396 | 317,553,060 | |||||||||||
| Short Duration Inflation Protection Bond Fund | 1,250,774 | 5,632,812 | — | — | 34,382 | 6,812,096 | ||||||||||||
| NT Emerging Markets Fund | 56,940,822 | 17,711,415 | 6,560,628 | 327,509 | 125,272 | 64,850,899 | ||||||||||||
NT Global Real Estate Fund(3) | — | 43,268,030 | 369,422 | (369 | ) | — | 41,333,660 | |||||||||||
| NT International Growth Fund | 159,954,360 | 43,856,142 | 68,673,901 | 600,762 | 6,747,573 | 134,269,245 | ||||||||||||
NT International Small-Mid Cap Fund(3) | — | 24,739,787 | 721,328 | 38,608 | — | 25,414,468 | ||||||||||||
NT International Value Fund(3) | — | 99,672,358 | 3,304,266 | 35,628 | — | 96,049,054 | ||||||||||||
| Premium Money Market Fund | 81,257,635 | 23,670,048 | 1,439,333 | — | 9,297 | 103,488,350 | ||||||||||||
| Global Bond Fund | — | 97,350,017 | 352,011 | (6,436 | ) | — | 95,551,004 | |||||||||||
| International Bond Fund | — | 4,149,601 | — | — | — | 4,125,821 | ||||||||||||
| $ | 1,690,899,185 | $ | 809,917,849 | $ | 395,921,836 | $ | 27,130,497 | $ | 121,765,448 | $ | 2,069,971,466 | |||||||
| (1) | Underlying fund investments represent Institutional Class, except Premium Money Market Fund Investor Class. |
| (2) | Distributions received includes distributions from net investment income and from capital gains, if any. |
| (3) | Non-income producing. |
68
Fund/Underlying Fund(1) | Beginning Value | Purchase Cost | Sales Cost | Realized Gain (Loss) | Distributions Received(2) | Ending Value | ||||||||||||
| One Choice 2040 Portfolio | ||||||||||||||||||
| NT Core Equity Plus Fund | $ | 33,643,317 | $ | 13,370,937 | $ | 6,539 | $ | (42 | ) | $ | 4,313,218 | $ | 45,466,882 | |||||
NT Disciplined Growth Fund(3) | — | 40,563,037 | — | — | — | 40,846,699 | ||||||||||||
| NT Equity Growth Fund | 97,204,560 | 35,893,798 | 1,638,739 | (67,908 | ) | 11,737,090 | 128,722,250 | |||||||||||
| NT Growth Fund | 130,636,594 | 46,427,665 | 48,172,276 | 343,626 | 20,978,987 | 126,633,113 | ||||||||||||
| NT Heritage Fund | 61,209,041 | 12,091,465 | 8,635,161 | 345,124 | 3,065,528 | 72,227,459 | ||||||||||||
| NT Large Company Value Fund | 130,440,902 | 47,954,598 | 23,252,854 | (19,034 | ) | 12,330,195 | 154,311,327 | |||||||||||
| NT Mid Cap Value Fund | 61,554,660 | 24,420,144 | 564,623 | (22,839 | ) | 7,448,468 | 83,700,170 | |||||||||||
| NT Small Company Fund | 39,601,289 | 13,914,008 | 12,460,080 | (337,481 | ) | 5,431,127 | 40,523,447 | |||||||||||
| Real Estate Fund | 22,064,852 | 2,999,125 | 19,615,798 | 9,022,288 | 396,220 | — | ||||||||||||
| High-Yield Fund | 22,787,989 | 10,557,748 | — | — | 1,710,503 | 31,595,930 | ||||||||||||
| Inflation-Adjusted Bond Fund | 45,977,800 | 20,113,089 | 401,655 | (44,287 | ) | 644,242 | 64,079,672 | |||||||||||
| NT Diversified Bond Fund | 161,778,774 | 68,285,090 | 60,593,005 | (236,724 | ) | 4,722,842 | 170,282,807 | |||||||||||
| NT Emerging Markets Fund | 40,912,527 | 18,267,593 | 1,912,993 | 17,059 | 100,071 | 54,797,379 | ||||||||||||
NT Global Real Estate Fund(3) | — | 30,178,209 | — | — | — | 29,078,399 | ||||||||||||
| NT International Growth Fund | 94,874,313 | 33,831,720 | 42,796,924 | (1,015,820 | ) | 4,129,367 | 86,918,273 | |||||||||||
NT International Small-Mid Cap Fund(3) | — | 18,844,392 | — | — | — | 19,939,905 | ||||||||||||
NT International Value Fund(3) | — | 64,605,356 | 838,529 | (808 | ) | — | 63,525,705 | |||||||||||
| Global Bond Fund | — | 55,500,047 | — | — | — | 54,685,296 | ||||||||||||
| Premium Money Market Fund | 21,824,390 | 13,741,525 | — | — | 2,862 | 35,565,915 | ||||||||||||
| $ | 964,511,008 | $ | 571,559,546 | $ | 220,889,176 | $ | 7,983,154 | $ | 77,010,720 | $ | 1,302,900,628 | |||||||
| (1) | Underlying fund investments represent Institutional Class, except Premium Money Market Fund Investor Class. |
| (2) | Distributions received includes distributions from net investment income and from capital gains, if any. |
| (3) | Non-income producing. |
69
Fund/Underlying Fund(1) | Beginning Value | Purchase Cost | Sales Cost | Realized Gain (Loss) | Distributions Received(2) | Ending Value | ||||||||||||
| One Choice 2045 Portfolio | ||||||||||||||||||
| NT Core Equity Plus Fund | $ | 52,748,164 | $ | 13,697,696 | $ | 2,577,502 | $ | 159,114 | $ | 6,290,328 | $ | 61,567,343 | ||||||
NT Disciplined Growth Fund(3) | — | 48,382,790 | 239,386 | 698 | — | 48,476,415 | ||||||||||||
| NT Equity Growth Fund | 123,952,889 | 34,859,833 | 3,185,552 | (15,264 | ) | 14,458,951 | 152,121,546 | |||||||||||
| NT Growth Fund | 174,316,985 | 48,892,491 | 62,116,891 | 2,011,275 | 27,148,966 | 156,184,411 | ||||||||||||
| NT Heritage Fund | 87,164,243 | 13,061,194 | 13,554,740 | 856,953 | 4,269,138 | 96,727,920 | ||||||||||||
| NT Large Company Value Fund | 174,412,519 | 52,413,567 | 31,242,669 | 9,423 | 15,941,898 | 194,197,872 | ||||||||||||
| NT Mid Cap Value Fund | 87,664,011 | 24,005,580 | 4,909,456 | (94,689 | ) | 10,365,335 | 104,511,046 | |||||||||||
| NT Small Company Fund | 47,776,691 | 12,624,743 | 15,449,790 | 89,210 | 6,303,286 | 43,879,877 | ||||||||||||
| Real Estate Fund | 30,575,161 | 4,092,320 | 24,900,052 | 14,570,271 | 532,164 | — | ||||||||||||
| NT Emerging Markets Fund | 63,250,343 | 22,785,480 | 7,653,575 | 177,348 | 144,929 | 74,785,693 | ||||||||||||
NT Global Real Estate Fund(3) | — | 38,978,262 | 294,569 | (295 | ) | — | 37,271,039 | |||||||||||
| NT International Growth Fund | 123,813,510 | 31,623,741 | 52,530,874 | (791,708 | ) | 5,196,004 | 103,364,416 | |||||||||||
NT International Small-Mid Cap Fund(3) | — | 26,440,686 | 310,827 | 14,826 | — | 27,647,725 | ||||||||||||
NT International Value Fund(3) | — | 77,979,147 | 2,275,347 | 10,101 | — | 75,462,779 | ||||||||||||
| High-Yield Fund | 24,118,993 | 8,304,566 | 791,555 | (39,871 | ) | 1,698,602 | 29,940,828 | |||||||||||
| Inflation-Adjusted Bond Fund | 48,498,016 | 16,065,871 | 2,750,644 | (334,595 | ) | 637,120 | 60,484,301 | |||||||||||
| NT Diversified Bond Fund | 170,288,678 | 56,276,656 | 68,813,592 | (170,409 | ) | 4,659,570 | 158,647,574 | |||||||||||
| Global Bond Fund | — | 58,200,349 | 1,040,801 | (27,346 | ) | — | 56,315,680 | |||||||||||
| Premium Money Market Fund | — | 3,714,267 | — | — | 100 | 3,714,267 | ||||||||||||
| $ | 1,208,580,203 | $ | 592,399,239 | $ | 294,637,822 | $ | 16,425,042 | $ | 97,646,391 | $ | 1,485,300,732 | |||||||
| (1) | Underlying fund investments represent Institutional Class, except Premium Money Market Fund Investor Class. |
| (2) | Distributions received includes distributions from net investment income and from capital gains, if any. |
| (3) | Non-income producing. |
70
Fund/Underlying Fund(1) | Beginning Value | Purchase Cost | Sales Cost | Realized Gain (Loss) | Distributions Received(2) | Ending Value | ||||||||||||
| One Choice 2050 Portfolio | ||||||||||||||||||
| NT Core Equity Plus Fund | $ | 23,798,903 | $ | 11,560,833 | $ | 351,601 | $ | (10,035 | ) | $ | 3,127,193 | $ | 33,887,672 | |||||
NT Disciplined Growth Fund(3) | — | 25,330,444 | — | — | — | 25,512,151 | ||||||||||||
| NT Equity Growth Fund | 54,182,084 | 25,900,517 | 1,213,890 | (51,425 | ) | 6,779,465 | 77,202,083 | |||||||||||
| NT Growth Fund | 78,113,200 | 33,752,128 | 30,382,471 | (513,999 | ) | 12,899,628 | 80,736,033 | |||||||||||
| NT Heritage Fund | 38,453,694 | 11,435,007 | 5,614,872 | 169,934 | 2,006,036 | 49,245,955 | ||||||||||||
| NT Large Company Value Fund | 79,436,310 | 35,682,394 | 11,876,027 | (246,867 | ) | 7,719,926 | 102,749,901 | |||||||||||
| NT Mid Cap Value Fund | 38,676,937 | 17,652,293 | 3,535,763 | (161,035 | ) | 4,850,087 | 51,770,946 | |||||||||||
| NT Small Company Fund | 24,383,176 | 8,881,352 | 7,703,600 | (172,680 | ) | 3,323,414 | 25,191,285 | |||||||||||
| Real Estate Fund | 14,865,267 | 3,631,622 | 15,442,625 | 5,510,628 | 271,705 | — | ||||||||||||
| NT Emerging Markets Fund | 32,593,074 | 16,526,112 | 2,945,381 | (11,165 | ) | 79,989 | 44,198,890 | |||||||||||
NT Global Real Estate Fund(3) | — | 21,307,499 | — | — | — | 20,530,826 | ||||||||||||
| NT International Growth Fund | 52,976,278 | 22,457,798 | 25,919,613 | (735,149 | ) | 2,378,633 | 50,213,090 | |||||||||||
NT International Small-Mid Cap Fund(3) | — | 15,316,154 | — | — | — | 16,192,474 | ||||||||||||
NT International Value Fund(3) | — | 40,425,586 | 359,484 | (5,742 | ) | — | 39,897,061 | |||||||||||
| High-Yield Fund | 9,279,822 | 4,824,927 | 51,858 | (1,702 | ) | 706,957 | 13,321,023 | |||||||||||
| Inflation-Adjusted Bond Fund | 18,644,842 | 8,951,677 | 240,517 | (26,838 | ) | 265,940 | 26,706,973 | |||||||||||
| NT Diversified Bond Fund | 66,515,538 | 31,202,871 | 27,754,260 | (73,105 | ) | 1,955,062 | 70,305,247 | |||||||||||
| Global Bond Fund | — | 26,152,571 | — | — | — | 25,771,878 | ||||||||||||
| $ | 531,919,125 | $ | 360,991,785 | $ | 133,391,962 | $ | 3,670,820 | $ | 46,364,035 | $ | 753,433,488 | |||||||
| (1) | Underlying fund investments represent Institutional Class. |
| (2) | Distributions received includes distributions from net investment income and from capital gains, if any. |
| (3) | Non-income producing. |
71
Fund/ Underlying Fund(1) | Beginning Value | Purchase Cost | Sales Cost | Realized Gain (Loss) | Distributions Received(2) | Ending Value | ||||||||||||
| One Choice 2055 Portfolio | ||||||||||||||||||
| NT Core Equity Plus Fund | $ | 5,506,746 | $ | 5,645,494 | $ | 190,858 | $ | (2,295 | ) | $ | 783,502 | $ | 10,685,895 | |||||
NT Disciplined Growth Fund(3) | — | 8,188,928 | — | — | — | 8,255,572 | ||||||||||||
| NT Equity Growth Fund | 13,144,513 | 13,320,431 | 647,399 | (19,490 | ) | 1,791,534 | 25,376,410 | |||||||||||
| NT Growth Fund | 18,642,499 | 16,650,074 | 9,482,348 | (433,072 | ) | 3,372,023 | 26,024,433 | |||||||||||
| NT Heritage Fund | 9,191,468 | 7,146,769 | 1,734,487 | 19,600 | 521,877 | 15,984,450 | ||||||||||||
| NT Large Company Value Fund | 18,944,338 | 18,118,274 | 3,488,714 | (122,375 | ) | 2,006,837 | 33,480,938 | |||||||||||
| NT Mid Cap Value Fund | 9,212,874 | 8,913,610 | 1,849,682 | (79,291 | ) | 1,251,038 | 16,036,456 | |||||||||||
| NT Small Company Fund | 6,080,855 | 5,503,412 | 2,381,392 | (92,497 | ) | 912,487 | 9,141,578 | |||||||||||
| Real Estate Fund | 3,680,880 | 2,000,611 | 5,277,533 | 1,062,861 | 74,157 | — | ||||||||||||
| NT Emerging Markets Fund | 7,955,213 | 8,812,204 | 790,196 | (22,874 | ) | 24,512 | 15,343,694 | |||||||||||
NT Global Real Estate Fund(3) | — | 7,314,998 | 2,360 | (131 | ) | — | 7,055,957 | |||||||||||
| NT International Growth Fund | 11,659,646 | 9,991,651 | 7,789,112 | (302,957 | ) | 567,792 | 14,258,947 | |||||||||||
NT International Small-Mid Cap Fund(3) | — | 5,514,849 | — | — | — | 5,809,954 | ||||||||||||
NT International Value Fund(3) | — | 13,006,935 | 289 | (8 | ) | — | 12,928,711 | |||||||||||
| High-Yield Fund | 1,856,771 | 1,932,936 | 54,416 | (892 | ) | 163,559 | 3,563,558 | |||||||||||
| Inflation-Adjusted Bond Fund | 3,738,921 | 3,809,129 | 347,887 | (37,164 | ) | 62,001 | 7,086,698 | |||||||||||
| NT Diversified Bond Fund | 13,103,228 | 12,016,452 | 7,235,970 | (11,947 | ) | 431,268 | 17,924,026 | |||||||||||
| Global Bond Fund | — | 7,383,337 | 119,849 | (3,255 | ) | — | 7,166,872 | |||||||||||
| $ | 122,717,952 | $ | 155,270,094 | $ | 41,392,492 | $ | (45,787 | ) | $ | 11,962,587 | $ | 236,124,149 | ||||||
| (1) | Underlying fund investments represent Institutional Class. |
| (2) | Distributions received includes distributions from net investment income and from capital gains, if any. |
| (3) | Non-income producing. |
7. Investments in Underlying Funds
The funds do not invest in the underlying funds for the purpose of exercising management or control; however, investments by the funds within their investment strategies may represent a significant portion of the underlying funds’ net assets.
8. Fair Value Measurements
The funds’ investments valuation process is based on several considerations and may use multiple inputs to determine the fair value of the investments held by the funds. In conformity with accounting principles generally accepted in the United States of America, the inputs used to determine a valuation are classified into three broad levels.
| • | Level 1 valuation inputs consist of unadjusted quoted prices in an active market for identical investments. |
| • | Level 2 valuation inputs consist of direct or indirect observable market data (including quoted prices for comparable investments, evaluations of subsequent market events, interest rates, prepayment speeds, |
72
credit risk, etc.). These inputs also consist of quoted prices for identical investments initially expressed in local currencies that are adjusted through translation into U.S. dollars.
| • | Level 3 valuation inputs consist of unobservable data (including a fund’s own assumptions). |
The level classification is based on the lowest level input that is significant to the fair valuation measurement. The valuation inputs are not necessarily an indication of the risks associated with investing in these securities or other financial instruments. There were no significant transfers between levels during the period.
As of period end, the funds’ investment securities were classified as Level 1. The Schedules of Investments provide additional information on the funds’ portfolio holdings.
9. Federal Tax Information
The tax character of distributions paid during the years ended July 31, 2015 and July 31, 2014 were as follows:
| 2015 | 2014 | |||||||||||
| Distributions Paid From: | Distributions Paid From: | |||||||||||
| Ordinary Income | Long-term capital gains | Ordinary Income | Long-term capital gains | |||||||||
| One Choice In Retirement Portfolio | $16,208,626 | $36,034,348 | $11,064,101 | $5,491,313 | ||||||||
| One Choice 2020 Portfolio | $31,030,514 | $22,481,660 | $22,955,607 | $8,118,107 | ||||||||
| One Choice 2025 Portfolio | $49,465,196 | $44,573,790 | $41,096,621 | $17,873,524 | ||||||||
| One Choice 2030 Portfolio | $30,251,106 | $28,852,574 | $23,043,333 | $8,404,245 | ||||||||
| One Choice 2035 Portfolio | $38,645,841 | $42,415,976 | $32,247,769 | $14,298,263 | ||||||||
| One Choice 2040 Portfolio | $22,978,838 | $24,347,811 | $17,734,546 | $6,129,116 | ||||||||
| One Choice 2045 Portfolio | $28,600,824 | $32,729,832 | $23,244,240 | $9,940,285 | ||||||||
| One Choice 2050 Portfolio | $12,977,487 | $13,454,680 | $9,480,679 | $3,346,492 | ||||||||
| One Choice 2055 Portfolio | $3,216,547 | $2,321,655 | $1,588,935 | $297,313 | ||||||||
The book-basis character of distributions made during the year from net investment income or net realized gains may differ from their ultimate characterization for federal income tax purposes. These differences reflect the differing character of certain income items and net realized gains and losses for financial statement and tax purposes, and may result in reclassification among certain capital accounts on the financial statements.
As of July 31, 2015, the federal tax cost of investments and the components of distributable earnings on a tax-basis were as follows:
| One Choice In Retirement Portfolio | One Choice 2020 Portfolio | One Choice 2025 Portfolio | One Choice 2030 Portfolio | One Choice 2035 Portfolio | |||||||||||
| Federal tax cost of investments | $ | 1,827,493,879 | $ | 1,578,859,783 | $ | 2,318,427,272 | $ | 1,567,189,470 | $ | 1,809,196,845 | |||||
| Gross tax appreciation of investments | $ | 182,830,705 | $ | 163,882,116 | $ | 321,778,220 | $ | 175,144,545 | $ | 270,786,936 | |||||
| Gross tax depreciation of investments | (21,870,847 | ) | (14,663,621 | ) | (21,747,659 | ) | (12,348,507 | ) | (10,012,315 | ) | |||||
| Net tax appreciation (depreciation) of investments | $ | 160,959,858 | $ | 149,218,495 | $ | 300,030,561 | $ | 162,796,038 | $ | 260,774,621 | |||||
| Undistributed ordinary income | $ | 1,774,375 | $ | 7,133,397 | $ | 13,639,860 | $ | 7,062,967 | $ | 10,404,310 | |||||
| Accumulated long-term gains | $ | 829,142 | $ | 58,485,510 | $ | 109,287,800 | $ | 70,406,050 | $ | 101,937,312 | |||||
73
| One Choice 2040 Portfolio | One Choice 2045 Portfolio | One Choice 2050 Portfolio | One Choice 2055 Portfolio | |||||||||
| Federal tax cost of investments | $ | 1,173,566,862 | $ | 1,295,651,841 | $ | 685,523,333 | $ | 227,645,960 | ||||
| Gross tax appreciation of investments | $ | 136,053,504 | $ | 196,121,617 | $ | 71,282,229 | $ | 9,337,677 | ||||
| Gross tax depreciation of investments | (6,719,738 | ) | (6,472,726 | ) | (3,372,074 | ) | (859,488 | ) | ||||
| Net tax appreciation (depreciation) of investments | $ | 129,333,766 | $ | 189,648,891 | $ | 67,910,155 | $ | 8,478,189 | ||||
| Undistributed ordinary income | $ | 4,183,167 | $ | 5,046,552 | $ | 1,951,930 | $ | 509,217 | ||||
| Accumulated long-term gains | $ | 59,908,593 | $ | 81,783,394 | $ | 36,388,043 | $ | 8,714,299 | ||||
The difference between book-basis and tax-basis unrealized appreciation (depreciation) is attributable primarily to the tax deferral of losses on wash sales.
10. Reorganization
On December 9, 2014, the Board of Directors approved an agreement and plan of reorganization (the reorganization), whereby the net assets of One Choice® 2015 Portfolio, one fund in a series issued by the corporation, were transferred to One Choice In Retirement Portfolio in exchange for shares of One Choice In Retirement Portfolio. One Choice 2015 Portfolio had reached its most conservative planned target asset allocation and its asset mix matched that of One Choice In Retirement Portfolio. The reorganization was executed to combine two funds that had the same target asset allocations, both funds’ investment objectives and strategies were substantially similar and their total expense ratios were expected to be the same. The financial statements and performance history of One Choice In Retirement Portfolio survived after the reorganization. The reorganization was effective as of the close of the NYSE on March 27, 2015.
The reorganization was accomplished by a tax-free exchange of shares. On March 27, 2015, One Choice 2015 Portfolio exchanged its shares for shares of One Choice In Retirement Portfolio as follows:
| Original Fund/Class | Shares Exchanged | New Fund/Class | Shares Received | |||
| One Choice 2015 Portfolio – Investor Class | 39,935,280 | One Choice In Retirement Portfolio – Investor Class | 38,767,212 | |||
| One Choice 2015 Portfolio – Institutional Class | 16,214,110 | One Choice In Retirement Portfolio – Institutional Class | 15,752,681 | |||
| One Choice 2015 Portfolio – A Class | 17,460,238 | One Choice In Retirement Portfolio – A Class | 16,935,741 | |||
| One Choice 2015 Portfolio – C Class | 429,438 | One Choice In Retirement Portfolio – C Class | 418,218 | |||
| One Choice 2015 Portfolio – R Class | 10,053,272 | One Choice In Retirement Portfolio – R Class | 9,766,945 | |||
The net assets of One Choice 2015 Portfolio and One Choice In Retirement Portfolio immediately before the reorganization were $1,032,439,637 and $921,010,059, respectively. One Choice 2015 Portfolio’s unrealized appreciation of $98,786,019 was combined with that of One Choice In Retirement Portfolio. Immediately after the reorganization, the combined net assets were $1,953,449,696.
Assuming the reorganization had been completed on August 1, 2014, the beginning of the annual reporting period, the pro forma results of operations for the year ended July 31, 2015 are as follows:
| Net investment income (loss) | $ | 40,097,268 | |
| Net realized and unrealized gain (loss) | 29,002,320 | ||
| Net increase (decrease) in net assets resulting from operations | $ | 69,099,588 | |
Because the combined investment portfolios have been managed as a single integrated portfolio since the reorganization was completed, it is not practicable to separate the amounts of revenue and earnings of One Choice 2015 Portfolio that have been included in One Choice In Retirement Portfolio's Statement of Operations since March 27, 2015.
74
| Financial Highlights |
| For a Share Outstanding Throughout the Years Ended July 31 (except as noted) | |||||||||||||||
| Per-Share Data | Ratios and Supplemental Data | ||||||||||||||
| Income From Investment Operations: | Distributions From: | Ratio to Average Net Assets of: | |||||||||||||
Net Asset Value, Beginning of Period | Net Investment Income (Loss)(1) | Net Realized and Unrealized Gain (Loss) | Total From Investment Operations | Net Investment Income | Net Realized Gains | Total Distributions | Net Asset Value, End of Period | Total Return(2) | Operating Expenses(3) | Net Investment Income (Loss) | Portfolio Turnover Rate | Net Assets, End of Period (in thousands) | |||
| One Choice In Retirement Portfolio | |||||||||||||||
| Investor Class | |||||||||||||||
| 2015 | $13.02 | 0.20 | 0.27 | 0.47 | (0.29) | (0.58) | (0.87) | $12.62 | 3.66% | 0.20% | 1.59% | 17% | $822,618 | ||
| 2014 | $12.41 | 0.27 | 0.73 | 1.00 | (0.27) | (0.12) | (0.39) | $13.02 | 8.19% | 0.20% | 2.09% | 16% | $255,133 | ||
| 2013 | $11.61 | 0.22 | 0.94 | 1.16 | (0.23) | (0.13) | (0.36) | $12.41 | 10.11% | 0.20% | 1.83% | 11% | $205,529 | ||
| 2012 | $11.23 | 0.25 | 0.39 | 0.64 | (0.26) | — | (0.26) | $11.61 | 5.81% | 0.21% | 2.21% | 28% | $128,450 | ||
| 2011 | $10.27 | 0.24 | 0.97 | 1.21 | (0.25) | — | (0.25) | $11.23 | 11.87% | 0.21% | 2.26% | 10% | $81,907 | ||
| Institutional Class | |||||||||||||||
| 2015 | $13.03 | 0.22 | 0.27 | 0.49 | (0.32) | (0.58) | (0.90) | $12.62 | 3.79% | 0.00%(4) | 1.79% | 17% | $485,416 | ||
| 2014 | $12.42 | 0.29 | 0.73 | 1.02 | (0.29) | (0.12) | (0.41) | $13.03 | 8.40% | 0.00%(4) | 2.29% | 16% | $130,406 | ||
| 2013 | $11.61 | 0.25 | 0.94 | 1.19 | (0.25) | (0.13) | (0.38) | $12.42 | 10.42% | 0.00%(4) | 2.03% | 11% | $104,270 | ||
| 2012 | $11.24 | 0.27 | 0.38 | 0.65 | (0.28) | — | (0.28) | $11.61 | 5.92% | 0.01% | 2.41% | 28% | $74,759 | ||
| 2011 | $10.27 | 0.28 | 0.96 | 1.24 | (0.27) | — | (0.27) | $11.24 | 12.20% | 0.01% | 2.46% | 10% | $104,778 | ||
| A Class | |||||||||||||||
| 2015 | $13.02 | 0.17 | 0.27 | 0.44 | (0.26) | (0.58) | (0.84) | $12.62 | 3.39% | 0.45% | 1.34% | 17% | $428,050 | ||
| 2014 | $12.41 | 0.24 | 0.73 | 0.97 | (0.24) | (0.12) | (0.36) | $13.02 | 7.92% | 0.45% | 1.84% | 16% | $139,911 | ||
| 2013 | $11.60 | 0.19 | 0.95 | 1.14 | (0.20) | (0.13) | (0.33) | $12.41 | 9.94% | 0.45% | 1.58% | 11% | $119,504 | ||
| 2012 | $11.23 | 0.23 | 0.37 | 0.60 | (0.23) | — | (0.23) | $11.60 | 5.46% | 0.46% | 1.96% | 28% | $105,111 | ||
| 2011 | $10.27 | 0.22 | 0.96 | 1.18 | (0.22) | — | (0.22) | $11.23 | 11.60% | 0.46% | 2.01% | 10% | $87,205 | ||
75
| For a Share Outstanding Throughout the Years Ended July 31 (except as noted) | |||||||||||||||
| Per-Share Data | Ratios and Supplemental Data | ||||||||||||||
| Income From Investment Operations: | Distributions From: | Ratio to Average Net Assets of: | |||||||||||||
Net Asset Value, Beginning of Period | Net Investment Income (Loss)(1) | Net Realized and Unrealized Gain (Loss) | Total From Investment Operations | Net Investment Income | Net Realized Gains | Total Distributions | Net Asset Value, End of Period | Total Return(2) | Operating Expenses(3) | Net Investment Income (Loss) | Portfolio Turnover Rate | Net Assets, End of Period (in thousands) | |||
| C Class | |||||||||||||||
| 2015 | $13.00 | 0.07 | 0.27 | 0.34 | (0.17) | (0.58) | (0.75) | $12.59 | 2.59% | 1.20% | 0.59% | 17% | $7,721 | ||
| 2014 | $12.41 | 0.14 | 0.73 | 0.87 | (0.16) | (0.12) | (0.28) | $13.00 | 7.13% | 1.20% | 1.09% | 16% | $2,574 | ||
| 2013 | $11.61 | 0.10 | 0.94 | 1.04 | (0.11) | (0.13) | (0.24) | $12.41 | 9.04% | 1.20% | 0.83% | 11% | $1,369 | ||
| 2012 | $11.24 | 0.14 | 0.38 | 0.52 | (0.15) | — | (0.15) | $11.61 | 4.69% | 1.21% | 1.21% | 28% | $810 | ||
| 2011 | $10.27 | 0.09 | 1.02 | 1.11 | (0.14) | — | (0.14) | $11.24 | 10.87% | 1.21% | 1.26% | 10% | $538 | ||
| R Class | |||||||||||||||
| 2015 | $13.00 | 0.16 | 0.25 | 0.41 | (0.23) | (0.58) | (0.81) | $12.60 | 3.13% | 0.70% | 1.09% | 17% | $244,718 | ||
| 2014 | $12.40 | 0.20 | 0.72 | 0.92 | (0.20) | (0.12) | (0.32) | $13.00 | 7.57% | 0.70% | 1.59% | 16% | $100,946 | ||
| 2013 | $11.59 | 0.16 | 0.95 | 1.11 | (0.17) | (0.13) | (0.30) | $12.40 | 9.67% | 0.70% | 1.33% | 11% | $60,104 | ||
| 2012 | $11.22 | 0.18 | 0.39 | 0.57 | (0.20) | — | (0.20) | $11.59 | 5.20% | 0.71% | 1.71% | 28% | $38,365 | ||
| 2011 | $10.26 | 0.19 | 0.96 | 1.15 | (0.19) | — | (0.19) | $11.22 | 11.33% | 0.71% | 1.76% | 10% | $24,616 | ||
| Notes to Financial Highlights |
| (1) | Computed using average shares outstanding throughout the period. |
| (2) | Total returns are calculated based on the net asset value of the last business day and do not reflect applicable sales charges, if any. Total returns for periods less than one year are not annualized. |
| (3) | Ratio of operating expenses to average net assets does not include any fees and expenses of the underlying funds. |
| (4) | Ratio was less than 0.005%. |
See Notes to Financial Statements.
76
| For a Share Outstanding Throughout the Years Ended July 31 (except as noted) | |||||||||||||||
| Per-Share Data | Ratios and Supplemental Data | ||||||||||||||
| Income From Investment Operations: | Distributions From: | Ratio to Average Net Assets of: | |||||||||||||
Net Asset Value, Beginning of Period | Net Investment Income (Loss)(1) | Net Realized and Unrealized Gain (Loss) | Total From Investment Operations | Net Investment Income | Net Realized Gains | Total Distributions | Net Asset Value, End of Period | Total Return(2) | Operating Expenses(3) | Net Investment Income (Loss) | Portfolio Turnover Rate | Net Assets, End of Period (in thousands) | |||
| One Choice 2020 Portfolio | |||||||||||||||
| Investor Class | |||||||||||||||
| 2015 | $12.26 | 0.26 | 0.24 | 0.50 | (0.27) | (0.19) | (0.46) | $12.30 | 4.14% | 0.20% | 2.08% | 19% | $611,536 | ||
| 2014 | $11.56 | 0.26 | 0.77 | 1.03 | (0.24) | (0.09) | (0.33) | $12.26 | 8.99% | 0.20% | 2.16% | 10% | $549,087 | ||
| 2013 | $10.64 | 0.20 | 1.02 | 1.22 | (0.20) | (0.10) | (0.30) | $11.56 | 11.67% | 0.20% | 1.79% | 6% | $384,010 | ||
| 2012 | $10.37 | 0.21 | 0.32 | 0.53 | (0.23) | (0.03) | (0.26) | $10.64 | 5.27% | 0.21% | 2.14% | 28% | $218,341 | ||
| 2011 | $9.30 | 0.20 | 1.06 | 1.26 | (0.19) | —(4) | (0.19) | $10.37 | 13.66% | 0.21% | 2.13% | 4% | $105,921 | ||
| Institutional Class | |||||||||||||||
| 2015 | $12.27 | 0.26 | 0.27 | 0.53 | (0.30) | (0.19) | (0.49) | $12.31 | 4.35% | 0.00%(5) | 2.28% | 19% | $579,653 | ||
| 2014 | $11.57 | 0.28 | 0.77 | 1.05 | (0.26) | (0.09) | (0.35) | $12.27 | 9.20% | 0.00%(5) | 2.36% | 10% | $310,325 | ||
| 2013 | $10.65 | 0.22 | 1.02 | 1.24 | (0.22) | (0.10) | (0.32) | $11.57 | 11.89% | 0.00%(5) | 1.99% | 6% | $211,576 | ||
| 2012 | $10.38 | 0.25 | 0.30 | 0.55 | (0.25) | (0.03) | (0.28) | $10.65 | 5.48% | 0.01% | 2.34% | 28% | $99,935 | ||
| 2011 | $9.31 | 0.24 | 1.04 | 1.28 | (0.21) | —(4) | (0.21) | $10.38 | 13.88% | 0.01% | 2.33% | 4% | $169,034 | ||
| A Class | |||||||||||||||
| 2015 | $12.23 | 0.23 | 0.25 | 0.48 | (0.24) | (0.19) | (0.43) | $12.28 | 3.97% | 0.45% | 1.83% | 19% | $357,730 | ||
| 2014 | $11.54 | 0.23 | 0.76 | 0.99 | (0.21) | (0.09) | (0.30) | $12.23 | 8.64% | 0.45% | 1.91% | 10% | $334,141 | ||
| 2013 | $10.62 | 0.17 | 1.02 | 1.19 | (0.17) | (0.10) | (0.27) | $11.54 | 11.41% | 0.45% | 1.54% | 6% | $270,040 | ||
| 2012 | $10.36 | 0.20 | 0.29 | 0.49 | (0.20) | (0.03) | (0.23) | $10.62 | 4.92% | 0.46% | 1.89% | 28% | $180,502 | ||
| 2011 | $9.28 | 0.19 | 1.05 | 1.24 | (0.16) | —(4) | (0.16) | $10.36 | 13.51% | 0.46% | 1.88% | 4% | $124,401 | ||
77
| For a Share Outstanding Throughout the Years Ended July 31 (except as noted) | |||||||||||||||
| Per-Share Data | Ratios and Supplemental Data | ||||||||||||||
| Income From Investment Operations: | Distributions From: | Ratio to Average Net Assets of: | |||||||||||||
Net Asset Value, Beginning of Period | Net Investment Income (Loss)(1) | Net Realized and Unrealized Gain (Loss) | Total From Investment Operations | Net Investment Income | Net Realized Gains | Total Distributions | Net Asset Value, End of Period | Total Return(2) | Operating Expenses(3) | Net Investment Income (Loss) | Portfolio Turnover Rate | Net Assets, End of Period (in thousands) | |||
| C Class | |||||||||||||||
| 2015 | $12.22 | 0.14 | 0.23 | 0.37 | (0.14) | (0.19) | (0.33) | $12.26 | 3.09% | 1.20% | 1.08% | 19% | $11,578 | ||
| 2014 | $11.52 | 0.14 | 0.77 | 0.91 | (0.12) | (0.09) | (0.21) | $12.22 | 7.91% | 1.20% | 1.16% | 10% | $10,743 | ||
| 2013 | $10.61 | 0.08 | 1.02 | 1.10 | (0.09) | (0.10) | (0.19) | $11.52 | 10.48% | 1.20% | 0.79% | 6% | $6,117 | ||
| 2012 | $10.34 | 0.10 | 0.32 | 0.42 | (0.12) | (0.03) | (0.15) | $10.61 | 4.23% | 1.21% | 1.14% | 28% | $2,304 | ||
| 2011 | $9.26 | 0.10 | 1.07 | 1.17 | (0.09) | —(4) | (0.09) | $10.34 | 12.68% | 1.21% | 1.13% | 4% | $578 | ||
| R Class | |||||||||||||||
| 2015 | $12.22 | 0.20 | 0.24 | 0.44 | (0.21) | (0.19) | (0.40) | $12.26 | 3.62% | 0.70% | 1.58% | 19% | $167,576 | ||
| 2014 | $11.53 | 0.20 | 0.76 | 0.96 | (0.18) | (0.09) | (0.27) | $12.22 | 8.37% | 0.70% | 1.66% | 10% | $140,753 | ||
| 2013 | $10.61 | 0.14 | 1.03 | 1.17 | (0.15) | (0.10) | (0.25) | $11.53 | 11.14% | 0.70% | 1.29% | 6% | $102,250 | ||
| 2012 | $10.34 | 0.16 | 0.31 | 0.47 | (0.17) | (0.03) | (0.20) | $10.61 | 4.76% | 0.71% | 1.64% | 28% | $61,212 | ||
| 2011 | $9.27 | 0.16 | 1.05 | 1.21 | (0.14) | —(4) | (0.14) | $10.34 | 13.13% | 0.71% | 1.63% | 4% | $35,703 | ||
| Notes to Financial Highlights |
| (1) | Computed using average shares outstanding throughout the period. |
| (2) | Total returns are calculated based on the net asset value of the last business day and do not reflect applicable sales charges, if any. Total returns for periods less than one year are not annualized. |
| (3) | Ratio of operating expenses to average net assets does not include any fees and expenses of the underlying funds. |
| (4) | Per-share amount was less than $0.005. |
| (5) | Ratio was less than 0.005%. |
See Notes to Financial Statements.
78
| For a Share Outstanding Throughout the Years Ended July 31 (except as noted) | |||||||||||||||
| Per-Share Data | Ratios and Supplemental Data | ||||||||||||||
| Income From Investment Operations: | Distributions From: | Ratio to Average Net Assets of: | |||||||||||||
Net Asset Value, Beginning of Period | Net Investment Income (Loss)(1) | Net Realized and Unrealized Gain (Loss) | Total From Investment Operations | Net Investment Income | Net Realized Gains | Total Distributions | Net Asset Value, End of Period | Total Return(2) | Operating Expenses(3) | Net Investment Income (Loss) | Portfolio Turnover Rate | Net Assets, End of Period (in thousands) | |||
| One Choice 2025 Portfolio | |||||||||||||||
| Investor Class | |||||||||||||||
| 2015 | $14.57 | 0.31 | 0.36 | 0.67 | (0.33) | (0.29) | (0.62) | $14.62 | 4.62% | 0.20% | 2.10% | 20% | $1,075,028 | ||
| 2014 | $13.71 | 0.32 | 0.98 | 1.30 | (0.30) | (0.14) | (0.44) | $14.57 | 9.61% | 0.20% | 2.23% | 7% | $992,507 | ||
| 2013 | $12.46 | 0.23 | 1.35 | 1.58 | (0.24) | (0.09) | (0.33) | $13.71 | 12.88% | 0.20% | 1.79% | 3% | $807,998 | ||
| 2012 | $12.13 | 0.25 | 0.34 | 0.59 | (0.26) | — | (0.26) | $12.46 | 4.99% | 0.21% | 2.07% | 21% | $554,462 | ||
| 2011 | $10.78 | 0.23 | 1.34 | 1.57 | (0.22) | — | (0.22) | $12.13 | 14.60% | 0.21% | 1.98% | 3% | $425,965 | ||
| Institutional Class | |||||||||||||||
| 2015 | $14.58 | 0.32 | 0.39 | 0.71 | (0.36) | (0.29) | (0.65) | $14.64 | 4.90% | 0.00%(4) | 2.30% | 20% | $729,071 | ||
| 2014 | $13.72 | 0.34 | 0.99 | 1.33 | (0.33) | (0.14) | (0.47) | $14.58 | 9.83% | 0.00%(4) | 2.43% | 7% | $424,420 | ||
| 2013 | $12.47 | 0.26 | 1.35 | 1.61 | (0.27) | (0.09) | (0.36) | $13.72 | 13.10% | 0.00%(4) | 1.99% | 3% | $298,052 | ||
| 2012 | $12.14 | 0.27 | 0.34 | 0.61 | (0.28) | — | (0.28) | $12.47 | 5.20% | 0.01% | 2.27% | 21% | $181,693 | ||
| 2011 | $10.79 | 0.27 | 1.32 | 1.59 | (0.24) | — | (0.24) | $12.14 | 14.82% | 0.01% | 2.18% | 3% | $257,121 | ||
| A Class | |||||||||||||||
| 2015 | $14.55 | 0.28 | 0.35 | 0.63 | (0.29) | (0.29) | (0.58) | $14.60 | 4.36% | 0.45% | 1.85% | 20% | $568,434 | ||
| 2014 | $13.69 | 0.29 | 0.98 | 1.27 | (0.27) | (0.14) | (0.41) | $14.55 | 9.35% | 0.45% | 1.98% | 7% | $528,142 | ||
| 2013 | $12.44 | 0.20 | 1.35 | 1.55 | (0.21) | (0.09) | (0.30) | $13.69 | 12.61% | 0.45% | 1.54% | 3% | $460,301 | ||
| 2012 | $12.11 | 0.22 | 0.34 | 0.56 | (0.23) | — | (0.23) | $12.44 | 4.73% | 0.46% | 1.82% | 21% | $327,130 | ||
| 2011 | $10.77 | 0.20 | 1.33 | 1.53 | (0.19) | — | (0.19) | $12.11 | 14.23% | 0.46% | 1.73% | 3% | $242,996 | ||
79
| For a Share Outstanding Throughout the Years Ended July 31 (except as noted) | |||||||||||||||
| Per-Share Data | Ratios and Supplemental Data | ||||||||||||||
| Income From Investment Operations: | Distributions From: | Ratio to Average Net Assets of: | |||||||||||||
Net Asset Value, Beginning of Period | Net Investment Income (Loss)(1) | Net Realized and Unrealized Gain (Loss) | Total From Investment Operations | Net Investment Income | Net Realized Gains | Total Distributions | Net Asset Value, End of Period | Total Return(2) | Operating Expenses(3) | Net Investment Income (Loss) | Portfolio Turnover Rate | Net Assets, End of Period (in thousands) | |||
| C Class | |||||||||||||||
| 2015 | $14.52 | 0.17 | 0.35 | 0.52 | (0.17) | (0.29) | (0.46) | $14.58 | 3.64% | 1.20% | 1.10% | 20% | $7,658 | ||
| 2014 | $13.67 | 0.18 | 0.97 | 1.15 | (0.16) | (0.14) | (0.30) | $14.52 | 8.46% | 1.20% | 1.23% | 7% | $7,147 | ||
| 2013 | $12.41 | 0.10 | 1.36 | 1.46 | (0.11) | (0.09) | (0.20) | $13.67 | 11.86% | 1.20% | 0.79% | 3% | $6,179 | ||
| 2012 | $12.09 | 0.12 | 0.34 | 0.46 | (0.14) | — | (0.14) | $12.41 | 3.87% | 1.21% | 1.07% | 21% | $3,498 | ||
| 2011 | $10.74 | 0.11 | 1.34 | 1.45 | (0.10) | — | (0.10) | $12.09 | 13.50% | 1.21% | 0.98% | 3% | $1,595 | ||
| R Class | |||||||||||||||
| 2015 | $14.52 | 0.24 | 0.36 | 0.60 | (0.25) | (0.29) | (0.54) | $14.58 | 4.17% | 0.70% | 1.60% | 20% | $239,213 | ||
| 2014 | $13.67 | 0.25 | 0.97 | 1.22 | (0.23) | (0.14) | (0.37) | $14.52 | 9.01% | 0.70% | 1.73% | 7% | $210,067 | ||
| 2013 | $12.42 | 0.17 | 1.35 | 1.52 | (0.18) | (0.09) | (0.27) | $13.67 | 12.34% | 0.70% | 1.29% | 3% | $172,227 | ||
| 2012 | $12.09 | 0.19 | 0.34 | 0.53 | (0.20) | — | (0.20) | $12.42 | 4.48% | 0.71% | 1.57% | 21% | $129,489 | ||
| 2011 | $10.75 | 0.17 | 1.33 | 1.50 | (0.16) | — | (0.16) | $12.09 | 13.97% | 0.71% | 1.48% | 3% | $88,153 | ||
| Notes to Financial Highlights |
| (1) | Computed using average shares outstanding throughout the period. |
| (2) | Total returns are calculated based on the net asset value of the last business day and do not reflect applicable sales charges, if any. Total returns for periods less than one year are not annualized. |
| (3) | Ratio of operating expenses to average net assets does not include any fees and expenses of the underlying funds. |
| (4) | Ratio was less than 0.005%. |
See Notes to Financial Statements.
80
| For a Share Outstanding Throughout the Years Ended July 31 (except as noted) | |||||||||||||||
| Per-Share Data | Ratios and Supplemental Data | ||||||||||||||
| Income From Investment Operations: | Distributions From: | Ratio to Average Net Assets of: | |||||||||||||
Net Asset Value, Beginning of Period | Net Investment Income (Loss)(1) | Net Realized and Unrealized Gain (Loss) | Total From Investment Operations | Net Investment Income | Net Realized Gains | Total Distributions | Net Asset Value, End of Period | Total Return(2) | Operating Expenses(3) | Net Investment Income (Loss) | Portfolio Turnover Rate | Net Assets, End of Period (in thousands) | |||
| One Choice 2030 Portfolio | |||||||||||||||
| Investor Class | |||||||||||||||
| 2015 | $12.44 | 0.26 | 0.41 | 0.67 | (0.27) | (0.26) | (0.53) | $12.58 | 5.43% | 0.20% | 2.04% | 20% | $590,896 | ||
| 2014 | $11.62 | 0.27 | 0.89 | 1.16 | (0.25) | (0.09) | (0.34) | $12.44 | 10.15% | 0.20% | 2.27% | 6% | $512,356 | ||
| 2013 | $10.41 | 0.18 | 1.30 | 1.48 | (0.18) | (0.09) | (0.27) | $11.62 | 14.53% | 0.21% | 1.66% | 5% | $333,309 | ||
| 2012 | $10.17 | 0.18 | 0.27 | 0.45 | (0.19) | (0.02) | (0.21) | $10.41 | 4.60% | 0.21% | 1.87% | 28% | $170,955 | ||
| 2011 | $8.95 | 0.16 | 1.21 | 1.37 | (0.15) | —(4) | (0.15) | $10.17 | 15.41% | 0.21% | 1.76% | 4% | $76,884 | ||
| Institutional Class | |||||||||||||||
| 2015 | $12.44 | 0.27 | 0.44 | 0.71 | (0.30) | (0.26) | (0.56) | $12.59 | 5.73% | 0.00%(5) | 2.24% | 20% | $574,390 | ||
| 2014 | $11.62 | 0.30 | 0.89 | 1.19 | (0.28) | (0.09) | (0.37) | $12.44 | 10.37% | 0.00%(5) | 2.47% | 6% | $320,834 | ||
| 2013 | $10.42 | 0.21 | 1.28 | 1.49 | (0.20) | (0.09) | (0.29) | $11.62 | 14.76% | 0.01% | 1.86% | 5% | $202,598 | ||
| 2012 | $10.18 | 0.21 | 0.26 | 0.47 | (0.21) | (0.02) | (0.23) | $10.42 | 4.71% | 0.01% | 2.07% | 28% | $94,349 | ||
| 2011 | $8.95 | 0.20 | 1.20 | 1.40 | (0.17) | —(4) | (0.17) | $10.18 | 15.62% | 0.01% | 1.96% | 4% | $144,661 | ||
| A Class | |||||||||||||||
| 2015 | $12.41 | 0.23 | 0.41 | 0.64 | (0.24) | (0.26) | (0.50) | $12.55 | 5.18% | 0.45% | 1.79% | 20% | $385,874 | ||
| 2014 | $11.59 | 0.24 | 0.89 | 1.13 | (0.22) | (0.09) | (0.31) | $12.41 | 9.89% | 0.45% | 2.02% | 6% | $355,604 | ||
| 2013 | $10.38 | 0.16 | 1.30 | 1.46 | (0.16) | (0.09) | (0.25) | $11.59 | 14.28% | 0.46% | 1.41% | 5% | $264,393 | ||
| 2012 | $10.15 | 0.17 | 0.24 | 0.41 | (0.16) | (0.02) | (0.18) | $10.38 | 4.25% | 0.46% | 1.62% | 28% | $170,227 | ||
| 2011 | $8.93 | 0.15 | 1.20 | 1.35 | (0.13) | —(4) | (0.13) | $10.15 | 15.15% | 0.46% | 1.51% | 4% | $114,892 | ||
81
| For a Share Outstanding Throughout the Years Ended July 31 (except as noted) | |||||||||||||||
| Per-Share Data | Ratios and Supplemental Data | ||||||||||||||
| Income From Investment Operations: | Distributions From: | Ratio to Average Net Assets of: | |||||||||||||
Net Asset Value, Beginning of Period | Net Investment Income (Loss)(1) | Net Realized and Unrealized Gain (Loss) | Total From Investment Operations | Net Investment Income | Net Realized Gains | Total Distributions | Net Asset Value, End of Period | Total Return(2) | Operating Expenses(3) | Net Investment Income (Loss) | Portfolio Turnover Rate | Net Assets, End of Period (in thousands) | |||
| C Class | |||||||||||||||
| 2015 | $12.39 | 0.13 | 0.42 | 0.55 | (0.14) | (0.26) | (0.40) | $12.54 | 4.46% | 1.20% | 1.04% | 20% | $5,628 | ||
| 2014 | $11.57 | 0.16 | 0.88 | 1.04 | (0.13) | (0.09) | (0.22) | $12.39 | 9.07% | 1.20% | 1.27% | 6% | $4,449 | ||
| 2013 | $10.37 | 0.07 | 1.29 | 1.36 | (0.07) | (0.09) | (0.16) | $11.57 | 13.32% | 1.21% | 0.66% | 5% | $3,417 | ||
| 2012 | $10.13 | 0.09 | 0.26 | 0.35 | (0.09) | (0.02) | (0.11) | $10.37 | 3.57% | 1.21% | 0.87% | 28% | $1,595 | ||
| 2011 | $8.92 | 0.06 | 1.20 | 1.26 | (0.05) | —(4) | (0.05) | $10.13 | 14.18% | 1.21% | 0.76% | 4% | $728 | ||
| R Class | |||||||||||||||
| 2015 | $12.39 | 0.20 | 0.42 | 0.62 | (0.21) | (0.26) | (0.47) | $12.54 | 4.99% | 0.70% | 1.54% | 20% | $173,221 | ||
| 2014 | $11.58 | 0.22 | 0.87 | 1.09 | (0.19) | (0.09) | (0.28) | $12.39 | 9.53% | 0.70% | 1.77% | 6% | $134,751 | ||
| 2013 | $10.37 | 0.13 | 1.30 | 1.43 | (0.13) | (0.09) | (0.22) | $11.58 | 14.00% | 0.71% | 1.16% | 5% | $103,886 | ||
| 2012 | $10.14 | 0.13 | 0.26 | 0.39 | (0.14) | (0.02) | (0.16) | $10.37 | 3.99% | 0.71% | 1.37% | 28% | $69,278 | ||
| 2011 | $8.92 | 0.12 | 1.20 | 1.32 | (0.10) | —(4) | (0.10) | $10.14 | 14.88% | 0.71% | 1.26% | 4% | $35,411 | ||
| Notes to Financial Highlights |
| (1) | Computed using average shares outstanding throughout the period. |
| (2) | Total returns are calculated based on the net asset value of the last business day and do not reflect applicable sales charges, if any. Total returns for periods less than one year are not annualized. |
| (3) | Ratio of operating expenses to average net assets does not include any fees and expenses of the underlying funds. |
| (4) | Per-share amount was less than $0.005. |
| (5) | Ratio was less than 0.005%. |
See Notes to Financial Statements.
82
| For a Share Outstanding Throughout the Years Ended July 31 (except as noted) | |||||||||||||||
| Per-Share Data | Ratios and Supplemental Data | ||||||||||||||
| Income From Investment Operations: | Distributions From: | Ratio to Average Net Assets of: | |||||||||||||
Net Asset Value, Beginning of Period | Net Investment Income (Loss)(1) | Net Realized and Unrealized Gain (Loss) | Total From Investment Operations | Net Investment Income | Net Realized Gains | Total Distributions | Net Asset Value, End of Period | Total Return(2) | Operating Expenses(3) | Net Investment Income (Loss) | Portfolio Turnover Rate | Net Assets, End of Period (in thousands) | |||
| One Choice 2035 Portfolio | |||||||||||||||
| Investor Class | |||||||||||||||
| 2015 | $15.60 | 0.33 | 0.62 | 0.95 | (0.34) | (0.38) | (0.72) | $15.83 | 6.25% | 0.20% | 2.03% | 23% | $839,655 | ||
| 2014 | $14.52 | 0.35 | 1.22 | 1.57 | (0.34) | (0.15) | (0.49) | $15.60 | 10.91% | 0.20% | 2.32% | 5% | $755,938 | ||
| 2013 | $12.81 | 0.22 | 1.82 | 2.04 | (0.22) | (0.11) | (0.33) | $14.52 | 16.24% | 0.20% | 1.62% | 3% | $573,216 | ||
| 2012 | $12.52 | 0.22 | 0.30 | 0.52 | (0.23) | — | (0.23) | $12.81 | 4.26% | 0.21% | 1.82% | 16% | $374,544 | ||
| 2011 | $10.92 | 0.20 | 1.59 | 1.79 | (0.19) | — | (0.19) | $12.52 | 16.44% | 0.21% | 1.68% | 3% | $277,333 | ||
| Institutional Class | |||||||||||||||
| 2015 | $15.62 | 0.33 | 0.67 | 1.00 | (0.38) | (0.38) | (0.76) | $15.86 | 6.52% | 0.00%(4) | 2.23% | 23% | $556,384 | ||
| 2014 | $14.55 | 0.38 | 1.21 | 1.59 | (0.37) | (0.15) | (0.52) | $15.62 | 11.04% | 0.00%(4) | 2.52% | 5% | $323,043 | ||
| 2013 | $12.83 | 0.25 | 1.83 | 2.08 | (0.25) | (0.11) | (0.36) | $14.55 | 16.54% | 0.00%(4) | 1.82% | 3% | $235,505 | ||
| 2012 | $12.54 | 0.25 | 0.29 | 0.54 | (0.25) | — | (0.25) | $12.83 | 4.46% | 0.01% | 2.02% | 16% | $138,143 | ||
| 2011 | $10.93 | 0.24 | 1.58 | 1.82 | (0.21) | — | (0.21) | $12.54 | 16.75% | 0.01% | 1.88% | 3% | $154,449 | ||
| A Class | |||||||||||||||
| 2015 | $15.58 | 0.29 | 0.62 | 0.91 | (0.30) | (0.38) | (0.68) | $15.81 | 5.98% | 0.45% | 1.78% | 23% | $460,605 | ||
| 2014 | $14.51 | 0.32 | 1.20 | 1.52 | (0.30) | (0.15) | (0.45) | $15.58 | 10.57% | 0.45% | 2.07% | 5% | $425,198 | ||
| 2013 | $12.79 | 0.19 | 1.83 | 2.02 | (0.19) | (0.11) | (0.30) | $14.51 | 16.05% | 0.45% | 1.37% | 3% | $356,751 | ||
| 2012 | $12.50 | 0.20 | 0.29 | 0.49 | (0.20) | — | (0.20) | $12.79 | 4.00% | 0.46% | 1.57% | 16% | $239,410 | ||
| 2011 | $10.90 | 0.17 | 1.59 | 1.76 | (0.16) | — | (0.16) | $12.50 | 16.17% | 0.46% | 1.43% | 3% | $174,230 | ||
83
| For a Share Outstanding Throughout the Years Ended July 31 (except as noted) | |||||||||||||||
| Per-Share Data | Ratios and Supplemental Data | ||||||||||||||
| Income From Investment Operations: | Distributions From: | Ratio to Average Net Assets of: | |||||||||||||
Net Asset Value, Beginning of Period | Net Investment Income (Loss)(1) | Net Realized and Unrealized Gain (Loss) | Total From Investment Operations | Net Investment Income | Net Realized Gains | Total Distributions | Net Asset Value, End of Period | Total Return(2) | Operating Expenses(3) | Net Investment Income (Loss) | Portfolio Turnover Rate | Net Assets, End of Period (in thousands) | |||
| C Class | |||||||||||||||
| 2015 | $15.53 | 0.16 | 0.64 | 0.80 | (0.18) | (0.38) | (0.56) | $15.77 | 5.25% | 1.20% | 1.03% | 23% | $6,587 | ||
| 2014 | $14.46 | 0.19 | 1.21 | 1.40 | (0.18) | (0.15) | (0.33) | $15.53 | 9.76% | 1.20% | 1.32% | 5% | $4,586 | ||
| 2013 | $12.76 | 0.08 | 1.82 | 1.90 | (0.09) | (0.11) | (0.20) | $14.46 | 15.05% | 1.20% | 0.62% | 3% | $3,572 | ||
| 2012 | $12.46 | 0.09 | 0.32 | 0.41 | (0.11) | — | (0.11) | $12.76 | 3.31% | 1.21% | 0.82% | 16% | $1,396 | ||
| 2011 | $10.87 | 0.07 | 1.59 | 1.66 | (0.07) | — | (0.07) | $12.46 | 15.25% | 1.21% | 0.68% | 3% | $630 | ||
| R Class | |||||||||||||||
| 2015 | $15.56 | 0.25 | 0.62 | 0.87 | (0.26) | (0.38) | (0.64) | $15.79 | 5.71% | 0.70% | 1.53% | 23% | $206,773 | ||
| 2014 | $14.49 | 0.27 | 1.21 | 1.48 | (0.26) | (0.15) | (0.41) | $15.56 | 10.30% | 0.70% | 1.82% | 5% | $182,137 | ||
| 2013 | $12.78 | 0.16 | 1.82 | 1.98 | (0.16) | (0.11) | (0.27) | $14.49 | 15.69% | 0.70% | 1.12% | 3% | $141,978 | ||
| 2012 | $12.48 | 0.16 | 0.31 | 0.47 | (0.17) | — | (0.17) | $12.78 | 3.83% | 0.71% | 1.32% | 16% | $101,164 | ||
| 2011 | $10.89 | 0.14 | 1.58 | 1.72 | (0.13) | — | (0.13) | $12.48 | 15.80% | 0.71% | 1.18% | 3% | $71,077 | ||
| Notes to Financial Highlights |
| (1) | Computed using average shares outstanding throughout the period. |
| (2) | Total returns are calculated based on the net asset value of the last business day and do not reflect applicable sales charges, if any. Total returns for periods less than one year are not annualized. |
| (3) | Ratio of operating expenses to average net assets does not include any fees and expenses of the underlying funds. |
| (4) | Ratio was less than 0.005%. |
See Notes to Financial Statements.
84
| For a Share Outstanding Throughout the Years Ended July 31 (except as noted) | |||||||||||||||
| Per-Share Data | Ratios and Supplemental Data | ||||||||||||||
| Income From Investment Operations: | Distributions From: | Ratio to Average Net Assets of: | |||||||||||||
Net Asset Value, Beginning of Period | Net Investment Income (Loss)(1) | Net Realized and Unrealized Gain (Loss) | Total From Investment Operations | Net Investment Income | Net Realized Gains | Total Distributions | Net Asset Value, End of Period | Total Return(2) | Operating Expenses(3) | Net Investment Income (Loss) | Portfolio Turnover Rate | Net Assets, End of Period (in thousands) | |||
| One Choice 2040 Portfolio | |||||||||||||||
| Investor Class | |||||||||||||||
| 2015 | $12.86 | 0.28 | 0.59 | 0.87 | (0.29) | (0.30) | (0.59) | $13.14 | 6.84% | 0.20% | 2.06% | 20% | $472,335 | ||
| 2014 | $11.87 | 0.30 | 1.07 | 1.37 | (0.28) | (0.10) | (0.38) | $12.86 | 11.63% | 0.20% | 2.38% | 4% | $392,199 | ||
| 2013 | $10.31 | 0.18 | 1.62 | 1.80 | (0.16) | (0.08) | (0.24) | $11.87 | 17.83% | 0.20% | 1.58% | 5% | $234,285 | ||
| 2012 | $10.11 | 0.17 | 0.23 | 0.40 | (0.17) | (0.03) | (0.20) | $10.31 | 4.05% | 0.21% | 1.71% | 20% | $107,290 | ||
| 2011 | $8.72 | 0.14 | 1.39 | 1.53 | (0.14) | —(4) | (0.14) | $10.11 | 17.57% | 0.21% | 1.57% | 5% | $44,433 | ||
| Institutional Class | |||||||||||||||
| 2015 | $12.87 | 0.28 | 0.61 | 0.89 | (0.31) | (0.30) | (0.61) | $13.15 | 7.05% | 0.00%(5) | 2.26% | 20% | $437,728 | ||
| 2014 | $11.88 | 0.32 | 1.07 | 1.39 | (0.30) | (0.10) | (0.40) | $12.87 | 11.84% | 0.00%(5) | 2.58% | 4% | $243,924 | ||
| 2013 | $10.32 | 0.20 | 1.62 | 1.82 | (0.18) | (0.08) | (0.26) | $11.88 | 18.05% | 0.00%(5) | 1.78% | 5% | $156,913 | ||
| 2012 | $10.12 | 0.19 | 0.23 | 0.42 | (0.19) | (0.03) | (0.22) | $10.32 | 4.26% | 0.01% | 1.91% | 20% | $70,149 | ||
| 2011 | $8.73 | 0.18 | 1.37 | 1.55 | (0.16) | —(4) | (0.16) | $10.12 | 17.78% | 0.01% | 1.77% | 5% | $78,468 | ||
| A Class | |||||||||||||||
| 2015 | $12.84 | 0.24 | 0.59 | 0.83 | (0.25) | (0.30) | (0.55) | $13.12 | 6.57% | 0.45% | 1.81% | 20% | $267,038 | ||
| 2014 | $11.85 | 0.26 | 1.07 | 1.33 | (0.24) | (0.10) | (0.34) | $12.84 | 11.36% | 0.45% | 2.13% | 4% | $230,764 | ||
| 2013 | $10.30 | 0.15 | 1.62 | 1.77 | (0.14) | (0.08) | (0.22) | $11.85 | 17.45% | 0.45% | 1.33% | 5% | $176,014 | ||
| 2012 | $10.10 | 0.15 | 0.22 | 0.37 | (0.14) | (0.03) | (0.17) | $10.30 | 3.80% | 0.46% | 1.46% | 20% | $110,524 | ||
| 2011 | $8.71 | 0.13 | 1.37 | 1.50 | (0.11) | —(4) | (0.11) | $10.10 | 17.29% | 0.46% | 1.32% | 5% | $69,629 | ||
85
| For a Share Outstanding Throughout the Years Ended July 31 (except as noted) | |||||||||||||||
| Per-Share Data | Ratios and Supplemental Data | ||||||||||||||
| Income From Investment Operations: | Distributions From: | Ratio to Average Net Assets of: | |||||||||||||
Net Asset Value, Beginning of Period | Net Investment Income (Loss)(1) | Net Realized and Unrealized Gain (Loss) | Total From Investment Operations | Net Investment Income | Net Realized Gains | Total Distributions | Net Asset Value, End of Period | Total Return(2) | Operating Expenses(3) | Net Investment Income (Loss) | Portfolio Turnover Rate | Net Assets, End of Period (in thousands) | |||
| C Class | |||||||||||||||
| 2015 | $12.80 | 0.15 | 0.58 | 0.73 | (0.15) | (0.30) | (0.45) | $13.08 | 5.77% | 1.20% | 1.06% | 20% | $3,158 | ||
| 2014 | $11.82 | 0.17 | 1.06 | 1.23 | (0.15) | (0.10) | (0.25) | $12.80 | 10.46% | 1.20% | 1.38% | 4% | $2,939 | ||
| 2013 | $10.26 | 0.07 | 1.62 | 1.69 | (0.05) | (0.08) | (0.13) | $11.82 | 16.71% | 1.20% | 0.58% | 5% | $2,049 | ||
| 2012 | $10.07 | 0.06 | 0.23 | 0.29 | (0.07) | (0.03) | (0.10) | $10.26 | 2.93% | 1.21% | 0.71% | 20% | $559 | ||
| 2011 | $8.68 | 0.05 | 1.38 | 1.43 | (0.04) | —(4) | (0.04) | $10.07 | 16.46% | 1.21% | 0.57% | 5% | $215 | ||
| R Class | |||||||||||||||
| 2015 | $12.82 | 0.21 | 0.59 | 0.80 | (0.22) | (0.30) | (0.52) | $13.10 | 6.31% | 0.70% | 1.56% | 20% | $122,661 | ||
| 2014 | $11.83 | 0.23 | 1.07 | 1.30 | (0.21) | (0.10) | (0.31) | $12.82 | 11.10% | 0.70% | 1.88% | 4% | $94,677 | ||
| 2013 | $10.28 | 0.12 | 1.62 | 1.74 | (0.11) | (0.08) | (0.19) | $11.83 | 17.18% | 0.70% | 1.08% | 5% | $64,687 | ||
| 2012 | $10.08 | 0.12 | 0.23 | 0.35 | (0.12) | (0.03) | (0.15) | $10.28 | 3.54% | 0.71% | 1.21% | 20% | $36,524 | ||
| 2011 | $8.69 | 0.10 | 1.38 | 1.48 | (0.09) | —(4) | (0.09) | $10.08 | 17.03% | 0.71% | 1.07% | 5% | $18,752 | ||
| Notes to Financial Highlights |
| (1) | Computed using average shares outstanding throughout the period. |
| (2) | Total returns are calculated based on the net asset value of the last business day and do not reflect applicable sales charges, if any. Total returns for periods less than one year are not annualized. |
| (3) | Ratio of operating expenses to average net assets does not include any fees and expenses of the underlying funds. |
| (4) | Per-share amount was less than $0.005. |
| (5) | Ratio was less than 0.005%. |
See Notes to Financial Statements.
86
| For a Share Outstanding Throughout the Years Ended July 31 (except as noted) | |||||||||||||||
| Per-Share Data | Ratios and Supplemental Data | ||||||||||||||
| Income From Investment Operations: | Distributions From: | Ratio to Average Net Assets of: | |||||||||||||
Net Asset Value, Beginning of Period | Net Investment Income (Loss)(1) | Net Realized and Unrealized Gain (Loss) | Total From Investment Operations | Net Investment Income | Net Realized Gains | Total Distributions | Net Asset Value, End of Period | Total Return(2) | Operating Expenses(3) | Net Investment Income (Loss) | Portfolio Turnover Rate | Net Assets, End of Period (in thousands) | |||
| One Choice 2045 Portfolio | |||||||||||||||
| Investor Class | |||||||||||||||
| 2015 | $16.22 | 0.35 | 0.80 | 1.15 | (0.37) | (0.43) | (0.80) | $16.57 | 7.22% | 0.20% | 2.10% | 23% | $608,154 | ||
| 2014 | $14.92 | 0.37 | 1.44 | 1.81 | (0.36) | (0.15) | (0.51) | $16.22 | 12.34% | 0.20% | 2.38% | 4% | $523,828 | ||
| 2013 | $12.84 | 0.22 | 2.17 | 2.39 | (0.21) | (0.10) | (0.31) | $14.92 | 18.94% | 0.20% | 1.58% | 3% | $355,470 | ||
| 2012 | $12.59 | 0.20 | 0.26 | 0.46 | (0.21) | — | (0.21) | $12.84 | 3.76% | 0.21% | 1.66% | 14% | $222,501 | ||
| 2011 | $10.82 | 0.18 | 1.76 | 1.94 | (0.17) | — | (0.17) | $12.59 | 17.98% | 0.21% | 1.51% | 2% | $157,711 | ||
| Institutional Class | |||||||||||||||
| 2015 | $16.24 | 0.36 | 0.84 | 1.20 | (0.41) | (0.43) | (0.84) | $16.60 | 7.50% | 0.00%(4) | 2.30% | 23% | $437,726 | ||
| 2014 | $14.94 | 0.40 | 1.44 | 1.84 | (0.39) | (0.15) | (0.54) | $16.24 | 12.55% | 0.00%(4) | 2.58% | 4% | $281,772 | ||
| 2013 | $12.86 | 0.25 | 2.17 | 2.42 | (0.24) | (0.10) | (0.34) | $14.94 | 19.15% | 0.00%(4) | 1.78% | 3% | $196,557 | ||
| 2012 | $12.60 | 0.23 | 0.26 | 0.49 | (0.23) | — | (0.23) | $12.86 | 4.04% | 0.01% | 1.86% | 14% | $116,894 | ||
| 2011 | $10.83 | 0.21 | 1.75 | 1.96 | (0.19) | — | (0.19) | $12.60 | 18.10% | 0.01% | 1.71% | 2% | $110,477 | ||
| A Class | |||||||||||||||
| 2015 | $16.19 | 0.31 | 0.80 | 1.11 | (0.33) | (0.43) | (0.76) | $16.54 | 6.96% | 0.45% | 1.85% | 23% | $306,435 | ||
| 2014 | $14.89 | 0.34 | 1.43 | 1.77 | (0.32) | (0.15) | (0.47) | $16.19 | 12.08% | 0.45% | 2.13% | 4% | $283,598 | ||
| 2013 | $12.82 | 0.18 | 2.17 | 2.35 | (0.18) | (0.10) | (0.28) | $14.89 | 18.59% | 0.45% | 1.33% | 3% | $231,054 | ||
| 2012 | $12.56 | 0.18 | 0.26 | 0.44 | (0.18) | — | (0.18) | $12.82 | 3.59% | 0.46% | 1.41% | 14% | $147,197 | ||
| 2011 | $10.80 | 0.15 | 1.75 | 1.90 | (0.14) | — | (0.14) | $12.56 | 17.63% | 0.46% | 1.26% | 2% | $104,426 | ||
87
| For a Share Outstanding Throughout the Years Ended July 31 (except as noted) | |||||||||||||||
| Per-Share Data | Ratios and Supplemental Data | ||||||||||||||
| Income From Investment Operations: | Distributions From: | Ratio to Average Net Assets of: | |||||||||||||
Net Asset Value, Beginning of Period | Net Investment Income (Loss)(1) | Net Realized and Unrealized Gain (Loss) | Total From Investment Operations | Net Investment Income | Net Realized Gains | Total Distributions | Net Asset Value, End of Period | Total Return(2) | Operating Expenses(3) | Net Investment Income (Loss) | Portfolio Turnover Rate | Net Assets, End of Period (in thousands) | |||
| C Class | |||||||||||||||
| 2015 | $16.15 | 0.16 | 0.83 | 0.99 | (0.20) | (0.43) | (0.63) | $16.51 | 6.21% | 1.20% | 1.10% | 23% | $2,459 | ||
| 2014 | $14.86 | 0.20 | 1.44 | 1.64 | (0.20) | (0.15) | (0.35) | $16.15 | 11.18% | 1.20% | 1.38% | 4% | $1,993 | ||
| 2013 | $12.79 | 0.10 | 2.15 | 2.25 | (0.08) | (0.10) | (0.18) | $14.86 | 17.72% | 1.20% | 0.58% | 3% | $1,220 | ||
| 2012 | $12.53 | 0.08 | 0.27 | 0.35 | (0.09) | — | (0.09) | $12.79 | 2.82% | 1.21% | 0.66% | 14% | $633 | ||
| 2011 | $10.78 | 0.03 | 1.77 | 1.80 | (0.05) | — | (0.05) | $12.53 | 16.68% | 1.21% | 0.51% | 2% | $363 | ||
| R Class | |||||||||||||||
| 2015 | $16.17 | 0.27 | 0.81 | 1.08 | (0.29) | (0.43) | (0.72) | $16.53 | 6.75% | 0.70% | 1.60% | 23% | $130,537 | ||
| 2014 | $14.88 | 0.30 | 1.42 | 1.72 | (0.28) | (0.15) | (0.43) | $16.17 | 11.73% | 0.70% | 1.88% | 4% | $117,392 | ||
| 2013 | $12.81 | 0.15 | 2.17 | 2.32 | (0.15) | (0.10) | (0.25) | $14.88 | 18.30% | 0.70% | 1.08% | 3% | $91,776 | ||
| 2012 | $12.55 | 0.14 | 0.27 | 0.41 | (0.15) | — | (0.15) | $12.81 | 3.33% | 0.71% | 1.16% | 14% | $62,208 | ||
| 2011 | $10.79 | 0.12 | 1.75 | 1.87 | (0.11) | — | (0.11) | $12.55 | 17.35% | 0.71% | 1.01% | 2% | $39,540 | ||
| Notes to Financial Highlights |
| (1) | Computed using average shares outstanding throughout the period. |
| (2) | Total returns are calculated based on the net asset value of the last business day and do not reflect applicable sales charges, if any. Total returns for periods less than one year are not annualized. |
| (3) | Ratio of operating expenses to average net assets does not include any fees and expenses of the underlying funds. |
| (4) | Ratio was less than 0.005%. |
See Notes to Financial Statements.
88
| For a Share Outstanding Throughout the Years Ended July 31 (except as noted) | |||||||||||||||
| Per-Share Data | Ratios and Supplemental Data | ||||||||||||||
| Income From Investment Operations: | Distributions From: | Ratio to Average Net Assets of: | |||||||||||||
Net Asset Value, Beginning of Period | Net Investment Income (Loss)(1) | Net Realized and Unrealized Gain (Loss) | Total From Investment Operations | Net Investment Income | Net Realized Gains | Total Distributions | Net Asset Value, End of Period | Total Return(2) | Operating Expenses(3) | Net Investment Income (Loss) | Portfolio Turnover Rate | Net Assets, End of Period (in thousands) | |||
| One Choice 2050 Portfolio | |||||||||||||||
| Investor Class | |||||||||||||||
| 2015 | $12.85 | 0.28 | 0.66 | 0.94 | (0.29) | (0.30) | (0.59) | $13.20 | 7.37% | 0.20% | 2.06% | 21% | $268,548 | ||
| 2014 | $11.77 | 0.29 | 1.17 | 1.46 | (0.28) | (0.10) | (0.38) | $12.85 | 12.59% | 0.20% | 2.35% | 4% | $214,823 | ||
| 2013 | $10.07 | 0.16 | 1.77 | 1.93 | (0.15) | (0.08) | (0.23) | $11.77 | 19.51% | 0.20% | 1.51% | 4% | $115,834 | ||
| 2012 | $9.88 | 0.14 | 0.21 | 0.35 | (0.14) | (0.02) | (0.16) | $10.07 | 3.67% | 0.21% | 1.53% | 12% | $48,553 | ||
| 2011 | $8.45 | 0.13 | 1.42 | 1.55 | (0.12) | —(4) | (0.12) | $9.88 | 18.35% | 0.21% | 1.37% | 6% | $20,035 | ||
| Institutional Class | |||||||||||||||
| 2015 | $12.87 | 0.28 | 0.68 | 0.96 | (0.31) | (0.30) | (0.61) | $13.22 | 7.58% | 0.00%(5) | 2.26% | 21% | $257,921 | ||
| 2014 | $11.79 | 0.32 | 1.17 | 1.49 | (0.31) | (0.10) | (0.41) | $12.87 | 12.79% | 0.00%(5) | 2.55% | 4% | $135,635 | ||
| 2013 | $10.09 | 0.19 | 1.76 | 1.95 | (0.17) | (0.08) | (0.25) | $11.79 | 19.72% | 0.00%(5) | 1.71% | 4% | $95,469 | ||
| 2012 | $9.90 | 0.17 | 0.20 | 0.37 | (0.16) | (0.02) | (0.18) | $10.09 | 3.87% | 0.01% | 1.73% | 12% | $49,284 | ||
| 2011 | $8.46 | 0.15 | 1.43 | 1.58 | (0.14) | —(4) | (0.14) | $9.90 | 18.69% | 0.01% | 1.57% | 6% | $30,796 | ||
| A Class | |||||||||||||||
| 2015 | $12.83 | 0.24 | 0.66 | 0.90 | (0.25) | (0.30) | (0.55) | $13.18 | 7.11% | 0.45% | 1.81% | 21% | $162,011 | ||
| 2014 | $11.75 | 0.26 | 1.17 | 1.43 | (0.25) | (0.10) | (0.35) | $12.83 | 12.32% | 0.45% | 2.10% | 4% | $131,709 | ||
| 2013 | $10.06 | 0.14 | 1.76 | 1.90 | (0.13) | (0.08) | (0.21) | $11.75 | 19.13% | 0.45% | 1.26% | 4% | $91,012 | ||
| 2012 | $9.87 | 0.13 | 0.20 | 0.33 | (0.12) | (0.02) | (0.14) | $10.06 | 3.41% | 0.46% | 1.28% | 12% | $55,073 | ||
| 2011 | $8.44 | 0.11 | 1.41 | 1.52 | (0.09) | —(4) | (0.09) | $9.87 | 18.08% | 0.46% | 1.12% | 6% | $29,685 | ||
89
| For a Share Outstanding Throughout the Years Ended July 31 (except as noted) | |||||||||||||||
| Per-Share Data | Ratios and Supplemental Data | ||||||||||||||
| Income From Investment Operations: | Distributions From: | Ratio to Average Net Assets of: | |||||||||||||
Net Asset Value, Beginning of Period | Net Investment Income (Loss)(1) | Net Realized and Unrealized Gain (Loss) | Total From Investment Operations | Net Investment Income | Net Realized Gains | Total Distributions | Net Asset Value, End of Period | Total Return(2) | Operating Expenses(3) | Net Investment Income (Loss) | Portfolio Turnover Rate | Net Assets, End of Period (in thousands) | |||
| C Class | |||||||||||||||
| 2015 | $12.80 | 0.15 | 0.65 | 0.80 | (0.15) | (0.30) | (0.45) | $13.15 | 6.30% | 1.20% | 1.06% | 21% | $2,197 | ||
| 2014 | $11.73 | 0.19 | 1.14 | 1.33 | (0.16) | (0.10) | (0.26) | $12.80 | 11.40% | 1.20% | 1.35% | 4% | $1,983 | ||
| 2013 | $10.04 | 0.06 | 1.76 | 1.82 | (0.05) | (0.08) | (0.13) | $11.73 | 18.26% | 1.20% | 0.51% | 4% | $1,748 | ||
| 2012 | $9.85 | 0.05 | 0.21 | 0.26 | (0.05) | (0.02) | (0.07) | $10.04 | 2.64% | 1.21% | 0.53% | 12% | $530 | ||
| 2011 | $8.42 | 0.05 | 1.40 | 1.45 | (0.02) | —(4) | (0.02) | $9.85 | 17.23% | 1.21% | 0.37% | 6% | $117 | ||
| R Class | |||||||||||||||
| 2015 | $12.81 | 0.21 | 0.66 | 0.87 | (0.22) | (0.30) | (0.52) | $13.16 | 6.84% | 0.70% | 1.56% | 21% | $62,763 | ||
| 2014 | $11.74 | 0.23 | 1.16 | 1.39 | (0.22) | (0.10) | (0.32) | $12.81 | 11.96% | 0.70% | 1.85% | 4% | $47,771 | ||
| 2013 | $10.05 | 0.11 | 1.76 | 1.87 | (0.10) | (0.08) | (0.18) | $11.74 | 18.84% | 0.70% | 1.01% | 4% | $32,896 | ||
| 2012 | $9.86 | 0.10 | 0.21 | 0.31 | (0.10) | (0.02) | (0.12) | $10.05 | 3.16% | 0.71% | 1.03% | 12% | $15,933 | ||
| 2011 | $8.43 | 0.09 | 1.41 | 1.50 | (0.07) | —(4) | (0.07) | $9.86 | 17.80% | 0.71% | 0.87% | 6% | $7,660 | ||
| Notes to Financial Highlights |
| (1) | Computed using average shares outstanding throughout the period. |
| (2) | Total returns are calculated based on the net asset value of the last business day and do not reflect applicable sales charges, if any. Total returns for periods less than one year are not annualized. |
| (3) | Ratio of operating expenses to average net assets does not include any fees and expenses of the underlying funds. |
| (4) | Per-share amount was less than $0.005. |
| (5) | Ratio was less than 0.005%. |
See Notes to Financial Statements.
90
| For a Share Outstanding Throughout the Years Ended July 31 (except as noted) | |||||||||||||||
| Per-Share Data | Ratios and Supplemental Data | ||||||||||||||
| Income From Investment Operations: | Distributions From: | Ratio to Average Net Assets of: | |||||||||||||
Net Asset Value, Beginning of Period | Net Investment Income (Loss)(1) | Net Realized and Unrealized Gain (Loss) | Total From Investment Operations | Net Investment Income | Net Realized Gains | Total Distributions | Net Asset Value, End of Period | Total Return(2) | Operating Expenses(3) | Net Investment Income (Loss) | Portfolio Turnover Rate | Net Assets, End of Period (in thousands) | |||
| One Choice 2055 Portfolio | |||||||||||||||
| Investor Class | |||||||||||||||
| 2015 | $13.22 | 0.27 | 0.72 | 0.99 | (0.28) | (0.21) | (0.49) | $13.72 | 7.56% | 0.20% | 1.94% | 24% | $66,163 | ||
| 2014 | $12.02 | 0.30 | 1.24 | 1.54 | (0.28) | (0.06) | (0.34) | $13.22 | 12.87% | 0.20% | 2.22% | 8% | $33,357 | ||
| 2013 | $10.19 | 0.15 | 1.85 | 2.00 | (0.14) | (0.03) | (0.17) | $12.02 | 19.86% | 0.20% | 1.36% | 13% | $14,959 | ||
| 2012 | $9.92 | 0.12 | 0.25 | 0.37 | (0.10) | — | (0.10) | $10.19 | 3.78% | 0.20% | 1.25% | 44% | $3,920 | ||
2011(4) | $10.00 | 0.03 | (0.11) | (0.08) | — | — | — | $9.92 | (0.80)% | 0.20%(5) | 0.86%(5) | 12% | $390 | ||
| Institutional Class | |||||||||||||||
| 2015 | $13.23 | 0.28 | 0.74 | 1.02 | (0.31) | (0.21) | (0.52) | $13.73 | 7.78% | 0.00%(6) | 2.14% | 24% | $92,653 | ||
| 2014 | $12.03 | 0.28 | 1.28 | 1.56 | (0.30) | (0.06) | (0.36) | $13.23 | 13.09% | 0.00%(6) | 2.42% | 8% | $43,147 | ||
| 2013 | $10.20 | 0.18 | 1.84 | 2.02 | (0.16) | (0.03) | (0.19) | $12.03 | 20.08% | 0.00%(6) | 1.56% | 13% | $10,951 | ||
| 2012 | $9.92 | 0.14 | 0.25 | 0.39 | (0.11) | — | (0.11) | $10.20 | 4.04% | 0.00%(6) | 1.45% | 44% | $3,939 | ||
2011(4) | $10.00 | 0.04 | (0.12) | (0.08) | — | — | — | $9.92 | (0.80)% | 0.00%(5)(6) | 1.06%(5) | 12% | $379 | ||
| A Class | |||||||||||||||
| 2015 | $13.19 | 0.24 | 0.72 | 0.96 | (0.25) | (0.21) | (0.46) | $13.69 | 7.31% | 0.45% | 1.69% | 24% | $51,889 | ||
| 2014 | $12.00 | 0.26 | 1.23 | 1.49 | (0.24) | (0.06) | (0.30) | $13.19 | 12.52% | 0.45% | 1.97% | 8% | $31,787 | ||
| 2013 | $10.17 | 0.13 | 1.85 | 1.98 | (0.12) | (0.03) | (0.15) | $12.00 | 19.59% | 0.45% | 1.11% | 13% | $14,138 | ||
| 2012 | $9.91 | 0.10 | 0.24 | 0.34 | (0.08) | — | (0.08) | $10.17 | 3.49% | 0.45% | 1.00% | 44% | $3,253 | ||
2011(4) | $10.00 | 0.02 | (0.11) | (0.09) | — | — | — | $9.91 | (0.90)% | 0.45%(5) | 0.61%(5) | 12% | $21 | ||
91
| For a Share Outstanding Throughout the Years Ended July 31 (except as noted) | |||||||||||||||
| Per-Share Data | Ratios and Supplemental Data | ||||||||||||||
| Income From Investment Operations: | Distributions From: | Ratio to Average Net Assets of: | |||||||||||||
Net Asset Value, Beginning of Period | Net Investment Income (Loss)(1) | Net Realized and Unrealized Gain (Loss) | Total From Investment Operations | Net Investment Income | Net Realized Gains | Total Distributions | Net Asset Value, End of Period | Total Return(2) | Operating Expenses(3) | Net Investment Income (Loss) | Portfolio Turnover Rate | Net Assets, End of Period (in thousands) | |||
| C Class | |||||||||||||||
| 2015 | $13.14 | 0.14 | 0.71 | 0.85 | (0.14) | (0.21) | (0.35) | $13.64 | 6.51% | 1.20% | 0.94% | 24% | $557 | ||
| 2014 | $11.95 | 0.17 | 1.23 | 1.40 | (0.15) | (0.06) | (0.21) | $13.14 | 11.72% | 1.20% | 1.22% | 8% | $428 | ||
| 2013 | $10.13 | 0.05 | 1.84 | 1.89 | (0.04) | (0.03) | (0.07) | $11.95 | 18.66% | 1.20% | 0.36% | 13% | $215 | ||
| 2012 | $9.88 | 0.02 | 0.26 | 0.28 | (0.03) | — | (0.03) | $10.13 | 2.81% | 1.20% | 0.25% | 44% | $87 | ||
2011(4) | $10.00 | (0.01) | (0.11) | (0.12) | — | — | — | $9.88 | (1.20)% | 1.20%(5) | (0.14)%(5) | 12% | $5 | ||
| R Class | |||||||||||||||
| 2015 | $13.18 | 0.21 | 0.72 | 0.93 | (0.21) | (0.21) | (0.42) | $13.69 | 7.11% | 0.70% | 1.44% | 24% | $24,867 | ||
| 2014 | $11.99 | 0.23 | 1.23 | 1.46 | (0.21) | (0.06) | (0.27) | $13.18 | 12.25% | 0.70% | 1.72% | 8% | $13,999 | ||
| 2013 | $10.16 | 0.09 | 1.86 | 1.95 | (0.09) | (0.03) | (0.12) | $11.99 | 19.31% | 0.70% | 0.86% | 13% | $6,983 | ||
| 2012 | $9.90 | 0.06 | 0.26 | 0.32 | (0.06) | — | (0.06) | $10.16 | 3.29% | 0.70% | 0.75% | 44% | $1,108 | ||
2011(4) | $10.00 | 0.01 | (0.11) | (0.10) | — | — | — | $9.90 | (1.00)% | 0.70%(5) | 0.36%(5) | 12% | $6 | ||
| Notes to Financial Highlights |
| (1) | Computed using average shares outstanding throughout the period. |
| (2) | Total returns are calculated based on the net asset value of the last business day and do not reflect applicable sales charges, if any. Total returns for periods less than one year are not annualized. |
| (3) | Ratio of operating expenses to average net assets does not include any fees and expenses of the underlying funds. |
| (4) | March 31, 2011 (fund inception) through July 31, 2011. |
| (5) | Annualized. |
| (6) | Ratio was less than 0.005%. |
See Notes to Financial Statements.
92
| Report of Independent Registered Public Accounting Firm |
To the Board of Directors and Shareholders of American Century Asset Allocation Portfolios, Inc.:
We have audited the accompanying statements of assets and liabilities, including the schedules of investments, of One Choice In Retirement Portfolio, One Choice 2020 Portfolio, One Choice 2025 Portfolio, One Choice 2030 Portfolio, One Choice 2035 Portfolio, One Choice 2040 Portfolio, One Choice 2045 Portfolio, One Choice 2050 Portfolio, and One Choice 2055 Portfolio, nine of the portfolios constituting American Century Asset Allocation Portfolios, Inc. (the “Funds”), as of July 31, 2015, and the related statements of operations for the year then ended, the statements of changes in net assets for each of the two years in the period then ended, and the financial highlights for each of the periods presented. These financial statements and financial highlights are the responsibility of the Funds’ management. Our responsibility is to express an opinion on these financial statements and financial highlights based on our audits.
We conducted our audits in accordance with the standards of the Public Company Accounting Oversight Board (United States). Those standards require that we plan and perform the audit to obtain reasonable assurance about whether the financial statements and financial highlights are free of material misstatement. The Funds are not required to have, nor were we engaged to perform, an audit of their internal control over financial reporting. Our audits included consideration of internal control over financial reporting as a basis for designing audit procedures that are appropriate in the circumstances, but not for the purpose of expressing an opinion on the effectiveness of the Funds' internal control over financial reporting. Accordingly, we express no such opinion. An audit also includes examining, on a test basis, evidence supporting the amounts and disclosures in the financial statements, assessing the accounting principles used and significant estimates made by management, as well as evaluating the overall financial statement presentation. Our procedures included confirmation of securities owned as of July 31, 2015, by correspondence with the transfer agent. We believe that our audits provide a reasonable basis for our opinion.
In our opinion, the financial statements and financial highlights referred to above present fairly, in all material respects, the financial position of each of the respective Funds as of July 31, 2015, the results of their operations for the year then ended, the changes in their net assets for each of the two years in the period then ended, and the financial highlights for each of the periods presented, in conformity with accounting principles generally accepted in the United States of America.
DELOITTE & TOUCHE LLP
Kansas City, Missouri
September 17, 2015
93
| Management |
The Board of Directors
The individuals listed below serve as directors of the funds. Each director will continue to serve in this capacity until death, retirement, resignation or removal from office. The board has adopted a mandatory retirement age for directors who are not “interested persons,” as that term is defined in the Investment Company Act (independent directors). Independent directors shall retire by December 31 of the year in which they reach their 75th birthday.
Mr. Thomas is an “interested person” because he currently serves as President and Chief Executive Officer of American Century Companies, Inc. (ACC), the parent company of American Century Investment Management, Inc. (ACIM or the advisor). Mr. Fink is treated as an “interested person” because of his recent employment with ACC and American Century Services, LLC (ACS). The other directors (more than three-fourths of the total number) are independent. They are not employees, directors or officers of, and have no financial interest in, ACC or any of its wholly owned, direct or indirect, subsidiaries, including ACIM, American Century Investment Services, Inc. (ACIS) and ACS, and they do not have any other affiliations, positions or relationships that would cause them to be considered “interested persons” under the Investment Company Act. The directors serve in this capacity for seven (in the case of Mr. Thomas, 15) registered investment companies in the American Century Investments family of funds.
The following table presents additional information about the directors. The mailing address for each director is 4500 Main Street, Kansas City, Missouri 64111.
Name (Year of Birth) | Position(s) Held with Funds | Length of Time Served | Principal Occupation(s) During Past 5 Years | Number of American Century Portfolios Overseen by Director | Other Directorships Held During Past 5 Years |
| Independent Directors | |||||
| Thomas A. Brown (1940) | Director | Since 1980 | Managing Member, Associated Investments, LLC (real estate investment company) | 78 | None |
| Andrea C. Hall (1945) | Director | Since 1997 | Retired | 78 | None |
| Jan M. Lewis (1957) | Director | Since 2011 | Retired; President and Chief Executive Officer, Catholic Charities of Northeast Kansas (human services organization) (2006 to 2013) | 78 | None |
| James A. Olson (1942) | Director and Chairman of the Board | Since 2007 (Chairman since 2014) | Member, Plaza Belmont LLC (private equity fund manager) | 78 | Saia, Inc. (2002 to 2012) and EPR Properties (2003 to 2013) |
| M. Jeannine Strandjord (1945) | Director | Since 1994 | Retired | 78 | Euronet Worldwide Inc.; MGP Ingredients, Inc.; Charming Shoppes, Inc. (2006 to 2010); and DST Systems Inc. (1996 to 2012) |
94
| Name (Year of Birth) | Position(s) Held with Funds | Length of Time Served | Principal Occupation(s) During Past 5 Years | Number of American Century Portfolios Overseen by Director | Other Directorships Held During Past 5 Years |
| Independent Directors | |||||
| John R. Whitten (1946) | Director | Since 2008 | Retired | 78 | Rudolph Technologies, Inc. |
| Stephen E. Yates (1948) | Director | Since 2012 | Retired; Executive Vice President, Technology & Operations, KeyCorp. (computer services) (2004 to 2010) | 78 | Applied Industrial Technologies, Inc. (2001 to 2010) |
| Interested Directors | |||||
| Barry Fink (1955) | Director | Since 2012 | Retired; Executive Vice President, ACC (September 2007 to February 2013); President, ACS (October 2007 to February 2013); Chief Operating Officer, ACC (September 2007 to November 2012) | 78 | None |
| Jonathan S. Thomas (1963) | Director and President | Since 2007 | President and Chief Executive Officer, ACC (March 2007 to present). Also serves as Chief Executive Officer, ACS; Executive Vice President, ACIM; Director, ACC, ACIM and other ACC subsidiaries | 124 | BioMed Valley Discoveries, Inc. |
The Statement of Additional Information has additional information about the funds' directors and is available without charge, upon request, by calling 1-800-345-2021.
95
Officers
The following table presents certain information about the executive officers of the funds. Each officer serves as an officer for each of the 15 investment companies in the American Century family of funds, unless otherwise noted. No officer is compensated for his or her service as an officer of the funds. The listed officers are interested persons of the funds and are appointed or re-appointed on an annual basis. The mailing address for each officer listed below is 4500 Main Street, Kansas City, Missouri 64111.
Name (Year of Birth) | Offices with the Funds | Principal Occupation(s) During the Past Five Years |
| Jonathan S. Thomas (1963) | Director and President since 2007 | President and Chief Executive Officer, ACC (March 2007 to present). Also serves as Chief Executive Officer, ACS; Executive Vice President, ACIM; Director, ACC, ACIM and other ACC subsidiaries |
| Amy D. Shelton (1964) | Chief Compliance Officer and Vice President since 2014 | Chief Compliance Officer, American Century funds, (March 2014 to present); Chief Compliance Officer, ACIM (February 2014 to present); Chief Compliance Officer, ACIS (October 2009 to present); Vice President, Client Interactions and Marketing, ACIS (February 2013 to January 2014); Director, Client Interactions and Marketing, ACIS (June 2007 to January 2013). Also serves as Vice President, ACIS |
| Charles A. Etherington (1957) | General Counsel since 2007 and Senior Vice President since 2006 | Attorney, ACC (February 1994 to present); Vice President, ACC (November 2005 to present); General Counsel, ACC (March 2007 to present). Also serves as General Counsel, ACIM, ACS, ACIS and other ACC subsidiaries; and Senior Vice President, ACIM and ACS |
| C. Jean Wade (1964) | Vice President, Treasurer and Chief Financial Officer since 2012 | Vice President, ACS (February 2000 to present) |
| Robert J. Leach (1966) | Vice President since 2006 and Assistant Treasurer since 2012 | Vice President, ACS (February 2000 to present) |
| David H. Reinmiller (1963) | Vice President since 2000 | Attorney, ACC (January 1994 to present); Associate General Counsel, ACC (January 2001 to present). Also serves as Vice President, ACIM and ACS |
| Ward D. Stauffer (1960) | Secretary since 2005 | Attorney, ACC (June 2003 to present) |
96
| Approval of Management Agreements |
At a meeting held on June 30, 2015, the Funds’ Board of Directors unanimously approved the renewal of the management agreements pursuant to which American Century Investment Management, Inc. (the “Advisor”) acts as the investment advisor for the Funds. Under Section
15(c) of the Investment Company Act, contracts for investment advisory services are required to be reviewed, evaluated, and approved by a majority of a funds’ directors (the “Directors”), including a majority of the independent Directors, each year.
Prior to its consideration of the renewal of each Fund’s management agreement, the Directors requested and reviewed extensive data and information compiled by the Advisor and certain independent providers of evaluation data concerning the Funds and the services provided to the Funds by the Advisor. This review was in addition to the oversight and evaluation undertaken by the Board and its committees on a continuous basis and the information received was supplemental to the extensive information that the Board and its committees receive and consider throughout the year.
In connection with its consideration of the renewal of each Fund’s management agreement, the Board’s review and evaluation of the services provided by the Advisor included, but was not limited to, the following:
| • | the nature, extent, and quality of investment management, shareholder services, and other services provided by the Advisor to each Fund; |
| • | the wide range of other programs and services the Advisor provides to each Fund and its shareholders on a routine and non-routine basis; |
| • | each Fund’s investment performance compared to appropriate benchmarks and/or a peer group of other mutual funds with similar investment objectives and strategies; |
| • | the cost of owning each Fund compared to the cost of owning similar funds; |
| • | the Advisor’s compliance policies, procedures, and regulatory experience; |
| • | financial data showing the cost of services provided to each Fund, the profitability of each Fund to the Advisor, and the overall profitability of the Advisor; |
| • | possible economies of scale associated with the Advisor’s management of the Funds and other accounts under its management; |
| • | data comparing services provided and charges to other investment management clients of the Advisor; |
| • | acquired fund fees and expenses; |
| • | payments to intermediaries by each Fund and the Advisor; and |
| • | any collateral benefits derived by the Advisor from the management of the Funds. |
In keeping with their practice, the Directors held two in-person meetings and one telephonic meeting to review and discuss the information provided. The independent Directors also had the benefit of the advice of their independent counsel throughout the process.
Factors Considered
The Directors considered all of the information provided by the Advisor, the independent data providers, and independent counsel, and evaluated such information for each Fund. In connection with their review, the Directors did not identify any single factor as being all-important or controlling, and each Director may have attributed different levels of importance to different factors. In deciding to renew the management agreements, the Board based its decision on a number of factors, including the following:
Nature, Extent and Quality of Services - Generally. Under the management agreements, the Advisor is responsible for providing or arranging for all services necessary for the operation of each
97
Fund. The Board noted that under the management agreements, the Advisor provides or arranges at its own expense a wide variety of services including:
| • | constructing and designing each Fund |
| • | portfolio research and security selection |
| • | initial capitalization/funding |
| • | securities trading |
| • | Fund administration |
| • | custody of Fund assets |
| • | daily valuation of each Fund’s portfolio |
| • | shareholder servicing and transfer agency, including shareholder confirmations, recordkeeping, and communications |
| • | legal services (except the independent Directors’ counsel) |
| • | regulatory and portfolio compliance |
| • | financial reporting |
| • | marketing and distribution (except Rule 12b-1 plans) |
The Board noted that many of these services have expanded over time both in terms of quantity and complexity in response to shareholder demands, competition in the industry, changing distribution channels, and the changing regulatory environment.
Investment Management Services. The nature of the investment management services provided to the Funds is quite complex and allows fund shareholders access to professional money management, instant diversification of their investments within an asset class, the opportunity to easily diversify among asset classes by investing in or exchanging among various American Century Investments funds, and liquidity. In evaluating investment performance, the Board expects the Advisor to manage each Fund in accordance with its investment objectives and approved strategies. Further, the Directors recognize that the Advisor has an obligation to monitor trading activities, and in particular to seek the best execution of fund trades, and to evaluate the use of and payment for research. In providing these services, the Advisor utilizes teams of investment professionals (portfolio managers, analysts, research assistants, and securities traders) who require extensive information technology, research, training, compliance, and other systems to conduct their business. The Board, directly and through its Fund Performance Review Committee, regularly reviews investment performance information for each Fund, together with comparative information for appropriate benchmarks and/or peer groups of similarly-managed funds, over different time horizons. The Directors also review detailed performance information during the management agreement approval process. If performance concerns are identified with respect to a fund, the Fund receives special reviews until performance improves, during which the Board discusses with the Advisor the reasons for such results (e.g., market conditions, security selection) and any efforts being undertaken to improve performance. The performance for One Choice In Retirement Portfolio, One Choice 2025 Portfolio, One Choice 2035 Portfolio, and One Choice 2045 Portfolio was above each Fund's respective benchmark for the one-, three-, five-, and ten-year periods reviewed by the Board. The performance for One Choice 2020 Portfolio, One Choice 2030 Portfolio, One Choice 2040 Portfolio, and One Choice 2050 Portfolio was above each Fund's respective benchmark for the one-, three-, and five-year periods reviewed by the Board. The performance for One Choice 2055 Portfolio was above its benchmark for the one- and three-year periods reviewed by the Board. Taking all of these factors into consideration, the Board found the investment management services provided to each Fund by the Advisor to be satisfactory and consistent with the management agreements.
Shareholder and Other Services. Under the management agreements, the Advisor provides the Funds with a comprehensive package of transfer agency, shareholder, and other services. The Board, directly and through various committees of the Board, regularly reviews reports and evaluations of such services at its regular meetings. These reports include, but are not limited to, information regarding the operational efficiency and accuracy of the shareholder and transfer agency services provided, staffing levels, shareholder satisfaction (as measured by external as well as internal sources), technology support, new products and services offered to fund shareholders,
98
securities trading activities, portfolio valuation services, auditing services, and legal and operational compliance activities. The Board particularly noted the Advisor’s continual efforts to maintain effective business continuity plans and to address cybersecurity threats. Certain aspects of shareholder and transfer agency service level efficiency and the quality of securities trading activities are measured by independent third party providers and are presented in comparison to other fund groups not managed by the Advisor. The Board found the services provided by the Advisor to each Fund under the management agreements to be competitive and of high quality.
Costs of Services and Profitability. The Advisor provides detailed information concerning its cost of providing various services to the Funds, its profitability in managing each Fund (pre- and post- distribution), its overall profitability, and its financial condition. The Directors have reviewed with the Advisor the methodology used to prepare this financial information. This information is considered in evaluating the Advisor’s financial condition, its ability to continue to provide services to the Funds, and the reasonableness of the current management agreements. The Board concluded that the Advisor’s profits were reasonable in light of the services provided to the Funds.
Ethics. The Board generally considers the Advisor’s commitment to providing quality services to shareholders and to conducting its business ethically. They noted that the Advisor’s practices generally meet or exceed industry best practices.
Economies of Scale. The Board also reviewed information provided by the Advisor regarding the possible existence of economies of scale in connection with the management of each Fund. The Board concluded that economies of scale are difficult to measure and predict with precision, especially on a fund-by-fund basis. The Board concluded that the Advisor is appropriately sharing economies of scale through its competitive fee structure, offering competitive fees from fund inception, and through reinvestment in its business to provide shareholders additional content and services.
Comparison to Other Funds’ Fees. The Funds invest their non-cash assets entirely in other American Century Investments funds. The Funds do not pay an investment advisory fee to the Advisor. Rather, each Fund pays the Advisor an administrative fee and indirectly bears its pro rata share of the expenses incurred by the underlying funds. Each of the underlying funds pay the Advisor a single, all-inclusive (or unified) management fee for providing all services necessary for the management and operation of the fund, other than brokerage expenses, taxes, interest, extraordinary expenses, and the fees and expenses of the fund’s independent directors (including their independent legal counsel), as well as expenses incurred in connection with the provision of shareholder services and distribution services under a plan adopted pursuant to Rule 12b-1 under the 1940 Act. The Board concluded that the administrative fee and other underlying fund expenses incurred by each Fund were reasonable in light of the services provided to each Fund.
Comparison to Fees and Services Provided to Other Clients of the Advisor. The Directors also requested and received information from the Advisor concerning the nature of the services, fees, costs, and profitability of its advisory services to advisory clients other than the Funds. They observed that these varying types of client accounts require different services and involve different regulatory and entrepreneurial risks than the management of each Fund. The Board analyzed this information and concluded that the fees charged and services provided to the Funds were reasonable by comparison.
Payments to Intermediaries. The Directors also requested and received a description of payments made to intermediaries by each Fund and the Advisor. These payments include various payments made by each Fund or the Advisor to different types of intermediaries and recordkeepers for distribution and service activities provided for each Fund. The Board reviewed such information and found the payments to be reasonable in scope and purpose.
Collateral or “Fall-Out” Benefits Derived by the Advisor. The Board considered the existence of collateral benefits the Advisor may receive as a result of its relationship with the Funds. They
99
concluded that the Advisor’s primary business is managing mutual funds and it generally does not use fund or shareholder information to generate profits in other lines of business, and therefore does not derive any significant collateral benefits from them. The Board noted that additional assets from other clients may offer the Advisor some benefit from increased leverage with service providers and counterparties. Additionally, the Advisor receives proprietary research from broker-dealers that execute fund portfolio transactions, which the Board concluded is likely to benefit other clients of the Advisor as well as fund shareholders. The Board also determined that the Advisor is able to provide investment management services to certain clients other than the Funds, at least in part, due to its existing infrastructure built to serve the fund complex.
Existing Relationship. The Board also considered whether there was any reason for not continuing the existing arrangement with the Advisor. In this regard, the Board was mindful of the potential disruptions of the Funds’ operations and various risks, uncertainties, and other effects that could occur as a result of a decision not to continue such relationship. In particular, the Board recognized that most shareholders have invested in the Funds on the strength of the Advisor’s industry standing and reputation and in the expectation that the Advisor will have a continuing role in providing advisory services to each Fund.
Conclusion of the Directors. As a result of this process, the Board, including all of the independent Directors, taking into account all of the factors discussed above and the information provided by the Advisor and others in connection with its review and throughout the year, determined that the management agreement between each Fund and the Advisor is fair and reasonable in light of the services provided and should be renewed.
100
| Additional Information |
Retirement Account Information
As required by law, distributions you receive from certain IRAs are subject to federal income tax withholding, unless you elect not to have withholding apply. Tax will be withheld on the total amount withdrawn even though you may be receiving amounts that are not subject to withholding, such as nondeductible contributions. In such case, excess amounts of withholding could occur. You may adjust your withholding election so that a greater or lesser amount will be withheld.
If you don’t want us to withhold on this amount, you must notify us to not withhold the federal income tax. You may notify us in writing or in certain situations by telephone or through other electronic means. For systematic withdrawals, your withholding election will remain in effect until revoked or changed by filing a new election. You have the right to revoke your election at any time.
Remember, even if you elect not to have income tax withheld, you are liable for paying income tax on the taxable portion of your withdrawal. If you elect not to have income tax withheld or you don’t have enough income tax withheld, you may be responsible for payment of estimated tax. You may incur penalties under the estimated tax rules if your withholding and estimated tax payments are not sufficient. You can reduce or defer the income tax on a distribution by directly or indirectly rolling such distribution over to another IRA or eligible plan. You should consult your tax advisor for additional information.
State tax will be withheld if, at the time of your distribution, your address is within one of the mandatory withholding states and you have federal income tax withheld (or as otherwise required by state law). State taxes will be withheld from your distribution in accordance with the respective state rules.
Distributions you receive from 403(b), 457 and qualified plans are subject to special tax and withholding rules. Your plan administrator or plan sponsor is required to provide you with a special tax notice explaining those rules at the time you request a distribution. If applicable, federal and/or state taxes may be withheld from your distribution amount.
Proxy Voting Policies
A description of the policies that the funds’ investment advisor uses in exercising the voting rights associated with the securities purchased and/or held by the funds is available without charge, upon request, by calling 1-800-345-2021. It is also available on the “About Us” page of American Century Investments’ website at americancentury.com and on the Securities and Exchange Commission’s
website at sec.gov. Information regarding how the investment advisor voted proxies relating to portfolio securities during the most recent 12-month period ended June 30 is available on the “About Us” page at americancentury.com. It is also available at sec.gov.
Quarterly Portfolio Disclosure
The funds file their complete schedule of portfolio holdings with the Securities and Exchange Commission (SEC) for the first and third quarters of each fiscal year on Form N-Q. The funds’ Forms N-Q are available on the SEC’s website at sec.gov, and may be reviewed and copied at the SEC’s Public Reference Room in Washington, DC. Information on the operation of the Public Reference Room may be obtained by calling 1-800-SEC-0330. The funds also make their complete
schedule of portfolio holdings for the most recent quarter of their fiscal year available on their website at americancentury.com and, upon request, by calling 1-800-345-2021.
101
Other Tax Information
The following information is provided pursuant to provisions of the Internal Revenue Code.
The funds hereby designate up to the maximum amount allowable as qualified dividend income for the fiscal year ended July 31, 2015.
For corporate taxpayers, the funds hereby designate the following, or up to the maximum amount allowable, of ordinary income distributions paid during the fiscal year ended July 31, 2015 as qualified for the corporate dividends received deduction.
One Choice In Retirement Portfolio | One Choice 2020 Portfolio | One Choice 2025 Portfolio | One Choice 2030 Portfolio | One Choice 2035 Portfolio |
| $4,858,250 | $9,169,415 | $14,833,601 | $9,810,570 | $12,956,023 |
One Choice 2040 Portfolio | One Choice 2045 Portfolio | One Choice 2050 Portfolio | One Choice 2055 Portfolio |
| $8,460,368 | $10,981,356 | $5,286,710 | $1,405,252 |
The funds hereby designate the following as qualified short-term capital gain distributions for purposes of Internal Revenue Code Section 871 for the fiscal year ended July 31, 2015.
One Choice In Retirement Portfolio | One Choice 2020 Portfolio | One Choice 2025 Portfolio | One Choice 2030 Portfolio | One Choice 2035 Portfolio |
| $62,311 | $235,041 | $558,919 | $216,423 | $1,073,965 |
One Choice 2040 Portfolio | One Choice 2045 Portfolio | One Choice 2050 Portfolio | One Choice 2055 Portfolio |
| $163,574 | $510,920 | $128,358 | $71,506 |
The funds hereby designate the following, or up to the maximum amount allowable, as long-term capital gain distributions for the fiscal year ended July 31, 2015.
One Choice In Retirement Portfolio | One Choice 2020 Portfolio | One Choice 2025 Portfolio | One Choice 2030 Portfolio | One Choice 2035 Portfolio |
| $36,034,348 | $22,481,660 | $44,573,790 | $28,852,574 | $42,415,976 |
One Choice 2040 Portfolio | One Choice 2045 Portfolio | One Choice 2050 Portfolio | One Choice 2055 Portfolio |
| $24,347,811 | $32,729,832 | $13,454,680 | $2,321,655 |
For the fiscal year ended July 31, 2015, the funds intend to pass through to shareholders the following foreign source income and foreign taxes paid, or up to the maximum amount allowable, as a foreign tax credit.
| Foreign Tax Credit | Foreign Source Income | |||||||
| Amount | Per Outstanding Share | Amount | Per Outstanding Share | |||||
| One Choice In Retirement Portfolio | $ | 60,518 | 0.0004 | $ | 161,612 | 0.0010 | ||
| One Choice 2020 Portfolio | $ | 147,925 | 0.0011 | $ | 395,029 | 0.0028 | ||
| One Choice 2025 Portfolio | $ | 275,099 | 0.0015 | $ | 734,646 | 0.0041 | ||
| One Choice 2030 Portfolio | $ | 211,076 | 0.0015 | $ | 563,673 | 0.0041 | ||
| One Choice 2035 Portfolio | $ | 303,993 | 0.0023 | $ | 811,806 | 0.0062 | ||
| One Choice 2040 Portfolio | $ | 186,037 | 0.0019 | $ | 496,807 | 0.0050 | ||
| One Choice 2045 Portfolio | $ | 234,091 | 0.0026 | $ | 625,135 | 0.0070 | ||
| One Choice 2050 Portfolio | $ | 107,163 | 0.0019 | $ | 286,175 | 0.0050 | ||
| One Choice 2055 Portfolio | $ | 25,580 | 0.0015 | $ | 68,312 | 0.0040 | ||
102
| Notes |
103
| Notes |
104
| ||
| Contact Us | americancentury.com | |
| Automated Information Line | 1-800-345-8765 | |
| Investor Services Representative | 1-800-345-2021 or 816-531-5575 | |
| Investors Using Advisors | 1-800-378-9878 | |
| Business, Not-For-Profit, Employer-Sponsored Retirement Plans | 1-800-345-3533 | |
| Banks and Trust Companies, Broker-Dealers, Financial Professionals, Insurance Companies | 1-800-345-6488 | |
| Telecommunications Relay Services for the Deaf | 711 | |
| American Century Asset Allocation Portfolios, Inc. | ||
Investment Advisor: American Century Investment Management, Inc. Kansas City, Missouri | ||
| This report and the statements it contains are submitted for the general information of our shareholders. The report is not authorized for distribution to prospective investors unless preceded or accompanied by an effective prospectus. | ||
| ©2015 American Century Proprietary Holdings, Inc. All rights reserved. CL-ANN-86670 1509 | ||
| ANNUAL REPORT | JULY 31, 2015 |
One Choice® In Retirement Portfolio R6
One Choice® 2020 Portfolio R6
One Choice® 2025 Portfolio R6
One Choice® 2030 Portfolio R6
One Choice® 2035 Portfolio R6
One Choice® 2040 Portfolio R6
One Choice® 2045 Portfolio R6
One Choice® 2050 Portfolio R6
One Choice® 2055 Portfolio R6
| Table of Contents |
| President's Letter | 2 | |
| Performance | 3 | |
| Portfolio Commentary | ||
| Portfolio Characteristics | ||
| Shareholder Fee Examples | ||
| Schedules of Investments | ||
| Statements of Assets and Liabilities | ||
| Statements of Operations | ||
| Statements of Changes in Net Assets | ||
| Notes to Financial Statements | ||
| Financial Highlights | ||
| Report of Independent Registered Public Accounting Firm | ||
| Management | ||
| Approval of Management Agreement | ||
| Additional Information | ||
Any opinions expressed in this report reflect those of the author as of the date of the report, and do not necessarily represent the opinions of American Century Investments® or any other person in the American Century Investments organization. Any such opinions are subject to change at any time based upon market or other conditions and American Century Investments disclaims any responsibility to update such opinions. These opinions may not be relied upon as investment advice and, because investment decisions made by American Century Investments funds are based on numerous factors, may not be relied upon as an indication of trading intent on behalf of any American Century Investments fund. Security examples are used for representational purposes only and are not intended as recommendations to purchase or sell securities. Performance information for comparative indices and securities is provided to American Century Investments by third party vendors. To the best of American Century Investments’ knowledge, such information is accurate at the time of printing.
| President’s Letter |
| Dear Investor: Thank you for reviewing this annual report for the 12 months ended July 31, 2015. It provides investment performance and portfolio information for the reporting period, plus longer-term historical performance data. Annual reports remain important vehicles for conveying information about fund returns, including market and economic factors that affected performance during the reporting period. For additional, updated investment and market insights, we encourage you to visit our website, americancentury.com. |
| Jonathan Thomas | |
Global Divergence Helped Trigger Market Volatility
“Global divergence” between the U.S. and the rest of the world emerged as a prevalent theme during the reporting period. This theme embraced not only the relatively stronger economic growth enjoyed by the U.S. compared with most of the world, but also the related contrast between the U.S. Federal Reserve’s unwinding of monetary stimulus compared with the continuation and expansion of stimulus by other major central banks. These central bank moves helped trigger big swings in market returns.
In October 2014, the U.S. Federal Reserve ended its latest bond-buying program (quantitative easing, QE). But while QE was ending in the U.S., other major central banks were starting or increasing QE as their economies faltered. This divergence helped fuel increased demand for the U.S. dollar and U.S. dollar-denominated assets, and put downward pressure on commodities prices, most notably oil. Low inflation also prevailed, after crude oil prices plunged amid muted demand for commodities in general. In this environment, the U.S. dollar, U.S. stocks, and longer-maturity U.S. Treasuries generally benefited from “flight to quality” capital flows, reinforced by geopolitical and financial turmoil, particularly in Russia/Ukraine, Greece, China, and the Middle East.
We expect more monetary policy divergence between the U.S. and other major developed economies in the coming months, accompanied by continued market volatility. This could present both challenges and opportunities for active investment managers. Upward pressures on inflation and interest rates could develop as the massive amount of global monetary stimulus in progress takes hold and economies improve. In this environment, we continue to believe in a disciplined, diversified, long-term investment approach, using professionally managed stock and bond portfolios to meet financial goals. We appreciate your continued trust in us.
Sincerely,
Jonathan Thomas
President and Chief Executive Officer
American Century Investments
2
| Performance |
| Total Returns as of July 31, 2015 | ||||
| Average Annual Returns | ||||
Ticker Symbol | 1 year | Since Inception | Inception Date | |
| One Choice In Retirement Portfolio R6 — R6 Class | ARDTX | 4.14% | 6.28% | 7/31/13 |
| S&P Target Date Retirement Income Index | — | 3.27% | 4.77% | — |
| One Choice 2020 Portfolio R6 — R6 Class | ARBDX | 4.55% | 6.87% | 7/31/13 |
| S&P Target Date To 2020 Index | — | 3.87% | 6.21% | — |
| One Choice 2025 Portfolio R6 — R6 Class | ARWDX | 5.05% | 7.52% | 7/31/13 |
| S&P Target Date To 2025 Index | — | 4.17% | 6.80% | — |
| One Choice 2030 Portfolio R6 — R6 Class | ARCUX | 5.94% | 8.19% | 7/31/13 |
| S&P Target Date To 2030 Index | — | 4.44% | 7.32% | — |
| One Choice 2035 Portfolio R6 — R6 Class | ARLDX | 6.74% | 8.94% | 7/31/13 |
| S&P Target Date To 2035 Index | — | 4.64% | 7.82% | — |
| One Choice 2040 Portfolio R6 — R6 Class | ARDUX | 7.15% | 9.61% | 7/31/13 |
| S&P Target Date To 2040 Index | — | 4.79% | 8.22% | — |
| One Choice 2045 Portfolio R6 — R6 Class | ARDOX | 7.72% | 10.15% | 7/31/13 |
| S&P Target Date To 2045 Index | — | 4.91% | 8.58% | — |
| One Choice 2050 Portfolio R6 — R6 Class | ARFEX | 7.76% | 10.29% | 7/31/13 |
| S&P Target Date To 2050 Index | — | 5.00% | 8.89% | — |
| One Choice 2055 Portfolio R6 — R6 Class | AREUX | 7.90% | 10.53% | 7/31/13 |
| S&P Target Date To 2055+ Index | — | 5.11% | 9.22% | — |
A One Choice Target Date Portfolio's target date is the approximate year when investors plan to retire or start withdrawing their money. The principal value of the investment is not guaranteed at any time, including at the target date.
Data presented reflect past performance. Past performance is no guarantee of future
results. Current performance may be higher or lower than the performance shown.
Investment return and principal value will fluctuate, and redemption value may be more or
less than original cost. Data assumes reinvestment of dividends and capital gains, and
none of the charts reflect the deduction of taxes that a shareholder would pay on fund
distributions or the redemption of fund shares. To obtain performance data current to the
most recent month end, please call 1-800-345-6488 or visit ipro.americancentury.com. For
additional information about the funds, please consult the prospectus.
3
| Growth of $10,000 Over Life of One Choice In Retirement Portfolio R6 |
| $10,000 investment made July 31, 2013 |
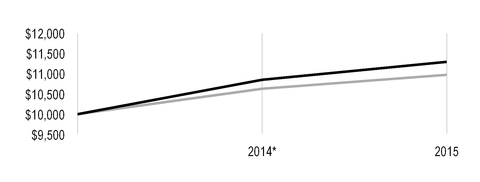
| Value on July 31, 2015 | |
| R6 Class — $11,295 | |
| S&P Target Date Retirement Income Index — $10,975 | |
*From July 31, 2013, the R6 Class’s inception date. Not annualized.
| Growth of $10,000 Over Life of One Choice 2020 Portfolio R6 |
| $10,000 investment made July 31, 2013 |
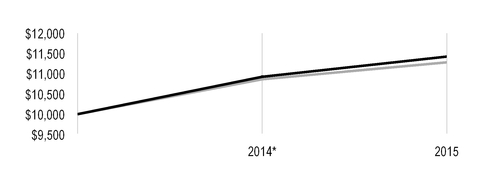
| Value on July 31, 2015 | |
| R6 Class — $11,421 | |
| S&P Target Date To 2020 Index — $11,281 | |
*From July 31, 2013, the R6 Class’s inception date. Not annualized.
A One Choice Target Date Portfolio's target date is the approximate year when investors plan to retire or start withdrawing their money. The principal value of the investment is not guaranteed at any time, including at the target date.
Data presented reflect past performance. Past performance is no guarantee of future
results. Current performance may be higher or lower than the performance shown.
Investment return and principal value will fluctuate, and redemption value may be more or
less than original cost. Data assumes reinvestment of dividends and capital gains, and
none of the charts reflect the deduction of taxes that a shareholder would pay on fund
distributions or the redemption of fund shares. To obtain performance data current to the
most recent month end, please call 1-800-345-6488 or visit ipro.americancentury.com. For
additional information about the funds, please consult the prospectus.
4
| Growth of $10,000 Over Life of One Choice 2025 Portfolio R6 |
| $10,000 investment made July 31, 2013 |

| Value on July 31, 2015 | |
| R6 Class — $11,560 | |
| S&P Target Date To 2025 Index — $11,404 | |
*From July 31, 2013, the R6 Class’s inception date. Not annualized.
| Growth of $10,000 Over Life of One Choice 2030 Portfolio R6 |
| $10,000 investment made July 31, 2013 |
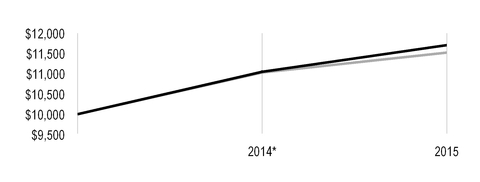
| Value on July 31, 2015 | |
| R6 Class — $11,704 | |
| S&P Target Date To 2030 Index — $11,517 | |
*From July 31, 2013, the R6 Class’s inception date. Not annualized.
A One Choice Target Date Portfolio's target date is the approximate year when investors plan to retire or start withdrawing their money. The principal value of the investment is not guaranteed at any time, including at the target date.
Data presented reflect past performance. Past performance is no guarantee of future
results. Current performance may be higher or lower than the performance shown.
Investment return and principal value will fluctuate, and redemption value may be more or
less than original cost. Data assumes reinvestment of dividends and capital gains, and
none of the charts reflect the deduction of taxes that a shareholder would pay on fund
distributions or the redemption of fund shares. To obtain performance data current to the
most recent month end, please call 1-800-345-6488 or visit ipro.americancentury.com. For
additional information about the funds, please consult the prospectus.
5
| Growth of $10,000 Over Life of One Choice 2035 Portfolio R6 |
| $10,000 investment made July 31, 2013 |
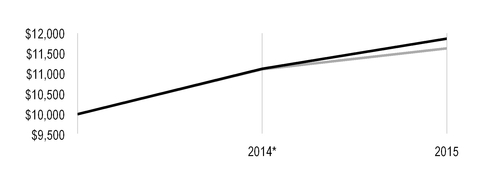
| Value on July 31, 2015 | |
| R6 Class — $11,867 | |
| S&P Target Date To 2035 Index — $11,624 | |
*From July 31, 2013, the R6 Class’s inception date. Not annualized.
| Growth of $10,000 Over Life of One Choice 2040 Portfolio R6 |
| $10,000 investment made July 31, 2013 |
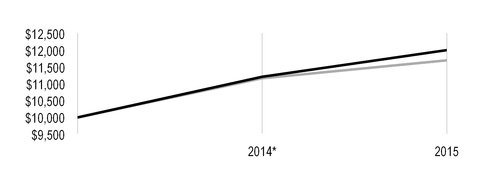
| Value on July 31, 2015 | |
| R6 Class — $12,014 | |
| S&P Target Date To 2040 Index — $11,710 | |
*From July 31, 2013, the R6 Class’s inception date. Not annualized.
A One Choice Target Date Portfolio's target date is the approximate year when investors plan to retire or start withdrawing their money. The principal value of the investment is not guaranteed at any time, including at the target date.
Data presented reflect past performance. Past performance is no guarantee of future
results. Current performance may be higher or lower than the performance shown.
Investment return and principal value will fluctuate, and redemption value may be more or
less than original cost. Data assumes reinvestment of dividends and capital gains, and
none of the charts reflect the deduction of taxes that a shareholder would pay on fund
distributions or the redemption of fund shares. To obtain performance data current to the
most recent month end, please call 1-800-345-6488 or visit ipro.americancentury.com. For
additional information about the funds, please consult the prospectus.
6
| Growth of $10,000 Over Life of One Choice 2045 Portfolio R6 |
| $10,000 investment made July 31, 2013 |
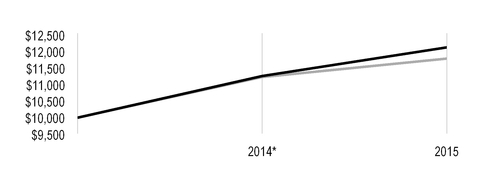
| Value on July 31, 2015 | |
| R6 Class — $12,132 | |
| S&P Target Date To 2045 Index — $11,788 | |
*From July 31, 2013, the R6 Class’s inception date. Not annualized.
| Growth of $10,000 Over Life of One Choice 2050 Portfolio R6 |
| $10,000 investment made July 31, 2013 |

| Value on July 31, 2015 | |
| R6 Class — $12,164 | |
| S&P Target Date To 2050 Index — $11,855 | |
*From July 31, 2013, the R6 Class’s inception date. Not annualized.
A One Choice Target Date Portfolio's target date is the approximate year when investors plan to retire or start withdrawing their money. The principal value of the investment is not guaranteed at any time, including at the target date.
Data presented reflect past performance. Past performance is no guarantee of future
results. Current performance may be higher or lower than the performance shown.
Investment return and principal value will fluctuate, and redemption value may be more or
less than original cost. Data assumes reinvestment of dividends and capital gains, and
none of the charts reflect the deduction of taxes that a shareholder would pay on fund
distributions or the redemption of fund shares. To obtain performance data current to the
most recent month end, please call 1-800-345-6488 or visit ipro.americancentury.com. For
additional information about the funds, please consult the prospectus.
7
| Growth of $10,000 Over Life of One Choice 2055 Portfolio R6 |
| $10,000 investment made July 31, 2013 |
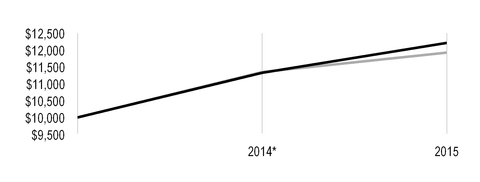
| Value on July 31, 2015 | |
| R6 Class — $12,217 | |
| S&P Target Date To 2055+ Index — $11,927 | |
*From July 31, 2013, the R6 Class’s inception date. Not annualized.
| Total Annual Fund Operating Expenses | |
| One Choice In Retirement Portfolio R6 — R6 Class | 0.50% |
| One Choice 2020 Portfolio R6 — R6 Class | 0.53% |
| One Choice 2025 Portfolio R6 — R6 Class | 0.56% |
| One Choice 2030 Portfolio R6 — R6 Class | 0.57% |
| One Choice 2035 Portfolio R6 — R6 Class | 0.60% |
| One Choice 2040 Portfolio R6 — R6 Class | 0.63% |
| One Choice 2045 Portfolio R6 — R6 Class | 0.66% |
| One Choice 2050 Portfolio R6 — R6 Class | 0.68% |
| One Choice 2055 Portfolio R6 — R6 Class | 0.67% |
The total annual fund operating expenses shown is as stated in the fund’s prospectus current as of the date of this report. The prospectus may vary from the expense ratio shown elsewhere in this report because it is based on a different time period, includes acquired fund fees and expenses, and, if applicable, does not include fee waivers or expense reimbursements.
A One Choice Target Date Portfolio's target date is the approximate year when investors plan to retire or start withdrawing their money. The principal value of the investment is not guaranteed at any time, including at the target date.
Data presented reflect past performance. Past performance is no guarantee of future
results. Current performance may be higher or lower than the performance shown.
Investment return and principal value will fluctuate, and redemption value may be more or
less than original cost. Data assumes reinvestment of dividends and capital gains, and
none of the charts reflect the deduction of taxes that a shareholder would pay on fund
distributions or the redemption of fund shares. To obtain performance data current to the
most recent month end, please call 1-800-345-6488 or visit ipro.americancentury.com. For
additional information about the funds, please consult the prospectus.
8
| Portfolio Commentary |
Portfolio Managers: Scott Wittman, Rich Weiss, Scott Wilson, Radu Gabudean, and David MacEwen
The One Choice 2015 Portfolio R6 was combined into the One Choice In Retirement Portfolio R6 on March 27, 2015.
In March 2015, we made enhancements to the Portfolios’ underlying asset mixes by adding NT Disciplined Growth Fund, NT International Value Fund, NT International Small-Mid Cap Fund (except for In Retirement Portfolio R6), NT Global Real Estate Fund (replacing U.S. Real Estate Fund), and Global Bond Fund. There were no changes in the overall target equity, fixed-income, and cash allocations, which set each Portfolio’s broad risk/return profile. The enhancements were designed to align Portfolios with future growth opportunities, broaden the fixed-income allocation to hedge interest rate and currency risks, and help manage volatility while optimizing return potential.
Performance Summary
Each of the nine One Choice® Target Date Portfolios R6 advanced for the fiscal year ended July 31, 2015, with returns ranging from 7.90% for the One Choice 2055 Portfolio R6 to 4.14% for the One Choice In Retirement Portfolio R6 (see pages 3-8 for more detailed performance information). Returns for the 12-month period were driven primarily by strong performance of U.S.-based equities, which outperformed their non-U.S. counterparts.
Because of the Portfolios’ strategic exposure to a variety of asset classes, a review of the financial markets helps explain much of their performance.
Market Overview
Global equities endured substantial volatility during the fiscal year as markets contended with concerns about the pace and breadth of global growth, falling energy and commodity prices, and currency volatility as the U.S. dollar strengthened relative to most global currencies. Geopolitical instability also dominated headlines and unsettled markets, from unrest in the Middle East and conflict between Russia and Ukraine, to worries about Greece’s ability to repay its debts and the long-term sustainability of the European Union. Monetary policy divergence of global central banks was another key theme as the U.S. Federal Reserve’s (the Fed) quantitative easing (QE) program came to an end and the likelihood of impending interest rate hikes increased. Meanwhile, the European Central Bank (ECB) instituted a long-awaited QE program and central banks throughout Asia maintained aggressive stimulus policies. Overall, U.S. equities dominated returns, although outperformance was somewhat concentrated during the first half of the period. Non-U.S. equities took over leadership during the second half, but were unable to match the rally seen in U.S. stocks. Broad U.S. indices reached record levels during the period, bolstered by ongoing, if uneven, economic growth with declines in unemployment and gains in employment growth, improving consumer confidence, a strong housing market, and a pick-up in nonresidential construction. Outside of the U.S., while the ECB’s stimulative monetary policies bolstered markets and the European economy showed true signs of recovery, worries persisted about slowing growth and financial market instability in China and deflationary pressures in Japan. Growth equities led value stocks across all market capitalizations both in the U.S. and globally. Non-U.S. developed markets ended the period flat, while emerging markets declined, pressured by stressed commodity prices and currency weakness.
Fixed-income returns around the globe varied during the 12-month period as bond yields fluctuated in response to global economic and monetary policy divergence. After declines in the first part of the fiscal year, U.S. bonds generally rallied on subdued inflation and heightened demand. Commodity and oil price weakness and persistently low inflation led longer-duration bonds to outperform those with shorter durations, with long-term U.S. Treasury securities producing especially strong gains. These forces also led inflation-protected securities to decline and finish the
9
period as some of the worst performers. High-yield bonds struggled during the first half of the fiscal year, but regained leadership later in the period, benefiting from investors’ heightened risk appetite. Non-U.S. bonds generally fell, impacted in large part by currency volatility and regional political and economic instability.
Fund Information
Each Portfolio is a “fund of funds” that invests in other American Century Investments mutual funds to achieve its investment objective and target asset allocation. (See pages 12-13 for the specific underlying fund allocations for each Portfolio.) A Portfolio’s target date is the approximate year when investors plan to retire and likely would stop making new investments in the fund. The principal value of the investment is not guaranteed at any time, including at the target date. One Choice In Retirement Portfolio R6 is generally intended for investors near, at, or in retirement. There is no guarantee that an investment in any of the funds will provide adequate income at or through an investor’s retirement.
Each target-dated Portfolio seeks the highest total return consistent with its asset mix. Over time, the asset mix and weightings are adjusted to be more conservative. In general, as the target year approaches, each Portfolio’s allocation becomes more conservative by decreasing the allocation to stock funds and increasing the allocation to bond and money market funds. By the time each Portfolio reaches its target date, its target asset mix will become fixed and match that of One Choice In Retirement Portfolio R6, which seeks current income and capital appreciation.
Portfolio Performance
The Portfolios’ U.S. equity funds generated positive performance for the 12-month period, with NT Heritage Fund (mid-cap growth) and NT Growth Fund producing the largest absolute gains. NT Small Company Fund also advanced substantially, and was a top absolute performer. Although NT International Growth Fund advanced more modestly than many U.S.-based funds, strong security selection in the fund produced considerable outperformance relative to its underlying fund benchmark and contributed to results across all Portfolios. Similarly, despite declining on an absolute basis, NT Emerging Markets Fund (not held by the In Retirement Portfolio R6) strongly outperformed its underlying benchmark. Other funds that outperformed their underlying benchmarks included NT Mid Cap Value Fund and NT Large Company Value Fund. Stock selection in the disciplined equity funds was less successful, with NT Core Equity Plus Fund and NT Equity Growth Fund underperforming their underlying benchmarks. NT Growth Fund was also unable to match the return of its benchmark due to stock selection.
Performance of the Portfolios’ fixed-income segments varied, with NT Diversified Bond Fund producing the strongest absolute returns and contributing to results across all Portfolios. In contrast, International Bond Fund (held by Portfolios at or approaching retirement), which is un-hedged, declined during the year as the U.S. dollar appreciated relative to most global currencies. Funds designed to protect against inflation—Short Duration Inflation Protection Bond Fund (not held by Portfolios further from retirement) and Inflation-Adjusted Bond Fund—declined. However, performance relative to underlying fund benchmarks was positive in Short Duration Inflation Protection Bond Fund, International Bond Fund, and NT Diversified Bond Fund, while the remaining fixed-income funds underperformed their underlying fund benchmarks.
A Look Ahead
We believe that although global economic activity appears to have diminished in breadth, it remains on track for slow yet steady growth. Divergence in global monetary policy is likely to remain a top story in the near future. We see an increasing likelihood that the Fed will raise short-term interest rates before 2015 is out, reflecting the evident improvement in employment, wages, consumer confidence, and financial markets in recent years. The European economy seems to have turned a corner and has begun producing sustainable growth, as evidenced by its fourth-consecutive quarter of expansion. The ECB’s quantitative easing program is likely to support
10
further economic growth, bolster financials markets, and boost investor confidence by increasing the money supply, improving access to credit, and weakening the euro. Meanwhile, the Japanese government’s stimulative policies have weakened the yen, benefiting manufacturers and exporters, including automakers, machinery firms, and technology companies. However, deflationary pressures continue to hamper the consumer-oriented and domestically focused sectors of the economy. In our opinion, a leading risk to global recovery is decelerating growth in China, which accounts for more than 16% of global gross domestic product. Although the government continues to implement aggressive steps to stimulate the economy and support financials markets, the country’s struggles with overinvestment and a build-up in inventories, softening corporate earnings, and falling consumer confidence are unlikely to be resolved in short order. Therefore, we think the combined forces of sluggish and uneven growth, stressed commodities prices, the strong dollar and a looming interest rate increase in the U.S. are likely to continue to lead to heightened levels of market volatility.
11
| Portfolio Characteristics |
Underlying Fund Allocations(1) as a % of net assets as of July 31, 2015 | |||||
One Choice In Retirement Portfolio R6 | One Choice 2020 Portfolio R6 | One Choice 2025 Portfolio R6 | One Choice 2030 Portfolio R6 | One Choice 2035 Portfolio R6 | |
| Equity | |||||
| NT Core Equity Plus Fund | 3.0% | 3.0% | 3.0% | 3.1% | 3.2% |
| NT Disciplined Growth Fund | 1.5% | 1.8% | 2.2% | 2.6% | 3.0% |
| NT Equity Growth Fund | 10.0% | 9.7% | 9.3% | 9.2% | 9.2% |
| NT Growth Fund | 4.5% | 5.3% | 6.0% | 7.2% | 8.9% |
| NT Heritage Fund | 2.2% | 3.1% | 4.1% | 4.4% | 4.8% |
| NT Large Company Value Fund | 9.4% | 9.6% | 9.7% | 10.2% | 10.6% |
| NT Mid Cap Value Fund | 4.5% | 5.1% | 5.9% | 6.0% | 6.0% |
| NT Small Company Fund | 2.0% | 1.8% | 1.7% | 2.4% | 3.1% |
| NT Emerging Markets Fund | — | 1.0% | 2.1% | 2.7% | 3.2% |
| NT Global Real Estate Fund | 1.0% | 1.2% | 1.5% | 1.7% | 2.0% |
| NT International Growth Fund | 4.5% | 4.8% | 5.0% | 5.8% | 6.5% |
| NT International Small-Mid Cap Fund | — | 0.3% | 0.6% | 0.9% | 1.2% |
| NT International Value Fund | 2.3% | 2.8% | 3.4% | 4.1% | 4.7% |
| Total Equity | 44.9% | 49.5% | 54.5% | 60.3% | 66.4% |
| Fixed Income | |||||
| High-Yield Fund | 3.8% | 3.7% | 3.5% | 3.2% | 2.9% |
| Inflation-Adjusted Bond Fund | 1.5% | 2.7% | 4.0% | 4.8% | 5.4% |
| NT Diversified Bond Fund | 21.7% | 20.8% | 19.8% | 17.7% | 15.2% |
| Short Duration Inflation Protection Bond Fund | 6.1% | 4.6% | 3.1% | 1.6% | 0.3% |
| Global Bond Fund | 7.0% | 6.4% | 5.8% | 5.2% | 4.6% |
| International Bond Fund | 5.0% | 4.6% | 4.1% | 2.2% | 0.2% |
| Total Fixed Income | 45.1% | 42.8% | 40.3% | 34.7% | 28.6% |
| Premium Money Market Fund | 10.0% | 7.7% | 5.2% | 5.0% | 5.0% |
| Other Assets and Liabilities | —(2) | —(2) | —(2) | —(2) | —(2) |
| (1) | Underlying fund investments represent R6 Class for all funds, except Institutional Class for NT Core Equity Plus Fund, NT Disciplined Growth Fund, NT Equity Growth Fund, NT Small Company Fund, Inflation-Adjusted Bond Fund and Investor Class for Premium Money Market Fund. |
| (2) | Category is less than 0.05% of total net assets. |
12
Underlying Fund Allocations(1) as a % of net assets as of July 31, 2015 | ||||
| One Choice 2040 Portfolio R6 | One Choice 2045 Portfolio R6 | One Choice 2050 Portfolio R6 | One Choice 2055 Portfolio R6 | |
| Equity | ||||
| NT Core Equity Plus Fund | 3.5% | 4.1% | 4.5% | 4.5% |
| NT Disciplined Growth Fund | 3.1% | 3.2% | 3.4% | 3.5% |
| NT Equity Growth Fund | 9.8% | 10.2% | 10.2% | 10.8% |
| NT Growth Fund | 9.7% | 10.5% | 10.7% | 11.0% |
| NT Heritage Fund | 5.6% | 6.5% | 6.5% | 6.7% |
| NT Large Company Value Fund | 11.8% | 13.0% | 13.6% | 14.2% |
| NT Mid Cap Value Fund | 6.4% | 7.1% | 6.9% | 6.8% |
| NT Small Company Fund | 3.1% | 3.0% | 3.4% | 3.9% |
| NT Emerging Markets Fund | 4.3% | 5.1% | 5.9% | 6.5% |
| NT Global Real Estate Fund | 2.2% | 2.5% | 2.7% | 3.0% |
| NT International Growth Fund | 6.7% | 6.9% | 6.7% | 6.0% |
| NT International Small-Mid Cap Fund | 1.6% | 1.9% | 2.2% | 2.4% |
| NT International Value Fund | 4.9% | 5.1% | 5.3% | 5.4% |
| Total Equity | 72.7% | 79.1% | 82.0% | 84.7% |
| Fixed Income | ||||
| High-Yield Fund | 2.5% | 2.0% | 1.8% | 1.5% |
| Inflation-Adjusted Bond Fund | 4.9% | 4.1% | 3.5% | 3.0% |
| NT Diversified Bond Fund | 13.0% | 10.7% | 9.3% | 7.7% |
| Global Bond Fund | 4.2% | 3.8% | 3.4% | 3.1% |
| Total Fixed Income | 24.6% | 20.6% | 18.0% | 15.3% |
| Premium Money Market Fund | 2.7% | 0.3% | — | — |
| Other Assets and Liabilities | —(2) | —(2) | —(2) | —(2) |
| (1) | Underlying fund investments represent R6 Class for all funds, except Institutional Class for NT Core Equity Plus Fund, NT Disciplined Growth Fund, NT Equity Growth Fund, NT Small Company Fund, Inflation-Adjusted Bond Fund and Investor Class for Premium Money Market Fund. |
| (2) | Category is less than 0.05% of total net assets. |
13
| Shareholder Fee Examples |
Fund shareholders may incur two types of costs: (1) transaction costs, including sales charges (loads) on purchase payments and redemption/exchange fees; and (2) ongoing costs, including management fees; distribution and service (12b-1) fees; and other fund expenses. This example is intended to help you understand your ongoing costs (in dollars) of investing in your fund and to compare these costs with the ongoing cost of investing in other mutual funds. As a shareholder in the underlying American Century Investments funds, your fund will indirectly bear its pro rata share of the expenses incurred by the underlying funds. These expenses are not included in the fund’s annualized expense ratio or the expenses paid during the period. These expenses are, however, included in the effective expenses paid during the period.
The example is based on an investment of $1,000 made at the beginning of the period and held for the entire period from February 1, 2015 to July 31, 2015.
Actual Expenses
The table provides information about actual account values and actual expenses for each class. You may use the information, together with the amount you invested, to estimate the expenses that you paid over the period. First, identify the share class you own. Then simply divide your account value by $1,000 (for example, an $8,600 account value divided by $1,000 = 8.6), then multiply the result by the number under the heading “Expenses Paid During Period” to estimate the expenses you paid on your account during this period.
Hypothetical Example for Comparison Purposes
The table also provides information about hypothetical account values and hypothetical expenses based on the actual expense ratio of each class of your fund and an assumed rate of return of 5% per year before expenses, which is not the actual return of a fund’s share class. The hypothetical account values and expenses may not be used to estimate the actual ending account balance or expenses you paid for the period. You may use this information to compare the ongoing costs of investing in your fund and other funds. To do so, compare this 5% hypothetical example with the 5% hypothetical examples that appear in the shareholder reports of the other funds.
Please note that the expenses shown in the table are meant to highlight your ongoing costs only and do not reflect any transactional costs, such as sales charges (loads) or redemption/exchange fees. Therefore, the table is useful in comparing ongoing costs only, and will not help you determine the relative total costs of owning different funds. In addition, if these transactional costs were included, your costs would have been higher.
14
| Beginning Account Value 2/1/15 | Ending Account Value 7/31/15 | Expenses Paid During Period(1)2/1/15 - 7/31/15 | Annualized Expense Ratio(1) | Effective Expenses Paid During Period(2) 2/1/15 - 7/31/15 | Effective Annualized Expense Ratio(2) | |
| One Choice In Retirement Portfolio R6 | ||||||
| Actual | ||||||
| R6 Class | $1,000 | $1,019.50 | $0.00 | 0.00%(3) | $2.60 | 0.52% |
| Hypothetical | ||||||
| R6 Class | $1,000 | $1,024.80 | $0.00 | 0.00%(3) | $2.61 | 0.52% |
| One Choice 2020 Portfolio R6 | ||||||
| Actual | ||||||
| R6 Class | $1,000 | $1,021.50 | $0.00 | 0.00%(3) | $2.66 | 0.53% |
| Hypothetical | ||||||
| R6 Class | $1,000 | $1,024.80 | $0.00 | 0.00%(3) | $2.66 | 0.53% |
| One Choice 2025 Portfolio R6 | ||||||
| Actual | ||||||
| R6 Class | $1,000 | $1,024.00 | $0.00 | 0.00%(3) | $2.81 | 0.56% |
| Hypothetical | ||||||
| R6 Class | $1,000 | $1,024.80 | $0.00 | 0.00%(3) | $2.81 | 0.56% |
| One Choice 2030 Portfolio R6 | ||||||
| Actual | ||||||
| R6 Class | $1,000 | $1,029.40 | $0.00 | 0.00%(3) | $2.92 | 0.58% |
| Hypothetical | ||||||
| R6 Class | $1,000 | $1,024.80 | $0.00 | 0.00%(3) | $2.91 | 0.58% |
| One Choice 2035 Portfolio R6 | ||||||
| Actual | ||||||
| R6 Class | $1,000 | $1,034.60 | $0.00 | 0.00%(3) | $3.03 | 0.60% |
| Hypothetical | ||||||
| R6 Class | $1,000 | $1,024.80 | $0.00 | 0.00%(3) | $3.01 | 0.60% |
| (1) | Expenses are equal to the class's annualized expense ratio listed in the table above, multiplied by the average account value over the period, multiplied by 181, the number of days in the most recent fiscal half-year, divided by 365, to reflect the one-half year period. The fees and expenses of the underlying American Century Investments funds in which the fund invests are not included in the class's annualized expense ratio. |
| (2) | Effective expenses reflect the sum of expenses borne directly by the class plus the fund's pro rata share of the weighted average expense ratio of the underlying funds in which it invests. The effective annualized expense ratio combines the class's annualized expense ratio and the annualized weighted average expense ratio of the underlying funds. The annualized weighted average expense ratio of the underlying funds for the one-half year period reflects the actual expense ratio of each underlying fund from its most recent shareholder report, annualized and weighted for the fund's relative average investment therein during the period. |
| (3) | Other expenses, which include directors' fees and expenses, did not exceed 0.005%. |
15
| Beginning Account Value 2/1/15 | Ending Account Value 7/31/15 | Expenses Paid During Period(1)2/1/15 - 7/31/15 | Annualized Expense Ratio(1) | Effective Expenses Paid During Period(2) 2/1/15 - 7/31/15 | Effective Annualized Expense Ratio(2) | |
| One Choice 2040 Portfolio R6 | ||||||
| Actual | ||||||
| R6 Class | $1,000 | $1,038.00 | $0.00 | 0.00%(3) | $3.13 | 0.62% |
| Hypothetical | ||||||
| R6 Class | $1,000 | $1,024.80 | $0.00 | 0.00%(3) | $3.11 | 0.62% |
| One Choice 2045 Portfolio R6 | ||||||
| Actual | ||||||
| R6 Class | $1,000 | $1,042.30 | $0.00 | 0.00%(3) | $3.34 | 0.66% |
| Hypothetical | ||||||
| R6 Class | $1,000 | $1,024.80 | $0.00 | 0.00%(3) | $3.31 | 0.66% |
| One Choice 2050 Portfolio R6 | ||||||
| Actual | ||||||
| R6 Class | $1,000 | $1,043.20 | $0.00 | 0.00%(3) | $3.39 | 0.67% |
| Hypothetical | ||||||
| R6 Class | $1,000 | $1,024.80 | $0.00 | 0.00%(3) | $3.36 | 0.67% |
| One Choice 2055 Portfolio R6 | ||||||
| Actual | ||||||
| R6 Class | $1,000 | $1,044.40 | $0.00 | 0.00%(3) | $3.45 | 0.68% |
| Hypothetical | ||||||
| R6 Class | $1,000 | $1,024.80 | $0.00 | 0.00%(3) | $3.41 | 0.68% |
| (1) | Expenses are equal to the class's annualized expense ratio listed in the table above, multiplied by the average account value over the period, multiplied by 181, the number of days in the most recent fiscal half-year, divided by 365, to reflect the one-half year period. The fees and expenses of the underlying American Century Investments funds in which the fund invests are not included in the class's annualized expense ratio. |
| (2) | Effective expenses reflect the sum of expenses borne directly by the class plus the fund's pro rata share of the weighted average expense ratio of the underlying funds in which it invests. The effective annualized expense ratio combines the class's annualized expense ratio and the annualized weighted average expense ratio of the underlying funds. The annualized weighted average expense ratio of the underlying funds for the one-half year period reflects the actual expense ratio of each underlying fund from its most recent shareholder report, annualized and weighted for the fund's relative average investment therein during the period. |
| (3) | Other expenses, which include directors' fees and expenses, did not exceed 0.005%. |
16
| Schedules of Investments |
JULY 31, 2015
One Choice In Retirement Portfolio R6
| Shares | Value | |||
MUTUAL FUNDS(1) — 100.0% | ||||
| Domestic Equity Funds — 37.1% | ||||
| NT Core Equity Plus Fund Institutional Class | 164,035 | $ | 2,414,588 | |
NT Disciplined Growth Fund Institutional Class(2) | 120,088 | 1,208,082 | ||
| NT Equity Growth Fund Institutional Class | 644,535 | 8,024,455 | ||
| NT Growth Fund R6 Class | 231,653 | 3,613,779 | ||
| NT Heritage Fund R6 Class | 126,485 | 1,808,733 | ||
| NT Large Company Value Fund R6 Class | 611,321 | 7,592,602 | ||
| NT Mid Cap Value Fund R6 Class | 284,831 | 3,617,348 | ||
| NT Small Company Fund Institutional Class | 160,562 | 1,612,044 | ||
| 29,891,631 | ||||
| Domestic Fixed Income Funds — 33.1% | ||||
| High-Yield Fund R6 Class | 533,969 | 3,075,662 | ||
| Inflation-Adjusted Bond Fund Institutional Class | 104,282 | 1,210,720 | ||
| NT Diversified Bond Fund R6 Class | 1,607,546 | 17,425,797 | ||
| Short Duration Inflation Protection Bond Fund R6 Class | 484,195 | 4,904,892 | ||
| 26,617,071 | ||||
| International Fixed Income Funds — 12.0% | ||||
| Global Bond Fund R6 Class | 573,214 | 5,640,425 | ||
| International Bond Fund R6 Class | 327,024 | 4,022,391 | ||
| 9,662,816 | ||||
| Money Market Funds — 10.0% | ||||
| Premium Money Market Fund Investor Class | 8,024,410 | 8,024,410 | ||
| International Equity Funds — 7.8% | ||||
NT Global Real Estate Fund R6 Class(2) | 84,024 | 807,471 | ||
| NT International Growth Fund R6 Class | 313,404 | 3,629,223 | ||
NT International Value Fund R6 Class(2) | 182,445 | 1,818,973 | ||
| 6,255,667 | ||||
TOTAL INVESTMENT SECURITIES — 100.0% (Cost $79,817,250) | 80,451,595 | |||
OTHER ASSETS AND LIABILITIES† | (27) | |||
| TOTAL NET ASSETS — 100.0% | $ | 80,451,568 | ||
| NOTES TO SCHEDULE OF INVESTMENTS |
| † | Category is less than 0.05% of total net assets. |
| (1) | Investments are funds within the American Century Investments family of funds and are considered affiliated funds. |
| (2) | Non-income producing. |
See Notes to Financial Statements.
17
JULY 31, 2015
One Choice 2020 Portfolio R6
| Shares | Value | |||
MUTUAL FUNDS(1) — 100.0% | ||||
| Domestic Equity Funds — 39.4% | ||||
| NT Core Equity Plus Fund Institutional Class | 242,245 | $ | 3,565,840 | |
NT Disciplined Growth Fund Institutional Class(2) | 217,105 | 2,184,074 | ||
| NT Equity Growth Fund Institutional Class | 930,166 | 11,580,572 | ||
| NT Growth Fund R6 Class | 401,708 | 6,266,638 | ||
| NT Heritage Fund R6 Class | 254,356 | 3,637,290 | ||
| NT Large Company Value Fund R6 Class | 917,025 | 11,389,447 | ||
| NT Mid Cap Value Fund R6 Class | 482,809 | 6,131,680 | ||
| NT Small Company Fund Institutional Class | 210,845 | 2,116,885 | ||
| 46,872,426 | ||||
| Domestic Fixed Income Funds — 31.8% | ||||
| High-Yield Fund R6 Class | 765,611 | 4,409,919 | ||
| Inflation-Adjusted Bond Fund Institutional Class | 280,361 | 3,254,989 | ||
| NT Diversified Bond Fund R6 Class | 2,280,994 | 24,725,972 | ||
| Short Duration Inflation Protection Bond Fund R6 Class | 544,174 | 5,512,484 | ||
| 37,903,364 | ||||
| International Fixed Income Funds — 11.0% | ||||
| Global Bond Fund R6 Class | 780,369 | 7,678,827 | ||
| International Bond Fund R6 Class | 440,986 | 5,424,132 | ||
| 13,102,959 | ||||
| International Equity Funds — 10.1% | ||||
| NT Emerging Markets Fund R6 Class | 114,265 | 1,191,782 | ||
NT Global Real Estate Fund R6 Class(2) | 152,578 | 1,466,270 | ||
| NT International Growth Fund R6 Class | 486,210 | 5,630,310 | ||
NT International Small-Mid Cap Fund R6 Class(2) | 31,399 | 332,514 | ||
NT International Value Fund R6 Class(2) | 337,606 | 3,365,930 | ||
| 11,986,806 | ||||
| Money Market Funds — 7.7% | ||||
| Premium Money Market Fund Investor Class | 9,211,606 | 9,211,606 | ||
TOTAL INVESTMENT SECURITIES — 100.0% (Cost $118,502,579) | 119,077,161 | |||
OTHER ASSETS AND LIABILITIES† | (39) | |||
| TOTAL NET ASSETS — 100.0% | $ | 119,077,122 | ||
| NOTES TO SCHEDULE OF INVESTMENTS |
| † | Category is less than 0.05% of total net assets. |
| (1) | Investments are funds within the American Century Investments family of funds and are considered affiliated funds. |
| (2) | Non-income producing. |
See Notes to Financial Statements.
18
JULY 31, 2015
One Choice 2025 Portfolio R6
| Shares | Value | |||
MUTUAL FUNDS(1) — 100.0% | ||||
| Domestic Equity Funds — 41.9% | ||||
| NT Core Equity Plus Fund Institutional Class | 251,434 | $ | 3,701,101 | |
NT Disciplined Growth Fund Institutional Class(2) | 271,375 | 2,730,028 | ||
| NT Equity Growth Fund Institutional Class | 921,803 | 11,476,446 | ||
| NT Growth Fund R6 Class | 474,113 | 7,396,166 | ||
| NT Heritage Fund R6 Class | 351,555 | 5,027,237 | ||
| NT Large Company Value Fund R6 Class | 963,590 | 11,967,783 | ||
| NT Mid Cap Value Fund R6 Class | 574,740 | 7,299,193 | ||
| NT Small Company Fund Institutional Class | 217,069 | 2,179,375 | ||
| 51,777,329 | ||||
| Domestic Fixed Income Funds — 30.4% | ||||
| High-Yield Fund R6 Class | 754,287 | 4,344,693 | ||
| Inflation-Adjusted Bond Fund Institutional Class | 418,860 | 4,862,961 | ||
| NT Diversified Bond Fund R6 Class | 2,256,867 | 24,464,442 | ||
| Short Duration Inflation Protection Bond Fund R6 Class | 374,932 | 3,798,059 | ||
| 37,470,155 | ||||
| International Equity Funds — 12.6% | ||||
| NT Emerging Markets Fund R6 Class | 251,321 | 2,621,279 | ||
NT Global Real Estate Fund R6 Class(2) | 190,105 | 1,826,912 | ||
| NT International Growth Fund R6 Class | 529,748 | 6,134,484 | ||
NT International Small-Mid Cap Fund R6 Class(2) | 69,869 | 739,917 | ||
NT International Value Fund R6 Class(2) | 426,836 | 4,255,552 | ||
| 15,578,144 | ||||
| International Fixed Income Funds — 9.9% | ||||
| Global Bond Fund R6 Class | 732,291 | 7,205,746 | ||
| International Bond Fund R6 Class | 407,320 | 5,010,041 | ||
| 12,215,787 | ||||
| Money Market Funds — 5.2% | ||||
| Premium Money Market Fund Investor Class | 6,466,570 | 6,466,570 | ||
TOTAL INVESTMENT SECURITIES — 100.0% (Cost $122,766,874) | 123,507,985 | |||
OTHER ASSETS AND LIABILITIES† | (39) | |||
| TOTAL NET ASSETS — 100.0% | $ | 123,507,946 | ||
| NOTES TO SCHEDULE OF INVESTMENTS |
| † | Category is less than 0.05% of total net assets. |
| (1) | Investments are funds within the American Century Investments family of funds and are considered affiliated funds. |
| (2) | Non-income producing. |
See Notes to Financial Statements.
19
JULY 31, 2015
One Choice 2030 Portfolio R6
| Shares | Value | |||
MUTUAL FUNDS(1) — 100.0% | ||||
| Domestic Equity Funds — 45.1% | ||||
| NT Core Equity Plus Fund Institutional Class | 264,919 | $ | 3,899,613 | |
NT Disciplined Growth Fund Institutional Class(2) | 321,070 | 3,229,963 | ||
| NT Equity Growth Fund Institutional Class | 927,203 | 11,543,671 | ||
| NT Growth Fund R6 Class | 578,322 | 9,021,823 | ||
| NT Heritage Fund R6 Class | 381,693 | 5,458,210 | ||
| NT Large Company Value Fund R6 Class | 1,028,094 | 12,768,931 | ||
| NT Mid Cap Value Fund R6 Class | 595,044 | 7,557,055 | ||
| NT Small Company Fund Institutional Class | 298,649 | 2,998,432 | ||
| 56,477,698 | ||||
| Domestic Fixed Income Funds — 27.3% | ||||
| High-Yield Fund R6 Class | 698,704 | 4,024,535 | ||
| Inflation-Adjusted Bond Fund Institutional Class | 517,970 | 6,013,629 | ||
| NT Diversified Bond Fund R6 Class | 2,040,935 | 22,123,737 | ||
| Short Duration Inflation Protection Bond Fund R6 Class | 197,230 | 1,997,938 | ||
| 34,159,839 | ||||
| International Equity Funds — 15.2% | ||||
| NT Emerging Markets Fund R6 Class | 324,672 | 3,386,333 | ||
NT Global Real Estate Fund R6 Class(2) | 225,431 | 2,166,391 | ||
| NT International Growth Fund R6 Class | 625,262 | 7,240,529 | ||
NT International Small-Mid Cap Fund R6 Class(2) | 107,858 | 1,142,218 | ||
NT International Value Fund R6 Class(2) | 512,018 | 5,104,822 | ||
| 19,040,293 | ||||
| International Fixed Income Funds — 7.4% | ||||
| Global Bond Fund R6 Class | 659,791 | 6,492,348 | ||
| International Bond Fund R6 Class | 224,217 | 2,757,870 | ||
| 9,250,218 | ||||
| Money Market Funds — 5.0% | ||||
| Premium Money Market Fund Investor Class | 6,241,726 | 6,241,726 | ||
TOTAL INVESTMENT SECURITIES — 100.0% (Cost $124,157,843) | 125,169,774 | |||
OTHER ASSETS AND LIABILITIES† | (36) | |||
| TOTAL NET ASSETS — 100.0% | $ | 125,169,738 | ||
| NOTES TO SCHEDULE OF INVESTMENTS |
| † | Category is less than 0.05% of total net assets. |
| (1) | Investments are funds within the American Century Investments family of funds and are considered affiliated funds. |
| (2) | Non-income producing. |
See Notes to Financial Statements.
20
JULY 31, 2015
One Choice 2035 Portfolio R6
| Shares | Value | |||
MUTUAL FUNDS(1) — 100.0% | ||||
| Domestic Equity Funds — 48.8% | ||||
| NT Core Equity Plus Fund Institutional Class | 208,414 | $ | 3,067,861 | |
NT Disciplined Growth Fund Institutional Class(2) | 278,463 | 2,801,336 | ||
| NT Equity Growth Fund Institutional Class | 700,839 | 8,725,448 | ||
| NT Growth Fund R6 Class | 538,925 | 8,407,225 | ||
| NT Heritage Fund R6 Class | 314,336 | 4,495,006 | ||
| NT Large Company Value Fund R6 Class | 804,042 | 9,986,201 | ||
| NT Mid Cap Value Fund R6 Class | 449,128 | 5,703,928 | ||
| NT Small Company Fund Institutional Class | 295,592 | 2,967,741 | ||
| 46,154,746 | ||||
| Domestic Fixed Income Funds — 23.8% | ||||
| High-Yield Fund R6 Class | 468,180 | 2,696,717 | ||
| Inflation-Adjusted Bond Fund Institutional Class | 436,396 | 5,066,554 | ||
| NT Diversified Bond Fund R6 Class | 1,335,502 | 14,476,838 | ||
| Short Duration Inflation Protection Bond Fund R6 Class | 30,676 | 310,751 | ||
| 22,550,860 | ||||
| International Equity Funds — 17.6% | ||||
| NT Emerging Markets Fund R6 Class | 291,059 | 3,035,750 | ||
NT Global Real Estate Fund R6 Class(2) | 195,211 | 1,875,980 | ||
| NT International Growth Fund R6 Class | 529,508 | 6,131,699 | ||
NT International Small-Mid Cap Fund R6 Class(2) | 109,573 | 1,160,375 | ||
NT International Value Fund R6 Class(2) | 446,118 | 4,447,801 | ||
| 16,651,605 | ||||
| Money Market Funds — 5.0% | ||||
| Premium Money Market Fund Investor Class | 4,718,552 | 4,718,552 | ||
| International Fixed Income Funds — 4.8% | ||||
| Global Bond Fund R6 Class | 440,467 | 4,334,200 | ||
| International Bond Fund R6 Class | 15,424 | 189,721 | ||
| 4,523,921 | ||||
TOTAL INVESTMENT SECURITIES — 100.0% (Cost $93,488,768) | 94,599,684 | |||
OTHER ASSETS AND LIABILITIES† | (24) | |||
| TOTAL NET ASSETS — 100.0% | $ | 94,599,660 | ||
| NOTES TO SCHEDULE OF INVESTMENTS |
| † | Category is less than 0.05% of total net assets. |
| (1) | Investments are funds within the American Century Investments family of funds and are considered affiliated funds. |
| (2) | Non-income producing. |
See Notes to Financial Statements.
21
JULY 31, 2015
One Choice 2040 Portfolio R6
| Shares | Value | |||
MUTUAL FUNDS(1) — 100.0% | ||||
| Domestic Equity Funds — 53.0% | ||||
| NT Core Equity Plus Fund Institutional Class | 189,384 | $ | 2,787,727 | |
NT Disciplined Growth Fund Institutional Class(2) | 246,085 | 2,475,614 | ||
| NT Equity Growth Fund Institutional Class | 629,217 | 7,833,745 | ||
| NT Growth Fund R6 Class | 493,710 | 7,701,883 | ||
| NT Heritage Fund R6 Class | 309,494 | 4,425,768 | ||
| NT Large Company Value Fund R6 Class | 756,176 | 9,391,702 | ||
| NT Mid Cap Value Fund R6 Class | 402,177 | 5,107,653 | ||
| NT Small Company Fund Institutional Class | 249,440 | 2,504,379 | ||
| 42,228,471 | ||||
| Domestic Fixed Income Funds — 20.4% | ||||
| High-Yield Fund R6 Class | 338,070 | 1,947,283 | ||
| Inflation-Adjusted Bond Fund Institutional Class | 336,478 | 3,906,511 | ||
| NT Diversified Bond Fund R6 Class | 956,078 | 10,363,886 | ||
| 16,217,680 | ||||
| International Equity Funds — 19.7% | ||||
| NT Emerging Markets Fund R6 Class | 325,265 | 3,392,511 | ||
NT Global Real Estate Fund R6 Class(2) | 184,962 | 1,777,482 | ||
| NT International Growth Fund R6 Class | 460,069 | 5,327,600 | ||
NT International Small-Mid Cap Fund R6 Class(2) | 115,638 | 1,224,606 | ||
NT International Value Fund R6 Class(2) | 393,743 | 3,925,615 | ||
| 15,647,814 | ||||
| International Fixed Income Funds — 4.2% | ||||
| Global Bond Fund R6 Class | 337,690 | 3,322,868 | ||
| Money Market Funds — 2.7% | ||||
| Premium Money Market Fund Investor Class | 2,185,829 | 2,185,829 | ||
TOTAL INVESTMENT SECURITIES — 100.0% (Cost $78,732,289) | 79,602,662 | |||
OTHER ASSETS AND LIABILITIES† | (18) | |||
| TOTAL NET ASSETS — 100.0% | $ | 79,602,644 | ||
| NOTES TO SCHEDULE OF INVESTMENTS |
| † | Category is less than 0.05% of total net assets. |
| (1) | Investments are funds within the American Century Investments family of funds and are considered affiliated funds. |
| (2) | Non-income producing. |
See Notes to Financial Statements.
22
JULY 31, 2015
One Choice 2045 Portfolio R6
| Shares | Value | |||
MUTUAL FUNDS(1) — 100.0% | ||||
| Domestic Equity Funds — 57.6% | ||||
| NT Core Equity Plus Fund Institutional Class | 169,985 | $ | 2,502,184 | |
NT Disciplined Growth Fund Institutional Class(2) | 195,047 | 1,962,173 | ||
| NT Equity Growth Fund Institutional Class | 499,257 | 6,215,748 | ||
| NT Growth Fund R6 Class | 408,371 | 6,370,591 | ||
| NT Heritage Fund R6 Class | 275,899 | 3,945,355 | ||
| NT Large Company Value Fund R6 Class | 639,283 | 7,939,889 | ||
| NT Mid Cap Value Fund R6 Class | 339,132 | 4,306,975 | ||
| NT Small Company Fund Institutional Class | 181,271 | 1,819,956 | ||
| 35,062,871 | ||||
| International Equity Funds — 21.5% | ||||
| NT Emerging Markets Fund R6 Class | 299,905 | 3,128,005 | ||
NT Global Real Estate Fund R6 Class(2) | 156,948 | 1,508,269 | ||
| NT International Growth Fund R6 Class | 364,636 | 4,222,489 | ||
NT International Small-Mid Cap Fund R6 Class(2) | 106,643 | 1,129,345 | ||
NT International Value Fund R6 Class(2) | 312,293 | 3,113,565 | ||
| 13,101,673 | ||||
| Domestic Fixed Income Funds — 16.8% | ||||
| High-Yield Fund R6 Class | 214,700 | 1,236,671 | ||
| Inflation-Adjusted Bond Fund Institutional Class | 215,271 | 2,499,294 | ||
| NT Diversified Bond Fund R6 Class | 597,376 | 6,475,559 | ||
| 10,211,524 | ||||
| International Fixed Income Funds — 3.8% | ||||
| Global Bond Fund R6 Class | 235,756 | 2,319,840 | ||
| Money Market Funds — 0.3% | ||||
| Premium Money Market Fund Investor Class | 152,091 | 152,091 | ||
TOTAL INVESTMENT SECURITIES — 100.0% (Cost $59,947,206) | 60,847,999 | |||
OTHER ASSETS AND LIABILITIES† | (11) | |||
| TOTAL NET ASSETS — 100.0% | $ | 60,847,988 | ||
| NOTES TO SCHEDULE OF INVESTMENTS |
| † | Category is less than 0.05% of total net assets. |
| (1) | Investments are funds within the American Century Investments family of funds and are considered affiliated funds. |
| (2) | Non-income producing. |
See Notes to Financial Statements.
23
JULY 31, 2015
One Choice 2050 Portfolio R6
| Shares | Value | |||
MUTUAL FUNDS(1) — 100.0% | ||||
| Domestic Equity Funds — 59.2% | ||||
| NT Core Equity Plus Fund Institutional Class | 128,971 | $ | 1,898,447 | |
NT Disciplined Growth Fund Institutional Class(2) | 140,431 | 1,412,735 | ||
| NT Equity Growth Fund Institutional Class | 345,812 | 4,305,353 | ||
| NT Growth Fund R6 Class | 288,263 | 4,496,902 | ||
| NT Heritage Fund R6 Class | 193,124 | 2,761,672 | ||
| NT Large Company Value Fund R6 Class | 462,491 | 5,744,144 | ||
| NT Mid Cap Value Fund R6 Class | 229,149 | 2,910,190 | ||
| NT Small Company Fund Institutional Class | 140,989 | 1,415,532 | ||
| 24,944,975 | ||||
| International Equity Funds — 22.8% | ||||
| NT Emerging Markets Fund R6 Class | 237,679 | 2,478,996 | ||
NT Global Real Estate Fund R6 Class(2) | 119,593 | 1,149,284 | ||
| NT International Growth Fund R6 Class | 243,342 | 2,817,904 | ||
NT International Small-Mid Cap Fund R6 Class(2) | 86,191 | 912,758 | ||
NT International Value Fund R6 Class(2) | 224,291 | 2,236,181 | ||
| 9,595,123 | ||||
| Domestic Fixed Income Funds — 14.6% | ||||
| High-Yield Fund R6 Class | 130,914 | 754,063 | ||
| Inflation-Adjusted Bond Fund Institutional Class | 129,578 | 1,504,397 | ||
| NT Diversified Bond Fund R6 Class | 360,822 | 3,911,315 | ||
| 6,169,775 | ||||
| International Fixed Income Funds — 3.4% | ||||
| Global Bond Fund R6 Class | 147,575 | 1,452,136 | ||
TOTAL INVESTMENT SECURITIES — 100.0% (Cost $41,673,739) | 42,162,009 | |||
OTHER ASSETS AND LIABILITIES† | (7) | |||
| TOTAL NET ASSETS — 100.0% | $ | 42,162,002 | ||
| NOTES TO SCHEDULE OF INVESTMENTS |
| † | Category is less than 0.05% of total net assets. |
| (1) | Investments are funds within the American Century Investments family of funds and are considered affiliated funds. |
| (2) | Non-income producing. |
See Notes to Financial Statements.
24
JULY 31, 2015
One Choice 2055 Portfolio R6
| Shares | Value | |||
MUTUAL FUNDS(1) — 100.0% | ||||
| Domestic Equity Funds — 61.4% | ||||
| NT Core Equity Plus Fund Institutional Class | 58,189 | $ | 856,537 | |
NT Disciplined Growth Fund Institutional Class(2) | 65,726 | 661,204 | ||
| NT Equity Growth Fund Institutional Class | 164,256 | 2,044,993 | ||
| NT Growth Fund R6 Class | 134,076 | 2,091,581 | ||
| NT Heritage Fund R6 Class | 89,651 | 1,282,010 | ||
| NT Large Company Value Fund R6 Class | 217,873 | 2,705,980 | ||
| NT Mid Cap Value Fund R6 Class | 102,229 | 1,298,312 | ||
| NT Small Company Fund Institutional Class | 72,946 | 732,379 | ||
| 11,672,996 | ||||
| International Equity Funds — 23.3% | ||||
| NT Emerging Markets Fund R6 Class | 117,987 | 1,230,608 | ||
NT Global Real Estate Fund R6 Class(2) | 58,564 | 562,799 | ||
| NT International Growth Fund R6 Class | 98,548 | 1,141,183 | ||
NT International Small-Mid Cap Fund R6 Class(2) | 43,871 | 464,598 | ||
NT International Value Fund R6 Class(2) | 103,909 | 1,035,973 | ||
| 4,435,161 | ||||
| Domestic Fixed Income Funds — 12.2% | ||||
| High-Yield Fund R6 Class | 49,728 | 286,434 | ||
| Inflation-Adjusted Bond Fund Institutional Class | 49,360 | 573,068 | ||
| NT Diversified Bond Fund R6 Class | 134,394 | 1,456,826 | ||
| 2,316,328 | ||||
| International Fixed Income Funds — 3.1% | ||||
| Global Bond Fund R6 Class | 59,130 | 581,840 | ||
TOTAL INVESTMENT SECURITIES — 100.0% (Cost $18,780,254) | 19,006,325 | |||
OTHER ASSETS AND LIABILITIES† | (3) | |||
| TOTAL NET ASSETS — 100.0% | $ | 19,006,322 | ||
| NOTES TO SCHEDULE OF INVESTMENTS |
| † | Category is less than 0.05% of total net assets. |
| (1) | Investments are funds within the American Century Investments family of funds and are considered affiliated funds. |
| (2) | Non-income producing. |
See Notes to Financial Statements.
25
| Statements of Assets and Liabilities |
| JULY 31, 2015 | |||||||||
One Choice In Retirement Portfolio R6 | One Choice 2020 Portfolio R6 | One Choice 2025 Portfolio R6 | |||||||
| Assets | |||||||||
| Investment securities in affiliates, at value (cost of $79,817,250, $118,502,579 and $122,766,874, respectively) | $ | 80,451,595 | $ | 119,077,161 | $ | 123,507,985 | |||
| Receivable for investments sold | 2,626 | — | — | ||||||
| Receivable for capital shares sold | 52,488 | 787,246 | 824,338 | ||||||
| Distributions receivable from affiliates | 47,779 | 65,415 | 66,253 | ||||||
| 80,554,488 | 119,929,822 | 124,398,576 | |||||||
| Liabilities | |||||||||
| Payable for investments purchased | 47,807 | 744,870 | 641,949 | ||||||
| Payable for capital shares redeemed | 55,113 | 107,830 | 248,681 | ||||||
| 102,920 | 852,700 | 890,630 | |||||||
| Net Assets | $ | 80,451,568 | $ | 119,077,122 | $ | 123,507,946 | |||
| R6 Class Capital Shares, $0.01 Par Value | |||||||||
| Shares outstanding | 7,672,935 | 10,894,987 | 11,117,127 | ||||||
| Net Asset Value Per Share | $ | 10.49 | $ | 10.93 | $ | 11.11 | |||
| Net Assets Consist of: | |||||||||
| Capital (par value and paid-in surplus) | $ | 80,319,810 | $ | 116,639,669 | $ | 120,526,532 | |||
| Undistributed net investment income | 59,549 | 515,975 | 605,794 | ||||||
| Accumulated undistributed net realized gain (loss) | (562,136 | ) | 1,346,896 | 1,634,509 | |||||
| Net unrealized appreciation | 634,345 | 574,582 | 741,111 | ||||||
| $ | 80,451,568 | $ | 119,077,122 | $ | 123,507,946 | ||||
See Notes to Financial Statements.
26
| JULY 31, 2015 | |||||||||
One Choice 2030 Portfolio R6 | One Choice 2035 Portfolio R6 | One Choice 2040 Portfolio R6 | |||||||
| Assets | |||||||||
| Investment securities in affiliates, at value (cost of $124,157,843, $93,488,768 and $78,732,289, respectively) | $ | 125,169,774 | $ | 94,599,684 | $ | 79,602,662 | |||
| Receivable for capital shares sold | 641,227 | 511,630 | 548,103 | ||||||
| Distributions receivable from affiliates | 59,319 | 39,291 | 27,722 | ||||||
| 125,870,320 | 95,150,605 | 80,178,487 | |||||||
| Liabilities | |||||||||
| Payable for investments purchased | 598,670 | 529,527 | 488,063 | ||||||
| Payable for capital shares redeemed | 101,912 | 21,418 | 87,780 | ||||||
| 700,582 | 550,945 | 575,843 | |||||||
| Net Assets | $ | 125,169,738 | $ | 94,599,660 | $ | 79,602,644 | |||
| R6 Class Capital Shares, $0.01 Par Value | |||||||||
| Shares outstanding | 11,159,173 | 8,323,189 | 6,947,321 | ||||||
| Net Asset Value Per Share | $ | 11.22 | $ | 11.37 | $ | 11.46 | |||
| Net Assets Consist of: | |||||||||
| Capital (par value and paid-in surplus) | $ | 121,815,257 | $ | 91,239,747 | $ | 76,739,336 | |||
| Undistributed net investment income | 506,146 | 413,025 | 286,913 | ||||||
| Undistributed net realized gain | 1,836,404 | 1,835,972 | 1,706,022 | ||||||
| Net unrealized appreciation | 1,011,931 | 1,110,916 | 870,373 | ||||||
| $ | 125,169,738 | $ | 94,599,660 | $ | 79,602,644 | ||||
See Notes to Financial Statements.
27
| JULY 31, 2015 | |||||||||
One Choice 2045 Portfolio R6 | One Choice 2050 Portfolio R6 | One Choice 2055 Portfolio R6 | |||||||
| Assets | |||||||||
| Investment securities in affiliates, at value (cost of $59,947,206, $41,673,739 and $18,780,254, respectively) | $ | 60,847,999 | $ | 42,162,009 | $ | 19,006,325 | |||
| Receivable for investments sold | — | — | 3,232 | ||||||
| Receivable for capital shares sold | 305,308 | 194,789 | 62,031 | ||||||
| Distributions receivable from affiliates | 17,857 | 10,789 | 4,021 | ||||||
| 61,171,164 | 42,367,587 | 19,075,609 | |||||||
| Liabilities | |||||||||
| Payable for investments purchased | 319,073 | 205,124 | 4,024 | ||||||
| Payable for capital shares redeemed | 4,103 | 461 | 65,263 | ||||||
| 323,176 | 205,585 | 69,287 | |||||||
| Net Assets | $ | 60,847,988 | $ | 42,162,002 | $ | 19,006,322 | |||
| R6 Class Capital Shares, $0.01 Par Value | |||||||||
| Shares outstanding | 5,260,538 | 3,641,299 | 1,615,597 | ||||||
| Net Asset Value Per Share | $ | 11.57 | $ | 11.58 | $ | 11.76 | |||
| Net Assets Consist of: | |||||||||
| Capital (par value and paid-in surplus) | $ | 58,246,766 | $ | 40,430,151 | $ | 18,210,077 | |||
| Undistributed net investment income | 233,483 | 144,294 | 63,124 | ||||||
| Undistributed net realized gain | 1,466,946 | 1,099,287 | 507,050 | ||||||
| Net unrealized appreciation | 900,793 | 488,270 | 226,071 | ||||||
| $ | 60,847,988 | $ | 42,162,002 | $ | 19,006,322 | ||||
See Notes to Financial Statements.
28
| Statements of Operations |
| YEAR ENDED JULY 31, 2015 | |||||||||
| One Choice In Retirement Portfolio R6 | One Choice 2020 Portfolio R6 | One Choice 2025 Portfolio R6 | |||||||
| Investment Income (Loss) | |||||||||
| Income from Affiliates: | |||||||||
| Income distributions from underlying funds | $ | 585,430 | $ | 1,495,676 | $ | 1,603,965 | |||
| Expenses: | |||||||||
| Directors' fees and expenses | 916 | 2,276 | 2,564 | ||||||
| Net investment income (loss) | 584,514 | 1,493,400 | 1,601,401 | ||||||
| Realized and Unrealized Gain (Loss) on Affiliates | |||||||||
| Net realized gain (loss) on: | |||||||||
| Sale of investments in underlying funds | (309,764 | ) | (348,442 | ) | (330,258 | ) | |||
| Capital gain distributions received from underlying funds | 497,760 | 1,885,702 | 2,027,313 | ||||||
| 187,996 | 1,537,260 | 1,697,055 | |||||||
| Change in net unrealized appreciation (depreciation) on investments in underlying funds | 24,264 | (331,967 | ) | (56,483 | ) | ||||
| Net realized and unrealized gain (loss) on affiliates | 212,260 | 1,205,293 | 1,640,572 | ||||||
| Net Increase (Decrease) in Net Assets Resulting from Operations | $ | 796,774 | $ | 2,698,693 | $ | 3,241,973 | |||
See Notes to Financial Statements.
29
| YEAR ENDED JULY 31, 2015 | |||||||||
| One Choice 2030 Portfolio R6 | One Choice 2035 Portfolio R6 | One Choice 2040 Portfolio R6 | |||||||
| Investment Income (Loss) | |||||||||
| Income from Affiliates: | |||||||||
| Income distributions from underlying funds | $ | 1,425,735 | $ | 1,272,235 | $ | 1,003,733 | |||
| Expenses: | |||||||||
| Directors' fees and expenses | 2,256 | 2,009 | 1,518 | ||||||
| Net investment income (loss) | 1,423,479 | 1,270,226 | 1,002,215 | ||||||
| Realized and Unrealized Gain (Loss) on Affiliates | |||||||||
| Net realized gain (loss) on: | |||||||||
| Sale of investments in underlying funds | (187,404 | ) | (274,104 | ) | (98,199 | ) | |||
| Capital gain distributions received from underlying funds | 2,096,053 | 2,143,536 | 1,835,075 | ||||||
| 1,908,649 | 1,869,432 | 1,736,876 | |||||||
| Change in net unrealized appreciation (depreciation) on investments in underlying funds | 112,382 | 457,060 | 261,163 | ||||||
| Net realized and unrealized gain (loss) on affiliates | 2,021,031 | 2,326,492 | 1,998,039 | ||||||
| Net Increase (Decrease) in Net Assets Resulting from Operations | $ | 3,444,510 | $ | 3,596,718 | $ | 3,000,254 | |||
See Notes to Financial Statements.
30
| YEAR ENDED JULY 31, 2015 | |||||||||
| One Choice 2045 Portfolio R6 | One Choice 2050 Portfolio R6 | One Choice 2055 Portfolio R6 | |||||||
| Investment Income (Loss) | |||||||||
| Income from Affiliates: | |||||||||
| Income distributions from underlying funds | $ | 857,373 | $ | 573,140 | $ | 253,595 | |||
| Expenses: | |||||||||
| Directors' fees and expenses | 1,284 | 857 | 386 | ||||||
| Net investment income (loss) | 856,089 | 572,283 | 253,209 | ||||||
| Realized and Unrealized Gain (Loss) on Affiliates | |||||||||
| Net realized gain (loss) on: | |||||||||
| Sale of investments in underlying funds | (170,094 | ) | (40,048 | ) | (7,636 | ) | |||
| Capital gain distributions received from underlying funds | 1,663,561 | 1,158,002 | 519,980 | ||||||
| 1,493,467 | 1,117,954 | 512,344 | |||||||
| Change in net unrealized appreciation (depreciation) on investments in underlying funds | 315,645 | 71,068 | 18,879 | ||||||
| Net realized and unrealized gain (loss) on affiliates | 1,809,112 | 1,189,022 | 531,223 | ||||||
| Net Increase (Decrease) in Net Assets Resulting from Operations | $ | 2,665,201 | $ | 1,761,305 | $ | 784,432 | |||
See Notes to Financial Statements.
31
| Statements of Changes in Net Assets |
| YEARS ENDED JULY 31, 2015 AND JULY 31, 2014 | ||||||||||||
| One Choice In Retirement Portfolio R6 | One Choice 2020 Portfolio R6 | |||||||||||
| Increase (Decrease) in Net Assets | July 31, 2015 | July 31, 2014 | July 31, 2015 | July 31, 2014 | ||||||||
| Operations | ||||||||||||
| Net investment income (loss) | $ | 584,514 | $ | 142,056 | $ | 1,493,400 | $ | 531,660 | ||||
| Net realized gain (loss) | 187,996 | 79,824 | 1,537,260 | 235,404 | ||||||||
| Change in net unrealized appreciation (depreciation) | 24,264 | 272,627 | (331,967 | ) | 906,549 | |||||||
| Net increase (decrease) in net assets resulting from operations | 796,774 | 494,507 | 2,698,693 | 1,673,613 | ||||||||
| Distributions to Shareholders | ||||||||||||
| From net investment income | (535,371 | ) | (131,650 | ) | (1,214,185 | ) | (294,116 | ) | ||||
| From net realized gains | (586,562 | ) | — | (426,552 | ) | — | ||||||
| Decrease in net assets from distributions | (1,121,933 | ) | (131,650 | ) | (1,640,737 | ) | (294,116 | ) | ||||
| Capital Share Transactions | ||||||||||||
| Proceeds from shares sold | 40,192,390 | 13,246,418 | 87,649,144 | 49,949,965 | ||||||||
| Issued in connection with reorganization (Note 9) | 45,158,345 | — | — | — | ||||||||
| Proceeds from reinvestment of distributions | 1,120,548 | 131,650 | 1,640,737 | 294,116 | ||||||||
| Payments for shares redeemed | (17,186,376 | ) | (2,274,105 | ) | (13,356,696 | ) | (9,562,597 | ) | ||||
| Net increase (decrease) in net assets from capital share transactions | 69,284,907 | 11,103,963 | 75,933,185 | 40,681,484 | ||||||||
| Net increase (decrease) in net assets | 68,959,748 | 11,466,820 | 76,991,141 | 42,060,981 | ||||||||
| Net Assets | ||||||||||||
| Beginning of period | 11,491,820 | 25,000 | 42,085,981 | 25,000 | ||||||||
| End of period | $ | 80,451,568 | $ | 11,491,820 | $ | 119,077,122 | $ | 42,085,981 | ||||
| Undistributed net investment income | $ | 59,549 | $ | 10,406 | $ | 515,975 | $ | 237,544 | ||||
| Transactions in Shares of the Funds | ||||||||||||
| Sold | 3,806,507 | 1,283,610 | 8,057,674 | 4,797,115 | ||||||||
| Issued in connection with reorganization (Note 9) | 4,307,104 | — | — | — | ||||||||
| Issued in reinvestment of distributions | 105,754 | 12,633 | 151,920 | 28,444 | ||||||||
| Redeemed | (1,628,527 | ) | (216,646 | ) | (1,223,397 | ) | (919,269 | ) | ||||
| Net increase (decrease) in shares of the funds | 6,590,838 | 1,079,597 | 6,986,197 | 3,906,290 | ||||||||
See Notes to Financial Statements.
32
| YEARS ENDED JULY 31, 2015 AND JULY 31, 2014 | ||||||||||||
| One Choice 2025 Portfolio R6 | One Choice 2030 Portfolio R6 | |||||||||||
| Increase (Decrease) in Net Assets | July 31, 2015 | July 31, 2014 | July 31, 2015 | July 31, 2014 | ||||||||
| Operations | ||||||||||||
| Net investment income (loss) | $ | 1,601,401 | $ | 367,500 | $ | 1,423,479 | $ | 386,557 | ||||
| Net realized gain (loss) | 1,697,055 | 181,382 | 1,908,649 | 250,873 | ||||||||
| Change in net unrealized appreciation (depreciation) | (56,483 | ) | 797,594 | 112,382 | 899,549 | |||||||
| Net increase (decrease) in net assets resulting from operations | 3,241,973 | 1,346,476 | 3,444,510 | 1,536,979 | ||||||||
| Distributions to Shareholders | ||||||||||||
| From net investment income | (1,205,349 | ) | (157,758 | ) | (1,109,196 | ) | (194,694 | ) | ||||
| From net realized gains | (243,928 | ) | — | (323,118 | ) | — | ||||||
| Decrease in net assets from distributions | (1,449,277 | ) | (157,758 | ) | (1,432,314 | ) | (194,694 | ) | ||||
| Capital Share Transactions | ||||||||||||
| Proceeds from shares sold | 92,930,987 | 43,877,013 | 98,987,973 | 39,637,910 | ||||||||
| Proceeds from reinvestment of distributions | 1,449,277 | 157,758 | 1,432,314 | 194,694 | ||||||||
| Payments for shares redeemed | (13,430,136 | ) | (4,483,367 | ) | (13,539,580 | ) | (4,923,054 | ) | ||||
| Net increase (decrease) in net assets from capital share transactions | 80,950,128 | 39,551,404 | 86,880,707 | 34,909,550 | ||||||||
| Net increase (decrease) in net assets | 82,742,824 | 40,740,122 | 88,892,903 | 36,251,835 | ||||||||
| Net Assets | ||||||||||||
| Beginning of period | 40,765,122 | 25,000 | 36,276,835 | 25,000 | ||||||||
| End of period | $ | 123,507,946 | $ | 40,765,122 | $ | 125,169,738 | $ | 36,276,835 | ||||
| Undistributed net investment income | $ | 605,794 | $ | 209,742 | $ | 506,146 | $ | 191,863 | ||||
| Transactions in Shares of the Funds | ||||||||||||
| Sold | 8,440,455 | 4,168,621 | 8,908,831 | 3,779,280 | ||||||||
| Issued in reinvestment of distributions | 132,354 | 15,169 | 130,092 | 18,649 | ||||||||
| Redeemed | (1,213,817 | ) | (428,155 | ) | (1,213,721 | ) | (466,458 | ) | ||||
| Net increase (decrease) in shares of the funds | 7,358,992 | 3,755,635 | 7,825,202 | 3,331,471 | ||||||||
See Notes to Financial Statements.
33
| YEARS ENDED JULY 31, 2015 AND JULY 31, 2014 | ||||||||||||
| One Choice 2035 Portfolio R6 | One Choice 2040 Portfolio R6 | |||||||||||
| Increase (Decrease) in Net Assets | July 31, 2015 | July 31, 2014 | July 31, 2015 | July 31, 2014 | ||||||||
| Operations | ||||||||||||
| Net investment income (loss) | $ | 1,270,226 | $ | 313,194 | $ | 1,002,215 | $ | 287,976 | ||||
| Net realized gain (loss) | 1,869,432 | 235,337 | 1,736,876 | 244,858 | ||||||||
| Change in net unrealized appreciation (depreciation) | 457,060 | 653,856 | 261,163 | 609,210 | ||||||||
| Net increase (decrease) in net assets resulting from operations | 3,596,718 | 1,202,387 | 3,000,254 | 1,142,044 | ||||||||
| Distributions to Shareholders | ||||||||||||
| From net investment income | (1,009,530 | ) | (160,865 | ) | (839,684 | ) | (163,594 | ) | ||||
| From net realized gains | (268,797 | ) | — | (275,712 | ) | — | ||||||
| Decrease in net assets from distributions | (1,278,327 | ) | (160,865 | ) | (1,115,396 | ) | (163,594 | ) | ||||
| Capital Share Transactions | ||||||||||||
| Proceeds from shares sold | 69,104,390 | 32,425,529 | 55,398,695 | 28,728,451 | ||||||||
| Proceeds from reinvestment of distributions | 1,278,327 | 160,865 | 1,115,396 | 163,594 | ||||||||
| Payments for shares redeemed | (9,554,198 | ) | (2,200,166 | ) | (6,655,460 | ) | (2,036,340 | ) | ||||
| Net increase (decrease) in net assets from capital share transactions | 60,828,519 | 30,386,228 | 49,858,631 | 26,855,705 | ||||||||
| Net increase (decrease) in net assets | 63,146,910 | 31,427,750 | 51,743,489 | 27,834,155 | ||||||||
| Net Assets | ||||||||||||
| Beginning of period | 31,452,750 | 25,000 | 27,859,155 | 25,000 | ||||||||
| End of period | $ | 94,599,660 | $ | 31,452,750 | $ | 79,602,644 | $ | 27,859,155 | ||||
| Undistributed net investment income | $ | 413,025 | $ | 152,329 | $ | 286,913 | $ | 124,382 | ||||
| Transactions in Shares of the Funds | ||||||||||||
| Sold | 6,175,050 | 3,065,738 | 4,902,086 | 2,702,785 | ||||||||
| Issued in reinvestment of distributions | 115,061 | 15,350 | 99,678 | 15,536 | ||||||||
| Redeemed | (844,540 | ) | (205,970 | ) | (585,894 | ) | (189,370 | ) | ||||
| Net increase (decrease) in shares of the funds | 5,445,571 | 2,875,118 | 4,415,870 | 2,528,951 | ||||||||
See Notes to Financial Statements.
34
| YEARS ENDED JULY 31, 2015 AND JULY 31, 2014 | ||||||||||||
| One Choice 2045 Portfolio R6 | One Choice 2050 Portfolio R6 | |||||||||||
| Increase (Decrease) in Net Assets | July 31, 2015 | July 31, 2014 | July 31, 2015 | July 31, 2014 | ||||||||
| Operations | ||||||||||||
| Net investment income (loss) | $ | 856,089 | $ | 226,144 | $ | 572,283 | $ | 165,635 | ||||
| Net realized gain (loss) | 1,493,467 | 190,627 | 1,117,954 | 144,539 | ||||||||
| Change in net unrealized appreciation (depreciation) | 315,645 | 585,148 | 71,068 | 417,202 | ||||||||
| Net increase (decrease) in net assets resulting from operations | 2,665,201 | 1,001,919 | 1,761,305 | 727,376 | ||||||||
| Distributions to Shareholders | ||||||||||||
| From net investment income | (723,825 | ) | (124,925 | ) | (498,177 | ) | (95,447 | ) | ||||
| From net realized gains | (217,148 | ) | — | (163,206 | ) | — | ||||||
| Decrease in net assets from distributions | (940,973 | ) | (124,925 | ) | (661,383 | ) | (95,447 | ) | ||||
| Capital Share Transactions | ||||||||||||
| Proceeds from shares sold | 43,173,005 | 23,496,563 | 27,960,831 | 17,740,478 | ||||||||
| Proceeds from reinvestment of distributions | 940,973 | 124,925 | 661,383 | 95,447 | ||||||||
| Payments for shares redeemed | (7,688,212 | ) | (1,825,488 | ) | (4,541,489 | ) | (1,511,499 | ) | ||||
| Net increase (decrease) in net assets from capital share transactions | 36,425,766 | 21,796,000 | 24,080,725 | 16,324,426 | ||||||||
| Net increase (decrease) in net assets | 38,149,994 | 22,672,994 | 25,180,647 | 16,956,355 | ||||||||
| Net Assets | ||||||||||||
| Beginning of period | 22,697,994 | 25,000 | 16,981,355 | 25,000 | ||||||||
| End of period | $ | 60,847,988 | $ | 22,697,994 | $ | 42,162,002 | $ | 16,981,355 | ||||
| Undistributed net investment income | $ | 233,483 | $ | 101,219 | $ | 144,294 | $ | 70,188 | ||||
| Transactions in Shares of the Funds | ||||||||||||
| Sold | 3,797,033 | 2,206,518 | 2,445,258 | 1,662,180 | ||||||||
| Issued in reinvestment of distributions | 83,494 | 11,819 | 58,633 | 9,030 | ||||||||
| Redeemed | (671,367 | ) | (169,459 | ) | (396,678 | ) | (139,624 | ) | ||||
| Net increase (decrease) in shares of the funds | 3,209,160 | 2,048,878 | 2,107,213 | 1,531,586 | ||||||||
See Notes to Financial Statements.
35
| YEARS ENDED JULY 31, 2015 AND JULY 31, 2014 | ||||||
One Choice 2055 Portfolio R6 | ||||||
| Increase (Decrease) in Net Assets | July 31, 2015 | July 31, 2014 | ||||
| Operations | ||||||
| Net investment income (loss) | $ | 253,209 | $ | 31,310 | ||
| Net realized gain (loss) | 512,344 | 5,741 | ||||
| Change in net unrealized appreciation (depreciation) | 18,879 | 207,192 | ||||
| Net increase (decrease) in net assets resulting from operations | 784,432 | 244,243 | ||||
| Distributions to Shareholders | ||||||
| From net investment income | (216,714 | ) | (4,681 | ) | ||
| From net realized gains | (11,035 | ) | — | |||
| Decrease in net assets from distributions | (227,749 | ) | (4,681 | ) | ||
| Capital Share Transactions | ||||||
| Proceeds from shares sold | 13,252,561 | 7,774,153 | ||||
| Proceeds from reinvestment of distributions | 227,749 | 4,681 | ||||
| Payments for shares redeemed | (2,239,299 | ) | (834,768 | ) | ||
| Net increase (decrease) in net assets from capital share transactions | 11,241,011 | 6,944,066 | ||||
| Net increase (decrease) in net assets | 11,797,694 | 7,183,628 | ||||
| Net Assets | ||||||
| Beginning of period | 7,208,628 | 25,000 | ||||
| End of period | $ | 19,006,322 | $ | 7,208,628 | ||
| Undistributed net investment income | $ | 63,124 | $ | 26,629 | ||
| Transactions in Shares of the Funds | ||||||
| Sold | 1,143,643 | 720,089 | ||||
| Issued in reinvestment of distributions | 19,874 | 440 | ||||
| Redeemed | (194,007 | ) | (76,942 | ) | ||
| Net increase (decrease) in shares of the funds | 969,510 | 643,587 | ||||
See Notes to Financial Statements.
36
| Notes to Financial Statements |
JULY 31, 2015
1. Organization
American Century Asset Allocation Portfolios, Inc. (the corporation) is registered under the Investment Company Act of 1940, as amended (the 1940 Act), as an open-end management investment company and is organized as a Maryland corporation. The corporation is authorized to issue 4,000,000,000 shares. One Choice In Retirement Portfolio R6, One Choice 2020 Portfolio R6, One Choice 2025 Portfolio R6, One Choice 2030 Portfolio R6, One Choice 2035 Portfolio R6, One Choice 2040 Portfolio R6, One Choice 2045 Portfolio R6, One Choice 2050 Portfolio R6 and One Choice 2055 Portfolio R6 (collectively, the funds) are nine funds in a series issued by the corporation. The funds operate as “funds of funds,” meaning substantially all of the funds’ assets will be invested in other American Century Investments mutual funds (the underlying funds). Each fund’s assets are allocated among underlying funds that represent major asset classes, including equity securities (stocks), fixed-income securities (bonds) and cash-equivalent instruments (money markets). The underlying funds do not invest in securities issued by companies assigned the Global Industry Classification Standard for the tobacco industry. The funds are diversified as defined under the 1940 Act. The funds will assume the risks associated with their underlying funds. Additional information and attributes of each underlying fund are available at americancentury.com. The investment objective of One Choice In Retirement Portfolio R6 is to seek current income. Capital appreciation is a secondary objective. The investment objective of each of the eight target date One Choice Portfolios R6 is to seek the highest total return consistent with its asset mix. When a fund reaches its most conservative planned target asset allocation, which is expected to occur on approximately November 30 of the year before the target date, its target asset mix will become fixed and will match that of One Choice In Retirement Portfolio R6.
2. Significant Accounting Policies
The following is a summary of significant accounting policies consistently followed by the funds in preparation of their financial statements. Each fund is an investment company and follows accounting and reporting guidance in accordance with accounting principles generally accepted in the United States of America. This may require management to make certain estimates and assumptions at the date of the financial statements. Actual results could differ from these estimates. Management evaluated the impact of events or transactions occurring through the date the financial statements were issued that would merit recognition or disclosure.
Investment Valuations — The funds determine the fair value of their investments and compute their net asset value per share at the close of regular trading (usually 4 p.m. Eastern time) on the New York Stock Exchange (NYSE) on each day the NYSE is open. The Board of Directors has adopted valuation policies and procedures to guide the investment advisor in the funds' investment valuation process and to provide methodologies for the oversight of the funds' pricing function. Investments in the underlying funds are valued at their reported net asset value.
Security Transactions — Security transactions are accounted for as of the trade date. Net realized gains and losses are determined on the identified cost basis, which is also used for federal income tax purposes.
Investment Income — Income and capital gain distributions, if any, from the underlying funds are recorded as of the ex-dividend date. Long-term capital gain distributions, if any, from the underlying funds are a component of net realized gain (loss).
Expenses — The expenses included in the accompanying financial statements reflect the expenses of each fund and do not include any expenses associated with the underlying funds.
Income Tax Status — It is each fund’s policy to distribute substantially all net investment income and net realized gains to shareholders and to otherwise qualify as a regulated investment company under provisions of the Internal Revenue Code. Accordingly, no provision has been made for income taxes. The funds file U.S. federal, state, local and non-U.S. tax returns as applicable. The funds' tax returns are subject to examination by the relevant taxing authority until expiration of the applicable statute of limitations, which is generally three years from the date of filing but can be longer in certain jurisdictions. At this time, management believes there are no uncertain tax positions which, based on their technical merit, would not be sustained upon examination and for which it is reasonably possible that the total amounts of unrecognized tax benefits will significantly change in the next twelve months.
37
Distributions to Shareholders — Distributions from net investment income, if any, are generally declared and paid quarterly for One Choice In Retirement Portfolio R6. Distributions from net investment income, if any, are generally declared and paid annually for the eight target date One Choice Portfolios R6. Distributions from net realized gains, if any, are generally declared and paid annually for all funds.
Indemnifications — Under the corporation’s organizational documents, its officers and directors are indemnified against certain liabilities arising out of the performance of their duties to the funds. In addition, in the normal course of business, the funds enter into contracts that provide general indemnifications. The maximum exposure under these arrangements is unknown as this would involve future claims that may be made against a fund. The risk of material loss from such claims is considered by management to be remote.
3. Fees and Transactions with Related Parties
Certain officers and directors of the corporation are also officers and/or directors of American Century Companies, Inc. (ACC). The corporation’s investment advisor, American Century Investment Management, Inc. (ACIM), the corporation's distributor, American Century Investment Services, Inc., and the corporation’s transfer agent, American Century Services, LLC, are wholly owned, directly or indirectly, by ACC. ACIM serves as the investment advisor for the underlying funds.
Administrative Fees — The corporation’s investment advisor, ACIM, does not receive an administrative fee for services provided to the funds.
Directors' Fees and Expenses — The Board of Directors is responsible for overseeing the investment advisor’s management and operations of the funds. The directors receive detailed information about the funds and their investment advisor regularly throughout the year, and meet at least quarterly with management of the investment advisor to review reports about fund operations. The funds' officers do not receive compensation from the funds.
Acquired Fund Fees and Expenses — Each fund will indirectly realize its pro rata share of the fees and expenses of the underlying funds in which it invests. These fees and expenses are already reflected in the valuation of the underlying funds.
4. Investment Transactions
Investment transactions for the year ended July 31, 2015 were as follows:
One Choice In Retirement Portfolio R6 | One Choice 2020 Portfolio R6 | One Choice 2025 Portfolio R6 | One Choice 2030 Portfolio R6 | One Choice 2035 Portfolio R6 | |
| Purchases | $40,301,289 | $96,389,952 | $105,182,106 | $109,127,138 | $80,618,040 |
| Sales | $16,187,713 | $18,718,376 | $22,052,514 | $20,159,187 | $17,654,070 |
| One Choice 2040 Portfolio R6 | One Choice 2045 Portfolio R6 | One Choice 2050 Portfolio R6 | One Choice 2055 Portfolio R6 | |
| Purchases | $63,907,899 | $49,827,315 | $32,142,469 | $14,887,205 |
| Sales | $12,327,362 | $11,822,864 | $6,992,838 | $3,100,752 |
38
5. Affiliated Fund Transactions
A summary of transactions for each underlying fund for the year ended July 31, 2015 follows:
Fund/ Underlying Fund(1) | Beginning Value | Purchase Cost | Sales Cost | Realized Gain (Loss) | Distributions Received(2) | Ending Value(3) | ||||||||||||
| One Choice In Retirement Portfolio R6 | ||||||||||||||||||
| NT Core Equity Plus Fund | $ | 341,065 | $ | 1,149,218 | $ | 439,168 | $ | (13,069 | ) | $ | 60,681 | $ | 2,414,588 | |||||
NT Disciplined Growth Fund(4) | — | 648,043 | 133,869 | (1,058 | ) | — | 1,208,082 | |||||||||||
| NT Equity Growth Fund | 1,136,842 | 4,030,161 | 1,704,575 | (35,997 | ) | 191,906 | 8,024,455 | |||||||||||
| NT Growth Fund | 738,548 | 1,998,074 | 1,253,216 | (32,098 | ) | 156,128 | 3,613,779 | |||||||||||
| NT Heritage Fund | 283,692 | 812,238 | 378,610 | 3,872 | 18,852 | 1,808,733 | ||||||||||||
| NT Large Company Value Fund | 1,249,918 | 3,912,403 | 1,884,276 | (7,775 | ) | 170,967 | 7,592,602 | |||||||||||
| NT Mid Cap Value Fund | 456,714 | 1,763,479 | 616,355 | (7,903 | ) | 80,935 | 3,617,348 | |||||||||||
| NT Small Company Fund | 225,405 | 778,318 | 271,831 | (10,165 | ) | 37,620 | 1,612,044 | |||||||||||
| Real Estate Fund | 113,917 | 106,769 | 210,169 | 31,479 | 2,738 | — | ||||||||||||
| High-Yield Fund | 438,528 | 1,406,293 | 430,435 | (21,122 | ) | 82,757 | 3,075,662 | |||||||||||
| Inflation-Adjusted Bond Fund | 173,671 | 536,941 | 164,298 | (3,665 | ) | 6,288 | 1,210,720 | |||||||||||
| NT Diversified Bond Fund | 3,083,503 | 8,687,542 | 3,962,010 | (31,389 | ) | 205,259 | 17,425,797 | |||||||||||
| Short Duration Inflation Protection Bond Fund | 707,909 | 2,127,046 | 706,350 | (15,044 | ) | 9,751 | 4,904,892 | |||||||||||
| Global Bond Fund | — | 3,197,008 | 676,403 | (8,723 | ) | — | 5,640,425 | |||||||||||
| International Bond Fund | 811,100 | 2,358,774 | 1,327,625 | (135,242 | ) | 25,331 | 4,022,391 | |||||||||||
| Premium Money Market Fund | 1,161,123 | 3,543,144 | 1,234,272 | — | 371 | 8,024,410 | ||||||||||||
NT Global Real Estate Fund(4) | — | 458,027 | 69,072 | (1,001 | ) | — | 807,471 | |||||||||||
| NT International Growth Fund | 569,888 | 1,746,975 | 818,245 | (21,164 | ) | 33,606 | 3,629,223 | |||||||||||
NT International Value Fund(4) | — | 1,040,836 | 216,698 | 300 | — | 1,818,973 | ||||||||||||
| $ | 11,491,823 | $ | 40,301,289 | $ | 16,497,477 | $ | (309,764 | ) | $ | 1,083,190 | $ | 80,451,595 | ||||||
| (1) | Underlying fund investments represent R6 Class for all funds, except Institutional Class for NT Core Equity Plus Fund, NT Disciplined Growth Fund, NT Equity Growth Fund, NT Small Company Fund, Inflation-Adjusted Bond Fund and Investor Class for Premium Money Market Fund. |
| (2) | Distributions received includes distributions from net investment income and from capital gains, if any. |
| (3) | Ending value may include underlying fund investments transferred as a result of an agreement and plan of reorganization. (Note 9) |
| (4) | Non-income producing. |
39
Fund/ Underlying Fund(1) | Beginning Value | Purchase Cost | Sales Cost | Realized Gain (Loss) | Distributions Received(2) | Ending Value | ||||||||||||
| One Choice 2020 Portfolio R6 | ||||||||||||||||||
| NT Core Equity Plus Fund | $ | 1,250,258 | $ | 2,487,572 | $ | 128,691 | $ | (7,180 | ) | $ | 193,268 | $ | 3,565,840 | |||||
NT Disciplined Growth Fund(3) | — | 2,227,754 | 64,849 | (420 | ) | — | 2,184,074 | |||||||||||
| NT Equity Growth Fund | 4,004,969 | 8,286,323 | 627,490 | (31,656 | ) | 604,525 | 11,580,572 | |||||||||||
| NT Growth Fund | 3,282,909 | 5,870,916 | 3,027,349 | (101,004 | ) | 632,341 | 6,266,638 | |||||||||||
| NT Heritage Fund | 1,515,078 | 2,493,360 | 661,479 | 19,885 | 89,496 | 3,637,290 | ||||||||||||
| NT Large Company Value Fund | 4,674,979 | 8,881,601 | 2,195,174 | (12,052 | ) | 548,698 | 11,389,447 | |||||||||||
| NT Mid Cap Value Fund | 2,047,314 | 4,443,511 | 303,932 | (8,649 | ) | 301,046 | 6,131,680 | |||||||||||
| NT Small Company Fund | 827,789 | 1,606,711 | 318,828 | (19,570 | ) | 134,319 | 2,116,885 | |||||||||||
| Real Estate Fund | 534,525 | 490,251 | 980,127 | 134,147 | 12,209 | — | ||||||||||||
| High-Yield Fund | 1,543,011 | 3,176,662 | 157,668 | (8,258 | ) | 165,634 | 4,409,919 | |||||||||||
| Inflation-Adjusted Bond Fund | 1,266,992 | 2,286,517 | 247,495 | (7,491 | ) | 22,526 | 3,254,989 | |||||||||||
| NT Diversified Bond Fund | 10,790,760 | 20,156,353 | 6,182,905 | (26,078 | ) | 441,422 | 24,725,972 | |||||||||||
| Short Duration Inflation Protection Bond Fund | 1,832,065 | 3,929,653 | 194,753 | (4,548 | ) | 24,580 | 5,512,484 | |||||||||||
| Global Bond Fund | — | 7,804,681 | 51,695 | (855 | ) | — | 7,678,827 | |||||||||||
| International Bond Fund | 2,504,281 | 5,021,144 | 1,785,616 | (213,710 | ) | 76,783 | 5,424,132 | |||||||||||
| NT Emerging Markets Fund | 471,944 | 839,364 | 67,670 | 359 | 2,880 | 1,191,782 | ||||||||||||
NT Global Real Estate Fund(3) | — | 1,539,883 | 30,092 | (361 | ) | — | 1,466,270 | |||||||||||
| NT International Growth Fund | 2,456,800 | 4,441,411 | 1,459,297 | (61,699 | ) | 131,102 | 5,630,310 | |||||||||||
NT International Small-Mid Cap Fund(3) | — | 338,442 | 21,924 | 511 | — | 332,514 | ||||||||||||
NT International Value Fund(3) | — | 3,531,151 | 152,378 | 187 | — | 3,365,930 | ||||||||||||
| Premium Money Market Fund | 3,082,320 | 6,536,692 | 407,406 | — | 549 | 9,211,606 | ||||||||||||
| $ | 42,085,994 | $ | 96,389,952 | $ | 19,066,818 | $ | (348,442 | ) | $ | 3,381,378 | $ | 119,077,161 | ||||||
| (1) | Underlying fund investments represent R6 Class for all funds, except Institutional Class for NT Core Equity Plus Fund, NT Disciplined Growth Fund, NT Equity Growth Fund, NT Small Company Fund, Inflation-Adjusted Bond Fund and Investor Class for Premium Money Market Fund. |
| (2) | Distributions received includes distributions from net investment income and from capital gains, if any. |
| (3) | Non-income producing. |
40
Fund/ Underlying Fund(1) | Beginning Value | Purchase Cost | Sales Cost | Realized Gain (Loss) | Distributions Received(2) | Ending Value | ||||||||||||
| One Choice 2025 Portfolio R6 | ||||||||||||||||||
| NT Core Equity Plus Fund | $ | 1,213,420 | $ | 2,666,615 | $ | 132,105 | $ | (4,284 | ) | $ | 198,922 | $ | 3,701,101 | |||||
NT Disciplined Growth Fund(3) | — | 2,752,927 | 44,979 | (156 | ) | — | 2,730,028 | |||||||||||
| NT Equity Growth Fund | 3,728,846 | 8,692,335 | 888,355 | (31,682 | ) | 594,138 | 11,476,446 | |||||||||||
| NT Growth Fund | 3,630,686 | 7,258,723 | 3,714,459 | (81,837 | ) | 711,960 | 7,396,166 | |||||||||||
| NT Heritage Fund | 1,818,718 | 3,600,797 | 834,550 | 17,346 | 114,300 | 5,027,237 | ||||||||||||
| NT Large Company Value Fund | 4,583,666 | 9,828,302 | 2,528,494 | (12,242 | ) | 568,204 | 11,967,783 | |||||||||||
| NT Mid Cap Value Fund | 2,236,541 | 5,378,277 | 252,673 | (7,880 | ) | 358,962 | 7,299,193 | |||||||||||
| NT Small Company Fund | 953,203 | 1,889,577 | 692,243 | (24,720 | ) | 152,958 | 2,179,375 | |||||||||||
| Real Estate Fund | 617,785 | 871,600 | 1,446,023 | 146,502 | 15,304 | — | ||||||||||||
| High-Yield Fund | 1,413,533 | 3,158,027 | 66,652 | (3,348 | ) | 174,681 | 4,344,693 | |||||||||||
| Inflation-Adjusted Bond Fund | 1,702,086 | 3,483,897 | 228,509 | (8,261 | ) | 35,752 | 4,862,961 | |||||||||||
| NT Diversified Bond Fund | 10,015,327 | 21,468,836 | 6,892,844 | (33,454 | ) | 465,161 | 24,464,442 | |||||||||||
| Short Duration Inflation Protection Bond Fund | 1,145,472 | 2,760,872 | 73,472 | (2,433 | ) | 16,243 | 3,798,059 | |||||||||||
| NT Emerging Markets Fund | 912,767 | 1,975,221 | 174,735 | (4,212 | ) | 7,904 | 2,621,279 | |||||||||||
NT Global Real Estate Fund(3) | — | 1,898,697 | 3,385 | (197 | ) | — | 1,826,912 | |||||||||||
| NT International Growth Fund | 2,779,189 | 5,669,314 | 2,629,021 | (99,770 | ) | 152,429 | 6,134,484 | |||||||||||
NT International Small-Mid Cap Fund(3) | — | 700,206 | — | — | — | 739,917 | ||||||||||||
NT International Value Fund(3) | — | 4,420,975 | 152,649 | (3,153 | ) | — | 4,255,552 | |||||||||||
| Global Bond Fund | — | 7,378,561 | 76,455 | (1,746 | ) | — | 7,205,746 | |||||||||||
| International Bond Fund | 1,948,325 | 4,735,829 | 1,359,651 | (174,731 | ) | 63,943 | 5,010,041 | |||||||||||
| Premium Money Market Fund | 2,065,570 | 4,592,518 | 191,518 | — | 417 | 6,466,570 | ||||||||||||
| $ | 40,765,134 | $ | 105,182,106 | $ | 22,382,772 | $ | (330,258 | ) | $ | 3,631,278 | $ | 123,507,985 | ||||||
| (1) | Underlying fund investments represent R6 Class for all funds, except Institutional Class for NT Core Equity Plus Fund, NT Disciplined Growth Fund, NT Equity Growth Fund, NT Small Company Fund, Inflation-Adjusted Bond Fund and Investor Class for Premium Money Market Fund. |
| (2) | Distributions received includes distributions from net investment income and from capital gains, if any. |
| (3) | Non-income producing. |
41
Fund/ Underlying Fund(1) | Beginning Value | Purchase Cost | Sales Cost | Realized Gain (Loss) | Distributions Received(2) | Ending Value | ||||||||||||
| One Choice 2030 Portfolio R6 | ||||||||||||||||||
| NT Core Equity Plus Fund | $ | 1,170,394 | $ | 2,953,414 | $ | 184,772 | $ | (8,508 | ) | $ | 196,400 | $ | 3,899,613 | |||||
NT Disciplined Growth Fund(3) | — | 3,234,831 | 34,767 | 174 | — | 3,229,963 | ||||||||||||
| NT Equity Growth Fund | 3,328,930 | 8,734,750 | 451,775 | (18,921 | ) | 539,980 | 11,543,671 | |||||||||||
| NT Growth Fund | 3,864,280 | 8,470,516 | 3,528,777 | (100,407 | ) | 811,487 | 9,021,823 | |||||||||||
| NT Heritage Fund | 1,797,401 | 4,033,816 | 771,390 | 42,329 | 121,310 | 5,458,210 | ||||||||||||
| NT Large Company Value Fund | 4,270,159 | 10,474,228 | 2,017,712 | (7,578 | ) | 542,416 | 12,768,931 | |||||||||||
| NT Mid Cap Value Fund | 1,897,697 | 5,930,130 | 206,670 | (9,208 | ) | 314,094 | 7,557,055 | |||||||||||
| NT Small Company Fund | 1,206,339 | 2,686,667 | 921,699 | (32,899 | ) | 202,368 | 2,998,432 | |||||||||||
| Real Estate Fund | 648,411 | 844,713 | 1,438,755 | 171,439 | 16,041 | — | ||||||||||||
| High-Yield Fund | 1,120,492 | 3,180,926 | 146,081 | (7,190 | ) | 141,591 | 4,024,535 | |||||||||||
| Inflation-Adjusted Bond Fund | 1,809,164 | 4,638,062 | 344,006 | (10,948 | ) | 38,629 | 6,013,629 | |||||||||||
| NT Diversified Bond Fund | 8,003,477 | 20,264,760 | 6,083,326 | (22,089 | ) | 374,215 | 22,123,737 | |||||||||||
| Short Duration Inflation Protection Bond Fund | 486,806 | 1,585,365 | 58,786 | (1,859 | ) | 7,457 | 1,997,938 | |||||||||||
| NT Emerging Markets Fund | 993,317 | 2,711,105 | 183,435 | (5,604 | ) | 8,215 | 3,386,333 | |||||||||||
NT Global Real Estate Fund(3) | — | 2,271,133 | 37,614 | 677 | — | 2,166,391 | ||||||||||||
| NT International Growth Fund | 3,024,600 | 6,827,752 | 2,925,797 | (112,451 | ) | 178,314 | 7,240,529 | |||||||||||
NT International Small-Mid Cap Fund(3) | — | 1,106,864 | 16,971 | 289 | — | 1,142,218 | ||||||||||||
NT International Value Fund(3) | — | 5,257,623 | 123,289 | 2,933 | — | 5,104,822 | ||||||||||||
| Global Bond Fund | — | 6,639,504 | 83,900 | (950 | ) | — | 6,492,348 | |||||||||||
| International Bond Fund | 824,174 | 2,616,003 | 532,615 | (66,633 | ) | 28,906 | 2,757,870 | |||||||||||
| Premium Money Market Fund | 1,831,204 | 4,664,976 | 254,454 | — | 365 | 6,241,726 | ||||||||||||
| $ | 36,276,845 | $ | 109,127,138 | $ | 20,346,591 | $ | (187,404 | ) | $ | 3,521,788 | $ | 125,169,774 | ||||||
| (1) | Underlying fund investments represent R6 Class for all funds, except Institutional Class for NT Core Equity Plus Fund, NT Disciplined Growth Fund, NT Equity Growth Fund, NT Small Company Fund, Inflation-Adjusted Bond Fund and Investor Class for Premium Money Market Fund. |
| (2) | Distributions received includes distributions from net investment income and from capital gains, if any. |
| (3) | Non-income producing. |
42
Fund/ Underlying Fund(1) | Beginning Value | Purchase Cost | Sales Cost | Realized Gain (Loss) | Distributions Received(2) | Ending Value | ||||||||||||
| One Choice 2035 Portfolio R6 | ||||||||||||||||||
| NT Core Equity Plus Fund | $ | 1,013,529 | $ | 2,156,203 | $ | 58,298 | $ | (6,582 | ) | $ | 180,636 | $ | 3,067,861 | |||||
NT Disciplined Growth Fund(3) | — | 2,823,091 | 44,177 | (515 | ) | — | 2,801,336 | |||||||||||
| NT Equity Growth Fund | 2,925,187 | 6,368,389 | 520,480 | (36,405 | ) | 495,798 | 8,725,448 | |||||||||||
| NT Growth Fund | 3,940,772 | 7,805,637 | 3,546,183 | (143,847 | ) | 901,386 | 8,407,225 | |||||||||||
| NT Heritage Fund | 1,681,487 | 3,016,493 | 607,662 | 3,771 | 118,851 | 4,495,006 | ||||||||||||
| NT Large Company Value Fund | 3,936,084 | 8,071,453 | 2,086,227 | (27,050 | ) | 526,578 | 9,986,201 | |||||||||||
| NT Mid Cap Value Fund | 1,692,194 | 4,247,417 | 183,268 | (9,046 | ) | 288,262 | 5,703,928 | |||||||||||
| NT Small Company Fund | 1,313,009 | 2,766,833 | 1,174,006 | (66,015 | ) | 244,663 | 2,967,741 | |||||||||||
| Real Estate Fund | 636,360 | 846,915 | 1,440,026 | 168,203 | 16,852 | — | ||||||||||||
| High-Yield Fund | 867,638 | 1,987,442 | 57,473 | (3,145 | ) | 110,567 | 2,696,717 | |||||||||||
| Inflation-Adjusted Bond Fund | 1,727,264 | 3,662,376 | 228,643 | (8,038 | ) | 38,572 | 5,066,554 | |||||||||||
| NT Diversified Bond Fund | 6,143,587 | 12,790,522 | 4,413,040 | (23,568 | ) | 291,897 | 14,476,838 | |||||||||||
| Short Duration Inflation Protection Bond Fund | 31,450 | 281,109 | — | — | 960 | 310,751 | ||||||||||||
| NT Emerging Markets Fund | 1,054,236 | 2,269,357 | 184,639 | (3,583 | ) | 8,817 | 3,035,750 | |||||||||||
NT Global Real Estate Fund(3) | — | 1,954,731 | 11,103 | (151 | ) | — | 1,875,980 | |||||||||||
| NT International Growth Fund | 2,971,553 | 5,788,856 | 2,933,732 | (115,866 | ) | 191,615 | 6,131,699 | |||||||||||
NT International Small-Mid Cap Fund(3) | — | 1,132,251 | 33,003 | 451 | — | 1,160,375 | ||||||||||||
NT International Value Fund(3) | — | 4,640,723 | 179,969 | (1,583 | ) | — | 4,447,801 | |||||||||||
| Premium Money Market Fund | 1,518,408 | 3,388,033 | 187,889 | — | 317 | 4,718,552 | ||||||||||||
| Global Bond Fund | — | 4,429,467 | 38,356 | (1,135 | ) | — | 4,334,200 | |||||||||||
| International Bond Fund | — | 190,742 | — | — | — | 189,721 | ||||||||||||
| $ | 31,452,758 | $ | 80,618,040 | $ | 17,928,174 | $ | (274,104 | ) | $ | 3,415,771 | $ | 94,599,684 | ||||||
| (1) | Underlying fund investments represent R6 Class for all funds, except Institutional Class for NT Core Equity Plus Fund, NT Disciplined Growth Fund, NT Equity Growth Fund, NT Small Company Fund, Inflation-Adjusted Bond Fund and Investor Class for Premium Money Market Fund. |
| (2) | Distributions received includes distributions from net investment income and from capital gains, if any. |
| (3) | Non-income producing. |
43
Fund/ Underlying Fund(1) | Beginning Value | Purchase Cost | Sales Cost | Realized Gain (Loss) | Distributions Received(2) | Ending Value | ||||||||||||
| One Choice 2040 Portfolio R6 | ||||||||||||||||||
| NT Core Equity Plus Fund | $ | 969,325 | $ | 1,913,157 | $ | 57,207 | $ | (3,710 | ) | $ | 156,127 | $ | 2,787,727 | |||||
NT Disciplined Growth Fund(3) | — | 2,478,466 | 24,378 | (242 | ) | — | 2,475,614 | |||||||||||
| NT Equity Growth Fund | 2,799,143 | 5,451,306 | 353,020 | (15,747 | ) | 428,188 | 7,833,745 | |||||||||||
| NT Growth Fund | 3,769,452 | 6,469,076 | 2,678,631 | (86,034 | ) | 758,250 | 7,701,883 | |||||||||||
| NT Heritage Fund | 1,761,383 | 2,836,943 | 533,235 | 3,835 | 109,872 | 4,425,768 | ||||||||||||
| NT Large Company Value Fund | 3,764,709 | 6,971,797 | 1,372,381 | (17,361 | ) | 453,604 | 9,391,702 | |||||||||||
| NT Mid Cap Value Fund | 1,782,005 | 3,529,774 | 152,791 | (5,576 | ) | 272,399 | 5,107,653 | |||||||||||
| NT Small Company Fund | 1,137,089 | 1,989,238 | 634,970 | (32,495 | ) | 192,167 | 2,504,379 | |||||||||||
| Real Estate Fund | 633,188 | 578,580 | 1,166,387 | 162,591 | 14,882 | — | ||||||||||||
| High-Yield Fund | 664,402 | 1,388,197 | 35,488 | (1,576 | ) | 72,352 | 1,947,283 | |||||||||||
| Inflation-Adjusted Bond Fund | 1,335,620 | 2,703,703 | 70,595 | (2,073 | ) | 26,521 | 3,906,511 | |||||||||||
| NT Diversified Bond Fund | 4,692,825 | 8,472,186 | 2,796,006 | (9,679 | ) | 193,258 | 10,363,886 | |||||||||||
| NT Emerging Markets Fund | 1,174,629 | 2,497,892 | 144,135 | 912 | 8,272 | 3,392,511 | ||||||||||||
NT Global Real Estate Fund(3) | — | 1,841,648 | 11,466 | (841 | ) | — | 1,777,482 | |||||||||||
| NT International Growth Fund | 2,737,767 | 4,617,932 | 2,239,690 | (87,912 | ) | 152,792 | 5,327,600 | |||||||||||
NT International Small-Mid Cap Fund(3) | — | 1,187,240 | 17,963 | 265 | — | 1,224,606 | ||||||||||||
NT International Value Fund(3) | — | 4,022,161 | 81,291 | (2,218 | ) | — | 3,925,615 | |||||||||||
| Global Bond Fund | — | 3,376,920 | 22,449 | (338 | ) | — | 3,322,868 | |||||||||||
| Premium Money Market Fund | 637,624 | 1,581,683 | 33,478 | — | 124 | 2,185,829 | ||||||||||||
| $ | 27,859,161 | $ | 63,907,899 | $ | 12,425,561 | $ | (98,199 | ) | $ | 2,838,808 | $ | 79,602,662 | ||||||
| (1) | Underlying fund investments represent R6 Class for all funds, except Institutional Class for NT Core Equity Plus Fund, NT Disciplined Growth Fund, NT Equity Growth Fund, NT Small Company Fund, Inflation-Adjusted Bond Fund and Investor Class for Premium Money Market Fund. |
| (2) | Distributions received includes distributions from net investment income and from capital gains, if any. |
| (3) | Non-income producing. |
44
Fund/ Underlying Fund(1) | Beginning Value | Purchase Cost | Sales Cost | Realized Gain (Loss) | Distributions Received(2) | Ending Value | ||||||||||||
| One Choice 2045 Portfolio R6 | ||||||||||||||||||
| NT Core Equity Plus Fund | $ | 990,139 | $ | 1,865,100 | $ | 322,661 | $ | (13,830 | ) | $ | 160,460 | $ | 2,502,184 | |||||
NT Disciplined Growth Fund(3) | — | 1,967,878 | 22,049 | (249 | ) | — | 1,962,173 | |||||||||||
| NT Equity Growth Fund | 2,325,601 | 4,564,220 | 635,849 | (31,289 | ) | 369,918 | 6,215,748 | |||||||||||
| NT Growth Fund | 3,272,430 | 5,406,177 | 2,433,846 | (84,793 | ) | 684,048 | 6,370,591 | |||||||||||
| NT Heritage Fund | 1,638,051 | 2,531,981 | 575,678 | 289 | 107,221 | 3,945,355 | ||||||||||||
| NT Large Company Value Fund | 3,273,446 | 5,851,121 | 1,210,341 | (22,265 | ) | 413,657 | 7,939,889 | |||||||||||
| NT Mid Cap Value Fund | 1,649,783 | 2,955,918 | 251,652 | (11,858 | ) | 266,794 | 4,306,975 | |||||||||||
| NT Small Company Fund | 894,716 | 1,683,743 | 798,094 | (53,003 | ) | 157,054 | 1,819,956 | |||||||||||
| Real Estate Fund | 573,749 | 621,166 | 1,153,899 | 148,813 | 13,777 | — | ||||||||||||
| NT Emerging Markets Fund | 1,187,941 | 2,219,718 | 163,254 | (6,326 | ) | 8,567 | 3,128,005 | |||||||||||
NT Global Real Estate Fund(3) | — | 1,579,396 | 16,414 | (613 | ) | — | 1,508,269 | |||||||||||
| NT International Growth Fund | 2,320,911 | 3,660,167 | 1,946,625 | (81,519 | ) | 135,092 | 4,222,489 | |||||||||||
NT International Small-Mid Cap Fund(3) | — | 1,079,123 | 7,063 | (45 | ) | — | 1,129,345 | |||||||||||
NT International Value Fund(3) | — | 3,223,802 | 93,347 | (297 | ) | — | 3,113,565 | |||||||||||
| High-Yield Fund | 454,735 | 869,356 | 38,045 | (1,923 | ) | 50,937 | 1,236,671 | |||||||||||
| Inflation-Adjusted Bond Fund | 911,134 | 1,748,619 | 113,722 | (4,177 | ) | 19,028 | 2,499,294 | |||||||||||
| NT Diversified Bond Fund | 3,205,361 | 5,472,533 | 2,185,381 | (6,991 | ) | 134,377 | 6,475,559 | |||||||||||
| Global Bond Fund | — | 2,375,206 | 25,038 | (18 | ) | — | 2,319,840 | |||||||||||
| Premium Money Market Fund | — | 152,091 | — | — | 4 | 152,091 | ||||||||||||
| $ | 22,697,997 | $ | 49,827,315 | $ | 11,992,958 | $ | (170,094 | ) | $ | 2,520,934 | $ | 60,847,999 | ||||||
| (1) | Underlying fund investments represent R6 Class for all funds, except Institutional Class for NT Core Equity Plus Fund, NT Disciplined Growth Fund, NT Equity Growth Fund, NT Small Company Fund, Inflation-Adjusted Bond Fund and Investor Class for Premium Money Market Fund. |
| (2) | Distributions received includes distributions from net investment income and from capital gains, if any. |
| (3) | Non-income producing. |
45
Fund/ Underlying Fund(1) | Beginning Value | Purchase Cost | Sales Cost | Realized Gain (Loss) | Distributions Received(2) | Ending Value | ||||||||||||
| One Choice 2050 Portfolio R6 | ||||||||||||||||||
| NT Core Equity Plus Fund | $ | 761,466 | $ | 1,216,587 | $ | 51,136 | $ | (2,554 | ) | $ | 114,100 | $ | 1,898,447 | |||||
NT Disciplined Growth Fund(3) | — | 1,402,377 | 2,175 | (26 | ) | — | 1,412,735 | |||||||||||
| NT Equity Growth Fund | 1,731,289 | 2,768,202 | 154,497 | (6,597 | ) | 248,343 | 4,305,353 | |||||||||||
| NT Growth Fund | 2,495,964 | 3,421,490 | 1,485,216 | (52,542 | ) | 482,465 | 4,496,902 | |||||||||||
| NT Heritage Fund | 1,228,039 | 1,624,060 | 313,991 | 1,624 | 74,451 | 2,761,672 | ||||||||||||
| NT Large Company Value Fund | 2,533,786 | 3,937,312 | 734,859 | (4,360 | ) | 287,142 | 5,744,144 | |||||||||||
| NT Mid Cap Value Fund | 1,235,380 | 1,926,750 | 219,638 | (5,437 | ) | 178,706 | 2,910,190 | |||||||||||
| NT Small Company Fund | 777,147 | 1,033,605 | 399,802 | (19,260 | ) | 117,625 | 1,415,532 | |||||||||||
| Real Estate Fund | 471,269 | 305,392 | 743,683 | 115,821 | 10,399 | — | ||||||||||||
| NT Emerging Markets Fund | 1,038,606 | 1,677,966 | 127,590 | (3,967 | ) | 5,916 | 2,478,996 | |||||||||||
NT Global Real Estate Fund(3) | — | 1,190,114 | — | — | — | 1,149,284 | ||||||||||||
| NT International Growth Fund | 1,693,860 | 2,305,438 | 1,282,576 | (55,051 | ) | 91,482 | 2,817,904 | |||||||||||
NT International Small-Mid Cap Fund(3) | — | 872,425 | 2,184 | 3 | — | 912,758 | ||||||||||||
NT International Value Fund(3) | — | 2,294,815 | 38,812 | 11 | — | 2,236,181 | ||||||||||||
| High-Yield Fund | 297,817 | 506,556 | 20,982 | (1,253 | ) | 29,745 | 754,063 | |||||||||||
| Inflation-Adjusted Bond Fund | 595,797 | 1,021,995 | 86,092 | (3,527 | ) | 11,174 | 1,504,397 | |||||||||||
| NT Diversified Bond Fund | 2,120,938 | 3,158,461 | 1,360,269 | (2,663 | ) | 79,594 | 3,911,315 | |||||||||||
| Global Bond Fund | — | 1,478,924 | 9,384 | (270 | ) | — | 1,452,136 | |||||||||||
| $ | 16,981,358 | $ | 32,142,469 | $ | 7,032,886 | $ | (40,048 | ) | $ | 1,731,142 | $ | 42,162,009 | ||||||
| (1) | Underlying fund investments represent R6 Class for all funds, except Institutional Class for NT Core Equity Plus Fund, NT Disciplined Growth Fund, NT Equity Growth Fund, NT Small Company Fund and Inflation-Adjusted Bond Fund. |
| (2) | Distributions received includes distributions from net investment income and from capital gains, if any. |
| (3) | Non-income producing. |
46
Fund/ Underlying Fund(1) | Beginning Value | Purchase Cost | Sales Cost | Realized Gain (Loss) | Distributions Received(2) | Ending Value | ||||||||||||
| One Choice 2055 Portfolio R6 | ||||||||||||||||||
| NT Core Equity Plus Fund | $ | 323,577 | $ | 569,048 | $ | 21,060 | $ | (124 | ) | $ | 50,144 | $ | 856,537 | |||||
NT Disciplined Growth Fund(3) | — | 656,318 | — | — | — | 661,204 | ||||||||||||
| NT Equity Growth Fund | 772,510 | 1,357,194 | 59,599 | (1,143 | ) | 115,507 | 2,044,993 | |||||||||||
| NT Growth Fund | 1,095,494 | 1,672,947 | 714,057 | (28,881 | ) | 214,556 | 2,091,581 | |||||||||||
| NT Heritage Fund | 538,409 | 782,000 | 140,580 | 939 | 32,769 | 1,282,010 | ||||||||||||
| NT Large Company Value Fund | 1,113,313 | 1,892,467 | 300,387 | (6,856 | ) | 131,214 | 2,705,980 | |||||||||||
| NT Mid Cap Value Fund | 541,468 | 913,547 | 142,602 | (4,275 | ) | 81,199 | 1,298,312 | |||||||||||
| NT Small Company Fund | 356,616 | 555,319 | 176,981 | (5,202 | ) | 57,590 | 732,379 | |||||||||||
| Real Estate Fund | 216,545 | 179,371 | 378,770 | 57,589 | 5,049 | — | ||||||||||||
| NT Emerging Markets Fund | 467,587 | 871,504 | 56,506 | (1,154 | ) | 3,092 | 1,230,608 | |||||||||||
NT Global Real Estate Fund(3) | — | 583,222 | — | — | — | 562,799 | ||||||||||||
| NT International Growth Fund | 684,614 | 983,249 | 565,333 | (18,095 | ) | 37,000 | 1,141,183 | |||||||||||
NT International Small-Mid Cap Fund(3) | — | 442,427 | 66 | 1 | — | 464,598 | ||||||||||||
NT International Value Fund(3) | — | 1,061,016 | 16,501 | 352 | — | 1,035,973 | ||||||||||||
| High-Yield Fund | 109,662 | 191,855 | 3,175 | (68 | ) | 11,415 | 286,434 | |||||||||||
| Inflation-Adjusted Bond Fund | 219,871 | 380,991 | 17,150 | (365 | ) | 4,271 | 573,068 | |||||||||||
| NT Diversified Bond Fund | 768,963 | 1,205,490 | 515,032 | (345 | ) | 29,769 | 1,456,826 | |||||||||||
| Global Bond Fund | — | 589,240 | 589 | (9 | ) | — | 581,840 | |||||||||||
| $ | 7,208,629 | $ | 14,887,205 | $ | 3,108,388 | $ | (7,636 | ) | $ | 773,575 | $ | 19,006,325 | ||||||
| (1) | Underlying fund investments represent R6 Class for all funds, except Institutional Class for NT Core Equity Plus Fund, NT Disciplined Growth Fund, NT Equity Growth Fund, NT Small Company Fund and Inflation-Adjusted Bond Fund. |
| (2) | Distributions received includes distributions from net investment income and from capital gains, if any. |
| (3) | Non-income producing. |
6. Investments in Underlying Funds
The funds do not invest in the underlying funds for the purpose of exercising management or control; however, investments by the funds within their investment strategies may represent a significant portion of the underlying funds’ net assets.
7. Fair Value Measurements
The funds’ investments valuation process is based on several considerations and may use multiple inputs to determine the fair value of the investments held by the funds. In conformity with accounting principles generally accepted in the United States of America, the inputs used to determine a valuation are classified into three broad levels.
| • | Level 1 valuation inputs consist of unadjusted quoted prices in an active market for identical investments. |
| • | Level 2 valuation inputs consist of direct or indirect observable market data (including quoted prices for comparable investments, evaluations of subsequent market events, interest rates, prepayment speeds, credit risk, etc.). These inputs also consist of quoted prices for identical investments initially expressed in local currencies that are adjusted through translation into U.S. dollars. |
| • | Level 3 valuation inputs consist of unobservable data (including a fund’s own assumptions). |
The level classification is based on the lowest level input that is significant to the fair valuation measurement. The valuation inputs are not necessarily an indication of the risks associated with investing in these securities or other financial instruments. There were no significant transfers between levels during the period.
As of period end, the funds' investment securities were classified as Level 1. The Schedules of Investments provide additional information on the funds' portfolio holdings.
47
8. Federal Tax Information
The tax character of distributions paid during the years ended July 31, 2015 and July 31, 2014 were as follows:
| 2015 | 2014 | ||||||||||
| Distributions Paid From: | Distributions Paid From: | ||||||||||
| Ordinary Income | Long-term capital gains | Ordinary Income | Long-term capital gains | ||||||||
| One Choice In Retirement Portfolio R6 | $ | 612,271 | $ | 509,662 | $ | 131,650 | — | ||||
| One Choice 2020 Portfolio R6 | $ | 1,323,467 | $ | 317,270 | $ | 294,116 | — | ||||
| One Choice 2025 Portfolio R6 | $ | 1,240,560 | $ | 208,717 | $ | 157,758 | — | ||||
| One Choice 2030 Portfolio R6 | $ | 1,167,424 | $ | 264,890 | $ | 194,694 | — | ||||
| One Choice 2035 Portfolio R6 | $ | 1,031,122 | $ | 247,205 | $ | 160,865 | — | ||||
| One Choice 2040 Portfolio R6 | $ | 863,423 | $ | 251,973 | $ | 163,594 | — | ||||
| One Choice 2045 Portfolio R6 | $ | 742,061 | $ | 198,912 | $ | 124,925 | — | ||||
| One Choice 2050 Portfolio R6 | $ | 511,016 | $ | 150,367 | $ | 95,447 | — | ||||
| One Choice 2055 Portfolio R6 | $ | 223,186 | $ | 4,563 | $ | 4,681 | — | ||||
The book-basis character of distributions made during the year from net investment income or net realized gains may differ from their ultimate characterization for federal income tax purposes. These differences reflect the differing character of certain income items and net realized gains and losses for financial statement and tax purposes, and may result in reclassification among certain capital accounts on the financial statements.
As of July 31, 2015, the federal tax cost of investments and the components of distributable earnings on a tax-basis were as follows:
One Choice In Retirement Portfolio R6 | One Choice 2020 Portfolio R6 | One Choice 2025 Portfolio R6 | One Choice 2030 Portfolio R6 | One Choice 2035 Portfolio R6 | |||||||||||
| Federal tax cost of investments | $ | 80,454,451 | $ | 119,079,368 | $ | 123,215,171 | $ | 124,518,341 | $ | 93,787,461 | |||||
| Gross tax appreciation of investments | $ | 612,786 | $ | 912,208 | $ | 1,271,299 | $ | 1,352,449 | $ | 1,254,863 | |||||
| Gross tax depreciation of investments | (615,642 | ) | (914,415 | ) | (978,485 | ) | (701,016 | ) | (442,640 | ) | |||||
| Net tax appreciation (depreciation) of investments | $ | (2,856 | ) | $ | (2,207 | ) | $ | 292,814 | $ | 651,433 | $ | 812,223 | |||
| Undistributed ordinary income | $ | 134,614 | $ | 515,975 | $ | 640,043 | $ | 562,677 | $ | 474,053 | |||||
| Accumulated long-term gains | — | $ | 1,923,685 | $ | 2,048,557 | $ | 2,140,371 | $ | 2,073,637 | ||||||
One Choice 2040 Portfolio R6 | One Choice 2045 Portfolio R6 | One Choice 2050 Portfolio R6 | One Choice 2055 Portfolio R6 | |||||||||
| Federal tax cost of investments | $ | 78,907,662 | $ | 60,213,858 | $ | 41,808,329 | $ | 18,827,655 | ||||
| Gross tax appreciation of investments | $ | 1,046,464 | $ | 926,052 | $ | 583,778 | $ | 277,972 | ||||
| Gross tax depreciation of investments | (351,464 | ) | (291,911 | ) | (230,098 | ) | (99,302 | ) | ||||
| Net tax appreciation (depreciation) of investments | $ | 695,000 | $ | 634,141 | $ | 353,680 | $ | 178,670 | ||||
| Undistributed ordinary income | $ | 312,407 | $ | 344,638 | $ | 204,484 | $ | 87,087 | ||||
| Accumulated long-term gains | $ | 1,855,901 | $ | 1,622,443 | $ | 1,173,687 | $ | 530,488 | ||||
The difference between book-basis and tax-basis unrealized appreciation (depreciation) is attributable primarily to the tax deferral of losses on wash sales.
48
9. Reorganization
On December 9, 2014, the Board of Directors approved an agreement and plan of reorganization (the reorganization), whereby the net assets of One Choice® 2015 Portfolio R6, one fund in a series issued by the corporation, were transferred to One Choice In Retirement Portfolio R6 in exchange for shares of One Choice In Retirement Portfolio R6. One Choice 2015 Portfolio R6 had reached its most conservative planned target asset allocation and its asset mix matched that of One Choice In Retirement Portfolio R6. The reorganization was executed to combine two funds that had the same target asset allocations, both funds’ investment objectives and strategies were substantially similar and their total expense ratios were expected to be the
same. The financial statements and performance history of One Choice In Retirement Portfolio R6 survived after the reorganization. The reorganization was effective as of the close of the NYSE on March 27, 2015.
The reorganization was accomplished by a tax-free exchange of shares. On March 27, 2015, One Choice 2015 Portfolio R6 exchanged its shares for shares of One Choice In Retirement Portfolio R6 as follows:
| Original Fund/Class | Shares Exchanged | New Fund/Class | Shares Received | |||
| One Choice 2015 Portfolio R6 – R6 Class | 4,266,394 | One Choice In Retirement Portfolio R6 – R6 Class | 4,307,104 | |||
The net assets of One Choice 2015 Portfolio R6 and One Choice In Retirement Portfolio R6 immediately before the reorganization were $45,158,345 and $21,165,837, respectively. One Choice 2015 Portfolio R6's unrealized appreciation of $337,454 was combined with that of One Choice In Retirement Portfolio R6. Immediately after the reorganization, the combined net assets were $66,324,182.
Assuming the reorganization had been completed on August 1, 2014, the beginning of the annual reporting period, the pro forma results of operations for the year ended July 31, 2015 are as follows:
| Net investment income (loss) | $ | 1,277,071 | |
| Net realized and unrealized gain (loss) | 756,159 | ||
| Net increase (decrease) in net assets resulting from operations | $ | 2,033,230 | |
Because the combined investment portfolios have been managed as a single integrated portfolio since the reorganization was completed, it is not practicable to separate the amounts of revenue and earnings of One Choice 2015 Portfolio R6 that have been included in the One Choice In Retirement Portfolio R6 Statement of Operations since March 27, 2015.
49
| Financial Highlights |
| For a Share Outstanding Throughout the Years Ended July 31 (except as noted) | |||||||||||||||
| Per-Share Data | Ratios and Supplemental Data | ||||||||||||||
| Income From Investment Operations: | Distributions From: | Ratio to Average Net Assets of: | |||||||||||||
| Net Asset Value, Beginning of Period | Net Investment Income (Loss)(1) | Net Realized and Unrealized Gain (Loss) | Total From Investment Operations | Net Investment Income | Net Realized Gains | Total Distributions | Net Asset Value, End of Period | Total Return(2) | Operating Expenses(3) | Net Investment Income (Loss) | Portfolio Turnover Rate | Net Assets, End of Period (in thousands) | |||
| One Choice In Retirement Portfolio R6 — R6 Class | |||||||||||||||
| 2015 | $10.62 | 0.17 | 0.26 | 0.43 | (0.25) | (0.31) | (0.56) | $10.49 | 4.14% | 0.00%(4) | 1.59% | 42% | $80,452 | ||
| 2014 | $10.00 | 0.23 | 0.61 | 0.84 | (0.22) | — | (0.22) | $10.62 | 8.46% | 0.00%(4) | 2.16% | 34% | $11,492 | ||
2013(5) | $10.00 | — | — | — | — | — | — | $10.00 | 0.00% | 0.00% | 0.00% | 0% | $25 | ||
| One Choice 2020 Portfolio R6 — R6 Class | |||||||||||||||
| 2015 | $10.77 | 0.23 | 0.25 | 0.48 | (0.24) | (0.08) | (0.32) | $10.93 | 4.55% | 0.00%(4) | 2.07% | 26% | $119,077 | ||
| 2014 | $10.00 | 0.25 | 0.67 | 0.92 | (0.15) | — | (0.15) | $10.77 | 9.24% | 0.00%(4) | 2.36% | 43% | $42,086 | ||
2013(5) | $10.00 | — | — | — | — | — | — | $10.00 | 0.00% | 0.00% | 0.00% | 0% | $25 | ||
| One Choice 2025 Portfolio R6 — R6 Class | |||||||||||||||
| 2015 | $10.85 | 0.22 | 0.33 | 0.55 | (0.24) | (0.05) | (0.29) | $11.11 | 5.05% | 0.00%(4) | 1.97% | 27% | $123,508 | ||
| 2014 | $10.00 | 0.22 | 0.78 | 1.00 | (0.15) | — | (0.15) | $10.85 | 10.04% | 0.00%(4) | 2.04% | 18% | $40,765 | ||
2013(5) | $10.00 | — | — | — | — | — | — | $10.00 | 0.00% | 0.00% | 0.00% | 0% | $25 | ||
| One Choice 2030 Portfolio R6 — R6 Class | |||||||||||||||
| 2015 | $10.88 | 0.22 | 0.42 | 0.64 | (0.23) | (0.07) | (0.30) | $11.22 | 5.94% | 0.00%(4) | 1.96% | 27% | $125,170 | ||
| 2014 | $10.00 | 0.23 | 0.81 | 1.04 | (0.16) | — | (0.16) | $10.88 | 10.48% | 0.00%(4) | 2.13% | 23% | $36,277 | ||
2013(5) | $10.00 | — | — | — | — | — | — | $10.00 | 0.00% | 0.00% | 0.00% | 0% | $25 | ||
50
| For a Share Outstanding Throughout the Years Ended July 31 (except as noted) | |||||||||||||||
| Per-Share Data | Ratios and Supplemental Data | ||||||||||||||
| Income From Investment Operations: | Distributions From: | Ratio to Average Net Assets of: | |||||||||||||
| Net Asset Value, Beginning of Period | Net Investment Income (Loss)(1) | Net Realized and Unrealized Gain (Loss) | Total From Investment Operations | Net Investment Income | Net Realized Gains | Total Distributions | Net Asset Value, End of Period | Total Return(2) | Operating Expenses(3) | Net Investment Income (Loss) | Portfolio Turnover Rate | Net Assets, End of Period (in thousands) | |||
| One Choice 2035 Portfolio R6 — R6 Class | |||||||||||||||
| 2015 | $10.93 | 0.23 | 0.50 | 0.73 | (0.23) | (0.06) | (0.29) | $11.37 | 6.74% | 0.00%(4) | 2.00% | 28% | $94,600 | ||
| 2014 | $10.00 | 0.24 | 0.87 | 1.11 | (0.18) | — | (0.18) | $10.93 | 11.18% | 0.00%(4) | 2.19% | 12% | $31,453 | ||
2013(5) | $10.00 | — | — | — | — | — | — | $10.00 | 0.00% | 0.00% | 0.00% | 0% | $25 | ||
| One Choice 2040 Portfolio R6 — R6 Class | |||||||||||||||
| 2015 | $11.01 | 0.24 | 0.54 | 0.78 | (0.25) | (0.08) | (0.33) | $11.46 | 7.15% | 0.00%(4) | 2.08% | 25% | $79,603 | ||
| 2014 | $10.00 | 0.24 | 0.96 | 1.20 | (0.19) | — | (0.19) | $11.01 | 12.13% | 0.00%(4) | 2.25% | 11% | $27,859 | ||
2013(5) | $10.00 | — | — | — | — | — | — | $10.00 | 0.00% | 0.00% | 0.00% | 0% | $25 | ||
| One Choice 2045 Portfolio R6 — R6 Class | |||||||||||||||
| 2015 | $11.06 | 0.24 | 0.61 | 0.85 | (0.26) | (0.08) | (0.34) | $11.57 | 7.72% | 0.00%(4) | 2.11% | 29% | $60,848 | ||
| 2014 | $10.00 | 0.23 | 1.02 | 1.25 | (0.19) | — | (0.19) | $11.06 | 12.62% | 0.00%(4) | 2.13% | 12% | $22,698 | ||
2013(5) | $10.00 | — | — | — | — | — | — | $10.00 | 0.00% | 0.00% | 0.00% | 0% | $25 | ||
| One Choice 2050 Portfolio R6 — R6 Class | |||||||||||||||
| 2015 | $11.07 | 0.24 | 0.61 | 0.85 | (0.26) | (0.08) | (0.34) | $11.58 | 7.76% | 0.00%(4) | 2.11% | 26% | $42,162 | ||
| 2014 | $10.00 | 0.23 | 1.05 | 1.28 | (0.21) | — | (0.21) | $11.07 | 12.88% | 0.00%(4) | 2.11% | 13% | $16,981 | ||
2013(5) | $10.00 | — | — | — | — | — | — | $10.00 | 0.00% | 0.00% | 0.00% | 0% | $25 | ||
51
| For a Share Outstanding Throughout the Years Ended July 31 (except as noted) | |||||||||||||||
| Per-Share Data | Ratios and Supplemental Data | ||||||||||||||
| Income From Investment Operations: | Distributions From: | Ratio to Average Net Assets of: | |||||||||||||
| Net Asset Value, Beginning of Period | Net Investment Income (Loss)(1) | Net Realized and Unrealized Gain (Loss) | Total From Investment Operations | Net Investment Income | Net Realized Gains | Total Distributions | Net Asset Value, End of Period | Total Return(2) | Operating Expenses(3) | Net Investment Income (Loss) | Portfolio Turnover Rate | Net Assets, End of Period (in thousands) | |||
| One Choice 2055 Portfolio R6 — R6 Class | |||||||||||||||
| 2015 | $11.16 | 0.24 | 0.63 | 0.87 | (0.26) | (0.01) | (0.27) | $11.76 | 7.90% | 0.00%(4) | 2.08% | 25% | $19,006 | ||
| 2014 | $10.00 | 0.13 | 1.19 | 1.32 | (0.16) | — | (0.16) | $11.16 | 13.22% | 0.00%(4) | 1.14% | 23% | $7,209 | ||
2013(5) | $10.00 | — | — | — | — | — | — | $10.00 | 0.00% | 0.00% | 0.00% | 0% | $25 | ||
| Notes to Financial Highlights |
| (1) | Computed using average shares outstanding throughout the period. |
| (2) | Total returns are calculated based on the net asset value of the last business day. Total returns for periods less than one year are not annualized. |
| (3) | Ratio of operating expenses to average net assets does not include any fees and expenses of the underlying funds. |
| (4) | Ratio was less than 0.005%. |
| (5) | For the one day period ended July 31, 2013 (fund inception). |
See Notes to Financial Statements.
52
| Report of Independent Registered Public Accounting Firm |
To the Board of Directors and Shareholders of American Century Asset Allocation Portfolios, Inc.:
We have audited the accompanying statements of assets and liabilities, including the schedules of investments, of One Choice In Retirement Portfolio R6, One Choice 2020 Portfolio R6, One Choice 2025 Portfolio R6, One Choice 2030 Portfolio R6, One Choice 2035 Portfolio R6, One Choice 2040 Portfolio R6, One Choice 2045 Portfolio R6, One Choice 2050 Portfolio R6, and One Choice 2055 Portfolio R6, nine of the portfolios constituting American Century Asset Allocation Portfolios, Inc. (the “Funds”), as of July 31, 2015, and the related statements of operations for the year then ended, the statements of changes in net assets for each of the two years in the period then ended, and the financial highlights for each of the periods presented. These financial statements and financial highlights are the responsibility of the Funds’ management. Our responsibility is to express an opinion on these financial statements and financial highlights based on our audits.
We conducted our audits in accordance with the standards of the Public Company Accounting Oversight Board (United States). Those standards require that we plan and perform the audit to obtain reasonable assurance about whether the financial statements and financial highlights are free of material misstatement. The Funds are not required to have, nor were we engaged to perform, an audit of their internal control over financial reporting. Our audits included consideration of internal control over financial reporting as a basis for designing audit procedures that are appropriate in the circumstances, but not for the purpose of expressing an opinion on the effectiveness of the Funds' internal control over financial reporting. Accordingly, we express no such opinion. An audit also includes examining, on a test basis, evidence supporting the amounts and disclosures in the financial statements, assessing the accounting principles used and significant estimates made by management, as well as evaluating the overall financial statement presentation. Our procedures included confirmation of securities owned as of July 31, 2015, by correspondence with the transfer agent. We believe that our audits provide a reasonable basis for our opinion.
In our opinion, the financial statements and financial highlights referred to above present fairly, in all material respects, the financial position of each of the respective Funds as of July 31, 2015, the results of their operations for the year then ended, the changes in their net assets for each of the two years in the period then ended, and the financial highlights for each of the periods presented, in conformity with accounting principles generally accepted in the United States of America.
DELOITTE & TOUCHE LLP
Kansas City, Missouri
September 17, 2015
53
| Management |
The Board of Directors
The individuals listed below serve as directors of the funds. Each director will continue to serve in this capacity until death, retirement, resignation or removal from office. The board has adopted a mandatory retirement age for directors who are not “interested persons,” as that term is defined in the Investment Company Act (independent directors). Independent directors shall retire by December 31 of the year in which they reach their 75th birthday.
Mr. Thomas is an “interested person” because he currently serves as President and Chief Executive Officer of American Century Companies, Inc. (ACC), the parent company of American Century Investment Management, Inc. (ACIM or the advisor). Mr. Fink is treated as an “interested person” because of his recent employment with ACC and American Century Services, LLC (ACS). The other directors (more than three-fourths of the total number) are independent. They are not employees, directors or officers of, and have no financial interest in, ACC or any of its wholly owned, direct or indirect, subsidiaries, including ACIM, American Century Investment Services, Inc. (ACIS) and ACS, and they do not have any other affiliations, positions or relationships that would cause them to be considered “interested persons” under the Investment Company Act. The directors serve in this capacity for seven (in the case of Mr. Thomas, 15) registered investment companies in the American Century Investments family of funds.
The following table presents additional information about the directors. The mailing address for each director is 4500 Main Street, Kansas City, Missouri 64111.
Name (Year of Birth) | Position(s) Held with Funds | Length of Time Served | Principal Occupation(s) During Past 5 Years | Number of American Century Portfolios Overseen by Director | Other Directorships Held During Past 5 Years |
| Independent Directors | |||||
| Thomas A. Brown (1940) | Director | Since 1980 | Managing Member, Associated Investments, LLC (real estate investment company) | 78 | None |
| Andrea C. Hall (1945) | Director | Since 1997 | Retired | 78 | None |
| Jan M. Lewis (1957) | Director | Since 2011 | Retired; President and Chief Executive Officer, Catholic Charities of Northeast Kansas (human services organization) (2006 to 2013) | 78 | None |
| James A. Olson (1942) | Director and Chairman of the Board | Since 2007 (Chairman since 2014) | Member, Plaza Belmont LLC (private equity fund manager) | 78 | Saia, Inc. (2002 to 2012) and EPR Properties (2003 to 2013) |
| M. Jeannine Strandjord (1945) | Director | Since 1994 | Retired | 78 | Euronet Worldwide Inc.; MGP Ingredients, Inc.; Charming Shoppes, Inc. (2006 to 2010); and DST Systems Inc. (1996 to 2012) |
54
| Name (Year of Birth) | Position(s) Held with Funds | Length of Time Served | Principal Occupation(s) During Past 5 Years | Number of American Century Portfolios Overseen by Director | Other Directorships Held During Past 5 Years |
| Independent Directors | |||||
| John R. Whitten (1946) | Director | Since 2008 | Retired | 78 | Rudolph Technologies, Inc. |
| Stephen E. Yates (1948) | Director | Since 2012 | Retired; Executive Vice President, Technology & Operations, KeyCorp. (computer services) (2004 to 2010) | 78 | Applied Industrial Technologies, Inc. (2001 to 2010) |
| Interested Directors | |||||
| Barry Fink (1955) | Director | Since 2012 | Retired; Executive Vice President, ACC (September 2007 to February 2013); President, ACS (October 2007 to February 2013); Chief Operating Officer, ACC (September 2007 to November 2012) | 78 | None |
| Jonathan S. Thomas (1963) | Director and President | Since 2007 | President and Chief Executive Officer, ACC (March 2007 to present). Also serves as Chief Executive Officer, ACS; Executive Vice President, ACIM; Director, ACC, ACIM and other ACC subsidiaries | 124 | BioMed Valley Discoveries, Inc. |
The Statement of Additional Information has additional information about the funds' directors and is available without charge, upon request, by calling 1-800-345-2021.
55
Officers
The following table presents certain information about the executive officers of the funds. Each officer serves as an officer for each of the 15 investment companies in the American Century family of funds, unless otherwise noted. No officer is compensated for his or her service as an officer of the funds. The listed officers are interested persons of the funds and are appointed or re-appointed on an annual basis. The mailing address for each officer listed below is 4500 Main Street, Kansas City, Missouri 64111.
Name (Year of Birth) | Offices with the Funds | Principal Occupation(s) During the Past Five Years |
| Jonathan S. Thomas (1963) | Director and President since 2007 | President and Chief Executive Officer, ACC (March 2007 to present). Also serves as Chief Executive Officer, ACS; Executive Vice President, ACIM; Director, ACC, ACIM and other ACC subsidiaries |
| Amy D. Shelton (1964) | Chief Compliance Officer and Vice President since 2014 | Chief Compliance Officer, American Century funds, (March 2014 to present); Chief Compliance Officer, ACIM (February 2014 to present); Chief Compliance Officer, ACIS (October 2009 to present); Vice President, Client Interactions and Marketing, ACIS (February 2013 to January 2014); Director, Client Interactions and Marketing, ACIS (June 2007 to January 2013). Also serves as Vice President, ACIS |
| Charles A. Etherington (1957) | General Counsel since 2007 and Senior Vice President since 2006 | Attorney, ACC (February 1994 to present); Vice President, ACC (November 2005 to present); General Counsel, ACC (March 2007 to present). Also serves as General Counsel, ACIM, ACS, ACIS and other ACC subsidiaries; and Senior Vice President, ACIM and ACS |
| C. Jean Wade (1964) | Vice President, Treasurer and Chief Financial Officer since 2012 | Vice President, ACS (February 2000 to present) |
| Robert J. Leach (1966) | Vice President since 2006 and Assistant Treasurer since 2012 | Vice President, ACS (February 2000 to present) |
| David H. Reinmiller (1963) | Vice President since 2000 | Attorney, ACC (January 1994 to present); Associate General Counsel, ACC (January 2001 to present). Also serves as Vice President, ACIM and ACS |
| Ward D. Stauffer (1960) | Secretary since 2005 | Attorney, ACC (June 2003 to present) |
56
| Approval of Management Agreement |
At a meeting held on June 30, 2015, the Funds’ Board of Directors unanimously approved the renewal of the management agreement pursuant to which American Century Investment Management, Inc. (the “Advisor”) acts as the investment advisor for the Funds. Under Section
15(c) of the Investment Company Act, contracts for investment advisory services are required to be reviewed, evaluated, and approved by a majority of a funds’ directors (the “Directors”), including a majority of the independent Directors, each year.
Prior to its consideration of the renewal of the management agreement, the Directors requested and reviewed extensive data and information compiled by the Advisor and certain independent providers of evaluation data concerning the Funds and the services provided to the Funds by the Advisor. This review was in addition to the oversight and evaluation undertaken by the Board and its committees on a continuous basis and the information received was supplemental to the extensive information that the Board and its committees receive and consider throughout the year.
In connection with its consideration of the renewal of the management agreement, the Board’s review and evaluation of the services provided by the Advisor included, but was not limited to, the following:
| • | the nature, extent, and quality of investment management, shareholder services, and other services provided by the Advisor to each Fund; |
| • | the wide range of other programs and services the Advisor provides to each Fund and its shareholders on a routine and non-routine basis; |
| • | each Fund’s investment performance compared to appropriate benchmarks and/or a peer group of other mutual funds with similar investment objectives and strategies; |
| • | the cost of owning each Fund compared to the cost of owning similar funds; |
| • | the Advisor’s compliance policies, procedures, and regulatory experience; |
| • | financial data showing the cost of services provided to each Fund, the profitability of each Fund to the Advisor, and the overall profitability of the Advisor; |
| • | possible economies of scale associated with the Advisor’s management of the Funds and other accounts under its management; |
| • | data comparing services provided and charges to other investment management clients of the Advisor; |
| • | acquired fund fees and expenses; |
| • | payments to intermediaries by each Fund and the Advisor; and |
| • | any collateral benefits derived by the Advisor from the management of the Funds. |
In keeping with their practice, the Directors held two in-person meetings and one telephonic meeting to review and discuss the information provided. The independent Directors also had the benefit of the advice of their independent counsel throughout the process.
Factors Considered
The Directors considered all of the information provided by the Advisor, the independent data providers, and independent counsel, and evaluated such information for each Fund. In connection with their review, the Directors did not identify any single factor as being all-important or controlling, and each Director may have attributed different levels of importance to different factors. In deciding to renew the management agreement, the Board based its decision on a number of factors, including the following:
Nature, Extent and Quality of Services - Generally. Under the management agreement, the Advisor is responsible for providing or arranging for all services necessary for the operation of each Fund. The Board noted that under the management agreement, the Advisor provides or arranges at its own expense a wide variety of services including:
57
| • | constructing and designing each Fund |
| • | portfolio research and security selection |
| • | initial capitalization/funding |
| • | securities trading |
| • | Fund administration |
| • | custody of Fund assets |
| • | daily valuation of each Fund’s portfolio |
| • | shareholder servicing and transfer agency, including shareholder confirmations, recordkeeping, and communications |
| • | legal services (except the independent Directors’ counsel) |
| • | regulatory and portfolio compliance |
| • | financial reporting |
| • | marketing and distribution (except Rule 12b-1 plans) |
The Board noted that many of these services have expanded over time both in terms of quantity and complexity in response to shareholder demands, competition in the industry, changing distribution channels, and the changing regulatory environment.
Investment Management Services. The nature of the investment management services provided to the Funds is quite complex and allows fund shareholders access to professional money management, instant diversification of their investments within an asset class, the opportunity to easily diversify among asset classes by investing in or exchanging among various American Century Investments funds, and liquidity. In evaluating investment performance, the Board expects the Advisor to manage each Fund in accordance with its investment objectives and approved strategies. Further, the Directors recognize that the Advisor has an obligation to monitor trading activities, and in particular to seek the best execution of fund trades, and to evaluate the use of and payment for research. In providing these services, the Advisor utilizes teams of investment professionals (portfolio managers, analysts, research assistants, and securities traders) who require extensive information technology, research, training, compliance, and other systems to conduct their business. The Board, directly and through its Fund Performance Review Committee, regularly reviews investment performance information for each Fund, together with comparative information for appropriate benchmarks and/or peer groups of similarly-managed funds, over different time horizons. The Directors also review detailed performance information during the management agreement approval process. If performance concerns are identified with respect to a fund, the Fund receives special reviews until performance improves, during which the Board discusses with the Advisor the reasons for such results (e.g., market conditions, security selection) and any efforts being undertaken to improve performance. The performance for each Fund was above its respective benchmark for the one-year period reviewed by the Board. Taking all of these factors into consideration, the Board found the investment management services provided to each Fund by the Advisor to be satisfactory and consistent with the management agreement.
Shareholder and Other Services. Under the management agreement, the Advisor provides the Funds with a comprehensive package of transfer agency, shareholder, and other services. The Board, directly and through various committees of the Board, regularly reviews reports and evaluations of such services at its regular meetings. These reports include, but are not limited to, information regarding the operational efficiency and accuracy of the shareholder and transfer agency services provided, staffing levels, shareholder satisfaction (as measured by external as well as internal sources), technology support, new products and services offered to fund shareholders, securities trading activities, portfolio valuation services, auditing services, and legal and operational compliance activities. The Board particularly noted the Advisor’s continual efforts to maintain effective business continuity plans and to address cybersecurity threats. Certain aspects of shareholder and transfer agency service level efficiency and the quality of securities trading activities are measured by independent third party providers and are presented in comparison to other fund groups not managed by the Advisor. The Board found the services provided by the Advisor to the Funds under the management agreement to be competitive and of high quality.
58
Costs of Services and Profitability. The Advisor provides detailed information concerning its cost of providing various services to the Funds, its profitability in managing each Fund (pre- and post- distribution), its overall profitability, and its financial condition. The Directors have reviewed with the Advisor the methodology used to prepare this financial information. This information is considered in evaluating the Advisor’s financial condition, its ability to continue to provide services to the Funds, and the reasonableness of the current management agreement. The Board concluded that the Advisor’s profits were reasonable in light of the services provided to the Funds.
Ethics. The Board generally considers the Advisor’s commitment to providing quality services to shareholders and to conducting its business ethically. They noted that the Advisor’s practices generally meet or exceed industry best practices.
Economies of Scale. The Board also reviewed information provided by the Advisor regarding the possible existence of economies of scale in connection with the management of each Fund. The Board concluded that economies of scale are difficult to measure and predict with precision, especially on a fund-by-fund basis. The Board concluded that the Advisor is appropriately sharing economies of scale through its competitive fee structure, offering competitive fees from fund inception, and through reinvestment in its business to provide shareholders additional content and services.
Comparison to Other Funds’ Fees. The Funds invest their non-cash assets entirely in other American Century Investments funds. The Funds do not pay an investment advisory fee to the Advisor. Rather, each Fund indirectly bears its pro rata share of the expenses incurred by the underlying funds. Each of the underlying funds pay the Advisor a single, all-inclusive (or unified) management fee for providing all services necessary for the management and operation of the fund, other than brokerage expenses, taxes, interest, extraordinary expenses, and the fees and expenses of the fund’s independent directors (including their independent legal counsel), as well as expenses incurred in connection with the provision of shareholder services and distribution services under a plan adopted pursuant to Rule 12b-1 under the 1940 Act. The Board concluded that the underlying fund expenses incurred by each Fund were reasonable in light of the services provided to each Fund.
Comparison to Fees and Services Provided to Other Clients of the Advisor. The Directors also requested and received information from the Advisor concerning the nature of the services, fees, costs, and profitability of its advisory services to advisory clients other than the Funds. They observed that these varying types of client accounts require different services and involve different regulatory and entrepreneurial risks than the management of each Fund. The Board analyzed this information and concluded that the fees charged and services provided to the Funds were reasonable by comparison.
Payments to Intermediaries. The Directors also requested and received a description of payments made to intermediaries by each Fund and the Advisor. These payments include various payments made by each Fund or the Advisor to different types of intermediaries and recordkeepers for distribution and service activities provided for each Fund. The Board reviewed such information and found the payments to be reasonable in scope and purpose.
Collateral or “Fall-Out” Benefits Derived by the Advisor. The Board considered the existence of collateral benefits the Advisor may receive as a result of its relationship with the Funds. They concluded that the Advisor’s primary business is managing mutual funds and it generally does not use fund or shareholder information to generate profits in other lines of business, and therefore does not derive any significant collateral benefits from them. The Board noted that additional assets from other clients may offer the Advisor some benefit from increased leverage with service providers and counterparties. Additionally, the Advisor receives proprietary research from broker-dealers that execute fund portfolio transactions, which the Board concluded is likely to benefit other clients of the Advisor as well as fund shareholders. The Board also determined that the Advisor is able to provide investment management services to certain clients other than the Funds, at least in part, due to its existing infrastructure built to serve the fund complex.
59
Existing Relationship. The Board also considered whether there was any reason for not continuing the existing arrangement with the Advisor. In this regard, the Board was mindful of the potential disruptions of the Funds’ operations and various risks, uncertainties, and other effects that could occur as a result of a decision not to continue such relationship. In particular, the Board recognized that most shareholders have invested in the Funds on the strength of the Advisor’s industry standing and reputation and in the expectation that the Advisor will have a continuing role in providing advisory services to each Fund.
Conclusion of the Directors. As a result of this process, the Board, including all of the independent Directors, taking into account all of the factors discussed above and the information provided by the Advisor and others in connection with its review and throughout the year, determined that the management agreement between the Funds and the Advisor is fair and reasonable in light of the services provided and should be renewed.
60
| Additional Information |
Retirement Account Information
As required by law, distributions you receive from certain IRAs are subject to federal income tax withholding, unless you elect not to have withholding apply. Tax will be withheld on the total amount withdrawn even though you may be receiving amounts that are not subject to withholding, such as nondeductible contributions. In such case, excess amounts of withholding could occur. You may adjust your withholding election so that a greater or lesser amount will be withheld.
If you don’t want us to withhold on this amount, you must notify us to not withhold the federal income tax. You may notify us in writing or in certain situations by telephone or through other electronic means. For systematic withdrawals, your withholding election will remain in effect until revoked or changed by filing a new election. You have the right to revoke your election at any time.
Remember, even if you elect not to have income tax withheld, you are liable for paying income tax on the taxable portion of your withdrawal. If you elect not to have income tax withheld or you don’t have enough income tax withheld, you may be responsible for payment of estimated tax. You may incur penalties under the estimated tax rules if your withholding and estimated tax payments are not sufficient. You can reduce or defer the income tax on a distribution by directly or indirectly rolling such distribution over to another IRA or eligible plan. You should consult your tax advisor for additional information.
State tax will be withheld if, at the time of your distribution, your address is within one of the mandatory withholding states and you have federal income tax withheld (or as otherwise required by state law). State taxes will be withheld from your distribution in accordance with the respective state rules.
Distributions you receive from 403(b), 457 and qualified plans are subject to special tax and withholding rules. Your plan administrator or plan sponsor is required to provide you with a special tax notice explaining those rules at the time you request a distribution. If applicable, federal and/or state taxes may be withheld from your distribution amount.
Proxy Voting Policies
A description of the policies that the funds’ investment advisor uses in exercising the voting rights associated with the securities purchased and/or held by the funds is available without charge, upon request, by calling 1-800-378-9878. It is also available on the “About Us” page of American Century Investments’ website at americancentury.com and on the Securities and Exchange Commission’s
website at sec.gov. Information regarding how the investment advisor voted proxies relating to portfolio securities during the most recent 12-month period ended June 30 is available on the “About Us” page at americancentury.com. It is also available at sec.gov.
Quarterly Portfolio Disclosure
The funds file their complete schedule of portfolio holdings with the Securities and Exchange Commission (SEC) for the first and third quarters of each fiscal year on Form N-Q. The funds’ Forms N-Q are available on the SEC’s website at sec.gov, and may be reviewed and copied at the SEC’s Public Reference Room in Washington, DC. Information on the operation of the Public Reference Room may be obtained by calling 1-800-SEC-0330. The funds also make their complete
schedule of portfolio holdings for the most recent quarter of their fiscal year available on their website at ipro.americancentury.com (for Investment Professionals) and, upon request, by calling 1-800-378-9878.
61
Other Tax Information
The following information is provided pursuant to provisions of the Internal Revenue Code.
The funds hereby designate up to the maximum amount allowable as qualified dividend income for the fiscal year ended July 31, 2015.
For corporate taxpayers, the funds hereby designate the following, or up to the maximum amount allowable, of ordinary income distributions paid during the fiscal year ended July 31, 2015 as qualified for the corporate dividends received deduction.
One Choice In Retirement Portfolio R6 | One Choice 2020 Portfolio R6 | One Choice 2025 Portfolio R6 | One Choice 2030 Portfolio R6 | One Choice 2035 Portfolio R6 |
| $131,621 | $382,070 | $414,732 | $396,149 | $377,706 |
One Choice 2040 Portfolio R6 | One Choice 2045 Portfolio R6 | One Choice 2050 Portfolio R6 | One Choice 2055 Portfolio R6 | |
| $324,666 | $295,112 | $205,628 | $101,322 | |
The funds hereby designate the following as qualified short-term capital gain distributions for purposes of Internal Revenue Code Section 871 for the fiscal year ended July 31, 2015.
One Choice In Retirement Portfolio R6 | One Choice 2020 Portfolio R6 | One Choice 2025 Portfolio R6 | One Choice 2030 Portfolio R6 | One Choice 2035 Portfolio R6 |
| $76,900 | $108,498 | $35,211 | $58,228 | $21,592 |
One Choice 2040 Portfolio R6 | One Choice 2045 Portfolio R6 | One Choice 2050 Portfolio R6 | One Choice 2055 Portfolio R6 | |
| $23,739 | $18,236 | $12,839 | $6,472 | |
The funds hereby designate the following, or up to the maximum amount allowable, as long-term capital gain distributions for the fiscal year ended July 31, 2015.
One Choice In Retirement Portfolio R6 | One Choice 2020 Portfolio R6 | One Choice 2025 Portfolio R6 | One Choice 2030 Portfolio R6 | One Choice 2035 Portfolio R6 |
| $509,662 | $317,270 | $208,717 | $264,890 | $247,205 |
One Choice 2040 Portfolio R6 | One Choice 2045 Portfolio R6 | One Choice 2050 Portfolio R6 | One Choice 2055 Portfolio R6 | |
| $251,973 | $198,912 | $150,367 | $4,563 | |
For the fiscal year ended July 31, 2015, the funds intend to pass through to shareholders the following foreign source income and foreign taxes paid, or up to the maximum amount allowable, as a foreign tax credit.
| Foreign Tax Credit | Foreign Source Income | |||||||
| Amount | Per Outstanding Share | Amount | Per Outstanding Share | |||||
| One Choice In Retirement Portfolio R6 | $ | 1,461 | 0.0002 | $ | 5,082 | 0.0007 | ||
| One Choice 2020 Portfolio R6 | $ | 5,699 | 0.0005 | $ | 19,824 | 0.0018 | ||
| One Choice 2025 Portfolio R6 | $ | 6,626 | 0.0006 | $ | 23,049 | 0.0021 | ||
| One Choice 2030 Portfolio R6 | $ | 7,751 | 0.0007 | $ | 26,963 | 0.0024 | ||
| One Choice 2035 Portfolio R6 | $ | 8,329 | 0.0010 | $ | 28,974 | 0.0035 | ||
| One Choice 2040 Portfolio R6 | $ | 6,642 | 0.0010 | $ | 23,104 | 0.0033 | ||
| One Choice 2045 Portfolio R6 | $ | 5,872 | 0.0011 | $ | 20,427 | 0.0039 | ||
| One Choice 2050 Portfolio R6 | $ | 3,977 | 0.0011 | $ | 13,833 | 0.0038 | ||
| One Choice 2055 Portfolio R6 | $ | 1,608 | 0.0010 | $ | 5,595 | 0.0035 | ||
62
| Notes |
63
| Notes |
64
| ||
| Contact Us | ipro.americancentury.com | |
| Automated Information Line | 1-800-345-8765 | |
| Investment Professional Service Representatives | 1-800-345-6488 | |
| Telecommunications Relay Services for the Deaf | 711 | |
| American Century Asset Allocation Portfolios, Inc. | ||
Investment Advisor: American Century Investment Management, Inc. Kansas City, Missouri | ||
| This report and the statements it contains are submitted for the general information of our shareholders. The report is not authorized for distribution to prospective investors unless preceded or accompanied by an effective prospectus. | ||
| ©2015 American Century Proprietary Holdings, Inc. All rights reserved. CL-ANN-86672 1509 | ||
ITEM 2. CODE OF ETHICS.
| (a) | The registrant has adopted a Code of Ethics for Senior Financial Officers that applies to the registrant’s principal executive officer, principal financial officer, principal accounting officer, and persons performing similar functions. |
| (b) | No response required. |
| (c) | None. |
| (d) | None. |
| (e) | Not applicable. |
| (f) | The registrant’s Code of Ethics for Senior Financial Officers was filed as Exhibit 12 (a)(1) to American Century Asset Allocation Portfolios, Inc.’s Annual Certified Shareholder Report on Form N-CSR, File No. 811-21591, on September 29, 2005, and is incorporated herein by reference. |
ITEM 3. AUDIT COMMITTEE FINANCIAL EXPERT.
| (a)(1) | The registrant’s board has determined that the registrant has at least one audit committee financial expert serving on its audit committee. |
| (a)(2) | M. Jeannine Strandjord, Stephen E. Yates, Thomas A. Brown and John R. Whitten are the registrant’s designated audit committee financial experts. They are “independent” as defined in Item 3 of Form N-CSR. |
| (a)(3) | Not applicable. |
| (b) | No response required. |
| (c) | No response required. |
| (d) | No response required. |
ITEM 4. PRINCIPAL ACCOUNTANT FEES AND SERVICES.
| (a) | Audit Fees. |
The aggregate fees billed for each of the last two fiscal years for professional services rendered by the principal accountant for the audit of the registrant’s annual financial statements or services that are normally provided by the accountant in connection with statutory and regulatory filings or engagements for those fiscal years were as follows:
FY 2014: $199,420
FY 2015: $195,129
| (b) | Audit-Related Fees. |
The aggregate fees billed in each of the last two fiscal years for assurance and related services by the principal accountant that are reasonably related to the performance of the audit of the registrant’s financial statements and are not reported under paragraph (a) of this Item were as follows:
67
For services rendered to the registrant:
FY 2014: $0
FY 2015: $0
Fees required to be approved pursuant to paragraph (c)(7)(ii) of Rule 2-01 of Regulation S-X (relating to certain engagements for non-audit services with the registrant’s investment adviser and its affiliates):
FY 2014: $0
FY 2015: $0
| (c) | Tax Fees. |
The aggregate fees billed in each of the last two fiscal years for professional services rendered by the principal accountant for tax compliance, tax advice, and tax planning were as follows:
For services rendered to the registrant:
FY 2014: $0
FY 2015: $0
Fees required to be approved pursuant to paragraph (c)(7)(ii) of Rule 2-01 of Regulation S-X (relating to certain engagements for non-audit services with the registrant’s investment adviser and its affiliates):
FY 2014: $0
FY 2015: $0
(d) All Other Fees.
The aggregate fees billed in each of the last two fiscal years for products and services provided by the principal accountant, other than the services reported in paragraphs (a) through (c) of this Item were as follows:
For services rendered to the registrant:
FY 2014: $0
FY 2015: $0
Fees required to be approved pursuant to paragraph (c)(7)(ii) of Rule 2-01 of Regulation S-X (relating to certain engagements for non-audit services with the registrant’s investment adviser and its affiliates):
FY 2014: $0
FY 2015: $0
| (e)(1) | In accordance with paragraph (c)(7)(i)(A) of Rule 2-01 of Regulation S-X, before the accountant is engaged by the registrant to render audit or non-audit services, the engagement is approved by the registrant’s audit committee. Pursuant to paragraph (c)(7)(ii) of Rule 2-01 of Regulation S-X, the registrant’s audit committee also pre-approves its accountant’s engagements for non-audit services with the registrant’s investment adviser, its parent company, and any entity controlled by, or under common control with the investment adviser that provides ongoing services to the registrant, if the engagement relates directly to the operations and financial reporting of the registrant. |
| (e)(2) | All services described in each of paragraphs (b) through (d) of this Item were pre-approved before the engagement by the registrant’s audit committee pursuant to paragraph (c)(7)(i)(A) of Rule 2-01 of Regulation S-X. Consequently, none of such services were required to be approved by the audit committee pursuant to paragraph (c)(7)(i)(C). |
68
| (f) | The percentage of hours expended on the principal accountant’s engagement to audit the registrant’s financial statements for the most recent fiscal year that were attributed to work performed by persons other than the principal accountant’s full-time, permanent employees was less than 50%. |
| (g) | The aggregate non-audit fees billed by the registrant’s accountant for services rendered to the registrant, and rendered to the registrant’s investment adviser (not including any sub-adviser whose role is primarily portfolio management and is subcontracted with or overseen by another investment adviser), and any entity controlling, controlled by, or under common control with the adviser that provides ongoing services to the registrant for each of the last two fiscal years of the registrant were as follows: |
FY 2014: $97,308
FY 2015: $95,500
| (h) | The registrant’s investment adviser and accountant have notified the registrant’s audit committee of all non-audit services that were rendered by the registrant’s accountant to the registrant’s investment adviser, its parent company, and any entity controlled by, or under common control with the investment adviser that provides services to the registrant, which services were not required to be pre-approved pursuant to paragraph (c)(7)(ii) of Rule 2-01 of Regulation S-X. The notification provided to the registrant’s audit committee included sufficient details regarding such services to allow the registrant’s audit committee to consider the continuing independence of its principal accountant. |
ITEM 5. AUDIT COMMITTEE OF LISTED REGISTRANTS.
Not applicable.
ITEM 6. INVESTMENTS.
| (a) | The schedule of investments is included as part of the report to stockholders filed under Item 1 of this Form. |
| (b) | Not applicable. |
ITEM 7. DISCLOSURE OF PROXY VOTING POLICIES AND PROCEDURES FOR CLOSED-END MANAGEMENT INVESTMENT COMPANIES.
Not applicable.
ITEM 8. PORTFOLIO MANAGERS OF CLOSED-END MANAGEMENT INVESTMENT COMPANIES.
Not applicable.
ITEM 9. PURCHASES OF EQUITY SECURITIES BY CLOSED-END MANAGEMENT INVESTMENT COMPANY AND AFFILIATED PURCHASERS.
Not applicable.
ITEM 10. SUBMISSION OF MATTERS TO A VOTE OF SECURITY HOLDERS.
During the reporting period, there were no material changes to the procedures by which shareholders may recommend nominees to the registrant’s board.
69
ITEM 11. CONTROLS AND PROCEDURES.
| (a) | The registrant's principal executive officer and principal financial officer have concluded that the registrant's disclosure controls and procedures (as defined in Rule 30a-3(c) under the Investment Company Act of 1940) are effective based on their evaluation of these controls and procedures as of a date within 90 days of the filing date of this report. |
| (b) | There were no changes in the registrant's internal control over financial reporting (as defined in Rule 30a-3(d) under the Investment Company Act of 1940) that occurred during the registrant's second fiscal quarter of the period covered by this report that have materially affected, or are reasonably likely to materially affect, the registrant's internal control over financial reporting. |
ITEM 12. EXHIBITS.
| (a)(1) | Registrant’s Code of Ethics for Senior Financial Officers, which is the subject of the disclosure required by Item 2 of Form N-CSR, was filed as Exhibit 12(a)(1) to American Century Asset Allocation Portfolios, Inc.’s Certified Shareholder Report on Form N-CSR, File No. 811-21591, on September 29, 2005. |
| (a)(2) | Separate certifications by the registrant’s principal executive officer and principal financial officer, pursuant to Section 302 of the Sarbanes-Oxley Act of 2002 and Rule 30a-2(a) under the Investment Company Act of 1940, are filed and attached hereto as EX-99.CERT. |
| (a)(3) | Not applicable. |
| (b) | A certification by the registrant’s chief executive officer and chief financial officer, pursuant to Section 906 of the Sarbanes-Oxley Act of 2002, is furnished and attached hereto as EX-99.906CERT. |
70
SIGNATURES
Pursuant to the requirements of the Securities Exchange Act of 1934 and the Investment Company Act of 1940, the registrant has duly caused this report to be signed on its behalf by the undersigned, thereunto duly authorized.
| Registrant: | American Century Asset Allocation Portfolios, Inc. | |||
| By: | /s/ Jonathan S. Thomas | |||
| Name: | Jonathan S. Thomas | |||
| Title: | President | |||
| Date: | September 28, 2015 | |||
Pursuant to the requirements of the Securities Exchange Act of 1934 and the Investment Company Act of 1940, this report has been signed below by the following persons on behalf of the registrant and in the capacities and on the dates indicated.
| By: | /s/ Jonathan S. Thomas | ||
| Name: | Jonathan S. Thomas | ||
| Title: | President | ||
| (principal executive officer) | |||
| Date: | September 28, 2015 | ||
| By: | /s/ C. Jean Wade | ||
| Name: | C. Jean Wade | ||
| Title: | Vice President, Treasurer, and | ||
| Chief Financial Officer | |||
| (principal financial officer) | |||
| Date: | September 28, 2015 | ||
71