UNITED STATES
SECURITIES AND EXCHANGE COMMISSION
Washington, D.C. 20549
FORM N-CSR
CERTIFIED SHAREHOLDER REPORT OF REGISTERED
MANAGEMENT INVESTMENT COMPANIES
|
| | | | | | |
| Investment Company Act file number | 811-21591 |
| | |
| AMERICAN CENTURY ASSET ALLOCATION PORTFOLIOS, INC. |
| (Exact name of registrant as specified in charter) |
| | |
| 4500 MAIN STREET, KANSAS CITY, MISSOURI | 64111 |
| (Address of principal executive offices) | (Zip Code) |
| | |
CHARLES A. ETHERINGTON 4500 MAIN STREET, KANSAS CITY, MISSOURI 64111 |
| (Name and address of agent for service) |
| | |
| Registrant’s telephone number, including area code: | 816-531-5575 |
| | |
| Date of fiscal year end: | 07-31 |
| | |
| Date of reporting period: | 07-31-2016 |
ITEM 1. REPORTS TO STOCKHOLDERS.
|
| |
| | |
| | Annual Report |
| | |
| | July 31, 2016 |
| | |
| | One Choice® Portfolio: Very Conservative |
| | |
| | One Choice® Portfolio: Conservative |
| | |
| | One Choice® Portfolio: Moderate |
| | |
| | One Choice® Portfolio: Aggressive |
| | |
| | One Choice® Portfolio: Very Aggressive |
|
| | |
| President’s Letter | 2 |
|
| Performance | 3 |
|
| Portfolio Commentary | |
|
| Portfolio Characteristics | |
|
| Shareholder Fee Examples | |
|
| Schedules of Investments | |
|
| Statements of Assets and Liabilities | |
|
| Statements of Operations | |
|
| Statements of Changes in Net Assets | |
|
| Notes to Financial Statements | |
|
| Financial Highlights | |
|
| Report of Independent Registered Public Accounting Firm | |
|
| Management | |
|
| Approval of Management Agreement | |
|
| Additional Information | |
|
Any opinions expressed in this report reflect those of the author as of the date of the report, and do not necessarily represent the opinions of American Century Investments® or any other person in the American Century Investments organization. Any such opinions are subject to change at any time based upon market or other conditions and American Century Investments disclaims any responsibility to update such opinions. These opinions may not be relied upon as investment advice and, because investment decisions made by American Century Investments funds are based on numerous factors, may not be relied upon as an indication of trading intent on behalf of any American Century Investments fund. Security examples are used for representational purposes only and are not intended as recommendations to purchase or sell securities. Performance information for comparative indices and securities is provided to American Century Investments by third party vendors. To the best of American Century Investments’ knowledge, such information is accurate at the time of printing.
 Jonathan Thomas
Dear Investor:
Thank you for reviewing this annual report for the period ended July 31, 2016. It provides investment performance and portfolio information for the reporting period, plus longer-term historical performance data.
Annual reports remain important vehicles for conveying information about fund returns, including market and economic factors that affected performance during the reporting period. For additional, updated investment and market insights, we encourage you to visit our website, americancentury.com.
Market Volatility Increased, But Not for the Reasons Anticipated
Going into this reporting period, investors anticipated increased market volatility and uncertainty as the Federal Reserve (the Fed) appeared poised to raise short-term interest rates toward more historically normal levels. This policy change was expected to affect investor sentiment, U.S. Treasury yield behavior, relative currency values, inflation expectations, and corporate costs and earnings.
This Fed-centric outlook didn’t fully account for global factors, which ultimately drove sentiment, volatility, and performance during the reporting period. During 2015, the primary catalyst was China, where slowing economic growth, currency devaluations, and massive monetary policy easing sent shock waves through the global markets. The Fed ended up delaying (until December 2015) its only small rate hike during the reporting period. Afterward, China-related events repeated in January and early February this year, further delaying Fed action.
Oil was another catalyst—its price collapses devalued entire market sectors and contributed to
broad market volatility and negative sentiment. Later, as China and oil appeared to stabilize, Brexit
occurred—the unexpected decision by United Kingdom voters to leave the European Union. This produced more shock waves, and altered central bank policies around the world. In this environment, relatively defensive assets performed well.
Looking ahead, we believe the markets face further uncertainty and volatility as they digest Brexit, the Italian bank crisis, China’s economic mysteries, and the U.S. presidential election. Negative interest rates in Europe and Japan represent part of the market’s response to the global macroeconomic climate. These negative rates are suppressing interest rates around the world while driving up the value of the U.S. dollar and U.S. bonds. In a broad sense, stocks also benefit from the central bank stimulus that is driving interest rates into negative territory, and from relative yield advantages as bond yields are pushed lower. It’s an unusual and challenging environment. We appreciate your continued trust in us.
Sincerely,
Jonathan Thomas
President and Chief Executive Officer
American Century Investments
|
| | | | | | |
| Total Returns as of July 31, 2016 |
| | | | Average Annual Returns | |
| | Ticker Symbol | 1 year | 5 years | 10 years | Since Inception | Inception Date |
| One Choice Portfolio: Very Conservative | | | |
| Investor Class | AONIX | 4.93% | 4.52% | 4.75% | — | 9/30/04 |
| R Class | AORHX | 4.39% | — | — | 2.34% | 3/20/15 |
| One Choice Portfolio: Conservative | | | | | |
| Investor Class | AOCIX | 3.13% | 6.12% | 5.58% | — | 9/30/04 |
| R Class | AORSX | 2.68% | — | — | 1.16% | 3/20/15 |
| One Choice Portfolio: Moderate | | | | |
| Investor Class | AOMIX | 1.62% | 7.19% | 6.04% | — | 9/30/04 |
| R Class | AORMX | 1.17% | — | — | 0.17% | 3/20/15 |
| One Choice Portfolio: Aggressive | | | | | |
| Investor Class | AOGIX | 0.69% | 8.01% | 6.43% | — | 9/30/04 |
| R Class | AORYX | 0.16% | — | — | -0.49% | 3/20/15 |
| One Choice Portfolio: Very Aggressive | | | |
| Investor Class | AOVIX | -0.44% | 8.84% | 6.35% | — | 9/30/04 |
| R Class | AORVX | -0.92% | — | — | -1.26% | 3/20/15 |
| Russell 3000 Index | — | 4.44% | 12.98% | 7.82% | — | — |
Barclays U.S. Aggregate Bond Index | — | 5.94% | 3.56% | 5.05% | — | — |
Average annual returns since inception are presented when ten years of performance history is not available.
The Russell 3000 Index represents approximately 98% of the investable U.S. equity market and provides a broad measure of equity performance. The Barclays U.S. Aggregate Bond Index represents the U.S. investment-grade fixed-rate bond market and provides a broad measure of bond market performance. Performance for these indices is provided for reference only. Neither index is intended to represent the composition of the portfolio, which invests in a mix of equity and fixed-income securities. (See the Schedule of Investments for each portfolio’s asset allocations as of the date of this report.)
Data presented reflect past performance. Past performance is no guarantee of future results. Current performance may be higher or lower than the performance shown. Total returns for periods less than one year are not annualized. Investment return and principal value will fluctuate, and redemption value may be more or less than original cost. Data assumes reinvestment of dividends and capital gains, and none of the charts reflect the deduction of taxes that a shareholder would pay on fund distributions or the redemption of fund shares. To obtain performance data current to the most recent month end, please call 1-800-345-2021 or visit americancentury.com. For additional information about the funds, please consult the prospectus.
|
|
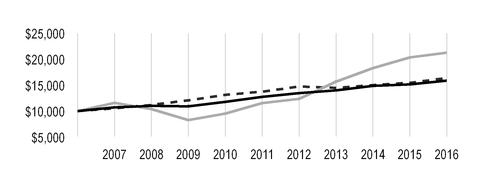
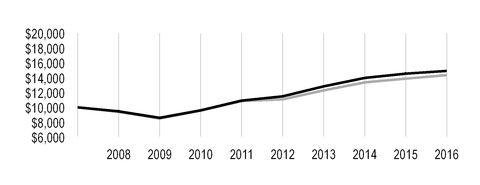
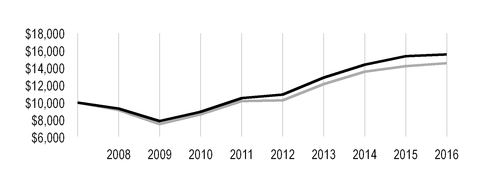
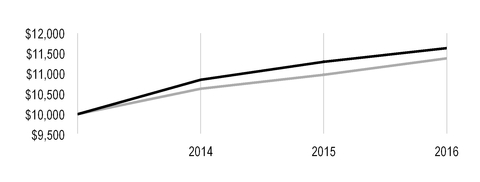
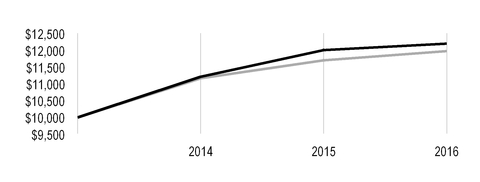
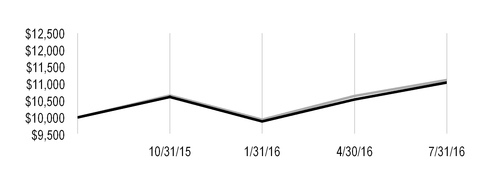
| Growth of $10,000 Over 10 Years of One Choice Portfolio: Very Conservative |
| $10,000 investment made July 31, 2006 |
| Performance for other share classes will vary due to differences in fee structure. |
|
| |
| Value on July 31, 2016 |
| | Investor Class — $15,904 |
| |
| | Russell 3000 Index — $21,244 |
| |
| | Barclays U.S. Aggregate Bond Index — $16,380 |
| |
|
|
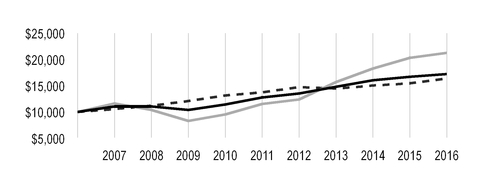
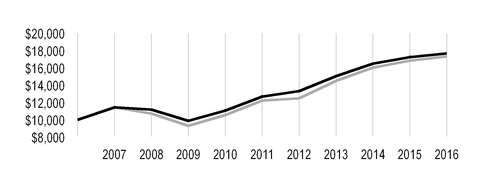
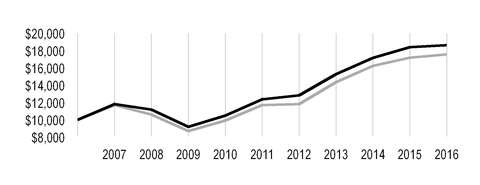
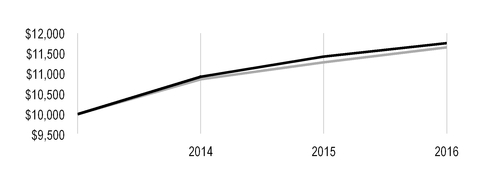
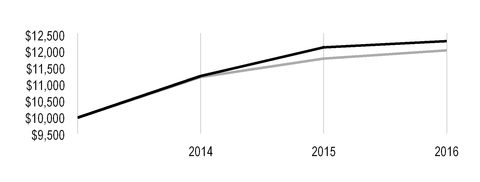
| Growth of $10,000 Over 10 Years of One Choice Portfolio: Conservative |
| $10,000 investment made July 31, 2006 |
| Performance for other share classes will vary due to differences in fee structure. |
|
| |
| Value on July 31, 2016 |
| | Investor Class — $17,220 |
| |
| | Russell 3000 Index — $21,244 |
| |
| | Barclays U.S. Aggregate Bond Index — $16,380 |
| |
Data presented reflect past performance. Past performance is no guarantee of future results. Current performance may be higher or lower than the performance shown. Total returns for periods less than one year are not annualized. Investment return and principal value will fluctuate, and redemption value may be more or less than original cost. Data assumes reinvestment of dividends and capital gains, and none of the charts reflect the deduction of taxes that a shareholder would pay on fund distributions or the redemption of fund shares. To obtain performance data current to the most recent month end, please call 1-800-345-2021 or visit americancentury.com. For additional information about the funds, please consult the prospectus.
|
|
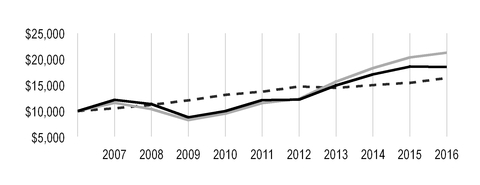
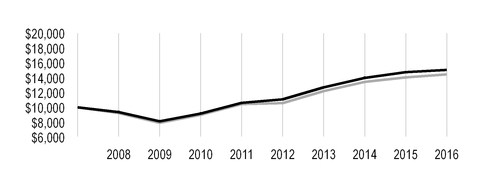
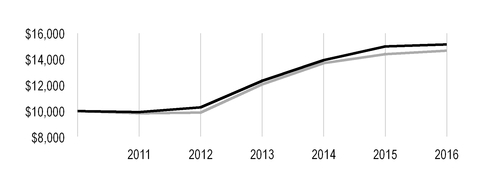
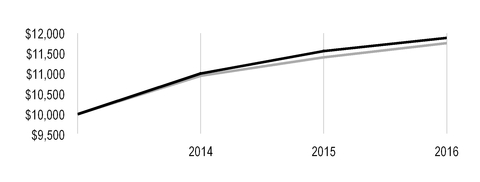
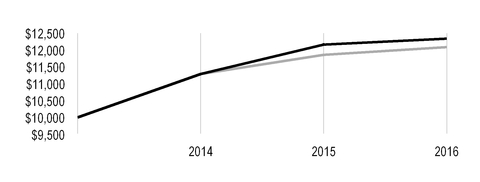
| Growth of $10,000 Over 10 Years of One Choice Portfolio: Moderate |
| $10,000 investment made July 31, 2006 |
| Performance for other share classes will vary due to differences in fee structure. |
|
| |
| Value on July 31, 2016 |
| | Investor Class — $17,992 |
| |
| | Russell 3000 Index — $21,244 |
| |
| | Barclays U.S. Aggregate Bond Index — $16,380 |
| |
|
|
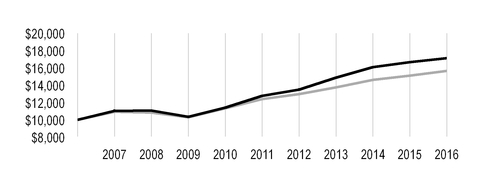
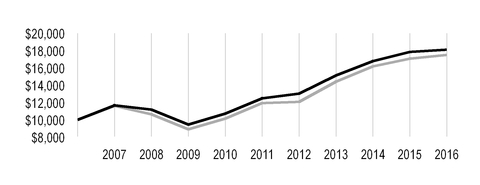
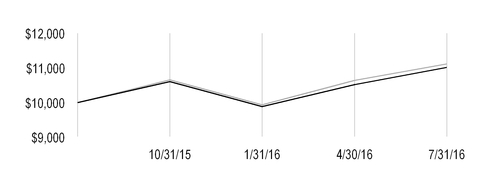
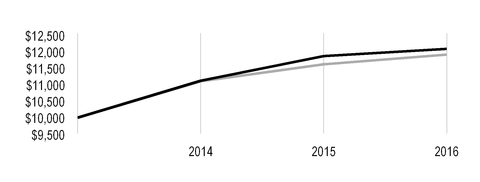
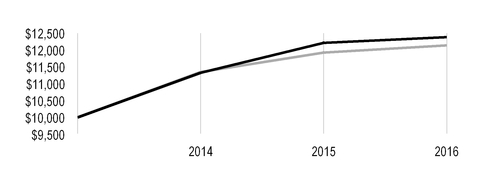
| Growth of $10,000 Over 10 Years of One Choice Portfolio: Aggressive |
| $10,000 investment made July 31, 2006 |
| Performance for other share classes will vary due to differences in fee structure. |
|
| |
| Value on July 31, 2016 |
| | Investor Class — $18,664 |
| |
| | Russell 3000 Index — $21,244 |
| |
| | Barclays U.S. Aggregate Bond Index — $16,380 |
| |
Data presented reflect past performance. Past performance is no guarantee of future results. Current performance may be higher or lower than the performance shown. Total returns for periods less than one year are not annualized. Investment return and principal value will fluctuate, and redemption value may be more or less than original cost. Data assumes reinvestment of dividends and capital gains, and none of the charts reflect the deduction of taxes that a shareholder would pay on fund distributions or the redemption of fund shares. To obtain performance data current to the most recent month end, please call 1-800-345-2021 or visit americancentury.com. For additional information about the funds, please consult the prospectus.
|
|
| Growth of $10,000 Over 10 Years of One Choice Portfolio: Very Aggressive |
| $10,000 investment made July 31, 2006 |
| Performance for other share classes will vary due to differences in fee structure. |
|
| |
| Value on July 31, 2016 |
| | Investor Class — $18,515 |
| |
| | Russell 3000 Index — $21,244 |
| |
| | Barclays U.S. Aggregate Bond Index — $16,380 |
| |
|
| | |
| Total Annual Fund Operating Expenses |
| | Investor Class | R Class |
| One Choice Portfolio: Very Conservative | 0.68% | 1.18% |
| One Choice Portfolio: Conservative | 0.76% | 1.26% |
| One Choice Portfolio: Moderate | 0.88% | 1.38% |
| One Choice Portfolio: Aggressive | 0.98% | 1.48% |
| One Choice Portfolio: Very Aggressive | 1.04% | 1.54% |
The total annual fund operating expenses shown is as stated in the fund’s prospectus current as of the date of this report. The prospectus may vary from the expense ratio shown elsewhere in this report because it is based on a different time period, includes acquired fund fees and expenses, and, if applicable, does not include fee waivers or expense reimbursements.
Data presented reflect past performance. Past performance is no guarantee of future results. Current performance may be higher or lower than the performance shown. Total returns for periods less than one year are not annualized. Investment return and principal value will fluctuate, and redemption value may be more or less than original cost. Data assumes reinvestment of dividends and capital gains, and none of the charts reflect the deduction of taxes that a shareholder would pay on fund distributions or the redemption of fund shares. To obtain performance data current to the most recent month end, please call 1-800-345-2021 or visit americancentury.com. For additional information about the funds, please consult the prospectus.
Portfolio Managers: Scott Wittman, Rich Weiss, Scott Wilson, Radu Gabudean, and David MacEwen
Performance Summary
For the fiscal year ended July 31, 2016, returns of the One Choice® Target Risk Portfolios ranged from 4.93%* for One Choice Portfolio: Very Conservative to -0.44% for One Choice Portfolio: Very Aggressive (see pages 3-6 for more detailed performance information). Returns for the 12-month period reflected strong performance of the Portfolios’ fixed-income investments, advances across most U.S.-based equity segments, and declines in non-U.S. equity components.
Because of the Portfolios’ strategic exposure to a variety of asset classes, a review of the financial markets helps explain much of their performance.
Market Overview
The reporting period began with pronounced volatility as markets receded in response to the slowing Chinese economy and the potential spillover effects on overall global growth. Equity indices experienced steep losses as investors exited riskier assets following currency devaluation by the Chinese government on the heels of disappointing economic growth data. Concerns about slowing growth reverberated throughout global markets and would serve as an ongoing driver of market returns throughout the period. Equity markets also came under pressure as commodity prices deteriorated in the first half of the fiscal year, with oil prices sinking to their lowest levels since early 2009 on widening oversupply and uncertain future demand. Oil and a number of other commodity prices rebounded somewhat in the second half of the fiscal year, but remained weak from an historical perspective.
Divergence of central bank policies remained a persistent theme throughout the reporting period, with global market headlines and returns dominated by anticipation of and reaction to monetary policy changes. The Federal Reserve (Fed) raised interest rates in December of 2015 for the first time in nearly a decade; in contrast, other central banks around the world pursued aggressive stimulus programs. This is consistent with the fact that economic growth rates in the U.S. continued to outpace those in most of the rest of the world.
Following a broad sell-off early in 2016, equities reversed course as investors took on a more optimistic outlook. Global growth concerns abated somewhat in response to more upbeat economic releases, improving sentiment about China, and rising commodity and oil prices. Accommodative monetary policy of major central banks and further delays in Fed tightening, as well as a weakening U.S. dollar, helped to drive equity market rallies around the globe. Market leadership shifted in early 2016, with value-oriented equities outperforming growth as more defensive names led those typically associated with a cyclical recovery. The close of the period was dominated by uncertainty around “Brexit,” the U.K. referendum about remaining in the European Union (EU). Following a “leave” vote at the end of June, global markets corrected sharply, with virtually all risky asset classes declining amid the uncertainty, with U.K. and European companies among the hardest hit. After a two-day sell-off that erased more than $3 trillion of global stock market value, cooler heads ultimately prevailed and investors adopted a longer-term view of Brexit and its effect on global growth and financial markets, concluding that the impact may not be as dire as originally thought. Global equities rallied in the final month of the reporting period, as investors shook off mounting geopolitical risks and tumbling oil prices, focusing instead on additional central bank stimulus on the horizon.
* All fund returns referenced in this commentary are for Investor Class shares. Performance for other share classes will vary due to differences in fee structure; when Investor Class performance exceeds that of the fund's benchmark, other share classes may not. See page 3 for returns for all share classes.
In this environment, U.S. equities ended the reporting period with advances, outperforming both developed non-U.S. equities, which produced substantive declines, and emerging markets, which fell more modestly. Within the U.S. market, value led growth stocks across all capitalization ranges, and broad large- and mid-cap indices outperformed their small-cap peers.
Fixed-income investments generally advanced, with positive returns largely generated during the second half of the reporting period. During the first part of the fiscal year, investors’ risk-aversion heightened on concerns about China’s growth rate and its likely impact on the overall health of the global economy. As investors gravitated toward the relative safety of higher-quality fixed-income investments, higher-yielding bonds declined. This preference for less-risky investments continued into 2016. While equities sold off broadly, bonds advanced, led by unhedged, non-U.S. aggregate bond indices, which benefited from supportive monetary policies of global central banks and from U.S.-dollar weakness. For the period as a whole, non-U.S. bonds led bonds in the U.S. Within the broad U.S. bond market, high-quality bonds slightly outperformed high-yield, and longer-duration bonds produced larger advances as compared to those with shorter-durations, with long-term U.S. Treasury securities producing substantial gains.
Portfolio Performance
Each One Choice Target Risk Portfolio is a “fund of funds” that invests in other American Century Investments mutual funds to achieve its investment objective and target asset allocation. (See page 10 for the specific underlying fund allocations for each Portfolio.)
The Portfolios’ U.S. equity funds generally contributed positively to performance for the 12-month period, with the exception of Heritage Fund (mid-cap growth) and Small Company Fund, which detracted modestly. Mid Cap Value Fund contributed most in absolute terms, and outperformed its underlying benchmark as a result of stock selection decisions. Growth Fund (large-cap growth), Large Company Value Fund, and Equity Growth Fund (large-cap core) all contributed notably to absolute results; however, all three funds underperformed their respective benchmarks.
Non-U.S. equity performance was mixed. International Growth Fund (not held by Very Conservative Portfolio) was a leading detractor from absolute performance and underperformed its benchmark. NT International Value Fund (not held by Very Conservative Portfolio) had negative absolute returns and was a leading detractor from performance in all Portfolios in which it was held; nevertheless, the fund held up better than its underlying benchmark thanks to effective stock selection decisions across a wide range of sectors and countries. Similarly, Emerging Markets Fund (not held by Very Conservative and Conservative Portfolios) had negative absolute results but outperformed its underlying benchmark. NT Global Real Estate Fund was a leading contributor to performance in every Portfolio except for Very Conservative, whose real estate allocation is the U.S.-focused Real Estate Fund, which also performed well on an absolute basis.
Performance was positive across all the Portfolios’ fixed-income segments, with Diversified Bond Fund contributing the most to return across all Portfolios in which it is represented (all except Very Aggressive). Consistent with the strong performance of high-quality bonds around the globe, International Bond Fund (not held by Aggressive or Very Aggressive Portfolios) made a sizeable contribution to return during the year. Similarly, Global Bond Fund, which is not held by Very Aggressive, was another source of strength. Funds designed to protect against inflation, such as Inflation-Adjusted Bond Fund and Short Duration Inflation Protection Bond Fund (neither was held by Very Aggressive Portfolio) also performed well. Diversified Bond Fund, International Bond Fund, and High-Yield Fund (also not held by Very Aggressive) underperformed their underlying fund benchmarks.
Portfolio Strategy
Each Portfolio has a “neutral” asset mix (the target allocations for stocks, bonds, and cash- equivalent investments) that remains fixed over time. Our management approach involves making
modest tactical adjustments to each Portfolio’s actual asset mix to add value and improve the Portfolios’ ability to meet their investment objectives.
Throughout the reporting period we maintained an overweight exposure to equities, with a corresponding decrease to Diversified Bond Fund (not held by Very Aggressive Portfolio) within the fixed-income segment weighting, while remaining underweight to cash. Within the stock allocation, for much of the period we maintained an underweight to international equities in favor of U.S. stocks. On balance, this positioning had a mixed effect; high-quality bonds performed well, so it generally detracted modestly to be underweight this space. But within equities, it was beneficial to overweight the U.S. and underweight non-U.S. developed market equities.
A Look Ahead
We believe that global divergence in economic growth and monetary policy by central banks seems likely to continue. Growth remains mostly slower outside the U.S., and non-U.S. monetary policies are generally more stimulative. Capital markets are increasingly taking their cues from global factors rather than focusing on the U.S. Therefore, China continues to be the leading influence on global economic expansion, although the U.K. jumped into the limelight by electing to exit the EU.
U.S. interest rates remain at historically low levels, but higher interest rates appear justified when considering domestic economic factors alone and ignoring global conditions. Falling unemployment, rising wages, higher rents, and improving home prices argue for higher rates. However, what happens in China, Europe, and Japan could have at least as much impact on U.S. interest rates as what happens in the U.S. Global macro headwinds are having more impact on the smaller manufacturing side of the U.S. economy than the larger services side, which is still expanding. The Fed owns a large bond portfolio acquired through past Quantitative Easing (QE) purchases, and will continue to reinvest coupon interest and principal from these bonds, which is likely to help keep interest rates low. While earlier predictions called for two small rate increases during 2016, the market is now pricing in a very low probability of tightening in the wake of Brexit and a lower-than-expected reported growth rate for the second quarter.
Looking ahead, we think that uncertainty in whether the Fed will raise interest rates again, the impact of the Brexit vote, slow global growth (and low corporate profits), and the possible impact from the U.S. presidential election will continue to affect market returns and volatility. While stock valuations on the whole are not terribly compelling, there have been significant rotations and corrections at the industry and sector level going back at least to 2015, creating select investment opportunities. Growth is likely to remain disappointing around much of the globe, particularly for countries with exposure to China and/or commodity markets. While tighter monetary policy and higher rates in the U.S. typically weigh on risk assets such as emerging markets equities, attractive valuations and monetary conditions in many emerging markets countries can lead to compelling investment opportunities.
Given this backdrop, we continue to favor equities over bonds and cash-equivalent investments. Within equities, we maintained a long-running overweight to growth stocks, generally adding to this position over the course of the 12 months. This positioning aided results during a period when growth strongly outperformed value. We remain neutral in terms of market capitalization and are marginally biased to U.S. equities as compared to non-U.S. in all Portfolios aside from Very Conservative.
Our fixed-income positioning reflects our expectation that economic conditions in the U.S. will meet the necessary targets for the Fed to raise interest rates further. We therefore remain underweight to U.S. Treasuries and government agencies in favor of higher-yielding corporate- and mortgage-backed securities. We believe that high-yield corporate bonds remain attractive, and remain overweight to that segment (for those Portfolios whose mandates allow exposure to these instruments).
|
|
| Portfolio Characteristics |
|
| | | | | |
Underlying Fund Allocations(1) as a % of net assets as of July 31, 2016 |
| | One Choice Portfolio: Very Conservative | One Choice Portfolio: Conservative | One Choice Portfolio: Moderate | One Choice Portfolio: Aggressive | One Choice Portfolio: Very Aggressive |
| Equity | | | | | |
| Core Equity Plus Fund | 1.0% | 1.9% | 4.0% | 4.6% | 4.8% |
| Equity Growth Fund | 3.9% | 7.3% | 11.5% | 10.5% | 12.2% |
| Growth Fund | 3.9% | 6.1% | 8.3% | 12.1% | 13.0% |
| Heritage Fund | 1.6% | 3.7% | 5.4% | 7.6% | 9.2% |
| Large Company Value Fund | 7.9% | 7.9% | 9.7% | 10.6% | 11.5% |
| Mid Cap Value Fund | 5.1% | 6.5% | 5.9% | 5.9% | 7.7% |
| NT Disciplined Growth Fund | 1.0% | 1.4% | 2.0% | 3.1% | 4.0% |
| Real Estate Fund | 2.5% | — | — | — | — |
| Small Company Fund | 1.0% | 1.5% | 1.7% | 1.7% | 6.5% |
| Emerging Markets Fund | — | — | 4.1% | 6.7% | 7.5% |
| International Growth Fund | — | 5.2% | 6.1% | 8.2% | 9.8% |
| NT Global Real Estate Fund | — | 2.6% | 2.4% | 3.2% | 3.0% |
| NT International Small-Mid Cap Fund | — | 0.9% | 1.5% | 1.9% | 3.0% |
| NT International Value Fund | — | 3.1% | 4.6% | 5.6% | 7.8% |
| Total Equity | 27.9% | 48.1% | 67.2% | 81.7% | 100.0% |
| Fixed Income | | | | | |
| Diversified Bond Fund | 18.9% | 19.3% | 12.9% | 5.7% | — |
| High-Yield Fund | 2.3% | 2.5% | 3.4% | 5.1% | — |
| Inflation-Adjusted Bond Fund | 9.9% | 6.8% | 5.9% | 3.1% | — |
| Short Duration Fund | 6.9% | — | — | — | — |
| Short Duration Inflation Protection Bond Fund | 12.8% | 4.8% | 1.0% | 1.0% | — |
| Global Bond Fund | 7.9% | 6.8% | 5.0% | 3.1% | — |
| International Bond Fund | 8.0% | 6.4% | 1.7% | — | — |
| Total Fixed Income | 66.7% | 46.6% | 29.9% | 18.0% | — |
| U.S. Government Money Market Fund | 5.4% | 5.3% | 2.9% | 0.3% | — |
| Other Assets and Liabilities | —(2) | —(2) | —(2) | —(2) | — |
| |
| (1) | Underlying fund investments represent Investor Class. |
| |
| (2) | Category is less than 0.05% of total net assets. |
Fund shareholders may incur two types of costs: (1) transaction costs, including sales charges (loads) on purchase payments and redemption/exchange fees; and (2) ongoing costs, including management fees; distribution and service (12b-1) fees; and other fund expenses. This example is intended to help you understand your ongoing costs (in dollars) of investing in your fund and to compare these costs with the ongoing cost of investing in other mutual funds. As a shareholder in the underlying American Century Investments funds, your fund will indirectly bear its pro rata share of the expenses incurred by the underlying funds. These expenses are not included in the fund’s annualized expense ratio or the expenses paid during the period. These expenses are, however, included in the effective expenses paid during the period.
The example is based on an investment of $1,000 made at the beginning of the period and held for the entire period from February 1, 2016 to July 31, 2016.
Actual Expenses
The table provides information about actual account values and actual expenses for each class. You may use the information, together with the amount you invested, to estimate the expenses that you paid over the period. First, identify the share class you own. Then simply divide your account value by $1,000 (for example, an $8,600 account value divided by $1,000 = 8.6), then multiply the result by the number under the heading “Expenses Paid During Period” to estimate the expenses you paid on your account during this period.
If you hold Investor Class shares of any American Century Investments fund, or Institutional Class shares of the American Century Diversified Bond Fund, in an American Century Investments account (i.e., not a financial intermediary or retirement plan account), American Century Investments may charge you a $12.50 semiannual account maintenance fee if the value of those shares is less than $10,000. We will redeem shares automatically in one of your accounts to pay the $12.50 fee. In determining your total eligible investment amount, we will include your investments in all personal accounts (including American Century Investments Brokerage accounts) registered under your Social Security number. Personal accounts include individual accounts, joint accounts, UGMA/UTMA accounts, personal trusts, Coverdell Education Savings Accounts and IRAs (including traditional, Roth, Rollover, SEP-, SARSEP- and SIMPLE-IRAs), and certain other retirement accounts. If you have only business, business retirement, employer-sponsored or American Century Investments Brokerage accounts, you are currently not subject to this fee. If you are subject to the Account Maintenance Fee, your account value could be reduced by the fee amount.
Hypothetical Example for Comparison Purposes
The table also provides information about hypothetical account values and hypothetical expenses based on the actual expense ratio of each class of your fund and an assumed rate of return of 5% per year before expenses, which is not the actual return of a fund’s share class. The hypothetical account values and expenses may not be used to estimate the actual ending account balance or expenses you paid for the period. You may use this information to compare the ongoing costs of investing in your fund and other funds. To do so, compare this 5% hypothetical example with the 5% hypothetical examples that appear in the shareholder reports of the other funds.
Please note that the expenses shown in the table are meant to highlight your ongoing costs only and do not reflect any transactional costs, such as sales charges (loads) or redemption/exchange fees. Therefore, the table is useful in comparing ongoing costs only, and will not help you determine the relative total costs of owning different funds. In addition, if these transactional costs were included, your costs would have been higher.
|
| | | | | | |
| | Beginning
Account Value
2/1/16 | Ending
Account Value
7/31/16 | Expenses Paid
During Period(1)
2/1/16 - 7/31/16 | Annualized
Expense Ratio(1) | Effective
Expenses
Paid During
Period(2)
2/1/16 - 7/31/16 | Effective Annualized Expense Ratio(2) |
| One Choice Portfolio: Very Conservative | | | | |
| Actual | | | | | | |
| Investor Class | $1,000 | $1,075.80 | $0.00 | 0.00%(3) | $3.66 | 0.71% |
| R Class | $1,000 | $1,073.10 | $2.58 | 0.50% | $6.24 | 1.21% |
| Hypothetical | | | | | | |
| Investor Class | $1,000 | $1,024.86 | $0.00 | 0.00%(3) | $3.57 | 0.71% |
| R Class | $1,000 | $1,022.38 | $2.51 | 0.50% | $6.07 | 1.21% |
| One Choice Portfolio: Conservative | | | | |
| Actual | | | | | | |
| Investor Class | $1,000 | $1,086.20 | $0.00 | 0.00%(3) | $4.25 | 0.82% |
| R Class | $1,000 | $1,084.40 | $2.59 | 0.50% | $6.84 | 1.32% |
| Hypothetical | | | | | | |
| Investor Class | $1,000 | $1,024.86 | $0.00 | 0.00%(3) | $4.12 | 0.82% |
| R Class | $1,000 | $1,022.38 | $2.51 | 0.50% | $6.62 | 1.32% |
| One Choice Portfolio: Moderate | | | | |
| Actual | | | | | | |
| Investor Class | $1,000 | $1,099.20 | $0.00 | 0.00%(3) | $4.80 | 0.92% |
| R Class | $1,000 | $1,096.50 | $2.61 | 0.50% | $7.40 | 1.42% |
| Hypothetical | | | | | | |
| Investor Class | $1,000 | $1,024.86 | $0.00 | 0.00%(3) | $4.62 | 0.92% |
| R Class | $1,000 | $1,022.38 | $2.51 | 0.50% | $7.12 | 1.42% |
| One Choice Portfolio: Aggressive | | | | |
| Actual | | | | | | |
| Investor Class | $1,000 | $1,110.70 | $0.00 | 0.00%(3) | $5.30 | 1.01% |
| R Class | $1,000 | $1,107.70 | $2.62 | 0.50% | $7.91 | 1.51% |
| Hypothetical | | | | | | |
| Investor Class | $1,000 | $1,024.86 | $0.00 | 0.00%(3) | $5.07 | 1.01% |
| R Class | $1,000 | $1,022.38 | $2.51 | 0.50% | $7.57 | 1.51% |
| One Choice Portfolio: Very Aggressive | | | | |
| Actual | | | | | | |
| Investor Class | $1,000 | $1,120.30 | $0.00 | 0.00%(3) | $5.69 | 1.08% |
| R Class | $1,000 | $1,118.10 | $2.63 | 0.50% | $8.32 | 1.58% |
| Hypothetical | | | | | | |
| Investor Class | $1,000 | $1,024.86 | $0.00 | 0.00%(3) | $5.42 | 1.08% |
| R Class | $1,000 | $1,022.38 | $2.51 | 0.50% | $7.92 | 1.58% |
| |
| (1) | Expenses are equal to the class's annualized expense ratio listed in the table above, multiplied by the average account value over the period, multiplied by 182, the number of days in the most recent fiscal half-year, divided by 366, to reflect the one-half year period. The fees and expenses of the underlying American Century Investments funds in which the fund invests are not included in the class's annualized expense ratio. |
| |
| (2) | Effective expenses reflect the sum of expenses borne directly by the class plus the fund's pro rata share of the weighted average expense ratio of the underlying funds in which it invests. The effective annualized expense ratio combines the class's annualized expense ratio and the annualized weighted average expense ratio of the underlying funds. The annualized weighted average expense ratio of the underlying funds for the one-half year period reflects the actual expense ratio of each underlying fund from its most recent shareholder report, annualized and weighted for the fund's relative average investment therein during the period. |
| |
| (3) | Other expenses, which include directors' fees and expenses, did not exceed 0.005%. |
JULY 31, 2016
One Choice Portfolio: Very Conservative
|
| | | | |
| | Shares | Value |
MUTUAL FUNDS(1) — 100.0% | | |
| Domestic Fixed Income Funds — 50.8% | | |
| Diversified Bond Fund Investor Class | 6,978,422 | $ | 77,600,055 |
|
| High-Yield Fund Investor Class | 1,680,136 | 9,425,561 |
|
| Inflation-Adjusted Bond Fund Investor Class | 3,402,440 | 40,693,182 |
|
| Short Duration Fund Investor Class | 2,744,933 | 28,300,263 |
|
Short Duration Inflation Protection Bond Fund Investor Class(2) | 5,172,854 | 52,918,301 |
|
| | | 208,937,362 |
|
| Domestic Equity Funds — 27.9% | | |
| Core Equity Plus Fund Investor Class | 307,575 | 3,946,186 |
|
| Equity Growth Fund Investor Class | 563,432 | 16,181,770 |
|
| Growth Fund Investor Class | 552,723 | 16,277,691 |
|
| Heritage Fund Investor Class | 297,770 | 6,649,207 |
|
| Large Company Value Fund Investor Class | 3,570,762 | 32,708,184 |
|
| Mid Cap Value Fund Investor Class | 1,263,501 | 20,847,762 |
|
| NT Disciplined Growth Fund Investor Class | 398,241 | 3,978,433 |
|
| Real Estate Fund Investor Class | 299,809 | 10,292,427 |
|
| Small Company Fund Investor Class | 285,180 | 3,767,222 |
|
| | | 114,648,882 |
|
| International Fixed Income Funds — 15.9% | | |
| Global Bond Fund Investor Class | 3,118,671 | 32,371,806 |
|
| International Bond Fund Investor Class | 2,456,128 | 32,912,117 |
|
| | | 65,283,923 |
|
| Money Market Funds — 5.4% | | |
| U.S. Government Money Market Fund Investor Class | 22,124,371 | 22,124,371 |
|
TOTAL INVESTMENT SECURITIES — 100.0%
(Cost $367,797,126) | | 410,994,538 |
|
OTHER ASSETS AND LIABILITIES† | | (128) |
|
| TOTAL NET ASSETS — 100.0% | | $ | 410,994,410 |
|
|
|
| NOTES TO SCHEDULE OF INVESTMENTS |
| |
| † | Category is less than 0.05% of total net assets. |
| |
| (1) | Investments are funds within the American Century Investments family of funds and are considered affiliated funds. |
See Notes to Financial Statements.
JULY 31, 2016
One Choice Portfolio: Conservative
|
| | | | |
| | Shares | Value |
MUTUAL FUNDS(1) — 100.0% | | |
| Domestic Equity Funds — 36.3% | | |
| Core Equity Plus Fund Investor Class | 1,634,821 | $ | 20,974,760 |
|
| Equity Growth Fund Investor Class | 2,805,377 | 80,570,420 |
|
| Growth Fund Investor Class | 2,285,450 | 67,306,488 |
|
| Heritage Fund Investor Class | 1,839,726 | 41,081,083 |
|
| Large Company Value Fund Investor Class | 9,476,566 | 86,805,342 |
|
| Mid Cap Value Fund Investor Class | 4,313,346 | 71,170,205 |
|
| NT Disciplined Growth Fund Investor Class | 1,574,823 | 15,732,485 |
|
| Small Company Fund Investor Class | 1,200,905 | 15,863,959 |
|
| | | 399,504,742 |
|
| Domestic Fixed Income Funds — 33.4% | | |
| Diversified Bond Fund Investor Class | 19,103,790 | 212,434,148 |
|
| High-Yield Fund Investor Class | 4,886,143 | 27,411,263 |
|
| Inflation-Adjusted Bond Fund Investor Class | 6,282,137 | 75,134,364 |
|
Short Duration Inflation Protection Bond Fund Investor Class(2) | 5,186,773 | 53,060,683 |
|
| | | 368,040,458 |
|
| International Fixed Income Funds — 13.2% | | |
| Global Bond Fund Investor Class | 7,220,241 | 74,946,099 |
|
| International Bond Fund Investor Class | 5,268,621 | 70,599,515 |
|
| | | 145,545,614 |
|
| International Equity Funds — 11.8% | | |
| International Growth Fund Investor Class | 5,112,911 | 56,906,703 |
|
| NT Global Real Estate Fund Investor Class | 2,696,079 | 28,012,258 |
|
| NT International Small-Mid Cap Fund Investor Class | 979,700 | 10,228,068 |
|
| NT International Value Fund Investor Class | 4,011,149 | 34,415,656 |
|
| | | 129,562,685 |
|
| Money Market Funds — 5.3% | | |
| U.S. Government Money Market Fund Investor Class | 58,493,332 | 58,493,332 |
|
TOTAL INVESTMENT SECURITIES — 100.0%
(Cost $982,785,744) | | 1,101,146,831 |
|
OTHER ASSETS AND LIABILITIES† | | (387) |
|
| TOTAL NET ASSETS — 100.0% | | $ | 1,101,146,444 |
|
|
|
| NOTES TO SCHEDULE OF INVESTMENTS |
| |
| † | Category is less than 0.05% of total net assets. |
| |
| (1) | Investments are funds within the American Century Investments family of funds and are considered affiliated funds. |
See Notes to Financial Statements.
JULY 31, 2016
One Choice Portfolio: Moderate
|
| | | | |
| | Shares | Value |
MUTUAL FUNDS(1) — 100.0% | | |
| Domestic Equity Funds — 48.5% | | |
| Core Equity Plus Fund Investor Class | 5,209,669 | $ | 66,840,050 |
|
| Equity Growth Fund Investor Class | 6,678,549 | 191,807,920 |
|
| Growth Fund Investor Class | 4,683,672 | 137,934,150 |
|
| Heritage Fund Investor Class | 4,012,016 | 89,588,318 |
|
| Large Company Value Fund Investor Class | 17,644,416 | 161,622,846 |
|
| Mid Cap Value Fund Investor Class | 5,930,907 | 97,859,973 |
|
| NT Disciplined Growth Fund Investor Class | 3,317,938 | 33,146,199 |
|
| Small Company Fund Investor Class | 2,124,220 | 28,060,948 |
|
| | | 806,860,404 |
|
| Domestic Fixed Income Funds — 23.2% | | |
| Diversified Bond Fund Investor Class | 19,367,436 | 215,365,885 |
|
| High-Yield Fund Investor Class | 10,017,141 | 56,196,162 |
|
| Inflation-Adjusted Bond Fund Investor Class | 8,248,073 | 98,646,958 |
|
Short Duration Inflation Protection Bond Fund Investor Class(2) | 1,587,697 | 16,242,137 |
|
| | | 386,451,142 |
|
| International Equity Funds — 18.7% | | |
| Emerging Markets Fund Investor Class | 8,009,309 | 69,360,617 |
|
| International Growth Fund Investor Class | 9,076,480 | 101,021,218 |
|
| NT Global Real Estate Fund Investor Class | 3,896,832 | 40,488,088 |
|
| NT International Small-Mid Cap Fund Investor Class | 2,336,587 | 24,393,963 |
|
| NT International Value Fund Investor Class | 8,874,390 | 76,142,268 |
|
| | | 311,406,154 |
|
| International Fixed Income Funds — 6.7% | | |
| Global Bond Fund Investor Class | 7,922,885 | 82,239,546 |
|
| International Bond Fund Investor Class | 2,152,394 | 28,842,076 |
|
| | | 111,081,622 |
|
| Money Market Funds — 2.9% | | |
| U.S. Government Money Market Fund Investor Class | 47,796,163 | 47,796,163 |
|
TOTAL INVESTMENT SECURITIES — 100.0%
(Cost $1,440,894,990) | | 1,663,595,485 |
|
OTHER ASSETS AND LIABILITIES† | | (337) |
|
| TOTAL NET ASSETS — 100.0% | | $ | 1,663,595,148 |
|
|
|
| NOTES TO SCHEDULE OF INVESTMENTS |
| |
| † | Category is less than 0.05% of total net assets. |
| |
| (1) | Investments are funds within the American Century Investments family of funds and are considered affiliated funds. |
See Notes to Financial Statements.
JULY 31, 2016
One Choice Portfolio: Aggressive
|
| | | | | |
| | Shares | Value |
MUTUAL FUNDS(1) — 100.0% | | |
| Domestic Equity Funds — 56.1% | | |
| Core Equity Plus Fund Investor Class | 3,943,469 |
| $ | 50,594,708 |
|
| Equity Growth Fund Investor Class | 4,017,300 |
| 115,376,857 |
|
| Growth Fund Investor Class | 4,484,691 |
| 132,074,137 |
|
| Heritage Fund Investor Class | 3,710,740 |
| 82,860,814 |
|
| Large Company Value Fund Investor Class | 12,600,206 |
| 115,417,884 |
|
| Mid Cap Value Fund Investor Class | 3,882,348 |
| 64,058,738 |
|
| NT Disciplined Growth Fund Investor Class | 3,391,266 |
| 33,878,751 |
|
| Small Company Fund Investor Class | 1,388,706 |
| 18,344,810 |
|
| | | 612,606,699 |
|
| International Equity Funds — 25.6% | | |
| Emerging Markets Fund Investor Class | 8,359,544 |
| 72,393,654 |
|
| International Growth Fund Investor Class | 8,022,419 |
| 89,289,527 |
|
| NT Global Real Estate Fund Investor Class | 3,356,337 |
| 34,872,345 |
|
| NT International Small-Mid Cap Fund Investor Class | 2,031,957 |
| 21,213,633 |
|
| NT International Value Fund Investor Class | 7,179,891 |
| 61,603,462 |
|
| | | 279,372,621 |
|
| Domestic Fixed Income Funds — 14.9% | | |
| Diversified Bond Fund Investor Class | 5,646,318 |
| 62,787,060 |
|
| High-Yield Fund Investor Class | 9,914,275 |
| 55,619,083 |
|
| Inflation-Adjusted Bond Fund Investor Class | 2,801,367 |
| 33,504,343 |
|
Short Duration Inflation Protection Bond Fund Investor Class(2) | 1,085,175 |
| 11,101,343 |
|
| | | 163,011,829 |
|
| International Fixed Income Funds — 3.1% | | |
| Global Bond Fund Investor Class | 3,221,087 |
| 33,434,880 |
|
| Money Market Funds — 0.3% | | |
| U.S. Government Money Market Fund Investor Class | 2,698,538 |
| 2,698,538 |
|
TOTAL INVESTMENT SECURITIES — 100.0%
(Cost $929,129,669) | | 1,091,124,567 |
|
OTHER ASSETS AND LIABILITIES† | | (21 | ) |
| TOTAL NET ASSETS — 100.0% | | $ | 1,091,124,546 |
|
|
|
| NOTES TO SCHEDULE OF INVESTMENTS |
| |
| † | Category is less than 0.05% of total net assets. |
| |
| (1) | Investments are funds within the American Century Investments family of funds and are considered affiliated funds. |
See Notes to Financial Statements.
JULY 31, 2016
One Choice Portfolio: Very Aggressive
|
| | | | |
| | Shares | Value |
MUTUAL FUNDS(1) — 100.0% | | |
| Domestic Equity Funds — 68.9% | | |
| Core Equity Plus Fund Investor Class | 944,816 | $ | 12,121,989 |
|
| Equity Growth Fund Investor Class | 1,085,997 | 31,189,824 |
|
| Growth Fund Investor Class | 1,125,278 | 33,139,448 |
|
| Heritage Fund Investor Class | 1,051,431 | 23,478,454 |
|
| Large Company Value Fund Investor Class | 3,187,783 | 29,200,095 |
|
| Mid Cap Value Fund Investor Class | 1,195,236 | 19,721,395 |
|
| NT Disciplined Growth Fund Investor Class | 1,024,103 | 10,230,787 |
|
| Small Company Fund Investor Class | 1,250,131 | 16,514,237 |
|
| | | 175,596,229 |
|
| International Equity Funds — 31.1% | | |
| Emerging Markets Fund Investor Class | 2,196,475 | 19,021,477 |
|
| International Growth Fund Investor Class | 2,244,716 | 24,983,685 |
|
| NT Global Real Estate Fund Investor Class | 747,993 | 7,771,647 |
|
| NT International Small-Mid Cap Fund Investor Class | 722,668 | 7,544,653 |
|
| NT International Value Fund Investor Class | 2,316,075 | 19,871,920 |
|
| | | 79,193,382 |
|
TOTAL INVESTMENT SECURITIES — 100.0%
(Cost $198,121,416) | | 254,789,611 |
|
| OTHER ASSETS AND LIABILITIES | | — |
|
| TOTAL NET ASSETS — 100.0% | | $ | 254,789,611 |
|
|
|
| NOTES TO SCHEDULE OF INVESTMENTS |
| |
| (1) | Investments are funds within the American Century Investments family of funds and are considered affiliated funds. |
See Notes to Financial Statements.
|
|
| Statements of Assets and Liabilities |
|
| | | | | | | | | |
| JULY 31, 2016 | | | |
| | One Choice Portfolio: Very Conservative | One Choice Portfolio: Conservative | One Choice Portfolio: Moderate |
| Assets | | | |
| Investment securities in affiliates, at value (cost of $367,797,126, $982,785,744 and $1,440,894,990, respectively) | $ | 410,994,538 |
| $ | 1,101,146,831 |
| $ | 1,663,595,485 |
|
| Cash | 21 |
| 31 |
| — |
|
| Receivable for capital shares sold | 289,775 |
| 1,588,103 |
| 1,384,841 |
|
| Distributions receivable from affiliates | 215,862 |
| 503,010 |
| 638,384 |
|
| | 411,500,196 |
| 1,103,237,975 |
| 1,665,618,710 |
|
| | | | |
| Liabilities | | | |
| Disbursements in excess of demand deposit cash | — |
| — |
| 157,302 |
|
| Payable for investments purchased | 434,436 |
| 1,731,544 |
| 720,270 |
|
| Payable for capital shares redeemed | 71,327 |
| 359,953 |
| 1,145,734 |
|
| Distribution and service fees payable | 23 |
| 34 |
| 256 |
|
| | 505,786 |
| 2,091,531 |
| 2,023,562 |
|
| | | | |
| Net Assets | $ | 410,994,410 |
| $ | 1,101,146,444 |
| $ | 1,663,595,148 |
|
| | | | |
| Net Assets Consist of: | | | |
| Capital (par value and paid-in surplus) | $ | 373,690,682 |
| $ | 986,018,492 |
| $ | 1,446,717,746 |
|
| Undistributed net investment income | — |
| 375,837 |
| 383,352 |
|
| Accumulated net realized loss | (5,893,684 | ) | (3,608,972 | ) | (6,206,445 | ) |
| Net unrealized appreciation | 43,197,412 |
| 118,361,087 |
| 222,700,495 |
|
| | $ | 410,994,410 |
| $ | 1,101,146,444 |
| $ | 1,663,595,148 |
|
|
| | | | | |
| Fund/Class | Net Assets | Shares Outstanding | Net Asset Value Per Share |
| One Choice Portfolio: Very Conservative |
| Investor Class, $0.01 Par Value |
| $410,937,247 |
| 34,342,616 | $11.97 |
| R Class, $0.01 Par Value |
| $57,163 |
| 4,775 | $11.97 |
| One Choice Portfolio: Conservative |
| Investor Class, $0.01 Par Value |
| $1,101,058,439 |
| 83,643,491 | $13.16 |
| R Class, $0.01 Par Value |
| $88,005 |
| 6,687 | $13.16 |
| One Choice Portfolio: Moderate |
| Investor Class, $0.01 Par Value |
| $1,662,962,168 |
| 114,431,645 | $14.53 |
| R Class, $0.01 Par Value |
| $632,980 |
| 43,574 | $14.53 |
See Notes to Financial Statements.
|
| | | | | | |
| JULY 31, 2016 | | |
| | One Choice Portfolio: Aggressive | One Choice Portfolio: Very Aggressive |
| Assets | | |
| Investment securities in affiliates, at value (cost of $929,129,669 and $198,121,416, respectively) | $ | 1,091,124,567 |
| $ | 254,789,611 |
|
| Cash | 137 |
| 45 |
|
| Receivable for investments sold | 158,078 |
| 389,636 |
|
| Receivable for capital shares sold | 204,523 |
| 44,632 |
|
| Distributions receivable from affiliates | 358,972 |
| — |
|
| | 1,091,846,277 |
| 255,223,924 |
|
| | | |
| Liabilities | | |
| Payable for investments purchased | 358,994 |
| — |
|
| Payable for capital shares redeemed | 362,584 |
| 434,263 |
|
| Distribution and service fees payable | 153 |
| 50 |
|
| | 721,731 |
| 434,313 |
|
| | | |
| Net Assets | $ | 1,091,124,546 |
| $ | 254,789,611 |
|
| | | |
| Net Assets Consist of: | | |
| Capital (par value and paid-in surplus) | $ | 923,528,516 |
| $ | 202,617,800 |
|
| Undistributed net investment income | 4,941,975 |
| 386,566 |
|
| Accumulated undistributed net realized gain (loss) | 659,157 |
| (4,882,950 | ) |
| Net unrealized appreciation | 161,994,898 |
| 56,668,195 |
|
| | $ | 1,091,124,546 |
| $ | 254,789,611 |
|
|
| | | | | |
| Fund/Class | Net Assets | Shares Outstanding | Net Asset Value Per Share |
| One Choice Portfolio: Aggressive |
| Investor Class, $0.01 Par Value |
| $1,090,738,705 |
| 72,001,003 | $15.15 |
| R Class, $0.01 Par Value |
| $385,841 |
| 25,521 | $15.12 |
| One Choice Portfolio: Very Aggressive |
| Investor Class, $0.01 Par Value |
| $254,675,639 |
| 16,085,232 | $15.83 |
| R Class, $0.01 Par Value |
| $113,972 |
| 7,209 | $15.81 |
See Notes to Financial Statements.
|
| | | | | | | | | |
| YEAR ENDED JULY 31, 2016 |
| | One Choice Portfolio: Very Conservative | One Choice Portfolio: Conservative | One Choice Portfolio: Moderate |
| Investment Income (Loss) | | | |
| Income from Affiliates: | | | |
| Income distributions from underlying funds | $ | 5,708,925 |
| $ | 16,617,067 |
| $ | 27,536,823 |
|
| | | | |
| Expenses: | | | |
| Distribution and service fees - R Class | 181 |
| 230 |
| 1,765 |
|
| Directors' fees and expenses | 13,055 |
| 35,138 |
| 56,501 |
|
| | 13,236 |
| 35,368 |
| 58,266 |
|
| | | | |
| Net investment income (loss) | 5,695,689 |
| 16,581,699 |
| 27,478,557 |
|
| | | | |
| Realized and Unrealized Gain (Loss) on Affiliates | | |
| Net realized gain (loss) on: | | | |
| Sale of investments in underlying funds | (1,703,277 | ) | (5,664,230 | ) | (6,074,080 | ) |
| Capital gain distributions received from underlying funds | 4,268,166 |
| 20,373,375 |
| 41,434,317 |
|
| | 2,564,889 |
| 14,709,145 |
| 35,360,237 |
|
| | | | |
| Change in net unrealized appreciation (depreciation) on investments in underlying funds | 10,004,700 |
| 3,208,993 |
| (35,269,072 | ) |
| | | | |
| Net realized and unrealized gain (loss) on affiliates | 12,569,589 |
| 17,918,138 |
| 91,165 |
|
| | | | |
| Net Increase (Decrease) in Net Assets Resulting from Operations | $ | 18,265,278 |
| $ | 34,499,837 |
| $ | 27,569,722 |
|
See Notes to Financial Statements.
|
| | | | | | |
| YEAR ENDED JULY 31, 2016 | | |
| | One Choice Portfolio: Aggressive | One Choice Portfolio: Very Aggressive |
| Investment Income (Loss) | | |
| Income from Affiliates: | | |
| Income distributions from underlying funds | $ | 18,576,509 |
| $ | 3,626,597 |
|
| | | |
| Expenses: | | |
| Distribution and service fees - R Class | 1,003 |
| 360 |
|
| Directors' fees and expenses | 36,574 |
| 8,649 |
|
| | 37,577 |
| 9,009 |
|
| | | |
| Net investment income (loss) | 18,538,932 |
| 3,617,588 |
|
| | | |
| Realized and Unrealized Gain (Loss) on Affiliates | | |
| Net realized gain (loss) on: | | |
| Sale of investments in underlying funds | (4,791,265 | ) | (593,705 | ) |
| Capital gain distributions received from underlying funds | 33,315,105 |
| 9,314,025 |
|
| | 28,523,840 |
| 8,720,320 |
|
| | | |
| Change in net unrealized appreciation (depreciation) on investments in underlying funds | (40,041,538 | ) | (13,887,555 | ) |
| | | |
| Net realized and unrealized gain (loss) on affiliates | (11,517,698 | ) | (5,167,235 | ) |
| | | |
| Net Increase (Decrease) in Net Assets Resulting from Operations | $ | 7,021,234 |
| $ | (1,549,647 | ) |
See Notes to Financial Statements.
|
|
| Statements of Changes in Net Assets |
|
| | | | | | | | | | | | |
| YEARS ENDED JULY 31, 2016 AND JULY 31, 2015 |
| | One Choice Portfolio: Very Conservative | One Choice Portfolio: Conservative |
| Increase (Decrease) in Net Assets | July 31, 2016 | July 31, 2015 | July 31, 2016 | July 31, 2015 |
| Operations | | | | |
| Net investment income (loss) | $ | 5,695,689 |
| $ | 6,419,691 |
| $ | 16,581,699 |
| $ | 17,742,969 |
|
| Net realized gain (loss) | 2,564,889 |
| 8,173,335 |
| 14,709,145 |
| 52,291,120 |
|
| Change in net unrealized appreciation (depreciation) | 10,004,700 |
| (6,585,682 | ) | 3,208,993 |
| (31,364,391 | ) |
| Net increase (decrease) in net assets resulting from operations | 18,265,278 |
| 8,007,344 |
| 34,499,837 |
| 38,669,698 |
|
| | | | | |
| Distributions to Shareholders | | | | |
| From net investment income: | | | | |
| Investor Class | (5,515,555 | ) | (6,257,908 | ) | (16,534,853 | ) | (18,048,067 | ) |
| R Class | (320 | ) | (32 | ) | (493 | ) | (25 | ) |
| From net realized gains: | | | | |
| Investor Class | (7,559,761 | ) | (5,178,987 | ) | (50,283,970 | ) | (8,617,670 | ) |
| R Class | (525 | ) | — |
| (1,800 | ) | — |
|
| Decrease in net assets from distributions | (13,076,161 | ) | (11,436,927 | ) | (66,821,116 | ) | (26,665,762 | ) |
| | | | | |
| Capital Share Transactions | | | | |
| Net increase (decrease) in net assets from capital share transactions (Note 5) | 23,891,661 |
| 30,178,175 |
| 107,351,249 |
| 86,157,307 |
|
| | | | | |
| Net increase (decrease) in net assets | 29,080,778 |
| 26,748,592 |
| 75,029,970 |
| 98,161,243 |
|
| | | | | |
| Net Assets | | | | |
| Beginning of period | 381,913,632 |
| 355,165,040 |
| 1,026,116,474 |
| 927,955,231 |
|
| End of period | $ | 410,994,410 |
| $ | 381,913,632 |
| $ | 1,101,146,444 |
| $ | 1,026,116,474 |
|
| | | | | |
| Undistributed net investment income | — |
| — |
| $ | 375,837 |
| $ | 329,484 |
|
See Notes to Financial Statements.
|
| | | | | | | | | | | | |
| YEARS ENDED JULY 31, 2016 AND JULY 31, 2015 |
| | One Choice Portfolio: Moderate | One Choice Portfolio: Aggressive |
| Increase (Decrease) in Net Assets | July 31, 2016 | July 31, 2015 | July 31, 2016 | July 31, 2015 |
| Operations | | | | |
| Net investment income (loss) | $ | 27,478,557 |
| $ | 29,778,263 |
| $ | 18,538,932 |
| $ | 20,319,750 |
|
| Net realized gain (loss) | 35,360,237 |
| 96,979,810 |
| 28,523,840 |
| 103,635,077 |
|
| Change in net unrealized appreciation (depreciation) | (35,269,072 | ) | (43,056,343 | ) | (40,041,538 | ) | (46,585,601 | ) |
| Net increase (decrease) in net assets resulting from operations | 27,569,722 |
| 83,701,730 |
| 7,021,234 |
| 77,369,226 |
|
| | | | | |
| Distributions to Shareholders | | | | |
| From net investment income: | | | | |
| Investor Class | (27,584,477 | ) | (30,074,942 | ) | (17,846,907 | ) | (23,614,774 | ) |
| R Class | (4,999 | ) | (27 | ) | (1,777 | ) | — |
|
| From net realized gains: | | | | |
| Investor Class | (93,272,474 | ) | (2,093,099 | ) | (100,199,123 | ) | (14,398,255 | ) |
| R Class | (23,007 | ) | — |
| (14,306 | ) | — |
|
| Decrease in net assets from distributions | (120,884,957 | ) | (32,168,068 | ) | (118,062,113 | ) | (38,013,029 | ) |
| | | | | |
| Capital Share Transactions | | | | |
| Net increase (decrease) in net assets from capital share transactions (Note 5) | 125,097,011 |
| 137,690,228 |
| 103,083,599 |
| 31,540,414 |
|
| | | | | |
| Net increase (decrease) in net assets | 31,781,776 |
| 189,223,890 |
| (7,957,280 | ) | 70,896,611 |
|
| | | | | |
| Net Assets | | | | |
| Beginning of period | 1,631,813,372 |
| 1,442,589,482 |
| 1,099,081,826 |
| 1,028,185,215 |
|
| End of period | $ | 1,663,595,148 |
| $ | 1,631,813,372 |
| $ | 1,091,124,546 |
| $ | 1,099,081,826 |
|
| | | | | |
| Undistributed net investment income | $ | 383,352 |
| $ | 494,271 |
| $ | 4,941,975 |
| $ | 4,255,122 |
|
See Notes to Financial Statements.
|
| | | | | | |
| YEARS ENDED JULY 31, 2016 AND JULY 31, 2015 |
| | One Choice Portfolio: Very Aggressive |
| Increase (Decrease) in Net Assets | July 31, 2016 | July 31, 2015 |
| Operations | | |
| Net investment income (loss) | $ | 3,617,588 |
| $ | 4,790,631 |
|
| Net realized gain (loss) | 8,720,320 |
| 37,553,759 |
|
| Change in net unrealized appreciation (depreciation) | (13,887,555 | ) | (18,516,001 | ) |
| Net increase (decrease) in net assets resulting from operations | (1,549,647 | ) | 23,828,389 |
|
| | | |
| Distributions to Shareholders | | |
| From net investment income: | | |
| Investor Class | (5,342,719 | ) | (5,097,597 | ) |
| R Class | (1,044 | ) | — |
|
| From net realized gains: | | |
| Investor Class | (29,811,799 | ) | — |
|
| R Class | (7,647 | ) | — |
|
| Decrease in net assets from distributions | (35,163,209 | ) | (5,097,597 | ) |
| | | |
| Capital Share Transactions | | |
Net increase (decrease) in net assets from capital share transactions (Note 5) | 22,700,357 |
| (17,465,348 | ) |
| | | |
| Net increase (decrease) in net assets | (14,012,499 | ) | 1,265,444 |
|
| | | |
| Net Assets | | |
| Beginning of period | 268,802,110 |
| 267,536,666 |
|
| End of period | $ | 254,789,611 |
| $ | 268,802,110 |
|
| | | |
| Undistributed net investment income | $ | 386,566 |
| $ | 2,117,122 |
|
See Notes to Financial Statements.
|
|
| Notes to Financial Statements |
JULY 31, 2016
1. Organization
American Century Asset Allocation Portfolios, Inc. (the corporation) is registered under the Investment Company Act of 1940, as amended (the 1940 Act), as an open-end management investment company and is organized as a Maryland corporation. One Choice Portfolio: Very Conservative, One Choice Portfolio: Conservative, One Choice Portfolio: Moderate, One Choice Portfolio: Aggressive and One Choice Portfolio: Very Aggressive (collectively, the funds) are five funds in a series issued by the corporation. The funds operate as “funds of funds,” meaning substantially all of the funds’ assets will be invested in other American Century Investments mutual funds (the underlying funds). Each fund’s assets are allocated among underlying funds that represent major asset classes, including equity securities (stocks), fixed-income securities (bonds) and cash-equivalent instruments (money markets). The funds will assume the risks associated with their underlying funds. Additional information and attributes of each underlying fund are available at americancentury.com. Each fund's investment objective is to seek the highest total return consistent with its asset mix.
The funds offer the Investor Class and the R Class, which have different fees and expenses. The difference in the fee structures between the classes is the result of their separate arrangements for shareholder and distribution services. It is not the result of any difference in advisory or custodial fees or other expenses related to the management of the funds' assets, which do not vary by class. Sale of the R Class commenced on March 20, 2015.
2. Significant Accounting Policies
The following is a summary of significant accounting policies consistently followed by the funds in preparation of their financial statements. Each fund is an investment company and follows accounting and reporting guidance in accordance with accounting principles generally accepted in the United States of America. This may require management to make certain estimates and assumptions at the date of the financial statements. Actual results could differ from these estimates. Management evaluated the impact of events or transactions occurring through the date the financial statements were issued that would merit recognition or disclosure.
Investment Valuations — The funds determine the fair value of their investments and compute their net asset value per share at the close of regular trading (usually 4 p.m. Eastern time) on the New York Stock Exchange (NYSE) on each day the NYSE is open. The Board of Directors has adopted valuation policies and procedures to guide the investment advisor in the funds' investment valuation process and to provide methodologies for the oversight of the funds' pricing function. Investments in the underlying funds are valued at their reported net asset value.
Security Transactions — Security transactions are accounted for as of the trade date. Net realized gains and losses are determined on the identified cost basis, which is also used for federal income tax purposes.
Investment Income — Income and capital gain distributions, if any, from the underlying funds are recorded as of the ex-dividend date. Long-term capital gain distributions, if any, from the underlying funds are a component of net realized gain (loss).
Expenses — The expenses included in the accompanying financial statements reflect the expenses of each fund and do not include any expenses associated with the underlying funds.
Income Tax Status — It is each fund’s policy to distribute substantially all net investment income and net realized gains to shareholders and to otherwise qualify as a regulated investment company under provisions of the Internal Revenue Code. Accordingly, no provision has been made for income taxes. The funds file U.S. federal, state, local and non-U.S. tax returns as applicable. The funds' tax returns are subject to examination by the relevant taxing authority until expiration of the applicable statute of limitations, which is generally three years from the date of filing but can be longer in certain jurisdictions. At this time, management believes there are no uncertain tax positions which, based on their technical merit, would not be sustained upon examination and for which it is reasonably possible that the total amounts of unrecognized tax benefits will significantly change in the next twelve months.
Multiple Class — All shares of each fund represent an equal pro rata interest in the net assets of the class to which such shares belong, and have identical voting, dividend, liquidation and other rights and the same terms and conditions, except for class specific expenses and exclusive rights to vote on matters affecting only individual classes. Income, non-class specific expenses, and realized and unrealized capital gains and losses of the funds are allocated to each class of shares based on their relative net assets.
Distributions to Shareholders — Distributions from net investment income, if any, are generally declared and paid quarterly for One Choice Portfolio: Very Conservative, One Choice Portfolio: Conservative and One Choice Portfolio: Moderate. Distributions from net investment income, if any, are generally declared and paid annually for One Choice Portfolio: Aggressive and One Choice Portfolio: Very Aggressive. Distributions from net realized gains, if any, are generally declared and paid annually for all funds. Each fund may elect to treat a portion of its payment to a redeeming shareholder, which represents the pro rata share of undistributed net investment income and net realized gains, as a distribution for federal income tax purposes (tax equalization).
Indemnifications — Under the corporation’s organizational documents, its officers and directors are indemnified against certain liabilities arising out of the performance of their duties to the funds. In addition, in the normal course of business, the funds enter into contracts that provide general indemnifications. The maximum exposure under these arrangements is unknown as this would involve future claims that may be made against a fund. The risk of material loss from such claims is considered by management to be remote.
3. Fees and Transactions with Related Parties
Certain officers and directors of the corporation are also officers and/or directors of American Century Companies, Inc. (ACC). The corporation’s investment advisor, American Century Investment Management, Inc. (ACIM), the corporation's distributor, American Century Investment Services, Inc. (ACIS), and the corporation’s transfer agent, American Century Services, LLC, are wholly owned, directly or indirectly, by ACC. ACIM serves as the investment advisor for the underlying funds.
Administrative Fees — The corporation's investment advisor, ACIM, does not receive an administrative fee for services provided to the funds.
Distribution and Service Fees — The Board of Directors has adopted a separate Master Distribution and Individual Shareholder Services Plan for the R Class (the plan), pursuant to Rule 12b-1 of the 1940 Act. The plan provides that the R Class will pay ACIS an annual distribution and service fee of 0.50%. The fee is computed and accrued daily based on the R Class's daily net assets and paid monthly in arrears. The fee is used to pay financial intermediaries for distribution and individual shareholder services. Fees incurred under the plan during the year ended July 31, 2016 are detailed in the Statements of Operations.
Directors' Fees and Expenses — The Board of Directors is responsible for overseeing the investment advisor’s management and operations of the funds. The directors receive detailed information about the funds and their investment advisor regularly throughout the year, and meet at least quarterly with management of the investment advisor to review reports about fund operations. The funds' officers do not receive compensation from the funds.
Acquired Fund Fees and Expenses — Each fund will indirectly realize its pro rata share of the fees and expenses of the underlying funds in which it invests. These fees and expenses are already reflected in the valuation of the underlying funds.
4. Investment Transactions
Investment transactions for the year ended July 31, 2016 were as follows:
|
| | | | | | | | | | | | | | | |
| | One Choice Portfolio: Very Conservative | One Choice Portfolio: Conservative | One Choice Portfolio: Moderate | One Choice Portfolio: Aggressive | One Choice Portfolio: Very Aggressive |
| Purchases | $ | 112,453,081 |
| $ | 267,617,333 |
| $ | 247,981,754 |
| $ | 169,312,780 |
| $ | 28,497,639 |
|
| Sales | $ | 91,673,783 |
| $ | 190,131,941 |
| $ | 174,857,234 |
| $ | 132,437,860 |
| $ | 28,028,877 |
|
5. Capital Share Transactions
The corporation is authorized to issue 4,000,000,000 shares. Transactions in shares of the funds were as follows:
|
| | | | | | | | | | |
| | Year ended
July 31, 2016 | Year ended July 31, 2015(1) |
| | Shares | Amount | Shares | Amount |
| One Choice Portfolio: Very Conservative | | | |
| Investor Class | | | | |
| Sold | 10,249,061 |
| $ | 118,571,218 |
| 11,915,396 |
| $ | 141,636,212 |
|
| Issued in reinvestment of distributions | 1,129,995 |
| 12,851,096 |
| 941,468 |
| 11,167,371 |
|
| Redeemed | (9,347,756 | ) | (107,561,322 | ) | (10,287,876 | ) | (122,650,440 | ) |
| | 2,031,300 |
| 23,860,992 |
| 2,568,988 |
| 30,153,143 |
|
| R Class | | | | |
| Sold | 2,610 |
| 29,824 |
| 2,088 |
| 25,000 |
|
| Issued in reinvestment of distributions | 74 |
| 845 |
| 3 |
| 32 |
|
| | 2,684 |
| 30,669 |
| 2,091 |
| 25,032 |
|
| Net increase (decrease) | 2,033,984 |
| $ | 23,891,661 |
| 2,571,079 |
| $ | 30,178,175 |
|
|
| | | | | | | | | | |
| One Choice Portfolio: Conservative | | | | |
| Investor Class | | | | |
| Sold | 18,584,533 |
| $ | 238,494,386 |
| 19,285,302 |
| $ | 262,828,525 |
|
| Issued in reinvestment of distributions | 5,219,630 |
| 65,491,896 |
| 1,924,989 |
| 26,156,687 |
|
| Redeemed | (15,301,229 | ) | (196,696,410 | ) | (14,886,646 | ) | (202,853,530 | ) |
| | 8,502,934 |
| 107,289,872 |
| 6,323,645 |
| 86,131,682 |
|
| R Class | | | | |
| Sold | 5,468 |
| 69,378 |
| 1,854 |
| 25,600 |
|
| Issued in reinvestment of distributions | 183 |
| 2,293 |
| 2 |
| 25 |
|
| Redeemed | (820 | ) | (10,294 | ) | — |
| — |
|
| | 4,831 |
| 61,377 |
| 1,856 |
| 25,625 |
|
| Net increase (decrease) | 8,507,765 |
| $ | 107,351,249 |
| 6,325,501 |
| $ | 86,157,307 |
|
|
| | | | | | | | | | |
| One Choice Portfolio: Moderate | | | | |
| Investor Class | | | | |
| Sold | 19,212,959 |
| $ | 270,531,214 |
| 23,115,876 |
| $ | 354,389,468 |
|
| Issued in reinvestment of distributions | 8,564,068 |
| 118,897,453 |
| 2,070,549 |
| 31,669,725 |
|
| Redeemed | (18,753,088 | ) | (264,938,123 | ) | (16,208,233 | ) | (248,397,576 | ) |
| | 9,023,939 |
| 124,490,544 |
| 8,978,192 |
| 137,661,617 |
|
| R Class | | | | |
| Sold | 50,333 |
| 734,079 |
| 1,830 |
| 28,584 |
|
| Issued in reinvestment of distributions | 2,018 |
| 28,006 |
| 2 |
| 27 |
|
| Redeemed | (10,609 | ) | (155,618 | ) | — |
| — |
|
| | 41,742 |
| 606,467 |
| 1,832 |
| 28,611 |
|
| Net increase (decrease) | 9,065,681 |
| $ | 125,097,011 |
| 8,980,024 |
| $ | 137,690,228 |
|
| |
| (1) | March 20, 2015 (commencement of sale) through July 31, 2015 for the R Class. |
|
| | | | | | | | | | |
| | Year ended
July 31, 2016 | Year ended July 31, 2015(1) |
| | Shares | Amount | Shares | Amount |
| One Choice Portfolio: Aggressive | | | |
| Investor Class | | | | |
| Sold | 11,801,260 |
| $ | 176,467,556 |
| 11,763,689 |
| $ | 196,349,221 |
|
| Issued in reinvestment of distributions | 8,114,234 |
| 117,088,398 |
| 2,299,528 |
| 37,689,248 |
|
| Redeemed | (12,936,984 | ) | (190,831,256 | ) | (12,137,997 | ) | (202,523,573 | ) |
| | 6,978,510 |
| 102,724,698 |
| 1,925,220 |
| 31,514,896 |
|
| R Class | | | | |
| Sold | 26,379 |
| 392,465 |
| 1,500 |
| 25,518 |
|
| Issued in reinvestment of distributions | 1,114 |
| 16,083 |
| — |
| — |
|
| Redeemed | (3,472 | ) | (49,647 | ) | — |
| — |
|
| | 24,021 |
| 358,901 |
| 1,500 |
| 25,518 |
|
| Net increase (decrease) | 7,002,531 |
| $ | 103,083,599 |
| 1,926,720 |
| $ | 31,540,414 |
|
|
| | | | | | | | | | |
| One Choice Portfolio: Very Aggressive | | | |
| Investor Class | | | | |
| Sold | 2,104,160 |
| $ | 32,760,604 |
| 2,600,213 |
| $ | 46,873,852 |
|
| Issued in reinvestment of distributions | 2,287,747 |
| 34,728,003 |
| 282,905 |
| 5,044,201 |
|
| Redeemed | (2,859,320 | ) | (44,875,097 | ) | (3,814,711 | ) | (69,413,906 | ) |
| | 1,532,587 |
| 22,613,510 |
| (931,593 | ) | (17,495,853 | ) |
| R Class | | | | |
| Sold | 6,778 |
| 106,316 |
| 1,644 |
| 30,505 |
|
| Issued in reinvestment of distributions | 572 |
| 8,691 |
| — |
| — |
|
| Redeemed | (1,785 | ) | (28,160 | ) | — |
| — |
|
| | 5,565 |
| 86,847 |
| 1,644 |
| 30,505 |
|
| Net increase (decrease) | 1,538,152 |
| $ | 22,700,357 |
| (929,949 | ) | $ | (17,465,348 | ) |
| |
| (1) | March 20, 2015 (commencement of sale) through July 31, 2015 for the R Class. |
6. Affiliated Fund Transactions
A summary of transactions for each underlying fund for the year ended July 31, 2016 follows:
|
| | | | | | | | | | | | | | | | | | |
Fund/ Underlying Fund(1) | Beginning
Value | Purchase
Cost | Sales Cost | Realized
Gain (Loss) | Distributions Received(2) | Ending Value |
| One Choice Portfolio: Very Conservative |
| Diversified Bond Fund | $ | 95,506,436 |
| $ | 11,591,707 |
| $ | 31,662,260 |
| $ | (179,182 | ) | $ | 2,075,209 |
| $ | 77,600,055 |
|
| High-Yield Fund | — |
| 11,690,530 |
| 2,540,607 |
| 9,113 |
| 390,645 |
| 9,425,561 |
|
| Inflation-Adjusted Bond Fund | 38,072,716 |
| 4,113,835 |
| 2,954,573 |
| (373,434 | ) | 566,691 |
| 40,693,182 |
|
| Short Duration Fund | 26,522,548 |
| 3,380,141 |
| 1,677,701 |
| (50,072 | ) | 423,762 |
| 28,300,263 |
|
Short Duration Inflation Protection Bond Fund(3) | 30,340,189 |
| 24,717,635 |
| 3,230,014 |
| (175,977 | ) | — |
| 52,918,301 |
|
| Core Equity Plus Fund | 3,775,892 |
| 620,527 |
| 123,461 |
| (1,379 | ) | 340,865 |
| 3,946,186 |
|
| Equity Growth Fund | 13,362,266 |
| 3,998,472 |
| 565,503 |
| (11,231 | ) | 1,005,724 |
| 16,181,770 |
|
| Growth Fund | 12,963,439 |
| 5,326,781 |
| 1,717,095 |
| 127,958 |
| 800,261 |
| 16,277,691 |
|
| Heritage Fund | 8,325,709 |
| 1,191,425 |
| 1,966,392 |
| (142,249 | ) | 838,734 |
| 6,649,207 |
|
| Large Company Value Fund | 29,622,911 |
| 5,877,567 |
| 3,520,940 |
| (197,808 | ) | 452,573 |
| 32,708,184 |
|
| Mid Cap Value Fund | 21,054,978 |
| 3,183,257 |
| 3,601,810 |
| (195,449 | ) | 2,045,414 |
| 20,847,762 |
|
| NT Disciplined Growth Fund | 3,770,299 |
| 275,358 |
| 60,011 |
| (1,200 | ) | 26,532 |
| 3,978,433 |
|
| Real Estate Fund | 7,522,879 |
| 4,593,017 |
| 3,343,571 |
| (53,751 | ) | 287,706 |
| 10,292,427 |
|
| Small Company Fund | 3,757,119 |
| 1,579,560 |
| 1,133,555 |
| 266,376 |
| 11,185 |
| 3,767,222 |
|
| Global Bond Fund | 30,386,234 |
| 2,308,713 |
| 2,019,325 |
| (33,640 | ) | 130,803 |
| 32,371,806 |
|
| International Bond Fund | 30,433,400 |
| 4,052,737 |
| 4,935,992 |
| (691,352 | ) | 578,867 |
| 32,912,117 |
|
| Prime Money Market Fund | 26,496,802 |
| 82,298 |
| 26,579,100 |
| — |
| 870 |
| — |
|
| U.S. Government Money Market Fund | — |
| 23,869,521 |
| 1,745,150 |
| — |
| 1,250 |
| 22,124,371 |
|
| | $ | 381,913,817 |
| $ | 112,453,081 |
| $ | 93,377,060 |
| $ | (1,703,277 | ) | $ | 9,977,091 |
| $ | 410,994,538 |
|
| |
| (1) | Underlying fund investments represent Investor Class. |
| |
| (2) | Distributions received includes distributions from net investment income and from capital gains, if any. |
|
| | | | | | | | | | | | | | | | | | |
Fund/ Underlying Fund(1) | Beginning
Value | Purchase
Cost | Sales Cost | Realized
Gain (Loss) | Distributions Received(2) | Ending Value |
| One Choice Portfolio: Conservative |
| Core Equity Plus Fund | $ | 20,639,612 |
| $ | 2,277,941 |
| $ | 111,420 |
| $ | (10,118 | ) | $ | 1,831,620 |
| $ | 20,974,760 |
|
| Equity Growth Fund | 67,143,972 |
| 18,751,086 |
| 790,429 |
| (31,568 | ) | 5,716,052 |
| 80,570,420 |
|
| Growth Fund | 58,668,843 |
| 13,441,459 |
| 3,282,061 |
| 32,573 |
| 3,652,955 |
| 67,306,488 |
|
| Heritage Fund | 43,324,692 |
| 6,492,214 |
| 3,968,918 |
| 46,203 |
| 4,240,126 |
| 41,081,083 |
|
| Large Company Value Fund | 72,593,695 |
| 13,571,657 |
| 578,009 |
| (26,053 | ) | 1,198,655 |
| 86,805,342 |
|
| Mid Cap Value Fund | 62,517,733 |
| 12,063,363 |
| 4,393,751 |
| (343,559 | ) | 6,584,823 |
| 71,170,205 |
|
| NT Disciplined Growth Fund | 15,676,134 |
| 251,299 |
| 93,600 |
| (2,714 | ) | 106,192 |
| 15,732,485 |
|
| Small Company Fund | 15,131,424 |
| 1,309,404 |
| 328,448 |
| (52,257 | ) | 44,615 |
| 15,863,959 |
|
| Diversified Bond Fund | 237,581,216 |
| 22,370,194 |
| 53,604,863 |
| (500,664 | ) | 5,628,807 |
| 212,434,148 |
|
| High-Yield Fund | — |
| 31,645,513 |
| 5,035,657 |
| 33,233 |
| 1,093,870 |
| 27,411,263 |
|
| Inflation-Adjusted Bond Fund | 92,072,978 |
| 2,112,505 |
| 23,690,480 |
| (2,745,036 | ) | 1,067,886 |
| 75,134,364 |
|
Short Duration Inflation Protection Bond Fund(3) | — |
| 51,971,377 |
| 80,182 |
| (160 | ) | — |
| 53,060,683 |
|
| Global Bond Fund | 72,184,655 |
| 1,327,254 |
| 2,603,763 |
| (46,121 | ) | 309,773 |
| 74,946,099 |
|
| International Bond Fund | 66,044,263 |
| 3,452,091 |
| 5,381,507 |
| (800,028 | ) | 1,263,071 |
| 70,599,515 |
|
| International Growth Fund | 62,244,919 |
| 10,681,013 |
| 8,634,583 |
| (300,860 | ) | 2,821,410 |
| 56,906,703 |
|
| NT Global Real Estate Fund | 20,343,314 |
| 11,301,830 |
| 6,109,970 |
| (321,869 | ) | 709,271 |
| 28,012,258 |
|
| NT International Small-Mid Cap Fund | 10,491,999 |
| 69,464 |
| 187,926 |
| 8,640 |
| 69,464 |
| 10,228,068 |
|
| NT International Value Fund | 40,611,572 |
| 5,914,471 |
| 7,955,083 |
| (603,872 | ) | 646,268 |
| 34,415,656 |
|
| Prime Money Market Fund | 68,845,655 |
| 2,247 |
| 68,847,902 |
| — |
| 2,265 |
| — |
|
| U.S. Government Money Market Fund | — |
| 58,610,951 |
| 117,619 |
| — |
| 3,319 |
| 58,493,332 |
|
| | $ | 1,026,116,676 |
| $ | 267,617,333 |
| $ | 195,796,171 |
| $ | (5,664,230 | ) | $ | 36,990,442 |
| $ | 1,101,146,831 |
|
| |
| (1) | Underlying fund investments represent Investor Class. |
| |
| (2) | Distributions received includes distributions from net investment income and from capital gains, if any. |
|
| | | | | | | | | | | | | | | | | | |
Fund/ Underlying Fund(1) | Beginning
Value | Purchase
Cost | Sales Cost | Realized
Gain (Loss) | Distributions Received(2) | Ending Value |
| One Choice Portfolio: Moderate |
| Core Equity Plus Fund | $ | 65,220,788 |
| $ | 7,395,481 |
| $ | 110,554 |
| $ | (10,867 | ) | $ | 5,748,529 |
| $ | 66,840,050 |
|
| Equity Growth Fund | 173,250,010 |
| 33,020,923 |
| 3,097,784 |
| (334,679 | ) | 13,742,136 |
| 191,807,920 |
|
| Growth Fund | 130,173,417 |
| 17,620,751 |
| 5,487,043 |
| 128,268 |
| 8,341,269 |
| 137,934,150 |
|
| Heritage Fund | 97,551,161 |
| 14,451,896 |
| 10,792,151 |
| 249,793 |
| 9,735,107 |
| 89,588,318 |
|
| Large Company Value Fund | 140,502,518 |
| 20,493,381 |
| 934,442 |
| (61,599 | ) | 2,257,868 |
| 161,622,846 |
|
| Mid Cap Value Fund | 92,078,132 |
| 14,150,500 |
| 9,676,934 |
| (1,196,145 | ) | 9,439,254 |
| 97,859,973 |
|
| NT Disciplined Growth Fund | 32,742,545 |
| 593,651 |
| — |
| — |
| 222,680 |
| 33,146,199 |
|
| Small Company Fund | 31,730,571 |
| 3,003,423 |
| 5,423,931 |
| 48,216 |
| 93,145 |
| 28,060,948 |
|
| Diversified Bond Fund | 209,210,200 |
| 14,361,183 |
| 14,070,162 |
| (80,938 | ) | 5,529,758 |
| 215,365,885 |
|
| High-Yield Fund | 65,034,786 |
| 4,481,948 |
| 13,140,669 |
| (1,641,475 | ) | 3,413,073 |
| 56,196,162 |
|
| Inflation-Adjusted Bond Fund | 97,086,977 |
| 1,530,225 |
| 3,198,347 |
| (463,403 | ) | 1,424,126 |
| 98,646,958 |
|
Short Duration Inflation Protection Bond Fund(3) | — |
| 15,876,966 |
| — |
| — |
| — |
| 16,242,137 |
|
| Emerging Markets Fund | 62,230,687 |
| 9,115,354 |
| 2,886,871 |
| (192,161 | ) | 83,982 |
| 69,360,617 |
|
| International Growth Fund | 114,296,683 |
| 14,140,028 |
| 12,463,572 |
| 169,534 |
| 5,304,231 |
| 101,021,218 |
|
| NT Global Real Estate Fund | 31,422,793 |
| 17,916,924 |
| 12,564,847 |
| (636,099 | ) | 1,111,793 |
| 40,488,088 |
|
| NT International Small-Mid Cap Fund | 25,826,252 |
| 165,673 |
| 1,207,006 |
| 47,073 |
| 165,673 |
| 24,393,963 |
|
| NT International Value Fund | 88,765,041 |
| 9,377,399 |
| 11,866,734 |
| (959,940 | ) | 1,509,029 |
| 76,142,268 |
|
| Global Bond Fund | 80,700,068 |
| 345,408 |
| 3,297,738 |
| (42,955 | ) | 345,408 |
| 82,239,546 |
|
| International Bond Fund | 31,788,152 |
| 2,142,472 |
| 8,507,188 |
| (1,096,703 | ) | 499,126 |
| 28,842,076 |
|
| Prime Money Market Fund | 62,203,336 |
| 2,005 |
| 62,205,341 |
| — |
| 2,021 |
| — |
|
| U.S. Government Money Market Fund | — |
| 47,796,163 |
| — |
| — |
| 2,932 |
| 47,796,163 |
|
| | $ | 1,631,814,117 |
| $ | 247,981,754 |
| $ | 180,931,314 |
| $ | (6,074,080 | ) | $ | 68,971,140 |
| $ | 1,663,595,485 |
|
| |
| (1) | Underlying fund investments represent Investor Class. |
| |
| (2) | Distributions received includes distributions from net investment income and from capital gains, if any. |
|
| | | | | | | | | | | | | | | | | | |
Fund/ Underlying Fund(1) | Beginning
Value | Purchase
Cost | Sales Cost | Realized
Gain (Loss) | Distributions Received(2) | Ending Value |
| One Choice Portfolio: Aggressive |
| Core Equity Plus Fund | $ | 50,753,394 |
| $ | 5,291,610 |
| $ | 1,029,460 |
| $ | (19,546 | ) | $ | 4,393,766 |
| $ | 50,594,708 |
|
| Equity Growth Fund | 105,378,735 |
| 23,001,138 |
| 6,144,092 |
| (594,981 | ) | 8,529,606 |
| 115,376,857 |
|
| Growth Fund | 127,296,401 |
| 20,218,124 |
| 10,992,131 |
| 215,540 |
| 8,162,715 |
| 132,074,137 |
|
| Heritage Fund | 91,669,705 |
| 12,175,554 |
| 8,970,794 |
| 949,623 |
| 9,351,409 |
| 82,860,814 |
|
| Large Company Value Fund | 105,510,055 |
| 17,079,183 |
| 8,675,693 |
| (443,224 | ) | 1,674,835 |
| 115,417,884 |
|
| Mid Cap Value Fund | 63,464,904 |
| 10,343,181 |
| 10,793,798 |
| (1,004,117 | ) | 6,440,075 |
| 64,058,738 |
|
| NT Disciplined Growth Fund | 34,150,967 |
| 531,566 |
| 594,402 |
| (11,888 | ) | 227,296 |
| 33,878,751 |
|
| Small Company Fund | 24,819,101 |
| 2,837,733 |
| 7,112,533 |
| 901,238 |
| 72,041 |
| 18,344,810 |
|
| Emerging Markets Fund | 67,481,883 |
| 9,689,279 |
| 5,519,476 |
| (383,018 | ) | 93,781 |
| 72,393,654 |
|
| International Growth Fund | 99,151,152 |
| 11,004,357 |
| 6,982,446 |
| 376,089 |
| 4,810,608 |
| 89,289,527 |
|
| NT Global Real Estate Fund | 32,589,392 |
| 12,591,928 |
| 13,599,181 |
| (613,671 | ) | 1,008,541 |
| 34,872,345 |
|
| NT International Small-Mid Cap Fund | 22,873,713 |
| 150,128 |
| 1,450,322 |
| 45,601 |
| 150,128 |
| 21,213,633 |
|
| NT International Value Fund | 69,621,791 |
| 6,449,121 |
| 5,688,268 |
| (443,249 | ) | 1,253,538 |
| 61,603,462 |
|
| Diversified Bond Fund | 57,726,506 |
| 16,763,762 |
| 13,456,542 |
| 69,063 |
| 1,633,020 |
| 62,787,060 |
|
| High-Yield Fund | 66,009,514 |
| 6,483,909 |
| 17,017,328 |
| (2,058,809 | ) | 3,464,977 |
| 55,619,083 |
|
| Inflation-Adjusted Bond Fund | 44,353,140 |
| 825,704 |
| 14,239,013 |
| (1,743,858 | ) | 484,053 |
| 33,504,343 |
|
Short Duration Inflation Protection Bond Fund(3) | — |
| 10,851,402 |
| — |
| — |
| — |
| 11,101,343 |
|
| Global Bond Fund | 33,403,038 |
| 326,470 |
| 2,134,494 |
| (32,058 | ) | 140,951 |
| 33,434,880 |
|
| Prime Money Market Fund | 2,829,059 |
| 93 |
| 2,829,152 |
| — |
| 94 |
| — |
|
| U.S. Government Money Market Fund | — |
| 2,698,538 |
| — |
| — |
| 180 |
| 2,698,538 |
|
| | $ | 1,099,082,450 |
| $ | 169,312,780 |
| $ | 137,229,125 |
| $ | (4,791,265 | ) | $ | 51,891,614 |
| $ | 1,091,124,567 |
|
| |
| (1) | Underlying fund investments represent Investor Class. |
| |
| (2) | Distributions received includes distributions from net investment income and from capital gains, if any. |
|
| | | | | | | | | | | | | | | | | | |
Fund/ Underlying Fund(1) | Beginning
Value | Purchase
Cost | Sales Cost | Realized
Gain (Loss) | Distributions Received(2) | Ending Value |
| One Choice Portfolio: Very Aggressive |
| Core Equity Plus Fund | $ | 12,875,007 |
| $ | 1,105,579 |
| $ | 755,964 |
| $ | (36,493 | ) | $ | 1,105,579 |
| $ | 12,121,989 |
|
| Equity Growth Fund | 31,615,392 |
| 4,738,578 |
| 3,022,561 |
| (236,732 | ) | 2,457,799 |
| 31,189,824 |
|
| Growth Fund | 35,616,478 |
| 3,188,703 |
| 3,680,954 |
| 655,818 |
| 2,154,592 |
| 33,139,448 |
|
| Heritage Fund | 24,332,337 |
| 2,956,899 |
| 819,077 |
| 6,504 |
| 2,585,676 |
| 23,478,454 |
|
| Large Company Value Fund | 28,261,774 |
| 3,910,560 |
| 3,222,341 |
| (114,855 | ) | 444,417 |
| 29,200,095 |
|
| Mid Cap Value Fund | 21,329,092 |
| 2,208,241 |
| 4,045,475 |
| (250,395 | ) | 2,046,742 |
| 19,721,395 |
|
| NT Disciplined Growth Fund | 10,946,709 |
| 72,065 |
| 715,805 |
| (14,555 | ) | 72,065 |
| 10,230,787 |
|
| Small Company Fund | 17,254,727 |
| 3,332,837 |
| 4,164,500 |
| (648,157 | ) | 49,899 |
| 16,514,237 |
|
| Emerging Markets Fund | 19,074,942 |
| 1,338,440 |
| 1,542,654 |
| (88,933 | ) | 24,577 |
| 19,021,477 |
|
| International Growth Fund | 28,543,448 |
| 2,786,223 |
| 2,215,751 |
| 318,713 |
| 1,356,297 |
| 24,983,685 |
|
| NT Global Real Estate Fund | 8,141,211 |
| 875,778 |
| 1,982,134 |
| (51,026 | ) | 181,455 |
| 7,771,647 |
|
| NT International Small-Mid Cap Fund | 8,099,144 |
| 150,922 |
| 579,508 |
| 486 |
| 53,442 |
| 7,544,653 |
|
| NT International Value Fund | 22,711,848 |
| 1,832,814 |
| 1,875,858 |
| (134,080 | ) | 408,082 |
| 19,871,920 |
|
| | $ | 268,802,109 |
| $ | 28,497,639 |
| $ | 28,622,582 |
| $ | (593,705 | ) | $ | 12,940,622 |
| $ | 254,789,611 |
|
| |
| (1) | Underlying fund investments represent Investor Class. |
| |
| (2) | Distributions received includes distributions from net investment income and from capital gains, if any. |
7. Investments in Underlying Funds
The funds do not invest in the underlying funds for the purpose of exercising management or control; however, investments by the funds within their investment strategies may represent a significant portion of the underlying funds’ net assets. As of July 31, 2016, One Choice Portfolio: Moderate and One Choice Portfolio: Aggressive owned 40% and 30%, respectively, of the shares of Core Equity Plus Fund.
8. Fair Value Measurements
The funds’ investments valuation process is based on several considerations and may use multiple inputs to determine the fair value of the investments held by the funds. In conformity with accounting principles generally accepted in the United States of America, the inputs used to determine a valuation are classified into three broad levels.
| |
| • | Level 1 valuation inputs consist of unadjusted quoted prices in an active market for identical investments. |
| |
| • | Level 2 valuation inputs consist of direct or indirect observable market data (including quoted prices for comparable investments, evaluations of subsequent market events, interest rates, prepayment speeds, credit risk, etc.). These inputs also consist of quoted prices for identical investments initially expressed in local currencies that are adjusted through translation into U.S. dollars. |
| |
| • | Level 3 valuation inputs consist of unobservable data (including a fund’s own assumptions). |
The level classification is based on the lowest level input that is significant to the fair valuation measurement. The valuation inputs are not necessarily an indication of the risks associated with investing in these securities or other financial instruments. There were no significant transfers between levels during the period.
As of period end, the funds’ investment securities were classified as Level 1. The Schedules of Investments provide additional information on the funds’ portfolio holdings.
9. Federal Tax Information
The tax character of distributions paid during the years ended July 31, 2016 and July 31, 2015 were as follows:
|
| | | | | | | | | | | | |
| | 2016 | 2015 |
| | Distributions Paid From: | Distributions Paid From: |
| | Ordinary Income | Long-term capital gains | Ordinary Income | Long-term capital gains |
| One Choice Portfolio: Very Conservative | $ | 5,592,306 |
| $ | 7,483,855 |
| $ | 6,628,992 |
| $ | 4,807,935 |
|
| One Choice Portfolio: Conservative | $ | 16,535,346 |
| $ | 50,285,770 |
| $ | 18,106,221 |
| $ | 8,559,541 |
|
| One Choice Portfolio: Moderate | $ | 27,589,476 |
| $ | 93,295,481 |
| $ | 30,204,542 |
| $ | 1,963,526 |
|
| One Choice Portfolio: Aggressive | $ | 22,169,992 |
| $ | 95,892,121 |
| $ | 24,107,514 |
| $ | 13,905,515 |
|
| One Choice Portfolio: Very Aggressive | $ | 5,343,763 |
| $ | 29,819,446 |
| $ | 5,097,597 |
| — |
|
The book-basis character of distributions made during the year from net investment income or net realized gains may differ from their ultimate characterization for federal income tax purposes. These differences reflect the differing character of certain income items and net realized gains and losses for financial statement and tax purposes, and may result in reclassification among certain capital accounts on the financial statements.
As of July 31, 2016, the federal tax cost of investments and the components of distributable earnings on a tax-basis were as follows:
|
| | | | | | | | | |
| | One Choice Portfolio: Very Conservative | One Choice Portfolio: Conservative | One Choice Portfolio: Moderate |
| Federal tax cost of investments | $ | 376,868,564 |
| $ | 1,002,062,663 |
| $ | 1,484,539,216 |
|
| Gross tax appreciation of investments | $ | 34,868,464 |
| $ | 105,145,153 |
| $ | 195,337,951 |
|
| Gross tax depreciation of investments | (742,490 | ) | (6,060,985 | ) | (16,281,682 | ) |
| Net tax appreciation (depreciation) of investments | $ | 34,125,974 |
| $ | 99,084,168 |
| $ | 179,056,269 |
|
| Undistributed ordinary income | — |
| $ | 375,837 |
| $ | 383,352 |
|
| Accumulated long-term gains | $ | 3,177,754 |
| $ | 15,667,947 |
| $ | 37,437,781 |
|
|
| | | | | | |
| | One Choice Portfolio: Aggressive | One Choice Portfolio: Very Aggressive |
| Federal tax cost of investments | $ | 958,585,686 |
| $ | 211,540,642 |
|
| Gross tax appreciation of investments | $ | 146,198,961 |
| $ | 46,757,796 |
|
| Gross tax depreciation of investments | (13,660,080 | ) | (3,508,827 | ) |
| Net tax appreciation (depreciation) of investments | $ | 132,538,881 |
| $ | 43,248,969 |
|
| Undistributed ordinary income | $ | 4,941,975 |
| $ | 386,566 |
|
| Accumulated long-term gains | $ | 30,115,174 |
| $ | 8,536,276 |
|
The difference between book-basis and tax-basis unrealized appreciation (depreciation) is attributable primarily to the tax deferral of losses on wash sales.
|
| | | | | | | | | | | | | | | |
| For a Share Outstanding Throughout the Years Ended July 31 (except as noted) | | | | | | |
| Per-Share Data | | | | | Ratios and Supplemental Data | |
| | | Income From Investment Operations: | Distributions From: | | | Ratio to Average Net Assets of: | | |
| | Net Asset Value, Beginning of Period | Net Investment Income (Loss)(1) | Net Realized and Unrealized Gain (Loss) | Total From Investment Operations | Net Investment Income | Net Realized Gains | Total Distributions | Net Asset Value, End of Period | Total Return(2) | Operating Expenses(3) | Net Investment Income (Loss) | Portfolio Turnover Rate | Net Assets, End of Period (in thousands) |
| One Choice Portfolio: Very Conservative | | | | | | | | | |
| Investor Class | | | | | | | | | |
| 2016 | $11.82 | 0.18 | 0.38 | 0.56 | (0.17) | (0.24) | (0.41) | $11.97 | 4.93% | 0.00%(4) | 1.52% | 24% |
| $410,937 |
|
| 2015 | $11.94 | 0.21 | 0.03 | 0.24 | (0.20) | (0.16) | (0.36) | $11.82 | 2.07% | 0.00%(4) | 1.73% | 24% |
| $381,889 |
|
| 2014 | $11.56 | 0.20 | 0.48 | 0.68 | (0.20) | (0.10) | (0.30) | $11.94 | 5.99% | 0.00%(4) | 1.74% | 12% |
| $355,165 |
|
| 2013 | $11.38 | 0.20 | 0.26 | 0.46 | (0.20) | (0.08) | (0.28) | $11.56 | 4.04% | 0.00%(4) | 1.75% | 28% |
| $351,627 |
|
| 2012 | $11.02 | 0.24 | 0.37 | 0.61 | (0.24) | (0.01) | (0.25) | $11.38 | 5.66% | 0.00%(4) | 2.14% | 13% |
| $295,065 |
|
| R Class | | | | | | | | | |
| 2016 | $11.82 | 0.11 | 0.39 | 0.50 | (0.11) | (0.24) | (0.35) | $11.97 | 4.39% | 0.50% | 1.02% | 24% |
| $57 |
|
2015(5) | $11.97 | 0.02 | (0.15) | (0.13) | (0.02) | — | (0.02) | $11.82 | (1.13)% | 0.50%(6) | 0.40%(6) | 24%(7) |
| $25 |
|
| One Choice Portfolio: Conservative | | | | | | | | | |
| Investor Class | | | | | | | | | |
| 2016 | $13.66 | 0.21 | 0.17 | 0.38 | (0.21) | (0.67) | (0.88) | $13.16 | 3.13% | 0.00%(4) | 1.63% | 19% |
| $1,101,058 |
|
| 2015 | $13.48 | 0.24 | 0.31 | 0.55 | (0.25) | (0.12) | (0.37) | $13.66 | 4.09% | 0.00%(4) | 1.77% | 22% |
| $1,026,091 |
|
| 2014 | $12.66 | 0.24 | 0.82 | 1.06 | (0.24) | — | (0.24) | $13.48 | 8.43% | 0.00%(4) | 1.85% | 2% |
| $927,955 |
|
| 2013 | $11.79 | 0.23 | 0.87 | 1.10 | (0.23) | — | (0.23) | $12.66 | 9.42% | 0.00%(4) | 1.86% | 3% |
| $746,126 |
|
| 2012 | $11.41 | 0.25 | 0.39 | 0.64 | (0.26) | — | (0.26) | $11.79 | 5.71% | 0.00%(4) | 2.24% | 12% |
| $573,351 |
|
| R Class | | | | | | | | | |
| 2016 | $13.65 | 0.13 | 0.20 | 0.33 | (0.15) | (0.67) | (0.82) | $13.16 | 2.68% | 0.50% | 1.13% | 19% |
| $88 |
|
2015(5) | $13.81 | 0.01 | (0.16) | (0.15) | (0.01) | — | (0.01) | $13.65 | (1.06)% | 0.50%(6) | 0.28%(6) | 22%(7) |
| $25 |
|
|
| | | | | | | | | | | | | | | |
| For a Share Outstanding Throughout the Years Ended July 31 (except as noted) | | | | | | |
| Per-Share Data | | | | | Ratios and Supplemental Data | |
| | | Income From Investment Operations: | Distributions From: | | | Ratio to Average Net Assets of: | | |
| | Net Asset Value, Beginning of Period | Net Investment Income (Loss)(1) | Net Realized and Unrealized Gain (Loss) | Total From Investment Operations | Net Investment Income | Net Realized Gains | Total Distributions | Net Asset Value, End of Period | Total Return(2) | Operating Expenses(3) | Net Investment Income (Loss) | Portfolio Turnover Rate | Net Assets, End of Period (in thousands) |
| One Choice Portfolio: Moderate | | | | | | | | |
| Investor Class | | | | | | | | | |
| 2016 | $15.48 | 0.25 | (0.06) | 0.19 | (0.26) | (0.88) | (1.14) | $14.53 | 1.62% | 0.00%(4) | 1.75% | 11% |
| $1,662,962 |
|
| 2015 | $14.96 | 0.29 | 0.55 | 0.84 | (0.30) | (0.02) | (0.32) | $15.48 | 5.66% | 0.00%(4) | 1.91% | 20% |
| $1,631,785 |
|
| 2014 | $13.79 | 0.27 | 1.17 | 1.44 | (0.27) | — | (0.27) | $14.96 | 10.51% | 0.00%(4) | 1.88% | 3% |
| $1,442,589 |
|
| 2013 | $12.27 | 0.24 | 1.52 | 1.76 | (0.24) | — | (0.24) | $13.79 | 14.48% | 0.00%(4) | 1.81% | 3% |
| $1,133,569 |
|
| 2012 | $12.01 | 0.23 | 0.26 | 0.49 | (0.23) | — | (0.23) | $12.27 | 4.21% | 0.00%(4) | 1.95% | 16% |
| $869,723 |
|
| R Class | | | | | | | | | |
| 2016 | $15.47 | 0.19 | (0.07) | 0.12 | (0.18) | (0.88) | (1.06) | $14.53 | 1.17% | 0.50% | 1.25% | 11% |
| $633 |
|
2015(5) | $15.63 | 0.02 | (0.16) | (0.14) | (0.02) | — | (0.02) | $15.47 | (0.92)% | 0.50%(6) | 0.28%(6) | 20%(7) |
| $28 |
|
| One Choice Portfolio: Aggressive | | | | | | | | |
| Investor Class | | | | | | | | | |
| 2016 | $16.90 | 0.26 | (0.23) | 0.03 | (0.27) | (1.51) | (1.78) | $15.15 | 0.69% | 0.00%(4) | 1.76% | 12% |
| $1,090,739 |
|
| 2015 | $16.30 | 0.31 | 0.89 | 1.20 | (0.37) | (0.23) | (0.60) | $16.90 | 7.44% | 0.00%(4) | 1.87% | 29% |
| $1,099,057 |
|
| 2014 | $14.75 | 0.28 | 1.52 | 1.80 | (0.25) | — | (0.25) | $16.30 | 12.26% | 0.00%(4) | 1.77% | 5% |
| $1,028,185 |
|
| 2013 | $12.68 | 0.23 | 2.05 | 2.28 | (0.21) | — | (0.21) | $14.75 | 18.15% | 0.00%(4) | 1.67% | 5% |
| $852,907 |
|
| 2012 | $12.58 | 0.20 | 0.10 | 0.30 | (0.20) | — | (0.20) | $12.68 | 2.50% | 0.00%(4) | 1.65% | 14% |
| $566,200 |
|
| R Class | | | | | | | | | |
| 2016 | $16.87 | 0.16 | (0.21) | (0.05) | (0.19) | (1.51) | (1.70) | $15.12 | 0.16% | 0.50% | 1.26% | 12% |
| $386 |
|
2015(5) | $17.01 | 0.01 | (0.15) | (0.14) | — | — | — | $16.87 | (0.82)% | 0.50%(6) | 0.23%(6) | 29%(7) |
| $25 |
|
|
| | | | | | | | | | | | | | | |
| For a Share Outstanding Throughout the Years Ended July 31 (except as noted) | | | | | | | | |
| Per-Share Data | | | | | Ratios and Supplemental Data | |
| | | Income From Investment Operations: | Distributions From: | | | Ratio to Average Net Assets of: | | |
| | Net Asset Value, Beginning of Period | Net Investment Income (Loss)(1) | Net Realized and Unrealized Gain (Loss) | Total From Investment Operations | Net Investment Income | Net Realized Gains | Total Distributions | Net Asset Value, End of Period | Total Return(2) | Operating Expenses(3) | Net Investment Income (Loss) | Portfolio Turnover Rate | Net Assets, End of Period (in thousands) |
| One Choice Portfolio: Very Aggressive | | | | | | | | |
| Investor Class | | | | | | | | | |
| 2016 | $18.47 | 0.23 | (0.42) | (0.19) | (0.37) | (2.08) | (2.45) | $15.83 | (0.44)% | 0.00%(4) | 1.47% | 11% |
| $254,676 |
|
| 2015 | $17.28 | 0.31 | 1.21 | 1.52 | (0.33) | — | (0.33) | $18.47 | 8.87% | 0.00%(4) | 1.72% | 42% |
| $268,772 |
|
| 2014 | $15.30 | 0.24 | 1.89 | 2.13 | (0.15) | — | (0.15) | $17.28 | 13.94% | 0.00%(4) | 1.45% | 8% |
| $267,537 |
|
| 2013 | $12.62 | 0.18 | 2.63 | 2.81 | (0.13) | — | (0.13) | $15.30 | 22.42% | 0.00%(4) | 1.29% | 16% |
| $234,629 |
|
| 2012 | $12.62 | 0.12 | —(8) | 0.12 | (0.12) | — | (0.12) | $12.62 | 1.05% | 0.00%(4) | 1.02% | 13% |
| $193,193 |
|
| R Class | | | | | | | | | |
| 2016 | $18.44 | 0.13 | (0.40) | (0.27) | (0.28) | (2.08) | (2.36) | $15.81 | (0.92)% | 0.50% | 0.97% | 11% |
| $114 |
|
2015(5) | $18.59 | (0.01) | (0.14) | (0.15) | — | — | — | $18.44 | (0.81)% | 0.50%(6) | (0.18)%(6) | 42%(7) |
| $30 |
|
|
|
| Notes to Financial Highlights |
| |
| (1) | Computed using average shares outstanding throughout the period. |
| |
| (2) | Total returns are calculated based on the net asset value of the last business day. Total returns for periods less than one year are not annualized. |
| |
| (3) | Ratio of operating expenses to average net assets does not include any fees and expenses of the underlying funds. |
| |
| (4) | Ratio was less than 0.005%. |
| |
| (5) | March 20, 2015 (commencement of sale) through July 31, 2015. |
| |
| (7) | Portfolio turnover is calculated at the fund level. Percentage indicated was calculated for the year ended July 31, 2015. |
| |
| (8) | Per-share amount was less than $0.005. |
See Notes to Financial Statements.
|
|
| Report of Independent Registered Public Accounting Firm |
To the Board of Directors and Shareholders of American Century Asset Allocation Portfolios, Inc.:
We have audited the accompanying statements of assets and liabilities, including the schedules of investments, of One Choice Portfolio: Very Conservative, One Choice Portfolio: Conservative, One Choice Portfolio: Moderate, One Choice Portfolio: Aggressive, and One Choice Portfolio: Very Aggressive, five of the portfolios constituting American Century Asset Allocation Portfolios, Inc. (the “Funds”), as of July 31, 2016, and the related statements of operations for the year then ended, the statements of changes in net assets for each of the two years in the period then ended, and the financial highlights for each of the periods presented. These financial statements and financial highlights are the responsibility of the Funds’ management. Our responsibility is to express an opinion on these financial statements and financial highlights based on our audits.
We conducted our audits in accordance with the standards of the Public Company Accounting Oversight Board (United States). Those standards require that we plan and perform the audit to obtain reasonable assurance about whether the financial statements and financial highlights are free of material misstatement. The Funds are not required to have, nor were we engaged to perform, an audit of their internal control over financial reporting. Our audits included consideration of internal control over financial reporting as a basis for designing audit procedures that are appropriate in the circumstances, but not for the purpose of expressing an opinion on the effectiveness of the Funds’ internal control over financial reporting. Accordingly, we express no such opinion. An audit also includes examining, on a test basis, evidence supporting the amounts and disclosures in the financial statements, assessing the accounting principles used and significant estimates made by management, as well as evaluating the overall financial statement presentation. Our procedures included confirmation of securities owned as of July 31, 2016, by correspondence with the transfer agent. We believe that our audits provide a reasonable basis for our opinion.
In our opinion, the financial statements and financial highlights referred to above present fairly, in all material respects, the financial position of each of the respective Funds as of July 31, 2016, the results of their operations for the year then ended, the changes in their net assets for each of the two years in the period then ended, and the financial highlights for each of the periods presented, in conformity with accounting principles generally accepted in the United States of America.
DELOITTE & TOUCHE LLP
Kansas City, Missouri
September 19, 2016
The Board of Directors
The individuals listed below serve as directors of the funds. Each director will continue to serve in this capacity until death, retirement, resignation or removal from office. The board has adopted a mandatory retirement age for directors who are not “interested persons,” as that term is defined in the Investment Company Act (independent directors). Independent directors shall retire by December 31 of the year in which they reach their 75th birthday.
Mr. Thomas is an “interested person” because he currently serves as President and Chief Executive Officer of American Century Companies, Inc. (ACC), the parent company of American Century Investment Management, Inc. (ACIM or the advisor). The other directors (more than three-fourths of the total number) are independent. They are not employees, directors or officers of, and have no financial interest in, ACC or any of its wholly owned, direct or indirect, subsidiaries, including ACIM, American Century Investment Services, Inc. (ACIS) and American Century Services, LLC (ACS), and they do not have any other affiliations, positions or relationships that would cause them to be considered “interested persons” under the Investment Company Act. The directors serve in this capacity for seven (in the case of Mr. Thomas, 15) registered investment companies in the American Century Investments family of funds.
The following table presents additional information about the directors. The mailing address for each director is 4500 Main Street, Kansas City, Missouri 64111.
|
| | | | | |
Name
(Year of Birth) | Position(s) Held with Funds | Length of Time Served | Principal Occupation(s) During Past 5 Years | Number of American Century Portfolios Overseen by Director | Other Directorships Held During Past
5 Years |
| Independent Directors | | |
Barry Fink
(1955) | Director | Since 2012 | Retired; Executive Vice President, ACC (September 2007 to February 2013); President, ACS (October 2007 to February 2013); Chief Operating Officer, ACC (September 2007 to November 2012) | 83 | None |
Andrea C. Hall
(1945) | Director | Since 1997 | Retired | 83 | None |
Jan M. Lewis
(1957) | Director | Since 2011 | Retired; President and Chief Executive Officer, Catholic Charities of Northeast Kansas (human services organization) (2006 to 2013) | 83 | None |
James A. Olson
(1942) | Director and Chairman of the Board | Since 2007 (Chairman since 2014) | Member, Plaza Belmont LLC (private equity fund manager) (1999 to present) | 83 | Saia, Inc. (2002 to 2012) and EPR Properties (2003 to 2013) |
M. Jeannine Strandjord
(1945) | Director | Since 1994 | Retired | 83 | Euronet Worldwide Inc.; MGP Ingredients, Inc.; and DST Systems Inc. (1996 to 2012) |
|
| | | | | |
Name
(Year of Birth) | Position(s) Held with Funds | Length of Time Served | Principal Occupation(s) During Past 5 Years | Number of American Century Portfolios Overseen by Director | Other Directorships Held During Past
5 Years |
| Independent Directors | | |
John R. Whitten
(1946) | Director | Since 2008 | Retired | 83 | Rudolph Technologies, Inc. |
Stephen E. Yates
(1948) | Director | Since 2012 | Retired | 83 | None |
| Interested Director | | |
Jonathan S. Thomas
(1963) | Director and President | Since 2007 | President and Chief Executive Officer, ACC (March 2007 to present). Also serves as Chief Executive Officer, ACS; Executive Vice President, ACIM; Director, ACC, ACIM and other ACC subsidiaries | 128 | BioMed Valley Discoveries, Inc. |
The Statement of Additional Information has additional information about the funds' directors and is available without charge, upon request, by calling 1-800-345-2021.
Officers
The following table presents certain information about the executive officers of the funds. Each officer serves as an officer for each of the 15 investment companies in the American Century family of funds, unless otherwise noted. No officer is compensated for his or her service as an officer of the funds. The listed officers are interested persons of the funds and are appointed or re-appointed on an annual basis. The mailing address for each officer listed below is 4500 Main Street, Kansas City, Missouri 64111.
|
| | |
Name (Year of Birth) | Offices with the Funds | Principal Occupation(s) During the Past Five Years |
Jonathan S.
Thomas
(1963) | Director and
President
since 2007 | President and Chief Executive Officer, ACC (March 2007 to present). Also serves as Chief Executive Officer, ACS; Executive Vice President, ACIM; Director, ACC, ACIM and other ACC subsidiaries |
Amy D. Shelton
(1964) | Chief Compliance
Officer and Vice President since 2014 | Chief Compliance Officer, American Century funds, (March 2014 to present); Chief Compliance Officer, ACIM (February 2014 to present); Chief Compliance Officer, ACIS (October 2009 to present); Vice President, Client Interactions and Marketing, ACIS (February 2013 to January 2014); Director, Client Interactions and Marketing, ACIS (June 2007 to January 2013). Also serves as Vice President, ACIS |
Charles A.
Etherington
(1957) | General Counsel
since 2007 and
Senior Vice
President since 2006 | Attorney, ACC (February 1994 to present); Vice President, ACC (November 2005 to present); General Counsel, ACC (March 2007 to present). Also serves as General Counsel, ACIM, ACS, ACIS and other ACC subsidiaries; and Senior Vice President, ACIM and ACS |
C. Jean Wade
(1964) | Vice President,
Treasurer and
Chief Financial
Officer since 2012 | Vice President, ACS (February 2000 to present) |
Robert J.
Leach
(1966) | Vice President
since 2006 and
Assistant Treasurer
since 2012 | Vice President, ACS (February 2000 to present) |
David H.
Reinmiller
(1963) | Vice President
since 2000 | Attorney, ACC (January 1994 to present); Associate General Counsel, ACC (January 2001 to present). Also serves as Vice President, ACIM and ACS |
Ward D.
Stauffer
(1960) | Secretary
since 2005 | Attorney, ACC (June 2003 to present) |
|
|
| Approval of Management Agreement |
At a meeting held on June 29, 2016, the Funds’ Board of Directors (the “Board) unanimously approved the renewal of the management agreement pursuant to which American Century Investment Management, Inc. (the “Advisor”) acts as the investment advisor for the Funds. Under Section 15(c) of the Investment Company Act, contracts for investment advisory services are required to be reviewed, evaluated, and approved by a majority of a fund’s directors (the “Directors”), including a majority of the independent Directors, each year.
Prior to its consideration of the renewal of the management agreement, the Directors requested and reviewed extensive data and information compiled by the Advisor and certain independent providers of evaluation data concerning the Funds and the services provided to the Funds by the Advisor. This review was in addition to the oversight and evaluation undertaken by the Board and its committees on a continual basis and the information received was supplemental to the extensive information that the Board and its committees receive and consider throughout the year.
In connection with its consideration of the renewal of the management agreement, the Board’s review and evaluation of the services provided by the Advisor included, but was not limited to, the following:
| |
| • | the nature, extent, and quality of investment management, shareholder services, and other services provided and to be provided by the Advisor to each Fund; |
| |
| • | the wide range of other programs and services provided and to be provided to each Fund and its shareholders on a routine and non-routine basis; |
| |
| • | the investment performance of each Fund, including data comparing each Fund’s performance to appropriate benchmarks and/or a peer group of other mutual funds with similar investment objectives and strategies; |
| |
| • | the cost of owning each Fund compared to the cost of owning similar funds; |
| |
| • | the compliance policies, procedures, and regulatory experience of the Advisor and the Funds’ other service providers; |
| |
| • | financial data showing the cost of services provided to each Fund and the overall profitability of the Advisor; |
| |
| • | possible economies of scale associated with the Advisor’s management of the Funds and other accounts under its management; |
| |
| • | data comparing services provided and charges to the Advisor's other investment management clients; |
| |
| • | acquired fund fees and expenses; |
| |
| • | payments by each Fund and the Advisor to financial intermediaries and the nature of services provided; and |
| |
| • | any collateral benefits derived by the Advisor from the management of the Funds. |
In keeping with their practice, the Directors held two in-person meetings and one telephonic meeting to review and discuss the information provided. The independent Directors also had the benefit of the advice of their independent counsel throughout the process.
Factors Considered
The Directors considered all of the information provided by the Advisor, the independent data providers, and independent counsel in connection with the approval of the management agreement. They determined that the information was sufficient for them to evaluate the management agreement for the Funds. In connection with their review, the Directors did not identify any single factor as being all-important or controlling, and each Director may have attributed different levels of importance to different factors. In deciding to renew the management agreement, the Board based its decision on a number of factors, including the following:
Nature, Extent and Quality of Services - Generally. Under the management agreement, the Advisor is responsible for providing or arranging for all services necessary for the operation of each Fund. The Board noted that under the management agreement, the Advisor provides or arranges at its own expense a wide variety of services including:
| |
| • | constructing and designing each Fund |
| |
| • | portfolio research and security selection |
| |
| • | initial capitalization/funding |
| |
| • | daily valuation of each Fund’s portfolio |
| |
| • | shareholder servicing and transfer agency, including shareholder confirmations, recordkeeping, and communications |
| |
| • | legal services (except the independent Directors’ counsel) |
| |
| • | regulatory and portfolio compliance |
| |
| • | marketing and distribution (except amounts paid by each Fund under Rule 12b-1 plans) |
The Board noted that many of these services have expanded over time in terms of both quantity and complexity in response to shareholder demands, competition in the industry, changing distribution channels, and the changing regulatory environment. The Board noted specifically the resources the Advisor has committed to enhancing cybersecurity protections for the benefit of shareholders.
Investment Management Services. The nature of the investment management services provided to the Funds is quite complex and allows fund shareholders access to professional money management, instant diversification of their investments within an asset class, the opportunity to easily diversify among asset classes by investing in or exchanging among various American Century Investments funds, and liquidity. In evaluating investment performance, the Board expects the Advisor to manage each Fund in accordance with its investment objectives and approved strategies. Further, the Directors recognize that the Advisor has an obligation to monitor trading activities, and in particular to seek the best execution of fund trades, and to evaluate the use of and payment for research. In providing these services, the Advisor utilizes teams of investment professionals (portfolio managers, analysts, research assistants, and securities traders) who require extensive information technology, research, training, compliance, and other systems to conduct their business. The Board, directly and through its Fund Performance Review Committee, provides oversight of the investment performance process. It regularly reviews investment performance information for each Fund, together with comparative information for appropriate benchmarks and/or peer groups of similarly-managed funds, over different time horizons. The Directors also review detailed performance information provided by the Advisor during the management agreement approval process. If performance concerns are identified with respect to a fund, the Fund receives special reviews until performance improves, during which the Board receives a report from the Advisor regarding the reasons for such results (e.g., market conditions, security selection) and any efforts being undertaken to improve performance. The Funds’ performance was above each Fund’s respective benchmark for the one-, three-, five-, and ten-year periods reviewed by the Board. Taking all of these factors into consideration, the Board found the investment management services provided by the Advisor to each Fund to be satisfactory and consistent with the management agreement.
Shareholder and Other Services. Under the management agreement, the Advisor provides the Funds with a comprehensive package of transfer agency, shareholder, and other services. The Board, directly and through various committees of the Board, regularly reviews reports and evaluations of such services at its regular meetings. These reports include, but are not limited to, information regarding the operational efficiency and accuracy of the shareholder and transfer agency services provided, staffing levels, shareholder satisfaction (as measured by external as well
as internal sources), technology support, new products and services offered to fund shareholders, securities trading activities, portfolio valuation services, auditing services, and legal and operational compliance activities. The Board particularly noted the Advisor’s continual efforts to maintain effective business continuity plans and to address cybersecurity threats. Certain aspects of shareholder and transfer agency service level efficiency and the quality of securities trading activities are measured by independent third party providers and are presented in comparison to other fund groups not managed by the Advisor. The Board found the services provided by the Advisor to each Fund under the management agreement to be competitive and of high quality.
Costs of Services and Profitability. The Advisor provides detailed information concerning its cost of providing various services to the Funds, its profitability in managing each Fund (pre- and post-distribution), its overall profitability, and its financial condition. The Directors have reviewed with the Advisor the methodology used to prepare this financial information. This information is considered in evaluating the Advisor’s financial condition, its ability to continue to provide services under the Funds’ management agreement, and the reasonableness of the current management agreement. The Board concluded that the Advisor’s profits were reasonable in light of the services provided to the Funds.
Ethics. The Board generally considers the Advisor’s commitment to providing quality services to shareholders and to conducting its business ethically. They noted that the Advisor’s practices generally meet or exceed industry best practices.
Economies of Scale. The Board also reviewed information provided by the Advisor regarding the possible existence of economies of scale in connection with the management of each Fund. The Board concluded that economies of scale are difficult to measure and predict with precision, especially on a fund-by-fund basis. The Board concluded that the Advisor is appropriately sharing economies of scale through its competitive fee structure, offering competitive fees from fund inception, and through reinvestment in its business to provide shareholders additional content and services.
Comparison to Other Funds’ Fees. The Funds invest their non-cash assets entirely in other American Century Investments funds. The Funds do not pay an investment advisory fee to the Advisor. Rather, each Fund indirectly bears its pro rata share of the expenses incurred by the underlying funds. Each underlying fund pays the Advisor a single, all-inclusive (or unified) management fee for providing all services necessary for the management and operation of the fund, other than brokerage expenses, expenses attributable to short sales, taxes, interest, extraordinary expenses, and the fees and expenses of the fund’s independent directors (including their independent legal counsel), as well as expenses incurred in connection with the provision of shareholder services and distribution services under a plan adopted pursuant to Rule 12b-1 under the 1940 Act. The Board concluded that the underlying fund expenses incurred by each Fund were reasonable in light of the services provided to each Fund.
Comparison to Fees and Services Provided to Other Clients of the Advisor. The Directors also requested and received information from the Advisor concerning the nature of the services, fees, costs, and profitability of its advisory services to advisory clients other than the Funds. They observed that these varying types of client accounts require different services and involve different regulatory and entrepreneurial risks than the management of each Fund. The Board analyzed this information and concluded that the fees charged and services provided to the Funds were reasonable by comparison.
Payments to Intermediaries. The Directors also requested and received a description of payments made to intermediaries by each Fund and the Advisor. These payments include various payments made by each Fund or the Advisor to different types of intermediaries and recordkeepers for distribution and service activities provided for each Fund. The Board received confirmation from the Advisor that all such payments by the Funds intended for distribution were made pursuant to each Fund’s 12b-1 Plan. The Board reviewed such information and found the payments to be reasonable in scope and purpose.
Collateral or “Fall-Out” Benefits Derived by the Advisor. The Board considered the existence of collateral benefits the Advisor may receive as a result of its relationship with the Funds. They concluded that the Advisor’s primary business is managing mutual funds and it generally does not use fund or shareholder information to generate profits in other lines of business, and therefore does not derive any significant collateral benefits from them. The Board noted that additional assets from other clients may offer the Advisor some benefit from increased leverage with service providers and counterparties. Additionally, the Advisor receives proprietary research from broker-dealers that execute fund portfolio transactions, which the Board concluded is likely to benefit other clients of the Advisor, as well as fund shareholders. The Board also determined that the Advisor is able to provide investment management services to certain clients other than the Funds, at least in part, due to its existing infrastructure built to serve the fund complex.
Existing Relationship. The Board also considered whether there was any reason for not continuing the existing arrangement with the Advisor. In this regard, the Board was mindful of the potential disruptions of the Funds’ operations and various risks, uncertainties, and other effects that could occur as a result of a decision not to continue such relationship. In particular, the Board recognized that most shareholders have invested in the Funds on the strength of the Advisor’s industry standing and reputation and in the expectation that the Advisor will have a continuing role in providing advisory services to each Fund.
Conclusion of the Directors. As a result of this process, the Board, including all of the independent Directors, taking into account all of the factors discussed above and the information provided by the Advisor and others in connection with its review and throughout the year, determined that the management agreement between the Funds and the Advisor is fair and reasonable in light of the services provided and should be renewed.
Retirement Account Information
As required by law, distributions you receive from certain IRAs are subject to federal income tax withholding, unless you elect not to have withholding apply. Tax will be withheld on the total amount withdrawn even though you may be receiving amounts that are not subject to withholding, such as nondeductible contributions. In such case, excess amounts of withholding could occur. You may adjust your withholding election so that a greater or lesser amount will be withheld.
If you don’t want us to withhold on this amount, you must notify us to not withhold the federal income tax. You may notify us in writing or in certain situations by telephone or through other electronic means. For systematic withdrawals, your withholding election will remain in effect until revoked or changed by filing a new election. You have the right to revoke your election at any time.
Remember, even if you elect not to have income tax withheld, you are liable for paying income tax on the taxable portion of your withdrawal. If you elect not to have income tax withheld or you don’t have enough income tax withheld, you may be responsible for payment of estimated tax. You may incur penalties under the estimated tax rules if your withholding and estimated tax payments are not sufficient. You can reduce or defer the income tax on a distribution by directly or indirectly rolling such distribution over to another IRA or eligible plan. You should consult your tax advisor for additional information.
State tax will be withheld if, at the time of your distribution, your address is within one of the mandatory withholding states and you have federal income tax withheld (or as otherwise required by state law). State taxes will be withheld from your distribution in accordance with the respective state rules.
Distributions you receive from 403(b), 457 and qualified plans are subject to special tax and withholding rules. Your plan administrator or plan sponsor is required to provide you with a special tax notice explaining those rules at the time you request a distribution. If applicable, federal and/or state taxes may be withheld from your distribution amount.
Proxy Voting Policies
A description of the policies that the funds’ investment advisor uses in exercising the voting rights associated with the securities purchased and/or held by the funds is available without charge, upon request, by calling 1-800-345-2021. It is also available on the “About Us” page of American Century Investments’ website at americancentury.com and on the Securities and Exchange Commission’s
website at sec.gov. Information regarding how the investment advisor voted proxies relating to portfolio securities during the most recent 12-month period ended June 30 is available on the “About Us” page at americancentury.com. It is also available at sec.gov.
Quarterly Portfolio Disclosure
The funds file their complete schedule of portfolio holdings with the Securities and Exchange Commission (SEC) for the first and third quarters of each fiscal year on Form N-Q. The funds’ Forms N-Q are available on the SEC’s website at sec.gov, and may be reviewed and copied at the SEC’s Public Reference Room in Washington, DC. Information on the operation of the Public Reference Room may be obtained by calling 1-800-SEC-0330. The funds also make their complete
schedule of portfolio holdings for the most recent quarter of their fiscal year available on their website at americancentury.com and, upon request, by calling 1-800-345-2021.
Other Tax Information
The following information is provided pursuant to provisions of the Internal Revenue Code.
The funds hereby designate up to the maximum amount allowable as qualified dividend income for the fiscal year ended July 31, 2016.
For corporate taxpayers, the funds hereby designate the following, or up to the maximum amount allowable, of ordinary income distributions paid during the fiscal year ended July 31, 2016 as qualified for the corporate dividends received deduction.
|
| | | | |
One Choice Portfolio: Very Conservative | One Choice Portfolio: Conservative | One Choice Portfolio: Moderate | One Choice Portfolio: Aggressive | One Choice Portfolio: Very Aggressive |
| $1,254,513 | $4,516,451 | $9,037,647 | $6,747,827 | $1,916,734 |
The funds hereby designate the following as qualified short-term capital gain distributions for purposes of Internal Revenue Code Section 871 for the fiscal year ended July 31, 2016.
|
| | | | |
One Choice Portfolio: Very Conservative | One Choice Portfolio: Conservative | One Choice Portfolio: Moderate | One Choice Portfolio: Aggressive | One Choice Portfolio: Very Aggressive |
| $54,482 | — | — | $4,317,913 | — |
The funds hereby designate the following, or up to the maximum amount allowable, as long-term capital gain distributions (20% rate gain distributions) for the fiscal year ended July 31, 2016.
|
| | | | |
One Choice Portfolio: Very Conservative | One Choice Portfolio: Conservative | One Choice Portfolio: Moderate | One Choice Portfolio: Aggressive | One Choice Portfolio: Very Aggressive |
| $7,670,229 | $50,285,770 | $93,295,481 | $95,892,121 | $29,819,446 |
For the fiscal year ended July 31, 2106, the funds intend to pass through to shareholders the following foreign source income and foreign taxes paid, or up to the maximum amount allowable, as a foreign tax credit.
|
| | | | | | | | |
| | Foreign Tax Credit | Foreign Source Income |
| | Amount | Per Outstanding Share | Amount | Per Outstanding Share |
| One Choice Portfolio: Very Conservative | — | — | — | — |
| One Choice Portfolio: Conservative | $ | 161,685 |
| 0.0019 | $ | 971,322 |
| 0.0116 |
| One Choice Portfolio: Moderate | $ | 341,795 |
| 0.0030 | $ | 2,155,208 |
| 0.0188 |
| One Choice Portfolio: Aggressive | $ | 296,725 |
| 0.0041 | $ | 1,839,455 |
| 0.0255 |
| One Choice Portfolio: Very Aggressive | $ | 91,210 |
| 0.0057 | $ | 584,390 |
| 0.0363 |
The funds utilized the following earnings and profits distributed to shareholders on redemptions of shares as part of the dividends paid deduction (tax equalization).
|
| | | | |
One Choice Portfolio: Very Conservative | One Choice Portfolio: Conservative | One Choice Portfolio: Moderate | One Choice Portfolio: Aggressive | One Choice Portfolio: Very Aggressive |
| $344,239 | — | — | — | — |
|
| | |
| |
| | | |
| Contact Us | americancentury.com | |
| Automated Information Line | 1-800-345-8765 | |
| Investor Services Representative | 1-800-345-2021
or 816-531-5575 | |
| Investors Using Advisors | 1-800-378-9878 | |
| Business, Not-For-Profit, Employer-Sponsored Retirement Plans | 1-800-345-3533 | |
| Banks and Trust Companies, Broker-Dealers, Financial Professionals, Insurance Companies | 1-800-345-6488 | |
| Telecommunications Relay Services for the Deaf | 711 | |
| | | |
| American Century Asset Allocation Portfolios, Inc. | |
| | | |
Investment Advisor: American Century Investment Management, Inc. Kansas City, Missouri | |
| | | |
| This report and the statements it contains are submitted for the general information of our shareholders. The report is not authorized for distribution to prospective investors unless preceded or accompanied by an effective prospectus. | |
| | | |
©2016 American Century Proprietary Holdings, Inc. All rights reserved. CL-ANN-90168 1609 | |

|
| |
| | |
| | Annual Report |
| | |
| | July 31, 2016 |
| | |
| | One Choice® In Retirement Portfolio |
| | |
| | One Choice® 2020 Portfolio |
| | |
| | One Choice® 2025 Portfolio |
| | |
| | One Choice® 2030 Portfolio |
| | |
| | One Choice® 2035 Portfolio |
| | |
| | One Choice® 2040 Portfolio |
| | |
| | One Choice® 2045 Portfolio |
| | |
| | One Choice® 2050 Portfolio |
| | |
| | One Choice® 2055 Portfolio |
| | |
| | One Choice® 2060 Portfolio |
|
| | |
| President’s Letter | |
|
| Performance | 3 |
|
| Portfolio Commentary | |
|
| Portfolio Characteristics | |
|
| Shareholder Fee Examples | |
|
| Schedules of Investments | |
|
| Statements of Assets and Liabilities | |
|
| Statements of Operations | |
|
| Statements of Changes in Net Assets | |
|
| Notes to Financial Statements | |
|
| Financial Highlights | |
|
| Report of Independent Registered Public Accounting Firm | |
|
| Management | |
|
| Approval of Management Agreements | |
|
| Additional Information | |
|
Any opinions expressed in this report reflect those of the author as of the date of the report, and do not necessarily represent the opinions of American Century Investments® or any other person in the American Century Investments organization. Any such opinions are subject to change at any time based upon market or other conditions and American Century Investments disclaims any responsibility to update such opinions. These opinions may not be relied upon as investment advice and, because investment decisions made by American Century Investments funds are based on numerous factors, may not be relied upon as an indication of trading intent on behalf of any American Century Investments fund. Security examples are used for representational purposes only and are not intended as recommendations to purchase or sell securities. Performance information for comparative indices and securities is provided to American Century Investments by third party vendors. To the best of American Century Investments’ knowledge, such information is accurate at the time of printing.
Jonathan Thomas
Dear Investor:
Thank you for reviewing this annual report for the period ended July 31, 2016. It provides investment performance and portfolio information for the reporting period, plus longer-term historical performance data.
Annual reports remain important vehicles for conveying information about fund returns, including market and economic factors that affected performance during the reporting period. For additional, updated investment and market insights, we encourage you to visit our website, americancentury.com.
Market Volatility Increased, But Not for the Reasons Anticipated
Going into this reporting period, investors anticipated increased market volatility and uncertainty as the Federal Reserve (the Fed) appeared poised to raise short-term interest rates toward more historically normal levels. This policy change was expected to affect investor sentiment, U.S. Treasury yield behavior, relative currency values, inflation expectations, and corporate costs and earnings.
This Fed-centric outlook didn’t fully account for global factors, which ultimately drove sentiment, volatility, and performance during the reporting period. During 2015, the primary catalyst was China, where slowing economic growth, currency devaluations, and massive monetary policy easing sent shock waves through the global markets. The Fed ended up delaying (until December 2015) its only small rate hike during the reporting period. Afterward, China-related events repeated in January and early February this year, further delaying Fed action.
Oil was another catalyst—its price collapses devalued entire market sectors and contributed to
broad market volatility and negative sentiment. Later, as China and oil appeared to stabilize, Brexit
occurred—the unexpected decision by United Kingdom voters to leave the European Union. This produced more shock waves, and altered central bank policies around the world. In this environment, relatively defensive assets performed well.
Looking ahead, we believe the markets face further uncertainty and volatility as they digest Brexit, the Italian bank crisis, China’s economic mysteries, and the U.S. presidential election. Negative interest rates in Europe and Japan represent part of the market’s response to the global macroeconomic climate. These negative rates are suppressing interest rates around the world while driving up the value of the U.S. dollar and U.S. bonds. In a broad sense, stocks also benefit from the central bank stimulus that is driving interest rates into negative territory, and from relative yield advantages as bond yields are pushed lower. It’s an unusual and challenging environment. We appreciate your continued trust in us.
Sincerely,
Jonathan Thomas
President and Chief Executive Officer
American Century Investments
|
| | | | | | |
| Total Returns as of July 31, 2016 |
| | | | Average Annual Returns | |
| | Ticker Symbol | 1 year | 5 years | 10 years | Since Inception | Inception Date |
| One Choice In Retirement Portfolio |
| Investor Class | ARTOX | 2.76% | 6.06% | 5.52% | — | 8/31/04 |
| S&P Target Date Retirement Income Index | — | 3.68% | 4.77% | 4.58% | — | — |
| Institutional Class | ATTIX | 2.97% | 6.26% | 5.73% | — | 8/31/04 |
| A Class | ARTAX | | | | — | 8/31/04 |
| No sales charge | | 2.50% | 5.80% | 5.26% | — | |
| With sales charge | | -3.39% | 4.55% | 4.64% | — | |
| C Class | ATTCX | 1.78% | 5.00% | — | 5.81% | 3/1/10 |
| R Class | ARSRX | 2.25% | 5.52% | 4.99% | — | 8/31/04 |
Average annual returns since inception are presented when ten years of performance history is not available.
Prior to March 1, 2010, the A Class was referred to as the Advisor Class and did not have a front-end sales charge. Performance prior to that date has been adjusted to reflect this charge.
Sales charges include initial sales charges and contingent deferred sales charges (CDSCs), as applicable. A Class shares have a 5.75% maximum initial sales charge and may be subject to a maximum CDSC of 1.00%. C Class shares redeemed within 12 months of purchase are subject to a maximum CDSC of 1.00%. The SEC requires that mutual funds provide performance information net of maximum sales charges in all cases where charges could be applied.
A One Choice Target Date Portfolio's target date is the approximate year when investors plan to retire or start withdrawing their money. The principal value of the investment is not guaranteed at any time, including at the target date.
Data presented reflect past performance. Past performance is no guarantee of future results. Current performance may be higher or lower than the performance shown. Total returns for periods less than one year are not annualized. Investment return and principal value will fluctuate, and redemption value may be more or less than original cost. Data assumes reinvestment of dividends and capital gains, and none of the charts reflect the deduction of taxes that a shareholder would pay on fund distributions or the redemption of fund shares. To obtain performance data current to the most recent month end, please call 1-800-345-2021 or visit americancentury.com. For additional information about the funds, please consult the prospectus.
|
| | | | | |
| Total Returns as of July 31, 2016 |
| | | | Average Annual Returns | |
| | Ticker Symbol | 1 year | 5 years | Since Inception | Inception Date |
| One Choice 2020 Portfolio |
| Investor Class | ARBVX | 2.60% | 6.47% | 5.04% | 5/30/08 |
| S&P Target Date To 2020 Index | — | 3.31% | 5.76% | 4.51% | — |
| Institutional Class | ARBSX | 2.80% | 6.69% | 5.24% | 5/30/08 |
| A Class | ARBMX | | | | 5/30/08 |
| No sales charge | | 2.33% | 6.20% | 4.77% | |
| With sales charge | | -3.56% | 4.95% | 4.02% | |
| C Class | ARNCX | 1.63% | 5.41% | 6.40% | 3/1/10 |
| R Class | ARBRX | 2.16% | 5.95% | 4.52% | 5/30/08 |
Prior to March 1, 2010, the A Class was referred to as the Advisor Class and did not have a front-end sales charge. Performance prior to that date has been adjusted to reflect this charge.
Sales charges include initial sales charges and contingent deferred sales charges (CDSCs), as applicable. A Class shares have a 5.75% maximum initial sales charge and may be subject to a maximum CDSC of 1.00%. C Class shares redeemed within 12 months of purchase are subject to a maximum CDSC of 1.00%. The SEC requires that mutual funds provide performance information net of maximum sales charges in all cases where charges could be applied.
A One Choice Target Date Portfolio's target date is the approximate year when investors plan to retire or start withdrawing their money. The principal value of the investment is not guaranteed at any time, including at the target date.
Data presented reflect past performance. Past performance is no guarantee of future results. Current performance may be higher or lower than the performance shown. Total returns for periods less than one year are not annualized. Investment return and principal value will fluctuate, and redemption value may be more or less than original cost. Data assumes reinvestment of dividends and capital gains, and none of the charts reflect the deduction of taxes that a shareholder would pay on fund distributions or the redemption of fund shares. To obtain performance data current to the most recent month end, please call 1-800-345-2021 or visit americancentury.com. For additional information about the funds, please consult the prospectus.
|
| | | | | | |
| Total Returns as of July 31, 2016 |
| | | | Average Annual Returns | |
| | Ticker Symbol | 1 year | 5 years | 10 years | Since Inception | Inception Date |
| One Choice 2025 Portfolio |
| Investor Class | ARWIX | 2.55% | 6.86% | 5.86% | — | 8/31/04 |
| S&P Target Date To 2025 Index | — | 3.10% | 6.23% | — | — | — |
| S&P Target Date 2025 Index | — | 2.89% | 7.22% | 5.65% | — | — |
| Institutional Class | ARWFX | 2.69% | 7.07% | 6.06% | — | 8/31/04 |
| A Class | ARWAX | | | | — | 8/31/04 |
| No sales charge | | 2.28% | 6.59% | 5.59% | — | |
| With sales charge | | -3.59% | 5.34% | 4.97% | — | |
| C Class | ARWCX | 1.42% | 5.78% | — | 6.80% | 3/1/10 |
| R Class | ARWRX | 2.03% | 6.33% | 5.33% | — | 8/31/04 |
Average annual returns since inception are presented when ten years of performance history is not available.
Prior to March 1, 2010, the A Class was referred to as the Advisor Class and did not have a front-end sales charge. Performance prior to that date has been adjusted to reflect this charge.
Benchmark data for the S&P Target Date To 2025 Index was first available May 2007.
Sales charges include initial sales charges and contingent deferred sales charges (CDSCs), as applicable. A Class shares have a 5.75% maximum initial sales charge and may be subject to a maximum CDSC of 1.00%. C Class shares redeemed within 12 months of purchase are subject to a maximum CDSC of 1.00%. The SEC requires that mutual funds provide performance information net of maximum sales charges in all cases where charges could be applied.
A One Choice Target Date Portfolio's target date is the approximate year when investors plan to retire or start withdrawing their money. The principal value of the investment is not guaranteed at any time, including at the target date.
Data presented reflect past performance. Past performance is no guarantee of future results. Current performance may be higher or lower than the performance shown. Total returns for periods less than one year are not annualized. Investment return and principal value will fluctuate, and redemption value may be more or less than original cost. Data assumes reinvestment of dividends and capital gains, and none of the charts reflect the deduction of taxes that a shareholder would pay on fund distributions or the redemption of fund shares. To obtain performance data current to the most recent month end, please call 1-800-345-2021 or visit americancentury.com. For additional information about the funds, please consult the prospectus.
|
| | | | | |
| Total Returns as of July 31, 2016 |
| | | | Average Annual Returns | |
| | Ticker Symbol | 1 year | 5 years | Since Inception | Inception Date |
| One Choice 2030 Portfolio |
| Investor Class | ARCVX | 2.08% | 7.26% | 5.14% | 5/30/08 |
| S&P Target Date To 2030 Index | — | 2.90% | 6.69% | 4.60% | — |
| Institutional Class | ARCSX | 2.29% | 7.47% | 5.35% | 5/30/08 |
| A Class | ARCMX | | | | 5/30/08 |
| No sales charge | | 1.82% | 6.98% | 4.87% | |
| With sales charge | | -4.07% | 5.72% | 4.11% | |
| C Class | ARWOX | 1.03% | 6.19% | 7.21% | 3/1/10 |
| R Class | ARCRX | 1.56% | 6.72% | 4.61% | 5/30/08 |
Prior to March 1, 2010, the A Class was referred to as the Advisor Class and did not have a front-end sales charge. Performance prior to that date has been adjusted to reflect this charge.
Sales charges include initial sales charges and contingent deferred sales charges (CDSCs), as applicable. A Class shares have a 5.75% maximum initial sales charge and may be subject to a maximum CDSC of 1.00%. C Class shares redeemed within 12 months of purchase are subject to a maximum CDSC of 1.00%. The SEC requires that mutual funds provide performance information net of maximum sales charges in all cases where charges could be applied.
A One Choice Target Date Portfolio's target date is the approximate year when investors plan to retire or start withdrawing their money. The principal value of the investment is not guaranteed at any time, including at the target date.
Data presented reflect past performance. Past performance is no guarantee of future results. Current performance may be higher or lower than the performance shown. Total returns for periods less than one year are not annualized. Investment return and principal value will fluctuate, and redemption value may be more or less than original cost. Data assumes reinvestment of dividends and capital gains, and none of the charts reflect the deduction of taxes that a shareholder would pay on fund distributions or the redemption of fund shares. To obtain performance data current to the most recent month end, please call 1-800-345-2021 or visit americancentury.com. For additional information about the funds, please consult the prospectus.
|
| | | | | | |
| Total Returns as of July 31, 2016 |
| | | | Average Annual Returns | |
| | Ticker Symbol | 1 year | 5 years | 10 years | Since Inception | Inception Date |
| One Choice 2035 Portfolio |
| Investor Class | ARYIX | 1.57% | 7.71% | 6.12% | — | 8/31/04 |
| S&P Target Date To 2035 Index | — | 2.52% | 7.04% | — | — | — |
| S&P Target Date 2035 Index | — | 2.50% | 7.99% | 5.76% | — | — |
| Institutional Class | ARLIX | 1.79% | 7.94% | 6.33% | — | 8/31/04 |
| A Class | ARYAX | | | | — | 8/31/04 |
| No sales charge | | 1.31% | 7.45% | 5.85% | — | |
| With sales charge | | -4.49% | 6.19% | 5.23% | — | |
| C Class | ARLCX | 0.59% | 6.66% | — | 7.71% | 3/1/10 |
| R Class | ARYRX | 1.11% | 7.20% | 5.59% | — | 8/31/04 |
Average annual returns since inception are presented when ten years of performance history is not available.
Prior to March 1, 2010, the A Class was referred to as the Advisor Class and did not have a front-end sales charge. Performance prior to that date has been adjusted to reflect this charge.
Benchmark data for the S&P Target Date To 2035 Index was first available May 2007.
Sales charges include initial sales charges and contingent deferred sales charges (CDSCs), as applicable. A Class shares have a 5.75% maximum initial sales charge and may be subject to a maximum CDSC of 1.00%. C Class shares redeemed within 12 months of purchase are subject to a maximum CDSC of 1.00%. The SEC requires that mutual funds provide performance information net of maximum sales charges in all cases where charges could be applied.
A One Choice Target Date Portfolio's target date is the approximate year when investors plan to retire or start withdrawing their money. The principal value of the investment is not guaranteed at any time, including at the target date.
Data presented reflect past performance. Past performance is no guarantee of future results. Current performance may be higher or lower than the performance shown. Total returns for periods less than one year are not annualized. Investment return and principal value will fluctuate, and redemption value may be more or less than original cost. Data assumes reinvestment of dividends and capital gains, and none of the charts reflect the deduction of taxes that a shareholder would pay on fund distributions or the redemption of fund shares. To obtain performance data current to the most recent month end, please call 1-800-345-2021 or visit americancentury.com. For additional information about the funds, please consult the prospectus.
|
| | | | | |
| Total Returns as of July 31, 2016 |
| | | | Average Annual Returns | |
| | Ticker Symbol | 1 year | 5 years | Since Inception | Inception Date |
| One Choice 2040 Portfolio |
| Investor Class | ARDVX | 1.34% | 8.17% | 5.55% | 5/30/08 |
| S&P Target Date To 2040 Index | — | 2.33% | 7.39% | 4.69% | — |
| Institutional Class | ARDSX | 1.55% | 8.39% | 5.76% | 5/30/08 |
| A Class | ARDMX | | | | 5/30/08 |
| No sales charge | | 1.08% | 7.89% | 5.29% | |
| With sales charge | | -4.73% | 6.61% | 4.53% | |
| C Class | ARNOX | 0.29% | 7.07% | 8.16% | 3/1/10 |
| R Class | ARDRX | 0.82% | 7.63% | 5.02% | 5/30/08 |
Prior to March 1, 2010, the A Class was referred to as the Advisor Class and did not have a front-end sales charge. Performance prior to that date has been adjusted to reflect this charge.
Sales charges include initial sales charges and contingent deferred sales charges (CDSCs), as applicable. A Class shares have a 5.75% maximum initial sales charge and may be subject to a maximum CDSC of 1.00%. C Class shares redeemed within 12 months of purchase are subject to a maximum CDSC of 1.00%. The SEC requires that mutual funds provide performance information net of maximum sales charges in all cases where charges could be applied.
A One Choice Target Date Portfolio's target date is the approximate year when investors plan to retire or start withdrawing their money. The principal value of the investment is not guaranteed at any time, including at the target date.
Data presented reflect past performance. Past performance is no guarantee of future results. Current performance may be higher or lower than the performance shown. Total returns for periods less than one year are not annualized. Investment return and principal value will fluctuate, and redemption value may be more or less than original cost. Data assumes reinvestment of dividends and capital gains, and none of the charts reflect the deduction of taxes that a shareholder would pay on fund distributions or the redemption of fund shares. To obtain performance data current to the most recent month end, please call 1-800-345-2021 or visit americancentury.com. For additional information about the funds, please consult the prospectus.
|
| | | | | | |
| Total Returns as of July 31, 2016 |
| | | | Average Annual Returns | |
| | Ticker Symbol | 1 year | 5 years | 10 years | Since Inception | Inception Date |
| One Choice 2045 Portfolio |
| Investor Class | AROIX | 1.19% | 8.50% | 6.41% | — | 8/31/04 |
| S&P Target Date To 2045 Index | — | 2.14% | 7.71% | — | — | — |
| S&P Target Date 2045 Index | — | 2.20% | 8.42% | 5.79% | — | — |
| Institutional Class | AOOIX | 1.40% | 8.74% | 6.62% | — | 8/31/04 |
| A Class | AROAX | | | | — | 8/31/04 |
| No sales charge | | 0.98% | 8.25% | 6.14% | — | |
| With sales charge | | -4.83% | 6.97% | 5.52% | — | |
| C Class | AROCX | 0.19% | 7.44% | — | 8.50% | 3/1/10 |
| R Class | ARORX | 0.66% | 7.97% | 5.87% | — | 8/31/04 |
Average annual returns since inception are presented when ten years of performance history is not available.
Prior to March 1, 2010, the A Class was referred to as the Advisor Class and did not have a front-end sales charge. Performance prior to that date has been adjusted to reflect this charge.
Benchmark data for the S&P Target Date To 2045 Index was first available May 2007.
Sales charges include initial sales charges and contingent deferred sales charges (CDSCs), as applicable. A Class shares have a 5.75% maximum initial sales charge and may be subject to a maximum CDSC of 1.00%. C Class shares redeemed within 12 months of purchase are subject to a maximum CDSC of 1.00%. The SEC requires that mutual funds provide performance information net of maximum sales charges in all cases where charges could be applied.
A One Choice Target Date Portfolio's target date is the approximate year when investors plan to retire or start withdrawing their money. The principal value of the investment is not guaranteed at any time, including at the target date.
Data presented reflect past performance. Past performance is no guarantee of future results. Current performance may be higher or lower than the performance shown. Total returns for periods less than one year are not annualized. Investment return and principal value will fluctuate, and redemption value may be more or less than original cost. Data assumes reinvestment of dividends and capital gains, and none of the charts reflect the deduction of taxes that a shareholder would pay on fund distributions or the redemption of fund shares. To obtain performance data current to the most recent month end, please call 1-800-345-2021 or visit americancentury.com. For additional information about the funds, please consult the prospectus.
|
| | | | | |
| Total Returns as of July 31, 2016 |
| | | | Average Annual Returns | |
| | Ticker Symbol | 1 year | 5 years | Since Inception | Inception Date |
| One Choice 2050 Portfolio |
| Investor Class | ARFVX | 1.09% | 8.64% | 5.46% | 5/30/08 |
| S&P Target Date To 2050 Index | — | 1.95% | 8.01% | 4.92% | — |
| Institutional Class | ARFSX | 1.30% | 8.84% | 5.68% | 5/30/08 |
| A Class | ARFMX | | | | 5/30/08 |
| No sales charge | | 0.83% | 8.35% | 5.20% | |
| With sales charge | | -4.94% | 7.08% | 4.44% | |
| C Class | ARFDX | 0.11% | 7.54% | 8.62% | 3/1/10 |
| R Class | ARFWX | 0.64% | 8.09% | 4.94% | 5/30/08 |
Prior to March 1, 2010, the A Class was referred to as the Advisor Class and did not have a front-end sales charge. Performance prior to that date has been adjusted to reflect this charge.
Sales charges include initial sales charges and contingent deferred sales charges (CDSCs), as applicable. A Class shares have a 5.75% maximum initial sales charge and may be subject to a maximum CDSC of 1.00%. C Class shares redeemed within 12 months of purchase are subject to a maximum CDSC of 1.00%. The SEC requires that mutual funds provide performance information net of maximum sales charges in all cases where charges could be applied.
A One Choice Target Date Portfolio's target date is the approximate year when investors plan to retire or start withdrawing their money. The principal value of the investment is not guaranteed at any time, including at the target date.
Data presented reflect past performance. Past performance is no guarantee of future results. Current performance may be higher or lower than the performance shown. Total returns for periods less than one year are not annualized. Investment return and principal value will fluctuate, and redemption value may be more or less than original cost. Data assumes reinvestment of dividends and capital gains, and none of the charts reflect the deduction of taxes that a shareholder would pay on fund distributions or the redemption of fund shares. To obtain performance data current to the most recent month end, please call 1-800-345-2021 or visit americancentury.com. For additional information about the funds, please consult the prospectus.
|
| | | | | |
| Total Returns as of July 31, 2016 |
| | | | Average Annual Returns | |
| | Ticker Symbol | 1 year | 5 years | Since Inception | Inception Date |
| One Choice 2055 Portfolio |
| Investor Class | AREVX | 1.02% | 8.81% | 8.07% | 3/31/11 |
| S&P Target Date To 2055+ Index | — | 1.75% | 8.29% | 7.42% | — |
| Institutional Class | ARENX | 1.23% | 9.03% | 8.28% | 3/31/11 |
| A Class | AREMX | | | | 3/31/11 |
| No sales charge | | 0.76% | 8.52% | 7.78% | |
| With sales charge | | -5.06% | 7.25% | 6.60% | |
| C Class | AREFX | 0.06% | 7.74% | 7.00% | 3/31/11 |
| R Class | AREOX | 0.51% | 8.28% | 7.54% | 3/31/11 |
Sales charges include initial sales charges and contingent deferred sales charges (CDSCs), as applicable. A Class shares have a 5.75% maximum initial sales charge and may be subject to a maximum CDSC of 1.00%. C Class shares redeemed within 12 months of purchase are subject to a maximum CDSC of 1.00%. The SEC requires that mutual funds provide performance information net of maximum sales charges in all cases where charges could be applied.
A One Choice Target Date Portfolio's target date is the approximate year when investors plan to retire or start withdrawing their money. The principal value of the investment is not guaranteed at any time, including at the target date.
Data presented reflect past performance. Past performance is no guarantee of future results. Current performance may be higher or lower than the performance shown. Total returns for periods less than one year are not annualized. Investment return and principal value will fluctuate, and redemption value may be more or less than original cost. Data assumes reinvestment of dividends and capital gains, and none of the charts reflect the deduction of taxes that a shareholder would pay on fund distributions or the redemption of fund shares. To obtain performance data current to the most recent month end, please call 1-800-345-2021 or visit americancentury.com. For additional information about the funds, please consult the prospectus.
|
| | | |
| Total Returns as of July 31, 2016 |
| | Ticker Symbol | Since Inception | Inception Date |
| One Choice 2060 Portfolio |
| Investor Class | ARGVX | 10.12% | 9/30/15 |
| S&P Target Date To 2055+ Index | — | 11.14% | — |
| Institutional Class | ARGNX | 10.27% | 9/30/15 |
| A Class | ARGMX | | 9/30/15 |
| No sales charge | | 9.84% | |
| With sales charge | | 3.53% | |
| C Class | ARGHX | | 9/30/15 |
| No sales charge | | 9.23% | |
| With sales charge | | 8.23% | |
| R Class | ARGRX | 9.67% | 9/30/15 |
Sales charges include initial sales charges and contingent deferred sales charges (CDSCs), as applicable. A Class shares have a 5.75% maximum initial sales charge and may be subject to a maximum CDSC of 1.00%. C Class shares redeemed within 12 months of purchase are subject to a maximum CDSC of 1.00%. The SEC requires that mutual funds provide performance information net of maximum sales charges in all cases where charges could be applied.
A One Choice Target Date Portfolio's target date is the approximate year when investors plan to retire or start withdrawing their money. The principal value of the investment is not guaranteed at any time, including at the target date.
Data presented reflect past performance. Past performance is no guarantee of future results. Current performance may be higher or lower than the performance shown. Total returns for periods less than one year are not annualized. Investment return and principal value will fluctuate, and redemption value may be more or less than original cost. Data assumes reinvestment of dividends and capital gains, and none of the charts reflect the deduction of taxes that a shareholder would pay on fund distributions or the redemption of fund shares. To obtain performance data current to the most recent month end, please call 1-800-345-2021 or visit americancentury.com. For additional information about the funds, please consult the prospectus.
|
|
| Growth of $10,000 Over 10 Years of One Choice In Retirement Portfolio — Investor Class |
| $10,000 investment made July 31, 2006 |
| Performance for other share classes will vary due to differences in fee structure. |
|
| |
| Value on July 31, 2016 |
| | Investor Class — $17,126 |
| |
| | S&P Target Date Retirement Income Index — $15,650 |
| |
|
|
| Growth of $10,000 Over Life of One Choice 2020 Portfolio — Investor Class |
| $10,000 investment made May 30, 2008 |
| Performance for other share classes will vary due to differences in fee structure. |
|
| |
| Value on July 31, 2016 |
| | Investor Class — $14,945 |
| |
| | S&P Target Date To 2020 Index — $14,347 |
| |
A One Choice Target Date Portfolio's target date is the approximate year when investors plan to retire or start withdrawing their money. The principal value of the investment is not guaranteed at any time, including at the target date.
Data presented reflect past performance. Past performance is no guarantee of future results. Current performance may be higher or lower than the performance shown. Total returns for periods less than one year are not annualized. Investment return and principal value will fluctuate, and redemption value may be more or less than original cost. Data assumes reinvestment of dividends and capital gains, and none of the charts reflect the deduction of taxes that a shareholder would pay on fund distributions or the redemption of fund shares. To obtain performance data current to the most recent month end, please call 1-800-345-2021 or visit americancentury.com. For additional information about the funds, please consult the prospectus.
|
|
| Growth of $10,000 Over 10 Years of One Choice 2025 Portfolio — Investor Class |
| $10,000 investment made July 31, 2006 |
| Performance for other share classes will vary due to differences in fee structure. |
|
| |
| Value on July 31, 2016 |
| | Investor Class — $17,686 |
| |
| | S&P Target Date 2025 Index — $17,324 |
| |
|
|
| Growth of $10,000 Over Life of One Choice 2030 Portfolio — Investor Class |
| $10,000 investment made May 30, 2008 |
| Performance for other share classes will vary due to differences in fee structure. |
|
| |
| Value on July 31, 2016 |
| | Investor Class — $15,064 |
| |
| | S&P Target Date To 2030 Index — $14,446 |
| |
A One Choice Target Date Portfolio's target date is the approximate year when investors plan to retire or start withdrawing their money. The principal value of the investment is not guaranteed at any time, including at the target date.
Data presented reflect past performance. Past performance is no guarantee of future results. Current performance may be higher or lower than the performance shown. Total returns for periods less than one year are not annualized. Investment return and principal value will fluctuate, and redemption value may be more or less than original cost. Data assumes reinvestment of dividends and capital gains, and none of the charts reflect the deduction of taxes that a shareholder would pay on fund distributions or the redemption of fund shares. To obtain performance data current to the most recent month end, please call 1-800-345-2021 or visit americancentury.com. For additional information about the funds, please consult the prospectus.
|
|
| Growth of $10,000 Over 10 Years of One Choice 2035 Portfolio — Investor Class |
| $10,000 investment made July 31, 2006 |
| Performance for other share classes will vary due to differences in fee structure. |
|
| |
| Value on July 31, 2016 |
| | Investor Class — $18,113 |
| |
| | S&P Target Date 2035 Index — $17,509 |
| |
|
|
| Growth of $10,000 Over Life of One Choice 2040 Portfolio — Investor Class |
| $10,000 investment made May 30, 2008 |
| Performance for other share classes will vary due to differences in fee structure. |
|
| |
| Value on July 31, 2016 |
| | Investor Class — $15,557 |
| |
| | S&P Target Date To 2040 Index — $14,540 |
| |
A One Choice Target Date Portfolio's target date is the approximate year when investors plan to retire or start withdrawing their money. The principal value of the investment is not guaranteed at any time, including at the target date.
Data presented reflect past performance. Past performance is no guarantee of future results. Current performance may be higher or lower than the performance shown. Total returns for periods less than one year are not annualized. Investment return and principal value will fluctuate, and redemption value may be more or less than original cost. Data assumes reinvestment of dividends and capital gains, and none of the charts reflect the deduction of taxes that a shareholder would pay on fund distributions or the redemption of fund shares. To obtain performance data current to the most recent month end, please call 1-800-345-2021 or visit americancentury.com. For additional information about the funds, please consult the prospectus.
|
|
| Growth of $10,000 Over 10 Years of One Choice 2045 Portfolio — Investor Class |
| $10,000 investment made July 31, 2006 |
| Performance for other share classes will vary due to differences in fee structure. |
|
| |
| Value on July 31, 2016 |
| | Investor Class — $18,614 |
| |
| | S&P Target Date 2045 Index — $17,554 |
| |
|
|
| Growth of $10,000 Over Life of One Choice 2050 Portfolio — Investor Class |
| $10,000 investment made May 30, 2008 |
| Performance for other share classes will vary due to differences in fee structure. |
|
| |
| Value on July 31, 2016 |
| | Investor Class — $15,449 |
| |
| | S&P Target Date To 2050 Index — $14,806 |
| |
A One Choice Target Date Portfolio's target date is the approximate year when investors plan to retire or start withdrawing their money. The principal value of the investment is not guaranteed at any time, including at the target date.
Data presented reflect past performance. Past performance is no guarantee of future results. Current performance may be higher or lower than the performance shown. Total returns for periods less than one year are not annualized. Investment return and principal value will fluctuate, and redemption value may be more or less than original cost. Data assumes reinvestment of dividends and capital gains, and none of the charts reflect the deduction of taxes that a shareholder would pay on fund distributions or the redemption of fund shares. To obtain performance data current to the most recent month end, please call 1-800-345-2021 or visit americancentury.com. For additional information about the funds, please consult the prospectus.
|
|
| Growth of $10,000 Over Life of One Choice 2055 Portfolio — Investor Class |
| $10,000 investment made March 31, 2011 |
| Performance for other share classes will vary due to differences in fee structure. |
|
| |
| Value on July 31, 2016 |
| | Investor Class — $15,134 |
| |
| | S&P Target Date To 2055+ Index — $14,652 |
| |
|
|
| Growth of $10,000 Over Life of One Choice 2060 Portfolio — Investor Class |
| $10,000 investment made September 30, 2015 |
| Performance for other share classes will vary due to differences in fee structure. |
|
| |
| Value on July 31, 2016 |
| | Investor Class — $11,012 |
| |
| | S&P Target Date To 2055+ Index — $11,114 |
| |
A One Choice Target Date Portfolio's target date is the approximate year when investors plan to retire or start withdrawing their money. The principal value of the investment is not guaranteed at any time, including at the target date.
Data presented reflect past performance. Past performance is no guarantee of future results. Current performance may be higher or lower than the performance shown. Total returns for periods less than one year are not annualized. Investment return and principal value will fluctuate, and redemption value may be more or less than original cost. Data assumes reinvestment of dividends and capital gains, and none of the charts reflect the deduction of taxes that a shareholder would pay on fund distributions or the redemption of fund shares. To obtain performance data current to the most recent month end, please call 1-800-345-2021 or visit americancentury.com. For additional information about the funds, please consult the prospectus.
|
| | | | | |
| Total Annual Fund Operating Expenses |
| | Investor Class | Institutional Class | A Class | C Class | R Class |
| One Choice In Retirement Portfolio | 0.79% | 0.59% | 1.04% | 1.79% | 1.29% |
| One Choice 2020 Portfolio | 0.79% | 0.59% | 1.04% | 1.79% | 1.29% |
| One Choice 2025 Portfolio | 0.83% | 0.63% | 1.08% | 1.83% | 1.33% |
| One Choice 2030 Portfolio | 0.85% | 0.65% | 1.10% | 1.85% | 1.35% |
| One Choice 2035 Portfolio | 0.87% | 0.67% | 1.12% | 1.87% | 1.37% |
| One Choice 2040 Portfolio | 0.90% | 0.70% | 1.15% | 1.90% | 1.40% |
| One Choice 2045 Portfolio | 0.94% | 0.74% | 1.19% | 1.94% | 1.44% |
| One Choice 2050 Portfolio | 0.96% | 0.76% | 1.21% | 1.96% | 1.46% |
| One Choice 2055 Portfolio | 0.97% | 0.77% | 1.22% | 1.97% | 1.47% |
| One Choice 2060 Portfolio | 0.99% | 0.79% | 1.24% | 1.99% | 1.49% |
The total annual fund operating expenses shown is as stated in the fund’s prospectus current as of the date of this report. The prospectus may vary from the expense ratio shown elsewhere in this report because it is based on a different time period, includes acquired fund fees and expenses, and, if applicable, does not include fee waivers or expense reimbursements.
A One Choice Target Date Portfolio's target date is the approximate year when investors plan to retire or start withdrawing their money. The principal value of the investment is not guaranteed at any time, including at the target date.
Data presented reflect past performance. Past performance is no guarantee of future results. Current performance may be higher or lower than the performance shown. Total returns for periods less than one year are not annualized. Investment return and principal value will fluctuate, and redemption value may be more or less than original cost. Data assumes reinvestment of dividends and capital gains, and none of the charts reflect the deduction of taxes that a shareholder would pay on fund distributions or the redemption of fund shares. To obtain performance data current to the most recent month end, please call 1-800-345-2021 or visit americancentury.com. For additional information about the funds, please consult the prospectus.
Portfolio Managers: Scott Wittman, Rich Weiss, Scott Wilson, Radu Gabudean, and David MacEwen
Performance Summary
Each of the nine One Choice® Target Date Portfolios existing for the full fiscal year ended July 31, 2016, advanced, with returns ranging from 2.76%* for the One Choice In Retirement Portfolio to 1.02% for the One Choice 2055 Portfolio. We also introduced the One Choice 2060 Portfolio on September 30, 2015, and it returned 10.12% from inception through July 31, 2016. (see pages 3-17 for more detailed performance information). Returns for the periods reflected strong performance of the Portfolios’ fixed-income investments and advances across most U.S.-based equity segments, which outperformed their non-U.S. counterparts.
Because of the Portfolios’ strategic exposure to a variety of asset classes, a review of the financial markets helps explain much of their performance.
Market Overview
The reporting period began with pronounced volatility as markets receded in response to the slowing Chinese economy and the potential spillover effects on overall global growth. Equity indices experienced steep losses as investors exited riskier assets following currency devaluation by the Chinese government on the heels of disappointing economic growth data. Concerns about slowing growth reverberated throughout global markets and would serve as an ongoing driver of market returns throughout the period. Equity markets also came under pressure as commodity prices deteriorated in the first half of the fiscal year, with oil prices sinking to their lowest levels since early 2009 on widening oversupply and uncertain future demand. Oil and a number of other commodity prices rebounded somewhat in the second half of the fiscal year, but remained weak from an historical perspective.
Divergence of central bank policies remained a persistent theme throughout the reporting period, with global market headlines and returns dominated by anticipation of and reaction to monetary policy changes. The Federal Reserve (Fed) raised interest rates in December of 2015 for the first time in nearly a decade; in contrast, other central banks around the world pursued aggressive stimulus programs. This is consistent with the fact that economic growth rates in the U.S. continued to outpace those in most of the rest of the world.
Following a broad sell-off early in 2016, equities reversed course as investors took on a more optimistic outlook. Global growth concerns abated somewhat in response to more upbeat economic releases, improving sentiment about China, and rising commodity and oil prices. Accommodative monetary policy of major central banks and further delays in Fed tightening, as well as a weakening U.S. dollar, helped to drive equity market rallies around the globe. Market leadership shifted in early 2016, with value-oriented equities outperforming growth as more defensive names led those typically associated with a cyclical recovery. The close of the period was dominated by uncertainty around “Brexit,” the U.K. referendum about remaining in the European Union (EU). Following a “leave” vote at the end of June, global markets corrected
sharply, with virtually all risky asset classes declining amid the uncertainty, with U.K. and European companies among the hardest hit. After a two-day sell-off that erased more than $3 trillion of global stock market value, cooler heads ultimately prevailed and investors adopted a longer-term view of
* All fund returns referenced in this commentary are for Investor Class shares. Total returns for periods less than one year are not annualized. Performance for other share classes will vary due to differences in fee structure; when Investor Class performance exceeds that of the fund's benchmark, other share classes may not. See pages 3-12 for returns for all share classes.
Brexit and its effect on global growth and financial markets, concluding that the impact may not be as dire as originally thought. Global equities rallied in the final month of the reporting period, as investors shook off mounting geopolitical risks and tumbling oil prices, focusing instead on additional central bank stimulus on the horizon.
In this environment, U.S. equities ended the reporting period with advances, outperforming both developed non-U.S. equities, which produced substantive declines, and emerging markets, which fell more modestly. Within the U.S. market, value led growth stocks across all capitalization ranges, and broad large- and mid-cap indices outperformed their small-cap peers.
Fixed-income investments generally advanced, with positive returns largely generated during the second half of the reporting period. During the first part of the fiscal year, investors’ risk-aversion heightened on concerns about China’s growth rate and its likely impact on the overall health of the global economy. As investors gravitated toward the relative safety of higher-quality fixed-income investments, higher-yielding bonds declined. This preference for less-risky investments continued into 2016. While equities sold off broadly, bonds advanced, led by unhedged, non-U.S. aggregate bond indices, which benefited from supportive monetary policies of global central banks and from U.S.-dollar weakness. For the period as a whole, non-U.S. bonds led bonds in the U.S. Within the broad U.S. bond market, high-quality bonds slightly outperformed high-yield, and longer-duration bonds produced larger advances as compared to those with shorter-durations, with long-term U.S. Treasury securities producing substantial gains.
Fund Information
Each One Choice Target Date Portfolio is a “fund of funds” that invests in other American Century Investments mutual funds to achieve its investment objective and target asset allocation. (See pages 22-23 for the specific underlying fund allocations for each Portfolio.) A Portfolio’s target date is the approximate year when investors plan to retire and likely would stop making new investments in the fund. The principal value of the investment is not guaranteed at any time, including at the target date. One Choice In Retirement Portfolio is generally intended for investors near, at, or in retirement. There is no guarantee that an investment in any of the funds will provide adequate income at or through an investor’s retirement.
Each target-dated Portfolio seeks the highest total return consistent with its asset mix. Over time, the asset mix and weightings are adjusted to be more conservative. In general, as the target year approaches, each Portfolio’s allocation becomes more conservative by decreasing the allocation to stock funds and increasing the allocation to bond and money market funds. By the time each Portfolio reaches its target date, its target asset mix will become fixed and match that of One Choice In Retirement Portfolio, which seeks current income and capital appreciation.
Portfolio Performance
The Portfolios’ U.S. equity funds generally contributed positively to performance for the period, with the exception of NT Heritage Fund and NT Small Company Fund, which detracted fractionally. NT Mid Cap Value Fund contributed most among all equity funds in absolute terms, and outperformed its underlying benchmark as a result of stock selection decisions. NT Growth Fund, NT Large Company Value Fund, and NT Equity Growth Fund all contributed notably to absolute results; however, all three funds underperformed their respective benchmarks.
Non-U.S. equity performance was mixed. NT International Growth Fund was a leading detractor from absolute performance and underperformed its benchmark. NT International Value Fund had negative absolute returns and was a leading detractor from performance in all Portfolios; nevertheless, the fund held up better than its underlying benchmark thanks to effective stock selection decisions across a wide range of sectors and countries. At the other end of the spectrum, NT Global Real Estate Fund contributed to absolute performance in every Portfolio despite lagging its benchmark.
The Portfolios’ fixed-income holdings contributed meaningfully to performance during the period. NT Diversified Bond Fund contributed most across all equity and fixed-income positions for Portfolios from In Retirement to 2040, and was the leading source of strength among fixed-income holdings in Portfolios dated 2045 and beyond. Consistent with the strong performance of high-quality bonds around the globe, International Bond Fund (not held by Portfolios dated 2040 and further from retirement) made a sizeable contribution to return during the year. Similarly, Global Bond Fund, which is represented in all Portfolios, aided performance. Inflation-Adjusted Bond Fund performed well and contributed positively to performance across all Portfolios, while Short Duration Inflation Protection Bond Fund contributed from the In Retirement Portfolio to Target Date 2035. Strong demand for yield meant below-investment-grade corporate securities also performed well, making the High-Yield Fund a source of strength across all portfolios. Nevertheless, while absolute performance was positive, a number of component funds underperformed their underlying benchmarks, led by High-Yield Fund, NT Diversified Bond Fund, and Global Bond Fund.
A Look Ahead
We believe that global divergence in economic growth and monetary policy by central banks seems likely to continue. Growth remains mostly slower outside the U.S., and non-U.S. monetary policies are generally more stimulative. Capital markets are increasingly taking their cues from global factors rather than focusing on the U.S. Therefore, China continues to be the leading influence on global economic expansion, although the U.K. jumped into the limelight by electing to exit the EU.
U.S. interest rates remain at historically low levels, but higher interest rates appear justified when considering domestic economic factors alone and ignoring global conditions. Falling unemployment, rising wages, higher rents, and improving home prices argue for higher rates. However, what happens in China, Europe, and Japan could have at least as much impact on U.S. interest rates as what happens in the U.S. Global macro headwinds are having more impact on the smaller manufacturing side of the U.S. economy than the larger services side, which is still expanding. The Fed owns a large bond portfolio acquired through past Quantitative Easing (QE) purchases, and will continue to reinvest coupon interest and principal from these bonds, which is likely to help keep interest rates low. While earlier predictions called for two small rate increases during 2016, the market is now pricing in a very low probability of tightening in the wake of Brexit and a lower-than-expected reported growth rate for the second quarter.
Looking ahead, we think that uncertainty in whether the Fed will raise interest rates again, the impact of the Brexit vote, slow global growth (and low corporate profits), and the possible impact from the U.S. presidential election will continue to affect market returns and volatility. While stock valuations on the whole are not terribly compelling, there have been significant rotations and corrections at the industry and sector level going back at least to 2015, creating select investment opportunities. Growth is likely to remain disappointing around much of the globe, particularly for countries with exposure to China and/or commodity markets. While tighter monetary policy and higher rates in the U.S. typically weigh on risk assets such as emerging markets equities, attractive valuations and monetary conditions in many emerging markets countries can lead to compelling investment opportunities.
|
|
| Portfolio Characteristics |
|
| | | | | |
Underlying Fund Allocations(1) as a % of net assets as of July 31, 2016 |
| | One Choice In Retirement Portfolio | One Choice
2020 Portfolio | One Choice
2025 Portfolio | One Choice
2030 Portfolio | One Choice 2035 Portfolio |
| Equity |
| NT Core Equity Plus Fund | 3.0% | 3.0% | 3.0% | 3.0% | 3.2% |
| NT Disciplined Growth Fund | 1.6% | 1.8% | 2.2% | 2.5% | 2.9% |
| NT Equity Growth Fund | 10.0% | 9.8% | 9.5% | 9.4% | 9.3% |
| NT Growth Fund | 4.6% | 5.2% | 5.9% | 7.1% | 8.7% |
| NT Heritage Fund | 2.3% | 2.9% | 3.9% | 4.4% | 4.7% |
| NT Large Company Value Fund | 9.5% | 9.6% | 9.7% | 10.2% | 10.4% |
| NT Mid Cap Value Fund | 4.5% | 5.0% | 5.8% | 6.0% | 6.0% |
| NT Small Company Fund | 2.0% | 1.9% | 1.8% | 2.3% | 3.1% |
| NT Emerging Markets Fund | — | 0.9% | 1.9% | 2.7% | 3.2% |
| NT Global Real Estate Fund | 1.0% | 1.2% | 1.5% | 1.7% | 2.0% |
| NT International Growth Fund | 4.6% | 4.7% | 4.9% | 5.6% | 6.4% |
| NT International Small-Mid Cap Fund | — | 0.3% | 0.6% | 0.8% | 1.1% |
| NT International Value Fund | 2.3% | 2.7% | 3.4% | 4.0% | 4.6% |
| Total Equity | 45.4% | 49.0% | 54.1% | 59.7% | 65.6% |
| Fixed Income | | | | | |
| High-Yield Fund | 3.8% | 3.7% | 3.5% | 3.2% | 2.9% |
| Inflation-Adjusted Bond Fund | 1.5% | 2.4% | 3.6% | 4.6% | 5.2% |
| NT Diversified Bond Fund | 21.6% | 20.8% | 19.9% | 18.0% | 15.7% |
| Short Duration Inflation Protection Bond Fund | 6.0% | 4.9% | 3.3% | 1.8% | 0.5% |
| Global Bond Fund | 6.9% | 6.4% | 5.9% | 5.2% | 4.6% |
| International Bond Fund | 5.0% | 4.7% | 4.1% | 2.6% | 0.6% |
| Total Fixed Income | 44.8% | 42.9% | 40.3% | 35.4% | 29.5% |
| U.S. Government Money Market Fund | 9.8% | 8.1% | 5.6% | 4.9% | 4.9% |
| Other Assets and Liabilities | —(2) | —(2) | —(2) | —(2) | —(2) |
| |
| (1) | Underlying fund investments represent Institutional Class, except U.S. Government Money Market Fund Investor Class. |
| |
| (2) | Category is less than 0.05% of total net assets. |
|
| | | | | |
Underlying Fund Allocations(1) as a % of net assets as of July 31, 2016 | |
| | One Choice
2040 Portfolio | One Choice
2045 Portfolio | One Choice
2050 Portfolio | One Choice
2055 Portfolio | One Choice
2060 Portfolio |
| Equity | | | | | |
| NT Core Equity Plus Fund | 3.4% | 3.9% | 4.5% | 4.5% | 4.5% |
| NT Disciplined Growth Fund | 3.1% | 3.2% | 3.3% | 3.5% | 3.5% |
| NT Equity Growth Fund | 9.8% | 10.3% | 10.2% | 10.6% | 10.7% |
| NT Growth Fund | 9.6% | 10.4% | 10.8% | 11.0% | 11.0% |
| NT Heritage Fund | 5.5% | 6.4% | 6.5% | 6.7% | 6.7% |
| NT Large Company Value Fund | 11.5% | 12.8% | 13.5% | 14.0% | 14.3% |
| NT Mid Cap Value Fund | 6.3% | 6.9% | 6.9% | 6.8% | 6.7% |
| NT Small Company Fund | 3.2% | 3.0% | 3.2% | 3.7% | 4.0% |
| NT Emerging Markets Fund | 4.1% | 4.9% | 5.8% | 6.4% | 6.4% |
| NT Global Real Estate Fund | 2.3% | 2.5% | 2.8% | 3.0% | 3.0% |
| NT International Growth Fund | 6.7% | 6.8% | 6.7% | 6.2% | 6.1% |
| NT International Small-Mid Cap Fund | 1.4% | 1.8% | 2.1% | 2.5% | 2.5% |
| NT International Value Fund | 4.9% | 5.1% | 5.3% | 5.5% | 5.6% |
| Total Equity | 71.8% | 78.0% | 81.6% | 84.4% | 85.0% |
| Fixed Income | | | | | |
| High-Yield Fund | 2.4% | 2.1% | 1.8% | 1.5% | 1.5% |
| Inflation-Adjusted Bond Fund | 5.0% | 4.2% | 3.6% | 3.1% | 3.0% |
| NT Diversified Bond Fund | 13.4% | 11.2% | 9.5% | 7.9% | 7.5% |
| Global Bond Fund | 4.2% | 3.8% | 3.5% | 3.1% | 3.0% |
| Total Fixed Income | 25.0% | 21.3% | 18.4% | 15.6% | 15.0% |
| U.S. Government Money Market Fund | 3.2% | 0.7% | — | — | — |
| Other Assets and Liabilities | —(2) | —(2) | —(2) | —(2) | —(2) |
| |
| (1) | Underlying fund investments represent Institutional Class, except U.S. Government Money Market Fund Investor Class. |
| |
| (2) | Category is less than 0.05% of total net assets. |
Fund shareholders may incur two types of costs: (1) transaction costs, including sales charges (loads) on purchase payments and redemption/exchange fees; and (2) ongoing costs, including management fees; distribution and service (12b-1) fees; and other fund expenses. This example is intended to help you understand your ongoing costs (in dollars) of investing in your fund and to compare these costs with the ongoing cost of investing in other mutual funds. As a shareholder in the underlying American Century Investments funds, your fund will indirectly bear its pro rata share of the expenses incurred by the underlying funds. These expenses are not included in the fund’s annualized expense ratio or the expenses paid during the period. These expenses are, however, included in the effective expenses paid during the period.
The example is based on an investment of $1,000 made at the beginning of the period and held for the entire period from February 1, 2016 to July 31, 2016.
Actual Expenses
The table provides information about actual account values and actual expenses for each class. You may use the information, together with the amount you invested, to estimate the expenses that you paid over the period. First, identify the share class you own. Then simply divide your account value by $1,000 (for example, an $8,600 account value divided by $1,000 = 8.6), then multiply the result by the number under the heading “Expenses Paid During Period” to estimate the expenses you paid on your account during this period.
If you hold Investor Class shares of any American Century Investments fund, or Institutional Class shares of the American Century Diversified Bond Fund, in an American Century Investments account (i.e., not a financial intermediary or retirement plan account), American Century Investments may charge you a $12.50 semiannual account maintenance fee if the value of those shares is less than $10,000. We will redeem shares automatically in one of your accounts to pay the $12.50 fee. In determining your total eligible investment amount, we will include your investments in all personal accounts (including American Century Investments Brokerage accounts) registered under your Social Security number. Personal accounts include individual accounts, joint accounts, UGMA/UTMA accounts, personal trusts, Coverdell Education Savings Accounts and IRAs (including traditional, Roth, Rollover, SEP-, SARSEP- and SIMPLE-IRAs), and certain other retirement accounts. If you have only business, business retirement, employer-sponsored or American Century Investments Brokerage accounts, you are currently not subject to this fee. If you are subject to the Account Maintenance Fee, your account value could be reduced by the fee amount.
Hypothetical Example for Comparison Purposes
The table also provides information about hypothetical account values and hypothetical expenses based on the actual expense ratio of each class of your fund and an assumed rate of return of 5% per year before expenses, which is not the actual return of a fund’s share class. The hypothetical account values and expenses may not be used to estimate the actual ending account balance or expenses you paid for the period. You may use this information to compare the ongoing costs of investing in your fund and other funds. To do so, compare this 5% hypothetical example with the 5% hypothetical examples that appear in the shareholder reports of the other funds.
Please note that the expenses shown in the table are meant to highlight your ongoing costs only and do not reflect any transactional costs, such as sales charges (loads) or redemption/exchange fees. Therefore, the table is useful in comparing ongoing costs only, and will not help you determine the relative total costs of owning different funds. In addition, if these transactional costs were included, your costs would have been higher.
|
| | | | | | |
| | Beginning
Account Value
2/1/16 | Ending
Account Value
7/31/16 | Expenses Paid
During Period(1)
2/1/16 - 7/31/16 |
Annualized
Expense Ratio(1) | Effective
Expenses
Paid During
Period(2)
2/1/16 - 7/31/16 | Effective Annualized Expense Ratio(2) |
| One Choice In Retirement Portfolio |
| Actual | | | | | | |
| Investor Class | $1,000 | $1,082.30 | $1.04 | 0.20% | $4.09 | 0.79% |
| Institutional Class | $1,000 | $1,082.40 | $0.00 | 0.00%(3) | $3.05 | 0.59% |
| A Class | $1,000 | $1,080.00 | $2.33 | 0.45% | $5.38 | 1.04% |
| C Class | $1,000 | $1,076.50 | $6.20 | 1.20% | $9.24 | 1.79% |
| R Class | $1,000 | $1,078.80 | $3.62 | 0.70% | $6.67 | 1.29% |
| Hypothetical | | | | | | |
| Investor Class | $1,000 | $1,023.87 | $1.01 | 0.20% | $3.97 | 0.79% |
| Institutional Class | $1,000 | $1,024.86 | $0.00 | 0.00%(3) | $2.97 | 0.59% |
| A Class | $1,000 | $1,022.63 | $2.26 | 0.45% | $5.22 | 1.04% |
| C Class | $1,000 | $1,018.90 | $6.02 | 1.20% | $8.97 | 1.79% |
| R Class | $1,000 | $1,021.38 | $3.52 | 0.70% | $6.47 | 1.29% |
| One Choice 2020 Portfolio |
| Actual | | | | | | |
| Investor Class | $1,000 | $1,085.10 | $1.04 | 0.20% | $4.25 | 0.82% |
| Institutional Class | $1,000 | $1,086.10 | $0.00 | 0.00%(3) | $3.22 | 0.62% |
| A Class | $1,000 | $1,083.30 | $2.33 | 0.45% | $5.54 | 1.07% |
| C Class | $1,000 | $1,080.50 | $6.21 | 1.20% | $9.41 | 1.82% |
| R Class | $1,000 | $1,083.40 | $3.63 | 0.70% | $6.84 | 1.32% |
| Hypothetical | | | | | | |
| Investor Class | $1,000 | $1,023.87 | $1.01 | 0.20% | $4.12 | 0.82% |
| Institutional Class | $1,000 | $1,024.86 | $0.00 | 0.00%(3) | $3.12 | 0.62% |
| A Class | $1,000 | $1,022.63 | $2.26 | 0.45% | $5.37 | 1.07% |
| C Class | $1,000 | $1,018.90 | $6.02 | 1.20% | $9.12 | 1.82% |
| R Class | $1,000 | $1,021.38 | $3.52 | 0.70% | $6.62 | 1.32% |
| |
| (1) | Expenses are equal to the class's annualized expense ratio listed in the table above, multiplied by the average account value over the period, multiplied by 182, the number of days in the most recent fiscal half-year, divided by 366, to reflect the one-half year period. The fees and expenses of the underlying American Century Investments funds in which the fund invests are not included in the class's annualized expense ratio. |
| |
| (2) | Effective expenses reflect the sum of expenses borne directly by the class plus the fund's pro rata share of the weighted average expense ratio of the underlying funds in which it invests. The effective annualized expense ratio combines the class's annualized expense ratio and the annualized weighted average expense ratio of the underlying funds. The annualized weighted average expense ratio of the underlying funds for the one-half year period reflects the actual expense ratio of each underlying fund from its most recent shareholder report, annualized and weighted for the fund's relative average investment therein during the period. |
| |
| (3) | Other expenses, which include directors' fees and expenses, did not exceed 0.005%. |
|
| | | | | | |
| | Beginning
Account Value
2/1/16 | Ending
Account Value
7/31/16 | Expenses Paid
During Period(1)
2/1/16 - 7/31/16 |
Annualized
Expense Ratio(1) | Effective
Expenses
Paid During
Period(2)
2/1/16 - 7/31/16 | Effective Annualized Expense Ratio(2) |
| One Choice 2025 Portfolio |
| Actual | | | | | | |
| Investor Class | $1,000 | $1,090.60 | $1.04 | 0.20% | $4.42 | 0.85% |
| Institutional Class | $1,000 | $1,091.40 | $0.00 | 0.00%(3) | $3.38 | 0.65% |
| A Class | $1,000 | $1,089.10 | $2.34 | 0.45% | $5.71 | 1.10% |
| C Class | $1,000 | $1,085.10 | $6.22 | 1.20% | $9.59 | 1.85% |
| R Class | $1,000 | $1,088.40 | $3.63 | 0.70% | $7.01 | 1.35% |
| Hypothetical | | | | | | |
| Investor Class | $1,000 | $1,023.87 | $1.01 | 0.20% | $4.27 | 0.85% |
| Institutional Class | $1,000 | $1,024.86 | $0.00 | 0.00%(3) | $3.27 | 0.65% |
| A Class | $1,000 | $1,022.63 | $2.26 | 0.45% | $5.52 | 1.10% |
| C Class | $1,000 | $1,018.90 | $6.02 | 1.20% | $9.27 | 1.85% |
| R Class | $1,000 | $1,021.38 | $3.52 | 0.70% | $6.77 | 1.35% |
| One Choice 2030 Portfolio |
| Actual | | | | | | |
| Investor Class | $1,000 | $1,093.00 | $1.04 | 0.20% | $4.53 | 0.87% |
| Institutional Class | $1,000 | $1,094.90 | $0.00 | 0.00%(3) | $3.49 | 0.67% |
| A Class | $1,000 | $1,092.30 | $2.34 | 0.45% | $5.83 | 1.12% |
| C Class | $1,000 | $1,087.50 | $6.23 | 1.20% | $9.71 | 1.87% |
| R Class | $1,000 | $1,090.40 | $3.64 | 0.70% | $7.12 | 1.37% |
| Hypothetical | | | | | | |
| Investor Class | $1,000 | $1,023.87 | $1.01 | 0.20% | $4.37 | 0.87% |
| Institutional Class | $1,000 | $1,024.86 | $0.00 | 0.00%(3) | $3.37 | 0.67% |
| A Class | $1,000 | $1,022.63 | $2.26 | 0.45% | $5.62 | 1.12% |
| C Class | $1,000 | $1,018.90 | $6.02 | 1.20% | $9.37 | 1.87% |
| R Class | $1,000 | $1,021.38 | $3.52 | 0.70% | $6.87 | 1.37% |
| |
| (1) | Expenses are equal to the class's annualized expense ratio listed in the table above, multiplied by the average account value over the period, multiplied by 182, the number of days in the most recent fiscal half-year, divided by 366, to reflect the one-half year period. The fees and expenses of the underlying American Century Investments funds in which the fund invests are not included in the class's annualized expense ratio. |
| |
| (2) | Effective expenses reflect the sum of expenses borne directly by the class plus the fund's pro rata share of the weighted average expense ratio of the underlying funds in which it invests. The effective annualized expense ratio combines the class's annualized expense ratio and the annualized weighted average expense ratio of the underlying funds. The annualized weighted average expense ratio of the underlying funds for the one-half year period reflects the actual expense ratio of each underlying fund from its most recent shareholder report, annualized and weighted for the fund's relative average investment therein during the period. |
| |
| (3) | Other expenses, which include directors' fees and expenses, did not exceed 0.005%. |
|
| | | | | | |
| | Beginning
Account Value
2/1/16 | Ending
Account Value
7/31/16 | Expenses Paid
During Period(1)
2/1/16 - 7/31/16 |
Annualized
Expense Ratio(1) | Effective
Expenses
Paid During
Period(2)
2/1/16 - 7/31/16 | Effective Annualized Expense Ratio(2) |
| One Choice 2035 Portfolio |
| Actual | | | | | | |
| Investor Class | $1,000 | $1,095.90 | $1.04 | 0.20% | $4.69 | 0.90% |
| Institutional Class | $1,000 | $1,097.30 | $0.00 | 0.00%(3) | $3.65 | 0.70% |
| A Class | $1,000 | $1,094.40 | $2.34 | 0.45% | $5.99 | 1.15% |
| C Class | $1,000 | $1,090.60 | $6.24 | 1.20% | $9.88 | 1.90% |
| R Class | $1,000 | $1,093.70 | $3.64 | 0.70% | $7.29 | 1.40% |
| Hypothetical | | | | | | |
| Investor Class | $1,000 | $1,023.87 | $1.01 | 0.20% | $4.52 | 0.90% |
| Institutional Class | $1,000 | $1,024.86 | $0.00 | 0.00%(3) | $3.52 | 0.70% |
| A Class | $1,000 | $1,022.63 | $2.26 | 0.45% | $5.77 | 1.15% |
| C Class | $1,000 | $1,018.90 | $6.02 | 1.20% | $9.52 | 1.90% |
| R Class | $1,000 | $1,021.38 | $3.52 | 0.70% | $7.02 | 1.40% |
| One Choice 2040 Portfolio |
| Actual | | | | | | |
| Investor Class | $1,000 | $1,101.50 | $1.05 | 0.20% | $4.86 | 0.93% |
| Institutional Class | $1,000 | $1,102.40 | $0.00 | 0.00%(3) | $3.82 | 0.73% |
| A Class | $1,000 | $1,100.70 | $2.35 | 0.45% | $6.16 | 1.18% |
| C Class | $1,000 | $1,095.20 | $6.25 | 1.20% | $10.05 | 1.93% |
| R Class | $1,000 | $1,098.90 | $3.65 | 0.70% | $7.46 | 1.43% |
| Hypothetical | | | | | | |
| Investor Class | $1,000 | $1,023.87 | $1.01 | 0.20% | $4.67 | 0.93% |
| Institutional Class | $1,000 | $1,024.86 | $0.00 | 0.00%(3) | $3.67 | 0.73% |
| A Class | $1,000 | $1,022.63 | $2.26 | 0.45% | $5.92 | 1.18% |
| C Class | $1,000 | $1,018.90 | $6.02 | 1.20% | $9.67 | 1.93% |
| R Class | $1,000 | $1,021.38 | $3.52 | 0.70% | $7.17 | 1.43% |
| |
| (1) | Expenses are equal to the class's annualized expense ratio listed in the table above, multiplied by the average account value over the period, multiplied by 182, the number of days in the most recent fiscal half-year, divided by 366, to reflect the one-half year period. The fees and expenses of the underlying American Century Investments funds in which the fund invests are not included in the class's annualized expense ratio. |
| |
| (2) | Effective expenses reflect the sum of expenses borne directly by the class plus the fund's pro rata share of the weighted average expense ratio of the underlying funds in which it invests. The effective annualized expense ratio combines the class's annualized expense ratio and the annualized weighted average expense ratio of the underlying funds. The annualized weighted average expense ratio of the underlying funds for the one-half year period reflects the actual expense ratio of each underlying fund from its most recent shareholder report, annualized and weighted for the fund's relative average investment therein during the period. |
| |
| (3) | Other expenses, which include directors' fees and expenses, did not exceed 0.005%. |
|
| | | | | | |
| | Beginning
Account Value
2/1/16 | Ending
Account Value
7/31/16 | Expenses Paid
During Period(1)
2/1/16 - 7/31/16 |
Annualized
Expense Ratio(1) | Effective
Expenses
Paid During
Period(2)
2/1/16 - 7/31/16 | Effective Annualized Expense Ratio(2) |
| One Choice 2045 Portfolio |
| Actual | | | | | | |
| Investor Class | $1,000 | $1,107.70 | $1.05 | 0.20% | $5.08 | 0.97% |
| Institutional Class | $1,000 | $1,109.10 | $0.00 | 0.00%(3) | $4.04 | 0.77% |
| A Class | $1,000 | $1,107.10 | $2.36 | 0.45% | $6.39 | 1.22% |
| C Class | $1,000 | $1,102.60 | $6.27 | 1.20% | $10.30 | 1.97% |
| R Class | $1,000 | $1,104.90 | $3.66 | 0.70% | $7.69 | 1.47% |
| Hypothetical | | | | | | |
| Investor Class | $1,000 | $1,023.87 | $1.01 | 0.20% | $4.87 | 0.97% |
| Institutional Class | $1,000 | $1,024.86 | $0.00 | 0.00%(3) | $3.87 | 0.77% |
| A Class | $1,000 | $1,022.63 | $2.26 | 0.45% | $6.12 | 1.22% |
| C Class | $1,000 | $1,018.90 | $6.02 | 1.20% | $9.87 | 1.97% |
| R Class | $1,000 | $1,021.38 | $3.52 | 0.70% | $7.37 | 1.47% |
| One Choice 2050 Portfolio |
| Actual | | | | | | |
| Investor Class | $1,000 | $1,111.20 | $1.05 | 0.20% | $5.20 | 0.99% |
| Institutional Class | $1,000 | $1,112.00 | $0.00 | 0.00%(3) | $4.15 | 0.79% |
| A Class | $1,000 | $1,109.40 | $2.36 | 0.45% | $6.50 | 1.24% |
| C Class | $1,000 | $1,105.70 | $6.28 | 1.20% | $10.42 | 1.99% |
| R Class | $1,000 | $1,108.50 | $3.67 | 0.70% | $7.81 | 1.49% |
| Hypothetical | | | | | | |
| Investor Class | $1,000 | $1,023.87 | $1.01 | 0.20% | $4.97 | 0.99% |
| Institutional Class | $1,000 | $1,024.86 | $0.00 | 0.00%(3) | $3.97 | 0.79% |
| A Class | $1,000 | $1,022.63 | $2.26 | 0.45% | $6.22 | 1.24% |
| C Class | $1,000 | $1,018.90 | $6.02 | 1.20% | $9.97 | 1.99% |
| R Class | $1,000 | $1,021.38 | $3.52 | 0.70% | $7.47 | 1.49% |
| |
| (1) | Expenses are equal to the class's annualized expense ratio listed in the table above, multiplied by the average account value over the period, multiplied by 182, the number of days in the most recent fiscal half-year, divided by 366, to reflect the one-half year period. The fees and expenses of the underlying American Century Investments funds in which the fund invests are not included in the class's annualized expense ratio. |
| |
| (2) | Effective expenses reflect the sum of expenses borne directly by the class plus the fund's pro rata share of the weighted average expense ratio of the underlying funds in which it invests. The effective annualized expense ratio combines the class's annualized expense ratio and the annualized weighted average expense ratio of the underlying funds. The annualized weighted average expense ratio of the underlying funds for the one-half year period reflects the actual expense ratio of each underlying fund from its most recent shareholder report, annualized and weighted for the fund's relative average investment therein during the period. |
| |
| (3) | Other expenses, which include directors' fees and expenses, did not exceed 0.005%. |
|
| | | | | | |
| | Beginning
Account Value
2/1/16 | Ending
Account Value
7/31/16 | Expenses Paid
During Period(1)
2/1/16 - 7/31/16 |
Annualized
Expense Ratio(1) | Effective
Expenses
Paid During
Period(2)
2/1/16 - 7/31/16 | Effective Annualized Expense Ratio(2) |
| One Choice 2055 Portfolio |
| Actual | | | | | | |
| Investor Class | $1,000 | $1,114.10 | $1.05 | 0.20% | $5.20 | 0.99% |
| Institutional Class | $1,000 | $1,115.00 | $0.00 | 0.00%(3) | $4.15 | 0.79% |
| A Class | $1,000 | $1,112.50 | $2.36 | 0.45% | $6.51 | 1.24% |
| C Class | $1,000 | $1,108.20 | $6.29 | 1.20% | $10.43 | 1.99% |
| R Class | $1,000 | $1,111.60 | $3.68 | 0.70% | $7.82 | 1.49% |
| Hypothetical | | | | | | |
| Investor Class | $1,000 | $1,023.87 | $1.01 | 0.20% | $4.97 | 0.99% |
| Institutional Class | $1,000 | $1,024.86 | $0.00 | 0.00%(3) | $3.97 | 0.79% |
| A Class | $1,000 | $1,022.63 | $2.26 | 0.45% | $6.22 | 1.24% |
| C Class | $1,000 | $1,018.90 | $6.02 | 1.20% | $9.97 | 1.99% |
| R Class | $1,000 | $1,021.38 | $3.52 | 0.70% | $7.47 | 1.49% |
| One Choice 2060 Portfolio |
| Actual | | | | | | |
| Investor Class | $1,000 | $1,114.60 | $1.05 | 0.20% | $5.21 | 0.99% |
| Institutional Class | $1,000 | $1,115.70 | $0.00 | 0.00%(3) | $4.16 | 0.79% |
| A Class | $1,000 | $1,112.60 | $2.36 | 0.45% | $6.51 | 1.24% |
| C Class | $1,000 | $1,109.60 | $6.29 | 1.20% | $10.44 | 1.99% |
| R Class | $1,000 | $1,112.70 | $3.68 | 0.70% | $7.83 | 1.49% |
| Hypothetical | | | | | | |
| Investor Class | $1,000 | $1,023.87 | $1.01 | 0.20% | $4.97 | 0.99% |
| Institutional Class | $1,000 | $1,024.86 | $0.00 | 0.00%(3) | $3.97 | 0.79% |
| A Class | $1,000 | $1,022.63 | $2.26 | 0.45% | $6.22 | 1.24% |
| C Class | $1,000 | $1,018.90 | $6.02 | 1.20% | $9.97 | 1.99% |
| R Class | $1,000 | $1,021.38 | $3.52 | 0.70% | $7.47 | 1.49% |
| |
| (1) | Expenses are equal to the class's annualized expense ratio listed in the table above, multiplied by the average account value over the period, multiplied by 182, the number of days in the most recent fiscal half-year, divided by 366, to reflect the one-half year period. The fees and expenses of the underlying American Century Investments funds in which the fund invests are not included in the class's annualized expense ratio. |
| |
| (2) | Effective expenses reflect the sum of expenses borne directly by the class plus the fund's pro rata share of the weighted average expense ratio of the underlying funds in which it invests. The effective annualized expense ratio combines the class's annualized expense ratio and the annualized weighted average expense ratio of the underlying funds. The annualized weighted average expense ratio of the underlying funds for the one-half year period reflects the actual expense ratio of each underlying fund from its most recent shareholder report, annualized and weighted for the fund's relative average investment therein during the period. |
| |
| (3) | Other expenses, which include directors' fees and expenses, did not exceed 0.005%. |
JULY 31, 2016
One Choice In Retirement Portfolio
|
| | | | |
| | Shares | Value |
MUTUAL FUNDS(1) — 100.0% | | |
| Domestic Equity Funds — 37.5% | | |
| NT Core Equity Plus Fund Institutional Class | 4,265,282 | $ | 58,221,095 |
|
| NT Disciplined Growth Fund Institutional Class | 2,953,235 | 29,532,355 |
|
| NT Equity Growth Fund Institutional Class | 16,422,026 | 192,466,140 |
|
| NT Growth Fund Institutional Class | 5,800,080 | 87,117,199 |
|
| NT Heritage Fund Institutional Class | 3,399,978 | 43,893,713 |
|
| NT Large Company Value Fund Institutional Class | 16,140,845 | 182,391,552 |
|
| NT Mid Cap Value Fund Institutional Class | 6,750,866 | 87,086,178 |
|
| NT Small Company Fund Institutional Class | 4,323,501 | 39,041,213 |
|
| | | 719,749,445 |
|
| Domestic Fixed Income Funds — 32.9% | | |
| High-Yield Fund Institutional Class | 13,030,739 | 73,232,751 |
|
| Inflation-Adjusted Bond Fund Institutional Class | 2,411,784 | 28,820,815 |
|
| NT Diversified Bond Fund Institutional Class | 37,309,783 | 413,765,492 |
|
| Short Duration Inflation Protection Bond Fund Institutional Class | 11,157,569 | 115,146,111 |
|
| | | 630,965,169 |
|
| International Fixed Income Funds — 11.9% | | |
| Global Bond Fund Institutional Class | 12,745,153 | 132,677,047 |
|
| International Bond Fund Institutional Class | 7,140,140 | 95,749,278 |
|
| | | 228,426,325 |
|
| Money Market Funds — 9.8% | | |
| U.S. Government Money Market Fund Investor Class | 189,203,377 | 189,203,377 |
|
| International Equity Funds — 7.9% | | |
| NT Global Real Estate Fund Institutional Class | 1,938,125 | 20,156,502 |
|
| NT International Growth Fund Institutional Class | 8,721,256 | 88,084,685 |
|
| NT International Value Fund Institutional Class | 5,053,187 | 43,406,874 |
|
| | | 151,648,061 |
|
TOTAL INVESTMENT SECURITIES — 100.0%
(Cost $1,742,326,598) | | 1,919,992,377 |
|
OTHER ASSETS AND LIABILITIES† | | (784) |
|
| TOTAL NET ASSETS — 100.0% | | $ | 1,919,991,593 |
|
|
|
| NOTES TO SCHEDULE OF INVESTMENTS |
| |
| † | Category is less than 0.05% of total net assets. |
| |
| (1) | Investments are funds within the American Century Investments family of funds and are considered affiliated funds. |
See Notes to Financial Statements.
JULY 31, 2016
One Choice 2020 Portfolio
|
| | | | |
| | Shares | Value |
MUTUAL FUNDS(1) — 100.0% | | |
| Domestic Equity Funds — 39.2% | | |
| NT Core Equity Plus Fund Institutional Class | 4,259,144 | $ | 58,137,314 |
|
| NT Disciplined Growth Fund Institutional Class | 3,443,815 | 34,438,152 |
|
| NT Equity Growth Fund Institutional Class | 16,139,808 | 189,158,552 |
|
| NT Growth Fund Institutional Class | 6,646,446 | 99,829,619 |
|
| NT Heritage Fund Institutional Class | 4,291,501 | 55,403,276 |
|
| NT Large Company Value Fund Institutional Class | 16,231,368 | 183,414,460 |
|
| NT Mid Cap Value Fund Institutional Class | 7,449,808 | 96,102,526 |
|
| NT Small Company Fund Institutional Class | 3,986,410 | 35,997,279 |
|
| | | 752,481,178 |
|
| Domestic Fixed Income Funds — 31.8% | | |
| High-Yield Fund Institutional Class | 12,594,997 | 70,783,884 |
|
| Inflation-Adjusted Bond Fund Institutional Class | 3,928,361 | 46,943,912 |
|
| NT Diversified Bond Fund Institutional Class | 35,981,197 | 399,031,479 |
|
| Short Duration Inflation Protection Bond Fund Institutional Class | 9,042,741 | 93,321,085 |
|
| | | 610,080,360 |
|
| International Fixed Income Funds — 11.1% | | |
| Global Bond Fund Institutional Class | 11,881,652 | 123,687,996 |
|
| International Bond Fund Institutional Class | 6,650,925 | 89,188,899 |
|
| | | 212,876,895 |
|
| International Equity Funds — 9.8% | | |
| NT Emerging Markets Fund Institutional Class | 1,707,779 | 17,726,743 |
|
| NT Global Real Estate Fund Institutional Class | 2,287,236 | 23,787,258 |
|
| NT International Growth Fund Institutional Class | 9,009,386 | 90,994,794 |
|
| NT International Small-Mid Cap Fund Institutional Class | 446,923 | 4,670,347 |
|
| NT International Value Fund Institutional Class | 6,041,260 | 51,894,421 |
|
| | | 189,073,563 |
|
| Money Market Funds — 8.1% | | |
| U.S. Government Money Market Fund Investor Class | 155,720,430 | 155,720,430 |
|
TOTAL INVESTMENT SECURITIES — 100.0%
(Cost $1,765,711,572) | | 1,920,232,426 |
|
OTHER ASSETS AND LIABILITIES† | | 42,774 |
|
| TOTAL NET ASSETS — 100.0% | | $ | 1,920,275,200 |
|
|
|
| NOTES TO SCHEDULE OF INVESTMENTS |
| |
| † | Category is less than 0.05% of total net assets. |
| |
| (1) | Investments are funds within the American Century Investments family of funds and are considered affiliated funds. |
See Notes to Financial Statements.
JULY 31, 2016
One Choice 2025 Portfolio
|
| | | | |
| | Shares | Value |
MUTUAL FUNDS(1) — 100.0% | | |
| Domestic Equity Funds — 41.8% | | |
| NT Core Equity Plus Fund Institutional Class | 6,206,755 | $ | 84,722,212 |
|
| NT Disciplined Growth Fund Institutional Class | 6,120,244 | 61,202,437 |
|
| NT Equity Growth Fund Institutional Class | 22,595,765 | 264,822,370 |
|
| NT Growth Fund Institutional Class | 10,975,638 | 164,854,079 |
|
| NT Heritage Fund Institutional Class | 8,462,632 | 109,252,578 |
|
| NT Large Company Value Fund Institutional Class | 24,058,004 | 271,855,441 |
|
| NT Mid Cap Value Fund Institutional Class | 12,493,226 | 161,162,619 |
|
| NT Small Company Fund Institutional Class | 5,452,047 | 49,231,984 |
|
| | | 1,167,103,720 |
|
| Domestic Fixed Income Funds — 30.3% | | |
| High-Yield Fund Institutional Class | 17,467,160 | 98,165,440 |
|
| Inflation-Adjusted Bond Fund Institutional Class | 8,558,940 | 102,279,328 |
|
| NT Diversified Bond Fund Institutional Class | 50,024,606 | 554,772,878 |
|
| Short Duration Inflation Protection Bond Fund Institutional Class | 8,813,706 | 90,957,441 |
|
| | | 846,175,087 |
|
| International Equity Funds — 12.3% | | |
| NT Emerging Markets Fund Institutional Class | 5,235,525 | 54,344,745 |
|
| NT Global Real Estate Fund Institutional Class | 4,093,617 | 42,573,615 |
|
| NT International Growth Fund Institutional Class | 13,710,073 | 138,471,734 |
|
| NT International Small-Mid Cap Fund Institutional Class | 1,451,058 | 15,163,558 |
|
| NT International Value Fund Institutional Class | 10,798,609 | 92,760,053 |
|
| | | 343,313,705 |
|
| International Fixed Income Funds — 10.0% | | |
| Global Bond Fund Institutional Class | 15,648,090 | 162,896,615 |
|
| International Bond Fund Institutional Class | 8,561,369 | 114,807,959 |
|
| | | 277,704,574 |
|
| Money Market Funds — 5.6% | | |
| U.S. Government Money Market Fund Investor Class | 156,660,995 | 156,660,995 |
|
TOTAL INVESTMENT SECURITIES — 100.0%
(Cost $2,479,145,724) | | 2,790,958,081 |
|
OTHER ASSETS AND LIABILITIES† | | (965) |
|
| TOTAL NET ASSETS — 100.0% | | $ | 2,790,957,116 |
|
|
|
| NOTES TO SCHEDULE OF INVESTMENTS |
| |
| † | Category is less than 0.05% of total net assets. |
| |
| (1) | Investments are funds within the American Century Investments family of funds and are considered affiliated funds. |
See Notes to Financial Statements.
JULY 31, 2016
One Choice 2030 Portfolio
|
| | | | |
| | Shares | Value |
MUTUAL FUNDS(1) — 100.0% | | |
| Domestic Equity Funds — 44.9% | | |
| NT Core Equity Plus Fund Institutional Class | 4,407,248 | $ | 60,158,933 |
|
| NT Disciplined Growth Fund Institutional Class | 5,087,042 | 50,870,419 |
|
| NT Equity Growth Fund Institutional Class | 15,999,263 | 187,511,367 |
|
| NT Growth Fund Institutional Class | 9,460,756 | 142,100,556 |
|
| NT Heritage Fund Institutional Class | 6,790,027 | 87,659,254 |
|
| NT Large Company Value Fund Institutional Class | 18,002,705 | 203,430,567 |
|
| NT Mid Cap Value Fund Institutional Class | 9,302,143 | 119,997,643 |
|
| NT Small Company Fund Institutional Class | 5,117,303 | 46,209,249 |
|
| | | 897,937,988 |
|
| Domestic Fixed Income Funds — 27.6% | | |
| High-Yield Fund Institutional Class | 11,486,427 | 64,553,720 |
|
| Inflation-Adjusted Bond Fund Institutional Class | 7,703,503 | 92,056,862 |
|
| NT Diversified Bond Fund Institutional Class | 32,494,582 | 360,364,920 |
|
| Short Duration Inflation Protection Bond Fund Institutional Class | 3,476,418 | 35,876,632 |
|
| | | 552,852,134 |
|
| International Equity Funds — 14.8% | | |
| NT Emerging Markets Fund Institutional Class | 5,173,297 | 53,698,819 |
|
| NT Global Real Estate Fund Institutional Class | 3,370,068 | 35,048,706 |
|
| NT International Growth Fund Institutional Class | 11,077,102 | 111,878,729 |
|
| NT International Small-Mid Cap Fund Institutional Class | 1,592,703 | 16,643,746 |
|
| NT International Value Fund Institutional Class | 9,265,374 | 79,589,558 |
|
| | | 296,859,558 |
|
| International Fixed Income Funds — 7.8% | | |
| Global Bond Fund Institutional Class | 10,039,714 | 104,513,418 |
|
| International Bond Fund Institutional Class | 3,816,059 | 51,173,346 |
|
| | | 155,686,764 |
|
| Money Market Funds — 4.9% | | |
| U.S. Government Money Market Fund Investor Class | 98,031,219 | 98,031,219 |
|
TOTAL INVESTMENT SECURITIES — 100.0%
(Cost $1,844,630,162) | | 2,001,367,663 |
|
OTHER ASSETS AND LIABILITIES† | | (2,606) |
|
| TOTAL NET ASSETS — 100.0% | | $ | 2,001,365,057 |
|
|
|
| NOTES TO SCHEDULE OF INVESTMENTS |
| |
| † | Category is less than 0.05% of total net assets. |
| |
| (1) | Investments are funds within the American Century Investments family of funds and are considered affiliated funds. |
See Notes to Financial Statements.
JULY 31, 2016
One Choice 2035 Portfolio
|
| | | | |
| | Shares | Value |
MUTUAL FUNDS(1) — 100.0% | | |
| Domestic Equity Funds — 48.3% | | |
| NT Core Equity Plus Fund Institutional Class | 5,400,403 | $ | 73,715,498 |
|
| NT Disciplined Growth Fund Institutional Class | 6,641,307 | 66,413,067 |
|
| NT Equity Growth Fund Institutional Class | 18,082,613 | 211,928,220 |
|
| NT Growth Fund Institutional Class | 13,229,089 | 198,700,918 |
|
| NT Heritage Fund Institutional Class | 8,325,757 | 107,485,525 |
|
| NT Large Company Value Fund Institutional Class | 21,105,908 | 238,496,765 |
|
| NT Mid Cap Value Fund Institutional Class | 10,619,080 | 136,986,133 |
|
| NT Small Company Fund Institutional Class | 7,747,702 | 69,961,749 |
|
| | | 1,103,687,875 |
|
| Domestic Fixed Income Funds — 24.3% | | |
| High-Yield Fund Institutional Class | 11,721,991 | 65,877,592 |
|
| Inflation-Adjusted Bond Fund Institutional Class | 9,980,326 | 119,264,896 |
|
| NT Diversified Bond Fund Institutional Class | 32,262,507 | 357,791,201 |
|
| Short Duration Inflation Protection Bond Fund Institutional Class | 1,087,864 | 11,226,761 |
|
| | | 554,160,450 |
|
| International Equity Funds — 17.3% | | |
| NT Emerging Markets Fund Institutional Class | 6,966,814 | 72,315,524 |
|
| NT Global Real Estate Fund Institutional Class | 4,409,999 | 45,863,992 |
|
| NT International Growth Fund Institutional Class | 14,415,134 | 145,592,857 |
|
| NT International Small-Mid Cap Fund Institutional Class | 2,498,987 | 26,114,413 |
|
| NT International Value Fund Institutional Class | 12,270,580 | 105,404,284 |
|
| | | 395,291,070 |
|
| International Fixed Income Funds — 5.2% | | |
| Global Bond Fund Institutional Class | 10,098,767 | 105,128,166 |
|
| International Bond Fund Institutional Class | 931,630 | 12,493,165 |
|
| | | 117,621,331 |
|
| Money Market Funds — 4.9% | | |
| U.S. Government Money Market Fund Investor Class | 112,074,731 | 112,074,731 |
|
TOTAL INVESTMENT SECURITIES — 100.0%
(Cost $2,041,699,867) | | 2,282,835,457 |
|
OTHER ASSETS AND LIABILITIES† | | (544) |
|
| TOTAL NET ASSETS — 100.0% | | $ | 2,282,834,913 |
|
|
|
| NOTES TO SCHEDULE OF INVESTMENTS |
| |
| † | Category is less than 0.05% of total net assets. |
| |
| (1) | Investments are funds within the American Century Investments family of funds and are considered affiliated funds. |
See Notes to Financial Statements.
JULY 31, 2016
One Choice 2040 Portfolio
|
| | | | |
| | Shares | Value |
MUTUAL FUNDS(1) — 100.0% | | |
| Domestic Equity Funds — 52.4% | | |
| NT Core Equity Plus Fund Institutional Class | 3,797,237 | $ | 51,832,291 |
|
| NT Disciplined Growth Fund Institutional Class | 4,732,226 | 47,322,259 |
|
| NT Equity Growth Fund Institutional Class | 12,781,009 | 149,793,421 |
|
| NT Growth Fund Institutional Class | 9,785,294 | 146,975,123 |
|
| NT Heritage Fund Institutional Class | 6,481,934 | 83,681,770 |
|
| NT Large Company Value Fund Institutional Class | 15,637,135 | 176,699,622 |
|
| NT Mid Cap Value Fund Institutional Class | 7,473,063 | 96,402,511 |
|
| NT Small Company Fund Institutional Class | 5,416,958 | 48,915,131 |
|
| | | 801,622,128 |
|
| Domestic Fixed Income Funds — 20.8% | | |
| High-Yield Fund Institutional Class | 6,644,444 | 37,341,773 |
|
| Inflation-Adjusted Bond Fund Institutional Class | 6,433,007 | 76,874,433 |
|
| NT Diversified Bond Fund Institutional Class | 18,486,418 | 205,014,375 |
|
| | | 319,230,581 |
|
| International Equity Funds — 19.4% | | |
| NT Emerging Markets Fund Institutional Class | 6,017,821 | 62,464,980 |
|
| NT Global Real Estate Fund Institutional Class | 3,306,992 | 34,392,712 |
|
| NT International Growth Fund Institutional Class | 10,149,400 | 102,508,938 |
|
| NT International Small-Mid Cap Fund Institutional Class | 2,115,834 | 22,110,462 |
|
| NT International Value Fund Institutional Class | 8,743,638 | 75,107,849 |
|
| | | 296,584,941 |
|
| International Fixed Income Funds — 4.2% | | |
| Global Bond Fund Institutional Class | 6,141,647 | 63,934,546 |
|
| Money Market Funds — 3.2% | | |
| U.S. Government Money Market Fund Investor Class | 48,777,807 | 48,777,807 |
|
TOTAL INVESTMENT SECURITIES — 100.0%
(Cost $1,420,950,214) | | 1,530,150,003 |
|
OTHER ASSETS AND LIABILITIES† | | (1,623) |
|
| TOTAL NET ASSETS — 100.0% | | $ | 1,530,148,380 |
|
|
|
| NOTES TO SCHEDULE OF INVESTMENTS |
| |
| † | Category is less than 0.05% of total net assets. |
| |
| (1) | Investments are funds within the American Century Investments family of funds and are considered affiliated funds. |
See Notes to Financial Statements.
JULY 31, 2016
One Choice 2045 Portfolio
|
| | | | |
| | Shares | Value |
MUTUAL FUNDS(1) — 100.0% | | |
| Domestic Equity Funds — 56.9% | | |
| NT Core Equity Plus Fund Institutional Class | 4,695,272 | $ | 64,090,468 |
|
| NT Disciplined Growth Fund Institutional Class | 5,342,206 | 53,422,059 |
|
| NT Equity Growth Fund Institutional Class | 14,538,096 | 170,386,482 |
|
| NT Growth Fund Institutional Class | 11,486,615 | 172,528,952 |
|
| NT Heritage Fund Institutional Class | 8,230,708 | 106,258,438 |
|
| NT Large Company Value Fund Institutional Class | 18,724,196 | 211,583,415 |
|
| NT Mid Cap Value Fund Institutional Class | 8,946,022 | 115,403,678 |
|
| NT Small Company Fund Institutional Class | 5,569,018 | 50,288,233 |
|
| | | 943,961,725 |
|
| International Equity Funds — 21.1% | | |
| NT Emerging Markets Fund Institutional Class | 7,902,710 | 82,030,128 |
|
| NT Global Real Estate Fund Institutional Class | 3,972,068 | 41,309,508 |
|
| NT International Growth Fund Institutional Class | 11,202,682 | 113,147,091 |
|
| NT International Small-Mid Cap Fund Institutional Class | 2,802,489 | 29,286,010 |
|
| NT International Value Fund Institutional Class | 9,839,617 | 84,522,309 |
|
| | | 350,295,046 |
|
| Domestic Fixed Income Funds — 17.5% | | |
| High-Yield Fund Institutional Class | 6,069,470 | 34,110,423 |
|
| Inflation-Adjusted Bond Fund Institutional Class | 5,806,035 | 69,382,124 |
|
| NT Diversified Bond Fund Institutional Class | 16,730,606 | 185,542,418 |
|
| | | 289,034,965 |
|
| International Fixed Income Funds — 3.8% | | |
| Global Bond Fund Institutional Class | 6,079,015 | 63,282,548 |
|
| Money Market Funds — 0.7% | | |
| U.S. Government Money Market Fund Investor Class | 11,669,647 | 11,669,647 |
|
TOTAL INVESTMENT SECURITIES — 100.0%
(Cost $1,493,268,663) | | 1,658,243,931 |
|
OTHER ASSETS AND LIABILITIES† | | 68 |
|
| TOTAL NET ASSETS — 100.0% | | $ | 1,658,243,999 |
|
|
|
| NOTES TO SCHEDULE OF INVESTMENTS |
| |
| † | Category is less than 0.05% of total net assets. |
| |
| (1) | Investments are funds within the American Century Investments family of funds and are considered affiliated funds. |
See Notes to Financial Statements.
JULY 31, 2016
One Choice 2050 Portfolio
|
| | | | |
| | Shares | Value |
MUTUAL FUNDS(1) — 100.0% | | |
| Domestic Equity Funds — 58.9% | | |
| NT Core Equity Plus Fund Institutional Class | 3,038,340 | $ | 41,473,334 |
|
| NT Disciplined Growth Fund Institutional Class | 3,086,646 | 30,866,460 |
|
| NT Equity Growth Fund Institutional Class | 8,094,409 | 94,866,479 |
|
| NT Growth Fund Institutional Class | 6,678,714 | 100,314,286 |
|
| NT Heritage Fund Institutional Class | 4,716,757 | 60,893,335 |
|
| NT Large Company Value Fund Institutional Class | 11,061,767 | 124,997,967 |
|
| NT Mid Cap Value Fund Institutional Class | 4,952,218 | 63,883,616 |
|
| NT Small Company Fund Institutional Class | 3,346,766 | 30,221,299 |
|
| | | 547,516,776 |
|
| International Equity Funds — 22.7% | | |
| NT Emerging Markets Fund Institutional Class | 5,223,520 | 54,220,137 |
|
| NT Global Real Estate Fund Institutional Class | 2,445,235 | 25,430,440 |
|
| NT International Growth Fund Institutional Class | 6,182,313 | 62,441,363 |
|
| NT International Small-Mid Cap Fund Institutional Class | 1,882,734 | 19,674,567 |
|
| NT International Value Fund Institutional Class | 5,742,315 | 49,326,490 |
|
| | | 211,092,997 |
|
| Domestic Fixed Income Funds — 14.9% | | |
| High-Yield Fund Institutional Class | 2,975,875 | 16,724,418 |
|
| Inflation-Adjusted Bond Fund Institutional Class | 2,816,018 | 33,651,415 |
|
| NT Diversified Bond Fund Institutional Class | 7,904,680 | 87,662,900 |
|
| | | 138,038,733 |
|
| International Fixed Income Funds — 3.5% | | |
| Global Bond Fund Institutional Class | 3,085,214 | 32,117,080 |
|
TOTAL INVESTMENT SECURITIES — 100.0%
(Cost $874,246,891) | | 928,765,586 |
|
OTHER ASSETS AND LIABILITIES† | | (728) |
|
| TOTAL NET ASSETS — 100.0% | | $ | 928,764,858 |
|
|
|
| NOTES TO SCHEDULE OF INVESTMENTS |
| |
| † | Category is less than 0.05% of total net assets. |
| |
| (1) | Investments are funds within the American Century Investments family of funds and are considered affiliated funds. |
See Notes to Financial Statements.
JULY 31, 2016
One Choice 2055 Portfolio
|
| | | | |
| | Shares | Value |
MUTUAL FUNDS(1) — 100.0% | | |
| Domestic Equity Funds — 60.8% | | |
| NT Core Equity Plus Fund Institutional Class | 1,216,194 | $ | 16,601,046 |
|
| NT Disciplined Growth Fund Institutional Class | 1,286,602 | 12,866,024 |
|
| NT Equity Growth Fund Institutional Class | 3,351,680 | 39,281,687 |
|
| NT Growth Fund Institutional Class | 2,704,632 | 40,623,578 |
|
| NT Heritage Fund Institutional Class | 1,936,163 | 24,995,861 |
|
| NT Large Company Value Fund Institutional Class | 4,598,050 | 51,957,963 |
|
| NT Mid Cap Value Fund Institutional Class | 1,962,123 | 25,311,389 |
|
| NT Small Company Fund Institutional Class | 1,537,103 | 13,880,042 |
|
| | | 225,517,590 |
|
| International Equity Funds — 23.6% | | |
| NT Emerging Markets Fund Institutional Class | 2,270,600 | 23,568,831 |
|
| NT Global Real Estate Fund Institutional Class | 1,056,805 | 10,990,770 |
|
| NT International Growth Fund Institutional Class | 2,289,786 | 23,126,836 |
|
| NT International Small-Mid Cap Fund Institutional Class | 874,457 | 9,138,078 |
|
| NT International Value Fund Institutional Class | 2,379,329 | 20,438,440 |
|
| | | 87,262,955 |
|
| Domestic Fixed Income Funds — 12.5% | | |
| High-Yield Fund Institutional Class | 1,010,012 | 5,676,267 |
|
| Inflation-Adjusted Bond Fund Institutional Class | 959,348 | 11,464,203 |
|
| NT Diversified Bond Fund Institutional Class | 2,640,590 | 29,284,147 |
|
| | | 46,424,617 |
|
| International Fixed Income Funds — 3.1% | | |
| Global Bond Fund Institutional Class | 1,104,275 | 11,495,502 |
|
TOTAL INVESTMENT SECURITIES — 100.0%
(Cost $363,096,030) | | 370,700,664 |
|
OTHER ASSETS AND LIABILITIES† | | (44) |
|
| TOTAL NET ASSETS — 100.0% | | $ | 370,700,620 |
|
|
|
| NOTES TO SCHEDULE OF INVESTMENTS |
| |
| † | Category is less than 0.05% of total net assets. |
| |
| (1) | Investments are funds within the American Century Investments family of funds and are considered affiliated funds. |
See Notes to Financial Statements.
JULY 31, 2016
One Choice 2060 Portfolio
|
| | | | |
| | Shares | Value |
MUTUAL FUNDS(1) — 100.0% | | |
| Domestic Equity Funds — 61.4% | | |
| NT Core Equity Plus Fund Institutional Class | 21,449 | $ | 292,781 |
|
| NT Disciplined Growth Fund Institutional Class | 22,801 | 228,006 |
|
| NT Equity Growth Fund Institutional Class | 59,735 | 700,098 |
|
| NT Growth Fund Institutional Class | 47,741 | 717,066 |
|
| NT Heritage Fund Institutional Class | 34,045 | 439,527 |
|
| NT Large Company Value Fund Institutional Class | 81,988 | 926,465 |
|
| NT Mid Cap Value Fund Institutional Class | 34,098 | 439,866 |
|
| NT Small Company Fund Institutional Class | 28,800 | 260,060 |
|
| | | 4,003,869 |
|
| International Equity Funds — 23.6% | | |
| NT Emerging Markets Fund Institutional Class | 40,557 | 420,984 |
|
| NT Global Real Estate Fund Institutional Class | 18,991 | 197,509 |
|
| NT International Growth Fund Institutional Class | 39,199 | 395,914 |
|
| NT International Small-Mid Cap Fund Institutional Class | 15,825 | 165,372 |
|
| NT International Value Fund Institutional Class | 42,362 | 363,894 |
|
| | | 1,543,673 |
|
| Domestic Fixed Income Funds — 12.0% | | |
| High-Yield Fund Institutional Class | 17,353 | 97,523 |
|
| Inflation-Adjusted Bond Fund Institutional Class | 16,363 | 195,533 |
|
| NT Diversified Bond Fund Institutional Class | 44,087 | 488,925 |
|
| | | 781,981 |
|
| International Fixed Income Funds — 3.0% | | |
| Global Bond Fund Institutional Class | 18,754 | 195,231 |
|
TOTAL INVESTMENT SECURITIES — 100.0%
(Cost $6,157,068) | | 6,524,754 |
|
OTHER ASSETS AND LIABILITIES† | | (1) |
|
| TOTAL NET ASSETS — 100.0% | | $ | 6,524,753 |
|
|
|
| NOTES TO SCHEDULE OF INVESTMENTS |
| |
| † | Category is less than 0.05% of total net assets. |
| |
| (1) | Investments are funds within the American Century Investments family of funds and are considered affiliated funds. |
See Notes to Financial Statements.
|
|
| Statements of Assets and Liabilities |
|
| | | | | | | | | |
| JULY 31, 2016 | | | |
| | One Choice In Retirement Portfolio | One Choice 2020 Portfolio | One Choice 2025 Portfolio |
| Assets | | | |
| Investment securities in affiliates, at value (cost of $1,742,326,598, $1,765,711,572 and $2,479,145,724, respectively) | $ | 1,919,992,377 |
| $ | 1,920,232,426 |
| $ | 2,790,958,081 |
|
| Cash | 375,870 |
| 308,671 |
| 477,610 |
|
| Receivable for investments sold | 2,057,175 |
| — |
| 1,253,753 |
|
| Receivable for capital shares sold | 4,410,837 |
| 3,262,521 |
| 3,922,188 |
|
| Distributions receivable from affiliates | 1,087,751 |
| 1,046,885 |
| 1,456,727 |
|
| | 1,927,924,010 |
| 1,924,850,503 |
| 2,798,068,359 |
|
| | | | |
| Liabilities | | | |
| Payable for investments purchased | 1,088,385 |
| 1,330,533 |
| 1,457,578 |
|
| Payable for capital shares redeemed | 6,437,021 |
| 2,902,657 |
| 5,124,256 |
|
| Accrued administrative fees | 237,148 |
| 198,296 |
| 318,884 |
|
| Distribution and service fees payable | 169,863 |
| 143,817 |
| 210,525 |
|
| | 7,932,417 |
| 4,575,303 |
| 7,111,243 |
|
| | | | |
| Net Assets | $ | 1,919,991,593 |
| $ | 1,920,275,200 |
| $ | 2,790,957,116 |
|
| | | | |
| Net Assets Consist of: | | | |
| Capital (par value and paid-in surplus) | $ | 1,745,051,063 |
| $ | 1,736,858,039 |
| $ | 2,457,555,481 |
|
| Undistributed net investment income | — |
| 9,290,125 |
| 10,353,112 |
|
| Accumulated undistributed net realized gain (loss) | (2,725,249 | ) | 19,606,182 |
| 11,236,166 |
|
| Net unrealized appreciation | 177,665,779 |
| 154,520,854 |
| 311,812,357 |
|
| | $ | 1,919,991,593 |
| $ | 1,920,275,200 |
| $ | 2,790,957,116 |
|
|
| | | | | | |
| Fund/Class | Net Assets | Shares Outstanding | Net Asset Value Per Share |
| One Choice In Retirement Portfolio | | | |
| Investor Class, $0.01 Par Value |
| $837,621,821 |
| 65,813,864 |
| $12.73 |
| Institutional Class, $0.01 Par Value |
| $510,188,184 |
| 40,073,928 |
| $12.73 |
| A Class, $0.01 Par Value |
| $361,051,618 |
| 28,359,805 |
| $12.73* |
| C Class, $0.01 Par Value |
| $9,704,763 |
| 764,258 |
| $12.70 |
| R Class, $0.01 Par Value |
| $201,425,207 |
| 15,843,051 |
| $12.71 |
| One Choice 2020 Portfolio | | | |
| Investor Class, $0.01 Par Value |
| $679,472,837 |
| 56,695,696 |
| $11.98 |
| Institutional Class, $0.01 Par Value |
| $733,519,774 |
| 61,157,726 |
| $11.99 |
| A Class, $0.01 Par Value |
| $342,985,255 |
| 28,672,956 |
| $11.96* |
| C Class, $0.01 Par Value |
| $7,967,539 |
| 666,812 |
| $11.95 |
| R Class, $0.01 Par Value |
| $156,329,795 |
| 13,086,275 |
| $11.95 |
| One Choice 2025 Portfolio | | | |
| Investor Class, $0.01 Par Value |
| $1,147,291,462 |
| 81,507,362 |
| $14.08 |
| Institutional Class, $0.01 Par Value |
| $884,533,922 |
| 62,785,255 |
| $14.09 |
| A Class, $0.01 Par Value |
| $528,973,404 |
| 37,627,381 |
| $14.06* |
| C Class, $0.01 Par Value |
| $7,821,670 |
| 557,351 |
| $14.03 |
| R Class, $0.01 Par Value |
| $222,336,658 |
| 15,841,268 |
| $14.04 |
| |
| * | Maximum offering price $13.51, $12.69 and $14.92 (net asset value divided by 0.9425) for One Choice In Retirement Portfolio, One Choice 2020 Portfolio and One Choice 2025 Portfolio, respectively. |
See Notes to Financial Statements.
|
| | | | | | | | | |
| JULY 31, 2016 | | | |
| | One Choice 2030 Portfolio | One Choice 2035 Portfolio | One Choice 2040 Portfolio |
| Assets | | | |
| Investment securities in affiliates, at value (cost of $1,844,630,162, $2,041,699,867 and $1,420,950,214, respectively) | $ | 2,001,367,663 |
| $ | 2,282,835,457 |
| $ | 1,530,150,003 |
|
| Cash | 328,208 |
| 398,267 |
| 242,749 |
|
| Receivable for investments sold | — |
| 311,791 |
| — |
|
| Receivable for capital shares sold | 3,276,437 |
| 2,962,022 |
| 2,878,787 |
|
| Distributions receivable from affiliates | 948,879 |
| 949,497 |
| 541,306 |
|
| | 2,005,921,187 |
| 2,287,457,034 |
| 1,533,812,845 |
|
| | | | |
| Liabilities | | | |
| Payable for investments purchased | 1,279,315 |
| 950,040 |
| 1,529,543 |
|
| Payable for capital shares redeemed | 2,913,704 |
| 3,230,426 |
| 1,865,750 |
|
| Accrued administrative fees | 206,545 |
| 259,060 |
| 157,048 |
|
| Distribution and service fees payable | 156,566 |
| 182,595 |
| 112,124 |
|
| | 4,556,130 |
| 4,622,121 |
| 3,664,465 |
|
| | | | |
| Net Assets | $ | 2,001,365,057 |
| $ | 2,282,834,913 |
| $ | 1,530,148,380 |
|
| | | | |
| Net Assets Consist of: | | | |
| Capital (par value and paid-in surplus) | $ | 1,816,674,639 |
| $ | 2,013,081,235 |
| $ | 1,393,427,162 |
|
| Undistributed net investment income | 6,436,104 |
| 6,593,601 |
| 4,016,732 |
|
| Undistributed net realized gain | 21,516,813 |
| 22,024,487 |
| 23,504,697 |
|
| Net unrealized appreciation | 156,737,501 |
| 241,135,590 |
| 109,199,789 |
|
| | $ | 2,001,365,057 |
| $ | 2,282,834,913 |
| $ | 1,530,148,380 |
|
|
| | | | | | |
| Fund/Class | Net Assets | Shares Outstanding | Net Asset Value Per Share |
| One Choice 2030 Portfolio | | | |
| Investor Class, $0.01 Par Value |
| $680,942,889 |
| 56,259,973 |
| $12.10 |
| Institutional Class, $0.01 Par Value |
| $763,857,997 |
| 63,078,980 |
| $12.11 |
| A Class, $0.01 Par Value |
| $378,866,459 |
| 31,382,045 |
| $12.07* |
| C Class, $0.01 Par Value |
| $6,714,338 |
| 556,614 |
| $12.06 |
| R Class, $0.01 Par Value |
| $170,983,374 |
| 14,175,853 |
| $12.06 |
| One Choice 2035 Portfolio | | | |
| Investor Class, $0.01 Par Value |
| $905,126,241 |
| 60,451,690 |
| $14.97 |
| Institutional Class, $0.01 Par Value |
| $726,622,282 |
| 48,448,719 |
| $15.00 |
| A Class, $0.01 Par Value |
| $438,397,990 |
| 29,316,647 |
| $14.95* |
| C Class, $0.01 Par Value |
| $6,533,015 |
| 437,986 |
| $14.92 |
| R Class, $0.01 Par Value |
| $206,155,385 |
| 13,802,355 |
| $14.94 |
| One Choice 2040 Portfolio | | | |
| Investor Class, $0.01 Par Value |
| $546,508,762 |
| 43,803,836 |
| $12.48 |
| Institutional Class, $0.01 Par Value |
| $585,380,885 |
| 46,879,345 |
| $12.49 |
| A Class, $0.01 Par Value |
| $266,243,729 |
| 21,373,440 |
| $12.46* |
| C Class, $0.01 Par Value |
| $3,528,555 |
| 283,994 |
| $12.42 |
| R Class, $0.01 Par Value |
| $128,486,449 |
| 10,331,498 |
| $12.44 |
| |
| * | Maximum offering price $12.81, $15.86 and $13.22 (net asset value divided by 0.9425) for One Choice 2030 Portfolio, One Choice 2035 Portfolio and One Choice 2040 Portfolio, respectively. |
See Notes to Financial Statements.
|
| | | | | | | | | |
| JULY 31, 2016 | | | |
| | One Choice 2045 Portfolio | One Choice 2050 Portfolio | One Choice 2055 Portfolio |
| Assets | | | |
| Investment securities in affiliates, at value (cost of $1,493,268,663, $874,246,891 and $363,096,030, respectively) | $ | 1,658,243,931 |
| $ | 928,765,586 |
| $ | 370,700,664 |
|
| Cash | 271,774 |
| 141,067 |
| 56,807 |
|
| Receivable for capital shares sold | 3,101,859 |
| 2,847,072 |
| 1,361,601 |
|
| Distributions receivable from affiliates | 490,535 |
| 232,969 |
| 77,797 |
|
| | 1,662,108,099 |
| 931,986,694 |
| 372,196,869 |
|
| | | | |
| Liabilities | | | |
| Payable for investments purchased | 1,055,350 |
| 1,213,911 |
| 605,510 |
|
| Payable for capital shares redeemed | 2,507,335 |
| 1,850,730 |
| 827,674 |
|
| Accrued administrative fees | 182,104 |
| 93,277 |
| 34,275 |
|
| Distribution and service fees payable | 119,311 |
| 63,918 |
| 28,790 |
|
| | 3,864,100 |
| 3,221,836 |
| 1,496,249 |
|
| | | | |
| Net Assets | $ | 1,658,243,999 |
| $ | 928,764,858 |
| $ | 370,700,620 |
|
| | | | |
| Net Assets Consist of: | | | |
| Capital (par value and paid-in surplus) | $ | 1,467,000,976 |
| $ | 856,354,859 |
| $ | 356,330,356 |
|
| Undistributed net investment income | 3,827,511 |
| 1,899,219 |
| 693,084 |
|
| Undistributed net realized gain | 22,440,244 |
| 15,992,085 |
| 6,072,546 |
|
| Net unrealized appreciation | 164,975,268 |
| 54,518,695 |
| 7,604,634 |
|
| | $ | 1,658,243,999 |
| $ | 928,764,858 |
| $ | 370,700,620 |
|
|
| | | | | | |
| Fund/Class | Net Assets | Shares Outstanding | Net Asset Value Per Share |
| One Choice 2045 Portfolio | | | |
| Investor Class, $0.01 Par Value |
| $666,583,078 |
| 42,912,007 |
| $15.53 |
| Institutional Class, $0.01 Par Value |
| $563,161,325 |
| 36,194,803 |
| $15.56 |
| A Class, $0.01 Par Value |
| $288,989,026 |
| 18,635,867 |
| $15.51* |
| C Class, $0.01 Par Value |
| $2,943,617 |
| 190,157 |
| $15.48 |
| R Class, $0.01 Par Value |
| $136,566,953 |
| 8,813,634 |
| $15.49 |
| One Choice 2050 Portfolio | | | |
| Investor Class, $0.01 Par Value |
| $332,785,729 |
| 26,647,685 |
| $12.49 |
| Institutional Class, $0.01 Par Value |
| $365,225,018 |
| 29,194,133 |
| $12.51 |
| A Class, $0.01 Par Value |
| $157,109,753 |
| 12,599,920 |
| $12.47* |
| C Class, $0.01 Par Value |
| $1,939,065 |
| 155,737 |
| $12.45 |
| R Class, $0.01 Par Value |
| $71,705,293 |
| 5,755,917 |
| $12.46 |
| One Choice 2055 Portfolio | | | |
| Investor Class, $0.01 Par Value |
| $106,441,133 |
| 8,074,891 |
| $13.18 |
| Institutional Class, $0.01 Par Value |
| $162,254,618 |
| 12,299,453 |
| $13.19 |
| A Class, $0.01 Par Value |
| $65,954,023 |
| 5,013,848 |
| $13.15* |
| C Class, $0.01 Par Value |
| $636,429 |
| 48,553 |
| $13.11 |
| R Class, $0.01 Par Value |
| $35,414,417 |
| 2,693,538 |
| $13.15 |
| |
| * | Maximum offering price $16.46, $13.23 and $13.95 (net asset value divided by 0.9425) for One Choice 2045 Portfolio, One Choice 2050 Portfolio and One Choice 2055 Portfolio, respectively. |
See Notes to Financial Statements.
|
| | | |
| JULY 31, 2016 | |
| | One Choice 2060 Portfolio |
| Assets | |
| Investment securities in affiliates, at value (cost of $6,157,068) | $ | 6,524,754 |
|
| Cash | 1,055 |
|
| Receivable for capital shares sold | 51,300 |
|
| Distributions receivable from affiliates | 1,141 |
|
| | 6,578,250 |
|
| | |
| Liabilities | |
| Payable for investments purchased | 51,370 |
|
| Payable for capital shares redeemed | 933 |
|
| Accrued administrative fees | 578 |
|
| Distribution and service fees payable | 616 |
|
| | 53,497 |
|
| | |
| Net Assets | $ | 6,524,753 |
|
| | |
| Net Assets Consist of: | |
| Capital (par value and paid-in surplus) | $ | 6,155,865 |
|
| Undistributed net investment income | 9,886 |
|
| Accumulated net realized loss | (8,684 | ) |
| Net unrealized appreciation | 367,686 |
|
| | $ | 6,524,753 |
|
|
| | | | | | |
| Fund/Class | Net Assets | Shares Outstanding | Net Asset Value Per Share |
| One Choice 2060 Portfolio | | | |
| Investor Class, $0.01 Par Value |
| $1,305,067 |
| 119,850 |
| $10.89 |
| Institutional Class, $0.01 Par Value |
| $2,443,207 |
| 224,084 |
| $10.90 |
| A Class, $0.01 Par Value |
| $2,143,447 |
| 197,159 |
| $10.87* |
| C Class, $0.01 Par Value |
| $27,860 |
| 2,573 |
| $10.83 |
| R Class, $0.01 Par Value |
| $605,172 |
| 55,738 |
| $10.86 |
| |
| * | Maximum offering price $11.53 (net asset value divided by 0.9425) for One Choice 2060 Portfolio. |
See Notes to Financial Statements.
|
| | | | | | | | | |
| YEAR ENDED JULY 31, 2016 |
| | One Choice In Retirement Portfolio | One Choice 2020 Portfolio | One Choice 2025 Portfolio |
| Investment Income (Loss) | | | |
| Income from Affiliates: | | | |
| Income distributions from underlying funds | $ | 36,374,067 |
| $ | 34,407,789 |
| $ | 52,171,507 |
|
| | | | |
| Expenses: | | | |
| Administrative fees: | | | |
| Investor Class | 1,604,153 |
| 1,248,595 |
| 2,137,619 |
|
| A Class | 769,775 |
| 672,970 |
| 1,063,658 |
|
| C Class | 16,836 |
| 18,510 |
| 14,845 |
|
| R Class | 430,991 |
| 315,441 |
| 444,471 |
|
| Distribution and service fees: | | | |
| A Class | 962,219 |
| 841,212 |
| 1,329,572 |
|
| C Class | 84,181 |
| 92,548 |
| 74,224 |
|
| R Class | 1,077,477 |
| 788,603 |
| 1,111,177 |
|
| Directors' fees and expenses | 65,770 |
| 60,742 |
| 89,718 |
|
| | 5,011,402 |
| 4,038,621 |
| 6,265,284 |
|
| | | | |
| Net investment income (loss) | 31,362,665 |
| 30,369,168 |
| 45,906,223 |
|
| | | | |
| Realized and Unrealized Gain (Loss) on Affiliates | | |
| Net realized gain (loss) on: | | | |
| Sale of investments in underlying funds | (18,447,760 | ) | (13,803,678 | ) | (15,313,478 | ) |
| Capital gain distributions received from underlying funds | 43,741,748 |
| 41,377,574 |
| 65,349,760 |
|
| | 25,293,988 |
| 27,573,896 |
| 50,036,282 |
|
| | | | |
| Change in net unrealized appreciation (depreciation) on investments in underlying funds | (7,958,382 | ) | (2,656,937 | ) | (22,192,028 | ) |
| | | | |
| Net realized and unrealized gain (loss) on affiliates | 17,335,606 |
| 24,916,959 |
| 27,844,254 |
|
| | | | |
| Net Increase (Decrease) in Net Assets Resulting from Operations | $ | 48,698,271 |
| $ | 55,286,127 |
| $ | 73,750,477 |
|
See Notes to Financial Statements.
|
| | | | | | | | | |
| YEAR ENDED JULY 31, 2016 |
| | One Choice 2030 Portfolio | One Choice 2035 Portfolio | One Choice 2040 Portfolio |
| Investment Income (Loss) | | | |
| Income from Affiliates: | | | |
| Income distributions from underlying funds | $ | 36,466,062 |
| $ | 42,536,579 |
| $ | 27,805,922 |
|
| | | | |
| Expenses: | | | |
| Administrative fees: | | | |
| Investor Class | 1,213,989 |
| 1,656,354 |
| 958,851 |
|
| A Class | 731,847 |
| 864,358 |
| 514,101 |
|
| C Class | 11,591 |
| 12,888 |
| 6,428 |
|
| R Class | 337,389 |
| 396,302 |
| 243,130 |
|
| Distribution and service fees: | | | |
| A Class | 914,808 |
| 1,080,447 |
| 642,626 |
|
| C Class | 57,957 |
| 64,441 |
| 32,138 |
|
| R Class | 843,473 |
| 990,753 |
| 607,826 |
|
| Directors' fees and expenses | 61,555 |
| 71,582 |
| 46,370 |
|
| | 4,172,609 |
| 5,137,125 |
| 3,051,470 |
|
| | | | |
| Net investment income (loss) | 32,293,453 |
| 37,399,454 |
| 24,754,452 |
|
| | | | |
| Realized and Unrealized Gain (Loss) on Affiliates | | |
| Net realized gain (loss) on: | | | |
| Sale of investments in underlying funds | (14,543,647 | ) | (10,197,387 | ) | (9,919,980 | ) |
| Capital gain distributions received from underlying funds | 46,844,527 |
| 57,777,382 |
| 40,355,607 |
|
| | 32,300,880 |
| 47,579,995 |
| 30,435,627 |
|
| | | | |
| Change in net unrealized appreciation (depreciation) on investments in underlying funds | (13,373,514 | ) | (40,823,351 | ) | (24,007,762 | ) |
| | | | |
| Net realized and unrealized gain (loss) on affiliates | 18,927,366 |
| 6,756,644 |
| 6,427,865 |
|
| | | | |
| Net Increase (Decrease) in Net Assets Resulting from Operations | $ | 51,220,819 |
| $ | 44,156,098 |
| $ | 31,182,317 |
|
See Notes to Financial Statements.
|
| | | | | | | | | |
| YEAR ENDED JULY 31, 2016 |
| | One Choice 2045 Portfolio | One Choice 2050 Portfolio | One Choice 2055 Portfolio |
| Investment Income (Loss) | | | |
| Income from Affiliates: | | | |
| Income distributions from underlying funds | $ | 30,932,119 |
| $ | 16,281,835 |
| $ | 5,608,427 |
|
| | | | |
| Expenses: | | | |
| Administrative fees: | | | |
| Investor Class | 1,207,553 |
| 558,249 |
| 155,356 |
|
| A Class | 568,105 |
| 308,638 |
| 111,931 |
|
| C Class | 5,462 |
| 3,933 |
| 1,169 |
|
| R Class | 253,639 |
| 127,820 |
| 57,305 |
|
| Distribution and service fees: | | | |
| A Class | 710,131 |
| 385,798 |
| 139,914 |
|
| C Class | 27,308 |
| 19,663 |
| 5,847 |
|
| R Class | 634,097 |
| 319,550 |
| 143,263 |
|
| Directors' fees and expenses | 51,358 |
| 27,201 |
| 9,467 |
|
| | 3,457,653 |
| 1,750,852 |
| 624,252 |
|
| | | | |
| Net investment income (loss) | 27,474,466 |
| 14,530,983 |
| 4,984,175 |
|
| | | | |
| Realized and Unrealized Gain (Loss) on Affiliates | | |
| Net realized gain (loss) on: | | | |
| Sale of investments in underlying funds | (6,609,092 | ) | (5,606,618 | ) | (1,457,509 | ) |
| Capital gain distributions received from underlying funds | 48,789,961 |
| 26,545,185 |
| 9,250,282 |
|
| | 42,180,869 |
| 20,938,567 |
| 7,792,773 |
|
| | | | |
| Change in net unrealized appreciation (depreciation) on investments in underlying funds | (40,488,221 | ) | (15,999,909 | ) | (1,770,845 | ) |
| | | | |
| Net realized and unrealized gain (loss) on affiliates | 1,692,648 |
| 4,938,658 |
| 6,021,928 |
|
| | | | |
| Net Increase (Decrease) in Net Assets Resulting from Operations | $ | 29,167,114 |
| $ | 19,469,641 |
| $ | 11,006,103 |
|
See Notes to Financial Statements.
|
| | | |
PERIOD ENDED JULY 31, 2016(1) |
| | One Choice 2060 Portfolio |
| Investment Income (Loss) | |
| Income from Affiliates: | |
| Income distributions from underlying funds | $ | 16,406 |
|
| | |
| Expenses: | |
| Administrative fees: | |
| Investor Class | 803 |
|
| A Class | 431 |
|
| C Class | 43 |
|
| R Class | 313 |
|
| Distribution and service fees: | |
| A Class | 538 |
|
| C Class | 216 |
|
| R Class | 782 |
|
| Directors' fees and expenses | 36 |
|
| | 3,162 |
|
| | |
| Net investment income (loss) | 13,244 |
|
| | |
| Realized and Unrealized Gain (Loss) on Affiliates |
| Net realized gain (loss) on: | |
| Sale of investments in underlying funds | (17,755 | ) |
| Capital gain distributions received from underlying funds | 9,071 |
|
| | (8,684 | ) |
| | |
| Change in net unrealized appreciation (depreciation) on investments in underlying funds | 367,686 |
|
| | |
| Net realized and unrealized gain (loss) on affiliates | 359,002 |
|
| | |
| Net Increase (Decrease) in Net Assets Resulting from Operations | $ | 372,246 |
|
| |
| (1) | September 30, 2015 (fund inception) through July 31, 2016. |
See Notes to Financial Statements.
|
|
| Statements of Changes in Net Assets |
|
| | | | | | | | | | | | |
| YEARS ENDED JULY 31, 2016 AND JULY 31, 2015 |
| | One Choice In Retirement Portfolio | One Choice 2020 Portfolio |
| Increase (Decrease) in Net Assets | July 31, 2016 | July 31, 2015 | July 31, 2016 | July 31, 2015 |
| Operations | | | | |
| Net investment income (loss) | $ | 31,362,665 |
| $ | 16,949,077 |
| $ | 30,369,168 |
| $ | 30,723,638 |
|
| Net realized gain (loss) | 25,293,988 |
| 22,713,321 |
| 27,573,896 |
| 56,902,480 |
|
| Change in net unrealized appreciation (depreciation) | (7,958,382 | ) | (15,394,485 | ) | (2,656,937 | ) | (29,289,826 | ) |
| Net increase (decrease) in net assets resulting from operations | 48,698,271 |
| 24,267,913 |
| 55,286,127 |
| 58,336,292 |
|
| | | | | |
| Distributions to Shareholders | | | | |
| From net investment income: | | | | |
| Investor Class | (14,010,410 | ) | (8,278,509 | ) | (10,178,870 | ) | (12,352,256 | ) |
| Institutional Class | (9,054,714 | ) | (5,038,644 | ) | (10,795,256 | ) | (9,406,680 | ) |
| A Class | (5,844,559 | ) | (3,747,083 | ) | (4,861,193 | ) | (6,389,870 | ) |
| C Class | (63,174 | ) | (39,543 | ) | (62,207 | ) | (136,434 | ) |
| R Class | (2,735,667 | ) | (2,349,792 | ) | (1,840,522 | ) | (2,510,233 | ) |
| From net realized gains: | | | | |
| Investor Class | (776,376 | ) | (12,996,429 | ) | (21,173,288 | ) | (8,843,300 | ) |
| Institutional Class | (442,736 | ) | (7,599,042 | ) | (20,019,050 | ) | (6,157,505 | ) |
| A Class | (384,045 | ) | (6,589,671 | ) | (11,933,341 | ) | (5,183,223 | ) |
| C Class | (7,711 | ) | (114,443 | ) | (331,822 | ) | (184,038 | ) |
| R Class | (215,775 | ) | (5,489,818 | ) | (5,510,819 | ) | (2,348,635 | ) |
| Decrease in net assets from distributions | (33,535,167 | ) | (52,242,974 | ) | (86,706,368 | ) | (53,512,174 | ) |
| | | | | |
| Capital Share Transactions | | | | |
| Net increase (decrease) in net assets from capital share transactions (Note 5) | (83,694,957 | ) | 1,387,527,297 |
| 223,623,193 |
| 378,199,710 |
|
| | | | | |
| Net increase (decrease) in net assets | (68,531,853 | ) | 1,359,552,236 |
| 192,202,952 |
| 383,023,828 |
|
| | | | | |
| Net Assets | | | | |
| Beginning of period | 1,988,523,446 |
| 628,971,210 |
| 1,728,072,248 |
| 1,345,048,420 |
|
| End of period | $ | 1,919,991,593 |
| $ | 1,988,523,446 |
| $ | 1,920,275,200 |
| $ | 1,728,072,248 |
|
| | | | | |
| Undistributed net investment income | — |
| $ | 802,762 |
| $ | 9,290,125 |
| $ | 6,660,069 |
|
See Notes to Financial Statements.
|
| | | | | | | | | | | | |
| YEARS ENDED JULY 31, 2016 AND JULY 31, 2015 |
| | One Choice 2025 Portfolio | One Choice 2030 Portfolio |
| Increase (Decrease) in Net Assets | July 31, 2016 | July 31, 2015 | July 31, 2016 | July 31, 2015 |
| Operations | | | | |
| Net investment income (loss) | $ | 45,906,223 |
| $ | 48,338,056 |
| $ | 32,293,453 |
| $ | 29,921,077 |
|
| Net realized gain (loss) | 50,036,282 |
| 112,440,271 |
| 32,300,880 |
| 70,225,200 |
|
| Change in net unrealized appreciation (depreciation) | (22,192,028 | ) | (57,670,276 | ) | (13,373,514 | ) | (24,454,278 | ) |
| Net increase (decrease) in net assets resulting from operations | 73,750,477 |
| 103,108,051 |
| 51,220,819 |
| 75,691,999 |
|
| | | | | |
| Distributions to Shareholders | |
| From net investment income: | | | | |
| Investor Class | (17,840,512 | ) | (22,521,580 | ) | (10,282,680 | ) | (11,527,431 | ) |
| Institutional Class | (13,300,403 | ) | (12,088,557 | ) | (11,447,909 | ) | (9,190,911 | ) |
| A Class | (7,799,325 | ) | (10,418,808 | ) | (5,475,848 | ) | (6,745,489 | ) |
| C Class | (50,260 | ) | (90,627 | ) | (39,504 | ) | (54,556 | ) |
| R Class | (2,671,460 | ) | (3,786,705 | ) | (2,059,631 | ) | (2,516,296 | ) |
| From net realized gains: | | | | |
| Investor Class | (47,092,035 | ) | (20,138,492 | ) | (24,531,253 | ) | (10,815,442 | ) |
| Institutional Class | (31,338,825 | ) | (9,890,637 | ) | (24,435,654 | ) | (7,873,516 | ) |
| A Class | (24,223,830 | ) | (10,542,107 | ) | (15,314,491 | ) | (7,184,678 | ) |
| C Class | (331,737 | ) | (151,236 | ) | (228,955 | ) | (97,635 | ) |
| R Class | (10,071,326 | ) | (4,410,237 | ) | (6,959,318 | ) | (3,097,726 | ) |
| Decrease in net assets from distributions | (154,719,713 | ) | (94,038,986 | ) | (100,775,243 | ) | (59,103,680 | ) |
| | | | | |
| Capital Share Transactions | | | | |
| Net increase (decrease) in net assets from capital share transactions (Note 5) | 252,521,495 |
| 448,053,159 |
| 320,909,830 |
| 385,425,967 |
|
| | | | | |
| Net increase (decrease) in net assets | 171,552,259 |
| 457,122,224 |
| 271,355,406 |
| 402,014,286 |
|
| | | | | |
| Net Assets | | | | |
| Beginning of period | 2,619,404,857 |
| 2,162,282,633 |
| 1,730,009,651 |
| 1,327,995,365 |
|
| End of period | $ | 2,790,957,116 |
| $ | 2,619,404,857 |
| $ | 2,001,365,057 |
| $ | 1,730,009,651 |
|
| | | | | |
| Undistributed net investment income | $ | 10,353,112 |
| $ | 9,884,158 |
| $ | 6,436,104 |
| $ | 6,020,965 |
|
See Notes to Financial Statements.
|
| | | | | | | | | | | | |
| YEARS ENDED JULY 31, 2016 AND JULY 31, 2015 |
| | One Choice 2035 Portfolio | One Choice 2040 Portfolio |
| Increase (Decrease) in Net Assets | July 31, 2016 | July 31, 2015 | July 31, 2016 | July 31, 2015 |
| Operations | | | | |
| Net investment income (loss) | $ | 37,399,454 |
| $ | 36,697,971 |
| $ | 24,754,452 |
| $ | 22,691,863 |
|
| Net realized gain (loss) | 47,579,995 |
| 107,058,111 |
| 30,435,627 |
| 59,447,013 |
|
| Change in net unrealized appreciation (depreciation) | (40,823,351 | ) | (34,923,732 | ) | (24,007,762 | ) | (12,280,750 | ) |
| Net increase (decrease) in net assets resulting from operations | 44,156,098 |
| 108,832,350 |
| 31,182,317 |
| 69,858,126 |
|
| | | | | |
| Distributions to Shareholders | | | | |
| From net investment income: | | | | |
| Investor Class | (14,386,902 | ) | (17,069,090 | ) | (8,264,396 | ) | (9,017,197 | ) |
| Institutional Class | (10,847,140 | ) | (8,933,739 | ) | (8,863,591 | ) | (7,299,870 | ) |
| A Class | (6,587,825 | ) | (8,314,219 | ) | (3,931,115 | ) | (4,642,592 | ) |
| C Class | (48,285 | ) | (62,683 | ) | (23,433 | ) | (37,054 | ) |
| R Class | (2,475,900 | ) | (3,192,145 | ) | (1,530,046 | ) | (1,818,551 | ) |
| From net realized gains: | | | | |
| Investor Class | (42,981,654 | ) | (19,055,364 | ) | (21,633,054 | ) | (9,445,838 | ) |
| Institutional Class | (29,032,052 | ) | (9,111,372 | ) | (20,793,544 | ) | (6,987,452 | ) |
| A Class | (23,026,842 | ) | (10,524,767 | ) | (12,027,043 | ) | (5,512,609 | ) |
| C Class | (344,079 | ) | (132,715 | ) | (145,548 | ) | (73,397 | ) |
| R Class | (10,426,436 | ) | (4,665,723 | ) | (5,635,265 | ) | (2,492,089 | ) |
| Decrease in net assets from distributions | (140,157,115 | ) | (81,061,817 | ) | (82,847,035 | ) | (47,326,649 | ) |
| | | | | |
| Capital Share Transactions | | | | |
| Net increase (decrease) in net assets from capital share transactions (Note 5) | 308,832,836 |
| 351,330,616 |
| 278,893,212 |
| 315,884,884 |
|
| | | | | |
| Net increase (decrease) in net assets | 212,831,819 |
| 379,101,149 |
| 227,228,494 |
| 338,416,361 |
|
| | | | | |
| Net Assets | | | | |
| Beginning of period | 2,070,003,094 |
| 1,690,901,945 |
| 1,302,919,886 |
| 964,503,525 |
|
| End of period | $ | 2,282,834,913 |
| $ | 2,070,003,094 |
| $ | 1,530,148,380 |
| $ | 1,302,919,886 |
|
| | | | | |
| Undistributed net investment income | $ | 6,593,601 |
| $ | 6,546,610 |
| $ | 4,016,732 |
| $ | 3,864,164 |
|
See Notes to Financial Statements.
|
| | | | | | | | | | | | |
| YEARS ENDED JULY 31, 2016 AND JULY 31, 2015 |
| | One Choice 2045 Portfolio | One Choice 2050 Portfolio |
| Increase (Decrease) in Net Assets | July 31, 2016 | July 31, 2015 | July 31, 2016 | July 31, 2015 |
| Operations | | | | |
| Net investment income (loss) | $ | 27,474,466 |
| $ | 27,506,221 |
| $ | 14,530,983 |
| $ | 12,870,093 |
|
| Net realized gain (loss) | 42,180,869 |
| 83,119,999 |
| 20,938,567 |
| 35,573,735 |
|
| Change in net unrealized appreciation (depreciation) | (40,488,221 | ) | (21,040,888 | ) | (15,999,909 | ) | (6,085,460 | ) |
| Net increase (decrease) in net assets resulting from operations | 29,167,114 |
| 89,585,332 |
| 19,469,641 |
| 42,358,368 |
|
| | | | | |
| Distributions to Shareholders | | | | |
| From net investment income: | | | | |
| Investor Class | (10,641,695 | ) | (12,417,396 | ) | (4,697,793 | ) | (4,991,296 | ) |
| Institutional Class | (8,700,408 | ) | (7,762,124 | ) | (5,341,095 | ) | (4,239,248 | ) |
| A Class | (4,393,927 | ) | (5,699,040 | ) | (2,368,166 | ) | (2,692,104 | ) |
| C Class | (21,431 | ) | (24,550 | ) | (15,105 | ) | (24,454 | ) |
| R Class | (1,617,492 | ) | (2,186,794 | ) | (776,216 | ) | (902,027 | ) |
| From net realized gains: | | | | |
| Investor Class | (34,032,164 | ) | (14,310,333 | ) | (12,796,697 | ) | (5,158,427 | ) |
| Institutional Class | (24,964,934 | ) | (8,195,367 | ) | (13,026,044 | ) | (4,002,833 | ) |
| A Class | (16,397,656 | ) | (7,415,660 | ) | (7,560,061 | ) | (3,154,095 | ) |
| C Class | (160,219 | ) | (52,135 | ) | (99,268 | ) | (47,826 | ) |
| R Class | (7,245,975 | ) | (3,267,257 | ) | (2,990,608 | ) | (1,219,857 | ) |
| Decrease in net assets from distributions | (108,175,901 | ) | (61,330,656 | ) | (49,671,053 | ) | (26,432,167 | ) |
| | | | | |
| Capital Share Transactions | | | | |
| Net increase (decrease) in net assets from capital share transactions (Note 5) | 251,942,193 |
| 248,473,490 |
| 205,526,202 |
| 205,592,971 |
|
| | | | | |
| Net increase (decrease) in net assets | 172,933,406 |
| 276,728,166 |
| 175,324,790 |
| 221,519,172 |
|
| | | | | |
| Net Assets | | | | |
| Beginning of period | 1,485,310,593 |
| 1,208,582,427 |
| 753,440,068 |
| 531,920,896 |
|
| End of period | $ | 1,658,243,999 |
| $ | 1,485,310,593 |
| $ | 928,764,858 |
| $ | 753,440,068 |
|
| | | | | |
| Undistributed net investment income | $ | 3,827,511 |
| $ | 4,031,434 |
| $ | 1,899,219 |
| $ | 1,873,490 |
|
See Notes to Financial Statements.
|
| | | | | | | | | |
| YEARS ENDED JULY 31, 2016 (EXCEPT AS NOTED) AND JULY 31, 2015 |
| | One Choice 2055 Portfolio | One Choice 2060 Portfolio |
| Increase (Decrease) in Net Assets | July 31, 2016 | July 31, 2015 | July 31, 2016(1) |
| Operations | | | |
| Net investment income (loss) | $ | 4,984,175 |
| $ | 3,283,826 |
| $ | 13,244 |
|
| Net realized gain (loss) | 7,792,773 |
| 8,193,394 |
| (8,684 | ) |
| Change in net unrealized appreciation (depreciation) | (1,770,845 | ) | (471,405 | ) | 367,686 |
|
| Net increase (decrease) in net assets resulting from operations | 11,006,103 |
| 11,005,815 |
| 372,246 |
|
| | | | |
| Distributions to Shareholders | | | |
| From net investment income: | | | |
| Investor Class | (1,182,971 | ) | (920,151 | ) | (2,158 | ) |
| Institutional Class | (2,042,853 | ) | (1,225,516 | ) | (302 | ) |
| A Class | (787,206 | ) | (707,023 | ) | (289 | ) |
| C Class | (3,972 | ) | (4,711 | ) | (222 | ) |
| R Class | (325,435 | ) | (287,640 | ) | (501 | ) |
| From net realized gains: | | | |
| Investor Class | (2,340,355 | ) | (680,925 | ) | — |
|
| Institutional Class | (3,600,749 | ) | (824,828 | ) | — |
|
| A Class | (1,837,241 | ) | (597,342 | ) | — |
|
| C Class | (20,185 | ) | (6,929 | ) | — |
|
| R Class | (926,522 | ) | (283,137 | ) | — |
|
| Decrease in net assets from distributions | (13,067,489 | ) | (5,538,202 | ) | (3,472 | ) |
| | | | |
| Capital Share Transactions | | | |
| Net increase (decrease) in net assets from capital share transactions (Note 5) | 136,632,415 |
| 107,943,826 |
| 6,155,979 |
|
| | | | |
| Net increase (decrease) in net assets | 134,571,029 |
| 113,411,439 |
| 6,524,753 |
|
| | | | |
| Net Assets | | | |
| Beginning of period | 236,129,591 |
| 122,718,152 |
| — |
|
| End of period | $ | 370,700,620 |
| $ | 236,129,591 |
| $ | 6,524,753 |
|
| | | | |
| Undistributed net investment income | $ | 693,084 |
| $ | 500,988 |
| $ | 9,886 |
|
| |
| (1) | September 30, 2015 (fund inception) through July 31, 2016. |
See Notes to Financial Statements.
|
|
| Notes to Financial Statements |
JULY 31, 2016
1. Organization
American Century Asset Allocation Portfolios, Inc. (the corporation) is registered under the Investment Company Act of 1940, as amended (the 1940 Act), as an open-end management investment company and is organized as a Maryland corporation. One Choice In Retirement Portfolio, One Choice 2020 Portfolio, One Choice 2025 Portfolio, One Choice 2030 Portfolio, One Choice 2035 Portfolio, One Choice 2040 Portfolio, One Choice 2045 Portfolio, One Choice 2050 Portfolio, One Choice 2055 Portfolio and One Choice 2060 Portfolio (collectively, the funds) are ten funds in a series issued by the corporation. The funds operate as “funds of funds,” meaning substantially all of the funds’ assets will be invested in other American Century Investments mutual funds (the underlying funds). Each fund’s assets are allocated among underlying funds that represent major asset classes, including equity securities (stocks), fixed-income securities (bonds) and cash-equivalent instruments (money markets). The underlying funds do not invest in securities issued by companies assigned the Global Industry Classification Standard for the tobacco industry. The funds will assume the risks associated with their underlying funds. Additional information and attributes of each underlying fund are available at americancentury.com. The investment objective of One Choice In Retirement Portfolio is to seek current income. Capital appreciation is a secondary objective. The investment objective of each of the nine target date One Choice Portfolios is to seek the highest total return consistent with its asset mix. When a fund reaches its most conservative planned target asset allocation, which is expected to occur on approximately November 30 of the year before the target date, its target allocation will become fixed and will match that of One Choice In Retirement Portfolio.
The funds offer the Investor Class, the Institutional Class, the A Class, the C Class and the R Class. The A Class may incur an initial sales charge. The A Class and C Class may be subject to a contingent deferred sales charge. The share classes differ principally in their respective sales charges and distribution and shareholder servicing expenses and arrangements. The Institutional Class is made available to institutional shareholders or through financial intermediaries whose clients do not require the same level of shareholder and administrative services as shareholders of other classes. As a result, the Institutional Class is not charged an administrative fee. All classes of One Choice 2060 Portfolio commenced sale on September 30, 2015, the fund’s inception date.
2. Significant Accounting Policies
The following is a summary of significant accounting policies consistently followed by the funds in preparation of their financial statements. Each fund is an investment company and follows accounting and reporting guidance in accordance with accounting principles generally accepted in the United States of America. This may require management to make certain estimates and assumptions at the date of the financial statements. Actual results could differ from these estimates. Management evaluated the impact of events or transactions occurring through the date the financial statements were issued that would merit recognition or disclosure.
Investment Valuations — The funds determine the fair value of their investments and compute their net asset value per share at the close of regular trading (usually 4 p.m. Eastern time) on the New York Stock Exchange (NYSE) on each day the NYSE is open. The Board of Directors has adopted valuation policies and procedures to guide the investment advisor in the funds' investment valuation process and to provide methodologies for the oversight of the funds' pricing function. Investments in the underlying funds are valued at their reported net asset value.
Security Transactions — Security transactions are accounted for as of the trade date. Net realized gains and losses are determined on the identified cost basis, which is also used for federal income tax purposes.
Investment Income — Income and capital gain distributions, if any, from the underlying funds are recorded as of the ex-dividend date. Long-term capital gain distributions, if any, from the underlying funds are a component of net realized gain (loss).
Expenses — The expenses included in the accompanying financial statements reflect the expenses of each fund and do not include any expenses associated with the underlying funds.
Income Tax Status — It is each fund’s policy to distribute substantially all net investment income and net realized gains to shareholders and to otherwise qualify as a regulated investment company under provisions of the Internal Revenue Code. Accordingly, no provision has been made for income taxes. The funds file U.S. federal, state, local and non-U.S. tax returns as applicable. The funds' tax returns are subject to examination by the relevant taxing authority until expiration of the applicable statute of limitations, which is generally three years from the date of filing but can be longer in certain jurisdictions. At this time, management believes there are no uncertain tax positions which, based on their technical merit, would not be sustained upon examination and for which it is reasonably possible that the total amounts of unrecognized tax benefits will significantly change in the next twelve months.
Multiple Class — All shares of each fund represent an equal pro rata interest in the net assets of the class to which such shares belong, and have identical voting, dividend, liquidation and other rights and the same terms and conditions, except for class specific expenses and exclusive rights to vote on matters affecting only individual classes. Income, non-class specific expenses, and realized and unrealized capital gains and losses of the funds are allocated to each class of shares based on their relative net assets.
Distributions to Shareholders — Distributions from net investment income, if any, are generally declared and paid quarterly for One Choice In Retirement Portfolio. Distributions from net investment income, if any, are generally declared and paid annually for the nine target date One Choice Portfolios. Distributions from net realized gains, if any, are generally declared and paid annually for all funds. Each fund may elect to treat a portion of its payment to a redeeming shareholder, which represents the pro rata share of undistributed net investment income and net realized gains, as a distribution for federal income tax purposes (tax equalization).
Indemnifications — Under the corporation’s organizational documents, its officers and directors are indemnified against certain liabilities arising out of the performance of their duties to the funds. In addition, in the normal course of business, the funds enter into contracts that provide general indemnifications. The maximum exposure under these arrangements is unknown as this would involve future claims that may be made against a fund. The risk of material loss from such claims is considered by management to be remote.
3. Fees and Transactions with Related Parties
Certain officers and directors of the corporation are also officers and/or directors of American Century Companies, Inc. (ACC). The corporation’s investment advisor, American Century Investment Management, Inc. (ACIM), the corporation's distributor, American Century Investment Services, Inc. (ACIS), and the corporation’s transfer agent, American Century Services, LLC, are wholly owned, directly or indirectly, by ACC. ACIM serves as the investment advisor for the underlying funds.
Administrative Fees — The corporation has entered into an agreement with ACIM, under which ACIM provides the funds with shareholder services in exchange for an administrative fee (the fee). The fee is computed and accrued daily based on each class’s daily net assets and paid monthly in arrears. The rate of the fee for the Investor Class, A Class, C Class and R Class is 0.20%. There is no administrative fee for the Institutional Class. Fees incurred under the agreement during the year ended July 31, 2016 (except as noted) are detailed in the Statements of Operations.
Distribution and Service Fees — The Board of Directors has adopted a separate Master Distribution and Individual Shareholder Services Plan for each of the A Class, C Class and R Class (collectively the plans), pursuant to Rule 12b-1 of the 1940 Act. The plans provide that the A Class will pay ACIS an annual distribution and service fee of 0.25%. The plans provide that the C Class will pay ACIS an annual distribution and service fee of 1.00%, of which 0.25% is paid for individual shareholder services and 0.75% is paid for distribution services. The plans provide that the R Class will pay ACIS an annual distribution and service fee of 0.50%. The fees are computed and accrued daily based on each class’s daily net assets and paid monthly in arrears. These fees are used to pay financial intermediaries for distribution and individual shareholder services. Fees incurred under the plans during the year ended July 31, 2016 (except as noted) are detailed in the Statements of Operations.
Directors' Fees and Expenses — The Board of Directors is responsible for overseeing the investment advisor’s management and operations of the funds. The directors receive detailed information about the funds and their investment advisor regularly throughout the year, and meet at least quarterly with management of the investment advisor to review reports about fund operations. The funds' officers do not receive compensation from the funds.
Acquired Fund Fees and Expenses — Each fund will indirectly realize its pro rata share of the fees and expenses of the underlying funds in which it invests. These fees and expenses are already reflected in the valuation of the underlying funds.
4. Investment Transactions
Investment transactions for the year ended July 31, 2016 (except as noted) were as follows:
|
| | | | | | | | | | | | | | | |
| | One Choice In Retirement Portfolio | One Choice 2020 Portfolio | One Choice 2025 Portfolio | One Choice 2030 Portfolio | One Choice 2035 Portfolio |
| Purchases | $ | 260,540,745 |
| $ | 427,875,950 |
| $ | 501,378,490 |
| $ | 475,570,282 |
| $ | 436,664,594 |
|
| Sales | $ | 302,595,963 |
| $ | 219,261,187 |
| $ | 291,372,736 |
| $ | 176,270,966 |
| $ | 172,779,865 |
|
|
| | | | | | | | | | | | | | | |
| | One Choice 2040 Portfolio | One Choice 2045 Portfolio | One Choice 2050 Portfolio | One Choice 2055 Portfolio | One Choice 2060 Portfolio(1) |
| Purchases | $ | 372,520,706 |
| $ | 331,407,319 |
| $ | 254,056,862 |
| $ | 154,300,307 |
| $ | 6,417,965 |
|
| Sales | $ | 111,343,589 |
| $ | 111,366,807 |
| $ | 57,118,237 |
| $ | 16,495,438 |
| $ | 243,142 |
|
| |
| (1) | September 30, 2015 (fund inception) through July 31, 2016. |
5. Capital Share Transactions
The corporation is authorized to issue 4,000,000,000 shares. Transactions in shares of the funds were as follows:
|
| | | | | | | | | | |
| | Year ended
July 31, 2016 | Year ended
July 31, 2015 |
| | Shares | Amount | Shares | Amount |
| One Choice In Retirement Portfolio | | | | |
| Investor Class | | | | |
| Sold | 18,223,970 |
| $ | 223,169,161 |
| 17,213,862 |
| $ | 221,160,056 |
|
Issued in connection with reorganization (Note 10) | — |
| — |
| 38,767,212 |
| 490,224,856 |
|
| Issued in reinvestment of distributions | 1,203,595 |
| 14,610,372 |
| 1,633,545 |
| 20,973,245 |
|
| Redeemed | (18,807,692 | ) | (230,116,802 | ) | (12,016,598 | ) | (153,949,116 | ) |
| | 619,873 |
| 7,662,731 |
| 45,598,021 |
| 578,409,041 |
|
| Institutional Class | | | | |
| Sold | 18,611,853 |
| 225,716,577 |
| 18,960,260 |
| 242,784,308 |
|
Issued in connection with reorganization (Note 10) | — |
| — |
| 15,752,681 |
| 199,204,707 |
|
| Issued in reinvestment of distributions | 762,651 |
| 9,257,074 |
| 962,851 |
| 12,361,297 |
|
| Redeemed | (17,756,771 | ) | (216,302,626 | ) | (7,231,026 | ) | (92,616,001 | ) |
| | 1,617,733 |
| 18,671,025 |
| 28,444,766 |
| 361,734,311 |
|
| A Class | | | | |
| Sold | 8,274,820 |
| 101,226,434 |
| 13,081,287 |
| 167,909,620 |
|
Issued in connection with reorganization (Note 10) | — |
| — |
| 16,935,741 |
| 214,308,053 |
|
| Issued in reinvestment of distributions | 469,575 |
| 5,704,618 |
| 743,527 |
| 9,552,136 |
|
| Redeemed | (14,300,444 | ) | (175,243,222 | ) | (7,593,284 | ) | (97,782,607 | ) |
| | (5,556,049 | ) | (68,312,170 | ) | 23,167,271 |
| 293,987,202 |
|
| C Class | | | | |
| Sold | 321,792 |
| 3,896,434 |
| 92,973 |
| 1,189,600 |
|
Issued in connection with reorganization (Note 10) | — |
| — |
| 418,218 |
| 5,283,721 |
|
| Issued in reinvestment of distributions | 5,766 |
| 70,021 |
| 11,987 |
| 153,874 |
|
| Redeemed | (176,421 | ) | (2,158,419 | ) | (108,132 | ) | (1,378,450 | ) |
| | 151,137 |
| 1,808,036 |
| 415,046 |
| 5,248,745 |
|
| R Class | | | | |
| Sold | 2,621,496 |
| 31,895,050 |
| 4,893,972 |
| 63,225,281 |
|
Issued in connection with reorganization (Note 10) | — |
| — |
| 9,766,945 |
| 123,418,300 |
|
| Issued in reinvestment of distributions | 235,088 |
| 2,854,071 |
| 598,120 |
| 7,680,888 |
|
| Redeemed | (6,429,566 | ) | (78,273,700 | ) | (3,605,660 | ) | (46,176,471 | ) |
| | (3,572,982 | ) | (43,524,579 | ) | 11,653,377 |
| 148,147,998 |
|
| Net increase (decrease) | (6,740,288 | ) | $ | (83,694,957 | ) | 109,278,481 |
| $ | 1,387,527,297 |
|
|
| | | | | | | | | | |
| | Year ended
July 31, 2016 | Year ended
July 31, 2015 |
| | Shares | Amount | Shares | Amount |
| One Choice 2020 Portfolio | | | | |
| Investor Class | | | | |
| Sold | 18,929,682 |
| $ | 220,119,493 |
| 14,280,676 |
| $ | 175,926,540 |
|
| Issued in reinvestment of distributions | 2,748,453 |
| 31,277,389 |
| 1,733,039 |
| 21,125,745 |
|
| Redeemed | (14,685,798 | ) | (170,776,248 | ) | (11,106,583 | ) | (136,839,437 | ) |
| | 6,992,337 |
| 80,620,634 |
| 4,907,132 |
| 60,212,848 |
|
| Institutional Class | | | | |
| Sold | 30,149,381 |
| 344,391,519 |
| 28,856,375 |
| 355,949,709 |
|
| Issued in reinvestment of distributions | 2,703,137 |
| 30,761,704 |
| 1,274,866 |
| 15,527,868 |
|
| Redeemed | (18,769,620 | ) | (216,823,220 | ) | (8,353,262 | ) | (102,935,651 | ) |
| | 14,082,898 |
| 158,330,003 |
| 21,777,979 |
| 268,541,926 |
|
| A Class | | | | |
| Sold | 9,632,648 |
| 112,111,367 |
| 8,393,327 |
| 103,181,602 |
|
| Issued in reinvestment of distributions | 1,396,180 |
| 15,888,527 |
| 908,384 |
| 11,064,112 |
|
| Redeemed | (11,486,387 | ) | (133,271,638 | ) | (7,483,026 | ) | (91,992,350 | ) |
| | (457,559 | ) | (5,271,744 | ) | 1,818,685 |
| 22,253,364 |
|
| C Class | | | | |
| Sold | 110,599 |
| 1,291,435 |
| 201,888 |
| 2,490,419 |
|
| Issued in reinvestment of distributions | 34,322 |
| 391,959 |
| 26,108 |
| 319,042 |
|
| Redeemed | (422,149 | ) | (4,885,148 | ) | (163,308 | ) | (2,008,971 | ) |
| | (277,228 | ) | (3,201,754 | ) | 64,688 |
| 800,490 |
|
| R Class | | | | |
| Sold | 3,614,885 |
| 41,833,704 |
| 4,699,903 |
| 57,844,285 |
|
| Issued in reinvestment of distributions | 628,108 |
| 7,147,870 |
| 388,598 |
| 4,733,123 |
|
| Redeemed | (4,820,597 | ) | (55,835,520 | ) | (2,944,639 | ) | (36,186,326 | ) |
| | (577,604 | ) | (6,853,946 | ) | 2,143,862 |
| 26,391,082 |
|
| Net increase (decrease) | 19,762,844 |
| $ | 223,623,193 |
| 30,712,346 |
| $ | 378,199,710 |
|
|
| | | | | | | | | | |
| | Year ended
July 31, 2016 | Year ended
July 31, 2015 |
| | Shares | Amount | Shares | Amount |
| One Choice 2025 Portfolio | | | | |
| Investor Class | | | | |
| Sold | 20,068,069 |
| $ | 274,649,250 |
| 15,982,482 |
| $ | 233,800,121 |
|
| Issued in reinvestment of distributions | 4,844,403 |
| 64,672,776 |
| 2,922,755 |
| 42,204,586 |
|
| Redeemed | (16,913,186 | ) | (231,383,477 | ) | (13,526,685 | ) | (198,262,902 | ) |
| | 7,999,286 |
| 107,938,549 |
| 5,378,552 |
| 77,741,805 |
|
| Institutional Class | | | | |
| Sold | 28,880,963 |
| 388,868,992 |
| 27,274,426 |
| 400,047,373 |
|
| Issued in reinvestment of distributions | 3,257,820 |
| 43,491,901 |
| 1,489,458 |
| 21,507,780 |
|
| Redeemed | (19,160,311 | ) | (262,797,216 | ) | (8,065,557 | ) | (118,097,955 | ) |
| | 12,978,472 |
| 169,563,677 |
| 20,698,327 |
| 303,457,198 |
|
| A Class | | | | |
| Sold | 11,445,660 |
| 156,848,824 |
| 13,216,694 |
| 193,358,730 |
|
| Issued in reinvestment of distributions | 2,226,779 |
| 29,749,766 |
| 1,348,142 |
| 19,467,175 |
|
| Redeemed | (14,966,488 | ) | (204,352,514 | ) | (11,947,133 | ) | (174,734,711 | ) |
| | (1,294,049 | ) | (17,753,924 | ) | 2,617,703 |
| 38,091,194 |
|
| C Class | | | | |
| Sold | 102,936 |
| 1,399,596 |
| 134,770 |
| 1,977,888 |
|
| Issued in reinvestment of distributions | 28,529 |
| 381,997 |
| 16,703 |
| 241,863 |
|
| Redeemed | (99,476 | ) | (1,359,526 | ) | (118,393 | ) | (1,732,147 | ) |
| | 31,989 |
| 422,067 |
| 33,080 |
| 487,604 |
|
| R Class | | | | |
| Sold | 3,707,105 |
| 50,572,212 |
| 5,531,354 |
| 80,852,800 |
|
| Issued in reinvestment of distributions | 905,469 |
| 12,088,015 |
| 537,074 |
| 7,755,353 |
|
| Redeemed | (5,176,224 | ) | (70,309,101 | ) | (4,126,096 | ) | (60,332,795 | ) |
| | (563,650 | ) | (7,648,874 | ) | 1,942,332 |
| 28,275,358 |
|
| Net increase (decrease) | 19,152,048 |
| $ | 252,521,495 |
| 30,669,994 |
| $ | 448,053,159 |
|
|
| | | | | | | | | | |
| | Year ended
July 31, 2016 | Year ended
July 31, 2015 |
| | Shares | Amount | Shares | Amount |
| One Choice 2030 Portfolio | | | | |
| Investor Class | | | | |
| Sold | 19,068,888 |
| $ | 223,972,654 |
| 12,342,855 |
| $ | 154,898,255 |
|
| Issued in reinvestment of distributions | 3,024,618 |
| 34,783,102 |
| 1,802,338 |
| 22,312,945 |
|
| Redeemed | (12,794,076 | ) | (150,248,622 | ) | (8,377,028 | ) | (105,463,245 | ) |
| | 9,299,430 |
| 108,507,134 |
| 5,768,165 |
| 71,747,955 |
|
| Institutional Class | | | | |
| Sold | 31,049,870 |
| 357,721,669 |
| 26,403,324 |
| 332,313,496 |
|
| Issued in reinvestment of distributions | 3,107,275 |
| 35,702,588 |
| 1,369,619 |
| 16,942,184 |
|
| Redeemed | (16,702,053 | ) | (193,626,560 | ) | (7,929,515 | ) | (99,577,803 | ) |
| | 17,455,092 |
| 199,797,697 |
| 19,843,428 |
| 249,677,877 |
|
| A Class | | | | |
| Sold | 10,114,288 |
| 118,744,551 |
| 8,621,434 |
| 107,989,095 |
|
| Issued in reinvestment of distributions | 1,684,661 |
| 19,356,754 |
| 1,066,619 |
| 13,183,409 |
|
| Redeemed | (11,160,784 | ) | (130,752,934 | ) | (7,604,709 | ) | (95,248,054 | ) |
| | 638,165 |
| 7,348,371 |
| 2,083,344 |
| 25,924,450 |
|
| C Class | | | | |
| Sold | 169,230 |
| 1,965,674 |
| 124,316 |
| 1,558,209 |
|
| Issued in reinvestment of distributions | 23,260 |
| 268,188 |
| 12,242 |
| 151,803 |
|
| Redeemed | (84,777 | ) | (1,000,789 | ) | (46,704 | ) | (585,833 | ) |
| | 107,713 |
| 1,233,073 |
| 89,854 |
| 1,124,179 |
|
| R Class | | | | |
| Sold | 4,561,651 |
| 53,142,145 |
| 5,221,381 |
| 65,515,655 |
|
| Issued in reinvestment of distributions | 761,312 |
| 8,747,474 |
| 442,326 |
| 5,471,578 |
|
| Redeemed | (4,961,583 | ) | (57,866,064 | ) | (2,720,916 | ) | (34,035,727 | ) |
| | 361,380 |
| 4,023,555 |
| 2,942,791 |
| 36,951,506 |
|
| Net increase (decrease) | 27,861,780 |
| $ | 320,909,830 |
| 30,727,582 |
| $ | 385,425,967 |
|
|
| | | | | | | | | | |
| | Year ended
July 31, 2016 | Year ended
July 31, 2015 |
| | Shares | Amount | Shares | Amount |
| One Choice 2035 Portfolio | | | | |
| Investor Class | | | | |
| Sold | 15,299,565 |
| $ | 223,089,752 |
| 12,171,906 |
| $ | 191,758,316 |
|
| Issued in reinvestment of distributions | 4,006,540 |
| 57,173,324 |
| 2,307,787 |
| 35,793,777 |
|
| Redeemed | (11,888,016 | ) | (173,150,871 | ) | (9,912,501 | ) | (156,679,334 | ) |
| | 7,418,089 |
| 107,112,205 |
| 4,567,192 |
| 70,872,759 |
|
| Institutional Class | | | | |
| Sold | 22,244,429 |
| 318,125,110 |
| 19,527,225 |
| 309,062,135 |
|
| Issued in reinvestment of distributions | 2,692,733 |
| 38,425,294 |
| 1,118,352 |
| 17,356,824 |
|
| Redeemed | (11,571,289 | ) | (168,001,679 | ) | (6,239,004 | ) | (98,411,697 | ) |
| | 13,365,873 |
| 188,548,725 |
| 14,406,573 |
| 228,007,262 |
|
| A Class | | | | |
| Sold | 9,473,530 |
| 138,114,390 |
| 9,416,842 |
| 148,486,107 |
|
| Issued in reinvestment of distributions | 1,918,627 |
| 27,378,808 |
| 1,122,939 |
| 17,416,778 |
|
| Redeemed | (11,204,929 | ) | (162,933,532 | ) | (8,706,317 | ) | (137,135,114 | ) |
| | 187,228 |
| 2,559,666 |
| 1,833,464 |
| 28,767,771 |
|
| C Class | | | | |
| Sold | 97,600 |
| 1,432,241 |
| 186,377 |
| 2,948,377 |
|
| Issued in reinvestment of distributions | 27,457 |
| 392,364 |
| 12,574 |
| 195,398 |
|
| Redeemed | (104,737 | ) | (1,511,159 | ) | (76,543 | ) | (1,202,927 | ) |
| | 20,320 |
| 313,446 |
| 122,408 |
| 1,940,848 |
|
| R Class | | | | |
| Sold | 3,774,625 |
| 54,865,811 |
| 4,473,556 |
| 70,511,806 |
|
| Issued in reinvestment of distributions | 862,750 |
| 12,311,437 |
| 482,651 |
| 7,490,741 |
|
| Redeemed | (3,927,490 | ) | (56,878,454 | ) | (3,570,822 | ) | (56,260,571 | ) |
| | 709,885 |
| 10,298,794 |
| 1,385,385 |
| 21,741,976 |
|
| Net increase (decrease) | 21,701,395 |
| $ | 308,832,836 |
| 22,315,022 |
| $ | 351,330,616 |
|
|
| | | | | | | | | | |
| | Year ended
July 31, 2016 | Year ended
July 31, 2015 |
| | Shares | Amount | Shares | Amount |
| One Choice 2040 Portfolio | | | | |
| Investor Class | | | | |
| Sold | 14,793,356 |
| $ | 178,794,079 |
| 10,078,550 |
| $ | 131,538,110 |
|
| Issued in reinvestment of distributions | 2,513,846 |
| 29,889,633 |
| 1,435,726 |
| 18,449,075 |
|
| Redeemed | (9,455,996 | ) | (114,560,086 | ) | (6,055,910 | ) | (79,239,135 | ) |
| | 7,851,206 |
| 94,123,626 |
| 5,458,366 |
| 70,748,050 |
|
| Institutional Class | | | | |
| Sold | 22,038,927 |
| 261,646,666 |
| 18,025,517 |
| 236,358,055 |
|
| Issued in reinvestment of distributions | 2,491,995 |
| 29,604,898 |
| 1,109,702 |
| 14,259,665 |
|
| Redeemed | (10,940,604 | ) | (130,862,409 | ) | (4,794,660 | ) | (62,615,500 | ) |
| | 13,590,318 |
| 160,389,155 |
| 14,340,559 |
| 188,002,220 |
|
| A Class | | | | |
| Sold | 7,736,029 |
| 93,694,315 |
| 6,382,928 |
| 83,276,597 |
|
| Issued in reinvestment of distributions | 1,242,923 |
| 14,765,927 |
| 746,460 |
| 9,592,013 |
|
| Redeemed | (7,962,745 | ) | (96,262,813 | ) | (4,742,076 | ) | (61,744,765 | ) |
| | 1,016,207 |
| 12,197,429 |
| 2,387,312 |
| 31,123,845 |
|
| C Class | | | | |
| Sold | 64,709 |
| 780,939 |
| 66,097 |
| 861,355 |
|
| Issued in reinvestment of distributions | 14,188 |
| 168,981 |
| 8,582 |
| 110,451 |
|
| Redeemed | (36,329 | ) | (442,952 | ) | (62,786 | ) | (822,235 | ) |
| | 42,568 |
| 506,968 |
| 11,893 |
| 149,571 |
|
| R Class | | | | |
| Sold | 3,442,433 |
| 41,473,487 |
| 3,716,455 |
| 48,500,389 |
|
| Issued in reinvestment of distributions | 579,653 |
| 6,886,282 |
| 323,310 |
| 4,154,537 |
|
| Redeemed | (3,056,839 | ) | (36,683,735 | ) | (2,058,328 | ) | (26,793,728 | ) |
| | 965,247 |
| 11,676,034 |
| 1,981,437 |
| 25,861,198 |
|
| Net increase (decrease) | 23,465,546 |
| $ | 278,893,212 |
| 24,179,567 |
| $ | 315,884,884 |
|
|
| | | | | | | | | | |
| | Year ended
July 31, 2016 | Year ended
July 31, 2015 |
| | Shares | Amount | Shares | Amount |
| One Choice 2045 Portfolio | | | | |
| Investor Class | | | | |
| Sold | 12,490,833 |
| $ | 188,101,895 |
| 9,660,379 |
| $ | 158,867,725 |
|
| Issued in reinvestment of distributions | 3,005,579 |
| 44,422,451 |
| 1,632,508 |
| 26,413,979 |
|
| Redeemed | (9,287,115 | ) | (139,685,506 | ) | (6,894,964 | ) | (113,809,339 | ) |
| | 6,209,297 |
| 92,838,840 |
| 4,397,923 |
| 71,472,365 |
|
| Institutional Class | | | | |
| Sold | 16,167,791 |
| 239,772,938 |
| 12,614,302 |
| 208,794,613 |
|
| Issued in reinvestment of distributions | 2,199,823 |
| 32,535,386 |
| 956,596 |
| 15,487,287 |
|
| Redeemed | (8,548,345 | ) | (128,709,445 | ) | (4,545,571 | ) | (74,791,278 | ) |
| | 9,819,269 |
| 143,598,879 |
| 9,025,327 |
| 149,490,622 |
|
| A Class | | | | |
| Sold | 6,430,580 |
| 97,034,185 |
| 6,000,030 |
| 98,735,500 |
|
| Issued in reinvestment of distributions | 1,303,740 |
| 19,269,273 |
| 757,645 |
| 12,258,689 |
|
| Redeemed | (7,624,265 | ) | (115,240,850 | ) | (5,751,918 | ) | (94,387,834 | ) |
| | 110,055 |
| 1,062,608 |
| 1,005,757 |
| 16,606,355 |
|
| C Class | | | | |
| Sold | 70,908 |
| 1,083,469 |
| 60,771 |
| 1,002,020 |
|
| Issued in reinvestment of distributions | 12,113 |
| 179,515 |
| 4,657 |
| 75,539 |
|
| Redeemed | (41,811 | ) | (616,027 | ) | (39,859 | ) | (659,134 | ) |
| | 41,210 |
| 646,957 |
| 25,569 |
| 418,425 |
|
| R Class | | | | |
| Sold | 2,669,511 |
| 40,182,973 |
| 2,927,240 |
| 48,182,396 |
|
| Issued in reinvestment of distributions | 579,202 |
| 8,566,396 |
| 324,338 |
| 5,251,030 |
|
| Redeemed | (2,333,538 | ) | (34,954,460 | ) | (2,611,853 | ) | (42,947,703 | ) |
| | 915,175 |
| 13,794,909 |
| 639,725 |
| 10,485,723 |
|
| Net increase (decrease) | 17,095,006 |
| $ | 251,942,193 |
| 15,094,301 |
| $ | 248,473,490 |
|
|
| | | | | | | | | | |
| | Year ended
July 31, 2016 | Year ended
July 31, 2015 |
| | Shares | Amount | Shares | Amount |
| One Choice 2050 Portfolio | | | | |
| Investor Class | | | | |
| Sold | 11,145,520 |
| $ | 134,024,936 |
| 7,231,609 |
| $ | 94,412,951 |
|
| Issued in reinvestment of distributions | 1,472,470 |
| 17,492,943 |
| 787,594 |
| 10,144,207 |
|
| Redeemed | (6,319,269 | ) | (76,253,579 | ) | (4,393,486 | ) | (57,584,351 | ) |
| | 6,298,721 |
| 75,264,300 |
| 3,625,717 |
| 46,972,807 |
|
| Institutional Class | | | | |
| Sold | 14,604,145 |
| 173,620,358 |
| 11,948,412 |
| 157,520,174 |
|
| Issued in reinvestment of distributions | 1,544,755 |
| 18,367,139 |
| 639,417 |
| 8,242,081 |
|
| Redeemed | (6,465,132 | ) | (77,252,570 | ) | (3,617,765 | ) | (47,416,705 | ) |
| | 9,683,768 |
| 114,734,927 |
| 8,970,064 |
| 118,345,550 |
|
| A Class | | | | |
| Sold | 5,392,486 |
| 65,104,219 |
| 4,538,845 |
| 59,389,523 |
|
| Issued in reinvestment of distributions | 787,057 |
| 9,350,238 |
| 437,490 |
| 5,634,876 |
|
| Redeemed | (5,875,050 | ) | (70,639,101 | ) | (2,949,894 | ) | (38,468,312 | ) |
| | 304,493 |
| 3,815,356 |
| 2,026,441 |
| 26,556,087 |
|
| C Class | | | | |
| Sold | 47,689 |
| 576,791 |
| 59,780 |
| 779,607 |
|
| Issued in reinvestment of distributions | 9,595 |
| 114,373 |
| 5,594 |
| 72,280 |
|
| Redeemed | (68,558 | ) | (814,747 | ) | (53,229 | ) | (697,097 | ) |
| | (11,274 | ) | (123,583 | ) | 12,145 |
| 154,790 |
|
| R Class | | | | |
| Sold | 2,327,271 |
| 27,889,032 |
| 2,118,190 |
| 27,698,775 |
|
| Issued in reinvestment of distributions | 305,066 |
| 3,627,231 |
| 159,263 |
| 2,052,906 |
|
| Redeemed | (1,644,466 | ) | (19,681,061 | ) | (1,237,820 | ) | (16,187,944 | ) |
| | 987,871 |
| 11,835,202 |
| 1,039,633 |
| 13,563,737 |
|
| Net increase (decrease) | 17,263,579 |
| $ | 205,526,202 |
| 15,674,000 |
| $ | 205,592,971 |
|
|
| | | | | | | | | | |
| | Year ended
July 31, 2016 | Year ended
July 31, 2015 |
| | Shares | Amount | Shares | Amount |
| One Choice 2055 Portfolio | | | | |
| Investor Class | | | | |
| Sold | 4,737,598 |
| $ | 59,648,772 |
| 3,066,992 |
| $ | 41,712,511 |
|
| Issued in reinvestment of distributions | 280,961 |
| 3,523,248 |
| 119,545 |
| 1,600,714 |
|
| Redeemed | (1,765,253 | ) | (22,307,271 | ) | (889,005 | ) | (12,092,296 | ) |
| | 3,253,306 |
| 40,864,749 |
| 2,297,532 |
| 31,220,929 |
|
| Institutional Class | | | | |
| Sold | 8,222,831 |
| 103,048,967 |
| 4,756,279 |
| 64,859,274 |
|
| Issued in reinvestment of distributions | 450,048 |
| 5,643,602 |
| 153,125 |
| 2,050,344 |
|
| Redeemed | (3,120,072 | ) | (39,568,331 | ) | (1,424,936 | ) | (19,297,793 | ) |
| | 5,552,807 |
| 69,124,238 |
| 3,484,468 |
| 47,611,825 |
|
| A Class | | | | |
| Sold | 2,772,073 |
| 34,987,273 |
| 2,265,221 |
| 30,702,476 |
|
| Issued in reinvestment of distributions | 198,329 |
| 2,485,057 |
| 93,074 |
| 1,245,329 |
|
| Redeemed | (1,745,688 | ) | (21,994,763 | ) | (979,181 | ) | (13,234,447 | ) |
| | 1,224,714 |
| 15,477,567 |
| 1,379,114 |
| 18,713,358 |
|
| C Class | | | | |
| Sold | 16,528 |
| 209,866 |
| 17,482 |
| 236,514 |
|
| Issued in reinvestment of distributions | 1,927 |
| 24,158 |
| 869 |
| 11,640 |
|
| Redeemed | (10,751 | ) | (129,845 | ) | (10,083 | ) | (136,673 | ) |
| | 7,704 |
| 104,179 |
| 8,268 |
| 111,481 |
|
| R Class | | | | |
| Sold | 1,376,195 |
| 17,348,754 |
| 1,164,264 |
| 15,811,677 |
|
| Issued in reinvestment of distributions | 96,579 |
| 1,211,095 |
| 41,365 |
| 554,281 |
|
| Redeemed | (596,267 | ) | (7,498,167 | ) | (450,762 | ) | (6,079,725 | ) |
| | 876,507 |
| 11,061,682 |
| 754,867 |
| 10,286,233 |
|
| Net increase (decrease) | 10,915,038 |
| $ | 136,632,415 |
| 7,924,249 |
| $ | 107,943,826 |
|
|
| | | | | |
| | Period ended
July 31, 2016(1) |
| | Shares | Amount |
| One Choice 2060 Portfolio | | |
| Investor Class | | |
| Sold | 135,558 |
| $ | 1,395,896 |
|
| Issued in reinvestment of distributions | 209 |
| 2,158 |
|
| Redeemed | (15,917 | ) | (160,609 | ) |
| | 119,850 |
| 1,237,445 |
|
| Institutional Class | | |
| Sold | 243,418 |
| 2,467,141 |
|
| Issued in reinvestment of distributions | 29 |
| 302 |
|
| Redeemed | (19,363 | ) | (195,488 | ) |
| | 224,084 |
| 2,271,955 |
|
| A Class | | |
| Sold | 213,322 |
| 2,210,037 |
|
| Issued in reinvestment of distributions | 28 |
| 289 |
|
| Redeemed | (16,191 | ) | (163,363 | ) |
| | 197,159 |
| 2,046,963 |
|
| C Class | | |
| Sold | 2,554 |
| 25,569 |
|
| Issued in reinvestment of distributions | 21 |
| 222 |
|
| Redeemed | (2 | ) | (24 | ) |
| | 2,573 |
| 25,767 |
|
| R Class | | |
| Sold | 61,517 |
| 632,564 |
|
| Issued in reinvestment of distributions | 48 |
| 501 |
|
| Redeemed | (5,827 | ) | (59,216 | ) |
| | 55,738 |
| 573,849 |
|
| Net increase (decrease) | 599,404 |
| $ | 6,155,979 |
|
| |
| (1) | September 30, 2015 (fund inception) through July 31, 2016. |
6. Affiliated Fund Transactions
A summary of transactions for each underlying fund for the year ended July 31, 2016 (except as noted) follows:
|
| | | | | | | | | | | | | | | | | | |
Fund/Underlying Fund(1) | Beginning
Value | Purchase
Cost | Sales Cost | Realized
Gain (Loss) | Distributions Received(2) | Ending Value |
| One Choice In Retirement Portfolio | | | | |
| NT Core Equity Plus Fund | $ | 59,733,204 |
| $ | 7,415,992 |
| $ | 5,487,103 |
| $ | (549,226 | ) | $ | 4,145,123 |
| $ | 58,221,095 |
|
| NT Disciplined Growth Fund | 29,825,831 |
| 1,724,501 |
| 2,051,694 |
| (96,815 | ) | 272,327 |
| 29,532,355 |
|
| NT Equity Growth Fund | 198,379,399 |
| 34,937,162 |
| 33,172,034 |
| (2,632,872 | ) | 12,281,502 |
| 192,466,140 |
|
| NT Growth Fund | 89,428,772 |
| 13,526,024 |
| 13,244,235 |
| 126,746 |
| 5,473,859 |
| 87,117,199 |
|
| NT Heritage Fund | 44,663,841 |
| 7,952,447 |
| 5,566,228 |
| (533,385 | ) | 3,339,502 |
| 43,893,713 |
|
| NT Large Company Value Fund | 187,853,852 |
| 46,489,375 |
| 41,024,239 |
| (4,084,898 | ) | 18,522,855 |
| 182,391,552 |
|
| NT Mid Cap Value Fund | 89,572,202 |
| 13,548,896 |
| 19,254,456 |
| (1,223,863 | ) | 7,392,860 |
| 87,086,178 |
|
| NT Small Company Fund | 39,745,272 |
| 7,509,791 |
| 5,720,681 |
| (891,920 | ) | 3,095,570 |
| 39,041,213 |
|
| High-Yield Fund | 75,413,721 |
| 6,674,862 |
| 7,900,499 |
| (865,411 | ) | 4,145,628 |
| 73,232,751 |
|
| Inflation-Adjusted Bond Fund | 30,071,749 |
| 850,665 |
| 2,989,028 |
| (88,507 | ) | 483,575 |
| 28,820,815 |
|
| NT Diversified Bond Fund | 430,087,844 |
| 57,298,735 |
| 84,217,611 |
| (1,640,618 | ) | 13,263,753 |
| 413,765,492 |
|
| Short Duration Inflation Protection Bond Fund | 121,327,958 |
| 4,893,926 |
| 13,533,786 |
| (425,279 | ) | 11,551 |
| 115,146,111 |
|
| Global Bond Fund | 139,256,889 |
| 4,863,809 |
| 19,124,952 |
| (206,733 | ) | 757,536 |
| 132,677,047 |
|
| International Bond Fund | 99,567,891 |
| 10,021,860 |
| 25,477,978 |
| (3,489,675 | ) | 2,187,517 |
| 95,749,278 |
|
U.S. Government Money Market Fund(3) | 198,538,100 |
| 13,460,173 |
| 22,794,896 |
| — |
| 18,790 |
| 189,203,377 |
|
| NT Global Real Estate Fund | 19,933,487 |
| 1,219,451 |
| 2,743,775 |
| (142,915 | ) | 481,600 |
| 20,156,502 |
|
| NT International Growth Fund | 90,158,246 |
| 20,380,127 |
| 12,911,101 |
| (1,202,287 | ) | 3,261,492 |
| 88,084,685 |
|
| NT International Value Fund | 44,895,479 |
| 7,772,949 |
| 3,829,427 |
| (500,102 | ) | 980,775 |
| 43,406,874 |
|
| | $ | 1,988,453,737 |
| $ | 260,540,745 |
| $ | 321,043,723 |
| $ | (18,447,760 | ) | $ | 80,115,815 |
| $ | 1,919,992,377 |
|
| |
| (1) | Underlying fund investments represent Institutional Class, except U.S. Government Money Market Fund Investor Class. |
| |
| (2) | Distributions received includes distributions from net investment income and from capital gains, if any. |
| |
| (3) | Effective December 1, 2015, the name of Premium Money Market Fund was changed to U.S. Government Money Market Fund. |
|
| | | | | | | | | | | | | | | | | | |
Fund/Underlying Fund(1) | Beginning
Value | Purchase
Cost | Sales Cost | Realized
Gain (Loss) | Distributions Received(2) | Ending Value |
| One Choice 2020 Portfolio | | | | |
| NT Core Equity Plus Fund | $ | 51,778,691 |
| $ | 12,608,570 |
| $ | 3,501,723 |
| $ | (396,451 | ) | $ | 3,813,892 |
| $ | 58,137,314 |
|
| NT Disciplined Growth Fund | 31,794,123 |
| 4,527,894 |
| 2,199,473 |
| (118,391 | ) | 304,073 |
| 34,438,152 |
|
| NT Equity Growth Fund | 168,090,023 |
| 50,586,432 |
| 24,748,825 |
| (2,385,792 | ) | 11,053,346 |
| 189,158,552 |
|
| NT Growth Fund | 91,032,007 |
| 23,309,264 |
| 12,665,492 |
| (23,950 | ) | 5,737,062 |
| 99,829,619 |
|
| NT Heritage Fund | 52,815,824 |
| 14,326,072 |
| 8,327,039 |
| (552,303 | ) | 3,967,284 |
| 55,403,276 |
|
| NT Large Company Value Fund | 165,317,337 |
| 60,975,257 |
| 34,247,274 |
| (3,215,944 | ) | 17,071,298 |
| 183,414,460 |
|
| NT Mid Cap Value Fund | 88,431,067 |
| 20,805,186 |
| 17,319,847 |
| (1,099,838 | ) | 7,540,463 |
| 96,102,526 |
|
| NT Small Company Fund | 30,751,249 |
| 9,227,860 |
| 1,987,481 |
| (311,404 | ) | 2,539,676 |
| 35,997,279 |
|
| High-Yield Fund | 63,823,182 |
| 12,430,075 |
| 4,818,300 |
| (498,677 | ) | 3,763,317 |
| 70,783,884 |
|
| Inflation-Adjusted Bond Fund | 47,246,424 |
| 4,307,749 |
| 6,242,351 |
| (306,580 | ) | 770,980 |
| 46,943,912 |
|
| NT Diversified Bond Fund | 358,863,003 |
| 89,038,848 |
| 58,706,394 |
| (1,021,351 | ) | 11,898,931 |
| 399,031,479 |
|
| Short Duration Inflation Protection Bond Fund | 80,028,196 |
| 16,087,893 |
| 4,645,687 |
| (181,263 | ) | 8,248 |
| 93,321,085 |
|
| Global Bond Fund | 111,332,264 |
| 14,539,188 |
| 9,094,075 |
| (164,287 | ) | 635,381 |
| 123,687,996 |
|
| International Bond Fund | 78,746,336 |
| 15,028,167 |
| 13,786,516 |
| (1,834,922 | ) | 1,835,161 |
| 89,188,899 |
|
| NT Emerging Markets Fund | 17,327,605 |
| 3,470,138 |
| 3,537,628 |
| (387,137 | ) | 56,022 |
| 17,726,743 |
|
| NT Global Real Estate Fund | 21,331,504 |
| 2,697,442 |
| 2,353,010 |
| (143,057 | ) | 527,052 |
| 23,787,258 |
|
| NT International Growth Fund | 81,672,277 |
| 27,250,289 |
| 8,664,901 |
| (574,624 | ) | 3,122,870 |
| 90,994,794 |
|
| NT International Small-Mid Cap Fund | 5,056,947 |
| 434,272 |
| 766,666 |
| 30,066 |
| 36,689 |
| 4,670,347 |
|
| NT International Value Fund | 48,928,397 |
| 14,459,884 |
| 5,695,321 |
| (617,773 | ) | 1,089,542 |
| 51,894,421 |
|
U.S. Government Money Market Fund(3) | 133,711,822 |
| 31,765,470 |
| 9,756,862 |
| — |
| 14,076 |
| 155,720,430 |
|
| | $ | 1,728,078,278 |
| $ | 427,875,950 |
| $ | 233,064,865 |
| $ | (13,803,678 | ) | $ | 75,785,363 |
| $ | 1,920,232,426 |
|
| |
| (1) | Underlying fund investments represent Institutional Class, except U.S. Government Money Market Fund Investor Class. |
| |
| (2) | Distributions received includes distributions from net investment income and from capital gains, if any. |
| |
| (3) | Effective December 1, 2015, the name of Premium Money Market Fund was changed to U.S. Government Money Market Fund. |
|
| | | | | | | | | | | | | | | | | | |
Fund/Underlying Fund(1) | Beginning
Value | Purchase
Cost | Sales Cost | Realized
Gain (Loss) | Distributions Received(2) | Ending Value |
| One Choice 2025 Portfolio | | | | |
| NT Core Equity Plus Fund | $ | 78,486,923 |
| $ | 13,263,814 |
| $ | 2,236,600 |
| $ | (156,296 | ) | $ | 5,638,618 |
| $ | 84,722,212 |
|
| NT Disciplined Growth Fund | 58,512,394 |
| 5,191,136 |
| 2,759,391 |
| (97,304 | ) | 543,319 |
| 61,202,437 |
|
| NT Equity Growth Fund | 243,011,480 |
| 54,069,265 |
| 22,845,892 |
| (1,771,853 | ) | 15,816,762 |
| 264,822,370 |
|
| NT Growth Fund | 156,705,841 |
| 29,030,099 |
| 16,844,411 |
| 149,357 |
| 9,874,798 |
| 164,854,079 |
|
| NT Heritage Fund | 106,284,897 |
| 25,691,791 |
| 15,323,720 |
| (1,074,418 | ) | 8,124,349 |
| 109,252,578 |
|
| NT Large Company Value Fund | 253,707,512 |
| 75,077,894 |
| 41,009,079 |
| (3,073,774 | ) | 25,894,927 |
| 271,855,441 |
|
| NT Mid Cap Value Fund | 154,286,546 |
| 27,884,968 |
| 26,918,344 |
| (1,454,738 | ) | 12,900,245 |
| 161,162,619 |
|
| NT Small Company Fund | 45,907,369 |
| 11,099,351 |
| 4,654,989 |
| (782,992 | ) | 3,775,885 |
| 49,231,984 |
|
| High-Yield Fund | 91,587,711 |
| 11,421,360 |
| 3,323,381 |
| (339,432 | ) | 5,247,845 |
| 98,165,440 |
|
| Inflation-Adjusted Bond Fund | 103,477,958 |
| 5,280,262 |
| 9,866,285 |
| (553,563 | ) | 1,680,110 |
| 102,279,328 |
|
| NT Diversified Bond Fund | 520,291,717 |
| 106,613,208 |
| 85,551,785 |
| (1,200,165 | ) | 16,706,405 |
| 554,772,878 |
|
| Short Duration Inflation Protection Bond Fund | 80,224,618 |
| 12,394,582 |
| 3,388,531 |
| (127,508 | ) | 8,206 |
| 90,957,441 |
|
| NT Emerging Markets Fund | 55,279,068 |
| 7,760,695 |
| 9,610,508 |
| (753,496 | ) | 166,709 |
| 54,344,745 |
|
| NT Global Real Estate Fund | 38,898,586 |
| 3,318,699 |
| 3,271,366 |
| (171,735 | ) | 942,666 |
| 42,573,615 |
|
| NT International Growth Fund | 129,656,582 |
| 34,399,643 |
| 10,588,581 |
| (514,359 | ) | 4,786,251 |
| 138,471,734 |
|
| NT International Small-Mid Cap Fund | 15,857,286 |
| 962,779 |
| 1,501,511 |
| 57,917 |
| 122,192 |
| 15,163,558 |
|
| NT International Value Fund | 90,013,155 |
| 22,384,306 |
| 8,529,050 |
| (800,537 | ) | 1,993,808 |
| 92,760,053 |
|
| Global Bond Fund | 153,294,094 |
| 14,014,334 |
| 13,501,854 |
| (235,611 | ) | 857,071 |
| 162,896,615 |
|
| International Bond Fund | 106,142,609 |
| 13,188,438 |
| 16,458,578 |
| (2,412,971 | ) | 2,426,891 |
| 114,807,959 |
|
U.S. Government Money Market Fund(3) | 136,831,487 |
| 28,331,866 |
| 8,502,358 |
| — |
| 14,210 |
| 156,660,995 |
|
| | $ | 2,618,457,833 |
| $ | 501,378,490 |
| $ | 306,686,214 |
| $ | (15,313,478 | ) | $ | 117,521,267 |
| $ | 2,790,958,081 |
|
| |
| (1) | Underlying fund investments represent Institutional Class, except U.S. Government Money Market Fund Investor Class. |
| |
| (2) | Distributions received includes distributions from net investment income and from capital gains, if any. |
| |
| (3) | Effective December 1, 2015, the name of Premium Money Market Fund was changed to U.S. Government Money Market Fund. |
|
| | | | | | | | | | | | | | | | | | |
Fund/Underlying Fund(1) | Beginning
Value | Purchase
Cost | Sales Cost | Realized
Gain (Loss) | Distributions Received(2) | Ending Value |
| One Choice 2030 Portfolio | | | | |
| NT Core Equity Plus Fund | $ | 53,828,448 |
| $ | 12,473,316 |
| $ | 3,200,262 |
| $ | (336,158 | ) | $ | 3,876,977 |
| $ | 60,158,933 |
|
| NT Disciplined Growth Fund | 44,934,594 |
| 7,921,575 |
| 2,524,568 |
| (180,057 | ) | 440,824 |
| 50,870,419 |
|
| NT Equity Growth Fund | 159,708,482 |
| 45,810,695 |
| 12,796,663 |
| (1,565,175 | ) | 10,663,770 |
| 187,511,367 |
|
| NT Growth Fund | 125,273,174 |
| 33,784,648 |
| 14,834,757 |
| (475,089 | ) | 8,088,003 |
| 142,100,556 |
|
| NT Heritage Fund | 75,228,613 |
| 23,644,582 |
| 6,606,374 |
| (821,242 | ) | 5,936,840 |
| 87,659,254 |
|
| NT Large Company Value Fund | 176,804,958 |
| 64,777,624 |
| 28,797,787 |
| (3,540,796 | ) | 18,674,290 |
| 203,430,567 |
|
| NT Mid Cap Value Fund | 104,235,520 |
| 25,200,319 |
| 14,562,743 |
| (1,423,721 | ) | 9,176,301 |
| 119,997,643 |
|
| NT Small Company Fund | 40,816,418 |
| 12,604,911 |
| 4,637,094 |
| (630,213 | ) | 3,308,279 |
| 46,209,249 |
|
| High-Yield Fund | 55,355,964 |
| 13,616,552 |
| 3,893,723 |
| (413,169 | ) | 3,346,296 |
| 64,553,720 |
|
| Inflation-Adjusted Bond Fund | 83,426,680 |
| 12,514,097 |
| 7,517,953 |
| (1,039,031 | ) | 1,471,187 |
| 92,056,862 |
|
| NT Diversified Bond Fund | 306,875,287 |
| 90,725,259 |
| 46,119,031 |
| (874,099 | ) | 10,406,313 |
| 360,364,920 |
|
| Short Duration Inflation Protection Bond Fund | 27,431,766 |
| 8,667,847 |
| 907,491 |
| (39,926 | ) | 3,070 |
| 35,876,632 |
|
| NT Emerging Markets Fund | 45,734,668 |
| 12,773,048 |
| 6,201,482 |
| (669,232 | ) | 151,164 |
| 53,698,819 |
|
| NT Global Real Estate Fund | 29,943,305 |
| 4,405,795 |
| 2,360,838 |
| (167,445 | ) | 757,146 |
| 35,048,706 |
|
| NT International Growth Fund | 99,529,358 |
| 32,455,611 |
| 8,713,908 |
| (573,034 | ) | 3,753,898 |
| 111,878,729 |
|
| NT International Small-Mid Cap Fund | 16,046,153 |
| 1,758,662 |
| 1,079,342 |
| 27,215 |
| 130,832 |
| 16,643,746 |
|
| NT International Value Fund | 69,925,278 |
| 26,952,781 |
| 9,015,977 |
| (1,068,553 | ) | 1,615,531 |
| 79,589,558 |
|
| Global Bond Fund | 90,375,097 |
| 15,308,936 |
| 6,891,733 |
| (122,704 | ) | 522,398 |
| 104,513,418 |
|
| International Bond Fund | 38,115,811 |
| 12,074,890 |
| 3,689,038 |
| (631,218 | ) | 978,527 |
| 51,173,346 |
|
U.S. Government Money Market Fund(3) | 86,395,934 |
| 18,099,134 |
| 6,463,849 |
| — |
| 8,943 |
| 98,031,219 |
|
| | $ | 1,729,985,508 |
| $ | 475,570,282 |
| $ | 190,814,613 |
| $ | (14,543,647 | ) | $ | 83,310,589 |
| $ | 2,001,367,663 |
|
| |
| (1) | Underlying fund investments represent Institutional Class, except U.S. Government Money Market Fund Investor Class. |
| |
| (2) | Distributions received includes distributions from net investment income and from capital gains, if any. |
| |
| (3) | Effective December 1, 2015, the name of Premium Money Market Fund was changed to U.S. Government Money Market Fund. |
|
| | | | | | | | | | | | | | | | | | |
Fund/Underlying Fund(1) | Beginning
Value | Purchase
Cost | Sales Cost | Realized
Gain (Loss) | Distributions Received(2) | Ending Value |
| One Choice 2035 Portfolio | | | | |
| NT Core Equity Plus Fund | $ | 67,498,413 |
| $ | 11,891,960 |
| $ | 1,528,174 |
| $ | (144,901 | ) | $ | 4,880,070 |
| $ | 73,715,498 |
|
| NT Disciplined Growth Fund | 62,026,540 |
| 6,421,466 |
| 2,357,409 |
| (124,343 | ) | 585,512 |
| 66,413,067 |
|
| NT Equity Growth Fund | 190,771,220 |
| 37,675,837 |
| 8,482,110 |
| (931,679 | ) | 12,386,399 |
| 211,928,220 |
|
| NT Growth Fund | 184,847,637 |
| 35,770,214 |
| 17,360,134 |
| 92,645 |
| 11,578,710 |
| 198,700,918 |
|
| NT Heritage Fund | 98,381,838 |
| 24,299,821 |
| 8,598,113 |
| (943,756 | ) | 7,626,599 |
| 107,485,525 |
|
| NT Large Company Value Fund | 218,763,549 |
| 59,710,380 |
| 25,677,354 |
| (2,201,039 | ) | 22,278,783 |
| 238,496,765 |
|
| NT Mid Cap Value Fund | 124,102,598 |
| 20,437,611 |
| 12,249,339 |
| (973,507 | ) | 10,717,153 |
| 136,986,133 |
|
| NT Small Company Fund | 63,519,225 |
| 15,626,703 |
| 4,506,875 |
| (549,589 | ) | 5,109,900 |
| 69,961,749 |
|
| High-Yield Fund | 58,729,196 |
| 8,991,303 |
| 829,802 |
| (97,481 | ) | 3,462,972 |
| 65,877,592 |
|
| Inflation-Adjusted Bond Fund | 111,883,593 |
| 13,927,043 |
| 11,327,267 |
| (1,538,551 | ) | 1,903,226 |
| 119,264,896 |
|
| NT Diversified Bond Fund | 317,553,060 |
| 78,815,004 |
| 47,126,665 |
| (737,965 | ) | 10,437,885 |
| 357,791,201 |
|
| Short Duration Inflation Protection Bond Fund | 6,812,096 |
| 4,400,900 |
| 198,324 |
| (8,188 | ) | 931 |
| 11,226,761 |
|
| NT Emerging Markets Fund | 64,850,899 |
| 12,137,462 |
| 5,920,050 |
| (637,818 | ) | 209,620 |
| 72,315,524 |
|
| NT Global Real Estate Fund | 41,333,660 |
| 3,623,763 |
| 2,973,999 |
| (185,951 | ) | 1,012,305 |
| 45,863,992 |
|
| NT International Growth Fund | 134,269,245 |
| 34,985,810 |
| 7,877,389 |
| (290,954 | ) | 4,997,325 |
| 145,592,857 |
|
| NT International Small-Mid Cap Fund | 25,414,468 |
| 2,970,084 |
| 2,129,247 |
| 65,695 |
| 206,792 |
| 26,114,413 |
|
| NT International Value Fund | 96,049,054 |
| 28,775,503 |
| 7,470,008 |
| (835,610 | ) | 2,179,883 |
| 105,404,284 |
|
| Global Bond Fund | 95,551,004 |
| 11,910,326 |
| 8,081,803 |
| (138,689 | ) | 539,349 |
| 105,128,166 |
|
| International Bond Fund | 4,125,821 |
| 7,732,072 |
| 308,239 |
| (15,706 | ) | 190,203 |
| 12,493,165 |
|
U.S. Government Money Market Fund(3) | 103,488,350 |
| 16,561,332 |
| 7,974,951 |
| — |
| 10,344 |
| 112,074,731 |
|
| | $ | 2,069,971,466 |
| $ | 436,664,594 |
| $ | 182,977,252 |
| $ | (10,197,387 | ) | $ | 100,313,961 |
| $ | 2,282,835,457 |
|
| |
| (1) | Underlying fund investments represent Institutional Class, except U.S. Government Money Market Fund Investor Class. |
| |
| (2) | Distributions received includes distributions from net investment income and from capital gains, if any. |
| |
| (3) | Effective December 1, 2015, the name of Premium Money Market Fund was changed to U.S. Government Money Market Fund. |
|
| | | | | | | | | | | | | | | | | | |
Fund/Underlying Fund(1) | Beginning
Value | Purchase
Cost | Sales Cost | Realized
Gain (Loss) | Distributions Received(2) | Ending Value |
| One Choice 2040 Portfolio | | | | |
| NT Core Equity Plus Fund | $ | 45,466,882 |
| $ | 10,994,192 |
| $ | 2,039,776 |
| $ | (341,827 | ) | $ | 3,401,968 |
| $ | 51,832,291 |
|
| NT Disciplined Growth Fund | 40,846,699 |
| 6,972,152 |
| 902,329 |
| (48,331 | ) | 405,829 |
| 47,322,259 |
|
| NT Equity Growth Fund | 128,722,250 |
| 33,175,446 |
| 7,320,292 |
| (875,065 | ) | 8,456,403 |
| 149,793,421 |
|
| NT Growth Fund | 126,633,113 |
| 32,545,805 |
| 10,094,641 |
| (375,772 | ) | 8,167,364 |
| 146,975,123 |
|
| NT Heritage Fund | 72,227,459 |
| 21,584,071 |
| 5,548,287 |
| (629,135 | ) | 5,647,260 |
| 83,681,770 |
|
| NT Large Company Value Fund | 154,311,327 |
| 49,011,889 |
| 17,475,584 |
| (2,341,900 | ) | 16,075,214 |
| 176,699,622 |
|
| NT Mid Cap Value Fund | 83,700,170 |
| 17,715,712 |
| 8,655,748 |
| (842,328 | ) | 7,372,196 |
| 96,402,511 |
|
| NT Small Company Fund | 40,523,447 |
| 13,163,068 |
| 1,859,503 |
| (296,458 | ) | 3,432,229 |
| 48,915,131 |
|
| High-Yield Fund | 31,595,930 |
| 7,908,766 |
| 1,846,574 |
| (202,596 | ) | 1,910,903 |
| 37,341,773 |
|
| Inflation-Adjusted Bond Fund | 64,079,672 |
| 15,909,432 |
| 6,195,381 |
| (925,892 | ) | 1,196,279 |
| 76,874,433 |
|
| NT Diversified Bond Fund | 170,282,807 |
| 55,660,868 |
| 25,954,444 |
| (501,886 | ) | 5,821,422 |
| 205,014,375 |
|
| NT Emerging Markets Fund | 54,797,379 |
| 16,391,210 |
| 10,467,747 |
| (1,155,954 | ) | 183,155 |
| 62,464,980 |
|
| NT Global Real Estate Fund | 29,078,399 |
| 4,427,358 |
| 2,055,718 |
| (137,906 | ) | 738,200 |
| 34,392,712 |
|
| NT International Growth Fund | 86,918,273 |
| 30,997,554 |
| 5,358,737 |
| (464,128 | ) | 3,369,212 |
| 102,508,938 |
|
| NT International Small-Mid Cap Fund | 19,939,905 |
| 3,771,524 |
| 1,579,657 |
| 41,003 |
| 168,312 |
| 22,110,462 |
|
| NT International Value Fund | 63,525,705 |
| 25,314,432 |
| 5,928,532 |
| (727,335 | ) | 1,495,649 |
| 75,107,849 |
|
| Global Bond Fund | 54,685,296 |
| 11,108,674 |
| 5,323,958 |
| (94,470 | ) | 315,861 |
| 63,934,546 |
|
U.S. Government Money Market Fund(3) | 35,565,915 |
| 15,868,553 |
| 2,656,661 |
| — |
| 4,073 |
| 48,777,807 |
|
| | $ | 1,302,900,628 |
| $ | 372,520,706 |
| $ | 121,263,569 |
| $ | (9,919,980 | ) | $ | 68,161,529 |
| $ | 1,530,150,003 |
|
| |
| (1) | Underlying fund investments represent Institutional Class, except U.S. Government Money Market Fund Investor Class. |
| |
| (2) | Distributions received includes distributions from net investment income and from capital gains, if any. |
| |
| (3) | Effective December 1, 2015, the name of Premium Money Market Fund was changed to U.S. Government Money Market Fund. |
|
| | | | | | | | | | | | | | | | | | |
Fund/Underlying Fund(1) | Beginning
Value | Purchase
Cost | Sales Cost | Realized
Gain (Loss) | Distributions Received(2) | Ending Value |
| One Choice 2045 Portfolio | | | | |
| NT Core Equity Plus Fund | $ | 61,567,343 |
| $ | 8,008,907 |
| $ | 1,578,301 |
| $ | (93,539 | ) | $ | 4,299,177 |
| $ | 64,090,468 |
|
| NT Disciplined Growth Fund | 48,476,415 |
| 5,617,870 |
| 871,678 |
| (32,894 | ) | 464,605 |
| 53,422,059 |
|
| NT Equity Growth Fund | 152,121,546 |
| 28,845,767 |
| 3,752,122 |
| (366,062 | ) | 9,844,691 |
| 170,386,482 |
|
| NT Growth Fund | 156,184,411 |
| 28,732,688 |
| 8,609,488 |
| 176,387 |
| 9,854,297 |
| 172,528,952 |
|
| NT Heritage Fund | 96,727,920 |
| 21,399,558 |
| 5,035,896 |
| (360,064 | ) | 7,380,818 |
| 106,258,438 |
|
| NT Large Company Value Fund | 194,197,872 |
| 51,367,877 |
| 21,139,845 |
| (2,248,362 | ) | 19,932,246 |
| 211,583,415 |
|
| NT Mid Cap Value Fund | 104,511,046 |
| 15,764,833 |
| 8,506,632 |
| (500,852 | ) | 8,907,762 |
| 115,403,678 |
|
| NT Small Company Fund | 43,879,877 |
| 10,588,510 |
| 612,349 |
| (34,812 | ) | 3,599,709 |
| 50,288,233 |
|
| NT Emerging Markets Fund | 74,785,693 |
| 15,699,556 |
| 9,958,276 |
| (893,738 | ) | 240,207 |
| 82,030,128 |
|
| NT Global Real Estate Fund | 37,271,039 |
| 3,798,866 |
| 3,240,015 |
| (181,862 | ) | 911,777 |
| 41,309,508 |
|
| NT International Growth Fund | 103,364,416 |
| 28,655,969 |
| 6,859,871 |
| (248,006 | ) | 3,826,483 |
| 113,147,091 |
|
| NT International Small-Mid Cap Fund | 27,647,725 |
| 3,948,209 |
| 2,178,555 |
| 75,606 |
| 226,644 |
| 29,286,010 |
|
| NT International Value Fund | 75,462,779 |
| 24,542,822 |
| 6,047,409 |
| (577,571 | ) | 1,727,133 |
| 84,522,309 |
|
| High-Yield Fund | 29,940,828 |
| 5,281,676 |
| 613,684 |
| (79,520 | ) | 1,761,758 |
| 34,110,423 |
|
| Inflation-Adjusted Bond Fund | 60,484,301 |
| 12,364,014 |
| 6,192,821 |
| (828,555 | ) | 1,092,131 |
| 69,382,124 |
|
| NT Diversified Bond Fund | 158,647,574 |
| 49,471,203 |
| 26,943,714 |
| (318,777 | ) | 5,330,123 |
| 185,542,418 |
|
| Global Bond Fund | 56,315,680 |
| 9,209,209 |
| 5,680,838 |
| (96,471 | ) | 321,753 |
| 63,282,548 |
|
U.S. Government Money Market Fund(3) | 3,714,267 |
| 8,109,785 |
| 154,405 |
| — |
| 766 |
| 11,669,647 |
|
| | $ | 1,485,300,732 |
| $ | 331,407,319 |
| $ | 117,975,899 |
| $ | (6,609,092 | ) | $ | 79,722,080 |
| $ | 1,658,243,931 |
|
| |
| (1) | Underlying fund investments represent Institutional Class, except U.S. Government Money Market Fund Investor Class. |
| |
| (2) | Distributions received includes distributions from net investment income and from capital gains, if any. |
| |
| (3) | Effective December 1, 2015, the name of Premium Money Market Fund was changed to U.S. Government Money Market Fund. |
|
| | | | | | | | | | | | | | | | | | |
Fund/Underlying Fund(1) | Beginning
Value | Purchase
Cost | Sales Cost | Realized
Gain (Loss) | Distributions Received(2) | Ending Value |
| One Choice 2050 Portfolio | | | | |
| NT Core Equity Plus Fund | $ | 33,887,672 |
| $ | 10,118,839 |
| $ | 512,377 |
| $ | (74,984 | ) | $ | 2,570,784 |
| $ | 41,473,334 |
|
| NT Disciplined Growth Fund | 25,512,151 |
| 5,655,597 |
| 606,544 |
| (35,164 | ) | 258,856 |
| 30,866,460 |
|
| NT Equity Growth Fund | 77,202,083 |
| 23,796,431 |
| 3,295,042 |
| (469,940 | ) | 5,206,661 |
| 94,866,479 |
|
| NT Growth Fund | 80,736,033 |
| 25,980,648 |
| 5,322,005 |
| (271,605 | ) | 5,375,084 |
| 100,314,286 |
|
| NT Heritage Fund | 49,245,955 |
| 17,413,768 |
| 2,687,770 |
| (408,703 | ) | 4,009,250 |
| 60,893,335 |
|
| NT Large Company Value Fund | 102,749,901 |
| 39,126,685 |
| 10,797,752 |
| (1,540,617 | ) | 10,997,026 |
| 124,997,967 |
|
| NT Mid Cap Value Fund | 51,770,946 |
| 14,310,528 |
| 4,533,576 |
| (414,962 | ) | 4,679,041 |
| 63,883,616 |
|
| NT Small Company Fund | 25,191,285 |
| 8,879,163 |
| 2,125,797 |
| (213,452 | ) | 2,063,173 |
| 30,221,299 |
|
| NT Emerging Markets Fund | 44,198,890 |
| 14,576,790 |
| 6,075,628 |
| (628,029 | ) | 146,181 |
| 54,220,137 |
|
| NT Global Real Estate Fund | 20,530,826 |
| 4,514,356 |
| 1,850,907 |
| (127,838 | ) | 527,857 |
| 25,430,440 |
|
| NT International Growth Fund | 50,213,090 |
| 20,994,864 |
| 2,948,256 |
| (280,212 | ) | 1,981,564 |
| 62,441,363 |
|
| NT International Small-Mid Cap Fund | 16,192,474 |
| 4,887,049 |
| 1,481,894 |
| 1,721 |
| 141,514 |
| 19,674,567 |
|
| NT International Value Fund | 39,897,061 |
| 17,490,409 |
| 3,158,467 |
| (415,015 | ) | 944,134 |
| 49,326,490 |
|
| High-Yield Fund | 13,321,023 |
| 4,461,444 |
| 968,807 |
| (106,994 | ) | 826,142 |
| 16,724,418 |
|
| Inflation-Adjusted Bond Fund | 26,706,973 |
| 8,362,169 |
| 2,752,918 |
| (393,056 | ) | 512,240 |
| 33,651,415 |
|
| NT Diversified Bond Fund | 70,305,247 |
| 26,252,327 |
| 11,013,431 |
| (181,264 | ) | 2,434,599 |
| 87,662,900 |
|
| Global Bond Fund | 25,771,878 |
| 7,235,795 |
| 2,593,684 |
| (46,504 | ) | 152,914 |
| 32,117,080 |
|
| | $ | 753,433,488 |
| $ | 254,056,862 |
| $ | 62,724,855 |
| $ | (5,606,618 | ) | $ | 42,827,020 |
| $ | 928,765,586 |
|
| |
| (1) | Underlying fund investments represent Institutional Class. |
| |
| (2) | Distributions received includes distributions from net investment income and from capital gains, if any. |
|
| | | | | | | | | | | | | | | | | | |
Fund/ Underlying Fund(1) | Beginning
Value | Purchase
Cost | Sales Cost | Realized
Gain (Loss) | Distributions Received(2) | Ending Value |
| One Choice 2055 Portfolio | | | | |
| NT Core Equity Plus Fund | $ | 10,685,895 |
| $ | 6,626,635 |
| $ | 182,066 |
| $ | (24,213 | ) | $ | 888,628 |
| $ | 16,601,046 |
|
| NT Disciplined Growth Fund | 8,255,572 |
| 4,429,280 |
| 72,850 |
| (2,203 | ) | 96,595 |
| 12,866,024 |
|
| NT Equity Growth Fund | 25,376,410 |
| 15,802,279 |
| 1,359,514 |
| (162,713 | ) | 1,874,330 |
| 39,281,687 |
|
| NT Growth Fund | 26,024,433 |
| 16,360,193 |
| 1,841,282 |
| (99,395 | ) | 1,884,786 |
| 40,623,578 |
|
| NT Heritage Fund | 15,984,450 |
| 10,481,867 |
| 696,361 |
| (56,305 | ) | 1,402,907 |
| 24,995,861 |
|
| NT Large Company Value Fund | 33,480,938 |
| 23,108,443 |
| 3,032,345 |
| (352,897 | ) | 3,913,922 |
| 51,957,963 |
|
| NT Mid Cap Value Fund | 16,036,456 |
| 9,099,099 |
| 892,417 |
| (33,039 | ) | 1,584,129 |
| 25,311,389 |
|
| NT Small Company Fund | 9,141,578 |
| 6,077,639 |
| 896,604 |
| (86,264 | ) | 811,175 |
| 13,880,042 |
|
| NT Emerging Markets Fund | 15,343,694 |
| 9,300,042 |
| 2,042,128 |
| (257,245 | ) | 56,181 |
| 23,568,831 |
|
| NT Global Real Estate Fund | 7,055,957 |
| 3,366,606 |
| 431,655 |
| (24,314 | ) | 194,445 |
| 10,990,770 |
|
| NT International Growth Fund | 14,258,947 |
| 11,173,226 |
| 711,350 |
| (64,826 | ) | 608,724 |
| 23,126,836 |
|
| NT International Small-Mid Cap Fund | 5,809,954 |
| 3,505,509 |
| 315,048 |
| (7,844 | ) | 54,789 |
| 9,138,078 |
|
| NT International Value Fund | 12,928,711 |
| 10,128,873 |
| 1,105,923 |
| (134,665 | ) | 332,567 |
| 20,438,440 |
|
| High-Yield Fund | 3,563,558 |
| 2,291,181 |
| 203,365 |
| (22,587 | ) | 247,840 |
| 5,676,267 |
|
| Inflation-Adjusted Bond Fund | 7,086,698 |
| 4,636,955 |
| 665,111 |
| (78,370 | ) | 159,359 |
| 11,464,203 |
|
| NT Diversified Bond Fund | 17,924,026 |
| 13,593,437 |
| 2,943,420 |
| (41,006 | ) | 702,427 |
| 29,284,147 |
|
| Global Bond Fund | 7,166,872 |
| 4,319,043 |
| 561,508 |
| (9,623 | ) | 45,905 |
| 11,495,502 |
|
| | $ | 236,124,149 |
| $ | 154,300,307 |
| $ | 17,952,947 |
| $ | (1,457,509 | ) | $ | 14,858,709 |
| $ | 370,700,664 |
|
| |
| (1) | Underlying fund investments represent Institutional Class. |
| |
| (2) | Distributions received includes distributions from net investment income and from capital gains, if any. |
|
| | | | | | | | | | | | | | | | | |
Fund/ Underlying Fund(1) | Beginning
Value | Purchase
Cost | Sales Cost | Realized
Gain (Loss) | Distributions Received(2) | Ending Value |
One Choice 2060 Portfolio(3) | | | | |
| NT Core Equity Plus Fund | — |
| $ | 289,662 |
| $ | 11,326 |
| $ | (871 | ) | $ | 2,015 |
| $ | 292,781 |
|
| NT Disciplined Growth Fund | — |
| 222,630 |
| 8,673 |
| (352 | ) | 431 |
| 228,006 |
|
| NT Equity Growth Fund | — |
| 687,552 |
| 28,838 |
| (1,918 | ) | 3,753 |
| 700,098 |
|
| NT Growth Fund | — |
| 699,755 |
| 29,900 |
| (2,143 | ) | 1,796 |
| 717,066 |
|
| NT Heritage Fund | — |
| 427,479 |
| 19,174 |
| (2,188 | ) | 1,333 |
| 439,527 |
|
| NT Large Company Value Fund | — |
| 913,477 |
| 41,666 |
| (3,764 | ) | 6,522 |
| 926,465 |
|
| NT Mid Cap Value Fund | — |
| 426,539 |
| 17,987 |
| (1,121 | ) | 2,568 |
| 439,866 |
|
| NT Small Company Fund | — |
| 251,522 |
| 11,817 |
| (1,303 | ) | 865 |
| 260,060 |
|
| NT Emerging Markets Fund | — |
| 406,684 |
| 19,710 |
| (920 | ) | 53 |
| 420,984 |
|
| NT Global Real Estate Fund | — |
| 187,711 |
| 6,995 |
| (253 | ) | 202 |
| 197,509 |
|
| NT International Growth Fund | — |
| 394,177 |
| 15,049 |
| (1,313 | ) | 576 |
| 395,914 |
|
| NT International Small-Mid Cap Fund | — |
| 161,750 |
| 5,754 |
| (262 | ) | 53 |
| 165,372 |
|
| NT International Value Fund | — |
| 360,514 |
| 12,996 |
| (1,103 | ) | 318 |
| 363,894 |
|
| High-Yield Fund | — |
| 96,996 |
| 2,945 |
| (130 | ) | 1,285 |
| 97,523 |
|
| Inflation-Adjusted Bond Fund | — |
| 196,490 |
| 4,719 |
| (7 | ) | 960 |
| 195,533 |
|
| NT Diversified Bond Fund | — |
| 499,614 |
| 18,532 |
| (104 | ) | 2,700 |
| 488,925 |
|
| Global Bond Fund | — |
| 195,413 |
| 4,816 |
| (3 | ) | 47 |
| 195,231 |
|
| | — |
| $ | 6,417,965 |
| $ | 260,897 |
| $ | (17,755 | ) | $ | 25,477 |
| $ | 6,524,754 |
|
| |
| (1) | Underlying fund investments represent Institutional Class. |
| |
| (2) | Distributions received includes distributions from net investment income and from capital gains, if any. |
| |
| (3) | September 30, 2015 (fund inception) through July 31, 2016. |
7. Investments in Underlying Funds
The funds do not invest in the underlying funds for the purpose of exercising management or control; however, investments by the funds within their investment strategies may represent a significant portion of the underlying funds’ net assets.
8. Fair Value Measurements
The funds’ investments valuation process is based on several considerations and may use multiple inputs to determine the fair value of the investments held by the funds. In conformity with accounting principles generally accepted in the United States of America, the inputs used to determine a valuation are classified into three broad levels.
| |
| • | Level 1 valuation inputs consist of unadjusted quoted prices in an active market for identical investments. |
| |
| • | Level 2 valuation inputs consist of direct or indirect observable market data (including quoted prices for comparable investments, evaluations of subsequent market events, interest rates, prepayment speeds, credit risk, etc.). These inputs also consist of quoted prices for identical investments initially expressed in local currencies that are adjusted through translation into U.S. dollars. |
| |
| • | Level 3 valuation inputs consist of unobservable data (including a fund’s own assumptions). |
The level classification is based on the lowest level input that is significant to the fair valuation measurement. The valuation inputs are not necessarily an indication of the risks associated with investing in these securities or other financial instruments. There were no significant transfers between levels during the period.
As of period end, the funds’ investment securities were classified as Level 1. The Schedules of Investments provide additional information on the funds’ portfolio holdings.
9. Federal Tax Information
The tax character of distributions paid during the years ended July 31, 2016 and July 31, 2015 (except as noted) were as follows:
|
| | | | | | | | | | | | |
| | 2016 | 2015 |
| | Distributions Paid From: | Distributions Paid From: |
| | Ordinary Income | Long-term capital gains | Ordinary Income | Long-term capital gains |
| One Choice In Retirement Portfolio | $ | 32,690,921 |
| $ | 844,246 |
| $ | 16,208,626 |
| $ | 36,034,348 |
|
| One Choice 2020 Portfolio | $ | 28,212,440 |
| $ | 58,493,928 |
| $ | 31,030,514 |
| $ | 22,481,660 |
|
| One Choice 2025 Portfolio | $ | 45,426,349 |
| $ | 109,293,364 |
| $ | 49,465,196 |
| $ | 44,573,790 |
|
| One Choice 2030 Portfolio | $ | 30,355,962 |
| $ | 70,419,281 |
| $ | 30,251,106 |
| $ | 28,852,574 |
|
| One Choice 2035 Portfolio | $ | 38,208,577 |
| $ | 101,948,538 |
| $ | 38,645,841 |
| $ | 42,415,976 |
|
| One Choice 2040 Portfolio | $ | 22,936,534 |
| $ | 59,910,501 |
| $ | 22,978,838 |
| $ | 24,347,811 |
|
| One Choice 2045 Portfolio | $ | 26,391,029 |
| $ | 81,784,872 |
| $ | 28,600,824 |
| $ | 32,729,832 |
|
| One Choice 2050 Portfolio | $ | 13,278,184 |
| $ | 36,392,869 |
| $ | 12,977,487 |
| $ | 13,454,680 |
|
| One Choice 2055 Portfolio | $ | 4,352,585 |
| $ | 8,714,904 |
| $ | 3,216,547 |
| $ | 2,321,655 |
|
One Choice 2060 Portfolio(1) | $ | 3,472 |
| — |
| N/A |
| N/A |
|
(1) September 30, 2015 (fund inception) through July 31, 2016.
The book-basis character of distributions made during the year from net investment income or net realized gains may differ from their ultimate characterization for federal income tax purposes. These differences reflect the differing character of certain income items and net realized gains and losses for financial statement and tax purposes, and may result in reclassification among certain capital accounts on the financial statements.
As of July 31, 2016, the federal tax cost of investments and the components of distributable earnings on a tax-basis were as follows:
|
| | | | | | | | | | | | | | | |
| | One Choice In Retirement Portfolio | One Choice 2020 Portfolio | One Choice 2025 Portfolio | One Choice 2030 Portfolio | One Choice 2035 Portfolio |
| Federal tax cost of investments | $ | 1,775,095,216 |
| $ | 1,783,292,873 |
| $ | 2,522,463,120 |
| $ | 1,863,703,938 |
| $ | 2,070,416,101 |
|
| Gross tax appreciation of investments | $ | 155,648,855 |
| $ | 146,658,468 |
| $ | 286,335,164 |
| $ | 150,143,383 |
| $ | 229,626,856 |
|
| Gross tax depreciation of investments | (10,751,694 | ) | (9,718,915 | ) | (17,840,203 | ) | (12,479,658 | ) | (17,207,500 | ) |
| Net tax appreciation (depreciation) of investments | $ | 144,897,161 |
| $ | 136,939,553 |
| $ | 268,494,961 |
| $ | 137,663,725 |
| $ | 212,419,356 |
|
| Undistributed ordinary income | — |
| $ | 9,290,125 |
| $ | 10,353,112 |
| $ | 6,436,104 |
| $ | 6,593,601 |
|
| Accumulated long-term gains | $ | 30,043,369 |
| $ | 37,187,483 |
| $ | 54,553,562 |
| $ | 40,590,589 |
| $ | 50,740,721 |
|
|
| | | | | | | | | | | | | | | |
| | One Choice 2040 Portfolio | One Choice 2045 Portfolio | One Choice 2050 Portfolio | One Choice 2055 Portfolio | One Choice 2060 Portfolio |
| Federal tax cost of investments | $ | 1,433,096,383 |
| $ | 1,514,510,528 |
| $ | 882,293,659 |
| $ | 365,453,585 |
| $ | 6,174,965 |
|
| Gross tax appreciation of investments | $ | 107,946,683 |
| $ | 156,665,408 |
| $ | 53,088,356 |
| $ | 8,231,123 |
| $ | 349,789 |
|
| Gross tax depreciation of investments | (10,893,063 | ) | (12,932,005 | ) | (6,616,429 | ) | (2,984,044 | ) | — |
|
| Net tax appreciation(depreciation) of investments | $ | 97,053,620 |
| $ | 143,733,403 |
| $ | 46,471,927 |
| $ | 5,247,079 |
| $ | 349,789 |
|
| Undistributed ordinary income | $ | 4,016,732 |
| $ | 3,827,511 |
| $ | 1,966,727 |
| $ | 710,708 |
| $ | 17,029 |
|
| Accumulated long-term gains | $ | 35,650,866 |
| $ | 43,682,109 |
| $ | 23,971,345 |
| $ | 8,412,477 |
| $ | 2,070 |
|
The difference between book-basis and tax-basis unrealized appreciation (depreciation) is attributable primarily to the tax deferral of losses on wash sales.
10. Reorganization
On December 9, 2014, the Board of Directors approved an agreement and plan of reorganization (the reorganization), whereby the net assets of One Choice® 2015 Portfolio, one fund in a series issued by the corporation, were transferred to One Choice In Retirement Portfolio in exchange for shares of One Choice In Retirement Portfolio. One Choice 2015 Portfolio had reached its most conservative planned target asset allocation and its asset mix matched that of One Choice In Retirement Portfolio. The reorganization was executed to combine two funds that had the same target asset allocations, both funds’ investment objectives and strategies were substantially similar and their total expense ratios were expected to be the same. The financial statements and performance history of One Choice In Retirement Portfolio survived after the reorganization. The reorganization was effective as of the close of the NYSE on March 27, 2015.
The reorganization was accomplished by a tax-free exchange of shares. On March 27, 2015, One Choice 2015 Portfolio exchanged its shares for shares of One Choice In Retirement Portfolio as follows:
|
| | | | | | |
| Original Fund/Class | Shares Exchanged | | New Fund/Class | Shares Received |
| One Choice 2015 Portfolio – Investor Class | 39,935,280 |
| | One Choice In Retirement Portfolio – Investor Class | 38,767,212 |
|
| One Choice 2015 Portfolio – Institutional Class | 16,214,110 |
| | One Choice In Retirement Portfolio – Institutional Class | 15,752,681 |
|
| One Choice 2015 Portfolio – A Class | 17,460,238 |
| | One Choice In Retirement Portfolio – A Class | 16,935,741 |
|
| One Choice 2015 Portfolio – C Class | 429,438 |
| | One Choice In Retirement Portfolio – C Class | 418,218 |
|
| One Choice 2015 Portfolio – R Class | 10,053,272 |
| | One Choice In Retirement Portfolio – R Class | 9,766,945 |
|
The net assets of One Choice 2015 Portfolio and One Choice In Retirement Portfolio immediately before the reorganization were $1,032,439,637 and $921,010,059, respectively. One Choice 2015 Portfolio’s unrealized appreciation of $98,786,019 was combined with that of One Choice In Retirement Portfolio. Immediately after the reorganization, the combined net assets were $1,953,449,696.
Assuming the reorganization had been completed on August 1, 2014, the beginning of the annual reporting period, the pro forma results of operations for the year ended July 31, 2015 are as follows:
|
| | | |
| Net investment income (loss) | $ | 40,097,268 |
|
| Net realized and unrealized gain (loss) | 29,002,320 |
|
| Net increase (decrease) in net assets resulting from operations | $ | 69,099,588 |
|
Because the combined investment portfolios have been managed as a single integrated portfolio since the reorganization was completed, it is not practicable to separate the amounts of revenue and earnings of One Choice 2015 Portfolio that have been included in One Choice In Retirement Portfolio's Statement of Operations since March 27, 2015.
|
| | | | | | | | | | | | | | | |
| For a Share Outstanding Throughout the Years Ended July 31 (except as noted) | | | | | |
| Per-Share Data | | | Ratios and Supplemental Data |
| | | Income From Investment Operations: | Distributions From: | | | Ratio to Average Net Assets of: | | |
| | Net Asset Value, Beginning of Period | Net Investment Income (Loss)(1) | Net Realized and Unrealized Gain (Loss) | Total From Investment Operations | Net Investment Income | Net Realized Gains | Total Distributions | Net Asset Value, End of Period | Total Return(2) | Operating Expenses(3) | Net Investment Income (Loss) | Portfolio Turnover Rate | Net Assets, End of Period (in thousands) |
| One Choice In Retirement Portfolio | | | | | | | | | |
| Investor Class | | | | | | | | | | | |
| 2016 | $12.62 | 0.21 | 0.12 | 0.33 | (0.21) | (0.01) | (0.22) | $12.73 | 2.76% | 0.20% | 1.73% | 14% |
| $837,622 |
|
| 2015 | $13.02 | 0.20 | 0.27 | 0.47 | (0.29) | (0.58) | (0.87) | $12.62 | 3.66% | 0.20% | 1.59% | 17% |
| $822,618 |
|
| 2014 | $12.41 | 0.27 | 0.73 | 1.00 | (0.27) | (0.12) | (0.39) | $13.02 | 8.19% | 0.20% | 2.09% | 16% |
| $255,133 |
|
| 2013 | $11.61 | 0.22 | 0.94 | 1.16 | (0.23) | (0.13) | (0.36) | $12.41 | 10.11% | 0.20% | 1.83% | 11% |
| $205,529 |
|
| 2012 | $11.23 | 0.25 | 0.39 | 0.64 | (0.26) | — | (0.26) | $11.61 | 5.81% | 0.21% | 2.21% | 28% |
| $128,450 |
|
| Institutional Class | | | | | | | | | |
| 2016 | $12.62 | 0.23 | 0.13 | 0.36 | (0.24) | (0.01) | (0.25) | $12.73 | 2.97% | 0.00%(4) | 1.93% | 14% |
| $510,188 |
|
| 2015 | $13.03 | 0.22 | 0.27 | 0.49 | (0.32) | (0.58) | (0.90) | $12.62 | 3.79% | 0.00%(4) | 1.79% | 17% |
| $485,416 |
|
| 2014 | $12.42 | 0.29 | 0.73 | 1.02 | (0.29) | (0.12) | (0.41) | $13.03 | 8.40% | 0.00%(4) | 2.29% | 16% |
| $130,406 |
|
| 2013 | $11.61 | 0.25 | 0.94 | 1.19 | (0.25) | (0.13) | (0.38) | $12.42 | 10.42% | 0.00%(4) | 2.03% | 11% |
| $104,270 |
|
| 2012 | $11.24 | 0.27 | 0.38 | 0.65 | (0.28) | — | (0.28) | $11.61 | 5.92% | 0.01% | 2.41% | 28% |
| $74,759 |
|
| A Class | | | | | | | | | | | | | |
| 2016 | $12.62 | 0.18 | 0.12 | 0.30 | (0.18) | (0.01) | (0.19) | $12.73 | 2.50% | 0.45% | 1.48% | 14% |
| $361,052 |
|
| 2015 | $13.02 | 0.17 | 0.27 | 0.44 | (0.26) | (0.58) | (0.84) | $12.62 | 3.39% | 0.45% | 1.34% | 17% |
| $428,050 |
|
| 2014 | $12.41 | 0.24 | 0.73 | 0.97 | (0.24) | (0.12) | (0.36) | $13.02 | 7.92% | 0.45% | 1.84% | 16% |
| $139,911 |
|
| 2013 | $11.60 | 0.19 | 0.95 | 1.14 | (0.20) | (0.13) | (0.33) | $12.41 | 9.94% | 0.45% | 1.58% | 11% |
| $119,504 |
|
| 2012 | $11.23 | 0.23 | 0.37 | 0.60 | (0.23) | — | (0.23) | $11.60 | 5.46% | 0.46% | 1.96% | 28% |
| $105,111 |
|
|
| | | | | | | | | | | | | | | |
| For a Share Outstanding Throughout the Years Ended July 31 (except as noted) | | | | | |
| Per-Share Data | | | Ratios and Supplemental Data |
| | | Income From Investment Operations: | Distributions From: | | | Ratio to Average Net Assets of: | | |
| | Net Asset Value, Beginning of Period | Net Investment Income (Loss)(1) | Net Realized and Unrealized Gain (Loss) | Total From Investment Operations | Net Investment Income | Net Realized Gains | Total Distributions | Net Asset Value, End of Period | Total Return(2) | Operating Expenses(3) | Net Investment Income (Loss) | Portfolio Turnover Rate | Net Assets, End of Period (in thousands) |
| C Class | | | | | | | | | | | | | |
| 2016 | $12.59 | 0.08 | 0.14 | 0.22 | (0.10) | (0.01) | (0.11) | $12.70 | 1.78% | 1.20% | 0.73% | 14% |
| $9,705 |
|
| 2015 | $13.00 | 0.07 | 0.27 | 0.34 | (0.17) | (0.58) | (0.75) | $12.59 | 2.59% | 1.20% | 0.59% | 17% |
| $7,721 |
|
| 2014 | $12.41 | 0.14 | 0.73 | 0.87 | (0.16) | (0.12) | (0.28) | $13.00 | 7.13% | 1.20% | 1.09% | 16% |
| $2,574 |
|
| 2013 | $11.61 | 0.10 | 0.94 | 1.04 | (0.11) | (0.13) | (0.24) | $12.41 | 9.04% | 1.20% | 0.83% | 11% |
| $1,369 |
|
| 2012 | $11.24 | 0.14 | 0.38 | 0.52 | (0.15) | — | (0.15) | $11.61 | 4.69% | 1.21% | 1.21% | 28% |
| $810 |
|
| R Class | | | | | | | | | | | | | |
| 2016 | $12.60 | 0.15 | 0.12 | 0.27 | (0.15) | (0.01) | (0.16) | $12.71 | 2.25% | 0.70% | 1.23% | 14% |
| $201,425 |
|
| 2015 | $13.00 | 0.16 | 0.25 | 0.41 | (0.23) | (0.58) | (0.81) | $12.60 | 3.13% | 0.70% | 1.09% | 17% |
| $244,718 |
|
| 2014 | $12.40 | 0.20 | 0.72 | 0.92 | (0.20) | (0.12) | (0.32) | $13.00 | 7.57% | 0.70% | 1.59% | 16% |
| $100,946 |
|
| 2013 | $11.59 | 0.16 | 0.95 | 1.11 | (0.17) | (0.13) | (0.30) | $12.40 | 9.67% | 0.70% | 1.33% | 11% |
| $60,104 |
|
| 2012 | $11.22 | 0.18 | 0.39 | 0.57 | (0.20) | — | (0.20) | $11.59 | 5.20% | 0.71% | 1.71% | 28% |
| $38,365 |
|
|
|
| Notes to Financial Highlights |
| |
| (1) | Computed using average shares outstanding throughout the period. |
| |
| (2) | Total returns are calculated based on the net asset value of the last business day and do not reflect applicable sales charges, if any. Total returns for periods less than one year are not annualized. |
| |
| (3) | Ratio of operating expenses to average net assets does not include any fees and expenses of the underlying funds. |
| |
| (4) | Ratio was less than 0.005%. |
See Notes to Financial Statements.
|
| | | | | | | | | | | | | | | |
| For a Share Outstanding Throughout the Years Ended July 31 (except as noted) | |
| Per-Share Data | | | Ratios and Supplemental Data |
| | | Income From Investment Operations: | Distributions From: | | | Ratio to Average Net Assets of: | | |
| | Net Asset Value, Beginning of Period | Net Investment Income (Loss)(1) | Net Realized and Unrealized Gain (Loss) | Total From Investment Operations | Net Investment Income | Net Realized Gains | Total Distributions | Net Asset Value, End of Period | Total Return(2) | Operating Expenses(3) | Net Investment Income (Loss) | Portfolio Turnover Rate | Net Assets, End of Period (in thousands) |
| One Choice 2020 Portfolio | | | | | | | | | | |
| Investor Class | | | | | | | | | | | | | |
| 2016 | $12.30 | 0.20 | 0.09 | 0.29 | (0.20) | (0.41) | (0.61) | $11.98 | 2.60% | 0.20% | 1.75% | 12% |
| $679,473 |
|
| 2015 | $12.26 | 0.26 | 0.24 | 0.50 | (0.27) | (0.19) | (0.46) | $12.30 | 4.14% | 0.20% | 2.08% | 19% |
| $611,536 |
|
| 2014 | $11.56 | 0.26 | 0.77 | 1.03 | (0.24) | (0.09) | (0.33) | $12.26 | 8.99% | 0.20% | 2.16% | 10% |
| $549,087 |
|
| 2013 | $10.64 | 0.20 | 1.02 | 1.22 | (0.20) | (0.10) | (0.30) | $11.56 | 11.67% | 0.20% | 1.79% | 6% |
| $384,010 |
|
| 2012 | $10.37 | 0.21 | 0.32 | 0.53 | (0.23) | (0.03) | (0.26) | $10.64 | 5.27% | 0.21% | 2.14% | 28% |
| $218,341 |
|
| Institutional Class | | | | | | | | | | |
| 2016 | $12.31 | 0.22 | 0.09 | 0.31 | (0.22) | (0.41) | (0.63) | $11.99 | 2.80% | 0.00%(4) | 1.95% | 12% |
| $733,520 |
|
| 2015 | $12.27 | 0.26 | 0.27 | 0.53 | (0.30) | (0.19) | (0.49) | $12.31 | 4.35% | 0.00%(4) | 2.28% | 19% |
| $579,653 |
|
| 2014 | $11.57 | 0.28 | 0.77 | 1.05 | (0.26) | (0.09) | (0.35) | $12.27 | 9.20% | 0.00%(4) | 2.36% | 10% |
| $310,325 |
|
| 2013 | $10.65 | 0.22 | 1.02 | 1.24 | (0.22) | (0.10) | (0.32) | $11.57 | 11.89% | 0.00%(4) | 1.99% | 6% |
| $211,576 |
|
| 2012 | $10.38 | 0.25 | 0.30 | 0.55 | (0.25) | (0.03) | (0.28) | $10.65 | 5.48% | 0.01% | 2.34% | 28% |
| $99,935 |
|
| A Class | | | | | | | | | | | | | |
| 2016 | $12.28 | 0.18 | 0.08 | 0.26 | (0.17) | (0.41) | (0.58) | $11.96 | 2.33% | 0.45% | 1.50% | 12% |
| $342,985 |
|
| 2015 | $12.23 | 0.23 | 0.25 | 0.48 | (0.24) | (0.19) | (0.43) | $12.28 | 3.97% | 0.45% | 1.83% | 19% |
| $357,730 |
|
| 2014 | $11.54 | 0.23 | 0.76 | 0.99 | (0.21) | (0.09) | (0.30) | $12.23 | 8.64% | 0.45% | 1.91% | 10% |
| $334,141 |
|
| 2013 | $10.62 | 0.17 | 1.02 | 1.19 | (0.17) | (0.10) | (0.27) | $11.54 | 11.41% | 0.45% | 1.54% | 6% |
| $270,040 |
|
| 2012 | $10.36 | 0.20 | 0.29 | 0.49 | (0.20) | (0.03) | (0.23) | $10.62 | 4.92% | 0.46% | 1.89% | 28% |
| $180,502 |
|
|
| | | | | | | | | | | | | | | |
| For a Share Outstanding Throughout the Years Ended July 31 (except as noted) | |
| Per-Share Data | | | Ratios and Supplemental Data |
| | | Income From Investment Operations: | Distributions From: | | | Ratio to Average Net Assets of: | | |
| | Net Asset Value, Beginning of Period | Net Investment Income (Loss)(1) | Net Realized and Unrealized Gain (Loss) | Total From Investment Operations | Net Investment Income | Net Realized Gains | Total Distributions | Net Asset Value, End of Period | Total Return(2) | Operating Expenses(3) | Net Investment Income (Loss) | Portfolio Turnover Rate | Net Assets, End of Period (in thousands) |
| C Class | | | | | | | | | | | | | |
| 2016 | $12.26 | 0.09 | 0.09 | 0.18 | (0.08) | (0.41) | (0.49) | $11.95 | 1.63% | 1.20% | 0.75% | 12% |
| $7,968 |
|
| 2015 | $12.22 | 0.14 | 0.23 | 0.37 | (0.14) | (0.19) | (0.33) | $12.26 | 3.09% | 1.20% | 1.08% | 19% |
| $11,578 |
|
| 2014 | $11.52 | 0.14 | 0.77 | 0.91 | (0.12) | (0.09) | (0.21) | $12.22 | 7.91% | 1.20% | 1.16% | 10% |
| $10,743 |
|
| 2013 | $10.61 | 0.08 | 1.02 | 1.10 | (0.09) | (0.10) | (0.19) | $11.52 | 10.48% | 1.20% | 0.79% | 6% |
| $6,117 |
|
| 2012 | $10.34 | 0.10 | 0.32 | 0.42 | (0.12) | (0.03) | (0.15) | $10.61 | 4.23% | 1.21% | 1.14% | 28% |
| $2,304 |
|
| R Class | | | | | | | | | | | | | |
| 2016 | $12.26 | 0.15 | 0.09 | 0.24 | (0.14) | (0.41) | (0.55) | $11.95 | 2.16% | 0.70% | 1.25% | 12% |
| $156,330 |
|
| 2015 | $12.22 | 0.20 | 0.24 | 0.44 | (0.21) | (0.19) | (0.40) | $12.26 | 3.62% | 0.70% | 1.58% | 19% |
| $167,576 |
|
| 2014 | $11.53 | 0.20 | 0.76 | 0.96 | (0.18) | (0.09) | (0.27) | $12.22 | 8.37% | 0.70% | 1.66% | 10% |
| $140,753 |
|
| 2013 | $10.61 | 0.14 | 1.03 | 1.17 | (0.15) | (0.10) | (0.25) | $11.53 | 11.14% | 0.70% | 1.29% | 6% |
| $102,250 |
|
| 2012 | $10.34 | 0.16 | 0.31 | 0.47 | (0.17) | (0.03) | (0.20) | $10.61 | 4.76% | 0.71% | 1.64% | 28% |
| $61,212 |
|
|
|
| Notes to Financial Highlights |
| |
| (1) | Computed using average shares outstanding throughout the period. |
| |
| (2) | Total returns are calculated based on the net asset value of the last business day and do not reflect applicable sales charges, if any. Total returns for periods less than one year are not annualized. |
| |
| (3) | Ratio of operating expenses to average net assets does not include any fees and expenses of the underlying funds. |
| |
| (4) | Ratio was less than 0.005%. |
See Notes to Financial Statements.
|
| | | | | | | | | | | | | | | |
| For a Share Outstanding Throughout the Years Ended July 31 (except as noted) | |
| Per-Share Data | | | Ratios and Supplemental Data |
| | | Income From Investment Operations: | Distributions From: | | | Ratio to Average Net Assets of: | | |
| | Net Asset Value, Beginning of Period | Net Investment Income (Loss)(1) | Net Realized and Unrealized Gain (Loss) | Total From Investment Operations | Net Investment Income | Net Realized Gains | Total Distributions | Net Asset Value, End of Period | Total Return(2) | Operating Expenses(3) | Net Investment Income (Loss) | Portfolio Turnover Rate | Net Assets, End of Period (in thousands) |
| One Choice 2025 Portfolio | | | | | | | | | | | |
| Investor Class | | | | | | | | | | | | | |
| 2016 | $14.62 | 0.25 | 0.08 | 0.33 | (0.24) | (0.63) | (0.87) | $14.08 | 2.55% | 0.20% | 1.81% | 11% |
| $1,147,291 |
|
| 2015 | $14.57 | 0.31 | 0.36 | 0.67 | (0.33) | (0.29) | (0.62) | $14.62 | 4.62% | 0.20% | 2.10% | 20% |
| $1,075,028 |
|
| 2014 | $13.71 | 0.32 | 0.98 | 1.30 | (0.30) | (0.14) | (0.44) | $14.57 | 9.61% | 0.20% | 2.23% | 7% |
| $992,507 |
|
| 2013 | $12.46 | 0.23 | 1.35 | 1.58 | (0.24) | (0.09) | (0.33) | $13.71 | 12.88% | 0.20% | 1.79% | 3% |
| $807,998 |
|
| 2012 | $12.13 | 0.25 | 0.34 | 0.59 | (0.26) | — | (0.26) | $12.46 | 4.99% | 0.21% | 2.07% | 21% |
| $554,462 |
|
| Institutional Class | | | | | | | | | | |
| 2016 | $14.64 | 0.27 | 0.08 | 0.35 | (0.27) | (0.63) | (0.90) | $14.09 | 2.69% | 0.00%(4) | 2.01% | 11% |
| $884,534 |
|
| 2015 | $14.58 | 0.32 | 0.39 | 0.71 | (0.36) | (0.29) | (0.65) | $14.64 | 4.90% | 0.00%(4) | 2.30% | 20% |
| $729,071 |
|
| 2014 | $13.72 | 0.34 | 0.99 | 1.33 | (0.33) | (0.14) | (0.47) | $14.58 | 9.83% | 0.00%(4) | 2.43% | 7% |
| $424,420 |
|
| 2013 | $12.47 | 0.26 | 1.35 | 1.61 | (0.27) | (0.09) | (0.36) | $13.72 | 13.10% | 0.00%(4) | 1.99% | 3% |
| $298,052 |
|
| 2012 | $12.14 | 0.27 | 0.34 | 0.61 | (0.28) | — | (0.28) | $12.47 | 5.20% | 0.01% | 2.27% | 21% |
| $181,693 |
|
| A Class | | | | | | | | | | | | | |
| 2016 | $14.60 | 0.22 | 0.07 | 0.29 | (0.20) | (0.63) | (0.83) | $14.06 | 2.28% | 0.45% | 1.56% | 11% |
| $528,973 |
|
| 2015 | $14.55 | 0.28 | 0.35 | 0.63 | (0.29) | (0.29) | (0.58) | $14.60 | 4.36% | 0.45% | 1.85% | 20% |
| $568,434 |
|
| 2014 | $13.69 | 0.29 | 0.98 | 1.27 | (0.27) | (0.14) | (0.41) | $14.55 | 9.35% | 0.45% | 1.98% | 7% |
| $528,142 |
|
| 2013 | $12.44 | 0.20 | 1.35 | 1.55 | (0.21) | (0.09) | (0.30) | $13.69 | 12.61% | 0.45% | 1.54% | 3% |
| $460,301 |
|
| 2012 | $12.11 | 0.22 | 0.34 | 0.56 | (0.23) | — | (0.23) | $12.44 | 4.73% | 0.46% | 1.82% | 21% |
| $327,130 |
|
|
| | | | | | | | | | | | | | | |
| For a Share Outstanding Throughout the Years Ended July 31 (except as noted) | |
| Per-Share Data | | | Ratios and Supplemental Data |
| | | Income From Investment Operations: | Distributions From: | | | Ratio to Average Net Assets of: | | |
| | Net Asset Value, Beginning of Period | Net Investment Income (Loss)(1) | Net Realized and Unrealized Gain (Loss) | Total From Investment Operations | Net Investment Income | Net Realized Gains | Total Distributions | Net Asset Value, End of Period | Total Return(2) | Operating Expenses(3) | Net Investment Income (Loss) | Portfolio Turnover Rate | Net Assets, End of Period (in thousands) |
| C Class | | | | | | | | | | | | | |
| 2016 | $14.58 | 0.11 | 0.07 | 0.18 | (0.10) | (0.63) | (0.73) | $14.03 | 1.42% | 1.20% | 0.81% | 11% |
| $7,822 |
|
| 2015 | $14.52 | 0.17 | 0.35 | 0.52 | (0.17) | (0.29) | (0.46) | $14.58 | 3.64% | 1.20% | 1.10% | 20% |
| $7,658 |
|
| 2014 | $13.67 | 0.18 | 0.97 | 1.15 | (0.16) | (0.14) | (0.30) | $14.52 | 8.46% | 1.20% | 1.23% | 7% |
| $7,147 |
|
| 2013 | $12.41 | 0.10 | 1.36 | 1.46 | (0.11) | (0.09) | (0.20) | $13.67 | 11.86% | 1.20% | 0.79% | 3% |
| $6,179 |
|
| 2012 | $12.09 | 0.12 | 0.34 | 0.46 | (0.14) | — | (0.14) | $12.41 | 3.87% | 1.21% | 1.07% | 21% |
| $3,498 |
|
| R Class | | | | | | | | | | | | | |
| 2016 | $14.58 | 0.18 | 0.08 | 0.26 | (0.17) | (0.63) | (0.80) | $14.04 | 2.03% | 0.70% | 1.31% | 11% |
| $222,337 |
|
| 2015 | $14.52 | 0.24 | 0.36 | 0.60 | (0.25) | (0.29) | (0.54) | $14.58 | 4.17% | 0.70% | 1.60% | 20% |
| $239,213 |
|
| 2014 | $13.67 | 0.25 | 0.97 | 1.22 | (0.23) | (0.14) | (0.37) | $14.52 | 9.01% | 0.70% | 1.73% | 7% |
| $210,067 |
|
| 2013 | $12.42 | 0.17 | 1.35 | 1.52 | (0.18) | (0.09) | (0.27) | $13.67 | 12.34% | 0.70% | 1.29% | 3% |
| $172,227 |
|
| 2012 | $12.09 | 0.19 | 0.34 | 0.53 | (0.20) | — | (0.20) | $12.42 | 4.48% | 0.71% | 1.57% | 21% |
| $129,489 |
|
| | | | | | | | | | | | | | |
|
|
| Notes to Financial Highlights |
| |
| (1) | Computed using average shares outstanding throughout the period. |
| |
| (2) | Total returns are calculated based on the net asset value of the last business day and do not reflect applicable sales charges, if any. Total returns for periods less than one year are not annualized. |
| |
| (3) | Ratio of operating expenses to average net assets does not include any fees and expenses of the underlying funds. |
| |
| (4) | Ratio was less than 0.005%. |
See Notes to Financial Statements.
|
| | | | | | | | | | | | | | | |
| For a Share Outstanding Throughout the Years Ended July 31 (except as noted) | | | | | |
| Per-Share Data | | | Ratios and Supplemental Data |
| | | Income From Investment Operations: | Distributions From: | | | Ratio to Average Net Assets of: | | |
| | Net Asset Value, Beginning of Period | Net Investment Income (Loss)(1) | Net Realized and Unrealized Gain (Loss) | Total From Investment Operations | Net Investment Income | Net Realized Gains | Total Distributions | Net Asset Value, End of Period | Total Return(2) | Operating Expenses(3) | Net Investment Income (Loss) | Portfolio Turnover Rate | Net Assets, End of Period (in thousands) |
| One Choice 2030 Portfolio | | | | | | | | | |
| Investor Class | | | | | | | | | | | |
| 2016 | $12.58 | 0.22 | 0.01 | 0.23 | (0.21) | (0.50) | (0.71) | $12.10 | 2.08% | 0.20% | 1.83% | 10% |
| $680,943 |
|
| 2015 | $12.44 | 0.26 | 0.41 | 0.67 | (0.27) | (0.26) | (0.53) | $12.58 | 5.43% | 0.20% | 2.04% | 20% |
| $590,896 |
|
| 2014 | $11.62 | 0.27 | 0.89 | 1.16 | (0.25) | (0.09) | (0.34) | $12.44 | 10.15% | 0.20% | 2.27% | 6% |
| $512,356 |
|
| 2013 | $10.41 | 0.18 | 1.30 | 1.48 | (0.18) | (0.09) | (0.27) | $11.62 | 14.53% | 0.21% | 1.66% | 5% |
| $333,309 |
|
| 2012 | $10.17 | 0.18 | 0.27 | 0.45 | (0.19) | (0.02) | (0.21) | $10.41 | 4.60% | 0.21% | 1.87% | 28% |
| $170,955 |
|
| Institutional Class | | | | | | | | | |
| 2016 | $12.59 | 0.23 | 0.02 | 0.25 | (0.23) | (0.50) | (0.73) | $12.11 | 2.29% | 0.00%(4) | 2.03% | 10% |
| $763,858 |
|
| 2015 | $12.44 | 0.27 | 0.44 | 0.71 | (0.30) | (0.26) | (0.56) | $12.59 | 5.73% | 0.00%(4) | 2.24% | 20% |
| $574,390 |
|
| 2014 | $11.62 | 0.30 | 0.89 | 1.19 | (0.28) | (0.09) | (0.37) | $12.44 | 10.37% | 0.00%(4) | 2.47% | 6% |
| $320,834 |
|
| 2013 | $10.42 | 0.21 | 1.28 | 1.49 | (0.20) | (0.09) | (0.29) | $11.62 | 14.76% | 0.01% | 1.86% | 5% |
| $202,598 |
|
| 2012 | $10.18 | 0.21 | 0.26 | 0.47 | (0.21) | (0.02) | (0.23) | $10.42 | 4.71% | 0.01% | 2.07% | 28% |
| $94,349 |
|
| A Class | | | | | | | | | | | | | |
| 2016 | $12.55 | 0.19 | 0.01 | 0.20 | (0.18) | (0.50) | (0.68) | $12.07 | 1.82% | 0.45% | 1.58% | 10% |
| $378,866 |
|
| 2015 | $12.41 | 0.23 | 0.41 | 0.64 | (0.24) | (0.26) | (0.50) | $12.55 | 5.18% | 0.45% | 1.79% | 20% |
| $385,874 |
|
| 2014 | $11.59 | 0.24 | 0.89 | 1.13 | (0.22) | (0.09) | (0.31) | $12.41 | 9.89% | 0.45% | 2.02% | 6% |
| $355,604 |
|
| 2013 | $10.38 | 0.16 | 1.30 | 1.46 | (0.16) | (0.09) | (0.25) | $11.59 | 14.28% | 0.46% | 1.41% | 5% |
| $264,393 |
|
| 2012 | $10.15 | 0.17 | 0.24 | 0.41 | (0.16) | (0.02) | (0.18) | $10.38 | 4.25% | 0.46% | 1.62% | 28% |
| $170,227 |
|
|
| | | | | | | | | | | | | | | |
| For a Share Outstanding Throughout the Years Ended July 31 (except as noted) | | | | | |
| Per-Share Data | | | Ratios and Supplemental Data |
| | | Income From Investment Operations: | Distributions From: | | | Ratio to Average Net Assets of: | | |
| | Net Asset Value, Beginning of Period | Net Investment Income (Loss)(1) | Net Realized and Unrealized Gain (Loss) | Total From Investment Operations | Net Investment Income | Net Realized Gains | Total Distributions | Net Asset Value, End of Period | Total Return(2) | Operating Expenses(3) | Net Investment Income (Loss) | Portfolio Turnover Rate | Net Assets, End of Period (in thousands) |
| C Class | | | | | | | | | | | | | |
| 2016 | $12.54 | 0.10 | 0.01 | 0.11 | (0.09) | (0.50) | (0.59) | $12.06 | 1.03% | 1.20% | 0.83% | 10% |
| $6,714 |
|
| 2015 | $12.39 | 0.13 | 0.42 | 0.55 | (0.14) | (0.26) | (0.40) | $12.54 | 4.46% | 1.20% | 1.04% | 20% |
| $5,628 |
|
| 2014 | $11.57 | 0.16 | 0.88 | 1.04 | (0.13) | (0.09) | (0.22) | $12.39 | 9.07% | 1.20% | 1.27% | 6% |
| $4,449 |
|
| 2013 | $10.37 | 0.07 | 1.29 | 1.36 | (0.07) | (0.09) | (0.16) | $11.57 | 13.32% | 1.21% | 0.66% | 5% |
| $3,417 |
|
| 2012 | $10.13 | 0.09 | 0.26 | 0.35 | (0.09) | (0.02) | (0.11) | $10.37 | 3.57% | 1.21% | 0.87% | 28% |
| $1,595 |
|
| R Class | | | | | | | | | | | | | |
| 2016 | $12.54 | 0.16 | 0.01 | 0.17 | (0.15) | (0.50) | (0.65) | $12.06 | 1.56% | 0.70% | 1.33% | 10% |
| $170,983 |
|
| 2015 | $12.39 | 0.20 | 0.42 | 0.62 | (0.21) | (0.26) | (0.47) | $12.54 | 4.99% | 0.70% | 1.54% | 20% |
| $173,221 |
|
| 2014 | $11.58 | 0.22 | 0.87 | 1.09 | (0.19) | (0.09) | (0.28) | $12.39 | 9.53% | 0.70% | 1.77% | 6% |
| $134,751 |
|
| 2013 | $10.37 | 0.13 | 1.30 | 1.43 | (0.13) | (0.09) | (0.22) | $11.58 | 14.00% | 0.71% | 1.16% | 5% |
| $103,886 |
|
| 2012 | $10.14 | 0.13 | 0.26 | 0.39 | (0.14) | (0.02) | (0.16) | $10.37 | 3.99% | 0.71% | 1.37% | 28% |
| $69,278 |
|
|
|
| Notes to Financial Highlights |
| |
| (1) | Computed using average shares outstanding throughout the period. |
| |
| (2) | Total returns are calculated based on the net asset value of the last business day and do not reflect applicable sales charges, if any. Total returns for periods less than one year are not annualized. |
| |
| (3) | Ratio of operating expenses to average net assets does not include any fees and expenses of the underlying funds. |
| |
| (4) | Ratio was less than 0.005%. |
See Notes to Financial Statements.
|
| | | | | | | | | | | | | | | |
| For a Share Outstanding Throughout the Years Ended July 31 (except as noted) | | | | | |
| Per-Share Data | | | Ratios and Supplemental Data |
| | | Income From Investment Operations: | Distributions From: | | | Ratio to Average Net Assets of: | | |
| | Net Asset Value, Beginning of Period | Net Investment Income (Loss)(1) | Net Realized and Unrealized Gain (Loss) | Total From Investment Operations | Net Investment Income | Net Realized Gains | Total Distributions | Net Asset Value, End of Period | Total Return(2) | Operating Expenses(3) | Net Investment Income (Loss) | Portfolio Turnover Rate | Net Assets, End of Period (in thousands) |
| One Choice 2035 Portfolio | | | | | | | | | |
| Investor Class | | | | | | | | | | | |
| 2016 | $15.83 | 0.27 | (0.07)(5) | 0.20 | (0.27) | (0.79) | (1.06) | $14.97 | 1.57% | 0.20% | 1.86% | 8% |
| $905,126 |
|
| 2015 | $15.60 | 0.33 | 0.62 | 0.95 | (0.34) | (0.38) | (0.72) | $15.83 | 6.25% | 0.20% | 2.03% | 23% |
| $839,655 |
|
| 2014 | $14.52 | 0.35 | 1.22 | 1.57 | (0.34) | (0.15) | (0.49) | $15.60 | 10.91% | 0.20% | 2.32% | 5% |
| $755,938 |
|
| 2013 | $12.81 | 0.22 | 1.82 | 2.04 | (0.22) | (0.11) | (0.33) | $14.52 | 16.24% | 0.20% | 1.62% | 3% |
| $573,216 |
|
| 2012 | $12.52 | 0.22 | 0.30 | 0.52 | (0.23) | — | (0.23) | $12.81 | 4.26% | 0.21% | 1.82% | 16% |
| $374,544 |
|
| Institutional Class | | | | | | | | | |
| 2016 | $15.86 | 0.29 | (0.06)(5) | 0.23 | (0.30) | (0.79) | (1.09) | $15.00 | 1.79% | 0.00%(4) | 2.06% | 8% |
| $726,622 |
|
| 2015 | $15.62 | 0.33 | 0.67 | 1.00 | (0.38) | (0.38) | (0.76) | $15.86 | 6.52% | 0.00%(4) | 2.23% | 23% |
| $556,384 |
|
| 2014 | $14.55 | 0.38 | 1.21 | 1.59 | (0.37) | (0.15) | (0.52) | $15.62 | 11.04% | 0.00%(4) | 2.52% | 5% |
| $323,043 |
|
| 2013 | $12.83 | 0.25 | 1.83 | 2.08 | (0.25) | (0.11) | (0.36) | $14.55 | 16.54% | 0.00%(4) | 1.82% | 3% |
| $235,505 |
|
| 2012 | $12.54 | 0.25 | 0.29 | 0.54 | (0.25) | — | (0.25) | $12.83 | 4.46% | 0.01% | 2.02% | 16% |
| $138,143 |
|
| A Class | | | | | | | | | | | | | |
| 2016 | $15.81 | 0.24 | (0.08)(5) | 0.16 | (0.23) | (0.79) | (1.02) | $14.95 | 1.31% | 0.45% | 1.61% | 8% |
| $438,398 |
|
| 2015 | $15.58 | 0.29 | 0.62 | 0.91 | (0.30) | (0.38) | (0.68) | $15.81 | 5.98% | 0.45% | 1.78% | 23% |
| $460,605 |
|
| 2014 | $14.51 | 0.32 | 1.20 | 1.52 | (0.30) | (0.15) | (0.45) | $15.58 | 10.57% | 0.45% | 2.07% | 5% |
| $425,198 |
|
| 2013 | $12.79 | 0.19 | 1.83 | 2.02 | (0.19) | (0.11) | (0.30) | $14.51 | 16.05% | 0.45% | 1.37% | 3% |
| $356,751 |
|
| 2012 | $12.50 | 0.20 | 0.29 | 0.49 | (0.20) | — | (0.20) | $12.79 | 4.00% | 0.46% | 1.57% | 16% |
| $239,410 |
|
|
| | | | | | | | | | | | | | | |
| For a Share Outstanding Throughout the Years Ended July 31 (except as noted) | | | | | |
| Per-Share Data | | | Ratios and Supplemental Data |
| | | Income From Investment Operations: | Distributions From: | | | Ratio to Average Net Assets of: | | |
| | Net Asset Value, Beginning of Period | Net Investment Income (Loss)(1) | Net Realized and Unrealized Gain (Loss) | Total From Investment Operations | Net Investment Income | Net Realized Gains | Total Distributions | Net Asset Value, End of Period | Total Return(2) | Operating Expenses(3) | Net Investment Income (Loss) | Portfolio Turnover Rate | Net Assets, End of Period (in thousands) |
| C Class | | | | | | | | | | | | | |
| 2016 | $15.77 | 0.13 | (0.08)(5) | 0.05 | (0.11) | (0.79) | (0.90) | $14.92 | 0.59% | 1.20% | 0.86% | 8% |
| $6,533 |
|
| 2015 | $15.53 | 0.16 | 0.64 | 0.80 | (0.18) | (0.38) | (0.56) | $15.77 | 5.25% | 1.20% | 1.03% | 23% |
| $6,587 |
|
| 2014 | $14.46 | 0.19 | 1.21 | 1.40 | (0.18) | (0.15) | (0.33) | $15.53 | 9.76% | 1.20% | 1.32% | 5% |
| $4,586 |
|
| 2013 | $12.76 | 0.08 | 1.82 | 1.90 | (0.09) | (0.11) | (0.20) | $14.46 | 15.05% | 1.20% | 0.62% | 3% |
| $3,572 |
|
| 2012 | $12.46 | 0.09 | 0.32 | 0.41 | (0.11) | — | (0.11) | $12.76 | 3.31% | 1.21% | 0.82% | 16% |
| $1,396 |
|
| R Class | | | | | | | | | | | | | |
| 2016 | $15.79 | 0.20 | (0.07)(5) | 0.13 | (0.19) | (0.79) | (0.98) | $14.94 | 1.11% | 0.70% | 1.36% | 8% |
| $206,155 |
|
| 2015 | $15.56 | 0.25 | 0.62 | 0.87 | (0.26) | (0.38) | (0.64) | $15.79 | 5.71% | 0.70% | 1.53% | 23% |
| $206,773 |
|
| 2014 | $14.49 | 0.27 | 1.21 | 1.48 | (0.26) | (0.15) | (0.41) | $15.56 | 10.30% | 0.70% | 1.82% | 5% |
| $182,137 |
|
| 2013 | $12.78 | 0.16 | 1.82 | 1.98 | (0.16) | (0.11) | (0.27) | $14.49 | 15.69% | 0.70% | 1.12% | 3% |
| $141,978 |
|
| 2012 | $12.48 | 0.16 | 0.31 | 0.47 | (0.17) | — | (0.17) | $12.78 | 3.83% | 0.71% | 1.32% | 16% |
| $101,164 |
|
|
|
| Notes to Financial Highlights |
| |
| (1) | Computed using average shares outstanding throughout the period. |
| |
| (2) | Total returns are calculated based on the net asset value of the last business day and do not reflect applicable sales charges, if any. Total returns for periods less than one year are not annualized. |
| |
| (3) | Ratio of operating expenses to average net assets does not include any fees and expenses of the underlying funds. |
| |
| (4) | Ratio was less than 0.005%. |
| |
| (5) | Per-share amount was not in accord with the net realized and unrealized gain (loss) for the period because of the timing of transactions in shares of the fund and the amount and timing of per-share net |
realized and unrealized gain (loss) on such shares.
See Notes to Financial Statements.
|
| | | | | | | | | | | | | | | |
| For a Share Outstanding Throughout the Years Ended July 31 (except as noted) | | | | | |
| Per-Share Data | | | Ratios and Supplemental Data |
| | | Income From Investment Operations: | Distributions From: | | | Ratio to Average Net Assets of: | | |
| | Net Asset Value, Beginning of Period | Net Investment Income (Loss)(1) | Net Realized and Unrealized Gain (Loss) | Total From Investment Operations | Net Investment Income | Net Realized Gains | Total Distributions | Net Asset Value, End of Period | Total Return(2) | Operating Expenses(3) | Net Investment Income (Loss) | Portfolio Turnover Rate | Net Assets, End of Period (in thousands) |
| One Choice 2040 Portfolio | | | | | | | | | |
| Investor Class | | | | | | | | | | | |
| 2016 | $13.14 | 0.23 | (0.09)(5) | 0.14 | (0.22) | (0.58) | (0.80) | $12.48 | 1.34% | 0.20% | 1.86% | 8% |
| $546,509 |
|
| 2015 | $12.86 | 0.28 | 0.59 | 0.87 | (0.29) | (0.30) | (0.59) | $13.14 | 6.84% | 0.20% | 2.06% | 20% |
| $472,335 |
|
| 2014 | $11.87 | 0.30 | 1.07 | 1.37 | (0.28) | (0.10) | (0.38) | $12.86 | 11.63% | 0.20% | 2.38% | 4% |
| $392,199 |
|
| 2013 | $10.31 | 0.18 | 1.62 | 1.80 | (0.16) | (0.08) | (0.24) | $11.87 | 17.83% | 0.20% | 1.58% | 5% |
| $234,285 |
|
| 2012 | $10.11 | 0.17 | 0.23 | 0.40 | (0.17) | (0.03) | (0.20) | $10.31 | 4.05% | 0.21% | 1.71% | 20% |
| $107,290 |
|
| Institutional Class | | | | | | | | | |
| 2016 | $13.15 | 0.24 | (0.07)(5) | 0.17 | (0.25) | (0.58) | (0.83) | $12.49 | 1.55% | 0.00%(4) | 2.06% | 8% |
| $585,381 |
|
| 2015 | $12.87 | 0.28 | 0.61 | 0.89 | (0.31) | (0.30) | (0.61) | $13.15 | 7.05% | 0.00%(4) | 2.26% | 20% |
| $437,728 |
|
| 2014 | $11.88 | 0.32 | 1.07 | 1.39 | (0.30) | (0.10) | (0.40) | $12.87 | 11.84% | 0.00%(4) | 2.58% | 4% |
| $243,924 |
|
| 2013 | $10.32 | 0.20 | 1.62 | 1.82 | (0.18) | (0.08) | (0.26) | $11.88 | 18.05% | 0.00%(4) | 1.78% | 5% |
| $156,913 |
|
| 2012 | $10.12 | 0.19 | 0.23 | 0.42 | (0.19) | (0.03) | (0.22) | $10.32 | 4.26% | 0.01% | 1.91% | 20% |
| $70,149 |
|
| A Class | | | | | | | | | | | | | |
| 2016 | $13.12 | 0.20 | (0.09)(5) | 0.11 | (0.19) | (0.58) | (0.77) | $12.46 | 1.08% | 0.45% | 1.61% | 8% |
| $266,244 |
|
| 2015 | $12.84 | 0.24 | 0.59 | 0.83 | (0.25) | (0.30) | (0.55) | $13.12 | 6.57% | 0.45% | 1.81% | 20% |
| $267,038 |
|
| 2014 | $11.85 | 0.26 | 1.07 | 1.33 | (0.24) | (0.10) | (0.34) | $12.84 | 11.36% | 0.45% | 2.13% | 4% |
| $230,764 |
|
| 2013 | $10.30 | 0.15 | 1.62 | 1.77 | (0.14) | (0.08) | (0.22) | $11.85 | 17.45% | 0.45% | 1.33% | 5% |
| $176,014 |
|
| 2012 | $10.10 | 0.15 | 0.22 | 0.37 | (0.14) | (0.03) | (0.17) | $10.30 | 3.80% | 0.46% | 1.46% | 20% |
| $110,524 |
|
|
| | | | | | | | | | | | | | | |
| For a Share Outstanding Throughout the Years Ended July 31 (except as noted) | | | | | |
| Per-Share Data | | | Ratios and Supplemental Data |
| | | Income From Investment Operations: | Distributions From: | | | Ratio to Average Net Assets of: | | |
| | Net Asset Value, Beginning of Period | Net Investment Income (Loss)(1) | Net Realized and Unrealized Gain (Loss) | Total From Investment Operations | Net Investment Income | Net Realized Gains | Total Distributions | Net Asset Value, End of Period | Total Return(2) | Operating Expenses(3) | Net Investment Income (Loss) | Portfolio Turnover Rate | Net Assets, End of Period (in thousands) |
| C Class | | | | | | | | | | | | | |
| 2016 | $13.08 | 0.10 | (0.09)(5) | 0.01 | (0.09) | (0.58) | (0.67) | $12.42 | 0.29% | 1.20% | 0.86% | 8% |
| $3,529 |
|
| 2015 | $12.80 | 0.15 | 0.58 | 0.73 | (0.15) | (0.30) | (0.45) | $13.08 | 5.77% | 1.20% | 1.06% | 20% |
| $3,158 |
|
| 2014 | $11.82 | 0.17 | 1.06 | 1.23 | (0.15) | (0.10) | (0.25) | $12.80 | 10.46% | 1.20% | 1.38% | 4% |
| $2,939 |
|
| 2013 | $10.26 | 0.07 | 1.62 | 1.69 | (0.05) | (0.08) | (0.13) | $11.82 | 16.71% | 1.20% | 0.58% | 5% |
| $2,049 |
|
| 2012 | $10.07 | 0.06 | 0.23 | 0.29 | (0.07) | (0.03) | (0.10) | $10.26 | 2.93% | 1.21% | 0.71% | 20% |
| $559 |
|
| R Class | | | | | | | | | | | | | |
| 2016 | $13.10 | 0.17 | (0.09)(5) | 0.08 | (0.16) | (0.58) | (0.74) | $12.44 | 0.82% | 0.70% | 1.36% | 8% |
| $128,486 |
|
| 2015 | $12.82 | 0.21 | 0.59 | 0.80 | (0.22) | (0.30) | (0.52) | $13.10 | 6.31% | 0.70% | 1.56% | 20% |
| $122,661 |
|
| 2014 | $11.83 | 0.23 | 1.07 | 1.30 | (0.21) | (0.10) | (0.31) | $12.82 | 11.10% | 0.70% | 1.88% | 4% |
| $94,677 |
|
| 2013 | $10.28 | 0.12 | 1.62 | 1.74 | (0.11) | (0.08) | (0.19) | $11.83 | 17.18% | 0.70% | 1.08% | 5% |
| $64,687 |
|
| 2012 | $10.08 | 0.12 | 0.23 | 0.35 | (0.12) | (0.03) | (0.15) | $10.28 | 3.54% | 0.71% | 1.21% | 20% |
| $36,524 |
|
|
|
| Notes to Financial Highlights |
| |
| (1) | Computed using average shares outstanding throughout the period. |
| |
| (2) | Total returns are calculated based on the net asset value of the last business day and do not reflect applicable sales charges, if any. Total returns for periods less than one year are not annualized. |
| |
| (3) | Ratio of operating expenses to average net assets does not include any fees and expenses of the underlying funds. |
| |
| (4) | Ratio was less than 0.005%. |
| |
| (5) | Per-share amount was not in accord with the net realized and unrealized gain (loss) for the period because of the timing of transactions in shares of the fund and the amount and timing of per-share net |
realized and unrealized gain (loss) on such shares.
See Notes to Financial Statements.
|
| | | | | | | | | | | | | | | |
| For a Share Outstanding Throughout the Years Ended July 31 (except as noted) | | | | | |
| Per-Share Data | | | Ratios and Supplemental Data |
| | | Income From Investment Operations: | Distributions From: | | | Ratio to Average Net Assets of: | | |
| | Net Asset Value, Beginning of Period | Net Investment Income (Loss)(1) | Net Realized and Unrealized Gain (Loss) | Total From Investment Operations | Net Investment Income | Net Realized Gains | Total Distributions | Net Asset Value, End of Period | Total Return(2) | Operating Expenses(3) | Net Investment Income (Loss) | Portfolio Turnover Rate | Net Assets, End of Period (in thousands) |
| One Choice 2045 Portfolio | | | | | | | | | |
| Investor Class | | | | | | | | | | | |
| 2016 | $16.57 | 0.29 | (0.15)(5) | 0.14 | (0.28) | (0.90) | (1.18) | $15.53 | 1.19% | 0.20% | 1.88% | 7% |
| $666,583 |
|
| 2015 | $16.22 | 0.35 | 0.80 | 1.15 | (0.37) | (0.43) | (0.80) | $16.57 | 7.22% | 0.20% | 2.10% | 23% |
| $608,154 |
|
| 2014 | $14.92 | 0.37 | 1.44 | 1.81 | (0.36) | (0.15) | (0.51) | $16.22 | 12.34% | 0.20% | 2.38% | 4% |
| $523,828 |
|
| 2013 | $12.84 | 0.22 | 2.17 | 2.39 | (0.21) | (0.10) | (0.31) | $14.92 | 18.94% | 0.20% | 1.58% | 3% |
| $355,470 |
|
| 2012 | $12.59 | 0.20 | 0.26 | 0.46 | (0.21) | — | (0.21) | $12.84 | 3.76% | 0.21% | 1.66% | 14% |
| $222,501 |
|
| Institutional Class | | | | | | | | | |
| 2016 | $16.60 | 0.31 | (0.14)(5) | 0.17 | (0.31) | (0.90) | (1.21) | $15.56 | 1.40% | 0.00%(4) | 2.08% | 7% |
| $563,161 |
|
| 2015 | $16.24 | 0.36 | 0.84 | 1.20 | (0.41) | (0.43) | (0.84) | $16.60 | 7.50% | 0.00%(4) | 2.30% | 23% |
| $437,726 |
|
| 2014 | $14.94 | 0.40 | 1.44 | 1.84 | (0.39) | (0.15) | (0.54) | $16.24 | 12.55% | 0.00%(4) | 2.58% | 4% |
| $281,772 |
|
| 2013 | $12.86 | 0.25 | 2.17 | 2.42 | (0.24) | (0.10) | (0.34) | $14.94 | 19.15% | 0.00%(4) | 1.78% | 3% |
| $196,557 |
|
| 2012 | $12.60 | 0.23 | 0.26 | 0.49 | (0.23) | — | (0.23) | $12.86 | 4.04% | 0.01% | 1.86% | 14% |
| $116,894 |
|
| A Class | | | | | | | | | | | | | |
| 2016 | $16.54 | 0.25 | (0.14)(5) | 0.11 | (0.24) | (0.90) | (1.14) | $15.51 | 0.98% | 0.45% | 1.63% | 7% |
| $288,989 |
|
| 2015 | $16.19 | 0.31 | 0.80 | 1.11 | (0.33) | (0.43) | (0.76) | $16.54 | 6.96% | 0.45% | 1.85% | 23% |
| $306,435 |
|
| 2014 | $14.89 | 0.34 | 1.43 | 1.77 | (0.32) | (0.15) | (0.47) | $16.19 | 12.08% | 0.45% | 2.13% | 4% |
| $283,598 |
|
| 2013 | $12.82 | 0.18 | 2.17 | 2.35 | (0.18) | (0.10) | (0.28) | $14.89 | 18.59% | 0.45% | 1.33% | 3% |
| $231,054 |
|
| 2012 | $12.56 | 0.18 | 0.26 | 0.44 | (0.18) | — | (0.18) | $12.82 | 3.59% | 0.46% | 1.41% | 14% |
| $147,197 |
|
|
| | | | | | | | | | | | | | | |
| For a Share Outstanding Throughout the Years Ended July 31 (except as noted) | | | | | |
| Per-Share Data | | | Ratios and Supplemental Data |
| | | Income From Investment Operations: | Distributions From: | | | Ratio to Average Net Assets of: | | |
| | Net Asset Value, Beginning of Period | Net Investment Income (Loss)(1) | Net Realized and Unrealized Gain (Loss) | Total From Investment Operations | Net Investment Income | Net Realized Gains | Total Distributions | Net Asset Value, End of Period | Total Return(2) | Operating Expenses(3) | Net Investment Income (Loss) | Portfolio Turnover Rate | Net Assets, End of Period (in thousands) |
| C Class | | | | | | | | | | | | | |
| 2016 | $16.51 | 0.14 | (0.15)(5) | (0.01) | (0.12) | (0.90) | (1.02) | $15.48 | 0.19% | 1.20% | 0.88% | 7% |
| $2,944 |
|
| 2015 | $16.15 | 0.16 | 0.83 | 0.99 | (0.20) | (0.43) | (0.63) | $16.51 | 6.21% | 1.20% | 1.10% | 23% |
| $2,459 |
|
| 2014 | $14.86 | 0.20 | 1.44 | 1.64 | (0.20) | (0.15) | (0.35) | $16.15 | 11.18% | 1.20% | 1.38% | 4% |
| $1,993 |
|
| 2013 | $12.79 | 0.10 | 2.15 | 2.25 | (0.08) | (0.10) | (0.18) | $14.86 | 17.72% | 1.20% | 0.58% | 3% |
| $1,220 |
|
| 2012 | $12.53 | 0.08 | 0.27 | 0.35 | (0.09) | — | (0.09) | $12.79 | 2.82% | 1.21% | 0.66% | 14% |
| $633 |
|
| R Class | | | | | | | | | | | | | |
| 2016 | $16.53 | 0.21 | (0.15)(5) | 0.06 | (0.20) | (0.90) | (1.10) | $15.49 | 0.66% | 0.70% | 1.38% | 7% |
| $136,567 |
|
| 2015 | $16.17 | 0.27 | 0.81 | 1.08 | (0.29) | (0.43) | (0.72) | $16.53 | 6.75% | 0.70% | 1.60% | 23% |
| $130,537 |
|
| 2014 | $14.88 | 0.30 | 1.42 | 1.72 | (0.28) | (0.15) | (0.43) | $16.17 | 11.73% | 0.70% | 1.88% | 4% |
| $117,392 |
|
| 2013 | $12.81 | 0.15 | 2.17 | 2.32 | (0.15) | (0.10) | (0.25) | $14.88 | 18.30% | 0.70% | 1.08% | 3% |
| $91,776 |
|
| 2012 | $12.55 | 0.14 | 0.27 | 0.41 | (0.15) | — | (0.15) | $12.81 | 3.33% | 0.71% | 1.16% | 14% |
| $62,208 |
|
|
|
| Notes to Financial Highlights |
| |
| (1) | Computed using average shares outstanding throughout the period. |
| |
| (2) | Total returns are calculated based on the net asset value of the last business day and do not reflect applicable sales charges, if any. Total returns for periods less than one year are not annualized. |
| |
| (3) | Ratio of operating expenses to average net assets does not include any fees and expenses of the underlying funds. |
| |
| (4) | Ratio was less than 0.005%. |
| |
| (5) | Per-share amount was not in accord with the net realized and unrealized gain (loss) for the period because of the timing of transactions in shares of the fund and the amount and timing of per-share net |
realized and unrealized gain (loss) on such shares.
See Notes to Financial Statements.
|
| | | | | | | | | | | | | | | |
| For a Share Outstanding Throughout the Years Ended July 31 (except as noted) | | | | | |
| Per-Share Data | | | Ratios and Supplemental Data |
| | | Income From Investment Operations: | Distributions From: | | | Ratio to Average Net Assets of: | | |
| | Net Asset Value, Beginning of Period | Net Investment Income (Loss)(1) | Net Realized and Unrealized Gain (Loss) | Total From Investment Operations | Net Investment Income | Net Realized Gains | Total Distributions | Net Asset Value, End of Period | Total Return(2) | Operating Expenses(3) | Net Investment Income (Loss) | Portfolio Turnover Rate | Net Assets, End of Period (in thousands) |
| One Choice 2050 Portfolio | | | | | | | | | |
| Investor Class | | | | | | | | | | | |
| 2016 | $13.20 | 0.22 | (0.12)(5) | 0.10 | (0.22) | (0.59) | (0.81) | $12.49 | 1.09% | 0.20% | 1.85% | 7% |
| $332,786 |
|
| 2015 | $12.85 | 0.28 | 0.66 | 0.94 | (0.29) | (0.30) | (0.59) | $13.20 | 7.37% | 0.20% | 2.06% | 21% |
| $268,548 |
|
| 2014 | $11.77 | 0.29 | 1.17 | 1.46 | (0.28) | (0.10) | (0.38) | $12.85 | 12.59% | 0.20% | 2.35% | 4% |
| $214,823 |
|
| 2013 | $10.07 | 0.16 | 1.77 | 1.93 | (0.15) | (0.08) | (0.23) | $11.77 | 19.51% | 0.20% | 1.51% | 4% |
| $115,834 |
|
| 2012 | $9.88 | 0.14 | 0.21 | 0.35 | (0.14) | (0.02) | (0.16) | $10.07 | 3.67% | 0.21% | 1.53% | 12% |
| $48,553 |
|
| Institutional Class | | | | | | | | | |
| 2016 | $13.22 | 0.24 | (0.12)(5) | 0.12 | (0.24) | (0.59) | (0.83) | $12.51 | 1.30% | 0.00%(4) | 2.05% | 7% |
| $365,225 |
|
| 2015 | $12.87 | 0.28 | 0.68 | 0.96 | (0.31) | (0.30) | (0.61) | $13.22 | 7.58% | 0.00%(4) | 2.26% | 21% |
| $257,921 |
|
| 2014 | $11.79 | 0.32 | 1.17 | 1.49 | (0.31) | (0.10) | (0.41) | $12.87 | 12.79% | 0.00%(4) | 2.55% | 4% |
| $135,635 |
|
| 2013 | $10.09 | 0.19 | 1.76 | 1.95 | (0.17) | (0.08) | (0.25) | $11.79 | 19.72% | 0.00%(4) | 1.71% | 4% |
| $95,469 |
|
| 2012 | $9.90 | 0.17 | 0.20 | 0.37 | (0.16) | (0.02) | (0.18) | $10.09 | 3.87% | 0.01% | 1.73% | 12% |
| $49,284 |
|
| A Class | | | | | | | | | | | | | |
| 2016 | $13.18 | 0.20 | (0.13)(5) | 0.07 | (0.19) | (0.59) | (0.78) | $12.47 | 0.83% | 0.45% | 1.60% | 7% |
| $157,110 |
|
| 2015 | $12.83 | 0.24 | 0.66 | 0.90 | (0.25) | (0.30) | (0.55) | $13.18 | 7.11% | 0.45% | 1.81% | 21% |
| $162,011 |
|
| 2014 | $11.75 | 0.26 | 1.17 | 1.43 | (0.25) | (0.10) | (0.35) | $12.83 | 12.32% | 0.45% | 2.10% | 4% |
| $131,709 |
|
| 2013 | $10.06 | 0.14 | 1.76 | 1.90 | (0.13) | (0.08) | (0.21) | $11.75 | 19.13% | 0.45% | 1.26% | 4% |
| $91,012 |
|
| 2012 | $9.87 | 0.13 | 0.20 | 0.33 | (0.12) | (0.02) | (0.14) | $10.06 | 3.41% | 0.46% | 1.28% | 12% |
| $55,073 |
|
|
| | | | | | | | | | | | | | | |
| For a Share Outstanding Throughout the Years Ended July 31 (except as noted) | | | | | |
| Per-Share Data | | | Ratios and Supplemental Data |
| | | Income From Investment Operations: | Distributions From: | | | Ratio to Average Net Assets of: | | |
| | Net Asset Value, Beginning of Period | Net Investment Income (Loss)(1) | Net Realized and Unrealized Gain (Loss) | Total From Investment Operations | Net Investment Income | Net Realized Gains | Total Distributions | Net Asset Value, End of Period | Total Return(2) | Operating Expenses(3) | Net Investment Income (Loss) | Portfolio Turnover Rate | Net Assets, End of Period (in thousands) |
| C Class | | | | | | | | | | | | | |
| 2016 | $13.15 | 0.11 | (0.13)(5) | (0.02) | (0.09) | (0.59) | (0.68) | $12.45 | 0.11% | 1.20% | 0.85% | 7% |
| $1,939 |
|
| 2015 | $12.80 | 0.15 | 0.65 | 0.80 | (0.15) | (0.30) | (0.45) | $13.15 | 6.30% | 1.20% | 1.06% | 21% |
| $2,197 |
|
| 2014 | $11.73 | 0.19 | 1.14 | 1.33 | (0.16) | (0.10) | (0.26) | $12.80 | 11.40% | 1.20% | 1.35% | 4% |
| $1,983 |
|
| 2013 | $10.04 | 0.06 | 1.76 | 1.82 | (0.05) | (0.08) | (0.13) | $11.73 | 18.26% | 1.20% | 0.51% | 4% |
| $1,748 |
|
| 2012 | $9.85 | 0.05 | 0.21 | 0.26 | (0.05) | (0.02) | (0.07) | $10.04 | 2.64% | 1.21% | 0.53% | 12% |
| $530 |
|
| R Class | | | | | | | | | | | | | |
| 2016 | $13.16 | 0.17 | (0.13)(5) | 0.04 | (0.15) | (0.59) | (0.74) | $12.46 | 0.64% | 0.70% | 1.35% | 7% |
| $71,705 |
|
| 2015 | $12.81 | 0.21 | 0.66 | 0.87 | (0.22) | (0.30) | (0.52) | $13.16 | 6.84% | 0.70% | 1.56% | 21% |
| $62,763 |
|
| 2014 | $11.74 | 0.23 | 1.16 | 1.39 | (0.22) | (0.10) | (0.32) | $12.81 | 11.96% | 0.70% | 1.85% | 4% |
| $47,771 |
|
| 2013 | $10.05 | 0.11 | 1.76 | 1.87 | (0.10) | (0.08) | (0.18) | $11.74 | 18.84% | 0.70% | 1.01% | 4% |
| $32,896 |
|
| 2012 | $9.86 | 0.10 | 0.21 | 0.31 | (0.10) | (0.02) | (0.12) | $10.05 | 3.16% | 0.71% | 1.03% | 12% |
| $15,933 |
|
|
|
| Notes to Financial Highlights |
| |
| (1) | Computed using average shares outstanding throughout the period. |
| |
| (2) | Total returns are calculated based on the net asset value of the last business day and do not reflect applicable sales charges, if any. Total returns for periods less than one year are not annualized. |
| |
| (3) | Ratio of operating expenses to average net assets does not include any fees and expenses of the underlying funds. |
| |
| (4) | Ratio was less than 0.005%. |
| |
| (5) | Per-share amount was not in accord with the net realized and unrealized gain (loss) for the period because of the timing of transactions in shares of the fund and the amount and timing of per-share net |
realized and unrealized gain (loss) on such shares.
See Notes to Financial Statements.
|
| | | | | | | | | | | | | | | |
| For a Share Outstanding Throughout the Years Ended July 31 (except as noted) | | | | | |
| Per-Share Data | | | Ratios and Supplemental Data |
| | | Income From Investment Operations: | Distributions From: | | | Ratio to Average Net Assets of: | | |
| | Net Asset Value, Beginning of Period | Net Investment Income (Loss)(1) | Net Realized and Unrealized Gain (Loss) | Total From Investment Operations | Net Investment Income | Net Realized Gains | Total Distributions | Net Asset Value, End of Period | Total Return(2) | Operating Expenses(3) | Net Investment Income (Loss) | Portfolio Turnover Rate | Net Assets, End of Period (in thousands) |
| One Choice 2055 Portfolio | | | | | | | | | |
| Investor Class | | | | | | | | | | | |
| 2016 | $13.72 | 0.22 | (0.11)(5) | 0.11 | (0.22) | (0.43) | (0.65) | $13.18 | 1.02% | 0.20% | 1.78% | 6% |
| $106,441 |
|
| 2015 | $13.22 | 0.27 | 0.72 | 0.99 | (0.28) | (0.21) | (0.49) | $13.72 | 7.56% | 0.20% | 1.94% | 24% |
| $66,163 |
|
| 2014 | $12.02 | 0.30 | 1.24 | 1.54 | (0.28) | (0.06) | (0.34) | $13.22 | 12.87% | 0.20% | 2.22% | 8% |
| $33,357 |
|
| 2013 | $10.19 | 0.15 | 1.85 | 2.00 | (0.14) | (0.03) | (0.17) | $12.02 | 19.86% | 0.20% | 1.36% | 13% |
| $14,959 |
|
| 2012 | $9.92 | 0.12 | 0.25 | 0.37 | (0.10) | — | (0.10) | $10.19 | 3.78% | 0.20% | 1.25% | 44% |
| $3,920 |
|
| Institutional Class | | | | | | | | | |
| 2016 | $13.73 | 0.25 | (0.12)(5) | 0.13 | (0.24) | (0.43) | (0.67) | $13.19 | 1.23% | 0.00%(4) | 1.98% | 6% |
| $162,255 |
|
| 2015 | $13.23 | 0.28 | 0.74 | 1.02 | (0.31) | (0.21) | (0.52) | $13.73 | 7.78% | 0.00%(4) | 2.14% | 24% |
| $92,653 |
|
| 2014 | $12.03 | 0.28 | 1.28 | 1.56 | (0.30) | (0.06) | (0.36) | $13.23 | 13.09% | 0.00%(4) | 2.42% | 8% |
| $43,147 |
|
| 2013 | $10.20 | 0.18 | 1.84 | 2.02 | (0.16) | (0.03) | (0.19) | $12.03 | 20.08% | 0.00%(4) | 1.56% | 13% |
| $10,951 |
|
| 2012 | $9.92 | 0.14 | 0.25 | 0.39 | (0.11) | — | (0.11) | $10.20 | 4.04% | 0.00%(4) | 1.45% | 44% |
| $3,939 |
|
| A Class | | | | | | | | | | | | | |
| 2016 | $13.69 | 0.20 | (0.13)(5) | 0.07 | (0.18) | (0.43) | (0.61) | $13.15 | 0.76% | 0.45% | 1.53% | 6% |
| $65,954 |
|
| 2015 | $13.19 | 0.24 | 0.72 | 0.96 | (0.25) | (0.21) | (0.46) | $13.69 | 7.31% | 0.45% | 1.69% | 24% |
| $51,889 |
|
| 2014 | $12.00 | 0.26 | 1.23 | 1.49 | (0.24) | (0.06) | (0.30) | $13.19 | 12.52% | 0.45% | 1.97% | 8% |
| $31,787 |
|
| 2013 | $10.17 | 0.13 | 1.85 | 1.98 | (0.12) | (0.03) | (0.15) | $12.00 | 19.59% | 0.45% | 1.11% | 13% |
| $14,138 |
|
| 2012 | $9.91 | 0.10 | 0.24 | 0.34 | (0.08) | — | (0.08) | $10.17 | 3.49% | 0.45% | 1.00% | 44% |
| $3,253 |
|
|
| | | | | | | | | | | | | | | |
| For a Share Outstanding Throughout the Years Ended July 31 (except as noted) | | | | | |
| Per-Share Data | | | Ratios and Supplemental Data |
| | | Income From Investment Operations: | Distributions From: | | | Ratio to Average Net Assets of: | | |
| | Net Asset Value, Beginning of Period | Net Investment Income (Loss)(1) | Net Realized and Unrealized Gain (Loss) | Total From Investment Operations | Net Investment Income | Net Realized Gains | Total Distributions | Net Asset Value, End of Period | Total Return(2) | Operating Expenses(3) | Net Investment Income (Loss) | Portfolio Turnover Rate | Net Assets, End of Period (in thousands) |
| C Class | | | | | | | | | | | | | |
| 2016 | $13.64 | 0.11 | (0.13)(5) | (0.02) | (0.08) | (0.43) | (0.51) | $13.11 | 0.06% | 1.20% | 0.78% | 6% |
| $636 |
|
| 2015 | $13.14 | 0.14 | 0.71 | 0.85 | (0.14) | (0.21) | (0.35) | $13.64 | 6.51% | 1.20% | 0.94% | 24% |
| $557 |
|
| 2014 | $11.95 | 0.17 | 1.23 | 1.40 | (0.15) | (0.06) | (0.21) | $13.14 | 11.72% | 1.20% | 1.22% | 8% |
| $428 |
|
| 2013 | $10.13 | 0.05 | 1.84 | 1.89 | (0.04) | (0.03) | (0.07) | $11.95 | 18.66% | 1.20% | 0.36% | 13% |
| $215 |
|
| 2012 | $9.88 | 0.02 | 0.26 | 0.28 | (0.03) | — | (0.03) | $10.13 | 2.81% | 1.20% | 0.25% | 44% |
| $87 |
|
| R Class | | | | | | | | | | | | | |
| 2016 | $13.69 | 0.17 | (0.13)(5) | 0.04 | (0.15) | (0.43) | (0.58) | $13.15 | 0.51% | 0.70% | 1.28% | 6% |
| $35,414 |
|
| 2015 | $13.18 | 0.21 | 0.72 | 0.93 | (0.21) | (0.21) | (0.42) | $13.69 | 7.11% | 0.70% | 1.44% | 24% |
| $24,867 |
|
| 2014 | $11.99 | 0.23 | 1.23 | 1.46 | (0.21) | (0.06) | (0.27) | $13.18 | 12.25% | 0.70% | 1.72% | 8% |
| $13,999 |
|
| 2013 | $10.16 | 0.09 | 1.86 | 1.95 | (0.09) | (0.03) | (0.12) | $11.99 | 19.31% | 0.70% | 0.86% | 13% |
| $6,983 |
|
| 2012 | $9.90 | 0.06 | 0.26 | 0.32 | (0.06) | — | (0.06) | $10.16 | 3.29% | 0.70% | 0.75% | 44% |
| $1,108 |
|
|
|
| Notes to Financial Highlights |
| |
| (1) | Computed using average shares outstanding throughout the period. |
| |
| (2) | Total returns are calculated based on the net asset value of the last business day and do not reflect applicable sales charges, if any. Total returns for periods less than one year are not annualized. |
| |
| (3) | Ratio of operating expenses to average net assets does not include any fees and expenses of the underlying funds. |
| |
| (4) | Ratio was less than 0.005%. |
| |
| (5) | Per-share amount was not in accord with the net realized and unrealized gain (loss) for the period because of the timing of transactions in shares of the fund and the amount and timing of per-share net |
realized and unrealized gain (loss) on such shares.
See Notes to Financial Statements.
|
| | | | | | | | | | | | | |
| For a Share Outstanding Throughout the Period Indicated | | | | | | |
| Per-Share Data | | | | | | Ratios and Supplemental Data | |
| | | Income From Investment Operations: | | | | Ratio to Average Net Assets of: | | |
| | Net Asset Value, Beginning of Period | Net Investment Income (Loss)(1) | Net Realized and Unrealized Gain (Loss) | Total From Investment Operations | Distributions From Net Investment Income | Net Asset Value, End of Period | Total Return(2) | Operating Expenses(3) | Net Investment Income (Loss) | Portfolio Turnover Rate | Net Assets, End of Period (in thousands) |
| One Choice 2060 Portfolio | | | | | | | |
| Investor Class | | | | | | | | | | | |
2016(4) | $10.00 | 0.10 | 0.91 | 1.01 | (0.12) | $10.89 | 10.12% | 0.20%(5) | 0.88%(5) | 13% |
| $1,305 |
|
| Institutional Class | | | | | | | | | | |
2016(4) | $10.00 | 0.08 | 0.94 | 1.02 | (0.12) | $10.90 | 10.27% | 0.00%(5)(6) | 1.08%(5) | 13% |
| $2,443 |
|
| A Class | | | | | | | | | | | |
2016(4) | $10.00 | 0.02 | 0.96 | 0.98 | (0.11) | $10.87 | 9.84% | 0.45%(5) | 0.63%(5) | 13% |
| $2,143 |
|
| C Class | | | | | | | | | | | |
2016(4) | $10.00 | 0.09 | 0.83 | 0.92 | (0.09) | $10.83 | 9.23% | 1.20%(5) | (0.12)%(5) | 13% |
| $28 |
|
| R Class | | | | | | | | | | | |
2016(4) | $10.00 | 0.04 | 0.92 | 0.96 | (0.10) | $10.86 | 9.67% | 0.70%(5) | 0.38%(5) | 13% |
| $605 |
|
|
|
| Notes to Financial Highlights |
| |
| (1) | Computed using average shares outstanding throughout the period. |
| |
| (2) | Total returns are calculated based on the net asset value of the last business day and do not reflect applicable sales charges, if any. Total returns for periods less than one year are not annualized. |
| |
| (3) | Ratio of operating expenses to average net assets does not include any fees and expenses of the underlying funds. |
| |
| (4) | September 30, 2015 (fund inception) through July 31, 2016. |
| |
| (6) | Ratio was less than 0.005%. |
See Notes to Financial Statements.
|
|
| Report of Independent Registered Public Accounting Firm |
To the Board of Directors and Shareholders of American Century Asset Allocation Portfolios, Inc.:
We have audited the accompanying statements of assets and liabilities, including the schedules of investments, of One Choice In Retirement Portfolio, One Choice 2020 Portfolio, One Choice 2025 Portfolio, One Choice 2030 Portfolio, One Choice 2035 Portfolio, One Choice 2040 Portfolio, One Choice 2045 Portfolio, One Choice 2050 Portfolio, One Choice 2055 Portfolio, and One Choice 2060 Portfolio, ten of the portfolios constituting American Century Asset Allocation Portfolios, Inc. (the “Funds”), as of July 31, 2016, and the related statements of operations for the year then ended, the statements of changes in net assets for each of the two years in the period then ended, and the financial highlights for each of the periods presented (as to One Choice 2060 Portfolio, the related statement of operations, statement of changes in net assets, and financial highlights for the period from September 30, 2015 (inception date) through July 31, 2016). These financial statements and financial highlights are the responsibility of the Funds’ management. Our responsibility is to express an opinion on these financial statements and financial highlights based on our audits.
We conducted our audits in accordance with the standards of the Public Company Accounting Oversight Board (United States). Those standards require that we plan and perform the audit to obtain reasonable assurance about whether the financial statements and financial highlights are free of material misstatement. The Funds are not required to have, nor were we engaged to perform, an audit of their internal control over financial reporting. Our audits included consideration of internal control over financial reporting as a basis for designing audit procedures that are appropriate in the circumstances, but not for the purpose of expressing an opinion on the effectiveness of the Funds’ internal control over financial reporting. Accordingly, we express no such opinion. An audit also includes examining, on a test basis, evidence supporting the amounts and disclosures in the financial statements, assessing the accounting principles used and significant estimates made by management, as well as evaluating the overall financial statement presentation. Our procedures included confirmation of securities owned as of July 31, 2016, by correspondence with the transfer agent. We believe that our audits provide a reasonable basis for our opinion.
In our opinion, the financial statements and financial highlights referred to above present fairly, in all material respects, the financial position of each of the respective Funds as of July 31, 2016, the results of their operations, the changes in their net assets, and the financial highlights for each of the periods presented, in conformity with accounting principles generally accepted in the United States of America.
DELOITTE & TOUCHE LLP
Kansas City, Missouri
September 19, 2016
The Board of Directors
The individuals listed below serve as directors of the funds. Each director will continue to serve in this capacity until death, retirement, resignation or removal from office. The board has adopted a mandatory retirement age for directors who are not “interested persons,” as that term is defined in the Investment Company Act (independent directors). Independent directors shall retire by December 31 of the year in which they reach their 75th birthday.
Mr. Thomas is an “interested person” because he currently serves as President and Chief Executive Officer of American Century Companies, Inc. (ACC), the parent company of American Century Investment Management, Inc. (ACIM or the advisor). The other directors (more than three-fourths of the total number) are independent. They are not employees, directors or officers of, and have no financial interest in, ACC or any of its wholly owned, direct or indirect, subsidiaries, including ACIM, American Century Investment Services, Inc. (ACIS) and American Century Services, LLC (ACS), and they do not have any other affiliations, positions or relationships that would cause them to be considered “interested persons” under the Investment Company Act. The directors serve in this capacity for seven (in the case of Mr. Thomas, 15) registered investment companies in the American Century Investments family of funds.
The following table presents additional information about the directors. The mailing address for each director is 4500 Main Street, Kansas City, Missouri 64111.
|
| | | | | |
Name
(Year of Birth) | Position(s) Held with Funds | Length of Time Served | Principal Occupation(s) During Past 5 Years | Number of American Century Portfolios Overseen by Director | Other Directorships Held During Past
5 Years |
| Independent Directors | | |
Barry Fink
(1955) | Director | Since 2012 | Retired; Executive Vice President, ACC (September 2007 to February 2013); President, ACS (October 2007 to February 2013); Chief Operating Officer, ACC (September 2007 to November 2012) | 83 | None |
Andrea C. Hall
(1945) | Director | Since 1997 | Retired | 83 | None |
Jan M. Lewis
(1957) | Director | Since 2011 | Retired; President and Chief Executive Officer, Catholic Charities of Northeast Kansas (human services organization) (2006 to 2013) | 83 | None |
James A. Olson
(1942) | Director and Chairman of the Board | Since 2007 (Chairman since 2014) | Member, Plaza Belmont LLC (private equity fund manager) (1999 to present) | 83 | Saia, Inc. (2002 to 2012) and EPR Properties (2003 to 2013) |
M. Jeannine Strandjord
(1945) | Director | Since 1994 | Retired | 83 | Euronet Worldwide Inc.; MGP Ingredients, Inc.; and DST Systems Inc. (1996 to 2012) |
|
| | | | | |
Name
(Year of Birth) | Position(s) Held with Funds | Length of Time Served | Principal Occupation(s) During Past 5 Years | Number of American Century Portfolios Overseen by Director | Other Directorships Held During Past
5 Years |
| Independent Directors | | |
John R. Whitten
(1946) | Director | Since 2008 | Retired | 83 | Rudolph Technologies, Inc. |
Stephen E. Yates
(1948) | Director | Since 2012 | Retired | 83 | None |
| Interested Director | | |
Jonathan S. Thomas
(1963) | Director and President | Since 2007 | President and Chief Executive Officer, ACC (March 2007 to present). Also serves as Chief Executive Officer, ACS; Executive Vice President, ACIM; Director, ACC, ACIM and other ACC subsidiaries | 128 | BioMed Valley Discoveries, Inc. |
The Statement of Additional Information has additional information about the funds' directors and is available without charge, upon request, by calling 1-800-345-2021.
Officers
The following table presents certain information about the executive officers of the funds. Each officer serves as an officer for each of the 15 investment companies in the American Century family of funds, unless otherwise noted. No officer is compensated for his or her service as an officer of the funds. The listed officers are interested persons of the funds and are appointed or re-appointed on an annual basis. The mailing address for each officer listed below is 4500 Main Street, Kansas City, Missouri 64111.
|
| | |
Name (Year of Birth) | Offices with the Funds | Principal Occupation(s) During the Past Five Years |
Jonathan S.
Thomas
(1963) | Director and
President
since 2007 | President and Chief Executive Officer, ACC (March 2007 to present). Also serves as Chief Executive Officer, ACS; Executive Vice President, ACIM; Director, ACC, ACIM and other ACC subsidiaries |
Amy D. Shelton
(1964) | Chief Compliance
Officer and Vice President since 2014 | Chief Compliance Officer, American Century funds, (March 2014 to present); Chief Compliance Officer, ACIM (February 2014 to present); Chief Compliance Officer, ACIS (October 2009 to present); Vice President, Client Interactions and Marketing, ACIS (February 2013 to January 2014); Director, Client Interactions and Marketing, ACIS (June 2007 to January 2013). Also serves as Vice President, ACIS |
Charles A.
Etherington
(1957) | General Counsel
since 2007 and
Senior Vice
President since 2006 | Attorney, ACC (February 1994 to present); Vice President, ACC (November 2005 to present); General Counsel, ACC (March 2007 to present). Also serves as General Counsel, ACIM, ACS, ACIS and other ACC subsidiaries; and Senior Vice President, ACIM and ACS |
C. Jean Wade
(1964) | Vice President,
Treasurer and
Chief Financial
Officer since 2012 | Vice President, ACS (February 2000 to present) |
Robert J.
Leach
(1966) | Vice President
since 2006 and
Assistant Treasurer
since 2012 | Vice President, ACS (February 2000 to present) |
David H.
Reinmiller
(1963) | Vice President
since 2000 | Attorney, ACC (January 1994 to present); Associate General Counsel, ACC (January 2001 to present). Also serves as Vice President, ACIM and ACS |
Ward D.
Stauffer
(1960) | Secretary
since 2005 | Attorney, ACC (June 2003 to present) |
|
|
| Approval of Management Agreements |
At a meeting held on June 29, 2016, the Funds’ Board of Directors (the “Board) unanimously approved the renewal of the management agreements pursuant to which American Century Investment Management, Inc. (the “Advisor”) acts as the investment advisor for the Funds. Under Section 15(c) of the Investment Company Act, contracts for investment advisory services are required to be reviewed, evaluated, and approved by a majority of a fund’s directors (the “Directors”), including a majority of the independent Directors, each year.
Prior to its consideration of the renewal of each Fund’s management agreement, the Directors requested and reviewed extensive data and information compiled by the Advisor and certain independent providers of evaluation data concerning the Funds and the services provided to the Funds by the Advisor. This review was in addition to the oversight and evaluation undertaken by the Board and its committees on a continual basis and the information received was supplemental to the extensive information that the Board and its committees receive and consider throughout the year.
In connection with its consideration of the renewal of each Fund’s management agreement, the Board’s review and evaluation of the services provided by the Advisor included, but was not limited to, the following:
| |
| • | the nature, extent, and quality of investment management, shareholder services, and other services provided and to be provided by the Advisor to each Fund; |
| |
| • | the wide range of other programs and services provided and to be provided to each Fund and its shareholders on a routine and non-routine basis; |
| |
| • | the investment performance of each Fund, including data comparing each Fund’s performance to appropriate benchmarks and/or a peer group of other mutual funds with similar investment objectives and strategies; |
| |
| • | the cost of owning each Fund compared to the cost of owning similar funds; |
| |
| • | the compliance policies, procedures, and regulatory experience of the Advisor and the Funds’ other service providers; |
| |
| • | financial data showing the cost of services provided to each Fund and the overall profitability of the Advisor; |
| |
| • | possible economies of scale associated with the Advisor’s management of the Funds and other accounts under its management; |
| |
| • | data comparing services provided and charges to the Advisor's other investment management clients; |
| |
| • | acquired fund fees and expenses; |
| |
| • | payments by each Fund and the Advisor to financial intermediaries and the nature of services provided; and |
| |
| • | any collateral benefits derived by the Advisor from the management of the Funds. |
In keeping with their practice, the Directors held two in-person meetings and one telephonic meeting to review and discuss the information provided. The independent Directors also had the benefit of the advice of their independent counsel throughout the process.
Factors Considered
The Directors considered all of the information provided by the Advisor, the independent data providers, and independent counsel in connection with the approvals. They determined that the information was sufficient for them to evaluate each Fund’s management agreement. In connection with their review, the Directors did not identify any single factor as being all-important or controlling, and each Director may have attributed different levels of importance to different factors. In deciding to renew the management agreements, the Board based its decision on a number of factors, including the following:
Nature, Extent and Quality of Services - Generally. Under the management agreements, the Advisor is responsible for providing or arranging for all services necessary for the operation of each Fund. The Board noted that under the management agreements, the Advisor provides or arranges at its own expense a wide variety of services including:
| |
| • | constructing and designing each Fund |
| |
| • | portfolio research and security selection |
| |
| • | initial capitalization/funding |
| |
| • | daily valuation of each Fund’s portfolio |
| |
| • | shareholder servicing and transfer agency, including shareholder confirmations, recordkeeping, and communications |
| |
| • | legal services (except the independent Directors’ counsel) |
| |
| • | regulatory and portfolio compliance |
| |
| • | marketing and distribution (except amounts paid by each Fund under Rule 12b-1 plans) |
The Board noted that many of these services have expanded over time in terms of both quantity and complexity in response to shareholder demands, competition in the industry, changing distribution channels, and the changing regulatory environment. The Board noted specifically the resources the Advisor has committed to enhancing cybersecurity protections for the benefit of shareholders.
Investment Management Services. The nature of the investment management services provided to the Funds is quite complex and allows fund shareholders access to professional money management, instant diversification of their investments within an asset class, the opportunity to easily diversify among asset classes by investing in or exchanging among various American Century Investments funds, and liquidity. In evaluating investment performance, the Board expects the Advisor to manage each Fund in accordance with its investment objectives and approved strategies. Further, the Directors recognize that the Advisor has an obligation to monitor trading activities, and in particular to seek the best execution of fund trades, and to evaluate the use of and payment for research. In providing these services, the Advisor utilizes teams of investment professionals (portfolio managers, analysts, research assistants, and securities traders) who require extensive information technology, research, training, compliance, and other systems to conduct their business. The Board, directly and through its Fund Performance Review Committee, provides oversight of the investment performance process. It regularly reviews investment performance information for each Fund, together with comparative information for appropriate benchmarks and/or peer groups of similarly-managed funds, over different time horizons. The Directors also review detailed performance information provided by the Advisor during the management agreement approval process. If performance concerns are identified with respect to a fund, the Fund receives special reviews until performance improves, during which the Board receives a report from the Advisor regarding the reasons for such results (e.g., market conditions, security selection) and any efforts being undertaken to improve performance. The performance for One Choice In Retirement Portfolio was above its benchmark for the five- and ten-year periods and below its benchmark for the one- and three-year periods reviewed by the Board. The performance for One Choice 2020 Portfolio was above its benchmark for the three- and five-year periods and slightly below its benchmark for the one-year period reviewed by the Board. The performance for One Choice 2025 Portfolio, One Choice 2035 Portfolio, and One Choice 2045 Portfolio was above each Fund’s respective benchmark for the one-, three-, five-, and ten-year periods reviewed by the Board. The performance for One Choice 2030 Portfolio, One Choice 2040 Portfolio, and One Choice 2050 Portfolio was above each Fund’s respective benchmark for the one-, three-, and five-year periods reviewed by the Board. The performance for One Choice 2055 Portfolio was above its benchmark for the one- and three-year periods reviewed by the Board. One Choice 2060 Portfolio has less than one year of performance history. The Board, directly and through its Fund Performance Review Committee, regularly reviews the investment management services of the
Advisor. Taking all of these factors into consideration, the Board found the investment management services provided by the Advisor to each Fund to be satisfactory and consistent with the management agreements.
Shareholder and Other Services. Under the management agreements, the Advisor provides the Funds with a comprehensive package of transfer agency, shareholder, and other services. The Board, directly and through various committees of the Board, regularly reviews reports and evaluations of such services at its regular meetings. These reports include, but are not limited to, information regarding the operational efficiency and accuracy of the shareholder and transfer agency services provided, staffing levels, shareholder satisfaction (as measured by external as well as internal sources), technology support, new products and services offered to fund shareholders, securities trading activities, portfolio valuation services, auditing services, and legal and operational compliance activities. The Board particularly noted the Advisor’s continual efforts to maintain effective business continuity plans and to address cybersecurity threats. Certain aspects of shareholder and transfer agency service level efficiency and the quality of securities trading activities are measured by independent third party providers and are presented in comparison to other fund groups not managed by the Advisor. The Board found the services provided by the Advisor to each Fund under the management agreements to be competitive and of high quality.
Costs of Services and Profitability. The Advisor provides detailed information concerning its cost of providing various services to the Funds, its profitability in managing each Fund (pre- and post-distribution), its overall profitability, and its financial condition. The Directors have reviewed with the Advisor the methodology used to prepare this financial information. This information is considered in evaluating the Advisor’s financial condition, its ability to continue to provide services under the Funds’ management agreements, and the reasonableness of the current management agreements. The Board concluded that the Advisor’s profits were reasonable in light of the services provided to the Funds.
Ethics. The Board generally considers the Advisor’s commitment to providing quality services to shareholders and to conducting its business ethically. They noted that the Advisor’s practices generally meet or exceed industry best practices.
Economies of Scale. The Board also reviewed information provided by the Advisor regarding the possible existence of economies of scale in connection with the management of each Fund. The Board concluded that economies of scale are difficult to measure and predict with precision, especially on a fund-by-fund basis. The Board concluded that the Advisor is appropriately sharing economies of scale through its competitive fee structure, offering competitive fees from fund inception, and through reinvestment in its business to provide shareholders additional content and services.
Comparison to Other Funds’ Fees. The Funds invest their non-cash assets entirely in other American Century Investments funds. The Funds do not pay an investment advisory fee to the Advisor. Rather, each Fund pays the Advisor an administrative fee and indirectly bears its pro rata share of the expenses incurred by the underlying funds. Each underlying fund pays the Advisor a single, all-inclusive (or unified) management fee for providing all services necessary for the management and operation of the fund, other than brokerage expenses, expenses attributable to short sales, taxes, interest, extraordinary expenses, and the fees and expenses of the fund’s independent directors (including their independent legal counsel), as well as expenses incurred in connection with the provision of shareholder services and distribution services under a plan adopted pursuant to Rule 12b-1 under the 1940 Act. The Board concluded that the administrative fee and other underlying fund expenses incurred by each Fund were reasonable in light of the services provided to each Fund.
Comparison to Fees and Services Provided to Other Clients of the Advisor. The Directors also requested and received information from the Advisor concerning the nature of the services, fees, costs, and profitability of its advisory services to advisory clients other than the Funds. They observed that these varying types of client accounts require different services and involve different regulatory and entrepreneurial risks than the management of each Fund. The Board analyzed this
information and concluded that the fees charged and services provided to the Funds were reasonable by comparison.
Payments to Intermediaries. The Directors also requested and received a description of payments made to intermediaries by each Fund and the Advisor. These payments include various payments made by each Fund or the Advisor to different types of intermediaries and recordkeepers for distribution and service activities provided for each Fund. The Board received confirmation from the Advisor that all such payments by the Funds intended for distribution were made pursuant to each Fund’s 12b-1 Plan. The Board reviewed such information and found the payments to be reasonable in scope and purpose.
Collateral or “Fall-Out” Benefits Derived by the Advisor. The Board considered the existence of collateral benefits the Advisor may receive as a result of its relationship with the Funds. They concluded that the Advisor’s primary business is managing mutual funds and it generally does not use fund or shareholder information to generate profits in other lines of business, and therefore does not derive any significant collateral benefits from them. The Board noted that additional assets from other clients may offer the Advisor some benefit from increased leverage with service providers and counterparties. Additionally, the Advisor receives proprietary research from broker-dealers that execute fund portfolio transactions, which the Board concluded is likely to benefit other clients of the Advisor, as well as fund shareholders. The Board also determined that the Advisor is able to provide investment management services to certain clients other than the Funds, at least in part, due to its existing infrastructure built to serve the fund complex.
Existing Relationship. The Board also considered whether there was any reason for not continuing the existing arrangement with the Advisor. In this regard, the Board was mindful of the potential disruptions of the Funds’ operations and various risks, uncertainties, and other effects that could occur as a result of a decision not to continue such relationship. In particular, the Board recognized that most shareholders have invested in the Funds on the strength of the Advisor’s industry standing and reputation and in the expectation that the Advisor will have a continuing role in providing advisory services to each Fund.
Conclusion of the Directors. As a result of this process, the Board, including all of the independent Directors, taking into account all of the factors discussed above and the information provided by the Advisor and others in connection with its review and throughout the year, determined that the management agreements between the Funds and the Advisor is fair and reasonable in light of the services provided and should be renewed.
Retirement Account Information
As required by law, distributions you receive from certain IRAs are subject to federal income tax withholding, unless you elect not to have withholding apply. Tax will be withheld on the total amount withdrawn even though you may be receiving amounts that are not subject to withholding, such as nondeductible contributions. In such case, excess amounts of withholding could occur. You may adjust your withholding election so that a greater or lesser amount will be withheld.
If you don’t want us to withhold on this amount, you must notify us to not withhold the federal income tax. You may notify us in writing or in certain situations by telephone or through other electronic means. For systematic withdrawals, your withholding election will remain in effect until revoked or changed by filing a new election. You have the right to revoke your election at any time.
Remember, even if you elect not to have income tax withheld, you are liable for paying income tax on the taxable portion of your withdrawal. If you elect not to have income tax withheld or you don’t have enough income tax withheld, you may be responsible for payment of estimated tax. You may incur penalties under the estimated tax rules if your withholding and estimated tax payments are not sufficient. You can reduce or defer the income tax on a distribution by directly or indirectly rolling such distribution over to another IRA or eligible plan. You should consult your tax advisor for additional information.
State tax will be withheld if, at the time of your distribution, your address is within one of the mandatory withholding states and you have federal income tax withheld (or as otherwise required by state law). State taxes will be withheld from your distribution in accordance with the respective state rules.
Distributions you receive from 403(b), 457 and qualified plans are subject to special tax and withholding rules. Your plan administrator or plan sponsor is required to provide you with a special tax notice explaining those rules at the time you request a distribution. If applicable, federal and/or state taxes may be withheld from your distribution amount.
Proxy Voting Policies
A description of the policies that the funds’ investment advisor uses in exercising the voting rights associated with the securities purchased and/or held by the funds is available without charge, upon request, by calling 1-800-345-2021. It is also available on the “About Us” page of American Century Investments’ website at americancentury.com and on the Securities and Exchange Commission’s
website at sec.gov. Information regarding how the investment advisor voted proxies relating to portfolio securities during the most recent 12-month period ended June 30 is available on the “About Us” page at americancentury.com. It is also available at sec.gov.
Quarterly Portfolio Disclosure
The funds file their complete schedule of portfolio holdings with the Securities and Exchange Commission (SEC) for the first and third quarters of each fiscal year on Form N-Q. The funds’ Forms N-Q are available on the SEC’s website at sec.gov, and may be reviewed and copied at the SEC’s Public Reference Room in Washington, DC. Information on the operation of the Public Reference Room may be obtained by calling 1-800-SEC-0330. The funds also make their complete
schedule of portfolio holdings for the most recent quarter of their fiscal year available on their website at americancentury.com and, upon request, by calling 1-800-345-2021.
Other Tax Information
The following information is provided pursuant to provisions of the Internal Revenue Code.
The funds hereby designate up to the maximum amount allowable as qualified dividend income for the fiscal year ended July 31, 2016.
For corporate taxpayers, the funds hereby designate the following, or up to the maximum amount allowable, of ordinary income distributions paid during the fiscal year ended July 31, 2016 as qualified for the corporate dividends received deduction.
|
| | | | |
One Choice In Retirement Portfolio | One Choice 2020 Portfolio | One Choice 2025 Portfolio | One Choice 2030 Portfolio | One Choice 2035 Portfolio |
| $9,329,707 | $8,936,239 | $13,883,757 | $10,110,906 | $12,459,928 |
|
| | | | |
One Choice 2040 Portfolio | One Choice 2045 Portfolio | One Choice 2050 Portfolio | One Choice 2055 Portfolio | One Choice 2060 Portfolio |
| $8,724,975 | $10,457,252 | $5,731,555 | $2,067,383 | $3,555 |
The funds hereby designate the following as qualified short-term capital gain distributions for purposes of Internal Revenue Code Section 871 for the fiscal year ended July 31, 2016.
|
| | | | |
One Choice In Retirement Portfolio | One Choice 2020 Portfolio | One Choice 2025 Portfolio | One Choice 2030 Portfolio | One Choice 2035 Portfolio |
| $971,613 | $473,328 | $3,755,702 | $1,042,002 | $3,857,700 |
|
| | | | |
One Choice 2040 Portfolio | One Choice 2045 Portfolio | One Choice 2050 Portfolio | One Choice 2055 Portfolio | One Choice 2060 Portfolio |
| $319,003 | $1,015,118 | $86,489 | $12,049 | — |
The funds hereby designate the following, or up to the maximum amount allowable, as long-term capital gain distributions (20% rate gain distributions) for the fiscal year ended July 31, 2016.
|
| | | | |
One Choice In Retirement Portfolio | One Choice 2020 Portfolio | One Choice 2025 Portfolio | One Choice 2030 Portfolio | One Choice 2035 Portfolio |
| $4,184,076 | $58,493,928 | $114,114,092 | $73,875,140 | $106,308,500 |
|
| | | | |
One Choice 2040 Portfolio | One Choice 2045 Portfolio | One Choice 2050 Portfolio | One Choice 2055 Portfolio | One Choice 2060 Portfolio |
| $62,965,738 | $85,709,421 | $38,718,027 | $9,533,416 | — |
For the fiscal year ended July 31, 2016, the funds intend to pass through to shareholders the following foreign source income and foreign taxes paid, or up to the maximum amount allowable, as a foreign tax credit. |
| | | | | | | | |
| | Foreign Tax Credit | Foreign Source Income |
| | Amount | Per Outstanding Share | Amount | Per Outstanding Share |
| One Choice In Retirement Portfolio | $ | 243,928 |
| 0.0016 | $ | 1,607,985 |
| 0.0107 |
| One Choice 2020 Portfolio | $ | 273,522 |
| 0.0017 | $ | 1,782,805 |
| 0.0111 |
| One Choice 2025 Portfolio | $ | 489,560 |
| 0.0025 | $ | 3,203,142 |
| 0.0162 |
| One Choice 2030 Portfolio | $ | 400,198 |
| 0.0024 | $ | 2,619,431 |
| 0.0158 |
| One Choice 2035 Portfolio | $ | 541,971 |
| 0.0036 | $ | 3,557,319 |
| 0.0233 |
| One Choice 2040 Portfolio | $ | 386,095 |
| 0.0031 | $ | 2,495,041 |
| 0.0203 |
| One Choice 2045 Portfolio | $ | 456,565 |
| 0.0043 | $ | 2,929,846 |
| 0.0274 |
| One Choice 2050 Portfolio | $ | 251,946 |
| 0.0034 | $ | 1,612,899 |
| 0.0217 |
| One Choice 2055 Portfolio | $ | 87,119 |
| 0.0031 | $ | 560,600 |
| 0.0199 |
| One Choice 2060 Portfolio | $ | 83 |
| 0.0001 | $ | 535 |
| 0.0009 |
The funds utilized the following earnings and profits distributed to shareholders on redemptions of shares as part of the dividends paid deduction (tax equalization).
|
| | | | |
One Choice In Retirement Portfolio | One Choice 2020 Portfolio | One Choice 2025 Portfolio | One Choice 2030 Portfolio | One Choice 2035 Portfolio |
| $3,785,949 | — | $8,587,350 | $6,020,213 | $7,361,548 |
|
| | | | |
One Choice 2040 Portfolio | One Choice 2045 Portfolio | One Choice 2050 Portfolio | One Choice 2055 Portfolio | One Choice 2060 Portfolio |
| $5,039,590 | $6,227,027 | $3,638,717 | $1,270,055 | — |
|
| | |
| |
| | | |
| Contact Us | americancentury.com | |
| Automated Information Line | 1-800-345-8765 | |
| Investor Services Representative | 1-800-345-2021
or 816-531-5575 | |
| Investors Using Advisors | 1-800-378-9878 | |
| Business, Not-For-Profit, Employer-Sponsored Retirement Plans | 1-800-345-3533 | |
| Banks and Trust Companies, Broker-Dealers, Financial Professionals, Insurance Companies | 1-800-345-6488 | |
| Telecommunications Relay Services for the Deaf | 711 | |
| | | |
| American Century Asset Allocation Portfolios, Inc. | |
| | | |
Investment Advisor: American Century Investment Management, Inc. Kansas City, Missouri | |
| | | |
| This report and the statements it contains are submitted for the general information of our shareholders. The report is not authorized for distribution to prospective investors unless preceded or accompanied by an effective prospectus. | |
| | | |
©2016 American Century Proprietary Holdings, Inc. All rights reserved. CL-ANN-90167 1609 | |
|
| |
| | |
| | Annual Report |
| | |
| | July 31, 2016 |
| | |
| | One Choice® In Retirement Portfolio R6 |
| | |
| | One Choice® 2020 Portfolio R6 |
| | |
| | One Choice® 2025 Portfolio R6 |
| | |
| | One Choice® 2030 Portfolio R6 |
| | |
| | One Choice® 2035 Portfolio R6 |
| | |
| | One Choice® 2040 Portfolio R6 |
| | |
| | One Choice® 2045 Portfolio R6 |
| | |
| | One Choice® 2050 Portfolio R6 |
| | |
| | One Choice® 2055 Portfolio R6 |
| | |
| | One Choice® 2060 Portfolio R6 |
|
| | |
| President's Letter | 2 |
|
| Performance | 3 |
|
| Portfolio Commentary | |
|
| Portfolio Characteristics | |
|
| Shareholder Fee Examples | |
|
| Schedules of Investments | |
|
| Statements of Assets and Liabilities | |
|
| Statements of Operations | |
|
| Statements of Changes in Net Assets | |
|
| Notes to Financial Statements | |
|
| Financial Highlights | |
|
| Report of Independent Registered Public Accounting Firm | |
|
| Management | |
|
| Approval of Management Agreement | |
|
| Additional Information | |
|
Any opinions expressed in this report reflect those of the author as of the date of the report, and do not necessarily represent the opinions of American Century Investments® or any other person in the American Century Investments organization. Any such opinions are subject to change at any time based upon market or other conditions and American Century Investments disclaims any responsibility to update such opinions. These opinions may not be relied upon as investment advice and, because investment decisions made by American Century Investments funds are based on numerous factors, may not be relied upon as an indication of trading intent on behalf of any American Century Investments fund. Security examples are used for representational purposes only and are not intended as recommendations to purchase or sell securities. Performance information for comparative indices and securities is provided to American Century Investments by third party vendors. To the best of American Century Investments’ knowledge, such information is accurate at the time of printing.
Jonathan Thomas
Dear Investor:
Thank you for reviewing this annual report for the period ended July 31, 2016. It provides investment performance and portfolio information for the reporting period, plus longer-term historical performance data.
Annual reports remain important vehicles for conveying information about fund returns, including market and economic factors that affected performance during the reporting period. For additional, updated investment and market insights, we encourage you to visit our website, americancentury.com.
Market Volatility Increased, But Not for the Reasons Anticipated
Going into this reporting period, investors anticipated increased market volatility and uncertainty as the Federal Reserve (the Fed) appeared poised to raise short-term interest rates toward more historically normal levels. This policy change was expected to affect investor sentiment, U.S. Treasury yield behavior, relative currency values, inflation expectations, and corporate costs and earnings.
This Fed-centric outlook didn’t fully account for global factors, which ultimately drove sentiment, volatility, and performance during the reporting period. During 2015, the primary catalyst was China, where slowing economic growth, currency devaluations, and massive monetary policy easing sent shock waves through the global markets. The Fed ended up delaying (until December 2015) its only small rate hike during the reporting period. Afterward, China-related events repeated in January and early February this year, further delaying Fed action.
Oil was another catalyst—its price collapses devalued entire market sectors and contributed to
broad market volatility and negative sentiment. Later, as China and oil appeared to stabilize, Brexit
occurred—the unexpected decision by United Kingdom voters to leave the European Union. This produced more shock waves, and altered central bank policies around the world. In this environment, relatively defensive assets performed well.
Looking ahead, we believe the markets face further uncertainty and volatility as they digest Brexit, the Italian bank crisis, China’s economic mysteries, and the U.S. presidential election. Negative interest rates in Europe and Japan represent part of the market’s response to the global macroeconomic climate. These negative rates are suppressing interest rates around the world while driving up the value of the U.S. dollar and U.S. bonds. In a broad sense, stocks also benefit from the central bank stimulus that is driving interest rates into negative territory, and from relative yield advantages as bond yields are pushed lower. It’s an unusual and challenging environment. We appreciate your continued trust in us.
Sincerely,
Jonathan Thomas
President and Chief Executive Officer
American Century Investments
|
| | | | |
| Total Returns as of July 31, 2016 |
| | | | Average Annual Returns | |
| | Ticker Symbol | 1 year | Since Inception | Inception Date |
| One Choice In Retirement Portfolio R6 — R6 Class | ARDTX | 2.98% | 5.16% | 7/31/13 |
| S&P Target Date Retirement Income Index | — | 3.68% | 4.40% | — |
| One Choice 2020 Portfolio R6 — R6 Class | ARBDX | 2.92% | 5.53% | 7/31/13 |
| S&P Target Date To 2020 Index | — | 3.31% | 5.23% | — |
| One Choice 2025 Portfolio R6 — R6 Class | ARWDX | 2.81% | 5.92% | 7/31/13 |
| S&P Target Date To 2025 Index | — | 3.10% | 5.54% | — |
| One Choice 2030 Portfolio R6 — R6 Class | ARCUX | 2.33% | 6.19% | 7/31/13 |
| S&P Target Date To 2030 Index | — | 2.90% | 5.82% | — |
| One Choice 2035 Portfolio R6 — R6 Class | ARLDX | 1.86% | 6.52% | 7/31/13 |
| S&P Target Date To 2035 Index | — | 2.52% | 6.02% | — |
| One Choice 2040 Portfolio R6 — R6 Class | ARDUX | 1.62% | 6.87% | 7/31/13 |
| S&P Target Date To 2040 Index | — | 2.33% | 6.21% | — |
| One Choice 2045 Portfolio R6 — R6 Class | ARDOX | 1.56% | 7.20% | 7/31/13 |
| S&P Target Date To 2045 Index | — | 2.14% | 6.38% | — |
| One Choice 2050 Portfolio R6 — R6 Class | ARFEX | 1.43% | 7.25% | 7/31/13 |
| S&P Target Date To 2050 Index | — | 1.95% | 6.51% | — |
| One Choice 2055 Portfolio R6 — R6 Class | AREUX | 1.39% | 7.39% | 7/31/13 |
| S&P Target Date To 2055+ Index | — | 1.75% | 6.66% | — |
| One Choice 2060 Portfolio R6 — R6 Class | ARGDX | — | 10.39% | 9/30/15 |
| S&P Target Date To 2055+ Index | — | — | 11.14% | — |
A One Choice Target Date Portfolio's target date is the approximate year when investors plan to retire or start withdrawing their money. The principal value of the investment is not guaranteed at any time, including at the target date.
Data presented reflect past performance. Past performance is no guarantee of future results. Current performance may be higher or lower than the performance shown. Total returns for periods less than one year are not annualized. Investment return and principal value will fluctuate, and redemption value may be more or less than original cost. Data assumes reinvestment of dividends and capital gains, and none of the charts reflect the deduction of taxes that a shareholder would pay on fund distributions or the redemption of fund shares. To obtain performance data current to the most recent month end, please call 1-800-345-6488 or visit ipro.americancentury.com. For additional information about the funds, please consult the prospectus.
|
|
| Growth of $10,000 Over Life of One Choice In Retirement Portfolio R6 |
| $10,000 investment made July 31, 2013 |
|
| |
| Value on July 31, 2016 |
| | R6 Class — $11,632 |
| |
| | S&P Target Date Retirement Income Index — $11,379 |
| |
|
|
| Growth of $10,000 Over Life of One Choice 2020 Portfolio R6 |
| $10,000 investment made July 31, 2013 |
|
| |
| Value on July 31, 2016 |
| | R6 Class — $11,754 |
| |
| | S&P Target Date To 2020 Index — $11,653 |
| |
A One Choice Target Date Portfolio's target date is the approximate year when investors plan to retire or start withdrawing their money. The principal value of the investment is not guaranteed at any time, including at the target date.
Data presented reflect past performance. Past performance is no guarantee of future results. Current performance may be higher or lower than the performance shown. Total returns for periods less than one year are not annualized. Investment return and principal value will fluctuate, and redemption value may be more or less than original cost. Data assumes reinvestment of dividends and capital gains, and none of the charts reflect the deduction of taxes that a shareholder would pay on fund distributions or the redemption of fund shares. To obtain performance data current to the most recent month end, please call 1-800-345-6488 or visit ipro.americancentury.com. For additional information about the funds, please consult the prospectus.
|
|
| Growth of $10,000 Over Life of One Choice 2025 Portfolio R6 |
| $10,000 investment made July 31, 2013 |
|
| |
| Value on July 31, 2016 |
| | R6 Class — $11,885 |
| |
| | S&P Target Date To 2025 Index — $11,758 |
| |
|
|
| Growth of $10,000 Over Life of One Choice 2030 Portfolio R6 |
| $10,000 investment made July 31, 2013 |
|
| |
| Value on July 31, 2016 |
| | R6 Class — $11,977 |
| |
| | S&P Target Date To 2030 Index — $11,851 |
| |
A One Choice Target Date Portfolio's target date is the approximate year when investors plan to retire or start withdrawing their money. The principal value of the investment is not guaranteed at any time, including at the target date.
Data presented reflect past performance. Past performance is no guarantee of future results. Current performance may be higher or lower than the performance shown. Total returns for periods less than one year are not annualized. Investment return and principal value will fluctuate, and redemption value may be more or less than original cost. Data assumes reinvestment of dividends and capital gains, and none of the charts reflect the deduction of taxes that a shareholder would pay on fund distributions or the redemption of fund shares. To obtain performance data current to the most recent month end, please call 1-800-345-6488 or visit ipro.americancentury.com. For additional information about the funds, please consult the prospectus.
|
|
| Growth of $10,000 Over Life of One Choice 2035 Portfolio R6 |
| $10,000 investment made July 31, 2013 |
|
| |
| Value on July 31, 2016 |
| | R6 Class — $12,089 |
| |
| | S&P Target Date To 2035 Index — $11,917 |
| |
|
|
| Growth of $10,000 Over Life of One Choice 2040 Portfolio R6 |
| $10,000 investment made July 31, 2013 |
|
| |
| Value on July 31, 2016 |
| | R6 Class — $12,209 |
| |
| | S&P Target Date To 2040 Index — $11,984 |
| |
A One Choice Target Date Portfolio's target date is the approximate year when investors plan to retire or start withdrawing their money. The principal value of the investment is not guaranteed at any time, including at the target date.
Data presented reflect past performance. Past performance is no guarantee of future results. Current performance may be higher or lower than the performance shown. Total returns for periods less than one year are not annualized. Investment return and principal value will fluctuate, and redemption value may be more or less than original cost. Data assumes reinvestment of dividends and capital gains, and none of the charts reflect the deduction of taxes that a shareholder would pay on fund distributions or the redemption of fund shares. To obtain performance data current to the most recent month end, please call 1-800-345-6488 or visit ipro.americancentury.com. For additional information about the funds, please consult the prospectus.
|
|
| Growth of $10,000 Over Life of One Choice 2045 Portfolio R6 |
| $10,000 investment made July 31, 2013 |
|
| |
| Value on July 31, 2016 |
| | R6 Class — $12,321 |
| |
| | S&P Target Date To 2045 Index — $12,040 |
| |
|
|
| Growth of $10,000 Over Life of One Choice 2050 Portfolio R6 |
| $10,000 investment made July 31, 2013 |
|
| |
| Value on July 31, 2016 |
| | R6 Class — $12,338 |
| |
| | S&P Target Date To 2050 Index — $12,087 |
| |
A One Choice Target Date Portfolio's target date is the approximate year when investors plan to retire or start withdrawing their money. The principal value of the investment is not guaranteed at any time, including at the target date.
Data presented reflect past performance. Past performance is no guarantee of future results. Current performance may be higher or lower than the performance shown. Total returns for periods less than one year are not annualized. Investment return and principal value will fluctuate, and redemption value may be more or less than original cost. Data assumes reinvestment of dividends and capital gains, and none of the charts reflect the deduction of taxes that a shareholder would pay on fund distributions or the redemption of fund shares. To obtain performance data current to the most recent month end, please call 1-800-345-6488 or visit ipro.americancentury.com. For additional information about the funds, please consult the prospectus.
|
|
| Growth of $10,000 Over Life of One Choice 2055 Portfolio R6 |
| $10,000 investment made July 31, 2013 |
|
| |
| Value on July 31, 2016 |
| | R6 Class — $12,387 |
| |
| | S&P Target Date To 2055+ Index — $12,137 |
| |
|
|
| Growth of $10,000 Over Life of One Choice 2060 Portfolio R6 |
| $10,000 investment made September 30, 2015 |
|
| |
| Value on July 31, 2016 |
| | R6 Class — $11,039 |
| |
| | S&P Target Date To 2055+ Index — $11,114 |
| |
A One Choice Target Date Portfolio's target date is the approximate year when investors plan to retire or start withdrawing their money. The principal value of the investment is not guaranteed at any time, including at the target date.
Data presented reflect past performance. Past performance is no guarantee of future results. Current performance may be higher or lower than the performance shown. Total returns for periods less than one year are not annualized. Investment return and principal value will fluctuate, and redemption value may be more or less than original cost. Data assumes reinvestment of dividends and capital gains, and none of the charts reflect the deduction of taxes that a shareholder would pay on fund distributions or the redemption of fund shares. To obtain performance data current to the most recent month end, please call 1-800-345-6488 or visit ipro.americancentury.com. For additional information about the funds, please consult the prospectus.
|
| |
| Total Annual Fund Operating Expenses | |
| One Choice In Retirement Portfolio R6 — R6 Class | 0.54% |
| One Choice 2020 Portfolio R6 — R6 Class | 0.53% |
| One Choice 2025 Portfolio R6 — R6 Class | 0.56% |
| One Choice 2030 Portfolio R6 — R6 Class | 0.58% |
| One Choice 2035 Portfolio R6 — R6 Class | 0.59% |
| One Choice 2040 Portfolio R6 — R6 Class | 0.62% |
| One Choice 2045 Portfolio R6 — R6 Class | 0.65% |
| One Choice 2050 Portfolio R6 — R6 Class | 0.66% |
| One Choice 2055 Portfolio R6 — R6 Class | 0.67% |
| One Choice 2060 Portfolio R6 — R6 Class | 0.69% |
The total annual fund operating expenses shown is as stated in the fund’s prospectus current as of the date of this report. The prospectus may vary from the expense ratio shown elsewhere in this report because it is based on a different time period, includes acquired fund fees and expenses, and, if applicable, does not include fee waivers or expense reimbursements.
A One Choice Target Date Portfolio's target date is the approximate year when investors plan to retire or start withdrawing their money. The principal value of the investment is not guaranteed at any time, including at the target date.
Data presented reflect past performance. Past performance is no guarantee of future results. Current performance may be higher or lower than the performance shown. Total returns for periods less than one year are not annualized. Investment return and principal value will fluctuate, and redemption value may be more or less than original cost. Data assumes reinvestment of dividends and capital gains, and none of the charts reflect the deduction of taxes that a shareholder would pay on fund distributions or the redemption of fund shares. To obtain performance data current to the most recent month end, please call 1-800-345-6488 or visit ipro.americancentury.com. For additional information about the funds, please consult the prospectus.
Portfolio Managers: Scott Wittman, Rich Weiss, Scott Wilson, Radu Gabudean, and David MacEwen
Performance Summary
Each of the nine One Choice® Target Date Portfolios R6 existing for the full fiscal year ended July 31, 2016, advanced, with returns ranging from 2.98% for the One Choice In Retirement Portfolio R6 to 1.39% for the One Choice 2055 Portfolio R6. We also introduced the One Choice 2060 Portfolio R6 on September 30, 2015, and it returned 10.39%* from inception through July 31, 2016 (see pages 3-8 for more detailed performance information). Returns for the periods reflected strong performance of the Portfolios’ fixed-income investments and advances across most U.S.-based equity segments, which outperformed their non-U.S. counterparts.
Because of the Portfolios’ strategic exposure to a variety of asset classes, a review of the financial markets helps explain much of their performance.
Market Overview
The reporting period began with pronounced volatility as markets receded in response to the slowing Chinese economy and the potential spillover effects on overall global growth. Equity indices experienced steep losses as investors exited riskier assets following currency devaluation by the Chinese government on the heels of disappointing economic growth data. Concerns about slowing growth reverberated throughout global markets and would serve as an ongoing driver of market returns throughout the period. Equity markets also came under pressure as commodity prices deteriorated in the first half of the fiscal year, with oil prices sinking to their lowest levels since early 2009 on widening oversupply and uncertain future demand. Oil and a number of other commodity prices rebounded somewhat in the second half of the fiscal year, but remained weak from an historical perspective.
Divergence of central bank policies remained a persistent theme throughout the reporting period, with global market headlines and returns dominated by anticipation of and reaction to monetary policy changes. The Federal Reserve (Fed) raised interest rates in December of 2015 for the first time in nearly a decade; in contrast, other central banks around the world pursued aggressive stimulus programs. This is consistent with the fact that economic growth rates in the U.S. continued to outpace those in most of the rest of the world.
Following a broad sell-off early in 2016, equities reversed course as investors took on a more optimistic outlook. Global growth concerns abated somewhat in response to more upbeat economic releases, improving sentiment about China, and rising commodity and oil prices. Accommodative monetary policy of major central banks and further delays in Fed tightening, as well as a weakening U.S. dollar, helped to drive equity market rallies around the globe. Market leadership shifted in early 2016, with value-oriented equities outperforming growth as more defensive names led those typically associated with a cyclical recovery. The close of the period was dominated by uncertainty around “Brexit,” the U.K. referendum about remaining in the European Union (EU). Following a “leave” vote at the end of June, global markets corrected sharply, with virtually all risky asset classes declining amid the uncertainty, with U.K. and European companies among the hardest hit. After a two-day sell-off that erased more than $3 trillion of global stock market value, cooler heads ultimately prevailed and investors adopted a longer-term view of Brexit and its effect on global growth and financial markets, concluding that the impact may not be as dire as originally thought. Global equities rallied in the final month of the reporting period, as investors shook off mounting geopolitical risks and tumbling oil prices, focusing instead on additional central bank stimulus on the horizon.
* Total returns for periods less than one year are not annualized.
In this environment, U.S. equities ended the reporting period with advances, outperforming both developed non-U.S. equities, which produced substantive declines, and emerging markets, which fell more modestly. Within the U.S. market, value led growth stocks across all capitalization ranges, and broad large- and mid-cap indices outperformed their small-cap peers.
Fixed-income investments generally advanced, with positive returns largely generated during the second half of the reporting period. During the first part of the fiscal year, investors’ risk-aversion heightened on concerns about China’s growth rate and its likely impact on the overall health of the global economy. As investors gravitated toward the relative safety of higher-quality fixed-income investments, higher-yielding bonds declined. This preference for less-risky investments continued into 2016. While equities sold off broadly, bonds advanced, led by unhedged, non-U.S. aggregate bond indices, which benefited from supportive monetary policies of global central banks and from U.S.-dollar weakness. For the period as a whole, non-U.S. bonds led bonds in the U.S. Within the broad U.S. bond market, high-quality bonds slightly outperformed high-yield, and longer-duration bonds produced larger advances as compared to those with shorter-durations, with long-term U.S. Treasury securities producing substantial gains.
Fund Information
Each One Choice Target Date Portfolio is a “fund of funds” that invests in other American Century Investments mutual funds to achieve its investment objective and target asset allocation. (See pages 13-14 for the specific underlying fund allocations for each Portfolio.) A Portfolio’s target date is the approximate year when investors plan to retire and likely would stop making new investments in the fund. The principal value of the investment is not guaranteed at any time, including at the target date. One Choice In Retirement Portfolio R6 is generally intended for investors near, at, or in retirement. There is no guarantee that an investment in any of the funds will provide adequate income at or through an investor’s retirement.
Each target-dated Portfolio seeks the highest total return consistent with its asset mix. Over time, the asset mix and weightings are adjusted to be more conservative. In general, as the target year approaches, each Portfolio’s allocation becomes more conservative by decreasing the allocation to stock funds and increasing the allocation to bond and money market funds. By the time each Portfolio reaches its target date, its target asset mix will become fixed and match that of One Choice In Retirement Portfolio R6, which seeks current income and capital appreciation.
Portfolio Performance
The Portfolios’ U.S. equity funds generally contributed positively to performance for the 12-month period, with the exception of NT Heritage Fund and NT Small Company Fund, which detracted fractionally. NT Mid Cap Value Fund contributed most among all equity funds in absolute terms, and outperformed its underlying benchmark as a result of stock selection decisions. NT Growth Fund, NT Large Company Value Fund, and NT Equity Growth Fund all contributed notably to absolute results; however, all three funds underperformed their respective benchmarks.
Non-U.S. equity performance was mixed. NT International Growth Fund was a leading detractor from absolute performance and underperformed its benchmark. NT International Value Fund had negative absolute returns and was a leading detractor from performance in all Portfolios; nevertheless, the fund held up better than its underlying benchmark thanks to effective stock selection decisions across a wide range of sectors and countries. At the other end of the spectrum, NT Global Real Estate Fund contributed to absolute performance in every Portfolio despite lagging its benchmark.
The Portfolios’ fixed-income holdings contributed meaningfully to performance during the period. NT Diversified Bond Fund contributed most across all equity and fixed-income positions for Portfolios from In Retirement to 2040, and was the leading source of strength among fixed-income holdings in Portfolios dated 2045 and beyond. Consistent with the strong performance of high-quality bonds around the globe, International Bond Fund (not held by Portfolios dated 2040 and further from retirement) made a sizeable contribution to return during the year. Similarly, Global Bond Fund, which is represented in all Portfolios, aided performance. Inflation-Adjusted Bond Fund performed well and contributed positively to performance across all Portfolios, while Short Duration Inflation Protection Bond Fund contributed from the In Retirement Portfolio to Target Date 2035. Strong demand for yield meant below-investment-grade corporate securities also performed well, making High-Yield Fund a source of strength across all portfolios. Nevertheless, while absolute performance was positive, a number of component funds underperformed their underlying benchmarks, led by High-Yield Fund, NT Diversified Bond Fund, and Global Bond Fund.
A Look Ahead
We believe that global divergence in economic growth and monetary policy by central banks seems likely to continue. Growth remains mostly slower outside the U.S., and non-U.S. monetary policies are generally more stimulative. Capital markets are increasingly taking their cues from global factors rather than focusing on the U.S. Therefore, China continues to be the leading influence on global economic expansion, although the U.K. jumped into the limelight by electing to exit the EU.
U.S. interest rates remain at historically low levels, but higher interest rates appear justified when considering domestic economic factors alone and ignoring global conditions. Falling unemployment, rising wages, higher rents, and improving home prices argue for higher rates. However, what happens in China, Europe, and Japan could have at least as much impact on U.S. interest rates as what happens in the U.S. Global macro headwinds are having more impact on the smaller manufacturing side of the U.S. economy than the larger services side, which is still expanding. The Fed owns a large bond portfolio acquired through past Quantitative Easing (QE) purchases, and will continue to reinvest coupon interest and principal from these bonds, which is likely to help keep interest rates low. While earlier predictions called for two small rate increases during 2016, the market is now pricing in a very low probability of tightening in the wake of Brexit and a lower-than-expected reported growth rate for the second quarter.
Looking ahead, we think that uncertainty in whether the Fed will raise interest rates again, the impact of the Brexit vote, slow global growth (and low corporate profits), and the possible impact from the U.S. presidential election will continue to affect market returns and volatility. While stock valuations on the whole are not terribly compelling, there have been significant rotations and corrections at the industry and sector level going back at least to 2015, creating select investment opportunities. Growth is likely to remain disappointing around much of the globe, particularly for countries with exposure to China and/or commodity markets. While tighter monetary policy and higher rates in the U.S. typically weigh on risk assets such as emerging markets equities, attractive valuations and monetary conditions in many emerging markets countries can lead to compelling investment opportunities.
|
|
| Portfolio Characteristics |
|
| | | | | |
Underlying Fund Allocations(1) as a % of net assets as of July 31, 2016 |
| | One Choice In Retirement Portfolio R6 | One Choice 2020 Portfolio R6 | One Choice 2025 Portfolio R6 | One Choice 2030 Portfolio R6 | One Choice 2035 Portfolio R6 |
| Equity |
| NT Core Equity Plus Fund | 3.0% | 3.0% | 3.0% | 3.0% | 3.2% |
| NT Disciplined Growth Fund | 1.5% | 1.8% | 2.2% | 2.5% | 2.9% |
| NT Equity Growth Fund | 10.0% | 9.7% | 9.4% | 9.3% | 9.2% |
| NT Growth Fund | 4.5% | 5.1% | 5.9% | 7.0% | 8.6% |
| NT Heritage Fund | 2.2% | 2.8% | 3.8% | 4.3% | 4.6% |
| NT Large Company Value Fund | 9.5% | 9.5% | 9.7% | 10.1% | 10.5% |
| NT Mid Cap Value Fund | 4.5% | 5.0% | 5.7% | 6.0% | 6.0% |
| NT Small Company Fund | 2.0% | 1.8% | 1.7% | 2.2% | 3.0% |
| NT Emerging Markets Fund | — | 0.9% | 1.9% | 2.6% | 3.1% |
| NT Global Real Estate Fund | 1.0% | 1.2% | 1.5% | 1.7% | 1.9% |
| NT International Growth Fund | 4.5% | 4.7% | 5.0% | 5.6% | 6.4% |
| NT International Small-Mid Cap Fund | — | 0.3% | 0.5% | 0.9% | 1.2% |
| NT International Value Fund | 2.3% | 2.7% | 3.4% | 4.0% | 4.6% |
| Total Equity | 45.0% | 48.5% | 53.7% | 59.2% | 65.2% |
| Fixed Income | | | | | |
| High-Yield Fund | 3.8% | 3.7% | 3.5% | 3.3% | 2.9% |
| Inflation-Adjusted Bond Fund | 1.5% | 2.5% | 3.7% | 4.7% | 5.3% |
| NT Diversified Bond Fund | 21.6% | 20.8% | 20.0% | 18.0% | 15.7% |
| Short Duration Inflation Protection Bond Fund | 6.1% | 5.0% | 3.3% | 1.9% | 0.6% |
| Global Bond Fund | 7.0% | 6.5% | 5.9% | 5.3% | 4.7% |
| International Bond Fund | 5.0% | 4.8% | 4.2% | 2.6% | 0.6% |
| Total Fixed Income | 45.0% | 43.3% | 40.6% | 35.8% | 29.8% |
| U.S. Government Money Market Fund | 10.0% | 8.2% | 5.7% | 5.0% | 5.0% |
| Other Assets and Liabilities | —(2) | —(2) | —(2) | —(2) | —(2) |
| |
| (1) | Underlying fund investments represent R6 Class for all funds, except Institutional Class for NT Core Equity Plus Fund, NT Disciplined Growth Fund, NT Equity Growth Fund, NT Small Company Fund, Inflation-Adjusted Bond Fund and Investor Class for U.S. Government Money Market Fund. |
| |
| (2) | Category is less than 0.05% of total net assets. |
|
| | | | | |
Underlying Fund Allocations(1) as a % of net assets as of July 31, 2016 | |
| | One Choice 2040 Portfolio R6 | One Choice 2045 Portfolio R6 | One Choice 2050 Portfolio R6 | One Choice 2055 Portfolio R6 | One Choice 2060 Portfolio R6 |
| Equity | |
| NT Core Equity Plus Fund | 3.4% | 3.9% | 4.5% | 4.5% | 4.5% |
| NT Disciplined Growth Fund | 3.1% | 3.2% | 3.3% | 3.5% | 3.5% |
| NT Equity Growth Fund | 9.7% | 10.2% | 10.2% | 10.6% | 10.7% |
| NT Growth Fund | 9.5% | 10.3% | 10.7% | 10.9% | 11.0% |
| NT Heritage Fund | 5.4% | 6.4% | 6.6% | 6.8% | 6.7% |
| NT Large Company Value Fund | 11.6% | 12.8% | 13.5% | 14.0% | 14.2% |
| NT Mid Cap Value Fund | 6.3% | 6.9% | 6.9% | 6.8% | 6.8% |
| NT Small Company Fund | 3.2% | 3.0% | 3.2% | 3.7% | 4.0% |
| NT Emerging Markets Fund | 4.0% | 4.8% | 5.7% | 6.3% | 6.4% |
| NT Global Real Estate Fund | 2.2% | 2.5% | 2.7% | 3.0% | 3.0% |
| NT International Growth Fund | 6.8% | 6.9% | 6.8% | 6.3% | 6.1% |
| NT International Small-Mid Cap Fund | 1.5% | 1.8% | 2.2% | 2.5% | 2.5% |
| NT International Value Fund | 4.9% | 5.1% | 5.3% | 5.5% | 5.6% |
| Total Equity | 71.6% | 77.8% | 81.6% | 84.4% | 85.0% |
| Fixed Income | | | | | |
| High-Yield Fund | 2.5% | 2.1% | 1.8% | 1.5% | 1.5% |
| Inflation-Adjusted Bond Fund | 5.1% | 4.3% | 3.6% | 3.1% | 3.0% |
| NT Diversified Bond Fund | 13.4% | 11.2% | 9.5% | 7.9% | 7.5% |
| Global Bond Fund | 4.2% | 3.9% | 3.5% | 3.1% | 3.0% |
| Total Fixed Income | 25.2% | 21.5% | 18.4% | 15.6% | 15.0% |
| U.S. Government Money Market Fund | 3.2% | 0.7% | — | — | — |
| Other Assets and Liabilities | —(2) | —(2) | —(2) | —(2) | — |
| |
| (1) | Underlying fund investments represent R6 Class for all funds, except Institutional Class for NT Core Equity Plus Fund, NT Disciplined Growth Fund, NT Equity Growth Fund, NT Small Company Fund, Inflation-Adjusted Bond Fund and Investor Class for U.S. Government Money Market Fund. |
| |
| (2) | Category is less than 0.05% of total net assets. |
Fund shareholders may incur two types of costs: (1) transaction costs, including sales charges (loads) on purchase payments and redemption/exchange fees; and (2) ongoing costs, including management fees; distribution and service (12b-1) fees; and other fund expenses. This example is intended to help you understand your ongoing costs (in dollars) of investing in your fund and to compare these costs with the ongoing cost of investing in other mutual funds. As a shareholder in the underlying American Century Investments funds, your fund will indirectly bear its pro rata share of the expenses incurred by the underlying funds. These expenses are not included in the fund’s annualized expense ratio or the expenses paid during the period. These expenses are, however, included in the effective expenses paid during the period.
The example is based on an investment of $1,000 made at the beginning of the period and held for the entire period from February 1, 2016 to July 31, 2016.
Actual Expenses
The table provides information about actual account values and actual expenses for each class. You may use the information, together with the amount you invested, to estimate the expenses that you paid over the period. First, identify the share class you own. Then simply divide your account value by $1,000 (for example, an $8,600 account value divided by $1,000 = 8.6), then multiply the result by the number under the heading “Expenses Paid During Period” to estimate the expenses you paid on your account during this period.
Hypothetical Example for Comparison Purposes
The table also provides information about hypothetical account values and hypothetical expenses based on the actual expense ratio of each class of your fund and an assumed rate of return of 5% per year before expenses, which is not the actual return of a fund’s share class. The hypothetical account values and expenses may not be used to estimate the actual ending account balance or expenses you paid for the period. You may use this information to compare the ongoing costs of investing in your fund and other funds. To do so, compare this 5% hypothetical example with the 5% hypothetical examples that appear in the shareholder reports of the other funds.
Please note that the expenses shown in the table are meant to highlight your ongoing costs only and do not reflect any transactional costs, such as sales charges (loads) or redemption/exchange fees. Therefore, the table is useful in comparing ongoing costs only, and will not help you determine the relative total costs of owning different funds. In addition, if these transactional costs were included, your costs would have been higher.
|
| | | | | | |
| | Beginning
Account Value
2/1/16 | Ending
Account Value
7/31/16 | Expenses Paid
During Period(1)
2/1/16 - 7/31/16 |
Annualized
Expense Ratio(1) | Effective
Expenses
Paid During
Period(2)
2/1/16 - 7/31/16 | Effective
Annualized
Expense
Ratio(2) |
| One Choice In Retirement Portfolio R6 | | | |
| Actual | | | | | | |
| R6 Class | $1,000 | $1,082.70 | $0.00 | 0.00%(3) | $2.74 | 0.53% |
| Hypothetical | | | | | | |
| R6 Class | $1,000 | $1,024.86 | $0.00 | 0.00%(3) | $2.66 | 0.53% |
| One Choice 2020 Portfolio R6 | | | |
| Actual | | | | | | |
| R6 Class | $1,000 | $1,086.70 | $0.00 | 0.00%(3) | $2.85 | 0.55% |
| Hypothetical | | | | | | |
| R6 Class | $1,000 | $1,024.86 | $0.00 | 0.00%(3) | $2.77 | 0.55% |
| One Choice 2025 Portfolio R6 | | | | |
| Actual | | | | | | |
| R6 Class | $1,000 | $1,091.80 | $0.00 | 0.00%(3) | $3.02 | 0.58% |
| Hypothetical | | | | | | |
| R6 Class | $1,000 | $1,024.86 | $0.00 | 0.00%(3) | $2.92 | 0.58% |
| One Choice 2030 Portfolio R6 | | |
| Actual | | | | | | |
| R6 Class | $1,000 | $1,094.60 | $0.00 | 0.00%(3) | $3.12 | 0.60% |
| Hypothetical | | | | | | |
| R6 Class | $1,000 | $1,024.86 | $0.00 | 0.00%(3) | $3.02 | 0.60% |
| One Choice 2035 Portfolio R6 | | | | |
| Actual | | | | | | |
| R6 Class | $1,000 | $1,097.30 | $0.00 | 0.00%(3) | $3.29 | 0.63% |
| Hypothetical | | | | | | |
| R6 Class | $1,000 | $1,024.86 | $0.00 | 0.00%(3) | $3.17 | 0.63% |
| |
| (1) | Expenses are equal to the class's annualized expense ratio listed in the table above, multiplied by the average account value over the period, multiplied by 182, the number of days in the most recent fiscal half-year, divided by 366, to reflect the one-half year period. The fees and expenses of the underlying American Century Investments funds in which the fund invests are not included in the class's annualized expense ratio. |
| |
| (2) | Effective expenses reflect the sum of expenses borne directly by the class plus the fund's pro rata share of the weighted average expense ratio of the underlying funds in which it invests. The effective annualized expense ratio combines the class's annualized expense ratio and the annualized weighted average expense ratio of the underlying funds. The annualized weighted average expense ratio of the underlying funds for the one-half year period reflects the actual expense ratio of each underlying fund from its most recent shareholder report, annualized and weighted for the fund's relative average investment therein during the period. |
| |
| (3) | Other expenses, which include directors' fees and expenses, did not exceed 0.005%. |
|
| | | | | | |
| | Beginning
Account Value
2/1/16 | Ending
Account Value
7/31/16 | Expenses Paid
During Period(1)
2/1/16 - 7/31/16 |
Annualized
Expense Ratio(1) | Effective
Expenses
Paid During
Period(2)
2/1/16 - 7/31/16 | Effective
Annualized
Expense
Ratio(2) |
| One Choice 2040 Portfolio R6 | | | |
| Actual | | | | | | |
| R6 Class | $1,000 | $1,102.30 | $0.00 | 0.00%(3) | $3.40 | 0.65% |
| Hypothetical | | | | | | |
| R6 Class | $1,000 | $1,024.86 | $0.00 | 0.00%(3) | $3.27 | 0.65% |
| One Choice 2045 Portfolio R6 | | | | |
| Actual | | | | | | |
| R6 Class | $1,000 | $1,110.30 | $0.00 | 0.00%(3) | $3.57 | 0.68% |
| Hypothetical | | | | | | |
| R6 Class | $1,000 | $1,024.86 | $0.00 | 0.00%(3) | $3.42 | 0.68% |
| One Choice 2050 Portfolio R6 | | |
| Actual | | | | | | |
| R6 Class | $1,000 | $1,112.80 | $0.00 | 0.00%(3) | $3.68 | 0.70% |
| Hypothetical | | | | | | |
| R6 Class | $1,000 | $1,024.86 | $0.00 | 0.00%(3) | $3.52 | 0.70% |
| One Choice 2055 Portfolio R6 | | | |
| Actual | | | | | | |
| R6 Class | $1,000 | $1,115.10 | $0.00 | 0.00%(3) | $3.73 | 0.71% |
| Hypothetical | | | | | | |
| R6 Class | $1,000 | $1,024.86 | $0.00 | 0.00%(3) | $3.57 | 0.71% |
| One Choice 2060 Portfolio R6 | | | |
| Actual | | | | | | |
| R6 Class | $1,000 | $1,117.00 | $0.00 | 0.00%(3) | $3.58 | 0.68% |
| Hypothetical | | | | | | |
| R6 Class | $1,000 | $1,024.86 | $0.00 | 0.00%(3) | $3.42 | 0.68% |
| |
| (1) | Expenses are equal to the class's annualized expense ratio listed in the table above, multiplied by the average account value over the period, multiplied by 182, the number of days in the most recent fiscal half-year, divided by 366, to reflect the one-half year period. The fees and expenses of the underlying American Century Investments funds in which the fund invests are not included in the class's annualized expense ratio. |
| |
| (2) | Effective expenses reflect the sum of expenses borne directly by the class plus the fund's pro rata share of the weighted average expense ratio of the underlying funds in which it invests. The effective annualized expense ratio combines the class's annualized expense ratio and the annualized weighted average expense ratio of the underlying funds. The annualized weighted average expense ratio of the underlying funds for the one-half year period reflects the actual expense ratio of each underlying fund from its most recent shareholder report, annualized and weighted for the fund's relative average investment therein during the period. |
| |
| (3) | Other expenses, which include directors' fees and expenses, did not exceed 0.005%. |
JULY 31, 2016
One Choice In Retirement Portfolio R6
|
| | | | |
| | Shares | Value |
MUTUAL FUNDS(1) — 100.0% | | |
| Domestic Equity Funds — 37.2% | | |
| NT Core Equity Plus Fund Institutional Class | 306,780 | $ | 4,187,546 |
|
| NT Disciplined Growth Fund Institutional Class | 210,550 | 2,105,503 |
|
| NT Equity Growth Fund Institutional Class | 1,194,402 | 13,998,393 |
|
| NT Growth Fund R6 Class | 422,807 | 6,346,338 |
|
| NT Heritage Fund R6 Class | 242,253 | 3,142,027 |
|
| NT Large Company Value Fund R6 Class | 1,174,800 | 13,275,235 |
|
| NT Mid Cap Value Fund R6 Class | 488,138 | 6,296,983 |
|
| NT Small Company Fund Institutional Class | 310,082 | 2,800,044 |
|
| | | 52,152,069 |
|
| Domestic Fixed Income Funds — 33.0% | | |
| High-Yield Fund R6 Class | 944,436 | 5,298,288 |
|
| Inflation-Adjusted Bond Fund Institutional Class | 176,918 | 2,114,165 |
|
| NT Diversified Bond Fund R6 Class | 2,732,179 | 30,299,863 |
|
| Short Duration Inflation Protection Bond Fund R6 Class | 827,191 | 8,536,613 |
|
| | | 46,248,929 |
|
| International Fixed Income Funds — 12.0% | | |
| Global Bond Fund R6 Class | 940,939 | 9,795,176 |
|
| International Bond Fund R6 Class | 531,296 | 7,119,362 |
|
| | | 16,914,538 |
|
| Money Market Funds — 10.0% | | |
| U.S. Government Money Market Fund Investor Class | 13,974,523 | 13,974,523 |
|
| International Equity Funds — 7.8% | | |
| NT Global Real Estate Fund R6 Class | 136,394 | 1,419,859 |
|
| NT International Growth Fund R6 Class | 631,376 | 6,383,208 |
|
| NT International Value Fund R6 Class | 371,896 | 3,198,309 |
|
| | | 11,001,376 |
|
TOTAL INVESTMENT SECURITIES — 100.0%
(Cost $137,827,005) | | 140,291,435 |
|
OTHER ASSETS AND LIABILITIES† | | (46) |
|
| TOTAL NET ASSETS — 100.0% | | $ | 140,291,389 |
|
|
|
| NOTES TO SCHEDULE OF INVESTMENTS |
| |
| † | Category is less than 0.05% of total net assets. |
| |
| (1) | Investments are funds within the American Century Investments family of funds and are considered affiliated funds. |
See Notes to Financial Statements.
JULY 31, 2016
One Choice 2020 Portfolio R6
|
| | | | |
| | Shares | Value |
MUTUAL FUNDS(1) — 100.0% | | |
| Domestic Equity Funds — 38.7% | | |
| NT Core Equity Plus Fund Institutional Class | 429,772 | $ | 5,866,393 |
|
| NT Disciplined Growth Fund Institutional Class | 347,363 | 3,473,632 |
|
| NT Equity Growth Fund Institutional Class | 1,630,497 | 19,109,429 |
|
| NT Growth Fund R6 Class | 668,027 | 10,027,089 |
|
| NT Heritage Fund R6 Class | 426,970 | 5,537,806 |
|
| NT Large Company Value Fund R6 Class | 1,644,910 | 18,587,483 |
|
| NT Mid Cap Value Fund R6 Class | 759,711 | 9,800,269 |
|
| NT Small Company Fund Institutional Class | 396,631 | 3,581,576 |
|
| | | 75,983,677 |
|
| Domestic Fixed Income Funds — 32.0% | | |
| High-Yield Fund R6 Class | 1,297,382 | 7,278,312 |
|
| Inflation-Adjusted Bond Fund Institutional Class | 407,911 | 4,874,535 |
|
| NT Diversified Bond Fund R6 Class | 3,693,335 | 40,959,087 |
|
| Short Duration Inflation Protection Bond Fund R6 Class | 945,475 | 9,757,302 |
|
| | | 62,869,236 |
|
| International Fixed Income Funds — 11.3% | | |
| Global Bond Fund R6 Class | 1,235,697 | 12,863,610 |
|
| International Bond Fund R6 Class | 697,087 | 9,340,972 |
|
| | | 22,204,582 |
|
| International Equity Funds — 9.8% | | |
| NT Emerging Markets Fund R6 Class | 166,811 | 1,731,496 |
|
| NT Global Real Estate Fund R6 Class | 225,169 | 2,344,006 |
|
| NT International Growth Fund R6 Class | 921,663 | 9,318,018 |
|
| NT International Small-Mid Cap Fund R6 Class | 42,718 | 446,825 |
|
| NT International Value Fund R6 Class | 623,885 | 5,365,408 |
|
| | | 19,205,753 |
|
| Money Market Funds — 8.2% | | |
| U.S. Government Money Market Fund Investor Class | 16,140,296 | 16,140,296 |
|
TOTAL INVESTMENT SECURITIES — 100.0%
(Cost $193,676,013) | | 196,403,544 |
|
OTHER ASSETS AND LIABILITIES† | | (62) |
|
| TOTAL NET ASSETS — 100.0% | | $ | 196,403,482 |
|
|
|
| NOTES TO SCHEDULE OF INVESTMENTS |
| |
| † | Category is less than 0.05% of total net assets. |
| |
| (1) | Investments are funds within the American Century Investments family of funds and are considered affiliated funds. |
See Notes to Financial Statements.
JULY 31, 2016
One Choice 2025 Portfolio R6
|
| | | | |
| | Shares | Value |
MUTUAL FUNDS(1) — 100.0% | | |
| Domestic Equity Funds — 41.4% | | |
| NT Core Equity Plus Fund Institutional Class | 503,628 | $ | 6,874,527 |
|
| NT Disciplined Growth Fund Institutional Class | 494,283 | 4,942,830 |
|
| NT Equity Growth Fund Institutional Class | 1,841,395 | 21,581,149 |
|
| NT Growth Fund R6 Class | 893,998 | 13,418,917 |
|
| NT Heritage Fund R6 Class | 676,253 | 8,770,998 |
|
| NT Large Company Value Fund R6 Class | 1,961,774 | 22,168,043 |
|
| NT Mid Cap Value Fund R6 Class | 1,015,522 | 13,100,235 |
|
| NT Small Company Fund Institutional Class | 432,223 | 3,902,974 |
|
| | | 94,759,673 |
|
| Domestic Fixed Income Funds — 30.5% | | |
| High-Yield Fund R6 Class | 1,420,976 | 7,971,677 |
|
| Inflation-Adjusted Bond Fund Institutional Class | 704,529 | 8,419,119 |
|
| NT Diversified Bond Fund R6 Class | 4,116,764 | 45,654,909 |
|
| Short Duration Inflation Protection Bond Fund R6 Class | 742,032 | 7,657,770 |
|
| | | 69,703,475 |
|
| International Equity Funds — 12.3% | | |
| NT Emerging Markets Fund R6 Class | 417,492 | 4,333,565 |
|
| NT Global Real Estate Fund R6 Class | 321,586 | 3,347,708 |
|
| NT International Growth Fund R6 Class | 1,136,917 | 11,494,235 |
|
| NT International Small-Mid Cap Fund R6 Class | 120,923 | 1,264,856 |
|
| NT International Value Fund R6 Class | 900,187 | 7,741,604 |
|
| | | 28,181,968 |
|
| International Fixed Income Funds — 10.1% | | |
| Global Bond Fund R6 Class | 1,297,316 | 13,505,058 |
|
| International Bond Fund R6 Class | 716,013 | 9,594,570 |
|
| | | 23,099,628 |
|
| Money Market Funds — 5.7% | | |
| U.S. Government Money Market Fund Investor Class | 13,047,118 | 13,047,118 |
|
TOTAL INVESTMENT SECURITIES — 100.0%
(Cost $225,747,836) | | 228,791,862 |
|
OTHER ASSETS AND LIABILITIES† | | (70) |
|
| TOTAL NET ASSETS — 100.0% | | $ | 228,791,792 |
|
|
|
| NOTES TO SCHEDULE OF INVESTMENTS |
| |
| † | Category is less than 0.05% of total net assets. |
| |
| (1) | Investments are funds within the American Century Investments family of funds and are considered affiliated funds. |
See Notes to Financial Statements.
JULY 31, 2016
One Choice 2030 Portfolio R6
|
| | | | |
| | Shares | Value |
MUTUAL FUNDS(1) — 100.0% | | |
| Domestic Equity Funds — 44.4% | | |
| NT Core Equity Plus Fund Institutional Class | 499,457 | $ | 6,817,586 |
|
| NT Disciplined Growth Fund Institutional Class | 573,347 | 5,733,469 |
|
| NT Equity Growth Fund Institutional Class | 1,805,680 | 21,162,574 |
|
| NT Growth Fund R6 Class | 1,059,732 | 15,906,584 |
|
| NT Heritage Fund R6 Class | 761,164 | 9,872,294 |
|
| NT Large Company Value Fund R6 Class | 2,042,539 | 23,080,688 |
|
| NT Mid Cap Value Fund R6 Class | 1,058,941 | 13,660,335 |
|
| NT Small Company Fund Institutional Class | 565,733 | 5,108,572 |
|
| | | 101,342,102 |
|
| Domestic Fixed Income Funds — 27.9% | | |
| High-Yield Fund R6 Class | 1,325,433 | 7,435,676 |
|
| Inflation-Adjusted Bond Fund Institutional Class | 891,750 | 10,656,418 |
|
| NT Diversified Bond Fund R6 Class | 3,710,505 | 41,149,501 |
|
| Short Duration Inflation Protection Bond Fund R6 Class | 414,352 | 4,276,109 |
|
| | | 63,517,704 |
|
| International Equity Funds — 14.8% | | |
| NT Emerging Markets Fund R6 Class | 569,283 | 5,909,158 |
|
| NT Global Real Estate Fund R6 Class | 370,956 | 3,861,653 |
|
| NT International Growth Fund R6 Class | 1,264,647 | 12,785,586 |
|
| NT International Small-Mid Cap Fund R6 Class | 189,634 | 1,983,570 |
|
| NT International Value Fund R6 Class | 1,060,211 | 9,117,815 |
|
| | | 33,657,782 |
|
| International Fixed Income Funds — 7.9% | | |
| Global Bond Fund R6 Class | 1,161,902 | 12,095,400 |
|
| International Bond Fund R6 Class | 448,320 | 6,007,485 |
|
| | | 18,102,885 |
|
| Money Market Funds — 5.0% | | |
| U.S. Government Money Market Fund Investor Class | 11,356,780 | 11,356,780 |
|
TOTAL INVESTMENT SECURITIES — 100.0%
(Cost $225,326,384) | | 227,977,253 |
|
OTHER ASSETS AND LIABILITIES† | | (63) |
|
| TOTAL NET ASSETS — 100.0% | | $ | 227,977,190 |
|
|
|
| NOTES TO SCHEDULE OF INVESTMENTS |
| |
| † | Category is less than 0.05% of total net assets. |
| |
| (1) | Investments are funds within the American Century Investments family of funds and are considered affiliated funds. |
See Notes to Financial Statements.
JULY 31, 2016
One Choice 2035 Portfolio R6
|
| | | | |
| | Shares | Value |
MUTUAL FUNDS(1) — 100.0% | | |
| Domestic Equity Funds — 48.0% | | |
| NT Core Equity Plus Fund Institutional Class | 428,901 | $ | 5,854,496 |
|
| NT Disciplined Growth Fund Institutional Class | 521,742 | 5,217,418 |
|
| NT Equity Growth Fund Institutional Class | 1,422,143 | 16,667,518 |
|
| NT Growth Fund R6 Class | 1,033,967 | 15,519,844 |
|
| NT Heritage Fund R6 Class | 643,963 | 8,352,195 |
|
| NT Large Company Value Fund R6 Class | 1,668,506 | 18,854,123 |
|
| NT Mid Cap Value Fund R6 Class | 836,435 | 10,790,008 |
|
| NT Small Company Fund Institutional Class | 598,429 | 5,403,817 |
|
| | | 86,659,419 |
|
| Domestic Fixed Income Funds — 24.5% | | |
| High-Yield Fund R6 Class | 943,130 | 5,290,959 |
|
| Inflation-Adjusted Bond Fund Institutional Class | 797,502 | 9,530,151 |
|
| NT Diversified Bond Fund R6 Class | 2,556,821 | 28,355,149 |
|
| Short Duration Inflation Protection Bond Fund R6 Class | 95,524 | 985,811 |
|
| | | 44,162,070 |
|
| International Equity Funds — 17.2% | | |
| NT Emerging Markets Fund R6 Class | 531,971 | 5,521,861 |
|
| NT Global Real Estate Fund R6 Class | 338,551 | 3,524,311 |
|
| NT International Growth Fund R6 Class | 1,143,431 | 11,560,089 |
|
| NT International Small-Mid Cap Fund R6 Class | 204,024 | 2,134,088 |
|
| NT International Value Fund R6 Class | 975,060 | 8,385,515 |
|
| | | 31,125,864 |
|
| International Fixed Income Funds — 5.3% | | |
| Global Bond Fund R6 Class | 812,003 | 8,452,956 |
|
| International Bond Fund R6 Class | 82,131 | 1,100,558 |
|
| | | 9,553,514 |
|
| Money Market Funds — 5.0% | | |
| U.S. Government Money Market Fund Investor Class | 8,993,692 | 8,993,692 |
|
TOTAL INVESTMENT SECURITIES — 100.0%
(Cost $178,526,949) | | 180,494,559 |
|
OTHER ASSETS AND LIABILITIES† | | (43) |
|
| TOTAL NET ASSETS — 100.0% | | $ | 180,494,516 |
|
|
|
| NOTES TO SCHEDULE OF INVESTMENTS |
| |
| † | Category is less than 0.05% of total net assets. |
| |
| (1) | Investments are funds within the American Century Investments family of funds and are considered affiliated funds. |
See Notes to Financial Statements.
JULY 31, 2016
One Choice 2040 Portfolio R6
|
| | | | |
| | Shares | Value |
MUTUAL FUNDS(1) — 100.0% | | |
| Domestic Equity Funds — 52.2% | | |
| NT Core Equity Plus Fund Institutional Class | 367,703 | $ | 5,019,142 |
|
| NT Disciplined Growth Fund Institutional Class | 459,432 | 4,594,319 |
|
| NT Equity Growth Fund Institutional Class | 1,236,545 | 14,492,307 |
|
| NT Growth Fund R6 Class | 940,670 | 14,119,454 |
|
| NT Heritage Fund R6 Class | 625,624 | 8,114,345 |
|
| NT Large Company Value Fund R6 Class | 1,525,897 | 17,242,632 |
|
| NT Mid Cap Value Fund R6 Class | 729,814 | 9,414,597 |
|
| NT Small Company Fund Institutional Class | 517,631 | 4,674,208 |
|
| | | 77,671,004 |
|
| Domestic Fixed Income Funds — 21.0% | | |
| High-Yield Fund R6 Class | 660,100 | 3,703,161 |
|
| Inflation-Adjusted Bond Fund Institutional Class | 632,382 | 7,556,968 |
|
| NT Diversified Bond Fund R6 Class | 1,804,224 | 20,008,849 |
|
| | | 31,268,978 |
|
| International Equity Funds — 19.4% | | |
| NT Emerging Markets Fund R6 Class | 569,083 | 5,907,084 |
|
| NT Global Real Estate Fund R6 Class | 314,651 | 3,275,514 |
|
| NT International Growth Fund R6 Class | 994,609 | 10,055,497 |
|
| NT International Small-Mid Cap Fund R6 Class | 212,385 | 2,221,543 |
|
| NT International Value Fund R6 Class | 857,892 | 7,377,873 |
|
| | | 28,837,511 |
|
| International Fixed Income Funds — 4.2% | | |
| Global Bond Fund R6 Class | 604,960 | 6,297,633 |
|
| Money Market Funds — 3.2% | | |
| U.S. Government Money Market Fund Investor Class | 4,822,595 | 4,822,595 |
|
TOTAL INVESTMENT SECURITIES — 100.0%
(Cost $147,298,766) | | 148,897,721 |
|
OTHER ASSETS AND LIABILITIES† | | (30) |
|
| TOTAL NET ASSETS — 100.0% | | $ | 148,897,691 |
|
|
|
| NOTES TO SCHEDULE OF INVESTMENTS |
| |
| † | Category is less than 0.05% of total net assets. |
| |
| (1) | Investments are funds within the American Century Investments family of funds and are considered affiliated funds. |
See Notes to Financial Statements.
JULY 31, 2016
One Choice 2045 Portfolio R6
|
| | | | |
| | Shares | Value |
MUTUAL FUNDS(1) — 100.0% | | |
| Domestic Equity Funds — 56.7% | | |
| NT Core Equity Plus Fund Institutional Class | 322,930 | $ | 4,407,999 |
|
| NT Disciplined Growth Fund Institutional Class | 366,862 | 3,668,618 |
|
| NT Equity Growth Fund Institutional Class | 994,106 | 11,650,918 |
|
| NT Growth Fund R6 Class | 783,048 | 11,753,552 |
|
| NT Heritage Fund R6 Class | 560,633 | 7,271,415 |
|
| NT Large Company Value Fund R6 Class | 1,286,232 | 14,534,420 |
|
| NT Mid Cap Value Fund R6 Class | 613,446 | 7,913,457 |
|
| NT Small Company Fund Institutional Class | 378,912 | 3,421,577 |
|
| | | 64,621,956 |
|
| International Equity Funds — 21.1% | | |
| NT Emerging Markets Fund R6 Class | 533,514 | 5,537,874 |
|
| NT Global Real Estate Fund R6 Class | 269,561 | 2,806,135 |
|
| NT International Growth Fund R6 Class | 774,887 | 7,834,112 |
|
| NT International Small-Mid Cap Fund R6 Class | 198,929 | 2,080,796 |
|
| NT International Value Fund R6 Class | 681,732 | 5,862,892 |
|
| | | 24,121,809 |
|
| Domestic Fixed Income Funds — 17.6% | | |
| High-Yield Fund R6 Class | 422,667 | 2,371,164 |
|
| Inflation-Adjusted Bond Fund Institutional Class | 404,865 | 4,838,139 |
|
| NT Diversified Bond Fund R6 Class | 1,155,374 | 12,813,095 |
|
| | | 20,022,398 |
|
| International Fixed Income Funds — 3.9% | | |
| Global Bond Fund R6 Class | 422,787 | 4,401,215 |
|
| Money Market Funds — 0.7% | | |
| U.S. Government Money Market Fund Investor Class | 843,209 | 843,209 |
|
TOTAL INVESTMENT SECURITIES — 100.0%
(Cost $112,757,539) | | 114,010,587 |
|
OTHER ASSETS AND LIABILITIES† | | (20) |
|
| TOTAL NET ASSETS — 100.0% | | $ | 114,010,567 |
|
|
|
| NOTES TO SCHEDULE OF INVESTMENTS |
| |
| † | Category is less than 0.05% of total net assets. |
| |
| (1) | Investments are funds within the American Century Investments family of funds and are considered affiliated funds. |
See Notes to Financial Statements.
JULY 31, 2016
One Choice 2050 Portfolio R6
|
| | | | |
| | Shares | Value |
MUTUAL FUNDS(1) — 100.0% | | |
| Domestic Equity Funds — 58.9% | | |
| NT Core Equity Plus Fund Institutional Class | 249,895 | $ | 3,411,064 |
|
| NT Disciplined Growth Fund Institutional Class | 254,323 | 2,543,229 |
|
| NT Equity Growth Fund Institutional Class | 664,691 | 7,790,178 |
|
| NT Growth Fund R6 Class | 546,295 | 8,199,883 |
|
| NT Heritage Fund R6 Class | 385,818 | 5,004,059 |
|
| NT Large Company Value Fund R6 Class | 908,741 | 10,268,769 |
|
| NT Mid Cap Value Fund R6 Class | 407,104 | 5,251,647 |
|
| NT Small Company Fund Institutional Class | 273,329 | 2,468,165 |
|
| | | 44,936,994 |
|
| International Equity Funds — 22.7% | | |
| NT Emerging Markets Fund R6 Class | 421,965 | 4,379,997 |
|
| NT Global Real Estate Fund R6 Class | 198,362 | 2,064,948 |
|
| NT International Growth Fund R6 Class | 509,536 | 5,151,405 |
|
| NT International Small-Mid Cap Fund R6 Class | 156,963 | 1,641,833 |
|
| NT International Value Fund R6 Class | 473,849 | 4,075,100 |
|
| | | 17,313,283 |
|
| Domestic Fixed Income Funds — 14.9% | | |
| High-Yield Fund R6 Class | 245,578 | 1,377,691 |
|
| Inflation-Adjusted Bond Fund Institutional Class | 232,161 | 2,774,323 |
|
| NT Diversified Bond Fund R6 Class | 649,195 | 7,199,570 |
|
| | | 11,351,584 |
|
| International Fixed Income Funds — 3.5% | | |
| Global Bond Fund R6 Class | 253,967 | 2,643,795 |
|
TOTAL INVESTMENT SECURITIES — 100.0%
(Cost $75,779,586) | | 76,245,656 |
|
OTHER ASSETS AND LIABILITIES† | | (11) |
|
| TOTAL NET ASSETS — 100.0% | | $ | 76,245,645 |
|
|
|
| NOTES TO SCHEDULE OF INVESTMENTS |
| |
| † | Category is less than 0.05% of total net assets. |
| |
| (1) | Investments are funds within the American Century Investments family of funds and are considered affiliated funds. |
See Notes to Financial Statements.
JULY 31, 2016
One Choice 2055 Portfolio R6
|
| | | | |
| | Shares | Value |
MUTUAL FUNDS(1) — 100.0% | | |
| Domestic Equity Funds — 60.8% | | |
| NT Core Equity Plus Fund Institutional Class | 125,155 | $ | 1,708,359 |
|
| NT Disciplined Growth Fund Institutional Class | 132,134 | 1,321,338 |
|
| NT Equity Growth Fund Institutional Class | 344,969 | 4,043,031 |
|
| NT Growth Fund R6 Class | 277,877 | 4,170,929 |
|
| NT Heritage Fund R6 Class | 198,422 | 2,573,533 |
|
| NT Large Company Value Fund R6 Class | 473,181 | 5,346,943 |
|
| NT Mid Cap Value Fund R6 Class | 202,016 | 2,606,010 |
|
| NT Small Company Fund Institutional Class | 157,492 | 1,422,157 |
|
| | | 23,192,300 |
|
| International Equity Funds — 23.6% | | |
| NT Emerging Markets Fund R6 Class | 233,039 | 2,418,940 |
|
| NT Global Real Estate Fund R6 Class | 108,457 | 1,129,040 |
|
| NT International Growth Fund R6 Class | 235,648 | 2,382,397 |
|
| NT International Small-Mid Cap Fund R6 Class | 89,913 | 940,494 |
|
| NT International Value Fund R6 Class | 245,169 | 2,108,451 |
|
| | | 8,979,322 |
|
| Domestic Fixed Income Funds — 12.5% | | |
| High-Yield Fund R6 Class | 104,323 | 585,252 |
|
| Inflation-Adjusted Bond Fund Institutional Class | 98,590 | 1,178,147 |
|
| NT Diversified Bond Fund R6 Class | 271,590 | 3,011,930 |
|
| | | 4,775,329 |
|
| International Fixed Income Funds — 3.1% | | |
| Global Bond Fund R6 Class | 113,730 | 1,183,927 |
|
TOTAL INVESTMENT SECURITIES — 100.0%
(Cost $37,480,140) | | 38,130,878 |
|
OTHER ASSETS AND LIABILITIES† | | (5) |
|
| TOTAL NET ASSETS — 100.0% | | $ | 38,130,873 |
|
|
|
| NOTES TO SCHEDULE OF INVESTMENTS |
| |
| † | Category is less than 0.05% of total net assets. |
| |
| (1) | Investments are funds within the American Century Investments family of funds and are considered affiliated funds. |
See Notes to Financial Statements.
JULY 31, 2016
One Choice 2060 Portfolio R6
|
| | | | |
| | Shares | Value |
MUTUAL FUNDS(1) — 100.0% | | |
| Domestic Equity Funds — 61.4% | | |
| NT Core Equity Plus Fund Institutional Class | 1,152 | $ | 15,721 |
|
| NT Disciplined Growth Fund Institutional Class | 1,224 | 12,240 |
|
| NT Equity Growth Fund Institutional Class | 3,207 | 37,586 |
|
| NT Growth Fund R6 Class | 2,564 | 38,491 |
|
| NT Heritage Fund R6 Class | 1,819 | 23,597 |
|
| NT Large Company Value Fund R6 Class | 4,403 | 49,752 |
|
| NT Mid Cap Value Fund R6 Class | 1,830 | 23,613 |
|
| NT Small Company Fund Institutional Class | 1,547 | 13,966 |
|
| | | 214,966 |
|
| International Equity Funds — 23.6% | | |
| NT Emerging Markets Fund R6 Class | 2,178 | 22,603 |
|
| NT Global Real Estate Fund R6 Class | 1,017 | 10,585 |
|
| NT International Growth Fund R6 Class | 2,100 | 21,229 |
|
| NT International Small-Mid Cap Fund R6 Class | 847 | 8,864 |
|
| NT International Value Fund R6 Class | 2,268 | 19,507 |
|
| | | 82,788 |
|
| Domestic Fixed Income Funds — 12.0% | | |
| High-Yield Fund R6 Class | 932 | 5,230 |
|
| Inflation-Adjusted Bond Fund Institutional Class | 878 | 10,496 |
|
| NT Diversified Bond Fund R6 Class | 2,365 | 26,225 |
|
| | | 41,951 |
|
| International Fixed Income Funds — 3.0% | | |
| Global Bond Fund R6 Class | 1,007 | 10,483 |
|
TOTAL INVESTMENT SECURITIES — 100.0%
(Cost $335,795) | | 350,188 |
|
| OTHER ASSETS AND LIABILITIES | | — |
|
| TOTAL NET ASSETS — 100.0% | | $ | 350,188 |
|
|
|
| NOTES TO SCHEDULE OF INVESTMENTS |
| |
| (1) | Investments are funds within the American Century Investments family of funds and are considered affiliated funds. |
See Notes to Financial Statements.
|
|
| Statements of Assets and Liabilities |
|
| | | | | | | | | |
| JULY 31, 2016 |
| | One Choice In Retirement Portfolio R6 | One Choice 2020 Portfolio R6 | One Choice 2025 Portfolio R6 |
| Assets |
| Investment securities in affiliates, at value (cost of $137,827,005, $193,676,013 and $225,747,836, respectively) | $ | 140,291,435 |
| $ | 196,403,544 |
| $ | 228,791,862 |
|
| Receivable for capital shares sold | 84,895 |
| 408,182 |
| 146,058 |
|
| Distributions receivable from affiliates | 80,408 |
| 107,603 |
| 119,867 |
|
| | 140,456,738 |
| 196,919,329 |
| 229,057,787 |
|
| | | | |
| Liabilities | | | |
| Payable for investments purchased | 148,104 |
| 514,006 |
| 173,798 |
|
| Payable for capital shares redeemed | 17,245 |
| 1,841 |
| 92,197 |
|
| | 165,349 |
| 515,847 |
| 265,995 |
|
| | | | |
| Net Assets | $ | 140,291,389 |
| $ | 196,403,482 |
| $ | 228,791,792 |
|
| | | | |
| R6 Class Capital Shares, $0.01 Par Value | | | |
| Shares outstanding | 13,242,125 |
| 18,000,898 |
| 20,683,839 |
|
| | | | |
| Net Asset Value Per Share | $ | 10.59 |
| $ | 10.91 |
| $ | 11.06 |
|
| | | | |
| Net Assets Consist of: | | | |
| Capital (par value and paid-in surplus) | $ | 137,488,710 |
| $ | 191,710,885 |
| $ | 222,762,323 |
|
| Undistributed net investment income | 72,883 |
| 1,084,696 |
| 1,228,153 |
|
| Undistributed net realized gain | 265,366 |
| 880,370 |
| 1,757,290 |
|
| Net unrealized appreciation | 2,464,430 |
| 2,727,531 |
| 3,044,026 |
|
| | $ | 140,291,389 |
| $ | 196,403,482 |
| $ | 228,791,792 |
|
See Notes to Financial Statements.
|
| | | | | | | | | |
| JULY 31, 2016 |
| | One Choice 2030 Portfolio R6 | One Choice 2035 Portfolio R6 | One Choice 2040 Portfolio R6 |
| Assets |
| Investment securities in affiliates, at value (cost of $225,326,384, $178,526,949 and $147,298,766, respectively) | $ | 227,977,253 |
| $ | 180,494,559 |
| $ | 148,897,721 |
|
| Receivable for investments sold | — |
| 411,500 |
| — |
|
| Receivable for capital shares sold | 1,092,316 |
| 123,361 |
| 1,092,348 |
|
| Distributions receivable from affiliates | 108,052 |
| 75,897 |
| 53,199 |
|
| | 229,177,621 |
| 181,105,317 |
| 150,043,268 |
|
| | | | |
| Liabilities | | | |
| Payable for investments purchased | 1,195,300 |
| 75,940 |
| 1,128,826 |
|
| Payable for capital shares redeemed | 5,131 |
| 534,861 |
| 16,751 |
|
| | 1,200,431 |
| 610,801 |
| 1,145,577 |
|
| | | | |
| Net Assets | $ | 227,977,190 |
| $ | 180,494,516 |
| $ | 148,897,691 |
|
| | | | |
| R6 Class Capital Shares, $0.01 Par Value | | | |
| Shares outstanding | 20,511,264 |
| 16,170,219 |
| 13,279,020 |
|
| | | | |
| Net Asset Value Per Share | $ | 11.11 |
| $ | 11.16 |
| $ | 11.21 |
|
| | | | |
| Net Assets Consist of: | | | |
| Capital (par value and paid-in surplus) | $ | 222,109,600 |
| $ | 175,939,872 |
| $ | 145,270,505 |
|
| Undistributed net investment income | 1,168,528 |
| 887,547 |
| 700,431 |
|
| Undistributed net realized gain | 2,048,193 |
| 1,699,487 |
| 1,327,800 |
|
| Net unrealized appreciation | 2,650,869 |
| 1,967,610 |
| 1,598,955 |
|
| | $ | 227,977,190 |
| $ | 180,494,516 |
| $ | 148,897,691 |
|
See Notes to Financial Statements.
|
| | | | | | | | | |
| JULY 31, 2016 |
| | One Choice 2045 Portfolio R6 | One Choice 2050 Portfolio R6 | One Choice 2055 Portfolio R6 |
| Assets |
| Investment securities in affiliates, at value (cost of $112,757,539, $75,779,586 and $37,480,140, respectively) | $ | 114,010,587 |
| $ | 76,245,656 |
| $ | 38,130,878 |
|
| Receivable for investments sold | 113,691 |
| — |
| — |
|
| Receivable for capital shares sold | 192,185 |
| 139,326 |
| 143,548 |
|
| Distributions receivable from affiliates | 34,194 |
| 19,394 |
| 8,170 |
|
| | 114,350,657 |
| 76,404,376 |
| 38,282,596 |
|
| | | | |
| Liabilities | | | |
| Payable for investments purchased | 34,214 |
| 123,723 |
| 80,127 |
|
| Payable for capital shares redeemed | 305,876 |
| 35,008 |
| 71,596 |
|
| | 340,090 |
| 158,731 |
| 151,723 |
|
| | | | |
| Net Assets | $ | 114,010,567 |
| $ | 76,245,645 |
| $ | 38,130,873 |
|
| | | | |
| R6 Class Capital Shares, $0.01 Par Value | | | |
| Shares outstanding | 10,120,748 |
| 6,778,545 |
| 3,336,093 |
|
| | | | |
| Net Asset Value Per Share | $ | 11.27 |
| $ | 11.25 |
| $ | 11.43 |
|
| | | | |
| Net Assets Consist of: | | | |
| Capital (par value and paid-in surplus) | $ | 110,817,174 |
| $ | 74,276,804 |
| $ | 36,951,115 |
|
| Undistributed net investment income | 525,940 |
| 332,922 |
| 158,541 |
|
| Undistributed net realized gain | 1,414,405 |
| 1,169,849 |
| 370,479 |
|
| Net unrealized appreciation | 1,253,048 |
| 466,070 |
| 650,738 |
|
| | $ | 114,010,567 |
| $ | 76,245,645 |
| $ | 38,130,873 |
|
See Notes to Financial Statements.
|
| | | |
| JULY 31, 2016 |
| | One Choice 2060 Portfolio R6 |
| Assets |
| Investment securities in affiliates, at value (cost of $335,795) | $ | 350,188 |
|
| Receivable for capital shares sold | 57,710 |
|
| Distributions receivable from affiliates | 55 |
|
| | 407,953 |
|
| | |
| Liabilities | |
| Payable for investments purchased | 57,324 |
|
| Payable for capital shares redeemed | 441 |
|
| | 57,765 |
|
| | |
| Net Assets | $ | 350,188 |
|
| | |
| R6 Class Capital Shares, $0.01 Par Value | |
| Shares outstanding | 32,197 |
|
| | |
| Net Asset Value Per Share | $ | 10.88 |
|
| | |
| Net Assets Consist of: | |
| Capital (par value and paid-in surplus) | $ | 334,625 |
|
| Undistributed net investment income | 651 |
|
| Undistributed net realized gain | 519 |
|
| Net unrealized appreciation | 14,393 |
|
| | $ | 350,188 |
|
See Notes to Financial Statements.
|
| | | | | | | | | |
| YEAR ENDED JULY 31, 2016 |
| | One Choice In Retirement Portfolio R6 | One Choice 2020 Portfolio R6 | One Choice 2025 Portfolio R6 |
| Investment Income (Loss) | | | |
| Income from Affiliates: | | | |
| Income distributions from underlying funds | $ | 2,029,481 |
| $ | 2,887,066 |
| $ | 3,160,321 |
|
| | | | |
| Expenses: | | | |
| Directors' fees and expenses | 3,430 |
| 4,850 |
| 5,164 |
|
| | | | |
| Net investment income (loss) | 2,026,051 |
| 2,882,216 |
| 3,155,157 |
|
| | | | |
| Realized and Unrealized Gain (Loss) on Affiliates | | | |
| Net realized gain (loss) on: | | | |
| Sale of investments in underlying funds | (1,285,575 | ) | (1,696,003 | ) | (1,289,871 | ) |
| Capital gain distributions received from underlying funds | 2,188,288 |
| 3,153,872 |
| 3,497,299 |
|
| | 902,713 |
| 1,457,869 |
| 2,207,428 |
|
| | | | |
| Change in net unrealized appreciation (depreciation) on investments in underlying funds | 1,830,085 |
| 2,152,949 |
| 2,302,915 |
|
| | | | |
| Net realized and unrealized gain (loss) on affiliates | 2,732,798 |
| 3,610,818 |
| 4,510,343 |
|
| | | | |
| Net Increase (Decrease) in Net Assets Resulting from Operations | $ | 4,758,849 |
| $ | 6,493,034 |
| $ | 7,665,500 |
|
See Notes to Financial Statements.
|
| | | | | | | | | |
| YEAR ENDED JULY 31, 2016 |
| | One Choice 2030 Portfolio R6 | One Choice 2035 Portfolio R6 | One Choice 2040 Portfolio R6 |
| Investment Income (Loss) | | | |
| Income from Affiliates: | | | |
| Income distributions from underlying funds | $ | 3,258,697 |
| $ | 2,476,681 |
| $ | 2,081,538 |
|
| | | | |
| Expenses: | | | |
| Directors' fees and expenses | 5,210 |
| 3,944 |
| 3,291 |
|
| | | | |
| Net investment income (loss) | 3,253,487 |
| 2,472,737 |
| 2,078,247 |
|
| | | | |
| Realized and Unrealized Gain (Loss) on Affiliates | | | |
| Net realized gain (loss) on: | | | |
| Sale of investments in underlying funds | (1,385,135 | ) | (973,953 | ) | (1,209,746 | ) |
| Capital gain distributions received from underlying funds | 3,796,303 |
| 2,973,633 |
| 2,713,540 |
|
| | 2,411,168 |
| 1,999,680 |
| 1,503,794 |
|
| | | | |
| Change in net unrealized appreciation (depreciation) on investments in underlying funds | 1,638,938 |
| 856,694 |
| 728,582 |
|
| | | | |
| Net realized and unrealized gain (loss) on affiliates | 4,050,106 |
| 2,856,374 |
| 2,232,376 |
|
| | | | |
| Net Increase (Decrease) in Net Assets Resulting from Operations | $ | 7,303,593 |
| $ | 5,329,111 |
| $ | 4,310,623 |
|
See Notes to Financial Statements.
|
| | | | | | | | | |
| YEAR ENDED JULY 31, 2016 |
| | One Choice 2045 Portfolio R6 | One Choice 2050 Portfolio R6 | One Choice 2055 Portfolio R6 |
| Investment Income (Loss) | | | |
| Income from Affiliates: | | | |
| Income distributions from underlying funds | $ | 1,669,122 |
| $ | 1,122,150 |
| $ | 531,531 |
|
| | | | |
| Expenses: | | | |
| Directors' fees and expenses | 2,620 |
| 1,777 |
| 860 |
|
| | | | |
| Net investment income (loss) | 1,666,502 |
| 1,120,373 |
| 530,671 |
|
| | | | |
| Realized and Unrealized Gain (Loss) on Affiliates | | | |
| Net realized gain (loss) on: | | | |
| Sale of investments in underlying funds | (697,028 | ) | (373,393 | ) | (393,630 | ) |
| Capital gain distributions received from underlying funds | 2,379,262 |
| 1,678,149 |
| 811,749 |
|
| | 1,682,234 |
| 1,304,756 |
| 418,119 |
|
| | | | |
| Change in net unrealized appreciation (depreciation) on investments in underlying funds | 352,255 |
| (22,200 | ) | 424,667 |
|
| | | | |
| Net realized and unrealized gain (loss) on affiliates | 2,034,489 |
| 1,282,556 |
| 842,786 |
|
| | | | |
| Net Increase (Decrease) in Net Assets Resulting from Operations | $ | 3,700,991 |
| $ | 2,402,929 |
| $ | 1,373,457 |
|
See Notes to Financial Statements.
|
| | | |
PERIOD ENDED JULY 31, 2016(1) |
| | One Choice 2060 Portfolio R6 |
| Investment Income (Loss) | |
| Income from Affiliates: | |
| Income distributions from underlying funds | $ | 1,033 |
|
| | |
| Expenses: | |
| Directors' fees and expenses | 2 |
|
| | |
| Net investment income (loss) | 1,031 |
|
| | |
| Realized and Unrealized Gain (Loss) on Affiliates | |
| Net realized gain (loss) on: | |
| Sale of investments in underlying funds | (401 | ) |
| Capital gain distributions received from underlying funds | 920 |
|
| | 519 |
|
| | |
Change in net unrealized appreciation (depreciation) on investments in underlying funds | 14,393 |
|
| | |
| Net realized and unrealized gain (loss) on affiliates | 14,912 |
|
| | |
| Net Increase (Decrease) in Net Assets Resulting from Operations | $ | 15,943 |
|
| |
| (1) | September 30, 2015 (fund inception) through July 31, 2016. |
See Notes to Financial Statements.
|
|
| Statements of Changes in Net Assets |
|
| | | | | | | | | | | | |
| YEARS ENDED JULY 31, 2016 AND JULY 31, 2015 |
| | One Choice In Retirement Portfolio R6 | One Choice 2020 Portfolio R6 |
| Increase (Decrease) in Net Assets | July 31, 2016 | July 31, 2015 | July 31, 2016 | July 31, 2015 |
| Operations | | | | |
| Net investment income (loss) | $ | 2,026,051 |
| $ | 584,514 |
| $ | 2,882,216 |
| $ | 1,493,400 |
|
| Net realized gain (loss) | 902,713 |
| 187,996 |
| 1,457,869 |
| 1,537,260 |
|
| Change in net unrealized appreciation (depreciation) | 1,830,085 |
| 24,264 |
| 2,152,949 |
| (331,967 | ) |
| Net increase (decrease) in net assets resulting from operations | 4,758,849 |
| 796,774 |
| 6,493,034 |
| 2,698,693 |
|
| | | | | |
| Distributions to Shareholders | | | | |
| From net investment income | (2,012,717 | ) | (535,371 | ) | (2,313,495 | ) | (1,214,185 | ) |
| From net realized gains | (75,211 | ) | (586,562 | ) | (1,924,395 | ) | (426,552 | ) |
| Decrease in net assets from distributions | (2,087,928 | ) | (1,121,933 | ) | (4,237,890 | ) | (1,640,737 | ) |
| | | | | |
| Capital Share Transactions | | | | |
| Proceeds from shares sold | 89,411,704 |
| 40,192,390 |
| 108,873,481 |
| 87,649,144 |
|
| Issued in connection with reorganization (Note 9) | — |
| 45,158,345 |
| — |
| — |
|
| Proceeds from reinvestment of distributions | 2,087,928 |
| 1,120,548 |
| 4,236,774 |
| 1,640,737 |
|
| Payments for shares redeemed | (34,330,732 | ) | (17,186,376 | ) | (38,039,039 | ) | (13,356,696 | ) |
| Net increase (decrease) in net assets from capital share transactions | 57,168,900 |
| 69,284,907 |
| 75,071,216 |
| 75,933,185 |
|
| | | | | |
| Net increase (decrease) in net assets | 59,839,821 |
| 68,959,748 |
| 77,326,360 |
| 76,991,141 |
|
| | | | | |
| Net Assets | | | | |
| Beginning of period | 80,451,568 |
| 11,491,820 |
| 119,077,122 |
| 42,085,981 |
|
| End of period | $ | 140,291,389 |
| $ | 80,451,568 |
| $ | 196,403,482 |
| $ | 119,077,122 |
|
| | | | | |
| Undistributed net investment income | $ | 72,883 |
| $ | 59,549 |
| $ | 1,084,696 |
| $ | 515,975 |
|
| | | | | |
| Transactions in Shares of the Funds | | | | |
| Sold | 8,755,950 |
| 3,806,507 |
| 10,345,979 |
| 8,057,674 |
|
| Issued in connection with reorganization (Note 9) | — |
| 4,307,104 |
| — |
| — |
|
| Issued in reinvestment of distributions | 206,581 |
| 105,754 |
| 409,746 |
| 151,920 |
|
| Redeemed | (3,393,341 | ) | (1,628,527 | ) | (3,649,814 | ) | (1,223,397 | ) |
| Net increase (decrease) in shares of the funds | 5,569,190 |
| 6,590,838 |
| 7,105,911 |
| 6,986,197 |
|
See Notes to Financial Statements.
|
| | | | | | | | | | | | |
| YEARS ENDED JULY 31, 2016 AND JULY 31, 2015 |
| | One Choice 2025
Portfolio R6 | One Choice 2030 Portfolio R6 |
| Increase (Decrease) in Net Assets | July 31, 2016 | July 31, 2015 | July 31, 2016 | July 31, 2015 |
| Operations | | | | |
| Net investment income (loss) | $ | 3,155,157 |
| $ | 1,601,401 |
| $ | 3,253,487 |
| $ | 1,423,479 |
|
| Net realized gain (loss) | 2,207,428 |
| 1,697,055 |
| 2,411,168 |
| 1,908,649 |
|
| Change in net unrealized appreciation (depreciation) | 2,302,915 |
| (56,483 | ) | 1,638,938 |
| 112,382 |
|
| Net increase (decrease) in net assets resulting from operations | 7,665,500 |
| 3,241,973 |
| 7,303,593 |
| 3,444,510 |
|
| | | | | |
| Distributions to Shareholders | | | | |
| From net investment income | (2,532,798 | ) | (1,205,349 | ) | (2,591,105 | ) | (1,109,196 | ) |
| From net realized gains | (2,084,647 | ) | (243,928 | ) | (2,199,379 | ) | (323,118 | ) |
| Decrease in net assets from distributions | (4,617,445 | ) | (1,449,277 | ) | (4,790,484 | ) | (1,432,314 | ) |
| | | | | |
| Capital Share Transactions | | | | |
| Proceeds from shares sold | 132,428,812 |
| 92,930,987 |
| 127,331,300 |
| 98,987,973 |
|
| Proceeds from reinvestment of distributions | 4,617,358 |
| 1,449,277 |
| 4,789,645 |
| 1,432,314 |
|
| Payments for shares redeemed | (34,810,379 | ) | (13,430,136 | ) | (31,826,602 | ) | (13,539,580 | ) |
| Net increase (decrease) in net assets from capital share transactions | 102,235,791 |
| 80,950,128 |
| 100,294,343 |
| 86,880,707 |
|
| | | | | |
| Net increase (decrease) in net assets | 105,283,846 |
| 82,742,824 |
| 102,807,452 |
| 88,892,903 |
|
| | | | | |
| Net Assets | | | | |
| Beginning of period | 123,507,946 |
| 40,765,122 |
| 125,169,738 |
| 36,276,835 |
|
| End of period | $ | 228,791,792 |
| $ | 123,507,946 |
| $ | 227,977,190 |
| $ | 125,169,738 |
|
| | | | | |
| Undistributed net investment income | $ | 1,228,153 |
| $ | 605,794 |
| $ | 1,168,528 |
| $ | 506,146 |
|
| | | | | |
| Transactions in Shares of the Funds | | | | |
| Sold | 12,409,289 |
| 8,440,455 |
| 11,884,551 |
| 8,908,831 |
|
| Issued in reinvestment of distributions | 441,008 |
| 132,354 |
| 454,425 |
| 130,092 |
|
| Redeemed | (3,283,585 | ) | (1,213,817 | ) | (2,986,885 | ) | (1,213,721 | ) |
| Net increase (decrease) in shares of the funds | 9,566,712 |
| 7,358,992 |
| 9,352,091 |
| 7,825,202 |
|
See Notes to Financial Statements.
|
| | | | | | | | | | | | |
| YEARS ENDED JULY 31, 2016 AND JULY 31, 2015 |
| | One Choice 2035
Portfolio R6 | One Choice 2040 Portfolio R6 |
| Increase (Decrease) in Net Assets | July 31, 2016 | July 31, 2015 | July 31, 2016 | July 31, 2015 |
| Operations | | | | |
| Net investment income (loss) | $ | 2,472,737 |
| $ | 1,270,226 |
| $ | 2,078,247 |
| $ | 1,002,215 |
|
| Net realized gain (loss) | 1,999,680 |
| 1,869,432 |
| 1,503,794 |
| 1,736,876 |
|
| Change in net unrealized appreciation (depreciation) | 856,694 |
| 457,060 |
| 728,582 |
| 261,163 |
|
| Net increase (decrease) in net assets resulting from operations | 5,329,111 |
| 3,596,718 |
| 4,310,623 |
| 3,000,254 |
|
| | | | | |
| Distributions to Shareholders | | | | |
| From net investment income | (1,998,215 | ) | (1,009,530 | ) | (1,664,729 | ) | (839,684 | ) |
| From net realized gains | (2,136,165 | ) | (268,797 | ) | (1,882,016 | ) | (275,712 | ) |
| Decrease in net assets from distributions | (4,134,380 | ) | (1,278,327 | ) | (3,546,745 | ) | (1,115,396 | ) |
| | | | | |
| Capital Share Transactions | | | | |
| Proceeds from shares sold | 107,095,491 |
| 69,104,390 |
| 92,034,526 |
| 55,398,695 |
|
| Proceeds from reinvestment of distributions | 4,134,380 |
| 1,278,327 |
| 3,546,737 |
| 1,115,396 |
|
| Payments for shares redeemed | (26,529,746 | ) | (9,554,198 | ) | (27,050,094 | ) | (6,655,460 | ) |
| Net increase (decrease) in net assets from capital share transactions | 84,700,125 |
| 60,828,519 |
| 68,531,169 |
| 49,858,631 |
|
| | | | | |
| Net increase (decrease) in net assets | 85,894,856 |
| 63,146,910 |
| 69,295,047 |
| 51,743,489 |
|
| | | | | |
| Net Assets | | | | |
| Beginning of period | 94,599,660 |
| 31,452,750 |
| 79,602,644 |
| 27,859,155 |
|
| End of period | $ | 180,494,516 |
| $ | 94,599,660 |
| $ | 148,897,691 |
| $ | 79,602,644 |
|
| | | | | |
| Undistributed net investment income | $ | 887,547 |
| $ | 413,025 |
| $ | 700,431 |
| $ | 286,913 |
|
| | | | | |
| Transactions in Shares of the Funds | | | | |
| Sold | 9,939,865 |
| 6,175,050 |
| 8,514,108 |
| 4,902,086 |
|
| Issued in reinvestment of distributions | 389,301 |
| 115,061 |
| 332,715 |
| 99,678 |
|
| Redeemed | (2,482,136 | ) | (844,540 | ) | (2,515,124 | ) | (585,894 | ) |
| Net increase (decrease) in shares of the funds | 7,847,030 |
| 5,445,571 |
| 6,331,699 |
| 4,415,870 |
|
See Notes to Financial Statements.
|
| | | | | | | | | | | | |
| YEARS ENDED JULY 31, 2016 AND JULY 31, 2015 |
| | One Choice 2045
Portfolio R6 | One Choice 2050 Portfolio R6 |
| Increase (Decrease) in Net Assets | July 31, 2016 | July 31, 2015 | July 31, 2016 | July 31, 2015 |
| Operations | | | | |
| Net investment income (loss) | $ | 1,666,502 |
| $ | 856,089 |
| $ | 1,120,373 |
| $ | 572,283 |
|
| Net realized gain (loss) | 1,682,234 |
| 1,493,467 |
| 1,304,756 |
| 1,117,954 |
|
| Change in net unrealized appreciation (depreciation) | 352,255 |
| 315,645 |
| (22,200 | ) | 71,068 |
|
| Net increase (decrease) in net assets resulting from operations | 3,700,991 |
| 2,665,201 |
| 2,402,929 |
| 1,761,305 |
|
| | | | | |
| Distributions to Shareholders | | | | |
| From net investment income | (1,374,045 | ) | (723,825 | ) | (931,745 | ) | (498,177 | ) |
| From net realized gains | (1,734,775 | ) | (217,148 | ) | (1,234,194 | ) | (163,206 | ) |
| Decrease in net assets from distributions | (3,108,820 | ) | (940,973 | ) | (2,165,939 | ) | (661,383 | ) |
| | | | | |
| Capital Share Transactions | | | | |
| Proceeds from shares sold | 66,773,939 |
| 43,173,005 |
| 41,804,024 |
| 27,960,831 |
|
| Proceeds from reinvestment of distributions | 3,108,707 |
| 940,973 |
| 2,165,939 |
| 661,383 |
|
| Payments for shares redeemed | (17,312,238 | ) | (7,688,212 | ) | (10,123,310 | ) | (4,541,489 | ) |
| Net increase (decrease) in net assets from capital share transactions | 52,570,408 |
| 36,425,766 |
| 33,846,653 |
| 24,080,725 |
|
| | | | | |
| Net increase (decrease) in net assets | 53,162,579 |
| 38,149,994 |
| 34,083,643 |
| 25,180,647 |
|
| | | | | |
| Net Assets | | | | |
| Beginning of period | 60,847,988 |
| 22,697,994 |
| 42,162,002 |
| 16,981,355 |
|
| End of period | $ | 114,010,567 |
| $ | 60,847,988 |
| $ | 76,245,645 |
| $ | 42,162,002 |
|
| | | | | |
| Undistributed net investment income | $ | 525,940 |
| $ | 233,483 |
| $ | 332,922 |
| $ | 144,294 |
|
| | | | | |
| Transactions in Shares of the Funds | | | | |
| Sold | 6,184,718 |
| 3,797,033 |
| 3,878,222 |
| 2,445,258 |
|
| Issued in reinvestment of distributions | 290,533 |
| 83,494 |
| 202,803 |
| 58,633 |
|
| Redeemed | (1,615,041 | ) | (671,367 | ) | (943,779 | ) | (396,678 | ) |
| Net increase (decrease) in shares of the funds | 4,860,210 |
| 3,209,160 |
| 3,137,246 |
| 2,107,213 |
|
See Notes to Financial Statements.
|
| | | | | | | | | |
| YEARS ENDED JULY 31, 2016 (EXCEPT AS NOTED) AND JULY 31, 2015 |
| | One Choice 2055 Portfolio R6 | One Choice 2060
Portfolio R6 |
| Increase (Decrease) in Net Assets | July 31, 2016 | July 31, 2015 | July 31, 2016(1) |
| Operations | | | |
| Net investment income (loss) | $ | 530,671 |
| $ | 253,209 |
| $ | 1,031 |
|
| Net realized gain (loss) | 418,119 |
| 512,344 |
| 519 |
|
| Change in net unrealized appreciation (depreciation) | 424,667 |
| 18,879 |
| 14,393 |
|
| Net increase (decrease) in net assets resulting from operations | 1,373,457 |
| 784,432 |
| 15,943 |
|
| | | | |
| Distributions to Shareholders | | | |
| From net investment income | (435,254 | ) | (216,714 | ) | (380 | ) |
| From net realized gains | (554,690 | ) | (11,035 | ) | — |
|
| Decrease in net assets from distributions | (989,944 | ) | (227,749 | ) | (380 | ) |
| | | | |
| Capital Share Transactions | | | |
| Proceeds from shares sold | 25,146,978 |
| 13,252,561 |
| 387,307 |
|
| Proceeds from reinvestment of distributions | 989,944 |
| 227,749 |
| 380 |
|
| Payments for shares redeemed | (7,395,884 | ) | (2,239,299 | ) | (53,062 | ) |
| Net increase (decrease) in net assets from capital share transactions | 18,741,038 |
| 11,241,011 |
| 334,625 |
|
| | | | |
| Net increase (decrease) in net assets | 19,124,551 |
| 11,797,694 |
| 350,188 |
|
| | | | |
| Net Assets | | | |
| Beginning of period | 19,006,322 |
| 7,208,628 |
| — |
|
| End of period | $ | 38,130,873 |
| $ | 19,006,322 |
| $ | 350,188 |
|
| | | | |
| Undistributed net investment income | $ | 158,541 |
| $ | 63,124 |
| $ | 651 |
|
| | | | |
| Transactions in Shares of the Funds | | | |
| Sold | 2,307,375 |
| 1,143,643 |
| 37,187 |
|
| Issued in reinvestment of distributions | 91,239 |
| 19,874 |
| 37 |
|
| Redeemed | (678,118 | ) | (194,007 | ) | (5,027 | ) |
| Net increase (decrease) in shares of the funds | 1,720,496 |
| 969,510 |
| 32,197 |
|
| |
| (1) | September 30, 2015 (fund inception) through July 31, 2016. |
See Notes to Financial Statements.
|
|
| Notes to Financial Statements |
JULY 31, 2016
1. Organization
American Century Asset Allocation Portfolios, Inc. (the corporation) is registered under the Investment Company Act of 1940, as amended (the 1940 Act), as an open-end management investment company and is organized as a Maryland corporation. The corporation is authorized to issue 4,000,000,000 shares. One Choice In Retirement Portfolio R6, One Choice 2020 Portfolio R6, One Choice 2025 Portfolio R6, One Choice 2030 Portfolio R6, One Choice 2035 Portfolio R6, One Choice 2040 Portfolio R6, One Choice 2045 Portfolio R6, One Choice 2050 Portfolio R6, One Choice 2055 Portfolio R6 and One Choice 2060 Portfolio R6 (collectively, the funds) are ten funds in a series issued by the corporation. The funds operate as “funds of funds,” meaning substantially all of the funds’ assets will be invested in other American Century Investments mutual funds (the underlying funds). Each fund’s assets are allocated among underlying funds that represent major asset classes, including equity securities (stocks), fixed-income securities (bonds) and cash-equivalent instruments (money markets). The underlying funds do not invest in securities issued by companies assigned the Global Industry Classification Standard for the tobacco industry. The funds will assume the risks associated with their underlying funds. Additional information and attributes of each underlying fund are available at americancentury.com. The investment objective of One Choice In Retirement Portfolio R6 is to seek current income. Capital appreciation is a secondary objective. The investment objective of each of the nine target date One Choice Portfolios R6 is to seek the highest total return consistent with its asset mix. When a fund reaches its most conservative planned target asset allocation, which is expected to occur on approximately November 30 of the year before the target date, its target asset mix will become fixed and will match that of One Choice In Retirement Portfolio R6. One Choice 2060 Portfolio R6 commenced sale on September 30, 2015, the fund’s inception date.
2. Significant Accounting Policies
The following is a summary of significant accounting policies consistently followed by the funds in preparation of their financial statements. Each fund is an investment company and follows accounting and reporting guidance in accordance with accounting principles generally accepted in the United States of America. This may require management to make certain estimates and assumptions at the date of the financial statements. Actual results could differ from these estimates. Management evaluated the impact of events or transactions occurring through the date the financial statements were issued that would merit recognition or disclosure.
Investment Valuations — The funds determine the fair value of their investments and compute their net asset value per share at the close of regular trading (usually 4 p.m. Eastern time) on the New York Stock Exchange (NYSE) on each day the NYSE is open. The Board of Directors has adopted valuation policies and procedures to guide the investment advisor in the funds' investment valuation process and to provide methodologies for the oversight of the funds' pricing function. Investments in the underlying funds are valued at their reported net asset value.
Security Transactions — Security transactions are accounted for as of the trade date. Net realized gains and losses are determined on the identified cost basis, which is also used for federal income tax purposes.
Investment Income — Income and capital gain distributions, if any, from the underlying funds are recorded as of the ex-dividend date. Long-term capital gain distributions, if any, from the underlying funds are a component of net realized gain (loss).
Expenses — The expenses included in the accompanying financial statements reflect the expenses of each fund and do not include any expenses associated with the underlying funds.
Income Tax Status — It is each fund’s policy to distribute substantially all net investment income and net realized gains to shareholders and to otherwise qualify as a regulated investment company under provisions of the Internal Revenue Code. Accordingly, no provision has been made for income taxes. The funds file U.S. federal, state, local and non-U.S. tax returns as applicable. The funds' tax returns are subject to examination by the relevant taxing authority until expiration of the applicable statute of limitations, which is generally three years from the date of filing but can be longer in certain jurisdictions. At this time, management believes there are no uncertain tax positions which, based on their technical merit, would not be sustained upon examination
and for which it is reasonably possible that the total amounts of unrecognized tax benefits will significantly change in the next twelve months.
Distributions to Shareholders — Distributions from net investment income, if any, are generally declared and paid quarterly for One Choice In Retirement Portfolio R6. Distributions from net investment income, if any, are generally declared and paid annually for the nine target date One Choice Portfolios R6. Distributions from net realized gains, if any, are generally declared and paid annually for all funds.
Indemnifications — Under the corporation’s organizational documents, its officers and directors are indemnified against certain liabilities arising out of the performance of their duties to the funds. In addition, in the normal course of business, the funds enter into contracts that provide general indemnifications. The maximum exposure under these arrangements is unknown as this would involve future claims that may be made against a fund. The risk of material loss from such claims is considered by management to be remote.
3. Fees and Transactions with Related Parties
Certain officers and directors of the corporation are also officers and/or directors of American Century Companies, Inc. (ACC). The corporation’s investment advisor, American Century Investment Management, Inc. (ACIM), the corporation's distributor, American Century Investment Services, Inc., and the corporation’s transfer agent, American Century Services, LLC, are wholly owned, directly or indirectly, by ACC. ACIM serves as the investment advisor for the underlying funds.
Administrative Fees — The corporation’s investment advisor, ACIM, does not receive an administrative fee for services provided to the funds.
Directors' Fees and Expenses — The Board of Directors is responsible for overseeing the investment advisor’s management and operations of the funds. The directors receive detailed information about the funds and their investment advisor regularly throughout the year, and meet at least quarterly with management of the investment advisor to review reports about fund operations. The funds' officers do not receive compensation from the funds.
Acquired Fund Fees and Expenses — Each fund will indirectly realize its pro rata share of the fees and expenses of the underlying funds in which it invests. These fees and expenses are already reflected in the valuation of the underlying funds.
4. Investment Transactions
Investment transactions for the year ended July 31, 2016 (except as noted) were as follows:
|
| | | | | |
| | One Choice In Retirement Portfolio R6 | One Choice 2020 Portfolio R6 | One Choice 2025 Portfolio R6 | One Choice 2030 Portfolio R6 | One Choice 2035 Portfolio R6 |
| Purchases | $81,683,274 | $101,241,663 | $123,199,250 | $120,178,645 | $99,342,610 |
| Sales | $22,387,944 | $24,372,226 | $18,928,417 | $17,624,969 | $13,330,476 |
|
| | | | | |
| | One Choice 2040 Portfolio R6 | One Choice 2045 Portfolio R6 | One Choice 2050 Portfolio R6 | One Choice 2055 Portfolio R6 | One Choice 2060 Portfolio R6(1) |
| Purchases | $84,855,761 | $60,894,328 | $38,083,474 | $22,843,160 | $378,354 |
| Sales | $15,079,538 | $7,386,967 | $3,604,234 | $3,749,644 | $42,158 |
| |
| (1) | September 30, 2015 (fund inception) through July 31, 2016. |
5. Affiliated Fund Transactions
A summary of transactions for each underlying fund for the year ended July 31, 2016 (except as noted) follows:
|
| | | | | | | | | | | | | | | | | | |
Fund/ Underlying Fund(1) | Beginning
Value | Purchase
Cost | Sales Cost | Realized
Gain (Loss) | Distributions
Received(2) | Ending
Value |
| One Choice In Retirement Portfolio R6 |
| NT Core Equity Plus Fund | $ | 2,414,588 |
| $ | 2,294,947 |
| $ | 429,146 |
| $ | (41,328 | ) | $ | 215,072 |
| $ | 4,187,546 |
|
| NT Disciplined Growth Fund | 1,208,082 |
| 1,036,170 |
| 186,843 |
| (10,369 | ) | 15,375 |
| 2,105,503 |
|
| NT Equity Growth Fund | 8,024,455 |
| 8,154,626 |
| 2,150,929 |
| (199,575 | ) | 630,655 |
| 13,998,393 |
|
| NT Growth Fund | 3,613,779 |
| 3,570,925 |
| 864,433 |
| (71,014 | ) | 304,851 |
| 6,346,338 |
|
| NT Heritage Fund | 1,808,733 |
| 1,758,586 |
| 344,901 |
| (42,834 | ) | 180,180 |
| 3,142,027 |
|
| NT Large Company Value Fund | 7,592,602 |
| 8,557,259 |
| 2,674,855 |
| (280,960 | ) | 943,278 |
| 13,275,235 |
|
| NT Mid Cap Value Fund | 3,617,348 |
| 3,306,609 |
| 946,062 |
| (66,001 | ) | 379,393 |
| 6,296,983 |
|
| NT Small Company Fund | 1,612,044 |
| 1,628,843 |
| 391,339 |
| (57,478 | ) | 155,358 |
| 2,800,044 |
|
| High-Yield Fund | 3,075,662 |
| 2,955,327 |
| 824,315 |
| (84,824 | ) | 230,236 |
| 5,298,288 |
|
| Inflation-Adjusted Bond Fund | 1,210,720 |
| 1,061,915 |
| 230,162 |
| (6,949 | ) | 30,091 |
| 2,114,165 |
|
| NT Diversified Bond Fund | 17,425,797 |
| 18,586,303 |
| 6,528,973 |
| (83,996 | ) | 717,342 |
| 30,299,863 |
|
| Short Duration Inflation Protection Bond Fund | 4,904,892 |
| 4,615,884 |
| 1,174,268 |
| (31,238 | ) | 3,648 |
| 8,536,613 |
|
| Global Bond Fund | 5,640,425 |
| 5,140,292 |
| 1,481,057 |
| (18,183 | ) | 41,040 |
| 9,795,176 |
|
| International Bond Fund | 4,022,391 |
| 3,935,209 |
| 1,492,378 |
| (96,373 | ) | 108,891 |
| 7,119,362 |
|
U.S. Government Money Market Fund(3) | 8,024,410 |
| 8,160,473 |
| 2,210,360 |
| — |
| 1,041 |
| 13,974,523 |
|
| NT Global Real Estate Fund | 807,471 |
| 622,853 |
| 141,542 |
| (7,680 | ) | 24,569 |
| 1,419,859 |
|
| NT International Growth Fund | 3,629,223 |
| 4,281,339 |
| 1,174,964 |
| (133,130 | ) | 181,575 |
| 6,383,208 |
|
| NT International Value Fund | 1,818,973 |
| 2,015,714 |
| 426,992 |
| (53,643 | ) | 55,174 |
| 3,198,309 |
|
| | $ | 80,451,595 |
| $ | 81,683,274 |
| $ | 23,673,519 |
| $ | (1,285,575 | ) | $ | 4,217,769 |
| $ | 140,291,435 |
|
| |
| (1) | Underlying fund investments represent R6 Class for all funds, except Institutional Class for NT Core Equity Plus Fund, NT Disciplined Growth Fund, NT Equity Growth Fund, NT Small Company Fund, Inflation-Adjusted Bond Fund and Investor Class for U.S. Government Money Market Fund. |
| |
| (2) | Distributions received includes distributions from net investment income and from capital gains, if any. |
| |
| (3) | Effective December 1, 2015, the name of Premium Money Market Fund was changed to U.S. Government Money Market Fund. |
|
| | | | | | | | | | | | | | | | | | |
Fund/ Underlying Fund(1) | Beginning
Value | Purchase
Cost | Sales Cost | Realized
Gain (Loss) | Distributions
Received(2) | Ending
Value |
| One Choice 2020 Portfolio R6 | |
| NT Core Equity Plus Fund | $ | 3,565,840 |
| $ | 2,755,706 |
| $ | 299,680 |
| $ | (27,852 | ) | $ | 296,580 |
| $ | 5,866,393 |
|
| NT Disciplined Growth Fund | 2,184,074 |
| 1,395,697 |
| 169,093 |
| (10,082 | ) | 25,374 |
| 3,473,632 |
|
| NT Equity Growth Fund | 11,580,572 |
| 9,810,764 |
| 2,163,257 |
| (219,762 | ) | 858,639 |
| 19,109,429 |
|
| NT Growth Fund | 6,266,638 |
| 4,726,280 |
| 983,474 |
| (82,164 | ) | 474,658 |
| 10,027,089 |
|
| NT Heritage Fund | 3,637,290 |
| 2,778,318 |
| 742,312 |
| (103,790 | ) | 317,381 |
| 5,537,806 |
|
| NT Large Company Value Fund | 11,389,447 |
| 10,918,928 |
| 3,423,595 |
| (403,741 | ) | 1,331,762 |
| 18,587,483 |
|
| NT Mid Cap Value Fund | 6,131,680 |
| 4,539,730 |
| 1,338,611 |
| (83,468 | ) | 591,716 |
| 9,800,269 |
|
| NT Small Company Fund | 2,116,885 |
| 1,887,813 |
| 340,954 |
| (45,351 | ) | 189,371 |
| 3,581,576 |
|
| High-Yield Fund | 4,409,919 |
| 3,573,680 |
| 762,298 |
| (66,554 | ) | 314,588 |
| 7,278,312 |
|
| Inflation-Adjusted Bond Fund | 3,254,989 |
| 2,010,452 |
| 557,059 |
| (23,270 | ) | 69,019 |
| 4,874,535 |
|
| NT Diversified Bond Fund | 24,725,972 |
| 22,224,237 |
| 7,055,746 |
| (110,426 | ) | 972,425 |
| 40,959,087 |
|
| Short Duration Inflation Protection Bond Fund | 5,512,484 |
| 4,864,803 |
| 813,619 |
| (21,209 | ) | 3,939 |
| 9,757,302 |
|
| Global Bond Fund | 7,678,827 |
| 5,926,991 |
| 1,376,928 |
| (21,094 | ) | 52,821 |
| 12,863,610 |
|
| International Bond Fund | 5,424,132 |
| 4,534,558 |
| 1,448,395 |
| (133,270 | ) | 142,033 |
| 9,340,972 |
|
| NT Emerging Markets Fund | 1,191,782 |
| 806,058 |
| 350,624 |
| (44,052 | ) | 6,425 |
| 1,731,496 |
|
| NT Global Real Estate Fund | 1,466,270 |
| 906,878 |
| 243,227 |
| (11,403 | ) | 41,070 |
| 2,344,006 |
|
| NT International Growth Fund | 5,630,310 |
| 5,641,329 |
| 1,419,002 |
| (163,772 | ) | 258,081 |
| 9,318,018 |
|
| NT International Small-Mid Cap Fund | 332,514 |
| 166,808 |
| 56,013 |
| (1,936 | ) | 3,171 |
| 446,825 |
|
| NT International Value Fund | 3,365,930 |
| 3,283,966 |
| 964,365 |
| (122,807 | ) | 90,710 |
| 5,365,408 |
|
U.S. Government Money Market Fund(3) | 9,211,606 |
| 8,488,667 |
| 1,559,977 |
| — |
| 1,175 |
| 16,140,296 |
|
| | $ | 119,077,161 |
| $ | 101,241,663 |
| $ | 26,068,229 |
| $ | (1,696,003 | ) | $ | 6,040,938 |
| $ | 196,403,544 |
|
| |
| (1) | Underlying fund investments represent R6 Class for all funds, except Institutional Class for NT Core Equity Plus Fund, NT Disciplined Growth Fund, NT Equity Growth Fund, NT Small Company Fund, Inflation-Adjusted Bond Fund and Investor Class for U.S. Government Money Market Fund. |
| |
| (2) | Distributions received includes distributions from net investment income and from capital gains, if any. |
| |
| (3) | Effective December 1, 2015, the name of Premium Money Market Fund was changed to U.S. Government Money Market Fund. |
|
| | | | | | | | | | | | | | | | | | |
Fund/ Underlying Fund(1) | Beginning
Value | Purchase
Cost | Sales Cost | Realized
Gain (Loss) | Distributions
Received(2) | Ending
Value |
| One Choice 2025 Portfolio R6 |
| NT Core Equity Plus Fund | $ | 3,701,101 |
| $ | 3,594,339 |
| $ | 282,388 |
| $ | (27,195 | ) | $ | 315,347 |
| $ | 6,874,527 |
|
| NT Disciplined Growth Fund | 2,730,028 |
| 2,291,764 |
| 186,770 |
| (11,153 | ) | 33,574 |
| 4,942,830 |
|
| NT Equity Growth Fund | 11,476,446 |
| 11,703,335 |
| 1,516,307 |
| (136,817 | ) | 868,508 |
| 21,581,149 |
|
| NT Growth Fund | 7,396,166 |
| 6,888,904 |
| 920,661 |
| (65,923 | ) | 576,744 |
| 13,418,917 |
|
| NT Heritage Fund | 5,027,237 |
| 4,725,053 |
| 773,434 |
| (93,178 | ) | 460,180 |
| 8,770,998 |
|
| NT Large Company Value Fund | 11,967,783 |
| 13,050,103 |
| 2,453,347 |
| (256,635 | ) | 1,422,705 |
| 22,168,043 |
|
| NT Mid Cap Value Fund | 7,299,193 |
| 6,404,048 |
| 1,238,397 |
| (88,140 | ) | 707,411 |
| 13,100,235 |
|
| NT Small Company Fund | 2,179,375 |
| 2,187,562 |
| 396,404 |
| (56,945 | ) | 200,995 |
| 3,902,974 |
|
| High-Yield Fund | 4,344,693 |
| 4,102,299 |
| 539,017 |
| (40,940 | ) | 320,274 |
| 7,971,677 |
|
| Inflation-Adjusted Bond Fund | 4,862,961 |
| 3,981,745 |
| 695,706 |
| (29,288 | ) | 113,989 |
| 8,419,119 |
|
| NT Diversified Bond Fund | 24,464,442 |
| 26,090,764 |
| 6,072,897 |
| (117,471 | ) | 985,797 |
| 45,654,909 |
|
| Short Duration Inflation Protection Bond Fund | 3,798,059 |
| 4,081,615 |
| 362,822 |
| (8,958 | ) | 2,715 |
| 7,657,770 |
|
| NT Emerging Markets Fund | 2,621,279 |
| 2,097,109 |
| 577,476 |
| (67,292 | ) | 13,613 |
| 4,333,565 |
|
| NT Global Real Estate Fund | 1,826,912 |
| 1,374,725 |
| 152,909 |
| (12,482 | ) | 51,341 |
| 3,347,708 |
|
| NT International Growth Fund | 6,134,484 |
| 6,806,611 |
| 770,615 |
| (85,294 | ) | 279,368 |
| 11,494,235 |
|
| NT International Small-Mid Cap Fund | 739,917 |
| 594,894 |
| 81,576 |
| (4,074 | ) | 7,708 |
| 1,264,856 |
|
| NT International Value Fund | 4,255,552 |
| 4,671,880 |
| 701,551 |
| (88,245 | ) | 117,596 |
| 7,741,604 |
|
| Global Bond Fund | 7,205,746 |
| 6,604,931 |
| 939,376 |
| (15,132 | ) | 49,109 |
| 13,505,058 |
|
| International Bond Fund | 5,010,041 |
| 4,675,366 |
| 864,980 |
| (84,709 | ) | 129,774 |
| 9,594,570 |
|
U.S. Government Money Market Fund(3) | 6,466,570 |
| 7,272,203 |
| 691,655 |
| — |
| 872 |
| 13,047,118 |
|
| | $ | 123,507,985 |
| $ | 123,199,250 |
| $ | 20,218,288 |
| $ | (1,289,871 | ) | $ | 6,657,620 |
| $ | 228,791,862 |
|
| |
| (1) | Underlying fund investments represent R6 Class for all funds, except Institutional Class for NT Core Equity Plus Fund, NT Disciplined Growth Fund, NT Equity Growth Fund, NT Small Company Fund, Inflation-Adjusted Bond Fund and Investor Class for U.S. Government Money Market Fund. |
| |
| (2) | Distributions received includes distributions from net investment income and from capital gains, if any. |
| |
| (3) | Effective December 1, 2015, the name of Premium Money Market Fund was changed to U.S. Government Money Market Fund. |
|
| | | | | | | | | | | | | | | | | | |
Fund/ Underlying Fund(1) | Beginning
Value | Purchase
Cost | Sales Cost | Realized
Gain (Loss) | Distributions
Received(2) | Ending
Value |
| One Choice 2030 Portfolio R6 | | |
| NT Core Equity Plus Fund | $ | 3,899,613 |
| $ | 3,396,952 |
| $ | 331,849 |
| $ | (34,625 | ) | $ | 323,859 |
| $ | 6,817,586 |
|
| NT Disciplined Growth Fund | 3,229,963 |
| 2,567,070 |
| 189,679 |
| (12,193 | ) | 40,031 |
| 5,733,469 |
|
| NT Equity Growth Fund | 11,543,671 |
| 10,988,956 |
| 1,249,161 |
| (122,604 | ) | 872,662 |
| 21,162,574 |
|
| NT Growth Fund | 9,021,823 |
| 7,910,162 |
| 1,087,287 |
| (78,859 | ) | 702,294 |
| 15,906,584 |
|
| NT Heritage Fund | 5,458,210 |
| 5,194,694 |
| 548,113 |
| (56,984 | ) | 499,907 |
| 9,872,294 |
|
| NT Large Company Value Fund | 12,768,931 |
| 12,850,782 |
| 2,010,773 |
| (225,752 | ) | 1,548,414 |
| 23,080,688 |
|
| NT Mid Cap Value Fund | 7,557,055 |
| 6,455,922 |
| 931,439 |
| (51,381 | ) | 770,309 |
| 13,660,335 |
|
| NT Small Company Fund | 2,998,432 |
| 2,722,240 |
| 512,687 |
| (70,524 | ) | 264,217 |
| 5,108,572 |
|
| High-Yield Fund | 4,024,535 |
| 3,904,825 |
| 546,516 |
| (48,108 | ) | 297,973 |
| 7,435,676 |
|
| Inflation-Adjusted Bond Fund | 6,013,629 |
| 5,226,061 |
| 918,130 |
| (37,716 | ) | 143,113 |
| 10,656,418 |
|
| NT Diversified Bond Fund | 22,123,737 |
| 22,528,890 |
| 4,522,044 |
| (97,223 | ) | 905,450 |
| 41,149,501 |
|
| Short Duration Inflation Protection Bond Fund | 1,997,938 |
| 2,329,306 |
| 126,789 |
| (3,701 | ) | 1,508 |
| 4,276,109 |
|
| NT Emerging Markets Fund | 3,386,333 |
| 2,950,275 |
| 710,739 |
| (91,812 | ) | 18,326 |
| 5,909,158 |
|
| NT Global Real Estate Fund | 2,166,391 |
| 1,645,562 |
| 301,976 |
| (16,681 | ) | 62,600 |
| 3,861,653 |
|
| NT International Growth Fund | 7,240,529 |
| 7,875,114 |
| 1,649,927 |
| (190,024 | ) | 325,726 |
| 12,785,586 |
|
| NT International Small-Mid Cap Fund | 1,142,218 |
| 941,880 |
| 123,152 |
| (5,555 | ) | 12,302 |
| 1,983,570 |
|
| NT International Value Fund | 5,104,822 |
| 5,861,170 |
| 1,382,995 |
| (197,197 | ) | 141,397 |
| 9,117,815 |
|
| Global Bond Fund | 6,492,348 |
| 5,882,001 |
| 842,025 |
| (14,541 | ) | 44,642 |
| 12,095,400 |
|
| International Bond Fund | 2,757,870 |
| 3,093,738 |
| 286,832 |
| (29,655 | ) | 79,481 |
| 6,007,485 |
|
U.S. Government Money Market Fund(3) | 6,241,726 |
| 5,853,045 |
| 737,991 |
| — |
| 789 |
| 11,356,780 |
|
| | $ | 125,169,774 |
| $ | 120,178,645 |
| $ | 19,010,104 |
| $ | (1,385,135 | ) | $ | 7,055,000 |
| $ | 227,977,253 |
|
| |
| (1) | Underlying fund investments represent R6 Class for all funds, except Institutional Class for NT Core Equity Plus Fund, NT Disciplined Growth Fund, NT Equity Growth Fund, NT Small Company Fund, Inflation-Adjusted Bond Fund and Investor Class for U.S. Government Money Market Fund. |
| |
| (2) | Distributions received includes distributions from net investment income and from capital gains, if any. |
| |
| (3) | Effective December 1, 2015, the name of Premium Money Market Fund was changed to U.S. Government Money Market Fund. |
|
| | | | | | | | | | | | | | | | | | |
Fund/ Underlying Fund(1) | Beginning
Value | Purchase
Cost | Sales Cost | Realized
Gain (Loss) | Distributions
Received(2) | Ending
Value |
| One Choice 2035 Portfolio R6 | |
| NT Core Equity Plus Fund | $ | 3,067,861 |
| $ | 3,126,254 |
| $ | 233,754 |
| $ | (26,101 | ) | $ | 260,880 |
| $ | 5,854,496 |
|
| NT Disciplined Growth Fund | 2,801,336 |
| 2,515,124 |
| 217,881 |
| (14,190 | ) | 35,022 |
| 5,217,418 |
|
| NT Equity Growth Fund | 8,725,448 |
| 8,971,874 |
| 971,892 |
| (100,940 | ) | 651,332 |
| 16,667,518 |
|
| NT Growth Fund | 8,407,225 |
| 8,136,420 |
| 1,110,986 |
| (76,529 | ) | 646,300 |
| 15,519,844 |
|
| NT Heritage Fund | 4,495,006 |
| 4,601,050 |
| 560,840 |
| (52,795 | ) | 412,764 |
| 8,352,195 |
|
| NT Large Company Value Fund | 9,986,201 |
| 10,905,646 |
| 1,663,181 |
| (166,512 | ) | 1,174,017 |
| 18,854,123 |
|
| NT Mid Cap Value Fund | 5,703,928 |
| 5,305,144 |
| 694,954 |
| (52,290 | ) | 569,605 |
| 10,790,008 |
|
| NT Small Company Fund | 2,967,741 |
| 2,994,874 |
| 460,046 |
| (55,550 | ) | 258,050 |
| 5,403,817 |
|
| High-Yield Fund | 2,696,717 |
| 2,826,789 |
| 272,918 |
| (19,876 | ) | 202,962 |
| 5,290,959 |
|
| Inflation-Adjusted Bond Fund | 5,066,554 |
| 4,997,074 |
| 839,240 |
| (40,227 | ) | 125,309 |
| 9,530,151 |
|
| NT Diversified Bond Fund | 14,476,838 |
| 16,580,521 |
| 3,398,601 |
| (53,143 | ) | 590,636 |
| 28,355,149 |
|
| Short Duration Inflation Protection Bond Fund | 310,751 |
| 658,226 |
| — |
| — |
| 291 |
| 985,811 |
|
| NT Emerging Markets Fund | 3,035,750 |
| 2,825,771 |
| 591,719 |
| (71,763 | ) | 16,363 |
| 5,521,861 |
|
| NT Global Real Estate Fund | 1,875,980 |
| 1,537,768 |
| 206,818 |
| (16,197 | ) | 52,753 |
| 3,524,311 |
|
| NT International Growth Fund | 6,131,699 |
| 6,980,633 |
| 902,954 |
| (97,936 | ) | 278,745 |
| 11,560,089 |
|
| NT International Small-Mid Cap Fund | 1,160,375 |
| 1,054,754 |
| 107,063 |
| (6,413 | ) | 12,502 |
| 2,134,088 |
|
| NT International Value Fund | 4,447,801 |
| 5,288,768 |
| 883,267 |
| (112,380 | ) | 122,938 |
| 8,385,515 |
|
| Global Bond Fund | 4,334,200 |
| 4,294,498 |
| 563,553 |
| (11,111 | ) | 29,491 |
| 8,452,956 |
|
| International Bond Fund | 189,721 |
| 841,520 |
| — |
| — |
| 9,753 |
| 1,100,558 |
|
U.S. Government Money Market Fund(3) | 4,718,552 |
| 4,899,902 |
| 624,762 |
| — |
| 601 |
| 8,993,692 |
|
| | $ | 94,599,684 |
| $ | 99,342,610 |
| $ | 14,304,429 |
| $ | (973,953 | ) | $ | 5,450,314 |
| $ | 180,494,559 |
|
| |
| (1) | Underlying fund investments represent R6 Class for all funds, except Institutional Class for NT Core Equity Plus Fund, NT Disciplined Growth Fund, NT Equity Growth Fund, NT Small Company Fund, Inflation-Adjusted Bond Fund and Investor Class for U.S. Government Money Market Fund. |
| |
| (2) | Distributions received includes distributions from net investment income and from capital gains, if any. |
| |
| (3) | Effective December 1, 2015, the name of Premium Money Market Fund was changed to U.S. Government Money Market Fund. |
|
| | | | | | | | | | | | | | | | | | |
Fund/ Underlying Fund(1) | Beginning
Value | Purchase
Cost | Sales Cost | Realized
Gain (Loss) | Distributions
Received(2) | Ending
Value |
| One Choice 2040 Portfolio R6 | | |
| NT Core Equity Plus Fund | $ | 2,787,727 |
| $ | 2,674,658 |
| $ | 344,398 |
| $ | (35,920 | ) | $ | 236,994 |
| $ | 5,019,142 |
|
| NT Disciplined Growth Fund | 2,475,614 |
| 2,312,725 |
| 305,776 |
| (18,969 | ) | 31,192 |
| 4,594,319 |
|
| NT Equity Growth Fund | 7,833,745 |
| 7,860,138 |
| 1,146,572 |
| (111,855 | ) | 580,008 |
| 14,492,307 |
|
| NT Growth Fund | 7,701,883 |
| 7,894,322 |
| 1,590,600 |
| (111,761 | ) | 590,286 |
| 14,119,454 |
|
| NT Heritage Fund | 4,425,768 |
| 4,775,058 |
| 943,371 |
| (83,190 | ) | 396,116 |
| 8,114,345 |
|
| NT Large Company Value Fund | 9,391,702 |
| 10,169,833 |
| 1,990,194 |
| (210,443 | ) | 1,102,125 |
| 17,242,632 |
|
| NT Mid Cap Value Fund | 5,107,653 |
| 4,771,480 |
| 873,586 |
| (50,270 | ) | 507,921 |
| 9,414,597 |
|
| NT Small Company Fund | 2,504,379 |
| 2,813,610 |
| 578,415 |
| (68,023 | ) | 227,821 |
| 4,674,208 |
|
| High-Yield Fund | 1,947,283 |
| 2,047,255 |
| 328,377 |
| (25,776 | ) | 143,306 |
| 3,703,161 |
|
| Inflation-Adjusted Bond Fund | 3,906,511 |
| 4,169,124 |
| 764,038 |
| (32,964 | ) | 99,574 |
| 7,556,968 |
|
| NT Diversified Bond Fund | 10,363,886 |
| 12,099,881 |
| 2,944,933 |
| (35,595 | ) | 422,606 |
| 20,008,849 |
|
| NT Emerging Markets Fund | 3,392,511 |
| 3,181,609 |
| 972,453 |
| (130,661 | ) | 18,505 |
| 5,907,084 |
|
| NT Global Real Estate Fund | 1,777,482 |
| 1,532,472 |
| 339,033 |
| (21,566 | ) | 50,224 |
| 3,275,514 |
|
| NT International Growth Fund | 5,327,600 |
| 6,362,791 |
| 1,098,053 |
| (120,134 | ) | 243,513 |
| 10,055,497 |
|
| NT International Small-Mid Cap Fund | 1,224,606 |
| 1,211,000 |
| 246,110 |
| (12,248 | ) | 13,208 |
| 2,221,543 |
|
| NT International Value Fund | 3,925,615 |
| 4,826,774 |
| 989,502 |
| (130,683 | ) | 109,049 |
| 7,377,873 |
|
| Global Bond Fund | 3,322,868 |
| 3,258,199 |
| 575,807 |
| (9,688 | ) | 22,324 |
| 6,297,633 |
|
U.S. Government Money Market Fund(3) | 2,185,829 |
| 2,894,832 |
| 258,066 |
| — |
| 306 |
| 4,822,595 |
|
| | $ | 79,602,662 |
| $ | 84,855,761 |
| $ | 16,289,284 |
| $ | (1,209,746 | ) | $ | 4,795,078 |
| $ | 148,897,721 |
|
| |
| (1) | Underlying fund investments represent R6 Class for all funds, except Institutional Class for NT Core Equity Plus Fund, NT Disciplined Growth Fund, NT Equity Growth Fund, NT Small Company Fund, Inflation-Adjusted Bond Fund and Investor Class for U.S. Government Money Market Fund. |
| |
| (2) | Distributions received includes distributions from net investment income and from capital gains, if any. |
| |
| (3) | Effective December 1, 2015, the name of Premium Money Market Fund was changed to U.S. Government Money Market Fund. |
|
| | | | | | | | | | | | | | | | | | |
Fund/ Underlying Fund(1) | Beginning
Value | Purchase
Cost | Sales Cost | Realized
Gain (Loss) | Distributions
Received(2) | Ending
Value |
| One Choice 2045 Portfolio R6 |
| NT Core Equity Plus Fund | $ | 2,502,184 |
| $ | 2,208,386 |
| $ | 203,579 |
| $ | (22,131 | ) | $ | 215,661 |
| $ | 4,407,999 |
|
| NT Disciplined Growth Fund | 1,962,173 |
| 1,732,036 |
| 117,637 |
| (10,723 | ) | 25,664 |
| 3,668,618 |
|
| NT Equity Growth Fund | 6,215,748 |
| 6,039,860 |
| 544,858 |
| (59,022 | ) | 487,130 |
| 11,650,918 |
|
| NT Growth Fund | 6,370,591 |
| 6,104,256 |
| 787,988 |
| (59,387 | ) | 513,838 |
| 11,753,552 |
|
| NT Heritage Fund | 3,945,355 |
| 3,849,310 |
| 357,467 |
| (34,274 | ) | 373,192 |
| 7,271,415 |
|
| NT Large Company Value Fund | 7,939,889 |
| 7,987,716 |
| 1,069,452 |
| (120,499 | ) | 990,699 |
| 14,534,420 |
|
| NT Mid Cap Value Fund | 4,306,975 |
| 3,714,852 |
| 487,578 |
| (39,994 | ) | 446,435 |
| 7,913,457 |
|
| NT Small Company Fund | 1,819,956 |
| 1,863,695 |
| 193,030 |
| (25,031 | ) | 171,902 |
| 3,421,577 |
|
| NT Emerging Markets Fund | 3,128,005 |
| 2,890,845 |
| 782,559 |
| (107,752 | ) | 17,492 |
| 5,537,874 |
|
| NT Global Real Estate Fund | 1,508,269 |
| 1,152,122 |
| 118,573 |
| (12,586 | ) | 45,188 |
| 2,806,135 |
|
| NT International Growth Fund | 4,222,489 |
| 4,666,203 |
| 601,787 |
| (64,675 | ) | 199,496 |
| 7,834,112 |
|
| NT International Small-Mid Cap Fund | 1,129,345 |
| 1,030,833 |
| 115,144 |
| (7,465 | ) | 12,806 |
| 2,080,796 |
|
| NT International Value Fund | 3,113,565 |
| 3,603,957 |
| 516,941 |
| (76,526 | ) | 91,021 |
| 5,862,892 |
|
| High-Yield Fund | 1,236,671 |
| 1,264,472 |
| 154,499 |
| (11,996 | ) | 95,702 |
| 2,371,164 |
|
| Inflation-Adjusted Bond Fund | 2,499,294 |
| 2,477,638 |
| 297,266 |
| (14,718 | ) | 64,724 |
| 4,838,139 |
|
| NT Diversified Bond Fund | 6,475,559 |
| 7,478,999 |
| 1,467,761 |
| (24,542 | ) | 281,086 |
| 12,813,095 |
|
| Global Bond Fund | 2,319,840 |
| 2,138,030 |
| 267,876 |
| (5,707 | ) | 16,304 |
| 4,401,215 |
|
U.S. Government Money Market Fund(3) | 152,091 |
| 691,118 |
| — |
| — |
| 44 |
| 843,209 |
|
| | $ | 60,847,999 |
| $ | 60,894,328 |
| $ | 8,083,995 |
| $ | (697,028 | ) | $ | 4,048,384 |
| $ | 114,010,587 |
|
| |
| (1) | Underlying fund investments represent R6 Class for all funds, except Institutional Class for NT Core Equity Plus Fund, NT Disciplined Growth Fund, NT Equity Growth Fund, NT Small Company Fund, Inflation-Adjusted Bond Fund and Investor Class for U.S. Government Money Market Fund. |
| |
| (2) | Distributions received includes distributions from net investment income and from capital gains, if any. |
| |
| (3) | Effective December 1, 2015, the name of Premium Money Market Fund was changed to U.S. Government Money Market Fund. |
|
| | | | | | | | | | | | | | | | | | |
Fund/ Underlying Fund(1) | Beginning
Value | Purchase
Cost | Sales Cost | Realized
Gain (Loss) | Distributions
Received(2) | Ending
Value |
| One Choice 2050 Portfolio R6 |
| NT Core Equity Plus Fund | $ | 1,898,447 |
| $ | 1,689,924 |
| $ | 94,851 |
| $ | (10,184 | ) | $ | 167,089 |
| $ | 3,411,064 |
|
| NT Disciplined Growth Fund | 1,412,735 |
| 1,148,399 |
| 76,152 |
| (5,582 | ) | 17,952 |
| 2,543,229 |
|
| NT Equity Growth Fund | 4,305,353 |
| 3,821,330 |
| 269,104 |
| (27,776 | ) | 333,326 |
| 7,790,178 |
|
| NT Growth Fund | 4,496,902 |
| 3,995,941 |
| 329,919 |
| (25,417 | ) | 358,697 |
| 8,199,883 |
|
| NT Heritage Fund | 2,761,672 |
| 2,566,133 |
| 199,436 |
| (19,359 | ) | 260,584 |
| 5,004,059 |
|
| NT Large Company Value Fund | 5,744,144 |
| 5,286,959 |
| 484,762 |
| (57,196 | ) | 707,710 |
| 10,268,769 |
|
| NT Mid Cap Value Fund | 2,910,190 |
| 2,307,983 |
| 194,920 |
| (15,267 | ) | 302,462 |
| 5,251,647 |
|
| NT Small Company Fund | 1,415,532 |
| 1,303,277 |
| 194,709 |
| (24,566 | ) | 130,047 |
| 2,468,165 |
|
| NT Emerging Markets Fund | 2,478,996 |
| 2,106,977 |
| 423,339 |
| (68,369 | ) | 13,638 |
| 4,379,997 |
|
| NT Global Real Estate Fund | 1,149,284 |
| 805,428 |
| 77,836 |
| (5,546 | ) | 34,443 |
| 2,064,948 |
|
| NT International Growth Fund | 2,817,904 |
| 2,922,222 |
| 271,771 |
| (34,907 | ) | 132,670 |
| 5,151,405 |
|
| NT International Small-Mid Cap Fund | 912,758 |
| 790,860 |
| 86,402 |
| (4,519 | ) | 10,186 |
| 1,641,833 |
|
| NT International Value Fund | 2,236,181 |
| 2,368,619 |
| 278,892 |
| (46,446 | ) | 63,997 |
| 4,075,100 |
|
| High-Yield Fund | 754,063 |
| 682,973 |
| 66,632 |
| (4,982 | ) | 56,458 |
| 1,377,691 |
|
| Inflation-Adjusted Bond Fund | 1,504,397 |
| 1,336,163 |
| 154,064 |
| (7,004 | ) | 37,607 |
| 2,774,323 |
|
| NT Diversified Bond Fund | 3,911,315 |
| 3,742,245 |
| 632,521 |
| (13,361 | ) | 163,270 |
| 7,199,570 |
|
| Global Bond Fund | 1,452,136 |
| 1,208,041 |
| 142,317 |
| (2,912 | ) | 10,163 |
| 2,643,795 |
|
| | $ | 42,162,009 |
| $ | 38,083,474 |
| $ | 3,977,627 |
| $ | (373,393 | ) | $ | 2,800,299 |
| $ | 76,245,656 |
|
| |
| (1) | Underlying fund investments represent R6 Class for all funds, except Institutional Class for NT Core Equity Plus Fund, NT Disciplined Growth Fund, NT Equity Growth Fund, NT Small Company Fund and Inflation-Adjusted Bond Fund. |
| |
| (2) | Distributions received includes distributions from net investment income and from capital gains, if any. |
|
| | | | | | | | | | | | | | | | | | |
Fund/ Underlying Fund(1) | Beginning
Value | Purchase
Cost | Sales Cost | Realized
Gain (Loss) | Distributions
Received(2) | Ending
Value |
| One Choice 2055 Portfolio R6 | |
| NT Core Equity Plus Fund | $ | 856,537 |
| $ | 1,021,940 |
| $ | 154,451 |
| $ | (19,029 | ) | $ | 79,270 |
| $ | 1,708,359 |
|
| NT Disciplined Growth Fund | 661,204 |
| 715,946 |
| 96,911 |
| (6,341 | ) | 9,082 |
| 1,321,338 |
|
| NT Equity Growth Fund | 2,044,993 |
| 2,329,930 |
| 351,019 |
| (41,284 | ) | 165,393 |
| 4,043,031 |
|
| NT Growth Fund | 2,091,581 |
| 2,454,392 |
| 438,303 |
| (35,074 | ) | 174,840 |
| 4,170,929 |
|
| NT Heritage Fund | 1,282,010 |
| 1,562,390 |
| 252,164 |
| (29,864 | ) | 126,646 |
| 2,573,533 |
|
| NT Large Company Value Fund | 2,705,980 |
| 3,279,216 |
| 589,325 |
| (75,998 | ) | 349,255 |
| 5,346,943 |
|
| NT Mid Cap Value Fund | 1,298,312 |
| 1,410,872 |
| 242,180 |
| (16,352 | ) | 141,948 |
| 2,606,010 |
|
| NT Small Company Fund | 732,379 |
| 868,309 |
| 171,613 |
| (22,504 | ) | 70,326 |
| 1,422,157 |
|
| NT Emerging Markets Fund | 1,230,608 |
| 1,369,541 |
| 330,643 |
| (48,634 | ) | 7,295 |
| 2,418,940 |
|
| NT Global Real Estate Fund | 562,799 |
| 556,406 |
| 99,921 |
| (7,042 | ) | 17,600 |
| 1,129,040 |
|
| NT International Growth Fund | 1,141,183 |
| 1,579,988 |
| 224,311 |
| (28,141 | ) | 56,910 |
| 2,382,397 |
|
| NT International Small-Mid Cap Fund | 464,598 |
| 539,093 |
| 84,228 |
| (5,245 | ) | 5,534 |
| 940,494 |
|
| NT International Value Fund | 1,035,973 |
| 1,461,173 |
| 294,433 |
| (42,697 | ) | 31,317 |
| 2,108,451 |
|
| High-Yield Fund | 286,434 |
| 346,958 |
| 57,517 |
| (5,149 | ) | 23,210 |
| 585,252 |
|
| Inflation-Adjusted Bond Fund | 573,068 |
| 696,472 |
| 130,667 |
| (3,969 | ) | 15,540 |
| 1,178,147 |
|
| NT Diversified Bond Fund | 1,456,826 |
| 1,966,694 |
| 487,048 |
| (4,757 | ) | 64,897 |
| 3,011,930 |
|
| Global Bond Fund | 581,840 |
| 683,840 |
| 138,540 |
| (1,550 | ) | 4,217 |
| 1,183,927 |
|
| | $ | 19,006,325 |
| $ | 22,843,160 |
| $ | 4,143,274 |
| $ | (393,630 | ) | $ | 1,343,280 |
| $ | 38,130,878 |
|
| |
| (1) | Underlying fund investments represent R6 Class for all funds, except Institutional Class for NT Core Equity Plus Fund, NT Disciplined Growth Fund, NT Equity Growth Fund, NT Small Company Fund and Inflation-Adjusted Bond Fund. |
| |
| (2) | Distributions received includes distributions from net investment income and from capital gains, if any. |
|
| | | | | | | | | | | | | | | | | |
Fund/ Underlying Fund(1) | Beginning
Value | Purchase
Cost | Sales Cost | Realized
Gain (Loss) | Distributions
Received(2) | Ending
Value |
One Choice 2060 Portfolio R6(3) | |
| NT Core Equity Plus Fund | — |
| $ | 17,071 |
| $ | 1,913 |
| $ | (23 | ) | $ | 148 |
| $ | 15,721 |
|
| NT Disciplined Growth Fund | — |
| 13,085 |
| 1,442 |
| (2 | ) | 28 |
| 12,240 |
|
| NT Equity Growth Fund | — |
| 40,514 |
| 4,576 |
| 4 |
| 254 |
| 37,586 |
|
| NT Growth Fund | — |
| 41,287 |
| 4,740 |
| (11 | ) | 192 |
| 38,491 |
|
| NT Heritage Fund | — |
| 25,250 |
| 2,881 |
| (86 | ) | 138 |
| 23,597 |
|
| NT Large Company Value Fund | — |
| 54,114 |
| 6,288 |
| (10 | ) | 513 |
| 49,752 |
|
| NT Mid Cap Value Fund | — |
| 25,360 |
| 2,875 |
| 26 |
| 206 |
| 23,613 |
|
| NT Small Company Fund | — |
| 14,949 |
| 1,784 |
| (42 | ) | 81 |
| 13,966 |
|
| NT Emerging Markets Fund | — |
| 23,984 |
| 2,768 |
| (20 | ) | 8 |
| 22,603 |
|
| NT Global Real Estate Fund | — |
| 11,035 |
| 1,152 |
| (9 | ) | 21 |
| 10,585 |
|
| NT International Growth Fund | — |
| 23,149 |
| 2,595 |
| (107 | ) | 63 |
| 21,229 |
|
| NT International Small-Mid Cap Fund | — |
| 9,525 |
| 1,037 |
| (19 | ) | 7 |
| 8,864 |
|
| NT International Value Fund | — |
| 21,369 |
| 2,494 |
| (71 | ) | 35 |
| 19,507 |
|
| High-Yield Fund | — |
| 5,713 |
| 601 |
| (1 | ) | 60 |
| 5,230 |
|
| Inflation-Adjusted Bond Fund | — |
| 11,539 |
| 1,190 |
| (9 | ) | 56 |
| 10,496 |
|
| NT Diversified Bond Fund | — |
| 28,942 |
| 3,037 |
| (18 | ) | 139 |
| 26,225 |
|
| Global Bond Fund | — |
| 11,468 |
| 1,186 |
| (3 | ) | 4 |
| 10,483 |
|
| | — |
| $ | 378,354 |
| $ | 42,559 |
| $ | (401 | ) | $ | 1,953 |
| $ | 350,188 |
|
| |
| (1) | Underlying fund investments represent R6 Class for all funds, except Institutional Class for NT Core Equity Plus Fund, NT Disciplined Growth Fund, NT Equity Growth Fund, NT Small Company Fund and Inflation-Adjusted Bond Fund. |
| |
| (2) | Distributions received includes distributions from net investment income and from capital gains, if any. |
| |
| (3) | September 30, 2015 (fund inception) through July 31, 2016. |
6. Investments in Underlying Funds
The funds do not invest in the underlying funds for the purpose of exercising management or control; however, investments by the funds within their investment strategies may represent a significant portion of the underlying funds’ net assets.
7. Fair Value Measurements
The funds’ investments valuation process is based on several considerations and may use multiple inputs to determine the fair value of the investments held by the funds. In conformity with accounting principles generally accepted in the United States of America, the inputs used to determine a valuation are classified into three broad levels.
| |
| • | Level 1 valuation inputs consist of unadjusted quoted prices in an active market for identical investments. |
| |
| • | Level 2 valuation inputs consist of direct or indirect observable market data (including quoted prices for comparable investments, evaluations of subsequent market events, interest rates, prepayment speeds, credit risk, etc.). These inputs also consist of quoted prices for identical investments initially expressed in local currencies that are adjusted through translation into U.S. dollars. |
| |
| • | Level 3 valuation inputs consist of unobservable data (including a fund’s own assumptions). |
The level classification is based on the lowest level input that is significant to the fair valuation measurement. The valuation inputs are not necessarily an indication of the risks associated with investing in these securities or other financial instruments. There were no significant transfers between levels during the period.
As of period end, the funds’ investment securities were classified as Level 1. The Schedules of Investments provide additional information on the funds' portfolio holdings.
8. Federal Tax Information
The tax character of distributions paid during the years ended July 31, 2016 and July 31, 2015 (except as noted) were as follows:
|
| | | | | | | | | | | | |
| | 2016 | 2015 |
| | Distributions Paid From: | Distributions Paid From: |
| | Ordinary Income | Long-term capital gains | Ordinary Income | Long-term capital gains |
| One Choice In Retirement Portfolio R6 | $ | 2,087,928 |
| — |
| $ | 612,271 |
| $ | 509,662 |
|
| One Choice 2020 Portfolio R6 | $ | 2,313,495 |
| $ | 1,924,395 |
| $ | 1,323,467 |
| $ | 317,270 |
|
| One Choice 2025 Portfolio R6 | $ | 2,567,789 |
| $ | 2,049,656 |
| $ | 1,240,560 |
| $ | 208,717 |
|
| One Choice 2030 Portfolio R6 | $ | 2,648,232 |
| $ | 2,142,252 |
| $ | 1,167,424 |
| $ | 264,890 |
|
| One Choice 2035 Portfolio R6 | $ | 2,059,984 |
| $ | 2,074,396 |
| $ | 1,031,122 |
| $ | 247,205 |
|
| One Choice 2040 Portfolio R6 | $ | 1,690,393 |
| $ | 1,856,352 |
| $ | 863,423 |
| $ | 251,973 |
|
| One Choice 2045 Portfolio R6 | $ | 1,485,878 |
| $ | 1,622,942 |
| $ | 742,061 |
| $ | 198,912 |
|
| One Choice 2050 Portfolio R6 | $ | 992,051 |
| $ | 1,173,888 |
| $ | 511,016 |
| $ | 150,367 |
|
| One Choice 2055 Portfolio R6 | $ | 459,353 |
| $ | 530,591 |
| $ | 223,186 |
| $ | 4,563 |
|
One Choice 2060 Portfolio R6(1) | $ | 380 |
| — |
| N/A |
| N/A |
|
(1) September 30, 2015 (fund inception) through July 31, 2016.
The book-basis character of distributions made during the year from net investment income or net realized gains may differ from their ultimate characterization for federal income tax purposes. These differences reflect the differing character of certain income items and net realized gains and losses for financial statement and tax purposes, and may result in reclassification among certain capital accounts on the financial statements.
As of July 31, 2016, the federal tax cost of investments and the components of distributable earnings on a tax-basis were as follows:
|
| | | | | | | | | | | | | | | |
| | One Choice In Retirement Portfolio R6 | One Choice 2020 Portfolio R6 | One Choice 2025 Portfolio R6 | One Choice 2030 Portfolio R6 | One Choice 2035 Portfolio R6 |
| Federal tax cost of investments | $ | 139,729,537 |
| $ | 195,906,083 |
| $ | 227,458,923 |
| $ | 227,074,309 |
| $ | 179,788,163 |
|
| Gross tax appreciation of investments | $ | 1,395,564 |
| $ | 2,092,010 |
| $ | 3,019,934 |
| $ | 2,836,276 |
| $ | 2,269,640 |
|
| Gross tax depreciation of investments | (833,666 | ) | (1,594,549 | ) | (1,686,995 | ) | (1,933,332 | ) | (1,563,244 | ) |
| Net tax appreciation (depreciation) of investments | $ | 561,898 |
| $ | 497,461 |
| $ | 1,332,939 |
| $ | 902,944 |
| $ | 706,396 |
|
| Undistributed ordinary income | $ | 156,316 |
| $ | 1,084,696 |
| $ | 1,230,428 |
| $ | 1,187,069 |
| $ | 888,744 |
|
| Accumulated long-term gains | $ | 2,084,465 |
| $ | 3,110,440 |
| $ | 3,466,102 |
| $ | 3,777,577 |
| $ | 2,959,504 |
|
|
| | | | | | | | | | | | | | | |
| | One Choice 2040 Portfolio R6 | One Choice 2045 Portfolio R6 | One Choice 2050 Portfolio R6 | One Choice 2055 Portfolio R6 | One Choice 2060 Portfolio R6 |
| Federal tax cost of investments | $ | 148,673,865 |
| $ | 113,719,884 |
| $ | 76,287,709 |
| $ | 37,921,877 |
| $ | 336,409 |
|
| Gross tax appreciation of investments | $ | 1,739,932 |
| $ | 1,529,166 |
| $ | 1,034,808 |
| $ | 515,310 |
| $ | 13,779 |
|
| Gross tax depreciation of investments | (1,516,076 | ) | (1,238,463 | ) | (1,076,861 | ) | (306,309 | ) | — |
|
| Net tax appreciation (depreciation) of investments | $ | 223,856 |
| $ | 290,703 |
| $ | (42,053 | ) | $ | 209,001 |
| $ | 13,779 |
|
| Undistributed ordinary income | $ | 716,198 |
| $ | 532,651 |
| $ | 339,299 |
| $ | 164,692 |
| $ | 876 |
|
| Accumulated long-term gains | $ | 2,687,132 |
| $ | 2,370,039 |
| $ | 1,671,595 |
| $ | 806,065 |
| $ | 908 |
|
The difference between book-basis and tax-basis unrealized appreciation (depreciation) is attributable primarily to the tax deferral of losses on wash sales.
9. Reorganization
On December 9, 2014, the Board of Directors approved an agreement and plan of reorganization (the reorganization), whereby the net assets of One Choice® 2015 Portfolio R6, one fund in a series issued by the corporation, were transferred to One Choice In Retirement Portfolio R6 in exchange for shares of One Choice In Retirement Portfolio R6. One Choice 2015 Portfolio R6 had reached its most conservative planned target asset allocation and its asset mix matched that of One Choice In Retirement Portfolio R6. The reorganization was executed to combine two funds that had the same target asset allocations, both funds’ investment objectives and strategies were substantially similar and their total expense ratios were expected to be the same. The financial statements and performance history of One Choice In Retirement Portfolio R6 survived after the reorganization. The reorganization was effective as of the close of the NYSE on March 27, 2015.
The reorganization was accomplished by a tax-free exchange of shares. On March 27, 2015, One Choice 2015 Portfolio R6 exchanged its shares for shares of One Choice In Retirement Portfolio R6 as follows:
|
| | | | | | |
| Original Fund/Class | Shares Exchanged | | New Fund/Class | Shares Received |
| One Choice 2015 Portfolio R6 – R6 Class | 4,266,394 |
| | One Choice In Retirement Portfolio R6 – R6 Class | 4,307,104 |
|
The net assets of One Choice 2015 Portfolio R6 and One Choice In Retirement Portfolio R6 immediately before the reorganization were $45,158,345 and $21,165,837, respectively. One Choice 2015 Portfolio R6's unrealized appreciation of $337,454 was combined with that of One Choice In Retirement Portfolio R6. Immediately after the reorganization, the combined net assets were $66,324,182.
Assuming the reorganization had been completed on August 1, 2014, the beginning of the annual reporting period, the pro forma results of operations for the year ended July 31, 2015 are as follows:
|
| | | |
| Net investment income (loss) | $ | 1,277,071 |
|
| Net realized and unrealized gain (loss) | 756,159 |
|
| Net increase (decrease) in net assets resulting from operations | $ | 2,033,230 |
|
Because the combined investment portfolios have been managed as a single integrated portfolio since the reorganization was completed, it is not practicable to separate the amounts of revenue and earnings of One Choice 2015 Portfolio R6 that have been included in the One Choice In Retirement Portfolio R6 Statement of Operations since March 27, 2015.
|
| | | | | | | | | | | | | | | |
| For a Share Outstanding Throughout the Years Ended July 31 (except as noted) | |
| Per-Share Data | | | | | Ratios and Supplemental Data |
| | | Income From Investment Operations: | Distributions From: | | | Ratio to Average Net Assets of: | | |
| | Net Asset
Value,
Beginning
of Period | Net
Investment
Income
(Loss)(1) | Net Realized
and
Unrealized
Gain (Loss) | Total From
Investment
Operations | Net
Investment
Income | Net
Realized
Gains | Total
Distributions | Net Asset
Value,
End
of Period | Total
Return(2) | Operating
Expenses(3) | Net
Investment
Income
(Loss) | Portfolio
Turnover
Rate | Net Assets,
End of
Period (in thousands) |
| One Choice In Retirement Portfolio R6 — R6 Class | | | | | | | | | |
| 2016 | $10.49 | 0.20 | 0.10 | 0.30 | (0.19) | (0.01) | (0.20) | $10.59 | 2.98% | 0.00%(4) | 1.94% | 22% |
| $140,291 |
|
| 2015 | $10.62 | 0.17 | 0.26 | 0.43 | (0.25) | (0.31) | (0.56) | $10.49 | 4.14% | 0.00%(4) | 1.59% | 42% |
| $80,452 |
|
| 2014 | $10.00 | 0.23 | 0.61 | 0.84 | (0.22) | — | (0.22) | $10.62 | 8.46% | 0.00%(4) | 2.16% | 34% |
| $11,492 |
|
2013(5) | $10.00 | — | — | — | — | — | — | $10.00 | 0.00% | 0.00% | 0.00% | 0% |
| $25 |
|
| One Choice 2020 Portfolio R6 — R6 Class | | | | | | | | | |
| 2016 | $10.93 | 0.21 | 0.10 | 0.31 | (0.18) | (0.15) | (0.33) | $10.91 | 2.92% | 0.00%(4) | 1.97% | 17% |
| $196,403 |
|
| 2015 | $10.77 | 0.23 | 0.25 | 0.48 | (0.24) | (0.08) | (0.32) | $10.93 | 4.55% | 0.00%(4) | 2.07% | 26% |
| $119,077 |
|
| 2014 | $10.00 | 0.25 | 0.67 | 0.92 | (0.15) | — | (0.15) | $10.77 | 9.24% | 0.00%(4) | 2.36% | 43% |
| $42,086 |
|
2013(5) | $10.00 | — | — | — | — | — | — | $10.00 | 0.00% | 0.00% | 0.00% | 0% |
| $25 |
|
| One Choice 2025 Portfolio R6 — R6 Class | | | | | | | | | |
| 2016 | $11.11 | 0.21 | 0.08 | 0.29 | (0.19) | (0.15) | (0.34) | $11.06 | 2.81% | 0.00%(4) | 2.01% | 12% |
| $228,792 |
|
| 2015 | $10.85 | 0.22 | 0.33 | 0.55 | (0.24) | (0.05) | (0.29) | $11.11 | 5.05% | 0.00%(4) | 1.97% | 27% |
| $123,508 |
|
| 2014 | $10.00 | 0.22 | 0.78 | 1.00 | (0.15) | — | (0.15) | $10.85 | 10.04% | 0.00%(4) | 2.04% | 18% |
| $40,765 |
|
2013(5) | $10.00 | — | — | — | — | — | — | $10.00 | 0.00% | 0.00% | 0.00% | 0% |
| $25 |
|
|
| | | | | | | | | | | | | | | |
| For a Share Outstanding Throughout the Years Ended July 31 (except as noted) | |
| Per-Share Data | | | | | Ratios and Supplemental Data |
| | | Income From Investment Operations: | Distributions From: | | | Ratio to Average Net Assets of: | | |
| | Net Asset
Value,
Beginning
of Period | Net
Investment
Income
(Loss)(1) | Net Realized
and
Unrealized
Gain (Loss) | Total From
Investment
Operations | Net
Investment
Income | Net
Realized
Gains | Total
Distributions | Net Asset
Value,
End
of Period | Total
Return(2) | Operating
Expenses(3) | Net
Investment
Income
(Loss) | Portfolio
Turnover
Rate | Net Assets,
End of
Period (in thousands) |
| One Choice 2030 Portfolio R6 — R6 Class | | | | | | | | | |
| 2016 | $11.22 | 0.22 | 0.02 | 0.24 | (0.19) | (0.16) | (0.35) | $11.11 | 2.33% | 0.00%(4) | 2.06% | 11% |
| $227,977 |
|
| 2015 | $10.88 | 0.22 | 0.42 | 0.64 | (0.23) | (0.07) | (0.30) | $11.22 | 5.94% | 0.00%(4) | 1.96% | 27% |
| $125,170 |
|
| 2014 | $10.00 | 0.23 | 0.81 | 1.04 | (0.16) | — | (0.16) | $10.88 | 10.48% | 0.00%(4) | 2.13% | 23% |
| $36,277 |
|
2013(5) | $10.00 | — | — | — | — | — | — | $10.00 | 0.00% | 0.00% | 0.00% | 0% |
| $25 |
|
| One Choice 2035 Portfolio R6 — R6 Class | | | | | | | | | |
| 2016 | $11.37 | 0.22 | (0.03)(8) | 0.19 | (0.19) | (0.21) | (0.40) | $11.16 | 1.86% | 0.00%(4) | 2.06% | 11% |
| $180,495 |
|
| 2015 | $10.93 | 0.23 | 0.50 | 0.73 | (0.23) | (0.06) | (0.29) | $11.37 | 6.74% | 0.00%(4) | 2.00% | 28% |
| $94,600 |
|
| 2014 | $10.00 | 0.24 | 0.87 | 1.11 | (0.18) | — | (0.18) | $10.93 | 11.18% | 0.00%(4) | 2.19% | 12% |
| $31,453 |
|
2013(5) | $10.00 | — | — | — | — | — | — | $10.00 | 0.00% | 0.00% | 0.00% | 0% |
| $25 |
|
| One Choice 2040 Portfolio R6 — R6 Class | | | | | | | | | |
| 2016 | $11.46 | 0.22 | (0.06)(8) | 0.16 | (0.19) | (0.22) | (0.41) | $11.21 | 1.62% | 0.00%(4) | 2.08% | 15% |
| $148,898 |
|
| 2015 | $11.01 | 0.24 | 0.54 | 0.78 | (0.25) | (0.08) | (0.33) | $11.46 | 7.15% | 0.00%(4) | 2.08% | 25% |
| $79,603 |
|
| 2014 | $10.00 | 0.24 | 0.96 | 1.20 | (0.19) | — | (0.19) | $11.01 | 12.13% | 0.00%(4) | 2.25% | 11% |
| $27,859 |
|
2013(5) | $10.00 | — | — | — | — | — | — | $10.00 | 0.00% | 0.00% | 0.00% | 0% |
| $25 |
|
| One Choice 2045 Portfolio R6 — R6 Class | | | | | | | | | |
| 2016 | $11.57 | 0.23 | (0.08)(8) | 0.15 | (0.20) | (0.25) | (0.45) | $11.27 | 1.56% | 0.00%(4) | 2.09% | 9% |
| $114,011 |
|
| 2015 | $11.06 | 0.24 | 0.61 | 0.85 | (0.26) | (0.08) | (0.34) | $11.57 | 7.72% | 0.00%(4) | 2.11% | 29% |
| $60,848 |
|
| 2014 | $10.00 | 0.23 | 1.02 | 1.25 | (0.19) | — | (0.19) | $11.06 | 12.62% | 0.00%(4) | 2.13% | 12% |
| $22,698 |
|
2013(5) | $10.00 | — | — | — | — | — | — | $10.00 | 0.00% | 0.00% | 0.00% | 0% |
| $25 |
|
|
| | | | | | | | | | | | | | | |
| For a Share Outstanding Throughout the Years Ended July 31 (except as noted) | |
| Per-Share Data | | | | | Ratios and Supplemental Data |
| | | Income From Investment Operations: | Distributions From: | | | Ratio to Average Net Assets of: | | |
| | Net Asset
Value,
Beginning
of Period | Net
Investment
Income
(Loss)(1) | Net Realized
and
Unrealized
Gain (Loss) | Total From
Investment
Operations | Net
Investment
Income | Net
Realized
Gains | Total
Distributions | Net Asset
Value,
End
of Period | Total
Return(2) | Operating
Expenses(3) | Net
Investment
Income
(Loss) | Portfolio
Turnover
Rate | Net Assets,
End of
Period (in thousands) |
| One Choice 2050 Portfolio R6 — R6 Class | | | | | | | | | |
| 2016 | $11.58 | 0.22 | (0.08)(8) | 0.14 | (0.20) | (0.27) | (0.47) | $11.25 | 1.43% | 0.00%(4) | 2.08% | 7% |
| $76,246 |
|
| 2015 | $11.07 | 0.24 | 0.61 | 0.85 | (0.26) | (0.08) | (0.34) | $11.58 | 7.76% | 0.00%(4) | 2.11% | 26% |
| $42,162 |
|
| 2014 | $10.00 | 0.23 | 1.05 | 1.28 | (0.21) | — | (0.21) | $11.07 | 12.88% | 0.00%(4) | 2.11% | 13% |
| $16,981 |
|
2013(5) | $10.00 | — | — | — | — | — | — | $10.00 | 0.00% | 0.00% | 0.00% | 0% |
| $25 |
|
| One Choice 2055 Portfolio R6 — R6 Class | | | | | | | | | |
| 2016 | $11.76 | 0.22 | (0.08)(8) | 0.14 | (0.21) | (0.26) | (0.47) | $11.43 | 1.39% | 0.00%(4) | 2.02% | 14% |
| $38,131 |
|
| 2015 | $11.16 | 0.24 | 0.63 | 0.87 | (0.26) | (0.01) | (0.27) | $11.76 | 7.90% | 0.00%(4) | 2.08% | 25% |
| $19,006 |
|
| 2014 | $10.00 | 0.13 | 1.19 | 1.32 | (0.16) | — | (0.16) | $11.16 | 13.22% | 0.00%(4) | 1.14% | 23% |
| $7,209 |
|
2013(5) | $10.00 | — | — | — | — | — | — | $10.00 | 0.00% | 0.00% | 0.00% | 0% |
| $25 |
|
| One Choice 2060 Portfolio R6 — R6 Class | | | | | | | | | |
2016(6) | $10.00 | 0.13 | 0.90 | 1.03 | (0.15) | — | (0.15) | $10.88 | 10.39% | 0.00%(4)(7) | 1.47%(7) | 45% |
| $350 |
|
|
|
| Notes to Financial Highlights |
| |
| (1) | Computed using average shares outstanding throughout the period. |
| |
| (2) | Total returns are calculated based on the net asset value of the last business day. Total returns for periods less than one year are not annualized. |
| |
| (3) | Ratio of operating expenses to average net assets does not include any fees and expenses of the underlying funds. |
| |
| (4) | Ratio was less than 0.005%. |
| |
| (5) | For the one day period ended July 31, 2013 (fund inception). |
| |
| (6) | September 30, 2015 (fund inception) through July 31, 2016. |
| |
| (8) | Per-share amount was not in accord with the net realized and unrealized gain (loss) for the period because of the timing of transactions in shares of the fund and the amount and timing of per-share net |
realized and unrealized gain (loss) on such shares.
See Notes to Financial Statements.
|
|
| Report of Independent Registered Public Accounting Firm |
To the Board of Directors and Shareholders of American Century Asset Allocation Portfolios, Inc.:
We have audited the accompanying statements of assets and liabilities, including the schedules of investments, of One Choice In Retirement Portfolio R6, One Choice 2020 Portfolio R6, One Choice 2025 Portfolio R6, One Choice 2030 Portfolio R6, One Choice 2035 Portfolio R6, One Choice 2040 Portfolio R6, One Choice 2045 Portfolio R6, One Choice 2050 Portfolio R6, One Choice 2055 Portfolio R6, and One Choice 2060 Portfolio R6, ten of the portfolios constituting American Century Asset Allocation Portfolios, Inc. (the “Funds”), as of July 31, 2016, and the related statements of operations for the year then ended, the statements of changes in net assets for each of the two years in the period then ended, and the financial highlights for each of the periods presented (as to One Choice 2060 Portfolio R6, the related statement of operations, statement of changes in net assets, and financial highlights for the period from September 30, 2015 (inception date) through July 31, 2016). These financial statements and financial highlights are the responsibility of the Funds’ management. Our responsibility is to express an opinion on these financial statements and financial highlights based on our audits.
We conducted our audits in accordance with the standards of the Public Company Accounting Oversight Board (United States). Those standards require that we plan and perform the audit to obtain reasonable assurance about whether the financial statements and financial highlights are free of material misstatement. The Funds are not required to have, nor were we engaged to perform, an audit of their internal control over financial reporting. Our audits included consideration of internal control over financial reporting as a basis for designing audit procedures that are appropriate in the circumstances, but not for the purpose of expressing an opinion on the effectiveness of the Funds’ internal control over financial reporting. Accordingly, we express no such opinion. An audit also includes examining, on a test basis, evidence supporting the amounts and disclosures in the financial statements, assessing the accounting principles used and significant estimates made by management, as well as evaluating the overall financial statement presentation. Our procedures included confirmation of securities owned as of July 31, 2016, by correspondence with the transfer agent. We believe that our audits provide a reasonable basis for our opinion.
In our opinion, the financial statements and financial highlights referred to above present fairly, in all material respects, the financial position of each of the respective Funds as of July 31, 2016, the results of their operations, the changes in their net assets, and the financial highlights for each of the periods presented, in conformity with accounting principles generally accepted in the United States of America.
DELOITTE & TOUCHE LLP
Kansas City, Missouri
September 19, 2016
The Board of Directors
The individuals listed below serve as directors of the funds. Each director will continue to serve in this capacity until death, retirement, resignation or removal from office. The board has adopted a mandatory retirement age for directors who are not “interested persons,” as that term is defined in the Investment Company Act (independent directors). Independent directors shall retire by December 31 of the year in which they reach their 75th birthday.
Mr. Thomas is an “interested person” because he currently serves as President and Chief Executive Officer of American Century Companies, Inc. (ACC), the parent company of American Century Investment Management, Inc. (ACIM or the advisor). The other directors (more than three-fourths of the total number) are independent. They are not employees, directors or officers of, and have no financial interest in, ACC or any of its wholly owned, direct or indirect, subsidiaries, including ACIM, American Century Investment Services, Inc. (ACIS) and American Century Services, LLC (ACS), and they do not have any other affiliations, positions or relationships that would cause them to be considered “interested persons” under the Investment Company Act. The directors serve in this capacity for seven (in the case of Mr. Thomas, 15) registered investment companies in the American Century Investments family of funds.
The following table presents additional information about the directors. The mailing address for each director is 4500 Main Street, Kansas City, Missouri 64111.
|
| | | | | |
Name
(Year of Birth) | Position(s) Held with Funds | Length of Time Served | Principal Occupation(s) During Past 5 Years | Number of American Century Portfolios Overseen by Director | Other Directorships Held During Past
5 Years |
| Independent Directors | | |
Barry Fink
(1955) | Director | Since 2012 | Retired; Executive Vice President, ACC (September 2007 to February 2013); President, ACS (October 2007 to February 2013); Chief Operating Officer, ACC (September 2007 to November 2012) | 83 | None |
Andrea C. Hall
(1945) | Director | Since 1997 | Retired | 83 | None |
Jan M. Lewis
(1957) | Director | Since 2011 | Retired; President and Chief Executive Officer, Catholic Charities of Northeast Kansas (human services organization) (2006 to 2013) | 83 | None |
James A. Olson
(1942) | Director and Chairman of the Board | Since 2007 (Chairman since 2014) | Member, Plaza Belmont LLC (private equity fund manager) (1999 to present) | 83 | Saia, Inc. (2002 to 2012) and EPR Properties (2003 to 2013) |
M. Jeannine Strandjord
(1945) | Director | Since 1994 | Retired | 83 | Euronet Worldwide Inc.; MGP Ingredients, Inc.; and DST Systems Inc. (1996 to 2012) |
|
| | | | | |
Name
(Year of Birth) | Position(s) Held with Funds | Length of Time Served | Principal Occupation(s) During Past 5 Years | Number of American Century Portfolios Overseen by Director | Other Directorships Held During Past
5 Years |
| Independent Directors | | |
John R. Whitten
(1946) | Director | Since 2008 | Retired | 83 | Rudolph Technologies, Inc. |
Stephen E. Yates
(1948) | Director | Since 2012 | Retired | 83 | None |
| Interested Director | | |
Jonathan S. Thomas
(1963) | Director and President | Since 2007 | President and Chief Executive Officer, ACC (March 2007 to present). Also serves as Chief Executive Officer, ACS; Executive Vice President, ACIM; Director, ACC, ACIM and other ACC subsidiaries | 128 | BioMed Valley Discoveries, Inc. |
The Statement of Additional Information has additional information about the funds' directors and is available without charge, upon request, by calling 1-800-345-2021.
Officers
The following table presents certain information about the executive officers of the funds. Each officer serves as an officer for each of the 15 investment companies in the American Century family of funds, unless otherwise noted. No officer is compensated for his or her service as an officer of the funds. The listed officers are interested persons of the funds and are appointed or re-appointed on an annual basis. The mailing address for each officer listed below is 4500 Main Street, Kansas City, Missouri 64111.
|
| | |
Name (Year of Birth) | Offices with the Funds | Principal Occupation(s) During the Past Five Years |
Jonathan S.
Thomas
(1963) | Director and
President
since 2007 | President and Chief Executive Officer, ACC (March 2007 to present). Also serves as Chief Executive Officer, ACS; Executive Vice President, ACIM; Director, ACC, ACIM and other ACC subsidiaries |
Amy D. Shelton
(1964) | Chief Compliance
Officer and Vice President since 2014 | Chief Compliance Officer, American Century funds, (March 2014 to present); Chief Compliance Officer, ACIM (February 2014 to present); Chief Compliance Officer, ACIS (October 2009 to present); Vice President, Client Interactions and Marketing, ACIS (February 2013 to January 2014); Director, Client Interactions and Marketing, ACIS (June 2007 to January 2013). Also serves as Vice President, ACIS |
Charles A.
Etherington
(1957) | General Counsel
since 2007 and
Senior Vice
President since 2006 | Attorney, ACC (February 1994 to present); Vice President, ACC (November 2005 to present); General Counsel, ACC (March 2007 to present). Also serves as General Counsel, ACIM, ACS, ACIS and other ACC subsidiaries; and Senior Vice President, ACIM and ACS |
C. Jean Wade
(1964) | Vice President,
Treasurer and
Chief Financial
Officer since 2012 | Vice President, ACS (February 2000 to present) |
Robert J.
Leach
(1966) | Vice President
since 2006 and
Assistant Treasurer
since 2012 | Vice President, ACS (February 2000 to present) |
David H.
Reinmiller
(1963) | Vice President
since 2000 | Attorney, ACC (January 1994 to present); Associate General Counsel, ACC (January 2001 to present). Also serves as Vice President, ACIM and ACS |
Ward D.
Stauffer
(1960) | Secretary
since 2005 | Attorney, ACC (June 2003 to present) |
|
|
| Approval of Management Agreement |
At a meeting held on June 29, 2016, the Funds’ Board of Directors (the “Board) unanimously approved the renewal of the management agreement pursuant to which American Century Investment Management, Inc. (the “Advisor”) acts as the investment advisor for the Funds. Under Section 15(c) of the Investment Company Act, contracts for investment advisory services are required to be reviewed, evaluated, and approved by a majority of a fund’s directors (the “Directors”), including a majority of the independent Directors, each year.
Prior to its consideration of the renewal of the management agreement, the Directors requested and reviewed extensive data and information compiled by the Advisor and certain independent providers of evaluation data concerning the Funds and the services provided to the Funds by the Advisor. This review was in addition to the oversight and evaluation undertaken by the Board and its committees on a continual basis and the information received was supplemental to the extensive information that the Board and its committees receive and consider throughout the year.
In connection with its consideration of the renewal of the management agreement, the Board’s review and evaluation of the services provided by the Advisor included, but was not limited to, the following:
| |
| • | the nature, extent, and quality of investment management, shareholder services, and other services provided and to be provided by the Advisor to each Fund; |
| |
| • | the wide range of other programs and services provided and to be provided to each Fund and its shareholders on a routine and non-routine basis; |
| |
| • | the investment performance of each Fund, including data comparing each Fund’s performance to appropriate benchmarks and/or a peer group of other mutual funds with similar investment objectives and strategies; |
| |
| • | the cost of owning each Fund compared to the cost of owning similar funds; |
| |
| • | the compliance policies, procedures, and regulatory experience of the Advisor and the Funds’ other service providers; |
| |
| • | financial data showing the cost of services provided to each Fund and the overall profitability of the Advisor; |
| |
| • | possible economies of scale associated with the Advisor’s management of the Funds and other accounts under its management; |
| |
| • | data comparing services provided and charges to the Advisor's other investment management clients; |
| |
| • | acquired fund fees and expenses; |
| |
| • | payments by each Fund and the Advisor to financial intermediaries and the nature of services provided; and |
| |
| • | any collateral benefits derived by the Advisor from the management of the Funds. |
In keeping with their practice, the Directors held two in-person meetings and one telephonic meeting to review and discuss the information provided. The independent Directors also had the benefit of the advice of their independent counsel throughout the process.
Factors Considered
The Directors considered all of the information provided by the Advisor, the independent data providers, and independent counsel in connection with the approval of the management agreement. They determined that the information was sufficient for them to evaluate the management agreement for the Funds. In connection with their review, the Directors did not identify any single factor as being all-important or controlling, and each Director may have attributed different levels of importance to different factors. In deciding to renew the management agreement, the Board based its decision on a number of factors, including the following:
Nature, Extent and Quality of Services - Generally. Under the management agreement, the Advisor is responsible for providing or arranging for all services necessary for the operation of each Fund. The Board noted that under the management agreement, the Advisor provides or arranges at its own expense a wide variety of services including:
| |
| • | constructing and designing each Fund |
| |
| • | portfolio research and security selection |
| |
| • | initial capitalization/funding |
| |
| • | daily valuation of each Fund’s portfolio |
| |
| • | shareholder servicing and transfer agency, including shareholder confirmations, recordkeeping, and communications |
| |
| • | legal services (except the independent Directors’ counsel) |
| |
| • | regulatory and portfolio compliance |
| |
| • | marketing and distribution |
The Board noted that many of these services have expanded over time in terms of both quantity and complexity in response to shareholder demands, competition in the industry, changing distribution channels, and the changing regulatory environment. The Board noted specifically the resources the Advisor has committed to enhancing cybersecurity protections for the benefit of shareholders.
Investment Management Services. The nature of the investment management services provided to the Funds is quite complex and allows fund shareholders access to professional money management, instant diversification of their investments within an asset class, the opportunity to easily diversify among asset classes by investing in or exchanging among various American Century Investments funds, and liquidity. In evaluating investment performance, the Board expects the Advisor to manage each Fund in accordance with its investment objectives and approved strategies. Further, the Directors recognize that the Advisor has an obligation to monitor trading activities, and in particular to seek the best execution of fund trades, and to evaluate the use of and payment for research. In providing these services, the Advisor utilizes teams of investment professionals (portfolio managers, analysts, research assistants, and securities traders) who require extensive information technology, research, training, compliance, and other systems to conduct their business. The Board, directly and through its Fund Performance Review Committee, provides oversight of the investment performance process. It regularly reviews investment performance information for each Fund, together with comparative information for appropriate benchmarks and/or peer groups of similarly-managed funds, over different time horizons. The Directors also review detailed performance information provided by the Advisor during the management agreement approval process. If performance concerns are identified with respect to a fund, the Fund receives special reviews until performance improves, during which the Board receives a report from the Advisor regarding the reasons for such results (e.g., market conditions, security selection) and any efforts being undertaken to improve performance. The Board found the investment management services provided by the Advisor to each Fund to be satisfactory and consistent with the management agreement.
Shareholder and Other Services. Under the management agreement, the Advisor provides the Funds with a comprehensive package of transfer agency, shareholder, and other services. The Board, directly and through various committees of the Board, regularly reviews reports and evaluations of such services at its regular meetings. These reports include, but are not limited to, information regarding the operational efficiency and accuracy of the shareholder and transfer agency services provided, staffing levels, shareholder satisfaction (as measured by external as well as internal sources), technology support, new products and services offered to fund shareholders, securities trading activities, portfolio valuation services, auditing services, and legal and operational compliance activities. The Board particularly noted the Advisor’s continual efforts to maintain
effective business continuity plans and to address cybersecurity threats. Certain aspects of shareholder and transfer agency service level efficiency and the quality of securities trading activities are measured by independent third party providers and are presented in comparison to other fund groups not managed by the Advisor. The Board found the services provided by the Advisor to each Fund under the management agreement to be competitive and of high quality.
Costs of Services and Profitability. The Advisor provides detailed information concerning its cost of providing various services to the Funds, its profitability in managing each Fund (pre- and post-distribution), its overall profitability, and its financial condition. The Directors have reviewed with the Advisor the methodology used to prepare this financial information. This information is considered in evaluating the Advisor’s financial condition, its ability to continue to provide services under the Funds’ management agreement, and the reasonableness of the current management agreement. The Board concluded that the Advisor’s profits were reasonable in light of the services provided to the Funds.
Ethics. The Board generally considers the Advisor’s commitment to providing quality services to shareholders and to conducting its business ethically. They noted that the Advisor’s practices generally meet or exceed industry best practices.
Economies of Scale. The Board also reviewed information provided by the Advisor regarding the possible existence of economies of scale in connection with the management of each Fund. The Board concluded that economies of scale are difficult to measure and predict with precision, especially on a fund-by-fund basis. The Board concluded that the Advisor is appropriately sharing economies of scale through its competitive fee structure, offering competitive fees from fund inception, and through reinvestment in its business to provide shareholders additional content and services.
Comparison to Other Funds’ Fees. The Funds invest their non-cash assets entirely in other American Century Investments funds. The Funds do not pay an investment advisory fee to the Advisor. Rather, each Fund indirectly bears its pro rata share of the expenses incurred by the underlying funds. Each underlying fund pays the Advisor a single, all-inclusive (or unified) management fee for providing all services necessary for the management and operation of the fund, other than brokerage expenses, expenses attributable to short sales, taxes, interest, extraordinary expenses, and the fees and expenses of the fund’s independent directors (including their independent legal counsel). The Board concluded that the underlying fund expenses incurred by each Fund were reasonable in light of the services provided to each Fund.
Comparison to Fees and Services Provided to Other Clients of the Advisor. The Directors also requested and received information from the Advisor concerning the nature of the services, fees, costs, and profitability of its advisory services to advisory clients other than the Funds. They observed that these varying types of client accounts require different services and involve different regulatory and entrepreneurial risks than the management of each Fund. The Board analyzed this information and concluded that the fees charged and services provided to the Funds were reasonable by comparison.
Payments to Intermediaries. The Directors also requested and received a description of payments made to intermediaries by each Fund and the Advisor. These payments include various payments made by each Fund or the Advisor to different types of intermediaries and recordkeepers for distribution and service activities provided for each Fund. The Board reviewed such information and found the payments to be reasonable in scope and purpose.
Collateral or “Fall-Out” Benefits Derived by the Advisor. The Board considered the existence of collateral benefits the Advisor may receive as a result of its relationship with the Funds. They concluded that the Advisor’s primary business is managing mutual funds and it generally does not use fund or shareholder information to generate profits in other lines of business, and therefore does not derive any significant collateral benefits from them. The Board noted that additional assets from other clients may offer the Advisor some benefit from increased leverage with service providers and counterparties. Additionally, the Advisor receives proprietary research from broker-
dealers that execute fund portfolio transactions, which the Board concluded is likely to benefit other clients of the Advisor, as well as fund shareholders. The Board also determined that the Advisor is able to provide investment management services to certain clients other than the Funds, at least in part, due to its existing infrastructure built to serve the fund complex.
Existing Relationship. The Board also considered whether there was any reason for not continuing the existing arrangement with the Advisor. In this regard, the Board was mindful of the potential disruptions of the Funds’ operations and various risks, uncertainties, and other effects that could occur as a result of a decision not to continue such relationship. In particular, the Board recognized that most shareholders have invested in the Funds on the strength of the Advisor’s industry standing and reputation and in the expectation that the Advisor will have a continuing role in providing advisory services to each Fund.
Conclusion of the Directors. As a result of this process, the Board, including all of the independent Directors, taking into account all of the factors discussed above and the information provided by the Advisor and others in connection with its review and throughout the year, determined that the management agreement between the Funds and the Advisor is fair and reasonable in light of the services provided and should be renewed.
Retirement Account Information
As required by law, distributions you receive from certain IRAs are subject to federal income tax withholding, unless you elect not to have withholding apply. Tax will be withheld on the total amount withdrawn even though you may be receiving amounts that are not subject to withholding, such as nondeductible contributions. In such case, excess amounts of withholding could occur. You may adjust your withholding election so that a greater or lesser amount will be withheld.
If you don’t want us to withhold on this amount, you must notify us to not withhold the federal income tax. You may notify us in writing or in certain situations by telephone or through other electronic means. For systematic withdrawals, your withholding election will remain in effect until revoked or changed by filing a new election. You have the right to revoke your election at any time.
Remember, even if you elect not to have income tax withheld, you are liable for paying income tax on the taxable portion of your withdrawal. If you elect not to have income tax withheld or you don’t have enough income tax withheld, you may be responsible for payment of estimated tax. You may incur penalties under the estimated tax rules if your withholding and estimated tax payments are not sufficient. You can reduce or defer the income tax on a distribution by directly or indirectly rolling such distribution over to another IRA or eligible plan. You should consult your tax advisor for additional information.
State tax will be withheld if, at the time of your distribution, your address is within one of the mandatory withholding states and you have federal income tax withheld (or as otherwise required by state law). State taxes will be withheld from your distribution in accordance with the respective state rules.
Distributions you receive from 403(b), 457 and qualified plans are subject to special tax and withholding rules. Your plan administrator or plan sponsor is required to provide you with a special tax notice explaining those rules at the time you request a distribution. If applicable, federal and/or state taxes may be withheld from your distribution amount.
Proxy Voting Policies
A description of the policies that the funds’ investment advisor uses in exercising the voting rights associated with the securities purchased and/or held by the funds is available without charge, upon request, by calling 1-800-378-9878. It is also available on the “About Us” page of American Century Investments’ website at americancentury.com and on the Securities and Exchange Commission’s
website at sec.gov. Information regarding how the investment advisor voted proxies relating to portfolio securities during the most recent 12-month period ended June 30 is available on the “About Us” page at americancentury.com. It is also available at sec.gov.
Quarterly Portfolio Disclosure
The funds file their complete schedule of portfolio holdings with the Securities and Exchange Commission (SEC) for the first and third quarters of each fiscal year on Form N-Q. The funds’ Forms N-Q are available on the SEC’s website at sec.gov, and may be reviewed and copied at the SEC’s Public Reference Room in Washington, DC. Information on the operation of the Public Reference Room may be obtained by calling 1-800-SEC-0330. The funds also make their complete
schedule of portfolio holdings for the most recent quarter of their fiscal year available on their website at ipro.americancentury.com (for Investment Professionals) and, upon request, by calling 1-800-378-9878.
Other Tax Information
The following information is provided pursuant to provisions of the Internal Revenue Code.
The funds hereby designate up to the maximum amount allowable as qualified dividend income for the fiscal year ended July 31, 2016.
For corporate taxpayers, the funds hereby designate the following, or up to the maximum amount allowable, of ordinary income distributions paid during the fiscal year ended July 31, 2016 as qualified for the corporate dividends received deduction.
|
| | | | |
One Choice In Retirement Portfolio R6 | One Choice 2020 Portfolio R6 | One Choice 2025 Portfolio R6 | One Choice 2030 Portfolio R6 | One Choice 2035 Portfolio R6 |
| $523,439 | $752,422 | $842,531 | $905,104 | $727,215 |
|
| | | | |
One Choice 2040 Portfolio R6 | One Choice 2045 Portfolio R6 | One Choice 2050 Portfolio R6 | One Choice 2055 Portfolio R6 | One Choice 2060 Portfolio R6 |
| $651,121 | $562,625 | $395,046 | $195,035 | $389 |
The funds hereby designate the following as qualified short-term capital gain distributions for purposes of Internal Revenue Code Section 871 for the fiscal year ended July 31, 2016.
|
| | | | |
One Choice In Retirement Portfolio R6 | One Choice 2020 Portfolio R6 | One Choice 2025 Portfolio R6 | One Choice 2030 Portfolio R6 | One Choice 2035 Portfolio R6 |
| $75,211 | — | $34,991 | $57,127 | $61,769 |
|
| | | | |
One Choice 2040 Portfolio R6 | One Choice 2045 Portfolio R6 | One Choice 2050 Portfolio R6 | One Choice 2055 Portfolio R6 | One Choice 2060 Portfolio R6 |
| $25,664 | $111,833 | $60,306 | $24,099 | — |
The funds hereby designate the following, or up to the maximum amount allowable, as long-term capital gain distributions (20% rate gain distributions) for the fiscal year ended July 31, 2016.
|
| | | | |
One Choice In Retirement Portfolio R6 | One Choice 2020 Portfolio R6 | One Choice 2025 Portfolio R6 | One Choice 2030 Portfolio R6 | One Choice 2035 Portfolio R6 |
| — | $1,924,395 | $2,049,656 | $2,142,252 | $2,074,396 |
|
| | | | |
One Choice 2040 Portfolio R6 | One Choice 2045 Portfolio R6 | One Choice 2050 Portfolio R6 | One Choice 2055 Portfolio R6 | One Choice 2060 Portfolio R6 |
| $1,856,352 | $1,622,942 | $1,173,888 | $530,591 | — |
For the fiscal year ended July 31, 2016, the funds intend to pass through to shareholders the following foreign source income and foreign taxes paid, or up to the maximum amount allowable, as a foreign tax credit.
|
| | | | | | | | |
| | Foreign Tax Credit | Foreign Source Income |
| | Amount | Per Outstanding Share | Amount | Per Outstanding Share |
| One Choice In Retirement Portfolio R6 | $ | 13,072 |
| 0.0010 | $ | 95,524 |
| 0.0072 |
| One Choice 2020 Portfolio R6 | $ | 21,700 |
| 0.0012 | $ | 157,657 |
| 0.0088 |
| One Choice 2025 Portfolio R6 | $ | 27,485 |
| 0.0013 | $ | 200,999 |
| 0.0097 |
| One Choice 2030 Portfolio R6 | $ | 33,367 |
| 0.0016 | $ | 244,409 |
| 0.0119 |
| One Choice 2035 Portfolio R6 | $ | 29,083 |
| 0.0018 | $ | 213,746 |
| 0.0132 |
| One Choice 2040 Portfolio R6 | $ | 26,813 |
| 0.0020 | $ | 194,875 |
| 0.0147 |
| One Choice 2045 Portfolio R6 | $ | 22,882 |
| 0.0023 | $ | 165,651 |
| 0.0164 |
| One Choice 2050 Portfolio R6 | $ | 16,209 |
| 0.0024 | $ | 117,303 |
| 0.0173 |
| One Choice 2055 Portfolio R6 | $ | 7,804 |
| 0.0023 | $ | 56,793 |
| 0.0170 |
| One Choice 2060 Portfolio R6 | $ | 9 |
| 0.0003 | $ | 63 |
| 0.0020 |
|
| | |
| |
| | | |
| Contact Us | ipro.americancentury.com | |
| Automated Information Line | 1-800-345-8765 | |
Investment Professional
Service Representatives | 1-800-345-6488 | |
| Telecommunications Relay Services for the Deaf | 711 | |
| | | |
| American Century Asset Allocation Portfolios, Inc. | |
| | | |
Investment Advisor: American Century Investment Management, Inc. Kansas City, Missouri | |
| | | |
| This report and the statements it contains are submitted for the general information of our shareholders. The report is not authorized for distribution to prospective investors unless preceded or accompanied by an effective prospectus. | |
| | | |
©2016 American Century Proprietary Holdings, Inc. All rights reserved. CL-ANN-90169 1609 | |
ITEM 2. CODE OF ETHICS.
| |
| (a) | The registrant has adopted a Code of Ethics for Senior Financial Officers that applies to the registrant’s principal executive officer, principal financial officer, principal accounting officer, and persons performing similar functions. |
| |
| (f) | The registrant’s Code of Ethics for Senior Financial Officers was filed as Exhibit 12 (a)(1) to American Century Asset Allocation Portfolios, Inc.’s Annual Certified Shareholder Report on Form N-CSR, File No. 811-21591, on September 29, 2005, and is incorporated herein by reference. |
ITEM 3. AUDIT COMMITTEE FINANCIAL EXPERT.
| |
| (a)(1) | The registrant’s board has determined that the registrant has at least one audit committee financial expert serving on its audit committee. |
| |
| (a)(2) | M. Jeannine Strandjord, Stephen E. Yates and John R. Whitten are the registrant’s designated audit committee financial experts. They are “independent” as defined in Item 3 of Form N-CSR. |
ITEM 4. PRINCIPAL ACCOUNTANT FEES AND SERVICES.
The aggregate fees billed for each of the last two fiscal years for professional services rendered by the principal accountant for the audit of the registrant’s annual financial statements or services that are normally provided by the accountant in connection with statutory and regulatory filings or engagements for those fiscal years were as follows:
FY 2015: $195,129
FY 2016: $208,075
The aggregate fees billed in each of the last two fiscal years for assurance and related services by the principal accountant that are reasonably related to the performance of the audit of the registrant’s financial statements and are not reported under paragraph (a) of this Item were as follows:
For services rendered to the registrant:
FY 2015: $0
FY 2016: $0
Fees required to be approved pursuant to paragraph (c)(7)(ii) of Rule 2-01 of Regulation S-X (relating to certain engagements for non-audit services with the registrant’s investment adviser and its affiliates):
FY 2015: $0
FY 2016: $0
(c)Tax Fees.
The aggregate fees billed in each of the last two fiscal years for professional services rendered by the principal accountant for tax compliance, tax advice, and tax planning were as follows:
For services rendered to the registrant:
FY 2015: $0
FY 2016: $0
Fees required to be approved pursuant to paragraph (c)(7)(ii) of Rule 2-01 of Regulation S-X (relating to certain engagements for non-audit services with the registrant’s investment adviser and its affiliates):
FY 2015: $0
FY 2016: $0
(d)All Other Fees.
The aggregate fees billed in each of the last two fiscal years for products and services provided by the principal accountant, other than the services reported in paragraphs (a) through (c) of this Item were as follows:
For services rendered to the registrant:
FY 2015: $0
FY 2016: $0
Fees required to be approved pursuant to paragraph (c)(7)(ii) of Rule 2-01 of Regulation S-X (relating to certain engagements for non-audit services with the registrant’s investment adviser and its affiliates):
FY 2015: $0
FY 2016: $0
| |
| (e)(1) | In accordance with paragraph (c)(7)(i)(A) of Rule 2-01 of Regulation S-X, before the accountant is engaged by the registrant to render audit or non-audit services, the engagement is approved by the registrant’s audit committee. Pursuant to paragraph (c)(7)(ii) of Rule 2-01 of Regulation S-X, the registrant’s audit committee also pre-approves its accountant’s engagements for non-audit services with the registrant’s investment adviser, its parent company, and any entity controlled by, or under common control with the investment adviser that provides ongoing services to the registrant, if the engagement relates directly to the operations and financial reporting of the registrant. |
| |
| (e)(2) | All services described in each of paragraphs (b) through (d) of this Item were pre-approved before the engagement by the registrant’s audit committee pursuant to paragraph (c)(7)(i)(A) of Rule 2-01 of Regulation S-X. Consequently, none of such services were required to be approved by the audit committee pursuant to paragraph (c)(7)(i)(C). |
| |
| (f) | The percentage of hours expended on the principal accountant’s engagement to audit the registrant’s financial statements for the most recent fiscal year that were attributed to work performed by persons other than the principal accountant’s full-time, permanent employees was less than 50%. |
| |
| (g) | The aggregate non-audit fees billed by the registrant’s accountant for services rendered to the registrant, and rendered to the registrant’s investment adviser (not including any sub-adviser whose role is primarily portfolio management and is subcontracted with or overseen by another investment adviser), and any entity controlling, controlled by, or under common control with the adviser that provides ongoing services to the registrant for each of the last two fiscal years of the registrant were as follows: |
FY 2015: $95,500
FY 2016: $95,000
| |
| (h) | The registrant’s investment adviser and accountant have notified the registrant’s audit committee of all non-audit services that were rendered by the registrant’s accountant to the registrant’s investment adviser, its parent company, and any entity controlled by, or under common control with the investment adviser that provides services to the registrant, which services were not required to be pre-approved pursuant to paragraph (c)(7)(ii) of Rule 2-01 of Regulation S-X. The notification provided to the registrant’s audit committee included sufficient details regarding such services to allow the registrant’s audit committee to consider the continuing independence of its principal accountant. |
ITEM 5. AUDIT COMMITTEE OF LISTED REGISTRANTS.
Not applicable.
ITEM 6. INVESTMENTS.
| |
| (a) | The schedule of investments is included as part of the report to stockholders filed under Item 1 of this Form. |
ITEM 7. DISCLOSURE OF PROXY VOTING POLICIES AND PROCEDURES FOR CLOSED-END MANAGEMENT INVESTMENT COMPANIES.
Not applicable.
ITEM 8. PORTFOLIO MANAGERS OF CLOSED-END MANAGEMENT INVESTMENT COMPANIES.
Not applicable.
ITEM 9. PURCHASES OF EQUITY SECURITIES BY CLOSED-END MANAGEMENT INVESTMENT COMPANY AND AFFILIATED PURCHASERS.
Not applicable.
ITEM 10. SUBMISSION OF MATTERS TO A VOTE OF SECURITY HOLDERS.
During the reporting period, there were no material changes to the procedures by which shareholders may recommend nominees to the registrant’s board.
ITEM 11. CONTROLS AND PROCEDURES.
| |
| (a) | The registrant's principal executive officer and principal financial officer have concluded that the registrant's disclosure controls and procedures (as defined in Rule 30a-3(c) under the Investment Company Act of 1940) are effective based on their evaluation of these controls and procedures as of a date within 90 days of the filing date of this report. |
| |
| (b) | There were no changes in the registrant's internal control over financial reporting (as defined in Rule 30a-3(d) under the Investment Company Act of 1940) that occurred during the registrant's second fiscal quarter of the period covered by this report that have materially affected, or are reasonably likely to materially affect, the registrant's internal control over financial reporting. |
ITEM 12. EXHIBITS.
| |
| (a)(1) | Registrant’s Code of Ethics for Senior Financial Officers, which is the subject of the disclosure required by Item 2 of Form N-CSR, was filed as Exhibit 12(a)(1) to American Century Asset Allocation Portfolios, Inc.’s Certified Shareholder Report on Form N-CSR, File No. 811-21591, on September 29, 2005. |
| |
| (a)(2) | Separate certifications by the registrant’s principal executive officer and principal financial officer, pursuant to Section 302 of the Sarbanes-Oxley Act of 2002 and Rule 30a-2(a) under the Investment Company Act of 1940, are filed and attached hereto as EX-99.CERT. |
| |
| (b) | A certification by the registrant’s chief executive officer and chief financial officer, pursuant to Section 906 of the Sarbanes-Oxley Act of 2002, is furnished and attached hereto as EX-99.906CERT. |
SIGNATURES
Pursuant to the requirements of the Securities Exchange Act of 1934 and the Investment Company Act of 1940, the registrant has duly caused this report to be signed on its behalf by the undersigned, thereunto duly authorized.
|
| | | | |
| Registrant: | American Century Asset Allocation Portfolios, Inc. | |
| | | | |
| | | | |
| By: | /s/ Jonathan S. Thomas | |
| | Name: | Jonathan S. Thomas | |
| | Title: | President | |
| | | | |
| Date: | September 27, 2016 | |
| | | |
Pursuant to the requirements of the Securities Exchange Act of 1934 and the Investment Company Act of 1940, this report has been signed below by the following persons on behalf of the registrant and in the capacities and on the dates indicated.
|
| | | |
| By: | /s/ Jonathan S. Thomas | |
| | Name: | Jonathan S. Thomas | |
| | Title: | President | |
| | | (principal executive officer) | |
| | | | |
| | | | |
| Date: | September 27, 2016 | |
|
| | | |
| By: | /s/ C. Jean Wade | |
| | Name: | C. Jean Wade | |
| | Title: | Vice President, Treasurer, and | |
| | | Chief Financial Officer | |
| | | (principal financial officer) | |
| | | | |
| Date: | September 27, 2016 | |