UNITED STATES
SECURITIES AND EXCHANGE COMMISSION
Washington, D.C. 20549
FORM N-CSR
CERTIFIED SHAREHOLDER REPORT OF REGISTERED
MANAGEMENT INVESTMENT COMPANIES
Investment Company Act file number | 811-21591 | |||||
AMERICAN CENTURY ASSET ALLOCATION PORTFOLIOS, INC. | ||||||
(Exact name of registrant as specified in charter) | ||||||
4500 MAIN STREET, KANSAS CITY, MISSOURI | 64111 | |||||
(Address of principal executive offices) | (Zip Code) | |||||
CHARLES A. ETHERINGTON 4500 MAIN STREET, KANSAS CITY, MISSOURI 64111 | ||||||
(Name and address of agent for service) | ||||||
Registrant’s telephone number, including area code: | 816-531-5575 | |||||
Date of fiscal year end: | 07-31 | |||||
Date of reporting period: | 07-31-2013 | |||||
ITEM 1. REPORTS TO STOCKHOLDERS.
ANNUAL REPORT | JULY 31, 2013 |


One Choice Portfolio®: Very Conservative
One Choice Portfolio®: Conservative
One Choice Portfolio®: Moderate
One Choice Portfolio®: Aggressive
One Choice Portfolio®: Very Aggressive
Table of Contents |
President’s Letter | 2 |
Independent Chairman’s Letter | 3 |
Performance | 4 |
Portfolio Commentary | 8 |
Portfolio Characteristics | 13 |
Shareholder Fee Examples | 14 |
Schedule of Investments | 16 |
Statement of Assets and Liabilities | 19 |
Statement of Operations | 21 |
Statement of Changes in Net Assets | 23 |
Notes to Financial Statements | 26 |
Financial Highlights | 35 |
Report of Independent Registered Public Accounting Firm | 37 |
Management | 38 |
Approval of Management Agreement | 41 |
Additional Information | 46 |
Any opinions expressed in this report reflect those of the author as of the date of the report, and do not necessarily represent the opinions of American Century Investments® or any other person in the American Century Investments organization. Any such opinions are subject to change at any time based upon market or other conditions and American Century Investments disclaims any responsibility to update such opinions. These opinions may not be relied upon as investment advice and, because investment decisions made by American Century Investments funds are based on numerous factors, may not be relied upon as an indication of trading intent on behalf of any American Century Investments fund. Security examples are used for representational purposes only and are not intended as recommendations to purchase or sell securities. Performance information for comparative indices and securities is provided to American Century Investments by third party vendors. To the best of American Century Investments’ knowledge, such information is accurate at the time of printing.
President’s Letter |

Jonathan Thomas
Dear Investor:
Thank you for reviewing this annual report for the 12 months ended July 31, 2013. It provides investment performance, market analysis, and portfolio information, presented with the expert perspective of our portfolio management team.
Annual reports remain important vehicles for conveying information about fund returns, including key factors that affected fund performance. For additional, updated investment and market insights, we encourage you to visit our website, americancentury.com.
Central Bank Intervention Boosted Stocks in Developed Countries
This annual report covers a period of unprecedented global monetary intervention, led by the U.S. Federal Reserve (the Fed), the European Central Bank, and the Bank of Japan. These central banks (and others) provided low short-term interest rates and/or made large purchases of government bonds in an effort to stimulate investing and spending.
Monetary stimulus encouraged investment risk-taking, resulting in double-digit stock index returns in many markets. Developed market stock indices generally outperformed their emerging market counterparts by a wide margin. In the U.S., the S&P 500 Index advanced 25.00%, while small- and mid-cap index gains exceeded 30.00%. Internationally, the MSCI EAFE Index, a benchmark for developed markets, advanced 23.48%, while the MSCI Emerging Markets Index lagged at just 1.95%.
Bond returns generally trailed those of stocks. U.S. interest rates, though still historically low, surged from the extremely low levels that prevailed during the risk-averse third quarter of 2012. For example, the 10-year U.S. Treasury note yield rose from 1.50% to 2.58%, according to Bloomberg. As a result, the 10-year Treasury note and the Barclays U.S. Aggregate Bond Index returned –6.50% and –1.91%, respectively, according to Barclays.
Most of the longer-term U.S. Treasury yield increases occurred late in the reporting period, when concerns that the Fed’s bond purchases might be tapered triggered volatility in both the stock and bond markets. Uncertainties about economic and monetary matters going forward took some wind out of the stock market’s sails. In addition, economic growth is still subpar compared with past recession recoveries, and the economy remains in a vulnerable position. Therefore, we continue to believe in a disciplined, diversified, long-term investment approach, using professionally managed stock and bond portfolios—as appropriate—for meeting financial goals. We appreciate your continued trust in us in this uncertain environment.
Sincerely,

Jonathan Thomas
President and Chief Executive Officer
American Century Investments
Independent Chairman’s Letter |

Don Pratt
Dear Fellow Shareholders,
In 2012, identity theft impacted 12.6 million Americans and roughly 16.5% or 2.1 million of those attacks took place in retirement or investment accounts. At a recent meeting, the board discussed the programs in place at American Century Investments to help protect shareholder accounts from identity theft and similar threats. As a part of that effort, American Century Investments’ personnel investigate possible identity theft events on an almost daily basis. In order to protect financial accounts from theft, there are several steps that every investor should take.
If you travel, take steps to ensure your mail is secure. Request a vacation hold or ask a trusted relative or friend to collect mail for you. If you are expecting financial paperwork, be mindful of when it is to arrive or have it delivered to a place other than your home. Consider using a post office box as a secure alternative.
When discarding documents, be sure to shred or otherwise destroy any receipts, credit offers, bank statements, insurance forms, or similar documents containing personal or financial information.
Be creative with electronic passwords and keep them private. For example, think of a phrase and use the first letter of each word as your password or substitute numbers for similarly appearing letters (4 for A, 8 for G, etc.).
Finally, be alert to impersonators. Do not give personal information over the phone unless you initiated the contact. If you receive an email asking you for information regarding an account, do not respond to the email or click any links. Rather, contact the company through their official website or call the customer service number listed on your account statement.
These few precautions could prevent a major identity theft problem. If you would like to know more about protecting your American Century Investments accounts, please visit our website at www.americancentury.com/security/protect_yourself_online.jsp.
If you have any thoughts you would like to share with the board, send them to dhpratt@fundboardchair.com. Thank you for your loyalty as an American Century Investments shareholder.
Best regards,

Don Pratt
Performance |
Total Returns as of July 31, 2013 | |||||
Average Annual Returns | |||||
Ticker | 1 year | 5 years | Since Inception | Inception Date | |
One Choice Portfolio: Very Conservative — Investor Class | AONIX | 4.04% | 4.89% | 4.89% | 9/30/04 |
One Choice Portfolio: | AOCIX | 9.42% | 5.99% | 5.97% | 9/30/04 |
One Choice Portfolio: | AOMIX | 14.48% | 6.27% | 6.92% | 9/30/04 |
One Choice Portfolio: | AOGIX | 18.15% | 6.14% | 7.42% | 9/30/04 |
One Choice Portfolio: Very Aggressive — Investor Class | AOVIX | 22.42% | 5.67% | 7.48% | 9/30/04 |
Russell 3000 Index | — | 26.86% | 8.57% | 7.49% | — |
Barclays U.S. Aggregate | — | -1.91% | 5.23% | 4.73% | — |
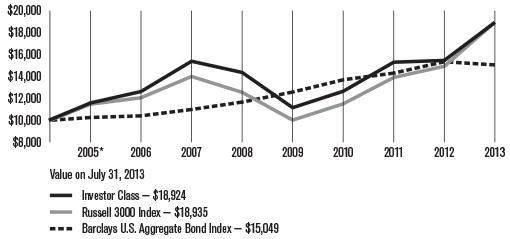
The Russell 3000 Index represents approximately 98% of the investable U.S. equity market and provides a broad measure of equity performance. The Barclays U.S. Aggregate Bond Index represents the U.S. investment-grade fixed-rate bond market and provides a broad measure of bond market performance. Performance for these indices is provided for reference only. Neither index is intended to represent the composition of the portfolio, which invests in a mix of equity and fixed-income securities. (See the Schedule of Investments for each portfolio’s asset allocations as of the date
of this report.)
Data presented reflect past performance. Past performance is no guarantee of future results. Current performance may be higher or lower than the performance shown. Investment return and principal value will fluctuate, and redemption value may be more or less than original cost. To obtain performance data current to the most recent month end, please call 1-800-345-2021 or visit americancentury.com. The performance of the portfolios is dependent on the performance of their underlying American Century Investments funds, and will assume the risks associated with these funds. The risks will vary according to each portfolio’s asset allocation, and the risk level assigned to each portfolio is intended to reflect the relative short-term price volatility among the funds in each.
Data assumes reinvestment of dividends and capital gains, and none of the charts reflect the deduction of taxes that a shareholder would pay on fund distributions or the redemption of fund shares. Returns for the indices are provided for comparison. The fund’s total returns include operating expenses that reduce returns, while the total returns of the indices do not.
Growth of $10,000 Over Life of One Choice Portfolio: Very Conservative |
$10,000 investment made September 30, 2004 |
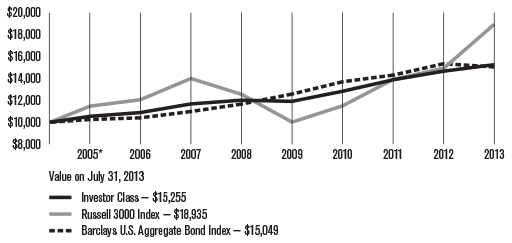
*From 9/30/04, the Investor Class’s inception date. Not annualized.
Growth of $10,000 Over Life of One Choice Portfolio: Conservative |
$10,000 investment made September 30, 2004 |
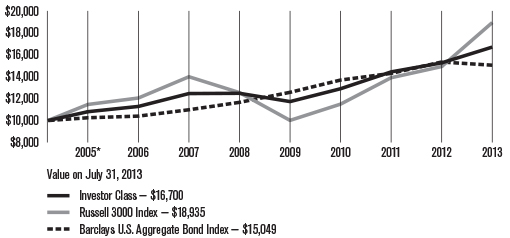
*From 9/30/04, the Investor Class’s inception date. Not annualized.
Data presented reflect past performance. Past performance is no guarantee of future results. Current performance may be higher or lower than the performance shown. Investment return and principal value will fluctuate, and redemption value may be more or less than original cost. To obtain performance data current to the most recent month end, please call 1-800-345-2021 or visit americancentury.com. The performance of the portfolios is dependent on the performance of their underlying American Century Investments funds, and will assume the risks associated with these funds. The risks will vary according to each portfolio’s asset allocation, and the risk level assigned to each portfolio is intended to reflect the relative short-term price volatility among the funds in each.
Data assumes reinvestment of dividends and capital gains, and none of the charts reflect the deduction of taxes that a shareholder would pay on fund distributions or the redemption of fund shares. Returns for the indices are provided for comparison. The fund’s total returns include operating expenses that reduce returns, while the total returns of the indices do not.
Growth of $10,000 Over Life of One Choice Portfolio: Moderate |
$10,000 investment made September 30, 2004 |
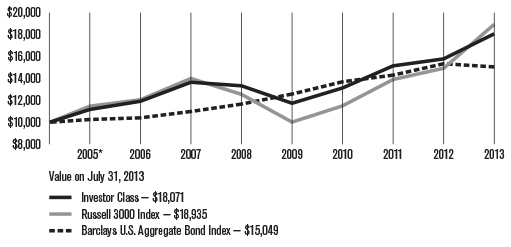
*From 9/30/04, the Investor Class’s inception date. Not annualized.
Growth of $10,000 Over Life of One Choice Portfolio: Aggressive |
$10,000 investment made September 30, 2004 |
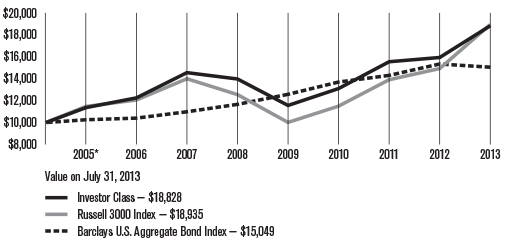
*From 9/30/04, the Investor Class’s inception date. Not annualized.
Data presented reflect past performance. Past performance is no guarantee of future results. Current performance may be higher or lower than the performance shown. Investment return and principal value will fluctuate, and redemption value may be more or less than original cost. To obtain performance data current to the most recent month end, please call 1-800-345-2021 or visit americancentury.com. The performance of the portfolios is dependent on the performance of their underlying American Century Investments funds, and will assume the risks associated with these funds. The risks will vary according to each portfolio’s asset allocation, and the risk level assigned to each portfolio is intended to reflect the relative short-term price volatility among the funds in each.
Data assumes reinvestment of dividends and capital gains, and none of the charts reflect the deduction of taxes that a shareholder would pay on fund distributions or the redemption of fund shares. Returns for the indices are provided for comparison. The fund’s total returns include operating expenses that reduce returns, while the total returns of the indices do not.
Growth of $10,000 Over Life of One Choice Portfolio: Very Aggressive |
$10,000 investment made September 30, 2004 |
*From 9/30/04, the Investor Class’s inception date. Not annualized.
Total Annual Fund Operating Expenses | |
One Choice Portfolio: Very Conservative — Investor Class | 0.62% |
One Choice Portfolio: Conservative — Investor Class | 0.76% |
One Choice Portfolio: Moderate — Investor Class | 0.90% |
One Choice Portfolio: Aggressive — Investor Class | 1.01% |
One Choice Portfolio: Very Aggressive — Investor Class | 1.07% |
The total annual fund operating expenses shown is as stated in the fund’s prospectus current as of the date of this report. The prospectus may vary from the expense ratio shown elsewhere in this report because it is based on a different time period, includes acquired fund fees and expenses, and, if applicable, does not include fee waivers or expense reimbursements.
Data presented reflect past performance. Past performance is no guarantee of future results. Current performance may be higher or lower than the performance shown. Investment return and principal value will fluctuate, and redemption value may be more or less than original cost. To obtain performance data current to the most recent month end, please call 1-800-345-2021 or visit americancentury.com. The performance of the portfolios is dependent on the performance of their underlying American Century Investments funds, and will assume the risks associated with these funds. The risks will vary according to each portfolio’s asset allocation, and the risk level assigned to each portfolio is intended to reflect the relative short-term price volatility among the funds in each.
Data assumes reinvestment of dividends and capital gains, and none of the charts reflect the deduction of taxes that a shareholder would pay on fund distributions or the redemption of fund shares. Returns for the indices are provided for comparison. The fund’s total returns include operating expenses that reduce returns, while the total returns of the indices do not.
Portfolio Commentary |
Portfolio Managers: Scott Wittman, Rich Weiss, Scott Wilson, and Radu Gabudean
In March 2013, portfolio manager Radu Gabudean joined the One Choice Portfolios’ management team.
In April 2013, portfolio manager Enrique Chang left the One Choice Portfolios’ management team.
Performance Summary
Each of the five Portfolios (collectively referred to as the One ChoiceSM Target Risk Portfolios) advanced for the fiscal year ended July 31, 2013, with returns ranging from 4.04% for Very Conservative to 22.42% for Very Aggressive (see pages 4–7 for more detailed performance information). The gains for the 12-month period reflected strong advances in global equity markets, tempered by declines in most bond market segments.
Because of the Portfolios’ strategic exposure to a variety of asset classes, a review of the financial markets helps explain much of their performance.
Stock Market Review
A rebound in investor sentiment and subsequent increased appetite for risk helped drive U.S. stock markets to repeatedly reach new highs during the 12 months ended July 31, 2013. As the reporting period began, U.S. stocks rallied in response to the Federal Reserve’s (the Fed’s) announced extension of its quantitative easing measures (QE3) and continuation of near-zero interest rate policy.
The fourth quarter of 2012 saw volatility increasing and returns declining amid uncertainty regarding the U.S. presidential election and Congress’s inability to come to an agreement about the looming fiscal cliff—a simultaneous increase in income tax rates coupled with a cut in government spending. Worries about the pace of the global economic recovery further weighed on markets in late 2012.
The resolution of political stalemates early in 2013 prompted a return of market rallies, and U.S. indices repeatedly reached record highs during the first half of 2013. Much of the period was characterized by heightened investor confidence in response to strengthening corporate fundamentals, substantive recovery in the housing sector, and evidence of a pickup in employment data. The Fed’s commitment to quantitative easing reassured investors, who gravitated toward riskier, higher-yielding assets.
This environment persisted until mid-May when investors were spooked by Fed chairman Ben Bernanke’s suggestion that the Fed was considering an exit strategy from its exceptionally accommodative monetary policy. Prospects of a tapering of the $85 billion monthly bond purchase operation, combined with worries about slower growth in the emerging markets, drove equities lower in June. But stocks largely rallied during July as central bankers around the world indicated that stimulus measures would remain in place for at least the near future and Bernanke signaled his commitment to stimulating growth and avoiding deflation.
Add it all up, and every segment of the U.S. stock market advanced strongly for the 12 months, with small-cap stocks posting larger advances than their mid- and large-cap counterparts (see the table on the next page). Growth and value stocks were somewhat mixed—growth issues outperformed among small-cap stocks, while value shares held up better in the mid- and large-cap segments of the market.
Non-U.S. stocks also advanced during the fiscal year, though returns were considerably more muted among the emerging markets. Central banks around the world repeatedly took steps to support their fiscally-troubled economies, implementing quantitative easing and economic stimulus measures which helped to support markets. Emerging markets led their developed counterparts during the first half of the period, but lagged for the remainder as worries about the impact of a potential slowdown in China discouraged market participants.
Market Index Total Returns | |
For the 12 months ended July 31, 2013 | |
U.S. Stocks | |
Russell 1000 Index (Large-Cap) | 26.23% |
Russell Midcap Index | 32.37% |
Russell 2000 Index (Small-Cap) | 34.76% |
International Stocks | |
MSCI EAFE Index | 23.48% |
MSCI Emerging Markets Index | 1.95% |
U.S. Fixed Income | |
Barclays U.S. Aggregate Bond Index (multi-sector) | -1.91% |
Barclays U.S. Corporate Bond Index (investment-grade) | -0.66% |
Barclays U.S. Corporate High-Yield Bond Index | 9.49% |
Barclays U.S. MBS Index (mortgage-backed securities) | -1.98% |
Barclays U.S. Treasury Bond Index | -2.72% |
Barclays U.S. Treasury Inflation Protected Securities (TIPS) Index | -5.87% |
International Bonds | |
Barclays Global Treasury ex-U.S. Bond Index | -5.23% |
Bond Market Review
Most sectors of the U.S. bond market posted negative returns for the 12-months ending July 31, 2013, with declines taking place primarily in the second half of the reporting period. The first part of the year saw the broad bond market indices gaining ground as the Fed implemented additional quantitative easing measures and kept interest rates at historically low levels. With investors hungry for yield and willing to take on higher levels of risk in such an environment, high-yield corporate bonds, commercial mortgage-backed securities, and investment-grade corporate bonds delivered the best returns.
The first part of 2013 saw many of these same themes, with higher-yielding bonds continuing their leadership and turning in positive results. As interest rates and bond yields remained at what many market watchers deemed to be artificially low levels, the broad bond indices were unable to keep pace and posted first quarter losses. Long-term Treasuries, investment-grade corporate bonds, and mortgage-backed securities led the market’s decline.
Fears of a change in the Fed’s policy following Bernanke’s May comments led to a sudden change in bond market sentiment, resulting in a largely “technical” (based more on fear of higher interest rates than on actual economic fundamentals that would drive them higher) broad market sell-off. Investor reaction was swift and severe. Typically, Treasuries and other longer-duration government
bonds would suffer most in such a sell-off. In this case, nominal Treasuries, along with mortgage-backed securities and agency securities, outperformed the Barclays U.S. Aggregate Bond Index, which was dragged down by a sharp sell-off of less-liquid, longer-duration investment-grade corporate debt. Treasury inflation-protected securities (TIPS) also declined substantially, primarily due to their longer duration and the market’s low inflation expectations. In contrast, the most-liquid and shortest-duration (least price-sensitive to interest rate changes) securities generally fared best during the sell-off.
Following the bond market’s upheaval during the second quarter, Bernanke’s July statement that the Fed remained committed to stimulating growth and avoiding deflation somewhat reassured investors. Returns remained divergent, however, with high-yield corporate bonds maintaining their market leadership, while long-term Treasuries continued to decline and municipal bonds fell in reaction to news that the City of Detroit was filing for bankruptcy. For the reporting period as a whole, most segments of the bond market declined. High-yield bonds were the notable exception.
Non-U.S. bonds also experienced negative returns for the 12 months. The early part of the reporting period saw investors worried about Europe’s debt crisis, while later in the year concerns turned to emerging market growth prospects and their impact on the global economic recovery. While bond market returns abroad remained highly attuned to central bank policies, which were largely accommodative over the course of the period, the U.S. dollar’s strength relative to most currencies negated any price appreciation.
Portfolio Performance
Each One Choice Target Risk Portfolio is a “fund of funds” that invests in other American Century Investments mutual funds to achieve its investment objective and target asset allocation. (See page 13 for the specific underlying fund allocations for each Portfolio.)
Within the Portfolios, each equity fund, both U.S. and non-U.S., produced positive returns for the 12-month period. Mid Cap Value Fund and Small Company Fund generated the best performance, both producing returns of over 30%. Real Estate Fund, which invests in real estate investment trusts, delivered the lowest returns among equities, gaining just under 6% for the reporting period. Emerging Markets Fund (not held by Very Conservative or Conservative) was another
relative laggard, with a near 7% return.
Among the Portfolios’ fixed-income components, the leading performer was High-Yield Fund (held only by Moderate and Aggressive), which gained nearly 9% for the 12-month period. The only other fixed-income holding to end the period with positive performance was Short Duration Fund (held only by Very Conservative), which managed a gain of less than 1%. All other bond components fell during the year, with Inflation-Adjusted Bond Fund (not held by Very Aggressive) and International Bond Fund (held only by Moderate, Conservative, and Very Conservative) declining the most.
Portfolio Strategy
Each Portfolio has a “neutral” asset mix (the target allocations for stocks, bonds, and cash-equivalent investments) that remains fixed over time. Our management approach involves making modest tactical adjustments to each Portfolio’s actual asset mix to add value and improve the Portfolios’ ability to meet their investment objectives.
We maintained a neutral allocation to stocks, bonds, and cash-equivalent investments for the Portfolios for much of the 12-month period. The sole exception to this was Very Conservative, in which we added exposure to Short Duration Inflation Protection Bond Fund and Short Duration Fund, and reduced exposure to Prime Money Market Fund during the early part of 2013.
We made some modest adjustments to our tactical positioning within the stock and bond components of the Portfolios over the course of the reporting period. Early in the fiscal year, we moved to an overweight position in Growth Fund (large-cap growth) and a corresponding underweight position in Large Company Value Fund within the equity component. While this positioning did not prove beneficial to overall Portfolio results, we believe that the current low inflation environment, combined with attractive valuations, present compelling prospects for growth stocks in the long term.
During the 12-month period, security selection in the equity portion was most successful in the Portfolios’ quantitative holdings—Small Company Fund, Equity Growth Fund and Core Equity Plus Fund. In contrast, stock selection in Vista Fund (mid-cap growth), Mid Cap Value Fund, and Growth Fund detracted from results relative to their respective benchmarks.
In the Portfolios’ fixed-income component, we slightly reduced an overweight position in High-Yield Fund and a matching underweight position in Diversified Bond Fund during the early part of the reporting period. (This positioning applied only to those Portfolios with an existing allocation to High-Yield Fund.)
The largest component of the Portfolios’ fixed-income allocation, Diversified Bond Fund, underperformed the broad bond market indices during the 12-month period. Sector allocation was detrimental, particularly during the latter part of the period, when an overweight position in TIPS and corresponding underweight to Treasuries negatively impacted performance. Although International Bond Fund finished the period with negative returns, it outperformed its benchmark thanks to favorable security selection.
A Look Ahead
The U.S. economic recovery appears to be progressing, albeit with headwinds. Improvements in housing, employment, and economic indicators have been consistent and point to slow but positive growth. While inflation is low, financial market volatility is likely to remain elevated as ongoing concerns over interest rates and Federal Reserve action dominate headlines. Turning overseas, we believe the low-growth environment seen in many non-U.S. markets is likely to persist. While economic conditions in Japan appear to be improving,
Europe’s recovery continues to lag that of the U.S., and a potential slowdown in China is likely to weigh on emerging markets, keeping international market volatility elevated.
Given this backdrop, we favor equities over bonds and cash-equivalent investments at the margin. Earnings yields on U.S. stocks continue to look attractive on a historical basis, despite their recent ascent. Within equities, we favor small-cap core holdings, and prefer large-cap growth over value. Elsewhere, Japan and the U.K. look more attractive than continental Europe, while emerging economies face a number of near-term challenges, despite their long-term appeal. The recent bond market sell-off brought yields from artificially low to merely low levels, and we believe that economic fundamentals suggest yields could continue their modest rise over the coming 12 months. Within Diversified Bond Fund, the largest component of the Portfolios’ fixed-income allocation, we remain overweight to corporate bonds and asset-backed securities. We also favor U.K. gilts over Treasuries and U.S. government agency bonds.
Portfolio Characteristics |
Underlying Fund Allocations(1) as a % of net assets as of July 31, 2013 | |||||||||||||||
Very | Conservative | Moderate | Aggressive | Very | |||||||||||
Equity | |||||||||||||||
Core Equity Plus Fund | 1.0 | % | 2.0 | % | 4.0 | % | 4.6 | % | 4.8 | % | |||||
Equity Growth Fund | 4.0 | % | 7.1 | % | 12.2 | % | 10.1 | % | 13.0 | % | |||||
Growth Fund | 3.5 | % | 5.7 | % | 8.9 | % | 15.5 | % | 18.8 | % | |||||
Large Company Value Fund | 7.0 | % | 10.1 | % | 8.6 | % | 7.6 | % | 9.5 | % | |||||
Mid Cap Value Fund | 5.0 | % | 6.8 | % | 5.6 | % | 4.9 | % | 6.0 | % | |||||
Real Estate Fund | 2.0 | % | 1.9 | % | 1.9 | % | 1.8 | % | 1.9 | % | |||||
Small Company Fund | 1.0 | % | 1.6 | % | 2.1 | % | 2.5 | % | 2.5 | % | |||||
VistaSM Fund | 1.5 | % | 4.1 | % | 7.1 | % | 13.8 | % | 16.6 | % | |||||
Emerging Markets Fund | — | — | 3.9 | % | 6.4 | % | 7.4 | % | |||||||
International Growth Fund | — | 6.1 | % | 10.0 | % | 12.4 | % | 15.5 | % | ||||||
Total Equity | 25.0 | % | 45.4 | % | 64.3 | % | 79.6 | % | 96.0 | % | |||||
Fixed Income | |||||||||||||||
Diversified Bond Fund | 32.0 | % | 29.9 | % | 18.4 | % | 10.0 | % | 3.0 | % | |||||
High-Yield Fund | — | — | 3.8 | % | 5.6 | % | — | ||||||||
Inflation-Adjusted Bond Fund | 10.0 | % | 8.9 | % | 5.8 | % | 3.8 | % | — | ||||||
Short Duration Fund | 7.0 | % | — | — | — | — | |||||||||
Short Duration Inflation Protection Bond Fund | 8.0 | % | — | — | — | — | |||||||||
International Bond Fund | 10.0 | % | 7.9 | % | 2.9 | % | — | — | |||||||
Total Fixed Income | 67.0 | % | 46.7 | % | 30.9 | % | 19.4 | % | 3.0 | % | |||||
Prime Money Market Fund | 8.0 | % | 7.9 | % | 4.8 | % | 1.0 | % | 1.0 | % | |||||
Other Assets and Liabilities | — | (2) | — | (2) | — | (2) | — | (2) | — | (2) | |||||
(1) | Underlying fund investments represent Investor Class. |
(2) | Category is less than 0.05% of total net assets. |
Shareholder Fee Example |
Fund shareholders may incur two types of costs: (1) transaction costs, including sales charges (loads) on purchase payments and redemption/exchange fees; and (2) ongoing costs, including management fees; distribution and service (12b-1) fees; and other fund expenses. This example is intended to help you understand your ongoing costs (in dollars) of investing in your fund and to compare these costs with the ongoing cost of investing in other mutual funds. As a shareholder in the underlying American Century Investments funds, your fund will indirectly bear its pro rata share of the expenses incurred by the underlying funds. These expenses are not included in the fund’s annualized expense ratio or the expenses paid during the period. These expenses are, however, included in the effective expenses paid during the period.
The example is based on an investment of $1,000 made at the beginning of the period and held for the entire period from February 1, 2013 to July 31, 2013.
Actual Expenses
The table provides information about actual account values and actual expenses for each class. You may use the information, together with the amount you invested, to estimate the expenses that you paid over the period. First, identify the share class you own. Then simply divide your account value by $1,000 (for example, an $8,600 account value divided by $1,000 = 8.6), then multiply the result by the number under the heading “Expenses Paid During Period” to estimate the expenses you paid on your account during this period.
If you hold Investor Class shares of any American Century Investments fund, or Institutional Class shares of the American Century Diversified Bond Fund, in an American Century Investments account (i.e., not a financial intermediary or retirement plan account), American Century Investments may charge you a $12.50 semiannual account maintenance fee if the value of those shares is less than $10,000. We will redeem shares automatically in one of your accounts to pay the $12.50 fee. In determining your total eligible investment amount, we will include your investments in all personal accounts (including American Century Investments Brokerage accounts) registered under your Social Security number. Personal accounts include individual accounts, joint accounts, UGMA/UTMA accounts, personal trusts, Coverdell Education Savings Accounts and IRAs (including traditional, Roth, Rollover, SEP-, SARSEP- and SIMPLE-IRAs), and certain other retirement accounts. If you have only business, business retirement, employer-sponsored or American Century Investments Brokerage accounts, you are currently not subject to this fee. If you are subject to the Account Maintenance Fee, your account value could be reduced by the fee amount.
Hypothetical Example for Comparison Purposes
The table also provides information about hypothetical account values and hypothetical expenses based on the actual expense ratio of each class of your fund and an assumed rate of return of 5% per year before expenses, which is not the actual return of a fund’s share class. The hypothetical account values and expenses may not be used to estimate the actual ending account balance or expenses you paid for the period. You may use this information to compare the ongoing costs of investing in your fund and other funds. To do so, compare this 5% hypothetical example with the 5% hypothetical examples that appear in the shareholder reports of the other funds.
Please note that the expenses shown in the table are meant to highlight your ongoing costs only and do not reflect any transactional costs, such as sales
charges (loads) or redemption/exchange fees. Therefore, the table is useful in comparing ongoing costs only, and will not help you determine the relative total costs of owning different funds. In addition, if these transactional costs were included, your costs would have been higher.
Beginning | Ending | Expenses Paid During Period(1) 2/1/13 - 7/31/13 | Annualized Expense Ratio(1) | Effective Expenses Paid During Period(2) 2/1/13 - 7/31/13 | Effective Annualized Expense Ratio(2) | |
One Choice Portfolio: Very Conservative | ||||||
Actual | ||||||
Investor Class | $1,000 | $1,012.30 | $0.00 | 0.00%(3) | $3.29 | 0.66% |
Hypothetical | ||||||
Investor Class | $1,000 | $1,024.80 | $0.00 | 0.00%(3) | $3.31 | 0.66% |
One Choice Portfolio: Conservative | ||||||
Actual | ||||||
Investor Class | $1,000 | $1,038.20 | $0.00 | 0.00%(3) | $3.79 | 0.75% |
Hypothetical | ||||||
Investor Class | $1,000 | $1,024.80 | $0.00 | 0.00%(3) | $3.76 | 0.75% |
One Choice Portfolio: Moderate | ||||||
Actual | ||||||
Investor Class | $1,000 | $1,060.20 | $0.00 | 0.00%(3) | $4.50 | 0.88% |
Hypothetical | ||||||
Investor Class | $1,000 | $1,024.80 | $0.00 | 0.00%(3) | $4.41 | 0.88% |
One Choice Portfolio: Aggressive | ||||||
Actual | ||||||
Investor Class | $1,000 | $1,075.10 | $0.00 | 0.00%(3) | $5.09 | 0.99% |
Hypothetical | ||||||
Investor Class | $1,000 | $1,024.80 | $0.00 | 0.00%(3) | $4.96 | 0.99% |
One Choice Portfolio: Very Aggressive | ||||||
Actual | ||||||
Investor Class | $1,000 | $1,096.80 | $0.00 | 0.00%(3) | $5.46 | 1.05% |
Hypothetical | ||||||
Investor Class | $1,000 | $1,024.80 | $0.00 | 0.00%(3) | $5.26 | 1.05% |
(1) | Expenses are equal to the class’s annualized expense ratio listed in the table above, multiplied by the average account value over the period, multiplied by 181, the number of days in the most recent fiscal half-year, divided by 365, to reflect the one-half year period. The fees and expenses of the underlying American Century Investments funds in which the fund invests are not included in the class’s annualized expense ratio. |
(2) | Effective expenses reflect the sum of expenses borne directly by the class plus the fund’s pro rata share of the weighted average expense ratio of the underlying funds in which it invests. The effective annualized expense ratio combines the class’s annualized expense ratio and the annualized weighted average expense ratio of the underlying funds. The annualized weighted average expense ratio of the underlying funds for the one-half year period reflects the actual expense ratio of each underlying fund from its most recent shareholder report, annualized and weighted for the fund’s relative average investment therein during the period. |
(3) | Other expenses, which include the fees and expenses of the fund’s independent directors and its legal counsel, as well as interest, did not exceed 0.005%. |
Schedule of Investments |
JULY 31, 2013
Shares | Value | |
One Choice Portfolio: Very Conservative | ||
Mutual Funds(1) — 100.0% | ||
DOMESTIC FIXED INCOME FUNDS — 57.0% | ||
Diversified Bond Fund Investor Class | 10,502,516 | $112,481,950 |
Inflation-Adjusted Bond Fund Investor Class | 2,885,421 | 35,259,848 |
Short Duration Fund Investor Class | 2,349,054 | 24,547,612 |
Short Duration Inflation Protection Bond Fund Investor Class | 2,721,692 | 28,115,083 |
200,404,493 | ||
DOMESTIC EQUITY FUNDS — 25.0% | ||
Core Equity Plus Fund Investor Class | 262,646 | 3,587,742 |
Equity Growth Fund Investor Class | 483,087 | 14,168,929 |
Growth Fund Investor Class | 397,452 | 12,261,388 |
Large Company Value Fund Investor Class | 3,231,472 | 24,591,504 |
Mid Cap Value Fund Investor Class | 1,122,835 | 17,516,220 |
Real Estate Fund Investor Class | 280,538 | 6,870,368 |
Small Company Fund Investor Class | 322,073 | 3,626,545 |
Vista Fund Investor Class(2) | 254,618 | 5,385,166 |
88,007,862 | ||
INTERNATIONAL FIXED INCOME FUNDS — 10.0% | ||
International Bond Fund Investor Class | 2,558,469 | 35,153,369 |
MONEY MARKET FUNDS — 8.0% | ||
Prime Money Market Fund Investor Class | 28,060,789 | 28,060,789 |
TOTAL INVESTMENT SECURITIES — 100.0% (Cost $320,289,334) | 351,626,513 | |
OTHER ASSETS AND LIABILITIES† | 27 | |
TOTAL NET ASSETS — 100.0% | $351,626,540 | |
Notes to Schedule of Investments
† | Category is less than 0.05% of total net assets. |
(1) | Investments are funds within the American Century Investments family of funds, of which certain funds may be deemed to be under common control because of the same board of directors. |
(2) | Non-income producing. |
Shares | Value | |
One Choice Portfolio: Conservative | ||
Mutual Funds(1) — 100.0% | ||
DOMESTIC EQUITY FUNDS — 39.3% | ||
Core Equity Plus Fund Investor Class | 1,105,876 | $15,106,260 |
Equity Growth Fund Investor Class | 1,804,508 | 52,926,215 |
Growth Fund Investor Class | 1,380,482 | 42,587,868 |
Large Company Value Fund Investor Class | 9,885,554 | 75,229,066 |
Mid Cap Value Fund Investor Class | 3,258,429 | 50,831,500 |
Real Estate Fund Investor Class | 577,662 | 14,146,953 |
Small Company Fund Investor Class | 1,055,298 | 11,882,650 |
Vista Fund Investor Class(2) | 1,441,253 | 30,482,498 |
293,193,010 | ||
DOMESTIC FIXED INCOME FUNDS — 38.8% | ||
Diversified Bond Fund Investor Class | 20,842,575 | 223,223,983 |
Inflation-Adjusted Bond Fund Investor Class | 5,457,947 | 66,696,116 |
289,920,099 | ||
MONEY MARKET FUNDS — 7.9% | ||
Prime Money Market Fund Investor Class | 58,920,014 | 58,920,014 |
INTERNATIONAL FIXED INCOME FUNDS — 7.9% | ||
International Bond Fund Investor Class | 4,282,243 | 58,838,025 |
INTERNATIONAL EQUITY FUNDS — 6.1% | ||
International Growth Fund Investor Class | 3,597,370 | 45,254,917 |
TOTAL INVESTMENT SECURITIES — 100.0% (Cost $638,866,863) | 746,126,065 | |
OTHER ASSETS AND LIABILITIES† | 46 | |
TOTAL NET ASSETS — 100.0% | $746,126,111 | |
Notes to Schedule of Investments
† | Category is less than 0.05% of total net assets. |
(1) | Investments are funds within the American Century Investments family of funds, of which certain funds may be deemed to be under common control because of the same board of directors. |
(2) | Non-income producing. |
See Notes to Financial Statements
Shares | Value | |
One Choice Portfolio: Moderate | ||
Mutual Funds(1) — 100.0% | ||
DOMESTIC EQUITY FUNDS — 50.4% | ||
Core Equity Plus Fund Investor Class | 3,351,440 | $45,780,664 |
Equity Growth Fund Investor Class | 4,694,532 | 137,690,638 |
Growth Fund Investor Class | 3,269,373 | 100,860,171 |
Large Company Value Fund Investor Class | 12,853,345 | 97,813,955 |
Mid Cap Value Fund Investor Class | 4,033,140 | 62,916,981 |
Real Estate Fund Investor Class | 856,552 | 20,976,956 |
Small Company Fund Investor Class | 2,156,543 | 24,282,674 |
Vista Fund Investor Class(2) | 3,819,594 | 80,784,413 |
571,106,452 | ||
DOMESTIC FIXED INCOME FUNDS — 28.0% | ||
Diversified Bond Fund Investor Class | 19,422,083 | 208,010,505 |
High-Yield Fund Investor Class | 7,016,156 | 43,500,168 |
Inflation-Adjusted Bond Fund Investor Class | 5,419,524 | 66,226,587 |
317,737,260 | ||
INTERNATIONAL EQUITY FUNDS — 13.9% | ||
Emerging Markets Fund Investor Class | 5,427,887 | 44,345,838 |
International Growth Fund Investor Class | 9,018,675 | 113,454,937 |
157,800,775 | ||
MONEY MARKET FUNDS — 4.8% | ||
Prime Money Market Fund Investor Class | 54,424,215 | 54,424,215 |
INTERNATIONAL FIXED INCOME FUNDS — 2.9% | ||
International Bond Fund Investor Class | 2,365,337 | 32,499,733 |
TOTAL INVESTMENT SECURITIES — 100.0% Cost $908,673,596) | 1,133,568,435 | |
OTHER ASSETS AND LIABILITIES† | 178 | |
TOTAL NET ASSETS — 100.0% | $1,133,568,613 | |
Notes to Schedule of Investments
† | Category is less than 0.05% of total net assets. |
(1) | Investments are funds within the American Century Investments family of funds, of which certain funds may be deemed to be under common control because of the same board of directors. |
(2) | Non-income producing. |
Shares | Value | |
One Choice Portfolio: Aggressive | ||
Mutual Funds(1) — 100.0% | ||
DOMESTIC EQUITY FUNDS — 60.8% | ||
Core Equity Plus Fund Investor Class | 2,882,148 | $39,370,144 |
Equity Growth Fund Investor Class | 2,949,572 | 86,510,946 |
Growth Fund Investor Class | 4,277,827 | 131,970,953 |
Large Company Value Fund Investor Class | 8,509,949 | 64,760,713 |
Mid Cap Value Fund Investor Class | 2,644,737 | 41,257,891 |
Real Estate Fund Investor Class | 638,350 | 15,633,180 |
Small Company Fund Investor Class | 1,852,700 | 20,861,399 |
Vista Fund Investor Class(2) | 5,578,990 | 117,995,648 |
518,360,874 | ||
DOMESTIC FIXED INCOME FUNDS — 19.4% | ||
Diversified Bond Fund Investor Class | 7,961,562 | 85,268,331 |
High-Yield Fund Investor Class | 7,784,718 | 48,265,254 |
Inflation-Adjusted Bond Fund Investor Class | 2,636,135 | 32,213,564 |
165,747,149 | ||
INTERNATIONAL EQUITY FUNDS — 18.8% | ||
Emerging Markets Fund Investor Class | 6,641,441 | 54,260,572 |
International Growth Fund Investor Class | 8,431,919 | 106,073,537 |
160,334,109 | ||
MONEY MARKET FUNDS — 1.0% | ||
Prime Money Market Fund Investor Class | 8,465,109 | 8,465,109 |
TOTAL INVESTMENT SECURITIES — 100.0% (Cost $667,936,281) | 852,907,241 | |
OTHER ASSETS AND LIABILITIES† | 154 | |
TOTAL NET ASSETS — 100.0% | $852,907,395 | |
Notes to Schedule of Investments
† | Category is less than 0.05% of total net assets. |
(1) | Investments are funds within the American Century Investments family of funds, of which certain funds may be deemed to be under common control because of the same board of directors. |
(2) | Non-income producing. |
See Notes to Financial Statements
Shares | Value | |
One Choice Portfolio: Very Aggressive | ||
Mutual Funds(1) — 100.0% | ||
DOMESTIC EQUITY FUNDS — 73.1% | ||
Core Equity Plus Fund Investor Class | 820,915 | $11,213,702 |
Equity Growth Fund Investor Class | 1,042,284 | 30,570,197 |
Growth Fund Investor Class | 1,427,034 | 44,023,984 |
Large Company Value Fund Investor Class | 2,932,090 | 22,313,208 |
Mid Cap Value Fund Investor Class | 899,878 | 14,038,094 |
Real Estate Fund Investor Class | 184,884 | 4,527,816 |
Small Company Fund Investor Class | 526,478 | 5,928,148 |
Vista Fund Investor Class(2) | 1,838,662 | 38,887,708 |
171,502,857 | ||
INTERNATIONAL EQUITY FUNDS — 22.9% | ||
Emerging Markets Fund Investor Class | 2,136,859 | 17,458,136 |
International Growth Fund Investor Class | 2,886,410 | 36,311,037 |
53,769,173 | ||
DOMESTIC FIXED INCOME FUNDS — 3.0% | ||
Diversified Bond Fund Investor Class | 656,804 | 7,034,367 |
MONEY MARKET FUNDS — 1.0% | ||
Prime Money Market Fund Investor Class | 2,322,936 | 2,322,936 |
TOTAL INVESTMENT SECURITIES — 100.0% (Cost $166,145,109) | 234,629,333 | |
OTHER ASSETS AND LIABILITIES† | 1 | |
TOTAL NET ASSETS — 100.0% | $234,629,334 | |
Notes to Schedule of Investments
† | Category is less than 0.05% of total net assets. |
(1) | Investments are funds within the American Century Investments family of funds, of which certain funds may be deemed to be under common control because of the same board of directors. |
(2) | Non-income producing. |
See Notes to Financial Statements
Statement of Assets and Liabilities |
JULY 31, 2013 | |||||||||
Very Conservative | Conservative | Moderate | |||||||
Assets | |||||||||
Investment securities in affiliates, at value (cost of | $351,626,513 | $746,126,065 | $1,133,568,435 | ||||||
Receivable for investments sold | — | 325,010 | — | ||||||
Receivable for capital shares sold | 633,445 | 511,699 | 1,242,380 | ||||||
Distributions receivable from affiliates | 241,019 | 424,176 | 592,297 | ||||||
| 352,500,977 | 747,386,950 | 1,135,403,112 | |||||||
Liabilities | |||||||||
Payable for investments purchased | 684,151 | 424,130 | 1,101,279 | ||||||
Payable for capital shares redeemed | 190,286 | 836,709 | 733,220 | ||||||
| 874,437 | 1,260,839 | 1,834,499 | |||||||
Net Assets | $351,626,540 | $746,126,111 | $1,133,568,613 | ||||||
Investor Class Capital Shares, $0.01 Par Value | |||||||||
Shares outstanding | 30,425,044 | 58,939,407 | 82,223,111 | ||||||
Net Asset Value Per Share | $11.56 | $12.66 | $13.79 | ||||||
Net Assets Consist of: | |||||||||
Capital (par value and paid-in surplus) | $325,104,720 | $662,941,421 | $977,543,209 | ||||||
Undistributed net investment income | 297,843 | 493,193 | 683,758 | ||||||
Accumulated net realized loss | (5,113,202 | ) | (24,567,705 | ) | (69,553,193 | ) | |||
Net unrealized appreciation | 31,337,179 | 107,259,202 | 224,894,839 | ||||||
| $351,626,540 | $746,126,111 | $1,133,568,613 | |||||||
See Notes to Financial Statements.
JULY 31, 2013 | ||||||
Aggressive | Very Aggressive | |||||
Assets | ||||||
Investment securities in affiliates, at value (cost of $667,936,281 | $852,907,241 | $234,629,333 | ||||
Receivable for investments sold | 123,074 | 324,425 | ||||
Receivable for capital shares sold | 463,822 | 82,718 | ||||
Distributions receivable from affiliates | 390,807 | 13,293 | ||||
| 853,884,944 | 235,049,769 | |||||
Liabilities | ||||||
Payable for investments purchased | 390,653 | 13,291 | ||||
Payable for capital shares redeemed | 586,896 | 407,144 | ||||
| 977,549 | 420,435 | |||||
Net Assets | $852,907,395 | $234,629,334 | ||||
Investor Class Capital Shares, $0.01 Par Value | ||||||
Shares outstanding | 57,820,921 | 15,337,345 | ||||
Net Asset Value Per Share | $14.75 | $15.30 | ||||
Net Assets Consist of: | ||||||
Capital (par value and paid-in surplus) | $705,998,603 | $190,621,680 | ||||
Undistributed net investment income | 5,550,331 | 1,467,772 | ||||
Accumulated net realized loss | (43,612,499 | ) | (25,944,342 | ) | ||
Net unrealized appreciation | 184,970,960 | 68,484,224 | ||||
| $852,907,395 | $234,629,334 | |||||
See Notes to Financial Statements.
Statement of Operations |
YEAR ENDED JULY 31, 2013 | |||||||||
Very Conservative | Conservative | Moderate | |||||||
Investment Income (Loss) | |||||||||
Income from Affiliates: | |||||||||
Income distributions from underlying funds | $5,798,617 | $12,157,939 | $17,889,095 | ||||||
Expenses: | |||||||||
Directors’ fees and expenses | 11,899 | 23,505 | 35,363 | ||||||
Other expenses | 28 | 34 | — | ||||||
| 11,927 | 23,539 | 35,363 | |||||||
Net investment income (loss) | 5,786,690 | 12,134,400 | 17,853,732 | ||||||
Net Realized and Unrealized Gain (Loss) on Affiliates | |||||||||
Net realized gain (loss) on: | |||||||||
Sale of investments in underlying funds | 1,403,650 | (478,782 | ) | (2,422,374 | ) | ||||
Capital gain distributions received from underlying funds | 1,187,855 | 2,660,387 | 4,480,251 | ||||||
| 2,591,505 | 2,181,605 | 2,057,877 | |||||||
Change in net unrealized appreciation (depreciation) | 4,329,003 | 43,533,461 | 111,824,039 | ||||||
Net realized and unrealized gain (loss) on affiliates | 6,920,508 | 45,715,066 | 113,881,916 | ||||||
Net Increase (Decrease) in Net Assets | $12,707,198 | $57,849,466 | $131,735,648 | ||||||
See Notes to Financial Statements.
YEAR ENDED JULY 31, 2013 | ||||||
Aggressive | Very Aggressive | |||||
Investment Income (Loss) | ||||||
Income from Affiliates: | ||||||
Income distributions from underlying funds | $12,655,653 | $2,744,976 | ||||
Expenses: | ||||||
Directors’ fees and expenses | 26,850 | 7,593 | ||||
Other expenses | 27 | — | ||||
| 26,877 | 7,593 | |||||
Net investment income (loss) | 12,628,776 | 2,737,383 | ||||
Net Realized and Unrealized Gain (Loss) on Affiliates | ||||||
Net realized gain (loss) on: | ||||||
Sale of investments in underlying funds | (1,923,320 | ) | 182,995 | |||
Capital gain distributions received from underlying funds | 4,610,905 | 1,376,733 | ||||
| 2,687,585 | 1,559,728 | |||||
Change in net unrealized appreciation (depreciation) | 110,506,997 | 38,409,586 | ||||
Net realized and unrealized gain (loss) on affiliates | 113,194,582 | 39,969,314 | ||||
Net Increase (Decrease) in Net Assets | $125,823,358 | $42,706,697 | ||||
See Notes to Financial Statements.
Statement of Changes in Net Assets |
YEARS ENDED JULY 31, 2013 AND JULY 31, 2012 | ||||||||||||
Very Conservative | Conservative | |||||||||||
Increase (Decrease) in Net Assets | July 31, 2013 | July 31, 2012 | July 31, 2013 | July 31, 2012 | ||||||||
Operations | ||||||||||||
Net investment income (loss) | $5,786,690 | $5,319,720 | $12,134,400 | $11,325,251 | ||||||||
Net realized gain (loss) | 2,591,505 | 1,681,052 | 2,181,605 | 377,846 | ||||||||
Change in net unrealized | 4,329,003 | 7,877,940 | 43,533,461 | 17,803,269 | ||||||||
Net increase (decrease) in net assets resulting from operations | 12,707,198 | 14,878,712 | 57,849,466 | 29,506,366 | ||||||||
Distributions to Shareholders | ||||||||||||
From net investment income | (5,714,296 | ) | (5,306,603 | ) | (12,019,382 | ) | (11,391,973 | ) | ||||
From net realized gains | (2,174,312 | ) | (292,644 | ) | — | — | ||||||
Decrease in net assets from distributions | (7,888,608 | ) | (5,599,247 | ) | (12,019,382 | ) | (11,391,973 | ) | ||||
Capital Share Transactions | ||||||||||||
Proceeds from shares sold | 175,070,125 | 161,452,080 | 238,210,253 | 184,238,222 | ||||||||
Proceeds from reinvestment of distributions | 7,669,525 | 5,458,005 | 11,764,492 | 11,170,239 | ||||||||
Payments for shares redeemed | (130,997,024 | ) | (87,663,900 | ) | (123,029,511 | ) | (106,498,484 | ) | ||||
Net increase (decrease) in net assets | 51,742,626 | 79,246,185 | 126,945,234 | 88,909,977 | ||||||||
Net increase (decrease) in net assets | 56,561,216 | 88,525,650 | 172,775,318 | 107,024,370 | ||||||||
Net Assets | ||||||||||||
Beginning of period | 295,065,324 | 206,539,674 | 573,350,793 | 466,326,423 | ||||||||
End of period | $351,626,540 | $295,065,324 | $746,126,111 | $573,350,793 | ||||||||
Undistributed net investment income | $297,843 | $225,449 | $493,193 | $378,175 | ||||||||
Transactions in Shares of the Funds | ||||||||||||
Sold | 15,207,290 | 14,595,247 | 19,357,865 | 16,170,226 | ||||||||
Issued in reinvestment of distributions | 671,694 | 496,269 | 967,975 | 989,619 | ||||||||
Redeemed | (11,388,907 | ) | (7,906,303 | ) | (10,017,581 | ) | (9,392,591 | ) | ||||
Net increase (decrease) | 4,490,077 | 7,185,213 | 10,308,259 | 7,767,254 | ||||||||
See Notes to Financial Statements.
YEARS ENDED JULY 31, 2013 AND JULY 31, 2012 | ||||||||||||
Moderate | Aggressive | |||||||||||
Increase (Decrease) in Net Assets | July 31, 2013 | July 31, 2012 | July 31, 2013 | July 31, 2012 | ||||||||
Operations | ||||||||||||
Net investment income (loss) | $17,853,732 | $15,863,508 | $12,628,776 | $8,707,122 | ||||||||
Net realized gain (loss) | 2,057,877 | (39,315 | ) | 2,687,585 | (731,310 | ) | ||||||
Change in net unrealized | 111,824,039 | 19,611,821 | 110,506,997 | 7,218,545 | ||||||||
Net increase (decrease) in net assets resulting from operations | 131,735,648 | 35,436,014 | 125,823,358 | 15,194,357 | ||||||||
Distributions to Shareholders | ||||||||||||
From net investment income | (17,736,660 | ) | (15,985,077 | ) | (11,004,640 | ) | (8,508,465 | ) | ||||
Capital Share Transactions | ||||||||||||
Proceeds from shares sold | 288,203,911 | 200,258,292 | 286,287,049 | 126,370,581 | ||||||||
Proceeds from reinvestment of distributions | 17,397,464 | 15,656,891 | 10,916,991 | 8,407,270 | ||||||||
Payments for shares redeemed | (155,755,184 | ) | (169,127,714 | ) | (125,315,608 | ) | (98,494,515 | ) | ||||
Net increase (decrease) in net assets | 149,846,191 | 46,787,469 | 171,888,432 | 36,283,336 | ||||||||
Net increase (decrease) in net assets | 263,845,179 | 66,238,406 | 286,707,150 | 42,969,228 | ||||||||
Net Assets | ||||||||||||
Beginning of period | 869,723,434 | 803,485,028 | 566,200,245 | 523,231,017 | ||||||||
End of period | $1,133,568,613 | $869,723,434 | $852,907,395 | $566,200,245 | ||||||||
Undistributed net investment income | $683,758 | $566,686 | $5,550,331 | $3,926,195 | ||||||||
Transactions in Shares of the Funds | ||||||||||||
Sold | 21,914,726 | 16,997,751 | 21,472,247 | 10,413,814 | ||||||||
Issued in reinvestment of distributions | 1,347,690 | 1,339,568 | 833,995 | 719,801 | ||||||||
Redeemed | (11,939,485 | ) | (14,352,413 | ) | (9,130,607 | ) | (8,095,066 | ) | ||||
Net increase (decrease) | 11,322,931 | 3,984,906 | 13,175,635 | 3,038,549 | ||||||||
See Notes to Financial Statements.
YEARS ENDED JULY 31, 2013 AND JULY 31, 2012 | ||||||
Very Aggressive | ||||||
Increase (Decrease) in Net Assets | July 31, 2013 | July 31, 2012 | ||||
Operations | ||||||
Net investment income (loss) | $2,737,383 | $1,940,888 | ||||
Net realized gain (loss) | 1,559,728 | (1,340,355 | ) | |||
Change in net unrealized appreciation (depreciation) | 38,409,586 | 1,266,701 | ||||
Net increase (decrease) in net assets resulting from operations | 42,706,697 | 1,867,234 | ||||
Distributions to Shareholders | ||||||
From net investment income | (2,001,337 | ) | (1,927,360 | ) | ||
Capital Share Transactions | ||||||
Proceeds from shares sold | 55,220,412 | 30,540,442 | ||||
Proceeds from reinvestment of distributions | 1,978,556 | 1,889,590 | ||||
Payments for shares redeemed | (56,467,670 | ) | (42,291,424 | ) | ||
Net increase (decrease) in net assets from capital share transactions | 731,298 | (9,861,392 | ) | |||
Net increase (decrease) in net assets | 41,436,658 | (9,921,518 | ) | |||
Net Assets | ||||||
Beginning of period | 193,192,676 | 203,114,194 | ||||
End of period | $234,629,334 | $193,192,676 | ||||
Undistributed net investment income | $1,467,772 | $731,726 | ||||
Transactions in Shares of the Funds | ||||||
Sold | 3,971,089 | 2,541,681 | ||||
Issued in reinvestment of distributions | 150,232 | 163,036 | ||||
Redeemed | (4,086,886 | ) | (3,499,529 | ) | ||
Net increase (decrease) in shares of the funds | 34,435 | (794,812 | ) | |||
See Notes to Financial Statements.
Notes to Financial Statements |
JULY 31, 2013
1. Organization
American Century Asset Allocation Portfolios, Inc. (the corporation) is registered under the Investment Company Act of 1940, as amended (the 1940 Act), as an open-end management investment company and is organized as a Maryland corporation. The corporation is authorized to issue 3,000,000,000 shares. One Choice Portfolio: Very Conservative (Very Conservative), One Choice Portfolio: Conservative (Conservative), One Choice Portfolio: Moderate (Moderate), One Choice Portfolio: Aggressive (Aggressive), and One Choice Portfolio: Very Aggressive (Very Aggressive) (collectively, the funds) are five funds in a series issued by the corporation. The funds operate as “fund of funds,” meaning substantially all of the funds’ assets will be invested in other funds in the American Century Investments family of funds (the underlying funds). Each fund’s assets are allocated among underlying funds that represent major asset classes, including equity securities (stocks), fixed-income securities (bonds) and cash-equivalent instruments (money markets). The funds are diversified as defined under the 1940 Act. Additionally, the underlying funds are generally diversified and so indirectly provide broad exposure to a large number of securities. The funds will assume the risks associated with their underlying funds. The funds’ investment objectives are to seek the highest total return consistent with their respective asset mix.
2. Significant Accounting Policies
The following is a summary of significant accounting policies consistently followed by the funds in preparation of their financial statements. The financial statements are prepared in conformity with accounting principles generally accepted in the United States of America, which may require management to make certain estimates and assumptions at the date of the financial statements. Actual results could differ from these estimates.
Investment Valuations — The funds determine the fair value of their investments and compute their net asset value per share as of the close of regular trading (usually 4 p.m. Eastern time) on the New York Stock Exchange (NYSE) on each day the NYSE is open. Investments in the underlying funds are valued at their reported net asset value.
Security Transactions — Security transactions are accounted for as of the trade date. Net realized gains and losses are determined on the identified cost basis, which is also used for federal income tax purposes.
Investment Income — Income and capital gain distributions, if any, from the underlying funds are recorded as of the ex-dividend date. Long-term capital gain distributions, if any, from the underlying funds are a component of net realized gain (loss).
Expenses — The expenses included in the accompanying financial statements reflect the expenses of each fund and do not include any expenses associated with the underlying funds.
Income Tax Status — It is each fund’s policy to distribute substantially all net investment income and net realized gains to shareholders and to otherwise qualify as a regulated investment company under provisions of the Internal Revenue Code. Accordingly, no provision has been made for income taxes. The funds file U.S. federal, state, local and non-U.S. tax returns as applicable. The funds’ tax returns are subject to examination by the relevant taxing authority until expiration of the applicable statute of limitations, which is generally three years from the date of filing but can be longer in certain jurisdictions. At this time, management believes there are no uncertain tax positions which, based on their technical merit, would not be sustained upon examination and for which it is reasonably possible that the total amounts of unrecognized tax benefits will significantly change in the next twelve months.
Distributions to Shareholders — Distributions from net investment income, if any, are generally declared and paid quarterly for Very Conservative, Conservative, and Moderate. Distributions from net investment income, if any, are generally declared and paid annually for Aggressive and Very Aggressive. Distributions from net realized gains, if any, are generally declared and paid annually for all funds.
Indemnifications — Under the corporation’s organizational documents, its officers and directors are indemnified against certain liabilities arising out of the performance of their duties to the funds. In addition, in the normal course of business, the funds enter into contracts that provide general indemnifications. The maximum exposure under these arrangements is unknown as this would involve future claims that may be made against a fund. The risk of material loss from such claims is considered by management to be remote.
3. Fees and Transactions with Related Parties
Administrative Fees — The corporation’s investment advisor, American Century Investment Management, Inc. (ACIM), does not receive an administrative fee for services provided to the funds.
Acquired Fund Fees and Expenses — Each fund will indirectly realize its pro rata share of the fees and expenses of the underlying funds in which it invests. These fees and expenses are already reflected in the valuation of the underlying funds.
Related Parties — Certain officers and directors of the corporation are also officers and/or directors of American Century Companies, Inc. (ACC). The corporation’s investment advisor, ACIM, the corporation’s distributor, American Century Investment Services, and the corporation’s transfer agent, American Century Services, LLC are wholly owned, directly or indirectly, by ACC. The directors of the corporation are also directors of some underlying funds and therefore those underlying funds may be deemed to be under common control with the corporation. The officers of the corporation are also officers of all the underlying funds. ACIM serves as the investment advisor for the underlying funds.
4. Investment Transactions
Investment transactions for the year ended July 31, 2013 were as follows:
Very Conservative | Conservative | Moderate | Aggressive | Very Aggressive | |||||||||||
Purchases | $142,797,174 | $148,832,559 | $187,374,365 | $215,462,499 | $36,318,297 | ||||||||||
Sales | $91,983,861 | $19,182,821 | $32,936,229 | $37,339,010 | $33,474,235 |
5. Affiliated Company Transactions
Investments are funds within the American Century Investments family of funds, of which certain funds may be deemed to be under common control because of the same board of directors. A summary of transactions for each underlying fund for the year ended July 31, 2013 follows:
July 31, 2012 | July 31, 2013 | ||||||||||||||||||||
Fund/ | Share | Purchase Cost | Sales | Realized | Distributions Received(1) | Share Balance | Market | ||||||||||||||
Very Conservative | |||||||||||||||||||||
Diversified Bond Fund Investor Class | 8,344,240 | $32,065,899 | $8,180,858 | $(141,109 | ) | $3,349,290 | 10,502,516 | $112,481,950 | |||||||||||||
Inflation-Adjusted Bond Fund Investor Class | 2,198,920 | 10,653,792 | 1,791,926 | (55,407 | ) | 838,295 | 2,885,421 | 35,259,848 | |||||||||||||
Short Duration Fund Investor Class | — | 26,199,051 | 1,445,885 | (5,138 | ) | 153,726 | 2,349,054 | 24,547,612 | |||||||||||||
Short Duration Inflation Protection Bond Fund Investor Class | — | 30,005,574 | 1,307,490 | (8,462 | ) | 42,202 | 2,721,692 | 28,115,083 | |||||||||||||
Core Equity Plus Fund Investor Class | 272,599 | 525,331 | 628,440 | 45,165 | 94,152 | 262,646 | 3,587,742 | ||||||||||||||
Equity Growth Fund Investor Class | 505,103 | 2,451,885 | 2,924,079 | 245,877 | 236,600 | 483,087 | 14,168,929 | ||||||||||||||
Growth Fund Investor Class | 272,764 | 5,594,890 | 2,139,943 | 71,399 | 475,941 | 397,452 | 12,261,388 | ||||||||||||||
Large Company Value Fund Investor Class | 4,008,295 | 4,889,421 | 9,208,141 | 850,628 | 412,753 | 3,231,472 | 24,591,504 | ||||||||||||||
Mid Cap Value Fund Investor Class | 1,188,763 | 3,379,621 | 4,181,403 | 285,925 | 680,844 | 1,122,835 | 17,516,220 | ||||||||||||||
Real Estate Fund Investor Class | 251,478 | 1,944,353 | 1,278,188 | 33,204 | 126,083 | 280,538 | 6,870,368 | ||||||||||||||
Small Company Fund Investor Class | 359,650 | 741,735 | 1,034,429 | 142,880 | 31,624 | 322,073 | 3,626,545 | ||||||||||||||
Vista Fund Investor Class(2) | 262,284 | 979,916 | 1,123,846 | 62,930 | — | 254,618 | 5,385,166 | ||||||||||||||
International Bond Fund Investor Class | 2,018,705 | 10,529,104 | 2,965,409 | (124,242 | ) | 540,279 | 2,558,469 | 35,153,369 | |||||||||||||
Prime Money Market Fund Investor Class | 67,594,361 | 12,836,602 | 52,370,174 | — | 4,683 | 28,060,789 | 28,060,789 | ||||||||||||||
| $142,797,174 | $90,580,211 | $1,403,650 | $6,986,472 | $351,626,513 | |||||||||||||||||
(1) | Distributions received includes distributions from net investment income and from capital gains, if any. |
(2) | Non-income producing. |
July 31, 2012 | July 31, 2013 | ||||||||||||||||||||
Fund/ | Share | Purchase Cost | Sales | Realized | Distributions Received(1) | Share Balance | Market | ||||||||||||||
Conservative | |||||||||||||||||||||
Core Equity Plus Fund Investor Class | 1,050,804 | $628,720 | — | — | $345,407 | 1,105,876 | $15,106,260 | ||||||||||||||
Equity Growth Fund Investor Class | 1,708,266 | 3,224,749 | $818,936 | $34,421 | 806,735 | 1,804,508 | 52,926,215 | ||||||||||||||
Growth Fund Investor Class | 1,000,409 | 10,564,809 | — | — | 1,434,265 | 1,380,482 | 42,587,868 | ||||||||||||||
Large Company Value Fund Investor Class | 10,629,310 | 6,003,315 | 11,139,178 | (519,723 | ) | 1,163,879 | 9,885,554 | 75,229,066 | |||||||||||||
Mid Cap Value Fund Investor Class | 3,096,936 | 3,237,612 | 1,089,726 | 18,629 | 1,738,148 | 3,258,429 | 50,831,500 | ||||||||||||||
Real Estate Fund Investor Class | 488,846 | 2,110,108 | 4,302 | 298 | 242,856 | 577,662 | 14,146,953 | ||||||||||||||
Small Company Fund Investor Class | 1,031,153 | 504,613 | 347,395 | 38,295 | 88,297 | 1,055,298 | 11,882,650 | ||||||||||||||
Vista Fund Investor Class(2) | 1,354,274 | 1,670,083 | 111,249 | 6,871 | — | 1,441,253 | 30,482,498 | ||||||||||||||
Diversified Bond Fund Investor Class | 15,205,914 | 66,167,351 | 3,916,867 | (31,714 | ) | 6,124,585 | 20,842,575 | 223,223,983 | |||||||||||||
Inflation-Adjusted Bond Fund Investor Class | 3,852,222 | 20,705,361 | 25,842 | (554 | ) | 1,433,309 | 5,457,947 | 66,696,116 | |||||||||||||
Prime Money Market Fund Investor Class | 45,447,776 | 13,472,238 | — | — | 5,180 | 58,920,014 | 58,920,014 | ||||||||||||||
International Bond Fund Investor Class | 3,136,466 | 16,199,075 | 33,945 | (1,455 | ) | 830,314 | 4,282,243 | 58,838,025 | |||||||||||||
International Growth Fund Investor Class | 3,421,543 | 4,344,525 | 2,174,163 | (23,850 | ) | 605,351 | 3,597,370 | 45,254,917 | |||||||||||||
| $148,832,559 | $19,661,603 | $(478,782 | ) | $14,818,326 | $746,126,065 | ||||||||||||||||
(1) | Distributions received includes distributions from net investment income and from capital gains, if any. |
(2) | Non-income producing. |
July 31, 2012 | July 31, 2013 | ||||||||||||||||||||
Fund/ | Share | Purchase Cost | Sales | Realized | Distributions Received(1) | Share Balance | Market | ||||||||||||||
Moderate | |||||||||||||||||||||
Core Equity Plus Fund Investor Class | 3,167,053 | $2,189,755 | — | — | $1,030,185 | 3,351,440 | $45,780,664 | ||||||||||||||
Equity Growth Fund Investor Class | 4,436,382 | 7,270,245 | $651,601 | $13,403 | 2,072,927 | 4,694,532 | 137,690,638 | ||||||||||||||
Growth Fund Investor Class | 2,520,984 | 20,888,551 | 48,888 | (485 | ) | 3,353,009 | 3,269,373 | 100,860,171 | |||||||||||||
Large Company Value Fund Investor Class | 13,928,544 | 5,024,655 | 13,482,191 | (2,099,673 | ) | 1,486,067 | 12,853,345 | 97,813,955 | |||||||||||||
Mid Cap Value Fund Investor Class | 3,829,910 | 3,221,403 | 448,100 | 8,564 | 2,116,738 | 4,033,140 | 62,916,981 | ||||||||||||||
Real Estate Fund Investor Class | 770,254 | 2,193,850 | 91,549 | 25,838 | 365,707 | 856,552 | 20,976,956 | ||||||||||||||
Small Company Fund Investor Class | 2,048,800 | 1,009,925 | 81,075 | (4,979 | ) | 173,671 | 2,156,543 | 24,282,674 | |||||||||||||
Vista Fund Investor Class(2) | 3,546,138 | 5,111,807 | 123,579 | 1,516 | — | 3,819,594 | 80,784,413 | ||||||||||||||
Diversified Bond Fund Investor Class | 13,248,092 | 73,998,944 | 5,857,476 | (1,371 | ) | 5,510,041 | 19,422,083 | 208,010,505 | |||||||||||||
High-Yield Fund Investor Class | 6,929,427 | 8,022,893 | 7,617,003 | (266,758 | ) | 2,705,317 | 7,016,156 | 43,500,168 | |||||||||||||
Inflation-Adjusted Bond Fund Investor Class | 3,946,445 | 19,488,956 | 500,086 | 4,064 | 1,420,903 | 5,419,524 | 66,226,587 | ||||||||||||||
Emerging Markets Fund Investor Class | 4,432,269 | 9,509,780 | 1,324,988 | (29,454 | ) | 141,332 | 5,427,887 | 44,345,838 | |||||||||||||
International Growth Fund Investor Class | 8,552,810 | 10,896,449 | 5,119,859 | (73,039 | ) | 1,524,089 | 9,018,675 | 113,454,937 | |||||||||||||
Prime Money Market Fund Investor Class | 43,879,863 | 10,556,560 | 12,208 | — | 4,867 | 54,424,215 | 54,424,215 | ||||||||||||||
International Bond Fund Investor Class | 1,799,097 | 7,990,592 | — | — | 464,493 | 2,365,337 | 32,499,733 | ||||||||||||||
| $187,374,365 | $35,358,603 | $(2,422,374 | ) | $22,369,346 | $1,133,568,435 | ||||||||||||||||
(1) | Distributions received includes distributions from net investment income and from capital gains, if any. |
(2) | Non-income producing. |
July 31, 2012 | July 31, 2013 | ||||||||||||||||||||
Fund/ | Share | Purchase Cost | Sales | Realized | Distributions Received(1) | Share Balance | Market | ||||||||||||||
Aggressive | |||||||||||||||||||||
Core Equity Plus Fund Investor Class | 2,368,269 | $6,362,679 | $713,947 | $40,742 | $889,122 | 2,882,148 | $39,370,144 | ||||||||||||||
Equity Growth Fund Investor Class | 2,426,659 | 14,290,307 | 1,881,786 | 92,639 | 1,323,063 | 2,949,572 | 86,510,946 | ||||||||||||||
Growth Fund Investor Class | 2,989,446 | 36,023,271 | 824,092 | 11,357 | 4,419,015 | 4,277,827 | 131,970,953 | ||||||||||||||
Large Company Value Fund Investor Class | 8,152,604 | 11,457,743 | 11,179,786 | (1,585,473 | ) | 1,004,284 | 8,509,949 | 64,760,713 | |||||||||||||
Mid Cap Value Fund Investor Class | 2,178,787 | 6,244,787 | 343,004 | 35,382 | 1,393,303 | 2,644,737 | 41,257,891 | ||||||||||||||
Real Estate Fund Investor Class | 500,321 | 3,429,430 | 181,510 | 12,085 | 276,531 | 638,350 | 15,633,180 | ||||||||||||||
Small Company Fund Investor Class | 1,520,553 | 3,345,383 | 756,374 | (70,275 | ) | 150,538 | 1,852,700 | 20,861,399 | |||||||||||||
Vista Fund Investor Class(2) | 4,456,567 | 22,907,132 | 3,887,146 | 131,822 | — | 5,578,990 | 117,995,648 | ||||||||||||||
Diversified Bond Fund Investor Class | 4,481,127 | 41,754,111 | 3,014,260 | (26,747 | ) | 2,333,800 | 7,961,562 | 85,268,331 | |||||||||||||
High-Yield Fund Investor Class | 6,549,242 | 15,317,177 | 7,860,971 | (252,951 | ) | 3,108,773 | 7,784,718 | 48,265,254 | |||||||||||||
Inflation-Adjusted Bond Fund Investor Class | 1,709,460 | 12,325,565 | 161,669 | (2,373 | ) | 732,443 | 2,636,135 | 32,213,564 | |||||||||||||
Emerging Markets Fund Investor Class | 4,735,309 | 18,021,982 | 2,903,923 | (125,029 | ) | 178,468 | 6,641,441 | 54,260,572 | |||||||||||||
International Growth Fund Investor Class | 6,960,363 | 21,158,434 | 5,553,862 | (184,499 | ) | 1,456,474 | 8,431,919 | 106,073,537 | |||||||||||||
Prime Money Market Fund Investor Class | 5,640,611 | 2,824,498 | — | — | 744 | 8,465,109 | 8,465,109 | ||||||||||||||
| $215,462,499 | $39,262,330 | $(1,923,320 | ) | $17,266,558 | $852,907,241 | ||||||||||||||||
(1) | Distributions received includes distributions from net investment income and from capital gains, if any. |
(2) | Non-income producing. |
July 31, 2012 | July 31, 2013 | ||||||||||||||||||||
Fund/ | Share | Purchase Cost | Sales | Realized | Distributions Received(1) | Share Balance | Market | ||||||||||||||
Very Aggressive | |||||||||||||||||||||
Core Equity Plus Fund Investor Class | 855,891 | $922,708 | $1,262,490 | $79,623 | $275,767 | 820,915 | $11,213,702 | ||||||||||||||
Equity Growth Fund Investor Class | 1,071,508 | 2,928,219 | 3,568,007 | 155,230 | 489,719 | 1,042,284 | 30,570,197 | ||||||||||||||
Growth Fund Investor Class | 1,262,996 | 8,324,441 | 3,746,915 | (31,191 | ) | 1,575,924 | 1,427,034 | 44,023,984 | |||||||||||||
Large Company Value Fund Investor Class | 3,416,010 | 2,277,970 | 5,814,808 | (450,141 | ) | 359,975 | 2,932,090 | 22,313,208 | |||||||||||||
Mid Cap Value Fund Investor Class | 934,024 | 1,447,916 | 1,838,452 | 85,548 | 513,704 | 899,878 | 14,038,094 | ||||||||||||||
Real Estate Fund Investor Class | 167,031 | 941,067 | 504,335 | 19,714 | 79,045 | 184,884 | 4,527,816 | ||||||||||||||
Small Company Fund Investor Class | 589,533 | 367,749 | 1,038,465 | (26,121 | ) | 49,338 | 526,478 | 5,928,148 | |||||||||||||
Vista Fund Investor Class(2) | 1,862,484 | 3,708,099 | 3,989,416 | 295,557 | — | 1,838,662 | 38,887,708 | ||||||||||||||
Emerging Markets Fund Investor Class | 1,877,284 | 5,417,589 | 3,269,364 | 23,787 | 57,666 | 2,136,859 | 17,458,136 | ||||||||||||||
International Growth Fund Investor Class | 2,930,630 | 6,627,507 | 6,912,637 | 35,790 | 520,427 | 2,886,410 | 36,311,037 | ||||||||||||||
Diversified Bond Fund Investor Class | 506,975 | 2,793,068 | 1,145,782 | (4,801 | ) | 199,934 | 656,804 | 7,034,367 | |||||||||||||
Prime Money Market Fund Investor Class | 1,961,541 | 561,964 | 200,569 | — | 210 | 2,322,936 | 2,322,936 | ||||||||||||||
| $36,318,297 | $33,291,240 | $182,995 | $4,121,709 | $234,629,333 | |||||||||||||||||
(1) | Distributions received includes distributions from net investment income and from capital gains, if any. |
(2) | Non-income producing. |
6. Investments in Underlying Funds
The funds do not invest in the underlying funds for the purpose of exercising management or control; however, investments by the funds within their investment strategies may represent a significant portion of the underlying funds’ net assets. As of July 31, 2013, Moderate and Aggressive owned 36% and 31%, respectively, of the total outstanding shares of Core Equity Plus Fund. As of July 31, 2013, the funds, in aggregate, owned 90% of the total outstanding shares of Core Equity Plus Fund.
7. Fair Value Measurements
The funds’ securities valuation process is based on several considerations and may use multiple inputs to determine the fair value of the positions held by the funds. In conformity with accounting principles generally accepted in the United States of America, the inputs used to determine a valuation are classified into three broad levels as follows:
• Level 1 valuation inputs consist of unadjusted quoted prices in an active market for identical securities;
• Level 2 valuation inputs consist of direct or indirect observable market data (including quoted prices for similar securities, evaluations of subsequent market events, interest rates, prepayment speeds, credit risk, etc.); or
• Level 3 valuation inputs consist of unobservable data (including a fund’s own assumptions).
The level classification is based on the lowest level input that is significant to the fair valuation measurement. The valuation inputs are not necessarily an indication of the risks associated with investing in these securities or other financial instruments.
As of period end, the funds’ investment securities were classified as Level 1. The Schedule of Investments provides additional information on the funds’ portfolio holdings.
8. Federal Tax Information
The tax character of distributions paid during the years ended July 31, 2013 and July 31, 2012 were as follows:
Very Conservative | Conservative | |||||||||||
2013 | 2012 | 2013 | 2012 | |||||||||
Distributions Paid From | ||||||||||||
Ordinary income | $5,911,434 | $5,533,730 | $12,019,382 | $11,391,973 | ||||||||
Long-term capital gains | $1,977,174 | $65,517 | — | — | ||||||||
Moderate | Aggressive | |||||||||||
2013 | 2012 | 2013 | 2012 | |||||||||
Distributions Paid From | ||||||||||||
Ordinary income | $17,736,660 | $15,985,077 | $11,004,640 | $8,508,465 | ||||||||
Long-term capital gains | — | — | — | — | ||||||||
Very Aggressive | ||||||
2013 | 2012 | |||||
Distributions Paid From | ||||||
Ordinary income | $2,001,337 | $1,927,360 | ||||
Long-term capital gains | — | — | ||||
The book-basis character of distributions made during the year from net investment income or net realized gains may differ from their ultimate characterization for federal income tax purposes. These differences reflect the differing character of certain income items and net realized gains and losses for financial statement and tax purposes, and may result in reclassification among certain capital accounts on the financial statements.
As of July 31, 2013, the federal tax cost of investments and the components of distributable earnings on a tax-basis were as follows:
Very Conservative | Conservative | Moderate | |||||||
Federal tax cost of investments | $327,827,526 | $660,265,877 | $958,173,300 | ||||||
Gross tax appreciation of investments | $25,741,826 | $87,036,686 | $175,599,436 | ||||||
Gross tax depreciation of investments | (1,942,839 | ) | (1,176,498 | ) | (204,301 | ) | |||
Net tax appreciation (depreciation) of investments | $23,798,987 | $85,860,188 | $175,395,135 | ||||||
Undistributed ordinary income | $743,769 | $493,193 | $683,758 | ||||||
Accumulated long-term gains | $1,979,064 | — | — | ||||||
Accumulated short-term capital losses | — | $(3,168,691 | ) | $(17,635,935 | ) | ||||
Accumulated long-term capital losses | — | — | $(2,417,554 | ) |
Aggressive | Very Aggressive | |||||
Federal tax cost of investments | $702,653,619 | $183,396,813 | ||||
Gross tax appreciation of investments | $150,253,622 | $51,232,520 | ||||
Gross tax depreciation of investments | — | — | ||||
Net tax appreciation (depreciation) of investments | $150,253,622 | $51,232,520 | ||||
Undistributed ordinary income | $5,550,331 | $1,467,772 | ||||
Accumulated short-term capital losses | $(8,895,161 | ) | $(7,418,345 | ) | ||
Accumulated long-term capital losses | — | $(1,274,293 | ) |
The difference between book-basis and tax-basis unrealized appreciation (depreciation) is attributable primarily to the tax deferral of losses on wash sales.
Accumulated capital losses represent net capital loss carryovers that may be used to offset future realized capital gains for federal income tax purposes. Any unlimited losses will be required to be utilized prior to the losses which carry an expiration date. Future capital loss carryover utilization in any given year may be subject to Internal Revenue Code limitations. Capital loss carryovers expire as follows:
2017 | 2018 | 2019 | Unlimited | Unlimited | |||||||||||
Very Conservative | — | — | — | — | — | ||||||||||
Conservative | — | $(2,774,313 | ) | $(394,378 | ) | — | — | ||||||||
Moderate | $(3,239,053 | ) | $(11,515,723 | ) | $(2,750,775 | ) | $(130,384 | ) | $(2,417,554 | ) | |||||
Aggressive | $(620,338 | ) | $(5,491,772 | ) | $(2,783,051 | ) | — | — | |||||||
Very Aggressive | $(2,321,712 | ) | $(2,861,624 | ) | $(2,233,776 | ) | $(1,233 | ) | $(1,274,293 | ) |
Financial Highlights |
For a Share Outstanding Throughout the Years Ended July 31 (except as noted) | |||||||||||||
Per-Share Data | Ratios and Supplemental Data | ||||||||||||
Income From Investment Operations: | Distributions From: | Ratio to Average Net Assets of: | |||||||||||
Net | Net | Net | Total From Investment Operations | Net | Net | Total | Net | Total | Operating | Net | Portfolio | Net Assets, | |
One Choice Portfolio: Very Conservative — Investor Class | |||||||||||||
2013 | $11.38 | 0.20 | 0.26 | 0.46 | (0.20) | (0.08) | (0.28) | $11.56 | 4.04% | 0.00%(4) | 1.75% | 28% | $351,627 |
2012 | $11.02 | 0.24 | 0.37 | 0.61 | (0.24) | (0.01) | (0.25) | $11.38 | 5.66% | 0.00%(4) | 2.14% | 13% | $295,065 |
2011 | $10.41 | 0.23 | 0.61 | 0.84 | (0.23) | — | (0.23) | $11.02 | 8.16% | 0.00%(4) | 2.15% | 17% | $206,540 |
2010 | $9.88 | 0.23 | 0.53 | 0.76 | (0.23) | — | (0.23) | $10.41 | 7.73% | 0.01% | 2.25% | 15% | $158,523 |
2009 | $10.36 | 0.30 | (0.40) | (0.10) | (0.32) | (0.06) | (0.38) | $9.88 | (0.87)% | 0.00%(4) | 3.13% | 42% | $114,699 |
One Choice Portfolio: Conservative — Investor Class | |||||||||||||
2013 | $11.79 | 0.23 | 0.87 | 1.10 | (0.23) | — | (0.23) | $12.66 | 9.42% | 0.00%(4) | 1.86% | 3% | $746,126 |
2012 | $11.41 | 0.25 | 0.39 | 0.64 | (0.26) | — | (0.26) | $11.79 | 5.71% | 0.00%(4) | 2.24% | 12% | $573,351 |
2011 | $10.42 | 0.24 | 0.99 | 1.23 | (0.24) | — | (0.24) | $11.41 | 11.90% | 0.00%(4) | 2.16% | 10% | $466,326 |
2010 | $9.69 | 0.23 | 0.73 | 0.96 | (0.23) | — | (0.23) | $10.42 | 9.99% | 0.00%(4) | 2.29% | 7% | $326,548 |
2009 | $10.89 | 0.29 | (0.98) | (0.69) | (0.31) | (0.20) | (0.51) | $9.69 | (6.05)% | 0.00%(4) | 3.13% | 40% | $252,404 |
One Choice Portfolio: Moderate — Investor Class | |||||||||||||
2013 | $12.27 | 0.24 | 1.52 | 1.76 | (0.24) | — | (0.24) | $13.79 | 14.48% | 0.00%(4) | 1.81% | 3% | $1,133,569 |
2012 | $12.01 | 0.23 | 0.26 | 0.49 | (0.23) | — | (0.23) | $12.27 | 4.21% | 0.00%(4) | 1.95% | 16% | $869,723 |
2011 | $10.60 | 0.21 | 1.41 | 1.62 | (0.21) | — | (0.21) | $12.01 | 15.35% | 0.00%(4) | 1.80% | 11% | $803,485 |
2010 | $9.65 | 0.20 | 0.94 | 1.14 | (0.19) | — | (0.19) | $10.60 | 11.90% | 0.01% | 1.89% | 9% | $634,333 |
2009 | $11.73 | 0.24 | (1.70) | (1.46) | (0.26) | (0.36) | (0.62) | $9.65 | (11.94)% | 0.00%(4) | 2.63% | 32% | $542,182 |
For a Share Outstanding Throughout the Years Ended July 31 (except as noted) | |||||||||||||
Per-Share Data | Ratios and Supplemental Data | ||||||||||||
Income From Investment Operations: | Distributions From: | Ratio to Average Net Assets of: | |||||||||||
Net | Net | Net | Total From Investment Operations | Net | Net | Total | Net | Total | Operating | Net | Portfolio | Net Assets, | |
One Choice Portfolio: Aggressive — Investor Class | |||||||||||||
2013 | $12.68 | 0.23 | 2.05 | 2.28 | (0.21) | — | (0.21) | $14.75 | 18.15% | 0.00%(4) | 1.67% | 5% | $852,907 |
2012 | $12.58 | 0.20 | 0.10 | 0.30 | (0.20) | — | (0.20) | $12.68 | 2.50% | 0.00%(4) | 1.65% | 14% | $566,200 |
2011 | $10.75 | 0.18 | 1.82 | 2.00 | (0.17) | — | (0.17) | $12.58 | 18.67% | 0.00%(4) | 1.48% | 11% | $523,231 |
2010 | $9.62 | 0.17 | 1.11 | 1.28 | (0.15) | — | (0.15) | $10.75 | 13.33% | 0.01% | 1.58% | 8% | $421,049 |
2009 | $12.62 | 0.20 | (2.49) | (2.29) | (0.24) | (0.47) | (0.71) | $9.62 | (17.28)% | 0.00%(4) | 2.12% | 27% | $351,089 |
One Choice Portfolio: Very Aggressive — Investor Class | |||||||||||||
2013 | $12.62 | 0.18 | 2.63 | 2.81 | (0.13) | — | (0.13) | $15.30 | 22.42% | 0.00%(4) | 1.29% | 16% | $234,629 |
2012 | $12.62 | 0.12 | —(5) | 0.12 | (0.12) | — | (0.12) | $12.62 | 1.05% | 0.00%(4) | 1.02% | 13% | $193,193 |
2011 | $10.52 | 0.11 | 2.09 | 2.20 | (0.10) | — | (0.10) | $12.62 | 20.97% | 0.00%(4) | 0.87% | 18% | $203,114 |
2010 | $9.36 | 0.10 | 1.15 | 1.25 | (0.09) | — | (0.09) | $10.52 | 13.39% | 0.01% | 0.93% | 9% | $163,785 |
2009 | $13.11 | 0.13 | (3.17) | (3.04) | (0.14) | (0.57) | (0.71) | $9.36 | (22.35)% | 0.00%(4) | 1.48% | 23% | $146,096 |
Notes to Financial Highlights
(1) | Computed using average shares outstanding throughout the period. |
(2) | Total returns are calculated based on the net asset value of the last business day. Total returns for periods less than one year are not annualized. |
(3) | Ratio of operating expenses to average net assets does not include any fees and expenses of the underlying funds. |
(4) | Ratio was less than 0.005%. |
(5) | Per-share amount was less than $0.005. |
See Notes to Financial Statements.
Report of Independent Registered Public Accounting Firm |
To the Shareholders and Board of Directors of
American Century Asset Allocation Portfolios, Inc.:
We have audited the accompanying statements of assets and liabilities, including the schedules of investments, of One Choice Portfolio: Very Conservative, One Choice Portfolio: Conservative, One Choice Portfolio: Moderate, One Choice Portfolio: Aggressive, and One Choice Portfolio: Very Aggressive, five of the portfolios constituting American Century Asset Allocation Portfolios, Inc. (the “Funds”) as of July 31, 2013, and the related statements of operations for the year then ended, the statements of changes in net assets for each of the two years in the period then ended, and the financial highlights for each of the five years in the period then ended. These financial statements and financial highlights are the responsibility of the Funds’ management. Our responsibility is to express an opinion on these financial statements and financial highlights based on our audits.
We conducted our audits in accordance with the standards of the Public Company Accounting Oversight Board (United States). Those standards require that we plan and perform the audit to obtain reasonable assurance about whether the financial statements and financial highlights are free of material misstatement. The Funds are not required to have, nor were we engaged to perform, an audit of their internal control over financial reporting. Our audits included consideration of internal control over financial reporting as a basis for designing audit procedures that are appropriate in the circumstances, but not for the purpose of expressing an opinion on the effectiveness of the Funds’ internal control over financial reporting. Accordingly, we express no such opinion. An audit also includes examining, on a test basis, evidence supporting the amounts and disclosures in the financial statements, assessing the accounting principles used and significant estimates made by management, as well as evaluating the overall financial statement presentation. Our procedures included confirmation of securities owned as of July 31, 2013, by correspondence with the transfer agent. We believe that our audits provide a reasonable basis for our opinion.
In our opinion, the financial statements and financial highlights referred to above present fairly, in all material respects, the financial position of One Choice Portfolio: Very Conservative, One Choice Portfolio: Conservative, One Choice Portfolio: Moderate, One Choice Portfolio: Aggressive, and One Choice Portfolio: Very Aggressive of American Century Asset Allocation Portfolios, Inc. as of July 31, 2013, the results of their operations for the year then ended, the changes in their net assets for each of the two years in the period then ended, and the financial highlights for each of the periods presented, in conformity with accounting principles generally accepted in the United States of America.
Deloitte & Touche LLP
Kansas City, Missouri
September 19, 2013
Management |
The Board of Directors
The individuals listed below serve as directors of the funds. Each director will continue to serve in this capacity until death, retirement, resignation or removal from office. The board has adopted a mandatory retirement age for directors who are not “interested persons,” as that term is defined in the Investment Company Act (independent directors). Independent directors shall retire by December 31 of the year in which they reach their 75th birthday. Mr. Pratt may serve until December 31 of the year in which he reaches his 76th birthday based on an extension granted under previous retirement guidelines.
Mr. Thomas is an “interested person” because he currently serves as President and Chief Executive Officer of American Century Companies, Inc. (ACC), the parent company of American Century Investment Management, Inc. (ACIM or the advisor). Mr. Fink is an “interested person” because of his employment with American Century Services, LLC (ACS).
The other directors (more than three-fourths of the total number) are independent; that is, they have never been employees, directors or officers of, and have no financial interest in, ACC or any of its wholly owned, direct or indirect, subsidiaries, including ACIM, American Century Investment Services, Inc. (ACIS) and ACS. The directors serve in this capacity for seven (in the case of Mr. Thomas, 15) registered investment companies in the American Century Investments family of funds.
The following table presents additional information about the directors. The mailing address for each director is 4500 Main Street, Kansas City, Missouri 64111.
Name | Position(s) Held with Funds | Length of Time Served | Principal Occupation(s) During Past 5 Years | Number of American Century Portfolios Overseen by Director | Other Directorships Held During Past 5 Years | |
Independent Directors | ||||||
Thomas A. Brown | Director | Since 1980 | Managing Member, Associated Investments, LLC (real estate investment company); Brown Cascade Properties, LLC (real estate investment company) (2001 to 2009) | 75 | None | |
Andrea C. Hall | Director | Since 1997 | Retired | 75 | None | |
Jan M. Lewis | Director | Since 2011 | President and Chief Executive Officer, Catholic Charities of Northeast Kansas (human services organization) | 75 | None | |
James A. Olson | Director | Since 2007 | Member, Plaza Belmont LLC (private equity fund manager) | 75 | Saia, Inc. (2002 to 2012) and EPR Properties (2003 to 2013) | |
Donald H. Pratt | Director and Chairman of the Board | Since 1995 (Chairman since 2005) | Chairman and Chief Executive Officer, Western Investments, Inc. (real estate company) | 75 | None | |
Name | Position(s) Held with Funds | Length of Time Served | Principal Occupation(s) During Past 5 Years | Number of American Century Portfolios Overseen by Director | Other Directorships Held During Past 5 Years | |
Independent Directors | ||||||
M. Jeannine Strandjord | Director | Since 1994 | Retired | 75 | Euronet Worldwide Inc.; Charming Shoppes, Inc. (2006 to 2010); and DST Systems Inc. (1996 | |
John R. Whitten | Director | Since 2008 | Retired | 75 | Rudolph Technologies, Inc. | |
Stephen E. Yates | Director | Since 2012 | Retired; Executive Vice President, Technology & Operations, KeyCorp. (computer services) (2004 to 2010) | 75 | Applied Industrial Technologies, Inc. (2001 to 2010) | |
Interested Directors | ||||||
Barry Fink | Director | Since 2012 | Retired; Executive Vice President, ACC (September 2007 to February 2013); President, ACS (October 2007 to February 2013); Chief Operating Officer, ACC (September 2007 to | 75 | None | |
Jonathan S. Thomas | Director and President | Since 2007 | President and Chief Executive Officer, ACC (March 2007 to present). Also serves as Chief Executive Officer and Manager, ACS; Executive Vice President, ACIM; Director, ACC, ACIM and other ACC subsidiaries | 116 | None | |
Officers
The following table presents certain information about the executive officers of the funds. Each officer serves as an officer for each of the 15 investment companies in the American Century family of funds, unless otherwise noted. No officer is compensated for his or her service as an officer of the funds. The listed officers are interested persons of the funds and are appointed or re-appointed on an annual basis. The mailing address for each officer listed below is 4500 Main Street, Kansas City, Missouri 64111.
Name | Offices with the Funds | Principal Occupation(s) During the Past Five Years |
Jonathan S. Thomas | Director and President since 2007 | President and Chief Executive Officer, ACC (March 2007 to present). Also serves as Chief Executive Officer and Manager, ACS; Executive Vice President, ACIM; Director, ACC, ACIM and other ACC subsidiaries |
Maryanne L. Roepke | Chief Compliance Officer since 2006 and Senior Vice President since 2000 | Chief Compliance Officer, American Century funds, ACIM and ACS (August 2006 to present). Also serves as Senior Vice President, ACS |
Charles A. Etherington | General Counsel since 2007 and Senior Vice President since 2006 | Attorney, ACC (February 1994 to present); Vice President, ACC (November 2005 to present); General Counsel, ACC (March 2007 to present). Also serves as General Counsel, ACIM, ACS, ACIS and other ACC subsidiaries; and Senior Vice President, ACIM and ACS |
C. Jean Wade | Vice President, Treasurer and Chief Financial Officer since 2012 | Vice President, ACS (February 2000 to present) |
Robert J. Leach | Vice President since 2006 and Assistant Treasurer since 2012 | Vice President, ACS (February 2000 to present) |
David H. Reinmiller | Vice President since 2000 | Attorney, ACC (January 1994 to present); Associate General Counsel, ACC (January 2001 to present). Also serves as Vice President, ACIM and ACS |
Ward D. Stauffer | Secretary since 2005 | Attorney, ACC (June 2003 to present) |
The Statement of Additional Information has additional information about the funds’ directors and is available without charge, upon request, by calling 1-800-345-2021.
Approval of Management Agreement |
At a meeting held on June 20, 2013, the Funds’ Board of Directors unanimously approved the renewal of the management agreement pursuant to which American Century Investment Management, Inc. (the “Advisor”) acts as the investment advisor for the Funds. Under Section 15(c) of the Investment Company Act, contracts for investment advisory services are required to be reviewed, evaluated, and approved by a majority of a Fund’s directors (the “Directors”), including a majority of the independent Directors, each year.
Prior to its consideration of the renewal of the management agreement, the Board requested and reviewed extensive data and information compiled by the Advisor and certain independent providers of evaluation data concerning the Funds and the services provided to the Funds by the Advisor. This review was in addition to the oversight and evaluation undertaken by the Board and its committees on a continuous basis throughout the year.
In connection with its consideration of the renewal of the management agreement, the Board’s review and evaluation of the services provided by the Advisor included, but was not limited to, the following:
• | the nature, extent, and quality of investment management, shareholder services, and other services provided by the Advisor to the Funds; |
• | the wide range of other programs and services the Advisor provides to the Funds and their shareholders on a routine and non-routine basis; |
• | the investment performance of the Funds, including data comparing the Funds’ performance to appropriate benchmarks and/or a peer group of other mutual funds with similar investment objectives and strategies; |
• | data comparing the cost of owning the Funds to the cost of owning similar funds; |
• | the Advisor’s compliance policies, procedures, and regulatory experience; |
• | financial data showing the cost of services provided to the Funds, the profitability of the Funds to the Advisor, and the overall profitability of the Advisor; |
• | possible economies of scale associated with the Advisor’s management of the Funds and other accounts under its management; |
• | data comparing services provided and charges to other investment management clients of the Advisor; and |
• | consideration of collateral benefits derived by the Advisor from the management of the Funds. |
In keeping with its practice, the Board held two in-person meetings and one telephonic meeting to review and discuss the information provided. The Directors also had the benefit of the advice of independent counsel throughout the period.
Factors Considered
The Directors considered all of the information provided by the Advisor, the independent data providers, and independent counsel, and evaluated such information for each Fund. In connection with their review, the Directors did
not identify any single factor as being all-important or controlling, and each Director may have attributed different levels of importance to different factors. In deciding to renew the management agreement, the Board based its decision on a number of factors, including the following:
Nature, Extent and Quality of Services - Generally. Under the management agreement, the Advisor is responsible for providing or arranging for all services necessary for the operation of the Funds. The Board noted that under the management agreement, the Advisor provides or arranges at its own expense a wide variety of services including:
• | constructing and designing the Funds |
• | portfolio research and security selection |
• | initial capitalization/funding |
• | securities trading |
• | Fund administration |
• | custody of Fund assets |
• | daily valuation of each Fund’s portfolio |
• | shareholder servicing and transfer agency, including shareholder confirmations, recordkeeping, and communications |
• | legal services |
• | regulatory and portfolio compliance |
• | financial reporting |
• | marketing and distribution |
The Board noted that many of these services have expanded over time both in terms of quantity and complexity in response to shareholder demands, competition in the industry, changing distribution channels, and the changing regulatory environment.
Investment Management Services. The nature of the investment management services provided to the Funds is quite complex and allows Fund shareholders access to professional money management, instant diversification of their investments within an asset class, the opportunity to easily diversify among asset classes by investing in or exchanging among various American Century Investments funds, and liquidity. In evaluating investment performance, the Board expects the Advisor to manage each Fund in accordance with its investment objectives and approved strategies. Further, the Directors recognize that the Advisor has an obligation to monitor trading activities, and in particular to seek the best execution of fund trades, and to evaluate the use of and payment for research. In providing these services, the Advisor utilizes teams of investment professionals (portfolio
managers, analysts, research assistants, and securities traders) who require extensive information technology, research, training, compliance and other systems to conduct their business. The Board, directly and through its Fund Performance Review Committee, regularly reviews investment performance information for the Funds, together with comparative information for appropriate benchmarks and/or peer groups of similarly-managed funds, over different time horizons. The Directors also review detailed performance information during the management agreement approval process. If performance concerns are identified, the underperforming Fund receives special reviews until performance improves, during which the Board discusses with the Advisor the reasons for such results (e.g., market conditions, security selection) and any efforts being undertaken to improve performance. Taking all these factors into consideration, the Board found the investment management services provided by the Advisor to the Funds to meet or exceed industry standards. More detailed information about the Funds’ performance can be found in the Performance and Portfolio Commentary sections of this report.
Shareholder and Other Services. Under the management agreement, the Advisor provides the Funds with a comprehensive package of transfer agency, shareholder, and other services. The Board, directly and through various committees of the Board, regularly reviews reports and evaluations of such services at its regular meetings. These reports include, but are not limited to, information regarding the operational efficiency and accuracy of the shareholder and transfer agency services provided, staffing levels, shareholder satisfaction (as measured by external as well as internal sources), technology support, new products and services offered to Fund shareholders, securities trading activities, portfolio valuation services, auditing services, and legal and operational compliance activities. Certain aspects of shareholder and transfer agency service level efficiency and the quality of securities trading activities are measured by independent third party providers and are presented in comparison to other fund groups not managed by the Advisor. The Board found the services provided by the Advisor to the Funds under the management agreement to be competitive and of high quality.
Costs of Services and Profitability. The Advisor provides detailed information concerning its cost of providing various services to the Funds, its profitability in managing the Funds, its overall profitability, and its financial condition. The Directors have reviewed with the Advisor the methodology used to prepare this financial information. The financial information regarding the Advisor is considered in evaluating the Advisor’s financial condition, its ability to continue to provide services to the Funds, and the reasonableness of the management agreement. The Board concluded that the Advisor’s profits were reasonable in light of the services provided to the Funds.
Ethics. The Board generally considers the Advisor’s commitment to providing quality services to shareholders and to conducting its business ethically. They noted that the Advisor’s practices generally meet or exceed industry best practices.
Economies of Scale. The Board also reviewed information provided by the Advisor regarding the possible existence of economies of scale in connection with the management of the Funds. The Board concluded that economies of scale are difficult to measure and predict with precision, especially on a fund-by-fund
basis. The Board concluded that the Advisor is appropriately sharing economies of scale through its competitive fee structure, offering competitive fees from fund inception, and through reinvestment in its business to provide shareholders additional content and services.
Comparison to Other Funds’ Fees. The Funds invest their non-cash assets entirely in other American Century Investments funds. The Funds do not pay an investment advisory fee to the Advisor. Rather, each Fund indirectly bears its pro rata share of the expenses incurred by the underlying funds. Each of the underlying funds pay the Advisor a single, all-inclusive (or unified) management fee for providing all services necessary for the management and operation of the Funds, other than brokerage expenses, taxes, interest, extraordinary expenses, and the fees and expenses of the Funds’ independent directors (including their independent legal counsel) and expenses incurred in connection with the provision of shareholder services and distribution services under a plan adopted pursuant to Rule 12b-1 under the 1940 Act. Under the unified fee structure, the Advisor is responsible for providing all investment advisory, custody, audit, administrative, compliance, recordkeeping, marketing and shareholder services, or arranging and supervising third parties to provide such services. By contrast, most other funds are charged a variety of fees, including an investment advisory fee, a transfer agency fee, an administrative fee, distribution charges and other expenses. Other than their investment advisory fees and any applicable Rule 12b-1 distribution fees, all other components of the total fees charged by these other funds may be increased without shareholder approval. The Board believes the unified fee structure is a benefit to Fund shareholders because it clearly discloses to shareholders the cost of owning Fund shares, and, since the unified fee cannot be increased without a vote of Fund shareholders, it shifts to the Advisor the risk of increased costs of operating the Funds and provides a direct incentive to minimize administrative inefficiencies. Part of the Board’s analysis of fee levels involves reviewing certain evaluative data compiled by an independent provider and comparing each Fund’s expenses to the total expense ratio of other funds in the Fund’s peer group. The Board concluded that the expenses of each Fund are reasonable in light of the services provided to the Fund.
Comparison to Fees and Services Provided to Other Clients of the Advisor. The Board also requested and received information from the Advisor concerning the nature of the services, fees, costs, and profitability of its advisory services to advisory clients other than the Funds. They observed that these varying types of client accounts require different services and involve different regulatory and entrepreneurial risks than the management of the Funds. The Board analyzed this information and concluded that the fees charged and services provided to the Funds were reasonable by comparison.
Collateral or “Fall-Out” Benefits Derived by the Advisor. The Board considered the existence of collateral benefits the Advisor may receive as a result of its relationship with the Funds. They concluded that the Advisor’s primary business is managing mutual funds and it generally does not use fund or shareholder information to generate profits in other lines of business, and therefore does not derive any significant collateral benefits from them. The Board noted that the Advisor receives proprietary research from broker-dealers that execute fund portfolio transactions and concluded that this research is likely to benefit Fund shareholders. The Board also determined that the Advisor is able to provide
investment management services to certain clients other than the Funds, at least in part, due to its existing infrastructure built to serve the fund complex. The Board concluded, however, that the assets of those other clients are not material to the analysis and, where applicable, may be included with the assets of the Funds to determine breakpoints in the management fee schedule.
Existing Relationship. The Board also considered whether there was any reason for not continuing the existing arrangement with the Advisor. In this regard, the Board was mindful of the potential disruptions of the Funds’ operations and various risks, uncertainties, and other effects that could occur as a result of a decision not to continue such relationship. In particular, the Board recognized that most shareholders have invested in the Funds on the strength of the Advisor’s industry standing and reputation and in the expectation that the Advisor will have a continuing role in providing advisory services to the Funds.
Conclusion of the Directors. As a result of this process, the Board, including all of the independent directors, taking into account all of the factors discussed above and the information provided by the Advisor and others, concluded that the management agreement between each Fund and the Advisor is fair and reasonable in light of the services provided and should be renewed.
Additional Information |
Retirement Account Information
As required by law, distributions you receive from certain IRAs are subject to federal income tax withholding, unless you elect not to have withholding apply. Tax will be withheld on the total amount withdrawn even though you may be receiving amounts that are not subject to withholding, such as nondeductible contributions. In such case, excess amounts of withholding could occur. You may adjust your withholding election so that a greater or lesser amount will be withheld.
If you don’t want us to withhold on this amount, you must notify us to not withhold the federal income tax. You may notify us in writing or in certain situations by telephone or through other electronic means. For systematic withdrawals, your withholding election will remain in effect until revoked or changed by filing a new election. You have the right to revoke your election at any time.
Remember, even if you elect not to have income tax withheld, you are liable for paying income tax on the taxable portion of your withdrawal. If you elect not to have income tax withheld or you don’t have enough income tax withheld, you may be responsible for payment of estimated tax. You may incur penalties under the estimated tax rules if your withholding and estimated tax payments are not sufficient. You can reduce or defer the income tax on a distribution by directly or indirectly rolling such distribution over to another IRA or eligible plan. You should consult your tax advisor for additional information.
State tax will be withheld if, at the time of your distribution, your address is within one of the mandatory withholding states and you have federal income tax withheld (or as otherwise required by state law). State taxes will be withheld from your distribution in accordance with the respective state rules.
Distributions you receive from 403(b), 457 and qualified plans are subject to special tax and withholding rules. Your plan administrator or plan sponsor is required to provide you with a special tax notice explaining those rules at the time you request a distribution. If applicable, federal and/or state taxes may be withheld from your distribution amount.
Proxy Voting Guidelines
American Century Investment Management, Inc., the funds’ investment advisor, is responsible for exercising the voting rights associated with the securities purchased and/or held by the funds. A description of the policies and procedures the advisor uses in fulfilling this responsibility is available without charge, upon request, by calling 1-800-345-2021. It is also available on American Century Investments’ website at americancentury.com and on the Securities and Exchange Commission’s website at sec.gov. Information regarding how the investment advisor voted proxies relating to portfolio securities during the most recent 12-month period ended June 30 is available on the “About Us” page at americancentury.com. It is also available at sec.gov.
Quarterly Portfolio Disclosure
The funds file their complete schedule of portfolio holdings with the Securities and Exchange Commission (SEC) for the first and third quarters of each fiscal year on Form N-Q. The funds’ Forms N-Q are available on the SEC’s website at sec.gov, and may be reviewed and copied at the SEC’s Public Reference Room in Washington, DC. Information on the operation of the Public Reference
Room may be obtained by calling 1-800-SEC-0330. The funds also make their complete schedule of portfolio holdings for the most recent quarter of their fiscal year available on their website at americancentury.com and, upon request, by calling 1-800-345-2021.
Other Tax Information
The following information is provided pursuant to provisions of the Internal Revenue Code.
The funds hereby designate up to the maximum amount allowable as qualified dividend income for the fiscal year ended July 31, 2013.
For corporate taxpayers, the funds hereby designate the following, or up to the maximum amount allowable, of ordinary income distributions paid during the fiscal year ended July 31, 2013 as qualified for the corporate dividends received deduction.
Very Conservative | Conservative | Moderate | Aggressive | Very Aggressive |
$1,290,365 | $3,740,214 | $6,810,620 | $6,946,309 | $2,292,193 |
The funds hereby designate the following as qualified short-term capital gain distributions for purposes of Internal Revenue Code Section 871.
Very Conservative | Conservative | Moderate | Aggressive | Very Aggressive |
$197,138 | — | — | — | — |
The funds hereby designate the following, or up to the maximum amount allowable, as long-term capital gain distributions for the fiscal year ended July 31, 2013.
Very Conservative | Conservative | Moderate | Aggressive | Very Aggressive |
$1,977,174 | — | — | — | — |
For the fiscal year ended July 31, 2013, the funds intend to pass through to shareholders the following, or up to the maximum amount allowable, as a foreign tax credit which represents taxes paid on income derived from sources within foreign countries or possessions of the United States. During the fiscal year ended July 31, 2013, the funds earned the following income derived from foreign sources.
Foreign Tax Credit | Foreign Source Income | |||
Amount | Per Outstanding Share | Amount | Per Outstanding Share | |
Very Conservative | — | — | — | — |
Conservative | $87,033 | 0.0015 | $618,067 | 0.0105 |
Moderate | $225,096 | 0.0027 | $1,599,319 | 0.0195 |
Aggressive | $203,855 | 0.0035 | $1,447,210 | 0.0250 |
Very Aggressive | $78,243 | 0.0051 | $555,995 | 0.0363 |
Notes |

Contact Us | americancentury.com |
Automated Information Line | 1-800-345-8765 |
Investor Services Representative | 1-800-345-2021 |
Investors Using Advisors | 1-800-378-9878 |
Business, Not-For-Profit, Employer-Sponsored Retirement Plans | 1-800-345-3533 |
Banks and Trust Companies, Broker-Dealers, Financial Professionals, Insurance Companies | 1-800-345-6488 |
Telecommunications Device for the Deaf | 1-800-634-4113 |
American Century Asset Allocation Portfolios, Inc.
Investment Advisor:
American Century Investment Management, Inc.
Kansas City, Missouri
This report and the statements it contains are submitted for the general information of our shareholders. The report is not authorized for distribution to prospective investors unless preceded or accompanied by an effective prospectus.
©2013 American Century Proprietary Holdings, Inc. All rights reserved.
CL-ANN-79573 1309
ANNUAL REPORT | JULY 31, 2013 |
One ChoiceSM In Retirement Portfolio
One ChoiceSM 2015 Portfolio
One ChoiceSM 2020 Portfolio
One ChoiceSM 2025 Portfolio
One ChoiceSM 2030 Portfolio
One ChoiceSM 2035 Portfolio
One ChoiceSM 2040 Portfolio
One ChoiceSM 2045 Portfolio
One ChoiceSM 2050 Portfolio
One ChoiceSM 2055 Portfolio
Table of Contents |
President’s Letter | 2 |
Independent Chairman’s Letter | 3 |
Performance | 4 |
Portfolio Commentary | 20 |
Portfolio Characteristics | 24 |
Shareholder Fee Examples | 26 |
Schedule of Investments | 33 |
Statement of Assets and Liabilities | 38 |
Statement of Operations | 42 |
Statement of Changes in Net Assets | 46 |
Notes to Financial Statements | 51 |
Financial Highlights | 76 |
Report of Independent Registered Public Accounting Firm | 96 |
Management | 97 |
Approval of Management Agreements | 100 |
Additional Information | 105 |
In 2006, American Century Investment Services, Inc. entered into an agreement with the LIVESTRONG® Foundation for rights to use the LIVESTRONG name. Effective May 31, 2013, the mutual funds known as LIVESTRONG Portfolios were renamed One ChoiceSM Portfolios. For more information about the foundation, visit LIVESTRONG.org.
Any opinions expressed in this report reflect those of the author as of the date of the report, and do not necessarily represent the opinions of American Century Investments® or any other person in the American Century Investments organization. Any such opinions are subject to change at any time based upon market or other conditions and American Century Investments disclaims any responsibility to update such opinions. These opinions may not be relied upon as investment advice and, because investment decisions made by American Century Investments funds are based on numerous factors, may not be relied upon as an indication of trading intent on behalf of any American Century Investments fund. Security examples are used for representational purposes only and are not intended as recommendations to purchase or sell securities. Performance information for comparative indices and securities is provided to American Century Investments by third party vendors. To the best of American Century Investments’ knowledge, such information is accurate at the time of printing.
President’s Letter |
Jonathan Thomas
Dear Investor:
Thank you for reviewing this annual report for the 12 months ended July 31, 2013. It provides investment performance, market analysis, and portfolio information, presented with the expert perspective of our portfolio management team.
Annual reports remain important vehicles for conveying information about fund returns, including key factors that affected fund performance. For additional, updated investment and market insights, we encourage you to visit our website, americancentury.com.
Central Bank Intervention Boosted Stocks in Developed Countries
This annual report covers a period of unprecedented global monetary intervention, led by the U.S. Federal Reserve (the Fed), the European Central Bank, and the Bank of Japan. These central banks (and others) provided low short-term interest rates and/or made large purchases of government bonds in an effort to stimulate investing and spending.
Monetary stimulus encouraged investment risk-taking, resulting in double-digit stock index returns in many markets. Developed market stock indices generally outperformed their emerging market counterparts by a wide margin. In the U.S., the S&P 500 Index advanced 25.00%, while small- and mid-cap index gains exceeded 30.00%. Internationally, the MSCI EAFE Index, a benchmark for developed markets, advanced 23.48%, while the MSCI Emerging Markets Index lagged at just 1.95%.
Bond returns generally trailed those of stocks. U.S. interest rates, though still historically low, surged from the extremely low levels that prevailed during the risk-averse third quarter of 2012. For example, the 10-year U.S. Treasury note yield rose from 1.50% to 2.58%, according to Bloomberg. As a result, the 10-year Treasury note and the Barclays U.S. Aggregate Bond Index returned –6.50% and –1.91%, respectively, according to Barclays.
Most of the longer-term U.S. Treasury yield increases occurred late in the reporting period, when concerns that the Fed’s bond purchases might be tapered triggered volatility in both the stock and bond markets. Uncertainties about economic and monetary matters going forward took some wind out of the stock market’s sails. In addition, economic growth is still subpar compared with past recession recoveries, and the economy remains in a vulnerable position. Therefore, we continue to believe in a disciplined, diversified, long-term investment approach, using professionally managed stock and bond portfolios—as appropriate—for meeting financial goals. We appreciate your continued trust in us in this uncertain environment.
Sincerely,
Jonathan Thomas
President and Chief Executive Officer
American Century Investments
Independent Chairman’s Letter |
Don Pratt
Dear Fellow Shareholders,
In 2012, identity theft impacted 12.6 million Americans and roughly 16.5% or 2.1 million of those attacks took place in retirement or investment accounts. At a recent meeting, the board discussed the programs in place at American Century Investments to help protect shareholder accounts from identity theft and similar threats. As a part of that effort, American Century Investments’ personnel investigate possible identity theft events on an almost daily basis. In order to protect financial accounts from theft, there are several steps that every investor should take.
If you travel, take steps to ensure your mail is secure. Request a vacation hold or ask a trusted relative or friend to collect mail for you. If you are expecting financial paperwork, be mindful of when it is to arrive or have it delivered to a place other than your home. Consider using a post office box as a secure alternative.
When discarding documents, be sure to shred or otherwise destroy any receipts, credit offers, bank statements, insurance forms, or similar documents containing personal or financial information.
Be creative with electronic passwords and keep them private. For example, think of a phrase and use the first letter of each word as your password or substitute numbers for similarly appearing letters (4 for A, 8 for G, etc.).
Finally, be alert to impersonators. Do not give personal information over the phone unless you initiated the contact. If you receive an email asking you for information regarding an account, do not respond to the email or click any links. Rather, contact the company through their official website or call the customer service number listed on your account statement.
These few precautions could prevent a major identity theft problem. If you would like to know more about protecting your American Century Investments accounts, please visit our website at www.americancentury.com/security/protect_yourself_online.jsp.
If you have any thoughts you would like to share with the board, send them to dhpratt@fundboardchair.com. Thank you for your loyalty as an American Century Investments shareholder.
Best regards,
Don Pratt
Performance |
Total Returns as of July 31, 2013 | |||||
Average Annual Returns | |||||
Ticker | 1 year | 5 years | Since Inception | Inception | |
One Choice In Retirement Portfolio | |||||
Investor Class | ARTOX | 10.11% | 6.08% | 5.81% | 8/31/04 |
Russell 3000 Index | — | 26.86% | 8.57% | 7.60% | — |
Barclays U.S. Aggregate | — | -1.91% | 5.23% | 4.72% | — |
Institutional Class | ATTIX | 10.42% | 6.30% | 6.03% | 8/31/04 |
A Class(1) No sales charge* With sales charge* | ARTAX
| 9.94% 3.60% | 5.81% 4.57% | 5.55% 4.85% | 8/31/04
|
C Class | ATTCX | 9.04% | — | 7.60% | 3/1/10 |
R Class | ARSRX | 9.67% | 5.55% | 5.28% | 8/31/04 |
| * | Sales charges include initial sales charges and contingent deferred sales charges (CDSCs), as applicable. A Class shares have a 5.75% maximum initial sales charge and may be subject to a maximum CDSC of 1.00%. C Class shares redeemed within 12 months of purchase are subject to a maximum CDSC of 1.00%. The SEC requires that mutual funds provide performance information net of maximum sales charges in all cases where charges could be applied. |
(1) | Prior to March 1, 2010, the A Class was referred to as the Advisor Class and did not have a front-end sales charge. Performance prior to that date has been adjusted to reflect this charge. |
The Russell 3000 Index represents approximately 98% of the investable U.S. equity market and provides a broad measure of equity performance. The Barclays U.S. Aggregate Bond Index represents the U.S. investment-grade fixed-rate bond market and provides a broad measure of bond market performance. Performance for these indices is provided for reference only. Neither index is intended to represent the composition of the portfolio, which invests in a mix of equity and fixed-income securities. (See the Schedule of Investments for each portfolio’s asset allocations as of the date of this report.)
Data presented reflect past performance. Past performance is no guarantee of future results. Current performance may be higher or lower than the performance shown. Investment return and principal value will fluctuate, and redemption value may be more or less than original cost. To obtain performance data current to the most recent month end, please call 1-800-345-2021 or visit americancentury.com. A portfolio’s target date is the approximate year when investors plan to start withdrawing their money. The principal value of the investment is not guaranteed at any time, including at the target date. The performance of the portfolios is dependent on the performance of their underlying American Century Investments funds, and will assume the risks associated with these funds. The risks will vary according to each portfolio’s asset allocation, and a fund with a later target date is expected to be more volatile than one with an earlier target date.
Unless otherwise indicated, performance reflects Investor Class shares; performance for other share classes will vary due to differences in fee structure. For information about other share classes available, please consult the prospectus. Data assumes reinvestment of dividends and capital gains, and none of the charts reflect the deduction of taxes that a shareholder would pay on fund distributions or the redemption of fund shares. Returns for the indices are provided for comparison. The fund’s total returns include operating expenses (such as administrative fees) that reduce returns, while the total returns of the indices do not.
Total Returns as of July 31, 2013 | |||||||||||||||
Average Annual Returns | |||||||||||||||
Ticker | 1 year | 5 years | Since Inception | Inception | |||||||||||
One Choice 2015 Portfolio | |||||||||||||||
Investor Class | ARFIX | 10.61 | % | 5.95 | % | 6.36 | % | 8/31/04 | |||||||
Russell 3000 Index | — | 26.86 | % | 8.57 | % | 7.60 | % | — | |||||||
Barclays U.S. Aggregate | — | -1.91 | % | 5.23 | % | 4.72 | % | — | |||||||
Institutional Class | ARNIX | 10.82 | % | 6.16 | % | 6.57 | % | 8/31/04 | |||||||
A Class(1) | ARFAX | 8/31/04 | |||||||||||||
No sales charge* | 10.34 | % | 5.70 | % | 6.09 | % | |||||||||
With sales charge* | 3.97 | % | 4.46 | % | 5.39 | % | |||||||||
C Class | AFNCX | 9.53 | % | — | 7.93 | % | 3/1/10 | ||||||||
R Class | ARFRX | 10.08 | % | 5.42 | % | 5.82 | % | 8/31/04 | |||||||
* | Sales charges include initial sales charges and contingent deferred sales charges (CDSCs), as applicable. A Class shares have a 5.75% maximum initial sales charge and may be subject to a maximum CDSC of 1.00%. C Class shares redeemed within 12 months of purchase are subject to a maximum CDSC of 1.00%. The SEC requires that mutual funds provide performance information net of maximum sales charges in all cases where charges could be applied. |
(1) | Prior to March 1, 2010, the A Class was referred to as the Advisor Class and did not have a front-end sales charge. Performance prior to that date has been adjusted to reflect this charge. |
The Russell 3000 Index represents approximately 98% of the investable U.S. equity market and provides a broad measure of equity performance. The Barclays U.S. Aggregate Bond Index represents the U.S. investment-grade fixed-rate bond market and provides a broad measure of bond market performance. Performance for these indices is provided for reference only. Neither index is intended to represent the composition of the portfolio, which invests in a mix of equity and fixed-income securities. (See the Schedule of Investments for each portfolio’s asset allocations as of the date of this report.)
Data presented reflect past performance. Past performance is no guarantee of future results. Current performance may be higher or lower than the performance shown. Investment return and principal value will fluctuate, and redemption value may be more or less than original cost. To obtain performance data current to the most recent month end, please call 1-800-345-2021 or visit americancentury.com. A portfolio’s target date is the approximate year when investors plan to start withdrawing their money. The principal value of the investment is not guaranteed at any time, including at the target date. The performance of the portfolios is dependent on the performance of their underlying American Century Investments funds, and will assume the risks associated with these funds. The risks will vary according to each portfolio’s asset allocation, and a fund with a later target date is expected to be more volatile than one with an earlier target date.
Unless otherwise indicated, performance reflects Investor Class shares; performance for other share classes will vary due to differences in fee structure. For information about other share classes available, please consult the prospectus. Data assumes reinvestment of dividends and capital gains, and none of the charts reflect the deduction of taxes that a shareholder would pay on fund distributions or the redemption of fund shares. Returns for the indices are provided for comparison. The fund’s total returns include operating expenses (such as administrative fees) that reduce returns, while the total returns of the indices do not.
Total Returns as of July 31, 2013 | |||||||||||||||
Average Annual Returns | |||||||||||||||
Ticker | 1 year | 5 years | Since Inception | Inception | |||||||||||
One Choice 2020 Portfolio | |||||||||||||||
Investor Class | ARBVX | 11.67 | % | 6.22 | % | 4.94 | % | 5/30/08 | |||||||
Russell 3000 Index | — | 26.86 | % | 8.57 | % | 6.32 | % | — | |||||||
Barclays U.S. Aggregate | — | -1.91 | % | 5.23 | % | 5.02 | % | — | |||||||
Institutional Class | ARBSX | 11.89 | % | 6.41 | % | 5.15 | % | 5/30/08 | |||||||
A Class(1) | ARBMX | 5/30/08 | |||||||||||||
No sales charge* | 11.41 | % | 5.94 | % | 4.68 | % | |||||||||
| With sales charge* | 4.99 | % | 4.69 | % | 3.49 | % | |||||||||
C Class | ARNCX | 10.48 | % | — | 8.40 | % | 3/1/10 | ||||||||
R Class | ARBRX | 11.14 | % | 5.68 | % | 4.43 | % | 5/30/08 | |||||||
* | Sales charges include initial sales charges and contingent deferred sales charges (CDSCs), as applicable. A Class shares have a 5.75% maximum initial sales charge and may be subject to a maximum CDSC of 1.00%. C Class shares redeemed within 12 months of purchase are subject to a maximum CDSC of 1.00%. The SEC requires that mutual funds provide performance information net of maximum sales charges in all cases where charges could be applied. |
(1) | Prior to March 1, 2010, the A Class was referred to as the Advisor Class and did not have a front-end sales charge. Performance prior to that date has been adjusted to reflect this charge. |
The Russell 3000 Index represents approximately 98% of the investable U.S. equity market and provides a broad measure of equity performance. The Barclays U.S. Aggregate Bond Index represents the U.S. investment-grade fixed-rate bond market and provides a broad measure of bond market performance. Performance for these indices is provided for reference only. Neither index is intended to represent the composition of the portfolio, which invests in a mix of equity and fixed-income securities. (See the Schedule of Investments for each portfolio’s asset allocations as of the date of this report.)
Data presented reflect past performance. Past performance is no guarantee of future results. Current performance may be higher or lower than the performance shown. Investment return and principal value will fluctuate, and redemption value may be more or less than original cost. To obtain performance data current to the most recent month end, please call 1-800-345-2021 or visit americancentury.com. A portfolio’s target date is the approximate year when investors plan to start withdrawing their money. The principal value of the investment is not guaranteed at any time, including at the target date. The performance of the portfolios is dependent on the performance of their underlying American Century Investments funds, and will assume the risks associated with these funds. The risks will vary according to each portfolio’s asset allocation, and a fund with a later target date is expected to be more volatile than one with an earlier target date.
Unless otherwise indicated, performance reflects Investor Class shares; performance for other share classes will vary due to differences in fee structure. For information about other share classes available, please consult the prospectus. Data assumes reinvestment of dividends and capital gains, and none of the charts reflect the deduction of taxes that a shareholder would pay on fund distributions or the redemption of fund shares. Returns for the indices are provided for comparison. The fund’s total returns include operating expenses (such as administrative fees) that reduce returns, while the total returns of the indices do not.
Total Returns as of July 31, 2013 | |||||||||||||||
Average Annual Returns | |||||||||||||||
Ticker | 1 year | 5 years | Since Inception | Inception | |||||||||||
One Choice 2025 Portfolio | |||||||||||||||
Investor Class | ARWIX | 12.88 | % | 6.12 | % | 6.82 | % | 8/31/04 | |||||||
Russell 3000 Index | — | 26.86 | % | 8.57 | % | 7.60 | % | — | |||||||
Barclays U.S. Aggregate | — | -1.91 | % | 5.23 | % | 4.72 | % | — | |||||||
Institutional Class | ARWFX | 13.10 | % | 6.33 | % | 7.03 | % | 8/31/04 | |||||||
A Class(1) | ARWAX | 8/31/04 | |||||||||||||
No sales charge* | 12.61 | % | 5.86 | % | 6.55 | % | |||||||||
| With sales charge* | 6.13 | % | 4.62 | % | 5.85 | % | |||||||||
C Class | ARWCX | 11.86 | % | — | 8.91 | % | 3/1/10 | ||||||||
R Class | ARWRX | 12.34 | % | 5.59 | % | 6.29 | % | 8/31/04 | |||||||
* | Sales charges include initial sales charges and contingent deferred sales charges (CDSCs), as applicable. A Class shares have a 5.75% maximum initial sales charge and may be subject to a maximum CDSC of 1.00%. C Class shares redeemed within 12 months of purchase are subject to a maximum CDSC of 1.00%. The SEC requires that mutual funds provide performance information net of maximum sales charges in all cases where charges could be applied. |
(1) | Prior to March 1, 2010, the A Class was referred to as the Advisor Class and did not have a front-end sales charge. Performance prior to that date has been adjusted to reflect this charge. |
The Russell 3000 Index represents approximately 98% of the investable U.S. equity market and provides a broad measure of equity performance. The Barclays U.S. Aggregate Bond Index represents the U.S. investment-grade fixed-rate bond market and provides a broad measure of bond market performance. Performance for these indices is provided for reference only. Neither index is intended to represent the composition of the portfolio, which invests in a mix of equity and fixed-income securities. (See the Schedule of Investments for each portfolio’s asset allocations as of the date of this report.)
Data presented reflect past performance. Past performance is no guarantee of future results. Current performance may be higher or lower than the performance shown. Investment return and principal value will fluctuate, and redemption value may be more or less than original cost. To obtain performance data current to the most recent month end, please call 1-800-345-2021 or visit americancentury.com. A portfolio’s target date is the approximate year when investors plan to start withdrawing their money. The principal value of the investment is not guaranteed at any time, including at the target date. The performance of the portfolios is dependent on the performance of their underlying American Century Investments funds, and will assume the risks associated with these funds. The risks will vary according to each portfolio’s asset allocation, and a fund with a later target date is expected to be more volatile than one with an earlier target date.
Unless otherwise indicated, performance reflects Investor Class shares; performance for other share classes will vary due to differences in fee structure. For information about other share classes available, please consult the prospectus. Data assumes reinvestment of dividends and capital gains, and none of the charts reflect the deduction of taxes that a shareholder would pay on fund distributions or the redemption of fund shares. Returns for the indices are provided for comparison. The fund’s total returns include operating expenses (such as administrative fees) that reduce returns, while the total returns of the indices do not.
Total Returns as of July 31, 2013 | |||||||||||||||
Average Annual Returns | |||||||||||||||
Ticker | 1 year | 5 years | Since Inception | Inception | |||||||||||
One Choice 2030 Portfolio | |||||||||||||||
Investor Class | ARCVX | 14.53 | % | 6.23 | % | 4.74 | % | 5/30/08 | |||||||
Russell 3000 Index | — | 26.86 | % | 8.57 | % | 6.32 | % | — | |||||||
Barclays U.S. Aggregate | — | -1.91 | % | 5.23 | % | 5.02 | % | — | |||||||
Institutional Class | ARCSX | 14.76 | % | 6.41 | % | 4.93 | % | 5/30/08 | |||||||
A Class(1) | ARCMX | 5/30/08 | |||||||||||||
No sales charge* | 14.28 | % | 5.94 | % | 4.46 | % | |||||||||
| With sales charge* | 7.74 | % | 4.70 | % | 3.27 | % | |||||||||
C Class | ARWOX | 13.32 | % | — | 9.37 | % | 3/1/10 | ||||||||
R Class | ARCRX | 14.00 | % | 5.68 | % | 4.21 | % | 5/30/08 | |||||||
* | Sales charges include initial sales charges and contingent deferred sales charges (CDSCs), as applicable. A Class shares have a 5.75% maximum initial sales charge and may be subject to a maximum CDSC of 1.00%. C Class shares redeemed within 12 months of purchase are subject to a maximum CDSC of 1.00%. The SEC requires that mutual funds provide performance information net of maximum sales charges in all cases where charges could be applied. |
(1) | Prior to March 1, 2010, the A Class was referred to as the Advisor Class and did not have a front-end sales charge. Performance prior to that date has been adjusted to reflect this charge. |
The Russell 3000 Index represents approximately 98% of the investable U.S. equity market and provides a broad measure of equity performance. The Barclays U.S. Aggregate Bond Index represents the U.S. investment-grade fixed-rate bond market and provides a broad measure of bond market performance. Performance for these indices is provided for reference only. Neither index is intended to represent the composition of the portfolio, which invests in a mix of equity and fixed-income securities. (See the Schedule of Investments for each portfolio’s asset allocations as of the date of this report.)
Data presented reflect past performance. Past performance is no guarantee of future results. Current performance may be higher or lower than the performance shown. Investment return and principal value will fluctuate, and redemption value may be more or less than original cost. To obtain performance data current to the most recent month end, please call 1-800-345-2021 or visit americancentury.com. A portfolio’s target date is the approximate year when investors plan to start withdrawing their money. The principal value of the investment is not guaranteed at any time, including at the target date. The performance of the portfolios is dependent on the performance of their underlying American Century Investments funds, and will assume the risks associated with these funds. The risks will vary according to each portfolio’s asset allocation, and a fund with a later target date is expected to be more volatile than one with an earlier target date.
Unless otherwise indicated, performance reflects Investor Class shares; performance for other share classes will vary due to differences in fee structure. For information about other share classes available, please consult the prospectus. Data assumes reinvestment of dividends and capital gains, and none of the charts reflect the deduction of taxes that a shareholder would pay on fund distributions or the redemption of fund shares. Returns for the indices are provided for comparison. The fund’s total returns include operating expenses (such as administrative fees) that reduce returns, while the total returns of the indices do not.
Total Returns as of July 31, 2013 | ||||||||||||||||||||
Average Annual Returns | ||||||||||||||||||||
Ticker | 1 year | 5 years | Since Inception | Inception | ||||||||||||||||
One Choice 2035 Portfolio | ||||||||||||||||||||
Investor Class | ARYIX | 16.24 | % | 6.24 | % | 7.23 | % | 8/31/04 | ||||||||||||
Russell 3000 Index | — | 26.86 | % | 8.57 | % | 7.60 | % | — | ||||||||||||
Barclays U.S. Aggregate | — | -1.91 | % | 5.23 | % | 4.72 | % | — | ||||||||||||
Institutional Class | ARLIX | 16.54 | % | 6.46 | % | 7.45 | % | 8/31/04 | ||||||||||||
A Class(1) | ARYAX | 8/31/04 | ||||||||||||||||||
No sales charge* |
| 16.05 | % | 5.98 | % | 6.97 | % | |||||||||||||
| With sales charge* | 9.38 | % | 4.73 | % | 6.27 | % | ||||||||||||||
C Class | ARLCX | 15.05 | % | — | 10.03 | % | 3/1/10 | |||||||||||||
R Class | ARYRX | 15.69 | % | 5.72 | % | 6.71 | % | 8/31/04 | ||||||||||||
* | Sales charges include initial sales charges and contingent deferred sales charges (CDSCs), as applicable. A Class shares have a 5.75% maximum initial sales charge and may be subject to a maximum CDSC of 1.00%. C Class shares redeemed within 12 months of purchase are subject to a maximum CDSC of 1.00%. The SEC requires that mutual funds provide performance information net of maximum sales charges in all cases where charges could be applied. |
(1) | Prior to March 1, 2010, the A Class was referred to as the Advisor Class and did not have a front-end sales charge. Performance prior to that date has been adjusted to reflect this charge. |
The Russell 3000 Index represents approximately 98% of the investable U.S. equity market and provides a broad measure of equity performance. The Barclays U.S. Aggregate Bond Index represents the U.S. investment-grade fixed-rate bond market and provides a broad measure of bond market performance. Performance for these indices is provided for reference only. Neither index is intended to represent the composition of the portfolio, which invests in a mix of equity and fixed-income securities. (See the Schedule of Investments for each portfolio’s asset allocations as of the date of this report.)
Data presented reflect past performance. Past performance is no guarantee of future results. Current performance may be higher or lower than the performance shown. Investment return and principal value will fluctuate, and redemption value may be more or less than original cost. To obtain performance data current to the most recent month end, please call 1-800-345-2021 or visit americancentury.com. A portfolio’s target date is the approximate year when investors plan to start withdrawing their money. The principal value of the investment is not guaranteed at any time, including at the target date. The performance of the portfolios is dependent on the performance of their underlying American Century Investments funds, and will assume the risks associated with these funds. The risks will vary according to each portfolio’s asset allocation, and a fund with a later target date is expected to be more volatile than one with an earlier target date.
Unless otherwise indicated, performance reflects Investor Class shares; performance for other share classes will vary due to differences in fee structure. For information about other share classes available, please consult the prospectus. Data assumes reinvestment of dividends and capital gains, and none of the charts reflect the deduction of taxes that a shareholder would pay on fund distributions or the redemption of fund shares. Returns for the indices are provided for comparison. The fund’s total returns include operating expenses (such as administrative fees) that reduce returns, while the total returns of the indices do not.
Total Returns as of July 31, 2013 | |||||||||||||||
Average Annual Returns | |||||||||||||||
Ticker | 1 year | 5 years | Since Inception | Inception | |||||||||||
One Choice 2040 Portfolio | |||||||||||||||
Investor Class | ARDVX | 17.83 | % | 6.74 | % | 5.00 | % | 5/30/08 | |||||||
Russell 3000 Index | — | 26.86 | % | 8.57 | % | 6.32 | % | — | |||||||
Barclays U.S. Aggregate | — | -1.91 | % | 5.23 | % | 5.02 | % | — | |||||||
Institutional Class | ARDSX | 18.05 | % | 6.95 | % | 5.21 | % | 5/30/08 | |||||||
A Class(1) | ARDMX | 5/30/08 | |||||||||||||
No sales charge* | 17.45 | % | 6.46 | % | 4.74 | % | |||||||||
| With sales charge* | 10.68 | % | 5.20 | % | 3.54 | % | |||||||||
C Class | ARNOX | 16.71 | % | — | 10.62 | % | 3/1/10 | ||||||||
R Class | ARDRX | 17.18 | % | 6.20 | % | 4.47 | % | 5/30/08 | |||||||
* | Sales charges include initial sales charges and contingent deferred sales charges (CDSCs), as applicable. A Class shares have a 5.75% maximum initial sales charge and may be subject to a maximum CDSC of 1.00%. C Class shares redeemed within 12 months of purchase are subject to a maximum CDSC of 1.00%. The SEC requires that mutual funds provide performance information net of maximum sales charges in all cases where charges could be applied. |
(1) | Prior to March 1, 2010, the A Class was referred to as the Advisor Class and did not have a front-end sales charge. Performance prior to that date has been adjusted to reflect this charge. |
The Russell 3000 Index represents approximately 98% of the investable U.S. equity market and provides a broad measure of equity performance. The Barclays U.S. Aggregate Bond Index represents the U.S. investment-grade fixed-rate bond market and provides a broad measure of bond market performance. Performance for these indices is provided for reference only. Neither index is intended to represent the composition of the portfolio, which invests in a mix of equity and fixed-income securities. (See the Schedule of Investments for each portfolio’s asset allocations as of the date of this report.)
Data presented reflect past performance. Past performance is no guarantee of future results. Current performance may be higher or lower than the performance shown. Investment return and principal value will fluctuate, and redemption value may be more or less than original cost. To obtain performance data current to the most recent month end, please call 1-800-345-2021 or visit americancentury.com. A portfolio’s target date is the approximate year when investors plan to start withdrawing their money. The principal value of the investment is not guaranteed at any time, including at the target date. The performance of the portfolios is dependent on the performance of their underlying American Century Investments funds, and will assume the risks associated with these funds. The risks will vary according to each portfolio’s asset allocation, and a fund with a later target date is expected to be more volatile than one with an earlier target date.
Unless otherwise indicated, performance reflects Investor Class shares; performance for other share classes will vary due to differences in fee structure. For information about other share classes available, please consult the prospectus. Data assumes reinvestment of dividends and capital gains, and none of the charts reflect the deduction of taxes that a shareholder would pay on fund distributions or the redemption of fund shares. Returns for the indices are provided for comparison. The fund’s total returns include operating expenses (such as administrative fees) that reduce returns, while the total returns of the indices do not.
Total Returns as of July 31, 2013 | |||||||||||||||
Average Annual Returns | |||||||||||||||
Ticker | 1 year | 5 years | Since Inception | Inception | |||||||||||
One Choice 2045 Portfolio | |||||||||||||||
Investor Class | AROIX | 18.94 | % | 6.45 | % | 7.49 | % | 8/31/04 | |||||||
Russell 3000 Index | — | 26.86 | % | 8.57 | % | 7.60 | % | — | |||||||
Barclays U.S. Aggregate | — | -1.91 | % | 5.23 | % | 4.72 | % | — | |||||||
Institutional Class | AOOIX | 19.15 | % | 6.68 | % | 7.71 | % | 8/31/04 | |||||||
| A Class(1) | AROAX | 8/31/04 | |||||||||||||
No sales charge* | 18.59 | % | 6.18 | % | 7.22 | % | |||||||||
| With sales charge* | 11.78 | % | 4.93 | % | 6.51 | % | |||||||||
C Class | AROCX | 17.72 | % | — | 10.96 | % | 3/1/10 | ||||||||
R Class | ARORX | 18.30 | % | 5.92 | % | 6.96 | % | 8/31/04 | |||||||
* | Sales charges include initial sales charges and contingent deferred sales charges (CDSCs), as applicable. A Class shares have a 5.75% maximum initial sales charge and may be subject to a maximum CDSC of 1.00%. C Class shares redeemed within 12 months of purchase are subject to a maximum CDSC of 1.00%. The SEC requires that mutual funds provide performance information net of maximum sales charges in all cases where charges could be applied. |
(1) | Prior to March 1, 2010, the A Class was referred to as the Advisor Class and did not have a front-end sales charge. Performance prior to that date has been adjusted to reflect this charge. |
The Russell 3000 Index represents approximately 98% of the investable U.S. equity market and provides a broad measure of equity performance. The Barclays U.S. Aggregate Bond Index represents the U.S. investment-grade fixed-rate bond market and provides a broad measure of bond market performance. Performance for these indices is provided for reference only. Neither index is intended to represent the composition of the portfolio, which invests in a mix of equity and fixed-income securities. (See the Schedule of Investments for each portfolio’s asset allocations as of the date of this report.)
Data presented reflect past performance. Past performance is no guarantee of future results. Current performance may be higher or lower than the performance shown. Investment return and principal value will fluctuate, and redemption value may be more or less than original cost. To obtain performance data current to the most recent month end, please call 1-800-345-2021 or visit americancentury.com. A portfolio’s target date is the approximate year when investors plan to start withdrawing their money. The principal value of the investment is not guaranteed at any time, including at the target date. The performance of the portfolios is dependent on the performance of their underlying American Century Investments funds, and will assume the risks associated with these funds. The risks will vary according to each portfolio’s asset allocation, and a fund with a later target date is expected to be more volatile than one with an earlier target date.
Unless otherwise indicated, performance reflects Investor Class shares; performance for other share classes will vary due to differences in fee structure. For information about other share classes available, please consult the prospectus. Data assumes reinvestment of dividends and capital gains, and none of the charts reflect the deduction of taxes that a shareholder would pay on fund distributions or the redemption of fund shares. Returns for the indices are provided for comparison. The fund’s total returns include operating expenses (such as administrative fees) that reduce returns, while the total returns of the indices do not.
Total Returns as of July 31, 2013 | ||||||||||||||||||||
Average Annual Returns | ||||||||||||||||||||
Ticker | 1 year | 5 years | Since Inception | Inception | ||||||||||||||||
One Choice 2050 Portfolio | ||||||||||||||||||||
Investor Class | ARFVX | 19.51 | % | 6.49 | % | 4.64 | % | 5/30/08 | ||||||||||||
Russell 3000 Index | — | 26.86 | % | 8.57 | % | 6.32 | % | — | ||||||||||||
Barclays U.S. Aggregate | — | -1.91 | % | 5.23 | % | 5.02 | % | — | ||||||||||||
Institutional Class | ARFSX | 19.72 | % | 6.72 | % | 4.86 | % | 5/30/08 | ||||||||||||
A Class(1) | ARFMX | |||||||||||||||||||
No sales charge* | 19.13 | % | 6.21 | % | 4.37 | % | 5/30/08 | |||||||||||||
| With sales charge* | 12.32 | % | 4.97 | % | 3.18 | % | ||||||||||||||
C Class | ARFDX | 18.26 | % | — | 11.14 | % | 3/1/10 | |||||||||||||
R Class | ARFWX | 18.84 | % | 5.97 | % | 4.12 | % | 5/30/08 | ||||||||||||
* | Sales charges include initial sales charges and contingent deferred sales charges (CDSCs), as applicable. A Class shares have a 5.75% maximum initial sales charge and may be subject to a maximum CDSC of 1.00%. C Class shares redeemed within 12 months of purchase are subject to a maximum CDSC of 1.00%. The SEC requires that mutual funds provide performance information net of maximum sales charges in all cases where charges could be applied. |
(1) | Prior to March 1, 2010, the A Class was referred to as the Advisor Class and did not have a front-end sales charge. Performance prior to that date has been adjusted to reflect this charge. |
The Russell 3000 Index represents approximately 98% of the investable U.S. equity market and provides a broad measure of equity performance. The Barclays U.S. Aggregate Bond Index represents the U.S. investment-grade fixed-rate bond market and provides a broad measure of bond market performance. Performance for these indices is provided for reference only. Neither index is intended to represent the composition of the portfolio, which invests in a mix of equity and fixed-income securities. (See the Schedule of Investments for each portfolio’s asset allocations as of the date of this report.)
Data presented reflect past performance. Past performance is no guarantee of future results. Current performance may be higher or lower than the performance shown. Investment return and principal value will fluctuate, and redemption value may be more or less than original cost. To obtain performance data current to the most recent month end, please call 1-800-345-2021 or visit americancentury.com. A portfolio’s target date is the approximate year when investors plan to start withdrawing their money. The principal value of the investment is not guaranteed at any time, including at the target date. The performance of the portfolios is dependent on the performance of their underlying American Century Investments funds, and will assume the risks associated with these funds. The risks will vary according to each portfolio’s asset allocation, and a fund with a later target date is expected to be more volatile than one with an earlier target date.
Unless otherwise indicated, performance reflects Investor Class shares; performance for other share classes will vary due to differences in fee structure. For information about other share classes available, please consult the prospectus. Data assumes reinvestment of dividends and capital gains, and none of the charts reflect the deduction of taxes that a shareholder would pay on fund distributions or the redemption of fund shares. Returns for the indices are provided for comparison. The fund’s total returns include operating expenses (such as administrative fees) that reduce returns, while the total returns of the indices do not.
Total Returns as of July 31, 2013 | ||||||||||||
Average | ||||||||||||
Ticker | 1 year | Since | Inception | |||||||||
One Choice 2055 Portfolio | ||||||||||||
Investor Class | AREVX | 19.86 | % | 9.41 | % | 3/31/11 | ||||||
Russell 3000 Index | — | 26.86 | % | 12.98 | % | — | ||||||
Barclays U.S. Aggregate | — | -1.91 | % | 3.89 | % | — | ||||||
Institutional Class | ARENX | 20.08 | % | 9.62 | % | 3/31/11 | ||||||
A Class | AREMX | 3/31/11 | ||||||||||
No sales charge* | 19.59 | % | 9.13 | % | ||||||||
| With sales charge* | 12.72 | % | 6.40 | % | ||||||||
C Class | AREFX | 18.66 | % | 8.32 | % | 3/31/11 | ||||||
R Class | AREOX | 19.31 | % | 8.88 | % | 3/31/11 | ||||||
* | Sales charges include initial sales charges and contingent deferred sales charges (CDSCs), as applicable. A Class shares have a 5.75% maximum initial sales charge and may be subject to a maximum CDSC of 1.00%. C Class shares redeemed within 12 months of purchase are subject to a maximum CDSC of 1.00%. The SEC requires that mutual funds provide performance information net of maximum sales charges in all cases where charges could be applied. |
The Russell 3000 Index represents approximately 98% of the investable U.S. equity market and provides a broad measure of equity performance. The Barclays U.S. Aggregate Bond Index represents the U.S. investment-grade fixed-rate bond market and provides a broad measure of bond market performance. Performance for these indices is provided for reference only. Neither index is intended to represent the composition of the portfolio, which invests in a mix of equity and fixed-income securities. (See the Schedule of Investments for each portfolio’s asset allocations as of the date of this report.)
Data presented reflect past performance. Past performance is no guarantee of future results. Current performance may be higher or lower than the performance shown. Investment return and principal value will fluctuate, and redemption value may be more or less than original cost. To obtain performance data current to the most recent month end, please call 1-800-345-2021 or visit americancentury.com. A portfolio’s target date is the approximate year when investors plan to start withdrawing their money. The principal value of the investment is not guaranteed at any time, including at the target date. The performance of the portfolios is dependent on the performance of their underlying American Century Investments funds, and will assume the risks associated with these funds. The risks will vary according to each portfolio’s asset allocation, and a fund with a later target date is expected to be more volatile than one with an earlier target date.
Unless otherwise indicated, performance reflects Investor Class shares; performance for other share classes will vary due to differences in fee structure. For information about other share classes available, please consult the prospectus. Data assumes reinvestment of dividends and capital gains, and none of the charts reflect the deduction of taxes that a shareholder would pay on fund distributions or the redemption of fund shares. Returns for the indices are provided for comparison. The fund’s total returns include operating expenses (such as administrative fees) that reduce returns, while the total returns of the indices do not.
Growth of $10,000 Over Life of One Choice In Retirement Portfolio — Investor Class |
$10,000 investment made August 31, 2004 |
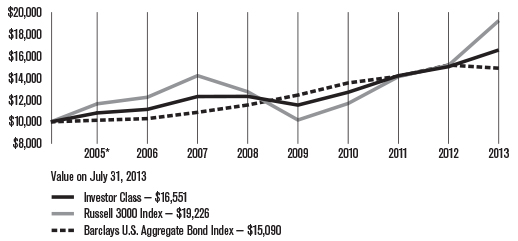
*From 8/31/04, the Investor Class’s inception date. Not annualized.
Growth of $10,000 Over Life of One Choice 2015 Portfolio — Investor Class |
$10,000 investment made August 31, 2004 |
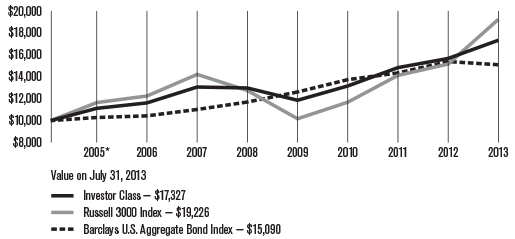
*From 8/31/04, the Investor Class’s inception date. Not annualized.
Data presented reflect past performance. Past performance is no guarantee of future results. Current performance may be higher or lower than the performance shown. Investment return and principal value will fluctuate, and redemption value may be more or less than original cost. To obtain performance data current to the most recent month end, please call 1-800-345-2021 or visit americancentury.com. A portfolio’s target date is the approximate year when investors plan to start withdrawing their money. The principal value of the investment is not guaranteed at any time, including at the target date. The performance of the portfolios is dependent on the performance of their underlying American Century Investments funds, and will assume the risks associated with these funds. The risks will vary according to each portfolio’s asset allocation, and a fund with a later target date is expected to be more volatile than one with an earlier target date.
Unless otherwise indicated, performance reflects Investor Class shares; performance for other share classes will vary due to differences in fee structure. For information about other share classes available, please consult the prospectus. Data assumes reinvestment of dividends and capital gains, and none of the charts reflect the deduction of taxes that a shareholder would pay on fund distributions or the redemption of fund shares. Returns for the indices are provided for comparison. The fund’s total returns include operating expenses (such as administrative fees) that reduce returns, while the total returns of the indices do not.
Growth of $10,000 Over Life of One Choice 2020 Portfolio — Investor Class |
$10,000 investment made May 30, 2008 |
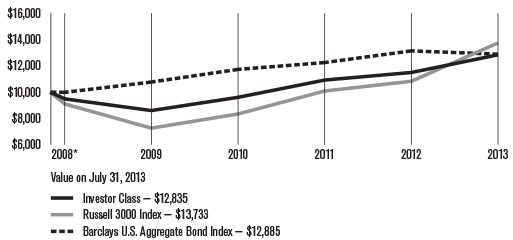
*From 5/30/08, the Investor Class’s inception date. Not annualized.
Growth of $10,000 Over Life of One Choice 2025 Portfolio — Investor Class |
$10,000 investment made August 31, 2004 |

*From 8/31/04, the Investor Class’s inception date. Not annualized.
Data presented reflect past performance. Past performance is no guarantee of future results. Current performance may be higher or lower than the performance shown. Investment return and principal value will fluctuate, and redemption value may be more or less than original cost. To obtain performance data current to the most recent month end, please call 1-800-345-2021 or visit americancentury.com. A portfolio’s target date is the approximate year when investors plan to start withdrawing their money. The principal value of the investment is not guaranteed at any time, including at the target date. The performance of the portfolios is dependent on the performance of their underlying American Century Investments funds, and will assume the risks associated with these funds. The risks will vary according to each portfolio’s asset allocation, and a fund with a later target date is expected to be more volatile than one with an earlier target date.
Unless otherwise indicated, performance reflects Investor Class shares; performance for other share classes will vary due to differences in fee structure. For information about other share classes available, please consult the prospectus. Data assumes reinvestment of dividends and capital gains, and none of the charts reflect the deduction of taxes that a shareholder would pay on fund distributions or the redemption of fund shares. Returns for the indices are provided for comparison. The fund’s total returns include operating expenses (such as administrative fees) that reduce returns, while the total returns of the indices do not.
Growth of $10,000 Over Life of One Choice 2030 Portfolio — Investor Class |
$10,000 investment made May 30, 2008 |
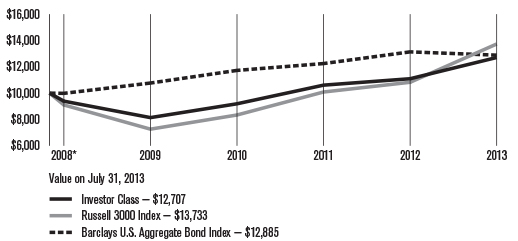
*From 5/30/08, the Investor Class’s inception date. Not annualized.
Growth of $10,000 Over Life of One Choice 2035 Portfolio — Investor Class |
$10,000 investment made August 31, 2004 |
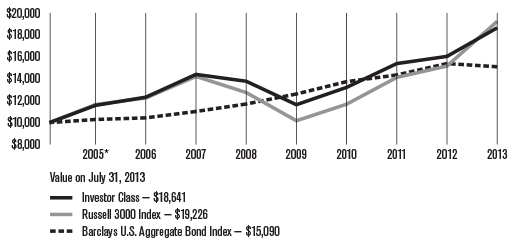
*From 8/31/04, the Investor Class’s inception date. Not annualized.
Data presented reflect past performance. Past performance is no guarantee of future results. Current performance may be higher or lower than the performance shown. Investment return and principal value will fluctuate, and redemption value may be more or less than original cost. To obtain performance data current to the most recent month end, please call 1-800-345-2021 or visit americancentury.com. A portfolio’s target date is the approximate year when investors plan to start withdrawing their money. The principal value of the investment is not guaranteed at any time, including at the target date. The performance of the portfolios is dependent on the performance of their underlying American Century Investments funds, and will assume the risks associated with these funds. The risks will vary according to each portfolio’s asset allocation, and a fund with a later target date is expected to be more volatile than one with an earlier target date.
Unless otherwise indicated, performance reflects Investor Class shares; performance for other share classes will vary due to differences in fee structure. For information about other share classes available, please consult the prospectus. Data assumes reinvestment of dividends and capital gains, and none of the charts reflect the deduction of taxes that a shareholder would pay on fund distributions or the redemption of fund shares. Returns for the indices are provided for comparison. The fund’s total returns include operating expenses (such as administrative fees) that reduce returns, while the total returns of the indices do not.
Growth of $10,000 Over Life of One Choice 2040 Portfolio — Investor Class |
$10,000 investment made May 30, 2008 |
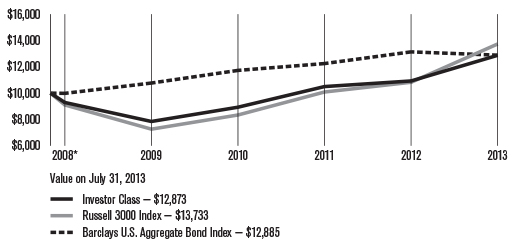
*From 5/30/08, the Investor Class’s inception date. Not annualized.
Growth of $10,000 Over Life of One Choice 2045 Portfolio — Investor Class |
$10,000 investment made August 31, 2004 |
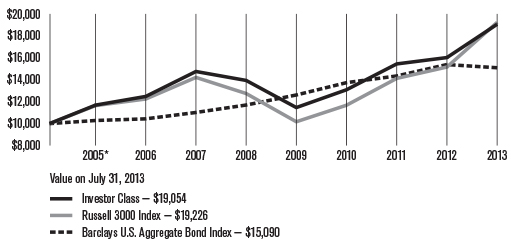
*From 8/31/04, the Investor Class’s inception date. Not annualized.
Data presented reflect past performance. Past performance is no guarantee of future results. Current performance may be higher or lower than the performance shown. Investment return and principal value will fluctuate, and redemption value may be more or less than original cost. To obtain performance data current to the most recent month end, please call 1-800-345-2021 or visit americancentury.com. A portfolio’s target date is the approximate year when investors plan to start withdrawing their money. The principal value of the investment is not guaranteed at any time, including at the target date. The performance of the portfolios is dependent on the performance of their underlying American Century Investments funds, and will assume the risks associated with these funds. The risks will vary according to each portfolio’s asset allocation, and a fund with a later target date is expected to be more volatile than one with an earlier target date.
Unless otherwise indicated, performance reflects Investor Class shares; performance for other share classes will vary due to differences in fee structure. For information about other share classes available, please consult the prospectus. Data assumes reinvestment of dividends and capital gains, and none of the charts reflect the deduction of taxes that a shareholder would pay on fund distributions or the redemption of fund shares. Returns for the indices are provided for comparison. The fund’s total returns include operating expenses (such as administrative fees) that reduce returns, while the total returns of the indices do not.
Growth of $10,000 Over Life of One Choice 2050 Portfolio — Investor Class |
$10,000 investment made May 30, 2008 |
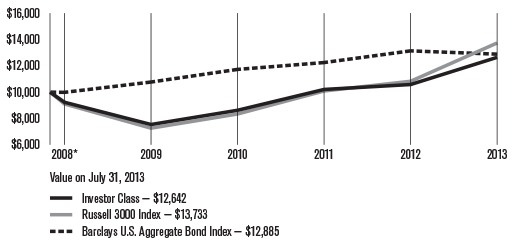
*From 5/30/08, the Investor Class’s inception date. Not annualized.
Growth of $10,000 Over Life of One Choice 2055 Portfolio — Investor Class |
$10,000 investment made March 31, 2011 |
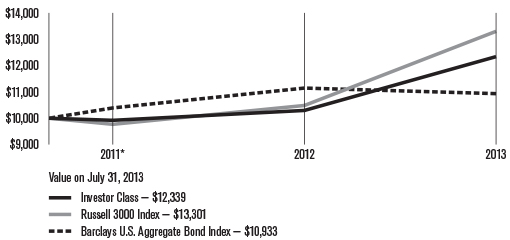
*From 3/31/11, the Investor Class’s inception date. Not annualized.
Data presented reflect past performance. Past performance is no guarantee of future results. Current performance may be higher or lower than the performance shown. Investment return and principal value will fluctuate, and redemption value may be more or less than original cost. To obtain performance data current to the most recent month end, please call 1-800-345-2021 or visit americancentury.com. A portfolio’s target date is the approximate year when investors plan to start withdrawing their money. The principal value of the investment is not guaranteed at any time, including at the target date. The performance of the portfolios is dependent on the performance of their underlying American Century Investments funds, and will assume the risks associated with these funds. The risks will vary according to each portfolio’s asset allocation, and a fund with a later target date is expected to be more volatile than one with an earlier target date.
Unless otherwise indicated, performance reflects Investor Class shares; performance for other share classes will vary due to differences in fee structure. For information about other share classes available, please consult the prospectus. Data assumes reinvestment of dividends and capital gains, and none of the charts reflect the deduction of taxes that a shareholder would pay on fund distributions or the redemption of fund shares. Returns for the indices are provided for comparison. The fund’s total returns include operating expenses (such as administrative fees) that reduce returns, while the total returns of the indices do not.
Total Annual Fund Operating Expenses | |||||
Investor Class | Institutional Class | A Class | C Class | R Class | |
One Choice In Retirement Portfolio | 0.77% | 0.57% | 1.02% | 1.77% | 1.27% |
One Choice 2015 Portfolio | 0.80% | 0.60% | 1.05% | 1.80% | 1.30% |
One Choice 2020 Portfolio | 0.83% | 0.63% | 1.08% | 1.83% | 1.33% |
One Choice 2025 Portfolio | 0.86% | 0.66% | 1.11% | 1.86% | 1.36% |
One Choice 2030 Portfolio | 0.88% | 0.68% | 1.13% | 1.88% | 1.38% |
One Choice 2035 Portfolio | 0.91% | 0.71% | 1.16% | 1.91% | 1.41% |
One Choice 2040 Portfolio | 0.95% | 0.75% | 1.20% | 1.95% | 1.45% |
One Choice 2045 Portfolio | 0.98% | 0.78% | 1.23% | 1.98% | 1.48% |
One Choice 2050 Portfolio | 1.00% | 0.80% | 1.25% | 2.00% | 1.50% |
One Choice 2055 Portfolio | 1.01% | 0.81% | 1.26% | 2.01% | 1.51% |
The total annual fund operating expenses shown is as stated in the fund’s prospectus current as of the date of this report. The prospectus may vary from the expense ratio shown elsewhere in this report because it is based on a different time period, includes acquired fund fees and expenses, and, if applicable, does not include fee waivers or expense reimbursements.
Data presented reflect past performance. Past performance is no guarantee of future results. Current performance may be higher or lower than the performance shown. Investment return and principal value will fluctuate, and redemption value may be more or less than original cost. To obtain performance data current to the most recent month end, please call 1-800-345-2021 or visit americancentury.com. A portfolio’s target date is the approximate year when investors plan to start withdrawing their money. The principal value of the investment is not guaranteed at any time, including at the target date. The performance of the portfolios is dependent on the performance of their underlying American Century Investments funds, and will assume the risks associated with these funds. The risks will vary according to each portfolio’s asset allocation, and a fund with a later target date is expected to be more volatile than one with an earlier target date.
Unless otherwise indicated, performance reflects Investor Class shares; performance for other share classes will vary due to differences in fee structure. For information about other share classes available, please consult the prospectus. Data assumes reinvestment of dividends and capital gains, and none of the charts reflect the deduction of taxes that a shareholder would pay on fund distributions or the redemption of fund shares. Returns for the indices are provided for comparison. The fund’s total returns include operating expenses (such as administrative fees) that reduce returns, while the total returns of the indices do not.
Portfolio Commentary |
Portfolio Managers: Scott Wittman, Rich Weiss, Scott Wilson, and Radu Gabudean
In March 2013, portfolio manager Radu Gabudean joined the One Choice Portfolios’ management team.
In April 2013, portfolio manager Enrique Chang left the One Choice Portfolios’ management team.
Performance Summary
Each of the ten Portfolios (collectively referred to as the One ChoiceSM Target Date Portfolios) advanced for the fiscal year ended July 31, 2013, with returns ranging from 19.86%* for One Choice 2055 Portfolio to 10.11% for One Choice In Retirement Portfolio (see pages 4–19 for more detailed performance information). The gains for the 12-month period reflected strong advances in global equity markets, tempered by declines in most bond market segments.
Because of the Portfolios’ strategic exposure to a variety of asset classes, a review of the financial markets helps explain much of their performance.
Stock Market Review
A rebound in investor sentiment and subsequent increased appetite for risk helped drive U.S. stock markets to repeatedly reach new highs during the 12 months ended July 31, 2013. As the reporting period began, U.S. stocks rallied in response to the Federal Reserve’s (the Fed’s) announced extension of its quantitative easing measures (QE3) and continuation of near-zero interest rate policy.
The fourth quarter of 2012 saw volatility increasing and returns declining amid uncertainty regarding the U.S. presidential election and Congress’s inability to come to an agreement about the looming fiscal cliff—a simultaneous increase in income tax rates coupled with a cut in government spending. Worries about the pace of the global economic recovery further weighed on markets in late 2012.
The resolution of political stalemates early in 2013 prompted a return of market rallies, and U.S. indices repeatedly reached record highs during the first half of 2013. Much of the period was characterized by heightened investor confidence in response to strengthening corporate fundamentals, substantive recovery in the housing sector, and evidence of a pickup in employment data. The Fed’s commitment to quantitative easing reassured investors, who gravitated toward riskier, higher-yielding assets.
This environment persisted until mid-May when investors were spooked by Fed chairman Ben Bernanke’s suggestion that the Fed was considering an exit strategy from its exceptionally accommodative monetary policy. Prospects of a tapering of the $85 billion monthly bond purchase operation, combined with worries about slower growth in the emerging markets, drove equities lower in June. But stocks largely rallied during July as central bankers around the world indicated that stimulus measures would remain in place for at least the near future and Bernanke signaled his commitment to stimulating growth and avoiding deflation.
*All fund returns referenced in this commentary are for Investor Class shares.
Market Index Total Returns | |
For the 12 months ended July 31, 2013 | |
U.S. Stocks | |
Russell 1000 Index (Large-Cap) | 26.23% |
Russell Midcap Index | 32.37% |
Russell 2000 Index (Small-Cap) | 34.76% |
International Stocks | |
MSCI EAFE Index | 23.48% |
MSCI Emerging Markets Index | 1.95% |
U.S. Fixed Income | |
Barclays U.S. Aggregate Bond Index (multi-sector) | -1.91% |
Barclays U.S. Corporate Bond Index (investment-grade) | -0.66% |
Barclays U.S. Corporate High-Yield Bond Index | 9.49% |
Barclays U.S. MBS Index (mortgage-backed securities) | -1.98% |
Barclays U.S. Treasury Bond Index | -2.72% |
Barclays U.S. Treasury Inflation Protected Securities (TIPS) Index | -5.87% |
International Bonds | |
Barclays Global Treasury ex-U.S. Bond Index | -5.23% |
Add it all up, and every segment of the U.S. stock market advanced strongly for the 12 months, with small-cap stocks posting larger advances than their mid- and large-cap counterparts (see the table above). Growth and value stocks were somewhat mixed—growth issues outperformed among small-cap stocks, while value shares held up better in the mid- and large-cap segments of the market.
Non-U.S. stocks also advanced during the fiscal year, though returns were considerably more muted among the emerging markets. Central banks around the world repeatedly took steps to support their fiscally-troubled economies, implementing quantitative easing and economic stimulus measures which helped to support markets. Emerging markets led their developed counterparts during the first half of the period, but lagged for the remainder as worries about the impact of a potential slowdown in China discouraged market participants.
Bond Market Review
Most sectors of the U.S. bond market posted negative returns for the 12-months ending July 31, 2013, with declines taking place primarily in the second half of the reporting period. The first part of the year saw the broad bond market indices gaining ground as the Fed implemented additional quantitative easing measures and kept interest rates at historically low levels. With investors hungry for yield and willing to take on higher levels of risk in such an environment, high-yield corporate bonds, commercial mortgage-backed securities, and investment-grade corporate bonds delivered the best returns.
The first part of 2013 saw many of these same themes, with higher-yielding bonds continuing their leadership and turning in positive results. As interest rates and bond yields remained at what many market watchers deemed to be artificially low levels, the broad bond indices were unable to keep pace and posted first quarter losses. Long-term Treasuries, investment-grade corporate bonds, and mortgage-backed securities led the market’s decline.
Fears of a change in the Fed’s policy following Bernanke’s May comments led to a sudden change in bond market sentiment, resulting in a largely “technical” (based more on fear of higher interest rates than on actual economic fundamentals that would drive them higher) broad market sell-off. Investor reaction was swift and severe. Typically, Treasuries and other longer-duration government bonds would suffer most in such a sell-off. In this case, nominal Treasuries, along with mortgage-backed securities and agency securities, outperformed the Barclays U.S. Aggregate Bond Index, which was dragged down by a sharp sell-off of less-liquid, longer-duration investment-grade corporate debt. Treasury inflation-protected securities also declined substantially, primarily due to their longer duration and the market’s low inflation expectations. In contrast, the most-liquid and shortest-duration (least price-sensitive to interest rate changes) securities generally fared best during the sell-off.
Following the bond market’s upheaval during the second quarter, Bernanke’s July statement that the Fed remained committed to stimulating growth and avoiding deflation somewhat reassured investors. Returns remained divergent, however, with high-yield corporate bonds maintaining their market leadership, while long-term Treasuries continued to decline and municipal bonds fell in reaction to news that the City of Detroit was filing for bankruptcy. For the reporting period as a whole, most segments of the bond market declined. High-yield bonds were the notable exception.
Non-U.S. bonds also experienced negative returns for the 12 months. The early part of the reporting period saw investors worried about Europe’s debt crisis, while later in the year concerns turned to emerging market growth prospects and their impact on the global economic recovery. While bond market returns abroad remained highly attuned to central bank policies, which were largely accommodative over the course of the period, the U.S. dollar’s strength relative to most currencies negated any price appreciation.
Fund Information
Each One Choice Target Date Portfolio is a “fund of funds” that invests in other American Century Investments mutual funds to achieve its investment objective and target asset allocation. (See pages 24–25 for the specific underlying fund allocations for each Portfolio.) A Portfolio’s target date is the approximate year when investors plan to retire and likely would stop making new investments in the fund. The principal value of the investment is not guaranteed at any time, including at the target date. One Choice In Retirement Portfolio is generally intended for investors near, at, or in retirement. There is no guarantee that an investment in any of the funds will provide adequate income at or through an investor’s retirement.
Each target-dated Portfolio seeks the highest total return consistent with its asset mix. Over time, the asset mix and weightings are adjusted to be more conservative. In general, as the target year approaches, each Portfolio’s allocation becomes more conservative by decreasing the allocation to stock funds and increasing the allocation to bond and money market funds. By the time each Portfolio reaches its target date, its target asset mix will become fixed and match that of One Choice In Retirement Portfolio, which seeks current income and capital appreciation.
Portfolio Performance
Within the Portfolios, each equity fund, both U.S. and non-U.S., produced positive returns for the 12-month period. NT Small Company Fund and NT Mid Cap Value Fund generated the best performance, both producing returns of over 30%. Real Estate Fund, which invests in real estate investment trusts, delivered the lowest returns among equities, gaining 6% for the reporting period. NT Emerging Markets Fund was another relative laggard, with a near 7% return.
Among the Portfolios’ fixed-income components, the leading performer was High-Yield Fund, which gained nearly 9% for the 12-month period. All other bond components fell during the year, with Inflation-Adjusted Bond Fund and International Bond Fund declining the most. NT Diversified Bond Fund (the Portfolios’ largest fixed-income holding) had a negative return and performed roughly in line with the broad bond market indices during the 12-month period.
A Look Ahead
The U.S. economic recovery appears to be progressing, albeit with headwinds. Improvements in housing, employment, and economic indicators have been consistent and point to slow but positive growth. While inflation is low, financial market volatility is likely to remain elevated as ongoing concerns over interest rates and Federal Reserve action dominate headlines. Turning overseas, we believe the low-growth environment seen in many non-U.S. markets is likely to persist. While economic conditions in Japan appear to be improving, Europe’s recovery continues to lag that of the U.S., and a potential slowdown in China is likely to weigh on emerging markets, keeping international market volatility elevated.
Although the investment team does not make tactical allocation shifts within the Portfolios, the teams managing the underlying funds may make adjustments based on where they see the greatest opportunities. For example, within NT Diversified Bond Fund, the largest component of the Portfolios’ fixed-income allocation, the fixed income team remains overweight to corporate bonds and asset-backed securities. They also favor U.K. gilts over Treasuries and U.S. government agency bonds. These market dynamics, and the constantly changing investment environment, reinforce our belief that broad-based diversification among asset classes and within asset classes is essential to long-term investing success.
Portfolio Characteristics |
Underlying Fund Allocations(1) as a % of net assets as of July 31, 2013 | ||||||||||||||
One Choice In Retirement Portfolio | One Choice 2015 Portfolio | One Choice 2020 Portfolio | One Choice 2025 Portfolio | One Choice 2030 Portfolio | ||||||||||
Equity | ||||||||||||||
NT Core Equity Plus Fund | 3.1 | % | 3.2 | % | 3.0 | % | 3.1 | % | 3.2 | % | ||||
NT Equity Growth Fund | 10.0 | % | 10.1 | % | 9.5 | % | 9.4 | % | 9.3 | % | ||||
NT Growth Fund | 6.5 | % | 7.0 | % | 8.0 | % | 9.5 | % | 11.1 | % | ||||
NT Large Company Value Fund | 11.0 | % | 11.2 | % | 11.2 | % | 11.6 | % | 12.1 | % | ||||
NT Mid Cap Value Fund | 4.0 | % | 4.4 | % | 5.0 | % | 5.6 | % | 5.2 | % | ||||
NT Small Company Fund | 2.0 | % | 2.2 | % | 2.1 | % | 2.7 | % | 3.6 | % | ||||
NT VistaSM Fund | 2.5 | % | 3.1 | % | 3.9 | % | 4.7 | % | 5.1 | % | ||||
Real Estate Fund | 1.0 | % | 1.0 | % | 1.3 | % | 1.5 | % | 1.8 | % | ||||
NT Emerging Markets Fund | — | 0.5 | % | 1.5 | % | 2.3 | % | 2.9 | % | |||||
NT International Growth Fund | 5.0 | % | 5.2 | % | 6.1 | % | 7.1 | % | 8.6 | % | ||||
Total Equity | 45.1 | % | 47.9 | % | 51.6 | % | 57.5 | % | 62.9 | % | ||||
Fixed Income | ||||||||||||||
High-Yield Fund | 3.8 | % | 3.6 | % | 3.6 | % | 3.3 | % | 3.0 | % | ||||
Inflation-Adjusted Bond Fund | 7.6 | % | 7.2 | % | 7.3 | % | 6.6 | % | 6.2 | % | ||||
NT Diversified Bond Fund | 26.6 | % | 26.0 | % | 25.1 | % | 23.6 | % | 21.2 | % | ||||
International Bond Fund | 6.9 | % | 6.4 | % | 5.7 | % | 4.1 | % | 1.7 | % | ||||
Total Fixed Income | 44.9 | % | 43.2 | % | 41.7 | % | 37.6 | % | 32.1 | % | ||||
Premium Money Market Fund | 10.0 | % | 8.9 | % | 6.7 | % | 4.9 | % | 5.0 | % | ||||
Other Assets and Liabilities | — | (2) | — | (2) | — | (2) | — | (2) | — | (2) | ||||
(1) | Institutional Class, except Premium Money Market Fund Investor Class. |
| (2) | Category is less than 0.05% of total net assets. |
Underlying Fund Allocations(1) as a % of net assets as of July 31, 2013 | |||||||||||||||
One Choice 2035 Portfolio | One Choice 2040 Portfolio | One Choice 2045 Portfolio | One Choice 2050 Portfolio | One Choice 2055 Portfolio | |||||||||||
Equity | |||||||||||||||
NT Core Equity Plus Fund | 3.3 | % | 3.6 | % | 4.5 | % | 4.5 | % | 4.5 | % | |||||
NT Equity Growth Fund | 9.7 | % | 10.3 | % | 10.3 | % | 10.4 | % | 10.8 | % | |||||
NT Growth Fund | 12.8 | % | 13.9 | % | 14.6 | % | 14.9 | % | 15.3 | % | |||||
NT Large Company Value Fund | 12.9 | % | 13.8 | % | 14.6 | % | 15.1 | % | 15.5 | % | |||||
NT Mid Cap Value Fund | 5.7 | % | 6.6 | % | 7.2 | % | 7.2 | % | 7.5 | % | |||||
NT Small Company Fund | 4.3 | % | 4.1 | % | 4.3 | % | 4.8 | % | 5.0 | % | |||||
NT VistaSM Fund | 5.8 | % | 6.7 | % | 7.4 | % | 7.3 | % | 7.5 | % | |||||
Real Estate Fund | 2.0 | % | 2.3 | % | 2.5 | % | 2.8 | % | 2.9 | % | |||||
NT Emerging Markets Fund | 3.4 | % | 4.4 | % | 5.2 | % | 6.2 | % | 6.5 | % | |||||
NT International Growth Fund | 9.7 | % | 10.0 | % | 10.1 | % | 9.9 | % | 9.5 | % | |||||
Total Equity | 69.6 | % | 75.7 | % | 80.7 | % | 83.1 | % | 85.0 | % | |||||
Fixed Income | |||||||||||||||
High-Yield Fund | 2.5 | % | 2.3 | % | 1.9 | % | 1.7 | % | 1.5 | % | |||||
Inflation-Adjusted Bond Fund | 5.3 | % | 4.5 | % | 3.8 | % | 3.3 | % | 3.0 | % | |||||
NT Diversified Bond Fund | 18.4 | % | 15.8 | % | 13.6 | % | 11.9 | % | 10.5 | % | |||||
Total Fixed Income | 26.2 | % | 22.6 | % | 19.3 | % | 16.9 | % | 15.0 | % | |||||
Premium Money Market Fund | 4.2 | % | 1.7 | % | — | — | — | ||||||||
Other Assets and Liabilities | — | (2) | — | (2) | — | (2) | — | (2) | — | (2) | |||||
(1) | Institutional Class, except Premium Money Market Fund Investor Class. |
| (2) | Category is less than 0.05% of total net assets. |
Shareholder Fee Example |
Fund shareholders may incur two types of costs: (1) transaction costs, including sales charges (loads) on purchase payments and redemption/exchange fees; and (2) ongoing costs, including management fees; distribution and service (12b-1) fees; and other fund expenses. This example is intended to help you understand your ongoing costs (in dollars) of investing in your fund and to compare these costs with the ongoing cost of investing in other mutual funds. As a shareholder in the underlying American Century Investments funds, your fund will indirectly bear its pro rata share of the expenses incurred by the underlying funds. These expenses are not included in the fund’s annualized expense ratio or the expenses paid during the period. These expenses are, however, included in the effective expenses paid during the period.
The example is based on an investment of $1,000 made at the beginning of the period and held for the entire period from February 1, 2013 to July 31, 2013.
Actual Expenses
The table provides information about actual account values and actual expenses for each class. You may use the information, together with the amount you invested, to estimate the expenses that you paid over the period. First, identify the share class you own. Then simply divide your account value by $1,000 (for example, an $8,600 account value divided by $1,000 = 8.6), then multiply the result by the number under the heading “Expenses Paid During Period” to estimate the expenses you paid on your account during this period.
If you hold Investor Class shares of any American Century Investments fund, or Institutional Class shares of the American Century Diversified Bond Fund, in an American Century Investments account (i.e., not a financial intermediary or retirement plan account), American Century Investments may charge you a $12.50 semiannual account maintenance fee if the value of those shares is less than $10,000. We will redeem shares automatically in one of your accounts to pay the $12.50 fee. In determining your total eligible investment amount, we will include your investments in all personal accounts (including American Century Investments Brokerage accounts) registered under your Social Security number. Personal accounts include individual accounts, joint accounts, UGMA/UTMA accounts, personal trusts, Coverdell Education Savings Accounts and IRAs (including traditional, Roth, Rollover, SEP-, SARSEP- and SIMPLE-IRAs), and certain other retirement accounts. If you have only business, business retirement, employer-sponsored or American Century Investments Brokerage accounts, you are currently not subject to this fee. If you are subject to the Account Maintenance Fee, your account value could be reduced by the fee amount.
Hypothetical Example for Comparison Purposes
The table also provides information about hypothetical account values and hypothetical expenses based on the actual expense ratio of each class of your fund and an assumed rate of return of 5% per year before expenses, which is not the actual return of a fund’s share class. The hypothetical account values and expenses may not be used to estimate the actual ending account balance or expenses you paid for the period. You may use this information to compare the ongoing costs of investing in your fund and other funds. To do so, compare this 5% hypothetical example with the 5% hypothetical examples that appear in the shareholder reports of the other funds.
Please note that the expenses shown in the table are meant to highlight your ongoing costs only and do not reflect any transactional costs, such as sales charges (loads) or redemption/exchange fees. Therefore, the table is useful in comparing ongoing costs only, and will not help you determine the relative total costs of owning different funds. In addition, if these transactional costs were included, your costs would have been higher.
Beginning Account | Ending Account | Expenses Paid During Period(1) 2/1/13 – 7/31/13 | Annualized Expense Ratio(1) | Effective Expenses Paid During Period(2) 2/1/13 – 7/31/13 | Effective Annualized Expense Ratio(2) | |
One Choice In Retirement Portfolio | ||||||
Actual | ||||||
Investor Class | $1,000 | $1,043.70 | $1.06 | 0.21% | $3.90 | 0.77% |
Institutional Class | $1,000 | $1,045.50 | $0.05 | 0.01% | $2.89 | 0.57% |
A Class | $1,000 | $1,042.50 | $2.33 | 0.46% | $5.17 | 1.02% |
C Class | $1,000 | $1,038.20 | $6.11 | 1.21% | $8.94 | 1.77% |
R Class | $1,000 | $1,041.30 | $3.59 | 0.71% | $6.43 | 1.27% |
Hypothetical | ||||||
Investor Class | $1,000 | $1,023.75 | $1.05 | 0.21% | $3.86 | 0.77% |
Institutional Class | $1,000 | $1,024.74 | $0.05 | 0.01% | $2.86 | 0.57% |
A Class | $1,000 | $1,022.51 | $2.31 | 0.46% | $5.11 | 1.02% |
C Class | $1,000 | $1,018.79 | $6.06 | 1.21% | $8.85 | 1.77% |
R Class | $1,000 | $1,021.27 | $3.56 | 0.71% | $6.36 | 1.27% |
(1) | Expenses are equal to the class’s annualized expense ratio listed in the table above, multiplied by the average account value over the period, multiplied by 181, the number of days in the most recent fiscal half-year, divided by 365, to reflect the one-half year period. The fees and expenses of the underlying American Century Investments funds in which the fund invests are not included in the class’s annualized expense ratio. |
(2) | Effective expenses reflect the sum of expenses borne directly by the class plus the fund’s pro rata share of the weighted average expense ratio of the underlying funds in which it invests. The effective annualized expense ratio combines the class’s annualized expense ratio and the annualized weighted average expense ratio of the underlying funds. The annualized weighted average expense ratio of the underlying funds for the one-half year period reflects the actual expense ratio of each underlying fund from its most recent shareholder report, annualized and weighted for the fund’s relative average investment therein during the period. |
Beginning Account | Ending Account | Expenses Paid During Period(1) 2/1/13 – 7/31/13 | Annualized Expense Ratio(1) | Effective Expenses Paid During Period(2) 2/1/13 – 7/31/13 | Effective Annualized Expense Ratio(2) | |
One Choice 2015 Portfolio | ||||||
Actual | ||||||
Investor Class | $1,000 | $1,046.00 | $1.07 | 0.21% | $4.01 | 0.79% |
Institutional Class | $1,000 | $1,046.80 | $0.05 | 0.01% | $2.99 | 0.59% |
A Class | $1,000 | $1,044.40 | $2.33 | 0.46% | $5.27 | 1.04% |
C Class | $1,000 | $1,040.40 | $6.12 | 1.21% | $9.06 | 1.79% |
R Class | $1,000 | $1,042.80 | $3.60 | 0.71% | $6.53 | 1.29% |
Hypothetical | ||||||
Investor Class | $1,000 | $1,023.75 | $1.05 | 0.21% | $3.96 | 0.79% |
Institutional Class | $1,000 | $1,024.74 | $0.05 | 0.01% | $2.96 | 0.59% |
A Class | $1,000 | $1,022.51 | $2.31 | 0.46% | $5.21 | 1.04% |
C Class | $1,000 | $1,018.79 | $6.06 | 1.21% | $8.95 | 1.79% |
R Class | $1,000 | $1,021.27 | $3.56 | 0.71% | $6.46 | 1.29% |
One Choice 2020 Portfolio | ||||||
Actual | ||||||
Investor Class | $1,000 | $1,049.00 | $1.07 | 0.21% | $4.17 | 0.82% |
Institutional Class | $1,000 | $1,049.90 | $0.05 | 0.01% | $3.15 | 0.62% |
A Class | $1,000 | $1,048.10 | $2.34 | 0.46% | $5.43 | 1.07% |
C Class | $1,000 | $1,043.50 | $6.13 | 1.21% | $9.22 | 1.82% |
R Class | $1,000 | $1,047.20 | $3.60 | 0.71% | $6.70 | 1.32% |
Hypothetical | ||||||
Investor Class | $1,000 | $1,023.75 | $1.05 | 0.21% | $4.11 | 0.82% |
Institutional Class | $1,000 | $1,024.74 | $0.05 | 0.01% | $3.11 | 0.62% |
A Class | $1,000 | $1,022.51 | $2.31 | 0.46% | $5.36 | 1.07% |
C Class | $1,000 | $1,018.79 | $6.06 | 1.21% | $9.10 | 1.82% |
R Class | $1,000 | $1,021.27 | $3.56 | 0.71% | $6.61 | 1.32% |
(1) | Expenses are equal to the class’s annualized expense ratio listed in the table above, multiplied by the average account value over the period, multiplied by 181, the number of days in the most recent fiscal half-year, divided by 365, to reflect the one-half year period. The fees and expenses of the underlying American Century Investments funds in which the fund invests are not included in the class’s annualized expense ratio. |
(2) | Effective expenses reflect the sum of expenses borne directly by the class plus the fund’s pro rata share of the weighted average expense ratio of the underlying funds in which it invests. The effective annualized expense ratio combines the class’s annualized expense ratio and the annualized weighted average expense ratio of the underlying funds. The annualized weighted average expense ratio of the underlying funds for the one-half year period reflects the actual expense ratio of each underlying fund from its most recent shareholder report, annualized and weighted for the fund’s relative average investment therein during the period. |
Beginning Account | Ending Account | Expenses Paid During Period(1) 2/1/13 – 7/31/13 | Annualized Expense Ratio(1) | Effective Expenses Paid During Period(2) 2/1/13 – 7/31/13 | Effective Annualized Expense Ratio(2) | |
One Choice 2025 Portfolio | ||||||
Actual | ||||||
Investor Class | $1,000 | $1,054.60 | $1.07 | 0.21% | $4.33 | 0.85% |
Institutional Class | $1,000 | $1,055.40 | $0.05 | 0.01% | $3.31 | 0.65% |
A Class | $1,000 | $1,053.10 | $2.34 | 0.46% | $5.60 | 1.10% |
C Class | $1,000 | $1,049.90 | $6.15 | 1.21% | $9.40 | 1.85% |
R Class | $1,000 | $1,052.30 | $3.61 | 0.71% | $6.87 | 1.35% |
Hypothetical | ||||||
Investor Class | $1,000 | $1,023.75 | $1.05 | 0.21% | $4.26 | 0.85% |
Institutional Class | $1,000 | $1,024.74 | $0.05 | 0.01% | $3.26 | 0.65% |
A Class | $1,000 | $1,022.51 | $2.31 | 0.46% | $5.51 | 1.10% |
C Class | $1,000 | $1,018.79 | $6.06 | 1.21% | $9.25 | 1.85% |
R Class | $1,000 | $1,021.27 | $3.56 | 0.71% | $6.76 | 1.35% |
One Choice 2030 Portfolio | ||||||
Actual | ||||||
Investor Class | $1,000 | $1,063.10 | $1.07 | 0.21% | $4.45 | 0.87% |
Institutional Class | $1,000 | $1,063.10 | $0.05 | 0.01% | $3.43 | 0.67% |
A Class | $1,000 | $1,061.40 | $2.35 | 0.46% | $5.72 | 1.12% |
C Class | $1,000 | $1,056.60 | $6.17 | 1.21% | $9.54 | 1.87% |
R Class | $1,000 | $1,060.40 | $3.63 | 0.71% | $7.00 | 1.37% |
Hypothetical | ||||||
Investor Class | $1,000 | $1,023.75 | $1.05 | 0.21% | $4.36 | 0.87% |
Institutional Class | $1,000 | $1,024.74 | $0.05 | 0.01% | $3.36 | 0.67% |
A Class | $1,000 | $1,022.51 | $2.31 | 0.46% | $5.61 | 1.12% |
C Class | $1,000 | $1,018.79 | $6.06 | 1.21% | $9.35 | 1.87% |
R Class | $1,000 | $1,021.27 | $3.56 | 0.71% | $6.85 | 1.37% |
(1) | Expenses are equal to the class’s annualized expense ratio listed in the table above, multiplied by the average account value over the period, multiplied by 181, the number of days in the most recent fiscal half-year, divided by 365, to reflect the one-half year period. The fees and expenses of the underlying American Century Investments funds in which the fund invests are not included in the class’s annualized expense ratio. |
(2) | Effective expenses reflect the sum of expenses borne directly by the class plus the fund’s pro rata share of the weighted average expense ratio of the underlying funds in which it invests. The effective annualized expense ratio combines the class’s annualized expense ratio and the annualized weighted average expense ratio of the underlying funds. The annualized weighted average expense ratio of the underlying funds for the one-half year period reflects the actual expense ratio of each underlying fund from its most recent shareholder report, annualized and weighted for the fund’s relative average investment therein during the period. |
Beginning Account | Ending Account | Expenses Paid During Period(1) 2/1/13 – 7/31/13 | Annualized Expense Ratio(1) | Effective Expenses Paid During Period(2) 2/1/13 – 7/31/13 | Effective Annualized Expense Ratio(2) | |
One Choice 2035 Portfolio | ||||||
Actual | ||||||
Investor Class | $1,000 | $1,070.80 | $1.08 | 0.21% | $4.62 | 0.90% |
Institutional Class | $1,000 | $1,072.20 | $0.05 | 0.01% | $3.60 | 0.70% |
A Class | $1,000 | $1,070.10 | $2.36 | 0.46% | $5.90 | 1.15% |
C Class | $1,000 | $1,065.60 | $6.20 | 1.21% | $9.73 | 1.90% |
R Class | $1,000 | $1,068.60 | $3.64 | 0.71% | $7.18 | 1.40% |
Hypothetical | ||||||
Investor Class | $1,000 | $1,023.75 | $1.05 | 0.21% | $4.51 | 0.90% |
Institutional Class | $1,000 | $1,024.74 | $0.05 | 0.01% | $3.51 | 0.70% |
A Class | $1,000 | $1,022.51 | $2.31 | 0.46% | $5.76 | 1.15% |
C Class | $1,000 | $1,018.79 | $6.06 | 1.21% | $9.49 | 1.90% |
R Class | $1,000 | $1,021.27 | $3.56 | 0.71% | $7.00 | 1.40% |
One Choice 2040 Portfolio | ||||||
Actual | ||||||
Investor Class | $1,000 | $1,077.10 | $1.08 | 0.21% | $4.79 | 0.93% |
Institutional Class | $1,000 | $1,079.00 | $0.05 | 0.01% | $3.76 | 0.73% |
A Class | $1,000 | $1,076.30 | $2.37 | 0.46% | $6.07 | 1.18% |
C Class | $1,000 | $1,072.60 | $6.22 | 1.21% | $9.92 | 1.93% |
R Class | $1,000 | $1,074.50 | $3.65 | 0.71% | $7.36 | 1.43% |
Hypothetical | ||||||
Investor Class | $1,000 | $1,023.75 | $1.05 | 0.21% | $4.66 | 0.93% |
Institutional Class | $1,000 | $1,024.74 | $0.05 | 0.01% | $3.66 | 0.73% |
A Class | $1,000 | $1,022.51 | $2.31 | 0.46% | $5.91 | 1.18% |
C Class | $1,000 | $1,018.79 | $6.06 | 1.21% | $9.64 | 1.93% |
R Class | $1,000 | $1,021.27 | $3.56 | 0.71% | $7.15 | 1.43% |
(1) | Expenses are equal to the class’s annualized expense ratio listed in the table above, multiplied by the average account value over the period, multiplied by 181, the number of days in the most recent fiscal half-year, divided by 365, to reflect the one-half year period. The fees and expenses of the underlying American Century Investments funds in which the fund invests are not included in the class’s annualized expense ratio. |
(2) | Effective expenses reflect the sum of expenses borne directly by the class plus the fund’s pro rata share of the weighted average expense ratio of the underlying funds in which it invests. The effective annualized expense ratio combines the class’s annualized expense ratio and the annualized weighted average expense ratio of the underlying funds. The annualized weighted average expense ratio of the underlying funds for the one-half year period reflects the actual expense ratio of each underlying fund from its most recent shareholder report, annualized and weighted for the fund’s relative average investment therein during the period. |
Beginning Account | Ending Account | Expenses Paid During Period(1) 2/1/13 – 7/31/13 | Annualized Expense Ratio(1) | Effective Expenses Paid During Period(2) 2/1/13 – 7/31/13 | Effective Annualized Expense Ratio(2) | |
One Choice 2045 Portfolio | ||||||
Actual | ||||||
Investor Class | $1,000 | $1,082.70 | $1.08 | 0.21% | $5.01 | 0.97% |
Institutional Class | $1,000 | $1,084.20 | $0.05 | 0.01% | $3.98 | 0.77% |
A Class | $1,000 | $1,081.30 | $2.37 | 0.46% | $6.30 | 1.22% |
C Class | $1,000 | $1,077.60 | $6.23 | 1.21% | $10.15 | 1.97% |
R Class | $1,000 | $1,080.60 | $3.66 | 0.71% | $7.58 | 1.47% |
Hypothetical | ||||||
Investor Class | $1,000 | $1,023.75 | $1.05 | 0.21% | $4.86 | 0.97% |
Institutional Class | $1,000 | $1,024.74 | $0.05 | 0.01% | $3.86 | 0.77% |
A Class | $1,000 | $1,022.51 | $2.31 | 0.46% | $6.11 | 1.22% |
C Class | $1,000 | $1,018.79 | $6.06 | 1.21% | $9.84 | 1.97% |
R Class | $1,000 | $1,021.27 | $3.56 | 0.71% | $7.35 | 1.47% |
One Choice 2050 Portfolio | ||||||
Actual | ||||||
Investor Class | $1,000 | $1,084.80 | $1.09 | 0.21% | $5.07 | 0.98% |
Institutional Class | $1,000 | $1,085.60 | $0.05 | 0.01% | $4.03 | 0.78% |
A Class | $1,000 | $1,082.90 | $2.38 | 0.46% | $6.35 | 1.23% |
C Class | $1,000 | $1,079.10 | $6.24 | 1.21% | $10.21 | 1.98% |
R Class | $1,000 | $1,082.00 | $3.67 | 0.71% | $7.64 | 1.48% |
Hypothetical | ||||||
Investor Class | $1,000 | $1,023.75 | $1.05 | 0.21% | $4.91 | 0.98% |
Institutional Class | $1,000 | $1,024.74 | $0.05 | 0.01% | $3.91 | 0.78% |
A Class | $1,000 | $1,022.51 | $2.31 | 0.46% | $6.16 | 1.23% |
C Class | $1,000 | $1,018.79 | $6.06 | 1.21% | $9.89 | 1.98% |
R Class | $1,000 | $1,021.27 | $3.56 | 0.71% | $7.40 | 1.48% |
(1) | Expenses are equal to the class’s annualized expense ratio listed in the table above, multiplied by the average account value over the period, multiplied by 181, the number of days in the most recent fiscal half-year, divided by 365, to reflect the one-half year period. The fees and expenses of the underlying American Century Investments funds in which the fund invests are not included in the class’s annualized expense ratio. |
(2) | Effective expenses reflect the sum of expenses borne directly by the class plus the fund’s pro rata share of the weighted average expense ratio of the underlying funds in which it invests. The effective annualized expense ratio combines the class’s annualized expense ratio and the annualized weighted average expense ratio of the underlying funds. The annualized weighted average expense ratio of the underlying funds for the one-half year period reflects the actual expense ratio of each underlying fund from its most recent shareholder report, annualized and weighted for the fund’s relative average investment therein during the period. |
Beginning Account | Ending Account | Expenses Paid During Period(1) 2/1/13 – 7/31/13 | Annualized Expense Ratio(1) | Effective Expenses Paid During Period(2) 2/1/13 – 7/31/13 | Effective Annualized Expense Ratio(2) | |
One Choice 2055 Portfolio | ||||||
Actual | ||||||
Investor Class | $1,000 | $1,086.80 | $1.09 | 0.21% | $5.12 | 0.99% |
Institutional Class | $1,000 | $1,087.70 | $0.05 | 0.01% | $4.09 | 0.79% |
A Class | $1,000 | $1,086.00 | $2.38 | 0.46% | $6.41 | 1.24% |
C Class | $1,000 | $1,081.40 | $6.24 | 1.21% | $10.27 | 1.99% |
R Class | $1,000 | $1,085.10 | $3.67 | 0.71% | $7.70 | 1.49% |
Hypothetical | ||||||
Investor Class | $1,000 | $1,023.75 | $1.05 | 0.21% | $4.96 | 0.99% |
Institutional Class | $1,000 | $1,024.74 | $0.05 | 0.01% | $3.96 | 0.79% |
A Class | $1,000 | $1,022.51 | $2.31 | 0.46% | $6.21 | 1.24% |
C Class | $1,000 | $1,018.79 | $6.06 | 1.21% | $9.94 | 1.99% |
R Class | $1,000 | $1,021.27 | $3.56 | 0.71% | $7.45 | 1.49% |
(1) | Expenses are equal to the class’s annualized expense ratio listed in the table above, multiplied by the average account value over the period, multiplied by 181, the number of days in the most recent fiscal half-year, divided by 365, to reflect the one-half year period. The fees and expenses of the underlying American Century Investments funds in which the fund invests are not included in the class’s annualized expense ratio. |
(2) | Effective expenses reflect the sum of expenses borne directly by the class plus the fund’s pro rata share of the weighted average expense ratio of the underlying funds in which it invests. The effective annualized expense ratio combines the class’s annualized expense ratio and the annualized weighted average expense ratio of the underlying funds. The annualized weighted average expense ratio of the underlying funds for the one-half year period reflects the actual expense ratio of each underlying fund from its most recent shareholder report, annualized and weighted for the fund’s relative average investment therein during the period. |
Schedule of Investments |
JULY 31, 2013
Shares | Value | |
One Choice In Retirement Portfolio | ||
Mutual Funds(1) — 100.0% | ||
DOMESTIC EQUITY FUNDS — 40.1% | ||
NT Core Equity Plus Fund Institutional Class | 1,075,913 | $ 14,944,428 |
NT Equity Growth Fund Institutional Class | 4,027,598 | 49,297,798 |
NT Growth Fund Institutional Class | 2,218,035 | 31,873,165 |
NT Large Company Value Fund Institutional Class | 4,691,688 | 53,907,490 |
NT Mid Cap Value Fund Institutional Class | 1,606,174 | 19,675,632 |
NT Small Company Fund Institutional Class | 932,733 | 10,036,211 |
NT Vista Fund Institutional Class | 963,648 | 12,508,155 |
Real Estate Fund Institutional Class | 192,130 | 4,714,870 |
196,957,749 | ||
DOMESTIC FIXED INCOME FUNDS — 37.9% | ||
High-Yield Fund Institutional Class | 2,983,014 | 18,494,686 |
Inflation-Adjusted Bond Fund Institutional Class | 3,045,484 | 37,215,811 |
NT Diversified Bond Fund Institutional Class | 12,260,943 | 130,456,430 |
186,166,927 | ||
MONEY MARKET FUNDS — 10.0% | ||
Premium Money Market Fund Investor Class | 48,837,927 | 48,837,927 |
INTERNATIONAL FIXED INCOME FUNDS — 7.0% | ||
International Bond Fund Institutional Class | 2,483,677 | 34,150,558 |
INTERNATIONAL EQUITY FUNDS — 5.0% | ||
NT International Growth Fund Institutional Class | 2,222,569 | 24,648,291 |
TOTAL INVESTMENT SECURITIES — 100.0% (Cost $411,096,602) | 490,761,452 | |
OTHER ASSETS AND LIABILITIES† | 15,408 | |
TOTAL NET ASSETS — 100.0% | $490,776,860 | |
Notes to Schedule of Investments
† Category is less than 0.05% of total net assets.
(1) | Investments are funds within the American Century Investments family of funds, of which certain funds may be deemed to be under common control because of the same board of directors. |
Shares | Value | |
One Choice 2015 Portfolio | ||
Mutual Funds(1) — 100.0% | ||
DOMESTIC EQUITY FUNDS — 42.2% | ||
NT Core Equity Plus Fund Institutional Class | 2,607,470 | $ 36,217,755 |
NT Equity Growth Fund Institutional Class | 9,388,481 | 114,915,003 |
NT Growth Fund Institutional Class | 5,572,458 | 80,076,226 |
NT Large Company Value Fund Institutional Class | 11,104,521 | 127,590,950 |
NT Mid Cap Value Fund Institutional Class | 4,100,679 | 50,233,314 |
NT Small Company Fund Institutional Class | 2,338,451 | 25,161,735 |
NT Vista Fund Institutional Class | 2,712,020 | 35,202,020 |
Real Estate Fund Institutional Class | 481,373 | 11,812,895 |
481,209,898 | ||
DOMESTIC FIXED INCOME FUNDS — 36.8% | ||
High-Yield Fund Institutional Class | 6,629,783 | 41,104,653 |
Inflation-Adjusted Bond Fund Institutional Class | 6,696,627 | 81,832,784 |
NT Diversified Bond Fund Institutional Class | 27,867,833 | 296,513,740 |
419,451,177 | ||
MONEY MARKET FUNDS — 8.9% | ||
Premium Money Market Fund Investor Class | 101,533,706 | 101,533,706 |
INTERNATIONAL FIXED INCOME FUNDS — 6.4% | ||
International Bond Fund Institutional Class | 5,316,033 | 73,095,451 |
INTERNATIONAL EQUITY FUNDS — 5.7% | ||
NT Emerging Markets Fund Institutional Class | 586,208 | 5,744,834 |
NT International Growth Fund Institutional Class | 5,358,497 | 59,425,731 |
65,170,565 | ||
TOTAL INVESTMENT SECURITIES — 100.0% (Cost $955,303,178) | 1,140,460,797 | |
OTHER ASSETS AND LIABILITIES† | 169 | |
TOTAL NET ASSETS — 100.0% | $1,140,460,966 | |
Notes to Schedule of Investments
† Category is less than 0.05% of total net assets.
(1) | Investments are funds within the American Century Investments family of funds, of which certain funds may be deemed to be under common control because of the same board of directors. |
See Notes to Financial Statements.
Shares | Value | |
One Choice 2020 Portfolio | ||
Mutual Funds(1) — 100.0% | ||
DOMESTIC EQUITY FUNDS — 44.0% | ||
NT Core Equity Plus Fund Institutional Class | 2,109,093 | $ 29,295,304 |
NT Equity Growth Fund Institutional Class | 7,567,704 | 92,628,694 |
NT Growth Fund Institutional Class | 5,424,075 | 77,943,958 |
NT Large Company Value Fund Institutional Class | 9,500,396 | 109,159,548 |
NT Mid Cap Value Fund Institutional Class | 3,964,015 | 48,559,183 |
NT Small Company Fund Institutional Class | 1,866,026 | 20,078,437 |
NT Vista Fund Institutional Class | 2,935,252 | 38,099,577 |
Real Estate Fund Institutional Class | 514,039 | 12,614,523 |
428,379,224 | ||
DOMESTIC FIXED INCOME FUNDS — 36.0% | ||
High-Yield Fund Institutional Class | 5,658,295 | 35,081,429 |
Inflation-Adjusted Bond Fund Institutional Class | 5,772,276 | 70,537,207 |
NT Diversified Bond Fund Institutional Class | 22,991,264 | 244,627,045 |
350,245,681 | ||
INTERNATIONAL EQUITY FUNDS — 7.6% | ||
NT Emerging Markets Fund Institutional Class | 1,480,359 | 14,507,523 |
NT International Growth Fund Institutional Class | 5,384,627 | 59,715,510 |
74,223,033 | ||
MONEY MARKET FUNDS — 6.7% | ||
Premium Money Market Fund Investor Class | 65,611,158 | 65,611,158 |
INTERNATIONAL FIXED INCOME FUNDS — 5.7% | ||
International Bond Fund Institutional Class | 4,038,033 | 55,522,955 |
TOTAL INVESTMENT SECURITIES — 100.0% (Cost $842,489,936) | 973,982,051 | |
OTHER ASSETS AND LIABILITIES† | 10,929 | |
TOTAL NET ASSETS — 100.0% | $973,992,980 | |
Notes to Schedule of Investments
† Category is less than 0.05% of total net assets.
(1) | Investments are funds within the American Century Investments family of funds, of which certain funds may be deemed to be under common control because of the same board of directors. |
Shares | Value | |
One Choice 2025 Portfolio | ||
Mutual Funds(1) — 100.0% | ||
DOMESTIC EQUITY FUNDS — 48.1% | ||
NT Core Equity Plus Fund Institutional Class | 3,841,659 | $ 53,360,644 |
NT Equity Growth Fund Institutional Class | 13,407,589 | 164,108,895 |
NT Growth Fund Institutional Class | 11,473,007 | 164,867,112 |
NT Large Company Value Fund Institutional Class | 17,688,022 | 203,235,375 |
NT Mid Cap Value Fund Institutional Class | 8,006,170 | 98,075,587 |
NT Small Company Fund Institutional Class | 4,389,883 | 47,235,143 |
NT Vista Fund Institutional Class | 6,367,562 | 82,650,950 |
Real Estate Fund Institutional Class | 1,037,027 | 25,448,646 |
838,982,352 | ||
DOMESTIC FIXED INCOME FUNDS — 33.5% | ||
High-Yield Fund Institutional Class | 9,207,943 | 57,089,248 |
Inflation-Adjusted Bond Fund Institutional Class | 9,501,028 | 116,102,568 |
NT Diversified Bond Fund Institutional Class | 38,736,091 | 412,152,010 |
585,343,826 | ||
INTERNATIONAL EQUITY FUNDS — 9.4% | ||
NT Emerging Markets Fund Institutional Class | 4,052,787 | 39,717,316 |
NT International Growth Fund Institutional Class | 11,184,672 | 124,038,009 |
163,755,325 | ||
MONEY MARKET FUNDS — 4.9% | ||
Premium Money Market Fund Investor Class | 84,682,336 | 84,682,336 |
INTERNATIONAL FIXED INCOME FUNDS — 4.1% | ||
International Bond Fund Institutional Class | 5,235,492 | 71,988,018 |
TOTAL INVESTMENT SECURITIES — 100.0% (Cost $1,445,597,176) | 1,744,751,857 | |
OTHER ASSETS AND LIABILITIES† | 3,878 | |
TOTAL NET ASSETS — 100.0% | $1,744,755,735 | |
Notes to Schedule of Investments
† Category is less than 0.05% of total net assets.
(1) | Investments are funds within the American Century Investments family of funds, of which certain funds may be deemed to be under common control because of the same board of directors. |
See Notes to Financial Statements.
Shares | Value | |
One Choice 2030 Portfolio | ||
Mutual Funds(1) — 100.0% | ||
DOMESTIC EQUITY FUNDS — 51.4% | ||
NT Core Equity Plus Fund Institutional Class | 2,128,304 | $ 29,562,141 |
NT Equity Growth Fund Institutional Class | 6,867,087 | 84,053,139 |
NT Growth Fund Institutional Class | 7,020,849 | 100,889,606 |
NT Large Company Value Fund Institutional Class | 9,538,044 | 109,592,131 |
NT Mid Cap Value Fund Institutional Class | 3,872,410 | 47,437,023 |
NT Small Company Fund Institutional Class | 3,042,249 | 32,734,602 |
NT Vista Fund Institutional Class | 3,539,295 | 45,940,052 |
Real Estate Fund Institutional Class | 657,257 | 16,129,099 |
466,337,793 | ||
DOMESTIC FIXED INCOME FUNDS — 30.4% | ||
High-Yield Fund Institutional Class | 4,418,124 | 27,392,368 |
Inflation-Adjusted Bond Fund Institutional Class | 4,569,525 | 55,839,595 |
NT Diversified Bond Fund Institutional Class | 18,116,815 | 192,762,914 |
275,994,877 | ||
INTERNATIONAL EQUITY FUNDS — 11.5% | ||
NT Emerging Markets Fund Institutional Class | 2,647,233 | 25,942,886 |
NT International Growth Fund Institutional Class | 7,058,493 | 78,278,686 |
104,221,572 | ||
MONEY MARKET FUNDS — 5.0% | ||
Premium Money Market Fund Investor Class | 45,224,828 | 45,224,828 |
INTERNATIONAL FIXED INCOME FUNDS — 1.7% | ||
International Bond Fund Institutional Class | 1,150,750 | 15,822,818 |
TOTAL INVESTMENT SECURITIES — 100.0% (Cost $769,148,085) | 907,601,888 | |
OTHER ASSETS AND LIABILITIES† | 1,012 | |
TOTAL NET ASSETS — 100.0% | $907,602,900 | |
Notes to Schedule of Investments
† Category is less than 0.05% of total net assets.
(1) | Investments are funds within the American Century Investments family of funds, of which certain funds may be deemed to be under common control because of the same board of directors. |
Shares | Value | |
One Choice 2035 Portfolio | ||
Mutual Funds(1) — 100.0% | ||
DOMESTIC EQUITY FUNDS — 56.4% | ||
NT Core Equity Plus Fund Institutional Class | 3,080,717 | $ 42,791,165 |
NT Equity Growth Fund Institutional Class | 10,361,071 | 126,819,514 |
NT Growth Fund Institutional Class | 11,715,612 | 168,353,342 |
NT Large Company Value Fund Institutional Class | 14,683,860 | 168,717,555 |
NT Mid Cap Value Fund Institutional Class | 6,047,493 | 74,081,793 |
NT Small Company Fund Institutional Class | 5,270,123 | 56,706,522 |
NT Vista Fund Institutional Class | 5,815,662 | 75,487,296 |
Real Estate Fund Institutional Class | 1,063,993 | 26,110,401 |
739,067,588 | ||
DOMESTIC FIXED INCOME FUNDS — 26.2% | ||
High-Yield Fund Institutional Class | 5,430,252 | 33,667,562 |
Inflation-Adjusted Bond Fund Institutional Class | 5,661,590 | 69,184,635 |
NT Diversified Bond Fund Institutional Class | 22,680,743 | 241,323,110 |
344,175,307 | ||
INTERNATIONAL EQUITY FUNDS — 13.2% | ||
NT Emerging Markets Fund Institutional Class | 4,619,617 | 45,272,251 |
NT International Growth Fund Institutional Class | 11,491,419 | 127,439,837 |
172,712,088 | ||
MONEY MARKET FUNDS — 4.2% | ||
Premium Money Market Fund Investor Class | 55,091,232 | 55,091,232 |
TOTAL INVESTMENT SECURITIES — 100.0% (Cost $1,071,585,551) | 1,311,046,215 | |
OTHER ASSETS AND LIABILITIES† | (23,397) | |
TOTAL NET ASSETS — 100.0% | $1,311,022,818 | |
Notes to Schedule of Investments
† Category is less than 0.05% of total net assets.
(1) | Investments are funds within the American Century Investments family of funds, of which certain funds may be deemed to be under common control because of the same board of directors. |
See Notes to Financial Statements.
Shares | Value | |
One Choice 2040 Portfolio | ||
Mutual Funds(1) — 100.0% | ||
DOMESTIC EQUITY FUNDS — 61.3% | ||
NT Core Equity Plus Fund Institutional Class | 1,661,736 | $ 23,081,510 |
NT Equity Growth Fund Institutional Class | 5,313,904 | 65,042,180 |
NT Growth Fund Institutional Class | 6,125,839 | 88,028,301 |
NT Large Company Value Fund Institutional Class | 7,634,726 | 87,722,997 |
NT Mid Cap Value Fund Institutional Class | 3,416,646 | 41,853,914 |
NT Small Company Fund Institutional Class | 2,444,335 | 26,301,041 |
NT Vista Fund Institutional Class | 3,254,491 | 42,243,287 |
Real Estate Fund Institutional Class | 587,623 | 14,420,260 |
388,693,490 | ||
DOMESTIC FIXED INCOME FUNDS — 22.6% | ||
High-Yield Fund Institutional Class | 2,299,621 | 14,257,648 |
Inflation-Adjusted Bond Fund Institutional Class | 2,336,857 | 28,556,394 |
NT Diversified Bond Fund Institutional Class | 9,430,054 | 100,335,778 |
143,149,820 | ||
INTERNATIONAL EQUITY FUNDS — 14.4% | ||
NT Emerging Markets Fund Institutional Class | 2,822,162 | 27,657,189 |
NT International Growth Fund Institutional Class | 5,718,528 | 63,418,475 |
91,075,664 | ||
MONEY MARKET FUNDS — 1.7% | ||
Premium Money Market Fund Investor Class | 11,028,928 | 11,028,928 |
TOTAL INVESTMENT SECURITIES — 100.0% (Cost $533,201,583) | 633,947,902 | |
OTHER ASSETS AND LIABILITIES† | 58 | |
TOTAL NET ASSETS — 100.0% | $633,947,960 | |
Notes to Schedule of Investments
† Category is less than 0.05% of total net assets.
(1) | Investments are funds within the American Century Investments family of funds, of which certain funds may be deemed to be under common control because of the same board of directors. |
Shares | Value | |
One Choice 2045 Portfolio | ||
Mutual Funds(1) — 100.0% | ||
DOMESTIC EQUITY FUNDS — 65.4% | ||
NT Core Equity Plus Fund Institutional Class | 2,848,538 | $ 39,566,192 |
NT Equity Growth Fund Institutional Class | 7,383,932 | 90,379,333 |
NT Growth Fund Institutional Class | 8,899,746 | 127,889,351 |
NT Large Company Value Fund Institutional Class | 11,132,399 | 127,911,268 |
NT Mid Cap Value Fund Institutional Class | 5,157,434 | 63,178,564 |
NT Small Company Fund Institutional Class | 3,457,090 | 37,198,289 |
NT Vista Fund Institutional Class | 4,954,886 | 64,314,419 |
Real Estate Fund Institutional Class | 898,233 | 22,042,634 |
572,480,050 | ||
DOMESTIC FIXED INCOME FUNDS — 19.3% | ||
High-Yield Fund Institutional Class | 2,706,768 | 16,781,963 |
Inflation-Adjusted Bond Fund Institutional Class | 2,756,318 | 33,682,211 |
NT Diversified Bond Fund Institutional Class | 11,177,474 | 118,928,323 |
169,392,497 | ||
INTERNATIONAL EQUITY FUNDS — 15.3% | ||
NT Emerging Markets Fund Institutional Class | 4,656,480 | 45,633,504 |
NT International Growth Fund Institutional Class | 7,986,801 | 88,573,621 |
134,207,125 | ||
TOTAL INVESTMENT SECURITIES — 100.0% (Cost $712,060,415) | 876,079,672 | |
OTHER ASSETS AND LIABILITIES† | (2,678) | |
TOTAL NET ASSETS — 100.0% | $876,076,994 | |
Notes to Schedule of Investments
† Category is less than 0.05% of total net assets.
(1) | Investments are funds within the American Century Investments family of funds, of which certain funds may be deemed to be under common control because of the same board of directors. |
See Notes to Financial Statements.
Shares | Value | |
One Choice 2050 Portfolio | ||
Mutual Funds(1) — 100.0% | ||
DOMESTIC EQUITY FUNDS — 67.0% | ||
NT Core Equity Plus Fund Institutional Class | 1,094,952 | $ 15,208,882 |
NT Equity Growth Fund Institutional Class | 2,859,451 | 34,999,679 |
NT Growth Fund Institutional Class | 3,486,184 | 50,096,465 |
NT Large Company Value Fund Institutional Class | 4,437,013 | 50,981,280 |
NT Mid Cap Value Fund Institutional Class | 1,988,839 | 24,363,275 |
NT Small Company Fund Institutional Class | 1,499,847 | 16,138,354 |
NT Vista Fund Institutional Class | 1,889,721 | 24,528,572 |
Real Estate Fund Institutional Class | 381,766 | 9,368,529 |
225,685,036 | ||
DOMESTIC FIXED INCOME FUNDS — 16.9% | ||
High-Yield Fund Institutional Class | 911,202 | 5,649,452 |
Inflation-Adjusted Bond Fund Institutional Class | 926,820 | 11,325,745 |
NT Diversified Bond Fund Institutional Class | 3,765,482 | 40,064,729 |
57,039,926 | ||
INTERNATIONAL EQUITY FUNDS — 16.1% | ||
NT Emerging Markets Fund Institutional Class | 2,139,963 | 20,971,635 |
NT International Growth Fund Institutional Class | 2,998,655 | 33,255,084 |
54,226,719 | ||
TOTAL INVESTMENT SECURITIES — 100.0% (Cost $287,101,232) | 336,951,681 | |
OTHER ASSETS AND LIABILITIES† | 5,943 | |
TOTAL NET ASSETS — 100.0% | $336,957,624 | |
Notes to Schedule of Investments
† Category is less than 0.05% of total net assets.
(1) | Investments are funds within the American Century Investments family of funds, of which certain funds may be deemed to be under common control because of the same board of directors. |
Shares | Value | |
One Choice 2055 Portfolio | ||
Mutual Funds(1) — 100.0% | ||
DOMESTIC EQUITY FUNDS — 69.0% | ||
NT Core Equity Plus Fund Institutional Class | 153,893 | $ 2,137,578 |
NT Equity Growth Fund Institutional Class | 415,586 | 5,086,776 |
NT Growth Fund Institutional Class | 501,753 | 7,210,190 |
NT Large Company Value Fund Institutional Class | 635,708 | 7,304,290 |
NT Mid Cap Value Fund Institutional Class | 288,684 | 3,536,383 |
NT Small Company Fund Institutional Class | 220,762 | 2,375,397 |
NT Vista Fund Institutional Class | 274,978 | 3,569,212 |
Real Estate Fund Institutional Class | 56,508 | 1,386,712 |
32,606,538 | ||
INTERNATIONAL EQUITY FUNDS — 16.0% | ||
NT Emerging Markets Fund Institutional Class | 312,478 | 3,062,283 |
NT International Growth Fund Institutional Class | 405,046 | 4,491,965 |
7,554,248 | ||
DOMESTIC FIXED INCOME FUNDS — 15.0% | ||
High-Yield Fund Institutional Class | 114,479 | 709,772 |
Inflation-Adjusted Bond Fund Institutional Class | 116,220 | 1,420,209 |
NT Diversified Bond Fund Institutional Class | 465,737 | 4,955,443 |
7,085,424 | ||
TOTAL INVESTMENT SECURITIES — 100.0% (Cost $42,648,667) | 47,246,210 | |
OTHER ASSETS AND LIABILITIES† | 3 | |
TOTAL NET ASSETS — 100.0% | $47,246,213 | |
Notes to Schedule of Investments
† Category is less than 0.05% of total net assets.
(1) | Investments are funds within the American Century Investments family of funds, of which certain funds may be deemed to be under common control because of the same board of directors. |
See Notes to Financial Statements.
Statement of Assets and Liabilities |
JULY 31, 2013 | |||||||||
One Choice In Retirement Portfolio | One Choice | One Choice | |||||||
Assets | |||||||||
Investment securities in affiliates, at value (cost of $411,096,602, $955,303,178 and $842,489,936, respectively) | $490,761,452 | $1,140,460,797 | $973,982,051 | ||||||
Cash | 111,853 | 264,546 | 222,421 | ||||||
Receivable for investments sold | 489,174 | 388,389 | 43,977 | ||||||
Receivable for capital shares sold | 741,940 | 873,314 | 1,281,977 | ||||||
Distributions receivable from affiliates | 297,508 | 676,611 | 556,870 | ||||||
| 492,401,927 | 1,142,663,657 | 976,087,296 | |||||||
Liabilities | |||||||||
Payable for investments purchased | 297,432 | 676,442 | 556,728 | ||||||
Payable for capital shares redeemed | 1,211,978 | 1,252,738 | 1,307,487 | ||||||
Accrued administrative fees | 64,512 | 160,148 | 126,731 | ||||||
Distribution and service fees payable | 51,145 | 113,363 | 103,370 | ||||||
| 1,625,067 | 2,202,691 | 2,094,316 | |||||||
Net Assets | $490,776,860 | $1,140,460,966 | $973,992,980 | ||||||
Net Assets Consist of: | |||||||||
Capital (par value and paid-in surplus) | $417,545,102 | $958,736,476 | $833,324,264 | ||||||
Undistributed net investment income | 190,595 | 5,579,393 | 4,447,250 | ||||||
Accumulated undistributed net realized gain (loss) | (6,623,687 | ) | (9,012,522 | ) | 4,729,351 | ||||
Net unrealized appreciation | 79,664,850 | 185,157,619 | 131,492,115 | ||||||
| $490,776,860 | $1,140,460,966 | $973,992,980 | |||||||
Fund/Class | Net Assets | Shares outstanding | Net asset value per share | ||||||
One Choice In Retirement Portfolio | |||||||||
Investor Class, $0.01 Par Value | $205,528,942 | 16,557,338 | $12.41 | ||||||
Institutional Class, $0.01 Par Value | $104,269,999 | 8,396,135 | $12.42 | ||||||
A Class, $0.01 Par Value | $119,504,140 | 9,629,571 | $12.41* | ||||||
C Class, $0.01 Par Value | $1,369,426 | 110,325 | $12.41 | ||||||
R Class, $0.01 Par Value | $60,104,353 | 4,847,436 | $12.40 | ||||||
One Choice 2015 Portfolio | |||||||||
Investor Class, $0.01 Par Value | $543,672,759 | 41,227,570 | $13.19 | ||||||
Institutional Class, $0.01 Par Value | $182,994,871 | 13,851,484 | $13.21 | ||||||
A Class, $0.01 Par Value | $295,376,716 | 22,433,039 | $13.17* | ||||||
C Class, $0.01 Par Value | $4,003,365 | 304,724 | $13.14 | ||||||
R Class, $0.01 Par Value | $114,413,255 | 8,700,251 | $13.15 | ||||||
One Choice 2020 Portfolio | |||||||||
Investor Class, $0.01 Par Value | $384,010,199 | 33,213,696 | $11.56 | ||||||
Institutional Class, $0.01 Par Value | $211,575,641 | 18,282,598 | $11.57 | ||||||
A Class, $0.01 Par Value | $270,039,649 | 23,399,593 | $11.54* | ||||||
C Class, $0.01 Par Value | $6,117,421 | 530,900 | $11.52 | ||||||
R Class, $0.01 Par Value | $102,250,070 | 8,871,994 | $11.53 | ||||||
| * | Maximum offering price $13.17, $13.97 and $12.24 (net asset value divided by 0.9425) for One Choice In Retirement Portfolio, One Choice 2015 Portfolio and One Choice 2020 Portfolio, respectively. |
See Notes to Financial Statements.
JULY 31, 2013 | |||||||||
One Choice | One Choice | One Choice | |||||||
Assets | |||||||||
Investment securities in affiliates, at value (cost of $1,445,597,176, $769,148,085 and $1,071,585,551, respectively) | $1,744,751,857 | $907,601,888 | $1,311,046,215 | ||||||
Cash | 402,693 | 211,536 | 305,967 | ||||||
Receivable for investments sold | 2,549,107 | 28,066 | — | ||||||
Receivable for capital shares sold | 1,322,646 | 1,118,804 | 1,819,559 | ||||||
Distributions receivable from affiliates | 938,112 | 437,264 | 545,146 | ||||||
| 1,749,964,415 | 909,397,558 | 1,313,716,887 | |||||||
Liabilities | |||||||||
Payable for investments purchased | 937,878 | 437,152 | 731,109 | ||||||
Payable for capital shares redeemed | 3,854,473 | 1,138,778 | 1,646,611 | ||||||
Accrued administrative fees | 242,309 | 117,413 | 179,422 | ||||||
Distribution and service fees payable | 174,020 | 101,315 | 136,927 | ||||||
| 5,208,680 | 1,794,658 | 2,694,069 | |||||||
Net Assets | $1,744,755,735 | $907,602,900 | $1,311,022,818 | ||||||
Net Assets Consist of: | |||||||||
Capital (par value and paid-in surplus) | $1,450,057,166 | $760,397,458 | $1,072,525,761 | ||||||
Undistributed net investment income | 7,982,585 | 3,691,430 | 5,005,242 | ||||||
Accumulated undistributed net realized gain (loss) | (12,438,697 | ) | 5,060,209 | (5,968,849 | ) | ||||
Net unrealized appreciation | 299,154,681 | 138,453,803 | 239,460,664 | ||||||
| $1,744,755,735 | $907,602,900 | $1,311,022,818 | |||||||
Fund/Class | Net Assets | Shares outstanding | Net asset value per share |
One Choice 2025 Portfolio | |||
Investor Class, $0.01 Par Value | $807,998,124 | 58,922,718 | $13.71 |
Institutional Class, $0.01 Par Value | $298,051,539 | 21,716,149 | $13.72 |
A Class, $0.01 Par Value | $460,300,563 | 33,612,990 | $13.69* |
C Class, $0.01 Par Value | $6,178,512 | 452,131 | $13.67 |
R Class, $0.01 Par Value | $172,226,997 | 12,596,748 | $13.67 |
One Choice 2030 Portfolio | |||
Investor Class, $0.01 Par Value | $333,309,050 | 28,694,440 | $11.62 |
Institutional Class, $0.01 Par Value | $202,597,700 | 17,431,684 | $11.62 |
A Class, $0.01 Par Value | $264,393,200 | 22,817,646 | $11.59* |
C Class, $0.01 Par Value | $3,416,919 | 295,288 | $11.57 |
R Class, $0.01 Par Value | $103,886,031 | 8,974,945 | $11.58 |
One Choice 2035 Portfolio | |||
Investor Class, $0.01 Par Value | $573,215,992 | 39,465,869 | $14.52 |
Institutional Class, $0.01 Par Value | $235,505,270 | 16,187,748 | $14.55 |
A Class, $0.01 Par Value | $356,750,842 | 24,594,028 | $14.51* |
C Class, $0.01 Par Value | $3,572,432 | 246,997 | $14.46 |
R Class, $0.01 Par Value | $141,978,282 | 9,800,256 | $14.49 |
| * | Maximum offering price $14.53, $12.30 and $15.40 (net asset value divided by 0.9425) for One Choice 2025 Portfolio, One Choice 2030 Portfolio and One Choice 2035 Portfolio, respectively. |
See Notes to Financial Statements.
JULY 31, 2013 | |||||||||
One Choice | One Choice | One Choice | |||||||
Assets | |||||||||
Investment securities in affiliates, at value (cost of $533,201,583, $712,060,415 and $287,101,232, respectively) | $633,947,902 | $876,079,672 | $336,951,681 | ||||||
Cash | 139,447 | 194,306 | 71,516 | ||||||
Receivable for investments sold | 52,610 | — | — | ||||||
Receivable for capital shares sold | 1,332,381 | 2,261,241 | 1,525,297 | ||||||
Distributions receivable from affiliates | 227,132 | 268,862 | 90,143 | ||||||
| 635,699,472 | 878,804,081 | 338,638,637 | |||||||
Liabilities | |||||||||
Payable for investments purchased | 227,073 | 1,329,616 | 1,203,065 | ||||||
Payable for capital shares redeemed | 1,380,222 | 1,196,569 | 403,988 | ||||||
Accrued administrative fees | 79,045 | 113,192 | 40,024 | ||||||
Distribution and service fees payable | 65,172 | 87,710 | 33,936 | ||||||
| 1,751,512 | 2,727,087 | 1,681,013 | |||||||
Net Assets | $633,947,960 | $876,076,994 | $336,957,624 | ||||||
Net Assets Consist of: | |||||||||
Capital (par value and paid-in surplus) | $526,908,509 | $713,752,682 | $283,714,592 | ||||||
Undistributed net investment income | 2,304,879 | 3,130,140 | 1,130,167 | ||||||
Accumulated undistributed net realized gain (loss) | 3,988,253 | (4,825,085 | ) | 2,262,416 | |||||
Net unrealized appreciation | 100,746,319 | 164,019,257 | 49,850,449 | ||||||
| $633,947,960 | $876,076,994 | $336,957,624 | |||||||
Fund/Class | Net Assets | Shares outstanding | Net asset value per share |
One Choice 2040 Portfolio | |||
Investor Class, $0.01 Par Value | $234,284,604 | 19,736,667 | $11.87 |
Institutional Class, $0.01 Par Value | $156,913,377 | 13,206,751 | $11.88 |
A Class, $0.01 Par Value | $176,013,698 | 14,850,223 | $11.85* |
C Class, $0.01 Par Value | $2,049,049 | 173,404 | $11.82 |
R Class, $0.01 Par Value | $64,687,232 | 5,466,841 | $11.83 |
One Choice 2045 Portfolio | |||
Investor Class, $0.01 Par Value | $355,469,978 | 23,826,261 | $14.92 |
Institutional Class, $0.01 Par Value | $196,557,097 | 13,154,904 | $14.94 |
A Class, $0.01 Par Value | $231,054,007 | 15,514,531 | $14.89* |
C Class, $0.01 Par Value | $1,220,177 | 82,114 | $14.86 |
R Class, $0.01 Par Value | $91,775,735 | 6,168,019 | $14.88 |
One Choice 2050 Portfolio | |||
Investor Class, $0.01 Par Value | $115,833,617 | 9,841,400 | $11.77 |
Institutional Class, $0.01 Par Value | $95,468,813 | 8,096,949 | $11.79 |
A Class, $0.01 Par Value | $91,011,671 | 7,744,060 | $11.75* |
C Class, $0.01 Par Value | $1,747,714 | 149,009 | $11.73 |
R Class, $0.01 Par Value | $32,895,809 | 2,801,988 | $11.74 |
| * | Maximum offering price $12.57, $15.80 and $12.47 (net asset value divided by 0.9425) for One Choice 2040 Portfolio, One Choice 2045 Portfolio and One Choice 2050 Portfolio, respectively. |
See Notes to Financial Statements.
JULY 31, 2013 | |||
One Choice | |||
Assets | |||
Investment securities in affiliates, at value (cost of $42,648,667) | $47,246,210 | ||
Cash | 11,504 | ||
Receivable for capital shares sold | 93,166 | ||
Distributions receivable from affiliates | 11,067 | ||
| 47,361,947 | |||
Liabilities | |||
Payable for investments purchased | 12,358 | ||
Payable for capital shares redeemed | 91,475 | ||
Accrued administrative fees | 5,918 | ||
Distribution and service fees payable | 5,983 | ||
| 115,734 | |||
Net Assets | $47,246,213 | ||
Net Assets Consist of: | |||
Capital (par value and paid-in surplus) | $42,359,369 | ||
Undistributed net investment income | 128,370 | ||
Undistributed net realized gain | 160,931 | ||
Net unrealized appreciation | 4,597,543 | ||
| $47,246,213 | |||
Fund/Class | Net Assets | Shares outstanding | Net asset value per share |
One Choice 2055 Portfolio | |||
Investor Class, $0.01 Par Value | $14,959,293 | 1,244,370 | $12.02 |
Institutional Class, $0.01 Par Value | $10,950,660 | 910,018 | $12.03 |
A Class, $0.01 Par Value | $14,137,973 | 1,178,323 | $12.00* |
C Class, $0.01 Par Value | $214,980 | 17,986 | $11.95 |
R Class, $0.01 Par Value | $6,983,307 | 582,470 | $11.99 |
| * | Maximum offering price $12.73 (net asset value divided by 0.9425) for One Choice 2055 Portfolio. |
See Notes to Financial Statements.
Statement of Operations |
YEAR ENDED JULY 31, 2013 | |||||||||
One Choice In Retirement Portfolio | One Choice | One Choice | |||||||
Investment Income (Loss) | |||||||||
Income from Affiliates: | |||||||||
Income distributions from underlying funds | $8,572,135 | $21,043,700 | $15,423,993 | ||||||
Expenses: | |||||||||
Administrative fees: | |||||||||
Investor Class | 340,298 | 984,880 | 612,103 | ||||||
A Class | 213,573 | 538,930 | 434,250 | ||||||
C Class | 1,987 | 6,381 | 7,652 | ||||||
R Class | 98,283 | 206,562 | 161,932 | ||||||
Distribution and service fees: | |||||||||
A Class | 266,966 | 673,663 | 542,813 | ||||||
C Class | 9,939 | 31,906 | 38,259 | ||||||
R Class | 245,708 | 516,404 | 404,831 | ||||||
Directors’ fees and expenses | 20,984 | 50,726 | 39,119 | ||||||
Other expenses | — | 136 | — | ||||||
| 1,197,738 | 3,009,588 | 2,240,959 | |||||||
Net investment income (loss) | 7,374,397 | 18,034,112 | 13,183,034 | ||||||
Net Realized and Unrealized Gain (Loss) on Affiliates | |||||||||
Net realized gain (loss) on: | |||||||||
Sale of investments in underlying funds | 347,309 | 1,639,715 | 29,235 | ||||||
Capital gain distributions received from underlying funds | 4,477,127 | 11,265,728 | 8,116,856 | ||||||
| 4,824,436 | 12,905,443 | 8,146,091 | |||||||
Change in net unrealized appreciation (depreciation) | 27,408,423 | 70,416,811 | 61,389,442 | ||||||
Net realized and unrealized gain (loss) on affiliates | 32,232,859 | 83,322,254 | 69,535,533 | ||||||
Net Increase (Decrease) in Net Assets | $39,607,256 | $101,356,366 | $82,718,567 | ||||||
See Notes to Financial Statements.
YEAR ENDED JULY 31, 2013 | |||||||||
One Choice | One Choice | One Choice | |||||||
Investment Income (Loss) | |||||||||
Income from Affiliates: | |||||||||
Income distributions from underlying funds | $29,593,589 | $13,335,055 | $19,700,872 | ||||||
Expenses: | |||||||||
Administrative fees: | |||||||||
Investor Class | 1,372,369 | 509,581 | 943,300 | ||||||
A Class | 793,419 | 422,065 | 588,434 | ||||||
C Class | 9,913 | 4,849 | 5,221 | ||||||
R Class | 302,957 | 174,694 | 243,386 | ||||||
Distribution and service fees: | |||||||||
A Class | 991,774 | 527,582 | 735,543 | ||||||
C Class | 49,564 | 24,244 | 26,108 | ||||||
R Class | 757,392 | 436,736 | 608,466 | ||||||
Directors’ fees and expenses | 73,907 | 36,802 | 54,171 | ||||||
| 4,351,295 | 2,136,553 | 3,204,629 | |||||||
Net investment income (loss) | 25,242,294 | 11,198,502 | 16,496,243 | ||||||
Net Realized and Unrealized Gain (Loss) on Affiliates | |||||||||
Net realized gain (loss) on: | |||||||||
Sale of investments in underlying funds | 813,067 | (55,416 | ) | 97,608 | |||||
Capital gain distributions received from underlying funds | 17,055,120 | 8,311,363 | 13,872,436 | ||||||
| 17,868,187 | 8,255,947 | 13,970,044 | |||||||
Change in net unrealized appreciation (depreciation) | 134,227,626 | 74,524,209 | 130,181,079 | ||||||
Net realized and unrealized gain (loss) on affiliates | 152,095,813 | 82,780,156 | 144,151,123 | ||||||
Net Increase (Decrease) in Net Assets | $177,338,107 | $93,978,658 | $160,647,366 | ||||||
See Notes to Financial Statements.
YEAR ENDED JULY 31, 2013 | |||||||||
One Choice | One Choice | One Choice | |||||||
Investment Income (Loss) | |||||||||
Income from Affiliates: | |||||||||
Income distributions from underlying funds | $8,572,318 | $12,649,988 | $4,293,434 | ||||||
Expenses: | |||||||||
Administrative fees: | |||||||||
Investor Class | 343,942 | 575,227 | 159,673 | ||||||
A Class | 275,357 | 372,071 | 141,743 | ||||||
C Class | 2,740 | 1,890 | 2,395 | ||||||
R Class | 100,987 | 154,525 | 47,943 | ||||||
Distribution and service fees: | |||||||||
A Class | 344,196 | 465,089 | 177,179 | ||||||
C Class | 13,697 | 9,452 | 11,977 | ||||||
R Class | 252,468 | 386,312 | 119,858 | ||||||
Directors’ fees and expenses | 24,254 | 35,125 | 12,539 | ||||||
| 1,357,641 | 1,999,691 | 673,307 | |||||||
Net investment income (loss) | 7,214,677 | 10,650,297 | 3,620,127 | ||||||
Net Realized and Unrealized Gain (Loss) on Affiliates | |||||||||
Net realized gain (loss) on: | |||||||||
Sale of investments in underlying funds | (138,594 | ) | 167,950 | (107,926 | ) | ||||
Capital gain distributions received from underlying funds | 6,099,332 | 9,548,305 | 3,325,091 | ||||||
| 5,960,738 | 9,716,255 | 3,217,165 | |||||||
Change in net unrealized appreciation (depreciation) | 64,517,805 | 101,630,509 | 37,345,827 | ||||||
Net realized and unrealized gain (loss) on affiliates | 70,478,543 | 111,346,764 | 40,562,992 | ||||||
Net Increase (Decrease) in Net Assets | $77,693,220 | $121,997,061 | $44,183,119 | ||||||
See Notes to Financial Statements.
YEAR ENDED JULY 31, 2013 | |||
One Choice | |||
Investment Income (Loss) | |||
Income from Affiliates: | |||
Income distributions from underlying funds | $423,101 | ||
Expenses: | |||
Administrative fees: | |||
Investor Class | 17,469 | ||
A Class | 15,588 | ||
C Class | 285 | ||
R Class | 7,011 | ||
Distribution and service fees: | |||
A Class | 19,486 | ||
C Class | 1,427 | ||
R Class | 17,528 | ||
Directors’ fees and expenses | 1,377 | ||
| 80,171 | |||
Net investment income (loss) | 342,930 | ||
Net Realized and Unrealized Gain (Loss) on Affiliates | |||
Net realized gain (loss) on: | |||
Sale of investments in underlying funds | (12,529 | ) | |
Capital gain distributions received from underlying funds | 301,506 | ||
| 288,977 | |||
Change in net unrealized appreciation (depreciation) on investments in underlying funds | 4,205,515 | ||
Net realized and unrealized gain (loss) on affiliates | 4,494,492 | ||
Net Increase (Decrease) in Net Assets Resulting from Operations | $4,837,422 | ||
See Notes to Financial Statements.
Statement of Changes in Net Assets |
YEARS ENDED JULY 31, 2013 AND JULY 31, 2012 | ||||||||||||
One Choice In Retirement Portfolio | One Choice 2015 Portfolio | |||||||||||
Increase (Decrease) in Net Assets | July 31, 2013 | July 31, 2012 | July 31, 2013 | July 31, 2012 | ||||||||
Operations | ||||||||||||
Net investment income (loss) | $7,374,397 | $7,171,217 | $18,034,112 | $17,595,552 | ||||||||
Net realized gain (loss) | 4,824,436 | 4,944,235 | 12,905,443 | 7,841,248 | ||||||||
Change in net unrealized | 27,408,423 | 6,871,351 | 70,416,811 | 20,775,825 | ||||||||
Net increase (decrease) in net assets resulting from operations | 39,607,256 | 18,986,803 | 101,356,366 | 46,212,625 | ||||||||
Distributions to Shareholders | ||||||||||||
From net investment income: | ||||||||||||
Investor Class | (3,099,580 | ) | (2,187,611 | ) | (9,289,549 | ) | (7,838,571 | ) | ||||
Institutional Class | (1,989,971 | ) | (2,585,674 | ) | (3,341,324 | ) | (4,072,861 | ) | ||||
A Class | (1,650,115 | ) | (1,928,951 | ) | (4,369,628 | ) | (4,143,809 | ) | ||||
C Class | (8,534 | ) | (8,286 | ) | (29,334 | ) | (15,317 | ) | ||||
R Class | (653,313 | ) | (519,173 | ) | (1,437,662 | ) | (1,171,673 | ) | ||||
From net realized gains: | ||||||||||||
Investor Class | (1,725,796 | ) | — | (3,680,481 | ) | — | ||||||
Institutional Class | (1,035,833 | ) | — | (1,200,865 | ) | — | ||||||
A Class | (995,765 | ) | — | (1,986,010 | ) | — | ||||||
C Class | (10,008 | ) | — | (23,852 | ) | — | ||||||
R Class | (492,170 | ) | — | (765,762 | ) | — | ||||||
Decrease in net assets from distributions | (11,661,085 | ) | (7,229,695 | ) | (26,124,467 | ) | (17,242,231 | ) | ||||
Capital Share Transactions | ||||||||||||
Net increase (decrease) in net assets | 115,335,129 | 36,694,164 | 185,205,306 | 115,537,471 | ||||||||
Net increase (decrease) in net assets | 143,281,300 | 48,451,272 | 260,437,205 | 144,507,865 | ||||||||
Net Assets | ||||||||||||
Beginning of period | 347,495,560 | 299,044,288 | 880,023,761 | 735,515,896 | ||||||||
End of period | $490,776,860 | $347,495,560 | $1,140,460,966 | $880,023,761 | ||||||||
Undistributed net investment income | $190,595 | $217,711 | $5,579,393 | $6,012,778 | ||||||||
See Notes to Financial Statements.
YEARS ENDED JULY 31, 2013 AND JULY 31, 2012 | ||||||||||||
One Choice 2020 Portfolio | One Choice 2025 Portfolio | |||||||||||
Increase (Decrease) in Net Assets | July 31, 2013 | July 31, 2012 | July 31, 2013 | July 31, 2012 | ||||||||
Operations | ||||||||||||
Net investment income (loss) | $13,183,034 | $11,010,269 | $25,242,294 | $22,433,836 | ||||||||
Net realized gain (loss) | 8,146,091 | 5,835,930 | 17,868,187 | 8,404,517 | ||||||||
Change in net unrealized | 61,389,442 | 12,566,331 | 134,227,626 | 25,689,808 | ||||||||
Net increase (decrease) in net assets resulting from operations | 82,718,567 | 29,412,530 | 177,338,107 | 56,528,161 | ||||||||
Distributions to Shareholders | ||||||||||||
From net investment income: | ||||||||||||
Investor Class | (5,192,741 | ) | (2,737,663 | ) | (11,938,501 | ) | (9,508,871 | ) | ||||
Institutional Class | (3,426,595 | ) | (4,008,922 | ) | (4,901,730 | ) | (5,441,026 | ) | ||||
A Class | (3,109,162 | ) | (2,725,776 | ) | (6,051,832 | ) | (5,135,370 | ) | ||||
C Class | (26,318 | ) | (9,415 | ) | (40,813 | ) | (23,576 | ) | ||||
R Class | (964,118 | ) | (683,076 | ) | (1,950,749 | ) | (1,626,743 | ) | ||||
From net realized gains: | ||||||||||||
Investor Class | (2,479,231 | ) | (415,940 | ) | (4,233,193 | ) | — | |||||
Institutional Class | (1,474,446 | ) | (558,701 | ) | (1,568,185 | ) | — | |||||
A Class | (1,719,772 | ) | (466,808 | ) | (2,480,785 | ) | — | |||||
C Class | (27,759 | ) | (2,605 | ) | (31,460 | ) | — | |||||
R Class | (633,751 | ) | (134,029 | ) | (947,538 | ) | — | |||||
Decrease in net assets from distributions | (19,053,893 | ) | (11,742,935 | ) | (34,144,786 | ) | (21,735,586 | ) | ||||
Capital Share Transactions | ||||||||||||
Net increase (decrease) in net assets | 348,035,745 | 108,986,100 | 405,289,600 | 145,649,813 | ||||||||
Net increase (decrease) in net assets | 411,700,419 | 126,655,695 | 548,482,921 | 180,442,388 | ||||||||
Net Assets | ||||||||||||
Beginning of period | 562,292,561 | 435,636,866 | 1,196,272,814 | 1,015,830,426 | ||||||||
End of period | $973,992,980 | $562,292,561 | $1,744,755,735 | $1,196,272,814 | ||||||||
Undistributed net investment income | $4,447,250 | $3,983,150 | $7,982,585 | $7,623,916 | ||||||||
See Notes to Financial Statements.
YEARS ENDED JULY 31, 2013 AND JULY 31, 2012 | ||||||||||||
One Choice 2030 Portfolio | One Choice 2035 Portfolio | |||||||||||
Increase (Decrease) in Net Assets | July 31, 2013 | July 31, 2012 | July 31, 2013 | July 31, 2012 | ||||||||
Operations | ||||||||||||
Net investment income (loss) | $11,198,502 | $8,409,080 | $16,496,243 | $13,304,783 | ||||||||
Net realized gain (loss) | 8,255,947 | 4,635,869 | 13,970,044 | 7,143,940 | ||||||||
Change in net unrealized | 74,524,209 | 9,996,355 | 130,181,079 | 15,096,275 | ||||||||
Net increase (decrease) in net assets resulting from operations | 93,978,658 | 23,041,304 | 160,647,366 | 35,544,998 | ||||||||
Distributions to Shareholders | ||||||||||||
From net investment income: | ||||||||||||
Investor Class | (3,947,509 | ) | (1,830,257 | ) | (7,251,291 | ) | (5,406,930 | ) | ||||
Institutional Class | (2,876,603 | ) | (3,077,742 | ) | (3,384,856 | ) | (3,029,165 | ) | ||||
A Class | (2,719,375 | ) | (2,149,526 | ) | (3,840,071 | ) | (3,139,941 | ) | ||||
C Class | (15,058 | ) | (9,176 | ) | (15,225 | ) | (6,446 | ) | ||||
R Class | (951,818 | ) | (543,391 | ) | (1,346,130 | ) | (1,032,297 | ) | ||||
From net realized gains: | ||||||||||||
Investor Class | (1,975,916 | ) | (232,302 | ) | (3,542,839 | ) | — | |||||
Institutional Class | (1,286,938 | ) | (353,815 | ) | (1,475,970 | ) | — | |||||
A Class | (1,599,427 | ) | (313,828 | ) | (2,207,333 | ) | — | |||||
C Class | (18,623 | ) | (2,436 | ) | (18,642 | ) | — | |||||
R Class | (678,597 | ) | (93,365 | ) | (940,223 | ) | — | |||||
Decrease in net assets from distributions | (16,069,864 | ) | (8,605,838 | ) | (24,022,580 | ) | (12,614,779 | ) | ||||
Capital Share Transactions | ||||||||||||
Net increase (decrease) in net assets | 323,289,308 | 119,392,493 | 319,740,799 | 154,007,455 | ||||||||
Net increase (decrease) in net assets | 401,198,102 | 133,827,959 | 456,365,585 | 176,937,674 | ||||||||
Net Assets | ||||||||||||
Beginning of period | 506,404,798 | 372,576,839 | 854,657,233 | 677,719,559 | ||||||||
End of period | $907,602,900 | $506,404,798 | $1,311,022,818 | $854,657,233 | ||||||||
Undistributed net investment income | $3,691,430 | $3,003,291 | $5,005,242 | $4,346,572 | ||||||||
See Notes to Financial Statements.
YEARS ENDED JULY 31, 2013 AND JULY 31, 2012 | ||||||||||||
One Choice 2040 Portfolio | One Choice 2045 Portfolio | |||||||||||
Increase (Decrease) in Net Assets | July 31, 2013 | July 31, 2012 | July 31, 2013 | July 31, 2012 | ||||||||
Operations | ||||||||||||
Net investment income (loss) | $7,214,677 | $4,450,020 | $10,650,297 | $7,413,545 | ||||||||
Net realized gain (loss) | 5,960,738 | 2,490,465 | 9,716,255 | 3,289,947 | ||||||||
Change in net unrealized | 64,517,805 | 6,010,271 | 101,630,509 | 8,691,559 | ||||||||
Net increase (decrease) in net assets resulting from operations | 77,693,220 | 12,950,756 | 121,997,061 | 19,395,051 | ||||||||
Distributions to Shareholders | ||||||||||||
From net investment income: | ||||||||||||
Investor Class | (2,367,781 | ) | (1,011,328 | ) | (4,114,710 | ) | (2,810,973 | ) | ||||
Institutional Class | (2,042,725 | ) | (1,534,527 | ) | (2,639,178 | ) | (1,950,267 | ) | ||||
A Class | (1,534,267 | ) | (1,150,842 | ) | (2,255,071 | ) | (1,677,792 | ) | ||||
C Class | (6,481 | ) | (1,828 | ) | (5,979 | ) | (2,642 | ) | ||||
R Class | (453,379 | ) | (253,308 | ) | (771,653 | ) | (547,065 | ) | ||||
From net realized gains: | ||||||||||||
Investor Class | (1,215,141 | ) | (155,119 | ) | (1,865,928 | ) | — | |||||
Institutional Class | (925,592 | ) | (211,151 | ) | (1,061,612 | ) | — | |||||
A Class | (944,512 | ) | (206,049 | ) | (1,215,722 | ) | — | |||||
C Class | (9,941 | ) | (658 | ) | (7,436 | ) | — | |||||
R Class | (348,689 | ) | (54,461 | ) | (512,841 | ) | — | |||||
Decrease in net assets from distributions | (9,848,508 | ) | (4,579,271 | ) | (14,450,130 | ) | (6,988,739 | ) | ||||
Capital Share Transactions | ||||||||||||
Net increase (decrease) in net assets | 241,056,994 | 105,177,975 | 219,097,607 | 124,508,655 | ||||||||
Net increase (decrease) in net assets | 308,901,706 | 113,549,460 | 326,644,538 | 136,914,967 | ||||||||
Net Assets | ||||||||||||
Beginning of period | 325,046,254 | 211,496,794 | 549,432,456 | 412,517,489 | ||||||||
End of period | $633,947,960 | $325,046,254 | $876,076,994 | $549,432,456 | ||||||||
Undistributed net investment income | $2,304,879 | $1,494,835 | $3,130,140 | $2,266,434 | ||||||||
See Notes to Financial Statements.
YEARS ENDED JULY 31, 2013 AND JULY 31, 2012 | ||||||||||||
One Choice 2050 Portfolio | One Choice 2055 Portfolio | |||||||||||
Increase (Decrease) in Net Assets | July 31, 2013 | July 31, 2012 | July 31, 2013 | July 31, 2012 | ||||||||
Operations | ||||||||||||
Net investment income (loss) | $3,620,127 | $1,811,853 | $342,930 | $65,496 | ||||||||
Net realized gain (loss) | 3,217,165 | 1,260,850 | 288,977 | (75,380 | ) | |||||||
Change in net unrealized | 37,345,827 | 3,181,937 | 4,205,515 | 405,755 | ||||||||
Net increase (decrease) in net assets resulting from operations | 44,183,119 | 6,254,640 | 4,837,422 | 395,871 | ||||||||
Distributions to Shareholders | ||||||||||||
From net investment income: | ||||||||||||
Investor Class | (987,428 | ) | (373,242 | ) | (82,911 | ) | (11,220 | ) | ||||
Institutional Class | (1,159,504 | ) | (608,639 | ) | (82,101 | ) | (13,191 | ) | ||||
A Class | (738,212 | ) | (447,045 | ) | (68,247 | ) | (6,923 | ) | ||||
C Class | (5,144 | ) | (1,921 | ) | (394 | ) | (14 | ) | ||||
R Class | (197,591 | ) | (102,650 | ) | (17,415 | ) | (876 | ) | ||||
From net realized gains: | ||||||||||||
Investor Class | (524,327 | ) | (39,193 | ) | (15,397 | ) | — | |||||
Institutional Class | (539,850 | ) | (56,556 | ) | (13,250 | ) | — | |||||
A Class | (475,028 | ) | (56,066 | ) | (15,618 | ) | — | |||||
C Class | (9,121 | ) | (578 | ) | (296 | ) | — | |||||
R Class | (161,483 | ) | (15,980 | ) | (5,185 | ) | — | |||||
Decrease in net assets from distributions | (4,797,688 | ) | (1,701,870 | ) | (300,814 | ) | (32,224 | ) | ||||
Capital Share Transactions | ||||||||||||
Net increase (decrease) in net assets | 128,200,280 | 76,526,183 | 30,402,144 | 11,142,359 | ||||||||
Net increase (decrease) in net assets | 167,585,711 | 81,078,953 | 34,938,752 | 11,506,006 | ||||||||
Net Assets | ||||||||||||
Beginning of period | 169,371,913 | 88,292,960 | 12,307,461 | 801,455 | ||||||||
End of period | $336,957,624 | $169,371,913 | $47,246,213 | $12,307,461 | ||||||||
Undistributed net investment income | $1,130,167 | $597,919 | $128,370 | $34,958 | ||||||||
See Notes to Financial Statements.
Notes to Financial Statements |
JULY 31, 2013
1. Organization
American Century Asset Allocation Portfolios, Inc. (the corporation) is registered under the Investment Company Act of 1940, as amended (the 1940 Act), as an open-end management investment company and is organized as a Maryland corporation. One Choice In Retirement Portfolio (formerly LIVESTRONG® Income Portfolio), One Choice 2015 Portfolio (formerly LIVESTRONG® 2015 Portfolio), One Choice 2020 Portfolio (formerly LIVESTRONG® 2020 Portfolio), One Choice 2025 Portfolio (formerly LIVESTRONG® 2025 Portfolio), One Choice 2030 Portfolio (formerly LIVESTRONG® 2030 Portfolio), One Choice 2035 Portfolio (formerly LIVESTRONG® 2035 Portfolio), One Choice 2040 Portfolio (formerly LIVESTRONG® 2040 Portfolio), One Choice 2045 Portfolio (formerly LIVESTRONG® 2045 Portfolio), One Choice 2050 Portfolio (formerly LIVESTRONG® 2050 Portfolio) and One Choice 2055 Portfolio (formerly LIVESTRONG® 2055 Portfolio) (collectively, the funds) are ten funds in a series issued by the corporation. The funds operate as “fund of funds,” meaning substantially all of the funds’ assets will be invested in other funds in the American Century Investments family of funds (the underlying funds). Each fund’s assets are allocated among underlying funds that represent major asset classes, including equity securities (stocks), fixed-income securities (bonds) and cash-equivalent instruments (money markets). The underlying funds are not permitted to invest in securities issued by companies assigned the Global Industry Classification Standard (GICS) for the tobacco industry. The funds are diversified as defined under the 1940 Act. Additionally, the underlying funds are generally diversified and so indirectly provide broad exposure to a large number of securities. The funds will assume the risks associated with their underlying funds. The investment objective of One Choice In Retirement Portfolio is to seek current income. Capital appreciation is a secondary objective. The investment objective of each of the nine target date One Choice Portfolios is to seek the highest total return consistent with its asset mix. When a fund reaches its most conservative planned target asset allocation, which is expected to occur on approximately November 30 of the year before the target date, its target asset mix will become fixed and will match that of One Choice In Retirement Portfolio.
The funds offer the Investor Class, the Institutional Class, the A Class, the C Class and the R Class. The A Class may incur an initial sales charge. The A Class and C Class may be subject to a contingent deferred sales charge. The share classes differ principally in their respective sales charges and distribution and shareholder servicing expenses and arrangements. The Institutional Class is made available to institutional shareholders or through financial intermediaries whose clients do not require the same level of shareholder and administrative services as shareholders of other classes. As a result, the Institutional Class is not charged an administrative fee.
2. Significant Accounting Policies
The following is a summary of significant accounting policies consistently followed by the funds in preparation of their financial statements. The financial statements are prepared in conformity with accounting principles generally accepted in the United States of America, which may require management to make certain estimates and assumptions at the date of the financial statements. Actual results could differ from these estimates.
Investment Valuations — The funds determine the fair value of their investments and compute their net asset value per share as of the close of regular trading (usually 4 p.m. Eastern time) on the New York Stock Exchange (NYSE) on each day the NYSE is open. Investments in the underlying funds are valued at their reported net asset value.
Security Transactions — Security transactions are accounted for as of the trade date. Net realized gains and losses are determined on the identified cost basis, which is also used for federal income tax purposes.
Investment Income — Income and capital gain distributions, if any, from the underlying funds are recorded as of the ex-dividend date. Long-term capital gain distributions, if any, from the underlying funds are a component of net realized gain (loss).
Expenses — The expenses included in the accompanying financial statements reflect the expenses of each fund and do not include any expenses associated with the underlying funds.
Income Tax Status — It is each fund’s policy to distribute substantially all net investment income and net realized gains to shareholders and to otherwise qualify as a regulated investment company under provisions of the Internal Revenue Code. Accordingly, no provision has been made for income taxes. The funds file U.S. federal, state, local and non-U.S. tax returns as applicable. The funds’ tax returns are subject to examination by the relevant taxing authority until expiration of the applicable statute of limitations, which is generally three years from the date of filing but can be longer in certain jurisdictions. At this time, management believes there are no uncertain tax positions which, based on their technical merit, would not be sustained upon examination and for which it is reasonably possible that the total amounts of unrecognized tax benefits will significantly change in the next twelve months.
Multiple Class — All shares of each fund represent an equal pro rata interest in the net assets of the class to which such shares belong, and have identical voting, dividend, liquidation and other rights and the same terms and conditions, except for class specific expenses and exclusive rights to vote on matters affecting only individual classes. Income, non-class specific expenses, and realized and unrealized capital gains and losses of the funds are allocated to each class of shares based on their relative net assets.
Distributions to Shareholders — Distributions from net investment income, if any, are generally declared and paid quarterly for One Choice In Retirement Portfolio. Distributions from net investment income, if any, are generally declared and paid annually for the nine target date One Choice Portfolios. Distributions from net realized gains, if any, are generally declared and paid annually for all funds.
Indemnifications — Under the corporation’s organizational documents, its officers and directors are indemnified against certain liabilities arising out of the performance of their duties to the funds. In addition, in the normal course of business, the funds enter into contracts that provide general indemnifications. The maximum exposure under these arrangements is unknown as this would involve future claims that may be made against a fund. The risk of material loss from such claims is considered by management to be remote.
3. Fees and Transactions with Related Parties
Administrative Fees — The corporation has entered into an agreement with American Century Investment Management, Inc. (ACIM), under which ACIM provides the funds with shareholder services in exchange for an administrative fee (the fee). The fee is computed and accrued daily based on each class’s daily net assets and paid monthly in arrears. The rate of the fee for the Investor Class, A Class, C Class and R Class is 0.20%. There is no administrative fee for the Institutional Class.
Distribution and Service Fees — The Board of Directors has adopted a separate Master Distribution and Individual Shareholder Services Plan for each of the A Class, C Class and R Class (collectively the plans), pursuant to Rule 12b-1 of the 1940 Act. The plans provide that the A Class will pay American Century Investment Services, Inc. (ACIS) an annual distribution and service fee of 0.25%. The plans provide that the C Class will pay ACIS an annual distribution and service fee of 1.00%, of which 0.25% is paid for individual shareholder services and 0.75% is paid for distribution services. The plans provide that the R Class will pay ACIS an annual distribution and service fee of 0.50%. The fees are computed and accrued daily based on each class’s daily net assets and paid monthly in arrears. These fees are used to pay financial intermediaries for distribution and individual shareholder services. Fees incurred under the plans during the year ended July 31, 2013 are detailed in the Statement of Operations.
Acquired Fund Fees and Expenses — Each fund will indirectly realize its pro rata share of the fees and expenses of the underlying funds in which it invests. These fees and expenses are already reflected in the valuation of the underlying funds.
Related Parties — Certain officers and directors of the corporation are also officers and/or directors of American Century Companies, Inc. (ACC). The corporation’s investment advisor, ACIM, the corporation’s distributor, ACIS, and the corporation’s transfer agent, American Century Services, LLC are wholly owned, directly or indirectly, by ACC. The directors of the corporation are also directors of some underlying funds and therefore those underlying funds may be deemed to be under common control with the corporation. The officers of the corporation are also officers of all the underlying funds. ACIM serves as the investment advisor for the underlying funds.
4. Investment Transactions
Investment transactions for the year ended July 31, 2013 were as follows:
One Choice In Retirement Portfolio | One Choice | One Choice | One Choice | One Choice | |||||||||||
Purchases | $162,348,668 | $253,693,066 | $393,143,496 | $462,787,794 | $365,276,565 | ||||||||||
Sales | $46,711,182 | $65,276,995 | $42,742,636 | $48,947,286 | $38,451,258 |
One Choice | One Choice | One Choice | One Choice | One Choice | |||||||||||
Purchases | $355,086,901 | $269,100,033 | $245,486,515 | $141,182,823 | $34,225,821 | ||||||||||
Sales | $28,949,500 | $24,498,917 | $20,618,065 | $10,814,458 | $3,476,524 |
5. Capital Share Transactions
The corporation is authorized to issue 3,000,000,000 shares. Transactions in shares of the funds were as follows:
Year ended July 31, 2013 | Year ended July 31, 2012 | |||||||||||
Shares | Amount | Shares | Amount | |||||||||
One Choice In Retirement Portfolio | ||||||||||||
Investor Class | ||||||||||||
Sold | 9,104,979 | $109,509,113 | 5,646,932 | $63,990,396 | ||||||||
Issued in reinvestment of distributions | 402,927 | 4,752,126 | 192,161 | 2,134,278 | ||||||||
Redeemed | (4,016,227 | ) | (48,370,149 | ) | (2,064,519 | ) | (23,118,867 | ) | ||||
| 5,491,679 | 65,891,090 | 3,774,574 | 43,005,807 | |||||||||
Institutional Class | ||||||||||||
Sold | 4,006,712 | 48,127,535 | 3,560,637 | 40,313,439 | ||||||||
Issued in reinvestment of distributions | 251,091 | 2,961,385 | 231,838 | 2,571,810 | ||||||||
Redeemed | (2,299,547 | ) | (27,726,781 | ) | (6,678,409 | ) | (76,338,602 | ) | ||||
| 1,958,256 | 23,362,139 | (2,885,934 | ) | (33,453,353 | ) | |||||||
A Class | ||||||||||||
Sold | 5,632,291 | 67,793,197 | 4,751,909 | 53,398,546 | ||||||||
Issued in reinvestment of distributions | 201,785 | 2,377,257 | 154,483 | 1,710,373 | ||||||||
Redeemed | (5,262,131 | ) | (63,039,073 | ) | (3,612,954 | ) | (40,855,442 | ) | ||||
| 571,945 | 7,131,381 | 1,293,438 | 14,253,477 | |||||||||
C Class | ||||||||||||
Sold | 42,885 | 520,670 | 28,505 | 319,609 | ||||||||
Issued in reinvestment of distributions | 1,549 | 18,127 | 741 | 8,181 | ||||||||
Redeemed | (3,873 | ) | (46,207 | ) | (7,379 | ) | (82,237 | ) | ||||
| 40,561 | 492,590 | 21,867 | 245,553 | |||||||||
R Class | ||||||||||||
Sold | 2,901,444 | 34,900,267 | 1,915,959 | 21,670,485 | ||||||||
Issued in reinvestment of distributions | 94,626 | 1,111,131 | 44,984 | 498,014 | ||||||||
Redeemed | (1,457,432 | ) | (17,553,469 | ) | (845,413 | ) | (9,525,819 | ) | ||||
| 1,538,638 | 18,457,929 | 1,115,530 | 12,642,680 | |||||||||
Net increase (decrease) | 9,601,079 | $115,335,129 | 3,319,475 | $36,694,164 | ||||||||
Year ended July 31, 2013 | Year ended July 31, 2012 | |||||||||||
Shares | Amount | Shares | Amount | |||||||||
One Choice 2015 Portfolio | ||||||||||||
Investor Class | ||||||||||||
Sold | 15,322,335 | $194,889,612 | 12,422,856 | $147,323,918 | ||||||||
Issued in reinvestment of distributions | 1,036,518 | 12,728,497 | 663,845 | 7,640,848 | ||||||||
Redeemed | (9,751,193 | ) | (124,494,749 | ) | (5,624,480 | ) | (66,135,026 | ) | ||||
| 6,607,660 | 83,123,360 | 7,462,221 | 88,829,740 | |||||||||
Institutional Class | ||||||||||||
Sold | 6,388,534 | 81,394,033 | 4,253,870 | 50,930,909 | ||||||||
Issued in reinvestment of distributions | 360,857 | 4,431,323 | 353,831 | 4,072,600 | ||||||||
Redeemed | (3,084,274 | ) | (39,390,870 | ) | (9,139,005 | ) | (110,142,044 | ) | ||||
| 3,665,117 | 46,434,486 | (4,531,304 | ) | (55,138,535 | ) | |||||||
A Class | ||||||||||||
Sold | 9,725,821 | 123,392,375 | 9,836,898 | 115,812,844 | ||||||||
Issued in reinvestment of distributions | 453,814 | 5,572,833 | 302,857 | 3,485,888 | ||||||||
Redeemed | (7,541,660 | ) | (95,732,604 | ) | (5,397,114 | ) | (63,926,048 | ) | ||||
| 2,637,975 | 33,232,604 | 4,742,641 | 55,372,684 | |||||||||
C Class | ||||||||||||
Sold | 237,757 | 3,012,748 | 117,324 | 1,384,701 | ||||||||
Issued in reinvestment of distributions | 3,789 | 46,602 | 1,016 | 11,713 | ||||||||
Redeemed | (110,740 | ) | (1,402,508 | ) | (23,346 | ) | (274,354 | ) | ||||
| 130,806 | 1,656,842 | 94,994 | 1,122,060 | |||||||||
R Class | ||||||||||||
Sold | 4,686,538 | 59,353,954 | 3,593,265 | 42,395,369 | ||||||||
Issued in reinvestment of distributions | 169,289 | 2,078,871 | 95,611 | 1,100,478 | ||||||||
Redeemed | (3,196,908 | ) | (40,674,811 | ) | (1,542,007 | ) | (18,144,325 | ) | ||||
| 1,658,919 | 20,758,014 | 2,146,869 | 25,351,522 | |||||||||
Net increase (decrease) | 14,700,477 | $185,205,306 | 9,915,421 | $115,537,471 | ||||||||
Year ended July 31, 2013 | Year ended July 31, 2012 | |||||||||||
Shares | Amount | Shares | Amount | |||||||||
One Choice 2020 Portfolio | ||||||||||||
Investor Class | ||||||||||||
Sold | 17,574,504 | $195,282,525 | 12,968,836 | $134,534,608 | ||||||||
Issued in reinvestment of distributions | 715,865 | 7,659,751 | 315,956 | 3,146,918 | ||||||||
Redeemed | (5,590,859 | ) | (62,630,333 | ) | (2,981,069 | ) | (30,578,709 | ) | ||||
| 12,699,510 | 140,311,943 | 10,303,723 | 107,102,817 | |||||||||
Institutional Class | ||||||||||||
Sold | 11,495,580 | 127,961,001 | 4,719,891 | 48,779,799 | ||||||||
Issued in reinvestment of distributions | 458,041 | 4,901,041 | 458,924 | 4,566,297 | ||||||||
Redeemed | (3,050,956 | ) | (34,121,293 | ) | (12,079,915 | ) | (127,529,964 | ) | ||||
| 8,902,665 | 98,740,749 | (6,901,100 | ) | (74,183,868 | ) | |||||||
A Class | ||||||||||||
Sold | 12,392,613 | 137,405,595 | 8,750,064 | 89,950,120 | ||||||||
Issued in reinvestment of distributions | 422,453 | 4,516,026 | 311,638 | 3,100,800 | ||||||||
Redeemed | (6,406,289 | ) | (70,755,348 | ) | (4,084,349 | ) | (42,559,491 | ) | ||||
| 6,408,777 | 71,166,273 | 4,977,353 | 50,491,429 | |||||||||
C Class | ||||||||||||
Sold | 379,741 | 4,240,608 | 174,001 | 1,805,448 | ||||||||
Issued in reinvestment of distributions | 4,935 | 52,903 | 1,069 | 10,665 | ||||||||
Redeemed | (70,974 | ) | (792,031 | ) | (13,763 | ) | (138,906 | ) | ||||
| 313,702 | 3,501,480 | 161,307 | 1,677,207 | |||||||||
R Class | ||||||||||||
Sold | 5,327,703 | 59,083,880 | 3,589,034 | 36,996,671 | ||||||||
Issued in reinvestment of distributions | 142,703 | 1,526,922 | 78,413 | 780,992 | ||||||||
Redeemed | (2,368,069 | ) | (26,295,502 | ) | (1,350,356 | ) | (13,879,148 | ) | ||||
| 3,102,337 | 34,315,300 | 2,317,091 | 23,898,515 | |||||||||
Net increase (decrease) | 31,426,991 | $348,035,745 | 10,858,374 | $108,986,100 | ||||||||
Year ended July 31, 2013 | Year ended July 31, 2012 | |||||||||||
Shares | Amount | Shares | Amount | |||||||||
One Choice 2025 Portfolio | ||||||||||||
Investor Class | ||||||||||||
Sold | 21,905,715 | $286,727,700 | 14,443,333 | $173,963,485 | ||||||||
Issued in reinvestment of distributions | 1,263,062 | 15,889,240 | 802,334 | 9,323,127 | ||||||||
Redeemed | (8,758,373 | ) | (115,212,720 | ) | (5,848,491 | ) | (69,835,717 | ) | ||||
| 14,410,404 | 187,404,220 | 9,397,176 | 113,450,895 | |||||||||
Institutional Class | ||||||||||||
Sold | 10,084,144 | 131,596,068 | 7,639,183 | 92,454,473 | ||||||||
Issued in reinvestment of distributions | 502,576 | 6,317,375 | 468,061 | 5,438,871 | ||||||||
Redeemed | (3,443,704 | ) | (45,308,666 | ) | (14,709,166 | ) | (179,334,095 | ) | ||||
| 7,143,016 | 92,604,777 | (6,601,922 | ) | (81,440,751 | ) | |||||||
A Class | ||||||||||||
Sold | 14,889,032 | 194,367,220 | 12,360,451 | 147,669,922 | ||||||||
Issued in reinvestment of distributions | 606,008 | 7,623,588 | 376,396 | 4,373,716 | ||||||||
Redeemed | (8,180,957 | ) | (107,134,483 | ) | (6,497,300 | ) | (78,008,967 | ) | ||||
| 7,314,083 | 94,856,325 | 6,239,547 | 74,034,671 | |||||||||
C Class | ||||||||||||
Sold | 231,924 | 3,020,371 | 176,345 | 2,125,037 | ||||||||
Issued in reinvestment of distributions | 5,688 | 71,730 | 1,990 | 23,185 | ||||||||
Redeemed | (67,347 | ) | (874,444 | ) | (28,459 | ) | (343,054 | ) | ||||
| 170,265 | 2,217,657 | 149,876 | 1,805,168 | |||||||||
R Class | ||||||||||||
Sold | 5,671,348 | 74,035,499 | 4,933,286 | 59,197,487 | ||||||||
Issued in reinvestment of distributions | 214,976 | 2,704,400 | 129,525 | 1,505,082 | ||||||||
Redeemed | (3,716,508 | ) | (48,533,278 | ) | (1,924,581 | ) | (22,902,739 | ) | ||||
| 2,169,816 | 28,206,621 | 3,138,230 | 37,799,830 | |||||||||
Net increase (decrease) | 31,207,584 | $405,289,600 | 12,322,907 | $145,649,813 | ||||||||
Year ended July 31, 2013 | Year ended July 31, 2012 | |||||||||||
Shares | Amount | Shares | Amount | |||||||||
One Choice 2030 Portfolio | ||||||||||||
Investor Class | ||||||||||||
Sold | 15,827,973 | $174,401,934 | 10,694,134 | $108,555,346 | ||||||||
Issued in reinvestment of distributions | 561,198 | 5,909,411 | 212,068 | 2,054,940 | ||||||||
Redeemed | (4,119,025 | ) | (45,821,607 | ) | (2,040,370 | ) | (20,468,814 | ) | ||||
| 12,270,146 | 134,489,738 | 8,865,832 | 90,141,472 | |||||||||
Institutional Class | ||||||||||||
Sold | 10,414,918 | 114,569,213 | 6,010,456 | 60,901,759 | ||||||||
Issued in reinvestment of distributions | 395,398 | 4,163,541 | 354,499 | 3,431,557 | ||||||||
Redeemed | (2,437,496 | ) | (27,035,315 | ) | (11,522,059 | ) | (118,774,329 | ) | ||||
| 8,372,820 | 91,697,439 | (5,157,104 | ) | (54,441,013 | ) | |||||||
A Class | ||||||||||||
Sold | 12,761,092 | 139,840,717 | 8,019,941 | 80,461,767 | ||||||||
Issued in reinvestment of distributions | 388,007 | 4,081,835 | 248,039 | 2,401,021 | ||||||||
Redeemed | (6,726,595 | ) | (73,434,908 | ) | (3,194,936 | ) | (32,630,899 | ) | ||||
| 6,422,504 | 70,487,644 | 5,073,044 | 50,231,889 | |||||||||
C Class | ||||||||||||
Sold | 163,316 | 1,803,792 | 89,788 | 886,613 | ||||||||
Issued in reinvestment of distributions | 3,084 | 32,568 | 1,101 | 10,689 | ||||||||
Redeemed | (24,919 | ) | (273,173 | ) | (8,923 | ) | (88,492 | ) | ||||
| 141,481 | 1,563,187 | 81,966 | 808,810 | |||||||||
R Class | ||||||||||||
Sold | 4,728,567 | 51,824,638 | 4,577,554 | 46,603,680 | ||||||||
Issued in reinvestment of distributions | 148,104 | 1,559,529 | 62,434 | 604,366 | ||||||||
Redeemed | (2,581,244 | ) | (28,332,867 | ) | (1,453,660 | ) | (14,556,711 | ) | ||||
| 2,295,427 | 25,051,300 | 3,186,328 | 32,651,335 | |||||||||
Net increase (decrease) | 29,502,378 | $323,289,308 | 12,050,066 | $119,392,493 | ||||||||
Year ended July 31, 2013 | Year ended July 31, 2012 | |||||||||||
Shares | Amount | Shares | Amount | |||||||||
One Choice 2035 Portfolio | ||||||||||||
Investor Class | ||||||||||||
Sold | 15,566,058 | $212,886,566 | 10,156,123 | $125,701,944 | ||||||||
Issued in reinvestment of distributions | 818,633 | 10,650,420 | 447,439 | 5,320,049 | ||||||||
Redeemed | (6,155,975 | ) | (84,525,108 | ) | (3,525,313 | ) | (43,327,043 | ) | ||||
| 10,228,716 | 139,011,878 | 7,078,249 | 87,694,950 | |||||||||
Institutional Class | ||||||||||||
Sold | 7,425,796 | 101,284,900 | 5,256,357 | 65,533,010 | ||||||||
Issued in reinvestment of distributions | 354,611 | 4,613,488 | 254,760 | 3,029,082 | ||||||||
Redeemed | (2,358,336 | ) | (32,419,009 | ) | (7,065,965 | ) | (88,754,801 | ) | ||||
| 5,422,071 | 73,479,379 | (1,554,848 | ) | (20,192,709 | ) | |||||||
A Class | ||||||||||||
Sold | 10,699,576 | 145,683,369 | 9,179,098 | 112,642,306 | ||||||||
Issued in reinvestment of distributions | 419,559 | 5,458,461 | 222,857 | 2,649,773 | ||||||||
Redeemed | (5,238,011 | ) | (71,270,665 | ) | (4,627,764 | ) | (57,133,487 | ) | ||||
| 5,881,124 | 79,871,165 | 4,774,191 | 58,158,592 | |||||||||
C Class | ||||||||||||
Sold | 154,242 | 2,080,840 | 64,941 | 802,822 | ||||||||
Issued in reinvestment of distributions | 2,597 | 33,832 | 531 | 6,328 | ||||||||
Redeemed | (19,292 | ) | (265,520 | ) | (6,593 | ) | (77,805 | ) | ||||
| 137,547 | 1,849,152 | 58,879 | 731,345 | |||||||||
R Class | ||||||||||||
Sold | 4,406,484 | 59,941,209 | 3,862,558 | 47,636,608 | ||||||||
Issued in reinvestment of distributions | 165,122 | 2,148,238 | 80,668 | 959,142 | ||||||||
Redeemed | (2,689,127 | ) | (36,560,222 | ) | (1,719,035 | ) | (20,980,473 | ) | ||||
| 1,882,479 | 25,529,225 | 2,224,191 | 27,615,277 | |||||||||
Net increase (decrease) | 23,551,937 | $319,740,799 | 12,580,662 | $154,007,455 | ||||||||
Year ended July 31, 2013 | Year ended July 31, 2012 | |||||||||||
Shares | Amount | Shares | Amount | |||||||||
One Choice 2040 Portfolio | ||||||||||||
Investor Class | ||||||||||||
Sold | 11,673,243 | $129,271,529 | 7,057,461 | $70,783,508 | ||||||||
Issued in reinvestment of distributions | 340,253 | 3,579,466 | 122,039 | 1,164,244 | ||||||||
Redeemed | (2,679,655 | ) | (30,048,104 | ) | (1,169,465 | ) | (11,569,620 | ) | ||||
| 9,333,841 | 102,802,891 | 6,010,035 | 60,378,132 | |||||||||
Institutional Class | ||||||||||||
Sold | 8,092,206 | 89,366,596 | 3,776,364 | 37,682,387 | ||||||||
Issued in reinvestment of distributions | 282,159 | 2,968,317 | 183,177 | 1,745,678 | ||||||||
Redeemed | (1,963,315 | ) | (22,106,041 | ) | (4,915,879 | ) | (50,019,329 | ) | ||||
| 6,411,050 | 70,228,872 | (956,338 | ) | (10,591,264 | ) | |||||||
A Class | ||||||||||||
Sold | 8,111,665 | 89,513,559 | 5,755,522 | 57,301,737 | ||||||||
Issued in reinvestment of distributions | 221,993 | 2,335,369 | 137,747 | 1,314,106 | ||||||||
Redeemed | (4,215,706 | ) | (46,186,634 | ) | (2,055,023 | ) | (20,679,903 | ) | ||||
| 4,117,952 | 45,662,294 | 3,838,246 | 37,935,940 | |||||||||
C Class | ||||||||||||
Sold | 129,859 | 1,422,687 | 45,306 | 448,375 | ||||||||
Issued in reinvestment of distributions | 1,536 | 16,193 | 249 | 2,382 | ||||||||
Redeemed | (12,412 | ) | (138,841 | ) | (12,450 | ) | (119,524 | ) | ||||
| 118,983 | 1,300,039 | 33,105 | 331,233 | |||||||||
R Class | ||||||||||||
Sold | 3,177,705 | 35,123,744 | 2,457,687 | 24,699,242 | ||||||||
Issued in reinvestment of distributions | 73,570 | 773,949 | 30,789 | 293,420 | ||||||||
Redeemed | (1,337,393 | ) | (14,834,795 | ) | (795,633 | ) | (7,868,728 | ) | ||||
| 1,913,882 | 21,062,898 | 1,692,843 | 17,123,934 | |||||||||
Net increase (decrease) | 21,895,708 | $241,056,994 | 10,617,891 | $105,177,975 | ||||||||
Year ended July 31, 2013 | Year ended July 31, 2012 | |||||||||||
Shares | Amount | Shares | Amount | |||||||||
One Choice 2045 Portfolio | ||||||||||||
Investor Class | ||||||||||||
Sold | 9,865,621 | $136,859,572 | 6,599,488 | $81,818,895 | ||||||||
Issued in reinvestment of distributions | 447,874 | 5,876,112 | 232,611 | 2,756,448 | ||||||||
Redeemed | (3,813,871 | ) | (53,371,988 | ) | (2,036,922 | ) | (25,039,771 | ) | ||||
| 6,499,624 | 89,363,696 | 4,795,177 | 59,535,572 | |||||||||
Institutional Class | ||||||||||||
Sold | 5,830,139 | 80,927,927 | 4,721,714 | 58,801,519 | ||||||||
Issued in reinvestment of distributions | 275,262 | 3,614,185 | 164,394 | 1,949,717 | ||||||||
Redeemed | (2,039,715 | ) | (28,820,490 | ) | (4,562,852 | ) | (55,973,622 | ) | ||||
| 4,065,686 | 55,721,622 | 323,256 | 4,777,614 | |||||||||
A Class | ||||||||||||
Sold | 7,207,169 | 99,695,460 | 5,713,213 | 70,172,011 | ||||||||
Issued in reinvestment of distributions | 243,458 | 3,194,164 | 126,180 | 1,495,230 | ||||||||
Redeemed | (3,419,440 | ) | (47,314,139 | ) | (2,668,501 | ) | (32,878,588 | ) | ||||
| 4,031,187 | 55,575,485 | 3,170,892 | 38,788,653 | |||||||||
C Class | ||||||||||||
Sold | 57,351 | 788,393 | 24,341 | 303,617 | ||||||||
Issued in reinvestment of distributions | 1,005 | 13,216 | 222 | 2,633 | ||||||||
Redeemed | (25,755 | ) | (356,111 | ) | (4,047 | ) | (48,730 | ) | ||||
| 32,601 | 445,498 | 20,516 | 257,520 | |||||||||
R Class | ||||||||||||
Sold | 2,800,637 | 38,731,448 | 2,739,722 | 33,863,762 | ||||||||
Issued in reinvestment of distributions | 93,228 | 1,224,088 | 43,449 | 515,302 | ||||||||
Redeemed | (1,583,628 | ) | (21,964,230 | ) | (1,075,859 | ) | (13,229,768 | ) | ||||
| 1,310,237 | 17,991,306 | 1,707,312 | 21,149,296 | |||||||||
Net increase (decrease) | 15,939,335 | $219,097,607 | 10,017,153 | $124,508,655 | ||||||||
Year ended July 31, 2013 | Year ended July 31, 2012 | |||||||||||
Shares | Amount | Shares | Amount | |||||||||
One Choice 2050 Portfolio | ||||||||||||
Investor Class | ||||||||||||
Sold | 6,049,436 | $66,148,608 | 3,372,720 | $32,957,155 | ||||||||
Issued in reinvestment of distributions | 146,269 | 1,509,492 | 44,258 | 411,156 | ||||||||
Redeemed | (1,173,785 | ) | (12,929,650 | ) | (625,339 | ) | (5,949,426 | ) | ||||
| 5,021,920 | 54,728,450 | 2,791,639 | 27,418,885 | |||||||||
Institutional Class | ||||||||||||
Sold | 4,643,778 | 50,574,652 | 3,204,167 | 30,914,804 | ||||||||
Issued in reinvestment of distributions | 164,666 | 1,699,354 | 71,526 | 665,195 | ||||||||
Redeemed | (1,594,792 | ) | (17,804,713 | ) | (1,504,227 | ) | (14,718,295 | ) | ||||
| 3,213,652 | 34,469,293 | 1,771,466 | 16,861,704 | |||||||||
A Class | ||||||||||||
Sold | 4,242,585 | 46,157,215 | 3,247,193 | 31,512,717 | ||||||||
Issued in reinvestment of distributions | 114,358 | 1,180,176 | 53,153 | 493,789 | ||||||||
Redeemed | (2,087,647 | ) | (22,595,813 | ) | (834,591 | ) | (8,104,329 | ) | ||||
| 2,269,296 | 24,741,578 | 2,465,755 | 23,902,177 | |||||||||
C Class | ||||||||||||
Sold | 129,920 | 1,411,412 | 52,241 | 481,017 | ||||||||
Issued in reinvestment of distributions | 1,356 | 14,016 | 257 | 2,392 | ||||||||
Redeemed | (35,017 | ) | (388,636 | ) | (11,599 | ) | (109,490 | ) | ||||
| 96,259 | 1,036,792 | 40,899 | 373,919 | |||||||||
R Class | ||||||||||||
Sold | 1,771,563 | 19,322,122 | 1,240,804 | 12,183,099 | ||||||||
Issued in reinvestment of distributions | 33,465 | 345,363 | 12,279 | 114,191 | ||||||||
Redeemed | (588,663 | ) | (6,443,318 | ) | (444,762 | ) | (4,327,792 | ) | ||||
| 1,216,365 | 13,224,167 | 808,321 | 7,969,498 | |||||||||
Net increase (decrease) | 11,817,492 | $128,200,280 | 7,878,080 | $76,526,183 | ||||||||
Year ended July 31, 2013 | Year ended July 31, 2012 | |||||||||||
Shares | Amount | Shares | Amount | |||||||||
One Choice 2055 Portfolio | ||||||||||||
Investor Class | ||||||||||||
Sold | 1,329,932 | $14,885,809 | 445,679 | $4,421,777 | ||||||||
Issued in reinvestment of distributions | 9,360 | 98,281 | 1,193 | 11,205 | ||||||||
Redeemed | (479,801 | ) | (5,422,948 | ) | (101,345 | ) | (998,562 | ) | ||||
| 859,491 | 9,561,142 | 345,527 | 3,434,420 | |||||||||
Institutional Class | ||||||||||||
Sold | 690,555 | 7,705,028 | 508,053 | 4,994,615 | ||||||||
Issued in reinvestment of distributions | 9,081 | 95,351 | 1,405 | 13,191 | ||||||||
Redeemed | (175,954 | ) | (1,943,140 | ) | (161,343 | ) | (1,594,825 | ) | ||||
| 523,682 | 5,857,239 | 348,115 | 3,412,981 | |||||||||
A Class | ||||||||||||
Sold | 1,082,184 | 12,072,068 | 363,321 | 3,583,648 | ||||||||
Issued in reinvestment of distributions | 7,862 | 82,547 | 738 | 6,923 | ||||||||
Redeemed | (231,729 | ) | (2,574,278 | ) | (46,166 | ) | (463,017 | ) | ||||
| 858,317 | 9,580,337 | 317,893 | 3,127,554 | |||||||||
C Class | ||||||||||||
Sold | 12,693 | 143,571 | 8,641 | 85,931 | ||||||||
Issued in reinvestment of distributions | 65 | 683 | 1 | 14 | ||||||||
Redeemed | (3,412 | ) | (39,903 | ) | (502 | ) | (4,983 | ) | ||||
| 9,346 | 104,351 | 8,140 | 80,962 | |||||||||
R Class | ||||||||||||
Sold | 556,067 | 6,227,902 | 126,415 | 1,266,300 | ||||||||
Issued in reinvestment of distributions | 2,149 | 22,562 | 93 | 876 | ||||||||
Redeemed | (84,792 | ) | (951,389 | ) | (18,073 | ) | (180,734 | ) | ||||
| 473,424 | 5,299,075 | 108,435 | 1,086,442 | |||||||||
Net increase (decrease) | 2,724,260 | $30,402,144 | 1,128,110 | $11,142,359 | ||||||||
6. Affiliated Company Transactions
Investments are funds within the American Century Investments family of funds, of which certain funds may be deemed to be under common control because of the same board of directors. A summary of transactions for each underlying fund for the year ended July 31, 2013 follows:
July 31, 2012 | July 31, 2013 | ||||||||||||||||||||
Fund/Underlying Fund | Share Balance | Purchase Cost | Sales | Realized | Distributions Received(1) | Share Balance | Market | ||||||||||||||
One Choice In Retirement Portfolio | |||||||||||||||||||||
NT Core Equity Plus Fund Institutional Class | 943,431 | $2,848,115 | $1,287,942 | $18,571 | $330,720 | 1,075,913 | $14,944,428 | ||||||||||||||
NT Equity Growth Fund Institutional Class | 3,359,605 | 14,117,276 | 7,094,025 | 26,510 | 2,634,071 | 4,027,598 | 49,297,798 | ||||||||||||||
NT Growth Fund Institutional Class | 1,786,456 | 8,588,315 | 3,016,869 | (18,326 | ) | 1,000,493 | 2,218,035 | 31,873,165 | |||||||||||||
NT Large Company Value Fund Institutional Class | 4,177,117 | 13,352,760 | 8,430,401 | 115,683 | 1,393,663 | 4,691,688 | 53,907,490 | ||||||||||||||
NT Mid Cap Value Fund Institutional Class | 1,402,010 | 4,189,602 | 2,067,004 | 42,400 | 780,099 | 1,606,174 | 19,675,632 | ||||||||||||||
NT Small Company Fund Institutional Class | 839,198 | 2,335,416 | 1,530,147 | 132,028 | 461,944 | 932,733 | 10,036,211 | ||||||||||||||
NT Vista Fund Institutional Class | 834,795 | 2,376,565 | 958,444 | 11,480 | 16,690 | 963,648 | 12,508,155 | ||||||||||||||
Real Estate Fund Institutional Class | 146,969 | 1,205,474 | 125,794 | (4,956 | ) | 87,132 | 192,130 | 4,714,870 | |||||||||||||
High-Yield Fund Institutional Class | 2,165,914 | 5,927,513 | 821,660 | (4,548 | ) | 1,125,456 | 2,983,014 | 18,494,686 | |||||||||||||
Inflation-Adjusted Bond Fund Institutional Class | 1,982,806 | 16,109,174 | 2,323,842 | 6,463 | 844,230 | 3,045,484 | 37,215,811 | ||||||||||||||
NT Diversified Bond Fund Institutional Class | 8,257,704 | 54,696,526 | 10,718,271 | (20,890 | ) | 3,572,870 | 12,260,943 | 130,456,430 | |||||||||||||
Premium Money Market Fund Investor Class | 34,761,888 | 17,092,089 | 3,016,050 | — | 4,202 | 48,837,927 | 48,837,927 | ||||||||||||||
International Bond Fund Institutional Class | 1,679,263 | 13,665,352 | 2,261,568 | (17,267 | ) | 503,139 | 2,483,677 | 34,150,558 | |||||||||||||
NT International Growth Fund Institutional Class | 1,922,365 | 5,844,491 | 2,711,856 | 60,161 | 294,553 | 2,222,569 | 24,648,291 | ||||||||||||||
| $162,348,668 | $46,363,873 | $347,309 | $13,049,262 | $490,761,452 | |||||||||||||||||
(1) | Distributions received includes distributions from net investment income and from capital gains, if any. |
July 31, 2012 | July 31, 2013 | ||||||||||||||||||||
Fund/Underlying Fund | Share Balance | Purchase Cost | Sales | Realized | Distributions Received(1) | Share Balance | Market | ||||||||||||||
One Choice 2015 Portfolio | |||||||||||||||||||||
NT Core Equity Plus Fund Institutional Class | 2,390,599 | $3,679,007 | $1,147,584 | $26,142 | $818,151 | 2,607,470 | $36,217,755 | ||||||||||||||
NT Equity Growth Fund Institutional Class | 8,301,220 | 22,237,154 | 10,974,530 | 180,053 | 6,421,446 | 9,388,481 | 114,915,003 | ||||||||||||||
NT Growth Fund Institutional Class | 4,959,081 | 14,215,030 | 6,373,845 | 157,552 | 2,692,761 | 5,572,458 | 80,076,226 | ||||||||||||||
NT Large Company Value Fund Institutional Class | 10,584,839 | 19,346,539 | 14,381,501 | 809,037 | 3,461,940 | 11,104,521 | 127,590,950 | ||||||||||||||
NT Mid Cap Value Fund Institutional Class | 3,890,798 | 6,030,453 | 3,876,689 | 95,604 | 2,071,002 | 4,100,679 | 50,233,314 | ||||||||||||||
NT Small Company Fund Institutional Class | 2,126,736 | 3,710,666 | 1,957,752 | 114,506 | 1,156,616 | 2,338,451 | 25,161,735 | ||||||||||||||
NT Vista Fund Institutional Class | 2,539,034 | 3,614,243 | 1,746,170 | 119,796 | 49,968 | 2,712,020 | 35,202,020 | ||||||||||||||
Real Estate Fund Institutional Class | 420,775 | 1,614,148 | 195,558 | 7,666 | 232,882 | 481,373 | 11,812,895 | ||||||||||||||
High-Yield Fund Institutional Class | 5,414,715 | 7,594,046 | — | — | 2,708,399 | 6,629,783 | 41,104,653 | ||||||||||||||
Inflation-Adjusted Bond Fund Institutional Class | 4,956,388 | 23,575,040 | 1,001,046 | (7,067 | ) | 2,034,746 | 6,696,627 | 81,832,784 | |||||||||||||
NT Diversified Bond Fund Institutional Class | 20,502,259 | 94,497,198 | 13,499,829 | (78,416 | ) | 8,657,179 | 27,867,833 | 296,513,740 | |||||||||||||
Premium Money Market Fund Investor Class | 77,061,666 | 25,206,664 | 734,624 | — | 9,139 | 101,533,706 | 101,533,706 | ||||||||||||||
International Bond Fund Institutional Class | 3,979,540 | 19,720,341 | 576,407 | — | 1,192,390 | 5,316,033 | 73,095,451 | ||||||||||||||
NT Emerging Markets Fund Institutional Class | 601,196 | 1,504,832 | 1,438,366 | 98,412 | 23,734 | 586,208 | 5,744,834 | ||||||||||||||
NT International Growth Fund Institutional Class | 5,231,088 | 7,147,705 | 5,733,379 | 116,430 | 779,075 | 5,358,497 | 59,425,731 | ||||||||||||||
| $253,693,066 | $63,637,280 | $1,639,715 | $32,309,428 | $1,140,460,797 | |||||||||||||||||
(1) | Distributions received includes distributions from net investment income and from capital gains, if any. |
July 31, 2012 | July 31, 2013 | ||||||||||||||||||||
Fund/Underlying Fund | Share Balance | Purchase Cost | Sales | Realized | Distributions Received(1) | Share Balance | Market | ||||||||||||||
One Choice 2020 Portfolio | |||||||||||||||||||||
NT Core Equity Plus Fund Institutional Class | 1,527,327 | $7,748,870 | $864,528 | $(8,161 | ) | $600,291 | 2,109,093 | $29,295,304 | |||||||||||||
NT Equity Growth Fund Institutional Class | 5,166,501 | 31,135,264 | 5,585,303 | 45,163 | 4,468,844 | 7,567,704 | 92,628,694 | ||||||||||||||
NT Growth Fund Institutional Class | 3,612,565 | 27,246,217 | 3,691,738 | (48,451 | ) | 2,192,209 | 5,424,075 | 77,943,958 | |||||||||||||
NT Large Company Value Fund Institutional Class | 6,915,890 | 31,067,021 | 5,927,663 | 55,949 | 2,573,187 | 9,500,396 | 109,159,548 | ||||||||||||||
NT Mid Cap Value Fund Institutional Class | 2,904,792 | 13,328,956 | 2,181,669 | (13,481 | ) | 1,744,419 | 3,964,015 | 48,559,183 | |||||||||||||
NT Small Company Fund Institutional Class | 1,358,447 | 5,534,613 | 1,232,820 | 34,047 | 818,104 | 1,866,026 | 20,078,437 | ||||||||||||||
NT Vista Fund Institutional Class | 2,161,742 | 10,416,005 | 1,960,151 | 11,589 | 47,560 | 2,935,252 | 38,099,577 | ||||||||||||||
Real Estate Fund Institutional Class | 328,371 | 4,760,613 | 331,783 | (8,351 | ) | 218,514 | 514,039 | 12,614,523 | |||||||||||||
High-Yield Fund Institutional Class | 3,304,070 | 15,633,034 | 941,654 | (9,451 | ) | 1,938,018 | 5,658,295 | 35,081,429 | |||||||||||||
Inflation-Adjusted Bond Fund Institutional Class | 3,033,421 | 37,836,897 | 2,285,832 | (8,259 | ) | 1,465,944 | 5,772,276 | 70,537,207 | |||||||||||||
NT Diversified Bond Fund Institutional Class | 12,561,991 | 124,200,675 | 9,569,626 | (19,601 | ) | 6,064,757 | 22,991,264 | 244,627,045 | |||||||||||||
NT Emerging Markets Fund Institutional Class | 1,067,325 | 5,353,251 | 1,200,961 | (48,809 | ) | 65,577 | 1,480,359 | 14,507,523 | |||||||||||||
NT International Growth Fund Institutional Class | 3,971,338 | 17,889,056 | 3,410,869 | 47,046 | 652,466 | 5,384,627 | 59,715,510 | ||||||||||||||
Premium Money Market Fund Investor Class | 35,177,103 | 32,490,105 | 2,056,050 | — | 5,018 | 65,611,158 | 65,611,158 | ||||||||||||||
International Bond Fund Institutional Class | 2,136,745 | 28,502,919 | 1,472,754 | 5 | 685,941 | 4,038,033 | 55,522,955 | ||||||||||||||
| $393,143,496 | $42,713,401 | $29,235 | $23,540,849 | $973,982,051 | |||||||||||||||||
(1) | Distributions received includes distributions from net investment income and from capital gains, if any. |
July 31, 2012 | July 31, 2013 | ||||||||||||||||||||
Fund/Underlying Fund | Share Balance | Purchase Cost | Sales | Realized | Distributions Received(1) | Share Balance | Market | ||||||||||||||
One Choice 2025 Portfolio | |||||||||||||||||||||
NT Core Equity Plus Fund Institutional Class | 3,250,717 | $7,566,193 | $628,792 | $8,788 | $1,166,287 | 3,841,659 | $53,360,644 | ||||||||||||||
NT Equity Growth Fund Institutional Class | 10,766,551 | 33,742,116 | 5,945,312 | (38,291 | ) | 8,620,639 | 13,407,589 | 164,108,895 | |||||||||||||
NT Growth Fund Institutional Class | 9,110,642 | 35,704,130 | 5,283,311 | 12,470 | 5,179,465 | 11,473,007 | 164,867,112 | ||||||||||||||
NT Large Company Value Fund Institutional Class | 15,112,679 | 33,332,541 | 8,656,692 | 204,097 | 5,168,871 | 17,688,022 | 203,235,375 | ||||||||||||||
NT Mid Cap Value Fund Institutional Class | 6,643,037 | 15,992,222 | 1,717,881 | 55,251 | 3,789,425 | 8,006,170 | 98,075,587 | ||||||||||||||
NT Small Company Fund Institutional Class | 3,947,074 | 8,565,874 | 4,857,226 | 401,723 | 2,124,503 | 4,389,883 | 47,235,143 | ||||||||||||||
NT Vista Fund Institutional Class | 5,408,310 | 12,871,887 | 2,398,070 | 86,545 | 109,880 | 6,367,562 | 82,650,950 | ||||||||||||||
Real Estate Fund Institutional Class | 825,369 | 5,148,323 | 142,891 | 4,717 | 487,991 | 1,037,027 | 25,448,646 | ||||||||||||||
High-Yield Fund Institutional Class | 6,578,085 | 16,398,117 | — | — | 3,529,883 | 9,207,943 | 57,089,248 | ||||||||||||||
Inflation-Adjusted Bond Fund Institutional Class | 6,003,576 | 45,859,996 | 444,925 | (982 | ) | 2,645,951 | 9,501,028 | 116,102,568 | |||||||||||||
NT Diversified Bond Fund Institutional Class | 24,854,951 | 160,530,894 | 7,828,360 | (56,992 | ) | 11,136,658 | 38,736,091 | 412,152,010 | |||||||||||||
NT Emerging Markets Fund Institutional Class | 3,283,139 | 8,914,091 | 1,160,848 | (37,331 | ) | 176,927 | 4,052,787 | 39,717,316 | |||||||||||||
NT International Growth Fund Institutional Class | 9,828,946 | 22,794,097 | 8,890,001 | 173,072 | 1,518,719 | 11,184,672 | 124,038,009 | ||||||||||||||
Premium Money Market Fund Investor Class | 59,881,950 | 24,831,124 | 30,738 | — | 7,358 | 84,682,336 | 84,682,336 | ||||||||||||||
International Bond Fund Institutional Class | 3,098,722 | 30,536,189 | 149,172 | — | 986,152 | 5,235,492 | 71,988,018 | ||||||||||||||
| $462,787,794 | $48,134,219 | $813,067 | $46,648,709 | $1,744,751,857 | |||||||||||||||||
(1) | Distributions received includes distributions from net investment income and from capital gains, if any. |
July 31, 2012 | July 31, 2013 | ||||||||||||||||||||
Fund/Underlying Fund | Share Balance | Purchase Cost | Sales | Realized | Distributions Received(1) | Share Balance | Market | ||||||||||||||
One Choice 2030 Portfolio | |||||||||||||||||||||
NT Core Equity Plus Fund Institutional Class | 1,491,503 | $8,585,151 | $1,009,904 | $(8,551 | ) | $595,255 | 2,128,304 | $29,562,141 | |||||||||||||
NT Equity Growth Fund Institutional Class | 4,534,797 | 28,295,286 | 3,366,294 | (33,254 | ) | 3,968,064 | 6,867,087 | 84,053,139 | |||||||||||||
NT Growth Fund Institutional Class | 4,612,041 | 36,837,087 | 5,506,610 | (53,437 | ) | 2,802,286 | 7,020,849 | 100,889,606 | |||||||||||||
NT Large Company Value Fund Institutional Class | 6,782,795 | 32,601,111 | 5,728,017 | 108,483 | 2,563,436 | 9,538,044 | 109,592,131 | ||||||||||||||
NT Mid Cap Value Fund Institutional Class | 2,685,003 | 14,219,087 | 1,685,789 | (17,265 | ) | 1,670,903 | 3,872,410 | 47,437,023 | |||||||||||||
NT Small Company Fund Institutional Class | 2,253,093 | 9,884,585 | 3,180,549 | 44,786 | 1,304,150 | 3,042,249 | 32,734,602 | ||||||||||||||
NT Vista Fund Institutional Class | 2,435,953 | 13,870,936 | 1,615,910 | (16,007 | ) | 54,030 | 3,539,295 | 45,940,052 | |||||||||||||
Real Estate Fund Institutional Class | 403,233 | 6,543,064 | 454,000 | (13,647 | ) | 277,174 | 657,257 | 16,129,099 | |||||||||||||
High-Yield Fund Institutional Class | 2,520,709 | 12,577,724 | 727,026 | (8,117 | ) | 1,505,102 | 4,418,124 | 27,392,368 | |||||||||||||
Inflation-Adjusted Bond Fund Institutional Class | 2,284,960 | 31,337,661 | 1,603,117 | 802 | 1,135,160 | 4,569,525 | 55,839,595 | ||||||||||||||
NT Diversified Bond Fund Institutional Class | 9,420,248 | 102,334,672 | 6,653,296 | 13,966 | 4,671,754 | 18,116,815 | 192,762,914 | ||||||||||||||
NT Emerging Markets Fund Institutional Class | 1,649,273 | 11,101,574 | 1,092,526 | (77,289 | ) | 105,358 | 2,647,233 | 25,942,886 | |||||||||||||
NT International Growth Fund Institutional Class | 4,982,532 | 25,482,459 | 4,248,100 | 3,224 | 830,922 | 7,058,493 | 78,278,686 | ||||||||||||||
Premium Money Market Fund Investor Class | 25,366,804 | 21,116,748 | 1,258,724 | — | 3,552 | 45,224,828 | 45,224,828 | ||||||||||||||
International Bond Fund Institutional Class | 437,707 | 10,489,420 | 376,812 | 890 | 159,272 | 1,150,750 | 15,822,818 | ||||||||||||||
| $365,276,565 | $38,506,674 | $(55,416 | ) | $21,646,418 | $907,601,888 | ||||||||||||||||
(1) | Distributions received includes distributions from net investment income and from capital gains, if any. |
July 31, 2012 | July 31, 2013 | ||||||||||||||||||||
Fund/Underlying Fund | Share Balance | Purchase Cost | Sales | Realized | Distributions Received(1) | Share Balance | Market | ||||||||||||||
One Choice 2035 Portfolio | |||||||||||||||||||||
NT Core Equity Plus Fund Institutional Class | 2,518,988 | $6,998,186 | $324,173 | $4,468 | $903,617 | 3,080,717 | $42,791,165 | ||||||||||||||
NT Equity Growth Fund Institutional Class | 8,074,607 | 27,208,993 | 3,016,545 | (36,621 | ) | 6,469,323 | 10,361,071 | 126,819,514 | |||||||||||||
NT Growth Fund Institutional Class | 8,807,150 | 40,000,298 | 2,271,195 | (30,146 | ) | 5,015,054 | 11,715,612 | 168,353,342 | |||||||||||||
NT Large Company Value Fund Institutional Class | 12,167,453 | 28,718,338 | 4,304,999 | 186,314 | 4,179,186 | 14,683,860 | 168,717,555 | ||||||||||||||
NT Mid Cap Value Fund Institutional Class | 5,080,596 | 11,894,470 | 1,783,933 | 6,479 | 2,825,758 | 6,047,493 | 74,081,793 | ||||||||||||||
NT Small Company Fund Institutional Class | 4,292,075 | 11,178,074 | 2,936,359 | 167,084 | 2,399,164 | 5,270,123 | 56,706,522 | ||||||||||||||
NT Vista Fund Institutional Class | 4,840,447 | 12,012,358 | 1,234,279 | 4,472 | 96,147 | 5,815,662 | 75,487,296 | ||||||||||||||
Real Estate Fund Institutional Class | 771,440 | 6,999,956 | — | — | 467,051 | 1,063,993 | 26,110,401 | ||||||||||||||
High-Yield Fund Institutional Class | 3,581,135 | 11,544,118 | — | — | 1,923,541 | 5,430,252 | 33,667,562 | ||||||||||||||
Inflation-Adjusted Bond Fund Institutional Class | 3,322,924 | 30,726,389 | 437,138 | (3,033 | ) | 1,470,941 | 5,661,590 | 69,184,635 | |||||||||||||
NT Diversified Bond Fund Institutional Class | 13,768,000 | 104,702,525 | 6,849,646 | (39,819 | ) | 6,156,097 | 22,680,743 | 241,323,110 | |||||||||||||
NT Emerging Markets Fund Institutional Class | 3,369,064 | 14,324,393 | 1,696,248 | (79,114 | ) | 182,802 | 4,619,617 | 45,272,251 | |||||||||||||
NT International Growth Fund Institutional Class | 9,351,486 | 25,665,035 | 3,938,356 | (82,476 | ) | 1,480,320 | 11,491,419 | 127,439,837 | |||||||||||||
Premium Money Market Fund Investor Class | 32,036,485 | 23,113,768 | 59,021 | — | 4,307 | 55,091,232 | 55,091,232 | ||||||||||||||
| $355,086,901 | $28,851,892 | $97,608 | $33,573,308 | $1,311,046,215 | |||||||||||||||||
(1) | Distributions received includes distributions from net investment income and from capital gains, if any. |
July 31, 2012 | July 31, 2013 | ||||||||||||||||||||
Fund/Underlying Fund | Share Balance | Purchase Cost | Sales | Realized | Distributions Received(1) | Share Balance | Market | ||||||||||||||
One Choice 2040 Portfolio | |||||||||||||||||||||
NT Core Equity Plus Fund Institutional Class | 1,105,545 | $7,436,048 | $847,471 | $ 8,337 | $457,920 | 1,661,736 | $23,081,510 | ||||||||||||||
NT Equity Growth Fund Institutional Class | 3,225,417 | 24,527,518 | 2,110,784 | (6,045 | ) | 2,920,052 | 5,313,904 | 65,042,180 | |||||||||||||
NT Growth Fund Institutional Class | 3,607,363 | 35,822,587 | 2,949,222 | (14,001 | ) | 2,296,959 | 6,125,839 | 88,028,301 | |||||||||||||
NT Large Company Value Fund Institutional Class | 4,984,032 | 30,173,109 | 4,087,968 | 110,895 | 1,959,561 | 7,634,726 | 87,722,997 | ||||||||||||||
NT Mid Cap Value Fund Institutional Class | 2,260,844 | 13,928,121 | 1,702,709 | 1,494 | 1,423,636 | 3,416,646 | 41,853,914 | ||||||||||||||
NT Small Company Fund Institutional Class | 1,573,431 | 8,636,584 | 1,182,379 | 1,751 | 983,220 | 2,444,335 | 26,301,041 | ||||||||||||||
NT Vista Fund Institutional Class | 2,153,929 | 14,136,307 | 1,926,746 | 3,165 | 48,035 | 3,254,491 | 42,243,287 | ||||||||||||||
Real Estate Fund Institutional Class | 327,896 | 6,599,152 | 371,793 | (17,186 | ) | 239,680 | 587,623 | 14,420,260 | |||||||||||||
High-Yield Fund Institutional Class | 1,159,364 | 7,453,241 | 323,377 | (3,610 | ) | 735,440 | 2,299,621 | 14,257,648 | |||||||||||||
Inflation-Adjusted Bond Fund Institutional Class | 1,063,741 | 17,299,699 | 727,908 | 220 | 553,284 | 2,336,857 | 28,556,394 | ||||||||||||||
NT Diversified Bond Fund Institutional Class | 4,501,664 | 58,078,006 | 3,909,726 | (27,570 | ) | 2,315,615 | 9,430,054 | 100,335,778 | |||||||||||||
NT Emerging Markets Fund Institutional Class | 1,634,762 | 13,776,560 | 1,867,088 | (141,946 | ) | 109,194 | 2,822,162 | 27,657,189 | |||||||||||||
NT International Growth Fund Institutional Class | 3,604,118 | 24,071,744 | 2,424,723 | (54,098 | ) | 628,322 | 5,718,528 | 63,418,475 | |||||||||||||
Premium Money Market Fund Investor Class | 4,073,188 | 7,161,357 | 205,617 | — | 732 | 11,028,928 | 11,028,928 | ||||||||||||||
| $269,100,033 | $24,637,511 | $(138,594 | ) | $14,671,650 | $633,947,902 | ||||||||||||||||
(1) | Distributions received includes distributions from net investment income and from capital gains, if any. |
July 31, 2012 | July 31, 2013 | ||||||||||||||||||||
Fund/Underlying Fund | Share Balance | Purchase Cost | Sales | Realized | Distributions Received(1) | Share Balance | Market | ||||||||||||||
One Choice 2045 Portfolio | |||||||||||||||||||||
NT Core Equity Plus Fund Institutional Class | 2,243,457 | $7,414,909 | $225,164 | $(934 | ) | $819,716 | 2,848,538 | $39,566,192 | |||||||||||||
NT Equity Growth Fund Institutional Class | 5,460,534 | 22,703,253 | 2,200,521 | (37,506 | ) | 4,429,070 | 7,383,932 | 90,379,333 | |||||||||||||
NT Growth Fund Institutional Class | 6,428,036 | 34,492,914 | 2,335,159 | 1,922 | 3,694,253 | 8,899,746 | 127,889,351 | ||||||||||||||
NT Large Company Value Fund Institutional Class | 8,880,192 | 25,650,931 | 3,567,990 | 252,644 | 3,095,471 | 11,132,399 | 127,911,268 | ||||||||||||||
NT Mid Cap Value Fund Institutional Class | 4,029,865 | 12,348,642 | 470,595 | 1,348 | 2,320,584 | 5,157,434 | 63,178,564 | ||||||||||||||
NT Small Company Fund Institutional Class | 2,827,526 | 8,093,706 | 2,877,314 | 177,134 | 1,591,626 | 3,457,090 | 37,198,289 | ||||||||||||||
NT Vista Fund Institutional Class | 3,839,534 | 12,818,029 | 418,695 | (3,098 | ) | 78,715 | 4,954,886 | 64,314,419 | |||||||||||||
Real Estate Fund Institutional Class | 612,651 | 6,981,660 | 113,890 | 875 | 384,411 | 898,233 | 22,042,634 | ||||||||||||||
High-Yield Fund Institutional Class | 1,697,991 | 6,311,588 | — | — | 940,470 | 2,706,768 | 16,781,963 | ||||||||||||||
Inflation-Adjusted Bond Fund Institutional Class | 1,549,978 | 15,876,212 | 221,613 | (2,259 | ) | 701,668 | 2,756,318 | 33,682,211 | |||||||||||||
NT Diversified Bond Fund Institutional Class | 6,513,102 | 54,516,545 | 3,287,226 | (25,914 | ) | 2,998,556 | 11,177,474 | 118,928,323 | |||||||||||||
NT Emerging Markets Fund Institutional Class | 3,283,043 | 16,320,641 | 2,384,693 | (138,036 | ) | 183,105 | 4,656,480 | 45,633,504 | |||||||||||||
NT International Growth Fund Institutional Class | 6,094,048 | 21,957,485 | 2,347,255 | (58,226 | ) | 960,648 | 7,986,801 | 88,573,621 | |||||||||||||
| $245,486,515 | $20,450,115 | $167,950 | $22,198,293 | $876,079,672 | |||||||||||||||||
(1) | Distributions received includes distributions from net investment income and from capital gains, if any. |
July 31, 2012 | July 31, 2013 | ||||||||||||||||||||
Fund/Underlying Fund | Share Balance | Purchase Cost | Sales | Realized | Distributions Received(1) | Share Balance | Market | ||||||||||||||
One Choice 2050 Portfolio | |||||||||||||||||||||
NT Core Equity Plus Fund Institutional Class | 691,586 | $5,184,133 | $330,463 | $(1,234 | ) | $286,623 | 1,094,952 | $15,208,882 | |||||||||||||
NT Equity Growth Fund Institutional Class | 1,724,371 | 13,223,838 | 988,181 | 9,404 | 1,551,652 | 2,859,451 | 34,999,679 | ||||||||||||||
NT Growth Fund Institutional Class | 2,015,143 | 20,581,264 | 1,290,609 | (7,779 | ) | 1,284,286 | 3,486,184 | 50,096,465 | |||||||||||||
NT Large Company Value Fund Institutional Class | 2,828,432 | 17,735,837 | 1,764,303 | 52,725 | 1,111,457 | 4,437,013 | 50,981,280 | ||||||||||||||
NT Mid Cap Value Fund Institutional Class | 1,264,534 | 8,476,576 | 726,990 | (16,401 | ) | 796,825 | 1,988,839 | 24,363,275 | |||||||||||||
NT Small Company Fund Institutional Class | 974,167 | 5,407,925 | 898,312 | 12,244 | 606,000 | 1,499,847 | 16,138,354 | ||||||||||||||
NT Vista Fund Institutional Class | 1,204,860 | 8,280,341 | 594,726 | (7,888 | ) | 26,929 | 1,889,721 | 24,528,572 | |||||||||||||
Real Estate Fund Institutional Class | 206,815 | 4,306,875 | 84,388 | (3,043 | ) | 151,117 | 381,766 | 9,368,529 | |||||||||||||
High-Yield Fund Institutional Class | 451,058 | 2,967,888 | 88,853 | (1,069 | ) | 287,836 | 911,202 | 5,649,452 | |||||||||||||
Inflation-Adjusted Bond Fund Institutional Class | 414,111 | 6,997,935 | 341,615 | (10,575 | ) | 213,633 | 926,820 | 11,325,745 | |||||||||||||
NT Diversified Bond Fund Institutional Class | 1,743,952 | 23,905,040 | 1,708,487 | (23,103 | ) | 907,217 | 3,765,482 | 40,064,729 | |||||||||||||
NT Emerging Markets Fund Institutional Class | 1,150,083 | 10,966,036 | 974,035 | (73,331 | ) | 76,276 | 2,139,963 | 20,971,635 | |||||||||||||
NT International Growth Fund Institutional Class | 1,831,658 | 13,149,135 | 1,131,422 | (37,876 | ) | 318,674 | 2,998,655 | 33,255,084 | |||||||||||||
| $141,182,823 | $10,922,384 | $(107,926 | ) | $7,618,525 | $336,951,681 | ||||||||||||||||
(1) | Distributions received includes distributions from net investment income and from capital gains, if any. |
| July 31, 2012 | July 31, 2013 | |||||||||||||||||||
Fund/Underlying Fund | Share Balance | Purchase Cost | Sales | Realized | Distributions Received(1) | Share Balance | Market | ||||||||||||||
One Choice 2055 Portfolio | |||||||||||||||||||||
NT Core Equity Plus Fund Institutional Class | 50,151 | $1,403,703 | $127,363 | $761 | $28,469 | 153,893 | $2,137,578 | ||||||||||||||
NT Equity Growth Fund Institutional Class | 128,167 | 3,566,818 | 408,498 | (2,622 | ) | 148,113 | 415,586 | 5,086,776 | |||||||||||||
NT Growth Fund Institutional Class | 148,776 | 5,179,713 | 487,529 | (1,673 | ) | 118,200 | 501,753 | 7,210,190 | |||||||||||||
NT Large Company Value Fund Institutional Class | 208,951 | 4,871,953 | 532,285 | 2,186 | 110,675 | 635,708 | 7,304,290 | ||||||||||||||
NT Mid Cap Value Fund Institutional Class | 93,260 | 2,381,334 | 239,526 | 1,017 | 77,620 | 288,684 | 3,536,383 | ||||||||||||||
NT Small Company Fund Institutional Class | 74,362 | 1,525,361 | 216,997 | 603 | 56,485 | 220,762 | 2,375,397 | ||||||||||||||
NT Vista Fund Institutional Class | 88,867 | 2,396,702 | 260,405 | 149 | 2,523 | 274,978 | 3,569,212 | ||||||||||||||
Real Estate Fund Institutional Class | 15,600 | 1,090,276 | 85,880 | (636 | ) | 17,535 | 56,508 | 1,386,712 | |||||||||||||
NT Emerging Markets Fund Institutional Class | 87,371 | 2,599,213 | 296,607 | (3,578 | ) | 9,050 | 312,478 | 3,062,283 | |||||||||||||
NT International Growth Fund Institutional Class | 130,645 | 3,200,338 | 335,015 | (85 | ) | 28,182 | 405,046 | 4,491,965 | |||||||||||||
High-Yield Fund Institutional Class | 30,137 | 573,325 | 45,204 | (146 | ) | 27,446 | 114,479 | 709,772 | |||||||||||||
Inflation-Adjusted Bond Fund Institutional Class | 27,675 | 1,231,251 | 85,113 | (2,027 | ) | 18,810 | 116,220 | 1,420,209 | |||||||||||||
NT Diversified Bond Fund Institutional Class | 115,567 | 4,205,834 | 368,631 | (6,478 | ) | 81,499 | 465,737 | 4,955,443 | |||||||||||||
| $34,225,821 | $3,489,053 | $(12,529 | ) | $724,607 | $47,246,210 | ||||||||||||||||
(1) | Distributions received includes distributions from net investment income and from capital gains, if any. |
7. Investments in Underlying Funds
The funds do not invest in the underlying funds for the purpose of exercising management or control; however, investments by the funds within their investment strategies may represent a significant portion of the underlying funds’ net assets.
As of July 31, 2013, the funds, in aggregate, owned 100% of the total outstanding shares of the underlying NT Core Equity Plus Fund, NT Diversified Bond Fund, NT Emerging Markets Fund, NT Equity Growth Fund, NT Growth Fund, NT International Growth Fund, NT Large Company Value Fund, NT Mid Cap Value Fund, NT Small Company Fund and NT Vista Fund.
8. Fair Value Measurements
The funds’ securities valuation process is based on several considerations and may use multiple inputs to determine the fair value of the positions held by the funds. In conformity with accounting principles generally accepted in the United States of America, the inputs used to determine a valuation are classified into three broad levels as follows:
• | Level 1 valuation inputs consist of unadjusted quoted prices in an active market for identical securities; |
• | Level 2 valuation inputs consist of direct or indirect observable market data (including quoted prices for similar securities, evaluations of subsequent market events, interest rates, prepayment speeds, credit risk, etc.); or |
• | Level 3 valuation inputs consist of unobservable data (including a fund’s own assumptions). |
The level classification is based on the lowest level input that is significant to the fair valuation measurement. The valuation inputs are not necessarily an indication of the risks associated with investing in these securities or other financial instruments.
As of period end, the funds’ investment securities were classified as Level 1. The Schedule of Investments provides additional information on the funds’ portfolio holdings.
9. Federal Tax Information
The tax character of distributions paid during the years ended July 31, 2013 and July 31, 2012 were as follows:
One Choice In Retirement Portfolio | One Choice 2015 Portfolio | |||||||||||
2013 | 2012 | 2013 | 2012 | |||||||||
Distributions Paid From | ||||||||||||
Ordinary income | $7,401,513 | $7,229,695 | $18,467,497 | $17,242,231 | ||||||||
Long-term capital gains | $4,259,572 | — | $7,656,970 | — | ||||||||
One Choice 2020 Portfolio | One Choice 2025 Portfolio | |||||||||||
2013 | 2012 | 2013 | 2012 | |||||||||
Distributions Paid From | ||||||||||||
Ordinary income | $12,718,934 | $10,354,037 | $24,883,625 | $21,735,586 | ||||||||
Long-term capital gains | $6,334,959 | $1,388,898 | $9,261,161 | — | ||||||||
One Choice 2030 Portfolio | One Choice 2035 Portfolio | |||||||||||
2013 | 2012 | 2013 | 2012 | |||||||||
Distributions Paid From | ||||||||||||
Ordinary income | $10,510,363 | $7,810,074 | $15,837,573 | $12,614,779 | ||||||||
Long-term capital gains | $5,559,501 | $795,764 | $8,185,007 | — | ||||||||
One Choice 2040 Portfolio | One Choice 2045 Portfolio | |||||||||||
2013 | 2012 | 2013 | 2012 | |||||||||
Distributions Paid From | ||||||||||||
Ordinary income | $6,404,633 | $4,036,951 | $9,786,591 | $6,988,739 | ||||||||
Long-term capital gains | $3,443,875 | $542,320 | $4,663,539 | — | ||||||||
One Choice 2050 Portfolio | One Choice 2055 Portfolio | |||||||||||
2013 | 2012 | 2013 | 2012 | |||||||||
Distributions Paid From | ||||||||||||
Ordinary income | $3,087,879 | $1,564,718 | $251,068 | $32,224 | ||||||||
Long-term capital gains | $1,709,809 | $137,152 | $49,746 | — | ||||||||
The book-basis character of distributions made during the year from net investment income or net realized gains may differ from their ultimate characterization for federal income tax purposes. These differences reflect the differing character of certain income items and net realized gains and losses for financial statement and tax purposes, and may result in reclassification among certain capital accounts on the financial statements.
As of July 31, 2013, the federal tax cost of investments and the components of distributable earnings on a tax-basis were as follows:
One Choice In Retirement Portfolio | One Choice 2015 Portfolio | One Choice 2020 Portfolio | One Choice 2025 Portfolio | One Choice 2030 Portfolio | |||||||||||
Federal tax cost of investments | $422,736,268 | $977,321,932 | $846,245,650 | $1,476,123,598 | $772,711,962 | ||||||||||
Gross tax appreciation of investments | $68,848,084 | $165,120,294 | $133,099,264 | $271,860,427 | $139,517,562 | ||||||||||
Gross tax depreciation of investments | (822,900 | ) | (1,981,429 | ) | (5,362,863 | ) | (3,232,168 | ) | (4,627,636 | ) | |||||
Net tax appreciation (depreciation) of investments | $68,025,184 | $163,138,865 | $127,736,401 | $268,628,259 | $134,889,926 | ||||||||||
Undistributed ordinary income | $670,729 | $6,459,133 | $4,814,874 | $8,703,947 | $3,913,814 | ||||||||||
Accumulated long-term gains | $4,535,845 | $12,126,492 | $8,117,441 | $17,366,363 | $8,401,702 |
One Choice | One Choice 2040 Portfolio | One Choice 2045 Portfolio | One Choice 2050 Portfolio | One Choice 2055 Portfolio | |||||||||||
Federal tax cost of investments | $1,091,904,606 | $535,563,300 | $726,952,050 | $288,282,700 | $42,810,138 | ||||||||||
Gross tax appreciation of investments | $220,920,902 | $101,243,236 | $150,757,857 | $50,061,457 | $4,722,263 | ||||||||||
Gross tax depreciation of investments | (1,779,293 | ) | (2,858,634 | ) | (1,630,235 | ) | (1,392,476 | ) | (286,191 | ) | |||||
Net tax appreciation (depreciation) of investments | $219,141,609 | $98,384,602 | $149,127,622 | $48,668,981 | $4,436,072 | ||||||||||
Undistributed ordinary income | $5,215,390 | $2,527,916 | $3,272,636 | $1,227,796 | $153,937 | ||||||||||
Accumulated long-term gains | $14,140,058 | $6,126,933 | $9,924,054 | $3,346,255 | $296,835 |
The difference between book-basis and tax-basis unrealized appreciation (depreciation) is attributable primarily to the tax deferral of losses on wash sales.
Financial Highlights |
For a Share Outstanding Throughout the Years Ended July 31 (except as noted) | |||||||||||||
Per-Share Data | Ratios and Supplemental Data | ||||||||||||
Income From Investment Operations: | Distributions From: | Ratio to Average Net Assets of: | |||||||||||
Net Asset Value, Beginning | Net | Net | Total From Investment Operations | Net | Net | Total Distributions | Net Asset Value, | Total | Operating Expenses(3) | Net | Portfolio Turnover | Net Assets, | |
One Choice In Retirement Portfolio | |||||||||||||
Investor Class | |||||||||||||
2013 | $11.61 | 0.22 | 0.94 | 1.16 | (0.23) | (0.13) | (0.36) | $12.41 | 10.11% | 0.20% | 1.83% | 11% | $205,529 |
2012 | $11.23 | 0.25 | 0.39 | 0.64 | (0.26) | — | (0.26) | $11.61 | 5.81% | 0.21% | 2.21% | 28% | $128,450 |
2011 | $10.27 | 0.24 | 0.97 | 1.21 | (0.25) | — | (0.25) | $11.23 | 11.87% | 0.21% | 2.26% | 10% | $81,907 |
2010 | $9.53 | 0.22 | 0.74 | 0.96 | (0.22) | — | (0.22) | $10.27 | 10.15% | 0.21% | 2.19% | 13% | $102,497 |
2009 | $10.64 | 0.24 | (0.95) | (0.71) | (0.31) | (0.09) | (0.40) | $9.53 | (6.44)% | 0.20% | 2.64% | 51% | $95,441 |
Institutional Class | |||||||||||||
2013 | $11.61 | 0.25 | 0.94 | 1.19 | (0.25) | (0.13) | (0.38) | $12.42 | 10.42% | 0.00%(4) | 2.03% | 11% | $104,270 |
2012 | $11.24 | 0.27 | 0.38 | 0.65 | (0.28) | — | (0.28) | $11.61 | 5.92% | 0.01% | 2.41% | 28% | $74,759 |
2011 | $10.27 | 0.28 | 0.96 | 1.24 | (0.27) | — | (0.27) | $11.24 | 12.20% | 0.01% | 2.46% | 10% | $104,778 |
2010 | $9.53 | 0.24 | 0.74 | 0.98 | (0.24) | — | (0.24) | $10.27 | 10.37% | 0.01% | 2.39% | 13% | $39,202 |
2009 | $10.64 | 0.26 | (0.95) | (0.69) | (0.33) | (0.09) | (0.42) | $9.53 | (6.25)% | 0.00%(4) | 2.84% | 51% | $25,088 |
A Class(5) | |||||||||||||
2013 | $11.60 | 0.19 | 0.95 | 1.14 | (0.20) | (0.13) | (0.33) | $12.41 | 9.94% | 0.45% | 1.58% | 11% | $119,504 |
2012 | $11.23 | 0.23 | 0.37 | 0.60 | (0.23) | — | (0.23) | $11.60 | 5.46% | 0.46% | 1.96% | 28% | $105,111 |
2011 | $10.27 | 0.22 | 0.96 | 1.18 | (0.22) | — | (0.22) | $11.23 | 11.60% | 0.46% | 2.01% | 10% | $87,205 |
2010 | $9.53 | 0.19 | 0.75 | 0.94 | (0.20) | — | (0.20) | $10.27 | 9.87% | 0.46% | 1.94% | 13% | $68,110 |
2009 | $10.64 | 0.21 | (0.94) | (0.73) | (0.29) | (0.09) | (0.38) | $9.53 | (6.67)% | 0.45% | 2.39% | 51% | $34,202 |
For a Share Outstanding Throughout the Years Ended July 31 (except as noted) | |||||||||||||
Per-Share Data | Ratios and Supplemental Data | ||||||||||||
Income From Investment Operations: | Distributions From: | Ratio to Average Net Assets of: | |||||||||||
Net Asset Value, Beginning | Net | Net | Total From Investment Operations | Net | Net | Total Distributions | Net Asset Value, | Total | Operating Expenses(3) | Net | Portfolio Turnover | Net Assets, | |
C Class | |||||||||||||
2013 | $11.61 | 0.10 | 0.94 | 1.04 | (0.11) | (0.13) | (0.24) | $12.41 | 9.04% | 1.20% | 0.83% | 11% | $1,369 |
2012 | $11.24 | 0.14 | 0.38 | 0.52 | (0.15) | — | (0.15) | $11.61 | 4.69% | 1.21% | 1.21% | 28% | $810 |
2011 | $10.27 | 0.09 | 1.02 | 1.11 | (0.14) | — | (0.14) | $11.24 | 10.87% | 1.21% | 1.26% | 10% | $538 |
2010(6) | $10.15 | 0.03 | 0.12 | 0.15 | (0.03) | — | (0.03) | $10.27 | 1.51% | 1.21%(7) | 0.77%(7) | 13%(8) | $35 |
R Class | |||||||||||||
2013 | $11.59 | 0.16 | 0.95 | 1.11 | (0.17) | (0.13) | (0.30) | $12.40 | 9.67% | 0.70% | 1.33% | 11% | $60,104 |
2012 | $11.22 | 0.18 | 0.39 | 0.57 | (0.20) | — | (0.20) | $11.59 | 5.20% | 0.71% | 1.71% | 28% | $38,365 |
2011 | $10.26 | 0.19 | 0.96 | 1.15 | (0.19) | — | (0.19) | $11.22 | 11.33% | 0.71% | 1.76% | 10% | $24,616 |
2010 | $9.52 | 0.16 | 0.75 | 0.91 | (0.17) | — | (0.17) | $10.26 | 9.61% | 0.71% | 1.69% | 13% | $12,527 |
2009 | $10.63 | 0.18 | (0.93) | (0.75) | (0.27) | (0.09) | (0.36) | $9.52 | (6.91)% | 0.70% | 2.14% | 51% | $3,466 |
Notes to Financial Highlights
(1) | Computed using average shares outstanding throughout the period. |
(2) | Total returns are calculated based on the net asset value of the last business day and do not reflect applicable sales charges, if any. Total returns for periods less than one year are not annualized. |
(3) | Ratio of operating expenses to average net assets does not include any fees and expenses of the underlying funds. |
(4) | Ratio was less than 0.005%. |
(5) | Prior to March 1, 2010, the A Class was referred to as the Advisor Class. |
(6) | March 1, 2010 (commencement of sale) through July 31, 2010. |
(7) | Annualized. |
(8) | Portfolio turnover is calculated at the fund level. Percentage indicated was calculated for the year ended July 31, 2010. |
See Notes to Financial Statements.
For a Share Outstanding Throughout the Years Ended July 31 (except as noted) | |||||||||||||
Per-Share Data | Ratios and Supplemental Data | ||||||||||||
Income From Investment Operations: | Distributions From: | Ratio to Average Net Assets of: | |||||||||||
Net Asset Value, Beginning | Net | Net | Total From Investment Operations | Net | Net | Total Distributions | Net Asset Value, | Total | Operating Expenses(3) | Net | Portfolio Turnover | Net Assets, | |
One Choice 2015 Portfolio | |||||||||||||
Investor Class | |||||||||||||
2013 | $12.26 | 0.24 | 1.04 | 1.28 | (0.25) | (0.10) | (0.35) | $13.19 | 10.61% | 0.20% | 1.85% | 6% | $543,673 |
2012 | $11.88 | 0.26 | 0.39 | 0.65 | (0.27) | — | (0.27) | $12.26 | 5.63% | 0.21% | 2.22% | 19% | $424,416 |
2011 | $10.76 | 0.25 | 1.11 | 1.36 | (0.24) | — | (0.24) | $11.88 | 12.72% | 0.21% | 2.21% | 4% | $322,747 |
2010 | $9.87 | 0.22 | 0.86 | 1.08 | (0.19) | — | (0.19) | $10.76 | 11.00% | 0.21% | 2.11% | 9% | $284,172 |
2009 | $11.39 | 0.26 | (1.29) | (1.03) | (0.35) | (0.14) | (0.49) | $9.87 | (8.63)% | 0.20% | 2.78% | 28% | $217,149 |
Institutional Class | |||||||||||||
2013 | $12.28 | 0.26 | 1.04 | 1.30 | (0.27) | (0.10) | (0.37) | $13.21 | 10.82% | 0.00%(4) | 2.05% | 6% | $182,995 |
2012 | $11.90 | 0.29 | 0.38 | 0.67 | (0.29) | — | (0.29) | $12.28 | 5.83% | 0.01% | 2.42% | 19% | $125,106 |
2011 | $10.78 | 0.29 | 1.09 | 1.38 | (0.26) | — | (0.26) | $11.90 | 12.92% | 0.01% | 2.41% | 4% | $175,214 |
2010 | $9.89 | 0.25 | 0.85 | 1.10 | (0.21) | — | (0.21) | $10.78 | 11.20% | 0.01% | 2.31% | 9% | $82,264 |
2009 | $11.41 | 0.24 | (1.25) | (1.01) | (0.37) | (0.14) | (0.51) | $9.89 | (8.42)% | 0.00%(4) | 2.98% | 28% | $59,500 |
A Class(5) | |||||||||||||
2013 | $12.24 | 0.20 | 1.05 | 1.25 | (0.22) | (0.10) | (0.32) | $13.17 | 10.34% | 0.45% | 1.60% | 6% | $295,377 |
2012 | $11.87 | 0.23 | 0.38 | 0.61 | (0.24) | — | (0.24) | $12.24 | 5.28% | 0.46% | 1.97% | 19% | $242,298 |
2011 | $10.75 | 0.22 | 1.11 | 1.33 | (0.21) | — | (0.21) | $11.87 | 12.44% | 0.46% | 1.96% | 4% | $178,615 |
2010 | $9.86 | 0.19 | 0.86 | 1.05 | (0.16) | — | (0.16) | $10.75 | 10.73% | 0.46% | 1.86% | 9% | $115,945 |
2009 | $11.37 | 0.25 | (1.29) | (1.04) | (0.33) | (0.14) | (0.47) | $9.86 | (8.79)% | 0.45% | 2.53% | 28% | $40,386 |
For a Share Outstanding Throughout the Years Ended July 31 (except as noted) | |||||||||||||
Per-Share Data | Ratios and Supplemental Data | ||||||||||||
Income From Investment Operations: | Distributions From: | Ratio to Average Net Assets of: | |||||||||||
Net Asset Value, Beginning | Net | Net | Total From Investment Operations | Net | Net | Total Distributions | Net Asset Value, | Total | Operating Expenses(3) | Net | Portfolio Turnover | Net Assets, | |
C Class | |||||||||||||
2013 | $12.21 | 0.11 | 1.04 | 1.15 | (0.12) | (0.10) | (0.22) | $13.14 | 9.53% | 1.20% | 0.85% | 6% | $4,003 |
2012 | $11.84 | 0.13 | 0.39 | 0.52 | (0.15) | — | (0.15) | $12.21 | 4.50% | 1.21% | 1.22% | 19% | $2,124 |
2011 | $10.72 | 0.12 | 1.12 | 1.24 | (0.12) | — | (0.12) | $11.84 | 11.62% | 1.21% | 1.21% | 4% | $934 |
2010(6) | $10.55 | 0.04 | 0.13 | 0.17 | — | — | — | $10.72 | 1.61% | 1.21%(7) | 0.83%(7) | 9%(8) | $182 |
R Class | |||||||||||||
2013 | $12.22 | 0.17 | 1.04 | 1.21 | (0.18) | (0.10) | (0.28) | $13.15 | 10.08% | 0.70% | 1.35% | 6% | $114,413 |
2012 | $11.85 | 0.20 | 0.38 | 0.58 | (0.21) | — | (0.21) | $12.22 | 5.02% | 0.71% | 1.72% | 19% | $86,079 |
2011 | $10.73 | 0.20 | 1.10 | 1.30 | (0.18) | — | (0.18) | $11.85 | 12.18% | 0.71% | 1.71% | 4% | $58,006 |
2010 | $9.84 | 0.16 | 0.87 | 1.03 | (0.14) | — | (0.14) | $10.73 | 10.47% | 0.71% | 1.61% | 9% | $37,643 |
2009 | $11.36 | 0.18 | (1.25) | (1.07) | (0.31) | (0.14) | (0.45) | $9.84 | (9.12)% | 0.70% | 2.28% | 28% | $13,316 |
Notes to Financial Highlights
(1) | Computed using average shares outstanding throughout the period. |
(2) | Total returns are calculated based on the net asset value of the last business day and do not reflect applicable sales charges, if any. Total returns for periods less than one year are not annualized. |
(3) | Ratio of operating expenses to average net assets does not include any fees and expenses of the underlying funds. |
(4) | Ratio was less than 0.005%. |
(5) | Prior to March 1, 2010, the A Class was referred to as the Advisor Class. |
(6) | March 1, 2010 (commencement of sale) through July 31, 2010. |
(7) | Annualized. |
(8) | Portfolio turnover is calculated at the fund level. Percentage indicated was calculated for the year ended July 31, 2010. |
See Notes to Financial Statements.
For a Share Outstanding Throughout the Years Ended July 31 (except as noted) | |||||||||||||
Per-Share Data | Ratios and Supplemental Data | ||||||||||||
Income From Investment Operations: | Distributions From: | Ratio to Average Net Assets of: | |||||||||||
Net Asset Value, Beginning | Net | Net | Total From Investment Operations | Net | Net | Total Distributions | Net Asset Value, | Total | Operating Expenses(3) | Net | Portfolio Turnover | Net Assets, | |
One Choice 2020 Portfolio | |||||||||||||
Investor Class | |||||||||||||
2013 | $10.64 | 0.20 | 1.02 | 1.22 | (0.20) | (0.10) | (0.30) | $11.56 | 11.67% | 0.20% | 1.79% | 6% | $384,010 |
2012 | $10.37 | 0.21 | 0.32 | 0.53 | (0.23) | (0.03) | (0.26) | $10.64 | 5.27% | 0.21% | 2.14% | 28% | $218,341 |
2011 | $9.30 | 0.20 | 1.06 | 1.26 | (0.19) | —(4) | (0.19) | $10.37 | 13.66% | 0.21% | 2.13% | 4% | $105,921 |
2010 | $8.47 | 0.19 | 0.80 | 0.99 | (0.15) | (0.01) | (0.16) | $9.30 | 11.69% | 0.21% | 1.99% | 8% | $127,604 |
2009 | $9.49 | 0.13 | (1.03) | (0.90) | (0.12) | — | (0.12) | $8.47 | (9.38)% | 0.20% | 1.70% | 53% | $91,329 |
Institutional Class | |||||||||||||
2013 | $10.65 | 0.22 | 1.02 | 1.24 | (0.22) | (0.10) | (0.32) | $11.57 | 11.89% | 0.00%(5) | 1.99% | 6% | $211,576 |
2012 | $10.38 | 0.25 | 0.30 | 0.55 | (0.25) | (0.03) | (0.28) | $10.65 | 5.48% | 0.01% | 2.34% | 28% | $99,935 |
2011 | $9.31 | 0.24 | 1.04 | 1.28 | (0.21) | —(4) | (0.21) | $10.38 | 13.88% | 0.01% | 2.33% | 4% | $169,034 |
2010 | $8.47 | 0.20 | 0.81 | 1.01 | (0.16) | (0.01) | (0.17) | $9.31 | 11.90% | 0.01% | 2.19% | 8% | $44,304 |
2009 | $9.50 | 0.15 | (1.05) | (0.90) | (0.13) | — | (0.13) | $8.47 | (9.26)% | 0.00%(5) | 1.90% | 53% | $21,532 |
A Class(6) | |||||||||||||
2013 | $10.62 | 0.17 | 1.02 | 1.19 | (0.17) | (0.10) | (0.27) | $11.54 | 11.41% | 0.45% | 1.54% | 6% | $270,040 |
2012 | $10.36 | 0.20 | 0.29 | 0.49 | (0.20) | (0.03) | (0.23) | $10.62 | 4.92% | 0.46% | 1.89% | 28% | $180,502 |
2011 | $9.28 | 0.19 | 1.05 | 1.24 | (0.16) | —(4) | (0.16) | $10.36 | 13.51% | 0.46% | 1.88% | 4% | $124,401 |
2010 | $8.45 | 0.15 | 0.81 | 0.96 | (0.12) | (0.01) | (0.13) | $9.28 | 11.43% | 0.46% | 1.74% | 8% | $80,483 |
2009 | $9.49 | 0.15 | (1.08) | (0.93) | (0.11) | — | (0.11) | $8.45 | (9.72)% | 0.45% | 1.45% | 53% | $3,882 |
For a Share Outstanding Throughout the Years Ended July 31 (except as noted) | |||||||||||||
Per-Share Data | Ratios and Supplemental Data | ||||||||||||
Income From Investment Operations: | Distributions From: | Ratio to Average Net Assets of: | |||||||||||
Net Asset Value, Beginning | Net | Net | Total From Investment Operations | Net | Net | Total Distributions | Net Asset Value, | Total | Operating Expenses(3) | Net | Portfolio Turnover | Net Assets, | |
C Class | |||||||||||||
2013 | $10.61 | 0.08 | 1.02 | 1.10 | (0.09) | (0.10) | (0.19) | $11.52 | 10.48% | 1.20% | 0.79% | 6% | $6,117 |
2012 | $10.34 | 0.10 | 0.32 | 0.42 | (0.12) | (0.03) | (0.15) | $10.61 | 4.23% | 1.21% | 1.14% | 28% | $2,304 |
2011 | $9.26 | 0.10 | 1.07 | 1.17 | (0.09) | —(4) | (0.09) | $10.34 | 12.68% | 1.21% | 1.13% | 4% | $578 |
2010(7) | $9.12 | 0.03 | 0.11 | 0.14 | — | — | — | $9.26 | 1.54% | 1.21%(8) | 0.67%(8) | 8%(9) | $103 |
R Class | |||||||||||||
2013 | $10.61 | 0.14 | 1.03 | 1.17 | (0.15) | (0.10) | (0.25) | $11.53 | 11.14% | 0.70% | 1.29% | 6% | $102,250 |
2012 | $10.34 | 0.16 | 0.31 | 0.47 | (0.17) | (0.03) | (0.20) | $10.61 | 4.76% | 0.71% | 1.64% | 28% | $61,212 |
2011 | $9.27 | 0.16 | 1.05 | 1.21 | (0.14) | —(4) | (0.14) | $10.34 | 13.13% | 0.71% | 1.63% | 4% | $35,703 |
2010 | $8.44 | 0.13 | 0.81 | 0.94 | (0.10) | (0.01) | (0.11) | $9.27 | 11.17% | 0.71% | 1.49% | 8% | $14,928 |
2009 | $9.49 | 0.14 | (1.10) | (0.96) | (0.09) | — | (0.09) | $8.44 | (9.96)% | 0.70% | 1.20% | 53% | $3,274 |
Notes to Financial Highlights
(1) | Computed using average shares outstanding throughout the period. |
(2) | Total returns are calculated based on the net asset value of the last business day and do not reflect applicable sales charges, if any. Total returns for periods less than one year are not annualized. |
(3) | Ratio of operating expenses to average net assets does not include any fees and expenses of the underlying funds. |
(4) | Per-share amount was less than $0.005. |
(5) | Ratio was less than 0.005%. |
(6) | Prior to March 1, 2010, the A Class was referred to as the Advisor Class. |
(7) | March 1, 2010 (commencement of sale) through July 31, 2010. |
(8) | Annualized. |
(9) | Portfolio turnover is calculated at the fund level. Percentage indicated was calculated for the year ended July 31, 2010. |
See Notes to Financial Statements.
For a Share Outstanding Throughout the Years Ended July 31 (except as noted) | |||||||||||||
Per-Share Data | Ratios and Supplemental Data | ||||||||||||
Income From Investment Operations: | Distributions From: | Ratio to Average Net Assets of: | |||||||||||
Net Asset Value, Beginning | Net | Net | Total From Investment Operations | Net | Net | Total Distributions | Net Asset Value, | Total | Operating Expenses(3) | Net | Portfolio Turnover | Net Assets, | |
One Choice 2025 Portfolio | |||||||||||||
Investor Class | |||||||||||||
2013 | $12.46 | 0.23 | 1.35 | 1.58 | (0.24) | (0.09) | (0.33) | $13.71 | 12.88% | 0.20% | 1.79% | 3% | $807,998 |
2012 | $12.13 | 0.25 | 0.34 | 0.59 | (0.26) | — | (0.26) | $12.46 | 4.99% | 0.21% | 2.07% | 21% | $554,462 |
2011 | $10.78 | 0.23 | 1.34 | 1.57 | (0.22) | — | (0.22) | $12.13 | 14.60% | 0.21% | 1.98% | 3% | $425,965 |
2010 | $9.76 | 0.19 | 1.00 | 1.19 | (0.17) | — | (0.17) | $10.78 | 12.19% | 0.21% | 1.83% | 10% | $393,154 |
2009 | $11.63 | 0.22 | (1.63) | (1.41) | (0.30) | (0.16) | (0.46) | $9.76 | (11.64)% | 0.20% | 2.43% | 22% | $313,816 |
Institutional Class | |||||||||||||
2013 | $12.47 | 0.26 | 1.35 | 1.61 | (0.27) | (0.09) | (0.36) | $13.72 | 13.10% | 0.00%(4) | 1.99% | 3% | $298,052 |
2012 | $12.14 | 0.27 | 0.34 | 0.61 | (0.28) | — | (0.28) | $12.47 | 5.20% | 0.01% | 2.27% | 21% | $181,693 |
2011 | $10.79 | 0.27 | 1.32 | 1.59 | (0.24) | — | (0.24) | $12.14 | 14.82% | 0.01% | 2.18% | 3% | $257,121 |
2010 | $9.77 | 0.21 | 1.00 | 1.21 | (0.19) | — | (0.19) | $10.79 | 12.40% | 0.01% | 2.03% | 10% | $103,770 |
2009 | $11.64 | 0.24 | (1.63) | (1.39) | (0.32) | (0.16) | (0.48) | $9.77 | (11.45)% | 0.00%(4) | 2.63% | 22% | $78,031 |
A Class(5) | |||||||||||||
2013 | $12.44 | 0.20 | 1.35 | 1.55 | (0.21) | (0.09) | (0.30) | $13.69 | 12.61% | 0.45% | 1.54% | 3% | $460,301 |
2012 | $12.11 | 0.22 | 0.34 | 0.56 | (0.23) | — | (0.23) | $12.44 | 4.73% | 0.46% | 1.82% | 21% | $327,130 |
2011 | $10.77 | 0.20 | 1.33 | 1.53 | (0.19) | — | (0.19) | $12.11 | 14.23% | 0.46% | 1.73% | 3% | $242,996 |
2010 | $9.74 | 0.16 | 1.01 | 1.17 | (0.14) | — | (0.14) | $10.77 | 12.03% | 0.46% | 1.58% | 10% | $143,045 |
2009 | $11.61 | 0.21 | (1.64) | (1.43) | (0.28) | (0.16) | (0.44) | $9.74 | (11.89)% | 0.45% | 2.18% | 22% | $49,723 |
For a Share Outstanding Throughout the Years Ended July 31 (except as noted) | |||||||||||||
Per-Share Data | Ratios and Supplemental Data | ||||||||||||
Income From Investment Operations: | Distributions From: | Ratio to Average Net Assets of: | |||||||||||
Net Asset Value, Beginning | Net | Net | Total From Investment Operations | Net | Net | Total Distributions | Net Asset Value, | Total | Operating Expenses(3) | Net | Portfolio Turnover | Net Assets, | |
C Class | |||||||||||||
2013 | $12.41 | 0.10 | 1.36 | 1.46 | (0.11) | (0.09) | (0.20) | $13.67 | 11.86% | 1.20% | 0.79% | 3% | $6,179 |
2012 | $12.09 | 0.12 | 0.34 | 0.46 | (0.14) | — | (0.14) | $12.41 | 3.87% | 1.21% | 1.07% | 21% | $3,498 |
2011 | $10.74 | 0.11 | 1.34 | 1.45 | (0.10) | — | (0.10) | $12.09 | 13.50% | 1.21% | 0.98% | 3% | $1,595 |
2010(6) | $10.58 | 0.02 | 0.14 | 0.16 | — | — | — | $10.74 | 1.51% | 1.21%(7) | 0.43%(7) | 10%(8) | $373 |
R Class | |||||||||||||
2013 | $12.42 | 0.17 | 1.35 | 1.52 | (0.18) | (0.09) | (0.27) | $13.67 | 12.34% | 0.70% | 1.29% | 3% | $172,227 |
2012 | $12.09 | 0.19 | 0.34 | 0.53 | (0.20) | — | (0.20) | $12.42 | 4.48% | 0.71% | 1.57% | 21% | $129,489 |
2011 | $10.75 | 0.17 | 1.33 | 1.50 | (0.16) | — | (0.16) | $12.09 | 13.97% | 0.71% | 1.48% | 3% | $88,153 |
2010 | $9.73 | 0.14 | 0.99 | 1.13 | (0.11) | – | (0.11) | $10.75 | 11.66% | 0.71% | 1.33% | 10% | $47,433 |
2009 | $11.60 | 0.16 | (1.62) | (1.46) | (0.25) | (0.16) | (0.41) | $9.73 | (12.12)% | 0.70% | 1.93% | 22% | $16,344 |
Notes to Financial Highlights
(1) | Computed using average shares outstanding throughout the period. |
(2) | Total returns are calculated based on the net asset value of the last business day and do not reflect applicable sales charges, if any. Total returns for periods less than one year are not annualized. |
(3) | Ratio of operating expenses to average net assets does not include any fees and expenses of the underlying funds. |
(4) | Ratio was less than 0.005%. |
(5) | Prior to March 1, 2010, the A Class was referred to as the Advisor Class. |
(6) | March 1, 2010 (commencement of sale) through July 31, 2010. |
(7) | Annualized. |
(8) | Portfolio turnover is calculated at the fund level. Percentage indicated was calculated for the year ended July 31, 2010. |
See Notes to Financial Statements.
For a Share Outstanding Throughout the Years Ended July 31 (except as noted) | |||||||||||||
Per-Share Data | Ratios and Supplemental Data | ||||||||||||
Income From Investment Operations: | Distributions From: | Ratio to Average Net Assets of: | |||||||||||
Net Asset Value, Beginning | Net | Net | Total From Investment Operations | Net | Net | Total Distributions | Net Asset Value, | Total | Operating Expenses(3) | Net | Portfolio Turnover | Net Assets, | |
One Choice 2030 Portfolio | |||||||||||||
Investor Class | |||||||||||||
2013 | $10.41 | 0.18 | 1.30 | 1.48 | (0.18) | (0.09) | (0.27) | $11.62 | 14.53% | 0.21% | 1.66% | 5% | $333,309 |
2012 | $10.17 | 0.18 | 0.27 | 0.45 | (0.19) | (0.02) | (0.21) | $10.41 | 4.60% | 0.21% | 1.87% | 28% | $170,955 |
2011 | $8.95 | 0.16 | 1.21 | 1.37 | (0.15) | —(4) | (0.15) | $10.17 | 15.41% | 0.21% | 1.76% | 4% | $76,884 |
2010 | $8.04 | 0.14 | 0.89 | 1.03 | (0.11) | (0.01) | (0.12) | $8.95 | 12.90% | 0.21% | 1.63% | 7% | $99,983 |
2009 | $9.39 | 0.10 | (1.36) | (1.26) | (0.09) | — | (0.09) | $8.04 | (13.30)% | 0.20% | 1.48% | 43% | $70,382 |
Institutional Class | |||||||||||||
2013 | $10.42 | 0.21 | 1.28 | 1.49 | (0.20) | (0.09) | (0.29) | $11.62 | 14.76% | 0.01% | 1.86% | 5% | $202,598 |
2012 | $10.18 | 0.21 | 0.26 | 0.47 | (0.21) | (0.02) | (0.23) | $10.42 | 4.71% | 0.01% | 2.07% | 28% | $94,349 |
2011 | $8.95 | 0.20 | 1.20 | 1.40 | (0.17) | —(4) | (0.17) | $10.18 | 15.62% | 0.01% | 1.96% | 4% | $144,661 |
2010 | $8.05 | 0.16 | 0.88 | 1.04 | (0.13) | (0.01) | (0.14) | $8.95 | 13.11% | 0.01% | 1.83% | 7% | $33,647 |
2009 | $9.40 | 0.12 | (1.37) | (1.25) | (0.10) | — | (0.10) | $8.05 | (13.18)% | 0.00%(5) | 1.68% | 43% | $17,528 |
A Class(6) | |||||||||||||
2013 | $10.38 | 0.16 | 1.30 | 1.46 | (0.16) | (0.09) | (0.25) | $11.59 | 14.28% | 0.46% | 1.41% | 5% | $264,393 |
2012 | $10.15 | 0.17 | 0.24 | 0.41 | (0.16) | (0.02) | (0.18) | $10.38 | 4.25% | 0.46% | 1.62% | 28% | $170,227 |
2011 | $8.93 | 0.15 | 1.20 | 1.35 | (0.13) | —(4) | (0.13) | $10.15 | 15.15% | 0.46% | 1.51% | 4% | $114,892 |
2010 | $8.03 | 0.12 | 0.88 | 1.00 | (0.09) | (0.01) | (0.10) | $8.93 | 12.51% | 0.46% | 1.38% | 7% | $71,159 |
2009 | $9.39 | 0.11 | (1.39) | (1.28) | (0.08) | — | (0.08) | $8.03 | (13.53)% | 0.45% | 1.23% | 43% | $3,378 |
For a Share Outstanding Throughout the Years Ended July 31 (except as noted) | |||||||||||||
Per-Share Data | Ratios and Supplemental Data | ||||||||||||
Income From Investment Operations: | Distributions From: | Ratio to Average Net Assets of: | |||||||||||
Net Asset Value, Beginning | Net | Net | Total From Investment Operations | Net | Net | Total Distributions | Net Asset Value, | Total | Operating Expenses(3) | Net | Portfolio Turnover | Net Assets, | |
C Class | |||||||||||||
2013 | $10.37 | 0.07 | 1.29 | 1.36 | (0.07) | (0.09) | (0.16) | $11.57 | 13.32% | 1.21% | 0.66% | 5% | $3,417 |
2012 | $10.13 | 0.09 | 0.26 | 0.35 | (0.09) | (0.02) | (0.11) | $10.37 | 3.57% | 1.21% | 0.87% | 28% | $1,595 |
2011 | $8.92 | 0.06 | 1.20 | 1.26 | (0.05) | —(4) | (0.05) | $10.13 | 14.18% | 1.21% | 0.76% | 4% | $728 |
2010(7) | $8.80 | 0.02 | 0.10 | 0.12 | — | — | — | $8.92 | 1.36% | 1.21%(8) | 0.41%(8) | 7%(9) | $162 |
R Class | |||||||||||||
2013 | $10.37 | 0.13 | 1.30 | 1.43 | (0.13) | (0.09) | (0.22) | $11.58 | 14.00% | 0.71% | 1.16% | 5% | $103,886 |
2012 | $10.14 | 0.13 | 0.26 | 0.39 | (0.14) | (0.02) | (0.16) | $10.37 | 3.99% | 0.71% | 1.37% | 28% | $69,278 |
2011 | $8.92 | 0.12 | 1.20 | 1.32 | (0.10) | —(4) | (0.10) | $10.14 | 14.88% | 0.71% | 1.26% | 4% | $35,411 |
2010 | $8.02 | 0.10 | 0.88 | 0.98 | (0.07) | (0.01) | (0.08) | $8.92 | 12.24% | 0.71% | 1.13% | 7% | $14,455 |
2009 | $9.39 | 0.12 | (1.42) | (1.30) | (0.07) | — | (0.07) | $8.02 | (13.76)% | 0.70% | 0.98% | 43% | $3,573 |
Notes to Financial Highlights
(1) | Computed using average shares outstanding throughout the period. |
(2) | Total returns are calculated based on the net asset value of the last business day and do not reflect applicable sales charges, if any. Total returns for periods less than one year are not annualized. |
(3) | Ratio of operating expenses to average net assets does not include any fees and expenses of the underlying funds. |
(4) | Per-share amount was less than $0.005. |
(5) | Ratio was less than 0.005%. |
(6) | Prior to March 1, 2010, the A Class was referred to as the Advisor Class. |
(7) | March 1, 2010 (commencement of sale) through July 31, 2010. |
(8) | Annualized. |
(9) | Portfolio turnover is calculated at the fund level. Percentage indicated was calculated for the year ended July 31, 2010. |
See Notes to Financial Statements.
For a Share Outstanding Throughout the Years Ended July 31 (except as noted) | |||||||||||||
Per-Share Data | Ratios and Supplemental Data | ||||||||||||
Income From Investment Operations: | Distributions From: | Ratio to Average Net Assets of: | |||||||||||
Net Asset Value, Beginning | Net | Net | Total From Investment Operations | Net | Net | Total Distributions | Net Asset Value, | Total | Operating Expenses(3) | Net | Portfolio Turnover | Net Assets, | |
One Choice 2035 Portfolio | |||||||||||||
Investor Class | |||||||||||||
2013 | $12.81 | 0.22 | 1.82 | 2.04 | (0.22) | (0.11) | (0.33) | $14.52 | 16.24% | 0.20% | 1.62% | 3% | $573,216 |
2012 | $12.52 | 0.22 | 0.30 | 0.52 | (0.23) | — | (0.23) | $12.81 | 4.26% | 0.21% | 1.82% | 16% | $374,544 |
2011 | $10.92 | 0.20 | 1.59 | 1.79 | (0.19) | — | (0.19) | $12.52 | 16.44% | 0.21% | 1.68% | 3% | $277,333 |
2010 | $9.74 | 0.17 | 1.15 | 1.32 | (0.14) | — | (0.14) | $10.92 | 13.58% | 0.21% | 1.54% | 8% | $231,716 |
2009 | $12.10 | 0.19 | (2.13) | (1.94) | (0.24) | (0.18) | (0.42) | $9.74 | (15.54)% | 0.20% | 2.12% | 18% | $170,455 |
Institutional Class | |||||||||||||
2013 | $12.83 | 0.25 | 1.83 | 2.08 | (0.25) | (0.11) | (0.36) | $14.55 | 16.54% | 0.00%(4) | 1.82% | 3% | $235,505 |
2012 | $12.54 | 0.25 | 0.29 | 0.54 | (0.25) | — | (0.25) | $12.83 | 4.46% | 0.01% | 2.02% | 16% | $138,143 |
2011 | $10.93 | 0.24 | 1.58 | 1.82 | (0.21) | — | (0.21) | $12.54 | 16.75% | 0.01% | 1.88% | 3% | $154,449 |
2010 | $9.76 | 0.19 | 1.14 | 1.33 | (0.16) | — | (0.16) | $10.93 | 13.68% | 0.01% | 1.74% | 8% | $66,385 |
2009 | $12.12 | 0.20 | (2.12) | (1.92) | (0.26) | (0.18) | (0.44) | $9.76 | (15.34)% | 0.00%(4) | 2.32% | 18% | $46,544 |
A Class(5) | |||||||||||||
2013 | $12.79 | 0.19 | 1.83 | 2.02 | (0.19) | (0.11) | (0.30) | $14.51 | 16.05% | 0.45% | 1.37% | 3% | $356,751 |
2012 | $12.50 | 0.20 | 0.29 | 0.49 | (0.20) | — | (0.20) | $12.79 | 4.00% | 0.46% | 1.57% | 16% | $239,410 |
2011 | $10.90 | 0.17 | 1.59 | 1.76 | (0.16) | — | (0.16) | $12.50 | 16.17% | 0.46% | 1.43% | 3% | $174,230 |
2010 | $9.73 | 0.14 | 1.14 | 1.28 | (0.11) | — | (0.11) | $10.90 | 13.21% | 0.46% | 1.29% | 8% | $103,002 |
2009 | $12.09 | 0.17 | (2.13) | (1.96) | (0.22) | (0.18) | (0.40) | $9.73 | (15.77)% | 0.45% | 1.87% | 18% | $32,896 |
For a Share Outstanding Throughout the Years Ended July 31 (except as noted) | |||||||||||||
Per-Share Data | Ratios and Supplemental Data | ||||||||||||
Income From Investment Operations: | Distributions From: | Ratio to Average Net Assets of: | |||||||||||
Net Asset Value, Beginning | Net | Net | Total From Investment Operations | Net | Net | Total Distributions | Net Asset Value, | Total | Operating Expenses(3) | Net | Portfolio Turnover | Net Assets, | |
C Class | |||||||||||||
2013 | $12.76 | 0.08 | 1.82 | 1.90 | (0.09) | (0.11) | (0.20) | $14.46 | 15.05% | 1.20% | 0.62% | 3% | $3,572 |
2012 | $12.46 | 0.09 | 0.32 | 0.41 | (0.11) | — | (0.11) | $12.76 | 3.31% | 1.21% | 0.82% | 16% | $1,396 |
2011 | $10.87 | 0.07 | 1.59 | 1.66 | (0.07) | — | (0.07) | $12.46 | 15.25% | 1.21% | 0.68% | 3% | $630 |
2010(6) | $10.74 | 0.01 | 0.12 | 0.13 | — | — | — | $10.87 | 1.21% | 1.21%(7) | 0.29%(7) | 8%(8) | $86 |
R Class | |||||||||||||
2013 | $12.78 | 0.16 | 1.82 | 1.98 | (0.16) | (0.11) | (0.27) | $14.49 | 15.69% | 0.70% | 1.12% | 3% | $141,978 |
2012 | $12.48 | 0.16 | 0.31 | 0.47 | (0.17) | — | (0.17) | $12.78 | 3.83% | 0.71% | 1.32% | 16% | $101,164 |
2011 | $10.89 | 0.14 | 1.58 | 1.72 | (0.13) | — | (0.13) | $12.48 | 15.80% | 0.71% | 1.18% | 3% | $71,077 |
2010 | $9.72 | 0.11 | 1.15 | 1.26 | (0.09) | — | (0.09) | $10.89 | 12.93% | 0.71% | 1.04% | 8% | $35,276 |
2009 | $12.07 | 0.14 | (2.11) | (1.97) | (0.20) | (0.18) | (0.38) | $9.72 | (15.92)% | 0.70% | 1.62% | 18% | $10,785 |
Notes to Financial Highlights
(1) | Computed using average shares outstanding throughout the period. |
(2) | Total returns are calculated based on the net asset value of the last business day and do not reflect applicable sales charges, if any. Total returns for periods less than one year are not annualized. |
(3) | Ratio of operating expenses to average net assets does not include any fees and expenses of the underlying funds. |
(4) | Ratio was less than 0.005%. |
(5) | Prior to March 1, 2010, the A Class was referred to as the Advisor Class. |
(6) | March 1, 2010 (commencement of sale) through July 31, 2010. |
(7) | Annualized. |
(8) | Portfolio turnover is calculated at the fund level. Percentage indicated was calculated for the year ended July 31, 2010. |
See Notes to Financial Statements.
For a Share Outstanding Throughout the Years Ended July 31 (except as noted) | |||||||||||||
Per-Share Data | Ratios and Supplemental Data | ||||||||||||
Income From Investment Operations: | Distributions From: | Ratio to Average Net Assets of: | |||||||||||
Net Asset Value, Beginning | Net | Net | Total From Investment Operations | Net | Net | Total Distributions | Net Asset Value, | Total | Operating Expenses(3) | Net | Portfolio Turnover | Net Assets, | |
One Choice 2040 Portfolio | |||||||||||||
Investor Class | |||||||||||||
2013 | $10.31 | 0.18 | 1.62 | 1.80 | (0.16) | (0.08) | (0.24) | $11.87 | 17.83% | 0.20% | 1.58% | 5% | $234,285 |
2012 | $10.11 | 0.17 | 0.23 | 0.40 | (0.17) | (0.03) | (0.20) | $10.31 | 4.05% | 0.21% | 1.71% | 20% | $107,290 |
2011 | $8.72 | 0.14 | 1.39 | 1.53 | (0.14) | —(4) | (0.14) | $10.11 | 17.57% | 0.21% | 1.57% | 5% | $44,433 |
2010 | $7.75 | 0.12 | 0.95 | 1.07 | (0.09) | (0.01) | (0.10) | $8.72 | 13.80% | 0.21% | 1.40% | 3% | $41,985 |
2009 | $9.29 | 0.09 | (1.54) | (1.45) | (0.09) | — | (0.09) | $7.75 | (15.53)% | 0.20% | 1.38% | 25% | $24,386 |
Institutional Class | |||||||||||||
2013 | $10.32 | 0.20 | 1.62 | 1.82 | (0.18) | (0.08) | (0.26) | $11.88 | 18.05% | 0.00%(5) | 1.78% | 5% | $156,913 |
2012 | $10.12 | 0.19 | 0.23 | 0.42 | (0.19) | (0.03) | (0.22) | $10.32 | 4.26% | 0.01% | 1.91% | 20% | $70,149 |
2011 | $8.73 | 0.18 | 1.37 | 1.55 | (0.16) | —(4) | (0.16) | $10.12 | 17.78% | 0.01% | 1.77% | 5% | $78,468 |
2010 | $7.75 | 0.14 | 0.96 | 1.10 | (0.11) | (0.01) | (0.12) | $8.73 | 14.16% | 0.01% | 1.60% | 3% | $22,593 |
2009 | $9.29 | 0.11 | (1.56) | (1.45) | (0.09) | — | (0.09) | $7.75 | (15.43)% | 0.00%(5) | 1.58% | 25% | $9,846 |
A Class(6) | |||||||||||||
2013 | $10.30 | 0.15 | 1.62 | 1.77 | (0.14) | (0.08) | (0.22) | $11.85 | 17.45% | 0.45% | 1.33% | 5% | $176,014 |
2012 | $10.10 | 0.15 | 0.22 | 0.37 | (0.14) | (0.03) | (0.17) | $10.30 | 3.80% | 0.46% | 1.46% | 20% | $110,524 |
2011 | $8.71 | 0.13 | 1.37 | 1.50 | (0.11) | —(4) | (0.11) | $10.10 | 17.29% | 0.46% | 1.32% | 5% | $69,629 |
2010 | $7.73 | 0.09 | 0.97 | 1.06 | (0.07) | (0.01) | (0.08) | $8.71 | 13.68% | 0.46% | 1.15% | 3% | $42,212 |
2009 | $9.29 | 0.09 | (1.57) | (1.48) | (0.08) | — | (0.08) | $7.73 | (15.87)% | 0.45% | 1.13% | 25% | $1,551 |
For a Share Outstanding Throughout the Years Ended July 31 (except as noted) | |||||||||||||
Per-Share Data | Ratios and Supplemental Data | ||||||||||||
Income From Investment Operations: | Distributions From: | Ratio to Average Net Assets of: | |||||||||||
Net Asset Value, Beginning | Net | Net | Total From Investment Operations | Net | Net | Total Distributions | Net Asset Value, | Total | Operating Expenses(3) | Net | Portfolio Turnover | Net Assets, | |
C Class | |||||||||||||
2013 | $10.26 | 0.07 | 1.62 | 1.69 | (0.05) | (0.08) | (0.13) | $11.82 | 16.71% | 1.20% | 0.58% | 5% | $2,049 |
2012 | $10.07 | 0.06 | 0.23 | 0.29 | (0.07) | (0.03) | (0.10) | $10.26 | 2.93% | 1.21% | 0.71% | 20% | $559 |
2011 | $8.68 | 0.05 | 1.38 | 1.43 | (0.04) | —(4) | (0.04) | $10.07 | 16.46% | 1.21% | 0.57% | 5% | $215 |
2010(7) | $8.60 | —(4) | 0.08 | 0.08 | — | — | — | $8.68 | 0.93% | 1.21%(8) | 0.12%(8) | 3%(9) | $68 |
R Class | |||||||||||||
2013 | $10.28 | 0.12 | 1.62 | 1.74 | (0.11) | (0.08) | (0.19) | $11.83 | 17.18% | 0.70% | 1.08% | 5% | $64,687 |
2012 | $10.08 | 0.12 | 0.23 | 0.35 | (0.12) | (0.03) | (0.15) | $10.28 | 3.54% | 0.71% | 1.21% | 20% | $36,524 |
2011 | $8.69 | 0.10 | 1.38 | 1.48 | (0.09) | —(4) | (0.09) | $10.08 | 17.03% | 0.71% | 1.07% | 5% | $18,752 |
2010 | $7.72 | 0.08 | 0.95 | 1.03 | (0.05) | (0.01) | (0.06) | $8.69 | 13.28% | 0.71% | 0.90% | 3% | $7,773 |
2009 | $9.28 | 0.10 | (1.59) | (1.49) | (0.07) | — | (0.07) | $7.72 | (16.01)% | 0.70% | 0.88% | 25% | $2,347 |
Notes to Financial Highlights
(1) | Computed using average shares outstanding throughout the period. |
(2) | Total returns are calculated based on the net asset value of the last business day and do not reflect applicable sales charges, if any. Total returns for periods less than one year are not annualized. |
(3) | Ratio of operating expenses to average net assets does not include any fees and expenses of the underlying funds. |
(4) | Per-share amount was less than $0.005. |
(5) | Ratio was less than 0.005%. |
(6) | Prior to March 1, 2010, the A Class was referred to as the Advisor Class. |
(7) | March 1, 2010 (commencement of sale) through July 31, 2010. |
(8) | Annualized. |
(9) | Portfolio turnover is calculated at the fund level. Percentage indicated was calculated for the year ended July 31, 2010. |
See Notes to Financial Statements.
For a Share Outstanding Throughout the Years Ended July 31 (except as noted) | |||||||||||||
Per-Share Data | Ratios and Supplemental Data | ||||||||||||
Income From Investment Operations: | Distributions From: | Ratio to Average Net Assets of: | |||||||||||
Net Asset Value, Beginning | Net | Net | Total From Investment Operations | Net | Net | Total Distributions | Net Asset Value, | Total | Operating Expenses(3) | Net | Portfolio Turnover | Net Assets, | |
One Choice 2045 Portfolio | |||||||||||||
Investor Class | |||||||||||||
2013 | $12.84 | 0.22 | 2.17 | 2.39 | (0.21) | (0.10) | (0.31) | $14.92 | 18.94% | 0.20% | 1.58% | 3% | $355,470 |
2012 | $12.59 | 0.20 | 0.26 | 0.46 | (0.21) | — | (0.21) | $12.84 | 3.76% | 0.21% | 1.66% | 14% | $222,501 |
2011 | $10.82 | 0.18 | 1.76 | 1.94 | (0.17) | — | (0.17) | $12.59 | 17.98% | 0.21% | 1.51% | 2% | $157,711 |
2010 | $9.59 | 0.14 | 1.22 | 1.36 | (0.13) | — | (0.13) | $10.82 | 14.16% | 0.21% | 1.35% | 9% | $113,447 |
2009 | $12.24 | 0.18 | (2.41) | (2.23) | (0.22) | (0.20) | (0.42) | $9.59 | (17.74)% | 0.20% | 1.99% | 18% | $85,095 |
Institutional Class | |||||||||||||
2013 | $12.86 | 0.25 | 2.17 | 2.42 | (0.24) | (0.10) | (0.34) | $14.94 | 19.15% | 0.00%(4) | 1.78% | 3% | $196,557 |
2012 | $12.60 | 0.23 | 0.26 | 0.49 | (0.23) | — | (0.23) | $12.86 | 4.04% | 0.01% | 1.86% | 14% | $116,894 |
2011 | $10.83 | 0.21 | 1.75 | 1.96 | (0.19) | — | (0.19) | $12.60 | 18.10% | 0.01% | 1.71% | 2% | $110,477 |
2010 | $9.60 | 0.16 | 1.22 | 1.38 | (0.15) | — | (0.15) | $10.83 | 14.48% | 0.01% | 1.55% | 9% | $57,836 |
2009 | $12.25 | 0.20 | (2.41) | (2.21) | (0.24) | (0.20) | (0.44) | $9.60 | (17.56)% | 0.00%(4) | 2.19% | 18% | $34,639 |
A Class(5) | |||||||||||||
2013 | $12.82 | 0.18 | 2.17 | 2.35 | (0.18) | (0.10) | (0.28) | $14.89 | 18.59% | 0.45% | 1.33% | 3% | $231,054 |
2012 | $12.56 | 0.18 | 0.26 | 0.44 | (0.18) | — | (0.18) | $12.82 | 3.59% | 0.46% | 1.41% | 14% | $147,197 |
2011 | $10.80 | 0.15 | 1.75 | 1.90 | (0.14) | — | (0.14) | $12.56 | 17.63% | 0.46% | 1.26% | 2% | $104,426 |
2010 | $9.57 | 0.11 | 1.22 | 1.33 | (0.10) | — | (0.10) | $10.80 | 13.90% | 0.46% | 1.10% | 9% | $56,695 |
2009 | $12.22 | 0.15 | (2.40) | (2.25) | (0.20) | (0.20) | (0.40) | $9.57 | (17.98)% | 0.45% | 1.74% | 18% | $17,537 |
For a Share Outstanding Throughout the Years Ended July 31 (except as noted) | |||||||||||||
Per-Share Data | Ratios and Supplemental Data | ||||||||||||
Income From Investment Operations: | Distributions From: | Ratio to Average Net Assets of: | |||||||||||
Net Asset Value, Beginning | Net | Net | Total From Investment Operations | Net | Net | Total Distributions | Net Asset Value, | Total | Operating Expenses(3) | Net | Portfolio Turnover | Net Assets, | |
C Class | |||||||||||||
2013 | $12.79 | 0.10 | 2.15 | 2.25 | (0.08) | (0.10) | (0.18) | $14.86 | 17.72% | 1.20% | 0.58% | 3% | $1,220 |
2012 | $12.53 | 0.08 | 0.27 | 0.35 | (0.09) | — | (0.09) | $12.79 | 2.82% | 1.21% | 0.66% | 14% | $633 |
2011 | $10.78 | 0.03 | 1.77 | 1.80 | (0.05) | — | (0.05) | $12.53 | 16.68% | 1.21% | 0.51% | 2% | $363 |
2010(6) | $10.67 | 0.01 | 0.10 | 0.11 | — | — | — | $10.78 | 1.03% | 1.21%(7) | 0.14%(7) | 9%(8) | $59 |
R Class | |||||||||||||
2013 | $12.81 | 0.15 | 2.17 | 2.32 | (0.15) | (0.10) | (0.25) | $14.88 | 18.30% | 0.70% | 1.08% | 3% | $91,776 |
2012 | $12.55 | 0.14 | 0.27 | 0.41 | (0.15) | — | (0.15) | $12.81 | 3.33% | 0.71% | 1.16% | 14% | $62,208 |
2011 | $10.79 | 0.12 | 1.75 | 1.87 | (0.11) | — | (0.11) | $12.55 | 17.35% | 0.71% | 1.01% | 2% | $39,540 |
2010 | $9.56 | 0.09 | 1.21 | 1.30 | (0.07) | — | (0.07) | $10.79 | 13.63% | 0.71% | 0.85% | 9% | $17,327 |
2009 | $12.21 | 0.11 | (2.38) | (2.27) | (0.18) | (0.20) | (0.38) | $9.56 | (18.20)% | 0.70% | 1.49% | 18% | $4,966 |
Notes to Financial Highlights
(1) | Computed using average shares outstanding throughout the period. |
(2) | Total returns are calculated based on the net asset value of the last business day and do not reflect applicable sales charges, if any. Total returns for periods less than one year are not annualized. |
(3) | Ratio of operating expenses to average net assets does not include any fees and expenses of the underlying funds. |
(4) | Ratio was less than 0.005%. |
(5) | Prior to March 1, 2010, the A Class was referred to as the Advisor Class. |
(6) | March 1, 2010 (commencement of sale) through July 31, 2010. |
(7) | Annualized. |
(8) | Portfolio turnover is calculated at the fund level. Percentage indicated was calculated for the year ended July 31, 2010. |
See Notes to Financial Statements.
For a Share Outstanding Throughout the Years Ended July 31 (except as noted) | |||||||||||||
Per-Share Data | Ratios and Supplemental Data | ||||||||||||
Income From Investment Operations: | Distributions From: | Ratio to Average Net Assets of: | |||||||||||
Net Asset Value, Beginning | Net | Net | Total From Investment Operations | Net | Net | Total Distributions | Net Asset Value, | Total | Operating Expenses(3) | Net | Portfolio Turnover | Net Assets, | |
One Choice 2050 Portfolio | |||||||||||||
Investor Class | |||||||||||||
2013 | $10.07 | 0.16 | 1.77 | 1.93 | (0.15) | (0.08) | (0.23) | $11.77 | 19.51% | 0.20% | 1.51% | 4% | $115,834 |
2012 | $9.88 | 0.14 | 0.21 | 0.35 | (0.14) | (0.02) | (0.16) | $10.07 | 3.67% | 0.21% | 1.53% | 12% | $48,553 |
2011 | $8.45 | 0.13 | 1.42 | 1.55 | (0.12) | —(4) | (0.12) | $9.88 | 18.35% | 0.21% | 1.37% | 6% | $20,035 |
2010 | $7.46 | 0.10 | 0.97 | 1.07 | (0.08) | —(4) | (0.08) | $8.45 | 14.33% | 0.22% | 1.17% | 13% | $10,225 |
2009 | $9.23 | 0.10 | (1.80) | (1.70) | (0.07) | — | (0.07) | $7.46 | (18.30)% | 0.20% | 1.57% | 26% | $3,454 |
Institutional Class | |||||||||||||
2013 | $10.09 | 0.19 | 1.76 | 1.95 | (0.17) | (0.08) | (0.25) | $11.79 | 19.72% | 0.00%(5) | 1.71% | 4% | $95,469 |
2012 | $9.90 | 0.17 | 0.20 | 0.37 | (0.16) | (0.02) | (0.18) | $10.09 | 3.87% | 0.01% | 1.73% | 12% | $49,284 |
2011 | $8.46 | 0.15 | 1.43 | 1.58 | (0.14) | —(4) | (0.14) | $9.90 | 18.69% | 0.01% | 1.57% | 6% | $30,796 |
2010 | $7.47 | 0.12 | 0.96 | 1.08 | (0.09) | —(4) | (0.09) | $8.46 | 14.54% | 0.02% | 1.37% | 13% | $8,482 |
2009 | $9.23 | 0.12 | (1.80) | (1.68) | (0.08) | — | (0.08) | $7.47 | (18.09)% | 0.00%(5) | 1.77% | 26% | $3,179 |
A Class(6) | |||||||||||||
2013 | $10.06 | 0.14 | 1.76 | 1.90 | (0.13) | (0.08) | (0.21) | $11.75 | 19.13% | 0.45% | 1.26% | 4% | $91,012 |
2012 | $9.87 | 0.13 | 0.20 | 0.33 | (0.12) | (0.02) | (0.14) | $10.06 | 3.41% | 0.46% | 1.28% | 12% | $55,073 |
2011 | $8.44 | 0.11 | 1.41 | 1.52 | (0.09) | —(4) | (0.09) | $9.87 | 18.08% | 0.46% | 1.12% | 6% | $29,685 |
2010 | $7.45 | 0.07 | 0.97 | 1.04 | (0.05) | —(4) | (0.05) | $8.44 | 14.06% | 0.47% | 0.92% | 13% | $13,463 |
2009 | $9.23 | 0.07 | (1.79) | (1.72) | (0.06) | — | (0.06) | $7.45 | (18.52)% | 0.45% | 1.32% | 26% | $336 |
For a Share Outstanding Throughout the Years Ended July 31 (except as noted) | |||||||||||||
Per-Share Data | Ratios and Supplemental Data | ||||||||||||
Income From Investment Operations: | Distributions From: | Ratio to Average Net Assets of: | |||||||||||
Net Asset Value, Beginning | Net | Net | Total From Investment Operations | Net | Net | Total Distributions | Net Asset Value, | Total | Operating Expenses(3) | Net | Portfolio Turnover | Net Assets, | |
C Class | |||||||||||||
2013 | $10.04 | 0.06 | 1.76 | 1.82 | (0.05) | (0.08) | (0.13) | $11.73 | 18.26% | 1.20% | 0.51% | 4% | $1,748 |
2012 | $9.85 | 0.05 | 0.21 | 0.26 | (0.05) | (0.02) | (0.07) | $10.04 | 2.64% | 1.21% | 0.53% | 12% | $530 |
2011 | $8.42 | 0.05 | 1.40 | 1.45 | (0.02) | —(4) | (0.02) | $9.85 | 17.23% | 1.21% | 0.37% | 6% | $117 |
2010(7) | $8.35 | —(4) | 0.07 | 0.07 | — | — | — | $8.42 | 0.84% | 1.22%(8) | 0.06%(8) | 13%(9) | $32 |
R Class | |||||||||||||
2013 | $10.05 | 0.11 | 1.76 | 1.87 | (0.10) | (0.08) | (0.18) | $11.74 | 18.84% | 0.70% | 1.01% | 4% | $32,896 |
2012 | $9.86 | 0.10 | 0.21 | 0.31 | (0.10) | (0.02) | (0.12) | $10.05 | 3.16% | 0.71% | 1.03% | 12% | $15,933 |
2011 | $8.43 | 0.09 | 1.41 | 1.50 | (0.07) | —(4) | (0.07) | $9.86 | 17.80% | 0.71% | 0.87% | 6% | $7,660 |
2010 | $7.44 | 0.06 | 0.96 | 1.02 | (0.03) | —(4) | (0.03) | $8.43 | 13.79% | 0.73% | 0.66% | 13% | $3,076 |
2009 | $9.22 | 0.08 | (1.81) | (1.73) | (0.05) | — | (0.05) | $7.44 | (18.66)% | 0.70% | 1.07% | 26% | $186 |
Notes to Financial Highlights
(1) | Computed using average shares outstanding throughout the period. |
(2) | Total returns are calculated based on the net asset value of the last business day and do not reflect applicable sales charges, if any. Total returns for periods less than one year are not annualized. |
(3) | Ratio of operating expenses to average net assets does not include any fees and expenses of the underlying funds. |
(4) | Per-share amount was less than $0.005. |
(5) | Ratio was less than 0.005%. |
(6) | Prior to March 1, 2010, the A Class was referred to as the Advisor Class. |
(7) | March 1, 2010 (commencement of sale) through July 31, 2010. |
(8) | Annualized. |
(9) | Portfolio turnover is calculated at the fund level. Percentage indicated was calculated for the year ended July 31, 2010. |
See Notes to Financial Statements.
For a Share Outstanding Throughout the Years Ended July 31 (except as noted) | |||||||||||||
Per-Share Data | Ratios and Supplemental Data | ||||||||||||
Income From Investment Operations: | Distributions From: | Ratio to Average Net Assets of: | |||||||||||
Net Asset Value, Beginning | Net | Net | Total From Investment Operations | Net | Net | Total Distributions | Net Asset Value, | Total | Operating Expenses(3) | Net | Portfolio Turnover | Net Assets, | |
One Choice 2055 Portfolio | |||||||||||||
Investor Class | |||||||||||||
2013 | $10.19 | 0.15 | 1.85 | 2.00 | (0.14) | (0.03) | (0.17) | $12.02 | 19.86% | 0.20% | 1.36% | 13% | $14,959 |
2012 | $9.92 | 0.12 | 0.25 | 0.37 | (0.10) | — | (0.10) | $10.19 | 3.78% | 0.20% | 1.25% | 44% | $3,920 |
2011(4) | $10.00 | 0.03 | (0.11) | (0.08) | — | — | — | $9.92 | (0.80)% | 0.20%(5) | 0.86%(5) | 12% | $390 |
Institutional Class | |||||||||||||
2013 | $10.20 | 0.18 | 1.84 | 2.02 | (0.16) | (0.03) | (0.19) | $12.03 | 20.08% | 0.00%(6) | 1.56% | 13% | $10,951 |
2012 | $9.92 | 0.14 | 0.25 | 0.39 | (0.11) | — | (0.11) | $10.20 | 4.04% | 0.00%(6) | 1.45% | 44% | $3,939 |
2011(4) | $10.00 | 0.04 | (0.12) | (0.08) | — | — | — | $9.92 | (0.80)% | 0.00%(5)(6) | 1.06%(5) | 12% | $379 |
A Class | |||||||||||||
2013 | $10.17 | 0.13 | 1.85 | 1.98 | (0.12) | (0.03) | (0.15) | $12.00 | 19.59% | 0.45% | 1.11% | 13% | $14,138 |
2012 | $9.91 | 0.10 | 0.24 | 0.34 | (0.08) | — | (0.08) | $10.17 | 3.49% | 0.45% | 1.00% | 44% | $3,253 |
2011(4) | $10.00 | 0.02 | (0.11) | (0.09) | — | — | — | $9.91 | (0.90)% | 0.45%(5) | 0.61%(5) | 12% | $21 |
C Class | |||||||||||||
2013 | $10.13 | 0.05 | 1.84 | 1.89 | (0.04) | (0.03) | (0.07) | $11.95 | 18.66% | 1.20% | 0.36% | 13% | $215 |
2012 | $9.88 | 0.02 | 0.26 | 0.28 | (0.03) | — | (0.03) | $10.13 | 2.81% | 1.20% | 0.25% | 44% | $87 |
2011(4) | $10.00 | (0.01) | (0.11) | (0.12) | — | — | — | $9.88 | (1.20)% | 1.20%(5) | (0.14)%(5) | 12% | $5 |
R Class | |||||||||||||
2013 | $10.16 | 0.09 | 1.86 | 1.95 | (0.09) | (0.03) | (0.12) | $11.99 | 19.31% | 0.70% | 0.86% | 13% | $6,983 |
2012 | $9.90 | 0.06 | 0.26 | 0.32 | (0.06) | — | (0.06) | $10.16 | 3.29% | 0.70% | 0.75% | 44% | $1,108 |
2011(4) | $10.00 | 0.01 | (0.11) | (0.10) | — | — | — | $9.90 | (1.00)% | 0.70%(5) | 0.36%(5) | 12% | $6 |
Notes to Financial Highlights
(1) | Computed using average shares outstanding throughout the period. |
(2) | Total returns are calculated based on the net asset value of the last business day and do not reflect applicable sales charges, if any. Total returns for periods less than one year are not annualized. |
(3) | Ratio of operating expenses to average net assets does not include any fees and expenses of the underlying funds. |
(4) | March 31, 2011 (fund inception) through July 31, 2011. |
(5) | Annualized. |
(6) | Ratio was less than 0.005%. |
See Notes to Financial Statements.
Report of Independent Registered Public Accounting Firm |
To the Shareholders and Board of Directors of
American Century Asset Allocation Portfolios, Inc.:
We have audited the accompanying statements of assets and liabilities, including the schedules of investments, of One Choice In Retirement Portfolio (formerly LIVESTRONG Income Portfolio), One Choice 2015 Portfolio (formerly LIVESTRONG 2015 Portfolio), One Choice 2020 Portfolio (formerly LIVESTRONG 2020 Portfolio), One Choice 2025 Portfolio (formerly LIVESTRONG 2025 Portfolio), One Choice 2030 Portfolio (formerly LIVESTRONG 2030 Portfolio), One Choice 2035 Portfolio (formerly LIVESTRONG 2035 Portfolio), One Choice 2040 Portfolio (formerly LIVESTRONG 2040 Portfolio), One Choice 2045 Portfolio (formerly LIVESTRONG 2045 Portfolio), One Choice 2050 Portfolio (formerly LIVESTRONG 2050 Portfolio), and Once Choice 2055 Portfolio (formerly LIVESTRONG 2055 Portfolio), ten of the portfolios constituting American Century Asset Allocation Portfolios, Inc. (the “Funds”) as of July 31, 2013, and the related statements of operations for the year then ended, the statements of changes in net assets for each of the two years in the period then ended, and the financial highlights for periods presented. These financial statements and financial highlights are the responsibility of the Funds’ management. Our responsibility is to express an opinion on these financial statements and financial highlights based on our audits.
We conducted our audits in accordance with the standards of the Public Company Accounting Oversight Board (United States). Those standards require that we plan and perform the audit to obtain reasonable assurance about whether the financial statements and financial highlights are free of material misstatement. The Funds are not required to have, nor were we engaged to perform, an audit of their internal control over financial reporting. Our audits included consideration of internal control over financial reporting as a basis for designing audit procedures that are appropriate in the circumstances, but not for the purpose of expressing an opinion on the effectiveness of the Funds’ internal control over financial reporting. Accordingly, we express no such opinion. An audit also includes examining, on a test basis, evidence supporting the amounts and disclosures in the financial statements, assessing the accounting principles used and significant estimates made by management, as well as evaluating the overall financial statement presentation. Our procedures included confirmation of securities owned as of July 31, 2013, by correspondence with the transfer agent. We believe that our audits provide a reasonable basis for our opinion.
In our opinion, the financial statements and financial highlights referred to above present fairly, in all material respects, the financial position of each of the respective Funds as of July 31, 2013, the results of their operations for the year then ended, changes in their net assets for each of the two years in the period then ended, and the financial highlights for each of the periods presented, in conformity with accounting principles generally accepted in the United States of America.
Deloitte & Touche LLP
Kansas City, Missouri
September 19, 2013
Management |
The Board of Directors
The individuals listed below serve as directors of the funds. Each director will continue to serve in this capacity until death, retirement, resignation or removal from office. The board has adopted a mandatory retirement age for directors who are not “interested persons,” as that term is defined in the Investment Company Act (independent directors). Independent directors shall retire by December 31 of the year in which they reach their 75th birthday. Mr. Pratt may serve until December 31 of the year in which he reaches his 76th birthday based on an extension granted under previous retirement guidelines.
Mr. Thomas is an “interested person” because he currently serves as President and Chief Executive Officer of American Century Companies, Inc. (ACC), the parent company of American Century Investment Management, Inc. (ACIM or the advisor). Mr. Fink is an “interested person” because of his employment with American Century Services, LLC (ACS).
The other directors (more than three-fourths of the total number) are independent; that is, they have never been employees, directors or officers of, and have no financial interest in, ACC or any of its wholly owned, direct or indirect, subsidiaries, including ACIM, American Century Investment Services, Inc. (ACIS) and ACS. The directors serve in this capacity for seven (in the case of Mr. Thomas, 15) registered investment companies in the American Century Investments family of funds.
The following table presents additional information about the directors. The mailing address for each director is 4500 Main Street, Kansas City, Missouri 64111.
Name | Position(s) Held with Funds | Length Served | Principal Occupation(s) During Past 5 Years | Number of American Century Portfolios Overseen | Other Directorships Held During Past 5 Years | |
Independent Directors | ||||||
Thomas A. Brown (1940) | Director | Since 1980 | Managing Member, Associated Investments, LLC (real estate investment company); Brown Cascade Properties, LLC (real estate investment company) (2001 to 2009) | 75 | None | |
Andrea C. Hall (1945) | Director | Since 1997 | Retired | 75 | None | |
Jan M. Lewis (1957) | Director | Since 2011 | President and Chief Executive Officer, Catholic Charities of Northeast Kansas (human services organization) | 75 | None | |
James A. Olson (1942) | Director | Since 2007 | Member, Plaza Belmont LLC (private equity fund manager) | 75 | Saia, Inc. (2002 to 2012) and EPR Properties (2003 to 2013) | |
Donald H. Pratt (1937) | Director and Chairman of the Board | Since 1995 (Chairman since 2005) | Chairman and Chief Executive Officer, Western Investments, Inc. (real estate company) | 75 | None | |
Name | Position(s) Held with Funds | Length Served | Principal Occupation(s) During Past 5 Years | Number of American Century Portfolios Overseen | Other Directorships Held During Past 5 Years | |
Independent Directors | ||||||
M. Jeannine Strandjord | Director | Since 1994 | Retired | 75 | Euronet Worldwide Inc.; Charming Shoppes, Inc. (2006 to 2010); and DST Systems Inc. (1996 to 2012) | |
John R. Whitten (1946) | Director | Since 2008 | Retired | 75 | Rudolph Technologies, Inc. | |
Stephen E. Yates (1948) | Director | Since 2012 | Retired; Executive Vice President, Technology & Operations, KeyCorp. (computer services) (2004 to 2010) | 75 | Applied Industrial Technologies, Inc. (2001 to 2010) | |
Interested Directors | ||||||
Barry Fink | Director | Since 2012 | Retired; Executive Vice President, ACC (September 2007 to February 2013); President, ACS (October 2007 to February 2013); Chief Operating Officer, ACC (September 2007 to November 2012). | 75 | None | |
Jonathan S. Thomas | Director and President | Since 2007 | President and Chief Executive Officer, ACC (March 2007 to present). Also serves as Chief Executive Officer and Manager, ACS; Executive Vice President, ACIM; Director, ACC, ACIM and other ACC subsidiaries | 116 | None | |
Officers
The following table presents certain information about the executive officers of the funds. Each officer serves as an officer for each of the 15 investment companies in the American Century family of funds, unless otherwise noted. No officer is compensated for his or her service as an officer of the funds. The listed officers are interested persons of the funds and are appointed or re-appointed on an annual basis. The mailing address for each officer listed below is 4500 Main Street, Kansas City, Missouri 64111.
Name | Offices with the Funds | Principal Occupation(s) During the Past Five Years | |
Jonathan S. Thomas | Director and President since 2007 | President and Chief Executive Officer, ACC (March 2007 to present). Also serves as Chief Executive Officer and Manager, ACS; Executive Vice President, ACIM; Director, ACC, ACIM and other ACC subsidiaries | |
Maryanne L. Roepke | Chief Compliance Officer since 2006 and Senior Vice President since 2000 | Chief Compliance Officer, American Century funds, ACIM and ACS (August 2006 to present). Also serves as Senior Vice President, ACS | |
Charles A. Etherington (1957) | General Counsel since 2007 and Senior Vice President since 2006 | Attorney, ACC (February 1994 to present); Vice President, ACC (November 2005 to present); General Counsel, ACC (March 2007 to present). Also serves as General Counsel, ACIM, ACS, ACIS and other ACC subsidiaries; and Senior Vice President, ACIM and ACS | |
C. Jean Wade (1964) | Vice President, Treasurer and Chief Financial Officer since 2012 | Vice President, ACS (February 2000 to present) | |
Robert J. Leach (1966) | Vice President since 2006 and Assistant Treasurer since 2012 | Vice President, ACS (February 2000 to present) | |
David H. Reinmiller (1963) | Vice President since 2000 | Attorney, ACC (January 1994 to present); Associate General Counsel, ACC (January 2001 to present). Also serves as Vice President, ACIM and ACS | |
Ward D. Stauffer (1960) | Secretary since 2005 | Attorney, ACC (June 2003 to present) |
The Statement of Additional Information has additional information about the funds’ directors and is available without charge, upon request, by calling 1-800-345-2021.
Approval of Management Agreement |
At a meeting held on June 20, 2013, the Funds’ Board of Directors unanimously approved the renewal of the management agreements pursuant to which American Century Investment Management, Inc. (the “Advisor”) acts as the investment advisor for the Funds. Under Section 15(c) of the Investment Company Act, contracts for investment advisory services are required to be reviewed, evaluated, and approved by a majority of a Fund’s directors (the “Directors”), including a majority of the independent Directors, each year.
Prior to its consideration of the renewal of the management agreement, the Board requested and reviewed extensive data and information compiled by the Advisor and certain independent providers of evaluation data concerning the Funds and the services provided to the Funds by the Advisor. This review was in addition to the oversight and evaluation undertaken by the Board and its committees on a continuous basis throughout the year.
In connection with its consideration of the renewal of the management agreement, the Board’s review and evaluation of the services provided by the Advisor included, but was not limited to, the following:
• | the nature, extent, and quality of investment management, shareholder services, and other services provided by the Advisor to the Funds; |
• | the wide range of other programs and services the Advisor provides to the Funds and their shareholders on a routine and non-routine basis; |
• | the investment performance of the Funds, including data comparing the Funds’ performance to appropriate benchmarks and/or a peer group of other mutual funds with similar investment objectives and strategies; |
• | data comparing the cost of owning the Funds to the cost of owning similar funds; |
• | the Advisor’s compliance policies, procedures, and regulatory experience; |
• | financial data showing the cost of services provided to the Funds, the profitability of the Funds to the Advisor, and the overall profitability of the Advisor; |
• | possible economies of scale associated with the Advisor’s management of the Funds and other accounts under its management; |
• | data comparing services provided and charges to other investment management clients of the Advisor; and |
• | consideration of collateral benefits derived by the Advisor from the management of the Funds. |
In keeping with its practice, the Board held two in-person meetings and one telephonic meeting to review and discuss the information provided. The Directors also had the benefit of the advice of independent counsel throughout the period.
Factors Considered
The Directors considered all of the information provided by the Advisor, the independent data providers, and independent counsel, and evaluated such information for each Fund. In connection with their review, the Directors did not identify any single factor as being all-important or controlling, and each Director may have attributed different levels of importance to different factors. In deciding to renew the management agreements, the Board based its decision on a number of factors, including the following:
Nature, Extent and Quality of Services — Generally. Under the management agreements, the Advisor is responsible for providing or arranging for all services necessary for the operation of the Funds. The Board noted that under the management agreements, the Advisor provides or arranges at its own expense a wide variety of services including:
• | constructing and designing the Funds |
• | portfolio research and security selection |
• | initial capitalization/funding |
• | securities trading |
• | Fund administration |
• | custody of Fund assets |
• | daily valuation of each Fund’s portfolio |
• | shareholder servicing and transfer agency, including shareholder confirmations, recordkeeping, and communications |
• | legal services |
• | regulatory and portfolio compliance |
• | financial reporting |
• | marketing and distribution |
The Board noted that many of these services have expanded over time both in terms of quantity and complexity in response to shareholder demands, competition in the industry, changing distribution channels, and the changing regulatory environment.
Investment Management Services. The nature of the investment management services provided to the Funds is quite complex and allows Fund shareholders access to professional money management, instant diversification of their investments within an asset class, the opportunity to easily diversify among asset classes by investing in or exchanging among various American Century Investments funds, and liquidity. In evaluating investment performance, the Board expects the Advisor to manage each Fund in accordance with its investment objectives and approved strategies. Further, the Directors recognize that the Advisor has
an obligation to monitor trading activities, and in particular to seek the best execution of fund trades, and to evaluate the use of and payment for research. In providing these services, the Advisor utilizes teams of investment professionals (portfolio managers, analysts, research assistants, and securities traders) who require extensive information technology, research, training, compliance and other systems to conduct their business. The Board, directly and through its Fund Performance Review Committee, regularly reviews investment performance information for the Funds, together with comparative information for appropriate benchmarks and/or peer groups of similarly-managed funds, over different time horizons. The Directors also review detailed performance information during the management agreement approval process. If performance concerns are identified, the underperforming Fund receives special reviews until performance improves, during which the Board discusses with the Advisor the reasons for such results (e.g., market conditions, security selection) and any efforts being undertaken to improve performance. Taking all these factors into consideration, the Board found the investment management services provided by the Advisor to the Funds to meet or exceed industry standards. More detailed information about the Funds’ performance can be found in the Performance and Portfolio Commentary sections of this report.
Shareholder and Other Services. Under the management agreements, the Advisor provides the Funds with a comprehensive package of transfer agency, shareholder, and other services. The Board, directly and through various committees of the Board, regularly reviews reports and evaluations of such services at its regular meetings. These reports include, but are not limited to, information regarding the operational efficiency and accuracy of the shareholder and transfer agency services provided, staffing levels, shareholder satisfaction (as measured by external as well as internal sources), technology support, new products and services offered to Fund shareholders, securities trading activities, portfolio valuation services, auditing services, and legal and operational compliance activities. Certain aspects of shareholder and transfer agency service level efficiency and the quality of securities trading activities are measured by independent third party providers and are presented in comparison to other fund groups not managed by the Advisor. The Board found the services provided by the Advisor to the Funds under the management agreements to be competitive and of high quality.
Costs of Services and Profitability. The Advisor provides detailed information concerning its cost of providing various services to the Funds, its profitability in managing the Funds, its overall profitability, and its financial condition. The Directors have reviewed with the Advisor the methodology used to prepare this financial information. The financial information regarding the Advisor is considered in evaluating the Advisor’s financial condition, its ability to continue to provide services to the Funds, and the reasonableness of the management agreement. The Board concluded that the Advisor’s profits were reasonable in light of the services provided to the Funds.
Ethics. The Board generally considers the Advisor’s commitment to providing quality services to shareholders and to conducting its business ethically. They noted that the Advisor’s practices generally meet or exceed industry best practices.
Economies of Scale. The Board also reviewed information provided by the Advisor regarding the possible existence of economies of scale in connection with the management of the Funds. The Board concluded that economies of scale are difficult to measure and predict with precision, especially on a fund-by-fund basis. The Board concluded that the Advisor is appropriately sharing economies of scale through its competitive fee structure, offering competitive fees from fund inception, and through reinvestment in its business to provide shareholders additional content and services.
Comparison to Other Funds’ Fees. The Funds invest their non-cash assets entirely in other American Century Investments funds. The Funds do not pay an investment advisory fee to the Advisor. Rather, each Fund pays the Advisor an administrative fee and indirectly bears its pro rata share of the expenses incurred by the underlying funds. Each of the underlying funds pay the Advisor a single, all-inclusive (or unified) management fee for providing all services necessary for the management and operation of the Funds, other than brokerage expenses, taxes, interest, extraordinary expenses, and the fees and expenses of the Funds’ independent directors (including their independent legal counsel) and expenses incurred in connection with the provision of shareholder services and distribution services under a plan adopted pursuant to Rule 12b-1 under the 1940 Act. Under the unified fee structure, the Advisor is responsible for providing all investment advisory, custody, audit, administrative, compliance, recordkeeping, marketing and shareholder services, or arranging and supervising third parties to provide such services. By contrast, most other funds are charged a variety of fees, including an investment advisory fee, a transfer agency fee, an administrative fee, distribution charges and other expenses. Other than their investment advisory fees and any applicable Rule 12b-1 distribution fees, all other components of the total fees charged by these other funds may be increased without shareholder approval. The Board believes the unified fee structure is a benefit to Fund shareholders because it clearly discloses to shareholders the cost of owning Fund shares, and, since the unified fee cannot be increased without a vote of Fund shareholders, it shifts to the Advisor the risk of increased costs of operating the Funds and provides a direct incentive to minimize administrative inefficiencies. Part of the Board’s analysis of fee levels involves reviewing certain evaluative data compiled by an independent provider and comparing each Fund’s expenses to the total expense ratio of other funds in the Fund’s peer group. The Board concluded that the expenses of each Fund are reasonable in light of the services provided to the Fund.
Comparison to Fees and Services Provided to Other Clients of the Advisor. The Board also requested and received information from the Advisor concerning the nature of the services, fees, costs, and profitability of its advisory services to advisory clients other than the Funds. They observed that these varying types of client accounts require different services and involve different regulatory and entrepreneurial risks than the management of the Funds. The Board analyzed this information and concluded that the fees charged and services provided to the Funds were reasonable by comparison.
Collateral or “Fall-Out” Benefits Derived by the Advisor. The Board considered the existence of collateral benefits the Advisor may receive as a result of its relationship with the Funds. They concluded that the Advisor’s primary business is managing mutual funds and it generally does not use fund or shareholder information to generate profits in other lines of business, and therefore does not derive any significant collateral benefits from them. The Board noted that the Advisor receives proprietary research from broker-dealers that execute fund portfolio transactions and concluded that this research is likely to benefit Fund shareholders. The Board also determined that the Advisor is able to provide investment management services to certain clients other than the Funds, at least in part, due to its existing infrastructure built to serve the fund complex. The Board concluded, however, that the assets of those other clients are not material to the analysis and, where applicable, may be included with the assets of the Funds to determine breakpoints in the management fee schedule.
Existing Relationship. The Board also considered whether there was any reason for not continuing the existing arrangement with the Advisor. In this regard, the Board was mindful of the potential disruptions of the Funds’ operations and various risks, uncertainties, and other effects that could occur as a result of a decision not to continue such relationship. In particular, the Board recognized that most shareholders have invested in the Funds on the strength of the Advisor’s industry standing and reputation and in the expectation that the Advisor will have a continuing role in providing advisory services to the Funds.
Conclusion of the Directors. As a result of this process, the Board, including all of the independent directors, taking into account all of the factors discussed above and the information provided by the Advisor and others, concluded that the management agreement between each Fund and the Advisor is fair and reasonable in light of the services provided and should be renewed.
Additional Information |
Retirement Account Information
As required by law, distributions you receive from certain IRAs are subject to federal income tax withholding, unless you elect not to have withholding apply. Tax will be withheld on the total amount withdrawn even though you may be receiving amounts that are not subject to withholding, such as nondeductible contributions. In such case, excess amounts of withholding could occur. You may adjust your withholding election so that a greater or lesser amount will be withheld.
If you don’t want us to withhold on this amount, you must notify us to not withhold the federal income tax. You may notify us in writing or in certain situations by telephone or through other electronic means. For systematic withdrawals, your withholding election will remain in effect until revoked or changed by filing a new election. You have the right to revoke your election at any time.
Remember, even if you elect not to have income tax withheld, you are liable for paying income tax on the taxable portion of your withdrawal. If you elect not to have income tax withheld or you don’t have enough income tax withheld, you may be responsible for payment of estimated tax. You may incur penalties under the estimated tax rules if your withholding and estimated tax payments are not sufficient. You can reduce or defer the income tax on a distribution by directly or indirectly rolling such distribution over to another IRA or eligible plan. You should consult your tax advisor for additional information.
State tax will be withheld if, at the time of your distribution, your address is within one of the mandatory withholding states and you have federal income tax withheld (or as otherwise required by state law). State taxes will be withheld from your distribution in accordance with the respective state rules.
Distributions you receive from 403(b), 457 and qualified plans are subject to special tax and withholding rules. Your plan administrator or plan sponsor is required to provide you with a special tax notice explaining those rules at the time you request a distribution. If applicable, federal and/or state taxes may be withheld from your distribution amount.
Proxy Voting Guidelines
American Century Investment Management, Inc., the funds’ investment advisor, is responsible for exercising the voting rights associated with the securities purchased and/or held by the funds. A description of the policies and procedures the advisor uses in fulfilling this responsibility is available without charge, upon request, by calling 1-800-345-2021. It is also available on American Century Investments’ website at americancentury.com and on the Securities and Exchange Commission’s website at sec.gov. Information regarding how the investment advisor voted proxies relating to portfolio securities during the most recent 12-month period ended June 30 is available on the “About Us” page at americancentury.com. It is also available at sec.gov.
Quarterly Portfolio Disclosure
The funds file their complete schedule of portfolio holdings with the Securities and Exchange Commission (SEC) for the first and third quarters of each fiscal year on Form N-Q. The funds’ Forms N-Q are available on the SEC’s website at sec.gov, and may be reviewed and copied at the SEC’s Public Reference Room in Washington, DC. Information on the operation of the Public Reference Room may be obtained by calling 1-800-SEC-0330. The funds also make their complete schedule of portfolio holdings for the most recent quarter of their fiscal year available on their website at americancentury.com and, upon request, by calling 1-800-345-2021.
Other Tax Information
The following information is provided pursuant to provisions of the Internal Revenue Code.
The funds hereby designate up to the maximum amount allowable as qualified dividend income for the fiscal year ended July 31, 2013.
For corporate taxpayers, the funds hereby designate the following, or up to the maximum amount allowable, of ordinary income distributions paid during the fiscal year ended July 31, 2013 as qualified for the corporate dividends received deduction.
One Choice In Retirement Portfolio | One Choice | One Choice | One Choice | One Choice |
$2,756,903 | $9,072,964 | $6,843,079 | $13,866,824 | $6,771,598 |
One Choice | One Choice | One Choice | One Choice | One Choice |
$11,085,164 | $5,071,113 | $8,054,592 | $2,773,814 | $254,350 |
The funds hereby designate the following, or up to the maximum amount allowable, as long-term capital gain distributions for the fiscal year ended July 31, 2013.
One Choice In Retirement Portfolio | One Choice | One Choice | One Choice | One Choice |
$4,259,572 | $7,656,970 | $6,334,959 | $9,261,161 | $5,559,501 |
One Choice | One Choice | One Choice | One Choice | One Choice |
$8,185,007 | $3,443,875 | $4,663,539 | $1,709,809 | $49,746 |
For the fiscal year ended July 31, 2013, the funds intend to pass through to shareholders the following, or up to the maximum amount allowable, as a foreign tax credit which represents taxes paid on income derived from sources within foreign countries or possessions of the United States. During the fiscal year ended July 31, 2013, the funds earned the following income derived from foreign sources.
Foreign Tax Credit | Foreign Source Income | |||||||||||
Amount | Per Outstanding Share | Amount | Per Outstanding Share | |||||||||
One Choice In Retirement Portfolio | $44,009 | 0.0011 | $288,953 | 0.0073 | ||||||||
One Choice 2015 Portfolio | $130,501 | 0.0015 | $769,910 | 0.0089 | ||||||||
One Choice 2020 Portfolio | $118,593 | 0.0014 | $647,016 | 0.0077 | ||||||||
One Choice 2025 Portfolio | $292,973 | 0.0023 | $1,514,354 | 0.0119 | ||||||||
One Choice 2030 Portfolio | $156,192 | 0.0020 | $825,716 | 0.0106 | ||||||||
One Choice 2035 Portfolio | $288,070 | 0.0032 | $1,476,206 | 0.0163 | ||||||||
One Choice 2040 Portfolio | $122,916 | 0.0023 | $625,766 | 0.0117 | ||||||||
One Choice 2045 Portfolio | $204,794 | 0.0035 | $964,229 | 0.0164 | ||||||||
One Choice 2050 Portfolio | $65,717 | 0.0023 | $318,632 | 0.0111 | ||||||||
One Choice 2055 Portfolio | $5,191 | 0.0013 | $27,688 | 0.0070 | ||||||||
Notes |
Contact Us | americancentury.com |
Automated Information Line | 1-800-345-8765 |
Investor Services Representative | 1-800-345-2021 |
Investors Using Advisors | 1-800-378-9878 |
Business, Not-For-Profit, Employer-Sponsored Retirement Plans | 1-800-345-3533 |
Banks and Trust Companies, Broker-Dealers, Financial Professionals, Insurance Companies | 1-800-345-6488 |
Telecommunications Device for the Deaf | 1-800-634-4113 |
American Century Asset Allocation Portfolios, Inc.
Investment Advisor:
American Century Investment Management, Inc.
Kansas City, Missouri
This report and the statements it contains are submitted for the general information of our shareholders. The report is not authorized for distribution to prospective investors unless preceded or accompanied by an effective prospectus.
©2013 American Century Proprietary Holdings, Inc. All rights reserved.
CL-ANN-79572 1309
ANNUAL REPORT | JULY 31, 2013 |
One ChoiceSM In Retirement Portfolio R6
One ChoiceSM 2015 Portfolio R6
One ChoiceSM 2020 Portfolio R6
One ChoiceSM 2025 Portfolio R6
One ChoiceSM 2030 Portfolio R6
One ChoiceSM 2035 Portfolio R6
One ChoiceSM 2040 Portfolio R6
One ChoiceSM 2045 Portfolio R6
One ChoiceSM 2050 Portfolio R6
One ChoiceSM 2055 Portfolio R6
Table of Contents |
Performance and Portfolio Commentary | 2 |
Portfolio Characteristics | 2 |
Shareholder Fee Examples | 4 |
Schedule of Investments | 5 |
Statement of Assets and Liabilities | 10 |
Statement of Operations and Changes in Net Assets | 14 |
Notes to Financial Statements | 19 |
Financial Highlights | 22 |
Report of Independent Registered Public Accounting Firm | 23 |
Management | 24 |
Approval of Management Agreement | 27 |
Additional Information | 29 |
Any opinions expressed in this report reflect those of the author as of the date of the report, and do not necessarily represent the opinions of American Century Investments® or any other person in the American Century Investments organization. Any such opinions are subject to change at any time based upon market or other conditions and American Century Investments disclaims any responsibility to update such opinions. These opinions may not be relied upon as investment advice and, because investment decisions made by American Century Investments funds are based on numerous factors, may not be relied upon as an indication of trading intent on behalf of any American Century Investments fund. Security examples are used for representational purposes only and are not intended as recommendations to purchase or sell securities. Performance information for comparative indices and securities is provided to American Century Investments by third party vendors. To the best of American Century Investments’ knowledge, such information is accurate at the time of printing.
Performance and Portfolio Commentary |
The funds commenced operations on July 31, 2013, their fiscal year end. The funds invested in the underlying funds at the close of business on their fiscal year end, resulting in no fund performance. Therefore the performance and portfolio commentary sections have been omitted.
Portfolio Characteristics |
Underlying Fund Allocations(1) as a % of net assets as of July 31, 2013 | |||||
In Retirement R6 | 2015 R6 | 2020 R6 | 2025 R6 | 2030 R6 | |
Equity | |||||
NT Core Equity Plus Fund | 3.0% | 3.0% | 3.0% | 3.0% | 3.3% |
NT Equity Growth Fund | 10.0% | 9.8% | 9.5% | 9.2% | 9.2% |
NT Growth Fund | 6.5% | 6.9% | 8.0% | 9.4% | 11.1% |
NT Large Company Value Fund | 11.0% | 11.0% | 11.2% | 11.5% | 12.1% |
NT Mid Cap Value Fund | 4.0% | 4.2% | 5.0% | 5.5% | 5.3% |
NT Small Company Fund | 2.0% | 2.0% | 2.0% | 2.5% | 3.5% |
NT VistaSM Fund | 2.5% | 2.9% | 3.9% | 4.6% | 5.0% |
Real Estate Fund | 1.0% | 1.1% | 1.3% | 1.6% | 1.8% |
NT Emerging Markets Fund | — | 0.4% | 1.5% | 2.4% | 2.9% |
NT International Growth Fund | 5.0% | 5.1% | 6.1% | 7.1% | 8.6% |
Total Equity | 45.0% | 46.4% | 51.5% | 56.8% | 62.8% |
Fixed Income | |||||
High-Yield Fund | 3.8% | 3.8% | 3.6% | 3.4% | 3.0% |
Inflation-Adjusted Bond Fund | 7.6% | 7.5% | 7.2% | 6.8% | 6.2% |
NT Diversified Bond Fund | 26.6% | 26.3% | 25.2% | 23.7% | 21.2% |
International Bond Fund | 7.0% | 6.7% | 5.7% | 4.3% | 1.8% |
Total Fixed Income | 45.0% | 44.3% | 41.7% | 38.2% | 32.2% |
Premium Money Market Fund | 10.0% | 9.3% | 6.8% | 5.0% | 5.0% |
Other Assets and Liabilities | — | — | — | — | — |
(1) | Underlying fund investments represent R6 Class for all funds, except Institutional Class for NT Core Equity Plus Fund, NT Equity Growth Fund, NT Small Company Fund, Inflation-Adjusted Bond Fund and Investor Class for Premium Money Market Fund. |
Underlying Fund Allocations(1) as a % of net assets as of July 31, 2013 | |||||
2035 R6 | 2040 R6 | 2045 R6 | 2050 R6 | 2055 R6 | |
Equity | |||||
NT Core Equity Plus Fund | 3.2% | 3.6% | 4.5% | 4.5% | 4.5% |
NT Equity Growth Fund | 9.6% | 10.3% | 10.3% | 10.4% | 10.7% |
NT Growth Fund | 12.9% | 13.9% | 14.6% | 14.9% | 15.3% |
NT Large Company Value Fund | 12.9% | 13.9% | 14.6% | 15.1% | 15.5% |
NT Mid Cap Value Fund | 5.6% | 6.6% | 7.3% | 7.3% | 7.5% |
NT Small Company Fund | 4.2% | 4.1% | 4.1% | 4.8% | 5.0% |
NT VistaSM Fund | 5.6% | 6.6% | 7.2% | 7.2% | 7.5% |
Real Estate Fund | 2.1% | 2.3% | 2.6% | 2.8% | 3.0% |
NT Emerging Markets Fund | 3.5% | 4.4% | 5.3% | 6.2% | 6.5% |
NT International Growth Fund | 9.8% | 10.0% | 10.1% | 9.9% | 9.5% |
Total Equity | 69.4% | 75.7% | 80.6% | 83.1% | 85.0% |
Fixed Income | |||||
High-Yield Fund | 2.6% | 2.3% | 1.9% | 1.7% | 1.5% |
Inflation-Adjusted Bond Fund | 5.3% | 4.5% | 3.9% | 3.3% | 3.0% |
NT Diversified Bond Fund | 18.4% | 15.8% | 13.6% | 11.9% | 10.5% |
Total Fixed Income | 26.3% | 22.6% | 19.4% | 16.9% | 15.0% |
Premium Money Market Fund | 4.3% | 1.7% | — | — | — |
Other Assets and Liabilities | — | — | — | — | — |
(1) | Underlying fund investments represent R6 Class for all funds, except Institutional Class for NT Core Equity Plus Fund, NT Equity Growth Fund, NT Small Company Fund, Inflation-Adjusted Bond Fund and Investor Class for Premium Money Market Fund. |
Shareholder Fee Example |
Fund shareholders may incur two types of costs: (1) transaction costs, including sales charges (loads) on purchase payments and redemption/exchange fees; and (2) ongoing costs, including management fees; distribution and service (12b-1) fees; and other fund expenses. This example is intended to help you understand your ongoing costs (in dollars) of investing in your fund and to compare these costs with the ongoing cost of investing in other mutual funds. As a shareholder in the underlying American Century Investments funds, your fund will indirectly bear its pro rata share of the expenses incurred by the underlying funds.
The shareholder fee examples were omitted as the funds commenced operations on the last day of the reporting period and no fees were incurred.
Schedule of Investments |
JULY 31, 2013
Shares | Value | |||||
One Choice In Retirement Portfolio R6 | ||||||
Mutual Funds(1) — 100.0% | ||||||
DOMESTIC EQUITY FUNDS — 40.0% | ||||||
NT Core Equity Plus Fund Institutional Class | 54 | $ 750 | ||||
NT Equity Growth Fund Institutional Class | 204 | 2,500 | ||||
NT Growth Fund R6 Class(2) | 113 | 1,625 | ||||
NT Large Company Value Fund R6 Class(2) | 239 | 2,750 | ||||
NT Mid Cap Value Fund R6 Class(2) | 82 | 1,000 | ||||
NT Small Company Fund Institutional Class | 46 | 500 | ||||
NT Vista Fund R6 Class(2) | 48 | 625 | ||||
Real Estate Fund R6 Class(2) | 10 | 250 | ||||
| 10,000 | ||||||
DOMESTIC FIXED INCOME FUNDS — 38.0% | ||||||
High-Yield Fund R6 Class | 153 | 950 | ||||
Inflation-Adjusted Bond Fund Institutional Class | 155 | 1,900 | ||||
NT Diversified Bond Fund R6 Class | 625 | 6,650 | ||||
| 9,500 | ||||||
MONEY MARKET FUNDS — 10.0% | ||||||
Premium Money Market Fund Investor Class | 2,500 | 2,500 | ||||
INTERNATIONAL FIXED INCOME FUNDS — 7.0% | ||||||
International Bond Fund R6 Class(2) | 127 | 1,750 | ||||
INTERNATIONAL EQUITY FUNDS — 5.0% | ||||||
NT International Growth Fund R6 Class(2) | 113 | 1,250 | ||||
TOTAL INVESTMENT SECURITIES — 100.0% (Cost $25,000) | 25,000 | |||||
OTHER ASSETS AND LIABILITIES | — | |||||
TOTAL NET ASSETS — 100.0% | $25,000 | |||||
Notes to Schedule of Investments
(1) | Investments are funds within the American Century Investments family of funds, of which certain funds may be deemed to be under common control because of the same board of directors. The cost of purchases for each underlying fund is the same as its value listed above. |
(2) | Non-income producing. |
Shares | Value | |||||
One Choice 2015 Portfolio R6 | ||||||
Mutual Funds(1) — 100.0% | ||||||
DOMESTIC EQUITY FUNDS — 40.9% | ||||||
NT Core Equity Plus Fund Institutional Class | 54 | $ 750 | ||||
NT Equity Growth Fund Institutional Class | 202 | 2,467 | ||||
NT Growth Fund R6 Class(2) | 120 | 1,717 | ||||
NT Large Company Value Fund R6 Class(2) | 239 | 2,750 | ||||
NT Mid Cap Value Fund R6 Class(2) | 87 | 1,063 | ||||
NT Small Company Fund Institutional Class | 46 | 500 | ||||
NT Vista Fund R6 Class(2) | 55 | 720 | ||||
Real Estate Fund R6 Class(2) | 11 | 270 | ||||
| 10,237 | ||||||
DOMESTIC FIXED INCOME FUNDS — 37.6% | ||||||
High-Yield Fund R6 Class | 151 | 937 | ||||
Inflation-Adjusted Bond Fund Institutional Class | 153 | 1,875 | ||||
NT Diversified Bond Fund R6 Class | 618 | 6,580 | ||||
| 9,392 | ||||||
MONEY MARKET FUNDS — 9.3% | ||||||
Premium Money Market Fund Investor Class | 2,313 | 2,313 | ||||
INTERNATIONAL FIXED INCOME FUNDS — 6.7% | ||||||
International Bond Fund R6 Class(2) | 122 | 1,680 | ||||
INTERNATIONAL EQUITY FUNDS — 5.5% | ||||||
NT Emerging Markets Fund R6 Class(2) | 10 | 95 | ||||
NT International Growth Fund R6 Class(2) | 116 | 1,283 | ||||
| 1,378 | ||||||
TOTAL INVESTMENT SECURITIES — 100.0% (Cost $25,000) | 25,000 | |||||
OTHER ASSETS AND LIABILITIES | — | |||||
TOTAL NET ASSETS — 100.0% | $25,000 | |||||
Notes to Schedule of Investments
(1) | Investments are funds within the American Century Investments family of funds, of which certain funds may be deemed to be under common control because of the same board of directors. The cost of purchases for each underlying fund is the same as its value listed above. |
(2) | Non-income producing. |
See Notes to Financial Statements.
Shares | Value | |||||
One Choice 2020 Portfolio R6 | ||||||
Mutual Funds(1) — 100.0% | ||||||
DOMESTIC EQUITY FUNDS — 43.9% | ||||||
NT Core Equity Plus Fund Institutional Class | 54 | $ 750 | ||||
NT Equity Growth Fund Institutional Class | 194 | 2,375 | ||||
NT Growth Fund R6 Class(2) | 139 | 2,000 | ||||
NT Large Company Value Fund R6 Class(2) | 245 | 2,810 | ||||
NT Mid Cap Value Fund R6 Class(2) | 102 | 1,250 | ||||
NT Small Company Fund Institutional Class | 46 | 500 | ||||
NT Vista Fund R6 Class(2) | 75 | 970 | ||||
Real Estate Fund R6 Class(2) | 14 | 332 | ||||
| 10,987 | ||||||
DOMESTIC FIXED INCOME FUNDS — 36.0% | ||||||
High-Yield Fund R6 Class | 145 | 900 | ||||
Inflation-Adjusted Bond Fund Institutional Class | 148 | 1,807 | ||||
NT Diversified Bond Fund R6 Class | 591 | 6,285 | ||||
| 8,992 | ||||||
INTERNATIONAL EQUITY FUNDS — 7.6% | ||||||
NT Emerging Markets Fund R6 Class(2) | 38 | 375 | ||||
NT International Growth Fund R6 Class(2) | 138 | 1,533 | ||||
| 1,908 | ||||||
MONEY MARKET FUNDS — 6.8% | ||||||
Premium Money Market Fund Investor Class | 1,688 | 1,688 | ||||
INTERNATIONAL FIXED INCOME FUNDS — 5.7% | ||||||
International Bond Fund R6 Class(2) | 104 | 1,425 | ||||
TOTAL INVESTMENT SECURITIES — 100.0% (Cost $25,000) | 25,000 | |||||
OTHER ASSETS AND LIABILITIES | — | |||||
TOTAL NET ASSETS — 100.0% | $25,000 | |||||
Notes to Schedule of Investments
(1) | Investments are funds within the American Century Investments family of funds, of which certain funds may be deemed to be under common control because of the same board of directors. The cost of purchases for each underlying fund is the same as its value listed above. |
(2) | Non-income producing. |
Shares | Value | |||||||
One Choice 2025 Portfolio R6 | ||||||||
Mutual Funds(1) — 100.0% | ||||||||
DOMESTIC EQUITY FUNDS — 47.3% | ||||||||
NT Core Equity Plus Fund Institutional Class | 54 | $ | 750 | |||||
NT Equity Growth Fund Institutional Class | 189 | 2,312 | ||||||
NT Growth Fund R6 Class(2) | 163 | 2,342 | ||||||
NT Large Company Value Fund R6 Class(2) | 250 | 2,875 | ||||||
NT Mid Cap Value Fund R6 Class(2) | 112 | 1,375 | ||||||
NT Small Company Fund Institutional Class | 59 | 638 | ||||||
NT Vista Fund R6 Class(2) | 88 | 1,143 | ||||||
Real Estate Fund R6 Class(2) | 16 | 395 | ||||||
| 11,830 | ||||||||
DOMESTIC FIXED INCOME FUNDS — 33.9% | ||||||||
High-Yield Fund R6 Class | 137 | 850 | ||||||
Inflation-Adjusted Bond Fund Institutional Class | 139 | 1,692 | ||||||
NT Diversified Bond Fund R6 Class | 558 | 5,938 | ||||||
| 8,480 | ||||||||
INTERNATIONAL EQUITY FUNDS — 9.5% | ||||||||
NT Emerging Markets Fund R6 Class(2) | 61 | 595 | ||||||
NT International Growth Fund R6 Class(2) | 161 | 1,782 | ||||||
| 2,377 | ||||||||
MONEY MARKET FUNDS — 5.0% | ||||||||
Premium Money Market Fund Investor Class | 1,250 | 1,250 | ||||||
INTERNATIONAL FIXED INCOME FUNDS — 4.3% | ||||||||
International Bond Fund R6 Class(2) | 77 | 1,063 | ||||||
TOTAL INVESTMENT SECURITIES — 100.0% (Cost $25,000) | 25,000 | |||||||
OTHER ASSETS AND LIABILITIES | — | |||||||
TOTAL NET ASSETS — 100.0% | $ | 25,000 | ||||||
Notes to Schedule of Investments
(1) | Investments are funds within the American Century Investments family of funds, of which certain funds may be deemed to be under common control because of the same board of directors. The cost of purchases for each underlying fund is the same as its value listed above. |
(2) | Non-income producing. |
See Notes to Financial Statements.
Shares | Value | |||||||
One Choice 2030 Portfolio R6 | ||||||||
Mutual Funds(1) — 100.0% | ||||||||
DOMESTIC EQUITY FUNDS — 51.3% | ||||||||
NT Core Equity Plus Fund Institutional Class | 58 | $ | 813 | |||||
NT Equity Growth Fund Institutional Class | 189 | 2,312 | ||||||
NT Growth Fund R6 Class(2) | 193 | 2,780 | ||||||
NT Large Company Value Fund R6 Class(2) | 264 | 3,030 | ||||||
NT Mid Cap Value Fund R6 Class(2) | 107 | 1,312 | ||||||
NT Small Company Fund Institutional Class | 81 | 875 | ||||||
NT Vista Fund R6 Class(2) | 96 | 1,250 | ||||||
Real Estate Fund R6 Class(2) | 19 | 458 | ||||||
| 12,830 | ||||||||
DOMESTIC FIXED INCOME FUNDS — 30.4% | ||||||||
High-Yield Fund R6 Class | 122 | 755 | ||||||
Inflation-Adjusted Bond Fund Institutional Class | 126 | 1,538 | ||||||
NT Diversified Bond Fund R6 Class | 499 | 5,312 | ||||||
| 7,605 | ||||||||
INTERNATIONAL EQUITY FUNDS — 11.5% | ||||||||
NT Emerging Markets Fund R6 Class(2) | 73 | 720 | ||||||
NT International Growth Fund R6 Class(2) | 194 | 2,157 | ||||||
| 2,877 | ||||||||
MONEY MARKET FUNDS — 5.0% | ||||||||
Premium Money Market Fund Investor Class | 1,250 | 1,250 | ||||||
INTERNATIONAL FIXED INCOME FUNDS — 1.8% | ||||||||
International Bond Fund R6 Class(2) | 32 | 438 | ||||||
TOTAL INVESTMENT SECURITIES — 100.0% (Cost $25,000) | 25,000 | |||||||
OTHER ASSETS AND LIABILITIES | — | |||||||
TOTAL NET ASSETS — 100.0% | $ | 25,000 | ||||||
Notes to Schedule of Investments
(1) | Investments are funds within the American Century Investments family of funds, of which certain funds may be deemed to be under common control because of the same board of directors. The cost of purchases for each underlying fund is the same as its value listed above. |
(2) | Non-income producing. |
Shares | Value | |||||
One Choice 2035 Portfolio R6 | ||||||
Mutual Funds(1) — 100.0% | ||||||
DOMESTIC EQUITY FUNDS — 56.1% | ||||||
NT Core Equity Plus Fund Institutional Class | 58 | $ 813 | ||||
NT Equity Growth Fund Institutional Class | 197 | 2,407 | ||||
NT Growth Fund R6 Class(2) | 224 | 3,217 | ||||
NT Large Company Value Fund R6 Class(2) | 280 | 3,217 | ||||
NT Mid Cap Value Fund R6 Class(2) | 115 | 1,407 | ||||
NT Small Company Fund Institutional Class | 98 | 1,050 | ||||
NT Vista Fund R6 Class(2) | 108 | 1,408 | ||||
Real Estate Fund R6 Class(2) | 21 | 518 | ||||
| 14,037 | ||||||
DOMESTIC FIXED INCOME FUNDS — 26.3% | ||||||
High-Yield Fund R6 Class | 105 | 650 | ||||
Inflation-Adjusted Bond Fund Institutional Class | 108 | 1,325 | ||||
NT Diversified Bond Fund R6 Class | 434 | 4,612 | ||||
| 6,587 | ||||||
INTERNATIONAL EQUITY FUNDS — 13.3% | ||||||
NT Emerging Markets Fund R6 Class(2) | 89 | 875 | ||||
NT International Growth Fund R6 Class(2) | 220 | 2,438 | ||||
| 3,313 | ||||||
MONEY MARKET FUNDS — 4.3% | ||||||
Premium Money Market Fund Investor Class | 1,063 | 1,063 | ||||
TOTAL INVESTMENT SECURITIES — 100.0% (Cost $25,000) | 25,000 | |||||
OTHER ASSETS AND LIABILITIES | — | |||||
TOTAL NET ASSETS — 100.0% | $25,000 | |||||
Notes to Schedule of Investments
(1) | Investments are funds within the American Century Investments family of funds, of which certain funds may be deemed to be under common control because of the same board of directors. The cost of purchases for each underlying fund is the same as its value listed above. |
(2) | Non-income producing. |
See Notes to Financial Statements.
Shares | Value | |||||
One Choice 2040 Portfolio R6 | ||||||
Mutual Funds(1) — 100.0% | ||||||
DOMESTIC EQUITY FUNDS — 61.3% | ||||||
NT Core Equity Plus Fund Institutional Class | 65 | $ 907 | ||||
NT Equity Growth Fund Institutional Class | 209 | 2,563 | ||||
NT Growth Fund R6 Class(2) | 241 | 3,470 | ||||
NT Large Company Value Fund R6 Class(2) | 302 | 3,470 | ||||
NT Mid Cap Value Fund R6 Class(2) | 135 | 1,655 | ||||
NT Small Company Fund Institutional Class | 95 | 1,020 | ||||
NT Vista Fund R6 Class(2) | 128 | 1,655 | ||||
Real Estate Fund R6 Class(2) | 24 | 583 | ||||
| 15,323 | ||||||
DOMESTIC FIXED INCOME FUNDS — 22.6% | ||||||
High-Yield Fund R6 Class | 91 | 563 | ||||
Inflation-Adjusted Bond Fund Institutional Class | 92 | 1,125 | ||||
NT Diversified Bond Fund R6 Class | 372 | 3,957 | ||||
| 5,645 | ||||||
INTERNATIONAL EQUITY FUNDS — 14.4% | ||||||
NT Emerging Markets Fund R6 Class(2) | 112 | 1,095 | ||||
NT International Growth Fund R6 Class(2) | 225 | 2,500 | ||||
| 3,595 | ||||||
MONEY MARKET FUNDS — 1.7% | ||||||
Premium Money Market Fund Investor Class | 437 | 437 | ||||
TOTAL INVESTMENT SECURITIES — 100.0% (Cost $25,000) | 25,000 | |||||
OTHER ASSETS AND LIABILITIES | — | |||||
TOTAL NET ASSETS — 100.0% | $25,000 | |||||
Notes to Schedule of Investments
(1) | Investments are funds within the American Century Investments family of funds, of which certain funds may be deemed to be under common control because of the same board of directors. The cost of purchases for each underlying fund is the same as its value listed above. |
(2) | Non-income producing. |
Shares | Value | |||||
One Choice 2045 Portfolio R6 | ||||||
Mutual Funds(1) — 100.0% | ||||||
DOMESTIC EQUITY FUNDS — 65.2% | ||||||
NT Core Equity Plus Fund Institutional Class | 81 | $ 1,125 | ||||
NT Equity Growth Fund Institutional Class | 210 | 2,575 | ||||
NT Growth Fund R6 Class(2) | 254 | 3,655 | ||||
NT Large Company Value Fund R6 Class(2) | 318 | 3,655 | ||||
NT Mid Cap Value Fund R6 Class(2) | 148 | 1,812 | ||||
NT Small Company Fund Institutional Class | 96 | 1,033 | ||||
NT Vista Fund R6 Class(2) | 140 | 1,813 | ||||
Real Estate Fund R6 Class(2) | 26 | 645 | ||||
| 16,313 | ||||||
DOMESTIC FIXED INCOME FUNDS — 19.4% | ||||||
High-Yield Fund R6 Class | 78 | 483 | ||||
Inflation-Adjusted Bond Fund Institutional Class | 79 | 962 | ||||
NT Diversified Bond Fund R6 Class | 319 | 3,397 | ||||
| 4,842 | ||||||
INTERNATIONAL EQUITY FUNDS — 15.4% | ||||||
NT Emerging Markets Fund R6 Class(2) | 134 | 1,313 | ||||
NT International Growth Fund R6 Class(2) | 228 | 2,532 | ||||
| 3,845 | ||||||
TOTAL INVESTMENT SECURITIES — 100.0% (Cost $25,000) | 25,000 | |||||
OTHER ASSETS AND LIABILITIES | — | |||||
TOTAL NET ASSETS — 100.0% | $25,000 | |||||
Notes to Schedule of Investments
(1) | Investments are funds within the American Century Investments family of funds, of which certain funds may be deemed to be under common control because of the same board of directors. The cost of purchases for each underlying fund is the same as its value listed above. |
(2) | Non-income producing. |
See Notes to Financial Statements.
Shares | Value | |||||
One Choice 2050 Portfolio R6 | ||||||
Mutual Funds(1) — 100.0% | ||||||
DOMESTIC EQUITY FUNDS — 67.0% | ||||||
NT Core Equity Plus Fund Institutional Class | 81 | $ 1,125 | ||||
NT Equity Growth Fund Institutional Class | 212 | 2,595 | ||||
NT Growth Fund R6 Class(2) | 259 | 3,717 | ||||
NT Large Company Value Fund R6 Class(2) | 329 | 3,782 | ||||
NT Mid Cap Value Fund R6 Class(2) | 148 | 1,813 | ||||
NT Small Company Fund Institutional Class | 110 | 1,188 | ||||
NT Vista Fund R6 Class(2) | 140 | 1,813 | ||||
Real Estate Fund R6 Class(2) | 29 | 707 | ||||
| 16,740 | ||||||
DOMESTIC FIXED INCOME FUNDS — 16.9% | ||||||
High-Yield Fund R6 Class | 68 | 420 | ||||
Inflation-Adjusted Bond Fund Institutional Class | 69 | 838 | ||||
NT Diversified Bond Fund R6 Class | 279 | 2,972 | ||||
| 4,230 | ||||||
INTERNATIONAL EQUITY FUNDS — 16.1% | ||||||
NT Emerging Markets Fund R6 Class(2) | 159 | 1,563 | ||||
NT International Growth Fund R6 Class(2) | 222 | 2,467 | ||||
| 4,030 | ||||||
TOTAL INVESTMENT SECURITIES — 100.0% (Cost $25,000) | 25,000 | |||||
OTHER ASSETS AND LIABILITIES | — | |||||
TOTAL NET ASSETS — 100.0% | $25,000 | |||||
Notes to Schedule of Investments
(1) | Investments are funds within the American Century Investments family of funds, of which certain funds may be deemed to be under common control because of the same board of directors. The cost of purchases for each underlying fund is the same as its value listed above. |
(2) | Non-income producing. |
Shares | Value | |||||
One Choice 2055 Portfolio R6 | ||||||
Mutual Funds(1) — 100.0% | ||||||
DOMESTIC EQUITY FUNDS — 69.0% | ||||||
NT Core Equity Plus Fund Institutional Class | 81 | $1,125 | ||||
NT Equity Growth Fund Institutional Class | 220 | 2,688 | ||||
NT Growth Fund R6 Class(2) | 265 | 3,812 | ||||
NT Large Company Value Fund R6 Class(2) | 337 | 3,875 | ||||
NT Mid Cap Value Fund R6 Class(2) | 153 | 1,875 | ||||
NT Small Company Fund Institutional Class | 116 | 1,250 | ||||
NT Vista Fund R6 Class(2) | 144 | 1,875 | ||||
Real Estate Fund R6 Class(2) | 31 | 750 | ||||
| 17,250 | ||||||
INTERNATIONAL EQUITY FUNDS — 16.0% | ||||||
NT Emerging Markets Fund R6 Class(2) | 166 | 1,625 | ||||
NT International Growth Fund R6 Class(2) | 214 | 2,375 | ||||
| 4,000 | ||||||
DOMESTIC FIXED INCOME FUNDS — 15.0% | ||||||
High-Yield Fund R6 Class | 61 | 375 | ||||
Inflation-Adjusted Bond Fund Institutional Class | 61 | 750 | ||||
NT Diversified Bond Fund R6 Class | 247 | 2,625 | ||||
| 3,750 | ||||||
TOTAL INVESTMENT SECURITIES — 100.0% (Cost $25,000) | 25,000 | |||||
OTHER ASSETS AND LIABILITIES | — | |||||
TOTAL NET ASSETS — 100.0% | $25,000 | |||||
Notes to Schedule of Investments
(1) | Investments are funds within the American Century Investments family of funds, of which certain funds may be deemed to be under common control because of the same board of directors. The cost of purchases for each underlying fund is the same as its value listed above. |
(2) | Non-income producing. |
See Notes to Financial Statements.
Statement of Assets and Liabilities |
JULY 31, 2013 | |||||||||
In Retirement R6 | 2015 R6 | 2020 R6 | |||||||
Assets | |||||||||
Investment securities in affiliates, at value (cost of $25,000, $25,000 and $25,000, respectively) | $25,000 | $25,000 | $25,000 | ||||||
Cash | 25,000 | 25,000 | 25,000 | ||||||
| 50,000 | 50,000 | 50,000 | |||||||
Liabilities | |||||||||
Payable for investments purchased | 25,000 | 25,000 | 25,000 | ||||||
Net Assets | $25,000 | $25,000 | $25,000 | ||||||
R6 Class Capital Shares, $0.01 Par Value | |||||||||
Shares outstanding | 2,500 | 2,500 | 2,500 | ||||||
Net Asset Value Per Share | $10.00 | $10.00 | $10.00 | ||||||
Net Assets Consist of: | |||||||||
Capital (par value and paid-in surplus) | $25,000 | $25,000 | $25,000 | ||||||
See Notes to Financial Statements.
JULY 31, 2013 | |||||||||
2025 R6 | 2030 R6 | 2035 R6 | |||||||
Assets | |||||||||
Investment securities in affiliates, at value (cost of $25,000, $25,000 and $25,000, respectively) | $25,000 | $25,000 | $25,000 | ||||||
Cash | 25,000 | 25,000 | 25,000 | ||||||
| 50,000 | 50,000 | 50,000 | |||||||
Liabilities | |||||||||
Payable for investments purchased | 25,000 | 25,000 | 25,000 | ||||||
Net Assets | $25,000 | $25,000 | $25,000 | ||||||
R6 Class Capital Shares, $0.01 Par Value | |||||||||
Shares outstanding | 2,500 | 2,500 | 2,500 | ||||||
Net Asset Value Per Share | $10.00 | $10.00 | $10.00 | ||||||
Net Assets Consist of: | |||||||||
Capital (par value and paid-in surplus) | $25,000 | $25,000 | $25,000 | ||||||
See Notes to Financial Statements.
JULY 31, 2013 | |||||||||
2040 R6 | 2045 R6 | 2050 R6 | |||||||
Assets | |||||||||
Investment securities in affiliates, at value (cost of $25,000, $25,000 and $25,000, respectively) | $25,000 | $25,000 | $25,000 | ||||||
Cash | 25,000 | 25,000 | 25,000 | ||||||
| 50,000 | 50,000 | 50,000 | |||||||
Liabilities | |||||||||
Payable for investments purchased | 25,000 | 25,000 | 25,000 | ||||||
Net Assets | $25,000 | $25,000 | $25,000 | ||||||
R6 Class Capital Shares, $0.01 Par Value | |||||||||
Shares outstanding | 2,500 | 2,500 | 2,500 | ||||||
Net Asset Value Per Share | $10.00 | $10.00 | $10.00 | ||||||
Net Assets Consist of: | |||||||||
Capital (par value and paid-in surplus) | $25,000 | $25,000 | $25,000 | ||||||
See Notes to Financial Statements.
JULY 31, 2013 | |||
2055 R6 | |||
Assets | |||
Investment securities in affiliates, at value (cost of $25,000) | $25,000 | ||
Cash | 25,000 | ||
| 50,000 | |||
Liabilities | |||
Payable for investments purchased | 25,000 | ||
Net Assets | $25,000 | ||
R6 Class Capital Shares, $0.01 Par Value | |||
Shares outstanding | 2,500 | ||
Net Asset Value Per Share | $10.00 | ||
Net Assets Consist of: | |||
Capital (par value and paid-in surplus) | $25,000 | ||
See Notes to Financial Statements.
Statement of Operations and Changes in Net Assets |
PERIOD ENDED JULY 31, 2013(1) | ||||||
Increase (Decrease) in Net Assets | In Retirement R6 | 2015 R6 | ||||
Operations | ||||||
Net increase (decrease) in net assets resulting from operations | — | — | ||||
Capital Share Transactions | ||||||
Proceeds from shares sold | $25,000 | $25,000 | ||||
Net increase (decrease) in net assets | 25,000 | 25,000 | ||||
Net Assets | ||||||
End of period | $25,000 | $25,000 | ||||
Transactions in Shares of the Funds | ||||||
Sold | 2,500 | 2,500 | ||||
(1) | For the one day period ended July 31, 2013 (fund inception). |
See Notes to Financial Statements.
PERIOD ENDED JULY 31, 2013(1) | ||||||
Increase (Decrease) in Net Assets | 2020 R6 | 2025 R6 | ||||
Operations | ||||||
Net increase (decrease) in net assets resulting from operations | — | — | ||||
Capital Share Transactions | ||||||
Proceeds from shares sold | $25,000 | $25,000 | ||||
Net increase (decrease) in net assets | 25,000 | 25,000 | ||||
Net Assets | ||||||
End of period | $25,000 | $25,000 | ||||
Transactions in Shares of the Funds | ||||||
Sold | 2,500 | 2,500 | ||||
(1) | For the one day period ended July 31, 2013 (fund inception). |
See Notes to Financial Statements.
PERIOD ENDED JULY 31, 2013(1) | ||||||
Increase (Decrease) in Net Assets | 2030 R6 | 2035 R6 | ||||
Operations | ||||||
Net increase (decrease) in net assets resulting from operations | — | — | ||||
Capital Share Transactions | ||||||
Proceeds from shares sold | $25,000 | $25,000 | ||||
Net increase (decrease) in net assets | 25,000 | 25,000 | ||||
Net Assets | ||||||
End of period | $25,000 | $25,000 | ||||
Transactions in Shares of the Funds | ||||||
Sold | 2,500 | 2,500 | ||||
(1) | For the one day period ended July 31, 2013 (fund inception). |
See Notes to Financial Statements.
PERIOD ENDED JULY 31, 2013(1) | ||||||
Increase (Decrease) in Net Assets | 2040 R6 | 2045 R6 | ||||
Operations | ||||||
Net increase (decrease) in net assets resulting from operations | — | — | ||||
Capital Share Transactions | ||||||
Proceeds from shares sold | $25,000 | $25,000 | ||||
Net increase (decrease) in net assets | 25,000 | 25,000 | ||||
Net Assets | ||||||
End of period | $25,000 | $25,000 | ||||
Transactions in Shares of the Funds | ||||||
Sold | 2,500 | 2,500 | ||||
(1) | For the one day period ended July 31, 2013 (fund inception). |
See Notes to Financial Statements.
PERIOD ENDED JULY 31, 2013(1) | ||||||
Increase (Decrease) in Net Assets | 2050 R6 | 2055 R6 | ||||
Operations | ||||||
Net increase (decrease) in net assets resulting from operations | — | — | ||||
Capital Share Transactions | ||||||
Proceeds from shares sold | $25,000 | $25,000 | ||||
Net increase (decrease) in net assets | 25,000 | 25,000 | ||||
Net Assets | ||||||
End of period | $25,000 | $25,000 | ||||
Transactions in Shares of the Funds | ||||||
Sold | 2,500 | 2,500 | ||||
(1) | For the one day period ended July 31, 2013 (fund inception). |
See Notes to Financial Statements.
Notes to Financial Statements |
JULY 31, 2013
1. Organization
American Century Asset Allocation Portfolios, Inc. (the corporation) is registered under the Investment Company Act of 1940, as amended (the 1940 Act), as an open-end management investment company and is organized as a Maryland corporation. The corporation is authorized to issue 3,000,000,000 shares. One Choice In Retirement Portfolio R6 (In Retirement R6), One Choice 2015 Portfolio R6 (2015 R6), One Choice 2020 Portfolio R6 (2020 R6), One Choice 2025 Portfolio R6 (2025 R6), One Choice 2030 Portfolio R6 (2030 R6), One Choice 2035 Portfolio R6 (2035 R6), One Choice 2040 Portfolio R6 (2040 R6), One Choice 2045 Portfolio R6 (2045 R6), One Choice 2050 Portfolio R6 (2050 R6), and One Choice 2055 Portfolio R6 (2055 R6) (collectively, the funds) are ten funds in a series issued by the corporation. The funds operate as “fund of funds,” meaning substantially all of the funds’ assets will be invested in other funds in the American Century Investments family of funds (the underlying funds). Each fund’s assets are allocated among underlying funds that represent major asset classes, including equity securities (stocks), fixed-income securities (bonds) and cash-equivalent instruments (money markets). The underlying funds are not permitted to invest in securities issued by companies assigned the Global Industry Classification Standard for the tobacco industry. The funds are diversified as defined under the 1940 Act. Additionally, the underlying funds are generally diversified and so indirectly provide broad exposure to a large number of securities. The funds will assume the risks associated with their underlying funds. The investment objective of In Retirement R6 is to seek current income. Capital appreciation is a secondary objective. The investment objectives of each of the nine target date One Choice Portfolios R6 are to seek the highest total return consistent with its asset mix. When a fund reaches its most conservative planned target asset allocation, which is expected to occur on approximately November 30 of the year before the target date, its target asset mix will become fixed and will match that of In Retirement R6 Portfolio. The funds incepted on July 31, 2013, resulting in a one day reporting period.
2. Significant Accounting Policies
The following is a summary of significant accounting policies consistently followed by the funds in preparation of their financial statements. The financial statements are prepared in conformity with accounting principles generally accepted in the United States of America, which may require management to make certain estimates and assumptions at the date of the financial statements. Actual results could differ from these estimates.
Investment Valuations — The funds determine the fair value of their investments and compute their net asset value per share as of the close of regular trading (usually 4 p.m. Eastern time) on the New York Stock Exchange (NYSE) on each day the NYSE is open. Investments in the underlying funds are valued at their reported net asset value.
Security Transactions — Security transactions are accounted for as of the trade date. Net realized gains and losses are determined on the identified cost basis, which is also used for federal income tax purposes.
Investment Income — Income and capital gain distributions, if any, from the underlying funds are recorded as of the ex-dividend date. Long-term capital gain distributions, if any, from the underlying funds are a component of net realized gain (loss).
Expenses — The expenses included in the accompanying financial statements reflect the expenses of each fund and do not include any expenses associated with the underlying funds.
Income Tax Status — It is each fund’s policy to distribute substantially all net investment income and net realized gains to shareholders and to otherwise qualify as a regulated investment company under provisions of the Internal Revenue Code. Accordingly, no provision has been made for income taxes. The funds file U.S. federal, state, local and non-U.S. tax returns as applicable. The funds’ tax returns are subject to examination by the relevant taxing authority until expiration of the applicable statute of limitations, which
is generally three years from the date of filing but can be longer in certain jurisdictions. At this time, management believes there are no uncertain tax positions which, based on their technical merit, would not be sustained upon examination and for which it is reasonably possible that the total amounts of unrecognized tax benefits will significantly change in the next twelve months.
Distributions to Shareholders — Distributions from net investment income, if any, are generally declared and paid quarterly for In Retirement R6. Distributions from net investment income, if any, are generally declared and paid annually for the nine target date One Choice Portfolios R6. Distributions from net realized gains, if any, are generally declared and paid annually for all funds.
Indemnifications — Under the corporation’s organizational documents, its officers and directors are indemnified against certain liabilities arising out of the performance of their duties to the funds. In addition, in the normal course of business, the funds enter into contracts that provide general indemnifications. The maximum exposure under these arrangements is unknown as this would involve future claims that may be made against a fund. The risk of material loss from such claims is considered by management to be remote.
3. Fees and Transactions with Related Parties
Administrative Fees — The corporation’s investment advisor, American Century Investment Management, Inc. (ACIM), does not receive an administrative fee for services provided to the funds.
Acquired Fund Fees and Expenses — Each fund will indirectly realize its pro rata share of the fees and expenses of the underlying funds in which it invests. These fees and expenses are already reflected in the valuation of the underlying funds.
Related Parties — Certain officers and directors of the corporation are also officers and/or directors of American Century Companies, Inc. (ACC). The corporation’s investment advisor, ACIM, the corporation’s distributor, American Century Investment Services, Inc., and the corporation’s transfer agent, American Century Services, LLC are wholly owned, directly or indirectly, by ACC. The directors of the corporation are also directors of some underlying funds and therefore those underlying funds may be deemed to be under common control with the corporation. The officers of the corporation are also officers of all the underlying funds. ACIM serves as the investment advisor for the underlying funds. ACIM owns 100% of the outstanding shares of the funds. Related parties do not invest in the fund for the purpose of excercising management or control.
4. Investment Transactions
Investment transactions for the one day period ended July 31, 2013 (fund inception) were as follows:
In Retirement R6 | 2015 R6 | 2020 R6 | 2025 R6 | 2030 R6 | |||||||||||
Purchases | $25,000 | $25,000 | $25,000 | $25,000 | $25,000 | ||||||||||
Sales | — | — | — | — | — | ||||||||||
2035 R6 | 2040 R6 | 2045 R6 | 2050 R6 | 2055 R6 | |||||||||||
Purchases | $25,000 | $25,000 | $25,000 | $25,000 | $25,000 | ||||||||||
Sales | — | — | — | — | — |
5. Investments in Underlying Funds
The funds do not invest in the underlying funds for the purpose of exercising management or control; however, investments by the funds within their investment strategies may represent a significant portion of the underlying funds’ net assets.
6. Fair Value Measurements
The funds’ securities valuation process is based on several considerations and may use multiple inputs to determine the fair value of the positions held by the funds. In conformity with accounting principles generally accepted in the United States of America, the inputs used to determine a valuation are classified into three broad levels as follows:
• Level 1 valuation inputs consist of unadjusted quoted prices in an active market for identical securities;
• Level 2 valuation inputs consist of direct or indirect observable market data (including quoted prices for similar securities, evaluations of subsequent market events, interest rates, prepayment speeds, credit risk, etc.); or
• Level 3 valuation inputs consist of unobservable data (including a fund’s own assumptions).
The level classification is based on the lowest level input that is significant to the fair valuation measurement. The valuation inputs are not necessarily an indication of the risks associated with investing in these securities or other financial instruments.
As of period end, the funds’ investment securities were classified as Level 1. The Schedule of Investments provides additional information on the funds’ portfolio holdings.
7. Federal Tax Information
As of July 31, 2013, the cost of investments for federal income tax purposes for all funds was the same as the cost for financial reporting purposes.
Financial Highlights |
For the One Day Period Ended July 31, 2013 (fund inception) | |||
Net Asset Value Per-Share, | Portfolio | Net Assets, End of Period | |
One Choice In Retirement Portfolio R6 — R6 Class | |||
2013 | $10.00 | 0% | $25 |
One Choice 2015 Portfolio R6 — R6 Class | |||
2013 | $10.00 | 0% | $25 |
One Choice 2020 Portfolio R6 — R6 Class | |||
2013 | $10.00 | 0% | $25 |
One Choice 2025 Portfolio R6 — R6 Class | |||
2013 | $10.00 | 0% | $25 |
One Choice 2030 Portfolio R6 — R6 Class | |||
2013 | $10.00 | 0% | $25 |
One Choice 2035 Portfolio R6 — R6 Class | |||
2013 | $10.00 | 0% | $25 |
One Choice 2040 Portfolio R6 — R6 Class | |||
2013 | $10.00 | 0% | $25 |
One Choice 2045 Portfolio R6 — R6 Class | |||
2013 | $10.00 | 0% | $25 |
One Choice 2050 Portfolio R6 — R6 Class | |||
2013 | $10.00 | 0% | $25 |
One Choice 2055 Portfolio R6 — R6 Class | |||
2013 | $10.00 | 0% | $25 |
See Notes to Financial Statements.
Report of Independent Registered Public Accounting Firm |
To the Shareholders and Board of Directors of
American Century Asset Allocation Portfolios, Inc.:
We have audited the accompanying statements of assets and liabilities, including the schedules of investments, of One Choice In Retirement Portfolio R6, One Choice 2015 Portfolio R6, One Choice 2020 Portfolio R6, One Choice 2025 Portfolio R6, One Choice 2030 Portfolio R6, One Choice 2035 Portfolio R6, One Choice 2040 Portfolio R6, One Choice 2045 Portfolio R6, One Choice 2050 Portfolio R6, One Choice 2055 Portfolio R6, ten of the portfolios constituting American Century Asset Allocation Portfolios, Inc. (the “Funds”) as of July 31, 2013, and the related statements of operations and changes in net assets for the one day period ended July 31, 2013 (fund inception). These financial statements are the responsibility of the Funds’ management. Our responsibility is to express an opinion on these financial statements based on our audits.
We conducted our audits in accordance with the standards of the Public Company Accounting Oversight Board (United States). Those standards require that we plan and perform the audit to obtain reasonable assurance about whether the financial statements and are free of material misstatement. The Funds are not required to have, nor were we engaged to perform, an audit of their internal control over financial reporting. Our audits included consideration of internal control over financial reporting as a basis for designing audit procedures that are appropriate in the circumstances, but not for the purpose of expressing an opinion on the effectiveness of the Funds’ internal control over financial reporting. Accordingly, we express no such opinion. An audit also includes examining, on a test basis, evidence supporting the amounts and disclosures in the financial statements, assessing the accounting principles used and significant estimates made by management, as well as evaluating the overall financial statement presentation. Our procedures included confirmation of securities owned as of July 31, 2013, by correspondence with the transfer agent. We believe that our audits provide a reasonable basis for our opinion.
In our opinion, the financial statements referred to above present fairly, in all material respects, the financial position of each of the respective Funds as of July 31, 2013, and the results of their operations and changes in their net assets for the one day period ended July 31, 2013 (fund inception), in conformity with accounting principles generally accepted in the United States of America.
Deloitte & Touche LLP
Kansas City, Missouri
September 19, 2013
Management |
The Board of Directors
The individuals listed below serve as directors of the funds. Each director will continue to serve in this capacity until death, retirement, resignation or removal from office. The board has adopted a mandatory retirement age for directors who are not “interested persons,” as that term is defined in the Investment Company Act (independent directors). Independent directors shall retire by December 31 of the year in which they reach their 75th birthday. Mr. Pratt may serve until December 31 of the year in which he reaches his 76th birthday based on an extension granted under previous retirement guidelines.
Mr. Thomas is an “interested person” because he currently serves as President and Chief Executive Officer of American Century Companies, Inc. (ACC), the parent company of American Century Investment Management, Inc. (ACIM or the advisor). Mr. Fink is an “interested person” because of his employment with American Century Services, LLC (ACS).
The other directors (more than three-fourths of the total number) are independent; that is, they have never been employees, directors or officers of, and have no financial interest in, ACC or any of its wholly owned, direct or indirect, subsidiaries, including ACIM, American Century Investment Services, Inc. (ACIS) and ACS. The directors serve in this capacity for seven (in the case of Mr. Thomas, 15) registered investment companies in the American Century Investments family of funds.
The following table presents additional information about the directors. The mailing address for each director is 4500 Main Street, Kansas City, Missouri 64111.
Name | Position(s) Held with Funds | Length Served | Principal Occupation(s) During Past 5 Years | Number of American Century Portfolios Overseen | Other Directorships Held During Past 5 Years | |
Independent Directors | ||||||
Thomas A. Brown | Director | Since 1980 | Managing Member, Associated Investments, LLC (real estate investment company); Brown Cascade Properties, LLC (real estate investment company) (2001 to 2009) | 75 | None | |
Andrea C. Hall | Director | Since 1997 | Retired | 75 | None | |
Jan M. Lewis | Director | Since 2011 | President and Chief Executive Officer, Catholic Charities of Northeast Kansas (human services organization) | 75 | None | |
James A. Olson | Director | Since 2007 | Member, Plaza Belmont LLC (private equity fund manager) | 75 | Saia, Inc. (2002 to 2012) and EPR Properties (2003 to 2013) | |
Donald H. Pratt | Director and Chairman of the Board | Since 1995 (Chairman since 2005) | Chairman and Chief Executive Officer, Western Investments, Inc. (real estate company) | 75 | None | |
Name | Position(s) Held with Funds | Length Served | Principal Occupation(s) During Past 5 Years | Number of American Century Portfolios Overseen | Other Directorships Held During Past 5 Years | |
Independent Directors | ||||||
M. Jeannine | Director | Since 1994 | Retired | 75 | Euronet Worldwide Inc.; Charming Shoppes, Inc. (2006 to 2010); and DST Systems Inc. (1996 to 2012) | |
John R. Whitten | Director | Since 2008 | Retired | 75 | Rudolph Technologies, Inc. | |
Stephen E. Yates | Director | Since 2012 | Retired; Executive Vice President, Technology & Operations, KeyCorp. (computer services) (2004 to 2010) | 75 | Applied Industrial Technologies, Inc. (2001 to 2010) | |
Interested Directors | ||||||
Barry Fink | Director | Since 2012 | Retired; Executive Vice President, ACC (September 2007 to February 2013); President, ACS (October 2007 to February 2013); Chief Operating Officer, ACC (September 2007 to November 2012) | 75 | None | |
Jonathan S. Thomas | Director and President | Since 2007 | President and Chief Executive Officer, ACC (March 2007 to present). Also serves as Chief Executive Officer and Manager, ACS; Executive Vice President, ACIM; Director, ACC, ACIM and other ACC subsidiaries | 116 | None | |
Officers
The following table presents certain information about the executive officers of the funds. Each officer serves as an officer for each of the 15 investment companies in the American Century family of funds, unless otherwise noted. No officer is compensated for his or her service as an officer of the funds. The listed officers are interested persons of the funds and are appointed or re-appointed on an annual basis. The mailing address for each officer listed below is 4500 Main Street, Kansas City, Missouri 64111.
Name | Offices with the Funds | Principal Occupation(s) During the Past Five Years | |
Jonathan S. | Director and President since 2007 | President and Chief Executive Officer, ACC (March 2007 to present). Also serves as Chief Executive Officer and Manager, ACS; Executive Vice President, ACIM; Director, ACC, ACIM and other ACC subsidiaries | |
Maryanne L. | Chief Compliance Officer since 2006 and Senior Vice President since 2000 | Chief Compliance Officer, American Century funds, ACIM and ACS (August 2006 to present). Also serves as Senior Vice President, ACS | |
Charles A. | General Counsel since 2007 and Senior Vice President since 2006 | Attorney, ACC (February 1994 to present); Vice President, ACC (November 2005 to present); General Counsel, ACC (March 2007 to present). Also serves as General Counsel, ACIM, ACS, ACIS and other ACC subsidiaries; and Senior Vice President, ACIM and ACS | |
C. Jean Wade | Vice President, Treasurer and Chief Financial Officer since 2012 | Vice President, ACS (February 2000 to present) | |
Robert J. Leach | Vice President since 2006 and Assistant Treasurer since 2012 | Vice President, ACS (February 2000 to present) | |
David H. Reinmiller | Vice President since 2000 | Attorney, ACC (January 1994 to present); Associate General Counsel, ACC (January 2001 to present). Also serves as Vice President, ACIM and ACS | |
Ward D. Stauffer | Secretary since 2005 | Attorney, ACC (June 2003 to present) |
The Statement of Additional Information has additional information about the funds’ directors and is available without charge, upon request, by calling 1-800-378-9878.
Approval of Management Agreement |
At a meeting held on March 5, 2013, the Funds’ Board of Directors unanimously approved the initial management agreement pursuant to which American Century Investment Management, Inc. (the “Advisor”) acts as the investment advisor for the Funds. Under Section 15(c) of the Investment Company Act, new contracts for investment advisory services are required to be approved by a majority of a fund’s independent directors (the “Directors”) and to be evaluated on an annual basis thereafter.
In advance of the Board’s consideration, the Advisor provided information concerning the Funds. The materials circulated in advance of the meeting and the discussions held at the meeting detailed the investment objective and strategy proposed to be utilized by the Advisor, the Funds’ characteristics and key attributes, the rationale for launching the Funds, the experience of the staff designated to manage the Funds, the proposed pricing, and the markets in which the Funds would be sold. The information considered and the discussions held at the meeting included, but were not limited to:
• | the nature, extent, and quality of investment management, shareholder services, and other services to be provided by the Advisor to the Funds; |
• | the wide range of other programs and services the Advisor would provide to the Funds and their shareholders on a routine and non-routine basis; |
• | the Funds’ proposed investment objective and strategy, including a discussion of the Funds’ anticipated investment performance and proposed benchmark; |
• | data comparing the cost of owning the Funds to the cost of owning similar funds; |
• | the Advisor’s compliance policies, procedures, and regulatory experience; |
• | consideration of collateral benefits derived by the Advisor from the management of the Funds. |
The Funds invest their non-cash assets entirely in other American Century Investments funds. The Funds do not pay an investment advisory fee to the Advisor. Rather, each Fund indirectly bears its pro rata share of the expenses incurred by the underlying funds.(1) Each of the underlying funds pay the Advisor a single, all-inclusive (or unified) management fee for providing all services necessary for the management and operation of the Funds, other than brokerage expenses, taxes, interest, extraordinary expenses, and the fees and expenses of the Funds’ independent directors (including their independent legal counsel) and expenses incurred in connection with the provision of shareholder services and distribution services under a plan adopted pursuant to Rule 12b-1 under the 1940 Act. The Board concluded that the administrative fee and other underlying fund expenses incurred by each Fund were reasonable in light of the services provided.
(1) | Certain classes may incur an administrative fee for additional services. |
When considering the approval of the management agreement for the Funds, the Board considered the entrepreneurial risk that the Advisor assumes in launching a new fund. In particular, they considered the fact that the Advisor will assume a substantial part of the start-up costs of the Funds and the risk that the Funds will grow to a level that will become profitable to the Advisor. The Board considered the position that the Funds would take in the lineup of the American Century Investments’ family of funds and the benefits to shareholders of existing funds of the broadened product offering. Finally, while not specifically discussed, but important in the decision to approve the management agreement, is the Directors’ familiarity with the Advisor. The Board oversees and evaluates on a continuous basis the nature and quality of all services the Advisor performs for other funds within the American Century Investments’ complex. As such, the Directors have confidence in the Advisor’s integrity and competence in providing services to the Funds.
In their deliberations, the Board did not identify any particular information that was all-important or controlling, and each Director attributed different weights to various factors. However, based on their evaluation of all material factors and assisted by the advice of independent legal counsel, the Directors, concluded that the overall arrangements between the Funds and the Advisor, as provided in the management agreement, were fair and reasonable in light of the services to be performed and should be approved.
Additional Information |
Retirement Account Information
As required by law, distributions you receive from certain IRAs are subject to federal income tax withholding, unless you elect not to have withholding apply. Tax will be withheld on the total amount withdrawn even though you may be receiving amounts that are not subject to withholding, such as nondeductible contributions. In such case, excess amounts of withholding could occur. You may adjust your withholding election so that a greater or lesser amount will be withheld.
If you don’t want us to withhold on this amount, you must notify us to not withhold the federal income tax. You may notify us in writing or in certain situations by telephone or through other electronic means. For systematic withdrawals, your withholding election will remain in effect until revoked or changed by filing a new election. You have the right to revoke your election at any time.
Remember, even if you elect not to have income tax withheld, you are liable for paying income tax on the taxable portion of your withdrawal. If you elect not to have income tax withheld or you don’t have enough income tax withheld, you may be responsible for payment of estimated tax. You may incur penalties under the estimated tax rules if your withholding and estimated tax payments are not sufficient. You can reduce or defer the income tax on a distribution by directly or indirectly rolling such distribution over to another IRA or eligible plan. You should consult your tax advisor for additional information.
State tax will be withheld if, at the time of your distribution, your address is within one of the mandatory withholding states and you have federal income tax withheld (or as otherwise required by state law). State taxes will be withheld from your distribution in accordance with the respective state rules.
Distributions you receive from 403(b), 457 and qualified plans are subject to special tax and withholding rules. Your plan administrator or plan sponsor is required to provide you with a special tax notice explaining those rules at the time you request a distribution. If applicable, federal and/or state taxes may be withheld from your distribution amount.
Proxy Voting Guidelines
American Century Investment Management, Inc., the funds’ investment advisor, is responsible for exercising the voting rights associated with the securities purchased and/or held by the funds. A description of the policies and procedures the advisor uses in fulfilling this responsibility is available without charge, upon request, by calling 1-800-378-9878. It is also available on American Century Investments’ website at americancentury.com and on the Securities and Exchange Commission’s website at sec.gov. Information regarding how the investment advisor voted proxies relating to portfolio securities during the most recent 12-month period ended June 30 is available on the “About Us” page at americancentury.com. It is also available at sec.gov.
Quarterly Portfolio Disclosure
The funds file their complete schedule of portfolio holdings with the Securities and Exchange Commission (SEC) for the first and third quarters of each fiscal year on Form N-Q. The funds’ Forms N-Q are available on the SEC’s website at sec.gov, and may be reviewed and copied at the SEC’s Public Reference Room in Washington, DC. Information on the operation of the Public Reference Room may be obtained by calling 1-800-SEC-0330. The funds also make their complete schedule of portfolio holdings for the most recent quarter of their fiscal year available on their website at ipro.americancentury.com and, upon request, by calling 1-800-378-9878.
Notes |
Notes |
Notes |
Contact Us | ipro.americancentury.com |
Automated Information Line | 1-800-345-8765 |
Investment Professional | 1-800-345-6488 |
Telecommunications Device for the Deaf | 1-800-634-4113 |
American Century Asset Allocation Portfolios, Inc.
Investment Advisor:
American Century Investment Management, Inc.
Kansas City, Missouri
This report and the statements it contains are submitted for the general information of our shareholders. The report is not authorized for distribution to prospective investors unless preceded or accompanied by an effective prospectus.
©2013 American Century Proprietary Holdings, Inc. All rights reserved.
CL-ANN-79574 1309
ITEM 2. CODE OF ETHICS.
(a) | The registrant has adopted a Code of Ethics for Senior Financial Officers that applies to the registrant’s principal executive officer, principal financial officer, principal accounting officer, and persons performing similar functions. |
(b) | No response required. |
(c) | None. |
(d) | None. |
(e) | Not applicable. |
(f) | The registrant’s Code of Ethics for Senior Financial Officers was filed as Exhibit 12 (a)(1) to American Century Asset Allocation Portfolios, Inc.’s Annual Certified Shareholder Report on Form N-CSR, File No. 811-21591, on September 29, 2005, and is incorporated herein by reference. |
ITEM 3. AUDIT COMMITTEE FINANCIAL EXPERT.
(a)(1) | The registrant’s board has determined that the registrant has at least one audit committee financial expert serving on its audit committee. |
(a)(2) | M. Jeannine Strandjord, James A. Olson, Andrea C. Hall and Stephen E. Yates are the registrant’s designated audit committee financial experts. They are “independent” as defined in Item 3 of Form N-CSR. |
(a)(3) | Not applicable. |
(b) | No response required. |
(c) | No response required. |
(d) | No response required. |
ITEM 4. PRINCIPAL ACCOUNTANT FEES AND SERVICES.
(a) | Audit Fees. |
The aggregate fees billed for each of the last two fiscal years for professional services rendered by the principal accountant for the audit of the registrant’s annual financial statements or services that are normally provided by the accountant in connection with statutory and regulatory filings or engagements for those fiscal years were as follows:
FY 2012: $113,408
FY 2013: $167,049
(b) | Audit-Related Fees. |
The aggregate fees billed in each of the last two fiscal years for assurance and related services by the principal accountant that are reasonably related to the performance of the audit of the registrant’s financial statements and are not reported under paragraph (a) of this Item were as follows:
For services rendered to the registrant:
FY 2012: $0 FY 2013: $0 |
Fees required to be approved pursuant to paragraph (c)(7)(ii) of Rule 2-01 of Regulation S-X (relating to certain engagements for non-audit services with the registrant’s investment adviser and its affiliates):
FY 2012: $0 FY 2013: $0 |
(c) | Tax Fees. |
The aggregate fees billed in each of the last two fiscal years for professional services rendered by the principal accountant for tax compliance, tax advice, and tax planning were as follows:
For services rendered to the registrant:
FY 2012: $0
FY 2013: $0
Fees required to be approved pursuant to paragraph (c)(7)(ii) of Rule 2-01 of Regulation S-X (relating to certain engagements for non-audit services with the registrant’s investment adviser and its affiliates):
FY 2012: $0
FY 2013: $0
(d) | All Other Fees. |
The aggregate fees billed in each of the last two fiscal years for products and services provided by the principal accountant, other than the services reported in paragraphs (a) through (c) of this Item were as follows:
For services rendered to the registrant:
FY 2012: $0 FY 2013: $0 |
Fees required to be approved pursuant to paragraph (c)(7)(ii) of Rule 2-01 of Regulation S-X (relating to certain engagements for non-audit services with the registrant’s investment adviser and its affiliates):
FY 2012: $0 FY 2013: $0 |
(e)(1) | In accordance with paragraph (c)(7)(i)(A) of Rule 2-01 of Regulation S-X, before the accountant is engaged by the registrant to render audit or non-audit services, the engagement is approved by the registrant’s audit committee. Pursuant to paragraph (c)(7)(ii) of Rule 2-01 of Regulation S-X, the registrant’s audit committee also pre-approves its accountant’s engagements for non-audit services with the registrant’s investment adviser, its parent company, and any entity controlled by, or under common control with the investment adviser that provides ongoing services to the registrant, if the engagement relates directly to the operations and financial reporting of the registrant. |
(e)(2) | All services described in each of paragraphs (b) through (d) of this Item were pre-approved before the engagement by the registrant’s audit committee pursuant to paragraph (c)(7)(i)(A) of Rule 2-01 of Regulation S-X. Consequently, none of such services were required to be approved by the audit committee pursuant to paragraph (c)(7)(i)(C). |
(f) | The percentage of hours expended on the principal accountant’s engagement to audit the registrant’s financial statements for the most recent fiscal year that were attributed to work performed by persons other than the principal accountant’s full-time, permanent employees was less than 50%. |
(g) | The aggregate non-audit fees billed by the registrant’s accountant for services rendered to the registrant, and rendered to the registrant’s investment adviser (not including any sub-adviser whose role is primarily portfolio management and is subcontracted with or overseen by another investment adviser), and any entity controlling, controlled by, or under common control with the adviser that provides ongoing services to the registrant for each of the last two fiscal years of the registrant were as follows: |
FY 2012: $71,548
FY 2013: $86,621
(h) | The registrant’s investment adviser and accountant have notified the registrant’s audit committee of all non-audit services that were rendered by the registrant’s accountant to the registrant’s investment adviser, its parent company, and any entity controlled by, or under common control with the investment adviser that provides services to the registrant, which services were not required to be pre-approved pursuant to paragraph (c)(7)(ii) of Rule 2-01 of Regulation S-X. The notification provided to the registrant’s audit committee included sufficient details regarding such services to allow the registrant’s audit committee to consider the continuing independence of its principal accountant. |
ITEM 5. AUDIT COMMITTEE OF LISTED REGISTRANTS.
Not applicable.
ITEM 6. INVESTMENTS.
(a) | The schedule of investments is included as part of the report to stockholders filed under Item 1 of this Form. |
(b) | Not applicable. |
ITEM 7. DISCLOSURE OF PROXY VOTING POLICIES AND PROCEDURES FOR CLOSED-END MANAGEMENT INVESTMENT COMPANIES.
Not applicable.
ITEM 8. PORTFOLIO MANAGERS OF CLOSED-END MANAGEMENT INVESTMENT COMPANIES.
Not applicable.
ITEM 9. PURCHASES OF EQUITY SECURITIES BY CLOSED-END MANAGEMENT INVESTMENT COMPANY AND AFFILIATED PURCHASERS.
Not applicable.
ITEM 10. SUBMISSION OF MATTERS TO A VOTE OF SECURITY HOLDERS.
During the reporting period, there were no material changes to the procedures by which shareholders may recommend nominees to the registrant’s board.
ITEM 11. CONTROLS AND PROCEDURES.
(a) | The registrant's principal executive officer and principal financial officer have concluded that the registrant's disclosure controls and procedures (as defined in Rule 30a-3(c) under the Investment Company Act of 1940) are effective based on their evaluation of these controls and procedures as of a date within 90 days of the filing date of this report. |
(b) | There were no changes in the registrant's internal control over financial reporting (as defined in Rule 30a-3(d) under the Investment Company Act of 1940) that occurred during the registrant's second fiscal quarter of the period covered by this report that have materially affected, or are reasonably likely to materially affect, the registrant's internal control over financial reporting. |
ITEM 12. EXHIBITS.
(a)(1) | Registrant’s Code of Ethics for Senior Financial Officers, which is the subject of the disclosure required by Item 2 of Form N-CSR, was filed as Exhibit 12(a)(1) to American Century Asset Allocation Portfolios, Inc.’s Certified Shareholder Report on Form N-CSR, File No. 811-21591, on September 29, 2005. |
(a)(2) | Separate certifications by the registrant’s principal executive officer and principal financial officer, pursuant to Section 302 of the Sarbanes-Oxley Act of 2002 and Rule 30a-2(a) under the Investment Company Act of 1940, are filed and attached hereto as EX-99.CERT. |
(a)(3) | Not applicable. |
(b) | A certification by the registrant’s chief executive officer and chief financial officer, pursuant to Section 906 of the Sarbanes-Oxley Act of 2002, is furnished and attached hereto as EX-99.906CERT. |
SIGNATURES
Pursuant to the requirements of the Securities Exchange Act of 1934 and the Investment Company Act of 1940, the registrant has duly caused this report to be signed on its behalf by the undersigned, thereunto duly authorized.
Registrant: | American Century Asset Allocation Portfolios, Inc. | |||
By: | /s/ Jonathan S. Thomas | |||
Name: | Jonathan S. Thomas | |||
Title: | President | |||
Date: | September 30, 2013 | |||
Pursuant to the requirements of the Securities Exchange Act of 1934 and the Investment Company Act of 1940, this report has been signed below by the following persons on behalf of the registrant and in the capacities and on the dates indicated.
By: | /s/ Jonathan S. Thomas | ||
Name: | Jonathan S. Thomas | ||
Title: | President | ||
(principal executive officer) | |||
Date: | September 30, 2013 | ||
By: | /s/ C. Jean Wade | ||
Name: | C. Jean Wade | ||
Title: | Vice President, Treasurer, and | ||
Chief Financial Officer | |||
(principal financial officer) | |||
Date: | September 30, 2013 | ||