
PRIMECAP Odyssey Stock Fund
PRIMECAP Odyssey Growth Fund
PRIMECAP Odyssey Aggressive Growth Fund
Core Financial Statements
October 31, 2024
UNITED STATES
SECURITIES AND EXCHANGE COMMISSION
Washington, D.C. 20549
FORM N-CSR
CERTIFIED SHAREHOLDER REPORT OF REGISTERED
MANAGEMENT INVESTMENT COMPANIES
Investment Company Act file number 811-21597
PRIMECAP Odyssey Funds
(Exact name of registrant as specified in charter)
177 East Colorado Boulevard, 11th Floor
Pasadena, CA 91105
(Address of principal executive offices) (Zip code)
Julietta Martikyan
PRIMECAP Management Company
177 East Colorado Boulevard, 11th Floor
Pasadena, CA 91105
(Name and address of agent for service)
(626) 304-9222
Registrant’s telephone number, including area code
Date of fiscal year end: October 31
Date of reporting period: October 31, 2024
Item 1. Reports to Stockholders.
| (a) |
PRIMECAP Odyssey Stock Fund |  | |
| POSKX | ||
| Annual Shareholder Report | October 31, 2024 | ||
Fund Name | Costs of a $10,000 investment | Costs paid as a percentage of a $10,000 investment |
| PRIMECAP Odyssey Stock Fund | $77 | 0.67% |
| PRIMECAP Odyssey Stock Fund | PAGE 1 | TSR-AR-74160Q301 |

1 Year | 5 Year | 10 Year | |
PRIMECAP Odyssey Stock Fund | 29.83 | 12.27 | 11.41 |
S&P 500® Index | 38.02 | 15.27 | 13.00 |
Net Assets | $5,229,150,351 |
Number of Holdings | 144 |
Net Advisory Fee | $30,958,259 |
Portfolio Turnover | 3% |
Top 10 Issuers | (%) |
Eli Lilly & Co. | 9.5% |
AstraZeneca PLC | 4.0% |
AECOM | 3.7% |
Amgen, Inc. | 3.0% |
KLA Corp. | 2.9% |
Flex Ltd. | 2.9% |
FedEx Corp. | 2.9% |
Microsoft Corp. | 2.9% |
Siemens AG | 2.9% |
Raymond James Financial, Inc. | 2.1% |
Top Sectors | (%) |
Health Care | 26.1% |
Information Technology | 22.6% |
Industrials | 21.8% |
Financials | 9.4% |
Consumer Discretionary | 8.5% |
Communication Services | 3.6% |
Energy | 2.3% |
Consumer Staples | 1.9% |
Materials | 1.8% |
Cash & Other | 2.0% |
| PRIMECAP Odyssey Stock Fund | PAGE 2 | TSR-AR-74160Q301 |
 | |
For additional information about the Fund; including its prospectus, financial information, holdings and proxy voting information, scan the QR code or visit https://www.primecap.com/funds/primecap-odyssey-stock-fund/. |
| PRIMECAP Odyssey Stock Fund | PAGE 3 | TSR-AR-74160Q301 |
PRIMECAP Odyssey Growth Fund |  | |
| POGRX | ||
| Annual Shareholder Report | October 31, 2024 | ||
Fund Name | Costs of a $10,000 investment | Costs paid as a percentage of a $10,000 investment |
| PRIMECAP Odyssey Growth Fund | $75 | 0.66% |
| PRIMECAP Odyssey Growth Fund | PAGE 1 | TSR-AR-74160Q103 |
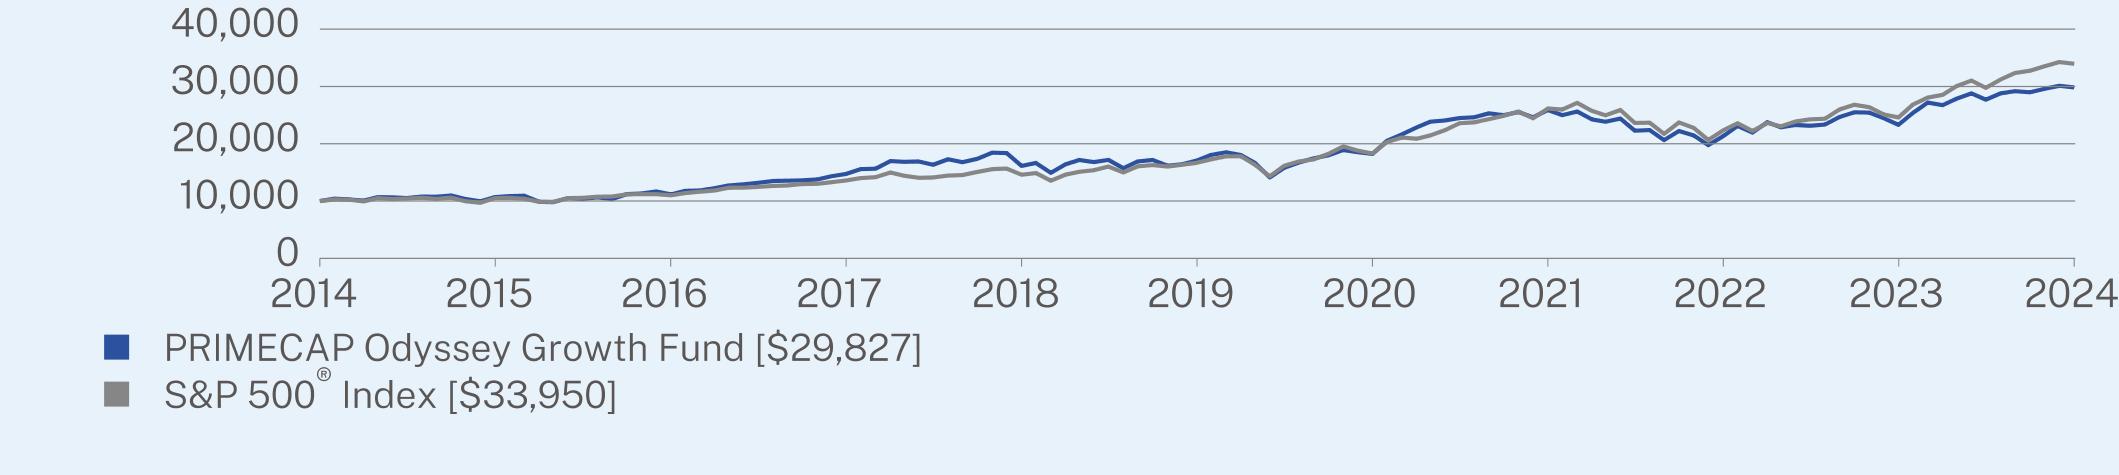
1 Year | 5 Year | 10 Year | |
PRIMECAP Odyssey Growth Fund | 27.97 | 11.81 | 11.55 |
S&P 500® Index | 38.02 | 15.27 | 13.00 |
Net Assets | $5,845,196,577 |
Number of Holdings | 188 |
Net Advisory Fee | $35,365,762 |
Portfolio Turnover | 5% |
Top 10 Issuers | (%) |
Eli Lilly & Co. | 7.9% |
Alphabet, Inc. - Class A & C | 3.8% |
Raymond James Financial, Inc. | 3.2% |
Micron Technology, Inc. | 3.0% |
AECOM | 2.8% |
BeiGene Ltd. | 2.4% |
Microsoft Corp. | 2.3% |
Flex Ltd. | 2.3% |
Amgen, Inc. | 2.2% |
Biogen, Inc. | 2.2% |
Top Sectors | (%) |
Health Care | 29.6% |
Information Technology | 23.1% |
Industrials | 17.6% |
Consumer Discretionary | 8.7% |
Financials | 8.5% |
Communication Services | 7.0% |
Energy | 2.1% |
Consumer Staples | 1.2% |
Materials | 0.6% |
Cash & Other | 1.6% |
| PRIMECAP Odyssey Growth Fund | PAGE 2 | TSR-AR-74160Q103 |
 | |
For additional information about the Fund; including its prospectus, financial information, holdings and proxy voting information, scan the QR code or visit https://www.primecap.com/funds/primecap-odyssey-growth-fund/. |
| PRIMECAP Odyssey Growth Fund | PAGE 3 | TSR-AR-74160Q103 |
PRIMECAP Odyssey Aggressive Growth Fund |  | |
| POAGX | ||
| Annual Shareholder Report | October 31, 2024 | ||
Fund Name | Costs of a $10,000 investment | Costs paid as a percentage of a $10,000 investment |
| PRIMECAP Odyssey Aggressive Growth Fund | $74 | 0.65% |
| PRIMECAP Odyssey Aggressive Growth Fund | PAGE 1 | TSR-AR-74160Q202 |
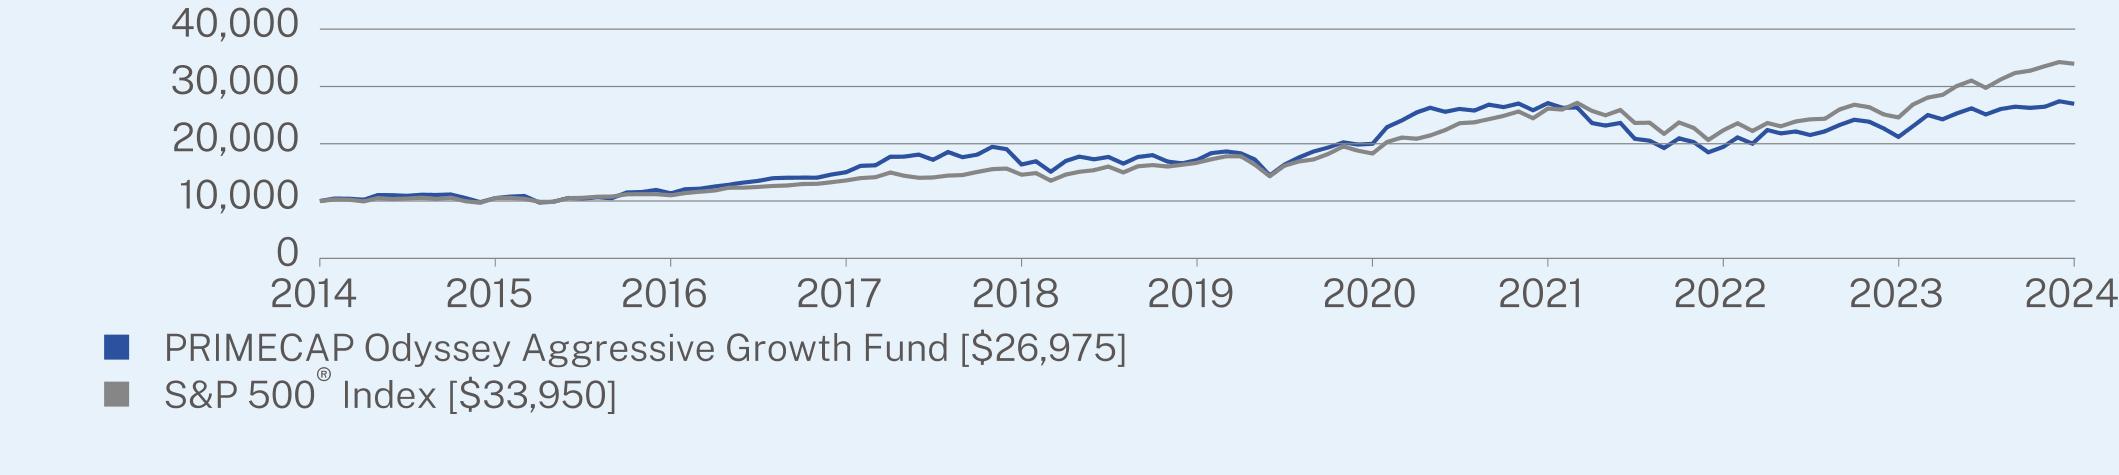
1 Year | 5 Year | 10 Year | |
PRIMECAP Odyssey Aggressive Growth Fund | 27.27 | 9.48 | 10.43 |
S&P 500® Index | 38.02 | 15.27 | 13.00 |
Net Assets | $6,882,857,448 |
Number of Holdings | 200 |
Net Advisory Fee | $38,429,054 |
Portfolio Turnover | 9% |
Top 10 Issuers | (%) |
Eli Lilly & Co. | 5.6% |
Micron Technology, Inc. | 4.1% |
Rhythm Pharmaceuticals, Inc. | 3.2% |
Alphabet, Inc. - Class A & C | 2.8% |
Flex Ltd. | 2.7% |
Sony Group Corp. | 2.5% |
MarketAxess Holdings, Inc. | 2.3% |
AECOM | 2.3% |
Tesla, Inc. | 2.3% |
Biogen, Inc. | 2.2% |
Top Sectors | (%) |
Information Technology | 27.7% |
Health Care | 27.6% |
Industrials | 14.4% |
Consumer Discretionary | 12.6% |
Communication Services | 6.5% |
Financials | 5.9% |
Energy | 1.3% |
Materials | 1.0% |
Consumer Staples | 0.7% |
Cash & Other | 2.3% |
| PRIMECAP Odyssey Aggressive Growth Fund | PAGE 2 | TSR-AR-74160Q202 |
 | |
For additional information about the Fund; including its prospectus, financial information, holdings and proxy voting information, scan the QR code or visit https://www.primecap.com/funds/primecap-odyssey-aggressive-growth-fund/. |
| PRIMECAP Odyssey Aggressive Growth Fund | PAGE 3 | TSR-AR-74160Q202 |
| (b) | Not applicable. |
Item 2. Code of Ethics.
The Registrant has adopted a code of ethics that applies to the Registrant’s principal executive officers and principal financial officer. The Registrant has not made any amendments to its code of ethics during the period covered by this report. The Registrant has not granted any waivers, including any implicit waivers, from any provisions of the code of ethics during the period covered by this report.
The Registrant undertakes to provide to any person without charge, upon request, a copy of its code of ethics by mail when such person calls the Registrant at 1-800-729-2307.
Item 3. Audit Committee Financial Expert.
The Registrant’s Board of Trustees has determined that there is at least one audit committee financial expert serving on its audit committee. Wayne H. Smith and Steven Paul Cesinger are the Registrant’s “audit committee financial experts” and are considered to be “independent” as each term is defined in Item 3 of Form N-CSR.
Item 4. Principal Accountant Fees and Services.
(a) Audit Fees
The Registrant has engaged its principal accountant, PricewaterhouseCoopers LLP, to perform audit services, audit-related services, and tax services during the past two fiscal years. “Audit services” refer to performing an audit of the Registrant’s annual financial statements or services that are normally provided by the accountant in connection with statutory and regulatory filings or engagements for those fiscal years.
(b) Audit-Related Fees
“Audit-related services” refer to the assurance and related services by the principal accountant that are reasonably related to the performance of the audit.
(c) Tax Fees
“Tax services” refer to professional services rendered by the principal accountant for tax compliance, tax advice, and tax planning and specifically relate to the accountant’s review of the Registrant’s federal and state tax returns.
(d) All Other Fees
There were no other services provided by the principal accountant to the Registrant during the past two fiscal years.
The following table details the aggregate fees billed or expected to be billed to the Registrant for each of the last two fiscal years for audit fees, audit-related fees, tax fees and all other fees by the principal accountant.
| FYE 10/31/2024 | FYE 10/31/2023 | |
| (a) Audit Fees | $163,697 | $186,946(1) |
| (b) Audit-Related Fees | $0 | $0 |
| (c) Tax Fees | $18,927 | $19,779 |
| (d) All Other Fees | $0 | $0 |
| (1) | The Audit Fees included $23,900 in scope change fees, which were paid by US Bancorp Fund Services, LLC, related to additional procedures performed due to US Bancorp Fund Accounting’s SOC-1 report not being completed prior to the issuance of the principal accountant’s audit report. |
(e)(1) The audit committee has adopted pre-approval policies and procedures that require the audit committee to pre-approve all audit and non-audit services of the Registrant, including services provided to any entity affiliated with the Registrant. All services were pre-approved and no waivers to the pre-approval requirement were made.
(e)(2) The percentage of fees billed by PricewaterhouseCoopers applicable to non-audit services pursuant to waiver of pre-approval requirement were as follows:
| FYE 10/31/2024 | FYE 10/31/2023 | |
| Audit-Related Fees | 0% | 0% |
| Tax Fees | 0% | 0% |
| All Other Fees | 0% | 0% |
(f) Not applicable.
(g) The following table indicates the non-audit fees billed or expected to be billed by the Registrant’s accountant for services rendered to the Registrant and to the Registrant’s investment adviser (and any entity controlling, controlled by, or under common control with the investment adviser) for the last two years.
| Non-Audit Fees | FYE 10/31/2024 | FYE 10/31/2023 |
| Registrant | $18,927 | $19,779 |
| Registrant’s Investment Adviser | $0 | $0 |
(h) The audit committee of the Board of Trustees has considered whether the provision of non-audit services that were rendered to the Registrant’s investment adviser is compatible with maintaining the principal accountant’s independence and has concluded that the provision of such non-audit services by the accountant has not compromised the accountant’s independence.
(i) Not applicable.
(j) Not applicable.
Item 5. Audit Committee of Listed Registrants.
Not applicable.
Item 6. Investments.
| (a) | Schedules of Investments are included within the financial statements filed under Item 7 of this Form. |
| (b) | Not Applicable. |
Item 7. Financial Statements and Financial Highlights for Open-End Management Investment Companies.
| (a) |
Page | |||
Schedule of Investments | |||
Shares | Value | |||||
COMMON STOCKS - 98.0% | ||||||
Communication Services - 3.6% | ||||||
Alphabet, Inc. - Class A | 322,170 | $55,126,509 | ||||
Alphabet, Inc. - Class C | 293,650 | 50,710,418 | ||||
Comcast Corp. - Class A | 138,600 | 6,052,662 | ||||
Meta Platforms, Inc. - Class A | 55,200 | 31,330,416 | ||||
Nintendo Co. Ltd. - JPY | 300,000 | 15,846,895 | ||||
Walt Disney Co. (The) | 296,200 | 28,494,440 | ||||
187,561,340 | ||||||
Consumer Discretionary - 8.5% | ||||||
Bath & Body Works, Inc. | 419,200 | 11,896,896 | ||||
Burlington Stores, Inc.(a) | 21,300 | 5,277,501 | ||||
Capri Holdings Ltd.(a) | 238,000 | 4,698,120 | ||||
CarMax, Inc.(a) | 455,100 | 32,940,138 | ||||
Carnival Corp.(a) | 933,500 | 20,537,000 | ||||
eBay, Inc. | 166,600 | 9,581,166 | ||||
Leslie’s, Inc.(a) | 217,800 | 585,882 | ||||
Mattel, Inc.(a) | 2,998,100 | 61,101,278 | ||||
MGM Resorts International(a) | 71,330 | 2,629,937 | ||||
Newell Brands, Inc. | 1,600,000 | 14,080,000 | ||||
Ross Stores, Inc. | 663,580 | 92,715,398 | ||||
Royal Caribbean Cruises Ltd. | 160,750 | 33,170,762 | ||||
Sony Group Corp. - ADR | 5,318,915 | 93,612,904 | ||||
TJX Cos., Inc. (The) | 130,100 | 14,705,203 | ||||
Victoria’s Secret & Co.(a) | 123,033 | 3,722,979 | ||||
Whirlpool Corp. | 429,059 | 44,411,897 | ||||
445,667,061 | ||||||
Consumer Staples - 1.9% | ||||||
Altria Group, Inc. | 126,100 | 6,867,406 | ||||
BJ’s Wholesale Club Holdings, Inc.(a) | 284,400 | 24,097,212 | ||||
Dollar Tree, Inc.(a) | 395,300 | 25,552,192 | ||||
Philip Morris International, Inc. | 63,800 | 8,466,260 | ||||
Sysco Corp. | 352,446 | 26,415,828 | ||||
Tyson Foods, Inc. - Class A | 137,600 | 8,061,984 | ||||
99,460,882 | ||||||
Energy - 2.3% | ||||||
Cameco Corp. | 140,700 | 7,347,354 | ||||
ConocoPhillips | 219,000 | 23,989,260 | ||||
EOG Resources, Inc. | 157,500 | 19,208,700 | ||||
Expand Energy Corp. | 85,000 | 7,201,200 | ||||
Exxon Mobil Corp. | 25,552 | 2,983,963 | ||||
Hess Corp. | 324,140 | 43,590,347 | ||||
TechnipFMC PLC | 228,000 | 6,085,320 | ||||
Transocean Ltd.(a) | 1,607,800 | 6,977,852 | ||||
Valero Energy Corp. | 15,000 | 1,946,400 | ||||
119,330,396 | ||||||
Financials - 9.4% | ||||||
Bank of America Corp. | 575,100 | 24,050,682 | ||||
Bank of New York Mellon Corp. (The) | 100,000 | 7,536,000 | ||||
Citigroup, Inc. | 428,200 | 27,477,594 | ||||
CME Group, Inc. - Class A | 216,500 | 48,790,440 | ||||
Shares | Value | |||||
Comerica, Inc. | 1,000 | $63,710 | ||||
Discover Financial Services | 68,800 | 10,211,984 | ||||
Evercore, Inc. - Class A | 9,290 | 2,454,139 | ||||
Fidelity National Information Services, Inc. | 70,900 | 6,361,857 | ||||
JPMorgan Chase & Co. | 305,100 | 67,707,792 | ||||
Northern Trust Corp. | 568,480 | 57,143,610 | ||||
PayPal Holdings, Inc.(a) | 265,100 | 21,022,430 | ||||
Progressive Corp. (The) | 57,010 | 13,843,738 | ||||
Raymond James Financial, Inc. | 725,315 | 107,506,189 | ||||
Visa, Inc. - Class A | 123,400 | 35,767,490 | ||||
Wells Fargo & Co. | 880,068 | 57,134,015 | ||||
WEX, Inc.(a) | 15,200 | 2,623,520 | ||||
489,695,190 | ||||||
Health Care - 26.1% | ||||||
Abbott Laboratories | 60,220 | 6,827,141 | ||||
Agilent Technologies, Inc. | 315,120 | 41,063,287 | ||||
Alcon, Inc. | 45,700 | 4,202,115 | ||||
Amgen, Inc. | 490,500 | 157,038,480 | ||||
AstraZeneca PLC - ADR | 2,927,170 | 208,268,146 | ||||
Biogen, Inc.(a) | 546,570 | 95,103,180 | ||||
Boston Scientific Corp.(a) | 322,500 | 27,096,450 | ||||
Bristol-Myers Squibb Co. | 1,159,500 | 64,665,315 | ||||
CVS Health Corp. | 152,550 | 8,612,973 | ||||
Elanco Animal Health, Inc.(a) | 3,330,571 | 42,098,418 | ||||
Eli Lilly & Co. | 597,323 | 495,622,786 | ||||
GRAIL, Inc.(a) | 7,934 | 107,664 | ||||
GSK PLC - ADR | 1,045,720 | 38,440,667 | ||||
Illumina, Inc.(a) | 77,300 | 11,142,022 | ||||
LivaNova PLC(a) | 199,460 | 10,296,125 | ||||
Medtronic PLC | 28,600 | 2,552,550 | ||||
Merck & Co., Inc. | 51,400 | 5,259,248 | ||||
Novartis AG - ADR | 252,120 | 27,329,808 | ||||
Revvity, Inc. | 151,940 | 18,018,565 | ||||
Roche Holding AG - CHF | 14,720 | 4,561,780 | ||||
Sanofi SA - ADR | 79,000 | 4,177,520 | ||||
Siemens Healthineers AG - EUR | 110,740 | 5,781,120 | ||||
Stryker Corp. | 16,200 | 5,771,736 | ||||
Thermo Fisher Scientific, Inc. | 87,860 | 47,999,675 | ||||
Waters Corp.(a) | 5,080 | 1,641,399 | ||||
Zimmer Biomet Holdings, Inc. | 306,640 | 32,785,949 | ||||
1,366,464,119 | ||||||
Industrials - 21.8% | ||||||
AECOM | 1,832,100 | 195,668,280 | ||||
Airbus SE - EUR | 258,469 | 39,427,132 | ||||
Alaska Air Group, Inc.(a) | 54,050 | 2,589,535 | ||||
Amentum Holdings, Inc.(a) | 449,020 | 13,353,855 | ||||
American Airlines Group, Inc.(a) | 2,187,350 | 29,310,490 | ||||
AMETEK, Inc. | 15,700 | 2,878,438 | ||||
Carrier Global Corp. | 125,032 | 9,092,327 | ||||
Caterpillar, Inc. | 29,200 | 10,985,040 | ||||
CSX Corp. | 70,400 | 2,368,256 | ||||
Curtiss-Wright Corp. | 169,530 | 58,481,069 | ||||
1 |
Shares | Value | |||||
COMMON STOCKS - (Continued) | ||||||
Industrials - (Continued) | ||||||
Delta Air Lines, Inc. | 924,450 | $52,897,029 | ||||
FedEx Corp. | 555,815 | 152,209,938 | ||||
General Dynamics Corp. | 60,180 | 17,549,090 | ||||
GXO Logistics, Inc.(a) | 76,700 | 4,587,427 | ||||
Jacobs Solutions, Inc. | 356,460 | 50,111,147 | ||||
JELD-WEN Holding, Inc.(a) | 250,000 | 3,540,000 | ||||
Kirby Corp.(a) | 248,800 | 28,552,288 | ||||
Knight-Swift Transportation Holdings, Inc. | 35,500 | 1,848,840 | ||||
L3Harris Technologies, Inc. | 23,300 | 5,766,051 | ||||
Matson, Inc. | 50,250 | 7,783,222 | ||||
Moog, Inc. - Class A | 94,900 | 17,898,140 | ||||
Nextracker, Inc. - Class A(a) | 667,508 | 26,580,169 | ||||
Norfolk Southern Corp. | 79,500 | 19,909,185 | ||||
Otis Worldwide Corp. | 28,881 | 2,836,114 | ||||
Rockwell Automation, Inc. | 15,800 | 4,214,018 | ||||
RTX Corp. | 9,062 | 1,096,411 | ||||
RXO, Inc.(a) | 150,000 | 4,228,500 | ||||
Saia, Inc.(a) | 15,900 | 7,768,899 | ||||
Siemens AG - EUR | 769,663 | 149,737,652 | ||||
Southwest Airlines Co. | 2,117,250 | 64,745,505 | ||||
Union Pacific Corp. | 32,400 | 7,519,068 | ||||
United Airlines Holdings, Inc.(a) | 1,303,960 | 102,047,910 | ||||
United Parcel Service, Inc. - Class B | 173,600 | 23,272,816 | ||||
XPO, Inc.(a) | 164,400 | 21,459,132 | ||||
1,142,312,973 | ||||||
Information Technology - 22.6% | ||||||
Adobe, Inc.(a) | 88,700 | 42,405,696 | ||||
Analog Devices, Inc. | 165,330 | 36,886,776 | ||||
Apple, Inc. | 10,000 | 2,259,100 | ||||
Applied Materials, Inc. | 365,950 | 66,449,201 | ||||
Ciena Corp.(a) | 3,700 | 234,987 | ||||
Corning, Inc. | 243,398 | 11,583,311 | ||||
Flex Ltd.(a) | 4,391,899 | 152,267,138 | ||||
Hewlett Packard Enterprise Co. | 3,179,700 | 61,972,353 | ||||
HP, Inc. | 1,169,960 | 41,556,979 | ||||
Infineon Technologies AG - EUR | 260,000 | 8,222,396 | ||||
Intel Corp. | 4,113,320 | 88,518,646 | ||||
Jabil, Inc. | 52,000 | 6,400,680 | ||||
Keysight Technologies, Inc.(a) | 108,660 | 16,191,427 | ||||
KLA Corp. | 229,290 | 152,759,877 | ||||
L.M. Ericsson Telephone Co. - ADR | 4,572,830 | 38,320,315 | ||||
Microsoft Corp. | 370,150 | 150,410,453 | ||||
NetApp, Inc. | 500,750 | 57,741,482 | ||||
NVIDIA Corp. | 118,620 | 15,747,991 | ||||
Oracle Corp. | 604,700 | 101,492,848 | ||||
QUALCOMM, Inc. | 197,547 | 32,154,725 | ||||
Seagate Technology Holdings PLC | 149,500 | 15,005,315 | ||||
Shares | Value | |||||
Teradyne, Inc. | 97,300 | $10,334,233 | ||||
Texas Instruments, Inc. | 351,610 | 71,433,088 | ||||
1,180,349,017 | ||||||
Materials - 1.8% | ||||||
Albemarle Corp. | 252,910 | 23,958,164 | ||||
Corteva, Inc. | 120,700 | 7,353,044 | ||||
Dow, Inc. | 114,930 | 5,675,243 | ||||
DuPont de Nemours, Inc. | 130,500 | 10,830,195 | ||||
Freeport-McMoRan, Inc. | 408,900 | 18,408,678 | ||||
Glencore PLC - GBP | 4,517,278 | 23,691,636 | ||||
Tronox Holdings PLC | 312,700 | 3,789,924 | ||||
93,706,884 | ||||||
TOTAL COMMON STOCKS (Cost $2,218,628,325) | 5,124,547,862 | |||||
SHORT-TERM INVESTMENTS - 2.1% | ||||||
Money Market Funds - 2.1% | ||||||
Dreyfus Treasury Securities Cash Management Fund - Institutional Shares - 4.66%(b) | 110,070,194 | 110,070,194 | ||||
TOTAL SHORT-TERM INVESTMENTS (Cost $110,070,194) | 110,070,194 | |||||
TOTAL INVESTMENTS - 100.1% (Cost $2,328,698,519) | $5,234,618,056 | |||||
Liabilities in Excess of Other Assets - (0.1)% | (5,467,705) | |||||
TOTAL NET ASSETS - 100.0% | $5,229,150,351 | |||||
(a) | Non-income producing security. |
(b) | The rate shown represents the 7-day annualized effective yield as of October 31, 2024. |
2 |
Shares | Value | |||||
COMMON STOCKS - 98.4% | ||||||
Communication Services - 7.0% | ||||||
Alphabet, Inc. - Class A | 714,070 | $122,184,518 | ||||
Alphabet, Inc. - Class C | 593,670 | 102,520,872 | ||||
Baidu, Inc. - ADR(a) | 679,600 | 61,999,908 | ||||
Electronic Arts, Inc. | 50,000 | 7,542,500 | ||||
IMAX Corp.(a) | 275,400 | 6,692,220 | ||||
Live Nation Entertainment, Inc.(a) | 41,600 | 4,873,024 | ||||
Meta Platforms, Inc. - Class A | 30,200 | 17,140,916 | ||||
Netflix, Inc.(a) | 11,750 | 8,883,353 | ||||
Nintendo Co. Ltd. - JPY | 550,000 | 29,052,641 | ||||
Shutterstock, Inc. | 40,000 | 1,283,600 | ||||
Spotify Technology SA(a) | 5,100 | 1,964,010 | ||||
Trade Desk, Inc. (The) - Class A(a) | 66,200 | 7,957,902 | ||||
Universal Music Group N.V. - EUR | 211,874 | 5,332,056 | ||||
Walt Disney Co. (The) | 301,200 | 28,975,440 | ||||
406,402,960 | ||||||
Consumer Discretionary - 8.7% | ||||||
Alibaba Group Holding Ltd. - ADR | 1,246,940 | 122,175,181 | ||||
Amazon.com, Inc.(a) | 11,000 | 2,050,400 | ||||
Bath & Body Works, Inc. | 418,898 | 11,888,325 | ||||
Bowlero Corp. - Class A | 282,100 | 2,925,377 | ||||
Burlington Stores, Inc.(a) | 5,000 | 1,238,850 | ||||
Capri Holdings Ltd.(a) | 213,800 | 4,220,412 | ||||
CarMax, Inc.(a) | 573,200 | 41,488,216 | ||||
Carnival Corp.(a) | 97,900 | 2,153,800 | ||||
Carvana Co.(a) | 25,600 | 6,331,136 | ||||
DoorDash, Inc. - Class A(a) | 14,510 | 2,273,717 | ||||
eBay, Inc. | 90,300 | 5,193,153 | ||||
Entain PLC - GBP | 400,000 | 3,847,023 | ||||
Flutter Entertainment PLC - GBP(a) | 24,477 | 5,725,997 | ||||
iRobot Corp.(a) | 154,200 | 1,346,166 | ||||
Leslie’s, Inc.(a) | 247,900 | 666,851 | ||||
Marriott International, Inc. - Class A | 25,000 | 6,500,500 | ||||
Mattel, Inc.(a) | 2,470,700 | 50,352,866 | ||||
McDonald’s Corp. | 9,300 | 2,716,623 | ||||
MGM Resorts International(a) | 67,000 | 2,470,290 | ||||
Norwegian Cruise Line Holdings Ltd.(a) | 252,300 | 6,393,282 | ||||
Ollie’s Bargain Outlet Holdings, Inc.(a) | 61,800 | 5,675,094 | ||||
Restaurant Brands International, Inc. | 11,000 | 765,050 | ||||
Ross Stores, Inc. | 85,400 | 11,932,088 | ||||
Royal Caribbean Cruises Ltd. | 259,671 | 53,583,111 | ||||
Sony Group Corp. - ADR | 3,026,385 | 53,264,376 | ||||
Tapestry, Inc. | 15,000 | 711,750 | ||||
Tesla, Inc.(a) | 360,000 | 89,946,000 | ||||
TJX Cos., Inc. (The) | 61,000 | 6,894,830 | ||||
Victoria’s Secret & Co.(a) | 166,699 | 5,044,312 | ||||
509,774,776 | ||||||
Consumer Staples - 1.2% | ||||||
Altria Group, Inc. | 65,500 | 3,567,130 | ||||
BellRing Brands, Inc.(a) | 54,900 | 3,614,067 | ||||
BJ’s Wholesale Club Holdings, Inc.(a) | 125,200 | 10,608,196 | ||||
Casey’s General Stores, Inc. | 12,200 | 4,807,044 | ||||
Shares | Value | |||||
Dollar Tree, Inc.(a) | 281,200 | $18,176,768 | ||||
e.l.f. Beauty, Inc.(a) | 55,560 | 5,847,690 | ||||
Performance Food Group Co.(a) | 311,700 | 25,325,625 | ||||
US Foods Holding Corp.(a) | 18,608 | 1,147,183 | ||||
73,093,703 | ||||||
Energy - 2.1% | ||||||
ConocoPhillips | 187,405 | 20,528,344 | ||||
Coterra Energy, Inc. | 312,000 | 7,463,040 | ||||
EOG Resources, Inc. | 75,900 | 9,256,764 | ||||
Expand Energy Corp. | 61,601 | 5,218,837 | ||||
Exxon Mobil Corp. | 159,470 | 18,622,906 | ||||
Hess Corp. | 289,621 | 38,948,232 | ||||
Schlumberger Ltd. | 48,500 | 1,943,395 | ||||
TechnipFMC PLC | 10,000 | 266,900 | ||||
Transocean Ltd.(a) | 5,298,304 | 22,994,639 | ||||
125,243,057 | ||||||
Financials - 8.5% | ||||||
Bank of America Corp. | 151,200 | 6,323,184 | ||||
Citigroup, Inc. | 259,200 | 16,632,864 | ||||
CME Group, Inc. - Class A | 119,100 | 26,840,376 | ||||
Discover Financial Services | 31,000 | 4,601,330 | ||||
Evercore, Inc. - Class A | 40,100 | 10,593,217 | ||||
JPMorgan Chase & Co. | 79,700 | 17,687,024 | ||||
MarketAxess Holdings, Inc. | 143,672 | 41,581,550 | ||||
Mastercard, Inc. - Class A | 3,900 | 1,948,401 | ||||
Northern Trust Corp. | 451,010 | 45,335,525 | ||||
PayPal Holdings, Inc.(a) | 207,900 | 16,486,470 | ||||
Raymond James Financial, Inc. | 1,246,225 | 184,715,470 | ||||
Tradeweb Markets, Inc. - Class A | 164,700 | 20,916,900 | ||||
Visa, Inc. - Class A | 180,250 | 52,245,462 | ||||
Wells Fargo & Co. | 773,040 | 50,185,757 | ||||
496,093,530 | ||||||
Health Care - 29.6% | ||||||
Agilent Technologies, Inc. | 92,700 | 12,079,737 | ||||
Alcon, Inc. | 57,050 | 5,245,748 | ||||
Alkermes PLC(a) | 264,500 | 6,797,650 | ||||
Amgen, Inc. | 407,100 | 130,337,136 | ||||
AstraZeneca PLC - ADR | 1,594,280 | 113,433,022 | ||||
BeiGene Ltd. - ADR(a) | 684,227 | 138,651,759 | ||||
Biogen, Inc.(a) | 734,980 | 127,886,520 | ||||
BioMarin Pharmaceutical, Inc.(a) | 1,458,536 | 96,102,937 | ||||
BioNTech SE - ADR(a) | 405,900 | 45,907,290 | ||||
Boston Scientific Corp.(a) | 1,004,700 | 84,414,894 | ||||
Bridgebio Pharma, Inc.(a) | 177,450 | 4,154,104 | ||||
Bristol-Myers Squibb Co. | 830,290 | 46,305,273 | ||||
CVS Health Corp. | 143,600 | 8,107,656 | ||||
Elanco Animal Health, Inc.(a) | 3,605,271 | 45,570,625 | ||||
Eli Lilly & Co. | 555,478 | 460,902,316 | ||||
Enovis Corp.(a) | 43,333 | 1,788,353 | ||||
Glaukos Corp.(a) | 23,800 | 3,147,550 | ||||
GRAIL, Inc.(a) | 16,116 | 218,694 | ||||
GSK PLC - ADR | 868,150 | 31,913,194 | ||||
3 |
Shares | Value | |||||
COMMON STOCKS - (Continued) | ||||||
Health Care - (Continued) | ||||||
Humana, Inc. | 2,000 | $515,660 | ||||
Illumina, Inc.(a) | 138,800 | 20,006,632 | ||||
Insulet Corp.(a) | 202,237 | 46,823,933 | ||||
IQVIA Holdings, Inc.(a) | 20,100 | 4,136,982 | ||||
LivaNova PLC(a) | 798,500 | 41,218,570 | ||||
Merck & Co., Inc. | 14,800 | 1,514,336 | ||||
Nektar Therapeutics(a) | 1,509,856 | 1,796,729 | ||||
Neurocrine Biosciences, Inc.(a) | 70,950 | 8,533,157 | ||||
Novartis AG - ADR | 150,136 | 16,274,742 | ||||
OraSure Technologies, Inc.(a) | 101,800 | 413,817 | ||||
QIAGEN N.V. - EUR(a) | 117,000 | 4,958,279 | ||||
Revvity, Inc. | 46,340 | 5,495,461 | ||||
Rhythm Pharmaceuticals, Inc.(a) | 1,986,102 | 94,796,648 | ||||
Roche Holding AG - CHF | 6,500 | 2,014,373 | ||||
Siemens Healthineers AG - EUR | 60,700 | 3,168,810 | ||||
Stryker Corp. | 10,800 | 3,847,824 | ||||
Thermo Fisher Scientific, Inc. | 54,430 | 29,736,198 | ||||
Waters Corp.(a) | 4,000 | 1,292,440 | ||||
Xencor, Inc.(a) | 2,591,100 | 54,439,011 | ||||
Zimmer Biomet Holdings, Inc. | 249,720 | 26,700,062 | ||||
1,730,648,122 | ||||||
Industrials - 17.6% | ||||||
AECOM | 1,517,952 | 162,117,274 | ||||
Airbus SE - EUR | 192,601 | 29,379,558 | ||||
Amentum Holdings, Inc.(a) | 583,614 | 17,356,680 | ||||
American Airlines Group, Inc.(a) | 2,917,201 | 39,090,493 | ||||
AMETEK, Inc. | 40,000 | 7,333,600 | ||||
Carrier Global Corp. | 33,600 | 2,443,392 | ||||
Chart Industries, Inc.(a) | 22,000 | 2,655,840 | ||||
Curtiss-Wright Corp. | 113,470 | 39,142,611 | ||||
Delta Air Lines, Inc. | 1,260,100 | 72,102,922 | ||||
FedEx Corp. | 180,000 | 49,293,000 | ||||
General Dynamics Corp. | 53,900 | 15,717,779 | ||||
IDEX Corp. | 35,760 | 7,675,526 | ||||
J.B. Hunt Transport Services, Inc. | 54,700 | 9,879,914 | ||||
Jacobs Solutions, Inc. | 581,084 | 81,688,789 | ||||
JetBlue Airways Corp.(a) | 121,300 | 691,410 | ||||
Lyft, Inc. - Class A(a) | 470,706 | 6,105,057 | ||||
Nextracker, Inc. - Class A(a) | 787,014 | 31,338,898 | ||||
Norfolk Southern Corp. | 22,500 | 5,634,675 | ||||
Saia, Inc.(a) | 19,600 | 9,576,756 | ||||
Siemens AG - EUR | 579,624 | 112,765,635 | ||||
Southwest Airlines Co. | 2,152,500 | 65,823,450 | ||||
Stratasys Ltd.(a) | 912,189 | 6,522,151 | ||||
Textron, Inc. | 214,300 | 17,234,006 | ||||
TransDigm Group, Inc. | 14,100 | 18,362,430 | ||||
Uber Technologies, Inc.(a) | 114,900 | 8,278,545 | ||||
Union Pacific Corp. | 24,500 | 5,685,715 | ||||
United Airlines Holdings, Inc.(a) | 1,561,050 | 122,167,773 | ||||
Xometry, Inc. - Class A(a)(b) | 4,058,058 | 79,862,582 | ||||
1,025,926,461 | ||||||
Shares | Value | |||||
Information Technology - 23.1% | ||||||
Adobe, Inc.(a) | 113,000 | $54,023,040 | ||||
Altair Engineering, Inc. - Class A(a) | 227,763 | 23,685,074 | ||||
Analog Devices, Inc. | 141,000 | 31,458,510 | ||||
Applied Materials, Inc. | 138,900 | 25,221,462 | ||||
AppLovin Corp. - Class A(a) | 61,400 | 10,400,546 | ||||
Arm Holdings PLC - ADR(a) | 64,000 | 9,043,200 | ||||
ASML Holding N.V. - ADR | 31,900 | 21,454,345 | ||||
Autodesk, Inc.(a) | 3,000 | 851,400 | ||||
Broadcom, Inc. | 25,550 | 4,337,624 | ||||
Dell Technologies, Inc. - Class C | 36,400 | 4,500,132 | ||||
Descartes Systems Group, Inc. (The)(a) | 165,300 | 17,179,629 | ||||
DocuSign, Inc.(a) | 14,200 | 985,196 | ||||
Flex Ltd.(a) | 3,898,329 | 135,155,066 | ||||
FormFactor, Inc.(a) | 481,518 | 18,288,054 | ||||
Gartner, Inc.(a) | 1,300 | 653,250 | ||||
Hewlett Packard Enterprise Co. | 1,525,600 | 29,733,944 | ||||
HP, Inc. | 401,736 | 14,269,663 | ||||
Intel Corp. | 2,653,200 | 57,096,864 | ||||
Intuit, Inc. | 4,500 | 2,746,350 | ||||
Jabil, Inc. | 427,700 | 52,645,593 | ||||
Keysight Technologies, Inc.(a) | 14,570 | 2,171,076 | ||||
KLA Corp. | 173,924 | 115,873,387 | ||||
L.M. Ericsson Telephone Co. - ADR | 1,406,900 | 11,789,822 | ||||
Marvell Technology, Inc. | 178,200 | 14,275,602 | ||||
MaxLinear, Inc.(a) | 257,500 | 3,339,775 | ||||
Micron Technology, Inc. | 1,764,100 | 175,792,565 | ||||
Microsoft Corp. | 335,600 | 136,371,060 | ||||
NetApp, Inc. | 257,111 | 29,647,469 | ||||
Nutanix, Inc. - Class A(a) | 379,980 | 23,596,758 | ||||
NVIDIA Corp. | 632,000 | 83,904,320 | ||||
Okta, Inc. - Class A(a) | 18,500 | 1,329,965 | ||||
Oracle Corp. | 265,600 | 44,578,304 | ||||
OSI Systems, Inc.(a) | 72,600 | 9,598,446 | ||||
Palo Alto Networks, Inc.(a) | 28,350 | 10,215,355 | ||||
QUALCOMM, Inc. | 171,650 | 27,939,471 | ||||
Salesforce, Inc. | 46,600 | 13,577,842 | ||||
Teradyne, Inc. | 74,590 | 7,922,204 | ||||
Texas Instruments, Inc. | 301,595 | 61,272,040 | ||||
Trimble, Inc.(a) | 313,000 | 18,936,500 | ||||
Universal Display Corp. | 188,019 | 33,903,586 | ||||
Wolfspeed, Inc.(a) | 726,200 | 9,665,722 | ||||
1,349,430,211 | ||||||
Materials - 0.6% | ||||||
Albemarle Corp. | 257,540 | 24,396,764 | ||||
Ivanhoe Mines Ltd. - Class A - CAD(a) | 600,000 | 7,933,350 | ||||
Linde PLC | 10,900 | 4,972,035 | ||||
37,302,149 | ||||||
TOTAL COMMON STOCKS (Cost $2,591,010,862) | 5,753,914,969 | |||||
4 |
Shares | Value | |||||
RIGHTS - 0.0% | ||||||
Health Care - 0.0% | ||||||
ABIOMED, Inc. - CVR (Issue Date 12/23/22)(a)(c)(d) | 387,250 | $394,995 | ||||
Epizyme, Inc. - CVR (Issue Date 8/15/22)(a)(c)(d) | 4,207,543 | 84,151 | ||||
Total Health Care | 479,146 | |||||
TOTAL RIGHTS (Cost $0) | 479,146 | |||||
SHORT-TERM INVESTMENTS - 1.7% | ||||||
Money Market Funds - 1.7% | ||||||
Dreyfus Treasury Securities Cash Management Fund - Institutional Shares - 4.66%(e) | 97,202,468 | 97,202,468 | ||||
TOTAL SHORT-TERM INVESTMENTS (Cost $97,202,468) | 97,202,468 | |||||
TOTAL INVESTMENTS - 100.1% (Cost $2,688,213,330) | $5,851,596,583 | |||||
Liabilities in Excess of Other Assets - (0.1)% | (6,400,006) | |||||
TOTAL NET ASSETS - 100.0% | $5,845,196,577 | |||||
(a) | Non-income producing security. |
(b) | Considered an affiliated company of the fund as the fund owns 5% or more of the outstanding voting securities of such company. (Note 7) |
(c) | Illiquid security. |
(d) | Fair-valued security. (Note 4) |
(e) | The rate shown represents the 7-day annualized effective yield as of October 31, 2024. |
5 |
Shares | Value | |||||
COMMON STOCKS - 97.8% | ||||||
Communication Services - 6.5% | ||||||
Alphabet, Inc. - Class A | 621,800 | $ 106,396,198 | ||||
Alphabet, Inc. - Class C | 481,840 | 83,208,949 | ||||
Baidu, Inc. - ADR(a) | 1,048,590 | 95,662,866 | ||||
Electronic Arts, Inc. | 75,500 | 11,389,175 | ||||
Ibotta, Inc. - Class A(a) | 56,130 | 4,113,768 | ||||
IMAX Corp.(a) | 562,000 | 13,656,600 | ||||
Live Nation Entertainment, Inc.(a) | 63,795 | 7,472,946 | ||||
Madison Square Garden Entertainment Corp.(a) | 76,100 | 3,174,131 | ||||
Meta Platforms, Inc. - Class A | 34,300 | 19,467,994 | ||||
Netflix, Inc.(a) | 16,500 | 12,474,495 | ||||
Pinterest, Inc. - Class A(a) | 1,310,750 | 41,668,742 | ||||
Sphere Entertainment Co.(a) | 392,223 | 16,398,844 | ||||
T-Mobile US, Inc. | 84,830 | 18,930,663 | ||||
WildBrain Ltd. - CAD(a) | 4,895,400 | 3,867,519 | ||||
ZoomInfo Technologies, Inc.(a) | 760,537 | 8,403,934 | ||||
446,286,824 | ||||||
Consumer Discretionary - 12.6% | ||||||
Alibaba Group Holding Ltd. - ADR | 1,281,600 | 125,571,168 | ||||
Amazon.com, Inc.(a) | 173,000 | 32,247,200 | ||||
Boot Barn Holdings, Inc.(a) | 62,370 | 7,768,183 | ||||
Burlington Stores, Inc.(a) | 90,400 | 22,398,408 | ||||
Capri Holdings Ltd.(a) | 340,937 | 6,730,096 | ||||
CarMax, Inc.(a) | 725,400 | 52,504,452 | ||||
Carvana Co.(a) | 36,400 | 9,002,084 | ||||
Deckers Outdoor Corp.(a) | 15,600 | 2,509,884 | ||||
Duolingo, Inc.(a) | 4,000 | 1,171,880 | ||||
eBay, Inc. | 214,740 | 12,349,697 | ||||
Entain PLC - GBP | 3,134,108 | 30,142,463 | ||||
Etsy, Inc.(a) | 14,200 | 730,448 | ||||
Flutter Entertainment PLC - GBP(a) | 22,700 | 5,310,297 | ||||
Gildan Activewear, Inc. | 95,535 | 4,671,661 | ||||
GrowGeneration Corp.(a) | 846,100 | 1,738,736 | ||||
iRobot Corp.(a) | 172,000 | 1,501,560 | ||||
Mobileye Global, Inc. - Class A(a) | 340,900 | 4,639,649 | ||||
Norwegian Cruise Line Holdings Ltd.(a) | 820,400 | 20,788,936 | ||||
Ollie’s Bargain Outlet Holdings, Inc.(a) | 128,900 | 11,836,887 | ||||
Restaurant Brands International, Inc. | 20,000 | 1,391,000 | ||||
Rivian Automotive, Inc. - Class A(a) | 15,300 | 154,530 | ||||
Royal Caribbean Cruises Ltd. | 570,300 | 117,681,405 | ||||
Savers Value Village, Inc.(a) | 398,600 | 4,077,678 | ||||
Sony Group Corp. - ADR | 9,894,550 | 174,144,080 | ||||
Tapestry, Inc. | 325,000 | 15,421,250 | ||||
Tesla, Inc.(a) | 627,590 | 156,803,362 | ||||
Ulta Beauty, Inc.(a) | 22,400 | 8,265,152 | ||||
XPeng, Inc. - ADR(a) | 3,423,130 | 38,441,750 | ||||
869,993,896 | ||||||
Shares | Value | |||||
Consumer Staples - 0.7% | ||||||
BellRing Brands, Inc.(a) | 115,729 | $ 7,618,440 | ||||
Dollar General Corp. | 7,000 | 560,280 | ||||
e.l.f. Beauty, Inc.(a) | 79,515 | 8,368,954 | ||||
Performance Food Group Co.(a) | 366,300 | 29,761,875 | ||||
46,309,549 | ||||||
Energy - 1.3% | ||||||
Coterra Energy, Inc. | 499,350 | 11,944,452 | ||||
EOG Resources, Inc. | 115,300 | 14,061,988 | ||||
New Fortress Energy, Inc. | 3,044,500 | 25,604,245 | ||||
Transocean Ltd.(a) | 8,214,982 | 35,653,022 | ||||
87,263,707 | ||||||
Financials - 5.9% | ||||||
CME Group, Inc. - Class A | 195,671 | 44,096,416 | ||||
Discover Financial Services | 166,713 | 24,745,211 | ||||
Flywire Corp.(a) | 1,818,383 | 31,676,232 | ||||
Galaxy Digital Holdings Ltd. - CAD(a) | 116,700 | 1,516,216 | ||||
LPL Financial Holdings, Inc. | 16,000 | 4,514,880 | ||||
MarketAxess Holdings, Inc. | 558,040 | 161,507,937 | ||||
Marqeta, Inc. - Class A(a) | 451,600 | 2,556,056 | ||||
Morgan Stanley | 217,533 | 25,288,211 | ||||
NMI Holdings, Inc. - Class A(a) | 436,300 | 16,876,084 | ||||
Progressive Corp. (The) | 97,950 | 23,785,198 | ||||
Tradeweb Markets, Inc. - Class A | 503,000 | 63,881,000 | ||||
WEX, Inc.(a) | 15,500 | 2,675,300 | ||||
403,118,741 | ||||||
Health Care - 27.6% | ||||||
10X Genomics, Inc. - Class A(a) | 132,600 | 2,125,578 | ||||
Accuray, Inc.(a) | 137,800 | 238,394 | ||||
Alkermes PLC(a) | 907,835 | 23,331,360 | ||||
Allogene Therapeutics, Inc.(a) | 1,835,770 | 4,690,392 | ||||
Amicus Therapeutics, Inc.(a) | 1,005,800 | 11,486,236 | ||||
BeiGene Ltd. - ADR(a) | 705,057 | 142,872,750 | ||||
Biogen, Inc.(a) | 869,794 | 151,344,156 | ||||
BioMarin Pharmaceutical, Inc.(a) | 1,894,130 | 124,804,226 | ||||
BioNTech SE - ADR(a) | 1,196,599 | 135,335,347 | ||||
Boston Scientific Corp.(a) | 539,010 | 45,287,620 | ||||
Bridgebio Pharma, Inc.(a) | 427,200 | 10,000,752 | ||||
Cerus Corp.(a) | 3,226,361 | 5,065,387 | ||||
Charles River Laboratories International, Inc.(a) | 13,750 | 2,455,475 | ||||
Elanco Animal Health, Inc.(a) | 626,992 | 7,925,179 | ||||
Eli Lilly & Co. | 464,094 | 385,077,356 | ||||
Exact Sciences Corp.(a) | 437,600 | 30,163,768 | ||||
FibroGen, Inc.(a) | 150,000 | 45,210 | ||||
Galapagos N.V. - ADR(a) | 593,800 | 15,700,072 | ||||
Glaukos Corp.(a) | 827,065 | 109,379,346 | ||||
Globus Medical, Inc. - Class A(a) | 40,150 | 2,952,631 | ||||
GRAIL, Inc.(a) | 1,490,519 | 20,226,343 | ||||
Health Catalyst, Inc.(a) | 1,635,100 | 12,704,727 | ||||
Illumina, Inc.(a) | 201,210 | 29,002,409 | ||||
6 |
Shares | Value | |||||
COMMON STOCKS - (Continued) | ||||||
Health Care - (Continued) | ||||||
Immunocore Holdings PLC - ADR(a) | 658,330 | $20,296,314 | ||||
Immunome, Inc.(a) | 239,600 | 2,748,212 | ||||
Insulet Corp.(a) | 317,696 | 73,556,155 | ||||
LivaNova PLC(a) | 1,019,140 | 52,608,007 | ||||
Mural Oncology PLC(a) | 45,260 | 159,315 | ||||
Nektar Therapeutics(a) | 3,604,176 | 4,288,969 | ||||
Nurix Therapeutics, Inc.(a) | 217,000 | 5,333,860 | ||||
OraSure Technologies, Inc.(a) | 271,400 | 1,103,241 | ||||
Penumbra, Inc.(a) | 19,220 | 4,398,881 | ||||
PolyPeptide Group AG - CHF(a) | 891,304 | 29,735,883 | ||||
Pulmonx Corp.(a)(b) | 3,791,931 | 23,699,569 | ||||
QIAGEN N.V. - EUR(a) | 181,170 | 7,677,705 | ||||
Repligen Corp.(a) | 12,800 | 1,718,656 | ||||
Rhythm Pharmaceuticals, Inc.(a)(b) | 4,680,380 | 223,394,537 | ||||
Roche Holding AG - CHF | 47,005 | 14,567,015 | ||||
Standard BioTools, Inc.(a) | 379,900 | 744,604 | ||||
Wave Life Sciences Ltd.(a) | 2,494,960 | 34,205,902 | ||||
Xencor, Inc.(a)(b) | 5,850,857 | 122,926,506 | ||||
Zentalis Pharmaceuticals, Inc.(a) | 1,129,510 | 3,083,562 | ||||
1,898,461,607 | ||||||
Industrials - 14.4% | ||||||
AECOM | 1,502,620 | 160,479,816 | ||||
Alaska Air Group, Inc.(a) | 381,100 | 18,258,501 | ||||
Allegiant Travel Co. | 25,100 | 1,631,751 | ||||
Amentum Holdings, Inc.(a) | 847,400 | 25,201,676 | ||||
American Airlines Group, Inc.(a) | 5,368,200 | 71,933,880 | ||||
Array Technologies, Inc.(a) | 837,900 | 5,471,487 | ||||
Axon Enterprise, Inc.(a) | 65,400 | 27,696,900 | ||||
Chart Industries, Inc.(a) | 39,300 | 4,744,296 | ||||
Controladora Vuela Compania de Aviacion, S.A.B. de C.V. - ADR(a) | 41,000 | 301,760 | ||||
Curtiss-Wright Corp. | 178,290 | 61,502,918 | ||||
Delta Air Lines, Inc. | 2,146,837 | 122,842,013 | ||||
FedEx Corp. | 33,500 | 9,173,975 | ||||
Frontier Group Holdings, Inc.(a) | 263,800 | 1,603,904 | ||||
GFL Environmental, Inc. | 356,300 | 14,893,340 | ||||
Gibraltar Industries, Inc.(a) | 95,600 | 6,452,044 | ||||
Griffon Corp. | 191,100 | 12,016,368 | ||||
Hertz Global Holdings, Inc.(a) | 296,200 | 823,436 | ||||
Jacobs Solutions, Inc. | 729,140 | 102,502,501 | ||||
JetBlue Airways Corp.(a) | 1,242,100 | 7,079,970 | ||||
Li-Cycle Holdings Corp.(a) | 131,050 | 326,315 | ||||
Lyft, Inc. - Class A(a) | 614,910 | 7,975,383 | ||||
Nextracker, Inc. - Class A(a) | 945,714 | 37,658,331 | ||||
NN, Inc.(a) | 330,000 | 1,039,500 | ||||
Old Dominion Freight Line, Inc. | 5,200 | 1,046,864 | ||||
Ryanair Holdings PLC - ADR | 39,500 | 1,748,270 | ||||
Southwest Airlines Co. | 1,535,500 | 46,955,590 | ||||
Stratasys Ltd.(a) | 708,970 | 5,069,136 | ||||
Shares | Value | |||||
Sun Country Airlines Holdings, Inc.(a) | 51,815 | $ 728,001 | ||||
TransDigm Group, Inc. | 36,700 | 47,794,410 | ||||
Uber Technologies, Inc.(a) | 318,200 | 22,926,310 | ||||
United Airlines Holdings, Inc.(a) | 1,873,740 | 146,638,892 | ||||
VSE Corp. | 97,500 | 10,005,450 | ||||
WillScot Holdings Corp.(a) | 120,000 | 3,976,800 | ||||
XPO, Inc.(a) | 40,000 | 5,221,200 | ||||
993,720,988 | ||||||
Information Technology - 27.7% | ||||||
Adobe, Inc.(a) | 124,650 | 59,592,672 | ||||
Ambarella, Inc.(a) | 28,700 | 1,612,653 | ||||
Applied Materials, Inc. | 77,500 | 14,072,450 | ||||
AppLovin Corp. - Class A(a) | 69,400 | 11,755,666 | ||||
Arlo Technologies, Inc.(a) | 2,988,100 | 30,359,096 | ||||
ASML Holding N.V. - ADR | 34,200 | 23,001,210 | ||||
Aurora Innovation, Inc. - Class A(a) | 3,295,500 | 17,120,122 | ||||
Autodesk, Inc.(a) | 37,700 | 10,699,260 | ||||
Axcelis Technologies, Inc.(a) | 896,976 | 76,521,023 | ||||
Broadcom, Inc. | 146,900 | 24,939,213 | ||||
Credo Technology Group Holding Ltd.(a) | 540,500 | 20,376,850 | ||||
Crowdstrike Holdings, Inc. - Class A(a) | 112,210 | 33,311,783 | ||||
CyberArk Software Ltd.(a) | 59,500 | 16,452,940 | ||||
Dell Technologies, Inc. - Class C | 83,000 | 10,261,290 | ||||
Descartes Systems Group, Inc. (The)(a) | 215,741 | 22,421,962 | ||||
DocuSign, Inc.(a) | 221,200 | 15,346,856 | ||||
Flex Ltd.(a) | 5,358,515 | 185,779,715 | ||||
FormFactor, Inc.(a) | 790,855 | 30,036,673 | ||||
Gitlab, Inc. - Class A(a) | 159,300 | 8,562,375 | ||||
Hewlett Packard Enterprise Co. | 565,000 | 11,011,850 | ||||
HP, Inc. | 184,000 | 6,535,680 | ||||
HubSpot, Inc.(a) | 88,950 | 49,348,570 | ||||
indie Semiconductor, Inc. - Class A(a)(b) | 16,250,460 | 53,789,023 | ||||
Intuit, Inc. | 73,200 | 44,673,960 | ||||
Jabil, Inc. | 563,000 | 69,299,670 | ||||
Jamf Holding Corp.(a) | 39,000 | 648,960 | ||||
Keysight Technologies, Inc.(a) | 35,000 | 5,215,350 | ||||
KLA Corp. | 167,015 | 111,270,403 | ||||
Marvell Technology, Inc. | 153,400 | 12,288,874 | ||||
MaxLinear, Inc.(a) | 1,491,020 | 19,338,529 | ||||
Micron Technology, Inc. | 2,818,050 | 280,818,683 | ||||
MongoDB, Inc.(a) | 13,900 | 3,758,560 | ||||
NetApp, Inc. | 563,692 | 64,999,325 | ||||
nLIGHT, Inc.(a) | 184,343 | 2,300,601 | ||||
Nutanix, Inc. - Class A(a) | 1,201,925 | 74,639,542 | ||||
NVIDIA Corp. | 1,102,590 | 146,379,848 | ||||
Okta, Inc. - Class A(a) | 318,600 | 22,904,154 | ||||
OneStream, Inc.(a) | 30,200 | 891,504 | ||||
OSI Systems, Inc.(a) | 190,800 | 25,225,668 | ||||
Palo Alto Networks, Inc.(a) | 70,035 | 25,235,712 | ||||
7 |
Shares | Value | |||||
COMMON STOCKS - (Continued) | ||||||
Information Technology - (Continued) | ||||||
PROS Holdings, Inc.(a) | 72,793 | $1,441,301 | ||||
QUALCOMM, Inc. | 306,623 | 49,909,026 | ||||
Rapid7, Inc.(a) | 94,900 | 3,835,858 | ||||
RingCentral, Inc. - Class A(a) | 9,000 | 324,090 | ||||
Trimble, Inc.(a) | 482,970 | 29,219,685 | ||||
Unity Software, Inc.(a) | 52,300 | 1,050,184 | ||||
Universal Display Corp. | 661,329 | 119,250,845 | ||||
Western Digital Corp.(a) | 187,000 | 12,212,970 | ||||
Wolfspeed, Inc.(a) | 1,401,300 | 18,651,303 | ||||
Zoom Video Communications, Inc. - Class A(a) | 370,700 | 27,706,118 | ||||
1,906,399,655 | ||||||
Materials - 1.0% | ||||||
Albemarle Corp. | 114,600 | 10,856,058 | ||||
Bioceres Crop Solutions Corp.(a) | 2,000 | 13,440 | ||||
Ingevity Corp.(a) | 54,500 | 2,277,555 | ||||
Ivanhoe Electric, Inc.(a) | 331,100 | 3,360,665 | ||||
Ivanhoe Mines Ltd. - Class A - CAD(a) | 2,855,600 | 37,757,457 | ||||
Perimeter Solutions SA(a) | 1,187,852 | 15,774,675 | ||||
70,039,850 | ||||||
Real Estate - 0.1% | ||||||
EPR Properties | 128,200 | 5,816,434 | ||||
TOTAL COMMON STOCKS (Cost $3,397,902,661) | 6,727,411,251 | |||||
RIGHTS - 0.0% | ||||||
Health Care - 0.0% | ||||||
ABIOMED, Inc. - CVR (Issue Date 12/23/22)(a)(c)(d) | 349,922 | 356,921 | ||||
Epizyme, Inc. - CVR (Issue Date 8/15/22)(a)(c)(d) | 10,344,756 | 206,895 | ||||
Total Health Care | 563,816 | |||||
TOTAL RIGHTS (Cost $0) | 563,816 | |||||
WARRANTS - 0.0% | ||||||
Materials - 0.0% | ||||||
Perimeter Solutions SA (Expiration Date 11/8/24)(a) | 364,100 | 120,153 | ||||
TOTAL WARRANTS (Cost $3,641) | 120,153 | |||||
Shares | Value | |||||
SHORT-TERM INVESTMENTS - 2.3% | ||||||
Money Market Funds - 2.3% | ||||||
Dreyfus Treasury Securities Cash Management Fund - Institutional Shares - 4.66%(e) | 158,983,867 | $158,983,867 | ||||
TOTAL SHORT-TERM INVESTMENTS (Cost $158,983,867) | 158,983,867 | |||||
TOTAL INVESTMENTS - 100.1% (Cost $3,556,890,169) | $6,887,079,087 | |||||
Liabilities in Excess of Other Assets - (0.1)% | (4,221,639) | |||||
TOTAL NET ASSETS - 100.0% | $6,882,857,448 | |||||
(a) | Non-income producing security. |
(b) | Considered an affiliated company of the fund as the fund owns 5% or more of the outstanding voting securities of such company. (Note 7) |
(c) | Illiquid security. |
(d) | Fair-valued security. (Note 4) |
(e) | The rate shown represents the 7-day annualized effective yield as of October 31, 2024. |
8 |
PRIMECAP Odyssey Stock Fund | PRIMECAP Odyssey Growth Fund | PRIMECAP Odyssey Aggressive Growth Fund | |||||||
ASSETS | |||||||||
Investments, at cost (unaffiliated) | $2,328,698,519 | $2,599,737,898 | $3,132,713,733 | ||||||
Investments, at cost (affiliated) | — | 88,475,432 | 424,176,436 | ||||||
Investments, at value (unaffiliated) | 5,234,618,056 | 5,771,734,001 | 6,463,269,452 | ||||||
Investments, at value (affiliated) | — | 79,862,582 | 423,809,635 | ||||||
Receivable for investments sold | 555,455 | 2,200,936 | 8,921,622 | ||||||
Receivable for dividends and interest | 6,922,731 | 6,531,968 | 2,673,673 | ||||||
Receivable for fund shares sold | 506,049 | 420,018 | 363,855 | ||||||
Prepaid expenses and other assets | 54,384 | 54,850 | 68,776 | ||||||
Total assets | 5,242,656,675 | 5,860,804,355 | 6,899,107,013 | ||||||
LIABILITIES | |||||||||
Payable for investments purchased | 332,447 | 109,905 | 868,366 | ||||||
Payable for fund shares repurchased | 4,571,918 | 5,991,349 | 4,506,862 | ||||||
Payable to the advisor (Note 6) | 7,407,803 | 8,265,932 | 9,521,440 | ||||||
Payable for shareholder servicing | 837,046 | 888,907 | 988,423 | ||||||
Payable to custodian | 20,970 | 24,963 | 24,999 | ||||||
Other accrued expenses and liabilities | 336,140 | 326,722 | 339,475 | ||||||
Total liabilities | 13,506,324 | 15,607,778 | 16,249,565 | ||||||
NET ASSETS | $ 5,229,150,351 | $5,845,196,577 | $6,882,857,448 | ||||||
Number of shares issued and outstanding (unlimited shares authorized, $0.01 par value) | 132,384,372 | 145,052,285 | 148,747,622 | ||||||
Net asset value, offering and redemption price per share | $39.50 | $40.30 | $46.27 | ||||||
Components of Net Assets | |||||||||
Paid-in capital | $1,566,337,403 | $1,745,200,277 | $2,970,649,354 | ||||||
Total distributable earnings | 3,662,812,948 | 4,099,996,300 | 3,912,208,094 | ||||||
Net Assets | $5,229,150,351 | $5,845,196,577 | $6,882,857,448 | ||||||
9 |
PRIMECAP Odyssey Stock Fund | PRIMECAP Odyssey Growth Fund | PRIMECAP Odyssey Aggressive Growth Fund | |||||||
INVESTMENT INCOME | |||||||||
Dividends (unaffiliated)(1) | $81,429,051 | $61,378,121 | $34,219,370 | ||||||
Interest income | 7,675,161 | 7,857,393 | 12,419,548 | ||||||
Total investment income | 89,104,212 | 69,235,514 | 46,638,918 | ||||||
EXPENSES | |||||||||
Advisory fees (Note 6) | 30,958,259 | 35,365,762 | 38,429,054 | ||||||
Shareholder servicing | 4,968,631 | 5,246,238 | 5,435,917 | ||||||
Trustee fees | 260,141 | 260,215 | 260,215 | ||||||
Custody | 119,656 | 142,308 | 138,409 | ||||||
Other | 1,160,934 | 1,173,521 | 1,215,353 | ||||||
Total expenses | 37,467,621 | 42,188,044 | 45,478,948 | ||||||
Net investment income | 51,636,591 | 27,047,470 | 1,159,970 | ||||||
REALIZED AND UNREALIZED GAIN (LOSS) ON INVESTMENTS AND FOREIGN CURRENCY | |||||||||
Net realized gain (loss) on: | |||||||||
Investments (unaffiliated) | 858,471,255 | 1,187,319,680 | 735,070,785 | ||||||
Investments (affiliated) | — | (312,488) | 4,441,205 | ||||||
Foreign currency transactions | 7,658 | 145 | 40,229 | ||||||
Change in unrealized appreciation/depreciation on: | |||||||||
Investments (unaffiliated) | 549,632,038 | 383,649,085 | 810,892,577 | ||||||
Investments (affiliated) | — | 19,506,503 | 103,864,742 | ||||||
Foreign currency translations | 111,715 | 117,894 | 50,547 | ||||||
Net realized and unrealized gain on investments and foreign currency | 1,408,222,666 | 1,590,280,819 | 1,654,360,085 | ||||||
NET INCREASE IN NET ASSETS RESULTING FROM OPERATIONS | $1,459,859,257 | $1,617,328,289 | $1,655,520,055 | ||||||
(1) | Net of foreign taxes withheld of $1,328,805, $1,116,258, and $386,426, respectively. |
10 |
Year Ended October 31, 2024 | Year Ended October 31, 2023 | |||||
INCREASE (DECREASE) IN NET ASSETS FROM: | ||||||
OPERATIONS | ||||||
Net investment income | $51,636,591 | $65,607,784 | ||||
Net realized gain (loss) on: | ||||||
Investments | 858,471,255 | 542,618,630 | ||||
Foreign currency transactions | 7,658 | (22,646) | ||||
Change in unrealized appreciation/depreciation on: | ||||||
Investments | 549,632,038 | (144,459,268) | ||||
Foreign currency translations | 111,715 | 239,197 | ||||
Net increase in net assets resulting from operations | 1,459,859,257 | 463,983,697 | ||||
Net distributions to shareholders | (543,292,220) | (623,026,904) | ||||
CAPITAL SHARE TRANSACTIONS | ||||||
Proceeds from shares sold | 365,296,780 | 424,348,515 | ||||
Proceeds from reinvestment of distributions | 520,727,056 | 603,545,405 | ||||
Cost of shares repurchased | (1,804,771,265) | (1,436,622,953) | ||||
Net decrease from capital share transactions | (918,747,429) | (408,729,033) | ||||
Total decrease in net assets | (2,180,392) | (567,772,240) | ||||
NET ASSETS | ||||||
Beginning of year | 5,231,330,743 | 5,799,102,983 | ||||
End of year | $5,229,150,351 | $5,231,330,743 | ||||
CHANGE IN CAPITAL SHARES | ||||||
Shares outstanding, beginning of year | 155,863,842 | 166,752,590 | ||||
Shares sold | 9,840,806 | 12,399,802 | ||||
Shares issued on reinvestment of distributions | 15,097,914 | 18,807,897 | ||||
Shares repurchased | (48,418,190) | (42,096,447) | ||||
Decrease in capital shares | (23,479,470) | (10,888,748) | ||||
Shares outstanding, end of year | 132,384,372 | 155,863,842 | ||||
11 |
Year Ended October 31, 2024 | Year Ended October 31, 2023 | |||||
INCREASE (DECREASE) IN NET ASSETS FROM: | ||||||
OPERATIONS | ||||||
Net investment income | $27,047,470 | $33,113,325 | ||||
Net realized gain on: | ||||||
Investments | 1,187,007,192 | 900,110,645 | ||||
Foreign currency transactions | 145 | 8,084 | ||||
Change in unrealized appreciation/depreciation on: | ||||||
Investments | 403,155,588 | (289,754,450) | ||||
Foreign currency translations | 117,894 | 259,701 | ||||
Net increase in net assets resulting from operations | 1,617,328,289 | 643,737,305 | ||||
Net distributions to shareholders | (831,948,160) | (759,221,460) | ||||
CAPITAL SHARE TRANSACTIONS | ||||||
Proceeds from shares sold | 321,730,178 | 494,456,847 | ||||
Proceeds from reinvestment of distributions | 797,037,283 | 727,799,102 | ||||
Cost of shares repurchased | (2,333,864,632) | (1,789,442,494) | ||||
Net decrease from capital share transactions | (1,215,097,171) | (567,186,545) | ||||
Total decrease in net assets | (429,717,042) | (682,670,700) | ||||
NET ASSETS | ||||||
Beginning of year | 6,274,913,619 | 6,957,584,319 | ||||
End of year | $5,845,196,577 | $6,274,913,619 | ||||
CHANGE IN CAPITAL SHARES | ||||||
Shares outstanding, beginning of year | 175,469,794 | 189,577,840 | ||||
Shares sold | 8,480,375 | 13,632,185 | ||||
Shares issued on reinvestment of distributions | 22,146,076 | 21,280,675 | ||||
Shares repurchased | (61,043,960) | (49,020,906) | ||||
Decrease in capital shares | (30,417,509) | (14,108,046) | ||||
Shares outstanding, end of year | 145,052,285 | 175,469,794 | ||||
12 |
Year Ended October 31, 2024 | Year Ended October 31, 2023 | |||||
INCREASE (DECREASE) IN NET ASSETS FROM: | ||||||
OPERATIONS | ||||||
Net investment income (loss) | $1,159,970 | $(6,012,989) | ||||
Net realized gain on: | ||||||
Investments | 739,511,990 | 461,964,269 | ||||
In-kind redemptions | — | 152,903,699 | ||||
Foreign currency transactions | 40,229 | 15,937 | ||||
Change in unrealized appreciation/depreciation on: | ||||||
Investments | 914,757,319 | 20,728,661 | ||||
Foreign currency translations | 50,547 | 60,395 | ||||
Net increase in net assets resulting from operations | 1,655,520,055 | 629,659,972 | ||||
NET DISTRIBUTIONS TO SHAREHOLDERS | (384,018,326) | (641,269,952) | ||||
CAPITAL SHARE TRANSACTIONS | ||||||
Proceeds from shares sold | 396,539,842 | 746,030,472 | ||||
Proceeds from reinvestment of distributions | 367,519,346 | 610,014,476 | ||||
Cost of shares repurchased | (1,506,111,302) | (1,922,098,498) | ||||
Other capital contribution | — | 78(1) | ||||
Net decrease from capital share transactions | (742,052,114) | (566,053,472) | ||||
Total increase (decrease) in net assets | 529,449,615 | (577,663,452) | ||||
NET ASSETS | ||||||
Beginning of year | 6,353,407,833 | 6,931,071,285 | ||||
End of year | $6,882,857,448 | $6,353,407,833 | ||||
CHANGE IN CAPITAL SHARES | ||||||
Shares outstanding, beginning of year | 165,450,352 | 178,104,760 | ||||
Shares sold | 9,092,025 | 18,814,530 | ||||
Shares issued on reinvestment of distributions | 8,686,347 | 16,371,832 | ||||
Shares repurchased | (34,481,102) | (47,840,770) | ||||
Decrease in capital shares | (16,702,730) | (12,654,408) | ||||
Shares outstanding, end of year | 148,747,622 | 165,450,352 | ||||
(1) | During the year ended October 31, 2023, the Transfer Agent reimbursed the Aggressive Growth Fund $78 for a net loss realized related to a shareholder redemption. |
13 |
Year Ended October 31, | |||||||||||||||
2024 | 2023 | 2022 | 2021 | 2020 | |||||||||||
Net asset value, beginning of year | $33.56 | $34.78 | $42.97 | $31.89 | $34.33 | ||||||||||
INCOME (LOSS) FROM INVESTMENT OPERATIONS: | |||||||||||||||
Net investment income(1) | 0.35 | 0.40 | 0.35 | 0.27 | 0.40 | ||||||||||
Net realized and unrealized gain (loss) on investments and foreign currency | 9.15 | 2.25 | (4.78) | 13.57 | (0.76) | ||||||||||
Total from investment operations | 9.50 | 2.65 | (4.43) | 13.84 | (0.36) | ||||||||||
LESS: | |||||||||||||||
Dividends from net investment income | (0.43) | (0.41) | (0.28) | (0.48) | (0.47) | ||||||||||
Distributions from net realized gain | (3.13) | (3.46) | (3.48) | (2.28) | (1.61) | ||||||||||
Total distributions | (3.56) | (3.87) | (3.76) | (2.76) | (2.08) | ||||||||||
Net asset value, end of year | $39.50 | $33.56 | $34.78 | $42.97 | $31.89 | ||||||||||
Total return | 29.83% | 8.13% | (11.33)% | 45.44% | (1.48)% | ||||||||||
RATIOS/SUPPLEMENTAL DATA: | |||||||||||||||
Net assets, end of year (millions) | $5,229.2 | $5,231.3 | $5,799.1 | $7,733.6 | $6,244.6 | ||||||||||
Ratio of expenses to average net assets | 0.67% | 0.67% | 0.66% | 0.65% | 0.65% | ||||||||||
Ratio of net investment income to average net assets | 0.92% | 1.15% | 0.93% | 0.67% | 1.28% | ||||||||||
Portfolio turnover rate | 3% | 4% | 4% | 6% | 8% | ||||||||||
(1) | Calculated using the average shares method. |
14 |
Year Ended October 31, | |||||||||||||||
2024 | 2023 | 2022 | 2021 | 2020 | |||||||||||
Net asset value, beginning of year | $35.76 | $36.70 | $50.78 | $40.31 | $39.68 | ||||||||||
INCOME (LOSS) FROM INVESTMENT OPERATIONS: | |||||||||||||||
Net investment income(1) | 0.16 | 0.18 | 0.16 | 0.05 | 0.16 | ||||||||||
Net realized and unrealized gain (loss) on investments and foreign currency | 9.26 | 3.04 | (8.21) | 15.72 | 2.57 | ||||||||||
Total from investment operations | 9.42 | 3.22 | (8.05) | 15.77 | 2.73 | ||||||||||
LESS: | |||||||||||||||
Dividends from net investment income | (0.19) | (0.21) | (0.05) | (0.17) | (0.20) | ||||||||||
Distributions from net realized gain | (4.69) | (3.95) | (5.98) | (5.13) | (1.90) | ||||||||||
Total distributions | (4.88) | (4.16) | (6.03) | (5.30) | (2.10) | ||||||||||
Net asset value, end of year | $40.30 | $35.76 | $36.70 | $50.78 | $40.31 | ||||||||||
Total return | 27.97% | 9.30% | (17.61)% | 41.97% | 6.83% | ||||||||||
RATIOS/SUPPLEMENTAL DATA: | |||||||||||||||
Net assets, end of year (millions) | $5,845.2 | $6,274.9 | $6,957.6 | $10,168.5 | $8,606.4 | ||||||||||
Ratio of expenses to average net assets | 0.66% | 0.66% | 0.65% | 0.65% | 0.65% | ||||||||||
Ratio of net investment income to average net assets | 0.42% | 0.48% | 0.40% | 0.10% | 0.42% | ||||||||||
Portfolio turnover rate | 5% | 7% | 4% | 7% | 9% | ||||||||||
(1) | Calculated using the average shares method. |
15 |
Year Ended October 31, | |||||||||||||||
2024 | 2023 | 2022 | 2021 | 2020 | |||||||||||
Net asset value, beginning of year | $38.40 | $38.92 | $60.37 | $48.07 | $43.46 | ||||||||||
INCOME (LOSS) FROM INVESTMENT OPERATIONS: | |||||||||||||||
Net investment income (loss)(1) | 0.01 | (0.03) | (0.09) | (0.22) | (0.10) | ||||||||||
Net realized and unrealized gain (loss) on investments and foreign currency | 10.24 | 3.42 | (15.51) | 16.73 | 7.10 | ||||||||||
Total from investment operations | 10.25 | 3.39 | (15.60) | 16.51 | 7.00 | ||||||||||
LESS: | |||||||||||||||
Dividends from net investment income | (0.01) | — | — | — | — | ||||||||||
Distributions from net realized gain | (2.37) | (3.91) | (5.85) | (4.21) | (2.39) | ||||||||||
Total distributions | (2.38) | (3.91) | (5.85) | (4.21) | (2.39) | ||||||||||
Net asset value, end of year | $46.27 | $38.40 | $38.92 | $60.37 | $48.07 | ||||||||||
Total return | 27.27% | 9.01% | (28.21)% | 35.53% | 16.52% | ||||||||||
RATIOS/SUPPLEMENTAL DATA: | |||||||||||||||
Net assets, end of year (millions) | $6,882.9 | $6,353.4 | $6,931.1 | $11,735.2 | $9,571.4 | ||||||||||
Ratio of expenses to average net assets | 0.65% | 0.65% | 0.65% | 0.64% | 0.64% | ||||||||||
Ratio of net investment income (loss) to average net assets | 0.02% | (0.09)% | (0.19)% | (0.39)% | (0.23)% | ||||||||||
Portfolio turnover rate | 9% | 5% | 4% | 9% | 17% | ||||||||||
(1) | Calculated using the average shares method. |
16 |
| A. | Security Valuation – Securities traded on a national securities exchange are valued at the last reported sales price at the close of regular trading on each day the exchanges are open for trading. Securities traded on the National Association of Securities Dealers Automated Quotations (“NASDAQ”) are valued at the NASDAQ Official Closing Price, which may not necessarily represent the last sale price. Non-U.S. traded stocks are valued at the last sale price or official closing price in the primary local market where the stock is traded. Securities traded on an exchange for which there have been no sales are valued at the mean between the bid and ask price. Because trading on most non-U.S. exchanges is normally completed before the close of the New York Stock Exchange, the value of securities traded on foreign exchanges can change by the time a Fund calculates its net asset value per share (“NAV”). To address these changes, the Funds may utilize adjustment factors provided by an independent pricing service to systematically value foreign securities at fair value. These adjustment factors are based on statistical analyses of subsequent movement in securities indices, specific security prices, and exchange rates in foreign markets. |
| B. | Share Valuation – The NAV of a Fund is calculated by dividing the sum of the value of the securities held by the Fund, plus cash or other assets, minus all liabilities (including estimated accrued expenses), by the total number of outstanding shares of the Fund. The result is rounded to the nearest cent. The Funds’ shares will not be priced on the days on which the New York Stock Exchange is closed for trading. |
| C. | Foreign Currency – Securities and other assets and liabilities denominated in foreign currencies are translated into U.S. dollars using exchange rates as of 4 p.m. Eastern time on the valuation date. Purchases and sales of investments and dividend and interest income are converted into U.S. dollars using the spot market rate of |
17 |
| D. | Federal Income Taxes – Each Fund has elected to be treated as a “regulated investment company” under Subchapter M of the Internal Revenue Code of 1986 (the “IRC”). Each Fund intends to distribute substantially all of its taxable income and any accumulated net realized capital gains. Accordingly, no provision for federal income taxes has been made in the financial statements. |
| E. | Allocation of Expenses – Each Fund is charged for those expenses directly attributable to it. Expenses that are not directly attributable to a Fund are allocated among the Funds by an appropriate method based on the nature of the expense. |
| F. | Security Transactions, Investment Income, and Distributions – Security transactions are accounted for on the trade date. Dividend income and distributions to shareholders are recorded on the ex-dividend date, and interest income is recognized on the accrual basis. Realized gains and losses are evaluated on the basis of identified costs. Premiums and discounts on the purchase of securities are amortized/accreted using the effective interest method. U.S. GAAP requires that permanent financial reporting and tax differences be reclassified in the capital accounts. |
| G. | Use of Estimates – The preparation of financial statements in conformity with U.S. GAAP requires management to make estimates and assumptions that affect the reported amounts of assets and liabilities and disclosure of contingent assets and liabilities at the date of the financial statements, and the reported amounts of revenues and expenses during the reporting period. Actual results could differ from these estimates, and such differences could be material. |
| H. | Indemnification Obligations – Under the Trust’s organizational documents, its current and former officers and trustees are indemnified against certain liabilities arising out of the performance of their duties to the Funds. In addition, in the normal course of business, the Funds enter into contracts that contain a variety of representations and warranties that provide general indemnifications. The Funds’ maximum exposure under these arrangements is unknown as this would involve future claims that may be made against the Funds that have not yet occurred. Based on experience, the Funds would expect the risk of loss to be minimal. |
18 |
Fund | Purchases | Sales | ||||
Stock Fund | $176,915,186 | $1,519,974,653 | ||||
Growth Fund | $299,730,372 | $2,325,315,866 | ||||
Aggressive Growth Fund | $573,683,891 | $1,693,734,784 | ||||
| Level 1 – | Unadjusted quoted prices in active markets for identical securities to which the Trust has access at the date of measurement. |
| Level 2 – | Other significant observable inputs (including quoted prices for similar or related securities in both active and inactive markets, interest rates, foreign exchange rates, and fair value estimates for foreign securities indices). |
| Level 3 – | Significant unobservable inputs to the extent observable inputs are unavailable (including the Funds’ own assumptions in determining fair value of investments based on the best available information). |
Fund | Description | Quoted prices in active markets for identical assets (Level 1) | Significant other observable inputs (Level 2) | Significant unobservable inputs (Level 3) | Total | ||||||||||
Stock Fund | Common Stocks(1) | $4,877,279,251 | $247,268,611 | $— | $5,124,547,862 | ||||||||||
Short-Term Investments | 110,070,194 | — | — | 110,070,194 | |||||||||||
Total Investments | $4,987,349,445 | $247,268,611 | $— | $5,234,618,056 | |||||||||||
Growth Fund | Common Stocks(1) | $5,557,670,597 | $196,244,372 | $— | $5,753,914,969 | ||||||||||
Rights(2) | — | — | 479,146 | 479,146 | |||||||||||
Short-Term Investments | 97,202,468 | — | — | 97,202,468 | |||||||||||
Total Investments | $5,654,873,065 | $196,244,372 | $479,146 | $5,851,596,583 | |||||||||||
19 |
Fund | Description | Quoted prices in active markets for identical assets (Level 1) | Significant other observable inputs (Level 2) | Significant unobservable inputs (Level 3) | Total | ||||||||||
Aggressive Growth Fund | Common Stocks(1) | $6,639,977,888 | $87,433,363 | $— | $6,727,411,251 | ||||||||||
Rights(2) | — | — | 563,816 | 563,816 | |||||||||||
Warrants(3) | 120,153 | — | — | 120,153 | |||||||||||
Short-Term Investments | 158,983,867 | — | — | 158,983,867 | |||||||||||
Total Investments | $6,799,081,908 | $87,433,363 | $563,816 | $6,887,079,087 | |||||||||||
(1) | Refer to each Fund’s respective Schedule of Investments for the breakdown of major categories. |
(2) | Health Care |
(3) | Materials |
Growth Fund | Aggressive Growth Fund | |||||
Balance at October 31, 2023 | $394,995 | $356,921 | ||||
Purchases (Received) | — | — | ||||
Sales (Proceeds) | — | — | ||||
Realized Gain (Loss) | — | — | ||||
Change in Unrealized Appreciation/Depreciation | — | — | ||||
Balance at October 31, 2024 | $394,995 | $356,921 | ||||
Growth Fund | Aggressive Growth Fund | |||||
Balance at October 31, 2023 | $84,151 | $206,895 | ||||
Purchases (Received) | — | — | ||||
Sales (Proceeds) | — | — | ||||
Realized Gain (Loss) | — | — | ||||
Change in Unrealized Appreciation/Depreciation | — | — | ||||
Balance at October 31, 2024 | $84,151 | $206,895 | ||||
20 |
PRIMECAP Odyssey Stock Fund | PRIMECAP Odyssey Growth Fund | PRIMECAP Odyssey Aggressive Growth Fund | |||||||
Cost of investments for tax purposes(1) | $2,348,927,174 | $2,734,434,577 | $3,604,398,067 | ||||||
Gross tax unrealized appreciation | 3,137,960,574 | 3,455,946,520 | 4,081,910,348 | ||||||
Gross tax unrealized depreciation | (252,269,692) | (338,784,514) | (799,229,328) | ||||||
Net tax unrealized appreciation | 2,885,690,882 | 3,117,162,006 | 3,282,681,020 | ||||||
Undistributed ordinary income | 44,984,177 | 34,572,704 | 1,762,520 | ||||||
Undistributed long-term capital gain | 732,137,889 | 948,261,590 | 627,764,554 | ||||||
Total distributable earnings | 777,122,066 | 982,834,294 | 629,527,074 | ||||||
Other accumulated gain (loss) | — | — | — | ||||||
Total accumulated gain | $3,662,812,948 | $4,099,996,300 | $3,912,208,094 | ||||||
(1) | At October 31, 2024 the differences in the basis for federal income tax purposes and financial reporting purposes are due to the tax deferral of losses on wash sales. |
Undistributed Net Investment Income (Loss) | Accumulated Net Realized Gain (Loss) | Paid In Capital | |||||||
Stock Fund | $7,618 | $(120,428,700) | $120,421,082 | ||||||
Growth Fund | $47,552 | $(207,404,065) | $207,356,513 | ||||||
Aggressive Growth Fund | $280,592 | $(102,670,079) | $102,389,487 | ||||||
October 31, 2024 | October 31, 2023 | |||||||||||
Ordinary Income Distributions | Long-Term Capital Gain Distributions | Ordinary Income Distributions | Long-Term Capital Gain Distributions | |||||||||
Stock Fund | $72,271,893 | $471,020,327 | $70,023,060 | $553,003,844 | ||||||||
Growth Fund | $40,741,870 | $791,206,290 | $52,353,122 | $706,868,338 | ||||||||
Aggressive Growth Fund | $2,357,310 | $381,661,016 | $— | $641,269,952 | ||||||||
21 |
Current Period Transactions | |||||||||||||||||||||
Common Stock | Market Value at October 31, 2023 | Purchases at Cost | Proceeds from Securities Sold | Dividend Income | Realized Gain (Loss) | Change in Unrealized Gain (Loss) | Market Value at October 31, 2024 | ||||||||||||||
Xometry, Inc. - Class A | $53,124,640 | $7,761,551 | $217,624 | $ — | $(312,488) | $19,506,503 | $79,862,582 | ||||||||||||||
Total | $53,124,640 | $7,761,551 | $217,624 | $— | $(312,488) | $19,506,503 | $79,862,582 | ||||||||||||||
Current Period Transactions | |||||||||||||||||||||
Common Stock | Market Value at October 31, 2023 | Purchases at Cost | Proceeds from Securities Sold | Dividend Income | Realized Gain (Loss) | Change in Unrealized Gain (Loss) | Market Value at October 31, 2024 | ||||||||||||||
indie Semiconductor, Inc. - Class A(1) | $N/A | $64,882,454 | $— | $ — | $— | $(31,101,844) | $53,789,023 | ||||||||||||||
Pulmonx Corp. | 32,935,875 | 1,212,238 | 623,669 | — | (3,597,341) | (6,227,534) | 23,699,569 | ||||||||||||||
Rhythm Pharmaceuticals, Inc. | 123,983,070 | 542,239 | 29,425,925 | — | 8,673,437 | 119,621,716 | 223,394,537 | ||||||||||||||
Xencor, Inc. | 98,407,239 | 4,333,652 | 751,898 | — | (634,891) | 21,572,404 | 122,926,506 | ||||||||||||||
Total | $255,326,184 | $70,970,583 | $30,801,492 | $— | $4,441,205 | $103,864,742 | $423,809,635 | ||||||||||||||
(1) | As of October 31, 2023, the company was not an affiliate. |
22 |
23 |
24 |
25 |
| • | The annualized total returns of the PRIMECAP Odyssey Stock Fund outperformed the returns of its benchmark, the S&P 500 Index, for the since inception period ended July 31, 2024, but underperformed compared to the Index for the one-, three- five- and ten-year periods by 4.64%, 1.53%, 2.41% and 1.29%, respectively. The Fund’s annualized total returns were below the median returns of the funds in the Morningstar Large Relative Value category for the one- three-, five and ten-year periods by 3.64%, 0.93% 1.31% and 0.42%. The Fund’s annualized total returns were below the median returns of the Peer Group for the one-, three-, five- and ten-year periods by 3.84%, 1.05%, 2.15% and 0.92%, respectively. |
| • | The annualized total returns of the PRIMECAP Odyssey Growth Fund outperformed the returns of its primary benchmark, the S&P 500 Index, for the since inception period ended July 31, 2024, but underperformed compared to the Index for the one-, three-, five- and ten-year periods by 8.45%, 4.54%, 3.97% and 1.25%, respectively. The Fund’s annualized total returns underperformed the returns of its secondary benchmark, the Russell 1000 Growth Index, for the one-, three-, five-, and ten-year and since inception periods by 13.24%, 4.40%, 7.38%, 4.41%, and 1.34%, respectively. The Fund’s annualized total returns were below the median returns of the funds in the Morningstar Large Core Growth category for the one-, three-, five- and ten-year periods by 10.85%, 2.68%, 5.03% and 2.71%, respectively. The Fund’s annualized total returns were below the median returns of the Peer Group for the one-, three-, five- and ten-year periods by 9.84%, 2.48%, 4.55% and 1.77%, respectively. |
| • | The annualized total returns of the PRIMECAP Odyssey Aggressive Growth Fund outperformed the return of its primary benchmark, the S&P 500 Index, for the since inception period ended July 31, 2024, but |
26 |
| • | The advisory fee of the Stock Fund was the same as the median fee of the funds in the Morningstar Large Blend retail category, but above the median fee of the Fund’s Expense Peer Group by 0.03%. |
| • | The advisory fee of the Growth Fund was below the median fees of the funds in the Morningstar Large Growth category and the Fund’s Expense Peer Group. |
| • | The advisory fee of the Aggressive Growth Fund was below the median fees of the funds in the Morningstar Mid-Cap Growth category and the Fund’s Expense Peer Group. |
| • | The total expense ratios of the Stock Fund, the Growth Fund and the Aggressive Growth Fund were below the medians of the respective Morningstar retail categories. The total expense ratio of the Stock Fund was above the median of its Expense Peer Group by 0.02%, but the expense ratios of the Growth Fund and Aggressive Growth Fund were below the medians of their respective Expense Peer Groups. |
27 |
28 |
29 |
| (b) | Financial Highlights are included within the financial statements filed under Item 7 of this Form. |
Item 8. Changes in and Disagreements with Accountants for Open-End Management Investment Companies.
There were no changes in or disagreements with accountants during the period covered by this report.
Item 9. Proxy Disclosure for Open-End Management Investment Companies.
There were no matters submitted to a vote of shareholders during the period covered by this report.
Item 10. Remuneration Paid to Directors, Officers, and Others of Open-End Management Investment Companies.
The remuneration information is included within the financial statements filed under Item 7 of this Form.
Item 11. Statement Regarding Basis for Approval of Investment Advisory Contract.
The statement is included within the financial statements filed under Item 7 of this Form.
Item 12. Disclosure of Proxy Voting Policies and Procedures for Closed-End Management Investment Companies.
Not applicable.
Item 13. Portfolio Managers of Closed-End Management Investment Companies.
Not applicable.
Item 14. Purchases of Equity Securities by Closed-End Management Investment Company and Affiliated Purchasers.
Not applicable.
Item 15. Submission of Matters to a Vote of Security Holders.
There have been no material changes to the procedures by which shareholders may recommend nominees to the Registrant’s Board of Trustees.
Item 16. Controls and Procedures.
| (a) | The Registrant’s Principal Executive Officers and Principal Financial Officer have reviewed the Registrant’s disclosure controls and procedures (as defined in Rule 30a-3(c) under the Investment Company Act of 1940 (the “Act”)) as of a date within 90 days of the filing of this report, as required by Rule 30a-3(b) under the Act and Rules 13a-15(b) or 15d-15(b) under the Securities Exchange Act of 1934. Based on their review, such officers have concluded that the disclosure controls and procedures are effective in ensuring that information required to be disclosed in this report is appropriately recorded, processed, summarized and reported and made known to them by others within the Registrant and by the Registrant’s service provider. |
| (b) | There were no changes in the Registrant’s internal control over financial reporting (as defined in Rule 30a-3(d) under the Act) that occurred during the period covered by this report that have materially affected, or are reasonably likely to materially affect, the Registrant’s internal control over financial reporting. |
Item 17. Disclosure of Securities Lending Activities for Closed-End Management Investment Companies
Not applicable.
Item 18. Recovery of Erroneously Awarded Compensation.
Not applicable.
Item 19. Exhibits.
| (a) | (1) Any code of ethics or amendment thereto, that is the subject of the disclosure required by Item 2, to the extent that the registrant intends to satisfy Item 2 requirements through filing an exhibit. Incorporated by reference to the Registrant’s Form N-CSR filed July 7, 2022. |
(2) Any policy required by the listing standards adopted pursuant to Rule 10D-1 under the Exchange Act (17 CFR 240.10D-1) by the registered national securities exchange or registered national securities association upon which the registrant’s securities are listed. Not Applicable.
(4) Any written solicitation to purchase securities under Rule 23c-1 under the Act sent or given during the period covered by the report by or on behalf of the registrant to 10 or more persons. Not applicable.
(5) Change in the registrant’s independent public accountant. Provide the information called for by Item 4 of Form 8-K under the Exchange Act (17 CFR 249.308). Unless otherwise specified by Item 4, or related to and necessary for a complete understanding of information not previously disclosed, the information should relate to events occurring during the reporting period. Not applicable.
| (b) | Certifications pursuant to Section 906 of the Sarbanes-Oxley Act of 2002. Filed herewith. |
SIGNATURES
Pursuant to the requirements of the Securities Exchange Act of 1934 and the Investment Company Act of 1940, the registrant has duly caused this report to be signed on its behalf by the undersigned, thereunto duly authorized.
| PRIMECAP Odyssey Funds | ||
| By | /s/ Joel P. Fried | |
| Joel P. Fried, Co-Chief Executive Officer | ||
| (Principal Executive Officer) | ||
| Date | December 20, 2024 |
| By | /s/ Alfred W. Mordecai | |
| Alfred W. Mordecai, Co-Chief Executive Officer | ||
| (Principal Executive Officer) |
| Date | December 23, 2024 |
Pursuant to the requirements of the Securities Exchange Act of 1934 and the Investment Company Act of 1940, this report has been signed below by the following persons on behalf of the registrant and in the capacities and on the dates indicated.
| By | /s/ Joel P. Fried | |
| Joel P. Fried, Co-Chief Executive Officer | ||
| (Principal Executive Officer) |
| Date | December 20, 2024 |
| By | /s/ Alfred W. Mordecai | |
| Alfred W. Mordecai, Co-Chief Executive Officer | ||
| (Principal Executive Officer) |
| Date | December 23, 2024 |
| By | /s/ Julietta Martikyan | |
| Julietta Martikyan, Chief Financial Officer | ||
| (Principal Financial Officer) |
| Date | December 20, 2024 |