As filed with the Securities and Exchange Commission on December 17, 2021
UNITED STATES
SECURITIES AND EXCHANGE COMMISSION
Washington, D.C. 20549
FORM N-CSR
CERTIFIED SHAREHOLDER REPORT OF REGISTERED
MANAGEMENT INVESTMENT COMPANIES
Investment Company Act file number 811-21597
PRIMECAP Odyssey Funds
(Exact name of registrant as specified in charter)
177 East Colorado Boulevard, 11th Floor
Pasadena, CA 91105
(Address of principal executive offices) (Zip code)
Michael J. Ricks
PRIMECAP Management Company
177 East Colorado Boulevard, 11th Floor
Pasadena, CA 91105
(Name and address of agent for service)
(626) 304-9222
Registrant’s telephone number, including area code
Date of fiscal year end: October 31
Date of reporting period: October 31, 2021
Item 1. Reports to Stockholders.
(a)
Item 1. Reports to Stockholders.
ANNUAL REPORT
For the Year Ended October 31, 2021

PRIMECAP ODYSSEY STOCK (POSKX)
PRIMECAP ODYSSEY GROWTH (POGRX)
PRIMECAP ODYSSEY AGGRESSIVE GROWTH (POAGX)
| | |
 | | Table of Contents PRIMECAP Odyssey Funds |
1
| | |
| | Letter to Shareholders PRIMECAP Odyssey Funds |
Dear Fellow Shareholders,
For the fiscal year ended October 31, 2021, the PRIMECAP Odyssey Stock Fund, PRIMECAP Odyssey Growth Fund, and PRIMECAP Odyssey Aggressive Growth Fund produced total returns of +45.44%, +41.97%, and +35.53%, respectively. The unmanaged S&P 500 Index produced a total return of +42.91% during the period. Sector allocation generally detracted from results relative to the S&P 500, while the impact from stock selection varied widely by Fund.
The fiscal year featured a steady rise in the equity markets alongside an uneven economic recovery. U.S. indices continued their aggressive upswing – the S&P 500 doubled from its March 2020 low to its fiscal year-end record high – as last year’s initial bounce, powered primarily by Big Tech and other pandemic beneficiaries, yielded to broader cyclical strength. Oil prices and interest rates rebounded during the fiscal year, ushering the energy (+111%) and financials (+72%) sectors sharply higher. Meanwhile, more defensive sectors, such as consumer staples (+19%) and utilities (+11%), lagged the market but still registered gains.
The improvement in underlying economic activity was less uniform. Following last winter’s alarming scourge, when the country retrenched amid several thousand daily Covid-related deaths, our springtime reopening signaled a robust economic renewal. More than 150 million Americans achieved ‘fully vaccinated’ status by mid-year, and daily deaths plummeted more than 90 percent. The Federal Reserve in June forecasted 7 percent real GDP growth for 2021, an annual growth rate not seen since 1984.
But the euphoria was short-lived. The highly transmissible Delta variant surfaced, powering yet another wave of infection. Meanwhile, abundant monetary-fiscal stimulus collided with fragile supply chains, inducing worrisome inflation. The recovery’s momentum thus stalled somewhat –the Federal Reserve now estimates less than 6 percent real GDP growth for 2021. Despite this economic stumble, the equity market, which briefly ceded ground in September, promptly returned to peak levels by October.
In this environment, the Funds rose significantly in absolute terms but managed only a mixed relative report card. Last year’s major themes largely reversed – value and small-capitalization stocks outpaced growth and large-cap stocks this year, respectively, while the performance of the energy and financials sectors flipped from worst to first. This market context was particularly amenable to the Stock Fund, where strong selection delivered robust returns.
But the Growth and Aggressive Growth Funds, facing a less forgiving climate, trailed the benchmark. These Funds’ outsized biotechnology ownership (more than 15 percent of each Fund’s average assets versus less than 2 percent of the S&P 500 Index), a driver of long-term outperformance, instead pressured results this year. The NASDAQ Biotechnology Index logged an unexceptional +22% gain, implying a biotechnology-specific allocation headwind of several hundred basis points per Fund. Compounding this pain, several key positions underperformed.
2
Letter to Shareholders
PRIMECAP Odyssey Funds
continued
The Funds have nonetheless maintained their health care sector overweight positions, and recent weakness has only strengthened our conviction in these holdings’ long-term prospects. Each of the Funds also held an overweight position in the industrials sector and an underweight position in the energy, real estate, consumer staples, communication services, materials, and utilities sectors. Within the information technology, consumer discretionary, and financials sectors, positioning varied by Fund. The Stock Fund maintained a modest underweight in information technology and consumer discretionary, but an overweight in financials; the Growth Fund held an underweight position in information technology and financials, but a slight overweight position in consumer discretionary. And the Aggressive Growth Fund featured overweight positions in information technology and consumer discretionary, but a substantial underweight position in financials.
A more detailed discussion of the results of each PRIMECAP Odyssey Fund follows.
PRIMECAP Odyssey Stock Fund
For the fiscal year ended October 31, 2021, the Stock Fund’s total return of +45.44% exceeded the S&P 500’s total return of +42.91%. Relative to the S&P 500, favorable stock selection drove the outperformance, while sector allocation acted as a partial offset.
All three Odyssey Funds faced multiple allocation headwinds: an underweight position in the energy sector (1% of average Stock Fund assets versus 3% for the index), which more than doubled (+111%) during the period after nearly halving the previous year; an overweight position (23% versus 13%) in health care (+34%); and a substantial drag from a small cash position. Likewise, across all three Funds, limited exposure to the two worst-performing sectors, utilities (+11%) and consumer staples (+19%), provided a partial offset. The Stock Fund’s financials overweight position (13% versus 11%), which contrasts with its Odyssey Fund peers’ underweight positions, served as an additional mitigant.
And this financials exposure proved even more beneficial at the individual stock level, where many of last year’s laggards registered healthy results. Wells Fargo (+142%), Bank of America (+106%), and JPMorgan Chase (+78%) led the big banks’ outperformance; all three finished the period as Top 10 Fund holdings. Charles Schwab (+102%) and Discover Financial Services (+78%) also tallied significant gains.
Stock selection elsewhere was also broadly favorable. Within information technology, the Fund’s differentiated exposure to semiconductors and technology hardware companies, including Applied Materials (+133%), NetApp (+109%), and KLA Corporation (+92%), more than offset a disappointing year from Ericsson (-2%) and inadequate exposure to NVIDIA (+104%) and bellwether Microsoft (+65%). Within materials, our position in lithium producer Albemarle (+171%) nearly tripled as vehicle electrification trends accelerated. And within industrials, where selection was more neutral, strength in Airbus (+76%) and AECOM (+53%) countered weakness in FedEx (-8%), whose earnings outlook succumbed to elevated cost inflation.
3
Letter to Shareholders
PRIMECAP Odyssey Funds
continued
Health care was the lone weak spot. The Fund’s largest holding, pharmaceutical giant Eli Lilly (+99%), had a stellar year, including achieving Breakthrough Therapy designation for its blockbuster-potential Alzheimer’s drug. But this performance failed to compensate for substantial relative weakness in several biopharmaceutical peers, most notably Amgen (-2%), Bristol-Myers Squibb (+3%), Biogen (+6%), and Astrazeneca (+28%).
The top 10 holdings, which collectively represented 29.8% of the portfolio at the period end, are listed below:
| | | | |
| | |
PRIMECAP Odyssey Stock Fund
Top 10 Holdings as of 10/31/21 | | Ending % of
Total Portfolio* | |
Eli Lilly and Company | | | 5.1 | |
Astrazeneca PLC – ADR | | | 3.7 | |
Microsoft Corporation | | | 3.4 | |
AECOM | | | 3.2 | |
Siemens AG | | | 2.7 | |
Sony Group Corporation – ADR | | | 2.6 | |
JP Morgan Chase & Co. | | | 2.4 | |
Wells Fargo & Company | | | 2.4 | |
Bank of America Corporation | | | 2.2 | |
KLA Corporation | | | 2.1 | |
Total % of Portfolio | | | 29.8 | |
| | * | The percentage is calculated by using the ending market value of the security divided by the ending market value of the total investments of the Fund. The Top 10 Holdings are subject to change. |
PRIMECAP Odyssey Growth Fund
For the fiscal year ended October 31, 2021, the Growth Fund returned +41.97%, slightly trailing both the S&P 500’s +42.91% total return and the Russell 1000 Growth Index’s total return of +43.21%. Favorable stock selection roughly offset unfavorable sector allocation relative to the S&P 500.
Sector allocation was somewhat worse than that of the Stock Fund due in large part to the Growth Fund’s lesser exposure to financials (9% of average assets) and greater allocation to health care (30%). This was only partially offset by the Growth Fund’s higher exposure to energy (2%), which served to reduce that sector’s headwind.
Stock selection was again favorable overall. 3D printing company Stratasys (+147%) and cybersecurity solutions company BlackBerry (+141%), two information technology stocks that rode the
4
Letter to Shareholders
PRIMECAP Odyssey Funds
continued
meme-stock roller coaster at times, finished the year at much higher levels; their gains more than compensated for underperformance from Splunk (-17%). Within consumer discretionary, despite a large position in Tesla (+187%) that notched dramatic gains ahead of its December index inclusion, the Growth Fund’s significant stake in Alibaba (-46%), which suffered under increased Chinese regulatory scrutiny, provided a complete offset. And in health care, where the Fund’s portfolio (+20%) badly lagged the benchmark (+34%), several additional biotechnology stocks faced company-specific challenges. FibroGen (-71%) experienced both clinical missteps and regulatory setbacks, while Epizyme (-66%) missed expectations with the anemic launch of its new oncology drug. Seagen (+6%), BioMarin (+6%), and BeiGene (+21%) also underperformed.
The top 10 holdings, which collectively represented 26.2% of the portfolio at the period end, are listed below:
| | | | |
| | |
PRIMECAP Odyssey Growth Fund
Top 10 Holdings as of 10/31/21 | | Ending % of
Total Portfolio* | |
Eli Lilly and Company | | | 4.0 | |
Alphabet Inc. Class A & Class C | | | 3.5 | |
AECOM | | | 2.6 | |
BeiGene, Ltd. – ADR | | | 2.5 | |
ABIOMED, Inc. | | | 2.5 | |
Biogen Inc. | | | 2.3 | |
Tesla Inc. | | | 2.3 | |
Splunk Inc. | | | 2.2 | |
Microsoft Corporation | | | 2.2 | |
Micron Technology, Inc. | | | 2.1 | |
Total % of Portfolio | | | 26.2 | |
| | * | The percentage is calculated by using the ending market value of the security divided by the ending market value of the total investments of the Fund. The Top 10 Holdings are subject to change. |
PRIMECAP Odyssey Aggressive Growth Fund
For the fiscal year ended October 31, 2021, the Aggressive Growth Fund’s total return of +35.53% trailed both the S&P 500’s total return of +42.91% and the Russell Midcap Growth Index’s total return of +39.43%. Both sector allocation and stock selection detracted from results relative to the S&P 500.
The Aggressive Growth Fund faced the greatest sector allocation headwind of the Odyssey Funds, a function of less exposure to the year’s two best-performing sectors, energy (less than one-half percent of average assets) and financials (5%). The Fund also delivered unfavorable stock selection results, a notable departure from the Stock and Growth Funds’ positive performances.
5
Letter to Shareholders
PRIMECAP Odyssey Funds
continued
Stock selection was quite positive within information technology. In addition to contributions from BlackBerry (+141%) and NetApp (+109%), the Aggressive Growth Fund also benefited from several differentiated positions, including HubSpot (+179%), Axcelis Technologies (+149%), MaxLinear (+138%), and Wolfspeed (+89%). Weakness in both Splunk (-17%) and Universal Display (-7%) provided a partial offset. Selection also provided a net benefit in consumer discretionary, as an even larger Tesla position, alongside Chinese electric vehicle producer Xpeng (+141%), were sufficient to overcome a sizable Alibaba stake and a decline in education technology company Chegg (-19%).
The story was quite different in financials and health care. MarketAxess (-24%), a source of strength last year, reversed course and weighed heavily on results; in addition, far less exposure to the big banks proved detrimental to the Fund. And in health care, the Fund’s biotechnology-skewed portfolio created an insurmountable sector headwind. In addition to familiar weakness in FibroGen, Epizyme, Biogen, and Seagen, the Aggressive Growth Fund’s larger stakes in Rhythm Pharmaceuticals (-46%) and Nektar Therapeutics (-4%) exacerbated the portfolio’s underperformance. This collective deficit swamped the Fund’s positive contribution from BioNTech (+227%), which soared as its mRNA-based Covid vaccine gained traction globally.
The top 10 holdings, which collectively represented 28.4% of the portfolio at the period end, are listed below:
| | | | |
| | |
PRIMECAP Odyssey Aggressive Growth Fund
Top 10 Holdings as of 10/31/21 | | Ending % of
Total Portfolio* | |
BioNTech SE – ADR | | | 3.9 | |
Tesla Inc. | | | 3.5 | |
Sony Group Corporation – ADR | | | 3.5 | |
Micron Technology, Inc. | | | 2.8 | |
Seagen, Inc. | | | 2.6 | |
ABIOMED, Inc. | | | 2.5 | |
Splunk Inc. | | | 2.5 | |
Eli Lilly and Company | | | 2.5 | |
Alphabet Inc. Class A & Class C | | | 2.3 | |
BeiGene, Ltd. – ADR | | | 2.3 | |
Total % of Portfolio | | | 28.4 | |
| | * | The percentage is calculated by using the ending market value of the security divided by the ending market value of the total investments of the Fund. The Top 10 Holdings are subject to change. |
6
Letter to Shareholders
PRIMECAP Odyssey Funds
continued
Outlook
Our view on U.S. equities overall remains conflicted. Importantly, we continue to view equities as relatively attractive compared to conventional alternatives. However, we still assess inflation as an underappreciated risk. Treasury yields jumped during the period (the 10-year Treasury yield increased from 0.9% to 1.6%) but remain historically low. The 10-year breakeven inflation rate, a market-based gauge of inflation expectations, finished the period higher than year-ago levels (2.5% versus 1.7%), but a mid-2 percent reading is hardly a distress signal. The market’s apparent complacency reflects the Federal Reserve’s ongoing characterization of inflation as a “transitory” phenomenon, even as price increases have persisted.
The market has thus managed to preserve its elevated valuation; the S&P 500 Index traded at a 20.9x P/E valuation on 2022 estimated earnings at period-end. This valuation metric has stabilized somewhat, with more recent index advances only modestly outpacing the upward revisions to estimated earnings. But absolute valuation levels are historically expensive. Coupled with stubbornly high inflation readings, this dynamic necessarily tempers our outlook.
And today’s macroeconomic uncertainty has a geopolitical complement in China’s increasingly strident posture. Ahead of Xi Jinping’s anticipated transition from two-term President to indefinite Chairman, U.S.-China relations have unambiguously soured. As just one example, China’s assertive behavior towards Taiwan of late has generated rare bipartisan antagonism. China’s rise as a global superpower has been a multi-decade development, and, unsurprisingly, dozens of Fund holdings have business links to the country. But from an investment perspective, the latest Sino-American tension has upped the proverbial ante for such ties.
Despite these twin top-down concerns, however, as bottom-up analysts we believe the Funds own individual stocks whose share prices underestimate our assessment of long-term value – even companies in obvious proximity to such risk factors. Alibaba is one such example; the stock’s abrupt descent (-46%) in an escalating market was a substantial relative blow for both the Growth and Aggressive Growth Funds, as the company became a posterchild for China’s increased scrutiny of private enterprise. Despite the painful equity reset, Alibaba’s underlying Asia-centric businesses continue to grow rapidly. The so-called “Amazon of China” sports a comparably large vision and addressable market as its American peer, and yet the company finished the year at less than one-quarter of Amazon’s valuation (0.4 trillion-dollar enterprise value versus 1.8) and one-third its multiple (16x P/E versus 50x).
China’s ongoing pivot weighed on other stocks, too. Neither search engine Baidu (+22%) nor oncology biotech BeiGene (+21%) were in China’s crosshairs, but both key holdings suffered as collateral damage. And Intel (+14%), a sizable Stock Fund position, also underperformed, though perhaps paradoxically. The threat of regional hostility should boost Intel’s strategic value as the only leading-edge semiconductor manufacturer outside of Asia – The Computer Inside the Western world, in Intel sloganeering. Regardless, these geopolitical considerations are secondary to our belief in Intel’s vast inherent potential. Our thesis imagines a reinvigorated Intel reclaiming its technological leadership in advanced processor manufacturing – a deeply contrarian conviction for a company trading as a bygone champion at just 13x P/E.
7
Letter to Shareholders
PRIMECAP Odyssey Funds
continued
Finally, as previously noted, the Funds’ biotechnology holdings detracted from results. This weakness included sluggish performances from several bellwethers, plus a few significant declines tied to clinical setbacks or botched drug launches. As long-time biotechnology owners, we carry ample scars from volatile industry performance, with extreme stock-specific moves a routine feature. In this instance, several independent events went against the Funds, a rare confluence of bad news. Notwithstanding the recent pain, we are undeterred; we continue to view the industry as a highly attractive source of long-term value creation.
Covid’s unwelcome impact has been more devastating and lasting than we first contemplated. And yet the core of our original conviction has sustained: normalcy will ultimately return. The contours of society have no doubt forever shifted, but society’s underlying purpose – our collective humanity – endures. As Covid evolves from pandemic to endemic, we believe this collective humanity, briefly obscured by both virus and fiat, will flourish once more, and our portfolio continues to be positioned for this eventuality.
Sincerely,
PRIMECAP Management Company
November 4, 2021
Past performance is not a guarantee of future results.
The funds invest in smaller companies, which involve additional risks such as limited liquidity and greater volatility. All funds may invest in foreign securities, which involves greater volatility and political, economic and currency risks and differences in accounting methods. Mutual fund investing involves risk, and loss of principal is possible. Growth stocks typically are more volatile than value stocks; however, value stocks have a lower expected growth rate in earnings and sales.
Please refer to the Schedule of Investments for details of fund holdings. Fund holdings and sector allocations are subject to change at any time and are not recommendations to buy or sell any security.
The S&P 500 is a market capitalization-weighted index of 500 large-capitalization stocks commonly used to represent the U.S. equity market. The Russell 1000 Growth Index is an index that measures the performance of those Russell 1000 companies with higher price-to-book ratios and higher forecasted growth values (the Russell 1000 Index measures the performance of the large-cap segment of the U.S. equity universe). The Russell Midcap Growth Index measures the performance of those Russell Midcap companies with higher price-to-book ratios and higher forecasted growth values. You cannot invest directly in an index. The NASDAQ Biotechnology Index is a stock market index comprising securities of NASDAQ-listed companies that have been classified as either Biotechnology or Pharmaceuticals by the Industry Classification Benchmark.
Earnings per share (EPS) is calculated by taking the total earnings divided by the number of shares outstanding.
8
Letter to Shareholders
PRIMECAP Odyssey Funds
continued
Price-to-earnings ratio is calculated by dividing the current share price of a stock by its earnings per share.
Earnings growth is not a prediction of a fund’s future performance.
The information provided herein represents the opinions of PRIMECAP Management Company and is not intended to be a forecast of future events, a guarantee of future results, or investment advice.
9
| | |
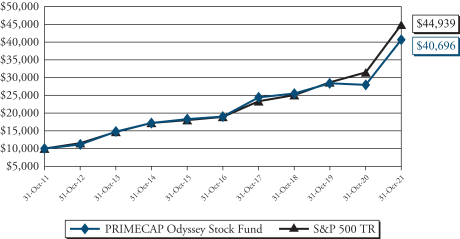
| | Performance Graphs PRIMECAP Odyssey Stock Fund |
The chart below illustrates the performance of a hypothetical $10,000 investment made on October 31, 2011 and is not intended to imply any future performance. The returns shown do not reflect the deduction of taxes that a shareholder would pay on fund distributions or the redemption of fund shares. The chart assumes reinvestment of dividends and capital gains for the fund and dividends for the index.
| | | | | | | | | | | | | | | | |
| | | Total Return
Period Ended October 31, 2021 | |
| | | 1 Year | | | Annualized
5 Year | | | Annualized
10 Year | | | Annualized
Since Inception^ | |
Stock Fund | | | 45.44% | | | | 16.48% | | | | 15.07% | | | | 11.22% | |
S&P 500* | | | 42.91% | | | | 18.93% | | | | 16.21% | | | | 10.84% | |
Performance data quoted represents past performance and does not guarantee future results. The investment return and principal value of an investment will fluctuate so that an investor’s shares, when redeemed, may be worth more or less than their original cost. Current performance of the fund may be lower or higher than the performance quoted. Performance data current to the most recent month end may be obtained by calling 1-800-729-2307.
| | * | The S&P 500 is a market capitalization-weighted index of 500 large-capitalization stocks commonly used to represent the U.S. equity market. |
10
| | |
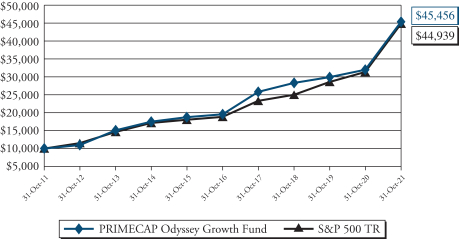
| | Performance Graphs PRIMECAP Odyssey Growth Fund |
The chart below illustrates the performance of a hypothetical $10,000 investment made on October 31, 2011 and is not intended to imply any future performance. The returns shown do not reflect the deduction of taxes that a shareholder would pay on fund distributions or the redemption of fund shares. The chart assumes reinvestment of dividends and capital gains for the fund and dividends for the index.
| | | | | | | | | | | | | | | | |
| | | Total Return
Period Ended October 31, 2021 | |
| | | 1 Year | | | Annualized
5 Year | | | Annualized
10 Year | | | Annualized
Since Inception^ | |
Growth Fund | | | 41.97% | | | | 18.33% | | | | 16.35% | | | | 12.31% | |
S&P 500* | | | 42.91% | | | | 18.93% | | | | 16.21% | | | | 10.84% | |
Performance data quoted represents past performance and does not guarantee future results. The investment return and principal value of an investment will fluctuate so that an investor’s shares, when redeemed, may be worth more or less than their original cost. Current performance of the fund may be lower or higher than the performance quoted. Performance data current to the most recent month end may be obtained by calling 1-800-729-2307.
| | * | The S&P 500 is a market capitalization-weighted index of 500 large-capitalization stocks commonly used to represent the U.S. equity market. |
11
| | |
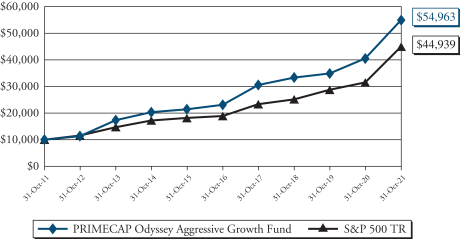
| | Performance Graphs PRIMECAP Odyssey Aggressive Growth Fund |
The chart below illustrates the performance of a hypothetical $10,000 investment made on October 31, 2011 and is not intended to imply any future performance. The returns shown do not reflect the deduction of taxes that a shareholder would pay on fund distributions or the redemption of fund shares. The chart assumes reinvestment of dividends and capital gains for the fund and dividends for the index.
| | | | | | | | | | | | | | | | |
| | | Total Return
Period Ended October 31, 2021 | |
| | | 1 Year | | | Annualized
5 Year | | | Annualized
10 Year | | | Annualized
Since Inception^ | |
Aggressive Growth Fund | | | 35.53% | | | | 19.01% | | | | 18.58% | | | | 14.40% | |
S&P 500* | | | 42.91% | | | | 18.93% | | | | 16.21% | | | | 10.84% | |
Performance data quoted represents past performance and does not guarantee future results. The investment return and principal value of an investment will fluctuate so that an investor’s shares, when redeemed, may be worth more or less than their original cost. Current performance of the fund may be lower or higher than the performance quoted. Performance data current to the most recent month end may be obtained by calling 1-800-729-2307.
| | * | The S&P 500 is a market capitalization-weighted index of 500 large-capitalization stocks commonly used to represent the U.S. equity market. |
12
| | |
| | Sector Breakdown PRIMECAP Odyssey Funds |
PRIMECAP Odyssey Stock Fund
| | | | |
Communication Services | | | 3.2% | |
Consumer Discretionary | | | 11.5% | |
Consumer Staples | | | 0.9% | |
Energy | | | 1.5% | |
Financials | | | 14.4% | |
Health Care | | | 22.6% | |
Industrials | | | 17.8% | |
Information Technology | | | 23.0% | |
Materials | | | 2.0% | |
Short-Term Investments, net of Liabilities in Excess of Other Assets | | | 3.1% | |
Total | | | 100.0% | |
PRIMECAP Odyssey Growth Fund
| | | | |
Communication Services | | | 5.4% | |
Consumer Discretionary | | | 12.8% | |
Consumer Staples | | | 0.2% | |
Energy | | | 2.0% | |
Financials | | | 9.8% | |
Health Care | | | 29.0% | |
Industrials | | | 12.6% | |
Information Technology | | | 25.3% | |
Materials | | | 0.6% | |
Short-Term Investments, net of Liabilities in Excess of Other Assets | | | 2.3% | |
Total | | | 100.0% | |
The tables above list sector allocations as a percentage of each fund’s total net assets as of October 31, 2021. The management report may make reference to average allocations during the period. As a result, the sector allocations above may differ from those discussed in the management report.
13
Sector Breakdown
PRIMECAP Odyssey Funds
continued
PRIMECAP Odyssey Aggressive Growth Fund
| | | | |
Communication Services | | | 6.3% | |
Consumer Discretionary | | | 15.4% | |
Consumer Staples | | | 0.1% | |
Energy | | | 0.5% | |
Financials | | | 4.8% | |
Health Care | | | 30.8% | |
Industrials | | | 10.1% | |
Information Technology | | | 28.8% | |
Materials | | | 0.5% | |
Real Estate | | | 0.1% | |
Preferred Stocks (Financials) | | | 0.1% | |
Warrants (Industrials) | | | 0.0% | |
Rights (Health Care) | | | 0.0% | |
Short-Term Investments, net of Liabilities in Excess of Other Assets | | | 2.5% | |
Total | | | 100.0% | |
The table above lists sector allocations as a percentage of the fund’s total net assets as of October 31, 2021. The management report may make reference to average allocations during the period. As a result, the sector allocations above may differ from those discussed in the management report.
14
| | |
| | Schedule of Investments PRIMECAP Odyssey Stock Fund October 31, 2021 |
| | | | | | | | |
| Shares | | | | | Value | |
| | COMMON STOCKS – 96.9% | | | | |
| |
| Communication Services – 3.2% | | | |
| | 437,400 | | | Activision Blizzard, Inc. | | $ | 34,200,306 | |
| | 21,415 | | | Alphabet, Inc. – Class A (a) | | | 63,408,102 | |
| | 26,865 | | | Alphabet, Inc. – Class C (a) | | | 79,665,739 | |
| | 138,600 | | | Comcast Corp. – Class A | | | 7,128,198 | |
| | 75,200 | | | Facebook, Inc. – Class A (a) | | | 24,332,464 | |
| | 30,100 | | | Nintendo Co. Ltd. - JPY | | | 13,257,469 | |
| | 141,600 | | | Walt Disney Co. (The) (a) | | | 23,940,312 | |
| | | | | | | | |
| | | | | | | 245,932,590 | |
| | | | | | | | |
| Consumer Discretionary – 11.5% | | | |
| | 10,830 | | | Amazon.com, Inc. (a) | | | 36,523,417 | |
| | 433,200 | | | Bath & Body Works, Inc. | | | 29,929,788 | |
| | 210,400 | | | Brinker International, Inc. (a) | | | 8,828,384 | |
| | 25,700 | | | Burlington Stores, Inc. (a) | | | 7,100,653 | |
| | 139,500 | | | Capri Holdings Ltd. (a) | | | 7,426,980 | |
| | 595,600 | | | CarMax, Inc. (a) | | | 81,549,552 | |
| | 1,268,700 | | | Carnival Corp. (a) | | | 28,114,392 | |
| | 213,000 | | | Dollar Tree, Inc. (a) | | | 22,952,880 | |
| | 283,000 | | | eBay, Inc. | | | 21,711,760 | |
| | 171,600 | | | Leslie’s, Inc. (a) | | | 3,548,688 | |
| | 27,000 | | | Lowe’s Companies, Inc. | | | 6,313,140 | |
| | 5,350,400 | | | Mattel, Inc. (a) | | | 116,692,224 | |
| | 85,000 | | | MGM Resorts International | | | 4,008,600 | |
| | 1,155,000 | | | Newell Brands, Inc. | | | 26,437,950 | |
| | 131,833 | | | Restaurant Brands International, Inc. | | | 7,467,021 | |
| | 944,600 | | | Ross Stores, Inc. | | | 106,928,720 | |
| | 184,550 | | | Royal Caribbean Cruises Ltd. (a) | | | 15,581,557 | |
| | 1,764,019 | | | Sony Group Corp. – ADR | | | 204,255,760 | |
| | 230,400 | | | TJX Cos., Inc. (The) | | | 15,088,896 | |
| | 195,499 | | | Victoria’s Secret & Co. (a) | | | 9,866,835 | |
| | 599,639 | | | Whirlpool Corp. | | | 126,421,890 | |
| | | | | | | | |
| | | | | | | 886,749,087 | |
| | | | | | | | |
| Consumer Staples – 0.9% | | | |
| | 220,000 | | | Altria Group, Inc. | | | 9,704,200 | |
| | 331,500 | | | BJ’s Wholesale Club Holdings, Inc. (a) | | | 19,372,860 | |
| | 111,700 | | | Philip Morris International, Inc. | | | 10,560,118 | |
| | 232,500 | | | Sysco Corp. | | | 17,879,250 | |
| | 173,300 | | | Tyson Foods, Inc. – Class A | | | 13,858,801 | |
| | | | | | | | |
| | | | | | | 71,375,229 | |
| | | | | | | | |
The accompanying notes are an integral part of these financial statements.
15
Schedule of Investments
PRIMECAP Odyssey Stock Fund
October 31, 2021 – continued
| | | | | | | | |
| Shares | | | | | Value | |
| Energy – 1.5% | | | |
| | 49,400 | | | Cameco Corp. | | $ | 1,200,420 | |
| | 284,000 | | | EOG Resources, Inc. | | | 26,258,640 | |
| | 355,290 | | | Hess Corp. | | | 29,336,295 | |
| | 172,900 | | | Pioneer Natural Resources Co. | | | 32,328,842 | |
| | 1,450,000 | | | Southwestern Energy Co. (a) | | | 7,076,000 | |
| | 922,800 | | | Transocean Ltd. (a) | | | 3,257,484 | |
| | 181,800 | | | Valero Energy Corp. | | | 14,058,594 | |
| | | | | | | | |
| | | | | | | 113,516,275 | |
| | | | | | | | |
| Financials – 14.4% | | | |
| | 3,491,670 | | | Bank of America Corp. | | | 166,831,993 | |
| | 1,588,400 | | | Charles Schwab Corp. (The) | | | 130,296,452 | |
| | 1,391,250 | | | Citigroup, Inc. | | | 96,218,850 | |
| | 155,900 | | | CME Group, Inc. – Class A | | | 34,383,745 | |
| | 1,040,380 | | | Discover Financial Services | | | 117,895,862 | |
| | 1,100,800 | | | JPMorgan Chase & Co. | | | 187,014,912 | |
| | 126,050 | | | Marsh & McLennan Cos., Inc. | | | 21,025,140 | |
| | 596,800 | | | Northern Trust Corp. | | | 73,430,272 | |
| | 107,310 | | | Progressive Corp. (The) | | | 10,181,573 | |
| | 940,965 | | | Raymond James Financial, Inc. | | | 92,769,739 | |
| | 3,648,408 | | | Wells Fargo & Co. | | | 186,652,553 | |
| | | | | | | | |
| | | | | | | 1,116,701,091 | |
| | | | | | | | |
| Health Care – 22.6% | | | |
| | 304,640 | | | Abbott Laboratories | | | 39,265,050 | |
| | 581,200 | | | Agilent Technologies, Inc. | | | 91,533,188 | |
| | 46,500 | | | Alcon, Inc. | | | 3,876,240 | |
| | 662,700 | | | Amgen, Inc. | | | 137,159,019 | |
| | 4,643,340 | | | AstraZeneca PLC – ADR | | | 289,651,549 | |
| | 553,100 | | | Biogen, Inc. (a) | | | 147,500,708 | |
| | 351,000 | | | Boston Scientific Corp. (a) | | | 15,138,630 | |
| | 1,685,350 | | | Bristol-Myers Squibb Co. | | | 98,424,440 | |
| | 333,710 | | | CVS Health Corp. | | | 29,793,629 | |
| | 2,016,390 | | | Elanco Animal Health, Inc. (a) | | | 66,298,903 | |
| | 1,543,453 | | | Eli Lilly & Co. | | | 393,210,086 | |
| | 27,000 | | | IQVIA Holdings, Inc. (a) | | | 7,058,340 | |
| | 90,100 | | | LivaNova PLC (a) | | | 6,912,472 | |
| | 59,400 | | | Medtronic PLC | | | 7,119,684 | |
| | 393,200 | | | Merck & Co., Inc. | | | 34,621,260 | |
| | 843,250 | | | Novartis AG – ADR | | | 69,787,370 | |
| | 294,450 | | | PerkinElmer, Inc. | | | 52,085,260 | |
The accompanying notes are an integral part of these financial statements.
16
Schedule of Investments
PRIMECAP Odyssey Stock Fund
October 31, 2021 – continued
| | | | | | | | |
| Shares | | | | | Value | |
| Health Care (continued) | | | |
| | 81,181 | | | Roche Holding AG – CHF | | $ | 31,391,583 | |
| | 218,700 | | | Sanofi – ADR | | | 11,029,041 | |
| | 364,266 | | | Siemens Healthineers AG – EUR | | | 24,195,971 | |
| | 30,000 | | | Stryker Corp. | | | 7,982,100 | |
| | 234,800 | | | Thermo Fisher Scientific, Inc. | | | 148,644,836 | |
| | 8,380 | | | Waters Corp. (a) | | | 3,080,069 | |
| | 255,700 | | | Zimmer Biomet Holdings, Inc. | | | 36,595,784 | |
| | | | | | | | |
| | | | | | | 1,752,355,212 | |
| | | | | | | | |
| Industrials – 17.8% | | | |
| | 3,578,400 | | | AECOM (a) | | | 244,655,208 | |
| | 467,755 | | | Airbus SE – EUR (a) | | | 59,804,292 | |
| | 54,050 | | | Alaska Air Group, Inc. (a) | | | 2,853,840 | |
| | 2,625,550 | | | American Airlines Group, Inc. (a) | | | 50,410,560 | |
| | 34,900 | | | AMETEK, Inc. | | | 4,620,760 | |
| | 412,862 | | | Carrier Global Corp. | | | 21,563,782 | |
| | 169,223 | | | Caterpillar, Inc. | | | 34,523,184 | |
| | 332,700 | | | CSX Corp. | | | 12,033,759 | |
| | 323,400 | | | Curtiss-Wright Corp. | | | 41,291,712 | |
| | 50,300 | | | Deere & Co. | | | 17,218,193 | |
| | 872,250 | | | Delta Air Lines, Inc. (a) | | | 34,131,143 | |
| | 665,685 | | | FedEx Corp. | | | 156,788,788 | |
| | 89,600 | | | General Dynamics Corp. | | | 18,166,400 | |
| | 97,200 | | | GXO Logistics, Inc. (a) | | | 8,631,360 | |
| | 542,000 | | | Jacobs Engineering Group, Inc. | | | 76,107,640 | |
| | 107,000 | | | JELD-WEN Holding, Inc. (a) | | | 2,932,870 | |
| | 405,600 | | | Kirby Corp. (a) | | | 21,257,496 | |
| | 28,900 | | | L3Harris Technologies, Inc. | | | 6,662,606 | |
| | 250,200 | | | Matson, Inc. | | | 20,836,656 | |
| | 650,500 | | | Maxar Technologies, Inc. | | | 17,270,775 | |
| | 113,100 | | | Norfolk Southern Corp. | | | 33,143,955 | |
| | 34,361 | | | Otis Worldwide Corp. | | | 2,759,532 | |
| | 40,400 | | | Pentair PLC | | | 2,988,388 | |
| | 16,162 | | | Raytheon Technologies Corp. | | | 1,436,155 | |
| | 20,300 | | | Rockwell Automation, Inc. | | | 6,483,820 | |
| | 87,800 | | | Science Applications International Corp. | | | 7,882,684 | |
| | 1,266,036 | | | Siemens AG – EUR | | | 205,305,509 | |
| | 2,875,550 | | | Southwest Airlines Co. (a) | | | 135,956,004 | |
| | 42,200 | | | Union Pacific Corp. | | | 10,187,080 | |
| | 1,571,000 | | | United Airlines Holdings, Inc. (a) | | | 72,485,940 | |
The accompanying notes are an integral part of these financial statements.
17
Schedule of Investments
PRIMECAP Odyssey Stock Fund
October 31, 2021 – continued
| | | | | | | | |
| Shares | | | | | Value | |
| Industrials (continued) | | | |
| | 185,300 | | | United Parcel Service, Inc. – Class B | | $ | 39,555,991 | |
| | 97,200 | | | XPO Logistics, Inc. (a) | | | 8,339,760 | |
| | | | | | | | |
| | | | | | | 1,378,285,842 | |
| | | | | | | | |
| Information Technology – 23.0% | | | |
| | 146,500 | | | Adobe, Inc. (a) | | | 95,277,740 | |
| | 326,000 | | | Analog Devices, Inc. | | | 56,557,740 | |
| | 751,650 | | | Applied Materials, Inc. | | | 102,712,973 | |
| | 549,900 | | | Cisco Systems, Inc. | | | 30,777,903 | |
| | 395,898 | | | Corning, Inc. | | | 14,082,092 | |
| | 269,000 | | | Diebold Nixdorf, Inc. (a) | | | 2,421,000 | |
| | 88,000 | | | Fidelity National Information Services, Inc. | | | 9,745,120 | |
| | 5,997,699 | | | Flex Ltd. (a) | | | 101,361,113 | |
| | 6,304,500 | | | Hewlett Packard Enterprise Co. | | | 92,360,925 | |
| | 1,566,000 | | | HP, Inc. | | | 47,496,780 | |
| | 2,367,030 | | | Intel Corp. | | | 115,984,470 | |
| | 85,000 | | | Jabil, Inc. | | | 5,096,600 | |
| | 214,550 | | | Keysight Technologies, Inc. (a) | | | 38,623,291 | |
| | 435,350 | | | KLA Corp. | | | 162,281,066 | |
| | 10,284,430 | | | L.M. Ericsson Telephone Co. – ADR | | | 111,791,754 | |
| | 800,250 | | | Microsoft Corp. | | | 265,378,905 | |
| | 1,407,094 | | | NetApp, Inc. | | | 125,653,494 | |
| | 140,000 | | | Nokia Corp. – ADR (a) | | | 795,200 | |
| | 64,500 | | | NVIDIA Corp. | | | 16,490,715 | |
| | 709,000 | | | Oracle Corp. | | | 68,021,460 | |
| | 215,400 | | | PayPal Holdings, Inc. (a) | | | 50,099,886 | |
| | 465,647 | | | QUALCOMM, Inc. | | | 61,949,677 | |
| | 207,000 | | | Teradyne, Inc. | | | 28,615,680 | |
| | 598,500 | | | Texas Instruments, Inc. | | | 112,206,780 | |
| | 144,100 | | | Visa, Inc. – Class A | | | 30,516,057 | |
| | 524,300 | | | Vonage Holdings Corp. (a) | | | 8,451,716 | |
| | 172,640 | | | WEX, Inc. (a) | | | 25,844,208 | |
| | | | | | | | |
| | | | | | | 1,780,594,345 | |
| | | | | | | | |
| Materials – 2.0% | | | |
| | 274,400 | | | Albemarle Corp. | | | 68,728,968 | |
| | 243,683 | | | Corteva, Inc. | | | 10,514,921 | |
| | 266,483 | | | Dow, Inc. | | | 14,915,054 | |
| | 233,084 | | | DuPont de Nemours, Inc. | | | 16,222,646 | |
| | 561,100 | | | Freeport-McMoRan, Inc. | | | 21,164,692 | |
The accompanying notes are an integral part of these financial statements.
18
Schedule of Investments
PRIMECAP Odyssey Stock Fund
October 31, 2021 – continued
| | | | | | | | |
| Shares | | | | | Value | |
| Materials (continued) | | | |
| | 4,297,278 | | | Glencore PLC – GBP | | $ | 21,480,509 | |
| | | | | | | | |
| | | | | | | 153,026,790 | |
| | | | | | | | |
| TOTAL COMMON STOCKS
(Cost $3,489,269,355) | | $ | 7,498,536,461 | |
| | | | | | | | |
| SHORT-TERM INVESTMENTS – 3.1% | | | |
| | 237,525,074 | | | Dreyfus Treasury Securities Cash Management Fund – Institutional Shares – 0.01% (b) | | $ | 237,525,074 | |
| | | | | | | | |
| TOTAL SHORT-TERM INVESTMENTS
(Cost $237,525,074) | | | 237,525,074 | |
| | | | | | | | |
| TOTAL INVESTMENTS IN SECURITIES
(Cost $3,726,794,429) – 100.0% | | | 7,736,061,535 | |
| | Liabilities in Excess of Other Assets – (0.0)% | | | (2,451,053 | ) |
| | | | | | | | |
| | TOTAL NET ASSETS – 100.0% | | $ | 7,733,610,482 | |
| | | | | | | | |
| ADR | American Depository Receipt |
| GBP | British Pound Sterling |
| (b) | Rate quoted is seven-day yield at period end. |
The Global Industry Classification Standard (GICS®) was developed by and is the exclusive property of MSCI Inc. and Standard & Poor’s Financial Services LLC (“S&P”). GICS is a service mark of MSCI and S&P and has been licensed for use by the fund’s administrator.
The accompanying notes are an integral part of these financial statements.
19
| | |
| | Schedule of Investments PRIMECAP Odyssey Growth Fund October 31, 2021 |
| | | | | | | | |
| Shares | | | | | Value | |
| | COMMON STOCKS – 97.7% | | | | |
| |
| Communication Services – 5.4% | | | |
| | 68,870 | | | Alphabet, Inc. – Class A (a) | | $ | 203,918,560 | |
| | 51,355 | | | Alphabet, Inc. – Class C (a) | | | 152,288,631 | |
| | 644,800 | | | Baidu, Inc. – ADR (a) | | | 104,612,352 | |
| | 957,182 | | | comScore, Inc. (a) | | | 3,742,582 | |
| | 140,000 | | | Electronic Arts, Inc. | | | 19,635,000 | |
| | 75,100 | | | Facebook, Inc. – Class A (a) | | | 24,300,107 | |
| | 333,400 | | | IMAX Corp. (a) | | | 6,284,590 | |
| | 118,600 | | | Live Nation Entertainment, Inc. (a) | | | 11,996,390 | |
| | 20,000 | | | Nintendo Co. Ltd. – JPY | | | 8,808,949 | |
| | 50,000 | | | Take-Two Interactive Software, Inc. (a) | | | 9,050,000 | |
| | 15,400 | | | Walt Disney Co. (The) (a) | | | 2,603,678 | |
| | | | | | | | |
| | | | | | | 547,240,839 | |
| | | | | | | | |
| Consumer Discretionary – 12.8% | | | |
| | 1,165,600 | | | Alibaba Group Holding Ltd. – ADR (a) | | | 192,254,064 | |
| | 12,750 | | | Amazon.com, Inc. (a) | | | 42,998,483 | |
| | 507,598 | | | Bath & Body Works, Inc. | | | 35,069,946 | |
| | 112,700 | | | Brinker International, Inc. (a) | | | 4,728,892 | |
| | 75,600 | | | Burlington Stores, Inc. (a) | | | 20,887,524 | |
| | 800,000 | | | Capri Holdings Ltd. (a) | | | 42,592,000 | |
| | 915,700 | | | CarMax, Inc. (a) | | | 125,377,644 | |
| | 1,296,946 | | | Carnival Corp. (a) | | | 28,740,323 | |
| | 135,000 | | | Dollar Tree, Inc. (a) | | | 14,547,600 | |
| | 33,600 | | | DoorDash, Inc. – Class A (a) | | | 6,545,280 | |
| | 174,100 | | | eBay, Inc. | | | 13,356,952 | |
| | 1,803,907 | | | Entain PLC – GBP (a) | | | 50,559,758 | |
| | 1,402,063 | | | iRobot Corp. (a) | | | 116,960,095 | |
| | 80,200 | | | Las Vegas Sands Corp. (a) | | | 3,112,562 | |
| | 193,800 | | | Leslie’s, Inc. (a) | | | 4,007,784 | |
| | 50,000 | | | Marriott International, Inc. – Class A (a) | | | 8,001,000 | |
| | 3,620,600 | | | Mattel, Inc. (a) | | | 78,965,286 | |
| | 95,850 | | | MGM Resorts International | | | 4,520,286 | |
| | 676,800 | | | Norwegian Cruise Line Holdings Ltd. (a) | | | 17,407,296 | |
| | 46,400 | | | Ollie’s Bargain Outlet Holdings, Inc. (a) | | | 3,139,424 | |
| | 4,800 | | | O’Reilly Automotive, Inc. (a) | | | 2,987,136 | |
| | 112,850 | | | Ross Stores, Inc. | | | 12,774,620 | |
| | 610,171 | | | Royal Caribbean Cruises Ltd. (a) | | | 51,516,738 | |
| | 1,410,004 | | | Sony Group Corp. – ADR | | | 163,264,363 | |
| | 207,350 | | | Tesla, Inc. (a) | | | 230,987,900 | |
The accompanying notes are an integral part of these financial statements.
20
Schedule of Investments
PRIMECAP Odyssey Growth Fund
October 31, 2021 – continued
| | | | | | | | |
| Shares | | | | | Value | |
| Consumer Discretionary (continued) | | | |
| | 215,700 | | | TJX Cos., Inc. (The) | | $ | 14,126,193 | |
| | 169,299 | | | Victoria’s Secret & Co. (a) | | | 8,544,521 | |
| | 45,100 | | | Xometry, Inc. – Class A (a) | | | 2,435,400 | |
| | | | | | | | |
| | | | | | | 1,300,409,070 | |
| | | | | | | | |
| Consumer Staples – 0.2% | | | |
| | 200,000 | | | Altria Group, Inc. | | | 8,822,000 | |
| | 111,900 | | | BJ’s Wholesale Club Holdings, Inc. (a) | | | 6,539,436 | |
| | 272,715 | | | Grocery Outlet Holding Corp. (a) | | | 6,051,546 | |
| | 6,990 | | | Mission Produce, Inc. (a) | | | 132,740 | |
| | | | | | | | |
| | | | | | | 21,545,722 | |
| | | | | | | | |
| Energy – 2.0% | | | |
| | 750,000 | | | Coterra Energy, Inc. | | | 15,990,000 | |
| | 129,100 | | | EOG Resources, Inc. | | | 11,936,586 | |
| | 612,421 | | | Hess Corp. | | | 50,567,602 | |
| | 497,200 | | | Pioneer Natural Resources Co. | | | 92,966,456 | |
| | 2,000,000 | | | Southwestern Energy Co. (a) | | | 9,760,000 | |
| | 6,394,204 | | | Transocean Ltd. (a) | | | 22,571,540 | |
| | | | | | | | |
| | | | | | | 203,792,184 | |
| | | | | | | | |
| Financials – 9.8% | | | |
| | 1,125,000 | | | Bank of America Corp. | | | 53,752,500 | |
| | 1,933,823 | | | Charles Schwab Corp. (The) | | | 158,631,500 | |
| | 524,600 | | | Citigroup, Inc. | | | 36,281,336 | |
| | 55,400 | | | CME Group, Inc. – Class A | | | 12,218,470 | |
| | 728,600 | | | Discover Financial Services | | | 82,564,952 | |
| | 235,900 | | | JPMorgan Chase & Co. | | | 40,077,051 | |
| | 24,500 | | | MarketAxess Holdings, Inc. | | | 10,012,415 | |
| | 1,945,972 | | | Morgan Stanley | | | 200,007,002 | |
| | 489,900 | | | Northern Trust Corp. | | | 60,277,296 | |
| | 25,000 | | | Progressive Corp. (The) | | | 2,372,000 | |
| | 1,701,425 | | | Raymond James Financial, Inc. | | | 167,743,491 | |
| | 100,000 | | | Tradeweb Markets, Inc. – Class A | | | 8,910,000 | |
| | 3,219,300 | | | Wells Fargo & Co. | | | 164,699,388 | |
| | | | | | | | |
| | | | | | | 997,547,401 | |
| | | | | | | | |
| Health Care – 29.0% | | | |
| | 279,318 | | | Abbott Laboratories | | | 36,001,297 | |
| | 754,200 | | | ABIOMED, Inc. (a) | | | 250,424,568 | |
| | 198,300 | | | Agilent Technologies, Inc. | | | 31,230,267 | |
| | 63,060 | | | Alcon, Inc. | | | 5,256,682 | |
| | 549,300 | | | Alkermes PLC (a) | | | 16,638,297 | |
The accompanying notes are an integral part of these financial statements.
21
Schedule of Investments
PRIMECAP Odyssey Growth Fund
October 31, 2021 – continued
| | | | | | | | |
| Shares | | | | | Value | |
| Health Care (continued) | | | |
| | 770,700 | | | Amgen, Inc. | | $ | 159,511,779 | |
| | 128,800 | | | Arena Pharmaceuticals, Inc. (a) | | | 7,391,832 | |
| | 2,697,100 | | | AstraZeneca PLC – ADR | | | 168,245,098 | |
| | 715,200 | | | BeiGene Ltd. – ADR (a) | | | 255,841,344 | |
| | 875,000 | | | Biogen, Inc. (a) | | | 233,345,000 | |
| | 1,787,556 | | | BioMarin Pharmaceutical, Inc. (a) | | | 141,628,062 | |
| | 14,800 | | | BioNTech SE – ADR (a) | | | 4,125,204 | |
| | 850,900 | | | Boston Scientific Corp. (a) | | | 36,699,317 | |
| | 180,271 | | | Bridgebio Pharma, Inc. (a) | | | 8,901,782 | |
| | 1,241,000 | | | Bristol-Myers Squibb Co. | | | 72,474,400 | |
| | 300,000 | | | CVS Health Corp. | | | 26,784,000 | |
| | 55,000 | | | Edwards Lifesciences Corp. (a) | | | 6,590,100 | |
| | 2,147,871 | | | Elanco Animal Health, Inc. (a) | | | 70,621,998 | |
| | 1,604,778 | | | Eli Lilly & Co. | | | 408,833,243 | |
| | 4,743,843 | | | Epizyme, Inc. (a) | | | 19,924,141 | |
| | 1,976,300 | | | FibroGen, Inc. (a) | | | 21,976,456 | |
| | 53,800 | | | Guardant Health, Inc. (a) | | | 6,283,302 | |
| | 137,160 | | | Illumina, Inc. (a) | | | 56,929,630 | |
| | 647,909 | | | Insulet Corp. (a) | | | 200,864,748 | |
| | 22,860 | | | IQVIA Holdings, Inc. (a) | | | 5,976,061 | |
| | 796,100 | | | LivaNova PLC (a) | | | 61,076,792 | |
| | 112,000 | | | Merck & Co., Inc. | | | 9,861,600 | |
| | 5,442,056 | | | Nektar Therapeutics (a) | | | 82,501,569 | |
| | 837,836 | | | Novartis AG – ADR | | | 69,339,307 | |
| | 16,100 | | | Omnicell, Inc. (a) | | | 2,868,215 | |
| | 176,500 | | | OraSure Technologies, Inc. (a) | | | 1,883,255 | |
| | 150,100 | | | PerkinElmer, Inc. | | | 26,551,189 | |
| | 214,300 | | | QIAGEN N.V. – EUR (a) | | | 11,789,535 | |
| | 1,205,200 | | | Rhythm Pharmaceuticals, Inc. (a) | | | 13,871,852 | |
| | 121,683 | | | Roche Holding AG – CHF | | | 47,053,152 | |
| | 997,900 | | | Seagen, Inc. (a) | | | 175,959,707 | |
| | 85,400 | | | Siemens Healthineers AG – EUR | | | 5,672,602 | |
| | 207,900 | | | Thermo Fisher Scientific, Inc. | | | 131,615,253 | |
| | 531,100 | | | Xencor, Inc. (a) | | | 21,010,316 | |
| | 272,120 | | | Zimmer Biomet Holdings, Inc. | | | 38,945,814 | |
| | | | | | | | |
| | | | | | | 2,952,498,766 | |
| | | | | | | | |
| Industrials – 12.6% | | | |
| | 3,899,342 | | | AECOM (a) | | | 266,598,013 | |
| | 324,078 | | | Airbus SE – EUR (a) | | | 41,434,630 | |
The accompanying notes are an integral part of these financial statements.
22
Schedule of Investments
PRIMECAP Odyssey Growth Fund
October 31, 2021 – continued
| | | | | | | | |
| Shares | | | | | Value | |
| Industrials (continued) | | | |
| | 2,973,701 | | | American Airlines Group, Inc. (a) | | $ | 57,095,059 | |
| | 60,000 | | | AMETEK, Inc. | | | 7,944,000 | |
| | 119,000 | | | Carrier Global Corp. | | | 6,215,370 | |
| | 353,300 | | | Colfax Corp. (a) | | | 18,237,346 | |
| | 442,900 | | | Curtiss-Wright Corp. | | | 56,549,472 | |
| | 1,140,400 | | | Delta Air Lines, Inc. (a) | | | 44,623,852 | |
| | 218,800 | | | FedEx Corp. | | | 51,533,964 | |
| | 135,200 | | | General Dynamics Corp. | | | 27,411,800 | |
| | 78,500 | | | IDEX Corp. | | | 17,471,745 | |
| | 1,077,494 | | | Jacobs Engineering Group, Inc. | | | 151,301,707 | |
| | 1,638,450 | | | JetBlue Airways Corp. (a) | | | 22,987,454 | |
| | 478,101 | | | Lyft, Inc. – Class A (a) | | | 21,930,493 | |
| | 24,400 | | | Old Dominion Freight Line, Inc. | | | 8,328,940 | |
| | 1,082,180 | | | Siemens AG – EUR | | | 175,490,677 | |
| | 2,842,300 | | | Southwest Airlines Co. (a) | | | 134,383,944 | |
| | 529,700 | | | Textron, Inc. | | | 39,118,345 | |
| | 11,400 | | | TransDigm Group, Inc. (a) | | | 7,111,548 | |
| | 140,200 | | | Uber Technologies, Inc. (a) | | | 6,143,564 | |
| | 68,300 | | | Union Pacific Corp. | | | 16,487,620 | |
| | 2,153,600 | | | United Airlines Holdings, Inc. (a) | | | 99,367,104 | |
| | | | | | | | |
| | | | | | | 1,277,766,647 | |
| | | | | | | | |
| Information Technology – 25.3% | | | |
| | 211,500 | | | Adobe, Inc. (a) | | | 137,551,140 | |
| | 670,800 | | | Altair Engineering, Inc. – Class A (a) | | | 52,181,532 | |
| | 390,700 | | | Analog Devices, Inc. | | | 67,782,543 | |
| | 389,100 | | | Applied Materials, Inc. | | | 53,170,515 | |
| | 70,500 | | | ASML Holding N.V. – ADR | | | 57,308,040 | |
| | 5,872,143 | | | BlackBerry Ltd. (a) | | | 63,419,144 | |
| | 46,700 | | | Cerence, Inc. (a) | | | 4,909,571 | |
| | 767,900 | | | Cisco Systems, Inc. | | | 42,979,363 | |
| | 53,000 | | | Dell Technologies, Inc. – Class C (a) | | | 5,829,470 | |
| | 603,100 | | | Descartes Systems Group, Inc. (The) (a) | | | 49,315,487 | |
| | 7,776,129 | | | Flex Ltd. (a) | | | 131,416,580 | |
| | 410,918 | | | FormFactor, Inc. (a) | | | 16,346,318 | |
| | 2,678,000 | | | Hewlett Packard Enterprise Co. | | | 39,232,700 | |
| | 792,436 | | | HP, Inc. | | | 24,034,584 | |
| | 1,345,140 | | | Intel Corp. | | | 65,911,860 | |
| | 14,400 | | | Intuit, Inc. | | | 9,014,256 | |
| | 648,000 | | | Jabil, Inc. | | | 38,854,080 | |
The accompanying notes are an integral part of these financial statements.
23
Schedule of Investments
PRIMECAP Odyssey Growth Fund
October 31, 2021 – continued
| | | | | | | | |
| Shares | | | | | Value | |
| Information Technology (continued) | | | |
| | 163,750 | | | Keysight Technologies, Inc. (a) | | $ | 29,478,275 | |
| | 400,754 | | | KLA Corp. | | | 149,385,061 | |
| | 4,827,400 | | | L.M. Ericsson Telephone Co. – ADR | | | 52,473,838 | |
| | 679,000 | | | MaxLinear, Inc. (a) | | | 42,777,000 | |
| | 3,039,700 | | | Micron Technology, Inc. | | | 210,043,270 | |
| | 674,150 | | | Microsoft Corp. | | | 223,561,623 | |
| | 1,190,111 | | | NetApp, Inc. | | | 106,276,912 | |
| | 87,000 | | | Nokia Corp. – ADR (a) | | | 494,160 | |
| | 589,000 | | | Nuance Communications, Inc. (a) | | | 32,424,450 | |
| | 742,700 | | | Nutanix, Inc. – Class A (a) | | | 25,482,037 | |
| | 178,000 | | | NVIDIA Corp. | | | 45,509,260 | |
| | 375,000 | | | Oracle Corp. | | | 35,977,500 | |
| | 50,000 | | | OSI Systems, Inc. (a) | | | 4,655,500 | |
| | 18,700 | | | Palo Alto Networks, Inc. (a) | | | 9,519,983 | |
| | 58,100 | | | PayPal Holdings, Inc. (a) | | | 13,513,479 | |
| | 486,500 | | | QUALCOMM, Inc. | | | 64,723,960 | |
| | 20,900 | | | RingCentral, Inc. – Class A (a) | | | 5,095,002 | |
| | 39,400 | | | salesforce.com, Inc. (a) | | | 11,807,786 | |
| | 1,394,510 | | | Splunk, Inc. (a) | | | 229,843,138 | |
| | 2,181,699 | | | Stratasys Ltd. (a) | | | 68,810,787 | |
| | 154,700 | | | Teradyne, Inc. | | | 21,385,728 | |
| | 620,195 | | | Texas Instruments, Inc. | | | 116,274,159 | |
| | 492,000 | | | Trimble, Inc. (a) | | | 42,986,040 | |
| | 309,566 | | | Universal Display Corp. | | | 56,712,491 | |
| | 222,800 | | | Visa, Inc. – Class A | | | 47,182,356 | |
| | 22,000 | | | VMware, Inc. – Class A (a) | | | 3,337,400 | |
| | 27,390 | | | Western Digital Corp. (a) | | | 1,432,223 | |
| | 149,640 | | | WEX, Inc. (a) | | | 22,401,108 | |
| | 378,800 | | | Wolfspeed, Inc. (a) | | | 45,497,668 | |
| | | | | | | | |
| | | | | | | 2,578,319,377 | |
| | | | | | | | |
| Materials – 0.6% | | | |
| | 237,300 | | | Albemarle Corp. | | | 59,436,531 | |
| | | | | | | | |
| |
| TOTAL COMMON STOCKS
(Cost $4,363,636,041) | | $ | 9,938,556,537 | |
| | | | | | | | |
The accompanying notes are an integral part of these financial statements.
24
Schedule of Investments
PRIMECAP Odyssey Growth Fund
October 31, 2021 – continued
| | | | | | | | |
| Shares | | | | | Value | |
| | SHORT-TERM INVESTMENTS – 2.3% | | | | |
| | 233,807,571 | | | Dreyfus Treasury Securities Cash Management Fund – Institutional Shares – 0.01% (b) | | $ | 233,807,571 | |
| | | | | | | | |
| TOTAL SHORT-TERM INVESTMENTS
(Cost $233,807,571) | | | 233,807,571 | |
| | | | | | | | |
| TOTAL INVESTMENTS IN SECURITIES
(Cost $4,597,443,612) – 100.0% | | | 10,172,364,108 | |
| | Liabilities in Excess of Other Assets – (0.0)% | | | (3,836,656 | ) |
| | | | | | | | |
| | TOTAL NET ASSETS – 100.0% | | $ | 10,168,527,452 | |
| | | | | | | | |
| ADR | American Depository Receipt |
| GBP | British Pound Sterling |
| (b) | Rate quoted is seven-day yield at period end. |
The Global Industry Classification Standard (GICS®) was developed by and is the exclusive property of MSCI Inc. and Standard & Poor’s Financial Services LLC (“S&P”). GICS is a service mark of MSCI and S&P and has been licensed for use by the fund’s administrator.
The accompanying notes are an integral part of these financial statements.
25
| | |
| | Schedule of Investments PRIMECAP Odyssey Aggressive Growth Fund October 31, 2021 |
| | | | | | | | |
| Shares | | | | | Value | |
| | COMMON STOCKS – 97.4% | | | | |
| |
| Communication Services – 6.3% | | | |
| | 45,825 | | | Alphabet, Inc. – Class A (a) | | $ | 135,684,159 | |
| | 46,612 | | | Alphabet, Inc. – Class C (a) | | | 138,223,691 | |
| | 1,062,500 | | | Baidu, Inc. – ADR (a) | | | 172,380,000 | |
| | 3,766,440 | | | comScore, Inc. (a) | | | 14,726,780 | |
| | 121,800 | | | Electronic Arts, Inc. | | | 17,082,450 | |
| | 80,700 | | | Facebook, Inc. – Class A (a) | | | 26,112,099 | |
| | 836,900 | | | IMAX Corp. (a) | | | 15,775,565 | |
| | 157,405 | | | Live Nation Entertainment, Inc. (a) | | | 15,921,516 | |
| | 730,178 | | | Madison Square Garden Entertainment Corp. – Class A (a) | | | 51,455,644 | |
| | 2,850 | | | Madison Square Garden Sports Corp. – Class A (a) | | | 540,103 | |
| | 266,500 | | | Magnite, Inc. (a) | | | 7,203,495 | |
| | 5,500 | | | Netflix, Inc. (a) | | | 3,796,705 | |
| | 1,380,100 | | | Pinterest, Inc. – Class A (a) | | | 61,607,664 | |
| | 200 | | | Roblox Corp. – Class A (a) | | | 16,804 | |
| | 340,300 | | | Skillz, Inc. – Class A (a) | | | 3,804,554 | |
| | 222,300 | | | Snap, Inc. – Class A (a) | | | 11,688,534 | |
| | 11,350 | | | Take-Two Interactive Software, Inc. (a) | | | 2,054,350 | |
| | 252,800 | | | T-Mobile US, Inc. (a) | | | 29,079,584 | |
| | 7,589,200 | | | WildBrain Ltd. – CAD (a) | | | 23,915,546 | |
| | 99,089 | | | ZoomInfo Technologies, Inc. – Class A (a) | | | 6,660,763 | |
| | | | | | | | |
| | | | | | | 737,730,006 | |
| | | | | | | | |
| Consumer Discretionary – 15.4% | | | |
| | 75,000 | | | 2U, Inc. (a) | | | 2,215,500 | |
| | 1,140,600 | | | Alibaba Group Holding Ltd. – ADR (a) | | | 188,130,564 | |
| | 17,665 | | | Amazon.com, Inc. (a) | | | 59,573,976 | |
| | 75,000 | | | Boot Barn Holdings, Inc. (a) | | | 7,836,750 | |
| | 88,300 | | | Burlington Stores, Inc. (a) | | | 24,396,407 | |
| | 1,059,300 | | | CarMax, Inc. (a) | | | 145,039,356 | |
| | 1,700,000 | | | Chegg, Inc. (a) | | | 101,048,000 | |
| | 13,500 | | | Darden Restaurants, Inc. | | | 1,945,890 | |
| | 310,000 | | | eBay, Inc. | | | 23,783,200 | |
| | 2,844,601 | | | Entain PLC – GBP (a) | | | 79,728,245 | |
| | 8,000 | | | Five Below, Inc. (a) | | | 1,578,400 | |
| | 1,715,285 | | | GAN Ltd. (a) | | | 24,494,270 | |
| | 108,340 | | | Gildan Activewear, Inc. | | | 3,978,245 | |
| | 1,181,850 | | | iRobot Corp. (a) | | | 98,589,927 | |
| | 1,067,565 | | | Norwegian Cruise Line Holdings Ltd. (a) | | | 27,457,772 | |
The accompanying notes are an integral part of these financial statements.
26
Schedule of Investments
PRIMECAP Odyssey Aggressive Growth Fund
October 31, 2021 – continued
| | | | | | | | |
| Shares | | | | | Value | |
| Consumer Discretionary (continued) | | | |
| | 152,340 | | | Ollie’s Bargain Outlet Holdings, Inc. (a) | | $ | 10,307,324 | |
| | 61,200 | | | Restaurant Brands International, Inc. | | | 3,466,368 | |
| | 994,976 | | | Royal Caribbean Cruises Ltd. (a) | | | 84,005,824 | |
| | 3,521,350 | | | Sony Group Corp. – ADR | | | 407,737,116 | |
| | 367,550 | | | Tesla, Inc. (a) | | | 409,450,700 | |
| | 1,218,200 | | | Tuesday Morning Corp. (a) | | | 2,765,314 | |
| | 31,300 | | | Ulta Beauty, Inc. (a) | | | 11,498,368 | |
| | 19,000 | | | Victoria’s Secret & Co. (a) | | | 958,930 | |
| | 1,799,850 | | | XPeng, Inc. – ADR (a) | | | 83,927,005 | |
| | | | | | | | |
| | | | | | | 1,803,913,451 | |
| | | | | | | | |
| Consumer Staples – 0.1% | | | |
| | 83,900 | | | Calavo Growers, Inc. | | | 3,372,780 | |
| | 438,200 | | | Grocery Outlet Holding Corp. (a) | | | 9,723,658 | |
| | | | | | | | |
| | | | | | | 13,096,438 | |
| | | | | | | | |
| Energy – 0.5% | | | |
| | 604,350 | | | Coterra Energy, Inc. | | | 12,884,742 | |
| | 169,900 | | | EOG Resources, Inc. | | | 15,708,954 | |
| | 73,200 | | | New Fortress Energy, Inc. | | | 2,196,000 | |
| | 8,973,882 | | | Transocean Ltd. (a) | | | 31,677,803 | |
| | | | | | | | |
| | | | | | | 62,467,499 | |
| | | | | | | | |
| Financials – 4.8% | | | |
| | 95,400 | | | AssetMark Financial Holdings, Inc. (a) | | | 2,446,056 | |
| | 149,300 | | | Charles Schwab Corp. (The) | | | 12,247,079 | |
| | 165,171 | | | CME Group, Inc. – Class A | | | 36,428,464 | |
| | 438,003 | | | Discover Financial Services | | | 49,634,500 | |
| | 76,000 | | | LPL Financial Holdings, Inc. | | | 12,465,520 | |
| | 380,150 | | | MarketAxess Holdings, Inc. | | | 155,355,900 | |
| | 1,750,584 | | | Morgan Stanley | | | 179,925,024 | |
| | 2,523,249 | | | NMI Holdings, Inc. – Class A (a) | | | 61,264,486 | |
| | 149,000 | | | Progressive Corp. (The) | | | 14,137,120 | |
| | 463,900 | | | Tradeweb Markets, Inc. – Class A | | | 41,333,490 | |
| | | | | | | | |
| | | | | | | 565,237,639 | |
| | | | | | | | |
| Health Care – 30.8% | | | |
| | 6,000 | | | 10x Genomics, Inc. – Class A (a) | | | 967,620 | |
| | 396,400 | | | Abbott Laboratories | | | 51,091,996 | |
| | 901,323 | | | ABIOMED, Inc. (a) | | | 299,275,289 | |
| | 608,200 | | | Accuray, Inc. (a) | | | 3,034,918 | |
| | 163,200 | | | Adaptive Biotechnologies Corp. (a) | | | 5,452,512 | |
| | 1,857,500 | | | Alkermes PLC (a) | | | 56,263,675 | |
The accompanying notes are an integral part of these financial statements.
27
Schedule of Investments
PRIMECAP Odyssey Aggressive Growth Fund
October 31, 2021 – continued
| | | | | | | | |
| Shares | | | | | Value | |
| Health Care (continued) | | | |
| | 1,633,120 | | | Allogene Therapeutics, Inc. (a) | | $ | 28,154,989 | |
| | 1,626,100 | | | Amicus Therapeutics, Inc. (a) | | | 17,074,050 | |
| | 500,000 | | | Arbutus Biopharma Corp. (a) | | | 2,015,000 | |
| | 295,400 | | | Arena Pharmaceuticals, Inc. (a) | | | 16,953,006 | |
| | 760,087 | | | BeiGene Ltd. – ADR (a) | | | 271,898,322 | |
| | 24,658 | | | Berkeley Lights, Inc. (a) | | | 573,298 | |
| | 954,939 | | | Biogen, Inc. (a) | | | 254,663,133 | |
| | 2,033,890 | | | BioMarin Pharmaceutical, Inc. (a) | | | 161,145,105 | |
| | 1,635,702 | | | BioNTech SE – ADR (a) | | | 455,919,218 | |
| | 423,000 | | | Boston Scientific Corp. (a) | | | 18,243,990 | |
| | 342,770 | | | Bridgebio Pharma, Inc. (a) | | | 16,925,983 | |
| | 7,389,400 | | | Calithera Biosciences, Inc. (a) (b) | | | 14,261,542 | |
| | 9,909,800 | | | Cerus Corp. (a) (b) | | | 65,404,680 | |
| | 17,000 | | | Charles River Laboratories International, Inc. (a) | | | 7,627,560 | |
| | 90,300 | | | Edwards Lifesciences Corp. (a) | | | 10,819,746 | |
| | 741,692 | | | Elanco Animal Health, Inc. (a) | | | 24,386,833 | |
| | 1,163,094 | | | Eli Lilly & Co. | | | 296,309,827 | |
| | 9,814,307 | | | Epizyme, Inc. (a) (b) | | | 41,220,089 | |
| | 509,600 | | | Exact Sciences Corp. (a) | | | 48,524,112 | |
| | 4,319,191 | | | FibroGen, Inc. (a) | | | 48,029,404 | |
| | 4,191,232 | | | Fluidigm Corp. (a) (b) | | | 21,584,845 | |
| | 435,600 | | | Glaukos Corp. (a) | | | 19,911,276 | |
| | 90,580 | | | Guardant Health, Inc. (a) | | | 10,578,838 | |
| | 225,671 | | | Health Catalyst, Inc. (a) | | | 11,879,321 | |
| | 13,000 | | | Illumina, Inc. (a) | | | 5,395,780 | |
| | 269,800 | | | ImmunoGen, Inc. (a) | | | 1,626,894 | |
| | 627,856 | | | Insulet Corp. (a) | | | 194,647,917 | |
| | 935,400 | | | LivaNova PLC (a) | | | 71,763,888 | |
| | 235,600 | | | Mereo Biopharma Group PLC – ADR (a) | | | 530,100 | |
| | 11,098,480 | | | Nektar Therapeutics (a) (b) | | | 168,252,957 | |
| | 189,900 | | | NuVasive, Inc. (a) | | | 10,133,064 | |
| | 801,700 | | | OraSure Technologies, Inc. (a) | | | 8,554,139 | |
| | 19,500 | | | Penumbra, Inc. (a) | | | 5,392,725 | |
| | 2,518,853 | | | Pulmonx Corp. (a) (b) | | | 98,058,947 | |
| | 226,000 | | | QIAGEN N.V. – EUR (a) | | | 12,433,200 | |
| | 13,470 | | | Repligen Corp. (a) | | | 3,913,035 | |
| | 4,793,580 | | | Rhythm Pharmaceuticals, Inc. (a) (b) | | | 55,174,106 | |
| | 127,600 | | | Roche Holding AG – CHF | | | 49,341,175 | |
| | 34,822 | | | Sage Therapeutics, Inc. (a) | | | 1,405,416 | |
The accompanying notes are an integral part of these financial statements.
28
Schedule of Investments
PRIMECAP Odyssey Aggressive Growth Fund
October 31, 2021 – continued
| | | | | | | | |
| Shares | | | | | Value | |
| Health Care (continued) | | | |
| | 1,718,873 | | | Seagen, Inc. (a) | | $ | 303,088,876 | |
| | 42,440 | | | Seer, Inc. – Class A (a) | | | 1,566,885 | |
| | 278,500 | | | Shockwave Medical, Inc. (a) | | | 59,515,450 | |
| | 18,300 | | | Sio Gene Therapies, Inc. (a) | | | 34,953 | |
| | 482,110 | | | Turning Point Therapeutics, Inc. (a) | | | 20,046,134 | |
| | 3,869,780 | | | Wave Life Sciences Ltd. (a) (b) | | | 17,762,290 | |
| | 4,271,701 | | | Xencor, Inc. (a) (b) | | | 168,988,492 | |
| | 947,440 | | | Zentalis Pharmaceuticals, Inc. (a) | | | 76,212,074 | |
| | | | | | | | |
| | | | | | | 3,614,028,674 | |
| | | | | | | | |
| Industrials – 10.1% | | | |
| | 2,873,600 | | | AECOM (a) | | | 196,468,032 | |
| | 601,300 | | | Alaska Air Group, Inc. (a) | | | 31,748,640 | |
| | 25,100 | | | Allegiant Travel Co. (a) | | | 4,399,277 | |
| | 5,461,700 | | | American Airlines Group, Inc. (a) | | | 104,864,640 | |
| | 216,000 | | | Axon Enterprise, Inc. (a) | | | 38,871,360 | |
| | 49,600 | | | Bloom Energy Corp. – Class A (a) | | | 1,550,496 | |
| | 41,000 | | | Controladora Vuela Compania de Aviacion, S.A.B. de C.V. – ADR (a) | | | 742,100 | |
| | 115,000 | | | Cornerstone Building Brands, Inc. (a) | | | 1,645,650 | |
| | 430,300 | | | Curtiss-Wright Corp. | | | 54,940,704 | |
| | 3,065,997 | | | Delta Air Lines, Inc. (a) | | | 119,972,463 | |
| | 1,509,078 | | | Everarc Holdings Ltd. (a) | | | 17,354,397 | |
| | 19,600 | | | FedEx Corp. | | | 4,616,388 | |
| | 42,400 | | | Frontier Group Holdings, Inc. (a) | | | 663,560 | |
| | 319,300 | | | Gibraltar Industries, Inc. (a) | | | 20,805,588 | |
| | 292,700 | | | Hawaiian Holdings, Inc. (a) | | | 5,663,745 | |
| | 1,193,000 | | | Jacobs Engineering Group, Inc. | | | 167,521,060 | |
| | 6,137,825 | | | JetBlue Airways Corp. (a) | | | 86,113,685 | |
| | 662,250 | | | Li-Cycle Holdings Corp. (a) | | | 8,569,515 | |
| | 453,550 | | | Lyft, Inc. – Class A (a) | | | 20,804,338 | |
| | 159,500 | | | Masonite International Corp. (a) | | | 19,141,595 | |
| | 2,653,008 | | | NN, Inc. (a) (b) | | | 13,238,510 | |
| | 37,500 | | | Old Dominion Freight Line, Inc. | | | 12,800,625 | |
| | 15,800 | | | Ryanair Holdings PLC – ADR (a) | | | 1,793,458 | |
| | 1,882,000 | | | Southwest Airlines Co. (a) | | | 88,980,960 | |
| | 299,500 | | | Spirit Airlines, Inc. (a) | | | 6,544,075 | |
| | 33,115 | | | Sun Country Airlines Holdings, Inc. (a) | | | 1,002,722 | |
| | 39,500 | | | TransDigm Group, Inc. (a) | | | 24,640,890 | |
| | 25,450 | | | TuSimple Holdings, Inc. – Class A (a) | | | 995,604 | |
The accompanying notes are an integral part of these financial statements.
29
Schedule of Investments
PRIMECAP Odyssey Aggressive Growth Fund
October 31, 2021 – continued
| | | | | | | | |
| Shares | | | | | Value | |
| Industrials (continued) | | | |
| | 272,350 | | | Uber Technologies, Inc. (a) | | $ | 11,934,377 | |
| | 2,509,470 | | | United Airlines Holdings, Inc. (a) | | | 115,786,946 | |
| | 71,800 | | | WillScot Mobile Mini Holdings Corp. (a) | | | 2,495,050 | |
| | | | | | | | |
| | | | | | | 1,186,670,450 | |
| | | | | | | | |
| Information Technology – 28.8% | | | |
| | 62,500 | | | 908 Devices, Inc. (a) | | | 2,056,250 | |
| | 218,600 | | | Adobe, Inc. (a) | | | 142,168,696 | |
| | 158,400 | | | Ambarella, Inc. (a) | | | 29,435,472 | |
| | 109,200 | | | Applied Materials, Inc. | | | 14,922,180 | |
| | 2,949,800 | | | Arlo Technologies, Inc. (a) | | | 20,353,620 | |
| | 61,000 | | | ASML Holding N.V. – ADR | | | 49,585,680 | |
| | 31,700 | | | Autodesk, Inc. (a) | | | 10,068,237 | |
| | 2,055,000 | | | Axcelis Technologies, Inc. (a) (b) | | | 112,881,150 | |
| | 12,437,766 | | | BlackBerry Ltd. (a) | | | 134,327,873 | |
| | 177,200 | | | Cerence, Inc. (a) | | | 18,629,036 | |
| | 159,399 | | | CrowdStrike Holdings, Inc. – Class A (a) | | | 44,918,638 | |
| | 79,750 | | | CyberArk Software Ltd. (a) | | | 14,363,773 | |
| | 100,000 | | | Dell Technologies, Inc. – Class C (a) | | | 10,999,000 | |
| | 1,026,900 | | | Descartes Systems Group, Inc. (The) (a) | | | 83,969,613 | |
| | 17,000 | | | Digimarc Corp. (a) | | | 859,010 | |
| | 26,550 | | | DocuSign, Inc. (a) | | | 7,388,599 | |
| | 75,200 | | | FARO Technologies, Inc. (a) | | | 5,532,464 | |
| | 8,551,719 | | | Flex Ltd. (a) | | | 144,524,051 | |
| | 1,011,100 | | | FormFactor, Inc. (a) | | | 40,221,558 | |
| | 237,000 | | | Freshworks, Inc. – Class A (a) | | | 11,909,250 | |
| | 47,000 | | | GitLab, Inc. – Class A (a) | | | 5,273,400 | |
| | 1,280,000 | | | Hewlett Packard Enterprise Co. | | | 18,752,000 | |
| | 505,790 | | | HP, Inc. | | | 15,340,611 | |
| | 215,000 | | | HubSpot, Inc. (a) | | | 174,199,450 | |
| | 632,000 | | | indie Semiconductor, Inc. – Class A (a) | | | 8,317,120 | |
| | 136,750 | | | Intuit, Inc. | | | 85,604,132 | |
| | 749,000 | | | Jabil, Inc. | | | 44,910,040 | |
| | 69,500 | | | Jamf Holding Corp. (a) | | | 3,311,675 | |
| | 151,450 | | | Keysight Technologies, Inc. (a) | | | 27,264,029 | |
| | 130,180 | | | Keywords Studios PLC – GBP | | | 5,052,559 | |
| | 465,910 | | | KLA Corp. | | | 173,672,612 | |
| | 105,200 | | | MACOM Technology Solutions Holdings, Inc. (a) | | | 7,345,064 | |
| | 20,000 | | | Marqeta, Inc. – Class A (a) | | | 612,000 | |
| | 345,224 | | | Materialise NV – ADR (a) | | | 8,330,255 | |
The accompanying notes are an integral part of these financial statements.
30
Schedule of Investments
PRIMECAP Odyssey Aggressive Growth Fund
October 31, 2021 – continued
| | | | | | | | |
| Shares | | | | | Value | |
| Information Technology (continued) | | | |
| | 2,596,400 | | | MaxLinear, Inc. (a) | | $ | 163,573,200 | |
| | 4,720,100 | | | Micron Technology, Inc. | | | 326,158,910 | |
| | 23,800 | | | MongoDB, Inc. (a) | | | 12,406,702 | |
| | 200 | | | nCino, Inc. (a) | | | 14,532 | |
| | 1,410,067 | | | NetApp, Inc. | | | 125,918,983 | |
| | 1,070,703 | | | nLIGHT, Inc. (a) | | | 30,108,168 | |
| | 873,000 | | | Nuance Communications, Inc. (a) | | | 48,058,650 | |
| | 1,920,925 | | | Nutanix, Inc. – Class A (a) | | | 65,906,937 | |
| | 384,810 | | | NVIDIA Corp. | | | 98,384,373 | |
| | 3,200 | | | Okta, Inc. – Class A (a) | | | 790,976 | |
| | 242,000 | | | OSI Systems, Inc. (a) | | | 22,532,620 | |
| | 33,700 | | | Palo Alto Networks, Inc. (a) | | | 17,156,333 | |
| | 1,610,100 | | | Plantronics, Inc. (a) | | | 43,086,276 | |
| | 819,637 | | | PROS Holdings, Inc. (a) | | | 24,589,110 | |
| | 650,623 | | | QUALCOMM, Inc. | | | 86,558,884 | |
| | 201,300 | | | Rapid7, Inc. (a) | | | 25,917,375 | |
| | 22,350 | | | RingCentral, Inc. – Class A (a) | | | 5,448,483 | |
| | 6,799,200 | | | ServiceSource International, Inc. (a) (b) | | | 8,838,960 | |
| | 1,806,950 | | | Splunk, Inc. (a) | | | 297,821,499 | |
| | 1,886,100 | | | Stratasys Ltd. (a) | | | 59,487,594 | |
| | 766,000 | | | Trimble, Inc. (a) | | | 66,925,420 | |
| | 149,050 | | | Unity Software, Inc. (a) | | | 22,552,755 | |
| | 884,809 | | | Universal Display Corp. | | | 162,097,009 | |
| | 200,000 | | | VMware, Inc. – Class A (a) | | | 30,340,000 | |
| | 358,830 | | | Western Digital Corp. (a) | | | 18,763,221 | |
| | 237,110 | | | WEX, Inc. (a) | | | 35,495,367 | |
| | 791,500 | | | Wolfspeed, Inc. (a) | | | 95,067,065 | |
| | 19,350 | | | Zoom Video Communications, Inc. – Class A (a) | | | 5,314,477 | |
| | | | | | | | |
| | | | | | | 3,376,412,976 | |
| | | | | | | | |
| Materials – 0.5% | | | |
| | 108,400 | | | Albemarle Corp. | | | 27,150,948 | |
| | 34,500 | | | Ingevity Corp. (a) | | | 2,687,895 | |
| | 2,682,400 | | | Ivanhoe Mines Ltd. – Class A – CAD (a) | | | 21,045,656 | |
| | 1,487,300 | | | Marrone Bio Innovations, Inc. (a) | | | 1,303,024 | |
| | | | | | | | |
| | | | | | | 52,187,523 | |
| | | | | | | | |
The accompanying notes are an integral part of these financial statements.
31
Schedule of Investments
PRIMECAP Odyssey Aggressive Growth Fund
October 31, 2021 – continued
| | | | | | | | |
| Shares | | | | | Value | |
| Real Estate – 0.1% | | | |
| | 219,000 | | | EPR Properties | | $ | 10,995,990 | |
| | 63,600 | | | Safehold, Inc. | | | 4,750,920 | |
| | | | | | | | |
| | | | | | | 15,746,910 | |
| | | | | | | | |
| TOTAL COMMON STOCKS
(Cost $5,188,412,353) | | $ | 11,427,491,566 | |
| | | | | | | | |
| | PREFERRED STOCKS – 0.1% | | | | |
| |
| Financials – 0.1% | | | |
| | 779,276 | | | Fannie Mae Fixed-to-Floating Rate Non-Cumulative Preferred Stock Series S, Perpetual Maturity 7.750% (a) | | | 2,711,880 | |
| | 1,512,400 | | | Freddie Mac Fixed-to-Floating Rate Non-Cumulative Preferred Stock Series Z, Perpetual Maturity 7.875% (a) | | | 4,885,052 | |
| | | | | | | | |
| | | | | | | 7,596,932 | |
| | | | | | | | |
| TOTAL PREFERRED STOCKS
(Cost $12,785,458) | | | 7,596,932 | |
| | | | | | | | |
| | WARRANTS – 0.0% | | | | |
| |
| Industrials – 0.0% | | | |
| | 364,100 | | | Everarc Holdings Ltd.
(Expiration Date 8/11/24) (a) (c) | | | 27,308 | |
| | | | | | | | |
| |
| TOTAL WARRANTS
(Cost $3,641) | | | 27,308 | |
| | | | | | | | |
| | RIGHTS – 0.0% | | | | |
| |
| Health Care – 0.0% | | | |
| | 2,980,900 | | | Ligand Pharmaceuticals, Inc. – CVR
(Issue Date 10/1/20) (a) (c) (d) | | | 0 | |
| | 3,786,300 | | | Mereo BioPharma Group PLC – CVR
(Issue Date 4/23/19) (a) (c) (d) | | | 0 | |
| | | | | | | | |
| | | | | | | 0 | |
| | | | | | | | |
| TOTAL RIGHTS
(Cost $0) | | | 0 | |
| | | | | | | | |
The accompanying notes are an integral part of these financial statements.
32
Schedule of Investments
PRIMECAP Odyssey Aggressive Growth Fund
October 31, 2021 – continued
| | | | | | | | |
| Shares | | | | | Value | |
| | SHORT-TERM INVESTMENTS – 2.7% | | | | |
| | 322,668,557 | | | Dreyfus Treasury Securities Cash Management Fund – Institutional Shares – 0.01% (e) | | $ | 322,668,557 | |
| | | | | | | | |
| TOTAL SHORT-TERM INVESTMENTS
(Cost $322,668,557) | | | 322,668,557 | |
| | | | | | | | |
| TOTAL INVESTMENTS IN SECURITIES
(Cost $5,523,870,009) – 100.2% | | | 11,757,784,363 | |
| | Liabilities in Excess of Other Assets – (0.2)% | | | (22,632,070 | ) |
| | | | | | | | |
| | TOTAL NET ASSETS – 100.0% | | $ | 11,735,152,293 | |
| | | | | | | | |
| ADR | American Depository Receipt |
| CVR | Contingent Value Rights |
| GBP | British Pound Sterling |
| PIPE | Private Investment in Public Equity |
| SPACs | Special Purpose Acquisition Companies |
| (b) | Considered an affiliated company of the fund as the fund owns 5% or more of the outstanding voting securities of such company. (Note 7) |
| (d) | Fair-valued security (Note 4) |
| (e) | Rate quoted is seven-day yield at period end. |
| ^ | The Fund entered into a commitment with a SPAC to purchase PIPE shares if and when the SPAC completes its merger and acquisition. |
Unfunded commitment with a SPAC outstanding at October 31, 2021:
| | | | | | | | | | | | | | | | |
Issuer ^ | | Shares | | | Unfunded
Commitment
Amount | | | Current Value | | | Unrealized
Depreciation | |
Reinvent Technology Partners Y –
Class A (a) (c) (d) | | | 3,065,000 | | | $ | 30,650,000 | | | $ | 27,722,925 | | | $ | (2,927,075 | ) |
| | | | | | | | | | | | | | | | |
The Global Industry Classification Standard (GICS®) was developed by and is the exclusive property of MSCI Inc. and Standard & Poor’s Financial Services LLC (“S&P”). GICS is a service mark of MSCI and S&P and has been licensed for use by the fund’s administrator.
The accompanying notes are an integral part of these financial statements.
33
| | |
| | Statements of Assets and Liabilities PRIMECAP Odyssey Funds October 31, 2021 |
| | | | | | | | | | | | |
| | | PRIMECAP
Odyssey
Stock Fund | | | PRIMECAP
Odyssey
Growth Fund | | | PRIMECAP
Odyssey Aggressive
Growth Fund | |
ASSETS | | | | | | | | | | | | |
Investments, at cost (unaffiliated) | | $ | 3,726,794,429 | | | $ | 4,597,443,612 | | | $ | 4,705,556,814 | |
| | | | | | | | | | | | |
Investments, at cost (affiliated) | | | — | | | | — | | | | 818,313,195 | |
| | | | | | | | | | | | |
| | | |
Investments, at value (unaffiliated) | | | 7,736,061,535 | | | | 10,172,364,108 | | | | 10,972,117,795 | |
Investments, at value (affiliated) | | | — | | | | — | | | | 785,666,568 | |
Receivable for investments sold | | | 4,059,205 | | | | 5,072,516 | | | | 13,949,621 | |
Receivable for dividends and interest | | | 11,905,699 | | | | 11,456,136 | | | | 3,276,429 | |
Receivable for fund shares sold | | | 4,154,840 | | | | 3,911,322 | | | | 4,113,725 | |
Prepaid expenses and other assets | | | 58,267 | | | | 76,179 | | | | 77,094 | |
| | | | | | | | | | | | |
Total assets | | | 7,756,239,546 | | | | 10,192,880,261 | | | | 11,779,201,232 | |
| | | | | | | | | | | | |
| | | |
| LIABILITIES | | | | | | | | | | | | |
Payable for investments purchased | | | 3,631,602 | | | | 3,325,695 | | | | 15,851,406 | |
Payable for fund shares repurchased | | | 7,410,257 | | | | 6,064,781 | | | | 8,139,519 | |
Unrealized depreciation on an unfunded commitment with a SPAC | | | — | | | | — | | | | 2,927,075 | |
Payable to the advisor (Note 6) | | | 10,714,573 | | | | 13,910,083 | | | | 16,020,069 | |
Payable to custodian | | | 22,036 | | | | 28,408 | | | | 28,603 | |
Other accrued expenses and liabilities | | | 850,596 | | | | 1,023,842 | | | | 1,082,267 | |
| | | | | | | | | | | | |
Total liabilities | | | 22,629,064 | | | | 24,352,809 | | | | 44,048,939 | |
| | | | | | | | | | | | |
| | | |
NET ASSETS | | $ | 7,733,610,482 | | | $ | 10,168,527,452 | | | $ | 11,735,152,293 | |
| | | | | | | | | | | | |
| | | |
Number of shares issued and outstanding (unlimited shares authorized, $0.01 par value) | | | 179,968,262 | | | | 200,231,866 | | | | 194,391,937 | |
| | | | | | | | | | | | |
| | | |
NET ASSET VALUE, OFFERING AND REDEMPTION PRICE PER SHARE | | $ | 42.97 | | | $ | 50.78 | | | $ | 60.37 | |
| | | | | | | | | | | | |
| | | |
| COMPONENTS OF NET ASSETS | | | | | | | | | | | | |
Paid-in capital | | $ | 3,090,333,267 | | | $ | 3,450,009,296 | | | $ | 4,414,880,510 | |
Total distributable earnings | | | 4,643,277,215 | | | | 6,718,518,156 | | | | 7,320,271,783 | |
| | | | | | | | | | | | |
| | | |
Net assets | | $ | 7,733,610,482 | | | $ | 10,168,527,452 | | | $ | 11,735,152,293 | |
| | | | | | | | | | | | |
The accompanying notes are an integral part of these financial statements.
34
| | |
| | Statements of Operations PRIMECAP Odyssey Funds For the Year Ended October 31, 2021 |
| | | | | | | | | | | | |
| | | PRIMECAP
Odyssey
Stock Fund | | | PRIMECAP
Odyssey Growth
Fund | | | PRIMECAP
Odyssey Aggressive
Growth Fund | |
INVESTMENT INCOME | | | | | | | | | | | | |
Dividends (unaffiliated)(1) | | $ | 98,628,094 | | | $ | 74,180,805 | | | $ | 28,975,897 | |
Interest income | | | 18,425 | | | | 15,095 | | | | 34,590 | |
| | | | | | | | | | | | |
Total investment income | | | 98,646,519 | | | | 74,195,900 | | | | 29,010,487 | |
| | | | | | | | | | | | |
| | | |
Expenses | | | | | | | | | | | | |
Advisory fees | | | 41,000,753 | | | | 54,612,499 | | | | 63,128,547 | |
Shareholder servicing | | | 5,828,470 | | | | 7,711,953 | | | | 8,829,484 | |
Trustee fees | | | 226,146 | | | | 226,146 | | | | 226,146 | |
Custody | | | 134,773 | | | | 179,660 | | | | 177,807 | |
Other | | | 1,349,099 | | | | 1,508,071 | | | | 1,623,332 | |
| | | | | | | | | | | | |
Total expenses | | | 48,539,241 | | | | 64,238,329 | | | | 73,985,316 | |
| | | | | | | | | | | | |
| | | |
Net investment income (loss) | | | 50,107,278 | | | | 9,957,571 | | | | (44,974,829 | ) |
| | | | | | | | | | | | |
| | | |
REALIZED AND UNREALIZED GAIN (LOSS) ON INVESTMENTS AND
FOREIGN CURRENCY | | | | | | | | | | | | |
Net realized gain on: | | | | | | | | | | | | |
Investments (unaffiliated) | | | 693,227,700 | | | | 1,314,846,652 | | | | 1,275,832,508 | |
Investments (affiliated) | | | — | | | | 18,683,610 | | | | 1,229,248 | |
Foreign currency transactions | | | 109,255 | | | | 85,833 | | | | 165,129 | |
Change in unrealized appreciation/depreciation on: | | | | | | | | | | | | |
Investments (unaffiliated) | | | 1,906,515,848 | | | | 1,959,763,589 | | | | 2,138,315,334 | |
Investments (affiliated) | | | — | | | | 44,858,272 | | | | (67,906,234 | ) |
Unfunded commitment with a SPAC | | | — | | | | — | | | | (2,927,075 | ) |
Foreign currency translations | | | (83,689 | ) | | | (96,195 | ) | | | (117,845 | ) |
| | | | | | | | | | | | |
| | | |
Net realized and unrealized gain on investments and foreign currency | | | 2,599,769,114 | | | | 3,338,141,761 | | | | 3,344,591,065 | |
| | | | | | | | | | | | |
| | | |
NET INCREASE IN NET ASSETS RESULTING FROM OPERATIONS | | $ | 2,649,876,392 | | | $ | 3,348,099,332 | | | $ | 3,299,616,236 | |
| | | | | | | | | | | | |
| | (1) | Net of foreign taxes withheld of $2,095,267, $1,777,710, and, $530,685, respectively. |
The accompanying notes are an integral part of these financial statements.
35
| | |
| | Statements of Changes in Net Assets PRIMECAP Odyssey Stock Fund |
| | | | | | | | |
| | | Year Ended
October 31, 2021 | | | Year Ended
October 31, 2020 | |
INCREASE (DECREASE) IN NET ASSETS FROM: | | | | | | | | |
| | |
| OPERATIONS | | | | | | | | |
Net investment income | | $ | 50,107,278 | | | $ | 104,246,846 | |
Net realized gain (loss) on: | | | | | | | | |
Investments | | | 693,227,700 | | | | 567,973,248 | |
Foreign currency transactions | | | 109,255 | | | | (41,619 | ) |
Change in unrealized appreciation/depreciation on: | | | | | | | | |
Investments | | | 1,906,515,848 | | | | (1,033,745,757 | ) |
Foreign currency translations | | | (83,689 | ) | | | 311,933 | |
| | | | | | | | |
Net increase (decrease) in net assets resulting from operations | | | 2,649,876,392 | | | | (361,255,349 | ) |
| | | | | | | | |
| | |
NET DISTRIBUTIONS TO SHAREHOLDERS | | | (521,946,602 | ) | | | (616,939,900 | ) |
| | | | | | | | |
| | |
| CAPITAL SHARE TRANSACTIONS | | | | | | | | |
Proceeds from shares sold | | | 820,313,951 | | | | 1,093,749,719 | |
Proceeds from reinvestment of distributions | | | 469,381,159 | | | | 530,011,881 | |
Cost of shares repurchased | | | (1,928,638,760 | ) | | | (4,675,289,455 | ) |
| | | | | | | | |
Net decrease from capital share transactions | | | (638,943,650 | ) | | | (3,051,527,855 | ) |
| | | | | | | | |
| | |
Total increase (decrease) in net assets | | | 1,488,986,140 | | | | (4,029,723,104 | ) |
| | | | | | | | |
| | |
| NET ASSETS | | | | | | | | |
Beginning of year | | | 6,244,624,342 | | | | 10,274,347,446 | |
| | | | | | | | |
End of year | | $ | 7,733,610,482 | | | $ | 6,244,624,342 | |
| | | | | | | | |
| | |
| CHANGE IN CAPITAL SHARES | | | | | | | | |
Shares outstanding, beginning of year | | | 195,799,339 | | | | 299,274,034 | |
| | | | | | | | |
Shares sold | | | 20,815,677 | | | | 35,877,952 | |
Shares issued on reinvestment of distributions | | | 13,511,260 | | | | 15,443,237 | |
Shares repurchased | | | (50,158,014 | ) | | | (154,795,884 | ) |
| | | | | | | | |
Decrease in capital shares | | | (15,831,077 | ) | | | (103,474,695 | ) |
| | | | | | | | |
Shares outstanding, end of year | | | 179,968,262 | | | | 195,799,339 | |
| | | | | | | | |
The accompanying notes are an integral part of these financial statements.
36
| | |
| | Statements of Changes in Net Assets PRIMECAP Odyssey Growth Fund |
| | | | | | | | |
| | | Year Ended
October 31, 2021 | | | Year Ended
October 31, 2020 | |
INCREASE (DECREASE) IN NET ASSETS FROM: | | | | | | | | |
| | |
| OPERATIONS | | | | | | | | |
Net investment income | | $ | 9,957,571 | | | $ | 43,727,563 | |
Net realized gain (loss) on: | | | | | | | | |
Investments | | | 1,333,530,262 | | | | 1,292,914,761 | |
Foreign currency transactions | | | 85,833 | | | | (45,190 | ) |
Change in unrealized appreciation/depreciation on: | | | | | | | | |
Investments | | | 2,004,621,861 | | | | (839,839,985 | ) |
Foreign currency translations | | | (96,195 | ) | | | 348,674 | |
| | | | | | | | |
Net increase in net assets resulting from operations | | | 3,348,099,332 | | | | 497,105,823 | |
| | | | | | | | |
| | |
NET DISTRIBUTIONS TO SHAREHOLDERS | | | (1,087,744,161 | ) | | | (634,259,506 | ) |
| | | | | | | | |
| | |
| CAPITAL SHARE TRANSACTIONS | | | | | | | | |
Proceeds from shares sold | | | 922,066,332 | | | | 1,113,502,358 | |
Proceeds from reinvestment of distributions | | | 1,047,279,976 | | | | 608,222,848 | |
Cost of shares repurchased | | | (2,667,590,516 | ) | | | (5,343,755,265 | ) |
| | | | | | | | |
Net decrease from capital share transactions | | | (698,244,208 | ) | | | (3,622,030,059 | ) |
| | | | | | | | |
| | |
Total increase (decrease) in net assets | | | 1,562,110,963 | | | | (3,759,183,742 | ) |
| | | | | | | | |
| | |
| NET ASSETS | | | | | | | | |
Beginning of year | | | 8,606,416,489 | | | | 12,365,600,231 | |
| | | | | | | | |
End of year | | $ | 10,168,527,452 | | | $ | 8,606,416,489 | |
| | | | | | | | |
| | |
| CHANGE IN CAPITAL SHARES | | | | | | | | |
Shares outstanding, beginning of year | | | 213,490,110 | | | | 311,638,641 | |
| | | | | | | | |
Shares sold | | | 19,494,793 | | | | 30,134,729 | |
Shares issued on reinvestment of distributions | | | 25,066,538 | | | | 14,962,431 | |
Shares repurchased | | | (57,819,575 | ) | | | (143,245,691 | ) |
| | | | | | | | |
Decrease in capital shares | | | (13,258,244 | ) | | | (98,148,531 | ) |
| | | | | | | | |
Shares outstanding, end of year | | | 200,231,866 | | | | 213,490,110 | |
| | | | | | | | |
The accompanying notes are an integral part of these financial statements.
37
| | |
| | Statements of Changes in Net Assets PRIMECAP Odyssey Aggressive Growth Fund |
| | | | | | | | |
| | | Year Ended
October 31, 2021 | | | Year Ended
October 31, 2020 | |
INCREASE (DECREASE) IN NET ASSETS FROM: | | | | | | | | |
| | |
| OPERATIONS | | | | | | | | |
Net investment loss | | $ | (44,974,829 | ) | | $ | (21,558,864 | ) |
Net realized gain (loss) on: | | | | | | | | |
Investments | | | 1,277,061,756 | | | | 890,527,024 | |
Foreign currency transactions | | | 165,129 | | | | (28,598 | ) |
Change in unrealized appreciation/depreciation on: | | | | | | | | |
Investments | | | 2,070,409,100 | | | | 522,636,441 | |
Unfunded commitment with a SPAC | | | (2,927,075 | ) | | | — | |
Foreign currency translations | | | (117,845 | ) | | | 201,517 | |
| | | | | | | | |
Net increase in net assets resulting from operations | | | 3,299,616,236 | | | | 1,391,777,520 | |
| | | | | | | | |
| | |
NET DISTRIBUTIONS TO SHAREHOLDERS | | | (822,100,806 | ) | | | (535,992,914 | ) |
| | | | | | | | |
| | |
| CAPITAL SHARE TRANSACTIONS | | | | | | | | |
Proceeds from shares sold | | | 1,003,449,519 | | | | 1,172,084,399 | |
Proceeds from reinvestment of distributions | | | 780,448,114 | | | | 506,900,448 | |
Cost of shares repurchased | | | (2,097,662,877 | ) | | | (2,814,746,914 | ) |
Other capital contribution | | | 13,817 | | | | — | |
| | | | | | | | |
Net decrease from capital share transactions | | | (313,751,427 | ) | | | (1,135,762,067 | ) |
| | | | | | | | |
| | |
Total increase (decrease) in net assets | | | 2,163,764,003 | | | | (279,977,461 | ) |
| | | | | | | | |
| | |
| NET ASSETS | | | | | | | | |
Beginning of year | | | 9,571,388,290 | | | | 9,851,365,751 | |
| | | | | | | | |
End of year | | $ | 11,735,152,293 | | | $ | 9,571,388,290 | |
| | | | | | | | |
| | |
| CHANGE IN CAPITAL SHARES | | | | | | | | |
Shares outstanding, beginning of year | | | 199,125,574 | | | | 226,657,092 | |
| | | | | | | | |
Shares sold | | | 17,501,649 | | | | 27,940,570 | |
Shares issued on reinvestment of distributions | | | 14,689,406 | | | | 11,334,983 | |
Shares repurchased | | | (36,924,692 | ) | | | (66,807,071 | ) |
| | | | | | | | |
Decrease in capital shares | | | (4,733,637 | ) | | | (27,531,518 | ) |
| | | | | | | | |
Shares outstanding, end of year | | | 194,391,937 | | | | 199,125,574 | |
| | | | | | | | |
The accompanying notes are an integral part of these financial statements.
38
| | |
| | Financial Highlights PRIMECAP Odyssey Stock Fund For a capital share outstanding throughout each year. |
| | | | | | | | | | | | | | | | | | | | |
| | | Year
Ended
Oct. 31,
2021 | | | Year
Ended
Oct. 31,
2020 | | | Year
Ended
Oct. 31,
2019 | | | Year
Ended
Oct. 31,
2018 | | | Year
Ended
Oct. 31,
2017 | |
| | | | | |
Net asset value, beginning of year | | $ | 31.89 | | | $ | 34.33 | | | $ | 31.79 | | | $ | 31.02 | | | $ | 24.84 | |
| | | | | | | | | | | | | | | | | | | | |
Income (loss) from investment operations: | | | | | | | | | | | | | | | | | | | | |
Net investment income | | | 0.27 | (1) | | | 0.40 | (1) | | | 0.46 | | | | 0.33 | | | | 0.33 | |
Net realized and unrealized gain (loss) on investments and foreign currency | | | 13.57 | | | | (0.76 | ) | | | 2.95 | | | | 1.13 | | | | 6.61 | |
| | | | | | | | | | | | | | | | | | | | |
Total from investment operations | | | 13.84 | | | | (0.36 | ) | | | 3.41 | | | | 1.46 | | | | 6.94 | |
| | | | | | | | | | | | | | | | | | | | |
Less: | | | | | | | | | | | | | | | | | | | | |
Dividends from net investment income | | | (0.48 | ) | | | (0.47 | ) | | | (0.34 | ) | | | (0.30 | ) | | | (0.31 | ) |
Distributions from net realized gain | | | (2.28 | ) | | | (1.61 | ) | | | (0.53 | ) | | | (0.39 | ) | | | (0.45 | ) |
| | | | | | | | | | | | | | | | | | | | |
Total distributions | | | (2.76 | ) | | | (2.08 | ) | | | (0.87 | ) | | | (0.69 | ) | | | (0.76 | ) |
| | | | | | | | | | | | | | | | | | | | |
Net asset value, end of year | | $ | 42.97 | | | $ | 31.89 | | | $ | 34.33 | | | $ | 31.79 | | | $ | 31.02 | |
| | | | | | | | | | | | | | | | | | | | |
| | | | | |
Total return | | | 45.44 | % | | | (1.48 | %) | | | 11.22 | % | | | 4.70 | % | | | 28.51 | % |
| | | | | |
Ratios/supplemental data: | | | | | | | | | | | | | | | | | | | | |
Net assets, end of year (millions) | | $ | 7,733.6 | | | $ | 6,244.6 | | | $ | 10,274.3 | | | $ | 10,157.1 | | | $ | 8,698.6 | |
| | | | | |
Ratio of expenses to average net assets | | | 0.65 | % | | | 0.65 | % | | | 0.65 | % | | | 0.64 | % | | | 0.65 | % |
| | | | | |
Ratio of net investment income to average net assets | | | 0.67 | % | | | 1.28 | % | | | 1.38 | % | | | 1.04 | % | | | 1.18 | % |
| | | | | |
Portfolio turnover rate | | | 6 | % | | | 8 | % | | | 6 | % | | | 5 | % | | | 6 | % |
| | (1) | Calculated using the average shares method. |
The accompanying notes are an integral part of these financial statements.
39
| | |
| | Financial Highlights PRIMECAP Odyssey Growth Fund For a capital share outstanding throughout each year. |
| | | | | | | | | | | | | | | | | | | | |
| | | Year
Ended
Oct. 31,
2021 | | | Year
Ended
Oct. 31,
2020 | | | Year
Ended
Oct. 31,
2019 | | | Year
Ended
Oct. 31,
2018 | | | Year
Ended
Oct. 31,
2017 | |
| | | | | |
Net asset value, beginning of year | | $ | 40.31 | | | $ | 39.68 | | | $ | 38.43 | | | $ | 35.64 | | | $ | 27.90 | |
| | | | | | | | | | | | | | | | | | | | |
Income from investment operations: | | | | | | | | | | | | | | | | | | | | |
Net investment income | | | 0.05 | (1) | | | 0.16 | (1) | | | 0.22 | | | | 0.10 | | | | 0.12 | |
Net realized and unrealized gain on investments and foreign currency | | | 15.72 | | | | 2.57 | | | | 1.88 | | | | 3.26 | | | | 8.62 | |
| | | | | | | | | | | | | | | | | | | | |
Total from investment operations | | | 15.77 | | | | 2.73 | | | | 2.10 | | | | 3.36 | | | | 8.74 | |
| | | | | | | | | | | | | | | | | | | | |
Less: | | | | | | | | | | | | | | | | | | | | |
Dividends from net investment income | | | (0.17 | ) | | | (0.20 | ) | | | (0.12 | ) | | | (0.11 | ) | | | (0.14 | ) |
Distributions from net realized gain | | | (5.13 | ) | | | (1.90 | ) | | | (0.73 | ) | | | (0.46 | ) | | | (0.86 | ) |
| | | | | | | | | | | | | | | | | | | | |
Total distributions | | | (5.30 | ) | | | (2.10 | ) | | | (0.85 | ) | | | (0.57 | ) | | | (1.00 | ) |
| | | | | | | | | | | | | | | | | | | | |
Net asset value, end of year | | $ | 50.78 | | | $ | 40.31 | | | $ | 39.68 | | | $ | 38.43 | | | $ | 35.64 | |
| | | | | | | | | | | | | | | | | | | | |
| | | | | |
Total return | | | 41.97 | % | | | 6.83 | % | | | 5.75 | % | | | 9.48 | % | | | 32.12 | % |
| | | | | |
Ratios/supplemental data: | | | | | | | | | | | | | | | | | | | | |
Net assets, end of year (millions) | | $ | 10,168.5 | | | $ | 8,606.4 | | | $ | 12,365.6 | | | $ | 13,144.9 | | | $ | 9,701.5 | |
| | | | | |
Ratio of expenses to average net assets | | | 0.65 | % | | | 0.65 | % | | | 0.64 | % | | | 0.64 | % | | | 0.66 | % |
| | | | | |
Ratio of net investment income to average net assets | | | 0.10 | % | | | 0.42 | % | | | 0.53 | % | | | 0.26 | % | | | 0.39 | % |
| | | | | |
Portfolio turnover rate | | | 7 | % | | | 9 | % | | | 6 | % | | | 4 | % | | | 5 | % |
| | (1) | Calculated using the average shares method. |
The accompanying notes are an integral part of these financial statements.
40
| | |
| | Financial Highlights PRIMECAP Odyssey Aggressive Growth Fund For a capital share outstanding throughout each year. |
| | | | | | | | | | | | | | | | | | | | |
| | | Year
Ended
Oct. 31,
2021 | | | Year
Ended
Oct. 31,
2020 | | | Year
Ended
Oct. 31,
2019 | | | Year
Ended
Oct. 31,
2018 | | | Year
Ended
Oct. 31,
2017 | |
| | | | | |
Net asset value, beginning of year | | $ | 48.07 | | | $ | 43.46 | | | $ | 44.71 | | | $ | 41.41 | | | $ | 33.78 | |
| | | | | | | | | | | | | | | | | | | | |
Income (loss) from investment operations: | | | | | | | | | | | | | | | | | | | | |
Net investment income (loss) | | | (0.22 | )(1) | | | (0.10 | )(1) | | | 0.03 | | | | 0.00 | (2) | | | (0.03 | ) |
Net realized and unrealized gain on investments and foreign currency | | | 16.73 | | | | 7.10 | | | | 1.72 | | | | 3.68 | | | | 10.44 | |
| | | | | | | | | | | | | | | | | | | | |
Total from investment operations | | | 16.51 | | | | 7.00 | | | | 1.75 | | | | 3.68 | | | | 10.41 | |
| | | | | | | | | | | | | | | | | | | | |
Less: | | | | | | | | | | | | | | | | | | | | |
Dividends from net investment income | | | — | | | | — | | | | (0.03 | ) | | | — | | | | — | |
Distributions from net realized gain | | | (4.21 | ) | | | (2.39 | ) | | | (2.97 | ) | | | (0.38 | ) | | | (2.78 | ) |
| | | | | | | | | | | | | | | | | | | | |
Total distributions | | | (4.21 | ) | | | (2.39 | ) | | | (3.00 | ) | | | (0.38 | ) | | | (2.78 | ) |
| | | | | | | | | | | | | | | | | | | | |
Net asset value, end of year | | $ | 60.37 | | | $ | 48.07 | | | $ | 43.46 | | | $ | 44.71 | | | $ | 41.41 | |
| | | | | | | | | | | | | | | | | | | | |
| | | | | |
Total return | | | 35.53 | % | | | 16.52 | % | | | 4.71 | % | | | 8.90 | % | | | 32.59 | % |
| | | | | |
Ratios/supplemental data: | | | | | | | | | | | | | | | | | | | | |
Net assets, end of year (millions) | | $ | 11,735.2 | | | $ | 9,571.4 | | | $ | 9,851.4 | | | $ | 10,245.3 | | | $ | 8,879.5 | |
| | | | | |
Ratio of expenses to average net assets | | | 0.64 | % | | | 0.64 | % | | | 0.63 | % | | | 0.63 | % | | | 0.64 | % |
| | | | | |
Ratio of net investment income (loss) to average net assets | | | (0.39 | %) | | | (0.23 | %) | | | 0.01 | % | | | (0.19 | %) | | | (0.07 | %) |
| | | | | |
Portfolio turnover rate | | | 9 | % | | | 17 | % | | | 7 | % | | | 12 | % | | | 9 | % |
| | (1) | Calculated using the average shares method. |
| | (2) | Less than one cent per share. |
The accompanying notes are an integral part of these financial statements.
41
| | |
| | Notes to Financial Statements PRIMECAP Odyssey Funds For the Year Ended October 31, 2021 |
(1) Organization
PRIMECAP Odyssey Funds (the “Trust”) was organized on June 8, 2004 as a Delaware statutory trust and is registered as an open-end management investment company under the Investment Company Act of 1940, as amended (the “1940 Act”). The Trust is comprised of three series: PRIMECAP Odyssey Stock Fund, PRIMECAP Odyssey Growth Fund, and PRIMECAP Odyssey Aggressive Growth Fund (the “Funds”), each of which is diversified within the meaning of the 1940 Act. PRIMECAP Management Company (the “Investment Advisor”) serves as investment advisor to the Funds. Each Fund commenced operations on November 1, 2004.
Each Fund’s investment objective is to achieve long-term capital appreciation. Each Fund is authorized to issue unlimited shares of beneficial interest. All shares of each Fund have equal rights with respect to voting. The PRIMECAP Odyssey Aggressive Growth Fund is closed to most new investors.
(2) Significant Accounting Policies
The Funds consistently follow the accounting policies set forth below which are in conformity with accounting principles generally accepted in the United States of America (“U.S. GAAP”). The Funds are considered investment companies under U.S. GAAP and follow the accounting and reporting guidance applicable to investment companies in the Financial Accounting Standards Board Auditing Standards Codification Topic 946.
Securities traded on a national securities exchange are valued at the last reported sales price at the close of regular trading on each day the exchanges are open for trading. Securities traded on the National Association of Securities Dealers Automated Quotations (“NASDAQ”) are valued at the NASDAQ Official Closing Price, which may not necessarily represent the last sale price. Non-U.S. traded stocks are valued at the last sale price or official closing price in the primary local market where the stock is traded. Securities traded on an exchange for which there have been no sales are valued at the mean between the bid and ask price. Because trading on most non-U.S. exchanges is normally completed before the close of the New York Stock Exchange, the value of securities traded on foreign exchanges can change by the time a Fund calculates its net asset value per share (“NAV”). To address these changes, the Funds may utilize adjustment factors provided by an independent pricing service to systematically value foreign securities at fair value. These adjustment factors are based on statistical analyses of subsequent movement in securities indices, specific security prices, and exchange rates in foreign markets.
Securities for which quotations are not readily available are valued at their respective fair values as determined in good faith by a valuation committee of the Investment Advisor in accordance with procedures approved by the Trust’s Board of Trustees. In determining fair value, the Funds take into account all relevant factors and available information. Consequently, the price of a security used by a Fund to calculate its NAV may differ from quoted or published prices for the same security. Fair value pricing involves
42
Notes to Financial Statements
PRIMECAP Odyssey Funds
For the Year Ended October 31, 2021 – continued
subjective judgments, and there is no single standard for determining a security’s fair value. As a result, different mutual funds could reasonably arrive at a different fair value for the same security. It is possible that the fair value determined for a security is materially different from the value that could be realized upon the sale of that security or from the values that other mutual funds may determine.
Investments in other funds are valued at their respective net asset values as determined by those funds, in accordance with the 1940 Act.
The NAV of a Fund is calculated by dividing the sum of the value of the securities held by the Fund, plus cash or other assets, minus all liabilities (including estimated accrued expenses), by the total number of outstanding shares of the Fund. The result is rounded to the nearest cent. The Funds’ shares will not be priced on the days on which the New York Stock Exchange is closed for trading.
Securities and other assets and liabilities denominated in foreign currencies are translated into U.S. dollars using exchange rates as of 4 p.m. Eastern time on the valuation date. Purchases and sales of investments and dividend and interest income are converted into U.S. dollars using the spot market rate of exchange prevailing on the respective dates of such translations. Realized foreign exchange gains or losses may arise from 1) sales of foreign currencies; 2) currency gains or losses realized between the trade and settlement dates on securities transactions; and 3) the difference between the recorded amounts of dividends, interest, and foreign withholding taxes and the U.S. dollar equivalent of the amounts actually received or paid. Net unrealized foreign exchange gains and losses arise from changes in foreign exchange rates on foreign denominated assets and liabilities other than investments in securities held at the end of the reporting period. Foreign securities and currency transactions may involve risks not associated with U.S. securities and currency.
| | D. | Private Investment in Public Equity (PIPE) |
The Funds may acquire equity securities of an issuer that are issued through a PIPE transaction, including on a when-issued basis. PIPE transactions typically involve the purchase of securities directly from a publicly traded company or its affiliates in a private placement transaction, typically at a discount to the market price of the issuer’s common equity. Shares in PIPEs generally are not registered with the Securities and Exchange Commission until after a certain time-period from the date the private sale is completed (“Restricted Period”), which can last for several months. Until the public registration process is completed, PIPEs are restricted as to resale and the Funds cannot freely trade the securities.
| | E. | Special Purpose Acquisition Companies (SPACs) |
SPACs are collective investment structures that allow public stock market qualified investors to invest in PIPE shares. SPACs are shell companies that have no operations
43
Notes to Financial Statements
PRIMECAP Odyssey Funds
For the Year Ended October 31, 2021 – continued
but go public with the intention of merging with or acquiring a company with the proceeds of the SPAC’s initial public offering (“IPO”). The Funds may enter into a commitment with a SPAC to purchase PIPE shares if and when the SPAC completes its merger or acquisition. Purchased PIPE shares will be restricted from trading until the registration statement for the shares is declared effective. Upon registration, the shares can be freely sold. The Aggressive Growth Fund had an unfunded commitment outstanding of $30,650,000 to purchase PIPE shares as of October 31, 2021.
Each Fund has elected to be treated as a “regulated investment company” under Subchapter M of the Internal Revenue Code of 1986 (the “IRC”). Each Fund intends to distribute substantially all of its taxable income and any accumulated net realized capital gains. Accordingly, no provision for federal income taxes has been made in the financial statements.
The Funds may be subject to foreign taxes on income, gains on investments, or currency repatriation, a portion of which may be reclaimed. The Funds will accrue such taxes and reclaims as applicable based upon their current interpretations of the tax rules and regulations that exist in the markets in which they invest.
Each Fund has adopted accounting standards regarding recognition and measurement of tax positions taken or expected to be taken on a tax return. The Funds recognize interest and penalties, if any, related to unrecognized tax benefits as income tax expense in the Statement of Operations. During the year ended October 31, 2021, the Funds did not incur any interest or penalties. As of October 31, 2021, open tax years include the tax years ended October 31, 2018 through October 31, 2021. No Fund is aware of any tax positions for which it is more likely than not that the total amounts of unrecognized tax benefits or loss will significantly change in the next 12 months.
Each Fund is charged for those expenses directly attributable to it. Expenses that are not directly attributable to a Fund are allocated among the Funds by an appropriate method based on the nature of the expense.
| | H. | Security Transactions, Investment Income, and Distributions |
Security transactions are accounted for on the trade date. Dividend income and distributions to shareholders are recorded on the ex-dividend date, and interest income is recognized on the accrual basis. Realized gains and losses are evaluated on the basis of identified costs. Premiums and discounts on the purchase of securities are amortized/accreted using the effective interest method. U.S. GAAP requires that permanent financial reporting and tax differences be reclassified in the capital accounts.
The preparation of financial statements in conformity with U.S. GAAP requires management to make estimates and assumptions that affect the reported amounts of assets and liabilities and disclosure of contingent assets and liabilities at the date of the
44
Notes to Financial Statements
PRIMECAP Odyssey Funds
For the Year Ended October 31, 2021 – continued
financial statements, and the reported amounts of revenues and expenses during the reporting period. Actual results could differ from these estimates, and such differences could be material.
| | J. | Indemnification Obligations |
Under the Trust’s organizational documents, its current and former officers and trustees are indemnified against certain liabilities arising out of the performance of their duties to the Funds. In addition, in the normal course of business, the Funds enter into contracts that contain a variety of representations and warranties that provide general indemnifications. The Funds’ maximum exposure under these arrangements is unknown as this would involve future claims that may be made against the Funds that have not yet occurred. Based on experience, the Funds would expect the risk of loss to be minimal.
| | K. | Recent Accounting Pronouncements |
On October 28, 2020, the Securities and Exchange Commission (the “SEC”) adopted new regulations governing the use of derivatives by registered investment companies (“Rule 18f-4”). The Funds will be required to implement and comply with Rule 18f-4 by August 19, 2022. Once implemented, Rule 18f-4 will impose limits on the amount of derivatives a fund can enter into, eliminate the asset segregation framework currently used by funds to comply with Section 18 of the 1940 Act, treat derivatives as senior securities and require funds whose use of derivatives is more than a limited specified exposure amount to establish and maintain a comprehensive derivatives risk management program and appoint a derivatives risk manager. The Funds currently do not hold derivatives.
In December 2020, the SEC adopted a new rule providing a framework for fund valuation practices (“Rule 2a-5”). Rule 2a-5 establishes requirements for determining fair value in good faith for purposes of the 1940 Act. Rule 2a-5 will permit fund boards to designate certain parties to perform fair value determinations, subject to board oversight and certain other conditions. Rule 2a-5 also defines when market quotations are “readily available” for purposes of the 1940 Act and the threshold for determining whether a fund must fair value a security. In connection with Rule 2a-5, the SEC also adopted related recordkeeping requirements and is rescinding previously issued guidance, including with respect to the role of a board in determining fair value and the accounting and auditing of fund investments. The Funds will be required to comply with the rules by September 8, 2022. Management is currently assessing the potential impact of the new rules on the Funds’ financial statements.
45
Notes to Financial Statements
PRIMECAP Odyssey Funds
For the Year Ended October 31, 2021 – continued
(3) Investment Transactions
The cost of purchases and the proceeds from sales of securities, excluding short-term investments, for the year ended October 31, 2021 were as follows:
| | | | | | | | |
Fund | | Purchases | | | Sales | |
Stock Fund | | $ | 402,888,566 | | | $ | 1,596,535,335 | |
Growth Fund | | $ | 703,466,240 | | | $ | 2,582,839,067 | |
Aggressive Growth Fund | | $ | 954,390,286 | | | $ | 2,119,321,578 | |
(4) Valuation Measurements
The Funds have adopted fair valuation accounting standards which establish an authoritative definition of fair value and set forth a hierarchy for measuring fair value. These standards require additional disclosure about the various inputs and valuation techniques used to develop the measurements of fair value and a discussion of changes in valuation techniques and related inputs during the period. These standards define fair value as the price that would be received in the sale of an asset or paid to transfer a liability in an orderly transaction between market participants on the measurement date. The fair value hierarchy is organized into three levels based upon the assumptions (referred to as “inputs”) used to value the asset or liability. These standards state that “observable inputs” reflect the significant assumptions that market participants would use in valuing an asset or liability based on market data obtained from independent sources. “Unobservable inputs” reflect the Funds’ own assumptions about the inputs market participants would use to value the asset or liability.
Various inputs are used in determining the value of each Fund’s investments, and the lowest level for any significant input determines leveling. These inputs are summarized in the three broad levels below:
| | Level 1 – | Unadjusted quoted prices in active markets for identical securities to which the Trust has access at the date of measurement. | |
| | Level 2 – | Other significant observable inputs (including quoted prices for similar or related securities in both active and inactive markets, interest rates, foreign exchange rates, and fair value estimates for foreign securities indices). | |
| | Level 3 – | Significant unobservable inputs to the extent observable inputs are unavailable (including the Funds’ own assumptions in determining fair value of investments based on the best available information). | |
46
Notes to Financial Statements
PRIMECAP Odyssey Funds
For the Year Ended October 31, 2021 – continued
The following table provides the fair value measurements of applicable Fund assets by level within the fair value hierarchy for each Fund as of October 31, 2021. These assets are measured on a recurring basis.
| | | | | | | | | | | | | | | | | | |
Fund | | Description | | Quoted prices
in active
markets for
identical assets
(Level 1) | | | Significant
other
observable
inputs
(Level 2) | | | Significant
unobservable
inputs
(Level 3) | | | Total | |
| | Investments in Securities | | | | | | | | | | | | | | | | |
| Stock | | Common Stocks(1) | | $ | 7,498,536,461 | | | $ | — | | | $ | — | | | $ | 7,498,536,461 | |
| Fund | | Short-Term Investments | | | 237,525,074 | | | | — | | | | — | | | | 237,525,074 | |
| | | | | | | | | | | | | | | | | | |
| | Total Investments in Securities | | $ | 7,736,061,535 | | | $ | — | | | $ | — | | | $ | 7,736,061,535 | |
| | | | | | | | | | | | | | | | | | |
| | | | | |
| Growth | | Common Stocks(1) | | $ | 9,938,556,537 | | | $ | — | | | $ | — | | | $ | 9,938,556,537 | |
| Fund | | Short-Term Investments | | | 233,807,571 | | | | — | | | | — | | | | 233,807,571 | |
| | | | | | | | | | | | | | | | | | |
| | Total Investments in Securities | | $ | 10,172,364,108 | | | $ | — | | | $ | — | | | $ | 10,172,364,108 | |
| | | | | | | | | | | | | | | | | | |
| | | | | |
| Aggressive | | Common Stocks(1) | | $ | 11,427,491,566 | | | $ | — | | | $ | — | | | $ | 11,427,491,566 | |
| Growth | | Preferred Stocks(2) | | | 7,596,932 | | | | — | | | | — | | | | 7,596,932 | |
| Fund | | Warrants(3) | | | 27,308 | | | | — | | | | — | | | | 27,308 | |
| | Rights(4) | | | — | | | | — | | | | 0 | | | | 0 | |
| | Short-Term Investments | | | 322,668,557 | | | | — | | | | — | | | | 322,668,557 | |
| | | | | | | | | | | | | | | | | | |
| | Total Investments in Securities | | $ | 11,757,784,363 | | | $ | — | | | $ | 0 | | | $ | 11,757,784,363 | |
| | | | | | | | | | | | | | | | | | |
| | Other Financial Instruments | | | | | | | | | | | | | | | | |
Aggressive Growth | | Unfunded Commitment with a SPAC(5) | | $ | — | | | $ | — | | | $ | (2,927,075 | ) | | $ | (2,927,075 | ) |
| | | | | | | | | | | | | | | | | | |
| Fund | | Total Other Financial Instruments | | $ | — | | | $ | — | | | $ | (2,927,075 | ) | | $ | (2,927,075 | ) |
| | | | | | | | | | | | | | | | | | |
| | (1) | Refer to each Fund’s respective Schedule of Investments for the breakdown of major categories. |
| | (5) | Unfunded commitment with a SPAC is not reflected in the Schedule of Investments and is recorded at net unrealized appreciation (depreciation). |
47
Notes to Financial Statements
PRIMECAP Odyssey Funds
For the Year Ended October 31, 2021 – continued
Following is a reconciliation of investments in which significant unobservable inputs (Level 3) were used in determining fair value.
| | | | |
Aggressive Growth Fund | | Ligand
Pharmaceuticals,
Inc. - CVR | |
Balance at October 31, 2020 | | $ | 2,235,675 | |
Purchase (Received) | | | — | |
Sales | | | — | |
Realized Gain (Loss) | | | — | |
Change in unrealized depreciation | | | (2,235,675 | ) |
Transfer into Level 3 | | | — | |
| | | | |
Balance at October 31, 2021 | | $ | 0 | |
| | | | |
The Aggressive Growth Fund received Ligand Pharmaceuticals Contingent Value Rights (the “Ligand CVR”) when Pfenex Inc. (“Pfenex”) was acquired by Ligand Pharmaceuticals Inc. in October 2020. Holders of Ligand CVR receive $2 per right if certain determinations are made by the U.S. Food and Drug Administration (the “USFDA”) with respect to Bonsity, a treatment for osteoporosis. If the USFDA does not make the determinations required by the terms of the CVR, rights holders receive nothing. During the year ended October 31, 2021, the Funds determined the fair value of Ligand CVR considering available information including the final trading price of Pfenex prior to the acquisition, the amount of cash received by Pfenex shareholders, the terms of the Ligand CVR, and disclosures made by Ligand in its financial reporting. Ligand CVR are non-tradeable.
(5) Distribution to Shareholders
Net investment income and net realized gains differ for financial statement and tax purposes due to differing treatments of deferred wash sale losses.
48
Notes to Financial Statements
PRIMECAP Odyssey Funds
For the Year Ended October 31, 2021 – continued
As of October 31, 2021, the components of capital on a tax basis were as follows:
| | | | | | | | | | | | |
| | | PRIMECAP
Odyssey
Stock Fund | | | PRIMECAP
Odyssey
Growth Fund | | | PRIMECAP
Odyssey Aggressive
Growth Fund | |
Cost of investments for tax purposes(1) | | $ | 3,749,317,812 | | | $ | 4,641,572,227 | | | $ | 5,555,147,115 | |
| | | | | | | | | | | | |
Gross tax unrealized appreciation | | | 4,170,483,431 | | | | 5,909,452,705 | | | | 7,058,885,207 | |
Gross tax unrealized depreciation | | | (183,587,219 | ) | | | (378,440,192 | ) | | | (856,161,956 | ) |
| | | | | | | | | | | | |
Net tax unrealized appreciation | | | 3,986,896,212 | | | | 5,531,012,513 | | | | 6,202,723,251 | |
| | | | | | | | | | | | |
Undistributed ordinary income | | | 49,799,139 | | | | 34,338,381 | | | | — | |
Undistributed long-term capital gain | | | 606,581,864 | | | | 1,153,167,262 | | | | 1,123,706,680 | |
| | | | | | | | | | | | |
Total distributable earnings | | | 656,381,003 | | | | 1,187,505,643 | | | | 1,123,706,680 | |
| | | | | | | | | | | | |
Other accumulated gain (loss) | | | — | | | | — | | | | (6,158,148 | ) |
| | | | | | | | | | | | |
Total accumulated gain | | $ | 4,643,277,215 | | | $ | 6,718,518,156 | | | $ | 7,320,271,783 | |
| | | | | | | | | | | | |
| | (1) | At October 31, 2021 the differences in the basis for federal income tax purposes and financial reporting purposes are due to the tax deferral of losses on wash sales. |
U.S. GAAP requires that permanent book-to-tax differences be reclassified among the components of net assets. These reclassifications have no effect on net assets or NAV. For the fiscal year ended October 31, 2021, the following reclassifications were made:
| | | | | | | | | | | | |
| | | Undistributed
Net Investment
Gain (Loss) | | | Accumulated
Net Realized
Gain (Loss) | | | Paid In Capital | |
Stock Fund | | $ | 109,255 | | | $ | (80,303,199) | | | $ | 80,193,944 | |
Growth Fund | | $ | 85,833 | | | $ | (150,236,359) | | | $ | 150,150,526 | |
Aggressive Growth Fund | | $ | 56,054,809 | | | $ | (155,204,973) | | | $ | 99,150,164 | |
The Funds used a tax accounting practice to treat a portion of the price of capital shares redeemed during the year as distributions from net realized capital gains. The PRIMECAP Odyssey Stock Fund, PRIMECAP Odyssey Growth Fund, and PRIMECAP Odyssey Aggressive Growth Fund reclassified $80,303,199, $150,236,359, and $155,204,973, respectively, from Accumulated Net Realized Gain to Paid In Capital. Other permanent book-to-tax differences that required reclassification among the Funds’ capital accounts related to foreign currency adjustments and net operating losses. The PRIMECAP Odyssey Aggressive Growth Fund deferred, on a tax basis, late-year ordinary losses of $3,231,073.
49
Notes to Financial Statements
PRIMECAP Odyssey Funds
For the Year Ended October 31, 2021 – continued
Tax components of dividends paid during the fiscal years ended October 31, 2021 and October 31, 2020 were as follows:
| | | | | | | | | | | | | | | | |
| | | October 31, 2021 | | | October 31, 2020 | |
| | | Ordinary
Income
Distributions | | | Long-Term
Capital Gain
Distributions | | | Ordinary
Income
Distributions | | | Long-Term
Capital Gain
Distributions | |
Stock Fund | | $ | 91,207,885 | | | $ | 430,738,717 | | | $ | 138,779,906 | | | $ | 478,159,994 | |
Growth Fund | | $ | 35,746,054 | | | $ | 1,051,998,107 | | | $ | 79,908,740 | | | $ | 554,350,766 | |
Aggressive Growth Fund | | $ | — | | | $ | 822,100,806 | | | $ | 25,463,714 | | | $ | 510,529,200 | |
The Funds designated as long-term capital gain dividends, pursuant to IRC Section 852 (b) (3), the amounts necessary to reduce the earnings and profits of the Funds related to net capital gains to zero for the tax year ended October 31, 2021.
(6) Investment Advisory and Other Agreements
The Trust has entered into an investment management agreement with the Investment Advisor on behalf of each Fund. For its services to the Funds prior to May 1, 2021, the Investment Advisor received a fee paid quarterly at the annual rate of 0.60% of the first $100 million of each Fund’s average daily net assets and 0.55% of each Fund’s average daily net assets in excess of $100 million. On May 4, 2021, the Board approved and ratified an Amended and Restated Investment Advisory Agreement that provided an additional breakpoint for each Fund. Effective May 1, 2021, the Investment Advisor receives an annual fee, payable on a quarterly basis, at the annual rate of 0.60% on the first $100 million of each Fund’s average daily assets, 0.55% on the next $9.9 billion of each Fund’s average daily net assets, and 0.50% on each Fund’s average daily assets in excess of $10 billion. For the year ended October 31, 2021, each Fund paid the Investment Advisor at an effective annual rate of 0.55% of its respective average net assets.
U.S. Bancorp Fund Services, LLC, d/b/a U.S. Bank Global Fund Services, serves as the administrator, fund accountant, and transfer agent to the Funds. U.S. Bank, N.A. serves as the Funds’ custodian. ALPS Distributors, Inc. serves as the Funds’ distributor.
(7) Other Affiliates
Certain of the Funds’ investments are in companies that are considered to be affiliated companies of a Fund because the Fund owns 5% or more of the outstanding voting securities of the company. With respect to each such investment, refer to each Fund’s respective Schedule of Investments for the information on the sector of each such company, the number of shares of each such company held, and the percentages of net assets represented by such companies held in each sector. Transactions during the period in securities of these companies were as follows:
50
Notes to Financial Statements
PRIMECAP Odyssey Funds
For the Year Ended October 31, 2021 – continued
PRIMECAP Odyssey Growth Fund
| | | | | | | | | | | | | | | | | | | | | | | | | | | | |
| | | | | | Current Period Transactions | | | | |
Common Stock | | Market
Value at
October 31,
2020 | | | Purchases
at Cost | | | Proceeds
from
Securities
Sold | | | Dividend
Income | | | Realized
Gain
(Loss) | | | Change in
Unrealized
Gain (Loss) | | | Market
Value at
October 31,
2021 | |
iRobot Corp.(1) | | $ | 149,050,396 | | | $ | — | | | $ | 43,519,767 | | | $ | — | | | $ | 13,223,441 | | | $ | (1,793,975 | ) | | $ | N/A | |
Stratasys Ltd.(1) | | | 35,860,667 | | | | — | | | | 19,162,296 | | | | — | | | | 5,460,169 | | | | 46,652,247 | | | | N/A | |
| | | | | | | | | | | | | | | | | | | | | | | | | | | | |
Total | | $ | 184,911,063 | | | $ | — | | | $ | 62,682,063 | | | $ | — | | | $ | 18,683,610 | | | $ | 44,858,272 | | | $ | N/A | |
| | | | | | | | | | | | | | | | | | | | | | | | | | | | |
| | (1) | No longer an affiliate as of October 31, 2021. |
PRIMECAP Odyssey Aggressive Growth Fund
| | | | | | | | | | | | | | | | | | | | | | | | | | | | |
| | | | | | Current Period Transactions | | | | |
Common Stock | | Market
Value at
October 31,
2020 | | | Purchases
at Cost | | | Proceeds
from
Securities
Sold | | | Dividend
Income | | | Realized
Gain
(Loss) | | | Change in
Unrealized
Gain
(Loss) | | | Market
Value at
October 31,
2021 | |
Axcelis Technologies, Inc. | | $ | 52,175,687 | | | $ | — | | | $ | 11,482,832 | | | $ | — | | | $ | 8,632,572 | | | $ | 63,555,723 | | | $ | 112,881,150 | |
Calithera Biosciences, Inc. | | | 24,949,566 | | | | 736,461 | | | | — | | | | — | | | | — | | | | (11,424,485 | ) | | | 14,261,542 | |
Cerus Corp | | | 56,543,025 | | | | — | | | | 5,438,093 | | | | — | | | | 706,443 | | | | 13,593,305 | | | | 65,404,680 | |
comScore, Inc.(1) | | | 7,514,251 | | | | — | | | | 483 | | | | — | | | | (30,371 | ) | | | 7,243,383 | | | | N/A | |
Epizyme, Inc. | | | 120,597,842 | | | | 388,091 | | | | — | | | | — | | | | — | | | | (79,765,844 | ) | | | 41,220,089 | |
Fluidigm Corp. | | | 25,397,962 | | | | — | | | | 1,416,561 | | | | — | | | | (3,762,143 | ) | | | 1,365,587 | | | | 21,584,845 | |
Nektar Therapeutics | | | 178,046,827 | | | | 55,850 | | | | 2,543,244 | | | | — | | | | (438,049 | ) | | | (6,868,427 | ) | | | 168,252,957 | |
NMI Holdings, Inc. – Class A(1) | | | 91,535,559 | | | | 339,799 | | | | 41,341,191 | | | | — | | | | 13,533,768 | | | | (2,803,449 | ) | | | N/A | |
NN, Inc. | | | 20,575,968 | | | | — | | | | 8,530,126 | | | | — | | | | (16,976,005 | ) | | | 18,168,673 | | | | 13,238,510 | |
Pulmonx Corp.(2) | | | N/A | | | | 101,327,582 | | | | 155,540 | | | | — | | | | (2,161 | ) | | | (9,062,424 | ) | | | 98,058,947 | |
Rhythm Pharmaceuticals, Inc. | | | 73,281,649 | | | | 37,348,341 | | | | 72,729 | | | | — | | | | (125,492 | ) | | | (55,257,663 | ) | | | 55,174,106 | |
ServiceSource International, Inc. | | | 9,480,495 | | | | — | | | | 26,047 | | | | — | | | | (149,760 | ) | | | (465,728 | ) | | | 8,838,960 | |
Wave Life Sciences Ltd. | | | 20,185,557 | | | | 9,007,087 | | | | 58,457 | | | | — | | | | (150,543 | ) | | | (11,221,354 | ) | | | 17,762,290 | |
Xencor, Inc. | | | 164,006,990 | | | | 55,116 | | | | 101,072 | | | | — | | | | (9,011 | ) | | | 5,036,469 | | | | 168,988,492 | |
| | | | | | | | | | | | | | | | | | | | | | | | | | | | |
Total | | $ | 844,291,378 | | | $ | 149,258,327 | | | $ | 71,166,375 | | | $ | — | | | $ | 1,229,248 | | | $ | (67,906,234 | ) | | $ | 785,666,568 | |
| | | | | | | | | | | | | | | | | | | | | | | | | | | | |
| | (1) | No longer an affiliate as of October 31, 2021. |
| | (2) | As of October 31, 2020, the company was not an affiliate. |
51
Notes to Financial Statements
PRIMECAP Odyssey Funds
For the Year Ended October 31, 2021 – continued
(8) Other Matters
The global outbreak of COVID-19 (commonly referred to as “coronavirus”) has disrupted economic markets, and the prolonged economic impact is uncertain. The ultimate economic fallout from the pandemic, and the long-term impact on economies, markets, industries, and individual issuers, are not known. The operational and financial performance of the issuers of securities in which each Fund invests depends on future developments, including the duration and spread of the outbreak, and such developments may negatively impact the value of each Fund’s investments and lead to losses. The ultimate impact of COVID-19 on the financial performance of each Fund’s investments is not reasonably estimable at this time.
(9) Subsequent Events
The Funds have evaluated subsequent events through the issuance of the financial statements and determined that no events have occurred that require disclosure.
52
| | |
| | Report of Independent Registered Public Accounting Firm |
To the Board of Trustees of PRIMECAP Odyssey Funds and Shareholders of
PRIMECAP Odyssey Stock Fund,
PRIMECAP Odyssey Growth Fund, and
PRIMECAP Odyssey Aggressive Growth Fund
Opinions on the Financial Statements
We have audited the accompanying statements of assets and liabilities, including the schedules of investments, of PRIMECAP Odyssey Stock Fund, PRIMECAP Odyssey Growth Fund, and PRIMECAP Odyssey Aggressive Growth Fund (constituting PRIMECAP Odyssey Funds, hereafter collectively referred to as the “Funds”) as of October 31, 2021, the related statements of operations for the year ended October 31, 2021, the statements of changes in net assets for each of the two years in the period ended October 31, 2021, including the related notes, and the financial highlights for each of the five years in the period ended October 31, 2021 (collectively referred to as the “financial statements”). In our opinion, the financial statements present fairly, in all material respects, the financial position of each of the Funds as of October 31, 2021, the results of each of their operations for the year then ended, the changes in each of their net assets for each of the two years in the period ended October 31, 2021 and each of the financial highlights for each of the five years in the period ended October 31, 2021 in conformity with accounting principles generally accepted in the United States of America.
Basis for Opinions
These financial statements are the responsibility of the Funds’ management. Our responsibility is to express an opinion on the Funds’ financial statements based on our audits. We are a public accounting firm registered with the Public Company Accounting Oversight Board (United States) (PCAOB) and are required to be independent with respect to the Funds in accordance with the U.S. federal securities laws and the applicable rules and regulations of the Securities and Exchange Commission and the PCAOB.
We conducted our audits of these financial statements in accordance with the standards of the PCAOB. Those standards require that we plan and perform the audit to obtain reasonable assurance about whether the financial statements are free of material misstatement, whether due to error or fraud.
Our audits included performing procedures to assess the risks of material misstatement of the financial statements, whether due to error or fraud, and performing procedures that respond to those risks. Such procedures included examining, on a test basis, evidence regarding the amounts and disclosures in the financial statements. Our audits also included evaluating the accounting principles used and significant estimates made by management, as well as evaluating the overall presentation of the financial statements. Our procedures included confirmation of securities owned as of October 31, 2021 by correspondence with the custodian and brokers; when replies were not received from brokers, we performed other auditing procedures. We believe that our audits provide a reasonable basis for our opinions.
/s/ PricewaterhouseCoopers LLP
Los Angeles, California
December 10, 2021
We have served as the auditor of one or more investment companies in PRIMECAP Odyssey Funds Investment Company Complex since 2004.
53
| | |
| | Expense Example PRIMECAP Odyssey Funds (Unaudited) |
As a shareholder of one or more of the Funds, you incur ongoing costs including management fees and other Fund expenses. This expense example is intended to help you understand your ongoing costs (in dollars) of investing in the Funds and to compare these costs with the ongoing costs of investing in other mutual funds.
The expense example is based on an investment of $1,000 invested for a six-month period beginning May 1, 2021 through October 31, 2021.
Actual Expenses
The information in the table adjacent to the heading “Actual Performance” provides actual account values and actual expenses. You may use the information in these columns, together with the amount you invested, to estimate the expenses that you paid over the period. Simply divide your account value by $1,000 (for example, an $8,600 account value divided by $1,000 = 8.6), then multiply the result by the number in the column entitled “Expenses Paid during Period” to estimate the expenses you paid on your account during this period.
Hypothetical Example for Comparison Purposes
The information in the table adjacent to the heading “Hypothetical Performance (5% return before expenses)” provides hypothetical account values and hypothetical expenses based on the Funds’ actual expense ratios and an assumed rate of return of 5% per year before expenses, which are not the Funds’ actual returns. The hypothetical account values and expenses may not be used to estimate the actual ending account balance or expenses you paid for the period. You may use this information to compare the ongoing costs of investing in the Funds and other mutual funds. To do so, compare these 5% hypothetical examples with the 5% hypothetical examples that appear in the shareholder reports of the other mutual funds.
Please note that the expenses shown in the table are meant to highlight your ongoing costs only. Therefore, the information adjacent to the heading “Hypothetical Performance (5% return before expenses)” is useful in comparing ongoing costs only and will not help you determine the relative total costs of owning different mutual funds. In addition, if transactional costs were included, your costs would have been higher.
54
Expense Example
PRIMECAP Odyssey Funds
(Unaudited) – continued
| | | | | | | | | | | | | | | | |
| | | Beginning
Account
Value
(5/1/21) | | | Ending
Account
Value
(10/31/21) | | | Expenses Paid
During Period(1)
(5/1/21 to
10/31/21) | | | Expense Ratio
During Period(1)
(5/1/21 to
10/31/21) | |
PRIMECAP Odyssey Stock Fund | | | | | | | | | | | | | |
Actual Performance | | $ | 1,000.00 | | | $ | 1,052.70 | | | $ | 3.36 | | | | 0.65% | |
Hypothetical Performance (5% return before expenses) | | $ | 1,000.00 | | | $ | 1,021.93 | | | $ | 3.31 | | | | 0.65% | |
PRIMECAP Odyssey Growth Fund | | | | | | | | | | | | | |
Actual Performance | | $ | 1,000.00 | | | $ | 1,056.80 | | | $ | 3.37 | | | | 0.65% | |
Hypothetical Performance (5% return before expenses) | | $ | 1,000.00 | | | $ | 1,021.93 | | | $ | 3.31 | | | | 0.65% | |
PRIMECAP Odyssey Stock Fund | | | | | | | | | | | | | |
Actual Performance | | $ | 1,000.00 | | | $ | 1,038.40 | | | $ | 3.29 | | | | 0.64% | |
Hypothetical Performance (5% return before expenses) | | $ | 1,000.00 | | | $ | 1,021.98 | | | $ | 3.26 | | | | 0.64% | |
| | (1) | Expenses are equal to a Fund’s annualized expense ratio as indicated, multiplied by the average account value over the period, multiplied by the number of days in the most recent fiscal half-year period (184), then divided by the number of days in the fiscal year (365) to reflect the one-half year period. |
55
| | |
| | Additional Information PRIMECAP Odyssey Funds (Unaudited) |
Additional Tax Information
PRIMECAP Odyssey Stock Fund, PRIMECAP Odyssey Growth Fund, and PRIMECAP Odys-sey Aggressive Growth Fund designate 100%, 100%, and 0%, respectively, of ordinary income distributions paid during the fiscal year ended October 31, 2021 as qualified dividend income.
PRIMECAP Odyssey Stock Fund, PRIMECAP Odyssey Growth Fund, and PRIMECAP Odys-sey Aggressive Growth Fund designate 100%, 100%, and 0%, respectively, of ordinary income distributions paid during the fiscal year ended October 31, 2021 as dividends qualifying for the dividends received deduction available for corporate shareholders.
PRIMECAP Odyssey Stock Fund, PRIMECAP Odyssey Growth Fund, and PRIMECAP Odys-sey Aggressive Growth Fund designate 0%, 0%, and 0%, respectively, of ordinary income distributions paid during the fiscal year ended October 31, 2021 as short-term capital gain under Internal Revenue Code 871(k)(2)(C).
Proxy Voting Procedures
The Investment Advisor votes proxies relating to portfolio securities in accordance with procedures that have been approved by the Trust’s Board of Trustees. You may obtain a description of these procedures, free of charge, by calling toll-free 1-800-729-2307. This information is also available through the Securities and Exchange Commission’s (“SEC”) website at www.sec.gov.
Proxy Voting Record
Information regarding how the Funds voted proxies relating to the portfolio securities during the most recent 12-month period ended June 30 is available, without charge, by calling toll-free 1-800-729-2307. This information is also available through the SEC’s website at www.sec.gov.
Portfolio Holdings Disclosure
The Funds file a complete schedule of portfolio holdings with the SEC for the first and third quarters of each fiscal year on Part F of Form N-PORT. This information is available, without charge, by calling toll-free 1-800-729-2307. The Funds’ Part F of Form N-PORT is also available on the SEC’s website at www.sec.gov. The Funds’ Part F of Form N-PORT may be reviewed and copied at the Commission’s Public Reference Room in Washington, DC, and information on the operation of the Public Reference Room may be obtained by calling 1-800-SEC-0330.
Board Approval of the Renewal of the Investment Advisory Agreement
The Board of Trustees (the “Board”) of PRIMECAP Odyssey Funds (the “Trust”) is comprised of seven Trustees, five of whom are not “interested persons” of the Trust as defined by the Investment Company Act of 1940, as amended (the “Independent Trustees”).1 In October 2021, the Board of Trustees, including the Independent Trustees, approved a one-year renewal of the Trust’s investment advisory agreement with PRIMECAP Management Company (the “Advisor”) with respect to the series of the Trust (the “Funds”).
| | 1 | Effective November 1, 2021, one Trustee previously classified as an “interested person” of the Trust, as defined by the Investment Company Act of 1940, was classified as an Independent Trustee by the other Independent Trustees. |
56
Additional Information
PRIMECAP Odyssey Funds
(Unaudited) – continued
General Information
As part of the annual contract review process, the Independent Trustees, through counsel to the Trust and the Independent Trustees, requested and received extensive materials, including information related to the nature, extent, and quality of the services provided to the Funds by the Advisor; the short- and long-term performance of each Fund relative to the performance of market indices and other funds in its Morningstar, Inc. (“Morningstar”) institutional category as selected by Broadridge Financial Solutions (“Broadridge”); the advisory fees paid to the Advisor and the total expense ratio of each Fund compared to the advisory fees and the total expense ratios of other funds in the Fund’s Morningstar retail category; financial information for the Advisor and information related to the profitability to the Advisor of the investment advisory agreement with the Trust; the extent to which the Advisor expects to achieve economies of scale in connection with the services it provides to each Fund; any ancillary or “fall out” benefits that the Advisor may derive from its relationship with the Funds; and the personnel of the Advisor providing services to the Funds. The Independent Trustees also requested and received information regarding the Advisor’s risk controls, risk evaluation processes, compliance program (including brokerage and trading processes), information technology infrastructure (including cyber security measures), business continuity plans, and other matters.
The Trust engaged Broadridge to prepare an independent expense and performance analysis for each Fund. Broadridge used data compiled by Morningstar to compare the expenses and performance of each Fund to those of similar funds managed by other advisors identified by Broadridge. The Board reviewed the Broadridge materials, which included comparisons of the performance and risk profile of each Fund to those of relevant market indices and of other funds in the relevant Morningstar institutional and retail categories and in a smaller group of funds selected by Broadridge (each a “peer group”). The Broadridge materials also included for each Fund comparisons of advisory fees and total expenses to those of other funds in the relevant Morningstar category and peer group.
With respect to investment performance, the Trustees noted that the Advisor had made quarterly presentations to the Board regarding the Funds’ portfolio construction, investment strategies, and results. The Trustees also noted that in addition to meeting with the Funds’ portfolio managers on a quarterly basis, they also received presentations from different investment analysts throughout the year on specific investment sectors and each Fund’s investments in those sectors. In considering the renewal of the agreement, the Board also took into account other information it had received at past Board and committee meetings with respect to various matters.
The Trustees reviewed information from counsel to the Trust and the Independent Trustees regarding their responsibilities in considering whether to renew the investment advisory agreement for an additional one-year period. In connection with their deliberations, the Board considered such information and factors that they believed to be relevant. The Board considered renewal of the investment advisory agreement separately for each Fund, although the Board took into account the common interests of all the Funds in its review. In considering these matters, the Board discussed the renewal of the investment advisory agreement with management, and the
57
Additional Information
PRIMECAP Odyssey Funds
(Unaudited) – continued
Trustees who are not employees of the Advisor met in a private session with counsel to the Trust and the Independent Trustees at which no employees of the Advisor were present.
In deciding to approve the renewal of the investment advisory agreement, the Board and the Independent Trustees did not identify a single factor that was controlling. The Board and the Independent Trustees concluded that each of the various factors referred to below favored such approval. The following summary describes the key factors considered by the Trustees and their conclusions that formed the basis for approving the renewal of the investment advisory agreement in light of the legal advice furnished by counsel and their own business judgment. This summary is not inclusive of all of the factors considered, and each Trustee did not necessarily attribute the same weight to each factor.
Nature, Extent, and Quality of Services
The Board considered the services provided by the Advisor to the Funds under the investment advisory agreement, including the background, education, and experience of the Advisor’s key portfolio management, compliance, and operational personnel; its overall financial strength and stability; its resources and efforts to retain, attract, and motivate capable personnel to serve the Funds; and the overall general quality and depth of its organization. The Board also took into account the experience, capability, and integrity of the Advisor’s senior management, the time that senior management commits to the Funds, and the Advisor’s demonstrated commitment to the Funds; its investment philosophy and processes, including its brokerage and trading practices; its disaster recovery and contingency planning; its oversight of the Funds’ internal control environment with regard to compliance with applicable laws and regulations; and the significant investment by each portfolio manager in the Funds that he manages, which helps align his interests with those of Fund shareholders. The Trustees concluded that the nature, extent, and quality of services provided under the investment advisory agreement were of a high level and satisfactory.
Investment Performance
The Board assessed the performance of each Fund compared with the performance of its benchmark(s) and other funds in the Fund’s Morningstar retail category and peer group for the one-, three-, five- and ten-year periods ended July 31, 2021. The Board made the following observations in reviewing the Funds’ performance:
| | • | | The annualized total return of the PRIMECAP Odyssey Stock Fund outperformed the S&P 500 Index for the one-year and since inception periods ended July 31, 2021, although it underperformed the S&P 500 Index during the three-, five-, and ten-year periods ended July 31, 2021, by 4.18%, 1.54%, and 0.81%, respectively. The Fund outperformed the medians of funds in the Morningstar Large Relative Value category and peer group for the one-year period. The Fund’s annualized total return was above the median of funds in the Morningstar category for the five- and ten-year periods, but below the median of funds in the category for the three-year period by 1.65%. The Fund’s annualized total returns were below the median returns of the peer group for the three-, five- and ten-year periods by 1.48%, 0.61%, and 0.10%, respectively. |
58
Additional Information
PRIMECAP Odyssey Funds
(Unaudited) – continued
| | • | | The annualized total returns of the PRIMECAP Odyssey Growth Fund outperformed the S&P 500 Index for the one-, five-, and ten-year and since inception periods ended July 31, 2021, although it underperformed the S&P 500 Index during the three-year period ended July 31, 2021, by 5.26%. The Fund’s annualized total returns underperformed its secondary benchmark, the Russell 1000 Growth Index, for the three-, five-, and ten-year and since inception periods by 12.39%, 5.92%, 2.83% and 0.76%, respectively. The Fund outperformed the medians of funds in the Morningstar Large Core Growth category and peer group for the one-year period. For the three-, five- and ten-year periods, the Fund’s annualized total returns were below the Morningstar category’s median return by 10.42%, 4.58% and 1.44%, respectively. The Fund’s annualized total returns were below the median returns of the peer group for the three-, five- and ten-year periods by 10.41%, 3.79%, and 0.97%, respectively. |
| | • | | The annualized total returns of the PRIMECAP Odyssey Aggressive Growth Fund were above the returns of the Fund’s primary benchmark, the S&P 500 Index, and its secondary benchmark, the Russell Mid Cap Growth Index, for the ten-year and since inception periods ended July 31, 2021. The Fund’s annualized total return was above the return of the S&P 500 Index for the five-year period but below the return of the Index for the one- and three-year periods by 0.09% and 4.77%, respectively. The Fund outperformed the Russell Mid Cap Growth Index for the one-year period, but the Fund’s annualized total returns for the three- and five-year periods were below the returns of the Russell Mid Cap Growth Index by 8.55% and 1.54%, respectively. The Fund’s performance was above the median of funds in the Morningstar All Cap Growth category for the ten-year period. For the one-, three-, and five-year periods, the Fund returned 3.69%, 6.68% and 1.73% less than the category median, respectively. The Fund’s annualized total returns exceeded the peer group medians for the five- and ten-year periods but were lower than the peer group medians for the one- and three-year periods by 4.13% and 5.20%, respectively. |
In assessing the performance of the Funds, the Trustees considered the Advisor’s explanation that the Funds’ recent strong performance relative to their respective indices and peer groups and Morningstar categories over various periods were principally due to the decreased impact of the COVID-19 pandemic on the U.S. economy and increased vaccination rates, which led to broader optimism and consumer confidence. The Trustees also considered that as the Advisor had reported in 2020, the Funds’ underweight positions in the high-performing “Big 5” technology stocks (i.e., Microsoft, Apple, Amazon, Alphabet and Facebook) relative to the S&P 500 Index materially hindered each Fund’s relative performance during the year ended July 31, 2020; that each Fund had overweight positions in the airline and cruise line industries when the COVID-19 pandemic first began, and that each of those industries had been negatively impacted by the pandemic; and that these two factors were the primary drivers that led to the underperformance by the Funds for the three-year and longer periods ended July 31, 2021. The Trustees noted, however, that the Adviser believed that each Fund continued to hold considerable value in its portfolio despite the various periods of underperformance. The Trustees also noted that each Fund had performed well over the long term.
59
Additional Information
PRIMECAP Odyssey Funds
(Unaudited) – continued
Based on the information provided to them and in consideration of the specific investment objectives and risk profiles of each Fund, the Board and the Independent Trustees concluded that the performance of each Fund was satisfactory.
Advisory Fees and Fund Expenses
The Board reviewed the advisory fees and expenses paid by each Fund compared to those of other funds in the same Morningstar retail category (for the Stock Fund – Large Blend funds; for the Growth Fund – Large Growth funds; and for the Aggressive Growth Fund – Mid-Cap Growth funds), and of other funds in the Fund’s expense peer group, which was selected by Broadridge and was comprised of funds comparable to the Fund with fee structures and characteristics similar to those of the Funds (e.g., no distribution or shareholder servicing fees, and excluding load funds, index and enhanced index funds, funds of funds, and multi-manager funds).
The materials for the meeting indicated as follows:
| | • | | The advisory fee of the Stock Fund was the same as the median of the expense peer group and below the median of funds in the Morningstar Large Blend retail category. |
| | • | | The advisory fee of the Growth Fund was below the median fees of the funds in the Morningstar Large Growth retail category and the Fund’s expense peer group. |
| | • | | The advisory fee of the Aggressive Growth Fund was below the median fees of the funds in the Morningstar Mid-Cap Growth retail category and the Fund’s expense peer group. |
| | • | | The total expense ratios of each Fund were below the medians of the respective expense peer group and Morningstar retail category. |
The Board also reviewed the fees charged by the Advisor to other clients, including other mutual funds for which it provides sub-advisory services. The Board considered that although those fees were lower than those charged by the Advisor to the Funds, the differences appropriately reflected the investment, operational, and regulatory differences between advising other clients and the Funds, noting that mutual funds are subject to certain requirements under the 1940 Act that do not apply to the Advisor’s separate account clients, and that the Advisor provides more services to the Funds than it does to those funds for which it provides sub-advisory services. The Board and the Independent Trustees determined that the advisory fees and expenses charged to the Funds were reasonable in consideration of the services provided.
Costs and Profits of the Advisor
The Board reviewed information regarding the Advisor’s financial position and concluded that the Advisor would be able to continue to provide advisory services to the Funds. The Board also reviewed information relating to the Advisor’s profitability. The Board noted that the Advisor had closed the Aggressive Growth Fund in January 2014 to most new investors, limiting the growth of the Fund and consequently future profits to the Advisor as it relates to the Fund. In considering the Advisor’s profitability, the Trustees recognized the competitiveness of the registered fund industry and the importance of the long-term profitability of the Advisor, not only in maintaining its own financial condition, but also in maintaining an environment in which it is able to
60
Additional Information
PRIMECAP Odyssey Funds
(Unaudited) – continued
attract and retain talented investment professionals, therefore promoting management stability and accountability. Recognizing the difficulty in evaluating an investment advisor’s profitability with respect to the funds it manages in the context of an advisor with multiple lines of business, and noting that other profitability methodologies might also be reasonable, the Board and the Independent Trustees concluded that the profit of the Advisor from its relationship with each Fund was reasonable.
Economies of Scale and Other Benefits to the Investment Advisor
The Trustees considered that the Investment Advisory Agreement originally provided for a fee breakpoint at $100 million in assets for each Fund. The Trustees also noted that the Advisor added an additional breakpoint effective May 1, 2021, on assets in excess of $10 billion with respect to each Fund. The Board considered that the Advisor had significant assets under management at the time the Funds commenced operations and that the Funds were offered advisory fee rates at inception that reflected scale within the Advisor’s business. The Board also acknowledged various diseconomies of scale experienced by the Advisor as the Funds have grown, including the hiring of additional personnel and the provision of additional services to the Funds including online access to shareholder accounts and improved technology, systems, and hardware. The Board and the Independent Trustees concluded that the Advisor had shared any economies of scale it had realized from the Funds with the Funds and their shareholders through advisory fee breakpoints, the hiring of additional personnel, and the provision of additional services to the Funds.
The Board also considered the benefits received by the Advisor as a result of its relationship with the Funds other than investment advisory fees, including any research provided to the Advisor by broker-dealers providing execution services to the Funds, the intangible benefits of the Advisor’s association with the Funds generally, and any favorable publicity arising in connection with the Funds’ performance.
Conclusions
Based on their review, including their consideration of each of the factors referred to above, the Board and the Independent Trustees concluded that the compensation payable to the Advisor pursuant to the investment advisory agreement with respect to each Fund was fair and reasonable in light of the services being provided by the Advisor to the Fund and its shareholders and that renewal of the investment advisory agreement with respect to each Fund was in the best interest of the Fund and its shareholders.
61
| | |
| | Management PRIMECAP Odyssey Funds (Unaudited) |
Portfolio Managers
PRIMECAP Management Company has five portfolio managers who together have more than 145 years of investment experience. The portfolio managers primarily responsible for overseeing the Funds’ investments are:
| | | | |
| Name | | Years of Experience | |
Theo A. Kolokotrones | | | 51 | |
Joel P. Fried | | | 36 | |
Alfred W. Mordecai | | | 24 | |
M. Mohsin Ansari | | | 21 | |
James Marchetti | | | 16 | |
Each of these five individuals manages a portion of the PRIMECAP Odyssey Stock Fund, the PRIMECAP Odyssey Growth Fund, and the PRIMECAP Odyssey Aggressive Growth Fund. A portion of each Fund’s assets may be managed by individuals in the Investment Advisor’s research department.
Officers and Trustees
The Trust’s officers, who oversee the Funds’ daily operations, are appointed by the Board of Trustees. The trustees are responsible for the overall management of the Trust, including establishing the Funds’ policies and general supervision and review of their investment activities. The Statement of Additional Information includes additional information about the trustees and is available, without charge, by calling 1-800-729-2307 or at the Funds’ website at www.primecap.com.
Executive Officers. The table below sets forth certain information about each of the Trust’s executive officers. The address for each officer is 177 East Colorado Boulevard, 11th Floor, Pasadena, CA 91105.
| | | | | | |
Name
Age | | Position(s)
Held
with Trust | | Term of Office;
Length of
Time Served | | Principal Occupation(s)
During Past 5 Years |
Theo A. Kolokotrones Age: 75 | | Co-Chief Executive Officer | | Indefinite;
Since 09/04 | | Chairman, Director, and Portfolio Manager PRIMECAP Management Company |
Joel P. Fried Age: 59 | | Co-Chief Executive Officer and Trustee | | Indefinite;
Since 09/04 | | President, Director, and Portfolio Manager PRIMECAP Management Company |
62
Management
PRIMECAP Odyssey Funds
(Unaudited) – continued
| | | | | | |
Name
Age | | Position(s)
Held
with Trust | | Term of Office;
Length of
Time Served | | Principal Occupation(s)
During Past 5 Years |
Alfred W. Mordecai Age: 54 | | Co-Chief Executive Officer | | Indefinite;
Since 10/12 | | Vice Chairman, Director, and Portfolio Manager PRIMECAP Management Company |
Michael J. Ricks Age: 43 | | Chief Financial Officer, Secretary, Chief Administrative Officer | | Indefinite;
Since 03/11 | | Director of Fund Administration PRIMECAP Management Company; Chief Compliance Officer, PRIMECAP Odyssey Funds; Chief Compliance Officer PRIMECAP Management Company March 2019-March 2020 |
Jennifer Ottosen Age: 61 | | Chief Compliance Officer, AML Compliance Officer | | Indefinite;
Since 02/20 | | Chief Compliance Officer, PRIMECAP Management Company since March 2020; Senior Compliance Officer, PRIMECAP Management Company May 2019-March 2020; CCO Dividend Assets Capital, LLC; CCO & General Counsel, GW Capital, Inc. |
“Independent” Trustees. The table below sets forth certain information about each of the trustees of the Trust who is not an “interested person” of the Trust as defined in the 1940 Act (“Independent Trustees”). The address for each Independent Trustee is 177 East Colorado Boulevard, 11th Floor, Pasadena, CA 91105.
| | | | | | | | | | |
Name
Age | | Position(s)
Held
with Trust | | Term of
Office;
Length of
Time Served | | Principal Occupation(s)
During Past 5 Years | | Number of
Portfolios in
Fund Complex
Overseen by
Trustee(1) | | Other
Director-
ships Held
by Trustee |
Benjamin F. Hammon Age: 86 | | Chairman of the Board and Trustee | | Indefinite;
Since 09/04 | | Retired; Private investor | | 3 | | None |
Wayne H. Smith Age: 80 | | Chairman of the Audit Committee and Trustee | | Indefinite;
Since 09/04 | | Retired; Private investor | | 3 | | None |
Joseph G. Uzelac Age: 77 | | Trustee | | Indefinite;
Since 10/07 | | Retired; Private investor | | 3 | | None |
Elizabeth D. Obershaw Age: 61 | | Trustee | | Indefinite;
Since 06/08 | | Retired; Formerly, Managing Director, Horsley Bridge Partners, an investment advisor (2007-2021) | | 3 | | None |
J. Blane Grinstead Age: 66 | | Trustee | | Indefinite;
Since 03/19 | | Retired; Private investor | | 3 | | Orenda, Inc.,
a renewable
energy
technology
company
(May 2020 –
Present) |
Michael Glazer(2) Age: 81 | | Trustee | | Indefinite;
Since 10/19 | | Formerly, Partner and Senior Counsel, Morgan, Lewis & Bockius LLP | | 3 | | None |
| | (1) | Fund Complex includes any funds, series of funds, or trusts that share the same advisor or that hold themselves out to investors as related companies. |
| | (2) | Independent Trustee effective 11-01-21. |
63
Management
PRIMECAP Odyssey Funds
(Unaudited) – continued
“Interested” Trustees. The table below sets forth certain information about each of the trustees of the Trust who is an “interested person” of the Trust as defined by the 1940 Act. The address for each interested trustee is 177 East Colorado Boulevard, 11th Floor, Pasadena, CA 91105.
| | | | | | | | | | |
Name
Age | | Position(s)
Held
with Trust | | Term of
Office;
Length of
Time Served | | Principal Occupation(s) During Past 5 Years | | Number of
Portfolios in
Fund Complex
Overseen by
Trustee(1) | | Other
Director-
ships Held
by Trustee |
Joel P. Fried(2) Age: 59 | | Co-Chief Executive Officer and Trustee | | Indefinite;
Since 09/04 | | President, Director, and Portfolio Manager
PRIMECAP Management Company | | 3 | | None |
| | (1) | Fund Complex means two or more registered investment companies that hold themselves out to investors as related companies for purposes of investment and investor services or have a common investment advisor or have an investment advisor that is an affiliated person of the investment advisor of any of the other registered investment companies. |
| | (2) | Mr. Fried is an “interested person” of the Trust, as defined by the 1940 Act, because of his employment with PRIMECAP Management Company, the investment advisor to the Trust. |
64
| | |
| | Privacy Notice PRIMECAP Odyssey Funds |
PRIMECAP Management Company
Maintaining the confidentiality of client personal financial information is very important to PRIMECAP Odyssey Funds (the “Trust”) and PRIMECAP Management Company (the “Advisor”). The Advisor and the Trust may collect several types of nonpublic personal information about investors, including:
| | • | | Information from forms that investors may fill out and send to the Advisor or the Trust in connection with an account (such as name, address, and social security number). |
| | • | | Information an investor may give the Advisor or the Trust orally. |
| | • | | Information about the amount investors have invested in an account. |
| | • | | Information about any bank account investors may use for transfers between a bank account and a shareholder account. |
The Advisor and the Trust will not sell or disclose client personal information to anyone except as permitted or required by law. For example, information collected may be shared with the independent auditors in the course of the annual audit of the Advisor or the Trust. The Advisor or the Trust may also share this information with the Advisor’s or the Trust’s legal counsel, as deemed appropriate, and with regulators. Finally, the Advisor or the Trust may disclose information about clients or investors at the client’s or investor’s request (for example, by sending duplicate account statements to someone designated by the client or investor), or as otherwise permitted or required by law.
Within the Advisor and the Trust, access to information about clients and investors is restricted to those employees or service providers who need to know the information to service client accounts. The Advisor’s employees are trained to follow its procedures to protect client privacy and are instructed to access information about clients only when they have a business reason to obtain it.
The Advisor and the Trust reserve the right to change this privacy policy in the future, but we will not disclose investor nonpublic personal information except as required or permitted by law without giving the investor an opportunity to instruct us not to do so.
Investment Advisor
PRIMECAP MANAGEMENT COMPANY
177 East Colorado Boulevard, 11th Floor
Pasadena, California 91105
•
Distributor
ALPS DISTRIBUTORS, INC.
1290 Broadway, Suite 1000
Denver, Colorado 80203
•
Custodian
U.S. BANK, N.A.
1555 North RiverCenter Drive, Suite 302
Milwaukee, Wisconsin 53212
•
Transfer Agent
U.S. BANCORP FUND SERVICES, LLC
615 East Michigan Street, 3rd Floor
Milwaukee, Wisconsin 53202
•
Administrator
U.S. BANCORP FUND SERVICES, LLC
2020 East Financial Way, Suite 100
Glendora, California 91741
•
Legal Counsel
MORGAN, LEWIS & BOCKIUS LLP
600 Anton Boulevard, Suite 1800
Costa Mesa, CA 92626
•
Independent Registered Public Accounting Firm
PRICEWATERHOUSECOOPERS LLP
601 South Figueroa Street, Suite 900
Los Angeles, California 90017
This report is intended for the shareholders of the PRIMECAP Odyssey Funds and may not be used as sales literature unless preceded or accompanied by a current prospectus.
Past performance results shown in this report should not be considered a representation of future performance. Share price and returns will fluctuate so that shares, when redeemed, may be worth more or less than their original cost. Statements and other information herein are dated and are subject to change.
PRIMECAP, PRIMECAP Odyssey, and the PRIMECAP Odyssey logo are trademarks of PRIMECAP Management Company.
Item 2. Code of Ethics.
The registrant has adopted a code of ethics that applies to the registrant’s principal executive officers and principal financial officer. The registrant has not made any amendments to its code of ethics during the period covered by this report. The registrant has not granted any waivers from any provisions of the code of ethics during the period covered by this report.
The registrant undertakes to provide to any person without charge, upon request, a copy of its code of ethics by mail when such person calls the registrant at 1-800-729-2307.
Item 3. Audit Committee Financial Expert.
The registrant’s Board of Trustees has determined that there is at least one audit committee financial expert serving on its audit committee. Wayne Smith is the registrant’s “audit committee financial expert” and is considered to be “independent” as each term is defined in Item 3 of Form N-CSR.
Item 4. Principal Accountant Fees and Services.
The registrant has engaged its principal accountant, PricewaterhouseCoopers LLP, to perform audit services, audit-related services, and tax services during the past two fiscal years. “Audit services” refer to performing an audit of the registrant’s annual financial statements or services that are normally provided by the accountant in connection with statutory and regulatory filings or engagements for those fiscal years. “Audit-related services” refer to the assurance and related services by the principal accountant that are reasonably related to the performance of the audit. “Tax services” refer to professional services rendered by the principal accountant for tax compliance, tax advice, and tax planning and specifically relate to the accountant’s review of the registrant’s federal and state tax returns. There were no other services provided by the principal accountant to the registrant during the past two fiscal years. The following table details the aggregate fees billed or expected to be billed to the registrant for each of the last two fiscal years for audit fees, audit-related fees, tax fees and other fees by the principal accountant.
| | | | | | | | |
| | | FYE 10/31/2021 | | | FYE 10/31/2020 | |
(a) Audit Fees | | $ | 142,888 | | | $ | 133,475 | |
(b) Audit-Related Fees | | $ | 0 | | | $ | 0 | |
(c) Tax Fees | | $ | 17,526 | | | $ | 17,049 | |
(d) All Other Fees | | $ | 0 | | | $ | 0 | |
(e)(1) The audit committee has adopted pre-approval policies and procedures that require the audit committee to pre-approve all audit and non-audit services of the registrant, including services provided to any entity affiliated with the registrant. All services were pre-approved and no waivers to the pre-approval requirement were made.
(e)(2) The percentage of fees billed by PricewaterhouseCoopers applicable to non-audit services pursuant to waiver of pre-approval requirement were as follows:
| | | | | | | | |
| | | FYE 10/31/2021 | | | FYE 10/31/2020 | |
Audit-Related Fees | | | 0 | % | | | 0 | % |
Tax Fees | | | 0 | % | | | 0 | % |
All Other Fees | | | 0 | % | | | 0 | % |
(f) All of the principal accountant’s hours spent on auditing the registrant’s financial statements were attributed to work performed by full-time permanent employees of the principal accountant.
(g) The following table indicates the non-audit fees billed or expected to be billed by the registrant’s accountant for services to the registrant and to the registrant’s investment adviser (and any entity controlling, controlled by, or under common control with the investment adviser) for the last two years.
| | | | | | | | |
Non-Audit Related Fees | | FYE 10/31/2021 | | | FYE 10/31/2020 | |
Registrant | | $ | 17,526 | | | $ | 17,049 | |
Registrant’s Investment Adviser | | $ | 0 | | | $ | 0 | |
(h) The audit committee of the board of trustees/directors has considered whether the provision of non-audit services that were rendered to the registrant’s investment adviser is compatible with maintaining the principal accountant’s independence and has concluded that the provision of such non-audit services by the accountant has not compromised the accountant’s independence.
(i) Not applicable.
(j) Not applicable.
Item 5. Audit Committee of Listed Registrants.
Not applicable to registrants who are not listed issuers (as defined in Rule 10A-3 under the Securities Exchange Act of 1934).
Item 6. Investments.
| (a) | The registrant’s Schedule of Investments is included as part of the report to shareholders filed under Item 1 of this Form. |
Item 7. Disclosure of Proxy Voting Policies and Procedures for Closed-End Management Investment Companies.
Not applicable to open-end investment companies.
Item 8. Portfolio Managers of Closed-End Management Investment Companies.
Not applicable to open-end investment companies.
Item 9. Purchases of Equity Securities by Closed-End Management Investment Company and Affiliated Purchasers.
Not applicable to open-end investment companies.
Item 10. Submission of Matters to a Vote of Security Holders.
There have been no material changes to the procedures by which shareholders may recommend nominees to the registrant’s board of trustees.
Item 11. Controls and Procedures.
| (a) | The Registrant’s Co-Chief Executive Officers and Chief Financial Officer have reviewed the Registrant’s disclosure controls and procedures (as defined in Rule 30a-3(c) under the Investment Company Act of 1940 (the “Act”)) as of a date within 90 days of the filing of this report, as required by Rule 30a-3(b) under the Act and Rules 13a-15(b) or 15d-15(b) under the Securities Exchange Act of 1934. Based on their review, such officers have concluded that the disclosure controls and procedures are effective in ensuring that information required to be disclosed in this report is appropriately recorded, processed, summarized and reported and made known to them by others within the Registrant and by the Registrant’s service provider. |
| (b) | There were no changes in the Registrant’s internal control over financial reporting (as defined in Rule 30a-3(d) under the Act) that occurred during the period covered by this report that have materially affected, or are reasonably likely to materially affect, the Registrant’s internal control over financial reporting. |
Item 12. Disclosure of Securities Lending Activities for Closed-End Management Investment Companies.
Not applicable to open-end investment companies.
Item 13. Exhibits.
(2) A separate certification for each principal executive and principal financial officer pursuant to Rule 30a-2(a) under the Act (17 CFR 270.30a-2(a)). Filed herewith.
(3) Any written solicitation to purchase securities under Rule 23c-1 under the Act sent or given during the period covered by the report by or on behalf of the registrant to 10 or more persons. Not applicable to open-end investment companies.
(4) Change in the registrant’s independent public accountant. There was no change in the registrant’s independent public accountant for the period covered by this report.
(b) Certifications pursuant to Section 906 of the Sarbanes-Oxley Act of 2002. Furnished herewith.
SIGNATURES
Pursuant to the requirements of the Securities Exchange Act of 1934 and the Investment Company Act of 1940, the registrant has duly caused this report to be signed on its behalf by the undersigned, thereunto duly authorized.
| | |
PRIMECAP Odyssey Funds |
| |
| By | | /s/ Joel P. Fried |
| | Joel P. Fried, Co-Chief Executive Officer |
| |
| Date | | December 15, 2021 |
| |
| By | | /s/ Theo A. Kolokotrones |
| | Theo A. Kolokotrones, Co-Chief Executive Officer |
| |
| Date | | December 15, 2021 |
| |
| By | | /s/ Alfred W. Mordecai |
| | Alfred W. Mordecai, Co-Chief Executive Officer |
| |
| Date | | December 15, 2021 |
Pursuant to the requirements of the Securities Exchange Act of 1934 and the Investment Company Act of 1940, this report has been signed below by the following persons on behalf of the registrant and in the capacities and on the dates indicated.
| | |
| By | | /s/ Joel P. Fried |
| | Joel P. Fried, Co-Chief Executive Officer |
| |
| Date | | December 15, 2021 |
| |
| By | | /s/ Theo A. Kolokotrones |
| | Theo A. Kolokotrones, Co-Chief Executive Officer |
| |
| Date | | December 15, 2021 |
| |
| By | | /s/ Alfred W. Mordecai |
| | Alfred W. Mordecai, Co-Chief Executive Officer |
| |
| Date | | December 15, 2021 |
| |
| By | | /s/ Michael J. Ricks |
| | Michael J. Ricks, Chief Financial Officer |
| |
| Date | | December 15, 2021 |