| UNITED STATES SECURITIES AND EXCHANGE COMMISSION | ||
| Washington, D.C. 20549 | ||
FORM N-CSR | ||
| CERTIFIED SHAREHOLDER REPORT OF REGISTERED MANAGEMENT INVESTMENT COMPANIES | ||
| Investment Company Act file number: | (811-21598) |
| Exact name of registrant as specified in charter: | Putnam RetirementReady Funds |
| Address of principal executive offices: | One Post Office Square, Boston, Massachusetts 02109 |
| Name and address of agent for service: | Robert T. Burns, Vice President One Post Office Square Boston, Massachusetts 02109 |
| Copy to: | Bryan Chegwidden, Esq. Ropes & Gray LLP 1211 Avenue of the Americas New York, New York 10036 |
| Registrant's telephone number, including area code: | (617) 292-1000 |
| Date of fiscal year end: | July 31, 2016 |
| Date of reporting period: | August 1, 2015 — January 31, 2016 |
Item 1. Report to Stockholders: |
| The following is a copy of the report transmitted to stockholders pursuant to Rule 30e-1 under the Investment Company Act of 1940: | |||
Putnam RetirementReady® Funds
| Putnam RetirementReady 2060 Fund | Putnam RetirementReady 2035 Fund | |
| Putnam RetirementReady 2055 Fund | Putnam RetirementReady 2030 Fund | |
| Putnam RetirementReady 2050 Fund | Putnam RetirementReady 2025 Fund | |
| Putnam RetirementReady 2045 Fund | Putnam RetirementReady 2020 Fund | |
| Putnam RetirementReady 2040 Fund | Putnam Retirement Income Fund Lifestyle 1 |
Semiannual report
1 | 31 | 16
| Message from the Trustees | 1 | ||
| About the funds | 2 | ||
| Performance snapshot | 4 | ||
| Interview with your fund’s portfolio manager | 5 | ||
| Your fund’s performance | 12 | ||
| Your fund’s expenses | 23 | ||
| Terms and definitions | 28 | ||
| Other information for shareholders | 29 | ||
| Financial statements | 30 | ||
Consider these risks before investing: Our allocation of assets among permitted asset categories may hurt performance. Stock and bond prices may fall or fail to rise over time for several reasons, including general financial market conditions, factors related to a specific issuer or industry and, with respect to bond prices, changing market perceptions of the risk of default and changes in government intervention. These factors may also lead to increased volatility and reduced liquidity in the bond markets. Growth stocks may be more susceptible to earnings disappointments, and value stocks may fail to rebound. Investments in small and/or midsize companies increase the risk of greater price fluctuations. Bond investments are subject to interest-rate risk (the risk of bond prices falling if interest rates rise) and credit risk (the risk of an issuer defaulting on interest or principal payments). Default risk is generally higher for non-qualified mortgages. Interest-rate risk is greater for longer-term bonds, and credit risk is greater for below-investment-grade bonds. Lower-rated bonds may offer higher yields in return for more risk. Funds that invest in government securities are not guaranteed. Mortgage-backed securities are subject to prepayment risk and the risk that they may increase in value less when interest rates decline and decline in value more when interest rates rise. International investing involves currency, economic, and political risks. Emerging-market securities carry illiquidity and volatility risks. Active trading strategies may lose money or not earn a return sufficient to cover trading and other costs. REITs are subject to the risk of economic downturns that have an adverse impact on real estate markets. Commodity-linked notes are subject to the same risks as commodities, such as weather, disease, political, tax and other regulatory developments and other factors affecting the value of commodities. Risks associated with derivatives include increased investment exposure (which may be considered leverage) and, in the case of over-the-counter instruments, the potential inability to terminate or sell derivatives positions and the potential failure of the other party to the instrument to meet its obligations. Efforts to produce lower-volatility returns may not be successful and may make it more difficult at times for the fund to achieve its targeted returns. In addition, under certain market conditions, the funds may accept greater volatility than would typically be the case, in order to seek their targeted return. There is no guarantee that the funds will provide adequate income at and through an investor’s retirement. You can lose money by investing in the funds.
Message from the Trustees
Dear Fellow Shareholder:
In markets around the world, 2016 began with a sharp downturn, driven mainly by fears of weak global growth. Equity and fixed-income markets are again showing some of the negative trends seen during late summer of 2015. Generally speaking, only high-quality bonds appear to be weathering the storm. Of course, as in any downturn, attractive valuation opportunities may be emerging.
While economic growth may be muted in many parts of the world, notably in China and in emerging markets, the U.S. economy appears to be among the more resilient. The unemployment rate has fallen below 5%, with some signs of moderate wage growth and solid housing market conditions. Low energy prices, while a negative for energy companies, mean more money in consumers’ pockets, helping to buoy consumption. Moreover, divergent economic policies among central banks around the globe may create potential opportunities for capturing growth.
Although no one can predict where markets will head going forward, Putnam’s experienced portfolio managers are actively seeking fundamental insights to maneuver in all types of conditions, relying on a proprietary global research framework to help guide their investment decisions. The interview on the following pages provides an overview of your fund’s performance for the reporting period ended January 31, 2016, as well as an outlook for the coming months.
For questions on market turbulence, it may be helpful for you to consult your financial advisor to ensure that your portfolio is aligned with your investment goals, time horizon, and risk tolerance.
As always, thank you for investing with Putnam.

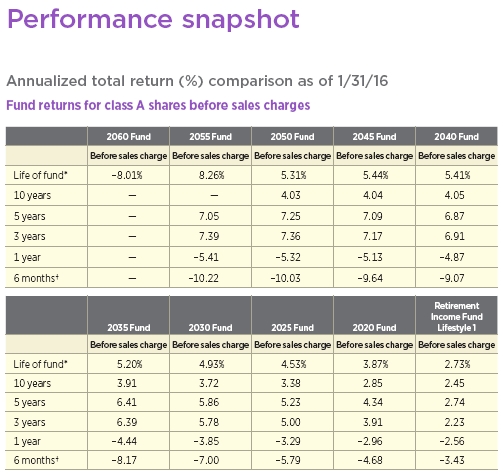
Current performance may be lower or higher than the quoted past performance, which cannot guarantee future results. Share price, principal value, and return will fluctuate, and you may have a gain or a loss when you sell your shares. Performance of class A shares assumes reinvestment of distributions and does not account for taxes. Fund returns in the table above do not reflect a sales charge of 4.00% for Retirement Income Fund Lifestyle 1 and 5.75% for all other funds; had they, returns would have been lower. See pages 5 and 12–22 for additional performance information. For a portion of the periods, the funds had expense limitations, without which returns would have been lower. To obtain the most recent month-end performance, visit putnam.com.
* With the exception of the Putnam RetirementReady 2050 Fund, 2055 Fund, and 2060 Fund (inceptions: 5/2/05, 11/30/10, and 11/30/15, respectively), the inception date of all share classes of the RetirementReady Funds is 11/1/04. Life-of-fund return for the 2060 Fund is cumulative.
† Returns for the six-month period are not annualized, but cumulative.
| 4 | RetirementReady® Funds |
Interview with your fund’s portfolio manager

How did Putnam RetirementReady® Funds perform during the six-month reporting period ended January 31, 2016?
Given the difficult global investment environment, the portfolios all produced negative returns for the six-month period, and in the case of Putnam RetirementReady 2060 Fund, for the period since inception. Investors in the longer-dated funds, which have greater exposure to equities because of their later target dates, underperformed those strategies that are closer to retirement. Investors in the shorter-dated funds, with their greater reliance on fixed-income instruments and absolute return strategies, experienced higher, although still negative, returns. Although the strategies finished negative, the inclusion of the Putnam Absolute Return Funds in the funds’ portfolios helped to dampen volatility during the semiannual period.
What was the global investment environment like during the six-month reporting period?
It was a challenging environment, punctuated by extreme volatility — starting in August 2015, with the economic slowdown in China and Beijing’s devaluation of the yuan. For the first time since 2011, major indexes experienced a correction, defined as a decline of 10% or more from a recent high. The market’s poor performance carried over into September, before recovering in October.
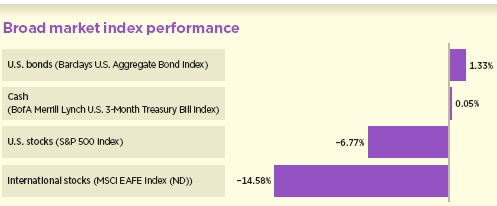
This comparison shows the performance of broad market indexes for the 6 months ended 1/31/16. See pages 4 and 12–22 for additional performance information. Index descriptions can be found on page 28.
| RetirementReady® Funds | 5 |
Also weighing on investor sentiment throughout much of the period were expectations for the U.S. Federal Reserve’s first interest-rate hike since June 2006. The Fed’s intention to begin normalizing U.S. interest rates was complicated by myriad global factors — notably, overlapping economic slowdowns in Europe and China and low commodity prices. The long-awaited quarter-point interest-rate hike from the Fed finally came on December 16, 2015. For all the anxiety about the prospect of the first rise in the federal funds rate in almost a decade, the Fed’s decision had little immediate impact on markets. By year’s end, markets were sliding, with a notable selloff at year-end. December’s stock market performance was essentially flat.
In the first week of 2016, U.S. stocks experienced their worst start in history to a calendar year. The selling was linked to market turmoil in China, combined with the country’s weak manufacturing data. U.S. stocks recovered during the second half of January, but it was not enough to lift them into positive territory. At its meeting in mid-January, the Fed decided to keep rates unchanged and adopt a “wait-and-see” policy. U.S. stocks fell sharply after the central bank’s meeting, as investors interpreted the Fed’s statement as leaving open the possibility of a rate increase in March.
At the same time, two additional factors — U.S. dollar strength and energy sector weakness — began to weigh more heavily on investors’ minds and on corporate earnings. The strengthening U.S. dollar hurt the earnings of U.S. companies that depend on non-U.S. markets for revenue.
What were some notable investment strategies that contributed to and detracted from the funds’ absolute performance during the six-month reporting period?
In the primary building blocks, there are two principal strategies through which we seek to add value to the portfolios’ performance — dynamic asset allocation and individual security selection. Our asset allocation strategy enables us to tactically shift our weightings to the various asset classes in order to capitalize on strengths or to reduce risk when we believe the investment environment to be vulnerable to downside movement. We also employ implementation and security selection strategies to help us take advantage of what we believe are the best risk/reward trade-offs in given market environments.
During the reporting period, we maintained a mostly neutral stance in our asset allocations, choosing to keep asset class weightings at or near their benchmark levels in each portfolio along the glide path. That said, we did have a slight overweight to small-cap equities and high-yield bonds during the period, and those strategic allocation decisions detracted slightly.
Security selection and implementation decisions netted out to very little, but there were several meaningful contributors and detractors during the period. Large-cap U.S. equity selection, which had been very strong to start 2015, gave back some of that performance over the trailing six months. Underperformance there was offset by strong selection in international equity markets, both developed and emerging. We also added value from security selection within high-yield bonds, despite a difficult environment for the asset class as a whole.
Our absolute return strategies were helpful in dampening volatility, although returns in all four strategies were also negative for the period. In Putnam Absolute Return 500 Fund and Absolute Return 700 Fund, positioning within interest-rate risk helped offset weakness in equities and in strategies designed to perform independent of global market movements. Performance for Putnam Absolute Return 100 Fund and Absolute
| 6 | RetirementReady® Funds |
Return 300 Fund was also slightly negative, with the 300 Fund in particular being hurt by spread widening in non-traditional fixed income. That said, the strategies were able to dampen volatility and helped the RetirementReady suite’s overall performance.

What is the philosophy behind the funds’ glide-path strategy?
The glide path governs the way that the funds’ allocations shift over time as investors progress toward their target retirement date. Early in the glide path, as investors are saving for their retirement decades in advance, the path favors large equity allocations in order to generate growth. While these larger equity positions can cause volatility, the extended time horizon allows for recovery from periodic downturns and the chance to benefit from the long-term upward trajectory of equity markets. Stock allocations gradually diminish over time in favor of less volatile assets, such as bonds, in order to protect capital as investors approach retirement. We also allocate a growing percentage to our Putnam Absolute Return suite of funds as an investor advances through the glide path. Our objective in this is to attempt to reduce market risk across all assets as an investor approaches retirement while delivering a more diverse set of risks and returns at the portfolio level.
What is your assessment of the risk of the United States falling into recession at this point?
I do not believe we are headed toward recession. Looking at history, recessions
ABOUT DERIVATIVES
Derivatives are an increasingly common type of investment instrument, the performance of which is derived from an underlying security, index, currency, or other area of the capital markets. Derivatives employed by the fund’s managers generally serve one of two main purposes: to implement a strategy that may be difficult or more expensive to invest in through traditional securities, or to hedge unwanted risk associated with a particular position.
For example, the fund’s managers might use currency forward contracts to capitalize on an anticipated change in exchange rates between two currencies. This approach would require a significantly smaller outlay of capital than purchasing traditional bonds denominated in the underlying currencies. In another example, the managers may identify a bond that they believe is undervalued relative to its risk of default, but may seek to reduce the interest-rate risk of that bond by using interest-rate swaps, a derivative through which two parties “swap” payments based on the movement of certain rates. In other examples, the managers may use options and futures contracts to hedge against a variety of risks by establishing a combination of long and short exposures to specific equity markets or sectors.
Like any other investment, derivatives may not appreciate in value and may lose money. Derivatives may amplify traditional investment risks through the creation of leverage and may be less liquid than traditional securities. And because derivatives typically represent contractual agreements between two financial institutions, derivatives entail “counterparty risk,” which is the risk that the other party is unable or unwilling to pay. Putnam monitors the counterparty risks we assume. For example, Putnam often enters into collateral agreements that require the counterparties to post collateral on a regular basis to cover their obligations to the fund. Counterparty risk for exchange-traded futures and centrally cleared swaps is mitigated by the daily exchange of margin and other safeguards against default through their respective clearinghouses.
| RetirementReady® Funds | 7 |
haven’t taken place because commodities are cheap — usually it’s the other way around. Many of the world’s consumers and industries ultimately stand to benefit from low energy costs. I also do not believe that China is going to pull the United States into recession. China does not appear to have enough consumer demand to keep its own economy going, let alone ours. What we have been experiencing is a period of anemic economic growth and low inflation, with, in my view, very little upside potential at this point.
What is your outlook as we enter the second quarter?
We are going through a softer patch in the U.S. economy. As I said, I do not think we are headed for recession. Our outlook is for continued, albeit slow, economic growth. The U.S. economy is experiencing low growth and low inflation. Until something picks up — or some new innovation comes along — I don’t see anything that will pull this economy out of this state.
As for our outlook globally, we continue to favor developed over emerging markets and have a slight country bias toward Europe and Japan. The view in each case is that central bank policy in those countries continues to be accommodative, while we’ve seen the first interest-rate hike here in the United States. We are being tactical in our overall equity positions, looking to buy on weakness and sell on strength. Within fixed income, we think it is hard to see global rates rising and believe they will be lower for longer. In credit markets, we believe high yield is later in the cycle and prefer to take equity risk to high-yield bonds. Lastly, we have de-emphasized inflation risk due to the negative performance that has continued to plague commodities and other inflation-sensitive asset classes.
Thank you, Bob, for bringing us up to date today.
The views expressed in this report are exclusively those of Putnam Management and are subject to change. They are not meant as investment advice.
Please note that the holdings discussed in this report may not have been held by the fund for the entire period. Portfolio composition is subject to review in accordance with the fund’s investment strategy and may vary in the future. Current and future portfolio holdings are subject to risk.
Portfolio Manager Robert J. Kea is Co-Head of Global Asset Allocation at Putnam. He holds an M.B.A. from the Bentley University Graduate School of Business and a B.A. from the University of Massachusetts, Amherst. Bob joined Putnam in 1989 and has been in the investment industry since 1988.
In addition to Bob, your fund’s portfolio managers are James A. Fetch, Robert J. Schoen, and Jason R. Vaillancourt, CFA.
| 8 | RetirementReady® Funds |
IN THE NEWS
The world may be awash in more oil than previously thought — and low oil prices may remain with us for the near term, according to the International Energy Agency (IEA). In January, the per-barrel price of crude dropped below $30, hitting a 12-year low. As Organization of Petroleum Exporting Countries (OPEC) members Iran and Iraq boost oil production and global demand growth slows, supply may exceed consumption by an average of 1.75 million barrels a day in the first six months of 2016, compared with the IEA’s estimate in January of 1.5 million barrels per day. The excess in supply could swell even further if OPEC adds output, the Paris-based IEA noted in its February market report. In January, Iran ramped up oil production following the removal of international oil sanctions, Iraqi volumes notched a record high, and Saudi Arabia, OPEC’s largest producer, “turned up the taps,” the IEA said. For 2016, the IEA has lowered its global oil demand estimates by 100,000 barrels per day, leaving the level of growth for this year unchanged at 1.2 million barrels per day.
| RetirementReady® Funds | 9 |
Composition of the funds’ underlying investments
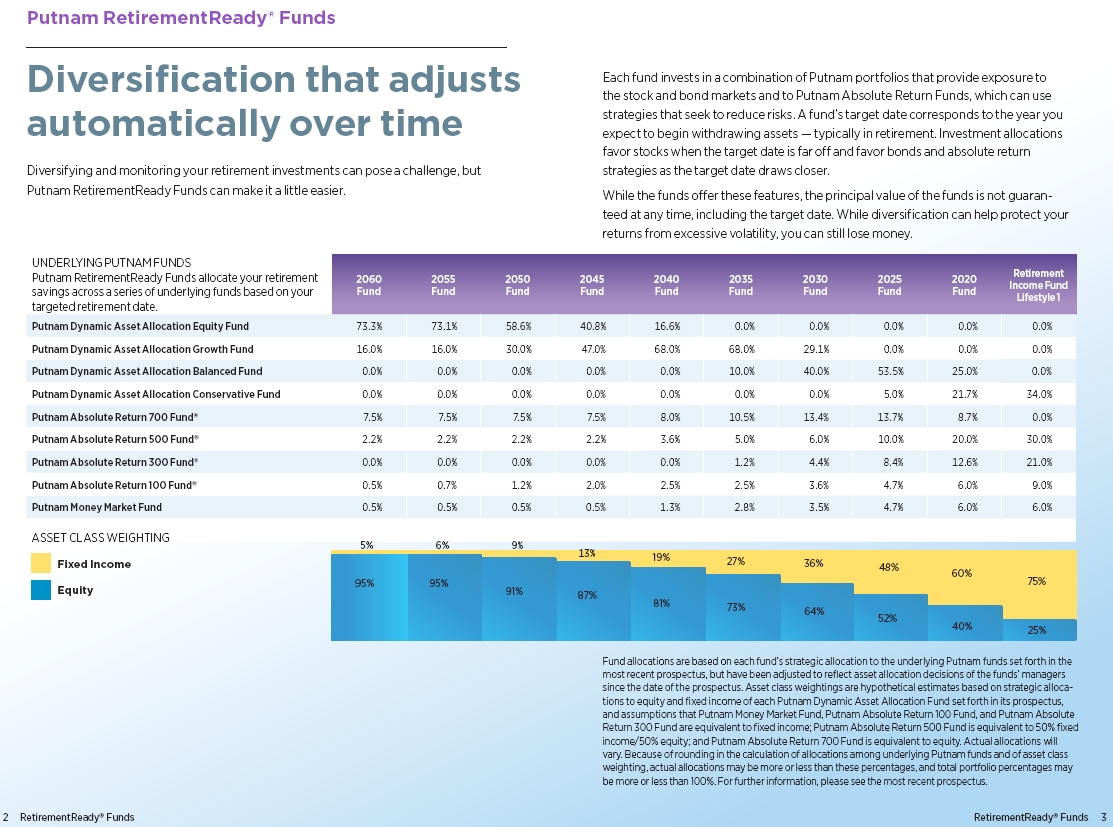
Historically, each Putnam RetirementReady® Fund invests, to varying degrees, in a variety of Putnam mutual funds. This section describes the goals and strategies of each of the underlying Putnam funds. For more information, please see the funds’ prospectus.
Putnam Absolute Return 100, 300, 500, and 700 Funds
Each fund pursues an “absolute return” strategy that seeks to earn a positive total return over a reasonable period of time (generally at least three years or more) regardless of market conditions or general market direction. Each fund seeks a return that exceeds that of U.S. Treasury bills by a targeted amount of basis points specified in the fund’s name on an annualized basis. For example, Absolute Return 500 Fund seeks to earn a total return of 500 basis points (or 5.00%) over the return on U.S. Treasury bills. The funds pursue their goals through portfolios that are structured to offer varying degrees of risk, expected volatility, and expected returns.
Putnam Dynamic Asset Allocation Equity Fund
The fund’s portfolio invests mainly in common stocks (growth or value stocks or both) of large and midsize companies worldwide and is designed for investors seeking long-term growth. The fund typically allocates approximately 75% of its assets to investments in U.S. companies and 25% of its assets to international companies, but allocations may vary. The Portfolio Managers can adjust allocations based on market conditions.
Putnam Dynamic Asset Allocation Growth Fund
The fund’s portfolio invests mainly in equity securities (growth or value stocks or both) of U.S. and international companies of any size and is designed for investors seeking capital appreciation with moderate risk. The fund’s strategic equity weighting is 80% (the range is 65% to 95%), with the balance invested in a range of fixed-income investments. The Portfolio Managers can adjust allocations based on market conditions.
Putnam Dynamic Asset Allocation Balanced Fund
The fund’s portfolio is diversified across stocks and bonds in global markets and is designed for investors seeking total return. The fund’s strategic equity allocation is 60% (the range is 45% to 75%), with the balance invested in bonds and money market instruments. The Portfolio Managers can adjust the allocations based on market conditions.
Putnam Dynamic Asset Allocation Conservative Fund
The fund’s globally diversified portfolio emphasizes bonds over stocks and is designed for investors who want to protect the value of their investment while receiving regular income and protection against inflation. The strategic fixed-income allocation is 70% (with a range of 55% to 85%), with the balance invested in stocks and money market instruments. The Portfolio Managers can adjust allocations based on market conditions.
| 10 | RetirementReady® Funds |
Putnam Money Market Fund
The fund seeks as high a rate of current income as Putnam Management believes is consistent with preservation of capital and maintenance of liquidity. The fund invests mainly in money market instruments that are high quality and have short-term maturities.
Money market funds are not insured or guaranteed by the Federal Deposit Insurance Corporation (FDIC) or any other governmental agency. Although the fund seeks to preserve the value of your investment at $1.00 per share, it is possible to lose money by investing in the fund.
Allocations by fund as of 1/31/16
| Underlying Putnam Fund | Putnam RetirementReady 2060 Fund | Putnam RetirementReady 2055 Fund | Putnam RetirementReady 2050 Fund | Putnam RetirementReady 2045 Fund | Putnam RetirementReady 2040 Fund | Putnam RetirementReady 2035 Fund | Putnam RetirementReady 2030 Fund | Putnam RetirementReady 2025 Fund | Putnam RetirementReady 2020 Fund | Putnam Retirement Income Fund Lifestyle 1 | ||||||||||
| Putnam Dynamic Asset | ||||||||||||||||||||
| Allocation Equity Fund | 72.8% | 72.5% | 57.9% | 40.3% | 16.4% | 0.0% | 0.0% | 0.0% | 0.0% | 0.0% | ||||||||||
| Putnam Dynamic Asset | ||||||||||||||||||||
| Allocation Growth Fund | 16.1% | 16.2% | 30.2% | 47.0% | 67.6% | 67.2% | 28.6% | 0.0% | 0.0% | 0.0% | ||||||||||
| Putnam Dynamic Asset | ||||||||||||||||||||
| Allocation Balanced Fund | 0.0% | 0.0% | 0.0% | 0.0% | 0.0% | 10.1% | 39.8% | 52.9% | 24.6% | 0.0% | ||||||||||
| Putnam Dynamic Asset | ||||||||||||||||||||
| Allocation Conservative Fund | 0.0% | 0.0% | 0.0% | 0.0% | 0.0% | 0.0% | 0.0% | 5.1% | 21.8% | 34.0% | ||||||||||
| Putnam Absolute Return | ||||||||||||||||||||
| 700 Fund | 7.8% | 7.8% | 7.8% | 7.8% | 8.3% | 10.8% | 13.6% | 13.8% | 8.7% | 0.0% | ||||||||||
| Putnam Absolute Return | ||||||||||||||||||||
| 500 Fund | 2.3% | 2.3% | 2.3% | 2.3% | 3.8% | 5.2% | 6.2% | 10.2% | 20.2% | 30.1% | ||||||||||
| Putnam Absolute Return | ||||||||||||||||||||
| 300 Fund | 0.0% | 0.0% | 0.0% | 0.0% | 0.0% | 1.2% | 4.5% | 8.4% | 12.5% | 20.8% | ||||||||||
| Putnam Absolute Return | ||||||||||||||||||||
| 100 Fund | 0.5% | 0.7% | 1.3% | 2.1% | 2.6% | 2.6% | 3.7% | 4.8% | 6.1% | 9.1% | ||||||||||
| Putnam Money Market Fund | 0.5% | 0.5% | 0.5% | 0.5% | 1.3% | 2.9% | 3.6% | 4.8% | 6.1% | 6.0% | ||||||||||
Percentages are based on net assets as of 1/31/16. Portfolio composition may vary over time. Due to rounding, percentages may not equal 100%.
| RetirementReady® Funds | 11 |
Your fund’s performance
This section shows your fund’s performance, price, and distribution information for periods ended January 31, 2016, the end of the first half of its current fiscal year. In accordance with regulatory requirements for mutual funds, we also include performance information as of the most recent calendar quarter-end and expense information taken from the fund’s current prospectus. Performance should always be considered in light of a fund’s investment strategy. Data represent past performance. Past performance does not guarantee future results. More recent returns may be less or more than those shown. Investment return and principal value will fluctuate, and you may have a gain or a loss when you sell your shares. Performance information does not reflect any deduction for taxes a shareholder may owe on fund distributions or on the redemption of fund shares. For the most recent month-end performance, please visit the Individual Investors section at putnam.com or call Putnam at 1-800-225-1581. Class R and Y shares are not available to all investors. See the Terms and Definitions section in this report for definitions of the share classes offered by your fund.
Fund performance Total return for periods ended 1/31/16
| Class A | Class B | Class C | Class M | Class R | Class Y | |||||
| (inception dates) | (11/1/04) | (11/1/04) | (11/1/04) | (11/1/04) | (11/1/04) | (11/1/04) | ||||
| Before | After | Before | After | Net | Net | |||||
| sales | sales | Before | After | Before | After | sales | sales | asset | asset | |
| charge | charge | CDSC | CDSC | CDSC | CDSC | charge | charge | value | value | |
| 2060 Fund* | ||||||||||
| Life of fund | –8.01% | –13.30% | –8.16% | –12.65% | –8.16% | –9.06% | –8.15% | –11.36% | –8.13% | –7.99% |
| 2055 Fund** | ||||||||||
| Life of fund | 50.73% | 42.06% | 44.92% | 43.96% | 45.08% | 45.08% | 46.97% | 41.82% | 48.81% | 52.73% |
| Annual average | 8.26 | 7.03 | 7.44 | 7.31 | 7.47 | 7.47 | 7.74 | 7.00 | 8.00 | 8.54 |
| 5 years | 40.56 | 32.47 | 35.35 | 33.44 | 35.50 | 35.50 | 37.10 | 32.30 | 38.80 | 42.40 |
| Annual average | 7.05 | 5.79 | 6.24 | 5.94 | 6.27 | 6.27 | 6.51 | 5.76 | 6.78 | 7.32 |
| 3 years | 23.86 | 16.74 | 21.10 | 18.41 | 21.23 | 21.23 | 22.11 | 17.84 | 23.04 | 24.91 |
| Annual average | 7.39 | 5.29 | 6.59 | 5.79 | 6.63 | 6.63 | 6.89 | 5.62 | 7.16 | 7.70 |
| 1 year | –5.41 | –10.85 | –6.19 | –10.53 | –6.11 | –6.98 | –5.83 | –9.13 | –5.63 | –5.15 |
| 6 months | –10.22 | –15.38 | –10.60 | –14.73 | –10.56 | –11.39 | –10.39 | –13.52 | –10.37 | –10.11 |
| 2050 Fund† | ||||||||||
| Annual average | ||||||||||
| (life of fund) | 5.31% | 4.73% | 4.73% | 4.73% | 4.52% | 4.52% | 4.78% | 4.43% | 5.04% | 5.57% |
| 10 years | 48.42 | 39.88 | 39.74 | 39.74 | 37.69 | 37.69 | 41.12 | 36.18 | 44.66 | 52.10 |
| Annual average | 4.03 | 3.41 | 3.40 | 3.40 | 3.25 | 3.25 | 3.50 | 3.14 | 3.76 | 4.28 |
| 5 years | 41.91 | 33.75 | 36.68 | 34.68 | 36.68 | 36.68 | 38.45 | 33.61 | 40.17 | 43.72 |
| Annual average | 7.25 | 5.99 | 6.45 | 6.13 | 6.45 | 6.45 | 6.72 | 5.97 | 6.99 | 7.52 |
| 3 years | 23.73 | 16.62 | 20.94 | 17.94 | 21.03 | 21.03 | 21.94 | 17.67 | 22.82 | 24.68 |
| Annual average | 7.36 | 5.26 | 6.54 | 5.66 | 6.57 | 6.57 | 6.84 | 5.57 | 7.09 | 7.63 |
| 1 year | –5.32 | –10.77 | –6.03 | –10.66 | –6.03 | –6.96 | –5.79 | –9.09 | –5.53 | –5.08 |
| 6 months | –10.03 | –15.21 | –10.39 | –14.81 | –10.33 | –11.21 | –10.22 | –13.37 | –10.14 | –9.89 |
| 12 | RetirementReady® Funds |
Fund performance Total return for periods ended 1/31/16 cont.
| Class A | Class B | Class C | Class M | Class R | Class Y | |||||
| (inception dates) | (11/1/04) | (11/1/04) | (11/1/04) | (11/1/04) | (11/1/04) | (11/1/04) | ||||
| Before | After | Before | After | Net | Net | |||||
| sales | sales | Before | After | Before | After | sales | sales | asset | asset | |
| charge | charge | CDSC | CDSC | CDSC | CDSC | charge | charge | value | value | |
| 2045 Fund | ||||||||||
| Annual average | ||||||||||
| (life of fund) | 5.44% | 4.89% | 4.88% | 4.88% | 4.65% | 4.65% | 4.92% | 4.58% | 5.18% | 5.70% |
| 10 years | 48.63 | 40.09 | 40.01 | 40.01 | 37.88 | 37.88 | 41.40 | 36.45 | 44.97 | 52.38 |
| Annual average | 4.04 | 3.43 | 3.42 | 3.42 | 3.26 | 3.26 | 3.52 | 3.16 | 3.78 | 4.30 |
| 5 years | 40.83 | 32.73 | 35.62 | 33.62 | 35.63 | 35.63 | 37.35 | 32.55 | 39.06 | 42.60 |
| Annual average | 7.09 | 5.83 | 6.28 | 5.97 | 6.29 | 6.29 | 6.55 | 5.80 | 6.82 | 7.36 |
| 3 years | 23.08 | 16.01 | 20.31 | 17.31 | 20.31 | 20.31 | 21.19 | 16.95 | 22.11 | 24.01 |
| Annual average | 7.17 | 5.07 | 6.36 | 5.47 | 6.36 | 6.36 | 6.62 | 5.36 | 6.89 | 7.44 |
| 1 year | –5.13 | –10.59 | –5.83 | –10.46 | –5.84 | –6.76 | –5.61 | –8.92 | –5.38 | –4.88 |
| 6 months | –9.64 | –14.83 | –9.99 | –14.41 | –9.99 | –10.87 | –9.84 | –12.99 | –9.74 | –9.49 |
| 2040 Fund | ||||||||||
| Annual average | ||||||||||
| (life of fund) | 5.41% | 4.86% | 4.85% | 4.85% | 4.63% | 4.63% | 4.89% | 4.56% | 5.16% | 5.68% |
| 10 years | 48.75 | 40.19 | 40.13 | 40.13 | 38.07 | 38.07 | 41.47 | 36.52 | 45.12 | 52.50 |
| Annual average | 4.05 | 3.44 | 3.43 | 3.43 | 3.28 | 3.28 | 3.53 | 3.16 | 3.79 | 4.31 |
| 5 years | 39.41 | 31.39 | 34.29 | 32.29 | 34.35 | 34.35 | 36.05 | 31.28 | 37.73 | 41.18 |
| Annual average | 6.87 | 5.61 | 6.07 | 5.76 | 6.08 | 6.08 | 6.35 | 5.59 | 6.61 | 7.14 |
| 3 years | 22.18 | 15.16 | 19.40 | 16.40 | 19.46 | 19.46 | 20.40 | 16.19 | 21.32 | 23.12 |
| Annual average | 6.91 | 4.82 | 6.09 | 5.19 | 6.11 | 6.11 | 6.38 | 5.13 | 6.65 | 7.18 |
| 1 year | –4.87 | –10.34 | –5.62 | –10.25 | –5.60 | –6.53 | –5.33 | –8.65 | –5.09 | –4.62 |
| 6 months | –9.07 | –14.30 | –9.46 | –13.90 | –9.44 | –10.32 | –9.31 | –12.48 | –9.18 | –8.96 |
| 2035 Fund | ||||||||||
| Annual average | ||||||||||
| (life of fund) | 5.20% | 4.64% | 4.63% | 4.63% | 4.42% | 4.42% | 4.67% | 4.34% | 4.93% | 5.46% |
| 10 years | 46.81 | 38.37 | 38.26 | 38.26 | 36.25 | 36.25 | 39.66 | 34.78 | 43.21 | 50.51 |
| Annual average | 3.91 | 3.30 | 3.29 | 3.29 | 3.14 | 3.14 | 3.40 | 3.03 | 3.66 | 4.17 |
| 5 years | 36.42 | 28.57 | 31.40 | 29.40 | 31.37 | 31.37 | 33.06 | 28.40 | 34.73 | 38.14 |
| Annual average | 6.41 | 5.15 | 5.61 | 5.29 | 5.61 | 5.61 | 5.88 | 5.13 | 6.14 | 6.67 |
| 3 years | 20.42 | 13.49 | 17.78 | 14.78 | 17.74 | 17.74 | 18.64 | 14.49 | 19.51 | 21.29 |
| Annual average | 6.39 | 4.31 | 5.61 | 4.70 | 5.59 | 5.59 | 5.86 | 4.61 | 6.12 | 6.64 |
| 1 year | –4.44 | –9.94 | –5.15 | –9.79 | –5.17 | –6.10 | –4.91 | –8.24 | –4.66 | –4.21 |
| 6 months | –8.17 | –13.45 | –8.50 | –12.98 | –8.53 | –9.42 | –8.40 | –11.60 | –8.31 | –8.08 |
| RetirementReady® Funds | 13 |
Fund performance Total return for periods ended 1/31/16 cont.
| Class A | Class B | Class C | Class M | Class R | Class Y | |||||
| (inception dates) | (11/1/04) | (11/1/04) | (11/1/04) | (11/1/04) | (11/1/04) | (11/1/04) | ||||
| Before | After | Before | After | Net | Net | |||||
| sales | sales | Before | After | Before | After | sales | sales | asset | asset | |
| charge | charge | CDSC | CDSC | CDSC | CDSC | charge | charge | value | value | |
| 2030 Fund | ||||||||||
| Annual average | ||||||||||
| (life of fund) | 4.93% | 4.38% | 4.37% | 4.37% | 4.14% | 4.14% | 4.40% | 4.07% | 4.66% | 5.19% |
| 10 years | 44.04 | 35.75 | 35.57 | 35.57 | 33.58 | 33.58 | 36.94 | 32.15 | 40.42 | 47.61 |
| Annual average | 3.72 | 3.10 | 3.09 | 3.09 | 2.94 | 2.94 | 3.19 | 2.83 | 3.45 | 3.97 |
| 5 years | 32.92 | 25.28 | 27.93 | 25.93 | 27.97 | 27.97 | 29.56 | 25.02 | 31.22 | 34.53 |
| Annual average | 5.86 | 4.61 | 5.05 | 4.72 | 5.06 | 5.06 | 5.32 | 4.57 | 5.59 | 6.11 |
| 3 years | 18.37 | 11.56 | 15.69 | 12.69 | 15.73 | 15.73 | 16.60 | 12.51 | 17.46 | 19.24 |
| Annual average | 5.78 | 3.71 | 4.98 | 4.06 | 4.99 | 4.99 | 5.25 | 4.01 | 5.51 | 6.04 |
| 1 year | –3.85 | –9.38 | –4.60 | –9.27 | –4.57 | –5.50 | –4.33 | –7.68 | –4.14 | –3.61 |
| 6 months | –7.00 | –12.35 | –7.37 | –11.90 | –7.34 | –8.25 | –7.23 | –10.48 | –7.13 | –6.86 |
| 2025 Fund | ||||||||||
| Annual average | ||||||||||
| (life of fund) | 4.53% | 3.98% | 3.98% | 3.98% | 3.75% | 3.75% | 4.01% | 3.68% | 4.27% | 4.80% |
| 10 years | 39.38 | 31.37 | 31.26 | 31.26 | 29.35 | 29.35 | 32.60 | 27.96 | 35.92 | 42.95 |
| Annual average | 3.38 | 2.77 | 2.76 | 2.76 | 2.61 | 2.61 | 2.86 | 2.50 | 3.12 | 3.64 |
| 5 years | 29.02 | 21.60 | 24.31 | 22.31 | 24.30 | 24.30 | 25.84 | 21.44 | 27.36 | 30.64 |
| Annual average | 5.23 | 3.99 | 4.45 | 4.11 | 4.45 | 4.45 | 4.70 | 3.96 | 4.96 | 5.49 |
| 3 years | 15.77 | 9.11 | 13.23 | 10.23 | 13.22 | 13.22 | 14.05 | 10.06 | 14.87 | 16.65 |
| Annual average | 5.00 | 2.95 | 4.23 | 3.30 | 4.22 | 4.22 | 4.48 | 3.25 | 4.73 | 5.27 |
| 1 year | –3.29 | –8.85 | –4.01 | –8.72 | –3.97 | –4.91 | –3.74 | –7.11 | –3.53 | –3.04 |
| 6 months | –5.79 | –11.20 | –6.14 | –10.74 | –6.11 | –7.03 | –5.98 | –9.27 | –5.91 | –5.62 |
| 2020 Fund | ||||||||||
| Annual average | ||||||||||
| (life of fund) | 3.87% | 3.32% | 3.31% | 3.31% | 3.09% | 3.09% | 3.35% | 3.02% | 3.61% | 4.13% |
| 10 years | 32.51 | 24.89 | 24.83 | 24.83 | 22.98 | 22.98 | 26.02 | 21.61 | 29.23 | 35.83 |
| Annual average | 2.85 | 2.25 | 2.24 | 2.24 | 2.09 | 2.09 | 2.34 | 1.98 | 2.60 | 3.11 |
| 5 years | 23.66 | 16.55 | 19.12 | 17.12 | 19.15 | 19.15 | 20.63 | 16.41 | 22.15 | 25.24 |
| Annual average | 4.34 | 3.11 | 3.56 | 3.21 | 3.57 | 3.57 | 3.82 | 3.09 | 4.08 | 4.60 |
| 3 years | 12.20 | 5.75 | 9.72 | 6.72 | 9.78 | 9.78 | 10.53 | 6.67 | 11.39 | 13.04 |
| Annual average | 3.91 | 1.88 | 3.14 | 2.19 | 3.16 | 3.16 | 3.40 | 2.17 | 3.66 | 4.17 |
| 1 year | –2.96 | –8.54 | –3.68 | –8.39 | –3.64 | –4.59 | –3.43 | –6.81 | –3.20 | –2.73 |
| 6 months | –4.68 | –10.16 | –5.04 | –9.69 | –5.00 | –5.93 | –4.91 | –8.24 | –4.77 | –4.55 |
| 14 | RetirementReady® Funds |
Fund performance Total return for periods ended 1/31/16 cont.
| Class A | Class B | Class C | Class M | Class R | Class Y | |||||
| (inception dates) | (11/1/04) | (11/1/04) | (11/1/04) | (11/1/04) | (11/1/04) | (11/1/04) | ||||
| Before | After | Before | After | Net | Net | |||||
| sales | sales | Before | After | Before | After | sales | sales | asset | asset | |
| charge | charge | CDSC | CDSC | CDSC | CDSC | charge | charge | value | value | |
| Retirement Income Fund Lifestyle 1 | ||||||||||
| Annual average | ||||||||||
| (life of fund) | 2.73% | 2.35% | 2.18% | 2.18% | 1.97% | 1.97% | 2.32% | 2.02% | 2.47% | 2.99% |
| 10 years | 27.38 | 22.28 | 19.97 | 19.97 | 18.21 | 18.21 | 22.61 | 18.63 | 24.18 | 30.64 |
| Annual average | 2.45 | 2.03 | 1.84 | 1.84 | 1.69 | 1.69 | 2.06 | 1.72 | 2.19 | 2.71 |
| 5 years | 14.47 | 9.89 | 10.25 | 8.25 | 10.22 | 10.22 | 12.96 | 9.29 | 12.99 | 15.93 |
| Annual average | 2.74 | 1.90 | 1.97 | 1.60 | 1.97 | 1.97 | 2.47 | 1.79 | 2.47 | 3.00 |
| 3 years | 6.82 | 2.55 | 4.51 | 1.57 | 4.43 | 4.43 | 6.06 | 2.62 | 6.02 | 7.68 |
| Annual average | 2.23 | 0.84 | 1.48 | 0.52 | 1.46 | 1.46 | 1.98 | 0.87 | 1.97 | 2.50 |
| 1 year | –2.56 | –6.46 | –3.27 | –7.96 | –3.27 | –4.20 | –2.75 | –5.91 | –2.81 | –2.30 |
| 6 months | –3.43 | –7.29 | –3.77 | –8.43 | –3.76 | –4.70 | –3.49 | –6.62 | –3.56 | –3.29 |
Current performance may be lower or higher than the quoted past performance, which cannot guarantee future results. After-sales-charge returns for class A and M shares reflect the deduction of the maximum 5.75% and 3.50% sales charge, respectively, levied at the time of purchase. The maximum sales charges for Retirement Income Fund Lifestyle 1 class A and M shares are 4.00% and 3.25%, respectively. Class B share returns after the contingent deferred sales charge (CDSC) reflect the applicable CDSC, which is 5% in the first year, declining over time to 1% in the sixth year, and is eliminated thereafter. Class C share returns after CDSC reflect a 1% CDSC for the first year that is eliminated thereafter. Class R and Y shares have no initial sales charge or CDSC.
For a portion of the periods, these funds had expense limitations, without which returns would have been lower.
For the funds with eight years of performance, class B share performance reflects conversion to class A shares after eight years.
* The inception date of Putnam RetirementReady 2060 Fund is 11/30/15, for all share classes.
** The inception date of Putnam RetirementReady 2055 Fund is 11/30/10, for all share classes.
† The inception date of Putnam RetirementReady 2050 Fund is 5/2/05, for all share classes.
| RetirementReady® Funds | 15 |
Comparative index returns For periods ended 1/31/16
| Barclays U.S. | ||
| S&P 500 Index | Aggregate Bond Index | |
| Annual average | ||
| (life of fund) (since 11/1/04)* | 7.13% | 4.36% |
| Annual average | ||
| (life of fund) (since 5/2/05)** | 7.15 | 4.47 |
| Life of fund | 83.26 | 17.66 |
| Annual average (since 11/30/10)† | 12.44 | 3.20 |
| Life of fund (since 11/30/15)‡ | –6.46 | 1.05 |
| 10 years | 87.41 | 57.65 |
| Annual average | 6.48 | 4.66 |
| 5 years | 67.80 | 18.80 |
| Annual average | 10.91 | 3.51 |
| 3 years | 37.88 | 6.57 |
| Annual average | 11.30 | 2.14 |
| 1 year | –0.67 | –0.16 |
| 6 months | –6.77 | 1.33 |
Index results should be compared with fund performance before sales charge, before CDSC, or at net asset value.
* Inception date of all Putnam RetirementReady Funds with the exception of the 2050, 2055, and 2060 Fund.
** Inception date of Putnam RetirementReady 2050 Fund.
† Inception date of Putnam RetirementReady 2055 Fund.
‡ Inception date of Putnam RetirementReady 2060 Fund.
Fund price and distribution information For the six-month period ended 1/31/16
| 2060 Fund* | ||||||||
| Distributions | Class A | Class B | Class C | Class M | Class R | Class Y | ||
| Number | 1 | 1 | 1 | 1 | 1 | 1 | ||
| Income | $0.222 | $0.216 | $0.216 | $0.218 | $0.220 | $0.224 | ||
| Capital gains | — | — | — | — | — | — | ||
| Total | $0.222 | $0.216 | $0.216 | $0.218 | $0.220 | $0.224 | ||
| Before | After | Net | Net | Before | After | Net | Net | |
| sales | sales | asset | asset | sales | sales | asset | asset | |
| Share value | charge | charge | value | value | charge | charge | value | value |
| 11/30/15 | $10.00 | $10.61 | $10.00 | $10.00 | $10.00 | $10.36 | $10.00 | $10.00 |
| 1/31/16 | 8.99 | 9.54 | 8.98 | 8.98 | 8.98 | 9.31 | 8.98 | 8.99 |
| 16 | RetirementReady® Funds |
Fund price and distribution information For the six-month period ended 1/31/16 cont.
| 2055 Fund | ||||||||
| Distributions | Class A | Class B | Class C | Class M | Class R | Class Y | ||
| Number | 1 | 1 | 1 | 1 | 1 | 1 | ||
| Income | $0.243 | $0.156 | $0.162 | $0.193 | $0.209 | $0.261 | ||
| Capital gains | ||||||||
| Long-term gains | 0.510 | 0.510 | 0.510 | 0.510 | 0.510 | 0.510 | ||
| Short-term gains | 0.153 | 0.153 | 0.153 | 0.153 | 0.153 | 0.153 | ||
| Total | $0.906 | $0.819 | $0.825 | $0.856 | $0.872 | $0.924 | ||
| Before | After | Net | Net | Before | After | Net | Net | |
| sales | sales | asset | asset | sales | sales | asset | asset | |
| Share value | charge | charge | value | value | charge | charge | value | value |
| 7/31/15 | $11.60 | $12.31 | $11.50 | $11.38 | $11.58 | $12.00 | $11.55 | $11.66 |
| 1/31/16 | 9.56 | 10.14 | 9.51 | 9.40 | 9.57 | 9.92 | 9.53 | 9.61 |
| 2050 Fund | ||||||||
| Distributions | Class A | Class B | Class C | Class M | Class R | Class Y | ||
| Number | 1 | 1 | 1 | 1 | 1 | 1 | ||
| Income | $0.355 | $0.230 | $0.238 | $0.271 | $0.227 | $0.384 | ||
| Capital gains | — | — | — | — | — | — | ||
| Total | $0.355 | $0.230 | $0.238 | $0.271 | $0.227 | $0.384 | ||
| Before | After | Net | Net | Before | After | Net | Net | |
| sales | sales | asset | asset | sales | sales | asset | asset | |
| Share value | charge | charge | value | value | charge | charge | value | value |
| 7/31/15 | $17.69 | $18.77 | $17.45 | $17.29 | $17.84 | $18.49 | $17.41 | $17.77 |
| 1/31/16 | 15.58 | 16.53 | 15.42 | 15.28 | 15.76 | 16.33 | 15.43 | 15.65 |
| 2045 Fund | ||||||||
| Distributions | Class A | Class B | Class C | Class M | Class R | Class Y | ||
| Number | 1 | 1 | 1 | 1 | 1 | 1 | ||
| Income | $0.415 | $0.309 | $0.327 | $0.318 | $0.288 | $0.452 | ||
| Capital gains | — | — | — | — | — | — | ||
| Total | $0.415 | $0.309 | $0.327 | $0.318 | $0.288 | $0.452 | ||
| Before | After | Net | Net | Before | After | Net | Net | |
| sales | sales | asset | asset | sales | sales | asset | asset | |
| Share value | charge | charge | value | value | charge | charge | value | value |
| 7/31/15 | $19.58 | $20.77 | $17.89 | $17.93 | $19.00 | $19.69 | $20.00 | $23.30 |
| 1/31/16 | 17.30 | 18.36 | 15.81 | 15.83 | 16.83 | 17.44 | 17.78 | 20.66 |
| 2040 Fund | ||||||||
| Distributions | Class A | Class B | Class C | Class M | Class R | Class Y | ||
| Number | 1 | 1 | 1 | 1 | 1 | 1 | ||
| Income | $0.485 | $0.345 | $0.353 | $0.386 | $0.313 | $0.521 | ||
| Capital gains | — | — | — | — | — | — | ||
| Total | $0.485 | $0.345 | $0.353 | $0.386 | $0.313 | $0.521 | ||
| Before | After | Net | Net | Before | After | Net | Net | |
| sales | sales | asset | asset | sales | sales | asset | asset | |
| Share value | charge | charge | value | value | charge | charge | value | value |
| 7/31/15 | $21.26 | $22.56 | $19.69 | $19.44 | $20.02 | $20.75 | $21.80 | $24.82 |
| 1/31/16 | 18.87 | 20.02 | 17.50 | 17.27 | 17.79 | 18.44 | 19.50 | 22.10 |
| RetirementReady® Funds | 17 |
Fund price and distribution information For the six-month period ended 1/31/16 cont.
| 2035 Fund | ||||||||
| Distributions | Class A | Class B | Class C | Class M | Class R | Class Y | ||
| Number | 1 | 1 | 1 | 1 | 1 | 1 | ||
| Income | $0.544 | $0.393 | $0.432 | $0.437 | $0.390 | $0.585 | ||
| Capital gains | — | — | — | — | — | — | ||
| Total | $0.544 | $0.393 | $0.432 | $0.437 | $0.390 | $0.585 | ||
| Before | After | Net | Net | Before | After | Net | Net | |
| sales | sales | asset | asset | sales | sales | asset | asset | |
| Share value | charge | charge | value | value | charge | charge | value | value |
| 7/31/15 | $21.53 | $22.84 | $19.81 | $19.78 | $20.74 | $21.49 | $20.67 | $24.99 |
| 1/31/16 | 19.25 | 20.42 | 17.75 | 17.68 | 18.58 | 19.25 | 18.58 | 22.41 |
| 2030 Fund | ||||||||
| Distributions | Class A | Class B | Class C | Class M | Class R | Class Y | ||
| Number | 1 | 1 | 1 | 1 | 1 | 1 | ||
| Income | $0.584 | $0.427 | $0.436 | $0.476 | $0.433 | $0.621 | ||
| Capital gains | — | — | — | — | — | — | ||
| Total | $0.584 | $0.427 | $0.436 | $0.476 | $0.433 | $0.621 | ||
| Before | After | Net | Net | Before | After | Net | Net | |
| sales | sales | asset | asset | sales | sales | asset | asset | |
| Share value | charge | charge | value | value | charge | charge | value | value |
| 7/31/15 | $21.38 | $22.68 | $20.32 | $20.29 | $20.75 | $21.50 | $20.23 | $24.34 |
| 1/31/16 | 19.32 | 20.50 | 18.41 | 18.38 | 18.79 | 19.47 | 18.37 | 22.07 |
| 2025 Fund | ||||||||
| Distributions | Class A | Class B | Class C | Class M | Class R | Class Y | ||
| Number | 1 | 1 | 1 | 1 | 1 | 1 | ||
| Income | $0.547 | $0.384 | $0.403 | $0.440 | $0.361 | $0.589 | ||
| Capital gains | — | — | — | — | — | — | ||
| Total | $0.547 | $0.384 | $0.403 | $0.440 | $0.361 | $0.589 | ||
| Before | After | Net | Net | Before | After | Net | Net | |
| sales | sales | asset | asset | sales | sales | asset | asset | |
| Share value | charge | charge | value | value | charge | charge | value | value |
| 7/31/15 | $21.73 | $23.06 | $20.29 | $20.27 | $20.60 | $21.35 | $20.29 | $21.83 |
| 1/31/16 | 19.94 | 21.16 | 18.67 | 18.64 | 18.94 | 19.63 | 18.74 | 20.03 |
| 2020 Fund | ||||||||
| Distributions | Class A | Class B | Class C | Class M | Class R | Class Y | ||
| Number | 1 | 1 | 1 | 1 | 1 | 1 | ||
| Income | $0.544 | $0.388 | $0.405 | $0.434 | $0.439 | $0.578 | ||
| Capital gains | — | — | — | — | — | — | ||
| Total | $0.544 | $0.388 | $0.405 | $0.434 | $0.439 | $0.578 | ||
| Before | After | Net | Net | Before | After | Net | Net | |
| sales | sales | asset | asset | sales | sales | asset | asset | |
| Share value | charge | charge | value | value | charge | charge | value | value |
| 7/31/15 | $19.18 | $20.35 | $18.45 | $18.46 | $18.82 | $19.50 | $18.44 | $21.41 |
| 1/31/16 | 17.75 | 18.83 | 17.14 | 17.14 | 17.47 | 18.10 | 17.13 | 19.87 |
| 18 | RetirementReady® Funds |
Fund price and distribution information For the six-month period ended 1/31/16 cont.
| Retirement Income Fund Lifestyle 1 | ||||||||
| Distributions | Class A | Class B | Class C | Class M | Class R | Class Y | ||
| Number | 6 | 1 | 1 | 6 | 5 | 6 | ||
| Income | $0.573 | $0.531 | $0.531 | $0.551 | $0.550 | $0.595 | ||
| Capital gains | — | — | — | — | — | — | ||
| Total | $0.573 | $0.531 | $0.531 | $0.551 | $0.550 | $0.595 | ||
| Before | After | Net | Net | Before | After | Net | Net | |
| sales | sales | asset | asset | sales | sales | asset | asset | |
| Share value | charge | charge | value | value | charge | charge | value | value |
| 7/31/15 | $17.69 | $18.43 | $17.45 | $17.49 | $17.73 | $18.33 | $17.68 | $17.75 |
| 1/31/16 | 16.52 | 17.21 | 16.27 | 16.31 | 16.57 | 17.13 | 16.51 | 16.58 |
The classification of distributions, if any, is an estimate. Before-sales-charge share value and current dividend rate for class A and M shares, if applicable, do not take into account any sales charge levied at the time of purchase. After-sales-charge share value, current dividend rate, and current 30-day SEC yield, if applicable, are calculated assuming that the maximum sales charge (5.75% for class A shares and 3.50% for class M shares for all funds except Retirement Income Fund Lifestyle 1, for which the rates are 4.00% for class A shares and 3.25% for class M shares) was levied at the time of purchase. Final distribution information will appear on your year-end tax forms.
* The inception date of Putnam RetirementReady 2060 Fund is 11/30/15, for all share classes.
Fund performance as of most recent calendar quarter
Total return for periods ended 12/31/15
| Class A | Class B | Class C | Class M | Class R | Class Y | |||||
| (inception dates) | (11/1/04) | (11/1/04) | (11/1/04) | (11/1/04) | (11/1/04) | (11/1/04) | ||||
| Before | After | Before | After | Net | Net | |||||
| sales | sales | Before | After | Before | After | sales | sales | asset | asset | |
| charge | charge | CDSC | CDSC | CDSC | CDSC | charge | charge | value | value | |
| 2060 Fund* | ||||||||||
| Life of fund | –2.48% | –8.09% | –2.54% | –7.30% | –2.54% | –3.49% | –2.52% | –5.93% | –2.50% | –2.46% |
| 2055 Fund** | ||||||||||
| Life of fund | 59.87% | 50.68% | 53.91% | 52.91% | 53.88% | 53.88% | 55.88% | 50.42% | 57.87% | 61.95% |
| Annual average | 9.67 | 8.40 | 8.85 | 8.71 | 8.85 | 8.85 | 9.12 | 8.36 | 9.40 | 9.95 |
| 5 years | 51.21 | 42.51 | 45.65 | 43.65 | 45.62 | 45.62 | 47.48 | 42.32 | 49.34 | 53.14 |
| Annual average | 8.62 | 7.34 | 7.81 | 7.51 | 7.81 | 7.81 | 8.08 | 7.31 | 8.35 | 8.90 |
| 3 years | 37.46 | 29.56 | 34.44 | 31.45 | 34.31 | 34.31 | 35.37 | 30.63 | 36.45 | 38.44 |
| Annual average | 11.19 | 9.02 | 10.37 | 9.54 | 10.33 | 10.33 | 10.62 | 9.32 | 10.91 | 11.45 |
| 1 year | –0.49 | –6.21 | –1.19 | –5.76 | –1.24 | –2.15 | –0.94 | –4.40 | –0.71 | –0.23 |
| 6 months | –3.61 | –9.15 | –3.97 | –8.41 | –3.96 | –4.85 | –3.79 | –7.16 | –3.75 | –3.44 |
| RetirementReady® Funds | 19 |
Fund performance as of most recent calendar quarter
Total return for periods ended 12/31/15 cont.
| Class A | Class B | Class C | Class M | Class R | Class Y | |||||
| (inception dates) | (11/1/04) | (11/1/04) | (11/1/04) | (11/1/04) | (11/1/04) | (11/1/04) | ||||
| Before | After | Before | After | Net | Net | |||||
| sales | sales | Before | After | Before | After | sales | sales | asset | asset | |
| charge | charge | CDSC | CDSC | CDSC | CDSC | charge | charge | value | value | |
| 2050 Fund† | ||||||||||
| Annual average | ||||||||||
| (life of fund) | 5.92% | 5.34% | 5.33% | 5.33% | 5.12% | 5.12% | 5.38% | 5.03% | 5.65% | 6.18% |
| 10 years | 62.84 | 53.47 | 53.37 | 53.37 | 50.96 | 50.96 | 54.77 | 49.35 | 58.70 | 66.79 |
| Annual average | 5.00 | 4.38 | 4.37 | 4.37 | 4.20 | 4.20 | 4.46 | 4.09 | 4.73 | 5.25 |
| 5 years | 52.45 | 43.69 | 46.80 | 44.80 | 46.71 | 46.71 | 48.62 | 43.42 | 50.59 | 54.26 |
| Annual average | 8.80 | 7.52 | 7.98 | 7.69 | 7.97 | 7.97 | 8.25 | 7.48 | 8.53 | 9.06 |
| 3 years | 36.97 | 29.09 | 33.90 | 30.90 | 33.83 | 33.83 | 34.91 | 30.18 | 35.93 | 37.89 |
| Annual average | 11.06 | 8.88 | 10.22 | 9.39 | 10.20 | 10.20 | 10.50 | 9.19 | 10.77 | 11.30 |
| 1 year | –0.50 | –6.22 | –1.25 | –6.12 | –1.27 | –2.25 | –0.99 | –4.45 | –0.74 | –0.27 |
| 6 months | –3.52 | –9.07 | –3.89 | –8.63 | –3.93 | –4.88 | –3.79 | –7.16 | –3.68 | –3.45 |
| 2045 Fund | ||||||||||
| Annual average | ||||||||||
| (life of fund) | 5.99% | 5.43% | 5.43% | 5.43% | 5.21% | 5.21% | 5.46% | 5.13% | 5.74% | 6.26% |
| 10 years | 62.82 | 53.45 | 53.32 | 53.32 | 51.13 | 51.13 | 54.88 | 49.46 | 58.90 | 66.89 |
| Annual average | 5.00 | 4.38 | 4.37 | 4.37 | 4.22 | 4.22 | 4.47 | 4.10 | 4.74 | 5.26 |
| 5 years | 50.77 | 42.10 | 45.22 | 43.22 | 45.31 | 45.31 | 47.03 | 41.88 | 48.94 | 52.68 |
| Annual average | 8.56 | 7.28 | 7.75 | 7.45 | 7.76 | 7.76 | 8.01 | 7.25 | 8.29 | 8.83 |
| 3 years | 35.49 | 27.69 | 32.49 | 29.49 | 32.46 | 32.46 | 33.49 | 28.81 | 34.47 | 36.46 |
| Annual average | 10.65 | 8.49 | 9.83 | 9.00 | 9.82 | 9.82 | 10.11 | 8.81 | 10.38 | 10.92 |
| 1 year | –0.51 | –6.23 | –1.22 | –6.07 | –1.23 | –2.20 | –1.00 | –4.46 | –0.74 | –0.26 |
| 6 months | –3.49 | –9.04 | –3.79 | –8.52 | –3.80 | –4.74 | –3.74 | –7.11 | –3.55 | –3.34 |
| 2040 Fund | ||||||||||
| Annual average | ||||||||||
| (life of fund) | 5.93% | 5.37% | 5.36% | 5.36% | 5.14% | 5.14% | 5.40% | 5.06% | 5.67% | 6.19% |
| 10 years | 62.03 | 52.71 | 52.55 | 52.55 | 50.32 | 50.32 | 54.07 | 48.68 | 58.07 | 66.04 |
| Annual average | 4.94 | 4.32 | 4.31 | 4.31 | 4.16 | 4.16 | 4.42 | 4.05 | 4.69 | 5.20 |
| 5 years | 48.60 | 40.06 | 43.06 | 41.06 | 43.06 | 43.06 | 44.97 | 39.89 | 46.75 | 50.38 |
| Annual average | 8.24 | 6.97 | 7.42 | 7.12 | 7.43 | 7.43 | 7.71 | 6.94 | 7.97 | 8.50 |
| 3 years | 33.63 | 25.94 | 30.61 | 27.61 | 30.65 | 30.65 | 31.66 | 27.05 | 32.62 | 34.55 |
| Annual average | 10.14 | 7.99 | 9.31 | 8.47 | 9.32 | 9.32 | 9.60 | 8.31 | 9.87 | 10.40 |
| 1 year | –0.51 | –6.23 | –1.29 | –6.13 | –1.32 | –2.28 | –1.01 | –4.47 | –0.75 | –0.29 |
| 6 months | –3.31 | –8.87 | –3.72 | –8.45 | –3.73 | –4.67 | –3.56 | –6.93 | –3.46 | –3.22 |
| 20 | RetirementReady® Funds |
Fund performance as of most recent calendar quarter
Total return for periods ended 12/31/15 cont.
| Class A | Class B | Class C | Class M | Class R | Class Y | |||||
| (inception dates) | (11/1/04) | (11/1/04) | (11/1/04) | (11/1/04) | (11/1/04) | (11/1/04) | ||||
| Before | After | Before | After | Net | Net | |||||
| sales | sales | Before | After | Before | After | sales | sales | asset | asset | |
| charge | charge | CDSC | CDSC | CDSC | CDSC | charge | charge | value | value | |
| 2035 Fund | ||||||||||
| Annual average | ||||||||||
| (life of fund) | 5.65% | 5.09% | 5.08% | 5.08% | 4.86% | 4.86% | 5.12% | 4.78% | 5.38% | 5.91% |
| 10 years | 58.49 | 49.38 | 49.25 | 49.25 | 47.07 | 47.07 | 50.70 | 45.42 | 54.58 | 62.44 |
| Annual average | 4.71 | 4.09 | 4.09 | 4.09 | 3.93 | 3.93 | 4.19 | 3.82 | 4.45 | 4.97 |
| 5 years | 44.34 | 36.04 | 39.02 | 37.02 | 39.01 | 39.01 | 40.69 | 35.77 | 42.52 | 46.10 |
| Annual average | 7.62 | 6.35 | 6.81 | 6.50 | 6.81 | 6.81 | 7.07 | 6.31 | 7.34 | 7.88 |
| 3 years | 30.28 | 22.79 | 27.41 | 24.41 | 27.38 | 27.38 | 28.34 | 23.85 | 29.31 | 31.23 |
| Annual average | 9.22 | 7.08 | 8.41 | 7.55 | 8.40 | 8.40 | 8.67 | 7.39 | 8.95 | 9.48 |
| 1 year | –0.51 | –6.23 | –1.24 | –6.07 | –1.24 | –2.21 | –1.01 | –4.48 | –0.75 | –0.27 |
| 6 months | –2.99 | –8.57 | –3.40 | –8.13 | –3.36 | –4.31 | –3.28 | –6.66 | –3.13 | –2.93 |
| 2030 Fund | ||||||||||
| Annual average | ||||||||||
| (life of fund) | 5.30% | 4.74% | 4.73% | 4.73% | 4.51% | 4.51% | 4.77% | 4.44% | 5.03% | 5.56% |
| 10 years | 53.91 | 45.06 | 44.87 | 44.87 | 42.72 | 42.72 | 46.33 | 41.21 | 50.03 | 57.69 |
| Annual average | 4.41 | 3.79 | 3.78 | 3.78 | 3.62 | 3.62 | 3.88 | 3.51 | 4.14 | 4.66 |
| 5 years | 39.24 | 31.24 | 34.07 | 32.07 | 34.13 | 34.13 | 35.84 | 31.09 | 37.48 | 41.01 |
| Annual average | 6.85 | 5.59 | 6.04 | 5.72 | 6.05 | 6.05 | 6.32 | 5.56 | 6.57 | 7.11 |
| 3 years | 26.31 | 19.05 | 23.41 | 20.41 | 23.45 | 23.45 | 24.42 | 20.06 | 25.26 | 27.22 |
| Annual average | 8.10 | 5.98 | 7.26 | 6.39 | 7.28 | 7.28 | 7.55 | 6.28 | 7.80 | 8.35 |
| 1 year | –0.46 | –6.19 | –1.23 | –6.06 | –1.19 | –2.15 | –0.96 | –4.43 | –0.75 | –0.21 |
| 6 months | –2.54 | –8.14 | –2.95 | –7.70 | –2.91 | –3.86 | –2.80 | –6.20 | –2.69 | –2.45 |
| 2025 Fund | ||||||||||
| Annual average | ||||||||||
| (life of fund) | 4.82% | 4.26% | 4.26% | 4.26% | 4.03% | 4.03% | 4.29% | 3.96% | 4.55% | 5.08% |
| 10 years | 47.37 | 38.89 | 38.73 | 38.73 | 36.69 | 36.69 | 40.18 | 35.27 | 43.69 | 51.08 |
| Annual average | 3.95 | 3.34 | 3.33 | 3.33 | 3.18 | 3.18 | 3.44 | 3.07 | 3.69 | 4.21 |
| 5 years | 33.93 | 26.23 | 29.06 | 27.06 | 28.98 | 28.98 | 30.66 | 26.09 | 32.23 | 35.60 |
| Annual average | 6.02 | 4.77 | 5.23 | 4.91 | 5.22 | 5.22 | 5.49 | 4.75 | 5.75 | 6.28 |
| 3 years | 21.74 | 14.74 | 19.05 | 16.05 | 19.05 | 19.05 | 19.97 | 15.77 | 20.85 | 22.65 |
| Annual average | 6.78 | 4.69 | 5.98 | 5.09 | 5.98 | 5.98 | 6.26 | 5.00 | 6.52 | 7.04 |
| 1 year | –0.49 | –6.21 | –1.19 | –6.03 | –1.20 | –2.17 | –0.95 | –4.41 | –0.75 | –0.24 |
| 6 months | –2.11 | –7.74 | –2.42 | –7.21 | –2.48 | –3.43 | –2.31 | –5.73 | –2.24 | –2.00 |
| RetirementReady® Funds | 21 |
Fund performance as of most recent calendar quarter
Total return for periods ended 12/31/15 cont.
| Class A | Class B | Class C | Class M | Class R | Class Y | |||||
| (inception dates) | (11/1/04) | (11/1/04) | (11/1/04) | (11/1/04) | (11/1/04) | (11/1/04) | ||||
| Before | After | Before | After | Net | Net | |||||
| sales | sales | Before | After | Before | After | sales | sales | asset | asset | |
| charge | charge | CDSC | CDSC | CDSC | CDSC | charge | charge | value | value | |
| 2020 Fund | ||||||||||
| Annual average | ||||||||||
| (life of fund) | 4.08% | 3.53% | 3.52% | 3.52% | 3.31% | 3.31% | 3.57% | 3.24% | 3.83% | 4.34% |
| 10 years | 38.45 | 30.49 | 30.37 | 30.37 | 28.48 | 28.48 | 31.74 | 27.13 | 34.99 | 41.92 |
| Annual average | 3.31 | 2.70 | 2.69 | 2.69 | 2.54 | 2.54 | 2.79 | 2.43 | 3.05 | 3.56 |
| 5 years | 27.36 | 20.03 | 22.72 | 20.72 | 22.75 | 22.75 | 24.28 | 19.93 | 25.78 | 28.99 |
| Annual average | 4.96 | 3.72 | 4.18 | 3.84 | 4.18 | 4.18 | 4.44 | 3.70 | 4.69 | 5.22 |
| 3 years | 16.57 | 9.87 | 14.01 | 11.01 | 14.00 | 14.00 | 14.84 | 10.82 | 15.68 | 17.41 |
| Annual average | 5.24 | 3.19 | 4.47 | 3.54 | 4.46 | 4.46 | 4.72 | 3.48 | 4.98 | 5.50 |
| 1 year | –0.57 | –6.28 | –1.28 | –6.11 | –1.24 | –2.21 | –1.01 | –4.47 | –0.78 | –0.30 |
| 6 months | –1.72 | –7.37 | –2.04 | –6.83 | –2.05 | –3.01 | –1.91 | –5.34 | –1.81 | –1.57 |
| Retirement Income Fund Lifestyle 1 | ||||||||||
| Annual average | ||||||||||
| (life of fund) | 2.88% | 2.51% | 2.33% | 2.33% | 2.12% | 2.12% | 2.48% | 2.17% | 2.62% | 3.14% |
| 10 years | 30.28 | 25.06 | 22.66 | 22.66 | 20.90 | 20.90 | 25.35 | 21.27 | 26.99 | 33.58 |
| Annual average | 2.68 | 2.26 | 2.06 | 2.06 | 1.92 | 1.92 | 2.28 | 1.95 | 2.42 | 2.94 |
| 5 years | 16.84 | 12.16 | 12.54 | 10.54 | 12.57 | 12.57 | 15.28 | 11.53 | 15.39 | 18.39 |
| Annual average | 3.16 | 2.32 | 2.39 | 2.02 | 2.40 | 2.40 | 2.88 | 2.21 | 2.90 | 3.43 |
| 3 years | 9.55 | 5.17 | 7.14 | 4.14 | 7.13 | 7.13 | 8.76 | 5.23 | 8.72 | 10.42 |
| Annual average | 3.09 | 1.69 | 2.33 | 1.36 | 2.32 | 2.32 | 2.84 | 1.71 | 2.83 | 3.36 |
| 1 year | –0.58 | –4.56 | –1.33 | –6.11 | –1.33 | –2.29 | –0.77 | –4.00 | –0.83 | –0.32 |
| 6 months | –1.19 | –5.14 | –1.56 | –6.33 | –1.56 | –2.51 | –1.25 | –4.46 | –1.32 | –1.00 |
* The inception date of Putnam RetirementReady 2060 Fund is 11/30/15, for all share classes.
** The inception date of Putnam RetirementReady 2055 Fund is 11/30/10, for all share classes.
† The inception date of Putnam RetirementReady 2050 Fund is 5/2/05, for all share classes.
See the discussion following the fund performance tables on page 15 for information about the calculation of fund performance.
| 22 | RetirementReady® Funds |
Your fund’s expenses
As a mutual fund investor, you pay ongoing expenses, such as management fees, distribution fees (12b-1 fees), and other expenses. In the most recent six-month period (or, for Putnam RetirementReady 2060 Fund, the period from commencement of operations (11/30/15) through 1/31/16), your fund’s expenses were limited; had expenses not been limited, they would have been higher. Using the following information, you can estimate how these expenses affect your investment and compare them with the expenses of other funds. You may also pay one-time transaction expenses, including sales charges (loads) and redemption fees, which are not shown in this section and would have resulted in higher total expenses. For more information, see your fund’s prospectus or talk to your financial representative.
Expense ratios
| Class A | Class B | Class C | Class M | Class R | Class Y | |
| Putnam RetirementReady 2060 Fund | ||||||
| Estimated net expenses for the fiscal year | ||||||
| ended 7/31/15*† | 1.23% | 1.98% | 1.98% | 1.73% | 1.48% | 0.98% |
| Estimated total annual operating expenses for the | ||||||
| fiscal year ended 7/31/15† | 1.89% | 2.64% | 2.64% | 2.39% | 2.14% | 1.64% |
| Annualized expense ratio for the period from | ||||||
| 11/30/15 (commencement of operations) | ||||||
| to 1/31/16‡ | 0.25% | 1.00% | 1.00% | 0.75% | 0.50% | 0.00% |
| Putnam RetirementReady 2055 Fund | ||||||
| Net expenses for the fiscal year ended 7/31/15* | 1.23% | 1.98% | 1.98% | 1.73% | 1.48% | 0.98% |
| Total annual operating expenses for the fiscal year | ||||||
| ended 7/31/15 | 3.32% | 4.07% | 4.07% | 3.82% | 3.57% | 3.07% |
| Annualized expense ratio for the six-month period | ||||||
| ended 1/31/16‡ | 0.25% | 1.00% | 1.00% | 0.75% | 0.50% | 0.00% |
| Putnam RetirementReady 2050 Fund | ||||||
| Net expenses for the fiscal year ended 7/31/15* | 1.20% | 1.95% | 1.95% | 1.70% | 1.45% | 0.95% |
| Total annual operating expenses for the fiscal year | ||||||
| ended 7/31/15 | 1.66% | 2.41% | 2.41% | 2.16% | 1.91% | 1.41% |
| Annualized expense ratio for the six-month period | ||||||
| ended 1/31/16‡ | 0.25% | 1.00% | 1.00% | 0.75% | 0.50% | 0.00% |
| Putnam RetirementReady 2045 Fund | ||||||
| Net expenses for the fiscal year ended 7/31/15* | 1.15% | 1.90% | 1.90% | 1.65% | 1.40% | 0.90% |
| Total annual operating expenses for the fiscal year | ||||||
| ended 7/31/15 | 1.51% | 2.26% | 2.26% | 2.01% | 1.76% | 1.26% |
| Annualized expense ratio for the six-month period | ||||||
| ended 1/31/16‡ | 0.25% | 1.00% | 1.00% | 0.75% | 0.50% | 0.00% |
| Putnam RetirementReady 2040 Fund | ||||||
| Net expenses for the fiscal year ended 7/31/15* | 1.09% | 1.84% | 1.84% | 1.59% | 1.34% | 0.84% |
| Total annual operating expenses for the fiscal year | ||||||
| ended 7/31/15 | 1.32% | 2.07% | 2.07% | 1.82% | 1.57% | 1.07% |
| Annualized expense ratio for the six-month period | ||||||
| ended 1/31/16‡ | 0.25% | 1.00% | 1.00% | 0.75% | 0.50% | 0.00% |
| RetirementReady® Funds | 23 |
Expense ratios cont.
| Class A | Class B | Class C | Class M | Class R | Class Y | |
| Putnam RetirementReady 2035 Fund | ||||||
| Net expenses for the fiscal year ended 7/31/15* | 1.04% | 1.79% | 1.79% | 1.54% | 1.29% | 0.79% |
| Total annual operating expenses for the fiscal year | ||||||
| ended 7/31/15 | 1.26% | 2.01% | 2.01% | 1.76% | 1.51% | 1.01% |
| Annualized expense ratio for the six-month period | ||||||
| ended 1/31/16‡ | 0.25% | 1.00% | 1.00% | 0.75% | 0.50% | 0.00% |
| Putnam RetirementReady 2030 Fund | ||||||
| Net expenses for the fiscal year ended 7/31/15* | 1.01% | 1.76% | 1.76% | 1.51% | 1.26% | 0.76% |
| Total annual operating expenses for the fiscal year | ||||||
| ended 7/31/15 | 1.18% | 1.93% | 1.93% | 1.68% | 1.43% | 0.93% |
| Annualized expense ratio for the six-month period | ||||||
| ended 1/31/16‡ | 0.25% | 1.00% | 1.00% | 0.75% | 0.50% | 0.00% |
| Putnam RetirementReady 2025 Fund | ||||||
| Net expenses for the fiscal year ended 7/31/15* | 0.98% | 1.73% | 1.73% | 1.48% | 1.23% | 0.73% |
| Total annual operating expenses for the fiscal year | ||||||
| ended 7/31/15 | 1.18% | 1.93% | 1.93% | 1.68% | 1.43% | 0.93% |
| Annualized expense ratio for the six-month period | ||||||
| ended 1/31/16‡ | 0.25% | 1.00% | 1.00% | 0.75% | 0.50% | 0.00% |
| Putnam RetirementReady 2020 Fund | ||||||
| Net expenses for the fiscal year ended 7/31/15* | 0.97% | 1.72% | 1.72% | 1.47% | 1.22% | 0.72% |
| Total annual operating expenses for the fiscal year | ||||||
| ended 7/31/15 | 1.15% | 1.90% | 1.90% | 1.65% | 1.40% | 0.90% |
| Annualized expense ratio for the six-month period | ||||||
| ended 1/31/16‡ | 0.25% | 1.00% | 1.00% | 0.75% | 0.50% | 0.00% |
| Putnam Retirement Income Fund Lifestyle 1 | ||||||
| Net expenses for the fiscal year ended 7/31/15* | 0.95% | 1.70% | 1.70% | 1.20% | 1.20% | 0.70% |
| Total annual operating expenses for the fiscal year | ||||||
| ended 7/31/15 | 1.38% | 2.13% | 2.13% | 1.63% | 1.63% | 1.13% |
| Annualized expense ratio for the six-month period | ||||||
| ended 1/31/16‡ | 0.25% | 1.00% | 1.00% | 0.50% | 0.50% | 0.00% |
Fiscal year expense information in this table is taken from the most recent prospectus, is subject to change, and differs from that shown for the annualized expense ratio and in the financial highlights of this report.
Expenses are shown as a percentage of average net assets.
Prospectus expense information also includes the impact of acquired fund fees and expense in which each fund invests (see table below), which are not included in financial highlights or annualized expense ratios.
| Putnam RetirementReady 2060 Fund | 0.98% | ||||
| Putnam RetirementReady 2055 Fund | 0.98% | ||||
| Putnam RetirementReady 2050 Fund | 0.95% | ||||
| Putnam RetirementReady 2045 Fund | 0.90% | ||||
| Putnam RetirementReady 2040 Fund | 0.84% | ||||
| Putnam RetirementReady 2035 Fund | 0.79% | ||||
| Putnam RetirementReady 2030 Fund | 0.76% | ||||
| Putnam RetirementReady 2025 Fund | 0.73% | ||||
| Putnam RetirementReady 2020 Fund | 0.72% | ||||
| Putnam Retirement Income Fund Lifestyle 1 | 0.70% |
* Reflects Putnam Management’s decision to contractually limit expenses through 11/30/16.
† Other expenses are based on estimated amounts for the current fiscal year.
‡ Excludes the expense ratio of the underlying Putnam mutual funds.
| 24 | RetirementReady® Funds |
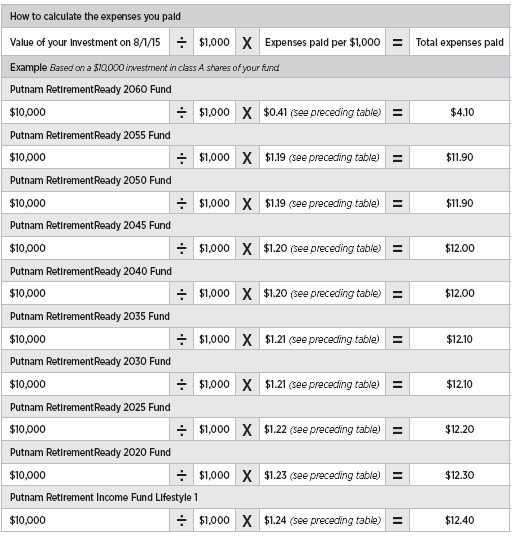
Expenses per $1,000
The following table shows the expenses you would have paid on a $1,000 investment in each fund from 8/1/15 to 1/31/16, except for RetirementReady 2060 Fund for which expenses are shown from 11/30/15 (commencement of operations) to 1/31/16. It also shows how much a $1,000 investment would be worth at the close of the period, assuming actual returns and expenses.
| Class A | Class B | Class C | Class M | Class R | Class Y | |
| Putnam RetirementReady 2060 Fund | ||||||
| Expenses paid per $1,000*† | $0.41 | $1.65 | $1.65 | $1.24 | $0.83 | $— |
| Ending value (after expenses) | $919.90 | $918.40 | $918.40 | $918.50 | $918.70 | $920.10 |
| Putnam RetirementReady 2055 Fund | ||||||
| Expenses paid per $1,000*† | $1.19 | $4.76 | $4.76 | $3.57 | $2.38 | $— |
| Ending value (after expenses) | $897.80 | $894.00 | $894.40 | $896.10 | $896.30 | $898.90 |
| Putnam RetirementReady 2050 Fund | ||||||
| Expenses paid per $1,000*† | $1.19 | $4.77 | $4.77 | $3.58 | $2.39 | $— |
| Ending value (after expenses) | $899.70 | $896.10 | $896.70 | $897.80 | $898.60 | $901.10 |
| Putnam RetirementReady 2045 Fund | ||||||
| Expenses paid per $1,000*† | $1.20 | $4.78 | $4.78 | $3.58 | $2.39 | $— |
| Ending value (after expenses) | $903.60 | $900.10 | $900.10 | $901.60 | $902.60 | $905.10 |
| Putnam RetirementReady 2040 Fund | ||||||
| Expenses paid per $1,000*† | $1.20 | $4.79 | $4.79 | $3.59 | $2.40 | $— |
| Ending value (after expenses) | $909.30 | $905.40 | $905.60 | $906.90 | $908.20 | $910.40 |
| Putnam RetirementReady 2035 Fund | ||||||
| Expenses paid per $1,000*† | $1.21 | $4.81 | $4.81 | $3.61 | $2.41 | $— |
| Ending value (after expenses) | $918.30 | $915.00 | $914.70 | $916.00 | $916.90 | $919.20 |
| Putnam RetirementReady 2030 Fund | ||||||
| Expenses paid per $1,000*† | $1.21 | $4.84 | $4.84 | $3.63 | $2.42 | $— |
| Ending value (after expenses) | $930.00 | $926.30 | $926.60 | $927.70 | $928.70 | $931.40 |
| Putnam RetirementReady 2025 Fund | ||||||
| Expenses paid per $1,000*† | $1.22 | $4.87 | $4.87 | $3.66 | $2.44 | $— |
| Ending value (after expenses) | $942.10 | $938.60 | $938.90 | $940.20 | $940.90 | $943.80 |
| Putnam RetirementReady 2020 Fund | ||||||
| Expenses paid per $1,000*† | $1.23 | $4.90 | $4.90 | $3.68 | $2.45 | $— |
| Ending value (after expenses) | $953.20 | $949.60 | $950.00 | $950.90 | $952.30 | $954.50 |
| Putnam Retirement Income Fund Lifestyle 1 | ||||||
| Expenses paid per $1,000*† | $1.24 | $4.93 | $4.93 | $2.47 | $2.47 | $— |
| Ending value (after expenses) | $965.70 | $962.30 | $962.40 | $965.10 | $964.40 | $967.10 |
* Expenses for each share class are calculated using the fund’s annualized expense ratio for each class, which represents the ongoing expenses as a percentage of average net assets for the six months ended 1/31/16, except for Putnam RetirementReady 2060 Fund, which is for the period from 11/30/15 (commencement of operations) to 1/31/16. The expense ratio may differ for each share class.
† Expenses are calculated by multiplying the expense ratio by the average account value for the period; then multiplying the result by the number of days in the period; and then dividing that result by the number of days in the year.
| RetirementReady® Funds | 25 |
Estimate the expenses you paid
To estimate the expenses you paid for the six months ended 1/31/16 (or in the case of Putnam RetirementReady 2060 Fund, for the period from 11/30/15 to 1/31/16), use the following calculation method. To find the value of your investment on 8/1/15, (or in the case of Putnam RetirementReady 2060 Fund, on 11/30/15 (commencement of operations)), call Putnam at 1-800-225-1581.
| 26 | RetirementReady® Funds |
Compare expenses using the SEC’s method
The Securities and Exchange Commission (SEC) has established guidelines to help investors assess fund expenses. Per these guidelines, the following table shows your fund’s expenses based on a $1,000 investment, assuming a hypothetical 5% annualized return. You can use this information to compare the ongoing expenses (but not transaction expenses or total costs) of investing in each of the RetirementReady Funds with those of other funds. All mutual fund shareholder reports will provide this information to help you make this comparison. Please note that you cannot use this information to estimate your actual ending account balance and expenses paid during the period.
| Class A | Class B | Class C | Class M | Class R | Class Y | |
| Putnam RetirementReady 2060 Fund | ||||||
| Expenses paid per $1,000*† | $1.27 | $5.08 | $5.08 | $3.81 | $2.54 | $— |
| Ending value (after expenses) | $1,023.88 | $1,020.11 | $1,020.11 | $1,021.37 | $1,022.62 | $1,025.14 |
| Putnam RetirementReady | ||||||
| 2055 Fund, 2050 Fund, 2045 Fund, | ||||||
| 2040 Fund, 2035 Fund, 2030 Fund, | ||||||
| 2025 Fund, 2020 Fund | ||||||
| Expenses paid per $1,000*† | $1.27 | $5.08 | $5.08 | $3.81 | $2.54 | $— |
| Ending value (after expenses) | $1,023.88 | $1,020.11 | $1,020.11 | $1,021.37 | $1,022.62 | $1,025.14 |
| Putnam Retirement Income Fund Lifestyle 1 | ||||||
| Expenses paid per $1,000*† | $1.27 | $5.08 | $5.08 | $2.54 | $2.54 | $— |
| Ending value (after expenses) | $1,023.88 | $1,020.11 | $1,020.11 | $1,022.62 | $1,022.62 | $1,025.14 |
* Expenses for each share class are calculated using the fund’s annualized expense ratio for each class, which represents the ongoing expenses as a percentage of average net assets for the six months ended 1/31/16, except for Putnam RetirementReady 2060 Fund, which is for the period from 11/30/15 (commencement of operations) to 1/31/16. The expense ratio may differ for each share class.
† Expenses are calculated by multiplying the expense ratio by the average account value for the six-month period; then multiplying the result by the number of days in the six-month period; and then dividing that result by the number of days in the year.
| RetirementReady® Funds | 27 |
Terms and definitions
Important terms
Total return shows how the value of the fund’s shares changed over time, assuming you held the shares through the entire period and reinvested all distributions in the fund.
Before sales charge, or net asset value, is the price, or value, of one share of a mutual fund, without a sales charge. Before-sales-charge figures fluctuate with market conditions, and are calculated by dividing the net assets of each class of shares by the number of outstanding shares in the class.
After sales charge is the price of a mutual fund share plus the maximum sales charge levied at the time of purchase. After-sales-charge performance figures shown here assume the 5.75% maximum sales charge for class A shares and 3.50% for class M shares (4.00% for class A shares and 3.25% for class M shares of Retirement Income Fund Lifestyle 1).
Contingent deferred sales charge (CDSC) is generally a charge applied at the time of the redemption of class B or C shares and assumes redemption at the end of the period. Your fund’s class B CDSC declines over time from a 5% maximum during the first year to 1% during the sixth year. After the sixth year, the CDSC no longer applies. The CDSC for class C shares is 1% for one year after purchase.
Share classes
Class A shares are generally subject to an initial sales charge and no CDSC (except on certain redemptions of shares bought without an initial sales charge).
Class B shares are not subject to an initial sales charge and may be subject to a CDSC.
Class C shares are not subject to an initial sales charge and are subject to a CDSC only if the shares are redeemed during the first year.
Class M shares have a lower initial sales charge and a higher 12b-1 fee than class A shares and no CDSC.
Class R shares are not subject to an initial sales charge or CDSC and are available only to employer-sponsored retirement plans.
Class Y shares are not subject to an initial sales charge or CDSC, and carry no 12b-1 fee. They are generally only available to corporate and institutional clients and clients in other approved programs.
Comparative indexes
Barclays U.S. Aggregate Bond Index is an unmanaged index of U.S. investment-grade fixed-income securities.
BofA Merrill Lynch U.S. 3-Month Treasury Bill Index is an unmanaged index that seeks to measure the performance of U.S. Treasury bills available in the marketplace.
MSCI EAFE Index (Europe, Australasia, Far East) (ND) is a free float-adjusted market capitalization index that is designed to measure the equity market performance of developed markets, excluding the U.S. and Canada.
S&P 500 Index is an unmanaged index of common stock performance.
Indexes assume reinvestment of all distributions and do not account for fees. Securities and performance of a fund and an index will differ. You cannot invest directly in an index.
Lipper is a third-party industry-ranking entity that ranks mutual funds. Its rankings do not reflect sales charges. Lipper rankings are based on total return at net asset value relative to other funds that have similar current investment styles or objectives as determined by Lipper. Lipper may change a fund’s category assignment at its discretion. Lipper category averages reflect performance trends for funds within a category.
| 28 | RetirementReady® Funds |
Other information for shareholders
Important notice regarding delivery of shareholder documents
In accordance with Securities and Exchange Commission (SEC) regulations, Putnam sends a single copy of annual and semiannual shareholder reports, prospectuses, and proxy statements to Putnam shareholders who share the same address, unless a shareholder requests otherwise. If you prefer to receive your own copy of these documents, please call Putnam at 1-800-225-1581, and Putnam will begin sending individual copies within 30 days.
Proxy voting
Putnam is committed to managing our mutual funds in the best interests of our shareholders. The Putnam funds’ proxy voting guidelines and procedures, as well as information regarding how your fund voted proxies relating to portfolio securities during the 12-month period ended June 30, 2015, are available in the Individual Investors section of putnam.com, and on the SEC’s website, www.sec.gov. If you have questions about finding forms on the SEC’s website, you may call the SEC at 1-800-SEC-0330. You may also obtain the Putnam funds’ proxy voting guidelines and procedures at no charge by calling Putnam’s Shareholder Services at 1-800-225-1581.
Fund portfolio holdings
The funds will file a complete schedule of their portfolio holdings with the SEC for the first and third quarters of each fiscal year on Form N-Q. Shareholders may obtain the funds’ Form N-Q on the SEC’s website at www.sec.gov. In addition, the funds’ Form N-Q may be reviewed and copied at the SEC’s Public Reference Room in Washington, D.C. You may call the SEC at 1-800-SEC-0330 for information about the SEC’s website or the operation of the Public Reference Room.
Trustee and employee fund ownership
Putnam employees and members of the Board of Trustees place their faith, confidence, and, most importantly, investment dollars in Putnam mutual funds. As of January 31, 2016, Putnam employees had approximately $463,000,000 and the Trustees had approximately $124,000,000 invested in Putnam mutual funds. These amounts include investments by the Trustees’ and employees’ immediate family members as well as investments through retirement and deferred compensation plans.
| RetirementReady® Funds | 29 |
Financial statements
A guide to financial statements
These sections of the report, as well as the accompanying Notes, constitute the fund’s financial statements.
The fund’s portfolio lists all the fund’s investments and their values as of the last day of the reporting period. Holdings are organized by asset type and industry sector, country, or state to show areas of concentration and diversification.
Statement of assets and liabilities shows how the fund’s net assets and share price are determined. All investment and non-investment assets are added together. Any unpaid expenses and other liabilities are subtracted from this total. The result is divided by the number of shares to determine the net asset value per share, which is calculated separately for each class of shares. (For funds with preferred shares, the amount subtracted from total assets includes the liquidation preference of preferred shares.)
Statement of operations shows the fund’s net investment gain or loss. This is done by first adding up all the fund’s earnings — from dividends and interest income — and subtracting its operating expenses to determine net investment income (or loss). Then, any net gain or loss the fund realized on the sales of its holdings — as well as any unrealized gains or losses over the period — is added to or subtracted from the net investment result to determine the fund’s net gain or loss for the fiscal period.
Statement of changes in net assets shows how the fund’s net assets were affected by the fund’s net investment gain or loss, by distributions to shareholders, and by changes in the number of the fund’s shares. It lists distributions and their sources (net investment income or realized capital gains) over the current reporting period and the most recent fiscal year-end. The distributions listed here may not match the sources listed in the Statement of operations because the distributions are determined on a tax basis and may be paid in a different period from the one in which they were earned. Dividend sources are estimated at the time of declaration. Actual results may vary. Any non-taxable return of capital cannot be determined until final tax calculations are completed after the end of the fund’s fiscal year.
Financial highlights provide an overview of the fund’s investment results, per-share distributions, expense ratios, net investment income ratios, and portfolio turnover in one summary table, reflecting the five most recent reporting periods. In a semiannual report, the highlights table also includes the current reporting period.
| 30 | RetirementReady® Funds |
The funds’ portfolios 1/31/16 (Unaudited)
| Putnam RetirementReady 2060 Fund | Shares | Value |
| Absolute Return Funds (10.6%)* | ||
| Putnam Absolute Return 100 Fund Class Y ††† | 31 | $305 |
| Putnam Absolute Return 300 Fund Class Y ††† | — | — |
| Putnam Absolute Return 500 Fund Class Y ††† | 127 | 1,338 |
| Putnam Absolute Return 700 Fund Class Y ††† | 416 | 4,527 |
| Total Absolute Return Funds (cost $6,834) | $6,170 | |
| Asset Allocation Funds (88.9%)* | ||
| Putnam Dynamic Asset Allocation Balanced Fund Class Y ††† | — | $— |
| Putnam Dynamic Asset Allocation Conservative Fund Class Y ††† | — | — |
| Putnam Dynamic Asset Allocation Equity Fund Class Y ††† | 4,098 | 42,337 |
| Putnam Dynamic Asset Allocation Growth Fund Class Y ††† | 663 | 9,352 |
| Total Asset Allocation Funds (cost $58,367) | $51,689 | |
| Fixed Income Funds (0.5%)* | ||
| Putnam Money Market Fund Class A ††† | 278 | $278 |
| Total Fixed Income Funds (cost $278) | $278 | |
| Total Investments (cost $65,479) | $58,137 | |
| * Percentages indicated are based on net assets of $58,126 | ||
| Putnam RetirementReady 2055 Fund | Shares | Value |
| Absolute Return Funds (10.8%)* | ||
| Putnam Absolute Return 100 Fund Class Y ††† | 4,892 | $48,091 |
| Putnam Absolute Return 300 Fund Class Y ††† | — | — |
| Putnam Absolute Return 500 Fund Class Y ††† | 14,255 | 150,672 |
| Putnam Absolute Return 700 Fund Class Y ††† | 46,850 | 509,728 |
| Total Absolute Return Funds (cost $772,306) | $708,491 | |
| Asset Allocation Funds (88.7%)* | ||
| Putnam Dynamic Asset Allocation Balanced Fund Class Y ††† | — | $— |
| Putnam Dynamic Asset Allocation Conservative Fund Class Y ††† | — | — |
| Putnam Dynamic Asset Allocation Equity Fund Class Y ††† | 459,414 | 4,745,747 |
| Putnam Dynamic Asset Allocation Growth Fund Class Y ††† | 74,578 | 1,051,552 |
| Total Asset Allocation Funds (cost $6,401,022) | $5,797,299 | |
| Fixed Income Funds (0.5%)* | ||
| Putnam Money Market Fund Class A ††† | 31,570 | $31,570 |
| Total Fixed Income Funds (cost $31,570) | $31,570 | |
| Total Investments (cost $7,204,898) | $6,537,360 | |
* Percentages indicated are based on net assets of $6,535,923
| RetirementReady® Funds | 31 |
The funds’ portfolios 1/31/16 (Unaudited) cont.
| Putnam RetirementReady 2050 Fund | Shares | Value |
| Absolute Return Funds (11.3%)* | ||
| Putnam Absolute Return 100 Fund Class Y ††† | 40,224 | $395,403 |
| Putnam Absolute Return 300 Fund Class Y ††† | — | — |
| Putnam Absolute Return 500 Fund Class Y ††† | 68,367 | 722,642 |
| Putnam Absolute Return 700 Fund Class Y ††† | 224,686 | 2,444,585 |
| Total Absolute Return Funds (cost $3,863,111) | $3,562,630 | |
| Asset Allocation Funds (88.2%)* | ||
| Putnam Dynamic Asset Allocation Balanced Fund Class Y ††† | — | $— |
| Putnam Dynamic Asset Allocation Conservative Fund Class Y ††† | — | — |
| Putnam Dynamic Asset Allocation Equity Fund Class Y ††† | 1,765,722 | 18,239,906 |
| Putnam Dynamic Asset Allocation Growth Fund Class Y ††† | 670,488 | 9,453,887 |
| Total Asset Allocation Funds (cost $30,386,366) | $27,693,793 | |
| Fixed Income Funds (0.5%)* | ||
| Putnam Money Market Fund Class A ††† | 150,577 | $150,577 |
| Total Fixed Income Funds (cost $150,577) | $150,577 | |
| Total Investments (cost $34,400,054) | $31,407,000 | |
| * Percentages indicated are based on net assets of $31,400,435 | ||
| Putnam RetirementReady 2045 Fund | Shares | Value |
| Absolute Return Funds (12.1%)* | ||
| Putnam Absolute Return 100 Fund Class Y ††† | 70,683 | $694,810 |
| Putnam Absolute Return 300 Fund Class Y ††† | — | — |
| Putnam Absolute Return 500 Fund Class Y ††† | 72,088 | 761,971 |
| Putnam Absolute Return 700 Fund Class Y ††† | 236,942 | 2,577,924 |
| Total Absolute Return Funds (cost $4,382,394) | $4,034,705 | |
| Asset Allocation Funds (87.4%)* | ||
| Putnam Dynamic Asset Allocation Balanced Fund Class Y ††† | — | $— |
| Putnam Dynamic Asset Allocation Conservative Fund Class Y ††† | — | — |
| Putnam Dynamic Asset Allocation Equity Fund Class Y ††† | 1,297,421 | 13,402,361 |
| Putnam Dynamic Asset Allocation Growth Fund Class Y ††† | 1,108,361 | 15,627,890 |
| Total Asset Allocation Funds (cost $32,409,762) | $29,030,251 | |
| Fixed Income Funds (0.5%)* | ||
| Putnam Money Market Fund Class A ††† | 157,386 | $157,386 |
| Total Fixed Income Funds (cost $157,386) | $157,386 | |
| Total Investments (cost $36,949,542) | $33,222,342 | |
* Percentages indicated are based on net assets of $33,215,303
| 32 | RetirementReady® Funds |
The funds’ portfolios 1/31/16 (Unaudited) cont.
| Putnam RetirementReady 2040 Fund | Shares | Value |
| Absolute Return Funds (14.6%)* | ||
| Putnam Absolute Return 100 Fund Class Y ††† | 207,086 | $2,035,657 |
| Putnam Absolute Return 300 Fund Class Y ††† | — | — |
| Putnam Absolute Return 500 Fund Class Y ††† | 276,454 | 2,922,117 |
| Putnam Absolute Return 700 Fund Class Y ††† | 592,226 | 6,443,417 |
| Total Absolute Return Funds (cost $12,274,148) | $11,401,191 | |
| Asset Allocation Funds (84.1%)* | ||
| Putnam Dynamic Asset Allocation Balanced Fund Class Y ††† | — | $— |
| Putnam Dynamic Asset Allocation Conservative Fund Class Y ††† | — | — |
| Putnam Dynamic Asset Allocation Equity Fund Class Y ††† | 1,235,378 | 12,761,453 |
| Putnam Dynamic Asset Allocation Growth Fund Class Y ††† | 3,753,975 | 52,931,041 |
| Total Asset Allocation Funds (cost $71,847,297) | $65,692,494 | |
| Fixed Income Funds (1.3%)* | ||
| Putnam Money Market Fund Class A ††† | 1,025,067 | $1,025,067 |
| Total Fixed Income Funds (cost $1,025,067) | $1,025,067 | |
| Total Investments (cost $85,146,512) | $78,118,752 | |
| * Percentages indicated are based on net assets of $78,102,827 | ||
| Putnam RetirementReady 2035 Fund | Shares | Value |
| Absolute Return Funds (19.7%)* | ||
| Putnam Absolute Return 100 Fund Class Y ††† | 157,463 | $1,547,864 |
| Putnam Absolute Return 300 Fund Class Y ††† | 77,225 | 731,323 |
| Putnam Absolute Return 500 Fund Class Y ††† | 291,955 | 3,085,969 |
| Putnam Absolute Return 700 Fund Class Y ††† | 591,020 | 6,430,295 |
| Total Absolute Return Funds (cost $12,839,357) | $11,795,451 | |
| Asset Allocation Funds (77.4%)* | ||
| Putnam Dynamic Asset Allocation Balanced Fund Class Y ††† | 460,111 | $6,018,250 |
| Putnam Dynamic Asset Allocation Conservative Fund Class Y ††† | — �� | — |
| Putnam Dynamic Asset Allocation Equity Fund Class Y ††† | — | — |
| Putnam Dynamic Asset Allocation Growth Fund Class Y ††† | 2,853,750 | 40,237,878 |
| Total Asset Allocation Funds (cost $52,045,092) | $46,256,128 | |
| Fixed Income Funds (2.9%)* | ||
| Putnam Money Market Fund Class A ††† | 1,718,058 | $1,718,058 |
| Total Fixed Income Funds (cost $1,718,058) | $1,718,058 | |
| Total Investments (cost $66,602,507) | $59,769,637 | |
* Percentages indicated are based on net assets of $59,755,564
| RetirementReady® Funds | 33 |
The funds’ portfolios 1/31/16 (Unaudited) cont.
| Putnam RetirementReady 2030 Fund | Shares | Value |
| Absolute Return Funds (27.9%)* | ||
| Putnam Absolute Return 100 Fund Class Y ††† | 430,838 | $4,235,138 |
| Putnam Absolute Return 300 Fund Class Y ††† | 538,147 | 5,096,256 |
| Putnam Absolute Return 500 Fund Class Y ††† | 665,739 | 7,036,855 |
| Putnam Absolute Return 700 Fund Class Y ††† | 1,433,467 | 15,596,116 |
| Total Absolute Return Funds (cost $34,366,628) | $31,964,365 | |
| Asset Allocation Funds (68.6%)* | ||
| Putnam Dynamic Asset Allocation Balanced Fund Class Y ††† | 3,499,974 | $45,779,660 |
| Putnam Dynamic Asset Allocation Conservative Fund Class Y ††† | — | — |
| Putnam Dynamic Asset Allocation Equity Fund Class Y ††† | — | — |
| Putnam Dynamic Asset Allocation Growth Fund Class Y ††† | 2,323,450 | 32,760,648 |
| Total Asset Allocation Funds (cost $85,019,010) | $78,540,308 | |
| Fixed Income Funds (3.6%)* | ||
| Putnam Money Market Fund Class A ††† | 4,098,518 | $4,098,518 |
| Total Fixed Income Funds (cost $4,098,518) | $4,098,518 | |
| Total Investments (cost $123,484,156) | $114,603,191 | |
| * Percentages indicated are based on net assets of $114,569,262 | ||
| Putnam RetirementReady 2025 Fund | Shares | Value |
| Absolute Return Funds (37.2%)* | ||
| Putnam Absolute Return 100 Fund Class Y ††† | 327,166 | $3,216,039 |
| Putnam Absolute Return 300 Fund Class Y ††† | 597,482 | 5,658,153 |
| Putnam Absolute Return 500 Fund Class Y ††† | 645,379 | 6,821,655 |
| Putnam Absolute Return 700 Fund Class Y ††† | 852,365 | 9,273,730 |
| Total Absolute Return Funds (cost $27,039,835) | $24,969,577 | |
| Asset Allocation Funds (58.1%)* | ||
| Putnam Dynamic Asset Allocation Balanced Fund Class Y ††† | 2,721,059 | $35,591,447 |
| Putnam Dynamic Asset Allocation Conservative Fund Class Y ††† | 344,925 | 3,397,514 |
| Putnam Dynamic Asset Allocation Equity Fund Class Y ††† | — | — |
| Putnam Dynamic Asset Allocation Growth Fund Class Y ††† | — | — |
| Total Asset Allocation Funds (cost $42,804,525) | $38,988,961 | |
| Fixed Income Funds (4.8%)* | ||
| Putnam Money Market Fund Class A ††† | 3,237,900 | $3,237,900 |
| Total Fixed Income Funds (cost $3,237,900) | $3,237,900 | |
| Total Investments (cost $73,082,260) | $67,196,438 | |
* Percentages indicated are based on net assets of $67,150,712
| 34 | RetirementReady® Funds |
The funds’ portfolios 1/31/16 (Unaudited) cont.
| Putnam RetirementReady 2020 Fund | Shares | Value |
| Absolute Return Funds (47.5%)* | ||
| Putnam Absolute Return 100 Fund Class Y ††† | 646,291 | $6,353,042 |
| Putnam Absolute Return 300 Fund Class Y ††† | 1,386,930 | 13,134,226 |
| Putnam Absolute Return 500 Fund Class Y ††† | 1,997,368 | 21,112,181 |
| Putnam Absolute Return 700 Fund Class Y ††† | 837,633 | 9,113,452 |
| Total Absolute Return Funds (cost $53,139,487) | $49,712,901 | |
| Asset Allocation Funds (46.4%)* | ||
| Putnam Dynamic Asset Allocation Balanced Fund Class Y ††† | 1,967,960 | $25,740,914 |
| Putnam Dynamic Asset Allocation Conservative Fund Class Y ††† | 2,316,630 | 22,818,806 |
| Putnam Dynamic Asset Allocation Equity Fund Class Y ††† | — | — |
| Putnam Dynamic Asset Allocation Growth Fund Class Y ††† | — | — |
| Total Asset Allocation Funds (cost $52,160,102) | $48,559,720 | |
| Fixed Income Funds (6.1%)* | ||
| Putnam Money Market Fund Class A ††† | 6,385,886 | $6,385,886 |
| Total Fixed Income Funds (cost $6,385,886) | $6,385,886 | |
| Total Investments (cost $111,685,475) | $104,658,507 | |
| * Percentages indicated are based on net assets of $104,592,761 | ||
| Putnam Retirement Income Fund Lifestyle 1 | Shares | Value |
| Absolute Return Funds (60.0%)* | ||
| Putnam Absolute Return 100 Fund Class Y ††† | 645,257 | $6,342,874 |
| Putnam Absolute Return 300 Fund Class Y ††† | 1,538,093 | 14,565,742 |
| Putnam Absolute Return 500 Fund Class Y ††† | 1,993,874 | 21,075,248 |
| Putnam Absolute Return 700 Fund Class Y ††† | — | — |
| Total Absolute Return Funds (cost $45,049,952) | $41,983,864 | |
| Asset Allocation Funds (34.0%)* | ||
| Putnam Dynamic Asset Allocation Balanced Fund Class Y ††† | — | $— |
| Putnam Dynamic Asset Allocation Conservative Fund Class Y ††† | 2,415,057 | 23,788,315 |
| Putnam Dynamic Asset Allocation Equity Fund Class Y ††† | — | — |
| Putnam Dynamic Asset Allocation Growth Fund Class Y ††† | — | — |
| Total Asset Allocation Funds (cost $25,820,609) | $23,788,315 | |
| Fixed Income Funds (6.0%)* | ||
| Putnam Money Market Fund Class A ††† | 4,223,132 | $4,223,132 |
| Total Fixed Income Funds (cost $4,223,132) | $4,223,132 | |
| Total Investments (cost $75,093,693) | $69,995,311 | |
* Percentages indicated are based on net assets of $69,977,639
| RetirementReady® Funds | 35 |
Notes to the funds’ portfolios
Unless noted otherwise, the notes to the funds’ portfolios are for the close of each fund’s reporting period, which ran from August 1, 2015 through January 31, 2016, except Putnam Retirement Ready 2060 Fund, which was for the period November 30, 2015 (commencement of operations) to January 31, 2016, (the reporting period). Within the following notes to the portfolio, references to “ASC 820” represent Accounting Standards Codification ASC 820 Fair Value Measurements and Disclosures.
††† Affiliated Company (Note 6).
ASC 820 establishes a three-level hierarchy for disclosure of fair value measurements. The valuation hierarchy is based upon the transparency of inputs to the valuation of each fund’s investments. The three levels are defined as follows:
Level 1 : Valuations based on quoted prices for identical securities in active markets.
Level 2 : Valuations based on quoted prices in markets that are not active or for which all significant inputs are observable, either directly or indirectly.
Level 3 : Valuations based on inputs that are unobservable and significant to the fair value measurement.
The following is a summary of the inputs used to value the funds’ net assets as of the close of the reporting period:
| Valuation inputs | |||||||
| Investments in securities: | Level 1 | Level 2 | Level 3 | Total | |||
| Putnam RetirementReady 2060 Fund | $58,137 | $— | $— | $58,137 | |||
| Putnam RetirementReady 2055 Fund | 6,537,360 | — | — | 6,537,360 | |||
| Putnam RetirementReady 2050 Fund | 31,407,000 | — | — | 31,407,000 | |||
| Putnam RetirementReady 2045 Fund | 33,222,342 | — | — | 33,222,342 | |||
| Putnam RetirementReady 2040 Fund | 78,118,752 | — | — | 78,118,752 | |||
| Putnam RetirementReady 2035 Fund | 59,769,637 | — | — | 59,769,637 | |||
| Putnam RetirementReady 2030 Fund | 114,603,191 | — | — | 114,603,191 | |||
| Putnam RetirementReady 2025 Fund | 67,196,438 | — | — | 67,196,438 | |||
| Putnam RetirementReady 2020 Fund | 104,658,507 | — | — | 104,658,507 | |||
| Putnam Retirement Income Fund Lifestyle 1 | 69,995,311 | — | — | 69,995,311 | |||
During the reporting period, transfers within the fair value hierarchy, if any, did not represent, in the aggregate, more than 1% of the funds’ net assets measured as of the end of the period.
The accompanying notes are an integral part of these financial statements.
| 36 | RetirementReady® Funds |
Statements of assets and liabilities 1/31/16 (Unaudited)
| Putnam | Putnam | Putnam | Putnam | Putnam | |
| Retirement- | Retirement- | Retirement- | Retirement- | Retirement- | |
| Ready | Ready | Ready | Ready | Ready | |
| ASSETS | 2060 Fund | 2055 Fund | 2050 Fund | 2045 Fund | 2040 Fund |
| Investments in affiliated | |||||
| underlying Putnam Funds, | |||||
| at value (Notes 1 and 6) | $58,137 | $6,537,360 | $31,407,000 | $33,222,342 | $78,118,752 |
| Receivable for income | |||||
| distributions from underlying | |||||
| Putnam Fund shares | — | — | 4 | 7 | 31 |
| Receivable for shares of | |||||
| the fund sold | 16 | 34,622 | 73,896 | 24,768 | 306,287 |
| Receivable for investments sold | 16 | 34,761 | 37,386 | 83,826 | 206,961 |
| Unamortized offering costs (Note 1) | 92,664 | — | — | — | — |
| Receivable from Manager (Note 2) | 18,729 | 4,787 | 12,960 | 11,216 | 21,027 |
| Total assets | 169,562 | 6,611,530 | 31,531,246 | 33,342,159 | 78,653,058 |
| LIABILITIES | |||||
| Payable for shares of | |||||
| the fund repurchased | — | 1,363 | 10,614 | 58,250 | 11,979 |
| Payable for investments | |||||
| purchased | 16 | 68,057 | 101,216 | 50,586 | 501,982 |
| Payable for distribution fees | |||||
| (Note 2) | 27 | 1,400 | 6,021 | 6,804 | 15,243 |
| Payable for reports to shareholders | 556 | 2,516 | 3,580 | 3,692 | 4,686 |
| Payable for auditing and tax fee | 11 | 1,212 | 5,906 | 6,415 | 14,712 |
| Payable for offering costs (Note 1) | 110,824 | — | — | — | — |
| Other accrued expenses | 2 | 1,059 | 3,474 | 1,109 | 1,629 |
| Total liabilities | 111,436 | 75,607 | 130,811 | 126,856 | 550,231 |
| Net assets | $58,126 | $6,535,923 | $31,400,435 | $33,215,303 | $78,102,827 |
| REPRESENTED BY | |||||
| Paid-in-capital (unlimited shares | |||||
| authorized) (Notes 1 and 4) | $64,280 | $7,620,025 | $37,041,101 | $42,475,221 | $93,178,598 |
| Undistributed net investment | |||||
| income (Distributions in excess | |||||
| of net investment income) (Note 1) | (338) | (37,345) | (115,985) | 133,621 | (15,550) |
| Accumulated net realized | |||||
| gain (loss) on investments | |||||
| (Note 1) | 1,526 | (379,219) | (2,531,627) | (5,666,339) | (8,032,461) |
| Net unrealized depreciation | |||||
| of investments | (7,342) | (667,538) | (2,993,054) | (3,727,200) | (7,027,760) |
| Total — Representing net | |||||
| assets applicable to | |||||
| capital outstanding | $58,126 | $6,535,923 | $31,400,435 | $33,215,303 | $78,102,827 |
(Continued on next page)
| Retirement Ready® Funds | 37 |
Statements of assets and liabilities 1/31/16 (Unaudited) cont.
| Putnam | Putnam | Putnam | Putnam | Putnam | |
| COMPUTATION OF | Retirement- | Retirement- | Retirement- | Retirement- | Retirement- |
| NET ASSET VALUE | Ready | Ready | Ready | Ready | Ready |
| AND OFFERING PRICE | 2060 Fund | 2055 Fund | 2050 Fund | 2045 Fund | 2040 Fund |
| Computation of net asset value, offering price and redemption price Class A | |||||
| Net Assets | $11,296 | $3,685,048 | $22,320,714 | $24,011,414 | $62,753,162 |
| Number of shares outstanding | 1,257 | 385,449 | 1,432,484 | 1,388,115 | 3,325,116 |
| Net asset value and redemption price | $8.99 | $9.56 | $15.58 | $17.30 | $18.87 |
| Offering price per class A share | |||||
| (100/94.25 of Class A net | |||||
| asset value) * | $9.54 | $10.14 | $16.53 | $18.36 | $20.02 |
| Computation of net asset value and offering price Class B | |||||
| Net Assets | $9,182 | $78,789 | $324,449 | $406,477 | $678,705 |
| Number of shares outstanding | 1,023 | 8,281 | 21,038 | 25,704 | 38,773 |
| Net asset value and offering price *** | $8.98 | $9.51 | $15.42 | $15.81 | $17.50 |
| Computation of net asset value and offering price Class C | |||||
| Net Assets | $9,182 | $525,671 | $585,584 | $971,844 | $812,192 |
| Number of shares outstanding | 1,023 | 55,942 | 38,329 | 61,379 | 47,032 |
| Net asset value and offering price *** | $8.98 | $9.40 | $15.28 | $15.83 | $17.27 |
| Computation of net asset value, offering price and redemption price Class M | |||||
| Net Assets | $9,186 | $44,320 | $90,347 | $149,998 | $137,816 |
| Number of shares outstanding | 1,023 | 4,633 | 5,733 | 8,913 | 7,747 |
| Net asset value and redemption price | $8.98 | $9.57 | $15.76 | $16.83 | $17.79 |
| Offering price per class M share | |||||
| (100/96.50 of Class M net | |||||
| asset value) * | $9.31 | $9.92 | $16.33 | $17.44 | $18.44 |
| Computation of net asset value, offering price and redemption price Class R | |||||
| Net Assets | $9,190 | $224,861 | $1,330,909 | $1,459,053 | $1,765,176 |
| Number of shares outstanding | 1,023 | 23,592 | 86,271 | 82,061 | 90,540 |
| Net asset value, offering price | |||||
| and redemption value | $8.98 | $9.53 | $15.43 | $17.78 | $19.50 |
| Computation of net asset value, offering price and redemption price Class Y | |||||
| Net Assets | $10,090 | $1,977,234 | $6,748,432 | $6,216,517 | $11,955,776 |
| Number of shares outstanding | 1,123 | 205,757 | 431,235 | 300,945 | 541,017 |
| Net asset value, offering price | |||||
| and redemption value | $8.99 † | $9.61 | $15.65 | $20.66 | $22.10 |
| Cost of investments (Note 1) | $65,479 | $7,204,898 | $34,400,054 | $36,949,542 | $85,146,512 |
* On retail sales of less than $50,000. On sales of $50,000 or more the offering price is reduced.
*** Redemption price per share is equal to the net asset value less any applicable contingent deferred sales charge.
† Net asset value may not recalculate due to rounding of fractional shares.
| 38 | Retirement Ready® Funds |
Statements of assets and liabilities 1/31/16 (Unaudited) cont.
| Putnam | Putnam | Putnam | Putnam | Putnam | |
| Retirement- | Retirement- | Retirement- | Retirement- | Retirement | |
| Ready | Ready | Ready | Ready | Income Fund | |
| ASSETS | 2035 Fund | 2030 Fund | 2025 Fund | 2020 Fund | Lifestyle 1 |
| Investments in affiliated | |||||
| underlying Putnam Funds, | |||||
| at value (Notes 1 and 6) | $59,769,637 | $114,603,191 | $67,196,438 | $104,658,507 | $69,995,311 |
| Receivable for income | |||||
| distributions from underlying | |||||
| Putnam Fund shares | 64 | 276 | 250 | 251 | 192 |
| Receivable for shares of | |||||
| the fund sold | 161,352 | 301,837 | 33,845 | 130,620 | 9,269 |
| Receivable for investments sold | 263,627 | 492,246 | 26,658 | 514,227 | 2,052 |
| Receivable from Manager (Note 2) 17,955 | 28,353 | 21,132 | 26,251 | 98,588 | |
| Total assets | 60,212,635 | 115,425,903 | 67,278,323 | 105,329,856 | 70,105,412 |
| LIABILITIES | |||||
| Payable for shares of the | |||||
| fund repurchased | 75,923 | 130,080 | 821 | 236,293 | — |
| Payable for investments | |||||
| purchased | 351,101 | 675,031 | 91,931 | 451,101 | 13,563 |
| Payable for distribution fees | |||||
| (Note 2) | 12,092 | 23,177 | 13,727 | 23,450 | 15,722 |
| Payable for reports to shareholders | 4,602 | 5,151 | 5,863 | 5,476 | 7,963 |
| Payable for auditing and tax fee | 11,731 | 21,260 | 12,997 | 18,735 | 15,928 |
| Payable for legal fee | — | — | — | — | 68,671 |
| Other accrued expenses | 1,622 | 1,942 | 2,272 | 2,040 | 5,926 |
| Total liabilities | 457,071 | 856,641 | 127,611 | 737,095 | 127,773 |
| Net assets | $59,755,564 | $114,569,262 | $67,150,712 | $104,592,761 | $69,977,639 |
| REPRESENTED BY | |||||
| Paid-in-capital (unlimited shares | |||||
| authorized) (Notes 1 and 4) | $75,635,767 | $137,929,667 | $90,968,403 | $135,663,721 | $104,657,359 |
| Undistributed net investment | |||||
| income (Distributions in excess | |||||
| of net investment income) | |||||
| (Note 1) | 390,511 | 63,374 | 630,772 | 638,804 | (316,642) |
| Accumulated net realized loss | |||||
| on investments (Note 1) | (9,437,844) | (14,542,814) | (18,562,641) | (24,682,796) | (29,264,696) |
| Net unrealized depreciation | |||||
| of investments | (6,832,870) | (8,880,965) | (5,885,822) | (7,026,968) | (5,098,382) |
| Total — Representing net | |||||
| assets applicable to | |||||
| capital outstanding | $59,755,564 | $114,569,262 | $67,150,712 | $104,592,761 | $69,977,639 |
(Continued on next page)
| Retirement Ready® Funds | 39 |
Statements of assets and liabilities 1/31/16 (Unaudited) cont.
| Putnam | Putnam | Putnam | Putnam | Putnam | |
| COMPUTATION OF | Retirement- | Retirement- | Retirement- | Retirement- | Retirement |
| NET ASSET VALUE | Ready | Ready | Ready | Ready | Income Fund |
| AND OFFERING PRICE | 2035 Fund | 2030 Fund | 2025 Fund | 2020 Fund | Lifestyle 1 |
| Computation of net asset value, offering price and redemption price Class A | |||||
| Net Assets | $42,808,018 | $93,944,821 | $50,211,222 | $93,271,610 | $59,154,146 |
| Number of shares outstanding | 2,223,581 | 4,863,468 | 2,517,951 | 5,253,569 | 3,580,055 |
| Net asset value and | |||||
| redemption price | $19.25 | $19.32 | $19.94 | $17.75 | $16.52 |
| Offering price per class A share | |||||
| (100/94.25 of Class A net | |||||
| asset value) * | $20.42 | $20.50 | $21.16 | $18.83 | N/A |
| Offering price per class A share | |||||
| (100/96.00 of Class A net | |||||
| asset value) ** | N/A | N/A | N/A | N/A | $17.21 |
| Computation of net asset value and offering price Class B | |||||
| Net Assets | $1,110,925 | $1,176,445 | $1,022,204 | $1,091,214 | $1,084,872 |
| Number of shares outstanding | 62,592 | 63,890 | 54,753 | 63,651 | 66,673 |
| Net asset value and offering price *** | $17.75 | $18.41 | $18.67 | $17.14 | $16.27 |
| Computation of net asset value and offering price Class C | |||||
| Net Assets | $1,335,069 | $1,407,874 | $1,505,648 | $1,930,658 | $1,660,162 |
| Number of shares outstanding | 75,507 | 76,593 | 80,795 | 112,642 | 101,767 |
| Net asset value and offering price *** | $17.68 | $18.38 | $18.64 | $17.14 | $16.31 |
| Computation of net asset value, offering price and redemption price Class M | |||||
| Net Assets | $428,517 | $239,797 | $198,825 | $164,015 | $522,252 |
| Number of shares outstanding | 23,063 | 12,762 | 10,500 | 9,386 | 31,524 |
| Net asset value and | |||||
| redemption price | $18.58 | $18.79 | $18.94 | $17.47 | $16.57 |
| Offering price per class M share | |||||
| (100/96.50 of Class M net | |||||
| asset value) * | $19.25 | $19.47 | $19.63 | $18.10 | N/A |
| Offering price per class M share | |||||
| (100/96.75 of Class M net | |||||
| asset value) * | N/A | N/A | N/A | N/A | $17.13 |
| Computation of net asset value, offering price and redemption price Class R | |||||
| Net Assets | $1,830,127 | $3,383,718 | $2,210,598 | $3,063,292 | $1,638,035 |
| Number of shares outstanding | 98,510 | 184,151 | 117,949 | 178,813 | 99,189 |
| Net asset value, offering price | |||||
| and redemption value | $18.58 | $18.37 | $18.74 | $17.13 | $16.51 |
| Computation of net asset value, offering price and redemption price Class Y | |||||
| Net Assets | $12,242,908 | $14,416,607 | $12,002,215 | $5,071,972 | $5,918,172 |
| Number of shares outstanding | 546,234 | 653,249 | 599,325 | 255,205 | 357,005 |
| Net asset value, offering | |||||
| price and redemption value | $22.41 | $22.07 | $20.03 | $19.87 | $16.58 |
| Cost of investments (Note 1) | $66,602,507 | $123,484,156 | $73,082,260 | $111,685,475 | $75,093,693 |
* On retail sales of less than $50,000. On sales of $50,000 or more the offering price is reduced.
** On retail sales of less than $100,000. On sales of $100,000 or more the offering price is reduced.
*** Redemption price per share is equal to the net asset value less any applicable contingent deferred sales charge.
The accompanying notes are an integral part of these financial statements.
| 40 | Retirement Ready® Funds |
Statements of operations Six months ended 1/31/16 (Unaudited)*
| Putnam | Putnam | Putnam | Putnam | Putnam | |
| Retirement- | Retirement- | Retirement- | Retirement- | Retirement- | |
| Ready | Ready | Ready | Ready | Ready | |
| INVESTMENT INCOME | 2060 Fund | 2055 Fund | 2050 Fund | 2045 Fund | 2040 Fund |
| Income distributions from | |||||
| underlying Putnam Fund shares | |||||
| (Note 6) | $1,035 | $115,008 | $589,546 | $661,595 | $1,745,789 |
| EXPENSES | |||||
| Distribution fees (Note 2) | 57 | 8,072 | 35,005 | 40,261 | 87,765 |
| Auditing and tax fees | 11 | 1,212 | 5,906 | 6,415 | 14,712 |
| Blue sky expense | 84 | 33,914 | 33,486 | 34,066 | 33,686 |
| Amortization of offering costs | |||||
| (Note 1) | 18,961 | — | — | — | — |
| Other | 565 | 2,352 | 4,474 | 3,576 | 4,902 |
| Fees waived and reimbursed by | |||||
| Manager (Note 2) | (19,621) | (37,478) | (43,866) | (44,057) | (53,300) |
| Total expenses | 57 | 8,072 | 35,005 | 40,261 | 87,765 |
| Net investment income | 978 | 106,936 | 554,541 | 621,334 | 1,658,024 |
| Net realized loss on sale of | |||||
| underlying Putnam Fund shares | |||||
| (Notes 1 and 3) | (124) | (291,028) | (1,577,792) | (937,889) | (4,333,265) |
| Capital gain distribution from | |||||
| underlying Putnam Fund shares | |||||
| (Note 6) | 1,650 | 186,412 | 973,595 | 1,115,861 | 2,884,702 |
| Net unrealized depreciation of | |||||
| underlying Putnam Fund shares | |||||
| during the period | (7,342) | (655,389) | (3,037,909) | (4,051,829) | (7,052,755) |
| Net loss on investments | (5,816) | (760,005) | (3,642,106) | (3,873,857) | (8,501,318) |
| Net decrease in net assets | |||||
| resulting from operations | $(4,838) | $(653,069) | $(3,087,565) | $(3,252,523) | $(6,843,294) |
* Except for Putnam RetirementReady 2060 Fund, which is for the period 11/30/15 (commencement of operations) to 1/31/16 (unaudited).
| Retirement Ready® Funds | 41 |
Statements of operations Six months ended 1/31/16 (Unaudited) cont.
| Putnam | Putnam | Putnam | Putnam | Putnam | |
| Retirement- | Retirement- | Retirement- | Retirement- | Retirement | |
| Ready | Ready | Ready | Ready | Income Fund | |
| INVESTMENT INCOME | 2035 Fund | 2030 Fund | 2025 Fund | 2020 Fund | Lifestyle 1 |
| Income distributions from | |||||
| underlying Putnam Fund shares | |||||
| (Note 6) | $1,452,315 | $2,588,871 | $1,609,234 | $2,749,584 | $1,987,713 |
| EXPENSES | |||||
| Distribution fees (Note 2) | 71,838 | 133,073 | 81,548 | 129,078 | 55,293 |
| Auditing and tax fees | 11,731 | 21,260 | 12,997 | 18,735 | 2,103 |
| Legal | — | — | — | — | 10,178 |
| Blue sky expense | 33,911 | 34,070 | 33,874 | 34,083 | 34,764 |
| Other | 4,517 | 5,528 | 5,756 | 5,499 | 7,389 |
| Fees waived and reimbursed by | |||||
| Manager (Note 2) | (50,159) | (60,858) | (52,627) | (58,317) | (54,434) |
| Total expenses | 71,838 | 133,073 | 81,548 | 129,078 | 55,293 |
| Net investment income | 1,380,477 | 2,455,798 | 1,527,686 | 2,620,506 | 1,932,420 |
| Net realized loss on sale of | |||||
| underlying Putnam Fund shares | |||||
| (Notes 1 and 3) | (1,383,978) | (5,007,110) | (1,665,423) | (2,883,317) | (700,472) |
| Capital gain distribution from | |||||
| underlying Putnam Fund shares | |||||
| (Note 6) | 2,286,549 | 4,026,935 | 2,260,704 | 2,854,959 | 1,522,382 |
| Net unrealized depreciation of | |||||
| underlying Putnam Fund shares | |||||
| during the period | (7,346,756) | (9,111,405) | (6,041,729) | (7,183,824) | (4,724,590) |
| Net loss on investments | (6,444,185) | (10,091,580) | (5,446,448) | (7,212,182) | (3,902,680) |
| Net decrease in net assets | |||||
| resulting from operations | $(5,063,708) | $(7,635,782) | $(3,918,762) | $(4,591,676) | $(1,970,260) |
The accompanying notes are an integral part of these financial statements.
| 42 | Retirement Ready® Funds |
Statements of changes in net assets
| For the period 11/30/15 | |
| Putnam RetirementReady 2060 Fund — | (commencement of operations) |
| TOTAL DECREASE IN NET ASSETS | to 1/31/16* |
| Operations: | |
| Net investment income | $978 |
| Net realized gain on underlying Putnam Fund shares | 1,526 |
| Net unrealized depreciation on underlying Putnam Fund shares | (7,342) |
| Net decrease in net assets resulting from operations | (4,838) |
| Distributions to shareholders (Note 1) | |
| From ordinary income | |
| Net investment income | |
| Class A | (222) |
| Class B | (216) |
| Class C | (216) |
| Class M | (218) |
| Class R | (220) |
| Class Y | (224) |
| Increase from capital share transactions (Note 4) | 4,280 |
| Total decrease in net assets | (1,874) |
| NET ASSETS | |
| Beginning of period (Note 5) | 60,000 |
| End of period | $58,126 |
| Distributions in excess of net investment income, end of period | $(338) |
* Unaudited
| Retirement Ready® Funds | 43 |
Statements of changes in net assets cont.
| Putnam RetirementReady 2055 Fund — | ||
| TOTAL INCREASE IN NET ASSETS | Six months ended 1/31/16* | Year ended 7/31/15 |
| Operations: | ||
| Net investment income | $106,936 | $40,245 |
| Net realized gain (loss) on underlying Putnam Fund shares | (104,616) | 284,706 |
| Net unrealized depreciation on underlying | ||
| Putnam Fund shares | (655,389) | (38,094) |
| Net increase (decrease) in net assets resulting from operations | (653,069) | 286,857 |
| Distributions to shareholders (Note 1) | ||
| From ordinary income | ||
| Net investment income | ||
| Class A | (82,110) | (51,880) |
| Class B | (1,182) | (3,138) |
| Class C | (8,364) | (19,089) |
| Class M | (810) | (1,407) |
| Class R | (4,456) | (8,480) |
| Class Y | (47,359) | (61,439) |
| Net realized short-term gain on investments | ||
| Class A | (51,699) | (55,500) |
| Class B | (1,159) | (3,849) |
| Class C | (7,900) | (22,975) |
| Class M | (642) | (1,722) |
| Class R | (3,262) | (9,348) |
| Class Y | (27,762) | (63,542) |
| From net realized long-term gain on investments | ||
| Class A | (172,330) | (20,539) |
| Class B | (3,863) | (1,425) |
| Class C | (26,332) | (8,504) |
| Class M | (2,139) | (637) |
| Class R | (10,874) | (3,459) |
| Class Y | (92,541) | (23,513) |
| Increase from capital share transactions (Note 4) | 2,413,620 | 3,054,850 |
| Total increase in net assets | 1,215,767 | 2,981,261 |
| NET ASSETS | ||
| Beginning of period | 5,320,156 | 2,338,895 |
| End of period | $6,535,923 | $5,320,156 |
| Distributions in excess of net investment income, | ||
| end of period | $(37,345) | $— |
* Unaudited
| 44 | Retirement Ready® Funds |
Statements of changes in net assets cont.
| Putnam RetirementReady 2050 Fund — | ||
| TOTAL INCREASE IN NET ASSETS | Six months ended 1/31/16* | Year ended 7/31/15 |
| Operations: | ||
| Net investment income | $554,541 | $225,134 |
| Net realized gain (loss) on underlying Putnam Fund shares | (604,197) | 1,623,186 |
| Net unrealized depreciation on underlying Putnam Fund shares | (3,037,909) | (365,157) |
| Net increase (decrease) in net assets resulting from operations | (3,087,565) | 1,483,163 |
| Distributions to shareholders (Note 1) | ||
| From ordinary income | ||
| Net investment income | ||
| Class A | (481,818) | (404,643) |
| Class B | (4,996) | (13,255) |
| Class C | (8,914) | (20,186) |
| Class M | (1,469) | (2,959) |
| Class R | (18,532) | (138,918) |
| Class Y | (159,617) | (234,206) |
| Increase from capital share transactions (Note 4) | 8,805,280 | 13,517,961 |
| Total increase in net assets | 5,042,369 | 14,186,957 |
| NET ASSETS | ||
| Beginning of period | 26,358,066 | 12,171,109 |
| End of period | $31,400,435 | $26,358,066 |
| Distributions in excess of net investment income | ||
| and undistributed net investment income, respectively, | ||
| end of period | $(115,985) | $4,820 |
* Unaudited
| Retirement Ready® Funds | 45 |
Statements of changes in net assets cont.
| Putnam RetirementReady 2045 Fund — | ||
| TOTAL INCREASE IN NET ASSETS | Six months ended 1/31/16* | Year ended 7/31/15 |
| Operations: | ||
| Net investment income | $621,334 | $339,038 |
| Net realized gain on underlying Putnam Fund shares | 177,972 | 1,971,501 |
| Net unrealized depreciation on underlying Putnam Fund shares | (4,051,829) | (318,595) |
| Net increase (decrease) in net assets resulting from operations | (3,252,523) | 1,991,944 |
| Distributions to shareholders (Note 1) | ||
| From ordinary income | ||
| Net investment income | ||
| Class A | (537,988) | (643,052) |
| Class B | (7,817) | (13,122) |
| Class C | (19,045) | (23,808) |
| Class M | (2,774) | (6,319) |
| Class R | (23,595) | (143,623) |
| Class Y | (133,310) | (259,055) |
| Increase from capital share transactions (Note 4) | 5,951,651 | 11,835,159 |
| Total increase in net assets | 1,974,599 | 12,738,124 |
| NET ASSETS | ||
| Beginning of period | 31,240,704 | 18,502,580 |
| End of period | $33,215,303 | $31,240,704 |
| Undistributed net investment income, | ||
| respectively, end of period | $133,621 | $236,816 |
* Unaudited
| 46 | Retirement Ready® Funds |
Statements of changes in net assets cont.
| Putnam RetirementReady 2040 Fund — | ||
| TOTAL INCREASE IN NET ASSETS | Six months ended 1/31/16* | Year ended 7/31/15 |
| Operations: | ||
| Net investment income | $1,658,024 | $616,597 |
| Net realized gain (loss) on underlying Putnam Fund shares | (1,448,563) | 3,594,104 |
| Net unrealized depreciation on underlying Putnam Fund shares | (7,052,755) | (1,028,729) |
| Net increase (decrease) in net assets resulting from operations | (6,843,294) | 3,181,972 |
| Distributions to shareholders (Note 1) | ||
| From ordinary income | ||
| Net investment income | ||
| Class A | (1,550,709) | (1,188,617) |
| Class B | (13,043) | (26,523) |
| Class C | (15,916) | (29,371) |
| Class M | (2,323) | (4,329) |
| Class R | (28,033) | (179,576) |
| Class Y | (271,074) | (321,886) |
| Increase from capital share transactions (Note 4) | 21,674,301 | 38,750,298 |
| Total increase in net assets | 12,949,909 | 40,181,968 |
| NET ASSETS | ||
| Beginning of period | 65,152,918 | 24,970,950 |
| End of period | $78,102,827 | $65,152,918 |
| Distributions in excess of net investment income | ||
| and undistributed net investment income, respectively, | ||
| end of period | $(15,550) | $207,524 |
* Unaudited
| Retirement Ready® Funds | 47 |
Statements of changes in net assets cont.
| Putnam RetirementReady 2035 Fund — | ||
| TOTAL INCREASE IN NET ASSETS | Six months ended 1/31/16* | Year ended 7/31/15 |
| Operations: | ||
| Net investment income | $1,380,477 | $699,691 |
| Net realized gain on underlying Putnam Fund shares | 902,571 | 3,955,877 |
| Net unrealized depreciation on underlying Putnam Fund shares | (7,346,756) | (1,364,289) |
| Net increase (decrease) in net assets resulting from operations | (5,063,708) | 3,291,279 |
| Distributions to shareholders (Note 1) | ||
| From ordinary income | ||
| Net investment income | ||
| Class A | (1,168,249) | (843,997) |
| Class B | (24,078) | (36,926) |
| Class C | (31,226) | (30,960) |
| Class M | (9,847) | (9,658) |
| Class R | (37,160) | (162,609) |
| Class Y | (311,739) | (375,537) |
| Increase from capital share transactions (Note 4) | 8,952,049 | 20,270,327 |
| Total increase in net assets | 2,306,042 | 22,101,919 |
| NET ASSETS | ||
| Beginning of period | 57,449,522 | 35,347,603 |
| End of period | $59,755,564 | $57,449,522 |
| Undistributed net investment income, respectively, | ||
| end of period | $390,511 | $592,333 |
* Unaudited
| 48 | Retirement Ready® Funds |
Statements of changes in net assets cont.
| Putnam RetirementReady 2030 Fund — | ||
| TOTAL INCREASE IN NET ASSETS | Six months ended 1/31/16* | Year ended 7/31/15 |
| Operations: | ||
| Net investment income | $2,455,798 | $939,936 |
| Net realized gain (loss) on underlying Putnam Fund shares | (980,175) | 5,607,160 |
| Net unrealized depreciation on underlying Putnam Fund shares | (9,111,405) | (2,241,679) |
| Net increase (decrease) in net assets resulting from operations | (7,635,782) | 4,305,417 |
| Distributions to shareholders (Note 1) | ||
| From ordinary income | ||
| Net investment income | ||
| Class A | (2,651,116) | (865,997) |
| Class B | (27,155) | (19,319) |
| Class C | (30,266) | (22,003) |
| Class M | (5,964) | (3,952) |
| Class R | (77,899) | (160,399) |
| Class Y | (388,255) | (273,623) |
| Increase from capital share transactions (Note 4) | 28,489,974 | 49,219,971 |
| Total increase in net assets | 17,673,537 | 52,180,095 |
| NET ASSETS | ||
| Beginning of period | 96,895,725 | 44,715,630 |
| End of period | $114,569,262 | $96,895,725 |
| Undistributed net investment income, respectively, end of period | $63,374 | $788,231 |
* Unaudited
| Retirement Ready® Funds | 49 |
Statements of changes in net assets cont.
| Putnam RetirementReady 2025 Fund — | ||
| TOTAL INCREASE IN NET ASSETS | Six months ended 1/31/16* | Year ended 7/31/15 |
| Operations: | ||
| Net investment income | $1,527,686 | $770,278 |
| Net realized gain on underlying Putnam Fund shares | 595,281 | 4,481,130 |
| Net unrealized depreciation on underlying Putnam Fund shares | (6,041,729) | (1,919,388) |
| Net increase (decrease) in net assets resulting from operations | (3,918,762) | 3,332,020 |
| Distributions to shareholders (Note 1) | ||
| From ordinary income | ||
| Net investment income | ||
| Class A | (1,320,536) | (411,276) |
| Class B | (20,683) | (6,806) |
| Class C | (32,318) | (8,980) |
| Class M | (4,489) | (1,811) |
| Class R | (41,389) | (66,220) |
| Class Y | (344,940) | (165,925) |
| Increase from capital share transactions (Note 4) | 10,319,370 | 14,574,617 |
| Total increase in net assets | 4,636,253 | 17,245,619 |
| NET ASSETS | ||
| Beginning of period | 62,514,459 | 45,268,840 |
| End of period | $67,150,712 | $62,514,459 |
| Undistributed net investment income, respectively, end of period | $630,772 | $867,441 |
* Unaudited
| 50 | Retirement Ready® Funds |
Statements of changes in net assets cont.
| Putnam RetirementReady 2020 Fund — | ||
| TOTAL INCREASE IN NET ASSETS | Six months ended 1/31/16* | Year ended 7/31/15 |
| Operations: | ||
| Net investment income | $2,620,506 | $869,587 |
| Net realized gain (loss) on underlying Putnam Fund shares | (28,358) | 3,197,604 |
| Net unrealized depreciation on underlying Putnam Fund shares | (7,183,824) | (1,224,986) |
| Net increase (decrease) in net assets resulting from operations | (4,591,676) | 2,842,205 |
| Distributions to shareholders (Note 1) | ||
| From ordinary income | ||
| Net investment income | ||
| Class A | (2,728,022) | (496,869) |
| Class B | (24,122) | (3,670) |
| Class C | (43,632) | (9,997) |
| Class M | (3,959) | (1,061) |
| Class R | (78,835) | (50,119) |
| Class Y | (141,521) | (57,106) |
| Increase from capital share transactions (Note 4) | 26,728,432 | 44,321,662 |
| Total increase in net assets | 19,116,665 | 46,545,045 |
| NET ASSETS | ||
| Beginning of period | 85,476,096 | 38,931,051 |
| End of period | $104,592,761 | $85,476,096 |
| Undistributed net investment income, respectively, end of period | $638,804 | $1,038,389 |
* Unaudited
| Retirement Ready® Funds | 51 |
Statements of changes in net assets cont.
| Putnam Retirement Income Fund Lifestyle 1 — | ||
| TOTAL INCREASE IN NET ASSETS | Six months ended 1/31/16* | Year ended 7/31/15 |
| Operations: | ||
| Net investment income | $1,932,420 | $351,705 |
| Net realized gain on underlying Putnam Fund shares | 821,910 | 837,596 |
| Net unrealized depreciation on underlying Putnam Fund shares | (4,724,590) | (459,316) |
| Net increase (decrease) in net assets resulting from operations | (1,970,260) | 729,985 |
| Distributions to shareholders (Note 1) | ||
| From ordinary income | ||
| Net investment income | ||
| Class A | (1,923,297) | (409,624) |
| Class B | (35,285) | (5,811) |
| Class C | (50,235) | (15,290) |
| Class M | (16,491) | (7,197) |
| Class R | (50,063) | (18,453) |
| Class Y | (211,492) | (32,142) |
| Increase from capital share transactions (Note 4) | 52,686,570 | 2,191,571 |
| Total increase in net assets | 48,429,447 | 2,433,039 |
| NET ASSETS | ||
| Beginning of period | 21,548,192 | 19,115,153 |
| End of period | $69,977,639 | $21,548,192 |
| Distributions in excess of net investment income and undistributed | ||
| net investment income, respectively, end of period | $(316,642) | $30,331 |
* Unaudited
The accompanying notes are an integral part of these financial statements.
| 52 | Retirement Ready® Funds |
| This page left blank intentionally. |
| RetirementReady® Funds | 53 |
Financial highlights (For a common share outstanding throughout the period)
Putnam RetirementReady 2060 Fund
| INVESTMENT OPERATIONS: | LESS DISTRIBUTIONS: | RATIOS AND SUPPLEMENTAL DATA: | ||||||||||
| Ratio of net | ||||||||||||
| Net asset | Net realized | Ratio | investment | |||||||||
| value, | and unrealized | Total from | From | Total return | Net assets, | of expenses | income (loss) | Portfolio | ||||
| beginning | Net investment | gain (loss) | investment | net investment | Total | Net asset value, | at net asset | end of period | to average | to average | turnover | |
| Period ended | of period | income (loss)a | on investments | operations | income | distributions | end of period | value (%)b | (in thousands) | net assets (%)c,d | net assets (%)d | (%) |
| Class A | ||||||||||||
| January 31, 2016†** | $10.00 | .16 | (.95) | (.79) | (.22) | (.22) | $8.99 | (8.01)* | $11 | .04* | 1.69* | 2* |
| Class B | ||||||||||||
| January 31, 2016†** | $10.00 | .15 | (.95) | (.80) | (.22) | (.22) | $8.98 | (8.16)* | $9 | .17* | 1.64* | 2* |
| Class C | ||||||||||||
| January 31, 2016†** | $10.00 | .15 | (.95) | (.80) | (.22) | (.22) | $8.98 | (8.16)* | $9 | .17* | 1.64* | 2* |
| Class M | ||||||||||||
| January 31, 2016†** | $10.00 | .16 | (.96) | (.80) | (.22) | (.22) | $8.98 | (8.15)* | $9 | .13* | 1.68* | 2* |
| Class R | ||||||||||||
| January 31, 2016†** | $10.00 | .16 | (.96) | (.80) | (.22) | (.22) | $8.98 | (8.13)* | $9 | .09* | 1.72* | 2* |
| Class Y | ||||||||||||
| January 31, 2016†** | $10.00 | .17 | (.96) | (.79) | (.22) | (.22) | $8.99 | (7.99)* | $10 | —* | 1.76* | 2* |
See page 74 for notes to financial highlights.
The accompanying notes are an integral part of these financial statements.
| 54 | RetirementReady® Funds | RetirementReady® Funds | 55 |
Financial highlights (For a common share outstanding throughout the period)
Putnam RetirementReady 2055 Fund
| INVESTMENT OPERATIONS: | LESS DISTRIBUTIONS: | RATIOS AND SUPPLEMENTAL DATA: | |||||||||||
| Ratio of net | |||||||||||||
| Ratio | investment | ||||||||||||
| Net asset | Net realized | of expenses | income (loss) | ||||||||||
| value, | and unrealized | Total from | From | From | Total | Net asset | Total return | Net assets, | to average | to average | Portfolio | ||
| beginning | Net investment | gain (loss) | investment | net investment | net realized gain | distribu- | value, end | at net asset | end of period | net assets | net assets | turnover | |
| Period ended | of period | income (loss)a | on investments | operations | income | on investments | tions | of period | value (%)b | (in thousands) | (%)c,d | (%)d | (%) |
| Class A | |||||||||||||
| January 31, 2016** | $11.60 | .19 | (1.33) | (1.14) | (.24) | (.66) | (.90) | $9.56 | (10.22)* | $3,685 | .13* | 1.77* | 64* |
| July 31, 2015 | 12.02 | .11 | .97 | 1.08 | (.61) | (.89) | (1.50) | 11.60 | 9.56 | 2,647 | .25 | .95 | 249 |
| July 31, 2014 | 11.67 | .09 | 1.56 | 1.65 | (.33) | (.97) | (1.30) | 12.02 | 14.60 | 568 | .25 | .76 | 202 |
| July 31, 2013 | 9.73 | .08 | 2.10 | 2.18 | (.18) | (.06) | (.24) | 11.67 | 22.79 | 512 | .25 | .79 | 183 |
| July 31, 2012 | 10.09 | .02 | (.02) | —e | (.26) | (.10) | (.36) | 9.73 | .34 | 312 | .25 | .26 | 167 |
| July 31, 2011†† | 10.00 | —e | .83 | .83 | (.65) | (.09) | (.74) | 10.09 | 8.53* | 179 | .17* | (.01)* | 101* |
| Class B | |||||||||||||
| January 31, 2016** | $11.50 | .14 | (1.31) | (1.17) | (.16) | (.66) | (.82) | $9.51 | (10.60)* | $79 | .50* | 1.30* | 64* |
| July 31, 2015 | 11.93 | .06 | .93 | .99 | (.53) | (.89) | (1.42) | 11.50 | 8.81 | 81 | 1.00 | .54 | 249 |
| July 31, 2014 | 11.62 | (.03) | 1.58 | 1.55 | (.27) | (.97) | (1.24) | 11.93 | 13.67 | 55 | 1.00 | (.23) | 202 |
| July 31, 2013 | 9.72 | .01 | 2.09 | 2.10 | (.14) | (.06) | (.20) | 11.62 | 21.85 | 28 | 1.00 | .12 | 183 |
| July 31, 2012 | 10.05 | (.05) | (.02) | (.07) | (.16) | (.10) | (.26) | 9.72 | (.44) | 12 | 1.00 | (.56) | 167 |
| July 31, 2011†† | 10.00 | .12 | .67 | .79 | (.65) | (.09) | (.74) | 10.05 | 8.03* | 17 | .67* | 1.13* | 101* |
| Class C | |||||||||||||
| January 31, 2016** | $11.38 | .14 | (1.30) | (1.16) | (.16) | (.66) | (.82) | $9.40 | (10.56)* | $526 | .50* | 1.29* | 64* |
| July 31, 2015 | 11.83 | .06 | .92 | .98 | (.54) | (.89) | (1.43) | 11.38 | 8.81 | 545 | 1.00 | .50 | 249 |
| July 31, 2014 | 11.54 | (.04) | 1.59 | 1.55 | (.29) | (.97) | (1.26) | 11.83 | 13.78 | 391 | 1.00 | (.35) | 202 |
| July 31, 2013 | 9.65 | —e | 2.07 | 2.07 | (.12) | (.06) | (.18) | 11.54 | 21.72 | 74 | 1.00 | (.01) | 183 |
| July 31, 2012 | 10.05 | (.06) | —e | (.06) | (.24) | (.10) | (.34) | 9.65 | (.36) | 36 | 1.00 | (.58) | 167 |
| July 31, 2011†† | 10.00 | .16 | .63 | .79 | (.65) | (.09) | (.74) | 10.05 | 8.03* | 15 | .67* | 1.58* | 101* |
| Class M | |||||||||||||
| January 31, 2016** | $11.58 | .16 | (1.32) | (1.16) | (.19) | (.66) | (.85) | $9.57 | (10.39)* | $44 | .38* | 1.50* | 64* |
| July 31, 2015 | 11.98 | .09 | .94 | 1.03 | (.54) | (.89) | (1.43) | 11.58 | 9.05 | 64 | .75 | .79 | 249 |
| July 31, 2014 | 11.65 | .02 | 1.57 | 1.59 | (.29) | (.97) | (1.26) | 11.98 | 14.02 | 30 | .75 | .18 | 202 |
| July 31, 2013 | 9.72 | —e | 2.12 | 2.12 | (.13) | (.06) | (.19) | 11.65 | 22.08 | 29 | .75 | .01 | 183 |
| July 31, 2012 | 10.06 | (.03) | (.01) | (.04) | (.20) | (.10) | (.30) | 9.72 | (.10) | 11 | .75 | (.30) | 167 |
| July 31, 2011†† | 10.00 | .21 | .59 | .80 | (.65) | (.09) | (.74) | 10.06 | 8.16* | 12 | .50* | 2.02* | 101* |
| Class R | |||||||||||||
| January 31, 2016** | $11.55 | .16 | (1.31) | (1.15) | (.21) | (.66) | (.87) | $9.53 | (10.37)* | $225 | .25* | 1.50* | 64* |
| July 31, 2015 | 11.98 | .20 | .85 | 1.05 | (.59) | (.89) | (1.48) | 11.55 | 9.34 | 253 | .50 | 1.65 | 249 |
| July 31, 2014 | 11.65 | .03 | 1.59 | 1.62 | (.32) | (.97) | (1.29) | 11.98 | 14.35 | 282 | .50 | .21 | 202 |
| July 31, 2013 | 9.72 | .05 | 2.10 | 2.15 | (.16) | (.06) | (.22) | 11.65 | 22.39 | 52 | .50 | .42 | 183 |
| July 31, 2012 | 10.08 | —e | (.02) | (.02) | (.24) | (.10) | (.34) | 9.72 | .10 | 15 | .50 | (.04) | 167 |
| July 31, 2011†† | 10.00 | .23 | .59 | .82 | (.65) | (.09) | (.74) | 10.08 | 8.40* | 11 | .33* | 2.23* | 101* |
| Class Y | |||||||||||||
| January 31, 2016** | $11.66 | .21 | (1.34) | (1.13) | (.26) | (.66) | (.92) | $9.61 | (10.11)* | $1,977 | —* | 1.90* | 64* |
| July 31, 2015 | 12.06 | .17 | .95 | 1.12 | (.63) | (.89) | (1.52) | 11.66 | 9.89 | 1,730 | — | 1.42 | 249 |
| July 31, 2014 | 11.70 | .13 | 1.56 | 1.69 | (.36) | (.97) | (1.33) | 12.06 | 14.88 | 1,013 | — | 1.13 | 202 |
| July 31, 2013 | 9.76 | .11 | 2.09 | 2.20 | (.20) | (.06) | (.26) | 11.70 | 22.98 | 578 | — | 1.05 | 183 |
| July 31, 2012 | 10.11 | .03 | —e | .03 | (.28) | (.10) | (.38) | 9.76 | .62 | 201 | — | .27 | 167 |
| July 31, 2011†† | 10.00 | .18 | .68 | .86 | (.66) | (.09) | (.75) | 10.11 | 8.76* | 28 | — | 1.73* | 101* |
See page 74 for notes to financial highlights.
The accompanying notes are an integral part of these financial statements.
| 56 | RetirementReady® Funds | RetirementReady® Funds | 57 |
Financial highlights (For a common share outstanding throughout the period)
Putnam RetirementReady 2050 Fund
| INVESTMENT OPERATIONS: | LESS DISTRIBUTIONS: | RATIOS AND SUPPLEMENTAL DATA: | ||||||||||
| Ratio of net | ||||||||||||
| Net asset | Net realized | Ratio | investment | |||||||||
| value, | and unrealized | Total from | From | Total return | Net assets, | of expenses | income (loss) | Portfolio | ||||
| beginning | Net investment | gain (loss) | investment | net investment | Total | Net asset value, | at net asset | end of period | to average | to average | turnover | |
| Period ended | of period | income (loss)a | on investments | operations | income | distributions | end of period | value (%)b | (in thousands) | net assets (%)c,d | net assets (%)d | (%) |
| Class A | ||||||||||||
| January 31, 2016** | $17.69 | .32 | (2.07) | (1.75) | (.36) | (.36) | $15.58 | (10.03)* | $22,321 | .13* | 1.91* | 68* |
| July 31, 2015 | 16.99 | .19 | 1.37 | 1.56 | (.86) | (.86) | 17.69 | 9.43 | 16,701 | .25 | 1.11 | 158 |
| July 31, 2014 | 15.22 | .12 | 2.06 | 2.18 | (.41) | (.41) | 16.99 | 14.45 | 4,423 | .25 | .76 | 100 |
| July 31, 2013 | 12.58 | .12 | 2.69 | 2.81 | (.17) | (.17) | 15.22 | 22.52 | 4,133 | .25 | .87 | 104 |
| July 31, 2012 | 12.86 | .02 | .15 | .17 | (.45) | (.45) | 12.58 | 1.60 | 3,590 | .25 | .19 | 61 |
| July 31, 2011 | 11.88 | .36 | 1.56 | 1.92 | (.94) | (.94) | 12.86 | 16.33 | 4,196 | .25 | 2.84 | 72 |
| Class B | ||||||||||||
| January 31, 2016** | $17.45 | .24 | (2.04) | (1.80) | (.23) | (.23) | $15.42 | (10.39)* | $324 | .50* | 1.43* | 68* |
| July 31, 2015 | 16.76 | .10 | 1.32 | 1.42 | (.73) | (.73) | 17.45 | 8.65 | 334 | 1.00 | .61 | 158 |
| July 31, 2014 | 15.05 | —e | 2.03 | 2.03 | (.32) | (.32) | 16.76 | 13.57 | 284 | 1.00 | (.01) | 100 |
| July 31, 2013 | 12.45 | .01 | 2.66 | 2.67 | (.07) | (.07) | 15.05 | 21.54 | 197 | 1.00 | .06 | 104 |
| July 31, 2012 | 12.76 | (.06) | .13 | .07 | (.38) | (.38) | 12.45 | .82 | 144 | 1.00 | (.54) | 61 |
| July 31, 2011 | 11.77 | .20 | 1.61 | 1.81 | (.82) | (.82) | 12.76 | 15.52 | 119 | 1.00 | 1.56 | 72 |
| Class C | ||||||||||||
| January 31, 2016** | $17.29 | .23 | (2.00) | (1.77) | (.24) | (.24) | $15.28 | (10.33)* | $586 | .50* | 1.44* | 68* |
| July 31, 2015 | 16.64 | .10 | 1.30 | 1.40 | (.75) | (.75) | 17.29 | 8.58 | 575 | 1.00 | .60 | 158 |
| July 31, 2014 | 14.96 | .01 | 2.01 | 2.02 | (.34) | (.34) | 16.64 | 13.58 | 409 | 1.00 | .04 | 100 |
| July 31, 2013 | 12.39 | —e | 2.66 | 2.66 | (.09) | (.09) | 14.96 | 21.60 | 210 | 1.00 | (.02) | 104 |
| July 31, 2012 | 12.68 | (.07) | .15 | .08 | (.37) | (.37) | 12.39 | .84 | 115 | 1.00 | (.57) | 61 |
| July 31, 2011 | 11.74 | .20 | 1.60 | 1.80 | (.86) | (.86) | 12.68 | 15.46 | 87 | 1.00 | 1.61 | 72 |
| Class M | ||||||||||||
| January 31, 2016** | $17.84 | .26 | (2.07) | (1.81) | (.27) | (.27) | $15.76 | (10.22)* | $90 | .38* | 1.56* | 68* |
| July 31, 2015 | 17.14 | .14 | 1.35 | 1.49 | (.79) | (.79) | 17.84 | 8.90 | 87 | .75 | .77 | 158 |
| July 31, 2014 | 15.37 | .03 | 2.09 | 2.12 | (.35) | (.35) | 17.14 | 13.85 | 52 | .75 | .15 | 100 |
| July 31, 2013 | 12.71 | .04 | 2.72 | 2.76 | (.10) | (.10) | 15.37 | 21.83 | 31 | .75 | .26 | 104 |
| July 31, 2012 | 12.74 | (.06) | .19 | .13 | (.16) | (.16) | 12.71 | 1.13 | 18 | .75 | (.48) | 61 |
| July 31, 2011 | 11.79 | .24 | 1.60 | 1.84 | (.89) | (.89) | 12.74 | 15.76 | 90 | .75 | 1.85 | 72 |
| Class R | ||||||||||||
| January 31, 2016** | $17.41 | .20 | (1.95) | (1.75) | (.23) | (.23) | $15.43 | (10.14)* | $1,331 | .25* | 1.19* | 68* |
| July 31, 2015 | 16.72 | .20 | 1.31 | 1.51 | (.82) | (.82) | 17.41 | 9.22 | 3,088 | .50 | 1.16 | 158 |
| July 31, 2014 | 15.00 | .07 | 2.03 | 2.10 | (.38) | (.38) | 16.72 | 14.13 | 2,553 | .50 | .43 | 100 |
| July 31, 2013 | 12.41 | .07 | 2.66 | 2.73 | (.14) | (.14) | 15.00 | 22.19 | 2,123 | .50 | .53 | 104 |
| July 31, 2012 | 12.72 | (.01) | .14 | .13 | (.44) | (.44) | 12.41 | 1.28 | 1,008 | .50 | (.06) | 61 |
| July 31, 2011 | 11.77 | .26 | 1.60 | 1.86 | (.91) | (.91) | 12.72 | 16.04 | 669 | .50 | 2.08 | 72 |
| Class Y | ||||||||||||
| January 31, 2016** | $17.77 | .33 | (2.07) | (1.74) | (.38) | (.38) | $15.65 | (9.89)* | $6,748 | —* | 1.96* | 68* |
| July 31, 2015 | 17.05 | .27 | 1.34 | 1.61 | (.89) | (.89) | 17.77 | 9.69 | 5,574 | — | 1.54 | 158 |
| July 31, 2014 | 15.27 | .18 | 2.05 | 2.23 | (.45) | (.45) | 17.05 | 14.73 | 4,450 | — | 1.08 | 100 |
| July 31, 2013 | 12.62 | .14 | 2.71 | 2.85 | (.20) | (.20) | 15.27 | 22.81 | 3,966 | — | .97 | 104 |
| July 31, 2012 | 12.91 | .05 | .15 | .20 | (.49) | (.49) | 12.62 | 1.83 | 2,403 | — | .41 | 61 |
| July 31, 2011 | 11.92 | .32 | 1.64 | 1.96 | (.97) | (.97) | 12.91 | 16.64 | 2,713 | — | 2.48 | 72 |
See page 74 for notes to financial highlights.
The accompanying notes are an integral part of these financial statements.
| 58 | RetirementReady® Funds | RetirementReady® Funds | 59 |
Financial highlights (For a common share outstanding throughout the period)
Putnam RetirementReady 2045 Fund
| INVESTMENT OPERATIONS: | LESS DISTRIBUTIONS: | RATIOS AND SUPPLEMENTAL DATA: | ||||||||||
| Ratio of net | ||||||||||||
| Net asset | Net realized | Ratio | investment | |||||||||
| value, | and unrealized | Total from | From | Total return | Net assets, | of expenses | income (loss) | Portfolio | ||||
| beginning | Net investment | gain (loss) | investment | net investment | Total | Net asset value, | at net asset | end of period | to average | to average | turnover | |
| Period ended | of period | income (loss)a | on investments | operations | income | distributions | end of period | value (%)b | (in thousands) | net assets (%)c,d | net assets (%)d | (%) |
| Class A | ||||||||||||
| January 31, 2016** | $19.58 | .36 | (2.22) | (1.86) | (.42) | (.42) | $17.30 | (9.64)* | $24,011 | .13* | 1.96* | 54* |
| July 31, 2015 | 18.86 | .25 | 1.43 | 1.68 | (.96) | (.96) | 19.58 | 9.14 | 20,065 | .25 | 1.30 | 116 |
| July 31, 2014 | 16.77 | .15 | 2.19 | 2.34 | (.25) | (.25) | 18.86 | 14.01 | 9,373 | .25 | .84 | 92 |
| July 31, 2013 | 14.14 | .14 | 2.87 | 3.01 | (.38) | (.38) | 16.77 | 21.70 | 7,036 | .25 | .90 | 86 |
| July 31, 2012 | 14.37 | .04 | .16 | .20 | (.43) | (.43) | 14.14 | 1.62 | 6,053 | .25 | .29 | 47 |
| July 31, 2011 | 13.24 | .40 | 1.71 | 2.11 | (.98) | (.98) | 14.37 | 16.14 | 8,782 | .25 | 2.77 | 48 |
| Class B | ||||||||||||
| January 31, 2016** | $17.89 | .25 | (2.02) | (1.77) | (.31) | (.31) | $15.81 | (9.99)* | $406 | .50* | 1.50* | 54* |
| July 31, 2015 | 17.31 | .12 | 1.29 | 1.41 | (.83) | (.83) | 17.89 | 8.31 | 420 | 1.00 | .67 | 116 |
| July 31, 2014 | 15.43 | .03 | 2.00 | 2.03 | (.15) | (.15) | 17.31 | 13.17 | 274 | 1.00 | .19 | 92 |
| July 31, 2013 | 13.06 | .04 | 2.63 | 2.67 | (.30) | (.30) | 15.43 | 20.81 | 230 | 1.00 | .29 | 86 |
| July 31, 2012 | 13.32 | (.07) | .15 | .08 | (.34) | (.34) | 13.06 | .84 | 215 | 1.00 | (.55) | 47 |
| July 31, 2011 | 12.34 | .23 | 1.63 | 1.86 | (.88) | (.88) | 13.32 | 15.27 | 160 | 1.00 | 1.76 | 48 |
| Class C | ||||||||||||
| January 31, 2016** | $17.93 | .26 | (2.03) | (1.77) | (.33) | (.33) | $15.83 | (9.99)* | $972 | .50* | 1.54* | 54* |
| July 31, 2015 | 17.38 | .11 | 1.31 | 1.42 | (.87) | (.87) | 17.93 | 8.33 | 864 | 1.00 | .59 | 116 |
| July 31, 2014 | 15.51 | .01 | 2.02 | 2.03 | (.16) | (.16) | 17.38 | 13.12 | 401 | 1.00 | .07 | 92 |
| July 31, 2013 | 13.16 | —e | 2.69 | 2.69 | (.34) | (.34) | 15.51 | 20.85 | 248 | 1.00 | .02 | 86 |
| July 31, 2012 | 13.42 | (.07) | .16 | .09 | (.35) | (.35) | 13.16 | .84 | 62 | 1.00 | (.53) | 47 |
| July 31, 2011 | 12.46 | .24 | 1.64 | 1.88 | (.92) | (.92) | 13.42 | 15.24 | 41 | 1.00 | 1.81 | 48 |
| Class M | ||||||||||||
| January 31, 2016** | $19.00 | .29 | (2.14) | (1.85) | (.32) | (.32) | $16.83 | (9.84)* | $150 | .38* | 1.63* | 54* |
| July 31, 2015 | 18.36 | .17 | 1.37 | 1.54 | (.90) | (.90) | 19.00 | 8.56 | 161 | .75 | .89 | 116 |
| July 31, 2014 | 16.34 | (.04) | 2.23 | 2.19 | (.17) | (.17) | 18.36 | 13.43 | 128 | .75 | (.23) | 92 |
| July 31, 2013 | 13.81 | .06 | 2.81 | 2.87 | (.34) | (.34) | 16.34 | 21.10 | 21 | .75 | .38 | 86 |
| July 31, 2012 | 14.08 | (.03) | .16 | .13 | (.40) | (.40) | 13.81 | 1.14 | 13 | .75 | (.19) | 47 |
| July 31, 2011 | 13.01 | .28 | 1.72 | 2.00 | (.93) | (.93) | 14.08 | 15.52 | 9 | .75 | 2.01 | 48 |
| Class R | ||||||||||||
| January 31, 2016** | $20.00 | .27 | (2.20) | (1.93) | (.29) | (.29) | $17.78 | (9.74)* | $1,459 | .25* | 1.40* | 54* |
| July 31, 2015 | 19.25 | .25 | 1.41 | 1.66 | (.91) | (.91) | 20.00 | 8.83 | 3,175 | .50 | 1.26 | 116 |
| July 31, 2014 | 17.13 | .12 | 2.22 | 2.34 | (.22) | (.22) | 19.25 | 13.72 | 2,784 | .50 | .65 | 92 |
| July 31, 2013 | 14.44 | .09 | 2.95 | 3.04 | (.35) | (.35) | 17.13 | 21.40 | 2,331 | .50 | .54 | 86 |
| July 31, 2012 | 14.68 | .01 | .16 | .17 | (.41) | (.41) | 14.44 | 1.36 | 1,085 | .50 | .04 | 47 |
| July 31, 2011 | 13.52 | .35 | 1.77 | 2.12 | (.96) | (.96) | 14.68 | 15.88 | 1,012 | .50 | 2.36 | 48 |
| Class Y | ||||||||||||
| January 31, 2016** | $23.30 | .45 | (2.64) | (2.19) | (.45) | (.45) | $20.66 | (9.49)* | $6,217 | —* | 2.03* | 54* |
| July 31, 2015 | 22.25 | .40 | 1.65 | 2.05 | (1.00) | (1.00) | 23.30 | 9.41 | 6,556 | — | 1.73 | 116 |
| July 31, 2014 | 19.74 | .27 | 2.53 | 2.80 | (.29) | (.29) | 22.25 | 14.25 | 5,544 | — | 1.25 | 92 |
| July 31, 2013 | 16.57 | .19 | 3.40 | 3.59 | (.42) | (.42) | 19.74 | 22.04 | 4,939 | — | 1.04 | 86 |
| July 31, 2012 | 16.77 | .07 | .20 | .27 | (.47) | (.47) | 16.57 | 1.86 | 3,247 | — | .44 | 47 |
| July 31, 2011 | 15.30 | .47 | 2.02 | 2.49 | (1.02) | (1.02) | 16.77 | 16.45 | 6,041 | — | 2.82 | 48 |
See page 74 for notes to financial highlights.
The accompanying notes are an integral part of these financial statements.
| 60 | RetirementReady® Funds | RetirementReady® Funds | 61 |
Financial highlights (For a common share outstanding throughout the period)
Putnam RetirementReady 2040 Fund
| INVESTMENT OPERATIONS: | LESS DISTRIBUTIONS: | RATIOS AND SUPPLEMENTAL DATA: | ||||||||||
| Ratio of net | ||||||||||||
| Net asset | Net realized | Ratio | investment | |||||||||
| value, | and unrealized | Total from | From | Total return | Net assets, | of expenses | income (loss) | Portfolio | ||||
| beginning | Net investment | gain (loss) | investment | net investment | Total | Net asset value, | at net asset | end of period | to average | to average | turnover | |
| Period ended | of period | income (loss)a | on investments | operations | income | distributions | end of period | value (%)b | (in thousands) | net assets (%)c,d | net assets (%)d | (%) |
| Class A | ||||||||||||
| January 31, 2016** | $21.26 | .45 | (2.35) | (1.90) | (.49) | (.49) | $18.87 | (9.07)* | $62,753 | .13* | 2.26* | 88* |
| July 31, 2015 | 20.51 | .28 | 1.46 | 1.74 | (.99) | (.99) | 21.26 | 8.65 | 49,628 | .25 | 1.34 | 204 |
| July 31, 2014 | 18.34 | .21 | 2.24 | 2.45 | (.28) | (.28) | 20.51 | 13.42 | 12,384 | .25 | 1.04 | 90 |
| July 31, 2013 | 15.48 | .16 | 3.01 | 3.17 | (.31) | (.31) | 18.34 | 20.74 | 10,268 | .25 | .94 | 84 |
| July 31, 2012 | 15.59 | .06 | .17 | .23 | (.34) | (.34) | 15.48 | 1.65 | 8,185 | .25 | .39 | 43 |
| July 31, 2011 | 14.23 | .46 | 1.78 | 2.24 | (.88) | (.88) | 15.59 | 15.90 | 11,819 | .25 | 2.98 | 45 |
| Class B | ||||||||||||
| January 31, 2016** | $19.69 | .34 | (2.18) | (1.84) | (.35) | (.35) | $17.50 | (9.46)* | $679 | .50* | 1.84* | 88* |
| July 31, 2015 | 19.01 | .16 | 1.32 | 1.48 | (.80) | (.80) | 19.69 | 7.92 | 666 | 1.00 | .82 | 204 |
| July 31, 2014 | 17.04 | .07 | 2.06 | 2.13 | (.16) | (.16) | 19.01 | 12.52 | 698 | 1.00 | .40 | 90 |
| July 31, 2013 | 14.42 | .03 | 2.81 | 2.84 | (.22) | (.22) | 17.04 | 19.87 | 694 | 1.00 | .16 | 84 |
| July 31, 2012 | 14.56 | (.05) | .16 | .11 | (.25) | (.25) | 14.42 | .92 | 456 | 1.00 | (.34) | 43 |
| July 31, 2011 | 13.38 | .32 | 1.67 | 1.99 | (.81) | (.81) | 14.56 | 15.00 | 434 | 1.00 | 2.21 | 45 |
| Class C | ||||||||||||
| January 31, 2016** | $19.44 | .34 | (2.16) | (1.82) | (.35) | (.35) | $17.27 | (9.44)* | $812 | .50* | 1.83* | 88* |
| July 31, 2015 | 18.83 | .15 | 1.31 | 1.46 | (.85) | (.85) | 19.44 | 7.91 | 805 | 1.00 | .78 | 204 |
| July 31, 2014 | 16.92 | .04 | 2.08 | 2.12 | (.21) | (.21) | 18.83 | 12.55 | 632 | 1.00 | .23 | 90 |
| July 31, 2013 | 14.33 | .02 | 2.79 | 2.81 | (.22) | (.22) | 16.92 | 19.80 | 279 | 1.00 | .15 | 84 |
| July 31, 2012 | 14.49 | (.04) | .16 | .12 | (.28) | (.28) | 14.33 | .96 | 163 | 1.00 | (.32) | 43 |
| July 31, 2011 | 13.32 | .27 | 1.70 | 1.97 | (.80) | (.80) | 14.49 | 14.96 | 137 | 1.00 | 1.88 | 45 |
| Class M | ||||||||||||
| January 31, 2016** | $20.02 | .35 | (2.19) | (1.84) | (.39) | (.39) | $17.79 | (9.31)* | $138 | .38* | 1.83* | 88* |
| July 31, 2015 | 19.37 | .22 | 1.33 | 1.55 | (.90) | (.90) | 20.02 | 8.16 | 114 | .75 | 1.11 | 204 |
| July 31, 2014 | 17.36 | .09 | 2.13 | 2.22 | (.21) | (.21) | 19.37 | 12.84 | 78 | .75 | .50 | 90 |
| July 31, 2013 | 14.71 | .07 | 2.85 | 2.92 | (.27) | (.27) | 17.36 | 20.11 | 50 | .75 | .45 | 84 |
| July 31, 2012 | 14.77 | (.05) | .20 | .15 | (.21) | (.21) | 14.71 | 1.15 | 26 | .75 | (.33) | 43 |
| July 31, 2011 | 13.53 | .31 | 1.75 | 2.06 | (.82) | (.82) | 14.77 | 15.34 | 31 | .75 | 2.11 | 45 |
| Class R | ||||||||||||
| January 31, 2016** | $21.80 | .29 | (2.28) | (1.99) | (.31) | (.31) | $19.50 | (9.18)* | $1,765 | .25* | 1.41* | 88* |
| July 31, 2015 | 20.98 | .29 | 1.45 | 1.74 | (.92) | (.92) | 21.80 | 8.45 | 4,726 | .50 | 1.35 | 204 |
| July 31, 2014 | 18.76 | .16 | 2.30 | 2.46 | (.24) | (.24) | 20.98 | 13.13 | 3,894 | .50 | .79 | 90 |
| July 31, 2013 | 15.84 | .11 | 3.08 | 3.19 | (.27) | (.27) | 18.76 | 20.39 | 3,362 | .50 | .66 | 84 |
| July 31, 2012 | 15.95 | .02 | .19 | .21 | (.32) | (.32) | 15.84 | 1.46 | 2,302 | .50 | .14 | 43 |
| July 31, 2011 | 14.57 | .42 | 1.82 | 2.24 | (.86) | (.86) | 15.95 | 15.55 | 2,057 | .50 | 2.63 | 45 |
| Class Y | ||||||||||||
| January 31, 2016** | $24.82 | .56 | (2.76) | (2.20) | (.52) | (.52) | $22.10 | (8.96)* | $11,956 | —* | 2.36* | 88* |
| July 31, 2015 | 23.75 | .44 | 1.65 | 2.09 | (1.02) | (1.02) | 24.82 | 8.96 | 9,215 | — | 1.79 | 204 |
| July 31, 2014 | 21.18 | .32 | 2.58 | 2.90 | (.33) | (.33) | 23.75 | 13.74 | 7,284 | — | 1.40 | 90 |
| July 31, 2013 | 17.83 | .20 | 3.49 | 3.69 | (.34) | (.34) | 21.18 | 20.99 | 6,259 | — | 1.00 | 84 |
| July 31, 2012 | 17.91 | .09 | .22 | .31 | (.39) | (.39) | 17.83 | 1.92 | 3,945 | — | .52 | 43 |
| July 31, 2011 | 16.23 | .53 | 2.07 | 2.60 | (.92) | (.92) | 17.91 | 16.17 | 10,316 | — | 2.99 | 45 |
See page 74 for notes to financial highlights.
The accompanying notes are an integral part of these financial statements.
| 62 | RetirementReady® Funds | RetirementReady® Funds | 63 |
Financial highlights (For a common share outstanding throughout the period)
Putnam RetirementReady 2035 Fund
| INVESTMENT OPERATIONS: | LESS DISTRIBUTIONS: | RATIOS AND SUPPLEMENTAL DATA: | ||||||||||
| Ratio of net | ||||||||||||
| Net asset | Net realized | Ratio | investment | |||||||||
| value, | and unrealized | Total from | From | Total return | Net assets, | of expenses | income (loss) | Portfolio | ||||
| beginning | Net investment | gain (loss) | investment | net investment | Total | Net asset value, | at net asset | end of period | to average | to average | turnover | |
| Period ended | of period | income (loss)a | on investments | operations | income | distributions | end of period | value (%)b | (in thousands) | net assets (%)c,d | net assets (%)d | (%) |
| Class A | ||||||||||||
| January 31, 2016** | $21.53 | .49 | (2.23) | (1.74) | (.54) | (.54) | $19.25 | (8.17)* | $42,808 | .13* | 2.39* | 54* |
| July 31, 2015 | 20.66 | .31 | 1.33 | 1.64 | (.77) | (.77) | 21.53 | 8.07 | 37,097 | .25 | 1.45 | 101 |
| July 31, 2014 | 18.55 | .24 | 2.03 | 2.27 | (.16) | (.16) | 20.66 | 12.25 | 17,699 | .25 | 1.21 | 79 |
| July 31, 2013 | 15.83 | .17 | 2.76 | 2.93 | (.21) | (.21) | 18.55 | 18.66 | 13,868 | .25 | 1.00 | 86 |
| July 31, 2012 | 16.01 | .09 | .15 | .24 | (.42) | (.42) | 15.83 | 1.73 | 13,194 | .25 | .62 | 42 |
| July 31, 2011 | 14.50 | .52 | 1.67 | 2.19 | (.68) | (.68) | 16.01 | 15.23 | 18,629 | .25 | 3.32 | 45 |
| Class B | ||||||||||||
| January 31, 2016** | $19.81 | .35 | (2.02) | (1.67) | (.39) | (.39) | $17.75 | (8.50)* | $1,111 | .50* | 1.87* | 54* |
| July 31, 2015 | 19.07 | .19 | 1.18 | 1.37 | (.63) | (.63) | 19.81 | 7.28 | 1,235 | 1.00 | .95 | 101 |
| July 31, 2014 | 17.17 | .10 | 1.85 | 1.95 | (.05) | (.05) | 19.07 | 11.39 | 1,061 | 1.00 | .55 | 79 |
| July 31, 2013 | 14.68 | .02 | 2.57 | 2.59 | (.10) | (.10) | 17.17 | 17.73 | 864 | 1.00 | .11 | 86 |
| July 31, 2012 | 14.89 | (.02) | .14 | .12 | (.33) | (.33) | 14.68 | .97 | 642 | 1.00 | (.12) | 42 |
| July 31, 2011 | 13.55 | .35 | 1.58 | 1.93 | (.59) | (.59) | 14.89 | 14.35 | 594 | 1.00 | 2.40 | 45 |
| Class C | ||||||||||||
| January 31, 2016** | $19.78 | .38 | (2.05) | (1.67) | (.43) | (.43) | $17.68 | (8.53)* | $1,335 | .50* | 2.02* | 54* |
| July 31, 2015 | 19.08 | .18 | 1.19 | 1.37 | (.67) | (.67) | 19.78 | 7.30 | 1,147 | 1.00 | .91 | 101 |
| July 31, 2014 | 17.17 | .09 | 1.87 | 1.96 | (.05) | (.05) | 19.08 | 11.44 | 655 | 1.00 | .51 | 79 |
| July 31, 2013 | 14.70 | .02 | 2.57 | 2.59 | (.12) | (.12) | 17.17 | 17.72 | 468 | 1.00 | .13 | 86 |
| July 31, 2012 | 14.91 | (.01) | .13 | .12 | (.33) | (.33) | 14.70 | .94 | 264 | 1.00 | (.07) | 42 |
| July 31, 2011 | 13.57 | .34 | 1.60 | 1.94 | (.60) | (.60) | 14.91 | 14.37 | 279 | 1.00 | 2.33 | 45 |
| Class M | ||||||||||||
| January 31, 2016** | $20.74 | .40 | (2.12) | (1.72) | (.44) | (.44) | $18.58 | (8.40)* | $429 | .38* | 2.03* | 54* |
| July 31, 2015 | 19.92 | .16 | 1.32 | 1.48 | (.66) | (.66) | 20.74 | 7.54 | 460 | .75 | .79 | 101 |
| July 31, 2014 | 17.93 | .14 | 1.96 | 2.10 | (.11) | (.11) | 19.92 | 11.70 | 298 | .75 | .73 | 79 |
| July 31, 2013 | 15.32 | (.04) | 2.79 | 2.75 | (.14) | (.14) | 17.93 | 18.08 | 248 | .75 | (.24) | 86 |
| July 31, 2012 | 15.14 | (.06) | .24 | .18 | — | — | 15.32 | 1.19 | 32 | .75 | (.40) | 42 |
| July 31, 2011 | 13.75 | .37 | 1.63 | 2.00 | (.61) | (.61) | 15.14 | 14.62 | 75 | .75 | 2.45 | 45 |
| Class R | ||||||||||||
| January 31, 2016** | $20.67 | .31 | (2.01) | (1.70) | (.39) | (.39) | $18.58 | (8.31)* | $1,830 | .25* | 1.58* | 54* |
| July 31, 2015 | 19.85 | .30 | 1.24 | 1.54 | (.72) | (.72) | 20.67 | 7.86 | 4,657 | .50 | 1.49 | 101 |
| July 31, 2014 | 17.84 | .19 | 1.94 | 2.13 | (.12) | (.12) | 19.85 | 11.96 | 4,334 | .50 | 1.01 | 79 |
| July 31, 2013 | 15.24 | .12 | 2.66 | 2.78 | (.18) | (.18) | 17.84 | 18.36 | 4,039 | .50 | .72 | 86 |
| July 31, 2012 | 15.45 | .05 | .14 | .19 | (.40) | (.40) | 15.24 | 1.46 | 2,650 | .50 | .37 | 42 |
| July 31, 2011 | 14.04 | .41 | 1.67 | 2.08 | (.67) | (.67) | 15.45 | 14.91 | 2,361 | .50 | 2.66 | 45 |
| Class Y | ||||||||||||
| January 31, 2016** | $24.99 | .57 | (2.56) | (1.99) | (.59) | (.59) | $22.41 | (8.08)* | $12,243 | —* | 2.37* | 54* |
| July 31, 2015 | 23.84 | .46 | 1.50 | 1.96 | (.81) | (.81) | 24.99 | 8.35 | 12,853 | — | 1.88 | 101 |
| July 31, 2014 | 21.37 | .37 | 2.30 | 2.67 | (.20) | (.20) | 23.84 | 12.55 | 11,300 | — | 1.64 | 79 |
| July 31, 2013 | 18.20 | .21 | 3.21 | 3.42 | (.25) | (.25) | 21.37 | 18.95 | 10,623 | — | 1.03 | 86 |
| July 31, 2012 | 18.35 | .14 | .18 | .32 | (.47) | (.47) | 18.20 | 1.97 | 6,059 | — | .78 | 42 |
| July 31, 2011 | 16.53 | .59 | 1.95 | 2.54 | (.72) | (.72) | 18.35 | 15.48 | 13,740 | — | 3.24 | 45 |
See page 74 for notes to financial highlights.
The accompanying notes are an integral part of these financial statements.
| 64 | RetirementReady® Funds | RetirementReady® Funds | 65 |
Financial highlights (For a common share outstanding throughout the period)
Putnam RetirementReady 2030 Fund
| INVESTMENT OPERATIONS: | LESS DISTRIBUTIONS: | RATIOS AND SUPPLEMENTAL DATA: | ||||||||||
| Ratio of net | ||||||||||||
| Net asset | Net realized | Ratio | investment | |||||||||
| value, | and unrealized | Total from | From | Total return | Net assets, | of expenses | income (loss) | Portfolio | ||||
| beginning | Net investment | gain (loss) | investment | net investment | Total | Net asset value, | at net asset | end of period | to average | to average | turnover | |
| Period ended | of period | income (loss)a | on investments | operations | income | distributions | end of period | value (%)b | (in thousands) | net assets (%)c,d | net assets (%)d | (%) |
| Class A | ||||||||||||
| January 31, 2016** | $21.38 | .48 | (1.96) | (1.48) | (.58) | (.58) | $19.32 | (7.00)* | $93,945 | .13* | 2.33* | 79* |
| July 31, 2015 | 20.35 | .29 | 1.23 | 1.52 | (.49) | (.49) | 21.38 | 7.53 | 72,342 | .25 | 1.36 | 157 |
| July 31, 2014 | 18.52 | .26 | 1.73 | 1.99 | (.16) | (.16) | 20.35 | 10.75 | 23,180 | .25 | 1.32 | 77 |
| July 31, 2013 | 16.16 | .17 | 2.36 | 2.53 | (.17) | (.17) | 18.52 | 15.76 | 18,538 | .25 | 1.01 | 80 |
| July 31, 2012 | 16.22 | .15 | .14 | .29 | (.35) | (.35) | 16.16 | 1.95 | 17,648 | .25 | 1.00 | 41 |
| July 31, 2011 | 14.70 | .54 | 1.51 | 2.05 | (.53) | (.53) | 16.22 | 14.08 | 26,432 | .25 | 3.39 | 43 |
| Class B | ||||||||||||
| January 31, 2016** | $20.32 | .36 | (1.84) | (1.48) | (.43) | (.43) | $18.41 | (7.37)* | $1,176 | .50* | 1.84* | 79* |
| July 31, 2015 | 19.35 | .16 | 1.13 | 1.29 | (.32) | (.32) | 20.32 | 6.71 | 1,325 | 1.00 | .80 | 157 |
| July 31, 2014 | 17.62 | .11 | 1.64 | 1.75 | (.02) | (.02) | 19.35 | 9.94 | 1,231 | 1.00 | .58 | 77 |
| July 31, 2013 | 15.38 | .04 | 2.25 | 2.29 | (.05) | (.05) | 17.62 | 14.92 | 1,210 | 1.00 | .23 | 80 |
| July 31, 2012 | 15.47 | .04 | .12 | .16 | (.25) | (.25) | 15.38 | 1.18 | 1,038 | 1.00 | .28 | 41 |
| July 31, 2011 | 14.06 | .38 | 1.47 | 1.85 | (.44) | (.44) | 15.47 | 13.20 | 1,015 | 1.00 | 2.48 | 43 |
| Class C | ||||||||||||
| January 31, 2016** | $20.29 | .36 | (1.83) | (1.47) | (.44) | (.44) | $18.38 | (7.34)* | $1,408 | .50* | 1.86* | 79* |
| July 31, 2015 | 19.36 | .17 | 1.11 | 1.28 | (.35) | (.35) | 20.29 | 6.68 | 1,313 | 1.00 | .84 | 157 |
| July 31, 2014 | 17.64 | .10 | 1.66 | 1.76 | (.04) | (.04) | 19.36 | 9.98 | 1,060 | 1.00 | .51 | 77 |
| July 31, 2013 | 15.41 | .04 | 2.25 | 2.29 | (.06) | (.06) | 17.64 | 14.90 | 742 | 1.00 | .24 | 80 |
| July 31, 2012 | 15.50 | .04 | .13 | .17 | (.26) | (.26) | 15.41 | 1.20 | 550 | 1.00 | .29 | 41 |
| July 31, 2011 | 14.11 | .35 | 1.50 | 1.85 | (.46) | (.46) | 15.50 | 13.20 | 558 | 1.00 | 2.30 | 43 |
| Class M | ||||||||||||
| January 31, 2016** | $20.75 | .39 | (1.87) | (1.48) | (.48) | (.48) | $18.79 | (7.23)* | $240 | .38* | 1.98* | 79* |
| July 31, 2015 | 19.75 | .20 | 1.17 | 1.37 | (.37) | (.37) | 20.75 | 6.99 | 248 | .75 | .97 | 157 |
| July 31, 2014 | 18.03 | .19 | 1.65 | 1.84 | (.12) | (.12) | 19.75 | 10.24 | 222 | .75 | .98 | 77 |
| July 31, 2013 | 15.74 | .08 | 2.30 | 2.38 | (.09) | (.09) | 18.03 | 15.17 | 101 | .75 | .47 | 80 |
| July 31, 2012 | 15.52 | —e | .22 | .22 | — | — | 15.74 | 1.42 | 76 | .75 | .01 | 41 |
| July 31, 2011 | 14.09 | .43 | 1.46 | 1.89 | (.46) | (.46) | 15.52 | 13.48 | 591 | .75 | 2.80 | 43 |
| Class R | ||||||||||||
| January 31, 2016** | $20.23 | .30 | (1.73) | (1.43) | (.43) | (.43) | $18.37 | (7.13)* | $3,384 | .25* | 1.52* | 79* |
| July 31, 2015 | 19.28 | .25 | 1.13 | 1.38 | (.43) | (.43) | 20.23 | 7.22 | 8,425 | .50 | 1.26 | 157 |
| July 31, 2014 | 17.56 | .20 | 1.64 | 1.84 | (.12) | (.12) | 19.28 | 10.51 | 7,296 | .50 | 1.07 | 77 |
| July 31, 2013 | 15.33 | .12 | 2.24 | 2.36 | (.13) | (.13) | 17.56 | 15.51 | 6,169 | .50 | .75 | 80 |
| July 31, 2012 | 15.43 | .11 | .13 | .24 | (.34) | (.34) | 15.33 | 1.70 | 4,580 | .50 | .73 | 41 |
| July 31, 2011 | 14.05 | .46 | 1.46 | 1.92 | (.54) | (.54) | 15.43 | 13.73 | 3,367 | .50 | 3.04 | 43 |
| Class Y | ||||||||||||
| January 31, 2016** | $24.34 | .55 | (2.20) | (1.65) | (.62) | (.62) | $22.07 | (6.86)* | $14,417 | —* | 2.37* | 79* |
| July 31, 2015 | 23.09 | .43 | 1.34 | 1.77 | (.52) | (.52) | 24.34 | 7.76 | 13,241 | — | 1.79 | 157 |
| July 31, 2014 | 20.98 | .38 | 1.93 | 2.31 | (.20) | (.20) | 23.09 | 11.05 | 11,725 | — | 1.70 | 77 |
| July 31, 2013 | 18.28 | .22 | 2.69 | 2.91 | (.21) | (.21) | 20.98 | 16.04 | 12,816 | — | 1.12 | 80 |
| July 31, 2012 | 18.31 | .21 | .16 | .37 | (.40) | (.40) | 18.28 | 2.21 | 6,919 | — | 1.19 | 41 |
| July 31, 2011 | 16.53 | .62 | 1.73 | 2.35 | (.57) | (.57) | 18.31 | 14.35 | 14,657 | — | 3.42 | 43 |
See page 74 for notes to financial highlights.
The accompanying notes are an integral part of these financial statements.
| 66 | RetirementReady® Funds | RetirementReady® Funds | 67 |
Financial highlights (For a common share outstanding throughout the period)
Putnam RetirementReady 2025 Fund
| INVESTMENT OPERATIONS: | LESS DISTRIBUTIONS: | RATIOS AND SUPPLEMENTAL DATA: | ||||||||||
| Ratio of net | ||||||||||||
| Net asset | Net realized | Ratio | investment | |||||||||
| value, | and unrealized | Total from | From | Total return | Net assets, | of expenses | income (loss) | Portfolio | ||||
| beginning | Net investment | gain (loss) | investment | net investment | Total | Net asset value, | at net asset | end of period | to average | to average | turnover | |
| Period ended | of period | income (loss)a | on investments | operations | income | distributions | end of period | value (%)b | (in thousands) | net assets (%)c,d | net assets (%)d | (%) |
| Class A | ||||||||||||
| January 31, 2016** | $21.73 | .50 | (1.74) | (1.24) | (.55) | (.55) | $19.94 | (5.79)* | $50,211 | .13* | 2.40* | 58* |
| July 31, 2015 | 20.62 | .31 | 1.07 | 1.38 | (.27) | (.27) | 21.73 | 6.72 | 40,668 | .25 | 1.44 | 71 |
| July 31, 2014 | 19.06 | .29 | 1.45 | 1.74 | (.18) | (.18) | 20.62 | 9.16 | 27,543 | .25 | 1.44 | 74 |
| July 31, 2013 | 17.21 | .20 | 1.92 | 2.12 | (.27) | (.27) | 19.06 | 12.44 | 23,727 | .25 | 1.12 | 89 |
| July 31, 2012 | 17.36 | .26 | .15 | .41 | (.56) | (.56) | 17.21 | 2.62 | 24,382 | .25 | 1.54 | 43 |
| July 31, 2011 | 15.98 | .59 | 1.36 | 1.95 | (.57) | (.57) | 17.36 | 12.30 | 33,235 | .25 | 3.46 | 50 |
| Class B | ||||||||||||
| January 31, 2016** | $20.29 | .36 | (1.60) | (1.24) | (.38) | (.38) | $18.67 | (6.14)* | $1,022 | .50* | 1.84* | 58* |
| July 31, 2015 | 19.28 | .14 | 1.00 | 1.14 | (.13) | (.13) | 20.29 | 5.91 | 1,128 | 1.00 | .72 | 71 |
| July 31, 2014 | 17.84 | .13 | 1.36 | 1.49 | (.05) | (.05) | 19.28 | 8.35 | 982 | 1.00 | .71 | 74 |
| July 31, 2013 | 16.12 | .05 | 1.82 | 1.87 | (.15) | (.15) | 17.84 | 11.66 | 987 | 1.00 | .32 | 89 |
| July 31, 2012 | 16.31 | .13 | .14 | .27 | (.46) | (.46) | 16.12 | 1.85 | 869 | 1.00 | .86 | 43 |
| July 31, 2011 | 15.05 | .42 | 1.30 | 1.72 | (.46) | (.46) | 16.31 | 11.47 | 930 | 1.00 | 2.64 | 50 |
| Class C | ||||||||||||
| January 31, 2016** | $20.27 | .38 | (1.61) | (1.23) | (.40) | (.40) | $18.64 | (6.11)* | $1,506 | .50* | 1.94* | 58* |
| July 31, 2015 | 19.27 | .14 | .99 | 1.13 | (.13) | (.13) | 20.27 | 5.90 | 1,532 | 1.00 | .68 | 71 |
| July 31, 2014 | 17.87 | .13 | 1.36 | 1.49 | (.09) | (.09) | 19.27 | 8.32 | 1,244 | 1.00 | .67 | 74 |
| July 31, 2013 | 16.14 | .05 | 1.82 | 1.87 | (.14) | (.14) | 17.87 | 11.67 | 807 | 1.00 | .27 | 89 |
| July 31, 2012 | 16.35 | .13 | .14 | .27 | (.48) | (.48) | 16.14 | 1.83 | 631 | 1.00 | .80 | 43 |
| July 31, 2011 | 15.11 | .38 | 1.34 | 1.72 | (.48) | (.48) | 16.35 | 11.46 | 517 | 1.00 | 2.37 | 50 |
| Class M | ||||||||||||
| January 31, 2016** | $20.60 | .40 | (1.62) | (1.22) | (.44) | (.44) | $18.94 | (5.98)* | $199 | .38* | 2.01* | 58* |
| July 31, 2015 | 19.57 | .20 | 1.00 | 1.20 | (.17) | (.17) | 20.60 | 6.16 | 205 | .75 | 1.00 | 71 |
| July 31, 2014 | 18.09 | .17 | 1.38 | 1.55 | (.07) | (.07) | 19.57 | 8.57 | 188 | .75 | .88 | 74 |
| July 31, 2013 | 16.37 | .11 | 1.83 | 1.94 | (.22) | (.22) | 18.09 | 11.95 | 226 | .75 | .64 | 89 |
| July 31, 2012 | 16.54 | .18 | .13 | .31 | (.48) | (.48) | 16.37 | 2.09 | 137 | .75 | 1.12 | 43 |
| July 31, 2011 | 15.26 | .45 | 1.33 | 1.78 | (.50) | (.50) | 16.54 | 11.76 | 163 | .75 | 2.79 | 50 |
| Class R | ||||||||||||
| January 31, 2016** | $20.29 | .27 | (1.46) | (1.19) | (.36) | (.36) | $18.74 | (5.91)* | $2,211 | .25* | 1.39* | 58* |
| July 31, 2015 | 19.28 | .23 | 1.00 | 1.23 | (.22) | (.22) | 20.29 | 6.42 | 6,829 | .50 | 1.18 | 71 |
| July 31, 2014 | 17.85 | .22 | 1.36 | 1.58 | (.15) | (.15) | 19.28 | 8.88 | 5,442 | .50 | 1.19 | 74 |
| July 31, 2013 | 16.13 | .14 | 1.81 | 1.95 | (.23) | (.23) | 17.85 | 12.19 | 4,692 | .50 | .81 | 89 |
| July 31, 2012 | 16.32 | .21 | .14 | .35 | (.54) | (.54) | 16.13 | 2.41 | 3,444 | .50 | 1.31 | 43 |
| July 31, 2011 | 15.09 | .49 | 1.31 | 1.80 | (.57) | (.57) | 16.32 | 12.01 | 3,393 | .50 | 3.04 | 50 |
| Class Y | ||||||||||||
| January 31, 2016** | $21.83 | .51 | (1.72) | (1.21) | (.59) | (.59) | $20.03 | (5.62)* | $12,002 | —* | 2.43* | 58* |
| July 31, 2015 | 20.72 | .37 | 1.05 | 1.42 | (.31) | (.31) | 21.83 | 6.92 | 12,152 | — | 1.70 | 71 |
| July 31, 2014 | 19.15 | .38 | 1.42 | 1.80 | (.23) | (.23) | 20.72 | 9.44 | 9,870 | — | 1.91 | 74 |
| July 31, 2013 | 17.28 | .23 | 1.95 | 2.18 | (.31) | (.31) | 19.15 | 12.77 | 12,138 | — | 1.26 | 89 |
| July 31, 2012 | 17.45 | .30 | .15 | .45 | (.62) | (.62) | 17.28 | 2.85 | 8,402 | — | 1.80 | 43 |
| July 31, 2011 | 16.05 | .60 | 1.41 | 2.01 | (.61) | (.61) | 17.45 | 12.65 | 13,497 | — | 3.47 | 50 |
See page 74 for notes to financial highlights.
The accompanying notes are an integral part of these financial statements.
| 68 | RetirementReady® Funds | RetirementReady® Funds | 69 |
Financial highlights (For a common share outstanding throughout the period)
Putnam RetirementReady 2020 Fund
| INVESTMENT OPERATIONS: | LESS DISTRIBUTIONS: | RATIOS AND SUPPLEMENTAL DATA: | ||||||||||
| Ratio of net | ||||||||||||
| Net asset | Net realized | Ratio | investment | |||||||||
| value, | and unrealized | Total from | From | Total return | Net assets, | of expenses | income (loss) | Portfolio | ||||
| beginning | Net investment | gain (loss) | investment | net investment | Total | Net asset value, | at net asset | end of period | to average | to average | turnover | |
| Period ended | of period | income (loss)a | on investments | operations | income | distributions | end of period | value (%)b | (in thousands) | net assets (%)c,d | net assets (%)d | (%) |
| Class A | ||||||||||||
| January 31, 2016** | $19.18 | .53 | (1.42) | (.89) | (.54) | (.54) | $17.75 | (4.68)* | $93,272 | .13* | 2.83* | 75* |
| July 31, 2015 | 18.40 | .27 | .73 | 1.00 | (.22) | (.22) | 19.18 | 5.44 | 71,290 | .25 | 1.43 | 160 |
| July 31, 2014 | 17.31 | .29 | .98 | 1.27 | (.18) | (.18) | 18.40 | 7.37 | 25,336 | .25 | 1.60 | 75 |
| July 31, 2013 | 16.19 | .19 | 1.27 | 1.46 | (.34) | (.34) | 17.31 | 9.12 | 22,557 | .25 | 1.16 | 89 |
| July 31, 2012 | 16.45 | .30 | .14 | .44 | (.70) | (.70) | 16.19 | 2.97 | 25,465 | .25 | 1.93 | 39 |
| July 31, 2011 | 15.44 | .54 | 1.03 | 1.57 | (.56) | (.56) | 16.45 | 10.30 | 33,513 | .25 | 3.34 | 55 |
| Class B | ||||||||||||
| January 31, 2016** | $18.45 | .39 | (1.31) | (.92) | (.39) | (.39) | $17.14 | (5.04)* | $1,091 | .50* | 2.19* | 75* |
| July 31, 2015 | 17.68 | .14 | .68 | .82 | (.05) | (.05) | 18.45 | 4.65 | 1,123 | 1.00 | .80 | 160 |
| July 31, 2014 | 16.66 | .15 | .94 | 1.09 | (.07) | (.07) | 17.68 | 6.56 | 1,380 | 1.00 | .84 | 75 |
| July 31, 2013 | 15.60 | .06 | 1.23 | 1.29 | (.23) | (.23) | 16.66 | 8.37 | 1,235 | 1.00 | .37 | 89 |
| July 31, 2012 | 15.90 | .18 | .13 | .31 | (.61) | (.61) | 15.60 | 2.17 | 943 | 1.00 | 1.17 | 39 |
| July 31, 2011 | 14.94 | .39 | 1.01 | 1.40 | (.44) | (.44) | 15.90 | 9.46 | 808 | 1.00 | 2.47 | 55 |
| Class C | ||||||||||||
| January 31, 2016** | $18.46 | .41 | (1.32) | (.91) | (.41) | (.41) | $17.14 | (5.00)* | $1,931 | .50* | 2.27* | 75* |
| July 31, 2015 | 17.74 | .15 | .67 | .82 | (.10) | (.10) | 18.46 | 4.63 | 1,842 | 1.00 | .80 | 160 |
| July 31, 2014 | 16.71 | .15 | .95 | 1.10 | (.07) | (.07) | 17.74 | 6.62 | 1,587 | 1.00 | .89 | 75 |
| July 31, 2013 | 15.65 | .06 | 1.23 | 1.29 | (.23) | (.23) | 16.71 | 8.30 | 1,047 | 1.00 | .35 | 89 |
| July 31, 2012 | 15.95 | .18 | .13 | .31 | (.61) | (.61) | 15.65 | 2.19 | 856 | 1.00 | 1.15 | 39 |
| July 31, 2011 | 14.99 | .33 | 1.07 | 1.40 | (.44) | (.44) | 15.95 | 9.43 | 733 | 1.00 | 2.08 | 55 |
| Class M | ||||||||||||
| January 31, 2016** | $18.82 | .41 | (1.33) | (.92) | (.43) | (.43) | $17.47 | (4.91)* | $164 | .38* | 2.23* | 75* |
| July 31, 2015 | 18.05 | .19 | .70 | .89 | (.12) | (.12) | 18.82 | 4.93 | 180 | .75 | 1.02 | 160 |
| July 31, 2014 | 16.99 | .20 | .96 | 1.16 | (.10) | (.10) | 18.05 | 6.81 | 154 | .75 | 1.12 | 75 |
| July 31, 2013 | 15.88 | .10 | 1.26 | 1.36 | (.25) | (.25) | 16.99 | 8.62 | 140 | .75 | .59 | 89 |
| July 31, 2012 | 16.14 | .24 | .11 | .35 | (.61) | (.61) | 15.88 | 2.40 | 133 | .75 | 1.54 | 39 |
| July 31, 2011 | 15.16 | .46 | 1.00 | 1.46 | (.48) | (.48) | 16.14 | 9.74 | 213 | .75 | 2.91 | 55 |
| Class R | ||||||||||||
| January 31, 2016** | $18.44 | .38 | (1.25) | (.87) | (.44) | (.44) | $17.13 | (4.77)* | $3,063 | .25* | 2.09* | 75* |
| July 31, 2015 | 17.69 | .23 | .68 | .91 | (.16) | (.16) | 18.44 | 5.17 | 5,716 | .50 | 1.29 | 160 |
| July 31, 2014 | 16.67 | .23 | .95 | 1.18 | (.16) | (.16) | 17.69 | 7.09 | 5,348 | .50 | 1.35 | 75 |
| July 31, 2013 | 15.60 | .14 | 1.23 | 1.37 | (.30) | (.30) | 16.67 | 8.86 | 4,587 | .50 | .84 | 89 |
| July 31, 2012 | 15.89 | .26 | .13 | .39 | (.68) | (.68) | 15.60 | 2.71 | 3,030 | .50 | 1.72 | 39 |
| July 31, 2011 | 14.98 | .48 | 1.01 | 1.49 | (.58) | (.58) | 15.89 | 10.04 | 3,172 | .50 | 3.06 | 55 |
| Class Y | ||||||||||||
| January 31, 2016** | $21.41 | .55 | (1.51) | (.96) | (.58) | (.58) | $19.87 | (4.55)* | $5,072 | —* | 2.66* | 75* |
| July 31, 2015 | 20.49 | .37 | .80 | 1.17 | (.25) | (.25) | 21.41 | 5.72 | 5,325 | — | 1.75 | 160 |
| July 31, 2014 | 19.26 | .44 | 1.02 | 1.46 | (.23) | (.23) | 20.49 | 7.60 | 5,125 | — | 2.20 | 75 |
| July 31, 2013 | 17.97 | .24 | 1.43 | 1.67 | (.38) | (.38) | 19.26 | 9.41 | 7,104 | — | 1.27 | 89 |
| July 31, 2012 | 18.19 | .40 | .13 | .53 | (.75) | (.75) | 17.97 | 3.22 | 3,500 | — | 2.27 | 39 |
| July 31, 2011 | 17.01 | .61 | 1.18 | 1.79 | (.61) | (.61) | 18.19 | 10.60 | 10,446 | — | 3.42 | 55 |
See page 74 for notes to financial highlights.
The accompanying notes are an integral part of these financial statements.
| 70 | RetirementReady® Funds | RetirementReady® Funds | 71 |
Financial highlights (For a common share outstanding throughout the period)
Putnam Retirement Income Fund Lifestyle 1
| INVESTMENT OPERATIONS: | LESS DISTRIBUTIONS: | RATIOS AND SUPPLEMENTAL DATA: | ||||||||||
| Ratio of net | ||||||||||||
| Net asset | Net realized | Ratio | investment | |||||||||
| value, | and unrealized | Total from | From | Total return | Net assets, | of expenses | income (loss) | Portfolio | ||||
| beginning | Net investment | gain (loss) | investment | net investment | Total | Net asset value, | at net asset | end of period | to average | to average | turnover | |
| Period ended | of period | income (loss)a | on investments | operations | income | distributions | end of period | value (%)b | (in thousands) | net assets (%)c,d | net assets (%)d | (%) |
| Class A | ||||||||||||
| January 31, 2016** | $17.69 | .84 | (1.44) | (.60) | (.57) | (.57) | $16.52 | (3.43)* | $59,154 | .13* | 4.89* | 31* |
| July 31, 2015 | 17.49 | .30 | .31 | .61 | (.41) | (.41) | 17.69 | 3.52 | 17,655 | .25 | 1.71 | 39 |
| July 31, 2014 | 16.98 | .33 | .52 | .85 | (.34) | (.34) | 17.49 | 5.04 | 15,527 | .25 | 1.90 | 98 |
| July 31, 2013 | 16.39 | .19 | .58 | .77 | (.18) | (.18) | 16.98 | 4.74 | 14,681 | .25 | 1.14 | 138 |
| July 31, 2012 | 16.30 | .28 | .09 | .37 | (.28) | (.28) | 16.39 | 2.35 | 18,008 | .25 | 1.78 | 40 |
| July 31, 2011 | 15.87 | .51 | .39 | .90 | (.47) | (.47) | 16.30 | 5.71 | 21,075 | .25 | 3.16 | 38 |
| Class B | ||||||||||||
| January 31, 2016** | $17.45 | .74 | (1.39) | (.65) | (.53) | (.53) | $16.27 | (3.77)* | $1,085 | .50* | 4.36* | 31* |
| July 31, 2015 | 17.32 | .15 | .31 | .46 | (.33) | (.33) | 17.45 | 2.68 | 368 | 1.00 | .88 | 39 |
| July 31, 2014 | 16.86 | .17 | .55 | .72 | (.26) | (.26) | 17.32 | 4.32 | 274 | 1.00 | 1.01 | 98 |
| July 31, 2013 | 16.34 | .06 | .58 | .64 | (.12) | (.12) | 16.86 | 3.92 | 172 | 1.00 | .35 | 138 |
| July 31, 2012 | 16.30 | .17 | .08 | .25 | (.21) | (.21) | 16.34 | 1.59 | 187 | 1.00 | 1.05 | 40 |
| July 31, 2011 | 15.90 | .39 | .38 | .77 | (.37) | (.37) | 16.30 | 4.88 | 206 | 1.00 | 2.43 | 38 |
| Class C | ||||||||||||
| January 31, 2016** | $17.49 | .59 | (1.24) | (.65) | (.53) | (.53) | $16.31 | (3.76)* | $1,660 | .50* | 3.49* | 31* |
| July 31, 2015 | 17.36 | .17 | .29 | .46 | (.33) | (.33) | 17.49 | 2.68 | 814 | 1.00 | .98 | 39 |
| July 31, 2014 | 16.91 | .20 | .51 | .71 | (.26) | (.26) | 17.36 | 4.25 | 710 | 1.00 | 1.16 | 98 |
| July 31, 2013 | 16.38 | .05 | .60 | .65 | (.12) | (.12) | 16.91 | 3.98 | 676 | 1.00 | .28 | 138 |
| July 31, 2012 | 16.34 | .15 | .10 | .25 | (.21) | (.21) | 16.38 | 1.58 | 536 | 1.00 | .95 | 40 |
| July 31, 2011 | 15.93 | .41 | .37 | .78 | (.37) | (.37) | 16.34 | 4.92 | 496 | 1.00 | 2.50 | 38 |
| Class M | ||||||||||||
| January 31, 2016** | $17.73 | .55 | (1.16) | (.61) | (.55) | (.55) | $16.57 | (3.49)* | $522 | .25* | 3.17* | 31* |
| July 31, 2015 | 17.54 | .25 | .30 | .55 | (.36) | (.36) | 17.73 | 3.18 | 396 | .50 | 1.42 | 39 |
| July 31, 2014 | 17.02 | .31 | .50 | .81 | (.29) | (.29) | 17.54 | 4.82 | 332 | .50 | 1.77 | 98 |
| July 31, 2013 | 16.43 | .14 | .59 | .73 | (.14) | (.14) | 17.02 | 4.47 | 313 | .50 | .86 | 138 |
| July 31, 2012 | 16.34 | .24 | .09 | .33 | (.24) | (.24) | 16.43 | 2.10 | 317 | .50 | 1.52 | 40 |
| July 31, 2011 | 15.91 | .38 | .44 | .82 | (.39) | (.39) | 16.34 | 5.19 | 328 | .72 | 2.36 | 38 |
| Class R | ||||||||||||
| January 31, 2016** | $17.68 | .75 | (1.37) | (.62) | (.55) | (.55) | $16.51 | (3.56)* | $1,638 | .25* | 4.37* | 31* |
| July 31, 2015 | 17.48 | .24 | .33 | .57 | (.37) | (.37) | 17.68 | 3.26 | 854 | .50 | 1.34 | 39 |
| July 31, 2014 | 16.97 | .30 | .51 | .81 | (.30) | (.30) | 17.48 | 4.78 | 1,069 | .50 | 1.75 | 98 |
| July 31, 2013 | 16.38 | .15 | .58 | .73 | (.14) | (.14) | 16.97 | 4.47 | 1,002 | .50 | .92 | 138 |
| July 31, 2012 | 16.30 | .25 | .07 | .32 | (.24) | (.24) | 16.38 | 2.05 | 1,222 | .50 | 1.55 | 40 |
| July 31, 2011 | 15.87 | .52 | .34 | .86 | (.43) | (.43) | 16.30 | 5.46 | 1,400 | .50 | 3.22 | 38 |
| Class Y | ||||||||||||
| January 31, 2016** | $17.75 | .90 | (1.47) | (.57) | (.60) | (.60) | $16.58 | (3.29)* | $5,918 | —* | 5.23* | 31* |
| July 31, 2015 | 17.55 | .34 | .32 | .66 | (.46) | (.46) | 17.75 | 3.78 | 1,460 | — | 1.90 | 39 |
| July 31, 2014 | 17.04 | .68f | .21 | .89 | (.38) | (.38) | 17.55 | 5.28 | 1,203 | — | 3.96f | 98 |
| July 31, 2013 | 16.44 | .16 | .66 | .82 | (.22) | (.22) | 17.04 | 5.04 | 7,232 | — | .93 | 138 |
| July 31, 2012 | 16.35 | .34 | .07 | .41 | (.32) | (.32) | 16.44 | 2.60 | 992 | — | 2.14 | 40 |
| July 31, 2011 | 15.92 | .52 | .41 | .93 | (.50) | (.50) | 16.35 | 5.95 | 5,542 | — | 3.20 | 38 |
See page 74 for notes to financial highlights.
The accompanying notes are an integral part of these financial statements.
| 72 | RetirementReady® Funds | RetirementReady® Funds | 73 |
Financial highlights (Continued)
* Not annualized.
** Unaudited.
† For the period November 30, 2015 (commencement of operations) to January 31, 2016.
†† For the period November 30, 2010 (commencement of operations) to July 31, 2011.
a Per share net investment income (loss) has been determined on the basis of the weighted average number of shares outstanding during the period.
b Total return does not reflect the effect of sales charges.
c Expense ratios do not include expenses of the underlying funds.
d Reflects an involuntary contractual expense limitation in effect during the period. As a result of such limitation the expenses for the following periods reflect a reduction of the following based on each fund’s average net assets (Note 2):
| 1/31/16 | 7/31/15 | 7/31/14 | 7/31/13 | 7/31/12 | 7/31/11 | |
| Putnam RetirementReady 2060 Fund | 33.93% | N/A | N/A | N/A | N/A | N/A |
| Putnam RetirementReady 2055 Fund | 0.61 | 2.09% | 3.14% | 0.28% | 7.30% | 23.04% |
| Putnam RetirementReady 2050 Fund | 0.15 | 0.46 | 0.45 | 0.13 | 0.15 | 0.22 |
| Putnam RetirementReady 2045 Fund | 0.14 | 0.36 | 0.45 | 0.12 | 0.12 | 0.18 |
| Putnam RetirementReady 2040 Fund | 0.07 | 0.23 | 0.35 | 0.12 | 0.12 | 0.17 |
| Putnam RetirementReady 2035 Fund | 0.08 | 0.22 | 0.27 | 0.11 | 0.11 | 0.08 |
| Putnam RetirementReady 2030 Fund | 0.06 | 0.17 | 0.23 | 0.11 | 0.11 | 0.08 |
| Putnam RetirementReady 2025 Fund | 0.08 | 0.20 | 0.23 | 0.11 | 0.10 | 0.08 |
| Putnam RetirementReady 2020 Fund | 0.06 | 0.18 | 0.25 | 0.11 | 0.10 | 0.08 |
| Putnam Retirement Income Fund | ||||||
| Lifestyle 1 | 0.14 | 0.55 | 0.37 | 0.12 | 0.12 | 0.07 |
e Amount represents less than $0.01 per share.
f The net investment income and per share amount shown for the period ending July 31, 2014, may not correspond with the expected class specific differences for the period due to the timing of redemptions out of the class.
The accompanying notes are an integral part of these financial statements.
| 74 | RetirementReady® Funds |
Notes to financial statements 1/31/16 (Unaudited)
Within the following Notes to financial statements, references to “State Street” represent State Street Bank and Trust Company, references to “the SEC” represent the Securities and Exchange Commission and references to “Putnam Management” represent Putnam Investment Management, LLC, the fund’s manager, an indirect wholly-owned subsidiary of Putnam Investments, LLC. Unless otherwise noted, the “reporting period” represents the period from August 1, 2015 through January 31, 2016.
Each of the Putnam RetirementReady® Funds: Putnam RetirementReady 2060 Fund, Putnam RetirementReady 2055 Fund, Putnam RetirementReady 2050 Fund, Putnam RetirementReady 2045 Fund, Putnam RetirementReady 2040 Fund, Putnam RetirementReady 2035 Fund, Putnam RetirementReady 2030 Fund, Putnam RetirementReady 2025 Fund, Putnam RetirementReady 2020 Fund, and Putnam Retirement Income Fund Lifestyle 1 (collectively the funds) is a diversified series of Putnam RetirementReady® Funds (the Trust), a Massachusetts business trust registered under the Investment Company Act of 1940, as amended, as an open-end investment company. Each fund, except the Putnam Retirement Income Fund Lifestyle 1, seeks capital appreciation and current income consistent with a decreasing emphasis on capital appreciation and an increasing emphasis on current income as it approaches its target date. Putnam Retirement Income Fund Lifestyle 1 seeks as high a rate of current income as Putnam Management believes is consistent with preservation of capital.
Currently there are ten separate funds, of which nine have a target date specified by the calendar year in the name of each fund. The target dates are in five-year increments beginning with the year 2020. The tenth fund is named Putnam Retirement Income Fund Lifestyle 1. Amounts invested in each target date fund are allocated among underlying Putnam funds based on the fund’s target date. The target percentages for each target date fund gradually change over time based on the number of years that remain until the target date of the fund so that a fund’s asset allocation will become more conservative as the fund approaches its target date. The asset allocation of each target date fund is designed to provide an investment that Putnam Management believes is neither overly aggressive nor overly conservative for a typical investor planning to retire (or otherwise begin using the invested funds) in the target year. When a fund’s target percentages correspond to those of the Putnam Retirement Income Fund Lifestyle 1, which currently is expected to occur during the latter part of the target year, the fund will be merged into the Putnam Retirement Income Fund Lifestyle 1.
These financial statements report on each fund, which may invest in certain Putnam Funds which are managed by Putnam Management. Each fund may invest in the following diversified funds: Putnam Absolute Return 100 Fund, Putnam Absolute Return 300 Fund, Putnam Absolute Return 500 Fund, Putnam Absolute Return 700 Fund, Putnam Dynamic Asset Allocation Balanced Fund, Putnam Dynamic Asset Allocation Conservative Fund, Putnam Dynamic Asset Allocation Equity Fund, Putnam Dynamic Asset Allocation Growth Fund and Putnam Money Market Fund (the underlying Putnam Funds). The financial statements of the underlying Putnam Funds contain additional information about the expenses and investments of the underlying Putnam Funds and are available upon request.
Each fund offers class A, class B, class C, class M, class R and class Y shares. Putnam RetirementReady 2060 Fund began offering each class of shares on November 30, 2015. Class A and class M shares are sold with a maximum front-end sales charge of 5.75% (4.00% for Putnam Retirement Income Fund Lifestyle 1) and 3.50% (3.25% for Putnam Retirement Income Fund Lifestyle 1), respectively, and generally do not pay a contingent deferred sales charge. Class B shares, which convert to class A shares after approximately eight years, do not pay a front-end sales charge and are subject to a contingent deferred sales charge, if those shares are redeemed within six years of purchase. Class C shares have a one-year 1.00% contingent deferred sales charge and do not convert to class A shares. Class R shares, which are not available to all investors, are sold at net asset value. The expenses for class A, class B, class C, class M and class R shares may differ based on the distribution fee of each class, which is identified in Note 2. Class Y shares, which are sold at net asset value, are generally subject to the same expenses as class A, class B, class C, class M and class R shares, but do not bear a distribution fee. Class Y shares are not available to all investors.
In the normal course of business, each fund enters into contracts that may include agreements to indemnify another party under given circumstances. Each fund’s maximum exposure under these arrangements is unknown as this would involve future claims that may be, but have not yet been, made against each fund. However, each fund’s management team expects the risk of material loss to be remote.
| RetirementReady® Funds | 75 |
Note 1: Significant accounting policies
The following is a summary of significant accounting policies consistently followed by each fund in the preparation of its financial statements. The preparation of financial statements is in conformity with accounting principles generally accepted in the United States of America and requires management to make estimates and assumptions that affect the reported amounts of assets and liabilities in the financial statements and the reported amounts of increases and decreases in net assets from operations. Actual results could differ from those estimates. Subsequent events after the Statement of assets and liabilities date through the date that the financial statements were issued have been evaluated in the preparation of the financial statements.
Investment income, realized and unrealized gains and losses and expenses of each fund are borne pro-rata based on the relative net assets of each class to the total net assets of each fund, except that each class bears expenses unique to that class (including the distribution fees applicable to such classes). Each class votes as a class only with respect to its own distribution plan or other matters on which a class vote is required by law or determined by the Trustees. Shares of each class would receive their pro-rata share of the net assets of the fund, if that fund were liquidated. In addition, the Trustees declare separate dividends on each class of shares.
Security valuation The price of each fund’s shares is based on its net asset value (NAV), which is in turn based on the NAVs of the underlying Putnam Funds in which it invests, which are classified as Level 1 securities under Accounting Standards Codification 820 Fair Value Measurements and Disclosures (ASC 820). The NAVs of the underlying Putnam Funds are determined based on the policies contained in each underlying Putnam Fund’s financial statements. The NAV per share of each class equals the total value of its assets, less its liabilities, divided by the number of its outstanding shares. Shares are only valued as of the close of regular trading on the New York Stock Exchange each day the exchange is open.
Security transactions and related investment income Security transactions, which consist of shares of the underlying Putnam Funds, are recorded on the trade date (date the order to buy or sell is executed). Gains or losses from the sale of the underlying Putnam Funds are determined on the identified cost basis. Income and capital gain distributions from the underlying Putnam Funds are recorded on the ex-dividend date.
Interfund lending Each fund, along with other Putnam funds, may participate in an interfund lending program pursuant to an exemptive order issued by the SEC. This program allows the funds to borrow from or lend to other Putnam funds that permit such transactions. Interfund lending transactions are subject to each fund’s investment policies and borrowing and lending limits. Interest earned or paid on the interfund lending transaction will be based on the average of certain current market rates. During the reporting period, the funds did not utilize the program.
Federal taxes It is the policy of each fund to distribute all of its taxable income within the prescribed time period and otherwise comply with the provisions of the Internal Revenue Code of 1986, as amended (the Code), applicable to regulated investment companies. It is also the intention of each fund to distribute an amount sufficient to avoid imposition of any excise tax under Section 4982 of the Code.
Each fund is subject to the provisions of Accounting Standards Codification 740 Income Taxes (ASC 740). ASC 740 sets forth a minimum threshold for financial statement recognition of the benefit of a tax position taken or expected to be taken in a tax return. The funds did not have a liability to record for any unrecognized tax benefits in the accompanying financial statements. No provision has been made for federal taxes on income, capital gains or unrealized appreciation on securities held nor for excise tax on income and capital gains. Each of the funds’ federal tax returns for the prior three fiscal years, or life of the fund, if shorter, remain subject to examination by the Internal Revenue Service.
| 76 | RetirementReady® Funds |
At July 31, 2015, the following funds had capital loss carryovers in the following amounts available to the extent allowed by the Code to offset future net capital gain, if any, which will expire on the following dates:
| Loss carryover | ||||
| Short-term | Long-term | Total | Expiration | |
| Putnam RetirementReady 2050 Fund | $644,661 | N/A | $644,661 | July 31, 2018 |
| Putnam RetirementReady 2045 Fund | 4,442,521 | N/A | 4,442,521 | July 31, 2018 |
| Putnam RetirementReady 2040 Fund | 4,045,570 | N/A | 4,045,570 | July 31, 2018 |
| Putnam RetirementReady 2035 Fund | 9,126,905 | N/A | 9,126,905 | July 31, 2018 |
| Putnam RetirementReady 2030 Fund | 12,005,355 | N/A | 12,005,355 | July 31, 2018 |
| Putnam RetirementReady 2025 Fund | 18,970,572 | N/A | 18,970,572 | July 31, 2018 |
| Putnam RetirementReady 2020 Fund | 23,735,497 | N/A | 23,735,497 | July 31, 2018 |
| Putnam Retirement Income Fund | 1,961,305 | N/A | 1,961,305 | July 31, 2017 |
| Lifestyle 1 | 3,966,628 | N/A | 3,966,628 | July 31, 2018 |
Under the Regulated Investment Company Modernization Act of 2010, the fund, as applicable, will be permitted to carry forward capital losses incurred in taxable years beginning after December 22, 2010 for an unlimited period. However, any losses incurred will be required to be utilized prior to the losses incurred in pre-enactment tax years. As a result of this ordering rule, pre-enactment capital loss carryforwards may be more likely to expire unused. Additionally, post-enactment capital losses that are carried forward will retain their character as either short-term or long-term capital losses rather than being considered all short-term as under previous law.
The tax basis components of each fund at the close of the reporting period were as follows:
| Net unrealized | Cost for federal | |||
| Unrealized | Unrealized | appreciation/ | income tax | |
| appreciation | (depreciation) | (depreciation) | purposes | |
| Putnam RetirementReady 2060 Fund | $36 | $(7,378) | $(7,342) | $65,479 |
| Putnam RetirementReady 2055 Fund | 14,735 | (952,906) | (938,171) | 7,475,531 |
| Putnam RetirementReady 2050 Fund | 57,590 | (4,333,413) | (4,275,823) | 35,682,823 |
| Putnam RetirementReady 2045 Fund | 48,378 | (5,177,368) | (5,128,990) | 38,351,332 |
| Putnam RetirementReady 2040 Fund | 107,107 | (9,673,193) | (9,566,086) | 87,684,838 |
| Putnam RetirementReady 2035 Fund | 61,511 | (8,107,891) | (8,046,380) | 67,816,017 |
| Putnam RetirementReady 2030 Fund | 155,213 | (10,593,463) | (10,438,250) | 125,041,441 |
| Putnam RetirementReady 2025 Fund | 41,154 | (6,114,327) | (6,073,173) | 73,269,611 |
| Putnam RetirementReady 2020 Fund | 82,043 | (8,027,952) | (7,945,909) | 112,604,416 |
| Putnam Retirement Income Fund | 8,130 | (5,269,585) | (5,261,455) | 75,256,766 |
| Lifestyle 1 | ||||
Distributions to shareholders Each fund normally distributes any net investment income and any net realized capital gains annually, except the Putnam Retirement Income Fund Lifestyle 1, which normally distributes any net investment income monthly and any net realized capital gains annually. The amount and character of income and gains to be distributed are determined in accordance with income tax regulations, which may differ from generally accepted accounting principles. Dividend sources are estimated at the time of declaration. Actual results may vary. Any non-taxable return of capital cannot be determined until final tax calculations are completed after the end of the fund’s fiscal year. Reclassifications are made to the fund’s capital accounts to reflect income and gains available for distribution (or available capital loss carryovers) under income tax regulations.
| RetirementReady® Funds | 77 |
Expenses of the Trust Expenses directly charged or attributable to any fund will be paid from the assets of that fund. Generally, expenses of the Trust will be allocated among and charged to the assets of each fund on a basis that the Trustees deem fair and equitable, which may be based on the relative assets of each fund or the nature of the services performed and relative applicability to each fund.
Offering costs For Putnam RetirementReady 2060 Fund, the offering costs of $111,625 are being fully amortized on a straight-line basis over a twelve-month period. The fund will reimburse Putnam Management for the payment of these expenses.
Note 2: Management fee, administrative services and other transactions
The funds do not pay a monthly management fee to Putnam Management.
Putnam Management has contractually agreed through November 30, 2016 to reimburse each fund for other expenses (excluding payments under the fund’s distribution plans, brokerage, interest, taxes, investment-related expenses, extraordinary expenses, and acquired fund fees and expenses). During the reporting period, each fund’s expenses were reduced by the following amounts as a result of this limit:
| Fees waived and reimbursed by | |
| the Manager | |
| Putnam RetirementReady 2060 Fund | $19,621 |
| Putnam RetirementReady 2055 Fund | 37,478 |
| Putnam RetirementReady 2050 Fund | 43,866 |
| Putnam RetirementReady 2045 Fund | 44,057 |
| Putnam RetirementReady 2040 Fund | 53,300 |
| Putnam RetirementReady 2035 Fund | 50,159 |
| Putnam RetirementReady 2030 Fund | 60,858 |
| Putnam RetirementReady 2025 Fund | 52,627 |
| Putnam RetirementReady 2020 Fund | 58,317 |
| Putnam Retirement Income Fund Lifestyle 1 | 54,434 |
Putnam Investments Limited (PIL), an affiliate of Putnam Management, is authorized by the Trustees to manage a separate portion of the assets of each fund as determined by Putnam Management from time to time. Putnam Management pays a quarterly sub-management fee to PIL for its services at an annual rate of 0.35% of the average net assets of the portion of the fund managed by PIL.
Each fund has adopted distribution plans (the Plans) with respect to its class A, class B, class C, class M and class R shares pursuant to Rule 12b–1 under the Investment Company Act of 1940. The purpose of the Plans is to compensate Putnam Retail Management Limited Partnership, an indirect wholly-owned subsidiary of Putnam Investments, LLC, for services provided and expenses incurred in distributing shares of the funds. The Plans provide for payments by each fund to Putnam Retail Management Limited Partnership at an annual rate of up to 0.35%, 1.00%, 1.00%, 1.00% and 1.00% of the average net assets attributable to class A, class B, class C, class M and class R shares, respectively. The Trustees have approved payment by the funds at an annual rate of 0.25%, 1.00%, 1.00%, 0.75% (0.50% for Putnam Retirement Income Fund Lifestyle 1) and 0.50% of the average net assets attributable to class A,
| 78 | RetirementReady® Funds |
class B, class C, class M, and class R shares, respectively. During the reporting period, the class specific expenses related to distribution fees for each fund were as follows:
| Class A | Class B | Class C | Class M | Class R | Total | |
| Putnam RetirementReady 2060 Fund | $5 | $16 | $16 | $12 | $8 | $57 |
| Putnam RetirementReady 2055 Fund | 4,218 | 403 | 2,710 | 158 | 583 | 8,072 |
| Putnam RetirementReady 2050 Fund | 25,699 | 1,728 | 2,916 | 321 | 4,341 | 35,005 |
| Putnam RetirementReady 2045 Fund | 28,480 | 2,122 | 4,377 | 586 | 4,696 | 40,261 |
| Putnam RetirementReady 2040 Fund | 73,924 | 3,354 | 3,847 | 432 | 6,208 | 87,765 |
| Putnam RetirementReady 2035 Fund | 51,995 | 5,885 | 6,127 | 1,676 | 6,155 | 71,838 |
| Putnam RetirementReady 2030 Fund | 107,659 | 6,373 | 6,637 | 921 | 11,483 | 133,073 |
| Putnam RetirementReady 2025 Fund | 59,556 | 5,425 | 7,637 | 760 | 8,170 | 81,548 |
| Putnam RetirementReady 2020 Fund | 104,143 | 5,618 | 9,275 | 653 | 9,389 | 129,078 |
| Putnam Retirement Income Fund | 42,549 | 3,315 | 5,851 | 1,122 | 2,456 | 55,293 |
| Lifestyle 1 | ||||||
For the reporting period, Putnam Retail Management Limited Partnership, acting as underwriter, received net commissions from the sale of class A and class M shares, and received contingent deferred sales charges from redemptions of class B and class C shares, in the following amounts:
| Class A Net | Class M Net | Class B | Class C | |
| commissions | commissions | CDSC | CDSC | |
| Putnam RetirementReady 2060 Fund | $— | $— | $— | $— |
| Putnam RetirementReady 2055 Fund | 672 | 59 | 31 | 203 |
| Putnam RetirementReady 2050 Fund | 3,719 | 161 | 871 | 220 |
| Putnam RetirementReady 2045 Fund | 3,530 | 34 | 195 | 66 |
| Putnam RetirementReady 2040 Fund | 3,120 | 189 | — | 100 |
| Putnam RetirementReady 2035 Fund | 3,675 | 44 | 53 | 147 |
| Putnam RetirementReady 2030 Fund | 4,107 | 89 | 212 | 8 |
| Putnam RetirementReady 2025 Fund | 6,732 | 26 | 1,369 | 266 |
| Putnam RetirementReady 2020 Fund | 1,811 | 164 | 206 | 24 |
| Putnam Retirement Income Fund Lifestyle 1 | 1,769 | — | — | 12 |
| RetirementReady® Funds | 79 |
A contingent deferred sales charge of up to 1.00% is assessed on certain redemptions of class A shares and through October 31, 2015, a certain contingent deferred sales charge of up to 0.65% (0.40% for Putnam Retirement Income Fund Lifestyle 1) was assessed on certain redemptions of class M shares. Effective November 1, 2015, class M shares are not subject to a contingent deferred sales charge. For the reporting period, Putnam Retail Management Limited Partnership, acting as underwriter, received the following amounts of class A and class M redemptions:
| Class A CDSC | Class M CDSC | |
| Putnam RetirementReady 2060 Fund | $— | $— |
| Putnam RetirementReady 2055 Fund | — | — |
| Putnam RetirementReady 2050 Fund | 89 | — |
| Putnam RetirementReady 2045 Fund | — | — |
| Putnam RetirementReady 2040 Fund | — | — |
| Putnam RetirementReady 2035 Fund | 144 | — |
| Putnam RetirementReady 2030 Fund | — | — |
| Putnam RetirementReady 2025 Fund | 1,892 | — |
| Putnam RetirementReady 2020 Fund | — | — |
| Putnam Retirement Income Fund Lifestyle 1 | — | — |
Note 3: Purchases and sales of securities
During the reporting period, cost of purchases and proceeds from sales of underlying Putnam Funds were as follows:
| Cost of purchases | Proceeds from sales | |
| Putnam RetirementReady 2060 Fund | $66,565 | $961 |
| Putnam RetirementReady 2055 Fund | 6,044,726 | 3,882,325 |
| Putnam RetirementReady 2050 Fund | 29,945,635 | 20,286,588 |
| Putnam RetirementReady 2045 Fund | 24,410,339 | 17,445,541 |
| Putnam RetirementReady 2040 Fund | 89,203,987 | 64,865,328 |
| Putnam RetirementReady 2035 Fund | 42,971,975 | 31,933,089 |
| Putnam RetirementReady 2030 Fund | 116,695,279 | 84,889,685 |
| Putnam RetirementReady 2025 Fund | 50,358,130 | 37,982,520 |
| Putnam RetirementReady 2020 Fund | 100,474,401 | 71,244,489 |
| Putnam Retirement Income Fund Lifestyle 1 | 67,568,710 | 13,471,534 |
Note 4: Capital shares
At the close of the reporting period, there were an unlimited number of shares of beneficial interest authorized. Transactions in capital shares were as follows:
Putnam RetirementReady 2060 Fund
| For the period 11/30/15 | ||
| (commencement of operations) to 1/31/16 | ||
| Class A | Shares | Amount |
| Shares sold | 234 | $2,069 |
| Shares issued in connection with | ||
| reinvestment of distributions | 23 | 222 |
| 257 | 2,291 | |
| Shares repurchased | — | — |
| Net increase | 257 | $2,291 |
| 80 | RetirementReady® Funds |
| For the period 11/30/15 | ||
| (commencement of operations) to 1/31/16 | ||
| Class B | Shares | Amount |
| Shares sold | — | $— |
| Shares issued in connection with | ||
| reinvestment of distributions | 23 | 216 |
| 23 | 216 | |
| Shares repurchased | — | — |
| Net increase | 23 | $216 |
| For the period 11/30/15 | ||
| (commencement of operations) to 1/31/16 | ||
| Class C | Shares | Amount |
| Shares sold | — | $— |
| Shares issued in connection with | ||
| reinvestment of distributions | 23 | 216 |
| 23 | 216 | |
| Shares repurchased | — | — |
| Net increase | 23 | $216 |
| For the period 11/30/15 | ||
| (commencement of operations) to 1/31/16 | ||
| Class M | Shares | Amount |
| Shares sold | — | $— |
| Shares issued in connection with | ||
| reinvestment of distributions | 23 | 218 |
| 23 | 218 | |
| Shares repurchased | — | — |
| Net increase | 23 | $218 |
| For the period 11/30/15 | ||
| (commencement of operations) to 1/31/16 | ||
| Class R | Shares | Amount |
| Shares sold | — | $— |
| Shares issued in connection with | ||
| reinvestment of distributions | 23 | 220 |
| 23 | 220 | |
| Shares repurchased | — | — |
| Net increase | 23 | $220 |
| RetirementReady® Funds | 81 |
| For the period 11/30/15 | ||
| (commencement of operations) to 1/31/16 | ||
| Class Y | Shares | Amount |
| Shares sold | 99 | $895 |
| Shares issued in connection with | ||
| reinvestment of distributions | 24 | 224 |
| 123 | 1,119 | |
| Shares repurchased | — | — |
| Net increase | 123 | $1,119 |
Putnam RetirementReady 2055 Fund
| Six months ended 1/31/16 | Year ended 7/31/15 | |||
| Class A | Shares | Amount | Shares | Amount |
| Shares sold | 211,918 | $2,304,910 | 307,595 | $3,601,576 |
| Shares issued in connection with | ||||
| reinvestment of distributions | 29,696 | 301,115 | 11,505 | 127,711 |
| 241,614 | 2,606,025 | 319,100 | 3,729,287 | |
| Shares repurchased | (84,306) | (907,855) | (138,255) | (1,617,138) |
| Net increase | 157,308 | $1,698,170 | 180,845 | $2,112,149 |
| Six months ended 1/31/16 | Year ended 7/31/15 | |||
| Class B | Shares | Amount | Shares | Amount |
| Shares sold | 714 | $7,611 | 2,337 | $27,553 |
| Shares issued in connection with | ||||
| reinvestment of distributions | 614 | 6,204 | 761 | 8,412 |
| 1,328 | 13,815 | 3,098 | 35,965 | |
| Shares repurchased | (93) | (871) | (659) | (7,623) |
| Net increase | 1,235 | $12,944 | 2,439 | $28,342 |
| Six months ended 1/31/16 | Year ended 7/31/15 | |||
| Class C | Shares | Amount | Shares | Amount |
| Shares sold | 6,534 | $69,399 | 12,817 | $147,911 |
| Shares issued in connection with | ||||
| reinvestment of distributions | 4,268 | 42,548 | 4,626 | 50,568 |
| 10,802 | 111,947 | 17,443 | 198,479 | |
| Shares repurchased | (2,727) | (28,367) | (2,668) | (30,864) |
| Net increase | 8,075 | $83,580 | 14,775 | $167,615 |
| Six months ended 1/31/16 | Year ended 7/31/15 | |||
| Class M | Shares | Amount | Shares | Amount |
| Shares sold | 1,161 | $12,634 | 2,779 | $31,787 |
| Shares issued in connection with | ||||
| reinvestment of distributions | 354 | 3,591 | 339 | 3,766 |
| 1,515 | 16,225 | 3,118 | 35,553 | |
| Shares repurchased | (2,396) | (27,575) | (92) | (1,064) |
| Net increase (decrease) | (881) | $(11,350) | 3,026 | $34,489 |
| 82 | RetirementReady® Funds |
| Six months ended 1/31/16 | Year ended 7/31/15 | |||
| Class R | Shares | Amount | Shares | Amount |
| Shares sold | 4,926 | $53,503 | 15,906 | $186,496 |
| Shares issued in connection with | ||||
| reinvestment of distributions | 1,835 | 18,549 | 1,925 | 21,287 |
| 6,761 | 72,052 | 17,831 | 207,783 | |
| Shares repurchased | (5,081) | (55,190) | (19,436) | (240,439) |
| Net increase (decrease) | 1,680 | $16,862 | (1,605) | $(32,656) |
| Six months ended 1/31/16 | Year ended 7/31/15 | |||
| Class Y | Shares | Amount | Shares | Amount |
| Shares sold | 59,989 | $653,688 | 92,698 | $1,093,705 |
| Shares issued in connection with | ||||
| reinvestment of distributions | 16,454 | 167,662 | 13,330 | 148,493 |
| 76,443 | 821,350 | 106,028 | 1,242,198 | |
| Shares repurchased | (19,066) | (207,936) | (41,595) | (497,287) |
| Net increase | 57,377 | $613,414 | 64,433 | $744,911 |
Putnam RetirementReady 2050 Fund
| Six months ended 1/31/16 | Year ended 7/31/15 | |||
| Class A | Shares | Amount | Shares | Amount |
| Shares sold | 669,234 | $11,191,961 | 908,145 | $15,934,845 |
| Shares issued in connection with | ||||
| reinvestment of distributions | 29,092 | 480,011 | 23,633 | 400,342 |
| 698,326 | 11,671,972 | 931,778 | 16,335,187 | |
| Shares repurchased | (209,944) | (3,458,232) | (248,045) | (4,354,553) |
| Net increase | 488,382 | $8,213,740 | 683,733 | $11,980,634 |
| Six months ended 1/31/16 | Year ended 7/31/15 | |||
| Class B | Shares | Amount | Shares | Amount |
| Shares sold | 3,119 | $51,773 | 3,485 | $60,469 |
| Shares issued in connection with | ||||
| reinvestment of distributions | 306 | 4,996 | 790 | 13,255 |
| 3,425 | 56,769 | 4,275 | 73,724 | |
| Shares repurchased | (1,512) | (23,210) | (2,074) | (35,860) |
| Net increase | 1,913 | $33,559 | 2,201 | $37,864 |
| Six months ended 1/31/16 | Year ended 7/31/15 | |||
| Class C | Shares | Amount | Shares | Amount |
| Shares sold | 6,452 | $105,761 | 11,194 | $192,386 |
| Shares issued in connection with | ||||
| reinvestment of distributions | 548 | 8,873 | 1,206 | 20,058 |
| 7,000 | 114,634 | 12,400 | 212,444 | |
| Shares repurchased | (1,901) | (30,698) | (3,766) | (64,529) |
| Net increase | 5,099 | $83,936 | 8,634 | $147,915 |
| RetirementReady® Funds | 83 |
| Six months ended 1/31/16 | Year ended 7/31/15 | |||
| Class M | Shares | Amount | Shares | Amount |
| Shares sold | 1,396 | $23,412 | 2,089 | $37,008 |
| Shares issued in connection with | ||||
| reinvestment of distributions | 88 | 1,469 | 173 | 2,959 |
| 1,484 | 24,881 | 2,262 | 39,967 | |
| Shares repurchased | (608) | (10,225) | (428) | (7,594) |
| Net increase | 876 | $14,656 | 1,834 | $32,373 |
| Six months ended 1/31/16 | Year ended 7/31/15 | |||
| Class R | Shares | Amount | Shares | Amount |
| Shares sold | 18,559 | $301,923 | 56,748 | $973,136 |
| Shares issued in connection with | ||||
| reinvestment of distributions | 1,118 | 18,274 | 8,323 | 138,918 |
| 19,677 | 320,197 | 65,071 | 1,112,054 | |
| Shares repurchased | (110,824) | (1,809,371) | (40,336) | (697,658) |
| Net increase (decrease) | (91,147) | $(1,489,174) | 24,735 | $414,396 |
| Six months ended 1/31/16 | Year ended 7/31/15 | |||
| Class Y | Shares | Amount | Shares | Amount |
| Shares sold | 138,039 | $2,291,777 | 97,691 | $1,707,536 |
| Shares issued in connection with | ||||
| reinvestment of distributions | 9,639 | 159,617 | 13,785 | 234,206 |
| 147,678 | 2,451,394 | 111,476 | 1,941,742 | |
| Shares repurchased | (30,113) | (502,831) | (58,806) | (1,036,963) |
| Net increase | 117,565 | $1,948,563 | 52,670 | $904,779 |
Putnam RetirementReady 2045 Fund
| Six months ended 1/31/16 | Year ended 7/31/15 | |||
| Class A | Shares | Amount | Shares | Amount |
| Shares sold | 551,522 | $10,163,242 | 772,358 | $14,969,919 |
| Shares issued in connection with | ||||
| reinvestment of distributions | 29,135 | 532,010 | 33,620 | 631,055 |
| 580,657 | 10,695,252 | 805,978 | 15,600,974 | |
| Shares repurchased | (217,485) | (3,999,586) | (278,014) | (5,386,917) |
| Net increase | 363,172 | $6,695,666 | 527,964 | $10,214,057 |
| Six months ended 1/31/16 | Year ended 7/31/15 | |||
| Class B | Shares | Amount | Shares | Amount |
| Shares sold | 2,583 | $44,864 | 8,554 | $153,793 |
| Shares issued in connection with | ||||
| reinvestment of distributions | 468 | 7,817 | 762 | 13,122 |
| 3,051 | 52,681 | 9,316 | 166,915 | |
| Shares repurchased | (808) | (13,574) | (1,659) | (29,290) |
| Net increase | 2,243 | $39,107 | 7,657 | $137,625 |
| 84 | RetirementReady® Funds |
| Six months ended 1/31/16 | Year ended 7/31/15 | |||
| Class C | Shares | Amount | Shares | Amount |
| Shares sold | 13,149 | $221,329 | 26,637 | $477,479 |
| Shares issued in connection with | ||||
| reinvestment of distributions | 1,138 | 19,045 | 1,379 | 23,808 |
| 14,287 | 240,374 | 28,016 | 501,287 | |
| Shares repurchased | (1,112) | (18,669) | (2,890) | (51,290) |
| Net increase | 13,175 | $221,705 | 25,126 | $449,997 |
| Six months ended 1/31/16 | Year ended 7/31/15 | |||
| Class M | Shares | Amount | Shares | Amount |
| Shares sold | 299 | $5,378 | 1,393 | $25,982 |
| Shares issued in connection with | ||||
| reinvestment of distributions | 156 | 2,774 | 346 | 6,319 |
| 455 | 8,152 | 1,739 | 32,301 | |
| Shares repurchased | (27) | (475) | (208) | (3,987) |
| Net increase | 428 | $7,677 | 1,531 | $28,314 |
| Six months ended 1/31/16 | Year ended 7/31/15 | |||
| Class R | Shares | Amount | Shares | Amount |
| Shares sold | 27,419 | $510,589 | 53,331 | $1,060,213 |
| Shares issued in connection with | ||||
| reinvestment of distributions | 1,194 | 22,431 | 7,378 | 141,723 |
| 28,613 | 533,020 | 60,709 | 1,201,936 | |
| Shares repurchased | (105,249) | (1,979,158) | (46,642) | (926,291) |
| Net increase (decrease) | (76,636) | $(1,446,138) | 14,067 | $275,645 |
| Six months ended 1/31/16 | Year ended 7/31/15 | |||
| Class Y | Shares | Amount | Shares | Amount |
| Shares sold | 27,705 | $611,808 | 70,679 | $1,618,027 |
| Shares issued in connection with | ||||
| reinvestment of distributions | 6,115 | 133,310 | 11,612 | 259,055 |
| 33,820 | 745,118 | 82,291 | 1,877,082 | |
| Shares repurchased | (14,218) | (311,484) | (50,054) | (1,147,561) |
| Net increase | 19,602 | $433,634 | 32,237 | $729,521 |
Putnam RetirementReady 2040 Fund
| Six months ended 1/31/16 | Year ended 7/31/15 | |||
| Class A | Shares | Amount | Shares | Amount |
| Shares sold | 1,544,814 | $31,231,076 | 2,481,191 | $52,265,636 |
| Shares issued in connection with | ||||
| reinvestment of distributions | 77,924 | 1,546,004 | 58,070 | 1,186,362 |
| 1,622,738 | 32,777,080 | 2,539,261 | 53,451,998 | |
| Shares repurchased | (631,652) | (12,683,971) | (809,148) | (17,076,754) |
| Net increase | 991,086 | $20,093,109 | 1,730,113 | $36,375,244 |
| RetirementReady® Funds | 85 |
| Six months ended 1/31/16 | Year ended 7/31/15 | |||
| Class B | Shares | Amount | Shares | Amount |
| Shares sold | 4,689 | $88,804 | 2,851 | $55,808 |
| Shares issued in connection with | ||||
| reinvestment of distributions | 701 | 12,908 | 1,379 | 26,210 |
| 5,390 | 101,712 | 4,230 | 82,018 | |
| Shares repurchased | (443) | (8,176) | (7,137) | (138,613) |
| Net increase (decrease) | 4,947 | $93,536 | (2,907) | $(56,595) |
| Six months ended 1/31/16 | Year ended 7/31/15 | |||
| Class C | Shares | Amount | Shares | Amount |
| Shares sold | 10,932 | $200,279 | 11,334 | $217,631 |
| Shares issued in connection with | ||||
| reinvestment of distributions | 876 | 15,916 | 1,566 | 29,371 |
| 11,808 | 216,195 | 12,900 | 247,002 | |
| Shares repurchased | (6,171) | (113,678) | (5,080) | (96,625) |
| Net increase | 5,637 | $102,517 | 7,820 | $150,377 |
| Six months ended 1/31/16 | Year ended 7/31/15 | |||
| Class M | Shares | Amount | Shares | Amount |
| Shares sold | 1,969 | $35,613 | 1,439 | $28,170 |
| Shares issued in connection with | ||||
| reinvestment of distributions | 124 | 2,323 | 224 | 4,329 |
| 2,093 | 37,936 | 1,663 | 32,499 | |
| Shares repurchased | (18) | (318) | (30) | (607) |
| Net increase | 2,075 | $37,618 | 1,633 | $31,892 |
| Six months ended 1/31/16 | Year ended 7/31/15 | |||
| Class R | Shares | Amount | Shares | Amount |
| Shares sold | 16,928 | $351,548 | 56,023 | $1,207,933 |
| Shares issued in connection with | ||||
| reinvestment of distributions | 1,333 | 27,323 | 8,555 | 179,389 |
| 18,261 | 378,871 | 64,578 | 1,387,322 | |
| Shares repurchased | (144,529) | (2,974,478) | (33,331) | (717,114) |
| Net increase (decrease) | (126,268) | $(2,595,607) | 31,247 | $670,208 |
| Six months ended 1/31/16 | Year ended 7/31/15 | |||
| Class Y | Shares | Amount | Shares | Amount |
| Shares sold | 209,288 | $4,892,305 | 102,686 | $2,509,967 |
| Shares issued in connection with | ||||
| reinvestment of distributions | 11,674 | 271,074 | 13,519 | 321,886 |
| 220,962 | 5,163,379 | 116,205 | 2,831,853 | |
| Shares repurchased | (51,253) | (1,220,251) | (51,600) | (1,252,681) |
| Net increase | 169,709 | $3,943,128 | 64,605 | $1,579,172 |
| 86 | RetirementReady® Funds |
Putnam RetirementReady 2035 Fund
| Six months ended 1/31/16 | Year ended 7/31/15 | |||
| Class A | Shares | Amount | Shares | Amount |
| Shares sold | 783,614 | $16,141,838 | 1,193,571 | $25,464,461 |
| Shares issued in connection with | ||||
| reinvestment of distributions | 57,876 | 1,163,884 | 40,471 | 840,175 |
| 841,490 | 17,305,722 | 1,234,042 | 26,304,636 | |
| Shares repurchased | (340,615) | (6,974,523) | (368,116) | (7,882,687) |
| Net increase | 500,875 | $10,331,199 | 865,926 | $18,421,949 |
| Six months ended 1/31/16 | Year ended 7/31/15 | |||
| Class B | Shares | Amount | Shares | Amount |
| Shares sold | 1,529 | $28,711 | 11,171 | $220,314 |
| Shares issued in connection with | ||||
| reinvestment of distributions | 1,298 | 24,078 | 1,925 | 36,926 |
| 2,827 | 52,789 | 13,096 | 257,240 | |
| Shares repurchased | (2,558) | (48,624) | (6,419) | (125,318) |
| Net increase | 269 | $4,165 | 6,677 | $131,922 |
| Six months ended 1/31/16 | Year ended 7/31/15 | |||
| Class C | Shares | Amount | Shares | Amount |
| Shares sold | 20,071 | $378,733 | 26,400 | $518,024 |
| Shares issued in connection with | ||||
| reinvestment of distributions | 1,659 | 30,654 | 1,570 | 30,073 |
| 21,730 | 409,387 | 27,970 | 548,097 | |
| Shares repurchased | (4,211) | (79,891) | (4,286) | (84,034) |
| Net increase | 17,519 | $329,496 | 23,684 | $464,063 |
| Six months ended 1/31/16 | Year ended 7/31/15 | |||
| Class M | Shares | Amount | Shares | Amount |
| Shares sold | 433 | $8,528 | 7,900 | $158,443 |
| Shares issued in connection with | ||||
| reinvestment of distributions | 507 | 9,847 | 482 | 9,658 |
| 940 | 18,375 | 8,382 | 168,101 | |
| Shares repurchased | (55) | (1,050) | (1,188) | (24,225) |
| Net increase | 885 | $17,325 | 7,194 | $143,876 |
| Six months ended 1/31/16 | Year ended 7/31/15 | |||
| Class R | Shares | Amount | Shares | Amount |
| Shares sold | 18,654 | $369,109 | 54,505 | $1,111,566 |
| Shares issued in connection with | ||||
| reinvestment of distributions | 1,897 | 36,812 | 7,526 | 150,148 |
| 20,551 | 405,921 | 62,031 | 1,261,714 | |
| Shares repurchased | (147,379) | (2,897,663) | (55,018) | (1,115,205) |
| Net increase (decrease) | (126,828) | $(2,491,742) | 7,013 | $146,509 |
| RetirementReady® Funds | 87 |
| Six months ended 1/31/16 | Year ended 7/31/15 | |||
| Class Y | Shares | Amount | Shares | Amount |
| Shares sold | 54,153 | $1,294,443 | 106,558 | $2,622,427 |
| Shares issued in connection with | ||||
| reinvestment of distributions | 13,322 | 311,739 | 15,615 | 375,537 |
| 67,475 | 1,606,182 | 122,173 | 2,997,964 | |
| Shares repurchased | (35,596) | (844,576) | (81,922) | (2,035,956) |
| Net increase | 31,879 | $761,606 | 40,251 | $962,008 |
Putnam RetirementReady 2030 Fund
| Six months ended 1/31/16 | Year ended 7/31/15 | |||
| Class A | Shares | Amount | Shares | Amount |
| Shares sold | 2,142,012 | $43,825,917 | 3,023,721 | $63,821,140 |
| Shares issued in connection with | ||||
| reinvestment of distributions | 132,127 | 2,643,868 | 41,725 | 863,299 |
| 2,274,139 | 46,469,785 | 3,065,446 | 64,684,439 | |
| Shares repurchased | (795,029) | (16,198,978) | (819,965) | (17,332,339) |
| Net increase | 1,479,110 | $30,270,807 | 2,245,481 | $47,352,100 |
| Six months ended 1/31/16 | Year ended 7/31/15 | |||
| Class B | Shares | Amount | Shares | Amount |
| Shares sold | 2,181 | $42,469 | 9,710 | $195,525 |
| Shares issued in connection with | ||||
| reinvestment of distributions | 1,369 | 26,123 | 940 | 18,560 |
| 3,550 | 68,592 | 10,650 | 214,085 | |
| Shares repurchased | (4,871) | (93,264) | (9,038) | (180,775) |
| Net increase (decrease) | (1,321) | $(24,672) | 1,612 | $33,310 |
| Six months ended 1/31/16 | Year ended 7/31/15 | |||
| Class C | Shares | Amount | Shares | Amount |
| Shares sold | 10,776 | $204,304 | 23,260 | $465,475 |
| Shares issued in connection with | ||||
| reinvestment of distributions | 1,588 | 30,254 | 1,116 | 22,003 |
| 12,364 | 234,558 | 24,376 | 487,478 | |
| Shares repurchased | (494) | (9,398) | (14,427) | (291,083) |
| Net increase | 11,870 | $225,160 | 9,949 | $196,395 |
| Six months ended 1/31/16 | Year ended 7/31/15 | |||
| Class M | Shares | Amount | Shares | Amount |
| Shares sold | 662 | $13,178 | 1,671 | $33,978 |
| Shares issued in connection with | ||||
| reinvestment of distributions | 306 | 5,964 | 196 | 3,952 |
| 968 | 19,142 | 1,867 | 37,930 | |
| Shares repurchased | (173) | (3,256) | (1,150) | (23,475) |
| Net increase | 795 | $15,886 | 717 | $14,455 |
| 88 | RetirementReady® Funds |
| Six months ended 1/31/16 | Year ended 7/31/15 | |||
| Class R | Shares | Amount | Shares | Amount |
| Shares sold | 23,362 | $451,961 | 77,851 | $1,549,415 |
| Shares issued in connection with | ||||
| reinvestment of distributions | 4,034 | 76,770 | 8,179 | 160,399 |
| 27,396 | 528,731 | 86,030 | 1,709,814 | |
| Shares repurchased | (259,683) | (5,045,713) | (48,022) | (946,684) |
| Net increase (decrease) | (232,287) | $(4,516,982) | 38,008 | $763,130 |
| Six months ended 1/31/16 | Year ended 7/31/15 | |||
| Class Y | Shares | Amount | Shares | Amount |
| Shares sold | 130,434 | $3,025,850 | 114,672 | $2,737,637 |
| Shares issued in connection with | ||||
| reinvestment of distributions | 16,991 | 388,255 | 11,634 | 273,623 |
| 147,425 | 3,414,105 | 126,306 | 3,011,260 | |
| Shares repurchased | (38,124) | (894,330) | (90,116) | (2,150,679) |
| Net increase | 109,301 | $2,519,775 | 36,190 | $860,581 |
Putnam RetirementReady 2025 Fund
| Six months ended 1/31/16 | Year ended 7/31/15 | |||
| Class A | Shares | Amount | Shares | Amount |
| Shares sold | 976,458 | $20,561,291 | 907,524 | $19,436,389 |
| Shares issued in connection with | ||||
| reinvestment of distributions | 64,304 | 1,316,955 | 19,369 | 409,267 |
| 1,040,762 | 21,878,246 | 926,893 | 19,845,656 | |
| Shares repurchased | (394,546) | (8,253,794) | (390,652) | (8,359,438) |
| Net increase | 646,216 | $13,624,452 | 536,241 | $11,486,218 |
| Six months ended 1/31/16 | Year ended 7/31/15 | |||
| Class B | Shares | Amount | Shares | Amount |
| Shares sold | 4,190 | $81,966 | 11,362 | $224,762 |
| Shares issued in connection with | ||||
| reinvestment of distributions | 1,078 | 20,683 | 343 | 6,797 |
| 5,268 | 102,649 | 11,705 | 231,559 | |
| Shares repurchased | (6,111) | (118,829) | (7,032) | (140,317) |
| Net increase (decrease) | (843) | $(16,180) | 4,673 | $91,242 |
| Six months ended 1/31/16 | Year ended 7/31/15 | |||
| Class C | Shares | Amount | Shares | Amount |
| Shares sold | 12,419 | $240,160 | 16,033 | $320,195 |
| Shares issued in connection with | ||||
| reinvestment of distributions | 1,688 | 32,318 | 454 | 8,980 |
| 14,107 | 272,478 | 16,487 | 329,175 | |
| Shares repurchased | (8,914) | (170,293) | (5,419) | (108,905) |
| Net increase | 5,193 | $102,185 | 11,068 | $220,270 |
| RetirementReady® Funds | 89 |
| Six months ended 1/31/16 | Year ended 7/31/15 | |||
| Class M | Shares | Amount | Shares | Amount |
| Shares sold | 320 | $6,313 | 1,426 | $28,186 |
| Shares issued in connection with | ||||
| reinvestment of distributions | 231 | 4,489 | 90 | 1,811 |
| 551 | 10,802 | 1,516 | 29,997 | |
| Shares repurchased | (12) | (215) | (1,166) | (23,581) |
| Net increase | 539 | $10,587 | 350 | $6,416 |
| Six months ended 1/31/16 | Year ended 7/31/15 | |||
| Class R | Shares | Amount | Shares | Amount |
| Shares sold | 23,283 | $453,604 | 87,350 | $1,733,925 |
| Shares issued in connection with | ||||
| reinvestment of distributions | 1,945 | 37,437 | 3,350 | 66,193 |
| 25,228 | 491,041 | 90,700 | 1,800,118 | |
| Shares repurchased | (243,865) | (4,799,132) | (36,428) | (723,605) |
| Net increase (decrease) | (218,637) | $(4,308,091) | 54,272 | $1,076,513 |
| Six months ended 1/31/16 | Year ended 7/31/15 | |||
| Class Y | Shares | Amount | Shares | Amount |
| Shares sold | 49,275 | $1,046,529 | 134,885 | $2,882,688 |
| Shares issued in connection with | ||||
| reinvestment of distributions | 16,774 | 344,881 | 7,825 | 165,893 |
| 66,049 | 1,391,410 | 142,710 | 3,048,581 | |
| Shares repurchased | (23,280) | (484,993) | (62,599) | (1,354,623) |
| Net increase | 42,769 | $906,417 | 80,111 | $1,693,958 |
Putnam RetirementReady 2020 Fund
| Six months ended 1/31/16 | Year ended 7/31/15 | |||
| Class A | Shares | Amount | Shares | Amount |
| Shares sold | 2,135,272 | $39,829,742 | 3,362,783 | $63,753,552 |
| Shares issued in connection with | ||||
| reinvestment of distributions | 149,938 | 2,715,373 | 26,064 | 488,965 |
| 2,285,210 | 42,545,115 | 3,388,847 | 64,242,517 | |
| Shares repurchased | (748,536) | (13,858,193) | (1,048,995) | (19,930,141) |
| Net increase | 1,536,674 | $28,686,922 | 2,339,852 | $44,312,376 |
| Six months ended 1/31/16 | Year ended 7/31/15 | |||
| Class B | Shares | Amount | Shares | Amount |
| Shares sold | 4,516 | $81,760 | 6,374 | $116,294 |
| Shares issued in connection with | ||||
| reinvestment of distributions | 1,378 | 24,122 | 203 | 3,670 |
| 5,894 | 105,882 | 6,577 | 119,964 | |
| Shares repurchased | (3,086) | (55,093) | (23,803) | (432,823) |
| Net increase (decrease) | 2,808 | $50,789 | (17,226) | $(312,859) |
| 90 | RetirementReady® Funds |
| Six months ended 1/31/16 | Year ended 7/31/15 | |||
| Class C | Shares | Amount | Shares | Amount |
| Shares sold | 13,953 | $249,621 | 31,862 | $581,505 |
| Shares issued in connection with | ||||
| reinvestment of distributions | 2,491 | 43,587 | 551 | 9,986 |
| 16,444 | 293,208 | 32,413 | 591,491 | |
| Shares repurchased | (3,573) | (64,131) | (22,140) | (406,597) |
| Net increase | 12,871 | $229,077 | 10,273 | $184,894 |
| Six months ended 1/31/16 | Year ended 7/31/15 | |||
| Class M | Shares | Amount | Shares | Amount |
| Shares sold | 459 | $8,421 | 1,292 | $23,850 |
| Shares issued in connection with | ||||
| reinvestment of distributions | 222 | 3,959 | 57 | 1,061 |
| 681 | 12,380 | 1,349 | 24,911 | |
| Shares repurchased | (860) | (15,916) | (304) | (5,581) |
| Net increase (decrease) | (179) | $(3,536) | 1,045 | $19,330 |
| Six months ended 1/31/16 | Year ended 7/31/15 | |||
| Class R | Shares | Amount | Shares | Amount |
| Shares sold | 27,151 | $486,616 | 60,351 | $1,095,849 |
| Shares issued in connection with | ||||
| reinvestment of distributions | 4,373 | 76,433 | 2,770 | 50,022 |
| 31,524 | 563,049 | 63,121 | 1,145,871 | |
| Shares repurchased | (162,630) | (2,927,020) | (55,531) | (1,008,593) |
| Net increase (decrease) | (131,106) | $(2,363,971) | 7,590 | $137,278 |
| Six months ended 1/31/16 | Year ended 7/31/15 | |||
| Class Y | Shares | Amount | Shares | Amount |
| Shares sold | 22,444 | $463,772 | 37,396 | $791,561 |
| Shares issued in connection with | ||||
| reinvestment of distributions | 6,982 | 141,521 | 2,731 | 57,106 |
| 29,426 | 605,293 | 40,127 | 848,667 | |
| Shares repurchased | (22,914) | (476,142) | (41,502) | (868,024) |
| Net increase (decrease) | 6,512 | $129,151 | (1,375) | $(19,357) |
| RetirementReady® Funds | 91 |
Putnam Retirement Income Fund Lifestyle 1
| Six months ended 1/31/16 | Year ended 7/31/15 | |||
| Class A | Shares | Amount | Shares | Amount |
| Shares sold | 323,095 | $5,549,846 | 328,817 | $5,779,605 |
| Shares issued in connection with | ||||
| reinvestment of distributions | 113,284 | 1,904,710 | 23,095 | 404,773 |
| Shares issued in connection with | ||||
| the merger of Putnam | ||||
| RetirementReady 2015 Fund | 2,418,458 | 42,298,836 | — | — |
| 2,854,837 | 49,753,392 | 351,912 | 6,184,378 | |
| Shares repurchased | (272,869) | (4,678,407) | (241,398) | (4,259,784) |
| Net increase | 2,581,968 | $45,074,985 | 110,514 | $1,924,594 |
| Six months ended 1/31/16 | Year ended 7/31/15 | |||
| Class B | Shares | Amount | Shares | Amount |
| Shares sold | 1,628 | $27,916 | 7,972 | $138,864 |
| Shares issued in connection with | ||||
| reinvestment of distributions | 2,103 | 34,827 | 319 | 5,525 |
| Shares issued in connection with | ||||
| the merger of Putnam | ||||
| RetirementReady 2015 Fund | 43,924 | 757,249 | — | — |
| 47,655 | 819,992 | 8,291 | 144,389 | |
| Shares repurchased | (2,095) | (34,640) | (3,004) | (52,287) |
| Net increase | 45,560 | $785,352 | 5,287 | $92,102 |
| Six months ended 1/31/16 | Year ended 7/31/15 | |||
| Class C | Shares | Amount | Shares | Amount |
| Shares sold | 19,627 | $333,028 | 10,920 | $191,283 |
| Shares issued in connection with | ||||
| reinvestment of distributions | 3,020 | 50,135 | 878 | 15,228 |
| Shares issued in connection with | ||||
| the merger of Putnam | ||||
| RetirementReady 2015 Fund | 35,434 | 612,306 | — | — |
| 58,081 | 995,469 | 11,798 | 206,511 | |
| Shares repurchased | (2,864) | (48,576) | (6,122) | (107,298) |
| Net increase | 55,217 | $946,893 | 5,676 | $99,213 |
| 92 | RetirementReady® Funds |
| Six months ended 1/31/16 | Year ended 7/31/15 | |||
| Class M | Shares | Amount | Shares | Amount |
| Shares sold | 2,727 | $46,805 | 6,369 | $112,375 |
| Shares issued in connection with | ||||
| reinvestment of distributions | 978 | 16,491 | 411 | 7,197 |
| Shares issued in connection with | ||||
| the merger of Putnam | ||||
| RetirementReady 2015 Fund | 6,980 | 122,364 | — | — |
| 10,685 | 185,660 | 6,780 | 119,572 | |
| Shares repurchased | (1,474) | (25,621) | (3,389) | (59,783) |
| Net increase | 9,211 | $160,039 | 3,391 | $59,789 |
| Six months ended 1/31/16 | Year ended 7/31/15 | |||
| Class R | Shares | Amount | Shares | Amount |
| Shares sold | 7,330 | $122,584 | 12,641 | $222,756 |
| Shares issued in connection with | ||||
| reinvestment of distributions | 2,980 | 50,063 | 1,054 | 18,453 |
| Shares issued in connection with | ||||
| the merger of Putnam | ||||
| RetirementReady 2015 Fund | 76,280 | 1,333,370 | — | — |
| 86,590 | 1,506,017 | 13,695 | 241,209 | |
| Shares repurchased | (35,731) | (621,953) | (26,531) | (468,941) |
| Net increase (decrease) | 50,859 | $884,064 | (12,836) | $(227,732) |
| Six months ended 1/31/16 | Year ended 7/31/15 | |||
| Class Y | Shares | Amount | Shares | Amount |
| Shares sold | 42,063 | $733,233 | 23,414 | $415,389 |
| Shares issued in connection with | ||||
| reinvestment of distributions | 12,541 | 211,492 | 1,826 | 32,142 |
| Shares issued in connection with | ||||
| the merger of Putnam | ||||
| RetirementReady 2015 Fund | 264,709 | 4,643,001 | — | — |
| 319,313 | 5,587,726 | 25,240 | 447,531 | |
| Shares repurchased | (44,581) | (752,489) | (11,521) | (203,926) |
| Net increase | 274,732 | $4,835,237 | 13,719 | $243,605 |
| RetirementReady® Funds | 93 |
At the close of the reporting period, Putnam Investments, LLC owned the following shares of each fund:
| Percentage of | Fair value at the | ||
| shares | end of the | ||
| Shares owned | outstanding | reporting period | |
| Putnam RetirementReady 2060 Fund class A | 1,023 | 81.38% | $9,197 |
| Putnam RetirementReady 2060 Fund class B | 1,023 | 100.00 | 9,182 |
| Putnam RetirementReady 2060 Fund class C | 1,023 | 100.00 | 9,182 |
| Putnam RetirementReady 2060 Fund class M | 1,023 | 100.00 | 9,186 |
| Putnam RetirementReady 2060 Fund class R | 1,023 | 100.00 | 9,190 |
| Putnam RetirementReady 2060 Fund class Y | 1,024 | 91.18 | 9,206 |
| Putnam RetirementReady 2055 Fund class B | 1,524 | 18.40 | 14,493 |
| Putnam RetirementReady 2055 Fund class M | 1,536 | 33.15 | 14,700 |
| Putnam RetirementReady 2055 Fund class R | 1,562 | 6.62 | 14,886 |
| Putnam RetirementReady 2050 Fund class R | 306 | 0.35 | 4,722 |
| Putnam RetirementReady 2045 Fund class R | 266 | 0.32 | 4,729 |
| Putnam RetirementReady 2045 Fund class Y | 826 | 0.27 | 17,065 |
| Putnam RetirementReady 2035 Fund class R | 256 | 0.26 | 4,756 |
| Putnam RetirementReady 2030 Fund class R | 261 | 0.14 | 4,795 |
| Putnam RetirementReady 2020 Fund class R | 283 | 0.16 | 4,848 |
| Putnam Retirement Income Fund Lifestyle 1 | |||
| class R | 296 | 0.30 | 4,887 |
Note 5: Initial capitalization and offering of shares
Putnam RetirementReady 2060 Fund was established as a series of the Trust on November 30, 2015 and commenced operations on November 30, 2015. Prior to November 30, 2015, the fund had no operations other than those related to organizational matters, including as noted below, the initial capital contributions by Putnam Investments, LLC and issuance of shares:
| Capital contribution | Shares issued | |
| Class A | $10,000 | 1,000 |
| Class B | 10,000 | 1,000 |
| Class C | 10,000 | 1,000 |
| Class M | 10,000 | 1,000 |
| Class R | 10,000 | 1,000 |
| Class Y | 10,000 | 1,000 |
| 94 | RetirementReady® Funds |
Note 6: Transactions with affiliated issuers
Transactions during the reporting period with a company which is under common ownership or control, or involving securities of companies in which a fund owned at least 5% of the outstanding voting securities, were as follows:
Putnam RetirementReady 2060 Fund
| Fair value | ||||||
| at the | Fair value | |||||
| beginning | at the end | |||||
| of the | of the | |||||
| reporting | Purchase | Sale | Investment | Capital gain | reporting | |
| Affiliates | period | cost | proceeds | income | distributions | period |
| Putnam Absolute Return | ||||||
| 100 Fund Class Y | $— | $325 | $11 | $5 | $— | $305 |
| Putnam Absolute Return | ||||||
| 300 Fund Class Y | — | — | — | — | — | — |
| Putnam Absolute Return | ||||||
| 500 Fund Class Y | — | 1,479 | 27 | 63 | 12 | 1,338 |
| Putnam Absolute Return | ||||||
| 700 Fund Class Y | — | 5,147 | 67 | 303 | 44 | 4,527 |
| Putnam Dynamic Asset | ||||||
| Allocation Balanced Fund | ||||||
| Class Y | — | — | — | — | — | — |
| Putnam Dynamic Asset | ||||||
| Allocation Conservative | ||||||
| Fund Class Y | — | — | — | — | — | — |
| Putnam Dynamic Asset | ||||||
| Allocation Equity Fund | ||||||
| Class Y | — | 48,484 | 656 | 490 | 1,172 | 42,337 |
| Putnam Dynamic Asset | ||||||
| Allocation Growth Fund | ||||||
| Class Y | — | 10,811 | 159 | 174 | 422 | 9,352 |
| Putnam Money Market | ||||||
| Fund Class A | — | 319 | 41 | — | — | 278 |
| Totals | $— | $66,565 | $961 | $1,035 | $1,650 | $58,137 |
| RetirementReady® Funds | 95 |
Putnam RetirementReady 2055 Fund
| Fair value | ||||||
| at the | Fair value | |||||
| beginning | at the end | |||||
| of the | of the | |||||
| reporting | Purchase | Sale | Investment | Capital gain | reporting | |
| Affiliates | period | cost | proceeds | income | distributions | period |
| Putnam Absolute Return | ||||||
| 100 Fund Class Y | $31,467 | $43,103 | $25,081 | $805 | $— | $48,091 |
| Putnam Absolute Return | ||||||
| 300 Fund Class Y | — | — | — | — | — | — |
| Putnam Absolute Return | ||||||
| 500 Fund Class Y | 117,611 | 139,149 | 92,429 | 6,678 | 1,277 | 150,672 |
| Putnam Absolute Return | ||||||
| 700 Fund Class Y | 403,037 | 486,188 | 311,232 | 32,443 | 4,707 | 509,728 |
| Putnam Dynamic Asset | ||||||
| Allocation Balanced Fund | ||||||
| Class Y | — | — | — | — | — | — |
| Putnam Dynamic Asset | ||||||
| Allocation Conservative | ||||||
| Fund Class Y | — | — | — | — | — | — |
| Putnam Dynamic Asset | ||||||
| Allocation Equity Fund | ||||||
| Class Y | 3,895,552 | 4,366,354 | 2,813,849 | 55,509 | 133,056 | 4,745,747 |
| Putnam Dynamic Asset | ||||||
| Allocation Growth Fund | ||||||
| Class Y | 849,600 | 974,903 | 612,166 | 19,573 | 47,372 | 1,051,552 |
| Putnam Money Market | ||||||
| Fund Class A | 24,109 | 35,029 | 27,568 | — | — | 31,570 |
| Totals | $5,321,376 | $6,044,726 | $3,882,325 | $115,008 | $186,412 | $6,537,360 |
| 96 | RetirementReady® Funds |
Putnam RetirementReady 2050 Fund
| Fair value | ||||||
| at the | Fair value | |||||
| beginning | at the end | |||||
| of the | of the | |||||
| reporting | Purchase | Sale | Investment | Capital gain | reporting | |
| Affiliates | period | cost | proceeds | income | distributions | period |
| Putnam Absolute Return | ||||||
| 100 Fund Class Y | $260,012 | $359,730 | $212,790 | $6,719 | $— | $395,403 |
| Putnam Absolute Return | ||||||
| 300 Fund Class Y | — | — | — | — | — | — |
| Putnam Absolute Return | ||||||
| 500 Fund Class Y | 582,896 | 668,353 | 462,416 | 32,521 | 6,220 | 722,642 |
| Putnam Absolute Return | ||||||
| 700 Fund Class Y | 1,997,232 | 2,335,831 | 1,557,416 | 158,004 | 22,924 | 2,444,585 |
| Putnam Dynamic Asset | ||||||
| Allocation Balanced Fund | ||||||
| Class Y | — | — | — | — | — | — |
| Putnam Dynamic Asset | ||||||
| Allocation Conservative | ||||||
| Fund Class Y | — | — | — | — | — | — |
| Putnam Dynamic Asset | ||||||
| Allocation Equity Fund | ||||||
| Class Y | 16,432,261 | 17,120,416 | 12,481,075 | 215,004 | 515,352 | 18,239,906 |
| Putnam Dynamic Asset | ||||||
| Allocation Growth Fund | ||||||
| Class Y | 6,974,446 | 9,295,919 | 5,441,274 | 177,289 | 429,099 | 9,453,887 |
| Putnam Money Market | ||||||
| Fund Class A | 116,808 | 165,386 | 131,617 | 9 | — | 150,577 |
| Totals | $26,363,655 | $29,945,635 | $20,286,588 | $589,546 | $973,595 | $31,407,000 |
| RetirementReady® Funds | 97 |
Putnam RetirementReady 2045 Fund
| Fair value | ||||||
| at the | Fair value | |||||
| beginning | at the end | |||||
| of the | of the | |||||
| reporting | Purchase | Sale | Investment | Capital gain | reporting | |
| Affiliates | period | cost | proceeds | income | distributions | period |
| Putnam Absolute Return | ||||||
| 100 Fund Class Y | $555,042 | $467,924 | $307,570 | $11,754 | $— | $694,810 |
| Putnam Absolute Return | ||||||
| 300 Fund Class Y | — | — | — | — | — | — |
| Putnam Absolute Return | ||||||
| 500 Fund Class Y | 691,293 | 539,684 | 398,282 | 34,123 | 6,526 | 761,971 |
| Putnam Absolute Return | ||||||
| 700 Fund Class Y | 2,368,679 | 1,900,044 | 1,336,806 | 165,789 | 24,053 | 2,577,924 |
| Putnam Dynamic Asset | ||||||
| Allocation Balanced Fund | ||||||
| Class Y | — | — | — | — | — | — |
| Putnam Dynamic Asset | ||||||
| Allocation Conservative | ||||||
| Fund Class Y | — | — | — | — | — | — |
| Putnam Dynamic Asset | ||||||
| Allocation Equity Fund | ||||||
| Class Y | 14,042,927 | 9,522,990 | 7,973,789 | 157,541 | 377,618 | 13,402,361 |
| Putnam Dynamic Asset | ||||||
| Allocation Growth Fund | ||||||
| Class Y | 13,451,150 | 11,838,467 | 7,307,078 | 292,382 | 707,664 | 15,627,890 |
| Putnam Money Market | ||||||
| Fund Class A | 138,172 | 141,230 | 122,016 | 6 | — | 157,386 |
| Totals | $31,247,263 | $24,410,339 | $17,445,541 | $661,595 | $1,115,861 | $33,222,342 |
| 98 | RetirementReady® Funds |
Putnam RetirementReady 2040 Fund
| Fair value | ||||||
| at the | Fair value | |||||
| beginning | at the end | |||||
| of the | of the | |||||
| reporting | Purchase | Sale | Investment | Capital gain | reporting | |
| Affiliates | period | cost | proceeds | income | distributions | period |
| Putnam Absolute Return | ||||||
| 100 Fund Class Y | $1,931,564 | $2,260,418 | $2,092,717 | $34,938 | $— | $2,035,657 |
| Putnam Absolute Return | ||||||
| 300 Fund Class Y | — | — | — | — | — | — |
| Putnam Absolute Return | ||||||
| 500 Fund Class Y | 2,032,492 | 3,178,186 | 2,028,016 | 132,774 | 25,394 | 2,922,117 |
| Putnam Absolute Return | ||||||
| 700 Fund Class Y | 5,139,140 | 7,041,938 | 4,865,217 | 420,408 | 60,994 | 6,443,417 |
| Putnam Dynamic Asset | ||||||
| Allocation Balanced Fund | ||||||
| Class Y | — | — | — | — | — | — |
| Putnam Dynamic Asset | ||||||
| Allocation Conservative | ||||||
| Fund Class Y | — | — | — | — | — | — |
| Putnam Dynamic Asset | ||||||
| Allocation Equity Fund | ||||||
| Class Y | 14,811,887 | 15,820,799 | 15,546,487 | 152,373 | 365,231 | 12,761,453 |
| Putnam Dynamic Asset | ||||||
| Allocation Growth Fund | ||||||
| Class Y | 40,960,909 | 59,500,425 | 39,665,616 | 1,005,265 | 2,433,083 | 52,931,041 |
| Putnam Money Market | ||||||
| Fund Class A | 290,121 | 1,402,221 | 667,275 | 31 | — | 1,025,067 |
| Totals | $65,166,113 | $89,203,987 | $64,865,328 | $1,745,789 | $2,884,702 | $78,118,752 |
| RetirementReady® Funds | 99 |
Putnam RetirementReady 2035 Fund
| Fair value | ||||||
| at the | Fair value | |||||
| beginning | at the end | |||||
| of the | of the | |||||
| reporting | Purchase | Sale | Investment | Capital gain | reporting | |
| Affiliates | period | cost | proceeds | income | distributions | period |
| Putnam Absolute Return | ||||||
| 100 Fund Class Y | $1,418,730 | $987,835 | $810,861 | $26,940 | $— | $1,547,864 |
| Putnam Absolute Return | ||||||
| 300 Fund Class Y | 512,175 | 592,790 | 315,565 | 33,471 | — | 731,323 |
| Putnam Absolute Return | ||||||
| 500 Fund Class Y | 2,660,102 | 2,133,816 | 1,419,705 | 142,253 | 27,207 | 3,085,969 |
| Putnam Absolute Return | ||||||
| 700 Fund Class Y | 5,812,133 | 4,540,203 | 3,026,528 | 425,752 | 61,770 | 6,430,295 |
| Putnam Dynamic Asset | ||||||
| Allocation Balanced Fund | ||||||
| Class Y | 4,545,148 | 4,851,375 | 2,682,739 | 46,138 | 315,313 | 6,018,250 |
| Putnam Dynamic Asset | ||||||
| Allocation Conservative | ||||||
| Fund Class Y | — | — | — | — | — | — |
| Putnam Dynamic Asset | ||||||
| Allocation Equity Fund | ||||||
| Class Y | 2,071,584 | 548,487 | 2,403,547 | 7 | 16 | — |
| Putnam Dynamic Asset | ||||||
| Allocation Growth Fund | ||||||
| Class Y | 39,048,243 | 28,138,610 | 20,419,975 | 777,677 | 1,882,243 | 40,237,878 |
| Putnam Money Market | ||||||
| Fund Class A | 1,393,368 | 1,178,859 | 854,169 | 77 | — | 1,718,058 |
| Totals | $57,461,483 | $42,971,975 | $31,933,089 | $1,452,315 | $2,286,549 | $59,769,637 |
| 100 | RetirementReady® Funds |
Putnam RetirementReady 2030 Fund
| Fair value | ||||||
| at the | Fair value | |||||
| beginning | at the end | |||||
| of the | of the | |||||
| reporting | Purchase | Sale | Investment | Capital gain | reporting | |
| Affiliates | period | cost | proceeds | income | distributions | period |
| Putnam Absolute Return | ||||||
| 100 Fund Class Y | $3,253,687 | $3,802,073 | $2,694,703 | $72,159 | $— | $4,235,138 |
| Putnam Absolute Return | ||||||
| 300 Fund Class Y | 3,454,519 | 5,171,737 | 3,131,454 | 228,309 | — | 5,096,256 |
| Putnam Absolute Return | ||||||
| 500 Fund Class Y | 5,653,517 | 6,580,880 | 4,557,054 | 317,496 | 60,723 | 7,036,855 |
| Putnam Absolute Return | ||||||
| 700 Fund Class Y | 12,636,818 | 15,161,763 | 10,106,957 | 1,010,502 | 146,608 | 15,596,116 |
| Putnam Dynamic Asset | ||||||
| Allocation Balanced Fund | ||||||
| Class Y | 32,688,707 | 47,361,553 | 29,112,649 | 345,291 | 2,331,260 | 45,779,660 |
| Putnam Dynamic Asset | ||||||
| Allocation Conservative | ||||||
| Fund Class Y | — | — | — | — | — | — |
| Putnam Dynamic Asset | ||||||
| Allocation Equity Fund | ||||||
| Class Y | — | — | — | — | — | — |
| Putnam Dynamic Asset | ||||||
| Allocation Growth Fund | ||||||
| Class Y | 36,017,681 | 34,942,543 | 32,499,474 | 614,932 | 1,488,344 | 32,760,648 |
| Putnam Money Market | ||||||
| Fund Class A | 3,211,183 | 3,674,730 | 2,787,394 | 182 | — | 4,098,518 |
| Totals | $96,916,112 | $116,695,279 | $84,889,685 | $2,588,871 | $4,026,935 | $114,603,191 |
| RetirementReady® Funds | 101 |
Putnam RetirementReady 2025 Fund
| Fair value | ||||||
| at the | Fair value | |||||
| beginning | at the end | |||||
| of the | of the | |||||
| reporting | Purchase | Sale | Investment | Capital gain | reporting | |
| Affiliates | period | cost | proceeds | income | distributions | period |
| Putnam Absolute Return | ||||||
| 100 Fund Class Y | $2,777,243 | $2,103,417 | $1,564,706 | $57,585 | $— | $3,216,039 |
| Putnam Absolute Return | ||||||
| 300 Fund Class Y | 4,642,048 | 4,207,186 | 2,726,721 | 266,411 | — | 5,658,153 |
| Putnam Absolute Return | ||||||
| 500 Fund Class Y | 5,660,953 | 5,060,234 | 3,254,923 | 323,387 | 61,850 | 6,821,655 |
| Putnam Absolute Return | ||||||
| 700 Fund Class Y | 8,598,021 | 6,724,674 | 4,723,663 | 631,283 | 91,589 | 9,273,730 |
| Putnam Dynamic Asset | ||||||
| Allocation Balanced Fund | ||||||
| Class Y | 32,604,260 | 26,024,195 | 18,466,538 | 301,003 | 1,920,864 | 35,591,447 |
| Putnam Dynamic Asset | ||||||
| Allocation Conservative | ||||||
| Fund Class Y | 1,873,382 | 3,257,051 | 1,442,311 | 29,416 | 186,401 | 3,397,514 |
| Putnam Dynamic Asset | ||||||
| Allocation Equity Fund | ||||||
| Class Y | — | — | — | — | — | — |
| Putnam Dynamic Asset | ||||||
| Allocation Growth Fund | ||||||
| Class Y | 3,622,910 | 880,118 | 4,191,140 | — | — | — |
| Putnam Money Market | ||||||
| Fund Class A | 2,749,163 | 2,101,255 | 1,612,518 | 149 | — | 3,237,900 |
| Totals | $62,527,980 | $50,358,130 | $37,982,520 | $1,609,234 | $2,260,704 | $67,196,438 |
| 102 | RetirementReady® Funds |
Putnam RetirementReady 2020 Fund
| Fair value | ||||||
| at the | Fair value | |||||
| beginning | at the end | |||||
| of the | of the | |||||
| reporting | Purchase | Sale | Investment | Capital gain | reporting | |
| Affiliates | period | cost | proceeds | income | distributions | period |
| Putnam Absolute Return | ||||||
| 100 Fund Class Y | $4,899,700 | $5,510,098 | $3,863,746 | $112,192 | $— | $6,353,042 |
| Putnam Absolute Return | ||||||
| 300 Fund Class Y | 9,827,310 | 12,356,430 | 7,992,311 | 610,110 | — | 13,134,226 |
| Putnam Absolute Return | ||||||
| 500 Fund Class Y | 15,233,981 | 20,340,126 | 12,536,846 | 987,270 | 188,822 | 21,112,181 |
| Putnam Absolute Return | ||||||
| 700 Fund Class Y | 8,736,892 | 8,939,542 | 7,258,110 | 610,972 | 88,642 | 9,113,452 |
| Putnam Dynamic Asset | ||||||
| Allocation Balanced Fund | ||||||
| Class Y | 26,125,385 | 25,191,413 | 22,062,930 | 226,531 | 1,353,733 | 25,740,914 |
| Putnam Dynamic Asset | ||||||
| Allocation Conservative | ||||||
| Fund Class Y | 15,812,207 | 22,664,431 | 13,583,810 | 202,256 | 1,223,762 | 22,818,806 |
| Putnam Dynamic Asset | ||||||
| Allocation Equity Fund | ||||||
| Class Y | — | — | — | — | — | — |
| Putnam Dynamic Asset | ||||||
| Allocation Growth Fund | ||||||
| Class Y | — | — | — | — | — | — |
| Putnam Money Market | ||||||
| Fund Class A | 4,860,261 | 5,472,361 | 3,946,736 | 253 | — | 6,385,886 |
| Totals | $85,495,736 | $100,474,401 | $71,244,489 | $2,749,584 | $2,854,959 | $104,658,507 |
| RetirementReady® Funds | 103 |
Putnam Retirement Income Fund Lifestyle 1
| Fair value | ||||||
| at the | Fair value | |||||
| beginning | at the end | |||||
| of the | of the | |||||
| reporting | Purchase | Sale | Investment | Capital gain | reporting | |
| Affiliates | period | cost | proceeds | income | distributions | period |
| Putnam Absolute Return | ||||||
| 100 Fund Class Y | $1,920,614 | $5,851,754 | $1,226,364 | $117,345 | $— | $6,342,874 |
| Putnam Absolute Return | ||||||
| 300 Fund Class Y | 4,494,590 | 14,147,382 | 2,829,895 | 708,728 | — | 14,565,742 |
| Putnam Absolute Return | ||||||
| 500 Fund Class Y | 6,526,249 | 20,478,088 | 3,996,823 | 1,026,810 | 196,384 | 21,075,248 |
| Putnam Absolute Return | ||||||
| 700 Fund Class Y | — | — | — | — | — | — |
| Putnam Dynamic Asset | ||||||
| Allocation Balanced Fund | ||||||
| Class Y | — | — | — | — | — | — |
| Putnam Dynamic Asset | ||||||
| Allocation Conservative | ||||||
| Fund Class Y | 7,342,378 | 23,253,678 | 4,534,208 | 134,596 | 1,325,998 | 23,788,315 |
| Putnam Dynamic Asset | ||||||
| Allocation Equity Fund | ||||||
| Class Y | — | — | — | — | — | — |
| Putnam Dynamic Asset | ||||||
| Allocation Growth Fund | ||||||
| Class Y | — | — | — | — | — | — |
| Putnam Money Market | ||||||
| Fund Class A | 1,269,568 | 3,837,808 | 884,244 | 234 | — | 4,223,132 |
| Totals | $21,553,399 | $67,568,710 | $13,471,534 | $1,987,713 | $1,522,382 | $69,995,311 |
| 104 | RetirementReady® Funds |
Note 7: Acquisition of Putnam RetirementReady 2015 Fund
On November 20, 2015, Putnam Retirement Income Fund Lifestyle 1 issued 2,418,458, 43,924, 35,434, 6,980, 76,280 and 264,709 class A, class B, class C, class M, class R and class Y shares, respectively, for 2,366,133, 43,634, 35,217, 6,910, 76,822, and 259,116 class A, class B, class C, class M, class R and class Y shares of Putnam RetirementReady 2015 Fund to acquire that fund’s net assets in a tax-free exchange. The purpose of the transaction, which was contemplated by the funds’ prospectus, was to combine two Putnam funds with substantially similar investment objectives and investment strategies into a single Putnam fund with a larger asset base and therefore potentially lower expenses for fund shareholders. The investment portfolio of Putnam RetirementReady 2015 Fund, with a fair value of $49,783,896 and an identified cost of $50,014,100 at November 20, 2015, was the principal asset acquired by Putnam Retirement Income Fund Lifestyle 1. The net assets of Putnam Retirement Income Fund Lifestyle 1 and Putnam RetirementReady 2015 Fund on November 20, 2015, were $22,912,059 and $49,767,126, respectively. On November 20, 2015, Putnam RetirementReady 2015 Fund had undistributed net investment income of $7,470, accumulated net realized (loss) of $23,995,600 and unrealized depreciation of $230,204. The aggregate net assets of Putnam Retirement Income Fund Lifestyle 1 immediately following the acquisition were $72,679,185. Assuming the acquisition had been completed on August 1, 2015, the fund’s pro forma results of operations for the reporting period are as follows:
| Net investment income | $2,010,523 | |||
| Net loss on investments | $4,562,829 | |||
| Net decrease in net assets resulting from operations | $2,552,306 |
Because the combined investment portfolios have been managed as a single portfolio since the acquisition was completed, it is not practicable to separate the amounts of revenue and earnings of Putnam RetirementReady 2015 Fund that have been included in Putnam Retirement Income Fund Lifestyle 1’s statement of operations for the current fiscal period.
Note 8: Market, credit and other risks
In the normal course of business, the underlying Putnam Funds trade financial instruments and enter into financial transactions where risk of potential loss exists due to changes in the market (market risk) or failure of the contracting party to the transaction to perform (credit risk). The underlying Putnam Funds may be exposed to additional credit risk that an institution or other entity with which the fund has unsettled or open transactions will default. The underlying Putnam Funds may invest in foreign securities that involve certain risks, including those related to economic instability, unfavorable political developments, and currency fluctuations. The financial statements of the underlying Putnam Funds contain additional information about the expenses and investments of the underlying Putnam Funds and are available upon request.
| RetirementReady® Funds | 105 |
Putnam family of funds
The following is a list of Putnam’s open-end mutual funds offered to the public. Investors should carefully consider the investment objective, risks, charges, and expenses of a fund before investing. For a prospectus, or a summary prospectus if available, containing this and other information for any Putnam fund or product, contact your financial advisor or call Putnam Investor Services at 1-800-225-1581. Please read the prospectus carefully before investing.
| Growth | International Value Fund |
| Growth Opportunities Fund | Multi-Cap Value Fund |
| International Growth Fund | Small Cap Value Fund |
| Multi-Cap Growth Fund | |
| Small Cap Growth Fund | Income |
| Voyager Fund | American Government Income Fund |
| Diversified Income Trust | |
| Blend | Emerging Markets Income Fund |
| Asia Pacific Equity Fund | Floating Rate Income Fund |
| Capital Opportunities Fund | Global Income Trust |
| Capital Spectrum Fund | High Yield Advantage Fund |
| Emerging Markets Equity Fund | High Yield Trust |
| Equity Spectrum Fund | Income Fund |
| Europe Equity Fund | Money Market Fund* |
| Global Equity Fund | Short Duration Income Fund |
| International Capital Opportunities Fund | U.S. Government Income Trust |
| International Equity Fund | |
| Investors Fund | Tax-free Income |
| Low Volatility Equity Fund | AMT-Free Municipal Fund |
| Multi-Cap Core Fund | Intermediate-Term Municipal Income Fund |
| Research Fund | Short-Term Municipal Income Fund |
| Strategic Volatility Equity Fund | Tax Exempt Income Fund |
| Tax-Free High Yield Fund | |
| Value | |
| Convertible Securities Fund | State tax-free income funds†: |
| Equity Income Fund | Arizona, California, Massachusetts, Michigan, |
| Global Dividend Fund | Minnesota, New Jersey, New York, Ohio, |
| The Putnam Fund for Growth and Income | and Pennsylvania. |
| 106 | RetirementReady® Funds |
| Absolute Return | Retirement Income Lifestyle Funds — |
| Absolute Return 100 Fund® | portfolios with managed allocations to |
| Absolute Return 300 Fund® | stocks, bonds, and money market |
| Absolute Return 500 Fund® | investments to generate retirement income. |
| Absolute Return 700 Fund® | |
| Retirement Income Fund Lifestyle 1 | |
| Global Sector | Retirement Income Fund Lifestyle 2 |
| Global Consumer Fund | Retirement Income Fund Lifestyle 3 |
| Global Energy Fund | |
| Global Financials Fund | RetirementReady® Funds — portfolios with |
| Global Health Care Fund | adjusting allocations to stocks, bonds, and |
| Global Industrials Fund | money market instruments, becoming more |
| Global Natural Resources Fund | conservative over time. |
| Global Sector Fund | |
| Global Technology Fund | RetirementReady® 2060 Fund |
| Global Telecommunications Fund | RetirementReady® 2055 Fund |
| Global Utilities Fund | RetirementReady® 2050 Fund |
| RetirementReady® 2045 Fund | |
| Asset Allocation | RetirementReady® 2040 Fund |
| George Putnam Balanced Fund | RetirementReady® 2035 Fund |
| RetirementReady® 2030 Fund | |
| Global Asset Allocation Funds — four | RetirementReady® 2025 Fund |
| investment portfolios that spread your | RetirementReady® 2020 Fund |
| money across a variety of stocks, bonds, and | |
| money market instruments. | |
| Dynamic Asset Allocation Balanced Fund | |
| Dynamic Asset Allocation Conservative Fund | |
| Dynamic Asset Allocation Growth Fund | |
| Dynamic Risk Allocation Fund |
* An investment in a money market fund is not insured or guaranteed by the Federal Deposit Insurance Corporation or any other government agency. Although the fund seeks to preserve the value of your investment at $1.00 per share, it is possible to lose money by investing in the fund.
† Not available in all states.
Check your account balances and the most recent month-end performance in the Individual Investors section at putnam.com.
| RetirementReady® Funds | 107 |
Services for shareholders
Investor services
Systematic investment plan Tell us how much you wish to invest regularly — weekly, semimonthly, or monthly — and the amount you choose will be transferred automatically from your checking or savings account. There’s no additional fee for this service, and you can suspend it at any time. This plan may be a great way to save for college expenses or to plan for your retirement.
Please note that regular investing does not guarantee a profit or protect against loss in a declining market. Before arranging a systematic investment plan, consider your financial ability to continue making purchases in periods when prices are low.
Systematic exchange You can make regular transfers from one Putnam fund to another Putnam fund. There are no additional fees for this service, and you can cancel or change your options at any time.
Dividends PLUS You can choose to have the dividend distributions from one of your Putnam funds automatically reinvested in another Putnam fund at no additional charge.
Free exchange privilege You can exchange money between Putnam funds free of charge, as long as they are the same class of shares. A signature guarantee is required if you are exchanging more than $500,000. The fund reserves the right to revise or terminate the exchange privilege.
Reinstatement privilege If you’ve sold Putnam shares or received a check for a dividend or capital gain, you may reinvest the proceeds with Putnam within 90 days of the transaction and they will be reinvested at the fund’s current net asset value — with no sales charge. However, reinstatement of class B shares may have special tax consequences. Ask your financial or tax representative for details.
Check-writing service You have ready access to many Putnam accounts. It’s as simple as writing a check, and there are no special fees or service charges. For more information about the check-writing service, call Putnam or visit our website.
Dollar cost averaging When you’re investing for long-term goals, it’s time, not timing, that counts. Investing on a systematic basis is a better strategy than trying to figure out when the markets will go up or down. This means investing the same amount of money regularly over a long period. This method of investing is called dollar cost averaging. When a fund’s share price declines, your investment dollars buy more shares at lower prices. When it increases, they buy fewer shares. Over time, you will pay a lower average price per share.
For more information
Visit the Individual Investors section at putnam.com A secure section of our website contains complete information on your account, including balances and transactions, updated daily. You may also conduct transactions, such as exchanges, additional investments, and address changes. Log on today to get your password.
Call us toll free at 1-800-225-1581 Ask a helpful Putnam representative or your financial advisor for details about any of these or other services, or see your prospectus.
| 108 | RetirementReady® Funds |
Fund information
Founded over 75 years ago, Putnam Investments was built around the concept that a balance between risk and reward is the hallmark of a well-rounded financial program. We manage over 100 funds across income, value, blend, growth, asset allocation, absolute return, and global sector categories.
| Investment Manager | Trustees | Robert T. Burns |
| Putnam Investment | Jameson A. Baxter, Chair | Vice President and |
| Management, LLC | Liaquat Ahamed | Chief Legal Officer |
| One Post Office Square | Ravi Akhoury | |
| Boston, MA 02109 | Barbara M. Baumann | James F. Clark |
| Robert J. Darretta | Chief Compliance Officer | |
| Investment Sub-Manager | Katinka Domotorffy | |
| Putnam Investments Limited | John A. Hill | Michael J. Higgins |
| 57–59 St James’s Street | Paul L. Joskow | Vice President, Treasurer, |
| London, England SW1A 1LD | Kenneth R. Leibler | and Clerk |
| Robert E. Patterson | ||
| Marketing Services | George Putnam, III | Janet C. Smith |
| Putnam Retail Management | Robert L. Reynolds | Vice President, |
| One Post Office Square | W. Thomas Stephens | Principal Accounting Officer, |
| Boston, MA 02109 | and Assistant Treasurer | |
| Officers | ||
| Custodian | Robert L. Reynolds | Susan G. Malloy |
| State Street Bank | President | Vice President and |
| and Trust Company | Assistant Treasurer | |
| Jonathan S. Horwitz | ||
| Legal Counsel | Executive Vice President, | James P. Pappas |
| Ropes & Gray LLP | Principal Executive Officer, and | Vice President |
| Compliance Liaison | ||
| Mark C. Trenchard | ||
| Steven D. Krichmar | Vice President and | |
| Vice President and | BSA Compliance Officer | |
| Principal Financial Officer | ||
| Nancy E. Florek | ||
| Vice President, Director of | ||
| Proxy Voting and Corporate | ||
| Governance, Assistant Clerk, | ||
| and Associate Treasurer |
This report is for the information of shareholders of Putnam RetirementReady® Funds. It may also be used as sales literature when preceded or accompanied by the current prospectus, the most recent copy of Putnam’s Quarterly Performance Summary, and Putnam’s Quarterly Ranking Summary. For more recent performance, please visit putnam.com. Investors should carefully consider the investment objectives, risks, charges, and expenses of a fund, which are described in its prospectus. For this and other information or to request a prospectus or summary prospectus, call 1-800-225-1581 toll free. Please read the prospectus carefully before investing. The funds’ Statement of Additional Information contains additional information about the funds’ Trustees and is available without charge upon request by calling 1-800-225-1581.
| Item 2. Code of Ethics: |
| Not applicable |
| Item 3. Audit Committee Financial Expert: |
| Not applicable |
| Item 4. Principal Accountant Fees and Services: |
| Not applicable |
| Item 5. Audit Committee of Listed Registrants |
| Not applicable |
| Item 6. Schedule of Investments: |
| The registrant's schedule of investments in unaffiliated issuers is included in the report to shareholders in Item 1 above. |
| Item 7. Disclosure of Proxy Voting Policies and Procedures For Closed-End Management Investment Companies: |
| Not applicable |
| Item 8. Portfolio Managers of Closed-End Investment Companies |
| Not Applicable |
| Item 9. Purchases of Equity Securities by Closed-End Management Investment Companies and Affiliated Purchasers: |
| Not applicable |
| Item 10. Submission of Matters to a Vote of Security Holders: |
| Not applicable |
| Item 11. Controls and Procedures: |
| (a) The registrant's principal executive officer and principal financial officer have concluded, based on their evaluation of the effectiveness of the design and operation of the registrant's disclosure controls and procedures as of a date within 90 days of the filing date of this report, that the design and operation of such procedures are generally effective to provide reasonable assurance that information required to be disclosed by the registrant in this report is recorded, processed, summarized and reported within the time periods specified in the Commission's rules and forms. |
| (b) Changes in internal control over financial reporting: Not applicable |
| Item 12. Exhibits: |
| (a)(1) Not applicable |
| (a)(2) Separate certifications for the principal executive officer and principal financial officer of the registrant as required by Rule 30a-2(a) under the Investment Company Act of 1940, as amended, are filed herewith. |
| (b) The certifications required by Rule 30a-2(b) under the Investment Company Act of 1940, as amended, are filed herewith. |
| Putnam RetirementReady Funds |
| By (Signature and Title): |
| /s/ Janet C. Smith Janet C. Smith Principal Accounting Officer |
| Date: March 25, 2016 |
| Pursuant to the requirements of the Securities Exchange Act of 1934 and the Investment Company Act of 1940, this report has been signed below by the following persons on behalf of the registrant and in the capacities and on the dates indicated. |
| By (Signature and Title): |
| /s/ Jonathan S. Horwitz Jonathan S. Horwitz Principal Executive Officer |
| Date: March 25, 2016 |
| By (Signature and Title): |
| /s/ Steven D. Krichmar Steven D. Krichmar Principal Financial Officer |
| Date: March 25, 2016 |