Annual Shareholders Meeting October 19, 2006 Exhibit 99.1 |
Safe Harbor Statements contained in the slide show presentation that state expectations or predictions about the future are forward-looking statements intended to be covered by the safe harbor provisions of the Securities Act and the Exchange Act. The Registrant’s actual results could differ materially from those projected in such forward-looking statements. Factors that could affect those results include “Risk Factors” and the other factors appearing in the documents that the Registrant has filed with the Securities and Exchange Commission. 2 |
Agenda • The Bank of Internet Franchise – Building Online Customer Trust for Six Years • Financial Highlights – Fiscal 2006 – Fifth Consecutive Year of Record Earnings • Steps to Build More Shareholder Value – Changes to Meet Challenging Market Conditions • Questions and Answers 3 |
Our Focus BofI will be the premier low- cost operator in consumer financial services MISSION STATEMENT 4 |
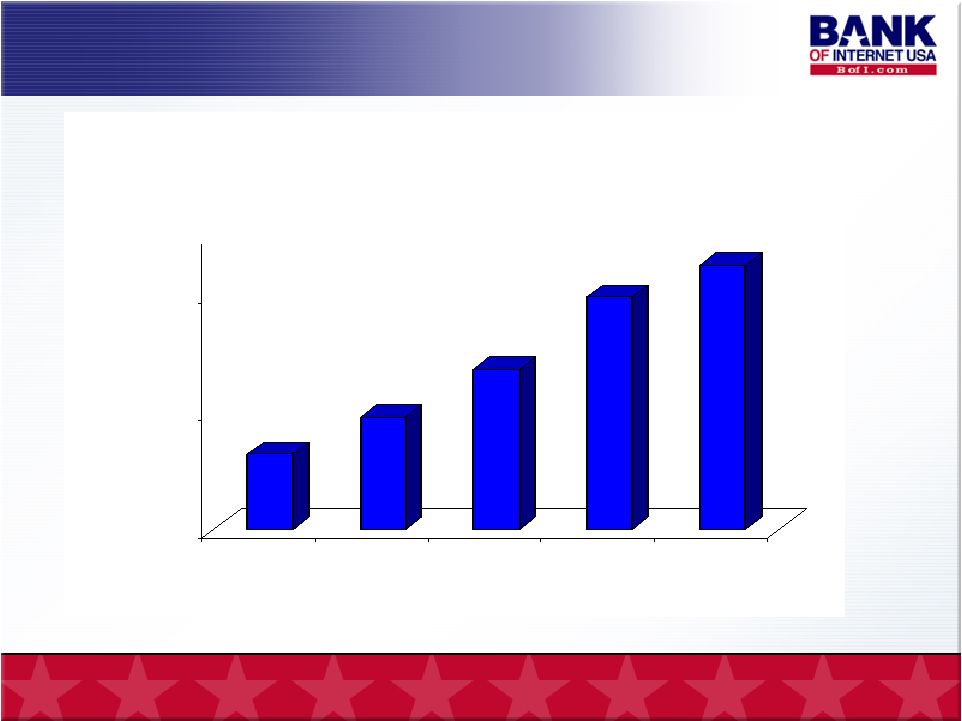
6,367 9,569 13,653 19,827 22,468 0 10,000 20,000 2002 2003 2004 2005 2006 Total Number of Deposit Accounts Building Our Online Franchise ………. 5 * * At each fiscal year end June 30. |
Online Deposit Franchise ….. • Online Retail Deposit Customers in all 50 states – six years - no brokered deposits • Proprietary Technology & Customer Data Base – six-year proprietary data base of Internet activity support unique fraud control • Proprietary Process – six years of process improvements • Demonstrated Scalability – six years of increased assets per employee • Target Marketing – six years experience target marketing on the Internet • 6%+ Customer Referral Rate – six years of customer satisfaction 6 |
Mr. Evans, I just love doing business with your bank! Last Friday I remembered that I had 2 CDs maturing on 8-13. I also noticed the great interest rate on your 18 month CD. Using the "contact" box on your web site I requested that I wished to redeem the CDs and purchase a new 18 month CD. I received an e-mail today indicating that everything was taken care of. No forms, no telephone calls, no hassle. I don't even check CD rates at other banks anymore because your service is so good. Thanks, Professor, xxxx State University 7 What our customers say ……… |
Building Online Lending…. • Single family online originations for five years • Home equity originations – system built in fiscal 2006 using “best practices” • Unique multifamily online origination site • Years of online authentication and underwriting experience • Disciplined lending and investing – avoiding the pitfalls of many early Internet banks • Perfect lending and investing history – no write offs, no foreclosure sales, etc. 8 |
Dear Mr. Evans: ………… I was completely truthful when I said that it was the easiest and most pleasant and professional loan process I have ever been through. And Ms. Mitchell actually knew her business. This is very unusual in our current environment. I work for a company that is in financial services on the internet, and I know good competition when I experience it. Great job and thanks! Executive Vice President & xxxxx, XXX Mutual Fund 9 What our customers say ……… |
Our Franchise Value … We Believe in: • Our People and Our Service Culture • Our Focus on Low Cost Delivery Systems – Regularly changing processes and proprietary software to improve efficiency • Our Consistent, Competitive Product Pricing – Across all product lines – customers trust that they are getting a good deal • Our Design for the Future of Banking 10 |
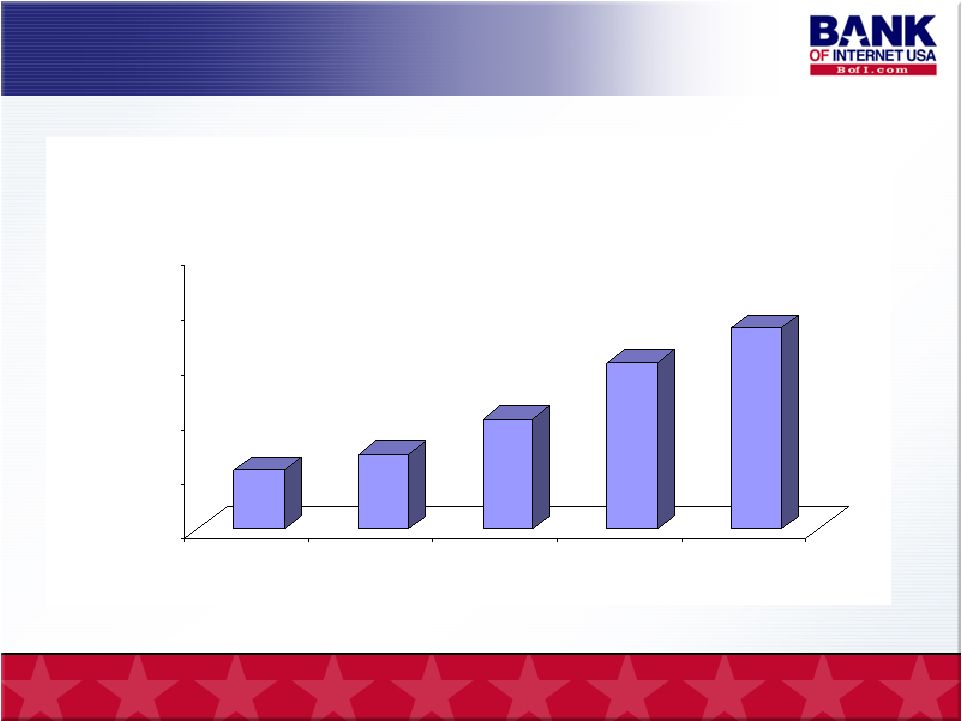
$217.6 $273.5 $405.0 $609.5 $737.8 $0 $200 $400 $600 $800 $1,000 2002 2003 2004 2005 2006 Total Assets ($ in millions) Fiscal 2006 - Financial Highlights Asset Growth 12 * At each fiscal year end June 30. * |
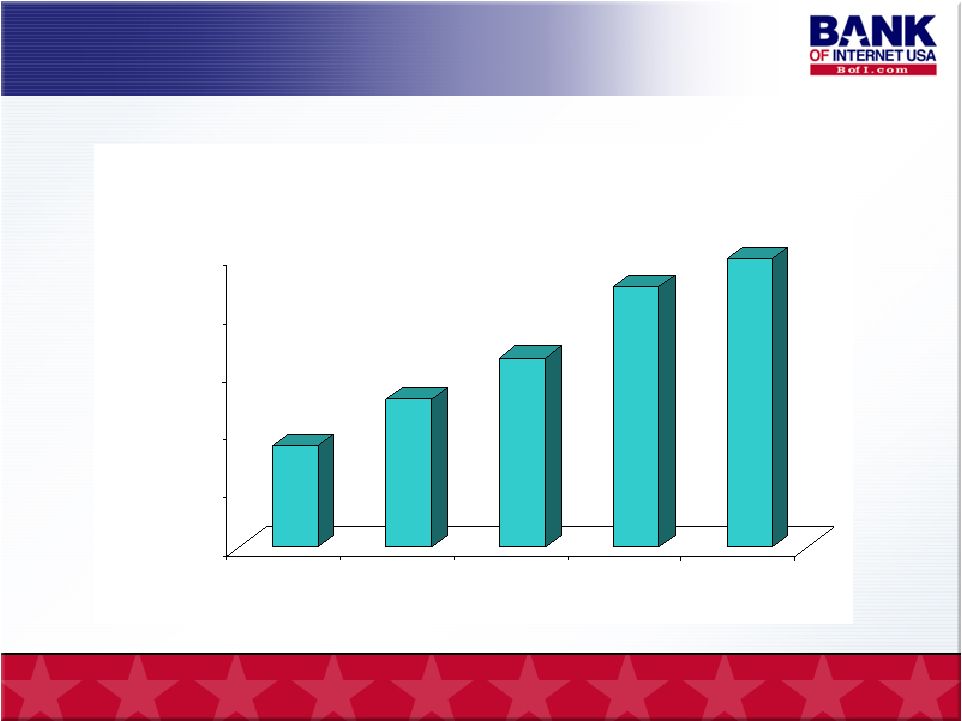
$3,497 $5,088 $6,530 $8,969 $9,955 $0 $2,000 $4,000 $6,000 $8,000 $10,000 2002 2003 2004 2005 2006 Net Interest Income ($ in thousands) 13 * For each fiscal year ended June 30. * Fiscal 2006 - Financial Highlights Net Interest Income Growth |
$1,020 $1,730 $2,175 $2,869 $3,266 $- $1,000 $2,000 $3,000 $4,000 2002 2003 2004 2005 2006 Net Income ($ in thousands) 14 * * For each fiscal year ended June 30. Fiscal 2006 - Financial Highlights Net Income Growth |
For or At the Year Ended 2005 2006 Net Income (000s) 2,869 $ 3,266 $ Diluted Earnings Per Share 0.40 $ 0.34 $ Return on Avg Common Stockholders' Equity 6.73% 4.56% Efficiency Ratio (1) 48.05% 51.24% Total Assets (000s) 609,508 $ 737,835 $ Loans Held For Investment (000s) 486,872 $ 533,641 $ Total Deposits (000s) 361,051 $ 424,204 $ Book Value Per Common Share 7.47 $ 7.77 $ (1) Non-interest expense divided by the sum of net interest income and non-interest income. June 30, Fiscal 2006 - Financial Highlights 2006 vs 2005 15 |
Our Task …………… Work to Improve: • Earnings Per Share • Return on Equity • Efficiency Ratio Get to our goals • 10%+ ROE • Less than 40% Efficiency Ratio • $1 Billion in Assets • Continue reducing G&A to average assets 16 |
3 Steps to Build More Shareholder Value in Fiscal 2007 17 |
Step One – Generate Higher Yielding Loans • Originate high-volume online consumer loans • Home Equity Lending Program is up now, expanding from 7 states to all 50 by December 2006 • Other Consumer Secured Loans like Autos & RVs • Hired consumer loan executive to start this quarter • 1 st goal is $10mm in originations per month Building Shareholder Value 18 |
The First - Home Equity Loans • Offering Favorable Rates to Most Credit Worthy Customers • Thru Start up Phase: – $3.1 million in originations, weighted average: – Balance = $80,000 – 1 st Mortgage =$295,000 – Combined Loan to Value= 61% – FICO= 756 – High of 820 and low of 649 – All Debt to Income= 34% • Average Rate = 7.31% • Compares favorably to last quarter loan portfolio yield of 5.39% and cost of funds of 4.18% • Compares favorably to new single family 1 st TD (6%) and multifamily 1 st TD (6.5%) in a 5/1 ARM 19 |
Step Two – Match Asset Growth with Higher Yield Loan Production: • Conserve Capital – Can grow assets to $1 Billion - match asset growth with production of higher yielding consumer loans and other opportunities for loans – Seek to replace lower yielding loan principal repays with higher rate consumer loans • Position for Re-Deployment When Yield Curve Comes Back – yield curve “lift” – MBS available for sale to re-deploy into other assets Building Shareholder Value 20 |
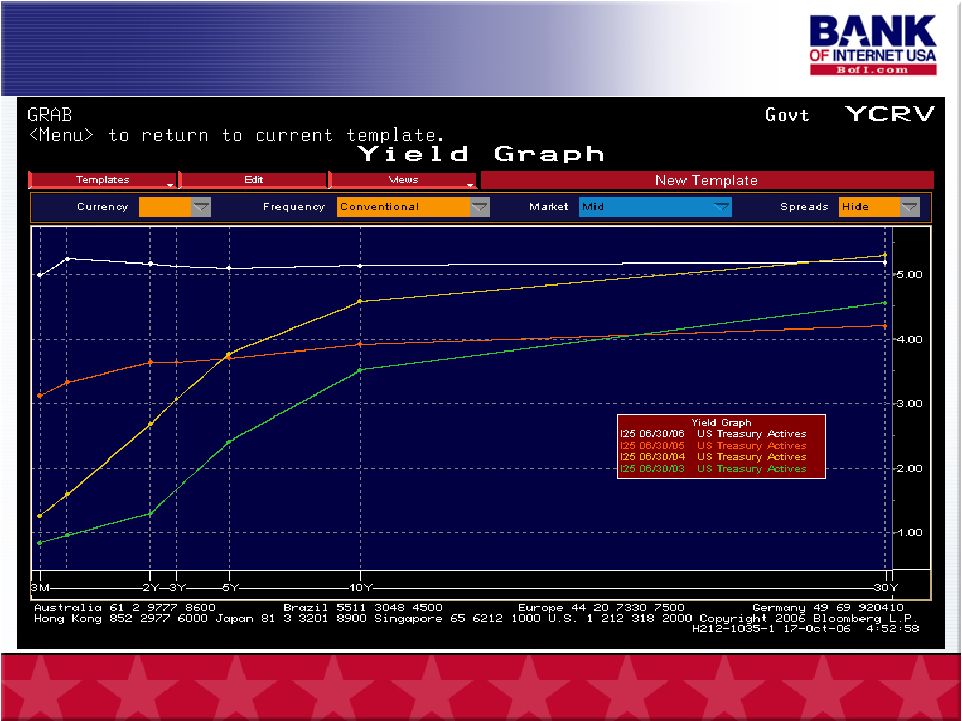
Yield Curve & Net Interest Margin 2003 – 2.11% 2004 – 2.04% 2005 – 1.87% 2006 - 1.51% B of I Fiscal Yr: NIM% 21 |
$1,000 $2,000 $3,000 $4,000 $5,000 $6,000 $7,000 $8,000 $9,000 $10,000 Net Interest Income vs Noninterest Expense $218,000 $273,000 $405,000 $609,000 $738,000 2002 2003 2004 2005 2006 Assets in Thousands Net Interest Income (in 000s) Noninterest Expense EXCLUDING SALARY & WAGES 22 For the Fiscal Years Ended June 30 $(000) |
$1,000 $2,000 $3,000 $4,000 $5,000 $6,000 $7,000 $8,000 $9,000 $10,000 Impact of 25 and 50 bps NIM Growth Hypothetical for Fiscal 2005 and 2006 $218,000 $273,000 $405,000 $609,000 $738,000 2002 2003 2004 2005 2006 Assets in Thousands 23 For the Fiscal Years Ended June 30 “Lift” Hypothetical – applying 25 and 50 bps increase to actual average earnings assets of $479 mil and $659 mil for fiscal 2005 and 2006 $10.2 $9.0 $10.0 $13.3 $(000) |
Clear Objective LONG RUN ON AVERAGE Net Interest Margin between 1.75% - 2.25% Operating Expense on Average Assets Between 0.10% - 0.20% 24 |
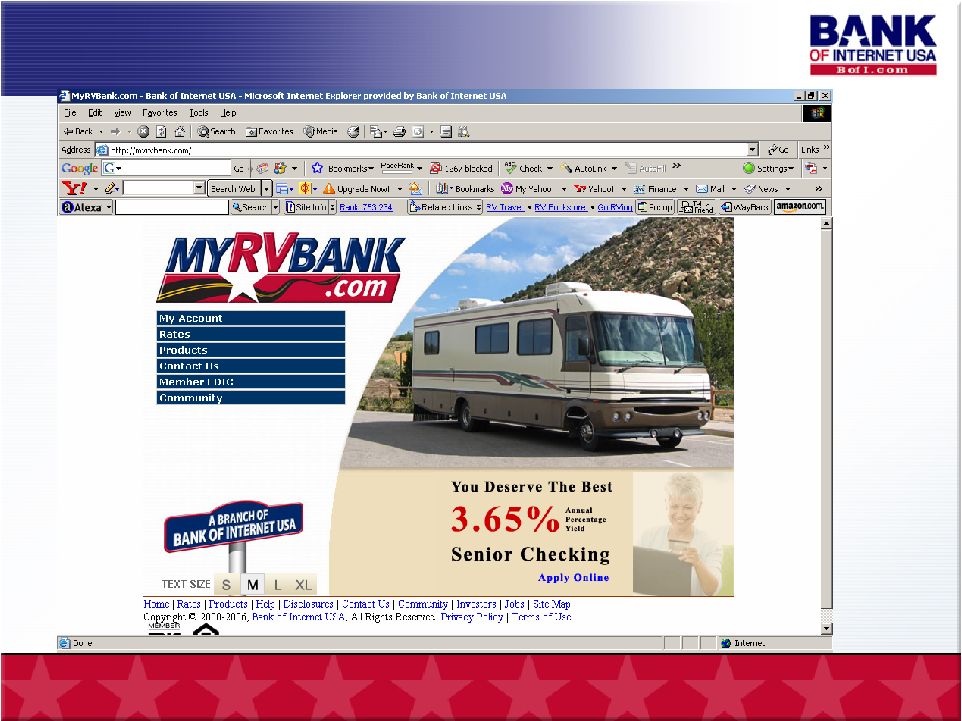
Step Three – Leverage Value of “Online” Assets • Affiliate Marketing Hire one staff member –within 30 days Inbound and Outbound affiliates Establish ties with aggregators • Social Marketing – Affinity Marketing to affinity groups ranging from RV owners to not for profits • Website Re-Design – improved marketing and navigation Building Shareholder Value 25 |
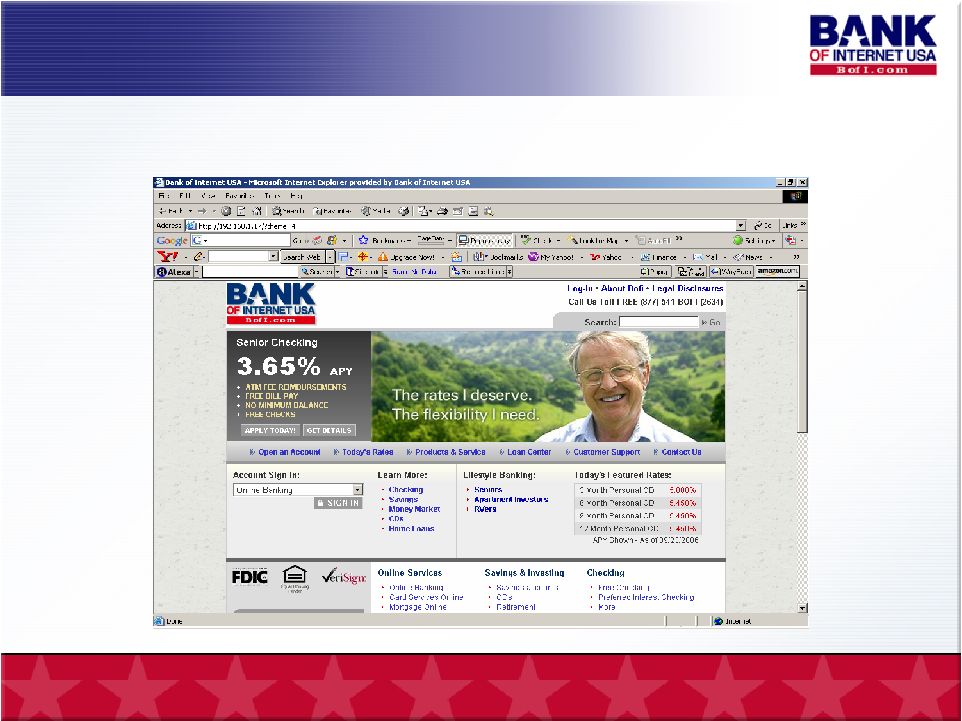
Website Re-fresh 27 • Reorganizing for Better Navigation – November 2006 |
Our Three Steps - summary • Generate Higher Yielding Loans • Match Asset Growth with Loan Growth - Conserving Capital, for New Loans / the yield lift • Leverage the Value of “Online” Assets- Affiliate Marketing and Social Networking 28 |
Our Task …………… Work to Improve: • Earnings Per Share • Return on Equity • Efficiency Ratio Get to our goals • 10%+ ROE • Less than 40% Efficiency Ratio • $1 Billion in Assets • Continue reducing G&A to average assets 29 |