Intrepid Capital Fund
Intrepid Small Cap Fund
Intrepid Income Fund
Intrepid All Cap Fund
Semi-Annual Report
March 31, 2009
Intrepid Capital Fund
April 24, 2009
Dear Fellow Shareholders,
In my last communication I wrote, “I believe today we are planting seeds for what will hopefully be attractive risk-adjusted returns tomorrow.” The cataclysmic drop in security prices in the fourth quarter of 2008 offered multiple opportunities to put capital to work at what we believed to be attractive prices.
The business of money management can be quite humbling when you buy at $X only to discover days hence that the market holds it in even lower regard and can be bought for $Y, often significantly lower. At Intrepid Capital, guided by the premise that “Price is not always indicative of value,” we often take comfort in our internal valuation work and buy more shares at $Y. In addition, we take concentrated positions in businesses we can value with a high degree of confidence. Initial equity positions in ICMBX are established at a 2.4% weight, and our other funds target position weights of 4%.
The beauty of running a “balanced” portfolio of stocks and bonds is that the work our analyst team does on a potential fixed income holding can lead to the purchase of the same company’s equity. Vice versa, if our analyst team is reviewing a business for equity acquisition, we may end up buying that company’s bond instead. In ICMBX, I am simply looking for what I think offers the best risk-adjusted return available.
There are a couple of our ideas worth mentioning here, keeping in mind our lawyers encourage us to acknowledge that “past performance is no guarantee of future results.” Central Garden & Pet (ticker: CENT) is a company where we initially had a position in their corporate bonds and eventually became comfortable being lower in the capital structure by buying the equity. In similar fashion, we also bought the equity of Scholastic (ticker: SCHL) after holding the bonds for sometime. These two equity positions worked out extremely well for the Fund and were liquidated during the first quarter of 2009 as they reached our calculated intrinsic values.
I take no comfort whatsoever in reporting that on a total return basis the N.A.V. of ICMBX has dropped 14.75% for the six months ending March 31, 2009, the first half of the Fund’s fiscal year. Despite this, our “relative” performance against our peer group was strong. However, I am pleased to say ICMBX received a 5-Star Overall Morningstar Rating™ among 968 moderate allocation funds as of 3/31/09, Morningstar’s highest star rating. Overall Morningstar Rating™ for a fund is derived from a weighted average of the fund’s three-year Morningstar Ratings™ metrics, which are based on risk-adjusted return performance.
Intrepid Capital Fund
Looking forward, I believe the Fund is well positioned to recover from what has been a challenging six-month period. I believe that our holdings provide things that people need and use often without a great deal of discretion. Our fixed income holdings at these prices may be the most compelling risk reward I see available in the capital markets.
The big wildcard to me is the size of the monkey wrench the politicians throw into the free markets, where the invisible hand of capitalism has allowed us all, not just a chosen few, to prosper. I think what we have observed over the last six months is not the failure of capitalism, but rather offers countless examples of what happens when the hand of government becomes too heavy.
Thank you for entrusting us with your hard-earned capital. That is a burden we don’t carry lightly.
Best regards,
Mark F. Travis
President/C.E.O.
Top Ten Holdings
3-31-09
| Oil-Dri Corporation of America | 3.4% |
Applied Signal Technology, Inc. | | 3.0% |
| Heineken N.V. | | 2.5% |
Central Garden & Pet Co. | | 2.2% |
The Coca Cola Co. | | 2.2% |
Automatic Data Processing | | 2.1% |
| T. Rowe Price | | 2.0% |
| Comcast Corp. | | 2.0% |
| DSW, Inc. | | 2.0% |
| Waters Corp. | | 2.0% |
Past performance is no guarantee of future results.
The Fund is subject to special risks including volatility and less liquidity due to investments in small- and mid-cap stocks, high yield securities and is considered non-diversified as a result of limiting its holdings to a relatively small number of positions. Investments in debt securities typically decrease in value when interest rates rise. This risk is usually greater for longer term debt securities.
Must be preceded or accompanied by a current prospectus.
Intrepid Capital Fund
© 2009 Morningstar, Inc. All Rights Reserved. The information contained herein: (1) is proprietary to Morningstar; (2) may not be copied or distributed; and (3) is not warranted to be accurate, complete or timely. Neither Morningstar nor its content providers are responsible for any damages or losses arising from any use of this information. For each fund with at least a three-year history, Morningstar calculates a Morningstar Rating™ metric each month by subtracting the return on a 90-day U.S. Treasury Bill from the fund’s load-adjusted return for the same period, and then adjusting this excess return for risk. The top 10% of funds in each category receive 5 stars, the next 22.5% receive 4 stars, the next 35% receive 3 stars, the next 22.5% receive 2 stars and the bottom 10% receive 1 star. The Intrepid Capital Fund was rated against 968 U.S.-domiciled Moderate Allocation Funds for Morningstar’s overall and three-year periods. With respect to these Moderate Allocation Funds, the Intrepid Capital Fund received a Morningstar Rating of 5 stars for the overall and three-year periods, respectively.
The Russell 2000 Index consists of the smallest 2,000 companies in a group of 3,000 U.S. Companies in the Russell 3000 Index, as ranked by market capitalization. The S&P 500 Index is a broad based unmanaged index of 500 stocks, which is widely recognized as representative of the equity market in general. You cannot invest directly in an index.
Fund holdings are subject to change and are not recommendations to buy or sell any security. Current and future portfolio holdings are subject to risk.
Please refer to the Schedule of Investments on pages 20-25 for a complete list of fund holdings.
Opinions expressed are subject to change, are not guaranteed and should not be considered recommendations to buy or sell any security.
Intrepid Small Cap Fund
April 24, 2009
Dear Fellow Shareholders,
The small-cap market experienced another difficult period over the past six months. The Russell 2000 fell 37.18% for the six months ending March 31, 2009. The Intrepid Small Cap Fund performed well on a relative basis, losing 8.76%. The Portfolio outperformed the index during the past six months mainly due to our continued focus on investing in businesses with strong balance sheets and less volatile end markets. We tend to view the Fund as the small-cap tortoise, not the hare. Although it may not be exciting investing, we have found that by focusing on more stable businesses with strong balance sheets, the results can be quite satisfying over an entire market cycle.
Over the past six months, the investment environment has changed considerably and has allowed us to find attractively priced high-quality small-cap businesses. Therefore, cash levels over the past six months were lower than previous periods and had less of an impact on performance.
One of the areas where we have allocated the Fund’s cash and have found considerable value has been in the beaten down energy sector. Recent energy purchases that are now in the Portfolio’s top ten holdings are: Patterson UTI (ticker: PTEN), Unit Corp (ticker: UNT) and Tidewater (ticker: TDW). All three of these energy companies have one thing in common – very strong balance sheets with little if any debt relative to assets. Although we do not have the ability to forecast when the energy markets will rebound, we believe all three of these businesses will make it through the current depressed environment due to their strong balance sheets. Furthermore, we have purchased these businesses at a discount to what we believe their underlying long-lived assets are worth.
We are often asked what we expect from the Fund going forward. Although it is difficult to predict market movements with a high degree of certainty, we are pleased with the current portfolio’s composition and are grateful the market has given us the opportunity to invest a large portion of the Fund’s low-yielding cash. Cash at the end of the quarter represented 12.6% of the Fund, which is down from our defensive levels in 2008 which at times exceeded 40%. With lower cash levels and an above-average weight in the often volatile energy sector, we expect the Fund to display larger swings in value than historical performance data would suggest.
During the quarter, we also established several new positions outside of the energy sector. Purchase examples include the following: Scholastic Corporation (ticker: SCHL), Prestige Brands (ticker: PBH), and Waters Corporation (ticker: WAT).
Scholastic is a leading manufacturer and distributor of children’s books. We believe Scholastic’s end market is relatively stable, which we believe allows us to value their business with a high degree of confidence. Although Scholastic has higher debt levels than most of the businesses in the Portfolio, we believe management’s plan to reduce debt and operating expenses should enhance shareholder value. Scholastic was discovered by our fixed-income research analysts and is a good example of how we leverage our research capabilities at Intrepid Capital.
Intrepid Small Cap Fund
Waters is a market leader in the manufacturing of equipment used by pharmaceutical companies for their research and development activities. Waters stock recently declined to levels that we found attractive, and thus was purchased near $34/share. Although we are aware of the risks (consumer consolidation and uncertain spending by biotech firms) to Waters end market, we believe its current market capitalization more than reflects these risks. We believe their business remains attractive with operating margins of over 20% and free cash flow of $349 million in fiscal 2008. Furthermore, Waters has a history of buying back stock with its free cash flow.
Prestige Brands is a recently purchased position that we have profited from in the past. Prestige Brands sells brand name over-the-counter drugs and household cleaning products. The company’s products include Chloraseptic, Clear eyes, and Comet. Prestige Brands out-sources all manufacturing, thus there is little need to plow large amounts of cash back into the business. This attribute allows the company to produce large, sustainable cash flows. The recent market volatility caused the shares to trade down significantly below what we believe its intrinsic value is, allowing us to purchase the shares at depressed prices.
As the Intrepid Small Cap Fund is closer to being fully invested, we have turned our attention to upgrading the quality and liquidity of the portfolio. We will continue to search for high-quality small-cap businesses selling at discounts to what we believe they are worth, and in addition, will sell those businesses that no longer meet our valuation criteria.
Sincerely,
Eric Cinnamond
Small Cap Fund Portfolio Manager
Intrepid Small Cap Fund
Past performance is no guarantee of future results.
The Fund is subject to special risks including volatility and less liquidity due to investments in smaller companies and is considered nondiversified as a result of limiting its holdings to a relatively small number of positions.
Must be preceded or accompanied by a current prospectus.
The Russell 2000 Index consists of the smallest 2,000 companies in a group of 3,000 U.S. Companies in the Russell 3000 Index, as ranked by market capitalization. You cannot invest directly in an index.
Free Cash Flow is a measure of financial performance calculated as operating cash flow minus capital expenditures.
Fund holdings are subject to change and are not recommendations to buy or sell any security. Please refer to the Schedule of Investments on pages 26-30 for a complete list of fund holdings.
Opinions expressed are subject to change, are not guaranteed and should not be considered recommendations to buy or sell any security.
Intrepid Income Fund
April 24, 2009
Dear Fellow Shareholders,
The events that unfolded in the financial world over the last six months were unprecedented by any definition of the word, and the results were not isolated to the equity markets. Net of fees, the Intrepid Income Fund lost 6.90% for the six-month period ending March 31. In contrast, the Merrill Lynch High-Yield Master II index fell 13.50% over the last six months. Yield spreads, or the difference between the yield offered by the high-yield index and that of a comparable U.S. Treasury bond, rose to an all-time high in mid-December. Recall that yields move inversely with prices; the record high yields offered by these bonds coincided with severely depressed prices. At Intrepid Capital, we viewed this as an opportunity to buy high-quality securities at depressed prices.
The primary contributor to the Portfolio’s outperformance continues to be our bias toward investing in higher-quality bonds. In general, we seek to invest in companies that produce recurring revenues in all phases of the business cycle. We also look for strong balance sheets where debt is low when compared to pre-tax cash flows. Additionally, the Portfolio is not limited to only high-yield bonds; we will invest in convertible bonds and even investment grade bonds if we believe the potential returns are compensatory of the risks.
The period from October 2008 to March 2009 will likely be marked as the most active period in the history of the Intrepid Income Fund. The intense de-leveraging experienced at the end of 2008 allowed us to capitalize when others were forced to liquidate their holdings without regard to valuation. Nine new issues were added to the portfolio, and we increased our weights in thirteen existing positions as their valuations became more compelling. Additionally, two holdings matured and three positions were exited.
Several of our purchases that are representative of the types of companies we look to invest in are Church & Dwight (ticker: CHD), Prestige Brands Holdings (ticker: PBH), Affiliated Computer Services (ticker: ACS), and Compass Minerals (ticker: CMP). Church & Dwight and Prestige Brands are both consumer products businesses that produce household cleaners, toothpaste, deodorant, and other personal care items. Affiliated Computer Services offers business process outsourcing and IT support. The principal product offered by Compass Minerals is road salt for deicing purposes. Demand for these companies’ products is relatively stable and we believe these businesses will perform well even in a recessionary environment.
Intrepid Income Fund
The three positions which were exited during the last six months were Elizabeth Arden (ticker: RDEN), Norampac (ticker: CAS.TO), and a floating rate closed-end fund (ticker: JFR). The two bonds were sold because the fundamentals of the businesses deteriorated to the point where we were no longer comfortable assuming the risks. The floating rate fund, which constituted only a small portion of the portfolio, was liquidated because the fund’s holdings were mainly bank loans and we believed this was outside of our core competency.
Looking ahead, we will continue to look to invest in higher-quality companies that exhibit the characteristics discussed above. While high-yield prices have recovered nicely since last December, business fundamentals have yet to show improvement. Yield spreads remain elevated, and high-yield bond prices are relatively low. On average, bonds in the Merrill Lynch High Yield Master II index are trading at roughly 62 cents on the dollar. For these reasons, we are confident that we will continue to discover attractive bonds in which to invest.
We would like to thank you for trusting us with your capital.
Sincerely,
| Jason Lazarus | Ben Franklin |
| Research Analyst | Research Analyst |
Past performance is no guarantee of future results.
The Fund is subject to special risks including volatility due to investments in high yield securities and is considered non-diversified as a result of limiting its holdings to a relatively small number of positions. Investments in debt securities typically decrease in value when interest rates rise. This risk is usually greater for longer term debt securities.
Must be preceded or accompanied by a current prospectus.
The Merrill Lynch High Yield Master II Index is Merrill Lynch’s broadest high yield index, and as such is comparable with the broad indices published by other investment banks. You cannot invest directly in an index.
Free Cash Flow is a measure of financial performance calculated as operating cash flow minus capital expenditures
Fund holdings are subject to change and are not recommendations to buy or sell any security.
Please refer to the Schedule of Investments on pages 31-34 for a complete list of fund holdings.
Opinions expressed are subject to change, are not guaranteed and should not be considered recommendations to buy or sell any security.
Intrepid All Cap Fund
April 24, 2009
Dear Fellow Shareholders,
Over the first six months of the fund year, October 2008 through March 2009, ICMCX returned -21.23% versus the S&P 500 Index’s return of - -30.54%. With the exception of October, the All Cap Fund outperformed the S&P 500 in every subsequent month through the six-month period.
The market sell-off in October and November was broad, which implies that the market made no distinction between good and bad businesses. That lack of distinction provides us with an opportunity to put cash to work in acquiring businesses with quality balance sheets and steady cash flows. While the market was selling off, we began to see much more interesting opportunities come our way. Activity in the All Cap Fund has slowed somewhat as we approached full investment. As of quarter end, the Fund has less than 5% cash.
Activity over the past six months has been high. We have added more than ten new businesses while selling out of five positions. What follows is a description of some of the notable additions to the All Cap Fund.
Hansen Natural (ticker: HANS) had the unique distinction of being carefully acquired and sold during the quarter as its stock price traded below eight times cash flow in early October to hitting our intrinsic value estimate in December. For our curious readers, Hansen Natural is the market leader in the emerging energy category of beverages, primarily sold under the brand name Monster. Another beverage company that many readers will recognize- if not for the fact that it has been in the portfolio several months earlier, but also from its brand name- is Coca-Cola (ticker: KO). Having sold this business in early 2008, we watched its share price fall to a level close to our initial investment back in late 2004. At the same time, pre-tax cash flows have grown from under $6 billion in 2004 to $8.6 billion at March 31, 2009, so we believe that we are buying the business at more than a 20% discount.
Other notable additions to the portfolio include C.R. Bard, which is a market leader in disposable vascular, urology, and oncology products like stents, angioplasty and urology catheters, ports, and guidewires. It sells high margin products which hospitals must keep on hand. Thus, it is less exposed to capital expenditure cutbacks at medical facilities. Brown-Forman (ticker: BF/B), which distills and distributed premium spirits suck as Jack Daniels Whiskey, Finlandia Vodka, and Southern Comfort, is an attractively-priced business which high operating margins and still growing sales volumes. They are proving the old adage that people drink in good times to celebrate and in bad times to forget.
Intrepid All Cap Fund
The Travelers Companies (ticker: TRV) position was rebalanced during the quarter back to a full weight. Travelers is one of if not the best among property and casualty businesses. What makes it a great business is that it has done what a P&C insurer is supposed to do: take premiums and invest them to generate a reasonable spread over the expected loss payouts for insurance claims. Many insurers reached too far and purchased overly risky assets which have been significantly devalued over the past eight months. Travelers has maintained attractive loss and expense ratios while suffering little erosion in the value of its assets over the entire period in question. As of March 31, 2009 it was trading just below book value, which afforded us the opportunity to purchase more shares.
As previously mentioned, five stocks were sold in the period. Hansen was the one example of a stock which closed the valuation gap and was sold after it hit intrinsic value. In the case of the other four stocks, we sold not because they reached intrinsic valuation, but because business fundamentals had deteriorated to the point in which in was better to liquidate and use the funds to purchase better businesses. In the case of the reinsurer XL Capital (ticker: XL), although the stock traded at a discount to its book value of assets, write-downs on assets became too great of a concern to justify holding the stock. In the case of Health Management Associates (ticker: HMA), while provisions for bad debt caused by rising uninsured and indigent care were becoming more of a concern, the unanticipated departure of CEO Burke Whitman, who was himself brought in to improve the situation, left us with no confidence in management’s ability to address the aforementioned problems. We viewed both companies as opportunity costs in that we believe we are better off buying other more attractive businesses and taking a loss on these two sales. Horace Mann (ticker: HMN), a property and casualty insurer, was sold as the uncertainty of asset quality has led to a continued erosion in confidence over the true value of common stock. In the case of Fisher & Paykel Appliances (ticker: FPA.NZ), a New Zealand-based manufacturer of high-end appliances, the planned cost-saving relocation of manufacturing facilities to Southeast Asia and Mexico has proceeded too slowly in the face of a deepening global recession. The misstep by management has impacted the Company’s cash position more than anticipated and led management to consider issuing dilutive equity to raise capital. At that point, we believed that it is better to cut our losses and avoid further pain.
One practice that we find useful is to view the entire portfolio by the average discount to intrinsic value. Each investment will have a discount to intrinsic value which is based upon its market price and our calculated intrinsic value. In essence, the Fund is a collection of investments, each with its own discount. By checking the average discount within the Fund, we can get a sense for the general attractiveness in the market. Broadly speaking, a bigger average discount implies that we are finding more and deeper discounts in the market. At the end of the period, the average discount for the Intrepid All Cap Fund was 38%. This is a good indicator that we are finding large discounts and we believe those make us well-positioned as we proceed through the bottom and eventual improvement in the market cycle.
Intrepid All Cap Fund
Sincerely,
Gregory M. Estes
All Cap Fund Portfolio Manager
Past performance is no guarantee of future results.
The Fund is subject to special risks including volatility and less liquidity due to investments in small- and mid-cap stocks and is considered non-diversified as a result of limiting its holdings to a relatively small number of positions.
Must be preceded or accompanied by a current prospectus.
The S&P 500 Index is a broad based unmanaged index of 500 stocks, which is widely recognized as a representative of the equity market in general. You cannot invest directly in an index.
Free Cash Flow is a measure of financial performance calculated as operating cash flow minus capital expenditures. Book value is the net asset value of a company, calculated by subtracting total liabilities from total assets.
Fund holdings are subject to change and are not recommendations to buy or sell any security.
Please refer to the Schedule of Investments on pages 35-38 for a complete list of fund holdings.
Opinions expressed are subject to change, are not guaranteed and should not be considered recommendations to buy or sell any security.
Intrepid Funds
EXPENSE EXAMPLE
March 31, 2009 (Unaudited)
As a shareholder of the Intrepid Capital Management Funds Trust (the “Funds”), you incur ongoing costs, including management fees; distribution and/or service fees; and other expenses incurred by the Funds. This example is intended to help you understand your ongoing costs (in dollars) of investing in the Funds and to compare costs with the ongoing costs of investing in other mutual funds.
The example is based on an investment of $1,000 invested at the beginning of the period and held the entire period of October 1, 2008 – March 31, 2009.
ACTUAL EXPENSES
The first line of the following table provides information about actual account values and actual expenses. Although the Funds charge no sales load or transaction fees, you will be assessed fees for outgoing wire transfers, returned checks or stop payment orders at prevailing rates charged by U.S. Bancorp Fund Services, LLC, the Funds’ transfer agent. If you request a redemption be made by wire transfer, currently a $15.00 fee is charged by the Funds’ transfer agent. To the extent that a Fund invests in shares of other investment companies as part of its investment strategy, you will indirectly bear your proportionate share of any fees and expenses charged by the underlying funds in which the Fund invests in addition to the expenses of the Fund. Actual expenses of the underlying funds are expected to vary among the various underlying funds. These expenses are not included in the following example. The example includes, but is not limited to, management fees, shareholder servicing fees, distribution fees, fund accounting, custody and transfer agent fees. However, the example below does not include portfolio trading commissions and related expenses, interest expense and other extraordinary expenses as determined under generally accepted accounting principles. You may use the information in this line, together with the amount you invested, to estimate the expenses that you paid over the period. Simply divide your account value by $1,000 (for example, an $8,600 account value divided by $1,000 = 8.6), then multiply the result by the number in the first line under the heading entitled “Expenses Paid During Period” to estimate the expenses you paid on your account during this period.
HYPOTHETICAL EXAMPLE FOR COMPARISON PURPOSES
The second line of the following table provides information about hypothetical account values and hypothetical expenses based on the Funds’ actual expense ratio and an assumed rate of return of 5% per year before expenses, which is not the Funds’ actual return. The hypothetical account values and expenses may not be used to estimate the actual ending account balance or expenses you paid for the period. You may use this information to compare the ongoing costs of investing in the Funds and other funds. To do so, compare this 5% hypothetical example with the 5% hypothetical examples that appear in the shareholder reports of the other funds.
Intrepid Funds
EXPENSE EXAMPLE (continued)
March 31, 2009 (Unaudited)
Please note that the expenses shown in the table are meant to highlight your ongoing costs only and do not reflect any transactional costs, such as sales charges (loads), redemption fees, or exchange fees. Therefore, the second line of the table is useful in comparing ongoing costs only, and will not help you determine the relative costs of owning different funds. In addition, if these transactional costs were included, your costs would have been higher.
INTREPID CAPITAL FUND
| | | | | | | Expenses Paid |
| | | Beginning | | Ending | | During Period* |
| | | Account Value | | Account Value | | October 1, 2008 - |
| | | October 1, 2008 | | March 31, 2009 | | March 31, 2009 |
| Actual | | $ 1,000.00 | | | | $ 9.01 |
| Hypothetical (5% return | | | | | | |
| before expenses) | | 1,000.00 | | 1,015.21 | | 9.80 |
* Expenses are equal to the Fund’s annualized expense ratio of 1.95%, multiplied by the average account value over the period, multiplied by 182/365 to reflect the period. |
| | | | | | Expenses Paid |
| | | Beginning | | Ending | | During Period* |
| | | Account Value | | Account Value | | October 1, 2008 - |
| | | October 1, 2008 | | March 31, 2009 | | March 31, 2009 |
| Actual | | $ 1,000.00 | | | | $ 8.97 |
| Hypothetical (5% return | | | | | | |
| before expenses) | | 1,000.00 | | | | 9.45 |
* Expenses are equal to the Fund’s annualized expense ratio of 1.95%, multiplied by the average account value over the period, multiplied by 182/365 to reflect the period. |
| | | | | | Expenses Paid |
| | | Beginning | | Ending | | During Period* |
| | | Account Value | | Account Value | | October 1, 2008 - |
| | | October 1, 2008 | | March 31, 2009 | | March 31, 2009 |
| Actual | | $ 1,000.00 | | | | $ 6.02 |
| Hypothetical (5% return | | | | | | |
| before expenses) | | 1,000.00 | | | | 6.29 |
* Expenses are equal to the Fund’s annualized expense ratio of 1.25%, multiplied by the average account value over the period, multiplied by 182/365 to reflect the period. |
Intrepid Funds
EXPENSE EXAMPLE (continued)
March 31, 2009 (Unaudited)
INTREPID ALL CAP FUND
| | | | | | Expenses Paid |
| | | Beginning | | Ending | | During Period* |
| | | Account Value | | Account Value | | October 1, 2008 - |
| | | October 1, 2008 | | March 31, 2009 | | March 31, 2009 |
| Actual | | $ 1,000.00 | | | | $ 8.69 |
| Hypothetical (5% return | | | | | | |
| before expenses) | | 1,000.00 | | 1,015.21 | | 9.80 |
* Expenses are equal to the Fund’s annualized expense ratio of 1.95%, multiplied by the average account value over the period, multiplied by 182/365 to reflect the period. |
Intrepid Capital Fund
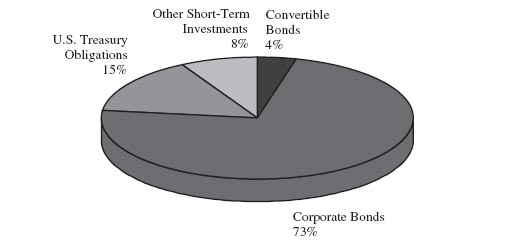
ALLOCATION OF PORTFOLIO HOLDINGS (as a % of total investments)
March 31, 2009 (Unaudited)
INTREPID CAPITAL FUND
| COMPONENTS OF PORTFOLIO HOLDINGS | | |
| | | |
Common Stock | $ | 18,096,622 |
| Convertible Bonds | 572,025 |
Corporate Bonds | | 11,097,901 |
Other Short-Term Investments | | 2,774,728 |
| Total | $ | 32,541,276 |
Intrepid Small Cap Fund
ALLOCATION OF PORTFOLIO HOLDINGS (as a % of total investments)
March 31, 2009 (Unaudited)
INTREPID SMALL CAP FUND
| COMPONENTS OF PORTFOLIO HOLDINGS | | |
| | | |
| Consumer Discretionary | $ | 7,226,572 |
| Consumer Staples | | 5,854,610 |
| Energy | | 11,883,881 |
| Financials | | 1,819,888 |
| Health Care | | 4,438,144 |
| Industrials | | 4,484,630 |
| Information Technology | | 7,298,977 |
| Materials | | 6,162,149 |
| U.S. Treasury Obligations | | 2,998,592 |
| Utilities | | 1,420,789 |
| Short-Term Investments | | 5,377,593 |
| Total | $ | 58,965,825 |
Intrepid Income Fund
ALLOCATION OF PORTFOLIO HOLDINGS (as a % of total investments)
March 31, 2009 (Unaudited)
INTREPID INCOME FUND
| COMPONENTS OF PORTFOLIO HOLDINGS | | |
| | | |
| Convertible Bonds | $ | 1,377,500 |
| Corporate Bonds | | 27,392,426 |
| U.S. Treasury Obligations | | 5,749,286 |
Other Short-Term Investments | | 3,075,674 |
| Total | | 37,594,886 |
| | | |
Intrepid All Cap Fund
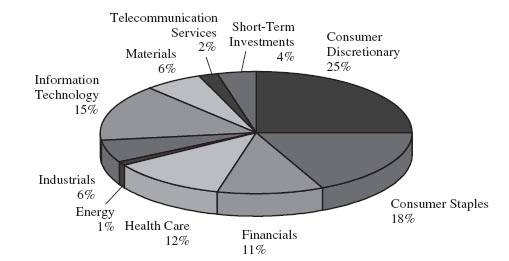
ALLOCATION OF PORTFOLIO HOLDINGS (as a % of total investments)
March 31, 2009 (Unaudited)
INTREPID ALL CAP FUND
| COMPONENTS OF PORTFOLIO HOLDINGS | | |
| | | |
| Consumer Discretionary | $ | 1,668,507 |
| Consumer Staples | | 1,233,067 |
| Financials | | 740,770 |
| Health Care | | 779,676 |
| Energy | | 107,565 |
| Industrials | | 402,602 |
| Information Technology | | 996,010 |
| Materials | | 388,127 |
| Telecommunication Services | | 133,213 |
| Short-Term Investments | | 249,553 |
| Total | $ | 6,699,090 |
Intrepid Capital Fund
| SCHEDULE OF INVESTMENTS | | | | |
| March 31, 2009 (Unaudited) | | | | |
| | | | | |
| | | Shares | | Value |
| COMMON STOCKS - 55.17% | | | | |
Aerospace & Defense - 3.0 1% | | | | |
Applied Signal Technology, Inc. | | 48,795 | $ | 987,123 |
| Auto Components - 0.78% | | | | |
| Semperit AG Holding (a) | | 13,265 | | 257,309 |
| Beverages - 5.56% | | | | |
Brown-Forman Corp. - Class B | | 7,606 | | 295,341 |
| The Coca-Cola Co. | | 16,295 | | 716,165 |
| Heineken N.V. - ADR (a) | | 57,220 | | 812,890 |
| | | | | 1,824,396 |
| Capital Markets - 3.22% | | | | |
| Franklin Resources, Inc. | | 7,440 | | 400,793 |
| T. Rowe Price Group, Inc. | | 22,665 | | 654,112 |
| | | | | 1,054,905 |
Commercial Services & Supplies - 1.75% | | | | |
| Cintas Corp. | | 23,255 | | 574,864 |
Electronic Equipment & Instruments - 0.69% | | | | |
| Mocon, Inc. | | 26,300 | | 225,654 |
Energy Equipment & Services- 1.86% | | | | |
Patterson-UTI Energy, Inc. | | 67,905 | | 608,429 |
| Food Products - 3.33% | | | | |
| Kraft Foods, Inc. | | 22,430 | | 499,965 |
| Sara Lee Corp. | | 73,135 | | 590,931 |
| | | | | 1,090,896 |
Hotels, Restaurants & Leisure- 3.02% | | | | |
| International Speedway Corp.- Class A | | 28,175 | | 621,541 |
| Starbucks Corp. (b) | | 33,295 | | 369,907 |
| | | | | 991,448 |
| Household Durables - 1.04% | | | | |
| Black & Decker Corp. | | 10,790 | | 340,532 |
| Household Products - 5.62% | | | | |
Central Garden & Pet Co. (b) | | 96,675 | | 735,697 |
See notes to financial statements.
Intrepid Capital Fund
| SCHEDULE OF INVESTMENTS (continued) | | | | |
| March 31, 2009 (Unaudited) | | | | |
| | | | | |
| | | Shares | | Value |
COMMON STOCKS-55.17% (continued) | | | | |
Household Products -5.62%(continued) | | | | |
Oil-Dri Corporation of America | | 75,117 | $ | 1,107,976 |
| | | | | 1,843,673 |
| Insurance - 4.15% | | | | |
| Baldwin & Lyons, Inc. | | 30,925 | | 585,101 |
Berkshire Hathaway, Inc.- Class B (b) | | 175 | | 493,500 |
| The Travelers Companies, Inc. | | 6,960 | | 282,854 |
| | | | | 1,361,455 |
| IT Services - 3.92% | | | | |
| Automatic Data Processing, Inc. | | 19,095 | | 671,380 |
Total Systems Services, Inc. | | 44,600 | | 615,926 |
| | | | | 1,287,306 |
Life Science Tools & Services -1.98% | | | | |
| Waters Corp. (b) | | 17,610 | | 650,690 |
| Media - 4.62% | | | | |
| Comcast Corp. | | 47,840 | | 652,538 |
| John Wiley & Sons, Inc. | | 18,195 | | 541,847 |
| Scholastic Corp. | | 21,320 | | 321,292 |
| | | | | 1,515,677 |
| Metals & Mining - 2.94% | | | | |
| Newmont Mining Corp. | | 12,080 | | 540,701 |
| Pan American Silver Corp. (a)(b) | | 24,320 | | 423,654 |
| | | | | 964,355 |
| Office Electronics - 1.96% | | | | |
| Zebra Technologies Corp. (b) | | 33,885 | | 644,493 |
| Real Estate - 1.77% | | | | |
| Potlatch Corp. | | 25,015 | | 580,098 |
| Specialty Retail - 2.88% | | | | |
| DSW, Inc. (b) | | 70,065 | | 650,904 |
| Ltd Brands, Inc. | | 33,695 | | 293,146 |
| | | | | 944,050 |
See notes to financial statements.
Intrepid Capital Fund
| SCHEDULE OF INVESTMENTS (continued) | | | | |
| March 31, 2009 (Unaudited) | | | | |
| | | | | |
| | | Shares | | Value |
COMMON STOCKS - 55.17% (continued) | | | | |
| Wireless Telecommunication Services - 1.07% | | | | |
| Telephone & Data Systems, Inc. | | 13,175 | $ | 349,269 |
| TOTAL COMMON STOCKS | | | | |
| (Cost $22,777,901) | | | | 18,096,622 |
| | | | | |
| | | Principal | | |
| | | Amount | | |
| CONVERTIBLE BONDS - 1.74% | | | | |
| Healt h Care Providers & Services - 1.74% | | | | |
| Chemed Corp. | | | | |
| 1.875%, 05/15/2014 | $ | 789,000 | | 572,025 |
TOTAL CONVERTIBLE BONDS | | | | |
| (Cost $591,947) | | | | 572,025 |
| | | | | |
CORPORATE BONDS -33.83% | | | | |
| Building Products - 0.89% | | | | |
| Gibralt ar Industries, Inc. | | | | |
| 8.000%, 12/01/2015 | | 539,000 | | 291,060 |
Chemical And Fertilizer Mineral Mining - 0.63% | | | | |
Compass Minerals n I ternational, Inc. | | | | |
| 12.000%, 06/01/2013 | | 200,000 | | 207,000 |
Commercial Services & Supplies - 2.57% | | | | |
| Blo unt, Inc. | | | | |
| 8.875%, 08/01/2012 | | 459,000 | | 432,607 |
| Mobile Mini, Inc. | | | | |
| 6.875%, 05/01/2015 | | 595,000 | | 410,550 |
| | | | | 843,157 |
Containers & Packaging- 1.69% | | | | |
| Silgan Holdings, Inc. | | | | |
| 6.750%, 11/15/2013 | | 591,000 | | 555,540 |
See notes to financial statements.
Intrepid Capital Fund
| SCHEDULE OF INVESTMENTS (continued) | | | | |
| March 31, 2009 (Unaudited) | | | | |
| | | | | |
| | | Principal | | |
| | | Amount | | Value |
| CORPORATE BONDS - 33.83% (continued) | | | | |
Electronic Equipment & Instruments - 1.75% | | | | |
Syniverse Technologies, Inc. | | | | |
| 7.750%, 08/15/2013 | $ | 684,000 | $ | 574,560 |
| Food & Staples Retailing - 1.07% | | | | |
| Ingles Markets, Inc. | | | | |
| 8.875%, 12/01/2011 | | 360,000 | | 351,000 |
Health Care Providers & Services - 1.44% | | | | |
| Eye Care Centers of America | | | | |
| 10.7 50%, 02/15/2015 | | 519,000 | | 472,290 |
Holding Company - 1.85% | | | | |
| AMR HoldCo, Inc. / EmCare HoldCo, Inc. | | | | |
| 10.0 00%, 02/15/2015 | | 610,000 | | 606,950 |
Hotels, Restaurants & Leisure - 1.76% | | | | |
Speedway Motorsports, Inc. | | | | |
| 6.750%, 06/01/2013 | | 691,000 | | 578,713 |
Household Products - 3.26% | | | | |
Central Garden & Pet Co. | | | | |
| 9.125%, 02/01/2013 | | 812,000 | | 641,480 |
Church & Dwight Co., Inc. | | | | |
| 6.000%, 12/15/2012 | | 429,000 | | 426,855 |
| | | | | 1,068,335 |
| IT Services - 1.67% | | | | |
| Affiliated Computer Services, Inc. | | | | |
| 4.700%, 06/01/2010 | | 570,000 | | 546,487 |
| Media - 1.89% | | | | |
| Comcast Cable Communications, LLC | | | | |
| 6.875%, 06/15/2009 | | 190,000 | | 191,204 |
| Scholastic Corp. | | | | |
| 5.000%, 04/15/2013 | | 556,000 | | 429,510 |
| | | | | 620,714 |
See notes to financial statements.
Intrepid Capital Fund
| SCHEDULE OF INVESTMENTS (continued) | | | | |
| March 31, 2009 (Unaudited) | | | | |
| | | | | |
| | | Principal | | |
| | | Amount | | Value |
CORPORATE BONDS - 33.83% (continued) | | | | |
Paper & Forest Products - 0.62% | | | | |
| Neenah Paper, Inc. | | | | |
| 7.375%, 11/15/2014 | $ | 547,000 | $ | 202,390 |
| Pharmaceutical Preparations - 1.43% | | | | |
| Prestige Brands, Inc. | | | | |
| 9.250%, 04/15/2012 | | 493,000 | | 470,815 |
Photo Equipment & Supplies - 1.42% | | | | |
| Da-Lite Screen Co., Inc. | | | | |
| 9.500%, 05/15/2011 | | 543,000 | | 466,980 |
| Real Estate - 1.63% | | | | |
Icahn Enterprises LP / Icahn | | | | |
| Enterprises Finance Corp. | | | | |
| 7.125%, 02/15/2013 | | 671,000 | | 533,445 |
| Specialty Retail - 4.15% | | | | |
| Home Depot, Inc. | | | | |
1.445%, 12/16/2009 (c) | | 174,000 | | 170,709 |
| Collective Brands, Inc. | | | | |
| 8.250%, 08/01/2013 | | 635,000 | | 501,650 |
| Rent-A-Center, Inc. | | | | |
| 7.500%, 05/01/2010 | | 705,000 | | 689,138 |
| | | | | 1,361,497 |
| Textiles, Apparel & Luxury Goods - 4.11% | | | | |
| Hanesbrands, Inc. | | | | |
5.698%, 12/15/2014 (c) | | 520,000 | | 345,800 |
| Perry Ellis International, Inc. | | | | |
| 8.875%, 09/15/2013 | | 443,000 | | 259,155 |
Phillips-Van Heusen Corp. | | | | |
| 7.250%, 02/15/2011 | | 613,000 | | 590,013 |
| Quiksilver, Inc. | | | | |
| 6.875%, 04/15/2015 | | 400,000 | | 152,000 |
| | | | | 1,346,968 |
TOTAL CORPORATE BONDS | | | | |
| (Cost $13,046,363). | | | | 11,097,901 |
See notes to financial statements.
Intrepid Capital Fund
SCHEDULE OF INVESTMENTS (continued) | | | | |
| March 31, 2009 (Unaudited) | | | | |
| | | | | |
| | | Shares | | Value |
SHORT-TERM INVESTMENTS - 8.46% | | | | |
| Money Market Funds - 8.46% | | | | |
| AIM STIT - STIC Prime Portfolio | | 198,728 | $ | 198,728 |
| AIM STIT - Treasury Portfolio | | 644,000 | | 644,000 |
Fidelity Institutional Money Market Funds - | | | | |
| Government Portfolio | | 644,000 | | 644,000 |
Fidelity Institutional Money Market Funds - | | | | |
| Money Market Portfolio | | 644,000 | | 644,000 |
| SEI Daily Income Trust Treasury Fund | | 644,000 | | 644,000 |
| | | | | 2,774,728 |
| TOTAL SHORT-TERM INVESTMENTS | | | | |
| (Cost $2,774,728) | | | | 2,774,728 |
| Total Investments - 99.20% | | | | |
| (Cost $39,190,939) | | | | 32,541,276 |
Other Assets in Excess of Liabilities -0.80% | | | | 261,419 |
| TOTAL NET ASSETS - 100.00% | | | $ | 32,802,695 |
ADR American Depository Receipt
| (a) | Foreign issued security. |
| (b) | Non-income producing security. |
| (c) | Variable rate security. The rate shown is as of March 31, 2009. |
See notes to financial statements.
Intrepid Small Cap Fund
| SCHEDULE OF INVESTMENTS | | | |
| March 31, 2009 (Unaudited) | | | |
| | | | |
| | Shares | | Value |
COMMON STOCKS - 86.84% | | | |
| Aerospace & Defense - 4.4 2% | | | |
Applied Signal Technology, Inc. | 89,665 | $ | 1,813,923 |
| Ducommun, Inc. | 52,405 | | 761,969 |
| | | | 2,575,892 |
| Auto Components - 1.49% | | | |
| Semperit AG Holding (a) | 44,860 | | 870,177 |
| Beverages - 4.44% | | | |
| Boston Beer Co, Inc. (b) | 7,000 | | 146,020 |
Heineken N.V. - ADR (a) | 105,750 | | 1,502,327 |
| National Beverage Corp. (b) | 42,071 | | 385,791 |
| PepsiAmericas, Inc. | 32,000 | | 552,000 |
| | | | 2,586,138 |
| Chemicals - 2.66% | | | |
International Flavors & Fragrances, Inc. | 35,340 | | 1,076,456 |
| Landec Corp. (b) | 85,103 | | 474,024 |
| | | | 1,550,480 |
Commercial Services & Supplies - 0.45% | | | |
| Ecology & Environment, Inc. | 20,700 | | 260,406 |
Communications Equipment - 4.63% | | | |
Communications Systems, Inc. | 117,941 | | 903,428 |
Tellabs, Inc. (b) | 391,340 | | 1,792,337 |
| | | | 2,695,765 |
Containers & Packaging - 2.32% | | | |
| Bemis Co., Inc. | 44,620 | | 935,681 |
| Packaging Corp of America | 32,105 | | 418,007 |
| | | | 1,353,688 |
Crude Petroleum And Natural Gas - 2.10% | | | |
Bill Barret Corp. (b) | 55,000 | | 1,223,200 |
| Distributors - 1.61% | | | |
| Prestige Brands Holdings, Inc. (b) | 181,635 | | 940,869 |
See notes to financial statements.
Intrepid Small Cap Fund
| SCHEDULE OF INVESTMENTS (continued) | | | |
| March 31, 2009 (Unaudited) | | | |
| | | | |
| | Shares | | Value |
COMMON STOCKS - 86.84% (continued) | | | |
| Electronic Equipment & Instruments - 1.57% | | | |
| Mocon, Inc. | 88,406 | $ | 758,523 |
| Park Electrochemical Corp. | 9,125 | | 157,680 |
| | | | 916,203 |
| Energy Equipment & Services - 14.76% | | | |
| CARBO Ceramics, Inc. | 29,000 | | 824,760 |
| Gulf Island Fabrication, Inc. | 43,975 | | 352,240 |
Patterson-UTI Energy, Inc. | 287,880 | | 2,579,405 |
| Tidewater, Inc. | 60,350 | | 2,240,795 |
| Unit Corp. ( b ) | 124,400 | | 2,602,448 |
| | | | 8,599,648 |
| Gas Utilities - 1.84% | | | |
| Delta Natural Gas Co., Inc. | 19,090 | | 408,717 |
| Energy West, Inc. | 47,798 | | 390,988 |
| RGC Resources, Inc. | 11,737 | | 269,364 |
| | | | 1,069,069 |
Health Care Equipment & Supplies - 4.05% | | | |
| Conmed Corp. (b) | 63,000 | | 907,830 |
| STERIS Corp. | 50,000 | | 1,164,000 |
| Varian, Inc. (b) | 12,000 | | 284,880 |
| | | | 2,356,710 |
| Health Care Providers & Services - 0.27% | | | |
| Chemed Corp. | 4,000 | | 155,600 |
Hotels, Restaurants & Leisure - 4.34% | | | |
| International Speedway Corp. - Class A | 86,690 | | 1,912,381 |
| Speedway Motorsports, Inc. | 52,335 | | 618,600 |
| | | | 2,530,981 |
| Household Durables - 1.39% | | | |
Blount International, Inc. (b) | 174,825 | | 807,692 |
| Household Products - 3.65% | | | |
| Oil-Dri Corp of America | 144,067 | | 2,124,988 |
See notes to financial statements.
Intrepid Small Cap Fund
SCHEDULE OF INVESTMENTS (continued) | | | |
| March 31, 2009 (Unaudited) | | | |
| | | | |
| | Shares | | Value |
COMMON STOCKS - 86.84% (continued) | | | |
| Insurance - 1.53% | | | |
| Baldwin & Lyons, Inc. | 46,965 | $ | 888,578 |
| IT Services - 3.21% | | | |
CSG Systems International, Inc. (b) | 64,182 | | 916,519 |
Total Systems Services, Inc. | 69,155 | | 955,031 |
| | | | 1,871,550 |
Life Science Tools & Services - 3.31% | | | |
| Waters Corp. (b) | 52,120 | | 1,925,834 |
| Machinery - 1.44% | | | |
| Chart Industries, Inc. (b) | 41,255 | | 325,090 |
Gencor Industries, Inc. (b) | 76,040 | | 515,551 |
| | | | 840,641 |
| Media - 1.90% | | | |
| Scholastic Corp. | 73,435 | | 1,106,665 |
| Metals & Mining - 5.59% | | | |
| Newmont Mining Corp. | 32,145 | | 1,438,810 |
Pan American Silver Corp. (a)(b) | 104,430 | | 1,819,171 |
| | | | 3,257,981 |
| Office Electronics - 3.12% | | | |
Zebra Technologies Corp. (b) | 95,450 | | 1,815,459 |
| Oil & Gas - 3.54% | | | |
| Cimarex Energy Co. | 48,000 | | 882,240 |
St. Mary Land & Exploration Co. | 89,100 | | 1,178,793 |
| | | | 2,061,033 |
| Personal Products - 0.35% | | | |
| United-Guardian, Inc. | 28,945 | | 202,615 |
| Real Estate - 1.60% | | | |
| Potlatch Corp. | 40,160 | | 931,310 |
| Specialty Retail - 3.20% | | | |
| DSW, Inc. (b) | 66,310 | | 616,020 |
Maid enform Brands, Inc. (b) | 98,555 | | 902,764 |
See notes to financial statements.
Intrepid Small Cap Fund
| SCHEDULE OF INVESTMENTS (continued) | | | |
| March 31, 2009 (Unaudited) | | | |
| | | | |
| | Shares | | Value |
COMMON STOCKS - 86.84% (continued) | | | |
Specialty Retail - 3.20% (continued) | | | |
| Regis Corp. | 24,060 | $ | 347,667 |
| | | | 1,866,451 |
Textiles, Apparel & Luxury Goods - 1.46% | | | |
| Hanesbrands, Inc. (b) | 48,455 | | 463,714 |
| McRae Industries, Inc. | 17,914 | | 228,583 |
| Quiksilver, Inc. (b) | 125,000 | | 160,000 |
| | | | 852,297 |
| Water Utilities - 0.60% | | | |
| Middlesex Water Co. | 24,425 | | 351,720 |
| TOTAL COMMON STOCKS | | | |
| (Cost $51,317,099) | | | 50,589,640 |
| | | | |
| SHORT-TERM INVESTMENTS - 14.38% | | | |
Money Market Funds - 9.23% | | | |
| AIM STIT Treasury Portfolio | 1,099,000 | | 1,099,000 |
AIM STIT-STIC Prime Portfolio | 981,593 | | 981,593 |
| Fidelity Institutional Money Market Funds - | | | |
| Government Portfolio | 1,099,000 | | 1,099,000 |
| Fidelity Institutional Money Market Funds - | | | |
| Money Market Portfolio | 1,099,000 | | 1,099,000 |
SEI Daily Income Trust Fund Treasury | 1,099,000 | | 1,099,000 |
| | | | 5,377,593 |
See notes to financial statements.
Intrepid Small Cap Fund
SCHEDULE OF INVESTMENTS (continued) | | | | |
| March 31, 2009 (Unaudited) | | | | |
| | | | | |
| | | Principal | | |
| | | Amount | | Value |
SHORT-TERM INVESTMENTS - 14.38% (continued) | | | | |
| U.S. Treasury Bills - 5.15% | | | | |
| United States Treasury Bills | | | | |
| 0.196%, 6/25/2009 (c) | $ | 3,000,000 | $ | 2,998,592 |
| | | | | 2,998,592 |
TOTAL SHORT-TERM INVESTMENTS | | | | |
| (Cost $8,376,185) | | | | 8,376,185 |
| Total Investments - 101.22% | | | | |
| (Cost $59,693,284) | | | | 58,965,825 |
Liabilities in Excess of Other Assets - ( 1 .22)% | | | | (710,2 53) |
TOTAL NET ASSETS - 100.00% | | | $ | 58,255,572 |
Percentages are stated as a percent of net assets.
ADR American Depository Receipt
| (a) | Non-income producing security. |
| (b) | Foreign issued security. |
| (c) | Rate shown is the effective yield based on purchase price. The calculation assumes the security is held to maturity. |
See notes to financial statements.
Intrepid Income Fund
| SCHEDULE OF INVESTMENTS | | | | |
| March 31, 2009 (Unaudited) | | | | |
| | | | | |
| | | Principal | | |
| | | Amount | | Value |
| CONVERTIBLE BONDS - 3.63% | | | | |
Health Care Providers & Services - 3.63% | | | | |
| Chemed Corp. | | | | |
| 1.875%, 05/15/2014 | $ | 1,900,000 | $ | 1,377,500 |
TOTAL CONVERTIBLE BONDS | | | | |
| (Cost $1,413,873) | | | | 1,377,500 |
| | | | | |
CORPORATE BONDS - 72.28% | | | | |
| Building Products - 2.36% | | | | |
| Gibraltar Industries, Inc. | | | | |
| 8.000%, 12/01/2015 | | 1,657,000 | | 894,780 |
Chemical And Fertilizer Mineral Mining - 2.66% | | | | |
| Compass Minerals International, Inc. | | | | |
| 12.0 00%, 06/01/2013 | | 972,000 | | 1,006,020 |
Commercial Services & Supplies - 6.90% | | | | |
| Blount, Inc. | | | | |
| 8.875%, 08/01/2012 | | 1,494,000 | | 1,408,095 |
| Mobile Mini, Inc. | | | | |
| 6.875%, 05/01/2015 | | 1,749,000 | | 1,206,810 |
| | | | | 2,614,905 |
Containers & Packaging - 3.03% | | | | |
| Silgan Holdings, Inc. | | | | |
| 6.750%, 11/15/2013 | | 1,223,000 | | 1,149,620 |
Electronic Equipment & Instruments - 2.23% | | | | |
Syniverse Technologies, Inc. | | | | |
| 7.750%, 08/15/2013 | | 1,006,000 | | 845,040 |
Food & Staples Retailing - 1.64% | | | | |
| Ingles Markets, Inc. | | | | |
| 8.875%, 12/01/2011 | | 637,000 | | 621,075 |
Health Care Equipment & Supplies - 2.52% | | | | |
| Fisher Scientific International, Inc. | | | | |
| 6.750%, 08/15/2014 | | 946,000 | | 953,158 |
See notes to financial statements.
Intrepid Funds
| STATEMENT OF OPERATIONS | | | | |
For the six months ended March 31, 2009 (Unaudited) | | | | |
| | | | | |
| | | Intrepid | | Intrepid Small |
| | | Capital Fund | | Cap Fund |
| INVESTMENT INCOME: | | | | |
| Dividend income | $ | 221,628 | $ | 296,757 |
| Interest income | | 611,775 | | 25,834 |
Total investment income | | 833,403 | | 322,591 |
| | | | | |
| Advisory fees | | 155,902 | | 161,817 |
Distribution (12b-1) fees | | 38,975 | | 40,454 |
Shareholder servicing fees and expenses | | 18,902 | | 12,271 |
| Administration fees | | 17,980 | | 17,138 |
| Fund accounting fees | | 17,424 | | 10,089 |
| Professional fees | | 16,436 | | 16,126 |
| Federal and state registration | | 8,530 | | 7,962 |
| Insurance | | 4,906 | | 1,374 |
| Custody fees | | 3,251 | | 5,197 |
| Trustees fees and expenses | | 2,884 | | 1,751 |
| Reports to shareholders | | 2,590 | | 2,087 |
| Compliance fees | | 1,433 | | 928 |
| Miscellaneous | | 641 | | 464 |
Total expenses before Adviser reimbursement | | 289,854 | | 277,658 |
Expenses recouped (reimbursed) by Adviser | | 14,159 | | 26,611 |
| Net expenses | | 304,013 | | 304,269 |
| Net investment income | | 529,390 | | 18,322 |
| | | | | |
| NET REALIZED AND UNREALIZED | | | | |
| LOSS ON INVESTMENTS: | | | | |
| Net realized loss on investments | | (772,328) | | (3,027,282) |
| Net change in unrealized depreciation on investments | | | | (45,613) |
| Net realized and unrealized loss on investments | | (5,965,674) | | (3,072,895) |
| Net decrease in net assets resulting from operations | $ | (5,436,284) | $ | (3,054,573) |
See notes to financial statements.
Intrepid Funds
| STATEMENT OF OPERATIONS (continued) | | | | |
For the six months ended March 31, 2009 (Unaudited) | | | | |
| | | | | |
| | | Intrepid | | Intrepid All |
| | | Income Fund | | Cap Fund |
| INVESTMENT INCOME: | | | | |
| Dividend income | $ | 7,080 | $ | 65,212 |
| Interest income | | 1,318,815 | | 8,555 |
Total investment income | | 1,325,895 | | 73,767 |
| | | | | |
| Advisory fees | | 113,834 | | 29,307 |
Distribution (12b-1) fees | | 37,945 | | 7,327 |
Shareholder servicing fees and expenses | | 14,864 | | 10,242 |
| Administration fees | | 17,536 | | 16,223 |
| Fund accounting fees | | 13,848 | | 3,494 |
| Professional fees | | 16,388 | | 15,389 |
| Federal and state registration | | 8,090 | | 4,861 |
| Insurance | | 4,113 | | 1,174 |
| Custody fees | | 1,890 | | 1,074 |
| Trustees fees and expenses | | 2,461 | | 446 |
| Reports to shareholders | | 2,377 | | 441 |
| Compliance fees | | 1,269 | | 264 |
| Miscellaneous | | 546 | | 364 |
Total expenses before Adviser reimbursement | | 235,161 | | 90,606 |
Expenses recouped (reimbursed) by Adviser | | (45,442) | | (33,457) |
| Net expenses | | 189,719 | | 57,149 |
| Net investment income | | 1,136,176 | | 16,618 |
| | | | | |
NET REALIZED AND UNREALIZED | | | | |
| LOSS ON INVESTMENTS: | | | | |
Net realized loss on investments | | (877,382) | | (658,713) |
| Net change in unrealized depreciation on investments | | (2,050,201) | | (704,708) |
| Net realized and unrealized loss on investments | | | | (1,363,421) |
| Net decrease in net assets resulting from operations | $ | (1,791,407) | $ | (1,346,803) |
| | | | | |
See notes to financial statements.
Intrepid Capital Fund
| STATEMENTS OF CHANGES IN NET ASSETS | | | | |
| | | | | |
| | | Six Months | | Year |
| | | Ended | | Ended |
| | | March 31, 2009 | | September 30, 2008 |
| | | (Unaudited) | | |
| OPERATIONS: | | | | |
| Net investment income | $ | 529,390 | $ | 624,461 |
| Net realized gain (loss) on investments | | (772,328) | | 762,052 |
Net change in unrealized | | | | |
depreciation on investments | | | | (1,953,983) |
| Net decrease in assets | | | | |
| resulting from operations | | | | (567,470) |
| | | | | |
| DISTRIBUTIONS TO SHAREHOLDERS: | | | | |
| From net investment income | | (526,428) | | (618,994) |
| From net realized gain | | (767,283) | | (1,866,102) |
| Total distributions | | | | (2,485,096) |
| | | | | |
| CAPITAL SHARE TRANSACTIONS: | | | | |
| Proceeds from shares sold | | 9,839,754 | | 8,780,113 |
| Proceeds from shares issued | | | | |
| to holders in reinvestment of dividends | | 1,265,103 | | 2,417,678 |
Cost of shares redeemed (1) | | (8,069,691) | | (5,129,315) |
| | | | | |
| Net in crease in net assets from | | | | |
| capital share transactions | | 3,035,166 | | 6,068,476 |
| | | | | |
| TOTAL INCREASE IN NET ASSETS | | | | 3,015,910 |
| | | | | |
| NET ASSETS: | | | | |
| Beginning of period | | 36,497,524 | | 33,481,614 |
| End of period (including undistributed net | | | | |
| investment income of $2,962 and $0) | $ | 32,802,695 | $ | 36,497,524 |
(1) Net of e r demption fees of $36,642 and $1,064, respectively.
See notes to financial statements.
Intrepid Small Cap Fund
STATEMENTS OF CHANGES ASSETS IN NET (continued) | | | |
| | | | | |
| | | Six Months | | Year |
| | | Ended | | Ended |
| | | March 31, 2009 | | September 30, 2008 |
| | | (Unaudited) | | |
| OPERATIONS: | | | | |
| Net investment income | $ | 18,322 | $ | 75,099 |
| Net realized gain (loss) on investments | | | | 699,051 |
| Net change in unrealized | | | | |
| depreciation on investments | | (45,613) | | (859,101) |
| Net decrease in assets | | | | |
| resulting from operations | | | | (84,951) |
| | | | | |
| DISTRIBUTIONS TO SHAREHOLDERS: | | | | |
| From net investment income | | (47,220) | | (65,144) |
| From net realized gain | | (670,153) | | (260,141) |
| Total distributions | | (717,373) | | (325,285) |
| | | | | |
| CAPITAL SHARE TRANSACTIONS: | | | | |
| Proceeds from shares sold | | 53,345,464 | | 17,403,351 |
| Proceeds from shares issued | | | | |
| to holders in reinvestment of dividends | | 717,075 | | 325,063 |
Cost of shares redeemed (1) | | (12,528,724) | | (2,211,163) |
| | | | | |
| Net increase in net assets from | | | | |
| capital share transactions | | 41,533,815 | | 15,517,251 |
| | | | | |
| TOTAL INCREASE IN NET ASSETS | | 37,761,869 | | 15,107,015 |
| | | | | |
| NET ASSETS: | | | | |
| Beginning of period | | 20,493,703 | | 5,386,688 |
| End of period (including undistributed net | | | | |
| investment income of $18,322 and $47,220) | $ | 58,255,572 | $ | 20,493,703 |
| (1) | Net of redemption fees of $9,648 and $324, respectively. | | |
See notes to financial statements.
Intrepid Income Fund
STATEMENTS OF CHANGES IN NET ASSETS (continued) | | | |
| | | | | |
| | | Six Months | | Year |
| | | Ended | | Ended |
| | | March 31, 2009 | | September 30, 2008 |
| | | (Unaudited) | | |
| OPERATIONS: | | | | |
| Net investment income | $ | 1,136,176 | $ | 1,331,393 |
| Net realized loss on investments | | (877,382) | | (139,196) |
| Net change in unrealized | | | | |
| depreciation on investments | | (2,050,201) | | |
| Net decrease in assets | | | | |
| resulting from operations | | | | (198,828) |
| | | | | |
| DISTRIBUTIONS TO SHAREHOLDERS: | | | | |
| From net investment income | | | | |
From net realized gain | | — | | (11,189) |
| Total distributions | | (1,140,508) | | |
| | | | | |
| CAPITAL SHARE TRANSACTIONS: | | | | |
| Proceeds from shares sold | | 12,401,712 | | 9,380,735 |
Proceeds from shares issued | | | | |
| to holders in reinvestment of dividends | | 1,139,992 | | 1,315,684 |
Cost of shares redeemed (1) | | (1,452,420) | | |
| | | | | |
| Net increase in net assets from | | | | |
| capital share transactions | | 12,089,284 | | 8,384,943 |
| | | | | |
| TOTAL INCREASE IN NET ASSETS | | 9,157,369 | | 6,870,431 |
| | | | | |
| NET ASSETS: | | | | |
| Beginning of period | | 28,742,799 | | 21,872,368 |
| End of period (including undistributed net | | | | |
| investment income of | | | | |
| $35,409 and $39,741) | $ | 37,900,168 | $ | 28,742,799 |
| (1) | Net of redemption fees of $1,707 and $0, respectively. |
See notes to financial statements.
Intrepid All Cap Fund
STATEMENTS OF CHANGES IN NET ASSETS (continued) |
| | | | | |
| | | Six Months | | October 31, 2007(1) |
| | | Ended | | through |
| | | March 31, 2009 | | September 30, 2008 |
| | | (Unaudited) | | |
| OPERATIONS: | | | | |
| Net investment income | $ | 16,618 | $ | 13,372 |
Net realized loss on investments | | (658,713) | | (96,299) |
Net change in unrealized | | | | |
depreciation on investments | | (704,708) | | (682,134) |
| Net decrease in assets | | | | |
| resulting from operations | | | | (765,061) |
| | | | | |
| DISTRIBUTIONS TO SHAREHOLDERS: | | | | |
| From net investment income | | (13,071) | | (7,166) |
| Total distributions | | (13,071) | | (7,166) |
| | | | | |
| CAPITAL SHARE TRANSACTIONS: | | | | |
Proceeds from shares sold | | 2,243,712 | | 8,804,233 |
Proceeds from shares issued | | | | |
to holders in reinvestment of dividends | | 13,071 | | 7,166 |
Cost of shares redeemed (9) | | (438,687) | | (1,788,879) |
| | | | | |
Net increase in net assets from | | | | |
capital share transactions | | 1,818,096 | | 7,022,520 |
| | | | | |
| TOTAL INCREASE IN NET ASSETS | | 458,222 | | 6,250,293 |
| | | | | |
| NET ASSETS: | | | | |
Beginning of period | | 6,250,293 | | — |
End of period (including undistributed net | | | | |
investment in come of $6,259 and $2,712) | $ | 6,708,515 | $ | 6,250,293 |
| (1) | Commencement of Operations. |
| (2) | Net of redemption fees of $150 and $0, respectively. |
See notes to financial statements.
Intrepid Capital Fund
FINANCIAL HIGHLIGHTS
Per share data for a share of capital stock outstanding for the entire period and selected in formation for the period are as follows:
| | | | | | | | | | | January 3, |
| | | Period | | | | | | | | |
| | | Ended | | | | Year Ended | | | | through |
| | | March 31, | | | | | | | | September 30, |
| | | 2009 | | 2008 | | 2007 | | 2006 | | 2005 |
| | | ( Unaudited) | | | | | | | | |
| NET ASSET VALUE: | | | | | | | | | | |
| Beginning of period | $ | 9.67 | $ | 10.55 | $ | 10.18 | $ | 9.76 | $ | 10.00 |
| OPERATIONS: | | | | | | | | | | |
Net investment income (2) | | 0.13 | | 0.18 | | 0.47 | | 0.19 | | 0.07 |
| Net realized and unrealized gain | | | | | | | | | | |
| (loss) on investment securities | | (1.56) | | (0.30) | | 0.55 | | 0.52 | | (0.24)(4) |
| Total from operations | | (1.43) | | (0.12) | | 1.02 | | 0.71 | | (0.17) |
| LESS DISTRIBUTIONS: | | | | | | | | | | |
| From net investment income | | (0.13) | | (0.18) | | (0.47) | | (0.19) | | (0.07) |
| From net realized gains | | (0.20) | | (0.58) | | (0.18) | | (0.10) | | 0.00 |
| Total distributions | | (0.33) | | (0.76) | | (0.65) | | (0.29) | | (0.07) |
| NET ASSET VALUE: | | | | | | | | | | |
| End of period | $ | 7.91 | $ | 9.67 | $ | 10.55 | $ | 10.18 | $ | 9.76 |
| Total return | | (14.75)%(5) | | (1.41)% | | 10.10% | | 7.34% | | (1.74)%(5) |
| Net assets at end of period | | | | | | | | | | |
| (000s omitted) | $ | 32,803 | $ | 36,498 | $ | 33,482 | $ | 27,845 | $ | 26,586 |
| RATIO OF EXPENSES TO | | | | | | | | | | |
| AVERAGE NET ASSETS: | | | | | | | | | | |
| Before expense | | | | | | | | | | |
| reimbursement/recapture | | 1.86%(6) | | 1.79% | | 1.95% | | 2.08% | | 3.08%(6) |
| After expense | | | | | | | | | | |
| reimbursement/recapture | | 1.95%(6) | | 1.95% | | 1.95%(3) | | 1.95% | | 1.95%(6) |
| RATIO OF NET INVESTMENT | | | | | | | | | | |
| INCOME TO AVERAGE NET ASSETS: | | | | | | | | | | |
| Before expense | | | | | | | | | | |
| reimbursement/recapture | | 3.49%(6) | | 1.95% | | 4.35% | | 1.76% | | 0.35%(6) |
| After expense | | | | | | | | | | |
| reimbursement/recapture | | 3.40%(6) | | 1.79% | | 4.35%(3) | | 1.89% | | 1.48%(6) |
| Portfolio turnover rate | | 14% | | 86% | | 40% | | 24% | | 25% |
| (1) | Commencement of Operations. |
| (2) | Net investment income per share is calculated using the ending balances prior to consideration or adjustment for permanent book-to-tax differences. |
| (3) | The recouped amount is less than 0.1% |
| (4) | The amount shown may not correlate with aggregate gains and losses of portfolio securities due to the timing of subscriptions and redemptions of Fund shares. |
| (5) | Not annualized. |
| (6) | Annualized. |
See notes to financial statements.
Intrepid Small Cap Fund
FINANCIAL HIGHLIGHTS (continued)
Per share data for a share of capital stock outstanding for the entire period and selected information for the period are as follows:
| | | | | | | | | |
| | | | | | | | | |
| | | Period | | Year Ended | | |
| | | | | September 30, | | |
| | | March 31, | | | | | | September 30, |
| | | 2009 | | 2008 | | 2007 | | 2006 |
| | | (Unaudited) | | | | | | |
| NET ASSET VALUE: | | | | | | | | |
| Beginning of period | $ | 11.60 | $ | 12.04 | $ | 10.37 | $ | 10.00 |
| OPERATIONS: | | | | | | | | |
Net investment income (loss) (2) | | (0.01) | | 0.04 | | 0.14 | | 0.14 |
| Net realized and unrealized gain | | | | | | | | |
| (loss) on investment securities | | (0.99) | | 0.07 | | 1.57 | | 0.37 |
| Total from operations | | (1.00) | | 0.11 | | 1.71 | | 0.51 |
| LESS DISTRIBUTIONS: | | | | | | | | |
| From net investment income | | (0.02) | | ( 0 .11) | | (0.04) | | (0.14) |
| From net realized gains | | (0.23) | | 0 ( .44) | | 0.00 | | 0.00 |
| Total distributions | | (0.25) | | 0 ( .55) | | (0.04) | | (0.14) |
| NET ASSET VALUE: | | | | | | | | |
| End of period | $ | 10.35 | $ | 11.60 | $ | 12.04 | $ | 10.37 |
| Total return | | (8.68)%(3) | | 0.74% | | 16.46% | | 5.14%(3) |
| Net assets at end of period | | | | | | | | |
| (000s omitted) | | $58,256 | | $20,494 | | $5,387 | | $1,993 |
| RATIO OF EXPENSES TO | | | | | | | | |
| AVERAGE NET ASSETS: | | | | | | | | |
| Before expense | | | | | | | | |
| reimbursement/recapture | | 1.72%(4) | | 2.28% | | 4.80% | | 7.88%(4) |
| After expense | | | | | | | | |
| reimbursement/recapture | | 1.88%(4) | | 1.95% | | 1.95% | | 1.95%(4) |
| RATIO OF NET INVESTMENT | | | | | | | | |
| INCOME TO AVERAGE NET ASSETS: | | | | | | |
| Before expense | | | | | | | | |
| reimbursement/recapture | | 0.27%(4) | | 0.24% | | (1.27)% | | 4 ( .12)%(4) |
| After expense | | | | | | | | |
| reimbursement/recapture | | 0.11%(4) | | 0.57% | | 1.58% | | 1.81%(4) |
| Portfolio turnover rate | | 78% | | 159% | | 126% | | 22% |
| (1) | Commencement of Operations. |
| (2) | Net investment income per share is calculated using the ending balances prior to consideration or adjustment for permanent book-to-tax differences. |
| (3) | Not annualized. |
| (4) | Annualized. |
See notes to financial statements.
Intrepid Income Fund
FINANCIAL HIGHLIGHTS (continued)
Per share data for a share of capital stock outstanding for the entire period and selected information for the period are as follows:
| | | Period | | Year | | |
| | | Ended | | Ended | | through |
| | | March 31, | | September 30, | | September 30, |
| | | 2009 | | 2008 | | 2007 |
| | | (Unaudited) | | | | |
| NET ASSET VALUE: | | | | | | |
| Beginning of period | $ | 9.43 | $ | 9.94 | $ | 10.00 |
| OPERATIONS: | | | | | | |
Net investment income(2) | | 0.29 | | 0.46 | | 0.13 |
| Net realized and unrealized | | | | | | |
| l o ss on investment securities | | (0.95) | | (0.51) | | (0.06) |
| Total from operations | | (0.66) | | (0.05) | | 0.07 |
| LESS DISTRIBUTIONS: | | | | | | |
| From net investment income | | (0.30) | | (0.46) | | (0.13) |
| From net realized gains | | 0.00 | | 0.00(5) | | 0.00 |
| Total distributions | | (0.30) | | (0.46) | | (0.13) |
| NET ASSET VALUE: | | | | | | |
| End of period | $ | 8.47 | $ | 9.43 | $ | 9.94 |
| Total return | | (6.90)%(3) | | (0.55)% | | 0.67%(3) |
| Net assets at end of period (000s omitted) | $ | 37,900 | $ | 28,743 | $ | 21,872 |
| RATIO OF EXPENSES TO | | | | | | |
| AVERAGE NET ASSETS: | | | | | | |
| Before expense reimbursement | | 1.55%(4) | | 1.61% | | 2.19%(4) |
| After expense reimbursement | | 1.25%(4) | | 1.25% | | 1.25%(4) |
| RATIO OF NET INVESTMENT INCOME | | | | | | |
| TO AVERAGE NET ASSETS: | | | | | | |
| Before expense reimbursement | | 7.19%(4) | | 4.62% | | 4.51%(4) |
| After expense reimbursement | | 7.49%(4) | | 4.98% | | 5.45%(4) |
| Portfolio turnover rate | | 6% | | 44% | | 12% |
| (1) | Commencement of Operations. |
| (2) | Net investment income per share is calculated using the ending balances prior to consideration adjustment for permanent book-to-tax differences. |
| (3) | Not annualized. |
| (4) | Annualized. |
| (5) | The amount represents less than $0.01 per share. |
See notes to financial statements.
Intrepid All Cap Fund
FINANCIAL HIGHLIGHTS (continued)
Per share data for a share of capital stock outstanding for the entire period and selected information for the period are as follows:
| | | Period | | |
| | | Ended | | through |
| | | March 31, | | September 30, |
| | | 2009 | | 2008 |
| | | (Unaudited) | | |
| NET ASSET VALUE: | | | | |
| Beginning of period | $ | 8.74 | $ | 10.00 |
| OPERATIONS: | | | | |
Net investment income(2) | | 0.02 | | 0.02 |
| Net realized and unrealized loss on investment securities | | (1.87) | | (1 .27) |
| Total from operations | | (1.85) | | (1 .25) |
| LESS DISTRIBUTIONS: | | | | |
| From net investment income | | (0.02) | | (0 .01) |
| Total distributions | | (0.02) | | (0 .01) |
| NET ASSET VALUE: | | | | |
| End of period | $ | 6.87 | $ | 8.74 |
| Total return | | (21.23)%(3) | | (12.50)%(3) |
| Net assets at end of period (000s omitted) | $ | 6,709 | $ | 6,250 |
| RATIO OF EXPENSES TO AVERAGE NET ASSETS: | | | | |
| Before expense reimbursement | | 3.10%(4) | | 2.99%(4) |
| After expense reimbursement | | 1.95%(4) | | 1.95%(4) |
| RATIO OF NET INVESTMENT INCOME | | | | |
| TO AVERAGE NET ASSETS: | | | | |
| Before expense reimbursement | | (0.58)%(4) | | (0.80)%(4) |
| After expense reimbursement | | 0.57%(4) | | 0.24%(4) |
| Portfolio turnover rate | | 24% | | 85% |
| (1) | Commencement of Operations. |
| (2) | Net investment income per share is calculated using the ending balances prior to consideration or adjustment for permanent book-to-tax differences. |
| (3) | Not annualized. |
| (4) | Annualized. |
See notes to financial statements.
Intrepid Funds
NOTES TO FINANCIAL STATEMENTS
March 31, 2009 (Unaudited)
Intrepid Capital Management Funds Trust (the “Trust”), was organized as a Delaware Statutory Trust on August 27, 2004 and is registered under the Investment Company Act of 1940, as amended (the “1940 Act”), as an open-end management investment company issuing its shares in series, each series representing a distinct portfolio with its own investment objectives and policies. At March 31, 2009, the Trust consisted of four series (the ��Funds”): Intrepid Capital Fund, Intrepid Small Cap Fund, Intrepid Income Fund and Intrepid All Cap Fund. The Intrepid Capital Fund commenced operations on January 3, 2005, the Intrepid Small Cap Fund commenced operations on October 3, 2005, the Intrepid Income Fund commenced operations on July 2, 2007 and the Intrepid All Cap Fund commenced operations on October 31, 2007.
| 2. | SIGNIFICANT ACCOUNTING POLICIES |
The following is a summary of significant accounting policies consistently followed by the Funds in the preparation of its financial statements. These policies are in conformity with accounting principles generally accepted in the United States (“GAAP”).
Valuation of Securities
The Funds’ securities that are listed on national securities exchanges are valued at the last sales price on the securities exchange on which such securities are primarily traded. Securities that are traded on the Nasdaq National Market or the Nasdaq Smallcap Market (collectively “Nasdaq traded securities”) are valued at the Nasdaq Official Closing Price (“NOCP”). Exchange-traded securities for which there were no transactions and Nasdaq traded securities for which there is no NOCP are valued at the most recent bid price. Other securities are valued by an independent pricing service at the most recent bid price, if market quotations are readily available. Short-term investments are stated at amortized cost, which approximates fair value. The valuation of certain debt securities for which market quotations are not readily available may be based upon current market prices of securities which are comparable in coupon, rating and maturity quality, general market conditions or an appropriate matrix utilizing similar factors. Any securities for which there are no readily available market quotations will be valued at a price determined in good faith by the Board of Trustees.
Use of Estimates
The preparation of financial statements in conformity with GAAP requires management to make estimates and assumptions that affect the reported amounts of assets and liabilities and disclosure of contingent assets and liabilities at the date of the financial statements and the reported amounts of revenues and expenses during the reporting period. Actual results could differ from those estimates.
Intrepid Funds
NOTES TO FINANCIAL STATEMENTS (continued)
March 31, 2009 (Unaudited)
Foreign Currency Transactions
The books and records are maintained in U.S. dollars. Foreign currency denominated transactions (i.e. market value of investment securities, assets and liabilities, purchases and sales of investment securities and income and expenses) are translated into U.S. dollars at the current rate of exchange. The Funds do not isolate that portion of the results of operations resulting from changes in foreign exchange rates on investments from the fluctuations arising from changes in market prices of securities held. Such fluctuations are included with the net realized and unrealized gain or loss from investments.
Securities Transactions and Investment Income
The Funds record security transactions based on trade date. Dividend income is recognized on the ex-dividend date, and interest income is recognized on an accrual basis. Discounts and premiums on securities purchased are amortized over the lives of the respective securities using the effective yield method. Withholding taxes on foreign dividends have been provided for in accordance with the Funds’ understanding of the applicable country’s tax rules and rates. Net realized gains or losses are determined using the identified cost method.
Distribution to Shareholder Policy
Dividends from net investment income, if any, are declared and paid at least annually. Distributions of net realized capital gains, if any, are declared and paid at least annually.
Organization and Offering Costs
Organization and offering costs consist of costs incurred to establish the Trust and enable it legally to do business. These expenses were paid by the Adviser. Prepaid initial registration expenses are deferred over the period of benefit not to exceed twelve months.
Federal Income Taxes
The Funds comply with the requirements of Subchapter M of the Internal Revenue Code necessary to qualify as a regulated investment company and to make the requisite distributions of income and capital gains to its shareholders sufficient to relieve it from Federal income taxes.
New Accounting Pronouncements
Effective June 29, 2007, the Company adopted Financial Accounting Standards Board (FASB) Interpretation No. 48 (FIN 48), Accounting for Uncertainty in Income Taxes, a clarification of FASB Statement No. 109, Accounting for Income Taxes.
Intrepid Funds
NOTES TO FINANCIAL STATEMENTS (continued)
March 31, 2009 (Unaudited)
FIN 48 establishes financial reporting rules regarding recognition and measurement of tax positions taken or expected to be taken on a tax return. The adoption of FIN 48 had no impact on the Company’s net assets or results of operations.
The Funds adopted the provisions of Statement of Financial Accounting Standards No. 157, Fair Value Measurements (“SFAS 157”), effective with the beginning of the Funds’ fiscal year. SFAS 157 establishes a hierarchy that prioritizes the inputs to valuation techniques giving the highest priority to readily available unadjusted quoted prices in active markets for identical assets (level 1 measurements) and the lowest priority to unobservable inputs (level 3 measurements) when market prices are not readily available or reliable.
Various inputs are used in determining the value of the Funds’ investments. The inputs are summarized in three broad levels listed below.
Level 1 – quoted prices in active markets for identical securities
Level 2 – -other significant observable inputs (including quoted prices for similar securities, interest rates, prepayment speeds, credit risk, etc.)
Level 3 – -significant unobservable inputs (including the Funds’ own assumptions in determining fair value of investments)
The following is a summary of the inputs used, as of March 31, 2009, involving the Funds’ assets carried at value. The inputs of methodology used for valuing securities may not be an indication of the risk associated with investing in those securities.
| Description | Level 1 | Level 2 | Level 3 | Total |
| Investments in Securities | | | | |
| The Intrepid Capital Fund | $20,871,350 | $11,669,926 | — | $32,541,276 |
| The Intrepid Small Cap Fund | 55,967,233 | 2,998,592 | — | 58,965,825 |
| The Intrepid n I come Fund | 3,075,674 | 34,519,212 | — | 37,594,886 |
| The Intrepid All Cap Fund | 6,507,690 | 191,400 | — | 6,699,090 |
In March 2008, the Financial Accounting Standards Board (FASB) issued Statement of Financial Accounting Standards No. 161, “Disclosures about Derivative Instruments and Hedging Activities” (“SFAS 161”) was issued and is effective for fiscal years beginning after November 15, 2008. SFAS 161 is intended to improve financial reporting for derivative instruments by requiring enhanced disclosure that enables investors to understand how and why an entity uses derivatives, how derivatives are accounted for, and how derivative instruments affect an entity’s results of operations and financial position. Management is currently evaluating the implications of SFAS 161. The impact on the Fund’s financial statement disclosures, if any, is currently being assessed.
Intrepid Funds
NOTES TO FINANCIAL STATEMENTS (continued)
March 31, 2009 (Unaudited)
The Trust has an Investment Advisory Agreement (the “Agreement”) with Intrepid Capital Management, Inc. (the “Adviser”), with whom certain officers and Trustees of the Trust are affiliated, to furnish investment advisory services to the Funds. Under the terms of the Agreement, the Trust, on behalf of the Funds, compensates the Adviser for its management services on the Intrepid Capital Fund, Intrepid Small Cap Fund and Intrepid All Cap Fund at the annual rate of 1.00% on the first $500 million of average daily net assets and 0.80% on the Fund’s average daily net assets in excess of $500 million, and on Intrepid Income Fund at the annual rate of 0.75% of average daily net assets.
For the Intrepid Capital Fund and Intrepid All Cap Fund, the Adviser has agreed to waive, through September 2009, its management fee and/or reimburse the other expenses of the Funds, including organization expense, to the extent necessary to ensure that each Fund’s operating expenses do not exceed 1.95% of the Fund’s average daily net assets. For the Intrepid Income Fund, the Adviser has agreed to waive, through September 2009, its management fee and/or reimburse the other expenses of the Fund, including organization expense, to the extent necessary to ensure that the Fund’s operating expenses do not exceed 1.25% of the Fund’s average daily net assets. For the Intrepid Small Cap Fund, the Adviser has agreed to waive, through September 2010, its management fee and/or reimburse other expenses of the Fund so that the Fund’s operating expenses do not exceed 1.50% of the Fund’s average daily net assets. Any such waiver or reimbursement is subject to later adjustment to allow the Adviser to recoup amounts waived or reimbursed to the extent actual fees and expenses on a monthly basis during the fiscal year are less than the respective expense cap limitations, provided, however, that the Adviser shall only be entitled to recoup such amounts for a period of three years from the date such amount was waived or reimbursed. Waived/reimbursed expenses subject to potential recovery by year of expiration are as follows:
| | | | Year of Expiration | | |
| | 9/30/09 | | 9/30/10 | | 9/30/11 | | 9/30/12 |
Intrepid Capital Fund | $ 21,836 | | | | $ — | | |
| Intrepid Small Cap Fund | 56,562 | | 95,022 | | 43,926 | | 742 |
Intrepid Income Fund | — | | 49,671 | | 95,694 | | 45,442 |
Intrepid All Cap Fund | — | | — | | 59,107 | | 33,457 |
The Trust, on behalf of the Funds, has adopted a distribution plan pursuant to Rule 12b-1 under the 1940 Act (the “12b-1 Plan”), which provides that the Funds may reimburse the Funds’ distributor or others at an annual rate of up to 0.25% of the average daily net assets of the Funds.
Intrepid Funds
NOTES TO FINANCIAL STATEMENTS (continued)
March 31, 2009 (Unaudited)
Quasar Distributors, LLC serves as the distributor to the Funds. Quasar Distributors, LLC is an affiliated company of U.S. Bank, N.A.
| 5. | INVESTMENT TRANSACTIONS |
The aggregate purchases and sales of securities (excluding short-term securities) by the Funds for the period ended March 31, 2009 were as follows:
PurchasesSales
| | Purchases | | Sales |
Intrepid Capital Fund | $10,531,721 | | |
| Intrepid Small Cap Fund | 60,323,567 | | 23,760,742 |
Intrepid Income Fund | 12,480,198 | | 1,399,428 |
Intrepid All Cap Fund | 3,824,016 | | 1,347,180 |
| 6. | CAPITAL SHARE TRANSACTIONS |
| Intrepid Capit al Fund | | | | |
| | | Period Ended | | Year Ended |
| | | March 31, 2009 | | September 30, 2008 |
| Shares sold | | 1,241,425 | | 864,374 |
| Shares issued to holders | | | | |
| in reinvestment of dividends | | 160,270 | | 239,365 |
| Shares redeemed | | (1,031,154) | | (503,531) |
| Net increase in shares | | 370,541 | | 600,208 |
| Shares outstanding: | | | | |
| Beginning of period | | 3,774,498 | | 3,174,880 |
| End of period | | 4,145,039 | | 3,774,498 |
| | | | | |
| Intrepid Small Cap Fund | | | | |
| | | Period Ended | | Year Ended |
| | | March 31, 2009 | | September 30, 2008 |
| Shares sold | | 5,120,325 | | 1,479,977 |
| Shares issued to holders | | | | |
| in reinvestment of dividends | | 67,969 | | 26,931 |
| Shares redeemed | | (1,324,816) | | (187,349) |
| Net increase in shares | | 3,863,478 | | 1,319,559 |
| Shares outstanding: | | | | |
| Beginning of period | | 1,766,978 | | 447,419 |
| End of period | | 5,630,456 | | 1,766,978 |
| | | | | |
Intrepid Funds
NOTES TO FINANCIAL STATEMENTS (continued)
March 31, 2009 (Unaudited)
| Intrepid Income Fund | | | | |
| | | Period Ended | | Period Ended |
| | | March 31, 2009 | | September 30, 2008 |
| Shares sold | | 1,459,828 | | 955,368 |
| Shares issued to holders | | | | |
| in reinvestment of dividends | | 137,807 | | 135,972 |
| Shares redeemed | | (172,242) | | (241,510) |
| Net increase in shares | | 1,425,393 | | 849,830 |
| Shares outstanding: | | | | |
| Beginning of period | | 3,049,244 | | 2,199,414 |
| End of period | | 4,474,637 | | 3,049,244 |
| | | | | |
| Intrepid All Cap Fund | | | | |
| | | Period Ended | | Period Ended |
| | | March 31, 2009 | | September 30, 2008 (1) |
| Shares sold | | 323,939 | | 909,618 |
| Shares issued to holders | | | | |
| in reinvestment of dividends | | 1,892 | | 754 |
| Shares redeemed | | (63,945) | | (195,585) |
| Net increase in shares | | 261,886 | | 714,787 |
| Shares outstanding: | | | | |
| Beginning of period | | 714,787 | | — |
| End of period | | 976,673 | | 714,787 |
| (1) | Fund commenced operations on October 31, 2007. |
| 7. | FEDERAL INCOME TAX INFORMATION |
The tax components of distributions paid during the fiscal period ended September 30, 2008 are as follows:
| | September 30, 2008 | | September 30, 2007 |
| | Ordinary | | Long-Term | | Ordinary | | Long-Term |
| | Income | | Capital Gains | | Income | | Capital Gains |
| Intrepid Capital Fund | $ 957,818 | | $1,527,278 | | $1,388,364 | | $484,602 |
| Intrepid Small Cap Fund | 294,760 | | 30,525 | | 7,376 | | — |
| Intrepid Income Fund | 1,315,684 | | — | | 275,658 | | — |
| Intrepid All Cap Fund | 7,166 | | — | | — | | — |
The Funds designated as long-term capital gain dividend, pursuant to Internal Revenue Code Section 852(b)(3), the amount necessary to reduce the earnings and profits of the Funds related to net capital gain to zero for the tax year ended September 30, 2008.
Intrepid Funds
NOTES TO FINANCIAL STATEMENTS (continued)
March 31, 2009 (Unaudited)
Additionally, U.S. generally accepted accounting principles require that certain components of net assets relating to permanent differences be reclassified between financial and tax reporting. These reclassifications have no effect on net assets or net asset value per share. For the year ended September 30, 2008, the following table shows the reclassifications made:
| | Accumulated | | Undistributed | | |
| | Net Realized | | Net Investment | | Paid -in |
| | Gains/Losses | | Income/Loss | | Capital |
Intrepid Capital Fund | $8,845 | | $(8,845) | | — |
| Intrepid Small Cap Fund | 7,905 | | (7,904) | | (1) |
Intrepid Income Fund | 4 | | (4) | | — |
Intrepid All Cap Fund | 3,494 | | (3,494) | | — |
The permanent differences primarily relate to Real Estate Investment Trust (REIT) adjustments with differing book and tax methods for accounting.
As of September 30, 2008, the cost of investments, gross unrealized appreciation and depreciation of investments and distributable income for tax purposes were as follows:
| | | Intrepid | | Intrepid |
| | | Capital Fund | | Small Cap Fund |
| Cost of investments | $ | 38,387,049 | $ | 21,537,953 |
| Unrealized appreciation | $ | 1,549,984 | $ | 658,913 |
| Unrealized depreciation | | | | (1,358,732) |
| Net unrealized appreciation (depreciation) | $ | | $ | (699,819) |
| Undistributed ordinary income | $ | — | $ | 578,294 |
| Undistributed long-term capital gain | | 767,271 | | 139,034 |
| Distributable income | $ | 767,271 | $ | 717,328 |
| Other accumulated losses | | — | | — |
| Total accumulated earnings (losses) | $ | (689,046) | $ | 17,509 |
Intrepid Funds
NOTES TO FINANCIAL STATEMENTS (continued)
March 31, 2009 (Unaudited)
| | | Intrepid | | Intrepid |
| | | Income Fund | | |
| Cost of investments | $ | 30,916,744 | $ | 7,406,513 |
| Unrealized appreciation | $ | 36,928 | $ | 197,115 |
| Unrealized depreciation | | (1,566,404) | | (884,671) |
| Net unrealized appreciation (depreciation) | $ | (1,529,476) | $ | (687,556) |
| Undistributed ordinary income | $ | 39,741 | $ | 3,061 |
| Undistributed long-term capital gain | | — | | — |
| Distributable income | $ | 39,741 | $ | 3,061 |
| Other accumulated losses | | (150,381) | | (87,732) |
| Total accumulated earnings (losses) | $ | (1,640,116) | $ | (772,227) |
The difference between book-basis and tax-basis unrealized appreciation is attributable primarily to the tax deferral of losses on wash sales, Section 1256 Mark to Market, and partnership adjustments.
At September 30, 2008, Intrepid Income Fund had a post-October capital loss of $150,381 and Intrepid All Cap Fund had a post-October capital loss of $87,383 and currency loss of $349.
On July 13, 2006, the Financial Accounting Standards Board (FASB) released FASB Interpretation No. 48 “Accounting for Uncertainty in Income Taxes” (“FIN 48”). FIN 48 provides guidance for how uncertain tax positions should be recognized, measured, presented and disclosed in the financial statements. FIN 48 requires the evaluation of tax positions taken or expected to be taken in the course of preparing the Funds’ tax returns to determine whether the tax positions are “more-likely-than-not” of being sustained by the applicable tax authority. Tax positions not deemed to meet the more-likely-than-not threshold would be recorded as a tax benefit or expense in the current year. Adoption of FIN 48 is required as of the date of the last Net Asset Value (“NAV”) calculation in the first required financial statement reporting period for fiscal years beginning after December 15, 2006 and is to be applied to all open tax years as of the effective date. The portfolios have adopted FIN 48 and as of September 30, 2008, the portfolios did not have any tax positions that did not meet the “more-likely-than-not threshold” of being sustained by the applicable tax authority.
Intrepid Funds
ADDITIONAL INFORMATION
March 31, 2009 (Unaudited)
Investment Advisory Agreement Disclosure
On November 11, 2008, the Board of Trustees of Intrepid Capital Management Funds Trust approved the investment advisory agreements between the Intrepid Capital Fund and Intrepid Small Cap Fund (the “Funds”) and Intrepid Capital Management, Inc. Prior to approving the agreement, the Board considered:
● The nature, extent and quality of the services to be provided by Intrepid Capital Management, Inc.
● The investment strategies and performance history of Intrepid Capital Management, Inc.
● The cost of the services to be provided and profits to be realized by Intrepid Capital Management, Inc. from its relationship with the Funds
● The extent to which economies of scale would be realized as the Funds grew and whether fee levels reflect any such economies of scale
● The expense ratio of the Funds
● The manner in which portfolio transactions for the Funds would be conducted, including the use of soft dollars
In considering the nature, extent and quality of the services to be provided by Intrepid Capital Management Inc., the Board considered the Adviser’s quality of investment management provided to the Funds, the Adviser’s management history and the Adviser’s ability to attract investors for the Funds. The Board concluded that the nature, extent and quality of the services to be provided by the Adviser would be satisfactory.
The Board considered the presentation from the Adviser on the investment strategies for the Funds and reviewed the investment performance of the strategies compared to their relevant benchmarks. After further discussion, the Board concluded that the performance of the strategies were satisfactory in comparison to the performance of similar investments.
The Board considered the cost of services provided and the profits to be realized by the Adviser, by reviewing reports provided by the Funds’ administrator that compared the Funds’ investment advisory fees to those of other comparable mutual funds. The Board concluded that the investment advisory fees were fair and within the range of the industry averages.
The Board considered the extent to which economies of scale would be realized as the Funds grow, including a consideration of breakpoints in the Agreement fee schedules. The Board concluded that given the expected growth of assets of the Funds in the next year, the Adviser was unlikely to realize economies of scale and the proposed fee schedule was acceptable.
Intrepid Funds
ADDITIONAL INFORMATION (continued)
March 31, 2009 (Unaudited)
The Board reviewed reports from the Funds’ administrator that compared the Funds’ total expense ratios to those of other comparable mutual funds. The Board concluded that the total expenses of the Funds were fair and within the range of the industry averages.
The Board reviewed reports discussing the manner in which portfolio transactions for the Funds were conducted, including the use of soft dollars. Based on these reports, the Board concluded that the research and services to be obtained by the Adviser were beneficial to the Funds and that the Adviser would execute the Funds’ portfolio transactions in a manner designed to obtain best execution for the Funds.
Shareholder Notification of Federal Tax Status
The Intrepid Capital Fund and Intrepid Small Cap Fund designate $1,526,231 (100%) and $30,525 (100%), respectively, of total distributions paid during the fiscal year ended September 30, 2008 as net capital gain distributions eligible for long-term capital gain rates for individual shareholders.
The Intrepid Capital Fund, Intrepid Small Cap Fund, Intrepid Income Fund and Intrepid All Cap Fund designate 53.74%, 27.90%, 0.29% and 100.00%, respectively, of their ordinary income distributions for the period ended September 30, 2008, as qualified dividend income under the Jobs & Growth Tax Relief Reconciliation Act of 2003.
For the period ended September 30, 2008, 54.2%, 26.3%, 0.3% and 100.0% of Intrepid Capital Fund, Intrepid Small Cap Fund, Intrepid Income Fund and Intrepid All Cap Fund dividends paid from net ordinary income, respectively, qualify for the dividends received deduction available to corporate shareholders.
Additional Information Applicable to Foreign Shareholders Only
The Intrepid Capital Fund, Intrepid Small Cap Fund, Intrepid Income Fund and Intrepid All Cap Fund hereby designate 63.18%, 16.96%, 100.00% and 22.71%, respectively, of their ordinary income distributions for the fiscal year as interest-related dividends under Internal Revenue Code Section 871(k)(1)(c).
The Intrepid Capital Fund, the Intrepid Small Cap Fund and the Intrepid Income Fund hereby designate 34.45%, 77.90% and 0.85%, respectively, of its ordinary income distributions as short-term capitalization distributions under Internal Revenue Code Section 871(k)(2)(c).
Intrepid Funds
ADDITIONAL INFORMATION (continued)
March 31, 2009 (Unaudited)
Availability of Quarterly Portfolio Holdings Schedules
The Funds are required to file their complete schedule of portfolio holdings with the SEC for the first and third quarters of each fiscal year on Form N-Q. Once filed, the Funds’ Form N-Q is available without charge, upon request on the SEC’s website (http://www.sec.gov) and may be available by calling 1.866.996.3863. You may also obtain copies at the SEC’s Public Reference Room in Washington, D.C. Information on the operation of the Public Reference Room may be obtained by calling 1.800.SEC.0330.
Proxy Voting Policies and Procedures and Proxy Voting Record (Unaudited)
A description of the policies and procedures that the Funds use to determine how to vote proxies relating to portfolio securities is available without charge, upon request, by calling 1.866.996.3863 and on the SEC’s website (http://www.sec.gov).
The Funds are required to file how they voted proxies related to portfolio securities during the most recent 12-month period ended June 30. Once filed, the information is available without charge, upon request, by calling 1.866.996.3863 and on the SEC’s website (http://www.sec.gov).
(This Page Intentionally Left Blank.)
Board of Trustees
Edward Vandergriff
Mark Travis
Peter Osterman
Roy Clarke
Investment Adviser
Intrepid Capital Management, Inc.
3652 South Third Street, Suite 200
Jacksonville Beach, FL 32250
Independent Registered Public Accounting Firm
Deloitte & Touche LLP
555 East Wells Street
Milwaukee, WI 53202
Legal Counsel
Foley & Lardner LLP
777 East Wisconsin Avenue
Milwaukee, WI 53202
Custodian
U.S. Bank, N.A.
1555 N. RiverCenter Drive, Suite 302
Milwaukee, WI 53212
Distributor
Quasar Distributors, LLC
615 East Michigan Street
Milwaukee, WI 53202
Administrator, Transfer Agent
and Dividend Disbursing Agent
U.S. Bancorp Fund Services, LLC
615 East Michigan Street
Milwaukee, WI 53202
Shareholder/Investor Information
1.866.996.3863
www.intrepidcapitalfunds.com