UNITED STATES
SECURITIES AND EXCHANGE COMMISSION
Washington, D.C. 20549
FORM N-CSR
CERTIFIED SHAREHOLDER REPORT OF REGISTERED
MANAGEMENT INVESTMENT COMPANIES
811-21625
Investment Company Act file number
Intrepid Capital Management Funds Trust
(Exact name of registrant as specified in charter)
1400 Marsh Landing Parkway, Suite 106
Jacksonville Beach, FL 32250
(Address of principal executive offices) (Zip code)
Mark F. Travis
1400 Marsh Landing Parkway, Suite 106
Jacksonville Beach FL 32250
(Name and address of agent for service)
1-904-246-3433
Registrant's telephone number, including area code
Date of fiscal year end: 09/30/2010
Date of reporting period: 03/31/2010
Item 1. Report to Stockholders.
Intrepid Capital Fund
Intrepid Small Cap Fund
Intrepid Income Fund
Intrepid All Cap Fund
Semi-Annual Report
March 31, 2010
Intrepid Capital Fund
Mark F. Travis, President/C.E.O.
April 22, 2010
Dear Fellow Shareholders,
Spring is here and flowers are not the only thing in full bloom! Prices of equity and debt securities in the Intrepid Capital Fund have blossomed as well. I am happy to announce that for the first six months of the fiscal year ending March 31, 2010, The Intrepid Capital Fund (ICMBX) had a total non-annualized return of 11.10%. This is comparable to the return of the all-equity indices (S&P 500, Dow Jones Industrial Average, Russell 2000), which appreciated 11.75%, 13.31% and 13.07% in the same time period.
Standardized performance data for 1 year, 5 year, and Since Inception (01/03/2005) for the period ending March 31, 2010 was 41.84%, 7.31%, and 6.41%, respectively. For the same periods, the S&P 500 Index returns were 49.77%, 1.92%, and 1.57%, the Dow Jones Industrial Average returns were 46.93%, 3.34%, and 2.87%, and the Russell 2000 Index returned 62.76%, 3.36%, and 2.46%. The funds gross expense ratio is 1.72%.
Performance data quoted represents past performance and does not guarantee future results. Investment returns and principal value will fluctuate, and when sold, may be worth more or less than their original cost. Performance current to the most recent month-end may be lower or higher than the performance quoted and can be obtained by calling 866-996-FUND. The Funds impose a 2.00% redemption fee on shares held less than one month. Performance data does not reflect the redemption fee. If it had, returns would be reduced.
The capital markets have generally increased over this time frame, with only brief interludes of price volatility, making it increasingly difficult to find securities that meet our selection criteria. I am pleased with our six month performance, as the total return is what I would have anticipated over a twelve-month period.
It is important to keep several things in mind. First, I would not annualize our six-month performance by multiplying by two. Second, the return of ICMBX in this six-month period is in line with long-term (70+ years) annualized equity-only index returns, as measured by the S&P Index, as calculated by Ibbotson Associates. Third, the indices I referenced above are all-equity, all the time, while ICMBX is a “balanced” fund, seldom investing more than 60% of its assets in the equity markets.
ICMBX continues to garner national attention with its five-star Overall Morningstar Rating as of 3/31/2010 out of 955 Moderate Allocation Funds. (The Overall Morningstar Rating™ for a fund is derived from a weighted average of the funds three year Morningstar Ratings™ metrics, which are based on risk adjusted returns). This recognition reflects our track record which is directly attributable to our disciplined investment process. With share prices meeting our valuation estimates
Intrepid Capital Fund
and a number of bonds being called, our discipline is being tested once again. I will continue to nibble at securities I already own, but would prefer a few big gulps if prices were to fall. So the next time you turn on the television and see that the equity markets have dropped 2% to 3%, think of me as I will have my shopping list ready.
I believe the Fund’s turnover rate has been unusually high, but this is directly correlated to the extreme swings in stock and bond pricing since the fall of 2008. I am hopeful next year’s expected tax increase will help moderate turnover, eventually returning it to our investment firm’s historical average (less than 50% annually).
The fund paid a per share dividend of $0.0388 on March 26, 2010. After the distribution the share price dropped to reflect the payment. ICMBX pays a quarterly dividend that includes all interest income and dividends received by the fund over the preceding calendar quarter. Short and long-term capital gains are distributed annually just before calendar year end.
Thank you for entrusting Intrepid Capital Funds with your hard-earned capital. In a world of almost infinite choice, the decision on your part is not one we take for granted. If there is anything we can do to serve you better, please call us at 1-866-996-FUND.
Best regards,
Mark F. Travis
President
| | |
| Berkshire Hathaway (BRK-B) | 3.1% |
| Tidewater (TDW) | 2.9% |
| Newmont Mining (NEM) | 2.2% |
| CR Bard (BCR) | 2.2% |
| JAKKS Pacific (JAKK) | 2.1% |
| Prestige Brands Holdings (PBH) | 2.1% |
| Foot Locker (FL) | 2.0% |
| Baldwin & Lyons (BWINB) | 1.9% |
| CSG Systems International (CSGS) | 1.8% |
| Oil-Dri Corporation of America (ODC) | 1.8% |
Intrepid Capital Fund
Fund holdings and sector allocations are subject to change and are not recommendations to buy or sell any security.
Opinions expressed are subject to change, are not guaranteed and should not be considered recommendations to buy or sell any security.
Past performance is no guarantee of future results.
The Fund is subject to special risks including volatility and less liquidity due to investments in small- and mid-cap stocks, high yield securities and is considered non-diversified as a result of limiting its holdings to a relatively small number of positions. Investments in debt securities typically decrease in value when interest rates rise. This risk is usually greater for longer term debt securities.
Must be preceded or accompanied by a prospectus.
©2010 Morningstar, Inc. All Rights Reserved. The information contained herein: (1) is proprietary to Morningstar; (2) may not be copied or distributed; and (3) is not warranted to be accurate, complete or timely. Neither Morningstar nor its content providers are responsible for any damages or losses arising from any use of this information. Past performance is no guarantee of future results.
For each fund with at least a three-year history, Morningstar calculates a Morningstar Rating (based on a Morningstar risk-adjusted return measure that accounts for variation in a fund’s monthly performance, including the effects of sales charges, loads, and redemption fees), placing more emphasis on downward variations and rewarding consistent performance. The top 10% of funds in each category receive 5 stars, the next 22.5% receive 4 stars, the next 35% receive 3 stars, the next 22.5% receive 2 stars and the bottom 10% receive 1 star. The Intrepid Capital Fund was rated 5-Stars against the following numbers of U.S. domiciled Moderate Allocation funds over the following time periods: 955 and 777 funds in the last three- and five-years respectively.
The S&P 500 Index is a broad based unmanaged index of 500 stocks, which is widely recognized as representative of the equity market in general. The Dow Jones Industrial Average is an unmanaged index of common stocks comprised of major industrial companies and assumes reinvestment of dividends. The Russell 2000 Index consists of the smallest 2,000 companies in a group of 3,000 U.S. companies in the Russell 3000 Index, as ranked by market capitalization.
One cannot invest directly in an index.
Intrepid Small Cap Fund
Eric Cinnamond,
Small Cap Fund Portfolio Manager
April 22, 2010
Dear Fellow Shareholders,
The Intrepid Small Cap Fund returned 11.26% over the six month period ending March 31, 2010. This result lagged the small cap market, with the Russell 2000 increasing 13.07% during the same six month period.
As mentioned in the last quarterly letter, the Intrepid Capital Small Cap Fund is more defensively positioned than a year ago. Cash remains near the 20% level as we’ve had difficulty replacing recent sales with enough small-cap investments that meet our buy criteria. We continue to search for businesses that we believe are high-quality, have above-average visibility, possess strong or improving balance sheets, and generate attractive free cash flows. Many of the small-cap businesses that have these characteristics are trading at or above our calculated valuations; therefore, our plan is to remain patient and possibly less active until prices become more advantageous to the buyer. We believe that the Fund underperformed its benchmark and its peers during the past six months due to our re latively defensive position.
When discussing whether small-cap valuations are attractive or expensive, some in the investment industry look to the risk premium for guidance. In the academic world, the risk premium is defined as the expected rate of return of a risky investment, such as a small-cap stock, over a “risk-free” investment, such as a Treasury bill. As the theory goes, when the risk premium is high, investors are getting paid an above average rate of return to take risk (the investment is attractively priced). Conversely, when the risk premium is low, investors are getting paid a below average rate of return for assuming risk (the investment is expensive).
In our opinion, this academic formula doesn’t measure the attractiveness of risky assets precisely due to the uncertainty of its two variables – the expected rate of return and the risk-free rate. Although the academic world also has a formula to help investors determine the expected rate of return of a risky investment, in practice, the expected rate of return is very subjective. Furthermore, the risk-free rate is often volatile in the short-term, which makes it difficult to apply to any long-term decision making model. For example, in 2007, T-bills were yielding 5.00%. Today, T-bills are yielding a measly 0.15%. Which risk-free rate should an investor use? Where will risk free rates be in 2011? No one knows for certain.
When risk-free rates are historically low, as they are now, the risk premium may appear adequate; however, after considering the absolute expected return of a particular investment, the risk premium may actually seem too low. For example, many junk bonds are now only yielding in the 5% to 6% range. This may be an attractive yield versus today’s T-bill rate, but from an absolute perspective, it is relatively low given the risks the investor is taking. Therefore, even when risk
Intrepid Small Cap Fund
premiums seem reasonable based on the academic definition, they may not be sufficient given the real world risks associated with the underlying investment.
When selecting small cap equities for the Fund, we view the expected rate of return on our investments from an absolute perspective, not simply as it compares to the current risk-free rate. Specifically, we attempt to generate a required rate of return on our small-cap investments that is commensurate with the risks we are taking as a partial owner of the underlying business. Although we consider the range of expected risk-free rates in our valuation, we are more concerned about the risks to the business’s cash flow and balance sheet. These operating and financial risks are the main variables we use in determining our expected or required rate of return.
The required rate of return we choose is essential in our valuation process as it is an important variable that we use to discount a business’s free cash flow. Historically, our required rate of return for most of our small-cap investments has been 10% to 15%, depending on the risks of the business (the higher the risk, the higher the required rate of return).
Despite historically low risk-free rates over the past year, we have not altered our required rate of return when valuing small-cap businesses. We believe small-cap investors should demand a healthy return premium considering the amount of business risk the investor is assuming. As we continue to use a 10% to 15% required rate of return when valuing small-cap businesses, fewer investments are selling at what we believe are sufficient discounts to intrinsic value.
When investing in small-cap stocks, there is a time to take risk and there is a time to step back and wait for better opportunities. In 2009, risk premiums in small-cap stocks were very high and valuations were attractive – we took risk as we believed we were being paid to do so. As of April 22, 2010, the Russell 2000 has increased 117% from its March 2009 lows. The small-cap investment environment has changed considerably. At current prices, we believe that risk premiums in the small-cap market on average are not high enough to provide investors with an adequate margin of safety. We base this assumption on our belief that implied return expectations on many small-cap stocks have declined to absolute levels that are insufficient relative to the risk assumed. Furthe rmore, we believe that risk-free rates will not remain at historically low levels indefinitely. As a result, we have not used current risk-free rates in our calculation of small-cap risk premiums.
Assuming small-cap risk premiums remain below our comfort level, we expect the portfolio to remain more defensively positioned than it was in 2009. Because of this defensive stance, we would expect the portfolio to continue to lag its peers and the Russell 2000 assuming the small-cap market continues its aggressive advance higher. Furthermore, as we tend to invest in what we believe are higher quality small-cap businesses, the Fund’s equity holdings could underperform assuming the more volatile and riskier sections of the small cap market continue their sprint higher.
Intrepid Small Cap Fund
In the April 19, 2010 edition of Barron’s, there was an interesting article written by Kopin Tan that broke out performance of small-cap stocks by their return on equity. In the first quarter of 2010, the top fifth of small-cap stocks with the highest return on equity performed poorly (up 7.4%) relative to the other 80% of small cap stocks in the Russell 2000. The small-cap stocks with the lowest return on equity, the bottom fifth of the Russell 2000, performed well relatively and were up 10.1%. The small-cap stocks that performed the best were those that did not make money (up 11.1%)! Regardless of how well lower-quality small cap stocks perform, especially those that are not profitable, you will not find us investing your capital in these types of businesses.
Refraining from speculating has hurt the Fund’s relative performance during certain periods of market enthusiasm; however, it has been essential to providing our shareholders with what we believe have been attractive risk-adjusted returns since inception. Our defensive posture is not an attempt on our part to time the market or to look uncompetitive, but it is a direct result of our strict valuation discipline of only buying businesses that we believe are undervalued. Furthermore, we strongly believe that to have superior long-term results, there will be periods where less than average short-term results are not only prudent, but necessary.
Although we consider small-caps fairly priced and in some cases expensive (valuations look rich in more cyclical and lower-quality names), we are not sitting idle hoping for volatility to return. As we patiently wait for the small-cap market to present a broader range of opportunities, we are working hard to find what we believe are attractively-priced small-cap equities. Although it has become more difficult to discover these small-cap gems, we continue to find interesting ideas that we believe are either misunderstood or underfollowed. A good example is one of our most recent purchases, EPIQ Systems (ticker: EPIQ).
EPIQ Systems is a leading technology provider to the legal industry. EPIQ’s focus is on bankruptcy administration, litigation and class action settlements. We believe its business will benefit from the higher level of bankruptcies, which we believe have been temporarily depressed from 2006-2008 due to a strong economy and changes in bankruptcy laws in 2005. Furthermore, based on our calculations, EPIQ’s earnings are not reflecting the true potential of its Chapter 7 business.
EPIQ Systems provides Chapter 7 bankruptcy trustees, at no cost, with the products (software) and services needed to process bankruptcies. In return, EPIQ receives deposit based fees from the liquidated proceeds. The fees received vary and depend mainly on the level of deposits being held by the trustees and the interest rates on these deposits. Chapter 7 deposit growth has been strong as the deposit base is up 25% year over year and recently reached an all-time record of $2 billion. However, abnormally low interest rates have masked this strong deposit performance and have cut this potential source of revenue growth considerably. We believe that when interest rates on these bank deposits rise, this business will improve.
Intrepid Small Cap Fund
We believe the normalized free cash flow of EPIQ Systems is higher than its current earnings run rate. Selling at 6.5x EBITDA (2010 estimate) and 12.0x our normalized free cash flow estimate, we believe EPIQ Systems is an attractively-priced software business, especially given its established market leader position. With a strong balance sheet and excess free cash flow, we could also expect EPIQ Systems to reward shareholders with a newly initiated dividend in the near future.
We had several small purchases and sales during the first quarter as we continue to reduce or exit positions that have reached our valuations and initiate new positions that are selling at discounts to what we believe the underlying businesses are worth. We expect this rotation to continue as long as the small-cap market marches higher. If the small-cap market declines – something we’d actually welcome – we will be ready with our potential buy list in hand along with the Fund’s available cash balance.
Sincerely,
Eric Cinnamond
Small Cap Portfolio Manager
Past performance is not a guarantee of future results.
Opinions expressed are subject to change, are not guaranteed and should not be considered recommendations to buy or sell any security.
The Fund is subject to special risks including volatility and less liquidity due to investments in smaller companies and is considered nondiversified as a result of limiting its holdings to a relatively small number of positions.
Must be preceded or accompanied by a prospectus.
The Russell 2000 Index consists of the smallest 2,000 companies in a group of 3,000 U.S. Companies in the Russell 3000 Index, as ranked by market capitalization. You cannot invest directly in an index.
Cash flow measures the cash generating capability of a company by adding non-cash charges (e.g. depreciation) and interest expense to pretax income.
EBITDA: Earnings Before Interest, Taxes, Depreciation and Amortization. An approximate measure of a company’s operating cash flow based on data from the company’s income statement.
Fund holdings and sector allocations are subject to change and should not be considered a recommendation to buy or sell any security. For a complete list of fund holdings, please see the Schedule of Investments included in this report.
Intrepid Income Fund
 |  |
| Jason Lazarus, | Ben Franklin, |
| Research Analyst | Research Analyst |
April 22, 2010
Dear Fellow Shareholders,
The high-yield market posted its fifth consecutive quarterly gain during the three month period ended March 31, 2010. As spreads have continued to compress, companies have taken advantage by issuing record levels of high-yield debt. March marked the highest ever monthly issuance at $36.2 billion. Many companies that looked headed toward bankruptcy just a few quarters ago have been able to refinance maturing debt. The ability of the market to absorb this level of issuance demonstrates that investors still have large appetites for high-yield risk. Combined with high-yield fund net inflows in 30 of the last 33 weeks, managers are increasingly reaching for yield. At Intrepid Capital, we believe these investors are misguided. By living through the last decade, many of us know what happens when investors get greedy.
We intend to keep the portfolio’s duration, a measure of sensitivity to changes in interest rates, on the short end due to the historically low risk-free rates available in the market. In line with this strategy, we have not invested in any new issues because these bonds typically mature in more than seven years. As the companies in the Intrepid High Yield portfolio have called (repurchased) their bonds from us and issued longer-dated, lower-coupon notes, our cash levels have increased. Our policy is to not force invest this cash into credits that do not meet our criteria. Thus, we were not invited to the party that was the high-yield bond market in the six months ending March 31, 2010. The Intrepid Income Fund returned 5.18% over the six-month period versus the Bank of Ameri ca/Merrill Lynch High Yield Master II Index return of 11.15%
During the period, we invested our clients’ hard-earned capital only in bonds that we felt offered attractive risk-adjusted returns. We established positions in AEP Industries 7.875% due 3/15/2013, Interline Brands 8.125% due 6/15/2014, Spartan Stores 3.375% convertible bond putable 5/15/2014, Mobile Services Group 9.75% due 8/01/2014, Valassis Communications 8.25% due 3/01/2015, and Phillips Van Heusen 8.125% due 5/01/2013.
Additionally, our positions in Eye Care Centers, Prestige Brands (ticker: PBH), Thermo Fisher Scientific (ticker: TMO) Constellation Brands (ticker: STZ), and Central Garden (ticker: CENT) were all repurchased by the issuers. Our Home Depot floating-rate bonds matured in December. We exited our positions in two bonds, American Real Estate Partners (ticker: IEP) and Neenah Paper (ticker: NP), as well as reduced our position in Chemed 1.875% convertible bonds due 5/15/2014. In the case of the two former bonds, we continued to follow our strategy of upgrading
Intrepid Income Fund
the quality of the portfolio as high-yield markets grind higher. With the Chemed position, the bond had rallied so much that felt it necessary to pare back the position in search of other ideas. As we find more appropriately priced bond ideas, we will look to exit the CHE position. In all of these scenarios, we simply believe we were not being well compensated for the risks being undertaken.
In our letters to shareholders, we like to give added detail on one of our newly entered positions, in this case Interline Brands. Interline Brands (ticker: IBI) is a national distributor and marketer of maintenance, repair and operations products headquartered in Jacksonville, FL. The company stocks over 100,000 products used in plumbing, janitorial and sanitary, electrical, lighting, hardware, security, heating, ventilation and air conditioning, as well as other miscellaneous products. 75% of the company’s sales are to the facilities maintenance end-market, which has historically been less cyclical than other markets such as manufacturing and new construction. IBI has solid credit metrics that will improve as sales demand returns. Total debt is low at just over $300 million . The balance sheet is strong, accounts receivable and inventory alone are greater than total debt, and the company has $63 million in cash. Additionally, IBI has a solid record of debt repayment and conservative uses of free cash. We believe the yield on this note is attractive and established a half weight, increasing the allocation if the bonds cheapen.
As we have noted in prior letters, we search for attractive absolute returns where we believe we are being well compensated for assuming risk. We will continue to be prudent stewards of our clients’ capital by not following the herd.
Sincerely,
 |  |
| Ben Franklin | Jason Lazarus |
| Research Analyst | Research Analyst |
Past performance is no guarantee of future results.
The Fund is subject to special risks including volatility due to investments in high yield securities and is considered non-diversified as a result of limiting its holdings to a relatively small number of positions. Investments in debt securities typically decrease in value when interest rates rise. This risk is usually greater for longer term debt securities.
Must be preceded or accompanied by a prospectus.
The Bank of America/Merrill Lynch High Yield Master II Index is Merrill Lynch’s broadest high yield index, and as such is comparable with the broad indices published by other investment banks. You cannot invest directly in an index.
Fund holdings and sector allocations are subject to change and are not recommendations to buy or sell any security. Please refer to the Schedule of Investments included in this report for a complete list of fund holdings.
Opinions expressed are subject to change, are not guaranteed and should not be considered recommendations to buy or sell any security.
Intrepid All Cap Fund
Greg Estes,
All Cap Fund Portfolio Manager
April 22, 2010
Dear Fellow Shareholders,
For the first six months of the fiscal year ending March 31st, 2010, the Intrepid All Cap Fund gained 12.93%. This result was slightly ahead of the S&P 500 Index, which returned 11.75% over the same period. Barring a bit of a pullback in the month of February, the equity market continued its unabated upward progress for the fourth consecutive quarter. Over the last twelve months, the S&P 500 Index has moved from a low of 783.32 on April 1, 2009 to a high of 1180.69 on March 25, 2010. What makes this bull market period stand out from others since 1980 is not the absolute increase. The bull markets periods from 1995 to 2000 and from 2003 through 2007 were bigger. Rather, it is the steepness of the run in such a short time. While we are pleased to generate solid results for our clients, we grow con cerned when the market moves so quickly in such a relatively short period of time. We prefer to see stocks appreciate based upon improvements in their respective underlying business fundamentals. To be fair, there were indeed improvements among many companies in the back half of 2009; however, much of that growth in earnings can be attributed to cost cutting. So, we are left to wonder whether the market’s run-up is truly due to better underlying performance or to the anticipation of better performance over the next year. We listen to many conference calls when following our investments, and many of the executives on those calls remain cautious about 2010. We think that caution should be first and foremost in the mind of the value investor.
A related reason for caution is in the shrinking risk premium, which goes hand-in-hand with the equity market’s run-up. The Price-Earnings (P/E) ratio for a stock tells us how much an investor is willing to pay for $1 in company net income. The higher the P/E ratio, the more expensive the stock is, and this is accompanied by an expectation of faster earnings growth. Just as we can view an individual stock’s P/E ratio, we can also look at an index’s P/E. Over the last ten years, the P/E ratio for the S&P 500 Index has fluctuated between a high of 29.4 times at the end of the internet bubble in April 2000 to a low of 10.0 times earnings in March 2009. Today, that ratio is 18.7 times, which is close to the average P/E (19.1 times) over that 10 year time frame.� 60; We can say that a dollar of earnings was much cheaper a year ago than it is today. We can also say that we are not being compensated as much today to take on risk as we were a year ago; however you look at it, taking on risk is not as rewarding as it was just a short time ago. In this environment, it is challenging to find new ideas that trade at discounts to intrinsic values.
Intrepid All Cap Fund
Given the performance over the period, nearly all stocks in the Fund composite generated a positive return. We will single out one investment in particular which contributed beneficially to the portfolio’s performance. Endo Pharmaceuticals (ticker: ENDP), a specialty drug company with a pain management franchise, exceeded the “Street’s” estimated earnings for the last quarter of 2009. More importantly, the market liked the company’s much improved forecast for 2010. Endo is a focused, niche company with a solid barrier to entry in the form of patent-protected drugs. It operates within a well-controlled cost structure. Its 2010 forecast shows improvement coming not only from cost controls, but also from sales growth in its Lidoderm patch, whic h is designed to alleviate after-shingles pain. We think that companies like Endo, which have entrenched products and stable cash flows, are reasonable investments that can perform well whether we have a rapid economic recovery or not.
On the flip side, our primary portfolio detractor for the quarter was Total Systems Services (ticker: TSS). More commonly referred to as TSYS, this business sells outsourcing services to banks to handle all aspects of electronic payment processing. If you have a credit card, there is a high likelihood that TSYS handles the processing of any transaction on the card as well as the account management, billing, and statements. It also handles merchant acquisition services, which is the other side (i.e., the seller) of the transaction on behalf of banks and their business customers. The challenge in the first quarter for TSYS can be boiled down to one major problem; transaction volume in the U.S. has not rebounded as much as management hoped and the executives at TSYS are very cautious about furth er improvement in 2010. In other words, folks in the U.S. are using their credit cards, corporate cards and/or debit cards with less frequency than they had been in the past. In TSYS’s case, it is not so much the total amount of spending but the level of transaction frequency that is the problem. In spite of this setback, we believe there is much to like in TSYS. It has a clean balance sheet with no net debt, and it is a market leader in payment processing services. We believe that the long-term thesis still holds for TSYS: the Company has an opportunity to capture new bank and corporate clients globally, and that coupled with increasing usage of electronic forms of payment outside the U.S., will mean more business for TSYS. At some point, improved transaction volume in the U.S. will also boost cash flows. We are maintaining this position in our portfolios and will continue to monitor its performance.
To close, we would like to review the average discount within the portfolio. Each investment will have a discount to intrinsic value which is based upon its market price and our calculated intrinsic value. The average discount at end of the first quarter for the All Cap composite was 7%, which means that more stocks within the
Intrepid All Cap Fund
portfolio are approaching fair value. We will continue to exercise care in putting our clients’ money to work by searching for stocks which trade at discounts to intrinsic value.
Sincerely,
Greg Estes
All Cap Fund Portfolio Manager
Past performance is no guarantee of future results.
The Fund is subject to special risks including volatility and less liquidity due to investments in small- and mid-cap stocks and is considered non-diversified as a result of limiting its holdings to a relatively small number of positions.
Must be preceded or accompanied by a prospectus
The S&P 500 Index is a broad based unmanaged index of 500 stocks, which is widely recognized as representative of the equity market in general. You cannot invest directly in an index.
Price to earnings ratio is a common tool for comparing the prices of different common stocks and is calculated by dividing the current market price of a stock by the earnings per share.
Fund holdings and sector allocations are subject to change and are not recommendations to buy or sell any security. Please refer to the Schedule of Investments included in this report for a complete list of fund holdings.
Opinions expressed are subject to change, are not guaranteed and should not be considered recommendations to buy or sell any security.
Intrepid Funds
EXPENSE EXAMPLE
March 31, 2010 (Unaudited)
As a shareholder of the Intrepid Capital Management Funds Trust (the “Funds”), you incur ongoing costs, including management fees; distribution and/or service fees; and other expenses incurred by the Funds. This example is intended to help you understand your ongoing costs (in dollars) of investing in the Funds and to compare costs with the ongoing costs of investing in other mutual funds.
The example is based on an investment of $1,000 invested at the beginning of the period and held the entire period of October 1, 2009 (November 3, 2009 for the Intrepid Small Cap Fund Institutional Class) through March 31, 2010.
ACTUAL EXPENSES
The first line of the following table provides information about actual account values and actual expenses. Although the Funds charge no sales load or transaction fees, you will be assessed fees for outgoing wire transfers, returned checks or stop payment orders at prevailing rates charged by U.S. Bancorp Fund Services, LLC, the Funds’ transfer agent. If you request a redemption be made by wire transfer, currently a $15.00 fee is charged by the Funds’ transfer agent. To the extent that a Fund invests in shares of other investment companies as part of its investment strategy, you will indirectly bear your proportionate share of any fees and expenses charged by the underlying funds in which the Fund invests in addition to the expenses of the Fun d. Actual expenses of the underlying funds are expected to vary among the various underlying funds. These expenses are not included in the following example. The example includes, but is not limited to, management fees, shareholder servicing fees, distribution fees, fund accounting, custody and transfer agent fees. However, the example below does not include portfolio trading commissions and related expenses, interest expense and other extraordinary expenses as determined under generally accepted accounting principles. You may use the information in this line, together with the amount you invested, to estimate the expenses that you paid over the period. Simply divide your account value by $1,000 (for example, an $8,600 account value divided by $1,000 = 8.6), then multiply the result by the number in the first line under the heading entitled “Expenses Paid During Period” to estimate the expenses you paid on your account during this period.
HYPOTHETICAL EXAMPLE FOR COMPARISON PURPOSES
The second line of the following table provides information about hypothetical account values and hypothetical expenses based on the Funds’ actual expense ratio and an assumed rate of return of 5% per year before expenses, which is not the Funds’ actual return. The hypothetical account values and expenses may not be used to estimate the actual ending account balance or expenses you paid for the period. You may use this information to compare the ongoing costs of investing in the Funds and other funds. To do so, compare this 5% hypothetical example with the 5% hypothetical examples that appear in the shareholder reports of the other funds.
Intrepid Funds
EXPENSE EXAMPLE (continued)
March 31, 2010 (Unaudited)
Please note that the expenses shown in the table are meant to highlight your ongoing costs only and do not reflect any transactional costs, such as sales charges (loads), redemption fees, or exchange fees. Therefore, the second line of the table is useful in comparing ongoing costs only, and will not help you determine the relative costs of owning different funds. In addition, if these transactional costs were included, your costs would have been higher.
INTREPID CAPITAL FUND
| | | | | | | | | Expenses Paid | |
| | | Beginning | | | Ending | | | During Period* | |
| | | Account Value | | | Account Value | | | October 1, 2009 - | |
| | | October 1, 2009 | | | March 31, 2010 | | | March 31, 2010 | |
| Actual | | $ | 1,000.00 | | | $ | 1,111.00 | | | $ | 7.84 | |
| Hypothetical (5% return | | | | | | | | | | | | |
| before expenses) | | | 1,000.00 | | | | 1,017.50 | | | | 7.49 | |
| * | Expenses are equal to the Fund’s annualized expense ratio of 1.49%, multiplied by the average account value over the period, multiplied by 182/365 to reflect the period. |
INTREPID SMALL CAP FUND – INVESTOR CLASS
| | | | | | | | | Expenses Paid | |
| | | Beginning | | | Ending | | | During Period* | |
| | | Account Value | | | Account Value | | | October 1, 2009 - | |
| | | October 1, 2009 | | | March 31, 2010 | | | March 31, 2010 | |
| Actual | | $ | 1,000.00 | | | $ | 1,112.60 | | | $ | 7.43 | |
| Hypothetical (5% return | | | | | | | | | | | | |
| before expenses) | | | 1,000.00 | | | | 1,017.90 | | | | 7.09 | |
| * | Expenses are equal to the Fund’s annualized expense ratio of 1.41%, multiplied by the average account value over the period, multiplied by 182/365 to reflect the period. |
INTREPID SMALL CAP FUND – INSTITUTIONAL CLASS
| | | | | | | | | Expenses Paid | |
| | | Beginning | | | Ending | | | During the Period* | |
| | | Account Value | | | Account Value | | | November 3, 2009 - | |
| | | November 3, 2009 | | | March 31, 2010 | | | March 31, 2010 | |
| Actual | | $ | 1,000.00 | | | $ | 1,124.80 | | | $ | 4.92 | |
| Hypothetical (5% return | | | | | | | | | | | | |
| before expenses) | | | 1,000.00 | | | | 1,015.51 | | | | 4.67 | |
| * | Expenses are equal to the Fund’s annualized expense ratio of 1.15%, multiplied by the average account value over the period, multiplied by 147/365 to reflect the period. |
Intrepid Funds
EXPENSE EXAMPLE (continued)
March 31, 2010 (Unaudited)
INTREPID INCOME FUND
| | | | | | | | | Expenses Paid | |
| | | Beginning | | | Ending | | | During Period* | |
| | | Account Value | | | Account Value | | | October 1, 2009 - | |
| | | October 1, 2009 | | | March 31, 2010 | | | March 31, 2010 | |
| Actual | | $ | 1,000.00 | | | $ | 1,051.80 | | | $ | 6.39 | |
| Hypothetical (5% return | | | | | | | | | | | | |
| before expenses) | | | 1,000.00 | | | | 1,018.70 | | | | 6.29 | |
| * | Expenses are equal to the Fund’s annualized expense ratio of 1.25%, multiplied by the average account value over the period, multiplied by 182/365 to reflect the period. |
INTREPID ALL CAP FUND
| | | | | | | | | Expenses Paid | |
| | | Beginning | | | Ending | | | During Period* | |
| | | Account Value | | | Account Value | | | October 1, 2009 - | |
| | | October 1, 2009 | | | March 31, 2010 | | | March 31, 2010 | |
| Actual | | $ | 1,000.00 | | | $ | 1,129.30 | | | $ | 10.35 | |
| Hypothetical (5% return | | | | | | | | | | | | |
| before expenses) | | | 1,000.00 | | | | 1,015.21 | | | | 9.80 | |
| * | Expenses are equal to the Fund’s annualized expense ratio of 1.95%, multiplied by the average account value over the period, multiplied by 182/365 to reflect the period. |
Intrepid Capital Fund
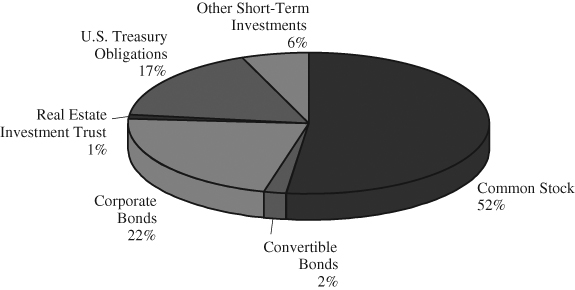
ALLOCATION OF PORTFOLIO HOLDINGS
March 31, 2010 (Unaudited)
INTREPID CAPITAL FUND
(as a % of total investments)
COMPONENTS OF PORTFOLIO HOLDINGS
| Common Stocks | | $ | 58,548,249 | |
| Convertible Bonds | | | 1,988,091 | |
| Corporate Bonds | | | 25,104,707 | |
| Real Estate Investment Trust | | | 959,045 | |
| U.S. Treasury Obligations | | | 19,993,700 | |
| Other Short-Term Investments | | | 6,519,273 | |
| Total | | $ | 113,113,065 | |
Intrepid Small Cap Fund
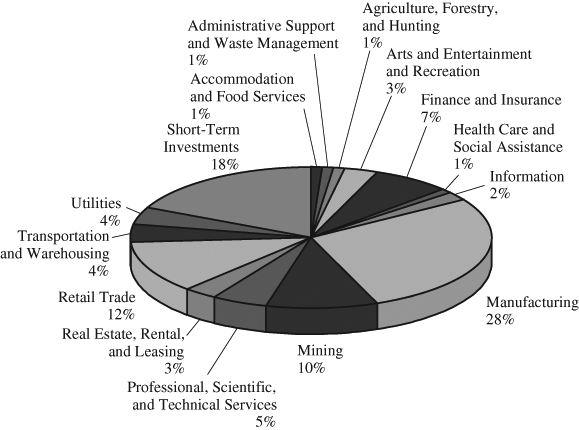
SECTOR ALLOCATION OF PORTFOLIO HOLDINGS
March 31, 2010 (Unaudited)
INTREPID SMALL CAP FUND
(as a % of total investments)
COMPONENTS OF PORTFOLIO HOLDINGS
| Accommodation and Food Services | | $ | 1,755,203 | |
| Administrative Support and Waste Management | | | 4,111,486 | |
| Agriculture, Forestry, and Hunting | | | 2,374,800 | |
| Arts and Entertainment and Recreation | | | 10,613,087 | |
| Finance and Insurance | | | 25,745,410 | |
| Health Care and Social Assistance | | | 1,903,300 | |
| Information | | | 9,560,963 | |
| Manufacturing | | | 110,309,158 | |
| Mining | | | 39,052,131 | |
| Professional, Scientific, and Technical Services | | | 20,080,435 | |
| Real Estate, Rental, and Leasing | | | 11,657,085 | |
| Retail Trade | | | 48,711,901 | |
| Transportation and Warehousing | | | 16,337,205 | |
| Utilities | | | 14,870,664 | |
| Short-Term Investments | | | 75,152,832 | |
| Total | | $ | 392,235,660 | |
Intrepid Income Fund
ALLOCATION OF PORTFOLIO HOLDINGS
March 31, 2010 (Unaudited)
INTREPID INCOME FUND
(as a % of total investments)
COMPONENTS OF PORTFOLIO HOLDINGS
| Convertible Bonds | | $ | 5,682,395 | |
| Corporate Bonds | | | 43,471,333 | |
| U.S. Treasury Obligations | | | 13,997,929 | |
| Other Short-Term Investments | | | 3,558,324 | |
| Total | | $ | 66,709,981 | |
Intrepid All Cap Fund
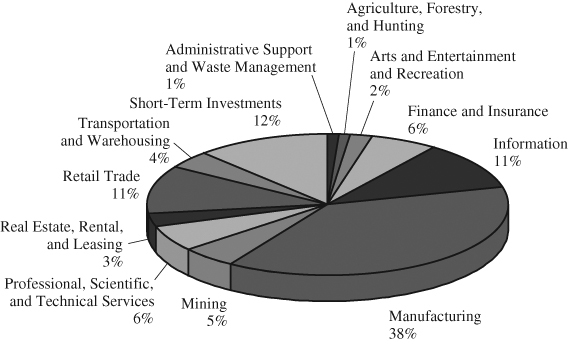
SECTOR ALLOCATION OF PORTFOLIO HOLDINGS
March 31, 2010 (Unaudited)
INTREPID ALL CAP FUND
(as a % of total investments)
COMPONENTS OF PORTFOLIO HOLDINGS
| Administrative Support and Waste Management | | $ | 97,660 | |
| Agriculture, Forestry, and Hunting | | | 192,900 | |
| Arts and Entertainment and Recreation | | | 436,802 | |
| Finance and Insurance | | | 1,262,467 | |
| Information | | | 2,234,952 | |
| Manufacturing | | | 7,369,005 | |
| Mining | | | 1,073,628 | |
| Professional, Scientific, and Technical Services | | | 1,085,977 | |
| Real Estate, Rental, and Leasing | | | 562,397 | |
| Retail Trade | | | 2,112,176 | |
| Transportation and Warehousing | | | 852,819 | |
| Short-Term Investments | | | 2,299,289 | |
| Total | | $ | 19,580,072 | |
Intrepid Capital Fund
SCHEDULE OF INVESTMENTS
March 31, 2010 (Unaudited)
| | | Shares | | | Value | |
| COMMON STOCKS - 51.58% | | | | | | |
Animal Production - 0.61% | | | | | | |
| HQ Sustainable Maritime Industries, Inc. (a) | | | 115,700 | | | $ | 694,200 | |
Beverage and Tobacco | | | | | | | | |
| Product Manufacturing - 2.96% | | | | | | | | |
| Brown Forman Corp. - Class B | | | 30,530 | | | | 1,815,009 | |
| Constellation Brands, Inc. (a) | | | 94,200 | | | | 1,548,648 | |
| | | | | | | | 3,363,657 | |
| Broadcasting (except Internet) - 1.71% | | | | | | | | |
| Comcast Corp. - Class A | | | 103,120 | | | | 1,940,718 | |
Chemical Manufacturing - 3.22% | | | | | | | | |
| Endo Pharmaceuticals Holdings, Inc. (a) | | | 54,300 | | | | 1,286,367 | |
| Prestige Brands Holdings, Inc. (a) | | | 262,606 | | | | 2,363,454 | |
| | | | | | | | 3,649,821 | |
| Clothing and Clothing Accessories Stores - 1.99% | | | | | | | | |
| Foot Locker, Inc. | | | 150,000 | | | | 2,256,000 | |
Computer and Electronic | | | | | | | | |
| Product Manufacturing - 4.56% | | | | | | | | |
| CSG Systems International, Inc. (a) | | | 97,325 | | | | 2,039,932 | |
| Dell, Inc. (a) | | | 77,605 | | | | 1,164,851 | |
| Mocon, Inc. | | | 26,300 | | | | 280,621 | |
| Tellabs, Inc. | | | 223,015 | | | | 1,688,224 | |
| | | | | | | | 5,173,628 | |
| Data Processing, Hosting | | | | | | | | |
| and Related Services - 1.38% | | | | | | | | |
| Automatic Data Processing, Inc. | | | 35,172 | | | | 1,564,099 | |
Food and Beverage Stores - 1.79% | | | | | | | | |
| Spartan Stores, Inc. | | | 3,677 | | | | 53,022 | |
| Weis Markets, Inc. | | | 54,430 | | | | 1,979,075 | |
| | | | | | | | 2,032,097 | |
| Food Manufacturing - 2.02% | | | | | | | | |
| Kraft Foods, Inc. | | | 32,677 | | | | 988,152 | |
| Sara Lee Corp. | | | 93,800 | | | | 1,306,634 | |
| | | | | | | | 2,294,786 | |
See notes to financial statements.
Intrepid Capital Fund
SCHEDULE OF INVESTMENTS (continued)
March 31, 2010 (Unaudited)
| | | Shares | | | Value | |
| COMMON STOCKS - 51.58% (continued) | | | | | | |
Insurance Carriers and Related Activities - 6.35% | | | | | | |
| Baldwin & Lyons, Inc. | | | 91,273 | | | $ | 2,198,767 | |
| Berkshire Hathaway, Inc. - Class B (a) | | | 42,500 | | | | 3,453,975 | |
| The Travelers Companies, Inc. | | | 28,796 | | | | 1,553,256 | |
| | | | | | | | 7,205,998 | |
| Merchant Wholesalers, Nondurable Goods - 1.42% | | | | | | | | |
| Central Garden & Pet Co. (a) | | | 176,080 | | | | 1,612,893 | |
Mining (except Oil and Gas) - 2.90% | | | | | | | | |
| Newmont Mining Corp. | | | 49,645 | | | | 2,528,420 | |
| Pan American Silver Corp. (a)(b) | | | 33,135 | | | | 767,075 | |
| | | | | | | | 3,295,495 | |
| Miscellaneous Manufacturing - 6.56% | | | | | | | | |
| CR Bard, Inc. | | | 28,600 | | | | 2,477,332 | |
| Jakks Pacific, Inc. (a) | | | 183,734 | | | | 2,397,729 | |
| Semperit AG Holding (b) | | | 13,265 | | | | 517,965 | |
| Oil-Dri Corporation of America | | | 105,847 | | | | 2,046,022 | |
| | | | | | | | 7,439,048 | |
| Motor Vehicle and Parts Dealers - 1.05% | | | | | | | | |
| Midas Group, Inc. (a) | | | 105,500 | | | | 1,190,040 | |
Performing Arts, Spectator | | | | | | | | |
| Sports, and Related Industries - 2.61% | | | | | | | | |
| Dover Motorsports, Inc. | | | 470,850 | | | | 969,951 | |
| International Speedway Corp. | | | 77,493 | | | | 1,996,995 | |
| | | | | | | | 2,966,946 | |
| Professional, Scientific, | | | | | | | | |
| and Technical Services - 4.35% | | | | | | | | |
| EPIQ Systems, Inc. (a) | | | 162,536 | | | | 2,020,323 | |
| Pharmaceutical Product Development, Inc. | | | 52,900 | | | | 1,256,375 | |
| Total Systems Services, Inc. | | | 105,920 | | | | 1,658,707 | |
| | | | | | | | 4,935,405 | |
| Publishing Industries (except Internet) - 1.00% | | | | | | | | |
| John Wiley & Sons, Inc. - Class A | | | 26,350 | | | | 1,140,428 | |
See notes to financial statements.
Intrepid Capital Fund
SCHEDULE OF INVESTMENTS (continued)
March 31, 2010 (Unaudited)
| | | Shares | | | Value | |
| COMMON STOCKS - 51.58% (continued) | | | | | | |
Rental and Leasing Services - 1.35% | | | | | | |
| Rent-A-Center, Inc. (a) | | | 64,800 | | | $ | 1,532,520 | |
Support Activities for Transportation - 2.84% | | | | | | | | |
| Tidewater, Inc. | | | 68,200 | | | | 3,223,814 | |
Telecommunications - 0.91% | | | | | | | | |
| Telephone & Data Systems, Inc. | | | 30,625 | | | | 1,036,656 | |
| TOTAL COMMON STOCKS | | | | | | | | |
| (Cost $50,325,022) | | | | | | | 58,548,249 | |
| | | | | | | | | |
| | | Principal | | | | | |
| | | Amount | | | | | |
| CONVERTIBLE BONDS - 1.75% | | | | | | | | |
Merchant Wholesalers, Nondurable Goods - 0.60% | | | | | | | | |
| Spartan Stores, Inc. | | | | | | | | |
| 3.375%, 05/15/2027 | | $ | 793,000 | | | | 686,936 | |
Miscellaneous Manufacturing - 0.56% | | | | | | | | |
| Jakks Pacific, Inc. | | | | | | | | |
| 4.625%, 06/15/2023 | | | 635,000 | | | | 630,238 | |
Oil and Gas Extraction - 0.59% | | | | | | | | |
| Bill Barrett Corp. | | | | | | | | |
| 5.000%, 03/15/2028 | | | 682,000 | | | | 670,917 | |
| TOTAL CONVERTIBLE BONDS | | | | | | | | |
| (Cost $1,904,394) | | | | | | | 1,988,091 | |
| | | | | | | | | |
| CORPORATE BONDS - 22.11% | | | | | | | | |
Apparel Manufacturing - 2.16% | | | | | | | | |
| Perry Ellis International, Inc. | | | | | | | | |
| 8.875%, 09/15/2013 | | | 622,000 | | | | 635,217 | |
| Phillips Van Heusen Corp. | | | | | | | | |
| 8.125%, 05/01/2013 | | | 221,000 | | | | 224,591 | |
| Phillips-Van Heusen Corp. | | | | | | | | |
| 7.250%, 02/15/2011 | | | 1,589,000 | | | | 1,592,973 | |
| | | | | | | | 2,452,781 | |
See notes to financial statements.
Intrepid Capital Fund
SCHEDULE OF INVESTMENTS (continued)
March 31, 2010 (Unaudited)
| | | Principal | | | | |
| | | Amount | | | Value | |
| CORPORATE BONDS - 22.11% (continued) | | | | | | |
Chemical Manufacturing - 0.04% | | | | | | |
| Church & Dwight, Inc. | | | | | | |
| 6.000%, 12/15/2012 | | $ | 46,000 | | | $ | 46,690 | |
Clothing and Clothing Accessories Stores - 2.93% | | | | | | | | |
| Collective Brands, Inc. | | | | | | | | |
| 8.250%, 08/01/2013 | | | 1,991,000 | | | | 2,030,820 | |
| Hanesbrands, Inc. | | | | | | | | |
| 6.508%, 12/15/2014 (c) | | | 1,359,000 | | | | 1,297,845 | |
| | | | | | | | 3,328,665 | |
| Construction of Buildings - 1.75% | | | | | | | | |
| Blount, Inc. | | | | | | | | |
| 8.875%, 08/01/2012 | | | 1,968,000 | | | | 1,990,140 | |
Data Processing, Hosting | | | | | | | | |
| and Related Services - 1.08% | | | | | | | | |
| Affiliated Computer Services, Inc. | | | | | | | | |
| 4.700%, 06/01/2010 | | | 1,225,000 | | | | 1,229,594 | |
Fabricated Metal Product Manufacturing - 1.08% | | | | | | | | |
| Silgan Holdings, Inc. | | | | | | | | |
| 6.750%, 11/15/2013 | | | 1,209,000 | | | | 1,224,113 | |
Food Services and Drinking Places - 1.12% | | | | | | | | |
| Brinker International, Inc. | | | | | | | | |
| 5.750%, 06/01/2014 | | | 1,233,000 | | | | 1,276,072 | |
Machinery Manufacturing - 0.93% | | | | | | | | |
| Da-Lite Screen Co., Inc. | | | | | | | | |
| 9.500%, 05/15/2011 | | | 1,035,000 | | | | 1,058,287 | |
Merchant Wholesalers, Durable Goods - 0.61% | | | | | | | | |
| Interline Brands, Inc. | | | | | | | | |
| 8.125%, 06/15/2014 | | | 667,000 | | | | 687,010 | |
Performing Arts, Spectator | | | | | | | | |
| Sports, and Related Industries - 1.52% | | | | | | | | |
| Speedway Motorsports, Inc. | | | | | | | | |
| 6.750%, 06/01/2013 | | | 1,725,000 | | | | 1,725,000 | |
See notes to financial statements.
Intrepid Capital Fund
SCHEDULE OF INVESTMENTS (continued)
March 31, 2010 (Unaudited)
| | | Principal | | | | |
| | | Amount | | | Value | |
| CORPORATE BONDS - 22.11% (continued) | | | | | | |
Plastics and Rubber | | | | | | |
| Products Manufacturing - 0.78% | | | | | | |
| AEP Industries, Inc. | | | | | | |
| 7.875%, 03/15/2013 | | $ | 898,000 | | | $ | 891,265 | |
Primary Metal Manufacturing - 0.97% | | | | | | | | |
| Gibraltar Industries, Inc. | | | | | | | | |
| 8.000%, 12/01/2015 (c) | | | 1,113,000 | | | | 1,096,305 | |
Professional, Scientific, | | | | | | | | |
| and Technical Services - 1.50% | | | | | | | | |
| Bio Rad Labs, Inc. | | | | | | | | |
| 7.500%, 08/15/2013 | | | 1,044,000 | | | | 1,064,880 | |
| Valassis Communications, Inc. | | | | | | | | |
| 8.250%, 03/01/2015 | | | 618,000 | | | | 634,995 | |
| | | | | | | | 1,699,875 | |
| Publishing Industries (except Internet) - 1.74% | | | | | | | | |
| Scholastic Corp. | | | | | | | | |
| 5.000%, 04/15/2013 | | | 2,029,000 | | | | 1,973,203 | |
Rental and Leasing Services - 1.07% | | | | | | | | |
| Mobile Mini, Inc. | | | | | | | | |
| 6.875%, 05/01/2015 | | | 963,000 | | | | 897,997 | |
| Mobile Mini, Inc. | | | | | | | | |
| 9.750%, 08/01/2014 | | | 311,000 | | | | 321,885 | |
| | | | | | | | 1,219,882 | |
| Special Purpose Entity - 1.19% | | | | | | | | |
| AMR Holding Co. / Emcare Holding Co. | | | | | | | | |
| 10.000%, 02/15/2015 | | | 1,284,000 | | | | 1,349,002 | |
Telecommunications - 1.64% | | | | | | | | |
| Syniverse Technologies, Inc. | | | | | | | | |
| 7.750%, 08/15/2013 | | | 1,843,000 | | | | 1,856,823 | |
| TOTAL CORPORATE BONDS | | | | | | | | |
| (Cost $24,126,566) | | | | | | | 25,104,707 | |
See notes to financial statements.
Intrepid Capital Fund
SCHEDULE OF INVESTMENTS (continued)
March 31, 2010 (Unaudited)
| | | Shares | | | Value | |
| REAL ESTATE INVESTMENT TRUST - 0.84% | | | | | | |
| Potlatch Corp. | | | 27,370 | | | $ | 959,045 | |
| TOTAL REAL ESTATE INVESTMENT TRUST | | | | | | | | |
| (Cost $759,649) | | | | | | | 959,045 | |
| | | | | | | | | |
| SHORT-TERM INVESTMENTS - 23.35% | | | | | | | | |
Money Market Funds - 5.74% | | | | | | | | |
| AIM - STIT Treasury Portfolio 0.03% (c) | | | 2,019,273 | | | | 2,019,273 | |
| Fidelity Institutional Money Market Funds - | | | | | | | | |
| Government Portfolio 0.04% (c) | | | 2,250,000 | | | | 2,250,000 | |
| SEI Daily Income Trust Treasury Fund 0.01% (c) | | | 2,250,000 | | | | 2,250,000 | |
| | | | | | | | 6,519,273 | |
| | | | | | | | | |
| | | Principal | | | | | |
| | | Amount | | | | | |
| U.S. Treasury Bills - 17.61% | | | | | | | | |
| 0.095%, 04/08/2010 (d) | | $ | 4,000,000 | | | | 3,999,926 | |
| 0.110%, 05/27/2010 (d) | | | 4,000,000 | | | | 3,999,317 | |
| 0.110%, 06/03/2010 (d) | | | 4,000,000 | | | | 3,999,022 | |
| 0.161%, 07/29/2010 (d) | | | 4,000,000 | | | | 3,997,884 | |
| 0.176%, 08/05/2010 (d) | | | 4,000,000 | | | | 3,997,551 | |
| | | | | | | | 19,993,700 | |
| TOTAL SHORT-TERM INVESTMENTS | | | | | | | | |
| (Cost $26,512,973) | | | | | | | 26,512,973 | |
Total Investments - 99.63% | | | | | | | | |
| (Cost $103,628,604) | | | | | | | 113,113,065 | |
| Other Assets in Excess of Liabilities - 0.37% | | | | | | | 415,681 | |
| TOTAL NET ASSETS - 100.00% | | | | | | $ | 113,528,746 | |
Percentages are stated as a percent of net assets.
| (a) | Non-income producing security. |
| (b) | Foreign issued security. |
| (c) | Variable rate security. The rate shown is as of March 31, 2010. |
| (d) | Rate shown is the effective yield based on purchase price. The calculation assumes the security is held to maturity. |
See notes to financial statements.
Intrepid Small Cap Fund
SCHEDULE OF INVESTMENTS
March 31, 2010 (Unaudited)
| | | Shares | | | Value | |
| COMMON STOCKS - 79.43% | | | | | | |
Accommodation - 1.84% | | | | | | |
| Gencor Industries, Inc. (a) | | | 179,435 | | | $ | 1,349,351 | |
| International Speedway Corporation - Class A | | | 227,490 | | | | 5,862,418 | |
| | | | | | | | 7,211,769 | |
| Administrative and Support Services - 1.05% | | | | | | | | |
| Mantech International Corp. (a) | | | 84,200 | | | | 4,111,486 | |
Ambulatory Health Care Services - 0.49% | | | | | | | | |
| Chemed Corp. | | | 35,000 | | | | 1,903,300 | |
Animal Production - 0.61% | | | | | | | | |
| HQ Sustainable Maritime Industries, Inc. (a) | | | 395,800 | | | | 2,374,800 | |
Apparel Manufacturing - 1.64% | | | | | | | | |
| Maidenform Brands, Inc. (a) | | | 293,855 | | | | 6,420,732 | |
Beverage and Tobacco | | | | | | | | |
| Product Manufacturing - 2.32% | | | | | | | | |
| Constellation Brands, Inc. (a) | | | 419,410 | | | | 6,895,100 | |
| Hansen Natural Corp. (a) | | | 50,400 | | | | 2,186,352 | |
| | | | | | | | 9,081,452 | |
| Chemical Manufacturing - 6.19% | | | | | | | | |
| Endo Pharmaceuticals Holdings, Inc. (a) | | | 237,000 | | | | 5,614,530 | |
| Landec Corp. (a) | | | 292,842 | | | | 1,941,542 | |
| Prestige Brands Holdings, Inc. (a) | | | 1,148,365 | | | | 10,335,285 | |
| Sensient Technologies Corp. | | | 218,767 | | | | 6,357,369 | |
| | | | | | | | 24,248,726 | |
| Clothing and Clothing Accessories Stores - 1.01% | | | | | | | | |
| Foot Locker, Inc. | | | 263,545 | | | | 3,963,717 | |
Computer and Electronic | | | | | | | | |
| Product Manufacturing - 8.67% | | | | | | | | |
| Applied Signal Technology, Inc. | | | 156,918 | | | | 3,072,455 | |
| Communications Systems, Inc. | | | 152,069 | | | | 1,966,252 | |
| CSG Systems International, Inc. (a) | | | 492,417 | | | | 10,321,060 | |
| Mocon, Inc. | | | 105,158 | | | | 1,122,036 | |
| Tekelec (a) | | | 322,500 | | | | 5,856,600 | |
See notes to financial statements.
Intrepid Small Cap Fund
SCHEDULE OF INVESTMENTS (continued)
March 31, 2010 (Unaudited)
| | | Shares | | | Value | |
| COMMON STOCKS - 79.43% (continued) | | | | | | |
Computer and Electronic | | | | | | |
| Product Manufacturing - 8.67% (continued) | | | | | | |
| Tellabs, Inc. | | | 1,536,340 | | | $ | 11,630,094 | |
| | | | | | | | 33,968,497 | |
| Credit Intermediation | | | | | | | | |
| and Related Activities - 2.23% | | | | | | | | |
| Fifth Street Finance Corp. | | | 355,610 | | | | 4,128,632 | |
| OceanFirst Financial Corp. | | | 163,800 | | | | 1,860,768 | |
| Washington Federal, Inc. | | | 134,499 | | | | 2,733,020 | |
| | | | | | | | 8,722,420 | |
| Electronics and Appliance Stores - 2.53% | | | | | | | | |
| Aarons, Inc. | | | 297,800 | | | | 9,928,652 | |
Fabricated Metal Product Manufacturing - 1.48% | | | | | | | | |
| Ducommun, Inc. | | | 276,605 | | | | 5,811,471 | |
Food and Beverage Stores - 6.37% | | | | | | | | |
| Core Mark Holding Co., Inc. (a) | | | 352,667 | | | | 10,795,137 | |
| Ruddick Corp. | | | 27,000 | | | | 854,280 | |
| Spartan Stores, Inc. | | | 132,000 | | | | 1,903,440 | |
| Weis Markets, Inc. | | | 313,583 | | | | 11,401,878 | |
| | | | | | | | 24,954,735 | |
| Food Manufacturing - 0.22% | | | | | | | | |
| Harbinger Group, Inc. (a) | | | 130,074 | | | | 880,601 | |
Food Services and Drinking Places - 0.45% | | | | | | | | |
| Nathan’s Famous, Inc. (a) | | | 113,312 | | | | 1,755,203 | |
Insurance Carriers and Related Activities - 4.34% | | | | | | | | |
| Baldwin & Lyons, Inc. - Class B | | | 248,520 | | | | 5,986,847 | |
| Brown & Brown, Inc. | | | 498,200 | | | | 8,927,744 | |
| Horace Mann Educators Corp. | | | 140,000 | | | | 2,108,400 | |
| | | | | | | | 17,022,991 | |
| Machinery Manufacturing - 0.39% | | | | | | | | |
| Blount International, Inc. (a) | | | 146,160 | | | | 1,514,218 | |
See notes to financial statements.
Intrepid Small Cap Fund
SCHEDULE OF INVESTMENTS (continued)
March 31, 2010 (Unaudited)
| | | Shares | | | Value | |
| COMMON STOCKS - 79.43% (continued) | | | | | | |
Merchant Wholesalers, Nondurable Goods - 0.51% | | | | | | |
| Central Garden & Pet Co. - Class A (a) | | | 219,224 | | | $ | 2,008,092 | |
Mining (except Oil and Gas) - 5.90% | | | | | | | | |
| Pan American Silver Corp. (a)(b) | | | 588,828 | | | | 13,631,368 | |
| Royal Gold, Inc. | | | 204,900 | | | | 9,468,429 | |
| | | | | | | | 23,099,797 | |
| Miscellaneous Manufacturing - 5.40% | | | | | | | | |
| Hillenbrand, Inc. | | | 205,100 | | | | 4,510,149 | |
| Jakks Pacific, Inc. (a) | | | 351,100 | | | | 4,581,855 | |
| Oil-Dri Corporation of America (c) | | | 336,052 | | | | 6,495,885 | |
| Semperit AG Holding (b) | | | 47,860 | | | | 1,868,814 | |
| Steris Corp. | | | 110,000 | | | | 3,702,600 | |
| | | | | | | | 21,159,303 | |
| Miscellaneous Store Retailers - 0.94% | | | | | | | | |
| PetSmart, Inc. | | | 115,155 | | | | 3,680,354 | |
Motor Vehicle and Parts Dealers - 1.07% | | | | | | | | |
| Midas Group, Inc. (a) | | | 370,244 | | | | 4,176,352 | |
Oil and Gas Extraction - 4.07% | | | | | | | | |
| Bill Barrett Corp. (a) | | | 295,077 | | | | 9,061,814 | |
| Contango Oil & Gas Company (a) | | | 134,712 | | | | 6,890,519 | |
| | | | | | | | 15,952,333 | |
| Performing Arts, Spectator | | | | | | | | |
| Sports, and Related Industries - 1.21% | | | | | | | | |
| Speedway Motorsports, Inc. | | | 304,335 | | | | 4,750,669 | |
Pipeline Transportation - 1.40% | | | | | | | | |
| WGL Holdings, Inc. | | | 158,397 | | | | 5,488,456 | |
Professional, Scientific, | | | | | | | | |
| and Technical Services - 5.12% | | | | | | | | |
| EPIQ Systems, Inc. (a) | | | 851,814 | | | | 10,588,048 | |
| Total Systems Services, Inc. | | | 606,155 | | | | 9,492,387 | |
| | | | | | | | 20,080,435 | |
See notes to financial statements.
Intrepid Small Cap Fund
SCHEDULE OF INVESTMENTS (continued)
March 31, 2010 (Unaudited)
| | | Shares | | | Value | |
| COMMON STOCKS - 79.43% (continued) | | | | | | |
Rental and Leasing Services - 2.97% | | | | | | |
| Rent-A-Center, Inc. (a) | | | 492,900 | | | $ | 11,657,085 | |
Support Activities for Transportation - 2.77% | | | | | | | | |
| Tidewater, Inc. | | | 229,506 | | | | 10,848,749 | |
Telecommunications - 2.44% | | | | | | | | |
| Syniverse Holdings, Inc. (a) | | | 207,674 | | | | 4,043,413 | |
| Telephone & Data Systems, Inc. | | | 163,000 | | | | 5,517,550 | |
| | | | | | | | 9,560,963 | |
| Utilities - 3.80% | | | | | | | | |
| Central Vermont Public Service Corp. | | | 94,732 | | | | 1,910,745 | |
| Middlesex Water Co. | | | 77,425 | | | | 1,320,096 | |
| Portland General Electric Co. | | | 305,300 | | | | 5,895,343 | |
| Westar Energy, Inc. | | | 257,600 | | | | 5,744,480 | |
| | | | | | | | 14,870,664 | |
| TOTAL COMMON STOCKS | | | | | | | | |
| (Cost $265,955,963) | | | | | | | 311,208,022 | |
| | | | | | | | | |
| REAL ESTATE INVESTMENT TRUST - 1.50% | | | | | | | | |
| Potlatch Corp. | | | 167,660 | | | | 5,874,806 | |
| TOTAL REAL ESTATE INVESTMENT TRUST | | | | | | | | |
| (Cost $4,489,168) | | | | | | | 5,874,806 | |
| | | | | | | | | |
| SHORT-TERM INVESTMENTS - 19.18% | | | | | | | | |
Money Market Funds - 9.48% | | | | | | | | |
| AIM - STIT Treasury Portfolio 0.03% (d) | | | 7,810,000 | | | | 7,810,000 | |
| AIM STIT - STIC Prime Portfolio 0.11%% (d) | | | 5,921,630 | | | | 5,921,630 | |
| Fidelity Institutional Money Market Funds - | | | | | | | | |
| Government Portfolio 0.04% (d) | | | 7,810,000 | | | | 7,810,000 | |
| Fidelity Institutional Money Market Funds - | | | | | | | | |
| Money Market Portfolio 0.16% (d) | | | 7,810,000 | | | | 7,810,000 | |
| SEI Daily Income Trust Treasury Fund 0.01% (d) | | | 7,810,000 | | | | 7,810,000 | |
| | | | | | | | 37,161,630 | |
See notes to financial statements.
Intrepid Small Cap Fund
SCHEDULE OF INVESTMENTS (continued)
March 31, 2010 (Unaudited)
| | | Principal | | | | |
| | | Amount | | | Value | |
| SHORT-TERM INVESTMENTS - 19.18% (continued) | | | | | | |
| U.S. Treasury Bills - 9.70% | | | | | | |
| 0.069%, 04/15/2010 (e) | | $ | 18,000,000 | | | $ | 17,999,510 | |
| 0.142%, 07/15/2010 (e) | | | 20,000,000 | | | | 19,991,692 | |
| | | | | | | | 37,991,202 | |
| TOTAL SHORT-TERM INVESTMENTS | | | | | | | | |
| (Cost $75,152,832) | | | | | | | 75,152,832 | |
Total Investments - 100.11% | | | | | | | | |
| (Cost $345,597,963) | | | | | | | 392,235,660 | |
| Liabilities in Excess of Other Assets - (0.11)% | | | | | | | (413,294 | ) |
| TOTAL NET ASSETS - 100.00% | | | | | | $ | 391,822,366 | |
Percentages are stated as a percent of net assets.
| (a) | Non-income producing security. |
| (b) | Foreign issued security. |
| (c) | Affiliated issuer. See footnote 3 to the financial statements. |
| (d) | Variable rate security. The rate listed is as of March 31, 2010. |
| (e) | Rate shown is the effective yield based on the purchase price. The calculation assumes the security is held to maturity. |
See notes to financial statements.
Intrepid Income Fund
SCHEDULE OF INVESTMENTS
March 31, 2010 (Unaudited)
| | | Principal | | | | |
| | | Amount | | | Value | |
| CONVERTIBLE BONDS - 8.48% | | | | | | |
Ambulatory Health Care Services - 2.89% | | | | | | |
| Chemed Corp. | | | | | | |
| 1.875%, 05/15/2014 | | $ | 2,120,000 | | | $ | 1,937,150 | |
Merchant Wholesalers, Nondurable Goods - 2.02% | | | | | | | | |
| Spartan Stores, Inc. | | | | | | | | |
| 3.375%, 05/15/2027 | | | 1,560,000 | | | | 1,351,350 | |
Miscellaneous Manufacturing - 1.90% | | | | | | | | |
| Jakks Pacific, Inc. | | | | | | | | |
| 4.625%, 06/15/2023 | | | 1,286,000 | | | | 1,276,355 | |
Oil and Gas Extraction - 1.67% | | | | | | | | |
| Bill Barrett Corp. | | | | | | | | |
| 5.000%, 03/15/2028 | | | 1,136,000 | | | | 1,117,540 | |
| TOTAL CONVERTIBLE BONDS | | | | | | | | |
| (Cost $5,256,776) | | | | | | | 5,682,395 | |
| | | | | | | | | |
| CORPORATE BONDS - 64.86% | | | | | | | | |
Apparel Manufacturing - 6.24% | | | | | | | | |
| Perry Ellis International, Inc. | | | | | | | | |
| 8.875%, 09/15/2013 | | | 1,173,000 | | | | 1,197,926 | |
| Phillips-Van Heusen Corp. | | | | | | | | |
| 8.125%, 05/01/2013 | | | 425,000 | | | | 431,906 | |
| Phillips-Van Heusen Corp. | | | | | | | | |
| 7.250%, 02/15/2011 | | | 2,547,000 | | | | 2,553,368 | |
| | | | | | | | 4,183,200 | |
| Beverage and Tobacco | | | | | | | | |
| Product Manufacturing - 1.41% | | | | | | | | |
| Reynolds American, Inc. | | | | | | | | |
| 6.500%, 07/15/2010 | | | 931,000 | | | | 941,941 | |
Chemical Manufacturing - 3.79% | | | | | | | | |
| Church & Dwight, Inc. | | | | | | | | |
| 6.000%, 12/15/2012 | | | 2,506,000 | | | | 2,543,590 | |
See notes to financial statements.
Intrepid Income Fund
SCHEDULE OF INVESTMENTS (continued)
March 31, 2010 (Unaudited)
| | | Principal | | | | |
| | | Amount | | | Value | |
| CORPORATE BONDS - 64.86% (continued) | | | | | | |
Clothing and Clothing Accessories Stores - 7.32% | | | | | | |
| Collective Brands, Inc. | | | | | | |
| 8.250%, 08/01/2013 | | $ | 2,818,000 | | | $ | 2,874,360 | |
| Hanesbrands, Inc. | | | | | | | | |
| 3.831%, 12/15/2014 (a) | | | 2,138,000 | | | | 2,041,790 | |
| | | | | | | | 4,916,150 | |
| Construction of Buildings - 4.12% | | | | | | | | |
| Blount, Inc. | | | | | | | | |
| 8.875%, 08/01/2012 | | | 2,730,000 | | | | 2,760,712 | |
Data Processing, Hosting | | | | | | | | |
| and Related Services - 3.69% | | | | | | | | |
| Affiliated Computer Services, Inc. | | | | | | | | |
| 4.700%, 06/01/2010 | | | 2,467,000 | | | | 2,476,251 | |
Fabricated Metal Product Manufacturing - 3.70% | | | | | | | | |
| Silgan Holdings, Inc. | | | | | | | | |
| 6.750%, 11/15/2013 | | | 2,447,000 | | | | 2,477,588 | |
Food Services and Drinking Places - 2.82% | | | | | | | | |
| Brinker International, Inc. | | | | | | | | |
| 5.750%, 06/01/2014 | | | 1,825,000 | | | | 1,888,753 | |
Machinery Manufacturing - 2.08% | | | | | | | | |
| Da-Lite Screen Co., Inc. | | | | | | | | |
| 9.500%, 05/15/2011 | | | 1,365,000 | | | | 1,395,712 | |
Merchant Wholesalers, Durable Goods - 2.60% | | | | | | | | |
| Interline Brands, Inc. | | | | | | | | |
| 8.125%, 06/15/2014 | | | 1,692,000 | | | | 1,742,760 | |
Performing Arts, Spectator Sports, | | | | | | | | |
| and Related Industries - 3.67% | | | | | | | | |
| Speedway Motorsports, Inc. | | | | | | | | |
| 6.750%, 06/01/2013 | | | 2,458,000 | | | | 2,458,000 | |
See notes to financial statements.
Intrepid Income Fund
SCHEDULE OF INVESTMENTS (continued)
March 31, 2010 (Unaudited)
| | | Principal | | | | |
| | | Amount | | | Value | |
| CORPORATE BONDS - 64.86% (continued) | | | | | | |
Plastics and Rubber | | | | | | |
| Products Manufacturing - 2.00% | | | | | | |
| AEP Industries, Inc. | | | | | | |
| 7.875%, 03/15/2013 | | $ | 1,351,000 | | | $ | 1,340,867 | |
Primary Metal Manufacturing - 2.76% | | | | | | | | |
| Gibraltar Industries, Inc. | | | | | | | | |
| 8.000%, 12/01/2015 | | | 1,875,000 | | | | 1,846,875 | |
Professional, Scientific, | | | | | | | | |
| and Technical Services - 3.89% | | | | | | | | |
| Bio-Rad Labs, Inc. | | | | | | | | |
| 7.500%, 08/15/2013 | | | 1,552,000 | | | | 1,583,040 | |
| Valassis Communications, Inc. | | | | | | | | |
| 8.250%, 03/01/2015 | | | 1,000,000 | | | | 1,027,500 | |
| | | | | | | | 2,610,540 | |
| Publishing Industries (except Internet) - 4.16% | | | | | | | | |
| Scholastic Corp. | | | | | | | | |
| 5.000%, 04/15/2013 | | | 2,869,000 | | | | 2,790,103 | |
Rental and Leasing Services - 2.87% | | | | | | | | |
| Mobile Mini, Inc. | | | | | | | | |
| 6.875%, 05/01/2015 | | | 1,928,000 | | | | 1,797,860 | |
| Mobile Mini, Inc. | | | | | | | | |
| 9.750%, 08/01/2014 | | | 114,000 | | | | 117,990 | |
| | | | | | | | 1,915,850 | |
| Special Purpose Entity - 3.66% | | | | | | | | |
| AMR Holding Co. / Emcare Holding Co. | | | | | | | | |
| 10.000%, 02/15/2015 | | | 2,333,000 | | | | 2,451,108 | |
Telecommunications - 4.08% | | | | | | | | |
| Syniverse Technologies, Inc. | | | | | | | | |
| 7.750%, 08/15/2013 | | | 2,711,000 | | | | 2,731,333 | |
| TOTAL CORPORATE BONDS | | | | | | | | |
| (Cost $41,654,353) | | | | | | | 43,471,333 | |
See notes to financial statements.
Intrepid Income Fund
SCHEDULE OF INVESTMENTS (continued)
March 31, 2010 (Unaudited)
| | | Shares | | | Value | |
| SHORT-TERM INVESTMENTS - 26.19% | | | | | | |
Money Market Funds - 5.31% | | | | | | |
| AIM - STIT Treasury Portfolio 0.03% (a) | | | 906,324 | | | $ | 906,324 | |
| Fidelity Institutional Money Market Funds - | | | | | | | | |
| Government Portfolio 0.04% (a) | | | 1,326,000 | | | | 1,326,000 | |
| SEI Daily Income Trust Treasury Fund 0.01% (a) | | | 1,326,000 | | | | 1,326,000 | |
| | | | | | | | 3,558,324 | |
| | | | | | | | | |
| | | Principal | | | | | |
| | | Amount | | | | | |
| U.S. Treasury Bills - 20.88% | | | | | | | | |
| 0.073%, 04/15/2010 (b) | | $ | 8,000,000 | | | | 7,999,797 | |
| 0.111%, 04/22/2010 (b) | | | 1,000,000 | | | | 999,933 | |
| 0.149%, 06/17/2010 (b) | | | 3,000,000 | | | | 2,999,046 | |
| 0.146%, 07/15/2010 (b) | | | 2,000,000 | | | | 1,999,153 | |
| | | | | | | | 13,997,929 | |
| TOTAL SHORT-TERM INVESTMENTS | | | | | | | | |
| (Cost $17,556,253) | | | | | | | 17,556,253 | |
Total Investments - 99.53% | | | | | | | | |
| (Cost $64,467,382) | | | | | | | 66,709,981 | |
| Other Assets in Excess of Liabilities - 0.47% | | | | | | | 316,691 | |
| TOTAL NET ASSETS - 100.00% | | | | | | $ | 67,026,672 | |
Percentages are stated as a percent of net assets.
| (a) | Variable rate security. The rate listed is as of March 31, 2010. |
| (b) | The rate shown is the effective yield based on purchase price. The calculation assumes the security is held to maturity. |
See notes to financial statements.
Intrepid All Cap Fund
SCHEDULE OF INVESTMENTS
March 31, 2010 (Unaudited)
| | | Shares | | | Value | |
| COMMON STOCKS - 83.75% | | | | | | |
Administrative and Support Services - 0.49% | | | | | | |
| Mantech International Corp. (a) | | | 2,000 | | | $ | 97,660 | |
Animal Production - 0.96% | | | | | | | | |
| HQ Sustainable Maritime Industries, Inc. (a) | | | 32,150 | | | | 192,900 | |
Beverage and Tobacco | | | | | | | | |
| Product Manufacturing - 7.72% | | | | | | | | |
| Brown Forman Corp. - Class B | | | 11,370 | | | | 675,946 | |
| Constellation Brands, Inc. (a) | | | 40,175 | | | | 660,477 | |
| Hansen Natural Corp. (a) | | | 5,000 | | | | 216,900 | |
| | | | | | | | 1,553,323 | |
| Broadcasting (except Internet) - 3.36% | | | | | | | | |
| Comcast Corp. - Class A | | | 35,865 | | | | 674,979 | |
Chemical Manufacturing - 6.56% | | | | | | | | |
| Endo Pharmaceuticals Holdings, Inc. (a) | | | 33,890 | | | | 802,854 | |
| Prestige Brands Holdings, Inc. (a) | | | 57,489 | | | | 517,401 | |
| | | | | | | | 1,320,255 | |
| Clothing and Clothing Accessories Stores - 3.02% | | | | | | | | |
| Foot Locker, Inc. | | | 40,450 | | | | 608,368 | |
Computer and Electronic | | | | | | | | |
| Product Manufacturing - 7.41% | | | | | | | | |
| CSG Systems International, Inc. (a) | | | 9,800 | | | | 205,408 | |
| Dell, Inc. (a) | | | 41,490 | | | | 622,765 | |
| Tellabs, Inc. | | | 87,500 | | | | 662,375 | |
| | | | | | | | 1,490,548 | |
| Credit Intermediation and Related Activities - 0.98% | | | | | | | | |
| Fifth Street Finance Corp. | | | 17,000 | | | | 197,370 | |
Electronics and Appliance Stores - 2.34% | | | | | | | | |
| Aarons, Inc. | | | 14,100 | | | | 470,094 | |
Food and Beverage Stores - 3.66% | | | | | | | | |
| Ruddick Corp. | | | 3,200 | | | | 101,248 | |
| Weis Markets, Inc. | | | 17,450 | | | | 634,482 | |
| | | | | | | | 735,730 | |
See notes to financial statements.
Intrepid All Cap Fund
SCHEDULE OF INVESTMENTS (continued)
March 31, 2010 (Unaudited)
| | | Shares | | | Value | |
| COMMON STOCKS - 83.75% (continued) | | | | | | |
Food Manufacturing - 6.71% | | | | | | |
| Kraft Foods, Inc. | | | 17,880 | | | $ | 540,691 | |
| Sara Lee Corp. | | | 58,160 | | | | 810,169 | |
| | | | | | | | 1,350,860 | |
| General Merchandise Stores - 0.50% | | | | | | | | |
| Family Dollar Stores, Inc. | | | 2,735 | | | | 100,128 | |
Insurance Carriers and Related Activities - 5.29% | | | | | | | | |
| Baldwin & Lyons, Inc. - Class B | | | 15,340 | | | | 369,541 | |
| The Travelers Companies, Inc. | | | 12,895 | | | | 695,556 | |
| | | | | | | | 1,065,097 | |
| Merchant Wholesalers, Nondurable Goods - 0.98% | | | | | | | | |
| Central Garden & Pet Co. - Class A (a) | | | 21,600 | | | | 197,856 | |
Mining (except Oil and Gas) - 5.34% | | | | | | | | |
| Newmont Mining Corp. | | | 11,310 | | | | 576,019 | |
| Pan American Silver Corp. (a)(b) | | | 21,495 | | | | 497,609 | |
| | | | | | | | 1,073,628 | |
| Miscellaneous Manufacturing - 6.07% | | | | | | | | |
| CR Bard, Inc. | | | 9,320 | | | | 807,298 | |
| Hillenbrand, Inc. | | | 9,900 | | | | 217,701 | |
| Jakks Pacific, Inc. (a) | | | 15,000 | | | | 195,750 | |
| | | | | | | | 1,220,749 | |
| Performing Arts, Spectator Sports, | | | | | | | | |
| and Related Industries - 2.17% | | | | | | | | |
| International Speedway Corp. - Class A | | | 16,950 | | | | 436,802 | |
Pipeline Transportation - 1.05% | | | | | | | | |
| WGL Holdings, Inc. | | | 6,100 | | | | 211,365 | |
Professional, Scientific, | | | | | | | | |
| and Technical Services - 5.40% | | | | | | | | |
| Cephalon, Inc. (a) | | | 2,985 | | | | 202,323 | |
| EPIQ Systems, Inc. (a) | | | 17,300 | | | | 215,039 | |
| Pharmaceutical Product Development, Inc. | | | 9,380 | | | | 222,775 | |
| Total Systems Services, Inc. | | | 28,470 | | | | 445,840 | |
| | | | | | | | 1,085,977 | |
See notes to financial statements.
Intrepid All Cap Fund
SCHEDULE OF INVESTMENTS (continued)
March 31, 2010 (Unaudited)
| | | Shares | | | Value | |
| COMMON STOCKS - 83.75% (continued) | | | | | | |
Publishing Industries (except Internet) - 3.75% | | | | | | |
| John Wiley & Sons, Inc. - Class A | | | 17,445 | | | $ | 755,020 | |
Rental and Leasing Services - 2.80% | | | | | | | | |
| Rent-A-Center, Inc. (a) | | | 23,780 | | | | 562,397 | |
Support Activities for Transportation - 3.19% | | | | | | | | |
| Tidewater, Inc. | | | 13,570 | | | | 641,454 | |
Telecommunications - 4.00% | | | | | | | | |
| Telephone & Data Systems, Inc. | | | 23,780 | | | | 804,953 | |
| TOTAL COMMON STOCKS | | | | | | | | |
| (Cost $14,135,056) | | | | | | | 16,847,513 | |
| | | | | | | | | |
| REAL ESTATE INVESTMENT TRUST - 2.15% | | | | | | | | |
| Potlatch Corp. | | | 12,365 | | | | 433,270 | |
| TOTAL REAL ESTATE INVESTMENT TRUST | | | | | | | | |
| (Cost $433,270) | | | | | | | 433,270 | |
| | | | | | | | | |
| | | Principal | | | | | |
| | | Amount | | | | | |
| SHORT-TERM INVESTMENTS - 11.43% | | | | | | | | |
U.S. Treasury Bills - 11.43% | | | | | | | | |
| 0.037%, 04/15/2010 (c) | | $ | 800,000 | | | | 799,988 | |
| 0.150%, 05/13/2010 (c) | | | 700,000 | | | | 699,878 | |
| 0.240%, 07/29/2010 (c) | | | 800,000 | | | | 799,423 | |
| | | | | | | | 2,299,289 | |
| TOTAL SHORT-TERM INVESTMENTS | | | | | | | | |
| (Cost $2,299,289) | | | | | | | 2,299,289 | |
Total Investments - 97.33% | | | | | | | | |
| (Cost $16,867,615) | | | | | | | 19,580,072 | |
| Other Assets in Excess of Liabilities - 2.67% | | | | | | | 537,941 | |
| TOTAL NET ASSETS - 100.00% | | | | | | $ | 20,118,013 | |
Percentages are stated as a percent of net assets.
| (a) | Non-income producing security. |
| (b) | Foreign issued security. |
| (c) | The rate shown is the effective yield based on the purchase price. The calculation assumes the security is held to maturity. |
See notes to financial statements.
Intrepid Funds
STATEMENT OF ASSETS AND LIABILITIES
March 31, 2010 (Unaudited)
| | | Intrepid | | | Intrepid Small | |
| | | Capital Fund | | | Cap Fund | |
| ASSETS: | | | | | | |
Investments, at market value(1) | | | | | | |
| Unaffiliated issuers | | $ | 113,113,065 | | | $ | 385,739,775 | |
| Affiliated issuers | | | — | | | | 6,495,885 | |
| Income receivable | | | 495,997 | | | | 239,875 | |
| Receivable for fund shares sold | | | 711,232 | | | | 2,764,174 | |
| Receivable for investments sold | | | 779,399 | | | | 2,236,973 | |
| Other assets | | | 33,444 | | | | 148,431 | |
| Total assets | | | 115,133,137 | | | | 397,625,113 | |
| LIABILITIES: | | | | | | | | |
| Payable for fund shares redeemed | | | 12,581 | | | | 1,748,880 | |
| Payable for investment securities purchased | | | 1,428,450 | | | | 3,687,086 | |
| Payable to Investment Adviser | | | 92,416 | | | | 301,837 | |
| Payable to Custodian | | | — | | | | 15,033 | |
| Accrued expenses | | | 70,944 | | | | 49,911 | |
| Total liabilities | | | 1,604,391 | | | | 5,802,747 | |
| Total net assets | | $ | 113,528,746 | | | $ | 391,822,366 | |
| NET ASSETS CONSIST OF: | | | | | | | | |
| Capital stock | | $ | 101,021,622 | | | $ | 338,416,989 | |
| Accumulated net investment loss | | | (3,719 | ) | | | (119,815 | ) |
| Accumulated undistributed net realized | | | | | | | | |
| gain on investments | | | 3,026,357 | | | | 6,887,404 | |
| Unrealized appreciation on investments | | | 9,484,486 | | | | 46,637,788 | |
| Total net assets | | $ | 113,528,746 | | | $ | 391,822,366 | |
| Investor Class | | | | | | | | |
| Net Assets | | $ | 113,528,746 | | | $ | 367,559,592 | |
| Shares outstanding (unlimited shares of | | | | | | | | |
| no par value authorized) | | | 10,461,256 | | | | 23,840,562 | |
| Investor Class Net asset value, offering and | | | | | | | | |
| redemption price per share | | $ | 10.85 | | | $ | 15.42 | |
| Institutional Class | | | | | | | | |
| Net Assets | | | — | | | $ | 24,262,774 | |
| Shares outstanding (unlimited shares of | | | | | | | | |
| no par value authorized) | | | — | | | | 1,571,580 | |
| Institutional Class Net asset value, | | | | | | | | |
| offering and redemption price per share | | | N/A | | | $ | 15.44 | |
(1) Cost of Investments | | | | | | | | |
| Unaffiliated issuers | | $ | 103,628,604 | | | $ | 340,366,491 | |
| Affiliated issuers | | | — | | | | 5,231,472 | |
See notes to financial statements.
Intrepid Funds
STATEMENT OF ASSETS AND LIABILITIES (continued)
March 31, 2010 (Unaudited)
| | | Intrepid | | | Intrepid All | |
| | | Income Fund | | | Cap Fund | |
| ASSETS: | | | | | | |
Investments, at market value(1) | | | | | | |
| Unaffiliated issuers | | $ | 66,709,981 | | | $ | 19,580,072 | |
| Income receivable | | | 787,382 | | | | 23,975 | |
| Receivable for fund shares sold | | | 31,657 | | | | 15,270 | |
| Receivable for investments sold | | | — | | | | 708,373 | |
| Other assets | | | 16,000 | | | | 18,282 | |
| Total assets | | | 67,545,020 | | | | 20,345,972 | |
| LIABILITIES: | | | | | | | | |
| Payable for fund shares redeemed | | | 4,000 | | | | — | |
| Payable for investment securities purchased | | | 425,385 | | | | — | |
| Payable to Investment Adviser | | | 41,132 | | | | 20,126 | |
| Payable to Custodian | | | — | | | | 182,178 | |
| Accrued expenses | | | 47,831 | | | | 25,655 | |
| Total liabilities | | | 518,348 | | | | 227,959 | |
| Total net assets | | $ | 67,026,672 | | | $ | 20,118,013 | |
| NET ASSETS CONSIST OF: | | | | | | | | |
| Capital stock | | $ | 65,314,821 | | | $ | 17,042,947 | |
| Accumulated net investment loss | | | (24,959 | ) | | | (44,175 | ) |
| Accumulated undistributed net realized | | | | | | | | |
| gain (loss) on investments | | | (505,789 | ) | | | 406,784 | |
| Unrealized appreciation on investments | | | 2,242,599 | | | | 2,712,457 | |
| Total net assets | | $ | 67,026,672 | | | $ | 20,118,013 | |
| Shares outstanding (unlimited shares of | | | | | | | | |
| no par value authorized) | | | 6,882,012 | | | | 1,983,438 | |
| Net asset value, | | | | | | | | |
| offering and redemption price per share | | $ | 9.74 | | | $ | 10.14 | |
(1) Cost of Investments | | | | | | | | |
| Unaffiliated issuers | | $ | 64,467,382 | | | $ | 16,867,615 | |
| Affiliated issuers | | | — | | | | — | |
See notes to financial statements.
Intrepid Funds
STATEMENT OF OPERATIONS
For the six months ended March 31, 2010 (Unaudited)
| | | Intrepid | | | Intrepid Small | |
| | | Capital Fund | | | Cap Fund | |
| INVESTMENT INCOME: | | | | | | |
| Dividend income* | | | | | | |
| Unaffiliated issuers | | $ | 425,830 | | | $ | 1,873,548 | |
| Affiliated issuers | | | — | | | | 98,979 | |
| Interest income | | | 1,070,790 | | | | 27,897 | |
| Total investment income | | | 1,496,620 | | | | 2,000,424 | |
| | | | | | | | | |
| Advisory fees | | | 454,231 | | | | 1,520,583 | |
| Distribution (12b-1) fees - Investor Class Only | | | 113,558 | | | | 359,969 | |
| Administration fees | | | 36,592 | | | | 121,949 | |
| Professional fees | | | 19,320 | | | | 46,188 | |
| Shareholder servicing fees and expenses | | | 18,558 | | | | 23,938 | |
| Fund accounting fees | | | 15,064 | | | | 42,476 | |
| Federal and state registration | | | 13,172 | | | | 17,760 | |
| Insurance | | | 6,168 | | | | 5,004 | |
| Custody fees | | | 3,898 | | | | 29,292 | |
| Reports to shareholders | | | 3,518 | | | | 10,540 | |
| Trustees fees and expenses | | | 1,646 | | | | 4,316 | |
| Compliance fees | | | 686 | | | | 2,724 | |
| Miscellaneous | | | 302 | | | | 740 | |
| Total expenses before Adviser reimbursement | | | 686,713 | | | | 2,185,479 | |
| Expenses recouped (reimbursed) by Adviser | | | (8,659 | ) | | | (65,920 | ) |
| Net expenses | | | 678,054 | | | | 2,119,559 | |
| Net investment income (loss) | | | 818,566 | | | | (119,135 | ) |
| | | | | | | | | |
| NET REALIZED AND UNREALIZED | | | | | | | | |
| LOSS ON INVESTMENTS: | | | | | | | | |
| Net realized gain on investments | | | 3,559,624 | | | | 9,182,439 | |
| Net change in unrealized appreciation on investments | | | 5,611,353 | | | | 24,044,345 | |
| Net realized and unrealized gain on investments | | | 9,170,977 | | | | 33,226,784 | |
| Net increase in net assets resulting from operations | | $ | 9,989,543 | | | $ | 33,107,649 | |
| | | | | | | | | |
| * Net of foreign taxes withheld | | $ | 124 | | | $ | 2,086 | |
See notes to financial statements.
Intrepid Funds
STATEMENT OF OPERATIONS (continued)
For the six months ended March 31, 2010 (Unaudited)
| | | Intrepid | | | Intrepid All | |
| | | Income Fund | | | Cap Fund | |
| INVESTMENT INCOME: | | | | | | |
| Dividend income* | | $ | — | | | $ | 137,917 | |
| Interest income | | | 2,048,765 | | | | 6,136 | |
| Total investment income | | | 2,048,765 | | | | 144,053 | |
| | | | | | | | | |
| Advisory fees | | | 236,042 | | | | 96,510 | |
| Distribution (12b-1) fees - Investor Class Only | | | 78,681 | | | | 24,127 | |
| Administration fees | | | 25,524 | | | | 16,214 | |
| Professional fees | | | 18,184 | | | | 18,298 | |
| Shareholder servicing fees and expenses | | | 14,622 | | | | 10,166 | |
| Fund accounting fees | | | 11,420 | | | | 4,428 | |
| Federal and state registration | | | 11,086 | | | | 8,932 | |
| Insurance | | | 5,246 | | | | 968 | |
| Custody fees | | | 2,234 | | | | 1,644 | |
| Reports to shareholders | | | 2,988 | | | | 694 | |
| Trustees fees and expenses | | | 1,100 | | | | 394 | |
| Compliance fees | | | 554 | | | | 182 | |
| Miscellaneous | | | 308 | | | | 302 | |
| Total expenses before Adviser reimbursement | | | 407,989 | | | | 182,859 | |
| Expenses recouped (reimbursed) by Adviser | | | (14,585 | ) | | | 5,334 | |
| Net expenses | | | 393,404 | | | | 188,193 | |
| Net investment income (loss) | | | 1,655,361 | | | | (44,140 | ) |
| | | | | | | | | |
| NET REALIZED AND UNREALIZED | | | | | | | | |
| LOSS ON INVESTMENTS: | | | | | | | | |
| Net realized gain on investments | | | 443,665 | | | | 839,829 | |
| Net change in unrealized appreciation on investments | | | 1,084,919 | | | | 1,628,610 | |
| Net realized and unrealized gain on investments | | | 1,528,584 | | | | 2,468,439 | |
| Net increase in net assets resulting from operations | | $ | 3,183,945 | | | $ | 2,424,299 | |
| | | | | | | | | |
| * Net of foreign taxes withheld | | $ | — | | | $ | 81 | |
See notes to financial statements.
Intrepid Capital Fund
STATEMENTS OF CHANGES IN NET ASSETS
| | | Six Months | | | Year | |
| | | Ended | | | Ended | |
| | | March 31, 2010 | | | September 30, 2009 | |
| | | (Unaudited) | | | | |
| OPERATIONS: | | | | | | |
| Net investment income | | $ | 818,566 | | | $ | 1,214,887 | |
| Net realized gain on investments | | | 3,559,624 | | | | 790,183 | |
| Net change in unrealized | | | | | | | | |
| appreciation on investments | | | 5,611,353 | | | | 5,329,262 | |
| Net increase in assets | | | | | | | | |
| resulting from operations | | | 9,989,543 | | | | 7,334,332 | |
| | | | | | | | | |
| DISTRIBUTIONS TO SHAREHOLDERS: | | | | | | | | |
| From net investment income | | | (812,972 | ) | | | (1,206,495 | ) |
| From net realized gain | | | (1,340,955 | ) | | | (767,283 | ) |
| Total distributions | | | (2,153,927 | ) | | | (1,973,778 | ) |
| | | | | | | | | |
| CAPITAL SHARE TRANSACTIONS: | | | | | | | | |
| Proceeds from shares sold | | | 35,175,689 | | | | 42,413,011 | |
| Proceeds from shares issued to | | | | | | | | |
| holders in reinvestment of dividends | | | 2,127,623 | | | | 1,934,213 | |
Cost of shares redeemed(1) | | | (6,208,275 | ) | | | (11,607,209 | ) |
| Net increase in net assets from | | | | | | | | |
| capital share transactions | | | 31,095,037 | | | | 32,740,015 | |
| | | | | | | | | |
| TOTAL INCREASE IN NET ASSETS | | | 38,930,653 | | | | 38,100,569 | |
| | | | | | | | | |
| NET ASSETS: | | | | | | | | |
| Beginning of period | | | 74,598,093 | | | | 36,497,524 | |
| End of period (including undistributed net | | | | | | | | |
| investment loss of $3,719 and $9,125) | | $ | 113,528,746 | | | $ | 74,598,093 | |
| (1) | Net of redemption fees of $1,846 and $37,161, respectively. |
See notes to financial statements.
Intrepid Small Cap Fund
STATEMENTS OF CHANGES IN NET ASSETS (continued)
| | | Six Months | | | Year | |
| | | Ended | | | Ended | |
| | | March 31, 2010 | | | September 30, 2009 | |
| | | (Unaudited) | | | | |
| OPERATIONS: | | | | | | |
| Net investment loss | | $ | (119,135 | ) | | $ | (95,265 | ) |
| Net realized gain on investments | | | 9,182,439 | | | | 14,338,596 | |
| Net change in unrealized | | | | | | | | |
| appreciation on investments | | | 24,044,345 | | | | 23,274,609 | |
| Net increase in assets | | | | | | | | |
| resulting from operations | | | 33,107,649 | | | | 37,517,940 | |
| | | | | | | | | |
| DISTRIBUTIONS TO SHAREHOLDERS: | | | | | | | | |
| From net investment income - Investor Class | | | — | | | | (47,220 | ) |
| From net investment income - Institutional Class | | | — | | | | — | |
| From net realized gain - Investor Class | | | (15,410,520 | ) | | | (670,152 | ) |
| From net realized gain - Institutional Class | | | (1,109,829 | ) | | | — | |
| Total distributions | | | (16,520,349 | ) | | | (717,372 | ) |
| | | | | | | | | |
| CAPITAL SHARE TRANSACTIONS: | | | | | | | | |
| Proceeds from shares sold - Investor Class | | | 176,852,346 | | | | 225,033,351 | |
| Proceeds from shares sold - Institutional Class | | | 24,903,369 | | | | — | |
| Proceeds from shares issued to holders in | | | | | | | | |
| reinvestment of dividends - Investor Class | | | 15,345,033 | | | | 717,075 | |
| Proceeds from shares issued to holders in | | | | | | | | |
| reinvestment of dividends - Institutional Class | | | 763,385 | | | | — | |
Cost of shares redeemed - Investor Class(1) | | | (83,145,901 | ) | | | (40,146,036 | ) |
Cost of shares redeemed - Institutional Class(2) | | | (2,381,827 | ) | | | — | |
| Net increase in net assets from | | | | | | | | |
| capital share transactions | | | 132,336,405 | | | | 185,604,390 | |
| | | | | | | | | |
| TOTAL INCREASE IN NET ASSETS | | | 148,923,705 | | | | 222,404,958 | |
| | | | | | | | | |
| NET ASSETS: | | | | | | | | |
| Beginning of period | | | 242,898,661 | | | | 20,493,703 | |
| End of period (including undistributed net | | | | | | | | |
| investment loss of $119,815 and $0) | | $ | 391,822,366 | | | $ | 242,898,661 | |
| (1) | Net of redemption fees of $29,530 and $33,073, respectively. |
| (2) | Net of redemption fees of $203 and $0, respectively. |
See notes to financial statements.
Intrepid Income Fund
STATEMENTS OF CHANGES IN NET ASSETS (continued)
| | | Six Months | | | Year | |
| | | Ended | | | Ended | |
| | | March 31, 2010 | | | September 30, 2009 | |
| | | (Unaudited) | | | | |
| OPERATIONS: | | | | | | |
| Net investment income | | $ | 1,655,361 | | | $ | 2,519,940 | |
| Net realized gain (loss) on investments | | | 443,665 | | | | (799,073 | ) |
| Net change in unrealized | | | | | | | | |
| appreciation on investments | | | 1,084,919 | | | | 2,687,156 | |
| Net increase in assets | | | | | | | | |
| resulting from operations | | | 3,183,945 | | | | 4,408,023 | |
| | | | | | | | | |
| DISTRIBUTIONS TO SHAREHOLDERS: | | | | | | | | |
| From net investment income | | | (1,696,053 | ) | | | (2,543,948 | ) |
| From net realized gain | | | — | | | | — | |
| Total distributions | | | (1,696,053 | ) | | | (2,543,948 | ) |
| | | | | | | | | |
| CAPITAL SHARE TRANSACTIONS: | | | | | | | | |
| Proceeds from shares sold | | | 14,996,805 | | | | 26,331,138 | |
| Proceeds from shares issued to | | | | | | | | |
| holders in reinvestment of dividends | | | 1,694,316 | | | | 2,542,453 | |
Cost of shares redeemed(1) | | | (5,124,012 | ) | | | (5,508,794 | ) |
| Net increase in net assets from | | | | | | | | |
| capital share transactions | | | 11,567,109 | | | | 23,364,797 | |
| | | | | | | | | |
| TOTAL INCREASE IN NET ASSETS | | | 13,055,001 | | | | 25,228,872 | |
| | | | | | | | | |
| NET ASSETS: | | | | | | | | |
| Beginning of period | | | 53,971,671 | | | | 28,742,799 | |
| End of period (including undistributed | | | | | | | | |
| net investment income (loss) | | | | | | | | |
| of $(24,959) and $15,733) | | $ | 67,026,672 | | | $ | 53,971,671 | |
| (1) | Net of redemption fees of $240 and $9,633, respectively. |
See notes to financial statements.
Intrepid All Cap Fund
STATEMENTS OF CHANGES IN NET ASSETS (continued)
| | | Six Months | | | Year | |
| | | Ended | | | Ended | |
| | | March 31, 2010 | | | September 30, 2009 | |
| | | (Unaudited) | | | | |
| OPERATIONS: | | | | | | |
| Net investment income (loss) | | $ | (44,140 | ) | | $ | 3,707 | |
| Net realized gain (loss) on investments | | | 839,829 | | | | (221,581 | ) |
| Net change in unrealized | | | | | | | | |
| appreciation on investments | | | 1,628,610 | | | | 1,765,981 | |
| Net increase in assets | | | | | | | | |
| resulting from operations | | | 2,424,299 | | | | 1,548,107 | |
| | | | | | | | | |
| DISTRIBUTIONS TO SHAREHOLDERS: | | | | | | | | |
| From net investment income | | | — | | | | (13,071 | ) |
| From net realized gain | | | (112,042 | ) | | | — | |
| Total distributions | | | (112,042 | ) | | | (13,071 | ) |
| | | | | | | | | |
| CAPITAL SHARE TRANSACTIONS: | | | | | | | | |
| Proceeds from shares sold | | | 3,396,888 | | | | 10,018,504 | |
| Proceeds from shares issued to | | | | | | | | |
| holders in reinvestment of dividends | | | 112,042 | | | | 13,071 | |
Cost of shares redeemed(1) | | | (2,155,582 | ) | | | (1,364,496 | ) |
| Net increase in net assets from | | | | | | | | |
| capital share transactions | | | 1,353,348 | | | | 8,667,079 | |
| | | | | | | | | |
| TOTAL INCREASE IN NET ASSETS | | | 3,665,605 | | | | 10,202,115 | |
| | | | | | | | | |
| NET ASSETS: | | | | | | | | |
| Beginning of period | | | 16,452,408 | | | | 6,250,293 | |
| End of period (including undistributed net | | | | | | | | |
| investment loss of $44,175 and $35) | | $ | 20,118,013 | | | $ | 16,452,408 | |
| (1) | Net of redemption fees of $0 and $150, respectively. |
See notes to financial statements.
Intrepid Capital Fund
FINANCIAL HIGHLIGHTS
Per share data for a share of capital stock outstanding for the entire period and selected information for the period are as follows:
| | | Period | | | | | | | | | | | | | | | January 3, | |
| | | Ended | | | Year Ended | | | 2005(1) through | |
| | | March 31, | | | September 30, | | | September 30, | |
| | | 2010 | | | 2009 | | | 2008 | | | 2007 | | | 2006 | | | 2005 | |
| | | (Unaudited) | | | | | | | | | | | | | | | | |
| NET ASSET VALUE: | | | | | | | | | | | | | | | | | | |
| Beginning of period | | $ | 9.99 | | | $ | 9.67 | | | $ | 10.55 | | | $ | 10.18 | | | $ | 9.76 | | | $ | 10.00 | |
| OPERATIONS: | | | | | | | | | | | | | | | | | | | | | | | | |
Net investment income(2) | | | 0.09 | | | | 0.23 | | | | 0.18 | | | | 0.47 | | | | 0.19 | | | | 0.07 | |
| Net realized and unrealized | | | | | | | | | | | | | | | | | | | | | | | | |
| gain (loss) on investment | | | | | | | | | | | | | | | | | | | | | | | | |
| securities | | | 1.01 | | | | 0.52 | | | | (0.30 | ) | | | 0.55 | | | | 0.52 | | | | (0.24 | )(4) |
| Total from operations | | | 1.10 | | | | 0.75 | | | | (0.12 | ) | | | 1.02 | | | | 0.71 | | | | (0.17 | ) |
| LESS DISTRIBUTIONS: | | | | | | | | | | | | | | | | | | | | | | | | |
| From net | | | | | | | | | | | | | | | | | | | | | | | | |
| investment income | | | (0.09 | ) | | | (0.23 | ) | | | (0.18 | ) | | | (0.47 | ) | | | (0.19 | ) | | | (0.07 | ) |
| From net realized gains | | | (0.15 | ) | | | (0.20 | ) | | | (0.58 | ) | | | (0.18 | ) | | | (0.10 | ) | | | — | |
| Total distributions | | | (0.24 | ) | | | (0.43 | ) | | | (0.76 | ) | | | (0.65 | ) | | | (0.29 | ) | | | (0.07 | ) |
| NET ASSET VALUE: | | | | | | | | | | | | | | | | | | | | | | | | |
| End of period | | $ | 10.85 | | | $ | 9.99 | | | $ | 9.67 | | | $ | 10.55 | | | $ | 10.18 | | | $ | 9.76 | |
| Total return | | | 11.10% | (5) | | | 8.85% | | | | (1.41)% | | | | 10.10% | | | | 7.34% | | | | (1.74)% | (5) |
| Net assets at end of | | | | | | | | | | | | | | | | | | | | | | | | |
| period (000s omitted) | | $ | 113,529 | | | $ | 74,598 | | | $ | 36,498 | | | $ | 33,482 | | | $ | 27,845 | | | $ | 26,586 | |
| RATIO OF EXPENSES TO | | | | | | | | | | | | | | | | | | | | | | | | |
| AVERAGE NET ASSETS: | | | | | | | | | | | | | | | | | | | | | | | | |
| Before expense | | | | | | | | | | | | | | | | | | | | | | | | |
| reimbursement /recapture | | | 1.51% | (6) | | | 1.71% | | | | 1.79% | | | | 1.95% | | | | 2.08% | | | | 3.08% | (6) |
| After expense | | | | | | | | | | | | | | | | | | | | | | | | |
| reimbursement /recapture | | | 1.49% | (6) | | | 1.80% | | | | 1.95% | | | | 1.95% | (3) | | | 1.95% | | | | 1.95% | (6) |
| RATIO OF NET INVESTMENT | | | | | | | | | | | | | | | | | | | | | | | | |
| INCOME TO AVERAGE NET ASSETS: | | | | | | | | | | | | | | | | | | | | | | | | |
| Before expense | | | | | | | | | | | | | | | | | | | | | | | | |
| reimbursement /recapture | | | 1.78% | (6) | | | 2.79% | | | | 1.95% | | | | 4.35% | | | | 1.76% | | | | 0.35% | (6) |
| After expense | | | | | | | | | | | | | | | | | | | | | | | | |
| reimbursement /recapture | | | 1.80% | (6) | | | 2.70% | | | | 1.79% | | | | 4.35% | (3) | | | 1.89% | | | | 1.48% | (6) |
| Portfolio turnover rate | | | 31% | (5) | | | 60% | | | | 86% | | | | 40% | | | | 24% | | | | 25% | (5) |
| (1) | Commencement of Operations. |
| (2) | Net investment income per share is calculated using the ending balances prior to consideration or adjustment for permanent book-to-tax differences. |
| (3) | The recouped amount is less than .01% |
| (4) | The amount shown may not correlate with aggregate gains and losses of portfolio securities due to the timing of subscriptions and redemptions of Fund shares. |
See notes to financial statements.
Intrepid Small Cap Fund – Investor Class
FINANCIAL HIGHLIGHTS (continued)
Per share data for a share of capital stock outstanding for the entire period and selected information for the period are as follows:
| | | | | | | | | | | | | | | October 3, | |
| | | Period | | | | | | | | | | | | 2005(1) | |
| | | Ended | | | Year Ended | | | through | |
| | | March 31, | | | September 30, | | | September 30, | |
| | | 2010 | | | 2009 | | | 2008 | | | 2007 | | | 2006 | |
| | | (Unaudited) | | | | | | | | | | | | | |
| NET ASSET VALUE: | | | | | | | | | | | | | | | |
| Beginning of period | | $ | 14.66 | | | $ | 11.60 | | | $ | 12.04 | | | $ | 10.37 | | | $ | 10.00 | |
| OPERATIONS: | | | | | | | | | | | | | | | | | | | | |
Net investment income (loss)(2) | | | (0.01 | ) | | | (0.01 | ) | | | 0.04 | | | | 0.14 | | | | 0.14 | |
| Net realized and unrealized | | | | | | | | | | | | | | | | | | | | |
| gain on investment securities | | | 1.61 | | | | 3.32 | | | | 0.07 | | | | 1.57 | | | | 0.37 | |
| Total from operations | | | 1.60 | | | | 3.31 | | | | 0.11 | | | | 1.71 | | | | 0.51 | |
| LESS DISTRIBUTIONS: | | | | | | | | | | | | | | | | | | | | |
| From net investment income | | | 0.00 | | | | (0.02 | ) | | | (0.11 | ) | | | (0.04 | ) | | | (0.14 | ) |
| From net realized gains | | | (0.84 | ) | | | (0.23 | ) | | | (0.44 | ) | | | — | | | | — | |
| Total distributions | | | (0.84 | ) | | | (0.25 | ) | | | (0.55 | ) | | | (0.04 | ) | | | (0.14 | ) |
| NET ASSET VALUE: | | | | | | | | | | | | | | | | | | | | |
| End of period | | $ | 15.42 | | | $ | 14.66 | | | $ | 11.60 | | | $ | 12.04 | | | $ | 10.37 | |
| Total return | | | 11.26% | (3) | | | 29.35% | | | | 0.74% | | | | 16.46% | | | | 5.14% | (3) |
| Net assets at end of | | | | | | | | | | | | | | | | | | | | |
| period (000s omitted) | | $ | 367,560 | | | $ | 242,899 | | | $ | 20,494 | | | $ | 5,387 | | | $ | 1,993 | |
| RATIO OF EXPENSES TO | | | | | | | | | | | | | | | | | | | | |
| AVERAGE NET ASSETS: | | | | | | | | | | | | | | | | | | | | |
| Before expense reimbursement | | | 1.45% | (4) | | | 1.62% | | | | 2.28% | | | | 4.80% | | | | 7.88% | (4) |
| After expense reimbursement | | | 1.41% | (4) | | | 1.57% | | | | 1.95% | | | | 1.95% | | | | 1.95% | (4) |
| RATIO OF NET INVESTMENT | | | | | | | | | | | | | | | | | | | | |
| INCOME (LOSS) TO | | | | | | | | | | | | | | | | | | | | |
| AVERAGE NET ASSETS: | | | | | | | | | | | | | | | | | | | | |
| Before expense reimbursement | | | (0.14)% | (4) | | | (0.16)% | | | | 0.24% | | | | (1.27)% | | | | (4.12)% | (4) |
| After expense reimbursement | | | (0.10)% | (4) | | | (0.11)% | | | | 0.57% | | | | 1.58% | | | | 1.81% | (4) |
| Portfolio turnover rate | | | 23% | (3) | | | 163% | | | | 159% | | | | 126% | | | | 22% | (3) |
| (1) | Commencement of Operations. |
| (2) | Net investment income per share is calculated using the ending balances prior to consideration or adjustment for permanent book-to-tax differences. |
See notes to financial statements.
Intrepid Small Cap Fund – Institutional Class
FINANCIAL HIGHLIGHTS (continued)
Per share data for a share of capital stock outstanding for the entire period and selected information for the period are as follows:
| | | November 3, | |
| | | 2009(1) | |
| | | through | |
| | | March 31, 2010 | |
| | | (Unaudited) | |
| NET ASSET VALUE: | | | |
| Beginning of period | | $ | 14.52 | |
| OPERATIONS: | | | | |
Net investment income(2) | | | 0.01 | |
| Net realized and unrealized gain on investment securities | | | 1.75 | |
| Total from operations | | | 1.76 | |
| LESS DISTRIBUTIONS: | | | | |
| From net investment income | | | — | |
| From net realized gains | | | (0.84 | ) |
| Total distributions | | | (0.84 | ) |
| NET ASSET VALUE: | | | | |
| End of period | | $ | 15.44 | |
| Total return | | | 12.48% | (3) |
| Net assets at end of period (000s omitted) | | $ | 24,263 | |
| RATIO OF EXPENSES TO | | | | |
| AVERAGE NET ASSETS: | | | | |
| Before expense reimbursement | | | 1.21% | (4) |
| After expense reimbursement | | | 1.15% | (4) |
| RATIO OF NET INVESTMENT | | | | |
| INCOME TO AVERAGE NET ASSETS: | | | | |
| Before expense reimbursement | | | 0.21% | (4) |
| After expense reimbursement | | | 0.27% | (4) |
| Portfolio turnover rate | | | 23% | (3) |
| (1) | Commencement of Operations. |
| (2) | Net investment income per share is calculated using the ending balances prior to consideration or adjustment for permanent book-to-tax differences. |
See notes to financial statements.
Intrepid Income Fund
FINANCIAL HIGHLIGHTS (continued)
Per share data for a share of capital stock outstanding for the entire period and selected information for the period are as follows:
| | | Period | | | | | | | | | July 2, 2007(1) | |
| | | Ended | | | Year Ended | | | through | |
| | | March 31, | | | September 30, | | | September 30, | |
| | | 2010 | | | 2009 | | | 2008 | | | 2007 | |
| | | (Unaudited) | | | | | | | | | | |
| NET ASSET VALUE: | | | | | | | | | | | | |
| Beginning of period | | $ | 9.51 | | | $ | 9.43 | | | $ | 9.94 | | | $ | 10.00 | |
| OPERATIONS: | | | | | | | | | | | | | | | | |
Net investment income(2) | | | 0.25 | | | | 0.57 | | | | 0.46 | | | | 0.13 | |
| Net realized and unrealized gain | | | | | | | | | | | | | | | | |
| (loss) on investment securities | | | 0.24 | | | | 0.09 | | | | (0.51 | ) | | | (0.06 | ) |
| Total from operations | | | 0.49 | | | | 0.66 | | | | (0.05 | ) | | | 0.07 | |
| LESS DISTRIBUTIONS: | | | | | | | | | | | | | | | | |
| From net investment income | | | (0.26 | ) | | | (0.58 | ) | | | (0.46 | ) | | | (0.13 | ) |
| From net realized gains | | | — | | | | — | | | | 0.00 | (5) | | | — | |
| Total distributions | | | (0.26 | ) | | | (0.58 | ) | | | (0.46 | ) | | | (0.13 | ) |
| NET ASSET VALUE: | | | | | | | | | | | | | | | | |
| End of period | | $ | 9.74 | | | $ | 9.51 | | | $ | 9.43 | | | $ | 9.94 | |
| Total return | | | 5.18% | (3) | | | 7.67% | | | | (0.55)% | | | | 0.67% | (3) |
| Net assets at end of | | | | | | | | | | | | | | | | |
| period (000s omitted) | | $ | 67,027 | | | $ | 53,972 | | | $ | 28,743 | | | $ | 21,872 | |
| RATIO OF EXPENSES TO | | | | | | | | | | | | | | | | |
| AVERAGE NET ASSETS: | | | | | | | | | | | | | | | | |
| Before expense reimbursement | | | 1.30% | (4) | | | 1.45% | | | | 1.61% | | | | 2.19% | (4) |
| After expense reimbursement | | | 1.25% | (4) | | | 1.25% | | | | 1.25% | | | | 1.25% | (4) |
| RATIO OF NET INVESTMENT | | | | | | | | | | | | | | | | |
| INCOME TO AVERAGE NET ASSETS: | | | | | | | | | | | | | | | | |
| Before expense reimbursement | | | 5.21% | (4) | | | 6.53% | | | | 4.62% | | | | 4.51% | (4) |
| After expense reimbursement | | | 5.26% | (4) | | | 6.73% | | | | 4.98% | | | | 5.45% | (4) |
| Portfolio turnover rate | | | 31% | (3) | | | 45% | | | | 44% | | | | 12% | (3) |
| (1) | Commencement of Operations. |
| (2) | Net investment income per share is calculated using the ending balances prior to consideration or adjustment for permanent book-to-tax differences. |
| (5) | The amount represents less than $0.01 per share. |
See notes to financial statements.
Intrepid All Cap Fund
FINANCIAL HIGHLIGHTS (continued)
Per share data for a share of capital stock outstanding for the entire period and selected information for the period are as follows:
| | | | | | | | | October 31, | |
| | | Period | | | Year | | | 2007(1) | |
| | | Ended | | | Ended | | | through | |
| | | March 31, | | | September 30, | | | September 30, | |
| | | 2010 | | | 2009 | | | 2008 | |
| | | (Unaudited) | | | | | | | |
| NET ASSET VALUE: | | | | | | | | | |
| Beginning of period | | $ | 9.03 | | | $ | 8.74 | | | $ | 10.00 | |
| OPERATIONS: | | | | | | | | | | | | |
Net investment income (loss)(2) | | | (0.02 | ) | | | 0.01 | | | | 0.02 | |
| Net realized and unrealized | | | | | | | | | | | | |
| gain (loss) on investment securities | | | 1.18 | | | | 0.30 | | | | (1.27 | ) |
| Total from operations | | | 1.16 | | | | 0.31 | | | | (1.25 | ) |
| LESS DISTRIBUTIONS: | | | | | | | | | | | | |
| From net investment income | | | — | | | | (0.02 | ) | | | (0.01 | ) |
| From net realized gains | | | (0.05 | ) | | | — | | | | — | |
| Total distributions | | | (0.05 | ) | | | (0.02 | ) | | | (0.01 | ) |
| NET ASSET VALUE: | | | | | | | | | | | | |
| End of period | | $ | 10.14 | | | $ | 9.03 | | | $ | 8.74 | |
| Total return | | | 12.93% | (3) | | | 3.53% | | | | (12.50)% | (3) |
| Net assets at end of period (000s omitted) | | $ | 20,118 | | | $ | 16,452 | | | $ | 6,250 | |
| RATIO OF EXPENSES TO | | | | | | | | | | | | |
| AVERAGE NET ASSETS: | | | | | | | | | | | | |
| Before expense reimbursement/recoupment | | | 1.89% | (4) | | | 2.65% | | | | 2.99% | (4) |
| After expense reimbursement/recoupment | | | 1.95% | (4) | | | 1.95% | | | | 1.95% | (4) |
| RATIO OF NET INVESTMENT | | | | | | | | | | | | |
| INCOME (LOSS) TO AVERAGE NET ASSETS: | | | | | | | | | | | | |
| Before expense reimbursement | | | (0.40)% | (4) | | | (0.65)% | | | | (0.80)% | (4) |
| After expense reimbursement | | | (0.46)% | (4) | | | 0.05% | | | | 0.24% | (4) |
| Portfolio turnover rate | | | 31% | (3) | | | 93% | | | | 85% | (3) |
| (1) | Commencement of Operations. |
| (2) | Net investment income per share is calculated using the ending balances prior to consideration or adjustment for permanent book-to-tax differences. |
See notes to financial statements.
Intrepid Funds
NOTES TO FINANCIAL STATEMENTS
March 31, 2010 (Unaudited)
1.ORGANIZATION
Intrepid Capital Management Funds Trust (the “Trust”), was organized as a Delaware Statutory Trust on August 27, 2004 and is registered under the Investment Company Act of 1940, as amended (the “1940 Act”), as an open-end management investment company issuing its shares in series, each series representing a distinct portfolio with its own investment objectives and policies. At March 31, 2010, the Trust consisted of four series (the “Funds”): Intrepid Capital Fund, Intrepid Small Cap Fund, Intrepid Income Fund and Intrepid All Cap Fund. The Intrepid Capital Fund commenced operations on January 3, 2005, the Intrepid Small Cap Fund’s Investor Class commenced operations on October 3, 2005, the Intrepid Small Cap Fund’s Ins titutional Class commenced operations on November 3, 2009, the Intrepid Income Fund commenced operations on July 2, 2007 and the Intrepid All Cap Fund commenced operations on October 31, 2007.
2.SIGNIFICANT ACCOUNTING POLICIES
The following is a summary of significant accounting policies consistently followed by the Funds in the preparation of its financial statements. These policies are in conformity with accounting principles generally accepted in the United States (“GAAP”).
Valuation of Securities
The Funds’ securities that are listed on national securities exchanges are valued at the last sales price on the securities exchange on which such securities are primarily traded. Securities that are traded on the Nasdaq National Market or the Nasdaq Smallcap Market (collectively “Nasdaq traded securities”) are valued at the Nasdaq Official Closing Price (“NOCP”). Exchange-traded securities for which there were no transactions and Nasdaq traded securities for which there is no NOCP are valued at the most recent bid price. Other securities are valued by an independent pricing service at the most recent bid price, if market quotations are readily available. Short-term investments are stated at amortized cost, which a pproximates fair value. The valuation of certain debt securities for which market quotations are not readily available may be based upon current market prices of securities which are comparable in coupon, rating and maturity quality, general market conditions or an appropriate matrix utilizing similar factors. Any securities for which there are no readily available market quotations will be valued at a price determined in good faith by the Board of Trustees.
Use of Estimates
The preparation of financial statements in conformity with GAAP requires management to make estimates and assumptions that affect the reported amounts of
Intrepid Funds
NOTES TO FINANCIAL STATEMENTS (continued)
March 31, 2010 (Unaudited)
assets and liabilities and disclosure of contingent assets and liabilities at the date of the financial statements and the reported amounts of revenues and expenses during the reporting period. Actual results could differ from those estimates.
Foreign Currency Transactions
The books and records are maintained in U.S. dollars. Foreign currency denominated transactions (i.e. market value of investment securities, assets and liabilities, purchases and sales of investment securities and income and expenses) are translated into U.S. dollars at the current rate of exchange. The Funds do not isolate that portion of the results of operations resulting from changes in foreign exchange rates on investments from the fluctuations arising from changes in market prices of securities held. Such fluctuations are included with the net realized and unrealized gain or loss from investments.
Securities Transactions and Investment Income
The Funds record security transactions based on trade date. Dividend income is recognized on the ex-dividend date, and interest income is recognized on an accrual basis. Discounts and premiums on securities purchased are amortized over the lives of the respective securities using the effective yield method. Withholding taxes on foreign dividends have been provided for in accordance with the Funds’ understanding of the applicable country’s tax rules and rates. Net realized gains or losses are determined using the identified cost method.
Distribution to Shareholder Policy
Dividends from net investment income, if any, are declared and paid quarterly in the Capital Fund and Income Fund and at least annually in the Small Cap Fund and All Cap Fund. Distributions of net realized capital gains, if any, are declared and paid at least annually.
Organization and Offering Costs
Organization and offering costs consist of costs incurred to establish the Trust and enable it legally to do business. These expenses were paid by the Adviser. Prepaid initial registration expenses are deferred over the period of benefit not to exceed twelve months.
Federal Income Taxes
The Funds comply with the requirements of Subchapter M of the Internal Revenue Code necessary to qualify as a regulated investment company and to make the requisite distributions of income and capital gains to its shareholders sufficient to relieve it from Federal income taxes.
Intrepid Funds
NOTES TO FINANCIAL STATEMENTS (continued)
March 31, 2010 (Unaudited)
Fair Valuation Pricing Inputs
The Trust has adopted authoritative fair valuation accounting standards which establish an authoritative definition of fair value and set out a hierarchy for measuring fair value. These standards require additional disclosures about the various inputs and valuation techniques used to develop the measurements of fair value and a discussion in changes in valuation techniques and related inputs during the period. These inputs are summarized in the three broad levels listed below.
| | Level 1 – | Quoted prices in active markets for identical securities. |
| | Level 2 – | Other significant observable inputs (including quoted prices for similar securities, interest rates, prepayment speeds, credit risk, etc.). |
| | Level 3 – | Significant unobservable inputs (including the Fund’s own assumptions in determining the fair value of investments). |
The following is a summary of the inputs used, as of March 31, 2010, involving the Fund’s assets carried at value. The inputs of methodology used for valuing securities may not be an indication of the risk associated with investing in those securities.
| Description | | Level 1 | | | Level 2 | | | Level 3 | | | Total | |
| The Intrepid Capital Fund | | | | | | | | | | | | |
| Total Common Stock* | | $ | 58,548,249 | | | $ | — | | | $ | — | | | $ | 58,548,249 | |
| Total Convertible Bonds* | | | — | | | | 1,988,091 | | | | — | | | | 1,988,091 | |
| Total Corporate Bonds* | | | — | | | | 25,104,707 | | | | — | | | | 25,104,707 | |
| Total Real Estate | | | | | | | | | | | | | | | | |
| Investment Trust | | | 959,045 | | | | — | | | | — | | | | 959,045 | |
| Total U.S. Treasury Bills | | | — | | | | 19,993,700 | | | | — | | | | 19,993,700 | |
| Total Money Market Funds | | | 6,519,273 | | | | — | | | | — | | | | 6,519,273 | |
| Total Fund | | $ | 66,026,567 | | | $ | 47,086,498 | | | $ | — | | | $ | 113,113,065 | |
| | | | | | | | | | | | | | | | | |
| The Intrepid Small Cap Fund | | | | | | | | | | | | | | | | |
| | | Level 1 | | | Level 2 | | | Level 3 | | | Total | |
| Total Common Stock* | | $ | 311,208,022 | | | $ | — | | | $ | — | | | $ | 311,208,022 | |
| Total Real Estate | | | | | | | | | | | | | | | | |
| Investment Trust | | | 5,874,806 | | | | — | | | | — | | | | 5,874,806 | |
| Total U.S. Treasury Bills | | | — | | | | 37,991,202 | | | | — | | | | 37,991,202 | |
| Total Money Market Funds | | | 37,161,630 | | | | — | | | | — | | | | 37,161,630 | |
| Total Fund | | $ | 354,244,458 | | | $ | 37,991,202 | | | $ | — | | | $ | 392,235,660 | |
Intrepid Funds
NOTES TO FINANCIAL STATEMENTS (continued)
March 31, 2010 (Unaudited)
| The Intrepid Income Fund | | | | | | | | | | | | |
| | | Level 1 | | | Level 2 | | | Level 3 | | | Total | |
| Total Convertible Bonds* | | $ | — | | | $ | 5,682,395 | | | $ | — | | | $ | 5,682,395 | |
| Total Corporate Bonds* | | | — | | | | 43,471,333 | | | | — | | | | 43,471,333 | |
| Total U.S. Treasury Bills | | | — | | | | 13,997,929 | | | | — | | | | 13,997,929 | |
| Total Money Market Funds | | | 3,558,324 | | | | — | | | | — | | | | 3,558,324 | |
| Total Fund | | $ | 3,558,324 | | | $ | 63,151,657 | | | $ | — | | | $ | 66,709,981 | |
| | | | | | | | | | | | | | | | | |
| The Intrepid All Cap Fund | | | | | | | | | | | | | | | | |
| | | Level 1 | | | Level 2 | | | Level 3 | | | Total | |
| Total Common Stocks* | | $ | 16,847,513 | | | $ | — | | | $ | — | | | $ | 16,847,513 | |
| Total Real Estate | | | | | | | | | | | | | | | | |
| Investment Trust | | | 433,270 | | | | — | | | | — | | | | 433,270 | |
| Total U.S. Treasury Bills | | | — | | | | 2,299,289 | | | | — | | | | 2,299,289 | |
| Total Fund | | $ | 17,280,783 | | | $ | 2,299,289 | | | $ | — | | | $ | 19,580,072 | |
| * | For further information regarding security characteristics, please see the Schedule of Investments. |
The Funds did not hold any investments during the period with significant unobservable inputs that would be classified as Level 3. The Funds did not hold any derivative instruments during the reporting period.
Subsequent Events Evaluation
Effective April 30, 2010, the Intrepid Capital Fund consists of two share classes. The original share class is now the Investor Class and the new share class is the Institutional Class. Details of the classes can be found in their prospectus dated April 30, 2010.
In preparing these financial statements, the Trust has evaluated events and transactions for potential recognition or disclosure resulting from subsequent events through the date the financial statements were available to be issued. With the exception of the inception of the Institutional Class of the Intrepid Capital Fund, this evaluation did not result in any subsequent events that necessitated disclosure and / or adjustments.
3.TRANSACTIONS WITH AFFILIATES
The following issuers are affiliated with the Funds; that is, the Fund had control of 5% or more of the outstanding voting securities during the period from October 1, 2009 through March 31, 2010. As defined in Section (2)(a)(3) of the Investment Company Act of 1940; such issues are:
Intrepid Funds
NOTES TO FINANCIAL STATEMENTS (continued)
March 31, 2010 (Unaudited)
Intrepid Small Cap Fund
| | | Share | | | | | | | | | Share | | | | | | | | | | |
| | | Balance at | | | | | | | | | Balance at | | | | | | Realized | | | Value at | |
| | | Oct. 1, | | | | | | | | | March 31, | | | Dividend | | | Gain/ | | | March 31, | |
| Issuer Name | | 2009 | | | Additions | | | Reductions | | | 2010 | | | Income | | | (Loss) | | | 2010 | |
| Oil Dri-Corporation | | | | | | | | | | | | | | | | | | | | | |
| of America | | 313,806 | | | 22,246 | | | — | | | 336,052 | | | $ | 98,979 | | | $ | — | | | $ | 6,495,885 | |
| | | | | | | | | | | | | | | | | | | $ | 98,979 | | | $ | — | | | $ | 6,495,885 | |
4.INVESTMENT ADVISER
The Trust has an Investment Advisory Agreement (the “Agreement”) with Intrepid Capital Management, Inc. (the “Adviser”), with whom certain officers and Trustees of the Trust are affiliated, to furnish investment advisory services to the Funds. Under the terms of the Agreement, the Trust, on behalf of the Funds, compensates the Adviser for its management services on the Intrepid Capital Fund and Intrepid All Cap Fund at the annual rate of 1.00% on the first $500 million of average daily net assets and 0.80% on the Fund’s average daily net assets in excess of $500 million, on the Intrepid Small Cap Fund at an annual rate of 1.00% of average daily net assets, and on Intrepid Income Fund at the annual rate of 0.75% of average daily net assets.
For the Intrepid Capital Fund, the Adviser agreed to waive its management fee and/or reimburse the other expenses of the Fund, including organization expense, to the extent necessary to ensure that the Fund’s operating expenses did not exceed 1.49% of the Fund’s average daily net assets. (Effective April 30, 2010 this was lowered to 1.40% for the Investor Class and set at 1.15% for the Institutional Class). For the Intrepid Small Cap Fund, the Adviser agreed to waive its management fee and/or reimburse the other expenses of the Fund, including organizational expenses, to the extent necessary to ensure that the Fund’s operating expenses did not exceed 1.45% of the Fund’s average daily net assets. (Effective November 3, 2009, this wa s lowered to 1.40% for the Investor Class and set at 1.15% for the Institutional Class). For the Intrepid Income Fund, the Adviser agreed to waive its management fee and/or reimburse the other expenses of the Fund, including organization expense, to the extent necessary to ensure that the Fund’s operating expenses did not exceed 1.25% of the Fund’s average daily net assets. For the Intrepid All Cap Fund, the Adviser agreed to waive its management fee and/or reimburse the other expenses of the Fund, including organization expense, to the extent necessary to ensure that the Fund’s operating expenses did not exceed 1.95% of the Fund’s average daily net assets.
Intrepid Funds
NOTES TO FINANCIAL STATEMENTS (continued)
March 31, 2010 (Unaudited)
| | | Year of Expiration | |
| | | 9/30/10 | | | 9/30/11 | | | 9/30/12 | | | 9/30/13 | |
| Intrepid Capital Fund | | | — | | | | — | | | | — | | | $ | 8,608 | |
| Intrepid Small Cap Fund | | $ | 95,022 | | | $ | 43,926 | | | $ | 77,189 | | | | 65,920 | |
| Intrepid Income Fund | | | 49,671 | | | | 95,694 | | | | 77,259 | | | | 14,585 | |
| Intrepid All Cap Fund | | | — | | | | 53,418 | | | | 56,937 | | | | — | |
5.DISTRIBUTION PLAN
The Trust, on behalf of the Funds, has adopted a distribution plan pursuant to Rule 12b-1 under the 1940 Act (the “12b-1 Plan”), which provides that the Funds may reimburse the Funds’ distributor or others at an annual rate of up to 0.25% of the average daily net assets of the Funds.
Quasar Distributors, LLC serves as the distributor to the Funds. Quasar Distributors, LLC is an affiliated company of U.S. Bank, N.A.
6.INVESTMENT TRANSACTIONS
The aggregate purchases and sales of securities (excluding short-term securities) by the Funds for the six months ended March 31, 2010 were as follows:
| | | Purchases | | | Sales | |
| Intrepid Capital Fund | | $ | 34,114,128 | | | $ | 23,274,696 | |
| Intrepid Small Cap Fund | | | 143,445,234 | | | | 58,149,309 | |
| Intrepid Income Fund | | | 17,375,701 | | | | 15,407,163 | |
| Intrepid All Cap Fund | | | 6,133,788 | | | | 4,993,619 | |
7.CAPITAL SHARE TRANSACTIONS
Intrepid Capital Fund
| | | Six Months Ended | | | Year Ended | |
| | | March 31, 2010 | | | September 30, 2009 | |
| Shares sold | | | 3,387,164 | | | | 4,884,623 | |
| Shares issued to holders in | | | | | | | | |
| reinvestment of dividends | | | 205,208 | | | | 230,735 | |
| Shares redeemed | | | (600,307 | ) | | | (1,420,665 | ) |
| Net increase in shares | | | 2,992,065 | | | | 3,694,693 | |
| Shares outstanding: | | | | | | | | |
| Beginning of period | | | 7,469,191 | | | | 3,774,498 | |
| End of period | | | 10,461,256 | | | | 7,469,191 | |
Intrepid Funds
NOTES TO FINANCIAL STATEMENTS (continued)
March 31, 2010 (Unaudited)
| Intrepid Small Cap Fund – Investor Class | | | | | | |
| | | Six Months Ended | | | Year Ended | |
| | | March 31, 2010 | | | September 30, 2009 | |
| Shares sold | | | 30,110,125 | | | | 18,107,716 | |
| Shares issued to holders in | | | | | | | | |
| reinvestment of dividends | | | 1,049,591 | | | | 67,969 | |
| Shares redeemed | | | (23,888,504 | ) | | | (3,373,313 | ) |
| Net increase in shares | | | 7,271,212 | | | | 14,802,372 | |
| Shares outstanding: | | | | | | | | |
| Beginning of period | | | 16,569,350 | | | | 1,766,978 | |
| End of period | | | 23,840,562 | | | | 16,569,350 | |
| | | | | | | | | |
Intrepid Small Cap Fund – Institutional Class | | | | | | | | |
| | | Period Ended | | | | | |
| | | March 31, 2010 | | | | | |
| Shares sold | | | 1,674,995 | | | | | |
| Shares issued to holders in | | | | | | | | |
| reinvestment of dividends | | | 52,179 | | | | | |
| Shares redeemed | | | (155,594 | ) | | | | |
| Net increase in shares outstanding: | | | 1,571,580 | | | | | |
| Beginning of period | | | — | | | | | |
| End of period | | | 1,571,580 | | | | | |
| | | | | | | | | |
| Intrepid Income Fund | | | | | | | | |
| | | Six Months Ended | | | Year Ended | |
| | | March 31, 2010 | | | September 30, 2009 | |
| Shares sold | | | 1,555,525 | | | | 2,970,253 | |
| Shares issued to holders in | | | | | | | | |
| reinvestment of dividends | | | 174,888 | | | | 288,345 | |
| Shares redeemed | | | (525,100 | ) | | | (631,143 | ) |
| Net increase in shares | | | 1,205,313 | | | | 2,627,455 | |
| Shares outstanding: | | | | | | | | |
| Beginning of period | | | 5,676,699 | | | | 3,049,244 | |
| End of period | | | 6,882,012 | | | | 5,676,699 | |
Intrepid Funds
NOTES TO FINANCIAL STATEMENTS (continued)
March 31, 2010 (Unaudited)
| Intrepid All Cap Fund | | | | | | |
| | | Six Months Ended | | | Year Ended | |
| | | March 31, 2010 | | | September 30, 2009 | |
| Shares sold | | | 365,665 | | | | 1,288,935 | |
| Shares issued to holders in | | | | | | | | |
| reinvestment of dividends | | | 11,769 | | | | 1,892 | |
| Shares redeemed | | | (216,506 | ) | | | (183,104 | ) |
| Net increase in shares | | | 160,928 | | | | 1,107,723 | |
| Shares outstanding: | | | | | | | | |
| Beginning of period | | | 1,822,510 | | | | 714,787 | |
| End of period | | | 1,983,438 | | | | 1,822,510 | |
8.FEDERAL INCOME TAX INFORMATION
The tax components of distributions paid during the fiscal periods ended September 30, 2009 and 2008 are as follows:
| | | September 30, 2009 | | | September 30, 2008 | |
| | | Ordinary | | | Long-Term | | | Ordinary | | | Long-Term | |
| | | Income | | | Capital Gains | | | Income | | | Capital Gains | |
| Intrepid Capital Fund | | $ | 1,206,507 | | | $ | 767,271 | | | $ | 957,818 | | | $ | 1,527,278 | |
| Intrepid Small Cap Fund | | | 578,320 | | | | 139,053 | | | | 294,760 | | | | 30,525 | |
| Intrepid Income Fund | | | 2,543,948 | | | | — | | | | 1,315,684 | | | | — | |
| Intrepid All Cap Fund | | | 13,071 | | | | — | | | | 7,166 | | | | — | |
The Funds designated as long-term capital gain dividend, pursuant to Internal Revenue Code Section 852(b)(3), the amount necessary to reduce the earnings and profits of the Funds related to net capital gain to zero for the tax year ended September 30, 2009.
Additionally, U.S. generally accepted accounting principles require that certain components of net assets relating to permanent differences be reclassified between financial and tax reporting. These reclassifications have no effect on net assets or net asset value per share. For the year ended September 30, 2009, the following table shows the reclassifications made:
Intrepid Funds
NOTES TO FINANCIAL STATEMENTS (continued)
March 31, 2010 (Unaudited)
| | | Accumulated | | | Undistributed | | | | |
| | | Net Realized | | | Net Investment | | | Paid-in | |
| | | Gains (Losses) | | | Income (Loss) | | | Capital | |
| Intrepid Capital Fund | | $ | 17,517 | | | $ | (17,517 | ) | | $ | — | |
| Intrepid Small Cap Fund | | | (95,266 | ) | | | 95,265 | | | | 1 | |
| Intrepid Income Fund | | | — | | | | — | | | | — | |
| Intrepid All Cap Fund | | | (6,617 | ) | | | 6,617 | | | | — | |
The permanent differences primarily relate to Real Estate Investment Trust (“REIT”) adjustments with differing book and tax methods for accounting.
As of September 30, 2009, the cost of investments, gross unrealized appreciation and depreciation of investments and distributable income for tax purposes were as follows:
| | | Intrepid | | | Intrepid | |
| | | Capital Fund | | | Small Cap Fund | |
| Cost of investments | | $ | 68,888,249 | | | $ | 220,950,569 | |
| Unrealized appreciation | | | 5,523,816 | | | | 22,599,971 | |
| Unrealized depreciation | | | (1,659,996 | ) | | | (1,370,246 | ) |
| Net unrealized appreciation (depreciation) | | | 3,863,820 | | | | 21,229,725 | |
| Undistributed ordinary income | | | 1,333,323 | | | | 15,418,486 | |
| Undistributed long-term capital gain | | | — | | | | 169,866 | |
| Distributable income | | | 1,333,323 | | | | 15,588,352 | |
| Other accumulated losses | | | (525,635 | ) | | | — | |
| Total accumulated earnings (losses) | | $ | 4,671,508 | | | $ | 36,818,077 | |
| | | | | | | | | |
| | | Intrepid | | | Intrepid | |
| | | Income Fund | | | All Cap Fund | |
| Cost of investments | | $ | 52,270,707 | | | $ | 15,792,066 | |
| Unrealized appreciation | | | 1,646,984 | | | | 1,301,929 | |
| Unrealized depreciation | | | (507,581 | ) | | | (377,669 | ) |
| Net unrealized appreciation (depreciation) | | | 1,139,403 | | | | 924,260 | |
| Undistributed ordinary income | | | 34,010 | | | | 108,973 | |
| Undistributed long-term capital gain | | | — | | | | 3,075 | |
| Distributable income | | | 34,010 | | | | 112,048 | |
| Other accumulated losses | | | (949,454 | ) | | | (273,499 | ) |
| Total accumulated earnings (losses) | | $ | 223,959 | | | $ | 762,809 | |
Intrepid Funds
NOTES TO FINANCIAL STATEMENTS (continued)
March 31, 2010 (Unaudited)
The difference between book-basis and tax-basis unrealized appreciation is attributable primarily to the tax deferral of losses on wash sales.
At September 30, 2009, the Intrepid Income Fund had $148,626 in capital loss carryforwards which can be used to offset future capital gains. This entire amount expires in 2017.
At September 30, 2009, the Intrepid Capital Fund, the Intrepid Income Fund and the Intrepid All Cap Fund had post-October capital losses of $525,635, $800,828 and $273,499, respectively.
There is no tax liability resulting from unrecognized tax benefits relating to uncertain income tax positions taken or expected to be taken on the tax return for the fiscal year-end September 30, 2009, or for any other tax years which are open for exam. As of September 30, 2009, open tax years include the tax years ended September 30, 2006 through 2009. The Trust is also not aware of any tax positions for which it is reasonably possible that the total amounts of unrecognized tax benefits will significantly change in the next year. The Fund recognizes interest and penalties, if any, related to unrecognized tax benefits as income tax expense in the Statement of Operations. During the period, the Fund did not incur any interest or penalties, nor were any accrued as of September 30, 2009.
Intrepid Funds
ADDITIONAL INFORMATION
March 31, 2010 (Unaudited)
Investment Advisory Agreement Disclosure
On November 10, 2009, the Board of Trustees of Intrepid Capital Management Funds Trust approved the investment advisory agreements between the Intrepid Capital Fund, the Intrepid Small Cap Fund, the Intrepid Income Fund and the Intrepid All Cap Fund (the “Funds”) and Intrepid Capital Management, Inc. Prior to approving the agreement, the Board considered:
| | • | The nature, extent and quality of the services to be provided by Intrepid Capital Management, Inc. |
| | • | The investment performance of the Funds |
| | • | The cost of the services to be provided and profits to be realized by Intrepid Capital Management, Inc. from its relationship with the Funds |
| | • | The extent to which economies of scale would be realized as the Funds grew and whether fee levels reflect any such economies of scale |
| | • | The expense ratio of the Funds |
| | • | The manner in which portfolio transactions for the Funds would be conducted, including the use of soft dollars |
In considering the nature, extent and quality of the services to be provided by Intrepid Capital Management Inc., the Board considered the Adviser’s quality of investment management provided to the Funds, the Adviser’s management history and the Adviser’s ability to attract investors for the Funds. The Board concluded that the nature, extent and quality of the services to be provided by the Adviser would be satisfactory.
The Board reviewed the investment performance of the Funds and compared the investment performance of the Funds to their relevant benchmarks. After further discussion, the Board concluded that the performance of the Funds was satisfactory in comparison to the relevant benchmarks.
The Board considered the cost of services provided and the profits to be realized by the Adviser, by reviewing reports provided by the Funds’ administrator that compared the Funds’ investment advisory fees to those of other comparable mutual funds. The Board concluded that the investment advisory fees were fair and within the range of the industry averages.
The Board considered the extent to which economies of scale would be realized as the Funds grow, including a consideration of breakpoints in the Agreement fee schedules. The Board concluded that given the expected growth of assets of the Funds in the next year, the Adviser was unlikely to realize economies of scale and the proposed fee schedules were acceptable.
Intrepid Funds
ADDITIONAL INFORMATION (continued)
March 31, 2010 (Unaudited)
The Board reviewed reports from the Funds’ administrator that compared the Funds’ total expense ratios to those of other comparable mutual funds. The Board concluded that the total expenses of the Funds were reasonable and within the range of the industry averages.
The Board reviewed reports discussing the manner in which portfolio transactions for the Funds were conducted, including the use of soft dollars. Based on these reports, the Board concluded that the research and services to be obtained by the Adviser were beneficial to the Funds and that the Adviser would execute the Funds’ portfolio transactions in a manner designed to obtain best execution for the Funds.
Shareholder Notification of Federal Tax Status
The Intrepid Capital Fund and Intrepid Small Cap Fund designate $767,271 and $139,053, respectively, of total distributions paid during the fiscal year ended September 30, 2009 as net capital gain distributions eligible for long-term capital gain rates for individual shareholders.
The Intrepid Capital Fund, Intrepid Small Cap Fund, Intrepid Income Fund and Intrepid All Cap Fund designate 43.00%, 27.75%, 0.28% and 100.00%, respectively, of their ordinary income distributions for the period ended September 30, 2009, as qualified dividend income under the Jobs & Growth Tax Relief Reconciliation Act of 2003.
For the period ended September 30, 2009, 38.40%, 27.31%, 0.28% and 100.00% of Intrepid Capital Fund, Intrepid Small Cap Fund, Intrepid Income Fund and Intrepid All Cap Fund dividends paid from net ordinary income, respectively, qualify for the dividends received deduction available to corporate shareholders.
The Intrepid Capital Fund, Intrepid Small Cap Fund, Intrepid Income Fund and Intrepid All Cap Fund hereby designate 75.23%, 14.23%, 100.00% and 11.39%, respectively, of their ordinary income distributions for the fiscal year as interest-related dividends under Internal Revenue Code Section 871(k)(1)(c).
The Intrepid Small Cap Fund hereby designates 91.83% of its ordinary income distributions as short-term capitalization distributions under Internal Revenue Code Section 871(k)(2)(c).
Intrepid Funds
ADDITIONAL INFORMATION (continued)
March 31, 2010 (Unaudited)
Availability of Quarterly Portfolio Holdings Schedules
The Funds are required to file their complete schedule of portfolio holdings with the SEC for the first and third quarters of each fiscal year on Form N-Q. Once filed, the Funds’ Form N-Q is available without charge, upon request on the SEC’s website (http://www.sec.gov) and may be available by calling 1.866.996.3863. You may also obtain copies at the SEC’s Public Reference Room in Washington, D.C. Information on the operation of the Public Reference Room may be obtained by calling 1.800.SEC.0330.
Proxy Voting Policies and Procedures and Proxy Voting Record (Unaudited)
A description of the policies and procedures that the Funds use to determine how to vote proxies relating to portfolio securities is available without charge, upon request, by calling 1.866.996.3863 and on the SEC’s website (http://www.sec.gov).
The Funds are required to file how they voted proxies related to portfolio securities during the most recent 12-month period ended June 30. Once filed, the information is available without charge, upon request, by calling 1.866.996.3863 and on the SEC’s website (http://www.sec.gov).
(This Page Intentionally Left Blank.)
(This Page Intentionally Left Blank.)
Board of Trustees
Edward Vandergriff
Mark Travis
Peter Osterman
Roy Clarke
Investment Adviser
Intrepid Capital Management, Inc.
1400 Marsh Landing Parkway, Suite 106
Jacksonville Beach, FL 32250
Independent Registered Public Accounting Firm
Deloitte & Touche LLP
555 East Wells Street
Milwaukee, WI 53202
Legal Counsel
Foley & Lardner LLP
777 East Wisconsin Avenue
Milwaukee, WI 53202
Custodian
U.S. Bank, N.A.
1555 N. RiverCenter Drive, Suite 302
Milwaukee, WI 53212
Distributor
Quasar Distributors, LLC
615 East Michigan Street
Milwaukee, WI 53202
Administrator, Transfer Agent
and Dividend Disbursing Agent
U.S. Bancorp Fund Services, LLC
615 East Michigan Street
Milwaukee, WI 53202
Shareholder/Investor Information
1.866.996.3863
www.intrepidcapitalfunds.com
Item 2. Code of Ethics.
Not applicable for semi-annual reports.
Item 3. Audit Committee Financial Expert.
Not applicable for semi-annual reports.
Item 4. Principal Accountant Fees and Services.
Not applicable for semi-annual reports.
Item 5. Audit Committee of Listed Registrants.
Not applicable to registrants who are not listed issuers (as defined in Rule 10A-3 under the Securities Exchange Act of 1934).
Item 6. Schedule of Investments.
Schedule of Investments is included as part of the report to shareholders filed under Item 1 of this Form.
Item 7. Disclosure of Proxy Voting Policies and Procedures for Closed-End Management Investment Companies.
Not applicable to open-end investment companies.
Item 8. Portfolio Managers of Closed-End Management Investment Companies
Not applicable to open-end investment companies.
Item 9. Purchases of Equity Securities by Closed-End Management Investment Company and Affiliated Purchases.
Not applicable to open-end investment companies.
Item 10. Submission of Matters to a Vote of Security Holders.
Not Applicable.
Item 11. Controls and Procedures.
| (a) | The Registrant’s President and Treasurer have concluded that the Registrant's disclosure controls and procedures (as defined in Rule 30a-3(c) under the Investment Company Act of 1940 (the “1940 Act”)) are effective as of a date within 90 days of the filing date of the report that includes the disclosure required by this paragraph, based on the evaluation of these controls and procedures required by Rule 30a-3(b) under the 1940 Act and Rules 15d-15(b) under the Securities Exchange Act of 1934, as amended. |
| (b) | There were no significant changes in the Registrant's internal controls over financial reporting (as defined in Rule 30a-3(d) under the Act) that occurred during the Registrant's last fiscal half-year that have materially affected, or are reasonably likely to materially affect, the Registrant's internal control over financial reporting. |
Item 12. Exhibits.
| (a) | (1) Not applicable for semi-annual reports. |
(2) Certifications pursuant to Section 302 of the Sarbanes-Oxley Act of 2002. Filed herewith.
(3) Any written solicitation to purchase securities under Rule 23c-1 under the Act sent or given during the period covered by the report by or on behalf of the registrant to 10 or more persons. Not applicable to open-end investment companies.
| (b) | Certification pursuant to Section 906 of the Sarbanes-Oxley Act of 2002. Furnished herewith. |
SIGNATURES
Pursuant to the requirements of the Securities Exchange Act of 1934 and the Investment Company Act of 1940, the registrant has duly caused this report to be signed on its behalf by the undersigned, thereunto duly authorized.
(Registrant) Intrepid Capital Management Funds Trust
By (Signature and Title) /s/ Mark F. Travis
Mark F. Travis, President
Date June 1, 2010
Pursuant to the requirements of the Securities Exchange Act of 1934 and the Investment Company Act of 1940, this report has been signed below by the following persons on behalf of the registrant and in the capacities and on the dates indicated.
By (Signature and Title)* /s/ Mark F. Travis
Mark F. Travis, President
Date June 1, 2010
By (Signature and Title)* /s/ Donald C. White
Donald C. White, Treasurer
Date June 1, 2010
* Print the name and title of each signing officer under his or her signature.