UNITED STATES
SECURITIES AND EXCHANGE COMMISSION
Washington, D.C. 20549
FORM N-CSR
CERTIFIED SHAREHOLDER REPORT OF REGISTERED
MANAGEMENT INVESTMENT COMPANIES
811-21625
Investment Company Act file number
Intrepid Capital Management Funds Trust
(Exact name of registrant as specified in charter)
1400 Marsh Landing Parkway, Suite 106
Jacksonville Beach, FL 32250
(Address of principal executive offices) (Zip code)
Mark F. Travis
1400 Marsh Landing Parkway, Suite 106
Jacksonville Beach, FL 32250
(Name and address of agent for service)
1-904-246-3433
Registrant's telephone number, including area code
Date of fiscal year end: 09/30/2012
Date of reporting period: 03/31/2013
Item 1. Reports to Stockholders.

Intrepid Capital Fund
Intrepid Small Cap Fund
Intrepid Income Fund
Intrepid Disciplined Value Fund
Semi-Annual Report
March 31, 2013
Intrepid Capital Fund
 | |
Mark F. Travis, President/C.E.O. | |
April 1, 2013
“We do better when the wind is in our face.”
Warren Buffett
Berkshire Hathaway 2012 Shareholder Letter
Dear Fellow Shareholders,
The stated corporate objective at Intrepid Capital is “to participate in a bull market, but to preserve capital in a bear market.” As we crossed the four year anniversary of the March 2009 market lows, it has become increasingly more difficult for us “to participate in a bull market.” The 150% return posted by the Russell 3000 since the 2009 market trough has made our job of finding high quality, conservatively-financed businesses trading at discounts an increasingly challenging endeavor.
We chuckled when reading Mr. Buffett’s quote as he was lamenting that he only achieved a $24 billion gain for shareholders and that the percentage increase in book value was less than the performance of the S&P 500 Index in 2012. The Intrepid Capital Fund (the “Fund”) also underperformed in 2012, a relatively short time period. Our underperformance is to be expected in a sharply rising market where we believe valuations were, and continue to be, stretched. As we moved into 2013, the markets have continued to rise, increasing at virtually 1% per week in the first quarter!
The Fund returned 5.67% in the three month period ending March 31, 2013. In the first six months of the Fund’s fiscal year, the Fund rose 6.01%. While we consider ourselves to be true absolute return investors and therefore do not manage the Fund to an index, we compare the Fund’s performance to a blended benchmark consisting of 60% invested in the S&P 500 and 40% invested in the Bank of America/Merrill Lynch High Yield Master II Index. Over the same three- and six-month periods, the benchmark returned 7.46% and 8.58%, respectively. For the one, three, five year and since inception (1/3/05) periods ending March 31, 2013, the Fund’s annualized returns were 10.02%, 9.22%, 9.56%, and 7.42% respectively. The benchmark returned 13.69%, 12.09%, 8.18%, and 6.77% over the same periods. The fund’s gross expense ratio is 1.45%.
Performance data quoted represents past performance and does not guarantee future results. Investment returns and principal value will fluctuate, and when sold, may be worth more or less than their original cost. Performance current to the most recent month-end may be lower or higher than the performance quoted and can be obtained by calling 866-996-FUND. The Fund imposes a 2% redemption fee on shares held less than 30 days. Performance data does not reflect the redemption fee. If it had, returns would be reduced.
The top contributors to the Fund’s performance in the first three months of 2013 were: Patterson UTI (ticker: PTEN), Big Lots (ticker: BIG), Bio Rad (ticker: BIO)
Intrepid Capital Fund
and Berkshire Hathaway (ticker: BRK/B). In contrast, the largest detractors for the same period were: Newfield Exploration (ticker: NFX), Newmont Mining (ticker: NEM), Royal Gold (ticker: RGLD) and Pan American Silver (ticker: PAAS). Several of these holdings are discussed in our Small Cap Fund and Disciplined Value Fund (formerly known as the Intrepid All Cap Fund) commentaries.
Once again, the Intrepid Capital Fund (ICMBX) received an overall 5-Star Morningstar Rating, the highest rating for risk-adjusted returns, out of 802 Moderate Allocation funds for the period ending March 31, 2013. Morningstar also ranked the Fund in the top 34%, 27%, and 1% out of 920, 802, and 697 Moderate Allocation funds for the one-, three-, and five-year periods, ending March 31, 2013, respectively, based on total returns.
The rules at Intrepid simple: buy low and sell high. One could say the rules are easy to understand but hard to follow. As prices for equities and fixed income securities have climbed and surpassed our conservative estimations of intrinsic value, we have been exiting positions. If attractive replacement ideas are in low supply, our sale proceeds are comfortably (or uncomfortably, depending on your perspective) held in cash, patiently waiting for opportunities to appear. We would like to draw a sharp contrast to many of our “index centric” peers who feel compelled (or pressured) to be fully invested, all of the time. In our opinion, to be fully invested today is to operate under the assumption that no better opportunities will appear in the future. That is not an assumption we have been willing to make.
Our hometown NFL team, the Jacksonville Jaguars, had a motto for the 2012 season: “All In.” We can say the same for our personal investments in Intrepid Capital Funds – we’re “all in.” We appreciate your continued support. It is not a position we take lightly.
Sincerely,
Mark F. Travis
President
Intrepid Capital Fund Portfolio Manager
Must be preceded or accompanied by a prospectus.
Mutual fund investing involves risk. Principal loss is possible. The Fund is subject to special risks including volatility due to investments in smaller companies, which involve additional risks such as limited liquidity and greater volatility. The Fund is considered non-diversified as a result of limiting its holdings to a relatively small number of positions and may be more exposed to individual stock volatility than a diversified fund. Investments in debt securities typically decrease in value when interest rates rise. This risk is usually greater for longer term debt securities. Investments by the
Intrepid Capital Fund
Fund in lower-rated and non-rated securities present a greater risk of loss to principal and interest than higher rated securities.
Please see the Schedule of Investments in this report for a full list of fund holdings. Fund holdings and sector allocations are subject to change at anytime and should not be considered a recommendation to buy or sell any security.
The S&P 500 Index is a broad based unmanaged index of 500 stocks, which is widely recognized as representative of the equity market in general. The Bank of America/Merrill Lynch High Yield Master II Index is Merrill Lynch’s broadest high yield index, and as such is comparable with the broad indices published by other investment banks. US OE Moderate Allocation is a group of moderate allocation funds that seek to provide both capital appreciation and income by investing in three major areas: stocks, bonds, and cash. These funds tend to hold larger positions in stocks than conservative-allocation funds. These funds typically have 50% to 70% of assets in equities and the remainder in fixed income and cash. The Russell 2000 Index consists of the smallest 2,000 companies in a group of 3,000 U.S. companies in the Russell 3000 Index, as ranked by market capitalization. The Russell 3000 Index is an index representing the largest 3,000 U.S. companies representing approximately 98% of the investable U.S. equity market. You cannot invest directly in an index.
Book Value is the net asset value of a company, calculated by subtracting total liabilities from total assets. Cash Flow measures the cash generating capability of a company by adding non-cash charges (e.g. depreciation) and interest expense to pretax income.
©2013 Morningstar, Inc. All Rights Reserved. The information contained herein: (1) is proprietary to Morningstar; (2) may not be copied or distributed; and (3) is not warranted to be accurate, complete or timely. Neither Morningstar nor its content providers are responsible for any damages or losses arising from any use of this information. Past performance is no guarantee of future results.
For each fund with at least a three-year history, Morningstar calculates a Morningstar Rating (based on a Morningstar risk-adjusted return measure that accounts for variation in a fund’s monthly performance, including the effects of sales charges, loads, and redemption fees), placing more emphasis on downward variations and rewarding consistent performance. The top 10% of funds in each category receive 5 stars, the next 22.5% receive 4 stars, the next 35% receive 3 stars, the next 22.5% receive 2 stars and the bottom 10% receive 1 star. The Intrepid Capital Fund (ICMBX) was rated 4-Stars and 5-Stars against the following numbers of U.S. domiciled Moderate Allocation funds over the following time periods: 802 and 697 funds in the last three- and five-years respectively.
Morningstar Rankings represent a fund’s total-return percentile rank relative to all funds that have the same Morningstar Category. The highest percentile rank is 1, the lowest is 100. It is based on Morningstar total return, which includes both income and capital gains or losses and is not adjusted for sales charges or redemption fees. The Intrepid Capital Fund’s (Investor) Morningstar percentile ranking over the one-, three-, and five-year periods is 34%, 27%, and 1% among 920, 802, and 697 Moderate Allocation funds, respectively, based on total return as of March 31, 2013.
Absolute return investing is not intended to outperform stocks and bonds during strong market rallies.
Opinions expressed are subject to change, are not guaranteed and should not be considered investment advice or recommendations to buy or sell any security.
Intrepid Small Cap Fund
 | |
Jayme Wiggins, Small Cap Fund Portfolio Manager | |
April 1, 2013
“I want my cake, wanna eat it too.”
-I Wanna Be Rich by Calloway
Dear Fellow Shareholders,
It’s all about the Benjamin baby. In early March Warren Buffett told CNBC, “Bernanke has sort of carried the load himself during this period,” and, “There’s no question stocks are higher—because interest rates are essentially zero—than they would be otherwise.” We have a consensus. The stock market is breaking records thanks to the Fed. All hail the Incredible Ben Bernanke, greatest magician ever! He waves his magic wand and money appears from thin air. Penn & Teller levitate a woman, but Bernanke levitates markets. Houdini escapes from chains underwater, and Bernanke rescues a nation of underwater borrowers. Copperfield makes the Statue of Liberty vanish, while Bernanke makes interest rates vanish.
Observing the capital markets today is like watching your kid conduct a magic show. You know it’s fake, but to keep everyone happy you pretend to believe in it. The stock market has rallied this year on relief from avoiding the fiscal cliff and any immediate disastrous impact from sequestration. A couple of famous bond market investors have recently proclaimed that fixed income buyers have it rough (no argument here), but equities look reasonable. We’ll forgive them for their relativist rants. Has the economy improved enough to justify investor bullishness?
We don’t believe the recovery story because it is not supported by a strong foundation. If you build your economic house of straw, it can be toppled by the slightest of winds. Imagine the impact of a 200 to 300 basis point rise in interest rates. Refinancing accounts for 75% of mortgage activity today and is generating significant fees for banks. Who would be refinancing their home if mortgage rates were 6%? Would home prices be increasing? The U.S. government paid $360 billion in interest on debt outstanding in fiscal 2012. In 1998, it paid $364 billion. Debt was $5.6 trillion then and is over $16 trillion now. The deficit would be hundreds of billions higher if the average government borrowing rate was 4.5%, which is in between the 1998 and 2012 rates. Low interest rates and high deficits have helped push corporate profit margins to record levels. We fear that too many investors believe current margins are sustainable.
We take most media reports of economic improvement with a grain of salt. The advertised unemployment rate ignores people who have stopped looking for work, which is at the highest level in over 30 years (highest on record for men). Additionally, the number of people who have part time jobs but wish they had full time jobs is 4 million higher than it was before the recession. Government
Intrepid Small Cap Fund
Debt/Gross Domestic Product exceeds 100%, although some economists and politicians wearing rose-colored glasses argue that only the “public” debt matters. In other words, they claim we shouldn’t count the $5 trillion of intragovernmental debt held as assets in accounts like the Social Security and Medicare Trust Funds. When Social Security is running a surplus, the government treats your payroll taxes as a loan to be spent on other things. Public Debt advocates claim this is money the government owes itself, not the people who have paid into these funds for years. Politicians will ultimately have to reduce benefits for future retirees, since unfunded liabilities exceed $80 trillion and could swamp our economy. Not helping matters is that a growing block of the working age population becomes lazier by the day—they want their cake, and they want to eat it too. More seniors reliant on the government + Fewer workers + Insufficient savings = Huge problem.
Our economic problems aren’t insurmountable, but let’s not pretend everything is peachy keen. We need to stop spending money we don’t have. The near-term implications of this would not be welcomed by politicians: Recession? Not under my watch! Who will be the responsible ones? There’s no easy way out of this situation. While the short-term repercussions of less Fed intervention, fiscal discipline, and a rebuilding of household savings would potentially be negative for the stock market, in the long run it should help us avoid economic calamity and ensure a brighter future. At Intrepid Capital, we are playing the long game. We are investing in what we believe are durable businesses when they can be purchased at a discount. We are not speculating by hopping on the Fed’s market bandwagon.
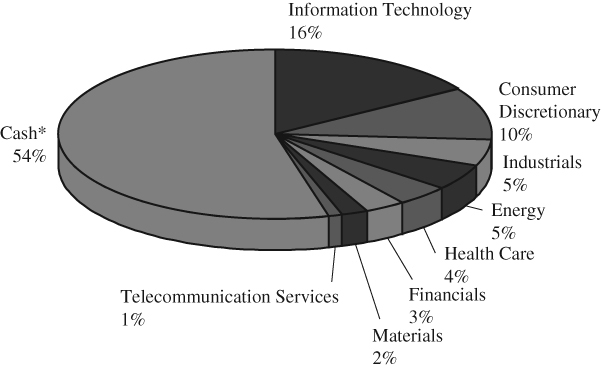
During the three months ending March 31, 2013, the Intrepid Small Cap Fund (the “Fund”) increased 4.47% compared to a 12.39% gain for the Russell 2000 benchmark. For the Fund’s fiscal six month period ending March 31, 2013, the Fund rose 6.03% versus 14.48% for the Russell Index. Our underperformance is primarily tied to our cash position, which swelled to 54.2% of Fund assets at quarter end. Lately, we have not found many durable businesses that can be bought cheaply. The absence of downside volatility makes true value investing difficult. Unfortunately, we can’t manufacture a good investment idea. If we could, here’s what it would look like:
•Predictable business that has weathered multiple economic cycles
•Significant recurring free cash flow
•Lightly levered balance sheet
•Management with a strong record of capital allocation
•Trading at or close to a double digit normalized free cash flow yield
During the first quarter, we purchased one new position and sold six existing holdings, three of which had weightings below 1% of assets. Think of it as spring cleaning. We bought SAIC (ticker: SAI), a defense IT services firm, in a pair trade
Intrepid Small Cap Fund
with ManTech (ticker: MANT). SAIC is larger, more diversified, and has a higher proportion of non-defense revenue compared to ManTech. Additionally, SAIC is pursuing a split into two companies in an effort to maximize shareholder value. To date, we have been disappointed with ManTech’s unwillingness to repurchase shares. When SAIC traded at a discount similar to ManTech, we sold some of our ManTech position and rotated into SAIC, which we viewed as a higher quality discount. We currently own stakes in both firms. Our first quarter portfolio sales included Patterson UTI (ticker: PTEN), Potlatch (ticker: PCH), Iconix Brand Group (ticker: ICON), Amerisafe (ticker: AMSF), Cott (ticker: COT), and TeleTech (ticker: TTEC). Each of these names exceeded our valuation.
The top three portfolio gainers during the first quarter were Bio-Rad (ticker: BIO), Aspen Insurance (ticker: AHL), and Big Lots (ticker: BIG). All of these were larger positions. Bio-Rad is a leading life sciences company with substantial recurring revenue. It has traded cheaper than peers for years because of the family controlled voting structure. The company has a large amount of long-term investments that do not show up in common screens and are worth about 15% of the market cap. Aspen Insurance is an insurance and reinsurance company that we purchased in 2011 at more than a 30% discount to tangible book value. The firm has a history of consistent reserving. Favorable underwriting results in 2012 as well as recent share repurchases have contributed to gains in the stock. Big Lots (ticker: BIG) was purchased a couple of quarters ago. While the closeout retailer hasn’t yet turned around operationally, the most recent quarter’s results met expectations, and the stock may be rising due to persistent buyout rumors.
The worst performers in the Fund over the past three months were Newfield Exploration (ticker: NFX), Pan American Silver (ticker: PAAS), and American Greetings (ticker: AM). Pan American’s underperformance was in line with other precious metals miners and can probably be attributed to renewed hope in the economy and stock market. Newfield’s shares fell significantly after the company announced that it intended to sell its Malaysia and China assets to fund domestic growth. Newfield’s international assets account for a large proportion of current production but a much smaller part of reserves. Sell side analysts said Newfield would receive a lower multiple on its short tail international EBITDA than the company’s current EBITDA multiple, implying that the sale would be dilutive to Newfield’s intrinsic value. They are valuing Newfield by using a multiple on EBITDA, whereas we primarily value energy companies based on reserves. As a result, the EBITDA multiple received for these finite assets matters much less to us than the sale price relative to the discounted cash flow stream. Newfield is trading at an Enterprise Value (EV) of $1.75/Mcfe per proved reserve ($10.50/Bbl), while the industry average is around $3.00/Mcfe ($18/Bbl). The company has a similar liquids mix and proportion of developed reserves relative to the industry, and we see no
Intrepid Small Cap Fund
compelling reason for the large discount. At current commodity prices, we believe that Newfield is undervalued based on all relevant metrics including the discounted cash flow stream of its existing assets, EV/EBITDA and EV/reserves compared to peers, and transaction comps within its producing areas.
American Greetings fell slightly during the first quarter. Last September, management offered to buy the company for $17.18 per share, which was a 20% premium to the intraday low from the prior day. In spite of the offer, short interest in the shares remained close to 40% of the float or higher. In reaction to a 7% unexplained drop in the shares over a two day period in January, management issued a press release stating that they had almost secured the necessary financing and were “materially” raising their offer to $17.50 per share (a 1.9% bump). American Greetings’ stock continued to trade at a persistent high single digit discount to the new offer price, likely because investors did not trust management to complete the transaction. We also have a negative opinion of the company’s management team, but we saw little reason for them to temporarily game the share price with a fake takeover offer, and we believed there were limited obstacles to obtaining sufficient financing.
Today, on April 1, 2013, the board announced it supported a final offer of $18.20 per share, and the shares quickly traded above $18. In the hands of better management, we think the stock could be worth significantly more. Unfortunately, there is no realistic option to replace the entrenched family management team, who collectively controls 43% of the voting power. While the merger requires a majority vote of shareholders other than management, we think it’s likely to be approved. Voting down the merger would only hand the company back to existing management, who could continue to make bad capital allocation decisions. We’re walking away from this one. We made a little bit of money on American Greetings, but it was not a very successful investment for the Fund.
There are still plenty of market skeptics today, but they are more likely to be retail investors burned by the credit crisis instead of professional investors. Stock prices are at highs. Mutual fund and hedge fund cash levels are near lows. Margins have stopped rising and profit growth has started to slow, yet expectations are robust. Whether it’s March 2009 or March 2013, too many investors make decisions by looking in the rearview mirror. Today, they see a scene straight out of investment utopia. Bushy-tailed rabbits are jumping in lush fields of green stock prices, while rainbows beam from pots of gold and cut across the pale blue sky. Up in the heavens, written in soft white clouds is, according to some, the only investment advice you’ll ever need: “Don’t Fight the Fed.” We need the occasional rainstorm to keep the investment landscape healthy. It’s not in our DNA to be Fed puppets when investment fundamentals don’t make sense. Given a choice between buying an overvalued asset or earning nothing, we’ll take the latter. Small capitalization stocks
Intrepid Small Cap Fund
continue to be priced richly, and we expect better opportunities in the future. Thank you for your investment.
Sincerely,
Jayme Wiggins, CFA
Intrepid Small Cap Fund Portfolio Manager
Must be preceded or accompanied by a prospectus.
Past performance does not guarantee future results.
Mutual fund investing involves risk. Principal loss is possible. The Fund is subject to special risks including volatility due to investments in smaller companies, which involve additional risks such as limited liquidity and greater volatility. The Fund is considered non-diversified as a result of limiting its holdings to a relatively small number of positions and may be more exposed to individual stock volatility than a diversified fund.
The Advisor believes that current market conditions warrant a defensive position from the requirement to invest at least 80% of its net assets in equity securities of small capitalization companies.
Please see the Schedule of Investments in this report for a full list of fund holdings. Fund holdings and sector allocations are subject to change at anytime and should not be considered a recommendation to buy or sell any security.
The Russell 2000 Index consists of the smallest 2,000 companies in a group of 3,000 U.S. Companies in the Russell 3000 Index, as ranked by market capitalization. You cannot invest directly in an index.
Cash Flow measures the cash generating capability of a company by adding non-cash charges and interest to pretax income. Free Cash Flow measures the cash generating capability of a company by subtracting capital expenditures from cash flow from operations. EBITDA is calculated as the company’s Earnings before Interest, Taxes and Depreciation. EV/EBITDA is the ratio of Enterprise Value to Earnings before Interest, Taxes, Depreciation, and Amortization. Enterprise Value equals market capitalization plus debt minus cash. Basis point is a unit that is equal to 1/100th of 1% and is used to denote the change in a financial instrument. Market cap is the market price of an entire company, calculated by multiplying the number of shares outstanding by the price per share. Tangible Book Value is calculated as shareholders’ equity minus intangible assets including goodwill. Normalized free cash flow is the free cash flow we expect a company to generate in a typical year given normal economic conditions, without large swings in working capital or unusually high or low capital spending. EV/Reserves is enterprise value divided by proved oil and gas reserves as reported in SEC filings.
Opinions expressed are subject to change, are not guaranteed and should not be considered investment advice or recommendations to buy or sell any security.
Intrepid Income Fund
 |  | |
| | | |
| Jason Lazarus, | Ben Franklin, | |
| Income Fund Co-Portfolio Manager | Income Fund Co-Portfolio Manager | |
April 1, 2013
Dear Fellow Shareholders,
The high yield market continued its strong performance into the first quarter of 2013 in conjunction with equity indices hitting all-time highs. The Bank of America / Merrill Lynch High Yield Master II Index completed its 10th straight month of positive performance. The yield-to-worst offered by index hit a new all-time low of 5.60% during the quarter, and stood at 5.71% on March 31, 2013. We believe the apparent optimism of market participants is largely misguided, and is rooted in the actions of “Helicopter Ben” and his sidekicks at the Federal Reserve. Unprecedented levels of market intervention, combined with chronic budget deficits, leave us increasingly wary of committing capital to risky asset classes.
The Intrepid Income Fund (the “Fund”) underperformed the high-yield index in the first quarter of the calendar year and in the first six months of the Fund’s fiscal year, which began on September 30, 2012. The Fund gained 0.95% in the three-month period and 1.91% in the six-month period ending March 31, 2013. In the same periods, the index rose 2.85% and 6.13%, respectively. Returns were diminished by our under-allocation to lower-rated bonds, which outperformed the broad market, as well as the high cash balance.
The Fund is positioned differently than a traditional high-yield fund and an investment-grade corporate bond fund. We generally have a higher-quality bias and hold cash to take advantage of market dislocations. Further, the Fund’s duration, a measure of interest rate sensitivity, is short in this record low interest rate environment. Investment grade bonds typically have a much longer duration and are therefore more exposed to interest rate risk. Given the higher-quality holdings and elevated cash position that averaged 45% of assets, the Fund performed as would be expected. Investment grade credit spreads remained essentially flat near 150 basis points, and prices declined in response to higher Treasury rates.
Portfolio activity was relatively muted in the quarter. Two of our largest holdings, Gibraltar Industries 8.00% due 12/01/2015 and Spartan Stores 3.375% convertible notes, were called in their entirety. It can be frustrating to see our portfolio companies call our notes and issue new longer-dated, lower-coupon bonds. In most cases we don’t believe the new paper is particularly attractive and therefore don’t get involved. Case in point is Gibraltar’s new issue, sporting a 6.25% coupon with a
Intrepid Income Fund
2/01/2021 maturity. It’s difficult for us to get excited about a moderately-leveraged, cyclical building products company even if it were trading near par. Apparently market participants disagree with us, as the notes are trading near $107 and offer a measly 5.1% yield for the next eight years. However, there are rare cases where we believe the new notes are attractive. We were able to get involved in Spartan’s new 6.625% notes due 12/15/2016 at what we believe is an attractive price for paper maturing in less than four years.
The Intrepid Income Fund has been a lender to Spartan Stores since late 2009. To refresh your memory, Spartan Stores is a leading grocery distributor and retailer operating almost exclusively in Michigan. The company holds the #1 or #2 market share in Northern and Western Michigan markets, and has the #3 position in other markets. Spartan has been battling against a very tough Michigan economy, and its financial performance has suffered. However, management has done an admirable job keeping costs contained, and has maintained a conservative balance sheet. Based on our adjusted figures, the company’s debt-to-EBITDA is only 1.2x. While poor capital allocation decisions are always a risk to a company’s credit quality, we are confident that a transaction would not impair the company’s ability to service its debt.
Over the past few months we worked to set up the back office infrastructure to support trading of term loans. For those unfamiliar with term loans, the instruments allow us to become senior lenders generally receiving a floating rate coupon, thereby minimizing interest rate risk. Having the ability to purchase term loans also broadens our investment universe. We purchased a sizeable position in The Pantry, Inc.’s 1st lien term loan B. The Pantry is a regional convenience store and fuel center operator. The Fund was previously an owner of The Pantry’s notes, which were called several months ago. The term loan pays us LIBOR + 450 bps with a floor of 125 bps for a current coupon of 5.75%. While we paid a premium to par to acquire the loan, we believe the yield is attractive given our position in the capital structure. The company has more debt than our typical holdings, but the loan is senior to the bonds and leases.
The Spartan notes and Pantry term loan were the only major positions established in the quarter. We added incrementally to some smaller positions, including Scotts Miracle-Gro 7.25% due 1/15/2018 and Cott Beverage 8.00% due 6/01/2019. Both of these positions were discussed in our fourth quarter 2012 commentary.
The largest contributors to the Fund’s performance in the quarter were PetroQuest 10.00% due 9/01/2017, EPL Oil & Gas 8.25% due 2/15/2018, and Ruby Tuesday 7.625% due 5/15/2020. PQ and EPL were top contributors in the fourth quarter as well. These securities materially outperformed the market and constitute larger positions. A combination of higher energy prices and more conservative capital allocation plans for 2013 probably supported the energy names. Additionally, lower-
Intrepid Income Fund
rated bonds such as these generally outperformed better quality high-yield bonds in the quarter (although we don’t believe these issuers are low quality). The few detractors had an immaterial impact on the Fund’s performance.
As regular readers of our letters know, our holdings have been called consistently over the past two or three years as high-yield rates continue to descend to historic lows. We expect several holdings to be called through the summer if the high-yield market remains strong. As we have stated in past letters, we are not required to reinvest this cash. If we cannot find securities that can stand on their own merits, we will default to cash and await more attractive opportunities. Absent a significant increase in interest rates or widening of credit spreads, our cash position could continue to grow.
To reiterate our view on cash, one that has been stated consistently in our commentaries, our cash position is solely a function of the opportunities available in the market. It is not a top-down call on asset prices. We believe our current holdings offer attractive returns for the risk borne, but unfortunately opportunities such as these do not abound. With that said, attractive ideas can be unearthed even when the environment is toughest for value investors – when prices are unreasonably high and opportunities are scarce. We are consistently finding new ideas, but must be increasingly selective in the process. Looking forward, we think it is prudent to maintain our defensive posture, both from a credit risk and interest rate risk perspective. We will continue to focus on higher-quality businesses while maintaining our short duration, which was 1.67 years at quarter-end. Thank you for your investment.
Sincerely,
 |  |
| Ben Franklin, CFA | Jason Lazarus, CFA |
| Intrepid Income | Intrepid Income |
| Co-Lead Portfolio Manager | Co-Lead Portfolio Manager |
Must be preceded or accompanied by a prospectus.
Past performance does not guarantee future results.
Mutual fund investing involves risk. Principal loss is possible. Investments in debt securities typically decrease in value when interest rates rise. The risk is generally greater for longer term debt securities. Investments by the Fund in lower-rated and non-rated securities present a greater risk of loss to principal and interest than higher rated securities. The Fund is non-diversified, meaning it may concentrate its assets in fewer individual holdings than a diversified fund. Therefore, the Fund is more exposed to individual securities volatility than a diversified fund.
Intrepid Income Fund
Please see the Schedule of Investments in this report for a full list of fund holdings. Fund holdings and sector allocations are subject to change at anytime and should not be considered a recommendation to buy or sell any security.
The Bank of America Merrill Lynch High Yield Master II Index is Merrill Lynch’s broadest high yield index, and as such is comparable with the broad indices published by other investment banks. You cannot invest directly in an index.
Duration is a commonly used measure of the potential volatility of the price of a debt security, or the aggregate market value of a portfolio of debt securities, prior to maturity. Securities with a longer duration generally have more volatile prices than securities of comparable quality with a shorter duration. Yield-to-Worst is the bond yield computed by using the lower of either the yield to maturity or the yield to call on every possible call date. Basis point is a unit that is equal to 1/100th of 1% and is used to denote the change in a financial instrument. Debt-to-EBITDA is calculated as Debt divided by Earnings, Before Interest, Taxes, Depreciation, and Amortization. LIBOR stands for London InterBank Offered Rate. It is the interest rate at which banks offer to lend funds to one another in the international interbank market.
Opinions expressed are subject to change, are not guaranteed and should not be considered investment advice or recommendations to buy or sell any security.
Intrepid Disciplined Value Fund
 | |
Greg Estes, Disciplined Value Fund Portfolio Manager | |
April 1, 2013
Dear Fellow Shareholders,
The stock market has been on a tear in the past quarter, and we are doing our best under the circumstances to keep up. Make no mistake- this is not the ideal environment for a value investor. With investor sentiment increasingly expecting economic expansion (and the ensuing earnings increases caused by it), market highs are being tested. Put another way, prevailing investor sentiment believes that earnings will improve, so it has pushed stock prices higher ahead of such improvement actually occurring. To be fair, there are some signs of an economy that might be improving. Housing prices appear to be better, although housing inventory is incredibly low and may be forcing too many buyers to bid up prices on too few houses. Jobless rates appear to be improving, although underemployment and wages appear to be no better. We think that this data is not at all definitive. And yet in the short-term, a wave of good feeling can propel a market higher, while investors like us, who always strive to be conscious of the prices we pay, must make a decision to either play along with the market, buying stocks that we believe are not cheap, or allow our cash levels to rise as we avoid paying higher prices. We have opted to forgo purchasing what we believe are overpriced securities.
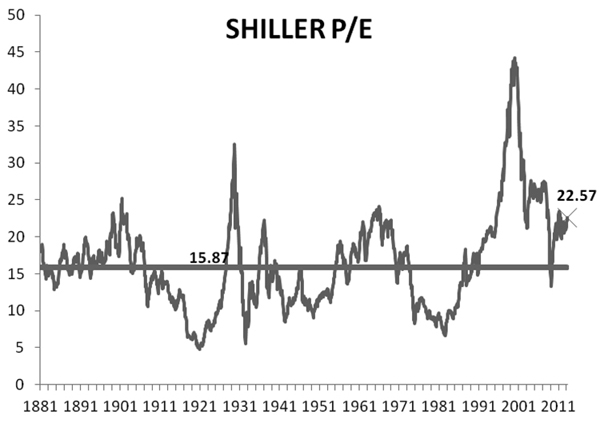
Consider the Shiller P/E, a stock market measure developed by Yale University economist Robert Shiller. Rather than a basic P/E ratio, which takes a current stock or index price and divides it by the latest annual earnings, the Shiller P/E uses the current S&P 500 Index and divides it by the average of yearly earnings over the past ten years, adjusting for inflation. By using ten years, Shiller hopes to avoid looking at a particular part of a cycle (expansion or recession) and get a broader view that encompasses one or two economic cycles. Dr. Shiller is kind enough to make his data public, and we have produced the historical chart below:
The huge spike was the tech bubble from the 1990’s. There was a short-lived reduction in the Shiller P/E after the tech bubble burst, and then the market corrected again from 2008 through early 2009. However, since that time, the market has quickly reinflated and, as of March 31, 2013, had a value of 22.57, which is well above the long-term median
Intrepid Disciplined Value Fund
Shiller P/E of 15.87. Now, one might reasonably argue that this long-term median might not be as applicable in today’s market. However, we believe that the Shiller P/E does provide some insight into the volatile nature of market outlook and expectations, especially in recent years. It appears to us to be an inflationary pattern, likely driven by an easy monetary policy along with large deficit spending. While we cannot accurately predict when corrections will occur, we can see that they are sudden and painful. This is not the experience we would choose for ourselves or for our shareholders.
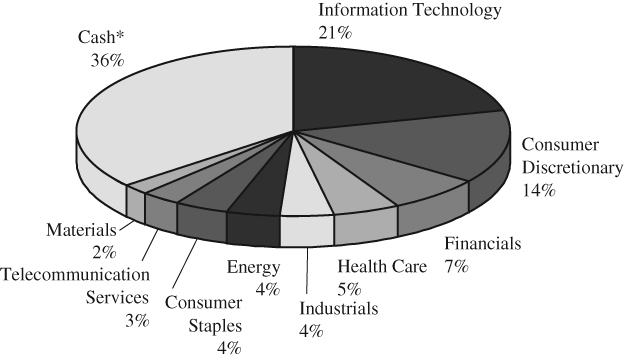
For the quarter ended March 31, 2013, the Intrepid Disciplined Value Fund (the “Fund”) gained 8.51%, while the S&P 500 Index gained 10.61% and the Russell 3000 Index was up 11.07%. Our goal in the current climate is to participate in the market gain. The Fund’s quarterly return was roughly 77% of the Russell 3000’s return while the Fund’s cash level rose from 27.3% as of December 31, 2012 to 36.2% at quarter end. For the first six months of the Fund’s fiscal year, the Intrepid Disciplined Value Fund was up 8.82% while the S&P 500 was up 10.19% and the Russell 3000 was up 11.35%.
Effective April 1, 2013, the Funds name changed to the Intrepid Disciplined Value Fund. The decision to change the name was motivated by our desire to highlight the investment process and commitment to find value where possible. As we mentioned above, we may not always make the comfortable choice, but when it comes to our shareholders’ investment in the Fund, we feel that our mandate is to maintain the discipline of our process above everything else.
Activity during the quarter was skewed more towards selling than purchasing, as five names were sold out of the Fund with only one being added. Potlatch (ticker: PCH), Johnson & Johnson (ticker: JNJ), Federated Investors (ticker: FII), Patterson UTI (ticker: PTEN), and Iconix (ticker: ICON) were all sold as the stocks hit our intrinsic value estimates. The sole addition to the portfolio was GameStop (ticker: GME). Somewhat of a contrarian idea, GameStop is a market leading retailer of new console video games. In addition, its used game business is highly profitable and has driven high returns on the company’s tangible capital. The stock has been heavily shorted for a few reasons. First, some investors fear that when new consoles, such as Sony’s PlayStation 4 and Microsoft’s Xbox, are launched, gamers who buy used titles will be unable to play those games on the newer consoles. Sony has all but completely dispelled this notion, and we think Microsoft is unlikely to go it alone and prevent used game play on its new console for fear of consumer backlash. A second fear is that games sales have been weak for the past couple of years, but we are likely to be entering a new gaming cycle with the advent of one or two new game consoles in time for the 2013 Holiday season. We look at this as an opportunity to buy a business on share price weakness, believing that it can generate free cash flow even in a challenging environment.
Intrepid Disciplined Value Fund
Top contributors for the quarter were Dell (ticker: DELL), Staples (ticker: SPLS), and Patterson UTI. In our opinion, the respective stock price for each company had been suppressed by concerns specific either to the company’s industry, as with Patterson and Dell, or to the firm itself, as with Staples’ reorganization of its European stores. These stocks started the quarter with relatively larger discounts. In the case of Dell, the competing go-private offers have driven the stock price considerably higher from where it started the quarter. Patterson UTI exceeded expectations in its most recent earnings release. In the case of Staples, we suspect that the market felt that, given the attractive dividend and the credible steps management is taking to control its costs in its international stores, the low share price was unwarranted.
The worst laggards in the quarter were Newfield Exploration (ticker: NFX), Pan American Silver (ticker: PAAS), and Telephone & Data Systems (ticker: TDS). In the case of TDS, the company continues to build out its 4G wireless infrastructure, which is weighing on free cash flow in the short-term. We believe that there is a potential for asset sales of the company’s less profitable business geographies which could add to shareholder value. As a precious metals miner, Pan American Silver is in an out-of-favor segment. Newfield is a company that we believe is misunderstood by the market, which is pricing the company well below its peers in the energy exploration & production industry.
We will close this letter as we have often done, by citing our estimated average discount within the Fund. Each investment will have a discount to intrinsic value which is based upon its market price and our calculated intrinsic value. The average discount within the Fund is roughly 11%. This discount has shrunk as the market has made such a sharp move up in the quarter. Nonetheless, we continue to look for suitable new value investments, but we recognize that the current climate is challenging. We thank you for your confidence in our process.
Sincerely,
Greg Estes, CFA
Intrepid Disciplined Value Fund Portfolio Manager
Must be preceded or accompanied by a prospectus.
Past performance does not guarantee future results.
Mutual fund investing involves risk. Principal loss is possible. The Fund is subject to special risks including volatility due to investments in smaller and medium sized companies, which involve additional risks such as limited liquidity and greater volatility. The Fund is considered non-diversified as a result of limiting its holdings to a relatively small number of positions and may be more exposed to individual stock volatility than a diversified fund.
Intrepid Disciplined Value Fund
The Advisor believes that current market conditions warrant a temporary defensive position invested more in cash and cash equivalents and away from the requirement to invest at least 80% of its net assets in equity securities.
Please see the Schedule of Investments in this report for a full list of fund holdings. Fund holdings and sector allocations are subject to change at anytime and should not be considered a recommendation to buy or sell any security.
The S&P 500 Index is a broad based unmanaged index of 500 stocks, which is widely recognized as representative of the equity market in general. The Russell 3000 Index is an index representing the largest 3,000 U.S. companies representing approximately 98% of the investable U.S. equity market. You cannot invest directly in an index.
Free Cash Flow measures the cash generating capability of a company by subtracting capital expenditures from cash flow from operations. Discount to Intrinsic Value is the difference between what an investor believes the company is worth and what the market price is of the company.
Opinions expressed are subject to change, are not guaranteed and should not be considered investment advice or recommendations to buy or sell any security.
Intrepid Funds
EXPENSE EXAMPLE
March 31, 2013 (Unaudited)
As a shareholder of the Intrepid Capital Management Funds Trust (the “Funds”), you incur ongoing costs, including management fees; distribution and/or service fees; and other expenses incurred by the Funds. This example is intended to help you understand your ongoing costs (in dollars) of investing in the Funds and to compare costs with the ongoing costs of investing in other mutual funds.
The example is based on an investment of $1,000 invested at the beginning of the period and held the entire period of October 1, 2012 through March 31, 2013.
ACTUAL EXPENSES
The first line of the following table provides information about actual account values and actual expenses. Although the Funds charge no sales load or transaction fees, you will be assessed fees for outgoing wire transfers, returned checks or stop payment orders at prevailing rates charged by U.S. Bancorp Fund Services, LLC, the Funds’ transfer agent. If you request a redemption be made by wire transfer, currently a $15.00 fee is charged by the Funds’ transfer agent. To the extent that a Fund invests in shares of other investment companies as part of its investment strategy, you will indirectly bear your proportionate share of any fees and expenses charged by the underlying funds in which the Fund invests in addition to the expenses of the Fund. Actual expenses of the underlying funds are expected to vary among the various underlying funds. These expenses are not included in the following example. The example includes, but is not limited to, management fees, shareholder servicing fees, distribution fees, fund accounting, custody and transfer agent fees. However, the example below does not include portfolio trading commissions and related expenses, interest expense and other extraordinary expenses as determined under generally accepted accounting principles. You may use the information in this line, together with the amount you invested, to estimate the expenses that you paid over the period. Simply divide your account value by $1,000 (for example, an $8,600 account value divided by $1,000 = 8.6), then multiply the result by the number in the first line under the heading entitled “Expenses Paid During Period” to estimate the expenses you paid on your account during this period.
HYPOTHETICAL EXAMPLE FOR COMPARISON PURPOSES
The second line of the following table provides information about hypothetical account values and hypothetical expenses based on the Funds’ actual expense ratio and an assumed rate of return of 5% per year before expenses, which is not the Funds’ actual return. The hypothetical account values and expenses may not be used to estimate the actual ending account balance or expenses you paid for the period. You may use this information to compare the ongoing costs of investing in the Funds and other funds. To do so, compare this 5% hypothetical example with the 5% hypothetical examples that appear in the shareholder reports of the other funds.
Intrepid Funds
EXPENSE EXAMPLE (continued)
March 31, 2013 (Unaudited)
Please note that the expenses shown in the table are meant to highlight your ongoing costs only and do not reflect any transactional costs, such as sales charges (loads), redemption fees, or exchange fees. Therefore, the second line of the table is useful in comparing ongoing costs only, and will not help you determine the relative costs of owning different funds. In addition, if these transactional costs were included, your costs would have been higher.
INTREPID CAPITAL FUND – INVESTOR CLASS
| | | | Expenses Paid |
| | Beginning | Ending | During Period* |
| | Account Value | Account Value | October 1, 2012 - |
| | October 1, 2012 | March 31, 2013 | March 31, 2013 |
| Actual | $1,000.00 | $1,060.10 | $7.19 |
| Hypothetical (5% return | | | |
| before expenses) | 1,000.00 | 1,017.95 | 7.04 |
| * | Expenses are equal to the Fund’s annualized expense ratio of 1.40%, multiplied by the average account value over the period, multiplied by 182/365 to reflect the period. |
INTREPID CAPITAL FUND – INSTITUTIONAL CLASS
| | | | Expenses Paid |
| | Beginning | Ending | During Period* |
| | Account Value | Account Value | October 1, 2012 - |
| | October 1, 2012 | March 31, 2013 | March 31, 2013 |
| Actual | $1,000.00 | $1,061.30 | $5.91 |
| Hypothetical (5% return | | | |
| before expenses) | 1,000.00 | 1,019.19 | 5.79 |
| * | Expenses are equal to the Fund’s annualized expense ratio of 1.15%, multiplied by the average account value over the period, multiplied by 182/365 to reflect the period. |
INTREPID SMALL CAP FUND – INVESTOR CLASS
| | | | Expenses Paid |
| | Beginning | Ending | During Period* |
| | Account Value | Account Value | October 1, 2012 - |
| | October 1, 2012 | March 31, 2013 | March 31, 2013 |
| Actual | $1,000.00 | $1,060.30 | $7.19 |
| Hypothetical (5% return | | | |
| before expenses) | 1,000.00 | 1,017.95 | 7.04 |
| * | Expenses are equal to the Fund’s annualized expense ratio of 1.40%, multiplied by the average account value over the period, multiplied by 182/365 to reflect the period. |
Intrepid Funds
EXPENSE EXAMPLE (continued)
March 31, 2013 (Unaudited)
INTREPID SMALL CAP FUND – INSTITUTIONAL CLASS
| | | | Expenses Paid |
| | Beginning | Ending | During Period* |
| | Account Value | Account Value | October 1, 2012 - |
| | October 1, 2012 | March 31, 2013 | March 31, 2013 |
| Actual | $1,000.00 | $1,061.70 | $5.92 |
| Hypothetical (5% return | | | |
| before expenses) | 1,000.00 | 1,019.19 | 5.80 |
| * | Expenses are equal to the Fund’s annualized expense ratio of 1.15%, multiplied by the average account value over the period, multiplied by 182/365 to reflect the period. |
INTREPID INCOME FUND – INVESTOR CLASS
| | | | Expenses Paid |
| | Beginning | Ending | During Period* |
| | Account Value | Account Value | October 1, 2012 - |
| | October 1, 2012 | March 31, 2013 | March 31, 2013 |
| Actual | $1,000.00 | $1,019.10 | $5.79 |
| Hypothetical (5% return | | | |
| before expenses) | 1,000.00 | 1,019.20 | 5.79 |
��
| * | Expenses are equal to the Fund’s annualized expense ratio of 1.15%, multiplied by the average account value over the period, multiplied by 182/365 to reflect the period. |
INTREPID INCOME FUND – INSTITUTIONAL CLASS
| | | | Expenses Paid |
| | Beginning | Ending | During Period* |
| | Account Value | Account Value | October 1, 2012 - |
| | October 1, 2012 | March 31, 2013 | March 31, 2013 |
| Actual | $1,000.00 | $1,020.40 | $4.53 |
| Hypothetical (5% return | | | |
| before expenses) | 1,000.00 | 1,020.44 | 4.53 |
| * | Expenses are equal to the Fund’s annualized expense ratio of 0.90%, multiplied by the average account value over the period, multiplied by 182/365 to reflect the period. |
Intrepid Funds
EXPENSE EXAMPLE (continued)
March 31, 2013 (Unaudited)
INTREPID DISCIPLINED VALUE FUND*
| | | | Expenses Paid |
| | Beginning | Ending | During Period** |
| | Account Value | Account Value | October 1, 2012 - |
| | October 1, 2012 | March 31, 2013 | March 31, 2013 |
| Actual | $1,000.00 | $1,088.20 | $7.29 |
| Hypothetical (5% return | | | |
| before expenses) | 1,000.00 | 1,017.95 | 7.04 |
| * | Effective April 1, 2013, the Intrepid All Cap Fund changed its name to Intrepid Disciplined Value Fund and its principal investment strategies changed (see Footnote 1 to the Financial Statements). |
| ** | Expenses are equal to the Fund’s annualized expense ratio of 1.40%, multiplied by the average account value over the period, multiplied by 182/365 to reflect the period. |
Intrepid Capital Fund
ALLOCATION OF PORTFOLIO HOLDINGS
March 31, 2013 (Unaudited)
INTREPID CAPITAL FUND
(as a % of total net assets)
COMPONENTS OF PORTFOLIO HOLDINGS
| Common Stocks | | $ | 223,368,332 | |
| Corporate Bonds | | | 85,485,004 | |
| Senior Loans | | | 3,016,122 | |
| Cash* | | | 112,411,819 | |
| | | $ | 424,281,277 | |
* Cash, cash equivalents and other assets less liabilities.
Intrepid Small Cap Fund
SECTOR ALLOCATION OF PORTFOLIO HOLDINGS
March 31, 2013 (Unaudited)
INTREPID SMALL CAP FUND
(as a % of total net assets)
COMPONENTS OF PORTFOLIO HOLDINGS
| Information Technology | | $ | 116,618,967 | |
| Consumer Discretionary | | | 69,387,651 | |
| Industrials | | | 39,834,697 | |
| Energy | | | 32,892,217 | |
| Health Care | | | 25,712,694 | |
| Financials | | | 24,059,894 | |
| Materials | | | 12,726,850 | |
| Telecommunication Services | | | 8,398,776 | |
| Cash* | | | 390,060,621 | |
| | | $ | 719,692,367 | |
The Global Industry Classification Standard (GICS®) was developed by and/or is the exclusive property of MSCI, Inc. and Standard & Poor Financial Services LLC (“S&P”). GICS is a service mark of MSCI and S&P and has been licensed for use by U.S. Bancorp Fund Services, LLC.
* Cash, cash equivalents and other assets less liabilities.
Intrepid Income Fund
ALLOCATION OF PORTFOLIO HOLDINGS
March 31, 2013 (Unaudited)
INTREPID INCOME FUND
(as a % of total net assets)
COMPONENTS OF PORTFOLIO HOLDINGS
| Corporate Bonds | | $ | 51,532,665 | |
| Senior Loans | | | 2,010,748 | |
| Common Stocks | | | 1,940,161 | |
| Cash* | | | 53,820,439 | |
| | | $ | 109,304,013 | |
* Cash, cash equivalents and other assets less liabilities.
Intrepid Disciplined Value Fund
SECTOR ALLOCATION OF PORTFOLIO HOLDINGS
March 31, 2013 (Unaudited)
INTREPID DISCIPLINED VALUE FUND
(as a % of total net assets)
COMPONENTS OF PORTFOLIO HOLDINGS
| Information Technology | | $ | 8,164,111 | |
| Consumer Discretionary | | | 5,643,068 | |
| Financials | | | 2,633,662 | |
| Health Care | | | 1,780,648 | |
| Industrials | | | 1,693,758 | |
| Energy | | | 1,599,298 | |
| Consumer Staples | | | 1,597,075 | |
| Telecommunication Services | | | 1,007,947 | |
| Materials | | | 778,214 | |
| Cash* | | | 14,057,639 | |
| | | $ | 38,955,420 | |
* Cash, cash equivalents and other assets less liabilities.
Intrepid Capital Fund
SCHEDULE OF INVESTMENTS
March 31, 2013 (Unaudited)
| | | Shares | | | Value | |
| COMMON STOCKS - 52.65% | | | | | | |
Commercial & Professional Services - 3.67% | | | | | | |
| FTI Consulting, Inc. (a) | | | 285,327 | | | $ | 10,745,415 | |
| Securitas AB (b) | | | 514,929 | | | | 4,847,794 | |
| | | | | | | | 15,593,209 | |
| Consumer Services - 1.84% | | | | | | | | |
| Speedway Motorsports, Inc. | | | 435,200 | | | | 7,829,248 | |
Diversified Financials - 5.21% | | | | | | | | |
| The Bank Of New York Mellon Corp. | | | 403,000 | | | | 11,279,970 | |
| The Western Union Co. | | | 718,470 | | | | 10,805,789 | |
| | | | | | | | 22,085,759 | |
| Energy - 5.50% | | | | | | | | |
| Bill Barrett Corp. (a) | | | 648,570 | | | | 13,146,514 | |
| Newfield Exploration Co. (a) | | | 278,130 | | | | 6,235,674 | |
| Swift Energy Co. (a) | | | 267,070 | | | | 3,955,307 | |
| | | | | | | | 23,337,495 | |
| Food & Staples Retailing - 0.98% | | | | | | | | |
| The Pantry, Inc. (a) | | | 332,233 | | | | 4,142,945 | |
Food, Beverage & Tobacco - 2.67% | | | | | | | | |
| Molson Coors Brewing Co. | | | 232,000 | | | | 11,351,760 | |
Household & Personal Products - 1.42% | | | | | | | | |
| American Greetings Corp. | | | 374,008 | | | | 6,021,529 | |
Insurance - 3.68% | | | | | | | | |
| Baldwin & Lyons, Inc. - Class B | | | 70,272 | | | | 1,671,771 | |
| Berkshire Hathaway, Inc. - Class B (a) | | | 134,000 | | | | 13,962,800 | |
| | | | | | | | 15,634,571 | |
| Materials - 4.52% | | | | | | | | |
| Newmont Mining Corp. | | | 214,630 | | | | 8,990,851 | |
| Pan American Silver Corp. (b) | | | 316,800 | | | | 5,189,184 | |
| Royal Gold, Inc. | | | 70,500 | | | | 5,007,615 | |
| | | | | | | | 19,187,650 | |
See notes to financial statements.
Intrepid Capital Fund
SCHEDULE OF INVESTMENTS (continued)
March 31, 2013 (Unaudited)
| | | Shares | | | Value | |
| COMMON STOCKS - 52.65% (continued) | | | | | | |
Media - 1.65% | | | | | | |
| World Wrestling Entertainment, Inc. (c) | | | 792,769 | | | $ | 6,992,223 | |
Pharmaceuticals, Biotechnology | | | | | | | | |
| & Life Sciences - 2.86% | | | | | | | | |
| Bio-Rad Laboratories, Inc. (a) | | | 96,327 | | | | 12,137,202 | |
Retailing - 4.38% | | | | | | | | |
| Aaron’s, Inc. | | | 73,674 | | | | 2,112,970 | |
| Big Lots, Inc. (a) | | | 334,610 | | | | 11,801,694 | |
| Staples, Inc. | | | 345,000 | | | | 4,633,350 | |
| | | | | | | | 18,548,014 | |
| Software & Services - 8.96% | | | | | | | | |
| Amdocs Ltd. (b) | | | 233,400 | | | | 8,460,750 | |
| CSG Systems International, Inc. (a) | | | 355,925 | | | | 7,542,051 | |
| EPIQ Systems, Inc. (c) | | | 612,066 | | | | 8,587,286 | |
| ManTech International Corp. | | | 206,660 | | | | 5,552,954 | |
| Microsoft Corp. | | | 275,000 | | | | 7,867,750 | |
| | | | | | | | 38,010,791 | |
| Technology Hardware & Equipment - 4.53% | | | | | | | | |
| Dell, Inc. | | | 928,000 | | | | 13,298,240 | |
| Ingram Micro, Inc. (a) | | | 299,521 | | | | 5,894,573 | |
| | | | | | | | 19,192,813 | |
| Telecommunication Services - 0.78% | | | | | | | | |
| Telephone & Data Systems, Inc. | | | 156,769 | | | | 3,303,123 | |
| TOTAL COMMON STOCKS | | | | | | | | |
| (Cost $203,058,454) | | | | | | | 223,368,332 | |
| | | | | | | | | |
| | | Principal | | | | | |
| | | Amount | | | | | |
| CORPORATE BONDS - 20.15% | | | | | | | | |
| Automobiles & Components - 0.75% | | | | | | | | |
| Affinia Group, Inc. (d) | | | | | | | | |
| 10.750%, 08/15/2016 | | $ | 2,945,000 | | | | 3,195,325 | |
See notes to financial statements.
Intrepid Capital Fund
SCHEDULE OF INVESTMENTS (continued)
March 31, 2013 (Unaudited)
| | | Principal | | | | |
| | | Amount | | | Value | |
| CORPORATE BONDS - 20.15% (continued) | | | | | | |
Capital Goods - 1.37% | | | | | | |
| Thermon Industries, Inc. | | | | | | |
| 9.500%, 05/01/2017 | | $ | 5,226,000 | | | $ | 5,800,860 | |
Commercial & Professional Services - 0.85% | | | | | | | | |
| ADS Tactical, Inc. (d)(e) | | | | | | | | |
| 11.000%, 04/01/2018 | | | 3,648,000 | | | | 3,620,640 | |
Consumer Durables & Apparel - 1.30% | | | | | | | | |
| Smith & Wesson Holding Corp. (d)(e) | | | | | | | | |
| 9.500%, 01/14/2016 | | | 5,089,000 | | | | 5,521,565 | |
Consumer Services - 3.55% | | | | | | | | |
| Ruby Tuesday, Inc. (d) | | | | | | | | |
| 7.625%, 05/15/2020 | | | 7,614,000 | | | | 7,556,895 | |
| Speedway Motorsports, Inc. | | | | | | | | |
| 8.750%, 06/01/2016 | | | 7,122,000 | | | | 7,513,710 | |
| | | | | | | | 15,070,605 | |
| Energy - 4.30% | | | | | | | | |
| Bill Barrett Corp. | | | | | | | | |
| 9.875%, 07/15/2016 | | | 5,665,000 | | | | 6,061,550 | |
| EPL Oil & Gas, Inc. | | | | | | | | |
| 8.250%, 02/15/2018 | | | 4,353,000 | | | | 4,625,062 | |
| PetroQuest Energy, Inc. | | | | | | | | |
| 10.000%, 09/01/2017 | | | 6,182,000 | | | | 6,630,195 | |
| PHI, Inc. | | | | | | | | |
| 8.625%, 10/15/2018 | | | 863,000 | | | | 938,513 | |
| | | | | | | | 18,255,320 | |
| Food, Beverage & Tobacco - 1.71% | | | | | | | | |
| Cott Beverages, Inc. | | | | | | | | |
| 8.125%, 09/01/2018 | | | 6,632,000 | | | | 7,245,460 | |
Food & Staples Retailing - 0.75% | | | | | | | | |
| Spartan Stores, Inc. (d)(e)(f) | | | | | | | | |
| 6.625%, 12/15/2016 | | | 3,000,000 | | | | 3,178,125 | |
See notes to financial statements.
Intrepid Capital Fund
SCHEDULE OF INVESTMENTS (continued)
March 31, 2013 (Unaudited)
| | | Principal | | | | |
| | | Amount | | | Value | |
| CORPORATE BONDS - 20.15% (continued) | | | | | | |
Household & Personal Products - 1.73% | | | | | | |
| Central Garden & Pet Co. | | | | | | |
| 8.250%, 03/01/2018 | | $ | 2,925,000 | | | $ | 3,012,750 | |
| The Scotts Miracle-Gro Co. | | | | | | | | |
| 7.250%, 01/15/2018 | | | 4,047,000 | | | | 4,310,055 | |
| | | | | | | | 7,322,805 | |
| Materials - 0.87% | | | | | | | | |
| Compass Minerals International, Inc. | | | | | | | | |
| 8.000%, 06/01/2019 | | | 1,151,000 | | | | 1,248,835 | |
| Intertape Polymer US, Inc. | | | | | | | | |
| 8.500%, 08/01/2014 | | | 2,479,000 | | | | 2,479,000 | |
| | | | | | | | 3,727,835 | |
| Media - 0.71% | | | | | | | | |
| Scholastic Corp. | | | | | | | | |
| 5.000%, 04/15/2013 | | | 2,977,000 | | | | 2,980,751 | |
Pharmaceuticals, Biotechnology | | | | | | | | |
| & Life Sciences - 0.44% | | | | | | | | |
| Bio-Rad Laboratories, Inc. | | | | | | | | |
| 8.000%, 09/15/2016 | | | 1,739,000 | | | | 1,853,223 | |
Transportation - 1.82% | | | | | | | | |
| Quality Distribution LLC / QD Capital Corp. | | | | | | | | |
| 9.875%, 11/01/2018 | | | 4,636,000 | | | | 5,099,600 | |
| Swift Services Holdings, Inc. | | | | | | | | |
| 10.000%, 11/15/2018 | | | 2,282,000 | | | | 2,612,890 | |
| | | | | | | | 7,712,490 | |
| TOTAL CORPORATE BONDS | | | | | | | | |
| (Cost $84,336,229) | | | | | | | 85,485,004 | |
See notes to financial statements.
Intrepid Capital Fund
SCHEDULE OF INVESTMENTS (continued)
March 31, 2013 (Unaudited)
| | | Principal | | | | |
| | | Amount | | | Value | |
| SENIOR LOANS - 0.71% | | | | | | |
Food & Staples Retailing - 0.71% | | | | | | |
| The Pantry, Inc. (g) | | | | | | |
| 5.750%, 08/03/2019 | | $ | 2,992,481 | | | $ | 3,016,122 | |
| TOTAL SENIOR LOANS | | | | | | | | |
| (Cost $3,063,505) | | | | | | | 3,016,122 | |
Total Investments | | | | | | | | |
| (Cost $290,458,188) - 73.51% | | | | | | | 311,869,458 | |
| Other Assets in Excess of Liabilities - 26.49% | | | | | | | 112,411,819 | |
| TOTAL NET ASSETS - 100.00% | | | | | | $ | 424,281,277 | |
Percentages are stated as a percent of net assets.
| (a) | Non-income producing security. |
| (b) | Foreign issued security. |
| (c) | Affiliated company. See Footnote 7. |
| (d) | Denotes a security is either fully or partially restricted to resale. The aggregate value of restricted securities as of March 31, 2013 was $23,072,550, which represented 5.44% of net assets. |
| (e) | Security is considered illiquid and may be difficult to sell. |
| (f) | Fair valued security. The aggregate value of fair valued securities as of March 31, 2013 was $3,178,125, which represented 0.75% of net assets. |
| (g) | Variable rate security. The rate is as of March 31, 2013. |
SCHEDULE OF OPEN FORWARD CURRENCY CONTRACTSMarch 31, 2013 (Unaudited)
| | Forward | | | Amount of | | | | Amount of | | | | |
| Counterparty | Expiration | Currency to | | Currency to | | Currency to | | Currency to | | | Unrealized | |
| of Contract | Date | be Received | | be Received | | be Delivered | | be Delivered | | | Depreciation | |
| Morgan | | | | | | Swedish | | | | | | |
| Stanley | 5/20/13 | U.S. Dollars | | | 5,145,924 | | Krona | | | 35,000,000 | | | $ | (218,849 | ) |
| | | | | | | | | | | | | | $ | (218,849 | ) |
See notes to financial statements.
Intrepid Small Cap Fund
SCHEDULE OF INVESTMENTS
March 31, 2013 (Unaudited)
| | | Shares | | | Value | |
| COMMON STOCKS - 45.80% | | | | | | |
Commercial & Professional Services - 5.54% | | | | | | |
| Forrester Research, Inc. | | | 1,800 | | | $ | 56,970 | |
| FTI Consulting, Inc. (a) | | | 660,821 | | | | 24,886,519 | |
| Securitas AB (b) | | | 1,587,784 | | | | 14,948,178 | |
| | | | | | | | 39,891,667 | |
| Consumer Services - 0.92% | | | | | | | | |
| International Speedway Corp. - Class A | | | 175,459 | | | | 5,734,000 | |
| Speedway Motorsports, Inc. | | | 48,054 | | | | 864,492 | |
| | | | | | | | 6,598,492 | |
| Energy - 4.57% | | | | | | | | |
| Bill Barrett Corp. (a) | | | 756,006 | | | | 15,324,241 | |
| Newfield Exploration Co. (a) | | | 783,585 | | | | 17,567,976 | |
| | | | | | | | 32,892,217 | |
| Household & Personal Products - 1.51% | | | | | | | | |
| American Greetings Corp. | | | 676,886 | | | | 10,897,865 | |
Insurance - 3.34% | | | | | | | | |
| Aspen Insurance Holdings Ltd. (b) | | | 569,081 | | | | 21,955,145 | |
| Baldwin & Lyons, Inc. - Class B | | | 88,472 | | | | 2,104,749 | |
| | | | | | | | 24,059,894 | |
| Materials - 1.77% | | | | | | | | |
| Pan American Silver Corp. (b) | | | 776,975 | | | | 12,726,850 | |
Media - 2.52% | | | | | | | | |
| World Wrestling Entertainment, Inc. (c) | | | 2,055,828 | | | | 18,132,403 | |
Pharmaceuticals, Biotechnology | | | | | | | | |
| & Life Sciences - 3.57% | | | | | | | | |
| Bio-Rad Laboratories, Inc. (a) | | | 204,069 | | | | 25,712,694 | |
Retailing - 4.69% | | | | | | | | |
| Aaron’s, Inc. | | | 625,130 | | | | 17,928,728 | |
| Big Lots, Inc. (a) | | | 448,828 | | | | 15,830,164 | |
| | | | | | | | 33,758,892 | |
See notes to financial statements.
Intrepid Small Cap Fund
SCHEDULE OF INVESTMENTS (continued)
March 31, 2013 (Unaudited)
| | | Shares | | | Value | |
| COMMON STOCKS - 45.80% (continued) | | | | | | |
Software & Services - 13.08% | | | | | | |
| Amdocs Ltd. (b) | | | 570,321 | | | $ | 20,674,136 | |
| CSG Systems International, Inc. (a) | | | 433,654 | | | | 9,189,128 | |
| EPIQ Systems, Inc. (c) | | | 1,460,074 | | | | 20,484,838 | |
| Global Payments, Inc. | | | 411,129 | | | | 20,416,666 | |
| ManTech International Corp. | | | 576,486 | | | | 15,490,179 | |
| SAIC, Inc. | | | 578,680 | | | | 7,841,114 | |
| | | | | | | | 94,096,061 | |
| Technology Hardware & Equipment - 3.12% | | | | | | | | |
| Ingram Micro, Inc. (a) | | | 1,101,323 | | | | 21,674,037 | |
| Tech Data Corp. (a) | | | 17,370 | | | | 791,898 | |
| | | | | | | | 22,465,935 | |
| Telecommunication Services - 1.17% | | | | | | | | |
| Telephone & Data Systems, Inc. | | | 398,613 | | | | 8,398,776 | |
| TOTAL COMMON STOCKS | | | | | | | | |
| (Cost $291,854,785) | | | | | | | 329,631,746 | |
Total Investments | | | | | | | | |
| (Cost $291,854,785) - 45.80% | | | | | | | 329,631,746 | |
| Other Assets in Excess of Liabilities - 54.20% | | | | | | | 390,060,621 | |
| TOTAL NET ASSETS - 100.00% | | | | | | $ | 719,692,367 | |
Percentages are stated as a percent of net assets.
| (a) | Non-income producing security. |
| (b) | Foreign issued security. |
| (c) | Affiliated company. See Footnote 7. |
SCHEDULE OF OPEN FORWARD CURRENCY CONTRACTSMarch 31, 2013 (Unaudited)
| | Forward | | | Amount of | | | | Amount of | | | | |
| Counterparty | Expiration | Currency to | | Currency to | | Currency to | | Currency to | | | Unrealized | |
| of Contract | Date | be Received | | be Received | | be Delivered | | be Delivered | | | Depreciation | |
| Morgan | | | | | | Swedish | | | | | | |
| Stanley | 7/10/13 | U.S. Dollars | | | 12,162,676 | | Krona | | | 80,000,000 | | | $ | (86,618 | ) |
| | | | | | | | | | | | | | $ | (86,618 | ) |
See notes to financial statements.
Intrepid Income Fund
SCHEDULE OF INVESTMENTS
March 31, 2013 (Unaudited)
| | | Shares | | | Value | |
| COMMON STOCKS - 1.77% | | | | | | |
Media - 0.95% | | | | | | |
| World Wrestling Entertainment, Inc. (a) | | | 118,525 | | | $ | 1,045,390 | |
Software & Services - 0.82% | | | | | | | | |
| ManTech International Corp. | | | 33,300 | | | | 894,771 | |
| TOTAL COMMON STOCKS | | | | | | | | |
| (Cost $1,837,754) | | | | | | | 1,940,161 | |
| | | | | | | | | |
| | | Principal | | | | | |
| | | Amount | | | | | |
| CORPORATE BONDS - 47.15% | | | | | | | | |
Automobiles & Components - 1.49% | | | | | | | | |
| Affinia Group, Inc. (b) | | | | | | | | |
| 10.750%, 08/15/2016 | | $ | 1,499,000 | | | | 1,626,415 | |
Capital Goods - 3.72% | | | | | | | | |
| Thermon Industries, Inc. | | | | | | | | |
| 9.500%, 05/01/2017 | | | 3,660,000 | | | | 4,062,600 | |
Commercial & Professional Services - 1.30% | | | | | | | | |
| ADS Tactical, Inc. (b)(c) | | | | | | | | |
| 11.000%, 04/01/2018 | | | 1,432,000 | | | | 1,421,260 | |
Consumer Durables & Apparel - 3.33% | | | | | | | | |
| Smith & Wesson Holding Corp. (b)(c) | | | | | | | | |
| 9.500%, 01/14/2016 | | | 3,353,000 | | | | 3,638,005 | |
Consumer Services - 6.01% | | | | | | | | |
| Ruby Tuesday, Inc. (b) | | | | | | | | |
| 7.625%, 05/15/2020 | | | 2,636,000 | | | | 2,616,230 | |
| Speedway Motorsports, Inc. | | | | | | | | |
| 8.750%, 06/01/2016 | | | 3,749,000 | | | | 3,955,195 | |
| | | | | | | | 6,571,425 | |
| Energy - 11.45% | | | | | | | | |
| Bill Barrett Corp. | | | | | | | | |
| 9.875%, 07/15/2016 | | | 3,916,000 | | | | 4,190,120 | |
| EPL Oil & Gas, Inc. | | | | | | | | |
| 8.250%, 02/15/2018 | | | 2,950,000 | | | | 3,134,375 | |
See notes to financial statements.
Intrepid Income Fund
SCHEDULE OF INVESTMENTS (continued)
March 31, 2013 (Unaudited)
| | | Principal | | | | |
| | | Amount | | | Value | |
| CORPORATE BONDS - 47.15% (continued) | | | | | | |
Energy - 11.45% (continued) | | | | | | |
| PetroQuest Energy, Inc. | | | | | | |
| 10.000%, 09/01/2017 | | $ | 3,662,000 | | | $ | 3,927,495 | |
| PHI, Inc. | | | | | | | | |
| 8.625%, 10/15/2018 | | | 556,000 | | | | 604,650 | |
| Swift Energy Co. | | | | | | | | |
| 7.125%, 06/01/2017 | | | 644,000 | | | | 660,100 | |
| | | | | | | | 12,516,740 | |
| Food, Beverage & Tobacco - 3.89% | | | | | | | | |
| Cott Beverages, Inc. | | | | | | | | |
| 8.125%, 09/01/2018 | | | 3,896,000 | | | | 4,256,380 | |
Food & Staples Retailing - 1.94% | | | | | | | | |
| Spartan Stores, Inc. (b)(c)(d) | | | | | | | | |
| 6.625%, 12/15/2016 | | | 2,000,000 | | | | 2,118,750 | |
Household & Personal Products - 4.18% | | | | | | | | |
| Central Garden & Pet Co. | | | | | | | | |
| 8.250%, 03/01/2018 | | | 1,890,000 | | | | 1,946,700 | |
| The Scotts Miracle-Gro Co. | | | | | | | | |
| 7.250%, 01/15/2018 | | | 2,465,000 | | | | 2,625,225 | |
| | | | | | | | 4,571,925 | |
| Materials - 1.90% | | | | | | | | |
| Intertape Polymer US, Inc. | | | | | | | | |
| 8.500%, 08/01/2014 | | | 1,288,000 | | | | 1,288,000 | |
| Compass Minerals International, Inc. | | | | | | | | |
| 8.000%, 06/01/2019 | | | 723,000 | | | | 784,455 | |
| | | | | | | | 2,072,455 | |
| Media - 1.71% | | | | | | | | |
| Scholastic Corp. | | | | | | | | |
| 5.000%, 04/15/2013 | | | 1,868,000 | | | | 1,870,354 | |
Pharmaceuticals, Biotechnology | | | | | | | | |
| & Life Sciences - 2.22% | | | | | | | | |
| Bio-Rad Laboratories, Inc. | | | | | | | | |
| 8.000%, 09/15/2016 | | | 2,278,000 | | | | 2,427,626 | |
See notes to financial statements.
Intrepid Income Fund
SCHEDULE OF INVESTMENTS (continued)
March 31, 2013 (Unaudited)
| | | Principal | | | | |
| | | Amount | | | Value | |
| CORPORATE BONDS - 47.15% (continued) | | | | | | |
Software & Services - 0.41% | | | | | | |
| ManTech International Corp. | | | | | | |
| 7.250%, 04/15/2018 | | $ | 420,000 | | | $ | 445,200 | |
Transportation - 3.60% | | | | | | | | |
| Quality Distribution LLC / QD Capital Corp. | | | | | | | | |
| 9.875%, 11/01/2018 | | | 2,000,000 | | | | 2,200,000 | |
| Swift Services Holdings, Inc. | | | | | | | | |
| 10.000%, 11/15/2018 | | | 1,514,000 | | | | 1,733,530 | |
| | | | | | | | 3,933,530 | |
| TOTAL CORPORATE BONDS | | | | | | | | |
| (Cost $50,736,209) | | | | | | | 51,532,665 | |
| | | | | | | | | |
| SENIOR LOANS - 1.84% | | | | | | | | |
Food & Staples Retailing - 1.84% | | | | | | | | |
| The Pantry, Inc. (e) | | | | | | | | |
| 5.750%, 08/03/2019 | | | 1,994,987 | | | | 2,010,748 | |
| TOTAL SENIOR LOANS | | | | | | | | |
| (Cost $2,042,327) | | | | | | | 2,010,748 | |
Total Investments | | | | | | | | |
| (Cost $54,616,290) - 50.76% | | | | | | | 55,483,574 | |
| Other Assets in Excess of Liabilities - 49.24% | | | | | | | 53,820,439 | |
| TOTAL NET ASSETS - 100.00% | | | | | | $ | 109,304,013 | |
Percentages are stated as a percent of net assets.
| (a) | Affiliated company. See Footnote 7. |
| (b) | Denotes a security is either fully or partially restricted to resale. The aggregate value of restricted securities at March 31, 2013 was $11,420,660, which represented 10.45% of net assets. |
| (c) | Security is considered illiquid and may be difficult to sell. |
| (d) | Fair valued security. The aggregate value of fair valued securities as of March 31, 2013 was $2,118,750, which represented 1.94% of net assets. |
| (e) | Variable rate security. The rate is as of March 31, 2013. |
See notes to financial statements.
Intrepid Disciplined Value Fund
SCHEDULE OF INVESTMENTS
March 31, 2013 (Unaudited)
| | | Shares | | | Value | |
| COMMON STOCKS - 63.91% | | | | | | |
Commercial & Professional Services - 4.35% | | | | | | |
| FTI Consulting, Inc. (a) | | | 44,975 | | | $ | 1,693,758 | |
Consumer Services - 5.83% | | | | | | | | |
| International Speedway Corp. | | | 30,260 | | | | 988,897 | |
| Regis Corp. | | | 20,406 | | | | 371,185 | |
| Speedway Motorsports, Inc. | | | 50,760 | | | | 913,172 | |
| | | | | | | | 2,273,254 | |
| Diversified Financials - 3.94% | | | | | | | | |
| The Bank Of New York Mellon Corp. | | | 54,810 | | | | 1,534,132 | |
Energy - 4.10% | | | | | | | | |
| Bill Barrett Corp. (a) | | | 48,870 | | | | 990,595 | |
| Newfield Exploration Co. (a) | | | 27,150 | | | | 608,703 | |
| | | | | | | | 1,599,298 | |
| Food, Beverage & Tobacco - 4.10% | | | | | | | | |
| Molson Coors Brewing Co. | | | 32,640 | | | | 1,597,075 | |
Health Care Equipment & Services - 1.42% | | | | | | | | |
| CR Bard, Inc. | | | 5,490 | | | | 553,282 | |
Household & Personal Products - 1.60% | | | | | | | | |
| American Greetings Corp. | | | 38,789 | | | | 624,503 | |
Insurance - 2.82% | | | | | | | | |
| Aspen Insurance Holdings Ltd. (b) | | | 28,500 | | | | 1,099,530 | |
Materials - 2.00% | | | | | | | | |
| Pan American Silver Corp. (b) | | | 47,510 | | | | 778,214 | |
Media - 2.32% | | | | | | | | |
| World Wrestling Entertainment, Inc. (c) | | | 102,231 | | | | 901,678 | |
Pharmaceuticals, Biotechnology | | | | | | | | |
| & Life Sciences - 3.15% | | | | | | | | |
| Bio-Rad Laboratories, Inc. (a) | | | 9,741 | | | | 1,227,366 | |
Retailing - 4.73% | | | | | | | | |
| Big Lots, Inc. (a) | | | 18,700 | | | | 659,549 | |
| GameStop Corp. | | | 23,800 | | | | 665,686 | |
See notes to financial statements.
Intrepid Disciplined Value Fund
SCHEDULE OF INVESTMENTS (continued)
March 31, 2013 (Unaudited)
| | | Shares | | | Value | |
| COMMON STOCKS - 63.91% (continued) | | | | | | |
Retailing - 4.73% (continued) | | | | | | |
| Staples, Inc. | | | 38,600 | | | $ | 518,398 | |
| | | | | | | | 1,843,633 | |
| Software & Services - 13.73% | | | | | | | | |
| Amdocs Ltd. (b) | | | 20,580 | | | | 746,025 | |
| CSG Systems International, Inc. (a) | | | 37,695 | | | | 798,757 | |
| EPIQ Systems, Inc. (c) | | | 67,170 | | | | 942,395 | |
| Global Payments, Inc. | | | 18,610 | | | | 924,173 | |
| Microsoft Corp. | | | 37,030 | | | | 1,059,428 | |
| SAIC, Inc. | | | 64,710 | | | | 876,820 | |
| | | | | | | | 5,347,598 | |
| Technology Hardware & Equipment - 7.23% | | | | | | | | |
| Dell, Inc. | | | 84,710 | | | | 1,213,894 | |
| Ingram Micro, Inc. (a) | | | 63,123 | | | | 1,242,261 | |
| Tellabs, Inc. | | | 172,420 | | | | 360,358 | |
| | | | | | | | 2,816,513 | |
| Telecommunication Services - 2.59% | | | | | | | | |
| Telephone & Data Systems, Inc. | | | 47,838 | | | | 1,007,947 | |
| TOTAL COMMON STOCKS | | | | | | | | |
| (Cost $21,629,513) | | | | | | | 24,897,781 | |
Total Investments | | | | | | | | |
| (Cost $21,629,513) - 63.91% | | | | | | | 24,897,781 | |
| Other Assets in Excess of Liabilities - 36.09% | | | | | | | 14,057,639 | |
| TOTAL NET ASSETS - 100.00% | | | | | | $ | 38,955,420 | |
Percentages are stated as a percent of net assets.
| (a) | Non-income producing security. |
| (b) | Foreign issued security. |
| (c) | Affiliated company. See Footnote 7. |
See notes to financial statements.
Intrepid Funds
STATEMENT OF ASSETS AND LIABILITIES
March 31, 2013 (Unaudited)
| | | Intrepid | | | Intrepid Small | |
| | | Capital Fund | | | Cap Fund | |
| ASSETS: | | | | | | |
Investments, at value(1) | | | | | | |
| Unaffiliated issuers | | $ | 284,715,466 | | | $ | 264,626,461 | |
| Affiliated issuers | | | 27,153,992 | | | | 65,005,285 | |
| Income receivable | | | 2,187,417 | | | | 237,125 | |
| Receivable for fund shares sold | | | 1,769,505 | | | | 1,622,986 | |
| Receivable for investments sold | | | — | | | | 282,145 | |
| Cash | | | 109,414,760 | | | | 390,753,849 | |
| Other assets | | | 54,946 | | | | 53,570 | |
| Total assets | | | 425,296,086 | | | | 722,581,421 | |
| LIABILITIES: | | | | | | | | |
| Depreciation on forward currency contracts | | | 218,849 | | | | 86,618 | |
| Payable for fund shares redeemed | | | 256,941 | | | | 723,951 | |
| Payable for investment securities purchased | | | — | | | | 1,100,875 | |
| Payable to Investment Adviser | | | 353,859 | | | | 595,027 | |
| Accrued distribution fees | | | 71,635 | | | | 148,284 | |
| Other accrued expenses | | | 113,525 | | | | 234,299 | |
| Total liabilities | | | 1,014,809 | | | | 2,889,054 | |
| Total net assets | | $ | 424,281,277 | | | $ | 719,692,367 | |
| NET ASSETS CONSIST OF: | | | | | | | | |
| Capital stock | | | 383,080,212 | | | | 669,816,537 | |
| Accumulated net investment loss | | | (132,477 | ) | | | (1,805,035 | ) |
| Accumulated undistributed net realized gain on investments | | | 20,141,121 | | | | 13,990,522 | |
| Unrealized appreciation (depreciation) on: | | | | | | | | |
| Investments and foreign currency translation | | | 21,411,270 | | | | 37,776,961 | |
| Forward currency contracts | | | (218,849 | ) | | | (86,618 | ) |
| Total net assets | | $ | 424,281,277 | | | $ | 719,692,367 | |
| | | | | | | | | |
| Investor Class | | | | | | | | |
| Net Assets | | | 316,480,121 | | | | 656,979,449 | |
| Shares outstanding | | | 26,639,596 | | | | 42,552,155 | |
| | | | | | | | | |
| Institutional Class | | | | | | | | |
| Net Assets | | | 107,801,156 | | | | 62,712,918 | |
| Shares outstanding | | | 9,067,220 | | | | 4,019,373 | |
| Total shares outstanding (unlimited | | | | | | | | |
| shares of no par value authorized) | | | 35,706,816 | | | | 46,571,528 | |
| Investor Class Net asset value, offering | | | | | | | | |
| and redemption price per share | | $ | 11.88 | | | $ | 15.44 | |
| Institutional Class Net asset value, offering | | | | | | | | |
| and redemption price per share | | $ | 11.89 | | | $ | 15.60 | |
(1) Cost of Investments | | | | | | | | |
| Unaffiliated issuers | | $ | 265,039,801 | | | $ | 229,617,579 | |
| Affiliated issuers | | | 25,418,387 | | | | 62,237,206 | |
See notes to financial statements.
Intrepid Funds
STATEMENT OF ASSETS AND LIABILITIES (continued)
March 31, 2013 (Unaudited)
| | | | | | Intrepid | |
| | | Intrepid | | | Disciplined | |
| | | Income Fund | | | Value Fund | |
| ASSETS: | | | | | | |
Investments, at value(1) | | | | | | |
| Unaffiliated issuers | | $ | 53,098,213 | | | $ | 22,429,205 | |
| Affiliated issuers | | | 2,385,361 | | | | 2,468,576 | |
| Income receivable | | | 1,065,469 | | | | 26,002 | |
| Receivable for fund shares sold | | | 32,014 | | | | 31,543 | |
| Receivable for investments sold | | | — | | | | — | |
| Cash | | | 53,299,853 | | | | 14,138,104 | |
| Other assets | | | 18,715 | | | | 15,720 | |
| Total assets | | | 109,899,625 | | | | 39,109,150 | |
| LIABILITIES: | | | | | | | | |
| Payable for fund shares redeemed | | | 13,107 | | | | 18,000 | |
| Payable for investment securities purchased | | | 458,800 | | | | — | |
| Payable to Investment Adviser | | | 62,147 | | | | 25,808 | |
| Accrued distribution fees | | | 17,548 | | | | 79,259 | |
| Other accrued expenses | | | 44,010 | | | | 30,663 | |
| Total liabilities | | | 595,612 | | | | 153,730 | |
| Total net assets | | $ | 109,304,013 | | | $ | 38,955,420 | |
| NET ASSETS CONSIST OF: | | | | | | | | |
| Capital stock | | | 108,240,206 | | | | 34,833,906 | |
| Accumulated net investment loss | | | (511,884 | ) | | | (59,217 | ) |
| Accumulated undistributed net realized gain on investments | | | 708,407 | | | | 912,463 | |
| Unrealized appreciation on: | | | | | | | | |
| Investments and foreign currency translation | | | 867,284 | | | | 3,268,268 | |
| Total net assets | | $ | 109,304,013 | | | $ | 38,955,420 | |
| | | | | | | | | |
| Investor Class | | | | | | | | |
| Net Assets | | | 36,782,641 | | | | 38,955,420 | |
| Shares outstanding | | | 3,786,732 | | | | 3,680,630 | |
| | | | | | | | | |
| Institutional Class | | | | | | | | |
| Net Assets | | | 72,521,372 | | | | — | |
| Shares outstanding | | | 7,475,130 | | | | — | |
| Total shares outstanding (unlimited | | | | | | | | |
| shares of no par value authorized) | | | 11,261,862 | | | | 3,680,630 | |
| Investor Class Net asset value, offering | | | | | | | | |
| and redemption price per share | | $ | 9.71 | | | $ | 10.58 | |
| Institutional Class Net asset value, offering | | | | | | | | |
| and redemption price per share | | $ | 9.70 | | | | N/A | |
(1) Cost of Investments | | | | | | | | |
| Unaffiliated issuers | | $ | 52,333,861 | | | $ | 19,343,619 | |
| Affiliated issuers | | | 2,282,429 | | | | 2,285,894 | |
See notes to financial statements.
Intrepid Funds
STATEMENT OF OPERATIONS
For the six months ended March 31, 2013 (Unaudited)
| | | Intrepid | | | Intrepid Small | |
| | | Capital Fund | | | Cap Fund | |
| INVESTMENT INCOME: | | | | | | |
| Dividend income | | | | | | |
| Unaffiliated issuers* | | $ | 1,693,627 | | | $ | 962,880 | |
| Affiliated issuers (See Note 7) | | | 579,814 | | | | 1,446,626 | |
| Interest income | | | | | | | | |
| Unaffiliated issuers* | | | 3,420,223 | | | | — | |
| Total investment income | | | 5,693,664 | | | | 2,409,506 | |
| | | | | | | | | |
| Advisory fees (See Note 3) | | | 2,000,588 | | | | 3,666,643 | |
| Distribution (12b-1) fees - Investor Class Only | | | 373,198 | | | | 838,263 | |
| Administration fees | | | 160,657 | | | | 289,816 | |
| Shareholder servicing fees and expenses | | | 46,960 | | | | 121,298 | |
| Fund accounting fees | | | 44,770 | | | | 84,246 | |
| Federal and state registration | | | 30,458 | | | | 56,650 | |
| Reports to shareholders | | | 16,436 | | | | 46,100 | |
| Audit fees | | | 12,788 | | | | 12,788 | |
| Custody fees | | | 12,396 | | | | 20,680 | |
| Trustees fees and expenses | | | 9,694 | | | | 19,278 | |
| Insurance | | | 8,068 | | | | 17,170 | |
| Legal fees | | | 3,464 | | | | 3,404 | |
| Miscellaneous | | | 2,848 | | | | 5,030 | |
| Total expenses before Adviser reimbursement | | | 2,722,325 | | | | 5,181,366 | |
| Expenses reimbursed by Adviser (See Note 3) | | | (48,518 | ) | | | (126,464 | ) |
| Net expenses | | | 2,673,807 | | | | 5,054,902 | |
| Net investment income (loss) | | | 3,019,857 | | | | (2,645,396 | ) |
| | | | | | | | | |
| NET REALIZED AND UNREALIZED | | | | | | | | |
| GAIN (LOSS) ON INVESTMENTS: | | | | | | | | |
| Net realized gain (loss) on: | | | | | | | | |
| Investments in unaffiliated issuers | | | 23,206,563 | | | | 28,883,557 | |
| Investments in affiliated issuers (See Note 7) | | | (468,675 | ) | | | (5,530,319 | ) |
| Foreign currency translation | | | 86 | | | | 87 | |
| Forward currency contracts | | | (68,077 | ) | | | (920,220 | ) |
| Net change in unrealized appreciation (depreciation) on: | | | | | | | | |
| Investments | | | 1,069,820 | | | | 22,978,514 | |
| Foreign currency translation | | | (2,607,260 | ) | | | (1,116,345 | ) |
| Forward currency contracts | | | (106,654 | ) | | | 753,743 | |
| Net realized and unrealized gain | | | 21,025,803 | | | | 45,049,017 | |
| Net increase in net assets resulting from operations | | $ | 24,045,660 | | | $ | 42,403,621 | |
| | | | | | | | | |
| * Net of foreign taxes withheld | | $ | 12,522 | | | $ | 24,659 | |
See notes to financial statements.
Intrepid Funds
STATEMENT OF OPERATIONS (continued)
For the six months ended March 31, 2013 (Unaudited)
| | | | | | Intrepid | |
| | | Intrepid | | | Disciplined | |
| | | Income Fund | | | Value Fund | |
| INVESTMENT INCOME: | | | | | | |
| Dividend income | | | | | | |
| Unaffiliated issuers* | | $ | — | | | $ | 386,618 | |
| Affiliated issuers (See Note 7) | | | 41,807 | | | | 57,044 | |
| Interest income | | | | | | | | |
| Unaffiliated issuers* | | | 2,108,953 | | | | — | |
| Total investment income | | | 2,150,760 | | | | 443,662 | |
| | | | | | | | | |
| Advisory fees (See Note 3) | | | 395,922 | | | | 196,422 | |
| Distribution (12b-1) fees - Investor Class Only | | | 47,298 | | | | 49,105 | |
| Administration fees | | | 43,599 | | | | 17,837 | |
| Shareholder servicing fees and expenses | | | 21,782 | | | | 12,200 | |
| Federal and state registration | | | 18,082 | | | | 11,770 | |
| Fund accounting fees | | | 14,454 | | | | 6,440 | |
| Audit fees | | | 12,728 | | | | 12,788 | |
| Custody fees | | | 4,202 | | | | 2,620 | |
| Reports to shareholders | | | 4,126 | | | | 3,636 | |
| Legal fees | | | 3,222 | | | | 3,222 | |
| Trustees fees and expenses | | | 2,604 | | | | 1,092 | |
| Insurance | | | 2,244 | | | | 1,030 | |
| Miscellaneous | | | 1,214 | | | | 730 | |
| Total expenses before Adviser reimbursement | | | 571,477 | | | | 318,892 | |
| Expenses reimbursed by Adviser (See Note 3) | | | (49,073 | ) | | | (43,902 | ) |
| Net expenses | | | 522,404 | | | | 274,990 | |
| Net investment income | | | 1,628,356 | | | | 168,672 | |
| | | | | | | | | |
| NET REALIZED AND UNREALIZED | | | | | | | | |
| GAIN (LOSS) ON INVESTMENTS: | | | | | | | | |
| Net realized gain (loss) on: | | | | | | | | |
| Investments in unaffiliated issuers | | | 1,148,625 | | | | 1,274,793 | |
| Investments in affiliated issuers (See Note 7) | | | — | | | | (127,107 | ) |
| Forward currency contracts | | | 12,958 | | | | — | |
| Net change in unrealized appreciation (depreciation) on: | | | | | | | | |
| Investments | | | 45,895 | | | | 1,881,773 | |
| Foreign currency translation | | | (716,213 | ) | | | (338,456 | ) |
| Forward currency contracts | | | (3,758 | ) | | | — | |
| Net realized and unrealized gain | | | 487,507 | | | | 2,691,003 | |
| Net increase in net assets resulting from operations | | $ | 2,115,863 | | | $ | 2,859,675 | |
| | | | | | | | | |
| * Net of foreign taxes withheld | | $ | — | | | $ | 1,287 | |
See notes to financial statements.
Intrepid Capital Fund
STATEMENTS OF CHANGES IN NET ASSETS
| | | Six Months | | | Year | |
| | | Ended | | | Ended | |
| | | March 31, 2013 | | | September 30, 2012 | |
| | | (Unaudited) | | | | |
| OPERATIONS: | | | | | | |
| Net investment income | | $ | 3,019,857 | | | $ | 6,103,891 | |
| Net realized gain on investments | | | | | | | | |
| and foreign currency translation | | | 22,669,897 | | | | 13,741,928 | |
| Net change in unrealized | | | | | | | | |
| appreciation (depreciation) | | | (1,644,094 | ) | | | 36,187,895 | |
| Net increase in assets | | | | | | | | |
| resulting from operations | | | 24,045,660 | | | | 56,033,714 | |
| | | | | | | | | |
| DISTRIBUTIONS TO SHAREHOLDERS: | | | | | | | | |
| From net investment income - Investor Class | | | (2,100,358 | ) | | | (4,494,768 | ) |
| From net investment income - Institutional Class | | | (833,693 | ) | | | (1,749,509 | ) |
| From net realized gain - Investor Class | | | (10,107,162 | ) | | | (14,686,184 | ) |
| From net realized gain - Institutional Class | | | (3,401,053 | ) | | | (5,492,289 | ) |
| Total distributions | | | (16,442,266 | ) | | | (26,422,750 | ) |
| | | | | | | | | |
| CAPITAL SHARE TRANSACTIONS: | | | | | | | | |
| Proceeds from shares sold - Investor Class | | | 69,989,667 | | | | 158,725,077 | |
| Proceeds from shares sold - Institutional Class | | | 9,514,986 | | | | 17,647,919 | |
| Proceeds from shares issued to holders in | | | | | | | | |
| reinvestment of dividends - Investor Class | | | 8,455,013 | | | | 13,482,824 | |
| Proceeds from shares issued to holders in | | | | | | | | |
| reinvestment of dividends - Institutional Class | | | 3,616,465 | | | | 6,163,820 | |
Cost of shares redeemed - Investor Class(1) | | | (56,167,297 | ) | | | (103,801,299 | ) |
Cost of shares redeemed - Institutional Class(2) | | | (7,694,331 | ) | | | (13,438,803 | ) |
| Net increase in net assets from | | | | | | | | |
| capital share transactions | | | 27,714,503 | | | | 78,779,538 | |
| | | | | | | | | |
| TOTAL INCREASE IN NET ASSETS | | | 35,317,897 | | | | 108,390,502 | |
| | | | | | | | | |
| NET ASSETS: | | | | | | | | |
| Beginning of period | | | 388,963,380 | | | | 280,572,878 | |
| End of period (including accumulated net | | | | | | | | |
| investment loss of $132,477 and $218,283) | | $ | 424,281,277 | | | $ | 388,963,380 | |
| (1) | Net of redemption fees of $6,501 and $13,103, respectively. |
| (2) | Net of redemption fees of $0 and $1,981, respectively. |
See notes to financial statements.
Intrepid Small Cap Fund
STATEMENTS OF CHANGES IN NET ASSETS (continued)
| | | Six Months | | | Year | |
| | | Ended | | | Ended | |
| | | March 31, 2013 | | | September 30, 2012 | |
| | | (Unaudited) | | | | |
| OPERATIONS: | | | | | | |
| Net investment loss | | $ | (2,645,396 | ) | | $ | (2,760,207 | ) |
| Net realized gain on investments | | | | | | | | |
| and foreign currency translation | | | 22,433,105 | | | | 64,568,889 | |
| Net change in unrealized appreciation | | | 22,615,912 | | | | 41,308,329 | |
| Net increase in assets | | | | | | | | |
| resulting from operations | | | 42,403,621 | | | | 103,117,011 | |
| | | | | | | | | |
| DISTRIBUTIONS TO SHAREHOLDERS: | | | | | | | | |
| From net realized gain - Investor Class | | | (52,426,184 | ) | | | (71,079,314 | ) |
| From net realized gain - Institutional Class | | | (4,944,027 | ) | | | (6,908,737 | ) |
| Total distributions | | | (57,370,211 | ) | | | (77,988,051 | ) |
| | | | | | | | | |
| CAPITAL SHARE TRANSACTIONS: | | | | | | | | |
| Proceeds from shares sold - Investor Class | | | 100,469,282 | | | | 360,411,957 | |
| Proceeds from shares sold - Institutional Class | | | 8,988,754 | | | | 30,289,556 | |
| Proceeds from shares issued to holders in | | | | | | | | |
| reinvestment of dividends - Investor Class | | | 49,056,256 | | | | 66,939,920 | |
| Proceeds from shares issued to holders in | | | | | | | | |
| reinvestment of dividends - Institutional Class | | | 4,304,965 | | | | 5,292,954 | |
Cost of shares redeemed - Investor Class(1) | | | (178,015,422 | ) | | | (294,097,802 | ) |
Cost of shares redeemed - Institutional Class(2) | | | (13,921,863 | ) | | | (22,800,906 | ) |
| Net increase (decrease) in net assets | | | | | | | | |
| from capital share transactions | | | (29,118,028 | ) | | | 146,035,679 | |
| | | | | | | | | |
| TOTAL INCREASE (DECREASE) | | | | | | | | |
| IN NET ASSETS | | | (44,084,618 | ) | | | 171,164,639 | |
| | | | | | | | | |
| NET ASSETS: | | | | | | | | |
| Beginning of period | | | 763,776,985 | | | | 592,612,346 | |
| End of period (including accumulated | | | | | | | | |
| net investment income (loss) | | | | | | | | |
| of $(1,805,035) and $840,361) | | $ | 719,692,367 | | | $ | 763,776,985 | |
| (1) | Net of redemption fees of $12,063 and $52,972, respectively. |
| (2) | Net of redemption fees of $4,124 and $5,122, respectively. |
See notes to financial statements.
Intrepid Income Fund
STATEMENTS OF CHANGES IN NET ASSETS (continued)
| | | Six Months | | | Year | |
| | | Ended | | | Ended | |
| | | March 31, 2013 | | | September 30, 2012 | |
| | | (Unaudited) | | | | |
| OPERATIONS: | | | | | | |
| Net investment income | | $ | 1,628,356 | | | $ | 4,263,622 | |
| Net realized gain on investments | | | | | | | | |
| and foreign currency translation | | | 1,161,583 | | | | 780,784 | |
| Net change in unrealized | | | | | | | | |
| appreciation (depreciation) | | | (674,076 | ) | | | 1,955,328 | |
| Net increase in assets | | | | | | | | |
| resulting from operations | | | 2,115,863 | | | | 6,999,734 | |
| | | | | | | | | |
| DISTRIBUTIONS TO SHAREHOLDERS: | | | | | | | | |
| From net investment income - Investor Class | | | (684,116 | ) | | | (1,714,576 | ) |
| From net investment income - Institutional Class | | | (1,348,389 | ) | | | (2,555,868 | ) |
| From net realized gain - Investor Class | | | (402,224 | ) | | | (560,848 | ) |
| From net realized gain - Institutional Class | | | (712,548 | ) | | | (733,271 | ) |
| Total distributions | | | (3,147,277 | ) | | | (5,564,563 | ) |
| | | | | | | | | |
| CAPITAL SHARE TRANSACTIONS: | | | | | | | | |
| Proceeds from shares sold - Investor Class | | | 4,522,057 | | | | 19,296,344 | |
| Proceeds from shares sold - Institutional Class | | | 11,814,083 | | | | 14,294,036 | |
| Proceeds from shares issued to holders in | | | | | | | | |
| reinvestment of dividends - Investor Class | | | 986,118 | | | | 2,087,047 | |
| Proceeds from shares issued to holders in | | | | | | | | |
| reinvestment of dividends - Institutional Class | | | 2,060,937 | | | | 3,288,143 | |
Cost of shares redeemed - Investor Class(1) | | | (8,130,050 | ) | | | (14,258,167 | ) |
Cost of shares redeemed - Institutional Class(2) | | | (3,758,982 | ) | | | (5,883,163 | ) |
| Net increase in net assets from | | | | | | | | |
| capital share transactions | | | 7,494,163 | | | | 18,824,240 | |
| | | | | | | | | |
| TOTAL INCREASE IN NET ASSETS | | | 6,462,749 | | | | 20,259,411 | |
| | | | | | | | | |
| NET ASSETS: | | | | | | | | |
| Beginning of period | | | 102,841,264 | | | | 82,581,853 | |
| End of period (including accumulated net | | | | | | | | |
| investment loss of $511,884 and $107,735) | | $ | 109,304,013 | | | $ | 102,841,264 | |
| (1) | Net of redemption fees of $105 and $2,280, respectively. |
| (2) | Net of redemption fees of $160 and $0, respectively. |
See notes to financial statements.
Intrepid Disciplined Value Fund
STATEMENTS OF CHANGES IN NET ASSETS (continued)
| | | Six Months | | | Year | |
| | | Ended | | | Ended | |
| | | March 31, 2013 | | | September 30, 2012 | |
| | | (Unaudited) | | | | |
| OPERATIONS: | | | | | | |
| Net investment income | | $ | 168,672 | | | $ | 16,641 | |
| Net realized gain on investments | | | | | | | | |
| and foreign currency translation | | | 1,147,686 | | | | 3,030,099 | |
| Net change in unrealized appreciation | | | 1,543,317 | | | | 4,720,945 | |
| Net increase in assets | | | | | | | | |
| resulting from operations | | | 2,859,675 | | | | 7,767,685 | |
| | | | | | | | | |
| DISTRIBUTIONS TO SHAREHOLDERS: | | | | | | | | |
| From net investment income | | | (227,889 | ) | | | (60,937 | ) |
| From net realized gain | | | (2,328,129 | ) | | | (2,375,902 | ) |
| Total distributions | | | (2,556,018 | ) | | | (2,436,839 | ) |
| | | | | | | | | |
| CAPITAL SHARE TRANSACTIONS: | | | | | | | | |
| Proceeds from shares sold | | | 3,635,513 | | | | 10,332,319 | |
| Proceeds from shares issued to holders | | | | | | | | |
| in reinvestment of dividends | | | 2,484,027 | | | | 2,305,781 | |
Cost of shares redeemed(1) | | | (14,443,084 | ) | | | (7,349,436 | ) |
| Net increase (decrease) in net assets | | | | | | | | |
| from capital share transactions | | | (8,323,544 | ) | | | 5,288,664 | |
| | | | | | | | | |
| TOTAL INCREASE (DECREASE) | | | | | | | | |
| IN NET ASSETS | | | (8,019,887 | ) | | | 10,619,510 | |
| | | | | | | | | |
| NET ASSETS: | | | | | | | | |
| Beginning of period | | | 46,975,307 | | | | 36,355,797 | |
| End of period(including accumulated net | | | | | | | | |
| investment income (loss) of $(59,217) and $0) | | $ | 38,955,420 | | | $ | 46,975,307 | |
| (1) | Net of redemption fees of $0 and $148, respectively. |
See notes to financial statements.
Intrepid Capital Fund – Investor Class
Per share data for a share of capital stock outstanding for the entire period and selected information for the period are as follows:
| | | Period | | | | | | | | | | | | | | | | |
| | | Ended | | | | | | | | | | | | | | | | |
| | | March 31, | | | Year Ended September 30, | |
| | | 2013 | | | 2012 | | | 2011 | | | 2010 | | | 2009 | | | 2008 | |
| | | (Unaudited) | | | | | | | | | | | | | | | | |
| NET ASSET VALUE: | | | | | | | | | | | | | | | | | | |
| Beginning of period | | $ | 11.69 | | | $ | 10.70 | | | $ | 11.09 | | | $ | 9.99 | | | $ | 9.67 | | | $ | 10.55 | |
| OPERATIONS: | | | | | | | | | | | | | | | | | | | | | | | | |
Net investment income(1) | | | 0.08 | | | | 0.18 | | | | 0.16 | | | | 0.16 | | | | 0.23 | | | | 0.18 | |
| Net realized and unrealized | | | | | | | | | | | | | | | | | | | | | | | | |
| gain (loss) on investment | | | | | | | | | | | | | | | | | | | | | | | | |
| securities | | | 0.59 | | | | 1.72 | | | | (0.05 | ) | | | 1.24 | | | | 0.52 | | | | (0.30 | ) |
| Total from | | | | | | | | | | | | | | | | | | | | | | | | |
operations(2) | | | 0.67 | | | | 1.90 | | | | 0.11 | | | | 1.40 | | | | 0.75 | | | | (0.12 | ) |
| LESS DISTRIBUTIONS: | | | | | | | | | | | | | | | | | | | | | | | | |
| From net | | | | | | | | | | | | | | | | | | | | | | | | |
| investment income | | | (0.08 | ) | | | (0.18 | ) | | | (0.17 | ) | | | (0.15 | ) | | | (0.23 | ) | | | (0.18 | ) |
| From net realized gains | | | (0.40 | ) | | | (0.73 | ) | | | (0.33 | ) | | | (0.15 | ) | | | (0.20 | ) | | | (0.58 | ) |
| Total distributions | | | (0.48 | ) | | | (0.91 | ) | | | (0.50 | ) | | | (0.30 | ) | | | (0.43 | ) | | | (0.76 | ) |
| NET ASSET VALUE: | | | | | | | | | | | | | | | | | | | | | | | | |
| End of period | | $ | 11.88 | | | $ | 11.69 | | | $ | 10.70 | | | $ | 11.09 | | | $ | 9.99 | | | $ | 9.67 | |
| Total return | | | 6.01 | %(3) | | | 18.63 | % | | | 0.74 | % | | | 14.27 | % | | | 8.85 | % | | | (1.41 | )% |
| Net assets at end of | | | | | | | | | | | | | | | | | | | | | | | | |
| period (000s omitted) | | $ | 316,480 | | | $ | 288,462 | | | $ | 198,898 | | | $ | 136,991 | | | $ | 74,598 | | | $ | 36,498 | |
| RATIO OF EXPENSES TO | | | | | | | | | | | | | | | | | | | | | | | | |
| AVERAGE NET ASSETS: | | | | | | | | | | | | | | | | | | | | | | | | |
| Before expense | | | | | | | | | | | | | | | | | | | | | | | | |
| reimbursement/recoupment | | | 1.43 | %(4) | | | 1.44 | % | | | 1.46 | % | | | 1.53 | % | | | 1.71 | % | | | 1.79 | % |
| After expense | | | | | | | | | | | | | | | | | | | | | | | | |
| reimbursement/recoupment | | | 1.40 | %(4) | | | 1.40 | % | | | 1.40 | % | | | 1.45 | % | | | 1.80 | % | | | 1.95 | % |
| RATIO OF NET INVESTMENT | | | | | | | | | | | | | | | | | | | | | | | | |
| INCOME TO AVERAGE NET ASSETS: | | | | | | | | | | | | | | | | | | | | | | | | |
| Before expense | | | | | | | | | | | | | | | | | | | | | | | | |
| reimbursement/recoupment | | | 1.42 | %(4) | | | 1.62 | % | | | 1.37 | % | | | 1.54 | % | | | 2.79 | % | | | 1.95 | % |
| After expense | | | | | | | | | | | | | | | | | | | | | | | | |
| reimbursement/recoupment | | | 1.45 | %(4) | | | 1.66 | % | | | 1.43 | % | | | 1.62 | % | | | 2.70 | % | | | 1.79 | % |
| Portfolio turnover rate | | | 26 | %(3) | | | 63 | % | | | 88 | % | | | 54 | % | | | 60 | % | | | 86 | % |
| (1) | Net investment income per share is calculated using the ending balances prior to consideration or adjustment for permanent book-to-tax differences. |
| (2) | Total from investment operations per share includes redemption fees of less than $0.01 per share for the six months ended March 31, 2013 and five years ended September 30, 2012, 2011, 2010, 2009 and 2008. |
See notes to financial statements.
Intrepid Capital Fund – Institutional Class
FINANCIAL HIGHLIGHTS (continued)
Per share data for a share of capital stock outstanding for the entire period and selected information for the period are as follows:
| | | Period | | | | | | | | | April 30, 2010(1) | |
| | | Ended | | | Year Ended | | | through | |
| | | March 31, | | | September 30, | | | September 30, | |
| | | 2013 | | | 2012 | | | 2011 | | | 2010 | |
| | | (Unaudited) | | | | | | | | | | |
| NET ASSET VALUE: | | | | | | | | | | | | |
| Beginning of period | | $ | 11.70 | | | $ | 10.70 | | | $ | 11.10 | | | $ | 11.17 | |
| OPERATIONS: | | | | | | | | | | | | | | | | |
Net investment income(2) | | | 0.10 | | | | 0.21 | | | | 0.18 | | | | 0.07 | |
| Net realized and unrealized | | | | | | | | | | | | | | | | |
gain (loss) on investment securities(3) | | | 0.59 | | | | 1.73 | | | | (0.05 | ) | | | (0.06 | ) |
| Total from operations | | | 0.69 | | | | 1.94 | | | | 0.13 | | | | 0.01 | |
| LESS DISTRIBUTIONS: | | | | | | | | | | | | | | | | |
| From net investment income | | | (0.10 | ) | | | (0.21 | ) | | | (0.20 | ) | | | (0.08 | ) |
| From net realized gains | | | (0.40 | ) | | | (0.73 | ) | | | (0.33 | ) | | | — | |
| Total distributions | | | (0.50 | ) | | | (0.94 | ) | | | (0.53 | ) | | | (0.08 | ) |
| NET ASSET VALUE: | | | | | | | | | | | | | | | | |
| End of period | | $ | 11.89 | | | $ | 11.70 | | | $ | 10.70 | | | $ | 11.10 | |
| Total return | | | 6.13 | %(4) | | | 19.02 | % | | | 0.93 | % | | | 0.09 | %(4) |
| Net assets at end of | | | | | | | | | | | | | | | | |
| period (000s omitted) | | $ | 107,801 | | | $ | 100,501 | | | $ | 81,675 | | | $ | 86,252 | |
| RATIO OF EXPENSES | | | | | | | | | | | | | | | | |
| TO AVERAGE NET ASSETS: | | | | | | | | | | | | | | | | |
| Before expense reimbursement | | | 1.18 | %(5) | | | 1.19 | % | | | 1.21 | % | | | 1.31 | %(5) |
| After expense reimbursement | | | 1.15 | %(5) | | | 1.15 | % | | | 1.15 | % | | | 1.15 | %(5) |
| RATIO OF NET INVESTMENT INCOME | | | | | | | | | | | | | | | | |
| TO AVERAGE NET ASSETS: | | | | | | | | | | | | | | | | |
| Before expense reimbursement | | | 1.67 | %(5) | | | 1.85 | % | | | 1.58 | % | | | 1.66 | %(5) |
| After expense reimbursement | | | 1.70 | %(5) | | | 1.89 | % | | | 1.64 | % | | | 1.82 | %(5) |
| Portfolio turnover rate | | | 26 | %(4) | | | 63 | % | | | 88 | % | | | 54 | %(4) |
| (1) | Commencement of Operations. |
| (2) | Net investment income per share is calculated using the ending balances prior to consideration or adjustment for permanent book-to-tax differences. |
| (3) | Total from investment operations per share includes redemption fees of less than $0.01 per share for the year ended September 30, 2012 and the period ended September 30, 2010. |
See notes to financial statements.
Intrepid Small Cap Fund – Investor Class
FINANCIAL HIGHLIGHTS (continued)
Per share data for a share of capital stock outstanding for the entire period and selected information for the period are as follows:
| | | Period | | | | | | | | | | | | | | | | |
| | | Ended | | | | | | | | | | | | | | | | |
| | | March 31, | | | Year Ended September 30, | |
| | | 2013 | | | 2012 | | | 2011 | | | 2010 | | | 2009 | | | 2008 | |
| | | (Unaudited) | | | | | | | | | | | | | | | | |
| NET ASSET VALUE: | | | | | | | | | | | | | | | | | | |
| Beginning of period | | $ | 15.80 | | | $ | 15.26 | | | $ | 15.98 | | | $ | 14.66 | | | $ | 11.60 | | | $ | 12.04 | |
| OPERATIONS: | | | | | | | | | | | | | | | | | | | | | | | | |
Net investment income(1) | | | (0.06 | ) | | | (0.06 | ) | | | (0.09 | ) | | | (0.02 | ) | | | (0.01 | ) | | | 0.04 | |
| Net realized and unrealized | | | | | | | | | | | | | | | | | | | | | | | | |
| gain on investment | | | | | | | | | | | | | | | | | | | | | | | | |
| securities | | | 0.95 | | | | 2.47 | | | | 0.32 | | | | 2.18 | | | | 3.32 | | | | 0.07 | |
| Total from | | | | | | | | | | | | | | | | | | | | | | | | |
operations(2) | | | 0.89 | | | | 2.41 | | | | 0.23 | | | | 2.16 | | | | 3.31 | | | | 0.11 | |
| LESS DISTRIBUTIONS: | | | | | | | | | | | | | | | | | | | | | | | | |
| From net | | | | | | | | | | | | | | | | | | | | | | | | |
| investment income | | | — | | | | — | | | | — | | | | — | | | | (0.02 | ) | | | (0.11 | ) |
| From net realized gains | | | (1.25 | ) | | | (1.87 | ) | | | (0.95 | ) | | | (0.84 | ) | | | (0.23 | ) | | | (0.44 | ) |
| Total distributions | | | (1.25 | ) | | | (1.87 | ) | | | (0.95 | ) | | | (0.84 | ) | | | (0.25 | ) | | | (0.55 | ) |
| NET ASSET VALUE: | | | | | | | | | | | | | | | | | | | | | | | | |
| End of period | | $ | 15.44 | | | $ | 15.80 | | | $ | 15.26 | | | $ | 15.98 | | | $ | 14.66 | | | $ | 11.60 | |
| Total return | | | 6.03 | %(3) | | | 16.76 | % | | | 1.02 | % | | | 15.30 | % | | | 29.35 | % | | | 0.74 | % |
| Net assets at end of | | | | | | | | | | | | | | | | | | | | | | | | |
| period (000s omitted) | | $ | 656,979 | | | $ | 699,196 | | | $ | 542,883 | | | $ | 511,726 | | | $ | 242,899 | | | $ | 20,494 | |
| RATIO OF EXPENSES | | | | | | | | | | | | | | | | | | | | | | | | |
| TO AVERAGE NET ASSETS: | | | | | | | | | | | | | | | | | | | | | | | | |
| Before expense | | | | | | | | | | | | | | | | | | | | | | | | |
| reimbursement/recoupment | | | 1.44 | %(4) | | | 1.44 | % | | | 1.45 | % | | | 1.49 | % | | | 1.62 | % | | | 2.28 | % |
| After expense | | | | | | | | | | | | | | | | | | | | | | | | |
| reimbursement/recoupment | | | 1.40 | %(4) | | | 1.40 | % | | | 1.40 | % | | | 1.40 | % | | | 1.57 | % | | | 1.95 | % |
| RATIO OF NET INVESTMENT | | | | | | | | | | | | | | | | | | | | | | | | |
| INCOME TO AVERAGE NET ASSETS: | | | | | | | | | | | | | | | | | | | | | | | | |
| Before expense | | | | | | | | | | | | | | | | | | | | | | | | |
| reimbursement/recoupment | | | (0.78 | )%(4) | | | (0.44 | )% | | | (0.54 | )% | | | (0.23 | )% | | | (0.16 | )% | | | 0.24 | % |
| After expense | | | | | | | | | | | | | | | | | | | | | | | | |
| reimbursement/recoupment | | | (0.74 | )%(4) | | | (0.40 | )% | | | (0.49 | )% | | | (0.14 | )% | | | (0.11 | )% | | | 0.57 | % |
| Portfolio turnover rate | | | 14 | %(3) | | | 68 | % | | | 88 | % | | | 61 | % | | | 163 | % | | | 159 | % |
| (1) | Net investment income (loss) per share is calculated using the ending balances prior to consideration or adjustment for permanent book-to-tax differences. |
| (2) | Total from investment operations per share includes redemption fees of less than $0.01 per share for the six months ended March 31, 2013 and five years ended September 30, 2012, 2011, 2010, 2009 and 2008. |
See notes to financial statements.
Intrepid Small Cap Fund – Institutional Class
FINANCIAL HIGHLIGHTS (continued)
Per share data for a share of capital stock outstanding for the entire period and selected information for the period are as follows:
| | | | | | | | | | | | November 3, | |
| | | Period | | | | | | | | | 2009(1) | |
| | | Ended | | | Year Ended | | | through | |
| | | March 31, | | | September 30, | | | September 30, | |
| | | 2013 | | | 2012 | | | 2011 | | | 2010 | |
| | | (Unaudited) | | | | | | | | | | |
| NET ASSET VALUE: | | | | | | | | | | | | |
| Beginning of period | | $ | 15.93 | | | $ | 15.34 | | | $ | 16.02 | | | $ | 14.52 | |
| OPERATIONS: | | | | | | | | | | | | | | | | |
Net investment income (loss)(2) | | | (0.04 | ) | | | (0.03 | ) | | | (0.02 | ) | | | 0.01 | |
| Net realized and unrealized | | | | | | | | | | | | | | | | |
| gain on investment securities | | | 0.96 | | | | 2.49 | | | | 0.29 | | | | 2.33 | |
Total from operations(3) | | | 0.92 | | | | 2.46 | | | | 0.27 | | | | 2.34 | |
| LESS DISTRIBUTIONS: | | | | | | | | | | | | | | | | |
| From net realized gains | | | (1.25 | ) | | | (1.87 | ) | | | (0.95 | ) | | | (0.84 | ) |
| Total distributions | | | (1.25 | ) | | | (1.87 | ) | | | (0.95 | ) | | | (0.84 | ) |
| NET ASSET VALUE: | | | | | | | | | | | | | | | | |
| End of period | | $ | 15.60 | | | $ | 15.93 | | | $ | 15.34 | | | $ | 16.02 | |
| Total return | | | 6.17 | %(4) | | | 17.02 | % | | | 1.28 | % | | | 16.70 | %(4) |
| Net assets at end of | | | | | | | | | | | | | | | | |
| period (000s omitted) | | $ | 62,713 | | | $ | 64,581 | | | $ | 49,729 | | | $ | 52,381 | |
| RATIO OF EXPENSES | | | | | | | | | | | | | | | | |
| TO AVERAGE NET ASSETS: | | | | | | | | | | | | | | | | |
| Before expense reimbursement | | | 1.18 | %(5) | | | 1.19 | % | | | 1.20 | % | | | 1.26 | %(5) |
| After expense reimbursement | | | 1.15 | %(5) | | | 1.15 | % | | | 1.15 | % | | | 1.15 | %(5) |
| RATIO OF NET INVESTMENT INCOME | | | | | | | | | | | | | | | | |
| TO AVERAGE NET ASSETS: | | | | | | | | | | | | | | | | |
| Before expense reimbursement | | | (0.52 | )%(5) | | | (0.18 | )% | | | (0.29 | )% | | | 0.01 | %(5) |
| After expense reimbursement | | | (0.49 | )%(5) | | | (0.14 | )% | | | (0.24 | )% | | | 0.12 | %(5) |
| Portfolio turnover rate | | | 14 | %(4) | | | 68 | % | | | 88 | % | | | 61 | %(4) |
| (1) | Commencement of Operations. |
| (2) | Net investment income (loss) per share is calculated using the ending balances prior to consideration or adjustment for permanent book-to-tax differences. |
| (3) | Total from investment operations per share includes redemption fees of less than $0.01 for the six months ended March 31, 2013, two years ended September 30, 2012 and 2011, and the period ended September 30, 2010. |
See notes to financial statements.
Intrepid Income Fund – Investor Class
FINANCIAL HIGHLIGHTS (continued)
Per share data for a share of capital stock outstanding for the entire period and selected information for the period are as follows:
| | | Period | | | | | | | | | | | | | | | | |
| | | Ended | | | | | | | | | | | | | | | | |
| | | March 31, | | | Year Ended September 30, | |
| | | 2013 | | | 2012 | | | 2011 | | | 2010 | | | 2009 | | | 2008 | |
| | | (Unaudited) | | | | | | | | | | | | | | | | |
| NET ASSET VALUE: | | | | | | | | | | | | | | | | | | |
| Beginning of period | | $ | 9.81 | | | $ | 9.65 | | | $ | 9.77 | | | $ | 9.51 | | | $ | 9.43 | | | $ | 9.94 | |
| OPERATIONS: | | | | | | | | | | | | | | | | | | | | | | | | |
Net investment income(1) | | | 0.15 | | | | 0.41 | | | | 0.41 | | | | 0.52 | | | | 0.57 | | | | 0.46 | |
| Net realized and unrealized | | | | | | | | | | | | | | | | | | | | | | | | |
| gain (loss) on investment | | | | | | | | | | | | | | | | | | | | | | | | |
| securities | | | 0.04 | | | | 0.33 | | | | (0.13 | ) | | | 0.24 | | | | 0.09 | | | | (0.51 | ) |
| Total from | | | | | | | | | | | | | | | | | | | | | | | | |
operations(2) | | | 0.19 | | | | 0.74 | | | | 0.28 | | | | 0.76 | | | | 0.66 | | | | (0.05 | ) |
| LESS DISTRIBUTIONS: | | | | | | | | | | | | | | | | | | | | | | | | |
| From net | | | | | | | | | | | | | | | | | | | | | | | | |
| investment income | | | (0.18 | ) | | | (0.43 | ) | | | (0.40 | ) | | | (0.50 | ) | | | (0.58 | ) | | | (0.46 | ) |
| From net realized gains | | | (0.11 | ) | | | (0.15 | ) | | | (0.00 | )(3) | | | — | | | | — | | | | (0.00 | )(3) |
| Total distributions | | | (0.29 | ) | | | (0.58 | ) | | | (0.40 | ) | | | (0.50 | ) | | | (0.58 | ) | | | (0.46 | ) |
| NET ASSET VALUE: | | | | | | | | | | | | | | | | | | | | | | | | |
| End of period | | $ | 9.71 | | | $ | 9.81 | | | $ | 9.65 | | | $ | 9.77 | | | $ | 9.51 | | | $ | 9.43 | |
| Total return | | | 1.91 | %(4) | | | 7.79 | % | | | 2.86 | % | | | 8.10 | % | | | 7.67 | % | | | (0.55 | )% |
| Net assets at end of | | | | | | | | | | | | | | | | | | | | | | | | |
| period (000s omitted) | | $ | 36,783 | | | $ | 39,756 | | | $ | 32,131 | | | $ | 41,456 | | | $ | 53,972 | | | $ | 28,743 | |
| RATIO OF EXPENSES | | | | | | | | | | | | | | | | | | | | | | | | |
| TO AVERAGE NET ASSETS: | | | | | | | | | | | | | | | | | | | | | | | | |
| Before expense | | | | | | | | | | | | | | | | | | | | | | | | |
| reimbursement | | | 1.24 | %(5) | | | 1.26 | % | | | 1.31 | % | | | 1.33 | % | | | 1.45 | % | | | 1.61 | % |
| After expense | | | | | | | | | | | | | | | | | | | | | | | | |
| reimbursement | | | 1.15 | %(5) | | | 1.15 | % | | | 1.15 | % | | | 1.24 | % | | | 1.25 | % | | | 1.25 | % |
| RATIO OF NET INVESTMENT | | | | | | | | | | | | | | | | | | | | | | | | |
| INCOME TO AVERAGE NET ASSETS: | | | | | | | | | | | | | | | | | | | | | | | | |
| Before expense | | | | | | | | | | | | | | | | | | | | | | | | |
| reimbursement | | | 2.84 | %(5) | | | 4.32 | % | | | 3.80 | % | | | 4.95 | % | | | 6.53 | % | | | 4.62 | % |
| After expense | | | | | | | | | | | | | | | | | | | | | | | | |
| reimbursement | | | 2.93 | %(5) | | | 4.43 | % | | | 3.96 | % | | | 5.04 | % | | | 6.73 | % | | | 4.98 | % |
| Portfolio turnover rate | | | 31 | %(4) | | | 54 | % | | | 77 | % | | | 67 | % | | | 45 | % | | | 44 | % |
| (1) | Net investment income per share is calculated using the ending balances prior to consideration or adjustment for permanent book-to-tax differences. |
| (2) | Total from investment operations per share includes redemption fees of less than $0.01 per share for the six months ended March 31, 2013 and four years ended September 30, 2012, 2011, 2010 and 2009. |
| (3) | The amount represents less than $0.01 per share. |
See notes to financial statements.
Intrepid Income Fund – Institutional Class
FINANCIAL HIGHLIGHTS (continued)
Per share data for a share of capital stock outstanding for the entire period and selected information for the period are as follows:
| | | Period | | | | | | | | | August 16, 2010(1) | |
| | | Ended | | | Year Ended | | | through | |
| | | March 31, | | | September 30, | | | September 30, | |
| | | 2013 | | | 2012 | | | 2011 | | | 2010 | |
| | | (Unaudited) | | | | | | | | | | |
| NET ASSET VALUE: | | | | | | | | | | | | |
| Beginning of period | | $ | 9.80 | | | $ | 9.63 | | | $ | 9.77 | | | $ | 9.73 | |
| OPERATIONS: | | | | | | | | | | | | | | | | |
Net investment income(2) | | | 0.16 | | | | 0.47 | | | | 0.38 | | | | 0.05 | |
| Net realized and unrealized | | | | | | | | | | | | | | | | |
| gain (loss) on investment securities | | | 0.04 | | | | 0.30 | | | | (0.09 | ) | | | 0.10 | |
Total from operations(3) | | | 0.20 | | | | 0.77 | | | | 0.29 | | | | 0.15 | |
| LESS DISTRIBUTIONS: | | | | | | | | | | | | | | | | |
| From net investment income | | | (0.19 | ) | | | (0.45 | ) | | | (0.43 | ) | | | (0.11 | ) |
| From net realized gains | | | (0.11 | ) | | | (0.15 | ) | | | (0.00 | )(4) | | | — | |
| Total distributions | | | (0.30 | ) | | | (0.60 | ) | | | (0.43 | ) | | | (0.11 | ) |
| NET ASSET VALUE: | | | | | | | | | | | | | | | | |
| End of period | | $ | 9.70 | | | $ | 9.80 | | | $ | 9.63 | | | $ | 9.77 | |
| Total return | | | 2.04 | %(5) | | | 8.17 | % | | | 2.97 | % | | | 1.59 | %(5) |
| Net assets at end of | | | | | | | | | | | | | | | | |
| period (000s omitted) | | $ | 72,521 | | | $ | 63,085 | | | $ | 50,451 | | | $ | 24,947 | |
| RATIO OF EXPENSES | | | | | | | | | | | | | | | | |
| TO AVERAGE NET ASSETS: | | | | | | | | | | | | | | | | |
| Before expense reimbursement | | | 0.99 | %(6) | | | 1.01 | % | | | 1.07 | % | | | 1.22 | %(6) |
| After expense reimbursement | | | 0.90 | %(6) | | | 0.90 | % | | | 0.90 | % | | | 0.90 | %(6) |
| RATIO OF NET INVESTMENT | | | | | | | | | | | | | | | | |
| INCOME TO AVERAGE NET ASSETS: | | | | | | | | | | | | | | | | |
| Before expense reimbursement | | | 3.08 | %(6) | | | 4.56 | % | | | 4.09 | % | | | 4.56 | %(6) |
| After expense reimbursement | | | 3.17 | %(6) | | | 4.67 | % | | | 4.26 | % | | | 4.88 | %(6) |
| Portfolio turnover rate | | | 31 | %(5) | | | 54 | % | | | 77 | % | | | 67 | %(5) |
| (1) | Commencement of Operations. |
| (2) | Net investment income per share is calculated using the ending balances prior to consideration or adjustment for permanent book-to-tax differences. |
| (3) | Total from investment operations per share includes redemption fees of less than $0.01 per share for the six months ended March 31, 2013. |
| (4) | The amount represents less than $0.01 per share. |
See notes to financial statements.
Intrepid Disciplined Value Fund
FINANCIAL HIGHLIGHTS (continued)
Per share data for a share of capital stock for the entire period and selected information for the period are as follows:
| | | | | | | | | | | | | | | | | | October 31, | |
| | | Six Months | | | | | | | | | | | | | | | 2007(1) | |
| | | Ended | | | | | | | | | | | | | | | through | |
| | | March 31, | | | Year Ended September 30, | | | September 30, | |
| | | 2013 | | | 2012 | | | 2011 | | | 2010 | | | 2009 | | | 2008 | |
| | | (Unaudited) | | | | | | | | | | | | | | | | |
| NET ASSET VALUE: | | | | | | | | | | | | �� | | | | | | |
| Beginning of period | | $ | 10.48 | | | $ | 9.23 | | | $ | 10.23 | | | $ | 9.03 | | | $ | 8.74 | | | $ | 10.00 | |
| OPERATIONS: | | | | | | | | | | | | | | | | | | | | | | | | |
| Net investment | | | | | | | | | | | | | | | | | | | | | | | | |
income (loss)(2) | | | 0.05 | | | | 0.01 | | | | (0.03 | ) | | | (0.05 | ) | | | 0.01 | | | | 0.02 | |
| Net realized and unrealized | | | | | | | | | | | | | | | | | | | | | | | | |
| gain (loss) on investment | | | | | | | | | | | | | | | | | | | | | | | | |
| securities | | | 0.81 | | | | 1.87 | | | | (0.16 | ) | | | 1.30 | | | | 0.30 | | | | (1.27 | ) |
| Total from | | | | | | | | | | | | | | | | | | | | | | | | |
operations(3) | | | 0.86 | | | | 1.88 | | | | (0.19 | ) | | | 1.25 | | | | 0.31 | | | | (1.25 | ) |
| LESS DISTRIBUTIONS: | | | | | | | | | | | | | | | | | | | | | | | | |
| From net | | | | | | | | | | | | | | | | | | | | | | | | |
| investment income | | | (0.07 | ) | | | (0.02 | ) | | | — | | | | — | | | | (0.02 | ) | | | (0.01 | ) |
| From net realized gains | | | (0.69 | ) | | | (0.61 | ) | | | (0.81 | ) | | | (0.05 | ) | | | — | | | | — | |
| Total distributions | | | (0.76 | ) | | | (0.63 | ) | | | (0.81 | ) | | | (0.05 | ) | | | (0.02 | ) | | | (0.01 | ) |
| NET ASSET VALUE: | | | | | | | | | | | | | | | | | | | | | | | | |
| End of period | | $ | 10.58 | | | $ | 10.48 | | | $ | 9.23 | | | $ | 10.23 | | | $ | 9.03 | | | $ | 8.74 | |
| Total return | | | 8.82 | %(4) | | | 21.07 | % | | | (2.61 | )% | | | 13.93 | % | | | 3.53 | % | | | (12.50 | )%(4) |
| Net assets at end of | | | | | | | | | | | | | | | | | | | | | | | | |
| period (000s omitted) | | $ | 38,955 | | | $ | 46,975 | | | $ | 36,356 | | | $ | 21,401 | | | $ | 16,452 | | | $ | 6,250 | |
| RATIO OF EXPENSES | | | | | | | | | | | | | | | | | | | | | | | | |
| TO AVERAGE NET ASSETS: | | | | | | | | | | | | | | | | | | | | | | | | |
| Before expense | | | | | | | | | | | | | | | | | | | | | | | | |
| reimbursement/recoupment | | | 1.62 | %(5) | | | 1.60 | % | | | 1.69 | % | | | 1.98 | % | | | 2.65 | % | | | 2.99 | %(5) |
| After expense | | | | | | | | | | | | | | | | | | | | | | | | |
| reimbursement/recoupment | | | 1.40 | %(5) | | | 1.40 | % | | | 1.54 | % | | | 1.95 | % | | | 1.95 | % | | | 1.95 | %(5) |
| RATIO OF NET INVESTMENT | | | | | | | | | | | | | | | | | | | | | | | | |
| INCOME TO AVERAGE NET ASSETS: | | | | | | | | | | | | | | | | | | | | | | | | |
| Before expense | | | | | | | | | | | | | | | | | | | | | | | | |
| reimbursement/recoupment | | | 0.64 | %(5) | | | (0.16 | )% | | | (0.48 | )% | | | (0.52 | )% | | | (0.65 | )% | | | (0.80 | )%(5) |
| After expense | | | | | | | | | | | | | | | | | | | | | | | | |
| reimbursement/recoupment | | | 0.86 | %(5) | | | 0.04 | % | | | (0.33 | )% | | | (0.49 | )% | | | 0.05 | % | | | 0.24 | %(5) |
| Portfolio turnover rate | | | 11 | %(4) | | | 71 | % | | | 74 | % | | | 82 | % | | | 93 | % | | | 85 | %(4) |
| (1) | Commencement of Operations. |
| (2) | Net investment income (loss) per share is calculated using the ending balances prior to consideration or adjustment for permanent book-to-tax differences. |
| (3) | Total from investment operations per share includes redemption fees of less than $0.01 per share for each of the four years ended September 30, 2012, 2011, 2010 and 2009. |
See notes to financial statements.
Intrepid Funds
NOTES TO FINANCIAL STATEMENTS
March 31, 2013 (Unaudited)
Intrepid Capital Management Funds Trust (the “Trust”) was organized as a Delaware Statutory Trust on August 27, 2004 and is registered under the Investment Company Act of 1940, as amended (the “1940 Act”), as an open-end management investment company issuing shares in series, each series representing a distinct portfolio with its own investment objectives and policies. At March 31, 2013, the Trust consisted of four series (the “Funds”): Intrepid Capital Fund, Intrepid Small Cap Fund, Intrepid Income Fund and Intrepid All Cap Fund. The Intrepid Capital Fund’s Investor Class commenced operations on January 3, 2005, the Intrepid Capital Fund’s Institutional Class commenced operations on April 30, 2010, the Intrepid Small Cap Fund’s Investor Class commenced operations on October 3, 2005, the Intrepid Small Cap Fund’s Institutional Class commenced operations on November 3, 2009, the Intrepid Income Fund’s Investor Class commenced operations on July 2, 2007, the Intrepid Income Fund’s Institutional Class commenced operations on August 16, 2010 and the Intrepid All Cap Fund commenced operations on October 31, 2007.
On January 28, 2013, the Board of Trustees of Intrepid Capital Management Funds Trust, based on the recommendation of Intrepid Capital Management, Inc., the adviser to the Intrepid All Cap Fund, approved a change in the name and principal investment strategies of the Intrepid All Cap Fund to Intrepid Disciplined Value Fund. In connection with this name change, the Board also approved the removal of the non-fundamental investment policy requiring that at least 80% of its net assets be invested in equity securities of companies of any size capitalization. Otherwise, the principal investment strategies remain unchanged, as do the principal risks. The changes to the name and principal investment strategies became effective on April 1, 2013 and were disclosed to shareholders in a supplement to the All Cap Fund’s prospectus on January 31, 2013.
| 2. | SIGNIFICANT ACCOUNTING POLICIES |
The following is a summary of significant accounting policies consistently followed by the Funds in the preparation of their financial statements. These policies are in conformity with accounting principles generally accepted in the United States (“GAAP”).
Fair Valuation Measurement
The Trust has adopted authoritative fair valuation accounting standards which establish an authoritative definition of fair value and set out a hierarchy for measuring fair value. These standards require additional disclosures about the various inputs and valuation techniques used to develop the measurements of fair value and a discussion in changes in valuation techniques and related inputs during the period. These inputs are summarized in the three broad levels listed below.
Intrepid Funds
NOTES TO FINANCIAL STATEMENTS (continued)
March 31, 2013 (Unaudited)
| | Level 1 – | Quoted prices in active markets for identical securities. |
| | Level 2 – | Other significant observable inputs (including quoted prices for similar securities, interest rates, prepayment speeds, credit risk, etc.). |
| | Level 3 – | Significant unobservable inputs (including the Fund’s own assumptions in determining the fair value of investments). |
Equity investments, including common stocks, foreign issued common stocks, exchange-traded funds, closed end mutual funds and real estate investments trusts, which are traded on an exchange are valued at the last sale price reported by the exchange on which the securities are primarily traded on the day of valuation. If there are no sales on a given day for securities traded on an exchange, the latest bid quotation will be used. If there is no Nasdaq Official Closing Price for a Nasdaq-listed security or sale price available for an over-the-counter security, the mean of the latest bid and asked quotations from Nasdaq will be used. When using the market quotations or closing price provided by the pricing service and when the market is considered active, the security will be classified as a Level 1 security.
Investment in mutual funds, including money market funds, are generally priced at the ending net asset value (NAV) provided by the service agent of the Funds and will be classified as Level 1 securities.
Debt securities, such as corporate bonds, convertible bonds, senior loans and U.S. government agency issues for which market quotations are not readily available may be valued based on information supplied by independent pricing services using matrix pricing formulas and/or independent broker bid quotations. Debt securities with remaining maturities of 60 days or less may be valued on an amortized cost basis, which involves valuing an instrument at its cost and thereafter assuming a constant amortization to maturity of any discount or premium, regardless of the impact of fluctuating rates on the fair value of the instrument. These securities will generally be classified as Level 2 securities.
Forward currency contracts derive their value from the underlying currency prices. These are valued by a pricing service using pricing models. The models use inputs that are observed from active markets, such as exchange rates. These contracts are classified as Level 2.
Any securities or other assets for which market quotations are not readily available are valued at fair value as determined in good faith by the Advisor pursuant to procedures established under the general supervision and responsibility of the Funds’ Board of Trustees and will be classified as Level 3 securities.
The inputs of methodology used for valuing securities may not be an indication of the risk associated with investing in those securities.
Intrepid Funds
NOTES TO FINANCIAL STATEMENTS (continued)
March 31, 2013 (Unaudited)
The following is a summary of the inputs used, as of March 31, 2013, in valuing the Funds’ investments carried at fair value:
| Description | | Level 1 | | | Level 2 | | | Level 3 | | | Total | |
| Intrepid Capital Fund | | | | | | | | | | | | |
| Total Common Stocks* | | $ | 223,368,332 | | | $ | — | | | $ | — | | | $ | 223,368,332 | |
| Corporate Bonds | | | | | | | | | | | | | | | | |
| Consumer Discretionary | | | — | | | | 26,768,246 | | | | — | | | | 26,768,246 | |
| Consumer Staples | | | — | | | | 10,258,210 | | | | 3,178,125 | | | | 13,436,335 | |
| Energy | | | — | | | | 18,255,320 | | | | — | | | | 18,255,320 | |
| Health Care | | | — | | | | 1,853,223 | | | | — | | | | 1,853,223 | |
| Industrials | | | — | | | | 17,133,990 | | | | — | | | | 17,133,990 | |
| Materials | | | — | | | | 8,037,890 | | | | — | | | | 8,037,890 | |
| Total Corporate Bonds* | | | — | | | | 82,306,879 | | | | 3,178,125 | | | | 85,485,004 | |
| Total Senior Loans* | | | — | | | | 3,016,122 | | | | — | | | | 3,016,122 | |
| Total Investments | | | | | | | | | | | | | | | | |
| in Securities | | $ | 223,368,332 | | | $ | 85,323,001 | | | $ | 3,178,125 | | | $ | 311,869,458 | |
| Other Financial Instruments** | | | | | | | | | | | | | | | | |
| Total Forward | | | | | | | | | | | | | | | | |
| Currency Contracts | | $ | — | | | $ | (218,849 | ) | | $ | — | | | $ | (218,849 | ) |
| | | | | | | | | | | | | | | | | |
| Intrepid Small Cap Fund | | | | | | | | | | | | | | | | |
| | | Level 1 | | | Level 2 | | | Level 3 | | | Total | |
| Total Common Stocks* | | $ | 329,631,746 | | | $ | — | | | $ | — | | | $ | 329,631,746 | |
| Total Investment | | | | | | | | | | | | | | | | |
| in Securities | | $ | 329,631,746 | | | $ | — | | | $ | — | | | $ | 329,631,746 | |
| Other Financial Instruments** | | | | | | | | | | | | | | | | |
| Total Forward | | | | | | | | | | | | | | | | |
| Currency Contracts | | $ | — | | | $ | (86,618 | ) | | $ | — | | | $ | (86,618 | ) |
Intrepid Funds
NOTES TO FINANCIAL STATEMENTS (continued)
March 31, 2013 (Unaudited)
Intrepid Income Fund
| | | Level 1 | | | Level 2 | | | Level 3 | | | Total | |
| Total Common Stocks* | | $ | 1,940,161 | | | $ | — | | | $ | — | | | $ | 1,940,161 | |
| Corporate Bonds | | | | | | | | | | | | | | | | |
| Consumer Discretionary | | | — | | | | 13,706,199 | | | | — | | | | 13,706,199 | |
| Consumer Staples | | | — | | | | 6,203,080 | | | | 2,118,750 | | | | 8,321,830 | |
| Energy | | | — | | | | 12,516,740 | | | | — | | | | 12,516,740 | |
| Health Care | | | — | | | | 2,427,626 | | | | — | | | | 2,427,626 | |
| Industrials | | | — | | | | 9,417,390 | | | | — | | | | 9,417,390 | |
| Information Technology | | | — | | | | 445,200 | | | | — | | | | 445,200 | |
| Materials | | | — | | | | 4,697,680 | | | | — | | | | 4,697,680 | |
| Total Corporate Bonds* | | | — | | | | 49,413,915 | | | | 2,118,750 | | | | 51,532,665 | |
| Total Senior Loans* | | | — | | | | 2,010,748 | | | | — | | | | 2,010,748 | |
| Total Investment | | | | | | | | | | | | | | | | |
| in Securities | | $ | 1,940,161 | | | $ | 51,424,663 | | | $ | 2,118,750 | | | $ | 55,483,574 | |
| | | | | | | | | | | | | | | | | |
| Intrepid Disciplined | | | | | | | | | | | | | | | | |
| Value Fund | | | | | | | | | | | | | | | | |
| | | Level 1 | | | Level 2 | | | Level 3 | | | Total | |
| Total Common Stocks* | | $ | 24,897,781 | | | $ | — | | | $ | — | | | $ | 24,897,781 | |
| Total Investment | | | | | | | | | | | | | | | | |
| in Securities | | $ | 24,897,781 | | | $ | — | | | $ | — | | | $ | 24,897,781 | |
| * | For further information regarding security characteristics, please see the Schedules of Investments. |
| ** | Other financial instruments are derivative instruments not reflected in the Schedule of Investments, such as forward currency contracts, which are reflected at the unrealized appreciation (depreciation) on the instrument. |
There were no transfers of securities between Level 1 and Level 2 during the reporting period.
Intrepid Funds
NOTES TO FINANCIAL STATEMENTS (continued)
March 31, 2013 (Unaudited)
Below is a reconciliation that details the activity of securities in Level 3 during the current fiscal period:
| | | Intrepid | | | Intrepid | | | Intrepid | | | Intrepid | |
| | | Capital | | | Small Cap | | | Income | | | Disciplined | |
| | | Fund | | | Fund | | | Fund | | | Value Fund | |
| Beginning Balance - | | | | | | | | | | | | |
| October 1, 2012 | | $ | — | | | $ | — | | | $ | — | | | $ | — | |
| Purchases | | | — | | | | — | | | | — | | | | — | |
| Sales | | | — | | | | — | | | | — | | | | — | |
| Realized gains | | | — | | | | — | | | | — | | | | — | |
| Realized losses | | | — | | | | — | | | | — | | | | — | |
| Change in unrealized | | | | | | | | | | | | | | | | |
| appreciation | | | | | | | | | | | | | | | | |
| (depreciation) | | | — | | | | — | | | | — | | | | — | |
| Transfers in/ | | | | | | | | | | | | | | | | |
| (out of) Level 3 | | | 3,178,125 | | | | — | | | | 2,118,750 | | | | — | |
| Ending Balance - | | | | | | | | | | | | | | | | |
| March 31, 2013 | | $ | 3,178,125 | | | $ | — | | | $ | 2,118,750 | | | $ | — | |
The movement from Level 2 to Level 3 in the Intrepid Capital Fund and the Intrepid Income Fund was due to the Funds’ pricing agent no longer pricing a bond held in those Funds. As such, the security is now being fair valued in accordance with procedures approved by the Board of Trustees.
Transfers between levels are recognized at the end of the reporting period.
The following table presents additional information about valuation methodologies and inputs used for investments that are measured at fair value and categorized within Level 3.
Intrepid Capital Fund
| | | | Fair Value | Valuation | Unobservable | |
| | Type of Security | Industry | at 3/31/2013 | Techniques | Inputs | Range |
| | Corporate Bond | Food & | $3,178,125 | Broker | Mean of two | N/A |
| | | Staples | | quotes | independent | |
| | | Retailing | | | broker quotes | |
Intrepid Funds
NOTES TO FINANCIAL STATEMENTS (continued)
March 31, 2013 (Unaudited)
Intrepid Income Fund
| | | | Fair Value | Valuation | Unobservable | |
| | Type of Security | Industry | at 3/31/2013 | Techniques | Inputs | Range |
| | Corporate Bond | Food & | $2,118,750 | Broker | Mean of two | N/A |
| | | Staples | | quotes | independent | |
| | | Retailing | | | broker quotes | |
The significant unobservable input used in the fair value measurement of the corporate bond is the mean of two unpublished independent broker quotes, which approximates the bond’s value in the market place.
Derivative Instruments and Hedging Activities
The Funds’ adviser may use derivative instruments, such as forward currency contracts, as a means to manage exposure to exchange rate risk. During the period ended March 31, 2013, the Intrepid Capital Fund and Intrepid Small Cap Fund held derivative instruments.
Balance Sheet – Values of Forward Currency Contracts as of March 31, 2013
| | | Asset Derivatives | | Liability Derivatives | |
| Derivatives not accounted | | Balance Sheet | | | | | Balance Sheet | | | |
| for as hedging instruments | | Location | | | Value | | Location | | Value | |
| Intrepid Capital Fund | | | | | | | | | | |
| | | | | | | | Depreciation of | | | |
| Forward Currency | | | | | | | forward currency | | | |
| Contracts | | | N/A | | | $ | — | | contracts | | $ | (218,849 | ) |
| Total | | | | | | $ | — | | | | $ | (218,849 | ) |
| Intrepid Small Cap Fund | | | | | | | | | | | | | |
| | | | | | | | | | Depreciation of | | | | |
| Forward Currency | | | | | | | | | forward currency | | | | |
| Contracts | | | N/A | | | $ | — | | contracts | | $ | (86,618 | ) |
| Total | | | | | | $ | — | | | | $ | (86,618 | ) |
Effect of Forward Currency Contracts on the Statement of Operations for the Six Months Ended March 31, 2013
| | | Change in unrealized | Realized loss |
| | | appreciation/(depreciation) | on forward |
| | | on forward currency contracts | currency contracts |
| | Intrepid Capital Fund | $(106,654) | $ (68,077) |
| | Intrepid Small Cap Fund | $ 753,743 | $(920,220) |
Intrepid Funds
NOTES TO FINANCIAL STATEMENTS (continued)
March 31, 2013 (Unaudited)
The average monthly notional amount of forward currency contracts during the period ended March 31, 2013 were as follows:
| | Intrepid | Intrepid |
| Long Positions | Capital Fund | Small Cap Fund |
| Forward currency contracts | $844,679 | $0 |
| | | |
| | Intrepid | Intrepid |
| Short Positions | Capital Fund | Small Cap Fund |
| Forward currency contract | $(5,121,603) | $(11,959,525) |
Derivative Risk
The risks of using the types of derivatives in which the Funds may engage include the risk that movements in the value of the derivative may not fully offset or complement instruments currently held in the Funds in the manner intended by the Adviser; the risk that the counterparty to a derivative contract may fail to comply with their obligations to the Fund; the risk that the derivative may not possess a liquid secondary market at a time when the Fund would look to disengage the position; the risk that additional capital from the Fund may be called upon to fulfill the conditions of the derivative contract; and the risk that the cost of the derivative contracts may reduce the overall returns experienced by the Funds.
Use of Estimates
The preparation of financial statements in conformity with GAAP requires management to make estimates and assumptions that affect the reported amounts of assets and liabilities and disclosure of contingent assets and liabilities at the date of the financial statements and the reported amounts of revenues and expenses during the reporting period. Actual results could differ from those estimates.
Indemnification
In the normal course of business the Funds enter into contracts that contain general indemnification clauses. The Funds’ maximum exposure under these arrangements is unknown, as this would involve future claims against the fund that have not yet occurred. Based on experience, the Funds expect the risk of loss to be remote.
Foreign Currency Transactions
The books and records are maintained in U.S. dollars. Foreign currency denominated transactions (i.e. market value of investment securities, assets and liabilities, purchases and sales of investment securities and income and expenses) are translated into U.S. dollars at the current rate of exchange. The Funds do not isolate that portion of the results of operations resulting from changes in foreign exchange
Intrepid Funds
NOTES TO FINANCIAL STATEMENTS (continued)
March 31, 2013 (Unaudited)
rates on investments from the fluctuations arising from changes in market prices of securities held. Such fluctuations are included with the net realized and unrealized gain or loss from investments.
Securities Transactions and Investment Income
The Funds record security transactions based on trade date. Dividend income is recognized on the ex-dividend date, and interest income is recognized on an accrual basis. Discounts and premiums on securities purchased are amortized over the lives of the respective securities using the effective yield method. Withholding taxes on foreign dividends have been provided for in accordance with the Funds’ understanding of the applicable country’s tax rules and rates. Net realized gains or losses are determined using the identified cost method.
Distribution to Shareholder Policy
Dividends from net investment income, if any, are declared and paid quarterly. Distributions of net realized capital gains, if any, are declared and paid at least annually.
Federal Income Taxes
The Funds comply with, and intend to continue to comply with, the requirements of Subchapter M of the Internal Revenue Code necessary to qualify as a regulated investment company and to make the requisite distributions of income and capital gains to its shareholders sufficient to relieve it from Federal income taxes.
Allocation of Income, Expenses, and Gains/Losses
Income, expenses (other than those deemed to be attributable to a specific share class), and gains and losses of each Fund are allocated to each class of shares based upon the ratio of net assets represented by each class as a percentage of the net assets of that Fund. Expenses deemed directly attributable to a specific share class of shares are charged against the operations of such class. Most Fund expenses are allocated by class based on relative net assets.
Recent Accounting Pronouncements
In January, 2013, the FASB issued ASU No. 2013-01 “Clarifying the Scope of Disclosures about Offsetting Assets and Liabilities” in GAAP and International Reporting Financial Standards (“IFRS”). ASU No. 2013-01 clarifies ASU No. 2011-11, Disclosures about Offsetting Assets and Liabilities to increase comparability and reduce presentation differences between financial statements prepared in accordance with GAAP and financial statements prepared in accordance with IFRS. This requires increased disclosure about derivative instruments that are offset in a reporting entity’s Statement of Assets and Liabilities and derivative
Intrepid Funds
NOTES TO FINANCIAL STATEMENTS (continued)
March 31, 2013 (Unaudited)
instruments that are subject to a master netting agreement (“MNA”). Specifically, the ASU requires reporting entities to present separately for assets and liabilities, a) the gross amounts of those recognized assets and recognized liabilities, b) the amounts offset to determine the net amounts presented in the Statement of Assets and Liabilities, c) The net amount presented in the Statement of Assets and Liabilities, d) the amounts subject to an enforceable MNA not included in (b), and e) the net amount after deducting the amounts from (d) and (c). The effective date of the ASU is for interim and annual periods beginning on or after January 1, 2013. The Trust is currently evaluating the impact of the ASU on its financial statements.
Subsequent Events Evaluation
In preparing these financial statements, the Trust has evaluated events and transactions for potential recognition or disclosure resulting from subsequent events after the statement of assets and liabilities date of March 31, 2013. This evaluation did not result in any subsequent events that necessitated disclosure and / or adjustments.
The Trust has an Investment Advisory Agreement (the “Agreement”) with Intrepid Capital Management, Inc. (the “Adviser”), with whom certain officers and Trustees of the Trust are affiliated, to furnish investment advisory services to the Funds. Under the terms of the Agreement, the Trust, on behalf of the Funds, compensates the Adviser for its management services on the Intrepid Capital Fund and Intrepid Disciplined Value Fund at the annual rate of 1.00% on the first $500 million of average daily net assets and 0.80% on the Fund’s average daily net assets in excess of $500 million, on the Intrepid Small Cap Fund at an annual rate of 1.00% of average daily net assets, and on Intrepid Income Fund at the annual rate of 0.75% of average daily net assets.
For the Intrepid Capital Fund and the Intrepid Small Cap Fund, the Adviser agreed to waive its management fee and/or reimburse other expenses of each of the Funds, including organization expenses, to the extent necessary to ensure that each Fund’s operating expenses did not exceed 1.40% of each Fund’s Investor Class’s average daily net assets and 1.15% of average daily net assets of each Fund’s Institutional Class. For the Intrepid Income Fund, the Adviser agreed to waive its management fee and/or reimburse other expenses of the Fund, including organization expense, to the extent necessary to ensure that the Fund’s operating expenses did not exceed 1.15% of average daily net assets of the Investor Class and 0.90% of average daily net assets of the Institutional Class. For the Intrepid Disciplined Value Fund, the Adviser agreed to waive its management fee and/or reimburse other expenses of
Intrepid Funds
NOTES TO FINANCIAL STATEMENTS (continued)
March 31, 2013 (Unaudited)
the Intrepid Disciplined Value Fund, including organization expense, to the extent necessary to ensure that the Fund’s operating expenses did not exceed 1.40% of average daily assets. Any such waivers or reimbursements for the Funds are subject to later adjustment to allow the Adviser to recoup amounts waived or reimbursed to the extent actual fees and expenses on a monthly basis during the fiscal year are less than the respective expense cap limitations, provided, however, that the Adviser shall only be entitled to recoup such amounts for a period of three years from the date such amount was waived or reimbursed. Waived/reimbursed expenses subject to potential recovery by year of expiration are as follows:
| | | Year of Expiration | |
| | | 9/30/13 | | | 9/30/14 | | | 9/30/15 | | | 9/30/16 | |
| Intrepid Capital Fund | | $ | 119,037 | | | $ | 191,305 | | | $ | 154,544 | | | $ | 48,517 | |
| Intrepid Small Cap Fund | | | 349,588 | | | | 353,297 | | | | 330,578 | | | | 126,464 | |
| Intrepid Income Fund | | | 63,406 | | | | 132,953 | | | | 104,137 | | | | 49,073 | |
| Intrepid Disciplined Value Fund | | | 14,971 | | | | 58,383 | | | | 89,179 | | | | 43,902 | |
Certain officers of the Trust are also officers of the Adviser. The officers of the Trust are not compensated by the Funds.
The Trust, on behalf of the Funds, has adopted a distribution plan pursuant to Rule 12b-1 under the 1940 Act (the “12b-1 Plan”), which provides that the Funds may reimburse the Funds’ distributor or others at an annual rate of up to 0.25% of the average daily net assets of the Investor Class of the Capital Fund, Small Cap Fund and Income Funds and the sole class of the Disciplined Value Fund.
Quasar Distributors, LLC serves as the distributor to the Funds. Quasar Distributors, LLC is an affiliated company of U.S. Bank, N.A.
| 5. | INVESTMENT TRANSACTIONS |
The aggregate purchases and sales of securities (excluding short-term securities) by the Funds for the six months ended March 31, 2013 were as follows:
| | | Non-U.S. Government | |
| | | Purchases | | | Sales | |
| Intrepid Capital Fund | | $ | 81,580,878 | | | $ | 111,160,219 | |
| Intrepid Small Cap Fund | | | 50,115,261 | | | | 152,152,645 | |
| Intrepid Income Fund | | | 18,241,596 | | | | 25,996,948 | |
| Intrepid Disciplined Value Fund | | | 3,012,747 | | | | 13,805,287 | |
Intrepid Funds
NOTES TO FINANCIAL STATEMENTS (continued)
March 31, 2013 (Unaudited)
| 6. | CAPITAL SHARE TRANSACTIONS |
| Intrepid Capital Fund – Investor Class | | | | | | |
| | | Six Months Ended | | | Year Ended | |
| | | March 31, 2013 | | | September 30, 2012 | |
| Shares sold | | | 6,047,859 | | | | 14,148,835 | |
| Shares issued to holders in | | | | | | | | |
| reinvestment of dividends | | | 750,478 | | | | 1,250,497 | |
| Shares redeemed | | | (4,838,951 | ) | | | (9,312,605 | ) |
| Net increase in shares | | | 1,959,386 | | | | 6,086,727 | |
| Shares outstanding: | | | | | | | | |
| Beginning of period | | | 24,680,210 | | | | 18,593,483 | |
| End of period | | | 26,639,596 | | | | 24,680,210 | |
| | | | | | | | | |
Intrepid Capital Fund – Institutional Class | | | | | | | | |
| | | Six Months Ended | | | Year Ended | |
| | | March 31, 2013 | | | September 30, 2012 | |
| Shares sold | | | 818,030 | | | | 1,576,491 | |
| Shares issued to holders in | | | | | | | | |
| reinvestment of dividends | | | 320,452 | | | | 571,409 | |
| Shares redeemed | | | (664,491 | ) | | | (1,186,229 | ) |
| Net increase in shares | | | 473,991 | | | | 961,671 | |
| Shares outstanding: | | | | | | | | |
| Beginning of period | | | 8,593,229 | | | | 7,631,558 | |
| End of period | | | 9,067,220 | | | | 8,593,229 | |
| | | | | | | | | |
Intrepid Small Cap Fund – Investor Class | | | | | | | | |
| | | Six Months Ended | | | Year Ended | |
| | | March 31, 2013 | | | September 30, 2012 | |
| Shares sold | | | 6,555,488 | | | | 23,184,274 | |
| Shares issued to holders in | | | | | | | | |
| reinvestment of dividends | | | 3,330,364 | | | | 4,572,399 | |
| Shares redeemed | | | (11,585,374 | ) | | | (19,084,018 | ) |
| Net increase (decrease) in shares | | | (1,699,522 | ) | | | 8,672,655 | |
| Shares outstanding: | | | | | | | | |
| Beginning of period | | | 44,251,677 | | | | 35,579,022 | |
| End of period | | | 42,552,155 | | | | 44,251,677 | |
Intrepid Funds
NOTES TO FINANCIAL STATEMENTS (continued)
March 31, 2013 (Unaudited)
| Intrepid Small Cap Fund – Institutional Class | | | | | | |
| | | Six Months Ended | | | Year Ended | |
| | | March 31, 2013 | | | September 30, 2012 | |
| Shares sold | | | 584,363 | | | | 1,935,297 | |
| Shares issued to holders in | | | | | | | | |
| reinvestment of dividends | | | 289,507 | | | | 359,088 | |
| Shares redeemed | | | (907,322 | ) | | | (1,483,909 | ) |
| Net increase (decrease) in shares | | | (33,452 | ) | | | 810,476 | |
| Shares outstanding: | | | | | | | | |
| Beginning of period | | | 4,052,825 | | | | 3,242,349 | |
| End of period | | | 4,019,373 | | | | 4,052,825 | |
| | | | | | | | | |
Intrepid Income Fund – Investor Class | | | | | | | | |
| | | Six Months Ended | | | Year Ended | |
| | | March 31, 2013 | | | September 30, 2012 | |
| Shares sold | | | 462,728 | | | | 1,964,883 | |
| Shares issued to holders in | | | | | | | | |
| reinvestment of dividends | | | 101,803 | | | | 214,905 | |
| Shares redeemed | | | (830,345 | ) | | | (1,458,488 | ) |
| Net increase (decrease) in shares | | | (265,814 | ) | | | 721,300 | |
| Shares outstanding: | | | | | | | | |
| Beginning of period | | | 4,052,546 | | | | 3,331,246 | |
| End of period | | | 3,786,732 | | | | 4,052,546 | |
| | | | | | | | | |
Intrepid Income Fund – Institutional Class | | | | | | | | |
| | | Six Months Ended | | | Year Ended | |
| | | March 31, 2013 | | | September 30, 2012 | |
| Shares sold | | | 1,207,480 | | | | 1,464,005 | |
| Shares issued to holders in | | | | | | | | |
| reinvestment of dividends | | | 212,967 | | | | 338,817 | |
| Shares redeemed | | | (383,401 | ) | | | (601,709 | ) |
| Net increase in shares | | | 1,037,046 | | | | 1,201,113 | |
| Shares outstanding: | | | | | | | | |
| Beginning of period | | | 6,438,084 | | | | 5,236,971 | |
| End of period | | | 7,475,130 | | | | 6,438,084 | |
Intrepid Funds
NOTES TO FINANCIAL STATEMENTS (continued)
March 31, 2013 (Unaudited)
| Intrepid Disciplined Value Fund | | | | | | |
| | | Six Months Ended | | | Year Ended | |
| | | March 31, 2013 | | | September 30, 2012 | |
| Shares sold | | | 354,614 | | | | 1,017,461 | |
| Shares issued to holders in | | | | | | | | |
| reinvestment of dividends | | | 255,822 | | | | 244,775 | |
| Shares redeemed | | | (1,411,775 | ) | | | (719,388 | ) |
| Net increase (decrease) in shares | | | (801,339 | ) | | | 542,848 | |
| Shares outstanding: | | | | | | | | |
| Beginning of period | | | 4,481,969 | | | | 3,939,121 | |
| End of period | | | 3,680,630 | | | | 4,481,969 | |
| 7. | TRANSACTIONS WITH AFFILIATES |
The following issuers are affiliated with the Funds; that is, the Adviser had control of 5% or more of the outstanding voting securities during the period from October 1, 2012 through March 31, 2013. As defined in Section (2)(a)(3) of the Investment Company Act of 1940; such issues are:
Intrepid Capital Fund
| | | | | | | | | | | | Share | | | | | | | | | | | | | |
| | | Share | | | | | | | | | Balance | | | | | | | | | | | | | |
| | | Balance | | | | | | | | | at | | | | | | | | | Value at | | | Cost at | |
| | | at Oct. | | | | | | | | | March | | | Dividend | | | Realized | | | March | | | March | |
| Issuer Name | | | 1, 2012 | | | Additions | | | Reductions | | | | 31, 2013 | | | Income | | | Loss | | | | 31, 2013 | | | | 31, 2013 | |
| American | | | | | | | | | | | | | | | | | | | | | | | | | | | | |
| Greetings | | | | | | | | | | | | | | | | | | | | | | | | | | | | |
| Corp. (a) | | | 542,619 | | | | — | | | | (168,611 | ) | | | 374,008 | | | $ | 137,494 | | | $ | (468,675 | ) | | $ 6,021,529 | | | $ | 5,901,452 | |
| EPIQ | | | | | | | | | | | | | | | | | | | | | | | | | | | | | | | | |
| Systems, Inc. | | | 612,066 | | | | — | | | | — | | | | 612,066 | | | | 165,258 | | | | — | | | | 8,587,286 | | | | 7,328,793 | |
| ManTech | | | | | | | | | | | | | | | | | | | | | | | | | | | | | | | | |
| International | | | | | | | | | | | | | | | | | | | | | | | | | | | | | | | | |
| Corp. (a) | | | 206,660 | | | | — | | | | — | | | | 206,660 | | | | 86,797 | | | | — | | | | 5,552,954 | | | | 4,928,788 | |
| World Wrestling | | | | | | | | | | | | | | | | | | | | | | | | | | | | | | | | |
| Entertainment, | | | | | | | | | | | | | | | | | | | | | | | | | | | | | | | | |
| Inc. | | | 792,769 | | | | — | | | | — | | | | 792,769 | | | | 190,265 | | | | — | | | | 6,992,223 | | | | 7,259,354 | |
| | | | | | | | | | | | | | | | | | | $ | 579,814 | | | $ | (468,675 | ) | | $ | 27,153,992 | | | $ | 25,418,387 | |
Intrepid Funds
NOTES TO FINANCIAL STATEMENTS (continued)
March 31, 2013 (Unaudited)
| Intrepid Small Cap Fund | | | | | | | | | | | | | | | | | | | | | | | | |
| | | | | | | | | | | | Share | | | | | | | | | | | | | |
| | | Share | | | | | | | | | Balance | | | | | | | | | | | | | |
| | | Balance | | | | | | | | | at | | | | | | | | | | | | | |
| | | at | | | | | | | | | March | | | | | | Realized | | | Value at | | | Cost at | |
| | | Oct. 1, | | | | | | | | | | 31, | | | Dividend | | | Gain/ | | | March | | | March | |
| Issuer Name | | 2012 | | | Additions | | | Reductions | | | | 2013 | | | Income | | | (Loss) | | | | 31, 2013 | | | | 31, 2013 | |
| American | | | | | | | | | | | | | | | | | | | | | | | | | | | |
| Greetings | | | | | | | | | | | | | | | | | | | | | | | | | | | |
| Corp. (a) | | | 1,100,587 | | | | — | | | | (423,701 | ) | | | 676,886 | | | $ | 239,604 | | | $ | (1,026,125 | ) | | $ | 10,897,865 | | | $ | 10,748,621 | |
| EPIQ | | | | | | | | | | | | | | | | | | | | | | | | | | | | | | | | |
| Systems, | | | | | | | | | | | | | | | | | | | | | | | | | | | | | | | | |
| Inc. | | | 1,536,074 | | | | — | | | | (76,000 | ) | | | 1,460,074 | | | | 394,220 | | | | 99,539 | | | | 20,484,838 | | | | 17,040,763 | |
| ManTech | | | | | | | | | | | | | | | | | | | | | | | | | | | | | | | | |
| International | | | | | | | | | | | | | | | | | | | | | | | | | | | | | | | | |
| Corp. (a) | | | 958,703 | | | | — | | | | (382,217 | ) | | | 576,486 | | | | 352,138 | | | | (4,603,733 | ) | | | 15,490,179 | | | | 16,052,169 | |
| World Wrestling | | | | | | | | | | | | | | | | | | | | | | | | | | | | | | | | |
| Entertainment, | | | | | | | | | | | | | | | | | | | | | | | | | | | | | | | | |
| Inc. | | �� | 1,742,782 | | | | 313,046 | | | | — | | | | 2,055,828 | | | | 460,664 | | | | — | | | | 18,132,403 | | | | 18,395,653 | |
| | | | | | | | | | | | | | | | | | | $ | 1,446,626 | | | $ | (5,530,319 | ) | | $ | 65,005,285 | | | $ | 62,237,206 | |
| | | | | | | | | | | | | | | | | | | | | | | | | | | | | | | | | |
| Intrepid Income Fund | | | | | | | | | | | | | | | | | | | | | | | | | | | | | | | | |
| | | | | | | | | | | | | | | Share | | | | | | | | | | | | | | | | | |
| | | Share | | | | | | | | | | | Balance/ | | | | | | | | | | | | | | | | | |
| | | Balance/ | | | | | | | | | | | Face | | | | | | | | | | | | | | | | | |
| | | Face | | | | | | | | | | | Value ($) | | | | | | | | | | | | | | | | | |
| | | Value ($) | | | | | | | | | | | at | | | | | | | Realized | | | Value at | | | Cost at | |
| | | at Oct. | | | | | | | | | | | March | | | Dividend | | | Gain/ | | | March | | | March | |
| Issuer Name | | | 1, 2012 | | | Additions | | | Reductions | | | | 31, 2013 | | | Income | | | (Loss) | | | | 31, 2013 | | | | 31, 2013 | |
| ManTech | | | | | | | | | | | | | | | | | | | | | | | | | | | | | | | | |
| International | | | | | | | | | | | | | | | | | | | | | | | | | | | | | | | | |
| Corp. (a) | | | 33,300 | | | | — | | | | — | | | | 33,300 | | | $ | 13,986 | | | $ | — | | | $ | 894,771 | | | $ | 749,160 | |
| World Wrestling | | | | | | | | | | | | | | | | | | | | | | | | | | | | | | | | |
| Entertainment, | | | | | | | | | | | | | | | | | | | | | | | | | | | | | | | | |
| Inc. | | | 113,320 | | | | 5,205 | | | | — | | | | 118,525 | | | | 27,821 | | | | — | | | | 1,045,390 | | | | 1,088,594 | |
| ManTech | | | | | | | | | | | | | | | | | | | | | | | | | | | | | | | | |
| International | | | | | | | | | | | | | | | | | | | | | | | | | | | | | | | | |
| Corp., 7.250%, | | | | | | | | | | | | | | | | | | | | | | | | | | | | | | | | |
| 04/15/2018 (a) | | | — | | | | 420,000 | | | | — | | | | 420,000 | | | | — | | | | — | | | | 445,200 | | | | 444,675 | |
| | | | | | | | | | | | | | | | | | | $ | 41,807 | | | $ | — | | | $ | 2,385,361 | | | $ | 2,282,429 | |
Intrepid Funds
NOTES TO FINANCIAL STATEMENTS (continued)
March 31, 2013 (Unaudited)
Intrepid Disciplined Value Fund
| | | | | | | | | | | | Share | | | | | | | | | | | | | |
| | | Share | | | | | | | | | Balance | | | | | | | | | | | | | |
| | | Balance | | | | | | | | | at | | | | | | | | | Value at | | | Cost at | |
| | | at Oct. | | | | | | | | | March | | | Dividend | | | Realized | | | March | | | March | |
| Issuer Name | | | 1, 2012 | | | Additions | | | Reductions | | | | 31, 2013 | | | Income | | | Loss | | | | 31, 2013 | | | | 31, 2013 | |
| American | | | | | | | | | | | | | | | | | | | | | | | | | | | | |
| Greetings | | | | | | | | | | | | | | | | | | | | | | | | | | | | |
| Corp. (a) | | | 58,711 | | | | — | | | | (19,922 | ) | | | 38,789 | | | $ | 12,950 | | | $ | (62,553 | ) | | $ | 624,503 | | | $ | 596,748 | |
| EPIQ | | | | | | | | | | | | | | | | | | | | | | | | | | | | | | | | |
| Systems, Inc. | | | 81,682 | | | | — | | | | (14,512 | ) | | | 67,170 | | | | 19,559 | | | | (18,498 | ) | | | 942,395 | | | | 778,040 | |
| World Wrestling | | | | | | | | | | | | | | | | | | | | | | | | | | | | | | | | |
| Entertainment, | | | | | | | | | | | | | | | | | | | | | | | | | | | | | | | | |
| Inc. | | | 126,084 | | | | — | | | | (23,853 | ) | | | 102,231 | | | | 24,535 | | | | (46,056 | ) | | | 901,678 | | | | 911,106 | |
| | | | | | | | | | | | | | | | | | | $ | 57,044 | | | $ | (127,107 | ) | | $ | 2,468,576 | | | $ | 2,285,894 | |
(a) Security is no longer an affiliated company at March 31, 2013.
| 8. | FEDERAL INCOME TAX INFORMATION |
The tax components of distributions paid during the fiscal periods ended September 30, 2012 and 2011 are as follows:
| | | September 30, 2012 | | | September 30, 2011 | |
| | | Ordinary | | | Long-Term | | | Ordinary | | | Long-Term | |
| | | Income | | | Capital Gains | | | Income | | | Capital Gains | |
| Intrepid Capital Fund | | $ | 21,103,137 | | | $ | 5,319,613 | | | $ | 11,436,546 | | | $ | 1,342,018 | |
| Intrepid Small Cap Fund | | | 34,344,831 | | | | 43,643,220 | | | | 27,543,308 | | | | 11,592,367 | |
| Intrepid Income Fund | | | 4,735,277 | | | | 829,286 | | | | 3,366,561 | | | | 8,950 | |
| Intrepid Disciplined | | | | | | | | | | | | | | | | |
| Value Fund | | | 904,705 | | | | 1,532,134 | | | | 1,567,653 | | | | 236,014 | |
Additionally, U.S. generally accepted accounting principles require that certain components of net assets relating to permanent differences be reclassified between financial and tax reporting. These reclassifications have no effect on net assets or net asset value per share. For the year ended September 30, 2012, the following table shows the reclassifications made:
| | | Accumulated Net | | | Undistributed Net | |
| | | Realized Losses | | | Investment Income | |
| Intrepid Capital Fund | | $ | (51,362 | ) | | $ | 51,362 | |
| Intrepid Small Cap Fund | | | (3,610,259 | ) | | | 3,610,259 | |
| Intrepid Income Fund | | | 648 | | | | (648 | ) |
| Intrepid Disciplined Value Fund | | | (44,296 | ) | | | 44,296 | |
These reclassifications primarily relate to investment losses and currency adjustments.
Intrepid Funds
NOTES TO FINANCIAL STATEMENTS (continued)
March 31, 2013 (Unaudited)
As of September 30, 2012, the components of accumulated earnings (losses) for income tax purposes were as follows:
| | | Intrepid | | | Intrepid | |
| | | Capital Fund | | | Small Cap Fund | |
| Cost of investments | | $ | 297,911,486 | | | $ | 376,766,441 | |
| Unrealized appreciation | | | 29,194,332 | | | | 30,387,441 | |
| Unrealized depreciation | | | (6,576,707 | ) | | | (20,700,159 | ) |
| Net unrealized appreciation | | | 22,617,625 | | | | 9,687,282 | |
| Undistributed ordinary income | | | 9,160,246 | | | | 29,637,478 | |
| Undistributed long-term capital gain | | | 1,819,800 | | | | 25,517,660 | |
| Distributable income | | | 10,980,046 | | | | 55,155,138 | |
| Other accumulated loss | | | — | | | | — | |
| Total accumulated gain/(loss) | | $ | 33,597,671 | | | $ | 64,842,420 | |
| | | | | | | | |
| | | | | | | Intrepid | |
| | | Intrepid | | | Disciplined | |
| | | Income Fund | | | Value Fund | |
| Cost of investments | | $ | 86,801,644 | | | $ | 31,403,029 | |
| Unrealized appreciation | | | 1,441,245 | | | | 3,067,212 | |
| Unrealized depreciation | | | (352,589 | ) | | | (1,470,923 | ) |
| Net unrealized appreciation | | | 1,088,656 | | | | 1,596,289 | |
| Undistributed ordinary income | | | 683,335 | | | | 1,808,604 | |
| Undistributed long-term capital gain | | | 323,230 | | | | 412,964 | |
| Distributable income | | | 1,006,565 | | | | 2,221,568 | |
| Other accumulated loss | | | — | | | | — | |
| Total accumulated gain/(loss) | | $ | 2,095,221 | | | $ | 3,817,857 | |
The difference between book-basis and tax-basis unrealized appreciation is attributable primarily to the tax deferral of losses on wash sales.
There is no tax liability resulting from unrecognized tax benefits relating to uncertain income tax positions taken or expected to be taken on the tax return for the fiscal year-end September 30, 2012, or for any other tax years which are open for exam. As of September 30, 2012, open tax years include the tax years ended September 30, 2009 through 2012. The Trust is also not aware of any tax positions for which it is reasonably possible that the total amounts of unrecognized tax benefits will significantly change in the next year. The Funds recognize interest and penalties,
Intrepid Funds
NOTES TO FINANCIAL STATEMENTS (continued)
March 31, 2013 (Unaudited)
if any, related to unrecognized tax benefits as income tax expense in the Statement of Operations. During the period, the Funds did not incur any interest or penalties, nor were any accrued as of September 30, 2012.
The Intrepid Capital Fund, Intrepid Small Cap Fund, Intrepid Income Fund, and Intrepid Disciplined Value Fund each have a revolving unsecured credit facility in the amounts of $5,000,000, $10,000,000, $5,000,000, and $2,000,000, respectively, for temporary emergency purposes, including the meeting of redemption requests that otherwise might require the untimely disposition of securities. The lines of credit have a one year term and are reviewed annually by the Board of Trustees. The current agreements run through October 15, 2013. The interest rate as of March 31, 2013 was 3.25%. During the six month period ended March 31, 2013, none of the Intrepid Funds drew on their line of credit.
Intrepid Funds
ADDITIONAL INFORMATION
March 31, 2013 (Unaudited)
Investment Advisory Agreement Disclosure
On November 8, 2012, the Board of Trustees of Intrepid Capital Management Funds Trust approved the investment advisory agreements between the Intrepid Capital Fund, the Intrepid Small Cap Fund, the Intrepid Income Fund and the Intrepid Disciplined Value Fund (the “Funds”) and Intrepid Capital Management, Inc. Prior to approving the agreement, the Board considered:
| | • | The nature, extent and quality of the services to be provided by Intrepid Capital Management, Inc. |
| | • | The investment performance of the Funds |
| | • | The cost of the services to be provided and profits to be realized by Intrepid Capital Management, Inc. from its relationship with the Funds |
| | • | The extent to which economies of scale would be realized as the Funds grew and whether fee levels reflect any such economies of scale |
| | • | The expense ratio of the Funds |
| | • | The manner in which portfolio transactions for the Funds would be conducted, including the use of soft dollars |
In considering the nature, extent and quality of the services to be provided by Intrepid Capital Management Inc., the Board considered the Adviser’s quality of investment management provided to the Funds, the Adviser’s management history and the Adviser’s ability to attract investors for the Funds. The Board concluded that the nature, extent and quality of the services to be provided by the Adviser would be satisfactory.
The Board reviewed the investment performance of the Funds and compared the investment performance of the Funds to their relevant benchmarks. After further discussion, the Board concluded that the performance of the Funds was satisfactory in comparison to the relevant benchmarks.
The Board considered the cost of services provided and the profits to be realized by the Adviser, by reviewing reports provided by the Funds’ administrator that compared the Funds’ investment advisory fees to those of other comparable mutual funds. The Board concluded that the investment advisory fees were fair and within the range of the industry averages.
The Board considered the extent to which economies of scale would be realized as the Funds grow, including a consideration of breakpoints in the Agreement fee schedules. The Board concluded that given the expected growth of assets of the Funds in the next year, the Adviser was unlikely to realize economies of scale and the proposed fee schedules were acceptable.
Intrepid Funds
ADDITIONAL INFORMATION
March 31, 2013 (Unaudited)
The Board reviewed reports from the Funds’ administrator that compared the Funds’ total expense ratios to those of other comparable mutual funds. The Board concluded that the total expenses of the Funds were reasonable and within the range of the industry averages.
The Board reviewed reports discussing the manner in which portfolio transactions for the Funds were conducted, including the use of soft dollars. Based on these reports, the Board concluded that the research and services to be obtained by the Adviser were beneficial to the Funds and that the Adviser would execute the Funds’ portfolio transactions in a manner designed to obtain best execution for the Funds.
Shareholder Notification of Federal Tax Status
The Intrepid Capital Fund, Intrepid Small Cap Fund, Intrepid Income Fund, and Intrepid Disciplined Value Fund designate $5,319,613, $43,643,220, $829,286 and $1,532,134, respectively, of total distributions paid during the fiscal year ended September 30, 2012 as net capital gain distributions eligible for long-term capital gain rates for individual shareholders.
The Intrepid Capital Fund, Intrepid Small Cap Fund, Intrepid Income Fund and Intrepid Disciplined Value Fund designate 19.17%, 15.77%, 2.99% and 28.74%, respectively, of their ordinary income distributions for the period ended September 30, 2012 as qualified dividend income under the Jobs & Growth Tax Relief Reconciliation Act of 2003.
For the period ended September 30, 2012, 15.30%, 12.60%, 1.37% and 28.70% of Intrepid Capital Fund, Intrepid Small Cap Fund, Intrepid Income Fund and Intrepid Disciplined Value Fund dividends paid from net ordinary income, respectively, qualify for the dividends received deduction available to corporate shareholders.
The Intrepid Capital Fund, Intrepid Small Cap Fund, Intrepid Income Fund and Intrepid Disciplined Value Fund designate 28.19%, 0.45%, 92.61% and 0.38%, respectively, of their ordinary income distributions for the fiscal year as interest-related dividends under Internal Revenue Code Section 871(k)(1)(c).
The Intrepid Capital Fund, Intrepid Small Cap Fund, Intrepid Income Fund and Intrepid Disciplined Value Fund designate 70.41%. 100%, 9.82% and 93.26%, respectively, of their ordinary income distributions as short-term capitalization distributions under Internal Revenue Code Section 871(k)(2)(c).
Intrepid Funds
ADDITIONAL INFORMATION
March 31, 2013 (Unaudited)
Availability of Quarterly Portfolio Holdings Schedules
The Funds are required to file their complete schedule of portfolio holdings with the SEC for the first and third quarters of each fiscal year on Form N-Q. Once filed, the Funds’ Form N-Q is available without charge, upon request on the SEC’s website (http://www.sec.gov) and may be available by calling 1.866.996.3863. You may also obtain copies at the SEC’s Public Reference Room in Washington, D.C. Information on the operation of the Public Reference Room may be obtained by calling 1.800.SEC.0330.
Proxy Voting Policies and Procedures and Proxy Voting Record (Unaudited)
A description of the policies and procedures that the Funds use to determine how to vote proxies relating to portfolio securities is available without charge, upon request, by calling 1.866.996.3863 and on the SEC’s website (http://www.sec.gov).
The Funds are required to file how they voted proxies related to portfolio securities during the most recent 12-month period ended June 30. Once filed, the information is available without charge, upon request, by calling 1.866.996.3863 and on the SEC’s website (http://www.sec.gov).
(This Page Intentionally Left Blank.)
Board of Trustees
Edward Vandergriff
Mark Travis
Peter Osterman
Roy Clarke
Investment Adviser
Intrepid Capital Management, Inc.
1400 Marsh Landing Parkway, Suite 106
Jacksonville Beach, FL 32250
Independent Registered Public Accounting Firm
Deloitte & Touche LLP
111 South Wacker Drive
Chicago, IL 60606
Legal Counsel
Foley & Lardner LLP
777 East Wisconsin Avenue
Milwaukee, WI 53202
Custodian
U.S. Bank, N.A.
1555 N. RiverCenter Drive, Suite 302
Milwaukee, WI 53212
Distributor
Quasar Distributors, LLC
615 East Michigan Street
Milwaukee, WI 53202
Administrator, Transfer Agent
and Dividend Disbursing Agent
U.S. Bancorp Fund Services, LLC
615 East Michigan Street
Milwaukee, WI 53202
Shareholder/Investor Information
1.866.996.3863
www.intrepidcapitalfunds.com
ITRPSEMI-0313
Item 2. Code of Ethics.
Not applicable for semi-annual reports.
Item 3. Audit Committee Financial Expert.
Not applicable for semi-annual reports.
Item 4. Principal Accountant Fees and Services.
Not applicable for semi-annual reports.
Item 5. Audit Committee of Listed Registrants.
Not applicable to registrants who are not listed issuers (as defined in Rule 10A-3 under the Securities Exchange Act of 1934).
Item 6. Investments.
Schedule of Investments is included as part of the report to shareholders filed under Item 1 of this Form.
Item 7. Disclosure of Proxy Voting Policies and Procedures for Closed-End Management Investment Companies.
Not applicable to open-end investment companies.
Item 8. Portfolio Managers of Closed-End Management Investment Companies.
Not applicable to open-end investment companies.
Item 9. Purchases of Equity Securities by Closed-End Management Investment Company and Affiliated Purchasers.
Not applicable to open-end investment companies.
Item 10. Submission of Matters to a Vote of Security Holders.
Not Applicable.
Item 11. Controls and Procedures.
(a) The Registrant’s President and Treasurer have reviewed the Registrant's disclosure controls and procedures (as defined in Rule 30a-3(c) under the Investment Company Act of 1940 (the “Act”)) as of a date within 90 days of the filing of this report, as required by Rule 30a-3(b) under the Act and Rules 13a-15(b) or 15d-15(b) under the Securities Exchange Act of 1934. Based on their review, such officers have concluded that the disclosure controls and procedures are effective in ensuring that information required to be disclosed in this report is appropriately recorded, processed, summarized and reported and made known to them by others within the Registrant and by the Registrant’s service provider.
(b) There were no changes in the Registrant's internal control over financial reporting (as defined in Rule 30a-3(d) under the Act) that occurred during the second fiscal quarter of the period covered by this report that has materially affected, or is reasonably likely to materially affect, the Registrant's internal control over financial reporting.
Item 12. Exhibits.
| (a) | (1) Any code of ethics or amendment thereto, that is the subject of the disclosure required by Item 2, to the extent that the registrant intends to satisfy Item 2 requirements through filing an exhibit. Not Applicable. |
(2) A separate certification for each principal executive and principal financial officer pursuant to Section 302 of the Sarbanes-Oxley Act of 2002. Filed herewith.
(3) Any written solicitation to purchase securities under Rule 23c-1 under the Act sent or given during the period covered by the report by or on behalf of the registrant to 10 or more persons. Not applicable to open-end investment companies.
| (b) | Certifications pursuant to Section 906 of the Sarbanes-Oxley Act of 2002. Furnished herewith. |
SIGNATURES
Pursuant to the requirements of the Securities Exchange Act of 1934 and the Investment Company Act of 1940, the registrant has duly caused this report to be signed on its behalf by the undersigned, thereunto duly authorized.
(Registrant) Intrepid Capital Management Funds Trust
By (Signature and Title)* /s/Mark F. Travis
Mark F. Travis, President
Date May 17, 2013
Pursuant to the requirements of the Securities Exchange Act of 1934 and the Investment Company Act of 1940, this report has been signed below by the following persons on behalf of the registrant and in the capacities and on the dates indicated.
By (Signature and Title)* /s/Mark F. Travis
Mark F. Travis, President
Date May 17, 2013
By (Signature and Title)* /s/Donald C. White
Donald C. White, Treasurer
Date May 17, 2013
* Print the name and title of each signing officer under his or her signature.