UNITED STATES
SECURITIES AND EXCHANGE COMMISSION
Washington, D.C. 20549
FORM N-CSR
CERTIFIED SHAREHOLDER REPORT OF REGISTERED
MANAGEMENT INVESTMENT COMPANIES
811-21625
Investment Company Act file number
Intrepid Capital Management Funds Trust
(Exact name of registrant as specified in charter)
1400 Marsh Landing Parkway, Suite 106
Jacksonville Beach, FL 32250
(Address of principal executive offices) (Zip code)
Mark F. Travis
1400 Marsh Landing Parkway, Suite 106
Jacksonville Beach, FL 32250
(Name and address of agent for service)
1-904-246-3433
Registrant's telephone number, including area code
Date of fiscal year end: 09/30/2015
Date of reporting period: 03/31/2015
Item 1. Reports to Stockholders.
Intrepid Capital Fund
Intrepid Small Cap Fund
Intrepid Income Fund
Intrepid Disciplined Value Fund
Intrepid International Fund
Semi-Annual Report
March 31, 2015
Intrepid Capital Fund
April 1, 2015
“To make money, buy some good stock, hold it until it goes up, and then sell it. If it doesn’t go up, don’t buy it.”
-Will Rogers
Mark F. Travis, President/C.E.O.
PERFORMANCE
| | Total Return |
| | Inception | | | |
| | Date | Qtr. | YTD | 1 Year |
| Intrepid Capital Fund – Inv. | 1/3/05 | 1.03% | 1.03% | 1.84% |
| Intrepid Capital Fund – Inst. | 4/30/10 | 1.09% | 1.09% | 2.09% |
| S&P 500 Index | | 0.95% | 0.95% | 12.73% |
| Russell 2000 Index | | 4.32% | 4.32% | 8.21% |
| BAML High Yield Master II Index | | 2.54% | 2.54% | 2.05% |
| | |
| | Average Annualized Total Returns |
| | as of March 31, 2015 |
| | | | | Since |
| | 3 Year | 5 Year | 10 Year | Inception |
| Intrepid Capital Fund – Inv. | 8.26% | 8.49% | 7.90% | 7.42% |
| Intrepid Capital Fund – Inst. | 8.51% | — | — | 8.27% |
| S&P 500 Index | 16.11% | 14.47% | 8.01% | 7.67%^ |
| Russell 2000 Index | 16.27% | 14.57% | 8.82% | 8.20%^ |
| BAML High Yield Master II Index | 7.47% | 8.40% | 8.04% | 7.67%^ |
| ^ | Since Inception returns are as of the fund’s Investor Class inception date. Since the inception date of the Institutional Class, the annualized return of the S&P 500 Index is 14.36%, Russell 2000 Index is 13.55%, and BAML High Yield Master II Index is 8.06%. |
Performance data quoted represents past performance and does not guarantee future results. Investment returns and principal value will fluctuate, and when sold, may be worth more or less than their original cost. Performance current to the most recent month-end may be lower or higher than the performance quoted and can be obtained by calling 866-996-FUND. The Fund imposes a 2% redemption fee on shares held for 30 days or less. Performance data does not reflect the redemption fee. If it had, returns would be reduced.
Per the prospectus, the Fund’s annual operating expenses (gross) for the Investor Share Class is 1.41% and for the Institutional Share Class is 1.16%. The Fund’s Advisor has contractually agreed to waive a portion of its fees and/or reimburse expenses such that the total operating expense (net) is 1.40% and 1.15% through 1/31/16, respectively. Otherwise, performance shows would have been lower.
Intrepid Capital Fund
Dear Friends and Clients,
I always chuckle when I read the above quote from Will Rogers. Most of the ‘good stock’ that Mr. Rogers refers to (i.e. those that went up!), in the first quarter of 2015, were too expensive for rational buyers like us at Intrepid Capital. Much of what “went up” during this period, biotechnology for example, is difficult, if not impossible, to value in absence of any pre-tax cash flow from which to form a business valuation.
I think to move forward, it may be helpful to look back. This time six years ago (March 2009/April 2009), gloom was the prevalent mood for investors as the financial crash from the prior fall weighed heavy and most were looking to sell, not buy. Opportunities were everywhere, from our perspective, as many were hiding under the bed with a flashlight on! High quality companies with cheap share prices were abundant for the taking, and we did, which led to high absolute returns for calendar year 2009, and the seeds for attractive returns for the next several years. The Intrepid Capital Fund (the “Fund”) had an increase of 31.28% for calendar year 2009.
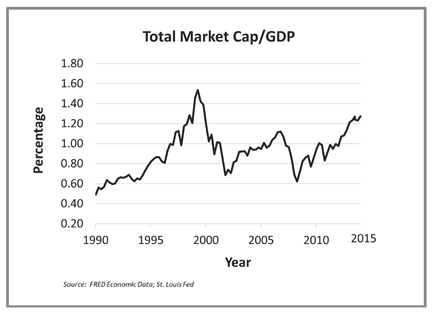
Fast forward to today, where fear appears non-existent and the expectation, for most, is that share prices are not allowed to decline! Please keep in mind that share prices tend to decline faster than they appreciate. From a historical standpoint, the S&P 500 Index has averaged between 14 – 15% the last 5 years, which is well above a longer term (20 years) average of 9 – 10%. Another data point to consider is the current total market cap/GDP ratio of approximately 1.24% (see chart below). The past peaks in the market/GDP ratio of early 2000 and late 2007 are being challenged with today’s equity prices. Our returns for the period are subdued by our unwillingness to over pay for both equity or debt securities, and our willingness to hold cash balances.
Intrepid Capital Fund
The cash balances create a great deal of consternation, externally and internally, particularly as prices continue to appreciate. We liken cash to be either a) a sea anchor in a rising market or b) a life boat in a falling one. The beauty of a cash balance, as one who has plied the less liquid corners of the capital markets (small cap equity, high yield debt), is that when the market seizes up, cash is king!
As a portfolio manager, you can make one decision to purchase, not two decisions (what to sell, then what to buy). If the environment continues in the second quarter of 2015 as it has for much of the recent past, we would anticipate more liquidations than acquisitions as holdings reach our conservative estimates of value. We are diligently searching for new investment opportunities that meet our criteria and we are ready to deploy cash when we find them.
For the quarter ended March 31, 2015, the Intrepid Capital Fund increased 1.03%, compared to the S&P 500 Index and the BAML High Yield Master II Index which returned 0.95% and 2.54%, respectively, for the period. Cash in the portfolio at the end of the quarter was 15.5%. The top performers in the Fund for the quarter were Northern Oil & Gas (ticker: NOG), Western Union (ticker: WU), Newfield Exploration (ticker: NFX), and Amdocs Limited (ticker: DOX). Worst performers for the period were Corus Entertainment (ticker: CJR/B), Bill Barrett (ticker: BBG), Tetra Tech (ticker: TTEK), and Dundee Corp. (ticker: DC/A).
We are pleased to announce that the Intrepid Capital Fund (Investor) celebrated its 10th anniversary in early January. For the 10 year period ending March 31, 2015, the Fund has outperformed 93% of the 444 funds in the Morningstar Moderate Allocation Peer Group, based on risk-adjusted returns. Morningstar ranked the Fund in the 95th, 77th, 64th, and 7th percentile out of 915, 787, 697, and 444 Moderate Allocation funds for one-, three-, five-, and ten-year periods ending March 31, 2015, respectively. We are also pleased to report the Fund received an overall 4-Star Morningstar Rating out of 787 Moderate Allocation funds for the period ending March 31, 2015 (derived from a weighted average of the fund’s three-, five-, and ten-year risk adjusted return measure). I would like to say a warm “Thank You” to Fund shareholders, Trustees, and the staff at Intrepid Capital for helping what was nothing more than a dream eleven years ago, come true.
Finally, we are happy to announce the most recent addition of the Intrepid International Fund (ticker: ICMIX) to its family of mutual funds. Opened to investors on December 30, 2014, with Ben Franklin, CFA, as lead portfolio manager, the International Fund will be managed with the same value philosophy and process developed over the last twenty years at Intrepid Capital. This fund will invest in international equity securities of all market capitalization, primarily in developed markets. Traditionally, we have found more value searching in the small cap space, which also has been our experience internationally. We expect this to continue. If you want to know more about the Intrepid International Fund or any of our other mutual funds, please visit our website at www.intrepidcapitalfunds.com.
Intrepid Capital Fund
Thank you for entrusting us with your hard earned capital, it is not a position we take lightly.
Best regards,
Mark F. Travis
President
Intrepid Capital Fund Portfolio Manager
Must be preceded or accompanied by a current prospectus.
Mutual fund investing involves risk. Principal loss is possible. The Fund is subject to special risks including volatility due to investments in smaller companies, which involve additional risks such as limited liquidity and greater volatility. The Fund is considered non-diversified as a result of limiting its holdings to a relatively small number of positions and may be more exposed to individual stock volatility than a diversified fund. Investments in debt securities typically decrease in value when interest rates rise. This risk is usually greater for longer-term debt securities. Investments by the Fund in lower-rated and non-rated securities present a greater risk of loss to principal and interest than higher rated securities. The Fund may invest in foreign securities which involve greater volatility and political, economic and currency risks and differences in accounting methods.
The S&P 500 Index is a broad-based unmanaged index of 500 stocks, which is widely recognized as representative of the equity market in general. The Bank of America/Merrill Lynch High Yield Master II Index is Merrill Lynch’s broadest high yield index, and as such is comparable with the broad indices published by other investment banks. The Russell 2000 Index consists of the smallest 2,000 companies in a group of 3,000 U.S. companies in the Russell 3000 Index, as ranked by market capitalization. The Russell 3000 Index is an index representing the largest 3,000 U.S. companies representing approximately 98% of the investable U.S. equity market. You cannot invest directly in an index.
GDP (Gross Domestic Product) is the total market value of goods and services produced within the borders of a country. Total Market Cap (also known as market value) is the share price times the number of shares outstanding of a company. TMC/GDP is the ratio of Total Market Cap to the Gross Domestic Product and it compares the total price of all publicly traded companies to GDP.
Morningstar Proprietary Ratings reflect risk-adjusted performance as of 3/31/15. For each fund with at least a three year history, Morningstar calculates a Morningstar Rating™ based on a Morningstar risk-adjusted return measure that accounts for variation in a fund’s monthly performance placing more emphasis on downward variations and rewarding consistent performance. The top 10% of funds in each category receive 5 stars, the next 22.5% receive 4 stars, the next 35% receive 3 stars, the next 22.5% receive 2 stars and the bottom 10% receive 1 star. Each share class is counted as a fraction of one fund within this scale and rated separately, which may cause slight variations in distribution percentage. The Intrepid Capital Fund-Investor received 2 stars among 787 for the three-year, 3 stars among 697 for the five-year, and 5 stars among 444 Moderate Allocation Funds for the ten-year period ending 3/31/15. The rating is specific to the Investor Share Class and does not apply to other share classes, which have different ratings.
Intrepid Capital Fund
Morningstar Rankings represent a fund’s total-return percentile rank relative to all funds that have the same Morningstar Category. The highest percentile rank is 1 and the lowest is 100. It is based on Morningstar total return, which includes both income and capital gains or losses and is not adjusted for sales charges or redemption fees. The ranking is specific to the Investor Share Class and does not apply to the other share class, which as different rankings.
© 2015 Morningstar, Inc. All Rights Reserved. The information contained herein (1) is proprietary to Morningstar (2) may not be copied or distributed and (3) is not warranted to be accurate, complete or timely. Neither Morningstar nor its content providers are responsible for any damages or losses arising from any sue of this information. Past performance is no guarantee of future results.
References to other mutual funds should not be interpreted as an offer of these securities.
Fund holdings and sector allocation are subject to change at any time and should not be considered recommendation to buy or sell any security. Please see the Schedule of Investments for a complete list of Fund Holdings.
Opinions expressed are subject to change, are not guaranteed and should not be considered investment advice or recommendations to buy or sell any security.
The Intrepid Capital Funds are distributed by Quasar Distributors, LLC.
Intrepid Small Cap Fund
April 1, 2015
 | |
| Jayme Wiggins, | |
| Small Cap Fund Portfolio Manager | |
Dear Fellow Shareholders,
Have you seen those movies where a guy is alone in the desert, dying of thirst under the 110 degree sun? With only a few breaths to spare, he struggles over a sandy dune. Through blurred vision, he sees a sparkling lake in the distance. He slowly crawls toward this refuge, but the oasis disintegrates. It was a mirage.
That’s what it feels like to be a value investor today. When you are desperate for an investment idea, you may start to see things that don’t exist. You ignore what could go wrong and focus on what could go right. You imagine a solution to any corporate conundrum. As far as earnings, Non-GAAP is the new black. You take your analysis sunny side up.
In a state of investment fatigue, survival depends on how you respond. Do you correctly recognize a mirage as an illusion and live to fight another day? Or do you dive in headfirst anyway, potentially choking on a mouthful of sand? With small cap stocks at record highs and multiples at nosebleed levels, we believe discretion is the better part of valor.
The Intrepid Small Cap Fund’s (the “Fund”) correlation of daily returns to the Russell 2000 benchmark is the lowest it has been since shortly after the Fund’s launch, when it had less than $3 million in assets. The correlation was relatively high when we thought small cap stocks were cheap or reasonably priced (2008-2011), and it has fallen precipitously in recent years as our perception of market risk has mushroomed. According to Morningstar, most mutual funds have correlations to their benchmarks of 0.95 or greater. Ours was 0.53 over the past three months.
Intrepid Small Cap Fund
The correlation is not necessarily influenced by cash, as a fund that always returned exactly half of its benchmark would have a perfect 1.0 correlation. Rather, our low correlation is the byproduct of deliberate actions to invest in things that aren’t popular and don’t move along with the benchmark. Today, that includes energy stocks, precious metals, foreign companies, a convertible bond, and preferred shares. Configuring the Fund to look different than the Russell 2000 hasn’t paid off yet, but we strongly believe this is the right course of action.
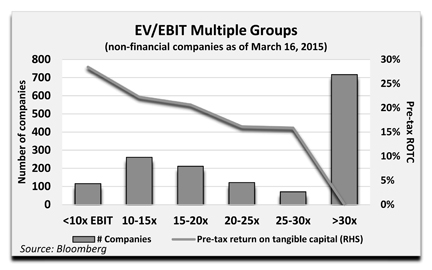
In mid-March, we calculated updated statistics for the Russell 2000 Index. As of March 16, 2015, the Russell 2000’s P/E ratio was 56x. Excluding financials, the P/E was 131x. In the aggregate, the Index has no free cash flow. The median non-financial EV/EBIT multiple was 27x and the pre-tax return on tangible capital (excluding Goodwill) was approximately 10%—not exactly “the stuff that dreams are made of.” Some might point out that younger, less profitable companies drag down the statistics. There are 821 “seasoned” non-financial companies in the Russell Index which were publicly traded in mid-2007, which was immediately before the last recession. The cumulative change in operating income for this group, over the past 7 years is...drumroll…less than zero (-4%). The cumulative change in market capitalization for this batch is +25%. This change in price is from July 13, 2007—the day of last market peak. Thus, a group of 821 small cap companies with lower earnings today than 7 years ago is collectively trading for more than 25% above prior peak levels. We don’t believe the prior Russell 2000 peak is a sound valuation reference point, but this example illustrates the extremes we currently face.
We typically purchase stocks trading at single digit multiples of normalized operating income (EBIT). When we ran our analysis two weeks ago, there were 116 non-financial stocks in the Russell 2000 that sold for an EV/EBIT multiple below
Intrepid Small Cap Fund
10x, compared to over 700 names with multiples exceeding 30x. In a slap in the face to logic, returns on invested capital decline as multiples increase. The sub-10x, lowest multiple group contains many melting ice cubes and firms with imploding business models, like Eastman Kodak and Weight Watchers, as well as a host of oil and oil services companies where trailing earnings are unlikely to represent the future. It’s not pretty. Nevertheless, this is the landfill that we rummage through on a daily basis, hoping to uncover something interesting.
During the first quarter, the Intrepid Small Cap Fund returned -0.28%, while the Russell 2000 benchmark gained 4.32%. The S&P 500’s year-to-date return is 0.95%. Small cap stocks have outperformed large caps year-to-date as investors rush toward businesses with less currency risk. Biotech and pharmaceutical companies were star performers during the quarter. The Russell 2000 Biotechnology (ticker: RGUSHSBT) and Pharmaceutical (ticker: RGUSHSPH) Indexes rose 16.71% and 16.56%, respectively, in the three months ending March 31, 2015. Collectively, these companies sport a market capitalization of $231 billion and reported a combined trailing twelve month net loss of $8.7 billion. Needless to say, we don’t own any of these firms, and it cost us on a relative performance basis. The equities within the Fund were basically flat in local currency terms in the first quarter (the Fund’s foreign stock positions were fully hedged). Collectively, commodity stocks did not move the needle much, as solid gains on some positions (SM Energy and Newfield Exploration) were offset by losses on others (Contango Oil & Gas, Unit Corp. and Dundee Corp.).
Over the past few years, many people look at the relative performance gap of our Fund compared to the benchmark and think we are idiots for holding so much cash. We are simply adhering to our mandate to not own stocks we deem to be overvalued. In our mind, stuffing a portfolio full of stocks trading at 50x or 100x earnings is
Intrepid Small Cap Fund
setting oneself up for a catastrophe. The Fund ended the first quarter with 73.9% cash. We wrote this to you in our third quarter 2012 letter:
| | Any fund with the words “Small Cap” in its name must have an investment objective to normally invest 80% of the Fund’s assets in small capitalization companies. Funds that invest in small caps but do not have Small Cap in their title are exempt from this rule. The Intrepid Small Cap Fund has not met the 80% objective for the past two years because we have not found enough undervalued small caps to fill the portfolio. Funds like ours are permitted to take a “temporary defensive position” and hold more than 20% cash in response to “adverse market or economic conditions.” Please review our prospectus for this disclosure. From our perspective, an adverse market is not when stocks are falling sharply but when they have risen beyond what normalized earnings can justify. |
| | We do not know when the Fund will be 80% invested again, since it depends on the external opportunity set. We approached the 20% cash level last August, but the market quickly resumed an upward path. Our cash is not a market call, but it is a byproduct of how many undervalued businesses we discover through our bottom-up analysis. While the Fund could become more invested without a change in market levels, we think that small caps will need to experience a selloff before we find enough ideas to reduce cash meaningfully. |
Our cash stake has remained elevated far longer than we anticipated, due to small cap stocks becoming increasingly overvalued, in our opinion. It has been a bull market run for the ages on the back of a feeble economic recovery. Despite our strong convictions that most small caps are exceedingly expensive, we don’t know when things will change. As a result, we expect that at some point during 2015 we will change the name of the Intrepid Small Cap Fund. There will be no change in the Fund’s approach. We will continue to seek out undervalued small cap stocks, and any change in cash levels will be contingent on finding undervalued securities.
This change is solely being made to address our interpretation of SEC rule 35d-1, which states that Funds with descriptive names should strive to invest 80% or more of assets in a manner consistent with the name (in our case, small cap stocks) “under normal circumstances.”1 We believe the investment climate has been anything but normal, as central banks have inspired a rally of epic proportions. We expected a correction long ago, and it could still happen at any time. We are overdue by any historical comparisons. However, the Fund’s last significant cash drawdown was in the summer of 2011, which was the last time stocks sold off appreciably. Our “temporary defensive position” is becoming more permanent than we ever predicted.
1 https://www.sec.gov/rules/final/ic-24828.htm
Intrepid Small Cap Fund
By changing the Fund’s name to a less descriptive label today, we can continue implementing the same investment philosophy (ironic, isn’t it?), which we believe will result in the best shareholder outcomes, while living within the spirit of the Commission’s naming rule.
We didn’t purchase anything new in the Small Cap Fund in the first quarter, although we sold a few names. We exited our positions in Ipsos (ticker: IPS FP), SM Energy (ticker: SM), Newfield Exploration (ticker: NFX), and Northern Oil & Gas (ticker: NOG). Ipsos reached our fair value target as European equities have performed well in 2015. SM Energy and Newfield Exploration also hit our intrinsic value estimates after the stocks popped due to end of year reports. We sold Northern Oil & Gas after the shares outperformed the peer group early in the year, potentially over enthusiasm related to an activist’s 13D filing. We rotated most of the proceeds into Unit Corp (ticker: UNT), one of our existing energy holdings, which has a stronger balance sheet than Northern.
The Fund’s largest contributors in the first quarter were Amdocs (ticker: DOX), SM Energy, and Bio-Rad (ticker: BIO). Both Amdocs and Bio-Rad have long been among the Fund’s biggest holdings. Amdocs has continued to be a reliable cash flow generator, steadily building intrinsic value each quarter. Bio-Rad’s shares rallied after the firm delivered better currency-neutral revenue performance than investors may have been expecting. Although Bio-Rad still trades far more cheaply than other life sciences companies, management has lost credibility with past projections about the cost and impact of a corporate ERP (Enterprise Resource Planning) system. We partially reduced the position. While our holding period for SM Energy was short, we realized a significant gain. We remain disciplined in selling energy positions when they factor in more favorable outcomes for oil prices than we are anticipating.
The positions detracting most from the Fund’s first quarter performance were Corus Entertainment (ticker: CJR/B CN), Tetra Tech (ticker: TTEK), and Contango Oil & Gas (ticker: MCF). Tetra Tech has struggled to meet guidance as it deals with the winding down of its fixed price construction segment in order to focus on its higher-margin consulting work. Tetra Tech is the nation’s leader in consulting on water projects, but it has also aggressively grown its oil & gas business (~one third of operating profit). Some investors may be concerned that oil & gas-related revenue will be pressured, although Tetra Tech is primarily exposed to more stable midstream projects.
Investors reacted negatively to Contango’s end of year production and reserve report and guidance for 2015. Production fell as the company curtailed drilling in response to cratering oil prices. Management axed planned 2015 capital spending by 73% versus 2014, pledging to only drill what is necessary to meet short term lease expirations, and in limited cases, exploratory well tests. Additionally, after analyzing new well data, Contango lowered its proved reserves due to a negative revision in a large offshore gas field. The company has a nasty habit of haircutting offshore reserves, although it’s admittedly difficult to know ahead of time what the decline
Intrepid Small Cap Fund
rate will be for a massive offshore field. While the reserve adjustment was unwelcome, we believe the market’s reaction was more tied to production and capex guidance. On this front, we think management is acting rationally. Contango has an excellent balance sheet, but its assets are not as robust to lower oil prices as some other domestic E&Ps. They are wise to defer drilling. Contango may trade at the lowest multiple to NAV of any unlevered small cap E&P. We believe investors give the company little credit for undeveloped reserves or a highly profitable gas joint venture. For those seeking E&P exposure who don’t mind owning a cigar butt, we think Contango is a good bet.
We typically devote more space in the letter to discussing our underperforming names, and Corus Entertainment was one of the Fund’s top detractors for the second quarter in a row. In March, the Canadian Radio-television and Telecommunications Commission (CRTC) announced a set of rules requiring TV broadcasters to offer channels on an a la carte basis (“pick-and-pay”) in Canada in order to “maximize choice.” Ironically, the CRTC’s decisions should ultimately lead to less viewer choice, with smaller channels dying and consumers paying significantly higher prices per channel for survivors. The policy decisions were more stringent than we predicted a few months ago, since we thought regulators would view the new U.S. over-the-top offerings of HBO, Showtime, CBS, and others as evidence that strict regulatory involvement was not necessary for the TV bundle to evolve. We were wrong and shouldn’t have underestimated the tendency for bureaucrats to cave to political pressures.
With that said, we believe we understand Corus’s pick-and-pay predicament better than most investors and sell side analysts. First, under an a la carte regime, we think both broadcasters (at the wholesale level) and cable and satellite providers (at the retail level) will meaningfully raise prices for popular channels to offset lost volumes. Many consumers will opt to remain in the bundle. Although Corus will face headwinds from TV unbundling, we believe investors are ignoring the aspects of the company’s portfolio that are more resilient to pick-and-pay, including Corus’s radio business, pay networks (e.g. HBO Canada), French channels, and merchandising and distribution revenues. These categories account for an estimated 40%+ of EBITDA and are either unrelated to network penetration (radio, merchandise) or already largely distributed on an a la carte basis (pay, French).
That still leaves almost 60% of cash flow that is directly exposed to the effects of pick-and-pay, including both subscriber fees and advertising revenue. Corus’s top 3 networks deliver the lion’s share of profitability, and these are each ranked by ratings as top 10 specialty networks in Canada. We do not expect them to go away, and we think that through shrewd pricing calculus the firm can withstand large losses to subscriber revenues even as household penetration falls. On the advertising side, ratings primarily drive revenues, and in theory, most of those households who have been watching the networks will still watch them after pick-and-pay is implemented.
Intrepid Small Cap Fund
We believe that some of Corus’s smaller networks will not survive, but these account for a minor share of profitability.
Pick-and-pay pricing is not Corus’s only issue. In spite of robust television ratings, the company has stumbled recently with shortfalls in advertising from U.S.-based consumer packaged goods manufacturers, partially due to the depreciating Canadian dollar. Also, cord-cutting trends remain an overhang on the whole industry as over-the-top solutions proliferate and strengthen. On the other hand, now that pick-and-pay decisions have been publicized, there may be a higher likelihood of Corus merging with Shaw. The Shaw family controls Corus, and economically it makes sense to combine Corus with Shaw Media, the broadcast division. The merged business would dominate the kids and women’s TV spaces in Canada. Corus’s stock is selling for 9.5x this fiscal year’s guided free cash flow. In our judgment, this multiple is too low and assumes more severe earnings pressure than we are forecasting.
When we think about the small cap market, it reminds us a lot of the rip currents you can find on the Florida beaches less than a mile from our offices. A riptide is a narrow current of water that flows strongly directly away from the shore. The leading cause of ocean deaths are rip currents, as swimmers try in vain to swim against the pull of water. If you are caught in a rip current, you’re supposed to keep calm and swim sideways, parallel to the beach, until you are past the current. If that doesn’t work, try to float until the current loses strength further offshore. In recent years, short sellers have been swimming against the world’s greatest artificial rip current—a central bank-driven bull market. The strong shorts could survive, exhausted, while the weak have already succumbed. At the Intrepid Small Cap Fund, we’ve been swimming sideways, paring positions and holding cash, and finding that this rip current has unimaginable breadth, with edges that continue to expand. It’s not a freak of nature, but a freak of the Fed. Most investors have been swimming with the current. We’re sure the rush has felt great, as they reach swimming speeds on par with Olympic athletes and exchange high-fives with Flipper in between strokes. Yet, we wonder if at some point in the future, these folks will pause for air, look around, and realize they are miles from shore with no way to make it back safely.
Thank you for your investment.
Sincerely,
Jayme Wiggins, CFA
Intrepid Small Cap Fund Portfolio Manager
Intrepid Small Cap Fund
Must be preceded or accompanied by a current prospectus.
Mutual fund investing involves risk. Principal loss is possible. The Fund is subject to special risks including volatility due to investments in smaller companies, which involve additional risks such as limited liquidity and greater volatility. The Fund is considered non-diversified as a result of limiting its holdings to a relatively small number of positions and may be more exposed to individual stock volatility than a diversified fund. The Fund may invest in foreign securities which involve greater volatility and political, economic and currency risks and differences in accounting methods.
The Advisor believes that current market conditions warrant a defensive position from the requirement to invest at least 80% of its net assets in equity securities of small capitalization companies.
The Russell 2000 Index consists of the smallest 2,000 companies in a group of 3,000 U.S. companies in the Russell 3000 Index, as ranked by market capitalization. The S&P 500 Index is a broad-based unmanaged index of 500 stocks, which is widely recognized as representative of the equity market in general. The Russell 2000 Biotechnology Index and the Russell 2000 Pharmaceutical Index are sectors of the Russell 2000 Index. You cannot invest directly in an index.
Cash Flow measures the cash generating capability of a company by adding non-cash charges and interest to pretax income. Free Cash Flow measures the cash generating capability of a company by subtracting capital expenditures from cash flow from operations. Free Cash Flow Yield equals normalized free cash flow divided by the company’s market capitalization. It measures how well a company generates cash from its current operations. EBITDA is calculated as the company’s Earnings Before Interest, Taxes, Depreciation and Amortization. Net Debt to EBITDA is a measurement of leverage, calculated as a company’s interest-bearing liabilities minus cash or cash equivalents, divided by its EBITDA. EV/EBIT is the ratio of a company’s enterprise value (EV) to its earnings before interest and taxes (EBIT). Enterprise Value equals market capitalization plus debt minus cash. Non-GAAP (Generally Accepted Accounting Principles) is an alternative earnings measure of the performance of a company. E&P (Exploration and Production) is a type of company in the oil and gas industry focused on discovering and extracting crude oil and natural gas from underground reserves. Capital Expenditure (CAPEX) is money invested by a company to acquire or upgrade fixed, physical, non-consumable assets, such as buildings and equipment or a new business. Correlation is a statistical measure of how securities move in relation to one another. Price to Earnings (P/E) Ratio is calculated by dividing the current price of a company’s stock by its trailing 12 months’ earnings per share. Pre-tax Return on Tangible Capital is calculated as Earnings Before Interest and Taxes (Operating Income) divided by Shareholders Equity plus Debt minus Cash, Goodwill and Other Intangible Assets.
Fund holdings and sector allocation are subject to change at any time and should not be considered recommendation to buy or sell any security. Please see the Schedule of Investments for a complete list of Fund Holdings.
Opinions expressed are subject to change, are not guaranteed and should not be considered investment advice or recommendations to buy or sell any security.
The Intrepid Capital Funds are distributed by Quasar Distributors, LLC.
Intrepid Income Fund
April 1, 2015
 | |
| Jason Lazarus, | |
| Income Fund Portfolio Manager | |
Dear Fellow Shareholders,
What strange times we live in when central banks have such an intense fear of the business cycle that they will go to literally unprecedented2 lengths to eke out meager economic growth and maintain asset prices, despite the long-term repercussions such policies might have. In January, the European Central Bank announced it would purchase more than €1 trillion in bonds over the next several quarters, despite the fact that interest rates were already at extraordinarily low levels in most European countries (and in some cases negative). Now, it’s not just deposit rates that are negative; in many European countries investors must pay for the privilege of owning government bonds for maturities up to seven years! Germany sold 5-year government bonds last week that sport a juicy -0.10% yield-to-maturity. Clearly some buyers of such debt have no intention of holding to maturity and locking in a loss. Instead, most are trying to find a “greater fool” to purchase the bonds at even higher prices. While the European intervention is certainly disconcerting, Japan has taken quantitative easing to an entirely new level. According to the Wall Street Journal, since April 2013 the Bank of Japan has purchased Japanese stocks (via ETFs) on 76% of the days the market has opened lower in an effort to prop up prices. The BoJ is also the largest holder of Japanese government bonds.
The miniscule yields found in Japan, Europe and elsewhere have made U.S. government bond yields in the low-single-digits seem relatively attractive, and investors plowed into Treasuries in the first quarter. After defying the forecasts of nearly all market prognosticators in 2014, Treasury bond yields sank early in 2015. The 30-year bond yield continued its descent in January, hitting new all-time lows on several trading days before reaching 2.22% on January 30th. To illustrate a 30-year bond’s sensitivity to interest rates, the roughly 0.53% decline in rates in January translated into a price gain of more than 11%.3 The entire rally and more was erased in February as investors became concerned about a potential Fed rate hike occurring in the summer. Treasuries rallied in the last few weeks of the quarter to register moderate gains, but clearly the ride was anything but smooth.
Broad fixed income markets benefited from the rally in government bonds. The Barclays U.S. Aggregate Bond Index, which is representative of the investment grade bond market as a whole (and includes a large allocation to U.S. Treasuries) rose 1.61% in the first quarter of 2015. Investment grade corporate bonds, as measured by the BofA/ML Corporate Index, rose 2.26% as a result of lower risk-free rates and tighter spreads. High-yield bonds outperformed both indexes in the quarter and
2 I know the term is absurdly overused, but we really are in uncharted waters.
3 Benchmark Treasury bond: 3% due 11/15/2044
Intrepid Income Fund
experienced less volatility as spread compression helped to offset the jump in rates in February. The BofA/ML High Yield Master II Index (the “Index”) rose 2.54% in the quarter. High-yield funds have experienced significant inflows in the last few months, which has forced portfolio managers to put cash to work regardless of fundamental credit quality. This demand for bonds always favors borrowers. Moody’s recently reported that the covenant quality of bonds issued in February was at the weakest level the firm had ever seen. Nearly half of high-yield corporate bonds issued during the month were “covenant-lite,” which means there were minimal protections to limit actions such as the incurrence of additional debt.
The Intrepid Income Fund (the “Fund”) returned 1.45% in the quarter. Our invested assets outperformed the Index in the period, but our large cash allocation tempered the Fund’s results. While we believe we have constructed a portfolio of attractively-priced securities, we continue to have difficulty finding new opportunities. The Fund’s large cash balance reflects our disciplined investment strategy. If we cannot uncover mispriced securities, we will simply hold cash.
The top contributor of the first quarter was Northern Oil & Gas 8.000% due 6/01/2020. Readers might recall that Northern happened to be our largest detractor in the full year and fourth quarter of 2014. The bonds of the oil producer were battered last year as the price of crude declined from over $100 per barrel (bbl) to under $50. As was discussed extensively in last quarter’s commentary, we believed investors were overlooking two critical points: 1) the large hedging position that locked in most of the company’s 2015 production at $90/bbl, and 2) the significant value of the producing reserves, even assuming low oil prices in perpetuity. When the dust had settled (oil finally stabilized around $45/bbl) and investors began to sort through the wreckage, we believe some came to appreciate these points and realized Northern’s bonds were trading at unreasonably low levels. The bonds returned nearly 20% in the first quarter despite oil prices remaining range-bound at around $50/bbl, and the notes are now trading above levels last experienced in November of 2014, when oil prices were around $75/bbl. While we took the opportunity to rebalance the position as the price rose, Northern continues to be a core position.
Our positions in AuRico Gold and PHI, Inc. were the Fund’s second and third largest contributors to first quarter performance. Both bonds were negative contributors in the fourth quarter due to each company’s exposure to commodity prices. AuRico is a Canadian gold miner, and spot gold prices tumbled in the second half of 2014. While gold prices were volatile in the first quarter, the March 31st spot price was slightly higher than the price on December 31st. We believe investors became more comfortable with the quality of AuRico’s primary mine, which has been in start-up phase. The ramp-up of the mine has so far exceeded management’s targets. PHI is a provider of helicopter transportation services to the offshore oil and gas industry and also supports the healthcare industry with an air ambulance business. The company’s bonds probably benefited from the stabilization of oil prices, and perhaps due to
Intrepid Income Fund
positive comments industry executives have made on prospects for the Gulf of Mexico, PHI’s primary region of operation in the oil and gas business.
The Fund had only one material detractor in the first quarter, EZCORP’s 2.125% convertible bonds due 6/15/2019, which happened to be the top contributor in the fourth quarter of 2014. The convertible bonds fell about 10 points as the company’s equity sold off sharply. The firm’s fourth quarter earnings were pressured by lower gold prices and weakness in the unsecured lending (payday loan) business, neither of which should have been a surprise to investors. Nevertheless, the stock sold off about 20%, which reduced the value of the convertible feature of our bonds. The stock fell sharply again later in the first quarter after the Consumer Financial Protection Bureau (CFPB) announced strict rules that many believe will shrink the entire payday loan industry to a fraction of its current size. The new rules will definitely reduce EZCORP’s earnings power, but we have never relied on the payday loan business to support the credit quality. We estimate that the company’s payday loan business represents only about one-third of normalized earnings, and the pawn earnings power and external investments easily support the credit quality of the issue, in our opinion. When we initially purchased the convertible bonds, we ignored any value the convertible feature might have; that is, we viewed the issue as a straight bond and assessed the yield relative to the company’s credit risk. We still believe the yield offered by the notes is attractive in spite of the recent negative events.
Portfolio activity was minimal in the first quarter, as we continue to have difficulty finding attractively-priced securities. The only significant purchase was the completion of our position in Teleflex 6.875% due 6/01/2019, which is now one of our largest holdings. Teleflex is a global provider of medical products primarily used in critical care and surgical applications. The company’s products include central venous and peripherally inserted central catheters, endotracheal and laryngoscopy products, and closure products. The vast majority of the company’s products are single-use, so revenues are highly recurring. Teleflex has a strong balance sheet, but management has historically used debt to fund acquisitions. However, we are not overly concerned about the risk of an overleveraged balance sheet. Management’s M&A track record is strong, and it has not sacrificed credit quality to complete a purchase. We believe the notes offer an attractive risk-adjusted return but are likely to be called in June of 2015 if the high-yield market maintains its strength.
In past updates we mentioned that we expected some of our holdings to be called by their issuers in early 2015, and in the absence of new opportunities cash levels would likely increase. Two of our positions were called in their entirety in the first quarter: Oshkosh 8.500% due 3/01/2020 and Speedway Motorsports 6.750% due 2/01/2019. Taken together, these issues constituted about 6% of the Fund’s assets. We expect some moderate call activity through the summer, which will lead to higher cash balances in the absence of attractive investment opportunities.
Intrepid Income Fund
Our ultimate objective is to offer an attractive risk-adjusted return over a full market cycle. However, paying too much for even the highest-quality businesses will not lead to a favorable outcome. The only thing we can directly control in the investment process is the price we pay. If we don’t believe we are being compensated to bear an investment’s risks, we will simply hold cash and wait for better opportunities. Following this strict discipline during a time when fixed income yields hit new lows seemingly every day has kept the Fund’s cash balance elevated for longer than we ever anticipated. Despite the perceived reputational risks that come with breaking away from the “safety” of the herd, we are as committed as ever to maintaining the integrity of the investment process. We are eagerly awaiting the opportunity to put capital to work in a more attractive environment. Thank you for your investment.
Sincerely,
Jason Lazarus, CFA
Intrepid Income Portfolio Manager
Must be preceded or accompanied by a current prospectus.
Mutual fund investing involves risk. Principal loss is possible. Investments in debt securities typically decrease in value when interest rates rise. The risk is generally greater for longer term debt securities. Investments by the Fund in lower-rated and non-rated securities present a greater risk of loss to principal and interest than higher rated securities. The Fund is non-diversified, meaning it may concentrate its assets in fewer individual holdings than a diversified fund. Therefore, the Fund is more exposed to individual securities volatility than a diversified fund. The Fund may invest in foreign securities which involve greater volatility and political, economic and currency risks and differences in accounting methods.
The Bank of America Merrill Lynch High Yield Master II Index (BAML High Yield Index) is Bank of America Merrill Lynch’s broadest high yield index, and as such is comparable with the broad indices published by other investment banks. Bank of America Merrill Lynch US Corporate Index (BAML Corporate Index) is an unmanaged index of U. S. dollar denominated investment grade corporate debt securities publicly issued in the U.S. domestic market with at least one year remaining term to final maturity. Barclays Capital U.S. Aggregate Bond Index is an index representing about 8,200 fixed income securities. To be included in the index, bonds must be rated investment grade by Moody’s and S&P. You cannot invest directly in an index.
Free Cash Flow measures the cash generating capability of a company by subtracting capital expenditures from cash flow from operations. EBITDA is calculated as the company’s Earnings, Before Interest, Taxes, Depreciation and Amortization. M&A refers to Mergers and Acquisitions. Yield-to-maturity is the rate of return anticipated on a bond if it is held until the maturity date and all coupons are reinvested at a similar rate. A Risk-Free Rate represents the interest an investor would expect from an absolutely risk-free investment over a specified period of time.
Fund holdings and sector allocation are subject to change at any time and should not be considered recommendation to buy or sell any security. Please see the Schedule of Investments for a complete list of Fund Holdings.
Opinions expressed are subject to change, are not guaranteed and should not be considered investment advice or recommendations to buy or sell any security.
The Intrepid Capital Funds are distributed by Quasar Distributors, LLC.
Intrepid Disciplined Value Fund
April 1, 2015
“Just keep matriculatin’ the ball down the field boys.”
-Hall of Fame Football Coach Hank Stram
 | |
| Greg Estes, | |
| Disciplined Value Fund | |
| Portfolio Manager | |
Dear Fellow Shareholders,
The quote above seems appropriate to us because it matches our goal of participating in up markets by making progress in challenging times. And these are difficult times for the value investor, as shown by the Intrepid Disciplined Value Fund’s high cash level of 49.1%. For the quarter, the Intrepid Disciplined Value Fund (“The Fund”) returned 1.52% versus the S&P 500 Index’s return of 0.95% and the Russell 3000 Index’s return of 1.80%. Because this quarter end is also the semi-annual mark for the Fund’s fiscal year, we note that the six month return for the Fund was 3.75% versus 5.93% for the S&P 500 and 7.13% for the Russell 3000.
The tough environment that we are witnessing now is evident not only in the Fund’s cash level, but also in stock prices. We are not holding this level of cash just for the fun of it. Rather, we cannot find many individual stocks to purchase. We believe that the market has benefitted from an extraordinarily accommodating Federal Reserve policy that has created excess money chasing relatively few investable opportunities. This cash cannot go into Treasury or high grade bonds with their near zero rates, so it goes into riskier assets such as stocks. Now, Fed Chairwoman Janet Yellen has finally changed that language pertaining to rate increases. In our mind, the language has gone from “wait and see” to a “definitely maybe” by year end. Such a change in language has done nothing really to this bull market. As a case in point, the current median enterprise value-to-EBIT (earnings before interest and taxes) multiple for non-financial companies in the Russell 3000 Index is 21.3 times. Typically, we view this multiple as being more helpful than the price-to-earnings ratio because companies have less room to manipulate their EBIT than they might for bottom-line GAAP earnings. On average, we are looking for businesses with EV to EBIT multiples less than ten. When the median EV/EBIT is over twenty, it makes it incredibly hard to find much worthwhile in which to invest.
Out of curiosity, we looked a bit further into the Russell 3000 Index’s component stocks. Of the 2,373 non-financial companies in the index, only 212 – less than 10% – have an EV/EBIT multiple below 10. Of those select few companies, 55 are energy companies, which we mention because EV/EBIT multiples are based upon a company’s earnings over the last twelve months. Given the significant drop in the price of oil that is just now beginning to impact these companies’ financial statements, EBIT over the next twelve months is bound to be much lower than over the trailing twelve months, which implies richer multiples going forward. What we are left with is
Intrepid Disciplined Value Fund
a remnant of relatively few potentially cheap stocks. In many cases, we believe that these cheaper companies have problems that make purchase too risky. To use a fishing analogy, the pond in which we fish has shrunk drastically due to a record-long drought.
Despite the difficulty in finding many ideas for investment, we have nonetheless been able to acquire a couple of stocks, but each new addition highlights our previous point: the candidates for investment typically have problems that we need to vet. For the quarter, we added Corus Entertainment (Ticker: CJR/B), a Canadian media company, in late March. We believe that there is a lot to like about this business, which owns some of the top-rated cable networks in Canada, such as YTV (a children’s network) and W Network, which is the leading women’s network in Canada. However, the price has suffered as Canada’s regulatory authority, the Canadian Radio-Television and Telecommunications Commission (CRTC), recently announced a roadmap to shift towards unbundling of channels, sometimes called pick-and-pay. This announcement caused a heightened level of uncertainty among Canadian media companies, which impacted the share price of Corus. In our minds, the share price was worth the uncertainty.
In the case of SanDisk (ticker: SNDK), we were early in establishing a position. Earlier in the quarter, the company, a leading manufacturer of flash media storage products, announced that it was having some inventory issues as it had to temporarily halt production at one of its fabrication plants. The selloff at that point made the stock more appealing to us. The company is one of the market-leaders in flash storage and it has a partnership with Toshiba, which means it has a captive supply of flash chips to produce its products. In addition, we believe that there will be less commoditization for newer 3D flash products, which are more difficult to produce than today’s standard two-dimensional offerings. After the sell-off earlier in the quarter, we bought shares, but our timing was not perfect. The company later announced that weakening sales to businesses and product qualification delays would hurt its sales for the next quarter and by extension the full year. The subsequent stock price reaction meant that SanDisk was our bottom contributor for the quarter. However, we are taking a longer view of the company’s prospects and have shored up our position.
Our other bottom contributors for the quarter were Mattel (ticker: MAT) and Microsoft (ticker: MSFT). In both cases, the market was disappointed with their respective earnings announcements and weaker outlooks in January. In the case of Mattel, toy sales for the company’s iconic Barbie brand have been weak. That, along with inventory issues, has left the stock with many doubters. For Microsoft, the company is shifting from a transactional model to a recurring revenue model. In the case of the transactional model, the user would purchase Microsoft’s Office product or its Window operating system once. In the recurring revenue model, the user effectively rents these products, which generates more of a stable recurring revenue stream for the company. In addition to this shift, which has increased investor uncertainty, the company is seeing a move towards its cloud-based services as well as
Intrepid Disciplined Value Fund
the end of a computer refresh cycle for businesses, both of which could potentially increase earnings volatility. With fewer expected commercial PC purchases, the growth of software license sales is likely to slow. Our view of both Mattel and Microsoft remains positive for the long-term.
Our top performers include a retailer, a money transfer business, and two lab service providers. American Eagle Outfitters (ticker: AEO) has benefitted from a strengthening dollar, which has reduced its material costs, while its own store sales have improved (most of which are domestic). Readers may recall that this stock had been among our bottom performers for a while. In this case, our patience paid off. We exited the position during the quarter when the price reached our intrinsic value estimate. For Western Union (ticker: WU), the market appears to be gaining confidence that pricing is stabilizing and that management’s initiatives to reduce costs will improve its bottom line. Finally, in a near tie for third place contributor, LabCorp (ticker: LH) and Quest Diagnostics (ticker: DGX) have both shown improved volume numbers as more patients are getting lab orders filled. LabCorp is also acquiring Covance (ticker: CVD), which is a contract research organization (CRO) that conducts outsourced clinical trials for pharmaceutical companies that are testing new drugs.
We sold a number of positions from the Fund during the quarter, including Ipsos (ticker: IPS FP), Aspen Insurance (ticker: AHL), Newfield Exploration (ticker: NFX), and SM Energy (ticker: SM). In addition, we exited Staples (ticker: SPLS), which announced its offer to take over Office Depot (ticker: ODP). This marked the end of our second foray into Staples (we owned it first back in 2012-2013). In all of these cases, the positions were sold because the stock price had reached our intrinsic value calculations. Given the increased sale activity, our cash position rose from last quarter end.
We close this letter as we typically do by citing the average security discount within the Fund, which is 12%. This is our own internal statistic in which we compare each stock within the Fund to our own corresponding estimate of its intrinsic value. Stocks that trade below what we believe they are worth are trading at a discount. The average is influenced by the size and frequency of these discounts. As one might expect, the level of the average discount is not very big, which we think is the result of a six year bull market. Our job is to find stocks trading at meaningful discounts, and we will continue to look for them, as difficult as it might be at this time. We thank you for investing alongside us.
Sincerely,
Greg Estes, CFA
Intrepid Disciplined Value Fund Portfolio Manager
Intrepid Disciplined Value Fund
Must be preceded or accompanied by a current prospectus.
Mutual fund investing involves risk. Principal loss is possible. The Fund is subject to special risks including volatility due to investments in smaller and medium sized companies, which involve additional risks such as limited liquidity and greater volatility. The Fund is considered non-diversified as a result of limiting its holdings to a relatively small number of positions and may be more exposed to individual stock volatility than a diversified fund. The Fund may invest in foreign securities which involve greater volatility and political, economic and currency risks and differences in accounting methods.
Prior to April 1, 2013, the Fund was named the Intrepid All Cap Fund.
The S&P 500 Index is a broad based unmanaged index of 500 stocks, which is widely recognized as representative of the equity market in general. The Russell 3000 Index is an index representing the largest 3,000 U.S. companies representing approximately 98% of the investable U.S. equity market. You cannot invest directly in an index.
EV/EBIT is the ratio of a company’s enterprise value (EV) to its earnings before interest and taxes (EBIT). Enterprise Value equals market capitalization plus debt minus cash. Price-to-earnings (P/E) Ratio is a valuation ratio of a company’s current share price compared to its per-share earnings. GAAP (Generally Accepted Accounting Principles) are the standard framework of guidelines for financial accounting used in any given jurisdiction.
Fund holdings and sector allocation are subject to change at any time and should not be considered recommendation to buy or sell any security. Please see the Schedule of Investments for a complete list of Fund Holdings.
Opinions expressed are subject to change, are not guaranteed and should not be considered investment advice or recommendations to buy or sell any security.
The Intrepid Capital Funds are distributed by Quasar Distributors, LLC.
Intrepid International Fund
April 1, 2015
 | |
| Ben Franklin, | |
| International Fund | |
| Portfolio Manager | |
Dear Fellow Shareholders,
Welcome to the first quarterly commentary for the Intrepid International Fund (the “Fund”). For those who are not familiar with the Fund, let me briefly explain our philosophy when investing internationally. To put it plainly, it’s very similar to our domestic process. We are typically looking for a high quality business trading at a discount to intrinsic value, and we will also search for other potentially mispriced securities. In our opinion, in today’s environment across the globe, most high quality businesses are not trading at bargain prices. We have, however, been able to find some smaller investment ideas that we believe others have overlooked.
During the first quarter of 2015, international securities continued to rise and the MSCI EAFE Index increased 4.88%. As reported on the front page of the Wall Street Journal, at least 17 stock indexes hit record highs in the first quarter. We believe securities are increasing in price due to easy-money policies across the globe. Interest rates are close to zero (and in some cases below zero!), enticing investors to look outside of fixed income securities if they want any potential return. To some, stocks may look like the next logical place to go for big returns; however, prices of equities have been bid to, as mentioned above, record highs, making positive future performance challenging.
Our performance for the quarter was -2.5%. During the first month and a half of the year, we were left unhedged due to unforeseen delays by third party partners in processing paperwork to establish a hedging account. As described in our prospectus, we will typically be hedged. The dollar soared during this unhedged period as the European Central Bank (ECB) cranked up the printing presses to purchase government bonds, causing the euro to be especially weak. The currency exposure of our foreign securities alone dinged performance for the first month and a half by over 2%. By the middle of February we were able to trade futures, and did so right away. This turned out to be beneficial, as the dollar continued to strengthen. The euro has declined by 13% year-to-date and now sits only $0.07 away from parity with the U.S. Dollar. We are invested in countries with currencies other than the euro, all of which declined in the quarter with the belief that the U.S. Federal Reserve will likely raise interest rates.
The largest three detractors to performance for the quarter were Corus Entertainment (ticker: CJR/B CN), Programmed Maintenance Services (ticker: PRG AU), and Dundee Corp (ticker: DC/A CN). Corus Entertainment suffered from an announcement by the Canadian Radio-television and Telecommunications Commission (CRTC) that requires television broadcasters to offer a “skinny basic”
Intrepid International Fund
cable package for $25, and this will not include Corus’s children’s channels. The decision is part of a shift toward pick-and-pay, whereby consumers have the option to order their television channels one-by-one, instead of in a group. The announcement was not a surprise to us; however, the stock reacted negatively to the news. You can find a more detailed explanation in the commentary for the Intrepid Small Cap Fund.
Programmed Maintenance Services is an Australian firm that provides maintenance services, as well as supplies the Australian market with labor. The stock has been volatile around a potential merger with a competitor, Skilled Group (SKE AU). Programmed Maintenance Services’ merger proposal was shut down by Skilled Group. Now the market is trying to guess if a new proposal will be attempted and according to the stock price movements, the market appears to believe a merger would be beneficial. However, we believe that even if a new merger is not proposed, Programmed Maintenance Services is still worth significantly more than where it is currently trading. Currency played a large part in the negative contribution of the security as the total return for the stock in local currency was -3.3%, compared to -9.8% in USD.
Dundee is a Canadian holding company with investments in a diverse set of businesses, including the currently weak energy sector. While energy is only a minority of the consolidated business, the company has been, in our opinion, unduly punished for these holdings. The company also has exposure to a public Canadian REIT, DREAM Unlimited (ticker: DRM CN), which has seen its stock price decline in recent months. These negative aspects have reduced our appraised value for the holding company; however, the stock is still trading at a significant discount to book value, even adjusting for DREAM’s market price and assuming the energy holdings are worthless.
The top equity contributors to the fund performance for the quarter were Quarto Group (ticker: QRT LN) and GUD Holdings (ticker: GUD AU). Quarto Group is a small illustrated book publisher. They released mid-year results back in August 2014 that were poor and the stock suffered. These results were not disappointing to us as the business is very seasonal, with the back half of the fiscal year much more important due to more business being conducted then. Seasonality has been increasing lately, causing first half results to continue to trend poorly while the latter half makes up the shortfall. Additionally, one of the company’s wholesalers filed for bankruptcy, disrupting business in the short-run. However, management began a direct relationship with their customers and cut out the middle man, which we see as a long-term positive development for the company despite the short-term pain. At the end of March, the company reported earnings which showed an improvement and the stock reacted positively.
GUD Holdings is an Australian firm that manages a variety of businesses but has historically been known for marketing and selling consumer brands such as Sunbeam and Oates products. The company’s consumer businesses have suffered in recent times; however, we believe the diamond in this rough is their auto oil and air filter
Intrepid International Fund
business where they are a significant market leader. The company reported solid results in almost all of their business segments in January.
Securities that contributed/detracted from fund performance can be a complex matter when there are large swings in currencies like we have seen year-to-date. Securities that show a large loss in U.S. Dollars may have even been winners when hedging is factored in. In fact, while the total performance of the Fund was negative, the majority of the holdings were up in their local currency during the period.
The Intrepid International Fund will never look like the Index because we will look anywhere for ideas as the Fund is not limited to the large companies typically found in the Index. However, there are plenty of other places to find potential ideas. While we are disappointed with a negative number out of the gates, we must remember that one quarter is a poor measure of long-term performance. Additionally, we believe the primary contributor to the poor performance, currency swings, cannot be predicted consistently. Going forward, we will attempt to hedge much of the currency exposure.
To further highlight our value approach, I wanted to share a brief conversation I had during the quarter with Jean-Marie Eveillard, former portfolio manager of First Eagle Global. Jean-Marie asked me if my philosophy was closer to Warren Buffett’s or Ben Graham’s. Warren Buffett has, at least in his later years, been known for buying high-quality businesses, whereas Ben Graham (and Buffett in his early years) was focused primarily on buying cheap securities despite business quality. I believe the efficacy of Ben Graham’s philosophy has been downplayed by many in recent years due to Buffett’s shift away from it. However, just this year in Buffett’s shareholder letter, when discussing his investment philosophy in his early years when it was similar to Ben Graham’s, he stated, “My cigar-butt strategy worked very well while I was managing small sums. Indeed, the many dozens of free puffs I obtained in the 1950s made that decade by far the best of my life for both relative and absolute performance.” We don’t think either approach should be ignored. Ideally, we’d like to buy cheap high-quality businesses, but these are close to nonexistent in times when many indexes are hitting record highs. We have found a few, but it is increasingly difficult. Internationally, however, we have found a few securities that are cheap enough to warrant purchase. Buying at a significant discount to the net assets on the balance sheet provides us with what we believe is an adequate margin of safety. In fact, we’ve even been able to find at least one idea that is a ‘net-net’. This is virtually unheard of in the United States, as well as in larger companies in developed markets. However, when scouring small businesses in developed markets for value, these do come along occasionally. So is my philosophy closer to Warren Buffett or Ben Graham? My answer is: it depends on our estimated margin of safety. There are times when I would take a significantly undervalued security over a higher quality business trading at only a minor discount. I believe that keeping an open mind and not discriminating can produce better investment results.
Intrepid International Fund
Lastly, we believe that the small size of the Intrepid International Fund provides us with a competitive advantage. We can search for small companies that other larger investors would completely overlook due solely to the small size of the securities. This means less competition for us, and potentially more investable ideas as there are many more of these small businesses to rummage through in an effort to find strong investment results. Some may claim that, with thousands of international securities, there must be plenty of easy investment ideas out there. We believe there are some, but a rising tide lifts all ships and most of the few that are below water deserve to be there. We will continue to investigate each of these for the few that have some buoyancy. Thank you for your trust in Intrepid and our process; it’s a responsibility we don’t take lightly.
Thank you for your investment,
Ben Franklin, CFA
Intrepid International Fund Portfolio Manager
Must be preceded or accompanied by a current prospectus.
Mutual fund investing involves risk. Principal loss is possible. The Fund is subject to special risks including volatility due to investments in smaller companies, which involve additional risks such as limited liquidity and greater volatility. The Fund is considered non-diversified as a result of limiting its holdings to a relatively small number of positions and may be more exposed to individual stock volatility than a diversified fund. The Fund may invest in foreign securities which involve greater volatility and political, economic and currency risks and differences in accounting methods.
Short term performance, in particular, is not a good indication of the fund’s future performance, and an investment should not be made based solely on returns.
The MSCI EAFE Index is recognized as the pre-eminent benchmark in the United States to measure international equity performance. You cannot invest directly in an index.
Free Cash Flow measures the cash generating capability of a company by subtracting capital expenditures from cash flow from operations. EBITDA is calculated as the company’s Earnings, Before Interest, Taxes, Depreciation and Amortization. Net-Net is a value investing technique in which a company is valued solely on its net current assets. Book Value equals total assets minus intangible asset and liabilities. It refers to the total amount a company would be worth if it liquidated its assets and paid back all its liabilities. Margin of Safety is the difference between the estimated intrinsic value of a stock and its market price.
Fund holdings and sector allocation are subject to change at any time and should not be considered recommendation to buy or sell any security. Please see the Schedule of Investments for a complete list of Fund Holdings.
Opinions expressed are subject to change, are not guaranteed and should not be considered investment advice or recommendations to buy or sell any security.
The Intrepid Capital Funds are distributed by Quasar Distributors, LLC.
Intrepid Funds
EXPENSE EXAMPLE
March 31, 2015 (Unaudited)
As a shareholder of the Intrepid Capital Management Funds Trust (the “Funds”), you incur ongoing costs, including management fees; distribution and/or service fees; and other expenses incurred by the Funds. This example is intended to help you understand your ongoing costs (in dollars) of investing in the Funds and to compare costs with the ongoing costs of investing in other mutual funds.
The example is based on an investment of $1,000 invested at the beginning of the period and held the entire period of October 1, 2014 through March 31, 2015. For the Intrepid International Fund, the example represents the period from Fund inception, December 30, 2014 through March 31, 2015.
ACTUAL EXPENSES
The first line of the following table provides information about actual account values and actual expenses. Although the Funds charge no sales load or transaction fees, you will be assessed fees for outgoing wire transfers, returned checks or stop payment orders at prevailing rates charged by U.S. Bancorp Fund Services, LLC, the Funds’ transfer agent. If you request a redemption be made by wire transfer, currently a $15.00 fee is charged by the Funds’ transfer agent. To the extent that a Fund invests in shares of other investment companies as part of its investment strategy, you will indirectly bear your proportionate share of any fees and expenses charged by the underlying funds in which the Fund invests in addition to the expenses of the Fund. Actual expenses of the underlying funds are expected to vary among the various underlying funds. These expenses are not included in the following example. The example includes, but is not limited to, management fees, shareholder servicing fees, distribution fees, fund accounting, custody and transfer agent fees. However, the example below does not include portfolio trading commissions and related expenses, interest expense and other extraordinary expenses as determined under generally accepted accounting principles. You may use the information in this line, together with the amount you invested, to estimate the expenses that you paid over the period. Simply divide your account value by $1,000 (for example, an $8,600 account value divided by $1,000 = 8.6), then multiply the result by the number in the first line under the heading entitled “Expenses Paid During Period” to estimate the expenses you paid on your account during this period.
HYPOTHETICAL EXAMPLE FOR COMPARISON PURPOSES
The second line of the following table provides information about hypothetical account values and hypothetical expenses based on the Funds’ actual expense ratio and an assumed rate of return of 5% per year before expenses, which is not the Funds’ actual return. The hypothetical account values and expenses may not be used to estimate the actual ending account balance or expenses you paid for the period. You may use this information to compare the ongoing costs of investing in the Funds
Intrepid Funds
EXPENSE EXAMPLE (continued)
March 31, 2015 (Unaudited)
and other funds. To do so, compare this 5% hypothetical example with the 5% hypothetical examples that appear in the shareholder reports of the other funds.
Please note that the expenses shown in the table are meant to highlight your ongoing costs only and do not reflect any transactional costs, such as sales charges (loads), redemption fees, or exchange fees. Therefore, the second line of the table is useful in comparing ongoing costs only, and will not help you determine the relative costs of owning different funds. In addition, if these transactional costs were included, your costs would have been higher.
INTREPID CAPITAL FUND – INVESTOR CLASS
| | | | Expenses Paid |
| | Beginning | Ending | During Period* |
| | Account Value | Account Value | October 1, 2014 - |
| | October 1, 2014 | March 31, 2015 | March 31, 2015 |
| Actual | $1,000.00 | $1,009.50 | $7.01 |
| Hypothetical (5% return | | | |
| before expenses) | 1,000.00 | 1,017.95 | 7.04 |
| * | Expenses are equal to the Fund’s annualized expense ratio of 1.40%, multiplied by the average account value over the period, multiplied by 182/365 to reflect the period. |
INTREPID CAPITAL FUND – INSTITUTIONAL CLASS
| | | | Expenses Paid |
| | Beginning | Ending | During Period* |
| | Account Value | Account Value | October 1, 2014 - |
| | October 1, 2014 | March 31, 2015 | March 31, 2015 |
| Actual | $1,000.00 | $1,010.70 | $5.76 |
| Hypothetical (5% return | | | |
| before expenses) | 1,000.00 | 1,019.20 | 5.79 |
| * | Expenses are equal to the Fund’s annualized expense ratio of 1.15%, multiplied by the average account value over the period, multiplied by 182/365 to reflect the period. |
Intrepid Funds
EXPENSE EXAMPLE (continued)
March 31, 2015 (Unaudited)
INTREPID SMALL CAP FUND – INVESTOR CLASS
| | | | Expenses Paid |
| | Beginning | Ending | During Period* |
| | Account Value | Account Value | October 1, 2014 - |
| | October 1, 2014 | March 31, 2015 | March 31, 2015 |
| Actual | $1,000.00 | $ 989.00 | $6.94 |
| Hypothetical (5% return | | | |
| before expenses) | 1,000.00 | 1,017.95 | 7.04 |
| * | Expenses are equal to the Fund’s annualized expense ratio of 1.40%, multiplied by the average account value over the period, multiplied by 182/365 to reflect the period. |
INTREPID SMALL CAP FUND – INSTITUTIONAL CLASS
| | | | Expenses Paid |
| | Beginning | Ending | During Period* |
| | Account Value | Account Value | October 1, 2014 - |
| | October 1, 2014 | March 31, 2015 | March 31, 2015 |
| Actual | $1,000.00 | $ 989.80 | $5.71 |
| Hypothetical (5% return | | | |
| before expenses) | 1,000.00 | 1,019.20 | 5.79 |
| * | Expenses are equal to the Fund’s annualized expense ratio of 1.15%, multiplied by the average account value over the period, multiplied by 182/365 to reflect the period. |
INTREPID INCOME FUND
| | | | Expenses Paid |
| | Beginning | Ending | During Period* |
| | Account Value | Account Value | October 1, 2014 - |
| | October 1, 2014 | March 31, 2015 | March 31, 2015 |
| Actual | $1,000.00 | $ 985.80 | $4.46 |
| Hypothetical (5% return | | | |
| before expenses) | 1,000.00 | 1,020.44 | 4.53 |
| * | Expenses are equal to the Fund’s annualized expense ratio of 0.90%, multiplied by the average account value over the period, multiplied by 182/365 to reflect the period. |
Intrepid Funds
EXPENSE EXAMPLE (continued)
March 31, 2015 (Unaudited)
INTREPID DISCIPLINED VALUE FUND
| | | | Expenses Paid |
| | Beginning | Ending | During Period* |
| | Account Value | Account Value | October 1, 2014 - |
| | October 1, 2014 | March 31, 2015 | March 31, 2015 |
| Actual | $1,000.00 | $1,037.50 | $6.60 |
| Hypothetical (5% return | | | |
| before expenses) | 1,000.00 | 1,018.45 | 6.54 |
| * | Expenses are equal to the Fund’s annualized expense ratio of 1.30%, multiplied by the average account value over the period, multiplied by 182/365 to reflect the period. |
INTREPID INTERNATIONAL FUND
| | | | Expenses Paid |
| | Beginning | Ending | During Period* |
| | Account Value | Account Value | December 30, 2014 - |
| | December 30, 2014 | March 31, 2015 | March 31, 2015 |
| Actual | $1,000.00 | $ 976.00 | $3.49 |
| Hypothetical (5% return | | | |
| before expenses) | 1,000.00 | 1,009.07 | 3.54 |
| * | Expenses are equal to the Fund’s annualized expense ratio of 1.40%, multiplied by the average account value over the period, multiplied by 92/365 to reflect the period. |
Intrepid Capital Fund
ALLOCATION OF PORTFOLIO HOLDINGS
March 31, 2015 (Unaudited)
INTREPID CAPITAL FUND
(as a % of total net assets)
COMPONENTS OF PORTFOLIO HOLDINGS
| Common Stocks | | $ | 235,481,577 | |
| Corporate Bonds | | | 94,424,708 | |
| Preferred Stock | | | 9,537,187 | |
| Convertible Bond | | | 7,191,885 | |
| Cash* | | | 63,829,350 | |
| | | $ | 410,464,707 | |
* Cash, cash equivalents and other assets less liabilities.
Intrepid Small Cap Fund
SECTOR ALLOCATION OF PORTFOLIO HOLDINGS
March 31, 2015 (Unaudited)
INTREPID SMALL CAP FUND
(as a % of total net assets)
COMPONENTS OF PORTFOLIO HOLDINGS
| Information Technology | | $ | 24,290,109 | |
| Industrials | | | 23,432,979 | |
| Financials | | | 20,146,793 | |
| Materials | | | 13,322,801 | |
| Energy | | | 13,023,064 | |
| Consumer Discretionary | | | 12,459,554 | |
| Health Care | | | 9,726,607 | |
| Cash* | | | 331,034,321 | |
| | | $ | 447,436,228 | |
The sector and industry classifications used in this report, use the Global Industry Classification Standard (GICS®). GICS® was developed by and/or is the exclusive property of MSCI, Inc. and Standard & Poor Financial Services LLC (“S&P”). GICS® is a service mark of MSCI and S&P and has been licensed for use by U.S. Bancorp Fund Services, LLC.
* Cash, cash equivalents and other assets less liabilities.
Intrepid Income Fund
ALLOCATION OF PORTFOLIO HOLDINGS
March 31, 2015 (Unaudited)
INTREPID INCOME FUND
(as a % of total net assets)
COMPONENTS OF PORTFOLIO HOLDINGS
| Corporate Bonds | | $ | 49,204,673 | |
| Preferred Stock | | | 4,397,703 | |
| Convertible Bond | | | 2,723,865 | |
| Common Stock | | | 1,032,980 | |
| Cash* | | | 40,493,114 | |
| | | $ | 97,852,335 | |
* Cash, cash equivalents and other assets less liabilities.
Intrepid Disciplined Value Fund
SECTOR ALLOCATION OF PORTFOLIO HOLDINGS
March 31, 2015 (Unaudited)
INTREPID DISCIPLINED VALUE FUND
(as a % of total net assets)
COMPONENTS OF PORTFOLIO HOLDINGS
| Information Technology | | $ | 6,525,727 | |
| Financials | | | 4,857,724 | |
| Consumer Discretionary | | | 4,195,297 | |
| Health Care | | | 3,219,583 | |
| Materials | �� | | 2,036,643 | |
| Telecommunication Services | | | 1,889,464 | |
| Energy | | | 1,310,980 | |
| Industrials | | | 422,752 | |
| Cash* | | | 23,596,841 | |
| | | $ | 48,055,011 | |
* Cash, cash equivalents and other assets less liabilities.
Intrepid International Fund
SECTOR ALLOCATION OF PORTFOLIO HOLDINGS
March 31, 2015 (Unaudited)
INTREPID INTERNATIONAL FUND
(as a % of total net assets)
COMPONENTS OF PORTFOLIO HOLDINGS
| Industrials | | $ | 769,048 | |
| Consumer Discretionary | | | 644,011 | |
| Health Care | | | 335,913 | |
| Financials | | | 188,793 | |
| Information Technology | | | 96,272 | |
| Materials | | | 78,917 | |
| Cash* | | | 2,779,964 | |
| | | $ | 4,892,918 | |
* Cash, cash equivalents and other assets less liabilities.
Intrepid Capital Fund
SCHEDULE OF INVESTMENTS
March 31, 2015 (Unaudited)
| | | Shares | | | Value | |
| COMMON STOCKS - 57.37% | | | | | | |
| | | | | | | |
| Capital Goods - 0.97% | | | | | | |
| Metka SA (a) | | | 424,884 | | | $ | 3,974,636 | |
| | | | | | | | | |
| Commercial & Professional Services - 2.62% | | | | | | | | |
| Tetra Tech, Inc. | | | 446,916 | | | | 10,734,922 | |
| | | | | | | | | |
| Consumer Durables & Apparel - 2.02% | | | | | | | | |
| Coach, Inc. | | | 114,000 | | | | 4,723,020 | |
| Mattel, Inc. | | | 156,000 | | | | 3,564,600 | |
| | | | | | | | 8,287,620 | |
| Diversified Financials - 13.52% | | | | | | | | |
| Berkshire Hathaway, Inc. - Class B (b) | | | 110,000 | | | | 15,875,200 | |
| Dundee Corp. - Class A (a)(b) | | | 923,025 | | | | 8,548,485 | |
| Leucadia National Corp. | | | 410,000 | | | | 9,138,900 | |
| Oaktree Capital Group LLC | | | 219,407 | | | | 11,334,565 | |
| The Bank Of New York Mellon Corp. | | | 263,000 | | | | 10,583,120 | |
| | | | | | | | 55,480,270 | |
| Energy - 4.45% | | | | | | | | |
| Contango Oil & Gas Co. (b) | | | 185,320 | | | | 4,077,040 | |
| Northern Oil and Gas, Inc. (b) | | | 778,040 | | | | 5,998,688 | |
| Patterson-UTI Energy, Inc. | | | 216,510 | | | | 4,064,975 | |
| Unit Corp. (b) | | | 147,768 | | | | 4,134,549 | |
| | | | | | | | 18,275,252 | |
| Health Care Equipment & Services - 5.74% | | | | | | | | |
| Express Scripts Holding Co. (b) | | | 166,000 | | | | 14,403,820 | |
| Intuitive Surgical, Inc. (b) | | | 18,090 | | | | 9,135,993 | |
| | | | | | | | 23,539,813 | |
| Materials - 2.23% | | | | | | | | |
| Hawkins, Inc. | | | 153,068 | | | | 5,815,054 | |
| Pan American Silver Corp. (a) | | | 381,000 | | | | 3,341,370 | |
| | | | | | | | 9,156,424 | |
| Media - 5.06% | | | | | | | | |
| Corus Entertainment, Inc. - Class B (a) | | | 828,605 | | | | 12,587,233 | |
| IPSOS (a) | | | 293,183 | | | | 8,199,490 | |
| | | | | | | | 20,786,723 | |
See notes to financial statements.
Intrepid Capital Fund
SCHEDULE OF INVESTMENTS (continued)
March 31, 2015 (Unaudited)
| | | Shares | | | Value | |
| COMMON STOCKS - 57.37% (continued) | | | | | | |
| | | | | | | |
| Pharmaceuticals, Biotechnology | | | | | | |
| & Life Sciences - 2.10% | | | | | | |
| Bio-Rad Laboratories, Inc. - Class A (b) | | | 63,814 | | | $ | 8,626,376 | |
| | | | | | | | | |
| Retailing - 2.42% | | | | | | | | |
| Hornbach Baumarkt AG (a) | | | 101,468 | | | | 3,802,241 | |
| Staples, Inc. | | | 377,350 | | | | 6,145,145 | |
| | | | | | | | 9,947,386 | |
| Software & Services - 7.84% | | | | | | | | |
| Amdocs Ltd. (a) | | | 233,400 | | | | 12,696,960 | |
| Microsoft Corp. | | | 138,000 | | | | 5,610,390 | |
| The Western Union Co. | | | 666,470 | | | | 13,869,241 | |
| | | | | | | | 32,176,591 | |
| Technology Hardware & Equipment - 4.25% | | | | | | | | |
| Cisco Systems, Inc. | | | 145,000 | | | | 3,991,125 | |
| Fabrinet (a)(b) | | | 310,585 | | | | 5,898,009 | |
| Ingram Micro, Inc. - Class A (b) | | | 301,106 | | | | 7,563,783 | |
| | | | | | | | 17,452,917 | |
| Telecommunication Services - 1.65% | | | | | | | | |
| Telephone & Data Systems, Inc. | | | 272,749 | | | | 6,791,450 | |
| | | | | | | | | |
| Transportation - 2.50% | | | | | | | | |
| Royal Mail PLC (a) | | | 1,576,332 | | | | 10,251,197 | |
| TOTAL COMMON STOCKS | | | | | | | | |
| (Cost $209,699,301) | | | | | | | 235,481,577 | |
| | | | | | | | | |
| PREFERRED STOCK - 2.32% | | | | | | | | |
| | | | | | | | | |
| Commercial & Professional Services - 2.32% | | | | | | | | |
| Pitney Bowes International Holdings, Inc. (c) | | | | | | | | |
| (Cost: $9,706,125; Original acquisition | | | | | | | | |
| date: 09/16/2014) | | | 9,000 | | | | 9,537,187 | |
| TOTAL PREFERRED STOCK | | | | | | | | |
| (Cost $9,706,125) | | | | | | | 9,537,187 | |
See notes to financial statements.
Intrepid Capital Fund
SCHEDULE OF INVESTMENTS (continued)
March 31, 2015 (Unaudited)
| | | Principal | | | | |
| | | Amount | | | Value | |
| CORPORATE BONDS - 23.01% | | | | | | |
| | | | | | | |
| Consumer Durables & Apparel - 2.69% | | | | | | |
| Smith & Wesson Holding Corp. | | | | | | |
| 5.875%, 06/15/2017 (c)(d) (Cost: $8,487,000; | | | | | | |
| Original acquisition date: 06/11/2013) | | $ | 8,487,000 | | | $ | 8,550,653 | |
| Smith & Wesson Holding Corp. | | | | | | | | |
| 5.000%, 07/15/2018 (c)(d) (Cost: $2,500,000; | | | | | | | | |
| Original acquisition date: 07/10/2014) | | | 2,500,000 | | | | 2,493,975 | |
| | | | | | | | 11,044,628 | |
| Consumer Services - 3.90% | | | | | | | | |
| Regis Corp. | | | | | | | | |
| 5.750%, 12/05/2017 (c)(d) (Cost: $8,275,000; | | | | | | | | |
| Original acquisition date: 11/27/2013) | | | 8,275,000 | | | | 8,295,687 | |
| Ruby Tuesday, Inc. | | | | | | | | |
| 7.625%, 05/15/2020 | | | 7,614,000 | | | | 7,728,210 | |
| | | | | | | | 16,023,897 | |
| Energy - 7.04% | | | | | | | | |
| EPL Oil & Gas, Inc. | | | | | | | | |
| 8.250%, 02/15/2018 | | | 8,355,000 | | | | 6,182,700 | |
| Era Group, Inc. | | | | | | | | |
| 7.750%, 12/15/2022 | | | 6,537,000 | | | | 6,308,205 | |
| Northern Oil and Gas, Inc. | | | | | | | | |
| 8.000%, 06/01/2020 | | | 9,103,000 | | | | 8,078,912 | |
| PetroQuest Energy, Inc. | | | | | | | | |
| 10.000%, 09/01/2017 | | | 3,386,000 | | | | 2,878,100 | |
| PHI, Inc. | | | | | | | | |
| 5.250%, 03/15/2019 | | | 6,018,000 | | | | 5,446,290 | |
| | | | | | | | 28,894,207 | |
| Food & Staples Retailing - 0.76% | | | | | | | | |
| SpartanNash Co. | | | | | | | | |
| 6.625%, 12/15/2016 (c)(d) (Cost: $3,087,541; | | | | | | | | |
| Original acquisition date: 02/06/2013) | | | 3,000,000 | | | | 3,105,000 | |
See notes to financial statements.
Intrepid Capital Fund
SCHEDULE OF INVESTMENTS (continued)
March 31, 2015 (Unaudited)
| | | Principal | | | | |
| | | Amount | | | Value | |
| CORPORATE BONDS - 23.01% (continued) | | | | | | |
| | | | | | | |
| Health Care Equipment & Services - 1.65% | | | | | | |
| Teleflex, Inc. | | | | | | |
| 6.875%, 06/01/2019 | | $ | 6,515,000 | | | $ | 6,791,888 | |
| | | | | | | | | |
| Household & Personal Products - 1.78% | | | | | | | | |
| Central Garden & Pet Co. | | | | | | | | |
| 8.250%, 03/01/2018 | | | 2,882,000 | | | | 2,948,661 | |
| The Scotts Miracle-Gro Co. | | | | | | | | |
| 6.625%, 12/15/2020 | | | 4,113,000 | | | | 4,339,215 | |
| | | | | | | | 7,287,876 | |
| Materials - 1.59% | | | | | | | | |
| AuRico Gold, Inc. | | | | | | | | |
| 7.750%, 04/01/2020 (a)(c) (Cost: $6,635,391; | | | | | | | | |
| Original acquisition date: 03/17/2014) | | | 6,675,000 | | | | 6,541,500 | |
| | | | | | | | | |
| Retailing - 2.05% | | | | | | | | |
| Brown Shoe Co., Inc. | | | | | | | | |
| 7.125%, 05/15/2019 | | | 8,080,000 | | | | 8,393,100 | |
| | | | | | | | | |
| Transportation - 1.55% | | | | | | | | |
| Quality Distribution LLC / QD Capital Corp. | | | | | | | | |
| 9.875%, 11/01/2018 | | | 6,055,000 | | | | 6,342,612 | |
| TOTAL CORPORATE BONDS | | | | | | | | |
| (Cost $99,149,379) | | | | | | | 94,424,708 | |
See notes to financial statements.
Intrepid Capital Fund
SCHEDULE OF INVESTMENTS (continued)
March 31, 2015 (Unaudited)
| | | Principal | | | | |
| | | Amount | | | Value | |
| CONVERTIBLE BOND - 1.75% | | | | | | |
| | | | | | | |
| Diversified Financials - 1.75% | | | | | | |
| Ezcorp, Inc. | | | | | | |
| 2.125%, 06/15/2019 (c) (Cost: $7,557,224; | | | | | | |
| Original acquisition date: 07/21/2014) | | $ | 8,486,000 | | | $ | 7,191,885 | |
| TOTAL CONVERTIBLE BOND | | | | | | | | |
| (Cost $7,557,224) | | | | | | | 7,191,885 | |
| Total Investments (Cost $326,112,029) - 84.45% | | | | | | | 346,635,357 | |
| Other Assets in Excess of Liabilities - 15.55% | | | | | | | 63,829,350 | |
| TOTAL NET ASSETS - 100.00% | | | | | | $ | 410,464,707 | |
Percentages are stated as a percent of net assets.
| (a) | Foreign issued security. |
| (b) | Non-income producing security. |
| (c) | The security, sold within the terms of a private placement memorandum, is exempt from registration upon resale under Rule 144A under the Securities Act of 1933. The aggregate value of restricted securities at March 31, 2015 was $45,715,887, which represented 11.14% of net assets. |
| (d) | Security is considered illiquid and may be difficult to sell. |
SCHEDULE OF OPEN FORWARD CURRENCY CONTRACTSMarch 31, 2015 (Unaudited)
| | | | Amount of | | Amount of | | |
| | | | Currency to | | Currency to | | |
| | Forward | | be Received | | be Delivered | | |
| Counterparty | Settlement | Currency to | in Local | Currency to | in Local | Unrealized | |
| of Contract | Date | be Received | Currency | be Delivered | Currency | Appreciation | |
| Wells Fargo | 04/14/15 | U.S. Dollars | 7,000,464 | Euro | 5,520,000 | $ | 1,063,973 | |
| | | | | | | | | |
| Morgan | | | | Canadian | | | | |
| Stanley | 08/24/15 | U.S. Dollars | 20,149,935 | Dollars | 25,400,000 | | 131,930 | |
| | | | | | | $ | 1,195,903 | |
See notes to financial statements.
Intrepid Small Cap Fund
SCHEDULE OF INVESTMENTS
March 31, 2015 (Unaudited)
| | | Shares | | | Value | |
| COMMON STOCKS - 21.55% | | | | | | |
| | | | | | | |
| Commercial & Professional Services - 3.05% | | | | | | |
| Tetra Tech, Inc. | | | 567,480 | | | $ | 13,630,870 | |
| | | | | | | | | |
| Diversified Financials - 2.23% | | | | | | | | |
| Dundee Corp. - Class A (a)(b) | | | 1,077,247 | | | | 9,976,793 | |
| | | | | | | | | |
| Energy - 2.91% | | | | | | | | |
| Contango Oil & Gas Co. (b) | | | 224,402 | | | | 4,936,844 | |
| Unit Corp. (b) | | | 289,000 | | | | 8,086,220 | |
| | | | | | | | 13,023,064 | |
| Materials - 2.98% | | | | | | | | |
| AuRico Gold, Inc. (a) | | | 1,155,290 | | | | 3,200,153 | |
| Pan American Silver Corp. (a) | | | 350,000 | | | | 3,069,500 | |
| Sandstorm Gold Ltd. (a)(b) | | | 2,150,350 | | | | 7,053,148 | |
| | | | | | | | 13,322,801 | |
| Media - 2.78% | | | | | | | | |
| Corus Entertainment, Inc. - Class B (a) | | | 820,200 | | | | 12,459,554 | |
| | | | | | | | | |
| Pharmaceuticals, Biotechnology | | | | | | | | |
| & Life Sciences - 2.17% | | | | | | | | |
| Bio-Rad Laboratories, Inc. - Class A (b) | | | 71,953 | | | | 9,726,606 | |
| | | | | | | | | |
| Software & Services - 3.95% | | | | | | | | |
| Amdocs Ltd. (a) | | | 254,296 | | | | 13,833,703 | |
| CSG Systems International, Inc. | | | 126,054 | | | | 3,830,781 | |
| | | | | | | | 17,664,484 | |
| Technology Hardware & Equipment - 1.48% | | | | | | | | |
| Ingram Micro, Inc. - Class A (b) | | | 263,759 | | | | 6,625,626 | |
| TOTAL COMMON STOCKS | | | | | | | | |
| (Cost $97,184,417) | | | | | | | 96,429,798 | |
| | | | | | | | | |
| PREFERRED STOCK - 2.19% | | | | | | | | |
| | | | | | | | | |
| Commercial & Professional Services - 2.19% | | | | | | | | |
| Pitney Bowes International | | | | | | | | |
| Holdings, Inc. (c) (Cost: $9,978,738; | | | | | | | | |
| Original acquisition date: 06/24/2014) | | | 9,250 | | | | 9,802,109 | |
| TOTAL PREFERRED STOCK (Cost $9,978,738) | | | | | | | 9,802,109 | |
See notes to financial statements.
Intrepid Small Cap Fund
SCHEDULE OF INVESTMENTS (continued)
March 31, 2015 (Unaudited)
| | | Principal | | | | |
| | | Amount | | | Value | |
| CONVERTIBLE BOND - 2.28% | | | | | | |
| | | | | | | |
| Diversified Financials - 2.28% | | | | | | |
| Ezcorp, Inc. | | | | | | |
| 2.125%, 06/15/2019 (c) (Cost: $10,247,648; | | | | | | |
| Original acquisition date: 10/08/2014) | | $ | 12,000,000 | | | $ | 10,170,000 | |
| TOTAL CONVERTIBLE BOND | | | | | | | | |
| (Cost $10,247,648) | | | | | | | 10,170,000 | |
| Total Investments (Cost $117,410,803) - 26.02% | | | | | | | 116,401,907 | |
| Other Assets in Excess of Liabilities - 73.98% | | | | | | | 331,034,321 | |
| TOTAL NET ASSETS - 100.00% | | | | | | $ | 447,436,228 | |
Percentages are stated as a percent of net assets.
| (a) | Foreign issued security. |
| (b) | Non-income producing security. |
| (c) | The security, sold within the terms of a private placement memorandum, is exempt from registration upon resale under Rule 144A under the Securities Act of 1933. The aggregate value of restricted securities at March 31, 2015 was $19,972,109, which represented 4.46% of net assets. |
SCHEDULE OF OPEN FORWARD CURRENCY CONTRACTS
March 31, 2015 (Unaudited)
| | | | Amount of | | Amount of | | |
| | | | Currency to | | Currency to | | |
| | Forward | | be Received | | be Delivered | Unrealized | |
| Counterparty | Settlement | Currency to | in Local | Currency to | in Local | Appreciation | |
| of Contract | Date | be Received | Currency | be Delivered | Currency | (Depreciation) | |
| Morgan | | | | U.S. | | | |
| Stanley | 05/29/15 | Euros | 3,385,000 | Dollars | 3,760,870 | $ | (118,254 | ) |
| | | | | | | | | |
| Morgan | | U.S. | | | | | | |
| Stanley | 05/29/15 | Dollars | 3,843,600 | Euro | 3,385,000 | | 200,984 | |
| | | | | | | | | |
| Morgan | | U.S. | | Canadian | | | | |
| Stanley | 07/28/15 | Dollars | 26,563,632 | Dollars | 33,000,000 | | 548,300 | |
| | | | | | | $ | 631,030 | |
See notes to financial statements.
Intrepid Income Fund
SCHEDULE OF INVESTMENTS
March 31, 2015 (Unaudited)
| | | Shares | | | Value | |
| COMMON STOCK - 1.06% | | | | | | |
| | | | | | | |
| Media - 1.06% | | | | | | |
| Corus Entertainment, Inc. - Class B (a) | | | 68,000 | | | $ | 1,032,980 | |
| TOTAL COMMON STOCK | | | | | | | | |
| (Cost $1,011,478) | | | | | | | 1,032,980 | |
| | | | | | | | | |
| PREFERRED STOCK - 4.49% | | | | | | | | |
| | | | | | | | | |
| Commercial & Professional Services - 4.49% | | | | | | | | |
| Pitney Bowes International | | | | | | | | |
| Holdings, Inc. (b) (Cost: $4,446,475; | | | | | | | | |
| Original acquisition date: 05/02/2014) | | | 4,150 | | | | 4,397,703 | |
| TOTAL PREFERRED STOCK | | | | | | | | |
| (Cost $4,446,475) | | | | | | | 4,397,703 | |
| | | | | | | | | |
| | | Principal | | | | | |
| | | Amount | | | Value | |
| CORPORATE BONDS - 50.29% | | | | | | | | |
| | | | | | | | | |
| Consumer Durables & Apparel - 4.81% | | | | | | | | |
| Smith & Wesson Holding Corp. | | | | | | | | |
| 5.875%, 06/15/2017 (b)(c) (Cost: $3,188,000; | | | | | | | | |
| Original acquisition date: 06/11/2013) | | $ | 3,188,000 | | | | 3,211,910 | |
| Smith & Wesson Holding Corp. | | | | | | | | |
| 5.000%, 07/15/2018 (b)(c) (Cost: $1,500,000; | | | | | | | | |
| Original acquisition date: 07/10/2014) | | | 1,500,000 | | | | 1,496,385 | |
| | | | | | | | 4,708,295 | |
| Consumer Services - 7.89% | | | | | | | | |
| Regis Corp. | | | | | | | | |
| 5.750%, 12/05/2017 (b)(c) (Cost: $4,225,000; | | | | | | | | |
| Original acquisition date: 11/27/2013) | | | 4,225,000 | | | | 4,235,563 | |
| Ruby Tuesday, Inc. | | | | | | | | |
| 7.625%, 05/15/2020 | | | 3,434,000 | | | | 3,485,510 | |
| | | | | | | | 7,721,073 | |
| Energy - 14.38% | | | | | | | | |
| EPL Oil & Gas, Inc. | | | | | | | | |
| 8.250%, 02/15/2018 | | | 4,744,000 | | | | 3,510,560 | |
| Era Group, Inc. | | | | | | | | |
| 7.750%, 12/15/2022 | | | 1,979,000 | | | | 1,909,735 | |
See notes to financial statements.
Intrepid Income Fund
SCHEDULE OF INVESTMENTS (continued)
March 31, 2015 (Unaudited)
| | | Principal | | | | |
| | | Amount | | | Value | |
| CORPORATE BONDS - 50.29% (continued) | | | | | | |
| | | | | | | |
| Energy - 14.38% (continued) | | | | | | |
| Northern Oil and Gas, Inc. | | | | | | |
| 8.000%, 06/01/2020 | | $ | 3,537,000 | | | $ | 3,139,087 | |
| PetroQuest Energy, Inc. | | | | | | | | |
| 10.000%, 09/01/2017 | | | 2,205,000 | | | | 1,874,250 | |
| PHI, Inc. | | | | | | | | |
| 5.250%, 03/15/2019 | | | 3,239,000 | | | | 2,931,295 | |
| Unit Corp. | | | | | | | | |
| 6.625%, 05/15/2021 | | | 750,000 | | | | 705,000 | |
| | | | | | | | 14,069,927 | |
| Food & Staples Retailing - 2.12% | | | | | | | | |
| SpartanNash Co. | | | | | | | | |
| 6.625%, 12/15/2016 (b)(c) (Cost: $2,058,361; | | | | | | | | |
| Original acquisition date: 02/06/2013) | | | 2,000,000 | | | | 2,070,000 | |
| | | | | | | | | |
| Health Care Equipment & Services - 4.23% | | | | | | | | |
| Teleflex, Inc. | | | | | | | | |
| 6.875%, 06/01/2019 | | | 3,974,000 | | | | 4,142,895 | |
| | | | | | | | | |
| Household & Personal Products - 3.60% | | | | | | | | |
| Central Garden and Pet Co. | | | | | | | | |
| 8.250%, 03/01/2018 | | | 1,884,000 | | | | 1,927,577 | |
| The Scotts Miracle-Gro Co. | | | | | | | | |
| 6.625%, 12/15/2020 | | | 1,513,000 | | | | 1,596,215 | |
| | | | | | | | 3,523,792 | |
| Materials - 3.23% | | | | | | | | |
| AuRico Gold, Inc. | | | | | | | | |
| 7.750%, 04/01/2020 (a)(b) (Cost: $3,205,858; | | | | | | | | |
| Original acquisition date: 03/17/2014) | | | 3,225,000 | | | | 3,160,500 | |
| | | | | | | | | |
| Retailing - 7.41% | | | | | | | | |
| Brown Shoe Co., Inc. | | | | | | | | |
| 7.125%, 05/15/2019 | | | 4,147,000 | | | | 4,307,696 | |
| Rent-A-Center, Inc. | | | | | | | | |
| 6.625%, 11/15/2020 | | | 2,000,000 | | | | 1,880,000 | |
| 4.750%, 05/01/2021 | | | 1,250,000 | | | | 1,062,500 | |
| | | | | | | | 7,250,196 | |
See notes to financial statements.
Intrepid Income Fund
SCHEDULE OF INVESTMENTS (continued)
March 31, 2015 (Unaudited)
| | | Principal | | | | |
| | | Amount | | | Value | |
| CORPORATE BONDS - 50.29% (continued) | | | | | | |
| | | | | | | |
| Transportation - 2.62% | | | | | | |
| Quality Distribution LLC / QD Capital Corp. | | | | | | |
| 9.875%, 11/01/2018 | | $ | 42,442,000 | | | $ | 2,557,995 | |
| TOTAL CORPORATE BONDS (Cost $51,965,338) | | | | | | | 49,204,673 | |
| | | | | | | | | |
| CONVERTIBLE BOND - 2.78% | | | | | | | | |
| | | | | | | | | |
| Diversified Financials - 2.78% | | | | | | | | |
| Ezcorp, Inc. | | | | | | | | |
| 2.125%, 06/15/2019 (b) (Cost: $2,848,906; | | | | | | | | |
| Original acquisition date: 07/21/2014) | | | 3,214,000 | | | | 2,723,865 | |
| TOTAL CONVERTIBLE BOND (Cost $2,848,906) | | | | | | | 2,723,865 | |
| Total Investments (Cost $60,272,197) - 58.62% | | | | | | | 57,359,221 | |
| Other Assets in Excess of Liabilities - 41.38% | | | | | | | 40,493,114 | |
| TOTAL NET ASSETS - 100.00% | | | | | | $ | 97,852,335 | |
Percentages are stated as a percent of net assets.
| (a) | Foreign issued security. |
| (b) | The security, sold within the terms of a private placement memorandum, is exempt from registration upon resale under Rule 144A under the Securities Act of 1933. The aggregate value of restricted securities at March 31, 2015 was $21,295,926, which represented 21.76% of net assets. |
| (c) | Security is considered illiquid and may be difficult to sell. |
SCHEDULE OF OPEN FORWARD CURRENCY CONTRACTS
March 31, 2015 (Unaudited)
| | | | Amount of | | Amount of | | |
| | | | Currency to | | Currency to | | |
| | Forward | | be Received | | be Delivered | | |
| Counterparty | Settlement | Currency to | in Local | Currency to | in Local | Unrealized | |
| of Contract | Date | be Received | Currency | be Delivered | Currency | Appreciation | |
| Wells | | Canadian | | | | | |
| Fargo | 09/09/15 | Dollars | 1,065,000 | U.S. Dollars | 829,439 | $ | 9,751 | |
| | | | | | | | | |
| Wells | | | | Canadian | | | | |
| Fargo | 09/09/15 | U.S. Dollars | 1,048,303 | Dollars | 1,313,000 | | 13,696 | |
| | | | | | | | | |
| Wells | | | | Canadian | | | | |
| Fargo | 09/09/15 | U.S. Dollars | 852,136 | Dollars | 1,065,000 | | 12,946 | |
| | | | | | | $ | 36,393 | |
See notes to financial statements.
Intrepid Disciplined Value Fund
SCHEDULE OF INVESTMENTS
March 31, 2015 (Unaudited)
| | | Shares | | | Value | |
| COMMON STOCKS - 50.90% | | | | | | |
| | | | | | | |
| Commercial & Professional Services - 0.88% | | | | | | |
| Tetra Tech, Inc. | | | 17,600 | | | $ | 422,752 | |
| | | | | | | | | |
| Consumer Durables & Apparel - 4.33% | | | | | | | | |
| Coach, Inc. | | | 27,700 | | | | 1,147,611 | |
| Mattel, Inc. | | | 40,900 | | | | 934,565 | |
| | | | | | | | 2,082,176 | |
| Diversified Financials - 10.11% | | | | | | | | |
| Leucadia National Corp. | | | 41,200 | | | | 918,348 | |
| Northern Trust Corp. | | | 18,000 | | | | 1,253,700 | |
| Oaktree Capital Group LLC | | | 28,300 | | | | 1,461,978 | |
| The Bank Of New York Mellon Corp. | | | 30,410 | | | | 1,223,698 | |
| | | | | | | | 4,857,724 | |
| Energy - 2.73% | | | | | | | | |
| Contango Oil & Gas Co. (a) | | | 31,610 | | | | 695,420 | |
| Unit Corp. (a) | | | 22,000 | | | | 615,560 | |
| | | | | | | | 1,310,980 | |
| Health Care Equipment & Services - 5.72% | | | | | | | | |
| Intuitive Surgical, Inc. (a) | | | 1,770 | | | | 893,903 | |
| Laboratory Corp. of America Holdings (a) | | | 5,950 | | | | 750,236 | |
| Quest Diagnostics, Inc. | | | 14,400 | | | | 1,106,640 | |
| | | | | | | | 2,750,779 | |
| Materials - 4.24% | | | | | | | | |
| AuRico Gold, Inc. (b) | | | 156,800 | | | | 434,336 | |
| Newmont Mining Corp. | | | 42,700 | | | | 927,017 | |
| Pan American Silver Corp. (b) | | | 77,000 | | | | 675,290 | |
| | | | | | | | 2,036,643 | |
| Media - 4.40% | | | | | | | | |
| Corus Entertainment, Inc. - Class B (b) | | | 100,400 | | | | 1,525,164 | |
| Quarto Group, Inc. | | | 222,674 | | | | 587,957 | |
| | | | | | | | 2,113,121 | |
| Pharmaceuticals, Biotechnology | | | | | | | | |
| & Life Sciences - 0.98% | | | | | | | | |
| Bio-Rad Laboratories, Inc. - Class A (a) | | | 3,468 | | | | 468,804 | |
See notes to financial statements.
Intrepid Disciplined Value Fund
SCHEDULE OF INVESTMENTS (continued)
March 31, 2015 (Unaudited)
| | | Shares | | | Value | |
| COMMON STOCKS - 50.90% (continued) | | | | | | |
| | | | | | | |
| Software & Services - 8.44% | | | | | | |
| Amdocs Ltd. (b) | | | 9,980 | | | $ | 542,912 | |
| CSG Systems International, Inc. | | | 16,715 | | | | 507,969 | |
| Microsoft Corp. | | | 22,130 | | | | 899,695 | |
| Teradata Corp. (a) | | | 29,300 | | | | 1,293,302 | |
| The Western Union Co. | | | 38,900 | | | | 809,509 | |
| | | | | | | | 4,053,387 | |
| Technology Hardware & Equipment - 5.14% | | | | | | | | |
| Apple, Inc. | | | 6,965 | | | | 866,655 | |
| Cisco Systems, Inc. | | | 16,500 | | | | 454,163 | |
| SanDisk Corp. | | | 18,100 | | | | 1,151,522 | |
| | | | | | | | 2,472,340 | |
| Telecommunication Services - 3.93% | | | | | | | | |
| Telephone & Data Systems, Inc. | | | 27,838 | | | | 693,166 | |
| Verizon Communications, Inc. | | | 24,600 | | | | 1,196,298 | |
| | | | | | | | 1,889,464 | |
| TOTAL COMMON STOCKS | | | | | | | | |
| (Cost $22,097,294) | | | | | | | 24,458,170 | |
| Total Investments | | | | | | | | |
| (Cost $22,097,294) - 50.90% | | | | | | | 24,458,170 | |
| Other Assets in Excess of Liabilities - 49.10% | | | | | | | 23,596,841 | |
| TOTAL NET ASSETS - 100.00% | | | | | | $ | 48,055,011 | |
Percentages are stated as a percent of net assets.
| (a) | Non-income producing security. |
| (b) | Foreign Issued Security. |
See notes to financial statements.
Intrepid International Fund
SCHEDULE OF INVESTMENTS
March 31, 2015 (Unaudited)
| | | Shares | | | Value | |
| COMMON STOCKS - 41.02% | | | | | | |
| | | | | | | |
| Australia - 15.06% | | | | | | |
| Coventry Group Ltd. | | | 116,127 | | | $ | 154,784 | |
| Data#3 Ltd. | | | 160,000 | | | | 96,272 | |
| Fantastic Holdings Ltd. | | | 23,667 | | | | 35,511 | |
| GUD Holdings Ltd. | | | 18,005 | | | | 112,999 | |
| Programmed Maintenance Services Ltd. | | | 108,745 | | | | 200,438 | |
| Vision Eye Institute Ltd. | | | 264,296 | | | | 136,885 | |
| | | | | | | | 736,889 | |
| Canada - 10.25% | | | | | | | | |
| Corus Entertainment, Inc. - Class B | | | 10,150 | | | | 154,187 | |
| Dundee Corp. - Class A (a) | | | 20,385 | | | | 188,793 | |
| Imvescor Restaurant Group Inc. | | | 61,000 | | | | 79,468 | |
| Sandstorm Gold Ltd. (a) | | | 24,060 | | | | 78,917 | |
| | | | | | | | 501,365 | |
| France - 1.91% | | | | | | | | |
| IPSOS | | | 824 | | | | 23,045 | |
| Vetoquinol SA | | | 1,815 | | | | 70,452 | |
| | | | | | | | 93,497 | |
| Germany - 6.33% | | | | | | | | |
| Balda AG (a) | | | 42,105 | | | | 128,576 | |
| Hornbach Baumarkt AG | | | 3,860 | | | | 144,643 | |
| KSB AG | | | 75 | | | | 36,435 | |
| | | | | | | | 309,654 | |
| Greece - 1.33% | | | | | | | | |
| Metka SA | | | 6,960 | | | | 65,108 | |
| | | | | | | | | |
| United Kingdom - 6.14% | | | | | | | | |
| Quarto Group, Inc. | | | 35,660 | | | | 94,158 | |
| Royal Mail PLC | | | 31,725 | | | | 206,314 | |
| | | | | | | | 300,472 | |
| TOTAL COMMON STOCKS | | | | | | | | |
| (Cost $2,121,291) | | | | | | | 2,006,985 | |
See notes to financial statements.
Intrepid International Fund
SCHEDULE OF INVESTMENTS (continued)
March 31, 2015 (Unaudited)
| | | Shares | | | Value | |
| PREFERRED STOCK - 2.16% | | | | | | |
| | | | | | | |
| United States - 2.16% | | | | | | |
| Pitney Bowes International | | | | | | |
| Holdings, Inc. (b) (Cost: $106,250; | | | | | | |
| Original acquisition date: 02/20/2015) | | | 100 | | | $ | 105,969 | |
| TOTAL PREFERRED STOCK | | | | | | | | |
| (Cost $106,250) | | | | | | | 105,969 | |
| Total Investments | | | | | | | | |
| (Cost $2,227,541) - 43.18% | | | | | | | 2,112,954 | |
| Other Assets in Excess of Liabilities - 56.82% | | | | | | | 2,779,964 | |
| TOTAL NET ASSETS - 100.00% | | | | | | $ | 4,892,918 | |
Percentages are stated as a percent of net assets.
| (a) | Non-income producing security. |
| (b) | The security, sold within the terms of a private placement memorandum, is exempt from registration upon resale under Rule 144A under the Securities Act of 1933. The aggregate value of restricted securities at March 31, 2015 was $105,969, which represented 2.16% of net assets. |
SCHEDULE OF OPEN FUTURES CONTRACTS
March 31, 2015 (Unaudited)
| | Number of | Notional | | | |
| | Contracts | Value in | | Unrealized | |
| Description | Sold | US Dollar | Settlement | Appreciation | |
| Australian Dollar Future | 9 | 682,290 | June 2015 | $ | 12,475 | |
| British Pound Future | 2 | 185,463 | June 2015 | | 4,039 | |
| Canadian Dollar Future | 5 | 394,600 | June 2015 | | 2,022 | |
| E-Micro Australian Dollar Future | 4 | 30,324 | June 2015 | | 275 | |
| E-Micro Canadian Dollar Future | 6 | 47,352 | June 2015 | | 107 | |
| E-Micro Euro Future | 7 | 94,098 | June 2015 | | 5,513 | |
| Euro E-Mini Future | 4 | 268,850 | June 2015 | | 16,357 | |
| Euro FX Future | 1 | 134,425 | June 2015 | | 8,301 | |
| E-Micro British Pound Future | 2 | 18,546 | June 2017 | | 631 | |
| | | | | $ | 49,720 | |
See notes to financial statements.
Intrepid Funds
STATEMENT OF ASSETS AND LIABILITIES
March 31, 2015 (Unaudited)
| | | Intrepid | | | Intrepid Small | | | Intrepid | |
| | | Capital Fund | | | Cap Fund | | | Income Fund | |
| ASSETS: | | | | | | | | | |
Investments, at value(1) | | $ | 346,635,357 | | | $ | 116,401,907 | | | $ | 57,359,221 | |
| Income receivable | | | 2,339,969 | | | | 131,672 | | | | 1,092,058 | |
| Receivable for fund shares sold | | | 368,246 | | | | 212,640 | | | | 29,975 | |
| Cash | | | 62,569,957 | | | | 331,539,097 | | | | 40,174,761 | |
| Appreciation on forward currency contracts | | | 1,195,903 | | | | 631,030 | | | | 36,393 | |
| Other assets | | | 51,530 | | | | 55,533 | | | | 13,138 | |
| Total assets | | | 413,160,962 | | | | 448,971,879 | | | | 98,705,546 | |
| LIABILITIES: | | | | | | | | | | | | |
| Payable for fund shares redeemed | | | 141,656 | | | | 826,989 | | | | 9,270 | |
| Payable for investment securities purchased | | | 1,997,867 | | | | — | | | | 731,271 | |
| Payable to Investment Adviser | | | 346,726 | | | | 378,932 | | | | 56,837 | |
| Payable to Trustees | | | 6,222 | | | | 10,241 | | | | 1,504 | |
| Accrued distribution fees | | | 36,378 | | | | 61,985 | | | | — | |
| Other expenses | | | 167,406 | | | | 257,504 | | | | 54,329 | |
| Total liabilities | | | 2,696,255 | | | | 1,535,651 | | | | 853,211 | |
| Total net assets | | $ | 410,464,707 | | | $ | 447,436,228 | | | $ | 97,852,335 | |
| NET ASSETS CONSIST OF: | | | | | | | | | | | | |
| Capital stock | | $ | 378,861,017 | | | $ | 428,777,498 | | | $ | 101,285,791 | |
| Accumulated net investment income (loss) | | | (416,548 | ) | | | (3,590,962 | ) | | | 144,835 | |
| Accumulated undistributed net realized | | | | | | | | | | | | |
| gain (loss) on investments | | | 10,302,032 | | | | 22,629,559 | | | | (701,312 | ) |
| Unrealized appreciation (depreciation) on: | | | | | | | | | | | | |
| Investments and foreign currency translation | | | 20,522,303 | | | | (1,010,897 | ) | | | (2,913,372 | ) |
| Forward currency contracts | | | 1,195,903 | | | | 631,030 | | | | 36,393 | |
| Total net assets | | $ | 410,464,707 | | | $ | 447,436,228 | | | $ | 97,852,335 | |
| Investor Class | | | | | | | | | | | | |
| Net Assets | | $ | 187,760,874 | | | $ | 321,461,034 | | | $ | — | |
| Shares outstanding | | | 16,204,794 | | | | 22,310,346 | | | | — | |
| Institutional Class | | | | | | | | | | | | |
| Net Assets | | | 222,703,833 | | | | 125,975,194 | | | | 97,852,335 | |
| Shares outstanding | | | 19,212,991 | | | | 8,590,450 | | | | 10,542,360 | |
| Total shares outstanding (unlimited | | | | | | | | | | | | |
| shares of no par value authorized) | | | 35,417,785 | | | | 30,900,796 | | | | 10,542,360 | |
| Investor Class Net asset value, offering | | | | | | | | | | | | |
and redemption price per share(2) | | $ | 11.59 | | | $ | 14.41 | | | $ | — | |
| Institutional Class Net asset value, offering | | | | | | | | | | | | |
and redemption price per share(2) | | $ | 11.59 | | | $ | 14.66 | | | $ | 9.28 | |
| | | | | | | | | | | | | |
(1) Cost of Investments | | $ | 326,112,029 | | | $ | 117,410,803 | | | $ | 60,272,197 | |
| (2) | If applicable, redemption price per share may be reduced by a 2.00% redemption fee for shares redeemed within 30 days of purchase. |
See notes to financial statements.
Intrepid Funds
STATEMENT OF ASSETS AND LIABILITIES (continued)
March 31, 2015 (Unaudited)
| | | Intrepid | | | Intrepid | |
| | | Disciplined | | | International | |
| | | Value Fund | | | Fund | |
| ASSETS: | | | | | | |
Investments, at value(1) | | $ | 24,458,170 | | | $ | 2,112,954 | |
| Income receivable | | | 11,654 | | | | 2,422 | |
| Receivable for fund shares sold | | | 11,913 | | | | 39,889 | |
| Cash | | | 23,755,082 | | | | 2,636,643 | |
| Deposit for futures at broker | | | — | | | | 91,547 | |
| Receivable from investment adviser | | | — | | | | 4,804 | |
| Variation margin receivable | | | — | | | | 5,813 | |
| Other assets | | | 15,075 | | | | 22,789 | |
| Total assets | | | 48,251,894 | | | | 4,916,861 | |
| LIABILITIES: | | | | | | | | |
| Payable for investment securities purchased | | | — | | | | 4,044 | |
| Payable to Investment Adviser | | | 41,374 | | | | — | |
| Payable to Trustees | | | 568 | | | | 91 | |
| Accrued distribution fees | | | 120,028 | | | | 954 | |
| Other expenses | | | 34,913 | | | | 18,854 | |
| Total liabilities | | | 196,883 | | | | 23,943 | |
| Total net assets | | $ | 48,055,011 | | | $ | 4,892,918 | |
| NET ASSETS CONSIST OF: | | | | | | | | |
| Capital stock | | $ | 43,422,950 | | | $ | 4,941,152 | |
| Accumulated net investment income (loss) | | | (121,400 | ) | | | 12,288 | |
| Accumulated undistributed net realized gain (loss) on investments | | | 2,392,643 | | | | 4,354 | |
| Unrealized appreciation (depreciation) on: | | | | | | | | |
| Investments and foreign currency translation | | | 2,360,818 | | | | (114,596 | ) |
| Futures contracts | | | — | | | | 49,720 | |
| Total net assets | | $ | 48,055,011 | | | $ | 4,892,918 | |
| Investor Class | | | | | | | | |
| Net Assets | | $ | 48,055,011 | | | $ | 4,892,918 | |
| Shares outstanding | | | 4,488,339 | | | | 501,454 | |
| Institutional Class | | | | | | | | |
| Net Assets | | | — | | | | — | |
| Shares outstanding | | | — | | | | — | |
| Total shares outstanding (unlimited | | | | | | | | |
| shares of no par value authorized) | | | 4,488,339 | | | | 501,454 | |
| Investor Class Net asset value, offering | | | | | | | | |
and redemption price per share(2) | | $ | 10.71 | | | $ | 9.76 | |
| Institutional Class Net asset value, offering | | | | | | | | |
and redemption price per share(2) | | | N/A | | | | N/A | |
| | | | | | | | | |
(1) Cost of Investments | | $ | 22,097,294 | | | $ | 2,227,541 | |
| (2) | If applicable, redemption price per share may be reduced by a 2.00% redemption fee for shares redeemed within 30 days of purchase. |
See notes to financial statements.
Intrepid Funds
STATEMENT OF OPERATIONS
For the period ended March 31, 2015 (Unaudited)
| | | Intrepid | | | Intrepid Small | | | Intrepid | |
| | | Capital Fund | | | Cap Fund | | | Income Fund | |
| INVESTMENT INCOME: | | | | | | | | | |
| Dividend income* | | $ | 1,699,579 | | | $ | 1,062,528 | | | $ | 141,931 | |
| Interest income* | | | 4,188,500 | | | | 285,409 | | | | 2,004,945 | |
| Total investment income | | | 5,888,079 | | | | 1,347,937 | | | | 2,146,876 | |
| Advisory fees (See Note 3) | | | 2,194,146 | | | | 2,848,946 | | | | 376,871 | |
| Distribution (12b-1) fees - | | | | | | | | | | | | |
| Investor Class Only (See Note 4) | | | 265,664 | | | | 477,271 | | | | — | |
| Administration fees | | | 158,152 | | | | 206,220 | | | | 36,279 | |
| Fund accounting fees | | | 50,366 | | | | 69,572 | | | | 13,177 | |
| Shareholder servicing fees and expenses | | | 44,796 | | | | 83,065 | | | | 12,655 | |
| Federal and state registration | | | 18,224 | | | | 20,336 | | | | 12,096 | |
| Reports to shareholders | | | 17,933 | | | | 35,805 | | | | 4,914 | |
| Audit fees | | | 14,536 | | | | 14,536 | | | | 14,536 | |
| Trustees fees and expenses | | | 12,146 | | | | 17,520 | | | | 2,730 | |
| Custody fees | | | 13,811 | | | | 17,595 | | | | 3,228 | |
| Insurance | | | 10,326 | | | | 16,089 | | | | 2,366 | |
| Legal fees | | | 4,829 | | | | 4,550 | | | | 4,829 | |
| Miscellaneous | | | 3,373 | | | | 4,465 | | | | 1,274 | |
| Total expenses before | | | | | | | | | | | | |
| Adviser reimbursement | | | 2,808,302 | | | | 3,815,970 | | | | 484,955 | |
| Expenses reimbursed by | | | | | | | | | | | | |
| Adviser (See Note 3) | | | (19,370 | ) | | | (62,411 | ) | | | (32,710 | ) |
| Net expenses before | | | | | | | | | | | | |
| Adviser recoupment | | | 2,788,932 | | | | 3,753,559 | | | | 452,245 | |
| Expenses recouped by Adviser | | | — | | | | — | | | | — | |
| Total net expenses | | | 2,788,932 | | | | 3,753,559 | | | | 452,245 | |
| Net investment income (loss) | | | 3,099,147 | | | | (2,405,622 | ) | | | 1,694,631 | |
| NET REALIZED AND UNREALIZED | | | | | | | | | | | | |
| GAIN (LOSS) ON INVESTMENTS: | | | | | | | | | | | | |
| Net realized gain (loss) on: | | | | | | | | | | | | |
| Investments and foreign | | | | | | | | | | | | |
| currency translation | | | 8,121,438 | | | | 18,322,953 | | | | (837,456 | ) |
| Forward currency contracts | | | 3,022,040 | | | | 6,001,089 | | | | 136,250 | |
| Futures contracts closed | | | — | | | | — | | | | — | |
| Net change in unrealized | | | | | | | | | | | | |
| appreciation (depreciation) on: | | | | | | | | | | | | |
| Investments and foreign | | | | | | | | | | | | |
| currency translation | | | (11,480,864 | ) | | | (28,264,664 | ) | | | (2,595,125 | ) |
| Forward currency contracts | | | 701,664 | | | | (503,612 | ) | | | 5,886 | |
| Futures contracts | | | — | | | | — | | | | — | |
| Net realized and unrealized gain (loss) | | | 364,278 | | | | (4,444,234 | ) | | | (3,290,445 | ) |
| Net increase (decrease) in net assets | | | | | | | | | | | | |
| resulting from operations | | $ | 3,463,425 | | | $ | (6,849,856 | ) | | $ | (1,595,814 | ) |
| * Net of foreign taxes withheld | | $ | 66,855 | | | $ | 82,556 | | | $ | 3,429 | |
See notes to financial statements.
Intrepid Funds
STATEMENT OF OPERATIONS (continued)
For the period ended March 31, 2015 (Unaudited)
| | | Intrepid | | | Intrepid | |
| | | Disciplined | | | International | |
| | | Value Fund | | | Fund | |
| INVESTMENT INCOME: | | | | | | |
| Dividend income* | | $ | 184,189 | | | $ | 20,458 | |
| Interest income* | | | — | | | | — | |
| Total investment income | | | 184,189 | | | | 20,458 | |
| Advisory fees (See Note 3) | | | 235,069 | | | | 5,835 | |
| Distribution (12b-1) fees - Investor Class Only (See Note 4) | | | 3,769 | | | | 1,459 | |
| Administration fees | | | 17,001 | | | | 500 | |
| Fund accounting fees | | | 5,448 | | | | 910 | |
| Shareholder servicing fees and expenses | | | 10,556 | | | | 4,641 | |
| Federal and state registration | | | 10,337 | | | | 6,370 | |
| Reports to shareholders | | | 2,827 | | | | 637 | |
| Audit fees | | | 14,536 | | | | 7,280 | |
| Trustees fees and expenses | | | 1,177 | | | | 91 | |
| Custody fees | | | 1,891 | | | | 120 | |
| Insurance | | | 1,165 | | | | 91 | |
| Legal fees | | | 4,744 | | | | 6,370 | |
| Miscellaneous | | | 631 | | | | 182 | |
| Total expenses before Adviser reimbursement | | | 309,151 | | | | 34,486 | |
| Expenses reimbursed by Adviser (See Note 3) | | | (4,082 | ) | | | (26,316 | ) |
| Net expenses before Adviser recoupment | | | 305,069 | | | | 8,170 | |
| Expenses recouped by Adviser | | | 520 | | | | — | |
| Total net expenses | | | 305,589 | | | | 8,170 | |
| Net investment income (loss) | | | (121,400 | ) | | | 12,288 | |
| NET REALIZED AND UNREALIZED | | | | | | | | |
| GAIN (LOSS) ON INVESTMENTS: | | | | | | | | |
| Net realized gain (loss) on: | | | | | | | | |
| Investments and foreign currency translation | | | 2,915,213 | | | | (3,287 | ) |
| Forward currency contracts | | | — | | | | — | |
| Futures contracts closed | | | — | | | | 7,641 | |
| Net change in unrealized appreciation (depreciation) on: | | | | | | | | |
| Investments and foreign currency translation | | | (1,069,192 | ) | | | (114,596 | ) |
| Forward currency contracts | | | — | | | | — | |
| Futures contracts | | | — | | | | 49,720 | |
| Net realized and unrealized gain (loss) | | | 1,846,021 | | | | (60,522 | ) |
| Net increase (decrease) in net assets resulting from operations | | $ | 1,724,621 | | | $ | (48,234 | ) |
| * Net of foreign taxes withheld | | $ | 908 | | | $ | 577 | |
See notes to financial statements.
Intrepid Capital Fund
STATEMENTS OF CHANGES IN NET ASSETS
| | | Six Months | | | Year | |
| | | Ended | | | Ended | |
| | | March 31, 2015 | | | September 30, 2014 | |
| | | (Unaudited) | | | | |
| OPERATIONS: | | | | | | |
| Net investment income | | $ | 3,099,147 | | | $ | 4,919,556 | |
| Net realized gain on investments | | | | | | | | |
| and foreign currency translation | | | 11,143,478 | | | | 38,428,812 | |
| Net change in unrealized depreciation | | | (10,779,200 | ) | | | (465,439 | ) |
| Net increase in assets | | | | | | | | |
| resulting from operations | | | 3,463,425 | | | | 42,882,929 | |
| | | | | | | | | |
| DISTRIBUTIONS TO SHAREHOLDERS: | | | | | | | | |
| From net investment income - Investor Class | | | (1,594,948 | ) | | | (2,264,546 | ) |
| From net investment income - Institutional Class | | | (1,916,955 | ) | | | (2,464,502 | ) |
| From net realized gain - Investor Class | | | (19,274,277 | ) | | | (11,880,891 | ) |
| From net realized gain - Institutional Class | | | (18,631,286 | ) | | | (9,947,298 | ) |
| Total distributions | | | (41,417,466 | ) | | | (26,557,237 | ) |
| | | | | | | | | |
| CAPITAL SHARE TRANSACTIONS: | | | | | | | | |
| Proceeds from shares sold - Investor Class | | | 16,706,253 | | | | 51,334,262 | |
| Proceeds from shares sold - Institutional Class | | | 41,114,574 | | | | 70,396,804 | |
| Proceeds from shares issued to holders in | | | | | | | | |
| reinvestment of dividends - Investor Class | | | 20,167,521 | | | | 13,541,228 | |
| Proceeds from shares issued to holders in | | | | | | | | |
| reinvestment of dividends - Institutional Class | | | 12,565,350 | | | | 6,579,428 | |
Cost of shares redeemed - Investor Class(1) | | | (68,262,898 | ) | | | (63,704,401 | ) |
Cost of shares redeemed - Institutional Class(2) | | | (46,322,154 | ) | | | (40,153,448 | ) |
| Net increase (decrease) in net assets from | | | | | | | | |
| capital share transactions | | | (24,031,354 | ) | | | 37,993,873 | |
| | | | | | | | | |
| TOTAL INCREASE (DECREASE) | | | | | | | | |
| IN NET ASSETS | | | (61,985,395 | ) | | | 54,319,565 | |
| | | | | | | | | |
| NET ASSETS: | | | | | | | | |
| Beginning of period | | | 472,450,102 | | | | 418,130,537 | |
| End of period (including accumulated net | | | | | | | | |
| investment loss of $416,548 and $3,792) | | $ | 410,464,707 | | | $ | 472,450,102 | |
| (1) | Net of redemption fees of $1,060 and $3,125, respectively. |
| (2) | Net of redemption fees of $987 and $7,265, respectively. |
See notes to financial statements.
Intrepid Small Cap Fund
STATEMENTS OF CHANGES IN NET ASSETS (continued)
| | | Six Months | | | Year | |
| | | Ended | | | Ended | |
| | | March 31, 2015 | | | September 30, 2014 | |
| | | (Unaudited) | | | | |
| OPERATIONS: | | | | | | |
| Net investment loss | | $ | (2,405,622 | ) | | $ | (7,213,530 | ) |
| Net realized gain on investments | | | | | | | | |
| and foreign currency translation | | | 24,324,042 | | | | 69,376,820 | |
| Net change in unrealized depreciation | | | (28,768,276 | ) | | | (19,315,962 | ) |
| Net increase (decrease) in assets | | | | | | | | |
| resulting from operations | | | (6,849,856 | ) | | | 42,847,328 | |
| | | | | | | | | |
| DISTRIBUTIONS TO SHAREHOLDERS: | | | | | | | | |
| From net realized gain - Investor Class | | | (38,986,522 | ) | | | (22,713,287 | ) |
| From net realized gain - Institutional Class | | | (18,134,403 | ) | | | (6,912,321 | ) |
| Total distributions | | | (57,120,925 | ) | | | (29,625,608 | ) |
| | | | | | | | | |
| CAPITAL SHARE TRANSACTIONS: | | | | | | | | |
| Proceeds from shares sold - Investor Class | | | 28,208,646 | | | | 90,133,116 | |
| Proceeds from shares sold - Institutional Class | | | 22,994,135 | | | | 161,538,057 | |
| Proceeds from shares issued to holders in | | | | | | | | |
| reinvestment of dividends - Investor Class | | | 38,381,039 | | | | 22,419,981 | |
| Proceeds from shares issued to holders in | | | | | | | | |
| reinvestment of dividends - Institutional Class | | | 16,119,538 | | | | 5,719,988 | |
Cost of shares redeemed - Investor Class(1) | | | (123,416,130 | ) | | | (268,263,839 | ) |
Cost of shares redeemed - Institutional Class(2) | | | (131,315,762 | ) | | | (39,685,971 | ) |
| Net decrease in net assets | | | | | | | | |
| from capital share transactions | | | (149,028,534 | ) | | | (28,138,668 | ) |
| | | | | | | | | |
| TOTAL DECREASE IN NET ASSETS | | | (212,999,315 | ) | | | (14,916,948 | ) |
| | | | | | | | | |
| NET ASSETS: | | | | | | | | |
| Beginning of period | | | 660,435,543 | | | | 675,352,491 | |
| End of period (including accumulated | | | | | | | | |
| net investment loss | | | | | | | | |
| of $3,590,962 and $1,185,340) | | $ | 447,436,228 | | | $ | 660,435,543 | |
| (1) | Net of redemption fees of $4,298 and $9,851, respectively. |
| (2) | Net of redemption fees of $14,407 and $672, respectively. |
See notes to financial statements.
Intrepid Income Fund
STATEMENTS OF CHANGES IN NET ASSETS (continued)
| | | Six Months | | | Year | |
| | | Ended | | | Ended | |
| | | March 31, 2015 | | | September 30, 2014 | |
| | | (Unaudited) | | | | |
| OPERATIONS: | | | | | | |
| Net investment income | | $ | 1,694,631 | | | $ | 3,074,705 | |
| Net realized gain (loss) on investments | | | (701,206 | ) | | | 734,654 | |
| Net change in unrealized depreciation | | | (2,589,239 | ) | | | (221,076 | ) |
| Net increase (decrease) in assets | | | | | | | | |
| resulting from operations | | | (1,595,814 | ) | | | 3,588,283 | |
| | | | | | | | | |
| DISTRIBUTIONS TO SHAREHOLDERS: | | | | | | | | |
| From net investment income - Investor Class | | | — | | | | (213,058 | ) |
| From net investment income - Institutional Class | | | (1,667,146 | ) | | | (2,817,994 | ) |
| From net realized gain - Investor Class | | | — | | | | (148,988 | ) |
| From net realized gain - Institutional Class | | | (742,996 | ) | | | (411,448 | ) |
| Total distributions | | | (2,410,142 | ) | | | (3,591,488 | ) |
| | | | | | | | | |
| CAPITAL SHARE TRANSACTIONS: | | | | | | | | |
Proceeds from shares sold - Investor Class(1) | | | — | | | | 2,110,357 | |
| Proceeds from shares sold - Institutional Class | | | 2,752,910 | | | | 11,257,357 | |
| Proceeds from shares | | | | | | | | |
| exchanged - Institutional Class | | | — | | | | 27,816,502 | |
| Proceeds from shares issued to holders in | | | | | | | | |
reinvestment of dividends - Investor Class(1) | | | — | | | | 355,610 | |
| Proceeds from shares issued to holders in | | | | | | | | |
| reinvestment of dividends - Institutional Class | | | 2,366,255 | | | | 3,160,929 | |
Cost of shares redeemed - Investor Class(1)(2) | | | — | | | | (8,080,436 | ) |
Cost of shares redeemed - Institutional Class(3) | | | (9,620,875 | ) | | | (10,525,268 | ) |
Cost of shares exchanged - Investor Class(1) | | | — | | | | (27,816,502 | ) |
| Net decrease in net assets from | | | | | | | | |
| capital share transactions | | | (4,501,710 | ) | | | (1,721,451 | ) |
| | | | | | | | | |
| TOTAL DECREASE IN NET ASSETS | | | (8,507,666 | ) | | | (1,724,656 | ) |
| | | | | | | | | |
| NET ASSETS: | | | | | | | | |
| Beginning of period | | | 106,360,001 | | | | 108,084,657 | |
| End of period (including accumulated net | | | | | | | | |
| investment income of $144,835 and $117,350) | | $ | 97,852,335 | | | $ | 106,360,001 | |
| (1) | Investor class shares converted to Institutional class shares on January 31, 2015. |
| (2) | Net of redemption fees of $0 and $641, respectively. |
| (3) | Net of redemption fees of $0 and $137, respectively. |
See notes to financial statements.
Intrepid Disciplined Value Fund
STATEMENTS OF CHANGES IN NET ASSETS (continued)
| | | Six Months | | | Year | |
| | | Ended | | | Ended | |
| | | March 31, 2015 | | | September 30, 2014 | |
| | | (Unaudited) | | | | |
| OPERATIONS: | | | | | | |
| Net investment loss | | $ | (121,400 | ) | | $ | (239,507 | ) |
| Net realized gain on investments | | | 2,915,213 | | | | 3,773,043 | |
| Net change in unrealized | | | | | | | | |
| appreciation (depreciation) | | | (1,069,192 | ) | | | 506,680 | |
| Net increase in assets resulting from operations | | | 1,724,621 | | | | 4,040,216 | |
| | | | | | | | | |
| DISTRIBUTIONS TO SHAREHOLDERS: | | | | | | | | |
| From net investment income | | | — | | | | — | |
| From net realized gain | | | (3,767,703 | ) | | | (3,423,839 | ) |
| Total distributions | | | (3,767,703 | ) | | | (3,423,839 | ) |
| | | | | | | | | |
| CAPITAL SHARE TRANSACTIONS: | | | | | | | | |
| Proceeds from shares sold | | | 2,097,309 | | | | 6,487,211 | |
| Proceeds from shares issued to holders | | | | | | | | |
| in reinvestment of dividends | | | 3,729,654 | | | | 3,300,043 | |
Cost of shares redeemed(1) | | | (1,866,354 | ) | | | (5,639,839 | ) |
| Net increase in net assets | | | | | | | | |
| from capital share transactions | | | 3,960,609 | | | | 4,147,415 | |
| | | | | | | | | |
| TOTAL INCREASE IN NET ASSETS | | | 1,917,527 | | | | 4,763,792 | |
| | | | | | | | | |
| NET ASSETS: | | | | | | | | |
| Beginning of period | | | 46,137,484 | | | | 41,373,692 | |
| End of period (including accumulated net | | | | | | | | |
| investment loss of $121,400 and $0) | | $ | 48,055,011 | | | $ | 46,137,484 | |
| (1) | Net of redemption fees of $0 and $3, respectively. |
See notes to financial statements.
Intrepid International Fund
STATEMENTS OF CHANGES IN NET ASSETS (continued)
| | | December 30, 2014(1) | |
| | | through | |
| | | March 31, 2015 | |
| OPERATIONS: | | | |
| Net investment income | | $ | 12,288 | |
| Net realized gain on investments | | | 4,354 | |
| Net change in unrealized depreciation | | | (64,876 | ) |
| Net decrease in assets resulting from operations | | | (48,234 | ) |
| | | | | |
| DISTRIBUTIONS TO SHAREHOLDERS: | | | | |
| From net investment income | | | — | |
| From net realized gain | | | — | |
| Total distributions | | | — | |
| | | | | |
| CAPITAL SHARE TRANSACTIONS: | | | | |
| Proceeds from shares sold | | | 4,941,152 | |
| Proceeds from shares issued to holders | | | | |
| in reinvestment of dividends | | | — | |
| Cost of shares redeemed | | | — | |
| Net increase in net assets from capital share transactions | | | 4,941,152 | |
| | | | | |
| TOTAL INCREASE IN NET ASSETS | | | 4,892,918 | |
| | | | | |
| NET ASSETS: | | | | |
| Beginning of period | | | — | |
| End of period (including accumulated net investment | | | | |
| income of $12,287) | | $ | 4,892,918 | |
| (1) | Fund commenced operations on December 30, 2014. |
See notes to financial statements.
Intrepid Capital Fund – Investor Class
FINANCIAL HIGHLIGHTS
Per share data for a share of capital stock outstanding for the entire period and selected information for the period are as follows:
| | | Period | | | | | | | | | | | | | | | | |
| | | Ended | | | | | | | | | | | | | | | | |
| | | March 31, | | | Year Ended September 30, | |
| | | 2015 | | | 2014 | | | 2013 | | | 2012 | | | 2011 | | | 2010 | |
| | | (Unaudited) | | | | | | | | | | | | | | | | |
| NET ASSET VALUE: | | | | | | | | | | | | | | | | | | |
| Beginning of period | | $ | 12.69 | | | $ | 12.23 | | | $ | 11.69 | | | $ | 10.70 | | | $ | 11.09 | | | $ | 9.99 | |
| OPERATIONS: | | | | | | | | | | | | | | | | | | | | | | | | |
Net investment income(1) | | | 0.07 | | | | 0.12 | | | | 0.18 | | | | 0.18 | | | | 0.16 | | | | 0.16 | |
| Net realized and unrealized | | | | | | | | | | | | | | | | | | | | | | | | |
| gain (loss) on investment | | | | | | | | | | | | | | | | | | | | | | | | |
| securities | | | 0.04 | | | | 1.09 | | | | 0.93 | | | | 1.72 | | | | (0.05 | ) | | | 1.24 | |
Total from operations(2) | | | 0.11 | | | | 1.21 | | | | 1.11 | | | | 1.90 | | | | 0.11 | | | | 1.40 | |
| LESS DISTRIBUTIONS: | | | | | | | | | | | | | | | | | | | | | | | | |
| From net | | | | | | | | | | | | | | | | | | | | | | | | |
| investment income | | | (0.09 | ) | | | (0.12 | ) | | | (0.17 | ) | | | (0.18 | ) | | | (0.17 | ) | | | (0.15 | ) |
| From net realized gains | | | (1.12 | ) | | | (0.63 | ) | | | (0.40 | ) | | | (0.73 | ) | | | (0.33 | ) | | | (0.15 | ) |
| Total distributions | | | (1.21 | ) | | | (0.75 | ) | | | (0.57 | ) | | | (0.91 | ) | | | (0.50 | ) | | | (0.30 | ) |
| NET ASSET VALUE: | | | | | | | | | | | | | | | | | | | | | | | | |
| End of period | | $ | 11.59 | | | $ | 12.69 | | | $ | 12.23 | | | $ | 11.69 | | | $ | 10.70 | | | $ | 11.09 | |
| Total return | | | 0.95 | %(3) | | | 10.23 | % | | | 9.89 | % | | | 18.63 | % | | | 0.74 | % | | | 14.27 | % |
| Net assets at end of | | | | | | | | | | | | | | | | | | | | | | | | |
| period (000s omitted) | | $ | 187,761 | | | $ | 238,691 | | | $ | 228,500 | | | $ | 288,462 | | | $ | 198,898 | | | $ | 136,991 | |
| RATIO OF EXPENSES TO | | | | | | | | | | | | | | | | | | | | | | | | |
| AVERAGE NET ASSETS: | | | | | | | | | | | | | | | | | | | | | | | | |
| Before expense | | | | | | | | | | | | | | | | | | | | | | | | |
| reimbursement/recoupment | | | 1.41 | %(4) | | | 1.41 | % | | | 1.42 | % | | | 1.44 | % | | | 1.46 | % | | | 1.53 | % |
| After expense | | | | | | | | | | | | | | | | | | | | | | | | |
| reimbursement/recoupment | | | 1.40 | %(4) | | | 1.40 | % | | | 1.40 | % | | | 1.40 | % | | | 1.40 | % | | | 1.45 | % |
| RATIO OF NET INVESTMENT | | | | | | | | | | | | | | | | | | | | | | | | |
| INCOME TO AVERAGE NET ASSETS: | | | | | | | | | | | | | | | | | | | | | |
| Before expense | | | | | | | | | | | | | | | | | | | | | | | | |
| reimbursement/recoupment | | | 1.27 | %(4) | | | 0.97 | % | | | 1.37 | % | | | 1.62 | % | | | 1.37 | % | | | 1.54 | % |
| After expense | | | | | | | | | | | | | | | | | | | | | | | | |
| reimbursement/recoupment | | | 1.28 | %(4) | | | 0.98 | % | | | 1.39 | % | | | 1.66 | % | | | 1.43 | % | | | 1.62 | % |
| Portfolio turnover rate | | | 26 | %(3) | | | 73 | % | | | 57 | % | | | 63 | % | | | 88 | % | | | 54 | % |
| (1) | Net investment income per share is calculated using the ending balances prior to consideration or adjustment for permanent book-to-tax differences. |
| (2) | Total from investment operations per share includes redemption fees of less than $0.01 per share for the six months ended March 31, 2015 and each of the five years ended September 30, 2014, 2013, 2012, 2011 and 2010. |
| (3) | Not annualized. |
| (4) | Annualized. |
See notes to financial statements.
Intrepid Capital Fund – Institutional Class
FINANCIAL HIGHLIGHTS (continued)
Per share data for a share of capital stock outstanding for the entire period and selected information for the period are as follows:
| | | Period | | | | | | | | | | | | | | | April 30, 2010(1) | |
| | | Ended | | | | | | | | | | | | | | | through | |
| | | March 31, | | | Year Ended September 30, | | | September 30, | |
| | | 2015 | | | 2014 | | | 2013 | | | 2012 | | | 2011 | | | 2010 | |
| | | (Unaudited) | | | | | | | | | | | | | | | | |
| NET ASSET VALUE: | | | | | | | | | | | | | | | | | | |
| Beginning of period | | $ | 12.69 | | | $ | 12.24 | | | $ | 11.70 | | | $ | 10.70 | | | $ | 11.10 | | | $ | 11.17 | |
| OPERATIONS: | | | | | | | | | | | | | | | | | | | | | | | | |
Net investment income(2) | | | 0.09 | | | | 0.15 | | | | 0.19 | | | | 0.21 | | | | 0.18 | | | | 0.07 | |
| Net realized and unrealized | | | | | | | | | | | | | | | | | | | | | | | | |
| gain (loss) on investment | | | | | | | | | | | | | | | | | | | | | | | | |
| securities | | | 0.04 | | | | 1.08 | | | | 0.95 | | | | 1.73 | | | | (0.05 | ) | | | (0.06 | ) |
Total from operations(3) | | | 0.13 | | | | 1.23 | | | | 1.14 | | | | 1.94 | | | | 0.13 | | | | 0.01 | |
| LESS DISTRIBUTIONS: | | | | | | | | | | | | | | | | | | | | | | | | |
| From net | | | | | | | | | | | | | | | | | | | | | | | | |
| investment income | | | (0.11 | ) | | | (0.15 | ) | | | (0.20 | ) | | | (0.21 | ) | | | (0.20 | ) | | | (0.08 | ) |
| From net realized gains | | | (1.12 | ) | | | (0.63 | ) | | | (0.40 | ) | | | (0.73 | ) | | | (0.33 | ) | | | — | |
| Total distributions | | | (1.23 | ) | | | (0.78 | ) | | | (0.60 | ) | | | (0.94 | ) | | | (0.53 | ) | | | (0.08 | ) |
| NET ASSET VALUE: | | | | | | | | | | | | | | | | | | | | | | | | |
| End of period | | $ | 11.59 | | | $ | 12.69 | | | $ | 12.24 | | | $ | 11.70 | | | $ | 10.70 | | | $ | 11.10 | |
| Total return | | | 1.07 | %(4) | | | 10.41 | % | | | 10.18 | % | | | 19.02 | % | | | 0.93 | % | | | 0.09 | %(4) |
| Net assets at end of | | | | | | | | | | | | | | | | | | | | | | | | |
| period (000s omitted) | | $ | 222,704 | | | $ | 233,759 | | | $ | 189,630 | | | $ | 100,501 | | | $ | 81,675 | | | $ | 86,252 | |
| RATIO OF EXPENSES TO | | | | | | | | | | | | | | | | | | | | | | | | |
| AVERAGE NET ASSETS: | | | | | | | | | | | | | | | | | | | | | | | | |
| Before expense | | | | | | | | | | | | | | | | | | | | | | | | |
| reimbursement/recoupment | | | 1.16 | %(5) | | | 1.16 | % | | | 1.17 | % | | | 1.19 | % | | | 1.21 | % | | | 1.31 | %(5) |
| After expense | | | | | | | | | | | | | | | | | | | | | | | | |
| reimbursement/recoupment | | | 1.15 | %(5) | | | 1.15 | % | | | 1.15 | % | | | 1.15 | % | | | 1.15 | % | | | 1.15 | %(5) |
| RATIO OF NET INVESTMENT | | | | | | | | | | | | | | | | | | | | | | | | |
| INCOME TO AVERAGE NET ASSETS: | | | | | | | | | | | | | | | | | | | | | |
| Before expense | | | | | | | | | | | | | | | | | | | | | | | | |
| reimbursement/recoupment | | | 1.53 | %(5) | | | 1.23 | % | | | 1.67 | % | | | 1.85 | % | | | 1.58 | % | | | 1.66 | %(5) |
| After expense | | | | | | | | | | | | | | | | | | | | | | | | |
| reimbursement/recoupment | | | 1.54 | %(5) | | | 1.24 | % | | | 1.69 | % | | | 1.89 | % | | | 1.64 | % | | | 1.82 | %(5) |
| Portfolio turnover rate | | | 26 | %(4) | | | 73 | % | | | 57 | % | | | 63 | % | | | 88 | % | | | 54 | %(4) |
| (1) | Commencement of Operations. |
| (2) | Net investment income per share is calculated using the ending balances prior to consideration or adjustment for permanent book-to-tax differences. |
| (3) | Total from investment operations per share includes redemption fees of less than $0.01 per share for the six months ended March 31, 2015, each of the three years ended September 30, 2014, 2013 and 2012 and the period ended September 30, 2010. |
| (4) | Not annualized. |
| (5) | Annualized. |
See notes to financial statements.
Intrepid Small Cap Fund – Investor Class
FINANCIAL HIGHLIGHTS (continued)
Per share data for a share of capital stock outstanding for the entire period and selected information for the period are as follows:
| | | Period | | | | | | | | | | | | | | | | |
| | | Ended | | | | | | | | | | | | | | | | |
| | | March 31, | | | Year Ended September 30, | |
| | | 2015 | | | 2014 | | | 2013 | | | 2012 | | | 2011 | | | 2010 | |
| | | (Unaudited) | | | | | | | | | | | | | | | | |
| NET ASSET VALUE: | | | | | | | | | | | | | | | | | | |
| Beginning of period | | $ | 16.18 | | | $ | 15.91 | | | $ | 15.80 | | | $ | 15.26 | | | $ | 15.98 | | | $ | 14.66 | |
| OPERATIONS: | | | | | | | | | | | | | | | | | | | | | | | | |
| Net investment | | | | | | | | | | | | | | | | | | | | | | | | |
income (loss)(1) | | | 0.06 | | | | (0.22 | ) | | | (0.12 | ) | | | (0.06 | ) | | | (0.09 | ) | | | (0.02 | ) |
| Net realized and unrealized | | | | | | | | | | | | | | | | | | | | | | | | |
| gain (loss) on investment | | | | | | | | | | | | | | | | | | | | | | | | |
| securities | | | (0.23 | ) | | | 1.17 | | | | 1.48 | | | | 2.47 | | | | 0.32 | | | | 2.18 | |
Total from operations(2) | | | (0.17 | ) | | | 0.95 | | | | 1.36 | | | | 2.41 | | | | 0.23 | | | | 2.16 | |
| LESS DISTRIBUTIONS: | | | | | | | | | | | | | | | | | | | | | | | | |
| From net | | | | | | | | | | | | | | | | | | | | | | | | |
| investment income | | | — | | | | — | | | | — | | | | — | | | | — | | | | — | |
| From net realized gains | | | (1.60 | ) | | | (0.68 | ) | | | (1.25 | ) | | | (1.87 | ) | | | (0.95 | ) | | | (0.84 | ) |
| Total distributions | | | (1.60 | ) | | | (0.68 | ) | | | (1.25 | ) | | | (1.87 | ) | | | (0.95 | ) | | | (0.84 | ) |
| NET ASSET VALUE: | | | | | | | | | | | | | | | | | | | | | | | | |
| End of period | | $ | 14.41 | | | $ | 16.18 | | | $ | 15.91 | | | $ | 15.80 | | | $ | 15.26 | | | $ | 15.98 | |
| Total return | | | (1.10 | )%(3) | | | 6.08 | % | | | 9.25 | % | | | 16.76 | % | | | 1.02 | % | | | 15.30 | % |
| Net assets at end of | | | | | | | | | | | | | | | | | | | | | | | | |
| period (000s omitted) | | $ | 321,461 | | | $ | 421,714 | | | $ | 566,624 | | | $ | 699,196 | | | $ | 542,883 | | | $ | 511,726 | |
| RATIO OF EXPENSES | | | | | | | | | | | | | | | | | | | | | | | | |
| TO AVERAGE NET ASSETS: | | | | | | | | | | | | | | | | | | | | | | | | |
| Before expense | | | | | | | | | | | | | | | | | | | | | | | | |
| reimbursement/recoupment | | | 1.42 | %(4) | | | 1.40 | % | | | 1.42 | % | | | 1.44 | % | | | 1.45 | % | | | 1.49 | % |
| After expense | | | | | | | | | | | | | | | | | | | | | | | | |
| reimbursement/recoupment | | | 1.40 | %(4) | | | 1.40 | % | | | 1.40 | % | | | 1.40 | % | | | 1.40 | % | | | 1.40 | % |
| RATIO OF NET INVESTMENT | | | | | | | | | | | | | | | | | | | | | | | | |
| LOSS TO AVERAGE NET ASSETS: | | | | | | | | | | | | | | | | | | | | | | | | |
| Before expense | | | | | | | | | | | | | | | | | | | | | | | | |
| reimbursement/recoupment | | | (0.95 | )%(4) | | | (1.11 | )% | | | (0.72 | )% | | | (0.44 | )% | | | (0.54 | )% | | | (0.23 | )% |
| After expense | | | | | | | | | | | | | | | | | | | | | | | | |
| reimbursement/recoupment | | | (0.93 | )%(4) | | | (1.11 | )% | | | (0.70 | )% | | | (0.40 | )% | | | (0.49 | )% | | | (0.14 | )% |
| Portfolio turnover rate | | | 42 | %(3) | | | 38 | % | | | 30 | % | | | 68 | % | | | 88 | % | | | 61 | % |
| (1) | Net investment income (loss) per share is calculated using the ending balances prior to consideration or adjustment for permanent book-to-tax differences. |
| (2) | Total from investment operations per share includes redemption fees of less than $0.01 per share for the six months ended March 31, 2015 and each of the five years ended September 30, 2014, 2013, 2012, 2011, and 2010. |
| (3) | Not annualized. |
| (4) | Annualized. |
See notes to financial statements.
Intrepid Small Cap Fund – Institutional Class
FINANCIAL HIGHLIGHTS (continued)
Per share data for a share of capital stock outstanding for the entire period and selected information for the period are as follows:
| | | | | | | | | | | | | | | | | | November 3, | |
| | | Period | | | | | | | | | | | | | | | 2009(1) | |
| | | Ended | | | | | | | | | | | | | | | through | |
| | | March 31, | | | Year Ended September 30, | | | September 30, | |
| | | 2015 | | | 2014 | | | 2013 | | | 2012 | | | 2011 | | | 2010 | |
| | | (Unaudited) | | | | | | | | | | | | | | | | |
| NET ASSET VALUE: | | | | | | | | | | | | | | | | | | |
| Beginning of period | | $ | 16.42 | | | $ | 16.09 | | | $ | 15.93 | | | $ | 15.34 | | | $ | 16.02 | | | $ | 14.52 | |
| OPERATIONS: | | | | | | | | | | | | | | | | | | | | | | | | |
| Net investment | | | | | | | | | | | | | | | | | | | | | | | | |
income (loss)(2) | | | 0.05 | | | | (0.16 | ) | | | (0.09 | ) | | | (0.03 | ) | | | (0.02 | ) | | | 0.01 | |
| Net realized and unrealized | | | | | | | | | | | | | | | | | | | | | | | | |
| gain on investment | | | | | | | | | | | | | | | | | | | | | | | | |
| securities | | | (0.21 | ) | | | 1.17 | | | | 1.50 | | | | 2.49 | | | | 0.29 | | | | 2.33 | |
Total from operations(3) | | | (0.16 | ) | | | 1.01 | | | | 1.41 | | | | 2.46 | | | | 0.27 | | | | 2.34 | |
| LESS DISTRIBUTIONS: | | | | | | | | | | | | | | | | | | | | | | | | |
| From net investment income | | | — | | | | — | | | | — | | | | — | | | | — | | | | — | |
| From net realized gains | | | (1.60 | ) | | | (0.68 | ) | | | (1.25 | ) | | | (1.87 | ) | | | (0.95 | ) | | | (0.84 | ) |
| Total distributions | | | (1.60 | ) | | | (0.68 | ) | | | (1.25 | ) | | | (1.87 | ) | | | (0.95 | ) | | | (0.84 | ) |
| NET ASSET VALUE: | | | | | | | | | | | | | | | | | | | | | | | | |
| End of period | | $ | 14.66 | | | $ | 16.42 | | | $ | 16.09 | | | $ | 15.93 | | | $ | 15.34 | | | $ | 16.02 | |
| Total return | | | (1.02 | )%(4) | | | 6.39 | % | | | 9.51 | % | | | 17.02 | % | | | 1.28 | % | | | 16.70 | %(4) |
| Net assets at end of | | | | | | | | | | | | | | | | | | | | | | | | |
| period (000s omitted) | | $ | 125,975 | | | $ | 238,722 | | | $ | 108,728 | | | $ | 64,581 | | | $ | 49,729 | | | $ | 52,381 | |
| RATIO OF EXPENSES TO | | | | | | | | | | | | | | | | | | | | | | | | |
| AVERAGE NET ASSETS: | | | | | | | | | | | | | | | | | | | | | | | | |
| Before expense | | | | | | | | | | | | | | | | | | | | | | | | |
| reimbursement/recoupment | | | 1.17 | %(5) | | | 1.15 | % | | | 1.17 | % | | | 1.19 | % | | | 1.20 | % | | | 1.26 | %(5) |
| After expense | | | | | | | | | | | | | | | | | | | | | | | | |
| reimbursement/recoupment | | | 1.15 | %(5) | | | 1.15 | % | | | 1.15 | % | | | 1.15 | % | | | 1.15 | % | | | 1.15 | %(5) |
| RATIO OF NET INVESTMENT | | | | | | | | | | | | | | | | | | | | | | | | |
| INCOME (LOSS) TO AVERAGE NET ASSETS: | | | | | | | | | | | | | | | | | | | | |
| Before expense | | | | | | | | | | | | | | | | | | | | | | | | |
| reimbursement/recoupment | | | (0.69 | )%(5) | | | (0.85 | )% | | | (0.47 | )% | | | (0.18 | )% | | | (0.29 | )% | | | 0.01 | %(5) |
| After expense | | | | | | | | | | | | | | | | | | | | | | | | |
| reimbursement/recoupment | | | (0.67 | )%(5) | | | (0.85 | )% | | | (0.45 | )% | | | (0.14 | )% | | | (0.24 | )% | | | 0.12 | %(5) |
| Portfolio turnover rate | | | 42 | %(4) | | | 38 | % | | | 30 | % | | | 68 | % | | | 88 | % | | | 61 | %(4) |
| (1) | Commencement of Operations. |
| (2) | Net investment income (loss) per share is calculated using the ending balances prior to consideration or adjustment for permanent book-to-tax differences. |
| (3) | Total from investment operations per share includes redemption fees of less than $0.01 for the six months ended March 31, 2015, each of the four years ended September 30, 2014, 2013, 2012 and 2011, and the period ended September 30, 2010. |
| (4) | Not annualized. |
| (5) | Annualized. |
See notes to financial statements.
Intrepid Income Fund
FINANCIAL HIGHLIGHTS (continued)
Per share data for a share of capital stock outstanding for the entire period and selected information for the period are as follows:
| | | | | | | | | | | | | | | | | | August 16, | |
| | | Period | | | | | | | | | | | | | | | 2010(1) | |
| | | Ended | | | | | | | | | | | | | | | through | |
| | | March 31, | | | Year Ended September 30, | | | September 30, | |
| | | 2015 | | | 2014 | | | 2013 | | | 2012 | | | 2011 | | | 2010 | |
| | | (Unaudited) | | | | | | | | | | | | | | | | |
| NET ASSET VALUE: | | | | | | | | | | | | | | | | | | |
| Beginning of period | | $ | 9.65 | | | $ | 9.66 | | | $ | 9.80 | | | $ | 9.63 | | | $ | 9.77 | | | $ | 9.73 | |
| OPERATIONS: | | | | | | | | | | | | | | | | | | | | | | | | |
Net investment income(2) | | | 0.16 | | | | 0.28 | | | | 0.30 | | | | 0.47 | | | | 0.38 | | | | 0.05 | |
| Net realized and unrealized | | | | | | | | | | | | | | | | | | | | | | | | |
| gain (loss) on investment | | | | | | | | | | | | | | | | | | | | | | | | |
| securities | | | (0.30 | ) | | | 0.04 | | | | (0.01 | ) | | | 0.30 | | | | (0.09 | ) | | | 0.10 | |
Total from operations(3) | | | (0.14 | ) | | | 0.32 | | | | 0.29 | | | | 0.77 | | | | 0.29 | | | | 0.15 | |
| LESS DISTRIBUTIONS: | | | | | | | | | | | | | | | | | | | | | | | | |
| From net investment income | | | (0.16 | ) | | | (0.28 | ) | | | (0.33 | ) | | | (0.45 | ) | | | (0.43 | ) | | | (0.11 | ) |
| From net realized gains | | | (0.07 | ) | | | (0.05 | ) | | | (0.10 | ) | | | (0.15 | ) | | | (0.00 | )(4) | | | — | |
| Total distributions | | | (0.23 | ) | | | (0.33 | ) | | | (0.43 | ) | | | (0.60 | ) | | | (0.43 | ) | | | (0.11 | ) |
| NET ASSET VALUE: | | | | | | | | | | | | | | | | | | | | | | | | |
| End of period | | $ | 9.28 | | | $ | 9.65 | | | $ | 9.66 | | | $ | 9.80 | | | $ | 9.63 | | | $ | 9.77 | |
| Total return | | | (1.42 | )%(5) | | | 3.38 | % | | | 3.03 | % | | | 8.17 | % | | | 2.97 | % | | | 1.59 | %(5) |
| Net assets at end of | | | | | | | | | | | | | | | | | | | | | | | | |
| period (000s omitted) | | $ | 97,852 | | | $ | 106,360 | | | $ | 74,828 | | | $ | 63,085 | | | $ | 50,451 | | | $ | 24,947 | |
| RATIO OF EXPENSES TO AVERAGE NET ASSETS: | | | | | | | | | | | | | | | | | | | | |
| Before expense | | | | | | | | | | | | | | | | | | | | | | | | |
| reimbursement/recoupment | | | 0.97 | %(6) | | | 0.95 | %(7) | | | 0.98 | % | | | 1.01 | % | | | 1.07 | % | | | 1.22 | %(6) |
| After expense | | | | | | | | | | | | | | | | | | | | | | | | |
| reimbursement/recoupment | | | 0.90 | %(6) | | | 0.90 | %(7) | | | 0.90 | % | | | 0.90 | % | | | 0.90 | % | | | 0.90 | %(6) |
| RATIO OF NET INVESTMENT INCOME TO AVERAGE NET ASSETS: | | | | | | | | | | | | | | | | |
| Before expense | | | | | | | | | | | | | | | | | | | | | | | | |
| reimbursement/recoupment | | | 3.30 | %(6) | | | 2.85 | %(8) | | | 2.96 | % | | | 4.56 | % | | | 4.09 | % | | | 4.56 | %(6) |
| After expense | | | | | | | | | | | | | | | | | | | | | | | | |
| reimbursement/recoupment | | | 3.37 | %(6) | | | 2.90 | %(8) | | | 3.04 | % | | | 4.67 | % | | | 4.26 | % | | | 4.88 | %(6) |
| Portfolio turnover rate | | | 9 | %(5) | | | 53 | % | | | 78 | % | | | 54 | % | | | 77 | % | | | 67 | %(5) |
| (1) | Commencement of Operations. |
| (2) | Net investment income per share is calculated using the ending balances prior to consideration or adjustment for permanent book-to-tax differences. |
| (3) | Total from investment operations per share includes redemption fees of less than $0.01 per share for the six months ended March 31, 2015 and the two years ended September 30, 2014 and 2013. |
| (4) | The amount represents less than $0.01 per share. |
| (5) | Not annualized. |
| (6) | Annualized. |
| (7) | Excludes expenses related to the Investor Class that was merged into the Institutional Class on January 31, 2014. With the inclusion of these expenses, the ratio would have been 0.98% and 0.93%, respectively. |
| (8) | Excludes income and expenses related to the Investor Class that was merged into the Institutional Class on January 31, 2014. With the inclusion of income and expenses, the ratio would have been 2.83% and 2.88%, respectively. |
See notes to financial statements.
Intrepid Disciplined Value Fund
FINANCIAL HIGHLIGHTS (continued)
Per share data for a share of capital stock outstanding for the entire period and selected information for the period are as follows:
| | | Period | | | | | | | | | | | | | | | | |
| | | Ended | | | | | | | | | | | | | | | | |
| | | March 31, | | | Year Ended September 30, | |
| | | 2015 | | | 2014 | | | 2013 | | | 2012 | | | 2011 | | | 2010 | |
| NET ASSET VALUE: | | | | | | | | | | | | | | | | | | |
| Beginning of period | | $ | 11.22 | | | $ | 11.11 | | | $ | 10.48 | | | $ | 9.23 | | | $ | 10.23 | | | $ | 9.03 | |
| OPERATIONS: | | | | | | | | | | | | | | | | | | | | | | | | |
| Net investment | | | | | | | | | | | | | | | | | | | | | | | | |
income (loss)(1) | | | 0.05 | | | | (0.06 | ) | | | 0.03 | | | | 0.01 | | | | (0.03 | ) | | | (0.05 | ) |
| Net realized and unrealized | | | | | | | | | | | | | | | | | | | | | | | | |
| gain (loss) on investment | | | | | | | | | | | | | | | | | | | | | | | | |
| securities | | | 0.36 | | | | 1.08 | | | | 1.36 | | | | 1.87 | | | | (0.16 | ) | | | 1.30 | |
Total from operations(2) | | | 0.41 | | | | 1.02 | | | | 1.39 | | | | 1.88 | | | | (0.19 | ) | | | 1.25 | |
| LESS DISTRIBUTIONS: | | | | | | | | | | | | | | | | | | | | | | | | |
| From net investment income | | | — | | | | — | | | | (0.07 | ) | | | (0.02 | ) | | | — | | | | — | |
| From net realized gains | | | (0.92 | ) | | | (0.91 | ) | | | (0.69 | ) | | | (0.61 | ) | | | (0.81 | ) | | | (0.05 | ) |
| Total distributions | | | (0.92 | ) | | | (0.91 | ) | | | (0.76 | ) | | | (0.63 | ) | | | (0.81 | ) | | | (0.05 | ) |
| NET ASSET VALUE: | | | | | | | | | | | | | | | | | | | | | | | | |
| End of period | | $ | 10.71 | | | $ | 11.22 | | | $ | 11.11 | | | $ | 10.48 | | | $ | 9.23 | | | $ | 10.23 | |
| Total return | | | 3.75 | %(3) | | | 9.69 | % | | | 14.27 | % | | | 21.07 | % | | | (2.61 | )% | | | 13.93 | % |
| Net assets at end of | | | | | | | | | | | | | | | | | | | | | | | | |
| period (000s omitted) | | $ | 48,055 | | | $ | 46,137 | | | $ | 41,374 | | | $ | 46,975 | | | $ | 36,356 | | | $ | 21,401 | |
| RATIO OF EXPENSES TO | | | | | | | | | | | | | | | | | | | | | | | | |
| AVERAGE NET ASSETS: | | | | | | | | | | | | | | | | | | | | | | | | |
| Before expense | | | | | | | | | | | | | | | | | | | | | | | | |
| reimbursement/recoupment | | | 1.32 | %(4) | | | 1.57 | % | | | 1.59 | % | | | 1.60 | % | | | 1.69 | % | | | 1.98 | % |
| After expense | | | | | | | | | | | | | | | | | | | | | | | | |
| reimbursement/recoupment | | | 1.30 | %(4) | | | 1.33 | % | | | 1.40 | % | | | 1.40 | % | | | 1.54 | % | | | 1.95 | % |
| RATIO OF NET INVESTMENT INCOME | | | | | | | | | | | | | | | | | | | | | | | | |
| (LOSS) TO AVERAGE NET ASSETS: | | | | | | | | | | | | | | | | | | | | | | | | |
| Before expense | | | | | | | | | | | | | | | | | | | | | | | | |
| reimbursement/recoupment | | | (0.53 | )%(4) | | | (0.78 | )% | | | 0.03 | % | | | (0.16 | )% | | | (0.48 | )% | | | (0.52 | )% |
| After expense | | | | | | | | | | | | | | | | | | | | | | | | |
| reimbursement/recoupment | | | (0.51 | )%(4) | | | (0.54 | )% | | | 0.22 | % | | | 0.04 | % | | | (0.33 | )% | | | (0.49 | )% |
| Portfolio turnover rate | | | 44 | %(3) | | | 66 | % | | | 30 | % | | | 71 | % | | | 74 | % | | | 82 | % |
| (1) | Net investment income (loss) per share is calculated using the ending balances prior to consideration or adjustment for permanent book-to-tax differences. |
| (2) | Total from investment operations per share includes redemption fees of less than $0.01 per share for the six months ended March 31, 2015 and each of the four years ended September 30, 2014, 2012, 2011 and 2010. |
| (3) | Not annualized. |
| (4) | Annualized. |
See notes to financial statements.
Intrepid International Fund
FINANCIAL HIGHLIGHTS (continued)
Per share data for a share of capital stock outstanding for the entire period and selected information for the period are as follows:
| | December 30, 2014(1) |
| | | through | |
| | March 31, 2015 |
| | | (Unaudited) | |
| NET ASSET VALUE: | | | |
| Beginning of period | | $ | 10.00 | |
| | | | | |
| OPERATIONS: | | | | |
Net investment income(2) | | | 0.02 | |
| Net realized and unrealized gain (loss) on investment securities | | | (0.26 | ) |
| Total from operations | | | (0.24 | ) |
| | | | | |
| LESS DISTRIBUTIONS: | | | | |
| From net investment income | | | — | |
| From net realized gains | | | — | |
| Total distributions | | | — | |
| | | | | |
| NET ASSET VALUE: | | | | |
| End of period | | $ | 9.76 | |
| Total return | | | (2.40 | )%(3) |
| Net assets at end of period (000s omitted) | | $ | 4,893 | |
| | | | | |
| RATIO OF EXPENSES TO AVERAGE NET ASSETS: | | | | |
| Before expense reimbursement/recoupment | | | 5.91 | %(4) |
| After expense reimbursement/recoupment | | | 1.40 | %(4) |
| | | | | |
| RATIO OF NET INVESTMENT INCOME (LOSS) | | | | |
| TO AVERAGE NET ASSETS: | | | | |
| Before expense reimbursement/recoupment | | | (2.40 | )%(4) |
| After expense reimbursement/recoupment | | | 2.11 | %(4) |
| Portfolio turnover rate | | | 15 | %(3) |
| (1) | Commencement of Operations. |
| (2) | Net investment income per share is calculated using the ending balances prior to consideration or adjustment for permanent book-to-tax differences. |
| (3) | Not annualized. |
| (4) | Annualized. |
See notes to financial statements.
Intrepid Funds
NOTES TO FINANCIAL STATEMENTS
March 31, 2015 (Unaudited)
Intrepid Capital Management Funds Trust (the “Trust”) was organized as a Delaware Statutory Trust on August 27, 2004 and is registered under the Investment Company Act of 1940, as amended (the “1940 Act”), as an open-end management investment company issuing shares in series, each series representing a distinct portfolio with its own investment objectives and policies. At March 31, 2015, the Trust consisted of five series (the “Funds”): Intrepid Capital Fund, Intrepid Small Cap Fund, Intrepid Income Fund, Intrepid Disciplined Value Fund and Intrepid International Fund. The Intrepid Capital Fund’s Investor Class commenced operations on January 3, 2005, the Intrepid Capital Fund’s Institutional Class commenced operations on April 30, 2010, the Intrepid Small Cap Fund’s Investor Class commenced operations on October 3, 2005, the Intrepid Small Cap Fund’s Institutional Class commenced operations on November 3, 2009, the Intrepid Income Fund’s Investor Class commenced operations on July 2, 2009 and ceased operations on January 31, 2014. Effective as of the close of business on January 31, 2014 all Investor Class shares of the Intrepid Income Fund were converted into Institutional Class shares. The Intrepid Income Fund’s Institutional Class commenced operations on August 16, 2010, Intrepid Disciplined Value Fund’s Investor Class commenced operations on October 31, 2007, and the Intrepid International Fund’s Investor Class commenced operations on December 30, 2014. The Intrepid Disciplined Value Fund’s and the Intrepid International Fund’s Institutional Class are not available for sale.
| 2. | SUMMARY OF SIGNIFICANT ACCOUNTING POLICIES |
The following is a summary of significant accounting policies consistently followed by the Funds in the preparation of their financial statements. These policies are in conformity with accounting principles generally accepted in the United States (“GAAP”).
Valuation of Securities
The Trust has adopted authoritative fair valuation accounting standards which establish an authoritative definition of fair value and set out a hierarchy for measuring fair value. These standards require additional disclosures about the various inputs and valuation techniques used to develop the measurements of fair value and a discussion in changes in valuation techniques and related inputs during the year. These inputs are summarized in the three broad levels listed below.
| | Level 1 – | Quoted prices in active markets for identical securities. |
| | Level 2 – | Other significant observable inputs (including quoted prices for similar securities, interest rates, prepayment speeds, credit risk, etc.). |
| | Level 3 – | Significant unobservable inputs (including the Fund’s own assumptions in determining the fair value of investments). |
Intrepid Funds
NOTES TO FINANCIAL STATEMENTS (continued)
March 31, 2015 (Unaudited)
Equity investments, including common stocks, foreign issued common stocks, exchange-traded funds, closed end mutual funds and real estate investments trusts, which are traded on an exchange are valued at the last sale price reported by the exchange on which the securities are primarily traded on the day of valuation. If there are no sales on a given day for securities traded on an exchange, the latest bid quotation will be used. If there is no Nasdaq Official Closing Price for a Nasdaq-listed security or sale price available for an over-the-counter security, the mean of the latest bid and asked quotations from Nasdaq will be used. When using the market quotations or closing price provided by the pricing service and when the market is considered active, the security will be classified as a Level 1 security.
Investment in mutual funds, including money market funds, are generally priced at the ending net asset value (NAV) provided by the service agent of the funds and will be classified as Level 1 securities.
Debt securities, such as corporate bonds, convertible bonds, senior loans, preferred securities and U.S. government agency issues for which market quotations are not readily available may be valued based on information supplied by independent pricing services using matrix pricing formulas and/or independent broker bid quotations. Debt securities with remaining maturities of 60 days or less may be valued on an amortized cost basis, which involves valuing an instrument at its cost and thereafter assuming a constant amortization to maturity of any discount or premium, regardless of the impact of fluctuating rates on the fair value of the instrument. Amortized cost will not be used if its use would be inappropriate due to credit or other impairments of the issuer. These securities will generally be classified as Level 2 securities.
Forward currency contracts derive their value from the underlying currency prices. These are valued by a pricing service using pricing models. The models use inputs that are observed from active markets, such as exchange rates. These contracts are classified as Level 2.
Futures contracts are valued at the last sale price at the close of trading on the relevant exchange or board of trade. If there was no sale on the applicable exchange or board of trade on such day, they are valued at the average of the quoted bid and asked prices as of the close of such exchange or board of trade. When using the market quotations and when the market is considered active, the contract will be classified as Level 1.
Any securities or other assets for which market quotations are not readily available are valued at fair value as determined in good faith by the Funds’ adviser pursuant to procedures established under the general supervision and responsibility of the Funds’ Board of Trustees and will be classified as Level 3 securities.
Intrepid Funds
NOTES TO FINANCIAL STATEMENTS (continued)
March 31, 2015 (Unaudited)
The inputs of methodology used for valuing securities may not be an indication of the risk associated with investing in those securities.
As of March 31, 2015, the Funds’ assets and liabilities carried at fair value were classified as follows:
| Description | | Level 1 | | | Level 2 | | | Level 3 | | | Total | |
| Intrepid Capital Fund | | | | | | | | | | | | |
| Assets | | | | | | | | | | | | |
| Total Common Stocks* | | $ | 235,481,577 | | | $ | — | | | $ | — | | | $ | 235,481,577 | |
| Total Preferred Stock* | | | — | | | | 9,537,187 | | | | — | | | | 9,537,187 | |
| Total Corporate Bonds* | | | — | | | | 94,424,708 | | | | — | | | | 94,424,708 | |
| Total Convertible Bond* | | | — | | | | 7,191,885 | | | | — | | | | 7,191,885 | |
| Total Forward Currency | | | | | | | | | | | | | | | | |
| Contracts** | | | — | | | | 1,195,903 | | | | — | | | | 1,195,903 | |
| Total Assets | | $ | 235,481,577 | | | $ | 112,349,683 | | | $ | — | | | $ | 347,831,260 | |
| | | | | | | | | | | | | | | | | |
| | | Level 1 | | | Level 2 | | | Level 3 | | | Total | |
| Intrepid Small Cap Fund | | | | | | | | | | | | | | | | |
| Assets | | | | | | | | | | | | | | | | |
| Total Common Stocks* | | $ | 96,429,798 | | | $ | — | | | $ | — | | | $ | 96,429,798 | |
| Total Preferred Stock* | | | — | | | | 9,802,109 | | | | — | | | | 9,802,109 | |
| Total Convertible Bond* | | | — | | | | 10,170,000 | | | | — | | | | 10,170,000 | |
| Total Forward Currency | | | | | | | | | | | | | | | | |
| Contracts** | | | — | | | | 749,284 | | | | — | | | | 749,284 | |
| Total Assets | | $ | 96,429,798 | | | $ | 20,721,393 | | | $ | — | | | $ | 117,151,191 | |
| | | | | | | | | | | | | | | | | |
| Liabilities | | | | | | | | | | | | | | | | |
| Total Forward Currency | | | | | | | | | | | | | | | | |
| Contracts** | | $ | — | | | $ | (118,254 | ) | | $ | — | | | $ | (118,254 | ) |
| Total Liabilities | | $ | — | | | $ | (118,254 | ) | | $ | — | | | $ | (118,254 | ) |
| | | | | | | | | | | | | | | | | |
| | | Level 1 | | | Level 2 | | | Level 3 | | | Total | |
| Intrepid Income Fund | | | | | | | | | | | | | | | | |
| Assets | | | | | | | | | | | | | | | | |
| Total Common Stock* | | $ | 1,032,980 | | | $ | — | | | $ | — | | | $ | 1,032,980 | |
| Total Preferred Stock* | | | — | | | | 4,397,703 | | | | — | | | | 4,397,703 | |
| Total Corporate Bonds* | | | — | | | | 49,204,673 | | | | — | | | | 49,204,673 | |
| Total Convertible Bond* | | | — | | | | 2,723,865 | | | | — | | | | 2,723,865 | |
| Total Forward Currency | | | | | | | | | | | | | | | | |
| Contracts** | | | — | | | | 36,393 | | | | — | | | | 36,393 | |
| Total Assets | | $ | 1,032,980 | | | $ | 56,362,634 | | | $ | — | | | $ | 57,395,614 | |
Intrepid Funds
NOTES TO FINANCIAL STATEMENTS (continued)
March 31, 2015 (Unaudited)
| | | Level 1 | | | Level 2 | | | Level 3 | | | Total | |
| Intrepid Disciplined Value Fund | | | | | | | | | | | | |
| Assets | | | | | | | | | | | | |
| Total Common Stocks* | | $ | 24,458,170 | | | $ | — | | | $ | — | | | $ | 24,458,170 | |
| Total Assets | | $ | 24,458,170 | | | $ | — | | | $ | — | | | $ | 24,458,170 | |
| | | | | | | | | | | | | | | | | |
| | | Level 1 | | | Level 2 | | | Level 3 | | | Total | |
| Intrepid International Fund | | | | | | | | | | | | | | | | |
| Assets | | | | | | | | | | | | | | | | |
| Total Common Stocks* | | $ | 2,006,985 | | | $ | — | | | $ | — | | | $ | 2,006,985 | |
| Total Preferred Stock* | | | — | | | | 105,969 | | | | — | | | | 105,969 | |
| Total Futures Contracts** | | | 49,720 | | | | — | | | | — | | | | 49,720 | |
| Total Assets | | $ | 2,056,705 | | | $ | 105,969 | | | $ | — | | | $ | 2,056,704 | |
| * | | For further information regarding security characteristics, please see the Schedules of Investments. |
| ** | | Derivative instruments not reflected in the Schedule of Investments, such as forward currency and futures contracts, which are reflected at the unrealized appreciation (depreciation) on the instrument. |
There were no transfers of securities between Level 1 and Level 2 during the reporting period.
Below is a reconciliation that details the activity of securities in Level 3 during the current fiscal period. Transfers between levels are recognized at the end of the reporting period.
| | | | Intrepid | | | Intrepid | | | Intrepid | | | Intrepid | | | Intrepid | |
| | | | Capital | | | Small Cap | | | Income | | | Disciplined | | | International | |
| | | | Fund | | | Fund | | | Fund | | | Value Fund | | | Fund | |
| | Beginning Balance - | | | | | | | | | | | | | | | |
| | October 1, 2014 | | $ | 2,462,500 | | | $ | — | | | $ | 1,477,500 | | | $ | — | | | $ | — | |
| | Purchases | | | — | | | | — | | | | — | | | | — | | | | — | |
| | Sales | | | — | | | | — | | | | — | | | | — | | | | — | |
| | Realized gains | | | — | | | | — | | | | — | | | | — | | | | — | |
| | Realized losses | | | — | | | | — | | | | — | | | | — | | | | — | |
| | Change in unrealized | | | | | | | | | | | | | | | | | | | | |
| | appreciation | | | 31,475 | | | | — | | | | 18,885 | | | | — | | | | — | |
| | Net Transfers | | | | | | | | | | | | | | | | | | | | |
| | Out of Level 3 | | | (2,493,975 | ) | | | — | | | | (1,496,385 | ) | | | — | | | | — | |
| | Ending Balance - | | | | | | | | | | | | | | | | | | | | |
| | March 31, 2015 | | $ | — | | | $ | — | | | $ | — | | | $ | — | | | $ | — | |
Intrepid Funds
NOTES TO FINANCIAL STATEMENTS (continued)
March 31, 2015 (Unaudited)
The transfer out of Level 3 into Level 2 in the Intrepid Capital Fund and the Intrepid Income Fund were due to the Funds’ pricing agent providing a value for a bond that was previously being fair valued in accordance with procedures approved by the Board of Trustees.
Derivative Instruments and Hedging Activities
The Funds’ adviser may use derivative instruments, such as forward currency and futures contracts, as a means to manage exposure to exchange rate risk. During the period ended March 31, 2015, the Intrepid Capital Fund, the Intrepid Small Cap Fund, the Intrepid Income Fund and the Intrepid International Fund held derivative instruments.
Forward Currency Contracts
The Intrepid Capital Fund, the Intrepid Small Cap Fund and the Intrepid Income Fund used forward currency contracts during the period for the purpose of hedging exposures to non- U.S. dollar denominated assets. In general the use of these contracts may reduce the overall risk level in a fund, but may also lower fund performance. The use of these contracts does not create leverage in the Funds.
Effect of Forward Currency Contracts on the Statement of Operations as of March 31, 2015
| | | Change in unrealized | | Realized gain |
| | | appreciation (depreciation) | | on forward |
| | | on forward currency contracts | | currency contracts |
| | Intrepid Capital Fund | | $ | 701,664 | | | | $ | 3,022,040 | |
| | Intrepid Small Cap Fund | | $ | (503,612 | ) | | | $ | 6,001,089 | |
| | Intrepid Income Fund | | $ | 5,886 | | | | $ | 136,250 | |
The average monthly notional amounts of forward currency contracts during the period ended March 31, 2015 were as follows:
| | | Intrepid | Intrepid | Intrepid |
| | Long Positions | Capital Fund | Small Cap Fund | Income Fund |
| | Forward currency contracts | $ — | $6,141,522 | $139,865 |
| | | | | |
| | | Intrepid | Intrepid | Intrepid |
| | Short Positions | Capital Fund | Small Cap Fund | Income Fund |
| | Forward currency contract | $(29,883,495) | $(49,128,609) | $(1,243,479) |
Futures
The Intrepid International Fund entered into futures contracts traded on domestic exchanges, including foreign currency futures contracts. Upon entering into a contract, the Fund deposits and maintains as collateral such initial margin as required by the exchange on which the transaction is effected. Pursuant to the contract, the Fund agrees to receive from or pay to the broker an amount of cash equal to the daily
Intrepid Funds
NOTES TO FINANCIAL STATEMENTS (continued)
March 31, 2015 (Unaudited)
fluctuation in value of the contract. Such receipts or payments are known as variation margin and are recorded by the Fund as unrealized gains and losses. When the contract is closed, the Fund records a realized gain or loss equal to the difference between the value of the contract at the time it was opened and the value at the time it was closed. In connection with physically settled futures contracts, the Fund is required under the 1940 Act to maintain assets consisting of cash, cash equivalents or liquid securities. This collateral is required to be adjusted daily to reflect the fair value of the purchase obligation for long futures contracts or the fair value of the instrument underlying the contract, but not less than the market price at which the futures contract was established, for short futures contracts.
The risks inherent in the use of futures contracts include. 1) adverse changes in the value of such instruments and 2) the possible absence of a liquid secondary market for any particular instrument at any time. Futures contracts also expose the Fund to counterparty credit risk. The use of futures contracts creates leverage in a fund. The Fund will not enter into these contracts unless it owns either 1) an offsetting position in the securities or 2) cash and liquid assets with a value marked-to-market daily, sufficient to cover their potential obligations.
Effect of Futures Contracts on the Statement of Operations as of March 31, 2015
| | | Change in unrealized | |
| | | appreciation on | Realized gain |
| | | futures contracts | on futures contracts |
| | Intrepid International Fund | $49,720 | $7,641 |
The average monthly notional amounts of future contracts during the period ended March 31, 2015 were as follows:
| | Long Positions | Intrepid International Fund | |
| | Futures contracts | $ — | |
| | | | |
| | Short Positions | Intrepid International Fund | |
| | Futures contract | $(873,484) | |
Offsetting on the Statement of Assets and Liabilities
In December 2011, the Financial Accounting Standard Board (“FASB”) issued Accounting Standards Update No. 2011-11 “Disclosures about Offsetting Assets and Liabilities” (“ASU 2011-11”). This disclosure requirement is intended to help investors and other financial statement users better assess the effect or potential effect of offsetting arrangements on a fund’s financial position. ASU 2011-11 requires entities to disclose both gross and net information about both instruments and transactions eligible for offset on the Statement of Assets and Liabilities, and disclose instruments and transactions subject to master netting or similar agreements.
Intrepid Funds
NOTES TO FINANCIAL STATEMENTS (continued)
March 31, 2015 (Unaudited)
In addition, in January 2013, FASB issued Accounting Standards Update No. 2013-1 “Clarifying the Scope of Offsetting Assets and Liabilities” (“ASU 2013-1”), specifying exactly which transactions are subject to offsetting disclosures. The scope of the disclosure requirements is limited to derivative instruments, repurchase agreements and reverse repurchase agreements, and securities borrowing and securities lending transactions. ASU 2011-11 and ASU 2013-1 are effective for financial statements with fiscal years beginning on or after January 1, 2013.
The Fund adopted the disclosure requirement on offsetting as of October 1, 2013. For financial reporting purposes, the Fund offsets financial assets and financial liabilities that are subject to master netting arrangements or similar agreements within appreciation on forward currency contracts and depreciation on forward currency contracts on the Statement of Assets and Liabilities.
As of March 31, 2015, the gross amount of derivative assets and liabilities which were not offset for the Intrepid Capital Fund, the Intrepid Income Fund, and the Intrepid International Fund are presented gross on the Statement of Assets and Liabilities. At March 31, 2015, the amount of derivative assets and liabilities by type that are subject to offsetting for the Intrepid Small Cap fund are as follows:
Forward Currency Contracts*
| | | | | | Gross Amounts not | |
| | | | | | Offset in the Statements | |
| | | | | | of Assets and Liabilities | |
| | | | Gross | Net | | | |
| | | | Amounts | Amounts | | | |
| | | Gross | Offset | Presented | | | |
| | | Amounts | in the | in the | | | |
| | | of | Statements | Statements | | Collateral | |
| | | Recognized | of Assets & | of Assets & | Financial | Amounts | Net |
| | | Assets | Liabilities | Liabilities | Instruments | Received | Amount |
| | Intrepid Small | | | | | | |
| | Cap Fund | $749,284 | $(118,254) | $631,030 | $ — | $ — | $631,030 |
| | | | | | | | |
| | | | | | Gross Amounts not | |
| | | | | | Offset in the Statements | |
| | | | | | of Assets and Liabilities | |
| | | | Gross | Net | | | |
| | | | Amounts | Amounts | | | |
| | | Gross | Offset | Presented | | | |
| | | Amounts | in the | in the | | | |
| | | of | Statements | Statements | | Collateral | |
| | | Recognized | of Assets & | of Assets & | Financial | Amounts | Net |
| | | Assets | Liabilities | Liabilities | Instruments | Received | Amount |
| | Intrepid Small | | | | | | |
| | Cap Fund | $(118,254) | $(118,254) | $ — | $ — | $ — | $ — |
| | * | The respective counterparties for each contract are disclosed in the Open Forward Currency Contract detail within the Schedule of Investments. |
Intrepid Funds
NOTES TO FINANCIAL STATEMENTS (continued)
March 31, 2015 (Unaudited)
Derivative Risk
The risks of using the types of derivatives in which the Funds may engage include the risk that movements in the value of the derivative may not fully offset or complement instruments currently held in the Funds in the manner intended by the Funds’ adviser; the risk that the counterparty to a derivative contract may fail to comply with their obligations to the Fund; the risk that the derivative may not possess a liquid secondary market at a time when the Fund would look to disengage the position; the risk that additional capital from the Fund may be called upon to fulfill the conditions of the derivative contract; and the risk that the cost of the derivative contracts may reduce the overall returns experienced by the Funds.
Use of Estimates
The preparation of financial statements in conformity with GAAP requires management to make estimates and assumptions that affect the reported amounts of assets and liabilities and disclosure of contingent assets and liabilities at the date of the financial statements and the reported amounts of revenues and expenses during the reporting period. Actual results could differ from those estimates.
Indemnification
In the normal course of business the Funds enter into contracts that contain general indemnification clauses. The Funds’ maximum exposure under these arrangements is unknown, as this would involve future claims against the Funds that have not yet occurred. Based on experience, the Funds expect the risk of loss to be remote.
Foreign Currency Transactions
The books and records are maintained in U.S. dollars. Foreign currency denominated transactions (i.e. market value of investment securities, assets and liabilities, purchases and sales of investment securities, and income and expenses) are translated into U.S. dollars at the current rate of exchange. The Funds do not isolate that portion of the results of operations resulting from changes in foreign exchange rates on investments from the fluctuations arising from changes in market prices of securities held. Such fluctuations are reflected in net realized and unrealized gain or loss on investments and foreign currency translation.
Securities Transactions and Investment Income
The Funds record security transactions based on trade date. Dividend income is recognized on the ex-dividend date, and interest income is recognized on an accrual basis. Discounts and premiums on securities purchased are amortized over the lives of the respective securities using the effective yield method. Withholding taxes on foreign dividends have been provided for in accordance with the Funds’ understanding of the applicable country’s tax rules and rates. Net realized gains or losses are determined using the identified cost method.
Intrepid Funds
NOTES TO FINANCIAL STATEMENTS (continued)
March 31, 2015 (Unaudited)
Distribution to Shareholder Policy
Dividends from net investment income, if any, are declared and paid quarterly. Distributions of net realized capital gains, if any, are declared and paid at least annually.
Federal Income Taxes
The Funds comply with, and intend to continue to comply with, the requirements of Subchapter M of the Internal Revenue Code necessary to qualify as a regulated investment company and to make the requisite distributions of income and capital gains to its shareholders sufficient to relieve it from Federal income taxes.
Allocation of Income, Expenses, and Gains/Losses
Income, expenses (other than those deemed to be attributable to a specific share class), and gains and losses of each Fund are allocated to each class of shares based upon the ratio of net assets represented by each class as a percentage of the net assets of that Fund. Expenses deemed directly attributable to a specific class of shares are charged against the operations of such class. Most Fund expenses are allocated by class based on relative net assets.
Subsequent Events Evaluation
On April 21, 2015, the Board of Trustees of Intrepid Capital Management Funds Trust, based on the recommendation of Intrepid Capital Management, Inc., the adviser to the Intrepid Small Cap Fund, approved a change in the name and principal investment strategies of the Intrepid Small Cap Fund to Intrepid Endurance Fund (the “Fund”). In connection with this name change, the Board also approved the removal of the Fund’s non-fundamental investment policy requiring that the Fund invest at least 80% of its net assets in equity securities of small capitalization companies. Otherwise, the principal investment strategies of the Fund remain unchanged, as do the “Principal Risks” of the Fund. The changes to the Fund’s name and principal investment strategies will become effective on June 26, 2015.
On May 15, 2015, the Trust filed an update to its registration statement to add an additional series to the Trust. The Intrepid Select Fund is scheduled to begin operations in late July 2015.
In preparing these financial statements, the Trust has evaluated events and transactions for potential recognition or disclosure resulting from subsequent events after the Statement of Assets and Liabilities date of March 31, 2015. This evaluation did not result in any subsequent events, other than those noted above, that necessitated disclosure and / or adjustments.
Intrepid Funds
NOTES TO FINANCIAL STATEMENTS (continued)
March 31, 2015 (Unaudited)
The Trust has an Investment Advisory Agreement (the “Agreement”) with Intrepid Capital Management, Inc. (the “Adviser”), with whom certain officers and Trustees of the Trust are affiliated, to furnish investment advisory services to the Funds. Under the terms of the Agreement, the Trust, on behalf of the Funds, compensates the Adviser for its management services on the Intrepid Capital Fund and Intrepid Disciplined Value Fund at the annual rate of 1.00% on the first $500 million of average daily net assets and 0.80% on each of the Fund’s average daily net assets in excess of $500 million, on the Intrepid Small Cap Fund and Intrepid International Fund at an annual rate of 1.00% of average daily net assets, and on Intrepid Income Fund at the annual rate of 0.75% of average daily net assets.
For the Intrepid Capital Fund and the Intrepid Small Cap Fund, the Adviser agreed to waive its management fee and/or reimburse other expenses of each of the Funds, including organization expenses, to the extent necessary to ensure that each Fund’s operating expenses did not exceed 1.40% of each Fund’s Investor Class average daily net assets and 1.15% of average daily net assets of each Fund’s Institutional Class. For the Intrepid Income Fund, the Adviser agreed to waive its management fee and/or reimburse other expenses of the Fund, including organization expenses, to the extent necessary to ensure that the Fund’s operating expenses did not exceed 0.90% of average daily net assets of the Institutional Class. For the Intrepid Disciplined Value Fund, the Adviser agreed to waive its management fee and/or reimburse other expenses of the Intrepid Disciplined Value Fund, including organization expenses, to the extent necessary to ensure that the Fund’s operating expenses did not exceed 1.30% of average daily net assets. The Intrepid Disciplined Value Fund’s expenses were previously capped at 1.40% of average daily net assets for the period of January 31, 2011 through January 31, 2014. For the Intrepid International Fund, the Adviser agreed to waive its management fee and/or reimburse other expenses of the Intrepid International Fund, including organization expenses, to the extent necessary to ensure that the Fund’s operating expenses did not exceed 1.40% of average daily assets. Any such waivers or reimbursements for the Funds are subject to later adjustment to allow the Adviser to recoup amounts waived or reimbursed to the extent actual fees and expenses on a monthly basis during the fiscal year are less than the respective expense cap limitations, provided, however, that the Adviser shall only be entitled to recoup such amounts for a period of three years from the date such amount was waived or reimbursed. Waived/reimbursed expenses subject to potential recovery by year of expiration are as follows:
Intrepid Funds
NOTES TO FINANCIAL STATEMENTS (continued)
March 31, 2015 (Unaudited)
| | �� | | Year of Expiration | |
| | | | 9/30/15 | | | 9/30/16 | | | 9/30/17 | | | 9/30/18 | |
| | Intrepid Capital Fund | | $ | 154,544 | | | $ | 78,422 | | | $ | 30,705 | | | $ | 19,370 | |
| | Intrepid Small Cap Fund | | | 330,578 | | | | 181,009 | | | | 51,755 | | | | 62,411 | |
| | Intrepid Income Fund | | | 104,137 | | | | 87,877 | | | | 68,989 | | | | 32,710 | |
| | Intrepid Disciplined Value Fund | | | 89,179 | | | | 76,307 | | | | 105,983 | | | | 4,082 | |
| | Intrepid International Fund | | | — | | | | — | | | | — | | | | 26,316 | |
The Trust, on behalf of the Funds, has adopted a distribution plan pursuant to Rule 12b-1 under the 1940 Act (the “12b-1 Plan”), which provides that the Funds may reimburse the Funds’ distributor or others at an annual rate of up to 0.25% of the average daily net assets of the Investor Class of the Capital Fund and the Small Cap Fund and the sole class of the Disciplined Value Fund and International Fund.
Quasar Distributors, LLC serves as the distributor to the Funds. Quasar Distributors, LLC is an affiliated company of U.S. Bank, N.A.
| 5. | INVESTMENT TRANSACTIONS |
The aggregate purchases and sales of securities (excluding short-term securities) by the Funds for the period ended March 31, 2015 were as follows:
| | | | Non-U.S. Government | |
| | | | Purchases | | | Sales | |
| | Intrepid Capital Fund | | $ | 101,511,797 | | | $ | 92,813,765 | |
| | Intrepid Small Cap Fund | | | 70,213,604 | | | | 118,302,481 | |
| | Intrepid Income Fund | | | 6,009,088 | | | | 15,080,282 | |
| | Intrepid Disciplined Value Fund | | | 10,778,494 | | | | 12,897,161 | |
| | Intrepid International Fund | | | 2,393,260 | | | | 164,169 | |
Intrepid Funds
NOTES TO FINANCIAL STATEMENTS (continued)
March 31, 2015 (Unaudited)
| 6. | CAPITAL SHARE TRANSACTIONS |
| | Intrepid Capital Fund – Investor Class | | | | | | | | |
| | | Six Months Ended | | Year Ended | |
| | | March 31, 2015 | | September 30, 2014 | |
| | Shares sold | | | 1,387,554 | | | | | 4,086,972 | | |
| | Shares issued to holders in | | | | | | | | | | |
| | reinvestment of dividends | | | 1,744,662 | | | | | 1,113,011 | | |
| | Shares redeemed | | | (5,738,409 | ) | | | | (5,070,240 | ) | |
| | Net increase (decrease) in shares | | | (2,606,193 | ) | | | | 129,743 | | |
| | Shares outstanding: | | | | | | | | | | |
| | Beginning of period | | | 18,810,987 | | | | | 18,681,244 | | |
| | End of period | | | 16,204,794 | | | | | 18,810,987 | | |
| | | | | | | | | | | | |
| | Intrepid Capital Fund – Institutional Class | | | | | | | | | | |
| | | Six Months Ended | | Year Ended | |
| | | March 31, 2015 | | September 30, 2014 | |
| | Shares sold | | | 3,510,501 | | | | | 5,593,593 | | |
| | Shares issued to holders in | | | | | | | | | | |
| | reinvestment of dividends | | | 1,087,034 | | | | | 539,686 | | |
| | Shares redeemed | | | (3,798,803 | ) | | | | (3,216,159 | ) | |
| | Net increase in shares | | | 789,732 | | | | | 2,917,120 | | |
| | Shares outstanding: | | | | | | | | | | |
| | Beginning of period | | | 18,414,259 | | | | | 15,497,139 | | |
| | End of period | | | 19,212,991 | | | | | 18,414,259 | | |
| | | | | | | | | | | | |
| | Intrepid Small Cap Fund – Investor Class | | | | | | | | | | |
| | | Six Months Ended | | Year Ended | |
| | | March 31, 2015 | | September 30, 2014 | |
| | Shares sold | | | 1,851,832 | | | | | 5,550,822 | | |
| | Shares issued to holders in | | | | | | | | | | |
| | reinvestment of dividends | | | 2,652,456 | | | | | 1,717,192 | | |
| | Shares redeemed | | | (8,250,250 | ) | | | | (16,529,998 | ) | |
| | Net decrease in shares | | | (3,745,962 | ) | | | | (9,261,984 | ) | |
| | Shares outstanding: | | | | | | | | | | |
| | Beginning of period | | | 26,056,308 | | | | | 35,618,292 | | |
| | End of period | | | 22,310,346 | | | | | 26,056,308 | | |
Intrepid Funds
NOTES TO FINANCIAL STATEMENTS (continued)
March 31, 2015 (Unaudited)
| | Intrepid Small Cap Fund – Institutional Class | | | | | | | | |
| | | Six Months Ended | | Year Ended | |
| | | March 31, 2015 | | September 30, 2014 | |
| | Shares sold | | | 1,504,728 | | | | | 9,837,540 | | |
| | Shares issued to holders in | | | | | | | | | | |
| | reinvestment of dividends | | | 1,095,822 | | | | | 356,830 | | |
| | Shares redeemed | | | (8,545,357 | ) | | | | (2,414,543 | ) | |
| | Net increase (decrease) in shares | | | (5,944,807 | ) | �� | | | 7,779,827 | | |
| | Shares outstanding: | | | | | | | | | | |
| | Beginning of period | | | 14,535,257 | | | | | 6,755,430 | | |
| | End of period | | | 8,590,450 | | | | | 14,535,257 | | |
| | | | | | | | | | | | |
| | Intrepid Income Fund – Investor Class | | | | | | | | | | |
| | | Six Months Ended | | Year Ended | |
| | | March 31, 2015 | | September 30, 2014 | |
| | Shares sold | | | — | | | | | 216,890 | | |
| | Shares issued to holders in | | | | | | | | | | |
| | reinvestment of dividends | | | — | | | | | 36,775 | | |
| | Shares exchanged into | | | | | | | | | | |
| | Institutional Class | | | — | | | | | (2,864,432 | ) | |
| | Shares redeemed | | | — | | | | | (828,317 | ) | |
| | Net decrease in shares | | | — | | | | | (3,439,084 | ) | |
| | Shares outstanding: | | | | | | | | | | |
| | Beginning of period | | | — | | | | | 3,439,084 | | |
| | End of period | | | — | | | | | — | | |
| | | | | | | | | | | | |
| | Intrepid Income Fund – Institutional Class | | | | | | | | | | |
| | | Six Months Ended | | Year Ended | |
| | | March 31, 2015 | | September 30, 2014 | |
| | Shares sold | | | 293,677 | | | | | 1,155,133 | | |
| | Shares issued to holders in | | | | | | | | | | |
| | reinvestment of dividends | | | 256,775 | | | | | 326,022 | | |
| | Shares exchanged from Investor Class | | | — | | | | | 2,867,740 | | |
| | Shares redeemed | | | (1,026,687 | ) | | | | (1,078,210 | ) | |
| | Net increase (decrease) in shares | | | (476,235 | ) | | | | 3,270,685 | | |
| | Shares outstanding: | | | | | | | | | | |
| | Beginning of period | | | 11,018,595 | | | | | 7,747,910 | | |
| | End of period | | | 10,542,360 | | | | | 11,018,595 | | |
Intrepid Funds
NOTES TO FINANCIAL STATEMENTS (continued)
March 31, 2015 (Unaudited)
| | Intrepid Disciplined Value Fund | | | | | | | | |
| | | Six Months Ended | | Year Ended | |
| | | March 31, 2015 | | September 30, 2014 | |
| | Shares sold | | | 193,273 | | | | | 594,968 | | |
| | Shares issued to holders in | | | | | | | | | | |
| | reinvestment of dividends | | | 351,854 | | | | | 311,325 | | |
| | Shares redeemed | | | (169,647 | ) | | | | (517,037 | ) | |
| | Net increase in shares | | | 375,480 | | | | | 389,256 | | |
| | Shares outstanding: | | | | | | | | | | |
| | Beginning of period | | | 4,112,859 | | | | | 3,723,603 | | |
| | End of period | | | 4,488,339 | | | | | 4,112,859 | | |
| | | | | | | | | | | | |
| | Intrepid International Fund | | | | | | | | | | |
| | | Period Ended | | | | | | |
| | | March 31, 2015(1) | | | | | | |
| | Shares sold | | | 501,454 | | | | | | | |
| | Shares issued to holders in | | | | | | | | | | |
| | reinvestment of dividends | | | — | | | | | | | |
| | Shares redeemed | | | — | | | | | | | |
| | Net increase in shares | | | 501,454 | | | | | | | |
| | Shares outstanding: | | | | | | | | | | |
| | Beginning of period | | | — | | | | | | | |
| | End of period | | | 501,454 | | | | | | | |
| | (1) | Fund commenced operations on December 30, 2014. |
| 7. | FEDERAL INCOME TAX INFORMATION |
The tax components of distributions paid during the fiscal years ended September 30, 2014 and 2013 are as follows:
| | | | September 30, 2014 | | | September 30, 2013 | |
| | | | Ordinary | | | Long-Term | | | Ordinary | | | Long-Term | |
| | | | Income | | | Capital Gains | | | Income | | | Capital Gains | |
| | Intrepid Capital Fund | | $ | 17,350,570 | | | $ | 9,206,667 | | | $ | 16,081,659 | | | $ | 3,462,698 | |
| | Intrepid Small Cap Fund | | | 16,425,546 | | | | 13,200,062 | | | | 29,637,548 | | | | 27,732,663 | |
| | Intrepid Income Fund | | | 3,067,890 | | | | 523,598 | | | | 3,921,807 | | | | 682,892 | |
| | Intrepid Disciplined | | | | | | | | | | | | | | | | |
| | Value Fund | | | 1,141,030 | | | | 2,282,809 | | | | 2,097,686 | | | | 458,332 | |
Intrepid Funds
NOTES TO FINANCIAL STATEMENTS (continued)
March 31, 2015 (Unaudited)
Additionally, U.S. generally accepted accounting principles require that certain components of net assets relating to permanent differences be reclassified between financial and tax reporting. These reclassifications have no effect on net assets or net asset value per share. For the year ended September 30, 2014, the following table shows the reclassifications made:
| | | | Accumulated | | | Undistributed | | | | |
| | | | Net Realized | | | Net Investment | | | Paid-in | |
| | | | Gains (Losses) | | | Income | | | Capital | |
| | Intrepid Capital Fund | | $ | 265,406 | | | $ | (265,406 | ) | | $ | — | |
| | Intrepid Small Cap Fund | | | (5,483,557 | ) | | | 5,483,558 | | | | (1 | ) |
| | Intrepid Income Fund | | | 8,304 | | | | (8,304 | ) | | | — | |
| | Intrepid Disciplined Value Fund | | | (328,461 | ) | | | 328,461 | | | | — | |
These reclassifications primarily relate to adjustments with differing book and tax methods for accounting, investment losses and currency adjustments.
As of September 30, 2014, the components of accumulated earnings (losses) for income tax purposes were as follows:
| | | | Intrepid | | | Intrepid | |
| | | | Capital Fund | | | Small Cap Fund | |
| | Cost of investments | | $ | 309,688,687 | | | $ | 147,167,821 | |
| | Unrealized appreciation | | | 36,784,009 | | | | 29,603,524 | |
| | Unrealized depreciation | | | (4,780,842 | ) | | | (2,561,430 | ) |
| | Net unrealized appreciation (depreciation) | | | 32,003,167 | | | | 27,042,094 | |
| | Undistributed ordinary income | | | 14,406,574 | | | | 3,016,846 | |
| | Undistributed long-term capital gain | | | 23,147,990 | | | | 52,577,341 | |
| | Distributable income | | | 37,554,564 | | | | 55,594,187 | |
| | Other accumulated loss | | | — | | | | (6,770 | ) |
| | Total accumulated gain | | $ | 69,557,731 | | | $ | 82,629,511 | |
Intrepid Funds
NOTES TO FINANCIAL STATEMENTS (continued)
March 31, 2015 (Unaudited)
| | | | | | | Intrepid | |
| | | | Intrepid | | | Disciplined | |
| | | | Income Fund | | | Value Fund | |
| | Cost of investments | | $ | 70,271,452 | | | $ | 21,350,542 | |
| | Unrealized appreciation | | | 560,852 | | | | 4,000,443 | |
| | Unrealized depreciation | | | (879,099 | ) | | | (592,572 | ) |
| | Net unrealized appreciation (depreciation) | | | (318,247 | ) | | | 3,407,871 | |
| | Undistributed ordinary income | | | 388,859 | | | | 398,372 | |
| | Undistributed long-term capital gain | | | 501,888 | | | | 2,868,900 | |
| | Distributable income | | | 890,747 | | | | 3,267,272 | |
| | Other accumulated loss | | | — | | | | — | |
| | Total accumulated gain | | $ | 572,500 | | | $ | 6,675,143 | |
The difference between book-basis and tax-basis unrealized appreciation is attributable primarily to the tax deferral of losses on wash sales.
There is no tax liability resulting from unrecognized tax benefits relating to uncertain income tax positions taken or expected to be taken on the tax returns for the fiscal year-end September 30, 2014, or for any other tax years which are open for exam. As of September 30, 2014, open tax years include the tax years ended September 30, 2011 through 2014. The Trust is also not aware of any tax positions for which it is reasonably possible that the total amounts of unrecognized tax benefits will significantly change in the next year. The Funds recognize interest and penalties, if any, related to unrecognized tax benefits as income tax expense in the Statement of Operations. During the period, the Funds did not incur any interest or penalties, nor were any accrued as of September 30, 2014.
The Intrepid Capital Fund, Intrepid Small Cap Fund, Intrepid Income Fund, and Intrepid Disciplined Value Fund each have a revolving unsecured credit facility in the amounts of $5,000,000, $10,000,000, $5,000,000, and $2,000,000, respectively, for temporary emergency purposes, including the meeting of redemption requests that otherwise might require the untimely disposition of securities. The Intrepid International Fund does not have a revolving unsecured credit facility. The lines of credit have a one year term and are reviewed annually by the Board of Trustees. The current agreements run through October 15, 2015. The interest rate as of March 31, 2015 was 3.25%. During the period ended March 31, 2015, none of the Funds drew on their line of credit.
Intrepid Funds
ADDITIONAL INFORMATION
March 31, 2015 (Unaudited)
Investment Advisory Agreement Disclosure
On November 18, 2014, the Board of Trustees (the “Board”) of Intrepid Capital Management Funds Trust approved renewing the investment advisory agreements between the Intrepid Capital Fund, the Intrepid Small Cap Fund, the Intrepid Income Fund and the Intrepid Disciplined Value Fund (the “Funds”) and Intrepid Capital Management, Inc. (the “Adviser”). The Board also approved the adoption of the investment advisory agreement between the Intrepid International Fund (the “International Fund”) and the Adviser. Prior to approving the renewal and adoption of the agreements, the Board considered:
| | • | The nature, extent and quality of the services provided by Intrepid Capital Management, Inc. to the Funds and the nature, extent and quality of the services anticipated to be provided to the International Fund; |
| | • | The investment performance of the Funds; |
| | • | The cost of the services provided by, and the profits realized by, Intrepid Capital Management, Inc. from its relationship with the Funds and the cost of the services anticipated for the International Fund, and the profits expected to be realized; |
| | • | The extent to which economies of scale would be realized as the Funds and the International Fund grew and whether fee levels reflect any such economies of scale; |
| | • | The expense ratio of the Funds and the anticipated expense ratio of the International Fund; and |
| | • | The manner in which portfolio transactions for the Funds were conducted, including the use of soft dollars. |
In considering the nature, extent and quality of the services provided and anticipated to be provided by the Adviser, the Board considered the Adviser’s quality of investment management provided to the Funds, the Adviser’s management history, the Adviser’s ability to attract investors for the Funds and the International Fund, and the Adviser’s experience and expertise related to the management of a foreign stock portfolio. The Board concluded that the nature, extent and quality of the services provided and anticipated to be provided and anticipated to be provided by the Adviser are satisfactory.
The Board reviewed the investment performance of the Funds and compared the investment performance of the Funds to their relevant benchmarks. After further discussion, the Board concluded that the performance of the Funds was satisfactory in comparison to the relevant benchmarks.
The Board considered the cost of services provided (and to be provided) and the profits realized (and to be realized) by the Adviser, by reviewing reports provided by the administrator that compared the Funds’ and the International Fund’s investment
Intrepid Funds
ADDITIONAL INFORMATION (continued)
March 31, 2015 (Unaudited)
advisory fees to those of other comparable mutual funds, and by reviewing information provided by the Adviser about its profitability and its anticipated profitability, including the expense limitation agreements. The Board concluded that the investment advisory fees were fair and within the range of the industry averages.
The Board considered the extent to which economies of scale would be realized as the Funds and the International Fund grow, including a consideration of breakpoints in the fee schedules of the agreements. The Board concluded that given the expected growth of assets of the Funds and the International Fund in the next year, the Adviser was unlikely to realize economies of scale and the proposed fee schedules were acceptable.
The Board reviewed reports from the administrator that compared the Funds’ and the International Fund’s total expense ratios to those of other comparable mutual funds. The Board concluded that the total expenses of the Funds and the International Fund were reasonable and within the range of the industry averages.
The Board reviewed reports discussing the manner in which portfolio transactions for the Funds were conducted, including the use of soft dollars. Based on these reports, the Board concluded that the research and services obtained by the Adviser were beneficial to the Funds and that the Adviser is executing the Funds’ portfolio transactions in a manner designed to obtain best execution for the Funds.
All of the factors above were considered separately by the Board, including the Trustees who are not “interested persons” (as defined in the 1940 Act) of the Funds (the “Independent Trustees”) meeting in an executive session. The factors were viewed in their totality by the Board, with no single factor being the principal or determinative factor in the Board’s determination of whether to approve the continuation of the advisory agreements. Based on the factors discussed above, the Board, including all of the Independent Trustees, approved the continuation of the advisory agreements.
Shareholder Notification of Federal Tax Status
The Intrepid Capital Fund, Intrepid Small Cap Fund, Intrepid Income Fund, and Intrepid Disciplined Value Fund designated $9,206,667, $13,200,062, $523,598 and $2,282,809, respectively, of total distributions paid during the fiscal year ended September 30, 2014 as net capital gain distributions eligible for long-term capital gain rates for individual shareholders.
The Intrepid Capital Fund, Intrepid Small Cap Fund, Intrepid Income Fund and Intrepid Disciplined Value Fund designated 20.92%, 27.28%, 1.14% and 43.08%, respectively, of their ordinary income distributions for the period ended September 30, 2014 as qualified dividend income under the Jobs & Growth Tax Relief Reconciliation Act of 2003.
Intrepid Funds
ADDITIONAL INFORMATION (continued)
March 31, 2015 (Unaudited)
For the period ended September 30, 2014, 18.60%, 10.70%, 0.43% and 41.50% of Intrepid Capital Fund, Intrepid Small Cap Fund, Intrepid Income Fund and Intrepid Disciplined Value Fund dividends paid from net ordinary income, respectively, qualify for the dividends received deduction available to corporate shareholders.
The Intrepid Capital Fund, Intrepid Small Cap Fund, Intrepid Income Fund and Intrepid Disciplined Value Fund designated 31.73%, 0.00%, 100.00% and 0.00%, respectively, of their ordinary income distributions for the fiscal year as interest-related dividends under Internal Revenue Code Section 871(k)(1)(c).
The Intrepid Capital Fund, Intrepid Small Cap Fund, Intrepid Income Fund and Intrepid Disciplined Value Fund designated 72.74%. 100.00%, 1.20% and 100.00%, respectively, of their ordinary income distributions as short-term capitalization distributions under Internal Revenue Code Section 871(k)(2)(c).
Availability of Quarterly Portfolio Holdings Schedules
The Funds are required to file their complete schedule of portfolio holdings with the SEC for the first and third quarters of each fiscal year on Form N-Q. Once filed, the Funds’ Form N-Q is available without charge, upon request on the SEC’s website (http://www.sec.gov) and may be available by calling 1.866.996.3863. You may also obtain copies at the SEC’s Public Reference Room in Washington, D.C. Information on the operation of the Public Reference Room may be obtained by calling 1.800.SEC.0330.
Proxy Voting Policies and Procedures and Proxy Voting Record (Unaudited)
A description of the policies and procedures that the Funds use to determine how to vote proxies relating to portfolio securities is available without charge, upon request, by calling 1.866.996.3863 and on the SEC’s website (http://www.sec.gov).
The Funds are required to file how they voted proxies related to portfolio securities during the most recent 12-month period ended June 30. Once filed, the information is available without charge, upon request, by calling 1.866.996.3863 and on the SEC’s website (http://www.sec.gov).
(This Page Intentionally Left Blank.)
Board of Trustees
Edward Vandergriff
Mark Travis
Peter Osterman, Jr.
Roy Clarke
Investment Adviser
Intrepid Capital Management, Inc.
1400 Marsh Landing Parkway, Suite 106
Jacksonville Beach, FL 32250
Independent Registered Public Accounting Firm
Deloitte & Touche LLP
111 South Wacker Drive
Chicago, IL 60606
Legal Counsel
Foley & Lardner LLP
777 East Wisconsin Avenue
Milwaukee, WI 53202
Custodian
U.S. Bank, N.A.
1555 N. RiverCenter Drive, Suite 302
Milwaukee, WI 53212
Distributor
Quasar Distributors, LLC
615 East Michigan Street
Milwaukee, WI 53202
Administrator, Transfer Agent
and Dividend Disbursing Agent
U.S. Bancorp Fund Services, LLC
615 East Michigan Street
Milwaukee, WI 53202
Shareholder/Investor Information
1.866.996.3863
www.intrepidcapitalfunds.com
ITRPSEMI-0315
Item 2. Code of Ethics.
Not applicable for semi-annual reports.
Item 3. Audit Committee Financial Expert.
Not applicable for semi-annual reports.
Item 4. Principal Accountant Fees and Services.
Not applicable for semi-annual reports.
Item 5. Audit Committee of Listed Registrants.
Not applicable to registrants who are not listed issuers (as defined in Rule 10A-3 under the Securities Exchange Act of 1934).
Item 6. Investments.
Schedule of Investments is included as part of the report to shareholders filed under Item 1 of this Form.
Item 7. Disclosure of Proxy Voting Policies and Procedures for Closed-End Management Investment Companies.
Not applicable to open-end investment companies.
Item 8. Portfolio Managers of Closed-End Management Investment Companies.
Not applicable to open-end investment companies.
Item 9. Purchases of Equity Securities by Closed-End Management Investment Company and Affiliated Purchasers.
Not applicable to open-end investment companies.
Item 10. Submission of Matters to a Vote of Security Holders.
Not Applicable.
Item 11. Controls and Procedures.
(a) The Registrant’s President and Treasurer have reviewed the Registrant's disclosure controls and procedures (as defined in Rule 30a-3(c) under the Investment Company Act of 1940 (the “Act”)) as of a date within 90 days of the filing of this report, as required by Rule 30a-3(b) under the Act and Rules 13a-15(b) or 15d-15(b) under the Securities Exchange Act of 1934. Based on their review, such officers have concluded that the disclosure controls and procedures are effective in ensuring that information required to be disclosed in this report is appropriately recorded, processed, summarized and reported and made known to them by others within the Registrant and by the Registrant’s service provider.
(b) There were no changes in the Registrant's internal control over financial reporting (as defined in Rule 30a-3(d) under the Act) that occurred during the second fiscal quarter of the period covered by this report that has materially affected, or is reasonably likely to materially affect, the Registrant's internal control over financial reporting.
Item 12. Exhibits.
| (a) | (1) Any code of ethics or amendment thereto, that is the subject of the disclosure required by Item 2, to the extent that the registrant intends to satisfy Item 2 requirements through filing an exhibit. 1) Incorporated by reference to the Registrant’s Form N-CSR filed December 5, 2008. |
(2) A separate certification for each principal executive and principal financial officer pursuant to Section 302 of the Sarbanes-Oxley Act of 2002. Filed herewith.
(3) Any written solicitation to purchase securities under Rule 23c-1 under the Act sent or given during the period covered by the report by or on behalf of the registrant to 10 or more persons. Not applicable to open-end investment companies.
| (b) | Certifications pursuant to Section 906 of the Sarbanes-Oxley Act of 2002. Furnished herewith. |
SIGNATURES
Pursuant to the requirements of the Securities Exchange Act of 1934 and the Investment Company Act of 1940, the registrant has duly caused this report to be signed on its behalf by the undersigned, thereunto duly authorized.
(Registrant) Intrepid Capital Management Funds Trust
By (Signature and Title)* /s/Mark F. Travis
Mark F. Travis, President
Date May 27, 2015
Pursuant to the requirements of the Securities Exchange Act of 1934 and the Investment Company Act of 1940, this report has been signed below by the following persons on behalf of the registrant and in the capacities and on the dates indicated.
By (Signature and Title)* /s/Mark F. Travis
Mark F. Travis, President
Date May 27, 2015
By (Signature and Title)* /s/Donald C. White
Donald C. White, Treasurer
Date May 27, 2015
* Print the name and title of each signing officer under his or her signature.