UNITED STATES
SECURITIES AND EXCHANGE COMMISSION
Washington, D.C. 20549
FORM N-CSR
CERTIFIED SHAREHOLDER REPORT OF REGISTERED
MANAGEMENT INVESTMENT COMPANIES
811-21625
Investment Company Act file number
Intrepid Capital Management Funds Trust
(Exact name of registrant as specified in charter)
1400 Marsh Landing Parkway, Suite 106
Jacksonville Beach, FL 32250
(Address of principal executive offices) (Zip code)
Mark F. Travis
1400 Marsh Landing Parkway, Suite 106
Jacksonville Beach, FL 32250
(Name and address of agent for service)
1-904-246-3433
Registrant's telephone number, including area code
Date of fiscal year end: 09/30/2017
Date of reporting period: 03/31/2017
Item 1. Reports to Stockholders.
Intrepid Capital Fund
Intrepid Endurance Fund
Intrepid Income Fund
Intrepid Disciplined Value Fund
Intrepid International Fund
Intrepid Select Fund
Semi-Annual Report
March 31, 2017
April 4, 2017
| “Better to remain silent and be thought a fool than to speak out and remove all doubt.” | |
| - Abraham Lincoln |
| | |
| | |
| | |
| | |
| | |
| | |
| | |
| | |
| | |
| | |
| | Mark F. Travis, President/C.E.O. |
Dear Friends and Clients,
No, I am not referring to Donald Trump or his incessant tweets. As an aside, I am not certain “tweeting” is appropriate for the President of the United States, especially since they seem to go out unfiltered to the public, which could be a positive or negative depending on your point of view. I was thinking how it would be much more comfortable for those of us at Intrepid Capital to “remain silent” than offer our opinions on the state of the capital markets. I am also reminded of the peril in what I would call “The Boy Who Cried Wolf” syndrome. We have consistently expressed the view that stock prices in relation to the underlying business values are high and likely distorted by the interest rate suppression activity of central banks across the globe. Frankly, I am sure you are tired of hearing this refrain, but it is true, using almost any valuation method one chooses. Always remember the quote from the godfather of value investing, Warren Buffett: “Price is what you pay. Value is what you get.”
My concern for our shareholders, after a long period of both low volatility and higher than normal annualized returns in the U.S. equity markets, is that it becomes expected that one will earn 15% with little risk. If only it were so! Since January 3, 2005, the inception date of the Intrepid Capital Fund (“the Fund”), the annualized rate of return of the S&P 500 is slightly higher than 7%, not twice that rate. The past twelve years encompass two bullish phases of upward equity prices and only one bearish phase, 2007-2009 – posthumously referred to as the Financial Crisis. This bullish phase commenced around this time eight years ago, interrupted only briefly by some volatility in the summer of 2011 around the U.S. debt downgrade. This business of money management is a strange one in that investors, contrary to consumers in virtually any other industry, generally want to buy more stocks, bonds, and commodities after – and only after – prices have risen considerably. Conversely, when stocks are on sale at deeply discounted prices, the majority of investors won’t touch them with a 10-foot pole. This is what I refer to regularly, and sarcastically, as “buying high and selling low!”
Intuitively, in order to create the mispriced opportunities we seek, there must be either a micro event (e.g. company specific - missed earnings, debt downgrade) or macro event (e.g. unexpected change in interest, outbreak of war). Unfortunately, with cheap credit available to all and no obvious global seismic shifts such as sudden
currency devaluations, we are left with mostly odds and ends to add to the portfolio. So, we sit here like firemen, waiting to slide down the pole when the bell rings to ferret out investments that meet the stringent qualifications of what we consider absolute value. In the interim, we wait, wait, and wait some more. What will be the catalyst that changes this placid sea into a stormy hurricane? I wish I knew! Believe me, if I did, I would rush to position the portfolio to take advantage of it.
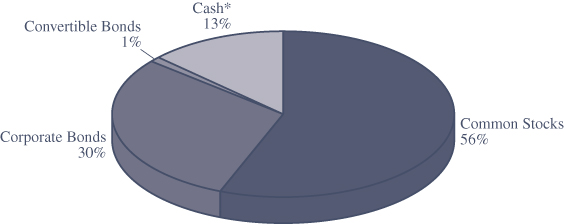
With all of that said, we are pleased with some recently received validation of our investment process. During the quarter, two of our portfolio holdings, Dominion Diamond (ticker: DDC) and Spotless Group (ticker: SPO AU), received buyout offers which helped the stocks reach our internal valuations for each company and led to positive performance for the Fund. For the quarter ending March 31, 2017, the Fund increased 2.54%. For the same period, the S&P 500 Index returned 6.07% and the Bank of America Merrill Lynch US High Yield Index returned 2.71%. Considering the minimal risk incurred due to a healthy 12.1% cash position at the end of the quarter, along with 32.1% in bonds, both investment grade and short duration high yield, and 55.8% in equities, both domestic and international, we are pleased with the performance of the Fund for the period.
The Fund’s five largest contributors during the quarter were Western Digital (ticker: WDC), Dominion Diamond (ticker: DDC), Oaktree Capital (ticker: OAK), Teradata (ticker: TDC), and Leucadia National (ticker: LUK). The Fund’s five largest detractors for the quarter were Syntel (ticker: SYNT), Dundee Corp. (ticker: DC/A CN), Patterson-UTI Energy (ticker: PTEN), Royal Mail PLC (ticker: RMG), and Verizon (ticker: VZ).
For the first six months of the fiscal year, which began September 30, 2016, the Fund increased 4.94% compared to the returns of the S&P 500 Index and Bank of America Merrill Lynch US High Yield Index of 10.12% and 4.64%, respectively. Contributors to the Fund for the six-month period were Western Digital, Leucadia National, Dominion Diamond, Fenner (ticker: FENR), and Tetra Tech (ticker: TTEK). Detractors to the Fund for the same period were Syntel, Royal Mail, Dundee (ticker: DC.A), Express Scripts (ticker: ESRX), and Primero Mining’s 5.75% convertible bonds due 2/28/2020.
Thank you for your continued support and entrusting us with your hard-earned capital.
Best regards,
Mark F. Travis President
Intrepid Capital Fund Portfolio Manager
Mutual fund investing involves risk. Principal loss is possible. The Fund is subject to special risks including volatility due to investments in smaller companies, which involve additional risks such as limited liquidity and greater volatility. Investments in debt securities typically decrease in value when interest rates rise. This risk is usually greater for longer-term debt securities. Investments by the Fund in lower-rated and non-rated securities present a greater risk of loss to principal and interest than higher-rated securities. The Fund may invest in foreign securities which involve greater volatility and political, economic and currency risks and differences in accounting methods. The risks of owning ETFs generally reflect the risks of owning the underlying securities they are designed to track. ETFs also have management fees that increase their costs versus the costs of owning the underlying securities directly.
The Russell 2000 Index consists of the smallest 2,000 companies in a group of 3,000 U.S. companies in the Russell 3000 Index, as ranked by market capitalization. The S&P 500 Index is a broad-based, unmanaged index of 500 stocks, which is widely recognized as representative of the equity market in general. The BofA Merrill Lynch US High Yield Index tracks the performance of US dollar denominated below investment grade corporate debt publicly issued in the US domestic market. Qualifying securities must have a below investment grade rating (based on an average of Moody’s, S&P and Fitch), at least 18 months to final maturity at the time of issuance, at least one year remaining term to final maturity as of the rebalancing date, a fixed coupon schedule and a minimum amount outstanding of $250 million. You cannot invest directly in an index.
Active investing has higher management fees because of the manager’s increased level of involvement while passive investing has lower management and operating fees. Investing in both actively and passively managed mutual funds involves risk and principal loss is possible. Both actively and passively managed mutual funds generally have daily liquidity. There are no guarantees regarding the performance of actively and passively managed mutual funds. Actively managed mutual funds may have higher portfolio turnover than passively managed funds. Excessive turnover can limit returns and can incur capital gains.
Opinions expressed are subject to change, are not guaranteed and should not be considered investment advice or recommendations to buy or sell any security.
The Intrepid Capital Funds are distributed by Quasar Distributors, LLC.
April 5, 2017
| “If your business is not a brand, it is a commodity.” | |
| - Donald Trump |
| | |
| | |
| | |
| | |
| | |
| | |
| | |
| | |
| | |
| | Jayme Wiggins, CIO |
| | | Endurance Fund Portfolio Manager |
Dear Fellow Shareholders,
You know that a brand has achieved success when it becomes the default word for the product or service to which it’s attached. We Google to search the Internet, ride a Jet Ski, need a Band-Aid, throw a Frisbee, drink from a Thermos, and relax in a Jacuzzi. Thirteen years ago, a Saturday Night Live skit spawned a neologism for a perennially pessimistic person: Debbie Downer.
Jingle:
“You’re enjoying your day, everything’s going your way
Then, along comes Debbie Downer!
Always there to tell you about a new disease
A car accident or killer bees.
You’ll beg her to spare you, “Debbie, please.”
But you can’t stop Debbie Downer!”
Dad: We did it, gang! We pulled it off! A family reunion at Disney! I don’t know about you guys, but the first thing I’m gonna do is ride that haunted elevator thingie! [laughs] It drops you straight down!
Sister 1: This is my dream come true! I mean, I’m totally serious! Tigger hugged me at the door, and I thought I was gonna cry!
Debbie Downer: [sullenly] I guess Roy isn’t doing as well as I first thought.
Sister 2: What? Who’s Roy?
Debbie Downer: Roy? Of Siegfried and Roy? He was attacked by his own tiger and suffered devastating injuries.
[drunken trombone sound effect “wah-wah”, as camera zooms in on Debbie’s comic distraught face]1
During the past few years, we have received friendly advice that our unenthusiastic view of small cap valuations could cause us to be seen as “perma-bears”…and nobody wants to hang out with a Debbie Downer. The path of least resistance in the investment business is to put on a happy face. We readily admit that we are wired to be more skeptical than your average Joe, but we hope the brand we are building will eventually be regarded as less Chicken Little and more Jiminy Cricket, the level-headed conscience of Pinocchio. We try to tell it like it is, ugly or not.
_________________
1 | http://www.nbc.com/saturday-night-live/video/debbie-downer/n11825?snl=1 |
While small cap stock prices should seem quite beautiful to a seller today, for a buyer eager to deploy capital, they’re downright hideous. The P/E ratio of the Russell 2000 is in the triple digits (113x), and the index’s constituents haven’t collectively grown GAAP earnings over the past 20 years. U.S. economic growth has been declining and leverage in the system has been rising, yet the EV/EBITDA of the benchmark is nearly 50% above the peak multiple reached before the credit crisis.
While I was writing this letter, a colleague forwarded to me just-released market commentary from a prominent small cap mutual fund company. That manager believes the small cap cycle has more room to run. They base this on the market’s resilience over the past year, in light of developments such as Brexit and the U.S. election. They support their argument by saying that this cycle is young, identifying the February 2016 pullback as the trough. They also noted that since the inception of the Russell 2000 in 1979, the index has declined by 15% or more 12 times. According to their analysis, the median return during the subsequent rebound was 99%. Since the Russell 2000 is only up 48% from their February 11, 2016 trough, they think we are less than halfway through a recovery. While we don’t know whether the market will continue to grind higher in the short-term, we couldn’t disagree more with their logic.
We believe it is highly misleading to claim that this cycle is “young.” We’re currently in the second longest bull market in history, as this one began in March 2009. While the Russell 2000 did experience a 26% peak-to-trough pullback from June 2015 to February 2016, in our opinion, this hardly qualifies as a bear market given its brevity and the extremes of the peak. The aforementioned small cap fund company thinks we’re halfway through the rebound based on a mechanical calculation of the median return from previous corrections exceeding 15%. The problem with this argument is that the small cap market was far cheaper at historical troughs than it was in February 2016.
| | Russell 2000 Peaks and Troughs Since Inception |
| | (Troughs defined by manager as at least 15% fall from peak) |
| | | | | | Russell | |
| | | Cycle | Index | % Price | 2000 EV/ | S&P 500 |
| | Date | Point | Price | Change* | EBITDA | P/E |
| | October 5, 1979 | Peak | 55.9 | | | |
| | October 23, 1979 | Trough | 47.2 | -15% | | 7.3 |
| | February 8, 1980 | Peak | 61.9 | 31% | | |
| | March 27, 1980 | Trough | 45.4 | -27% | | 6.8 |
| | June 15, 1981 | Peak | 85.2 | 88% | | |
| | August 12, 1982 | Trough | 60.3 | -29% | | 7.1 |
| | June 24, 1983 | Peak | 127.0 | 110% | | |
| | July 25, 1984 | Trough | 94.0 | -26% | | 9.8 |
| | August 25, 1987 | Peak | 174.4 | 86% | | |
| | October 28, 1987 | Trough | 106.1 | -39% | | 16.8 |
| | October 9, 1989 | Peak | 180.8 | 70% | | |
| | October 30, 1990 | Trough | 118.8 | -34% | | 13.9 |
| | May 22, 1996 | Peak | 364.6 | 207% | | |
| | July 24, 1996 | Trough | 307.8 | -16% | 9.2 | 17.8 |
| | April 21, 1998 | Peak | 491.4 | 60% | | |
| | October 8, 1998 | Trough | 310.3 | -37% | 9.8 | 22.0 |
| | March 9, 2000 | Peak | 606.1 | 95% | | |
| | October 9, 2002 | Trough | 327.0 | -46% | 9.8 | 17.3 |
| | July 13, 2007 | Peak | 855.8 | 162% | | |
| | March 9, 2009 | Trough | 343.3 | -60% | 7.8 | 11.1 |
| | April 29, 2011 | Peak | 865.3 | 152% | | |
| | October 31, 2011 | Trough | 609.5 | -30% | 9.4 | 13.9 |
| | June 23, 2015 | Peak | 1,295.8 | 113% | | |
| | February 11, 2016 | Trough | 953.7 | -26% | 17.9 | 16.8 |
| | March 31, 2017 | Present | 1,385.9 | 45% | | |
*Excluding dividends Source: Bloomberg
Our firm only has access to Russell 2000 earnings data going back to 1995. Per share earnings for the small cap index are extremely volatile and sometimes negative, so we examined the historical EV/EBITDA multiple of the Russell at the last five troughs prior to 2016. The average multiple was 9.2x. The multiple in February 2016 was 17.9x. For the periods prior to 1995 where we don’t have Russell data, we do have access to S&P 500 earnings. The P/E of the S&P 500 in these earlier years was much lower, on average, than it was in the late 90’s and 2000’s. While large and small caps don’t always behave similarly (e.g. during the tech bubble), we are confident that the 17.9x EV/EBITDA seen in February 2016 was above any previous trough valuation for the Russell index. Therefore, we think it’s extremely imprudent to project past returns from Russell 2000 troughs onto today’s market without acknowledging the materially different starting point for valuations. Simply put, small caps have never been this expensive.
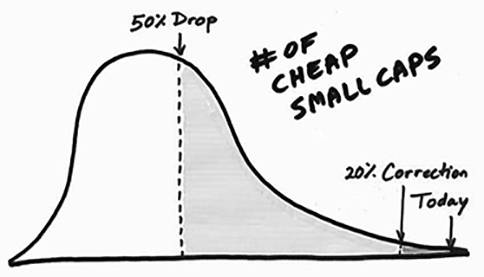
We are often asked what it will take for us to put more money to work. One good new idea would get us excited. We found two of them in Q4 but none this quarter. We would probably need more than a dozen opportunities for the Intrepid Endurance Fund (the “Fund”) to reach a more fully invested status. While that could happen even amid the broadest small cap bubble of all time, our gut tells us the market will need to fall significantly before the Endurance Fund is fully invested again. To help visualize how we judge today’s opportunity set, for illustrative purposes only, consider a positively skewed distribution.2 We are currently on the far end of the right tail. With a correction of 10% or 20% to small cap prices, we would still remain close to valuation extremes. A 50% plummet would just take us back to levels reached in 2011. While we expect that we would be aggressively deploying capital under that scenario, the market would not be reflecting the fire sale valuations we saw in 2009.
Source: Intrepid Capital
The Endurance Fund was exactly flat for the calendar first quarter ending March 31, 2017, while the Russell 2000 increased 2.47%. The median stock in the Russell 2000 was up 0.12% in the quarter, so almost all of the index’s performance was derived from larger capitalization constituents. For most of the quarter, the Fund’s return was in negative territory, as a few of our top holdings experienced large markdowns. However, performance improved near the end of the quarter due to a proposed takeover for one of the Fund’s main positions and increases in the value of other holdings.
This begs the question: how can we have so much cash and still have been losing money until the very end of Q1? It’s not easy! We often invest in complicated situations and unloved businesses, but usually not in unloved business models. Currently, we own very few securities that belong to the Russell 2000 benchmark, and that’s not a coincidence. Russell stocks are expensive, no doubt pumped up by indiscriminate ETF buying. The Fund’s holdings are as uncorrelated to the market as they have ever been, which has been achieved by owning foreign securities, convertible bonds, precious metals, and other investments that fall outside of the U.S. small cap benchmark.
_________________
2 | We chose a positively skewed distribution because we believe periods of overvaluation are more extreme and frequent than the periods of undervaluation. |
While the Fund’s performance over the past two quarters has not been impressive, we believe there are two points worth considering. First, price does not equal value. In general, we think that some our key holdings became even better bargains in recent months. Many of our top losers from 2015, a difficult year, were top gainers for us in 2016. Second, it’s not unusual for the Fund’s performance to deviate significantly from the small cap index. Last year, all of the Fund’s return came in the first 8 months of the year, and we didn’t rally at all post-election. The small cap market exhibited the opposite behavior.
The largest contributors to the Fund in the first quarter were Dominion Diamond (ticker: DDC), Corus Entertainment (ticker: CJR/B CN), and the iShares Gold Trust (ticker: IAU). On March 16th, Dominion announced strong guidance for its 2018 fiscal year, which ends on January 31, 2018. This led to a 12% spike in the stock, which had been selling off over concerns that India’s demonetization could have longer-lasting impacts on rough diamond prices than previously thought. That weekend, The Washington Companies disclosed that it made a U.S. $13.50 per share takeover offer to Dominion’s board in February, which was a 54% premium to where the stock traded before the company issued guidance. We were not completely surprised by the offer, since Dominion’s balance sheet has a large amount of cash and because the stock had been trading near multiyear lows. Washington consists of a group of privately held businesses in the U.S. and Canada, including one of the largest copper and molybdenum mines in North America. Billionaire Dennis Washington owns the firm, and the bid for Dominion was rumored to be pushed by David Batchelder, the activist who co-founded Relational Investors and who sits on Washington’s board. Dominion and Washington have not been able to agree on terms that would allow Washington to complete its due diligence. Both parties have publicized their dispute.
On March 27th, Dominion said it would explore strategic alternatives that could include a sale of the company. The firm engaged in a similar process beginning in 2015, but the effort seemed to fizzle after Dominion entered into a settlement with an activist group. We believe the odds are higher of a deal being completed this time due to Washington’s expressed interest and because the composition of the board has changed. The rough diamond market is also in better shape today. Dominion’s shares are now fully valued using our base case assumptions, so we partially reduced the position. However, the stock continues to trade below Washington’s conditional offer. We think Dominion could be more valuable in the arms of a strategic suitor, so we have maintained exposure to the name.
Corus Entertainment’s stock appreciated modestly in the first quarter. We believe the company’s television advertising revenue is only one quarter away from showing year-over-year growth, which would end a painful chapter in Corus’s history. If Corus’s earnings start to improve, we think investors should be willing to assign a higher
multiple to the company’s free cash flow stream. Corus’s shares currently offer a dividend yield of 8.7%. We expect management to apply cash flow to debt reduction.
iShares Gold Trust benefited from the 8.9% increase in the price of gold over the first three months of the calendar year. We don’t envision this as a permanent holding for the Fund and would rather own actual businesses, like precious metal streamers. Nevertheless, if streaming companies or miners trade at higher valuations than can be justified by current metals prices, we will sell them, just like any other stock.
The top detractors from Q1 performance were Dundee Corp. (ticker: DC/A CN), Syntel (ticker: SYNT), and Primero Mining’s 5.75% Convertible Notes (CUSIP: 74164WAB2). Dundee’s performance has been abysmal, and that comment doesn’t just apply to the stock. The company is involved in many different ventures, but almost nothing has worked out. We attribute at least half of the unfavorable outcomes to poor decisions by management and the rest to bad luck. Hindsight is 20/20, and our involvement in Dundee came from trying too hard to find value in an over-picked market. Our fair value for the stock is based on asset value, in contrast to our typical discounted free cash flow valuation. We felt comfortable with this approach because the assets were originally anchored by publicly-traded equities that seemed reasonably valued to us on inspection. Dundee’s cash flow has been negative as the team attempted to nurture a basket of various nascent businesses into self-sustaining enterprises. It hasn’t worked. We had chances to revisit the investment as the situation changed and decent investments were exchanged for speculative ones. The mistake is on me, your Portfolio Manager. We have not added to the holding in over a year and reduced our position last summer at better prices—a small victory in an otherwise dreadful investment.
So where do we go from here? Dundee is a $3.50 stock with $12.25 of book value. That book value continues to decline as the company’s portfolio is not generating cash flow but Dundee is incurring corporate overhead and financing costs. Right now the market is implying that every single private company Dundee manages is worth nothing, plus that the business burns cash at the current rate for another three years. We have urged management to sell Dundee’s public investments to pay off bank debt and preferred stock, which would reduce cash burn by half. If the company then catches a break on one of its major private investments, it could mark a turning point for the company’s fortunes. We’re not holding our breath but aren’t yet inclined to sell Dundee at today’s prices. The Fund’s weight in Dundee is approximately 1%, so its impact on performance going forward should be more limited.
Dundee Corp. Net Assets
| Assets | | Liabilities | |
| Publicly-traded investments | | $ | 283,445 | | Corporate net debt | | $ | (52,954 | ) |
| Private inv mgd by Dundee | | $ | 387,198 | | Preference shares | | $ | (201,455 | ) |
| Private inv mgd by 3rd parties | | $ | 303,115 | | | | $ | (254,409 | ) |
| | | $ | 973,758 | | | | | | |
| | Assets - Liabilities | $719,349 | |
| | Market cap | $205,578 | |
| | Shares outstanding | 58,736 | |
| | Equity per share | $12.25 | |
| | Price per share | $3.50 | |
Our investment in Syntel started off well, increasing over 15% in just a few months…then the company announced guidance in February. The stock gave it all back and then some, so now we’re about 15% in the red. While fourth quarter results were in line with projections, the company’s outlook for 2017 was well below consensus estimates. Management painted a subdued spending picture for the industries Syntel serves. The stock’s underperformance is primarily tied to Syntel’s revenue declines versus growth for the rest of the IT services industry. The company coasted for years on sales growth from its largest customers—American Express, State Street, and FedEx. Those customers are now reducing spending, and Syntel’s smaller clients are not picking up the slack. This has prompted management to increase the heretofore lean marketing budget.
Some investors are also concerned about Syntel’s chops in the digital arena, but the company’s well-regarded SyntBots automation platform demonstrates that Syntel can develop cutting edge IP. Lastly, legal immigration policy remains an overhang, as there are several bills in Congress that seek to change the H-1B visa program, and the Trump administration has already made a couple of marginal changes that could negatively impact outsourcers. We take some comfort that both Chuck Schumer (D-NY) and Paul Ryan (R-WI) have previously expressed support for the H-1B program, suggesting that it may be difficult to push a bill through Congress that severely curtails visa issuances. Even if we are wrong, Syntel has several ways to deal with fewer visas, including sending more work offshore, increasing local hiring of Americans, expanding automation to reduce labor, and also passing along cost increases to customers. Syntel trades for about 9x expected free cash flow. It is now the second largest position in the Fund and one of the biggest discounts to our estimated fair value.
Primero Mining experienced an eventful quarter, which included a mine strike, reserve reduction, CEO resignation, and going concern language. Did we mention we like this security? The bonds certainly carry risk, but they yield 25%. We believe the strike at the San Dimas Mine in Mexico will end shortly, since the miners have
few other options for employment. Additionally, Silver Wheaton has indicated that it is willing to modify its silver stream with Primero if it is fairly compensated. Silver Wheaton also recently guaranteed Primero’s credit facility, enabling a six month extension that gives Primero time to explore strategic alternatives. In other words, Silver Wheaton is as attached as ever to Primero. We view this relationship as the main lever to improve the company’s health.
With that said, Primero, Silver Wheaton, and the Tax Administration Service (SAT) are embroiled in a Mexican standoff at the moment (pun intended). Primero can survive if either the SAT relinquishes its pursuit of Primero for higher taxes on its silver production or if Silver Wheaton reduces the burden of its silver stream on San Dimas. However, if either the SAT or Silver Wheaton acts, the other party may not have to yield anything. We think Silver Wheaton will cave first, since its Herculean efforts to avoid paying taxes in Mexico and almost everywhere else make it unlikely that it would want to see this situation through a restructuring. Silver Wheaton as a mine owner in Mexico would be a much juicier target than Primero.
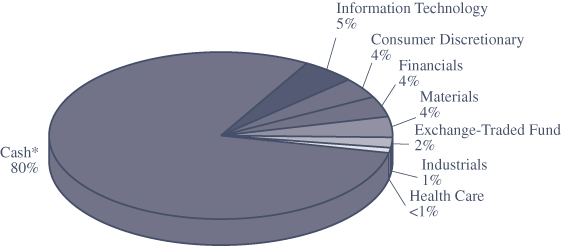
Our promise to you is straightforward: we have a process and we’re sticking to it, come hell or high water. The linchpin of our process is to not own stocks that we think are overvalued, which covers just about everything today. If we cannot find an undervalued security, we hold cash or equivalents. As a result, cash and Treasury bills account for 79.4% of the Endurance Fund—an all-time high. Some shareholders have departed because they don’t want to pay us a fee on cash, even though they respect our stock selection. We understand. In spite of the temporary consequences to fund flows for holding “too much cash,” we wouldn’t feel comfortable justifying our management fee by intentionally owning overvalued stocks.
Investing is a tough, competitive business. The hardest aspect is managing your emotions. When do you get into the market? When do you get out? Most investors struggle with these questions. This Fund is designed to take that burden from you. If the stock market is bubbly, our positioning is sober. If it’s a bloodbath, we’re Bram Stoker. We’re not any smarter than the next guy and we make plenty of mistakes, but our process is our guidepost. The one thing that we’re certain we do well is follow
our investment process. As shareholders in the Fund, that helps us sleep well at night. Thank you for your investment.
Sincerely,
Jayme Wiggins, CFA
Chief Investment Officer
Intrepid Endurance Fund Portfolio Manager
Past performance is not a guarantee of future results.
Mutual fund investing involves risk. Principal loss is possible. The Fund is subject to special risks including volatility due to investments in smaller companies, which involve additional risks such as limited liquidity and greater volatility. The Fund may invest in foreign securities which involve greater volatility and political, economic and currency risks and differences in accounting methods. The risks of owning ETFs generally reflect the risks of owning the underlying securities they are designed to track. ETFs also have management fees that increase their costs versus the costs of owning the underlying securities directly.
Prior to June 26, 2015, the Fund was named the Intrepid Small Cap Fund.
The Russell 2000 Index consists of the smallest 2,000 companies in a group of 3,000 U.S. companies in the Russell 3000 Index, as ranked by market capitalization. The S&P 500 Index is a broad-based unmanaged index of 500 stocks, which is widely recognized as representative of the equity market in general. You cannot invest directly in an index.
Cash Flow measures the cash generating capability of a company by adding non-cash charges and interest to pretax income. Free Cash Flow measures the cash generating capability of a company by subtracting capital expenditures from cash flow from operations. Enterprise Value equals market capitalization plus debt minus cash. EV/EBITDA equals the company’s Enterprise Value (EV) divided by Earnings Before Interest, Taxes, Depreciation, and Amortization (EBITDA). Basis Point is a unit that is equal to 1/100th of 1% and is used to denote the change in a financial instrument. Yield is the income return on an investment. It refers to the interest or dividends received from a security and is usually expressed annually as a percentage based on the investment’s cost, its current market value or its face value. A Credit Facility is a type of loan made in a business or corporate finance context, involving revolving credit, term loans, committed facilities, letters of credit and most retail credit accounts. Bank Revolver is a credit card consumer who carries a balance from month to month. Streaming Partner refers to two or more parties involved in financing arrangements customized to fit the specific needs of a particular mining company, a particular project and the related financing requirements. Book Value is the value of a security or asset as entered in a company’s books.
Fund Holdings and sector allocations are subject to change at any time and should not be considered a recommendation to buy or sell any security. Please see the Schedule of Investments in this report for complete Fund holdings.
Opinions expressed are subject to change, are not guaranteed and should not be considered investment advice or recommendations to buy or sell any security.
The Intrepid Capital Funds are distributed by Quasar Distributors, LLC.
| | |
| | Jason Lazarus, |
| | Income Fund Portfolio Manager |
April 1, 2017
Dear Fellow Shareholders,
The Trump euphoria continued almost unabated into the first quarter of 2017 despite mediocre macroeconomic results, higher inflation, and another 25 basis point rate hike. Small caps felt some pressure in March due to declining oil prices and pressure on the retail sector, but they subsequently recovered when crude regained $50 per barrel. Large caps essentially shrugged off any negative news and rocketed 6.07% higher in the first quarter with historically low volatility. In fact, the S&P 500 traded lower on just three of the nineteen trading days in February. Here’s another fun fact: the Dow Jones Industrial Average closed at record highs for twelve straight days in February. This has only occurred two other times in history.
U.S. fixed income assets also recorded positive returns in the first quarter. Longer duration risk-free bond yields spiked in March to the highest levels seen in years. This caused moderate losses, but bonds recovered significantly over the last three weeks. By the end of the quarter, longer-dated Treasury bond yields were slightly lower, adding positive pricing contribution to the income production. The appetite for risk resulted in credit spread tightening. The worse the credit rating, the greater the magnitude of the tightening, meaning riskier bonds outperformed safer bonds. The Bloomberg Barclays US Aggregate Index gained 0.82% in the quarter ended March 31, 2017. Investment-grade corporates, as measured by the BAML US Corporate Index, returned 1.42% in the quarter. As experienced in equities, the decline in oil prices had a negative impact on riskier bonds, but only temporarily. The high-yield market, as measured by the BAML High Yield Index, rose 2.71% in the quarter.
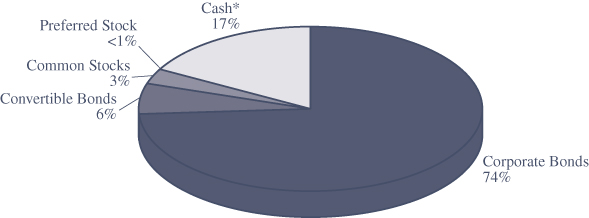
The Intrepid Income Fund (the “Fund”) gained 1.16% in the quarter. The Fund participated in little if any of the volatility experienced by the indexes presented above. This is explained by the Fund’s very low energy exposure, ownership of less-volatile short-term investment grade corporates (~36% of the Fund’s assets) and U.S. Treasury bills (~15% of AUM). Furthermore, the Fund typically exhibits a low correlation to the high-yield index simply because many of our holdings are not included in the Index. At the end of the quarter, approximately 16% of the Fund’s assets were invested in bonds that are represented in the high-yield index. Lastly, the Fund has a much shorter duration than the indexes presented above, so the impact of changes in interest rates was minimal. At the end of the quarter, the effective duration of the Fund was 1.2 years.
Last year we owned the bonds of three different publicly-traded pawn shop operators – EZCORP (ticker: EZPW), Cash America (ticker: CSH), and First Cash Financial (ticker: FCFS). First Cash acquired Cash America last September and retired the Cash
America bonds at a significant premium as required by the make-whole covenant. The Cash America notes were one of the Fund’s top contributors last year. After the notes were retired, we were contacted by a broker asking us to sell our rights to participate in a legal settlement. The lawsuit was related to the retirement of $103.5 million of the notes after Cash America spun off an online lending business in 2014. Despite the notes being non-callable at the time, CSH did not pay a make-whole premium on the retirement. A hedge fund has been suing since then.
The broker offered us 1-2 cents on the dollar for our participation rights. We analyzed the relevant documents and spoke to one of the lawyers on the case and determined that the case might possibly be resolved within a few months. Summary judgment had already been completed on September 19, 2016, and was in favor of the bondholders. The only disagreement was the amount of compensation that would be awarded to bondholders. We chose to hold onto the rights. After several short delays, the parties came to an agreement. On January 13, 2017, the Fund received 8.6 cents on the dollar in compensation. This gain was the top contributor in the three-month period ended March 31, 2017.
Dominion Diamond common stock (ticker: DDC) is one of the Fund’s newest positions and happened to be the second largest contributor in the first quarter. Dominion is the world’s third largest diamond producer. The company owns interests in two mines located in Canada, which is one of the most stable political jurisdictions in the world.
While the diamond industry is not recession-resistant, the long-term supply and demand fundamentals appear to be supportive of prices. Diamond mines can take over a decade to construct from start to finish, which tends to stabilize the supply side of the equation. Furthermore, because just four producers account for roughly 75% of global production value, the industry has historically been quite rational in pulling back supply in the face of weak end-market demand.
Last month we attended a mining conference where we met with Dominion’s management team and that of a competing diamond producer. We left more confident in the long-term industry fundamentals, as well as Dominion’s capital allocation plans. Dominion’s equity appeared quite a bit cheaper than comparable diamond producers. The firm has a very strong balance sheet that includes a large cash balance and sizeable inventory of diamonds. We purchased the stock in early March. Two weeks later, Dominion received an unsolicited buyout offer from billionaire David Washington at a 36% premium to the prior closing price.
Rent-A-Center 4.75% notes due 5/01/2021 (ticker: RCII) were our worst performing security in the quarter but had an immaterial impact on the Fund’s performance. We cut our position last year and exited the remainder in the first quarter. The business began to show cracks in the November earnings report when operations were hurt by bugs in a new software system that impacted stores’ ability to sell and collect payment. We assumed the software issues were fixable, but the sales trends were
clearly deteriorating, even excluding management’s estimate of the software impact. We have various ideas as to why the top line might be experiencing secular pressure, but what was most enlightening to us was the level of operating leverage the business exhibited with a higher than nominal change in sales. The company has been cutting store-level costs for years to battle a slowing declining business, which masked the operating leverage.
Fast forward to January. Rent-A-Center pre-announced fourth quarter earnings. A pre-announcement is almost never good. It means the business has deteriorated significantly (or not improved as hoped) in relatively short order. Importantly, there was no issue with the software system, yet sales deteriorated even further. The firm announced same store sales in the core rent-to-own business were down about 14%. The company also announced management turnover. Our view is that Rent-A-Center is not suffering from company-specific or transient issues. We exited the position when we learned the point-of-sale system was not responsible for the operational missteps. Our timing could have been better, as a well-known activist hedge fund stepped in less than two weeks later and so far has provided significant support for the bonds and the stock.
As short-term rates have risen over the past few quarters, we have had some success in identifying investment-grade bonds maturing in 1-2 years that in some cases offer yields close to 2%. We believe such bonds are an attractive use of cash in the current environment of extremely low yields offered by lower-rated issues. We sourced several new short-term investment-grade ideas in the first quarter, including the bonds of familiar businesses such as Hasbro and Wyndham Worldwide. We also added to existing investment-grade and high-yield positions. The Fund initiated positions in two new high-yield securities in the quarter; Actuant Corp 5.625% due 6/15/2022 and Cable One 5.75% due 6/15/2022. As for the Fund’s sales, the exit of the Rent-A-Center position was discussed previously. Lion’s Gate finally completed its acquisition of Starz in December, and our Starz bonds were retired. Lastly, two short-term investment-grade issues matured.
Actuant (ticker: ATU) is a leading provider of niche tools and solutions to diverse end markets. The firm’s Enerpac business has dominated its market for years and has branded itself as the most trusted supplier of heavy lifting products, and Actuant also has commanding positions in other product lines. While its end markets can be highly cyclical, the company prints cash in good times and in bad. This is a blessing during recessionary periods, as ATU generates plenty of cash to service and reduce debt. However, limited reinvestment opportunities have resulted in a number of questionable acquisitions over the last several years, mostly funded with debt.
All of Actuant’s businesses have struggled over the last two years due to weak end markets, which has pushed leverage above the high end of management’s targeted range, but the market for high-margin industrial tools appears to have stabilized. Actuant has a long history of generating significant free cash flow. While gross
leverage appears elevated for an industrial firm, its debt/free cash flow is quite low at 3.9x. Actuant also holds $180 million in cash, or 31% of the outstanding debt. Furthermore, we believe management has the ability and willingness to pull multiple levers, if needed, including potentially divesting segments. Our view is that the Enerpac business alone is worth more than the par value of all of the debt.
Cable One (ticker: CABO) is one of the largest cable operators in the United States. The company targets smaller metro areas with less competition. CABO has been transitioning its business toward data as video subscribers have turned to over-the-top offerings, such as Netflix, Amazon, and Hulu. While the firm did use debt to fund a recent acquisition, we believe the obligations are manageable. Cable One has one of the better balance sheets in the industry. We believe the notes maturing in 2022 offer a fair return for the risks.
There have been some rumblings in the high-yield market recently, specifically in energy and distressed retailers. Several of the largest brick-and-mortar retailers are closing stores at a rapid pace, and the number of retailer bankruptcies is on pace to exceed 2008. So far this year, well-known retailers Gander Mountain, HHGregg, Wet Seal, and Limited Stores have declared bankruptcy, in addition to five other large businesses. RadioShack filed Chapter 22, meaning the firm has entered Chapter 11 for the second time in recent history. Several others are on the brink. Some distressed retailers may be able exit bankruptcy and continue to operate with newly restructured balance sheets. The weaker concepts may be shuttered for good. Wet Seal and Limited have already closed all of their stores. HHGregg is likely to follow suit. The Income Fund has limited exposure to the discretionary retail sector, a position we have maintained for some time considering the current state of the economic cycle, but we welcome any market dislocations that might lead to attractive investment opportunities.
As always, we are diligently searching for undervalued securities on your behalf. Thank you for your investment.
Sincerely,
Jason Lazarus, CFA
Intrepid Income Fund Portfolio Manager
Mutual fund investing involves risk. Principal loss is possible. Investments in debt securities typically decrease in value when interest rates rise. The risk is generally greater for longer term debt securities. Investments by the Fund in lower-rated and non-rated securities present a greater risk of loss to principal and interest than higher rated securities. The Fund may invest in foreign securities which involve greater volatility and political, economic and currency risks and differences in accounting methods.
The BofA Merrill Lynch US High Yield Index tracks the performance of US dollar denominated below investment grade corporate debt publicly issued in the US domestic market. Qualifying securities must have a below investment grade rating (based on an average of Moody’s, S&P and Fitch), at least 18 months to final maturity at the time of issuance, at least one year remaining term to final maturity as of the rebalancing date, a fixed coupon schedule and a minimum amount outstanding of $250 million. Barclays Capital U.S. Aggregate Bond Index is an index representing about 8,200 fixed income securities. To be included in the index, bonds must be rated investment grade by Moody’s and S&P. BofA Merrill Lynch U.S. Corporate Index (Corporate) is an unmanaged index of U.S. dollar denominated investment grade corporate debt securities publicly issued in the U.S. domestic market with at least one year remaining term to final maturity. The Dow Jones Industrial Average a price-weighted average of 30 significant stocks traded on the New York Stock Exchange. You cannot invest directly in an index.
Bond ratings are grades given to bonds that indicate their credit quality as determined by private independent rating services such as Standard & Poor’s, Moody’s and Fitch. These firms evaluate a bond issuer’s financial strength, or its ability to pay a bond’s principal and interest in a timely fashion. Ratings are expressed as letters ranging from ‘AAA’, which is the highest grade, to ‘D’, which is the lowest grade.
Basis Point is a unit that is equal to 1/100th of 1% and is used to denote the change in a financial instrument. Yield is the income return on an investment. It refers to the interest or dividends received from a security and is usually expressed annually as a percentage based on the investment’s cost, its current market value or its face value. Investment Grade (IG) is a bond with credit rating of BBB or higher by Standard & Poor’s or Baa3 or higher by Moody’s. Yield to Maturity is the total return anticipated on a bond if the bond is held until the end of its lifetime. Dividend Yield is calculated by dividing the dollar value of dividends paid in a given year per share of stock held by the dollar value of one share of stock. Free Cash Flow measures the cash generating capability of a company by subtracting capital expenditures from cash flow from operations.
Opinions expressed are subject to change, are not guaranteed and should not be considered investment advice or recommendations to buy or sell any security.
The Intrepid Capital Funds are distributed by Quasar Distributors, LLC.
| Intrepid Disciplined Value Fund |
| |  |
| | |
| | Mark F. Travis, President/C.E.O. |
April 4, 2017
Dear Fellow Shareholders,
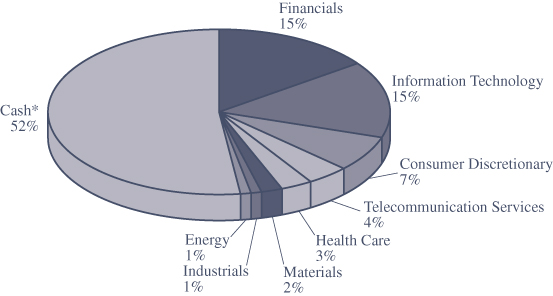
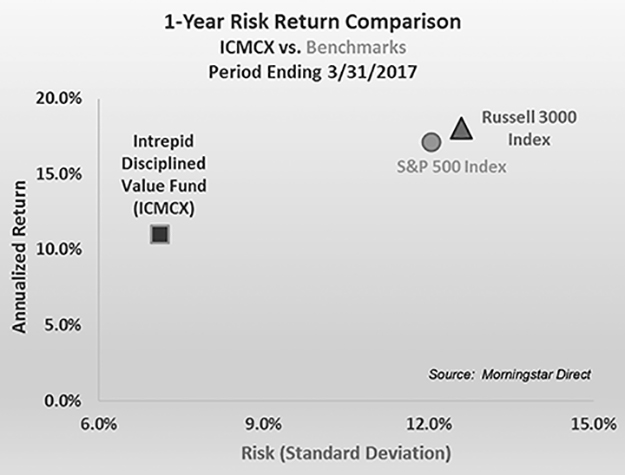
We are pleased to announce the performance of the Intrepid Disciplined Value Fund (the “Fund”) for the quarter and six-month periods ending March 31, 2017. For the quarter, the Fund increased 3.08%, which brings the return to 5.03% for the first six months of the fiscal year, which commenced September 30, 2016. For comparison, the returns of the S&P 500 Index and the Russell 3000 Index for the quarter were 6.07% and 5.74%, respectively. For the six-month period, the S&P 500 Index and the Russell 3000 Index returned 10.12% and 10.19%, respectively. Considering that the Fund held 52.2% in cash at the end of the period and cash has been at a consistently high level over the last several periods due to the challenge of finding high-quality businesses at what we consider a discount to intrinsic value, we believe the Fund has performed well with less risk than the benchmarks in this continued bull market.
The Fund’s five largest contributors during the quarter were Western Digital (ticker: WDC), Oaktree Capital (ticker: OAK), Apple (ticker: AAPL), Teradata (ticker: TDC), and Coach (ticker: COH). The Fund’s five largest detractors for the quarter were Dundee Corp. (ticker: DC/A CN), Verizon (ticker: VZ), Contango Oil & Gas (ticker: MCF), Telephone & Data Systems (ticker: TDS), and Western Union (ticker:
| Intrepid Disciplined Value Fund |
WU). Contributors to the Fund for the six-month period were Western Digital, Northern Trust (ticker: NTRS), Leucadia National (ticker: LUK), Apple, and Oaktree Capital. Detractors to the Fund for the same period were Dundee, Contango Oil & Gas, Verizon Communications, Alamos Gold (ticker: AGI), and Baldwin & Lyons (ticker: BWINB).
As you know from any recent communication from Intrepid Capital, we believe prices continue to be high, with the current trailing price-to-earnings ratio (P/E) of the S&P 500 north of 21x. The Fund has ample cash reserves if something were to go “bump in the night.” To be fully invested today assumes there will be no better opportunity tomorrow. Since we are stewards of your hard-earned capital, our goal is to first protect and then strive to grow what has been entrusted to us. Between the cash in the Fund and a now more global reach in our equity search than when the firm began, we hope to find more suitable investments in the days ahead, enabling us to put some of the cash to work.
There are changes afoot with the Fund going forward. Effective March 31, 2017, Gregory Estes, CFA, resigned from Intrepid Capital Management. After 16 years of working closely with Greg, I will miss his keen intellect and sense of humor. His departure is almost a calling from the Catholic Church. Greg was raised in Jacksonville, FL, receiving his early and high school education in local Catholic schools before heading off to Notre Dame for his undergraduate degree, then returning to attend the University of Florida for his graduate degree. He has continued his involvement with the Church over the years. Greg is moving to a local asset management firm which works with the local Diocese and will help them pursue other opportunities of this kind. We wish him well with his new adventure and appreciate his work here at Intrepid Capital. The two of us have a lunch bet on the outcome of the UGA v. Notre Dame football game, September 9th in South Bend. The outcome will be known by our fiscal year end September 30th, so stay tuned.
Assisting me in the role of lead portfolio manager of the Disciplined Value Fund are two analysts who both started here as summer interns between their undergraduate and graduate coursework. Clay Kirkland, CFA, was an All-American swimmer at Auburn University and completed his MBA at Columbia University. Prior to joining Intrepid Capital in 2012, he worked at UBS in New York City. Matt Parker, CPA, interned with us for two summers while earning his undergraduate and graduate degrees at the University of North Carolina at Chapel Hill. After he earned his Master of Accounting degree, Matt worked in the audit practice of EY in Atlanta. In 2014, Matt returned to Jacksonville to join Intrepid Capital and is currently a Level II candidate in the Chartered Financial Analyst® program. With my 32 years of “wisdom” in the investment management business, coupled with their collective skills and intellect, I am confident this will be a productive combination, and we will continue with our goal of providing attractive risk-
| Intrepid Disciplined Value Fund |
adjusted returns to our shareholders. We thank you for your investment and your continued confidence in our process.
Best regards,
Mark F. Travis President
Intrepid Disciplined Value Fund Portfolio Manager
Mutual fund investing involves risk. Principal loss is possible. The Fund is subject to special risks including volatility due to investments in smaller and medium sized companies, which involve additional risks such as limited liquidity and greater volatility. The Fund may invest in foreign securities which involve greater volatility and political, economic and currency risks and differences in accounting methods. The risks of owning ETFs generally reflect the risks of owning the underlying securities they are designed to track. ETFs also have management fees that increase their costs versus the costs of owning the underlying securities directly.
Prior to April 1, 2013, the Fund was named the Intrepid All Cap Fund.
The S&P 500 Index is a broad based unmanaged index of 500 stocks, which is widely recognized as representative of the equity market in general. The Russell 3000 Index is an index representing the largest 3,000 U.S. companies representing approximately 98% of the investable U.S. equity market. You cannot invest directly in an index.
Price-to-Earnings (P/E) Ratio is calculated by dividing the current price of the stock by the company’s trailing 12 months’ earnings per share. Forward P/E Ratio is calculated by dividing the current price of the stock by the company’s expected earnings per share. Earnings Per Share (EPS) is the portion of a company’s profit allocated to each outstanding share of common stock.
Opinions expressed are subject to change, are not guaranteed and should not be considered investment advice or recommendations to buy or sell any security.
The Intrepid Capital Funds are distributed by Quasar Distributors, LLC.
| Intrepid International Fund |
| |  |
| | |
| | Ben Franklin, |
| | International Fund |
| | Portfolio Manager |
April 1, 2017
Dear Fellow Shareholders,
The Intrepid International Fund (the “Fund”) increased 0.31% in the first quarter of 2017 compared to a gain of 7.25% for the MSCI EAFE Net Index (the “Index”). As we commonly do, we’d like to remind the reader that we typically do not look like the index and don’t behave like one – the large difference in performance is to be expected. That being said, there were some negative developments this quarter in some of the companies in the portfolio. However, we do not believe the securities are permanently impaired.
There appear to be cracks in the European Union, with “-exit” being used to describe a growing number of countries (e.g. Brexit, Grexit, etc.). The upcoming French and German elections will be good indicators of the amount of populism and nationalism within the group. Despite these risks, European stocks appear to be on Viagra as investors continue to take more risk in an already expensive market. Fund flows poured into European stock funds during the quarter, causing markets to rise.
Here in the United States, a potential border-adjustment tax has been proposed. The 20% tax on imports would theoretically cause the dollar to strengthen by 25%. Pundits from all over claim this to be true, but we think they should adhere to the proverb, “In theory, there is no difference between practice and theory. In practice, there is.” There are likely secondary and tertiary impacts, some of which are impossible to predict. If the dollar were to strengthen by 25%, many of our holdings would “theoretically” decline in value on a dollar basis. However, we wish to remind our investors that we hedge our currency exposure. At quarter end, nearly 90% of foreign denominated securities were hedged.
In practice, the top three contributors during the period were Dominion Diamond (ticker: DDC CN), RM PLC (ticker: RM/ LN), and G.U.D. Holdings (ticker: GUD AU). Our three largest detractors were Dundee (ticker: DC/A CN), Noranda Income Fund (ticker: NIF-U CN), and Coventry Group (ticker: CYG AU).
In March, Dominion Diamond announced guidance far above market expectations, causing the stock to jump. Soon thereafter, the company received a buyout offer that was more than 50% above where the stock was trading prior to the increased guidance. This is a short-term gain for us, as our original purchases occurred in September of last year.
RM provides school supplies, IT and other professional services to the UK education market. It’s a high-quality, recession-resistant business that delivers industry-leading margins, strong free cash flow, and has a debt-free balance sheet. The stock fell in early 2016 as investors were concerned that the election of the Conservative Party would result in cuts to education spending that would weigh on the earnings of RM.
| Intrepid International Fund |
While we acknowledged the risk was important, we thought the market was overreacting based on the spending pledges of the incoming party. We established a position midway through 2016. In February 2017, the company reported solid earnings due to margins which held up better than investors expected. They also announced that they would be acquiring an important competitor called Consortium – the education division of Connect Group (ticker: CNCT LN). RM did not overpay for the acquisition, and the combination should strengthen their position in the industry. The market rewarded the stock and we exited the position as the price reached our estimate of intrinsic value.
G.U.D. Holdings is an Australian company that owns several businesses, with their automotive segment being their largest. The company reported satisfactory earnings in early February, and we believe the market is starting to realize the potential this company has with their recently acquired Brown and Watson International acquisition.
Dundee Corporation is habitually either a top contributor or detractor, but has been a detractor far more often. While net tangible assets are significantly higher than the stock’s current price, the company has been burning cash. Additionally, while the holding company has many different investments, it seems as if nothing can go right with any of them. We don’t believe this will be true in perpetuity, but in the short-term the problems mount.
Noranda Income Fund is a Canadian zinc smelter. The company has historically benefited from an agreement with Glencore, which owns 25% of the company, whereby they received stable fees for converting zinc concentrate into zinc metal. However, the agreement ends May 2nd and the company will be forced to switch to operating on market terms. Unfortunately, the timing could not be worse. The fees smelters earn for converting the concentrate into the metal are at, or near, historic lows. Additionally, this change required the company, which has had a stable dividend for years, to discontinue paying dividends. The security is widely held by both income funds and retail investors. We believe the weakness in the stock was exacerbated by these types of investors selling. We also believe the net asset value of the company, which owns 866 acres on the St. Lawrence River just outside of Montreal, is higher than the current trading price. Additionally, if and when the cycle rebounds from the current down cycle, this low-cost smelter should be operating at significantly higher earnings. One additional risk, however, is that the company is 25% owned by behemoth commodity company Glencore (ticker: GLEN LN), and their interests may not be aligned with other shareholders.
Coventry Group is an Australian nuts and bolts company. Their largest business literally sells these commodities. The company has net tangible assets per share of AUD $1.86, compared to a current share price of only AUD $0.70. However, the company recently reported earnings and they are burning cash. We are not happy with the operations and have sent a letter to the company’s Board of Directors urging them to liquidate this failing operation. This activism is a rare occurrence for the
| Intrepid International Fund |
Fund, but we feel in this case that it is justified. Coventry’s assets are worth significantly more than the trading price, but the cash burn is swiftly deteriorating value. If management’s interests were truly aligned with shareholders, we believe they should be willing to sell the operations rather than continue to destroy value. At the end of the quarter, the company announced its CEO has stepped down, with reports that there were “differences of opinion” between directors and the CEO.
While there were negative developments with some of the companies in the portfolio, that is expected to occur from time to time. We are invested in the Fund alongside our investors and manage it for our own future as well as our investors’. We view money as work, and we don’t want to lose what we’ve worked for. However, we feel comfortable having our money invested in a security that has gone down in price if we have good reason to believe the value remains higher than the price. In fact, we’d rather have excess cash invested in this type of security than in an overvalued stock or cash. While we spent much of this quarter reviewing our existing positions, we also continue to search for new undervalued investments.
Thank you for your investment,
Ben Franklin, CFA
Intrepid International Fund Portfolio Manager
Mutual fund investing involves risk. Principal loss is possible. The Fund is subject to special risks including volatility due to investments in smaller companies, which involve additional risks such as limited liquidity and greater volatility. The Fund is considered non-diversified as a result of limiting its holdings to a relatively small number of positions and may be more exposed to individual stock volatility than a diversified fund. The Fund may invest in foreign securities which involve greater volatility and political, economic and currency risks and differences in accounting methods. The risks of owning ETFs generally reflect the risks of owning the underlying securities they are designed to track. ETFs also have management fees that increase their costs versus the costs of owning the underlying securities directly.
The MSCI EAFE Net Index is recognized as the pre-eminent benchmark in the United States to measure international equity performance. The MSCI EAFE Hedged Index represents a close estimation of the performance that can be achieved by hedging the currency exposures of its parent index, the MSCI EAFE Index, to the USD, the “home” currency for the hedged index. The index is 100% hedged to the USD by selling each foreign currency forward at the one-month Forward weight. You cannot invest directly in an index.
Yield is the income return on an investment. It refers to the interest or dividends received from a security and is usually expressed annually as a percentage based on the investment’s cost, its current market value or its face value. Dividend Yield is calculated by dividing the dollar value of dividends paid in a given year per share of stock held by the dollar value of one share of stock. Net tangible assets, or net asset value, is calculated as a company’s total assets, minus intangible assets (goodwill, patents, trademarks, etc.) and all liabilities.
Opinions expressed are subject to change, are not guaranteed and should not be considered investment advice or recommendations to buy or sell any security.
The Intrepid Capital Funds are distributed by Quasar Distributors, LLC.
| |  |
| | |
| | Jayme Wiggins, CIO |
| | Select Fund |
| | Portfolio Manager |
April 5, 2017
Dear Fellow Shareholders,
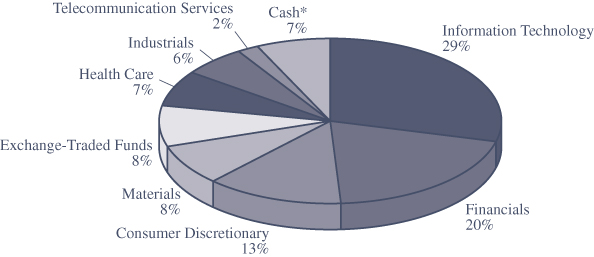
The Intrepid Select Fund (the “Fund”) increased 4.47% for the first quarter ending March 31, 2017, while the Russell 2000 increased 2.47%. The larger capitalization securities in the Fund generally performed better over this period, which was consistent with the overall market. The S&P MidCap 400 rose 3.94% during Q1. Cash accounted for 12.8% of the Fund’s assets as of March 31st.
The largest contributors to the Fund in the first quarter were Dominion Diamond (ticker: DDC), Western Digital (ticker: WDC), and Oaktree Capital (ticker: OAK). On March 16th, Dominion announced strong guidance for its 2018 fiscal year, which ends on January 31, 2018. This led to a 12% spike in the stock, which had been selling off over concerns that India’s demonetization could have longer-lasting impacts on rough diamond prices than previously thought. That weekend, The Washington Companies disclosed that it made a U.S. $13.50 per share takeover offer to Dominion’s board in February, which was a 54% premium to where the stock traded before the company issued guidance. We were not completely surprised by the offer, since Dominion’s balance sheet has a large amount of cash and because the stock had been trading near multiyear lows. Washington consists of a group of privately held businesses in the U.S. and Canada, including one of the largest copper and molybdenum mines in North America. Billionaire Dennis Washington owns the firm, and the bid for Dominion was rumored to be pushed by David Batchelder, the activist who co-founded Relational Investors and who sits on Washington’s board. Dominion and Washington have not been able to agree on terms that would allow Washington to complete it due diligence. Both parties have publicized their dispute.
On March 27th, Dominion said it would explore strategic alternatives that could include a sale of the company. The firm engaged in a similar process beginning in 2015, but the effort seemed to fizzle after Dominion entered into a settlement with an activist group. We believe the odds are higher of a deal being completed this time due to Washington’s expressed interest and because the composition of the board has changed. The rough diamond market is also in better shape today. Dominion’s shares are now fully valued using our base case assumptions, so we partially reduced the position. However, the stock continues to trade below Washington’s conditional offer. We think Dominion could be more valuable in the arms of a strategic suitor, so we have maintained exposure to the name.
Western Digital has been a standout performer for the Fund over the past year. The company’s results, announced in January, were once again better than anticipated, with strength in each end-market. Data center growth is being driven by cloud-
related storage demand, while mobile phones are experiencing increasing storage capacity. Our thesis is that Western Digital can continue to improve results through cost cutting at its acquired Hitachi Global and SanDisk subsidiaries, combined with an industry recovery for Solid State Drives and Hard Disk Drives.
Oaktree Capital now has over $100 billion of assets under management. On the latest earnings call, Chairman Howard Marks commented, “We still face some of the lowest prospective returns in history as well as asset prices that I generally describe as being, on the high side of fair or the beginning of rich.” We agree with the first half of that comment but are much more negative than Mr. Marks about asset prices. In our opinion, we are way beyond “the beginning of rich.” We think the market is Uncle Scrooge Rich, except it isn’t backed by a giant swimming pool full of gold coins like that owned by the Disney character. Nevertheless, we think our pessimistic view of asset prices should eventually be favorable for Oaktree, since they are renowned distressed debt investors.
The top detractors from Q1 performance were Dundee Corp. (ticker: DC/A CN), Syntel (ticker: SYNT), and Primero Mining’s 5.75% Convertible Notes (CUSIP: 74164WAB2). Dundee’s performance has been abysmal, and that comment doesn’t just apply to the stock. The company is involved in many different ventures, but almost nothing has worked out. We attribute at least half of the unfavorable outcomes to poor decisions by management and the rest to bad luck. Hindsight is 20/20, and our involvement in Dundee came from trying too hard to find value in an over-picked market. Our fair value for the stock is based on asset value, in contrast to our typical discounted free cash flow valuation. We felt comfortable with this approach because the assets were originally anchored by publicly-traded equities that seemed reasonably valued to us on inspection. Dundee’s cash flow has been negative as the team attempted to nurture a basket of various nascent businesses into self-sustaining enterprises. It hasn’t worked. We had chances to revisit the investment as the situation changed and decent investments were exchanged for speculative ones. The mistake is on me, your Portfolio Manager.
So where do we go from here? Dundee is a $3.50 stock with $12.25 of book value. That book value continues to decline as the company’s portfolio is not generating cash flow but Dundee is incurring corporate overhead and financing costs. Right now the market is implying that every single private company Dundee manages is worth nothing, plus that the business burns cash at the current rate for another three years. We have urged management to sell Dundee’s public investments to pay off bank debt and preferred stock, which would reduce cash burn by half. If the company then catches a break on one of its major private investments, it could mark a turning point for the company’s fortunes. We’re not holding our breath but aren’t yet inclined to sell Dundee at today’s prices.
Dundee Corp. Net Assets
| Assets | | Liabilities | |
| Publicly-traded investments | | $ | 283,445 | | Corporate net debt | | $ | (52,954 | ) |
| Private inv mgd by Dundee | | $ | 387,198 | | Preference shares | | $ | (201,455 | ) |
| Private inv mgd by 3rd parties | | $ | 303,115 | | | | $ | (254,409 | ) |
| | | $ | 973,758 | | | | | | |
| | Assets - Liabilities | $719,349 | |
| | Market cap | $205,578 | |
| | Shares outstanding | 58,736 | |
| | Equity per share | $12.25 | |
| | Price per share | $3.50 | |
Our investment in Syntel started off well, increasing over 15% in just a few months…then the company announced guidance in February. The stock gave it all back and then some, so now we’re about 15% in the red. While fourth quarter results were in line with projections, the company’s outlook for 2017 was well below consensus estimates. Management painted a subdued spending picture for the industries Syntel serves. The stock’s underperformance is primarily tied to Syntel’s revenue declines versus growth for the rest of the IT services industry. The company coasted for years on sales growth from its largest customers—American Express, State Street, and FedEx. Those customers are now reducing spending, and Syntel’s smaller clients are not picking up the slack. This has prompted management to increase the heretofore lean marketing budget.
Some investors are also concerned about Syntel’s chops in the digital arena, but the company’s well-regarded SyntBots automation platform demonstrates that Syntel can develop cutting edge IP. Lastly, legal immigration policy remains an overhang, as there are several bills in Congress that seek to change the H-1B visa program, and the Trump administration has already made a couple of marginal changes that could negatively impact outsourcers. We take some comfort that both Chuck Schumer (D-NY) and Paul Ryan (R-WI) have previously expressed support for the H-1B program, suggesting that it may be difficult to push a bill through Congress that severely curtails visa issuances. Even if we are wrong, Syntel has several ways to deal with fewer visas, including sending more work offshore, increasing local hiring of Americans, expanding automation to reduce labor, and also passing along cost increases to customers. Syntel trades for about 9x expected free cash flow. It is now the second largest position in the Fund and one of the biggest discounts to our estimated fair value.
Primero Mining experienced an eventful quarter, which included a mine strike, reserve reduction, CEO resignation, and going concern language. Did we mention we like this security? The bonds certainly carry risk, but they yield 25%. We believe the strike at the San Dimas Mine in Mexico will end shortly, since the miners have
few other options for employment. Additionally, Silver Wheaton has indicated that it is willing to modify its silver stream with Primero if it is fairly compensated. Silver Wheaton also recently guaranteed Primero’s credit facility, enabling a 6 month extension that gives Primero time to explore strategic alternatives. In other words, Silver Wheaton is as attached as ever to Primero. We view this relationship as the main lever to improve the company’s health.
With that said, Primero, Silver Wheaton, and the Tax Administration Service (SAT) are embroiled in a Mexican standoff at the moment (pun intended). Primero can survive if either the SAT relinquishes its pursuit of Primero for higher taxes on its silver production or if Silver Wheaton reduces the burden of its silver stream on San Dimas. However, if either the SAT or Silver Wheaton acts, the other party may not have to yield anything. We think Silver Wheaton will cave first, since its Herculean efforts to avoid paying taxes in Mexico and almost everywhere else make it unlikely that it would want to see this situation through a restructuring. Silver Wheaton as a mine owner in Mexico would be a much juicier target than Primero.
The Select Fund’s Co-Lead Portfolio Manager, Greg Estes, notified us last month that he would be leaving Intrepid Capital for another opportunity in the Jacksonville area. Greg has been a valued employee of Intrepid since 2000. His focus was on sourcing mid and large capitalization equity ideas. Two Intrepid analysts have absorbed primary coverage of the mid cap names held in the Select Fund that Greg previously followed. We are also in the process of hiring a new analyst for our investment team.
Thank you for your investment.
Sincerely,
Jayme Wiggins, CFA
Chief Investment Officer
Intrepid Select Fund Portfolio Manager
Mutual fund investing involves risk. Principal loss is possible. The Fund is subject to special risks including volatility due to investments in smaller and medium companies, which involve additional risks such as limited liquidity and greater volatility. The Fund is considered non-diversified as a result of limiting its holdings to a relatively small number of positions and may be more exposed to individual stock volatility than a diversified fund. The Fund may invest in foreign securities which involve greater volatility and political, economic and currency risks and differences in accounting methods. There can be no assurance that a newly organized Fund will grow to or maintain an economically viable size. The risks of owning ETFs generally reflect the risks of owning the underlying securities they are designed to track. ETFs also have management fees that increase their costs versus the costs of owning the underlying securities directly.
The Russell 2000 Index consists of the smallest 2,000 companies in a group of 3,000 U.S. companies in the Russell 3000 Index, as ranked by market capitalization. The S&P MidCap 400 Index seeks to track the performance of mid-cap U.S. equities, representing more than 7% of available U.S. market cap. You cannot invest directly in an index.
Yield is the income return on an investment. It refers to the interest or dividends received from a security and is usually expressed annually as a percentage based on the investment’s cost, its current market value or its face value. A Credit Facility is a type of loan made in a business or corporate finance context, involving revolving credit, term loans, committed facilities, letters of credit and most retail credit accounts. Streaming Partner refers to two or more parties involved in financing arrangements customized to fit the specific needs of a particular mining company, a particular project and the related financing requirements.
Opinions expressed are subject to change, are not guaranteed and should not be considered investment advice or recommendations to buy or sell any security.
The Intrepid Capital Funds are distributed by Quasar Distributors, LLC.
| EXPENSE EXAMPLE |
| March 31, 2017 (Unaudited) |
As a shareholder of the Intrepid Capital Management Funds Trust (the “Funds”), you incur ongoing costs, including management fees; distribution and/or service fees; and other expenses incurred by the Funds. This example is intended to help you understand your ongoing costs (in dollars) of investing in the Funds and to compare costs with the ongoing costs of investing in other mutual funds.
The example is based on an investment of $1,000 invested at the beginning of the period and held the entire period of October 1, 2016 through March 31, 2017.
Actual Expenses
The first line of the following table provides information about actual account values and actual expenses. Although the Funds charge no sales load or transaction fees, you will be assessed fees for outgoing wire transfers, returned checks or stop payment orders at prevailing rates charged by U.S. Bancorp Fund Services, LLC, the Funds’ transfer agent. If you request a redemption be made by wire transfer, currently a $15.00 fee is charged by the Funds’ transfer agent. To the extent that a Fund invests in shares of other investment companies as part of its investment strategy, you will indirectly bear your proportionate share of any fees and expenses charged by the underlying funds in which the Fund invests in addition to the expenses of the Fund. Actual expenses of the underlying funds are expected to vary among the various underlying funds. These expenses are not included in the following example. The example includes, but is not limited to, management fees, shareholder servicing fees, distribution fees, fund accounting, custody and transfer agent fees. However, the example below does not include portfolio trading commissions and related expenses, interest expense and other extraordinary expenses as determined under generally accepted accounting principles. You may use the information in this line, together with the amount you invested, to estimate the expenses that you paid over the period. Simply divide your account value by $1,000 (for example, an $8,600 account value divided by $1,000 = 8.6), then multiply the result by the number in the first line under the heading entitled “Expenses Paid During Period” to estimate the expenses you paid on your account during this period.
Hypothetical Example for Comparison Purposes
The second line of the following table provides information about hypothetical account values and hypothetical expenses based on the Funds’ actual expense ratio and an assumed rate of return of 5% per year before expenses, which is not the Funds’ actual return. The hypothetical account values and expenses may not be used to estimate the actual ending account balance or expenses you paid for the period. You may use this information to compare the ongoing costs of investing in the Funds and other funds. To do so, compare this 5% hypothetical example with the 5% hypothetical examples that appear in the shareholder reports of the other funds.
| EXPENSE EXAMPLE (continued) |
| March 31, 2017 (Unaudited) |
Please note that the expenses shown in the table are meant to highlight your ongoing costs only and do not reflect any transactional costs, such as sales charges (loads), redemption fees, or exchange fees. Therefore, the second line of the table is useful in comparing ongoing costs only, and will not help you determine the relative costs of owning different funds. In addition, if these transactional costs were included, your costs would have been higher.
INTREPID CAPITAL FUND – INVESTOR CLASS
| | | | Expenses Paid |
| | Beginning | Ending | During Period* |
| | Account Value | Account Value | October 1, 2016 - |
| | October 1, 2016 | March 31, 2017 | March 31, 2017 |
| Actual | $1,000.00 | $1,049.40 | $7.15 |
| Hypothetical (5% return | | | |
| before expenses) | 1,000.00 | 1,017.95 | 7.04 |
| * | Expenses are equal to the Fund’s annualized expense ratio of 1.40%, multiplied by the average account value over the period, multiplied by 182/365 to reflect the period. |
INTREPID CAPITAL FUND – INSTITUTIONAL CLASS
| | | | Expenses Paid |
| | Beginning | Ending | During Period* |
| | Account Value | Account Value | October 1, 2016 - |
| | October 1, 2016 | March 31, 2017 | March 31, 2017 |
| Actual | $1,000.00 | $1,050.70 | $5.88 |
| Hypothetical (5% return | | | |
| before expenses) | 1,000.00 | 1,019.20 | 5.79 |
| * | Expenses are equal to the Fund’s annualized expense ratio of 1.15%, multiplied by the average account value over the period, multiplied by 182/365 to reflect the period. |
INTREPID ENDURANCE FUND – INVESTOR CLASS
| | | | Expenses Paid |
| | Beginning | Ending | During Period* |
| | Account Value | Account Value | October 1, 2016 - |
| | October 1, 2016 | March 31, 2017 | March 31, 2017 |
| Actual | $1,000.00 | $ 996.00 | $6.97 |
| Hypothetical (5% return | | | |
| before expenses) | 1,000.00 | 1,017.95 | 7.04 |
| * | Expenses are equal to the Fund’s annualized expense ratio of 1.40%, multiplied by the average account value over the period, multiplied by 182/365 to reflect the period. |
| EXPENSE EXAMPLE (continued) |
| March 31, 2017 (Unaudited) |
INTREPID ENDURANCE FUND – INSTITUTIONAL CLASS
| | | | Expenses Paid |
| | Beginning | Ending | During Period* |
| | Account Value | Account Value | October 1, 2016 - |
| | October 1, 2016 | March 31, 2017 | March 31, 2017 |
| Actual | $1,000.00 | $ 997.60 | $5.73 |
| Hypothetical (5% return | | | |
| before expenses) | 1,000.00 | 1,019.20 | 5.79 |
| * | Expenses are equal to the Fund’s annualized expense ratio of 1.15%, multiplied by the average account value over the period, multiplied by 182/365 to reflect the period. |
INTREPID INCOME FUND
| | | | Expenses Paid |
| | Beginning | Ending | During Period* |
| | Account Value | Account Value | October 1, 2016 - |
| | October 1, 2016 | March 31, 2017 | March 31, 2017 |
| Actual | $1,000.00 | $1,013.20 | $4.52 |
| Hypothetical (5% return | | | |
| before expenses) | 1,000.00 | 1,020.44 | 4.53 |
| * | Expenses are equal to the Fund’s annualized expense ratio of 0.90%, multiplied by the average account value over the period, multiplied by 182/365 to reflect the period. |
INTREPID DISCIPLINED VALUE FUND
| | | | Expenses Paid |
| | Beginning | Ending | During Period* |
| | Account Value | Account Value | October 1, 2016 - |
| | October 1, 2016 | March 31, 2017 | March 31, 2017 |
| Actual | $1,000.00 | $1,050.30 | $6.65 |
| Hypothetical (5% return | | | |
| before expenses) | 1,000.00 | 1,018.45 | 6.54 |
| * | Expenses are equal to the Fund’s annualized expense ratio of 1.30%, multiplied by the average account value over the period, multiplied by 182/365 to reflect the period. |
| EXPENSE EXAMPLE (continued) |
| March 31, 2017 (Unaudited) |
INTREPID INTERNATIONAL FUND
| | | | Expenses Paid |
| | Beginning | Ending | During Period* |
| | Account Value | Account Value | October 1, 2016 - |
| | October 1, 2016 | March 31, 2017 | March 31, 2017 |
| Actual | $1,000.00 | $1,003.60 | $6.99 |
| Hypothetical (5% return | | | |
| before expenses) | 1,000.00 | 1,017.95 | 7.04 |
| * | Expenses are equal to the Fund’s annualized expense ratio of 1.40%, multiplied by the average account value over the period, multiplied by 182/365 to reflect the period. |
INTREPID SELECT FUND
| | | | Expenses Paid |
| | Beginning | Ending | During Period* |
| | Account Value | Account Value | October 1, 2016 - |
| | October 1, 2016 | March 31, 2017 | March 31, 2017 |
| Actual | $1,000.00 | $1,037.60 | $7.11 |
| Hypothetical (5% return | | | |
| before expenses) | 1,000.00 | 1,017.95 | 7.04 |
| * | Expenses are equal to the Fund’s annualized expense ratio of 1.40%, multiplied by the average account value over the period, multiplied by 182/365 to reflect the period. |
| ALLOCATION OF PORTFOLIO HOLDINGS (as a % of total net assets) |
| March 31, 2017 (Unaudited) |
INTREPID CAPITAL FUND
| Components of Portfolio Holdings | | | |
| Common Stocks | | $ | 232,446,467 | |
| Corporate Bonds | | | 127,118,754 | |
| Convertible Bonds | | | 4,641,952 | |
| Cash* | | | 53,353,521 | |
| | | $ | 417,560,694 | |
| * | Cash, cash equivalents and other assets less liabilities. |
| ALLOCATION OF PORTFOLIO HOLDINGS (as a % of total net assets) |
| March 31, 2017 (Unaudited) |
INTREPID ENDURANCE FUND
| Components of Portfolio Holdings | | | |
| Information Technology | | $ | 12,319,714 | |
| Consumer Discretionary | | | 9,669,278 | |
| Financials | | | 9,658,869 | |
| Materials | | | 8,887,105 | |
| Exchange-Traded Fund | | | 4,299,580 | |
| Industrials | | | 1,537,703 | |
| Health Care | | | 221,866 | |
| Cash* | | | 181,052,985 | |
| | | $ | 227,647,100 | |
The sector and industry classifications presented in this report, present the Global Industry Classification Standard (GICS®). GICS® was developed by and/or is the exclusive property of MSCI, Inc. and Standard & Poor Financial Services LLC (“S&P”). GICS® is a service mark of MSCI and S&P and has been licensed for use by U.S. Bancorp Fund Services, LLC.
| * | Cash, cash equivalents and other assets less liabilities. |
| ALLOCATION OF PORTFOLIO HOLDINGS (as a % of total net assets) |
| March 31, 2017 (Unaudited) |
INTREPID INCOME FUND
| Components of Portfolio Holdings | | | |
| Corporate Bonds | | $ | 60,577,758 | |
| Convertible Bonds | | | 4,510,457 | |
| Common Stocks | | | 2,197,400 | |
| Preferred Stock | | | 312,756 | |
| Cash* | | | 13,703,292 | |
| | | $ | 81,301,663 | |
| * | Cash, cash equivalents and other assets less liabilities. |
| Intrepid Disciplined Value Fund |
| ALLOCATION OF PORTFOLIO HOLDINGS (as a % of total net assets) |
| March 31, 2017 (Unaudited) |
INTREPID DISCIPLINED VALUE FUND
| Components of Portfolio Holdings | | | |
| Financials | | $ | 7,753,502 | |
| Information Technology | | | 7,340,409 | |
| Consumer Discretionary | | | 3,388,463 | |
| Telecommunication Services | | | 2,093,236 | |
| Health Care | | | 1,375,374 | |
| Materials | | | 876,244 | |
| Industrials | | | 718,960 | |
| Energy | | | 374,125 | |
| Cash* | | | 26,104,685 | |
| | | $ | 50,024,998 | |
| * | Cash, cash equivalents and other assets less liabilities. |
| Intrepid International Fund |
| ALLOCATION OF PORTFOLIO HOLDINGS (as a % of total net assets) |
| March 31, 2017 (Unaudited) |
INTREPID INTERNATIONAL FUND
| Components of Portfolio Holdings | | | |
| Industrials | | $ | 5,332,340 | |
| Financials | | | 3,491,757 | |
| Consumer Discretionary | | | 2,766,872 | |
| Health Care | | | 1,636,464 | |
| Materials | | | 1,259,112 | |
| Information Technology | | | 456,103 | |
| Cash* | | | 5,131,063 | |
| | | $ | 20,073,711 | |
| * | Cash, cash equivalents and other assets less liabilities. |
| ALLOCATION OF PORTFOLIO HOLDINGS (as a % of total net assets) |
| March 31, 2017 (Unaudited) |
INTREPID SELECT FUND
| Components of Portfolio Holdings | | | |
| Information Technology | | $ | 4,904,011 | |
| Financials | | | 3,411,143 | |
| Consumer Discretionary | | | 2,198,405 | |
| Materials | | | 1,428,407 | |
| Exchange-Traded Funds | | | 1,279,565 | |
| Health Care | | | 1,189,715 | |
| Industrials | | | 1,076,991 | |
| Telecommunication Services | | | 415,677 | |
| Cash* | | | 1,127,378 | |
| | | $ | 17,031,292 | |
| * | Cash, cash equivalents and other assets less liabilities. |
| SCHEDULE OF INVESTMENTS |
| March 31, 2017 (Unaudited) |
| COMMON STOCKS - 55.67% | | Shares | | | Value | |
| | | | | | | |
| Capital Goods - 1.49% | | | | | | |
| Cubic Corp. | | | 57,023 | | | $ | 3,010,814 | |
| Metka Industrial - Construction SA (a) | | | 424,884 | | | | 3,222,733 | |
| | | | | | | | 6,233,547 | |
| Commercial & Professional Services - 3.46% | | | | | | | | |
| Spotless Group Holdings Ltd. (a) | | | 11,279,979 | | | | 9,350,429 | |
| Tetra Tech, Inc. | | | 124,469 | | | | 5,084,559 | |
| | | | | | | | 14,434,988 | |
| Consumer Durables & Apparel - 3.14% | | | | | | | | |
| Coach, Inc. | | | 108,000 | | | | 4,463,640 | |
| GUD Holdings Ltd. (a) | | | 719,004 | | | | 6,503,940 | |
| Mattel, Inc. | | | 84,000 | | | | 2,151,240 | |
| | | | | | | | 13,118,820 | |
| Diversified Financials - 11.19% | | | | | | | | |
| Berkshire Hathaway, Inc. - Class B (b) | | | 90,600 | | | | 15,101,208 | |
| Dundee Corp. - Class A (a)(b) | | | 952,125 | | | | 2,913,974 | |
| Leucadia National Corp. | | | 534,000 | | | | 13,884,000 | |
| Oaktree Capital Group LLC | | | 201,631 | | | | 9,133,884 | |
| The Bank of New York Mellon Corp. | | | 120,000 | | | | 5,667,600 | |
| | | | | | | | 46,700,666 | |
| Energy - 2.61% | | | | | | | | |
| Patterson-UTI Energy, Inc. | | | 449,510 | | | | 10,909,608 | |
| | | | | | | | | |
| Health Care Equipment & Services - 2.53% | | | | | | | | |
| Express Scripts Holding Co. (b) | | | 160,000 | | | | 10,545,600 | |
| | | | | | | | | |
| Insurance - 2.51% | | | | | | | | |
| Baldwin & Lyons, Inc. - Class B (c) | | | 428,541 | | | | 10,477,828 | |
| | | | | | | | | |
| Materials - 2.39% | | | | | | | | |
| Dominion Diamond Corp. (a) | | | 788,400 | | | | 9,957,492 | |
| | | | | | | | | |
| Media - 3.04% | | | | | | | | |
| Corus Entertainment, Inc. - Class B (a) | | | 1,291,885 | | | | 12,687,159 | |
| | | | | | | | | |
See notes to financial statements.
| SCHEDULE OF INVESTMENTS (continued) |
| March 31, 2017 (Unaudited) |
| COMMON STOCKS - 55.67% (continued) | | Shares | | | Value | |
| | | | | | | |
| Pharmaceuticals, Biotechnology | | | | | | |
| & Life Sciences - 1.50% | | | | | | |
| Bio-Rad Laboratories, Inc. - Class A (b) | | | 15,779 | | | $ | 3,145,386 | |
| Stallergenes Greer PLC (a)(b) | | | 91,861 | | | | 3,126,124 | |
| | | | | | | | 6,271,510 | |
| Retailing - 1.47% | | | | | | | | |
| Hornbach Baumarkt AG (a) | | | 197,158 | | | | 6,147,911 | |
| | | | | | | | | |
| Software & Services - 10.88% | | | | | | | | |
| Amdocs Ltd. | | | 177,600 | | | | 10,831,824 | |
| HNZ Group, Inc. (a)(b) | | | 438,640 | | | | 4,393,491 | |
| Syntel, Inc. | | | 597,140 | | | | 10,049,866 | |
| Teradata Corp. (b) | | | 416,930 | | | | 12,974,862 | |
| The Western Union Co. | | | 353,470 | | | | 7,193,114 | |
| | | | | | | | 45,443,157 | |
| Technology Hardware & Equipment - 4.09% | | | | | | | | |
| Cisco Systems, Inc. | | | 117,000 | | | | 3,954,600 | |
| Western Digital Corp. | | | 159,000 | | | | 13,122,270 | |
| | | | | | | | 17,076,870 | |
| Telecommunication Services - 2.39% | | | | | | | | |
| Verizon Communications, Inc. | | | 205,000 | | | | 9,993,750 | |
| | | | | | | | | |
| Transportation - 2.98% | | | | | | | | |
| Royal Mail PLC (a) | | | 2,337,652 | | | | 12,447,561 | |
| TOTAL COMMON STOCKS (Cost $212,195,379) | | | | | | | 232,446,467 | |
| | | | | | | | | |
| CONVERTIBLE BONDS - 1.11% | Principal Amount | | | | |
| | | | | | | | | |
| Materials - 0.63% | | | | | | | | |
| Primero Mining Corp. | | | | | | | | |
| 5.750%, 02/28/2020 (a)(d) | | $ | 4,399,000 | | | | 2,639,400 | |
| | | | | | | | | |
| Diversified Financials - 0.48% | | | | | | | | |
| EZCORP, Inc. | | | | | | | | |
| 2.125%, 06/15/2019 | | | 2,162,000 | | | | 2,002,552 | |
| TOTAL CONVERTIBLE BONDS (Cost $5,518,399) | | | | | | | 4,641,952 | |
See notes to financial statements.
| SCHEDULE OF INVESTMENTS (continued) |
| March 31, 2017 (Unaudited) |
| CORPORATE BONDS - 30.44% | | Principal Amount | | | Value | |
| | | | | | | |
| Capital Goods - 1.51% | | | | | | |
| Actuant Corp. | | | | | | |
| 5.625%, 06/15/2022 | | $ | 4,103,000 | | | $ | 4,210,704 | |
| WESCO Distribution, Inc. | | | | | | | | |
| 5.375%, 12/15/2021 | | | 2,020,000 | | | | 2,095,750 | |
| | | | | | | | 6,306,454 | |
| Commercial & Professional Services - 1.70% | | | | | | | | |
| Multi-Color Corp. | | | | | | | | |
| 6.125%, 12/01/2022 (e)(Cost: $6,992,451; | | | | | | | | |
| Original acquisition date: 05/27/2015) | | | 6,802,000 | | | | 7,091,085 | |
| | | | | | | | | |
| Consumer Durables & Apparel - 0.59% | | | | | | | | |
| American Outdoor Brands Corp. | | | | | | | | |
| 5.000%, 07/15/2018 (d)(e)(Cost: $2,500,000; | | | | | | | | |
| Original acquisition date: 07/10/2014) | | | 2,500,000 | | | | 2,475,000 | |
| | | | | | | | | |
| Consumer Services - 5.84% | | | | | | | | |
| Carrols Restaurant Group, Inc. | | | | | | | | |
| 8.000%, 05/01/2022 | | | 5,321,000 | | | | 5,680,168 | |
| Nathan’s Famous, Inc. | | | | | | | | |
| 10.000%, 03/15/2020 (e)(Cost: $8,624,360; | | | | | | | | |
| Original acquisition date: 09/06/2016) | | | 7,930,000 | | | | 8,524,750 | |
| Regis Corp. | | | | | | | | |
| 5.500%, 12/02/2019 (d)(e)(Cost: $5,517,746; | | | | | | | | |
| Original acquisition date: 11/27/2013) | | | 5,612,875 | | | | 5,584,811 | |
| Wyndham Worldwide Corp. | | | | | | | | |
| 2.500%, 03/01/2018 | | | 4,562,000 | | | | 4,583,961 | |
| | | | | | | | 24,373,690 | |
| Diversified Financials - 1.82% | | | | | | | | |
| FirstCash, Inc. | | | | | | | | |
| 6.750%, 04/01/2021 | | | 7,293,000 | | | | 7,602,953 | |
| | | | | | | | | |
| Energy - 2.12% | | | | | | | | |
| PHI, Inc. | | | | | | | | |
| 5.250%, 03/15/2019 | | | 2,574,000 | | | | 2,432,430 | |
| Unit Corp. | | | | | | | | |
| 6.625%, 05/15/2021 | | | 6,500,000 | | | | 6,402,500 | |
| | | | | | | | 8,834,930 | |
See notes to financial statements.
| SCHEDULE OF INVESTMENTS (continued) |
| March 31, 2017 (Unaudited) |
| CORPORATE BONDS - 30.44% (continued) | | Principal Amount | | | Value | |
| | | | | | | |
| Household & Personal Products - 0.63% | | | | | | |
| Central Garden & Pet Co. | | | | | | |
| 6.125%, 11/15/2023 | | $ | 2,493,000 | | | $ | 2,630,115 | |
| | | | | | | | | |
| Materials - 2.57% | | | | | | | | |
| Alamos Gold, Inc. | | | | | | | | |
| 7.750%, 04/01/2020 (a)(e)(Cost: $6,438,752; | | | | | | | | |
| Original acquisition date: 03/17/2014) | | | 6,471,000 | | | | 6,721,751 | |
| Ecolab, Inc. | | | | | | | | |
| 1.450%, 12/08/2017 | | | 4,036,000 | | | | 4,031,540 | |
| | | | | | | | 10,753,291 | |
| Media - 1.15% | | | | | | | | |
| Cable One, Inc. | | | | | | | | |
| 5.750%, 06/15/2022 (e)(Cost: $4,822,779; | | | | | | | | |
| Original acquisition date: 03/09/2017) | | | 4,629,000 | | | | 4,814,160 | |
| | | | | | | | | |
| Real Estate - 1.12% | | | | | | | | |
| Hospitality Properties Trust | | | | | | | | |
| 6.700%, 01/15/2018 | | | 4,597,000 | | | | 4,658,292 | |
| | | | | | | | | |
| Retailing - 5.16% | | | | | | | | |
| Caleres, Inc. | | | | | | | | |
| 6.250%, 08/15/2023 | | | 4,692,000 | | | | 4,891,410 | |
| Dollar General Corp. | | | | | | | | |
| 4.125%, 07/15/2017 | | | 3,663,000 | | | | 3,692,593 | |
| Dollar Tree, Inc. | | | | | | | | |
| 5.250%, 03/01/2020 | | | 4,963,000 | | | | 5,112,883 | |
| Expedia, Inc. | | | | | | | | |
| 7.456%, 08/15/2018 | | | 4,169,000 | | | | 4,464,323 | |
| Sally Holdings LLC / Sally Capital, Inc. | | | | | | | | |
| 5.750%, 06/01/2022 | | | 3,289,000 | | | | 3,383,559 | |
| | | | | | | | 21,544,768 | |
| Software & Services - 2.02% | | | | | | | | |
| eBay, Inc. | | | | | | | | |
| 1.239%, 07/28/2017 (f) | | | 3,730,000 | | | | 3,730,981 | |
| Total System Services, Inc. | | | | | | | | |
| 2.375%, 06/01/2018 | | | 4,683,000 | | | | 4,702,500 | |
| | | | | | | | 8,433,481 | |
See notes to financial statements.
| SCHEDULE OF INVESTMENTS (continued) |
| March 31, 2017 (Unaudited) |
| CORPORATE BONDS - 30.44% (continued) | | Principal Amount | | | Value | |
| | | | | | | |
| Technology Hardware & Equipment - 3.32% | | | | | | |
| Jabil Circuit, Inc. | | | | | | |
| 8.250%, 03/15/2018 | | $ | 4,999,000 | | | $ | 5,283,293 | |
| Tech Data Corp. | | | | | | | | |
| 3.750%, 09/21/2017 | | | 8,514,000 | | | | 8,593,010 | |
| | | | | | | | 13,876,303 | |
| Telecommunication Services - 0.89% | | | | | | | | |
| AT&T, Inc. | | | | | | | | |
| 5.500%, 02/01/2018 | | | 3,612,000 | | | | 3,724,232 | |
| TOTAL CORPORATE BONDS (Cost $126,178,790) | | | | | | | 127,118,754 | |
| | | | | | | | | |
| SHORT-TERM INVESTMENTS - 10.75% | | Shares | | | | | |
| | | | | | | | | |
| Money Market Fund - 2.38% | | | | | | | | |
| STIT-Treasury Portfolio - | | | | | | | | |
| Institutional Class, 0.580% (g) | | | 9,955,631 | | | | 9,955,631 | |
| | | | | | | | | |
| U.S. Treasury Bill - 8.37% | | Principal Amount | | | | | |
| 0.766%, 06/29/2017 (h) | | $ | 35,000,000 | | | | 34,934,239 | |
| TOTAL SHORT-TERM INVESTMENTS | | | | | | | | |
| (Cost $44,889,870) | | | | | | | 44,889,870 | |
| Total Investments (Cost $388,782,438) - 97.97% | | | | | | | 409,097,043 | |
| Other Assets in Excess of Liabilities - 2.03% | | | | | | | 8,463,651 | |
| TOTAL NET ASSETS - 100.00% | | | | | | $ | 417,560,694 | |
Percentages are stated as a percent of net assets.
| (a) | Foreign Issued Security. |
| (b) | Non-income producing security. |
| (c) | Affiliate company. See Footnote 6. |
| (d) | Security is considered illiquid and may be difficult to sell. |
| (e) | The security, sold within the terms of a private placement memorandum, is exempt from registration upon resale under Rule 144A under the Securities Act of 1933. The aggregate value of restricted securities at March 31, 2017 was $35,211,557, which represented 8.43% of net assets. |
| (f) | Variable rate security. The rate listed is as of 03/31/2017. |
| (g) | Rate listed is the 7-day effective yield. |
| (h) | Rate shown is the effective yield based on purchased price. The calculation assumes the security is held to maturity. |
See notes to financial statements.
| OPEN FORWARD CURRENCY CONTRACTS |
| March 31, 2017 (Unaudited) |
| | | | | | | | Amount of | | | | Amount of | | | | |
| | | | | | | | Currency to | | | | Currency to | | | | |
| | | | Forward | | | | be Received | | | | be Delivered | | | Unrealized | |
| Counterparty | | Settlement | | Currency to | | in Local | | Currency to | | in Local | | | Appreciation | |
| of Contract | | Date | | be Received | | Currency | | be Delivered | | Currency | | | (Depreciation) | |
| Bank of | | | | U.S. | | | | | | | | | | |
| Montreal | | 04/12/2017 | | Dollars | | 11,224,500 | | Euro | | 10,000,000 | | | $ | 550,898 | |
| Bank of | | | | | | | | | | | | | | | |
| New York | | | | British | | | | U.S. | | | | | | | |
| Mellon | | 04/12/2017 | | Pounds | | 5,800,000 | | Dollars | | 7,167,942 | | | | 100,872 | |
| Bank of | | | | | | | | | | | | | | | |
| New York | | | | U.S. | | | | British | | | | | | | |
| Mellon | | 04/12/2017 | | Dollars | | 19,843,200 | | Pounds | | 16,000,000 | | | | (208,701 | ) |
| Bank of | | | | | | | | | | | | | | | |
| New York | | | | U.S. | | | | Australian | | | | | | | |
| Mellon | | 05/03/2017 | | Dollars | | 4,871,360 | | Dollars | | 6,400,000 | | | | (15,361 | ) |
| Bank of | | | | | | | | | | | | | | | |
| New York | | | | U.S. | | | | Australian | | | | | | | |
| Mellon | | 05/03/2017 | | Dollars | | 5,655,758 | | Dollars | | 7,500,000 | | | | (70,869 | ) |
| Bank of | | | | | | | | | | | | | | | |
| New York | | | | U.S. | | | | Canadian | | | | | | | |
| Mellon | | 08/15/2017 | | Dollars | | 19,733,068 | | Dollars | | 25,800,000 | | | | 293,303 | |
| | | | | | | | | | | | | | | $ | 650,142 | |
See notes to financial statements.
| SCHEDULE OF INVESTMENTS |
| March 31, 2017 (Unaudited) |
| COMMON STOCKS - 15.99% | | Shares | | | Value | |
| | | | | | | |
| Capital Goods - 0.12% | | | | | | |
| Cubic Corp. | | | 5,000 | | | $ | 264,000 | |
| | | | | | | | | |
| Commercial & Professional Services - 0.56% | | | | | | | | |
| Tetra Tech, Inc. | | | 31,180 | | | | 1,273,703 | |
| | | | | | | | | |
| Consumer Durables & Apparel - 0.00% | | | | | | | | |
| Vista Outdoor, Inc. (a) | | | 200 | | | | 4,118 | |
| | | | | | | | | |
| Diversified Financials - 1.10% | | | | | | | | |
| Dundee Corp. - Class A (a)(b) | | | 821,295 | | | | 2,513,570 | |
| | | | | | | | | |
| Insurance - 2.23% | | | | | | | | |
| Baldwin & Lyons, Inc. - Class B (c) | | | 207,837 | | | | 5,081,614 | |
| | | | | | | | | |
| Materials - 2.22% | | | | | | | | |
| Dominion Diamond Corp. (b) | | | 396,104 | | | | 5,002,794 | |
| Primero Mining Corp. (a)(b) | | | 100,000 | | | | 55,000 | |
| Sandstorm Gold Ltd. (a)(b) | | | 100 | | | | 427 | |
| Silver Wheaton Corp. (b) | | | 100 | | | | 2,084 | |
| | | | | | | | 5,060,305 | |
| Media - 4.24% | | | | | | | | |
| Corus Entertainment, Inc. - Class B (b) | | | 947,335 | | | | 9,303,452 | |
| DHX Media Ltd. (b) | | | 1,000 | | | | 4,143 | |
| Liberty Media Corp. - Liberty Braves - Class C (a) | | | 14,700 | | | | 347,655 | |
| | | | | | | | 9,655,250 | |
| Pharmaceuticals, Biotechnology & Life Sciences - 0.10% | | | | | | | | |
| Bio-Rad Laboratories, Inc. - Class A (a) | | | 1,113 | | | | 221,866 | |
| | | | | | | | | |
| Retailing - 0.01% | | | | | | | | |
| AMCON Distributing Co. | | | 100 | | | | 9,910 | |
| | | | | | | | | |
| Software & Services - 5.41% | | | | | | | | |
| Amdocs Ltd. | | | 85,120 | | | | 5,191,469 | |
| Syntel, Inc. | | | 423,544 | | | | 7,128,245 | |
| | | | | | | | 12,319,714 | |
| TOTAL COMMON STOCKS (Cost $34,977,363) | | | | | | | 36,404,050 | |
See notes to financial statements.
| SCHEDULE OF INVESTMENTS (continued) |
| March 31, 2017 (Unaudited) |
| EXCHANGE-TRADED FUND - 1.89% | | Shares | | | Value | |
| | | | | | | |
| Capital Markets - 1.89% | | | | | | |
| iShares Gold Trust (a) | | | 358,000 | | | $ | 4,299,580 | |
| TOTAL EXCHANGE-TRADED FUND | | | | | | | | |
| (Cost $4,618,619) | | | | | | | 4,299,580 | |
| | | | | | | | | |
| CONVERTIBLE BONDS - 2.59% | | Principal Amount | | | | | |
| | | | | | | | | |
| Materials - 1.68% | | | | | | | | |
| Primero Mining Corp. | | | | | | | | |
| 5.750%, 02/28/2020 (b)(d) | | $ | 6,378,000 | | | | 3,826,800 | |
| | | | | | | | | |
| Diversified Financials - 0.91% | | | | | | | | |
| EZCORP, Inc. | | | | | | | | |
| 2.125%, 06/15/2019 | | | 2,228,000 | | | | 2,063,685 | |
| TOTAL CONVERTIBLE BONDS (Cost $7,282,398) | | | | | | | 5,890,485 | |
| | | | | | | | | |
| SHORT-TERM INVESTMENTS - 43.90% | | | | | | | | |
| | | | | | | | | |
| U.S. Treasury Bills - 43.90% | | | | | | | | |
| 0.554%, 04/20/2017 (e) | | | 50,000,000 | | | | 49,985,354 | |
| 0.608%, 05/18/2017 (e) | | | 50,000,000 | | | | 49,960,833 | |
| TOTAL SHORT-TERM INVESTMENTS | | | | | | | | |
| (Cost $99,946,187) | | | | | | | 99,946,187 | |
| Total Investments (Cost $146,824,567) - 64.37% | | | | | | | 146,540,302 | |
| Other Assets in Excess of Liabilities - 35.63% | | | | | | | 81,106,798 | |
| TOTAL NET ASSETS - 100.00% | | | | | | $ | 227,647,100 | |
Percentages are stated as a percent of net assets.
| (a) | Non-income producing security. |
| (b) | Foreign Issued Security. |
| (c) | Affiliate company. See Footnote 6. |
| (d) | Security is considered illiquid and may be difficult to sell. |
| (e) | Rate shown is the effective yield based on purchased price. The calculation assumes the security is held to maturity. |
| OPEN FORWARD CURRENCY CONTRACTS |
| March 31, 2017 (Unaudited) |
| | | | | | | | Amount of | | | | Amount of | | | | |
| | | | | | | | Currency to | | | | Currency to | | | | |
| | | | Forward | | | | be Received | | | | be Delivered | | | | |
| Counterparty | | Settlement | | Currency to | | in Local | | Currency to | | in Local | | | Unrealized | |
| of Contract | | Date | | be Received | | Currency | | be Delivered | | Currency | | | Appreciation | |
| Bank of | | | | U.S. | | | | Canadian | | | | | | |
| Montreal | | 08/15/2017 | | Dollars | | 12,474,744 | | Dollars | | 16,300,000 | | | $ | 193,032 | |
| | | | | | | | | | | | | | | | | |
See notes to financial statements.
| SCHEDULE OF INVESTMENTS |
| March 31, 2017 (Unaudited) |
| COMMON STOCKS - 2.70% | | Shares | | | Value | |
| | | | | | | |
| Insurance - 0.48% | | | | | | |
| Baldwin & Lyons, Inc. - Class B (a) | | | 16,061 | | | $ | 392,692 | |
| | | | | | | | | |
| Materials - 0.50% | | | | | | | | |
| Dominion Diamond Corp. (b) | | | 32,243 | | | | 407,229 | |
| | | | | | | | | |
| Media - 1.72% | | | | | | | | |
| Corus Entertainment, Inc. - Class B (b) | | | 142,300 | | | | 1,397,479 | |
| TOTAL COMMON STOCKS (Cost $2,475,221) | | | | | | | 2,197,400 | |
| | | | | | | | | |
| PREFERRED STOCK - 0.39% | | | | | | | | |
| | | | | | | | | |
| Diversified Financials - 0.39% | | | | | | | | |
| Dundee Corp., 4.64% (b)(c) | | | 29,290 | | | | 312,756 | |
| TOTAL PREFERRED STOCK (Cost $283,450) | | | | | | | 312,756 | |
| | | | | | | | | |
| CONVERTIBLE BONDS - 5.55% | | Principal Amount | | | | | |
| | | | | | | | | |
| Diversified Financials - 1.92% | | | | | | | | |
| EZCORP, Inc. | | | | | | | | |
| 2.125%, 06/15/2019 | | $ | 1,686,000 | | | | 1,561,657 | |
| | | | | | | | | |
| Materials - 1.14% | | | | | | | | |
| Primero Mining Corp. | | | | | | | | |
| 5.750%, 02/28/2020 (b)(d) | | | 1,548,000 | | | | 928,800 | |
| | | | | | | | | |
| Real Estate - 2.49% | | | | | | | | |
| Consolidated-Tomoka Land Co. | | | | | | | | |
| 4.500%, 03/15/2020 | | | 2,000,000 | | | | 2,020,000 | |
| TOTAL CONVERTIBLE BONDS (Cost $4,779,796) | | | | | | | 4,510,457 | |
| | | | | | | | | |
| CORPORATE BONDS - 74.51% | | | | | | | | |
| | | | | | | | | |
| Capital Goods - 3.69% | | | | | | | | |
| Actuant Corp. | | | | | | | | |
| 5.625%, 06/15/2022 | | | 1,643,000 | | | | 1,686,129 | |
| WESCO Distribution, Inc. | | | | | | | | |
| 5.375%, 12/15/2021 | | | 1,266,000 | | | | 1,313,475 | |
| | | | | | | | 2,999,604 | |
See notes to financial statements.
| SCHEDULE OF INVESTMENTS (continued) |
| March 31, 2017 (Unaudited) |
| CORPORATE BONDS - 74.51% (continued) | | Principal Amount | | | Value | |
| | | | | | | |
| Commercial & Professional Services - 3.93% | | | | | | |
| Multi-Color Corp. | | | | | | |
| 6.125%, 12/01/2022 (e) (Cost: $3,148,536; | | | | | | |
| Original acquisition date: 05/18/2015) | | $ | 3,064,000 | | | $ | 3,194,220 | |
| | | | | | | | | |
| Consumer Durables & Apparel - 4.02% | | | | | | | | |
| Hasbro, Inc. | | | | | | | | |
| 6.300%, 09/15/2017 | | | 1,750,000 | | | | 1,786,094 | |
| American Outdoor Brands Corp. | | | | | | | | |
| 5.000%, 07/15/2018 (d)(e) (Cost: $1,500,000; | | | | | | | | |
| Original acquisition date: 07/10/2014) | | | 1,500,000 | | | | 1,485,000 | |
| | | | | | | | 3,271,094 | |
| Consumer Services - 13.13% | | | | | | | | |
| Carrols Restaurant Group, Inc. | | | | | | | | |
| 8.000%, 05/01/2022 | | | 1,090,000 | | | | 1,163,575 | |
| Nathan’s Famous, Inc. | | | | | | | | |
| 10.000%, 03/15/2020 (e) (Cost: $3,588,933; | | | | | | | | |
| Original acquisition date: 09/06/2016) | | | 3,300,000 | | | | 3,547,500 | |
| Regis Corp. | | | | | | | | |
| 5.500%, 12/02/2019 (d)(e) (Cost: $3,931,838; | | | | | | | | |
| Original acquisition date: 11/27/2013) | | | 3,999,625 | | | | 3,979,627 | |
| Wyndham Worldwide Corp. | | | | | | | | |
| 2.500%, 03/01/2018 | | | 1,972,000 | | | | 1,981,493 | |
| | | | | | | | 10,672,195 | |
| Diversified Financials - 4.41% | | | | | | | | |
| FirstCash, Inc. | | | | | | | | |
| 6.750%, 04/01/2021 | | | 3,438,000 | | | | 3,584,115 | |
| | | | | | | | | |
| Energy - 1.89% | | | | | | | | |
| PHI, Inc. | | | | | | | | |
| 5.250%, 03/15/2019 | | | 1,626,000 | | | | 1,536,570 | |
| | | | | | | | | |
| Health Care Equipment & Services - 0.50% | | | | | | | | |
| Edwards Lifesciences Corp. | | | | | | | | |
| 2.875%, 10/15/2018 | | | 400,000 | | | | 405,316 | |
| | | | | | | | | |
| Household & Personal Products - 0.80% | | | | | | | | |
| Central Garden & Pet Co. | | | | | | | | |
| 6.125%, 11/15/2023 | | | 619,000 | | | | 653,045 | |
See notes to financial statements.
| SCHEDULE OF INVESTMENTS (continued) |
| March 31, 2017 (Unaudited) |
| CORPORATE BONDS - 74.51% (continued) | | Principal Amount | | | Value | |
| | | | | | | |
| Materials - 7.02% | | | | | | |
| Alamos Gold, Inc. | | | | | | |
| 7.750%, 04/01/2020 (b)(e) (Cost: $2,913,874; | | | | | | |
| Original acquisition date: 03/17/2014) | | $ | 2,929,000 | | | $ | 3,042,499 | |
| Ecolab, Inc. | | | | | | | | |
| 1.450%, 12/08/2017 | | | 2,670,000 | | | | 2,667,049 | |
| | | | | | | | 5,709,548 | |
| Media - 2.89% | | | | | | | | |
| Cable One, Inc. | | | | | | | | |
| 5.750%, 06/15/2022 (e) (Cost: $803,510; | | | | | | | | |
| Original acquisition date: 03/09/2017) | | | 771,000 | | | | 801,840 | |
| Time Warner Cos, Inc. | | | | | | | | |
| 7.250%, 10/15/2017 | | | 1,500,000 | | | | 1,545,459 | |
| | | | | | | | 2,347,299 | |
| Real Estate - 2.75% | | | | | | | | |
| Hospitality Properties Trust | | | | | | | | |
| 6.700%, 01/15/2018 | | | 2,207,000 | | | | 2,236,426 | |
| | | | | | | | | |
| Retailing - 16.24% | | | | | | | | |
| Caleres, Inc. | | | | | | | | |
| 6.250%, 08/15/2023 | | | 1,841,000 | | | | 1,919,242 | |
| Dillard’s, Inc. | | | | | | | | |
| 7.130%, 08/01/2018 | | | 1,600,000 | | | | 1,699,386 | |
| Dollar General Corp. | | | | | | | | |
| 4.125%, 07/15/2017 | | | 2,000,000 | | | | 2,016,158 | |
| 1.875%, 04/15/2018 | | | 1,965,000 | | | | 1,966,837 | |
| Dollar Tree, Inc. | | | | | | | | |
| 5.250%, 03/01/2020 | | | 1,674,000 | | | | 1,724,555 | |
| Expedia, Inc. | | | | | | | | |
| 7.456%, 08/15/2018 | | | 2,011,000 | | | | 2,153,455 | |
| Sally Holdings LLC / Sally Capital, Inc. | | | | | | | | |
| 5.750%, 06/01/2022 | | | 1,678,000 | | | | 1,726,243 | |
| | | | | | | | 13,205,876 | |
| Software & Services - 5.52% | | | | | | | | |
| eBay, Inc. | | | | | | | | |
| 1.350%, 07/15/2017 | | | 843,000 | | | | 842,625 | |
| 1.239%, 07/28/2017 (c) | | | 1,174,000 | | | | 1,174,309 | |
See notes to financial statements.
| SCHEDULE OF INVESTMENTS (continued) |
| March 31, 2017 (Unaudited) |
| CORPORATE BONDS - 74.51% (continued) | | Principal Amount | | | Value | |
| | | | | | | |
| Software & Services - 5.52% (continued) | | | | | | |
| Total System Services, Inc. | | | | | | |
| 2.375%, 06/01/2018 | | $ | 2,460,000 | | | $ | 2,470,243 | |
| | | | | | | | 4,487,177 | |
| Technology Hardware & Equipment - 6.93% | | | | | | | | |
| Jabil Circuit, Inc. | | | | | | | | |
| 8.250%, 03/15/2018 | | | 2,335,000 | | | | 2,467,791 | |
| Tech Data Corp. | | | | | | | | |
| 3.750%, 09/21/2017 | | | 3,135,000 | | | | 3,164,093 | |
| | | | | | | | 5,631,884 | |
| Telecommunication Services - 0.79% | | | | | | | | |
| AT&T, Inc. | | | | | | | | |
| 5.500%, 02/01/2018 | | | 624,000 | | | | 643,389 | |
| TOTAL CORPORATE BONDS (Cost $60,334,881) | | | | | | | 60,577,758 | |
| | | | | | | | | |
| SHORT-TERM INVESTMENTS - 16.47% | | Shares | | | | | |
| | | | | | | | | |
| Money Market Fund - 1.73% | | | | | | | | |
| STIT-Treasury Portfolio - | | | | | | | | |
| Institutional Class, 0.580% (f) | | | 1,408,512 | | | | 1,408,512 | |
| | | | | | | | | |
| U.S. Treasury Bills - 14.74% | | Principal Amount | | | | | |
| 0.511%, 05/25/2017 (g) | | $ | 6,000,000 | | | | 5,995,432 | |
| 0.766%, 06/29/2017 (g) | | | 6,000,000 | | | | 5,988,727 | |
| | | | | | | | 11,984,159 | |
| TOTAL SHORT-TERM INVESTMENTS | | | | | | | | |
| (Cost $13,392,671) | | | | | | | 13,392,671 | |
| Total Investments (Cost $81,266,019) - 99.62% | | | | | | | 80,991,042 | |
| Other Assets in Excess of Liabilities - 0.38% | | | | | | | 310,621 | |
| TOTAL NET ASSETS - 100.00% | | | | | | $ | 81,301,663 | |
Percentages are stated as a percent of net assets.
| (a) | Affiliate company. See Footnote 6. |
| (b) | Foreign Issued Security. |
| (c) | Variable rate security. The rate shown is as of 03/31/2017. |
| (d) | Security is considered illiquid and may be difficult to sell. |
| (e) | The security, sold within the terms of a private placement memorandum, is exempt from registration upon resale under Rule 144A under the Securities Act of 1933. The aggregate value of restricted securities at March 31, 2017 was $16,050,686, which represented 19.74% of net assets. |
| (f) | Rate listed is the 7-day effective yield. |
| (g) | Rate shown is the effective yield based on purchased price. The calculation assumes the security is held to maturity. |
See notes to financial statements.
| OPEN FORWARD CURRENCY CONTRACTS |
| March 31, 2017 (Unaudited) |
| | | | | | Amount of | | | | Amount of | | |
| | | | | | | Currency to | | | | Currency to | | |
| | | Forward | | | | be Received | | | | be Delivered | | |
| Counterparty | | Settlement | | Currency to | | in Local | | Currency to | | in Local | | Unrealized |
| of Contract | | Date | | be Received | | Currency | | be Delivered | | Currency | | Appreciation |
| Bank of | | | | | | | | | | | | |
| New York | | | | U.S. | | | | Canadian | | | | |
| Mellon | | 08/23/2017 | | Dollars | | 1,637,372 | | Dollars | | 2,150,000 | | $17,191 |
See notes to financial statements.
| Intrepid Disciplined Value Fund |
| SCHEDULE OF INVESTMENTS |
| March 31, 2017 (Unaudited) |
| COMMON STOCKS - 47.81% | | Shares | | | Value | |
| | | | | | | |
| Commercial & Professional Services - 1.44% | | | | | | |
| Tetra Tech, Inc. | | | 17,600 | | | $ | 718,960 | |
| | | | | | | | | |
| Consumer Durables & Apparel - 2.48% | | | | | | | | |
| Coach, Inc. | | | 30,000 | | | | 1,239,900 | |
| | | | | | | | | |
| Diversified Financials - 14.42% | | | | | | | | |
| Dundee Corp. - Class A (a)(b) | | | 144,730 | | | | 442,945 | |
| Leucadia National Corp. | | | 63,000 | | | | 1,638,000 | |
| Oaktree Capital Group LLC | | | 50,150 | | | | 2,271,795 | |
| Northern Trust Corp. | | | 17,050 | | | | 1,476,189 | |
| The Bank of New York Mellon Corp. | | | 29,360 | | | | 1,386,673 | |
| | | | | | | | 7,215,602 | |
| Energy - 0.75% | | | | | | | | |
| Contango Oil & Gas Co. (b) | | | 51,110 | | | | 374,125 | |
| | | | | | | | | |
| Health Care Equipment & Services - 2.04% | | | | | | | | |
| Laboratory Corp. of America Holdings (b) | | | 7,130 | | | | 1,022,941 | |
| | | | | | | | | |
| Insurance - 1.08% | | | | | | | | |
| Baldwin & Lyons, Inc. - Class B (c) | | | 22,000 | | | | 537,900 | |
| | | | | | | | | |
| Materials - 1.75% | | | | | | | | |
| Alamos Gold, Inc. - Class A (a) | | | 109,121 | | | | 876,244 | |
| | | | | | | | | |
| Media - 4.29% | | | | | | | | |
| Corus Entertainment, Inc. - Class B (a) | | | 218,780 | | | | 2,148,563 | |
| | | | | | | | | |
| Pharmaceuticals, Biotechnology & Life Sciences - 0.70% | | | | | | | | |
| Bio-Rad Laboratories, Inc. - Class A (b) | | | 1,768 | | | | 352,433 | |
| | | | | | | | | |
| Software & Services - 6.29% | | | | | | | | |
| Amdocs Ltd. | | | 9,980 | | | | 608,680 | |
| Teradata Corp. (b) | | | 58,800 | | | | 1,829,856 | |
| The Western Union Co. | | | 34,700 | | | | 706,145 | |
| | | | | | | | 3,144,681 | |
| Technology Hardware & Equipment - 8.39% | | | | | | | | |
| Apple, Inc. | | | 11,015 | | | | 1,582,415 | |
| Western Digital Corp. | | | 31,665 | | | | 2,613,313 | |
| | | | | | | | 4,195,728 | |
See notes to financial statements.
| Intrepid Disciplined Value Fund |
| SCHEDULE OF INVESTMENTS (continued) |
| March 31, 2017 (Unaudited) |
| COMMON STOCKS - 47.81% (continued) | | Shares | | | Value | |
| | | | | | | |
| Telecommunication Services - 4.18% | | | | | | |
| Telephone & Data Systems, Inc. | | | 27,838 | | | $ | 737,986 | |
| Verizon Communications, Inc. | | | 27,800 | | | | 1,355,250 | |
| | | | | | | | 2,093,236 | |
| TOTAL COMMON STOCKS (Cost $19,566,798) | | | | | | | 23,920,313 | |
| | | | | | | | | |
| SHORT-TERM INVESTMENT - 9.99% | | Principal Amount | | | | | |
| | | | | | | | | |
| U.S. Treasury Bill - 9.99% | | | | | | | | |
| 0.592%, 05/18/2017 (d) | | $ | 5,000,000 | | | | 4,996,142 | |
| TOTAL SHORT-TERM INVESTMENT | | | | | | | | |
| (Cost $4,996,142) | | | | | | | 4,996,142 | |
| Total Investments (Cost $24,562,940) - 57.80% | | | | | | | 28,916,455 | |
| Other Assets in Excess of Liabilities - 42.20% | | | | | | | 21,108,543 | |
| TOTAL NET ASSETS - 100.00% | | | | | | $ | 50,024,998 | |
Percentages are stated as a percent of net assets.
| (a) | Foreign Issued Security. |
| (b) | Non-income producing security. |
| (c) | Affiliate company. See Footnote 6. |
| (d) | Rate shown is the effective yield based on purchased price. The calculation assumes the security is held to maturity. |
| OPEN FORWARD CURRENCY CONTRACTS |
| March 31, 2017 (Unaudited) |
| | | | | | | Amount of | | | | Amount of | | |
| | | | | | | Currency to | | | | Currency to | | |
| | | Forward | | | | be Received | | | | be Delivered | | |
| Counterparty | | Settlement | | Currency to | | in Local | | Currency to | | in Local | | Unrealized |
| of Contract | | Date | | be Received | | Currency | | be Delivered | | Currency | | Depreciation |
| Bank of | | | | | | | | | | | | |
| New York | | | | U.S. | | | | Canadian | | | | |
| Mellon | | 09/13/2017 | | Dollars | | 2,457,277 | | Dollars | | 3,300,000 | | $(30,319) |
See notes to financial statements.
| Intrepid International Fund |
| SCHEDULE OF INVESTMENTS |
| March 31, 2017 (Unaudited) |
| COMMON STOCKS - 68.28% | | Shares | | | Value | |
| | | | | | | |
| Australia - 19.84% | | | | | | |
| Coventry Group Ltd. (a)(b) | | | 1,393,375 | | | $ | 745,177 | |
| GUD Holdings Ltd. | | | 86,976 | | | | 786,764 | |
| LifeHealthcare Group Ltd. | | | 355,535 | | | | 578,570 | |
| Programmed Maintenance Services Ltd. | | | 414,192 | | | | 593,330 | |
| Spotless Group Holdings Ltd. | | | 489,000 | | | | 405,352 | |
| Tox Free Solutions Ltd. | | | 490,436 | | | | 873,035 | |
| | | | | | | | 3,982,228 | |
| Canada - 15.59% | | | | | | | | |
| Corus Entertainment, Inc. - Class B | | | 76,130 | | | | 747,646 | |
| Dominion Diamond Corp. | | | 31,809 | | | | 401,748 | |
| Dundee Corp. - Class A (a) | | | 224,840 | | | | 688,122 | |
| HNZ Group, Inc. (a) | | | 62,590 | | | | 626,912 | |
| Noranda Income Fund | | | 535,780 | | | | 664,764 | |
| | | | | | | | 3,129,192 | |
| France - 4.63% | | | | | | | | |
| GEA | | | 4,851 | | | | 455,406 | |
| Vetoquinol SA | | | 8,400 | | | | 472,969 | |
| | | | | | | | 928,375 | |
| Germany - 16.43% | | | | | | | | |
| Clere AG | | | 105,699 | | | | 1,759,620 | |
| Hornbach Baumarkt AG | | | 24,907 | | | | 776,666 | |
| KSB AG | | | 35 | | | | 14,385 | |
| KSB AG | | | 1,812 | | | | 747,123 | |
| | | | | | | | 3,297,794 | |
| Greece - 2.92% | | | | | | | | |
| Metka Industrial - Construction SA | | | 77,328 | | | | 586,531 | |
| | | | | | | | | |
| Japan - 0.00% | | | | | | | | |
| Broadleaf Co Ltd. | | | 102 | | | | 698 | |
| | | | | | | | | |
See notes to financial statements.
| Intrepid International Fund |
| SCHEDULE OF INVESTMENTS (continued) |
| March 31, 2017 (Unaudited) |
| COMMON STOCKS - 68.28% (continued) | | Shares | | | Value | |
| | | | | | | |
| United Kingdom - 8.87% | | | | | | |
| Quarto Group, Inc. | | | 144,362 | | | $ | 455,795 | |
| Royal Mail PLC | | | 139,065 | | | | 740,495 | |
| Stallergenes Greer PLC (a) | | | 17,188 | | | | 584,925 | |
| | | | | | | | 1,781,215 | |
| TOTAL COMMON STOCKS (Cost $13,977,124) | | | | | | | 13,706,033 | |
| | | | | | | | | |
| PREFERRED STOCK - 4.79% | | | | | | | | |
| | | | | | | | | |
| Canada - 4.79% | | | | | | | | |
| Dundee Corp., 4.640% (c) | | | 90,140 | | | | 962,505 | |
| TOTAL PREFERRED STOCK (Cost $832,593) | | | | | | | 962,505 | |
| | | | | | | | | |
| CONVERTIBLE BONDS - 1.37% | | Principal Amount | | | | | |
| | | | | | | | | |
| Canada - 0.96% | | | | | | | | |
| Primero Mining Corp. | | | | | | | | |
| 5.750%, 02/28/2020 (d) | | $ | 321,000 | | | | 192,600 | |
| | | | | | | | | |
| United States - 0.41% | | | | | | | | |
| EZCORP, Inc. | | | | | | | | |
| 2.125%, 06/15/2019 | | | 88,000 | | | | 81,510 | |
| TOTAL CONVERTIBLE BONDS (Cost $324,493) | | | | | | | 274,110 | |
| | | | | | | | | |
| SHORT-TERM INVESTMENT - 9.25% | | | | | | | | |
| | | | | | | | | |
| U.S. Treasury Bill - 9.25% | | | | | | | | |
| 0.602%, 08/03/2017 (e) | | | 1,860,000 | | | | 1,856,152 | |
| TOTAL SHORT-TERM INVESTMENT | | | | | | | | |
| (Cost $1,856,152) | | | | | | | 1,856,152 | |
| Total Investments (Cost $16,990,362) - 83.69% | | | | | | | 16,798,800 | |
| Other Assets in Excess of Liabilities - 16.31% | | | | | | | 3,274,911 | |
| TOTAL NET ASSETS - 100.00% | | | | | | $ | 20,073,711 | |
Percentages are stated as a percent of net assets.
| (a) | Non-income producing security. |
| (b) | Affiliate company. See Footnote 6. |
| (c) | Variable rate security. The rate listed is as of 03/31/2017. |
| (d) | Security is considered illiquid and may be difficult to sell. |
| (e) | Rate shown is the effective yield based on purchase price. The calculation assumes the security is held to maturity. |
See notes to financial statements.
| Intrepid International Fund |
| OPEN FORWARD CURRENCY CONTRACTS |
| March 31, 2017 (Unaudited) |
| | | | | | | | Amount of | | | | Amount of | | | | |
| | | | | | | | Currency to | | | | Currency to | | | | |
| | | | Forward | | | | be Received | | | | be Delivered | | | Unrealized | |
| Counterparty | | Settlement | | Currency to | | in Local | | Currency to | | in Local | | | Appreciation | |
| of Contract | | Date | | be Received | | Currency | | be Delivered | | Currency | | | (Depreciation) | |
| Bank of | | | | U.S. | | | | Canadian | | | | | | |
| Montreal | | 09/14/2017 | | Dollars | | | 3,430,941 | | Dollars | | | 4,600,000 | | | $ | (36,671 | ) |
| Bank of | | | | U.S. | | | | | Australian | | | | | | | | |
| Montreal | | 09/18/2017 | | Dollars | | | 3,437,162 | | Dollars | | | 4,470,000 | | | | 32,208 | |
| Bank of | | | | U.S. | | | | | | | | | | | | | |
| Montreal | | 09/18/2017 | | Dollars | | | 4,968,345 | | Euro | | | 4,600,000 | | | | 18,279 | |
| Bank of | | | | U.S. | | | | | British | | | | | | | | |
| Montreal | | 09/18/2017 | | Dollars | | | 662,201 | | Pounds | | | 536,000 | | | | (12,379 | ) |
| | | | | | | | | | | | | | | | | $ | 1,437 | |
| | | | | | | | | | | | | | | | | | | |
See notes to financial statements.
| SCHEDULE OF INVESTMENTS |
| March 31, 2017 (Unaudited) |
| COMMON STOCKS - 80.74% | | Shares | | | Value | |
| | | | | | | |
| Capital Goods - 2.69% | | | | | | |
| Cubic Corp. | | | 8,688 | | | $ | 458,726 | |
| | | | | | | | | |
| Commercial & Professional Services - 3.63% | | | | | | | | |
| Tetra Tech, Inc. | | | 15,135 | | | | 618,265 | |
| | | | | | | | | |
| Consumer Durables & Apparel - 3.44% | | | | | | | | |
| Coach, Inc. | | | 14,175 | | | | 585,853 | |
| | | | | | | | | |
| Diversified Financials - 12.13% | | | | | | | | |
| Dundee Corp. - Class A (a)(b) | | | 151,185 | | | | 462,701 | |
| Leucadia National Corp. | | | 28,865 | | | | 750,490 | |
| Oaktree Capital Group LLC | | | 18,835 | | | | 853,226 | |
| | | | | | | | 2,066,417 | |
| Health Care Equipment & Services - 3.83% | | | | | | | | |
| Laboratory Corp. of America Holdings (b) | | | 4,541 | | | | 651,497 | |
| | | | | | | | | |
| Insurance - 6.27% | | | | | | | | |
| Baldwin & Lyons, Inc. - Class B (c) | | | 43,634 | | | | 1,066,851 | |
| | | | | | | | | |
| Materials - 4.89% | | | | | | | | |
| Dominion Diamond Corp. (a) | | | 65,923 | | | | 832,607 | |
| | | | | | | | | |
| Media - 9.47% | | | | | | | | |
| Corus Entertainment, Inc. - Class B (a) | | | 164,200 | | | | 1,612,552 | |
| | | | | | | | | |
| Pharmaceuticals, Biotechnology & Life Sciences - 3.16% | | | | | | | | |
| Bio-Rad Laboratories, Inc. - Class A (b) | | | 2,700 | | | | 538,218 | |
| | | | | | | | | |
| Software & Services - 22.91% | | | | | | | | |
| Amdocs Ltd. | | | 19,710 | | | | 1,202,113 | |
| Syntel, Inc. | | | 66,770 | | | | 1,123,739 | |
| Teradata Corp. (b) | | | 35,020 | | | | 1,089,822 | |
| The Western Union Co. | | | 23,915 | | | | 486,670 | |
| | | | | | | | 3,902,344 | |
| Technology Hardware & Equipment - 5.88% | | | | | | | | |
| Western Digital Corp. | | | 12,137 | | | | 1,001,667 | |
| | | | | | | | | |
| Telecommunication Services - 2.44% | | | | | | | | |
| Telephone & Data Systems, Inc. | | | 15,680 | | | | 415,677 | |
| TOTAL COMMON STOCKS (Cost $12,151,555) | | | | | | | 13,750,674 | |
| | | | | | | | | |
See notes to financial statements.
| SCHEDULE OF INVESTMENTS (continued) |
| March 31, 2017 (Unaudited) |
| EXCHANGE-TRADED FUNDS - 7.51% | | Shares | | | Value | |
| | | | | | | |
| Diversified Financials - 7.51% | | | | | | |
| iShares Gold Trust (b) | | | 71,345 | | | $ | 856,854 | |
| iShares Silver Trust (b) | | | 24,505 | | | | 422,711 | |
| TOTAL EXCHANGE-TRADED FUNDS | | | | | | | | |
| (Cost $1,297,541) | | | | | | | 1,279,565 | |
| | | | | | | | | |
| CONVERTIBLE BONDS - 5.13% | | Principal Amount | | | | | |
| | | | | | | | | |
| Diversified Financials - 1.63% | | | | | | | | |
| EZCORP, Inc. | | | | | | | | |
| 2.125%, 06/15/2019 | | $ | 300,000 | | | | 277,875 | |
| | | | | | | | | |
| Materials - 3.50% | | | | | | | | |
| Primero Mining Corp. | | | | | | | | |
| 5.750%, 02/28/2020 (a)(d) | | | 993,000 | | | | 595,800 | |
| TOTAL CONVERTIBLE BONDS (Cost $1,041,451) | | | | | | | 873,675 | |
| Total Investments (Cost $14,490,547) - 93.38% | | | | | | | 15,903,914 | |
| Other Assets in Excess of Liabilities - 6.62% | | | | | | | 1,127,378 | |
| TOTAL NET ASSETS - 100.00% | | | | | | $ | 17,031,292 | |
Percentages are stated as a percent of net assets.
| (a) | Foreign Issued Security. |
| (b) | Non-income producing security. |
| (c) | Affiliate company. See Footnote 6. |
| (d) | Security is considered illiquid and may be difficult to sell. |
| OPEN FORWARD CURRENCY CONTRACTS |
| March 31, 2017 (Unaudited) |
| | | | | | Amount of | | | | Amount of | | |
| | | | | | | Currency to | | | | Currency to | | |
| | | Forward | | | | be Received | | | | be Delivered | | |
| Counterparty | | Settlement | | Currency to | | in Local | | Currency to | | in Local | | Unrealized |
| of Contract | | Date | | be Received | | Currency | | be Delivered | | Currency | | Appreciation |
| Bank of | | | | | | | | | | | | |
| New York | | | | U.S. | | | | Canadian | | | | |
| Mellon | | 08/23/2017 | | Dollars | | 2,088,111 | | Dollars | | 2,750,000 | | $15,787 |
See notes to financial statements.
| STATEMENT OF ASSETS AND LIABILITIES |
| March 31, 2017 (Unaudited) |
| | | Intrepid | | | Intrepid | | | Intrepid | |
| | | Capital Fund | | | Endurance Fund | | | Income Fund | |
| ASSETS: | | | | | | | | | |
Investments, at value(1) | | | | | | | | | |
| Unaffiliated issuers | | $ | 398,619,215 | | | $ | 141,458,688 | | | $ | 80,598,350 | |
| Affiliated issuers | | | 10,477,828 | | | | 5,081,614 | | | | 392,692 | |
| Income receivable | | | 2,117,477 | | | | 66,284 | | | | 810,779 | |
| Receivable for fund shares sold | | | 816,802 | | | | 334,789 | | | | 75,350 | |
| Receivable for investments sold | | | 6,365,372 | | | | — | | | | 316,347 | |
| Cash | | | — | | | | 81,186,546 | | | | — | |
| Appreciation on forward currency contracts | | | 650,142 | | | | 193,032 | | | | 17,191 | |
| Deposit for forwards at broker | | | 280,000 | | | | — | | | | | |
| Other assets | | | 61,436 | | | | 26,747 | | | | 12,373 | |
| Total assets | | | 419,388,272 | | | | 228,347,700 | | | | 82,223,082 | |
| LIABILITIES: | | | | | | | | | | | | |
| Payable for fund shares redeemed | | | 72,953 | | | | 381,361 | | | | 14,025 | |
| Payable for investment securities purchased | | | 1,257,120 | | | | — | | | | 812,214 | |
| Payable to Investment Adviser | | | 338,741 | | | | 181,551 | | | | 44,080 | |
| Payable to Trustees | | | 7,830 | | | | 7,376 | | | | 2,150 | |
| Accrued distribution fees | | | 16,456 | | | | 7,028 | | | | — | |
| Other expenses | | | 134,478 | | | | 123,284 | | | | 48,950 | |
| Total liabilities | | | 1,827,578 | | | | 700,600 | | | | 921,419 | |
| Total net assets | | $ | 417,560,694 | | | $ | 227,647,100 | | | $ | 81,301,663 | |
See notes to financial statements.
| STATEMENT OF ASSETS AND LIABILITIES (continued) |
| March 31, 2017 (Unaudited) |
| | | Intrepid | | | Intrepid | | | Intrepid | |
| | | Capital Fund | | | Endurance Fund | | | Income Fund | |
| NET ASSETS CONSIST OF: | | | | | | | | | |
| Capital stock | | $ | 391,930,922 | | | $ | 226,054,731 | | | $ | 85,151,349 | |
| Accumulated net investment loss | | | (1,828,843 | ) | | | (110,202 | ) | | | (4,177 | ) |
| Accumulated undistributed net realized | | | | | | | | | | | | |
| gain (loss) on investments | | | 6,497,040 | | | | 1,793,804 | | | | (3,587,723 | ) |
| Unrealized appreciation (depreciation) on: | | | | | | | | | | | | |
| Investments and foreign currency translation | | | 20,311,433 | | | | (284,265 | ) | | | (274,977 | ) |
| Forward currency contracts | | | 650,142 | | | | 193,032 | | | | 17,191 | |
| Total net assets | | $ | 417,560,694 | | | $ | 227,647,100 | | | $ | 81,301,663 | |
| Investor Class | | | | | | | | | | | | |
| Net assets | | $ | 109,745,876 | | | $ | 158,813,995 | | | $ | — | |
| Shares outstanding | | | 9,312,233 | | | | 11,063,351 | | | | — | |
| Institutional Class | | | | | | | | | | | | |
| Net assets | | | 307,814,818 | | | | 68,833,105 | | | | 81,301,663 | |
| Shares outstanding | | | 26,115,403 | | | | 4,689,936 | | | | 8,759,194 | |
| Total shares outstanding (unlimited | | | | | | | | | | | | |
| shares of no par value authorized) | | | 35,427,636 | | | | 15,753,287 | | | | 8,759,194 | |
| Investor Class Net asset value, offering | | | | | | | | | | | | |
and redemption price per share(2) | | $ | 11.79 | | | $ | 14.35 | | | $ | — | |
| Institutional Class Net asset value, offering | | | | | | | | | | | | |
and redemption price per share(2) | | $ | 11.79 | | | $ | 14.68 | | | $ | 9.28 | |
| | | | | | | | | | | | | |
(1) Cost of Investments | | | | | | | | | | | | |
| Unaffiliated issuers | | $ | 378,596,466 | | | $ | 141,989,552 | | | $ | 80,902,325 | |
| Affiliated issuers | | | 10,185,972 | | | | 4,835,015 | | | | 363,694 | |
(2) | If applicable, redemption price per share may be reduced by a 2.00% redemption fee for shares redeemed within 30 days of purchase. |
See notes to financial statements.
| STATEMENT OF ASSETS AND LIABILITIES (continued) |
| March 31, 2017 (Unaudited) |
| | | Intrepid | | | Intrepid | | | | |
| | | Disciplined | | | International | | | Intrepid | |
| | | Value Fund | | | Fund | | | Select Fund | |
| ASSETS: | | | | | | | | | |
Investments, at value(1) | | | | | | | | | |
| Unaffiliated issuers | | $ | 28,378,555 | | | $ | 16,053,623 | | | $ | 14,837,063 | |
| Affiliated issuers | | | 537,900 | | | | 745,177 | | | | 1,066,851 | |
| Income receivable | | | 34,632 | | | | 55,387 | | | | 22,300 | |
| Receivable for fund shares sold | | | 55,154 | | | | 345,000 | | | | 7,410 | |
| Receivable for investments sold | | | — | | | | 59,465 | | | | — | |
| Cash | | | 21,130,345 | | | | 2,932,445 | | | | 2,177,099 | |
| Appreciation on forward currency contracts | | | — | | | | 1,437 | | | | 15,787 | |
| Other assets | | | 12,643 | | | | 16,541 | | | | 11,782 | |
| Total assets | | | 50,149,229 | | | | 20,209,075 | | | | 18,138,292 | |
| LIABILITIES: | | | | | | | | | | | | |
| Depreciation on forward currency contracts | | | 30,319 | | | | — | | | | — | |
| Payable for fund shares redeemed | | | 16,025 | | | | 6,163 | | | | 1,072,566 | |
| Payable for investment securities purchased | | | — | | | | 88,778 | | | | — | |
| Payable to Investment Adviser | | | 37,242 | | | | 4,927 | | | | 8,336 | |
| Accrued distribution fees | | | 3,374 | | | | 8,690 | | | | 3,688 | |
| Payable to Trustees | | | 1,198 | | | | 290 | | | | 87 | |
| Other expenses | | | 36,073 | | | | 26,516 | | | | 22,323 | |
| Total liabilities | | | 124,231 | | | | 135,364 | | | | 1,107,000 | |
| Total net assets | | $ | 50,024,998 | | | $ | 20,073,711 | | | $ | 17,031,292 | |
See notes to financial statements.
| STATEMENT OF ASSETS AND LIABILITIES (continued) |
| March 31, 2017 (Unaudited) |
| | | Intrepid | | | Intrepid | | | | |
| | | Disciplined | | | International | | | Intrepid | |
| | | Value Fund | | | Fund | | | Select Fund | |
| NET ASSETS CONSIST OF: | | | | | | | | | |
| Capital stock | | $ | 45,660,088 | | | $ | 19,981,424 | | | $ | 15,626,973 | |
| Accumulated net investment income (loss) | | | (98,476 | ) | | | (394,650 | ) | | | 1,004 | |
| Accumulated undistributed net realized | | | | | | | | | | | | |
| gain (loss) on investments | | | 140,190 | | | | 676,843 | | | | (25,839 | ) |
| Unrealized appreciation (depreciation) on: | | | | | | | | | | | | |
| Investments and foreign currency translation | | | 4,353,515 | | | | (191,343 | ) | | | 1,413,367 | |
| Forward currency contracts | | | (30,319 | ) | | | 1,437 | | | | 15,787 | |
| Total net assets | | $ | 50,024,998 | | | $ | 20,073,711 | | | $ | 17,031,292 | |
| Investor Class | | | | | | | | | | | | |
| Net assets | | $ | 50,024,998 | | | $ | 20,073,711 | | | | 17,031,292 | |
| Shares outstanding | | | 4,671,016 | | | | 2,058,788 | | | | 1,549,112 | |
| Total shares outstanding (unlimited | | | | | | | | | | | | |
shares of no par value authorized)(2) | | | 4,671,016 | | | | 2,058,788 | | | | 1,549,112 | |
| Investor Class Net asset value, offering | | | | | | | | | | | | |
and redemption price per share(2) | | $ | 10.71 | | | $ | 9.75 | | | $ | 10.99 | |
| | | | | | | | | | | | | |
(1) Cost of Investments | | | | | | | | | | | | |
| Unaffiliated issuers | | $ | 24,056,280 | | | $ | 15,868,368 | | | $ | 13,428,471 | |
| Affiliated issuers | | | 506,660 | | | | 1,121,994 | | | | 1,062,076 | |
(2) | If applicable, redemption price per share may be reduced by a 2.00% redemption fee for shares redeemed within 30 days of purchase. |
See notes to financial statements.
| STATEMENT OF OPERATIONS |
| For the period ended March 31, 2017 (Unaudited) |
| | | Intrepid | | | Intrepid | | | Intrepid | |
| | | Capital Fund | | | Endurance Fund | | | Income Fund | |
| INVESTMENT INCOME: | | | | | | | | | |
| Dividend income | | | | | | | | | |
| Unaffiliated issuers* | | $ | 2,068,819 | | | $ | 724,952 | | | $ | 154,502 | |
| Affiliated issuers (See Note 6) | | | — | | | | 110,154 | | | | 8,512 | |
| Interest income | | | | | | | | | | | | |
| Unaffiliated issuers | | | 3,052,038 | | | | 667,921 | | | | 1,331,288 | |
| Total investment income | | | 5,120,857 | | | | 1,503,027 | | | | 1,494,302 | |
| Advisory fees (See Note 3) | | | 1,991,151 | | | | 1,206,885 | | | | 300,052 | |
| Administration fees | | | 143,297 | | | | 87,402 | | | | 29,007 | |
| Distribution (12b-1) fees - | | | | | | | | | | | | |
| Investor Class Only (See Note 4) | | | 138,666 | | | | 212,881 | | | | — | |
| Fund accounting fees | | | 70,920 | | | | 46,340 | | | | 18,594 | |
| Shareholder servicing fees and expenses | | | 40,056 | | | | 43,450 | | | | 13,110 | |
| Custody fees | | | 23,664 | | | | 7,934 | | | | 2,544 | |
| Trustees fees and expenses | | | 16,090 | | | | 10,846 | | | | 3,460 | |
| Federal and state registration fees | | | 15,922 | | | | 16,298 | | | | 9,738 | |
| Audit fees | | | 15,098 | | | | 15,098 | | | | 15,098 | |
| Reports to shareholders | | | 14,834 | | | | 18,112 | | | | 4,004 | |
| Insurance | | | 9,466 | | | | 8,738 | | | | 2,820 | |
| Legal fees | | | 4,906 | | | | 4,728 | | | | 4,364 | |
| Miscellaneous | | | 4,188 | | | | 3,006 | | | | 1,366 | |
| Total expenses before Adviser waiver | | | 2,488,258 | | | | 1,681,718 | | | | 404,157 | |
| Expenses waived by Adviser (See Note 3) | | | (59,768 | ) | | | (80,920 | ) | | | (44,095 | ) |
| Net expenses before Adviser recoupment | | | 2,428,490 | | | | 1,600,798 | | | | 360,062 | |
| Expenses recouped by Adviser (See Note 3) | | | — | | | | — | | | | — | |
| Total net expenses | | | 2,428,490 | | | | 1,600,798 | | | | 360,062 | |
| Net investment income (loss) | | | 2,692,367 | | | | (97,771 | ) | | | 1,134,240 | |
| NET REALIZED AND UNREALIZED | | | | | | | | | | | | |
| GAIN (LOSS) ON INVESTMENTS: | | | | | | | | | | | | |
| Net realized gain (loss) on: | | | | | | | | | | | | |
| Investments and foreign currency translation | | | 6,286,126 | | | | 3,439,410 | | | | (380,114 | ) |
| Forward currency contracts | | | 2,746,680 | | | | 236,521 | | | | 8,144 | |
| Net change in unrealized | | | | | | | | | | | | |
| appreciation (depreciation) on: | | | | | | | | | | | | |
| Investments and foreign currency translation | | | 9,005,640 | | | | (4,454,601 | ) | | | 348,438 | |
| Forward currency contracts | | | (1,289,937 | ) | | | (58,723 | ) | | | 4,713 | |
| Net realized and unrealized gain (loss) | | | 16,748,509 | | | | (837,393 | ) | | | (18,819 | ) |
| Net increase (decrease) in net assets | | | | | | | | | | | | |
| resulting from operations | | $ | 19,440,876 | | | $ | (935,164 | ) | | $ | 1,115,421 | |
| * Net of foreign taxes withheld | | $ | 80,027 | | | $ | 75,252 | | | $ | 9,957 | |
See notes to financial statements.
| STATEMENT OF OPERATIONS (continued) |
| For the period ended March 31, 2017 (Unaudited) |
| | | Intrepid | | | Intrepid | | | | |
| | | Disciplined | | | International | | | Intrepid | |
| | | Value Fund | | | Fund | | | Select Fund | |
| INVESTMENT INCOME: | | | | | | | | | |
| Dividend income | | | | | | | | | �� |
| Unaffiliated issuers* | | $ | 233,783 | | | $ | 151,944 | | | $ | 104,931 | |
| Affiliated issuers (See Note 6) | | | 11,660 | | | | — | | | | 18,688 | |
| Interest income | | | | | | | | | | | | |
| Unaffiliated issuers | | | 17,041 | | | | 21,720 | | | | 60,625 | |
| Total investment income | | | 262,484 | | | | 173,664 | | | | 184,244 | |
| Advisory fees (See Note 3) | | | 244,355 | | | | 89,296 | | | | 74,572 | |
| Administration fees | | | 17,925 | | | | 6,707 | | | | 5,492 | |
| Distribution (12b-1) fees - Investor Class Only | | | 16,415 | | | | 22,324 | | | | 18,643 | |
| Audit fees | | | 15,098 | | | | 15,098 | | | | 15,098 | |
| Shareholder servicing fees and expenses | | | 11,560 | | | | 9,912 | | | | 9,552 | |
| Federal and state registration fees | | | 9,738 | | | | 9,730 | | | | 8,554 | |
| Fund accounting fees | | | 9,376 | | | | 5,630 | | | | 2,910 | |
| Legal fees | | | 4,090 | | | | 5,268 | | | | 3,910 | |
| Reports to shareholders | | | 2,818 | | | | 1,730 | | | | 636 | |
| Trustees fees and expenses | | | 2,094 | | | | 726 | | | | 454 | |
| Custody fees | | | 1,856 | | | | 17,157 | | | | 2,283 | |
| Insurance | | | 1,546 | | | | 184 | | | | 92 | |
| Miscellaneous | | | 638 | | | | 1,274 | | | | 274 | |
| Total expenses before Adviser waiver | | | 337,509 | | | | 185,036 | | | | 142,470 | |
| Expenses waived by Adviser (See Note 3) | | | (19,848 | ) | | | (60,021 | ) | | | (38,069 | ) |
| Net expenses before Adviser recoupment | | | 317,661 | | | | 125,015 | | | | 104,401 | |
| Expenses recouped by Adviser (See Note 3) | | | — | | | | — | | | | — | |
| Total net expenses | | | 317,661 | | | | 125,015 | | | | 104,401 | |
| Net investment income (loss) | | | (55,177 | ) | | | 48,649 | | | | 79,843 | |
| NET REALIZED AND UNREALIZED | | | | | | | | | | | | |
| GAIN (LOSS) ON INVESTMENTS: | | | | | | | | | | | | |
| Net realized gain on: | | | | | | | | | | | | |
| Investments and foreign currency translation | | | 549,868 | | | | 336,633 | | | | 93,067 | |
| Forward currency contracts | | | 53,153 | | | | 395,809 | | | | 13,813 | |
| Net change in unrealized | | | | | | | | | | | | |
| appreciation (depreciation) on: | | | | | | | | | | | | |
| Investments and foreign currency translation | | | 1,874,374 | | | | (717,851 | ) | | | 402,742 | |
| Forward currency contracts | | | (16,490 | ) | | | 29,766 | | | | (656 | ) |
| Purchased options contracts | | | — | | | | — | | | | 56,139 | |
| Net realized and unrealized gain | | | 2,460,905 | | | | 44,357 | | | | 565,105 | |
| Net increase in net assets resulting | | | | | | | | | | | | |
| from operations | | $ | 2,405,728 | | | $ | 93,006 | | | $ | 644,948 | |
| * Net of foreign taxes withheld | | $ | 13,268 | | | $ | 15,376 | | | $ | 10,469 | |
See notes to financial statements.
| |
| STATEMENTS OF CHANGES IN NET ASSETS |
| | | Six Months Ended | | | Year Ended | |
| | | March 31, 2017 | | | September 30, 2016 | |
| | | (Unaudited) | | | | |
| OPERATIONS: | | | | | | |
| Net investment income | | $ | 2,692,367 | | | $ | 6,678,864 | |
| Net realized gain on investments | | | | | | | | |
| and foreign currency translation | | | 9,032,806 | | | | 10,375,898 | |
| Net change in unrealized appreciation | | | 7,715,703 | | | | 22,390,537 | |
| Net increase in assets | | | | | | | | |
| resulting from operations | | | 19,440,876 | | | | 39,445,299 | |
| | | | | | | | | |
| DISTRIBUTIONS TO SHAREHOLDERS: | | | | | | | | |
| From net investment income - Investor Class | | | (1,435,458 | ) | | | (2,992,796 | ) |
| From net investment income - Institutional Class | | | (4,009,578 | ) | | | (5,326,153 | ) |
| From net realized gain - Investor Class | | | (2,292,178 | ) | | | (5,281 | ) |
| From net realized gain - Institutional Class | | | (5,793,689 | ) | | | (6,622 | ) |
| Total distributions | | | (13,530,903 | ) | | | (8,330,852 | ) |
| | | | | | | | | |
| CAPITAL SHARE TRANSACTIONS: | | | | | | | | |
| Proceeds from shares sold - Investor Class | | | 7,874,931 | | | | 12,446,725 | |
| Proceeds from shares sold - Institutional Class | | | 36,384,482 | | | | 135,478,379 | |
| Proceeds from shares issued to holders in | | | | | | | | |
| reinvestment of dividends - Investor Class | | | 3,617,599 | | | | 2,870,073 | |
| Proceeds from shares issued to holders in | | | | | | | | |
| reinvestment of dividends - Institutional Class | | | 7,538,600 | | | | 3,780,361 | |
Cost of shares redeemed - Investor Class(1) | | | (13,712,792 | ) | | | (65,496,789 | ) |
Cost of shares redeemed - Institutional Class(2) | | | (16,141,567 | ) | | | (65,881,576 | ) |
| Net increase in net assets | | | | | | | | |
| from capital share transactions | | | 25,561,253 | | | | 23,197,173 | |
| | | | | | | | | |
| TOTAL INCREASE IN NET ASSETS | | | 31,471,226 | | | | 54,311,620 | |
| | | | | | | | | |
| NET ASSETS: | | | | | | | | |
| Beginning of period | | | 386,089,468 | | | | 331,777,848 | |
| End of period (including accumulated | | | | | | | | |
| net investment income (loss) of | | | | | | | | |
| $(1,828,843) and $923,826) | | $ | 417,560,694 | | | $ | 386,089,468 | |
(1) | Net of redemption fees of $17 and $1,663, respectively. |
(2) | Net of redemption fees of $0 and $4,625, respectively. |
See notes to financial statements.
| |
| STATEMENTS OF CHANGES IN NET ASSETS (continued) |
| | | Six Months Ended | | | Year Ended | |
| | | March 31, 2017 | | | September 30, 2016 | |
| | | (Unaudited) | | | | |
| OPERATIONS: | | | | | | |
| Net investment loss | | $ | (97,771 | ) | | $ | (546,808 | ) |
| Net realized gain on investments | | | | | | | | |
| and foreign currency translation | | | 3,675,931 | | | | 4,782,314 | |
| Net change in unrealized | | | | | | | | |
| appreciation (depreciation) | | | (4,513,324 | ) | | | 14,299,092 | |
| Net increase (decrease) in assets | | | | | | | | |
| resulting from operations | | | (935,164 | ) | | | 18,534,598 | |
| | | | | | | | | |
| DISTRIBUTIONS TO SHAREHOLDERS: | | | | | | | | |
| From net investment income - Investor Class | | | — | | | | (2,562,801 | ) |
| From net investment income - Institutional Class | | | (12,431 | ) | | | (1,007,410 | ) |
| From net realized gain - Investor Class | | | (1,679,018 | ) | | | — | |
| From net realized gain - Institutional Class | | | (682,158 | ) | | | — | |
| Total distributions | | | (2,373,607 | ) | | | (3,570,211 | ) |
| | | | | | | | | |
| CAPITAL SHARE TRANSACTIONS: | | | | | | | | |
| Proceeds from shares sold - Investor Class | | | 10,282,162 | | | | 20,338,682 | |
| Proceeds from shares sold - Institutional Class | | | 1,919,896 | | | | 9,572,307 | |
| Proceeds from shares issued to holders in | | | | | | | | |
| reinvestment of dividends - Investor Class | | | 1,643,000 | | | | 2,516,140 | |
| Proceeds from shares issued to holders in | | | | | | | | |
| reinvestment of dividends - Institutional Class | | | 640,492 | | | | 875,565 | |
Cost of shares redeemed - Investor Class(1) | | | (31,701,349 | ) | | | (69,687,297 | ) |
Cost of shares redeemed - Institutional Class(2) | | | (5,368,562 | ) | | | (27,322,716 | ) |
| Net decrease in net assets | | | | | | | | |
| from capital share transactions | | | (22,584,361 | ) | | | (63,707,319 | ) |
| | | | | | | | | |
| TOTAL DECREASE IN NET ASSETS | | | (25,893,132 | ) | | | (48,742,932 | ) |
| | | | | | | | | |
| NET ASSETS: | | | | | | | | |
| Beginning of period | | | 253,540,232 | | | | 302,283,164 | |
| End of period (including accumulated | | | | | | | | |
| net investment loss of $(110,202) and $0) | | $ | 227,647,100 | | | $ | 253,540,232 | |
(1) | Net of redemption fees of $1,558 and $5,368, respectively. |
(2) | Net of redemption fees of $143 and $22, respectively. |
See notes to financial statements.
| |
| STATEMENTS OF CHANGES IN NET ASSETS (continued) |
| | | Six Months Ended | | | Year Ended | |
| | | March 31, 2017 | | | September 30, 2016 | |
| | | (Unaudited) | | | | |
| OPERATIONS: | | | | | | |
| Net investment income | | $ | 1,134,240 | | | $ | 2,430,578 | |
| Net realized gain (loss) on investments | | | | | | | | |
| and foreign currency translation | | | (371,970 | ) | | | 263,978 | |
| Net change in unrealized appreciation | | | 353,151 | | | | 2,176,594 | |
| Net increase in assets | | | | | | | | |
| resulting from operations | | | 1,115,421 | | | | 4,871,150 | |
| | | | | | | | | |
| DISTRIBUTIONS TO SHAREHOLDERS: | | | | | | | | |
| From net investment income | | | (1,137,068 | ) | | | (2,801,334 | ) |
| From net realized gain | | | — | | | | — | |
| Total distributions | | | (1,137,068 | ) | | | (2,801,334 | ) |
| | | | | | | | | |
| CAPITAL SHARE TRANSACTIONS: | | | | | | | | |
| Proceeds from shares sold | | | 3,591,967 | | | | 5,789,500 | |
| Proceeds from shares issued to holders in | | | | | | | | |
| reinvestment of dividends | | | 1,069,963 | | | | 2,616,417 | |
| Cost of shares redeemed | | | (3,098,147 | ) | | | (15,703,723 | ) |
| Net increase (decrease) in net assets from | | | | | | | | |
| capital share transactions | | | 1,563,783 | | | | (7,297,806 | ) |
| | | | | | | | | |
| TOTAL INCREASE (DECREASE) | | | | | | | | |
| IN NET ASSETS | | | 1,542,136 | | | | (5,227,990 | ) |
| | | | | | | | | |
| NET ASSETS: | | | | | | | | |
| Beginning of period | | | 79,759,527 | | | | 84,987,517 | |
| End of period (including accumulated | | | | | | | | |
| net investment loss of $4,177 and $1,349) | | $ | 81,301,663 | | | $ | 79,759,527 | |
See notes to financial statements.
| Intrepid Disciplined Value Fund |
| |
| STATEMENTS OF CHANGES IN NET ASSETS (continued) |
| | | Six Months Ended | | | Year Ended | |
| | | March 31, 2017 | | | September 30, 2016 | |
| | | (Unaudited) | | | | |
| OPERATIONS: | | | | | | |
| Net investment income (loss) | | $ | (55,177 | ) | | $ | 301,940 | |
| Net realized gain on investments | | | | | | | | |
| and foreign currency translation | | | 603,021 | | | | 1,470,410 | |
| Net change in unrealized appreciation | | | 1,857,884 | | | | 3,394,359 | |
| Net increase in assets | | | | | | | | |
| resulting from operations | | | 2,405,728 | | | | 5,166,709 | |
| | | | | | | | | |
| DISTRIBUTIONS TO SHAREHOLDERS: | | | | | | | | |
| From net investment income | | | (266,049 | ) | | | (175,496 | ) |
| From net realized gain | | | (1,703,809 | ) | | | (2,006,232 | ) |
| Total distributions | | | (1,969,858 | ) | | | (2,181,728 | ) |
| | | | | | | | | |
| CAPITAL SHARE TRANSACTIONS: | | | | | | | | |
| Proceeds from shares sold | | | 2,022,235 | | | | 5,402,770 | |
| Proceeds from shares issued to holders | | | | | | | | |
| in reinvestment of dividends | | | 1,943,927 | | | | 2,156,213 | |
Cost of shares redeemed(1) | | | (2,368,373 | ) | | | (7,482,964 | ) |
| Net increase in net assets from | | | | | | | | |
| capital share transactions | | | 1,597,789 | | | | 76,019 | |
| | | | | | | | | |
| TOTAL INCREASE IN NET ASSETS | | | 2,033,659 | | | | 3,061,000 | |
| | | | | | | | | |
| NET ASSETS: | | | | | | | | |
| Beginning of period | | | 47,991,339 | | | | 44,930,339 | |
| End of period (including accumulated | | | | | | | | |
| net investment income (loss) of | | | | | | | | |
| $(98,476) and $222,750) | | $ | 50,024,998 | | | $ | 47,991,339 | |
(1) | Net of redemption fees of $0 and $192, respectively. |
See notes to financial statements.
| Intrepid International Fund |
| |
| STATEMENTS OF CHANGES IN NET ASSETS (continued) |
| | | Six Months Ended | | | Year Ended | |
| | | March 31, 2017 | | | September 30, 2016 | |
| | | (Unaudited) | | | | |
| OPERATIONS: | | | | | | |
| Net investment income | | $ | 48,649 | | | $ | 473,020 | |
| Net realized gain on investments | | | | | | | | |
| and foreign currency translation | | | 732,442 | | | | 276,894 | |
| Net change in unrealized | | | | | | | | |
| appreciation (depreciation) | | | (688,085 | ) | | | 726,443 | |
| Net increase in assets | | | | | | | | |
| resulting from operations | | | 93,006 | | | | 1,476,357 | |
| | | | | | | | | |
| DISTRIBUTIONS TO SHAREHOLDERS: | | | | | | | | |
| From net investment income | | | (635,320 | ) | | | (637,422 | ) |
| From net realized gain | | | (125,755 | ) | | | (154,652 | ) |
| Total distributions | | | (761,075 | ) | | | (792,074 | ) |
| | | | | | | | | |
| CAPITAL SHARE TRANSACTIONS: | | | | | | | | |
| Proceeds from shares sold | | | 5,412,959 | | | | 8,495,163 | |
| Proceeds from shares issued to holders in | | | | | | | | |
| reinvestment of dividends | | | 754,574 | | | | 792,074 | |
Cost of shares redeemed(1) | | | (2,473,702 | ) | | | (496,716 | ) |
| Net increase in net assets from | | | | | | | | |
| capital share transactions | | | 3,693,831 | | | | 8,790,521 | |
| | | | | | | | | |
| TOTAL INCREASE IN NET ASSETS | | | 3,025,762 | | | | 9,474,804 | |
| | | | | | | | | |
| NET ASSETS: | | | | | | | | |
| Beginning of period | | | 17,047,949 | | | | 7,573,145 | |
| End of period (including accumulated | | | | | | | | |
| net investment income (loss) of | | | | | | | | |
| $(394,650) and $192,021) | | $ | 20,073,711 | | | $ | 17,047,949 | |
(1) | Net of redemption fees of $961 and $726, respectively. |
See notes to financial statements.
| |
| STATEMENTS OF CHANGES IN NET ASSETS (continued) |
| | | Six Months Ended | | | Year Ended | |
| | | March 31, 2017 | | | September 30, 2016 | |
| | | (Unaudited) | | | | |
| OPERATIONS: | | | | | | |
| Net investment income | | $ | 79,843 | | | $ | 92,268 | |
| Net realized gain on investments | | | | | | | | |
| and foreign currency translation | | | 106,880 | | | | 737,078 | |
| Net change in unrealized appreciation | | | 458,225 | | | | 1,059,377 | |
| Net increase in assets | | | | | | | | |
| resulting from operations | | | 644,948 | | | | 1,888,723 | |
| | | | | | | | | |
| DISTRIBUTIONS TO SHAREHOLDERS: | | | | | | | | |
| From net investment income | | | (130,814 | ) | | | (9,538 | ) |
| From net realized gain | | | (901,847 | ) | | | — | |
| Total distributions | | | (1,032,661 | ) | | | (9,538 | ) |
| | | | | | | | | |
| CAPITAL SHARE TRANSACTIONS: | | | | | | | | |
| Proceeds from shares sold | | | 7,267,305 | | | | 8,880,314 | |
| Proceeds from shares issued to holders in | | | | | | | | |
| reinvestment of dividends | | | 1,032,235 | | | | 9,538 | |
Cost of shares redeemed(1) | | | (2,711,290 | ) | | | (328,322 | ) |
| Net increase in net assets from | | | | | | | | |
| capital share transactions | | | 5,588,250 | | | | 8,561,530 | |
| | | | | | | | | |
| TOTAL INCREASE IN NET ASSETS | | | 5,200,537 | | | | 10,440,715 | |
| | | | | | | | | |
| NET ASSETS: | | | | | | | | |
| Beginning of period | | | 11,830,755 | | | | 1,390,040 | |
| End of period (including accumulated net | | | | | | | | |
| investment income of $1,004 and $51,975) | | $ | 17,031,292 | | | $ | 11,830,755 | |
(1) | Net of redemption fees of $60 and $721, respectively. |
See notes to financial statements.
| Intrepid Capital Fund – Investor Class |
Per share data for a share of capital stock outstanding for the entire period and selected information for the period are as follows:
| | | Period | | | | | | | | | | | | | | | | |
| | | Ended | | | Year Ended September 30, | |
| | | March 31, | | | | | | | | | | | | | | | | |
| | | 2017 | | | 2016 | | | 2015 | | | 2014 | | | 2013 | | | 2012 | |
| | | (Unaudited) | | | | | | | | | | | | | | | | |
| NET ASSET VALUE: | | | | | | | | | | | | | | | | | | |
| Beginning of period | | $ | 11.62 | | | $ | 10.56 | | | $ | 12.69 | | | $ | 12.23 | | | $ | 11.69 | | | $ | 10.70 | |
| OPERATIONS: | | | | | | | | | | | | | | | | | | | | | | | | |
Net investment income(1) | | | 0.07 | | | | 0.26 | | | | 0.18 | | | | 0.12 | | | | 0.18 | | | | 0.18 | |
| Net realized and unrealized | | | | | | | | | | | | | | | | | | | | | | | | |
| gain (loss) on investment | | | | | | | | | | | | | | | | | | | | | | | | |
| securities | | | 0.49 | | | | 1.07 | | | | (1.00 | ) | | | 1.09 | | | | 0.93 | | | | 1.72 | |
Total from operations(2) | | | 0.56 | | | | 1.33 | | | | (0.82 | ) | | | 1.21 | | | | 1.11 | | | | 1.90 | |
| LESS DISTRIBUTIONS: | | | | | | | | | | | | | | | | | | | | | | | | |
| From net investment income | | | (0.15 | ) | | | (0.27 | ) | | | (0.19 | ) | | | (0.12 | ) | | | (0.17 | ) | | | (0.18 | ) |
| From net realized gains | | | (0.24 | ) | | | (0.00 | )(3) | | | (1.12 | ) | | | (0.63 | ) | | | (0.40 | ) | | | (0.73 | ) |
| Total distributions | | | (0.39 | ) | | | (0.27 | ) | | | (1.31 | ) | | | (0.75 | ) | | | (0.57 | ) | | | (0.91 | ) |
| NET ASSET VALUE: | | | | | | | | | | | | | | | | | | | | | | | | |
| End of period | | $ | 11.79 | | | $ | 11.62 | | | $ | 10.56 | | | $ | 12.69 | | | $ | 12.23 | | | $ | 11.69 | |
| Total return | | | 4.94 | %(4) | | | 12.87 | % | | | (7.17 | )% | | | 10.23 | % | | | 9.89 | % | | | 18.63 | % |
| Net assets at end of | | | | | | | | | | | | | | | | | | | | | | | | |
| period (000s omitted) | | $ | 109,746 | | | $ | 110,395 | | | $ | 149,504 | | | $ | 238,691 | | | $ | 228,500 | | | $ | 288,462 | |
| RATIO OF EXPENSES TO | | | | | | | | | | | | | | | | | | | | | | | | |
| AVERAGE NET ASSETS: | | | | | | | | | | | | | | | | | | | | | | | | |
| Before expense | | | | | | | | | | | | | | | | | | | | | | | | |
| reimbursement/recoupment | | | 1.43 | %(5) | | | 1.45 | % | | | 1.42 | % | | | 1.41 | % | | | 1.42 | % | | | 1.44 | % |
| After expense | | | | | | | | | | | | | | | | | | | | | | | | |
| reimbursement/recoupment | | | 1.40 | %(5) | | | 1.40 | % | | | 1.40 | % | | | 1.40 | % | | | 1.40 | % | | | 1.40 | % |
| RATIO OF NET INVESTMENT | | | | | | | | | | | | | | | | | | | | | | | | |
| INCOME TO AVERAGE NET ASSETS: | | | | | | | | | | | | | | | | | | | | | | | | |
| Before expense | | | | | | | | | | | | | | | | | | | | | | | | |
| reimbursement/recoupment | | | 1.14 | %(5) | | | 1.97 | % | | | 1.45 | % | | | 0.97 | % | | | 1.37 | % | | | 1.62 | % |
| After expense | | | | | | | | | | | | | | | | | | | | | | | | |
| reimbursement/recoupment | | | 1.17 | %(5) | | | 2.02 | % | | | 1.47 | % | | | 0.98 | % | | | 1.39 | % | | | 1.66 | % |
| Portfolio turnover rate | | | 17 | %(4) | | | 43 | % | | | 54 | % | | | 73 | % | | | 57 | % | | | 63 | % |
(1) | Net investment income per share is calculated using the ending accumulated net investment income balances prior to consideration or adjustment for permanent book-to-tax differences. |
(2) | Total from investment operations per share includes redemption fees of less than $0.01 per share for the six months ended March 31, 2017 and each of the five years ended September 30, 2016, 2015, 2014, 2013 and 2012. |
(3) | The amount represents less than $0.01 per share. |
(4) | Not annualized. |
(5) | Annualized. |
See notes to financial statements.
| Intrepid Capital Fund – Institutional Class |
| |
| FINANCIAL HIGHLIGHTS (continued) |
Per share data for a share of capital stock outstanding for the entire period and selected information for the period are as follows:
| | | Period | | | | | | | | | | | | | | | | |
| | | Ended | | | Year Ended September 30, | |
| | | March 31, | | | | | | | | | | | | | | | | |
| | | 2017 | | | 2016 | | | 2015 | | | 2014 | | | 2013 | | | 2012 | |
| | | (Unaudited) | | | | | | | | | | | | | | | | |
| NET ASSET VALUE: | | | | | | | | | | | | | | | | | | |
| Beginning of period | | $ | 11.62 | | | $ | 10.56 | | | $ | 12.69 | | | $ | 12.24 | | | $ | 11.70 | | | $ | 10.70 | |
| OPERATIONS: | | | | | | | | | | | | | | | | | | | | | | | | |
Net investment income(1) | | | 0.09 | | | | 0.24 | | | | 0.22 | | | | 0.15 | | | | 0.19 | | | | 0.21 | |
| Net realized and unrealized | | | | | | | | | | | | | | | | | | | | | | | | |
| gain (loss) on investment | | | | | | | | | | | | | | | | | | | | | | | | |
| securities | | | 0.49 | | | | 1.12 | | | | (1.00 | ) | | | 1.08 | | | | 0.95 | | | | 1.73 | |
Total from operations(2) | | | 0.58 | | | | 1.36 | | | | (0.78 | ) | | | 1.23 | | | | 1.14 | | | | 1.94 | |
| LESS DISTRIBUTIONS: | | | | | | | | | | | | | | | | | | | | | | | | |
| From net investment income | | | (0.17 | ) | | | (0.30 | ) | | | (0.23 | ) | | | (0.15 | ) | | | (0.20 | ) | | | (0.21 | ) |
| From net realized gains | | | (0.24 | ) | | | (0.00 | )(3) | | | (1.12 | ) | | | (0.63 | ) | | | (0.40 | ) | | | (0.73 | ) |
| Total distributions | | | (0.41 | ) | | | (0.30 | ) | | | (1.35 | ) | | | (0.78 | ) | | | (0.60 | ) | | | (0.94 | ) |
| NET ASSET VALUE: | | | | | | | | | | | | | | | | | | | | | | | | |
| End of period | | $ | 11.79 | | | $ | 11.62 | | | $ | 10.56 | | | $ | 12.69 | | | $ | 12.24 | | | $ | 11.70 | |
| Total return | | | 5.07 | %(4) | | | 13.16 | % | | | (6.92 | )% | | | 10.41 | % | | | 10.18 | % | | | 19.02 | % |
| Net assets at end of | | | | | | | | | | | | | | | | | | | | | | | | |
| period (000s omitted) | | $ | 307,815 | | | $ | 275,694 | | | $ | 182,274 | | | $ | 233,759 | | | $ | 189,630 | | | $ | 100,501 | |
| RATIO OF EXPENSES TO | | | | | | | | | | | | | | | | | | | | | | | | |
| AVERAGE NET ASSETS: | | | | | | | | | | | | | | | | | | | | | | | | |
| Before expense | | | | | | | | | | | | | | | | | | | | | | | | |
| reimbursement/recoupment | | | 1.18 | %(5) | | | 1.20 | % | | | 1.17 | % | | | 1.16 | % | | | 1.17 | % | | | 1.19 | % |
| After expense | | | | | | | | | | | | | | | | | | | | | | | | |
| reimbursement/recoupment | | | 1.15 | %(5) | | | 1.15 | % | | | 1.15 | % | | | 1.15 | % | | | 1.15 | % | | | 1.15 | % |
| RATIO OF NET INVESTMENT | | | | | | | | | | | | | | | | | | | | | | | | |
| INCOME TO AVERAGE NET ASSETS: | | | | | | | | | | | | | | | | | | | | | | | | |
| Before expense | | | | | | | | | | | | | | | | | | | | | | | | |
| reimbursement/recoupment | | | 1.40 | %(5) | | | 2.13 | % | | | 1.72 | % | | | 1.23 | % | | | 1.67 | % | | | 1.85 | % |
| After expense | | | | | | | | | | | | | | | | | | | | | | | | |
| reimbursement/recoupment | | | 1.43 | %(5) | | | 2.18 | % | | | 1.74 | % | | | 1.24 | % | | | 1.69 | % | | | 1.89 | % |
| Portfolio turnover rate | | | 17 | %(4) | | | 43 | % | | | 54 | % | | | 73 | % | | | 57 | % | | | 63 | % |
(1) | Net investment income per share is calculated using the ending accumulated net investment income balances prior to consideration or adjustment for permanent book-to-tax differences. |
(2) | Total from investment operations per share includes redemption fees of less than $0.01 per share for the six months ended March 31, 2017 and each of the five years ended September 30, 2016, 2015, 2014, 2013 and 2012. |
(3) | The amount represents less than $0.01 per share. |
(4) | Not annualized. |
(5) | Annualized. |
See notes to financial statements.
| Intrepid Endurance Fund – Investor Class |
| |
| FINANCIAL HIGHLIGHTS (continued) |
Per share data for a share of capital stock outstanding for the entire period and selected information for the period are as follows:
| | | Period | | | | | | | | | | | | | | | | |
| | | Ended | | | Year Ended September 30, | |
| | | March 31, | | | | | | | | | | | | | | | | |
| | | 2017 | | | 2016 | | | 2015 | | | 2014 | | | 2013 | | | 2012 | |
| | | (Unaudited) | | | | | | | | | | | | | | | | |
| NET ASSET VALUE: | | | | | | | | | | | | | | | | | | |
| Beginning of period | | $ | 14.55 | | | $ | 13.70 | | | $ | 16.18 | | | $ | 15.91 | | | $ | 15.80 | | | $ | 15.26 | |
| OPERATIONS: | | | | | | | | | | | | | | | | | | | | | | | | |
Net investment loss (1) | | | (0.02 | ) | | | (0.05 | ) | | | (0.17 | ) | | | (0.22 | ) | | | (0.12 | ) | | | (0.06 | ) |
| Net realized and unrealized | | | | | | | | | | | | | | | | | | | | | | | | |
| gain (loss) on investment | | | | | | | | | | | | | | | | | | | | | | | | |
| securities | | | (0.04 | ) | | | 1.08 | | | | (0.71 | ) | | | 1.17 | | | | 1.48 | | | | 2.47 | |
Total from operations(2) | | | (0.06 | ) | | | 1.03 | | | | (0.88 | ) | | | 0.95 | | | | 1.36 | | | | 2.41 | |
| LESS DISTRIBUTIONS: | | | | | | | | | | | | | | | | | | | | | | | | |
| From net investment income | | | — | | | | (0.18 | ) | | | — | | | | — | | | | — | | | | — | |
| From net realized gains | | | (0.14 | ) | | | — | | | | (1.60 | ) | | | (0.68 | ) | | | (1.25 | ) | | | (1.87 | ) |
| Total distributions | | | (0.14 | ) | | | (0.18 | ) | | | (1.60 | ) | | | (0.68 | ) | | | (1.25 | ) | | | (1.87 | ) |
| NET ASSET VALUE: | | | | | | | | | | | | | | | | | | | | | | | | |
| End of period | | $ | 14.35 | | | $ | 14.55 | | | $ | 13.70 | | | $ | 16.18 | | | $ | 15.91 | | | $ | 15.80 | |
| Total return | | | (0.40 | )%(3) | | | 7.63 | % | | | (6.03 | )% | | | 6.08 | % | | | 9.25 | % | | | 16.76 | % |
| Net assets at end of | | | | | | | | | | | | | | | | | | | | | | | | |
| period (000s omitted) | | $ | 158,814 | | | $ | 181,001 | | | $ | 216,933 | | | $ | 421,714 | | | $ | 566,624 | | | $ | 699,196 | |
| RATIO OF EXPENSES TO | | | | | | | | | | | | | | | | | | | | | | | | |
| AVERAGE NET ASSETS: | | | | | | | | | | | | | | | | | | | | | | | | |
| Before expense | | | | | | | | | | | | | | | | | | | | | | | | |
| reimbursement/recoupment | | | 1.47 | %(4) | | | 1.46 | % | | | 1.42 | % | | | 1.40 | % | | | 1.42 | % | | | 1.44 | % |
| After expense | | | | | | | | | | | | | | | | | | | | | | | | |
| reimbursement/recoupment | | | 1.40 | %(4) | | | 1.40 | % | | | 1.40 | % | | | 1.40 | % | | | 1.40 | % | | | 1.40 | % |
| RATIO OF NET INVESTMENT | | | | | | | | | | | | | | | | | | | | | | | | |
| LOSS TO AVERAGE NET ASSETS: | | | | | | | | | | | | | | | | | | | | | | | | |
| Before expense | | | | | | | | | | | | | | | | | | | | | | | | |
| reimbursement/recoupment | | | (0.22 | )%(4) | | | (0.34 | )% | | | (0.67 | )% | | | (1.11 | )% | | | (0.72 | )% | | | (0.44 | )% |
| After expense | | | | | | | | | | | | | | | | | | | | | | | | |
| reimbursement/recoupment | | | (0.15 | )%(4) | | | (0.28 | )% | | | (0.65 | )% | | | (1.11 | )% | | | (0.70 | )% | | | (0.40 | )% |
| Portfolio turnover rate | | | 32 | %(3) | | | 40 | % | | | 75 | % | | | 38 | % | | | 30 | % | | | 68 | % |
(1) | Net investment loss per share is calculated using the ending accumulated net investment loss balances prior to consideration or adjustment for permanent book-to-tax differences. |
(2) | Total from investment operations per share includes redemption fees of less than $0.01 per share for the six months ended March 31, 2017 and each of the five years ended September 30, 2016, 2015, 2014, 2013 and 2012. |
(3) | Not annualized. |
(4) | Annualized. |
See notes to financial statements.
| Intrepid Endurance Fund – Institutional Class |
| |
| FINANCIAL HIGHLIGHTS (continued) |
Per share data for a share of capital stock outstanding for the entire period and selected information for the period are as follows:
| | | Period Ended | | | Year Ended September 30, | |
| | | March 31, | | | | | | | | | | | | | | | | |
| | | 2017 | | | 2016 | | | 2015 | | | 2014 | | | 2013 | | | 2012 | |
| | | (Unaudited) | | | | | | | | | | | | | | | | |
| NET ASSET VALUE: | | | | | | | | | | | | | | | | | | |
| Beginning of period | | $ | 14.86 | | | $ | 13.97 | | | $ | 16.42 | | | $ | 16.09 | | | $ | 15.93 | | | $ | 15.34 | |
| OPERATIONS: | | | | | | | | | | | | | | | | | | | | | | | | |
| Net investment | | | | | | | | | | | | | | | | | | | | | | | | |
income (loss)(1)(2) | | | 0.02 | | | | (0.00 | )(3) | | | (0.06 | ) | | | (0.16 | ) | | | (0.09 | ) | | | (0.03 | ) |
| Net realized and unrealized | | | | | | | | | | | | | | | | | | | | | | | | |
| gain (loss) on investment | | | | | | | | | | | | | | | | | | | | | | | | |
| securities | | | (0.06 | ) | | | 1.08 | | | | (0.79 | ) | | | 1.17 | | | | 1.50 | | | | 2.49 | |
Total from operations(4) | | | (0.04 | ) | | | 1.08 | | | | (0.85 | ) | | | 1.01 | | | | 1.41 | | | | 2.46 | |
| LESS DISTRIBUTIONS: | | | | | | | | | | | | | | | | | | | | | | | | |
| From net investment income | | | (0.00 | )(3) | | | (0.19 | ) | | | — | | | | — | | | | — | | | | — | |
| From net realized gains | | | (0.14 | ) | | | — | | | | (1.60 | ) | | | (0.68 | ) | | | (1.25 | ) | | | (1.87 | ) |
| Total distributions | | | (0.14 | ) | | | (0.19 | ) | | | (1.60 | ) | | | (0.68 | ) | | | (1.25 | ) | | | (1.87 | ) |
| NET ASSET VALUE: | | | | | | | | | | | | | | | | | | | | | | | | |
| End of period | | $ | 14.68 | | | $ | 14.86 | | | $ | 13.97 | | | $ | 16.42 | | | $ | 16.09 | | | $ | 15.93 | |
| Total return | | | (0.24 | )%(5) | | | 7.85 | % | | | (5.68 | )% | | | 6.39 | % | | | 9.51 | % | | | 17.02 | % |
| Net assets at end of | | | | | | | | | | | | | | | | | | | | | | | | |
| period (000s omitted) | | $ | 68,833 | | | $ | 72,539 | | | $ | 85,350 | | | $ | 238,722 | | | $ | 108,728 | | | $ | 64,581 | |
| RATIO OF EXPENSES TO | | | | | | | | | | | | | | | | | | | | | | | | |
| AVERAGE NET ASSETS: | | | | | | | | | | | | | | | | | | | | | | | | |
| Before expense | | | | | | | | | | | | | | | | | | | | | | | | |
| reimbursement/recoupment | | | 1.22 | %(6) | | | 1.21 | % | | | 1.17 | % | | | 1.15 | % | | | 1.17 | % | | | 1.19 | % |
| After expense | | | | | | | | | | | | | | | | | | | | | | | | |
| reimbursement/recoupment | | | 1.15 | %(6) | | | 1.15 | % | | | 1.15 | % | | | 1.15 | % | | | 1.15 | % | | | 1.15 | % |
| RATIO OF NET INVESTMENT INCOME | | | | | | | | | | | | | | | | | | | | | | | | |
| (LOSS) TO AVERAGE NET ASSETS: | | | | | | | | | | | | | | | | | | | | | | | | |
| Before expense | | | | | | | | | | | | | | | | | | | | | | | | |
| reimbursement/recoupment | | | 0.03 | %(6) | | | (0.09 | )% | | | (0.44 | )% | | | (0.85 | )% | | | (0.47 | )% | | | (0.18 | )% |
| After expense | | | | | | | | | | | | | | | | | | | | | | | | |
| reimbursement/recoupment | | | 0.10 | %(6) | | | (0.03 | )% | | | (0.42 | )% | | | (0.85 | )% | | | (0.45 | )% | | | (0.14 | )% |
| Portfolio turnover rate | | | 32 | %(5) | | | 40 | % | | | 75 | % | | | 38 | % | | | 30 | % | | | 68 | % |
(1) | Net investment income (loss) per share is calculated using the ending accumulated net investment income (loss) balances prior to consideration or adjustment for permanent book-to-tax differences for the six months ended March 31, 2017 and each of the four years ended September 30, 2015, 2014, 2013 and 2012. |
(2) | Net investment loss per share is calculated using the average shares outstanding method for the year ended September 30, 2016. |
(3) | The amount represents less than $0.01 per share. |
(4) | Total from investment operations per share includes redemption fees of less than $0.01 for the six months ended March 31, 2017 and each of the five years ended September 30, 2016, 2015, 2014, 2013 and 2012. |
(5) | Not annualized. |
(6) | Annualized. |
See notes to financial statements.
| |
| FINANCIAL HIGHLIGHTS (continued) |
Per share data for a share of capital stock outstanding for the entire period and selected information for the period are as follows:
| | | Period | | | | | | | | | | | | | | | | |
| | | Ended | | | Year Ended September 30, | |
| | | March 31, | | | | | | | | | | | | | | | | |
| | | 2017 | | | 2016 | | | 2015 | | | 2014 | | | 2013 | | | 2012 | |
| | | (Unaudited) | | | | | | | | | | | | | | | | |
| NET ASSET VALUE: | | | | | | | | | | | | | | | | | | |
| Beginning of period | | $ | 9.29 | | | $ | 9.02 | | | $ | 9.65 | | | $ | 9.66 | | | $ | 9.80 | | | $ | 9.63 | |
| OPERATIONS: | | | | | | | | | | | | | | | | | | | | | | | | |
Net investment income(1) | | | 0.13 | | | | 0.28 | | | | 0.30 | | | | 0.28 | | | | 0.30 | | | | 0.47 | |
| Net realized and unrealized | | | | | | | | | | | | | | | | | | | | | | | | |
| gain (loss) on investment | | | | | | | | | | | | | | | | | | | | | | | | |
| securities | | | (0.01 | ) | | | 0.31 | | | | (0.56 | ) | | | 0.04 | | | | (0.01 | ) | | | 0.30 | |
Total from operations(2) | | | 0.12 | | | | 0.59 | | | | (0.26 | ) | | | 0.32 | | | | 0.29 | | | | 0.77 | |
| LESS DISTRIBUTIONS: | | | | | | | | | | | | | | | | | | | | | | | | |
| From net investment income | | | (0.13 | ) | | | (0.32 | ) | | | (0.30 | ) | | | (0.28 | ) | | | (0.33 | ) | | | (0.45 | ) |
| From net realized gains | | | — | | | | — | | | | (0.07 | ) | | | (0.05 | ) | | | (0.10 | ) | | | (0.15 | ) |
| Total distributions | | | (0.13 | ) | | | (0.32 | ) | | | (0.37 | ) | | | (0.33 | ) | | | (0.43 | ) | | | (0.60 | ) |
| NET ASSET VALUE: | | | | | | | | | | | | | | | | | | | | | | | | |
| End of period | | $ | 9.28 | | | $ | 9.29 | | | $ | 9.02 | | | $ | 9.65 | | | $ | 9.66 | | | $ | 9.80 | |
| Total return | | | 1.32 | %(5) | | | 6.76 | % | | | (2.76 | )% | | | 3.38 | % | | | 3.03 | % | | | 8.17 | % |
| Net assets at end of | | | | | | | | | | | | | | | | | | | | | | | | |
| period (000s omitted) | | $ | 81,302 | | | $ | 79,760 | | | $ | 84,988 | | | $ | 106,360 | | | $ | 74,828 | | | $ | 63,085 | |
| RATIO OF EXPENSES TO | | | | | | | | | | | | | | | | | | | | | | | | |
| AVERAGE NET ASSETS: | | | | | | | | | | | | | | | | | | | | | | | | |
| Before expense | | | | | | | | | | | | | | | | | | | | | | | | |
| reimbursement/recoupment | | | 1.01 | %(6) | | | 1.01 | % | | | 0.96 | % | | | 0.95 | %(3) | | | 0.98 | % | | | 1.01 | % |
| After expense | | | | | | | | | | | | | | | | | | | | | | | | |
| reimbursement/recoupment | | | 0.90 | %(6) | | | 0.90 | % | | | 0.90 | % | | | 0.90 | %(3) | | | 0.90 | % | | | 0.90 | % |
| RATIO OF NET INVESTMENT | | | | | | | | | | | | | | | | | | | | | | | | |
| INCOME TO AVERAGE NET ASSETS: | | | | | | | | | | | | | | | | | | | | | | | | |
| Before expense | | | | | | | | | | | | | | | | | | | | | | | | |
| reimbursement/recoupment | | | 2.73 | %(6) | | | 2.97 | % | | | 3.05 | % | | | 2.85 | %(4) | | | 2.96 | % | | | 4.56 | % |
| After expense | | | | | | | | | | | | | | | | | | | | | | | | |
| reimbursement/recoupment | | | 2.84 | %(6) | | | 3.08 | % | | | 3.11 | % | | | 2.90 | %(4) | | | 3.04 | % | | | 4.67 | % |
| Portfolio turnover rate | | | 23 | %(5) | | | 52 | % | | | 51 | % | | | 53 | % | | | 78 | % | | | 54 | % |
(1) | Net investment income per share is calculated using the ending accumulated net investment income balances prior to consideration or adjustment for permanent book-to-tax differences. |
(2) | Total from investment operations per share includes redemption fees of less than $0.01 per share for the six months ended March 31, 2017 and the two years ended September 30, 2014 and 2013. |
(3) | Excludes expenses related to the Investor Class that was merged into the Institutional Class on January 31, 2014. With the inclusion of these expenses, the ratio would have been 0.98% and 0.93%, respectively. |
(4) | Excludes income and expenses related to the Investor Class that was merged into the Institutional Class on January 31, 2014. With the inclusion of these expenses, the ratio would have been 2.83% and 2.88%, respectively. |
(5) | Not annualized. |
(6) | Annualized. |
See notes to financial statements.
| Intrepid Disciplined Value Fund |
| |
| FINANCIAL HIGHLIGHTS (continued) |
Per share data for a share of capital stock outstanding for the entire period and selected information for the period are as follows:
| | | Period | | | | | | | | | | | | | | | | |
| | | Ended | | | Year Ended September 30, | |
| | | March 31, | | | | | | | | | | | | | | | | |
| | | 2017 | | | 2016 | | | 2015 | | | 2014 | | | 2013 | | | 2012 | |
| | | (Unaudited) | | | | | | | | | | | | | | | | |
| NET ASSET VALUE: | | | | | | | | | | | | | | | | | | |
| Beginning of period | | $ | 10.62 | | | $ | 9.98 | | | $ | 11.22 | | | $ | 11.11 | | | $ | 10.48 | | | $ | 9.23 | |
| OPERATIONS: | | | | | | | | | | | | | | | | | | | | | | | | |
| Net investment | | | | | | | | | | | | | | | | | | | | | | | | |
income (loss)(1) | | | (0.01 | ) | | | 0.07 | | | | (0.01 | ) | | | (0.06 | ) | | | 0.03 | | | | 0.01 | |
| Net realized and unrealized | | | | | | | | | | | | | | | | | | | | | | | | |
| gain (loss) on investment | | | | | | | | | | | | | | | | | | | | | | | | |
| securities | | | 0.53 | | | | 1.07 | | | | (0.31 | ) | | | 1.08 | | | | 1.36 | | | | 1.87 | |
Total from operations(2) | | | 0.52 | | | | 1.14 | | | | (0.32 | ) | | | 1.02 | | | | 1.39 | | | | 1.88 | |
| LESS DISTRIBUTIONS: | | | | | | | | | | | | | | | | | | | | | | | | |
| From net investment income | | | (0.06 | ) | | | (0.04 | ) | | | — | | | | — | | | | (0.07 | ) | | | (0.02 | ) |
| From net realized gains | | | (0.37 | ) | | | (0.46 | ) | | | (0.92 | ) | | | (0.91 | ) | | | (0.69 | ) | | | (0.61 | ) |
| Total distributions | | | (0.43 | ) | | | (0.50 | ) | | | (0.92 | ) | | | (0.91 | ) | | | (0.76 | ) | | | (0.63 | ) |
| NET ASSET VALUE: | | | | | | | | | | | | | | | | | | | | | | | | |
| End of period | | $ | 10.71 | | | $ | 10.62 | | | $ | 9.98 | | | $ | 11.22 | | | $ | 11.11 | | | $ | 10.48 | |
| Total return | | | 5.03 | %(3) | | | 11.91 | % | | | (3.32 | )% | | | 9.69 | % | | | 14.27 | % | | | 21.07 | % |
| Net assets at end of | | | | | | | | | | | | | | | | | | | | | | | | |
| period (000s omitted) | | $ | 50,025 | | | $ | 47,991 | | | $ | 44,930 | | | $ | 46,137 | | | $ | 41,374 | | | $ | 46,975 | |
| RATIO OF EXPENSES | | | | | | | | | | | | | | | | | | | | | | | | |
| TO AVERAGE NET ASSETS: | | | | | | | | | | | | | | | | | | | | | | | | |
| Before expense | | | | | | | | | | | | | | | | | | | | | | | | |
| reimbursement/recoupment | | | 1.38 | %(4) | | | 1.34 | % | | | 1.31 | % | | | 1.57 | % | | | 1.59 | % | | | 1.60 | % |
| After expense | | | | | | | | | | | | | | | | | | | | | | | | |
| reimbursement/recoupment | | | 1.30 | %(4) | | | 1.30 | % | | | 1.30 | % | | | 1.33 | % | | | 1.40 | % | | | 1.40 | % |
| RATIO OF NET INVESTMENT | | | | | | | | | | | | | | | | | | | | | | | | |
| INCOME (LOSS) TO | | | | | | | | | | | | | | | | | | | | | | | | |
| AVERAGE NET ASSETS: | | | | | | | | | | | | | | | | | | | | | | | | |
| Before expense | | | | | | | | | | | | | | | | | | | | | | | | |
| reimbursement/recoupment | | | (0.31 | )%(4) | | | 0.62 | % | | | (0.14 | )% | | | (0.78 | )% | | | 0.03 | % | | | (0.16 | )% |
| After expense | | | | | | | | | | | | | | | | | | | | | | | | |
| reimbursement/recoupment | | | (0.23 | )%(4) | | | 0.66 | % | | | (0.13 | )% | | | (0.54 | )% | | | 0.22 | % | | | 0.04 | % |
| Portfolio turnover rate | | | 4 | %(3) | | | 32 | % | | | 71 | % | | | 66 | % | | | 30 | % | | | 71 | % |
(1) | Net investment income (loss) per share is calculated using the ending accumulated net investment income (loss) balances prior to consideration or adjustment for permanent book-to-tax differences. |
(2) | Total from investment operations per share includes redemption fees of less than $0.01 per share for the six months ended March 31, 2017 and each of the three years ended September 30, 2016, 2014, and 2012. |
(3) | Not annualized. |
(4) | Annualized. |
See notes to financial statements.
| Intrepid International Fund |
| |
| FINANCIAL HIGHLIGHTS (continued) |
Per share data for a share of capital stock outstanding for the entire period and selected information for the period are as follows:
| | | | | | | | | December 30, 2014(1) | |
| | | Period Ended | | | Year Ended | | | through | |
| | | March 31, 2017 | | | September 30, 2016 | | | September 30, 2015 | |
| NET ASSET VALUE: | | | | | | | | | |
| Beginning of period | | $ | 10.16 | | | $ | 9.95 | | | $ | 10.00 | |
| | | | | | | | | | | | | |
| OPERATIONS: | | | | | | | | | | | | |
Net investment income(2) | | | 0.06 | | | | 0.51 | | | | 0.06 | |
| Net realized and unrealized gain | | | | | | | | | | | | |
| (loss) on investment securities | | | (0.03 | ) | | | 0.60 | | | | (0.11 | ) |
Total from operations(3) | | | 0.03 | | | | 1.11 | | | | (0.05 | ) |
| | | | | | | | | | | | | |
| LESS DISTRIBUTIONS: | | | | | | | | | | | | |
| From net investment income | | | (0.37 | ) | | | (0.72 | ) | | | — | |
| From net realized gains | | | (0.07 | ) | | | (0.18 | ) | | | — | |
| Total distributions | | | (0.44 | ) | | | (0.90 | ) | | | — | |
| | | | | | | | | | | | | |
| NET ASSET VALUE: | | | | | | | | | | | | |
| End of period | | $ | 9.75 | | | $ | 10.16 | | | $ | 9.95 | |
| Total return | | | 0.36 | %(4) | | | 12.67 | % | | | (0.50 | )%(4) |
| Net assets at end of period | | | | | | | | | | | | |
| (000s omitted) | | $ | 20,074 | | | $ | 17,048 | | | $ | 7,573 | |
| | | | | | | | | | | | | |
| RATIO OF EXPENSES | | | | | | | | | | | | |
| TO AVERAGE NET ASSETS: | | | | | | | | | | | | |
| Before expense | | | | | | | | | | | | |
| reimbursement/recoupment | | | 2.07 | %(5) | | | 2.50 | % | | | 4.07 | %(5) |
| After expense | | | | | | | | | | | | |
| reimbursement/recoupment | | | 1.40 | %(5) | | | 1.40 | % | | | 1.40 | %(5) |
| | | | | | | | | | | | | |
| RATIO OF NET INVESTMENT | | | | | | | | | | | | |
| INCOME (LOSS) TO | | | | | | | | | | | | |
| AVERAGE NET ASSETS: | | | | | | | | | | | | |
| Before expense | | | | | | | | | | | | |
| reimbursement/recoupment | | | (0.13 | )%(5) | | | 3.46 | % | | | (1.47 | )%(5) |
| After expense | | | | | | | | | | | | |
| reimbursement/recoupment | | | 0.54 | %(5) | | | 4.56 | % | | | 1.20 | %(5) |
| Portfolio turnover rate | | | 26 | %(4) | | | 33 | % | | | 32 | %(4) |
(1) | Commencement of Operations. |
(2) | Net investment income per share is calculated using the ending accumulated net investment income balances prior to consideration or adjustment for permanent book-to-tax differences. |
(3) | Total from investment operations per share includes redemption fees of less than $0.01 per share for the six months ended March 31, 2017 and the year ended September 30, 2016. |
(4) | Not annualized. |
(5) | Annualized. |
See notes to financial statements.
| |
| FINANCIAL HIGHLIGHTS (continued) |
Per share data for a share of capital stock outstanding for the entire period and selected information for the period are as follows:
| | | | | | | | | July 31, 2015(1) | |
| | | Period Ended | | | Year Ended | | | through | |
| | | March 31, 2017 | | | September 30, 2016 | | | September 30, 2015 | |
| NET ASSET VALUE: | | | | | | | | | |
| Beginning of period | | $ | 11.43 | | | $ | 9.17 | | | $ | 10.00 | |
| | | | | | | | | | | | | |
| OPERATIONS: | | | | | | | | | | | | |
Net investment income(2) | | | 0.06 | | | | 0.08 | | | | 0.02 | |
| Net realized and unrealized gain | | | | | | | | | | | | |
| (loss) on investment securities | | | 0.34 | | | | 2.20 | | | | (0.85 | ) |
Total from operations(3) | | | 0.40 | | | | 2.28 | | | | (0.83 | ) |
| | | | | | | | | | | | | |
| LESS DISTRIBUTIONS: | | | | | | | | | | | | |
| From net investment income | | | (0.11 | ) | | | (0.02 | ) | | | — | |
| From net realized gains | | | (0.73 | ) | | | — | | | | — | |
| Total distributions | | | (0.84 | ) | | | (0.02 | ) | | | — | |
| | | | | | | | | | | | | |
| NET ASSET VALUE: | | | | | | | | | | | | |
| End of period | | $ | 10.99 | | | $ | 11.43 | | | $ | 9.17 | |
| Total return | | | 3.76 | %(4) | | | 24.89 | % | | | (8.30 | )%(4) |
| Net assets at end of period | | | | | | | | | | | | |
| (000s omitted) | | $ | 17,031 | | | $ | 11,831 | | | $ | 1,390 | |
| | | | | | | | | | | | | |
| RATIO OF EXPENSES | | | | | | | | | | | | |
| TO AVERAGE NET ASSETS: | | | | | | | | | | | | |
| Before expense | | | | | | | | | | | | |
| reimbursement/recoupment | | | 1.91 | %(5) | | | 3.02 | % | | | 21.45 | %(5) |
| After expense | | | | | | | | | | | | |
| reimbursement/recoupment | | | 1.40 | %(5) | | | 1.40 | % | | | 1.40 | %(5) |
| | | | | | | | | | | | | |
| RATIO OF NET INVESTMENT | | | | | | | | | | | | |
| INCOME (LOSS) TO | | | | | | | | | | | | |
| AVERAGE NET ASSETS: | | | | | | | | | | | | |
| Before expense | | | | | | | | | | | | |
| reimbursement/recoupment | | | 0.56 | %(5) | | | (0.30 | )% | | | (18.42 | )%(5) |
| After expense | | | | | | | | | | | | |
| reimbursement/recoupment | | | 1.07 | %(5) | | | 1.32 | % | | | 1.63 | %(5) |
| Portfolio turnover rate | | | 9 | %(4) | | | 64 | % | | | 1 | %(4) |
(1) | Commencement of Operations. |
(2) | Net investment income per share is calculated using the ending accumulated net investment income balances prior to consideration or adjustment for permanent book-to-tax differences. |
(3) | Total from investment operations per share includes redemption fees of less than $0.01 per share for the six months ended March 31, 2017 and the year ended September 30, 2016. |
(4) | Not annualized. |
(5) | Annualized. |
See notes to financial statements.
| NOTES TO FINANCIAL STATEMENTS |
| March 31, 2017 (Unaudited) |
Intrepid Capital Management Funds Trust (the “Trust”) was organized as a Delaware Statutory Trust on August 27, 2004 and is registered under the Investment Company Act of 1940, as amended (the “1940 Act”), as an open-end management investment company issuing shares in series, each series representing a distinct portfolio with its own investment objectives and policies. At March 31, 2017, the Trust consisted of six series (the “Funds”): Intrepid Capital Fund, Intrepid Endurance Fund, Intrepid Income Fund, Intrepid Disciplined Value Fund, Intrepid International Fund and Intrepid Select Fund. The Intrepid Capital Fund’s Investor Class commenced operations on January 3, 2005, the Intrepid Capital Fund’s Institutional Class commenced operations on April 30, 2010, the Intrepid Endurance Fund’s Investor Class commenced operations on October 3, 2005, the Intrepid Endurance Fund’s Institutional Class commenced operations on November 3, 2009, the Intrepid Income Fund’s Investor Class commenced operations on July 2, 2009 and ceased operations on January 31, 2014. Effective as of the close of business on January 31, 2014 all Investor Class shares of the Intrepid Income Fund were converted into Institutional Class shares. The Intrepid Income Fund’s Institutional Class commenced operations on August 16, 2010, the Intrepid Disciplined Value Fund’s Investor Class commenced operations on October 31, 2007, the Intrepid International Fund’s Investor Class commenced operations on December 30, 2014, and the Intrepid Select Fund’s Investor Class commenced operations on July 31, 2015. The Intrepid Disciplined Value Fund’s, the Intrepid International Fund’s, and the Intrepid Select Fund’s Institutional Class are not available for sale.
| 2. | SUMMARY OF SIGNIFICANT ACCOUNTING POLICIES |
The following is a summary of significant accounting policies consistently followed by the Funds in the preparation of their financial statements. These policies are in conformity with accounting principles generally accepted in the United States (“GAAP”). The Funds are investment companies and, accordingly, follow the investment company accounting and reporting guidance of the Financial Accounting Standards Board Accounting Standards Codification Topic 946, Investment Companies.
Valuation of Securities
The Trust has adopted authoritative fair valuation accounting standards which establish an authoritative definition of fair value and set out a hierarchy for measuring fair value. These standards require additional disclosures about the various inputs and valuation techniques used to develop the measurements of fair value and a discussion in changes in valuation techniques and related inputs during the period. These inputs are summarized in the three broad levels listed below.
| NOTES TO FINANCIAL STATEMENTS (continued) |
| March 31, 2017 (Unaudited) |
| Level 1 – | Quoted prices in active markets for identical securities. |
| Level 2 – | Other significant observable inputs (including quoted prices for similar securities, interest rates, prepayment speeds, credit risk, etc.). |
| Level 3 – | Significant unobservable inputs (including the Fund’s own assumptions in determining the fair value of investments). |
Equity investments, including common stocks, foreign issued common stocks, exchange-traded funds, closed end mutual funds, real estate investments trusts and certain preferred securities, which are traded on an exchange (other than The NASDAQ OMX Group, Inc., referred to as “NASDAQ”) are valued at the last sale price reported by the exchange on which the securities are primarily traded on the day of valuation. Securities that are traded on NASDAQ under one of its three listing tiers, NASDAQ Global Market, NASDAQ Global Select Market and NASDAQ Capital Market, are valued at the NASDAQ Official Closing Price. If there are no sales on a given day for securities traded on an exchange, the latest bid quotation will be used. If there is no Nasdaq Official Closing Price for a Nasdaq-listed security or sale price available for an over-the-counter security, the latest bid quotations from Nasdaq will be used. When using the market quotations or closing price provided by the pricing service and when the market is considered active, the security will be classified as a Level 1 security. When using the latest bid quotation, the security will be classified as Level 2.
Investment in mutual funds, including money market funds, are generally priced at the ending net asset value (NAV) provided by the service agent of the funds and will be classified as Level 1 securities.
Debt securities, such as corporate bonds, convertible bonds, senior loans, preferred securities and U.S. government agency issues for which market quotations are not readily available may be valued based on information supplied by independent pricing services using matrix pricing formulas and/or independent broker bid quotations. Debt securities with remaining maturities of 60 days or less may be valued on an amortized cost basis to the extent it is equivalent to fair value, which involves valuing an instrument at its cost and thereafter assuming a constant amortization to maturity of any discount or premium, regardless of the impact of fluctuating rates on the fair value of the instrument. Amortized cost will not be used if it does not approximate fair value, due to credit or other impairments of the issuer. These securities will generally be classified as Level 2 securities.
Options can diverge from the prices of their underlying instruments. These are valued at the composite last price reported by the exchange on which the options are primarily traded on the day of the valuation and are classified as Level 1. If there is no composite last price on a given day the latest bid will be used. When using the latest bid quotation, these contracts are classified as Level 2.
| NOTES TO FINANCIAL STATEMENTS (continued) |
| March 31, 2017 (Unaudited) |
Forward currency contracts derive their value from the underlying currency prices. These are valued by a pricing service using pricing models. The models use inputs that are observed from active markets, such as exchange rates. These contracts are classified as Level 2.
Futures contracts are valued at the last sale price at the close of trading on the relevant exchange or board of trade. If there was no sale on the applicable exchange or board of trade on such day, they are valued at the average of the quoted bid and asked prices as of the close of such exchange or board of trade. When using the market quotations and when the market is considered active, the contract will be classified as Level 1.
Any securities or other assets for which market quotations are not readily available are valued at fair value as determined in good faith by the Funds’ adviser pursuant to procedures established under the general supervision and responsibility of the Funds’ Board of Trustees and will be classified as Level 3 assets.
The inputs of methodology used for valuing securities may not be an indication of the risk associated with investing in those securities.
As of March 31, 2017, the Funds’ assets and liabilities carried at fair value were classified as follows:
| Intrepid Capital Fund | | | | | | | | | | | | |
| Description | | Level 1 | | | Level 2 | | | Level 3 | | | Total | |
| Assets | | | | | | | | | | | | |
| Total Common Stocks* | | $ | 232,446,467 | | | $ | — | | | $ | — | | | $ | 232,446,467 | |
| Total Convertible Bonds* | | | — | | | | 4,641,952 | | | | — | | | | 4,641,952 | |
| Total Corporate Bonds* | | | — | | | | 127,118,754 | | | | — | | | | 127,118,754 | |
| Total Money | | | | | | | | | | | | | | | | |
| Market Fund* | | | 9,955,631 | | | | — | | | | — | | | | 9,955,631 | |
| U.S. Treasury Bill | | | — | | | | 34,934,239 | | | | — | | | | 34,934,239 | |
| Total Forward | | | | | | | | | | | | | | | | |
| Currency Contracts | | | — | | | | 945,073 | | | | — | | | | 945,073 | |
| Total Assets | | $ | 242,402,098 | | | $ | 167,640,018 | | | $ | — | | | $ | 410,042,116 | |
| Liabilities | | | | | | | | | | | | | | | | |
| Total Forward | | | | | | | | | | | | | | | | |
| Currency Contracts | | $ | — | | | $ | (294,931 | ) | | $ | — | | | $ | (294,931 | ) |
| Total Liabilities | | $ | — | | | $ | (294,931 | ) | | $ | — | | | $ | (294,931 | ) |
| NOTES TO FINANCIAL STATEMENTS (continued) |
| March 31, 2017 (Unaudited) |
| Intrepid Endurance Fund | | | | | | | | | | | | |
| Description | | Level 1 | | | Level 2 | | | Level 3 | | | Total | |
| Assets | | | | | | | | | | | | |
| Common Stocks | | | | | | | | | | | | |
| Capital Goods | | $ | 264,000 | | | $ | — | | | $ | — | | | $ | 264,000 | |
| Commercial & | | | | | | | | | | | | | | | | |
| Professional Services | | | 1,273,703 | | | | — | | | | — | | | | 1,273,703 | |
| Consumer Durables | | | | | | | | | | | | | | | | |
| & Apparel | | | 4,118 | | | | — | | | | — | | | | 4,118 | |
| Diversified Financials | | | 2,513,570 | | | | — | | | | — | | | | 2,513,570 | |
| Insurance | | | 5,081,614 | | | | — | | | | — | | | | 5,081,614 | |
| Materials | | | 5,060,305 | | | | — | | | | — | | | | 5,060,305 | |
| Media | | | 9,651,107 | | | | 4,143 | | | | — | | | | 9,655,250 | |
| Pharmaceuticals, | | | | | | | | | | | | | | | | |
| Biotechnology & | | | | | | | | | | | | | | | | |
| Life Sciences | | | 221,866 | | | | — | | | | — | | | | 221,866 | |
| Retailing | | | 9,910 | | | | — | | | | — | | | | 9,910 | |
| Software & Services | | | 12,319,714 | | | | — | | | | — | | | | 12,319,714 | |
| Total Common Stocks | | | 36,399,907 | | | | 4,143 | | | | — | | | | 36,404,050 | |
| Total Exchange- | | | | | | | | | | | | | | | | |
| Traded Fund* | | | 4,299,580 | | | | — | | | | — | | | | 4,299,580 | |
| Total Convertible Bonds* | | | — | | | | 5,890,485 | | | | — | | | | 5,890,485 | |
| U.S. Treasury Bills | | | — | | | | 99,946,187 | | | | — | | | | 99,946,187 | |
| Total Forward | | | | | | | | | | | | | | | | |
| Currency Contract | | | — | | | | 193,032 | | | | — | | | | 193,032 | |
| Total Assets | | $ | 40,699,487 | | | $ | 106,033,847 | | | $ | — | | | $ | 146,733,334 | |
| | | | | | | | | | | | | | | | | |
| Intrepid Income Fund | | | | | | | | | | | | | | | | |
| Description | | Level 1 | | | Level 2 | | | Level 3 | | | Total | |
| Assets | | | | | | | | | | | | | | | | |
| Total Common Stocks* | | $ | 2,197,400 | | | $ | — | | | $ | — | | | $ | 2,197,400 | |
| Total Preferred Stock* | | | 312,756 | | | | — | | | | — | | | | 312,756 | |
| Total Convertible Bonds* | | | — | | | | 4,510,457 | | | | — | | | | 4,510,457 | |
| Total Corporate Bonds* | | | — | | | | 60,577,758 | | | | — | | | | 60,577,758 | |
| Total Money | | | | | | | | | | | | | | | | |
| Market Fund* | | | 1,408,512 | | | | — | | | | — | | | | 1,408,512 | |
| U.S. Treasury Bills | | | — | | | | 11,984,159 | | | | — | | | | 11,984,159 | |
| Total Forward | | | | | | | | | | | | | | | | |
| Currency Contract | | | — | | | | 17,191 | | | | — | | | | 17,191 | |
| Total Assets | | $ | 3,918,668 | | | $ | 77,089,565 | | | $ | — | | | $ | 81,008,233 | |
| NOTES TO FINANCIAL STATEMENTS (continued) |
| March 31, 2017 (Unaudited) |
| Intrepid Disciplined Value Fund | | | | | | | | | | | | |
| Description | | Level 1 | | | Level 2 | | | Level 3 | | | Total | |
| Assets | | | | | | | | | | | | |
| Total Common Stocks* | | $ | 23,920,313 | | | $ | — | | | $ | — | | | $ | 23,920,313 | |
| U.S. Treasury Bill | | | — | | | | 4,996,142 | | | | — | | | | 4,996,142 | |
| Total Assets | | $ | 23,920,313 | | | $ | 4,996,142 | | | $ | — | | | $ | 28,916,455 | |
| Liabilities | | | | | | | | | | | | | | | | |
| Total Forward | | | | | | | | | | | | | | | | |
| Currency Contract | | $ | — | | | $ | (30,319 | ) | | $ | — | | | $ | (30,319 | ) |
| Total Liabilities | | $ | — | | | $ | (30,319 | ) | | $ | — | | | $ | (30,319 | ) |
| | | | | | | | | | | | | | | | | |
| Intrepid International Fund | | | | | | | | | | | | | | | | |
| Description | | Level 1 | | | Level 2 | | | Level 3 | | | Total | |
| Assets | | | | | | | | | | | | | | | | |
| Total Common Stocks* | | $ | 13,706,033 | | | $ | — | | | $ | — | | | $ | 13,706,033 | |
| Total Preferred Stock* | | | 962,505 | | | | — | | | | — | | | | 962,505 | |
| Total Convertible Bonds* | | | — | | | | 274,110 | | | | — | | | | 274,110 | |
| U.S. Treasury Bill | | | — | | | | 1,856,152 | | | | — | | | | 1,856,152 | |
| Total Forward | | | | | | | | | | | | | | | | |
| Currency Contracts | | $ | — | | | $ | 50,487 | | | | — | | | $ | 50,487 | |
| Total Assets | | $ | 14,668,538 | | | $ | 2,180,749 | | | $ | — | | | $ | 16,849,287 | |
| Liabilities | | | | | | | | | | | | | | | | |
| Total Forward | | | | | | | | | | | | | | | | |
| Currency Contracts | | $ | — | | | $ | (49,050 | ) | | $ | — | | | $ | (49,050 | ) |
| Total Liabilities | | $ | — | | | $ | (49,050 | ) | | $ | — | | | $ | (49,050 | ) |
| | | | | | | | | | | | | | | | | |
| Intrepid Select Fund | | | | | | | | | | | | | | | | |
| Description | | Level 1 | | | Level 2 | | | Level 3 | | | Total | |
| Assets | | | | | | | | | | | | | | | | |
| Total Common Stocks* | | $ | 13,750,674 | | | $ | — | | | $ | — | | | $ | 13,750,674 | |
| Total Exchange- | | | | | | | | | | | | | | | | |
| Traded Funds* | | | 1,279,565 | | | | — | | | | — | | | | 1,279,565 | |
| Total Convertible Bonds* | | | — | | | | 873,675 | | | | — | | | | 873,675 | |
| Total Forward | | | | | | | | | | | | | | | | |
| Currency Contract | | | — | | | | 15,787 | | | | — | | | | 15,787 | |
| Total Assets | | $ | 15,030,239 | | | $ | 889,462 | | | $ | — | | | $ | 15,919,701 | |
| * | For further information regarding security characteristics, please see the Schedules of Investments. |
| NOTES TO FINANCIAL STATEMENTS (continued) |
| March 31, 2017 (Unaudited) |
Below is a reconciliation that details the transfer of securities between Level 1 and Level 2 during the reporting period:
| | | | Intrepid | | | Intrepid | |
| | | | Endurance | | | International | |
| | | | Fund | | | Fund | |
| | Transfer Into Level 1 | | $ | — | | | $ | 686,055 | |
| | Transfer Out of Level 1 | | | (4,143 | ) | | | — | |
| | Net Transfer Into/(Out of) Level 1 | | | (4,143 | ) | | | 686,055 | |
| | Transfers Into Level 2 | | | 4,143 | | | | — | |
| | Transfers Out of Level 2 | | | — | | | | (686,055 | ) |
| | Net Transfers Into/(Out of) Level 2 | | $ | 4,143 | | | $ | (686,055 | ) |
The movement from Level 1 to Level 2 in the Endurance Fund was from the securities being priced using the bid price due to the lack of trading volume on March 31, 2017.
The movement from Level 2 to Level 1 in the International Fund was due to the use of a closing price provided by the pricing service because the market was considered active.
There were no transfers of securities between Level 1 and Level 2 during the reporting period for the Intrepid Capital Fund, Intrepid Income Fund, Intrepid Disciplined Value Fund or Intrepid Select Fund. The Funds did not hold any investments during the period ended March 31, 2017 with significant unobservable inputs which would be classified as Level 3. Transfers between levels are recognized at the end of the reporting period.
Derivative Instruments and Hedging Activities
The Funds’ adviser may use derivative instruments, such as options, forward currency contracts, and futures contracts, as a means to manage exposure to different types of risk, including market risk and exchange rate risk, and to gain exposure to underlying securities. During the period ended March 31, 2017, the Intrepid Capital Fund, the Intrepid Endurance Fund, the Intrepid Income Fund, the Intrepid Disciplined Value Fund, the Intrepid International Fund and the Intrepid Select Fund held derivative instruments.
Forward Currency Contracts
The Intrepid Capital Fund, the Intrepid Endurance Fund, the Intrepid Income Fund, the Intrepid Disciplined Value Fund, the Intrepid International Fund and the Intrepid Select Fund used forward currency contracts during the period for the purpose of hedging exposures to non-U.S. dollar denominated assets. In general the use of these contracts may reduce the overall risk level in a fund, but may also lower fund performance. The use of these contracts does not create leverage in the Funds, but does expose the Funds to counterparty credit risk. When the contract is closed,
| NOTES TO FINANCIAL STATEMENTS (continued) |
| March 31, 2017 (Unaudited) |
the Fund records a realized gain or loss equal to the difference between the value of the contract at the time it was opened and the value at the time it was closed.
Effect of Forward Currency Contracts on the Statement of Operations as of March 31, 2017
| | | Change in unrealized | | Realized gain |
| | | appreciation (depreciation) | | on forward |
| | | on forward currency contracts | | currency contracts |
| | Intrepid Capital Fund | | $ | (1,289,937 | ) | | | $ | 2,746,680 | |
| | Intrepid Endurance Fund | | $ | (58,723 | ) | | | $ | 236,521 | |
| | Intrepid Income Fund | | $ | 4,713 | | | | $ | 8,144 | |
| | Intrepid Disciplined Value Fund | | $ | (16,490 | ) | | | $ | 53,153 | |
| | Intrepid International Fund | | $ | 29,766 | | | | $ | 395,809 | |
| | Intrepid Select Fund | | $ | (656 | ) | | | $ | 13,813 | |
The average monthly notional amounts of forward currency contracts during the period ended March 31, 2017 were as follows:
| | | | | | | | | | | | | Intrepid | |
| | | | Intrepid | | | Intrepid | | | Intrepid | | | Disciplined | |
| | Long Positions | | Capital Fund | | | Endurance Fund | | | Income Fund | | | Value Fund | |
| | Forward currency | | | | | | | | | | | | |
| | contracts | | $ | 3,630,405 | | | $ | — | | | $ | — | | | $ | — | |
| | | | | | | | | | | | | | | | | |
| | | | | | | | | | | | | | | | Intrepid | |
| | | | Intrepid | | | Intrepid | | | Intrepid | | | Disciplined | |
| | Short Positions | | Capital Fund | | | Endurance Fund | | | Income Fund | | | Value Fund | |
| | Forward currency | | | | | | | | | | | | | | | | |
| | contract | | $ | 57,267,987 | | | $ | 12,617,431 | | | $ | 1,380,942 | | | $ | 2,393,230 | |
| | | | | | | | | | | | | | | | | |
| | | | Intrepid | | | | | | | | | | | | | |
| | | | International | | | Intrepid | | | | | | | | | |
| | Long Positions | | Fund | | | Select Fund | | | | | | | | | |
| | Forward currency | | | | | | | | | | | | | | | | |
| | contracts | | $ | 696,909 | | | $ | — | | | | | | | | | |
| | | | | | | | | | | | | | | | | |
| | | | Intrepid | | | | | | | | | | | | | |
| | | | International | | | Intrepid | | | | | | | | | |
| | Short Positions | | Fund | | | Select Fund | | | | | | | | | |
| | Forward currency | | | | | | | | | | | | | | | | |
| | contract | | $ | 13,048,120 | | | $ | 1,768,510 | | | | | | | | | |
Long position forward currency contracts are received and settled in foreign currency. Short position forward currency contracts are received and settled in U.S. dollar.
| NOTES TO FINANCIAL STATEMENTS (continued) |
| March 31, 2017 (Unaudited) |
Offsetting on the Statement of Assets and Liabilities
For financial reporting purposes, the Fund offsets financial assets and financial liabilities that are subject to master netting arrangements or similar agreements within appreciation on forward currency contracts and depreciation on forward currency contracts on the Statements of Assets and Liabilities.
At March 31, 2017, the amount of derivative assets and liabilities by type that are subject to offsetting of the Intrepid Capital Fund and Intrepid International Fund are as follows:
Forward Currency Contracts*
| | | | | | | | | | | | | | Gross Amounts not | | | | |
| | | | | | | | | | | | | | Offset in the Statements | | | | |
| | | | | | | | | | | | | | of Assets and Liabilities | | | | |
| | | | | | | | | | | | | | | | | | | | | |
| | | | | | | | | | | Net | | | | | | | | | | |
| | | | | | | | Gross | | | Amounts | | | | | | | | | | |
| | | | | | | | Amounts | | | of Assets | | | | | | | | | | |
| | | | | Gross | | | Offset | | | Presented | | | | | | | | | | |
| | | | | Amounts | | | in the | | | in the | | | | | | | | | | |
| | | | | of | | | Statements | | | Statements | | | | | | Collateral | | | | |
| | | | | Recognized | | | of Assets & | | | of Assets & | | | Financial | | | Amounts | | | Net | |
| | | | | Assets | | | Liabilities | | | Liabilities | | | Instruments | | | Received | | | Amount | |
| Intrepid Capital Fund | | | $ | 945,073 | | | $ | (294,931 | ) | | $ | 650,142 | | | $ | — | | | $ | — | | | $ | 650,142 | |
| Intrepid | | | | | | | | | | | | | | | | | | | | | | | | | |
| International Fund | | | $ | 50,487 | | | $ | (49,050 | ) | | $ | 1,437 | | | $ | — | | | $ | — | | | $ | 1,437 | |
| | | | | | | | | | | | | | | | | | | | | | |
| | | | | | | | | | | | | | | | | Gross Amounts not | | | | | |
| | | | | | | | | | | | | | | | | Offset in the Statements | | | | | |
| | | | | | | | | | | | | | | | | of Assets and Liabilities | | | | | |
| | | | | | | | | | | | | Net | | | | | | | | | | | | | |
| | | | | | | | | Gross | | | Amounts of | | | | | | | | | | | | | |
| | | | | | | | | Amounts | | | Liabilities | | | | | | | | | | | | | |
| | | | | Gross | | | Offset | | | Presented | | | | | | | | | | | | | |
| | | | | Amounts | | | in the | | | in the | | | | | | | | | | | | | |
| | | | | of | | | Statements | | | Statements | | | | | | | Collateral | | | | | |
| | | | | Recognized | | | of Assets & | | | of Assets & | | | Financial | | | Amounts | | | Net | |
| | | | | Liabilities | | | Liabilities | | | Liabilities | | | Instruments | | | Pledged | | | Amount | |
| Intrepid Capital Fund | | | $ | 294,931 | | | $ | (294,931 | ) | | $ | — | | | $ | — | | | $ | — | | | $ | — | |
| Intrepid | | | | | | | | | | | | | | | | | | | | | | | | | |
| International Fund | | | $ | 49,050 | | | $ | (49,050 | ) | | $ | — | | | $ | — | | | $ | — | | | $ | — | |
| * | The respective counterparties for each contract are disclosed in the Open Forward Currency Contracts detail within the Schedule of Investments. |
As of March 31, 2017, the Intrepid Endurance Fund, the Intrepid Income Fund, the Intrepid Disciplined Value Fund and the Intrepid Select Fund each had one open forward currency contract. Each contract is presented gross on the Statement of Assets and Liabilities.
| NOTES TO FINANCIAL STATEMENTS (continued) |
| March 31, 2017 (Unaudited) |
Derivative Risk
The risks of using the types of derivatives in which the Funds may engage include the risk that movements in the value of the derivative may not fully offset or complement instruments currently held in the Funds in the manner intended by the Funds’ adviser; the risk that the counterparty to a derivative contract may fail to comply with their obligations to the Fund; the risk that the derivative may not possess a liquid secondary market at a time when the Fund would look to disengage the position; the risk that additional capital from the Fund may be called upon to fulfill the conditions of the derivative contract; and the risk that the cost of the derivative contracts may reduce the overall returns experienced by the Funds.
Use of Estimates
The preparation of financial statements in conformity with GAAP requires management to make estimates and assumptions that affect the reported amounts of assets and liabilities and disclosure of contingent assets and liabilities at the date of the financial statements and the reported amounts of revenues and expenses during the reporting period. Actual results could differ from those estimates.
Indemnification
In the normal course of business the Funds enter into contracts that contain general indemnification clauses. The Funds’ maximum exposure under these arrangements is unknown, as this would involve future claims against the Funds that have not yet occurred. Based on experience, the Funds expect the risk of loss to be remote.
Foreign Currency Transactions
The books and records are maintained in U.S. dollars. Foreign currency denominated transactions (i.e. market value of investment securities, assets and liabilities, purchases and sales of investment securities, and income and expenses) are translated into U.S. dollars at the current rate of exchange. The Funds do not isolate that portion of the results of operations resulting from changes in foreign exchange rates on investments from the fluctuations arising from changes in market prices of securities held. Such fluctuations are reflected in net realized and unrealized gain or loss on investments and foreign currency translation.
Securities Transactions and Investment Income
The Funds record security transactions based on trade date. Dividend income is recognized on the ex-dividend date, and interest income is recognized on an accrual basis. Discounts and premiums on securities purchased are amortized over the lives of the respective securities using the effective yield method. Withholding taxes on foreign dividends have been provided for in accordance with the Funds’ understanding of the applicable country’s tax rules and rates. Net realized gains or losses are determined using the identified cost method.
| NOTES TO FINANCIAL STATEMENTS (continued) |
| March 31, 2017 (Unaudited) |
Distribution to Shareholder Policy
Dividends from net investment income, if any, are declared and paid quarterly for the Intrepid Capital Fund and Intrepid Income Fund and paid annually for the Intrepid Endurance Fund, Intrepid Disciplined Value Fund, Intrepid International Fund and Intrepid Select Fund. Distributions of net realized capital gains, if any, are declared and paid at least annually.
Federal Income Taxes
The Funds comply with, and intend to continue to comply with, the requirements of Subchapter M of the Internal Revenue Code necessary to qualify as a regulated investment company and to make the requisite distributions of income and capital gains to its shareholders sufficient to relieve it from Federal income taxes.
Allocation of Income, Expenses, and Gains/Losses
Income, expenses (other than those deemed to be attributable to a specific share class), and gains and losses of each Fund are allocated to each class of shares based upon the ratio of net assets represented by each class as a percentage of the net assets of that Fund. Expenses deemed directly attributable to a specific class of shares are charged against the operations of such class. Most Fund expenses are allocated by class based on relative net assets.
Subsequent Events Evaluation
In preparing these financial statements, the Trust has evaluated events and transactions for potential recognition or disclosure resulting from subsequent events after the Statement of Assets and Liabilities date of March 31, 2017 through the date the financial statements were available for issue. This evaluation did not result in any subsequent events, other than those noted above, that necessitated disclosure and / or adjustments.
The Trust has an Investment Advisory Agreement (the “Agreement”) with Intrepid Capital Management, Inc. (the “Adviser”), with whom certain officers and Trustees of the Trust are affiliated, to furnish investment advisory services to the Funds. Under the terms of the Agreement, the Trust, on behalf of the Funds, compensates the Adviser for its management services on the Intrepid Capital Fund and Intrepid Disciplined Value Fund at the annual rate of 1.00% on the first $500 million of average daily net assets and 0.80% on each of the Fund’s average daily net assets in excess of $500 million, on the Intrepid Endurance Fund, Intrepid International Fund and Intrepid Select Fund at an annual rate of 1.00% of average daily net assets, and on Intrepid Income Fund at the annual rate of 0.75% of average daily net assets.
| NOTES TO FINANCIAL STATEMENTS (continued) |
| March 31, 2017 (Unaudited) |
For the Intrepid Capital Fund and the Intrepid Endurance Fund, the Adviser agreed to waive its management fee and/or reimburse other expenses of each of the Funds, including organization expenses, to the extent necessary to ensure that each Fund’s operating expenses did not exceed 1.40% of each Fund’s Investor Class average daily net assets and 1.15% of average daily net assets of each Fund’s Institutional Class. For the Intrepid Income Fund, the Adviser agreed to waive its management fee and/or reimburse other expenses of the Fund, including organization expenses, to the extent necessary to ensure that the Fund’s operating expenses did not exceed 0.90% of average daily net assets. For the Intrepid Disciplined Value Fund, the Adviser agreed to waive its management fee and/or reimburse other expenses of the Fund, including organization expenses, to the extent necessary to ensure that the Fund’s operating expenses did not exceed 1.30% of average daily net assets. The Intrepid Disciplined Value Fund’s expenses were previously capped at 1.40% of average daily net assets for the period of January 31, 2011 through January 31, 2014. For the Intrepid International Fund and the Intrepid Select Fund, the Adviser agreed to waive its management fee and/or reimburse other expenses of each Fund, including organization expenses, to the extent necessary to ensure that each Fund’s operating expenses did not exceed 1.40% of average daily assets. Any such waivers or reimbursements for the Funds are subject to later adjustment to allow the Adviser to recoup amounts waived or reimbursed to the extent actual fees and expenses on a monthly basis during the fiscal year are less than the respective expense cap limitations, provided, however, that the Adviser shall only be entitled to recoup such amounts for a period of three years from the date such amount was waived or reimbursed. Waived/reimbursed expenses subject to potential recovery by year of expiration are as follows:
| | | Year of Expiration | |
| | | 9/30/17 | | | 9/30/18 | | | 9/30/19 | | | 9/30/20 | |
| Intrepid Capital Fund | | $ | 30,705 | | | $ | 67,817 | | | $ | 170,587 | | | $ | 59,768 | |
| Intrepid Endurance Fund | | | 51,755 | | | | 115,800 | | | | 177,796 | | | | 80,920 | |
| Intrepid Income Fund | | | 68,989 | | | | 62,100 | | | | 91,707 | | | | 44,095 | |
| Intrepid Disciplined Value Fund | | | 105,983 | | | | 7,266 | | | | 18,064 | | | | 19,848 | |
| Intrepid International Fund | | | — | | | | 99,268 | | | | 114,349 | | | | 60,021 | |
| Intrepid Select Fund | | | — | | | | 33,729 | | | | 112,983 | | | | 38,069 | |
| NOTES TO FINANCIAL STATEMENTS (continued) |
| March 31, 2017 (Unaudited) |
The Trust, on behalf of the Funds, has adopted a distribution plan pursuant to Rule 12b-1 under the 1940 Act (the “12b-1 Plan”), which provides that the Funds may reimburse the Funds’ distributor or others at an annual rate of up to 0.25% of the average daily net assets of the Investor Class of the Capital Fund and the Endurance Fund and the sole class of the Disciplined Value Fund, the International Fund and the Select Fund.
Quasar Distributors, LLC serves as the distributor to the Funds. Quasar Distributors, LLC is an affiliated company of U.S. Bank, N.A.
| 5. | INVESTMENT TRANSACTIONS |
The aggregate purchases and sales of securities (excluding short-term securities) by the Funds for the period ended March 31, 2017 were as follows:
| | | Non-U.S. Government | |
| | | Purchases | | | Sales | |
| Intrepid Capital Fund | | $ | 101,412,596 | | | $ | 54,032,282 | |
| Intrepid Endurance Fund | | | 15,799,696 | | | | 20,460,042 | |
| Intrepid Income Fund | | | 20,108,861 | | | | 12,313,505 | |
| Intrepid Disciplined Value Fund | | | 899,274 | | | | 1,970,572 | |
| Intrepid International Fund | | | 5,622,387 | | | | 3,601,806 | |
| Intrepid Select Fund | | | 6,984,236 | | | | 1,171,499 | |
| 6. | TRANSACTIONS WITH AFFILIATES |
The following issuers are affiliated with the Funds; that is, the Adviser had control of 5% or more of the outstanding voting securities during the period from October 1, 2016 through March 31, 2017. As defined in Section (2)(a)(3) of the Investment Company Act of 1940; such issues are:
Intrepid Capital Fund
| | | | | Share | | | | | | | | | Share | | | | | | | | | | | | | |
| | | | | Balance at | | | | | | | | | Balance at | | | | | | | | | Value at | | | Cost at | |
| | | | | Oct. 1, | | | Addi- | | | Reduc- | | | March 31, | | | Dividend | | | Realized | | | March 31, | | | March 31, | |
Issuer Name | | | 2016 | | | tions | | | tions | | | at 2017 | | | Income | | | Gain | | | 2017 | | | 2017 | |
| Baldwin & | | | | | | | | | | | | | | | | | | | | | | | | | | | | |
| Lyons, Inc. - | | | | | | | | | | | | | | | | | | | | | | | | | | | | |
| Class B | | | | — | | | | 428,541 | | | | — | | | | 428,541 | | | $ | — | | | $ | — | | | $ | 10,477,828 | | | $ | 10,185,972 | |
| | | | | | | | | | | | | | | | | | | | | $ | — | | | $ | — | | | $ | 10,477,828 | | | $ | 10,185,972 | |
| NOTES TO FINANCIAL STATEMENTS (continued) |
| March 31, 2017 (Unaudited) |
| Intrepid Endurance Fund | | | | | | | | | | | | | |
| | | Share | | | | | | | | | Share | | | | | | | | | | | | | |
| | | Balance at | | | | | | | | | Balance at | | | | | | | | | Value at | | | Cost at | |
| | | Oct. 1, | | | Addi- | | | Reduc- | | | March 31, | | | Dividend | | | Realized | | | March 31, | | | March 31, | |
Issuer Name | | 2016 | | | tions | | | tions | | | 2017 | | | Income | | | Gain | | | 2017 | | | 2017 | |
| Baldwin & | | | | | | | | | | | | | | | | | | | | | | | | |
| Lyons, Inc. - | | | | | | | | | | | | | | | | | | | | | | | | |
| Class B | | | 146,137 | | | | 61,700 | | | | — | | | | 207,837 | | | $ | 110,154 | | | $ | — | | | $ | 5,081,614 | | | $ | 4,835,015 | |
| | | | | | | | | | | | | | | | | | | $ | 110,154 | | | $ | — | | | $ | 5,081,614 | | | $ | 4,835,015 | |
Intrepid Income Fund | | | | | | | | | | | | | | | | | |
| | | Share | | | | | | | | | | | Share | | | | | | | | | | | | | | | | | |
| | | Balance at | | | | | | | | | | | Balance at | | | | | | | | | | | Value at | | | Cost at | |
| | | Oct. 1, | | | Addi- | | | Reduc- | | | March 31, | | | Dividend | | | Realized | | | March 31, | | | March 31, | |
Issuer Name | | 2016 | | | tions | | | tions | | | 2017 | | | Income | | | Gain | | | 2017 | | | 2017 | |
| Baldwin & | | | | | | | | | | | | | | | | | | | | | | | | | | | | | | | | |
| Lyons, Inc. - | | | | | | | | | | | | | | | | | | | | | | | | | | | | | | | | |
| Class B | | | 16,061 | | | | — | | | | — | | | | 16,061 | | | $ | 8,512 | | | $ | — | | | $ | 392,692 | | | $ | 363,694 | |
| | | | | | | | | | | | | | | | | | | $ | 8,512 | | | $ | — | | | $ | 392,692 | | | $ | 363,694 | |
Intrepid Disciplined Value Fund | | | | | | | | | | | | | | | | | |
| | | Share | | | | | | | | | | | Share | | | | | | | | | | | | | | | | | |
| | | Balance at | | | | | | | | | | | Balance at | | | | | | | | | | | Value at | | | Cost at | |
| | | Oct. 1, | | | Addi- | | | Reduc- | | | March 31, | | | Dividend | | | Realized | | | March 31, | | | March 31, | |
Issuer Name | | 2016 | | | tions | | | tions | | | 2017 | | | Income | | | Gain | | | 2017 | | | 2017 | |
| Baldwin & | | | | | | | | | | | | | | | | | | | | | | | | | | | | | | | | |
| Lyons, Inc. - | | | | | | | | | | | | | | | | | | | | | | | | | | | | | | | | |
| Class B | | | 22,000 | | | | — | | | | — | | | | 22,000 | | | $ | 11,660 | | | $ | — | | | $ | 537,900 | | | $ | 506,660 | |
| | | | | | | | | | | | | | | | | | | $ | 11,660 | | | $ | — | | | $ | 537,900 | | | $ | 506,660 | |
Intrepid International Fund | | | | | | | | | |
| | | Share | | | | | | | | | | | Share | | | | | | | | | | | | | | | | | |
| | | Balance at | | | | | | | | | | | Balance at | | | | | | | | | | | Value at | | | Cost at | |
| | | Oct. 1, | | | Addi- | | | Reduc- | | | March 31, | | | Dividend | | | Realized | | | March 31, | | | March 31, | |
Issuer Name | | 2016 | | | tions | | | tions | | | 2017 | | | Income | | | Gain | | | 2017 | | | 2017 | |
| Coventry | | | | | | | | | | | | | | | | | | | | | | | | | | | | | | | | |
| Group Ltd. | | | 824,481 | | | | 568,894 | | | | — | | | | 1,393,375 | | | $ | — | | | $ | — | | | $ | 745,177 | | | $ | 1,121,994 | |
| | | | | | | | | | | | | | | | | | | $ | — | | | $ | — | | | $ | 745,177 | | | $ | 1,121,994 | |
Intrepid Select Fund | | | | | | | | | | | | | | | | | |
| | | Share | | | | | | | | | | | Share | | | | | | | | | | | | | | | | | |
| | | Balance at | | | | | | | | | | | Balance at | | | | | | | | | | | Value at | | | Cost at | |
| | | Oct. 1, | | | Addi- | | | Reduc- | | | March 31, | | | Dividend | | | Realized | | | March 31, | | | March 31, | |
Issuer Name | | 2016 | | | tions | | | tions | | | 2017 | | | Income | | | Gain | | | 2017 | | | 2017 | |
| Baldwin & | | | | | | | | | | | | | | | | | | | | | | | | | | | | | | | | |
| Lyons, Inc. - | | | | | | | | | | | | | | | | | | | | | | | | | | | | | | | | |
| Class B | | | 18,875 | | | | 24,759 | | | | — | | | | 43,634 | | | $ | 18,688 | | | $ | — | | | $ | 1,066,851 | | | $ | 1,062,076 | |
| | | | | | | | | | | | | | | | | | | $ | 18,688 | | | $ | — | | | $ | 1,066,851 | | | $ | 1,062,076 | |
| NOTES TO FINANCIAL STATEMENTS (continued) |
| March 31, 2017 (Unaudited) |
| 7. | CAPITAL SHARE TRANSACTIONS |
Intrepid Capital Fund – Investor Class
| | | | Six Months Ended | | | Year Ended | |
| | | | March 31, 2017 | | | September 30, 2016 | |
| | Shares sold | | | 673,024 | | | | 1,142,292 | |
| | Shares issued to holders in | | | | | | | | |
| | reinvestment of dividends | | | 314,542 | | | | 266,140 | |
| | Shares redeemed | | | (1,175,425 | ) | | | (6,067,415 | ) |
| | Net decrease in shares | | | (187,859 | ) | | | (4,658,983 | ) |
| | Shares outstanding: | | | | | | | | |
| | Beginning of period | | | 9,500,092 | | | | 14,159,075 | |
| | End of period | | | 9,312,233 | | | | 9,500,092 | |
| | | | | | | | | | |
| | Intrepid Capital Fund – Institutional Class | | | | | | | | |
| | | | Six Months Ended | | | Year Ended | |
| | | | March 31, 2017 | | | September 30, 2016 | |
| | Shares sold | | | 3,120,144 | | | | 12,235,466 | |
| | Shares issued to holders in | | | | | | | | |
| | reinvestment of dividends | | | 655,173 | | | | 347,104 | |
| | Shares redeemed | | | (1,380,764 | ) | | | (6,119,800 | ) |
| | Net increase in shares | | | 2,394,553 | | | | 6,462,770 | |
| | Shares outstanding: | | | | | | | | |
| | Beginning of period | | | 23,720,850 | | | | 17,258,080 | |
| | End of period | | | 26,115,403 | | | | 23,720,850 | |
| | | | | | | | | | |
| | Intrepid Endurance Fund – Investor Class | | | | | | | | |
| | | | Six Months Ended | | | Year Ended | |
| | | | March 31, 2017 | | | September 30, 2016 | |
| | Shares sold | | | 713,277 | | | | 1,465,390 | |
| | Shares issued to holders in | | | | | | | | |
| | reinvestment of dividends | | | 114,734 | | | | 186,657 | |
| | Shares redeemed | | | (2,200,933 | ) | | | (5,044,745 | ) |
| | Net decrease in shares | | | (1,372,922 | ) | | | (3,392,698 | ) |
| | Shares outstanding: | | | | | | | | |
| | Beginning of period | | | 12,436,273 | | | | 15,828,971 | |
| | End of period | | | 11,063,351 | | | | 12,436,273 | |
| NOTES TO FINANCIAL STATEMENTS (continued) |
| March 31, 2017 (Unaudited) |
| | Intrepid Endurance Fund – Institutional Class | | | | | | |
| | | | Six Months Ended | | | Year Ended | |
| | | | March 31, 2017 | | | September 30, 2016 | |
| | Shares sold | | | 129,972 | | | | 678,697 | |
| | Shares issued to holders in | | | | | | | | |
| | reinvestment of dividends | | | 43,749 | | | | 63,724 | |
| | Shares redeemed | | | (364,792 | ) | | | (1,972,675 | ) |
| | Net decrease in shares | | | (191,071 | ) | | | (1,230,254 | ) |
| | Shares outstanding: | | | | | | | | |
| | Beginning of period | | | 4,881,007 | | | | 6,111,261 | |
| | End of period | | | 4,689,936 | | | | 4,881,007 | |
| | | | | | | | | | |
| | Intrepid Income Fund | | | | | | | | |
| | | | Six Months Ended | | | Year Ended | |
| | | | March 31, 2017 | | | September 30, 2016 | |
| | Shares sold | | | 386,530 | | | | 640,422 | |
| | Shares issued to holders in | | | | | | | | |
| | reinvestment of dividends | | | 115,774 | | | | 291,815 | |
| | Shares redeemed | | | (333,192 | ) | | | (1,761,350 | ) |
| | Net increase (decrease) in shares | | | 169,112 | | | | (829,113 | ) |
| | Shares outstanding: | | | | | | | | |
| | Beginning of period | | | 8,590,082 | | | | 9,419,195 | |
| | End of period | | | 8,759,194 | | | | 8,590,082 | |
| | | | | | | | | | |
| | Intrepid Disciplined Value Fund | | | | | | | | |
| | | | Six Months Ended | | | Year Ended | |
| | | | March 31, 2017 | | | September 30, 2016 | |
| | Shares sold | | | 190,785 | | | | 535,962 | |
| | Shares issued to holders in | | | | | | | | |
| | reinvestment of dividends | | | 186,737 | | | | 221,604 | |
| | Shares redeemed | | | (223,921 | ) | | | (742,313 | ) |
| | Net increase in shares | | | 153,601 | | | | 15,253 | |
| | Shares outstanding: | | | | | | | | |
| | Beginning of period | | | 4,517,415 | | | | 4,502,162 | |
| | End of period | | | 4,671,016 | | | | 4,517,415 | |
| NOTES TO FINANCIAL STATEMENTS (continued) |
| March 31, 2017 (Unaudited) |
| | Intrepid International Fund | | | | | | |
| | | | Six Months Ended | | | Year Ended | |
| | | | March 31, 2017 | | | September 30, 2016 | |
| | Shares sold | | | 552,216 | | | | 880,678 | |
| | Shares issued to holders in | | | | | | | | |
| | reinvestment of dividends | | | 77,952 | | | | 90,834 | |
| | Shares redeemed | | | (249,947 | ) | | | (54,417 | ) |
| | Net increase in shares | | | 380,221 | | | | 917,095 | |
| | Shares outstanding: | | | | | | | | |
| | Beginning of period | | | 1,678,567 | | | | 761,472 | |
| | End of period | | | 2,058,788 | | | | 1,678,567 | |
| | | | | | | | | | |
| | Intrepid Select Fund | | | | | | | | |
| | | | Six Months Ended | | | Year Ended | |
| | | | March 31, 2017 | | | September 30, 2016 | |
| | Shares sold | | | 663,645 | | | | 912,487 | |
| | Shares issued to holders in | | | | | | | | |
| | reinvestment of dividends | | | 98,402 | | | | 1,024 | |
| | Shares redeemed | | | (248,028 | ) | | | (29,992 | ) |
| | Net increase in shares | | | 514,019 | | | | 883,519 | |
| | Shares outstanding: | | | | | | | | |
| | Beginning of period | | | 1,035,093 | | | | 151,574 | |
| | End of period | | | 1,549,112 | | | | 1,035,093 | |
| 8. | FEDERAL INCOME TAX INFORMATION |
The tax components of distributions paid during the fiscal years ended September 30, 2016 and 2015 are as follows:
| | | | September 30, 2016 | | | September 30, 2015 | |
| | | | Ordinary | | | Long-Term | | | Ordinary | | | Long-Term | |
| | | | Income | | | Capital Gains | | | Income | | | Capital Gains | |
| | Intrepid Capital Fund | | $ | 8,318,949 | | | $ | 11,903 | | | $ | 21,062,154 | | | $ | 23,982,093 | |
| | Intrepid | | | | | | | | | | | | | | | | |
| | Endurance Fund | | | 3,570,211 | | | | — | | | | 3,017,144 | | | | 54,103,781 | |
| | Intrepid Income Fund | | | 2,801,334 | | | | — | | | | 3,234,027 | | | | 501,888 | |
| | Intrepid Disciplined | | | | | | | | | | | | | | | | |
| | Value Fund | | | 1,242,745 | | | | 938,983 | | | | 538,775 | | | | 3,228,928 | |
| | Intrepid | | | | | | | | | | | | | | | | |
| | International Fund | | | 792,074 | | | | — | | | | — | | | | — | |
| | Intrepid Select Fund | | | 9,538 | | | | — | | | | — | | | | — | |
| | | | | | | | | | | | | | | | | | |
| NOTES TO FINANCIAL STATEMENTS (continued) |
| March 31, 2017 (Unaudited) |
Additionally, U.S. generally accepted accounting principles require that certain components of net assets relating to permanent differences be reclassified between financial and tax reporting. These reclassifications have no effect on net assets or net asset value per share. For the year ended September 30, 2016, the following table shows the reclassifications made:
| | | | Accumulated | | | Undistributed | | | | |
| | | | Net Realized | | | Net Investment | | | Paid-in | |
| | | | Gains (Losses) | | | Income (Losses) | | | Capital | |
| | Intrepid Capital Fund | | $ | (3,004,926 | ) | | $ | 91,387 | | | $ | 2,913,539 | |
| | Intrepid Endurance Fund | | | (1,947,091 | ) | | | 972,514 | | | | 974,577 | |
| | Intrepid Income Fund | | | 8,887 | | | | (8,887 | ) | | | — | |
| | Intrepid Disciplined | | | | | | | | | | | | |
| | Value Fund | | | (183,533 | ) | | | 44,618 | | | | 138,915 | |
| | Intrepid International Fund | | | (196,756 | ) | | | 195,716 | | | | 1,040 | |
| | Intrepid Select Fund | | | 33,472 | | | | (33,472 | ) | | | — | |
These reclassifications primarily relate to adjustments with differing book and tax methods of accounting for the usage of tax equalization, investment losses and currency adjustments.
As of September 30, 2016, the components of accumulated earnings (losses) for income tax purposes were as follows:
| | | | Intrepid | | | Intrepid | |
| | | | Capital Fund | | | Endurance Fund | |
| | Cost of investments | | $ | 290,906,939 | | | $ | 49,263,089 | |
| | Unrealized appreciation | | | 32,780,677 | | | | 8,501,672 | |
| | Unrealized depreciation | | | (23,421,668 | ) | | | (5,688,403 | ) |
| | Net unrealized appreciation | | | 9,359,009 | | | | 2,813,269 | |
| | Undistributed ordinary income | | | 3,786,372 | | | | 2,087,871 | |
| | Undistributed long-term capital gain | | | 6,574,418 | | | | — | |
| | Distributable income | | | 10,360,790 | | | | 2,087,871 | |
| | Other accumulated gain (loss) | | | — | | | | — | |
| | Total accumulated gain | | $ | 19,719,799 | | | $ | 4,901,140 | |
| NOTES TO FINANCIAL STATEMENTS (continued) |
| March 31, 2017 (Unaudited) |
| | | | Intrepid | | | | |
| | | | Intrepid | | | Disciplined | |
| | | | Income Fund | | | Value Fund | |
| | Cost of investments | | $ | 79,730,567 | | | $ | 20,195,661 | |
| | | | | | | | | | |
| | Unrealized appreciation | | | 802,397 | | | | 3,986,785 | |
| | Unrealized depreciation | | | (1,648,832 | ) | | | (1,559,178 | ) |
| | Net unrealized appreciation (depreciation) | | | (846,435 | ) | | | 2,427,607 | |
| | Undistributed ordinary income | | | 11,129 | | | | 590,255 | |
| | Undistributed long-term capital gain | | | — | | | | 911,178 | |
| | Distributable income | | | 11,129 | | | | 1,501,433 | |
| | Other accumulated loss | | | (2,992,733 | ) | | | — | |
| | Total accumulated gain (loss) | | $ | (3,828,039 | ) | | $ | 3,929,040 | |
| | | | | | | | | | |
| | | | Intrepid | | | | | |
| | | | International | | | Intrepid | |
| | | | Fund | | | Select Fund | |
| | Cost of investments | | $ | 13,730,777 | | | | 8,639,850 | |
| | | | | | | | | | |
| | Unrealized appreciation | | | 1,372,842 | | | | 1,177,259 | |
| | Unrealized depreciation | | | (1,112,455 | ) | | | (291,131 | ) |
| | Net unrealized appreciation | | | 260,387 | | | | 886,128 | |
| | Undistributed ordinary income | | | 499,969 | | | | 797,991 | |
| | Undistributed long-term capital gain | | | — | | | | 107,913 | |
| | Distributable income | | | 499,969 | | | | 905,904 | |
| | Other accumulated gain (loss) | | | — | | | | — | |
| | Total accumulated gain | | $ | 760,356 | | | $ | 1,792,032 | |
| | | | | | | | | | |
The difference between book-basis and tax-basis unrealized appreciation is attributable primarily to the tax deferral of losses on wash sales long term.
At September 30, 2016, Intrepid Income Fund had tax basis capital losses of $2,992,733 which may be carried foward to offset future capital gains. To the extent that Intrepid Income Fund may realize future net capital gains, those gains will be offset by any of its unused capital loss carryfowards. These losses do not expire.
There is no tax liability resulting from unrecognized tax benefits relating to uncertain income tax positions taken or expected to be taken on the tax returns for the fiscal year-end September 30, 2016, or for any other tax years which are open for exam. As of September 30, 2016, the Intrepid Capital Fund, the Intrepid Endurance Fund, the Intrepid Income Fund and the Intrepid Disciplined Value Fund’s open tax years include the tax years ended September 30, 2013 through 2016. The Intrepid International Fund and the Intrepid Select Fund’s open tax years include the tax years ended September 30, 2015 and September 30, 2016. The Trust is also not aware of any tax positions for which it is reasonably possible that the total amounts of
| NOTES TO FINANCIAL STATEMENTS (continued) |
| March 31, 2017 (Unaudited) |
unrecognized tax benefits will significantly change in the next year. The Funds recognize interest and penalties, if any, related to unrecognized tax benefits as income tax expense in the Statement of Operations. During the year, the Funds did not incur any interest or penalties, nor were any accrued as of September 30, 2016.
The Intrepid Capital Management Funds Trust has a $25,000,000 uncommitted, unsecured, umbrella 364-day line of credit, for temporary emergency purposes, including the meeting of redemption requests that otherwise might require the untimely disposition of securities. The interest rate as of March 31, 2017 was 3.75%. During the period ended March 31, 2017, none of the Funds drew on their line of credit.
| ADDITIONAL INFORMATION |
| March 31, 2017 (Unaudited) |
Investment Advisory Agreement Disclosure
On November 15, 2016, the Board of Trustees of Intrepid Capital Management Funds Trust (the “Trustees”) approved the continuation of the investment advisory agreements for the Intrepid Capital Fund, the Intrepid Endurance Fund, the Intrepid Income Fund, the Intrepid Disciplined Value Fund, the Intrepid International Fund and the Intrepid Select Fund (collectively the “Funds”, or the, “Fund”) with the investment adviser to the Funds, Intrepid Capital Management, Inc. (the “Adviser”). As part of the process of approving the continuation of the advisory agreements, the Trustees reviewed the fiduciary duties of the Trustees with respect to approving the advisory agreements and the relevant factors for the Trustees to consider, and the members of the Board of Trustees who are not deemed “interested persons” (as that term is defined by the Investment Company Act of 1940) of the Funds (the “Independent Trustees”) met in executive session to discuss the approval of the advisory agreements.
In advance of the meetings, the Adviser sent detailed information to the Trustees to assist them in their evaluation of the investment advisory agreements. This information included, but was not limited to, a memorandum from Fund counsel that summarized the legal standards applicable to the Trustees’ consideration of the advisory agreements; detailed comparative information relating to the Funds’ management fees and other expenses of the Funds; information regarding fees paid and other payments; information on the Adviser’s profitability; information about brokerage commissions; detailed comparative information relating to the Funds’ performance; information about sales and redemptions of the Funds; information about the Funds’ compliance program; and other information the Trustees believed was useful in evaluating the approval of advisory agreements.
All of the factors discussed by the Trustees were considered as a whole, and were considered separately by the Independent Trustees, meeting in executive session. The factors were viewed in their totality by the Trustees, with no single factor being the principal or determinative factor in the Trustees’ determination of whether to approve the continuation of the investment advisory agreements. The Trustees recognized that the management and fee arrangements for the Funds are the result of years of review and discussion between the Independent Trustees and the Adviser, that certain aspects of such arrangements may receive greater scrutiny in some years than in others and that the Trustees’ conclusions may be based, in part, on their consideration of these same arrangements and information received during the course of the year and in prior years.
| ADDITIONAL INFORMATION (continued) |
| March 31, 2017 (Unaudited) |
Prior to approving the continuation of the investment advisory agreements, the Trustees and the Independent Trustees in executive session considered, among other items:
| • | The nature and quality of the investment advisory services provided by the Adviser. |
| • | A comparison of the fees and expenses of the Funds to other similar funds. |
| • | A comparison of the fee structures of other accounts managed by the Adviser. |
| • | Whether economies of scale are recognized by the Funds. |
| • | The costs and profitability of the Funds to the Adviser. |
| • | The performance of the Funds. |
| • | The other benefits to the Adviser from serving as investment adviser to the Funds (in addition to the advisory fee). |
The material considerations and determinations of the Board of Trustees, including all of the Independent Trustees, are as follows:
Nature and Quality of Investment Advisory Services
The Trustees noted that the Adviser supervises the investment portfolios of the Funds, directing the day-to-day management of the Funds’ portfolios, including the purchase and sale of investment securities. The Trustees discussed with management the nature of the investment process employed by the portfolio managers of the Funds, which is highly research intensive. Management noted that in employing its strategy, the Adviser conducts extensive research on target companies, including interviews with management, competitors, analysts and others.
The Trustees also considered the background and experience of the Adviser’s senior management and expertise of, and the amount of attention given to the Funds by investment personnel of the Adviser. They discussed staffing at the Adviser, and concluded that the Adviser is well staffed to conduct the research needed to meet the investment objectives of the Funds. In addition, the Trustees considered the quality of the material service providers to the Funds, who provide administrative and distribution services on behalf of the Funds and are overseen by the Adviser, and the overall reputation and capabilities of the Adviser. Based on this review, the Trustees believe that the Adviser provides high quality services to the Funds.
The Trustees also concluded that they were satisfied with the nature, extent and quality of the investment advisory services provided to the Funds by the Adviser, and that the nature and extent of the services provided by the Adviser are appropriate to assure that each Fund’s operations are conducted in compliance with applicable laws, rules and regulations.
| ADDITIONAL INFORMATION (continued) |
| March 31, 2017 (Unaudited) |
Comparative Fees and Expenses
The Trustees then discussed with management the variables, in addition to the management fees, such as administrative and transaction fees, that impact costs to the shareholders of the Funds. Management reviewed with the Trustees the comparison of the Funds’ expense ratios to other similar funds. As part of the discussion with management, the Trustees ensured that they understood and were comfortable with the criteria used by the Adviser to determine the mutual funds that make up the peer universe for purposes of the materials. The Directors concluded that the Funds’ fees are reasonable in relation to the nature and quality of the services provided, and are reasonable when compared to the funds in the peer universe.
Comparison of Fee Structures of Other Accounts
The Trustees then inquired of management regarding the distinction between the services performed by the Adviser for separate accounts or private investment companies and those performed by the Adviser for the Funds. The Adviser noted that the management of the Funds involves more comprehensive and substantive duties than the management of separate accounts or private investment companies.
The Trustees concluded that the services performed by the Adviser for the Funds require a higher level of service and oversight than the services performed by the Adviser for separate accounts or private investment companies. Based on this determination, the Trustees believe that the differential in advisory fees between the Funds and the separate accounts and private investment companies is reasonable, and concluded that the fee rates charged to the Funds in comparison to those charged to the Adviser’s other clients are reasonable.
Performance
The Trustees reviewed the Adviser’s quality of investment management, management history and ability to successfully market the Funds. With respect to the underperformance of the Funds, the Board considered the Adviser’s assessment of whether performance was consistent with each Fund’s investment strategy and was satisfactory over time, and the Board ensured that steps are being taken by the Adviser to monitor and address performance for each Fund. They noted that while the Funds have underperformed in the short-term, it is their expectation that the Adviser’s discipline will lead to more favorable results in the long-term. Based on their review, the Trustees concluded that each Fund’s performance was satisfactory, in light of its stated investment strategy, and concluded that renewal of the existing advisory agreements was in the best interest of the Funds’ shareholders.
The Trustees noted that at each quarterly meeting, the Trustees review reports comparing the investment performance of the Funds to various indices. Based on the
| ADDITIONAL INFORMATION (continued) |
| March 31, 2017 (Unaudited) |
information provided at this meeting and the information and quarterly discussions regarding the Funds’ investment performance, the Trustees believe that the Adviser manages the Funds in a manner that is materially consistent with their stated investment objective and style.
Costs and Profitability
The Trustees considered the cost of services provided and the profits realized by the Adviser, by reviewing reports provided by the Funds’ administrator that compared the Funds’ investment advisory fees to those of other comparable mutual funds. They noted that the Funds’ contractual investment advisory fee was higher than the industry average and attributed it to other peer funds realizing economies of scale to decrease advisory costs. The Trustees also considered the Funds’ overall expense ratios compared to peer group funds, which they believe are reasonable, and the Adviser’s willingness to waive a portion of their advisory fees to keep the overall expenses of the Funds lower.
The Trustees discussed the Adviser’s profitability, as presented, and the impact of the intermediary service fees on the profitability. The Trustees also considered the resources and revenues that the Adviser has put into managing and distributing the Funds, and concluded that the level of profitability realized by the Adviser from its provision of services to the Funds is reasonable, and that the overall expense ratios and investment advisory fees were fair and within the range of industry averages.
Economies of Scale
The Trustees then discussed with management whether economies of scale are recognized by the Funds. They noted that as Fund assets grow, certain fixed costs are spread over the larger asset base, which may lead to some economies of scale. On the other hand, the Trustees noted that many of the Funds’ expenses are subject to diseconomies of scale. For example, the intermediary service fees generally increase as the Funds’ assets grow. Given the size of the Funds and the reimbursements being made by the Adviser, the Trustees determined that economies of scale were not being recognized, and that the proposed fee schedules were acceptable.
Fall-Out Benefits
The Trustees then considered other benefits to the Adviser from serving as investment adviser to the Funds (in addition to the advisory fee). The Trustees noted that the Adviser derives ancillary benefits from its association with the Funds in the form of proprietary and third party research products and services received from broker dealers that execute portfolio trades for the Funds. The Trustees determined such products and services have been used for legitimate purposes relating to the Funds by providing assistance in the investment decision-making process. The
| ADDITIONAL INFORMATION (continued) |
| March 31, 2017 (Unaudited) |
Trustees concluded that the other benefits realized by the Adviser from its relationship with the Funds were reasonable.
Conclusion
After reviewing the materials provided at the meeting, management’s presentation, as well as other information regularly provided at the Board’s quarterly meetings throughout the year regarding the quality of services provided by the Adviser, the performance of the Funds, expense information, regulatory compliance issues, trading information and related matters and other factors deemed relevant by the Board, the Trustees, including all of the Independent Trustees, approved the continuation of the investment advisory agreements.
Shareholder Notification of Federal Tax Status
The Intrepid Capital Fund and Intrepid Disciplined Value Fund designated $11,903 and $938,983, respectively, of total distributions paid during the fiscal year ended September 30, 2016 as net capital gain distributions eligible for long-term capital gain rates for individual shareholders.
The Intrepid Capital Fund, Intrepid Endurance Fund, Intrepid Income Fund, Intrepid Disciplined Value Fund, Intrepid International Fund and Intrepid Select Fund designated 55.02%, 54.75%, 13.83%, 40.53%, 0.00% and 47.97%, respectively, of their ordinary income distributions for the year ended September 30, 2016 as qualified dividend income under the Jobs & Growth Tax Relief Reconciliation Act of 2003.
For the year ended September 30, 2016, 37.77%, 25.81%, 10.26%, 36.33%, 2.47% and 30.62% of Intrepid Capital Fund, Intrepid Endurance Fund, Intrepid Income Fund, Intrepid Disciplined Value Fund, Intrepid International Fund and Intrepid Select Fund dividends paid from net ordinary income, respectively, qualify for the dividends received deduction available to corporate shareholders.
The Intrepid Capital Fund, Intrepid Endurance Fund, Intrepid Income Fund, Intrepid Disciplined Value Fund, Intrepid International Fund and Intrepid Select Fund designated 36.86%, 0.00%, 99.02%, 1.00%, 2.18% and 0.00%, respectively, of their ordinary income distributions for the fiscal year as interest-related dividends under Internal Revenue Code Section 871(k)(1)(c).
The Intrepid Capital Fund, Intrepid Endurance Fund, Intrepid Income Fund, Intrepid Disciplined Value Fund, Intrepid International Fund and Intrepid Select Fund designated 0.00%, 0.00%, 0.00%, 85.88%, 19.52% and 0.00%, respectively, of their ordinary income distributions as short-term capitalization distributions under Internal Revenue Code Section 871(k)(2)(c).
| ADDITIONAL INFORMATION (continued) |
| March 31, 2017 (Unaudited) |
Availability of Quarterly Portfolio Holdings Schedules
The Funds are required to file their complete schedule of portfolio holdings with the SEC for the first and third quarters of each fiscal year on Form N-Q. Once filed, the Funds’ Form N-Q is available without charge, upon request on the SEC’s website (http://www.sec.gov) and may be available by calling 1.866.996.3863. You may also obtain copies at the SEC’s Public Reference Room in Washington, D.C. Information on the operation of the Public Reference Room may be obtained by calling 1.800.SEC.0330.
Proxy Voting Policies and Procedures and Proxy Voting Record (Unaudited)
A description of the policies and procedures that the Funds use to determine how to vote proxies relating to portfolio securities is available without charge, upon request, by calling 1.866.996.3863 and on the SEC’s website (http://www.sec.gov).
The Funds are required to file how they voted proxies related to portfolio securities during the most recent 12-month period ended June 30. Once filed, the information is available without charge, upon request, by calling 1.866.996.3863 and on the SEC’s website (http://www.sec.gov).
(This Page Intentionally Left Blank.)
Board of Trustees
Edward Vandergriff
Mark Travis
Peter Osterman, Jr.
Roy Clarke
Investment Adviser
Intrepid Capital Management, Inc.
1400 Marsh Landing Parkway, Suite 106
Jacksonville Beach, FL 32250
Independent Registered Public Accounting Firm
Deloitte & Touche LLP
111 South Wacker Drive
Chicago, IL 60606
Legal Counsel
Foley & Lardner LLP
777 East Wisconsin Avenue
Milwaukee, WI 53202
Custodian
U.S. Bank, N.A.
1555 N. RiverCenter Drive, Suite 302
Milwaukee, WI 53212
Distributor
Quasar Distributors, LLC
777 East Wisconsin Avenue
Milwaukee, WI 53202
Administrator, Transfer Agent
and Dividend Disbursing Agent
U.S. Bancorp Fund Services, LLC
615 East Michigan Street
Milwaukee, WI 53202
Shareholder/Investor Information
1.866.996.3863
www.intrepidcapitalfunds.com
ITRPSEMI-0317
Item 2. Code of Ethics.
Not applicable for semi-annual reports.
Item 3. Audit Committee Financial Expert.
Not applicable for semi-annual reports.
Item 4. Principal Accountant Fees and Services.
Not applicable for semi-annual reports.
Item 5. Audit Committee of Listed Registrants.
Not applicable to registrants who are not listed issuers (as defined in Rule 10A-3 under the Securities Exchange Act of 1934).
Item 6. Investments.
Schedule of Investments is included as part of the report to shareholders filed under Item 1 of this Form.
Item 7. Disclosure of Proxy Voting Policies and Procedures for Closed-End Management Investment Companies.
Not applicable to open-end investment companies.
Item 8. Portfolio Managers of Closed-End Management Investment Companies.
Not applicable to open-end investment companies.
Item 9. Purchases of Equity Securities by Closed‑End Management Investment Company and Affiliated Purchasers.
Not applicable to open-end investment companies.
Item 10. Submission of Matters to a Vote of Security Holders.
Not Applicable.
Item 11. Controls and Procedures.
(a) The Registrant’s President and Treasurer have reviewed the Registrant's disclosure controls and procedures (as defined in Rule 30a-3(c) under the Investment Company Act of 1940 (the “Act”)) as of a date within 90 days of the filing of this report, as required by Rule 30a-3(b) under the Act and Rules 13a-15(b) or 15d‑15(b) under the Securities Exchange Act of 1934. Based on their review, such officers have concluded that the disclosure controls and procedures are effective in ensuring that information required to be disclosed in this report is appropriately recorded, processed, summarized and reported and made known to them by others within the Registrant and by the Registrant’s service provider.
(b) There were no changes in the Registrant's internal control over financial reporting (as defined in Rule 30a-3(d) under the Act) that occurred during the second fiscal quarter of the period covered by this report that has materially affected, or is reasonably likely to materially affect, the Registrant's internal control over financial reporting.
Item 12. Exhibits.
| (a) | (1) Any code of ethics or amendment thereto, that is the subject of the disclosure required by Item 2, to the extent that the registrant intends to satisfy Item 2 requirements through filing an exhibit. 1) Incorporated by reference to the Registrant’s Form N-CSR filed December 5, 2008. |
(2) A separate certification for each principal executive and principal financial officer pursuant to Section 302 of the Sarbanes-Oxley Act of 2002. Filed herewith.
(3) Any written solicitation to purchase securities under Rule 23c‑1 under the Act sent or given during the period covered by the report by or on behalf of the registrant to 10 or more persons. Not applicable to open-end investment companies.
| (b) | Certifications pursuant to Section 906 of the Sarbanes‑Oxley Act of 2002. Furnished herewith. |
SIGNATURES
Pursuant to the requirements of the Securities Exchange Act of 1934 and the Investment Company Act of 1940, the registrant has duly caused this report to be signed on its behalf by the undersigned, thereunto duly authorized.
(Registrant) Intrepid Capital Management Funds Trust
By (Signature and Title)* /s/Mark F. Travis
Mark F. Travis, President
Date May 24, 2017
Pursuant to the requirements of the Securities Exchange Act of 1934 and the Investment Company Act of 1940, this report has been signed below by the following persons on behalf of the registrant and in the capacities and on the dates indicated.
By (Signature and Title)* /s/Mark F. Travis
Mark F. Travis, President
Date May 24, 2017
By (Signature and Title)* /s/Donald C. White
Donald C. White, Treasurer
Date May 24, 2017
* Print the name and title of each signing officer under his or her signature.