Intrepid Capital Fund
Intrepid Endurance Fund
Intrepid Income Fund
Intrepid Disciplined Value Fund
Intrepid International Fund
Semi-Annual Report
March 31, 2019
Beginning on January 1, 2021, as permitted by regulations adopted by the U.S. Securities and Exchange Commission, paper copies of the Funds’ annual and semi-annual shareholder reports will no longer be sent by mail, unless you specifically request paper copies of the reports. Instead, the reports will be made available on the Fund’s website (www.intrepidcapitalfunds.com), and you will be notified by mail each time a report is posted and provided with a website link to access the report.
If you already elected to receive shareholder reports electronically, you will not be affected by this change and you need not take any action. You may elect to receive shareholder reports and other communications from the Funds electronically anytime by contacting your financial intermediary (such as a broker-dealer or bank) or, if you are a direct investor, by calling 1-866-996-FUND, sending an e-mail request to invest@intrepidcapitalfunds.com, or by enrolling at www.intrepidcapitalfunds.com.
You may elect to receive all future reports in paper free of charge. If you invest through a financial intermediary, you can contact your financial intermediary to request that you continue to receive paper copies of your shareholder reports. If you invest directly with the Funds, you can call 1-866-996-FUND or send an e-mail request to invest@intrepidcapitalfunds.com to let the Funds know you wish to continue receiving paper copies of your shareholder reports. Your election to receive reports in paper will apply to all funds held in your account if you invest through your financial intermediary or all Funds held with the fund complex if you invest directly with the Funds.
April 5, 2019
| “In prosperity, caution; in adversity, patience.” | |
| | – Dutch Proverb |
 | |
| Mark F. Travis, President/C.E.O. | |
Dear Friends and Clients,
I’m beginning to think a neck brace is a necessity as an equity investor after the whiplash the markets have delivered in the last two quarters. To set the stage for the impressive rally in the first quarter of 2019, we have to look back to mid-December when the Federal Open Market Committee (FOMC) hiked interest rates for the ninth time of this economic expansion, even as global stocks were quickly descending into a bear market. Markets viewed the hike as a signal the FOMC was serious about curbing excesses in corporate credit – excesses we at Intrepid have discussed at length in previous letters.
But in January the Federal Reserve, led by chairman Jerome Powell, abruptly reversed course. Mr. Powell merely uttered the word “patience” (four times, but who’s counting?) in an early January interview regarding the Fed’s position for the rest of 2019, which investors interpreted as a sign of the Fed’s willingness to pump the brakes on interest rate hikes, and off to the races the equity markets went. Mr. Powell and other FOMC members reinforced the expectation that they would revert to supporting the markets with subsequent comments in the financial media during the quarter. In a classic Pavlovian response, the S&P 500 Index and Russell 2000 Index both posted returns in the low teens for the first quarter ended March 31, 2019, the best quarterly return since the early days of the financial crisis recovery in mid-2009.
That’s the good news. The bad news is that by returning to its accommodative policies of the last decade in an effort to support asset prices, the Fed risks overheating a healthy economy that by most measures is already running at full capacity and employment. While positive for markets in the short term, this strategy increases the risk of potentially more damaging excesses down the road.
For the quarter ended March 31, 2019, the Intrepid Capital Fund (the “Fund”) increased 5.18% compared to an increase of 9.44% for the Fund’s benchmark, the Bloomberg Barclays Combined Index, comprised of 60% S&P 500/40% Bloomberg Barclays US Government/Credit Index, and 13.65% for the S&P 500. For the Fund’s fiscal six-month period ending March 31, 2019, the Fund decreased 6.83% compared to a return of 1.10% for the balanced benchmark and a decline of 1.72% for the S&P 500.
The sense of borderline panic I observed in the market in December 2018 reminded me of the fourth quarter ten years prior (2008) in the aftermath of Lehman’s failure. My father, Forrest, is fond of saying, “In times like these, let’s not lose our heads while those around us are losing theirs.” With that ringing in my ears, and with the help of our analyst team, we were able to acquire a total of ten new securities in the
quarter that we believe were mispriced and have long-term merit for our portfolio. Seven of the new additions were equity holdings, three were corporate bonds, and most were purchased in early-to-mid January before the rally kicked into high gear. I would like to highlight the three largest purchases.
Cabot Oil & Gas (ticker: COG) is a $11 billion market cap oil and gas company that produces over 2% of the United States’ natural gas supply from its large, productive field in Pennsylvania’s Marcellus shale formation. We believe it is one of the highest-quality energy companies in the mid cap universe, but this quality hasn’t been recognized because of the general negative sentiment around natural gas producers. As a low-cost producer due to the exceptional location of its reserves, Cabot expects to grow production over 20% in 2019 while reducing capital expenditures and generating strong free cash flow – a combination of qualities that is highly unusual in small and mid-cap energy.
Sykes Enterprises (ticker: SYKE) is a global call center business that provides customer care support for financial services, communication and technology companies and sports a $1.2 billion market cap. Sykes is juggling several issues that have weighed on its market value: challenging wage and labor availability trends, a reduction in call volumes at major telecom customers, and low capacity utilization at its domestic call centers. These are common occurrences in the call center industry, and Sykes management is taking active steps to address them by moving customer programs overseas and rationalizing a large percentage of its US capacity. Margins have already begun to recover to normalized ranges, and the company’s strong balance sheet with net cash should provide additional stability. We were able to acquire shares after the stock fell 26% between early November and late December, much of which the stock recovered by the end of the first quarter.
Vistra Energy (ticker: VST) was formerly the unregulated subsidiary of TXU, the largest leveraged buyout ever in 2007 and then the largest corporate bankruptcy ever in 2012. Vistra was spun off in 2016 and emerged from bankruptcy with almost no debt. In 2018, it completed a merger that diversified it away from its concentration in Texas, added scale, and made it the largest independent power producer in the country.
Vistra’s industry of competitive power has historically operated in a highly leveraged, “go for broke” fashion by trying to play the upside of volatile power cycles and shown no supply discipline when building new generation capacity. This has left a trail of disillusioned equity investors who have not yet realized that the industry is showing much more supply discipline than in the past and that Vistra is deliberately trying to structure itself to (1) generate stable, bond-like cash flows at the expense of missing out on wild cyclical industry swings, and (2) virtually eliminate the risk of any future financial distress. We believe equity investors have yet to process these developments and are still punishing Vistra for sins of the industry’s past by valuing the company with a high-teens free cash flow yield – something more appropriate for a stock with a high degree of operating AND financial risk.
In contrast, credit investors have already reacted positively to these changes, and as such have facilitated the company’s ability to refinance existing debt at attractive mid-single digit rates. This discrepancy has created an opportunity to purchase the stock of a company that is generating so much free cash flow relative to its stock price that it is deleveraging, repurchasing shares, and growing a dividend all at the same time. We hope to benefit from these actions as we wait for equity investors to eventually recognize the improved business model and re-rate the company accordingly.
As affirmation of our vigorous valuation process, it is always pleasing to see businesses we’ve acquired in the Fund be bought out at prices close to (or even better, above) where we have valued their share prices. This happened with two of our holdings in the first quarter, which made them both top contributors to the Fund with over 25% returns for each.
First, Oaktree Asset Management (ticker: OAK) sold a majority stake in its business to Brookfield Asset Management (ticker: BAM) in a cash and stock deal worth $4.7 billion at the time it was announced. Oaktree, run by noted distressed debt investor Howard Marks, was organized as a public partnership which, as some of our shareholders know from firsthand experience, requires the generation of a Schedule K-1 for reporting to the IRS. Private equity competitors KKR & Co. (ticker: KKR) and Ares Management Corp. (ticker: ARES) both chose last year to convert from partnerships to C corporations, a choice that became more palatable because of tax reform. As KKR COO Scott Nuttall said, “Our stock has been too challenging to buy and too challenging to own, so many investors go elsewhere.” We believe the move helped lift their respective share prices by simplifying the tax filing requirements and appealing to a broader shareholder base, and Oaktree could see similar halo effects under the Brookfield umbrella.
At an implied 12% premium over the pre-announcement price, we think Brookfield paid a very modest amount for Oaktree, which is a positive for its shareholders and a negative for us as OAK shareholders. Our estimated fair value for Oaktree was $50 per share, and the buyout was remarkably close to this price at $49 per share. However, between a healthy dividend yield of almost 6% and the buyout premium, we think the position gave us a reasonable risk-adjusted total return over our five-year holding period.
The second buyout, Stallergenes Greer (ticker: STAGR FP), is a closely held, London-based manufacturer of allergy immunotherapy treatment products that became profitable again in 2018 after several years of operational struggles. The firm was already 84% owned by Waypoint, a Geneva-based family office run by Ernesto Bertarelli, Switzerland’s richest man, and in March, Ares Life Sciences, a subsidiary of Waypoint, agreed to take Stallergenes Greer private. The cash buyout of the remaining 16% is Bertarelli’s second largest public pharmaceutical company acquisition in the last year and values STAGR at $830 million, a 43% premium to its pre-announcement price.
Aside from the two buyouts, other top contributors to the Fund for the first quarter were Sketchers (ticker: SKX), Dollar Tree (ticker: DLTR), and Cisco Systems (ticker: CSCO). The five largest detractors to performance for the quarter were Net 1 UEPS Technologies (ticker: UEPS), Party City (ticker: PRTY), Greenhill & Co. (ticker: GHL), Hornbach Baumarkt AG (ticker: HBM GR), and Royal Mail (ticker: RMG LN).
For the six-month period ended March 31, 2019, the Fund’s top contributors were Dollar Tree (ticker: DLTR), Skechers (ticker: SKX), Oaktree Capital (ticker: OAK), Teradata (ticker: TDC), and Stallergenes Greer (ticker: STAGR FP). The largest six-month detractors to performance were Net1 UEPS Technologies (ticker: UEPS), GUD Holdings (ticker: GUD AU), Hallmark Financial Services ticker: HALL), Western Union (ticker: WU), and Greenhill (ticker: GHL).
After a difficult 2018, it is nice to be off to a positive start in 2019. The acquisitions of Oaktree and Stallergenes have created some cash within the Fund which we are trying to intelligently redeploy in companies with similar price and quality characteristics to the securities we purchased late in 2018.
Thank you for your continued support.
Best regards,
Mark F. Travis, President
Intrepid Capital Fund Portfolio Manager
All investments involve risk. Principal loss is possible. The Fund is subject to special risks including volatility due to investments in smaller companies, which involve additional risks such as limited liquidity and greater volatility. Investments in debt securities typically decrease in value when interest rates rise. This risk is usually greater for longer-term debt securities. Investments by the Fund in lower-rated and non-rated securities present a greater risk of loss to principal and interest than higher-rated securities. The Fund may invest in foreign securities which involve greater volatility and political, economic and currency risks and differences in accounting methods. The risks of owning ETFs generally reflect the risks of owning the underlying securities they are designed to track. ETFs also have management fees that increase their costs versus the costs of owning the underlying securities directly.
The S&P 500 Index is a broad-based, unmanaged index of 500 stocks, which is widely recognized as representative of the equity market in general. ICE BofAML U.S. Corporate Index is an unmanaged index of U.S. dollar denominated investment grade corporate debt securities publicly issued in the U.S. domestic market with at least one-year remaining term to final maturity. The ICE BofAML US High Yield Index tracks the performance of US dollar denominated below investment grade corporate debt publicly issued in the US domestic market. Qualifying securities must have a below investment grade rating (based on an average of Moody’s, S&P and Fitch), at least 18 months to final maturity at the time of issuance, at least one year remaining term to final maturity as of the rebalancing date, a fixed coupon schedule and a minimum amount outstanding of $250 million. The Bloomberg Barclays Combined Index consists of an unmanaged portfolio of 60% common stocks represented by the S&P 500 Index and 40% bonds
represented Bloomberg Barclays US Government/Credit Index. You cannot invest directly in an index. The indices are used herein for comparative purposes in accordance with SEC regulations.
Dividend Yield is calculated by dividing the dollar value of dividends paid in a given year per share of stock held by the dollar value of one share of stock.
Opinions expressed are subject to change, are not guaranteed and should not be considered investment advice or recommendations to buy or sell any security.
Fund holdings and sector allocations are subject to change at any time and should not be considered a recommendation to buy or sell any security. Please see the Schedule of Investments in this report for complete Fund holdings.
The Intrepid Capital Funds are distributed by Quasar Distributors, LLC.
April 8, 2019
 | | 
| |
| Matt Parker, CFA, CPA | | Joe Van Cavage, CFA | |
| Endurance Fund | | Endurance Fund | |
| Co-Portfolio Manager | | Co-Portfolio Manager | |
Dear Fellow Shareholders,
Stock and bond markets bounced back sharply in early 2019 after demonstrating broad and severe volatility late in 2018. The Morningstar Small Cap Index returned an impressive 15.50% in the first three months of 2019.
The Endurance Fund’s (the “Fund”) results were not as impressive, returning 2.10% during this period. The Fund’s large Treasuries position and focus on stocks with stable fundamentals and operating profiles drove a high degree of underperformance in a “risk-on” market with little downside volatility.
However, these same characteristics and positioning drove significant outperformance for the Fund during the last three months of 2018. As a reminder, the Fund returned -3.52% in calendar Q4 2018 versus the Morningstar Small Cap Index’s -19.54%. When linking these two quarters, which encapsulate the Fund’s first half of fiscal 2019, the Fund outperformed by returning -1.49% versus -7.06% for the Morningstar Small Cap Index.
The Fund’s strategy is designed around three objectives: i) to generate positive absolute returns; ii) avoid large drawdowns of capital; and iii) take advantage during periods of volatility. These three objectives combine to create guardrails that encourage us to take risks with your capital when it is attractively priced, avoid risk with your capital when expected returns are inadequate, and – in doing so – compound your capital in a manner that over-compensates you for the amount of risk you took by participating in the stock market.
We think the last six months provide a unique opportunity over which to judge the Fund on these objectives, as it included both the wild panic and euphoria reminiscent of a full market cycle – in only a fraction of the time frame.
Over this period, our disciplined absolute return focus clearly added value above the index, primarily by avoiding large drawdowns on your capital. However, due to the lackluster upside we demonstrated during calendar Q1, we did fall short of our objective of generating positive absolute returns during the full six-month period. While small cap indices fell much more than the Fund, we are not satisfied with outperformance when it includes a slightly negative absolute return, even over a short “mini” market cycle.
Finally, it’s important to assess what actions we took to exploit the recent volatility in order to achieve the Fund’s objectives moving forward.
You may remember that the Fund was extremely active (relative to its recent history) in the fourth quarter of 2018 as markets buckled and went into freefall. In that short time frame, we added four new positions in high-quality small cap companies with pristine balance sheets. Despite the rally in small cap prices to date in 2019, we were able to continue to find attractively priced opportunities – primarily by pivoting our focus throughout our opportunity set to companies with a bit more financial leverage. In fact, four of the six new positions established in Q1 2019 possess meaningful debt on their balance sheet.
This flexible approach allowed us to benefit by avoiding companies with a higher degree of financial risk when they were not priced as such, but then swoop in and selectively take on this risk as interest rates rose, credit spreads widened, and high yield issuance closed late in 2018 – punishing stocks with any sort of leverage concern. Of note, we remained disciplined when sourcing these opportunities with higher debt levels, requiring higher absolute returns on equity and a stable operating profile combined with ample asset coverage or extended debt maturities.
Essentially, we quickly shifted our focus in early Q1 2019 from avoiding financial risk to looking for opportunities to take it on in an acceptable manner. Later in the quarter, we again utilized our flexible, opportunistic mandate to purchase a well-run, conservatively-financed bank – the Fund’s first bank investment in nine years – as investors began to aggressively price the risk of an inverted yield curve into bank stocks. We also purchased an energy stock with a strong balance sheet and added meaningfully to two positions initially purchased in the fourth quarter of 2018, Cabot Oil & Gas and Protector Forsikring.
In summary, this activity drove the Fund’s cash levels down to 59.7% at the end of the first quarter, a decline of 13.5% from the 73.2% cash position at the end of Q4 2018. This follows the 9.3% decline that occurred in Q4 2018 from the 82.5% cash balance at the end of Q3 2018.
As a result, the Fund’s equity exposure has more than doubled over the last six months. Despite the meaningful change in positioning, this does not represent a change in the Fund’s strategy. Over this six-month period, we have been deliberate about utilizing any adverse market conditions or circumstances to take advantage of opportunities presented by volatility – consistent with the core objectives listed above. Executing on this objective drove the change in the Fund’s exposure, rather than any top-down change in strategy.
However, the increased equity exposure does represent a meaningful step-change in the potential return profile of the Fund. In that sense, we are excited to be able to address the objective we fell just short on (generating positive absolute returns) through the ten new stocks introduced over the last six months, all purchased at
prices we believe will provide attractive absolute returns over reasonable holding periods. While we reiterate our disappointment in our modest upside performance during the first quarter, we are encouraged by the fact that our best performing stocks were all new holdings purchased over the last six months.
New purchases
| | • | SP Plus Corporation (ticker: SP) is a leading parking facility operator in the US for office buildings, airports, hotels, hospitals, etc. Like many small caps with debt, SP sold off sharply late in 2018. However, SP’s debt load is comfortably supported by its stable operations and attractive business model primarily consisting of fixed rate contracts. |
| | | |
| | • | PotlatchDeltic Corporation (ticker: PCH) is a leading timber REIT and top-10 lumber producer in the US. Investor concerns about the state of the housing market provided the opportunity to purchase the company’s stock at an attractive discount to the value of its high-quality timberland and lumber mill assets. While the company sports a leverage ratio of 2.2x, it is very well supported by the value of its assets and is much less levered than its timber peers or companies in other REIT categories. |
| | | |
| | • | Hanesbrands, Inc. (ticker: HBI) owns and distributes many leading brands in innerwear, intimates, and activewear apparel. Despite a meaningful debt load, the company is utilizing its substantial free cash flow generation to aggressively deleverage while maintaining an attractive dividend. HBI’s recent results also indicate a return to growth due to stabilization in several core innerwear categories, along with booming distribution expansion in its 100-year-old Champion activewear brand, which has made a comeback as a fashion statement brand with teens, millennials and celebrities. |
| | | |
| | • | Ingles Markets, Inc. (ticker: IMKTA) is a regional grocery chain with stores throughout six states in the Southeast US. Ingles’ rural store base has shielded it from many of the negative external pressures in the broad grocery category over the past several years, including new entrants, price competition, omni-channel adoption, and channel convergence. In addition, Ingles has aggressively invested in modernizing its stores to ensure it can compete as customer tastes and preferences change. While the company carries debt on its balance sheet, it also has substantial real estate holdings that support the debt (80% of it store locations are owned) and steady operating income that easily covers interest expense several times over. |
| | | |
| | • | Bonanza Creek Energy Inc. (ticker: BCEI) is an energy producer with 67,000 net acres of primarily oil-producing property in the Wattenberg Field in Weld County, Colorado. The company sports an attractive investment profile that includes an extremely strong balance sheet and the ability to grow production at a 20% rate while maintaining low leverage and a high degree of liquidity. In addition, the company trades at a substantial discount to the replacement cost of |
| | | its producing assets and owns a hidden midstream asset that has attracted interest from external parties in the past. We believe BCEI’s stock is depressed primarily due to political risk in Colorado as legislators plot industry-unfriendly reforms, but we expect the company’s valuation to re-rate as the regulatory changes become finalized and investor uncertainty diminishes. |
| | | |
| | • | Hilltop Holdings, Inc. (ticker: HTH) is a holding company whose primary operations are a regional bank and a handful of ancillary finance-related businesses. Hilltop’s stock has underperformed due to a flattening yield curve and slower-than-expected loan growth. However, we believe the firm has been well-managed and the deliberate effort to restrain loan growth in the interest of good underwriting has masked meaningfully higher earnings power. |
Sales
| | • | We sold the Fund’s entire position in Donnelley Financial Solutions, Inc. (DFIN) during the first quarter, reallocating the proceeds in the opportunities discussed above. A combination of challenging fundamentals, our concern regarding management’s decision to invest in growth in its mature legacy business line, and management’s reluctance to return value to shareholders drove our decision. |
Top three contributors:
| | • | Skechers USA, Inc. (SKX) reported robust growth and better-than-expected margins for the fourth quarter of 2018, which drove a reversal in investor pessimism and a higher stock price following several quarters of slowing domestic results and margin compression. We believe the stock still trades at a meaningful discount to its valuation based on reasonable assumptions and continue to maintain the position. |
| | | |
| | • | During the quarter, it was reported that Protective Insurance Corporation (PTVCB) was in talks with several potential acquirers. This followed the company’s announcement in October of the formation of a Board subcommittee to explore opportunities to maximize long-term value, a common precursor to a company sale. The share price increased as a result of this development. We continue to maintain a meaningful position in the stock. |
| | | |
| | • | Cabot Oil and Gas Corporation (COG) reported in-line results and, more importantly, began to show proof points regarding its two primary catalysts: a return to 20% production growth and an improvement in differentials as new takeaway pipelines begin operations. COG also jettisoned its only small exploration project during the quarter, clearing the way for consistent 20% production growth, reduced capex, substantial free cash flow production, and accelerated shareholder returns. We increased the Fund’s position meaningfully during the quarter and it is now our top holding. |
Top three detractors:
| | • | Net 1 UEPS Technologies, Inc. (UEPS) was the largest negative contributor during the quarter. In late January, UEPS preannounced two pieces of negative news: the reversal of a key South African Court decision and large operating losses in the December quarter. While we still believe there is value in the company’s collections of operating and investment assets, our confidence in management’s ability to realize that value has diminished materially. As a result, we have substantially reduced Net1’s position size in the Fund. |
| | | |
| | • | Amdocs Limited (DOX) reported satisfactory results but fell victim to a highly-publicized short seller report in early January that was skeptical of the company’s growth profile, accounting policies, and numerous other characteristics. While hyperbolic on many points, the report did raise some important questions, which we believe management addressed more than adequately on their Q4 earnings call several weeks later. Nevertheless, the accusations did create an overhang on the stock during the quarter. We have maintained the Fund’s position. |
| | | |
| | • | Hallmark Financial’s (HALL) stock fell during the first quarter despite Q4 results showcasing improved underwriting. While the company’s investment holdings predictably lost some value in Q4, we believe the stock’s decline was more due to the under-followed nature of this small, closely-held company than any fundamental developments. We maintained our position in the Fund. |
Looking forward, we are committed to executing on our core objectives by remaining focused on capital preservation, while finding opportunities to put capital to work at attractive risk-adjusted returns. We will remain both highly disciplined and highly opportunistic. While we cannot commit to doubling the size of the Fund’s equity exposure again over the next six months – cash levels remain dependent on the potential returns available in high-quality small cap companies – we stand prepared to do so should the opportunity arise. The flexibility to move quickly and opportunistically has been a hallmark of this strategy’s ability to add value throughout past market cycles. We believe this will prove to be true regarding our recent spike in activity, along with future opportunities to do so as they emerge.
Thank you for your investment.
 |  |
| Matt Parker, CFA, CPA | Joe Van Cavage, CFA |
| Intrepid Endurance Fund | Intrepid Endurance Fund |
| Co-Portfolio Manager | Co-Portfolio Manager |
Past performance is not a guarantee of future results.
Mutual fund investing involves risk. Principal loss is possible. The Fund is subject to special risks including volatility due to investments in smaller companies, which involve additional risks such as limited liquidity and greater volatility. The Fund may invest in foreign securities which involve greater volatility and political, economic and currency risks and differences in accounting methods. The risks of owning ETFs generally reflect the risks of owning the underlying securities they are designed to track. ETFs also have management fees that increase their costs versus the costs of owning the underlying securities directly.
Prior to June 26, 2015, the Fund was named the Intrepid Small Cap Fund.
The Morningstar Small Cap Index tracks the performance of U.S. small-cap stocks that fall between 90th and 97th percentile in market capitalization of the investable universe. You cannot invest directly in an index. The index is used herein for comparative purposes in accordance with SEC regulations.
Tangible Book Value is the total net asset value of a company (book value) minus intangible assets and goodwill. Free Cash Flow measures the cash generating capability of a company by subtracting capital expenditures from cash flow from operations.
Capital Expenditure (CAPEX) is incurred when a business spends money either to buy fixed assets or to add to the value of an existing fixed asset with a useful life extending beyond the taxable year.
Opinions expressed are subject to change, are not guaranteed and should not be considered investment advice or recommendations to buy or sell any security.
Fund holdings and sector allocations are subject to change at any time and should not be considered a recommendation to buy or sell any security. Please see the Schedule of Investments in this report for complete Fund holdings.
The Intrepid Capital Funds are distributed by Quasar Distributors, LLC.
April 8, 2019
| | |  | |
| Mark F. Travis, President/C.E.O. | | Hunter Hayes | |
| Income Fund Co-Portfolio Manager | | Income Fund Co-Portfolio Manager | |
Dear Fellow Shareholders,
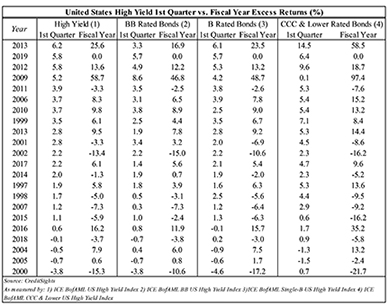
After a tumultuous fourth quarter last year, markets shrugged off the short-lived period of volatility and rallied for the first three months of 2019. Rising rates, decreasing profitability, and overleveraged balance sheets were worries of the past as corporate bond investors reached for yield and pushed risk-on assets back to peak price levels. High yield bonds outperformed Treasuries by one of the widest margins for a first quarter in the last two decades, bolstered by the lowest rung of the credit quality ladder.
At the beginning of the year, Federal Funds futures implied there was a 13% chance of a rate hike, a 3% chance of a rate cut, and an 84% chance of no rate change at the September FOMC meeting. By the end of the first quarter, the same methodology implied a 0% chance of a rate hike, a 45% chance that rates are cut, and a 55%
chance that rates stay the same. We believe that interest rate expectations, more than any other variable, were what drove this quarter’s returns. As long as rates remain low, investors will hunt for an adequate yield in parts of the market they otherwise wouldn’t. Additionally, with rates low, companies with onerous debt loads can raise or refinance debt at a lower cost of interest, often kicking debt repayment further down the road and adding more leverage to heavily encumbered balance sheets.
Last quarter saw one of the longest issuance droughts on record in the high-yield debt market. Not a single deal priced in December 2018, the first time that has happened since November 2008. That drought came to an end in the first quarter of this year, with 80 deals pricing for nearly $61 billion dollars. Although the reopening of the debt window is a natural consequence of the Fed’s dovish commentary, we were surprised by some of the types of deals that have been getting done.
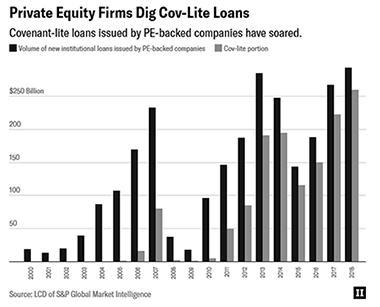
Debt investors are universally weary of private equity sponsors. PE firms take over companies in deals funded with debt and influence the companies’ decisions with the goal of reaping a gain from their equity in a subsequent buyout. We have talked in previous letters about the trend towards covenant-lite credit agreements, which lack safeguards protecting lenders. Around 89% of institutional loans issued last year by private equity-backed borrowers fall under this category. We believe this is another consequence of low interest rates and yield-starved investors.
If credit markets continue to rip, these loans will likely continue to squeeze through. The lack of covenants won’t begin to hurt investors until we go into a default cycle and investors start to worry about potential recoveries. By then, it will be too late.
In a sign of the times, Sycamore, a private equity firm, is about to pull off a $5.4 billion refinancing of Staples, the once-popular office supply company and a former Intrepid equity holding. As part of the refinancing, Sycamore will pay itself a $1 billion dividend. Combined with another payment it took in January, Sycamore has recovered 80% of the equity it originally put up as part of the deal. PE investors normally run companies for many years before taking profits or exiting. Sycamore has managed to pull this off in just two.
We were interested to hear that investors were clamoring to get their hands on this deal and that the book for the new notes was oversubscribed. Sycamore was involved in several retail bankruptcies over the past several years, including Aeropostale and Nine West. Credit default swaps, essentially “insurance” on a company’s debt in the event they default, rose significantly for Staples following the deal.
The Sycamore dividend recapitalization at Staples is just one of many eyebrow-raising deals we’ve seen come to market over the past few months. As investors continue to hunt for yield at the expense of covenant protections and cash flow support, our emphasis remains on finding reliable, creditworthy businesses to lend to at an acceptable rate of interest. Our thoroughly researched holdings and low portfolio duration give us confidence we are well positioned for another shock to the credit markets. In the meantime, we continue to find unique positions that have the potential to perform well in any market.
As we mentioned, corporate bonds saw gains across the board to start off the year. The ICE BofAML High Yield Index (the “HY Index”) returned 7.40%, composed of a 5.70% increase in price and a 1.70% gain from interest income, in the quarter ended March 31, 2019. The shorter-duration Bloomberg Barclays US Govt/Credit 1-5 Year Total Return USD Index (the “1-5 year TR Index”) gained 1.62%. Longer-duration investment grade securities also outperformed, but to a lesser extent. The Bloomberg Barclays US Aggregate Index (the “Barclays Aggregate Index”) returned 2.94% for the quarter and the ICE BofAML US Corporate Index (the “Corporate Index”) recorded a 5.01% gain over the same period. The Intrepid Income Fund (the “Fund”) gained 2.36% in the quarter ended March 31, 2019.
Our performance in the first six months of the Fund’s fiscal year was also favorable. The Income Fund returned 1.84% in the six-month period ended March 31, 2019, compared to a 2.39% gain for the HY Index and a 3.10% gain for the 1-5 year TR Index. Investment grade bonds recorded better results for the period with the Barclays Aggregate Index gaining 4.63%, and the Corporate Index gaining 4.95%. We are happy with our results over the past three and six months. The Fund’s effective duration remains below one and the majority of our holdings are rated investment grade as of quarter-end.1 Our objective has always been on downside risk mitigation while still meaningfully participating in the upside. We believe we are positioned well to continue doing that.
_________________
1 According to S&P’s rating of grade level BBB- or better.
The Fund’s top contributors for both the three and six-month periods ending March 31, 2019, were FirstCash Inc. 5.375% notes due 6/01/2024, Central Garden 6.125% notes due 11/15/2023, and Caleres 6.25% notes due 8/15/2023. Although all three of these companies had solid year-end earnings and continue to be core holdings for us, their strong returns reflect the broader surge in high yield markets. The Fund had no material detractors in the 1st quarter of 2019 or the first six months of the Fund’s fiscal year.
The Income Fund had four corporate bond positions that were called or matured in the first quarter. We also rebalanced several positions. The proceeds from the bonds that matured or were called were redeployed into short-term paper of investment grade issuers that we believe offer attractive yields in excess of government securities. Additionally, we purchased bonds in four new companies – General Motors, Invista Finance, Nexteer Automotive Group, and LSC Communications.
General Motors Co. (“GM”) is one of the more conservatively positioned US automakers. Compared to Ford, its closest comp, GM is less leveraged and its operations have been faring better. The GM 8/07/2020 floating rate notes we purchased seem very defensible given the fact that the notes sit at the far less risky GM auto level (not GM financial). Additionally, GM is generating decent levels of cash, has $33.9 billion of untapped credit including a $4 billion 2021 revolver, and the company could pay for its debt obligations through 2020 with cash currently on hand. We believe the debt was mispriced when we purchased it because of the negative sentiment around autos.
Invista Finance is a manufacturer of nylon, spandex, and polyester. The company is owned by Koch Industries and is one of the key suppliers to Lululemon. Invista has a pristine balance sheet with net cash and is growing on both the top and bottom line. Additionally, Koch Industries is a smart operator with deep pockets and tends to run their portfolio companies conservatively and not lever them up. We purchased the 4.25% secured notes due 10/15/2019, which come with an investment grade rating, at around par.
Nexteer Automotive Group is another automotive company whose debt we find attractive. Nexteer produces automotive components, mainly steering and driveline systems. The 5.875% unsecured notes due 11/15/2021 were yielding over 5% when we purchased them. Nexteer has a balance sheet that boasts net cash and the company is producing copious amounts of free cash flow (over a 10% free cash flow yield over the trailing 12 months). Its clients are some of the largest auto manufacturers in the world, and we believe the company can weather a downturn in the auto markets. The company also has an investment grade rating.
Lastly, LSC Communications specializes in print and print-related services, as well as office products. It’s 3.3x levered and has produced a lot of free cash flow. The company is being purchased by Quad/Graphics, Inc., which announced it will be
taking out the existing LSC Communications debt. The deal hasn’t been fully approved yet, but we believe it will get the necessary approvals by the end of the summer and that LSC’s 8.75% unsecured notes due 10/15/2023 will get a favorable call price or even a make-whole premium. Were that scenario to occur, the notes should generate a high-single-digit return or better.
Portfolio activity was otherwise subdued, but we are excited about the way we are currently positioned. We continue to diligently search for attractive opportunities to take credit risk while limiting the Fund’s duration, which as of March 31st was 0.89.
Thank you for your investment.
Sincerely,
 |  |
| Mark F. Travis, President | Hunter Hayes |
| Intrepid Income Fund | Intrepid Income Fund |
| Co-Portfolio Manager | Co-Portfolio Manager |
All investments involve risk. Principal loss is possible. Investments in debt securities typically decrease in value when interest rates rise. The risk is generally greater for longer term debt securities. Investments by the Fund in lower-rated and non-rated securities present a greater risk of loss to principal and interest than higher rated securities. The Fund may invest in foreign securities which involve greater volatility and political, economic and currency risks and differences in accounting methods.
The ICE BofAML US High Yield Index tracks the performance of US dollar denominated below investment grade corporate debt publicly issued in the US domestic market. Qualifying securities must have a below investment grade rating (based on an average of Moody’s, S&P and Fitch), at least 18 months to final maturity at the time of issuance, at least one year remaining term to final maturity as of the rebalancing date, a fixed coupon schedule and a minimum amount outstanding of $250 million. Bloomberg Barclays Capital U.S. Aggregate Bond Index is an index representing about 8,200 fixed income securities. To be included in the index, bonds must be rated investment grade by Moody’s and S&P. ICE BofAML U.S. Corporate Index is an unmanaged index of U.S. dollar denominated investment grade corporate debt securities publicly issued in the U.S. domestic market with at least one-year remaining term to final maturity. The Bloomberg Barclays US Gov/Credit 1-5Y TR Index measures the performance of U.S. dollar-denominated U.S. Treasury bonds, government-related bonds, and investment-grade U.S. corporate bonds that have a remaining maturity of greater than or equal to one year and less than five years. ICE BofAML B U.S. High Yield Index is a subset of the ICE BofAML US High Yield Index including all securities with a given investment grade rating B. ICE BofAML CCC & Lower US High Yield Index is a subset of the ICE BofAML US High Yield Index including all securities rated CCC and below, inclusive. You cannot invest directly in an index. The indices are used herein for comparative purposes in accordance with SEC regulations.
Bond ratings are grades given to bonds that indicate their credit quality as determined by private independent rating services such as Standard & Poor’s, Moody’s and Fitch. These firms evaluate a bond issuer’s financial strength, or its ability to pay a bond’s principal and interest in a timely fashion. Ratings are expressed as letters ranging from ‘AAA’, which is the highest grade, to ‘D’, which is the lowest grade.
Investing involves risk. Principal loss is possible.
A high-yield bond is a high paying bond with lower credit rating than investment-grade corporate bonds, Treasury bonds and municipal bonds. Bonds in high yield indices tend to be less liquid and more volatile than U.S. Treasuries. Corporate bonds come with significant credit risks and, although sometimes secured by collateral, do not have any guarantee of principal repayment. U.S. Treasury Bonds are long-term government debt securities with a maturity of more than 10 years. They are guaranteed as to the timely payment of principal and interest and are backed by the full faith and credit of the U.S. Government.
Yield is the income return on an investment. It refers to the interest or dividends received from a security and is usually expressed annually as a percentage based on the investment’s cost, its current market value or its face value. Investment Grade (IG) is a bond with credit rating of BBB or higher by Standard & Poor’s or Baa3 or higher by Moody’s. Cash Flow measures the cash generating capability of a company by adding non-cash charges and interest to pretax income. Duration is an approximate measure of the price sensitivity of a fixed-income investment to a change in interest rates, expressed as a number of years. A Credit Default Swap is a financial swap agreement that the seller of the CDS will compensate the buyer in the event of a debt default or other credit event. Par most commonly refers to bonds, in which case, it means the face value, or value at which the bond will be redeemed at maturity. Revolver is a borrower who carries a balance from month to month through a revolving credit line. Call is an option contract that gives the holder the right to buy a certain quantity of an underlying security from the writer of the option, at a specified price up to a specified date.
Opinions expressed are subject to change, are not guaranteed and should not be considered investment advice or recommendations to buy or sell any security.
Fund holdings and sector allocations are subject to change at any time and should not be considered a recommendation to buy or sell any security. Please see the Schedule of Investments in this report for complete Fund holdings.
The Intrepid Capital Funds are distributed by Quasar Distributors, LLC.
| Intrepid Disciplined Value Fund |
April 8, 2019
 | |
| Clay Kirkland, CFA | |
| Disciplined Fund Portfolio Manager | |
Dear Fellow Shareholders,
The first quarter of 2019 began with the world’s largest company, Apple, cutting its outlook for the year. It appeared as though we were set to see an extension of the volatility experienced in the fourth quarter and a further descent in the indices. However, Federal Reserve Chairman Jerome Powell’s early January comments, which were reiterated throughout the quarter, were enough to calm fears that the Fed was raising interest rates too quickly. The indices never looked back and rocketed to the best first quarter since 1998.1 Growth was once again favored over value, with some small cap growth indices outperforming small cap value by over 500 basis points in the quarter.
The Intrepid Disciplined Value Fund’s (the “Fund”) return of 5.97% fell well short of the S&P 500 Index and the S&P MidCap 400 Index for the quarter. While this is an attractive absolute return for a quarter, we expected to do better. We were hampered by higher than ideal cash levels in January, and frankly, many positions that inexplicably sat still as most stocks rallied. Perhaps most frustrating were a few positions that performed very well before giving back most of their gains, and in one case it resulted in a nearly 150 basis point reversal in the Fund’s return.
As mentioned in the last letter, the Intrepid Select Fund merged into the Disciplined Value Fund in late January. This resulted in new positions and required a rebalance of the portfolio. Rather than go through every new name that merged into the Disciplined Value Fund, we will instead focus on the new purchases.
We continue to find undervalued securities and have been deploying capital, leaving cash of 10% at quarter end. New purchases during the quarter include Vistra Energy (ticker: VST), Take-Two Interactive Software (ticker: TTWO), Multi-Color Corp (ticker: LABL), and Bonanza Creek Energy (ticker: BCEI).
Vistra Energy was a subsidiary of TXU and was spun off in 2016. It emerged from bankruptcy with little debt and is now the largest independent power producer in the country. Vistra’s management team is top-notch in our opinion and has committed to maintain a strong balance sheet by remaining disciplined in its approach. In what has historically been a volatile industry, the company is taking a different approach, having structured itself seeking to generate stable cash flows while taking little balance sheet risk. Vistra generates copious free cash flow and has a high-teens yield at its current valuation. The company recently announced a dividend and is also repurchasing shares. For additional detail on Vistra, please see the Intrepid Capital Fund’s commentary.
_________________
1 For the S&P 500
| Intrepid Disciplined Value Fund |
Multi-Color Corp is a company we have followed for years as holders of its debt. The label manufacturer has been around for over a century and produces a variety of labels for products like detergents, beverages, chewing gum, and liquid cleaners. Its customers include large corporations like Proctor & Gamble and Miller Brewing. We purchased shares shortly before it was announced that the company would be acquired by a private equity firm that owns a competitor. The premium is not what we would have expected, but we do acknowledge that the company is facing some challenges that will take time to work through, so going private was the right move in our opinion.
Bonanza Creek Energy is a small cap E&P (Exploration & Production) with 67,000 net acres in Weld County, Colorado. Similar to other Colorado-exposed producers, Bonanza trades at extremely depressed multiples primarily due to political risk as Colorado legislators work to implement regulatory changes. We do not believe Bonanza will be materially affected by the proposed changes and anticipate the valuation to re-rate once everything is finalized. As it stands now, Bonanza is in the unique position of having a very clean balance sheet with little debt that should support 20%+ production growth going forward. Furthermore, the market is assigning little to no value to its midstream operations, despite the company having fetched bids for the asset in the past amounting to half of the company’s current market cap.
Take-Two Interactive Software develops and publishes video games. It is the owner of some of the most popular and valuable franchises like Grand Theft Auto. The group has come under pressure over the past year due to competition from a new entrant in the space. We like the asset-light business and the fact that Take-Two has over $1.6 billion in cash on its balance sheet. We believe the company’s earnings power is significantly higher and is being undervalued by investors. In addition, the fact that its recurring revenue streams continue to grow should help margins improve.
The three largest contributors in the quarter were Oaktree Capital Group (ticker: OAK), Laboratory Corp (ticker: LH), and Skechers USA (ticker: SKX).
We have written about Oaktree in the past and thought of it as a defensive investment. We argued the distressed credit investment manager would be able to call (and begin charging fees) on committed capital that has been standing by idle whenever the credit markets experienced turmoil. We will not have the opportunity to see that play out, as it was announced on March 13th that Brookfield Asset Management would be acquiring Oaktree. The deal came at only a 12.4% premium and consisted of both a cash and stock component. This was about 2% below where we had valued the shares. The position was one of our largest weights, so we reduced it materially.
Labcorp was one of the largest detractors in the fourth quarter but was just the opposite in the first quarter. We thought the shares had fallen too far as investors turned overly pessimistic on the company and its main competitor. Not much has changed. The equity’s strong performance likely had much to do with the overall market rally.
| Intrepid Disciplined Value Fund |
Shares of Skechers performed very well in the quarter after the company was rumored to be an acquisition target in January and then reported better than expected fourth quarter earnings in February. We put little weight in the rumor but were pleased with the progress made with its margins following several quarters of domestic margin compression. We believe the company is currently valued as if it will have little to no growth going forward, and that simply is not the case. We look forward to the shares re-rating as the company executes on its plan.
The three largest detractors to performance in the first quarter were Net 1 UEPS Technologies (ticker: UEPS), Party City (ticker: PRTY), and Amdocs (ticker: DOX).
Net 1 UEPS has been mentioned in a negative light in prior letters and this quarter is no different. Management once again disappointed investors and lost what little credibility it had left when the company pre-announced more negative news in January. We had continued to own UEPS due to the substantial discount that the equity traded relative to its net assets and the fact that it was still generating strong cash flow. However, after reporting a large operating loss we felt misled by management and decided to exit the position completely.
Party City was a top contributor in the fourth quarter, but unfortunately, we did not take advantage of the strength to sell any of our position and it reversed course during the first quarter. There is a worldwide shortage of helium that is resulting in elevated prices and is negatively impacting the company’s ability to keep the gas in stock. We thought this issue would be resolved more quickly but it continues to linger. Compounding matters, inventory was much too high exiting the fourth quarter which, given the very low rate of revenue growth, is concerning. We still believe that shares are undervalued but question whether investors will look past the other issues or simply wait until the story becomes cleaner.
Amdocs is a company we have owned as a firm for many years. We like its business as it is a steady grower with a history of stable cash flows. However, the company came under attack in January when a well-known short seller published a report questioning the steady growth and alleging accounting irregularities among other things. We acknowledge that some of the concerns raised were valid points, but we were satisfied with management’s explanations and continue to own the shares.
The final position we will discuss is Protective Insurance Corp (ticker: PTVCB). It was the largest position in the Fund during the quarter, at nearly 7.5% of assets at its peak. We wrote about Protective last quarter, summarizing the challenges the company faced and why we continued to own the shares. We urged the Board to sell the company since the public markets were not giving it proper credit for its business, and it appeared as though a sale was in the works when it was reported in February that the company was in talks with multiple interested parties. The shares shot up in value on the news to a level we thought was still a material discount to where a transaction would take place. Unfortunately, another bad quarter which
| Intrepid Disciplined Value Fund |
included an announcement that the dividend would be slashed sent the share price reeling once again. While the equity remains at depressed valuations, we decided to trim our position in an effort to better manage risk given the illiquid nature of the investment and because it appears a sale is now off the table.
Hindsight is 20/20, making it easy to look back and question a few key decisions that had a material impact on performance. We’d rather focus on the future and on how we can improve. We are optimistic on the portfolio’s prospects and believe it is well-positioned to better capture market appreciation and defend against drawdowns.
Thank you for your investment.
Sincerely,
Clay Kirkland, CFA
Intrepid Disciplined Value Fund Portfolio Manager
All investments involve risk. Principal loss is possible. The Fund is subject to special risks including volatility due to investments in smaller and medium sized companies, which involve additional risks such as limited liquidity and greater volatility. The Fund may invest in foreign securities which involve greater volatility and political, economic and currency risks and differences in accounting methods.
Prior to April 1, 2013, the Fund was named the Intrepid All Cap Fund.
The S&P 500 Index is a broad based, unmanaged index of 500 stocks, which is widely recognized as representative of the U.S. equity market in general. The S&P MidCap 400 Index seeks to track the performance of mid-cap U.S. equities, representing more than 7% of available U.S. market cap. You cannot invest directly in an index. The indices are used herein for comparative purposes in accordance with SEC regulations.
Free Cash Flow measures the cash generating capability of a company by subtracting capital expenditures from cash flow from operations. Basis Point is a unit that is equal to 1/100th of 1% and is used to denote the change in a financial instrument.
Opinions expressed are subject to change, are not guaranteed and should not be considered investment advice or recommendations to buy or sell any security.
Fund holdings and sector allocations are subject to change at any time and should not be considered a recommendation to buy or sell any security. Please see the Schedule of Investments in this report for complete Fund holdings.
The Intrepid Capital Funds are distributed by Quasar Distributors, LLC.
| Intrepid International Fund |
April 8, 2019
 | |
| Ben Franklin, | |
| International Fund | |
| Portfolio Manager | |
Dear Fellow Shareholders,
After a difficult fourth quarter, markets rebounded in the first quarter of 2019. The MSCI EAFE Index (the “Index”) increased 9.98% during the quarter. The Intrepid International Fund (the “Fund”) did not quite keep up, climbing only 7.01%. Despite the short-term underperformance, we are encouraged by the improved fundamentals of most stocks held in the Fund. While it’s impossible to ever know why markets do what they do, we speculate the dovish position of central banks around the world contributed to the rebound. It appears there is zero acceptance for market volatility – at the first whiff of trouble central banks step in. We do not believe this is a solid approach as it can result in more instability. Nicholas Taleb devoted most of his book “Antifragile” to this mistake in judgment. In it, he compares the destruction caused by the inability to stomach small variations to “systematically preventing forest fires”:
Variations also act as purges. Small forest fires periodically cleanse the system of the most flammable material, so this does not have the opportunity to accumulate. Systematically preventing forest fires from taking place “to be safe” makes the big one much worse. For similar reasons, stability is not good for the economy: firms become very weak during long periods of steady prosperity devoid of setbacks, and hidden vulnerabilities accumulate silently under the surface—so delaying crises is not a very good idea. Likewise, absence of fluctuations in the market causes hidden risks to accumulate with impunity. The longer one goes without a market trauma, the worse the damage when commotion does occur.
To be clear, we do not know what will happen in the future; however, cycles do exist, and we do not see this phenomenon ceasing. As investors, we attempt to make prudent choices based on the risks we see in the market. And despite some large macro risks, we believe there are still some attractively priced securities to invest in. We are happy with the positioning of the Fund regardless of what the global economy has in store for us.
For the half-year period ending March 31, 2019, the portfolio declined 5.97%, compared to the Index’s decline of 3.81%. In general, smaller companies declined more than larger ones. For example, the EAFE Small Cap index declined 7.10% over the same period. Many of our smaller, more illiquid names fell significantly in the fourth quarter of 2018 and did not bounce back as much as we had hoped in the first quarter.
During the first quarter, the three largest contributors were Noranda Income Fund (ticker: NIF-U CN), Coventry Group (ticker: CYG AU), and Stallergenes Greer
| Intrepid International Fund |
(ticker: STAGR FP). There were only a few detractors, including Net 1 UEPS (ticker: UEPS), Hornbach Baumarkt (ticker: HBM GR), and Quarto Group (ticker: QRT LN).
Noranda Income Fund is a long-term holding that we have discussed in previous commentaries. The company is a Canadian zinc smelter whose stock price historically traded below its working capital per share. Coming back to the theme of cycles, the zinc smelting market had been at a cyclical low. Despite this, the company was still generating cash. While we typically do not purchase cyclical companies, the value on the balance sheet was enough for us to have confidence to hold the stock through a cyclical low. The zinc smelting market began to rebound in 2018 and into 2019. When the company renegotiated its annual contract to smelt zinc for Glencore in February, the terms were much more advantageous for the company and its stock price responded in kind. We have been taking advantage of the strength of the stock price (up 75% in local currency terms in the first quarter) to reduce our position.
Noranda is a good example of our discipline of remaining patient paying off. We have owned the stock for a long time, and it appeared as if the stock would never go up. We were confident that the value was there, but that it would take time for it to be realized. We think many market participants had simply given up. While this has been a long-term holding for us, and frustrating at times, we were happy to see the market finally unlock its true worth. The stock is now 137% off its 52-week low. We have several more ideas in the portfolio that have been flat to down for a long time, but we believe in the end the value will be realized.
Coventry Group is discussed frequently in commentaries due to its large position size causing it to be either a contributor or detractor each quarter. This quarter, it was a contributor. The company has been on an acquiring spree. Normally, we are not fans of this type of management behavior, but due to the company’s large tax loss carryforwards, as well as the types of businesses they are acquiring, we think it is a sound strategy. The fundamentals continue to improve for its core business, and we look forward to owning this position for a long time to come.
Stallergenes Greer is a company in the allergen immunotherapy industry. The company produces solutions for people suffering from allergic reactions to common allergens such as dust mites. In America, this is typically deployed by giving patients a shot containing a cocktail of allergens they are allergic to. The fundamentals have been improving and the majority holder of the company, Ares Life Sciences, offered to buy out the minority shareholders at a 43% premium. While we see the deal as likely to happen, we do not believe there is a high probability of a better deal for shareholders. The shares traded up to close to the buyout price, and we took advantage of this to completely exit the position after the end of the quarter.
On the last day of January, we were caught by surprise when Net 1 UEPS Technologies Inc. (“UEPS”) issued a brief press release. According to the release, the High Court of the Republic of South Africa had reversed a portion of a November
| Intrepid International Fund |
decision that now made it unlikely a large number of EPE account holders would continue to get paid social grants. This November court decision was one of the key reasons we were still bullish on the stock in our last commentary. Additionally, the company announced it expected significant losses for the quarter and would try and get back to break-even status by the end of June. We still believe UEPS has substantial value in its investments outside of South Africa and could take steps to realize that value. The stock currently trades at a substantial discount to the market value of these investments.
Hornbach Baumarkt is a German DIY retailer. The company’s revenue has been consistently increasing; however, the bottom line has gone in the opposite direction. The reason is due to higher purchasing costs, as well as costs associated with growing their digital offering. With the former, we expect the cost pressures to abate as they are affecting the entire industry. With regards to the large investment in digital, while it has hurt earnings it has positioned Hornbach as the number one online DIY retailer in Germany. We believe this is a sound strategy, but it may take years for it to pay off.
Quarto Group is a long-time holding of the Fund. Over the last year the company’s earnings and cash flow have improved; however, there is still concern over the amount of debt the company carries on its balance sheet. We believe the company is taking the right steps and has the right person in charge with CK Lau leading the company.
Cash and cash equivalents increased from about 12% at the end of the calendar year to 18% by the end of the first quarter. Despite selling down many of our positions, we still believe there are attractive securities in the portfolio that we look forward to owning over the coming years. We continue to search for attractive investments to take the place of those that we have exited.
Thank you for your investment.
Sincerely,
Ben Franklin, CFA
Intrepid International Fund Portfolio Manager
Mutual fund investing involves risk. Principal loss is possible. The Fund is subject to special risks including volatility due to investments in smaller companies, which involve additional risks such as limited liquidity and greater volatility. The Fund may invest in foreign securities which involve greater volatility and political, economic and currency risks and differences in accounting methods. The risks of owning ETFs generally reflect the risks of owning the underlying securities they are designed to track. ETFs also have management fees that increase their costs versus the costs of owning the underlying securities directly.
| Intrepid International Fund |
The MSCI EAFE Net Index is recognized as the pre-eminent benchmark in the United States to measure international equity performance. The MSCI EAFE Hedged Index represents a close estimation of the performance that can be achieved by hedging the currency exposures of its parent index, the MSCI EAFE Index, to the USD, the “home” currency for the hedged index. The index is 100% hedged to the USD by selling each foreign currency forward at the one-month Forward weight. The S&P 500 Index is a broad based, unmanaged index of 500 stocks, which is widely recognized as representative of the U.S. equity market in general. You cannot invest directly in an index. The indices are used herein for comparative purposes in accordance with SEC regulations.
Yield is the income return on an investment. It refers to the interest or dividends received from a security and is usually expressed annually as a percentage based on the investment’s cost, its current market value or its face value. Cash Flow measures the cash generating capability of a company by adding non-cash charges and interest to pretax income. Free Cash Flow measures the cash generating capability of a company by subtracting capital expenditures from cash flow from operations. EBIT refers to Earnings before Interest and Taxes. Basis Points (bps) is a unit that is equal to 1/100th of 1% and is used to denote the change in a financial instrument. Tax Loss Carryfoward is an accounting technique that applies the current year’s net operating losses to future years’ profits in order to reduce tax liability.
As of 3/31/19, 1 USD = 0.89039 EUR (€), 1.33432 CAD (C$), 1.40910 AUD (A$)
Opinions expressed are subject to change, are not guaranteed and should not be considered investment advice or recommendations to buy or sell any security.
Fund holdings and sector allocations are subject to change at any time and should not be considered a recommendation to buy or sell any security. Please see the Schedule of Investments in this report for complete Fund holdings.
Diversification does not guarantee a profit or protect from loss in a declining market.
The Intrepid Capital Funds are distributed by Quasar Distributors, LLC.
On April 30, 2018, the Board of Trustees approved the liquidation of the Fund on or around September 27, 2019. In anticipation of the liquidation, the Fund was closed to new investors on May 8, 2019, and the Fund is no longer being managed to achieve its investment objective, but is being managed to effect the liquidation.
| EXPENSE EXAMPLE |
| March 31, 2019 (Unaudited) |
As a shareholder of the Intrepid Capital Management Funds Trust (the “Funds”), you incur ongoing costs, including management fees; distribution and/or service fees; and other expenses incurred by the Funds. This example is intended to help you understand your ongoing costs (in dollars) of investing in the Funds and to compare costs with the ongoing costs of investing in other mutual funds.
The example is based on an investment of $1,000 invested at the beginning of the period and held the entire period of October 1, 2018 through March 31, 2019.
Actual Expenses
The first line of the following table provides information about actual account values and actual expenses. Although the Funds charge no sales load or transaction fees, you will be assessed fees for outgoing wire transfers, returned checks or stop payment orders at prevailing rates charged by U.S. Bank Global Fund Services, the Funds’ transfer agent. If you request a redemption be made by wire transfer, currently a $15.00 fee is charged by the Funds’ transfer agent. To the extent that a Fund invests in shares of other investment companies as part of its investment strategy, you will indirectly bear your proportionate share of any fees and expenses charged by the underlying funds in which the Fund invests in addition to the expenses of the Fund. Actual expenses of the underlying funds are expected to vary among the various underlying funds. These expenses are not included in the following example. The example includes, but is not limited to, management fees, shareholder servicing fees, distribution fees, fund accounting, custody and transfer agent fees. However, the example below does not include portfolio trading commissions and related expenses, interest expense and other extraordinary expenses as determined under generally accepted accounting principles. You may use the information in this line, together with the amount you invested, to estimate the expenses that you paid over the period. Simply divide your account value by $1,000 (for example, an $8,600 account value divided by $1,000 = 8.6), then multiply the result by the number in the first line under the heading entitled “Expenses Paid During Period” to estimate the expenses you paid on your account during this period.
Hypothetical Example for Comparison Purposes
The second line of the following table provides information about hypothetical account values and hypothetical expenses based on the Funds’ actual expense ratio and an assumed rate of return of 5% per year before expenses, which is not the Funds’ actual return. The hypothetical account values and expenses may not be used to estimate the actual ending account balance or expenses you paid for the period. You may use this information to compare the ongoing costs of investing in the Funds and other funds. To do so, compare this 5% hypothetical example with the 5% hypothetical examples that appear in the shareholder reports of the other funds.
| EXPENSE EXAMPLE (continued) |
| March 31, 2019 (Unaudited) |
Please note that the expenses shown in the table are meant to highlight your ongoing costs only and do not reflect any transactional costs, such as sales charges (loads), redemption fees, or exchange fees. Therefore, the second line of the table is useful in comparing ongoing costs only, and will not help you determine the relative costs of owning different funds. In addition, if these transactional costs were included, your costs would have been higher.
INTREPID CAPITAL FUND – INVESTOR CLASS
| | | | Expenses Paid |
| | Beginning | Ending | During Period* |
| | Account Value | Account Value | October 1, 2018 - |
| | October 1, 2018 | March 31, 2019 | March 31, 2019 |
| Actual | $1,000.00 | $ 931.70 | $6.74 |
| Hypothetical (5% return | | | |
| before expenses) | 1,000.00 | 1,017.95 | 7.04 |
| * | Expenses are equal to the Fund’s annualized expense ratio of 1.40%, multiplied by the average account value over the period, multiplied by 182/365 to reflect the period. |
INTREPID CAPITAL FUND – INSTITUTIONAL CLASS
| | | | Expenses Paid |
| | Beginning | Ending | During Period* |
| | Account Value | Account Value | October 1, 2018 - |
| | October 1, 2018 | March 31, 2019 | March 31, 2019 |
| Actual | $1,000.00 | $ 932.30 | $5.54 |
| Hypothetical (5% return | | | |
| before expenses) | 1,000.00 | 1,019.20 | 5.79 |
| * | Expenses are equal to the Fund’s annualized expense ratio of 1.15%, multiplied by the average account value over the period, multiplied by 182/365 to reflect the period. |
INTREPID ENDURANCE FUND – INVESTOR CLASS
| | | | Expenses Paid |
| | Beginning | Ending | During Period* |
| | Account Value | Account Value | October 1, 2018 - |
| | October 1, 2018 | March 31, 2019 | March 31, 2019 |
| Actual | $1,000.00 | $ 985.10 | $6.73 |
| Hypothetical (5% return | | | |
| before expenses) | 1,000.00 | 1,018.15 | 6.84 |
| * | Expenses are equal to the Fund’s annualized expense ratio of 1.36%, multiplied by the average account value over the period, multiplied by 182/365 to reflect the period. |
| EXPENSE EXAMPLE (continued) |
| March 31, 2019 (Unaudited) |
INTREPID ENDURANCE FUND – INSTITUTIONAL CLASS
| | | | Expenses Paid |
| | Beginning | Ending | During Period* |
| | Account Value | Account Value | October 1, 2018 - |
| | October 1, 2018 | March 31, 2019 | March 31, 2019 |
| Actual | $1,000.00 | $ 986.00 | $5.69 |
| Hypothetical (5% return | | | |
| before expenses) | 1,000.00 | 1,019.20 | 5.79 |
| * | Expenses are equal to the Fund’s annualized expense ratio of 1.15%, multiplied by the average account value over the period, multiplied by 182/365 to reflect the period. |
INTREPID INCOME FUND
| | | | Expenses Paid |
| | Beginning | Ending | During Period* |
| | Account Value | Account Value | October 1, 2018 - |
| | October 1, 2018 | March 31, 2019 | March 31, 2019 |
| Actual | $1,000.00 | $1,018.40 | $4.53 |
| Hypothetical (5% return | | | |
| before expenses) | 1,000.00 | 1,020.44 | 4.53 |
| * | Expenses are equal to the Fund’s annualized expense ratio of 0.90%, multiplied by the average account value over the period, multiplied by 182/365 to reflect the period. |
INTREPID DISCIPLINED VALUE FUND
| | | | Expenses Paid |
| | Beginning | Ending | During Period* |
| | Account Value | Account Value | October 1, 2018 - |
| | October 1, 2018 | March 31, 2019 | March 31, 2019 |
| Actual | $1,000.00 | $ 920.60 | $6.22 |
| Hypothetical (5% return | | | |
| before expenses) | 1,000.00 | 1,018.45 | 6.54 |
| * | Expenses are equal to the Fund’s annualized expense ratio of 1.30%, multiplied by the average account value over the period, multiplied by 182/365 to reflect the period. |
| EXPENSE EXAMPLE (continued) |
| March 31, 2019 (Unaudited) |
INTREPID INTERNATIONAL FUND
| | | | Expenses Paid |
| | Beginning | Ending | During Period* |
| | Account Value | Account Value | October 1, 2018 - |
| | October 1, 2018 | March 31, 2019 | March 31, 2019 |
| Actual | $1,000.00 | $ 940.30 | $6.77 |
| Hypothetical (5% return | | | |
| before expenses) | 1,000.00 | 1,017.95 | 7.04 |
| * | Expenses are equal to the Fund’s annualized expense ratio of 1.40%, multiplied by the average account value over the period, multiplied by 182/365 to reflect the period. |
| ALLOCATION OF PORTFOLIO HOLDINGS (as a % of total net assets) |
| March 31, 2019 (Unaudited) |
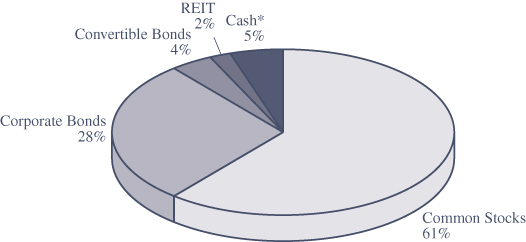
INTREPID CAPITAL FUND
| Components of Portfolio Holdings | | | |
| Common Stocks | | $ | 98,159,841 | |
| Corporate Bonds | | | 44,286,111 | |
| Convertible Bonds | | | 6,082,600 | |
| Real Estate Investment Trust (REIT) | | | 2,792,681 | |
| Cash* | | | 8,103,567 | |
| | | $ | 159,424,800 | |
* Cash, cash equivalents and other assets less liabilities.
| ALLOCATION OF PORTFOLIO HOLDINGS (as a % of total net assets) |
| March 31, 2019 (Unaudited) |
INTREPID ENDURANCE FUND
| Components of Portfolio Holdings | | | |
| Financials | | $ | 14,144,241 | |
| Information Technology | | | 6,609,026 | |
| Energy | | | 6,009,926 | |
| Consumer Discretionary | | | 4,962,120 | |
| Exchange-Traded Fund | | | 3,194,040 | |
| Industrials | | | 2,652,591 | |
| Real Estate | | | 2,231,953 | |
| Consumer Staples | | | 1,003,766 | |
| Cash* | | | 58,049,323 | |
| | | $ | 98,856,986 | |
The sector and industry classifications presented in this report, present the Global Industry Classification Standard (GICS®). GICS® was developed by and/or is the exclusive property of MSCI, Inc. and Standard & Poor Financial Services LLC (“S&P”). GICS® is a service mark of MSCI and S&P and has been licensed for use by U.S. Bancorp Fund Services, LLC.
* Cash, cash equivalents and other assets less liabilities.
Note: For purposes of categorizing securities for compliance with Section 8(b)(1) of the Investment Company Act of 1940, as amended, the Fund uses more specific industry classifications.
| ALLOCATION OF PORTFOLIO HOLDINGS (as a % of total net assets) |
| March 31, 2019 (Unaudited) |
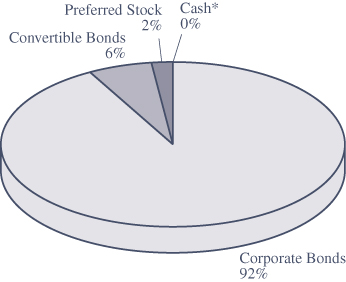
INTREPID INCOME FUND
| Components of Portfolio Holdings | | | |
| Corporate Bonds | | $ | 56,750,304 | |
| Convertible Bonds | | | 3,813,762 | |
| Preferred Stock | | | 1,156,201 | |
| Cash* | | | (286,599 | ) |
| | | $ | 61,433,668 | |
* Cash, cash equivalents and other liabilities in excess of other assets.
| Intrepid Disciplined Value Fund |
| ALLOCATION OF PORTFOLIO HOLDINGS (as a % of total net assets) |
| March 31, 2019 (Unaudited) |
INTREPID DISCIPLINED VALUE FUND
| Components of Portfolio Holdings | | | |
| Financials | | $ | 10,211,788 | |
| Consumer Discretionary | | | 6,677,443 | |
| Health Care | | | 5,634,985 | |
| Information Technology | | | 5,522,841 | |
| Communication Services | | | 4,611,511 | |
| Exchange-Traded Funds | | | 2,618,004 | |
| Industrials | | | 2,386,733 | |
| Consumer Staples | | | 2,034,493 | |
| Utilities | | | 1,231,219 | |
| Real Estate | | | 951,650 | |
| Energy | | | 566,774 | |
| Cash* | | | 4,892,646 | |
| | | $ | 47,340,087 | |
* Cash, cash equivalents and other assets less liabilities.
Note: For purposes of categorizing securities for compliance with Section 8(b)(1) of the Investment Company Act of 1940, as amended, the Fund uses more specific industry classifications.
| Intrepid International Fund |
| ALLOCATION OF PORTFOLIO HOLDINGS (as a % of total net assets) |
| March 31, 2019 (Unaudited) |
INTREPID INTERNATIONAL FUND
| Components of Portfolio Holdings | | | |
| Industrials | | $ | 3,649,291 | |
| Financials | | | 3,229,588 | |
| Consumer Staples | | | 2,199,543 | |
| Consumer Discretionary | | | 2,164,800 | |
| Information Technology | | | 1,837,694 | |
| Health Care | | | 1,309,829 | |
| U.S. Government Note | | | 1,243,750 | |
| Communication Services | | | 987,848 | |
| Materials | | | 951,949 | |
| Cash* | | | 2,612,892 | |
| | | $ | 20,187,184 | |
* Cash, cash equivalents and other assets less liabilities.
Note: For purposes of categorizing securities for compliance with Section 8(b)(1) of the Investment Company Act of 1940, as amended, the Fund uses more specific industry classifications.
| SCHEDULE OF INVESTMENTS |
| March 31, 2019 (Unaudited) |
| COMMON STOCKS - 61.57% | | Shares | | | Value | |
| Automobiles & Components - 1.08% | | | | | | |
| GUD Holdings Ltd. (a) | | | 202,949 | | | $ | 1,719,162 | |
| | | | | | | | | |
| Commercial & Professional Services - 3.57% | | | | | | | | |
| Gattaca PLC (a)(b) | | | 1,967,030 | | | | 2,997,506 | |
| SP Plus Corp.(c) | | | 79,100 | | | | 2,698,892 | |
| | | | | | | | 5,696,398 | |
| Consumer Durables & Apparel - 2.22% | | | | | | | | |
| Skechers U.S.A., Inc. - Class A (c) | | | 105,100 | | | | 3,532,411 | |
| | | | | | | | | |
| Consumer Services - 4.68% | | | | | | | | |
| The Cheesecake Factory, Inc. | | | 84,525 | | | | 4,134,963 | |
| Wyndham Destinations, Inc. | | | 82,370 | | | | 3,335,161 | |
| | | | | | | | 7,470,124 | |
| Diversified Financials - 9.45% | | | | | | | | |
| Berkshire Hathaway, Inc. - Class B (c) | | | 34,200 | | | | 6,870,438 | |
| Greenhill & Co., Inc. | | | 78,293 | | | | 1,684,082 | |
| Jefferies Financial Group, Inc. | | | 196,420 | | | | 3,690,732 | |
| The Bank Of New York Mellon Corp. | | | 56,130 | | | | 2,830,636 | |
| | | | | | | | 15,075,888 | |
| Energy - 2.79% | | | | | | | | |
| Cabot Oil & Gas Corp. | | | 170,600 | | | | 4,452,660 | |
| | | | | | | | | |
| Food, Beverage & Tobacco - 1.86% | | | | | | | | |
| Berentzen-Gruppe AG (a)(b) | | | 383,375 | | | | 2,958,764 | |
| | | | | | | | | |
| Health Care Equipment & Services - 2.88% | | | | | | | | |
| AmerisourceBergen Corp. | | | 57,820 | | | | 4,597,846 | |
| | | | | | | | | |
| Insurance - 5.05% | | | | | | | | |
| Hallmark Financial Services, Inc. (b)(c) | | | 267,220 | | | | 2,779,088 | |
| Protective Insurance Corp. - Class B (b) | | | 284,222 | | | | 5,263,792 | |
| | | | | | | | 8,042,880 | |
| Media & Entertainment - 2.78% | | | | | | | | |
| The Madison Square Garden Co. - Class A (c) | | | 15,140 | | | | 4,437,988 | |
See notes to financial statements.
| SCHEDULE OF INVESTMENTS (continued) |
| March 31, 2019 (Unaudited) |
| COMMON STOCKS - 61.57% (continued) | | Shares | | | Value | |
| Pharmaceuticals, Biotechnology | | | | | | |
| & Life Sciences - 1.31% | | | | | | |
| Stallergenes Greer PLC (a)(c) | | | 50,866 | | | $ | 2,082,661 | |
| | | | | | | | | |
| Real Estate - 4.45% | | | | | | | | |
| Consolidated-Tomoka Land Co. | | | 50,576 | | | | 2,986,513 | |
| FRP Holdings, Inc. (c) | | | 86,220 | | | | 4,101,485 | |
| | | | | | | | 7,087,998 | |
| Retailing - 5.78% | | | | | | | | |
| Dollar Tree, Inc. (c) | | | 47,535 | | | | 4,993,076 | |
| Hornbach Baumarkt AG (a) | | | 137,344 | | | | 2,452,737 | |
| Party City Holdco, Inc. (c) | | | 223,534 | | | | 1,774,860 | |
| | | | | | | | 9,220,673 | |
| Software & Services - 7.21% | | | | | | | | |
| Amdocs Ltd. (a) | | | 42,926 | | | | 2,322,726 | |
| Mediagrif Interactive Technologies, Inc. (a) | | | 187,078 | | | | 1,350,921 | |
| Sykes Enterprises, Inc. (c) | | | 90,223 | | | | 2,551,506 | |
| Teradata Corp. (c) | | | 56,634 | | | | 2,472,074 | |
| The Western Union Co. | | | 151,380 | | | | 2,795,989 | |
| | | | | | | | 11,493,216 | |
| Technology Hardware & Equipment - 1.97% | | | | | | | | |
| Cisco Systems, Inc. | | | 58,110 | | | | 3,137,359 | |
| | | | | | | | | |
| Transportation - 1.50% | | | | | | | | |
| Royal Mail PLC (a) | | | 768,462 | | | | 2,385,117 | |
| | | | | | | | | |
| Utilities - 2.99% | | | | | | | | |
| Vistra Energy Corp. | | | 183,200 | | | | 4,768,696 | |
| TOTAL COMMON STOCKS (Cost $93,379,508) | | | | | | | 98,159,841 | |
| | | | | | | | | |
| REAL ESTATE INVESTMENT TRUST (REIT) - 1.75% | | | | | | | | |
| Real Estate - 1.75% | | | | | | | | |
| PotlatchDeltic Corp. | | | 73,900 | | | | 2,792,681 | |
| TOTAL REIT (Cost $2,624,809) | | | | | | | 2,792,681 | |
See notes to financial statements.
| SCHEDULE OF INVESTMENTS (continued) |
| March 31, 2019 (Unaudited) |
| CONVERTIBLE BONDS - 3.82% | | Principal Amount | | | Value | |
| Consumer Durables & Apparel - 1.94% | | | | | | |
| Dorel Industries, Inc. | | | | | | |
| 5.500%, 11/30/2019 (a) | | $ | 3,133,000 | | | $ | 3,093,837 | |
| | | | | | | | | |
| Media & Entertainment - 1.36% | | | | | | | | |
| Twitter, Inc. | | | | | | | | |
| 0.250%, 09/15/2019 | | | 2,197,000 | | | | 2,166,030 | |
| | | | | | | | | |
| Real Estate - 0.52% | | | | | | | | |
| Consolidated-Tomoka Land Co. | | | | | | | | |
| 4.500%, 03/15/2020 | | | 804,000 | | | | 822,733 | |
| TOTAL CONVERTIBLE BONDS (Cost $6,124,095) | | | | | | | 6,082,600 | |
| | | | | | | | | |
| CORPORATE BONDS - 27.78% | | | | | | | | |
| Automobiles & Components - 2.06% | | | | | | | | |
| General Motors Co. | | | | | | | | |
| 3.501% (3 Month LIBOR USD + 0.900%) (d)(e) | | | 3,314,000 | | | | 3,288,339 | |
| | | | | | | | | |
| Capital Goods - 3.37% | | | | | | | | |
| Actuant Corp. | | | | | | | | |
| 5.625%, 06/15/2022 | | | 3,071,000 | | | | 3,113,226 | |
| Fortive Corp. | | | | | | | | |
| 1.800%, 06/15/2019 | | | 210,000 | | | | 209,134 | |
| WESCO Distribution, Inc. | | | | | | | | |
| 5.375%, 12/15/2021 | | | 2,020,000 | | | | 2,047,775 | |
| | | | | | | | 5,370,135 | |
| Commercial & Professional Services - 2.28% | | | | | | | | |
| Multi-Color Corp. | | | | | | | | |
| 6.125%, 12/01/2022 (f) | | | 3,520,000 | | | | 3,634,400 | |
| | | | | | | | | |
| Consumer Durables & Apparel - 2.19% | | | | | | | | |
| American Outdoor Brands Corp. | | | | | | | | |
| 5.000%, 08/28/2020 (f) | | | 3,500,000 | | | | 3,491,250 | |
| | | | | | | | | |
| Consumer Services - 6.83% | | | | | | | | |
| Carrols Restaurant Group, Inc. | | | | | | | | |
| 8.000%, 05/01/2022 | | | 3,821,000 | | | | 3,913,659 | |
See notes to financial statements.
| SCHEDULE OF INVESTMENTS (continued) |
| March 31, 2019 (Unaudited) |
| CORPORATE BONDS - 27.78% (continued) | | Principal Amount | | | Value | |
| Consumer Services - 6.83% (continued) | | | | | | |
| Nathan’s Famous, Inc. | | | | | | |
| 6.625%, 11/01/2025 (f) | | $ | 3,549,000 | | | $ | 3,464,711 | |
| Wyndham Destinations, Inc. | | | | | | | | |
| 3.900%, 03/01/2023 | | | 2,282,000 | | | | 2,240,639 | |
| 5.400%, 04/01/2024 | | | 1,250,000 | | | | 1,275,000 | |
| | | | | | | | 10,894,009 | |
| Containers & Packaging - 0.23% | | | | | | | | |
| W/S Packaging Holdings, Inc. | | | | | | | | |
| 9.000%, 04/15/2023 (f) | | | 355,000 | | | | 372,750 | |
| | | | | | | | | |
| Diversified Financials - 3.38% | | | | | | | | |
| Donnelley Financial Solutions, Inc. | | | | | | | | |
| 8.250%, 10/15/2024 | | | 2,000,000 | | | | 2,020,000 | |
| FirstCash, Inc. | | | | | | | | |
| 5.375%, 06/01/2024 (f) | | | 3,273,000 | | | | 3,363,040 | |
| | | | | | | | 5,383,040 | |
| Energy - 1.27% | | | | | | | | |
| Unit Corp. | | | | | | | | |
| 6.625%, 05/15/2021 | | | 2,100,000 | | | | 2,026,500 | |
| | | | | | | | | |
| Media & Entertainment - 2.19% | | | | | | | | |
| Cable One, Inc. | | | | | | | | |
| 5.750%, 06/15/2022 (f) | | | 3,424,000 | | | | 3,483,920 | |
| | | | | | | | | |
| Retailing - 2.14% | | | | | | | | |
| Caleres, Inc. | | | | | | | | |
| 6.250%, 08/15/2023 | | | 3,267,000 | | | | 3,405,848 | |
| | | | | | | | | |
| Utilities - 1.84% | | | | | | | | |
| Vistra Energy Corp. | | | | | | | | |
| 7.375%, 11/01/2022 | | | 2,823,000 | | | | 2,935,920 | |
| TOTAL CORPORATE BONDS (Cost $44,232,117) | | | | | | | 44,286,111 | |
See notes to financial statements.
| SCHEDULE OF INVESTMENTS (continued) |
| March 31, 2019 (Unaudited) |
| SHORT-TERM INVESTMENT - 4.05% | | Shares | | | Value | |
| Money Market Fund - 4.05% | | | | | | |
| STIT-Treasury Portfolio - | | | | | | |
| Institutional Class, 2.298% (g) | | | 6,457,250 | | | $ | 6,457,250 | |
| TOTAL SHORT-TERM INVESTMENT | | | | | | | | |
| (Cost $6,457,250) | | | | | | | 6,457,250 | |
| Total Investments (Cost $152,817,779) - 98.97% | | | | | | | 157,778,483 | |
| Other Assets in Excess of Liabilities - 1.03% | | | | | | | 1,646,317 | |
| TOTAL NET ASSETS - 100.00% | | | | | | $ | 159,424,800 | |
Percentages are stated as a percent of net assets.
| (a) | Foreign Issued Security. |
| (b) | Affiliate company. See Note 7. |
| (c) | Non-income producing security. |
| (d) | Variable rate security. The coupon rate, reference rate and spread rate is shown as of 03/31/2019. |
| (e) | Perpetual maturity date. |
| (f) | Securities purchases pursuant to Rule 144A of the Securities Act of 1933, as amended, and may be sold only to dealers in that program or other “qualified institutional buyers.” As of March 31, 2019, the value of these investments was $17,810,071, or 11.17% of total net assets. |
| (g) | Rate listed is the 7-day effective yield. |
See notes to financial statements.
| SCHEDULE OF OPEN FORWARD CURRENCY CONTRACTS |
| March 31, 2019 (Unaudited) |
| | |
| | | | | Amount of | | | | Amount of | | | | |
| | | | | | | | Currency to | | | | Currency to | | | | |
| | | | Forward | | Currency | | be Received | | Currency | | be Delivered | | | Unrealized | |
| Counterparty | | Settlement | | to be | | in Local | | to be | | in Local | | | Appreciation | |
| of Contracts | | Date | | Received | | Currency | | Delivered | | Currency | | | (Depreciation) | |
| State Street Bank | | 04/09/2019 | | USD | | | 11,043,551 | | EUR | | | 9,443,000 | | | $ | 441,003 | |
| State Street Bank | | 04/09/2019 | | USD | | | 14,163,229 | | GBP | | | 10,779,000 | | | | 116,219 | |
| State Street Bank | | 04/09/2019 | | GBP | | | 792,000 | | USD | | | 1,053,884 | | | | (21,763 | ) |
| State Street Bank | | 04/09/2019 | | GBP | | | 4,589,000 | | USD | | | 5,905,355 | | | | 74,952 | |
| State Street Bank | | 04/09/2019 | | GBP | | | 310,000 | | USD | | | 406,185 | | | | (2,198 | ) |
| State Street Bank | | 04/09/2019 | | GBP | | | 394,000 | | USD | | | 507,301 | | | | 6,153 | |
| State Street Bank | | 04/09/2019 | | GBP | | | 792,000 | | USD | | | 1,005,418 | | | | 26,703 | |
| State Street Bank | | 04/09/2019 | | GBP | | | 238,000 | | USD | | | 314,830 | | | | (4,673 | ) |
| State Street Bank | | 04/09/2019 | | EUR | | | 720,000 | | USD | | | 846,500 | | | | (38,088 | ) |
| State Street Bank | | 04/09/2019 | | EUR | | | 732,000 | | USD | | | 840,611 | | | | (18,726 | ) |
| State Street Bank | | 04/09/2019 | | EUR | | | 1,371,000 | | USD | | | 1,574,672 | | | | (35,320 | ) |
| State Street Bank | | 04/09/2019 | | EUR | | | 435,000 | | USD | | | 495,295 | | | | (6,879 | ) |
| National | | | | | | | | | | | | | | | | | |
| Australia Bank | | 04/29/2019 | | USD | | | 2,046,883 | | AUD | | | 2,882,000 | | | | (729 | ) |
| National | | | | | | | | | | | | | | | | | |
| Australia Bank | | 04/29/2019 | | USD | | | 155,819 | | AUD | | | 217,000 | | | | 1,644 | |
| National | | | | | | | | | | | | | | | | | |
| Australia Bank | | 04/29/2019 | | AUD | | | 818,000 | | USD | | | 582,299 | | | | (1,124 | ) |
| National | | | | | | | | | | | | | | | | | |
| Australia Bank | | 08/01/2019 | | USD | | | 1,802,487 | | CAD | | | 2,362,000 | | | | 29,663 | |
| National | | | | | | | | | | | | | | | | | |
| Australia Bank | | 08/01/2019 | | CAD | | | 574,000 | | USD | | | 436,882 | | | | (6,061 | ) |
| National | | | | | | | | | | | | | | | | | |
| Australia Bank | | 08/01/2019 | | CAD | | | 162,000 | | USD | | | 121,612 | | | | (22 | ) |
| | | | | | | | | | | | | | | | | $ | 560,754 | |
AUD - Australian Dollar
CAD - Canadian Dollar
EUR - Euro
GBP - British Pound
USD - U.S. Dollars
See notes to financial statements.
| SCHEDULE OF INVESTMENTS |
| March 31, 2019 (Unaudited) |
| COMMON STOCKS - 35.56% | | Shares | | | Value | |
| Banks - 1.52% | | | | | | |
| Hilltop Holdings, Inc. | | | 82,300 | | | $ | 1,501,975 | |
| | | | | | | | | |
| Commercial & Professional Services - 2.68% | | | | | | | | |
| SP Plus Corp. (a) | | | 77,743 | | | | 2,652,591 | |
| | | | | | | | | |
| Consumer Durables & Apparel - 5.02% | | | | | | | | |
| Hanesbrands, Inc. | | | 90,300 | | | | 1,614,564 | |
| Skechers U.S.A., Inc. - Class A (a) | | | 99,600 | | | | 3,347,556 | |
| | | | | | | | 4,962,120 | |
| Energy - 6.08% | | | | | | | | |
| Bonanza Creek Energy, Inc. (a) | | | 61,558 | | | | 1,396,751 | |
| Cabot Oil & Gas Corp. | | | 176,750 | | | | 4,613,175 | |
| | | | | | | | 6,009,926 | |
| Food & Staples Retailing - 1.01% | | | | | | | | |
| Ingles Markets, Inc. - Class A | | | 36,342 | | | | 1,003,766 | |
| | | | | | | | | |
| Insurance - 12.56% | | | | | | | | |
| Crawford & Co. - Class A | | | 142,517 | | | | 1,316,857 | |
| Crawford & Co. - Class B | | | 51,610 | | | | 471,199 | |
| Hallmark Financial Services, Inc. (a)(b) | | | 276,792 | | | | 2,878,637 | |
| Protective Insurance Corp. - Class B (b) | | | 235,017 | | | | 4,352,515 | |
| Protector Forsikring ASA (a)(c) | | | 561,963 | | | | 3,394,602 | |
| | | | | | | | 12,413,810 | |
| Software & Services - 6.69% | | | | | | | | |
| Amdocs Ltd. (c) | | | 46,315 | | | | 2,506,105 | |
| Net 1 UEPS Technologies, Inc. (a) | | | 284,833 | | | | 1,022,550 | |
| Sykes Enterprises, Inc. (a) | | | 108,924 | | | | 3,080,371 | |
| | | | | | | | 6,609,026 | |
| TOTAL COMMON STOCKS (Cost $33,322,900) | | | | | | | 35,153,214 | |
| | | | | | | | | |
| REAL ESTATE INVESTMENT TRUST (REIT) - 2.26% | | | | | | | | |
| Real Estate - 2.26% | | | | | | | | |
| PotlatchDeltic Corp. | | | 59,062 | | | | 2,231,953 | |
| TOTAL REIT (Cost $2,097,333) | | | | | | | 2,231,953 | |
See notes to financial statements.
| SCHEDULE OF INVESTMENTS (continued) |
| March 31, 2019 (Unaudited) |
| EXCHANGE-TRADED FUND - 3.23% | | Shares | | | Value | |
| Diversified Financials - 3.23% | | | | | | |
| iShares Gold Trust (a) | | | 258,000 | | | $ | 3,194,040 | |
| TOTAL EXCHANGE-TRADED FUND | | | | | | | | |
| (Cost $3,318,949) | | | | | | | 3,194,040 | |
| | | | | | | | | |
| CONVERTIBLE BOND - 0.23% | | Principal Amount | | | | | |
| Diversified Financials - 0.23% | | | | | | | | |
| EZCORP, Inc. | | | | | | | | |
| 2.125%, 06/15/2019 | | $ | 228,000 | | | | 228,456 | |
| TOTAL CONVERTIBLE BOND (Cost $224,237) | | | | | | | 228,456 | |
| | | | | | | | | |
| SHORT-TERM INVESTMENTS - 58.26% | | | | | | | | |
| U.S. Treasury Bills - 58.26% | | | | | | | | |
| 2.524%, 05/23/2019 (d) | | | 7,600,000 | | | | 7,573,022 | |
| 2.389%, 04/11/2019 (d) | | | 15,690,000 | | | | 15,679,732 | |
| 2.389%, 06/13/2019 (d) | | | 13,150,000 | | | | 13,086,270 | |
| 2.450%, 07/11/2019 (d) | | | 21,400,000 | | | | 21,255,906 | |
| TOTAL SHORT-TERM INVESTMENTS | | | | | | | | |
| (Cost $57,594,930) | | | | | | | 57,594,930 | |
| Total Investments (Cost $96,558,349) - 99.54% | | | | | | | 98,402,593 | |
| Other Assets in Excess of Liabilities - 0.46% | | | | | | | 454,393 | |
| TOTAL NET ASSETS - 100.00% | | | | | | $ | 98,856,986 | |
Percentages are stated as a percent of net assets.
| (a) | Non-income producing security. |
| (b) | Affiliate company. See Note 7. |
| (c) | Foreign Issued Security. |
| (d) | Rate shown is the effective yield based on purchased price. The calculation assumes the security is held to maturity. |
See notes to financial statements.
| SCHEDULE OF OPEN FORWARD CURRENCY CONTRACTS |
| March 31, 2019 (Unaudited) |
| | |
| | | | | Amount of | | | | Amount of | | | | |
| | | | | | | | Currency to | | | | Currency to | | | | |
| | | | Forward | | Currency | | be Received | | Currency | | be Delivered | | | Unrealized | |
| Counterparty | | Settlement | | to be | | in Local | | to be | | in Local | | | Appreciation | |
| of Contracts | | Date | | Received | | Currency | | Delivered | | Currency | | | (Depreciation) | |
| State Street Bank | | 07/02/2019 | | USD | | | 2,187,070 | | NOK | | | 18,900,000 | | | $ | (12,284 | ) |
| State Street Bank | | 07/02/2019 | | USD | | | 1,100,655 | | NOK | | | 9,350,000 | | | | 12,616 | |
| | | | | | | | | | | | | | | | | $ | 332 | |
NOK - Norwegian Krone
USD - U.S. Dollars
See notes to financial statements.
| SCHEDULE OF INVESTMENTS |
| March 31, 2019 (Unaudited) |
| PREFERRED STOCK - 1.88% | | Shares | | | Value | |
| Energy - 1.88% | | | | | | |
| Targa Resources Partners LP | | | | | | |
| 9.000% (1 Month LIBOR USD + 7.710%) (a) | | | 42,854 | | | $ | 1,156,201 | |
| TOTAL PREFERRED STOCK (Cost $1,142,168) | | | | | | | 1,156,201 | |
| | | | | | | | | |
| CONVERTIBLE BONDS - 6.21% | | Principal Amount | | | | | |
| Commercial & Professional Services - 0.83% | | | | | | | | |
| Huron Consulting Group, Inc. | | | | | | | | |
| 1.250%, 10/01/2019 | | $ | 515,000 | | | | 508,427 | |
| | | | | | | | | |
| Consumer Durables & Apparel - 1.48% | | | | | | | | |
| Dorel Industries, Inc. | | | | | | | | |
| 5.500%, 11/30/2019 (b) | | | 919,000 | | | | 907,512 | |
| | | | | | | | | |
| Media & Entertainment - 1.70% | | | | | | | | |
| Twitter, Inc. | | | | | | | | |
| 0.250%, 09/15/2019 | | | 1,061,000 | | | | 1,046,044 | |
| | | | | | | | | |
| Real Estate - 2.20% | | | | | | | | |
| Consolidated-Tomoka Land Co. | | | | | | | | |
| 4.500%, 03/15/2020 | | | 1,321,000 | | | | 1,351,779 | |
| TOTAL CONVERTIBLE BONDS (Cost $3,797,224) | | | | | | | 3,813,762 | |
| | | | | | | | | |
| CORPORATE BONDS - 92.38% | | | | | | | | |
| Asset Management - 4.11% | | | | | | | | |
| CDP Financial, Inc. | | | | | | | | |
| 4.400%, 11/25/2019 (b)(c) | | | 2,500,000 | | | | 2,528,573 | |
| | | | | | | | | |
| Automobiles & Components - 4.12% | | | | | | | | |
| General Motors Co. | | | | | | | | |
| 3.501% (3 Month LIBOR USD + 0.900%) (a) | | | 2,144,000 | | | | 2,127,398 | |
| Nexteer Automotive Group Ltd. | | | | | | | | |
| 5.875%, 11/15/2021 (b)(c) | | | 400,000 | | | | 406,121 | |
| | | | | | | | 2,533,519 | |
| Capital Goods - 6.26% | | | | | | | | |
| Actuant Corp. | | | | | | | | |
| 5.625%, 06/15/2022 | | | 2,326,000 | | | | 2,357,983 | |
See notes to financial statements.
| SCHEDULE OF INVESTMENTS (continued) |
| March 31, 2019 (Unaudited) |
| CORPORATE BONDS - 92.38% (continued) | | Principal Amount | | | Value | |
| Capital Goods - 6.26% (continued) | | | | | | |
| Fortive Corp. | | | | | | |
| 1.800%, 06/15/2019 | | $ | 201,000 | | | $ | 200,171 | |
| WESCO Distribution, Inc. | | | | | | | | |
| 5.375%, 12/15/2021 | | | 1,266,000 | | | | 1,283,407 | |
| | | | | | | | 3,841,561 | |
| Capital Goods - 0.24% | | | | | | | | |
| General Electric Co. | | | | | | | | |
| 2.100%, 12/11/2019 | | | 150,000 | | | | 148,959 | |
| | | | | | | | | |
| Commercial & Professional Services - 4.42% | | | | | | | | |
| LSC Communications, Inc. | | | | | | | | |
| 8.750%, 10/15/2023 (c) | | | 1,250,000 | | | | 1,328,125 | |
| Multi-Color Corp. | | | | | | | | |
| 6.125%, 12/01/2022 (c) | | | 1,346,000 | | | | 1,389,745 | |
| | | | | | | | 2,717,870 | |
| Consumer Durables & Apparel - 2.44% | | | | | | | | |
| American Outdoor Brands Corp. | | | | | | | | |
| 5.000%, 08/28/2020 (c) | | | 1,500,000 | | | | 1,496,250 | |
| | | | | | | | | |
| Consumer Services - 7.40% | | | | | | | | |
| Carrols Restaurant Group, Inc. | | | | | | | | |
| 8.000%, 05/01/2022 | | | 1,340,000 | | | | 1,372,495 | |
| Nathan’s Famous, Inc. | | | | | | | | |
| 6.625%, 11/01/2025 (c) | | | 1,451,000 | | | | 1,416,539 | |
| Wyndham Destinations, Inc. | | | | | | | | |
| 5.625%, 03/01/2021 | | | 709,000 | | | | 733,815 | |
| 5.400%, 04/01/2024 | | | 1,000,000 | | | | 1,020,000 | |
| | | | | | | | 4,542,849 | |
| Containers & Packaging - 0.25% | | | | | | | | |
| W/S Packaging Holdings, Inc. | | | | | | | | |
| 9.000%, 04/15/2023 (c) | | | 145,000 | | | | 152,250 | |
| | | | | | | | | |
| Diversified Financials - 10.07% | | | | | | | | |
| Donnelley Financial Solutions, Inc. | | | | | | | | |
| 8.250%, 10/15/2024 | | | 650,000 | | | | 656,500 | |
| FirstCash, Inc. | | | | | | | | |
| 5.375%, 06/01/2024 (c) | | | 2,314,000 | | | | 2,377,658 | |
See notes to financial statements.
| SCHEDULE OF INVESTMENTS (continued) |
| March 31, 2019 (Unaudited) |
| CORPORATE BONDS - 92.38% (continued) | | Principal Amount | | | Value | |
| Diversified Financials - 10.07% (continued) | | | | | | |
| INVISTA Finance LLC | | | | | | |
| 4.250%, 10/15/2019 (c) | | $ | 2,830,000 | | | $ | 2,855,926 | |
| General Electric Co. | | | | | | | | |
| 2.330% (Fed H.15: Non-Financial | | | | | | | | |
| CP 30 Day + -0.100%) (a) | | | 300,000 | | | | 295,343 | |
| | | | | | | | 6,185,427 | |
| Energy - 4.16% | | | | | | | | |
| Exxon Mobil Corp. | | | | | | | | |
| 1.912%, 03/06/2020 | | | 1,402,000 | | | | 1,393,967 | |
| Unit Corp. | | | | | | | | |
| 6.625%, 05/15/2021 | | | 1,205,000 | | | | 1,162,825 | |
| | | | | | | | 2,556,792 | |
| Food & Staples Retailing - 0.87% | | | | | | | | |
| Ingles Markets, Inc. | | | | | | | | |
| 5.750%, 06/15/2023 | | | 520,000 | | | | 532,350 | |
| | | | | | | | | |
| Food, Beverage & Tobacco - 2.49% | | | | | | | | |
| Altria Group, Inc. | | | | | | | | |
| 9.250%, 08/06/2019 | | | 1,500,000 | | | | 1,533,463 | |
| | | | | | | | | |
| Health Care Equipment & Services - 2.87% | | | | | | | | |
| Express Scripts Holding Co. | | | | | | | | |
| 2.250%, 06/15/2019 | | | 1,767,000 | | | | 1,764,378 | |
| | | | | | | | | |
| Household & Personal Products - 3.86% | | | | | | | | |
| Central Garden & Pet Co. | | | | | | | | |
| 6.125%, 11/15/2023 | | | 2,259,000 | | | | 2,369,126 | |
| | | | | | | | | |
| Materials - 6.33% | | | | | | | | |
| Bemis Co, Inc. | | | | | | | | |
| 6.800%, 08/01/2019 | | | 1,500,000 | | | | 1,518,045 | |
| The Sherwin-Williams Co. | | | | | | | | |
| 7.250%, 06/15/2019 | | | 2,349,000 | | | | 2,369,508 | |
| | | | | | | | 3,887,553 | |
See notes to financial statements.
| SCHEDULE OF INVESTMENTS (continued) |
| March 31, 2019 (Unaudited) |
| CORPORATE BONDS - 92.38% (continued) | | Principal Amount | | | Value | |
| Media & Entertainment - 6.89% | | | | | | |
| Cable One, Inc. | | | | | | |
| 5.750%, 06/15/2022 (c) | | $ | 1,791,000 | | | $ | 1,822,343 | |
| Omnicom Group Inc / Omnicom Capital, Inc. | | | | | | | | |
| 6.250%, 07/15/2019 | | | 2,390,000 | | | | 2,412,048 | |
| | | | | | | | 4,234,391 | |
| Pharmaceuticals, Biotechnology | | | | | | | | |
| & Life Sciences - 4.06% | | | | | | | | |
| Gilead Sciences, Inc. | | | | | | | | |
| 1.850%, 09/20/2019 | | | 2,500,000 | | | | 2,490,987 | |
| | | | | | | | | |
| Retailing - 11.53% | | | | | | | | |
| AutoZone, Inc. | | | | | | | | |
| 1.625%, 04/21/2019 | | | 1,000,000 | | | | 999,063 | |
| Caleres, Inc. | | | | | | | | |
| 6.250%, 08/15/2023 | | | 1,841,000 | | | | 1,919,242 | |
| Dollar Tree, Inc. | | | | | | | | |
| 3.473% (3 Month LIBOR USD + 0.700%) (a) | | | 2,711,000 | | | | 2,711,625 | |
| eBay, Inc. | | | | | | | | |
| 2.200%, 08/01/2019 | | | 1,458,000 | | | | 1,455,238 | |
| | | | | | | | 7,085,168 | |
| Software & Services - 7.02% | | | | | | | | |
| International Business Machines Corp. | | | | | | | | |
| 1.800%, 05/17/2019 | | | 2,325,000 | | | | 2,322,628 | |
| Oracle Corp. | | | | | | | | |
| 2.500%, 10/15/2022 | | | 2,000,000 | | | | 1,990,238 | |
| | | | | | | | 4,312,866 | |
| Technology Hardware & Equipment - 1.08% | | | | | | | | |
| Arrow Electronics, Inc. | | | | | | | | |
| 6.000%, 04/01/2020 | | | 200,000 | | | | 205,504 | |
| Jabil, Inc. | | | | | | | | |
| 5.625%, 12/15/2020 | | | 438,000 | | | | 456,308 | |
| | | | | | | | 661,812 | |
See notes to financial statements.
| SCHEDULE OF INVESTMENTS (continued) |
| March 31, 2019 (Unaudited) |
| CORPORATE BONDS - 92.38% (continued) | | Principal Amount | | | Value | |
| Utilities - 1.91% | | | | | | |
| Vistra Energy Corp. | | | | | | |
| 7.375%, 11/01/2022 | | $ | 1,129,000 | | | $ | 1,174,160 | |
| TOTAL CORPORATE BONDS (Cost $56,590,129) | | | | | | | 56,750,304 | |
| | | | | | | | | |
| SHORT-TERM INVESTMENT - 1.69% | | Shares | | | | | |
| Money Market Fund - 1.69% | | | | | | | | |
| STIT-Treasury Portfolio - | | | | | | | | |
| Institutional Class, 2.298% (d) | | | 1,038,393 | | | | 1,038,393 | |
| TOTAL SHORT-TERM INVESTMENT | | | | | | | | |
| (Cost $1,038,393) | | | | | | | 1,038,393 | |
| Total Investments (Cost $62,567,914) - 102.16% | | | | | | | 62,758,660 | |
| Liabilities in Excess of Other Assets - (2.16)% | | | | | | | (1,324,992 | ) |
| TOTAL NET ASSETS - 100.00% | | | | | | $ | 61,433,668 | |
Percentages are stated as a percent of net assets.
| (a) | Variable rate security. The coupon rate, reference rate and spread rate is shown as of 03/31/2019. |
| (b) | Foreign Issued Security. |
| (c) | Securities purchases pursuant to Rule 144A of the Securities Act of 1933, as amended, and may be sold only to dealers in that program or other “qualified institutional buyers.” As of March 31, 2019, the value of these investments was $15,773,530, or 25.68% of total net assets. |
| (d) | Rate listed is the 7-day effective yield. |
See notes to financial statements.
| Intrepid Disciplined Value Fund |
| SCHEDULE OF INVESTMENTS |
| March 31, 2019 (Unaudited) |
| COMMON STOCKS - 83.50% | | Shares | | | Value | |
| Capital Goods - 2.55% | | | | | | |
| Cubic Corp. | | | 21,503 | | | $ | 1,209,329 | |
| | | | | | | | | |
| Commercial & Professional Services - 2.49% | | | | | | | | |
| Multi-Color Corp. | | | 23,600 | | | | 1,177,404 | |
| | | | | | | | | |
| Consumer Durables & Apparel - 2.97% | | | | | | | | |
| Skechers U.S.A., Inc. - Class A (a) | | | 36,000 | | | | 1,209,960 | |
| Tapestry, Inc. | | | 5,990 | | | | 194,615 | |
| | | | | | | | 1,404,575 | |
| Consumer Services - 2.15% | | | | | | | | |
| The Cheesecake Factory, Inc. | | | 20,810 | | | | 1,018,025 | |
| | | | | | | | | |
| Diversified Financials - 12.45% | | | | | | | | |
| Berkshire Hathaway, Inc. - Class B (a) | | | 8,550 | | | | 1,717,610 | |
| Jefferies Financial Group, Inc. | | | 72,085 | | | | 1,354,477 | |
| Oaktree Capital Group LLC | | | 29,175 | | | | 1,448,539 | |
| The Bank Of New York Mellon Corp. | | | 27,240 | | | | 1,373,713 | |
| | | | | | | | 5,894,339 | |
| Energy - 1.20% | | | | | | | | |
| Bonanza Creek Energy, Inc. (a) | | | 24,979 | | | | 566,774 | |
| | | | | | | | | |
| Food & Staples Retailing - 2.25% | | | | | | | | |
| The Kroger Co. | | | 43,300 | | | | 1,065,180 | |
| | | | | | | | | |
| Food, Beverage & Tobacco - 2.05% | | | | | | | | |
| Molson Coors Brewing Co. - Class B | | | 16,250 | | | | 969,312 | |
| | | | | | | | | |
| Health Care Equipment & Services - 9.41% | | | | | | | | |
| AmerisourceBergen Corp. | | | 28,770 | | | | 2,287,791 | |
| Laboratory Corp. of America Holdings (a) | | | 14,181 | | | | 2,169,409 | |
| | | | | | | | 4,457,200 | |
| Insurance - 8.49% | | | | | | | | |
| Crawford & Co. - Class A | | | 105,343 | | | | 973,369 | |
| Hallmark Financial Services, Inc. (a) | | | 18,258 | | | | 189,883 | |
| Protective Insurance Corp. - Class B (b) | | | 154,082 | | | | 2,853,599 | |
| | | | | | | | 4,016,851 | |
See notes to financial statements.
| Intrepid Disciplined Value Fund |
| SCHEDULE OF INVESTMENTS (continued) |
| March 31, 2019 (Unaudited) |
| COMMON STOCKS - 83.50% (continued) | | Shares | | | Value | |
| Media & Entertainment - 9.74% | | | | | | |
| Discovery, Inc. - Class C (a) | | | 36,050 | | | $ | 916,391 | |
| Omnicom Group, Inc. | | | 7,230 | | | | 527,718 | |
| Take-Two Interactive Software, Inc. (a) | | | 14,880 | | | | 1,404,225 | |
| The Madison Square Garden Co. - Class A (a) | | | 6,015 | | | | 1,763,177 | |
| | | | | | | | 4,611,511 | |
| Pharmaceuticals, Biotechnology | | | | | | | | |
| & Life Sciences - 2.49% | | | | | | | | |
| Bio-Rad Laboratories, Inc. - Class A (a) | | | 3,853 | | | | 1,177,785 | |
| | | | | | | | | |
| Real Estate - 2.01% | | | | | | | | |
| Consolidated-Tomoka Land Co. | | | 16,116 | | | | 951,650 | |
| | | | | | | | | |
| Retailing - 8.98% | | | | | | | | |
| Dollar General Corp. | | | 10,800 | | | | 1,288,440 | |
| Dollar Tree, Inc. (a) | | | 17,810 | | | | 1,870,762 | |
| Party City Holdco, Inc. (a) | | | 137,990 | | | | 1,095,641 | |
| | | | | | | | 4,254,843 | |
| Software & Services - 11.67% | | | | | | | | |
| Amdocs Ltd. (c) | | | 38,490 | | | | 2,082,694 | |
| Teradata Corp. (a) | | | 38,451 | | | | 1,678,386 | |
| The Western Union Co. | | | 95,385 | | | | 1,761,761 | |
| | | | | | | | 5,522,841 | |
| Utilities - 2.60% | | | | | | | | |
| Vistra Energy Corp. | | | 47,300 | | | | 1,231,219 | |
| TOTAL COMMON STOCKS (Cost $36,414,291) | | | | | | | 39,528,838 | |
| | | | | | | | | |
| EXCHANGE-TRADED FUNDS - 5.53% | | | | | | | | |
| Diversified Financials - 5.53% | | | | | | | | |
| iShares Gold Trust (a) | | | 70,770 | | | | 876,133 | |
| iShares Silver Trust (a) | | | 122,840 | | | | 1,741,871 | |
| TOTAL EXCHANGE-TRADED FUNDS | | | | | | | | |
| (Cost $2,573,071) | | | | | | | 2,618,004 | |
See notes to financial statements.
| Intrepid Disciplined Value Fund |
| SCHEDULE OF INVESTMENTS (continued) |
| March 31, 2019 (Unaudited) |
| CONVERTIBLE BOND - 0.64% | | Principal Amount | | | Value | |
| Diversified Financials - 0.64% | | | | | | |
| EZCORP, Inc. | | | | | | |
| 2.125%, 06/15/2019 | | $ | 300,000 | | | $ | 300,599 | |
| TOTAL CONVERTIBLE BOND (Cost $290,968) | | | | | | | 300,599 | |
| | | | | | | | | |
| SHORT-TERM INVESTMENT - 4.82% | | | | | | | | |
| U.S. Treasury Bill - 4.82% | | | | | | | | |
| 2.289%, 04/16/2019 (d) | | | 2,285,000 | | | | 2,282,727 | |
| TOTAL SHORT-TERM INVESTMENT | | | | | | | | |
| (Cost $2,282,727) | | | | | | | 2,282,727 | |
| Total Investments (Cost $41,561,057) - 94.49% | | | | | | | 44,730,168 | |
| Other Assets in Excess of Liabilities - 5.51% | | | | | | | 2,609,919 | |
| TOTAL NET ASSETS - 100.00% | | | | | | $ | 47,340,087 | |
Percentages are stated as a percent of net assets.
| (a) | Non-income producing security. |
| (b) | Affiliate company. See Note 7. |
| (c) | Foreign Issued Security. |
| (d) | Rate shown is the effective yield based on purchased price. The calculation assumes the security is held to maturity. |
See notes to financial statements.
| Intrepid International Fund |
| SCHEDULE OF INVESTMENTS |
| March 31, 2019 (Unaudited) |
| COMMON STOCKS - 71.73% | | Shares | | | Value | |
| Australia - 9.58% | | | | | | |
| Coventry Group Ltd. (a)(b) | | | 2,333,453 | | | $ | 1,375,202 | |
| GUD Holdings Ltd. | | | 65,912 | | | | 558,335 | |
| | | | | | | | 1,933,537 | |
| Canada - 9.98% | | | | | | | | |
| Aimia, Inc. (a) | | | 72,300 | | | | 212,082 | |
| Corus Entertainment, Inc. - Class B | | | 46,575 | | | | 206,326 | |
| Dundee Corp. - Class A (a) | | | 200,098 | | | | 172,195 | |
| Mediagrif Interactive Technologies, Inc. | | | 65,330 | | | | 471,759 | |
| Noranda Income Fund | | | 557,955 | | | | 951,949 | |
| | | | | | | | 2,014,311 | |
| Estonia - 3.24% | | | | | | | | |
| Silvano Fashion Group AS - Class A | | | 234,849 | | | | 653,339 | |
| | | | | | | | | |
| France - 7.58% | | | | | | | | |
| GEA | | | 9,596 | | | | 942,958 | |
| Vetoquinol SA | | | 9,165 | | | | 588,067 | |
| | | | | | | | 1,531,025 | |
| Germany - 16.91% | | | | | | | | |
| Berentzen-Gruppe AG (b) | | | 159,888 | | | | 1,233,964 | |
| Clere AG (a) | | | 109,676 | | | | 1,414,841 | |
| Hornbach Baumarkt AG | | | 41,818 | | | | 746,800 | |
| KSB SE & Co KGaA | | | 54 | | | | 18,415 | |
| | | | | | | | 3,414,020 | |
| Greece - 0.79% | | | | | | | | |
| Aegean Airlines SA | | | 17,140 | | | | 159,006 | |
| | | | | | | | | |
| Italy - 4.78% | | | | | | | | |
| Italian Wine Brands SpA | | | 74,850 | | | | 965,579 | |
| | | | | | | | | |
| South Africa - 2.10% | | | | | | | | |
| Net 1 UEPS Technologies, Inc. (a) | | | 117,821 | | | | 422,977 | |
| | | | | | | | | |
| United Kingdom - 14.39% | | | | | | | | |
| Gattaca PLC (b) | | | 655,531 | | | | 998,947 | |
| Quarto Group, Inc. (a)(b) | | | 882,396 | | | | 775,765 | |
See notes to financial statements.
| Intrepid International Fund |
| SCHEDULE OF INVESTMENTS (continued) |
| March 31, 2019 (Unaudited) |
| COMMON STOCKS - 71.73% (continued) | | Shares | | | Value | |
| United Kingdom - 14.39% (continued) | | | | | | |
| Royal Mail PLC | | | 131,465 | | | $ | 408,035 | |
| Stallergenes Greer PLC (a) | | | 17,628 | | | | 721,762 | |
| | | | | | | | 2,904,509 | |
| United States - 2.38% | | | | | | | | |
| Protective Insurance Corp. - Class B (b) | | | 26,034 | | | | 482,150 | |
| TOTAL COMMON STOCKS (Cost $17,468,333) | | | | | | | 14,480,453 | |
| | | | | | | | | |
| PREFERRED STOCKS - 9.16% | | | | | | | | |
| Canada - 5.74% | | | | | | | | |
| Dundee Corp. | | | 42,818 | | | | 461,390 | |
| 5.760% (3 Month Canada Treasury | | | | | | | | |
| Bill CAD + 4.100%) (c) | | | | | | | | |
| Dundee Corp. 7.500% | | | 74,730 | | | | 699,012 | |
| | | | | | | | 1,160,402 | |
| Germany - 3.42% | | | | | | | | |
| KSB SE & Co KGaA | | | 2,188 | | | | 689,687 | |
| TOTAL PREFERRED STOCKS (Cost $2,293,801) | | | | | | | 1,850,089 | |
| | | | | | | | | |
| U.S. GOVERNMENT NOTE - 6.16% | | | | | | | | |
| U.S. Government Note - 6.16% | | | | | | | | |
| United States Treasury Fixed Rate Note | | | | | | | | |
| 0.750%, 07/15/2019 | | | 1,250,000 | | | | 1,243,750 | |
| TOTAL U.S. GOVERNMENT NOTE | | | | | | | | |
| (Cost $1,243,604) | | | | | | | 1,243,750 | |
See notes to financial statements.
| Intrepid International Fund |
| SCHEDULE OF INVESTMENTS (continued) |
| March 31, 2019 (Unaudited) |
| SHORT-TERM INVESTMENT - 4.93% | | Principal Amount | | | Value | |
| U.S. Treasury Bill - 4.93% | | | | | | |
| 2.430%, 06/20/2019 (d) | | $ | 1,000,000 | | | $ | 994,702 | |
| TOTAL SHORT-TERM INVESTMENT | | | | | | | | |
| (Cost $994,702) | | | | | | | 994,702 | |
| Total Investments (Cost $22,000,440) - 91.98% | | | | | | | 18,568,994 | |
| Other Assets in Excess of Liabilities - 8.02% | | | | | | | 1,618,190 | |
| TOTAL NET ASSETS - 100.00% | | | | | | $ | 20,187,184 | |
Percentages are stated as a percent of net assets.
| (a) | Non-income producing security. |
| (b) | Affiliate company. See Note 7. |
| (c) | Variable rate security. The coupon rate, reference rate and spread rate is shown as of 03/31/2019. |
| (d) | Rate shown is the effective yield based on purchased price. The calculation assumes the security is held to maturity. |
| SCHEDULE OF OPEN FORWARD CURRENCY CONTRACTS |
| March 31, 2019 (Unaudited) |
| | |
| | | | | Amount of | | | | Amount of | | | | |
| | | | | | | | Currency to | | | | Currency to | | | | |
| | | | Forward | | Currency | | be Received | | Currency | | be Delivered | | | Unrealized | |
| Counterparty | | Settlement | | to be | | in Local | | to be | | in Local | | | Appreciation | |
| of Contracts | | Date | | Received | | Currency | | Delivered | | Currency | | | (Depreciation) | |
| State Street Bank | | 06/21/2019 | | USD | | | 1,954,507 | | AUD | | | 2,739,000 | | | $ | 6,630 | |
| State Street Bank | | 06/21/2019 | | AUD | | | 158,000 | | USD | | | 112,650 | | | | (287 | ) |
| State Street Bank | | 09/06/2019 | | USD | | | 3,085,247 | | CAD | | | 4,100,000 | | | | 5,615 | |
| National | | | | | | | | | | | | | | | | | |
| Australia Bank | | 09/16/2019 | | USD | | | 1,389,276 | | GBP | | | 1,052,000 | | | | 7,585 | |
| State Street Bank | | 09/16/2019 | | USD | | | 7,440,837 | | EUR | | | 6,490,000 | | | | 54,783 | |
| National | | | | | | | | | | | | | | | | | |
| Australia Bank | | 09/16/2019 | | GBP | | | 67,000 | | USD | | | 89,287 | | | | (1,289 | ) |
| | | | | | | | | | | | | | | | | $ | 73,037 | |
AUD - Australian Dollar
CAD - Canadian Dollar
EUR - Euro
GBP - British Pound
USD - U.S. Dollars
See notes to financial statements.
| STATEMENTS OF ASSETS AND LIABILITIES |
| March 31, 2019 (Unaudited) |
| | | Intrepid | | | Intrepid | | | Intrepid | |
| | | Capital Fund | | Endurance Fund | | Income Fund | |
| ASSETS: | | | | | | | | | |
Investments, at value(1) | | | | | | | | | |
| Unaffiliated issuers | | $ | 143,779,333 | | | $ | 91,171,441 | | | $ | 62,758,660 | |
| Affiliated issuers (see Note 7) | | | 13,999,150 | | | | 7,231,152 | | | | — | |
| Income receivable | | | 969,402 | | | | 14,626 | | | | 866,625 | |
| Receivable for fund shares sold | | | 105,429 | | | | 11,290 | | | | 100,000 | |
| Receivable for investment securities sold | | | 716,770 | | | | — | | | | — | |
| Cash | | | — | | | | 3,842,062 | | | | — | |
| Net appreciation on forward currency contracts | | | 560,754 | | | | 332 | | | | — | |
| Deposit for forwards at broker | | | 860,000 | | | | — | | | | — | |
| Other assets | | | 41,460 | | | | 25,888 | | | | 13,641 | |
| Total assets | | | 161,032,298 | | | | 102,296,791 | | | | 63,738,926 | |
| LIABILITIES: | | | | | | | | | | | | |
| Payable for fund shares redeemed | | | 1,124,313 | | | | 2,277,229 | | | | 2,196,140 | |
| Payable for investment securities purchased | | | — | | | | 977,796 | | | | — | |
| Payable to Investment Adviser | | | 112,011 | | | | 73,393 | | | | 32,007 | |
| Payable to Trustees | | | 11,808 | | | | 4,648 | | | | 2,340 | |
| Payable to Custodian | | | 8,189 | | | | 1,669 | | | | 1,728 | |
| Dividend payable | | | 192,938 | | | | — | | | | 18,852 | |
| Accrued distribution fees | | | 11,224 | | | | 18,045 | | | | — | |
| Other expenses payable | | | 147,015 | | | | 87,025 | | | | 54,191 | |
| Total liabilities | | | 1,607,498 | | | | 3,439,805 | | | | 2,305,258 | |
| Total net assets | | $ | 159,424,800 | | | $ | 98,856,986 | | | $ | 61,433,668 | |
| NET ASSETS CONSIST OF: | | | | | | | | | | | | |
| Capital stock | | $ | 170,948,082 | | | $ | 105,011,443 | | | $ | 65,701,493 | |
| Total distributable earnings | | | (11,523,282 | ) | | | (6,154,457 | ) | | | (4,267,825 | ) |
| Total net assets | | $ | 159,424,800 | | | $ | 98,856,986 | | | $ | 61,433,668 | |
| Investor Class | | | | | | | | | | | | |
| Net assets | | $ | 47,931,104 | | | $ | 62,094,138 | | | $ | — | |
| Shares outstanding | | | 4,556,478 | | | | 4,562,914 | | | | — | |
| Institutional Class | | | | | | | | | | | | |
| Net assets | | | 111,493,696 | | | | 36,762,848 | | | | 61,433,668 | |
| Shares outstanding | | | 10,587,161 | | | | 2,631,038 | | | | 6,662,769 | |
| Total shares outstanding (unlimited | | | | | | | | | | | | |
| shares of no par value authorized) | | | 15,143,639 | | | | 7,193,952 | | | | 6,662,769 | |
| Investor Class Net asset value, offering | | | | | | | | | | | | |
and redemption price per share(2) | | $ | 10.52 | | | $ | 13.61 | | | $ | — | |
| Institutional Class Net asset value, offering | | | | | | | | | | | | |
and redemption price per share(2) | | $ | 10.53 | | | $ | 13.97 | | | $ | 9.22 | |
(1) | Cost of Investments | | | | | | | | | |
| | Unaffiliated issuers | | $ | 133,162,251 | | | $ | 88,365,898 | | | $ | 62,567,914 | |
| | Affiliated issuers (see Note 7) | | | 19,655,528 | | | | 8,192,451 | | | | — | |
(2) | If applicable, redemption price per share may be reduced by a 2.00% redemption fee for shares redeemed within 30 days of purchase. |
See notes to financial statements.
| STATEMENTS OF ASSETS AND LIABILITIES (continued) |
| March 31, 2019 (Unaudited) |
| | | Intrepid | | | Intrepid | |
| | | Disciplined | | | International | |
| | | Value Fund | | | Fund | |
| ASSETS: | | | | | | |
Investments, at value(1) | | | | | | |
| Unaffiliated issuers | | $ | 41,876,569 | | | $ | 13,702,966 | |
| Affiliated issuers (see Note 7) | | | 2,853,599 | | | | 4,866,028 | |
| Income receivable | | | 19,568 | | | | 118,381 | |
| Receivable for fund shares sold | | | 13,018 | | | | 35,942 | |
| Receivable for investment securities sold | | | 15,955 | | | | 144,329 | |
| Cash | | | 2,881,230 | | | | 1,308,916 | |
| Appreciation on forward currency contracts | | | — | | | | 73,037 | |
| Deposit for forwards at broker | | | 260,000 | | | | — | |
| Other assets | | | 38,717 | | | | 16,907 | |
| Total assets | | | 47,958,656 | | | | 20,266,506 | |
| LIABILITIES: | | | | | | | | |
| Payable for fund shares redeemed | | | 49,677 | | | | 17,650 | |
| Payable for investment securities purchased | | | 465,366 | | | | — | |
| Payable to Investment Adviser | | | 35,048 | | | | 6,113 | |
| Payable to Trustees | | | 1,411 | | | | 854 | |
| Payable to Custodian | | | — | | | | 7,684 | |
| Accrued distribution fees | | | 7,622 | | | | 10,408 | |
| Other expenses payable | | | 59,445 | | | | 36,613 | |
| Total liabilities | | | 618,569 | | | | 79,322 | |
| Total net assets | | $ | 47,340,087 | | | $ | 20,187,184 | |
| NET ASSETS CONSIST OF: | | | | | | | | |
| Capital stock | | $ | 45,573,901 | | | $ | 24,843,892 | |
| Total distributable earnings | | | 1,766,186 | | | | (4,656,708 | ) |
| Total net assets | | $ | 47,340,087 | | | $ | 20,187,184 | |
| Investor Class | | | | | | | | |
| Net assets | | $ | 47,340,087 | | | $ | 20,187,184 | |
| Shares outstanding | | | 4,935,587 | | | | 2,404,046 | |
| Total shares outstanding (unlimited | | | | | | | | |
| shares of no par value authorized) | | | 4,935,587 | | | | 2,404,046 | |
| Investor Class Net asset value, offering | | | | | | | | |
and redemption price per share(2) | | $ | 9.59 | | | $ | 8.40 | |
(1) | Cost of Investments | | | | | | |
| | Unaffiliated issuers | | $ | 38,024,380 | | | $ | 15,149,026 | |
| | Affiliated issuers (see Note 7) | | | 3,536,677 | | | | 6,851,414 | |
(2) | If applicable, redemption price per share may be reduced by a 2.00% redemption fee for shares redeemed within 30 days of purchase. |
See notes to financial statements.
| STATEMENTS OF OPERATIONS |
| For the period ended March 31, 2019 (Unaudited) |
| | | Intrepid | | | Intrepid | | | Intrepid | |
| | | Capital Fund | | | Endurance Fund | | | Income Fund | |
| INVESTMENT INCOME: | | | | | | | | | |
Dividend income(1) | | | | | | | | | |
| Unaffiliated issuers | | $ | 947,178 | | | $ | 100,263 | | | $ | 53,066 | |
| Affiliated issuers (See Note 7) | | | 148,742 | | | | 96,314 | | | | — | |
| Interest income | | | 2,257,989 | | | | 873,780 | | | | 1,314,593 | |
| Total investment income | | | 3,353,909 | | | | 1,070,357 | | | | 1,367,659 | |
| Advisory fees (See Note 3) | | | 1,148,880 | | | | 556,187 | | | | 251,844 | |
| Administration fees | | | 89,616 | | | | 42,655 | | | | 25,859 | |
| Fund accounting fees | | | 76,400 | | | | 28,504 | | | | 19,462 | |
| Distribution (12b-1) fees - | | | | | | | | | | | | |
| Investor Class Only (See Note 4) | | | 67,740 | | | | 71,323 | | | | — | |
| Shareholder servicing fees and expenses | | | 43,546 | | | | 28,592 | | | | 13,286 | |
| Custody fees | | | 22,104 | | | | 4,513 | | | | 3,141 | |
| Trustees fees and expenses | | | 17,766 | | | | 6,928 | | | | 4,080 | |
| Federal and state registration | | | 17,108 | | | | 18,212 | | | | 10,468 | |
| Audit fees | | | 15,194 | | | | 15,194 | | | | 15,194 | |
| Reports to shareholders | | | 13,550 | | | | 9,898 | | | | 2,912 | |
| Insurance | | | 9,646 | | | | 3,370 | | | | 1,726 | |
| Miscellaneous | | | 5,008 | | | | 3,446 | | | | 1,456 | |
| Legal fees | | | 4,808 | | | | 3,910 | | | | 3,810 | |
| Total expenses before Adviser waiver | | | 1,531,366 | | | | 792,732 | | | | 353,238 | |
| Expenses waived by Adviser (See Note 3) | | | (142,414 | ) | | | (81,794 | ) | | | (51,026 | ) |
| Total net expenses | | | 1,388,952 | | | | 710,938 | | | | 302,212 | |
| Net investment income | | | 1,964,957 | | | | 359,419 | | | | 1,065,447 | |
| NET REALIZED AND UNREALIZED | | | | | | | | | | | | |
| GAIN (LOSS) ON INVESTMENTS: | | | | | | | | | | | | |
| Net realized gain (loss) on: | | | | | | | | | | | | |
| Investments and foreign currency translation | | | (11,293,308 | ) | | | (2,490,148 | ) | | | (323,758 | ) |
| Investments in affiliated | | | | | | | | | | | | |
| issuers (See Note 7) | | | (872,840 | ) | | | (84,477 | ) | | | — | |
| Forward currency contracts | | | 2,778,806 | | | | — | | | | — | |
| Net change in unrealized | | | | | | | | | | | | |
| appreciation (depreciation) on: | | | | | | | | | | | | |
| Investments and foreign currency translation | | | (16,847,971 | ) | | | 298,286 | | | | 365,029 | |
| Forward currency contracts | | | (1,957,914 | ) | | | 332 | | | | — | |
| Net realized and unrealized gain (loss) | | | (28,193,227 | ) | | | (2,276,007 | ) | | | 41,271 | |
| Net increase (decrease) in net assets | | | | | | | | | | | | |
| resulting from operations | | $ | (26,228,270 | ) | | $ | (1,916,588 | ) | | $ | 1,106,718 | |
| | | | | | | | | | | | | |
(1) Net of foreign taxes withheld | | $ | 5,014 | | | $ | 1 | | | $ | — | |
See notes to financial statements.
| STATEMENTS OF OPERATIONS (continued) |
| For the period ended March 31, 2019 (Unaudited) |
| | | Intrepid | | | Intrepid | |
| | | Disciplined | | | International | |
| | | Value Fund | | | Fund | |
| INVESTMENT INCOME: | | | | | | |
Dividend income(1) | | | | | | |
| Unaffiliated issuers | | $ | 200,805 | | | $ | 121,986 | |
| Affiliated issuers (See Note 7) | | | 33,816 | | | | 11,237 | |
| Interest income | | | 47,901 | | | | 30,456 | |
| Total investment income | | | 282,522 | | | | 163,679 | |
| Advisory fees (See Note 3) | | | 180,412 | | | | 110,676 | |
| Distribution (12b-1) fees - Investor Class Only (See Note 4) | | | 18,041 | | | | 16,602 | |
| Audit fees | | | 15,194 | | | | 15,194 | |
| Administration fees | | | 13,897 | | | | 9,016 | |
| Shareholder servicing fees and expenses | | | 11,724 | | | | 10,832 | |
| Federal and state registration | | | 10,462 | | | | 10,450 | |
| Fund accounting fees | | | 8,554 | | | | 8,642 | |
| Legal fees | | | 4,948 | | | | 4,626 | |
| Reports to shareholders | | | 2,272 | | | | 1,544 | |
| Trustees fees and expenses | | | 1,820 | | | | 1,450 | |
| Custody fees | | | 1,530 | | | | 24,207 | |
| Miscellaneous | | | 998 | | | | 1,638 | |
| Insurance | | | 816 | | | | 816 | |
| Total expenses before Adviser waiver | | | 270,668 | | | | 215,693 | |
| Expenses waived by Adviser (See Note 3) | | | (36,133 | ) | | | (60,746 | ) |
| Total net expenses | | | 234,535 | | | | 154,947 | |
| Net investment income | | | 47,987 | | | | 8,732 | |
| NET REALIZED AND UNREALIZED | | | | | | | | |
| GAIN (LOSS) ON INVESTMENTS: | | | | | | | | |
| Net realized gain (loss) on: | | | | | | | | |
| Investments and foreign currency translation | | | (687,022 | ) | | | (752,410 | ) |
| Investments in affiliated issuers (See Note 7) | | | (14,029 | ) | | | (339,663 | ) |
| Forward currency contracts | | | 89,822 | | | | 492,380 | |
| Net change in unrealized appreciation (depreciation) on: | | | | | | | | |
| Investments and foreign currency translation | | | (1,719,287 | ) | | | (1,209,368 | ) |
| Forward currency contracts | | | (56,970 | ) | | | 98,222 | |
| Net realized and unrealized loss | | | (2,387,486 | ) | | | (1,710,839 | ) |
| Net decrease in net assets resulting from operations | | $ | (2,339,499 | ) | | $ | (1,702,107 | ) |
| | | | | | | | | |
(1) Net of foreign taxes withheld | | $ | — | | | $ | 16,515 | |
See notes to financial statements.
| |
| STATEMENTS OF CHANGES IN NET ASSETS |
| | | Six Months Ended | | | Year Ended | |
| | | March 31, 2019 | | | September 30, 2018 | |
| | | (Unaudited) | | | | |
| OPERATIONS: | | | | | | |
| Net investment income | | $ | 1,964,957 | | | $ | 5,561,934 | |
| Net realized loss on investments | | | | | | | | |
| and foreign currency translation | | | (9,387,342 | ) | | | (2,270,585 | ) |
| Net change in unrealized | | | | | | | | |
| appreciation (depreciation) | | | (18,805,885 | ) | | | 2,715,966 | |
| Net increase (decrease) in assets | | | | | | | | |
| resulting from operations | | | (26,228,270 | ) | | | 6,007,315 | |
| | | | | | | | | |
| DISTRIBUTIONS TO SHAREHOLDERS: | | | | | | | | |
| Net dividends and distributions | | | | | | | | |
| to shareholders - Investor Class | | | (1,519,991 | ) | | | (2,740,314 | ) |
| Net dividends and distributions | | | | | | | | |
| to shareholders - Institutional Class | | | (3,939,393 | ) | | | (11,851,429 | ) |
| Total dividends and distributions | | | (5,459,384 | ) | | | (14,591,743 | ) |
| | | | | | | | | |
| CAPITAL SHARE TRANSACTIONS: | | | | | | | | |
| Proceeds from shares sold - Investor Class | | | 1,556,305 | | | | 7,123,382 | |
| Proceeds from shares sold - Institutional Class | | | 7,930,466 | | | | 42,837,125 | |
| Proceeds from shares issued to holders in | | | | | | | | |
| reinvestment of dividends - Investor Class | | | 1,456,277 | | | | 2,638,833 | |
| Proceeds from shares issued to holders in | | | | | | | | |
| reinvestment of dividends - Institutional Class | | | 3,155,551 | | | | 9,475,114 | |
Cost of shares redeemed - Investor Class(1) | | | (13,292,368 | ) | | | (32,463,242 | ) |
Cost of shares redeemed - Institutional Class(2) | | | (130,860,618 | ) | | | (112,706,794 | ) |
| Net decrease in net assets | | | | | | | | |
| from capital share transactions | | | (130,054,387 | ) | | | (83,095,582 | ) |
| | | | | | | | | |
| TOTAL DECREASE IN NET ASSETS | | | (161,742,041 | ) | | | (91,680,010 | ) |
| | | | | | | | | |
| NET ASSETS: | | | | | | | | |
| Beginning of Period | | | 321,166,841 | | | | 412,846,851 | |
| End of Period | | $ | 159,424,800 | | | $ | 321,166,841 | |
(1) | Net of redemption fees of $74 and $431, respectively. |
(2) | Net of redemption fees of $650 and $33, respectively. |
See notes to financial statements.
| |
| STATEMENTS OF CHANGES IN NET ASSETS (continued) |
| | | Six Months Ended | | | Year Ended | |
| | | March 31, 2019 | | | September 30, 2018 | |
| | | (Unaudited) | | | | |
| OPERATIONS: | | | | | | |
| Net investment income | | $ | 359,419 | | | $ | 512,625 | |
| Net realized loss on investments | | | | | | | | |
| and foreign currency translation | | | (2,574,625 | ) | | | (3,567,871 | ) |
| Net change in unrealized appreciation | | | 298,618 | | | | 2,754,003 | |
| Net decrease in assets | | | | | | | | |
| resulting from operations | | | (1,916,588 | ) | | | (301,243 | ) |
| | | | | | | | | |
| DISTRIBUTIONS TO SHAREHOLDERS: | | | | | | | | |
| Net dividends and distributions | | | | | | | | |
| to shareholders - Investor Class | | | (364,080 | ) | | | (3,478,881 | ) |
| Net dividends and distributions | | | | | | | | |
| to shareholders - Institutional Class | | | (218,652 | ) | | | (2,015,154 | ) |
| Total dividends and distributions | | | (582,732 | ) | | | (5,494,035 | ) |
| | | | | | | | | |
| CAPITAL SHARE TRANSACTIONS: | | | | | | | | |
| Proceeds from shares sold - Investor Class | | | 1,471,644 | | | | 4,508,574 | |
| Proceeds from shares sold - Institutional Class | | | 3,375,540 | | | | 9,953,949 | |
| Proceeds from shares issued to holders in | | | | | | | | |
| reinvestment of dividends - Investor Class | | | 354,855 | | | | 3,407,247 | |
| Proceeds from shares issued to holders in | | | | | | | | |
| reinvestment of dividends - Institutional Class | | | 203,423 | | | | 1,892,133 | |
Cost of shares redeemed - Investor Class(1) | | | (13,633,852 | ) | | | (54,233,435 | ) |
Cost of shares redeemed - Institutional Class(2) | | | (13,937,738 | ) | | | (29,482,207 | ) |
| Net decrease in net assets | | | | | | | | |
| from capital share transactions | | | (22,166,128 | ) | | | (63,953,739 | ) |
| | | | | | | | | |
| TOTAL DECREASE IN NET ASSETS | | | (24,665,448 | ) | | | (69,749,017 | ) |
| | | | | | | | | |
| NET ASSETS: | | | | | | | | |
| Beginning of Period | | | 123,522,434 | | | | 193,271,451 | |
| End of Period | | $ | 98,856,986 | | | $ | 123,522,434 | |
(1) | Net of redemption fees of $66 and $244, respectively. |
(2) | Net of redemption fees of $0 and $0, respectively. |
See notes to financial statements.
| |
| STATEMENTS OF CHANGES IN NET ASSETS (continued) |
| | | Six Months Ended | | | Year Ended | |
| | | March 31, 2019 | | | September 30, 2018 | |
| | | (Unaudited) | | | | |
| OPERATIONS: | | | | | | |
| Net investment income | | $ | 1,065,447 | | | $ | 2,143,668 | |
| Net realized loss on investments | | | | | | | | |
| and foreign currency translation | | | (323,758 | ) | | | (627,686 | ) |
| Net change in unrealized appreciation | | | 365,029 | | | | 127,306 | |
| Net increase in assets | | | | | | | | |
| resulting from operations | | | 1,106,718 | | | | 1,643,288 | |
| | | | | | | | | |
| DISTRIBUTIONS TO SHAREHOLDERS: | | | | | | | | |
| Net dividends and distributions to shareholders | | | (1,083,344 | ) | | | (2,138,103 | ) |
| Total dividends and distributions | | | (1,083,344 | ) | | | (2,138,103 | ) |
| | | | | | | | | |
| CAPITAL SHARE TRANSACTIONS: | | | | | | | | |
| Proceeds from shares sold | | | 5,265,599 | | | | 12,051,869 | |
| Proceeds from shares issued to holders | | | | | | | | |
| in reinvestment of dividends | | | 1,043,243 | | | | 2,042,253 | |
Cost of shares redeemed(1) | | | (19,518,290 | ) | | | (18,513,001 | ) |
| Net decrease in net assets | | | | | | | | |
| from capital share transactions | | | (13,209,448 | ) | | | (4,418,879 | ) |
| | | | | | | | | |
| TOTAL DECREASE IN NET ASSETS | | | (13,186,074 | ) | | | (4,913,694 | ) |
| | | | | | | | | |
| NET ASSETS: | | | | | | | | |
| Beginning of Period | | | 74,619,742 | | | | 79,533,436 | |
| End of Period | | $ | 61,433,668 | | | $ | 74,619,742 | |
(1) | Net of redemption fees of $0 and $15, respectively. |
See notes to financial statements.
| Intrepid Disciplined Value Fund |
| |
| STATEMENTS OF CHANGES IN NET ASSETS (continued) |
| | | Six Months Ended | | | Year Ended | |
| | | March 31, 2019 | | | September 30, 2018 | |
| | | (Unaudited) | | | | |
| OPERATIONS: | | | | | | |
| Net investment income | | $ | 47,987 | | | $ | 167,009 | |
| Net realized gain (loss) on investments | | | | | | | | |
| and foreign currency translation | | | (611,229 | ) | | | 614,765 | |
| Net change in unrealized depreciation | | | (1,776,257 | ) | | | (214,040 | ) |
| Net increase (decrease) in assets | | | | | | | | |
| resulting from operations | | | (2,339,499 | ) | | | 567,734 | |
| | | | | | | | | |
| DISTRIBUTIONS TO SHAREHOLDERS: | | | | | | | | |
| Net dividends and distributions to shareholders | | | (498,025 | ) | | | (1,292,230 | ) |
| Total dividends and distributions | | | (498,025 | ) | | | (1,292,230 | ) |
| | | | | | | | | |
| CAPITAL SHARE TRANSACTIONS: | | | | | | | | |
| Proceeds from shares sold | | | 3,665,141 | | | | 1,729,365 | |
| Proceeds from merger (See Note 10) | | | 20,968,527 | | | | — | |
| Proceeds from shares issued to holders | | | | | | | | |
| in reinvestment of dividends | | | 487,192 | | | | 1,265,840 | |
Cost of shares redeemed(1) | | | (8,748,624 | ) | | | (13,921,810 | ) |
| Net increase (decrease) in net assets | | | | | | | | |
| from capital share transactions | | | 16,372,236 | | | | (10,926,605 | ) |
| | | | | | | | | |
| TOTAL INCREASE (DECREASE) | | | | | | | | |
| IN NET ASSETS | | | 13,534,712 | | | | (11,651,101 | ) |
| | | | | | | | | |
| NET ASSETS: | | | | | | | | |
| Beginning of Period | | | 33,805,375 | | | | 45,456,476 | |
| End of Period | | $ | 47,340,087 | | | $ | 33,805,375 | |
(1) | Net of redemption fees of $1 and $48, respectively. |
See notes to financial statements.
| Intrepid International Fund |
| |
| STATEMENTS OF CHANGES IN NET ASSETS (continued) |
| | | Six Months Ended | | | Year Ended | |
| | | March 31, 2019 | | | September 30, 2018 | |
| | | (Unaudited) | | | | |
| OPERATIONS: | | | | | | |
| Net investment income | | $ | 8,732 | | | $ | 740,082 | |
| Net realized gain (loss) on investments | | | | | | | | |
| and foreign currency translation | | | (599,693 | ) | | | 1,136,288 | |
| Net change in unrealized depreciation | | | (1,111,146 | ) | | | (3,969,912 | ) |
| Net decrease in assets | | | | | | | | |
| resulting from operations | | | (1,702,107 | ) | | | (2,093,542 | ) |
| | | | | | | | | |
| DISTRIBUTIONS TO SHAREHOLDERS: | | | | | | | | |
| Net dividends and distributions to shareholders | | | (901,645 | ) | | | (1,332,538 | ) |
| Total dividends and distributions | | | (901,645 | ) | | | (1,332,538 | ) |
| | | | | | | | | |
| CAPITAL SHARE TRANSACTIONS: | | | | | | | | |
| Proceeds from shares sold | | | 570,196 | | | | 11,542,039 | |
| Proceeds from shares issued to holders | | | | | | | | |
| in reinvestment of dividends | | | 895,245 | | | | 1,326,196 | |
Cost of shares redeemed(1) | | | (6,277,639 | ) | | | (4,023,692 | ) |
| Net increase (decrease) in net assets | | | | | | | | |
| from capital share transactions | | | (4,812,198 | ) | | | 8,844,543 | |
| | | | | | | | | |
| TOTAL INCREASE (DECREASE) | | | | | | | | |
| IN NET ASSETS | | | (7,415,950 | ) | | | 5,418,463 | |
| | | | | | | | | |
| NET ASSETS: | | | | | | | | |
| Beginning of Period | | | 27,603,134 | | | | 22,184,671 | |
| End of Period | | $ | 20,187,184 | | | $ | 27,603,134 | |
(1) | Net of redemption fees of $5 and $3, respectively. |
See notes to financial statements.
| Intrepid Capital Fund – Investor Class |
Per share data for a share of capital stock outstanding for the entire period and selected information for the period are as follows:
| | | Period Ended | | | | | | | | | | | | | | | | |
| | | March 31, | | | Year Ended September 30, | |
| | | 2019 | | | 2018 | | | 2017 | | | 2016 | | | 2015 | | | 2014 | |
| | | (Unaudited) | | | | | | | | | | | | | | | | |
| NET ASSET VALUE: | | | | | | | | | | | | | | | | | | |
| Beginning of period | | $ | 11.64 | | | $ | 11.92 | | | $ | 11.62 | | | $ | 10.56 | | | $ | 12.69 | | | $ | 12.23 | |
| OPERATIONS: | | | | | | | | | | | | | | | | | | | | | | | | |
Net investment income(1) | | | 0.11 | | | | 0.19 | | | | 0.16 | | | | 0.26 | | | | 0.18 | | | | 0.12 | |
| Net realized and unrealized | | | | | | | | | | | | | | | | | | | | | | | | |
| gain (loss) on | | | | | | | | | | | | | | | | | | | | | | | | |
| investment securities | | | (0.92 | ) | | | (0.04 | ) | | | 0.62 | | | | 1.07 | | | | (1.00 | ) | | | 1.09 | |
Total from operations(2) | | | (0.81 | ) | | | 0.15 | | | | 0.78 | | | | 1.33 | | | | (0.82 | ) | | | 1.21 | |
| LESS DISTRIBUTIONS: | | | | | | | | | | | | | | | | | | | | | | | | |
| From net investment income | | | (0.12 | ) | | | (0.19 | ) | | | (0.24 | ) | | | (0.27 | ) | | | (0.19 | ) | | | (0.12 | ) |
| From net realized gains | | | (0.19 | ) | | | (0.24 | ) | | | (0.24 | ) | | | (0.00 | )(3) | | | (1.12 | ) | | | (0.63 | ) |
| Total distributions | | | (0.31 | ) | | | (0.43 | ) | | | (0.48 | ) | | | (0.27 | ) | | | (1.31 | ) | | | (0.75 | ) |
| NET ASSET VALUE: | | | | | | | | | | | | | | | | | | | | | | | | |
| End of period | | $ | 10.52 | | | $ | 11.64 | | | $ | 11.92 | | | $ | 11.62 | | | $ | 10.56 | | | $ | 12.69 | |
| Total return | | | -6.83 | %(4) | | | 1.24 | % | | | 6.86 | % | | | 12.87 | % | | | -7.17 | % | | | 10.23 | % |
| Net assets at end of | | | | | | | | | | | | | | | | | | | | | | | | |
| period (000s omitted) | | $ | 47,931 | | | $ | 64,198 | | | $ | 88,405 | | | $ | 110,395 | | | $ | 149,504 | | | $ | 238,691 | |
| RATIO OF EXPENSES TO | | | | | | | | | | | | | | | | | | | | | | | | |
| AVERAGE NET ASSETS: | | | | | | | | | | | | | | | | | | | | | | | | |
| Before expense | | | | | | | | | | | | | | | | | | | | | | | | |
| reimbursement/recoupment | | | 1.53 | %(5) | | | 1.46 | % | | | 1.44 | % | | | 1.45 | % | | | 1.42 | % | | | 1.41 | % |
| After expense | | | | | | | | | | | | | | | | | | | | | | | | |
| reimbursement/recoupment | | | 1.40 | %(5) | | | 1.40 | % | | | 1.40 | % | | | 1.40 | % | | | 1.40 | % | | | 1.40 | % |
| RATIO OF NET INVESTMENT | | | | | | | | | | | | | | | | | | | | | | | | |
| INCOME TO AVERAGE NET ASSETS: | | | | | | | | | | | | | | | | | | | | | |
| Before expense | | | | | | | | | | | | | | | | | | | | | | | | |
| reimbursement/recoupment | | | 1.38 | %(5) | | | 1.20 | % | | | 1.26 | % | | | 1.97 | % | | | 1.45 | % | | | 0.97 | % |
| After expense | | | | | | | | | | | | | | | | | | | | | | | | |
| reimbursement/recoupment | | | 1.51 | %(5) | | | 1.26 | % | | | 1.30 | % | | | 2.02 | % | | | 1.47 | % | | | 0.98 | % |
| Portfolio turnover rate | | | 24 | %(4) | | | 46 | % | | | 47 | % | | | 43 | % | | | 54 | % | | | 73 | % |
(1) | Net investment income per share is calculated using the ending accumulated net investment income balances prior to consideration or adjustment for permanent book-to-tax differences. |
(2) | Total from investment operations per share includes redemption fees of less than $0.01 per share for the six months ended March 31, 2019 and each of the five years ended September 30, 2018, 2017, 2016, 2015 and 2014. |
(3) | The amount represents less than $0.01 per share. |
(4) | Not Annualized. |
(5) | Annualized. |
See notes to financial statements.
| Intrepid Capital Fund – Institutional Class |
| |
| FINANCIAL HIGHLIGHTS (continued) |
Per share data for a share of capital stock outstanding for the entire period and selected information for the period are as follows:
| | | Period Ended | | | | | | | | | | | | | | | | |
| | | March 31, | | | Year Ended September 30, | |
| | | 2019 | | | 2018 | | | 2017 | | | 2016 | | | 2015 | | | 2014 | |
| | | (Unaudited) | | | | | | | | | | | | | | | | |
| NET ASSET VALUE: | | | | | | | | | | | | | | | | | | |
| Beginning of period | | $ | 11.65 | | | $ | 11.92 | | | $ | 11.62 | | | $ | 10.56 | | | $ | 12.69 | | | $ | 12.24 | |
| OPERATIONS: | | | | | | | | | | | | | | | | | | | | | | | | |
Net investment income(1) | | | 0.12 | | | | 0.18 | | | | 0.19 | | | | 0.24 | | | | 0.22 | | | | 0.15 | |
| Net realized and unrealized | | | | | | | | | | | | | | | | | | | | | | | | |
| gain (loss) on | | | | | | | | | | | | | | | | | | | | | | | | |
| investment securities | | | (0.92 | ) | | | (0.00 | )(3) | | | 0.62 | | | | 1.12 | | | | (1.00 | ) | | | 1.08 | |
Total from operations(2) | | | (0.80 | ) | | | 0.18 | | | | 0.81 | | | | 1.36 | | | | (0.78 | ) | | | 1.23 | |
| LESS DISTRIBUTIONS: | | | | | | | | | | | | | | | | | | | | | | | | |
| From net investment income | | | (0.13 | ) | | | (0.21 | ) | | | (0.27 | ) | | | (0.30 | ) | | | (0.23 | ) | | | (0.15 | ) |
| From net realized gains | | | (0.19 | ) | | | (0.24 | ) | | | (0.24 | ) | | | (0.00 | )(3) | | | (1.12 | ) | | | (0.63 | ) |
| Total distributions | | | (0.32 | ) | | | (0.45 | ) | | | (0.51 | ) | | | (0.30 | ) | | | (1.35 | ) | | | (0.78 | ) |
| NET ASSET VALUE: | | | | | | | | | | | | | | | | | | | | | | | | |
| End of period | | $ | 10.53 | | | $ | 11.65 | | | $ | 11.92 | | | $ | 11.62 | | | $ | 10.56 | | | $ | 12.69 | |
| Total return | | | -6.77 | %(4) | | | 1.52 | % | | | 7.13 | % | | | 13.16 | % | | | -6.92 | % | | | 10.41 | % |
| Net assets at end of | | | | | | | | | | | | | | | | | | | | | | | | |
| period (000s omitted) | | $ | 111,494 | | | $ | 256,969 | | | $ | 324,442 | | | $ | 275,694 | | | $ | 182,274 | | | $ | 233,759 | |
| RATIO OF EXPENSES TO | | | | | | | | | | | | | | | | | | | | | | | | |
| AVERAGE NET ASSETS: | | | | | | | | | | | | | | | | | | | | | | | | |
| Before expense | | | | | | | | | | | | | | | | | | | | | | | | |
| reimbursement/recoupment | | | 1.28 | %(5) | | | 1.21 | % | | | 1.19 | % | | | 1.20 | % | | | 1.17 | % | | | 1.16 | % |
| After expense | | | | | | | | | | | | | | | | | | | | | | | | |
| reimbursement/recoupment | | | 1.15 | %(5) | | | 1.15 | % | | | 1.15 | % | | | 1.15 | % | | | 1.15 | % | | | 1.15 | % |
| RATIO OF NET INVESTMENT | | | | | | | | | | | | | | | | | | | | | | | | |
| INCOME TO AVERAGE NET ASSETS: | | | | | | | | | | | | | | | | | | | | | |
| Before expense | | | | | | | | | | | | | | | | | | | | | | | | |
| reimbursement/recoupment | | | 1.65 | %(5) | | | 1.46 | % | | | 1.52 | % | | | 2.13 | % | | | 1.72 | % | | | 1.23 | % |
| After expense | | | | | | | | | | | | | | | | | | | | | | | | |
| reimbursement/recoupment | | | 1.78 | %(5) | | | 1.52 | % | | | 1.56 | % | | | 2.18 | % | | | 1.74 | % | | | 1.24 | % |
| Portfolio turnover rate | | | 24 | %(4) | | | 46 | % | | | 47 | % | | | 43 | % | | | 54 | % | | | 73 | % |
(1) | Net investment income per share is calculated using the ending accumulated net investment income balances prior to consideration or adjustment for permanent book-to-tax differences. |
(2) | Total from investment operations per share includes redemption fees of less than $0.01 per share for the six months ended March 31, 2019 and each of the five years ended September 30, 2018, 2017, 2016, 2015 and 2014. |
(3) | The amount represents less than $0.01 per share. |
(4) | Not Annualized. |
(5) | Annualized. |
See notes to financial statements.
| Intrepid Endurance Fund – Investor Class |
| |
| FINANCIAL HIGHLIGHTS (continued) |
Per share data for a share of capital stock outstanding for the entire period and selected information for the period are as follows:
| | | Period Ended | | | | | | | | | | | | | | | | |
| | | March 31, | | | Year Ended September 30, | |
| | | 2019 | | | 2018 | | | 2017 | | | 2016 | | | 2015 | | | 2014 | |
| | | (Unaudited) | | | | | | | | | | | | | | | | |
| NET ASSET VALUE: | | | | | | | | | | | | | | | | | | |
| Beginning of period | | $ | 13.89 | | | $ | 14.46 | | | $ | 14.55 | | | $ | 13.70 | | | $ | 16.18 | | | $ | 15.91 | |
| OPERATIONS: | | | | | | | | | | | | | | | | | | | | | | | | |
| Net investment | | | | | | | | | | | | | | | | | | | | | | | | |
income (loss)(1)(2) | | | 0.04 | | | | 0.04 | | | | (0.07 | ) | | | (0.05 | ) | | | (0.17 | ) | | | (0.22 | ) |
| Net realized and unrealized | | | | | | | | | | | | | | | | | | | | | | | | |
| gain (loss) on | | | | | | | | | | | | | | | | | | | | | | | | |
| investment securities | | | (0.25 | ) | | | (0.10 | ) | | | 0.12 | | | | 1.08 | | | | (0.71 | ) | | | 1.17 | |
Total from operations(3) | | | (0.21 | ) | | | (0.06 | ) | | | 0.05 | | | | 1.03 | | | | (0.88 | ) | | | 0.95 | |
| LESS DISTRIBUTIONS: | | | | | | | | | | | | | | | | | | | | | | | | |
| From net investment income | | | (0.07 | ) | | | (0.01 | ) | | | — | | | | (0.18 | ) | | | — | | | | — | |
| From net realized gains | | | — | | | | (0.50 | ) | | | (0.14 | ) | | | — | | | | (1.60 | ) | | | (0.68 | ) |
| Total distributions | | | (0.07 | ) | | | (0.51 | ) | | | (0.14 | ) | | | (0.18 | ) | | | (1.60 | ) | | | (0.68 | ) |
| NET ASSET VALUE: | | | | | | | | | | | | | | | | | | | | | | | | |
| End of period | | $ | 13.61 | | | $ | 13.89 | | | $ | 14.46 | | | $ | 14.55 | | | $ | 13.70 | | | $ | 16.18 | |
| Total return | | | -1.49 | %(4) | | | -0.49 | % | | | 0.36 | % | | | 7.63 | % | | | -6.03 | % | | | 6.08 | % |
| Net assets at end of | | | | | | | | | | | | | | | | | | | | | | | | |
| period (000s omitted) | | $ | 62,094 | | | $ | 75,405 | | | $ | 125,433 | | | $ | 181,001 | | | $ | 216,933 | | | $ | 421,714 | |
| RATIO OF EXPENSES TO | | | | | | | | | | | | | | | | | | | | | | | | |
| AVERAGE NET ASSETS: | | | | | | | | | | | | | | | | | | | | | | | | |
| Before expense | | | | | | | | | | | | | | | | | | | | | | | | |
| reimbursement/recoupment | | | 1.51 | %(5) | | | 1.48 | % | | | 1.46 | % | | | 1.46 | % | | | 1.42 | % | | | 1.40 | % |
| After expense | | | | | | | | | | | | | | | | | | | | | | | | |
| reimbursement/recoupment | | | 1.36 | %(5) | | | 1.37 | % | | | 1.40 | % | | | 1.40 | % | | | 1.40 | % | | | 1.40 | % |
| RATIO OF NET INVESTMENT | | | | | | | | | | | | | | | | | | | | | | | | |
| INCOME (LOSS) TO | | | | | | | | | | | | | | | | | | | | | | | | |
| AVERAGE NET ASSETS: | | | | | | | | | | | | | | | | | | | | | | | | |
| Before expense | | | | | | | | | | | | | | | | | | | | | | | | |
| reimbursement/recoupment | | | 0.41 | %(5) | | | 0.14 | % | | | (0.18 | )% | | | (0.34 | )% | | | (0.67 | )% | | | (1.11 | )% |
| After expense | | | | | | | | | | | | | | | | | | | | | | | | |
| reimbursement/recoupment | | | 0.56 | %(5) | | | 0.25 | % | | | (0.12 | )% | | | (0.28 | )% | | | (0.65 | )% | | | (1.11 | )% |
| Portfolio turnover rate | | | 14 | %(4) | | | 44 | % | | | 43 | % | | | 40 | % | | | 75 | % | | | 38 | % |
(1) | Net investment income per share is calculated using the average shares outstanding method for the six months ended March 31, 2019 and the year ended September 30, 2018. |
(2) | Net investment loss per share is calculated using the ending accumulated net investment loss balances prior to consideration or adjustment for permanent book-to-tax differences for each of the four years ended September 30, 2017, 2016, 2015 and 2014. |
(3) | Total from investment operations per share includes redemption fees of less than $0.01 per share for the six months ended March 31, 2019 and each of the five years ended September 30, 2018, 2017, 2016, 2015 and 2014. |
(4) | Not Annualized. |
(5) | Annualized. |
See notes to financial statements.
| Intrepid Endurance Fund – Institutional Class |
| |
| FINANCIAL HIGHLIGHTS (continued) |
Per share data for a share of capital stock outstanding for the entire period and selected information for the period are as follows:
| | | Period Ended | | | | | | | | | | | | | | | | |
| | | March 31, | | | Year Ended September 30, | |
| | | 2019 | | | 2018 | | | 2017 | | | 2016 | | | 2015 | | | 2014 | |
| | | (Unaudited) | | | | | | | | | | | | | | | | |
| NET ASSET VALUE: | | | | | | | | | | | | | | | | | | |
| Beginning of period | | $ | 14.25 | | | $ | 14.81 | | | $ | 14.86 | | | $ | 13.97 | | | $ | 16.42 | | | $ | 16.09 | |
| OPERATIONS: | | | | | | | | | | | | | | | | | | | | | | | | |
| Net investment | | | | | | | | | | | | | | | | | | | | | | | | |
income (loss)(1)(2) | | | 0.05 | | | | 0.19 | | | | 0.03 | | | | (0.00 | )(3) | | | (0.06 | ) | | | (0.16 | ) |
| Net realized and unrealized | | | | | | | | | | | | | | | | | | | | | | | | |
| gain (loss) on | | | | | | | | | | | | | | | | | | | | | | | | |
| investment securities | | | (0.25 | ) | | | (0.23 | ) | | | 0.06 | | | | 1.08 | | | | (0.79 | ) | | | 1.17 | |
Total from operations(4) | | | (0.20 | ) | | | (0.04 | ) | | | 0.09 | | | | 1.08 | | | | (0.85 | ) | | | 1.01 | |
| LESS DISTRIBUTIONS: | | | | | | | | | | | | | | | | | | | | | | | | |
| From net investment income | | | (0.08 | ) | | | (0.02 | ) | | | (0.00 | )(3) | | | (0.19 | ) | | | — | | | | — | |
| From net realized gains | | | — | | | | (0.50 | ) | | | (0.14 | ) | | | — | | | | (1.60 | ) | | | (0.68 | ) |
| Total distributions | | | (0.08 | ) | | | (0.52 | ) | | | (0.14 | ) | | | (0.19 | ) | | | (1.60 | ) | | | (0.68 | ) |
| NET ASSET VALUE: | | | | | | | | | | | | | | | | | | | | | | | | |
| End of period | | $ | 13.97 | | | $ | 14.25 | | | $ | 14.81 | | | $ | 14.86 | | | $ | 13.97 | | | $ | 16.42 | |
| Total return | | | -1.40 | %(5) | | | -0.34 | % | | | 0.64 | % | | | 7.85 | % | | | -5.68 | % | | | 6.39 | % |
| Net assets at end of | | | | | | | | | | | | | | | | | | | | | | | | |
| period (000s omitted) | | $ | 36,763 | | | $ | 48,117 | | | $ | 67,839 | | | $ | 72,539 | | | $ | 85,350 | | | $ | 238,722 | |
| RATIO OF EXPENSES TO | | | | | | | | | | | | | | | | | | | | | | | | |
| AVERAGE NET ASSETS: | | | | | | | | | | | | | | | | | | | | | | | | |
| Before expense | | | | | | | | | | | | | | | | | | | | | | | | |
| reimbursement/recoupment | | | 1.30 | %(6) | | | 1.26 | % | | | 1.21 | % | | | 1.21 | % | | | 1.17 | % | | | 1.15 | % |
| After expense | | | | | | | | | | | | | | | | | | | | | | | | |
| reimbursement/recoupment | | | 1.15 | %(6) | | | 1.15 | % | | | 1.15 | % | | | 1.15 | % | | | 1.15 | % | | | 1.15 | % |
| RATIO OF NET INVESTMENT | | | | | | | | | | | | | | | | | | | | | | | | |
| INCOME (LOSS) TO | | | | | | | | | | | | | | | | | | | | | | | | |
| AVERAGE NET ASSETS: | | | | | | | | | | | | | | | | | | | | | | | | |
| Before expense | | | | | | | | | | | | | | | | | | | | | | | | |
| reimbursement/recoupment | | | 0.63 | %(6) | | | 0.37 | % | | | 0.07 | % | | | (0.09 | )% | | | (0.44 | )% | | | (0.85 | )% |
| After expense | | | | | | | | | | | | | | | | | | | | | | | | |
| reimbursement/recoupment | | | 0.78 | %(6) | | | 0.48 | % | | | 0.13 | % | | | (0.03 | )% | | | (0.42 | )% | | | (0.85 | )% |
| Portfolio turnover rate | | | 14 | %(5) | | | 44 | % | | | 43 | % | | | 40 | % | | | 75 | % | | | 38 | % |
(1) | Net investment income (loss) per share is calculated using the ending accumulated net investment income (loss) balances prior to consideration or adjustment for permanent book-to-tax differences for each of the four years ended September 30, 2018, 2017, 2015 and 2014. |
(2) | Net investment income per share is calculated using the average shares outstanding method for the six months ended March 31, 2019 and the year ended September 30, 2016. |
(3) | The amount represents less than $0.01 per share. |
(4) | Total from investment operations per share includes redemption fees of less than $0.01 for each of the five years ended September 30, 2018, 2017, 2016, 2015 and 2014. |
(5) | Not Annualized. |
(6) | Annualized. |
See notes to financial statements.
| |
| FINANCIAL HIGHLIGHTS (continued) |
Per share data for a share of capital stock outstanding for the entire period and selected information for the period are as follows:
| | | Period Ended | | | | | | | | | | | | | | | | |
| | | March 31, | | | Year Ended September 30, | |
| | | 2019 | | | 2018 | | | 2017 | | | 2016 | | | 2015 | | | 2014 | |
| | | (Unaudited) | | | | | | | | | | | | | | | | |
| NET ASSET VALUE: | | | | | | | | | | | | | | | | | | |
| Beginning of period | | $ | 9.21 | | | $ | 9.29 | | | $ | 9.29 | | | $ | 9.02 | | | $ | 9.65 | | | $ | 9.66 | |
| OPERATIONS: | | | | | | | | | | | | | | | | | | | | | | | | |
Net investment income(1) | | | 0.16 | | | | 0.27 | | | | 0.27 | | | | 0.28 | | | | 0.30 | | | | 0.28 | |
| Net realized and unrealized | | | | | | | | | | | | | | | | | | | | | | | | |
| gain (loss) on | | | | | | | | | | | | | | | | | | | | | | | | |
| investment securities | | | 0.01 | | | | (0.08 | ) | | | 0.00 | (2) | | | 0.31 | | | | (0.56 | ) | | | 0.04 | |
Total from operations(3) | | | 0.17 | | | | 0.19 | | | | 0.27 | | | | 0.59 | | | | (0.26 | ) | | | 0.32 | |
| LESS DISTRIBUTIONS: | | | | | | | | | | | | | | | | | | | | | | | | |
| From net investment income | | | (0.16 | ) | | | (0.27 | ) | | | (0.27 | ) | | | (0.32 | ) | | | (0.30 | ) | | | (0.28 | ) |
| From net realized gains | | | — | | | | — | | | | — | | | | — | | | | (0.07 | ) | | | (0.05 | ) |
| Total distributions | | | (0.16 | ) | | | (0.27 | ) | | | (0.27 | ) | | | (0.32 | ) | | | (0.37 | ) | | | (0.33 | ) |
| NET ASSET VALUE: | | | | | | | | | | | | | | | | | | | | | | | | |
| End of period | | $ | 9.22 | | | $ | 9.21 | | | $ | 9.29 | | | $ | 9.29 | | | $ | 9.02 | | | $ | 9.65 | |
| Total return | | | 1.84 | %(6) | | | 2.05 | % | | | 2.92 | % | | | 6.76 | % | | | -2.76 | % | | | 3.38 | % |
| Net assets at end of | | | | | | | | | | | | | | | | | | | | | | | | |
| period (000s omitted) | | $ | 61,434 | | | $ | 74,620 | | | $ | 79,533 | | | $ | 79,760 | | | $ | 84,988 | | | $ | 106,360 | |
| RATIO OF EXPENSES TO | | | | | | | | | | | | | | | | | | | | | | | | |
| AVERAGE NET ASSETS: | | | | | | | | | | | | | | | | | | | | | | | | |
| Before expense | | | | | | | | | | | | | | | | | | | | | | | | |
| reimbursement/recoupment | | | 1.05 | %(7) | | | 1.03 | % | | | 1.01 | % | | | 1.01 | % | | | 0.96 | % | | | 0.95 | %(4) |
| After expense | | | | | | | | | | | | | | | | | | | | | | | | |
| reimbursement/recoupment | | | 0.90 | %(7) | | | 0.90 | % | | | 0.90 | % | | | 0.90 | % | | | 0.90 | % | | | 0.90 | %(4) |
| RATIO OF NET INVESTMENT | | | | | | | | | | | | | | | | | | | | | | | | |
| INCOME TO AVERAGE NET ASSETS: | | | | | | | | | | | | | | | | | | | | | |
| Before expense | | | | | | | | | | | | | | | | | | | | | | | | |
| reimbursement/recoupment | | | 3.02 | %(7) | | | 2.70 | % | | | 2.77 | % | | | 2.97 | % | | | 3.05 | % | | | 2.85 | %(5) |
| After expense | | | | | | | | | | | | | | | | | | | | | | | | |
| reimbursement/recoupment | | | 3.17 | %(7) | | | 2.83 | % | | | 2.88 | % | | | 3.08 | % | | | 3.11 | % | | | 2.90 | %(5) |
| Portfolio turnover rate | | | 24 | %(6) | | | 54 | % | | | 49 | % | | | 52 | % | | | 51 | % | | | 53 | % |
(1) | Net investment income per share is calculated using the ending accumulated net investment income balances prior to consideration or adjustment for permanent book-to-tax differences. |
(2) | The amount represents less than $0.01 per share. |
(3) | Total from investment operations per share includes redemption fees of less than $0.01 per share for each of the two years ended September 30, 2018 and 2014. |
(4) | Excludes expenses related to the Investor Class that was merged into the Institutional Class on January 31, 2014. With the inclusion of these expenses, the ratio would have been 0.98% and 0.93%, respectively. |
(5) | Excludes income and expenses related to the Investor Class that was merged into the Institutional Class on January 31, 2014. With the inclusion of these expenses, the ratio would have been 2.83% and 2.88%, respectively. |
(6) | Not Annualized. |
(7) | Annualized. |
See notes to financial statements.
| Intrepid Disciplined Value Fund |
| |
| FINANCIAL HIGHLIGHTS (continued) |
Per share data for a share of capital stock outstanding for the entire period and selected information for the period are as follows:
| | | Period Ended | | | | | | | | | | | | | | | | |
| | | March 31, | | | Year Ended September 30, | |
| | | 2019 | | | 2018 | | | 2017 | | | 2016 | | | 2015 | | | 2014 | |
| | | (Unaudited) | | | | | | | | | | | | | | | | |
| NET ASSET VALUE: | | | | | | | | | | | | | | | | | | |
| Beginning of period | | $ | 10.63 | | | $ | 10.89 | | | $ | 10.62 | | | $ | 9.98 | | | $ | 11.22 | | | $ | 11.11 | |
| OPERATIONS: | | | | | | | | | | | | | | | | | | | | | | | | |
| Net investment | | | | | | | | | | | | | | | | | | | | | | | | |
income (loss)(1) | | | 0.01 | | | | 0.05 | | | | 0.00 | (2) | | | 0.07 | | | | (0.01 | ) | | | (0.06 | ) |
| Net realized and unrealized | | | | | | | | | | | | | | | | | | | | | | | | |
| gain (loss) on | | | | | | | | | | | | | | | | | | | | | | | | |
| investment securities | | | (0.87 | ) | | | 0.07 | | | | 0.70 | | | | 1.07 | | | | (0.31 | ) | | | 1.08 | |
Total from operations(3) | | | (0.86 | ) | | | 0.12 | | | | 0.70 | | | | 1.14 | | | | (0.32 | ) | | | 1.02 | |
| LESS DISTRIBUTIONS: | | | | | | | | | | | | | | | | | | | | | | | | |
| From net investment income | | | (0.03 | ) | | | (0.08 | ) | | | (0.06 | ) | | | (0.04 | ) | | | — | | | | — | |
| From net realized gains | | | (0.15 | ) | | | (0.30 | ) | | | (0.37 | ) | | | (0.46 | ) | | | (0.92 | ) | | | (0.91 | ) |
| Total distributions | | | (0.18 | ) | | | (0.38 | ) | | | (0.43 | ) | | | (0.50 | ) | | | (0.92 | ) | | | (0.91 | ) |
| NET ASSET VALUE: | | | | | | | | | | | | | | | | | | | | | | | | |
| End of period | | $ | 9.59 | | | $ | 10.63 | | | $ | 10.89 | | | $ | 10.62 | | | $ | 9.98 | | | $ | 11.22 | |
| Total return | | | -7.94 | %(4) | | | 1.06 | % | | | 6.80 | % | | | 11.91 | % | | | -3.32 | % | | | 9.69 | % |
| Net assets at end of | | | | | | | | | | | | | | | | | | | | | | | | |
| period (000s omitted) | | $ | 47,340 | | | $ | 33,805 | | | $ | 45,456 | | | $ | 47,991 | | | $ | 44,930 | | | $ | 46,137 | |
| RATIO OF EXPENSES TO | | | | | | | | | | | | | | | | | | | | | | | | |
| AVERAGE NET ASSETS: | | | | | | | | | | | | | | | | | | | | | | | | |
| Before expense | | | | | | | | | | | | | | | | | | | | | | | | |
| reimbursement/recoupment | | | 1.50 | %(5) | | | 1.47 | % | | | 1.41 | % | | | 1.34 | % | | | 1.31 | % | | | 1.57 | % |
| After expense | | | | | | | | | | | | | | | | | | | | | | | | |
| reimbursement/recoupment | | | 1.30 | %(5) | | | 1.30 | % | | | 1.30 | % | | | 1.30 | % | | | 1.30 | % | | | 1.33 | % |
| RATIO OF NET INVESTMENT | | | | | | | | | | | | | | | | | | | | | | | | |
| INCOME (LOSS) TO | | | | | | | | | | | | | | | | | | | | | | | | |
| AVERAGE NET ASSETS: | | | | | | | | | | | | | | | | | | | | | | | | |
| Before expense | | | | | | | | | | | | | | | | | | | | | | | | |
| reimbursement/recoupment | | | 0.07 | %(5) | | | 0.27 | % | | | (0.10 | %) | | | 0.62 | % | | | (0.14 | )% | | | (0.78 | )% |
| After expense | | | | | | | | | | | | | | | | | | | | | | | | |
| reimbursement/recoupment | | | 0.27 | %(5) | | | 0.44 | % | | | 0.01 | % | | | 0.66 | % | | | (0.13 | )% | | | (0.54 | )% |
| Portfolio turnover rate | | | 38 | %(4) | | | 51 | % | | | 13 | % | | | 32 | % | | | 71 | % | | | 66 | % |
(1) | Net investment income (loss) per share is calculated using the ending accumulated net investment income (loss) balances prior to consideration or adjustment for permanent book-to-tax differences. |
(2) | The amount represents less than $0.01 per share. |
(3) | Total from investment operations per share includes redemption fees of less than $0.01 per share for the six months ended March 31, 2019 and each of the four years ended September 30, 2018, 2017, 2016 and 2014. |
(4) | Not Annualized. |
(5) | Annualized. |
See notes to financial statements.
| Intrepid International Fund |
| |
| FINANCIAL HIGHLIGHTS (continued) |
Per share data for a share of capital stock outstanding for the entire period and selected information for the period are as follows:
| | | Period Ended | | | | | | | | | | | | December 30, 2014(1) | |
| | | March 31, | | | Year Ended September 30, | | | through | |
| | | 2019 | | | 2018 | | | 2017 | | | 2016 | | | September 30, 2015 | |
| | | (Unaudited) | | | | | | | | | | | | | |
| NET ASSET VALUE: | | | | | | | | | | | | | | | |
| Beginning of period | | $ | 9.37 | | | $ | 10.40 | | | $ | 10.16 | | | $ | 9.95 | | | $ | 10.00 | |
| OPERATIONS: | | | | | | | | | | | | | | | | | | | | |
| Net investment | | | | | | | | | | | | | | | | | | | | |
income (loss)(2) | | | (0.01 | ) | | | 0.34 | | | | 0.36 | | | | 0.51 | | | | 0.06 | |
| Net realized and unrealized | | | | | | | | | | | | | | | | | | | | |
| gain (loss) on | | | | | | | | | | | | | | | | | | | | |
| investment securities | | | (0.58 | ) | | | (0.85 | ) | | | 0.32 | | | | 0.60 | | | | (0.11 | ) |
Total from operations(3) | | | (0.59 | ) | | | (0.51 | ) | | | 0.68 | | | | 1.11 | | | | (0.05 | ) |
| LESS DISTRIBUTIONS: | | | | | | | | | | | | | | | | | | | | |
| From net investment income | | | (0.08 | ) | | | (0.18 | ) | | | (0.37 | ) | | | (0.72 | ) | | | — | |
| From net realized gains | | | (0.30 | ) | | | (0.34 | ) | | | (0.07 | ) | | | (0.18 | ) | | | — | |
| Total distributions | | | (0.38 | ) | | | (0.52 | ) | | | (0.44 | ) | | | (0.90 | ) | | | — | |
| NET ASSET VALUE: | | | | | | | | | | | | | | | | | | | | |
| End of period | | $ | 8.40 | | | $ | 9.37 | | | $ | 10.40 | | | $ | 10.16 | | | $ | 9.95 | |
| Total return | | | -5.97 | %(4) | | | -5.43 | % | | | 7.05 | % | | | 12.67 | % | | | -0.50 | %(4) |
| Net assets at end of | | | | | | | | | | | | | | | | | | | | |
| period (000s omitted) | | $ | 20,187 | | | $ | 27,603 | | | $ | 22,185 | | | $ | 17,048 | | | $ | 7,573 | |
| RATIO OF EXPENSES TO | | | | | | | | | | | | | | | | | | | | |
| AVERAGE NET ASSETS: | | | | | | | | | | | | | | | | | | | | |
| Before expense | | | | | | | | | | | | | | | | | | | | |
| reimbursement/recoupment | | | 1.95 | %(5) | | | 1.74 | % | | | 2.14 | % | | | 2.50 | % | | | 4.07 | %(5) |
| After expense | | | | | | | | | | | | | | | | | | | | |
| reimbursement/recoupment | | | 1.40 | %(5) | | | 1.40 | % | | | 1.40 | % | | | 1.40 | % | | | 1.40 | %(5) |
| RATIO OF NET INVESTMENT | | | | | | | | | | | | | | | | | | | | |
| INCOME (LOSS) TO | | | | | | | | | | | | | | | | | | | | |
| AVERAGE NET ASSETS: | | | | | | | | | | | | | | | | | | | | |
| Before expense | | | | | | | | | | | | | | | | | | | | |
| reimbursement/recoupment | | | (0.47 | )%(5) | | | 2.28 | % | | | 2.67 | % | | | 3.46 | % | | | (1.47 | )%(5) |
| After expense | | | | | | | | | | | | | | | | | | | | |
| reimbursement/recoupment | | | 0.08 | %(5) | | | 2.62 | % | | | 3.41 | % | | | 4.56 | % | | | 1.20 | %(5) |
| Portfolio turnover rate | | | 14 | %(4) | | | 55 | % | | | 51 | % | | | 33 | % | | | 32 | %(4) |
(1) | Commencement of Operations. |
(2) | Net investment income (loss) per share is calculated using the ending accumulated net investment income (loss) balances prior to consideration or adjustment for permanent book-to-tax differences. |
(3) | Total from investment operations per share includes redemption fees of less than $0.01 per share for the six months ended March 31, 2019, and each of the three years ended September 30, 2018, 2017 and 2016. |
(4) | Not Annualized. |
(5) | Annualized. |
See notes to financial statements.
| NOTES TO FINANCIAL STATEMENTS |
| March 31, 2019 (Unaudited) |
1. ORGANIZATION
Intrepid Capital Management Funds Trust (the “Trust”) was organized as a Delaware Statutory Trust on August 27, 2004 and is registered under the Investment Company Act of 1940, as amended (the “1940 Act”), as an open-end management investment company issuing shares in series, each series representing a distinct portfolio with its own investment objectives and policies. At March 31, 2019, the Trust consisted of five series (the “Funds”): Intrepid Capital Fund, Intrepid Endurance Fund, Intrepid Income Fund, Intrepid Disciplined Value Fund and Intrepid International Fund. The Intrepid Capital Fund’s Investor Class commenced operations on January 3, 2005, the Intrepid Capital Fund’s Institutional Class commenced operations on April 30, 2010, the Intrepid Endurance Fund’s Investor Class commenced operations on October 3, 2005, the Intrepid Endurance Fund’s Institutional Class commenced operations on November 3, 2009, the Intrepid Income Fund’s Investor Class commenced operations on July 2, 2009 and ceased operations on January 31, 2014. Effective as of the close of business on January 31, 2014 all Investor Class shares of the Intrepid Income Fund were converted into Institutional Class shares. The Intrepid Income Fund’s Institutional Class commenced operations on August 16, 2010, the Intrepid Disciplined Value Fund’s Investor Class commenced operations on October 31, 2007, the Intrepid International Fund’s Investor Class commenced operations on December 30, 2014. The Intrepid Disciplined Value Fund’s and the Intrepid International Fund’s Institutional Class are not available for sale.
On November 13, 2018, the Board of Trustees (the “Board”) of Intrepid Capital Management Funds Trust (the “Trust”) approved: (1) a plan of reorganization pursuant to which the Intrepid Select Fund (the “Select Fund”) was reorganized into the Intrepid Disciplined Value Fund (the “Disciplined Value Fund”) (each, a “Fund,” and together, the “Funds”); and (2) the subsequent liquidation and dissolution of the Select Fund, effective on January 25, 2019. The reorganization, which was tax free to the shareholders of the Select Fund and was subject to customary closing conditions, was effected by transferring all of the assets and liabilities of the Select Fund to the Disciplined Value Fund in exchange for shares of the Disciplined Value Fund, with the shares being distributed pro rata by the Select Fund to its shareholders.
2. SUMMARY OF SIGNIFICANT ACCOUNTING POLICIES
The following is a summary of significant accounting policies consistently followed by the Funds in the preparation of their financial statements. These policies are in conformity with accounting principles generally accepted in the United States (“GAAP”). The Funds are investment companies and, accordingly, follow the investment company accounting and reporting guidance of the Financial Accounting Standards Board Accounting Standards Codification Topic 946, Investment Companies.
| NOTES TO FINANCIAL STATEMENTS (continued) |
| March 31, 2019 (Unaudited) |
Valuation of Securities
The Trust has adopted authoritative fair valuation accounting standards which establish an authoritative definition of fair value and set out a hierarchy for measuring fair value. These standards require additional disclosures about the various inputs and valuation techniques used to develop the measurements of fair value and a discussion in changes in valuation techniques and related inputs during the period. These inputs are summarized in the three broad levels listed below.
| | • Level 1 – | Quoted prices in active markets for identical securities. |
| | | |
| | • Level 2 – | Other significant observable inputs (including quoted prices for similar securities, interest rates, prepayment speeds, credit risk, etc.). |
| | | |
| | • Level 3 – | Significant unobservable inputs (including the Fund’s own assumptions in determining the fair value of investments). |
Equity investments, including common stocks, foreign issued common stocks, exchange-traded funds, closed end mutual funds, real estate investments trusts and certain preferred securities, which are traded on an exchange (other than The NASDAQ OMX Group, Inc., referred to as “NASDAQ”) are valued at the last sale price reported by the exchange on which the securities are primarily traded on the day of valuation. Securities that are traded on NASDAQ under one of its three listing tiers, NASDAQ Global Market, NASDAQ Global Select Market and NASDAQ Capital Market, are valued at the NASDAQ Official Closing Price. If there are no sales on a given day for securities traded on an exchange, the latest mean between the current ask and bid prices will be used. If there is no Nasdaq Official Closing Price for a Nasdaq-listed security or sale price available for an over-the-counter security, the latest mean between the current ask and bid prices from Nasdaq will be used. When using the market quotations or closing price provided by the pricing service and when the market is considered active, the security will be classified as a Level 1 security. When using the latest mean between the current ask and bid prices, the security will be classified as Level 2.
Investment in mutual funds, including money market funds, are generally priced at the ending net asset value (NAV) provided by the service agent of the funds and will be classified as Level 1 securities.
Debt securities, such as corporate bonds, convertible bonds, senior loans, and U.S. government agency issues for which market quotations are not readily available may be valued based on information supplied by independent pricing services using matrix pricing formulas and/or independent broker bid quotations. Debt securities with remaining maturities of 60 days or less may be valued on an amortized cost basis to the extent it is equivalent to fair value, which involves valuing an instrument at its cost and thereafter assuming a constant amortization to maturity of any discount or premium, regardless of the impact of fluctuating rates on the fair value of the instrument. Amortized cost will not be used if it does not approximate fair value,
| NOTES TO FINANCIAL STATEMENTS (continued) |
| March 31, 2019 (Unaudited) |
due to credit or other impairments of the issuer. These securities will generally be classified as Level 2 securities.
Options can diverge from the prices of their underlying instruments. These are valued at the composite last price reported by the exchange on which the options are primarily traded on the day of the valuation and are classified as Level 1. If there is no composite last price on a given day the latest mean between the current ask and bid prices will be used. When using the latest mean between the current ask and bid prices, these contracts are classified as Level 2.
Forward currency contracts derive their value from the underlying currency prices. These are valued by a pricing service using pricing models. The models use inputs that are observed from active markets, such as exchange rates. These contracts are classified as Level 2.
Futures contracts are valued at the last sale price at the close of trading on the relevant exchange or board of trade. If there was no sale on the applicable exchange or board of trade on such day, they are valued at the average of the quoted bid and asked prices as of the close of such exchange or board of trade. When using the market quotations and when the market is considered active, the contract will be classified as Level 1.
Any securities or other assets for which market quotations are not readily available are valued at fair value as determined in good faith by the Funds’ adviser pursuant to procedures established under the general supervision and responsibility of the Funds’ Board of Trustees and will be classified as Level 3 assets.
The inputs of methodology used for valuing securities may not be an indication of the risk associated with investing in those securities.
| NOTES TO FINANCIAL STATEMENTS (continued) |
| March 31, 2019 (Unaudited) |
As of March 31, 2019, the Funds’ assets and liabilities carried at fair value were classified as follows:
Intrepid Capital Fund
| Description | | Level 1 | | | Level 2 | | | Level 3 | | | Total | |
| Assets | | | | | | | | | | | | |
| Total Common Stocks* | | $ | 98,159,841 | | | $ | — | | | $ | — | | | $ | 98,159,841 | |
| Total Real Estate | | | | | | | | | | | | | | | | |
| Investment Trust (REIT)* | | | 2,792,681 | | | | — | | | | — | | | | 2,792,681 | |
| Total Convertible Bonds* | | | — | | | | 6,082,600 | | | | — | | | | 6,082,600 | |
| Total Corporate Bonds* | | | — | | | | 44,286,111 | | | | — | | | | 44,286,111 | |
| Money Market Fund* | | | 6,457,250 | | | | — | | | | — | | | | 6,457,250 | |
| Unrealized Appreciation | | | | | | | | | | | | | | | | |
| on Forward Currency | | | | | | | | | | | | | | | | |
| Contracts | | | — | | | | 696,337 | | | | — | | | | 696,337 | |
| Total Assets | | $ | 107,409,772 | | | $ | 51,065,048 | | | $ | — | | | $ | 158,474,820 | |
| Liabilities | | | | | | | | | | | | | | | | |
| Unrealized Depreciation | | | | | | | | | | | | | | | | |
| on Forward Currency | | | | | | | | | | | | | | | | |
| Contracts | | $ | — | | | $ | (135,583 | ) | | $ | — | | | $ | (135,583 | ) |
| Total Liabilities | | $ | — | | | $ | (135,583 | ) | | $ | — | | | $ | (135,583 | ) |
| | | | | | | | | | | | | | |
| Intrepid Endurance Fund | | | | | | | | | | | | | |
| | | | | | | | | | | | | | |
| Description | | Level 1 | | | Level 2 | | | Level 3 | | | Total | |
| Assets | | | | | | | | | | | | | | | | |
| Total Common Stocks* | | $ | 35,153,214 | | | $ | — | | | $ | — | | | $ | 35,153,214 | |
| Total Real Estate | | | | | | | | | | | | | | | | |
| Investment Trust (REIT)* | | | 2,231,953 | | | | — | | | | — | | | | 2,231,953 | |
| Total Exchange- | | | | | | | | | | | | | | | | |
| Traded Fund* | | | 3,194,040 | | | | — | | | | — | | | | 3,194,040 | |
| Total Convertible Bond* | | | — | | | | 228,456 | | | | — | | | | 228,456 | |
| U.S. Treasury Bills* | | | — | | | | 57,594,930 | | | | — | | | | 57,594,930 | |
| Unrealized Appreciation | | | | | | | | | | | | | | | | |
| on Forward Currency | | | | | | | | | | | | | | | | |
| Contract | | | — | | | | 12,616 | | | | — | | | | 12,616 | |
| Total Assets | | $ | 40,579,207 | | | $ | 57,836,002 | | | $ | — | | | $ | 98,415,209 | |
| Liabilities | | | | | | | | | | | | | | | | |
| Unrealized Depreciation | | | | | | | | | | | | | | | | |
| on Forward Currency | | | | | | | | | | | | | | | | |
| Contract | | $ | — | | | $ | (12,284 | ) | | $ | — | | | $ | (12,284 | ) |
| Total Liabilities | | $ | — | | | $ | (12,284 | ) | | $ | — | | | $ | (12,284 | ) |
| NOTES TO FINANCIAL STATEMENTS (continued) |
| March 31, 2019 (Unaudited) |
Intrepid Income Fund
| Description | | Level 1 | | | Level 2 | | | Level 3 | | | Total | |
| Assets | | | | | | | | | | | | |
| Total Preferred Stock* | | $ | 1,156,201 | | | $ | — | | | $ | — | | | $ | 1,156,201 | |
| Total Convertible Bonds* | | | — | | | | 3,813,762 | | | | — | | | | 3,813,762 | |
| Total Corporate Bonds* | | | — | | | | 56,750,304 | | | | — | | | | 56,750,304 | |
| Money Market Fund* | | | 1,038,393 | | | | — | | | | — | | | | 1,038,393 | |
| Total Assets | | $ | 2,194,594 | | | $ | 60,564,066 | | | $ | — | | | $ | 62,758,660 | |
| | | | | | | | | | | | | | |
| Intrepid Disciplined Value Fund | | | | | | | | | | | | | |
| | | | | | | | | | | | | | |
| Description | | Level 1 | | | Level 2 | | | Level 3 | | | Total | |
| Assets | | | | | | | | | | | | | | | | |
| Total Common Stocks* | | $ | 39,528,838 | | | $ | — | | | $ | — | | | $ | 39,528,838 | |
| Total Exchange- | | | | | | | | | | | | | | | | |
| Traded Funds* | | | 2,618,004 | | | | — | | | | — | | | | 2,618,004 | |
| Total Convertible Bond* | | | — | | | | 300,599 | | | | — | | | | 300,599 | |
| U.S. Treasury Bill* | | | — | | | | 2,282,727 | | | | — | | | | 2,282,727 | |
| Total Assets | | $ | 42,146,842 | | | $ | 2,583,326 | | | $ | — | | | $ | 44,730,168 | |
| | | | | | | | | | | | | | |
| Intrepid International Fund | | | | | | | | | | | | | |
| | | | | | | | | | | | | | |
| Description | | Level 1 | | | Level 2 | | | Level 3 | | | Total | |
| Assets | | | | | | | | | | | | | | | | |
| Total Common Stocks* | | $ | 14,480,453 | | | $ | — | | | $ | — | | | $ | 14,480,453 | |
| Total Preferred Stocks* | | | 1,850,089 | | | | — | | | | — | | | | 1,850,089 | |
| U.S. Government Note* | | | — | | | | 1,243,750 | | | | — | | | | 1,243,750 | |
| U.S. Treasury Bill* | | | — | | | | 994,702 | | | | — | | | | 994,702 | |
| Unrealized Appreciation | | | | | | | | | | | | | | | | |
| on Forward Currency | | | | | | | | | | | | | | | | |
| Contracts | | | — | | | | 74,613 | | | | — | | | | 74,613 | |
| Total Assets | | $ | 16,330,542 | | | $ | 2,313,065 | | | $ | — | | | $ | 18,643,607 | |
| Liabilities | | | | | | | | | | | | | | | | |
| Unrealized Depreciation | | | | | | | | | | | | | | | | |
| on Forward Currency | | | | | | | | | | | | | | | | |
| Contracts | | $ | — | | | $ | (1,576 | ) | | $ | — | | | $ | (1,576 | ) |
| Total Liabilities | | $ | — | | | $ | (1,576 | ) | | $ | — | | | $ | (1,576 | ) |
| * | For further information regarding security characteristics, please see the Schedules of Investments. |
The Funds did not hold any investments during the period ended March 31, 2019 with significant unobservable inputs which would be classified as Level 3.
Derivative Instruments and Hedging Activities
The Funds’ adviser may use derivative instruments, such as forward currency contracts, as a means to manage exposure to different types of risk, including market
| NOTES TO FINANCIAL STATEMENTS (continued) |
| March 31, 2019 (Unaudited) |
risk and exchange rate risk, and to gain exposure to underlying securities. During the period ended March 31, 2019, the Intrepid Capital Fund, the Intrepid Endurance Fund, the Intrepid Disciplined Value Fund, and the Intrepid International Fund held derivative instruments.
Forward Currency Contracts
The Intrepid Capital Fund, the Intrepid Endurance Fund, the Intrepid Disciplined Value Fund, and the Intrepid International Fund used forward currency contracts during the period for the purpose of hedging exposures to non-U.S. dollar denominated assets. In general the use of these contracts may reduce the overall risk level in a fund, but may also lower fund performance. The use of these contracts does not create leverage in the Funds, but does expose the Funds to counterparty credit risk. When the contract is settled, the Fund records a realized gain or loss equal to the difference between the value of the contract at the time it was opened and the value at the time it settled.
Effect of Forward Currency Contracts on the Statement of Operations for the period ended March 31, 2019
| | | | Change in unrealized | | | | Realized gain | |
| | | appreciation (depreciation) | | | on forward | |
| | | on forward currency contracts | | currency contracts |
| | Intrepid Capital Fund | | $ | (1,957,914 | ) | | | $ | 2,778,806 | |
| | Intrepid Endurance Fund | | $ | 332 | | | | $ | — | |
| | Intrepid Disciplined Value Fund | | $ | (56,970 | ) | | | $ | 89,822 | |
| | Intrepid International Fund | | $ | 98,222 | | | | $ | 492,380 | |
The average monthly notional amounts of forward currency contracts during the period ended March 31, 2019 were as follows:
| | | | | | Intrepid |
| | | Intrepid | Intrepid | Intrepid | Disciplined |
| | Long Positions | Capital Fund | Endurance Fund | Income Fund | Value Fund |
| | Forward currency | | | | |
| | contracts | $12,606,995 | $ — | $ — | $1,072,873 |
| | | | | | |
| | | | | | Intrepid |
| | | Intrepid | Intrepid | Intrepid | Disciplined |
| | Short Positions | Capital Fund | Endurance Fund | Income Fund | Value Fund |
| | Forward currency | | | | |
| | contracts | $31,014,738 | $2,008,374 | $ — | $1,100,356 |
| NOTES TO FINANCIAL STATEMENTS (continued) |
| March 31, 2019 (Unaudited) |
| | | Intrepid | |
| | | International | |
| | Long Positions | Fund | |
| | Forward currency | | |
| | contract | $2,642,052 | |
| | | | |
| | | Intrepid | |
| | | International | |
| | Short Positions | Fund | |
| | Forward currency | | |
| | contracts | $17,095,048 | |
Long position forward currency contracts are received and settled in foreign currency. Short position forward currency contracts are received and settled in U.S. dollar.
Offsetting on the Statement of Assets and Liabilities
For financial reporting purposes, the Fund offsets financial assets and financial liabilities that are subject to master netting arrangements or similar agreements within appreciation on forward currency contracts and depreciation on forward currency contracts on the Statements of Assets and Liabilities.
As of March 31, 2019, the amount of derivative assets and liabilities by type that are subject to offsetting for the Intrepid Capital Fund, the Intrepid Endurance Fund and the Intrepid International Fund are as follows:
Forward Currency Contracts*
| | |
| | | | | | | | | | | Gross Amounts not | | | | |
| | | | | | | | | | | | | | Offset in the Statements | | | | |
| | | | | | | | | | | | | | of Assets and Liabilities | | | | |
| | | | | | | | | | | Net | | | | | | | | | | |
| | | | | | | | Gross | | | Amounts | | | | | | | | | | |
| | | | | | | | Amounts | | | of Assets | | | | | | | | | | |
| | | | | Gross | | | Offset | | | Presented | | | | | | | | | | |
| | | | | Amounts | | | in the | | | in the | | | | | | | | | | |
| | | | | of | | | Statements | | | Statements | | | | | | Collateral | | | | |
| | | | | Recognized | | | of Assets & | | | of Assets & | | | Financial | | | Amounts | | | Net | |
| | | | | Assets | | | Liabilities | | | Liabilities | | | Instruments | | | Received | | | Amount | |
| Intrepid Capital Fund | | | $ | 696,337 | | | $ | (135,583 | ) | | $ | 560,754 | | | $ | — | | | $ | — | | | $ | 560,754 | |
| Intrepid Endurance Fund | | | $ | 12,616 | | | $ | (12,284 | ) | | $ | 332 | | | $ | — | | | $ | — | | | $ | 332 | |
| Intrepid | | | | | | | | | | | | | | | | | | | | | | | | | |
| International Fund | | | $ | 74,613 | | | $ | (1,576 | ) | | $ | 73,037 | | | $ | — | | | $ | — | | | $ | 73,037 | |
| NOTES TO FINANCIAL STATEMENTS (continued) |
| March 31, 2019 (Unaudited) |
| | |
| | | | | | | | | | | Gross Amounts not | | | | |
| | | | | | | | | | | | | | Offset in the Statements | | | | |
| | | | | | | | | | | | | | of Assets and Liabilities | | | | |
| | | | | | | | | | | Net | | | | | | | | | | |
| | | | | | | | Gross | | | Amounts of | | | | | | | | | | |
| | | | | | | | Amounts | | | Liabilities | | | | | | | | | | |
| | | | | Gross | | | Offset | | | Presented | | | | | | | | | | |
| | | | | Amounts | | | in the | | | in the | | | | | | | | | | |
| | | | | of | | | Statements | | | Statements | | | | | | Collateral | | | | |
| | | | | Recognized | | | of Assets & | | | of Assets & | | | Financial | | | Amounts | | | Net | |
| | | | | Liabilities | | | Liabilities | | | Liabilities | | | Instruments | | | Pledged | | | Amount | |
| Intrepid Capital Fund | | | $ | 135,583 | | | $ | (135,583 | ) | | $ | — | | | $ | — | | | $ | — | | | $ | — | |
| Intrepid Endurance Fund | | | $ | 12,284 | | | $ | (12,284 | ) | | $ | — | | | $ | — | | | $ | — | | | $ | — | |
| Intrepid | | | | | | | | | | | | | | | | | | | | | | | | | |
| International Fund | | | $ | 1,576 | | | $ | (1,576 | ) | | $ | — | | | $ | — | | | $ | — | | | $ | — | |
Derivative Risk
The risks of using the types of derivatives in which the Funds may engage include the risk that movements in the value of the derivative may not fully offset or complement instruments currently held in the Funds in the manner intended by the Funds’ adviser; the risk that the counterparty to a derivative contract may fail to comply with their obligations to the Fund; the risk that the derivative may not possess a liquid secondary market at a time when the Fund would look to disengage the position; the risk that additional capital from the Fund may be called upon to fulfill the conditions of the derivative contract; and the risk that the cost of the derivative contracts may reduce the overall returns experienced by the Funds.
Use of Estimates
The preparation of financial statements in conformity with GAAP requires management to make estimates and assumptions that affect the reported amounts of assets and liabilities and disclosure of contingent assets and liabilities at the date of the financial statements and the reported amounts of revenues and expenses during the reporting period. Actual results could differ from those estimates.
Indemnification
In the normal course of business the Funds enter into contracts that contain general indemnification clauses. The Funds’ maximum exposure under these arrangements is unknown, as this would involve future claims against the Funds that have not yet occurred. Based on experience, the Funds expect the risk of loss to be remote.
Foreign Currency Transactions
The books and records are maintained in U.S. dollars. Foreign currency denominated transactions (i.e. market value of investment securities, assets and liabilities, purchases and sales of investment securities, and income and expenses) are translated into U.S. dollars at the current rate of exchange. The Funds do not isolate that portion of the results of operations resulting from changes in foreign
| NOTES TO FINANCIAL STATEMENTS (continued) |
| March 31, 2019 (Unaudited) |
exchange rates on investments from the fluctuations arising from changes in market prices of securities held. Such fluctuations are reflected in net realized and unrealized gain or loss on investments and foreign currency translation.
The value of a Fund’s foreign investments may be significantly affected by changes in currency exchange rates and the Fund may incur costs in converting securities denominated in foreign currencies to U.S. dollars. In many countries, there is less publicly available information about issuers than is available in the reports and ratings published about companies in the United States. Additionally, foreign companies are not subject to uniform accounting, auditing and financial reporting standards. Dividends and interest on foreign securities may be subject to foreign withholding taxes, which would reduce the Fund’s income without providing a tax credit for the Fund’s shareholders. Although each Fund intends to invest in securities of foreign issuers domiciled in nations which the Adviser considers as having stable and friendly governments, there is the possibility of expropriation, confiscatory taxation, currency blockage or political or social instability which would affect investments in those nations.
Securities Transactions and Investment Income
The Funds record security transactions based on trade date. Dividend income is recognized on the ex-dividend date, and interest income is recognized on an accrual basis. Discounts and premiums on securities purchased are amortized over the lives of the respective securities using the effective yield method. Withholding taxes on foreign dividends have been provided for in accordance with the Funds’ understanding of the applicable country’s tax rules and rates. Net realized gains or losses are determined using the identified cost method.
Distribution to Shareholder Policy
Dividends from net investment income, if any, are declared and paid at least monthly or quarterly, for Intrepid Income Fund and Intrepid Capital Fund, respectively. Distributions of net realized capital gains, if any, are declared and paid at least annually.
Federal Income Taxes
The Funds comply with, and intend to continue to comply with, the requirements of Subchapter M of the Internal Revenue Code necessary to qualify as a regulated investment company and to make the requisite distributions of income and capital gains to its shareholders sufficient to relieve it from Federal income taxes.
Allocation of Income, Expenses, and Gains/Losses
Income, expenses (other than those deemed to be attributable to a specific share class), and gains and losses of each Fund are allocated to each class of shares based upon the ratio of net assets represented by each class as a percentage of the net assets of that Fund. Expenses deemed directly attributable to a specific class of shares are
| NOTES TO FINANCIAL STATEMENTS (continued) |
| March 31, 2019 (Unaudited) |
charged against the operations of such class. Most Fund expenses are allocated by class based on relative net assets.
Subsequent Events Evaluation
On April 30, 2018, the Board of Trustees (the “Board”) of the Trust approved a plan of liquidation (the “Plan of Liquidation”) of the Intrepid International Fund (the “Fund”), a series of the Trust. Pursuant to the Plan of Liquidation, the Fund will be liquidated on or around September 27, 2019 (the “Liquidation” or “Liquidation Date”).
In anticipation of the Liquidation, effective as of the close of trading on the New York Stock Exchange on May 8, 2019 (“close of business”), the Fund is closed to new investments. Shareholders may continue to redeem shares of the Fund as described in the Fund’s Prospectus. In addition, effective May 8, 2019, the Adviser will begin an orderly transition of the Fund’s portfolio holdings to cash and cash equivalents and the Fund will cease investing its assets in a manner designed to achieve its investment objective. The Adviser will bear all expenses incurred in carrying out the Plan of Liquidation.
In preparing these financial statements, the Trust has evaluated events and transactions for potential recognition or disclosure resulting from subsequent events after the Statements of Assets and Liabilities date of March 31, 2019 through the date the financial statements were available for issue. This evaluation did not result in any subsequent events, other than those noted above, that necessitated disclosure and/or adjustments.
3. INVESTMENT ADVISER
The Trust has an Investment Advisory Agreement (the “Agreement”) with Intrepid Capital Management, Inc. (the “Adviser”), with whom certain officers and Trustees of the Trust are affiliated, to furnish investment advisory services to the Funds. Under the terms of the Agreement, the Trust, on behalf of the Funds, compensates the Adviser for its management services on the Intrepid Capital Fund and Intrepid Disciplined Value Fund at the annual rate of 1.00% on the first $500 million of average daily net assets and 0.80% on each of the Fund’s average daily net assets in excess of $500 million, on the Intrepid Endurance Fund and Intrepid International Fund at an annual rate of 1.00% of average daily net assets, and on Intrepid Income Fund at the annual rate of 0.75% of average daily net assets.
For the Intrepid Capital Fund and the Intrepid Endurance Fund, the Adviser agreed to waive its management fee and/or reimburse other expenses in both the Investor Share Class and Institutional Share Class, including organization expenses, to the extent necessary to ensure that operating expenses did not exceed 1.15%. The Investor Share Class of each Fund may have a Net Expense ratio higher than these expense caps as a result of any sales, distribution and other fees incurred under a plan adopted pursuant to Rule 12b-1 under the Investment Company Act of 1940, as amended (the “Investment
| NOTES TO FINANCIAL STATEMENTS (continued) |
| March 31, 2019 (Unaudited) |
Company Act”), acquired fund fees and expenses or other expenses (such as taxes, interest, brokerage commissions and extraordinary items) that are excluded from the calculation. For the Intrepid Income Fund, the Adviser agreed to waive its management fee and/or reimburse other expenses of the Fund, including organization expenses, to the extent necessary to ensure that the Fund’s operating expenses did not exceed 0.90% of average daily net assets. For the Intrepid Disciplined Value Fund, the Adviser agreed to waive its management fee and/or reimburse other expenses of the Fund, including organization expenses, to the extent necessary to ensure that the Fund’s operating expenses did not exceed 1.30% of average daily net assets. The Intrepid Disciplined Value Fund’s expenses were previously capped at 1.40% of average daily net assets for the period of January 31, 2011 through January 31, 2014. For the Intrepid International Fund, the Adviser agreed to waive its management fee and/or reimburse other expenses of each Fund, including organization expenses, to the extent necessary to ensure that each Fund’s operating expenses did not exceed 1.40% of average daily assets. Any such waivers or reimbursements for the Funds are subject to later adjustment to allow the Adviser to recoup amounts waived or reimbursed to the extent actual fees and expenses on a monthly basis during the fiscal year are less than the respective expense cap limitations, provided, however, that the Adviser shall only be entitled to recoup such amounts for a period of three years from the month such amount was waived or reimbursed. Waived/reimbursed expenses subject to potential recovery by year of expiration are as follows:
| | | Year of Expiration | |
| | | 2020 | | | 2021 | | | 2022 | |
| Intrepid Capital Fund | | $ | 152,608 | | | $ | 223,729 | | | $ | 142,414 | |
| Intrepid Endurance Fund | | | 129,391 | | | | 164,533 | | | | 81,794 | |
| Intrepid Income Fund | | | 85,208 | | | | 96,554 | | | | 51,026 | |
| Intrepid Disciplined Value Fund | | | 54,608 | | | | 65,575 | | | | 36,133 | |
| Intrepid International Fund | | | 142,502 | | | | 96,372 | | | | 60,746 | |
4. DISTRIBUTION PLAN
The Trust, on behalf of the Funds, has adopted a distribution plan pursuant to Rule 12b-1 under the 1940 Act (the “12b-1 Plan”), which provides that the Funds may reimburse the Funds’ distributor or others at an annual rate of up to 0.25% of the average daily net assets of the Investor Class of the Capital Fund and the Endurance Fund and the sole class of the Disciplined Value Fund and the International Fund.
Quasar Distributors, LLC serves as the distributor to the Funds. Quasar Distributors, LLC is an affiliated company of U.S. Bank, N.A.
| NOTES TO FINANCIAL STATEMENTS (continued) |
| March 31, 2019 (Unaudited) |
5. INVESTMENT TRANSACTIONS
The aggregate purchases and sales of securities (excluding short-term securities) by the Funds for the year ended March 31, 2019 were as follows:
| | | Non-U.S. Government | | | U.S. Government | |
| | | Purchases | | | Sales | | | Purchases | | | Sales | |
| Intrepid Capital Fund | | $ | 50,031,679 | | | $ | 150,050,432 | | | $ | — | | | $ | — | |
| Intrepid Endurance Fund | | | 25,781,645 | | | | 4,428,725 | | | | — | | | | — | |
| Intrepid Income Fund | | | 14,884,494 | | | | 21,475,681 | | | | — | | | | 1,485,620 | |
| Intrepid Disciplined | | | | | | | | | | | | | | | | |
| Value Fund | | | 12,047,004 | | | | 13,124,408 | | | | — | | | | — | |
| Intrepid International Fund | | | 2,860,589 | | | | 4,280,837 | | | | — | | | | — | |
6. CAPITAL SHARE TRANSACTIONS
| Intrepid Capital Fund – Investor Class | | | | | | |
| | | Six Months Ended | | | Year Ended | |
| | | March 31, 2019 | | | September 30, 2018 | |
| Shares sold | | | 145,027 | | | | 593,270 | |
| Shares issued to holders in | | | | | | | | |
| reinvestment of dividends | | | 142,018 | | | | 221,403 | |
| Shares redeemed | | | (1,246,053 | ) | | | (2,716,294 | ) |
| Net decrease in shares | | | (959,008 | ) | | | (1,901,621 | ) |
| Shares outstanding: | | | | | | | | |
| Beginning of period | | | 5,515,486 | | | | 7,417,107 | |
| End of period | | | 4,556,478 | | | | 5,515,486 | |
| | | | | | | | | |
| Intrepid Capital Fund – Institutional Class | | | | | | | | |
| | | Six Months Ended | | | Year Ended | |
| | | March 31, 2019 | | | September 30, 2018 | |
| Shares sold | | | 722,282 | | | | 3,542,124 | |
| Shares issued to holders in | | | | | | | | |
| reinvestment of dividends | | | 307,155 | | | | 795,000 | |
| Shares redeemed | | | (12,506,601 | ) | | | (9,491,438 | ) |
| Net decrease in shares | | | (11,477,164 | ) | | | (5,154,314 | ) |
| Shares outstanding: | | | | | | | | |
| Beginning of period | | | 22,064,325 | | | | 27,218,639 | |
| End of period | | | 10,587,161 | | | | 22,064,325 | |
| NOTES TO FINANCIAL STATEMENTS (continued) |
| March 31, 2019 (Unaudited) |
| Intrepid Endurance Fund – Investor Class | | | | | | |
| | | Six Months Ended | | | Year Ended | |
| | | March 31, 2019 | | | September 30, 2018 | |
| Shares sold | | | 108,101 | | | | 318,600 | |
| Shares issued to holders in | | | | | | | | |
| reinvestment of dividends | | | 26,661 | | | | 241,306 | |
| Shares redeemed | | | (1,002,515 | ) | | | (3,801,359 | ) |
| Net decrease in shares | | | (867,753 | ) | | | (3,241,453 | ) |
| Shares outstanding: | | | | | | | | |
| Beginning of period | | | 5,430,667 | | | | 8,672,120 | |
| End of period | | | 4,562,914 | | | | 5,430,667 | |
| | | | | | | | | |
| Intrepid Endurance Fund – Institutional Class | | | | | | | | |
| | | Six Months Ended | | | Year Ended | |
| | | March 31, 2019 | | | September 30, 2018 | |
| Shares sold | | | 241,539 | | | | 680,594 | |
| Shares issued to holders in | | | | | | | | |
| reinvestment of dividends | | | 14,892 | | | | 130,762 | |
| Shares redeemed | | | (1,002,785 | ) | | | (2,015,649 | ) |
| Net decrease in shares | | | (746,354 | ) | | | (1,204,293 | ) |
| Shares outstanding: | | | | | | | | |
| Beginning of period | | | 3,377,392 | | | | 4,581,685 | |
| End of period | | | 2,631,038 | | | | 3,377,392 | |
| | | | | | | | | |
| Intrepid Income Fund | | | | | | | | |
| | | Six Months Ended | | | Year Ended | |
| | | March 31, 2019 | | | September 30, 2018 | |
| Shares sold | | | 571,078 | | | | 1,300,361 | |
| Shares issued to holders in | | | | | | | | |
| reinvestment of dividends | | | 114,078 | | | | 221,102 | |
| Shares redeemed | | | (2,120,166 | ) | | | (1,987,975 | ) |
| Net decrease in shares | | | (1,435,010 | ) | | | (466,512 | ) |
| Shares outstanding: | | | | | | | | |
| Beginning of period | | | 8,097,779 | | | | 8,564,291 | |
| End of period | | | 6,662,769 | | | | 8,097,779 | |
| NOTES TO FINANCIAL STATEMENTS (continued) |
| March 31, 2019 (Unaudited) |
| Intrepid Disciplined Value Fund | | | | | | |
| | | Six Months Ended | | | Year Ended | |
| | | March 31, 2019 | | | September 30, 2018 | |
| Shares sold | | | 534,194 | | | | 160,409 | |
| Shares issued in | | | | | | | | |
| connection with merger | | | 2,070,561 | | | | — | |
| Shares issued to holders in | | | | | | | | |
| reinvestment of dividends | | | 54,012 | | | | 118,303 | |
| Shares redeemed | | | (902,100 | ) | | | (1,275,307 | ) |
| Net increase (decrease) in shares | | | 1,756,667 | | | | (996,595 | ) |
| Shares outstanding: | | | | | | | | |
| Beginning of period | | | 3,178,920 | | | | 4,175,515 | |
| End of period | | | 4,935,587 | | | | 3,178,920 | |
| | | | | | | | | |
| Intrepid International Fund | | | | | | | | |
| | | Six Months Ended | | | Year Ended | |
| | | March 31, 2019 | | | September 30, 2018 | |
| Shares sold | | | 70,058 | | | | 1,086,434 | |
| Shares issued to holders in | | | | | | | | |
| reinvestment of dividends | | | 114,922 | | | | 126,545 | |
| Shares redeemed | | | (727,898 | ) | | | (399,643 | ) |
| Net increase (decrease) in shares | | | (542,918 | ) | | | 813,336 | |
| Shares outstanding: | | | | | | | | |
| Beginning of period | | | 2,946,964 | | | | 2,133,628 | |
| End of period | | | 2,404,046 | | | | 2,946,964 | |
7. TRANSACTIONS WITH AFFILIATES
The following issuers are affiliated with the Funds; that is, the Adviser had control of 5% or more of the outstanding voting securities during the period from October 1, 2018 through March 31, 2019. As defined in Section (2)(a)(3) of the Investment Company Act of 1940; such issues are:
| NOTES TO FINANCIAL STATEMENTS (continued) |
| March 31, 2019 (Unaudited) |
Intrepid Capital Fund
| | | Share | | | | | | | | | Share | | | | | | | | | | | | Value as of | | | Cost as of | |
| | | Balance as of | | | | | | | | | Balance as of | | | Dividend | | | Realized | | | Unrealized | | | March 31, | | | March 31, | |
| Issuer Name | | Sept. 30, 2018 | | | Additions | | | Reductions | | | March 31,2019 | | | Income | | | Gain (Loss) | | | Depreciation | | | 2019 | | | 2019 | |
Berentzen- Gruppe AG | | | 383,375 | | | | — | | | | — | | | | 383,375 | | | $ | — | | | $ | — | | | $ | (112,544 | ) | | $ | 2,958,764 | | | $ | 3,587,646 | |
| Gattaca PLC | | | 1,967,030 | | | | — | | | | — | | | | 1,967,030 | | | | — | | | | — | | | | (207,295 | ) | | | 2,997,506 | | | | 6,854,297 | |
Hallmark Financial | | | | | | | | | | | | | | | | | | | | | | | | | | | | | | | | | | | | |
| Services, Inc. (a) | 528,592 | | | | — | | | | (261,372 | ) | | | 267,220 | | | | — | | | | 49,275 | | | | (418,667 | ) | | | 2,779,088 | | | | 2,465,871 | |
Protective Insurance | | | | | | | | | | | | | | | | | | | | | | | | | | | | | | | | | | | | |
Corp. – Class B | | | 428,541 | | | | — | | | | (144,319 | ) | | | 284,222 | | | | 148,742 | | | | (922,115 | ) | | | (1,132,967 | ) | | | 5,263,792 | | | | 6,747,714 | |
| | | | | | | | | | | | | | | | | | | $ | 148,742 | | | $ | (872,840 | ) | | $ | (1,871,473 | ) | | $ | 13,999,150 | | | $ | 19,655,528 | |
| | | | | | | | | | | | | | | | | | | | | | | | | | | | | | |
| Intrepid Endurance Fund | | | | | | | | | | | | | | | | | | | | | | | | | | | | | |
| | | | | | | | | | | | | | | | | | | | | | | | | | | | | | |
| | | Share | | | | | | | | | | | Share | | | | | | | | | | | | | | | Value as of | | | Cost as of | |
| | | Balance as of | | | | | | | | | | | Balance as of | | | Dividend | | | Realized | | | Unrealized | | | March 31, | | | March 31, | |
| Issuer Name | | Sept. 30, 2018 | | | Additions | | | Reductions | | | March 31, 2019 | | | Income | | | Loss | | | Depreciation | | | | 2019 | | | | 2019 | |
Hallmark Financial | | | | | | | | | | | | | | | | | | | | | | | | | | | | | | | | | | | | |
| Services, Inc. (a) | 227,598 | | | | 49,194 | | | | — | | | | 276,792 | | | $ | — | | | $ | — | | | $ | (166,362 | ) | | $ | 2,878,637 | | | $ | 2,835,792 | |
Protective Insurance | | | | | | | | | | | | | | | | | | | | | | | | | | | | | | | | | | | | |
Corp. – Class B | | | 260,044 | | | | — | | | | (25,027 | ) | | | 235,017 | | | | 96,314 | | | | (84,477 | ) | | | (1,020,076 | ) | | | 4,352,515 | | | | 5,356,659 | |
| | | | | | | | | | | | | | | | | | | $ | 96,314 | | | $ | (84,477 | ) | | $ | (1,186,438 | ) | | $ | 7,231,152 | | | $ | 8,192,451 | |
| | | | | | | | | | | | | | | | | | | | | | | | | | | | | | |
| Intrepid Disciplined Value Fund | | | | | | | | | | | | | | | | | | | | | | | | | | | | | |
| | | | | | | | | | | | | | | | | | | | | | | | | | | | | | |
| | | Share | | | | | | | | | | | Share | | | | | | | | | | | | | | | Value as of | | | Cost as of | |
| | | Balance as of | | | | | | | | | | | Balance as of | | | Dividend | | | Realized | | | Unrealized | | | March 31, | | | March 31, | |
| Issuer Name | | Sept. 30, 2018 | | | Additions | | | Reductions | | | March 31, 2019 | | | Income | | | Loss | | | Depreciation | | | | 2019 | | | | 2019 | |
Protective Insurance | | | | | | | | | | | | | | | | | | | | | | | | | | | | | | | | | | | | |
Corp. – Class B | | | 65,808 | | | | 92,061 | | | | (3,787 | ) | | | 154,082 | | | $ | 33,816 | | | $ | (14,029 | ) | | $ | (712,822 | ) | | $ | 2,853,599 | | | $ | 3,536,677 | |
| | | | | | | | | | | | | | | | | | | $ | 33,816 | | | $ | (14,029 | ) | | $ | (712,822 | ) | | $ | 2,853,599 | | | $ | 3,536,677 | |
| NOTES TO FINANCIAL STATEMENTS (continued) |
| March 31, 2019 (Unaudited) |
Intrepid International Fund
| | | Share | | | | | | | | | Share | | | | | | | | | Unrealized | | | Value as of | | | Cost as of | |
| | | Balance as of | | | | | | | | | Balance as of | | | Dividend | | | Realized | | | Appreciation | | | March 31, | | | March 31, | |
| Issuer Name | | Sept. 30, 2018 | | | Additions | | | Reductions | | | March 31, 2019 | | | Income | | | Loss | | | (Depreciation) | | | 2019 | | | 2019 | |
Berentzen Gruppe AG | | | 141,001 | | | | 28,079 | | | | (9,192 | ) | | | 159,888 | | | $ | — | | | $ | (31,479 | ) | | $ | 2,367 | | | $ | 1,233,964 | | | $ | 1,452,047 | |
Coventry Group Ltd. (a) | 1,768,049 | | | | 618,818 | | | | (53,414 | ) | | | 2,333,453 | | | | — | | | | (11,949 | ) | | | (470,739 | ) | | | 1,375,202 | | | | 1,476,488 | |
Coventry Group Ltd. | | | | | | | | | | | | | | | | | | | | | | | | | | | | | | | | | | | | |
| (Right) (a)(b) | | | 353,610 | | | | — | | | | (353,610 | ) | | | — | | | | — | | | | (98,149 | ) | | | 14,868 | | | | — | | | | — | |
| Gattaca PLC | | | 751,573 | | | | — | | | | (96,042 | ) | | | 655,531 | | | | — | | | | (196,320 | ) | | | 128,909 | | | | 998,947 | | | | 1,555,513 | |
Protective Insurance | | | | | | | | | | | | | | | | | | | | | | | | | | | | | | | | | | | | |
Corp. – Class B | | | 30,834 | | | | — | | | | (4,800 | ) | | | 26,034 | | | | 11,237 | | | | (1,766 | ) | | | (115,227 | ) | | | 482,150 | | | | 580,262 | |
Quarto Group, Inc. | | | 882,396 | | | | — | | | | — | | | | 882,396 | | | | — | | | | — | | | | (69,574 | ) | | | 775,765 | | | | 1,787,104 | |
| | | | | | | | | | | | | | | | | | | $ | 11,237 | | | $ | (339,663 | ) | | $ | (509,396 | ) | | $ | 4,866,028 | | | $ | 6,851,414 | |
(a) Security is no longer an affiliated company at March 31, 2019.
(b) Rights exercised during period and combined with other securities.
| NOTES TO FINANCIAL STATEMENTS (continued) |
| March 31, 2019 (Unaudited) |
8. FEDERAL INCOME TAX INFORMATION
The tax components of distributions paid during the fiscal years ended September 30, 2018 and 2017 are as follows:
| | | September 30, 2018 | | | September 30, 2017 | |
| | | Ordinary | | | Long-Term | | | Ordinary | | | Long-Term | |
| | | Income | | | Capital Gains | | | Income | | | Capital Gains | |
| Intrepid Capital Fund | | $ | 11,388,093 | | | $ | 3,203,650 | | | $ | 10,076,082 | | | $ | 6,877,815 | |
| Intrepid | | | | | | | | | | | | | | | | |
| Endurance Fund | | | 4,210,794 | | | | 1,283,241 | | | | 2,209,712 | | | | 163,896 | |
| Intrepid Income Fund | | | 2,138,103 | | | | — | | | | 2,310,320 | | | | — | |
| Intrepid Disciplined | | | | | | | | | | | | | | | | |
| Value Fund | | | 649,731 | | | | 642,499 | | | | 647,401 | | | | 1,322,457 | |
| Intrepid | | | | | | | | | | | | | | | | |
| International Fund | | | 1,234,997 | | | | 97,541 | | | | 761,075 | | | | — | |
Additionally, U.S. generally accepted accounting principles require that certain components of net assets relating to permanent differences be reclassified between financial and tax reporting. These reclassifications have no effect on net assets or net asset value per share. For the year ended September 30, 2018, the following table shows the reclassifications made:
| | | Undistributed | | | Accumulated | | | | |
| | | Net Investment | | | Net Realized | | | Paid-in | |
| | | Income (Losses) | | | Gains (Losses) | | | Capital | |
| Intrepid Capital Fund | | $ | (128,664 | ) | | $ | 128,664 | | | $ | — | |
| Intrepid Endurance Fund | | | (48,216 | ) | | | 48,216 | | | | — | |
| Intrepid Income Fund | | | 7,271 | | | | (7,271 | ) | | | — | |
| Intrepid Disciplined | | | | | | | | | | | | |
| Value Fund | | | 141,611 | | | | (171,611 | ) | | | 30,000 | |
| Intrepid International Fund | | | 52,503 | | | | (116,430 | ) | | | 63,927 | |
These reclassifications primarily relate to adjustments with differing book and tax methods of accounting for the usage of tax equalization, investment losses and currency adjustments.
| NOTES TO FINANCIAL STATEMENTS (continued) |
| March 31, 2019 (Unaudited) |
As of September 30, 2018, the components of accumulated earnings (losses) for income tax purposes were as follows:
| | | Intrepid | | | Intrepid | |
| | | Capital Fund | | | Endurance Fund | |
| Cost of investments | | $ | 298,228,325 | | | $ | 118,684,099 | |
| Unrealized appreciation | | | 35,197,974 | | | | 2,855,216 | |
| Unrealized depreciation | | | (14,920,050 | ) | | | (1,309,258 | ) |
| Net unrealized appreciation | | | 20,277,924 | | | | 1,545,958 | |
| Undistributed ordinary income | | | 3,507,202 | | | | 357,028 | |
| Undistributed long-term capital gain | | | — | | | | — | |
| Distributable income | | | 3,507,202 | | | | 357,028 | |
| Other accumulated loss | | | (3,620,754 | ) | | | (5,558,123 | ) |
| Total accumulated gain (loss) | | | 20,164,372 | | | | (3,655,137 | ) |
| | | | | | | | |
| | | | | | | Intrepid | |
| | | Intrepid | | | Disciplined | |
| | | Income Fund | | | Value Fund | |
| Cost of investments | | $ | 73,640,307 | | | $ | 27,895,546 | |
| Unrealized appreciation | | | 223,322 | | | | 5,329,795 | |
| Unrealized depreciation | | | (397,604 | ) | | | (962,062 | ) |
| Net unrealized appreciation (depreciation) | | | (174,282 | ) | | | 4,367,733 | |
| Undistributed ordinary income | | | 27,258 | | | | 497,998 | |
| Undistributed long-term capital gain | | | — | | | | — | |
| Distributable income | | | 27,258 | | | | 497,998 | |
| Other accumulated loss | | | (4,144,176 | ) | | | (529,695 | ) |
| Total accumulated gain (loss) | | | (4,291,200 | ) | | | 4,336,036 | |
| | | | | | | | |
| | | Intrepid | | | | | |
| | | International | | | | | |
| | | Fund | | | | | |
| Cost of investments | | $ | 27,999,030 | | | | | |
| Unrealized appreciation | | | 1,487,879 | | | | | |
| Unrealized depreciation | | | (4,470,762 | ) | | | | |
| Net unrealized depreciation | | | (2,982,883 | ) | | | | |
| Undistributed ordinary income | | | 287,864 | | | | | |
| Undistributed long-term capital gain | | | 642,064 | | | | | |
| Distributable income | | | 929,928 | | | | | |
| Other accumulated gain (loss) | | | — | | | | | |
| Total accumulated loss | | | (2,052,955 | ) | | | | |
| NOTES TO FINANCIAL STATEMENTS (continued) |
| March 31, 2019 (Unaudited) |
The difference between book-basis and tax-basis unrealized appreciation is attributable primarily to the tax deferral of losses on wash sales long term.
At September 30, 2018, the Intrepid Income Fund had short-term tax basis capital losses of $366,537 and long-term tax basis capital losses of $3,777,639 which may be carried forward to offset future capital gains. To the extent that the Intrepid Income Fund may realize future net capital gains, those gains will be offset by any of its unused capital loss carryforwards. These losses do not expire.
At September 30, 2018, the Intrepid Endurance Fund had late year losses of $5,558,123.
At September 30, 2018, the Intrepid Disciplined Value Fund had post-October capital losses of $528,426.
There is no tax liability resulting from unrecognized tax benefits relating to uncertain income tax positions taken or expected to be taken on the tax returns for the fiscal year-end September 30, 2018, or for any other tax years which are open for exam. As of September 30, 2018, the Intrepid Capital Fund, the Intrepid Endurance Fund, the Intrepid Income Fund, the Intrepid Disciplined Value Fund and the Intrepid International Fund’s open tax years include the tax years ended September 30, 2015 through 2018. The Trust is also not aware of any tax positions for which it is reasonably possible that the total amounts of unrecognized tax benefits will significantly change in the next year. The Funds recognize interest and penalties, if any, related to unrecognized tax benefits as income tax expense in the Statement of Operations. During the year, the Funds did not incur any interest or penalties, nor were any accrued as of September 30, 2018.
9. LINE OF CREDIT
The Intrepid Capital Management Funds Trust has a $25,000,000 uncommitted, unsecured, umbrella 364-day line of credit, for temporary emergency purposes, including the meeting of redemption requests that otherwise might require the untimely disposition of securities. The interest rate as of March 31, 2019 was 5.25%. During the period ended March 31, 2019, the Intrepid Capital Fund’s maximum borrowing was $4,353,000 and average borrowing was $114,540. The Intrepid Endurance Fund, Intrepid Income Fund, Intrepid Disciplined Value Fund and Intrepid International Fund did not use the line.
10. REORGANIZATION
On January 25, 2019, Intrepid Disciplined Value Fund (the “acquiring fund”) acquired the net assets of Intrepid Select Fund (the “acquired fund”) pursuant to an Agreement and Plan of Reorganization approved by the series’ board of trustees on November 13, 2018. The purpose of the transaction was to combine two funds
| NOTES TO FINANCIAL STATEMENTS (continued) |
| March 31, 2019 (Unaudited) |
managed by the Adviser with comparable investment objectives and strategies. The acquisition was accomplished by a tax-free exchange of 2,215,028 shares of the acquiring fund (valued at $20,968,527) for all 2,070,561 shares of the acquired fund at the close of business January 25, 2019. For financial reporting purposes, assets received and shares issued by the acquiring fund were recorded at fair value; however, the cost basis of the investments received from the acquired fund was carried forward to align ongoing reporting to the acquiring fund’s realized and unrealized gains and losses with amounts distributable to shareholders for tax purposes. The acquired fund’s net assets at that date ($20,968,527), including $297,674 of unrealized appreciation, were combined with those of the acquiring fund. The aggregate net assets of the acquiring fund immediately before the acquisition were $27,104,693. The aggregate net assets of the acquiring fund immediately after the acquisition were $48,073,220. Because the combined investment portfolios have been managed as a single integrated portfolio since the acquisition was completed, it is not practicable to separate the amounts of revenue and earnings of the acquired fund that have been included on the acquiring fund’s Statement of Operations since January 25, 2019. 60% of the costs associated with the Plan of Reorganization were paid by the Adviser, 20% were paid by the acquiring Fund and 20% were paid by the acquired Fund.
Assuming the acquisition had been completed on October 1, 2018, the beginning of the annual reporting period of the acquiring fund, the acquired fund’s pro forma results of operations for the period ended March 31, 2019, are as follows:
| Net Investment Income: | | $ | 55,814 | |
| Net realized loss on investments: | | | (2,121,768 | ) |
| Net decrease in net assets resulting from operations | | | (5,346,767 | ) |
| ADDITIONAL INFORMATION |
| March 31, 2019 (Unaudited) |
Investment Advisory Agreement Disclosure
On November 13, 2018, the Board of Trustees of Intrepid Capital Management Funds Trust (the “Trustees”) approved the continuation of the investment advisory agreements for the Intrepid Capital Fund, the Intrepid Endurance Fund, the Intrepid Income Fund, the Intrepid Disciplined Value Fund, the Intrepid International Fund and the Intrepid Select Fund (collectively the “Funds”, or the, “Fund”) with the investment adviser to the Funds, Intrepid Capital Management, Inc. (the “Adviser”). As part of the process of approving the continuation of the advisory agreements, the Trustees reviewed the fiduciary duties of the Trustees with respect to approving the advisory agreements and the relevant factors for the Trustees to consider, and the members of the Board of Trustees who are not deemed “interested persons” (as that term is defined by the Investment Company Act of 1940) of the Funds (the “Independent Trustees”) met in executive session to discuss the renewal of the advisory agreements.
In advance of the meetings, the Adviser sent detailed information to the Trustees to assist them in their evaluation of the investment advisory agreements. This information included, but was not limited to, a memorandum from Fund counsel that summarized the legal standards applicable to the Trustees’ consideration of the advisory agreements; detailed comparative information relating to the Funds’ management fees and other expenses of the Funds; information regarding fees paid and other payments; information on the Adviser’s profitability; information about brokerage commissions; detailed comparative information relating to the Funds’ performance; information about sales and redemptions of the Funds; information about the Funds’ compliance program; and other information the Trustees believed was useful in evaluating the approval of advisory agreements.
All of the factors discussed by the Trustees were considered as a whole, and were considered separately by the Independent Trustees, meeting in executive session. The factors were viewed in their totality by the Trustees, with no single factor being the principal or determinative factor in the Trustees’ determination of whether to approve the continuation of the investment advisory agreements. The Trustees recognized that the management and fee arrangements for the Funds are the result of years of review and discussion between the Independent Trustees and the Adviser, that certain aspects of such arrangements may receive greater scrutiny in some years than in others and that the Trustees’ conclusions may be based, in part, on their consideration of these same arrangements and information received during the course of the year and in prior years.
| ADDITIONAL INFORMATION (continued) |
| March 31, 2019 (Unaudited) |
Prior to approving the continuation of the investment advisory agreements, the Trustees and the Independent Trustees in executive session considered, among other items:
| • | The nature and quality of the investment advisory services provided by the Adviser. |
| | |
| • | A comparison of the fees and expenses of the Funds to other similar funds. |
| | |
| • | A comparison of the fee structures of other accounts managed by the Adviser. |
| | |
| • | Whether economies of scale are recognized by the Funds. |
| | |
| • | The costs and profitability of the Funds to the Adviser. |
| | |
| • | The performance of the Funds. |
| | |
| • | The other benefits to the Adviser from serving as investment adviser to the Funds (in addition to the advisory fee). |
The material considerations and determinations of the Board of Trustees, including all of the Independent Trustees, are as follows:
Nature and Quality of Investment Advisory Services
The Trustees noted that the Adviser supervises the investment portfolios of the Funds, directing the day-to-day management of the Funds’ portfolios, including the purchase and sale of investment securities, and they concluded that the Adviser expends substantial resources to provide this supervision. The Trustees then discussed with management the nature of the investment process employed by the portfolio managers of the Funds, which is highly research intensive, and requires that the Adviser expend substantial resources to determine the portfolios of the Funds. The Trustees then discussed staffing at the Adviser, and concluded that the Adviser has sufficient staffing to conduct the research needed to meet the investment objectives of the Funds.
The Trustees also considered the background and experience of the Adviser’s senior management and expertise of, and the level of attention given to the Funds by, investment personnel of the Adviser, and determined that the personnel servicing the Funds are well qualified. In addition, the Trustees deliberated on the quality of the material service providers to the Funds, who provide administrative and distribution services on behalf of the Funds and are overseen by the Adviser, and the overall reputation and capabilities of the Adviser, noting that they believe the services providers are respected in the industry and provide valuable services to the Funds.
| ADDITIONAL INFORMATION (continued) |
| March 31, 2019 (Unaudited) |
Based on the Trustees’ review, the Trustees believe that the Adviser provides high quality services to the Funds, and they noted that they continue to have confidence in the Adviser. The Trustees also determined that they were satisfied with the nature, extent and quality of the investment advisory services provided to the Funds by the Adviser, and that the nature and extent of the services provided by the Adviser are appropriate to assure that each Fund’s operations are conducted in compliance with applicable laws, rules and regulations.
Comparative Fees and Expenses
The Trustees then discussed with management the variables, in addition to the management fees, such as administrative and transaction fees that impact costs to the shareholders of the Funds, noting that as discussed, managing the Funds is resource intensive. Management reviewed with the Trustees the comparison of the Funds’ expense ratios to other similar funds. As part of the discussion with management, the Trustees ensured that they understood and were comfortable with the criteria used by the Adviser to determine the mutual funds that make up the peer universes for purposes of the materials.
While the Funds had higher than average fees and expenses, the Trustees believe this was due to the resource intensive nature of the Funds and the lower average net assets under management of the Funds when compared to the peer groups. The Trustees concluded that the expense ratios of the Funds are within a reasonable range of comparable mutual funds, and that the Funds’ fees are reasonable.
Comparison of Fee Structures of Other Accounts
The Trustees then inquired of management regarding the distinction between the services performed by the Adviser for separate accounts or private investment companies and those performed by the Adviser for the Funds. The Adviser noted that the management of the Funds involves more comprehensive and substantive duties than the management of separate accounts or private investment companies. Specifically, the Adviser noted the following:
| • | The Adviser provides tailored investment advisory services to the Funds in order to accommodate the cash flow volatility presented by the purchases and redemptions of shareholders. |
| | |
| • | With regard to the Funds, the Adviser attempts to serve the needs of thousands of accounts, ranging from direct accounts holding a few thousand dollars to the large omnibus accounts of intermediaries who in turn service thousands of large and small accounts. |
| | |
| • | The Adviser maintains a robust shareholder communication effort for the Funds to reach shareholders through direct contact, through intermediaries, or via the financial press. |
| ADDITIONAL INFORMATION (continued) |
| March 31, 2019 (Unaudited) |
| • | The Adviser coordinates with the Funds’ Chief Compliance Officer and other service providers to insure compliance with regulatory regimens imposed by Federal law and the Internal Revenue Code. |
| | |
| • | Separate accounts or private investment companies do not require the same level of services and oversight, nor do they present the same compliance or litigation risk. |
The Trustees concluded that the services performed by the Adviser for the Funds require a higher level of service and oversight than the services performed by the Adviser for separate accounts or private investment companies. Based on this determination, the Trustees believe that the differential in advisory fees between the Funds and the separate accounts and private investment companies is reasonable, and concluded that the fee rates charged to the Funds in comparison to those charged to the Adviser’s other clients are reasonable.
In addition to the above, the Trustees discussed with management the fact that increasingly investors in the Funds invest through brokerage platforms (intermediaries), with fewer investors going directly to the Funds’ transfer agent. The Trustees noted that in connection with the intermediaries, the Adviser absorbs all costs in excess of the fees paid by the Funds. As result, the cost of obtaining, retaining and servicing shareholders for the Funds is significantly higher than the costs for separately managed accounts.
Performance
The Trustees noted that at each quarterly meeting, the Trustees review reports comparing the investment performance of the Funds to various indices. Based on the information provided at this meeting and the information and quarterly discussions regarding the Funds’ investment performance, the Trustees believe that the Adviser manages the Funds in a manner that is materially consistent with their stated investment objective and style.
The Trustees reviewed the Adviser’s quality of investment management, management history and ability to successfully market the Funds. The Trustees noted that while the Funds have underperformed, the investment strategies of the Funds are designed to provide lower risk, which means it is expected that the Funds will underperform on a comparative basis during periods of market outperformance, but that investors should be protected in case of a downturn in the market. They also discussed with the Adviser actions that the Adviser is taking to address the underperformance of the Funds.
The Trustees concluded that the performance of the Funds, adjusting for risk, has been satisfactory on a relative basis and on an absolute basis. They also determined that the Adviser is taking sufficient steps to improve performance, and
| ADDITIONAL INFORMATION (continued) |
| March 31, 2019 (Unaudited) |
that they believe that the Adviser’s discipline should lead to more favorable results in the long-term. Based on these factors, the Trustees concluded that renewal of the existing advisory agreement was in the best interest of the Funds’ shareholders.
Costs and Profitability
The Trustees considered the cost of services provided and the profits realized by the Adviser, by reviewing reports provided by the Funds’ administrator that compared the Funds’ investment advisory fees to those of other comparable mutual funds. Mr. Travis acknowledged that the Funds’ contractual investment advisory fee was higher than the industry average and attributed it to other peer funds realizing economies of scale to decrease advisory costs. The Trustees also considered the Funds’ overall expense ratios compared to peer group funds and the Adviser’s willingness to waive a portion of its advisory fees to keep the overall expenses of the Funds lower.
The Trustees discussed in detail the profitability of the Adviser as it relates to the Funds.
The Trustees discussed the Adviser’s profitability, as presented, and the impact of the intermediary service fees on the profitability. The Trustees also considered the resources and revenues that the Adviser has put into managing and distributing the Funds, and concluded that the level of profitability realized by the Adviser from its provision of services to the Funds is reasonable, and that the overall expense ratios and investment advisory fees were fair and within the range of industry averages.
Economies of Scale
The Trustees then discussed with management whether economies of scale are recognized by the Funds. They noted that as Fund assets grow, certain fixed costs are spread over the larger asset base, which may lead to some economies of scale. On the other hand, the Trustees noted that many of the Funds’ expense are subject to diseconomies of scale. For example, the intermediary service fees generally increase as the Funds’ assets grow. Given the size of the Funds and the reimbursements being made by the Adviser, the Trustees determined that the Funds are not recognizing economies of scale, and that the proposed fee schedules were acceptable.
Fall-Out Benefits
The Trustees then considered other benefits to the Adviser from serving as adviser to the Funds (in addition to the advisory fee). The Trustees noted that the Adviser derives ancillary benefits from its association with the Funds in the form of proprietary and third party research products and services received from broker dealers that execute portfolio trades for the Funds. The Trustees determined such products and services have been used for legitimate purposes relating to the Funds by
| ADDITIONAL INFORMATION (continued) |
| March 31, 2019 (Unaudited) |
providing assistance in the investment decision-making process. The Trustees concluded that the other benefits realized by the Adviser from its relationship with the Funds were reasonable.
Conclusion
After reviewing the materials and management’s presentation, as well as other information regularly provided at the Board’s quarterly meetings throughout the year regarding the quality of services provided by the Adviser, the performance of the Funds, expense information, regulatory compliance issues, trading information and related matters and other factors deemed relevant by the Trustees, the Trustees, including all of the Independent Trustees, approved the continuation of the investment advisory agreements.
Shareholder Notification of Federal Tax Status
The Intrepid Capital Fund, Intrepid Endurance Fund, Intrepid Disciplined Value Fund and Intrepid International Fund designated $3,203,650, $1,283,241, $642,499 and $97,541, respectively, of total distributions paid during the fiscal year ended September 30, 2018 as net capital gain distributions eligible for long-term capital gain rates for individual shareholders.
The Intrepid Capital Fund, Intrepid Endurance Fund, Intrepid Income Fund, Intrepid Disciplined Value Fund and Intrepid International Fund designated 37.98%, 39.82%, 4.85%, 80.63% and 100.00%, respectively, of their ordinary income distributions for the year ended September 30, 2018 as qualified dividend income under the Jobs & Growth Tax Relief Reconciliation Act of 2003.
For the year ended September 30, 2018, 19.15%, 16.24%, 3.05%, 94.98% and 3.27% of Intrepid Capital Fund, Intrepid Endurance Fund, Intrepid Income Fund, Intrepid Disciplined Value Fund and Intrepid International Fund dividends paid from net ordinary income, respectively, qualify for the dividends received deduction available to corporate shareholders.
The Intrepid Capital Fund, Intrepid Endurance Fund, Intrepid Income Fund, Intrepid Disciplined Value Fund and Intrepid International Fund designated 51.99%, 28.82%, 100.00%, 8.75% and 7.82%, respectively, of their ordinary income distributions for the fiscal year as interest-related dividends under Internal Revenue Code Section 871(k)(1)(c).
The Intrepid Capital Fund, Intrepid Endurance Fund, Intrepid Income Fund, Intrepid Disciplined Value Fund and Intrepid International Fund designated 43.72%, 97.45%, 0.00%, 56.50% and 61.90%, respectively, of their ordinary income distributions as short-term capitalization distributions under Internal Revenue Code Section 871(k)(2)(c).
| ADDITIONAL INFORMATION (continued) |
| March 31, 2019 (Unaudited) |
Availability of Quarterly Portfolio Holdings Schedules
The Funds are required to file their complete schedule of portfolio holdings with the SEC for the first and third quarters of each fiscal year on Form N-Q. Once filed, the Funds’ Form N-Q is available without charge, upon request on the SEC’s website (http://www.sec.gov) and may be available by calling 1.866.996.3863. You may also obtain copies at the SEC’s Public Reference Room in Washington, D.C. Information on the operation of the Public Reference Room may be obtained by calling 1.800.SEC.0330.
Proxy Voting Policies and Procedures and Proxy Voting Record (Unaudited)
A description of the policies and procedures that the Funds use to determine how to vote proxies relating to portfolio securities is available without charge, upon request, by calling 1.866.996.3863 and on the SEC’s website (http://www.sec.gov).
The Funds are required to file how they voted proxies related to portfolio securities during the most recent 12-month period ended June 30. Once filed, the information is available without charge, upon request, by calling 1.866.996.3863 and on the SEC’s website (http://www.sec.gov).
(This Page Intentionally Left Blank.)
Board of Trustees
Edward Vandergriff
Mark Travis
Peter Osterman, Jr.
John J. Broaddus
Investment Adviser
Intrepid Capital Management, Inc.
1400 Marsh Landing Parkway, Suite 106
Jacksonville Beach, FL 32250
Independent Registered Public Accounting Firm
Deloitte & Touche LLP
111 South Wacker Drive
Chicago, IL 60606
Legal Counsel
Foley & Lardner LLP
777 East Wisconsin Avenue
Milwaukee, WI 53202
Custodian
U.S. Bank, N.A.
1555 N. RiverCenter Drive, Suite 302
Milwaukee, WI 53212
Distributor
Quasar Distributors, LLC
777 East Wisconsin Avenue
Milwaukee, WI 53202
Administrator, Transfer Agent
and Dividend Disbursing Agent
U.S. Bancorp Fund Services, LLC,
doing business as U.S. Bank Global Fund Services
615 East Michigan Street
Milwaukee, WI 53202
Shareholder/Investor Information
1.866.996.3863
www.intrepidcapitalfunds.com
ITRPSEMI-0319
Item 2. Code of Ethics.
Not applicable for semi-annual reports.
Item 3. Audit Committee Financial Expert.
Not applicable for semi-annual reports.
Item 4. Principal Accountant Fees and Services.
Not applicable for semi-annual reports.
Item 5. Audit Committee of Listed Registrants.
Not applicable to registrants who are not listed issuers (as defined in Rule 10A-3 under the Securities Exchange Act of 1934).
Item 6. Investments.
Schedule of Investments is included as part of the report to shareholders filed under Item 1 of this Form.
Item 7. Disclosure of Proxy Voting Policies and Procedures for Closed-End Management Investment Companies.
Not applicable to open-end investment companies.
Item 8. Portfolio Managers of Closed-End Management Investment Companies.
Not applicable to open-end investment companies.
Item 9. Purchases of Equity Securities by Closed‑End Management Investment Company and Affiliated Purchasers.
Not applicable to open-end investment companies.
Item 10. Submission of Matters to a Vote of Security Holders.
Not Applicable.
Item 11. Controls and Procedures.
| (a) | The Registrant’s President and Treasurer have reviewed the Registrant's disclosure controls and procedures (as defined in Rule 30a-3(c) under the Investment Company Act of 1940 (the “Act”)) as of a date within 90 days of the filing of this report, as required by Rule 30a-3(b) under the Act and Rules 13a-15(b) or 15d‑15(b) under the Securities Exchange Act of 1934. Based on their review, such officers have concluded that the disclosure controls and procedures are effective in ensuring that information required to be disclosed in this report is appropriately recorded, processed, summarized and reported and made known to them by others within the Registrant and by the Registrant’s service provider. |
| (b) | There were no changes in the Registrant's internal control over financial reporting (as defined in Rule 30a-3(d) under the Act) that occurred during the second fiscal quarter of the period covered by this report that has materially affected, or is reasonably likely to materially affect, the Registrant's internal control over financial reporting. |
Item 12. Disclosure of Securities Lending Activities for Closed-End Management Investment Companies
Not applicable to open-end investment companies.
Item 13. Exhibits.
| (a) | (1) Any code of ethics or amendment thereto, that is the subject of the disclosure required by Item 2, to the extent that the registrant intends to satisfy Item 2 requirements through filing an exhibit. 1) Incorporated by reference to the Registrant’s Form N-CSR filed December 5, 2008. |
(2) A separate certification for each principal executive officer and principal financial officer pursuant to Section 302 of the Sarbanes-Oxley Act of 2002. Filed herewith.
(3) Any written solicitation to purchase securities under Rule 23c‑1 under the Act sent or given during the period covered by the report by or on behalf of the registrant to 10 or more persons. Not applicable to open-end investment companies.
| (b) | Certifications pursuant to Section 906 of the Sarbanes‑Oxley Act of 2002. Furnished herewith. |
SIGNATURES
Pursuant to the requirements of the Securities Exchange Act of 1934 and the Investment Company Act of 1940, the registrant has duly caused this report to be signed on its behalf by the undersigned, thereunto duly authorized.
(Registrant) Intrepid Capital Management Funds Trust
By (Signature and Title)* /s/Mark F. Travis
Mark F. Travis, President
Date June 6, 2019
Pursuant to the requirements of the Securities Exchange Act of 1934 and the Investment Company Act of 1940, this report has been signed below by the following persons on behalf of the registrant and in the capacities and on the dates indicated.
By (Signature and Title)* /s/Mark F. Travis
Mark F. Travis, President
Date June 6, 2019
By (Signature and Title)* /s/Donald C. White
Donald C. White, Treasurer
Date June 6, 2019
* Print the name and title of each signing officer under his or her signature.