Intrepid Capital Fund
Intrepid Small Cap Fund
Intrepid Income Fund
Intrepid Disciplined Value Fund
Semi-Annual Report
March 31, 2014
Intrepid Capital Fund
April 3, 2014
“There can be no freedom of the individual, no democracy, without the capital system, the profit system, the private enterprise system. These are, in the end, inseparable. Those who would destroy freedom have only first to destroy the hope of gain, the profit of enterprise and risk-taking, the hope of accumulating capital, the hope to save something for one’s old age and for one’s children. For a community of men without property, and without the hope of getting it by honest effort, is a community of slaves of a despotic State.”
-Russell C. Leffingwell
 | | |
| | | |
| Mark F. Travis, President/C.E.O. | | |
Dear Friends and Clients,
We are pleased to report our results once again differ from the indices, but this time to the positive side. The Intrepid Capital Fund (the “Fund”) returned 4.40% in the quarter ended March 31, 2014, while the S&P 500 and the Russell 2000 rose 1.81% and 1.12%, respectively. This result is driven by the fact that Intrepid portfolios are built from the ground up, without consideration to sector or security allocations in an index. Operationally, it would be much easier to be index huggers. However, such a posture, which owns securities without consideration for market prices, subjects capital to the risk of permanent impairment.
As pleased as we are with year-to-date performance, we are much less sanguine regarding prospective returns. To move forward it’s helpful to reflect back. As Mark Twain said, “History doesn’t repeat itself, but it does rhyme.” The 5-year annualized returns of the S&P 500 and the Russell 2000 are north of 20%. This is considerably above the longer term performance record of around 10%. In addition, the average mutual fund portfolio manager now keeps roughly 3% of the fund’s assets in cash (the Intrepid Capital Fund is over 8 times that figure), and margin debt has now surpassed the peaks reached in 2000 and 2007. We believe investors with high equity exposure should be wary, particularly should something go bump in the night. While we are pleased to be up 4.40% for the first quarter of 2014, the contrarian indicators and a dearth of new equity or debt ideas cause us to approach the capital markets with caution.
The top contributors to the Fund’s performance in the quarter ending March 31, 2014 were Newfield Exploration (ticker: NFX), World Wrestling Entertainment (ticker: WWE), Royal Gold (ticker: RGLD), Ingram Micro (ticker: IM), and Big Lots (ticker: BIG). Each of these ideas produced double-digit returns, with four of the five returning more than 25% in the quarter. Newfield Exploration, World Wrestling Entertainment, and Ingram Micro are each discussed in the Small Cap commentary.
Intrepid Capital Fund
The top detractors with an impact on the portfolio of more than 10 basis points included FTI Consulting (ticker: FCN), American Eagle Outfitters (ticker: AEO), and Western Union (ticker: WU). FTI Consulting and American Eagle had significantly larger impacts than Western Union, with both declining in the mid- to high-teens. FTI Consulting is discussed in the Small Cap Fund commentary.
We are pleased to report that the Intrepid Capital Fund (Investor Class) received an overall 4-Star Morningstar Rating out of 742 Moderate Allocation funds for the period ending March 31, 2014 (derived from a weighted average of the fund’s three-, five-, and ten-year risk adjusted return measure, if applicable).
Thank you for entrusting your hard earned capital to our firm. It is not a responsibility we take lightly.
Best regards,
Mark F. Travis
President
Intrepid Capital Fund Portfolio Manager
Must be preceded or accompanied by a prospectus.
Past performance does not guarantee future results.
Mutual fund investing involves risk. Principal loss is possible. The Fund is subject to special risks including volatility due to investments in smaller companies, which involve additional risks such as limited liquidity and greater volatility. The Fund is considered non-diversified as a result of limiting its holdings to a relatively small number of positions and may be more exposed to individual stock volatility than a diversified fund. Investments in debt securities typically decrease in value when interest rates rise. This risk is usually greater for longer term debt securities. Investments by the Fund in lower-rated and non-rated securities present a greater risk of loss to principal and interest than higher rated securities. The Fund may invest in foreign securities which involve greater volatility and political, economic and currency risks and differences in accounting methods.
The S&P 500 Index is a broad based unmanaged index of 500 stocks, which is widely recognized as representative of the equity market in general. The Bank of America/Merrill Lynch High Yield Master II Index is Merrill Lynch’s broadest high yield index, and as such is comparable with the broad indices published by other investment banks. The Russell 2000 Index consists of the smallest 2,000 companies in a group of 3,000 U.S. companies in the Russell 3000 Index, as ranked by market capitalization. The Russell 3000 Index is an index representing the largest 3,000 U.S. companies representing approximately 98% of the investable U.S. equity market. You cannot invest directly in an index.
Morningstar Proprietary Ratings reflect risk-adjusted performance as of 3/31/14. For each fund with at least a three year history, Morningstar calculates a Morningstar Rating™ based on a Morningstar risk-adjusted return measure that accounts for variation in a fund’s monthly performance placing more emphasis on downward variations and rewarding consistent performance. The top 10% of funds in each category receive 5 stars, the next 22.5% receive 4 stars, the next 35% receive 3 stars, the next 22.5% receive 2 stars and the bottom 10% receive 1 star. Each share class is counted as a fraction of one fund
Intrepid Capital Fund
within this scale and rated separately, which may cause slight variations in distribution percentage. The Intrepid Capital Fund received 4 Stars among 742 for the three-year and 4 Stars among 666 Moderate Allocation Funds for the five-year period ending 3/31/14. ©Morningstar, Inc. All Rights Reserved. Past performance is no guarantee of future results.
Please see the Schedule of Investments in this report for a full list of fund holdings. Fund holdings and sector allocations are subject to change at any time and should not be considered a recommendation to buy or sell any security.
Opinions expressed are subject to change, are not guaranteed and should not be considered investment advice or recommendations to buy or sell any security.
The Intrepid Capital Funds are distributed by Quasar Distributors, LLC.
Intrepid Small Cap Fund
 | | |
| | | |
| Jayme Wiggins, | | |
| Small Cap Fund Portfolio Manager | | |
April 1, 2014
Dear Fellow Shareholders,
Thanks to a surge in small cap stocks on the last day of March, the Russell 2000 Index (the “Index”) notched its seventh consecutive quarterly gain. The 1.84% jump in the Index on March 31st was the second largest daily increase for the entire three month period. Media reports attributed the end-of-quarter rally to a dovish speech by the Fed’s newly-installed leader, Janet Yellen, but we think Wall Street was prepared to use any excuse to push stocks into positive territory for the first quarter. The show goes on.
In a classic scene from Star Wars, Obi-Wan Kenobi admonished Darth Vader, “If you strike me down, I shall become more powerful than you can possibly imagine.” Since the beginning of the bull market, stocks have demonstrated an Obi-Wan resilience that has only increased in intensity. Every negative data point is quickly explained away by ardent bulls. Poor retail sales during the holiday season were attributed to a migration of shoppers to the Internet, where market share hippos like Amazon.com garner $157 billion valuations and triple digit P/E ratios. Harsh winter weather has been squarely blamed for a raft of recent weak economic data, and economists project that the demand suppressed by winter storms will snap back like a rubber band once the nation thaws. If we happen to receive more GDP-killing bad weather this month, it’s no matter, as April showers bring May flowers. Stocks momentarily lost their breath in late January, on fears of the potential impact from a pullback in unprecedented Fed stimulus. However, investors were reassured that the Fed has no intention of actually shrinking its bloated balance sheet or raising short-term interest rates anytime soon. Savers be damned, cheap money is bullish for speculation.
You may have noticed recent press coverage describing underperformance in the more frothy areas of the market. Biotech stocks were called out, in particular, and the Russell 2000 Biotechnology Index ended the first quarter 15.5% off the highs. Do not be fooled. The small cap biotech index still rose 7.9% during the three months ending March 31, 2014, trouncing the returns of all major indexes. At one point in the first quarter, the Biotechnology Index was up 27.8% year-to-date. This same group of stocks skyrocketed 55% in 2013. We found 189 companies in the Russell 2000 classified as belonging to the biotechnology and pharmaceutical industries. As of April 1, 2014, these names collectively sold for $154 billion, while the group incurred an aggregate net loss of $6.6 billion over the trailing twelve months. If past is prologue, a handful of names on this list will hit pay dirt and be acquired by a larger entity, but far more will never generate a dollar of profit and will disappear. Just for kicks, we also carved out Russell 2000 companies belonging to the Internet industry. These 78 companies traded for $64 billion with combined
Intrepid Small Cap Fund
losses of $300 million. This list has many companies that make money, like Orbitz and Shutterfly, but more that do not, such as Yelp and Angie’s List.
| |
| Russell 2000 Biotechnology Index |
| |
 |
| |
Past performance does not guarantee future results.
The biotech, pharmaceutical, and Internet small caps together constitute about 10% of the total market capitalization of the Russell 2000. While they offer some of the clearest examples of excess, they are not outliers. The P/E of the Russell 2000 is approximately 60x today. The median free cash flow multiple for nonfinancial firms is over 50x. We believe the small cap market is broadly overvalued. A small, brief retreat, like the one we experienced through early February of this year, did little to rectify the situation. We’re feeling a bit like a starved vampire, highly attuned to any signs of blood, but the small cap sunshine is never ending. And so we wait.
For the quarter ending March 31, 2014, the Intrepid Small Cap Fund (the “Fund”) increased 2.53%. The Russell 2000 Index gained 1.12%. The Fund’s equity holdings significantly outperformed the benchmark, as our equity-only return was 9.22% in the first quarter. However, our cash position muted overall returns. Cash was 70.9% of assets at March 31st.
The largest positive contributors to the Fund’s performance in the first quarter were Newfield Exploration (ticker: NFX), Ingram Micro (ticker: IM), and World Wrestling Entertainment (ticker: WWE). The energy exploration and production company Newfield had underperformed in the fourth quarter. The stock’s recovery this quarter was based on positive indications from the firm’s nascent, liquids-rich Anadarko Basin plays as well as an implied disposition value for the company’s Chinese assets that was larger than expected. Ingram Micro was historically a distributor of
Intrepid Small Cap Fund
broadline IT products like PCs and peripherals, but the company is demonstrating improved performance from the distribution and servicing of higher value products, such as mobile phones. WWE was one of the market’s best performing stocks in the first quarter, as investor enthusiasm about the company’s TV rights and new WWE Network have reached a fever pitch.
The largest detractors to first quarter returns were FTI Consulting (ticker: FCN) and CSG Systems International (ticker: CSGS). No other positions impacted the Fund by more than 10 basis points. FTI Consulting’s shares fell sharply after management warned that margins in one of its primary segments would be permanently lower due to contract renegotiations with key personnel, who will now keep a larger portion of the revenue they generate. We did not anticipate this impact, and we have adjusted our valuation accordingly. The Street didn’t like CSG Systems’ 2014 guidance, but it met our expectations. CSG is a growth-challenged operator that nonetheless produces substantial free cash flow.
We fully exited our holdings of ManTech (ticker: MANT) and WWE in the first quarter. Both were long-term holdings, but they had very different outcomes. We incurred a modest loss on ManTech over our holding period. The defense IT services company had a large exposure to overseas operations in Iraq and Afghanistan, which wound down sooner than expected. More importantly, curbs on U.S. defense spending have led to increased competition and lower margins for many of ManTech’s contracts. While the stock still appears cheap based on trailing earnings and free cash flow, we have become accustomed to a management team that predictably fails to meet projections. Additionally, we are concerned that management is likely to use cash flow to overpay for acquisitions in order to offset organic revenue declines.
WWE was an important and successful position for Intrepid Capital, and it has occupied a fair amount of real estate in our past quarterly letters to you. We sold out of the position by the end of January as the stock surged past our valuation. Since then, WWE’s shares have continued to appreciate to all-time highs. There are two large unknowns driving the stock price: the value WWE will receive once it renews its domestic television agreements and the success of the WWE Network. We are bullish on the first and bearish on the second.
Management claims the WWE Network needs 1 million domestic subscribers to break even on an EBITDA basis, which would still leave the company $15 million per year worse off on EBIT basis. Factoring in capital spending (the “DA” in EBITDA), the true domestic breakeven is probably closer to 1.2 million subscribers. It may even be higher, since we believe management underestimated the percentage of subscription revenue WWE must share with technology partners like Apple and Roku. Each year, around 650,000 U.S. households purchase WrestleMania, WWE’s signature pay-per-view event. We believe there are relatively few WWE fans who do not purchase WrestleMania but buy other WWE pay-per-views. Our guess is that there could be 800,000 households in the U.S. who have demonstrated a willingness
Intrepid Small Cap Fund
to pay for WWE content. Therefore, we believe the company will need to enlist an additional 400,000 U.S. fans as WWE Network subscribers (~1.2 million total) just to get back to square one. We doubt it will get much better than that for the WWE Network. The current Enterprise Value for WWE is $2.14 billion. Assuming the WWE Network is valuation-neutral, the shares are pricing in more than a doubling of the company’s global TV rights deals. We think WWE will register a solid increase for its domestic television rights renewal, but we do not expect the tripling that has been discussed in some media articles. Over the next two months, the company should unveil enough new information to help investors decide whether the current valuation is reasonable.
We purchased Corus Entertainment (ticker: CJR/B CN) during the first quarter. This was our first new purchase since last July. Corus owns leading specialty television networks and radio stations in Canada. TV accounts for approximately 80% of cash flow. The company derives almost half of revenue from advertising and the remainder from subscription fees and licensing. Corus’s TV channels dominate the target markets for women and children. Popular HGTV programs such as Love It or List It and Property Brothers first aired on Corus’s W Network in Canada. The company controls over 90% of the purchasable TV ratings points in Canada for kids. Corus is Canada’s last remaining pure-play media and entertainment company. The rest have been acquired by large, vertically-integrated communication firms including Bell Canada, Rogers, and Shaw. Shaw spun off Corus in 1999, when the government encouraged the separation of television distribution and content, but the official position has since shifted back the other way. The Shaw family still controls Corus through super-voting stock.
The Canadian television industry is more regulated than the U.S. One risk facing Corus is that the government mandates that cable and satellite providers offer a la carte programming, which is called pick and pay in Canada, and would allow consumers to choose which channels they pay for. The purpose of a la carte is to lower cable bills, but the primary reason for cable inflation is the sports networks, and Corus owns none of these. We expect Corus to withstand major damage from an implementation of a la carte, since they mainly operate top specialty networks with strong viewership. While declines in distribution would negatively impact subscriber fees, the industry is likely to offset lower volume by raising per household pricing. Furthermore, the majority of Corus’s earnings come from advertising revenue and premium channel subscriptions, both of which should be far less impacted by pick and pay. Nevertheless, Corus’s juicy 30% operating margins could make them a potential regulatory piñata in Canada. The company benefits from genre-protection rules that protect their networks from competition but also indirectly limit their ability to raise subscriber fees. Leading U.S. specialty network owners such as AMC, Scripps, and Discovery have operating margins ranging from 28%-39% in a more market-based environment where pricing power and competition are both prevalent.
Intrepid Small Cap Fund
The business performed very well during the last recession, when declines in advertising revenue were offset by the launch of new networks and higher merchandising sales. In music to our ears, management recently said, “Typically the street looks at a multiple of EBITDA…However, we believe the truest measure of shareholder value is sustainable free cash flow, because it’s cash you can return to shareholders.” Corus pays a dividend yield exceeding 4% and is currently trading at 12.5x free cash flow. In Corus, we believe we have found a good business trading at a reasonable discount to fair value. We also think there is an above-average chance of a takeover. We have hedged the currency risk on this investment.
In today’s market, cheap small caps seem as elusive as Bigfoot. While there are plenty of sightings (see www.bfro.net), they turn out to be bogus. We aren’t sure when this market will turn, but when it does, we are ready to act. Our high cash is not a permanent feature of the Intrepid Small Cap Fund. Historically, our cash levels have grown slowly as bull markets age and then declined rapidly along with plummeting stock prices. Most recently, this occurred in the summer of 2011. Before that, late 2008. We promise to continue managing the Fund according to our philosophy of selling positions once they exceed our estimates of intrinsic value, since we firmly believe this will produce the best long-term outcome for you, our fund holders. Thank you for your investment.
Sincerely,
Jayme Wiggins, CFA
Intrepid Small Cap Fund Portfolio Manager
Must be preceded or accompanied by a prospectus.
Past performance does not guarantee future results.
Past performance does not guarantee future results. Index performance is not indicative of fund performance. To obtain standardized fund performance visit www.intrepidcapitalfunds.com or call 866-996-FUND (3863).
Mutual fund investing involves risk. Principal loss is possible. The Fund is subject to special risks including volatility due to investments in smaller companies, which involve additional risks such as limited liquidity and greater volatility. The Fund is considered non-diversified as a result of limiting its holdings to a relatively small number of positions and may be more exposed to individual stock volatility than a diversified fund. The Fund may invest in foreign securities which involve greater volatility and political, economic and currency risks and differences in accounting methods.
The Advisor believes that current market conditions warrant a defensive position from the requirement to invest at least 80% of its net assets in equity securities of small capitalization companies.
Intrepid Small Cap Fund
The Russell 2000 Index consists of the smallest 2,000 companies in a group of 3,000 U.S. Companies in the Russell 3000 Index, as ranked by market capitalization. The Russell 1000 Index consists of the largest 1,000 companies in the Russell 3000 Index. The Russell 2000 Biotechnology Index is comprised of the smallest Biotechnology companies in the Russell 3000 Index. You cannot invest directly in an index.
Cash Flow measures the cash generating capability of a company by adding non-cash charges and interest to pretax income. Free Cash Flow measures the cash generating capability of a company by subtracting capital expenditures from cash flow from operations. EBIT is calculated as the company’s Earnings Before Interest and Taxes. EBITDA is calculated as the company’s Earnings Before Interest, Taxes, Depreciation and Amortization. Price-to-Earnings Ratio (P/E Ratio) is an equity valuation multiple calculated as market price per share divided by annual earnings per share. Basis Point is a unit that is equal to 1/100th of 1% and is used to denote the change in a financial instrument. Gross Domestic Product (GDP) is the market value of all officially recognized final goods and services produced within a country in a year, or other given period of time.
Please see the Schedule of Investments in this report for a full list of fund holdings. Fund holdings and sector allocations are subject to change at any time and should not be considered a recommendation to buy or sell any security.
Opinions expressed are subject to change, are not guaranteed and should not be considered investment advice or recommendations to buy or sell any security.
The Intrepid Capital Funds are distributed by Quasar Distributors, LLC.
Intrepid Income Fund
 | |  | |
| | | | |
| Jason Lazarus, | | Ben Franklin, | |
| Income Fund Co-Portfolio Manager | | Income Fund Co-Portfolio Manager | |
April 4, 2014
Dear Fellow Shareholders,
Fixed income assets rallied across the board in the quarter ended March 31, 2014, due to both spread compression and lower risk-free rates. The ten-year U.S. Treasury rate declined to 2.72% from 3.03% at the end of calendar year 2013. The Barclays U.S. Aggregate, which is a proxy for the broader investment-grade fixed income market, rallied 1.84% after struggling last year. Corporate bonds performed even better as spreads compressed to levels not experienced since the summer of 2007. This led to impressive performances by investment-grade and high-yield corporate bonds, which returned 2.97% and 3.00%, respectively, in the period ending March 31, 2014, as measured by the BofA ML US Corporate Index and the BofA ML High Yield Master II Index (the “Index”).
The high-yield market has seen significant inflows this year as investors continue to search for yield. The asset class is flooded with cash, and managers with a full-invested mandate are forced to put money to work regardless of price levels, pushing bond prices up further. This constant need to put money to work has distorted the high-yield bond market by allowing distressed businesses to kick the can down the road, rather than restructure as a free market system would obligate them to do. When companies that should fail are bailed out by yield-hungry investors, those who have taken the most risk have reaped the rewards. At Intrepid, we manage our fixed income assets differently. We do not analyze technical factors such as fund flows, nor do we allocate capital based on expected market default rates. Most importantly, we have no mandate to be fully invested, and therefore only put money to work when we believe we are being compensated to assume the risks. When we cannot find a suitable investment candidate, we will hold what most investors seem to hate: cash. Due to the dearth of opportunities, we have been holding quite a lot of cash, which averaged 38% of assets in the quarter. The Intrepid Income Fund’s (the “Fund”) cash position was also 38.8% at the end of the quarter, but we expect this to increase, absent a pullback in bond prices, as several of our holdings are likely to be called in coming months. Our significant cash position and higher-quality bond portfolio resulted in a wide gap in performance between the Fund and the Index. The Fund returned 1.47% in the quarter and 2.98% in the six month period ending March 31, 2014, while the Index returned 3.00% and 6.60% in the same periods.
The Fund had no material detractors to performance in the quarter. PetroQuest Energy 10% due 9/01/2017 and Smith & Wesson 5.875% due 6/15/2017 were top contributors to the Fund’s quarterly performance. Both issues represent large
Intrepid Income Fund
holdings and outperformed the high-yield benchmark. We see several reasons the PetroQuest bonds may have been bid up. The company’s near-term credit quality has been boosted by higher natural gas prices and the rolling off of a contract to sell gas at unfavorable prices. Additionally, the company has expanded its hedging program, reducing some of the inherent commodity risk. Lastly, we believe yield-to-call buyers have become interested in the issue due to the upcoming September call date. As for our Smith & Wesson holding, the company continues to increase revenue despite an overall industry decline from recent highs. The company’s balance sheet remains lightly levered, which is required for this holding as we view gun industry sales at above normalized levels.
AuRico Gold (ticker: AUQ) has a small convertible bond issued by subsidiary Northgate Minerals. The 3.5% convertible notes represent a fairly new position that was established in the fall of 2013, and were the top contributor to the Fund’s performance in the quarter ended March 31, 2014. The bonds jumped in early March when AuRico announced its intention to redeem the notes at a substantial premium with proceeds from a new longer-dated issue. We analyzed the new bond in depth, but concluded we weren’t being compensated adequately for the credit risk and long 2022 maturity. We weren’t the only ones with this opinion. Demand for the issue was weak, and substantial changes were made to attract investors. The company shortened the maturity date by two years, increased the bonds’ priority in the capital structure from senior to second lien, and offered the bonds at a discount to par. We decided to participate in the altered deal, and together with secondary market purchases were able to accumulate a 2.5% position in the new 7.75% second lien notes due April 1, 2020.
In addition to the new AuRico Gold notes, we purchased small positions in two businesses we have followed for several years; Oshkosh 8.5% due 3/01/2020 (ticker: OSK) and two Rent-A-Center bonds (ticker: RCII). Our largest new position is PHI Inc 5.25% due 3/15/2019 (ticker: PHII). We first became involved in PHI in late 2012 and subsequently built up the position over the next several months. We outlined our thesis on the company in our quarterly letter for the period ending September 30, 2013. PHI issued new notes late in the most recent quarter, and offered to repurchase the old notes, which we elected to do. We were able to purchase the new notes at what we believe to be attractive prices for a business with a solid credit profile and tangible assets.
On the sales side, two of our large positions were repurchased by the issuers; PHI Inc, as mentioned above, and Scotts Miracle Gro 7.250% due 1/15/2018 (ticker: SMG). The repurchase of the Scotts bonds was expected. We also exited our position in WWE common stock (ticker: WWE), for a solid gain. WWE is discussed in more detail in the Small Cap commentary. Lastly, we decided to sell our holdings in Texas-based Swift Energy’s 8.875% notes due 1/15/2020, which gives us the opportunity to delineate how we think about selling when a business has deteriorated.
Intrepid Income Fund
Swift Energy is a small-cap energy exploration and production business (E&P) with core assets in the prolific Eagle Ford shale in South Texas. About a year ago, we identified Swift as a potentially attractive bond holding due to its average leverage and significant undeveloped, but highly valuable, oil and gas reserves. Our view was that the reserves easily covered the company’s debt even if energy prices were to weaken, and we believed the bonds compensated us well given the risks. Since we first purchased the notes, our valuation of the assets protecting our investment has declined. Additionally, our confidence in management to execute on its plans has deteriorated. Going further, we now have serious questions regarding management’s integrity.
In the last year, Swift has twice attempted to monetize assets, both through a joint venture and an asset sale, the proceeds of which would be used to reduce debt. In the first case, a joint venture in the key Eagle Ford properties was abandoned for the sale of other properties, presumably because no joint venture partner would sign on under terms that were attractive to Swift’s management. In the second case, management put its Central Louisiana assets up for sale in lieu of the joint venture. The bid deadline was initially in November 2013, and on the Q313 conference call held in late October management said it was “pleased with the progress thus far” and anticipated bids in the fourth quarter with a deal closing in Q114. As we rolled into 2014 with no announcement, our confidence in the management team had dwindled to almost nothing, and we highly doubted a deal could be done on favorable terms. We concluded that nothing positive would come by holding through the fourth quarter earnings report, and sold the notes prior to the earnings release. Our suspicions proved to be correct, and Swift’s stock sank when management did not announce a deal and stated it would seek another joint venture for natural gas assets in South Texas. These and other issues, including skepticism about the reserve audit and related party transactions, led us to question management’s integrity and ability to execute.
We should note that even with the issues described, we still made money on our investment in Swift’s bonds. However, making or losing money on an investment does not necessarily equate to success or failure, in our opinion. At Intrepid, we believe the focus should be on the process, not the outcome. We feel strongly that process-driven investing is the only way to produce repeatable results over the long-term. To paraphrase Nassim Nicholas Taleb in his book Fooled by Randomness, if you put enough monkeys in front of typewriters, one of them will eventually pound out the Iliad. But would you bet money that our literary primate would write the Odyssey next?
To close, we would like everyone to know that the Fund’s Investor Class shares have been converted to the Institutional Class, and the Investor Class has been closed. This action will reduce the total operating expense paid by Investor Class owners to 90 basis points. We have also reduced the investment minimum of the Institutional
Intrepid Income Fund
Class to $2,500. This is our commitment to offer the product you desire at a reasonable price. Thank you for your investment.
Sincerely,
 |  |
| | |
| Jason Lazarus, CFA | Ben Franklin, CFA |
| Intrepid Income | Intrepid Income |
| Co-Lead Portfolio Manager | Co-Lead Portfolio Manager |
Must be preceded or accompanied by a prospectus.
Past performance does not guarantee future results.
Mutual fund investing involves risk. Principal loss is possible. Investments in debt securities typically decrease in value when interest rates rise. The risk is generally greater for longer term debt securities. Investments by the Fund in lower-rated and non-rated securities present a greater risk of loss to principal and interest than higher rated securities. The Fund is non-diversified, meaning it may concentrate its assets in fewer individual holdings than a diversified fund. Therefore, the Fund is more exposed to individual securities volatility than a diversified fund. The Fund may invest in foreign securities which involve greater volatility and political, economic and currency risks and differences in accounting methods.
The Bank of America Merrill Lynch High Yield Master II Index is Bank of America Merrill Lynch’s broadest high yield index, and as such is comparable with the broad indices published by other investment banks. Bank of America Merrill Lynch US Corporate Index is an unmanaged index of U.S. dollar denominated investment grade corporate debt securities publicly issued in the U.S. domestic market with at least one year remaining term to final maturity. Barclays Capital U.S. Aggregate Bond Index is an index representing about 8,200 fixed income securities. To be included in the index, bonds must be rated investment grade by Moody’s and S&P. You cannot invest directly in an index.
Yield-to-Call means that the issuer of the bond can redeem the bond prior to maturity by paying the call price, whichever is greater than the face value of the bond, to the bondholder. Basis Point is a unit that is equal to 1/100th of 1% and is used to denote the change in a financial instrument.
Please see the Schedule of Investments in this report for a full list of fund holdings. Fund holdings and sector allocations are subject to change at any time and should not be considered a recommendation to buy or sell any security.
Opinions expressed are subject to change, are not guaranteed and should not be considered investment advice or recommendations to buy or sell any security.
The Intrepid Capital Funds are distributed by Quasar Distributors, LLC.
Intrepid Disciplined Value Fund
 | | |
| | | |
| Greg Estes, | | |
| Disciplined Value Fund | | |
| Portfolio Manager | | |
April 2, 2014
Dear Fellow Shareholders,
For the quarter ended March 31, 2014, the S&P 500 Index returned 1.81%, and the Russell 3000 Index returned 1.97%. For the same period, the Intrepid Disciplined Value Fund (the “Fund”) returned 2.73%. At first blush, the quarter appears to be rather boring in light of some of the much higher returns achieved in other recent quarters. But when we dig a bit deeper, we see a market with much more volatility, as shown in the chart below. By February 3, 2014, the S&P 500 Index’s year-to-date return was -5.66%, while the Russell 3000 Index was down -5.51%. In that same window of time, the Fund was down -1.32%. In our opinion, the markets were down because of fear that company results could not match the relatively high earnings multiples being placed on the underlying stocks. In addition, investors were worried about the Federal Reserve reducing its monetary stimulus scheme which has kept short term rates near zero for more than five years. By the end of February, however, most of this fear had subsided. As March ended, Federal Reserve Chairwoman Janet Yellen reassured investors that the Fed’s easy monetary policy would continue until the employment picture looked better. The last two weeks of January were like a bad dream that investors were happy to forget.
| |
| Comparative Total Return |
| First Quarter 2014 |
| |
 |
| |
Figure 1 Source: Bloomberg.
Past performance does not guarantee future results.
And yet the short period in late January should serve as a reminder to all investors of what could happen when an outside force- in this case, the Federal Reserve- discontinues its interference. And we firmly believe that the market’s reflation is a result of the Fed’s easy monetary policy. Consider the chart on the following page. The dark shaded line shows the value of the S&P 500 beginning four years ago in April 2010. With the exception of a few hiccups along the way, it has climbed inexorably to an all time high. Meanwhile, the price to earnings ratio for the S&P 500 (the light shaded line) has also been climbing. Why? Is a dollar of corporate earnings inherently more valuable than it was four years ago? We think not. Rather, with interest rates near zero, we believe that the Fed has forced money into the equity market, because there is
Intrepid Disciplined Value Fund
nowhere else for the money to go. Thus, equity investment becomes less of an exercise in determining what a business is worth, and more of a game of musical chairs. The Fed makes the music while investors walk around the chairs. To remain fully committed to such a market is in our minds a dangerous game, and it is clear to see what happens when investors fear that the music is about to stop. No song can last forever.
| |
| S & P 500 Index |
| |
 |
| |
Figure 2 Source: Bloomberg
Past performance does not guarantee future results.
In light of the current environment, what is an investor to do? It is our goal not only to outperform the market when it is selling down, but also to find new ideas for investment when prices become more favorable. Last quarter, we reported the Fund’s cash level at an all-time high of 61.3%. The brief selloff in this quarter did enable us to pick up some new investments. By quarter end, cash was at 48.8%. The purchasing activity includes both new purchases and additions to existing positions.
Among the new additions to the portfolio were some recognizable names that we consider to be somewhat out of favor. We’d like to highlight a few of those. We’ll start with the most recognizable company in the stock market: Apple, Inc. (ticker: AAPL). The very simple case for investing is this: the balance sheet is loaded with cash and at the time of investment, the stock was selling for just over six times its EBIT (Earnings before Interest and Taxes). The company had just released results and guided revenue to be flat to down for the next quarter, which is something Apple had not done in ten years. The stock sold off, and we saw that as an opportunity. Will Apple be able to permanently maintain dominant market share and command massive gross margins from 45% to 55% for iPhones? We don’t think it can. Nor do we think it must to justify investing in it. As a matter of fact, when we value this business, we assume a reduction in gross margin. And yet we still believe that we own a company that trades at a discount to its intrinsic value.
We also purchased shares of Mattel, Inc (ticker: MAT). Mattel is the world’s largest toy maker and owns a diversified portfolio of enduring brands including Barbie, Fisher-Price, American Girl, and Hot Wheels. Mattel caught our eye as shares declined sharply in early February due to poor fourth-quarter sales. We were able to buy shares of this shareholder-friendly company at a 4% dividend yield and a reasonable discount to our valuation.
Another investment was Intuitive Surgical (ticker: ISRG). Intuitive is the market leader in robotic assisted surgical units. Actually, it is the only FDA-approved device
Intrepid Disciplined Value Fund
maker for robotic surgery. Its product is known as the da Vinci, and its applications for minimally invasive surgery can be found in the fields of urology, gynecology, cardiothoracic and general surgery. Like several of our recent investments, this was an opportunistic purchase. The stock had sold down on concerns that unit sales had slowed, which is natural given the changing regulations in U.S. healthcare. In addition, there are criticisms that outcomes for robotic-assisted surgery are no better than more standard laparoscopic surgery. However, we believe that adoption of robotic assisted surgery will continue onward as more physicians become trained on it and as the FDA approves the device for more types of procedures. The implementation of the ACA (Affordable Care Act) is more of a general concern among all healthcare companies. We believe that, as the only company in this field, the company is well positioned and it should continue to see procedure growth in robotic-assisted surgeries.
The top performers in the quarter were varied. Newfield Exploration (ticker: NFX) was the Fund’s top gainer as commodity companies were among the best performers in the market for the quarter. World Wrestling Entertainment (ticker: WWE) gained on continued speculation that the company would sign a more lucrative television deal, thus boosting operating profits. The decision has not yet been announced, and we have exited the position because the current price is above our estimate of the company’s underlying worth. Finally, the Fund’s investment in two lab service providers, Quest Diagnostics (ticker: DGX) and Labcorp (ticker: LH) both rebounded in the quarter on news that Congress is considering controlling the amount of reimbursement cuts for lab service paid by Medicare and Medicaid.
The Fund’s worst performers included FTI Consulting (ticker: FCN), which posted weak forward guidance for 2014. Staples (ticker: SPLS), a name we have owned in the past and had repurchased in the quarter, announced that it will be cutting its brick-and-mortar footprint in the U.S. to focus more resources towards its online presence. Although this development gave us an opportunity to purchase, our timing was not perfect. We believe that Staples will be able to add value by shrinking its less profitable operations over time. Finally, CSG Systems (ticker: CSGS) delivered what was, in our opinion, a solid fourth quarter. However, the market wanted better forward guidance for 2014 than the company delivered. Therefore, the shares traded down for the quarter.
As we have done with every quarterly letter, we close by citing the average discount within the Fund. We derive our own internal values for each stock, and we compare those values with their corresponding stock prices to calculate the discount for each position. When we cite the average discount in the Fund then, we are simply giving you the mid-point among all the individual discounts within the Fund. At quarter end, that average discount was 7%. To us, this indicates that discounts are small, which should come as no surprise given the increase in the stock market over the past five years. We will, however, continue searching for value and when possible take
Intrepid Disciplined Value Fund
opportunities in the event of a market selloff. We appreciate your confidence in our investment process.
Sincerely,
Greg Estes, CFA
Intrepid Disciplined Value Fund Portfolio Manager
Must be preceded or accompanied by a prospectus.
Past performance does not guarantee future results.
Mutual fund investing involves risk. Principal loss is possible. The Fund is subject to special risks including volatility due to investments in smaller and medium sized companies, which involve additional risks such as limited liquidity and greater volatility. The Fund is considered non-diversified as a result of limiting its holdings to a relatively small number of positions and may be more exposed to individual stock volatility than a diversified fund. The Fund may invest in foreign securities which involve greater volatility and political, economic and currency risks and differences in accounting methods.
Past performance does not guarantee future results. Index performance is not indicative of fund performance. To obtain standardized fund performance visit www.intrepidcapitalfunds.com or call 866-996-FUND (3863).
Diversification does not assure a profit or protect against a loss in a declining market.
Prior to April 1, 2013, the Fund was named the Intrepid All Cap Fund.
The S&P 500 Index is a broad based unmanaged index of 500 stocks, which is widely recognized as representative of the equity market in general. The Russell 3000 Index is an index representing the largest 3,000 U.S. companies representing approximately 98% of the investable U.S. equity market. The Dow Jones Industrial Average is an unmanaged index of common stocks comprised of major industrial companies and assumes reinvestment of dividends. You cannot invest directly in an index.
EBIT is calculated as the company’s Earnings Before Interest and Taxes. Price-to-Earnings Ratio (P/E Ratio) is an equity valuation multiple calculated as market price per share divided by annual earnings per share.
Please see the Schedule of Investments in this report for a full list of fund holdings. Fund holdings and sector allocations are subject to change at any time and should not be considered a recommendation to buy or sell any security.
Opinions expressed are subject to change, are not guaranteed and should not be considered investment advice or recommendations to buy or sell any security.
The Intrepid Capital Funds are distributed by Quasar Distributors, LLC.
Intrepid Funds
EXPENSE EXAMPLE
March 31, 2014 (Unaudited)
As a shareholder of the Intrepid Capital Management Funds Trust (the “Funds”), you incur ongoing costs, including management fees; distribution and/or service fees; and other expenses incurred by the Funds. This example is intended to help you understand your ongoing costs (in dollars) of investing in the Funds and to compare costs with the ongoing costs of investing in other mutual funds.
The example is based on an investment of $1,000 invested at the beginning of the period and held the entire period of October 1, 2013 through March 31, 2014.
ACTUAL EXPENSES
The first line of the following table provides information about actual account values and actual expenses. Although the Funds charge no sales load or transaction fees, you will be assessed fees for outgoing wire transfers, returned checks or stop payment orders at prevailing rates charged by U.S. Bancorp Fund Services, LLC, the Funds’ transfer agent. If you request a redemption be made by wire transfer, currently a $15.00 fee is charged by the Funds’ transfer agent. To the extent that a Fund invests in shares of other investment companies as part of its investment strategy, you will indirectly bear your proportionate share of any fees and expenses charged by the underlying funds in which the Fund invests in addition to the expenses of the Fund. Actual expenses of the underlying funds are expected to vary among the various underlying funds. These expenses are not included in the following example. The example includes, but is not limited to, management fees, shareholder servicing fees, distribution fees, fund accounting, custody and transfer agent fees. However, the example below does not include portfolio trading commissions and related expenses, interest expense and other extraordinary expenses as determined under generally accepted accounting principles. You may use the information in this line, together with the amount you invested, to estimate the expenses that you paid over the period. Simply divide your account value by $1,000 (for example, an $8,600 account value divided by $1,000 = 8.6), then multiply the result by the number in the first line under the heading entitled “Expenses Paid During Period” to estimate the expenses you paid on your account during this period.
HYPOTHETICAL EXAMPLE FOR COMPARISON PURPOSES
The second line of the following table provides information about hypothetical account values and hypothetical expenses based on the Funds’ actual expense ratio and an assumed rate of return of 5% per year before expenses, which is not the Funds’ actual return. The hypothetical account values and expenses may not be used to estimate the actual ending account balance or expenses you paid for the period. You may use this information to compare the ongoing costs of investing in the Funds and other funds. To do so, compare this 5% hypothetical example with the 5% hypothetical examples that appear in the shareholder reports of the other funds.
Intrepid Funds
EXPENSE EXAMPLE (continued)
March 31, 2014 (Unaudited)
Please note that the expenses shown in the table are meant to highlight your ongoing costs only and do not reflect any transactional costs, such as sales charges (loads), redemption fees, or exchange fees. Therefore, the second line of the table is useful in comparing ongoing costs only, and will not help you determine the relative costs of owning different funds. In addition, if these transactional costs were included, your costs would have been higher.
INTREPID CAPITAL FUND – INVESTOR CLASS
| | | | Expenses Paid |
| | Beginning | Ending | During Period* |
| | Account Value | Account Value | October 1, 2013 - |
| | October 1, 2013 | March 31, 2014 | March 31, 2014 |
| Actual | $1,000.00 | $1,092.60 | $7.30 |
| Hypothetical (5% return | | | |
| before expenses) | 1,000.00 | 1,017.95 | 7.04 |
| * | Expenses are equal to the Fund’s annualized expense ratio of 1.40%, multiplied by the average account value over the period, multiplied by 182/365 to reflect the period. |
INTREPID CAPITAL FUND – INSTITUTIONAL CLASS
| | | | Expenses Paid |
| | Beginning | Ending | During Period* |
| | Account Value | Account Value | October 1, 2013 - |
| | October 1, 2013 | March 31, 2014 | March 31, 2014 |
| Actual | $1,000.00 | $1,093.10 | $6.00 |
| Hypothetical (5% return | | | |
| before expenses) | 1,000.00 | 1,019.20 | 5.79 |
| * | Expenses are equal to the Fund’s annualized expense ratio of 1.15%, multiplied by the average account value over the period, multiplied by 182/365 to reflect the period. |
INTREPID SMALL CAP FUND – INVESTOR CLASS
| | | | Expenses Paid |
| | Beginning | Ending | During Period* |
| | Account Value | Account Value | October 1, 2013 - |
| | October 1, 2013 | March 31, 2014 | March 31, 2014 |
| Actual | $1,000.00 | $1,064.70 | $7.21 |
| Hypothetical (5% return | | | |
| before expenses) | 1,000.00 | 1,017.95 | 7.04 |
| * | Expenses are equal to the Fund’s annualized expense ratio of 1.40%, multiplied by the average account value over the period, multiplied by 182/365 to reflect the period. |
EXPENSE EXAMPLE (continued)
March 31, 2014 (Unaudited)
INTREPID SMALL CAP FUND – INSTITUTIONAL CLASS
| | | | Expenses Paid |
| | Beginning | Ending | During Period* |
| | Account Value | Account Value | October 1, 2013 - |
| | October 1, 2013 | March 31, 2014 | March 31, 2014 |
| Actual | $1,000.00 | $1,066.50 | $5.92 |
| Hypothetical (5% return | | | |
| before expenses) | 1,000.00 | 1,019.20 | 5.79 |
| * | Expenses are equal to the Fund’s annualized expense ratio of 1.15%, multiplied by the average account value over the period, multiplied by 182/365 to reflect the period. |
INTREPID INCOME FUND – INSTITUTIONAL CLASS
| | | | Expenses Paid |
| | Beginning | Ending | During Period* |
| | Account Value | Account Value | October 1, 2013 - |
| | October 1, 2013 | March 31, 2014 | March 31, 2014 |
| Actual | $1,000.00 | $1,029.80 | $4.55 |
| Hypothetical (5% return | | | |
| before expenses) | 1,000.00 | 1,020.44 | 4.53 |
| * | Expenses are equal to the Fund’s annualized expense ratio of 0.90%, multiplied by the average account value over the period, multiplied by 182/365 to reflect the period. |
INTREPID DISCIPLINED VALUE FUND*
| | | | Expenses Paid |
| | Beginning | Ending | During Period** |
| | Account Value | Account Value | October 1, 2013 - |
| | October 1, 2013 | March 31, 2014 | March 31, 2014 |
| Actual | $1,000.00 | $1,068.50 | $7.07 |
| Hypothetical (5% return | | | |
| before expenses) | 1,000.00 | 1,018.10 | 6.89 |
| * | Effective January 31, 2014, the Adviser contractually agreed to reduce its fees and/or reimburse the Fund to ensure that Total Annual Fund Operating Expenses After Waiver and/or Expense Reimbursement do not exceed 1.30% of the Fund’s average daily net assets. |
| ** | Expenses are equal to the Fund’s annualized expense ratio of 1.37%, multiplied by the average account value over the period, multiplied by 182/365 to reflect the period. |
Intrepid Capital Fund
ALLOCATION OF PORTFOLIO HOLDINGS
March 31, 2014 (Unaudited)
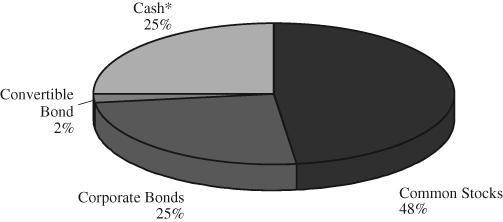
INTREPID CAPITAL FUND
(as a % of total net assets)
COMPONENTS OF PORTFOLIO HOLDINGS
| Common Stocks | | $ | 214,359,829 | |
| Corporate Bonds | | | 113,394,451 | |
| Convertible Bond | | | 6,125,130 | |
| Cash* | | | 113,349,108 | |
| | | $ | 447,228,518 | |
| * | Cash, cash equivalents and other assets less liabilities. |
Intrepid Small Cap Fund
SECTOR ALLOCATION OF PORTFOLIO HOLDINGS
March 31, 2014 (Unaudited)
INTREPID SMALL CAP FUND
(as a % of total net assets)
COMPONENTS OF PORTFOLIO HOLDINGS
| Information Technology | | $ | 60,029,435 | |
| Consumer Discretionary | | | 41,557,834 | |
| Industrials | | | 29,255,315 | |
| Health Care | | | 21,355,554 | |
| Energy | | | 21,199,360 | |
| Financials | | | 14,255,516 | |
| Materials | | | 13,402,502 | |
| Telecommunication Services | | | 6,277,793 | |
| Cash* | | | 504,583,310 | |
| | | $ | 711,916,619 | |
The sector and industry classifications used in this report, use the Global Industry Classification Standard (GICS®). GICS® was developed by and/or is the exclusive property of MSCI, Inc. and Standard & Poor Financial Services LLC (“S&P”). GICS® is a service mark of MSCI and S&P and has been licensed for use by U.S. Bancorp Fund Services, LLC.
| * | Cash, cash equivalents and other assets less liabilities. |
Intrepid Income Fund
ALLOCATION OF PORTFOLIO HOLDINGS
March 31, 2014 (Unaudited)
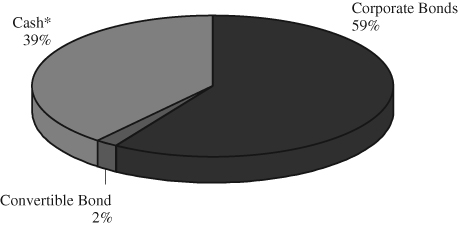
INTREPID INCOME FUND
(as a % of total net assets)
COMPONENTS OF PORTFOLIO HOLDINGS
| Corporate Bonds | | $ | 62,703,600 | |
| Convertible Bond | | | 2,608,200 | |
| Cash* | | | 41,395,271 | |
| | | $ | 106,707,071 | |
| * | Cash, cash equivalents and other assets less liabilities. |
Intrepid Disciplined Value Fund
SECTOR ALLOCATION OF PORTFOLIO HOLDINGS
March 31, 2014 (Unaudited)
INTREPID DISCIPLINED VALUE FUND
(as a % of total net assets)
COMPONENTS OF PORTFOLIO HOLDINGS
| Information Technology | | $ | 6,363,572 | |
| Health Care | | | 3,918,756 | |
| Consumer Discretionary | | | 3,896,779 | |
| Financials | | | 3,015,053 | |
| Energy | | | 1,786,912 | |
| Materials | | | 1,320,574 | |
| Industrials | | | 1,216,756 | |
| Consumer Staples | | | 926,808 | |
| Telecommunication Services | | | 729,634 | |
| Cash* | | | 21,747,481 | |
| | | $ | 44,922,325 | |
| * | Cash, cash equivalents and other assets less liabilities. |
SCHEDULE OF INVESTMENTS
March 31, 2014 (Unaudited)
| | | Shares | | | Value | |
| | | | | | | |
| COMMON STOCKS - 47.93% | | | | | | |
| | | | | | | |
| Commercial & Professional Services - 1.63% | | | | | | |
| FTI Consulting, Inc. (a) | | | 218,195 | | | $ | 7,274,621 | |
| | | | | | | | | |
| Consumer Durables & Apparel - 4.15% | | | | | | | | |
| Coach, Inc. | | | 208,659 | | | | 10,362,006 | |
| Mattel, Inc. | | | 205,000 | | | | 8,222,550 | |
| | | | | | | | 18,584,556 | |
| | | | | | | | | |
| Consumer Services - 0.53% | | | | | | | | |
| Speedway Motorsports, Inc. | | | 126,606 | | | | 2,371,330 | |
| | | | | | | | | |
| Diversified Financials - 10.09% | | | | | | | | |
| Berkshire Hathaway, Inc. - Class B (a) | | | 110,000 | | | | 13,746,700 | |
| Oaktree Capital Group LLC | | | 115,847 | | | | 6,737,662 | |
| The Bank Of New York Mellon Corp. | | | 403,000 | | | | 14,221,870 | |
| The Western Union Co. | | | 636,470 | | | | 10,412,649 | |
| | | | | | | | 45,118,881 | |
| | | | | | | | | |
| Energy - 5.41% | | | | | | | | |
| Bill Barrett Corp. (a) | | | 317,121 | | | | 8,118,298 | |
| Newfield Exploration Co. (a) | | | 474,870 | | | | 14,891,923 | |
| Warren Resources, Inc. (a) | | | 250,950 | | | | 1,204,560 | |
| | | | | | | | 24,214,781 | |
| | | | | | | | | |
| Health Care Equipment & Services - 2.04% | | | | | | | | |
| Intuitive Surgical, Inc. (a) | | | 20,800 | | | | 9,110,192 | |
| | | | | | | | | |
| Materials - 2.14% | | | | | | | | |
| Hawkins, Inc. | | | 9,619 | | | | 353,402 | |
| Royal Gold, Inc. | | | 147,500 | | | | 9,236,450 | |
| | | | | | | | 9,589,852 | |
| | | | | | | | | |
| Media - 1.70% | | | | | | | | |
| Corus Entertainment, Inc. - Class B (b) | | | 344,807 | | | | 7,613,513 | |
| | | | | | | | | |
| Pharmaceuticals, Biotechnology | | | | | | | | |
| & Life Sciences - 2.76% | | | | | | | | |
| Bio-Rad Laboratories, Inc. (a) | | | 96,327 | | | | 12,341,415 | |
See notes to financial statements.
Intrepid Capital Fund
SCHEDULE OF INVESTMENTS (continued)
March 31, 2014 (Unaudited)
| | | Shares | | | Value | |
| | | | | | | |
| COMMON STOCKS - 47.93% (continued) | | | | | | |
| | | | | | | |
| Retailing - 8.08% | | | | | | |
| Aaron’s, Inc. | | | 330,834 | | | $ | 10,004,420 | |
| American Eagle Outfitters, Inc. | | | 545,610 | | | | 6,678,267 | |
| Big Lots, Inc. (a) | | | 305,610 | | | | 11,573,451 | |
| Staples, Inc. | | | 694,000 | | | | 7,869,960 | |
| | | | | | | | 36,126,098 | |
| | | | | | | | | |
| Software & Services - 4.66% | | | | | | | | |
| Amdocs Ltd. (b) | | | 233,400 | | | | 10,843,764 | |
| Check Point Software Technologies Ltd. (a)(b) | | | 63,980 | | | | 4,326,968 | |
| Microsoft Corp. | | | 138,000 | | | | 5,656,620 | |
| | | | | | | | 20,827,352 | |
| | | | | | | | | |
| Technology Hardware & Equipment - 3.82% | | | | | | | | |
| Cisco Systems, Inc. | | | 295,000 | | | | 6,610,950 | |
| Ingram Micro, Inc. (a) | | | 354,106 | | | | 10,467,373 | |
| | | | | | | | 17,078,323 | |
| | | | | | | | | |
| Telecommunication Services - 0.92% | | | | | | | | |
| Telephone & Data Systems, Inc. | | | 156,769 | | | | 4,108,915 | |
| TOTAL COMMON STOCKS | | | | | | | | |
| (Cost $175,358,490) | | | | | | | 214,359,829 | |
| | | | | | | | | |
| | | Principal | | | | | |
| | | Amount | | | | | |
| | | | | | | | | |
| CORPORATE BONDS - 25.36% | | | | | | | | |
| | | | | | | | | |
| Capital Goods - 0.95% | | | | | | | | |
| Oshkosh Corp. | | | | | | | | |
| 8.500%, 03/01/2020 | | $ | 3,881,000 | | | | 4,259,397 | |
| | | | | | | | | |
| Consumer Durables & Apparel - 1.97% | | | | | | | | |
| Smith & Wesson Holding Corp. | | | | | | | | |
| 5.875%, 06/15/2017 (c)(d) (Cost: $8,487,000. | | | | | | | | |
| Original acquisition date: 6/11/2013) | | | 8,487,000 | | | | 8,826,480 | |
See notes to financial statements.
Intrepid Capital Fund
SCHEDULE OF INVESTMENTS (continued)
March 31, 2014 (Unaudited)
| | | Principal | | | | |
| | | Amount | | | Value | |
| | | | | | | |
| CORPORATE BONDS - 25.36% (continued) | | | | | | |
| | | | | | | |
| Consumer Services - 3.42% | | | | | | |
| Regis Corp. | | | | | | |
| 5.750%, 12/05/2017 (c)(d) (Cost: $8,275,000. | | | | | | |
| Original acquisition date: 11/27/2013) | | $ | 8,275,000 | | | $ | 8,502,563 | |
| Ruby Tuesday, Inc. | | | | | | | | |
| 7.625%, 05/15/2020 | | | 7,614,000 | | | | 6,795,495 | |
| | | | | | | | 15,298,058 | |
| | | | | | | | | |
| Diversified Financials - 0.88% | | | | | | | | |
| National Money Mart Co. | | | | | | | | |
| 10.375%, 12/15/2016 (b) | | | 3,901,000 | | | | 3,920,505 | |
| | | | | | | | | |
| Energy - 7.82% | | | | | | | | |
| EPL Oil & Gas, Inc. | | | | | | | | |
| 8.250%, 02/15/2018 | | | 8,355,000 | | | | 9,044,287 | |
| Northern Oil & Gas, Inc. | | | | | | | | |
| 8.000%, 06/01/2020 | | | 12,632,000 | | | | 13,421,500 | |
| PetroQuest Energy, Inc. | | | | | | | | |
| 10.000%, 09/01/2017 | | | 6,182,000 | | | | 6,583,830 | |
| PHI, Inc. | | | | | | | | |
| 5.250%, 03/15/2019 (c) (Cost: $5,903,841. | | | | | | | | |
| Original acquisition date: 3/6/2014) | | | 5,851,000 | | | | 5,909,510 | |
| | | | | | | | 34,959,127 | |
| | | | | | | | | |
| Food & Staples Retailing - 0.70% | | | | | | | | |
| Spartan Stores, Inc. | | | | | | | | |
| 6.625%, 12/15/2016 (c)(d) (Cost: $3,135,684. | | | | | | | | |
| Original acquisition date: 2/6/2013) | | | 3,000,000 | | | | 3,142,500 | |
| | | | | | | | | |
| Food, Beverage & Tobacco - 1.58% | | | | | | | | |
| Cott Beverages, Inc. | | | | | | | | |
| 8.125%, 09/01/2018 | | | 6,632,000 | | | | 7,038,210 | |
| | | | | | | | | |
| Household & Personal Products - 0.75% | | | | | | | | |
| Central Garden & Pet Co. | | | | | | | | |
| 8.250%, 03/01/2018 | | | 3,242,000 | | | | 3,343,312 | |
See notes to financial statements.
Intrepid Capital Fund
SCHEDULE OF INVESTMENTS (continued)
March 31, 2014 (Unaudited)
| | | Principal | | | | |
| | | Amount | | | Value | |
| | | | | | | |
| CORPORATE BONDS - 25.36% (continued) | | | | | | |
| | | | | | | |
| Materials - 2.67% | | | | | | |
| AuRico Gold, Inc. | | | | | | |
| 7.750%, 04/01/2020 (b)(c) (Cost: $5,627,844. | | | | | | |
| Original acquisition date: 3/17/2014) | | $ | 5,663,000 | | | $ | 5,620,528 | |
| Compass Minerals International, Inc. | | | | | | | | |
| 8.000%, 06/01/2019 | | | 6,029,000 | | | | 6,330,450 | |
| | | | | | | | 11,950,978 | |
| | | | | | | | | |
| Retailing - 0.96% | | | | | | | | |
| Brown Shoe Co., Inc. | | | | | | | | |
| 7.125%, 05/15/2019 | | | 4,070,000 | | | | 4,304,025 | |
| | | | | | | | | |
| Software & Services - 1.55% | | | | | | | | |
| ManTech International Corp. | | | | | | | | |
| 7.250%, 04/15/2018 | | | 6,665,000 | | | | 6,916,604 | |
| | | | | | | | | |
| Transportation - 2.11% | | | | | | | | |
| Quality Distribution LLC / QD Capital Corp. | | | | | | | | |
| 9.875%, 11/01/2018 | | | 4,173,000 | | | | 4,559,003 | |
| Swift Services Holdings, Inc. | | | | | | | | |
| 10.000%, 11/15/2018 | | | 4,438,000 | | | | 4,876,252 | |
| | | | | | | | 9,435,255 | |
| | | | | | | | | |
| TOTAL CORPORATE BONDS | | | | | | | | |
| (Cost $112,585,966) | | | | | | | 113,394,451 | |
See notes to financial statements.
Intrepid Capital Fund
SCHEDULE OF INVESTMENTS (continued)
March 31, 2014 (Unaudited)
| | | Principal | | | | |
| | | Amount | | | Value | |
| | | | | | | |
| CONVERTIBLE BOND - 1.37% | | | | | | |
| | | | | | | |
| Materials - 1.37% | | | | | | |
| AuRico Gold, Inc. | | | | | | |
| 3.500%, 10/01/2016 (b) | | $ | 5,918,000 | | | $ | 6,125,130 | |
| TOTAL CONVERTIBLE BOND | | | | | | | | |
| (Cost $5,644,261) | | | | | | | 6,125,130 | |
| Total Investments | | | | | | | | |
| (Cost $293,588,717) - 74.66% | | | | | | | 333,879,410 | |
| Other Assets in Excess of Liabilities - 25.34% | | | | | | | 113,349,108 | |
| TOTAL NET ASSETS - 100.00% | | | | | | $ | 447,228,518 | |
Percentages are stated as a percent of net assets.
| (a) | Non-income producing security. |
| (b) | Foreign issued security. |
| (c) | Security is restricted to resale. The aggregate value of restricted securities at March 31, 2014 was $32,001,581 which represented 7.2% of net assets. |
| (d) | Security is considered illiquid and may be difficult to sell. |
SCHEDULE OF OPEN FORWARD CURRENCY CONTRACTSMarch 31, 2014 (Unaudited)
| | Forward | | | Amount of | | | | Amount of | | | | |
| Counterparty | Expiration | Currency to | | Currency to | | Currency to | | Currency to | | | Unrealized | |
| of Contract | Date | be Received | | be Received | | be Delivered | | be Delivered | | | Depreciation | |
| Morgan | | | | | | Canadian | | | | | | |
| Stanley | 8/27/14 | U.S. Dollars | | | 7,622,635 | | Dollars | | | 8,500,000 | | | $ | (38,829 | ) |
| | | | | | | | | | | | | | $ | (38,829 | ) |
| | | | | | | | | | | | | | | | |
See notes to financial statements.
Intrepid Small Cap Fund
SCHEDULE OF INVESTMENTS
March 31, 2014 (Unaudited)
| | | Shares | | | Value | |
| | | | | | | |
| COMMON STOCKS - 29.12% | | | | | | |
| | | | | | | |
| Commercial & Professional Services - 4.11% | | | | | | |
| FTI Consulting, Inc. (a) | | | 371,960 | | | $ | 12,401,146 | |
| Tetra Tech, Inc. (a) | | | 569,590 | | | | 16,854,168 | |
| | | | | | | | 29,255,314 | |
| | | | | | | | | |
| Energy - 2.98% | | | | | | | | |
| Newfield Exploration Co. (a) | | | 676,000 | | | | 21,199,360 | |
| | | | | | | | | |
| Insurance - 2.00% | | | | | | | | |
| Aspen Insurance Holdings Ltd. (b) | | | 359,081 | | | | 14,255,516 | |
| | | | | | | | | |
| Materials - 1.88% | | | | | | | | |
| AuRico Gold, Inc. (b) | | | 1,016,000 | | | | 4,419,600 | |
| Pan American Silver Corp. (b) | | | 335,000 | | | | 4,311,450 | |
| Royal Gold, Inc. | | | 74,600 | | | | 4,671,452 | |
| | | | | | | | 13,402,502 | |
| | | | | | | | | |
| Media - 1.93% | | | | | | | | |
| Corus Entertainment, Inc. - Class B (b) | | | 620,900 | | | | 13,709,787 | |
| | | | | | | | | |
| Pharmaceuticals, Biotechnology | | | | | | | | |
| & Life Sciences - 3.00% | | | | | | | | |
| Bio-Rad Laboratories, Inc. (a) | | | 166,684 | | | | 21,355,554 | |
| | | | | | | | | |
| Retailing - 3.91% | | | | | | | | |
| Aaron’s, Inc. | | | 678,910 | | | | 20,530,238 | |
| Big Lots, Inc. (a) | | | 193,235 | | | | 7,317,810 | |
| | | | | | | | 27,848,048 | |
| | | | | | | | | |
| Software & Services - 5.33% | | | | | | | | |
| Amdocs Ltd. (b) | | | 527,321 | | | | 24,499,334 | |
| CSG Systems International, Inc. | | | 230,904 | | | | 6,012,740 | |
| Global Payments, Inc. | | | 105,000 | | | | 7,466,550 | |
| | | | | | | | 37,978,624 | |
| | | | | | | | | |
| Technology Hardware & Equipment - 3.10% | | | | | | | | |
| Ingram Micro, Inc. (a) | | | 500,408 | | | | 14,792,060 | |
| Tech Data Corp. (a) | | | 119,074 | | | | 7,258,751 | |
| | | | | | | | 22,050,811 | |
See notes to financial statements.
Intrepid Small Cap Fund
SCHEDULE OF INVESTMENTS (continued)
March 31, 2014 (Unaudited)
| | | Shares | | | Value | |
| | | | | | | |
| COMMON STOCKS - 29.12% | | | | | | |
| | | | | | | |
| Telecommunication Services - 0.88% | | | | | | |
| Telephone & Data Systems, Inc. | | | 239,519 | | | $ | 6,277,793 | |
| TOTAL COMMON STOCKS | | | | | | | | |
| (Cost $152,767,966) | | | | | | | 207,333,309 | |
| Total Investments | | | | | | | | |
| (Cost $152,767,966) - 29.12% | | | | | | | 207,333,309 | |
| Other Assets in Excess of Liabilities - 70.88% | | | | | | | 504,583,310 | |
| TOTAL NET ASSETS - 100.00% | | | | | | $ | 711,916,619 | |
Percentages are stated as a percent of net assets.
| (a) | Non-income producing security. |
| (b) | Foreign issued security. |
SCHEDULE OF OPEN FORWARD CURRENCY CONTRACTSMarch 31, 2014 (Unaudited)
| | Forward | | | Amount of | | | | Amount of | | | | |
| Counterparty | Expiration | Currency to | | Currency to | | Currency to | | Currency to | | | Unrealized | |
| of Contract | Date | be Received | | be Received | | be Delivered | | be Delivered | | | Appreciation | |
| Morgan | | | | | | Canadian | | | | | | |
| Stanley | 8/11/14 | U.S. Dollars | | | 13,550,136 | | Dollars | | | 15,000,000 | | | $ | 24,735 | |
| | | | | | | | | | | | | | $ | 24,735 | |
See notes to financial statements.
Intrepid Income Fund
SCHEDULE OF INVESTMENTS
March 31, 2014 (Unaudited)
| | | Principal | | | | |
| | | Amount | | | Value | |
| | | | | | | |
| CORPORATE BONDS - 58.76% | | | | | | |
| | | | | | | |
| Capital Goods - 1.75% | | | | | | |
| Oshkosh Corp. | | | | | | |
| 8.500%, 03/01/2020 | | $ | 1,698,000 | | | $ | 1,863,555 | |
| | | | | | | | | |
| Consumer Durables & Apparel - 4.57% | | | | | | | | |
| Smith & Wesson Holding Corp. | | | | | | | | |
| 5.875%, 06/15/2017 (a)(b) (Cost: $4,688,000. | | | | | | | | |
| Original acquisition date: 6/11/2013) | | | 4,688,000 | | | | 4,875,520 | |
| | | | | | | | | |
| Consumer Services - 6.94% | | | | | | | | |
| Regis Corp. | | | | | | | | |
| 5.750%, 12/05/2017 (a)(b) (Cost: $4,225,000. | | | | | | | | |
| Original acquisition date: 11/27/2013) | | | 4,225,000 | | | | 4,341,188 | |
| Ruby Tuesday, Inc. | | | | | | | | |
| 7.625%, 05/15/2020 | | | 3,434,000 | | | | 3,064,845 | |
| | | | | | | | 7,406,033 | |
| | | | | | | | | |
| Diversified Financials - 1.89% | | | | | | | | |
| National Money Mart Co. | | | | | | | | |
| 10.375%, 12/15/2016 (c) | | | 2,005,000 | | | | 2,015,025 | |
| | | | | | | | | |
| Energy - 15.82% | | | | | | | | |
| EPL Oil & Gas, Inc. | | | | | | | | |
| 8.250%, 02/15/2018 | | | 4,744,000 | | | | 5,135,380 | |
| Northern Oil & Gas, Inc. | | | | | | | | |
| 8.000%, 06/01/2020 | | | 4,395,000 | | | | 4,669,687 | |
| PetroQuest Energy, Inc. | | | | | | | | |
| 10.000%, 09/01/2017 | | | 3,662,000 | | | | 3,900,030 | |
| PHI, Inc. | | | | | | | | |
| 5.250%, 03/15/2019 (a) (Cost: $3,177,437. | | | | | | | | |
| Original acquisition date: 3/6/2014) | | | 3,149,000 | | | | 3,180,490 | |
| | | | | | | | 16,885,587 | |
| | | | | | | | | |
| Food & Staples Retailing - 1.96% | | | | | | | | |
| Spartan Stores, Inc. | | | | | | | | |
| 6.625%, 12/15/2016 (a)(b) (Cost: $2,090,456. | | | | | | | | |
| Original acquisition date: 2/6/2013) | | | 2,000,000 | | | | 2,095,000 | |
| | | | | | | | | |
See notes to financial statements.
Intrepid Income Fund
SCHEDULE OF INVESTMENTS (continued)
March 31, 2014 (Unaudited)
| | | Principal | | | | |
| | | Amount | | | Value | |
| | | | | | | |
| CORPORATE BONDS - 58.76% | | | | | | |
| | | | | | | |
| Food, Beverage & Tobacco - 3.88% | | | | | | |
| Cott Beverages, Inc. | | | | | | |
| 8.125%, 09/01/2018 | | $ | 3,896,000 | | | $ | 4,134,630 | |
| | | | | | | | | |
| Household & Personal Products - 2.05% | | | | | | | | |
| Central Garden & Pet Co. | | | | | | | | |
| 8.250%, 03/01/2018 | | | 2,120,000 | | | | 2,186,250 | |
| | | | | | | | | |
| Materials - 6.40% | | | | | | | | |
| AuRico Gold, Inc. | | | | | | | | |
| 7.750%, 04/01/2020 (a)(c) (Cost: $2,720,001. | | | | | | | | |
| Original acquisition date: 3/17/2014) | | | 2,737,000 | | | | 2,716,473 | |
| Compass Minerals International, Inc. | | | | | | | | |
| 8.000%, 06/01/2019 | | | 3,921,000 | | | | 4,117,050 | |
| | | | | | | | 6,833,523 | |
| | | | | | | | | |
| Retailing - 5.48% | | | | | | | | |
| Brown Shoe Co., Inc. | | | | | | | | |
| 7.125%, 05/15/2019 | | | 3,452,000 | | | | 3,650,490 | |
| Rent-A-Center, Inc. | | | | | | | | |
| 6.625%, 11/15/2020 | | | 1,000,000 | | | | 1,032,500 | |
| 4.750%, 05/01/2021 | | | 1,250,000 | | | | 1,165,625 | |
| | | | | | | | 5,848,615 | |
| | | | | | | | | |
| Software & Services - 3.03% | | | | | | | | |
| ManTech International Corp. | | | | | | | | |
| 7.250%, 04/15/2018 | | | 3,120,000 | | | | 3,237,780 | |
| | | | | | | | | |
| Transportation - 4.99% | | | | | | | | |
| Quality Distribution LLC / QD Capital Corp. | | | | | | | | |
| 9.875%, 11/01/2018 | | | 1,800,000 | | | | 1,966,500 | |
| Swift Services Holdings, Inc. | | | | | | | | |
| 10.000%, 11/15/2018 | | | 3,054,000 | | | | 3,355,582 | |
| | | | | | | | 5,322,082 | |
| | | | | | | | | |
| TOTAL CORPORATE BONDS | | | | | | | | |
| (Cost $62,244,881) | | | | | | | 62,703,600 | |
| | | | | | | | | |
See notes to financial statements.
Intrepid Income Fund
SCHEDULE OF INVESTMENTS (continued)
March 31, 2014 (Unaudited)
| | | Principal | | | | |
| | | Amount | | | Value | |
| | | | | | | |
| CONVERTIBLE BOND - 2.45% | | | | | | |
| | | | | | | |
| Materials - 2.45% | | | | | | |
| AuRico Gold, Inc. | | | | | | |
| 3.500%, 10/01/2016 (c) | | $ | 2,520,000 | | | $ | 2,608,200 | |
| TOTAL CONVERTIBLE BOND | | | | | | | | |
| (Cost $2,408,954) | | | | | | | 2,608,200 | |
| Total Investments | | | | | | | | |
| (Cost $64,653,835) - 61.21% | | | | | | | 65,311,800 | |
| Other Assets in Excess of Liabilities - 38.79% | | | | | | | 41,395,271 | |
| TOTAL NET ASSETS - 100.00% | | | | | | $ | 106,707,071 | |
Percentages are stated as a percent of net assets.
| (a) | Security is restricted to resale. The aggregate value of restricted securities at March 31, 2014 was 16.12% of net assets. |
| (b) | Security is considered illiquid and may be difficult to sell. |
| (c) | Foreign issued security. |
See notes to financial statements.
Intrepid Disciplined Value Fund
SCHEDULE OF INVESTMENTS
March 31, 2014 (Unaudited)
| | | Shares | | | Value | |
| | | | | | | |
| COMMON STOCKS - 51.59% | | | | | | |
| | | | | | | |
| Commercial & Professional Services - 2.71% | | | | | | |
| FTI Consulting, Inc. (a) | | | 20,875 | | | $ | 695,972 | |
| Tetra Tech, Inc. (a) | | | 17,600 | | | | 520,784 | |
| | | | | | | | 1,216,756 | |
| | | | | | | | | |
| Consumer Durables & Apparel - 4.16% | | | | | | | | |
| Coach, Inc. | | | 19,100 | | | | 948,506 | |
| Mattel, Inc. | | | 22,900 | | | | 918,519 | |
| | | | | | | | 1,867,025 | |
| | | | | | | | | |
| Diversified Financials - 6.89% | | | | | | | | |
| Northern Trust Corp. | | | 18,000 | | | | 1,180,080 | |
| The Bank Of New York Mellon Corp. | | | 35,010 | | | | 1,235,503 | |
| The Western Union Co. | | | 41,500 | | | | 678,940 | |
| | | | | | | | 3,094,523 | |
| | | | | | | | | |
| Energy - 3.98% | | | | | | | | |
| Bill Barrett Corp. (a) | | | 14,370 | | | | 367,872 | |
| Newfield Exploration Co. (a) | | | 45,250 | | | | 1,419,040 | |
| | | | | | | | 1,786,912 | |
| | | | | | | | | |
| Health Care Equipment & Services - 7.73% | | | | | | | | |
| Intuitive Surgical, Inc. (a) | | | 2,040 | | | | 893,500 | |
| Laboratory Corp. of America Holdings (a) | | | 13,600 | | | | 1,335,656 | |
| Quest Diagnostics, Inc. | | | 21,500 | | | | 1,245,280 | |
| | | | | | | | 3,474,436 | |
| | | | | | | | | |
| Household & Personal Products - 2.06% | | | | | | | | |
| Energizer Holdings, Inc. | | | 9,200 | | | | 926,808 | |
| | | | | | | | | |
| Insurance - 1.34% | | | | | | | | |
| Aspen Insurance Holdings Ltd. (b) | | | 15,100 | | | | 599,470 | |
| | | | | | | | | |
| Materials - 2.94% | | | | | | | | |
| AuRico Gold, Inc. (b) | | | 41,800 | | | | 181,830 | |
| Newmont Mining Corp. | | | 37,600 | | | | 881,344 | |
| Pan American Silver Corp. (b) | | | 20,000 | | | | 257,400 | |
| | | | | | | | 1,320,574 | |
See notes to financial statements.
Intrepid Disciplined Value Fund
SCHEDULE OF INVESTMENTS (continued)
March 31, 2014 (Unaudited)
| | | Shares | | | Value | |
| | | | | | | |
| COMMON STOCKS - 51.59% | | | | | | |
| | | | | | | |
| Pharmaceuticals, Biotechnology | | | | | | |
| & Life Sciences - 0.99% | | | | | | |
| Bio-Rad Laboratories, Inc. (a) | | | 3,468 | | | $ | 444,320 | |
| | | | | | | | | |
| Retailing - 4.52% | | | | | | | | |
| American Eagle Outfitters, Inc. | | | 54,000 | | | | 660,960 | |
| Big Lots, Inc. (a) | | | 6,200 | | | | 234,794 | |
| Staples, Inc. | | | 100,000 | | | | 1,134,000 | |
| | | | | | | | 2,029,754 | |
| | | | | | | | | |
| Software & Services - 5.98% | | | | | | | | |
| Amdocs Ltd. (b) | | | 9,980 | | | | 463,671 | |
| Check Point Software Technologies Ltd. (a)(b) | | | 8,000 | | | | 541,040 | |
| CSG Systems International, Inc. | | | 16,715 | | | | 435,258 | |
| Global Payments, Inc. | | | 3,110 | | | | 221,152 | |
| Microsoft Corp. | | | 25,030 | | | | 1,025,980 | |
| | | | | | | | 2,687,101 | |
| | | | | | | | | |
| Technology Hardware & Equipment - 6.67% | | | | | | | | |
| Apple, Inc. | | | 2,100 | | | | 1,127,154 | |
| Cisco Systems, Inc. | | | 61,700 | | | | 1,382,697 | |
| Tech Data Corp. (a) | | | 8,000 | | | | 487,680 | |
| | | | | | | | 2,997,531 | |
| | | | | | | | | |
| Telecommunication Services - 1.62% | | | | | | | | |
| Telephone & Data Systems, Inc. | | | 27,838 | | | | 729,634 | |
| TOTAL COMMON STOCKS | | | | | | | | |
| (Cost $19,978,682) | | | | | | | 23,174,844 | |
| Total Investments | | | | | | | | |
| (Cost $19,978,682) - 51.59% | | | | | | | 23,174,844 | |
| Other Assets in Excess of Liabilities - 48.41% | | | | | | | 21,747,481 | |
| TOTAL NET ASSETS - 100.00% | | | | | | $ | 44,922,325 | |
| | | | | | | | | |
Percentages are stated as a percent of net assets.
| (a) | Non-income producing security. |
| (b) | Foreign issued security. |
See notes to financial statements.
Intrepid Funds
STATEMENT OF ASSETS AND LIABILITIES
March 31, 2014 (Unaudited)
| | | Intrepid | | | Intrepid Small | |
| | | Capital Fund | | | Cap Fund | |
| | | | | | | |
| ASSETS: | | | | | | |
Investments, at value(1) | | | | | | |
| Unaffiliated issuers | | $ | 333,879,410 | | | $ | 207,333,309 | |
| Affiliated issuers | | | — | | | | — | |
| Income receivable | | | 2,429,891 | | | | 107,203 | |
| Receivable for fund shares sold | | | 555,399 | | | | 1,177,252 | |
| Receivable for investments sold | | | 3,228,586 | | | | 2,623,184 | |
| Cash | | | 113,842,822 | | | | 502,531,612 | |
Foreign Currency, at value(2) | | | 21,248 | | | | 38,262 | |
| Appreciation on forward currency contracts | | | — | | | | 24,735 | |
| Other assets | | | 45,487 | | | | 52,696 | |
| Total assets | | | 454,002,843 | | | | 713,888,253 | |
| | | | | | | | | |
| LIABILITIES: | | | | | | | | |
| Depreciation on forward currency contracts | | | 38,829 | | | | — | |
| Payable for fund shares redeemed | | | 580,468 | | | | 1,094,933 | |
| Payable for investment securities purchased | | | 5,632,598 | | | | — | |
| Payable to Investment Adviser | | | 373,744 | | | | 601,747 | |
| Accrued distribution fees | | | 35,659 | | | | 50,601 | |
| Other expenses | | | 113,027 | | | | 224,353 | |
| Total liabilities | | | 6,774,325 | | | | 1,971,634 | |
| Total net assets | | $ | 447,228,518 | | | $ | 711,916,619 | |
| | | | | | | | | |
| NET ASSETS CONSIST OF: | | | | | | | | |
| Capital Stock | | $ | 379,590,841 | | | $ | 627,667,204 | |
| Accumulated net investment income (loss) | | | 193,596 | | | | (3,195,163 | ) |
| Accumulated undistributed net realized gain on investments | | | 27,192,208 | | | | 32,854,496 | |
| Unrealized appreciation (depreciation) on: | | | | | | | | |
| Investments and foreign currency translation | | | 40,290,702 | | | | 54,565,347 | |
| Forward currency contracts | | | (38,829 | ) | | | 24,735 | |
| Total net assets | | $ | 447,228,518 | | | $ | 711,916,619 | |
See notes to financial statements.
Intrepid Funds
STATEMENT OF ASSETS AND LIABILITIES (continued)
March 31, 2014 (Unaudited)
| | | Intrepid | | | Intrepid Small | |
| | | Capital Fund | | | Cap Fund | |
| Investor Class | | | | | | |
| Net assets | | $ | 244,354,937 | | | $ | 510,294,609 | |
| Shares outstanding | | | 19,336,343 | | | | 31,428,587 | |
| Institutional Class | | | | | | | | |
| Net assets | | | 202,873,581 | | | | 201,622,010 | |
| Shares outstanding | | | 16,046,706 | | | | 12,252,184 | |
| Total shares outstanding (unlimited | | | | | | | | |
| shares of no par value authorized) | | | 35,383,049 | | | | 43,680,771 | |
| Investor Class Net asset value, offering | | | | | | | | |
and redemption price per share(3) | | $ | 12.64 | | | $ | 16.24 | |
| Institutional Class Net asset value, offering | | | | | | | | |
and redemption price per share(3) | | $ | 12.64 | | | $ | 16.46 | |
(1) Cost of Investments | | | | | | | | |
| Unaffiliated Issuers | | $ | 293,588,717 | | | $ | 152,767,966 | |
| Affiliated Issuers | | | — | | | | — | |
(2) Cost of Foreign Currencies | | $ | 21,248 | | | $ | 38,262 | |
| (3) | If applicable, redemption price per share may be reduced by a 2.00% redemption fee for shares redeemed within 30 days of purchase. |
See notes to financial statements.
Intrepid Funds
STATEMENT OF ASSETS AND LIABILITIES (continued)
March 31, 2014 (Unaudited)
| | | | | | Intrepid | |
| | | Intrepid | | | Disciplined | |
| | | Income Fund | | | Value Fund | |
| | | | | | | |
| ASSETS: | | | | | | |
Investments, at value(1) | | | | | | |
| Unaffiliated issuers | | $ | 65,311,800 | | | $ | 23,174,844 | |
| Affiliated issuers | | | — | | | | — | |
| Income receivable | | | 1,208,533 | | | | 23,357 | |
| Receivable for fund shares sold | | | 44,075 | | | | 30,924 | |
| Cash | | | 40,256,957 | | | | 22,630,974 | |
| Other assets | | | 21,517 | | | | 18,298 | |
| Total assets | | | 106,842,882 | | | | 45,878,397 | |
| | | | | | | | | |
| LIABILITIES: | | | | | | | | |
| Payable for fund shares redeemed | | | 15,513 | | | | 349,920 | |
| Payable for investment securities purchased | | | — | | | | 414,901 | |
| Payable to Investment Adviser | | | 79,083 | | | | 27,927 | |
| Accrued distribution fees | | | — | | | | 139,619 | |
| Other expenses | | | 41,215 | | | | 23,705 | |
| Total liabilities | | | 135,811 | | | | 956,072 | |
| Total net assets | | $ | 106,707,071 | | | $ | 44,922,325 | |
| | | | | | | | | |
| NET ASSETS CONSIST OF: | | | | | | | | |
| Capital Stock | | $ | 105,210,538 | | | $ | 39,425,312 | |
| Accumulated net investment income (loss) | | | 34,689 | | | | (267,253 | ) |
| Accumulated undistributed net realized gain on investments | | | 803,879 | | | | 2,568,104 | |
| Unrealized appreciation on: | | | | | | | | |
| Investments and foreign currency translation | | | 657,965 | | | | 3,196,162 | |
| Total net assets | | $ | 106,707,071 | | | $ | 44,922,325 | |
| Investor Class | | | | | | | | |
| Net assets | | | — | | | | 44,922,325 | |
| Shares outstanding | | | — | | | | 4,110,488 | |
| Institutional Class | | | | | | | | |
| Net assets | | | 106,707,071 | | | | — | |
| Shares outstanding | | | 10,957,830 | | | | — | |
| Total shares outstanding (unlimited | | | | | | | | |
| shares of no par value authorized) | | | 10,957,830 | | | | 4,110,488 | |
| Investor Class Net asset value, offering | | | | | | | | |
and redemption price per share(2) | | $ | — | | | $ | 10.93 | |
| Institutional Class Net asset value, offering | | | | | | | | |
and redemption price per share(2) | | $ | 9.74 | | | $ | — | |
(1) Cost of Investments | | | | | | | | |
| Unaffiliated Issuers | | $ | 64,653,835 | | | $ | 19,978,682 | |
| Affiliated Issuers | | | — | | | | — | |
| (2) | If applicable, redemption price per share may be reduced by a 2.00% redemption fee for shares redeemed within 30 days of purchase. |
See notes to financial statements.
Intrepid Funds
STATEMENT OF OPERATIONS
For the six months ended March 31, 2014 (Unaudited)
| | | Intrepid | | | Intrepid Small | |
| | | Capital Fund | | | Cap Fund | |
| | | | | | | |
| INVESTMENT INCOME: | | | | | | |
| Dividend income | | | | | | |
| Unaffiliated issuers* | | $ | 1,056,311 | | | $ | 792,150 | |
| Affiliated issuers (See Note 7) | | | 154,741 | | | | 235,161 | |
| Interest income | | | | | | | | |
| Unaffiliated issuers* | | | 3,903,372 | | | | — | |
| Total investment income | | | 5,114,424 | | | | 1,027,311 | |
| Advisory fees (See Note 3) | | | 2,163,588 | | | | 3,555,034 | |
| Distribution (12b-1) fees - Investor Class Only | | | 295,119 | | | | 678,818 | |
| Administration fees | | | 154,890 | | | | 251,762 | |
| Fund accounting fees | | | 45,743 | | | | 70,499 | |
| Shareholder servicing fees and expenses | | | 45,609 | | | | 106,772 | |
| Federal and state registration fees | | | 23,371 | | | | 31,105 | |
| Reports to shareholders | | | 18,945 | | | | 43,536 | |
| Audit fees | | | 13,851 | | | | 13,851 | |
| Trustees fees and expenses | | | 11,260 | | | | 18,503 | |
| Custody fees | | | 9,209 | | | | 10,061 | |
| Insurance | | | 8,458 | | | | 15,749 | |
| Legal fees | | | 4,904 | | | | 4,274 | |
| Miscellaneous | | | 3,010 | | | | 4,783 | |
| Total expenses before Adviser reimbursement | | | 2,797,957 | | | | 4,804,747 | |
| Expenses reimbursed by Adviser (See Note 3) | | | (14,712 | ) | | | (37,641 | ) |
| Total net expenses | | | 2,783,245 | | | | 4,767,106 | |
| Net investment income (loss) | | | 2,331,179 | | | | (3,739,795 | ) |
| | | | | | | | | |
| REALIZED AND UNREALIZED | | | | | | | | |
| GAIN (LOSS) ON INVESTMENTS: | | | | | | | | |
| Net realized gain (loss) on: | | | | | | | | |
| Investments in unaffiliated issuers | | | 18,263,904 | | | | 19,668,929 | |
| Investments in affiliated issuers | | | 10,629,489 | | | | 22,197,342 | |
| Forward currency contracts | | | (71,106 | ) | | | (544,632 | ) |
| Foreign currency translation | | | 22 | | | | (322 | ) |
| Net change in unrealized appreciation (depreciation) on: | | | | | | | | |
| Investments | | | 7,998,033 | | | | 7,636,779 | |
| Foreign currency translation | | | (741,282 | ) | | | (1,320,435 | ) |
| Forward currency contracts | | | 32,277 | | | | 569,367 | |
| Net realized and unrealized gain | | | 36,111,337 | | | | 48,207,028 | |
| Net increase in net assets resulting from operations | | $ | 38,442,516 | | | $ | 44,467,233 | |
| * Net of foreign taxes withheld | | $ | 5,311 | | | $ | 40,054 | |
See notes to financial statements.
Intrepid Funds
STATEMENT OF OPERATIONS (continued)
For the six months ended March 31, 2014 (Unaudited)
| | | | | | Intrepid | |
| | | Intrepid | | | Disciplined | |
| | | Income Fund | | | Value Fund | |
| | | | | | | |
| INVESTMENT INCOME: | | | | | | |
| Dividend income | | | | | | |
| Unaffiliated issuers* | | $ | — | | | $ | 104,507 | |
| Affiliated issuers (See Note 7) | | | 11,839 | | | | 12,268 | |
| Interest income | | | | | | | | |
| Unaffiliated issuers* | | | 2,086,550 | | | | — | |
| Total investment income | | | 2,098,389 | | | | 116,775 | |
| Advisory fees (See Note 3) | | | 401,285 | | | | 215,963 | |
| Distribution (12b-1) fees - Investor Class Only | | | 7,977 | | | | 53,991 | |
| Administration fees | | | 38,365 | | | | 15,567 | |
| Fund accounting fees | | | 13,958 | | | | 5,230 | |
| Shareholder servicing fees and expenses | | | 22,119 | | | | 10,951 | |
| Federal and state registration fees | | | 16,559 | | | | 10,134 | |
| Reports to shareholders | | | 4,782 | | �� | | 3,673 | |
| Audit fees | | | 13,851 | | | | 13,851 | |
| Trustees fees and expenses | | | 2,911 | | | | 1,092 | |
| Custody fees | | | 1,907 | | | | 1,175 | |
| Insurance | | | 2,269 | | | | 728 | |
| Legal fees | | | 4,095 | | | | 4,455 | |
| Miscellaneous | | | 1,117 | | | | 462 | |
| Total expenses before Adviser reimbursement | | | 531,195 | | | | 337,272 | |
| Expenses reimbursed by Adviser (See Note 3) | | | (34,792 | ) | | | (42,198 | ) |
| Net expenses before Adviser recoupment | | | 496,403 | | | | 295,074 | |
| Expenses recouped by Adviser | | | 11,192 | | | | — | |
| Total net expenses | | | 507,595 | | | | 295,074 | |
| Net investment income (loss) | | | 1,590,794 | | | | (178,299 | ) |
| | | | | | | | | |
| REALIZED AND UNREALIZED | | | | | | | | |
| GAIN (LOSS) ON INVESTMENTS: | | | | | | | | |
| Net realized gain (loss) on: | | | | | | | | |
| Investments in unaffiliated issuers | | | (97,300 | ) | | | 1,678,904 | |
| Investments in affiliated issuers | | | 901,247 | | | | 1,088,649 | |
| Net change in unrealized appreciation on: | | | | | | | | |
| Investments | | | 724,629 | | | | 272,832 | |
| Net realized and unrealized gain | | | 1,528,576 | | | | 3,040,385 | |
| Net increase in net assets resulting from operations | | $ | 3,119,370 | | | $ | 2,862,086 | |
| * Net of foreign taxes withheld | | $ | — | | | $ | 1,252 | |
See notes to financial statements.
Intrepid Capital Fund
STATEMENTS OF CHANGES IN NET ASSETS
| | | Six Months | | | Year | |
| | | Ended | | | Ended | |
| | | March 31, 2014 | | | September 30, 2013 | |
| | | (Unaudited) | | | | |
| | | | | | | |
| OPERATIONS: | | | | | | |
| Net investment income | | $ | 2,331,179 | | | $ | 6,093,852 | |
| Net realized gain on investments | | | | | | | | |
| and foreign currency translation | | | 28,822,309 | | | | 22,958,542 | |
| Net change in unrealized appreciation | | | 7,289,028 | | | | 10,126,330 | |
| Net increase in assets | | | | | | | | |
| resulting from operations | | | 38,442,516 | | | | 39,178,724 | |
| | | | | | | | | |
| DISTRIBUTIONS TO SHAREHOLDERS: | | | | | | | | |
| From net investment income - Investor Class | | | (1,071,085 | ) | | | (3,638,816 | ) |
| From net investment income - Institutional Class | | | (1,137,604 | ) | | | (2,397,326 | ) |
| From net realized gain - Investor Class | | | (11,880,891 | ) | | | (10,107,162 | ) |
| From net realized gain - Institutional Class | | | (9,947,298 | ) | | | (3,401,053 | ) |
| Total distributions | | | (24,036,878 | ) | | | (19,544,357 | ) |
| | | | | | | | | |
| CAPITAL SHARE TRANSACTIONS: | | | | | | | | |
| Proceeds from shares sold - Investor Class | | | 25,988,127 | | | | 106,946,998 | |
| Proceeds from shares sold - Institutional Class | | | 25,792,425 | | | | 109,092,842 | |
| Proceeds from shares issued to holders in | | | | | | | | |
| reinvestment of dividends - Investor Class | | | 12,411,614 | | | | 9,901,041 | |
| Proceeds from shares issued to holders in | | | | | | | | |
| reinvestment of dividends - Institutional Class | | | 5,815,906 | | | | 4,410,609 | |
Cost of shares redeemed - Investor Class(1) | | | (30,425,696 | ) | | | (190,022,121 | ) |
Cost of shares redeemed - Institutional Class(2) | | | (24,890,033 | ) | | | (30,796,579 | ) |
| Net increase in net assets from | | | | | | | | |
| capital share transactions | | | 14,692,343 | | | | 9,532,790 | |
| | | | | | | | | |
| TOTAL INCREASE IN NET ASSETS | | | 29,097,981 | | | | 29,167,157 | |
| | | | | | | | | |
| NET ASSETS: | | | | | | | | |
| Beginning of Period | | | 418,130,537 | | | | 388,963,380 | |
| End of Period (including accumulated net | | | | | | | | |
| investment income of $193,596 and $71,106) | | $ | 447,228,518 | | | $ | 418,130,537 | |
| | | | | | | | | |
| (1) | Net of redemption fees of $2,554 and $8,401, respectively. |
| (2) | Net of redemption fees of $4,578 and $2,882, respectively. |
See notes to financial statements.
Intrepid Small Cap Fund
STATEMENTS OF CHANGES IN NET ASSETS (continued)
| | | Six Months | | | Year | |
| | | Ended | | | Ended | |
| | | March 31, 2014 | | | September 30, 2013 | |
| | | (Unaudited) | | | | |
| | | | | | | |
| OPERATIONS: | | | | | | |
| Net investment loss | | $ | (3,739,795 | ) | | $ | (4,734,733 | ) |
| Net realized gain on investments | | | | | | | | |
| and foreign currency translation | | | 41,321,317 | | | | 34,040,374 | |
| Net change in unrealized appreciation | | | 6,885,711 | | | | 32,629,940 | |
| Net increase in assets | | | | | | | | |
| resulting from operations | | | 44,467,233 | | | | 61,935,581 | |
| | | | | | | | | |
| DISTRIBUTIONS TO SHAREHOLDERS: | | | | | | | | |
| From net investment income - Investor Class | | | — | | | | — | |
| From net investment income - Institutional Class | | | — | | | | — | |
| From net realized gain - Investor Class | | | (22,713,287 | ) | | | (52,426,184 | ) |
| From net realized gain - Institutional Class | | | (6,912,321 | ) | | | (4,944,027 | ) |
| Total distributions | | | (29,625,608 | ) | | | (57,370,211 | ) |
| | | | | | | | | |
| CAPITAL SHARE TRANSACTIONS: | | | | | | | | |
| Proceeds from shares sold - Investor Class | | | 53,760,578 | | | | 178,200,644 | |
| Proceeds from shares sold - Institutional Class | | | 103,110,098 | | | | 72,032,517 | |
| Proceeds from shares issued to holders in | | | | | | | | |
| reinvestment of dividends - Investor Class | | | 22,419,981 | | | | 49,056,256 | |
| Proceeds from shares issued to holders in | | | | | | | | |
| reinvestment of dividends - Institutional Class | | | 5,719,988 | | | | 4,304,965 | |
Cost of shares redeemed - Investor Class(1) | | | (144,157,735 | ) | | | (362,910,684 | ) |
Cost of shares redeemed - Institutional Class(2) | | | (19,130,407 | ) | | | (33,673,562 | ) |
| Net increase (decrease) in net assets | | | | | | | | |
| from capital share transactions | | | 21,722,503 | | | | (92,989,864 | ) |
| TOTAL INCREASE (DECREASE) | | | | | | | | |
| IN NET ASSETS | | | 36,564,128 | | | | (88,424,494 | ) |
| | | | | | | | | |
| NET ASSETS: | | | | | | | | |
| Beginning of Period | | | 675,352,491 | | | | 763,776,985 | |
| End of Period (including accumulated | | | | | | | | |
| net investment income (loss) | | | | | | | | |
| of $(3,195,163) and $544,632) | | $ | 711,916,619 | | | $ | 675,352,491 | |
| (1) | Net of redemption fees of $5,345 and $18,925, respectively. |
| (2) | Net of redemption fees of $254 and $6,058, respectively. |
See notes to financial statements.
Intrepid Income Fund
STATEMENTS OF CHANGES IN NET ASSETS (continued)
| | | Six Months | | | Year | |
| | | Ended | | | Ended | |
| | | March 31, 2014 | | | September 30, 2013 | |
| | | (Unaudited) | | | | |
| | | | | | | |
| OPERATIONS: | | | | | | |
| Net investment income | | $ | 1,590,794 | | | $ | 3,192,129 | |
| Net realized gain on investments | | | | | | | | |
| and foreign currency translation | | | 803,947 | | | | 1,501,078 | |
| Net change in unrealized | | | | | | | | |
| appreciation (depreciation) | | | 724,629 | | | | (1,608,024 | ) |
| Net increase in assets | | | | | | | | |
| resulting from operations | | | 3,119,370 | | | | 3,085,183 | |
| | | | | | | | | |
| DISTRIBUTIONS TO SHAREHOLDERS: | | | | | | | | |
From net investment income - Investor Class(1) | | | (213,058 | ) | | | (1,102,181 | ) |
| From net investment income - Institutional Class | | | (1,425,048 | ) | | | (2,387,745 | ) |
From net realized gain - Investor Class(1) | | | (148,988 | ) | | | (402,225 | ) |
| From net realized gain - Institutional Class | | | (411,448 | ) | | | (712,548 | ) |
| Total distributions | | | (2,198,542 | ) | | | (4,604,699 | ) |
| | | | | | | | | |
| CAPITAL SHARE TRANSACTIONS: | | | | | | | | |
Proceeds from shares sold - Investor Class(1) | | | 2,110,357 | | | | 7,869,893 | |
| Proceeds from shares sold - Institutional Class | | | 5,439,748 | | | | 19,869,788 | |
| Proceeds from shares | | | | | | | | |
| exchanged - Institutional Class | | | 27,816,502 | | | | — | |
| Proceeds from shares issued to holders in | | | | | | | | |
reinvestment of dividends - Investor Class(1) | | | 355,610 | | | | 1,398,189 | |
| Proceeds from shares issued to holders in | | | | | | | | |
| reinvestment of dividends - Institutional Class | | | 1,794,435 | | | | 3,062,933 | |
Cost of shares redeemed - Investor Class(1)(2) | | | (8,080,436 | ) | | | (15,280,919 | ) |
Cost of shares redeemed - Institutional Class(3) | | | (3,918,128 | ) | | | (10,156,975 | ) |
Cost of shares exchanged - Investor Class(1) | | | (27,816,502 | ) | | | — | |
| Net increase (decrease) in net assets from | | | | | | | | |
| capital share transactions | | | (2,298,414 | ) | | | 6,762,909 | |
| | | | | | | | | |
| TOTAL INCREASE (DECREASE) | | | | | | | | |
| IN NET ASSETS | | | (1,377,586 | ) | | | 5,243,393 | |
| | | | | | | | | |
| NET ASSETS: | | | | | | | | |
| Beginning of Period | | | 108,084,657 | | | | 102,841,264 | |
| End of Period (including accumulated net | | | | | | | | |
| investment income of $34,689 and $82,001) | | $ | 106,707,071 | | | $ | 108,084,657 | |
| (1) | Investor class shares converted to Institutional class shares on January 31, 2014. |
| (2) | Net of redemption fees of $641 and $105, respectively. |
| (3) | Net of redemption fees of $0 and $515, respectively. |
See notes to financial statements.
Intrepid Disciplined Value Fund
STATEMENTS OF CHANGES IN NET ASSETS (continued)
| | | | | | | |
| | | Six Months | | | Year | |
| | | Ended | | | Ended | |
| | | March 31, 2014 | | | September 30, 2013 | |
| | | (Unaudited) | | | | |
| | | | | | | |
| OPERATIONS: | | | | | | |
| Net investment income (loss) | | $ | (178,299 | ) | | $ | 89,393 | |
| Net realized gain on investments | | | | | | | | |
| and foreign currency translation | | | 2,767,553 | | | | 3,509,155 | |
| Net change in unrealized appreciation | | | 272,832 | | | | 1,198,379 | |
| Net increase in assets | | | | | | | | |
| resulting from operations | | | 2,862,086 | | | | 4,796,927 | |
| | | | | | | | | |
| DISTRIBUTIONS TO SHAREHOLDERS: | | | | | | | | |
| From net investment income - Investor Class | | | — | | | | (227,889 | ) |
| From net realized gain - Investor Class | | | (3,423,839 | ) | | | (2,328,129 | ) |
| Total distributions | | | (3,423,839 | ) | | | (2,556,018 | ) |
| | | | | | | | | |
| CAPITAL SHARE TRANSACTIONS: | | | | | | | | |
| Proceeds from shares sold - Investor Class | | | 4,036,209 | | | | 8,818,324 | |
| Proceeds from shares issued to holders | | | | | | | | |
| in reinvestment of dividends - Investor Class | | | 3,300,043 | | | | 2,484,028 | |
Cost of shares redeemed - Investor Class(1) | | | (3,225,866 | ) | | | (19,144,876 | ) |
| Net increase (decrease) in net assets | | | | | | | | |
| from capital share transactions | | | 4,110,386 | | | | (7,842,524 | ) |
| | | | | | | | | |
| TOTAL INCREASE (DECREASE) | | | | | | | | |
| IN NET ASSETS | | | 3,548,633 | | | | (5,601,615 | ) |
| | | | | | | | | |
| NET ASSETS: | | | | | | | | |
| Beginning of Period | | | 41,373,692 | | | | 46,975,307 | |
| End of Period (including accumulated net | | | | | | | | |
| investment loss of $267,253 and $88,954) | | $ | 44,922,325 | | | $ | 41,373,692 | |
| (1) | Net of redemption fees of $3 and $0, respectively. |
See notes to financial statements.
Intrepid Income Fund
STATEMENT OF CASH FLOWS
For the Period Ended March 31, 2014 (Unaudited)
| CASH FLOWS FROM OPERATING ACTIVITIES: | | | |
| Net increase in net assets resulting from operations | | $ | 3,119,370 | |
| Adjustments to reconcile net increase in | | | | |
| net assets resulting from operations to net | | | | |
| cash used in operating activities: | | | | |
| Net realized and unrealized loss on investments | | | (1,528,576 | ) |
| Amortization and accretion of premium and discount | | | 188,000 | |
| Changes in assets and liabilities: | | | | |
| Receivable for investments sold | | | 412,222 | |
| Interest receivable | | | (45,360 | ) |
| Other assets | | | (4,376 | ) |
| Accrued investment advisory fees | | | 18,033 | |
| Payable for investments purchased | | | (1,596,831 | ) |
| Accrued distribution fees | | | (23,824 | ) |
| Accrued expenses and other liabilities | | | (19,348 | ) |
| Purchases of investments | | | (22,850,235 | ) |
| Proceeds from sale of investments | | | 14,659,605 | |
| NET CASH USED BY OPERATING ACTIVITIES | | | (7,671,320 | ) |
| | | | | |
| CASH FLOWS FROM FINANCING ACTIVITIES: | | | | |
| Proceeds from shares issued | | | 35,358,022 | |
| Payment on shares redeemed | | | (39,828,870 | ) |
| Cash distributions to shareholders | | | (48,497 | ) |
| NET CASH USED BY FINANCING ACTIVITIES | | | (4,519,345 | ) |
| | | | | |
| NET DECREASE IN CASH | | | (12,190,665 | ) |
| | | | | |
| CASH, BEGINNING OF PERIOD | | | 52,447,622 | |
| CASH, END OF PERIOD | | $ | 40,256,957 | |
See notes to financial statements.
Intrepid Capital Fund – Investor Class
Per share data for a share of capital stock outstanding for the entire period and selected information for the period are as follows:
| | | Period | | | | | | | | | | | | | | | | |
| | | Ended | | | | | | | | | | | | | | | | |
| | | March 31, | | | Year Ended September 30, | |
| | | 2014 | | | 2013 | | | 2012 | | | 2011 | | | 2010 | | | 2009 | |
| | | (Unaudited) | | | | | | | | | | | | | | | | |
| NET ASSET VALUE: | | | | | | | | | | | | | | | | | | |
| Beginning of period | | $ | 12.23 | | | $ | 11.69 | | | $ | 10.70 | | | $ | 11.09 | | | $ | 9.99 | | | $ | 9.67 | |
| OPERATIONS: | | | | | | | | | | | | | | | | | | | | | | | | |
Net investment income(1) | | | 0.06 | | | | 0.18 | | | | 0.18 | | | | 0.16 | | | | 0.16 | | | | 0.23 | |
| Net realized and unrealized | | | | | | | | | | | | | | | | | | | | | | | | |
| gain (loss) on investment | | | | | | | | | | | | | | | | | | | | | | | | |
| securities | | | 1.04 | | | | 0.93 | | | | 1.72 | | | | (0.05 | ) | | | 1.24 | | | | 0.52 | |
| Total from | | | | | | | | | | | | | | | | | | | | | | | | |
operations(2) | | | 1.10 | | | | 1.11 | | | | 1.90 | | | | 0.11 | | | | 1.40 | | | | 0.75 | |
| LESS DISTRIBUTIONS: | | | | | | | | | | | | | | | | | | | | | | | | |
| From net | | | | | | | | | | | | | | | | | | | | | | | | |
| investment income | | | (0.06 | ) | | | (0.17 | ) | | | (0.18 | ) | | | (0.17 | ) | | | (0.15 | ) | | | (0.23 | ) |
| From net realized gains | | | (0.63 | ) | | | (0.40 | ) | | | (0.73 | ) | | | (0.33 | ) | | | (0.15 | ) | | | (0.20 | ) |
| Total distributions | | | (0.69 | ) | | | (0.57 | ) | | | (0.91 | ) | | | (0.50 | ) | | | (0.30 | ) | | | (0.43 | ) |
| NET ASSET VALUE: | | | | | | | | | | | | | | | | | | | | | | | | |
| End of period | | $ | 12.64 | | | $ | 12.23 | | | $ | 11.69 | | | $ | 10.70 | | | $ | 11.09 | | | $ | 9.99 | |
| Total return | | | 9.26 | %(3) | | | 9.89 | % | | | 18.63 | % | | | 0.74 | % | | | 14.27 | % | | | 8.85 | % |
| Net assets at end of | | | | | | | | | | | | | | | | | | | | | | | | |
| period (000s omitted) | | $ | 244,355 | | | $ | 228,500 | | | $ | 288,462 | | | $ | 198,898 | | | $ | 136,991 | | | $ | 74,598 | |
| RATIO OF EXPENSES TO | | | | | | | | | | | | | | | | | | | | | | | | |
| AVERAGE NET ASSETS: | | | | | | | | | | | | | | | | | | | | | | | | |
| Before expense | | | | | | | | | | | | | | | | | | | | | | | | |
| reimbursement/recoupment | | | 1.41 | %(4) | | | 1.42 | % | | | 1.44 | % | | | 1.46 | % | | | 1.53 | % | | | 1.71 | % |
| After expense | | | | | | | | | | | | | | | | | | | | | | | | |
| reimbursement/recoupment | | | 1.40 | %(4) | | | 1.40 | % | | | 1.40 | % | | | 1.40 | % | | | 1.45 | % | | | 1.80 | % |
| RATIO OF NET INVESTMENT | | | | | | | | | | | | | | | | | | | | | | | | |
| INCOME TO AVERAGE NET ASSETS: | | | | | | | | | | | | | | | | | | | | | | | | |
| Before expense | | | | | | | | | | | | | | | | | | | | | | | | |
| reimbursement/recoupment | | | 0.96 | %(4) | | | 1.37 | % | | | 1.62 | % | | | 1.37 | % | | | 1.54 | % | | | 2.79 | % |
| After expense | | | | | | | | | | | | | | | | | | | | | | | | |
| reimbursement/recoupment | | | 0.97 | %(4) | | | 1.39 | % | | | 1.66 | % | | | 1.43 | % | | | 1.62 | % | | | 2.70 | % |
| Portfolio turnover rate | | | 38 | %(3) | | | 57 | % | | | 63 | % | | | 88 | % | | | 54 | % | | | 60 | % |
| (1) | Net investment income per share is calculated using the ending balances prior to consideration or adjustment for permanent book-to-tax differences. |
| (2) | Total from investment operations per share includes redemption fees of less than $0.01 per share for the six months ended March 31, 2014 and each of the five years ended September 30, 2013, 2012, 2011, 2010 and 2009. |
See notes to financial statements.
Intrepid Capital Fund – Institutional Class
FINANCIAL HIGHLIGHTS (continued)
Per share data for a share of capital stock outstanding for the entire period and selected information for the period are as follows:
| | | Period | | | | | | | | | | | | April 30, 2010(1) | |
| | | Ended | | | | | | through | |
| | | March 31, | | | September 30, | | | September 30, | |
| | | 2014 | | | 2013 | | | 2012 | | | 2011 | | | 2010 | |
| | | (Unaudited) | | | | | | | | | | | | | |
| NET ASSET VALUE: | | | | | | | | | | | | | | | |
| Beginning of period | | $ | 12.24 | | | $ | 11.70 | | | $ | 10.70 | | | $ | 11.10 | | | $ | 11.17 | |
| OPERATIONS: | | | | | | | | | | | | | | | | | | | | |
Net investment income(2) | | | 0.08 | | | | 0.19 | | | | 0.21 | | | | 0.18 | | | | 0.07 | |
| Net realized and unrealized gain | | | | | | | | | | | | | | | | | | | | |
| (loss) on investment securities | | | 1.03 | | | | 0.95 | | | | 1.73 | | | | (0.05 | ) | | | (0.06 | ) |
Total from operations(3) | | | 1.11 | | | | 1.14 | | | | 1.94 | | | | 0.13 | | | | 0.01 | |
| LESS DISTRIBUTIONS: | | | | | | | | | | | | | | | | | | | | |
| From net investment income | | | (0.07 | ) | | | (0.20 | ) | | | (0.21 | ) | | | (0.20 | ) | | | (0.08 | ) |
| From net realized gains | | | (0.64 | ) | | | (0.40 | ) | | | (0.73 | ) | | | (0.33 | ) | | | — | |
| Total distributions | | | (0.71 | ) | | | (0.60 | ) | | | (0.94 | ) | | | (0.53 | ) | | | (0.08 | ) |
| NET ASSET VALUE: | | | | | | | | | | | | | | | | | | | | |
| End of period | | $ | 12.64 | | | $ | 12.24 | | | $ | 11.70 | | | $ | 10.70 | | | $ | 11.10 | |
| Total return | | | 9.31 | %(4) | | | 10.18 | % | | | 19.02 | % | | | 0.93 | % | | | 0.09 | %(4) |
| Net assets at end of | | | | | | | | | | | | | | | | | | | | |
| period (000s omitted) | | $ | 202,874 | | | $ | 189,630 | | | $ | 100,501 | | | $ | 81,675 | | | $ | 86,252 | |
| RATIO OF EXPENSES | | | | | | | | | | | | | | | | | | | | |
| TO AVERAGE NET ASSETS: | | | | | | | | | | | | | | | | | | | | |
| Before expense | | | | | | | | | | | | | | | | | | | | |
| reimbursement/recoupment | | | 1.16 | %(5) | | | 1.17 | % | | | 1.19 | % | | | 1.21 | % | | | 1.31 | %(5) |
| After expense | | | | | | | | | | | | | | | | | | | | |
| reimbursement/recoupment | | | 1.15 | %(5) | | | 1.15 | % | | | 1.15 | % | | | 1.15 | % | | | 1.15 | %(5) |
| RATIO OF NET INVESTMENT INCOME | | | | | | | | | | | | | | | | | | | | |
| TO AVERAGE NET ASSETS: | | | | | | | | | | | | | | | | | | | | |
| Before expense | | | | | | | | | | | | | | | | | | | | |
| reimbursement/recoupment | | | 1.21 | %(5) | | | 1.67 | % | | | 1.85 | % | | | 1.58 | % | | | 1.66 | %(5) |
| After expense | | | | | | | | | | | | | | | | | | | | |
| reimbursement/recoupment | | | 1.22 | %(5) | | | 1.69 | % | | | 1.89 | % | | | 1.64 | % | | | 1.82 | %(5) |
| Portfolio turnover rate | | | 38 | %(4) | | | 57 | % | | | 63 | % | | | 88 | % | | | 54 | %(4) |
| | | | | | | | | | | | | | | | | | | | | |
| (1) | Commencement of Operations. |
| (2) | Net investment income per share is calculated using the ending balances prior to consideration or adjustment for permanent book-to-tax differences. |
| (3) | Total from investment operations per share includes redemption fees of less than $0.01 per share for the six months ended March 31, 2014, each of the two years ended September 30, 2013 and 2012 and the period ended September 30, 2010. |
See notes to financial statements.
Intrepid Small Cap Fund – Investor Class
FINANCIAL HIGHLIGHTS (continued)
Per share data for a share of capital stock outstanding for the entire period and selected information for the period are as follows:
| | | Period | | | | | | | | | | | | | | | | |
| | | Ended | | | | | | | | | | | | | | | | |
| | | March 31, | | | Year Ended September 30, | |
| | | 2014 | | | 2013 | | | 2012 | | | 2011 | | | 2010 | | | 2009 | |
| | | (Unaudited) | | | | | | | | | | | | | | | | |
| NET ASSET VALUE: | | | | | | | | | | | | | | | | | | |
| Beginning of period | | $ | 15.91 | | | $ | 15.80 | | | $ | 15.26 | | | $ | 15.98 | | | $ | 14.66 | | | $ | 11.60 | |
| OPERATIONS: | | | | | | | | | | | | | | | | | | | | | | | | |
| Net investment | | | | | | | | | | | | | | | | | | | | | | | | |
income (loss)(1) | | | (0.10 | ) | | | (0.12 | ) | | | (0.06 | ) | | | (0.09 | ) | | | (0.02 | ) | | | (0.01 | ) |
| Net realized and unrealized | | | | | | | | | | | | | | | | | | | | | | | | |
| gain on investment | | | | | | | | | | | | | | | | | | | | | | | | |
| securities | | | 1.11 | | | | 1.48 | | | | 2.47 | | | | 0.32 | | | | 2.18 | | | | 3.32 | |
Total from operations(2) | | | 1.01 | | | | 1.36 | | | | 2.41 | | | | 0.23 | | | | 2.16 | | | | 3.31 | |
| LESS DISTRIBUTIONS: | | | | | | | | | | | | | | | | | | | | | | | | |
| From net | | | | | | | | | | | | | | | | | | | | | | | | |
| investment income | | | — | | | | — | | | | — | | | | — | | | | — | | | | (0.02 | ) |
| From net realized gains | | | (0.68 | ) | | | (1.25 | ) | | | (1.87 | ) | | | (0.95 | ) | | | (0.84 | ) | | | (0.23 | ) |
| Total distributions | | | (0.68 | ) | | | (1.25 | ) | | | (1.87 | ) | | | (0.95 | ) | | | (0.84 | ) | | | (0.25 | ) |
| NET ASSET VALUE: | | | | | | | | | | | | | | | | | | | | | | | | |
| End of period | | $ | 16.24 | | | $ | 15.91 | | | $ | 15.80 | | | $ | 15.26 | | | $ | 15.98 | | | $ | 14.66 | |
| Total return | | | 6.47 | %(3) | | | 9.25 | % | | | 16.76 | % | | | 1.02 | % | | | 15.30 | % | | | 29.35 | % |
| Net assets at end of | | | | | | | | | | | | | | | | | | | | | | | | |
| period (000s omitted) | | $ | 510,295 | | | $ | 566,624 | | | $ | 699,196 | | | $ | 542,883 | | | $ | 511,726 | | | $ | 242,899 | |
| RATIO OF EXPENSES | | | | | | | | | | | | | | | | | | | | | | | | |
| TO AVERAGE NET ASSETS: | | | | | | | | | | | | | | | | | | | | | | | | |
| Before expense | | | | | | | | | | | | | | | | | | | | | | | | |
| reimbursement/recoupment | | | 1.41 | %(4) | | | 1.42 | % | | | 1.44 | % | | | 1.45 | % | | | 1.49 | % | | | 1.62 | % |
| After expense | | | | | | | | | | | | | | | | | | | | | | | | |
| reimbursement/recoupment | | | 1.40 | %(4) | | | 1.40 | % | | | 1.40 | % | | | 1.40 | % | | | 1.40 | % | | | 1.57 | % |
| RATIO OF NET INVESTMENT | | | | | | | | | | | | | | | | | | | | | | | | |
| LOSS TO AVERAGE NET ASSETS: | | | | | | | | | | | | | | | | | | | | | | | | |
| Before expense | | | | | | | | | | | | | | | | | | | | | | | | |
| reimbursement/recoupment | | | (1.12 | )%(4) | | | (0.72 | )% | | | (0.44 | )% | | | (0.54 | )% | | | (0.23 | )% | | | (0.16 | )% |
| After expense | | | | | | | | | | | | | | | | | | | | | | | | |
| reimbursement/recoupment | | | (1.11 | )%(4) | | | (0.70 | )% | | | (0.40 | )% | | | (0.49 | )% | | | (0.14 | )% | | | (0.11 | )% |
| Portfolio turnover rate | | | 10 | %(3) | | | 30 | % | | | 68 | % | | | 88 | % | | | 61 | % | | | 163 | % |
| (1) | Net investment income (loss) per share is calculated using the ending balances prior to consideration or adjustment for permanent book-to-tax differences. |
| (2) | Total from investment operations per share includes redemption fees of less than $0.01 per share for the six months ended March 31, 2014 and each of the five years ended September 30, 2013, 2012, 2011, 2010 and 2009. |
See notes to financial statements.
Intrepid Small Cap Fund – Institutional Class
FINANCIAL HIGHLIGHTS (continued)
Per share data for a share of capital stock outstanding for the entire period and selected information for the period are as follows:
| | | | | | | | | | | | | | | November 30, | |
| | | Period | | | | | | | | | | | | 2009(1) | |
| | | Ended | | | | | | through | |
| | | March 31, | | | September 30, | | | September 30, | |
| | | 2014 | | | 2013 | | | 2012 | | | 2011 | | | 2010 | |
| | | (Unaudited) | | | | | | | | | | | | | |
| NET ASSET VALUE: | | | | | | | | | | | | | | | |
| Beginning of period | | $ | 16.09 | | | $ | 15.93 | | | $ | 15.34 | | | $ | 16.02 | | | $ | 14.52 | |
| OPERATIONS: | | | | | | | | | | | | | | | | | | | | |
| Net investment | | | | | | | | | | | | | | | | | | | | |
income (loss)(2) | | | (0.10 | ) | | | (0.09 | ) | | | (0.03 | ) | | | (0.02 | ) | | | 0.01 | |
| Net realized and unrealized gain | | | | | | | | | | | | | | | | | | | | |
| on investment securities | | | 1.15 | | | | 1.50 | | | | 2.49 | | | | 0.29 | | | | 2.33 | |
Total from operations(3) | | | 1.05 | | | | 1.41 | | | | 2.46 | | | | 0.27 | | | | 2.34 | |
| LESS DISTRIBUTIONS: | | | | | | | | | | | | | | | | | | | | |
| From net investment income | | | — | | | | — | | | | — | | | | — | | | | — | |
| From net realized gains | | | (0.68 | ) | | | (1.25 | ) | | | (1.87 | ) | | | (0.95 | ) | | | (0.84 | ) |
| Total distributions | | | (0.68 | ) | | | (1.25 | ) | | | (1.87 | ) | | | (0.95 | ) | | | (0.84 | ) |
| NET ASSET VALUE: | | | | | | | | | | | | | | | | | | | | |
| End of period | | $ | 16.46 | | | $ | 16.09 | | | $ | 15.93 | | | $ | 15.34 | | | $ | 16.02 | |
| Total return | | | 6.65 | %(4) | | | 9.51 | % | | | 17.02 | % | | | 1.28 | % | | | 16.70 | %(4) |
| Net assets at end of | | | | | | | | | | | | | | | | | | | | |
| period (000s omitted) | | $ | 201,622 | | | $ | 108,728 | | | $ | 64,581 | | | $ | 49,729 | | | $ | 52,381 | |
| RATIO OF EXPENSES | | | | | | | | | | | | | | | | | | | | |
| TO AVERAGE NET ASSETS: | | | | | | | | | | | | | | | | | | | | |
| Before expense | | | | | | | | | | | | | | | | | | | | |
| reimbursement/recoupment | | | 1.16 | %(5) | | | 1.17 | % | | | 1.19 | % | | | 1.20 | % | | | 1.26 | %(5) |
| After expense | | | | | | | | | | | | | | | | | | | | |
| reimbursement/recoupment | | | 1.15 | %(5) | | | 1.15 | % | | | 1.15 | % | | | 1.15 | % | | | 1.15 | %(5) |
| RATIO OF NET INVESTMENT | | | | | | | | | | | | | | | | | | | | |
| INCOME (LOSS) TO AVERAGE NET ASSETS: | | | | | | | | | | | | | | | | | | | | |
| Before expense | | | | | | | | | | | | | | | | | | | | |
| reimbursement/recoupment | | | (0.87 | )%(5) | | | (0.47 | )% | | | (0.18 | )% | | | (0.29 | )% | | | 0.01 | %(5) |
| After expense | | | | | | | | | | | | | | | | | | | | |
| reimbursement/recoupment | | | (0.86 | )%(5) | | | (0.45 | )% | | | (0.14 | )% | | | (0.24 | )% | | | 0.12 | %(5) |
| Portfolio turnover rate | | | 10 | %(4) | | | 30 | % | | | 68 | % | | | 88 | % | | | 61 | %(4) |
| (1) | Commencement of Operations. |
| (2) | Net investment income (loss) per share is calculated using the ending balances prior to consideration or adjustment for permanent book-to-tax differences. |
| (3) | Total from investment operations per share includes redemption fees of less than $0.01 for the six months ended March 31, 2014, each of the three years ended September 30, 2013, 2012 and 2011, and the period ended September 30, 2010. |
See notes to financial statements.
Intrepid Income Fund – Institutional Class
FINANCIAL HIGHLIGHTS (continued)
Per share data for a share of capital stock outstanding for the entire period and selected information for the period are as follows:
| | | Period | | | | | | | | | | | | August 16, 2010(1) | |
| | | Ended | | | | | | through | |
| | | March 31, | | | September 30, | | | September 30, | |
| | | 2014 | | | 2013 | | | 2012 | | | 2011 | | | 2010 | |
| | | (Unaudited) | | | | | | | | | | | | | |
| NET ASSET VALUE: | | | | | | | | | | | | | | | |
| Beginning of period | | $ | 9.66 | | | $ | 9.80 | | | $ | 9.63 | | | $ | 9.77 | | | $ | 9.73 | |
| OPERATIONS: | | | | | | | | | | | | | | | | | | | | |
Net investment income(2) | | | 0.15 | | | | 0.30 | | | | 0.47 | | | | 0.38 | | | | 0.05 | |
| Net realized and unrealized gain | | | | | | | | | | | | | | | | | | | | |
| (loss) on investment securities | | | 0.13 | | | | (0.01 | ) | | | 0.30 | | | | (0.09 | ) | | | 0.10 | |
Total from operations(3) | | | 0.28 | | | | 0.29 | | | | 0.77 | | | | 0.29 | | | | 0.15 | |
| LESS DISTRIBUTIONS: | | | | | | | | | | | | | | | | | | | | |
| From net investment income | | | (0.15 | ) | | | (0.33 | ) | | | (0.45 | ) | | | (0.43 | ) | | | (0.11 | ) |
| From net realized gains | | | (0.05 | ) | | | (0.10 | ) | | | (0.15 | ) | | | (0.00 | )(4) | | | — | |
| Total distributions | | | (0.20 | ) | | | (0.43 | ) | | | (0.60 | ) | | | (0.43 | ) | | | (0.11 | ) |
| NET ASSET VALUE: | | | | | | | | | | | | | | | | | | | | |
| End of period | | $ | 9.74 | | | $ | 9.66 | | | $ | 9.80 | | | $ | 9.63 | | | $ | 9.77 | |
| Total return | | | 2.98 | %(5) | | | 3.03 | % | | | 8.17 | % | | | 2.97 | % | | | 1.59 | %(5) |
| Net assets at end of | | | | | | | | | | | | | | | | | | | | |
| period (000s omitted) | | $ | 106,707 | | | $ | 74,828 | | | $ | 63,085 | | | $ | 50,451 | | | $ | 24,947 | |
| RATIO OF EXPENSES TO | | | | | | | | | | | | | | | | | | | | |
| AVERAGE NET ASSETS: | | | | | | | | | | | | | | | | | | | | |
| Before expense | | | | | | | | | | | | | | | | | | | | |
| reimbursement/recoupment | | | 0.97 | %(6)(7) | | | 0.98 | % | | | 1.01 | % | | | 1.07 | % | | | 1.22 | %(6) |
| After expense | | | | | | | | | | | | | | | | | | | | |
| reimbursement/recoupmen | | | 0.93 | %(6)(7) | | | 0.90 | % | | | 0.90 | % | | | 0.90 | % | | | 0.90 | %(6) |
| RATIO OF NET INVESTMENT INCOME | | | | | | | | | | | | | | | | | | | | |
| TO AVERAGE NET ASSETS: | | | | | | | | | | | | | | | | | | | | |
| Before expense | | | | | | | | | | | | | | | | | | | | |
| reimbursement/recoupment | | | 2.93 | %(6)(8) | | | 2.96 | % | | | 4.56 | % | | | 4.09 | % | | | 4.56 | %(6) |
| After expense | | | | | | | | | | | | | | | | | | | | |
| reimbursement/recoupment | | | 2.97 | %(6)(8) | | | 3.04 | % | | | 4.67 | % | | | 4.26 | % | | | 4.88 | %(6) |
| Portfolio turnover rate | | | 24 | %(5) | | | 78 | % | | | 54 | % | | | 77 | % | | | 67 | %(5) |
| (1) | Commencement of Operations. |
| (2) | Net investment income per share is calculated using the ending balances prior to consideration or adjustment for permanent book-to-tax differences. |
| (3) | Total from investment operations per share includes redemption fees of less than $0.01 per share for the six months ended March 31, 2014 and the year ended September 30, 2013. |
| (4) | The amount represents less than $0.01 per share. |
| (7) | Includes expenses related to the Investor Class that was merged into the Institutional Class on January 31, 2014. In the absence of these expenses, the ratios would have been 0.94% and 0.90%, respectively. |
| (8) | Includes net investment income related to the Investor Class that was merged into the Institutional Class on January 31, 2014. In the absence of these expenses, the ratios would have been 3.01% and 3.05%, respectively. |
See notes to financial statements.
Intrepid Disciplined Value Fund
FINANCIAL HIGHLIGHTS (continued)
Per share data for a share of capital stock outstanding for the entire period and selected information for the period are as follows:
| | | Period | | | | | | | | | | | | | | | | |
| | | Ended | | | | | | | | | | | | | | | | |
| | | March 31, | | | Year Ended September 30, | |
| | | 2014 | | | 2013 | | | 2012 | | | 2011 | | | 2010 | | | 2009 | |
| | | (Unaudited) | | | | | | | | | | | | | | | | |
| NET ASSET VALUE: | | | | | | | | | | | | | | | | | | |
| Beginning of period | | $ | 11.11 | | | $ | 10.48 | | | $ | 9.23 | | | $ | 10.23 | | | $ | 9.03 | | | $ | 8.74 | |
| OPERATIONS: | | | | | | | | | | | | | | | | | | | | | | | | |
| Net investment | | | | | | | | | | | | | | | | | | | | | | | | |
income (loss)(1) | | | (0.04 | ) | | | 0.03 | | | | 0.01 | | | | (0.03 | ) | | | (0.05 | ) | | | 0.01 | |
| Net realized and unrealized | | | | | | | | | | | | | | | | | | | | | | | | |
| gain (loss) on investment | | | | | | | | | | | | | | | | | | | | | | | | |
| securities | | | 0.77 | | | | 1.36 | | | | 1.87 | | | | (0.16 | ) | | | 1.30 | | | | 0.30 | |
Total from operations(2) | | | 0.73 | | | | 1.39 | | | | 1.88 | | | | (0.19 | ) | | | 1.25 | | | | 0.31 | |
| LESS DISTRIBUTIONS: | | | | | | | | | | | | | | | | | | | | | | | | |
| From net investment income | | | — | | | | (0.07 | ) | | | (0.02 | ) | | | — | | | | — | | | | (0.02 | ) |
| From net realized gains | | | (0.91 | ) | | | (0.69 | ) | | | (0.61 | ) | | | (0.81 | ) | | | (0.05 | ) | | | — | |
| Total distributions | | | (0.91 | ) | | | (0.76 | ) | | | (0.63 | ) | | | (0.81 | ) | | | (0.05 | ) | | | (0.02 | ) |
| NET ASSET VALUE: | | | | | | | | | | | | | | | | | | | | | | | | |
| End of period | | $ | 10.93 | | | $ | 11.11 | | | $ | 10.48 | | | $ | 9.23 | | | $ | 10.23 | | | $ | 9.03 | |
| Total return | | | 6.85 | %(3) | | | 14.27 | % | | | 21.07 | % | | | (2.61 | )% | | | 13.93 | % | | | 3.53 | % |
| Net assets at end of | | | | | | | | | | | | | | | | | | | | | | | | |
| period (000s omitted) | | $ | 44,922 | | | $ | 41,374 | | | $ | 46,975 | | | $ | 36,356 | | | $ | 21,401 | | | $ | 16,452 | |
| RATIO OF EXPENSES TO | | | | | | | | | | | | | | | | | | | | | | | | |
| AVERAGE NET ASSETS: | | | | | | | | | | | | | | | | | | | | | | | | |
| Before expense | | | | | | | | | | | | | | | | | | | | | | | | |
| reimbursement/recoupment | | | 1.56 | %(4) | | | 1.59 | % | | | 1.60 | % | | | 1.69 | % | | | 1.98 | % | | | 2.65 | % |
| After expense | | | | | | | | | | | | | | | | | | | | | | | | |
| reimbursement/recoupment | | | 1.37 | %(4)(5) | | | 1.40 | % | | | 1.40 | % | | | 1.54 | % | | | 1.95 | % | | | 1.95 | % |
| RATIO OF NET INVESTMENT INCOME | | | | | | | | | | | | | | | | | | | | | | | | |
| (LOSS) TO AVERAGE NET ASSETS: | | | | | | | | | | | | | | | | | | | | | | | | |
| Before expense | | | | | | | | | | | | | | | | | | | | | | | | |
| reimbursement/recoupment | | | (1.02 | )%(4) | | | 0.03 | % | | | (0.16 | )% | | | (0.48 | )% | | | (0.52 | )% | | | (0.65 | )% |
| After expense | | | | | | | | | | | | | | | | | | | | | | | | |
| reimbursement/recoupment | | | (0.83 | )%(4)(5) | | | 0.22 | % | | | 0.04 | % | | | (0.33 | )% | | | (0.49 | )% | | | 0.05 | % |
| Portfolio turnover rate | | | 54 | %(3) | | | 30 | % | | | 71 | % | | | 74 | % | | | 82 | % | | | 93 | % |
| (1) | Net investment income (loss) per share is calculated using the ending balances prior to consideration or adjustment for permanent book-to-tax differences. |
| (2) | Total from investment operations per share includes redemption fees of less than $0.01 per share for the six months ended March 31, 2014 and each of the four years ended September 30, 2012, 2011, 2010 and 2009. |
| (5) | Effective January 31, 2014, the Adviser contractually agreed to reduce its fees and/or reimburse the Fund to ensure that Total Annual Fund Operating Expenses After Waiver and/or Expense Reimbursement do not exceed 1.30% of the Fund’s average daily net assets. |
See notes to financial statements.
Intrepid Funds
NOTES TO FINANCIAL STATEMENTS
March 31, 2014 (Unaudited)
Intrepid Capital Management Funds Trust (the “Trust”) was organized as a Delaware Statutory Trust on August 27, 2004 and is registered under the Investment Company Act of 1940, as amended (the “1940 Act”), as an open-end management investment company issuing shares in series, each series representing a distinct portfolio with its own investment objectives and policies. At March 31, 2014, the Trust consisted of four series (the “Funds”): Intrepid Capital Fund, Intrepid Small Cap Fund, Intrepid Income Fund and Intrepid Disciplined Value Fund. The Intrepid Capital Fund’s Investor Class commenced operations on January 3, 2005, the Intrepid Capital Fund’s Institutional Class commenced operations on April 30, 2010, the Intrepid Small Cap Fund’s Investor Class commenced operations on October 3, 2005, the Intrepid Small Cap Fund’s Institutional Class commenced operations on November 3, 2009, the Intrepid Income Fund’s Investor Class commenced operations on July 2, 2009 and ceased operations on January 31, 2014. Effective as of the close of business on January 31, 2014 all Investor Class shares of the Intrepid Income Fund were converted into Institutional Class shares. The Intrepid Income Fund’s Institutional Class commenced operations on August 16, 2010 and the Intrepid Disciplined Value Fund commenced operations on October 31, 2007.
Effective January 31, 2014, the investment strategy of the Intrepid Income Fund was changed as described in the Funds’ prospectus. The Intrepid Income Fund will invest primarily in high-yield corporate debt securities (sometimes called “junk bonds”), bank debt, convertible debt, and government securities, as well as the debt of foreign issuers. In addition, the Fund may invest in equity securities, consisting of dividend paying common stock or preferred stock. The principal investment strategies of the Funds are described in the prospectus.
The following is a summary of significant accounting policies consistently followed by the Funds in the preparation of their financial statements. These policies are in conformity with accounting principles generally accepted in the United States (“GAAP”).
Valuation of Securities
The Trust has adopted authoritative fair valuation accounting standards which establish an authoritative definition of fair value and set out a hierarchy for measuring fair value. These standards require additional disclosures about the various inputs and valuation techniques used to develop the measurements of fair value and a discussion in changes in valuation techniques and related inputs during the period. These inputs are summarized in the three broad levels listed below.
Intrepid Funds
NOTES TO FINANCIAL STATEMENTS (continued)
March 31, 2014 (Unaudited)
| | Level 1 – | Quoted prices in active markets for identical securities. |
| | | |
| | Level 2 – | Other significant observable inputs (including quoted prices for similar securities, interest rates, prepayment speeds, credit risk, etc.). |
| | | |
| | Level 3 – | Significant unobservable inputs (including the Fund’s own assumptions in determining the fair value of investments). |
Equity investments, including common stocks, foreign issued common stocks, exchange-traded funds, closed end mutual funds and real estate investments trusts, which are traded on an exchange are valued at the last sale price reported by the exchange on which the securities are primarily traded on the day of valuation. If there are no sales on a given day for securities traded on an exchange, the latest bid quotation will be used. If there is no Nasdaq Official Closing Price for a Nasdaq-listed security or sale price available for an over-the-counter security, the mean of the latest bid and asked quotations from Nasdaq will be used. When using the market quotations or closing price provided by the pricing service and when the market is considered active, the security will be classified as a Level 1 security.
Investment in mutual funds, including money market funds, are generally priced at the ending net asset value (NAV) provided by the service agent of the funds and will be classified as Level 1 securities.
Debt securities, such as corporate bonds, convertible bonds, senior loans and U.S. government agency issues for which market quotations are not readily available may be valued based on information supplied by independent pricing services using matrix pricing formulas and/or independent broker bid quotations. Debt securities with remaining maturities of 60 days or less may be valued on an amortized cost basis, which involves valuing an instrument at its cost and thereafter assuming a constant amortization to maturity of any discount or premium, regardless of the impact of fluctuating rates on the fair value of the instrument. These securities will generally be classified as Level 2 securities.
Forward currency contracts derive their value from the underlying currency prices. These are valued by a pricing service using pricing models. The models use inputs that are observed from active markets, such as exchange rates. These contracts are classified as Level 2.
Any securities or other assets for which market quotations are not readily available are valued at fair value as determined in good faith by the Advisor pursuant to procedures established under the general supervision and responsibility of the Funds’ Board of Trustees and will be classified as Level 3 securities.
The inputs of methodology used for valuing securities may not be an indication of the risk associated with investing in those securities.
Intrepid Funds
NOTES TO FINANCIAL STATEMENTS (continued)
March 31, 2014 (Unaudited)
The following is a summary of the inputs used, as of March 31, 2014, in valuing the Funds’ investments carried at fair value:
| Description | | Level 1 | | | Level 2 | | | Level 3 | | | Total | |
| Intrepid Capital Fund | | | | | | | | | | | | |
| Assets | | | | | | | | | | | | |
| Total Common Stocks* | | $ | 214,359,829 | | | $ | — | | | $ | — | | | $ | 214,359,829 | |
| Total Corporate Bonds* | | | — | | | | 113,394,451 | | | | — | | | | 113,394,451 | |
| Total Convertible Bond* | | | — | | | | 6,125,130 | | | | — | | | | 6,125,130 | |
| Total Assets | | $ | 214,359,829 | | | $ | 119,519,581 | | | $ | — | | | $ | 333,879,410 | |
| | | | | | | | | | | | | | | | | |
| Liabilities | | | | | | | | | | | | | | | | |
| Total Forward Currency | | | | | | | | | | | | | | | | |
| Contracts** | | $ | — | | | $ | (38,829 | ) | | $ | — | | | $ | (38,829 | ) |
| Total Liabilities | | $ | — | | | $ | (38,829 | ) | | $ | — | | | $ | (38,829 | ) |
| Description | | Level 1 | | | Level 2 | | | Level 3 | | | Total | |
| Intrepid Small Cap Fund | | | | | | | | | | | | |
| Assets | | | | | | | | | | | | |
| Total Common Stocks* | | $ | 207,333,309 | | | $ | — | | | $ | — | | | $ | 207,333,309 | |
| Total Forward Currency | | | | | | | | | | | | | | | | |
| Contracts** | | | — | | | | 24,735 | | | | — | | | | 24,735 | |
| Total Assets | | $ | 207,333,309 | | | $ | 24,735 | | | $ | — | | | $ | 207,358,044 | |
| Intrepid Income Fund | | | | | | | | | | | | |
| | | Level 1 | | | Level 2 | | | Level 3 | | | Total | |
| Assets | | | | | | | | | | | | |
| Total Corporate Bonds* | | $ | — | | | $ | 62,703,600 | | | $ | — | | | $ | 62,703,600 | |
| Total Convertible Bond* | | | — | | | | 2,608,200 | | | | — | | | | 2,608,200 | |
| Total Assets | | $ | — | | | $ | 65,311,800 | | | $ | — | | | $ | 65,311,800 | |
| Description | | Level 1 | | | Level 2 | | | Level 3 | | | Total | |
| Intrepid Disciplined Value Fund | | | | | | | | | | | | |
| Assets | | | | | | | | | | | | |
| Total Common Stocks* | | $ | 23,174,844 | | | $ | — | | | $ | — | | | $ | 23,174,844 | |
| Total Assets | | $ | 23,174,844 | | | $ | — | | | $ | — | | | $ | 23,174,844 | |
| * | For further information regarding security characteristics, please see the Schedules of Investments. |
| ** | Other financial instruments are derivative instruments not reflected in the Schedule of Investments, such as forward currency contracts, which are reflected at the unrealized appreciation (depreciation) on the instrument. |
Intrepid Funds
NOTES TO FINANCIAL STATEMENTS (continued)
March 31, 2014 (Unaudited)
There were no transfers of securities between Level 1 and Level 2 during the reporting period.
Below is a reconciliation that details the activity of securities in Level 3 during the current fiscal period. Transfers between levels are recognized at the end of the reporting period.
| | | Intrepid | | | Intrepid | | | Intrepid | | | Intrepid | |
| | | Capital | | | Small Cap | | | Income | | | Disciplined | |
| | | Fund | | | Fund | | | Fund | | | Value Fund | |
| Beginning Balance - | | | | | | | | | | | | |
| October 1, 2013 | | $ | 3,168,750 | | | $ | — | | | $ | 2,112,500 | | | $ | — | |
| Purchases | | | 8,275,000 | | | | — | | | | 4,225,000 | | | | — | |
| Sales | | | — | | | | — | | | | — | | | | — | |
| Realized gains | | | — | | | | — | | | | — | | | | — | |
| Realized losses | | | — | | | | — | | | | — | | | | — | |
| Change in unrealized | | | | | | | | | | | | | | | | |
| appreciation | | | | | | | | | | | | | | | | |
| (depreciation) | | | 201,313 | | | | — | | | | 98,688 | | | | — | |
| Net Transfers Into/ | | | | | | | | | | | | | | | | |
| (Out of) Level 3 | | $ | (11,645,063 | ) | | | — | | | $ | (6,436,188 | ) | | | — | |
| Ending Balance - | | | | | | | | | | | | | | | | |
| March 31, 2014 | | $ | — | | | $ | — | | | $ | — | | | $ | — | |
The movements from Level 3 to Level 2 in the Interpid Capital Fund and the Intrepid Income Fund were due to the Funds’ pricing agent pricing bonds that were previously being fair valued in accordance with procedures approved by the Board of Trustees.
Derivative Instruments and Hedging Activities
The Funds’ adviser may use derivative instruments, such as forward currency contracts, as a means to manage exposure to exchange rate risk. During the period ended March 31, 2014, the Intrepid Capital Fund and the Intrepid Small Cap Fund held derivative instruments.
The Intrepid Capital Fund and the Intrepid Small Cap Fund used forward currency contracts during the period for the purpose of hedging exposures to non- U.S. dollar denominated assets. In general the use of these contracts may reduce the overall risk level in a fund, but may also lower fund performance. The use of these contracts does not create leverage in the Funds.
Intrepid Funds
NOTES TO FINANCIAL STATEMENTS (continued)
March 31, 2014 (Unaudited)
Values of Forward Currency Contracts as of March 31, 2014
| | Asset Derivatives | | Liability Derivatives | |
| Derivatives not accounted | Balance Sheet | | | | Balance Sheet | | | |
| for as hedging instruments | Location | | Value | | Location | | Value | |
| Intrepid Capital Fund | | | | | | | | |
| | Appreciation of | | | | Depreciation of | | | |
| Forward Currency | forward currency | | | | forward currency | | | |
| Contracts | contracts | | $ | — | | contracts | | $ | (38,829 | ) |
| Total | | | $ | — | | | | $ | (38,829 | ) |
| | | | | | | | | | | |
| Intrepid Small Cap Fund | | | | | | | | | | |
| | Appreciation of | | | | | Depreciation of | | | | |
| Forward Currency | forward currency | | | | | forward currency | | | | |
| Contracts | contracts | | $ | 24,735 | | contracts | | $ | — | |
| Total | | | $ | 24,735 | | | | $ | — | |
Effect of Forward Currency Contracts on the Statement of Operations as of March 31, 2014
| | | Change in unrealized | | | Realized loss | |
| | | appreciation on forward | | | on forward | |
| | | currency contracts | | | currency contracts | |
| Intrepid Capital Fund | | $ | 32,277 | | | $ | (71,106 | ) |
| Intrepid Small Cap Fund | | $ | 569,367 | | | $ | (544,632 | ) |
The average monthly notional amounts of forward currency contracts during the period ended March 31, 2014 were as follows:
| | | Intrepid | | | Intrepid | |
| Long Positions | | Capital Fund | | | Small Cap Fund | |
| Forward currency contracts | | $ | 835,574 | | | $ | 6,266,556 | |
| | | | | | | |
| | | Intrepid | | | Intrepid | |
| Short Positions | | Capital Fund | | | Small Cap Fund | |
| Forward currency contract | | $ | (3,364,602 | ) | | $ | (10,510,951 | ) |
Derivative Risk
The risks of using the types of derivatives in which the Funds may engage include the risk that movements in the value of the derivative may not fully offset or complement instruments currently held in the Funds in the manner intended by the Adviser; the risk that the counterparty to a derivative contract may fail to comply with their obligations to the Fund; the risk that the derivative may not possess a
Intrepid Funds
NOTES TO FINANCIAL STATEMENTS (continued)
March 31, 2014 (Unaudited)
liquid secondary market at a time when the Fund would look to disengage the position; the risk that additional capital from the Fund may be called upon to fulfill the conditions of the derivative contract; and the risk that the cost of the derivative contracts may reduce the overall returns experienced by the Funds.
Use of Estimates
The preparation of financial statements in conformity with GAAP requires management to make estimates and assumptions that affect the reported amounts of assets and liabilities and disclosure of contingent assets and liabilities at the date of the financial statements and the reported amounts of revenues and expenses during the reporting period. Actual results could differ from those estimates.
Indemnification
In the normal course of business the Funds enter into contracts that contain general indemnification clauses. The Funds’ maximum exposure under these arrangements is unknown, as this would involve future claims against the fund that have not yet occurred. Based on experience, the Funds expect the risk of loss to be remote.
Foreign Currency Transactions
The books and records are maintained in U.S. dollars. Foreign currency denominated transactions (i.e. market value of investment securities, assets and liabilities, purchases and sales of investment securities and income and expenses) are translated into U.S. dollars at the current rate of exchange. The Funds isolate that portion of the results of operations resulting from changes in foreign exchange rates on investments from the fluctuations arising from changes in market prices of securities held. Such fluctuations are reflected in net realized and unrealized gain or loss on foreign currency translation.
Securities Transactions and Investment Income
The Funds record security transactions based on trade date. Dividend income is recognized on the ex-dividend date, and interest income is recognized on an accrual basis. Discounts and premiums on securities purchased are amortized over the lives of the respective securities using the effective yield method. Withholding taxes on foreign dividends have been provided for in accordance with the Funds’ understanding of the applicable country’s tax rules and rates. Net realized gains or losses are determined using the identified cost method.
Distribution to Shareholder Policy
Dividends from net investment income, if any, are declared and paid quarterly. Distributions of net realized capital gains, if any, are declared and paid at least annually.
Intrepid Funds
NOTES TO FINANCIAL STATEMENTS (continued)
March 31, 2014 (Unaudited)
Federal Income Taxes
The Funds comply with, and intend to continue to comply with, the requirements of Subchapter M of the Internal Revenue Code necessary to qualify as a regulated investment company and to make the requisite distributions of income and capital gains to its shareholders sufficient to relieve it from Federal income taxes.
Allocation of Income, Expenses, and Gains/Losses
Income, expenses (other than those deemed to be attributable to a specific share class), and gains and losses of each Fund are allocated to each class of shares based upon the ratio of net assets represented by each class as a percentage of the net assets of that Fund. Expenses deemed directly attributable to a specific share class of shares are charged against the operations of such class. Most Fund expenses are allocated by class based on relative net assets.
Subsequent Events Evaluation
In preparing these financial statements, the Trust has evaluated events and transactions for potential recognition or disclosure resulting from subsequent events after the statement of assets and liabilities date of March 31, 2014. This evaluation did not result in any subsequent events that necessitated disclosure and / or adjustments.
The Trust has an Investment Advisory Agreement (the “Agreement”) with Intrepid Capital Management, Inc. (the “Adviser”), with whom certain officers and Trustees of the Trust are affiliated, to furnish investment advisory services to the Funds. Under the terms of the Agreement, the Trust, on behalf of the Funds, compensates the Adviser for its management services on the Intrepid Capital Fund and Intrepid Disciplined Value Fund at the annual rate of 1.00% on the first $500 million of average daily net assets and 0.80% on the Fund’s average daily net assets in excess of $500 million, on the Intrepid Small Cap Fund at an annual rate of 1.00% of average daily net assets, and on Intrepid Income Fund at the annual rate of 0.75% of average daily net assets.
For the Intrepid Capital Fund and the Intrepid Small Cap Fund, the Adviser agreed to waive its management fee and/or reimburse other expenses of each of the Funds, including organization expenses, to the extent necessary to ensure that each Fund’s operating expenses did not exceed 1.40% of each Fund’s Investor Class’s average daily net assets and 1.15% of average daily net assets of each Fund’s Institutional Class. For the Intrepid Income Fund, the Adviser agreed to waive its management fee and/or reimburse other expenses of the Fund, including organization
Intrepid Funds
NOTES TO FINANCIAL STATEMENTS (continued)
March 31, 2014 (Unaudited)
expense, to the extent necessary to ensure that the Fund’s operating expenses did not exceed 0.90% of average daily net assets of the Institutional Class. For the Intrepid Disciplined Value Fund, the Adviser agreed to waive its management fee and/or reimburse other expenses of the Intrepid Disciplined Value Fund, including organization expense, to the extent necessary to ensure that the Fund’s operating expenses did not exceed 1.30% of average daily assets. The Intrepid Disciplined Value Fund’s expenses were previously capped at 1.40% of average daily net assets for the period of January 31, 2011 through January 31, 2014. Any such waivers or reimbursements for the Funds are subject to later adjustment to allow the Adviser to recoup amounts waived or reimbursed to the extent actual fees and expenses on a monthly basis during the fiscal year are less than the respective expense cap limitations, provided, however, that the Adviser shall only be entitled to recoup such amounts for a period of three years from the date such amount was waived or reimbursed. Waived/reimbursed expenses subject to potential recovery by year of expiration are as follows:
| | | Year of Expiration | |
| | | 9/30/14 | | | 9/30/15 | | | 9/30/16 | | | 9/30/17 | |
| Intrepid Capital Fund | | $ | 191,305 | | | $ | 154,544 | | | $ | 78,422 | | | $ | 15,996 | |
| Intrepid Small Cap Fund | | | 353,297 | | | | 330,578 | | | | 181,009 | | | | 39,582 | |
| Intrepid Income Fund | | | 132,953 | | | | 104,137 | | | | 87,877 | | | | 42,038 | |
| Intrepid Disciplined Value Fund | | | 58,383 | | | | 89,179 | | | | 76,307 | | | | 52,307 | |
Certain Officers of the Trust are also officers of the Adviser. The Officers of the Trust are not compensated by the Funds.
The Trust, on behalf of the Funds, has adopted a distribution plan pursuant to Rule 12b-1 under the 1940 Act (the “12b-1 Plan”), which provides that the Funds may reimburse the Funds’ distributor or others at an annual rate of up to 0.25% of the average daily net assets of the Investor Class of the Capital Fund, Small Cap Fund and the sole class of the Disciplined Value Fund.
Quasar Distributors, LLC serves as the distributor to the Funds. Quasar Distributors, LLC is an affiliated company of U.S. Bank, N.A.
Intrepid Funds
NOTES TO FINANCIAL STATEMENTS (continued)
March 31, 2014 (Unaudited)
| 5. | INVESTMENT TRANSACTIONS |
The aggregate purchases and sales of securities (excluding short-term securities) by the Funds for the six months ended March 31, 2014 were as follows:
| | | Non-U.S. Government | |
| | | Purchases | | | Sales | |
| Intrepid Capital Fund | | $ | 118,288,875 | | | $ | 116,217,806 | |
| Intrepid Small Cap Fund | | | 23,711,871 | | | | 144,420,393 | |
| Intrepid Income Fund | | | 22,850,235 | | | | 14,659,605 | |
| Intrepid Disciplined Value Fund | | | 12,885,934 | | | | 9,656,836 | |
| 6. | CAPITAL SHARE TRANSACTIONS |
Intrepid Capital Fund – Investor Class
| | | Six Months Ended | | | Year Ended | |
| | | March 31, 2014 | | | September 30, 2013 | |
| Shares sold | | | 2,091,620 | | | | 9,128,920 | |
| Shares issued to holders in | | | | | | | | |
| reinvestment of dividends | | | 1,024,481 | | | | 872,212 | |
| Shares redeemed | | | (2,461,002 | ) | | | (16,000,098 | ) |
| Net increase (decrease) in shares | | | 655,099 | | | | (5,998,966 | ) |
| Shares outstanding: | | | | | | | | |
| Beginning of period | | | 18,681,244 | | | | 24,680,210 | |
| End of period | | | 19,336,343 | | | | 18,681,244 | |
Intrepid Capital Fund – Institutional Class
| | | Six Months Ended | | | Year Ended | |
| | | March 31, 2014 | | | September 30, 2013 | |
| Shares sold | | | 2,088,623 | | | | 9,104,079 | |
| Shares issued to holders in | | | | | | | | |
| reinvestment of dividends | | | 479,865 | | | | 387,245 | |
| Shares redeemed | | | (2,018,921 | ) | | | (2,587,414 | ) |
| Net increase in shares | | | 549,567 | | | | 6,903,910 | |
| Shares outstanding: | | | | | | | | |
| Beginning of period | | | 15,497,139 | | | | 8,593,229 | |
| End of period | | | 16,046,706 | | | | 15,497,139 | |
NOTES TO FINANCIAL STATEMENTS (continued)
March 31, 2014 (Unaudited)
Intrepid Small Cap Fund – Investor Class
| | | Six Months Ended | | | Year Ended | |
| | | March 31, 2014 | | | September 30, 2013 | |
| Shares sold | | | 3,322,415 | | | | 11,564,221 | |
| Shares issued to holders in | | | | | | | | |
| reinvestment of dividends | | | 1,417,192 | | | | 3,330,364 | |
| Shares redeemed | | | (8,929,312 | ) | | | (23,527,970 | ) |
| Net decrease in shares | | | (4,189,705 | ) | | | (8,633,385 | ) |
| Shares outstanding: | | | | | | | | |
| Beginning of period | | | 35,618,292 | | | | 44,251,677 | |
| End of period | | | 31,428,587 | | | | 35,618,292 | |
Intrepid Small Cap Fund – Institutional Class
| | | Six Months Ended | | | Year Ended | |
| | | March 31, 2014 | | | September 30, 2013 | |
| Shares sold | | | 6,314,610 | | | | 4,581,697 | |
| Shares issued to holders in | | | | | | | | |
| reinvestment of dividends | | | 356,830 | | | | 289,506 | |
| Shares redeemed | | | (1,174,686 | ) | | | (2,168,598 | ) |
| Net increase in shares | | | 5,496,754 | | | | 2,702,605 | |
| Shares outstanding: | | | | | | | | |
| Beginning of period | | | 6,755,430 | | | | 4,052,825 | |
| End of period | | | 12,252,184 | | | | 6,755,430 | |
Intrepid Income Fund – Investor Class
| | | Six Months Ended | | | Year Ended | |
| | | March 31, 2014 | | | September 30, 2013 | |
| Shares sold | | | 216,890 | | | | 807,121 | |
| Shares issued to holders in | | | | | | | | |
| reinvestment of dividends | | | 36,775 | | | | 144,501 | |
| Shares exchanged into | | | | | | | | |
| Institutional Class | | | (2,864,432 | ) | | | — | |
| Shares redeemed | | | (828,317 | ) | | | (1,565,084 | ) |
| Net decrease in shares | | | (3,439,084 | ) | | | (613,462 | ) |
| Shares outstanding: | | | | | | | | |
| Beginning of period | | | 3,439,084 | | | | 4,052,546 | |
| End of period | | | — | | | | 3,439,084 | |
NOTES TO FINANCIAL STATEMENTS (continued)
March 31, 2014 (Unaudited)
Intrepid Income Fund – Institutional Class
| | | Six Months Ended | | | Year Ended | |
| | | March 31, 2014 | | | September 30, 2013 | |
| Shares sold | | | 559,793 | | | | 2,035,741 | |
| Shares issued to holders in | | | | | | | | |
| reinvestment of dividends | | | 185,191 | | | | 316,901 | |
| Shares exchanged from | | | | | | | | |
| Investor Class | | | 2,867,740 | | | | –– | |
| Shares redeemed | | | (402,804 | ) | | | (1,042,816 | ) |
| Net increase in shares | | | 3,209,920 | | | | 1,309,826 | |
| Shares outstanding: | | | | | | | | |
| Beginning of period | | | 7,747,910 | | | | 6,438,084 | |
| End of period | | | 10,957,830 | | | | 7,747,910 | |
Intrepid Disciplined Value Fund
| | | Six Months Ended | | | Year Ended | |
| | | March 31, 2014 | | | September 30, 2013 | |
| Shares sold | | | 374,062 | | | | 828,130 | |
| Shares issued to holders in | | | | | | | | |
| reinvestment of dividends | | | 311,324 | | | | 255,822 | |
| Shares redeemed | | | (298,501 | ) | | | (1,842,318 | ) |
| Net increase (decrease) in shares | | | 386,885 | | | | (758,366 | ) |
| Shares outstanding: | | | | | | | | |
| Beginning of period | | | 3,723,603 | | | | 4,481,969 | |
| End of period | | | 4,110,488 | | | | 3,723,603 | |
NOTES TO FINANCIAL STATEMENTS (continued)
March 31, 2014 (Unaudited)
| 7. | TRANSACTIONS WITH AFFILIATES |
The following issuers are affiliated with the Funds; that is, the Adviser had control of 5% or more of the outstanding voting securities during the period from October 1, 2013 through March 31, 2014. As defined in Section (2)(a)(3) of the Investment Company Act of 1940; such issues are:
Intrepid Capital Fund
| | | | | | | | | | | | Share | | | | | | | | | | | | | |
| | | Share | | | | | | | | | Balance | | | | | | | | | | | | | |
| | | Balance | | | | | | | | | at | | | | | | | | | Value at | | | Cost at | |
| | | at Oct. | | | | | | | | | March | | | Dividend | | | Realized | | | March | | | March | |
| Issuer Name | | 1, 2013 | | | | | | | | | 31, 2014 | | | | | | | | | 31, 2014 | | | | 31, 2014 | |
| EPIQ Systems, | | | | | | | | | | | | | | | | | | | | | | | | | | | | |
| Inc. (a) | | | 612,066 | | | | — | | | | (612,066 | ) | | | — | | | $ | 55,086 | | | $ | 1,833,798 | | | $ | — | | | $ | — | |
| World Wrestling | | | | | | | | | | | | | | | | | | | | | | | | | | | | | | | | |
| Entertainment, | | | | | | | | | | | | | | | | | | | | | | | | | | | | | | | | |
| Inc. (a) | | | 830,459 | | | | — | | | | (830,459 | ) | | | — | | | | 99,655 | | | | 8,795,691 | | | | — | | | | — | |
| | | | | | | | | | | | | | | | | | | $ | 154,741 | | | $ | 10,629,489 | | | $ | — | | | $ | — | |
Intrepid Small Cap Fund
| | | | | | | | | | | | Share | | | | | | | | | | | | | |
| | | Share | | | | | | | | | Balance | | | | | | | | | | | | | |
| | | Balance | | | | | | | | | at | | | | | | | | | Value at | | | Cost at | |
| | | at Oct. | | | | | | | | | March | | | Dividend | | | Realized | | | March | | | March | |
| Issuer Name | | 1, 2013 | | | Additions | | | Reductions | | | 31, 2014 | | | Income | | | Gain | | | 31, 2014 | | | 31, 2014 | |
| EPIQ Systems, | | | | | | | | | | | | | | | | | | | | | | | | | | | | |
| Inc. (a) | | | 1,260,574 | | | | — | | | | (1,260,574 | ) | | | — | | | $ | — | | | $ | 3,737,643 | | | $ | — | | | $ | — | |
| World Wrestling | | | | | | | | | | | | | | | | | | | | | | | | | | | | | | | | |
| Entertainment, | | | | | | | | | | | | | | | | | | | | | | | | | | | | | | | | |
| Inc. (a) | | | 2,055,828 | | | | — | | | | (2,055,828 | ) | | | — | | | | 235,161 | | | | 18,459,699 | | | | — | | | | — | |
| | | | | | | | | | | | | | | | | | | $ | 235,161 | | | $ | 22,197,342 | | | $ | — | | | $ | — | |
Intrepid Income Fund
| | | | | | | | | | | | Share | | | | | | | | | | | | | |
| | | Share | | | | | | | | | Balance | | | | | | | | | | | | | |
| | | Balance | | | | | | | | | at | | | | | | | | | | | | Cost at | |
| | | at Oct. | | | | | | | | | March | | | Dividend | | | Realized | | | March | | | March | |
| Issuer Name | | 1, 2013 | | | Additions | | | Reductions | | | 31, 2014 | | | | | | | | | 31, 2014 | | | 31, 2014 | |
| World Wrestling | | | | | | | | | | | | | | | | | | | | | | | | | | | | |
| Entertainment, | | | | | | | | | | | | | | | | | | | | | | | | | | | | |
| Inc. (a) | | | 118,525 | | | | — | | | | (118,525 | ) | | | — | | | $ | 11,839 | | | $ | 901,247 | | | $ | — | | | $ | — | |
| | | | | | | | | | | | | | | | | | | $ | 11,839 | | | $ | 901,247 | | | $ | — | | | $ | — | |
NOTES TO FINANCIAL STATEMENTS (continued)
March 31, 2014 (Unaudited)
Intrepid Disciplined Value Fund
| | | | | | | | | | | | Share | | | | | | | | | | | | | |
| | | Share | | | | | | | | | Balance | | | | | | | | | | | | | |
| | | Balance | | | | | | | | | at | | | | | | | | | Value at | | | Cost at | |
| | | at Oct. | | | | | | | | | March | | | Dividend | | | Realized | | | March | | | March | |
| Issuer Name | | 1, 2013 | | | Additions | | | Reductions | | | 31, 2014 | | | Income | | | Gain | | | 31, 2014 | | | 31, 2014 | |
| EPIQ Systems, | | | | | | | | | | | | | | | | | | | | | | | | | | | | |
| Inc. (a) | | | 32,570 | | | | — | | | | (32,570 | ) | | | — | | | $ | — | | | $ | 115,745 | | | $ | — | | | $ | — | |
| World Wrestling | | | | | | | | | | | | | | | | | | | | | | | | | | | | | | | | |
| Entertainment, | | | | | | | | | | | | | | | | | | | | | | | | | | | | | | | | |
| Inc. (a) | | | 102,231 | | | | — | | | | (102,231 | ) | | | — | | | | 12,268 | | | | 972,904 | | | | — | | | | — | |
| | | | | | | | | | | | | | | | | | | $ | 12,268 | | | $ | 1,088,649 | | | $ | — | | | $ | — | |
| (a) | Security is no longer an affiliated company at March 31, 2014. |
| 8. | FEDERAL INCOME TAX INFORMATION |
The tax components of distributions paid during the fiscal years ended September 30, 2013 and 2012 are as follows:
| | | September 30, 2013 | | | September 30, 2012 | |
| | | Ordinary | | | Long-Term | | | Ordinary | | | Long-Term | |
| | | Income | | | Capital Gains | | | Income | | | Capital Gains | |
| Intrepid Capital Fund | | $ | 16,081,659 | | | $ | 3,462,698 | | | $ | 21,103,137 | | | $ | 5,319,613 | |
| Intrepid Small Cap Fund | | | 29,637,548 | | | | 27,732,663 | | | | 34,344,831 | | | | 43,643,220 | |
| Intrepid Income Fund | | | 3,921,807 | | | | 682,892 | | | | 4,735,277 | | | | 829,286 | |
| Intrepid Disciplined | | | | | | | | | | | | | | | | |
| Value Fund | | | 2,097,686 | | | | 458,332 | | | | 904,705 | | | | 1,532,134 | |
Additionally, U.S. generally accepted accounting principles require that certain components of net assets relating to permanent differences be reclassified between financial and tax reporting. These reclassifications have no effect on net assets or net asset value per share. For the year ended September 30, 2013, the following table shows the reclassifications made:
| | | Accumulated | | | Undistributed | | | | |
| | | Net Realized | | | Net Investment | | | Paid-in | |
| | | Losses | | | Income | | | Capital | |
| Intrepid Capital Fund | | $ | (231,678 | ) | | $ | 231,679 | | | $ | (1 | ) |
| Intrepid Small Cap Fund | | | (4,439,004 | ) | | | 4,439,004 | | | | — | |
| Intrepid Income Fund | | | (487,533 | ) | | | 487,533 | | | | — | |
| Intrepid Disciplined Value Fund | | | (49,542 | ) | | | 49,542 | | | | — | |
NOTES TO FINANCIAL STATEMENTS (continued)
March 31, 2014 (Unaudited)
These reclassifications primarily relate to Real Estate Investment Trust (“REIT”) adjustments with differing book and tax methods for accounting, investment losses and currency adjustments.
As of September 30, 2013, the components of accumulated earnings (losses) for income tax purposes were as follows:
| | | Intrepid | | | Intrepid | |
| | | Capital Fund | | | Small Cap Fund | |
| Cost of investments | | $ | 262,926,057 | | | $ | 233,216,971 | |
| Unrealized appreciation | | | 36,604,995 | | | | 49,574,506 | |
| Unrealized depreciation | | | (3,571,044 | ) | | | (2,932,257 | ) |
| Net unrealized appreciation | | | 33,033,951 | | | | 46,642,249 | |
| Undistributed ordinary income | | | 12,621,335 | | | | 16,425,333 | |
| Undistributed long-term capital gain | | | 7,576,753 | | | | 6,340,208 | |
| Distributable income | | | 20,198,088 | | | | 22,765,541 | |
| Other accumulated loss | | | — | | | | — | |
| Total accumulated gain | | $ | 53,232,039 | | | $ | 69,407,790 | |
| | | | | | | | | |
| | | Intrepid | | | | | |
| | | Intrepid | | | Disciplined | |
| | | Income Fund | | | Value Fund | |
| Cost of investments | | $ | 55,847,258 | | | $ | 14,017,629 | |
| Unrealized appreciation | | | 659,866 | | | | 3,072,052 | |
| Unrealized depreciation | | | (726,530 | ) | | | (184,320 | ) |
| Net unrealized appreciation (depreciation) | | | (66,664 | ) | | | 2,887,732 | |
| Undistributed ordinary income | | | 118,773 | | | | 1,141,022 | |
| Undistributed long-term capital gain | | | 523,596 | | | | 2,118,966 | |
| Distributable income | | | 642,369 | | | | 3,259,988 | |
| Other accumulated loss | | | — | | | | (88,954 | ) |
| Total accumulated gain | | $ | 575,705 | | | $ | 6,058,766 | |
The difference between book-basis and tax-basis unrealized appreciation is attributable primarily to the tax deferral of losses on wash sales.
At September 30, 2013, the Intrepid Disciplined Value Fund has post-December late year losses of $88,954, which the Fund will elect to defer to its next tax year.
Intrepid Funds
NOTES TO FINANCIAL STATEMENTS (continued)
March 31, 2014 (Unaudited)
There is no tax liability resulting from unrecognized tax benefits relating to uncertain income tax positions taken or expected to be taken on the tax return for the fiscal year-end September 30, 2013, or for any other tax years which are open for exam. As of September 30, 2013, open tax years include the tax years ended September 30, 2010 through 2013. The Trust is also not aware of any tax positions for which it is reasonably possible that the total amounts of unrecognized tax benefits will significantly change in the next year. The Funds recognize interest and penalties, if any, related to unrecognized tax benefits as income tax expense in the Statement of Operations. During the period, the Funds did not incur any interest or penalties, nor were any accrued as of September 30, 2013.
The Intrepid Capital Fund, Intrepid Small Cap Fund, Intrepid Income Fund, and Intrepid Disciplined Value Fund each have a revolving unsecured credit facility in the amounts of $5,000,000, $10,000,000, $5,000,000, and $2,000,000, respectively, for temporary emergency purposes, including the meeting of redemption requests that otherwise might require the untimely disposition of securities. The lines of credit have a one year term and are reviewed annually by the Board of Trustees. The current agreements run through October 15, 2014. The interest rate as of March 31, 2014 was 3.25%. During the six months ended March 31, 2014, none of the Intrepid Funds drew on their line of credit.
ADDITIONAL INFORMATION
March 31, 2014 (Unaudited)
Investment Advisory Agreement Disclosure
On November 5, 2013, the Board of Trustees of Intrepid Capital Management Funds Trust approved renewing the investment advisory agreements between the Intrepid Capital Fund, the Intrepid Small Cap Fund, the Intrepid Income Fund and the Intrepid Disciplined Value Fund (the “Funds”) and Intrepid Capital Management, Inc. Prior to approving the renewal of the agreements, the Board considered:
| | • | The nature, extent and quality of the services provided by Intrepid Capital Management, Inc. |
| | • | The investment performance of the Funds |
| | • | The cost of the services provided by, and the profits realized by, Intrepid Capital Management, Inc. from its relationship with the Funds |
| | • | The extent to which economies of scale would be realized as the Funds grew and whether fee levels reflect any such economies of scale |
| | • | The expense ratio of the Funds |
| | • | The manner in which portfolio transactions for the Funds were conducted, including the use of soft dollars |
In considering the nature, extent and quality of the services provided by Intrepid Capital Management Inc. (the “Adviser”), the Board considered the Adviser’s quality of investment management provided to the Funds, the Adviser’s management history and the Adviser’s ability to attract investors for the Funds. The Board concluded that the nature, extent and quality of the services provided by the Adviser are satisfactory.
The Board reviewed the investment performance of the Funds and compared the investment performance of the Funds to their relevant benchmarks. After further discussion, the Board concluded that the performance of the Funds was satisfactory in comparison to the relevant benchmarks.
The Board considered the cost of services provided and the profits realized by the Adviser, by reviewing reports provided by the Funds’ administrator that compared the Funds’ investment advisory fees to those of other comparable mutual funds, and by reviewing information provided by the Adviser about its profitability. The Board concluded that the investment advisory fees were fair and within the range of the industry averages.
The Board considered the extent to which economies of scale would be realized as the Funds grow, including a consideration of breakpoints in the fee schedules of the agreements. The Board concluded that given the expected growth of assets of the Funds in the next year, the Adviser was unlikely to realize economies of scale and the proposed fee schedules were acceptable.
ADDITIONAL INFORMATION (continued)
March 31, 2014 (Unaudited)
The Board reviewed reports from the Funds’ administrator that compared the Funds’ total expense ratios to those of other comparable mutual funds. The Board concluded that the total expenses of the Funds were reasonable and within the range of the industry averages.
The Board reviewed reports discussing the manner in which portfolio transactions for the Funds were conducted, including the use of soft dollars. Based on these reports, the Board concluded that the research and services obtained by the Adviser were beneficial to the Funds and that the Adviser is executing the Funds’ portfolio transactions in a manner designed to obtain best execution for the Funds.
All of the factors above were considered separately by the Board, including the Trustees who are not “interested persons” (as defined in the 1940 Act) of the Funds (the “Independent Trustees”) meeting in an executive session. The factors were viewed in their totality by the Board, with no single factor being the principal or determinative factor in the Board’s determination of whether to approve the continuation of the advisory agreements. Based on the factors discussed above, the Board, including all of the Independent Trustees, approved the continuation of the advisory agreements.
Shareholder Notification of Federal Tax Status
The Intrepid Capital Fund, Intrepid Small Cap Fund, Intrepid Income Fund, and Intrepid Disciplined Value Fund designate $3,462,698, $27,732,663, $682,892 and $458,332, respectively, of total distributions paid during the fiscal year ended September 30, 2013 as net capital gain distributions eligible for long-term capital gain rates for individual shareholders.
The Intrepid Capital Fund, Intrepid Small Cap Fund, Intrepid Income Fund and Intrepid Disciplined Value Fund designate 24.58%, 25.60%, 2.43% and 35.05%, respectively, of their ordinary income distributions for the period ended September 30, 2013 as qualified dividend income under the Jobs & Growth Tax Relief Reconciliation Act of 2003.
For the period ended September 30, 2013, 20.70%, 18.50%, 2.08% and 31.80% of Intrepid Capital Fund, Intrepid Small Cap Fund, Intrepid Income Fund and Intrepid Disciplined Value Fund dividends paid from net ordinary income, respectively, qualify for the dividends received deduction available to corporate shareholders.
The Intrepid Capital Fund, Intrepid Small Cap Fund, Intrepid Income Fund and Intrepid Disciplined Value Fund designate 36.20%, 0.00%, 98.68% and 0.00%, respectively, of their ordinary income distributions for the fiscal year as interest-related dividends under Internal Revenue Code Section 871(k)(1)(c).
ADDITIONAL INFORMATION (continued)
March 31, 2014 (Unaudited)
The Intrepid Capital Fund, Intrepid Small Cap Fund, Intrepid Income Fund and Intrepid Disciplined Value Fund designate 62.47%. 100%, 11.01% and 89.14%, respectively, of their ordinary income distributions as short-term capitalization distributions under Internal Revenue Code Section 871(k)(2)(c).
Availability of Quarterly Portfolio Holdings Schedules
The Funds are required to file their complete schedule of portfolio holdings with the SEC for the first and third quarters of each fiscal year on Form N-Q. Once filed, the Funds’ Form N-Q is available without charge, upon request on the SEC’s website (http://www.sec.gov) and may be available by calling 1.866.996.3863. You may also obtain copies at the SEC’s Public Reference Room in Washington, D.C. Information on the operation of the Public Reference Room may be obtained by calling 1.800.SEC.0330.
Proxy Voting Policies and Procedures and Proxy Voting Record (Unaudited)
A description of the policies and procedures that the Funds use to determine how to vote proxies relating to portfolio securities is available without charge, upon request, by calling 1.866.996.3863 and on the SEC’s website (http://www.sec.gov).
The Funds are required to file how they voted proxies related to portfolio securities during the most recent 12-month period ended June 30. Once filed, the information is available without charge, upon request, by calling 1.866.996.3863 and on the SEC’s website (http://www.sec.gov).
Board of Trustees
Edward Vandergriff
Mark Travis
Peter Osterman, Jr.
Roy Clarke
Investment Adviser
Intrepid Capital Management, Inc.
1400 Marsh Landing Parkway, Suite 106
Jacksonville Beach, FL 32250
Independent Registered Public Accounting Firm
Deloitte & Touche LLP
111 South Wacker Drive
Chicago, IL 60606
Legal Counsel
Foley & Lardner LLP
777 East Wisconsin Avenue
Milwaukee, WI 53202
Custodian
U.S. Bank, N.A.
1555 N. RiverCenter Drive, Suite 302
Milwaukee, WI 53212
Distributor
Quasar Distributors, LLC
615 East Michigan Street
Milwaukee, WI 53202
Administrator, Transfer Agent
and Dividend Disbursing Agent
U.S. Bancorp Fund Services, LLC
615 East Michigan Street
Milwaukee, WI 53202
Shareholder/Investor Information
1.866.996.3863
www.intrepidcapitalfunds.com
Not applicable for semi-annual reports.
Item 3. Audit Committee Financial Expert.
Not applicable for semi-annual reports.
Item 4. Principal Accountant Fees and Services.
Not applicable for semi-annual reports.
Item 5. Audit Committee of Listed Registrants.
Not applicable to registrants who are not listed issuers (as defined in Rule 10A-3 under the Securities Exchange Act of 1934).
Item 6. Investments.
Schedule of Investments is included as part of the report to shareholders filed under Item 1 of this Form.
Item 7. Disclosure of Proxy Voting Policies and Procedures for Closed-End Management Investment Companies.
Not applicable to open-end investment companies.
Item 8. Portfolio Managers of Closed-End Management Investment Companies.
Not applicable to open-end investment companies.
Item 9. Purchases of Equity Securities by Closed-End Management Investment Company and Affiliated Purchasers.
Not applicable to open-end investment companies.
Item 10. Submission of Matters to a Vote of Security Holders.
Not Applicable.
Item 11. Controls and Procedures.
| (a) | The Registrant’s President and Treasurer have reviewed the Registrant's disclosure controls and procedures (as defined in Rule 30a-3(c) under the Investment Company Act of 1940 (the “Act”)) as of a date within 90 days of the filing of this report, as required by Rule 30a-3(b) under the Act and Rules 13a-15(b) or 15d-15(b) under the Securities Exchange Act of 1934. Based on their review, such officers have concluded that the disclosure controls and procedures are effective in ensuring that information required to be disclosed in this report is appropriately recorded, processed, summarized and reported and made known to them by others within the Registrant and by the Registrant’s service provider. |
| (b) | There were no changes in the Registrant's internal control over financial reporting (as defined in Rule 30a-3(d) under the Act) that occurred during the second fiscal quarter of the period covered by this report that has materially affected, or is reasonably likely to materially affect, the Registrant's internal control over financial reporting. |
Item 12. Exhibits.
| (a) | (1) Any code of ethics or amendment thereto, that is the subject of the disclosure required by Item 2, to the extent that the registrant intends to satisfy Item 2 requirements through filing an exhibit. 1) Incorporated by reference to the Registrant’s Form N-CSR filed December 5, 2008. |
(2) A separate certification for each principal executive and principal financial officer pursuant to Section 302 of the Sarbanes-Oxley Act of 2002. Filed herewith.
(3) Any written solicitation to purchase securities under Rule 23c-1 under the Act sent or given during the period covered by the report by or on behalf of the registrant to 10 or more persons. Not applicable to open-end investment companies.
| (b) | Certifications pursuant to Section 906 of the Sarbanes-Oxley Act of 2002. Furnished herewith. |
SIGNATURES
Pursuant to the requirements of the Securities Exchange Act of 1934 and the Investment Company Act of 1940, the registrant has duly caused this report to be signed on its behalf by the undersigned, thereunto duly authorized.
(Registrant) Intrepid Capital Management Funds Trust
By (Signature and Title)* /s/ Mark F. Travis
Mark F. Travis, President
Date 5/30/2014
Pursuant to the requirements of the Securities Exchange Act of 1934 and the Investment Company Act of 1940, this report has been signed below by the following persons on behalf of the registrant and in the capacities and on the dates indicated.
By (Signature and Title)* /s/ Mark F. Travis
Mark F. Travis, President
Date 5/30/2014
By (Signature and Title)* /s/ Donald C. White
Donald C. White, Treasurer
Date 5/30/2014
* Print the name and title of each signing officer under his or her signature.