UNITED STATES
SECURITIES AND EXCHANGE COMMISSION
Washington, D.C. 20549
FORM N-CSR
CERTIFIED SHAREHOLDER REPORT OF REGISTERED
MANAGEMENT INVESTMENT COMPANIES
811-21625
Investment Company Act file number
Intrepid Capital Management Funds Trust
(Exact name of registrant as specified in charter)
1400 Marsh Landing Parkway, Suite 106
Jacksonville Beach, FL 32250
(Address of principal executive offices) (Zip code)
Mark F. Travis
1400 Marsh Landing Parkway, Suite 106
Jacksonville Beach FL 32250
(Name and address of agent for service)
1-904-246-3433
Registrant's telephone number, including area code
Date of fiscal year end: 09/30/2012
Date of reporting period: 03/31/2012
Item 1. Report to Stockholders.
Intrepid Capital Fund
Intrepid Small Cap Fund
Intrepid Income Fund
Intrepid All Cap Fund
Semi-Annual Report
March 31, 2012
Intrepid Capital Fund
Mark F. Travis, President/C.E.O.
April 11, 2012
Dear Fellow Shareholders,
For the period ended March 31, 2012, the Intrepid Capital Fund (the “Fund”) returned 6.56% in the first calendar quarter and 14.31% in the first six months of its fiscal year. Taking a step back, the Fund has produced annualized returns of 5.31%, 18.88%, 7.44%, and 7.07% over the last one year, three years, five years, and since the Fund’s inception on January 3, 2005, respectively. Over the same periods, the S&P 500 returned 12.59% for the first calendar quarter, 25.89% during the first six months of the fiscal year, and 8.54%, 23.42%, 2.01%, and 4.36% for the last one year, three year, five year, and since the Fund’s inception on an annualized basis. The Fund’s other benchmark, the Bank of America Merrill Lynch High Yield Master II Index returned 5.15% for the first calendar quarter, 11.65% during the first six months of the fiscal year, and 5.63%, 23.78%, 7.84%, and 7.76% for the last one year, three year, five year, and since the Fund’s inception on an annualized basis. The Fund’s gross expense ratio is 1.47%.
Performance data quoted represents past performance and does not guarantee future results. Investment returns and principal value will fluctuate, and when sold, may be worth more or less than their original cost. Performance current to the most recent month-end may be lower or higher than the performance quoted and can be obtained by calling 866-996-FUND. The Fund imposes a 2% redemption fee on shares held less than 30 days. Performance data does not reflect the redemption fee. If it had, returns would be reduced.
At this point in all of my letters, our lawyers force us to remind you that “past performance is no guarantee of future results.” With that out of the way, we do tend to agree with the lawyers on past performance, but we also think well designed strategies with a rigorous, disciplined process should continue to attain attractive risk-adjusted results over the long run.
Prospective investment returns depend on what an investor is willing to pay today for a stream of expected future cash flows, whether those cash flows are delivered by a stock, bond, or other type of investment vehicle. In an environment where broad equity indices such as the S&P 500 have annualized three-year returns exceeding 20%, finding strong businesses trading at attractive prices has become quite challenging. The same can be said of corporate debt securities, whose prices remain artificially inflated by the lowest interest rate environment in years.
The easy way to think of the investment process we deploy at Intrepid Capital is that when security prices are depressed and offer attractive prospective returns, our cash levels tend to be low. Conversely, when prices are high and your brother-in-law is bragging about his stock market winnings, our cash levels tend to be high.
Intrepid Capital Fund
I have often lamented over the last 17 years as a portfolio manager about how much easier my life would be if I were a “closet indexer,” holding a basket of securities that closely resembled market benchmarks and floating with the tide, whichever way it may be going. Easier for me, yes, but much harder for you, since I would be able to blame losses of your capital on “the market” and avoid accepting any culpability.
At Intrepid Capital our value-sensitive, contrarian-tilted investment process can be “painful” as we try to grow your capital base and ours, with an ever-watchful eye on risk. Risk is the evil twin sister of return that is often ignored when markets march upward, but will quickly find its way to the front of investors’ minds when asset values begin to fall.
For the quarter, the three biggest contributors to positive performance were: Computer Sciences (ticker: CSC), CoreLogic (ticker: CLGX), and Microsoft (ticker: MSFT). To be “fair and balanced” in our reporting, our largest detractors for the same period were: Newmont Mining (ticker: NEM) and Bill Barrett Corp. (ticker: BBG). Interestingly, these last two are what we refer to as “asset valuations,” where we think there is a material disconnect between the current market price of a business and the long-term value of its asset base net of liabilities. The recent decline in share prices has only increased our conviction, and we have taken the opportunity to increase our weights in these holdings.
I am pleased to say that for the period ending March 31, 2012, Morningstar ranked the Intrepid Capital Fund in the top 31%, 15%, and 1% out of 969, 839 and 749 Moderate Allocation Funds for the one-, three- and five-year periods, respectively, based on total returns. The Fund also received an Overall 5-Star Morningstar Rating, the highest rating for risk-adjusted returns, out of 839 Moderate Allocation Funds for the period ending March 31, 2012 (derived from a weighted average of the fund’s three-, five-, and ten-year risk-adjusted return measure, if applicable). The largest part of my family’s investments continues to be held in the Intrepid Capital Funds, along with the assets of the analytical staff at Intrepid Capital that made these results possible.
Thank you for entrusting your hard-earned assets to our care; it is not an obligation we take lightly.
Best regards,
Mark F. Travis
President
Intrepid Capital Fund Portfolio Manager
Must be preceded or accompanied by a prospectus.
Intrepid Capital Fund
Please see the Schedule of Investments in this report for a full list of fund holdings. Fund holdings and sector allocations are subject to change at any time and should not be considered a recommendation to buy or sell any security.
Mutual fund investing involves risk. Principal loss is possible. The Fund is subject to special risks including volatility due to investments in smaller companies, which involve additional risks such as limited liquidity and greater volatility. The Fund is considered non-diversified as a result of limiting its holdings to a relatively small number of positions and may be more exposed to individual stock volatility than a diversified fund. Investments in debt securities typically decrease in value when interest rates rise. This risk is usually greater for longer term debt securities. Investments by the Fund in lower-rated and non-rated securities present a greater risk of loss to principal and interest than higher rated securities.
The S&P 500 Index is a broad based unmanaged index of 500 stocks, which is widely recognized as representative of the equity market in general. The Bank of America/Merrill Lynch High Yield Master II Index is Merrill Lynch’s broadest high yield index, and as such is comparable with the broad indices published by other investment banks. The Russell 2000 Index consists of the smallest 2,000 companies in a group of 3,000 Index, as ranked by market capitalization. You cannot invest directly in an index.
©2012 Morningstar, Inc. All Rights Reserved. The information contained herein: (1) is proprietary to Morningstar; (2) may not be copied or distributed; and (3) is not warranted to be accurate, complete or timely. Neither Morningstar nor its content providers are responsible for any damages or losses arising from any use of this information. Past performance is no guarantee of future results.
Morningstar Rankings represent a fund’s total-return percentile rank relative to all funds that have the same Morningstar Category. The highest percentile rank is 1 and the lowest is 100. It is based on Morningstar total return, which includes both income and capital gains or losses and is not adjusted for sales charges or redemption fees. Morningstar ranked the Intrepid Capital Fund in the top 31%, 15% and 1% out of 969, 839, and 749 Moderate Allocation funds for the one- , three- and five-year periods ending 3/31/12, respectively.
The Intrepid Capital Fund was rated 4-Stars and 5-Stars against the following numbers of U.S. domiciled Moderate Allocation funds over the following time periods: 839 and 749 funds in the last three- and five-years, respectively.
For each fund with at least a three-year history, Morningstar calculates a Morningstar Rating (based on a Morningstar risk-adjusted return measure that accounts for variation in a fund’s monthly performance, including the effects of sales charges, loads, and redemption fees), placing more emphasis on downward variations and rewarding consistent performance. The top 10% of funds in each category receive 5 stars, the next 22.5% receive 4 stars, the next 35% receive 3 stars, the next 22.5% receive 2 stars and the bottom 10% receive 1 star.
Cash flow measures the cash generating capability of a company by adding non-cash charges (e.g. deprecation) and interest expense to pretax income. Duration is a commonly used measure of the potential volatility of the price of a debt security, or the aggregate market value of a portfolio of debt securities, prior to maturity. Securities with a longer duration generally have more volatile prices than securities of comparable quality with a shorter duration.
Opinions expressed are subject to change, are not guaranteed and should not be considered investment advice or recommendations to buy or sell any security.
The Intrepid Capital Funds are distributed by Quasar Distributors, LLC.
Intrepid Small Cap Fund
Jayme Wiggins,
Small Cap Fund Portfolio Manager
April 5, 2012
Dear Fellow Shareholders,
Like a tired dog, Wall Street is accustomed to walking around in circles. Instead of writing this letter, we almost re-posted the commentary from last year’s first quarter. Little has changed since then, even though the market has bounced around quite a bit. Through the first three months of 2012, the Intrepid Small Cap Fund (the “Fund”) gained 5.23% versus a 12.44% increase for the Russell 2000 Index. During the Fund’s fiscal six month period, ending March 31, 2012, the Fund rose 14.54%, while the Russell 2000 gained 29.83%. We have trailed small cap benchmarks during this upswing, much like we did in last year’s early ramp. The reasons are basically the same. Small caps are back to all-time highs and undervalued securities are scarce. As a result, our portfolio consists of lower beta holdings and a large amount of cash.
Cash and equivalents equaled 47% of Fund assets at March 31, 2012. According to the Investment Company Institute, the average equity mutual fund has 3.6% of assets in cash, which is close to a historical low. A record high level of cash for the fund industry of almost 6% was reached in early 2009. That was the one time since the inception of the Intrepid Small Cap Fund that we held less cash than our peers. Our cash has returned to 2007 levels because the small cap opportunity set is similarly constrained. Unlike then, when we earned 5% in Treasury bills, the Federal Reserve has eliminated the returns from owning risk-free investments. By punishing savers and promoting higher stock prices, the Fed hopes to create a virtuous circle of consumer and corporate confidence. Why own a risk-free Treasury that pays nothing if an investment grade bond yields 3%? Why accept a high grade coupon of only 3% if junk bonds yield 7%? Why settle for below investment grade debt at 7% if stocks have increased 9% annually over the “long run”? The logic of the slope of relative returns is very slippery. Pitfalls abound.
Although certain European economies are worse off than the U.S. is today, America isn’t an economic oasis. Unfortunately, the short-term impact of doing the right thing by reducing spending is politically unpalatable. Today, the front page headline on The Wall Street Journal reads, “Markets Fear End of Stimulus.” Investors shouldn’t be trading on hopes of unsustainable government intervention, but it has existed for so long now that it’s difficult to discern how our economy would look standing on its own two feet. What would happen to the collective top line of Corporate America if our government had a balanced budget? To what extent has the decades-long decline in interest rates given a tailwind to borrowers?
There were rumblings of margin pressure in the fourth quarter, but corporate profitability remains near peak levels. Some market participants claim that small cap
Intrepid Small Cap Fund
margins, in contrast to large caps, are not yet back to the record highs of 2006. Based on our internal analysis, this is false. The median operating margin for non-financial companies in the Russell 2000 was 6.8% in 2011 and 7% in 2006. The market cap weighted average margin was 10.2% and 10.1% in 2011 and 2006, respectively, excluding outliers. Larger companies in the small cap index have higher profitability. Financials were excluded from the data because interest is a component of their operating profit. The margins of financial companies, namely banks, have fallen significantly since the housing bubble.
Some in the investment community claim that there have been structural changes in the economy (e.g. technology, globalization) that permit higher margins than were historically attainable. The economy has shifted from manufacturing toward services over the years. One can make the case that since service businesses generally require fewer assets than manufacturing businesses, the economy’s steady state margin should actually be lower, not higher. Competition drives down returns toward the cost of capital. The return on capital is the product of unlevered after-tax margins and invested capital turnover (operating margin * [1 – tax rate] * [sales/invested capital]). Therefore, if the economy becomes more asset light (i.e. invested capital declines), margins for companies without a sustainable competitive advantage should be competed downward. We believe small company margins are as high as they’ve been in a long time and expect them to eventually contract.
The Fund’s largest contributors during the first quarter included many of the same companies that fell furthest in the preceding quarter. The three stocks adding the most to the portfolio’s return were Federated Investors (ticker: FII), Computer Sciences (ticker: CSC), and CoreLogic (ticker: CLGX). Federated’s stock previously suffered from the specter of SEC regulation of money market funds, as well as the Fed’s pledge to keep interest rates near zero through 2014. Speculation has grown that the SEC committee charged with proposing money fund reforms is leaning in the direction of less harsh regulation. Additionally, the market has started to doubt that interest rates will remain at zero for another two years. These developments helped drive Federated’s shares up 48% in the quarter, adding 1% to the Fund’s overall return.
We opined in last quarter’s letter that Computer Sciences was “broadly hated” and believed the shares were attractive. The stock received a nice bounce in early February as the firm simultaneously announced earnings and the appointment of Mike Lawrie as CEO. Lawrie has a successful track record of turning around troubled firms, and the resignations of CSC’s former CEO and CFO could help restore credibility to the management team. The company’s earnings report was weak, but bookings were strong. CSC also is making progress in its negotiations with the U.K. National Health System. This contract has dogged the firm for years and clarity would be welcomed by investors.
CoreLogic was the Fund’s third largest gainer in the first quarter. The stock has been highly volatile over the past year, and we have taken advantage of these movements to
Intrepid Small Cap Fund
resize our position. For example, CoreLogic was briefly a 4% weighting and the Fund’s largest holding last August, before the company announced it was examining strategic alternatives. In Q1, CoreLogic said its strategic review was complete and the firm plans to remain independent. To the surprise of many, the stock rallied on this news, which was accompanied by solid guidance for 2012. As CoreLogic, Federated, and CSC have approached their intrinsic values, we have reduced the positions.
Bill Barrett (ticker: BBG) was the Fund’s only major detractor in the quarter. This position negatively impacted the Fund’s return by 65 basis points. Bill Barrett’s stock has been hammered by the lowest natural gas prices in ten years. The Wall Street Journal even speculated recently that natural gas prices will turn negative this summer (March 28, 2012: “Why Natural Gas Prices Could Fade to Red”). There’s no denying that natural gas inventories are bloated and prices are in the gutter. We do not expect natural gas prices to stay at existing low levels. There is no incentive for E&P companies to drill for new gas today, and we are fast approaching the point when operators will take a loss producing already developed reserves. We expect supply to fall and demand to gradually increase. Nevertheless, our investment thesis for Bill Barrett does not depend on a sharp rebound in natural gas prices back to the averages of recent years. While Bill Barrett is clearly perceived as a natural gas company (see chart below), approximately half of its revenue comes from oil and natural gas liquids, which are priced at a premium to dry gas. Ultimately, we believe that investors will recognize that Bill Barrett has substantial “wet” assets that are more highly valued in today’s market. We more than doubled our ownership in Bill Barrett’s stock during the quarter as the shares fell 23%.
| | | |
| | Per MMBtu = per 1 million Btus | Source: Intrepid |
Intrepid Small Cap Fund
New purchase activity was limited in the first quarter. We bought small positions in Amdocs (ticker: DOX) and Pan American Silver (ticker: PAAS). Amdocs is the world’s leading provider of billing and customer care solutions to the communications industry. It is a high-quality business that generates substantial free cash flow and possesses a pristine balance sheet. Pan American is a silver miner that we have previously owned. Over the past two years, the price of silver has doubled while Pan American’s stock has slightly declined. The stock trades for 5x operating income. Shares have fallen because of reduced expectations for another round of money printing by the Fed. In theory, no more quantitative easing should lower inflation expectations. In our opinion, the Fed’s money printing antics are not over. Pan American Silver provides a small hedge against the possibility of increased inflation. We will not claim to know the fair value for an ounce of silver, but our Pan American valuation assumes a normalized silver price that is well below recent levels.
During the quarter, we sold our holdings of ICU Medical (ticker: ICUI), Oshkosh (ticker: OSK), Scholastic (ticker: SCHL), Standard Parking (ticker: STAN), and Total Systems Services (ticker: TSS). Each of these stocks crossed our estimated fair value. Scholastic’s rise was more company-specific than the others, as the success of The Hunger Games gave a temporary boost to earnings.
Lower-quality stocks have outperformed this year. We don’t believe that increasing portfolio risk is prudent at current market valuations. We have a long shopping list of companies we want to own at the right price. While bargains are limited today, the sentiment of the market can change rapidly. We believe we are well-positioned to capitalize when this occurs. Thank you for your investment.
Sincerely,
Jayme Wiggins, CFA
Intrepid Small Cap Fund Portfolio Manager
Please see the Schedule of Investments in this report for a full list of fund holdings. Fund holdings and sector allocations are subject to change at any time and should not be considered a recommendation to buy or sell any security.
Mutual fund investing involves risk. Principal loss is possible. The Fund is subject to special risks including volatility due to investments in smaller companies, which involve additional risks such as limited liquidity and greater volatility. The Fund is considered non-diversified as a result of limiting its holdings to a relatively small number of positions and may be more exposed to individual stock volatility than a diversified fund.
The Advisor believes that current market conditions warrant a defensive position from the requirement to invest at least 80% of its net assets in equity securities of small capitalization companies.
Intrepid Small Cap Fund
The Russell 2000 Index consists of the smallest 2,000 companies in a group of 3,000 U.S. Companies in the Russell 3000 Index, as ranked by market capitalization. You cannot invest directly in an index.
Cash Flow measures the cash generating capability of a company by adding non-cash charges and interest to pretax income. Free Cash Flow measures the cash generating capability of a company by subtracting capital expenditures from cash flow from operations. Unlevered free cash flow equals free cash flow plus after-tax interest expense. Beta measures the sensitivity of rates of return on a fund to general market movements. Market Cap is the market price of an entire company, calculated by multiplying the number of shares outstanding by the price per share. Basis Point is a unit that is equal to 1/100th of 1% and is used to denote a change in a financial instrument.
Opinions expressed are subject to change, are not guaranteed and should not be considered investment advice or recommendations to buy or sell any security.
The Intrepid Capital Funds are distributed by Quasar Distributors, LLC.
Intrepid Income Fund
 | |
| Jason Lazarus, | Ben Franklin, |
| Income Fund Co-Portfolio Manager | Income Fund Co-Portfolio Manager |
April 5, 2012
Dear Fellow Shareholders,
The high-yield market extended the gains booked at the end of 2011, rising 5.15% in the first quarter, ended March 31, 2012, as measured by the Merrill Lynch / Bank of America High Yield Master II index (the “Index”). In contrast, the Intrepid Income Fund (the “Fund”) gained 2.45% in the quarter, net-of-fees. In the six months ended March 31, 2012, the Fund returned 5.36%, while the Index gained 11.65%. As discussed in previous quarterly commentaries, our short-duration, high-quality bias has tended to underperform in periods of rapidly rising prices.
Last quarter we reported that the only bond that negatively impacted the portfolio’s performance was Smith & Wesson 9.5% due 1/14/2016. While the notes fell less than 1% in the fourth quarter, we felt this was unwarranted and remained confident in our holding. We are happy to report that Smith & Wesson was our top performer in the first quarter 2012, both for total return and contribution. Fears of both regulatory reform from the upcoming election and a deteriorating economy have caused consumers to flock to firearm purchases. Many of these purchases are for second and third firearms. The company’s balance sheet continues to strengthen, and management has no intention of using resources to acquire. They appear focused on maintaining a conservative capital structure. This should bode well for the future of our investment. Rounding out the top performers, Central Garden & Pet 8.25% due 3/01/2018 and Spartan Stores 3.375% convertible notes putable 5/14/2014 both outperformed the market as a whole. These businesses are long-term holdings of the Intrepid Income Fund and represent large positions of around 4% of assets.
Due to the significant gains in the bond and equity markets, the Fund had only one detractor in the first quarter. We initiated a small position in World Wrestling Entertainment (ticker: WWE) common stock, which declined slightly after the target position was established. The position had an immaterial effect on the Fund’s return in the quarter. WWE is a market-leading producer of live and broadcasted wrestling events. The company’s Monday Night Raw program on USA is the longest running weekly entertainment show on television, which has strong and stable TV ratings. WWE not only offers a 5%+ dividend, but we believe is significantly undervalued at below $9 per share.
The first quarter was fairly active from a trading perspective. We initiated five new positions, primarily in ideas where we had completed our research but could not
Intrepid Income Fund
immediately find a willing seller. These positions include Affinia Group 10.75% due 8/15/2016, Computer Sciences 6.5% due 3/15/2018, Energy Partners 8.25% due 2/15/2018, Quality Distribution 9.875% due 11/01/2018, and World Wrestling Entertainment common stock. We also added to our holdings of Intertape Polymer 8.5% due 8/01/2014, Libbey Glass 10% due 2/15/2015, and PetroQuest Energy 10% due 9/01/2017.
Our small position in CoreLogic 7.25% due 6/01/2021 was sold early in the quarter as the security appreciated significantly. The CoreLogic position was initiated in the third quarter of 2011 as the corporate bond and equity markets collapsed. Intrepid’s equity team had been following the company for over a year and alerted us to the bond issue, which had fallen from par to below $90. While the bond’s duration is longer than our typical target of five years or less, we were very comfortable with the company’s credit quality and felt the 9.4% yield-to-maturity compensated us well for the increased interest rate risk. The CoreLogic position is a good example of how Intrepid’s investment team collaborates across asset classes.
The equity team is also responsible for sourcing our newly entered Computer Sciences bond. Early in the year, the market became concerned that the possible loss of a large contract with the United Kingdom’s National Health Service would result in a downgrade of the company’s credit rating. While this concern was not unfounded, we believed CSC’s credit quality would not be materially impaired if the contract were lost. CSC’s 6.5% issue is an investment grade bond. Because the Fund is not constrained to only the high-yield bond asset class, our flexibility allowed us to capitalize on this unique opportunity, acquiring an investment-grade credit offering a junk-bond yield.
Another new position, Quality Distribution, operates the largest chemical tank truck network in North America. The logistics company transports everything from the raw materials that go into Tide laundry detergent to herbicides for Monsanto. The growth in “fracking”, which requires massive amounts of water to be pumped into rock layer to extract oil and natural gas, has been an avenue of growth for Quality, which entered the space as a transporter of water in the fourth quarter of 2010. Recently, the company has been shifting to an asset-light business model that runs with less operating leverage. The new model utilizes independent affiliates to provide the physical transportation of chemicals. This can be thought of as a franchise model, and the new strategy requires capital expenditures of only about 1% of revenue, compared to industry-wide percentages of around 10%. This reduction in spending allows the company to use cash for other purposes, such as paying down debt.
Unlike last quarter, only one of our holdings was called by its issuer in the first quarter. Mac-Gray (ticker: TUC) repurchased its 7.625% notes. Our purchase activity more than offset the cash influx, and the fund finished the quarter with 23.2% in cash. While this level reflects a decline from the end of 2011, it is
Intrepid Income Fund
important to note that we expect several of our holdings to be called through the summer. As a reminder, our cash levels do not reflect any attempt to time the market. Cash will fluctuate purely as a function of the available opportunities. As such, we expect the fund’s cash level to grow over the next few quarters in the absence of a market sell-off.
The rise in high-yield bond prices has compressed the Index’s yield-to-worst down to 7.13%. This is a historically low level of potential return offered by the asset class. On only a handful of occasions over the last decade have yields been this low, first in 2004/2005 then again in early 2011. We believe the portfolio is positioned defensively to insulate our shareholders from adverse credit events and higher risk-free rates. The Fund’s modified duration as of quarter-end is 2.4 years. While the opportunity set looks to be fairly limited, persistence and patience are still allowing us to find attractive high-yield issues. Thank you for your investment.
Sincerely,
 |  |
| Ben Franklin, CFA | Jason Lazarus |
| Intrepid Income | Intrepid Income |
| Co-Lead Portfolio Manager | Co-Lead Portfolio Manager |
Please see the Schedule of Investments in this report for a full list of fund holdings. Fund holdings and sector allocations are subject to change at any time and should not be considered a recommendation to buy or sell any security.
Mutual fund investing involves risk. Principal loss is possible. Investments in debt securities typically decrease in value when interest rates rise. The risk is generally greater for longer term debt securities. Investments by the Fund in lower-rated and non-rated securities present a greater risk of loss to principal and interest than higher rated securities. The Fund is non-diversified, meaning it may concentrate its assets in fewer individual holdings than a diversified. Therefore, the Fund is more exposed to individual securities volatility than a diversified fund.
The Bank of America Merrill Lynch High Yield Master II Index is Merrill Lynch’s broadest high yield index, and as such is comparable with the broad indices published by other investment banks. You cannot invest directly in an index.
Duration is a commonly used measure of the potential volatility of the price of a debt security, or the aggregate market value of a portfolio of debt securities, prior to maturity. Securities with a longer duration generally have more volatile prices than securities of comparable quality with a shorter duration. Modified Duration is a time measure of interest-rate risk exposure that estimates how much a bond, or a bond’s price, fluctuates with changes in interest rates. Yield-to-Worst is the bond yield computed by using the lower of either the yield to maturity or the yield to call on every possible call date. Par or par value is the face value of a bond.
Opinions expressed are subject to change, are not guaranteed and should not be considered investment advice or recommendations to buy or sell any security.
The Intrepid Capital Funds are distributed by Quasar Distributors, LLC.
Intrepid All Cap Fund
Greg Estes,
All Cap Fund Portfolio Manager
April 5, 2012
Dear Fellow Shareholders,
For the first calendar quarter ended March 31, 2012, the Intrepid All Cap Fund (the “Fund”) returned 9.04%. During the same period, the Standard & Poors 500 Index returned 12.59% and the Russell 3000 Index rose 12.87%. In this environment, in which the broad market increases so steeply, we believe our results will typically underperform compared to benchmark indices. We believe this because we strive to maintain a consistent investment process in all environments. Because we do not shift from our disciplined value investment process to a more growth-oriented or momentum-driven approach, we may sometimes encounter periods of underperformance, as we did in this quarter.
One result of our investment process was an increase in the Fund’s cash position. A rising market has usually resulted in fewer discounted investments available for purchase and more sales of existing holdings that reached our estimated intrinsic value. The Fund’s cash level has risen from 18.7% in the previous quarter to nearly 35% at the end of the most recent quarter. Naturally, this has a dampening effect on performance in current rising market conditions. On the other hand, there is a method to our madness. Our cash levels have typically been inversely related to our investment opportunities available. In times like these, where discounts are harder to find, cash will be high. Should the market pull back, we have cash to deploy in purchasing new opportunities. Our cash position has two purposes. First, we think that it should help hedge against potential losses in the event of a market correction. Second, it affords us the flexibility to buy new positions without having to sell other positions. In doing this, we believe that we can provide a lower-volatility experience for Fund investors.
For the first six months of the Fund’s fiscal year ended March 31, 2012, the Fund gained 19.80% versus the S&P 500 Index’s 25.89% and the Russell 3000 Index’s 26.55%. The two quarters were very similar, both in terms of the high benchmark returns and in the relative underperformance of the Fund. Again, cash muted the Fund’s return as the position grew through the six-month period.
When we write about our cash positions, the first question on most investors’ minds has to do with our expectations for future market performance. Given the Fund’s high level of cash, are we implying that we believe that the market will decline in the future? We respond by saying that we do not attempt to time the market. However, our cash position is evidence of our perception of the overall risk of the market. To us, risk and volatility are not synonymous. Volatility is short-term movement in market prices; risk is the potential for long-term loss of principal. Can we say with certainty that the market will decline? Of course we cannot. We know of many
Intrepid All Cap Fund
value investors who point to the S&P 500 Index’s P/E multiple (Price to Earnings ratio) and say that it looks reasonable. In our view, that number, currently 14.59 times, does look reasonable, but only if one assumes that the earnings in the statistic are maintained or grow. Statistics such as P/E only look at the trailing twelve month period, which in this case has seen growth in overall corporate profits. We do not consider future growth in profits to be a given.
As a matter of fact, we are concerned that overall corporate profit margins (defined as trailing twelve month net income divided by trailing twelve month net sales) are at or near peak values. Profit margin is a sign of a firm’s efficiency in generating profits, or viewed more simply, how well a firm is performing. They can fluctuate. In the case of the S&P 500 Index, the current profit margin is 13.81%. Over the past ten years, it has fluctuated, going as low as 8.30% in September 2009 and as high as 14.53% in January 2007. Likewise, the Russell 3000 Index’s profit margin is currently 13.41%, with a ten-year high of 17.62% in July 2011 and a low of 7.53% in September 2009. It is amazing to see how rapidly these margins re-inflated from their floors in September 2009. We believe that corporate profit margins have benefitted from aggressive cost cutting activities over the past two years. Going forward, we believe there is much less room for increasing efficiency through continued cost-cutting measures, and some of the measures currently benefiting margins may even be unsustainable.
For the quarter, there were not many holdings which performed poorly. Of the two which detracted from performance, one was a new addition and another was a position to which we are adding. The former is Bill Barrett Corporation (ticker: BBG), which is widely known as a natural gas driller. The stock has been hurt by the massive decline in natural gas prices. What is less obvious to casual observers is that Bill Barrett also has liquid production, both in petroleum and natural gas liquids. We think that the market is pricing Bill Barrett at trough natural gas prices instead of long-term normalized prices. The net result of our investment was a detraction of 44 basis points from the Fund’s quarterly return. You can read more about Bill Barrett in the Intrepid Small Cap Fund section. Our second underperformer, World Wrestling Entertainment (ticker: WWE), took away only approximately 3 basis points from the Fund’s quarterly return. Continued uncertainty over the launch of WWE’s television network has been weighing on the stock. We will continue adding to the position as the stock price permits.
The Fund’s performance benefitted from its flexibility to invest across all market capitalizations. Specifically, the Fund’s investment in select large cap equities added to overall quarterly performance. At the end of 2011, four of the Fund’s top five holdings were large caps: Gilead Sciences (ticker: GILD), Dell, Inc. (ticker: DELL), Microsoft Corp. (ticker: MSFT), and Bank of New York Mellon Corp. (ticker: BK). These four securities accounted for more than one third of the total return in the quarter. We were compelled to sell Gilead when it reached intrinsic value, and we
Intrepid All Cap Fund
are closely monitoring the discounts in the other stocks mentioned. The best performer in the quarter was Federated Investors (ticker: FII), which added 99 basis points to the Fund’s total return in the quarter. Prior to the first quarter, the uncertainty of money market regulation had weighed down FII’s share price. As the quarter progressed, the market seemed to grow more confident that: 1) added regulation is less certain than originally thought, and 2) if regulation is added, it will not happen anytime soon. Given the increase in FII’s share price and corresponding decrease in discount, we cut the position in half.
As we have stated before, sustained increases in stock prices have led to smaller discounts in our holdings, which means we will likely be selling more than we are buying. That was the case in this quarter. At the start of the quarter, the Fund comprised 36 equities. It ended the quarter with 30 holdings. We added two new positions in the quarter: Bill Barrett, mentioned above, and Cott Corp. (ticker: COT), a market leading private-label soft drink and juice manufacturer and distributor. Of the eight positions we exited completely, all were due to their stock prices reaching our corresponding intrinsic value estimates.
We end this letter by examining the discount within the Fund. Each security we own has a discount to its intrinsic value which is based upon its market price and our calculated intrinsic values. At the end of the quarter, that average discount was 12%. Bear in mind that this metric is a snapshot taken at the end of the quarter. We exited those positions whose discounts evaporated as their stock prices rose, so they are not included in the Fund’s discount calculation. Selling positions which have a small discount or a premium to our calculated intrinsic values while keeping those equities with larger discounts has a net effect of maintaining a larger average discount than if we had simply held a static portfolio over the quarter. As always, we thank you for your investment.
Sincerely,
Greg Estes, CFA
Intrepid All Cap Fund Portfolio Manager
Please see the Schedule of Investments in this report for a full list of fund holdings. Fund holdings and sector allocations are subject to change at any time and should not be considered a recommendation to buy or sell any security.
Mutual fund investing involves risk. Principal loss is possible. The Fund is subject to special risks including volatility due to investments in smaller and medium sized companies, which involve additional risks such as limited liquidity and greater volatility. The Fund is considered non-diversified as a result of limiting its holdings to a relatively small number of positions and may be more exposed to individual stock volatility than a diversified fund.
Intrepid All Cap Fund
The S&P 500 Index is a broad based unmanaged index of 500 stocks, which is widely recognized as representative of the equity market in general. The Russell 2000 Index consists of the smallest 2,000 companies in a group of 3,000 U.S. Companies in the Russell 3000 Index, as ranked by market capitalization. The Russell 3000 Index is an index representing the largest 3,000 U.S. companies representing approximately 98% of the investable U.S. equity market. You cannot invest directly in an index.
Price-to-Earnings Ratio (P/E) is a valuation ratio of a company’s current share price compared to its per-share earnings as calculated by Market Value per Share divided by Earnings per Share (EPS). Basis point is a unit that is equal to 1/100th of 1% and is used to denote the change in a financial instrument.
Opinions expressed are subject to change, are not guaranteed and should not be considered investment advice or recommendations to buy or sell any security.
The Intrepid Capital Funds are distributed by Quasar Distributors, LLC.
Intrepid Funds
EXPENSE EXAMPLE
March 31, 2012 (Unaudited)
As a shareholder of the Intrepid Capital Management Funds Trust (the “Funds”), you incur ongoing costs, including management fees; distribution and/or service fees; and other expenses incurred by the Funds. This example is intended to help you understand your ongoing costs (in dollars) of investing in the Funds and to compare costs with the ongoing costs of investing in other mutual funds.
The example is based on an investment of $1,000 invested at the beginning of the period and held the entire period of October 1, 2011 through March 31, 2012.
ACTUAL EXPENSES
The first line of the following table provides information about actual account values and actual expenses. Although the Funds charge no sales load or transaction fees, you will be assessed fees for outgoing wire transfers, returned checks or stop payment orders at prevailing rates charged by U.S. Bancorp Fund Services, LLC, the Funds’ transfer agent. If you request a redemption be made by wire transfer, currently a $15.00 fee is charged by the Funds’ transfer agent. To the extent that a Fund invests in shares of other investment companies as part of its investment strategy, you will indirectly bear your proportionate share of any fees and expenses charged by the underlying funds in which the Fund invests in addition to the expenses of the Fund. Actual expenses of the underlying funds are expected to vary among the various underlying funds. These expenses are not included in the following example. The example includes, but is not limited to, management fees, shareholder servicing fees, distribution fees, fund accounting, custody and transfer agent fees. However, the example below does not include portfolio trading commissions and related expenses, interest expense and other extraordinary expenses as determined under generally accepted accounting principles. You may use the information in this line, together with the amount you invested, to estimate the expenses that you paid over the period. Simply divide your account value by $1,000 (for example, an $8,600 account value divided by $1,000 = 8.6), then multiply the result by the number in the first line under the heading entitled “Expenses Paid During Period” to estimate the expenses you paid on your account during this period.
HYPOTHETICAL EXAMPLE FOR COMPARISON PURPOSES
The second line of the following table provides information about hypothetical account values and hypothetical expenses based on the Funds’ actual expense ratio and an assumed rate of return of 5% per year before expenses, which is not the Funds’ actual return. The hypothetical account values and expenses may not be used to estimate the actual ending account balance or expenses you paid for the period. You may use this information to compare the ongoing costs of investing in the Funds and other funds. To do so, compare this 5% hypothetical example with the 5% hypothetical examples that appear in the shareholder reports of the other funds.
Intrepid Funds
EXPENSE EXAMPLE (continued)
March 31, 2012 (Unaudited)
Please note that the expenses shown in the table are meant to highlight your ongoing costs only and do not reflect any transactional costs, such as sales charges (loads), redemption fees, or exchange fees. Therefore, the second line of the table is useful in comparing ongoing costs only, and will not help you determine the relative costs of owning different funds. In addition, if these transactional costs were included, your costs would have been higher.
INTREPID CAPITAL FUND – INVESTOR CLASS
| | | | | | | | | Expenses Paid | |
| | | Beginning | | | Ending | | | During Period* | |
| | | Account Value | | | Account Value | | | October 1, 2011 - | |
| | | October 1, 2011 | | | March 31, 2012 | | | March 31, 2012 | |
| Actual | | $ | 1,000.00 | | | $ | 1,143.10 | | | $ | 7.50 | |
| Hypothetical (5% return | | | | | | | | | | | | |
| before expenses) | | | 1,000.00 | | | | 1,018.00 | | | | 7.06 | |
| * | Expenses are equal to the Fund’s annualized expense ratio of 1.40%, multiplied by the average account value over the period, multiplied by 183/366 to reflect the period. |
INTREPID CAPITAL FUND – INSTITUTIONAL CLASS
| | | | | | | | | Expenses Paid | |
| | | Beginning | | | Ending | | | During Period* | |
| | | Account Value | | | Account Value | | | October 1, 2011 - | |
| | | October 1, 2011 | | | March 31, 2012 | | | March 31, 2012 | |
| Actual | | $ | 1,000.00 | | | $ | 1,145.40 | | | $ | 6.17 | |
| Hypothetical (5% return | | | | | | | | | | | | |
| before expenses) | | | 1,000.00 | | | | 1,019.25 | | | | 5.81 | |
| * | Expenses are equal to the Fund’s annualized expense ratio of 1.15%, multiplied by the average account value over the period, multiplied by 183/366 to reflect the period. |
INTREPID SMALL CAP FUND – INVESTOR CLASS
| | | | | | | | | Expenses Paid | |
| | | Beginning | | | Ending | | | During Period* | |
| | | Account Value | | | Account Value | | | October 1, 2011 - | |
| | | October 1, 2011 | | | March 31, 2012 | | | March 31, 2012 | |
| Actual | | $ | 1,000.00 | | | $ | 1,145.40 | | | $ | 7.51 | |
| Hypothetical (5% return | | | | | | | | | | | | |
| before expenses) | | | 1,000.00 | | | | 1,018.00 | | | | 7.06 | |
| * | Expenses are equal to the Fund’s annualized expense ratio of 1.40%, multiplied by the average account value over the period, multiplied by 183/366 to reflect the period. |
Intrepid Funds
EXPENSE EXAMPLE (continued)
March 31, 2012 (Unaudited)
INTREPID SMALL CAP FUND – INSTITUTIONAL CLASS
| | | | | | | | | Expenses Paid | |
| | | Beginning | | | Ending | | | During Period* | |
| | | Account Value | | | Account Value | | | October 1, 2011 - | |
| | | October 1, 2011 | | | March 31, 2012 | | | March 31, 2012 | |
| Actual | | $ | 1,000.00 | | | $ | 1,146.70 | | | $ | 6.17 | |
| Hypothetical (5% return | | | | | | | | | | | | |
| before expenses) | | | 1,000.00 | | | | 1,019.25 | | | | 5.81 | |
| * | Expenses are equal to the Fund’s annualized expense ratio of 1.15%, multiplied by the average account value over the period, multiplied by 183/366 to reflect the period. |
INTREPID INCOME FUND – INVESTOR CLASS
| | | | | | | | | Expenses Paid | |
| | | Beginning | | | Ending | | | During Period* | |
| | | Account Value | | | Account Value | | | October 1, 2011 - | |
| | | October 1, 2011 | | | March 31, 2012 | | | March 31, 2012 | |
| Actual | | $ | 1,000.00 | | | $ | 1,053.60 | | | $ | 5.90 | |
| Hypothetical (5% return | | | | | | | | | | | | |
| before expenses) | | | 1,000.00 | | | | 1,019.25 | | | | 5.81 | |
| * | Expenses are equal to the Fund’s annualized expense ratio of 1.15%, multiplied by the average account value over the period, multiplied by 183/366 to reflect the period. |
INTREPID INCOME FUND – INSTITUTIONAL CLASS
| | | | | | | | | Expenses Paid | |
| | | Beginning | | | Ending | | | During Period* | |
| | | Account Value | | | Account Value | | | October 1, 2011 - | |
| | | October 1, 2011 | | | March 31, 2012 | | | March 31, 2012 | |
| Actual | | $ | 1,000.00 | | | $ | 1,056.00 | | | $ | 4.63 | |
| Hypothetical (5% return | | | | | | | | | | | | |
| before expenses) | | | 1,000.00 | | | | 1,020.50 | | | | 4.55 | |
| * | Expenses are equal to the Fund’s annualized expense ratio of 0.90%, multiplied by the average account value over the period, multiplied by 183/366 to reflect the period. |
INTREPID ALL CAP FUND
| | | | | | | | | Expenses Paid | |
| | | Beginning | | | Ending | | | During Period* | |
| | | Account Value | | | Account Value | | | October 1, 2011 - | |
| | | October 1, 2011 | | | March 31, 2012 | | | March 31, 2012 | |
| Actual | | $ | 1,000.00 | | | $ | 1,198.00 | | | $ | 7.69 | |
| Hypothetical (5% return | | | | | | | | | | | | |
| before expenses) | | | 1,000.00 | | | | 1,018.00 | | | | 7.06 | |
| * | Expenses are equal to the Fund’s annualized expense ratio of 1.40%, multiplied by the average account value over the period, multiplied by 183/366 to reflect the period. |
Intrepid Capital Fund
ALLOCATION OF PORTFOLIO HOLDINGS
March 31, 2012 (Unaudited)
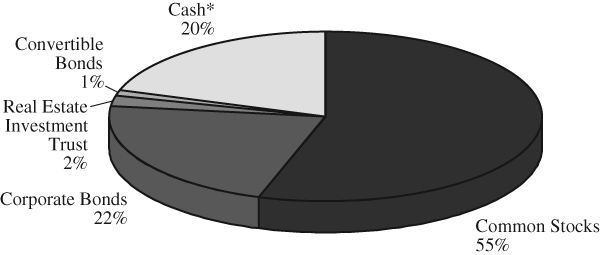
INTREPID CAPITAL FUND
(as a % of total net assets)
COMPONENTS OF PORTFOLIO HOLDINGS
| Common Stocks | | $ | 213,995,453 | |
| Corporate Bonds | | | 85,265,047 | |
| Real Estate Investment Trust | | | 7,340,423 | |
| Convertible Bonds | | | 2,992,465 | |
| Cash* | | | 81,020,930 | |
| | | $ | 390,614,318 | |
* Cash, cash equivalents and other assets less liabilities.
Intrepid Small Cap Fund
SECTOR ALLOCATION OF PORTFOLIO HOLDINGS
March 31, 2012 (Unaudited)
INTREPID SMALL CAP FUND
(as a % of total net assets)
COMPONENTS OF PORTFOLIO HOLDINGS
| Information Technology | | $ | 133,266,079 | |
| Consumer Discretionary | | | 88,490,655 | |
| Financials | | | 75,495,681 | |
| Health Care | | | 52,409,599 | |
| Energy | | | 23,225,604 | |
| Industrials | | | 18,374,878 | |
| Consumer Staples | | | 15,734,983 | |
| Materials | | | 10,556,262 | |
| Telecommunication Services | | | 9,227,891 | |
| Cash* | | | 375,362,904 | |
| | | $ | 802,144,536 | |
The Global Industry Classification Standard (GICS®) was developed by and/or is the exclusive property of MSCI, Inc. and Standard & Poor Financial Services LLC (“S&P”). GICS is a service mark of MSCI and S&P and has been licensed for use by U.S. Bancorp Fund Services, LLC.
* Cash, cash equivalents and other assets less liabilities.
Intrepid Income Fund
ALLOCATION OF PORTFOLIO HOLDINGS
March 31, 2012 (Unaudited)
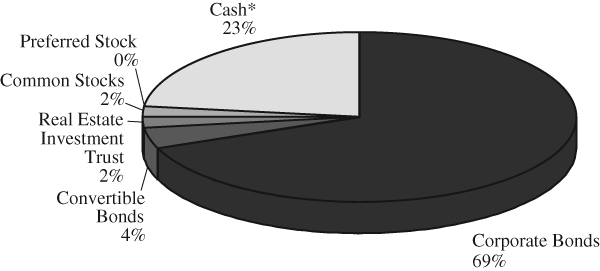
INTREPID INCOME FUND
(as a % of total net assets)
COMPONENTS OF PORTFOLIO HOLDINGS
| Corporate Bonds | | $ | 64,982,672 | |
| Convertible Bonds | | | 3,901,495 | |
| Real Estate Investment Trust | | | 1,902,338 | |
| Common Stocks | | | 1,708,665 | |
| Preferred Stock | | | 335,010 | |
| Cash* | | | 22,053,995 | |
| | | $ | 94,884,175 | |
* Cash, cash equivalents and other assets less liabilities.
Intrepid All Cap Fund
SECTOR ALLOCATION OF PORTFOLIO HOLDINGS
March 31, 2012 (Unaudited)
INTREPID ALL CAP FUND
(as a % of total net assets)
COMPONENTS OF PORTFOLIO HOLDINGS
| Information Technology | | $ | 9,628,137 | |
| Financials | | | 6,134,777 | |
| Consumer Discretionary | | | 5,918,558 | |
| Health Care | | | 5,283,533 | |
| Consumer Staples | | | 2,522,319 | |
| Telecommunication Services | | | 1,753,914 | |
| Energy | | | 1,326,510 | |
| Materials | | | 458,848 | |
| Cash* | | | 16,655,424 | |
| | | $ | 49,682,020 | |
* Cash, cash equivalents and other assets less liabilities.
Intrepid Capital Fund
SCHEDULE OF INVESTMENTS
March 31, 2012 (Unaudited)
| | | Shares | | | Value | |
| COMMON STOCKS - 54.78% | | | | | | |
Commercial & Professional Services - 1.80% | | | | | | |
| Securitas AB (a) | | | 730,117 | | | $ | 7,040,942 | |
Consumer Services - 4.79% | | | | | | | | |
| Regis Corp. | | | 557,988 | | | | 10,283,719 | |
| Speedway Motorsports, Inc. | | | 450,314 | | | | 8,411,865 | |
| | | | | | | | 18,695,584 | |
| Diversified Financials - 6.01% | | | | | | | | |
| The Bank Of New York Mellon Corp. | | | 403,000 | | | | 9,724,390 | |
| CoreLogic, Inc. (b) | | | 566,878 | | | | 9,251,449 | |
| Federated Investors, Inc. | | | 201,650 | | | | 4,518,977 | |
| | | | | | | | 23,494,816 | |
| Energy - 2.29% | | | | | | | | |
| Bill Barrett Corp. (b) | | | 344,000 | | | | 8,947,440 | |
Food, Beverage & Tobacco - 3.75% | | | | | | | | |
| Cott Corp. (a)(b) | | | 868,077 | | | | 5,720,628 | |
| Molson Coors Brewing Co. | | | 197,000 | | | | 8,914,250 | |
| | | | | | | | 14,634,878 | |
| Household & Personal Products - 3.21% | | | | | | | | |
| American Greetings Corp. | | | 437,619 | | | | 6,713,075 | |
| Central Garden & Pet Co. - Class A (b) | | | 335,536 | | | | 3,231,212 | |
| Central Garden & Pet Co. - Class B (b) | | | 35,000 | | | | 329,350 | |
| Oil-Dri Corporation of America - Class A (c) | | | 105,847 | | | | 2,253,483 | |
| | | | | | | | 12,527,120 | |
| Insurance - 8.47% | | | | | | | | |
| AMERISAFE, Inc. (b) | | | 176,221 | | | | 4,359,708 | |
| Aspen Insurance Holdings Ltd. (a) | | | 301,914 | | | | 8,435,477 | |
| Baldwin & Lyons, Inc. - Class B | | | 117,804 | | | | 2,636,453 | |
| Berkshire Hathaway, Inc. - Class B (b) | | | 134,000 | | | | 10,874,100 | |
| The Travelers Companies, Inc. | | | 114,556 | | | | 6,781,715 | |
| | | | | | | | 33,087,453 | |
See notes to financial statements.
Intrepid Capital Fund
SCHEDULE OF INVESTMENTS (continued)
March 31, 2012 (Unaudited)
| | | Shares | | | Value | |
| COMMON STOCKS - 54.78% (continued) | | | | | | |
Materials - 4.95% | | | | | | |
| Newmont Mining Corp. | | | 214,630 | | | $ | 11,004,080 | |
| Pan American Silver Corp. (a) | | | 169,600 | | | | 3,741,376 | |
| Royal Gold, Inc. | | | 70,500 | | | | 4,598,010 | |
| | | | | | | | 19,343,466 | |
| Media - 1.77% | | | | | | | | |
| World Wrestling Entertainment, Inc. (c) | | | 777,669 | | | | 6,897,924 | |
Pharmaceuticals, Biotechnology | | | | | | | | |
| & Life Sciences - 4.50% | | | | | | | | |
| Bio-Rad Laboratories, Inc. (b) | | | 98,357 | | | | 10,198,637 | |
| Johnson & Johnson | | | 112,200 | | | | 7,400,712 | |
| | | | | | | | 17,599,349 | |
| Software & Services - 9.33% | | | | | | | | |
| Computer Sciences Corp. | | | 172,000 | | | | 5,149,680 | |
| CSG Systems International, Inc. (b)(c) | | | 601,246 | | | | 9,102,864 | |
| DST Systems, Inc. | | | 18,350 | | | | 995,121 | |
| EPIQ Systems, Inc. (c) | | | 433,871 | | | | 5,249,839 | |
| Mantech International Corp. | | | 205,888 | | | | 7,094,901 | |
| Microsoft Corp. | | | 275,000 | | | | 8,868,750 | |
| | | | | | | | 36,461,155 | |
| Technology Hardware & Equipment - 2.98% | | | | | | | | |
| Dell, Inc. (b) | | | 511,890 | | | | 8,497,374 | |
| Tellabs, Inc. | | | 775,000 | | | | 3,138,750 | |
| | | | | | | | 11,636,124 | |
| Telecommunication Services - 0.93% | | | | | | | | |
| Telephone & Data Systems, Inc. | | | 156,769 | | | | 3,629,202 | |
| TOTAL COMMON STOCKS | | | | | | | | |
| (Cost $197,768,257) | | | | | | | 213,995,453 | |
See notes to financial statements.
Intrepid Capital Fund
SCHEDULE OF INVESTMENTS (continued)
March 31, 2012 (Unaudited)
| | | Principal | | | | |
| | | Amount | | | Value | |
| CONVERTIBLE BONDS - 0.77% | | | | | | |
Food & Staples Retailing - 0.77% | | | | | | |
| Spartan Stores, Inc. | | | | | | |
| 3.375%, 05/15/2027 | | $ | 3,101,000 | | | $ | 2,992,465 | |
| TOTAL CONVERTIBLE BONDS | | | | | | | | |
| (Cost $2,825,602) | | | | | | | 2,992,465 | |
| | | | | | | | | |
| CORPORATE BONDS - 21.83% | | | | | | | | |
Capital Goods - 1.39% | | | | | | | | |
| Gibraltar Industries, Inc. | | | | | | | | |
| 8.000%, 12/01/2015 (d) | | | 5,284,000 | | | | 5,416,100 | |
Commercial & Professional Services - 1.36% | | | | | | | | |
| Ashtead Capital, Inc. | | | | | | | | |
| 9.000%, 08/15/2016 | | | 3,312,000 | | | | 3,456,900 | |
| Mobile Mini, Inc. | | | | | | | | |
| 6.875%, 05/01/2015 | | | 1,815,000 | | | | 1,833,150 | |
| | | | | | | | 5,290,050 | |
| Consumer Durables & Apparel - 2.82% | | | | | | | | |
| Hanesbrands, Inc. | | | | | | | | |
| 4.155%, 12/15/2014 (d) | | | 2,290,000 | | | | 2,292,885 | |
| Levi Strauss & Co. | | | | | | | | |
| 8.875%, 04/01/2016 | | | 3,411,000 | | | | 3,521,892 | |
| Smith & Wesson Holding Corp. | | | | | | | | |
| 9.500%, 01/14/2016 | | | 5,089,000 | | | | 5,203,503 | |
| | | | | | | | 11,018,280 | |
| Consumer Services - 0.92% | | | | | | | | |
| Speedway Motorsports, Inc. | | | | | | | | |
| 8.750%, 06/01/2016 | | | 3,285,000 | | | | 3,597,075 | |
Energy - 3.12% | | | | | | | | |
| Bill Barrett Corp. | | | | | | | | |
| 9.875%, 07/15/2016 | | | 4,203,000 | | | | 4,623,300 | |
| Energy Partners Ltd. | | | | | | | | |
| 8.250%, 02/15/2018 | | | 1,176,000 | | | | 1,192,170 | |
See notes to financial statements.
Intrepid Capital Fund
SCHEDULE OF INVESTMENTS (continued)
March 31, 2012 (Unaudited)
| | | Principal | | | | |
| | | Amount | | | Value | |
| CORPORATE BONDS - 21.83% (continued) | | | | | | |
Energy - 3.12% (continued) | | | | | | |
| Petroquest Energy, Inc. | | | | | | |
| 10.000%, 09/01/2017 | | $ | 6,182,000 | | | $ | 6,382,915 | |
| | | | | | | | 12,198,385 | |
| Household & Personal Products - 2.53% | | | | | | | | |
| Amscan Holdings, Inc. | | | | | | | | |
| 8.750%, 05/01/2014 | | | 4,489,000 | | | | 4,505,879 | |
| Central Garden & Pet Co. | | | | | | | | |
| 8.250%, 03/01/2018 | | | 5,202,000 | | | | 5,364,562 | |
| | | | | | | | 9,870,441 | |
| Materials - 0.30% | | | | | | | | |
| Silgan Holdings, Inc. | | | | | | | | |
| 7.250%, 08/15/2016 | | | 1,050,000 | | | | 1,179,938 | |
Media - 0.77% | | | | | | | | |
| Scholastic Corp. | | | | | | | | |
| 5.000%, 04/15/2013 | | | 2,977,000 | | | | 3,021,655 | |
Paper Manufacturing - 1.94% | | | | | | | | |
| Intertape Polymer US, Inc. | | | | | | | | |
| 8.500%, 08/01/2014 | | | 7,549,000 | | | | 7,586,745 | |
Pharmaceuticals, Biotechnology | | | | | | | | |
| & Life Sciences - 0.49% | | | | | | | | |
| Bio-Rad Laboratories, Inc. | | | | | | | | |
| 8.000%, 09/15/2016 | | | 1,739,000 | | | | 1,930,290 | |
Retailing - 2.89% | | | | | | | | |
| Collective Brands, Inc. | | | | | | | | |
| 8.250%, 08/01/2013 | | | 3,555,000 | | | | 3,581,698 | |
| HSN, Inc. | | | | | | | | |
| 11.250%, 08/01/2016 | | | 4,000,000 | | | | 4,340,040 | |
| PEP Boys-Manny Moe & Jack | | | | | | | | |
| 7.500%, 12/15/2014 | | | 3,312,000 | | | | 3,361,713 | |
| | | | | | | | 11,283,451 | |
See notes to financial statements.
Intrepid Capital Fund
SCHEDULE OF INVESTMENTS (continued)
March 31, 2012 (Unaudited)
| | | Principal | | | | |
| | | Amount | | | Value | |
| CORPORATE BONDS - 21.83% (continued) | | | | | | |
| Software & Services - 0.88% | | | | | | |
| Computer Sciences Corp. | | | | | | |
| 6.500%, 03/15/2018 | | $ | 3,183,000 | | | $ | 3,445,597 | |
Transportation Equipment | | | | | | | | |
| Manufacturing - 1.27% | | | | | | | | |
| Affinia Group, Inc. | | | | | | | | |
| 10.750%, 08/15/2016 | | | 3,313,000 | | | | 3,627,735 | |
| Oshkosh Corp. | | | | | | | | |
| 8.250%, 03/01/2017 | | | 1,220,000 | | | | 1,323,700 | |
| | | | | | | | 4,951,435 | |
| Truck Transportation - 1.15% | | | | | | | | |
| Quality Distribution LLC / QD Capital Corp. | | | | | | | | |
| 9.875%, 11/01/2018 | | | 4,078,000 | | | | 4,475,605 | |
| TOTAL CORPORATE BONDS | | | | | | | | |
| (Cost $83,684,682) | | | | | | | 85,265,047 | |
| | | | | | | | | |
| | | Shares | | | | | |
| REAL ESTATE INVESTMENT TRUST - 1.88% | | | | | | | | |
Real Estate - 1.88% | | | | | | | | |
| Potlatch Corp. | | | 234,219 | | | | 7,340,423 | |
| TOTAL REAL ESTATE INVESTMENT TRUST | | | | | | | | |
| (Cost $7,448,166) | | | | | | | 7,340,423 | |
Total Investments - 79.26% | | | | | | | | |
| (Cost $291,726,707) | | | | | | | 309,593,388 | |
| Other Assets in Excess of Liabilities - 20.74% | | | | | | | 81,020,930 | |
| TOTAL NET ASSETS - 100.00% | | | | | | $ | 390,614,318 | |
Percentages are stated as a percent of net assets.
| (a) | Foreign issued security. |
| (b) | Non-income producing security. |
| (c) | Affiliated company. See Footnote 7. |
| (d) | Variable rate security. The rate shown is as of March 31, 2012. |
See notes to financial statements.
Intrepid Small Cap Fund
SCHEDULE OF INVESTMENTS
March 31, 2012 (Unaudited)
| | | Shares | | | Value | |
| COMMON STOCKS - 51.22% | | | | | | |
Commercial & Professional Services - 2.29% | | | | | | |
| Securitas AB (a) | | | 1,905,400 | | | $ | 18,374,878 | |
Consumer Services - 4.19% | | | | | | | | |
| International Speedway Corp. - Class A | | | 315,109 | | | | 8,744,275 | |
| Regis Corp. | | | 629,469 | | | | 11,601,114 | |
| Speedway Motorsports, Inc. | | | 710,098 | | | | 13,264,630 | |
| | | | | | | | 33,610,019 | |
| Diversified Financials - 3.34% | | | | | | | | |
| CoreLogic, Inc. (b) | | | 964,513 | | | | 15,740,852 | |
| Federated Investors, Inc. | | | 492,148 | | | | 11,029,037 | |
| | | | | | | | 26,769,889 | |
| Energy - 2.89% | | | | | | | | |
| Bill Barrett Corp. (b) | | | 892,949 | | | | 23,225,604 | |
Food, Beverage & Tobacco - 1.37% | | | | | | | | |
| Cott Corp. (a)(b) | | | 1,664,695 | | | | 10,970,340 | |
Health Care Equipment & Services - 2.15% | | | | | | | | |
| Teleflex, Inc. | | | 282,697 | | | | 17,286,922 | |
Household & Personal Products - 2.70% | | | | | | | | |
| American Greetings Corp. | | | 1,100,587 | | | | 16,883,005 | |
| Central Garden & Pet Co. - Class A (b) | | | 194,458 | | | | 1,872,630 | |
| Oil-Dri Corporation of America - Class A (c) | | | 135,839 | | | | 2,892,012 | |
| | | | | | | | 21,647,647 | |
| Insurance - 6.05% | | | | | | | | |
| AMERISAFE, Inc. (b) | | | 602,036 | | | | 14,894,371 | |
| Aspen Insurance Holdings Ltd. (a) | | | 600,181 | | | | 16,769,057 | |
| Baldwin & Lyons, Inc. - Class B | | | 259,708 | | | | 5,812,265 | |
| Brown & Brown, Inc. | | | 464,300 | | | | 11,041,054 | |
| | | | | | | | 48,516,747 | |
| Materials - 1.32% | | | | | | | | |
| Pan American Silver Corp. (a) | | | 478,525 | | | | 10,556,262 | |
Media - 1.50% | | | | | | | | |
| World Wrestling Entertainment, Inc. (c) | | | 1,352,429 | | | | 11,996,045 | |
See notes to financial statements.
Intrepid Small Cap Fund
SCHEDULE OF INVESTMENTS (continued)
March 31, 2012 (Unaudited)
| | | Shares | | | Value | |
| COMMON STOCKS - 51.22% (continued) | | | | | | |
Pharmaceuticals, Biotechnology | | | | | | |
| & Life Sciences - 4.38% | | | | | | |
| Bio-Rad Laboratories, Inc. (b) | | | 229,831 | | | $ | 23,831,176 | |
| ICON PLC - ADR (b) | | | 532,116 | | | | 11,291,502 | |
| | | | | | | | 35,122,678 | |
| Retailing - 3.24% | | | | | | | | |
| Aaron’s, Inc. | | | 388,790 | | | | 10,069,661 | |
| Core-Mark Holding Co., Inc. | | | 227,201 | | | | 9,301,609 | |
| Halfords Group PLC (a) | | | 1,334,602 | | | | 6,630,316 | |
| | | | | | | | 26,001,586 | |
| Software & Services - 11.88% | | | | | | | | |
| Amdocs Ltd. (a)(b) | | | 112,620 | | | | 3,556,540 | |
| Computer Sciences Corp. | | | 375,000 | | | | 11,227,500 | |
| Convergys Corp. (b) | | | 704,276 | | | | 9,402,085 | |
| CSG Systems International, Inc. (b)(c) | | | 1,487,299 | | | | 22,517,707 | |
| EPIQ Systems, Inc. (c) | | | 1,568,655 | | | | 18,980,725 | |
| Global Payments, Inc. | | | 153,654 | | | | 7,293,955 | |
| Mantech International Corp. | | | 575,044 | | | | 19,816,016 | |
| TECMO KOEI HOLDINGS CO., Ltd. (a) | | | 318,500 | | | | 2,520,448 | |
| | | | | | | | 95,314,976 | |
| Technology Hardware & Equipment - 2.77% | | | | | | | | |
| Ingram Micro, Inc. (b) | | | 496,970 | | | | 9,223,763 | |
| Tellabs, Inc. | | | 3,206,540 | | | | 12,986,487 | |
| | | | | | | | 22,210,250 | |
| Telecommunication Services - 1.15% | | | | | | | | |
| Telephone & Data Systems, Inc. | | | 398,613 | | | | 9,227,891 | |
| TOTAL COMMON STOCKS | | | | | | | | |
| (Cost $374,201,062) | | | | | | | 410,831,734 | |
See notes to financial statements.
Intrepid Small Cap Fund
SCHEDULE OF INVESTMENTS (continued)
March 31, 2012 (Unaudited)
| | | Shares | | | Value | |
| REAL ESTATE INVESTMENT TRUST - 1.99% | | | | | | |
Real Estate - 1.99% | | | | | | |
| Potlatch Corp. | | | 508,931 | | | $ | 15,949,898 | |
| TOTAL REAL ESTATE INVESTMENT TRUST | | | | | | | | |
| (Cost $15,459,019) | | | | | | | 15,949,898 | |
| | | | | | | | | |
| | | Principal | | | | | |
| | | Amount | | | | | |
| SHORT-TERM INVESTMENTS - 14.80% | | | | | | | | |
U.S. Treasury Bills - 14.80% | | | | | | | | |
| 0.025%, 04/12/2012 (d) | | $ | 50,000,000 | | | | 49,999,618 | |
| 0.020%, 05/03/2012 (d) | | | 33,750,000 | | | | 33,749,400 | |
| 0.035%, 06/14/2012 (d) | | | 35,000,000 | | | | 34,997,482 | |
| TOTAL SHORT-TERM INVESTMENTS | | | | | | | | |
| (Cost $118,746,500) | | | | | | | 118,746,500 | |
Total Investments - 68.01% | | | | | | | | |
| (Cost $508,406,581) | | | | | | | 545,528,132 | |
| Other Assets in Excess of Liabilities - 31.99% | | | | | | | 256,616,404 | |
| TOTAL NET ASSETS - 100.00% | | | | | | $ | 802,144,536 | |
Percentages are stated as a percent of net assets.
| (a) | Foreign issued security. |
| (b) | Non-income producing security. |
| (c) | Affiliated company. See Footnote 7. |
| (d) | Rate shown is the effective yield based on purchase price. The calculation assumes the security is held to maturity. |
SCHEDULE OF OPEN FORWARD CURRENCY CONTRACTSMarch 31, 2012 (Unaudited)
| | | Amount of | | Amount of | |
| Forward | Currency to | Currency to | Currency to | Currency to | Unrealized |
| Expiration Date | be Received | be Received | be Delivered | be Delivered | Depreciation |
| 7/10/12 | U.S. Dollars | 11,925,287 | Swedish Krona | 83,000,000 | $(570,549) |
See notes to financial statements.
Intrepid Income Fund
SCHEDULE OF INVESTMENTS
March 31, 2012 (Unaudited)
| | | Shares | | | Value | |
| COMMON STOCKS - 1.80% | | | | | | |
Media - 0.99% | | | | | | |
| World Wrestling Entertainment, Inc. (a) | | | 105,820 | | | $ | 938,623 | |
Retailing - 0.81% | | | | | | | | |
| Halfords Group PLC (b) | | | 155,000 | | | | 770,042 | |
| TOTAL COMMON STOCKS | | | | | | | | |
| (Cost $1,695,386) | | | | | | | 1,708,665 | |
| | | | | | | | | |
| PREFERRED STOCK - 0.35% | | | | | | | | |
Insurance - 0.35% | | | | | | | | |
| Aspen Insurance Holdings Ltd., 7.401% (b) | | | 13,000 | | | | 335,010 | |
| TOTAL PREFERRED STOCK | | | | | | | | |
| (Cost $298,935) | | | | | | | 335,010 | |
| | | | | | | | | |
| | | Principal | | | | | |
| | | Amount | | | | | |
| CONVERTIBLE BONDS - 4.11% | | | | | | | | |
Food & Staples Retailing - 4.11% | | | | | | | | |
| Spartan Stores, Inc. | | | | | | | | |
| 3.375%, 05/15/2027 | | $ | 4,043,000 | | | | 3,901,495 | |
| TOTAL CONVERTIBLE BONDS | | | | | | | | |
| (Cost $3,588,100) | | | | | | | 3,901,495 | |
| | | | | | | | | |
| CORPORATE BONDS - 68.49% | | | | | | | | |
Capital Goods - 3.66% | | | | | | | | |
| Gibraltar Industries, Inc. | | | | | | | | |
| 8.000%, 12/01/2015 (c) | | | 3,391,000 | | | | 3,475,775 | |
Commercial & Professional Services - 6.04% | | | | | | | | |
| Ashtead Capital, Inc. | | | | | | | | |
| 9.000%, 08/15/2016 | | | 2,438,000 | | | | 2,544,662 | |
| FTI Consulting, Inc. | | | | | | | | |
| 7.750%, 10/01/2016 | | | 1,205,000 | | | | 1,239,644 | |
| Mobile Mini, Inc. | | | | | | | | |
| 6.875%, 05/01/2015 | | | 1,928,000 | | | | 1,947,280 | |
| | | | | | | | 5,731,586 | |
See notes to financial statements.
Intrepid Income Fund
SCHEDULE OF INVESTMENTS (continued)
March 31, 2012 (Unaudited)
| | | Principal | | | | |
| | | Amount | | | Value | |
| CORPORATE BONDS - 68.49% (continued) | | | | | | |
Consumer Durables & Apparel - 7.58% | | | | | | |
| Hanesbrands, Inc. | | | | | | |
| 4.146%, 12/15/2014 (c) | | $ | 2,072,000 | | | $ | 2,074,611 | |
| Levi Strauss & Co. | | | | | | | | |
| 8.875%, 04/01/2016 | | | 1,735,000 | | | | 1,791,405 | |
| Smith & Wesson Holding Corp. | | | | | | | | |
| 9.500%, 01/14/2016 | | | 3,256,000 | | | | 3,329,260 | |
| | | | | | | | 7,195,276 | |
| Consumer Services - 3.59% | | | | | | | | |
| Speedway Motorsports, Inc. | | | | | | | | |
| 8.750%, 06/01/2016 | | | 3,113,000 | | | | 3,408,735 | |
Energy - 9.06% | | | | | | | | |
| Bill Barrett Corp. | | | | | | | | |
| 9.875%, 07/15/2016 | | | 2,653,000 | | | | 2,918,300 | |
| Energy Partners Ltd. | | | | | | | | |
| 8.250%, 02/15/2018 | | | 1,874,000 | | | | 1,899,768 | |
| Petroquest Energy, Inc. | | | | | | | | |
| 10.000%, 09/01/2017 | | | 3,662,000 | | | | 3,781,015 | |
| | | | | | | | 8,599,083 | |
| General Merchandise Stores - 2.06% | | | | | | | | |
| Dollar General Corp. | | | | | | | | |
| 11.875%, 07/15/2017 | | | 1,798,000 | | | | 1,950,848 | |
Household & Personal Products - 7.09% | | | | | | | | |
| Amscan Holdings, Inc. | | | | | | | | |
| 8.750%, 05/01/2014 | | | 2,923,000 | | | | 2,933,990 | |
| Central Garden & Pet Co. | | | | | | | | |
| 8.250%, 03/01/2018 | | | 3,683,000 | | | | 3,798,094 | |
| | | | | | | | 6,732,084 | |
| Materials - 0.24% | | | | | | | | |
| Silgan Holdings, Inc. | | | | | | | | |
| 7.250%, 08/15/2016 | | | 200,000 | | | | 224,750 | |
See notes to financial statements.
Intrepid Income Fund
SCHEDULE OF INVESTMENTS (continued)
March 31, 2012 (Unaudited)
| | | Principal | | | | |
| | | Amount | | | Value | |
| CORPORATE BONDS - 68.49% (continued) | | | | | | |
Media - 2.00% | | | | | | |
| Scholastic Corp. | | | | | | |
| 5.000%, 04/15/2013 | | $ | 1,868,000 | | | $ | 1,896,020 | |
Nonmetallic Mineral | | | | | | | | |
| Product Manufacturing - 3.25% | | | | | | | | |
| Libbey Glass, Inc. | | | | | | | | |
| 10.000%, 02/15/2015 | | | 2,881,000 | | | | 3,079,069 | |
Paper Manufacturing - 3.99% | | | | | | | | |
| Intertape Polymer US, Inc. | | | | | | | | |
| 8.500%, 08/01/2014 | | | 3,763,000 | | | | 3,781,815 | |
Pharmaceuticals, Biotechnology | | | | | | | | |
| & Life Sciences - 2.64% | | | | | | | | |
| Bio-Rad Laboratories, Inc. | | | | | | | | |
| 8.000%, 09/15/2016 | | | 2,253,000 | | | | 2,500,830 | |
Retailing - 9.96% | | | | | | | | |
| Collective Brands, Inc. | | | | | | | | |
| 8.250%, 08/01/2013 | | | 2,630,000 | | | | 2,649,751 | |
| HSN, Inc. | | | | | | | | |
| 11.250%, 08/01/2016 | | | 2,904,000 | | | | 3,150,869 | |
| PEP Boys-Manny Moe & Jack | | | | | | | | |
| 7.500%, 12/15/2014 | | | 3,597,000 | | | | 3,650,991 | |
| | | | | | | | 9,451,611 | |
| Software & Services - 1.13% | | | | | | | | |
| Computer Sciences Corp. | | | | | | | | |
| 6.500%, 03/15/2018 | | | 988,000 | | | | 1,069,510 | |
Transportation Equipment | | | | | | | | |
| Manufacturing - 3.89% | | | | | | | | |
| Affinia Group, Inc. | | | | | | | | |
| 10.750%, 08/15/2016 | | | 1,687,000 | | | | 1,847,265 | |
| Oshkosh Corp. | | | | | | | | |
| 8.250%, 03/01/2017 | | | 1,699,000 | | | | 1,843,415 | |
| | | | | | | | 3,690,680 | |
See notes to financial statements.
Intrepid Income Fund
SCHEDULE OF INVESTMENTS (continued)
March 31, 2012 (Unaudited)
| | | Principal | | | | |
| | | Amount | | | Value | |
| CORPORATE BONDS - 68.49% (continued) | | | | | | |
Truck Transportation - 2.31% | | | | | | |
| Quality Distribution LLC / QD Capital Corp. | | | | | | |
| 9.875%, 11/01/2018 | | $ | 2,000,000 | | | $ | 2,195,000 | |
| TOTAL CORPORATE BONDS | | | | | | | | |
| (Cost $63,418,081) | | | | | | | 64,982,672 | |
| | | | | | | | | |
| | | Shares | | | | | |
| REAL ESTATE INVESTMENT TRUST - 2.01% | | | | | | | | |
Real Estate - 2.01% | | | | | | | | |
| Potlatch Corp. | | | 60,700 | | | | 1,902,338 | |
| TOTAL REAL ESTATE INVESTMENT TRUST | | | | | | | | |
| (Cost $1,979,858) | | | | | | | 1,902,338 | |
Total Investments - 76.76% | | | | | | | | |
| (Cost $70,980,360) | | | | | | | 72,830,180 | |
| Other Assets in Excess of Liabilities - 23.24% | | | | | | | 22,053,995 | |
| TOTAL NET ASSETS - 100.00% | | | | | | $ | 94,884,175 | |
Percentages are stated as a percent of net assets.
| (a) | Affiliated company. See Footnote 7. |
| (b) | Foreign issued security. |
| (c) | Variable rate security. The rate listed is as of March 31, 2012. |
See notes to financial statements.
Intrepid All Cap Fund
SCHEDULE OF INVESTMENTS
March 31, 2012 (Unaudited)
| | | Shares | | | Value | |
| COMMON STOCKS - 64.46% | | | | | | |
Consumer Services - 7.29% | | | | | | |
| International Speedway Corp. - Class A | | | 45,600 | | | $ | 1,265,400 | |
| Regis Corp. | | | 48,176 | | | | 887,884 | |
| Speedway Motorsports, Inc. | | | 78,511 | | | | 1,466,585 | |
| | | | | | | | 3,619,869 | |
| Diversified Financials - 7.18% | | | | | | | | |
| The Bank Of New York Mellon Corp. | | | 83,900 | | | | 2,024,507 | |
| CoreLogic, Inc. (a) | | | 65,841 | | | | 1,074,525 | |
| Federated Investors, Inc. | | | 20,791 | | | | 465,926 | |
| | | | | | | | 3,564,958 | |
| Energy - 2.67% | | | | | | | | |
| Bill Barrett Corp. (a) | | | 51,000 | | | | 1,326,510 | |
Food, Beverage & Tobacco - 5.08% | | | | | | | | |
| Cott Corp. (a)(b) | | | 106,031 | | | | 698,744 | |
| Molson Coors Brewing Co. | | | 40,300 | | | | 1,823,575 | |
| | | | | | | | 2,522,319 | |
| Health Care Equipment & Services - 4.86% | | | | | | | | |
| CR Bard, Inc. | | | 13,270 | | | | 1,310,014 | |
| Teleflex, Inc. | | | 18,100 | | | | 1,106,815 | |
| | | | | | | | 2,416,829 | |
| Household & Personal Products - 1.81% | | | | | | | | |
| American Greetings Corp. | | | 58,711 | | | | 900,627 | |
Insurance - 5.32% | | | | | | | | |
| Aspen Insurance Holdings Ltd. (b) | | | 35,200 | | | | 983,488 | |
| Brown & Brown, Inc. | | | 18,870 | | | | 448,729 | |
| The Travelers Companies, Inc. | | | 20,445 | | | | 1,210,344 | |
| | | | | | | | 2,642,561 | |
| Materials - 0.92% | | | | | | | | |
| Pan American Silver Corp. (b) | | | 20,800 | | | | 458,848 | |
Media - 1.95% | | | | | | | | |
| World Wrestling Entertainment, Inc. (c) | | | 109,169 | | | | 968,329 | |
See notes to financial statements.
Intrepid All Cap Fund
SCHEDULE OF INVESTMENTS (continued)
March 31, 2012 (Unaudited)
| | | Shares | | | Value | |
| COMMON STOCKS - 64.46% (continued) | | | | | | |
Pharmaceuticals, Biotechnology | | | | | | |
| & Life Sciences - 5.77% | | | | | | |
| Bio-Rad Laboratories, Inc. (a) | | | 12,021 | | | $ | 1,246,458 | |
| ICON PLC - ADR (a) | | | 24,600 | | | | 522,012 | |
| Johnson & Johnson | | | 16,650 | | | | 1,098,234 | |
| | | | | | | | 2,866,704 | |
| Retailing - 0.86% | | | | | | | | |
| Halfords Group PLC (b) | | | 86,500 | | | | 429,733 | |
Software & Services - 10.66% | | | | | | | | |
| CSG Systems International, Inc. (a)(c) | | | 95,050 | | | | 1,439,057 | |
| EPIQ Systems, Inc. (c) | | | 45,249 | | | | 547,513 | |
| Mantech International Corp. | | | 18,210 | | | | 627,517 | |
| Microsoft Corp. | | | 63,500 | | | | 2,047,875 | |
| SAIC, Inc. | | | 47,900 | | | | 632,280 | |
| | | | | | | | 5,294,242 | |
| Technology Hardware & Equipment - 6.56% | | | | | | | | |
| Dell, Inc. (a) | | | 106,190 | | | | 1,762,754 | |
| Tellabs, Inc. | | | 369,535 | | | | 1,496,617 | |
| | | | | | | | 3,259,371 | |
| Telecommunication Services - 3.53% | | | | | | | | |
| Telephone & Data Systems, Inc. | | | 75,763 | | | | 1,753,913 | |
| TOTAL COMMON STOCKS | | | | | | | | |
| (Cost $30,086,541) | | | | | | | 32,024,813 | |
See notes to financial statements.
Intrepid All Cap Fund
SCHEDULE OF INVESTMENTS (continued)
March 31, 2012 (Unaudited)
| | | Shares | | | Value | |
| REAL ESTATE INVESTMENT TRUST - 2.02% | | | | | | |
Real Estate - 2.02% | | | | | | |
| Potlatch Corp. | | | 31,965 | | | $ | 1,001,783 | |
| TOTAL REAL ESTATE INVESTMENT TRUST | | | | | | | | |
| (Cost $987,586) | | | | | | | 1,001,783 | |
Total Investments - 66.48% | | | | | | | | |
| (Cost $31,074,127) | | | | | | | 33,026,596 | |
| Other Assets in Excess of Liabilities - 33.52% | | | | | | | 16,655,424 | |
| TOTAL NET ASSETS - 100.00% | | | | | | $ | 49,682,020 | |
Percentages are stated as a percent of net assets.
| (a) | Non-income producing security. |
| (b) | Foreign issued security. |
| (c) | Affiliated company. See Footnote 7. |
See notes to financial statements.
Intrepid Funds
STATEMENT OF ASSETS AND LIABILITIES
March 31, 2012 (Unaudited)
| | | Intrepid | | | Intrepid Small | |
| | | Capital Fund | | | Cap Fund | |
| ASSETS: | | | | | | |
Investments, at market value(1) | | | | | | |
| Unaffiliated issuers | | $ | 281,729,570 | | | $ | 474,247,272 | |
| Affiliated issuers | | | 27,863,818 | | | | 71,280,860 | |
| Income receivable | | | 1,734,404 | | | | 165,294 | |
| Receivable for fund shares sold | | | 611,081 | | | | 2,196,400 | |
| Receivable for investments sold | | | — | | | | 1,656,322 | |
| Cash | | | 84,118,092 | | | | 258,133,622 | |
| Other assets | | | 53,398 | | | | 105,645 | |
| Total assets | | | 396,110,363 | | | | 807,785,415 | |
| LIABILITIES: | | | | | | | | |
| Depreciation on forward currency contracts | | | — | | | | 570,549 | |
| Payable for fund shares redeemed | | | 297,639 | | | | 2,457,714 | |
| Payable for investment securities purchased | | | 4,672,770 | | | | 1,510,186 | |
| Payable to Investment Adviser | | | 319,371 | | | | 660,696 | |
| Accrued distribution fees | | | 45,489 | | | | 114,097 | |
| Other expenses | | | 160,776 | | | | 327,637 | |
| Total liabilities | | | 5,496,045 | | | | 5,640,879 | |
| Total net assets | | $ | 390,614,318 | | | $ | 802,144,536 | |
| NET ASSETS CONSIST OF: | | | | | | | | |
| Capital stock | | $ | 366,808,785 | | | $ | 750,700,408 | |
| Accumulated net investment loss | | | (108,490 | ) | | | (1,367,327 | ) |
| Accumulated undistributed net realized gain on investments | | | 6,047,342 | | | | 16,260,054 | |
| Unrealized appreciation (depreciation) on: | | | | | | | | |
| Investments and foreign currency translation | | | 17,866,681 | | | | 37,121,950 | |
| Forward currency contracts | | | — | | | | (570,549 | ) |
| Total net assets | | $ | 390,614,318 | | | $ | 802,144,536 | |
| Investor Class | | | | | | | | |
| Net Assets | | $ | 295,651,205 | | | $ | 733,633,686 | |
| Shares outstanding | | | 25,997,918 | | | | 47,338,406 | |
| Institutional Class | | | | | | | | |
| Net Assets | | | 94,963,113 | | | | 68,510,850 | |
| Shares outstanding | | | 8,346,032 | | | | 4,389,021 | |
| Total shares outstanding (unlimited | | | | | | | | |
| shares of no par value authorized) | | | 34,343,950 | | | | 51,727,427 | |
| Investor Class Net asset value, offering | | | | | | | | |
| and redemption price per share | | $ | 11.37 | | | $ | 15.50 | |
| Institutional Class Net asset value, offering | | | | | | | | |
| and redemption price per share | | $ | 11.38 | | | $ | 15.61 | |
(1) Cost of Investments | | | | | | | | |
| Unaffiliated issuers | | $ | 264,532,805 | | | $ | 439,381,693 | |
| Affiliated issuers | | | 27,193,902 | | | | 69,024,888 | |
See notes to financial statements.
Intrepid Funds
STATEMENT OF ASSETS AND LIABILITIES (continued)
March 31, 2012 (Unaudited)
| | | Intrepid | | | Intrepid | |
| | | Income Fund | | | All Cap Fund | |
| ASSETS: | | | | | | |
Investments, at market value(1) | | | | | | |
| Unaffiliated issuers | | $ | 71,891,557 | | | $ | 30,071,697 | |
| Affiliated issuers | | | 938,623 | | | | 2,954,899 | |
| Income receivable | | | 1,278,595 | | | | 4,043 | |
| Receivable for fund shares sold | | | 32,321 | | | | 26,950 | |
| Cash | | | 20,899,290 | | | | 17,198,261 | |
| Other assets | | | 20,812 | | | | 16,541 | |
| Total assets | | | 95,061,198 | | | | 50,272,391 | |
| LIABILITIES: | | | | | | | | |
| Payable for fund shares redeemed | | | 3,000 | | | | 5,500 | |
| Payable for investment securities purchased | | | 51,619 | | | | 468,873 | |
| Payable to Investment Adviser | | | 52,189 | | | | 34,894 | |
| Accrued distribution fees | | | 7,838 | | | | 40,887 | |
| Other expenses | | | 62,377 | | | | 40,217 | |
| Total liabilities | | | 177,023 | | | | 590,371 | |
| Total net assets | | $ | 94,884,175 | | | $ | 49,682,020 | |
| NET ASSETS CONSIST OF: | | | | | | | | |
| Capital stock | | $ | 92,917,366 | | | $ | 46,372,488 | |
| Accumulated net investment loss | | | (49,503 | ) | | | (62,041 | ) |
| Accumulated undistributed net realized gain on investments | | | 166,492 | | | | 1,419,104 | |
| Unrealized appreciation on: | | | | | | | | |
| Investments and foreign currency translation | | | 1,849,820 | | | | 1,952,469 | |
| Total net assets | | $ | 94,884,175 | | | $ | 49,682,020 | |
| Investor Class | | | | | | | | |
| Net Assets | | $ | 39,075,523 | | | $ | 49,682,020 | |
| Shares outstanding | | | 3,989,550 | | | | 4,790,677 | |
| Institutional Class | | | | | | | | |
| Net Assets | | | 55,808,652 | | | | — | |
| Shares outstanding | | | 5,704,875 | | | | — | |
| Total shares outstanding (unlimited | | | | | | | | |
| shares of no par value authorized) | | | 9,694,425 | | | | 4,790,677 | |
| Investor Class Net asset value, offering | | | | | | | | |
| and redemption price per share | | $ | 9.79 | | | $ | 10.37 | |
| Institutional Class Net asset value, offering | | | | | | | | |
| and redemption price per share | | $ | 9.78 | | | | N/A | |
(1) Cost of Investments | | | | | | | | |
| Unaffiliated issuers | | $ | 69,996,382 | | | $ | 27,884,010 | |
| Affiliated issuers | | | 983,978 | | | | 3,190,117 | |
See notes to financial statements.
Intrepid Funds
STATEMENT OF OPERATIONS
For the six months ended March 31, 2012 (Unaudited)
| | | Intrepid | | | Intrepid Small | |
| | | Capital Fund | | | Cap Fund | |
| INVESTMENT INCOME: | | | | | | |
| Dividend income | | | | | | |
| Unaffiliated issuers* | | $ | 1,640,157 | | | $ | 3,084,127 | |
| Affiliated issuers (See Note 7) | | | 176,161 | | | | 422,096 | |
| Interest income | | | 3,023,343 | | | | 43,952 | |
| Total investment income | | | 4,839,661 | | | | 3,550,173 | |
| | | | | | | | | |
| Advisory fees (See Note 3) | | | 1,671,909 | | | | 3,560,822 | |
| Distribution (12b-1) fees - Investor Class Only | | | 305,967 | | | | 812,866 | |
| Administration fees | | | 146,876 | | | | 292,957 | |
| Fund accounting fees | | | 41,006 | | | | 83,741 | |
| Shareholder servicing fees and expenses | | | 37,928 | | | | 94,959 | |
| Federal and state registration | | | 26,279 | | | | 48,017 | |
| Custody fees | | | 17,904 | | | | 46,488 | |
| Reports to shareholders | | | 14,084 | | | | 46,248 | |
| Audit fees | | | 12,949 | | | | 12,949 | |
| Trustees fees and expenses | | | 8,481 | | | | 18,362 | |
| Insurance | | | 7,542 | | | | 18,982 | |
| Legal fees | | | 4,154 | | | | 4,351 | |
| Miscellaneous | | | 2,239 | | | | 4,339 | |
| Total expenses before Adviser reimbursement | | | 2,297,318 | | | | 5,045,081 | |
| Expenses reimbursed by Adviser | | | (68,655 | ) | | | (137,270 | ) |
| Net expenses | | | 2,228,663 | | | | 4,907,811 | |
| Net investment income (loss) | | | 2,610,998 | | | | (1,357,636 | ) |
| | | | | | | | | |
| NET REALIZED AND UNREALIZED | | | | | | | | |
| LOSS ON INVESTMENTS: | | | | | | | | |
| Net realized gain (loss) on: | | | | | | | | |
| Investments in unaffiliated issuers | | | 8,412,751 | | | | 26,734,934 | |
| Investments in affiliated issuers (See Note 7) | | | 678,834 | | | | 1,580,656 | |
| Foreign currency translation | | | — | | | | (264 | ) |
| Forward currency contracts | | | (333,116 | ) | | | (24,270 | ) |
| Net change in unrealized appreciation (depreciation) on: | | | | | | | | |
| Investments | | | 28,063,732 | | | | 50,743,232 | |
| Foreign currency translation | | | 2,821,213 | | | | 12,423,359 | |
| Forward currency contracts | | | 333,116 | | | | (381,292 | ) |
| Net realized and unrealized gain | | | 39,976,530 | | | | 91,076,355 | |
| Net increase in net assets resulting from operations | | $ | 42,587,528 | | | $ | 89,718,719 | |
| | | | | | | | | |
| * Net of foreign taxes withheld | | $ | — | | | $ | 26,904 | |
See notes to financial statements.
Intrepid Funds
STATEMENT OF OPERATIONS (continued)
For the six months ended March 31, 2012 (Unaudited)
| | | Intrepid | | | Intrepid All | |
| | | Income Fund | | | Cap Fund | |
| INVESTMENT INCOME: | | | | | | |
| Dividend income | | | | | | |
| Unaffiliated issuers* | | $ | 66,189 | | | $ | 281,169 | |
| Affiliated issuers (See Note 7) | | | 12,000 | | | | 14,367 | |
| Interest income | | | 2,512,605 | | | | 437 | |
| Total investment income | | | 2,590,794 | | | | 295,973 | |
| | | | | | | | | |
| Advisory fees (See Note 3) | | | 330,205 | | | | 212,198 | |
| Distribution (12b-1) fees - Investor Class Only | | | 45,176 | | | | 53,049 | |
| Administration fees | | | 38,527 | | | | 18,664 | |
| Fund accounting fees | | | 12,627 | | | | 6,270 | |
| Shareholder servicing fees and expenses | | | 19,402 | | | | 11,386 | |
| Federal and state registration | | | 17,569 | | | | 16,434 | |
| Custody fees | | | 4,933 | | | | 3,620 | |
| Reports to shareholders | | | 3,109 | | | | 2,693 | |
| Audit fees | | | 12,954 | | | | 12,954 | |
| Trustees fees and expenses | | | 2,177 | | | | 997 | |
| Insurance | | | 2,042 | | | | 838 | |
| Legal fees | | | 4,077 | | | | 4,082 | |
| Miscellaneous | | | 967 | | | | 669 | |
| Total expenses before Adviser reimbursement | | | 493,765 | | | | 343,854 | |
| Expenses reimbursed by Adviser | | | (52,339 | ) | | | (46,777 | ) |
| Net expenses | | | 441,426 | | | | 297,077 | |
| Net investment income (loss) | | | 2,149,368 | | | | (1,104 | ) |
| | | | | | | | | |
| NET REALIZED AND UNREALIZED | | | | | | | | |
| LOSS ON INVESTMENTS: | | | | | | | | |
| Net realized gain (loss) on: | | | | | | | | |
| Investments in unaffiliated issuers | | | 286,328 | | | | 2,277,914 | |
| Investments in affiliated issuers (See Note 7) | | | — | | | | 34,087 | |
| Net change in unrealized appreciation (depreciation) on: | | | | | | | | |
| Investments | | | 2,303,626 | | | | 4,931,608 | |
| Foreign currency translation | | | (39,838 | ) | | | 16,855 | |
| Net realized and unrealized gain | | | 2,550,116 | | | | 7,260,464 | |
| Net increase in net assets resulting from operations | | $ | 4,699,484 | | | $ | 7,259,360 | |
| | | | | | | | | |
| * Net of foreign taxes withheld | | $ | 2,158 | | | $ | 1,321 | |
See notes to financial statements.
Intrepid Capital Fund
STATEMENTS OF CHANGES IN NET ASSETS
| | | Six Months | | | Year | |
| | | Ended | | | Ended | |
| | | March 31, 2012 | | | September 30, 2011 | |
| | | (Unaudited) | | | | |
| OPERATIONS: | | | | | | |
| Net investment income | | $ | 2,610,998 | | | $ | 4,593,349 | |
| Net realized gain on investments | | | | | | | | |
| and foreign currency translation | | | 8,758,469 | | | | 19,483,962 | |
| Net change in unrealized | | | | | | | | |
| appreciation (depreciation) | | | 31,218,061 | | | | (25,528,791 | ) |
| Net increase (decrease) in assets | | | | | | | | |
| resulting from operations | | | 42,587,528 | | | | (1,451,480 | ) |
| | | | | | | | | |
| DISTRIBUTIONS TO SHAREHOLDERS: | | | | | | | | |
| From net investment income - Investor Class | | | (1,850,946 | ) | | | (3,282,777 | ) |
| From net investment income - Institutional Class | | | (739,283 | ) | | | (1,658,534 | ) |
| From net realized gain - Investor Class | | | (14,686,184 | ) | | | (5,139,117 | ) |
| From net realized gain - Institutional Class | | | (5,492,289 | ) | | | (2,698,136 | ) |
| Total distributions | | | (22,768,702 | ) | | | (12,778,564 | ) |
| | | | | | | | | |
| CAPITAL SHARE TRANSACTIONS: | | | | | | | | |
| Proceeds from shares sold - Investor Class | | | 109,458,160 | | | | 171,894,883 | |
| Proceeds from shares sold - Institutional Class | | | 11,478,766 | | | | 16,606,353 | |
| Proceeds from shares issued to holders in | | | | | | | | |
| reinvestment of dividends - Investor Class | | | 11,676,699 | | | | 6,558,863 | |
| Proceeds from shares issued to holders in | | | | | | | | |
| reinvestment of dividends - Institutional Class | | | 5,301,360 | | | | 4,174,562 | |
Cost of shares redeemed - Investor Class(1) | | | (38,514,571 | ) | | | (104,984,253 | ) |
Cost of shares redeemed - Institutional Class(2) | | | (9,177,800 | ) | | | (22,690,694 | ) |
| Net increase in net assets from | | | | | | | | |
| capital share transactions | | | 90,222,614 | | | | 71,559,714 | |
| | | | | | | | | |
| TOTAL INCREASE IN NET ASSETS | | | 110,041,440 | | | | 57,329,670 | |
| | | | | | | | | |
| NET ASSETS: | | | | | | | | |
| Beginning of period | | | 280,572,878 | | | | 223,243,208 | |
| End of period (including accumulated net | | | | | | | | |
| investment loss of $108,490 and $129,259) | | $ | 390,614,318 | | | $ | 280,572,878 | |
| (1) | Net of redemption fees of $6,190 and $13,692, respectively. |
| (2) | Net of redemption fees of $1,981 and $0, respectively. |
See notes to financial statements.
Intrepid Small Cap Fund
STATEMENTS OF CHANGES IN NET ASSETS (continued)
| | | Six Months | | | Year | |
| | | Ended | | | Ended | |
| | | March 31, 2012 | | | September 30, 2011 | |
| | | (Unaudited) | | | | |
| OPERATIONS: | | | | | | |
| Net investment loss | | $ | (1,357,636 | ) | | $ | (3,300,934 | ) |
| Net realized gain on investments | | | | | | | | |
| and foreign currency translation | | | 28,291,056 | | | | 79,262,195 | |
| Net change in unrealized | | | | | | | | |
| appreciation (depreciation) | | | 62,785,299 | | | | (69,955,377 | ) |
| Net increase in assets resulting from operations | | | 89,718,719 | | | | 6,005,884 | |
| | | | | | | | | |
| DISTRIBUTIONS TO SHAREHOLDERS: | | | | | | | | |
| From net realized gain - Investor Class | | | (71,079,314 | ) | | | (35,837,950 | ) |
| From net realized gain - Institutional Class | | | (6,908,737 | ) | | | (3,297,726 | ) |
| Total distributions | | | (77,988,051 | ) | | | (39,135,676 | ) |
| | | | | | | | | |
| CAPITAL SHARE TRANSACTIONS: | | | | | | | | |
| Proceeds from shares sold - Investor Class | | | 254,363,053 | | | | 410,720,841 | |
| Proceeds from shares sold - Institutional Class | | | 21,620,482 | | | | 32,171,293 | |
| Proceeds from shares issued to holders in | | | | | | | | |
| reinvestment of dividends - Investor Class | | | 66,939,920 | | | | 34,530,261 | |
| Proceeds from shares issued to holders in | | | | | | | | |
| reinvestment of dividends - Institutional Class | | | 5,292,954 | | | | 2,816,212 | |
Cost of shares redeemed - Investor Class(1) | | | (141,437,135 | ) | | | (383,021,308 | ) |
Cost of shares redeemed - Institutional Class(2) | | | (8,977,752 | ) | | | (35,582,656 | ) |
| Net increase in net assets from | | | | | | | | |
| capital share transactions | | | 197,801,522 | | | | 61,634,643 | |
| | | | | | | | | |
| TOTAL INCREASE IN NET ASSETS | | | 209,532,190 | | | | 28,504,851 | |
| | | | | | | | | |
| NET ASSETS: | | | | | | | | |
| Beginning of period | | | 592,612,346 | | | | 564,107,495 | |
| End of period (including accumulated net | | | | | | | | |
| investment loss of $1,367,327 and $9,691) | | $ | 802,144,536 | | | $ | 592,612,346 | |
| (1) | Net of redemption fees of $39,632 and $89,462, respectively. |
| (2) | Net of redemption fees of $2,307 and $611, respectively. |
See notes to financial statements.
Intrepid Income Fund
STATEMENTS OF CHANGES IN NET ASSETS (continued)
| | | Six Months | | | Year | |
| | | Ended | | | Ended | |
| | | March 31, 2012 | | | September 30, 2011 | |
| | | (Unaudited) | | | | |
| OPERATIONS: | | | | | | |
| Net investment income | | $ | 2,149,368 | | | $ | 3,242,062 | |
| Net realized gain on investments | | | 286,328 | | | | 1,464,635 | |
| Net change in unrealized | | | | | | | | |
| appreciation (depreciation) | | | 2,263,788 | | | | (2,569,269 | ) |
| Net increase in assets | | | | | | | | |
| resulting from operations | | | 4,699,484 | | | | 2,137,428 | |
| | | | | | | | | |
| DISTRIBUTIONS TO SHAREHOLDERS: | | | | | | | | |
| From net investment income - Investor Class | | | (864,952 | ) | | | (1,255,010 | ) |
| From net investment income - Institutional Class | | | (1,233,654 | ) | | | (2,111,551 | ) |
| From net realized gain - Investor Class | | | (560,848 | ) | | | (3,454 | ) |
| From net realized gain - Institutional Class | | | (733,271 | ) | | | (5,496 | ) |
| Total distributions | | | (3,392,725 | ) | | | (3,375,511 | ) |
| | | | | | | | | |
| CAPITAL SHARE TRANSACTIONS: | | | | | | | | |
| Proceeds from shares sold - Investor Class | | | 11,546,877 | | | | 20,528,246 | |
| Proceeds from shares sold - Institutional Class | | | 6,696,978 | | | | 38,461,065 | |
| Proceeds from shares issued to holders in | | | | | | | | |
| reinvestment of dividends - Investor Class | | | 1,309,325 | | | | 1,106,532 | |
| Proceeds from shares issued to holders in | | | | | | | | |
| reinvestment of dividends - Institutional Class | | | 1,965,929 | | | | 2,116,255 | |
Cost of shares redeemed - Investor Class(1) | | | (6,376,247 | ) | | | (30,588,699 | ) |
Cost of shares redeemed - Institutional Class(2) | | | (4,147,299 | ) | | | (14,206,335 | ) |
| Net increase in net assets from | | | | | | | | |
| capital share transactions | | | 10,995,563 | | | | 17,417,064 | |
| | | | | | | | | |
| TOTAL INCREASE IN NET ASSETS | | | 12,302,322 | | | | 16,178,981 | |
| | | | | | | | | |
| NET ASSETS: | | | | | | | | |
| Beginning of period | | | 82,581,853 | | | | 66,402,872 | |
| End of period (including accumulated net | | | | | | | | |
| investment loss of $49,503 and $100,265) | | $ | 94,884,175 | | | $ | 82,581,853 | |
| (1) | Net of redemption fees of $796 and $96, respectively. |
| (2) | Net of redemption fees of $0 and $0, respectively. |
See notes to financial statements.
Intrepid All Cap Fund
STATEMENTS OF CHANGES IN NET ASSETS (continued)
| | | Six Months | | | Year | |
| | | Ended | | | Ended | |
| | | March 31, 2012 | | | September 30, 2011 | |
| | | (Unaudited) | | | | |
| OPERATIONS: | | | | | | |
| Net investment loss | | $ | (1,104 | ) | | $ | (109,327 | ) |
| Net realized gain on investments | | | 2,312,001 | | | | 1,806,533 | |
| Net change in unrealized | | | | | | | | |
| appreciation (depreciation) | | | 4,948,463 | | | | (4,678,641 | ) |
| Net increase (decrease) in assets | | | | | | | | |
| resulting from operations | | | 7,259,360 | | | | (2,981,435 | ) |
| | | | | | | | | |
| DISTRIBUTIONS TO SHAREHOLDERS: | | | | | | | | |
| From net investment income | | | (60,937 | ) | | | — | |
| From net realized gain | | | (2,375,902 | ) | | | (1,803,667 | ) |
| Total distributions | | | (2,436,839 | ) | | | (1,803,667 | ) |
| | | | | | | | | |
| CAPITAL SHARE TRANSACTIONS: | | | | | | | | |
| Proceeds from shares sold | | | 8,575,786 | | | | 25,794,768 | |
| Proceeds from shares issued to holders | | | | | | | | |
| in reinvestment of dividends | | | 2,305,781 | | | | 1,803,339 | |
Cost of shares redeemed(1) | | | (2,377,865 | ) | | | (7,858,138 | ) |
| Net increase in net assets from | | | | | | | | |
| capital share transactions | | | 8,503,702 | | | | 19,739,969 | |
| | | | | | | | | |
| TOTAL INCREASE IN NET ASSETS | | | 13,326,223 | | | | 14,954,867 | |
| | | | | | | | | |
| NET ASSETS: | | | | | | | | |
| Beginning of period | | | 36,355,797 | | | | 21,400,930 | |
| End of period (including accumulated net | | | | | | | | |
| investment loss of $62,041 and $0) | | $ | 49,682,020 | | | $ | 36,355,797 | |
| (1) | Net of redemption fees of $148 and $206, respectively. |
See notes to financial statements.
Intrepid Capital Fund – Investor Class
FINANCIAL HIGHLIGHTS
Per share data for a share of capital stock outstanding for the entire period and selected information for the period are as follows:
| | | Period | | | | | | | | | | | | | | | | |
| | | Ended | | | | | | | | | | | | | | | | |
| | | March 31, | | | Year Ended September 30, | |
| | | 2012 | | | 2011 | | | 2010 | | | 2009 | | | 2008 | | | 2007 | |
| | | (Unaudited) | | | | | | | | | | | | | | | | |
| NET ASSET VALUE: | | | | | | | | | | | | | | | | | | |
| Beginning of period | | $ | 10.70 | | | $ | 11.09 | | | $ | 9.99 | | | $ | 9.67 | | | $ | 10.55 | | | $ | 10.18 | |
| OPERATIONS: | | | | | | | | | | | | | | | | | | | | | | | | |
Net investment income(1) | | | 0.08 | | | | 0.16 | | | | 0.16 | | | | 0.23 | | | | 0.18 | | | | 0.47 | |
| Net realized and unrealized | | | | | | | | | | | | | | | | | | | | | | | | |
| gain (loss) on investment | | | | | | | | | | | | | | | | | | | | | | | | |
| securities | | | 1.40 | | | | (0.05 | ) | | | 1.24 | | | | 0.52 | | | | (0.30 | ) | | | 0.55 | |
| Total from | | | | | | | | | | | | | | | | | | | | | | | | |
operations(2) | | | 1.48 | | | | 0.11 | | | | 1.40 | | | | 0.75 | | | | (0.12 | ) | | | 1.02 | |
| LESS DISTRIBUTIONS: | | | | | | | | | | | | | | | | | | | | | | | | |
| From net | | | | | | | | | | | | | | | | | | | | | | | | |
| investment income | | | (0.08 | ) | | | (0.17 | ) | | | (0.15 | ) | | | (0.23 | ) | | | (0.18 | ) | | | (0.47 | ) |
| From net realized gains | | | (0.73 | ) | | | (0.33 | ) | | | (0.15 | ) | | | (0.20 | ) | | | (0.58 | ) | | | (0.18 | ) |
| Total distributions | | | (0.81 | ) | | | (0.50 | ) | | | (0.30 | ) | | | (0.43 | ) | | | (0.76 | ) | | | (0.65 | ) |
| NET ASSET VALUE: | | | | | | | | | | | | | | | | | | | | | | | | |
| End of period | | $ | 11.37 | | | $ | 10.70 | | | $ | 11.09 | | | $ | 9.99 | | | $ | 9.67 | | | $ | 10.55 | |
| Total return | | | 14.31 | %(4) | | | 0.74 | % | | | 14.27 | % | | | 8.85 | % | | | (1.41 | )% | | | 10.10 | % |
| Net assets at end of | | | | | | | | | | | | | | | | | | | | | | | | |
| period (000s omitted) | | $ | 295,651 | | | $ | 198,898 | | | $ | 136,991 | | | $ | 74,598 | | | $ | 36,498 | | | $ | 33,482 | |
| RATIO OF EXPENSES TO | | | | | | | | | | | | | | | | | | | | | | | | |
| AVERAGE NET ASSETS: | | | | | | | | | | | | | | | | | | | | | | | | |
| Before expense | | | | | | | | | | | | | | | | | | | | | | | | |
| reimbursement/recoupment | | | 1.44 | %(5) | | | 1.46 | % | | | 1.53 | % | | | 1.71 | % | | | 1.79 | % | | | 1.95 | % |
| After expense | | | | | | | | | | | | | | | | | | | | | | | | |
| reimbursement/recoupment | | | 1.40 | %(5) | | | 1.40 | % | | | 1.45 | % | | | 1.80 | % | | | 1.95 | % | | | 1.95 | %(3) |
| RATIO OF NET INVESTMENT | | | | | | | | | | | | | | | | | | | | | | | | |
| INCOME TO AVERAGE NET ASSETS: | | | | | | | | | | | | | | | | | | | | | | | | |
| Before expense | | | | | | | | | | | | | | | | | | | | | | | | |
| reimbursement/recoupment | | | 1.46 | %(5) | | | 1.37 | % | | | 1.54 | % | | | 2.79 | % | | | 1.95 | % | | | 4.35 | % |
| After expense | | | | | | | | | | | | | | | | | | | | | | | | |
| reimbursement/recoupment | | | 1.50 | %(5) | | | 1.43 | % | | | 1.62 | % | | | 2.70 | % | | | 1.79 | % | | | 4.35 | %(3) |
| Portfolio turnover rate | | | 32 | %(4) | | | 88 | % | | | 54 | % | | | 60 | % | | | 86 | % | | | 40 | % |
| (1) | Net investment income per share is calculated using the ending balances prior to consideration or adjustment for permanent book-to-tax differences. |
| (2) | Total from investment operations per share includes redemption fees of less than $0.01 per share for the six months ended March 31, 2012 and five years ended September 30, 2011, 2010, 2009, 2008 and 2007. |
| (3) | The recouped amount is less than .01% |
See notes to financial statements.
Intrepid Capital Fund – Institutional Class
FINANCIAL HIGHLIGHTS (continued)
Per share data for a share of capital stock outstanding for the entire period and selected information for the period are as follows:
| | | Period | | | Year | | | April 30, 2010(1) | |
| | | Ended | | | Ended | | | through | |
| | | March 31, | | | September 30, | | | September 30, | |
| | | 2012 | | | 2011 | | | 2010 | |
| | | (Unaudited) | | | | | | | |
| NET ASSET VALUE: | | | | | | | | | |
| Beginning of period | | $ | 10.70 | | | $ | 11.10 | | | $ | 11.17 | |
| OPERATIONS: | | | | | | | | | | | | |
Net investment income(2) | | | 0.10 | | | | 0.18 | | | | 0.07 | |
| Net realized and unrealized | | | | | | | | | | | | |
| gain (loss) on investment securities | | | 1.40 | | | | (0.05 | ) | | | (0.06 | ) |
Total from operations(3) | | | 1.50 | | | | 0.13 | | | | 0.01 | |
| LESS DISTRIBUTIONS: | | | | | | | | | | | | |
| From net investment income | | | (0.09 | ) | | | (0.20 | ) | | | (0.08 | ) |
| From net realized gains | | | (0.73 | ) | | | (0.33 | ) | | | — | |
| Total distributions | | | (0.82 | ) | | | (0.53 | ) | | | (0.08 | ) |
| NET ASSET VALUE: | | | | | | | | | | | | |
| End of period | | $ | 11.38 | | | $ | 10.70 | | | $ | 11.10 | |
| Total return | | | 14.54 | %(4) | | | 0.93 | % | | | 0.09 | %(4) |
| Net assets at end of period (000s omitted) | | $ | 94,963 | | | $ | 81,675 | | | $ | 86,252 | |
| RATIO OF EXPENSES | | | | | | | | | | | | |
| TO AVERAGE NET ASSETS: | | | | | | | | | | | | |
| Before expense reimbursement | | | 1.19 | %(5) | | | 1.21 | % | | | 1.31 | %(5) |
| After expense reimbursement | | | 1.15 | %(5) | | | 1.15 | % | | | 1.15 | %(5) |
| RATIO OF NET INVESTMENT INCOME | | | | | | | | | | | | |
| TO AVERAGE NET ASSETS: | | | | | | | | | | | | |
| Before expense reimbursement | | | 1.70 | %(5) | | | 1.58 | % | | | 1.66 | %(5) |
| After expense reimbursement | | | 1.74 | %(5) | | | 1.64 | % | | | 1.82 | %(5) |
| Portfolio turnover rate | | | 32 | %(4) | | | 88 | % | | | 54 | %(4) |
| (1) | Commencement of Operations. |
| (2) | Net investment income per share is calculated using the ending balances prior to consideration or adjustment for permanent book-to-tax differences. |
| (3) | Total from investment operations includes redemption fees of less than $0.01 per share for the six months ended March 31, 2012 and the period ended September 30, 2010. |
See notes to financial statements.
Intrepid Small Cap Fund – Investor Class
FINANCIAL HIGHLIGHTS (continued)
Per share data for a share of capital stock outstanding for the entire period and selected information for the period are as follows:
| | | Period | | | | | | | | | | | | | | | | |
| | | Ended | | | | | | | | | | | | | | | | |
| | | March 31, | | | Year Ended September 30, | |
| | | 2012 | | | 2011 | | | 2010 | | | 2009 | | | 2008 | | | 2007 | |
| | | (Unaudited) | | | | | | | | | | | | | | | | |
| NET ASSET VALUE: | | | | | | | | | | | | | | | | | | |
| Beginning of period | | $ | 15.26 | | | $ | 15.98 | | | $ | 14.66 | | | $ | 11.60 | | | $ | 12.04 | | | $ | 10.37 | |
| OPERATIONS: | | | | | | | | | | | | | | | | | | | | | | | | |
| Net investment | | | | | | | | | | | | | | | | | | | | | | | | |
income (loss)(1) | | | (0.03 | ) | | | (0.09 | ) | | | (0.02 | ) | | | (0.01 | ) | | | 0.04 | | | | 0.14 | |
| Net realized and unrealized | | | | | | | | | | | | | | | | | | | | | | | | |
| gain on investment | | | | | | | | | | | | | | | | | | | | | | | | |
| securities | | | 2.14 | | | | 0.32 | | | | 2.18 | | | | 3.32 | | | | 0.07 | | | | 1.57 | |
| Total from | | | | | | | | | | | | | | | | | | | | | | | | |
operations(2) | | | 2.11 | | | | 0.23 | | | | 2.16 | | | | 3.31 | | | | 0.11 | | | | 1.71 | |
| LESS DISTRIBUTIONS: | | | | | | | | | | | | | | | | | | | | | | | | |
| From net investment income | | | — | | | | — | | | | — | | | | (0.02 | ) | | | (0.11 | ) | | | (0.04 | ) |
| From net realized gains | | | (1.87 | ) | | | (0.95 | ) | | | (0.84 | ) | | | (0.23 | ) | | | (0.44 | ) | | | — | |
| Total distributions | | | (1.87 | ) | | | (0.95 | ) | | | (0.84 | ) | | | (0.25 | ) | | | (0.55 | ) | | | (0.04 | ) |
| NET ASSET VALUE: | | | | | | | | | | | | | | | | | | | | | | | | |
| End of period | | $ | 15.50 | | | $ | 15.26 | | | $ | 15.98 | | | $ | 14.66 | | | $ | 11.60 | | | $ | 12.04 | |
| Total return | | | 14.54 | %(3) | | | 1.02 | % | | | 15.30 | % | | | 29.35 | % | | | 0.74 | % | | | 16.46 | % |
| Net assets at end of | | | | | | | | | | | | | | | | | | | | | | | | |
| period (000s omitted) | | $ | 733,634 | | | $ | 542,883 | | | $ | 511,726 | | | $ | 242,899 | | | $ | 20,494 | | | $ | 5,387 | |
| RATIO OF EXPENSES | | | | | | | | | | | | | | | | | | | | | | | | |
| TO AVERAGE NET ASSETS: | | | | | | | | | | | | | | | | | | | | | | | | |
| Before expense | | | | | | | | | | | | | | | | | | | | | | | | |
| reimbursement/recoupment | | | 1.44 | %(4) | | | 1.45 | % | | | 1.49 | % | | | 1.62 | % | | | 2.28 | % | | | 4.80 | % |
| After expense | | | | | | | | | | | | | | | | | | | | | | | | |
| reimbursement/recoupment | | | 1.40 | %(4) | | | 1.40 | % | | | 1.40 | % | | | 1.57 | % | | | 1.95 | % | | | 1.95 | % |
| RATIO OF NET INVESTMENT | | | | | | | | | | | | | | | | | | | | | | | | |
| INCOME (LOSS) TO | | | | | | | | | | | | | | | | | | | | | | | | |
| AVERAGE NET ASSETS: | | | | | | | | | | | | | | | | | | | | | | | | |
| Before expense | | | | | | | | | | | | | | | | | | | | | | | | |
| reimbursement/recoupment | | | (0.44 | )%(4) | | | (0.54 | )% | | | (0.23 | )% | | | (0.16 | )% | | | 0.24 | % | | | (1.27 | )% |
| After expense | | | | | | | | | | | | | | | | | | | | | | | | |
| reimbursement/recoupment | | | (0.40 | )%(4) | | | (0.49 | )% | | | (0.14 | )% | | | (0.11 | )% | | | 0.57 | % | | | 1.58 | % |
| Portfolio turnover rate | | | 31 | %(3) | | | 88 | % | | | 61 | % | | | 163 | % | | | 159 | % | | | 126 | % |
| (1) | Net investment income (loss) per share is calculated using the ending balances prior to consideration or adjustment for permanent book-to-tax differences. |
| (2) | Total from investment operations per share includes redemption fees of less than $0.01 per share for the six months ended March 31, 2012 and five years ended September 30, 2011, 2010, 2009, 2008 and 2007. |
See notes to financial statements.
Intrepid Small Cap Fund – Institutional Class
FINANCIAL HIGHLIGHTS (continued)
Per share data for a share of capital stock outstanding for the entire period and selected information for the period are as follows:
| | | | | | | | | November 3, | |
| | | Period | | | Year | | | 2009(1) | |
| | | Ended | | | Ended | | | through | |
| | | March 31, | | | September 30, | | | September 30, | |
| | | 2012 | | | 2011 | | | 2010 | |
| | | (Unaudited) | | | | | | | |
| NET ASSET VALUE: | | | | | | | | | |
| Beginning of period | | $ | 15.34 | | | $ | 16.02 | | | $ | 14.52 | |
| OPERATIONS: | | | | | | | | | | | | |
Net investment income (loss)(2) | | | (0.03 | ) | | | (0.02 | ) | | | 0.01 | |
| Net realized and unrealized | | | | | | | | | | | | |
| gain on investment securities | | | 2.17 | | | | 0.29 | | | | 2.33 | |
Total from operations(3) | | | 2.14 | | | | 0.27 | | | | 2.34 | |
| LESS DISTRIBUTIONS: | | | | | | | | | | | | |
| From net realized gains | | | (1.87 | ) | | | (0.95 | ) | | | (0.84 | ) |
| Total distributions | | | (1.87 | ) | | | (0.95 | ) | | | (0.84 | ) |
| NET ASSET VALUE: | | | | | | | | | | | | |
| End of period | | $ | 15.61 | | | $ | 15.34 | | | $ | 16.02 | |
| Total return | | | 14.67 | %(4) | | | 1.28 | % | | | 16.70 | %(4) |
| Net assets at end of period (000s omitted) | | $ | 68,511 | | | $ | 49,729 | | | $ | 52,381 | |
| RATIO OF EXPENSES | | | | | | | | | | | | |
| TO AVERAGE NET ASSETS: | | | | | | | | | | | | |
| Before expense reimbursement | | | 1.19 | %(5) | | | 1.20 | % | | | 1.26 | %(5) |
| After expense reimbursement | | | 1.15 | %(5) | | | 1.15 | % | | | 1.15 | %(5) |
| RATIO OF NET INVESTMENT | | | | | | | | | | | | |
| INCOME (LOSS) TO AVERAGE NET ASSETS: | | | | | | | | | | | | |
| Before expense reimbursement | | | (0.19 | )%(5) | | | (0.29 | )% | | | 0.01 | %(5) |
| After expense reimbursement | | | (0.15 | )%(5) | | | (0.24 | )% | | | 0.12 | %(5) |
| Portfolio turnover rate | | | 31 | %(4) | | | 88 | % | | | 61 | %(4) |
| (1) | Commencement of Operations. |
| (2) | Net investment income per share is calculated using the ending balances prior to consideration or adjustment for permanent book-to-tax differences. |
| (3) | Total from investment operations per share includes redemption fees of less than $0.01 for the six months ended March 31, 2012, year ended September 30, 2011, and the period ended September 30, 2010. |
See notes to financial statements.
Intrepid Income Fund – Investor Class
FINANCIAL HIGHLIGHTS (continued)
Per share data for a share of capital stock outstanding for the entire period and selected information for the period are as follows:
| | | Period | | | | | | | | | | | | | | | July 2, 2007(1) | |
| | | Ended | | | Year Ended | | | through | |
| | | March 31, | | | September 30, | | | September 30, | |
| | | 2012 | | | 2011 | | | 2010 | | | 2009 | | | 2008 | | | 2007 | |
| | | (Unaudited) | | | | | | | | | | | | | | | | |
| NET ASSET VALUE: | | | | | | | | | | | | | | | | | | |
| Beginning of period | | $ | 9.65 | | | $ | 9.77 | | | $ | 9.51 | | | $ | 9.43 | | | $ | 9.94 | | | $ | 10.00 | |
| OPERATIONS: | | | | | | | | | | | | | | | | | | | | | | | | |
Net investment income(2) | | | 0.21 | | | | 0.41 | | | | 0.52 | | | | 0.57 | | | | 0.46 | | | | 0.13 | |
| Net realized and | | | | | | | | | | | | | | | | | | | | | | | | |
| unrealized gain (loss) on | | | | | | | | | | | | | | | | | | | | | | | | |
| investment securities | | | 0.30 | | | | (0.13 | ) | | | 0.24 | | | | 0.09 | | | | (0.51 | ) | | | (0.06 | ) |
| Total from | | | | | | | | | | | | | | | | | | | | | | | | |
operations(3) | | | 0.51 | | | | 0.28 | | | | 0.76 | | | | 0.66 | | | | (0.05 | ) | | | 0.07 | |
| LESS DISTRIBUTIONS: | | | | | | | | | | | | | | | | | | | | | | | | |
| From net | | | | | | | | | | | | | | | | | | | | | | | | |
| investment income | | | (0.22 | ) | | | (0.40 | ) | | | (0.50 | ) | | | (0.58 | ) | | | (0.46 | ) | | | (0.13 | ) |
| From net realized gains | | | (0.15 | ) | | | (0.00 | )(4) | | | — | | | | — | | | | (0.00 | )(4) | | | — | |
| Total distributions | | | (0.37 | ) | | | (0.40 | ) | | | (0.50 | ) | | | (0.58 | ) | | | (0.46 | ) | | | (0.13 | ) |
| NET ASSET VALUE: | | | | | | | | | | | | | | | | | | | | | | | | |
| End of period | | $ | 9.79 | | | $ | 9.65 | | | $ | 9.77 | | | $ | 9.51 | | | $ | 9.43 | | | $ | 9.94 | |
| Total return | | | 5.36 | %(5) | | | 2.86 | % | | | 8.10 | % | | | 7.67 | % | | | (0.55 | )% | | | 0.67 | %(5) |
| Net assets at end of | | | | | | | | | | | | | | | | | | | | | | | | |
| period (000s omitted) | | $ | 39,076 | | | $ | 32,131 | | | $ | 41,456 | | | $ | 53,972 | | | $ | 28,743 | | | $ | 21,872 | |
| RATIO OF EXPENSES TO | | | | | | | | | | | | | | | | | | | | | | | | |
| AVERAGE NET ASSETS: | | | | | | | | | | | | | | | | | | | | | | | | |
| Before expense | | | | | | | | | | | | | | | | | | | | | | | | |
| reimbursement | | | 1.27 | %(6) | | | 1.31 | % | | | 1.33 | % | | | 1.45 | % | | | 1.61 | % | | | 2.19 | %(6) |
| After expense | | | | | | | | | | | | | | | | | | | | | | | | |
| reimbursement | | | 1.15 | %(6) | | | 1.15 | % | | | 1.24 | % | | | 1.25 | % | | | 1.25 | % | | | 1.25 | %(6) |
| RATIO OF NET INVESTMENT | | | | | | | | | | | | | | | | | | | | | | | | |
| INCOME TO AVERAGE NET ASSETS: | | | | | | | | | | | | | | | | | | | | | | | | |
| Before expense | | | | | | | | | | | | | | | | | | | | | | | | |
| reimbursement | | | 4.61 | %(6) | | | 3.80 | % | | | 4.95 | % | | | 6.53 | % | | | 4.62 | % | | | 4.51 | %(6) |
| After expense | | | | | | | | | | | | | | | | | | | | | | | | |
| reimbursement | | | 4.73 | %(6) | | | 3.96 | % | | | 5.04 | % | | | 6.73 | % | | | 4.98 | % | | | 5.45 | %(6) |
| Portfolio turnover rate | | | 28 | %(5) | | | 77 | % | | | 67 | % | | | 45 | % | | | 44 | % | | | 12 | %(5) |
| (1) | Commencement of Operations. |
| (2) | Net investment income per share is calculated using the ending balances prior to consideration or adjustment for permanent book-to-tax differences. |
| (3) | Total from investment operations per share includes redemption fees of less than $0.01 per share for the six months ended March 31, 2012 and for each of three years ended September 30, 2011, 2010 and 2009. |
| (4) | The amount represents less than $0.01 per share. |
See notes to financial statements.
Intrepid Income Fund – Institutional Class
FINANCIAL HIGHLIGHTS (continued)
Per share data for a share of capital stock outstanding for the entire period and selected information for the period are as follows:
| | | | | | | | | August 16, | |
| | | Period | | | Year | | | 2010(1) | |
| | | Ended | | | Ended | | | through | |
| | | March 31, | | | September 30, | | | September 30, | |
| | | 2012 | | | 2011 | | | 2010 | |
| | | (Unaudited) | | | | | | | |
| NET ASSET VALUE: | | | | | | | | | |
| Beginning of period | | $ | 9.63 | | | $ | 9.77 | | | $ | 9.73 | |
| OPERATIONS: | | | | | | | | | | | | |
Net investment income(2) | | | 0.25 | | | | 0.38 | | | | 0.05 | |
| Net realized and unrealized | | | | | | | | | | | | |
| gain (loss) on investment securities | | | 0.28 | | | | (0.09 | ) | | | 0.10 | |
| Total from operations | | | 0.53 | | | | 0.29 | | | | 0.15 | |
| LESS DISTRIBUTIONS: | | | | | | | | | | | | |
| From net investment income | | | (0.23 | ) | | | (0.43 | ) | | | (0.11 | ) |
| From net realized gains | | | (0.15 | ) | | | (0.00 | )(3) | | | — | |
| Total distributions | | | (0.38 | ) | | | (0.43 | ) | | | (0.11 | ) |
| NET ASSET VALUE: | | | | | | | | | | | | |
| End of period | | $ | 9.78 | | | $ | 9.63 | | | $ | 9.77 | |
| Total return | | | 5.60 | %(4) | | | 2.97 | % | | | 1.59 | %(4) |
| Net assets at end of period (000s omitted) | | $ | 55,809 | | | $ | 50,451 | | | $ | 24,947 | |
| RATIO OF EXPENSES | | | | | | | | | | | | |
| TO AVERAGE NET ASSETS: | | | | | | | | | | | | |
| Before expense reimbursement | | | 1.02 | %(5) | | | 1.07 | % | | | 1.22 | %(5) |
| After expense reimbursement | | | 0.90 | %(5) | | | 0.90 | % | | | 0.90 | %(5) |
| RATIO OF NET INVESTMENT INCOME | | | | | | | | | | | | |
| TO AVERAGE NET ASSETS: | | | | | | | | | | | | |
| Before expense reimbursement | | | 4.87 | %(5) | | | 4.09 | % | | | 4.56 | %(5) |
| After expense reimbursement | | | 4.99 | %(5) | | | 4.26 | % | | | 4.88 | %(5) |
| Portfolio turnover rate | | | 28 | %(4) | | | 77 | % | | | 67 | %(4) |
| (1) | Commencement of Operations. |
| (2) | Net investment income per share is calculated using the ending balances prior to consideration or adjustment for permanent book-to-tax differences. |
| (3) | The amount represents less than $0.01 per share. |
See notes to financial statements.
Intrepid All Cap Fund
FINANCIAL HIGHLIGHTS (continued)
Per share data for a share of capital stock outstanding for the entire period and selected information for the period are as follows:
| | | | | | | | | | | | | | | October 31, | |
| | | Period | | | | | | | | | | | | 2007(1) | |
| | | Ended | | | Year Ended | | | through | |
| | | March 31, | | | September 30, | | | September 30, | |
| | | 2012 | | | 2011 | | | 2010 | | | 2009 | | | 2008 | |
| | | (Unaudited) | | | | | | | | | | | | | |
| NET ASSET VALUE: | | | | | | | | | | | | | | | |
| Beginning of period | | $ | 9.23 | | | $ | 10.23 | | | $ | 9.03 | | | $ | 8.74 | | | $ | 10.00 | |
| OPERATIONS: | | | | | | | | | | | | | | | | | | | | |
Net investment income (loss)(2) | | | 0.00 | (6) | | | (0.03 | ) | | | (0.05 | ) | | | 0.01 | | | | 0.02 | |
| Net realized and unrealized gain (loss) | | | | | | | | | | | | | | | | | | | | |
| on investment securities | | | 1.76 | | | | (0.16 | ) | | | 1.30 | | | | 0.30 | | | | (1.27 | ) |
Total from operations(3) | | | 1.76 | | | | (0.19 | ) | | | 1.25 | | | | 0.31 | | | | (1.25 | ) |
| LESS DISTRIBUTIONS: | | | | | | | | | | | | | | | | | | | | |
| From net investment income | | | (0.01 | ) | | | — | | | | — | | | | (0.02 | ) | | | (0.01 | ) |
| From net realized gains | | | (0.61 | ) | | | (0.81 | ) | | | (0.05 | ) | | | — | | | | — | |
| Total distributions | | | (0.62 | ) | | | (0.81 | ) | | | (0.05 | ) | | | (0.02 | ) | | | (0.01 | ) |
| NET ASSET VALUE: | | | | | | | | | | | | | | | | | | | | |
| End of period | | $ | 10.37 | | | $ | 9.23 | | | $ | 10.23 | | | $ | 9.03 | | | $ | 8.74 | |
| Total return | | | 19.80 | %(4) | | | (2.61 | )% | | | 13.93 | % | | | 3.53 | % | | | (12.50 | )%(4) |
| Net assets at end of | | | | | | | | | | | | | | | | | | | | |
| period (000s omitted) | | $ | 49,682 | | | $ | 36,356 | | | $ | 21,401 | | | $ | 16,452 | | | $ | 6,250 | |
| RATIO OF EXPENSES | | | | | | | | | | | | | | | | | | | | |
| TO AVERAGE NET ASSETS: | | | | | | | | | | | | | | | | | | | | |
| Before expense | | | | | | | | | | | | | | | | | | | | |
| reimbursement/recoupment | | | 1.62 | %(5) | | | 1.69 | % | | | 1.98 | % | | | 2.65 | % | | | 2.99 | %(5) |
| After expense | | | | | | | | | | | | | | | | | | | | |
| reimbursement/recoupment | | | 1.40 | %(5) | | | 1.54 | % | | | 1.95 | % | | | 1.95 | % | | | 1.95 | %(5) |
| RATIO OF NET INVESTMENT | | | | | | | | | | | | | | | | | | | | |
| INCOME (LOSS) TO | | | | | | | | | | | �� | | | | | | | | | |
| AVERAGE NET ASSETS: | | | | | | | | | | | | | | | | | | | | |
| Before expense | | | | | | | | | | | | | | | | | | | | |
| reimbursement/recoupment | | | (0.23 | )%(5) | | | (0.48 | )% | | | (0.52 | )% | | | (0.65 | )% | | | (0.80 | )%(5) |
| After expense | | | | | | | | | | | | | | | | | | | | |
| reimbursement/recoupment | | | (0.01 | )%(5) | | | (0.33 | )% | | | (0.49 | )% | | | 0.05 | % | | | 0.24 | %(5) |
| Portfolio turnover rate | | | 35 | %(4) | | | 74 | % | | | 82 | % | | | 93 | % | | | 85 | %(4) |
| (1) | Commencement of Operations. |
| (2) | Net investment income (loss) per share is calculated using the ending balances prior to consideration or adjustment for permanent book-to-tax differences. |
| (3) | Total from investment operations per share includes redemption fees of less than $0.01 per share for the six months ended March 31, 2012 and the years ended September 30, 2011, 2010 and 2009. |
| (6) | Amount is less than $0.01 per share. |
See notes to financial statements.
Intrepid Funds
NOTES TO FINANCIAL STATEMENTS
March 31, 2012 (Unaudited)
Intrepid Capital Management Funds Trust (the “Trust”) was organized as a Delaware Statutory Trust on August 27, 2004 and is registered under the Investment Company Act of 1940, as amended (the “1940 Act”), as an open-end management investment company issuing shares in series, each series representing a distinct portfolio with its own investment objectives and policies. At March 31, 2012, the Trust consisted of four series (the “Funds”): Intrepid Capital Fund, Intrepid Small Cap Fund, Intrepid Income Fund and Intrepid All Cap Fund. The Intrepid Capital Fund’s Investor Class commenced operations on January 3, 2005, the Intrepid Capital Fund’s Institutional Class commenced operations on April 30, 2010, the Intrepid Small Cap Fund’s Investor Class commenced operations on October 3, 2005, the Intrepid Small Cap Fund’s Institutional Class commenced operations on November 3, 2009, the Intrepid Income Fund’s Investor Class commenced operations on July 2, 2007, the Intrepid Income Fund’s Institutional Class commenced operations on August 16, 2010 and the Intrepid All Cap Fund commenced operations on October 31, 2007.
| 2. | SIGNIFICANT ACCOUNTING POLICIES |
The following is a summary of significant accounting policies consistently followed by the Funds in the preparation of its financial statements. These policies are in conformity with accounting principles generally accepted in the United States (“GAAP”).
Valuation of Securities
The Trust has adopted authoritative fair valuation accounting standards which establish an authoritative definition of fair value and set out a hierarchy for measuring fair value. These standards require additional disclosures about the various inputs and valuation techniques used to develop the measurements of fair value and a discussion in changes in valuation techniques and related inputs during the period. These inputs are summarized in the three broad levels listed below.
Level 1 – Quoted prices in active markets for identical securities.
Level 2 – Other significant observable inputs (including quoted prices for similar securities, interest rates, prepayment speeds, credit risk, etc.).
Level 3 – Significant unobservable inputs (including the Fund’s own assumptions in determining the fair value of investments).
Equity investments, including common stocks, foreign issued common stocks, exchange-traded funds, closed end mutual funds and real estate investments trusts, which are traded on an exchange are valued at the last sale price reported by the exchange on which the securities are primarily traded on the day of valuation. If there are no sales on a given day for securities traded on an exchange, the latest bid quotation will be used. If there is no Nasdaq Official Closing Price for a Nasdaq-
Intrepid Funds
NOTES TO FINANCIAL STATEMENTS (continued)
March 31, 2012 (Unaudited)
listed security or sale price available for an over-the-counter security, the mean of the latest bid and asked quotations from Nasdaq will be used. When using the market quotations or closing price provided by the pricing service and when the market is considered active, the security will be classified as a Level 1 security.
Investment in mutual funds, including money market funds, are generally priced at the ending net asset value (NAV) provided by the service agent of the funds and will be classified as Level 1 securities.
Debt securities, such as corporate bonds, convertible bonds and U.S. government agency issues for which market quotations are not readily available may be valued based on information supplied by independent pricing services using matrix pricing formulas and/or independent broker bid quotations. Debt securities with remaining maturities of 60 days or less may be valued on an amortized cost basis, which involves valuing an instrument at its cost and thereafter assuming a constant amortization to maturity of any discount or premium, regardless of the impact of fluctuating rates on the fair value of the instrument. These securities will generally be classified as Level 2 securities.
Forward currency contracts derive their value from the underlying currency prices. These are valued by a pricing service using pricing models. The models use inputs that are observed from active markets, such as exchange rates. These contracts are classified as Level 2.
Any securities or other assets for which market quotations are not readily available are valued at fair value as determined in good faith by the Advisor pursuant to procedures established under the general supervision and responsibility of the Funds’ Board of Trustees and will be classified as Level 3 securities.
The inputs of methodology used for valuing securities may not be an indication of the risk associated with investing in those securities.
The following is a summary of the inputs used, as of March 31, 2012, in valuing the Funds’ investments carried at fair value:
| Description | | Level 1 | | | Level 2 | | | Level 3 | | | Total | |
| The Intrepid Capital Fund | | | | | | | | | | | | |
| Total Common Stocks* | | $ | 213,995,453 | | | $ | — | | | $ | — | | | $ | 213,995,453 | |
| Total Convertible Bonds* | | | — | | | | 2,992,465 | | | | — | | | | 2,992,465 | |
| Total Corporate Bonds* | | | — | | | | 85,265,047 | | | | — | | | | 85,265,047 | |
| Total Real Estate | | | | | | | | | | | | | | | | |
| Investment Trust | | | 7,340,423 | | | | — | | | | — | | | | 7,340,423 | |
| Total Investments in Securities | | $ | 221,335,876 | | | $ | 88,257,512 | | | $ | — | | | $ | 309,593,388 | |
Intrepid Funds
NOTES TO FINANCIAL STATEMENTS (continued)
March 31, 2012 (Unaudited)
The Intrepid Small Cap Fund
| | | Level 1 | | | Level 2 | | | Level 3 | | | Total | |
| Total Common Stocks* | | $ | 410,831,734 | | | $ | — | | | $ | — | | | $ | 410,831,734 | |
| Total Real Estate | | | | | | | | | | | | | | | | |
| Investment Trust* | | | 15,949,898 | | | | — | | | | — | | | | 15,949,898 | |
| Total U.S. Treasury Bills | | | — | | | | 118,746,500 | | | | — | | | | 118,746,500 | |
| Total Investment in Securities | | $ | 426,781,632 | | | $ | 118,746,500 | | | $ | — | | | $ | 545,528,132 | |
| Other Financial Instruments** | | | | | | | | | | | | | | | | |
| Total Forward | | | | | | | | | | | | | | | | |
| Currency Contracts | | $ | — | | | $ | (570,549 | ) | | $ | — | | | $ | (570,549 | ) |
| | | | | | | | | | | | | | | | | |
| The Intrepid Income Fund | | | | | | | | | | | | | | | | |
| | | Level 1 | | | Level 2 | | | Level 3 | | | Total | |
| Total Common Stocks* | | $ | 1,708,665 | | | $ | — | | | $ | — | | | $ | 1,708,665 | |
| Total Preferred Stock* | | | 335,010 | | | | — | | | | — | | | | 335,010 | |
| Total Convertible Bond* | | | — | | | | 3,901,495 | | | | — | | | | 3,901,495 | |
| Total Corporate Bonds* | | | — | | | | 64,982,672 | | | | — | | | | 64,982,672 | |
| Total Real Estate | | | | | | | | | | | | | | | | |
| Investment Trust* | | | 1,902,338 | | | | — | | | | — | | | | 1,902,338 | |
| Total Investment in Securities | | $ | 3,946,013 | | | $ | 68,884,167 | | | $ | — | | | $ | 72,830,180 | |
| | | | | | | | | | | | | | | | | |
| The Intrepid All Cap Fund | | | | | | | | | | | | | | | | |
| | | Level 1 | | | Level 2 | | | Level 3 | | | Total | |
| Total Common Stocks* | | $ | 32,024,813 | | | $ | — | | | $ | — | | | $ | 32,024,813 | |
| Total Real Estate | | | | | | | | | | | | | | | | |
| Investment Trust* | | | 1,001,783 | | | | — | | | | — | | | | 1,001,783 | |
| Total Investment in Securities | | $ | 33,026,596 | | | $ | — | | | $ | — | | | $ | 33,026,596 | |
| * | For further information regarding security characteristics, please see the Schedules of Investments. |
| ** | Other financial instruments are derivative instruments not reflected in the Schedule of Investments, such as forward currency contracts, which are reflected at the unrealized appreciation (depreciation) on the instrument. |
There were no transfers of securities between levels during the period ended March 31, 2012. The Funds did not hold any Level 3 securities during the period ended March 31, 2012. The Funds recognize transfers between levels at the end of the reporting period.
Derivative Instruments and Hedging Activities
The Funds’ adviser may use derivative instruments, such as forward currency contracts, as a means to manage exposure to exchange rate risk. During the period
Intrepid Funds
NOTES TO FINANCIAL STATEMENTS (continued)
March 31, 2012 (Unaudited)
ended March 31, 2012, the Intrepid Capital Fund and the Intrepid Small Cap Fund held derivative instruments.
Balance Sheet – Values of Derivative Instruments as of March 31, 2012.
| | | Asset Derivatives | | | Liability Derivatives | |
| Derivatives not accounted | | Balance Sheet | | | | | | Balance Sheet | | | | |
| for as hedging instruments | | Location | | | Value | | | Location | | | Value | |
| Intrepid Capital Fund | | | | | | | | | | | | |
| Forward Currency Contracts | | | N/A | | | $ | — | | | | N/A | | | $ | — | |
| Total | | | | | | $ | — | | | | | | | $ | — | |
| | | | | | | | | | | | | | | | | |
| Intrepid Small Cap Fund | | | | | | | | | | | | | | | | |
| | | | | | | | | | | Depreciation | | | | | |
| | | | | | | | | | | of forward | | | | | |
| Forward Currency Contracts | | | N/A | | | $ | — | | | currency contracts | | | $ | (570,549 | ) |
| Total | | | | | | $ | — | | | | | | | $ | (570,549 | ) |
Effect of Derivative Instruments on the Statement of Operations for the Six Months Ended March 31, 2012.
| | | Change in unrealized | Realized gain (loss) |
| | | appreciation (depreciation) | on forward |
| | | on forward currency contracts | currency contracts |
| | Intrepid Capital Fund | $ 333,116 | $(333,116) |
| | Intrepid Small Cap Fund | $(381,292) | $ (24,270) |
| | | | |
The average monthly notional amount of forward currency contracts during the period ended March 31, 2012 were as follows: |
| | | Intrepid | Intrepid |
| | Long Positions | Capital Fund | Small Cap Fund |
| | Forward currency contracts | $5,166,558 | $2,180,074 |
| | | | |
| | | Intrepid | Intrepid |
| | Short Positions | Capital Fund | Small Cap Fund |
| | Forward currency contracts | $(5,000,000) | $(18,679,071) |
Derivative Risk
The risks of using the types of derivatives in which the Funds may engage include the risk that movements in the value of the derivative may not fully offset or complement instruments currently held in the Funds in the manner intended by the Adviser; the risk that the counterparty to a derivative contract may fail to comply with their obligations to the Fund; the risk that the derivative may not possess a
Intrepid Funds
NOTES TO FINANCIAL STATEMENTS (continued)
March 31, 2012 (Unaudited)
liquid secondary market at a time when the Fund would look to disengage the position; the risk that additional capital from the Fund may be called upon to fulfill the conditions of the derivative contract; and the risk that the cost of the derivative contracts may reduce the overall returns experienced by the Funds.
Use of Estimates
The preparation of financial statements in conformity with GAAP requires management to make estimates and assumptions that affect the reported amounts of assets and liabilities and disclosure of contingent assets and liabilities at the date of the financial statements and the reported amounts of revenues and expenses during the reporting period. Actual results could differ from those estimates.
Indemnification
In the normal course of business the Funds enter into contracts that contain general indemnification clauses. The Funds’ maximum exposure under these arrangements is unknown, as this would involve future claims against the fund that have not yet occurred. Based on experience, the Funds expect the risk of loss to be remote.
Foreign Currency Transactions
The books and records are maintained in U.S. dollars. Foreign currency denominated transactions (i.e. market value of investment securities, assets and liabilities, purchases and sales of investment securities and income and expenses) are translated into U.S. dollars at the current rate of exchange. The Funds do not isolate that portion of the results of operations resulting from changes in foreign exchange rates on investments from the fluctuations arising from changes in market prices of securities held. Such fluctuations are included with the net realized and unrealized gain or loss from investments.
Securities Transactions and Investment Income
The Funds record security transactions based on trade date. Dividend income is recognized on the ex-dividend date, and interest income is recognized on an accrual basis. Discounts and premiums on securities purchased are amortized over the lives of the respective securities using the effective yield method. Withholding taxes on foreign dividends have been provided for in accordance with the Funds’ understanding of the applicable country’s tax rules and rates. Net realized gains or losses are determined using the identified cost method.
Distribution to Shareholder Policy
Dividends from net investment income, if any, are declared and paid quarterly in the Capital Fund and Income Fund and annually in the Small Cap Fund and the All Cap Fund. Distributions of net realized capital gains, if any, are declared and paid at least annually.
Intrepid Funds
NOTES TO FINANCIAL STATEMENTS (continued)
March 31, 2012 (Unaudited)
Federal Income Taxes
The Funds comply with the requirements of Subchapter M of the Internal Revenue Code necessary to qualify as a regulated investment company and to make the requisite distributions of income and capital gains to its shareholders sufficient to relieve it from Federal income taxes.
Allocation of Income, Expenses, and Gains/Losses
Income, expenses (other than those deemed to be attributable to a specific share class), and gains and losses of each Fund are allocated to each class of shares based upon the ratio of net assets represented by each class as a percentage of the net assets of that Fund. Expenses deemed directly attributable to a specific share class of shares are charged against the operations of such class. Most Fund expenses are allocated by class based on relative net assets.
Subsequent Events Evaluation
In preparing these financial statements, the Trust has evaluated events and transactions for potential recognition or disclosure resulting from subsequent events after the statement of assets and liabilities date of March 31, 2012. This evaluation did not result in any subsequent events that necessitated disclosure and / or adjustments.
The Trust has an Investment Advisory Agreement (the “Agreement”) with Intrepid Capital Management, Inc. (the “Adviser”), with whom certain officers and Trustees of the Trust are affiliated, to furnish investment advisory services to the Funds. Under the terms of the Agreement, the Trust, on behalf of the Funds, compensates the Adviser for its management services on the Intrepid Capital Fund and Intrepid All Cap Fund at the annual rate of 1.00% on the first $500 million of average daily net assets and 0.80% on the average daily net assets in excess of $500 million, on the Intrepid Small Cap Fund at an annual rate of 1.00% of average daily net assets, and on Intrepid Income Fund at the annual rate of 0.75% of average daily net assets.
For the Intrepid Capital Fund and the Intrepid Small Cap Fund, the Adviser agreed to waive its management fee and/or reimburse other expenses of each of the Funds, including organization expenses, to the extent necessary to ensure that each Fund’s operating expenses did not exceed 1.40% of each Fund’s Investor Class’s average daily net assets and 1.15% of average daily net assets of each Fund’s Institutional Class. The Intrepid Capital Fund’s Investor Class’s expenses were previously capped at 1.50% of average daily net assets for the period from October 1, 2009 through November 30, 2009. The expense limitation agreement was subsequently lowered to 1.49% of average daily net assets until April 30, 2010 when
Intrepid Funds
NOTES TO FINANCIAL STATEMENTS (continued)
March 31, 2012 (Unaudited)
it was lowered to the current level. The Intrepid Small Cap Fund’s Investor Class’s expenses were previously capped at 1.45% of average daily net assets for the period of October 1, 2009 through November 2, 2009. For the Intrepid Income Fund, the Adviser agreed to waive its management fee and/or reimburse other expenses of the Fund, including organization expense, to the extent necessary to ensure that the Fund’s operating expenses did not exceed 1.15% of average daily net assets of the Investor Class and 0.90% of average daily net assets of the Institutional Class. The Investor Class’s expenses were previously capped at 1.25% of average daily net assets of the Investor’s Class’s average daily assets for the period of October 1, 2009 through August 16, 2010. Effective January 31, 2011, the Advisor agreed to waive its management fee and/or reimburse other expenses of the Intrepid All Cap Fund, including organization expense, to the extent necessary to ensure that the Fund’s operating expenses did not exceed 1.40% of average daily assets. The Fund’s expenses were previously capped at 1.95% of average daily net assets. Any such waivers or reimbursements for the Funds are subject to later adjustment to allow the Adviser to recoup amounts waived or reimbursed to the extent actual fees and expenses on a monthly basis during the fiscal year are less than the respective expense cap limitations, provided, however, that the Adviser shall only be entitled to recoup such amounts for a period of three years from the date such amount was waived or reimbursed. Waived/reimbursed expenses subject to potential recovery by year of expiration are as follows:
| | | Year of Expiration | |
| | | 9/30/12 | | | 9/30/13 | | | 9/30/14 | | | 9/30/15 | |
| Intrepid Capital Fund | | $ | — | | | $ | 119,037 | | | $ | 191,305 | | | $ | 68,655 | |
| Intrepid Small Cap Fund | | | 77,189 | | | | 349,588 | | | | 353,297 | | | | 137,270 | |
| Intrepid Income Fund | | | 77,259 | | | | 63,406 | | | | 132,953 | | | | 52,339 | |
| Intrepid All Cap Fund | | | 56,937 | | | | 14,971 | | | | 58,383 | | | | 46,777 | |
The Trust, on behalf of the Funds, has adopted a distribution plan pursuant to Rule 12b-1 under the 1940 Act (the “12b-1 Plan”), which provides that the Funds may reimburse the Funds’ distributor or others at an annual rate of up to 0.25% of the average daily net assets of the Investor Class of the Capital Fund, Small Cap Fund and Income Funds and the sole class of the All Cap Fund.
Quasar Distributors, LLC serves as the distributor to the Funds. Quasar Distributors, LLC is an affiliated company of U.S. Bank, N.A.
Intrepid Funds
NOTES TO FINANCIAL STATEMENTS (continued)
March 31, 2012 (Unaudited)
| 5. | INVESTMENT TRANSACTIONS |
The aggregate purchases and sales of securities (excluding short-term securities) by the Funds for the six months ended March 31, 2012 were as follows:
| | | Non-U.S. Government | |
| | | Purchases | | | Sales | |
| Intrepid Capital Fund | | $ | 95,619,126 | | | $ | 90,139,079 | |
| Intrepid Small Cap Fund | | | 142,718,620 | | | | 232,159,433 | |
| Intrepid Income Fund | | | 19,656,477 | | | | 20,254,545 | |
| Intrepid All Cap Fund | | | 11,624,201 | | | | 16,194,950 | |
| 6. | CAPITAL SHARE TRANSACTIONS |
| Intrepid Capital Fund – Investor Class | | | | | | |
| | | Six Months Ended | | | Year Ended | |
| | | March 31, 2012 | | | September 30, 2011 | |
| Shares sold | | | 9,738,552 | | | | 14,963,704 | |
| Shares issued to holders in | | | | | | | | |
| reinvestment of dividends | | | 1,090,817 | | | | 575,079 | |
| Shares redeemed | | | (3,424,934 | ) | | | (9,300,536 | ) |
| Net increase in shares | | | 7,404,435 | | | | 6,238,247 | |
| Shares outstanding: | | | | | | | | |
| Beginning of period | | | 18,593,483 | | | | 12,355,236 | |
| End of period | | | 25,997,918 | | | | 18,593,483 | |
| | | | | | | | | |
| Intrepid Capital Fund – Institutional Class | | | | | | | | |
| | | Six Months Ended | | | Year Ended | |
| | | March 31, 2012 | | | September 30, 2011 | |
| Shares sold | | | 1,022,950 | | | | 1,455,274 | |
| Shares issued to holders in | | | | | | | | |
| reinvestment of dividends | | | 495,280 | | | | 365,664 | |
| Shares redeemed | | | (803,756 | ) | | | (1,962,177 | ) |
| Net increase (decrease) in shares | | | 714,474 | | | | (141,239 | ) |
| Shares outstanding: | | | | | | | | |
| Beginning of period | | | 7,631,558 | | | | 7,772,797 | |
| End of period | | | 8,346,032 | | | | 7,631,558 | |
Intrepid Funds
NOTES TO FINANCIAL STATEMENTS (continued)
March 31, 2012 (Unaudited)
| Intrepid Small Cap Fund – Investor Class | | | | | | |
| | | Six Months Ended | | | Year Ended | |
| | | March 31, 2012 | | | September 30, 2011 | |
| Shares sold | | | 16,203,815 | | | | 24,900,620 | |
| Shares issued to holders in | | | | | | | | |
| reinvestment of dividends | | | 4,572,399 | | | | 2,102,939 | |
| Shares redeemed | | | (9,016,830 | ) | | | (23,445,516 | ) |
| Net increase in shares | | | 11,759,384 | | | | 3,558,043 | |
| Shares outstanding: | | | | | | | | |
| Beginning of period | | | 35,579,022 | | | | 32,020,979 | |
| End of period | | | 47,338,406 | | | | 35,579,022 | |
| | | | | | | | | |
Intrepid Small Cap Fund – Institutional Class | | | | | | | | |
| | | Six Months Ended | | | Year Ended | |
| | | March 31, 2012 | | | September 30, 2011 | |
| Shares sold | | | 1,368,439 | | | | 1,944,014 | |
| Shares issued to holders in | | | | | | | | |
| reinvestment of dividends | | | 359,088 | | | | 170,990 | |
| Shares redeemed | | | (580,855 | ) | | | (2,141,695 | ) |
| Net increase (decrease) in shares | | | 1,146,672 | | | | (26,691 | ) |
| Shares outstanding: | | | | | | | | |
| Beginning of period | | | 3,242,349 | | | | 3,269,040 | |
| End of period | | | 4,389,021 | | | | 3,242,349 | |
| | | | | | | | | |
Intrepid Income Fund – Investor Class | | | | | | | | |
| | | Six Months Ended | | | Year Ended | |
| | | March 31, 2012 | | | September 30, 2011 | |
| Shares sold | | | 1,174,993 | | | | 2,086,436 | |
| Shares issued to holders in | | | | | | | | |
| reinvestment of dividends | | | 135,286 | | | | 113,064 | |
| Shares redeemed | | | (651,975 | ) | | | (3,111,349 | ) |
| Net increase (decrease) in shares | | | 658,304 | | | | (911,849 | ) |
| Shares outstanding: | | | | | | | | |
| Beginning of period | | | 3,331,246 | | | | 4,243,095 | |
| End of period | | | 3,989,550 | | | | 3,331,246 | |
Intrepid Funds
NOTES TO FINANCIAL STATEMENTS (continued)
March 31, 2012 (Unaudited)
| Intrepid Income Fund - Institutional Class | | | | | | |
| | | Six Months Ended | | | Year Ended | |
| | | March 31, 2012 | | | September 30, 2011 | |
| Shares sold | | | 688,697 | | | | 3,912,770 | |
| Shares issued to holders in | | | | | | | | |
| reinvestment of dividends | | | 203,315 | | | | 216,429 | |
| Shares redeemed | | | (424,108 | ) | | | (1,446,807 | ) |
| Net increase in shares | | | 467,904 | | | | 2,682,392 | |
| Shares outstanding: | | | | | | | | |
| Beginning of period | | | 5,236,971 | | | | 2,554,579 | |
| End of period | | | 5,704,875 | | | | 5,236,971 | |
| | | | | | | | | |
| Intrepid All Cap Fund | | | | | | | | |
| | | Six Months Ended | | | Year Ended | |
| | | March 31, 2012 | | | September 30, 2011 | |
| Shares sold | | | 842,604 | | | | 2,447,696 | |
| Shares issued to holders in | | | | | | | | |
| reinvestment of dividends | | | 244,775 | | | | 175,935 | |
| Shares redeemed | | | (235,823 | ) | | | (776,725 | ) |
| Net increase in shares | | | 851,556 | | | | 1,846,906 | |
| Shares outstanding: | | | | | | | | |
| Beginning of period | | | 3,939,121 | | | | 2,092,215 | |
| End of period | | | 4,790,677 | | | | 3,939,121 | |
Intrepid Funds
NOTES TO FINANCIAL STATEMENTS (continued)
March 31, 2012 (Unaudited)
7.TRANSACTIONS WITH AFFILIATES
The following issuers are affiliated with the Funds; that is, the Adviser had control of 5% or more of the outstanding voting securities during the period from October 1, 2011 through March 31, 2012. As defined in Section (2)(a)(3) of the Investment Company Act of 1940; such issues are:
| Intrepid Capital Fund | | | | | | | | | | | | | | | | | | | | | | | | |
| | | | | | | | | | | | Share | | | | | | | | | | | | | |
| | | Share | | | | | | | | | Balance | | | | | | | | | | | | | |
| | | Balance | | | | | | | | | at | | | | | | Realized | | | Value at | | | Cost at | |
| | | at Oct. | | | | | | | | | March | | | Dividend | | | Gain/ | | | March | | | March | |
| Issuer Name | | 1, 2011 | | | Additions | | | Reductions | | | 31, 2012 | | | Income | | | (Loss) | | | 31, 2012 | | | 31, 2012 | |
| AMERISAFE, | | | | | | | | | | | | | | | | | | | | | | | | | | | | |
| Inc. (a) | | | 305,405 | | | | 500 | | | | (129,684 | ) | | | 176,221 | | | $ | — | | | $ | 678,834 | | | $ | 4,359,708 | | | $ | 3,205,936 | |
| CSG Systems | | | | | | | | | | | | | | | | | | | | | | | | | | | | | | | | |
| International, | | | | | | | | | | | | | | | | | | | | | | | | | | | | | | | | |
| Inc. | | | 498,950 | | | | 102,296 | | | | — | | | | 601,246 | | | | — | | | | — | | | | 9,102,864 | | | | 9,995,212 | |
| EPIQ | | | | | | | | | | | | | | | | | | | | | | | | | | | | | | | | |
| Systems, Inc. | | | 351,910 | | | | 81,961 | | | | — | | | | 433,871 | | | | 35,191 | | | | — | | | | 5,249,839 | | | | 5,288,568 | |
| Oil-Dri | | | | | | | | | | | | | | | | | | | | | | | | | | | | | | | | |
| Corporation | | | | | | | | | | | | | | | | | | | | | | | | | | | | | | | | |
| of America - | | | | | | | | | | | | | | | | | | | | | | | | | | | | | | | | |
| Class A | | | 105,847 | | | | — | | | | — | | | | 105,847 | | | | 35,988 | | | | — | | | | 2,253,483 | | | | 1,577,768 | |
| World Wrestling | | �� | | | | | | | | | | | | | | | | | | | | | | | | | | | | | | |
| Entertainment, | | | | | | | | | | | | | | | | | | | | | | | | | | | | | | | | |
| Inc. | | | 415,524 | | | | 362,145 | | | | — | | | | 777,669 | | | | 104,982 | | | | — | | | | 6,897,924 | | | | 7,126,418 | |
| | | | | | | | | | | | | | | | | | | $ | 176,161 | | | $ | 678,834 | | | $ | 27,863,818 | | | $ | 27,193,902 | |
| | | | | | | | | | | | | | | | | | | | | | | | | | | | | | | | | |
| Intrepid Small Cap Fund | | | | | | | | | | | | | | | | | | | | | | | | | | | | | | | | |
| | | | | | | | | | | | | | | Share | | | | | | | | | | | | | | | | | |
| | | Share | | | | | | | | | | | Balance | | | | | | | | | | | | | | | | | |
| | | Balance | | | | | | | | | | | at | | | | | | | Realized | | | Value at | | | Cost at | |
| | | at Oct. | | | | | | | | | | | March | | | Dividend | | | Gain/ | | | March | | | March | |
| Issuer Name | | 1, 2011 | | | Additions | | | Reductions | | | 31, 2012 | | | Income | | | (Loss) | | | 31, 2012 | | | 31, 2012 | |
| AMERISAFE, | | | | | | | | | | | | | | | | | | | | | | | | | | | | | | | | |
| Inc. (a) | | | 762,226 | | | | — | | | | (160,190 | ) | | | 602,036 | | | $ | — | | | $ | 841,447 | | | $ | 14,894,371 | | | $ | 10,609,700 | |
| CSG Systems | | | | | | | | | | | | | | | | | | | | | | | | | | | | | | | | |
| International, | | | | | | | | | | | | | | | | | | | | | | | | | | | | | | | | |
| Inc. | | | 1,413,299 | | | | 121,100 | | | | (47,100 | ) | | | 1,487,299 | | | | — | | | | (277,777 | ) | | | 22,517,707 | | | | 25,240,090 | |
| EPIQ | | | | | | | | | | | | | | | | | | | | | | | | | | | | | | | | |
| Systems, Inc. | | | 822,794 | | | | 979,020 | | | | (233,159 | ) | | | 1,568,655 | | | | 71,096 | | | | 294,906 | | | | 18,980,725 | | | | 18,579,778 | |
| Oil-Dri | | | | | | | | | | | | | | | | | | | | | | | | | | | | | | | | |
| Corporation | | | | | | | | | | | | | | | | | | | | | | | | | | | | | | | | |
| of America - | | | | | | | | | | | | | | | | | | | | | | | | | | | | | | | | |
| Class A | | | 272,997 | | | | — | | | | (137,158 | ) | | | 135,839 | | | | 73,301 | | | | 722,080 | | | | 2,892,012 | | | | 1,925,248 | |
| World Wrestling | | | | | | | | | | | | | | | | | | | | | | | | | | | | | | | | |
| Entertainment, | | | | | | | | | | | | | | | | | | | | | | | | | | | | | | | | |
| Inc. | | | 910,965 | | | | 441,464 | | | | — | | | | 1,352,429 | | | | 277,699 | | | | — | | | | 11,996,045 | | | | 12,670,072 | |
| | | | | | | | | | | | | | | | | | | $ | 422,096 | | | $ | 1,580,656 | | | $ | 71,280,860 | | | $ | 69,024,888 | |
Intrepid Funds
NOTES TO FINANCIAL STATEMENTS (continued)
March 31, 2012 (Unaudited)
| Intrepid Income Fund | | | | | | | | | | | | | | | | | | | | | | | | |
| | | | | | | | | | | | Share | | | | | | | | | | | | | |
| | | Share | | | | | | | | | Balance | | | | | | | | | | | | | |
| | | Balance | | | | | | | | | at | | | | | | Realized | | | Value at | | | Cost at | |
| | | at Oct. | | | | | | | | | March | | | Dividend | | | Gain/ | | | March | | | March | |
| Issuer Name | | 1, 2011 | | | Additions | | | Reductions | | | 31, 2012 | | | Income | | | (Loss) | | | 31, 2012 | | | 31, 2012 | |
| World | | | | | | | | | | | | | | | | | | | | | | | | | | | | |
| Wrestling | | | | | | | | | | | | | | | | | | | | | | | | | | | | |
| Entertainment, | | | | | | | | | | | | | | | | | | | | | | | | | | | | |
| Inc. | | | — | | | | 105,820 | | | | — | | | | 105,820 | | | $ | 12,000 | | | $ | — | | | $ | 938,623 | | | $ | 983,978 | |
| | | | | | | | | | | | | | | | | | | $ | 12,000 | | | $ | — | | | $ | 938,623 | | | $ | 983,978 | |
| | | | | | | | | | | | | | | | | | | | | | | | | | | | | | | | | |
| Intrepid All Cap Fund | | | | | | | | | | | | | | | | | | | | | | | | | | | | | | | | |
| | | | | | | | | | | | | | | Share | | | | | | | | | | | | | | | | | |
| | | Share | | | | | | | | | | | Balance | | | | | | | | | | | | | | | | | |
| | | Balance | | | | | | | | | | | at | | | | | | | | | | | Value at | | | Cost at | |
| | | at Oct. | | | | | | | | | | | March | | | Dividend | | | Realized | | | March | | | March | |
| Issuer Name | | 1, 2011 | | | Additions | | | Reductions | | | 31, 2012 | | | Income | | | Gain | | | 31, 2012 | | | 31, 2012 | |
| CSG Systems | | | | | | | | | | | | | | | | | | | | | | | | | | | | | | | | |
| International, | | | | | | | | | | | | | | | | | | | | | | | | | | | | | | | | |
| Inc. | | | 73,450 | | | | 21,600 | | | | — | | | | 95,050 | | | $ | — | | | $ | — | | | $ | 1,439,057 | | | $ | 1,650,276 | |
| EPIQ | | | | | | | | | | | | | | | | | | | | | | | | | | | | | | | | |
| Systems, Inc. | | | 46,765 | | | | 17,484 | | | | (19,000 | ) | | | 45,249 | | | | 3,727 | | | | 34,087 | | | | 547,513 | | | | 537,001 | |
| World | | | | | | | | | | | | | | | | | | | | | | | | | | | | | | | | |
| Wrestling | | | | | | | | | | | | | | | | | | | | | | | | | | | | | | | | |
| Entertainment, | | | | | | | | | | | | | | | | | | | | | | | | | | | | | | | | |
| Inc. | | | 38,483 | | | | 70,686 | | | | — | | | | 109,169 | | | | 10,640 | | | | — | | | | 968,329 | | | | 1,002,840 | |
| | | | | | | | | | | | | | | | | | | $ | 14,367 | | | $ | 34,087 | | | $ | 2,954,899 | | | $ | 3,190,117 | |
(a) Security is no longer an affiliated company at March 31, 2012.
| 8. | FEDERAL INCOME TAX INFORMATION |
The tax components of distributions paid during the fiscal periods ended September 30, 2011 and 2010 are as follows:
| | | September 30, 2011 | | | September 30, 2010 | |
| | | Ordinary | | | Long-Term | | | Ordinary | | | | |
| | | Income | | | Capital Gains | | | Income | | | | |
| Intrepid Capital Fund | | $ | 11,436,546 | | | $ | 1,342,018 | | | $ | 3,370,222 | | | $ | — | |
| Intrepid Small Cap Fund | | | 27,543,308 | | | | 11,592,367 | | | | 16,350,377 | | | | 169,972 | |
| Intrepid Income Fund | | | 3,366,561 | | | | 8,950 | | | | 3,270,904 | | | | — | |
| Intrepid All Cap Fund | | | 1,567,653 | | | | 236,014 | | | | 108,967 | | | | 3,075 | |
The Funds designated as long-term capital gain dividend, pursuant to Internal Revenue Code Section 852(b)(3), the amount necessary to reduce the earnings and
Intrepid Funds
NOTES TO FINANCIAL STATEMENTS (continued)
March 31, 2012 (Unaudited)
profits of the Funds related to net capital gain to zero for the tax year ended September 30, 2011.
The Intrepid Income Fund utilized $281,402 in capital loss carryovers during the current fiscal year.
Additionally, U.S. generally accepted accounting principles require that certain components of net assets relating to permanent differences be reclassified between financial and tax reporting. These reclassifications have no effect on net assets or net asset value per share. For the year ended September 30, 2011, the following table shows the reclassifications made:
| | | Accumulated | | | Undistributed | |
| | | Net Realized | | | Net Investment | |
| | | Losses | | | Income | |
| Intrepid Capital Fund | | $ | (260,448 | ) | | $ | 260,448 | |
| Intrepid Small Cap Fund | | | (3,293,393 | ) | | | 3,293,393 | |
| Intrepid Income Fund | | | (4,751 | ) | | | 4,751 | |
| Intrepid All Cap Fund | | | (109,327 | ) | | | 109,327 | |
These reclassifications primarily relate to investment losses and currency adjustments.
As of September 30, 2011, the components of accumulated earnings (losses) for income tax purposes were as follows:
| | | Intrepid | | | Intrepid | |
| | | Capital Fund | | | Small Cap Fund | |
| Cost of investments | | $ | 293,982,407 | | | $ | 632,082,235 | |
| Unrealized appreciation | | | 8,893,323 | | | | 22,565,271 | |
| Unrealized depreciation | | | (22,519,987 | ) | | | (60,640,547 | ) |
| Net unrealized depreciation | | | (13,626,664 | ) | | | (38,075,276 | ) |
| Undistributed ordinary income | | | 13,604,673 | | | | 34,320,418 | |
| Undistributed long-term capital gain | | | 4,346,984 | | | | 43,667,266 | |
| Distributable income | | | 17,951,657 | | | | 77,987,684 | |
| Other accumulated loss | | | (338,286 | ) | | | (198,948 | ) |
| Total accumulated gain/(loss) | | $ | 3,986,707 | | | $ | 39,713,460 | |
Intrepid Funds
NOTES TO FINANCIAL STATEMENTS (continued)
March 31, 2012 (Unaudited)
| | | Intrepid | | | Intrepid | |
| | | Income Fund | | | All Cap Fund | |
| Cost of investments | | $ | 82,883,530 | | | $ | 40,256,321 | |
| Unrealized appreciation | | | 1,112,392 | | | | 1,013,827 | |
| Unrealized depreciation | | | (1,711,783 | ) | | | (4,796,593 | ) |
| Net unrealized depreciation | | | (599,391 | ) | | | (3,782,766 | ) |
| Undistributed ordinary income | | | 460,736 | | | | 843,519 | |
| Undistributed long-term capital gain | | | 798,705 | | | | 1,426,258 | |
| Distributable income | | | 1,259,441 | | | | 2,269,777 | |
| Other accumulated loss | | | — | | | | — | |
| Total accumulated gain/(loss) | | $ | 660,050 | | | $ | (1,512,989 | ) |
The difference between book-basis and tax-basis unrealized appreciation is attributable primarily to the tax deferral of losses on wash sales.
At September 30, 2011, the Intrepid Capital Fund and the Intrepid Small Cap Fund had post-October currency losses of $338,286 and $198,948, respectively.
There is no tax liability resulting from unrecognized tax benefits relating to uncertain income tax positions taken or expected to be taken on the tax return for the fiscal year-end September 30, 2011, or for any other tax years which are open for exam. As of September 30, 2011, open tax years include the tax years ended September 30, 2008 through 2011. The Trust is also not aware of any tax positions for which it is reasonably possible that the total amounts of unrecognized tax benefits will significantly change in the next year. The Funds recognize interest and penalties, if any, related to unrecognized tax benefits as income tax expense in the Statement of Operations. During the period, the Funds did not incur any interest or penalties, nor were any accrued as of September 30, 2011.
The Intrepid Capital Fund, Intrepid Small Cap Fund, Intrepid Income Fund, and Intrepid All Cap Fund each have a revolving unsecured credit facility in the amounts of $5,000,000, $10,000,000, $5,000,000, and $2,000,000, respectively, for temporary emergency purposes, including the meeting of redemption requests that otherwise might require the untimely disposition of securities. The lines of credit have a one year term and are reviewed annually by the Board of Trustees. The current agreements run through October 15, 2012. The interest rate as of March 31, 2012 was 3.25%. During the six month period ended March 31, 2012, none of the Intrepid Funds drew on their line of credit.
Intrepid Funds
NOTES TO FINANCIAL STATEMENTS (continued)
March 31, 2012 (Unaudited)
10.NEW TAX LAW
On December 22, 2010, The Regulated Investment Company Modernization Act of 2010 (the “Modernization Act”) was signed into law. The Modernization Act is the first major piece of legislation affecting regulated investment companies (“RICs”) since 1986 and it modernizes several of the federal income and excise tax provisions related to RICs. Some highlights of the enacted provisions are as follows:
New capital losses may now be carried forward indefinitely, and retain the character of the original loss. Under preenactment law, capital losses could be carried forward for eight years, and carried forward as short-term capital losses, irrespective of the character of the original loss.
The Modernization Act contains simplification provisions, which are aimed at preventing disqualification of a RIC for “inadvertent” failures of the asset diversification and/or qualifying income tests. Additionally, the Modernization Act exempts RICs from the preferential dividend rule, and repealed the 60-day designation requirement for certain types of paythrough income and gains.
Finally, the Modernization Act contains several provisions aimed at preserving the character of distributions made by a RIC during the portion of its taxable year ending after October 31 or December 31, reducing the circumstances under which a RIC might be required to file amended Forms 1099 to restate previously reported distributions. The provisions related to the RIC Modernization Act for qualification testing are effective for the September 30, 2011 taxable year. The effective date for changes in the treatment of capital losses is September 30, 2012 taxable year.
Intrepid Funds
ADDITIONAL INFORMATION
March 31, 2012 (Unaudited)
Investment Advisory Agreement Disclosure
On November 16, 2011, the Board of Trustees of Intrepid Capital Management Funds Trust approved the investment advisory agreements between the Intrepid Capital Fund, the Intrepid Small Cap Fund, the Intrepid Income Fund and the Intrepid All Cap Fund (the “Funds”) and Intrepid Capital Management, Inc. Prior to approving the agreement, the Board considered:
| | • | The nature, extent and quality of the services to be provided by Intrepid Capital Management, Inc. |
| | • | The investment performance of the Funds |
| | • | The cost of the services to be provided and profits to be realized by Intrepid Capital Management, Inc. from its relationship with the Funds |
| | • | The extent to which economies of scale would be realized as the Funds grew and whether fee levels reflect any such economies of scale |
| | • | The expense ratio of the Funds |
| | • | The manner in which portfolio transactions for the Funds would be conducted, including the use of soft dollars |
In considering the nature, extent and quality of the services to be provided by Intrepid Capital Management Inc., the Board considered the Adviser’s quality of investment management provided to the Funds, the Adviser’s management history and the Adviser’s ability to attract investors for the Funds. The Board concluded that the nature, extent and quality of the services to be provided by the Adviser would be satisfactory.
The Board reviewed the investment performance of the Funds and compared the investment performance of the Funds to their relevant benchmarks. After further discussion, the Board concluded that the performance of the Funds was satisfactory in comparison to the relevant benchmarks.
The Board considered the cost of services provided and the profits to be realized by the Adviser, by reviewing reports provided by the Funds’ administrator that compared the Funds’ investment advisory fees to those of other comparable mutual funds. The Board concluded that the investment advisory fees were fair and within the range of the industry averages.
The Board considered the extent to which economies of scale would be realized as the Funds grow, including a consideration of breakpoints in the Agreement fee schedules. The Board concluded that given the expected growth of assets of the Funds in the next year, the Adviser was unlikely to realize economies of scale and the proposed fee schedules were acceptable.
Intrepid Funds
ADDITIONAL INFORMATION
March 31, 2012 (Unaudited)
The Board reviewed reports from the Funds’ administrator that compared the Funds’ total expense ratios to those of other comparable mutual funds. The Board concluded that the total expenses of the Funds were reasonable and within the range of the industry averages.
The Board reviewed reports discussing the manner in which portfolio transactions for the Funds were conducted, including the use of soft dollars. Based on these reports, the Board concluded that the research and services to be obtained by the Adviser were beneficial to the Funds and that the Adviser would execute the Funds’ portfolio transactions in a manner designed to obtain best execution for the Funds.
Shareholder Notification of Federal Tax Status
The Intrepid Capital Fund, Intrepid Small Cap Fund, Intrepid Income Fund, and Intrepid All Cap Fund designate $1,342,018, $11,592,367, $8,950 and $236,014, respectively, of total distributions paid during the fiscal year ended September 30, 2011 as net capital gain distributions eligible for long-term capital gain rates for individual shareholders.
The Intrepid Capital Fund, Intrepid Small Cap Fund, Intrepid Income Fund and Intrepid All Cap Fund designate 16.47%, 19.28%, 0.16% and 17.77%, respectively, of their ordinary income distributions for the period ended September 30, 2011 as qualified dividend income under the Jobs & Growth Tax Relief Reconciliation Act of 2003.
For the period ended September 30, 2011, 13.70%, 18.20%, 0.16% and 18.30% of Intrepid Capital Fund, Intrepid Small Cap Fund, Intrepid Income Fund and Intrepid All Cap Fund dividends paid from net ordinary income, respectively, qualify for the dividends received deduction available to corporate shareholders.
The Intrepid Capital Fund, Intrepid Small Cap Fund, Intrepid Income Fund and Intrepid All Cap Fund designate 25.51%, 0.45%, 94.57% and 0.41%, respectively, of their ordinary income distributions for the fiscal year as interest-related dividends under Internal Revenue Code Section 871(k)(1)(c).
The Intrepid Capital Fund, Intrepid Small Cap Fund, Intrepid Income Fund and Intrepid All Cap Fund designate 56.79%. 100%, 0% and 100%, respectively, of their ordinary income distributions as short-term capitalization distributions under Internal Revenue Code Section 871(k)(2)(c).
Intrepid Funds
ADDITIONAL INFORMATION
March 31, 2012 (Unaudited)
Availability of Quarterly Portfolio Holdings Schedules
The Funds are required to file their complete schedule of portfolio holdings with the SEC for the first and third quarters of each fiscal year on Form N-Q. Once filed, the Funds’ Form N-Q is available without charge, upon request on the SEC’s website (http://www.sec.gov) and may be available by calling 1.866.996.3863. You may also obtain copies at the SEC’s Public Reference Room in Washington, D.C. Information on the operation of the Public Reference Room may be obtained by calling 1.800.SEC.0330.
Proxy Voting Policies and Procedures and Proxy Voting Record (Unaudited)
A description of the policies and procedures that the Funds use to determine how to vote proxies relating to portfolio securities is available without charge, upon request, by calling 1.866.996.3863 and on the SEC’s website (http://www.sec.gov).
The Funds are required to file how they voted proxies related to portfolio securities during the most recent 12-month period ended June 30. Once filed, the information is available without charge, upon request, by calling 1.866.996.3863 and on the SEC’s website (http://www.sec.gov).
Board of Trustees
Edward Vandergriff
Mark Travis
Peter Osterman
Roy Clarke
Investment Adviser
Intrepid Capital Management, Inc.
1400 Marsh Landing Parkway, Suite 106
Jacksonville Beach, FL 32250
Independent Registered Public Accounting Firm
Deloitte & Touche LLP
555 East Wells Street
Milwaukee, WI 53202
Legal Counsel
Foley & Lardner LLP
777 East Wisconsin Avenue
Milwaukee, WI 53202
Custodian
U.S. Bank, N.A.
1555 N. RiverCenter Drive, Suite 302
Milwaukee, WI 53212
Distributor
Quasar Distributors, LLC
615 East Michigan Street
Milwaukee, WI 53202
Administrator, Transfer Agent
and Dividend Disbursing Agent
U.S. Bancorp Fund Services, LLC
615 East Michigan Street
Milwaukee, WI 53202
Shareholder/Investor Information
1.866.996.3863
www.intrepidcapitalfunds.com
ITRPSEMI-0312
Item 2. Code of Ethics.
Not applicable for semi-annual reports.
Item 3. Audit Committee Financial Expert.
Not applicable for semi-annual reports.
Item 4. Principal Accountant Fees and Services.
Not applicable for semi-annual reports.
Item 5. Audit Committee of Listed Registrants.
Not applicable to registrants who are not listed issuers (as defined in Rule 10A-3 under the Securities Exchange Act of 1934).
Item 6. Schedule of Investments.
Schedule of Investments is included as part of the report to shareholders filed under Item 1 of this Form.
Item 7. Disclosure of Proxy Voting Policies and Procedures for Closed-End Management Investment Companies.
Not applicable to open-end investment companies.
Item 8. Portfolio Managers of Closed-End Management Investment Companies
Not applicable to open-end investment companies.
Item 9. Purchases of Equity Securities by Closed-End Management Investment Company and Affiliated Purchases.
Not applicable to open-end investment companies.
Item 10. Submission of Matters to a Vote of Security Holders.
Not Applicable.
Item 11. Controls and Procedures.
| (a) | The Registrant’s President and Treasurer have concluded that the Registrant's disclosure controls and procedures (as defined in Rule 30a-3(c) under the Investment Company Act of 1940 (the “1940 Act”)) are effective as of a date within 90 days of the filing date of the report that includes the disclosure required by this paragraph, based on the evaluation of these controls and procedures required by Rule 30a-3(b) under the 1940 Act and Rules 15d-15(b) under the Securities Exchange Act of 1934, as amended. |
| (b) | There were no significant changes in the Registrant's internal controls over financial reporting (as defined in Rule 30a-3(d) under the Act) that occurred during the Registrant's last fiscal half-year that have materially affected, or are reasonably likely to materially affect, the Registrant's internal control over financial reporting. |
Item 12. Exhibits.
| (a) | (1) Not applicable for semi-annual reports. |
(2) Certifications pursuant to Section 302 of the Sarbanes-Oxley Act of 2002. Filed herewith.
(3) Any written solicitation to purchase securities under Rule 23c-1 under the Act sent or given during the period covered by the report by or on behalf of the registrant to 10 or more persons. Not applicable to open-end investment companies.
| (b) | Certification pursuant to Section 906 of the Sarbanes-Oxley Act of 2002. Furnished herewith. |
SIGNATURES
Pursuant to the requirements of the Securities Exchange Act of 1934 and the Investment Company Act of 1940, the registrant has duly caused this report to be signed on its behalf by the undersigned, thereunto duly authorized.
(Registrant) Intrepid Capital Management Funds Trust
By (Signature and Title) /s/ Mark F. Travis
Mark F. Travis, President
Date May 30, 2012
Pursuant to the requirements of the Securities Exchange Act of 1934 and the Investment Company Act of 1940, this report has been signed below by the following persons on behalf of the registrant and in the capacities and on the dates indicated.
By (Signature and Title)* /s/ Mark F. Travis
Mark F. Travis, President
Date May 30, 2012
By (Signature and Title)* /s/ Donald C. White
Donald C. White, Treasurer
Date May 30, 2012
* Print the name and title of each signing officer under his or her signature.