UNITED STATES
SECURITIES AND EXCHANGE COMMISSION
Washington, D.C. 20549
Form 10-K
| (Mark One) |
| þ | ANNUAL REPORT PURSUANT TO SECTION 13 OR 15(d) OF THE SECURITIES EXCHANGE ACT OF 1934 |
| | |
| | For the fiscal year ended January 4, 2014 |
| OR |
| | |
| o | TRANSITION REPORT PURSUANT TO SECTION 13 OR 15(d) OF THE SECURITIES EXCHANGE ACT OF 1934 |
Commission file number: 1-32383
BLUELINX HOLDINGS INC.
(Exact name of registrant as specified in its charter)
| Delaware | 77-0627356 |
(State or other jurisdiction of incorporation or organization) | (I.R.S. Employer Identification No.) |
| | |
| 4300 Wildwood Parkway, Atlanta, Georgia | 30339 |
| (Address of principal executive offices) | (Zip Code) |
Registrant’s telephone number, including area code:
770-953-7000
Securities registered pursuant to Section 12(b) of the Act:
Title of Each Class | | Name of Each Exchange on Which Registered |
| Common stock, par value $0.01 per share | | New York Stock Exchange |
Securities registered pursuant to Section 12(g) of the Act:
None
Indicate by check mark if the registrant is a well-known seasoned issuer, as defined in Rule 405 of the Securities Act. Yes o No þ
Indicate by check mark if the registrant is not required to file reports pursuant to Section 13 or Section 15(d) of the Act. Yes o No þ
Indicate by check mark whether the registrant (1) has filed all reports required to be filed by Section 13 or 15(d) of the Securities Exchange Act of 1934 during the preceding 12 months (or for such shorter period that the registrant was required to file such reports), and (2) has been subject to such filing requirements for the past 90 days. Yes þ No o
Indicate by check mark whether the registrant has submitted electronically and posted on its corporate Web site, if any, every Interactive Data File required to be submitted and posted pursuant to Rule 405 of Regulation S-T during the preceding 12 months (or for such shorter period that the registrant was required to submit and post such files). Yes þ No o
Indicate by check mark if disclosure of delinquent filers pursuant to Item 405 of Regulation S-K is not contained herein, and will not be contained, to the best of registrant’s knowledge, in definitive proxy or information statements incorporated by reference in Part III of this Form 10-K or any amendment to this Form 10-K. þ
Indicate by check mark whether the registrant is a large accelerated filer, an accelerated filer, a non-accelerated filer, or a smaller reporting company. See the definitions of “large accelerated filer,” “accelerated filer” and “smaller reporting company” in Rule 12b-2 of the Exchange Act. (Check one):
| Large accelerated filer o | Accelerated filer o | Non-accelerated filer þ | Smaller reporting company o |
| | | | |
| (Do not check if a smaller reporting company) |
Indicate by check mark whether the registrant is a shell company (as defined in Rule 12b-2 of the Act). Yes o No þ
The aggregate market value of the registrant’s common stock held by non-affiliates of the registrant as of June 29, 2013 was $54,108,842, based on the closing price on the New York Stock Exchange of $2.15 per share on June 28, 2013.
As of February 24, 2014, the registrant had 87,621,553 shares of common stock outstanding.
DOCUMENTS INCORPORATED BY REFERENCE
Part III of this Annual Report on Form 10-K incorporates by reference to the registrant’s definitive Proxy Statement, to be filed with the Securities and Exchange Commission within 120 days of the close of the fiscal year ended January 4, 2014.
BLUELINX HOLDINGS INC.
ANNUAL REPORT ON FORM 10-K
For the Fiscal year ended January 4, 2014
CAUTIONARY STATEMENT CONCERNING FORWARD-LOOKING STATEMENTS
This Annual Report on Form 10-K includes “forward-looking statements” within the meaning of Section 27A of the Securities Act of 1933, as amended, and Section 21E of the Securities Exchange Act of 1934, as amended. Forward-looking statements include, without limitation, any statement that may predict, forecast, indicate or imply future results, performance or achievements, and may contain the words “anticipate,” “believe,” “could,” “expect,” “estimate,” “intend,” “may,” “project,” “plan,” “should,” “will be,” “will likely continue,” “will likely result” or words or phrases of similar meaning. You should read statements containing these words carefully, because they discuss our future expectations, contain projections of our future results or state other “forward-looking” information.
Forward-looking statements are based on estimates and assumptions made by us that, although believed by us to be reasonable, involve inherent risks and uncertainties, including, but not limited to, economic, competitive, governmental and technological factors outside of our control, that may cause our business, strategy or actual results to differ materially from the forward-looking statements. We operate in a changing environment in which new risks can emerge from time to time. It is not possible for management to predict all of these risks, nor can it assess the extent to which any factor, or a combination of factors, may cause our business, strategy or actual results to differ materially from those contained in forward-looking statements. Factors you should consider that could cause these differences include, among other things:
| | ● | changes in the prices, supply and/or demand for products which we distribute, especially as a result of conditions in the residential housing market; |
| | ● | the acceptance by our customers of our privately branded products; |
| | ● | inventory levels of new and existing homes for sale; |
| | ● | general economic and business conditions in the United States; |
| | ● | the financial condition and credit worthiness of our customers; |
| | ● | the activities of competitors; |
| | ● | changes in significant operating expenses; |
| | ● | risk of losses associated with accidents; |
| | ● | exposure to product liability claims; |
| | ● | changes in the availability of capital and interest rates; |
| | ● | immigration patterns and job and household formation; |
| | ● | our ability to identify acquisition opportunities and effectively and cost-efficiently integrate acquisitions; |
| | ● | adverse weather patterns or conditions; |
| | ● | acts of war or terrorist activities, including cyber intrusion; |
| | ● | variations in the performance of the financial markets, including the credit markets; and |
| | ● | the risk factors discussed under Item 1A. Risk Factors and elsewhere in this Form 10-K. |
Forward-looking statements speak only as of the date of this Form 10-K. Except as required under federal securities laws and the rules and regulations of the SEC, we do not have any intention, and do not undertake, to update any forward-looking statements to reflect events or circumstances arising after the date of this Form 10-K, whether as a result of new information, future events or otherwise. As a result of these risks and uncertainties, readers are cautioned not to place undue reliance on the forward-looking statements included in this Form 10-K or that may be made elsewhere from time to time by or on behalf of us. All forward-looking statements attributable to us are expressly qualified by these cautionary statements.
As used herein, unless the context otherwise requires, “BlueLinx,” the “Company,” “we,” “us” and “our” refer to BlueLinx Holdings Inc. and its subsidiaries. BlueLinx Corporation is the wholly-owned operating subsidiary of BlueLinx Holdings Inc. and is referred to herein as the “operating company” when necessary. Reference to “fiscal 2013” refers to the 53-week period ended January 4, 2014. Reference to “fiscal 2012” refers to the 52-week period ended December 29, 2012. Reference to “fiscal 2011” refers to the 52-week period ended December 31, 2011.
Company Overview
BlueLinx Holdings Inc., operating through our wholly-owned subsidiary, BlueLinx Corporation, is a leading distributor of building products in North America. We operate in all of the major metropolitan areas in the United States (“U.S.”) and, as of January 4, 2014, we distributed approximately 10,000 products from over 750 suppliers to service approximately 11,500 customers nationwide, including dealers, industrial manufacturers, manufactured housing producers and home improvement retailers. We operate our distribution business from sales centers in Atlanta and Denver, and our network of approximately 50 distribution centers.
We distribute products in two principal categories: structural products and specialty products. Structural products, which represented approximately 44%, 42% and 39% of our fiscal 2013, fiscal 2012 and fiscal 2011 gross sales, respectively, include plywood, oriented strand board (“OSB”), rebar and remesh, lumber and other wood products primarily used for structural support, walls and flooring in construction projects. Specialty products, which represented approximately 56%, 58% and 61% of our fiscal 2013, fiscal 2012 and fiscal 2011 gross sales, respectively, include roofing, insulation, specialty panels, moulding, engineered wood products, vinyl products (used primarily in siding), outdoor living and metal products (excluding rebar and remesh).
Our customers include building materials dealers, industrial users of building products, manufactured housing builders and home improvement centers. We purchase products from over 750 suppliers and serve as a national distributor for a number of our suppliers. We distribute products through our owned and leased fleet of over 480 trucks and over 700 trailers, as well as by common carrier.
Our principal executive offices are located at 4300 Wildwood Parkway, Atlanta, Georgia 30339 and our telephone number is (770) 953-7000. Our filings with the U.S. Securities and Exchange Commission, including annual reports on Form 10-K, quarterly reports on Form 10-Q, current reports on Form 8-K, proxy statements and amendments to those reports, are accessible free of charge at our official website, www.BlueLinxCo.com. We have adopted a Code of Ethics within the meaning of Item 406(b) of Regulation S-K. This Code of Ethics applies to our principal executive officer, principal financial officer and principal accounting officer. This Code of Ethics, our board committee charters and our corporate governance guidelines are publicly available without charge at www.BlueLinxCo.com or without charge upon request by writing to BlueLinx Holdings Inc., Attn: Corporate Secretary, 4300 Wildwood Parkway, Atlanta, Georgia 30339. If we make substantial amendments to our Code of Ethics or grant any waiver, including any implicit waiver, we will disclose the nature of such amendment or waiver on our website or in a report on Form 8-K. The reference to our website does not constitute incorporation by reference of the information contained at the site, and our website is not considered part of this filing.
History
We were created on March 8, 2004 as a Georgia corporation named ABP Distribution Holdings Inc. (“ABP”). ABP was owned by Cerberus Capital Management, L.P. (Cerberus Capital Management, L.P. and its subsidiaries are referred to herein as “Cerberus”), a private, New York-based investment firm, and members of our management team. Prior to May 7, 2004, certain of our assets were owned by the distribution division (the “Division”) of Georgia-Pacific Corporation (“Georgia-Pacific” or “G-P”). The Division commenced operations in 1954 with 13 warehouses primarily used as an outlet for G-P’s plywood. On May 7, 2004, G-P sold the assets of the Division to ABP. ABP subsequently merged into BlueLinx Holdings Inc. On December 17, 2004, we consummated an initial public offering of our common stock.
Products and Services
As of January 4, 2014, we distributed approximately 10,000 different structural and specialty products to approximately 11,500 customers nationwide. Our structural products are primarily used for structural support, walls, flooring and roofing in construction projects. Additional end uses of our structural products include outdoor decks, sheathing, crates and boxes. Our specialty products include engineered lumber, roofing, insulation, metal products (excluding rebar and remesh), vinyl products (used primarily in siding), moulding, outdoor living and particle board. In some cases, these products are branded by us. None of our customers individually constitute more than 10% of fiscal 2013 sales.
We also provide a wide range of value-added services and solutions to our customers and suppliers including:
| | ● | providing “less-than-truckload” delivery services; |
| | ● | pre-negotiated program pricing plans; |
| | ● | automated order processing through an electronic data interchange, or “EDI”, that provides a direct link between us and our customers; |
| | ● | inter-modal distribution services, including railcar unloading and cargo reloading onto customers’ trucks; and |
| | ● | back-haul services, when otherwise empty trucks are returning from customer deliveries. |
Distribution Channels
We sell products through three main distribution channels:
Warehouse Sales
Warehouse sales are delivered from our warehouses to dealers, home improvement centers and industrial users. We deliver products primarily using our fleet of over 480 trucks and over 700 trailers, but also occasionally use common carriers for peak load flexibility. We operate in all of the major metropolitan areas in the U.S. through our network of approximately 50 distribution centers. The warehouses from which we operate have approximately 9.5 million square feet of space under roof, plus significant outdoor storage space. Warehouse sales accounted for approximately 71% of our fiscal 2013 and fiscal 2012 gross sales.
Reload Sales
Reload sales are similar to warehouse sales but are shipped from third-party warehouses where we store owned product in order to enhance operating efficiencies. This channel is employed primarily to service strategic customers that would be uneconomical to service from our warehouses and to distribute large volumes of imported products from port facilities. Reload sales accounted for approximately 10% and 9% of our gross sales in fiscal 2013 and fiscal 2012, respectively.
Direct Sales
Direct sales are shipped from the manufacturer to the customer without our taking physical inventory possession. This channel requires the lowest amount of committed capital and fixed costs. Direct sales accounted for approximately 19% and 20% of our fiscal 2013 and fiscal 2012 gross sales, respectively.
Customers
As of January 4, 2014, our customer base included approximately 11,500 customers across multiple market segments and various end-use markets, including the following types of customers:
| | ● | building materials dealers; |
| | ● | industrial users of building products; |
| | ● | manufactured housing builders; and |
| | ● | home improvement centers. |
None of these customers individually constitute more than 10% of fiscal 2013 sales.
Sales and Marketing
Our sales efforts are directed primarily through our sales force of approximately 450 sales representatives, of which approximately 275 are primarily located at our two sales centers in Denver and Atlanta and inside various branch locations. Within these sales centers, our sales representatives interact with our customers over the telephone. The remaining sales representatives are located throughout the country and are responsible for maintaining a local dialogue with our customers, including making frequent, in-person visits.
Our sales force is separated between industrial/dealer sales and home improvement center sales. Industrial/dealer sales are managed by regional vice-presidents with sales teams organized by geographical customer regions. The majority of industrial/dealer orders are processed by telephone and are facilitated by our centralized database of customer preferences and purchasing history. We also have dedicated cross-functional customer support teams focused on strategic growth with the home improvement centers.
Suppliers
As of January 4, 2014, our vendor base included over 750 suppliers of both structural and specialty building products. In some cases, these products are branded. We have supply contracts in place with many of our vendors. Terms for these agreements frequently include prompt payment discounts, freight allowances and occasionally include volume discounts, growth incentives, marketing allowances, and consigned inventory.
Competition
The U.S. building products distribution market is a highly fragmented market, served by a small number of multi-regional distributors, several regionally focused distributors and a large number of independent local distributors. Local and regional distributors tend to be closely held and often specialize in a limited number of segments, such as the roofing segment, in which they offer a broader selection of products. Some of our multi-regional competitors are part of larger companies and therefore have access to greater financial and other resources than those to which we have access. We compete on the basis of breadth of product offering, consistent availability of product, product price and quality, reputation, service and distribution facility location.
Our two largest competitors are Boise Cascade Company and Weyerhaeuser Company. Most major markets are served by at least one of these distributors.
Seasonality
We are exposed to fluctuations in quarterly sales volumes and expenses due to seasonal factors. These seasonal factors are common in the building products distribution industry. The first and fourth quarters are typically our slowest quarters due to the impact of poor weather on the construction market. Our second and third quarters are typically our strongest quarters, reflecting a substantial increase in construction due to more favorable weather conditions. Our working capital and accounts receivable and payable generally peak in the third quarter, while inventory generally peaks in the second quarter in anticipation of the summer building season.
Trademarks
As of January 4, 2014, we had 43 U.S. trademark applications and registrations, one issued U.S. patent and one Canadian trademark registration. Depending on the jurisdiction, trademarks are valid as long as they are in use and/or their registrations are properly maintained and they have not become generic. Registrations of trademarks generally can be renewed indefinitely as long as the trademarks are in use. We do not believe our business is dependent on any one of our trademarks or on our patent.
Employees
As of January 4, 2014, we employed approximately 1,700 persons on a full-time basis. Approximately 33% of our employees were represented by various labor unions. As of January 4, 2014, we had 36 collective bargaining agreements, of which 5, covering approximately 58 total employees, are up for renewal in fiscal 2014. We consider our relationship with our employees generally to be good.
Executive Officers
The following table contains the name, age and position with our Company of each of our current executive officers as of February 24, 2014.
Name | | | Age | | Position |
| Mitchell B. Lewis | | 51 | | President, Chief Executive Officer and Director (since January 20, 2014) |
| H. Douglas Goforth | | 50 | | Chief Financial Officer and Treasurer (since 2008) and Principal Accounting Officer (since January 2014) |
| Sara E. Epstein | | 36 | | Vice President, General Counsel and Corporate Secretary (since February 2013) |
| Robert P. McKagen | | 54 | | Senior Vice President, Sales and Operations (since 2012) |
Mitchell B. Lewis has served as our President and Chief Executive Officer, and as a Director of BlueLinx Holdings Inc. effective as of January 20, 2014. Mr. Lewis has held numerous leadership positions in the building products industry since 1992. Mr. Lewis served as a director and as President and Chief Executive Officer of Euramax Holdings, Inc. from February 2008 through November 2013. Mr. Lewis also served as chief operating officer in 2005, executive vice president in 2002, and group vice president in 1997 of Euramax Holdings, Inc. and its predecessor companies. Prior to being appointed group vice president, Mr. Lewis served as president of Amerimax Building Products, Inc. Prior to 1992, Mr. Lewis served as corporate counsel with Alumax Inc. and practiced law with Alston & Bird LLP, specializing in mergers and acquisitions.
H. Douglas Goforth has served as our Senior Vice President, Chief Financial Officer and Treasurer since February 2008. He has served as our Principal Accounting Officer since January 2014. From November 2006 until February 2008, Mr. Goforth served as Vice President and Corporate Controller for Armor Holdings Inc. which was acquired by BAE Systems in July 2007. Previously he served as Corporate Controller for BlueLinx from May 2004 until October 2006, where he played a key role in our 2004 IPO. From 2002 until 2004, he served as Controller for the Distribution Division of Georgia-Pacific Corporation. Mr. Goforth has 25 years of combined accounting, finance, treasury, acquisition and management experience with leading distribution and manufacturing companies including Mitsubishi Wireless Communications, Inc., Yamaha Motor Manufacturing, Inc. and Ingersoll-Rand. Mr. Goforth is a North Carolina State Board Certified Public Accountant and earned a Bachelor of Science in Accounting from Mars Hill College in North Carolina.
Sara E. Epstein has served as our Vice President, General Counsel and Corporate Secretary since February 2013, and our Senior Counsel and Corporate Secretary since March 2010. Prior to joining us, Ms. Epstein was an attorney with Jones Day. Ms. Epstein received a Juris Doctor degree from Tulane University and a Bachelor of Arts degree from Tufts University.
Robert P. McKagen has served as our Senior Vice President of Sales and Operations since 2012. He served as our Vice President Supply Chain from 2009 through 2011 and our Regional Vice President of the South Region from the Company’s inception in 2001 through 2009. Mr. McKagen has nearly 29 years of industry experience. Prior to working at BlueLinx, Mr. McKagen worked at the Division from 1985 through 2001 in a wide range of roles, including inside sales, outside sales, branch manager, regional commodity manager, and general manager. He received a Bachelor in Business Administration from Florida Atlantic University.
Environmental and Other Governmental Regulations
Our operations are subject to various federal, state, provincial and local laws, rules and regulations. We are subject to environmental laws, rules and regulations that limit discharges into the environment, establish standards for the handling, generation, emission, release, discharge, treatment, storage and disposal of hazardous materials, substances and wastes, and require cleanup of contaminated soil and groundwater. These laws, ordinances and regulations are complex, change frequently and have tended to become more stringent over time. Many of them provide for substantial fines and penalties, orders (including orders to cease operations) and criminal sanctions for violations. They may also impose liability for property damage and personal injury stemming from the presence of, or exposure to, hazardous substances. In addition, certain of our operations require us to obtain, maintain compliance with, and periodically renew permits.
Certain of these laws, including the Comprehensive Environmental Response, Compensation, and Liability Act, may require the investigation and cleanup of an entity’s or its predecessor’s current or former properties, even if the associated contamination was caused by the operations of a third party. These laws also may require the investigation and cleanup of third-party sites at which an entity or its predecessor sent hazardous wastes for disposal, notwithstanding that the original disposal activity accorded with all applicable requirements. Liability under such laws may be imposed jointly and severally, and regardless of fault.
G-P has agreed to indemnify us against any claim arising from environmental conditions that existed prior to May 7, 2004 in connection with the properties acquired when G-P sold the assets of the Division to us (see “History” above). In addition, we carry environmental insurance. While we do not expect to incur significant costs to BlueLinx arising from environmental conditions, there can be no assurance that all such costs will be covered by indemnification or insurance.
We are also subject to the requirements of the U.S. Department of Labor Occupational Safety and Health Administration, or “OSHA”. In order to maintain compliance with applicable OSHA requirements, we have established uniform safety and compliance procedures for our operations and implemented measures to prevent workplace injuries.
The U.S. Department of Transportation, or “DOT”, regulates our operations in domestic interstate commerce. We are subject to safety requirements governing interstate operations prescribed by the DOT. Vehicle dimensions and driver hours of service also remain subject to both federal and state regulation.
We incur and will continue to incur costs to comply with the requirements of environmental, health and safety and transportation laws, ordinances and regulations. We anticipate that these requirements could become more stringent in the future, and we cannot assure you that compliance costs will not be material.
In addition to the other information contained in this Form 10-K, the following risk factors should be considered carefully in evaluating our business. Our business, financial condition, or results of operations could be materially adversely affected by any of these risks. Additional risks not presently known to us or that we currently deem immaterial may also impair our business and operations.
Our industry is highly cyclical, and prolonged periods of weak demand or excess supply may reduce our net sales and/or margins, which may reduce our net income or cause us to incur losses.
The building products distribution industry is subject to cyclical market pressures. Prices of building products are determined by overall supply and demand in the market for building products. Market prices of building products historically have been volatile and cyclical, and we have limited ability to control the timing and amount of pricing changes for building products. Demand for building products is driven mainly by factors outside of our control, such as general economic and political conditions, interest rates, availability of mortgage financing, the construction, repair and remodeling and industrial markets, weather and population growth. The supply of building products fluctuates based on available manufacturing capacity, and excess capacity in the industry can result in significant declines in market prices for those products. To the extent that prices and volumes experience a sustained or sharp decline, our net sales and margins likely would decline as well. Because we have substantial fixed costs, a decrease in sales and margin generally may have a significant adverse impact on our financial condition, operating results and cash flows. Our results in some periods have been affected by market volatility, including a reduction in gross profits due to a decline in the resale value of our structural products inventory. All of these factors make it difficult to forecast our operating results.
Our industry is dependent on the homebuilding industry which has suffered from a prolonged significant downturn, and any slowdown in the current recovery or any future downturns would materially affect our business, liquidity and operating results.
Our sales depend heavily on the strength of national and local new residential construction and home improvement and remodeling markets. The strength of these markets depends on new housing starts and residential renovation projects, which are a function of many factors beyond our control. Some of these factors include general economic conditions, employment levels, job and household formation, interest rates, housing prices, tax policy, availability of mortgage financing, prices of commodity wood and steel products, immigration patterns, regional demographics and consumer confidence. The overall housing market and the economy have been improving; however, the U.S. residential construction market has suffered from a multi-year downturn that was one of the most severe housing downturns in United States history. While there have been signs of improvement in the U.S. economy generally, and in the residential housing market in particular, it is unclear if and to what extent the residential construction market will continue to improve during fiscal 2014.
Our results of operations were adversely affected by the severe downturn in new housing activity in the United States, and, while recently improving, any slowdown in the current recovery or any future downturns in the markets that we serve or in the economy generally will have a material adverse effect on our operating results, liquidity and financial condition. Reduced levels of construction activity may result in continued intense price competition among building materials suppliers, which may adversely affect our gross margins. We cannot provide assurance that our responses to future downturns in the economy in general, and in the residential housing market in particular, will be successful.
A significant portion of our sales are on credit to our customers. Material changes in their credit worthiness or our inability to forecast deterioration in their credit position could have a material adverse effect on our operating results, cash flow and liquidity.
The majority of our sales are on account where we provide credit to our customers. Market disruptions could cause economic downturns, which may lead to lower demand for our products and increased incidence of customers’ inability to pay their accounts. Bankruptcies by our customers may cause us to incur bad debt expense at levels higher than historically experienced. In fiscal 2013, approximately 0.1% in bad debt expense to total net sales was incurred related to credit sales. Our customers are generally susceptible to the same economic business risks as we are. Furthermore, we may not necessarily be aware of any deterioration in their financial position. If our customers’ financial position becomes impaired, it could have a significant impact on our bad debt exposure and could have a material adverse effect on our operating results, cash flow and liquidity. In addition, certain of our suppliers potentially may be impacted as well, causing disruption or delay of product availability. These events would adversely impact our results of operations, cash flows and financial position.
Our cash flows and capital resources may be insufficient to make required payments on our substantial indebtedness and future indebtedness or to maintain our required level of excess liquidity.
We have a substantial amount of debt. As of January 4, 2014, we had outstanding borrowings of $207.9 million and excess availability of $44.5 million under the terms of our U.S. revolving credit facility (the “U.S. revolving credit facility”), outstanding borrowings of $3.3 million and excess availability of $1.3 million under our Canadian revolving credit facility (the “Canadian revolving credit facility”) and outstanding letters of credit totaling $3.6 million. As of January 4, 2014, the principal amount outstanding on our mortgage loan with the German American Capital Corporation was $186.9 million.
Our substantial debt could have important consequences to you. For example, it could:
| | ● | make it difficult for us to satisfy our debt obligations; |
| | ● | make us more vulnerable to general adverse economic and industry conditions; |
| | ● | limit our ability to obtain additional financing for working capital, capital expenditures, acquisitions and other general corporate requirements as our excess liquidity likely will decrease while our industry and our Company continues its recovery from the historic housing market downturn; |
| | ● | expose us to interest rate fluctuations because the interest rate on the debt under our U.S. revolving credit facility is variable; |
| | ● | require us to dedicate a substantial portion of our cash flow from operations to payments on our debt, thereby reducing the availability of our cash flow for operations and other purposes; |
| | ● | limit our flexibility in planning for, or reacting to, changes in our business and the industry in which we operate; and |
| | ● | place us at a competitive disadvantage compared to competitors that may have proportionately less debt, and therefore may be in a better position to get favorable credit terms. |
In addition, our ability to make scheduled payments or refinance our obligations depends on our successful financial and operating performance, cash flows and capital resources, which in turn depend upon prevailing economic conditions and certain financial, business and other factors, many of which are beyond our control. These factors include, among others:
| | ● | economic and demand factors affecting the building products distribution industry; |
| | ● | increased operating costs; |
| | ● | competitive conditions; and |
| | ● | other operating difficulties. |
If our cash flows and capital resources are insufficient to fund our debt service obligations, we may be forced to reduce or delay capital expenditures, sell material assets or operations, obtain additional capital or restructure our debt. Obtaining additional capital or restructuring our debt could be accomplished in part through new or additional borrowings or placements of debt or equity securities. There is no assurance that we could obtain additional capital or restructure our debt on terms acceptable to us or at all. In the event that we are required to dispose of material assets or operations to meet our debt service and other obligations, the value realized on the disposition of such assets or operations will depend on market conditions and the availability of buyers. Accordingly, any such sale may not, among other things, be for a sufficient dollar amount. Our obligations under the revolving credit facilities are secured by a first priority security interest in all of our operating subsidiary’s and BlueLinx Building Products Canada Ltd.’s (“BlueLinx Canada’s”) (for the Canadian revolving credit facility) inventories, receivables and proceeds from those items. In addition, our mortgage loan is secured by the majority of our real property. The foregoing encumbrances may limit our ability to dispose of material assets or operations. We also may not be able to restructure our indebtedness on favorable economic terms, if at all. We may incur substantial additional indebtedness in the future, including under the revolving credit facilities. Our incurring additional indebtedness would intensify the risks described above.
The instruments governing our indebtedness contain various covenants limiting the discretion of our management in operating our business, including requiring us to maintain a minimum level of excess liquidity.
Our revolving credit facilities and mortgage loan contain various restrictive covenants and restrictions, including financial covenants customary for asset-based loans that limit management’s discretion in operating our business. In particular, these instruments limit our ability to, among other things:
| ● | | make investments, including capital expenditures; |
| ● | | sell or acquire assets outside the ordinary course of business; |
| ● | | engage in transactions with affiliates; and |
| ● | | make fundamental business changes. |
As of January 4, 2014, the U.S. revolving credit facility requires us to maintain a fixed charge coverage ratio of 1.1 to 1.0 in the event our excess availability falls below the greater of $31.8 million or the amount equal to 12.5% of the lesser of the borrowing base or $447.5 million (the “Excess Availability Threshold”). If we fail to maintain this minimum excess availability, the U.S. revolving credit facility requires us to (i) maintain certain financial ratios, which we would not meet with current operating results, and (ii) limit our capital expenditures, which would have a negative impact on our ability to finance working capital needs and capital expenditures. In the event that excess availability falls below $37.1 million or the amount equal to 15% of the lesser of the borrowing base or $447.5 million, the U.S. revolving credit facility gives the lenders the right, but not the obligation, to dominion over our bank accounts. This would not make the underlying debt callable by the lender and may not change our ability to borrow on the U.S. revolving credit facility. However, we would be required to reclassify the “Long-term debt” to “Current maturities of long-term debt” on our Consolidated Balance Sheet.
If we fail to comply with the restrictions in the U.S. revolving credit facility, the Canadian revolving credit facility, the mortgage loan documents or any other current or future financing agreements, a default may allow the creditors under the relevant instruments to accelerate the related debt and to exercise their remedies under these agreements, which will typically include the right to declare the principal amount of that debt, together with accrued and unpaid interest and other related amounts, immediately due and payable, to exercise any remedies the creditors may have to foreclose on assets that are subject to liens securing that debt and to terminate any commitments they had made to supply further funds.
We are dependent upon several large suppliers for a significant percentage of our products.
Although we have made progress in diversifying our supplier base, we are still dependent on several large suppliers for a significant percentage of our products. Purchases in fiscal 2013 from the five largest suppliers were approximately 26% in the aggregate. None of these suppliers individually constitute more than 10% of our product purchases.
Although in many instances we have agreements with our suppliers, these agreements are generally terminable by either party on limited notice. Failure by our suppliers to continue to supply us with products on commercially reasonable terms, or at all, could put pressure on our gross margins or have a material adverse effect on our financial condition, operating results, and cash flows.
The market for our private label products may not develop as anticipated, and we may have problems in the supply chain for these products.
We have been increasing the number of private label products that we offer to our customers. Private label products are those that are manufactured for us by third parties, but are then branded by us. The market for these products may be slow to develop or may not develop at all if customers prefer to purchase the more commonly recognized “name brand” versions of the same products. These products are manufactured on our behalf by third party suppliers, and we do not directly control the manufacturing process. As a result, while such products must generally meet certain quality standards set by us, it is possible that our results may be negatively impacted if there are defects in the manufacturing process that are not identified prior to our branding of the products and the sale to our customers. Further, problems in the supply chain, including but not limited to manufacturing disruptions, transportation disruptions, or other operational problems for these products may adversely impact our ability to maintain sufficient inventory levels for the private label products.
We source many products internationally and are exposed to risks associated with doing business globally.
We import a variety of products from countries located in Asia, South America and the Middle East. The business, regulatory and political environments in these countries differ from those in the U.S. Our global sourcing strategy is subject to risks and uncertainties, including changes in foreign country regulatory requirements; differing business practices associated with foreign operations; imposition of foreign tariffs and other trade barriers; political, legal and economic instability; foreign currency exchange rate fluctuations; foreign country tax rules, regulations and other requirements, such as changes in tax rates and statutory and judicial interpretations in tax laws; inflation; differing labor laws and changes in those laws; government price controls; and work stoppages and disruptions in the shipping of imported and exported products.
Our transportation operations are subject to significant governmental regulation.
We use our own fleet of over 480 tractors and over 700 trailers to service customers throughout the United States. Our transportation operations are subject to the regulatory jurisdiction of the DOT. The DOT has broad administrative powers with respect to our transportation operations. If we fail to adequately comply with DOT regulations or regulations become more stringent, we could experience increased inspections, regulatory authorities could take remedial action including imposing fines or shutting down our operations or we could be subject to increased audit and compliance costs. If any of these events were to occur, our results of operations, business, cash flow, and financial condition would be adversely affected.
Product shortages, loss of key suppliers, and our dependence on third-party suppliers and manufacturers could affect our financial health.
Our ability to offer a wide variety of products to our customers is dependent upon our ability to obtain adequate product supply from manufacturers and other suppliers. Generally, our products are obtainable from various sources and in sufficient quantities. However, the loss of, or a substantial decrease in the availability of, products from our suppliers or the loss of key supplier arrangements could adversely impact our financial condition, operating results, and cash flows.
Although in many instances we have agreements with our suppliers, these agreements are generally terminable by either party on limited notice. Failure by our suppliers to continue to supply us with products on commercially reasonable terms, or at all, could put pressure on our gross margins or have a material adverse effect on our financial condition, operating results, and cash flows.
Our industry is highly fragmented and competitive. If we are unable to compete effectively, our net sales and operating results will be reduced.
The building products distribution industry is highly fragmented and competitive, and the barriers to entry for local competitors are relatively low. Competitive factors in our industry include pricing and availability of product, service and delivery capabilities, ability to assist with problem-solving, customer relationships, geographic coverage and breadth of product offerings. Also, financial stability is important to suppliers and customers in choosing distributors for their products and affects the favorability of the terms on which we are able to obtain our products from our suppliers and sell our products to our customers.
Some of our competitors are part of larger companies and therefore have access to greater financial and other resources than those to which we have access. In addition, certain product manufacturers sell and distribute their products directly to customers. Additional manufacturers of products distributed by us may elect to sell and distribute directly to end-users in the future or enter into exclusive supply arrangements with other distributors. Finally, we may not be able to maintain our costs at a level sufficiently low for us to compete effectively. If we are unable to compete effectively, our net sales and net income will be reduced.
Integrating acquisitions may be time-consuming and create costs that could reduce our operating results and cash flows.
We may elect to selectively pursue acquisitions. Any integration process may be complex and time consuming, may be disruptive to the business and may cause an interruption of, or a distraction of management’s attention from, the business as a result of a number of obstacles, including but not limited to:
| | ● | the loss of key customers of the acquired company; |
| | ● | the incurrence of unexpected expenses and working capital requirements; |
| | ● | a failure of our due diligence process to identify significant issues or contingencies; |
| | ● | difficulties assimilating the operations and personnel of the acquired company; |
| | ● | difficulties effectively integrating the acquired technologies with our current technologies; |
| | ● | our inability to retain key personnel of acquired entities; |
| | ● | failure to maintain the quality of customer service; |
| | ● | our inability to achieve the financial and strategic goals for the acquired and combined businesses; and |
| | ● | difficulty in maintaining internal controls, procedures and policies. |
Any of the foregoing obstacles, or a combination of them, could increase selling, general and administrative expenses in absolute terms and/or as a percentage of net sales, which could in turn negatively impact our operating results and cash flows.
We may not be able to consummate acquisitions in the future on terms acceptable to us, or at all. In addition, future acquisitions are accompanied by the risk that the obligations and liabilities of an acquired company may not be adequately reflected in the historical financial statements of that company and the risk that those historical financial statements may be based on assumptions which are incorrect or inconsistent with our assumptions or approach to accounting policies. Any of these material obligations, liabilities or incorrect or inconsistent assumptions could adversely impact our results of operations.
A significant percentage of our employees are unionized. Wage increases or work stoppages by our unionized employees may reduce our results of operations.
As of January 4, 2014, approximately 33% of our employees were represented by various labor unions. As of January 4, 2014, we had 36 collective bargaining agreements, of which 5, covering approximately 58 total employees, are up for renewal in fiscal 2014. Although we have generally had good relations with our unionized employees and expect to renew collective bargaining agreements as they expire, no assurances can be provided that we will be able to reach a timely agreement as to the renewal of the agreements, and their expiration or continued work under an expired agreement, as applicable, could result in a work stoppage. In addition, we may become subject to material cost increases, or additional work rules imposed by agreements with labor unions. The foregoing could increase our selling, general and administrative expenses in absolute terms and/or as a percentage of net sales. In addition, work stoppages or other labor disturbances may occur in the future, which could adversely impact our net sales and/or selling, general and administrative expenses. All of these factors could negatively impact our operating results and cash flows.
Increases in the cost of employee benefits, such as pension and other postretirement benefits, could impact our financial results and cash flow.
Unfavorable changes in the cost of our pension retirement benefits and current employees’ medical benefits could materially impact our financial results and cash flow. We sponsor several defined benefit pension plans covering substantially all of our hourly employees. Our estimates of the amount and timing of our future funding obligations for our defined benefit pension plans are based upon various assumptions. These assumptions include, but are not limited to, the discount rate, projected return on plan assets, compensation increase rates, mortality rates, retirement patterns, and turnover rates. In addition, the amount and timing of our pension funding obligations can be influenced by funding requirements that are established by the Employee Retirement Income and Security Act of 1974 (“ERISA”), the Pension Protection Act, Congressional Acts, or other governing bodies.
The Company’s minimum required contribution to the noncontributory defined benefit pension plans (the “hourly pension plan”) for plan year 2012 was $3.2 million. In an effort to preserve additional cash for operations, we applied for a waiver from the Internal Revenue Service (“IRS”) for our 2012 minimum required contribution. Although the Company’s outside counsel has been notified by the IRS that its waiver request has been preliminarily approved and that the IRS is in the process of finalizing the waiver request, no assurances can be provided that the waiver request will be granted until the Company receives final approval from the IRS. If we are granted the requested waiver, our contributions for 2012 will be amortized over the following five years, increasing our future minimum required contributions.
The Company’s minimum required contribution for plan year 2013 was estimated to be $6.0 million, assuming we receive the requested waiver. During the second quarter of fiscal 2013, we contributed certain qualifying employer real property to the hourly pension plan. The properties, including certain land and buildings, are located in Charleston, S.C. and Buffalo, N.Y., and were valued at approximately $6.8 million by independent appraisals prior to the contribution. The contribution was recorded by the hourly pension plan at the fair market value of $6.8 million.
We currently are required to make three quarterly cash contributions during fiscal 2014 of $1.5 million each related to our 2014 minimum required contribution.
We participate in various multi-employer pension plans in the United States. The majority of these plans are underfunded. If, in the future, we choose to withdraw from these plans, we likely would need to record a withdrawal liability, which may be material to our financial results.
The payment of dividends has been suspended, and resumption is dependent on business conditions, among other factors. Further, the instruments governing our indebtedness contain various covenants that may limit our ability to pay dividends.
We suspended the payment of dividends on our common stock for an indefinite period of time on December 5, 2007. Resumption of the payment of dividends will depend on, among other things, business conditions in the housing industry, our results of operations, cash requirements, financial condition, contractual restrictions, provisions of applicable law and other factors that our board of directors may deem relevant. Accordingly, we may not be able to resume the payment of dividends at the same quarterly rate in the future, if at all.
Environmental laws impose risks and costs on us.
Our operations are subject to federal, state, provincial and local laws, rules and regulations governing the protection of the environment, including, but not limited to, those regulating discharges into the air and water, the use, handling and disposal of hazardous or toxic substances, the management of wastes, the cleanup of contamination and the control of noise and odors. We have made, and will continue to make, expenditures to comply with these requirements. While we believe, based upon current information, that we are in substantial compliance with all applicable environmental laws, rules and regulations, we could be subject to potentially significant fines or penalties for any failure to comply. Moreover, under certain environmental laws, a current or previous owner or operator of real property, and parties that generate or transport hazardous substances that are disposed of at that real property, may be held liable for the cost to investigate or clean up such real property and for related damages to natural resources. We may be subject to liability, including liability for investigation and cleanup costs, if contamination is discovered at one of our current or former warehouse facilities, or at a landfill or other location where we have disposed of, or arranged for the disposal of, wastes. G-P has agreed to indemnify us against any claim arising from environmental conditions that existed prior to May 7, 2004 in connection with the properties we acquired when we purchased the assets of the Division. However, any remediation costs either not related to conditions existing prior to May 7, 2004 or on properties acquired after May 7, 2004 may not be covered by indemnification. We also carry environmental insurance, but certain remediation costs may not be covered by insurance. We could also be subject to claims brought pursuant to applicable laws, rules or regulations for property damage or personal injury resulting from the environmental impact of our operations. Increasingly stringent environmental requirements, more aggressive enforcement actions, the discovery of unknown conditions or the bringing of future claims may cause our expenditures for environmental matters to increase, and we may incur material costs associated with these matters.
Failure to comply with governmental laws and regulations could harm our business.
Our business is subject to regulation by various federal, state, local and foreign governmental agencies, including agencies responsible for monitoring and enforcing employment and labor laws, workplace safety, product safety, environmental laws, consumer protection laws, anti-bribery laws, import/export controls, federal securities laws and tax laws and regulations. Noncompliance with applicable regulations or requirements could subject us to investigations, sanctions, mandatory product recalls, enforcement actions, disgorgement of profits, fines, damages, civil and criminal penalties or injunctions. If any governmental sanctions are imposed, or if we do not prevail in any possible civil or criminal litigation, our business, operating results and financial condition could be materially adversely affected. In addition, responding to any action will likely result in a significant diversion of management’s attention and resources and an increase in professional fees. Enforcement actions and sanctions could harm our business, operating results and financial condition.
Affiliates of Cerberus control us and may have conflicts of interest with other stockholders in the future.
Cerberus beneficially owned approximately 54% of our common stock as of January 4, 2014. As a result, Cerberus is able to control the election of our directors, determine our corporate and management policies and determine, without the consent of our other stockholders, the outcome of any corporate transaction or other matter submitted to our stockholders for approval, including potential mergers or acquisitions, asset sales and other significant corporate transactions. This concentrated ownership position limits other stockholders’ ability to influence corporate matters and, as a result, we may take actions that some of our stockholders do not view as beneficial.
Cerberus is controlled by Cerberus Capital Management. Two of our nine directors are employees of or current advisors to Cerberus Capital Management. Cerberus also has sufficient voting power to amend our organizational documents. The interests of Cerberus may not coincide with the interests of other holders of our common stock. Additionally, Cerberus is in the business of making investments in companies and may, from time to time, acquire and hold interests in businesses that compete directly or indirectly with us. Cerberus may also pursue, for its own account, acquisition opportunities that may be complementary to our business, and as a result, those acquisition opportunities may not be available to us. So long as Cerberus continues to own a significant amount of the outstanding shares of our common stock, it will continue to be able to strongly influence or effectively control our decisions, including potential mergers or acquisitions, asset sales and other significant corporate transactions. In addition, because we are a controlled company within the meaning of the New York Stock Exchange rules, we are exempt from the NYSE requirements that our board be composed of a majority of independent directors, that our compensation committee be composed entirely of independent directors, and that we maintain a nominating/corporate governance committee composed entirely of independent directors.
Even if Cerberus no longer controls us in the future, certain provisions of our charter documents and agreements and Delaware law could discourage, delay or prevent a merger or acquisition at a premium price.
Our Second Amended and Restated Certificate of Incorporation and Amended and Restated Bylaws contain provisions that:
| ● | | permit us to issue, without any further vote or action by the stockholders, up to 30 million shares of preferred stock in one or more series and, with respect to each series, to fix the number of shares constituting the series and the designation of the series, the voting powers (if any) of the shares of such series, and the preferences and other special rights, if any, and any qualifications, limitations or restrictions, of the shares of the series; and |
| ● | | limit the stockholders’ ability to call special meetings. |
These provisions may discourage, delay or prevent a merger or acquisition at a premium price.
In addition, we are subject to Section 203 of the General Corporation Law of the State of Delaware, or the “DGCL”, which also imposes certain restrictions on mergers and other business combinations between us and any holder of 15% or more of our common stock. Further, certain of our incentive plans provide for vesting of stock options and/or payments to be made to our employees in connection with a change of control, which could discourage, delay or prevent a merger or acquisition at a premium price.
We are subject to cyber security risks and may incur increasing costs in an effort to minimize those risks.
Our business employs systems and a website that allow for the secure storage and transmission of customers’ proprietary information. Security breaches could expose us to a risk of loss or misuse of this information, litigation and potential liability. We may not have the resources or technical sophistication to anticipate or prevent rapidly evolving types of cyber attacks. Any compromise of our security could result in a violation of applicable privacy and other laws, significant legal and financial exposure, damage to our reputation, and a loss of confidence in our security measures, which could harm our business. As cyber attacks become more sophisticated generally, we may be required to incur significant costs to strengthen our systems from outside intrusions and/or obtain insurance coverage related to the threat of such attacks.
None.
We own 50 warehouse facilities and lease 2 warehouse facilities . Certain of our warehouse facilities have two buildings. For one of these multiple building facilities, one of the buildings is leased and one is owned. The total square footage under roof at our owned warehouses is approximately 9.4 million square feet. Fifty of our owned warehouse facilities secure our mortgage loan.
Our corporate headquarters located at 4300 Wildwood Parkway, Atlanta, Georgia 30339 is approximately 150,000 square feet. During the fourth quarter of fiscal 2007, as part of a restructuring effort, we vacated approximately 100,000 square feet of our corporate headquarters space in the building located at 4100 Wildwood Parkway, Atlanta, Georgia 30339 (the “unoccupied 4100 building”). During the third quarter of fiscal 2011, we entered into an amendment to our corporate headquarters lease in Atlanta, Georgia related to the unoccupied 4100 building. This amendment released us from our obligations with respect to this unoccupied space as of January 31, 2012, in exchange for a $5.0 million space remittance fee, which was paid in the first quarter of 2012. We also paid $0.9 million in the third quarter of fiscal 2012 and paid an additional $0.3 million in the first quarter fiscal 2014 related to contractually obligated tenant improvement reimbursement expense. The provisions relating to the occupied 4300 building remain unchanged. Under the existing provisions, the current term of the lease ends on January 31, 2019. The amendment resulted in a reduction of our restructuring reserve of approximately $2.0 million, with the credit recorded in “Selling, general, and administrative” expenses in the Consolidated Statements of Operations included in “Item 8. Financial Statements and Supplementary Data” during fiscal 2011.
The following table summarizes our real estate facilities including their inside square footage:
Facility Type | | | Number | | | Owned Facilities
(sq. ft.) | | | Leased Facilities
(sq. ft.) | |
Office Space(1) | | | 3 | | | | — | | | | 167,308 | |
Warehouses (2) | | | 52 | | | | 9,386,755 | | | | 340,600 | |
TOTAL | | | 55 | | | | 9,386,755 | | | | 507,908 | |
| | (1) | Includes corporate headquarters in Atlanta, the Denver Sales Center and a call center in Vancouver. |
| | (2) | Includes our owned Beaverton, Oregon distribution center (129,389 sq. ft), designated as held for sale during the second quarter of fiscal 2013 and our leased Stockton, California facility, which is being marketed for sublease (120,000 sq. ft). |
We also store materials, such as lumber and rebar, outdoors at all of our warehouse locations, which increases their distribution and storage capacity. We believe that substantially all of our property and equipment is in good condition, subject to normal wear and tear. We believe that our facilities have sufficient capacity to meet current and projected distribution needs.
We are, and from time to time may be, a party to routine legal proceedings incidental to the operation of our business. The outcome of any pending or threatened proceedings is not expected to have a material adverse effect on our financial condition, operating results or cash flows, based on our current understanding of the relevant facts. Legal expenses incurred related to these contingencies are generally expensed as incurred. We establish reserves for pending or threatened proceedings when the costs associated with such proceedings become probable and can be reasonably estimated.
Not applicable.
ITEM 5. MARKET FOR REGISTRANT’S COMMON EQUITY, RELATED STOCKHOLDER MATTERS AND ISSUER PURCHASES OF EQUITY SECURITIES.
Our equity securities consist of one class of common stock, that is traded on the New York Stock Exchange under the symbol “BXC”. The following table sets forth, for the periods indicated, the range of the high and low sales prices for the common stock as quoted on the New York Stock Exchange:
| | | High | | | Low | |
| Fiscal Year Ended January 4, 2014 | | | | | | |
First Quarter | | $ | 3.48 | | | $ | 2.42 | |
Second Quarter | | $ | 3.10 | | | $ | 1.90 | |
Third Quarter | | $ | 2.29 | | | $ | 1.56 | |
Fourth Quarter | | $ | 2.14 | | | $ | 1.57 | |
| Fiscal Year Ended December 29, 2012 | | | | | | | | |
First Quarter | | $ | 2.87 | | | $ | 1.45 | |
Second Quarter | | $ | 2.89 | | | $ | 1.96 | |
Third Quarter | | $ | 2.72 | | | $ | 1.97 | |
Fourth Quarter | | $ | 2.85 | | | $ | 1.83 | |
As of February 24, 2014, there were 45 registered stockholders, and, as of that date we estimate there were approximately 2,200 beneficial owners holding our common stock in nominee or “street” name.
In December 2007, we suspended the payment of dividends on our common stock for an indefinite period of time. Resumption of the payment of dividends will depend on, among other things, business conditions in the housing industry, our results of operations, cash requirements, financial condition, contractual restrictions, provisions of applicable law and other factors that our board of directors may deem relevant. See “Item 8. Financial Statements and Supplementary Data, Note 10. Revolving Credit Facilities” for additional information regarding limitations on the ability of BlueLinx Corporation to transfer funds to its parent, BlueLinx Holdings Inc., which could impact our ability to pay dividends to our stockholders. Accordingly, we may not be able to resume the payment of dividends at the same quarterly rate in the future, if at all.
Performance Graph
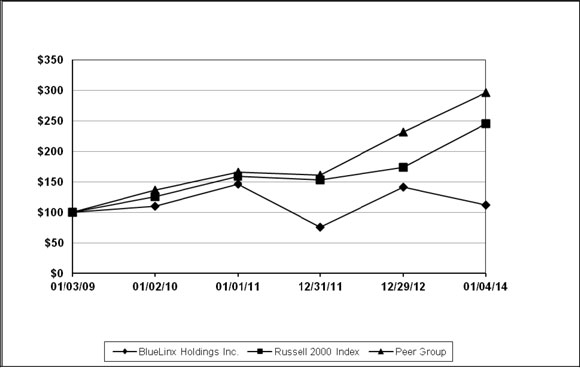
The chart below compares the quarterly percentage change in the cumulative total stockholder return on our common stock with the cumulative total return on the Russell 2000 Index and a peer group index for the period commencing January 3, 2009 and ending January 4, 2014, assuming an investment of $100 and the reinvestment of any dividends.
Our peer group index was selected by us and is comprised of reporting companies with lines of business and product offerings that are comparable to ours and which we believe most accurately represent our business. Our peer group consists of the following companies: Beacon Roofing Supply Inc., Boise Cascade Co. (from February 6, 2013), Builders FirstSource, Inc., Huttig Building Products Inc., Interline Brands Inc. (through September 10, 2012), Universal Forest Products Inc. and Watsco Inc.
Comparison of Cumulative Total Return
Cumulative Total Return
Years Ending
| | | Base Period | | | | | | | | | | | | | | | | |
| Company Name/Index | | 01/03/09 | | | 01/02/10 | | | 01/01/11 | | | 12/31/11 | | | 12/29/12 | | | 01/04/14 | |
| BlueLinx Holdings Inc. | | $ | 100 | | | $ | 110.36 | | | $ | 145.82 | | | $ | 75.32 | | | $ | 141.10 | | | $ | 111.43 | |
| Russell 2000 Index | | $ | 100 | | | $ | 125.56 | | | $ | 159.28 | | | $ | 152.63 | | | $ | 173.98 | | | $ | 244.94 | |
| Peer Group | | $ | 100 | | | $ | 136.78 | | | $ | 165.54 | | | $ | 161.21 | | | $ | 231.08 | | | $ | 295.79 | |
The following table sets forth certain historical financial data of our Company. The selected financial data for the fiscal years ended January 4, 2014, December 29, 2012, December 31, 2011, January 1, 2011 and January 2, 2010 have been derived from our audited financial statements included elsewhere in this Annual Report on Form 10-K or from prior financial statements. The following information should be read in conjunction with our financial statements and “Management’s Discussion and Analysis of Financial Condition and Results of Operations.”
| | | | | | | | | | | | | | | | |
| | | Year Ended January 4, 2014 | | | Year Ended December 29, 2012 | | | Year Ended December 31, 2011 | | | Year Ended January 1, 2011 | | | Year Ended January 2, 2010 | |
| | | (In thousands, except per share data) | |
| Statements of Operations Data: | | | | | | | | | | | | | | | |
Net sales | | $ | 2,151,972 | | | $ | 1,907,842 | | | $ | 1,755,431 | | | $ | 1,804,418 | | | $ | 1,646,108 | |
Cost of sales | | | 1,923,489 | | | | 1,677,772 | | | | 1,545,282 | | | | 1,593,745 | | | | 1,452,947 | |
Gross profit | | | 228,483 | | | | 230,070 | | | | 210,149 | | | | 210,673 | | | | 193,161 | |
| Operating expenses: | | | | | | | | | | | | | | | | | | | | |
Selling, general and administrative | | | 240,667 | | | | 215,996 | | | | 207,857 | | | | 221,185 | | | | 210,214 | |
| Net gain from terminating the Georgia-Pacific supply agreement | | | — | | | | — | | | | — | | | | — | | | | (17,772 | ) |
Depreciation and amortization | | | 9,117 | | | | 8,565 | | | | 10,562 | | | | 13,365 | | | | 16,984 | |
Total operating expenses | | | 249,784 | | | | 224,561 | | | | 218,419 | | | | 234,550 | | | | 209,426 | |
Operating (loss) income | | | (21,301 | ) | | | 5,509 | | | | (8,270 | ) | | | (23,877 | ) | | | (16,265 | ) |
| Non-operating expenses (income): | | | | | | | | | | | | | | | | | | | | |
Interest expense | | | 28,024 | | | | 28,157 | | | | 30,510 | | | | 33,788 | | | | 32,456 | |
| Changes associated with the ineffective interest rate swap | | | — | | | | — | | | | (1,676 | ) | | | (4,603 | ) | | | 6,252 | |
Write-off of debt issue costs | | | — | | | | — | | | | — | | | | 183 | | | | 1,407 | |
| Other expense (income), net | | | 306 | | | | (7 | ) | | | 501 | | | | 587 | | | | 519 | |
| Loss before (benefit from) provision for income taxes | | | (49,631 | ) | | | (22,641 | ) | | | (37,605 | ) | | | (53,832 | ) | | | (56,899 | ) |
| (Benefit from) provision for income taxes | | | (9,013 | ) | | | 386 | | | | 962 | | | | (589 | ) | | | 4,564 | |
Net loss | | $ | (40,618 | ) | | $ | (23,027 | ) | | $ | (38,567 | ) | | $ | (53,243 | ) | | $ | (61,463 | ) |
| Basic weighted average number of common shares outstanding | | | 80,163 | | | | 65,452 | | | | 47,049 | | | | 33,432 | | | | 33,791 | |
| Basic net loss per share applicable to common stock | | $ | (0.51 | ) | | $ | (0.35 | ) | | $ | (0.82 | ) | | $ | (1.59 | ) | | $ | (1.82 | ) |
| Diluted weighted average number of common shares outstanding | | | 80,163 | | | | 65,452 | | | | 47,049 | | | | 33,432 | | | | 33,791 | |
| Diluted net loss per share applicable to common stock | | $ | (0.51 | ) | | $ | (0.35 | ) | | $ | (0.82 | ) | | $ | (1.59 | ) | | $ | (1.82 | ) |
| Dividends declared per share of common stock | | $ | — | | | $ | — | | | $ | — | | | $ | — | | | $ | — | |
| | | | | | | | | | | | | | | | |
| | | Year Ended January 4, 2014 | | | Year Ended December 29, 2012 | | | Year Ended December 31, 2011 | | | Year Ended January 1, 2011 | | | Year Ended January 2, 2010 | |
| | | (In thousands, except per share data) | |
| Other Financial Data: | | | | | | | | | | | | | | | |
Capital expenditures | | $ | 4,912 | | | $ | 2,826 | | | $ | 6,533 | | | $ | 4,140 | | | $ | 1,815 | |
EBITDA(1) | | | (12,489 | ) | | | 14,081 | | | | 1,791 | | | | (11,099 | ) | | | 200 | |
Net cash used in operating activities | | | (39,881 | ) | | | (74,250 | ) | | | (50,332 | ) | | | (29,861 | ) | | | (19,853 | ) |
| Net cash provided by (used in) investing activities | | | 5,453 | | | | 16,369 | | | | 11,822 | | | | (3,429 | ) | | | 12,636 | |
| Net cash provided by (used in) financing activities | | | 34,274 | | | | 58,171 | | | | 29,111 | | | | 18,130 | | | $ | (113,679 | ) |
| Balance Sheet Data (at end of period): | | | | | | | | | | | | | | | | | | | | |
Cash and cash equivalents | | $ | 5,034 | | | $ | 5,188 | | | $ | 4,898 | | | $ | 14,297 | | | $ | 29,457 | |
Working capital | | | 294,899 | | | | 272,403 | | | | 233,414 | | | | 236,168 | | | | 247,722 | |
Total assets | | | 530,246 | | | | 544,736 | | | | 503,915 | | | | 525,019 | | | | 546,846 | |
Total debt(2) | | | 406,834 | | | | 383,783 | | | | 341,017 | | | | 384,256 | | | | 341,669 | |
Stockholders’ (deficit) equity | | | (5,898 | ) | | | (20,592 | ) | | | 8,374 | | | | 991 | | | $ | 50,820 | |
| (1) | EBITDA is an amount equal to net (loss) income plus interest expense and all interest expense related items (e.g. changes associated with ineffective interest rate swap, write-off of debt issue costs, charges associated with mortgage refinancing), income taxes, and depreciation and amortization. EBITDA is presented herein because we believe it is a useful supplement to cash flow from operations in understanding cash flows generated from operations that are available for debt service (interest and principal payments) and further investment in acquisitions. However, EBITDA is not a presentation made in accordance with U.S. generally accepted accounting principles, (“GAAP”), and is not intended to present a superior measure of the financial condition from those determined under GAAP. EBITDA, as used herein, is not necessarily comparable to other similarly titled captions of other companies due to differences in methods of calculations. |
| | |
| (2) | Total debt represents long-term debt related to our mortgage and revolving credit facilities, including current maturities and capital lease obligations. |
A reconciliation of net cash (used in) provided by operating activities, the most directly comparable GAAP measure, to EBITDA for each of the respective periods indicated is as follows (in thousands):
| | | | | | | | | | | | | | | | |
| | | Year Ended January 4, 2014 | | | Year Ended December 29, 2012 | | | Year Ended December 31, 2011 | | | Year Ended January 1, 2011 | | | Year Ended January 2, 2010 | |
| Net cash used in operating activities | | $ | (39,881 | ) | | $ | (74,250 | ) | | $ | (50,332 | ) | | $ | (29,861 | ) | | $ | (19,853 | ) |
Amortization of debt issue costs | | | (3,184 | ) | | | (3,746 | ) | | | (2,940 | ) | | | (1,963 | ) | | | (2,459 | ) |
| Net gain from terminating the Georgia-Pacific supply agreement | | | — | | | | — | | | | — | | | | — | | | | 17,772 | |
| Payments from terminating the Georgia-Pacific supply agreement | | | — | | | | — | | | | — | | | | (4,706 | ) | | | (14,118 | ) |
Vacant property charges, net | | | (1,321 | ) | | | 30 | | | | 291 | | | | (53 | ) | | | (1,222 | ) |
Write-off of debt issuance costs | | | (119 | ) | | | — | | | | — | | | | — | | | | — | |
| Payments on modification of lease agreement | | | 300 | | | | 5,875 | | | | — | | | | — | | | | — | |
| Deferred income tax benefit (provision) | | | 5 | | | | 20 | | | | 25 | | | | 600 | | | | (24,220 | ) |
| Intraperiod income tax allocation related to hourly pension plan | | | 8,894 | | | | — | | | | — | | | | — | | | | 649 | |
| Pension expense | | | (4,591 | ) | | | (3,942 | ) | | | (1,774 | ) | | | (2,304 | ) | | | (2,511 | ) |
| Prepayment fees associated with sale of property | | | — | | | | — | | | | — | | | | — | | | | (616 | ) |
Gain on sale of properties | | | 5,220 | | | | 9,885 | | | | 10,604 | | | | — | | | | 10,397 | |
Gain from insurance settlement | | | — | | | | 476 | | | | 1,230 | | | | — | | | | — | |
| Gain from modification of lease agreement | | | — | | | | — | | | | 1,971 | | | | — | | | | — | |
Severance charges | | | (5,607 | ) | | | — | | | | — | | | | — | | | | — | |
| Share-based compensation, excluding restructuring related | | | (3,222 | ) | | | (2,797 | ) | | | (1,974 | ) | | | (3,978 | ) | | | (2,922 | ) |
| Share-based compensation, restructuring related | | | (2,895 | ) | | | — | | | | — | | | | — | | | | — | |
Changes in assets and liabilities | | | 14,901 | | | | 53,987 | | | | 13,218 | | | | (2,033 | ) | | | 2,283 | |
Interest expense | | | 28,024 | | | | 28,157 | | | | 30,510 | | | | 33,788 | | | | 32,456 | |
| (Benefit from) provision for income taxes | | | (9,013 | ) | | | 386 | | | | 962 | | | | (589 | ) | | | 4,564 | |
EBITDA | | $ | (12,489 | ) | | $ | 14,081 | | | $ | 1,791 | | | $ | (11,099 | ) | | $ | 200 | |
The following discussion should be read in conjunction with our consolidated financial statements and related notes and other financial information appearing elsewhere in this Form 10-K. In addition to historical information, the following discussion and other parts of this Form 10-K contain forward-looking information that involves risks and uncertainties. Our actual results could differ materially from those anticipated by this forward-looking information due to the factors discussed under “Risk Factors,” “Cautionary Statement Concerning Forward-Looking Statements” and elsewhere in this Form 10-K.
Overview
Company Background
BlueLinx is a leading distributor of building products in North America. As of January 4, 2014, we distributed approximately 10,000 products from over 750 suppliers to service approximately 11,500 customers nationwide, including dealers, industrial manufacturers, manufactured housing producers and home improvement retailers. We operate our distribution business from sales centers in Atlanta and Denver, and our network of approximately 50 distribution centers. We distribute products in two principal categories: structural products and specialty products. Structural products include plywood, OSB, rebar and remesh, lumber and other wood products primarily used for structural support, walls and flooring in construction projects. Structural products represented approximately 44% and 42% of our fiscal 2013 and fiscal 2012 gross sales, respectively. Specialty products include roofing, insulation, moulding, engineered wood, vinyl products (used primarily in siding), outdoor living and metal products (excluding rebar and remesh). Specialty products accounted for approximately 56% and 58% of our fiscal 2013 and fiscal 2012 gross sales, respectively.
Industry Conditions
We operate in a changing environment in which new risks can emerge from time to time. A number of factors cause our results of operations to fluctuate from period to period. Many of these factors are seasonal or cyclical in nature. Conditions in the U.S. housing market, while improving, continue to be at historically low levels. Our operating results have declined during the past several years as they are closely tied to U.S. housing starts. Additionally, over the past several years, the mortgage markets have experienced substantial disruption due to an unprecedented number of defaults. This disruption and the related defaults have increased the inventory of homes for sale in some markets (some markets have sold through excess inventory now) and also have caused lenders to tighten mortgage qualification criteria, which further reduces demand for new homes. While now showing signs of improvement, we expect the lower than historical average level of new housing activity will continue to negatively impact our operating results. However, along with many forecasters, we believe that we are in the beginning of a housing recovery and that U.S. housing demand will continue to improve in the long term based on population demographics and a variety of other factors.
As the housing market and general economic conditions continue to improve, the Company believes that additional capital would allow the Company to participate more fully in these improving conditions, and therefore we will continue to evaluate capital structure opportunities that make sense for the Company . The Company’s sales depend heavily on the strength of national and local new residential construction and home improvement and remodeling markets, which are showing signs of improvement. The overall housing market and economy are also improving, which is expected to lead to an increase in residential construction and, to a lesser extent, in home improvement activity. As the Company and its industry continue to recover from the historic housing market downturn, the Company expects its sales to improve and therefore its need for inventory and its accounts receivable to increase. This increased need for working capital is expected to use some of the Company’s current excess availability under its revolving credit facilities.
Facility Lease Obligation and Related Restructuring
During the second quarter of fiscal 2013, we announced our 2013 restructuring plan (the “2013 restructuring”), which included the realignment of headquarters resources and the strategic review of our distribution centers. This review resulted in the Company designating five distribution centers to be sold or closed. These distribution centers were closed or ceased operations during the third quarter of fiscal 2013. In addition to the 2013 restructuring, we announced during the second quarter of fiscal 2013 that George R. Judd no longer would serve as President and Chief Executive Officer of the Company (the “change in executive leadership”). In connection with the 2013 restructuring and the change in executive leadership, the Company has recognized severance related charges of $5.6 million, $2.9 million of related share-based compensation charges, a $1.3 million facility lease obligation and $1.4 million of other restructuring related charges in “Selling, general, and administrative” expenses in the Consolidated Statements of Operations and Comprehensive Loss during fiscal 2013. In addition, we recognized a $1.0 million inventory reserve charge recorded in “Cost of sales” in the Consolidated Statements of Operations and Comprehensive Loss. The majority of the remaining payments related to the 2013 restructuring will be made during fiscal 2014 and will be paid from our revolving credit facility. The anticipated impact of the 2013 restructuring is directly related to the elimination of the activity in the five closed distribution centers. This activity includes an anticipated reduction to “Selling, general, and administrative” and “Depreciation” expenses, as well as an increase to Net Income in the Consolidated Statements of Operations and Comprehensive Loss.
During the first quarter of fiscal 2013, we completed the transition of our Fremont, California operation to our new facility in Stockton, California. We incurred approximately $0.8 million of transition costs related to this move which are recorded in “Selling, general, and administrative” expenses in the Consolidated Statements of Operations and Comprehensive Loss in the first nine months of fiscal 2013.
During the third quarter of fiscal 2011, we entered into an amendment to our corporate headquarters lease in Atlanta, Georgia related to the unoccupied 4100 building. This amendment released us from our obligations with respect to this unoccupied space as of January 31, 2012, in exchange for a $5.0 million space remittance fee, which was paid in the first quarter of 2012. We also paid $0.9 million in the third quarter of fiscal 2012 and paid an additional $0.3 million in the first quarter of fiscal 2014 related to contractually obligated tenant improvement reimbursement expense. The provisions relating to the occupied 4300 building remain unchanged. Under the existing provisions, the current term of the lease ends on January 31, 2019. The amendment resulted in a reduction of our restructuring reserve of approximately $2.0 million, with the credit recorded in “Selling, general, and administrative” expenses in the Consolidated Statements of Operations and Comprehensive Loss during fiscal 2011.
Stock Rights Offerings
On March 27, 2013, we concluded the 2013 Rights Offering. The 2013 Rights Offering was fully subscribed and resulted in net proceeds of approximately $38.6 million. Remaining expenses to be paid related to the 2013 Rights Offering as of January 4, 2014 totaled $0.1 million. We issued 22.9 million shares of stock to our stockholders in conjunction with the 2013 Rights Offering.
On July 22, 2011, we concluded a rights offering of our common stock to our stockholders (the “2011 Rights Offering”). The 2011 Rights Offering was fully subscribed and resulted in net proceeds of approximately $58.0 million. We issued 28.6 million shares of stock to our stockholders in conjunction with the 2011 Rights Offering.
Private Label Products
In February of 2012, we launched our own privately branded engineered product line for all geographic markets other than New England. In addition, on February 13, 2012, we entered into a distribution agreement with Weyerhaeuser Company for the sale of certain engineered wood products in the New England region. We have subsequently increased the number of private label products that we offer to customers and currently offer several products under our private labels.
Selected Factors that Affect our Operating Results
Our operating results are affected by housing starts, mobile home production, industrial production, repair and remodeling spending and non-residential construction. We believe a substantial percentage of our sales are directly related to new home construction.
Our operating results also are impacted by changes in product prices. Structural products prices can vary significantly based on short-term and long-term changes in supply and demand. The prices of specialty products also can vary from time to time, although they generally are less variable than structural products.
The following table sets forth changes in net sales by product category, sales variances due to changes in unit volume and dollar and percentage changes in unit volume and price, in each case for fiscal 2013, fiscal 2012 and fiscal 2011:
Sales Revenue Variances by Product
| | | | | | | | | | |
| | | Fiscal 2013 | | | Fiscal 2012 | | | Fiscal 2011 | |
| | | (Dollars in millions) | |
| Sales by Category | | | | | | | | | |
Structural Products | | $ | 968 | | | $ | 806 | | | $ | 705 | |
Specialty Products | | | 1,200 | | | | 1,114 | | | | 1,068 | |
Other(1) | | | (16 | ) | | | (12 | ) | | | (18 | ) |
Total Sales | | $ | 2,152 | | | $ | 1,908 | | | $ | 1,755 | |
| Sales Variances | | | | | | | | | | | | |
Unit Volume $ Change | | $ | 161 | | | $ | 42 | | | $ | (52 | ) |
Price/Other(1) | | | 83 | | | | 111 | | | | 3 | |
Total $ Change | | $ | 244 | | | $ | 153 | | | $ | (49 | ) |
Unit Volume % Change | | | 8.4 | % | | | 2.3 | % | | | (2.8 | )% |
Price/Other(1) % Change | | | 4.4 | % | | | 6.4 | % | | | 0.1 | % |
Total % Change | | | 12.8 | % | | | 8.7 | % | | | (2.7 | )% |
| (1) | “Other” includes unallocated allowances and discounts. |
The following table sets forth changes in gross margin dollars and percentages by product category, and percentage changes in unit volume growth by product, in each case for fiscal 2013, fiscal 2012 and fiscal 2011:
| | | | | | | | | | |
| | | Fiscal 2013 | | | Fiscal 2012 | | | Fiscal 2011 | |
| | | (Dollars in millions) | |
| Gross Margin $ by Category | | | | | | | | | |
Structural Products | | $ | 67 | | | $ | 77 | | | $ | 65 | |
Specialty Products | | | 155 | | | | 146 | | | | 137 | |
Other(1) | | | 6 | | | | 7 | | | | 8 | |
Total Gross Margin | | $ | 228 | | | $ | 230 | | | $ | 210 | |
| Gross Margin % by Category | | | | | | | | | | | | |
Structural Products | | | 6.9 | % | | | 9.6 | % | | | 9.2 | % |
Specialty Products | | | 12.9 | % | | | 13.1 | % | | | 12.8 | % |
Total Gross Margin % | | | 10.6 | % | | | 12.1 | % | | | 12.0 | % |
| Unit Volume % Change by Product | | | | | | | | | | | | |
Structural Products | | | 10.0 | % | | | 1.4 | % | | | (15.1 | )% |
Specialty Products | | | 7.1 | % | | | 2.9 | % | | | 7.4 | % |
Total Unit Volume % Change | | | 8.4 | % | | | 2.3 | % | | | (2.8 | )% |
| (1) | “Other” includes unallocated allowances and discounts. |
The following table sets forth changes in net sales and gross margin by channel and percentage changes in gross margin by channel, in each case for fiscal 2013, fiscal 2012 and fiscal 2011:
| | | | | | | | | | |
| | | Fiscal 2013 | | | Fiscal 2012 | | | Fiscal 2011 | |
| | | (Dollars in millions) | |
| Sales by Channel | | | | | | | | | |
| Warehouse/Reload | | $ | 1,755 | | | $ | 1,534 | | | $ | 1,397 | |
Direct | | | 413 | | | | 386 | | | | 376 | |
Other(1) | | | (16 | ) | | | (12 | ) | | | (18 | ) |
Total | | $ | 2,152 | | | $ | 1,908 | | | $ | 1,755 | |
| Gross Margin by Channel | | | | | | | | | | | | |
Warehouse/Reload | | $ | 198 | | | $ | 199 | | | $ | 179 | |
Direct | | | 24 | | | | 24 | | | | 23 | |
Other(1) | | | 6 | | | | 7 | | | | 8 | |
Total | | $ | 228 | | | $ | 230 | | | $ | 210 | |
| Gross Margin % by Channel | | | | | | | | | | | | |
Warehouse/Reload | | | 11.3 | % | | | 13.0 | % | | | 12.8 | % |
Direct | | | 5.8 | % | | | 6.2 | % | | | 6.1 | % |
Total | | | 10.6 | % | | | 12.1 | % | | | 12.0 | % |
| (1) | “Other” includes unallocated allowances and discounts. |
Fiscal Year
Fiscal 2013 contained 53 weeks. Fiscal 2012 and fiscal 2011 each contained 52 weeks. Our fiscal quarters are based on a 5-4-4 week period, with the exception of the fourth fiscal quarter of fiscal years containing 53 weeks, which are based on a 5-4-5 week period.
Results of Operations
Fiscal 2013 Compared to Fiscal 2012
The following table sets forth our results of operations for fiscal 2013 and fiscal 2012.
| | | | | | | | | | | | | |
| | | Fiscal 2013 | | | % of Net Sales | | | Fiscal 2012 | | | % of Net Sales | |
| | | (Dollars in thousands) | |
| Net sales | | $ | 2,151,972 | | | | 100.0 | % | | $ | 1,907,842 | | | | 100.0 | % |
Gross profit | | | 228,483 | | | | 10.6 | % | | | 230,070 | | | | 12.1 | % |
Selling, general and administrative | | | 240,667 | | | | 11.2 | % | | | 215,996 | | | | 11.3 | % |
Depreciation and amortization | | | 9,117 | | | | 0.4 | % | | | 8,565 | | | | 0.4 | % |
Operating (loss) income | | | (21,301 | ) | | | (1.0 | )% | | | 5,509 | | | | 0.3 | % |
Interest expense, net | | | 28,024 | | | | 1.3 | % | | | 28,157 | | | | 1.5 | % |
Other expense (income), net | | | 306 | | | | 0.0 | % | | | (7 | ) | | | 0.0 | % |
Loss before (benefit from) provision for income taxes | | | (49,631 | ) | | | (2.3 | )% | | | (22,641 | ) | | | (1.2 | )% |
(Benefit from) provision for income taxes | | | (9,013 | ) | | | (0.4 | )% | | | 386 | | | | 0.0 | % |
Net loss | | $ | (40,618 | ) | | | (1.9 | )% | | $ | (23,027 | ) | | | (1.2 | )% |
Net sales. For the fiscal year ended January 4, 2014, net sales increased by 12.8%, or $244.1 million, to $2.2 billion. Sales during the fiscal year were positively impacted by a 15.5% increase in single family housing starts. Single family home construction has a significant impact on our sales. Structural sales increased by $162.2 million, or 20.1% from a year ago, as a result of a 10.1% increase in structural product prices and a 10.0% increase in unit volume. In addition, specialty sales increased $86.0 million, or 7.7% from a year ago, as a result of a 7.1% increase in unit volume and a 0.6% increase in specialty product prices.
Gross profit. Gross profit for fiscal 2013 was $228.5 million, or 10.6% of sales, compared to $230.1 million and 12.1% a year ago . Declines in gross margin were driven by volatility in wood-based structural product pricing, primarily during the second quarter of fiscal 2013. The declines in gross margin were further impacted by a greater percentage of our sales being comprised of lower gross margin structural products. In addition, we experienced lower margin sales as we sold through inventory at the five distribution centers we closed during the third quarter of fiscal 2013.
Selling, general and administrative. Selling, general and administrative expenses for fiscal 2013 were $240.7 million, or 11.2% of net sales, compared to $216.0 million, or 11.3% of net sales, during fiscal 2012. The increase in selling, general, and administrative expenses primarily was due to $11.2 million of restructuring and other charges associated with the fiscal 2013 restructuring and the change in executive leadership. In addition, during fiscal 2013 the Company recognized $5.2 million of other gains in selling, general and administrative expenses compared to $10.4 million of other gains recognized in selling, general and administrative expenses in fiscal 2012, resulting in an increase in total selling, general, and administrative expenses of $5.2 million. During fiscal 2013 there were also increases in third party freight, professional fees, and general maintenance and supplies of $2.3 million, $1.9 million and $1.3 million, respectively. These changes were partially offset by a decrease in payroll of $1.2 million related to a reduced headcount from the 2013 restructuring and change in executive leadership.
The other gains recorded in selling, general and administrative expenses during fiscal 2013 were comprised of $5.2 million of gains on sales of property. In comparison, during fiscal 2012, other gains recorded in selling, general and administrative expenses were comprised of $9.9 million of gains on sales of property and a $0.5 million gain related to the insurance settlement on the Newtown, Connecticut facility. The increases to third party freight and general maintenance and supplies are largely due to the increase in revenue during fiscal 2013. The increase in professional fees relates to certain non-recurring activities requiring the services of various professionals. These activities included the 2013 Rights Offering, the freeze of the non-union participants in the hourly pension plan, the contribution of certain real properties to the hourly pension plan and the waiver process for the 2012 minimum required contribution of the hourly pension plan.
Depreciation and amortization. Depreciation and amortization expense was $9.1 million for fiscal 2013, compared to $8.6 million for fiscal 2012. The $0.5 million increase in depreciation and amortization is primarily due to an increase in capital expenditures for mobile equipment consisting of trucks, trailers, forklifts and automobiles.
Operating (loss) income. Operating loss for fiscal 2013 was $21.3 million compared to operating income of $5.5 million for fiscal 2012. The change in operating (loss) income reflects a $1.6 million decrease in gross profit as a result of the above factors, and an increase in depreciation of $0.5 million and an increase in selling, general, and administrative expenses of $24.7 million.
Interest expense, net. Interest expense for fiscal 2013 was $28.0 million compared to $28.2 million for fiscal 2012. The $0.2 million decrease is due to a decrease in interest expense related to our mortgage of $1.7 million due to a decrease in principal and a decrease in amortization of debt issuance costs of $0.6 million. These changes were partially offset by an increase in interest related to our revolving credit facilities of $1.8 million, an increase in interest related to our capital lease obligations of $0.3 million, and expense of $0.1 million for the write-off of deferred financing costs that had been capitalized in fiscal 2013 with no similar activity during fiscal 2012. Interest expense included $3.2 million and $3.7 million of debt issue cost amortization for fiscal 2013 and fiscal 2012, respectively. In fiscal 2013, interest expense related to our revolving credit facilities and mortgage was $11.4 million and $13.0 million, respectively. In fiscal 2012, interest expense related to our revolving credit facilities and mortgage was $9.6 million and $14.7 million, respectively. See “Liquidity and Capital Resources” below for a description of agreements for the revolving credit facilities and the mortgage.
(Benefit from) provision for income taxes. Our effective tax rate was 18.2% and (1.7)% for fiscal 2013 and fiscal 2012, respectively. The effective tax rate for fiscal 2013 is largely due to a full valuation allowance recorded against our tax benefit and an allocation of income tax expense to other comprehensive income (loss) for an actuarial gain associated with our hourly pension plan resulting in a benefit to continuing operations. The main driver of the actuarial pension gain is an increase in the market value of the underlying assets and a decrease in the pension liability resulting largely from the change in the underlying discount rate assumption, which increased from 4.24% in fiscal 2012 to 5.00% in fiscal 2013. The effective tax rate for fiscal 2012 is largely due to a full valuation allowance recorded against our tax benefit related to our fiscal 2012 loss. The effect of the valuation allowance was offset by state income taxes, gross receipts taxes, and foreign income taxes recorded on a separate company basis partially offset by various refundable tax credits.
Net loss. Net loss for fiscal 2013 was $40.6 million, compared to $23.0 million for fiscal 2012 as a result of the factors discussed above.
On a per-share basis, basic and diluted loss applicable to common stockholders for fiscal 2013 each was $0.51. For fiscal 2012, basic and diluted loss per share each was $0.35.
Fiscal 2012 Compared to Fiscal 2011
The following table sets forth our results of operations for fiscal 2012 and fiscal 2011.
| | | | | | | | | | | | | | | | | |
| | | Fiscal 2012 | | | % of
Net
Sales | | | Fiscal 2011 | | | % of
Net
Sales | |
| | | (Dollars in thousands) | |
| Net sales | | $ | 1,907,842 | | | | 100.0 | % | | $ | 1,755,431 | | | | 100.0 | % |
Gross profit | | | 230,070 | | | | 12.1 | % | | | 210,149 | | | | 12.0 | % |
Selling, general and administrative | | | 215,996 | | | | 11.3 | % | | | 207,857 | | | | 11.8 | % |
Depreciation and amortization | | | 8,565 | | | | 0.4 | % | | | 10,562 | | | | 0.6 | % |
Operating income (loss) | | | 5,509 | | | | 0.3 | % | | | (8,270 | ) | | | (0.5 | )% |
Interest expense, net | | | 28,157 | | | | 1.5 | % | | | 30,510 | | | | 1.7 | % |
Changes associated with the ineffective interest rate swap | | | — | | | | 0.0 | % | | | (1,676 | ) | | | (0.1 | )% |
Other (income) expense, net | | | (7 | ) | | | 0.0 | % | | | 501 | | | | 0.0 | % |
Loss before provision for income taxes | | | (22,641 | ) | | | (1.2 | )% | | | (37,605 | ) | | | (2.1 | )% |
Provision for income taxes | | | 386 | | | | 0.0 | % | | | 962 | | | | 0.1 | % |
Net loss | | $ | (23,027 | ) | | | (1.2 | )% | | $ | (38,567 | ) | | | (2.2 | )% |
Net sales. For the fiscal year ended December 29, 2012, net sales increased by 8.7%, or $152.4 million, to $1.9 billion. Sales during the fiscal year were positively impacted by a 28% increase in single family housing starts. Single family home construction has a significant impact on our sales. Structural sales increased by $101.2 million, or 14.3% from a year ago, as a result of a 12.9% increase in structural product prices and a 1.4% increase in unit volume. In addition, specialty sales increased $45.8 million, or 4.3% from a year ago, as a result of a 1.4% increase in specialty product prices and a 2.9% increase in unit volume.
Gross profit. Gross profit for fiscal 2012 was $230.1 million, or 12.1% of sales, compared to $210.1 million, or 12.0% of sales, in fiscal 2011. The increase in gross profit dollars compared to fiscal 2011 was driven primarily by the factors noted above, coupled with an improvement in gross margin percentage due to the Company’s efforts to improve gross margin.
Selling, general and administrative. Selling, general and administrative expenses for fiscal 2012 were $216.0 million, or 11.3% of net sales, compared to $207.9 million, or 11.8% of net sales, during fiscal 2011. The increase in selling, general, and administrative expenses is primarily due to a reduction in other gains recorded in selling, general and administrative expenses in 2012 when compared to 2011 coupled with increases in certain variable costs and pension expense. During 2012 the Company recognized $10.4 million of other gains in selling, general and administrative expenses compared to $14.0 million of other gains recognized in selling, general and administrative expenses in fiscal 2011, both of which were recorded in selling, general and administrative expenses, resulting in an increase in total selling, general, and administrative expenses of $3.6 million. In addition, during fiscal 2012 there were increases in pension expense, commissions, stock compensation and other salary based incentives of $2.1 million, $0.7 million, $0.8 million and $1.7 million, respectively. These increases were partially offset by a decrease in payroll of $2.8 million.
The other gains recorded in selling, general and administrative expenses during fiscal 2012 were comprised of $9.9 million of gains on property sales and a $0.5 million gain related to the insurance settlement on the Newtown, Connecticut facility. In comparison, during fiscal 2011, other gains recorded in selling, general and administrative expenses were comprised of $10.6 million of gains on property sales, a $2.0 million gain related to the modification of the lease agreement for our headquarters in Atlanta, Georgia and a $1.4 million gain related to the insurance settlement on the Newtown, Connecticut facility. The increase in pension expense was due to changes in the underlying pension valuation assumptions. The increases in incentives and commissions were largely attributable to higher sales activity in fiscal 2012. The $2.8 million decrease in payroll was due to reduction in force activities occurring in fiscal 2011, which resulted in $1.4 million in severance charges in fiscal 2011. We did not materially increase headcount during fiscal 2012 or perform any material restructuring.
Depreciation and amortization. Depreciation and amortization expense was $8.6 million for fiscal 2012, compared to $10.6 million for fiscal 2011. The $2.0 million decrease in depreciation and amortization is primarily related to a portion of our property and equipment becoming fully depreciated during fiscal 2012 and replenishment of fixed assets occurring at a slower rate.
Operating income (loss). Operating income for fiscal 2012 was $5.5 million compared to an operating loss of $8.3 million for fiscal 2011. The change in operating income (loss) reflects a $19.9 million increase in gross profit as a result of the above factors, and a decrease in depreciation of $2.0 million. This change was partially offset by an increase in selling, general, and administrative expenses of $8.1 million.
Interest expense, net. Interest expense for fiscal 2012 was $28.2 million compared to $30.5 million for fiscal 2011. The $2.3 million decrease is due to a decrease of $2.2 million in fees related to the interest rate swap due to the expiration of the interest rate swap during fiscal 2011 and a decrease in interest expense related to our mortgage of $2.3 million due to a decrease in principal. These changes were partially offset by an increase in interest related to our revolving credit facilities of $1.4 million and an increase in debt issuance cost amortization of $0.8 million. Interest expense included $3.7 million and $2.9 million of debt issue cost amortization for fiscal 2012 and fiscal 2011, respectively. In fiscal 2012, interest expense related to our revolving credit facilities and mortgage was $9.6 million and $14.7 million, respectively. In fiscal 2011, interest expense related to our revolving credit facilities and mortgage was $10.3 million and $17.0 million, respectively. See “Liquidity and Capital Resources” below for a description of agreements for the revolving credit facilities and the mortgage.
Changes associated with the ineffective interest rate swap. Changes associated with the ineffective interest rate swap totaled $1.7 million of income in fiscal 2011. As the effective interest rate swap terminated in March of 2011, there was no comparable activity in the fiscal 2012.
Provision for income taxes. Our effective tax rate was (1.7)% and (2.5)% for fiscal 2012 and fiscal 2011, respectively. The effective tax rates for fiscal 2012 and 2011 are largely due to a full valuation allowance recorded against our tax benefit related to our fiscal 2012 loss and our 2011 loss, respectively. The effect of the valuation allowance was offset by state income taxes, gross receipts taxes, and foreign income taxes recorded on a separate company basis partially offset by various refundable tax credits.
Net loss. Net loss for fiscal 2012 was $23.0 million, compared to $38.6 million for fiscal 2011 as a result of the factors discussed above.
On a per-share basis, basic and diluted loss applicable to common stockholders for fiscal 2012 was $0.35. For fiscal 2011, basic and diluted loss per share was $0.82.
Seasonality
We are exposed to fluctuations in quarterly sales volumes and expenses due to seasonal factors. These seasonal factors are common in the building products distribution industry. The first and fourth quarters are typically our slowest quarters due to the impact of poor weather on the construction market. Our second and third quarters are typically our strongest quarters, reflecting a substantial increase in construction due to more favorable weather conditions. Our working capital and accounts receivable and payable generally peak in the third quarter, while inventory generally peaks in the second quarter in anticipation of the summer building season.
Liquidity and Capital Resources
We depend on cash flow from operations and funds available under our revolving credit facilities to finance working capital needs and capital expenditures. We had approximately $44.5 million of excess availability under our U.S. revolving credit facility and $1.3 million under our Canadian revolving credit facility, described further below, as of January 4, 2014. As of January 4, 2014, under the U.S. revolving credit facility, we are required to maintain a fixed charge coverage ratio of 1.1 to 1.0 in the event our excess availability falls below the greater of $31.8 million or the amount equal to 12.5% of the lesser of the borrowing base or $447.5 million (the “Excess Availability Threshold”). If we fail to maintain this minimum excess availability, the U.S. revolving credit facility requires us to (i) maintain certain financial ratios, which we would not meet with current operating results, and (ii) limit our capital expenditures, which would have a negative impact on our ability to finance working capital needs and capital expenditures. In the event that excess availability falls below $37.1 million or the amount equal to 15% of the lesser of the borrowing base or $447.5 million, the U.S. revolving credit facility gives the lenders the right, but not the obligation, to dominion over our bank accounts. This would not make the underlying debt callable by the lender and may not change our ability to borrow on the U.S. revolving credit facility. However, we would be required to reclassify the “Long-term debt” to “Current maturities of long-term debt” on our Consolidated Balance Sheet. For additional information regarding our financial covenants under our revolving credit facilities, see the Risk Factors “The instruments governing our indebtedness contain various covenants limiting the discretion of our management in operating our business” set forth under Item 1.A. Risk Factors.
Excess availability may decrease while our industry and the Company continue to participate in the recovery of the housing market.While the Company believes that the amounts currently available from its revolving credit facilities and other sources will be sufficient to fund its routine operations and capital requirements for at least the next 12 months, the Company believes that additional capital will provide it with a stronger liquidity position and allow it to more fully participate in the improving housing market.
On March 27, 2013, we concluded the 2013 Rights Offering. The 2013 Rights Offering was fully subscribed and resulted in net proceeds of approximately $38.6 million. Remaining expenses to be paid related to the 2013 Rights Offering as of January 4, 2014 totaled $0.1 million. We issued 22.9 million shares of stock to our stockholders in conjunction with the 2013 Rights Offering.
On July 22, 2011, we concluded an offering of our common stock to our stockholders (the “2011 Rights Offering”). The 2011 Rights Offering was fully subscribed and resulted in net proceeds of approximately $58.0 million. We issued 28.6 million shares of stock to our stockholders in conjunction with the 2011 Rights Offering.
The following tables indicate our working capital and cash flows for the periods indicated.
| | | | | | | | | |
| | | January 4,
2014 | | | December 29,
2012 | |
| | | (Dollars in thousands) | |
Working capital | | $ | 294,899 | | | $ | 272,403 | |
| | | | | | | | | | | | | |
| | | Year Ended
January 4,
2014 | | | Year Ended
December 29,
2012 | | | Year Ended
December 31,
2011 | |
| | | | | | (Dollars in thousands) | | | | |
Cash flows used in operating activities | | $ | (39,881 | ) | | $ | (74,250 | ) | | $ | (50,332 | ) |
Cash flows provided by investing activities | | | 5,453 | | | | 16,369 | | | | 11,822 | |
Cash flows provided by financing activities | | | 34,274 | | | | 58,171 | | | | 29,111 | |
Working Capital
Working capital increased by $22.5 million to $294.9 million at January 4, 2014 from $272.4 million at December 29, 2012. The increase in working capital reflected a decrease in accounts payable and bank overdrafts of $17.5 million and $16.0 million, respectively, primarily due to the timing of payments. The decreases were partially offset by an increase in other current liabilities of $2.0 million and decreases in receivables and inventories of $7.2 million and $6.5 million, respectively. The increase in other current liabilities was primarily attributable to severance and lease facility reserves increasing year over year as the company went through restructuring in fiscal 2013 that resulted in a reduction in force and the closing of five facilities. The change in receivables is due to a decrease in daily sales outstanding over the prior year. The change in inventories is due to our continued focus on managing our inventory levels and lower anticipated demand in the first quarter of 2014.
Operating Activities
During fiscal 2013, cash flows used in operating activities totaled $39.9 million. The primary driver of cash flows used in operations was a net loss, as adjusted for non-cash charges of $24.7 million, a decrease in accounts payable of $17.6 million, partially offset by a decrease in receivables and inventories of $7.2 million and $6.5 million, respectively. Refer to the Working Capital section above for further discussion of these items.
During fiscal 2012, cash flows used in operating activities totaled $74.3 million. The primary driver of cash flows used in operations was a net loss, as adjusted for non-cash charges of $14.4 million, an increase in receivables of $18.6 million and an increase in inventories of $44.5 million. In addition, we made payments totaling $5.9 million associated with the 2011 amendment to our lease agreement in Atlanta, Georgia related to the unoccupied 4100 building. These changes were partially offset by an increase in accounts payable of $9.1 million.
During fiscal 2011, cash flows used in operating activities totaled $50.3 million. The primary driver of cash flows used in operations was a net loss, as adjusted for non-cash charges of $37.1 million, an increase in receivables of $19.7 million, partially offset by a decrease in inventories of $2.7 and an increase in accounts payable of $6.0 million.
Investing Activities
During fiscal 2013, cash flows provided by investing activities totaled $5.5 million, compared to $16.4 million in fiscal 2012.
During fiscal 2013, fiscal 2012 and fiscal 2011, our expenditures for property and equipment were $4.9 million, $2.8 million and $6.5 million, respectively. These expenditures were primarily to purchase information technology, leasehold improvements, and certain machinery and equipment. During fiscal 2013 we purchased an additional warehouse for our facility in Elkhart, Indiana. During fiscal 2011 we purchased a replacement warehouse facility in Nashville, Tennessee. We estimate that capital expenditures for fiscal 2014 will be approximately $6.5 million. The majority of our capital expenditures for fiscal 2013 and 2012 have been and likely will continue to be paid from our revolving credit facility. We intend to purchase additional vehicles to replenish the fleet during the fiscal 2014 and anticipate financing these tractors with a third party leasing company.
Proceeds from the disposition of property and equipment were $10.4 million, $19.2 million and $18.4 million during fiscal 2013, fiscal 2012 and fiscal 2011, respectively. During fiscal 2013, the proceeds of $10.4 million included $9.4 million related to the sale of certain real properties classified as held for sale assets included in “Other current assets” on our Consolidated Balance Sheets. During fiscal 2012, the proceeds of $19.2 million included $17.8 million related to the sale of certain real properties classified as held for sale assets included in “Other current assets” on our Consolidated Balance Sheets. During fiscal 2011, the proceeds of $18.4 million included $9.2 million related to the sale of certain real properties classified as held for sale assets included in “Other current assets” on our Consolidated Balance Sheets.
Financing Activities
Net cash provided by financing activities was $34.3 million during fiscal 2013, compared to $58.2 million during fiscal 2012. The net cash provided by financing activities in fiscal 2013 primarily reflected net borrowings on our revolving credit facility of $39.8 million and the receipt of proceeds from the 2013 Rights Offering, netted with expenses related to that offering, of $38.7 million. These cash inflows were offset by payments of principal on our mortgage of $19.0 million, payments for debt financing costs of $2.9 million, a $3.2 million decrease related to the repurchase of shares to satisfy employee tax withholding and a decrease in bank overdrafts of $16.0 million.
The net cash provided by financing activities in fiscal 2012 of $58.2 million primarily reflected net borrowings on our revolving credit facility of $76.9 million, increases in bank overdrafts of $13.0 million and $10.0 million related to the decrease in restricted cash on our mortgage. These cash inflows were offset by payments of principal on our mortgage of $37.3 million and payments for debt financing costs of $1.7 million.
The net cash provided by financing activities in fiscal 2011 of $29.1 million primarily reflected the receipt of proceeds from the 2011 Rights Offering, netted with expenses related to that offering, of $58.5 million and cash provided by changes in restricted cash related to our mortgage of $20.6 million. These cash inflows were offset by additional repayments on our revolving credit facilities of $2.7 million (net of borrowings) and payments of principal on our mortgage of $42.4 million.
Debt and Credit Sources
Our U.S. revolving credit facility is with several lenders including Wells Fargo Bank, National Association, successor by merger to Wachovia Bank, National Association, dated August 4, 2006, as amended. The U.S. revolving credit facility has a final maturity of April 15, 2016 and maximum available credit of $447.5 million. The U.S. revolving credit facility also includes an additional $75 million uncommitted accordion credit facility, which permits us to increase the maximum available credit up to $522.5 million.
On June 28, 2013, we entered into an amendment to our U.S. revolving credit facility, which became effective on that date and pursuant to which certain components of the borrowing base calculation and excess liquidity calculation were adjusted. The most significant of the changes included in the amendment is the addition of PNC Bank, National Association as a lender and their additional loan commitment of $25.0 million, which increased the maximum availability under the U.S. revolving credit facility to $447.5 million. The terms of this amended agreement are described below. In conjunction with this amendment, we incurred $0.1 million of debt fees that were capitalized and are being amortized over the amended debt term.
On March 29, 2013, we entered into an amendment to our U.S. revolving credit facility, which became effective on that date and pursuant to which certain components of the borrowing base calculation and excess liquidity calculation were adjusted. The most significant of the changes included in the amendment are extending the final maturity of our U.S. revolving credit facility, increasing the maximum available credit under the facility and adjusting the excess availability threshold calculation. In conjunction with this amendment, we incurred $2.8 million of debt fees that were capitalized and are being amortized over the amended debt term.
On March 27, 2013, we concluded the 2013 Rights Offering. The 2013 Rights Offering was fully subscribed and resulted in net proceeds of approximately $38.6 million. Remaining expenses to be paid related to the 2013 Rights Offering as of January 4, 2014 totaled $0.1 million. We issued 22.9 million shares of stock to our stockholders in conjunction with the 2013 Rights Offering.
On July 22, 2011, we concluded the 2011 Rights Offering. The 2011 Rights Offering was fully subscribed and resulted in net proceeds of approximately $58.0 million. We issued 28.6 million shares of stock to our stockholders in conjunction with the 2011 Rights Offering.
As of January 4, 2014, we had outstanding borrowings of $207.9 million and excess availability of $44.5 million under the terms of our U.S. revolving credit facility. The interest rate on the U.S. revolving credit facility was 3.7% at January 4, 2014. As of December 29, 2012, we had outstanding borrowings of $169.5 million and excess availability of $86.0 million under the terms of our U.S. revolving credit facility. The interest rate on the U.S. revolving credit facility was 4.1% at December 29, 2012. As of January 4, 2014 and December 29, 2012, we had outstanding letters of credit totaling $3.6 million and $4.5 million, respectively, for the purposes of securing collateral requirements under casualty insurance programs and for guaranteeing lease and certain other obligations. The $3.6 million in outstanding letters of credit as of January 4, 2014, does not include an additional $1.5 million fully collateralized letter of credit securing certain insurance obligations that was issued outside of the U.S. revolving credit facility.
As of January 4, 2014, our U.S. revolving credit facility, as amended, contains customary negative covenants and restrictions for asset based loans, including a requirement that we maintain a fixed charge coverage ratio of 1.1 to 1.0 in the event our excess availability falls below the Excess Availability Threshold. The fixed charge coverage ratio is calculated as EBITDA divided by the sum of cash payments for income taxes, interest expense, cash dividends, principal payments on debt, and capital expenditures. EBITDA is defined, for purposes of the U.S. revolving credit facility, as BlueLinx Corporation’s net income before interest and tax expense, depreciation and amortization expense, and other non-cash charges. The fixed charge coverage ratio requirement only applies to us when excess availability under our amended U.S. revolving credit facility is less than the Excess Availability Threshold on any date. As of January 4, 2014, and through the time of the filing of this Form 10-K, we were in compliance with all covenants under the U.S. revolving credit facility. We are required to maintain the Excess Availability Threshold in order to avoid being required to meet certain financial ratios and triggering additional limits on capital expenditures. Our lowest level of fiscal month-end availability in the last three years as of January 4, 2014, was $44.5 million. We do not anticipate our excess availability in fiscal 2014 will drop below the Excess Availability Threshold. Should our excess availability fall below the Excess Availability Threshold on any date, however, we would not meet the required fixed charge coverage ratio covenant with our current operating results.
In the event that excess availability falls below $37.1 million or the amount equal to 15% of the lesser of the borrowing base or $447.5 million, the U.S. revolving credit facility gives the lenders the right to dominion over our bank accounts. This would not make the underlying debt callable by the lender and may not change our ability to borrow on the U.S. revolving credit facility. However, we would be required to reclassify the “Long-term debt” to “Current maturities of long-term debt” on our Consolidated Balance Sheet. In addition, we would be required to maintain a springing lock-box arrangement where customer remittances go directly to a lock-box maintained by our lenders and then are forwarded to our general bank accounts. Our amended U.S. revolving credit facility does not contain a subjective acceleration clause, which would allow our lenders to accelerate the scheduled maturities of our debt or to cancel our agreement.
Our subsidiary BlueLinx Canada has a revolving credit agreement with Canadian Imperial Bank of Commerce (as successor to CIBC Asset-Based Lending Inc.) and the other signatories thereto, as lender, administrative agent and collateral agent, dated August 12, 2011, as amended.
As of January 4, 2014, we had outstanding borrowings of $3.3 million and excess availability of $1.3 million under the terms of our Canadian revolving credit facility. As of December 29, 2012, we had outstanding borrowings of $1.9 million and excess availability of $2.0 million under the terms of our Canadian revolving credit facility. The interest rate on the Canadian revolving credit facility was 4.0% at January 4, 2014 and December 29, 2012. The Canadian revolving credit facility contains customary covenants and events of default for asset-based credit agreements of this type, including the requirement for BlueLinx Canada to maintain a minimum adjusted tangible net worth of $3.9 million and for that entity’s capital expenditures not to exceed 120% of the amount budgeted in a given year. As of January 4, 2014, and through the time of the filing of this Form 10-K, we were in compliance with all covenants under this facility
Under the terms of our mortgage, we are required to transfer certain funds to be held as collateral. On September 19, 2012, we entered into an amendment to our mortgage agreement, which provided for the immediate prepayment of approximately $11.8 million of the indebtedness under the mortgage agreement without incurring a prepayment premium from cash currently held as collateral under the mortgage agreement. In addition, on the last business day of each calendar quarter, starting with the fourth quarter of fiscal 2012, additional funds held as collateral under the mortgage agreement are used to prepay indebtedness under the mortgage agreement, without prepayment premium, up to an aggregate additional prepayment of $10.0 million. Thereafter, any cash remaining in the collateral account under the mortgage agreement, up to an aggregate of $10.0 million, is released to the Company on the last business day of each calendar quarter through the third quarter of fiscal 2014. All funds released pursuant to these provisions may only be used by the Company to pay for usual and customary operating expenses. During the periods described above in which cash in the collateral account is used to either prepay indebtedness under the mortgage agreement or released to the Company, the lenders will not release any of the cash collateral to the Company for specified capital expenditures as previously provided under the mortgage agreement. Approximately $6.3 million of funds held in collateral were used to prepay indebtedness under the mortgage agreement during fiscal 2013. Approximately $2.7 million of cash held in collateral were released to the Company during fiscal 2013 to pay for usual and customary operating expenses. We expect to transfer approximately $13.2 million as collateral during the next twelve month period, approximately $7.3 million of which will be remitted to us on a quarterly basis to pay for usual and customary operating expenses. In conjunction with the modification of our mortgage agreement we incurred approximately $0.3 million in fees that were capitalized and are being amortized over the remaining term of the mortgage.
During the third quarter of fiscal 2013, we sold our sales center in Denver, Colorado and increased the restricted cash related to our mortgage by $8.4 million, which represents the allocated mortgage related to the property. During the fourth quarter of fiscal 2013, we sold our Sioux Falls, South Dakota facility and increased the restricted cash related to our mortgage by $1.9 million, which represents the allocated mortgage related to the property. This restricted cash for both locations was used to pay down the outstanding principal of the mortgage in the fourth quarter of fiscal 2013. During the first quarter of fiscal 2012, we sold certain parcels of excess land. As a result of the sale of one of these parcels, we increased the amount of restricted cash required to be held in connection with our mortgage by $0.3 million. In addition, during the third quarter of fiscal 2012, we sold our facility in Fremont, California and increased the restricted cash related to our mortgage by $12.8 million. This restricted cash was used to pay down the mortgage in the fourth quarter of fiscal 2012.
We intend to ensure that we have a solid capital structure to provide runway for the Company as our markets recover. We will continue to accelerate our emphasis on our working capital metrics and management. But growing markets typically necessitate increased working capital , and we want to have the flexibility to take advantage of opportunities as the market recovery occurs. We will continue to evaluate capital structure opportunities that make sense for the Company .
Contractual Commitments. The following table represents our contractual commitments associated with our debt and other obligations disclosed above as of the fiscal year end of each year set forth below (in thousands).
| | | | | | | | | | | | | | | | | | | | | | | | | | | | | |
| | | 2014 | | | 2015 | | | 2016 | | | 2017 | | | 2018 | | | Thereafter | | | Total | |
| Revolving credit facilities(1) | | $ | — | | | $ | — | | | $ | 211,213 | | | $ | — | | | $ | — | | | $ | — | | | $ | 211,213 | |
Mortgage indebtedness | | | 2,761 | | | | 2,744 | | | | 181,438 | | | | — | | | | — | | | | — | | | | 186,943 | |
| Interest payments on our revolving credit facilities(2) | | | 7,808 | | | | 7,808 | | | | 2,252 | | | | — | | | | — | | | | — | | | | 17,868 | |
Interest payments on our mortgage(3) | | | 12,969 | | | | 11,776 | | | | 5,805 | | | | — | | | | — | | | | — | | | | 30,550 | |
Subtotal | | | 23,538 | | | | 22,328 | | | | 400,708 | | | | — | | | | — | | | | — | | | | 446,574 | |
Operating leases(4) | | | 4,391 | | | | 3,968 | | | | 4,036 | | | | 4,060 | | | | 3,498 | | | | 10,060 | | | | 30,013 | |
Capital leases(5) | | | 1,753 | | | | 1,847 | | | | 1,746 | | | | 1,342 | | | | 1,406 | | | | 604 | | | | 8,698 | |
| Interest payments on our capital leases(6) | | | 509 | | | | 399 | | | | 273 | | | | 186 | | | | 95 | | | | 20 | | | | 1,482 | |
Letters of credit(7) | | | 3,585 | | | | — | | | | — | | | | — | | | | — | | | | — | | | | 3,585 | |
Letters of credit(8) | | | 1,505 | | | | — | | | | — | | | | — | | | | — | | | | — | | | | 1,505 | |
Total | | $ | 35,281 | | | $ | 28,542 | | | $ | 406,763 | | | $ | 5,588 | | | $ | 4,999 | | | $ | 10,684 | | | $ | 491,857 | |
| (1) | Payments for both the U.S. and Canadian revolving credit facilities are included. |
| | |
| (2) | Interest on the revolving credit facilities is variable, based on Libor or prime plus the applicable margin. The interest rate on the U.S. revolving credit facility and the Canadian revolving credit facility was 3.7% and 4.0%, respectively, at January 4, 2014. The final maturity date on our U.S. revolving credit facility and Canadian revolving credit facility is April 15, 2016. |
| | |
| (3) | Interest payments on the mortgage are based on a fixed rate of 6.35%. |
| | |
| (4) | We lease various facilities and vehicles under non-cancelable operating leases. |
| | |
| (5) | We lease certain other fixed assets under non cancelable leases that we have determined to be capital leases. |
| | |
| (6) | Includes imputed interest based on individual capital lease agreements. |
| | |
| (7) | Letters of credit included under the credit facilities. |
| | |
| (8) | Letters of credit not included under the credit facilities. |
Purchase orders entered into in the ordinary course of business are excluded from the above table. Amounts for which we are liable under purchase orders are reflected on our Consolidated Balance Sheets (to the extent entered into prior to the end of the applicable period) as accounts payable and accrued liabilities.
Off-Balance Sheet Arrangements. As of January 4, 2014, we did not have any material off-balance sheet arrangements.
Critical Accounting Policies
The preparation of our consolidated financial statements and related disclosures in conformity with U.S. generally accepted accounting principles requires our management to make judgments and estimates that affect the amounts reported in our consolidated financial statements and accompanying notes. Our management believes that we consistently apply these judgments and estimates and the consolidated financial statements and accompanying notes fairly represent all periods presented. However, any differences between these judgments and estimates and actual results could have a material impact on our Consolidated Statements of Operations and financial position. Critical accounting estimates, as defined by the Securities and Exchange Commission (“SEC”), are those that are most important to the portrayal of our financial condition and results of operations and require our management’s most difficult and subjective judgments and estimates of matters that are inherently uncertain. Our critical accounting estimates include those regarding (1) revenue recognition; (2) allowance for doubtful accounts and related reserves; (3) inventory valuation; (4) impairment of long-lived assets; (5) income taxes; (6) defined benefit pension plans; and (7) stock-based compensation. Our significant accounting policies are more fully described in the Notes to the Consolidated Financial Statements.
Revenue Recognition
We recognize revenue when the following criteria are met: persuasive evidence of an agreement exists, delivery has occurred or services have been rendered, our price to the buyer is fixed and determinable and collectability is reasonably assured. Delivery is not considered to have occurred until the customer takes title and assumes the risks and rewards of ownership. The timing of revenue recognition is largely dependent on shipping terms. Revenue is recorded at the time of shipment for terms designated as FOB (free on board) shipping point. For sales transactions designated FOB destination, revenue is recorded when the product is delivered to the customer’s delivery site.
All revenues are recorded at gross. The key indicators used to determine when and how revenue is recorded are as follows:
| | ● | We are the primary obligor responsible for fulfillment and all other aspects of the customer relationship. |
| | | Title passes to BlueLinx, and we carry all risk of loss related to warehouse, reload inventory and inventory shipped directly from vendors to our customers. |
| | ● | We are responsible for all product returns. |
| | ● | We control the selling price for all channels. |
| | ● | We bear all credit risk. |
In addition, we provide inventory to certain customers through pre-arranged agreements on a consignment basis. Customer consigned inventory is maintained and stored by certain customers; however, ownership and risk of loss remains with us. When the inventory is sold by the customer, we recognize revenue on a gross basis.
All revenues recognized are net of trade allowances, cash discounts and sales returns. Cash discounts and sales returns are estimated using historical experience. Trade allowances are based on the estimated obligations and historical experience. Adjustments to earnings resulting from revisions to estimates on discounts and returns have been insignificant for each of the reported periods.
Allowance for Doubtful Accounts and Related Reserves
We evaluate the collectability of accounts receivable based on numerous factors, including past transaction history with customers and their creditworthiness. We maintain an allowance for doubtful accounts for each aging category on our aged trial balance based on our historical loss experience. This estimate is periodically adjusted when we become aware of specific customers’ inability to meet their financial obligations (e.g., bankruptcy filing or other evidence of liquidity problems). As we determine that specific balances will ultimately be uncollectible, we remove them from our aged trial balance. Additionally, we maintain reserves for cash discounts that we expect customers to earn as well as expected returns.
Inventory Valuation
Inventories are carried at the lower of cost or market. The cost of all inventories is determined by the moving average cost method. We include all charges directly or indirectly incurred in bringing inventory to its existing condition and location. We evaluate our inventory value at the end of each quarter to ensure that first quality, actively moving inventory, when viewed by category, is carried at the lower of cost or market.
Additionally, we maintain a reserve for the estimated value impairment associated with damaged, excess and obsolete inventory. The damaged, excess and obsolete reserve generally includes discontinued items or inventory that has turn days in excess of 270 days, excluding new items during their product launch.
Impairment of Long-Lived Assets
Long-lived assets, including property and equipment and intangible assets with definite useful lives, are reviewed for possible impairment whenever events or circumstances indicate that the carrying amount of an asset may not be recoverable.
We consider whether there were indicators of potential impairment on a quarterly basis. Indicators of impairment include current period losses combined with a history of losses, management’s decision to exit a facility, reductions in the fair market value of real properties and changes in other circumstances that indicate the carrying amount of an asset may not be recoverable.
Our evaluation of long-lived assets is performed at the lowest level of identifiable cash flows, which is generally the individual distribution facility. In the event of indicators of impairment, the assets of the distribution facility are evaluated by comparing the facility’s undiscounted cash flows over the estimated useful life of the asset, which ranges between 5-40 years, to its carrying value. If the carrying value is greater than the undiscounted cash flows, an impairment loss is recognized for the difference between the carrying value of the asset and the estimated fair market value. Impairment losses are recorded as a component of “Selling, general and administrative” expense in the Consolidated Statements of Operations and Comprehensive Loss .
Our estimate of undiscounted cash flows is subject to assumptions that affect estimated operating income at a distribution facility level. These assumptions are related to future sales, margin growth rates, economic conditions, market competition and inflation. In the event that undiscounted cash flows do not exceed the carrying value of a facility, our estimates of fair market value are generally based on market appraisals and our experience with related market transactions. We use a two year average of cash flows based on 2013 EBITDA and 2014 projected EBITDA, which includes a growth factor assumption, to estimate undiscounted cash flows. These assumptions used to determine impairment are considered to be level 3 measurements in the fair value hierarchy as defined in Note 13 to the Consolidated Financial Statements.
While operating results have declined during the past several years as they are closely tied to U.S. housing starts, during fiscal 2012 we began to see signs of a housing recovery, and our results have improved; however our sales are still below normal levels. To the extent that reductions in volume and operating income have resulted in impairment indicators, in all cases our carrying values continue to be less than our projected undiscounted cash flows. As such, we have not identified significant known trends impacting the fair value of long-lived assets to an extent that would indicate impairment.
During the first quarter of fiscal 2011 our Newtown, CT facility was damaged due to severe winter weather. As a result of the damage to the facility and its contents, we have received approximately $5.8 million in proceeds from the insurance company comprised of $2.2 million related to the damaged building, $2.4 million related to damaged and destroyed inventory and $1.2 million related to the recovery of additional expenses incurred as a result of the damage. Cash received related to the damaged building was classified as an investing cash inflow in our Consolidated Statement s of Cash Flows and used to reduce the principal of our mortgage. All other cash inflows related to the insurance settlement were classified as operating cash flows in our Consolidated Statement s of Cash Flows. The majority of the remaining cash inflows were used to fund costs incurred related to the Newtown loss. We recognized a $1.4 million gain in fiscal 2011 of which $1.2 million related to the damaged building and $0.2 million related to the recovery of gross margin on the inventory. We recorded the gain at the time that the recovery of the minimum expected proceeds under our insurance policy became probable and was estimable. This gain was recorded in “Selling, general and administrative expenses” in our Consolidated Statement s of Operations and Comprehensive Loss .
Income Taxes
The federal statutory income tax rate was 35%. Our (benefit from) provision for income taxes is reconciled to the federal statutory amount as follows:
| | | | | | | | | | |
| | | Fiscal Year Ended January 4, 2014 | | | Fiscal Year Ended December 29, 2012 | | | Fiscal Year Ended December 31, 2011 | |
| | | (In thousands) | |
| Benefit from income taxes computed at the federal statutory tax rate | | $ | (17,371 | ) | | $ | (7,924 | ) | | $ | (13,162 | ) |
Benefit from state income taxes, net of federal benefit | | | (1,991 | ) | | | (866 | ) | | | (1,296 | ) |
Valuation allowance change | | | 19,445 | | | | 8,820 | | | | 14,498 | |
Nondeductible items | | | 270 | | | | 484 | | | | 806 | |
| Benefit from allocation of income taxes to other comprehensive income (loss) | | | (8,726 | ) | | | — | | | | — | |
Other | | | (640 | ) | | | (128 | ) | | | 116 | |
| (Benefit from) provision for income taxes | | | (9,013 | ) | | $ | 386 | | | $ | 962 | |
Our income before provision for income taxes for our Canadian operations was $0.1 million, $0.1 million and $0.9 million for fiscal 2013, fiscal 2012, and fiscal 2011, respectively.
Our federal NOL carryovers are $168.1 million and will expire in 15 to 20 years. Our state NOL carryovers are $232.2 million and will expire in 1 to 20 years. The NOL carryovers are fully valued.
For fiscal 2013, we recognized tax benefit of $9.0 million. The benefit recognized for the year is primarily comprised of $8.7 million of deferred income tax benefit resulting from the allocation of income tax expense to other comprehensive income (loss). In addition, we recognized an income tax benefit related to the reversal of a $0.6 million reserve for an uncertain tax position due to the expiration of the statue of limitations. Finally, we recognized current state income tax expense of $0.3 million related to earnings generated on a separate company basis.
For fiscal 2012, we recognized tax expense of $0.4 million. The expense recognized for the year is primarily comprised of $0.3 million for current state income tax expense related to earnings generated on a separate company basis.
For fiscal 2011, we recognized tax expense of $1.0 million. The expense recognized for the year is primarily comprised of $0.8 million for current state income tax expense related to earnings generated on a separate company basis and $0.3 million of current income tax expense resulting from foreign income taxes.
In accordance with the intraperiod tax allocation provisions of U.S. GAAP, we are required to consider all items (including items recorded in other comprehensive income) in determining the amount of tax benefit that results from a loss from continuing operations that should be allocated to continuing operations. In fiscal 2013, a non-cash tax benefit on the loss from continuing operations of $8.7 million, which was offset in full by income tax expense, was recorded in other comprehensive income. In fiscal 2012 and fiscal 2011, there was no intraperiod tax allocation due to the fact that there was a loss in other comprehensive income for the period. While the income tax benefit from continuing operations is reported in our Consolidated Statements of Operations and Comprehensive Loss, the income tax expense on other comprehensive income is recorded directly to accumulated other comprehensive loss, which is a component of stockholders’ equity.
Our financial statements contain certain deferred tax assets which have arisen primarily as a result of tax benefits associated with the loss before income taxes incurred, as well as net deferred income tax assets resulting from other temporary differences related to certain reserves, pension obligations and differences between book and tax depreciation and amortization. We record a valuation allowance against our net deferred tax assets when we determine that based on the weight of available evidence, it is more likely than not that our net deferred tax assets will not be realized.
In our evaluation of the weight of available evidence, we considered recent reported losses as negative evidence which carried substantial weight. Therefore, we considered evidence related to the four sources of taxable income, to determine whether such positive evidence outweighed the negative evidence associated with the losses incurred. The positive evidence considered included:
| | ● | taxable income in prior carryback years, if carryback is permitted under the tax law; |
| | ● | future reversals of existing taxable temporary differences; |
| | ● | tax planning strategies; |
| | ● | future reversals of existing taxable temporary differences; and |
| | ● | future taxable income exclusive of reversing temporary differences and carryforwards. |
In estimating future taxable income, we develop assumptions including the amount of future state and federal pretax operating and non-operating income, the reversal of temporary differences and the implementation of feasible prudent tax planning strategies. These assumptions require significant judgment about the forecasts of future taxable income. Substantial changes in these assumptions could result in changes in our judgments around our ability to realize future tax benefit.
Defined Benefit Pension Plans
We sponsor several defined benefit pension plans covering substantially all of our hourly employees. Our estimates of the amount and timing of our future funding obligations for our defined benefit pension plans are based upon various assumptions. These assumptions include, but are not limited to, the discount rate, projected return on plan assets, compensation increase rates, mortality rates, retirement patterns, and turnover rates. In addition, the amount and timing of our pension funding obligations can be influenced by funding requirements that are established by the Employee Retirement Income and Security Act of 1974 (“ERISA”), the Pension Protection Act, Congressional Acts, or other governing bodies.
We recognize the unfunded status (i.e., the difference between the fair value of plan assets and the projected benefit obligations) of the hourly pension plan in our Consolidated Balance Sheets, with a corresponding adjustment to accumulated other comprehensive loss. On January 4, 2014, we measured the fair value of our plan assets and benefit obligations. As of January 4, 2014, and December 29, 2012, the net unfunded status of our benefit plan was $27.9 million and $46.6 million, respectively. These amounts were included in “Other non-current liabilities” on our Consolidated Balance Sheets. The net adjustment to other comprehensive loss for fiscal 2013, fiscal 2012, and fiscal 2011 was $13.9 million gain ($22.8 million gain, net of tax of $8.9 million), $8.2 million loss ($8.2 million loss, net of tax, offset by a valuation allowance), $15.0 million loss ($15.0 million loss, net of tax, offset by a valuation allowance), respectively, which represents the net unrecognized actuarial (loss) gain and unrecognized prior service cost.
The portion of estimated net loss for the hourly pension plan that is expected to be amortized from accumulated other comprehensive loss into net periodic cost over the next fiscal year is $0.8 million. The expected amortization of prior service cost recognized into net periodic cost over the next fiscal year is immaterial.
The Company’s minimum required contribution for plan year 2012 was $3.2 million. In an effort to preserve additional cash for operations, we applied for a waiver from the IRS for our 2012 minimum required contribution. Although the Company’s outside counsel has been notified by the IRS that its waiver request has been preliminarily approved and that the IRS is in the process of finalizing the waiver request, no assurances can be provided that the waiver request will be granted until the Company receives final approval from the IRS. If we are granted the requested waiver, our contributions for 2012 will be amortized over the following five years, increasing our future minimum required contributions.
The Company’s minimum required contribution for plan year 2013 was estimated to be $6.0 million, assuming we receive the requested waiver. During the second quarter of fiscal 2013, we contributed certain qualifying employer real property to the hourly pension plan. The properties, including certain land and buildings, are located in Charleston, S.C. and Buffalo, N.Y., and were valued at approximately $6.8 million by independent appraisals prior to the contribution. The contribution was recorded by the hourly pension plan at the fair market value of $6.8 million. We are leasing back the contributed properties for an initial term of 20 years with two five-year extension options and continue to use the properties in our distribution operations. Each lease provides us a right of first refusal on any subsequent sale by the hourly pension plan and a repurchase option. The hourly pension plan engaged an independent fiduciary who evaluated the transaction on behalf of the hourly pension plan, negotiated the terms of the property contribution and the leases, and also manages the properties on behalf of the hourly pension plan. Depending on whether the 2012 waiver is granted, portions of the property contribution may be designated to either the 2012 or 2013 plan year. If the waiver is not granted, it may be necessary to contribute an additional $2.2 million on or before September 15, 2014, to fully satisfy the 2012 and 2013 minimum required contributions.
We determined that the contribution of the properties does not meet the accounting definition of a plan asset within the scope of relevant accounting guidance. Accordingly, the contributed properties are not considered a contribution for financial reporting purposes and, as a result, are not included in plan assets and have no impact on the net pension liability recorded on our Consolidated Balance Sheets. We continue to depreciate the carrying value of the properties in our financial statements, and no gain or loss was recognized at the contribution date for financial reporting purposes. Rent payments will be made on a monthly basis and will be recorded as contributions to the hourly pension plan, of which $0.5 million has been recorded as of January 4, 2014. These rental payments will reduce our unfunded obligation to the hourly pension plan.
We currently are required to make three quarterly cash contributions during fiscal 2014 of $1.5 million each related to our 2014 minimum required contribution.
We used a discount rate of 5.00% to compute the projected benefit obligation, which was determined by matching of plan liability cash flows to a portfolio of bonds. A change in the discount rate of 25 basis points, from 5.00% to 5.25%, while holding all other assumptions constant, would have resulted in a reduction in the Company’s projected benefit obligation of approximately $3.1 million in 2013.
We used an estimated rate of future compensation increases of graded 5.5% - 2.5% to compute the projected benefit obligation. A change in the rate of 25 basis points, from graded 5.5% - 2.5% to graded 5.75% - 2.75%, while holding all other assumptions constant, would have resulted in an increase in the Company’s projected benefit obligation of less than $0.1 million in 2013.
Plan assets are managed as a balanced portfolio comprised of two major components: an equity portion and a fixed income portion. The expected role of plan equity investments will be to maximize the long-term real growth of fund assets, while the role of fixed income investments will be to generate current income, provide for more stable periodic returns, and provide some downside protection against the possibility of a prolonged decline in the market value of equity investments. We review this investment policy statement at least once per year. In addition, the portfolio will be reviewed quarterly to determine the deviation from target weightings and will be rebalanced as necessary. Target allocations for fiscal 2014 are 50% domestic and 15% international equity investments, 30% fixed income investments, and 5% cash. The expected long-term rate of return for the plan’s total assets is based on the expected return of each of the above categories, weighted based on the target allocation for each class.
Share-Based Compensation
We recognize compensation expense equal to the grant-date fair value for all share-based payment awards that are expected to vest. This expense is recorded on a straight-line basis over the requisite service period of the entire award, unless the awards are subject to market or performance conditions, in which case we recognize compensation expense over the requisite service period of each separate vesting tranche to the extent market and performance conditions are considered probable. The calculation of fair value related to share-based compensation is subject to certain assumptions discussed in more detail in Note 7 to the Consolidated Financial Statements. Management updates such estimates when circumstances warrant. All compensation expense related to our share-based payment awards is recorded in “Selling, general and administrative” expense in the Consolidated Statements of Operations and Comprehensive Loss .
Recently Issued Accounting Pronouncements
In the first quarter of fiscal 2013, the Financial Accounting Standards Board issued an amendment to previously issued guidance which requires companies to report, in one place, information about reclassifications out of accumulated other comprehensive income (“AOCI”). The update also requires companies to present reclassifications by component when reporting changes in AOCI balances. For significant items reclassified out of AOCI to net income in their entirety in the period, companies must report the effect of the reclassifications on the respective line items in the statement where net income is presented. In certain circumstances, this can be done on the face of that statement. Otherwise, it must be presented in the notes. For items not reclassified to net income in their entirety in the period, companies must cross-reference in a note to other required disclosures. The amendments are effective for public companies in fiscal years, and interim periods within those years, beginning after December 15, 2012. We adopted this guidance during the first quarter of fiscal 2013. Refer to Note 17 of the Notes to Consolidated Financial Statements for the required disclosures.
There were no other accounting pronouncements adopted during fiscal 2013 that had a material impact on our financial statements.
General. We are exposed to risks such as changes in interest rates, commodity prices and foreign currency exchange rates. We employ a variety of practices to manage these risks including the use of derivative instruments. Derivative instruments are used only for risk management purposes and not for speculation or trading, and are not used to address risks related to foreign currency exchange rates. We record derivative instruments as assets or liabilities on the balance sheet at fair value. The following discussion provides additional information regarding our market risk exposure.
Interest Rates. Our revolving credit facilities accrue interest based on a floating benchmark rate (the prime rate or LIBOR rate), plus an applicable margin. A change in interest rates under the revolving credit facility would have an impact on our results of operations. However, a change of 100 basis points in the market rate of interest would have an impact of $2.2 million and $1.8 million based on borrowings outstanding at January 4, 2014, and December 29, 2012, respectively, which we do not believe to be material. Additionally, to the extent changes in interest rates impact the housing market, we would be impacted by such changes.
Foreign Exchange Rates. Less than 2.0% of our net sales are denominated in currencies other than the U.S. dollar, and we do not believe our total exposure to currency fluctuations to be significant.
Commodity Prices. Many of the products we purchase and resell are commodities whose price is determined by the market’s supply and demand for such products. Commodity price fluctuations have from time to time created cyclicality in our financial performance and may do so in the future. The markets for most of these commodities are cyclical and are affected by factors such as global economic conditions, including the strength of the U.S. housing market, changes in or disruptions to industry production capacity, changes in inventory levels, and other factors beyond our control.
Index to Financial Statements and Supplemental Data
| | | |
| | | Page |
| | 39 |
| | 40 |
| | 42 |
| | 43 |
| | 44 |
| | 45 |
| | 46 |
BLUELINX HOLDINGS INC. AND SUBSIDIARIES
To the Stockholders of BlueLinx Holdings Inc.:
Our management is responsible for establishing and maintaining adequate internal control over financial reporting as defined in Rule 13a-15(f) under the Securities Exchange Act of 1934, as amended. Our internal control over financial reporting is designed to provide reasonable assurance to our management and board of directors regarding the preparation and fair presentation of published financial statements.
Our management, including our chief executive officer and our chief financial officer, does not expect that our internal controls over financial reporting will prevent all errors and all fraud. Internal controls, no matter how well designed and operated, can provide only reasonable, not absolute, assurance that the objectives of the internal controls are met. Given the inherent limitations of internal controls, internal controls over financial reporting may not prevent or detect all misstatements or fraud. Therefore, no evaluation of internal control can provide absolute assurance that all control issues or instances of fraud will be prevented or detected.
Management assessed the effectiveness of our internal control over financial reporting as of January 4, 2014. In making this assessment, management used the criteria established by the Committee of Sponsoring Organizations of the Treadway Commission set forth inInternal Control — Integrated Framework (1992 framework).Based on our assessment, our management concluded that, as of January 4, 2014, our internal control over financial reporting was effective.
Ernst & Young LLP, an independent registered public accounting firm that audited our consolidated financial statements as of and for the year ended January 4, 2014 included in this Annual Report on Form 10-K, has issued an attestation report on our internal control over financial reporting as of January 4, 2014, dated February 24, 2014.
February 24, 2014
CONTROL OVER FINANCIAL REPORTING
The Board of Directors and Stockholders of BlueLinx Holdings Inc. and subsidiaries
We have audited BlueLinx Holdings Inc. and subsidiaries’ internal control over financial reporting as of January 4, 2014, based on criteria established in Internal Control—Integrated Framework issued by the Committee of Sponsoring Organizations of the Treadway Commission (1992 framework) (the COSO criteria). BlueLinx Holdings Inc. and subsidiaries’ management is responsible for maintaining effective internal control over financial reporting, and for its assessment of the effectiveness of internal control over financial reporting included in the accompanying Management’s Report on Internal Control Over Financial Reporting. Our responsibility is to express an opinion on the Company’s internal control over financial reporting based on our audit.
We conducted our audit in accordance with the standards of the Public Company Accounting Oversight Board (United States). Those standards require that we plan and perform the audit to obtain reasonable assurance about whether effective internal control over financial reporting was maintained in all material respects. Our audit included obtaining an understanding of internal control over financial reporting, assessing the risk that a material weakness exists, testing and evaluating the design and operating effectiveness of internal control based on the assessed risk, and performing such other procedures as we considered necessary in the circumstances. We believe that our audit provides a reasonable basis for our opinion.
A company’s internal control over financial reporting is a process designed to provide reasonable assurance regarding the reliability of financial reporting and the preparation of financial statements for external purposes in accordance with generally accepted accounting principles. A company’s internal control over financial reporting includes those policies and procedures that (1) pertain to the maintenance of records that, in reasonable detail, accurately and fairly reflect the transactions and dispositions of the assets of the company; (2) provide reasonable assurance that transactions are recorded as necessary to permit preparation of financial statements in accordance with generally accepted accounting principles, and that receipts and expenditures of the company are being made only in accordance with authorizations of management and directors of the company; and (3) provide reasonable assurance regarding prevention or timely detection of unauthorized acquisition, use or disposition of the company’s assets that could have a material effect on the financial statements.
Because of its inherent limitations, internal control over financial reporting may not prevent or detect misstatements. Also, projections of any evaluation of effectiveness to future periods are subject to the risk that controls may become inadequate because of changes in conditions, or that the degree of compliance with the policies or procedures may deteriorate.
In our opinion, BlueLinx Holdings Inc. and subsidiaries maintained, in all material respects, effective internal control over financial reporting as of January 4, 2014, based on the COSO criteria.
We also have audited, in accordance with the standards of the Public Company Accounting Oversight Board (United States), the 2013 Consolidated Financial Statements of BlueLinx Holdings Inc. and subsidiaries and our report dated February 24, 2014 expressed an unqualified opinion thereon.
/s/ Ernst & Young LLP
Atlanta, Georgia
February 24, 2014
REPORT OF INDEPENDENT REGISTERED PUBLIC ACCOUNTING FIRM ON THE
CONSOLIDATED FINANCIAL STATEMENTS
The Board of Directors and Stockholders of BlueLinx Holdings Inc. and subsidiaries
We have audited the accompanying consolidated balance sheets of BlueLinx Holdings Inc. and subsidiaries as of January 4, 2014 and December 29, 2012, and the related consolidated statements of operations and comprehensive loss, stockholders’ equity (deficit), and cash flows for the fiscal years ended January 4, 2014, December 29, 2012, and December 31, 2011. These financial statements are the responsibility of the Company’s management. Our responsibility is to express an opinion on these financial statements based on our audits.
We conducted our audits in accordance with the standards of the Public Company Accounting Oversight Board (United States). Those standards require that we plan and perform the audit to obtain reasonable assurance about whether the financial statements are free of material misstatement. An audit includes examining, on a test basis, evidence supporting the amounts and disclosures in the financial statements. An audit also includes assessing the accounting principles used and significant estimates made by management, as well as evaluating the overall financial statement presentation. We believe that our audits provide a reasonable basis for our opinion.
In our opinion, the financial statements referred to above present fairly, in all material respects, the consolidated financial position of BlueLinx Holdings Inc. and subsidiaries at January 4, 2014 and December 29, 2012, and the consolidated results of their operations and their cash flows for the fiscal years ended January 4, 2014, December 29, 2012, and December 31, 2011, in conformity with U.S. generally accepted accounting principles.
We also have audited, in accordance with the standards of the Public Company Accounting Oversight Board (United States), BlueLinx Holdings Inc. and subsidiaries’ internal control over financial reporting as of January 4, 2014, based on criteria established in Internal Control-Integrated Framework issued by the Committee of Sponsoring Organizations of the Treadway Commission (1992 framework) and our report dated February 24, 2014 expressed an unqualified opinion thereon.
/s/ Ernst & Young LLP
Atlanta, Georgia
February 24, 2014
BLUELINX HOLDINGS INC. AND SUBSIDIARIES
| | | | | | | |
| | | January 4, 2014 | | | December 29, 2012 | |
| | | (In thousands, except share data) | |
ASSETS | | | | | | |
| Current assets: | | | | | | |
| Cash and cash equivalents | | $ | 5,034 | | | $ | 5,188 | |
| Receivables, less allowances of $4,359 in fiscal 2013 and $4,720 in fiscal 2012 | | | 150,297 | | | | 157,465 | |
| Inventories, net | | | 223,580 | | | | 230,059 | |
| Other current assets | | | 22,814 | | | | 19,427 | |
| Total current assets | | | 401,725 | | | | 412,139 | |
| Property and equipment: | | | | | | | | |
| Land and improvements | | | 41,176 | | | | 43,120 | |
| Buildings | | | 90,082 | | | | 94,070 | |
| Machinery and equipment | | | 73,004 | | | | 78,674 | |
| Construction in progress | | | 3,028 | | | | 1,173 | |
| Property and equipment, at cost | | | 207,290 | | | | 217,037 | |
| Accumulated depreciation | | | (96,171 | ) | | | (101,684 | ) |
| Property and equipment, net | | | 111,119 | | | | 115,353 | |
| Non-current deferred income tax assets, net | | | 824 | | | | 445 | |
| Other non-current assets | | | 16,578 | | | | 16,799 | |
| Total assets | | $ | 530,246 | | | $ | 544,736 | |
LIABILITIES AND STOCKHOLDERS’ (DEFICIT) EQUITY | | | | | | | | |
| Current liabilities: | | | | | | | | |
| Accounts payable | | $ | 60,363 | | | $ | 77,850 | |
| Bank overdrafts | | | 19,377 | | | | 35,384 | |
| Accrued compensation | | | 4,173 | | | | 6,170 | |
| Current maturities of long-term debt | | | 9,141 | | | | 8,946 | |
| Deferred income taxes, net | | | 823 | | | | 449 | |
| Other current liabilities | | | 12,949 | | | | 10,937 | |
| Total current liabilities | | | 106,826 | | | | 139,736 | |
| Non-current liabilities: | | | | | | | | |
| Long-term debt | | | 388,995 | | | | 368,446 | |
| Other non-current liabilities | | | 40,323 | | | | 57,146 | |
| Total liabilities | | | 536,144 | | | | 565,328 | |
STOCKHOLDERS’ DEFICIT | | | | | | | | |
| Common Stock, $0.01 par value, 200,000,000 and 100,000,000 shares authorized at January 4, 2014 and December 29, 2012, respectively; 86,545,000 and 63,664,115 shares issued and outstanding at January 4, 2014 and December 29, 2012, respectively | | | 866 | | | | 637 | |
| Additional paid-in-capital | | | 251,150 | | | | 209,815 | |
| Accumulated other comprehensive loss | | | (16,293 | ) | | | (30,042 | ) |
| Accumulated deficit | | | (241,621 | ) | | | (201,002 | ) |
Total stockholders’ deficit | | | (5,898 | ) | | | (20,592 | ) |
Total liabilities and stockholders’ deficit | | $ | 530,246 | | | $ | 544,736 | |
BLUELINX HOLDINGS INC. AND SUBSIDIARIES
COMPREHENSIVE LOSS
| | | | | | | | | | |
| | | Fiscal Year Ended January 4, 2014 | | | Fiscal Year Ended December 29, 2012 | | | Fiscal Year Ended December 31, 2011 | |
| | | (In thousands, except per share data) | |
| Net sales | | $ | 2,151,972 | | | $ | 1,907,842 | | | $ | 1,755,431 | |
| Cost of sales | | | 1,923,489 | | | | 1,677,772 | | | | 1,545,282 | |
| Gross profit | | | 228,483 | | | | 230,070 | | | | 210,149 | |
| Operating expenses: | | | | | | | | | | | | |
| Selling, general, and administrative | | | 240,667 | | | | 215,996 | | | | 207,857 | |
| Depreciation and amortization | | | 9,117 | | | | 8,565 | | | | 10,562 | |
| Total operating expenses | | | 249,784 | | | | 224,561 | | | | 218,419 | |
| Operating (loss) income | | | (21,301 | ) | | | 5,509 | | | | (8,270 | ) |
| Non-operating expenses (income): | | | | | | | | | | | | |
| Interest expense | | | 28,024 | | | | 28,157 | | | | 30,510 | |
| Changes associated with the ineffective interest rate swap | | | — | | | | — | | | | (1,676 | ) |
| Other expense (income), net | | | 306 | | | | (7 | ) | | | 501 | |
| Loss before (benefit from) provision for income taxes | | | (49,631 | ) | | | (22,641 | ) | | | (37,605 | ) |
| (Benefit from) provision for income taxes | | | (9,013 | ) | | | 386 | | | | 962 | |
| Net loss | | $ | (40,618 | ) | | $ | (23,027 | ) | | $ | (38,567 | ) |
| | | | | | | | | | | | | |
| Basic and diluted weighted average number of common shares outstanding | | | 80,163 | | | | 65,452 | | | | 47,049 | |
| Basic and diluted net loss per share applicable to common shares outstanding | | $ | (0.51 | ) | | $ | (0.35 | ) | | $ | (0.82 | ) |
| | | | | | | | | | | | | |
| Comprehensive loss: | | | | | | | | | | | | |
| Net loss | | $ | (40,618 | ) | | $ | (23,027 | ) | | $ | (38,567 | ) |
| Other comprehensive income (loss): | | | | | | | | | | | | |
| Foreign currency translation, net of taxes | | | (161 | ) | | | 103 | | | | (92 | ) |
| Unrealized gain (loss) from pension plan, net of taxes | | | 13,910 | | | | (8,245 | ) | | | (14,969 | ) |
| Unrealized gain from ineffective interest rate swap, net of taxes | | | — | | | | — | | | | 519 | |
| Total other comprehensive income (loss) | | | 13,749 | | | | (8,142 | ) | | | (14,542 | ) |
| Comprehensive loss | | $ | (26,869 | ) | | $ | (31,169 | ) | | $ | (53,109 | ) |
BLUELINX HOLDINGS INC. AND SUBSIDIARIES
| | | | | | | | | | | | | |
| | | Fiscal Year Ended January 4, 2014 | | | Fiscal Year Ended December 29, 2012 | | | Fiscal Year Ended December 31, 2011 | |
| | | (In thousands) | |
Cash flows from operating activities: | | | | | | | | | |
| Net loss | | $ | (40,618 | ) | | $ | (23,027 | ) | | $ | (38,567 | ) |
| Adjustments to reconcile net loss to cash used in operations: | | | | | | | | | | | | |
| Depreciation and amortization | | | 9,117 | | | | 8,565 | | | | 10,562 | |
| Amortization of debt issue costs | | | 3,184 | | | | 3,746 | | | | 2,940 | |
| Write-off of debt issue costs | | | 119 | | | | — | | | | — | |
| Gain from sale of properties | | | (5,220 | ) | | | (9,885 | ) | | | (10,604 | ) |
| Gain from property insurance settlements | | | — | | | | (476 | ) | | | (1,230 | ) |
| Changes associated with the ineffective interest rate swap | | | — | | | | — | | | | (1,676 | ) |
| Vacant property charges, net | | | 1,321 | | | | (30 | ) | | | (291 | ) |
| Severance charges | | | 5,607 | | | | — | | | | — | |
| Gain from modification of lease agreement | | | — | | | | — | | | | (1,971 | ) |
| Payments on modification on lease agreement | | | (300 | ) | | | (5,875 | ) | | | — | |
| Deferred income tax benefit | | | (5 | ) | | | (20 | ) | | | (25 | ) |
| Intraperiod income tax allocation related to hourly pension plan | | | (8,894 | ) | | | — | | | | — | |
| Pension expense | | | 4,591 | | | | 3,942 | | | | 1,774 | |
| Share-based compensation, excluding restructuring related | | | 3,222 | | | | 2,797 | | | | 1,974 | |
| Share-based compensation, restructuring related | | | 2,895 | | | | — | | | | — | |
| (Increase) decrease in restricted cash related to the ineffective interest rate swap, insurance, and other | | | (1,810 | ) | | | 695 | | | | 987 | |
Accrued compensation and other | | | (9,152 | ) | | | (657 | ) | | | (3,181 | ) |
| | | | (35,943 | ) | | | (20,225 | ) | | | (39,308 | ) |
| Changes in assets and liabilities: | | | | | | | | | | | | |
| Receivables | | | 7,168 | | | | (18,593 | ) | | | (19,670 | ) |
| Inventories | | | 6,479 | | | | (44,482 | ) | | | 2,673 | |
| Accounts payable | | | (17,585 | ) | | | 9,050 | | | | 5,973 | |
| Net cash used in operating activities | | | (39,881 | ) | | | (74,250 | ) | | | (50,332 | ) |
Cash flows from investing activities: | | | | | | | | | | | | |
| Property, plant and equipment investments | | | (4,912 | ) | | | (2,826 | ) | | | (6,533 | ) |
| Proceeds from disposition of assets | | | 10,365 | | | | 19,195 | | | | 18,355 | |
| Net cash provided by investing activities | | | 5,453 | | | | 16,369 | | | | 11,822 | |
Cash flows from financing activities: | | | | | | | | | | | | |
| Excess tax benefits from share-based compensation arrangements | | | 16 | | | | — | | | | — | |
| Repurchase of shares to satisfy employee tax withholdings | | | (3,192 | ) | | | (526 | ) | | | — | |
| Repayments on revolving credit facilities | | | (560,186 | ) | | | (473,349 | ) | | | (478,630 | ) |
| Borrowings from revolving credit facilities | | | 599,968 | | | | 550,270 | | | | 475,918 | |
| Principal payments on mortgage | | | (19,038 | ) | | | (37,272 | ) | | | (42,416 | ) |
| Payments on capital lease obligations | | | (3,142 | ) | | | (2,259 | ) | | | (1,440 | ) |
| (Decrease) increase in bank overdrafts | | | (16,007 | ) | | | 13,020 | | | | (725 | ) |
Decrease in restricted cash related to the mortgage | | | 40 | | | | 9,970 | | | | 20,604 | |
| Debt financing costs | | | (2,900 | ) | | | (1,683 | ) | | | (2,721 | ) |
| Proceeds from stock offering less expenses paid | | | 38,715 | | | | — | | | | 58,521 | |
| Net cash provided by financing activities | | | 34,274 | | | | 58,171 | | | | 29,111 | |
| (Decrease) increase in cash | | | (154 | ) | | | 290 | | | | (9,399 | ) |
| Cash and cash equivalents balance, beginning of period | | | 5,188 | | | | 4,898 | | | | 14,297 | |
| Cash and cash equivalents balance, end of period | | $ | 5,034 | | | $ | 5,188 | | | $ | 4,898 | |
Supplemental Cash Flow Information | | | | | | | | | | | | |
| Net income tax payments during the period | | $ | (332 | ) | | $ | (508 | ) | | $ | (22 | ) |
| Interest paid during the period | | $ | 24,706 | | | $ | 24,288 | | | $ | 28,098 | |
| Noncash transactions: | | | | | | | | | | | | |
| Capital leases | | $ | 5,069 | | | $ | 5,238 | | | $ | 3,131 | |
BLUELINX HOLDINGS INC. AND SUBSIDIARIES
| | | | | | | | | | | | | | | | | | | | | | | | |
| | | | | | | | | Accumulated | | | | | | Stockholders’ | |
| | | | | | Additional | | | Other | | | | | | (Deficit) | |
| | | Common Stock | | | Paid-In- | | | Comprehensive | | | Accumulated | | | Equity | |
| | | Shares | | | Amount | | | Capital | | | Income (Loss) | | | Deficit | | | Total | |
| | | (In thousands) | |
| Balance, January 1, 2011 | | | 32,668 | | | $ | 327 | | | $ | 147,427 | | | $ | (7,358 | ) | | $ | (139,405 | ) | | $ | 991 | |
| Net loss | | | — | | | | — | | | | — | | | | — | | | | (38,567 | ) | | | (38,567 | ) |
| Foreign currency translation adjustment, net of tax | | | — | | | | — | | | | — | | | | (92 | ) | | | — | | | | (92 | ) |
| Unrealized loss from pension plan, net of tax | | | — | | | | — | | | | — | | | | (14,969 | ) | | | — | | | | (14,969 | ) |
| Unrealized gain from cash flow hedge, net of tax | | | — | | | | — | | | | — | | | | 519 | | | | — | | | | 519 | |
| Issuance of restricted stock, net of forfeitures | | | 774 | | | | 7 | | | | — | | | | — | | | | — | | | | 7 | |
| Issuance of stock related to the rights offering, net of expenses | | | 28,571 | | | | 286 | | | | 58,235 | | | | — | | | | — | | | | 58,521 | |
| Compensation related to share-based grants | | | — | | | | — | | | | 2,158 | | | | — | | | | — | | | | 2,158 | |
| Impact of net settled shares for vested grants | | | — | | | | — | | | | (194 | ) | | | — | | | | — | | | | (194 | ) |
| Balance, December 31, 2011 | | | 62,013 | | | | 620 | | | | 207,626 | | | | (21,900 | ) | | | (177,972 | ) | | | 8,374 | |
| Net loss | | | — | | | | — | | | | — | | | | — | | | | (23,027 | ) | | | (23,027 | ) |
| Foreign currency translation adjustment, net of tax | | | — | | | | — | | | | — | | | | 103 | | | | — | | | | 103 | |
| Unrealized loss from pension plan, net of tax | | | — | | | | — | | | | — | | | | (8,245 | ) | | | — | | | | (8,245 | ) |
| Issuance of restricted stock, net of forfeitures | | | 1,875 | | | | 19 | | | | — | | | | — | | | | — | | | | 19 | |
| Compensation related to share-based grants | | | — | | | | — | | | | 2,730 | | | | — | | | | — | | | | 2,730 | |
| Impact of net settled shares for vested grants | | | (224 | ) | | | (2 | ) | | | (524 | ) | | | — | | | | — | | | | (526 | ) |
| Other | | | — | | | | — | | | | (17 | ) | | | — | | | | (3 | ) | | | (20 | ) |
| Balance, December 29, 2012 | | | 63,664 | | | | 637 | | | | 209,815 | | | | (30,042 | ) | | | (201,002 | ) | | | (20,592 | ) |
| Net loss | | | — | | | | — | | | | — | | | | — | | | | (40,618 | ) | | | (40,618 | ) |
| Foreign currency translation adjustment, net of tax | | | — | | | | — | | | | — | | | | (161 | ) | | | — | | | | (161 | ) |
| Unrealized gain from pension plan, net of tax | | | — | | | | — | | | | — | | | | 13,910 | | | | — | | | | 13,910 | |
| Issuance of restricted stock, net of forfeitures | | | 651 | | | | 6 | | | | — | | | | — | | | | — | | | | 6 | |
| Issuance of performance shares | | | 628 | | | | 6 | | | | — | | | | — | | | | — | | | | 6 | |
| Issuance of stock related to rights offerings, net of expenses | | | 22,857 | | | �� | 229 | | | | 38,384 | | | | — | | | | — | | | | 38,613 | |
| Compensation related to share-based grants | | | — | | | | — | | | | 6,117 | | | | — | | | | — | | | | 6,117 | |
| Impact of net settled shares for vested grants | | | (1,255 | ) | | | (12 | ) | | | (3,181 | ) | | | — | | | | — | | | | (3,193 | ) |
| Excess tax benefits from share-based compensation arrangements | | | — | | | | — | | | | 16 | | | | — | | | | — | | | | 16 | |
| Other | | | — | | | | — | | | | (1 | ) | | | — | | | | (1 | ) | | | (2 | ) |
| Balance, January 4, 2014 | | | 86,545 | | | $ | 866 | | | $ | 251,150 | | | $ | (16,293 | ) | | $ | (241,621 | ) | | $ | (5,898 | ) |
BLUELINX HOLDINGS INC. AND SUBSIDIARIES
1. Basis of Presentation and Background
Basis of Presentation
BlueLinx Holdings Inc., operating through our wholly-owned subsidiary, BlueLinx Corporation (BlueLinx Holdings Inc. and its subsidiaries are collectively referred to as “BlueLinx” or the “Company”), is a leading distributor of building products in North America, with approximately 1,700 employees as of January 4, 2014. We offer approximately 10,000 products from over 750 suppliers to service approximately 11,500 customers nationwide, including dealers, industrial manufacturers, manufactured housing producers and home improvement retailers. We operate our distribution business from sales centers in Atlanta and Denver, and our current network of approximately 50 distribution centers. The Consolidated Financial Statements include our accounts and those of our wholly-owned subsidiaries. All significant intercompany accounts and transactions have been eliminated. Fiscal 2013 contained 53 weeks. Fiscal 2012 and fiscal 2011 each contained 52 weeks. Our fiscal quarters are quarters based on a 5-4-4 week period, with the exception of the fourth fiscal quarter of fiscal years containing 53 weeks, which are based on a 5-4-5 week period.
Nature of Operations
We are a wholesale supplier of building products in North America. We distribute products in two principal categories: structural products and specialty products. Structural products include plywood, oriented strand board (“OSB”), rebar and remesh, lumber and other wood products primarily used for structural support, walls and flooring in construction projects. Specialty products include roofing, insulation, moulding, engineered wood, vinyl products (used primarily in siding), outdoor living and metal products (excluding rebar and remesh). These products are sold to a diversified customer base, including independent building materials dealers, industrial and manufactured housing builders and home improvement centers. Net sales by product category are summarized below:
| | | | | | | | | | | | | |
| | | Fiscal Year Ended January 4, 2014 | | | Fiscal Year Ended December 29, 2012 | | | Fiscal Year Ended December 31, 2011 | |
| | | (Dollars in millions) | |
Sales by category | | | | | | | | | |
| Structural products | | $ | 968 | | | $ | 806 | | | $ | 705 | |
| Specialty products | | | 1,200 | | | | 1,114 | | | | 1,068 | |
| Unallocated allowances and adjustments | | | (16 | ) | | | (12 | ) | | | (18 | ) |
| Total sales | | $ | 2,152 | | | $ | 1,908 | | | $ | 1,755 | |
Suppliers
As of January 4, 2014, our vendor base included over 750 suppliers of both structural and specialty building products. In some cases, these products are branded. We have supply contracts in place with many of our vendors. Terms for these agreements frequently include prompt payment discounts and freight allowances and occasionally include volume discounts, growth incentives, marketing allowances, consigned inventory and extended payment terms.
2. Summary of Significant Accounting Policies
Revenue Recognition
We recognize revenue when the following criteria are met: persuasive evidence of an agreement exists, delivery has occurred or services have been rendered, our price to the buyer is fixed and determinable and collectability is reasonably assured. Delivery is not considered to have occurred until the customer takes title and assumes the risks and rewards of ownership. The timing of revenue recognition is largely dependent on shipping terms. For sales transactions designated as FOB (free on board) shipping point, revenue is recorded at the time of shipment. For sales transactions designated FOB destination, revenue is recorded when the product is delivered to the customer’s delivery site.
All revenues are recorded gross. The key indicators used to determine when and how revenue is recorded are as follows:
| | ● | We are the primary obligor responsible for fulfillment and all other aspects of the customer relationship. |
| | ● | Title passes from BlueLinx, and we carry all risk of loss related to warehouse and third-party (“reload”) inventory and inventory shipped directly from vendors to our customers. |
| | ● | We are responsible for all product returns. |
| | ● | We control the selling price for all channels. |
| | ● | We bear all credit risk. |
In addition, we provide inventory to certain customers through pre-arranged agreements on a consignment basis. Customer consigned inventory is maintained and stored by certain customers; however, ownership and risk of loss remains with us. When the inventory is sold by the customer, we recognize revenue on a gross basis. Customer consigned inventory at January 4, 2014, and December 29, 2012 was approximately $10.1 million and $10.3 million, respectively.
All revenues are recorded after trade allowances, cash discounts and sales returns are deducted. Cash discounts and sales returns are estimated using historical experience. Trade allowances are based on the estimated obligations and historical experience.
Cash and Cash Equivalents
Cash and cash equivalents include all highly-liquid investments with maturity dates of less than three months when purchased.
Restricted Cash
We had restricted cash of $11.7 million and $9.9 million at January 4, 2014, and December 29, 2012, respectively. Restricted cash primarily includes amounts held in escrow related to our mortgage and insurance for workers’ compensation, auto liability, and general liability. Restricted cash is included in “Other current assets” and “Other non-current assets” on the accompanying Consolidated Balance Sheets.
The table below provides the balances of each individual component in restricted cash as of January 4, 2014, and December 29, 2012 (in thousands):
| | | | | | | | | |
| | | At January 4, 2014 | | | At December 29, 2012 | |
| Cash in escrow: | | | | | | |
| Mortgage | | $ | — | | | $ | 40 | |
| Insurance | | | 7,921 | | | | 7,906 | |
| Other | | | 3,760 | | | | 1,965 | |
| Total | | $ | 11,681 | | | $ | 9,911 | |
During fiscal 2013, 2012 and 2011, changes in restricted cash required under our mortgage were classified in the financing section of our Consolidated Statement of Cash Flows. On September 19, 2012, we entered into an amendment to our mortgage agreement, which provided for the immediate prepayment of approximately $11.8 million of the indebtedness under the mortgage agreement. In addition, on a quarterly basis, starting with the fourth quarter of fiscal 2012, additional funds held as collateral under the mortgage agreement were used to prepay indebtedness under the mortgage agreement, without prepayment premium, up to an aggregate additional prepayment of $10.0 million. Thereafter, any cash remaining in the collateral account under the mortgage agreement, up to an aggregate of $10.0 million, is released to the Company on the last business day of each calendar quarter through the third quarter of fiscal 2014. All funds released pursuant to these provisions may be used by the Company to pay for usual and customary operating expenses. During the period described above in which cash in the collateral account is used to either prepay indebtedness under the mortgage agreement or released to the Company, the lenders will not release any of the cash collateral to the Company for specified capital expenditures as previously provided under the mortgage agreement.
Concentrations of Credit Risk
Our receivables are principally from customers in the building products industry located in the United States and Canada. We believe concentration of credit risk with respect to receivables is limited due to the large number of customers comprising our customer base. None of our customers individually constitute more than 10% of fiscal 2013 sales.
Allowance for Doubtful Accounts and Related Reserves
We evaluate the collectability of receivables based on numerous factors, including past transaction history with customers and their creditworthiness. We maintain an allowance for doubtful accounts for each aging category on our aged trial balance, which is aged utilizing contractual terms, based on our historical loss experience. This estimate is periodically adjusted when we become aware of specific customers’ inability to meet their financial obligations (e.g., bankruptcy filing or other evidence of liquidity problems). As we determine that specific balances ultimately will be uncollectible, we remove them from our aged trial balance. Additionally, we maintain reserves for cash discounts that we expect customers to earn as well as expected returns. At January 4, 2014, and December 29, 2012, these reserves totaled $4.4 million and $4.7 million, respectively.
Inventory Valuation
Inventories are carried at the lower of cost or market. The cost of all inventories is determined by the moving average cost method. We have included all material charges directly or indirectly incurred in bringing inventory to its existing condition and location. We evaluate our inventory value at the end of each quarter to ensure that first quality, actively moving inventory, when viewed by category, is carried at the lower of cost or market. During the second quarter of fiscal 2013, we recorded in “Cost of sales” in the Consolidated Statements of Operations and Comprehensive Loss a lower of cost or market charge of $3.8 million related to declines in prices for our lumber, oriented strand board (“OSB”) and plywood inventory. As we sold through inventory impacted by this reserve during the third quarter of fiscal 2013 and prices of lumber, OSB and plywood stabilized, the reserve was reduced to zero as of January 4, 2014.
Additionally, we maintain a reserve for the estimated value impairment associated with damaged, excess and obsolete inventory. The damaged, excess and obsolete reserve generally includes discontinued items or inventory that has turn days in excess of 270 days, excluding new items during their product launch. At January 4, 2014, and December 29, 2012, our damaged, excess and obsolete inventory reserves were $1.8 million and $1.1 million, respectively. During the second quarter of fiscal 2013, approximately $1.0 million was recorded in “Cost of sales” in the Consolidated Statements of Operations and Comprehensive Loss for damaged, excess and obsolete inventory related to the closure of five distribution centers. There was $0.3 million of this reserve remaining as of January 4, 2014, related to this inventory. We discuss the closure or ceasing of operations of these distribution centers, which is included in our 2013 restructuring plan (the “2013 restructuring”), further in “Note 3 – Restructuring Charges”.
Consignment Inventory
We enter into consignment inventory agreements with vendors. This vendor consignment inventory relationship allows us to obtain and store vendor inventory at our warehouses and third-party (“reload”) facilities; however, ownership and risk of loss generally remains with the vendor. When the inventory is sold, we are required to pay the vendor, and we simultaneously take and transfer ownership from the vendor to the customer.
Consideration Received from Vendors and Paid to Customers
Each year, we enter into agreements with many of our vendors providing for inventory purchase rebates, generally based on achievement of specified volume purchasing levels. We also receive rebates related to price protection and various marketing allowances that are common industry practice. We accrue for the receipt of vendor rebates based on purchases, and also reduce inventory to reflect the net acquisition cost (purchase price less expected purchase rebates). At January 4, 2014, and December 29, 2012, the vendor rebate receivable totaled $7.6 million and $9.0 million, respectively. Adjustments to earnings resulting from revisions to rebate estimates have been immaterial.
In addition, we enter into agreements with many of our customers to offer customer rebates, generally based on achievement of specified volume sales levels and various marketing allowances that are common industry practice. We accrue for the payment of customer rebates based on sales to the customer, and also reduce sales to reflect the net sales (sales price less expected customer rebates). At January 4, 2014, and December 29, 2012, the customer rebate payable totaled $6.3 million and $5.5 million, respectively. Adjustments to earnings resulting from revisions to rebate estimates have been immaterial.
Shipping and Handling
Amounts billed to customers in sales transactions related to shipping and handling are classified as revenue. Shipping and handling costs included in “Selling, general, and administrative” expenses were $99.7 million, $91.2 million, and $87.9 million for fiscal 2013, fiscal 2012, and fiscal 2011, respectively.
Advertising Costs
Advertising costs are expensed as incurred. Advertising expenses of $1.2 million, $1.1 million, and $1.9 million were included in “Selling, general and administrative” expenses for fiscal 2013, fiscal 2012 and fiscal 2011, respectively.
Loss per Common Share
We calculate our basic loss per share by dividing net loss by the weighted average number of common shares and participating securities outstanding for the period. Restricted stock granted by us to certain management employees and non-employee directors participate in dividends on the same basis as common shares and are non-forfeitable by the holder. The unvested restricted stock contains non-forfeitable rights to dividends or dividend equivalents. As a result, these share-based awards meet the definition of a participating security and are included in the weighted average number of common shares outstanding, pursuant to the two-class method, for the periods that present net income. The two-class method is an earnings allocation formula that treats a participating security as having rights to earnings that would otherwise have been available to common stockholders.
Given that the restricted stockholders do not have a contractual obligation to participate in the losses and the inclusion of such unvested restricted shares in our basic and dilutive per share calculations would be anti-dilutive, we have not included these amounts in our weighted average number of common shares outstanding for periods in which we report a net loss. Therefore, we have not included 1,618,283, 3,554,738 and 2,361,424 of unvested restricted shares that had the right to participate in dividends in our basic and dilutive calculations for fiscal 2013, fiscal 2012, and fiscal 2011, respectively, because all periods reflected net losses.
Except when the effect would be anti-dilutive, the diluted earnings per share calculation includes the dilutive effect of the assumed exercise of stock options and performance shares using the treasury stock method. During fiscal 2013, we granted 2,969,424 performance shares under our 2006 Long-Term Equity Incentive Plan (the “2006 Plan”) in which shares are issuable upon satisfaction of certain performance criteria. As of January 4, 2014, we assumed that 2,192,868 of these performance shares will vest, net of forfeitures and vestings to date, based on our assumption that meeting the performance criteria is probable. The performance shares are not considered participating shares under the two-class method because they do not receive any non-transferable rights to dividends. The 2,192,868 performance shares we assume will vest were not included in the computation of diluted earnings per share calculation because they were antidilutive.
Except when the effect would be anti-dilutive, the diluted earnings per share calculation includes the dilutive effect of the assumed exercise of stock options and performance shares using the treasury stock method. As we experienced losses in all periods, basic and diluted loss per share are computed by dividing net loss by the weighted average number of common shares outstanding for the period. For fiscal 2013, fiscal 2012, and fiscal 2011, we excluded 4,595,650, 4,460,054 and 3,266,740 unvested share-based awards, respectively, from the diluted earnings per share calculation because they were anti-dilutive. The unvested share-based awards total excludes the assumed exercise of unexpired stock options.
On March 27, 2013, we completed a rights offering of common stock to our stockholders (the “2013 Rights Offering”) at a subscription price that was lower than the market price of our common stock. The 2013 Rights Offering was deemed to contain a bonus element that is similar to a stock dividend, requiring us to adjust the weighted average number of common shares used to calculate basic and diluted earnings per share in prior periods retrospectively by a factor of 1.0894. Weighted average shares for fiscal 2012 prior to giving effect to the 2013 Rights Offering were 60,079,528 and 65,451,808 after application of the adjustment factor above. Weighted average shares for fiscal 2011 prior to giving effect to the 2013 Rights Offering were 43,187,315 and 47,049,102 after application of the adjustment factor above.
Common Stock Dividends
On December 5, 2007, our Board of Directors suspended the payment of dividends on our common stock for an indefinite period of time. Resumption of the payment of dividends will depend on, among other things, business conditions in the housing industry, our results of operations, cash requirements, financial condition, contractual restrictions, provisions of applicable law and other factors that our Board of Directors may deem relevant. Accordingly, we may not be able to resume the payment of dividends at the same quarterly rate in the future, if at all.
Property and Equipment
Property and equipment are recorded at cost. Lease obligations for which we assume or retain substantially all the property rights and risks of ownership are capitalized. Replacements of major units of property are capitalized and the replaced properties are retired. Replacements of minor components of property and repair and maintenance costs are charged to expense as incurred.
Depreciation is computed using the straight-line method over the estimated useful lives of the related assets. Useful lives are 2 to 18 years for land improvements, 5 to 40 years for buildings, and 3 to 7 years for machinery and equipment, which includes mobile equipment. Upon retirement or disposition of assets, cost and accumulated depreciation are removed from the related accounts and any gain or loss is included in income. Depreciation expense totaled $9.1 million for fiscal 2013, $8.4 million for fiscal 2012 and $10.4 million for fiscal 2011.
During fiscal 2013, we sold certain properties with carrying values of $3.9 million, which resulted in gains totaling $5.2 million. During fiscal 2012, we sold certain properties with carrying values of $7.4 million, which resulted in gains totaling $9.9 million. These gains are recorded in “Selling, general and administrative” expense in the Consolidated Statements of Operations and Comprehensive Loss . All of these properties in fiscal 2013 and fiscal 2012 were classified as held for sale. See Note 4 for discussion of the held for sale properties sold during the year.
Impairment of Long-Lived Assets
Long-lived assets, including property and equipment and intangible assets with definite useful lives, are reviewed for possible impairment whenever events or circumstances indicate that the carrying amount of an asset may not be recoverable.
We consider whether there were indicators of potential impairment on a quarterly basis. Indicators of impairment include current period losses combined with a history of losses, management’s decision to exit a facility, reductions in the fair market value of real properties and changes in other circumstances that indicate the carrying amount of an asset may not be recoverable.
Our evaluation of long-lived assets is performed at the lowest level of identifiable cash flows, which is generally the individual distribution facility. In the event of indicators of impairment, the assets of the distribution facility are evaluated by comparing the facility’s undiscounted cash flows over the estimated useful life of the asset, which ranges between 5-40 years, to its carrying value. If the carrying value is greater than the undiscounted cash flows, an impairment loss is recognized for the difference between the carrying value of the asset and the estimated fair market value. Impairment losses are recorded as a component of “Selling, general and administrative” expense in the Consolidated Statements of Operations and Comprehensive Loss .
Our estimate of undiscounted cash flows is subject to assumptions that affect estimated operating income at a distribution facility level. These assumptions are related to future sales, margin growth rates, economic conditions, market competition and inflation. In the event that undiscounted cash flows do not exceed the carrying value of a facility, our estimates of fair market value are generally based on market appraisals and our experience with related market transactions. We use a two year average of cash flows based on 2013 EBITDA and 2014 projected EBITDA, which includes a growth factor assumption, to estimate undiscounted cash flows. These assumptions used to determine impairment are considered to be level 3 measurements in the fair value hierarchy as defined in Note 13.
While operating results have declined during the past several years as they are closely tied to U.S. housing starts, during fiscal 2012 we began to see signs of a housing recovery, and our results have improved; however, our sales are still below normal levels. To the extent that reductions in volume and operating income have resulted in impairment indicators, in all cases our carrying values continue to be less than our projected undiscounted cash flows. As such, we have not identified significant known trends impacting the fair value of long-lived assets to an extent that would indicate impairment.
During the first quarter of fiscal 2011 our Newtown, CT facility was damaged due to severe winter weather. As a result of the damage to the facility and its contents we received approximately $5.8 million in proceeds from the insurance company comprised of $2.2 million related to the damaged building, $2.4 million related to damaged and destroyed inventory and $1.2 million related to the recovery of additional expenses incurred as a result of the damage. Cash received related to the damaged building was classified as an investing cash inflow in our Consolidated Statement s of Cash Flows and used to reduce the principal of our mortgage. All other cash inflows related to the insurance settlement were classified as operating cash flows in our Consolidated Statement s of Cash Flows. The majority of the remaining cash inflows were used to fund costs incurred related to the Newtown loss. We recognized a $1.4 million gain in fiscal 2011 of which $1.2 million related to the damaged building and $0.2 million related to the recovery of gross margin on the inventory. We recorded the gain at the time that the recovery of the minimum expected proceeds under our insurance policy became probable and was estimable. This gain was recorded in “Selling, general and administrative expenses” in our Consolidated Statement s of Operations and Comprehensive Loss .
Share-Based Compensation
We recognize compensation expense equal to the grant-date fair value for all share-based payment awards that are expected to vest. This expense is recorded on a straight-line basis over the requisite service period of the entire award, unless the awards are subject to market or performance conditions, in which case we recognize compensation expense over the requisite service period of each separate vesting tranche to the extent market and performance conditions are considered probable. The calculation of fair value related to share-based compensation is subject to certain assumptions discussed in more detail in Note 7. Management updates such estimates when circumstances warrant. All compensation expense related to our share-based payment awards is recorded in “Selling, general and administrative” expense in the Consolidated Statements of Operations and Comprehensive Loss .
Income Taxes
Deferred income taxes are provided using the liability method. Accordingly, deferred income taxes are recognized for differences between the income tax and financial reporting bases of our assets and liabilities based on enacted tax laws and tax rates applicable to the periods in which the differences are expected to affect taxable income. We recognize a valuation allowance, when based on the weight of all available evidence, we believe it is more likely than not that some or all of our deferred tax assets will not be realized. In evaluating our ability to recover our deferred income tax assets, we considered available positive and negative evidence, including our past operating results, our ability to carryback losses against prior taxable income, the existence of cumulative losses in the most recent years, our forecast of future taxable income and an excess of appreciated assets over the tax basis of our net assets. In estimating future taxable income, we developed assumptions including the amount of future state and federal pretax operating and non-operating income, the reversal of temporary differences and the implementation of feasible and prudent tax planning strategies. These assumptions required significant judgment about the forecasts of future taxable income. When we considered all of the available positive and negative evidence, when based on the weight of all available evidence, we believe it is more likely than not that some or all of our deferred tax assets will not be realized. Such amounts are disclosed in Note 5 of the Notes to the Consolidated Financial Statements .
If the realization of deferred tax assets in the future is considered more likely than not, a reduction to the valuation allowance related to the deferred tax assets would increase net income in the period such determination is made. The amount of the deferred tax asset considered realizable is based on significant estimates, and it is possible that changes in these estimates could materially affect the financial condition and results of operations. Our effective tax rate may vary from period to period based on changes in estimated taxable income or loss; changes to the valuation allowance; changes to federal or state tax laws; and as a result of acquisitions.
We generally believe that the positions taken on previously filed tax returns are more likely than not to be sustained by the taxing authorities. We have recorded income tax and related interest liabilities where we believe our position may not be sustained. Such amounts are disclosed in Note 5 of the Notes to the Consolidated Financial Statements .
Foreign Currency Translation
The functional currency for our Canadian operations is the Canadian dollar. The translation of the applicable currencies into U.S. dollars is performed for balance sheet accounts using current exchange rates in effect at the balance sheet date and for revenue and expense accounts using a weighted average exchange rate during the period. Any related translation adjustments are recorded directly in stockholders’ equity. Foreign currency transaction gains and losses are reflected in the Consolidated Statements of Operations and Comprehensive Loss . Accumulated other comprehensive loss at January 4, 2014, and December 29, 2012 included the accumulated gain from foreign currency translation (net of tax) of $1.6 million and $1.8 million, respectively.
Compensated Absences
We accrue for the costs of compensated absences to the extent that the employee’s right to receive payment relates to service already rendered, the obligation vests or accumulates, payment is probable and the amount can be reasonably estimated.
Use of Estimates
The preparation of financial statements in conformity with U.S. generally accepted accounting principles (“GAAP”) requires management to make certain estimates and assumptions. These estimates and assumptions affect the reported amounts of assets and liabilities and disclosure of contingent assets and liabilities at the date of the financial statements, as well as reported amounts of revenues and expenses during the reporting period. Actual results could differ from these estimates and such differences could be material.
Reclassifications
During fiscal 2012, we classified certain amounts, which had historically been presented as “Property, plant and equipment investments” in the “Cash flows from investing activities” section of the Consolidated Statements of Cash Flows to “Other” changes in the “Cash flows from operating activities” section of the Consolidated Statements of Cash Flows. To conform the historical presentation to the current and future presentation, we reclassified similar items in prior periods from “Net cash (used in) provided by investing activities” to “Net cash used in operating activities” in our Consolidated Statements of Cash Flows. The presentation of these same items during fiscal 2013 is consistent with the adjusted presentation in fiscal 2012 and will be going forward.
New Accounting Standards
In the first quarter of fiscal 2013, the Financial Accounting Standards Board (the “FASB”) issued an amendment to previously issued guidance which requires companies to report, in one place, information about reclassifications out of accumulated other comprehensive income (“AOCI”). The update also requires companies to present reclassifications by component when reporting changes in AOCI balances. For significant items reclassified out of AOCI to net income in their entirety in the period, companies must report the effect of the reclassifications on the respective line items in the statement where net income is presented. In certain circumstances, this can be done on the face of that statement. Otherwise, it must be presented in the notes. For items not reclassified to net income in their entirety in the period, companies must cross-reference in a note to other required disclosures. The amendments are effective for public companies in fiscal years, and interim periods within those years, beginning after December 15, 2012. We adopted this guidance during the first quarter of fiscal 2013; refer to “Note 17 – Accumulated Other Comprehensive Loss” for the required disclosures.
There were no other accounting pronouncements adopted during fiscal 2013 that had a material impact on our financial statements.
3. Restructuring Charges
We account for exit and disposal costs by recognizing a liability for costs associated with an exit or disposal activity at fair value in the period in which it is incurred or when the entity ceases using the right conveyed by a contract (i.e., the right to use a leased property). We account for severance and outplacement costs by recognizing a liability for employees’ rights to post-employment benefits when management has committed to a plan, due to the existence of a post employment benefit agreement. These costs are included in “Selling, general, and administrative” expenses in the Consolidated Statements of Operations and Comprehensive Loss for the fiscal years ended January 4, 2014, December 29, 2012, and December 31, 2011, and in “Accrued compensation” on the Consolidated Balance Sheets at January 4, 2014 and December 29, 2012.
2013 Facility Lease Obligation and Severance Costs
During the second quarter of fiscal 2013, we announced the 2013 restructuring which included the realignment of headquarters resources and the strategic review of our distribution centers. This review resulted in the Company designating five distribution centers to be sold or closed. These distribution centers were closed or ceased operations during the third quarter of fiscal 2013. During the second quarter of fiscal 2013, we also announced that George R. Judd no longer would serve as President and Chief Executive Officer of the Company (the “change in executive leadership”). In connection with the 2013 restructuring and the change in executive leadership the Company has recognized severance related charges of $5.6 million and $2.9 million of related share-based compensation charges in “Selling, general, and administrative” expenses in the Consolidated Statements of Operations and Comprehensive Loss during fiscal 2013. In addition, the Company has recognized facility lease obligation charges of $1.3 million for two closed facilities in “Selling, general, and administrative” expenses in the Consolidated Statements of Operations and Comprehensive Loss during fiscal 2013.
The table below summarizes the balance of reduction in force activities and the related accrued facility lease obligation reserve and the changes in the accrual for fiscal 2013 (in thousands):
| | | | | | | | | | | | | |
| | | Reduction in
Force
Activities | | | Facility Lease
Obligation | | | Total | |
| Balance at December 29, 2012 | | $ | — | | | $ | — | | | $ | — | |
| Charges | | | 5,709 | | | | 1,398 | | | | 7,107 | |
| Assumption changes | | | (102 | ) | | | (77 | ) | | | (179 | ) |
| Payments | | | (3,057 | ) | | | (402 | ) | | | (3,459 | ) |
| Accretion of Liability | | | — | | | | 9 | | | | 9 | |
| Balance at January 4, 2014 | | $ | 2,550 | | | $ | 928 | | | $ | 3,478 | |
In addition to the charges described above, as a result of the 2013 restructuring we recorded approximately $1.4 million of other restructuring related charges, which were recorded in “Selling, general and administrative” expenses in the Consolidated Statement of Operations and Comprehensive Loss during fiscal 2013.
During the first quarter of fiscal 2013, we completed the transition of our Fremont, California operation to our new facility in Stockton, California. We incurred approximately $0.8 million of transition costs related to this move which are recorded in “Selling, general, and administrative” expenses in the Consolidated Statements of Operations and Comprehensive Loss in the first nine months of fiscal 2013.
During the third quarter of fiscal 2011, we entered into an amendment to our corporate headquarters lease in Atlanta, Georgia related to the unoccupied 4100 building, which was exited during fiscal 2007. This amendment released us from our obligations with respect to this unoccupied space as of January 31, 2012, in exchange for a $5.0 million space remittance fee, which was paid in the first quarter of fiscal 2012. We also paid $0.9 million in the third quarter of fiscal 2012 and paid an additional $0.3 million in the first quarter of fiscal 2014 related to contractually obligated tenant improvement reimbursement expense. As of January 4, 2014 and December 29, 2012, there was a remaining balance of this accrued facility consolidation reserve of $0.3 million. The provisions relating to the occupied 4300 building remain unchanged. Under the existing provisions, the current term of the lease ends on January 31, 2019.
4. Assets Held for Sale and Net Gain on Disposition
We have certain assets that we have designated as assets held for sale. At the time of designation, we ceased recognizing depreciation expense on these assets. As of January 4, 2014, and December 29, 2012, total assets held for sale were $2.6 million and $1.6 million, respectively, and were included in “Other current assets” in our Consolidated Balance Sheets. During the second quarter of fiscal 2013, we designated the Denver, Colorado sales center and the Sioux Falls, South Dakota distribution center as held for sale. We finalized the sale of the owned Denver, Colorado sales center, which had a carrying value of $3.3 million, during the third quarter. We finalized the sale of the Sioux Falls facility, which had a carrying value of $0.6 million, during the fourth quarter of fiscal 2013. We also designated one of our distribution centers as held for sale during the second quarter of fiscal 2013. This property has a total carrying value of $1.9 million, and we plan to finalize a sale of the facility within the next 12 months. We continue to actively market all properties that are designated as held for sale.
During fiscal 2013 we recognized a gain of $5.0 million on the sale of the Denver, Colorado sales center and the Sioux Falls, South Dakota facility. This gain was net of $0.5 million of capitalized broker commissions related to the Denver, Colorado sales center lease that were written off during the period. This gain was recorded in “Selling, general, and administrative” expenses in the Consolidated Statements of Operations and Comprehensive Loss. We recognized an additional gain related to the sale of our Fremont, California location during fiscal 2013 of approximately $0.2 million. The gain was related to seller’s proceeds that were held by the title company for certain remediation activities that were settled during the first quarter of fiscal 2013.
5. Income Taxes
Our (benefit from) provision for income taxes consists of the following:
| | | | | | | | | | | | | |
| | | Fiscal Year
Ended
January 4,
2014 | | | Fiscal Year
Ended
December 29,
2012 | | | Fiscal Year
Ended
December 31,
2011 | |
| | | (In thousands) | |
| Federal income taxes: | | | | | | | | | |
| Current | | $ | (492 | ) | | $ | 16 | | | $ | (89 | ) |
| Deferred | | | (7,385 | ) | | | — | | | | — | |
| State income taxes: | | | | | | | | | | | | |
| Current | | | 192 | | | | 334 | | | | 759 | |
| Deferred | | | (1,343 | ) | | | — | | | | — | |
| Foreign income taxes: | | | | | | | | | | | | |
| Current | | | 19 | | | | 56 | | | | 317 | |
| Deferred | | | (4 | ) | | | (20 | ) | | | (25 | ) |
| (Benefit from) provision for income taxes | | $ | (9,013 | ) | | $ | 386 | | | $ | 962 | |
The federal statutory income tax rate was 35%. Our provision for (benefit from) income taxes is reconciled to the federal statutory amount as follows:
| | | | | | | | | | | | | |
| | | Fiscal Year
Ended
January 4,
2014 | | | Fiscal Year
Ended
December 29,
2012 | | | Fiscal Year
Ended
December 31,
2011 | |
| | | (In thousands) | |
| Benefit from income taxes computed at the federal statutory tax rate | | $ | (17,371 | ) | | $ | (7,924 | ) | | $ | (13,162 | ) |
| Benefit from state income taxes, net of federal benefit | | | (1,991 | ) | | | (866 | ) | | | (1,296 | ) |
| Valuation allowance change | | | 19,445 | | | | 8,820 | | | | 14,498 | |
| Nondeductible items | | | 270 | | | | 484 | | | | 806 | |
| Benefit from allocation of income taxes to other comprehensive income (loss) | | | (8,726 | ) | | | — | | | | — | |
| | | | | | | | | | | | | |
| Other | | | (640 | ) | | | (128 | ) | | | 116 | |
| (Benefit from) provision for income taxes | | $ | (9,013 | ) | | $ | 386 | | | $ | 962 | |
Our income before provision for income taxes for our Canadian operations was $0.1 million, $0.1 million and $0.9 million for fiscal 2013, fiscal 2012, and fiscal 2011, respectively.
For fiscal 2013, we recognized tax benefit of $9.0 million. The benefit recognized for the year is primarily comprised of $8.7 million of deferred income tax benefit resulting from the allocation of income tax expense to other comprehensive income (loss). In addition, we recognized an income tax benefit related to the reversal of a $0.6 million reserve for an uncertain tax position due to the expiration of the statue of limitations. Finally, we recognized current state income tax expense of $0.3 million related to earnings generated on a separate company basis.
For fiscal 2012, we recognized tax expense of $0.4 million. The expense recognized for the year is primarily comprised of $0.3 million for current state income tax expense related to earnings generated on a separate company basis.
For fiscal 2011, we recognized tax expense of $1.0 million. The expense recognized for the year is primarily comprised of $0.8 million for current state income tax expense related to earnings generated on a separate company basis and $0.3 million of current income tax expense resulting from foreign income taxes.
In accordance with the intraperiod tax allocation provisions of U.S. GAAP, we are required to consider all items (including items recorded in other comprehensive income) in determining the amount of tax benefit that results from a loss from continuing operations that should be allocated to continuing operations. In fiscal 2013, a non-cash tax benefit on the loss from continuing operations of $8.7 million, which was offset in full by income tax expense, was recorded in other comprehensive income. In fiscal 2012 and fiscal 2011, there was no intraperiod tax allocation due to the fact that there was a loss in other comprehensive income for the period. While the income tax benefit from continuing operations is reported in our Consolidated Statements of Operations and Comprehensive Loss , the income tax expense on other comprehensive income is recorded directly to accumulated other comprehensive loss, which is a component of stockholders’ equity.
Our financial statements contain certain deferred tax assets which have arisen primarily as a result of tax benefits associated with the loss before income taxes incurred, as well as net deferred income tax assets resulting from other temporary differences related to certain reserves, pension obligations and differences between book and tax depreciation and amortization. We record a valuation allowance against our net deferred tax assets when we determine that based on the weight of available evidence, it is more likely than not that our net deferred tax assets will not be realized.
In our evaluation of the weight of available evidence, we considered recent reported losses as negative evidence which carried substantial weight. Therefore, we considered evidence related to the four sources of taxable income, to determine whether such positive evidence outweighed the negative evidence associated with the losses incurred. The positive evidence considered included:
| | ● | taxable income in prior carryback years, if carryback is permitted under the tax law; |
| | ● | future reversals of existing taxable temporary differences; |
| | ● | tax planning strategies; and |
| | ● | future taxable income exclusive of reversing temporary differences and carryforwards. |
During fiscal 2013 and 2012, we weighed all available positive and negative evidence and concluded the weight of the negative evidence of a three year cumulative loss continued to outweigh the positive evidence. Based on the conclusions reached, we maintained a full valuation allowance during 2013 and 2012.
The components of our net deferred income tax assets (liabilities) are as follows:
| | | | | | | | | |
| | | January 4,
2014 | | | December 29,
2012 | |
| | | (In thousands) | |
| Deferred income tax assets: | | | | | | |
| Inventory reserves | | $ | 2,832 | | | $ | 2,816 | |
| Compensation-related accruals | | | 4,893 | | | | 5,838 | |
| Accruals and reserves | | | 1,030 | | | | 92 | |
| Accounts receivable | | | 1,291 | | | | 1,327 | |
| Restructuring costs | | | 488 | | | | 118 | |
| Pension | | | 8,245 | | | | 16,936 | |
| Benefit from NOL carryovers(1) | | | 70,169 | | | | 52,088 | |
| Other | | | 703 | | | | 695 | |
| Total gross deferred income tax assets | | | 89,651 | | | | 79,910 | |
| Less: Valuation allowances | | | (88,279 | ) | | | (78,050 | ) |
| Total net deferred income tax assets | | $ | 1,372 | | | $ | 1,860 | |
| Deferred income tax liabilities: | | | | | | | | |
| Intangible assets | | | — | | | | (60 | ) |
| Property and equipment | | | (365 | ) | | | (1,065 | ) |
| Other | | | (1,006 | ) | | | (739 | ) |
| Total deferred income tax liabilities | | | (1,371 | ) | | | (1,864 | ) |
| Deferred income tax assets (liabilities), net | | $ | 1 | | | $ | (4 | ) |
| (1) | Our federal NOL carryovers are $168.1 million and will expire in 15 to 20 years. Our state NOL carryovers are $232.2 million and will expire in 1 to 20 years. |
Activity in our deferred tax asset valuation allowance for fiscal 2013 and fiscal 2012 was as follows (in thousands):
| | | | | | | | | |
| | | Fiscal Year
Ended
January 4,
2014 | | | Fiscal Year
Ended
December 29,
2012 | |
| Balance at beginning of the year | | $ | 78,050 | | | $ | 66,793 | |
| Valuation allowance removed for taxes related to: | | | | | | | | |
| Income before income taxes | | | — | | | | — | |
| Valuation allowance provided for taxes related to: | | | | | | | | |
| Loss before income taxes | | | 10,229 | | | | 11,257 | |
| Effect of a change in judgment | | | — | | | | — | |
| Balance at end of the year | | $ | 88,279 | | | $ | 78,050 | |
We have recorded income tax and related interest liabilities where we believe certain of our tax positions are not more likely than not to be sustained if challenged. The following table summarizes the activity related to our unrecognized tax benefits:
| | | | | |
| | | (In thousands) | |
| Balance at January 1, 2011 | | $ | 677 | |
| Increases related to current year tax positions | | | — | |
| Additions for tax positions in prior years | | | 196 | |
| Reductions for tax positions in prior years | | | — | |
| Settlements | | | — | |
| Balance at December 31, 2011 | | | 873 | |
| Increases related to current year tax positions | | | — | |
| Additions for tax positions in prior years | | | — | |
| Reductions for tax positions in prior years | | | — | |
| Reductions due to lapse of applicable statue of limitations | | | (47 | ) |
| Settlements | | | — | |
| Balance at December 29, 2012 | | | 826 | |
| Increases related to current year tax positions | | | — | |
| Additions for tax positions in prior years | | | — | |
| Reductions for tax positions in prior years | | | — | |
| Reductions due to lapse of applicable statute of limitations | | | (567 | ) |
| Settlements | | | — | |
| Balance at January 4, 2014 | | $ | 259 | |
Included in the unrecognized tax benefits at January 4, 2014 and December 29, 2012 were $0.3 million and $0.8 million, respectively, of tax benefits that, if recognized, would reduce our annual effective tax rate. We also accrued an immaterial amount of interest related to these unrecognized tax benefits during 2013 and 2012, and this amount is reported in “Interest expense” in our Consolidated Statements of Operations and Comprehensive Loss . We do not expect our unrecognized tax benefits to change materially over the next 12 months.
We file U.S., state, and foreign income tax returns in jurisdictions with varying statutes of limitations. The 2010 through 2013 tax years generally remain subject to examination by federal and most state and foreign tax authorities.
6. Receivables
We have a diversified customer base concentrated in the building products business. Credit risk is monitored and provisions for expected losses are provided as determined necessary by management. We generally do not require collateral.
The following reflects our activity in receivables related reserve accounts:
| | | | | | | | | | | | | | | | | |
| | | Beginning
Balance | | | Expense/
(Income) | | | Write offs and
Other, Net | | | Ending
Balance | |
| | | (In thousands) | |
Fiscal 2011 | | | | | | | | | | | | |
| Allowance for doubtful accounts and related reserves | | $ | 5,715 | | | $ | 2,576 | | | $ | (3,156 | ) | | $ | 5,135 | |
Fiscal 2012 | | | | | | | | | | | | | | | | |
| Allowance for doubtful accounts and related reserves | | $ | 5,135 | | | $ | 2,034 | | | $ | (2,449 | ) | | $ | 4,720 | |
Fiscal 2013 | | | | | | | | | | | | | | | | |
| Allowance for doubtful accounts and related reserves | | $ | 4,720 | | | $ | 1,581 | | | $ | (1,942 | ) | | $ | 4,359 | |
7. Stock-Based Compensation
We have two stock-based compensation plans covering officers, directors and certain employees and consultants: the 2004 Equity Incentive Plan (the “2004 Plan”) and the 2006 Long Term Equity Incentive Plan (the “2006 Plan”). The plans are designed to motivate and retain individuals who are responsible for the attainment of our primary long-term performance goals. The plans provide a means whereby our employees and directors develop a sense of proprietorship and personal involvement in our development and financial success and encourage them to devote their best efforts to our business. Although we do not have a formal policy on the matter, we issue new shares of our common stock to participants, upon the exercise of options, upon the granting of restricted stock or upon the vesting of performance shares, out of the total amount of common shares authorized for issuance under the 2004 Plan or the 2006 Plan.
The 2004 Plan provides for the grant of nonqualified stock options, incentive stock options and restricted shares of our common stock to participants of the plan selected by our Board of Directors or a committee of the Board that administers the 2004 Plan. We reserved 2,222,222 shares of our common stock for issuance under the 2004 Plan. The terms and conditions of awards under the 2004 Plan are determined by the administrator for each grant.
The 2006 Plan permits the grant of nonqualified stock options, incentive stock options, stock appreciation rights, restricted stock, restricted stock units, performance shares, performance units, cash-based awards, and other stock-based awards to participants of the 2006 Plan selected by our Board of Directors or a committee of the Board that administers the 2006 Plan. We reserved 12,200,000 shares of our common stock for issuance under the 2006 Plan. The terms and conditions of awards under the 2006 Plan are determined by the administrator for each grant. Awards issued under the 2006 Plan are subject to accelerated vesting in the event of a change in control as such event is defined in the 2006 Plan.
During fiscal 2013, the Compensation Committee granted 1,202,185 restricted shares of our common stock to certain of our officers and directors. Due to the change in executive leadership, 1,081,071 restricted shares vested. In addition, 378,629 restricted shares of certain other executives vested as a result of the 2013 restructuring. Restricted shares of 2,587,452 vested in fiscal 2013 due to the completion of the vesting term and the modification related to the change in executive leadership and the 2013 restructuring. In addition, in fiscal 2013 the Compensation Committee granted certain of our executive officers and directors awards of performance shares of our common stock. These performance share awards, which totaled 2,969,424, and vest in three equal tranches, are contingent upon the successful achievement of certain financial and strategic goals approved by the Compensation Committee. In conjunction with the change in executive leadership and the 2013 restructuring, performance shares of 627,320 vested due to the removal of vesting and performance criteria. There were no stock options granted during fiscal 2013, 2012 or fiscal 2011.
We recognize compensation expense equal to the grant-date fair value for all share-based payment awards that are expected to vest. This expense is recorded on a straight-line basis over the requisite service period of the entire award, unless the awards are subject to market or performance conditions, in which case we recognize compensation expense over the requisite service period of each separate vesting tranche to the extent the occurrence of such conditions are probable. All compensation expense related to our share-based payment awards is recorded in “Selling, general and administrative” expense in the Consolidated Statements of Operations and Comprehensive Loss .
As of January 4, 2014, there was $1.4 million and $4.4 million of total unrecognized compensation expense related to restricted stock and performance shares, respectively. The unrecognized compensation expense is expected to be recognized over weighted average term of 1.4 years and 1.5 years for restricted stock and performance shares, respectively. As of December 29, 2012, there was $2.5 million of total unrecognized compensation expense related to restricted stock. There was no future compensation expense remaining for options as of January 4, 2014 and December 29, 2012. As of January 4, 2014, the weighted average remaining contractual term for our options, restricted stock, and performance shares was 4.1 years, 1.2 years and 1.2 years, respectively. As of December 29, 2012, the weighted average remaining contractual term for our options and restricted stock was 4.9 years and 1.4 years, respectively. The maximum contractual term for stock options, restricted stock, and performance shares is 10 years, 1 to 3 years, and 1 to 3 years, respectively.
For fiscal 2013, fiscal 2012 and fiscal 2011, our total stock-based compensation expense was $6.1 million, $2.8 million, and $2.0 million, respectively. We also recognized related income tax benefits of $2.4 million, $1.1 million and $0.8 million, respectively which has been offset by a valuation allowance. Approximately $2.9 million of total stock-based compensation during fiscal 2013 is related to the 2013 restructuring and the change in executive leadership.
The total fair value of the options vested in fiscal 2011 was $0.7 million. There were no options vested in fiscal 2012 and fiscal 2013. For restricted stock, the total fair value vested in 2013, fiscal 2012 and fiscal 2011 was $6.4 million, $2.3 million and $2.2 million, respectively. For performance shares, the total fair value vested in 2013 was $1.5 million.
There were no stock option exercises during fiscal 2013, fiscal 2012 or fiscal 2011. We present the benefits of tax deductions in excess of recognized compensation expense as both a financing cash inflow and an operating cash outflow in our Consolidated Statements of Cash Flows when present. There were $16 thousand excess tax benefits in fiscal 2013. There were no excess tax benefits in fiscal 2012 and fiscal 2011.
On December 30, 2013, the Compensation Committee approved an amendment to the 2013 Performance Share Award Agreement under the 2006 Plan (the “2013 Amendment”). The 2013 Amendment provides that the first tranche of the performance shares granted during fiscal 2013 will vest in fiscal 2014, despite the original performance criteria not being achieved. The 2013 Amendment was determined to be a modification of the award and an adjustment related to the difference in fair value was recorded in fiscal 2013. The related awards will vest in fiscal 2014.
On December 14, 2010, the Compensation Committee approved an amendment to the 2008 Performance Share Award Agreement under the 2006 Plan (the “2010 Amendment”). The 2010 Amendment provides that the Company may, at the discretion of the Compensation Committee, settle grants pursuant to Performance Share Award Agreements either in (i) one share of common stock of the Company for each Performance Share (as defined in the 2006 Plan) earned or (ii) a lump sum cash payment equal to the Fair Market Value (as defined in the 2006 Plan) of one share of common stock of the Company for each Performance Share earned. The 2010 Amendment was determined to be a modification of the award and an adjustment related to the difference in fair value was recorded in fiscal 2010. The award, which impacts eight employees, was classified as a liability award and was marked to market. On January 1, 2011, the fair value of these awards was based on the closing price of our common stock on December 31, 2010 of $3.66. These awards were settled in cash on January 7, 2011. Our restricted stock units were also settled in cash upon vesting and were considered liability awards. Therefore, these are not included in the computation of the basic and diluted earnings per share.
The tables below summarize activity and include certain additional information related to our outstanding employee stock options for the three years ended January 4, 2014. There have been no new employee stock option grants for the three years ended January 4, 2014.
| | | | | | | | | |
| | | Shares | | | Weighted
Average
Exercise
Price | |
| Options outstanding at January 1, 2011 | | | 924,815 | | | $ | 6.31 | |
| Options granted | | | — | | | | — | |
| Options exercised | | | — | | | | — | |
| Options forfeited | | | — | | | | — | |
| Options expired | | | (19,499 | ) | | | 12.53 | |
| Options outstanding at December 31, 2011 | | | 905,316 | | | | 6.18 | |
| Options granted | | | — | | | | — | |
| Options exercised | | | — | | | | — | |
| Options forfeited | | | — | | | | — | |
| Options expired | | | — | | | | — | |
| Options outstanding at December 29, 2012 | | | 905,316 | | | | 6.18 | |
| Options granted | | | — | | | | — | |
| Options exercised | | | — | | | | — | |
| Options forfeited | | | — | | | | — | |
| Options expired | | | (120,816 | ) | | | 13.58 | |
| Options outstanding at January 4, 2014 | | | 784,500 | | | | 5.05 | |
| Options exercisable at January 4, 2014 | | | 784,500 | | | $ | 5.05 | |
| | | | | | | | | | | | | | | | | | | | | | | | | | |
| | | Outstanding | | | Exercisable | | | |
| Price Range | | | Number of
Options | | | Weighted
Average
Exercise
Price | | | Remaining Contractual Life (in Years) | | | Number of
Options | | | Weighted
Average
Exercise
Price | | | Remaining
Contractual Life
(in Years) | |
| $4.66 | | | 750,000 | | | $ | 4.66 | | | | 4.2 | | | | 750,000 | | | $ | 4.66 | | | | 4.2 | |
| $11.40-$14.01 | | | 34,500 | | | $ | 13.25 | | | | 2.3 | | | | 34,500 | | | $ | 13.25 | | | | 2.3 | |
| | | | 784,500 | | | | | | | | 4.1 | | | | 784,500 | | | | | | | | 4.1 | |
The following tables summarize activity for our performance shares, restricted stock awards and restricted stock unit awards during fiscal 2013, fiscal 2012 and fiscal 2011:
| | | | | | | | | | | | | | | | | |
| | | Restricted Stock | | | | | | | |
| | | | | | Weighted | | | | | | | |
| | | Number of | | | Average Fair | | | Number of | | | Number of | |
| | | Awards | | | Value | | | Awards | | | Awards (1) | |
| Outstanding at January 1, 2011(2) | | | 1,914,288 | | | | 2.67 | | | | 240,835 | | | | 127,950 | |
| Granted | | | 819,240 | | | | 3.14 | | | | — | | | | — | |
| Vested(2) | | | (364,303 | ) | | | 6.16 | | | | (240,835 | ) | | | (63,200 | ) |
| Forfeited | | | (7,801 | ) | | | 3.26 | | | | — | | | | (15,400 | ) |
| Outstanding at December 31, 2011 | | | 2,361,424 | | | | 3.22 | | | | — | | | | 49,350 | |
| Granted | | | 2,067,835 | | | | 1.52 | | | | — | | | | — | |
| Vested | | | (681,484 | ) | | | 3.39 | | | | — | | | | (48,250 | ) |
| Forfeited | | | (193,037 | ) | | | 2.76 | | | | — | | | | (1,100 | ) |
| Outstanding at December 29, 2012 | | | 3,554,738 | | | | 1.22 | | | | — | | | | — | |
| Granted(3) | | | 1,202,185 | | | | 3.15 | | | | 2,969,424 | | | | — | |
| Vested(3) | | | (2,587,452 | ) | | | 2.48 | | | | (627,320 | ) | | | — | |
| Forfeited(3) | | | (551,188 | ) | | | 2.28 | | | | (149,236 | ) | | | — | |
| Outstanding at January 4, 2014(3) | | | 1,618,283 | | | $ | 2.50 | | | | 2,192,868 | | | | — | |
| (1) | The restricted stock units were settled in cash. The fair value of these awards was marked-to-market each reporting period through the date of settlement. During fiscal 2012 and fiscal 2011, certain restricted stock units vested and approximately $0.1 million and $0.2 million, respectively, was paid out to settle these awards. |
| | |
| (2) | During fiscal 2011 certain performance shares vested and approximately $0.9 million was paid out to settle these awards. The fair value of these shares was marked to market each reporting period through the settlement date. |
| | |
| (3) | The performance shares granted in 2013 will be settled in shares of common stock of the Company. The weighted average fair value for performance shares granted, vested, and forfeited was $2.95, $2.36, and $3.13, respectively. The weighted average fair value for performance shares outstanding as of January 4, 2014 is $2.55. |
8. Employee Benefits
Defined Benefit Pension Plans
Most of our hourly employees participate in noncontributory defined benefit pension plans, which include a plan that is administered solely by us (the “hourly pension plan”) and union-administered multiemployer plans. Our funding policy for the hourly pension plan is based on actuarial calculations and the applicable requirements of federal law. We believe that each multiemployer pension plan is immaterial to our financial statements and that we represent an immaterial portion of the total contributions and future obligations of these plans. Contributions to multiemployer plans are generally based on negotiated labor contracts. We contributed $1.3 million, $1.3 million, and $1.2 million to union administered multiemployer pension plans for fiscal 2013, fiscal 2012, and fiscal 2011, respectively. Benefits under the majority of plans for hourly employees (including multiemployer plans) are primarily related to years of service.
The following tables set forth the change in projected benefit obligation and the change in plan assets for the hourly pension plan:
| | | | | | | | | |
| | | January 4,
2014 | | | December 29,
2012 | |
| | | (In thousands) | |
| Change in projected benefit obligation: | | | | | | |
| Projected benefit obligation at beginning of period | | $ | 114,330 | | | $ | 99,425 | |
| Service cost | | | 2,193 | | | | 1,878 | |
| Interest cost | | | 4,750 | | | | 4,885 | |
| Actuarial (gain) loss | | | (10,710 | ) | | | 12,183 | |
| Curtailment | | | (910 | ) | | | — | |
| Benefits paid | | | (4,729 | ) | | | (4,041 | ) |
Projected benefit obligation at end of period | | | 104,924 | | | | 114,330 | |
| Change in plan assets: | | | | | | | | |
| Fair value of assets at beginning of period | | | 67,760 | | | | 63,896 | |
| Actual return on plan assets | | | 13,536 | | | | 6,758 | |
| Employer contributions | | | 472 | | | | 1,147 | |
| Benefits paid | | | (4,729 | ) | | | (4,041 | ) |
Fair value of assets at end of period | | | 77,039 | | | | 67,760 | |
Net (unfunded) status of plan | | $ | (27,885 | ) | | $ | (46,570 | ) |
We recognize the unfunded status (i.e., the difference between the fair value of plan assets and the projected benefit obligations) of our pension plan in our Consolidated Balance Sheets, with a corresponding adjustment to accumulated other comprehensive loss, net of tax. During fiscal 2012 and fiscal 2011 this amount was offset by a valuation allowance. On January 4, 2014, we measured the fair value of our plan assets and benefit obligations. As of January 4, 2014, and December 29, 2012, the net unfunded status of our benefit plan was $27.9 million and $46.6 million, respectively. These amounts were included in “Other non-current liabilities” on our Consolidated Balance Sheets. The net adjustment to other comprehensive loss for fiscal 2013, fiscal 2012, and fiscal 2011 was a $13.9 million gain ($22.8 million gain, net of tax of $8.9 million), $8.2 million loss ($8.2 million loss, net of tax, offset by a valuation allowance), $15.0 million loss ($15.0 million loss, net of tax, offset by a valuation allowance), respectively, which represents the net unrecognized actuarial gain (loss) and unrecognized prior service cost.
The decrease in the unfunded obligation for the period was approximately $18.7 million and was comprised of $10.7 million of actuarial gains, $13.5 million of asset returns, a decrease of $0.9 million to the liability related to freezing our non-union pension plan and $0.5 million of pension contributions. These changes were offset by an increase in the projected benefit obligation of $6.9 million due to current year service and interest cost. The main driver of the decrease in the liability related to the actuarial (gain) loss was the change in the underlying discount rate assumption which increased from 4.24% in fiscal 2012 to 5.00% in fiscal 2013. The net periodic pension costs also increased to $4.6 million in fiscal 2013 from $3.9 million in fiscal 2012 and was primarily driven by an increase in the amortization of the actuarial loss attributable to the decrease in the discount rate from 5.02% in fiscal 2011 to 4.24% in 2012.
The freeze of the non-union pension plan resulted in a reduction in future years of service for the active participants in the plan, which triggered a curtailment. An immaterial amount of unrecognized prior service costs were recognized in the Consolidated Statements of Operations and Comprehensive Loss during fiscal 2013 as a result of this event. In addition, there was a curtailment gain from the event which resulted in a decrease to the projected benefit obligation of $0.9 million.
The unfunded status and the amounts recognized on our Consolidated Balance Sheets for the hourly pension plan are set forth in the following table:
| | | | | | | | | |
| | | January 4,
2014 | | | December 29,
2012 | |
| | | (In thousands) | |
| Unfunded status | | $ | (27,885 | ) | | $ | (46,570 | ) |
| Unrecognized prior service cost | | | 1 | | | | 2 | |
| Unrecognized actuarial loss | | | 14,656 | | | | 37,459 | |
| Net amount recognized | | $ | (13,228 | ) | | $ | (9,109 | ) |
| Amounts recognized on the balance sheet consist of: | | | | | | | | |
| Accrued pension liability | | | (27,885 | ) | | | (46,570 | ) |
| Accumulated other comprehensive loss (pre-tax) | | | 14,657 | | | | 37,461 | |
| Net amount recognized | | $ | (13,228 | ) | | $ | (9,109 | ) |
The portion of estimated net loss for the hourly pension plan that is expected to be amortized from accumulated other comprehensive loss into net periodic cost over the next fiscal year is $0.8 million. The expected amortization of prior service cost recognized into net periodic cost over the next fiscal year is immaterial.
The accumulated benefit obligation for the hourly pension plan was $103.7 million and $111.1 million at January 4, 2014, and December 29, 2012, respectively.
Net periodic pension cost for our pension plans included the following:
| | | | | | | | | | | | | |
| | | Fiscal Year Ended
January 4,
2014 | | | Fiscal Year Ended
December 29,
2012 | | | Fiscal Year Ended
December 31,
2011 | |
| | | (In thousands) | |
| Service cost | | $ | 2,193 | | | $ | 1,878 | | | $ | 2,091 | |
| Interest cost on projected benefit obligation | | | 4,750 | | | | 4,885 | | | | 4,609 | |
| Expected return on plan assets | | | (5,225 | ) | | | (4,897 | ) | | | (5,505 | ) |
| Amortization of unrecognized loss | | | 2,873 | | | | 2,077 | | | | 579 | |
| Amortization of unrecognized prior service cost | | | — | | | | — | | | | — | |
| Net periodic pension cost | | $ | 4,591 | | | $ | 3,943 | | | $ | 1,774 | |
The following assumptions were used to determine the projected benefit obligation at the measurement date and the net periodic pension cost:
| | | | | | | | | |
| | | January 4,
2014 | | December 29,
2012 |
| Projected benefit obligation: | | | | | | |
| Discount rate | | | 5.00 | % | | | 4.24 | % |
| Average rate of increase in future compensation levels | | Graded 5.5%-2.5 | % | | | 3.00 | % |
| Net periodic pension cost | | | | | | | | |
| Discount rate | | | 4.24 | % | | | 5.02 | % |
| Average rate of increase in future compensation levels | | | 3.00 | % | | | 3.00 | % |
| Expected long-term rate of return on plan assets | | | 7.85 | % | | | 7.85 | % |
Our estimates of the amount and timing of our future funding obligations for our defined benefit pension plans are based upon various assumptions specified above. These assumptions include, but are not limited to, the discount rate, projected return on plan assets, compensation increase rates, mortality rates, retirement patterns, and turnover rates.
As indicated in the table above, we used a discount rate of 5.00% to compute the projected benefit obligation, which was determined by the matching of plan liability cash flows to a portfolio of bonds. A change in the discount rate of 25 basis points, from 5.00% to 5.25%, while holding all other assumptions constant, would have resulted in a reduction in the Company’s projected benefit obligation of approximately $3.1 million in 2013.
As indicated in the table above, we used an estimated rate of future compensation increases of graded 5.5% - 2.5% to compute the projected benefit obligation. A change in the rate of 25 basis points, from graded 5.5% - 2.5% to graded 5.75% - 2.75%, while holding all other assumptions constant, would have resulted in an increase in the Company’s projected benefit obligation of less than $0.1 million in 2013.
Determination of expected long-term rate of return
In developing expected return assumptions for our pension plan, the most influential decision affecting long-term portfolio performance is the determination of overall asset allocation. An asset class is a group of securities that exhibit similar characteristics and behave similarly in the marketplace. The three main asset classes are equities, fixed income, and cash equivalents.
Upon calculation of the historical risk premium for each asset class, an expected rate of return can be established based on assumed 90-day Treasury bill rates. Based on the normal asset allocation structure of the portfolio (65% equities, 30% fixed income, and 5% other) with historical compound annualized risk free rate of 3.78%, the expected overall portfolio return is 8.35% offset by 0.5% expense estimate resulting in a 7.85% net long term rate of return as of January 4, 2014.
Our percentage of fair value of total assets by asset category as of our measurement date is as follows:
| | | | | | | | | | |
Asset Category | | | January 4,
2014 | | | December 29, 2012 | |
| Equity securities — domestic | | | 55 | % | | | 56 | % |
| Equity securities — international | | | 16 | % | | | 9 | % |
| Fixed income | | | 24 | % | | | 31 | % |
| Other | | | 5 | % | | | 4 | % |
Total | | | 100 | % | | | 100 | % |
The fair value of our plan assets by asset category as of January 4, 2014 was as follows (in thousands):
| | | | | | |
Asset Category | | | Level 1 | |
| Equity securities — domestic | | $ | 42,710 | |
| Equity securities — international | | | 12,067 | |
| Fixed income | | | 18,836 | |
| Other | | | 3,426 | |
Total | | $ | 77,039 | |
The fair value of our plan assets by asset category as of December 29, 2012 was as follows (in thousands):
| | | | | | |
Asset Category | | | Level 1 | |
| Equity securities — domestic | | $ | 37,623 | |
| Equity securities — international | | | 6,304 | |
| Fixed income | | | 20,848 | |
| Other | | | 2,985 | |
Total | | $ | 67,760 | |
The plan assets are valued using quoted market prices in active markets and we consider the investments to be Level 1 in the fair value hierarchy. See Note 13 for a discussion of the levels of inputs to determine fair value.
Investment policy and strategy
Plan assets are managed as a balanced portfolio comprised of two major components: an equity portion and a fixed income portion. The expected role of plan equity investments will be to maximize the long-term real growth of fund assets, while the role of fixed income investments will be to generate current income, provide for more stable periodic returns, and provide some downside protection against the possibility of a prolonged decline in the market value of equity investments. We review this investment policy statement at least once per year. In addition, the portfolio will be reviewed quarterly to determine the deviation from target weightings and will be rebalanced as necessary. Target allocations for fiscal 2014 are 50% domestic and 15% international equity investments, 30% fixed income investments, and 5% cash. The expected long-term rate of return for the plan’s total assets is based on the expected return of each of the above categories, weighted based on the target allocation for each class.
Our estimated future benefit payments reflecting expected future service are as follows (in thousands):
| | | | | | |
Fiscal Year Ending | | | (In thousands) | |
| January 3, 2015 | | | 4,998 | |
| January 2, 2016 | | | 5,332 | |
| December 31, 2016 | | | 5,641 | |
| December 30, 2017 | | | 5,914 | |
| December 29, 2018 | | | 6,206 | |
| Thereafter | | | 34,372 | |
The Company’s minimum required contribution for plan year 2012 was $3.2 million. In an effort to preserve additional cash for operations, we applied for a waiver from the Internal Revenue Service (“IRS”) for our 2012 minimum required contribution. Although the Company’s outside counsel has been notified by the IRS that its waiver request has been preliminarily approved and that the IRS is in the process of finalizing the waiver request, no assurances can be provided that the waiver request will be granted until the Company receives final approval from the IRS. If we are granted the requested waiver, our contributions for 2012 will be amortized over the following five years, increasing our future minimum required contributions.
The Company’s minimum required contribution for plan year 2013 was estimated to be $6.0 million, assuming we receive the requested waiver. During the second quarter of fiscal 2013, we contributed certain qualifying employer real property to the hourly pension plan. The properties, including certain land and buildings, are located in Charleston, S.C. and Buffalo, N.Y., and were valued at approximately $6.8 million by independent appraisals prior to the contribution. The contribution was recorded by the hourly pension plan at the fair market value of $6.8 million. We are leasing back the contributed properties for an initial term of twenty years with two five-year extension options and continue to use the properties in our distribution operations. Each lease provides us a right of first refusal on any subsequent sale by the hourly pension plan and a repurchase option. The hourly pension plan engaged an independent fiduciary who evaluated the transaction on behalf of the hourly pension plan, negotiated the terms of the property contribution and the leases, and also manages the properties on behalf of the hourly pension plan. Depending on whether the 2012 waiver is granted, portions of the property contribution may be designated to either the 2012 or 2013 plan year. If the waiver is not granted, it may be necessary to contribute an additional $2.2 million on or before September 15, 2014 to fully satisfy the 2012 and 2013 minimum required contributions.
We determined that the contribution of the properties does not meet the accounting definition of a plan asset within the scope of relevant accounting guidance. Accordingly, the contributed properties are not considered a contribution for financial reporting purposes and, as a result, are not included in plan assets and have no impact on the net pension liability recorded on our Consolidated Balance Sheets. We continue to depreciate the carrying value of the properties in our financial statements, and no gain or loss was recognized at the contribution date for financial reporting purposes. Rent payments will be made on a monthly basis and will be recorded as contributions to the hourly pension plan, of which $0.5 million has been recorded as of January 4, 2014. These rental payments will reduce our unfunded obligation to the hourly pension plan.
We currently are required to make three quarterly cash contributions during fiscal 2014 of $1.5 million each related to our 2014 minimum required contribution.
Defined Contribution Plans
Our employees also participate in several defined contribution plans. Contributions to the plans are based on employee contributions and compensation. Contributions to the hourly defined contribution plan totaled $0.1 million, $0.1 million, and $0.1 million for fiscal 2013, fiscal 2012, and fiscal 2011, respectively. During fiscal 2009, we suspended the Company matching contributions to our defined salaried contribution plan as part of our cost reduction initiatives. The Company match was reinstated on January 1, 2012. Contributions to the salaried defined contribution plan totaled $1.1 million and $1.0 million for fiscal 2013 and fiscal 2012, respectively.
9. Inventory Reserve Accounts
The following reflects our activity for inventory reserve accounts (in thousands):
| | | | | | | | | | | | | | | | | |
| | | Beginning
Balance | | | Expense | | | Write-offs and
Other, net | | | Ending
Balance | |
Fiscal 2011 | | | | | | | | | | | | |
| Obsolescence/damaged inventory reserve | | $ | 1,670 | | | $ | 2,309 | | | $ | (2,487 | ) | | $ | 1,492 | |
| Lower of cost or market reserve | | $ | — | | | $ | — | | | $ | — | | | $ | — | |
Fiscal 2012 | | | | | | | | | | | | | | | | |
| Obsolescence/damaged inventory reserve | | $ | 1,492 | | | $ | 3,625 | | | $ | (3,991 | ) | | $ | 1,126 | |
| Lower of cost or market reserve | | $ | — | | | $ | — | | | $ | — | | | $ | — | |
Fiscal 2013 | | | | | | | | | | | | | | | | |
| Obsolescence/damaged inventory reserve | | $ | 1,126 | | | $ | 4,783 | | | $ | (4,111 | ) | | $ | 1,798 | |
| Lower of cost or market reserve | | $ | — | | | $ | 3,843 | | | $ | (3,843 | ) | | $ | — | |
10. Revolving Credit Facilities
We have our U.S. revolving credit facility agreement (the “U.S. revolving credit facility”) with Wells Fargo Bank, National Association, successor by merger to Wachovia Bank, National Association, dated August 4, 2006, as amended. The U.S. revolving credit facility has a final maturity of April 15, 2016 and maximum available credit of $447.5 million. The U.S. revolving credit facility also includes an additional $75 million uncommitted accordion credit facility, which permits us to increase the maximum available credit up to $522.5 million.
On June 28, 2013, we entered into an amendment to our U.S. revolving credit facility, which became effective on that date and pursuant to which certain components of the borrowing base calculation and excess liquidity calculation were adjusted. The most significant of the changes included in the amendment is the addition of PNC Bank, National Association (“PNC”) as a lender and their additional loan commitment of $25.0 million, which increased the maximum availability of the U.S. revolving credit facility to $447.5 million. The new terms of this amended agreement are described in this footnote. In conjunction with this amendment, we incurred $0.1 million of debt fees that were capitalized and are being amortized over the amended debt term.
On March 29, 2013, we entered into an amendment to our U.S. revolving credit facility, which became effective on that date and pursuant to which certain components of the borrowing base calculation and excess liquidity calculation were adjusted. The most significant of the changes included in the amendment are extending the final maturity of the U.S. revolving credit facility, increasing the maximum available credit under the facility and adjusting the excess availability threshold calculation. In conjunction with this amendment, we incurred $2.8 million of debt fees that were capitalized and are being amortized over the amended debt term.
On March 27, 2013, we concluded the 2013 Rights Offering. The 2013 Rights Offering was fully subscribed and resulted in net proceeds of approximately $38.6 million. Remaining expenses to be paid related to the 2013 Rights Offering as of January 4, 2014 totaled $0.1 million. We issued 22.9 million shares of stock to our stockholders in conjunction with the 2013 Rights Offering.
On July 22, 2011, we concluded an offering of our common stock to our stockholders (the “2011 Rights Offering”). The 2011 Rights Offering was fully subscribed and resulted in net proceeds of approximately $58.0 million. We issued 28.6 million shares of stock to our stockholders in conjunction with the 2011 Rights Offering.
As of January 4, 2014, we had outstanding borrowings of $207.9 million and excess availability of $44.5 million under the terms of our U.S. revolving credit facility. The interest rate on the U.S. revolving credit facility was 3.7% at January 4, 2014. As of December 29, 2012, we had outstanding borrowings of $169.5 million and excess availability of $86.0 million under the terms of our U.S. revolving credit facility. The interest rate on the U.S. revolving credit facility was 4.1% at December 29, 2012. As of January 4, 2014 and December 29, 2012, we had outstanding letters of credit totaling $3.6 million and $4.5 million, respectively, for the purposes of securing collateral requirements under casualty insurance programs and for guaranteeing lease and certain other obligations. The $3.6 million in outstanding letters of credit as of January 4, 2014 does not include an additional $1.5 million fully collateralized letter of credit securing certain insurance obligations that was issued outside of the U.S. revolving credit facility.
As of January 4, 2014, our U.S. revolving credit facility, as amended, contains customary negative covenants and restrictions for asset based loans, including a requirement that we maintain a fixed charge coverage ratio of 1.1 to 1.0 in the event our excess availability falls below the greater of $31.8 million or the amount equal to 12.5% of the lesser of the borrowing base or $447.5 million (the “Excess Availability Threshold”). The fixed charge coverage ratio is calculated as EBITDA divided by the sum of cash payments for income taxes, interest expense, cash dividends, principal payments on debt, and capital expenditures. EBITDA is defined as BlueLinx Corporation’s net income before interest and tax expense, depreciation and amortization expense, and other non-cash charges. The fixed charge coverage ratio requirement only applies to us when excess availability under our amended U.S. revolving credit facility is less than the Excess Availability Threshold on any date. As of January 4, 2014 and through the time of the filing of this Form 10-K, we were in compliance with all covenants under the U.S. revolving credit facility. We are required to maintain the Excess Availability Threshold in order to avoid being required to meet certain financial ratios and triggering additional limits on capital expenditures. Our lowest level of fiscal month-end availability in the last three years as of January 4, 2014 was $44.5 million, which is the excess availability as of that date. We do not anticipate our excess availability in fiscal 2014 will drop below the Excess Availability Threshold. Should our excess availability fall below the Excess Availability Threshold on any date, however, we would not meet the required fixed charge coverage ratio covenant with our current operating results.
In the event that excess availability falls below $37.1 million or the amount equal to 15% of the lesser of the borrowing base or $447.5 million, the U.S. revolving credit facility gives the lenders the right to dominion of our bank accounts. This would not make the underlying debt callable by the lender and may not change our ability to borrow on the U.S. revolving credit facility. However, we would be required to reclassify the “Long-term debt” to “Current maturities of long-term debt” on our Consolidated Balance Sheet. In addition, we would be required to maintain a springing lock-box arrangement where customer remittances go directly to a lock-box maintained by our lenders and then are forwarded to our general bank accounts. Our outstanding borrowings are not reduced by these payments unless our excess availability falls below the greater of $35 million or the amount equal to 15% of the lesser of the borrowing base or $400 million on any date or in the event of default. Our amended U.S. revolving credit facility does not contain a subjective acceleration clause, which would allow our lenders to accelerate the scheduled maturities of our debt or to cancel our agreement.
On August 16, 2013, we entered into an amendment to our Canadian revolving credit facility (the “Canadian revolving credit facility”), which became effective on that date. The Amendment modifies the maturity date under the Credit Agreement to the earlier of (i) August 12, 2016 or the (ii) maturity date of the U.S. revolving credit facility. All other terms of the Canadian revolving credit facility remain the same.
As of January 4, 2014, we had outstanding borrowings of $3.3 million and excess availability of $1.3 million under the terms of our Canadian revolving credit facility. As of December 29, 2012, we had outstanding borrowings of $1.9 million and excess availability of $2.0 million under the terms of our Canadian revolving credit facility. The interest rate on the Canadian revolving credit facility was 4.0% at January 4, 2014 and December 29, 2012. The Canadian revolving credit facility contains customary covenants and events of default for asset-based credit agreements of this type, including the requirement for BlueLinx Canada to maintain a minimum adjusted tangible net worth of $3.9 million and for that entity’s capital expenditures not to exceed 120% of the amount budgeted in a given year. As of January 4, 2014 and through the time of the filing of this Form 10-K, we were in compliance with all covenants under this facility
11. Mortgage
We have a $295 million mortgage loan with the German American Capital Corporation. The mortgage has a term of ten years and is secured by 50 distribution facilities. The stated interest rate on the mortgage is fixed at 6.35%. German American Capital Corporation assigned half of its interest in the mortgage loan to Wachovia Bank, National Association and both lenders securitized their Notes in separate commercial mortgage backed securities pools in 2006. As of January 4, 2014 and December 29, 2012, the balance on our mortgage loan was $186.9 million and $206 million, respectively.
On September 19, 2012, we entered into an amendment to our mortgage agreement, which provided for the immediate prepayment of approximately $11.8 million of the indebtedness under the mortgage agreement without incurring a prepayment premium from cash currently held as collateral under the mortgage agreement. In addition, on the last business day of each calendar quarter, starting with the fourth quarter of fiscal 2012, additional funds held as collateral under the mortgage agreement will be used to prepay indebtedness under the mortgage agreement, without prepayment premium, up to an aggregate additional prepayment of $10.0 million. Thereafter, any cash remaining in the collateral account under the mortgage agreement, up to an aggregate of $10.0 million, will be released to the Company on the last business day of each calendar quarter through the third quarter of fiscal 2014. All funds released pursuant to these provisions may only be used by the Company to pay for usual and customary operating expenses. During the periods described above in which cash in the collateral account is used to either prepay indebtedness under the mortgage agreement or released to the Company, the lenders will not release any of the cash collateral to the Company for specified capital expenditures as previously provided under the mortgage agreement. Under the terms of our mortgage, we are required to transfer certain funds to be held as collateral. Approximately $6.3 million of funds held in collateral were used to prepay indebtedness under the mortgage agreement during fiscal 2013. Approximately $2.7 million of cash held in collateral were released to the Company during fiscal 2013 to pay for usual and customary operating expenses. We expect to transfer approximately $13.2 million as collateral during the next twelve month period, approximately $7.3 million of which will be remitted to us on a quarterly basis to pay for usual and customary operating expenses. In conjunction with the modification of our mortgage agreement we incurred approximately $0.3 million in fees that were capitalized and are being amortized over the remaining term of the mortgage.
During the third quarter of fiscal 2013, we sold our sales center in Denver, Colorado and increased the restricted cash related to our mortgage by $8.4 million, which represents the allocated mortgage related to the property. During the fourth quarter of fiscal 2013, we sold our Sioux Falls, South Dakota facility and increased the restricted cash related to our mortgage by $1.9 million, which represents the allocated mortgage related to the property. This restricted cash for both locations was used to pay down the outstanding principal of the mortgage in the fourth quarter of fiscal 2013. During the first quarter of fiscal 2012, we sold certain parcels of excess land. As a result of the sale of one of these parcels, we increased the amount of restricted cash required to be held in connection with our mortgage by $0.3 million. In addition, during the third quarter of fiscal 2012, we sold our facility in Fremont, California and increased the restricted cash related to our mortgage by $12.8 million. This restricted cash was used to pay down the mortgage in the fourth quarter of fiscal 2012.
The mortgage loan required interest-only payments through June 2011, at which time we began making payments on the outstanding principal balance. The balance of the loan outstanding at the end of ten years will then become due and payable. The principal will be paid in the following increments (in thousands):
| | | | | |
| 2014 | | $ | 2,761 | |
| 2015 | | | 2,744 | |
| 2016 | | | 181,438 | |
| 2017 | | | — | |
| 2018 | | | — | |
| Thereafter | | | — | |
| Total | | $ | 186,943 | |
12. Derivatives
On June 12, 2006, we entered into an interest rate swap agreement with Goldman Sachs Capital Markets, to hedge against interest rate risks related to our variable rate U.S. revolving credit facility. The interest rate swap was terminated in March of 2011. Due to the termination of the swap in fiscal 2011, the fair value of the swap as of December 31, 2011 was zero. Changes associated with the ineffective interest rate swap recognized in the Consolidated Statement s of Operations and Comprehensive Loss for fiscal 2011 were approximately $1.7 million of income and were comprised of amortization of the remaining accumulated other comprehensive loss of the ineffective swap of $0.5 million offset by income of $2.2 million related to reducing the fair value of the ineffective interest rate swap liability to zero.
13. Fair Value Measurements
We determine a fair value measurement based on the assumptions a market participant would use in pricing an asset or liability. The fair value measurement guidance established a three level hierarchy making a distinction between market participant assumptions based on (i) unadjusted quoted prices for identical assets or liabilities in an active market (Level 1), (ii) quoted prices in markets that are not active or inputs that are observable either directly or indirectly for substantially the full term of the asset or liability (Level 2), and (iii) prices or valuation techniques that require inputs that are both unobservable and significant to the overall fair value measurement (Level 3).
Carrying amounts for our financial instruments are not significantly different from their fair value, with the exception of our mortgage. To determine the fair value of our mortgage, we used a discounted cash flow model. We believe the mortgage fair value valuation to be Level 2 in the fair value hierarchy, as the valuation model has inputs that are observable for substantially the full term of the liability. Assumptions critical to our fair value measurements in the period are present value factors used in determining fair value and an interest rate. At January 4, 2014, the discounted carrying value and fair value of our mortgage was $186.9 million and $186.6 million, respectively. At December 29, 2012, the discounted carrying value and fair value of our mortgage was $206.0 million and $205.5 million, respectively.
14. Related Party Transactions
Cerberus Capital Management, L.P., our equity sponsor, retains consultants that specialize in operations management and support and who provide Cerberus with consulting advice concerning portfolio companies in which funds and accounts managed by Cerberus or its affiliates have invested. From time to time, Cerberus makes the services of these consultants available to Cerberus portfolio companies. We believe that the terms of these consulting arrangements are favorable to us, or, alternatively, are materially consistent with those terms that would have been obtained by us in an arrangement with an unaffiliated third party. We have normal service, purchase and sales arrangements with other entities that are owned or controlled by Cerberus. We believe that these transactions are not material to our results of operations or financial position.
In connection with the 2013 Rights Offering, Cerberus ABP Investor LLC (“Cerberus”), the Company’s majority shareholder, exercised all of the rights issued to it and subscribed for the maximum additional shares pursuant to the over-subscription privilege that it was entitled to purchase.
15. Commitments and Contingencies
Self-Insurance
It is our policy to self-insure, up to certain limits, traditional risks including workers’ compensation, comprehensive general liability, and auto liability. Our self-insured deductible for each claim involving workers’ compensation, and auto liability is limited to $0.8 million and $2.0 million, respectively. Our self-insured retention for each claim involving comprehensive general liability (including product liability claims) is limited to $0.8 million. We are also self-insured up to certain limits for certain other insurable risks, primarily physical loss to property, excluding natural catastrophes ($0.1 million per occurrence), Director and Officer ($0.8 million per occurrence) and the majority of our medical benefit plans ($0.3 million per occurrence). Insurance coverage is maintained for catastrophic property and casualty exposures as well as those risks required to be insured by law or contract. A provision for claims under this self-insured program, based on our estimate of the aggregate liability for claims incurred, is revised and recorded annually. The estimate is derived from both internal and external sources including but not limited to actuarial estimates. The actuarial estimates are subject to uncertainty from various sources, including, among others, changes in claim reporting patterns, claim settlement patterns, judicial decisions, legislation, and economic conditions. Although, we believe that the actuarial estimates are reasonable, significant differences related to the items noted above could materially affect our self-insurance obligations, future expense and cash flow. At January 4, 2014, and December 29, 2012, the self-insurance reserves totaled $6.9 million and $7.2 million, respectively. We incurred $11.7 million in expense and $12.0 million in payments, net of reimbursements in fiscal 2013 related to our workers compensation, auto, general liability and health and welfare reserves. We incurred $10.7 million in expense and $11.1 million in payments, net of reimbursements in fiscal 2012 related to our workers compensation, auto, general liability and health and welfare reserves.
Operating Leases
Total rental expense was approximately $4.8 million for fiscal 2013, fiscal 2012, and fiscal 2011.
At January 4, 2014, our total commitments under long-term, non-cancelable operating leases were as follows (in thousands):
| | | | | |
| 2014 | | $ | 4,391 | |
| 2015 | | | 3,968 | |
| 2016 | | | 4,036 | |
| 2017 | | | 4,060 | |
| 2018 | | | 3,498 | |
| Thereafter | | | 10,060 | |
| Total | | $ | 30,013 | |
Certain of our operating leases have extension options and escalation clauses.
Capital Leases
We entered into certain capital leases for trucks and trailers during fiscal 2013, fiscal 2012 and fiscal 2011. These capital leases have maturities of 5 to 6 years. As of January 4, 2014, the basis and net book value of assets under capital leases was $15.4 million and $11.1 million, respectively. As of December 29, 2012, the basis and net book value of assets under capital leases was $10.3 million and $9.3 million, respectively. As of December 31, 2011, the basis and net book value of assets under capital leases was $5.0 million and $4.0 million, respectively. Depreciation expense for assets under capital leases is included in the total depreciation expense disclosed in the Consolidated Statements of Operations and Comprehensive Loss.
At January 4, 2014, our total commitments under long-term, non-cancelable capital leases were as follows (in thousands):
| | | | | | | | | |
| | | Principal | | | Interest | |
| | | | | | | |
| 2014 | | $ | 1,753 | | | $ | 509 | |
| 2015 | | | 1,847 | | | | 399 | |
| 2016 | | | 1,746 | | | | 273 | |
| 2017 | | | 1,342 | | | | 186 | |
| 2018 | | | 1,406 | | | | 95 | |
| Thereafter | | | 604 | | | | 20 | |
| Total | | $ | 8,698 | | | $ | 1,482 | |
Executory costs are nominal for each of the years presented.
Environmental and Legal Matters
From time to time, we are involved in various proceedings incidental to our businesses, and we are subject to a variety of environmental and pollution control laws and regulations in all jurisdictions in which we operate. Although the ultimate outcome of these proceedings cannot be determined with certainty, based on presently available information management believes that adequate reserves have been established for probable losses with respect thereto. Management further believes that the ultimate outcome of these matters could be material to operating results in any given quarter but will not have a materially adverse effect on our long-term financial condition, our results of operations, or our cash flows.
Collective Bargaining Agreements
As of January 4, 2014, approximately 33% of our employees were represented by various labor unions. As of January 4, 2014, we had 36 collective bargaining agreements, of which 5 are up for renewal in fiscal 2014. We consider our relationship with our employees generally to be good.
16. Subsequent Events
We are not aware of any additional significant events that occurred subsequent to the balance sheet date but prior to the filing of this report that would have a material impact on our Consolidated Financial Statements.
17. Accumulated Other Comprehensive Loss
Comprehensive income (loss) is a measure of income which includes both net loss and other comprehensive income (loss). Other comprehensive income (loss) results from items deferred from recognition into our Consolidated Statements of Operations and Comprehensive Loss . Accumulated other comprehensive loss is separately presented on our Consolidated Balance Sheets as part of common stockholders’ deficit. Other comprehensive income (loss) was $13.7 million, $(8.1) million, and $(14.5) million for fiscal 2013, fiscal 2012, and fiscal 2011, respectively.
The changes in accumulated balances for each component of other comprehensive income (loss) for fiscal 2013 were as follows (in thousands):
| | Foreign
currency,net
of tax | | Defined
benefit pension
plan, net of tax | | Other, net of tax | | Total | |
| Beginning balance | | | $ | 1,797 | | | | $ | (32,051 | ) | | | $ | 212 | | | | $ | (30,042 | ) | |
| Other comprehensive loss (income) before reclassification, net of tax | | | | (161 | ) | | | | — | | | | | — | | | | | (161 | ) | |
| Amounts reclassified from accumulated other comprehensive loss, net of tax | | | | — | | | | | 13,910 | | | | | — | | | | | 13,910 | | |
Current-period other comprehensive (loss) income, net of tax | | | | (161 | ) | | | | 13,910 | | | | | — | | | | | 13,749 | | |
| Ending balance, net of tax | | | $ | 1,636 | | | | $ | (18,141 | ) | | | $ | 212 | | | | $ | (16,293 | ) | |
The changes in accumulated balances for each component of other comprehensive income (loss) for fiscal 2012 were as follows (in thousands):
| | Foreign
currency,net
of tax | | Defined
benefit pension
plan, net of tax | | Other, net of tax | | Total | |
| Beginning balance | | | $ | 1,694 | | | | $ | (23,806 | ) | | | $ | 212 | | | | $ | (21,900 | ) | |
Current-period other comprehensive income (loss) net of tax | | | | 103 | | | | | (8,245 | ) | | | | — | | | | | (8,142 | ) | |
| Ending balance, net of tax | | | $ | 1,797 | | | | $ | (32,051 | ) | | | $ | 212 | | | | $ | (30,042 | ) | |
The changes in accumulated balances for each component of other comprehensive income (loss) for fiscal 2011 were as follows (in thousands):
|
| | Foreign
currency,net
of tax | | Defined
benefit pension
plan, net of tax | | Other, net of tax | | Total | |
| Beginning balance | | | $ | 1,786 | | | | $ | (8,837 | ) | | | $ | (307 | ) | | | $ | (7,358 | ) | |
Current-period other comprehensive (loss) income, net of tax | | | | (92 | ) | | | | (14,969 | ) | | | | 519 | | | | | (14,542 | ) | |
| Ending balance, net of tax | | | $ | 1,694 | | | | $ | (23,806 | ) | | | $ | 212 | | | | $ | (21,900 | ) | |
Reclassifications out of accumulated other comprehensive loss into the Consolidated Statements of Operations and Comprehensive Loss for fiscal 2013 were as follows (in thousands):
| | | | | | | |
Details about accumulated other comprehensive
loss components | | Amount reclassified from
accumulated other
comprehensive loss | | Affected line item in the statement where net income is presented |
| Amortization of defined benefit pension items: | | | | | | |
| Actuarial gain | | | $ | 22,804 | | | Total before tax (1) |
Tax impact | | | | 8,894 | | | Tax impact (2) |
| Total, net of tax | | | $ | 13,910 | | | Net of tax |
(1) This accumulated other comprehensive loss component is included in the computation of net periodic pension cost. Refer to Note 8 of the Notes to Consolidated Financial Statements for the required disclosures.
(2) We allocated income tax expense to accumulated other comprehensive loss to the extent income was recorded in accumulated other comprehensive loss and we have a loss from continuing operations. Refer to Note 5 of the Notes to Consolidated Financial Statements for the required disclosures.
There were no reclassifications out of accumulated other comprehensive loss for fiscal 2012 and fiscal 2011 due to the fact that there was no intraperiod income tax allocation and the deferred tax benefit was fully offset by a valuation allowance.
18. Unaudited Selected Quarterly Financial Data
Fiscal 2013 contained 53 weeks. Fiscal 2012 and fiscal 2011 each contained 52 weeks. Our fiscal quarters are based on a 5-4-4 week period, with the exception of the fourth fiscal quarter of fiscal years containing 53 weeks, which are based on a 5-4-5 week period.
| | | | | | | | | | | | | | | | | | | | | | | | | | | | | | | | | |
| | | First Quarter | | | Second Quarter | | | Third Quarter | | | Fourth Quarter | |
| | | Three Months | | | Three Months | | | Three Months | | | Three Months | | | Three Months | | | Three Months | | | Three Months | | | Three Months | |
| | | Ended | | | Ended | | | Ended | | | Ended | | | Ended | | | Ended | | | Ended | | | Ended | |
| | | March 30, | | | March 31, | | | June 29, | | | June 30, | | | September 28, | | | September 29, | | | January 4, | | | December 29, | |
| | | 2013(a) | | | 2012(b) | | | 2013(c) | | | 2012(d) | | | 2013(e) | | | 2012(f) | | | 2014(g) | | | 2012(h) | |
| | | | (In thousands, except per share amounts) | |
| Net sales | | $ | 503,153 | | | $ | 453,708 | | | $ | 604,592 | | | $ | 517,026 | | | $ | 557,952 | | | $ | 496,810 | | | $ | 486,275 | | | $ | 440,298 | |
| Gross profit | | | 56,458 | | | | 54,232 | | | | 55,185 | | | | 63,188 | | | | 62,492 | | | | 60,531 | | | | 54,348 | | | | 52,119 | |
| Operating expenses: | | | | | | | | | | | | | | | | | | | | | | | | | | | | | | | | |
| Selling, general and administrative | | | 58,760 | | | | 56,644 | | | | 61,201 | | | | 57,564 | | | | 58,176 | | | | 57,307 | | | | 55,627 | | | | 54,842 | |
| Gain from property insurance settlement | | | — | | | | — | | | | — | | | | (476 | ) | | | — | | | | — | | | | — | | | | — | |
| (Gain) loss from sale of properties | | | (230 | ) | | | (578 | ) | | | — | | | | 48 | | | | (3,679 | ) | | | (9,151 | ) | | | (1,311 | ) | | | (204 | ) |
| Restructuring and other charges | | | 889 | | | | — | | | | 7,309 | | | | — | | | | 2,758 | | | | — | | | | 1,167 | | | | — | |
| | | | | | | | | | | | | | | | | | | | | | | | | | | | | | | | | |
| Depreciation and amortization | | | 2,173 | | | | 2,260 | | | | 2,229 | | | | 2,187 | | | | 2,144 | | | | 2,106 | | | | 2,571 | | | | 2,012 | |
| Operating (loss) income | | | (5,134 | ) | | | (4,094 | ) | | | (15,554 | ) | | | 3,865 | | | | 3,093 | | | | 10,269 | | | | (3,706 | ) | | | (4,531 | ) |
| Non-operating expenses: | | | | | | | | | | | | | | | | | | | | | | | | | | | | | | | | |
| Interest expense | | | 7,192 | | | | 6,782 | | | | 6,916 | | | | 7,325 | | | | 6,918 | | | | 7,294 | | | | 6,998 | | | | 6,756 | |
| Other expense (income) | | | 110 | | | | (62 | ) | | | 128 | | | | 49 | | | | 17 | | | | (16 | ) | | | 50 | | | | 22 | |
| (Benefit from) provision for income taxes | | | (4,637 | ) | | | (3,969 | ) | | | (9,105 | ) | | | (1,157 | ) | | | (2,134 | ) | | | 1,078 | | | | (12,491 | ) | | | (4,305 | ) |
| Tax valuation allowance | | | 4,850 | | | | 4,174 | | | | 8,813 | | | | 1,354 | | | | 1,498 | | | | (1,155 | ) | | | 4,194 | | | | 4,366 | |
| Net (loss) income | | $ | (12,649 | ) | | $ | (11,019 | ) | | $ | (22,306 | ) | | $ | (3,706 | ) | | $ | (3,206 | ) | | $ | 3,068 | | | $ | (2,457 | ) | | $ | (11,370 | ) |
Basic and diluted weighted average number of common shares outstanding | | | 66,714 | | | | 65,368 | | | | 84,167 | | | | 65,471 | | | | 84,596 | | | | 65,473 | | | | 84,818 | | | | 65,494 | |
Basic and diluted net (loss) income per share applicable to common shares | | $ | (0.19 | ) | | $ | (0.17 | ) | | $ | (0.27 | ) | | $ | (0.06 | ) | | $ | (0.04 | ) | | $ | 0.04 | | | $ | (0.03 | ) | | $ | (0.17 | ) |
| (a) | During the three months ended March 30, 2013 basic and diluted weighted average shares were 66,713,964. Total share-based awards of 5,512,899 were excluded from our diluted earnings per share calculation because they were anti-dilutive. |
| | |
| (b) | During the three months ended March 31, 2012, basic and diluted weighted average shares were 65,368,259. Total share-based awards of 4,519,590 were excluded from our diluted earnings per share calculation because they were anti-dilutive. |
| | |
| (c) | During the three months ended June 29, 2013, basic and diluted weighted average shares were 84,167,120. Total share-based awards of 5,203,076 were excluded from our diluted earnings per share calculation because they were anti-dilutive. |
| | |
| (d) | During the three months ended June 30, 2012, basic and diluted weighted average shares were 65,471,450. Total share-based awards of 4,515,590 were excluded from our diluted earnings per share calculation because they were anti-dilutive. |
| | |
| (e) | During the three months ended September 28, 2013, basic and diluted weighted average shares were 84,595,708. Total share-based awards of 5,136,430 were excluded from our diluted earnings per share calculation because they were anti-dilutive. |
| | |
| (f) | During the three months ended September 29, 2012, basic and diluted weighted average shares were 65,472,685. |
| | |
| (g) | During the three months ended January 4, 2014, basic and diluted weighted average shares were 84,818,331, respectively. Total share-based awards of 4,595,650 were excluded from our diluted earnings per share calculation because they were anti-dilutive. |
| | |
| (h) | During the three months ended December 29, 2012, basic and diluted weighted average shares were 65,493,920, respectively. Total share-based awards of 4,460,054 were excluded from our diluted earnings per share calculation because they were anti-dilutive. |
19. Supplemental Condensed Consolidating Financial Statements
The condensed consolidating financial information as of January 4, 2014, and December 29, 2012 and for fiscal 2013, fiscal 2012, and fiscal 2011 is provided due to restrictions in our revolving credit facility that limit distributions by BlueLinx Corporation, our operating company and our wholly-owned subsidiary, to us, which, in turn, may limit our ability to pay dividends to holders of our common stock (see Note 10, Revolving Credit Facility, for a more detailed discussion of these restrictions and the terms of the facility). Also included in the supplemental condensed consolidated/combining financial statements are fifty-three single member limited liability companies, which are wholly owned by us (the “LLC subsidiaries”). The LLC subsidiaries own certain warehouse properties that are occupied by BlueLinx Corporation, each under the terms of a master lease agreement. The warehouse properties collateralize a mortgage loan and are not available to satisfy the debts and other obligations of either us or BlueLinx Corporation. Certain changes have been made to the prior year presentation to conform to the current year presentation.
The condensed consolidating statement of operations for BlueLinx Holdings Inc. for the fiscal year ended January 4, 2014 follows (in thousands):
| | | | | | | | | | | | | | | | | | | | | |
| | | BlueLinx Holdings | | | BlueLinx Corporation and Subsidiaries | | | LLC Subsidiaries | | | Eliminations | | | Consolidated | |
| Net sales | | $ | — | | | $ | 2,151,972 | | | $ | 27,363 | | | $ | (27,363 | ) | | $ | 2,151,972 | |
| Cost of sales | | | — | | | | 1,923,489 | | | | — | | | | — | | | | 1,923,489 | |
| Gross profit | | | — | | | | 228,483 | | | | 27,363 | | | | (27,363 | ) | | | 228,483 | |
| Operating expenses (income): | | | | | | | | | | | | | | | | | | | | |
| Selling, general and administrative | | | 5,913 | | | | 267,232 | | | | (5,115 | ) | | | (27,363 | ) | | | 240,667 | |
| Depreciation and amortization | | | — | | | | 5,700 | | | | 3,417 | | | | — | | | | 9,117 | |
| Total operating expenses (income) | | | 5,913 | | | | 272,932 | | | | (1,698 | ) | | | (27,363 | ) | | | 249,784 | |
| Operating (loss) income | | | (5,913 | ) | | | (44,449 | ) | | | 29,061 | | | | — | | | | (21,301 | ) |
| Non-operating expenses: | | | | | | | | | | | | | | | | | | | | |
| Interest expense | | | — | | | | 13,686 | | | | 14,338 | | | | — | | | | 28,024 | |
| Other expense (income), net | | | — | | | | 318 | | | | (12 | ) | | | — | | | | 306 | |
| (Loss) income before provision for (benefit from) income taxes | | | (5,913 | ) | | | (58,453 | ) | | | 14,735 | | | | — | | | | (49,631 | ) |
| Provision for (benefit from) income taxes | | | (157 | ) | | | (9,248 | ) | | | 392 | | | | — | | | | (9,013 | ) |
| Equity in (loss) income of subsidiaries | | | (34,862 | ) | | | — | | | | — | | | | 34,862 | | | | — | |
| Net (loss) income | | $ | (40,618 | ) | | $ | (49,205 | ) | | $ | 14,343 | | | $ | 34,862 | | | $ | (40,618 | ) |
The condensed consolidating statement of operations for BlueLinx Holdings Inc. for the fiscal year ended December 29, 2012 follows (in thousands):
| | | | | | | | | | | | | | | | | | | | | |
| | | BlueLinx Holdings | | | BlueLinx Corporation and Subsidiaries | | | LLC Subsidiaries | | | Eliminations | | | Consolidated | |
| Net sales | | $ | — | | | $ | 1,907,842 | | | $ | 28,330 | | | $ | (28,330 | ) | | $ | 1,907,842 | |
| Cost of sales | | | — | | | | 1,677,772 | | | | — | | | | — | | | | 1,677,772 | |
| Gross profit | | | — | | | | 230,070 | | | | 28,330 | | | | (28,330 | ) | | | 230,070 | |
| Operating expenses (income): | | | | | | | | | | | | | | | | | | | | |
| Selling, general and administrative | | | 3,940 | | | | 250,098 | | | | (9,712 | ) | | | (28,330 | ) | | | 215,996 | |
| Depreciation and amortization | | | — | | | | 5,040 | | | | 3,525 | | | | — | | | | 8,565 | |
| Total operating expenses (income) | | | 3,940 | | | | 255,138 | | | | (6,187 | ) | | | (28,330 | ) | | | 224,561 | |
| Operating (loss) income | | | (3,940 | ) | | | (25,068 | ) | | | 34,517 | | | | — | | | | 5,509 | |
| Non-operating expenses: | | | | | | | | | | | | | | | | | | | | |
| Interest expense | | | — | | | | 12,159 | | | | 15,998 | | | | — | | | | 28,157 | |
| Other expense (income), net | | | — | | | | 10 | | | | (17 | ) | | | — | | | | (7 | ) |
| (Loss) income before provision for income taxes | | | (3,940 | ) | | | (37,237 | ) | | | 18,536 | | | | — | | | | (22,641 | ) |
Provision for income taxes | | | 386 | | | | | | | | — | | | | — | | | | 386 | |
| Equity in (loss) income of subsidiaries | | | (18,701 | ) | | | — | | | | — | | | | 18,701 | | | | — | |
| Net (loss) income | | $ | (23,027 | ) | | $ | (37,237 | ) | | $ | 18,536 | | | $ | 18,701 | | | $ | (23,027 | ) |
The condensed consolidating statement of operations for BlueLinx Holdings Inc. for the fiscal year ended December 31, 2011 follows (in thousands):
| | | | | | | | | | | | | | | | | | | | | |
| | | BlueLinx Holdings | | | BlueLinx Corporation and Subsidiaries | | | LLC Subsidiaries | | | Eliminations | | | Consolidated | |
| Net sales | | $ | — | | | $ | 1,755,431 | | | $ | 29,665 | | | $ | (29,665 | ) | | $ | 1,755,431 | |
| Cost of sales | | | — | | | | 1,545,282 | | | | — | | | | — | | | | 1,545,282 | |
| Gross profit | | | — | | | | 210,149 | | | | 29,665 | | | | (29,665 | ) | | | 210,149 | |
| Operating expenses (income): | | | | | | | | | | | | | | | | | | | | |
| Selling, general and administrative | | | 3,728 | | | | 244,398 | | | | (10,604 | ) | | | (29,665 | ) | | | 207,857 | |
| Depreciation and amortization | | | — | | | | 6,790 | | | | 3,772 | | | | — | | | | 10,562 | |
| Total operating expenses (income) | | | 3,728 | | | | 251,188 | | | | (6,832 | ) | | | (29,665 | ) | | | 218,419 | |
| Operating (loss) income | | | (3,728 | ) | | | (41,039 | ) | | | 36,497 | | | | — | | | | (8,270 | ) |
| Non-operating expenses: | | | | | | | | | | | | | | | | | | | | |
| Interest expense | | | — | | | | 12,528 | | | | 17,982 | | | | — | | | | 30,510 | |
| Changes associated with ineffective interest rate swap | | | — | | | | (1,676 | ) | | | — | | | | — | | | | (1,676 | ) |
| Other expense (income), net | | | — | | | | 516 | | | | (15 | ) | | | — | | | | 501 | |
| (Loss) income before provision for income taxes | | | (3,728 | ) | | | (52,407 | ) | | | 18,530 | | | | — | | | | (37,605 | ) |
Provision for income taxes | | | 459 | | | | 503 | | | | — | | | | — | | | | 962 | |
| Equity in (loss) income of subsidiaries | | | (34,380 | ) | | | — | | | | — | | | | 34,380 | | | | — | |
| Net (loss) income | | $ | (38,567 | ) | | $ | (52,910 | ) | | $ | 18,530 | | | $ | 34,380 | | | $ | (38,567 | ) |
The condensed consolidating balance sheet for BlueLinx Holdings Inc. as of January 4, 2014 follows (in thousands):
| | | | | | | | | | | | | | | | | | | | | |
| | | BlueLinx Holdings Inc. | | | BlueLinx Corporation and Subsidiaries | | | LLC Subsidiaries | | | Eliminations | | | Consolidated | |
| Assets: | | | | | | | | | | | | | | | |
| Current assets: | | | | | | | | | | | | | | | |
| Cash | | $ | 47 | | | $ | 4,987 | | | $ | — | | | $ | — | | | $ | 5,034 | |
| Receivables | | | — | | | | 150,297 | | | | — | | | | — | | | | 150,297 | |
| Inventories | | | — | | | | 223,580 | | | | — | | | | — | | | | 223,580 | |
| Deferred income tax asset, net | | | — | | | | — | | | | 397 | | | | (397 | ) | | | — | |
| Other current assets | | | 790 | | | | 20,208 | | | | 1,816 | | | | — | | | | 22,814 | |
| Intercompany receivable | | | 68,454 | | | | 26,374 | | | | — | | | | (94,828 | ) | | | — | |
| Total current assets | | | 69,291 | | | | 425,446 | | | | 2,213 | | | | (95,225 | ) | | | 401,725 | |
| Property and equipment: | | | | | | | | | | | | | | | | | | | | |
| Land and land improvements | | | — | | | | 4,040 | | | | 37,136 | | | | — | | | | 41,176 | |
| Buildings | | | — | | | | 10,839 | | | | 79,243 | | | | — | | | | 90,082 | |
| Machinery and equipment | | | — | | | | 73,004 | | | | — | | | | — | | | | 73,004 | |
| Construction in progress | | | — | | | | 3,028 | | | | — | | | | — | | | | 3,028 | |
| Property and equipment, at cost | | | — | | | | 90,911 | | | | 116,379 | | | | — | | | | 207,290 | |
| Accumulated depreciation | | | — | | | | (64,557 | ) | | | (31,614 | ) | | | — | | | | (96,171 | ) |
| Property and equipment, net | | | — | | | | 26,354 | | | | 84,765 | | | | — | | | | 111,119 | |
| Investment in subsidiaries | | | (47,735 | ) | | | — | | | | — | | | | 47,735 | | | | — | |
| Non-current deferred income tax assets, net | | | — | | | | 1,221 | | | | — | | | | (397 | ) | | | 824 | |
| Other non-current assets | | | — | | | | 11,768 | | | | 4,810 | | | | — | | | | 16,578 | |
| Total assets | | $ | 21,556 | | | $ | 464,789 | | | $ | 91,788 | | | $ | (47,887 | ) | | $ | 530,246 | |
| Liabilities: | | | | | | | | | | | | | | | | | | | | |
| Current liabilities: | | | | | | | | | | | | | | | | | | | | |
| Accounts payable | | $ | 1,080 | | | $ | 59,283 | | | $ | — | | | $ | — | | | | 60,363 | |
| Bank overdrafts | | | — | | | | 19,377 | | | | — | | | | — | | | | 19,377 | |
| Accrued compensation | | | — | | | | 4,173 | | | | — | | | | — | | | | 4,173 | |
| Current maturities of long-term debt | | | — | | | | — | | | | 9,141 | | | | — | | | | 9,141 | |
| Deferred income tax liabilities, net | | | — | | | | 1,220 | | | | — | | | | (397 | ) | | | 823 | |
| Other current liabilities | | | — | | | | 11,727 | | | | 1,222 | | | | — | | | | 12,949 | |
| Intercompany payable | | | 26,374 | | | | 68,454 | | | | — | | | | (94,828 | ) | | | — | |
| Total current liabilities | | | 27,454 | | | | 164,234 | | | | 10,363 | | | | (95,225 | ) | | | 106,826 | |
| Non-current liabilities: | | | | | | | | | | | | | | | | | | | | |
| Long-term debt | | | — | | | | 211,193 | | | | 177,802 | | | | — | | | | 388,995 | |
| Non-current deferred income taxes | | | — | | | | — | | | | 397 | | | | (397 | ) | | | — | |
| Other non-current liabilities | | | — | | | | 40,323 | | | | — | | | | — | | | | 40,323 | |
| Total liabilities | | | 27,454 | | | | 415,750 | | | | 188,562 | | | | (95,622 | ) | | | 536,144 | |
| Stockholders’ (deficit) equity/Parent’s Investment | | | (5,898 | ) | | | 49,039 | | | | (96,774 | ) | | | 47,735 | | | | (5,898 | ) |
| Total liabilities and (deficit) equity | | $ | 21,556 | | | $ | 464,789 | | | $ | 91,788 | | | $ | (47,887 | ) | | $ | 530,246 | |
The condensed consolidating balance sheet for BlueLinx Holdings Inc. as of December 29, 2012 follows (in thousands):
| | | | | | | | | | | | | | | | | | | | | |
| | | BlueLinx Holdings Inc. | | | BlueLinx Corporation
and Subsidiaries | | | LLC Subsidiaries | | | Eliminations | | | Consolidated | |
| Assets: | | | | | | | | | | | | | | | |
| Current assets: | | | | | | | | | | | | | | | |
| Cash | | $ | 28 | | | $ | 5,160 | | | $ | — | | | $ | — | | | $ | 5,188 | |
| Receivables | | | — | | | | 157,465 | | | | — | | | | — | | | | 157,465 | |
| Inventories | | | — | | | | 230,059 | | | | — | | | | — | | | | 230,059 | |
| Other current assets | | | 1,596 | | | | 17,790 | | | | 41 | | | | — | | | | 19,427 | |
| Intercompany receivable | | | 73,981 | | | | 28,814 | | | | — | | | | (102,795 | ) | | | — | |
| Total current assets | | | 75,605 | | | | 439,288 | | | | 41 | | | | (102,795 | ) | | | 412,139 | |
| Property and equipment: | | | | | | | | | | | | | | | | | | | | |
| Land and land improvements | | | — | | | | 3,250 | | | | 39,870 | | | | — | | | | 43,120 | |
| Buildings | | | — | | | | 10,213 | | | | 83,857 | | | | — | | | | 94,070 | |
| Machinery and equipment | | | — | | | | 78,674 | | | | — | | | | — | | | | 78,674 | |
| Construction in progress | | | — | | | | 1,173 | | | | — | | | | — | | | | 1,173 | |
| Property and equipment, at cost | | | — | | | | 93,310 | | | | 123,727 | | | | — | | | | 217,037 | |
| Accumulated depreciation | | | — | | | | (71,583 | ) | | | (30,101 | ) | | | — | | | | (101,684 | ) |
| Property and equipment, net | | | — | | | | 21,727 | | | | 93,626 | | | | — | | | | 115,353 | |
| Investment in subsidiaries | | | (67,053 | ) | | | — | | | | — | | | | 67,053 | | | | — | |
| Non-current deferred income tax assets, net | | | — | | | | 445 | | | | — | | | | — | | | | 445 | |
| Other non-current assets | | | — | | | | 10,646 | | | | 6,153 | | | | — | | | | 16,799 | |
| Total assets | | $ | 8,552 | | | $ | 472,106 | | | $ | 99,820 | | | $ | (35,742 | ) | | $ | 544,736 | |
| Liabilities: | | | | | | | | | | | | | | | | | | | | |
| Current liabilities: | | | | | | | | | | | | | | | | | | | | |
| Accounts payable | | $ | 203 | | | $ | 77,257 | | | $ | 390 | | | $ | — | | | | 77,850 | |
| Bank overdrafts | | | — | | | | 35,384 | | | | — | | | | — | | | | 35,384 | |
| Accrued compensation | | | 127 | | | | 6,043 | | | | — | | | | — | | | | 6,170 | |
| Current maturities of long-term debt | | | — | | | | — | | | | 8,946 | | | | — | | | | 8,946 | |
| Deferred income tax liabilities, net | | | — | | | | 449 | | | | — | | | | — | | | | 449 | |
| Other current liabilities | | | — | | | | 9,831 | | | | 1,106 | | | | — | | | | 10,937 | |
| Intercompany payable | | | 28,814 | | | | 73,981 | | | | — | | | | (102,795 | ) | | | — | |
| Total current liabilities | | | 29,144 | | | | 202,945 | | | | 10,442 | | | | (102,795 | ) | | | 139,736 | |
| Non-current liabilities: | | | | | | | | | | | | | | | | | | | | |
| Long-term debt | | | — | | | | 171,412 | | | | 197,034 | | | | — | | | | 368,446 | |
| Other non-current liabilities | | | — | | | | 57,146 | | | | — | | | | — | | | | 57,146 | |
| Total liabilities | | | 29,144 | | | | 431,503 | | | | 207,476 | | | | (102,795 | ) | | | 565,328 | |
| Stockholders’ (deficit) equity/Parent’s Investment | | | (20,592 | ) | | | 40,603 | | | | (107,656 | ) | | | 67,053 | | | | (20,592 | ) |
| Total liabilities and (deficit) equity | | $ | 8,552 | | | $ | 472,106 | | | $ | 99,820 | | | $ | (35,742 | ) | | $ | 544,736 | |
The condensed consolidating statement of cash flows for BlueLinx Holdings Inc. for the fiscal year endedJanuary 4, 2014 follows (in thousands):
| | | | | | | | | | | | | | | | |
| | | BlueLinx Holdings Inc. | | | BlueLinx Corporation | | | LLC Subsidiaries | | | Eliminations | | | Consolidated | |
| Cash flows from operating activities: | | | | | | | | | | | | | | | | | | | | |
| Net (loss) income | | $ | (40,618 | ) | | $ | (49,205 | ) | | $ | 14,343 | | | $ | 34,862 | | | $ | (40,618 | ) |
| Adjustments to reconcile net (loss) income to cash (used in) provided by operating activities: | | | | | | | | | | | | | | | | | | | | |
| Depreciation and amortization | | | — | | | | 5,700 | | | | 3,417 | | | | — | | | | 9,117 | |
| Amortization of debt issue costs | | | — | | | | 1,841 | | | | 1,343 | | | | — | | | | 3,184 | |
| Write-off of debt issuance costs | | | — | | | | 119 | | | | — | | | | — | | | | 119 | |
| Loss (gain) from sale of properties | | | — | | | | 554 | | | | (5,774 | ) | | | — | | | | (5,220 | ) |
| Gain from property insurance settlement | | | — | | | | — | | | | — | | | | — | | | | — | |
| Vacant property charges, net | | | — | | | | 1,321 | | | | — | | | | — | | | | 1,321 | |
| Severance charges | | | — | | | | 5,607 | | | | — | | | | — | | | | 5,607 | |
| Payments on modification of lease agreement | | | — | | | | (300 | ) | | | — | | | | — | | | | (300 | ) |
| Deferred income tax benefit | | | — | | | | (5 | ) | | | (397) | | | | 397 | | | | (5 | ) |
| Intraperiod income tax allocation related to the hourly pension plan | | | — | | | | (8,894 | ) | | | — | | | | — | | | | (8,894 | ) |
| Pension expense | | | — | | | | 4,591 | | | | — | | | | — | | | | 4,591 | |
| Share-based compensation, excluding restructuring related | | | 904 | | | | 2,318 | | | | — | | | | — | | | | 3,222 | |
| Share-based compensation, restructuring related | | | — | | | | 2,895 | | | | — | | | | — | | | | 2,895 | |
| Increase in restricted cash related to insurance and other | | | — | | | | (1,810 | ) | | | — | | | | — | | | | (1,810 | ) |
| Accrued compensation and other | | | 684 | | | | (10,064 | ) | | | 625 | | | | (397) | | | | (9,152 | ) |
| Equity (deficit) in earnings of subsidiaries | | | 34,862 | | | | — | | | | — | | | | (34,862 | ) | | | — | |
| Intercompany receivable | | | 5,527 | | | | 2,440 | | | | — | | | | (7,967 | ) | | | — | |
| Intercompany payable | | | (2,440 | ) | | | (5,527 | ) | | | — | | | | 7,967 | | | | — | |
| | | | (1,081 | ) | | | (48,419 | ) | | | 13,557 | | | | — | | | | (35,943 | ) |
| Changes in primary working capital components: | | | | | | | | | | | | | | | | | | | | |
| Receivables | | | — | | | | 7,168 | | | | — | | | | — | | | | 7,168 | |
| Inventories | | | — | | | | 6,479 | | | | — | | | | — | | | | 6,479 | |
| Accounts payable | | | 779 | | | | (17,973 | ) | | | (391 | ) | | | — | | | | (17,585 | ) |
| Net cash (used in) provided by operating activities | | | (302 | ) | | | (52,745 | ) | | | 13,166 | | | | — | | | | (39,881 | ) |
| Cash flows from investing activities: | | | | | | | | | | | | | | | | | | | | |
| Investment in subsidiaries | | | (35,202 | ) | | | 38,663 | | | | (3,461 | ) | | | — | | | | — | |
| Property, plant and equipment investments | | | — | | | | (4,912 | ) | | | — | | | | — | | | | (4,912 | ) |
| Proceeds from disposition of assets | | | — | | | | 1,072 | | | | 9,293 | | | | — | | | | 10,365 | |
| Net cash provided by (used in) investing activities | | | (35,202 | ) | | | 34,823 | | | | 5,832 | | | | — | | | | 5,453 | |
| Cash flows from financing activities: | | | | | | | | | | | | | | | | | | | | |
| Excess tax benefits from share-based compensation arrangements | | | — | | | | 16 | | | | — | | | | — | | | | 16 | |
| Repurchase of shares to satisfy employee tax withholdings | | | (3,192 | ) | | | — | | | | — | | | | — | | | | (3,192 | ) |
| Repayments on revolving credit facilities | | | — | | | | (560,186 | ) | | | — | | | | — | | | | (560,186 | ) |
| Borrowings on revolving credit facilities | | | — | | | | 599,968 | | | | — | | | | — | | | | 599,968 | |
| Payments of principal on mortgage | | | — | | | | — | | | | (19,038 | ) | | | — | | | | (19,038 | ) |
| Payments on capital lease obligations | | | — | | | | (3,142 | ) | | | — | | | | — | | | | (3,142 | ) |
| (Decrease) increase in bank overdrafts | | | — | | | | (16,007 | ) | | | — | | | | — | | | | (16,007 | ) |
| Increase in restricted cash related to the mortgage | | | — | | | | — | | | | 40 | | | | — | | | | 40 | |
| Proceeds from rights offering, less expenses paid | | | 38,715 | | | | — | | | | — | | | | — | | | | 38,715 | |
| Debt issuance costs | | | — | | | | (2,900 | ) | | | — | | | | — | | | | (2,900 | ) |
| Net cash provided by (used in) financing activities | | | 35,523 | | | | 17,749 | | | | (18,998 | ) | | | — | | | | 34,274 | |
| Increase (decrease) in cash | | | 19 | | | | (173 | ) | | | — | | | | — | | | | (154 | ) |
| Balance, beginning of period | | | 28 | | | | 5,160 | | | | — | | | | — | | | | 5,188 | |
| Balance, end of period | | $ | 47 | | | $ | 4,987 | | | $ | — | | | $ | — | | | $ | 5,034 | |
| Supplemental cash flow information: | | | | | | | | | | | | | | | | | | | | |
| Net income tax refunds (income taxes paid) during the period | | $ | — | | | $ | (61 | ) | | $ | (271 | ) | | $ | — | | | $ | (332 | ) |
| Interest paid during the period | | $ | 13,480 | | | $ | 11,226 | | | $ | — | | | $ | — | | | $ | 24,706 | |
| | | | | | | | | | | | | | | | | | | | | |
| Noncash transactions: | | | | | | | | | | | | | | | | | | | | |
| Capital leases | | $ | — | | | $ | 5,069 | | | $ | — | | | $ | — | | | $ | 5,069 | |
The condensed consolidating statement of cash flows for BlueLinx Holdings Inc. for the fiscal year ended December 29, 2012 follows (in thousands):
| | | | | | | | | | | | | | | | |
| | | BlueLinx Holdings Inc. | | | BlueLinx Corporation | | | LLC Subsidiaries | | | Eliminations | | | Consolidated | |
Cash flowsfrom operating activities: | | | | | | | | | | | | | | | |
| Net (loss) income | | $ | (23,027 | ) | | $ | (37,237 | ) | | $ | 18,536 | | | $ | 18,701 | | | $ | (23,027 | ) |
| Adjustments to reconcile net (loss) income to cash (used in) providedby operations: | | | | | | | | | | | | | | | | | | | | |
| Depreciation and amortization | | | — | | | | 5,040 | | | | 3,525 | | | | — | | | | 8,565 | |
| Amortization of debt issue costs | | | — | | | | 2,471 | | | | 1,275 | | | | — | | | | 3,746 | |
| Write-off of debt issuance costs | | | — | | | | — | | | | — | | | | — | | | | — | |
| Gain from sale of properties | | | — | | | | — | | | | (9,885 | ) | | | — | | | | (9,885 | ) |
| Gain from property insurance settlement | | | — | | | | — | | | | (476 | ) | | | — | | | | (476 | ) |
| Vacant property charges, net | | | — | | | | (30 | ) | | | — | | | | — | | | | (30 | ) |
| Severance charges | | | — | | | | — | | | | — | | | | — | | | | — | |
| Payments on modification of lease agreement | | | — | | | | (5,875 | ) | | | — | | | | — | | | | (5,875 | ) |
| Deferred income tax benefit | | | — | | | | (20 | ) | | | — | | | | — | | | | (20 | ) |
| Pension expense | | | — | | | | 3,942 | | | | — | | | | — | | | | 3,942 | |
| Share-based compensation, excluding restructuring related | | | 528 | | | | 2,269 | | | | — | | | | — | | | | 2,797 | |
| Share-based compensation, restructuring related | | | — | | | | — | | | | — | | | | — | | | | — | |
| Decrease in restricted cash related to the ineffective interest swap, insurance, and other | | | — | | | | 695 | | | | — | | | | — | | | | 695 | |
| Accrued compensation and other | | | (971 | ) | | | 875 | | | | (561 | ) | | | — | | | | (657 | ) |
| Equity (deficit) in earnings of subsidiaries | | | 18,701 | | | | — | | | | — | | | | (18,701 | ) | | | — | |
| Intercompany receivable | | | (6,940 | ) | | | (10,332 | ) | | | — | | | | 17,272 | | | | — | |
| Intercompany payable | | | 10,332 | | | | 6,940 | | | | — | | | | (17,272 | ) | | | — | |
| | | | (1,377 | ) | | | (31,262 | ) | | | 12,414 | | | | — | | | | (20,225 | ) |
| Changes in primary working capital components: | | | | | | | | | | | | | | | | | | | | |
| Receivables | | | — | | | | (18,593 | ) | | | — | | | | — | | | | (18,593 | ) |
| Inventories | | | — | | | | (44,482 | ) | | | — | | | | — | | | | (44,482 | ) |
| Accounts payable | | | 42 | | | | 8,619 | | | | 389 | | | | — | | | | 9,050 | |
| Net cash (used in) provided by operating activities | | | (1,335 | ) | | | (85,718 | ) | | | 12,803 | | | | — | | | | (74,250 | ) |
Cash flows from investing activities: | | | | | | | | | | | | | | | | | | | | |
| Investment in subsidiaries | | | 1,862 | | | | 154 | | | | (2,016 | ) | | | — | | | | — | |
| Property, plant and equipment investments | | | — | | | | (2,826 | ) | | | | | | | — | | | | (2,826 | ) |
| Proceeds from disposition of assets | | | — | | | | 997 | | | | 18,198 | | | | — | | | | 19,195 | |
| Net cash provided by (used in) investing activities | | | 1,862 | | | | (1,675 | ) | | | 16,182 | | | | — | | | | 16,369 | |
Cash flows from financing activities: | | | | | | | | | | | | | | | | | | | | |
| Excess tax benefits from share-based compensation arrangements | | | — | | | | — | | | | — | | | | — | | | | — | |
| Repurchase of shares to satisfy employee tax withholdings | | | (526 | ) | | | — | | | | — | | | | — | | | | (526 | ) |
| Repayments on revolving credit facilities | | | — | | | | (473,349 | ) | | | — | | | | — | | | | (473,349 | ) |
| Borrowings on revolving credit facilities | | | — | | | | 550,270 | | | | — | | | | — | | | | 550,270 | |
| Principal payments on mortgage | | | — | | | | — | | | | (37,272 | ) | | | — | | | | (37,272 | ) |
| Payments on capital lease obligations | | | — | | | | (2,259 | ) | | | — | | | | — | | | | (2,259 | ) |
| Increase in bank overdrafts | | | — | | | | 13,020 | | | | — | | | | — | | | | 13,020 | |
| Decrease in restricted cash related to the mortgage | | | — | | | | — | | | | 9,970 | | | | — | | | | 9,970 | |
| Debt financing costs | | | — | | | | — | | | | (1,683 | ) | | | — | | | | (1,683 | ) |
| Net cash (used in) provided by financing activities | | | (526 | ) | | | 87,682 | | | | (28,985 | ) | | | — | | | | 58,171 | |
| Increase in cash | | | 1 | | | | 289 | | | | — | | | | — | | | | 290 | |
| Cash and cash equivalents balance, beginning of period | | | 27 | | | | 4,871 | | | | — | | | | — | | | | 4,898 | |
| Cash and cash equivalents balance, end of period | | $ | 28 | | | $ | 5,160 | | | $ | — | | | $ | — | | | $ | 5,188 | |
Supplemental cash flow information: | | | | | | | | | | | | | | | | | | | | |
| Net income tax refunds (income taxes paid) during the period | | $ | — | | | $ | 37 | | | $ | (545 | ) | | $ | — | | | $ | (508 | ) |
| Interest paid during the period | | $ | — | | | $ | 9,309 | | | $ | 14,979 | | | $ | — | | | $ | 24,288 | |
| | | | | | | | | | | | | | | | | | | | | |
| Noncash transactions: | | | | | | | | | | | | | | | | | | | | |
| Capital leases | | $ | — | | | $ | 5,238 | | | $ | — | | | $ | — | | | $ | 5,238 | |
The condensed consolidating statement of cash flows for BlueLinx Holdings Inc. for the fiscal year ended December 31, 2011 follows (in thousands):
| | | | | | | | | | | | | | | | |
| | | BlueLinx Holdings Inc. | | | BlueLinx Corporation | | | LLC Subsidiaries | | | Eliminations | | | Consolidated | |
Cash flows from operating activities: | | | | | | | | | | | | | | | |
| Net (loss) income | | $ | (38,567 | ) | | $ | (52,910 | ) | | $ | 18,530 | | | $ | 34,380 | | | $ | (38,567 | ) |
| Adjustments to reconcile net (loss) income to cash (used in) provided by operations: | | | | | | | | | | | | | | | | | | | | |
| Depreciation and amortization | | | — | | | | 6,790 | | | | 3,772 | | | | — | | | | 10,562 | |
| Amortization of debt issue costs | | | — | | | | 1,983 | | | | 957 | | | | — | | | | 2,940 | |
| Write-off of debt issuance costs | | | — | | | | — | | | | — | | | | — | | | | — | |
| Gain from sale of properties | | | — | | | | — | | | | (10,604 | ) | | | — | | | | (10,604 | ) |
| Gain from property insurance settlement | | | — | | | | — | | | | (1,230 | ) | | | — | | | | (1,230 | ) |
| Changes associated with ineffective interest rate swap | | | — | | | | (1,676 | ) | | | — | | | | — | | | | (1,676 | ) |
| Vacant property charges, net | | | — | | | | (291 | ) | | | — | | | | — | | | | (291 | ) |
| Severance charges | | | — | | | | — | | | | — | | | | — | | | | — | |
| Gain on modification of lease agreement | | | — | | | | (1,971 | ) | | | — | | | | — | | | | (1,971 | ) |
| Deferred income tax benefit | | | — | | | | (25 | ) | | | — | | | | — | | | | (25 | ) |
| Pension expense | | | — | | | | 1,774 | | | | — | | | | — | | | | 1,774 | |
| Share-based compensation, excluding restructuring related | | | — | | | | 1,602 | | | | 372 | | | | — | | | | 1,974 | |
| Share-based compensation, restructuring related | | | — | | | | — | | | | — | | | | — | | | | — | |
| Decrease in restricted cash related to the ineffective interest swap, insurance, and other | | | — | | | | 987 | | | | — | | | | — | | | | 987 | |
| Accrued compensation and other | | | 167 | | | | — | | | | (2,104 | ) | | | (1,244 | ) | | | (3,181 | ) |
| Equity in earnings of subsidiaries | | | 34,380 | | | | — | | | | — | | | | (34,380 | ) | | | — | |
| Intercompany receivable | | | (9,829 | ) | | | (9,727 | ) | | | — | | | | 19,556 | | | | — | |
| Intercompany payable | | | 9,218 | | | | 9,094 | | | | — | | | | (18,312 | ) | | | — | |
| | | | (4,631 | ) | | | (44,370 | ) | | | 9,693 | | | | — | | | | (39,308 | ) |
| Changes in assets and liabilities: | | | | | | | | | | | | | | | | | | | | |
| Receivables | | | — | | | | (19,670 | ) | | | — | | | | — | | | | (19,670 | ) |
| Inventories | | | — | | | | 2,673 | | | | — | | | | — | | | | 2,673 | |
| Accounts payable | | | 102 | | | | 5,871 | | | | — | | | | — | | | | 5,973 | |
| Net cash (used in) provided by operating activities | | | (4,529 | ) | | | (55,496 | ) | | | 9,693 | | | | — | | | | (50,332 | ) |
Cash flows from investing activities: | | | | | | | | | | | | | | | | | | | | |
| Investment in subsidiaries | | | (54,349 | ) | | | 55,209 | | | | (860 | ) | | | — | | | | — | |
| Property, plant and equipment investments | | | — | | | | (3,203 | ) | | | (3,330 | ) | | | — | | | | (6,533 | ) |
| Proceeds from sale of assets | | | — | | | | 504 | | | | 17,851 | | | | — | | | | 18,355 | |
| Net cash (used in) provided by investing activities | | | (54,349 | ) | | | 52,510 | | | | 13,661 | | | | — | | | | 11,822 | |
Cash flows from financing activities: | | | | | | | | | | | | | | | | | | | | |
| Excess tax benefits from share-based compensation arrangements | | | — | | | | — | | | | — | | | | — | | | | — | |
| Repayments on revolving credit facilities | | | — | | | | (478,630 | ) | | | — | | | | — | | | | (478,630 | ) |
| Borrowings on revolving credit facilities | | | — | | | | 475,918 | | | | — | | | | — | | | | 475,918 | |
| Principal payments on mortgage | | | — | | | | — | | | | (42,416 | ) | | | — | | | | (42,416 | ) |
| Payments on capital lease obligations | | | — | | | | (1,440 | ) | | | — | | | | — | | | | (1,440 | ) |
| Decrease in bank overdrafts | | | — | | | | (725 | ) | | | — | | | | — | | | | (725 | ) |
| Decrease in restricted cash related to the mortgage | | | — | | | | — | | | | 20,604 | | | | — | | | | 20,604 | |
| Debt financing costs | | | — | | | | (1,179 | ) | | | (1,542 | ) | | | — | | | | (2,721 | ) |
| Proceeds from stock offering less expenses paid | | | 58,521 | | | | — | | | | — | | | | — | | | | 58,521 | |
| Net cash provided by (used in) financing activities | | | 58,521 | | | | (6,056 | ) | | | (23,354 | ) | | | — | | | | 29,111 | |
| Decrease in cash | | | (357 | ) | | | (9,042 | ) | | | — | | | | — | | | | (9,399 | ) |
| Cash and cash equivalents balance, beginning of period | | | 384 | | | | 13,913 | | | | — | | | | — | | | | 14,297 | |
| Cash and cash equivalents balance, end of period | | $ | 27 | | | $ | 4,871 | | | $ | — | | | $ | — | | | $ | 4,898 | |
Supplemental cash flow information: | | | | | | | | | | | | | | | | | | | | |
| Net income tax refunds (income taxes paid) during the period | | $ | — | | | $ | 231 | | | $ | (253 | ) | | $ | — | | | $ | (22 | ) |
| Interest paid during the period | | $ | — | | | $ | 10,783 | | | $ | 17,315 | | | $ | — | | | $ | 28,098 | |
| | | | | | | | | | | | | | | | | | | | | |
| Noncash transactions: | | | | | | | | | | | | | | | | | | | | |
| Capital leases | | $ | — | | | $ | 3,131 | | | $ | — | | | $ | — | | | $ | 3,131 | |
The condensed consolidating statement of stockholders’ equity (deficit) for BlueLinx Holdings Inc. for fiscal 2011, fiscal 2012, and fiscal 2013 follows (in thousands):
| | | BlueLinx Holdings Inc. | | | BlueLinx Corporation and Subsidiaries | | | LLC Subsidiaries | | | Eliminations | | | Consolidated | |
| Balance, January 1, 2011 | | $ | 991 | | | $ | 94,273 | | | $ | (140,314 | ) | | $ | 46,041 | | | $ | 991 | |
Net (loss) income | | | (38,567 | ) | | | (52,910 | ) | | | 18,530 | | | | 34.380 | | | | (38,567 | ) |
| Foreign currency translation adjustment, net of tax | | | (92 | ) | | | (92 | ) | | | — | | | | 92 | | | | (92 | ) |
| Unrealized (loss) income from pension plan, net of tax | | | (14,969 | ) | | | (14,969 | ) | | | — | | | | 14,969 | | | | (14,969 | ) |
| Unrealized gain (loss) from cash flow hedge, net of tax | | | 519 | | | | 519 | | | | — | | | | (519 | ) | | | 519 | |
| Issuance of restricted stock, net of forfeitures | | | 7 | | | | — | | | | — | | | | — | | | | 7 | |
| Issuance of stock related to the rights offering, net of expenses | | | 58,521 | | | | — | | | | — | | | | — | | | | 58,521 | |
| Compensation related to share-based grants | | | 2,158 | | | | — | | | | — | | | | — | | | | 2,158 | |
| Impact of net settled shares for vested grants | | | (194 | ) | | | — | | | | — | | | | — | | | | (194 | ) |
| | | | | | | | | | | | | | | | | | | | | |
| Net transactions with the Parent | | | — | | | | 56,805 | | | | (2,391 | ) | | | (54,414 | ) | | | — | |
| Balance, December 31, 2011 | | $ | 8,374 | | | $ | 83,626 | | | $ | (124,175 | ) | | $ | 40,549 | | | $ | 8,374 | |
Net (loss) income | | | (23,027 | ) | | | (37,237 | ) | | | 18,536 | | | | 18,701 | | | | (23,027 | ) |
| Foreign currency translation adjustment, net of tax | | | 103 | | | | 103 | | | | — | | | | (103 | ) | | | 103 | |
| Unrealized loss (income) from pension plan, net of tax | | | (8,245 | ) | | | (8,245 | ) | | | — | | | | 8,245 | | | | (8,245 | ) |
| Issuance of restricted stock, net of forfeitures | | | 19 | | | | 19 | | | | — | | | | (19 | ) | | | 19 | |
| Compensation related to share-based grants | | | 2,730 | | | | — | | | | — | | | | — | | | | 2,730 | |
| Impact of net settled shares for vested grants | | | (526 | ) | | | — | | | | — | | | | — | | | | (526 | ) |
| Other | | | (20 | ) | | | — | | | | — | | | | — | | | | (20 | ) |
| | | | | | | | | | | | | | | | | | | | | |
| Net transactions with the Parent | | | — | | | | 2,337 | | | | (2,017 | ) | | | (320 | ) | | | — | |
| Balance, December 29, 2012 | | $ | (20,592 | ) | | $ | 40,603 | | | $ | (107,656 | ) | | $ | 67,053 | | | $ | (20,592 | ) |
Net (loss) income | | | (40,618 | ) | | | (49,205 | ) | | | 14,343 | | | | 34,862 | | | | (40,618 | ) |
| Foreign currency translation adjustment, net of tax | | | (161 | ) | | | (161 | ) | | | — | | | | 161 | | | | (161 | ) |
| Unrealized income (loss) from pension plan, net of tax | | | 13,910 | | | | 13,910 | | | | — | | | | (13,910 | ) | | | 13,910 | |
| Issuance of restricted stock, net of forfeitures | | | 6 | | | | 6 | | | | — | | | | (6 | ) | | | 6 | |
| Issuance of performance shares | | | 6 | | | | 6 | | | | — | | | | (6 | ) | | | 6 | |
| Issuance of stock related to the rights offering, net of expenses | | | 38,613 | | | | — | | | | — | | | | — | | | | 38,613 | |
| Compensation related to share-based grants | | | 6,117 | | | | — | | | | — | | | | — | | | | 6,117 | |
| Impact of net settled shares for vested grants | | | (3,193 | ) | | | — | | | | — | | | | — | | | | (3,193 | ) |
| Excess tax benefits from share-based compensation arrangements | | | 16 | | | | — | | | | — | | | | — | | | | 16 | |
| Other | | | (2 | ) | | | — | | | | — | | | | — | | | | (2 | ) |
| | | | | | | | | | | | | | | | | | | | | |
| Net transactions with the Parent | | | — | | | | 43,880 | | | | (3,461 | ) | | | (40,419 | ) | | | — | |
| | | | | | | | | | | | | | | | | | | | | |
| Balance, January 4, 2014 | | $ | (5,898 | ) | | $ | 49,039 | | | $ | (96,774 | ) | | $ | 47,735 | | | $ | (5,898 | ) |
None.
Conclusion Regarding the Effectiveness of Disclosure Controls and Procedures
We maintain disclosure controls and procedures designed to ensure that information required to be disclosed in our reports pursuant to the Securities Exchange Act of 1934, as amended (the “Exchange Act”), is recorded, processed, summarized and reported within the time periods specified in the SEC’s rules and forms, and that such information is accumulated and communicated to our management, including our chief executive officer and chief financial officer, as appropriate, to allow timely decisions regarding required disclosure. Management necessarily applied its judgment in assessing the costs and benefits of such controls and procedures that, by their nature, can provide only reasonable assurance regarding management’s control objectives.
Our management performed an evaluation, as of the end of the period covered by this Annual Report on Form 10-K, under the supervision of our chief executive officer and chief financial officer of the effectiveness of the design and operation of our disclosure controls and procedures (as defined in rule 13a-15(e) and 15d-15(e) of the Exchange Act). Based on that evaluation, our chief executive officer and chief financial officer have concluded that our disclosure controls and procedures are effective to ensure that information required to be disclosed by us in reports that we file or submit under the Exchange Act is recorded, processed, summarized and reported within the time periods specified in the SEC’s rules and forms, and is accumulated and communicated to our management including our chief executive officer and chief financial officer, to allow timely decisions regarding required disclosure.
Management’s Report on Internal Control over Financial Reporting
Management’s Report on Internal Control Over Financial Reporting and the Report of Independent Registered Public Accounting Firm thereon are set out in Item 8 of this Annual Report on Form 10-K.
Changes in Internal Control over Financial Reporting
No change in our internal control over financial reporting occurred during the fiscal quarter ended January 4, 2014 that materially affected, or is reasonably likely to materially affect, our internal control over financial reporting.
The certifications of our Chief Executive Officer and Chief Financial Officer required by Section 302 of the Sarbanes-Oxley Act of 2002 are filed as Exhibits 31.1 and 31.2 to this Annual Report on Form 10-K. Additionally, as required by Section 303A.12 (a) of the NYSE Listed Company Manual, our acting Chief Executive Officer filed a certification with the NYSE on May 16, 2013 reporting that he was not aware of any violation by us of the NYSE’s Corporate Governance listing standards. On November 1, 2012, our Chief Executive Officer filed an interim written affirmation with the NYSE reporting that the Company was out of compliance with the NYSE’s Corporate governance listing standards due to only having two directors on the Company’s Audit Committee (following the resignation of Charles H. McElrea), rather than the three directors required by Section 303A.07(a) of the NYSE Listed Company Manual. On February 14, 2013, the Board affirmatively determined Mr. M. Richard Warner to be independent. Mr. Warner joined the Audit Committee as the third director on the Company’s Audit Committee, bringing the Company back into compliance with Section 303A.07(a) of the NYSE Listed Company Manual.
None.
Certain information required by this Item is set forth in our definitive proxy statement for the 2014 Annual Meeting of Stockholders of BlueLinx Holdings Inc. to be held on May 15, 2014, and is incorporated herein by reference. Information regarding executive officers is included under Item 1 of this report and is incorporated herein by reference.
The information required by this Item is set forth in our definitive proxy statement for the 2014 Annual Meeting of Stockholders of BlueLinx Holdings Inc. to be held on May 15, 2014, and is incorporated herein by reference.
Except as set forth below, the information required by this Item is set forth in our definitive proxy statement for the 2014 Annual Meeting of Stockholders of BlueLinx Holdings Inc. to be held on May 15, 2014, and is incorporated herein by reference.
Equity Compensation Plan Information
The following table provides information about the shares of our common stock that may be issued upon the exercise of options and other awards under our existing equity compensation plans as of January 4, 2014. Our stockholder-approved equity compensation plans are the 2004 Equity Incentive Plan and the 2006 Long-Term Equity Incentive Plan. We do not have any non-stockholder approved equity compensation plans.
| | | (a) | | | (b) | | (c) |
Plan Category | | Number of Securities to be Issued Upon Exercise of Outstanding Options, Warrants and Rights | | | Weighted-Average Exercise Price of Outstanding Options, Warrants and Rights | | Number of Securities Remaining Available for Future Issuance Under Equity Compensation Plans (Excluding Securities Reflected in Column (a)) |
| Equity compensation plans approved by security holders | | 784,500 | | | | $ 5.05 | | | 5,526,285 | |
| Equity compensation plans not approved by security holders | | — | | | | n/a | | | — | |
| Total | | 784,500 | | | | $ 5.05 | | | 5,526,285 | |
The information required by this Item is set forth in our definitive proxy statement for the 2014 Annual Meeting of Stockholders of BlueLinx Holdings Inc. to be held on May 15, 2014, and is incorporated herein by reference.
The information required by this Item is set forth in our definitive proxy statement for the 2014 Annual Meeting of Stockholders of BlueLinx Holdings Inc. to be held on May 15, 2014, and is incorporated herein by reference.
ITEM 15. EXHIBITS, FINANCIAL STATEMENT SCHEDULES.
(a) Financial Statements, Schedules and Exhibits
1. Financial Statements.The Financial Statements of BlueLinx Holdings Inc. and the Reports of Independent Registered Public Accounting Firm are presented under Item 8 of this Form 10-K.
2. Financial Statement Schedules.Not applicable.
3. Exhibits.
| | |
| | | |
| 3.1 | | Second Amended and Restated Certificate of Incorporation of BlueLinx (A) |
| | | |
| 3.2 | | Amended and Restated By-Laws of BlueLinx(B) |
| | | |
| 4.1 | | Registration Rights Agreement, dated as of May 7, 2004, by and among BlueLinx and the initial holders specified on the signature pages thereto(C) |
| | | |
| 4.2 | | Letter Agreement, dated as of August 30, 2004, by and among BlueLinx, Cerberus ABP Investor LLC, Charles H. McElrea, George R. Judd, David J. Morris, James C. Herbig, Wayne E. Wiggleton and Steven C. Hardin(C) |
| | | |
| 4.3 | | Investment Letter, dated March 10, 2004, between BlueLinx and Cerberus ABP Investor LLC, as Purchaser of Common Stock(D) |
| | | |
| 4.4 | | Investment Letter, dated May 7, 2004, between BlueLinx and Cerberus ABP Investor LLC, as Purchaser of Common Stock(D) |
| | | |
| 4.5 | | Executive Purchase Agreement dated May 7, 2004 by and among BlueLinx, Cerberus ABP Investor LLC and Charles H. McElrea(D) |
| | | |
| 4.6 | | Executive Purchase Agreement dated May 7, 2004 by and among BlueLinx, Cerberus ABP Investor LLC and George R. Judd(D) |
4.7 | | Registration Rights Agreement, dated as of June 16, 2011 between BlueLinx Holdings Inc. and Stadium Capital Management, LLC (incorporated by reference to Form 8-K filed with the Securities and Exchange Commission on June 20, 2011) |
| 10.1 | | Asset Purchase Agreement, dated as of March 12, 2004, by and among Georgia-Pacific Corporation, Georgia-Pacific Building Materials Sales, Ltd. and BlueLinx Corporation(C) |
| 10.2 | | First Amendment to Asset Purchase Agreement, dated as of May 6, 2004, by and among Georgia-Pacific Corporation, Georgia-Pacific Building Materials Sales, Ltd. and BlueLinx Corporation(C) |
| 10.3† | | Master Purchase, Supply and Distribution Agreement, dated May 7, 2004 by and between BlueLinx Corporation and Georgia-Pacific(B) |
| 10.4 | | Form of Director and Officer Indemnification Agreement (incorporated by reference to Form 8-K filed with the Securities and Exchange Commission on January 13, 2011) |
| | | |
| 10.5 | | BlueLinx Holdings Inc. Amended and Restated Short-Term Incentive Plan (incorporated by reference to Attachment B to the Definitive Proxy Statement for the 2011 Annual Meeting of Stockholders, filed with the Securities and Exchange Commission on April 18, 2011) |
| 10.6 | | BlueLinx Holdings Inc. 2004 Long Term Equity Incentive Plan(C) |
| 10.7 | | BlueLinx Holdings Inc. 2004 Long-Term Equity Incentive Plan Form of Restricted Stock Award Agreement (incorporated by reference to Form 8-K filed with the Securities and Exchange Commission on January 11, 2008) |
| 10.8 | | BlueLinx Holdings Inc. 2006 Long-Term Equity Incentive Plan (as amended and restated effective May 21, 2008) (incorporated by reference to Appendix A to the Definitive Proxy Statement for the 2011 Annual Meeting of Stockholders, filed with the Securities and Exchange Commission on April 18, 2011) |
| | | |
| 10.9 | | Amended and Restated Bluelinx Holdings Inc. 2006 Long-Term Equity Incentive Plan (as amended through May 17, 2012 and restated solely for purposes of filing pursuant to Item 601 of Regulation S-K) (Incorporated by reference to Appendix A to the Definitive Proxy Statement for the 2012 Annual Meeting of Stockholders, filed with the Securities and Exchange Commission on April 16, 2012) |
| 10.10 | | BlueLinx Holdings Inc. 2006 Long-Term Equity Incentive Plan Restricted Stock Award Agreement (incorporated by reference to Form 8-K filed with the Securities and Exchange Commission on June 9, 2006) |
| 10.11 | | BlueLinx Holdings Inc. 2006 Long-Term Equity Incentive Plan Nonqualified Stock Option Award Agreement (incorporated by reference to Form 8-K filed with the Securities and Exchange Commission on June 9, 2006) |
| 10.12 | | BlueLinx Holdings Inc. 2006 Long-Term Equity Incentive Plan Form of Performance Share Award Agreement (incorporated by reference to Form 8-K filed with the Securities and Exchange Commission on January 4, 2013) |
| 10.13 | | BlueLinx Holdings Inc. Short-Term Incentive Plan (as amended and restated effective January 1, 2011) (Incorporated by reference to Appendix B to the Definitive Proxy Statement for the 2011 Annual Meeting of Stockholders, filed with the Securities and Exchange Commission on April 18, 2011)
|
| 10.14 | | Canadian Credit Agreement, dated August 12, 2011, by and among Bluelinx Canada, CIBC Asset-Based Lending Inc. and the lenders from time to time parties thereto (Incorporated by reference to Form 8-K filed with the Securities and Exchange Commission on August 16, 2 011) |
| 10.15 | | Letter Agreement, dated December 18, 2006, relating to and amending the Master Purchase, Supply and Distribution Agreement between Georgia-Pacific Corporation and BlueLinx Corporation dated May 7, 2004 (incorporated by reference to Form 8-K filed with the Securities and Exchange Commission on December 22, 2006) |
| 10.16† | | Loan and Security Agreement, dated as of June 9, 2006, between the entities set forth therein collectively as borrower and German American Capital Corporation as Lender (incorporated by reference to Form 10-Q filed with the Securities and Exchange Commission on November 6, 2009) |
| 10.17 | | Twelfth Amendment to Loan and Security Agreement, dated as of June 9, 2006, between the entities set forth therein collectively as borrower and German American Capital Corporation as Lender (incorporated by reference to Form 8-K filed with the Securities and Exchange Commission on September 20, 2012) |
| 10.18 | | Guaranty of Recourse Obligations, dated as of June 9, 2006, by BlueLinx Holdings Inc. for the benefit of German American Capital Corporation (incorporated by reference to Form 8-K filed with the Securities and Exchange Commission on June 15, 2006) |
| 10.19 | | Environmental Indemnity Agreement, dated as of June 9, 2006, by BlueLinx Holdings Inc. in favor of German American Capital Corporation (incorporated by reference to Form 8-K filed with the Securities and Exchange Commission on June 15, 2006) |
| | | |
| 10.20† | | Amended and Restated Loan and Security Agreement, dated August 4, 2006, by and between BlueLinx Corporation, Wachovia and the other signatories listed therein (incorporated by reference to Form 10-Q filed with the Securities and Exchange Commission on November 6, 2009) |
| 10.21 | | Second Amendment to Amended and Restated Loan and Security Agreement, dated August 4, 2006, by and between BlueLinx Corporation, Wachovia and the other signatories listed therein, dated October 22, 2008 (incorporated by reference to Exhibit 10.19 to Annual Report on Form 10-K for the year ended January 1, 2011, filed with the Securities and Exchange Commission on February 25, 2011) |
| 10.22 | | Second Amendment to Amended and Restated Loan and Security Agreement, dated August 4, 2006, by and between BlueLinx Corporation, Wells Fargo, as successor in interest to Wachovia, and the other signatories listed therein, dated July 7, 2010 (incorporated by reference to Form 8-K filed with the Securities and Exchange Commission on July 7, 2010) |
| 10.23 | | Third Amendment to Amended and Restated Loan and Security Agreement, dated August 4, 2006, by and between BlueLinx Corporation, Wells Fargo, as successor in interest to Wachovia, and the other signatories listed therein, dated May 10, 2011(incorporated by reference to Form 8-K filed with the Securities and Exchange Commission on May 12, 2011)
|
| 10.24 | | Fourth Amendment to Amended and Restated Loan and Security Agreement, dated August 4, 2006, by and between BlueLinx Corporation, Wells Fargo, as successor in interest to Wachovia, and the other signatories listed therein, dated August 11, 2011 (incorporated by reference to Form 8-K filed with the Securities and Exchange Commission on August 16, 2011)
|
| 10.25 | | Fifth Amendment to Loan and Security Agreement, dated July 14, 2011, by and between BlueLinx Corporation and certain of its subsidiaries and U.S. Bank National Association in its capacity as trustee for the registered holders of Wachovia Bank Commercial Mortgage Trust, Commercial Mortgage Pass Through Certificates, Series 2006-C 27, as successor in interest to German American Capital Corporation (Incorporated by reference to Form 8-K filed with the Securities and Exchange Commission on July 14, 2011)
|
| 10.26 | | Second Amended and Restated Employment Agreement between BlueLinx Corporation and George R. Judd, dated January 22, 2013, (incorporated by reference to Form 8-K filed with the Securities and Exchange Commission on January 28, 2013) |
| 10.27 | | Second Amended and Restated Employment Agreement between BlueLinx Corporation and Howard D. Goforth, dated January 22, 2013 (incorporated by reference to Form 8-K filed with the Securities and Exchange Commission on January 28, 2013) |
| 10.28 | | Amended and Restated Employment Agreement between BlueLinx Corporation and Dean A. Adelman, dated January 21, 2011 (incorporated by reference to Form 8-K/A filed with the Securities and Exchange Commission on January 27, 2011) |
10.29 | | Employment Agreement between BlueLinx Corporation and Ned M. Bassil, dated October 31, 2011 (Incorporated by reference to Form 8-K filed with the Securities and Exchange Commission on November 4, 2011) |
| 10.30 | | Investment Agreement, dated as of April 26, 2011, between BlueLinx and Cerberus ABP Investor LLC (incorporated by reference to Form 8-K, filed with the Securities and Exchange Commission on April 26, 2011) |
| 10.31 | | Amended and Restated 2006 Long-Term Equity Incentive Plan Performance Share Award Agreement, dated January 2013 (incorporated by reference to Form8-K filed with the Securities and Exchange Commission on January 4, 2013). |
| | | |
| 10.32 | | Second Amended and Restated Employment Agreement between BlueLinx Corporation and George R. Judd, dated January 22, 2013 (incorporated by reference to Form 8-K filed with the Securities and Exchange Commission on January 28, 2013). |
| 10.33 | | Second Amended and Restated Employment Agreement between BlueLinx Corporation and Doug Goforth , dated January 22, 2013 (incorporated by reference to Form 8-K filed with the Securities and Exchange Commission on January 28, 2013). |
| 10.34 | | Fifth Amendment to Amended and Restated Loan and Security Agreement and Lender Joinder , dated March 29, 2013 (incorporated by reference to Form 8-K filed with the Securities and Exchange Commission on March 29, 2013). |
| 10.35 | | Employment Agreement between BlueLinx Corporation and Sara Epstein , dated May 15, 2013 (incorporated by reference to Form 8-Kfiled with the Securities and Exchange Commission on May 17, 2013). |
| 10.36 | | Employment Agreement between BlueLinx Corporation and James Soggs , dated May 15, 2013 (incorporated by reference to Form 8-Kfiled with the Securities and Exchange Commission on May 17, 2013). |
| 10.37 | | Separation Agreement between George Judd and BlueLinx Corporation , dated June 5, 2013 (incorporated by reference to Form 8-Kfiled with the Securities and Exchange Commission on June 11, 2013). |
| 10.38 | | Sixth Amendment to Amended and Restated Loan and Security Agreement by and among Wells Fargo Bank, National Association, a national banking association, in its capacity as administrative and collateral agent for the Lenders (incorporated by reference to Form 8-K filed with the Securities and Exchange Commission on June 28, 2013). |
| 10.39 | | Lender Joinder Agreement by and between PNC Bank, National Association and BlueLinx Corporation , dated June 28, 2013 (incorporated by reference to Form 8-K filed with the Securities and Exchange Commission on June 28, 2013). |
| 10.40 | | First Amending Agreement among BlueLinx Corporation and Canadian Imperial Bank of Commerce as successor to CIBC Asset-Based Lending Inc., dated August 16, 2013 (incorporated by reference to Form 8-K filed with the Securities and Exchange Commission on August 19, 2013). |
| 10.41 | | BlueLinx Holding Inc. Second Half Incentive Plan, effective as of June 30, 2013 (incorporated by reference to Form 8-K filed with the Securities and Exchange Commission on August 23, 2013). |
| 10.42 | | Third Amended and Restated Employment Agreement , dated December 9, 2013 between BlueLinx Corporation and Robert McKagen (incorporated by reference to Form 8-K filed with the Securities and Exchange Commission on December 13, 2013). |
| 10.43 | | Amendment No. 1 to BlueLinx Holdings Inc. Amended and Restated 2006 Long-Term Equity Incentive Plan Performance Share Award Agreement (incorporated by reference to Form 8-K filed with the Securities and Exchange Commission on January 3, 2014). |
10.4 4 | | Release Agreement by and between Ned M. Bassil and BlueLinx Corporation, dated December 30, 2013 (incorporated by reference to Form 8-K filed with the Securities and Exchange Commission on January 3, 2014). |
| 10.45 | | Employment Agreement between BlueLinx Corporation and Mitchell Lewis, dated January 15, 2014 (incorporated by reference to Form 8-K filed with the Securities and Exchange Commission on January 17, 2014). |
| 10.46 | | BlueLinx Holdings Inc. Amended and Restated 2006 Long-Term Equity Incentive Plan Restricted Stock Award Agreement (incorporated by reference to Form 8-K filed with the Securities and Exchange Commission on January 17, 2014). |
| 14.1 | | BlueLinx Code of Ethical Conduct (incorporated by reference to Exhibit 14.1 to Annual Report on Form 10-K for the year ended January 1, 2005, filed with the Securities and Exchange Commission on March 22, 2005) . |
| 21.1 | | List of subsidiaries of the Company * |
| 23.1 | | Consent of Ernst & Young LLP* |
| 31.1 | | Certification of Mitchell B. Lewis, Chief Executive Officer, pursuant to Section 302 of the Sarbanes-Oxley Act of 2002* |
| 31.2 | | Certification of Howard D. Goforth, Chief Financial Officer and Treasurer, pursuant to Section 302 of the Sarbanes-Oxley Act of 2002* |
| 32.1 | | Certification of Mitchell B. Lewis, Chief Executive Officer, pursuant to Section 906 of the Sarbanes-Oxley Act of 2002* |
| 32.2 | | Certification of Howard D. Goforth, Chief Financial Officer and Treasurer, pursuant to Section 906 of the Sarbanes-Oxley Act of 2002* |
| | | |
| 101 | | The following financial information from the Registrant’s Annual Report on Form 10-K for the fiscal year ended January 4, 2014, formatted in Extensible Business Reporting Language (“XBRL”): (i) Consolidated Statements of Operations and Comprehensive Loss, (ii) Consolidated Balance Sheets, (iii) Consolidated Statements of Stockholders’ (Deficit) Equity, (iv) Consolidated Statements of Cash Flows and (v) Notes to Consolidated Financial Statements.** |
| | |
| * | Filed herewith. |
| | |
| ** | Pursuant to Rule 406T of Regulation S-T, these interactive data files are deemed not to be “filed” or part of a registration statement or prospectus for purposes of Sections 11 or 12 of the Securities Act of 1933, as amended, or Section 18 of the Securities Act of 1934, as amended, and otherwise are not subject to liability under these sections. |
| | |
| † | Portions of this document were omitted and filed separately with the SEC pursuant to a request for confidential treatment in accordance with Rule 24b-2 of the Exchange Act. |
| | |
| (A) | Previously filed as Appendix B to the proxy statement for the 2012 Annual Meeting of Stockholders filed on Schedule 14A with the Securities and Exchange Commission on April 16, 2012. |
| | |
| (B) | Previously filed as an exhibit to Amendment No. 3 to the Company’s Registration Statement on Form S-1 (Reg. No. 333-118750) filed with the Securities and Exchange Commission on November 26, 2004. |
| | |
| (C) | Previously filed as an exhibit to Amendment No. 1 to the Company’s Registration Statement on Form S-1 (Reg. No. 333-118750) filed with the Securities and Exchange Commission on October 1, 2004. |
| | |
| (D) | Previously filed as an exhibit to Amendment No. 2 to the Company’s Registration Statement on Form S-1 (Reg. No. 333-118750) filed with the Securities and Exchange Commission on October 8, 2004. |