
Exhibit (C)(12) STRICTLY CONFIDENTIAL The blacked out information indicates information has been omitted on the basis of a confidential treatment request pursuant to Rule 24b-2 of the Securities Exchange Act of 1934, as amended. This information has been filed separately with the Securities and Exchange Commission. Discussion Materials of Brown Gibbons Lang & Company for the Board of Directors and the Transaction Committee of Manitex, dated September 11, 2024 Presentation to the Board of Directors of Manitex International, Inc.: Regarding the Proposed Manitex International, Inc. Transaction September 11, 2024 August 2024 CHICAGO • CLEVELAND • LOS ANGELES • NEW YORK BGLCO.COM

NOTICE The accompanying materials are confidential and intended solely for the benefit and use of the Transaction Committee (the “Transaction Committee”) of the Board of Directors (the “Board”) of Manitex International, Inc. (“Manitex” or the “Company”), in evaluating the proposed transaction described herein. This material is not intended to provide the sole basis for evaluating the transaction and does not purport to contain all information that may be required in connection with such evaluation and analysis. Neither BGL nor any of its officers, directors, employees, affiliates, advisors, agents or representatives warrants the accuracy or completeness of any of the material set forth herein. All of the estimates, valuations and projections contained in the materials were prepared or derived from information supplied by Manitex or from public sources, without assuming responsibility for any independent verification thereof by BGL. Accordingly, no representation or warranty, express or implied, can be or is made by BGL as to the accuracy or achievability of any such valuations, estimates or projections, and BGL expressly disclaims any and all liability relating to or resulting from the use of this material. Actual results may vary from such valuations, estimates or projections and such variations may be material. BGL does not provide accounting, tax or legal advice. In preparing this presentation, BGL has made certain key assumptions, as noted, regarding the information contained herein and certain limitations apply to such information. BGL does not undertake any obligation to update or otherwise revise the accompanying materials. This material may not be copied, reproduced, distributed or passed to others at any time without the prior written consent of BGL. BGL’s analysis must be considered as a whole. Selecting portions of our analysis, without considering all of it, would create an incomplete view and could be misleading. Individual estimates of value contained in our analysis are not necessarily indicative of actual value, which may be significantly more or less favorable than as set forth herein. Estimates of the financial value of comparable companies and their securities do not purport to be appraisals or necessarily reflect the actual values of such companies or their securities. Because such estimates are inherently subject to uncertainty, BGL does not assume responsibility for their accuracy. Our analysis is necessarily based on economic, market, and other conditions as in effect on, and information made available to us as of, the date hereof.

Table of Contents I. Introduction II. Valuation Assumptions III. Summary of Analyses i. Relative Valuation Summary ii. Comparable Public Companies Analysis iii. Comparable Precedent Transactions Analysis iv. Premiums Paid Analysis v. Discounted Cash Flow Analysis IV. Disclaimers V. Appendix

Click to I. In editt M rod au st ce tr ion title style

Summary of Proposed Transaction • On July 24, 2024, Tadano Ltd (“Tadano”) submitted an unsolicited non-binding proposal to acquire each issued and outstanding share of common stock of the Company, other than shares of common stock that are owned by Tadano, any subsidiary of Tadano or the Company (the “Excluded (1) Shares”) , for $5.80 per share in cash net of transaction expenses. On August 11, 2024, Manitex and Tadano executed a non-disclosure agreement and Tadano began conducting confirmatory due diligence • Tadano will acquire Manitex through a merger of a wholly-owned newly formed subsidiary, with Manitex to survive and become a wholly-owned subsidiary of Tadano Except as expressly agreed in writing, this presentation and the analyses included herein are intended solely for the benefit and use of the Transaction Committee and it may not be delivered, communicated, or disclosed (in whole or in part) to any third party for any purposes whatsoever, or used or relied upon for any other purpose (1) Tadano purchased 2,918,542 shares in May 2018, 45,000 shares in subsequent period, and holds 9,000 Restricted Stock Units (“RSUs”) which will vest upon a change of control, collectively representing 14.1% of the fully diluted common stock outstanding as of June 30, 2024 5 Introduction Confidential: BGL considered several analyses and factors in rendering its opinion. BGL’s opinion is based on all such analyses and factors taken as a whole and not on any one analysis or factor.

Key Assumptions • We have relied upon and assumed, without independent verification, the accuracy and completeness of all of the financial, legal, regulatory, tax, accounting, and other information provided to, discussed with, or reviewed by us, including, without limitation, the forecasts, the components, and value without assuming any responsibility for independent verification, and we do not assume any liability for and shall be held harmless if any such information is not accurate or complete • As to any information provided to us by the Company, we have relied upon the assurances of management of the Company that all such information was prepared on a reasonable basis and that the management of the Company are not aware of any information or facts that would make the information provided to us inaccurate, incomplete, or misleading • We have assumed that the projected financial performance provided by the Company is predicated upon reasonable assumptions and reflects the best currently available estimates and judgments of the Company’s management and we express no view as to the reasonableness of such forecasts and projections or the assumptions upon which they are based • We have assumed that there has been no material change in the assets, liabilities, financial condition, results of operations, business, or prospects of the Company since the date of the last financial statements made available to us • We have assumed that in the course of obtaining any necessary regulatory or third-party approvals and consents for the Proposed Merger, no modification, delay, limitation, restriction, condition, or waiver will be imposed or granted, the effect of which would be material to our analysis • We have assumed that the Proposed Merger will be consummated in accordance with the terms and conditions stated in the Merger Agreement and in accordance with all applicable laws and other relevant documents or requirements, without delay or any material amendment to the agreement or waiver by any party of any condition stated in the Merger Agreement that would be material to our analysis • EBITDA adjustments presented are consistent with those reported by the Company and included in its publicly reported financial statements • Potential synergies and cost savings arising as a result of the proposed merger were not taken into consideration in BGL’s analyses • We have assumed that the representations and warranties contained in the Merger Agreement are true and correct 6 Introduction Confidential: BGL considered several analyses and factors in rendering its opinion. BGL’s opinion is based on all such analyses and factors taken as a whole and not on any one analysis or factor.

Disclosures • In accordance with the Engagement Letter executed July 23, 2024, between Manitex and BGL, BGL received a fee of $125,000 upon both parties’ execution of the Engagement Letter. BGL will receive an additional $125,000 on the date when BGL delivers a Fairness Opinion or when BGL notifies the Transaction Committee that it is ready to deliver its Fairness Opinion. BGL’s fee for the Fairness Opinion is not contingent upon its views expressed in a Fairness Opinion, nor upon the closing of the Proposed Merger • On August 24, 2023, Manitex engaged BGL as exclusive financial advisor to explore a potential sale of the Company, for which BGL would receive an estimated fee of $2,850,912 contingent upon the sale of the Company • On March 31, 2022, Manitex engaged BGL to deliver a Fairness Opinion on the Company’s acquisition of Rabern Rentals LLC (“Rabern”), for which BGL received a fee totaling $125,000 • BGL is being indemnified by Manitex for certain liabilities arising from its engagement described above and reimbursed for certain expenses • BGL may, in the future, provide investment banking and financial advisory services to the Company or entities affiliated with the Company or Tadano and its affiliates 7 Introduction Confidential: BGL considered several analyses and factors in rendering its opinion. BGL’s opinion is based on all such analyses and factors taken as a whole and not on any one analysis or factor.
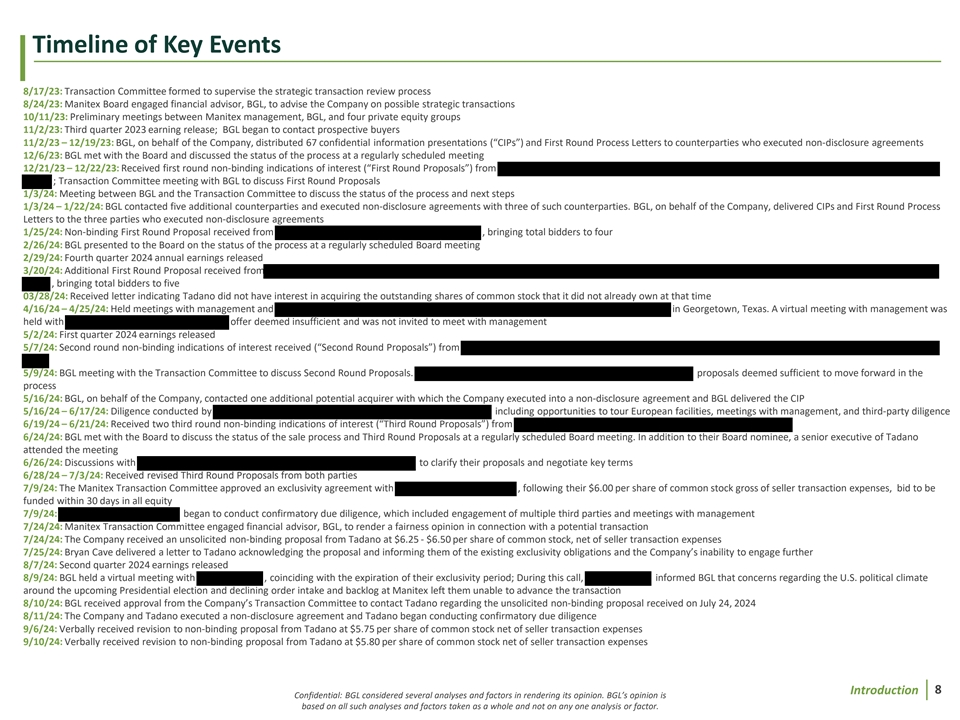
Timeline of Key Events 8/17/23: Transaction Committee formed to supervise the strategic transaction review process 8/24/23: Manitex Board engaged financial advisor, BGL, to advise the Company on possible strategic transactions 10/11/23: Preliminary meetings between Manitex management, BGL, and four private equity groups 11/2/23: Third quarter 2023 earning release; BGL began to contact prospective buyers 11/2/23 – 12/19/23: BGL, on behalf of the Company, distributed 67 confidential information presentations (“CIPs”) and First Round Process Letters to counterparties who executed non-disclosure agreements 12/6/23: BGL met with the Board and discussed the status of the process at a regularly scheduled meeting 12/21/23 – 12/22/23: Received first round non-binding indications of interest (“First Round Proposals”) from ; Transaction Committee meeting with BGL to discuss First Round Proposals 1/3/24: Meeting between BGL and the Transaction Committee to discuss the status of the process and next steps 1/3/24 – 1/22/24: BGL contacted five additional counterparties and executed non-disclosure agreements with three of such counterparties. BGL, on behalf of the Company, delivered CIPs and First Round Process Letters to the three parties who executed non-disclosure agreements 1/25/24: Non-binding First Round Proposal received from , bringing total bidders to four 2/26/24: BGL presented to the Board on the status of the process at a regularly scheduled Board meeting 2/29/24: Fourth quarter 2024 annual earnings released 3/20/24: Additional First Round Proposal received from , bringing total bidders to five 03/28/24: Received letter indicating Tadano did not have interest in acquiring the outstanding shares of common stock that it did not already own at that time 4/16/24 – 4/25/24: Held meetings with management and in Georgetown, Texas. A virtual meeting with management was held with offer deemed insufficient and was not invited to meet with management 5/2/24: First quarter 2024 earnings released 5/7/24: Second round non-binding indications of interest received (“Second Round Proposals”) from 5/9/24: BGL meeting with the Transaction Committee to discuss Second Round Proposals. proposals deemed sufficient to move forward in the process 5/16/24: BGL, on behalf of the Company, contacted one additional potential acquirer with which the Company executed into a non-disclosure agreement and BGL delivered the CIP 5/16/24 – 6/17/24: Diligence conducted by including opportunities to tour European facilities, meetings with management, and third-party diligence 6/19/24 – 6/21/24: Received two third round non-binding indications of interest (“Third Round Proposals”) from 6/24/24: BGL met with the Board to discuss the status of the sale process and Third Round Proposals at a regularly scheduled Board meeting. In addition to their Board nominee, a senior executive of Tadano attended the meeting 6/26/24: Discussions with to clarify their proposals and negotiate key terms 6/28/24 – 7/3/24: Received revised Third Round Proposals from both parties 7/9/24: The Manitex Transaction Committee approved an exclusivity agreement with , following their $6.00 per share of common stock gross of seller transaction expenses, bid to be funded within 30 days in all equity 7/9/24: began to conduct confirmatory due diligence, which included engagement of multiple third parties and meetings with management 7/24/24: Manitex Transaction Committee engaged financial advisor, BGL, to render a fairness opinion in connection with a potential transaction 7/24/24: The Company received an unsolicited non-binding proposal from Tadano at $6.25 - $6.50 per share of common stock, net of seller transaction expenses 7/25/24: Bryan Cave delivered a letter to Tadano acknowledging the proposal and informing them of the existing exclusivity obligations and the Company’s inability to engage further 8/7/24: Second quarter 2024 earnings released 8/9/24: BGL held a virtual meeting with , coinciding with the expiration of their exclusivity period; During this call, informed BGL that concerns regarding the U.S. political climate around the upcoming Presidential election and declining order intake and backlog at Manitex left them unable to advance the transaction 8/10/24: BGL received approval from the Company’s Transaction Committee to contact Tadano regarding the unsolicited non-binding proposal received on July 24, 2024 8/11/24: The Company and Tadano executed a non-disclosure agreement and Tadano began conducting confirmatory due diligence 9/6/24: Verbally received revision to non-binding proposal from Tadano at $5.75 per share of common stock net of seller transaction expenses 9/10/24: Verbally received revision to non-binding proposal from Tadano at $5.80 per share of common stock net of seller transaction expenses 8 Introduction Confidential: BGL considered several analyses and factors in rendering its opinion. BGL’s opinion is based on all such analyses and factors taken as a whole and not on any one analysis or factor.

Marketing Summary 193 Parties Contacted 184 Parties Received Marketing Materials, Elected Not to Submit a First Round Proposal 3 Parties Declined to Submit a First Round Proposal After In-Person Preliminary Management Meetings 1 Party Submitted Non-Binding First Round Proposal, Not Invited to Move Forward in Process 2 Parties Submitted Non-Binding Second Round Proposals, Not Invited to Move Forward in Process 3 Parties Submitted Non-Binding Third Round Proposals 9 Introduction Confidential: BGL considered several analyses and factors in rendering its opinion. BGL’s opinion is based on all such analyses and factors taken as a whole and not on any one analysis or factor.

Trading Volume (in actual) Stock Price Analysis & Timeline Manitex Trading Volume and Closing Share Price: August 24, 2023 – September 11, 2024 • Manitex has a single class of common stock traded on the NASDAQ exchange under the ticker MNTX • Manitex’s shares of common stock have traded between $3.21 and $9.02 per share over the last 52 weeks and closed at $3.81 on September 11, 2024. Tadano’s current offer of $5.80 per share represents a premium to the general historical trading ranges, the volume-weighted average price over various time periods, and the current market price for the shares Significant increase in trading volume and share price in Q4 2023, which was at a level equal to 144.6% of the 52-week daily average, or a daily average of 112,307 shares compared to a 52-week daily average of 77,654 shares. This activity coincides with The Vanguard Group’s purchase of 656,515 shares (9.3% of Q4 2023 volume), evidenced by publicly available 13F filings (see appendix) 12/27/2023 Offer Net Share 09/11/2024 $10.00 600,000 8/24/2023 52-Week High: Price $5.80 / share MNTX: Signing of $9.02 / share (diluted) $3.81 / share Agreement between 8/13/2024 $8.00 480,000 Manitex and 52-Week Low: BGL $3.21 / share $4.74 / share $6.00 360,000 $4.00 240,000 $2.00 120,000 $- - Denotes Manitex Earnings Release Date Trading Volume Closing Price Source: S&P Capital IQ 10 Introduction Confidential: BGL considered several analyses and factors in rendering its opinion. BGL’s opinion is based on all such analyses and factors taken as a whole and not on any one analysis or factor. Closing Share Price ($ in actual)

Transaction Summary Proposed Transaction • At Close Tadano will pay: (1) – $5.80 per share in cash (“Per Share Merger Consideration”) for the issued and outstanding shares of common stock of Manitex other than the Excluded Shares – Each share of common stock issued and outstanding immediately prior to the closing other than the Excluded Shares shall automatically be converted into the right to receive the Per Share Merger Consideration in cash, other than shares for which appraisal rights have been properly exercised • The Per Share Merger Consideration of $5.80 represents the actual per share purchase price delivered to shareholders of common stock at closing and is net of the seller transaction expenses and all other applicable expenses that have been or will be incurred through the execution of this transaction • Tadano has not conditioned the transaction on the receipt of any debt financing Please refer to page 14 for further detail Expected Timing • Signing of the Merger Agreement on or about September 12, 2024 • Closing subject to regulatory and shareholder approval (1) Fully diluted shares outstanding of 21,113,504 11 Confidential: BGL considered several analyses and factors in rendering its opinion. BGL’s opinion is inclusive of Tadano (see pg. 25 for details) based on all such analyses and factors taken as a whole and not on any one analysis or factor.

Transaction Summary Cont’d Relative Valuation Summary as September 11, 2024 (Based on Trailing Twelve-Month June 2024 Adjusted EBITDA of $33.0 million) Comparable Public Companies Precedent Transactions Original Equipment Manufacturers Original Equipment Manufacturers 5.6x – 5.8x 6.4x – 6.6x $3.70 – $4.06 $4.92 – $5.32 TTM Jun-24 Adj. TTM Jun-24 Adj. per share per share EBITDA EBITDA Sum of the Parts Sum of the Parts 6.2x – 6.4x 6.1x – 6.5x $4.64 – $5.03 $4.54 – $5.13 TTM Jun-24 Adj. TTM Jun-24 Adj. per share per share EBITDA EBITDA Premiums Paid Analysis Discounted Cash Flow Analyses 1-Day Transaction Premium Management Case 6.3x – 6.4x 6.2x – 6.4x $4.89 – $4.93 $4.65 – $5.04 TTM Jun-24 Adj. TTM Jun-24 Adj. per share per share EBITDA EBITDA 1-Week Transaction Premium Updated Management Forecast 6.4x – 6.5x 6.2x – 6.4x $5.02 – $5.07 $4.62 – $5.01 TTM Jun-24 Adj. TTM Jun-24 Adj. per share per share EBITDA EBITDA 12 Introduction Confidential: BGL considered several analyses and factors in rendering its opinion. BGL’s opinion is based on all such analyses and factors taken as a whole and not on any one analysis or factor.
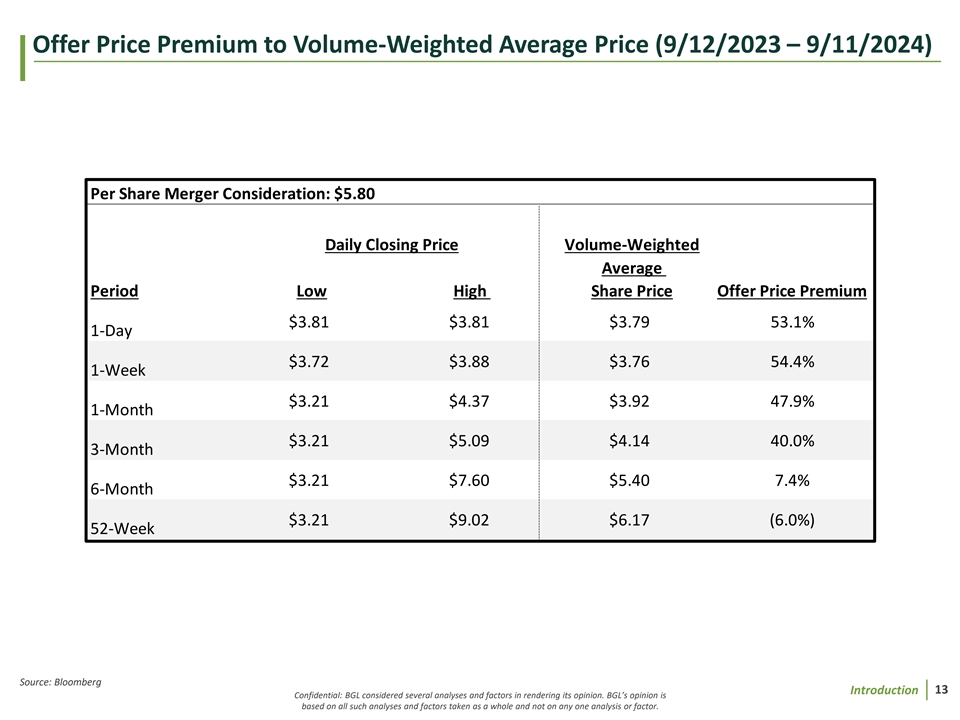
Offer Price Premium to Volume-Weighted Average Price (9/12/2023 – 9/11/2024) Per Share Merger Consideration: $5.80 Daily Closing Price Volume-Weighted Average Period Low High Share Price Offer Price Premium $3.81 $3.81 $3.79 53.1% 1-Day $3.72 $3.88 $3.76 54.4% 1-Week $3.21 $4.37 $3.92 47.9% 1-Month $3.21 $5.09 $4.14 40.0% 3-Month $3.21 $7.60 $5.40 7.4% 6-Month $3.21 $9.02 $6.17 (6.0%) 52-Week Source: Bloomberg 13 Introduction Confidential: BGL considered several analyses and factors in rendering its opinion. BGL’s opinion is based on all such analyses and factors taken as a whole and not on any one analysis or factor.

Overview of Proposed Merger Consideration ($ in thousands, except per share) Proposed Transaction Consideration Per Share Merger Consideration for the Issued and Outstanding Shares of Common Stock of Manitex other than the Excluded Shares $ 5.80 (1) Times: Fully Diluted Shares of Common Stock Outstanding 21,114 Implied Equity Value of Merger Consideration $ 122,458 (2) Plus: Total Indebtedness 89,280 (2) Less: Cash and Equivalents (5,097) (3) Plus: Estimated Seller Transaction Expenses 6,173 (4) Plus: Non-Controlling Interest of Rabern 15,258 Enterprise Value $ 228,073 Proposed Valuation Enterprise Value $ 228,073 2023 Adjusted EBITDA $ 30,061 Enterprise Value / 2023 Adjusted EBITDA 7.6x TTM Jun-24 Adjusted EBITDA $ 32,965 Enterprise Value / TTM Jun-24 Adjusted EBITDA 6.9x 2024B Adjusted EBITDA $ 35,718 Enterprise Value / 2024B Adjusted EBITDA 6.4x Notes: (1) Fully diluted shares outstanding as of September 11, 2024, plus all equity awards and options that would vest upon a change of control (2) As of June 30, 2024 Balance Sheet per 10-Q (3) See page 25 for additional details (4) Value of Steven Berner 30% non-controlling interest in Rabern at 5.5x Rabern's TTM Jun-24 EBITDA of $11.5 million which is not required to be paid in cash (see page 18 for additional details) 14 Introduction Confidential: BGL considered several analyses and factors in rendering its opinion. BGL’s opinion is based on all such analyses and factors taken as a whole and not on any one analysis or factor.

Third Round Proposal Summary ($ in thousands, except per share values) Tadano Date Received 9/10/2024 6/26/2024 6/26/2024 Gross Offer Price Per Share N/A $ 6.00 $ 5.60 Net Offer Price Per Share $ 5.80 N/A N/A (1) Fully Diluted Shares Outstanding as of 09/11/2024 21,114 21,114 21,114 Third Round Equity Value $ 122,458 $ 126,681 $ 118,236 Proposal Summary As of 6/30/2024 (-) Cash and Equivalents 5,097 5,097 5,097 (+) Total Indebtedness 89,280 89,280 89,280 (+) Non-Controlling Interest of Rabern 15,258 15,258 15,258 (1) (+) Estimated Seller Transaction Expenses 6,173 Transaction Value $ 228,073 $ 226,123 $ 217,677 $228.1M $226.1M $217.7M $215M $220M $225M $230M Transaction Value (1) See page 25 for additional details 15 Introduction Confidential: BGL considered several analyses and factors in rendering its opinion. BGL’s opinion is based on all such analyses and factors taken as a whole and not on any one analysis or factor.

Due Diligence In connection with its evaluation, BGL has made such reviews, analyses, and inquires as we have deemed necessary and appropriate. In conducting its evaluation, BGL reviewed a number of other consideration including, but not limited to: • Reviewed the draft Merger Agreement dated September 7, 2024 and assumes the final version will be inclusive of $5.80 per share of common stock as verbally communicated on September 10, 2024, and will not differ in any material respect • Reviewed the July 24, 2024, unsolicited non-binding proposal submitted by Tadano • Reviewed relevant public filings including but not limited to form 10-Ks, form 10-Qs, form 8-Ks, proxies, investor presentations, and quarterly analyst calls • Reviewed publicly available analyst research coverage reports for Manitex • Reviewed Manitex’s audited financial statements for each of the fiscal years ended December 31, 2021, December 31, 2022, and December 31, 2023 • Reviewed a forecast model, prepared by Manitex’s management, including the budget for the fiscal year ended December 31, 2024, and forecasts for the fiscal years ended December 31, 2025, 2026, 2027, and 2028, formulated in October 2023 • Participated in reviews of the Company’s forecast model with the Chief Executive Officer and Chief Financial Officer of Manitex on August 21, 2024 and August 27, 2024 • Reviewed schedules of non-recurring expenses and adjustments as prepared by Manitex’s management for the fiscal years ended December 31, 2021, 2022, 2023, and the year-to-date period ending June 2024 • Reviewed certain other historical operating and financial information provided to us by Manitex, including division level internal financial statements and key performance indicators of the Company • Reviewed analyses regarding the business, service offerings, markets, customers, vendors, personnel, asset base, facilities, and operations • Reviewed the publicly available Securities Purchase Agreement dated May 24, 2018 (“Securities Purchase Agreement”), related to Tadano’s strategic investment in Manitex • Reviewed the Membership Interest Purchase Agreement dated April 11, 2022, related to Manitex’s acquisition of Rabern Rentals • Reviewed the Stockholders Agreement dated April 11, 2022 (“Stockholders Agreement”), between Manitex and Steven Berner and discussed with Company’s legal counsel • Considered financial and other publicly available information including that of comparable publicly-traded companies 16 Introduction Confidential: BGL considered several analyses and factors in rendering its opinion. BGL’s opinion is based on all such analyses and factors taken as a whole and not on any one analysis or factor.
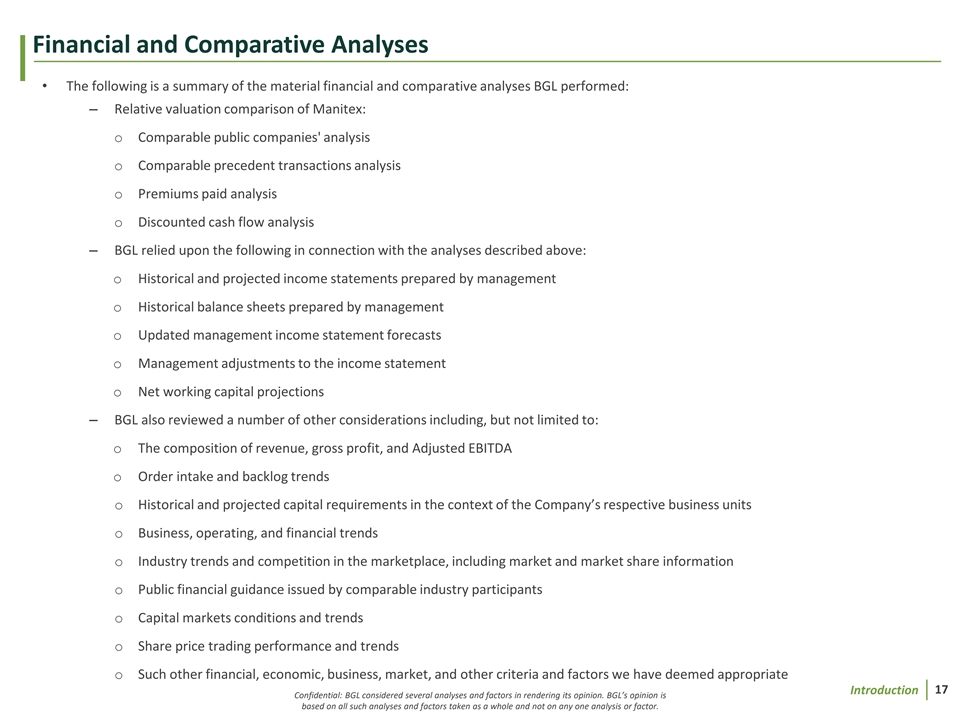
Financial and Comparative Analyses • The following is a summary of the material financial and comparative analyses BGL performed: – Relative valuation comparison of Manitex: o Comparable public companies' analysis o Comparable precedent transactions analysis o Premiums paid analysis o Discounted cash flow analysis – BGL relied upon the following in connection with the analyses described above: o Historical and projected income statements prepared by management o Historical balance sheets prepared by management o Updated management income statement forecasts o Management adjustments to the income statement o Net working capital projections – BGL also reviewed a number of other considerations including, but not limited to: o The composition of revenue, gross profit, and Adjusted EBITDA o Order intake and backlog trends o Historical and projected capital requirements in the context of the Company’s respective business units o Business, operating, and financial trends o Industry trends and competition in the marketplace, including market and market share information o Public financial guidance issued by comparable industry participants o Capital markets conditions and trends o Share price trading performance and trends o Such other financial, economic, business, market, and other criteria and factors we have deemed appropriate 17 Introduction Confidential: BGL considered several analyses and factors in rendering its opinion. BGL’s opinion is based on all such analyses and factors taken as a whole and not on any one analysis or factor.

Non-Controlling Interest of Rabern Rentals • In April 2022, Manitex acquired a 70% membership interest in Rabern Steven Berner Non-Controlling Interest Equity Value Calculation from Steven Berner for a purchase price of approximately $26 million in ($ in millions) Jun-24 cash plus assumed debt of $13 million Rabern Reported EBITDA - TTM June 2024 $ 11.5 • The acquisition expanded the Company’s business to include the rental (x): Transaction Multiple 5.50x of third-party manufactured heavy duty and light duty commercial Implied Enterprise Value $ 63.5 (2) construction equipment primarily in Texas (-): Rabern Net Debt (12.6) Rabern Implied Equity Value $ 50.9 • Tadano’s acquisition of Manitex does not contemplate purchasing the (x): Steve Berner Equity Interest in Rabern - % 30.0% 30% stake of Rabern owned by Steven Berner Implied Value of Steve Berner Equity Interest in Rabern $ 15.3 (1) Key Intercompany and Related Party Terms and Conditions Key Terms of the Stockholders Agreement • Per the Stockholders Agreement, in the event that Steven Berner dies, • Corporate overhead is allocated to the income statement based on becomes incapacitated, retires, or otherwise ceases to be employed by Management estimates of time and resources utilized the Company or any of its Affiliates, Manitex has a Right of First Refusal to purchase his equity ownership in Rabern at 5.5x EBITDA less Rabern’s • If Manitex funds Rabern capital expenditures using Manitex cash flow, indebtedness such amount is treated as intercompany indebtedness and applied to Rabern’s balance sheet • The Company has no contractual obligation to purchase Steven Berner’s stake in Rabern and no contractual right to force a sale of his shares • In leveraging the Manitex balance sheet, the Company has the ability to other than the triggering events mentioned above leverage the full cash flow of Manitex’s EBITDA. There is no limit on the amount of leverage that can be placed on the balance sheet so long as • In the event of a sale of Manitex, the Company has a “drag-along” any lenders are comfortable with the corresponding liquidity ratios provision equal to the EBITDA multiple received by Manitex shareholders, no “tag-along” exists • Manitex leases four locations from HTS Management LLC, an entity controlled by Steven Berner. This relationship has been publicly • The payment terms are undefined, the Company and Steven Berner disclosed and a review of comparable market rent was completed to have the ability to negotiate a structured payment plan assess fairness at the time of the transaction (1) Stockholders Agreement dated April 11, 2022 (“Stockholders Agreement”); (2) Company provided net debt detail comprised of $13.5 million revolver and $814 thousand cash balance as of June 30, 2024 18 Introduction Confidential: BGL considered several analyses and factors in rendering its opinion. BGL’s opinion is based on all such analyses and factors taken as a whole and not on any one analysis or factor.

Clic II.k V ta olu ea dtit io M n A as st se urm tit ple tio sn ts yle

Historical and Projected Income Statement Summary – Management Case • The historical financial information presented above was derived from the Company’s publicly available financial information for the years 2021, 2022, 2023, and TTM Jun-24 and reflects publicly disclosed adjustments made to present the Company’s normalized historical operating performance, excluding extraordinary and non-recurring items, and including the pro forma impact of the Rabern acquisition (see page 18 for adjustment details) • The projected financial information for the years 2024, 2025, 2026, 2027, and 2028 was provided by the Company and were prepared in October of 2023 and have been presented to prospective buyers during the sale process ($ in thousands) Historical TTM Budget Projected 2021PF 2022PF 2023 Jun-24 2024B 2025P 2026P 2027P 2028P Sales $ 232, 994 $ 279,377 $ 291,389 $ 299,560 $ 309, 050 $ 346, 519 $ 382, 922 $ 414, 409 $ 442,067 Growth - % 24.3% 19.9% 4.3% n/a 6.1% 12.1% 10.5% 8.2% 6.7% Cost of Sales 186, 520 226,594 229,190 232,510 237,145 258, 002 284, 124 305,801 324,060 Gross Profit $ 46,475 $ 52,783 $ 62,199 $ 67,050 $ 71,904 $ 88, 517 $ 98, 798 $ 108, 608 $ 118,008 Gross Profit Margin - % 19.9% 18.9% 21.3% 22.4% 23.3% 25.5% 25.8% 26.2% 26.7% Operating Expenses $ 36,593 $ 39, 684 $ 43,536 $ 45,029 $ 47,146 $ 51, 743 $ 56, 205 $ 60, 712 $ 64,878 Operating Expenses - % of Sales 15.7% 14.2% 14.9% 15.0% 15.3% 14.9% 14.7% 14.7% 14.7% Operating Income $ 9, 881 $ 13,100 $ 18,662 $ 22,021 $ 24,758 $ 36,774 $ 42, 592 $ 47,896 $ 53,130 (+): Depreciation and Amortization 5,397 9,408 11,399 10, 945 10, 960 12, 474 12, 640 13, 488 13,674 Adjusted EBITDA $ 15, 278 $ 22,507 $ 30,061 $ 32,965 $ 35, 718 $ 49,248 $ 55, 232 $ 61, 384 $ 66, 804 Adjusted EBITDA Margin - % 6.6% 8.1% 10.3% 11.0% 11.6% 14.2% 14.4% 14.8% 15.1% 20 Valuation Assumptions Confidential: BGL considered several analyses and factors in rendering its opinion. BGL’s opinion is based on all such analyses and factors taken as a whole and not on any one analysis or factor.
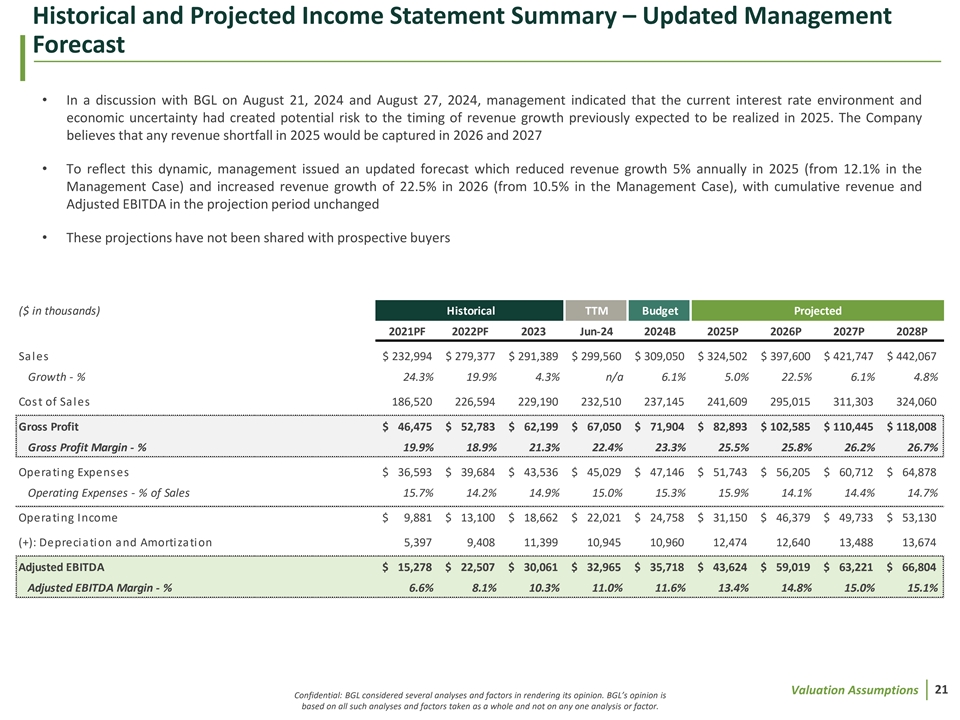
Historical and Projected Income Statement Summary – Updated Management Forecast • In a discussion with BGL on August 21, 2024 and August 27, 2024, management indicated that the current interest rate environment and economic uncertainty had created potential risk to the timing of revenue growth previously expected to be realized in 2025. The Company believes that any revenue shortfall in 2025 would be captured in 2026 and 2027 • To reflect this dynamic, management issued an updated forecast which reduced revenue growth 5% annually in 2025 (from 12.1% in the Management Case) and increased revenue growth of 22.5% in 2026 (from 10.5% in the Management Case), with cumulative revenue and Adjusted EBITDA in the projection period unchanged • These projections have not been shared with prospective buyers ($ in thousands) Historical TTM Budget Projected 2021PF 2022PF 2023 Jun-24 2024B 2025P 2026P 2027P 2028P Sales $ 232, 994 $ 279,377 $ 291,389 $ 299,560 $ 309, 050 $ 324,502 $ 397,600 $ 421,747 $ 442, 067 Growth - % 24.3% 19.9% 4.3% n/a 6.1% 5.0% 22.5% 6.1% 4.8% Cost of Sales 186, 520 226,594 229,190 232,510 237,145 241,609 295,015 311, 303 324,060 Gross Profit $ 46, 475 $ 52,783 $ 62,199 $ 67,050 $ 71, 904 $ 82,893 $ 102,585 $ 110,445 $ 118,008 Gross Profit Margin - % 19.9% 18.9% 21.3% 22.4% 23.3% 25.5% 25.8% 26.2% 26.7% Operating Expenses $ 36,593 $ 39, 684 $ 43,536 $ 45,029 $ 47,146 $ 51, 743 $ 56,205 $ 60,712 $ 64,878 Operating Expenses - % of Sales 15.7% 14.2% 14.9% 15.0% 15.3% 15.9% 14.1% 14.4% 14.7% Operating Income $ 9, 881 $ 13,100 $ 18,662 $ 22,021 $ 24,758 $ 31,150 $ 46, 379 $ 49,733 $ 53, 130 (+): Depreciation and Amortization 5,397 9,408 11,399 10, 945 10,960 12, 474 12,640 13, 488 13,674 Adjusted EBITDA $ 15, 278 $ 22,507 $ 30,061 $ 32,965 $ 35,718 $ 43,624 $ 59,019 $ 63,221 $ 66,804 Adjusted EBITDA Margin - % 6.6% 8.1% 10.3% 11.0% 11.6% 13.4% 14.8% 15.0% 15.1% 21 Valuation Assumptions Confidential: BGL considered several analyses and factors in rendering its opinion. BGL’s opinion is based on all such analyses and factors taken as a whole and not on any one analysis or factor.

Management Income Statement Adjustments Non-operating and management adjustments as presented here have Adjustments to EBITDA: 2021PF – 2024B been publicly disclosed in Manitex’s quarterly earnings announcements. ($ in thousands) Historical Budget Pro forma Rabern adjustment based on historical EBITDA provided by management 2021PF 2022PF 2023 2024B Summary of Adjustments Reported EBITDA $ 3,069 $ 11,872 $ 24,445 $ 33, 798 Reported EBITDA Margin - % 1.5% 4.3% 8.4% 10.9% To more accurately depict normalized operating performance and cost structure, financial results presented herein have been adjusted for Non-Operating Income & Expenses certain expense items determined to be extraordinary and/or non- 1.) Foreign Exchange 543 108 2,539 - recurring 2.) Gain/Loss on Sale of Assets - ( 688) - - Description of Non-Operating Income & Expenses: 3.) Gain on Loan Forgiveness (3,747) - - - 4.) Impairment of Intangibles 2,078 - - - 1. Foreign Exchange – Gains and losses related to foreign exchange fluctuations Management Adjustments 5.) Inventory Impairment & Writeoff 3,226 - - - 2. Gain/Loss on Sale of Assets – Gain and loss related to sale of assets 6.) Litigation and Legal Expense 1,193 4, 018 325 - 7.) Rabern Deal Costs - 2, 237 - - 3. Gain on Loan Forgiveness – Gain related to loan forgiveness 8.) Other Adjustments 442 (138) (15) - 4. Impairment of Intangibles – Assets for which carrying amount is 9.) Restructuring Costs 150 1,654 - - greater than fair market value 10.) Trade Show Expense Normalization ( 247) ( 247) 493 - Description of Management Adjustments 11.) Stock Compensation Expense 1, 056 2, 196 2,274 1, 920 5. Inventory Impairment & Writeoff – One-time writeoff of obsolete Management Adjusted EBITDA $ 7,763 $ 21,013 $ 30,061 $ 35,718 inventory located at the Badger facility Pro Forma Adjustments 6. Litigation and Legal Expense – Legal settlements and other 12.) Rabern Historical EBITDA 7, 516 1,495 - - extraordinary litigation and legal expenses Pro Forma Adjusted EBITDA $ 15,278 $ 22,507 $ 30,061 $ 35,718 7. Rabern Deal Costs – Costs associated with the acquisition of Pro Forma Adjusted EBITDA Margin - % 6.6% 8.1% 10.3% 11.6% Rabern Rentals Description of Management Adjustments (continued) 8. Other Adjustments – Consists of items management deemed as one time in nature 11. Stock Compensation Expense – RSU amortization, stock options, and CEO FV Grant. Stock compensation expense associated with the Executive Chairman and independent members of the Board represented 9. Restructuring Costs – Operating company related restructuring 38.8%, 23.8%, and 12.7% of total stock compensation expense in 2021, 2022, and 2023, respectively costs related to the divestiture of business lines and severance charges Pro Forma Adjustments 10. Trade Show Expense Normalization – Normalizing expenses 12. Rabern Historical EBITDA – EBITDA generated by Rabern Rentals (2021– Mar. 2022) prior to acquisition related to the CONEXPO and Bauma tradeshow to proportionally incur expenses over the three-year timeframe each show is conducted 22 Valuation Assumptions Confidential: BGL considered several analyses and factors in rendering its opinion. BGL’s opinion is based on all such analyses and factors taken as a whole and not on any one analysis or factor.
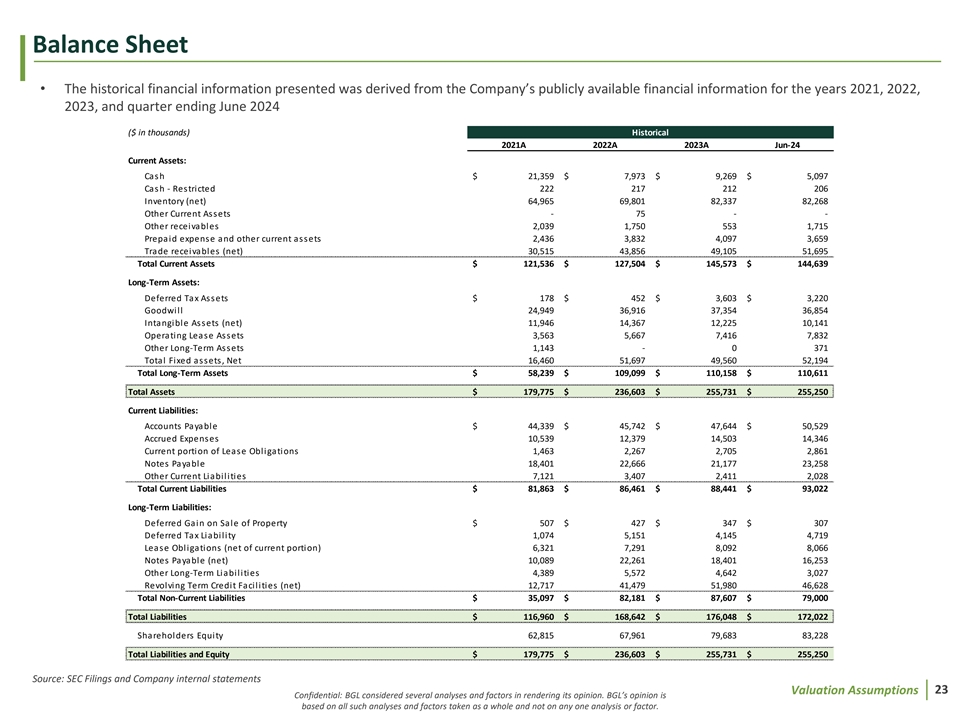
Balance Sheet • The historical financial information presented was derived from the Company’s publicly available financial information for the years 2021, 2022, 2023, and quarter ending June 2024 ($ in thousands) Historical 2021A 2022A 2023A Jun-24 Current Assets: Cash $ 21,359 $ 7,973 $ 9,269 $ 5,097 Cash - Restricted 222 217 212 206 Inventory (net) 64,965 69,801 82,337 82,268 Other Current Assets - 75 - - Other receivables 2,039 1,750 553 1,715 Prepaid expense and other current assets 2,436 3,832 4,097 3,659 Trade receivables (net) 30,515 43,856 49,105 51,695 Total Current Assets $ 121,536 $ 127,504 $ 145,573 $ 144,639 Long-Term Assets: Deferred Tax Assets $ 178 $ 452 $ 3,603 $ 3,220 Goodwill 24,949 36,916 37,354 36,854 Intangible Assets (net) 11,946 14,367 12,225 10,141 Operating Lease Assets 3,563 5,667 7,416 7,832 Other Long-Term Assets 1,143 - 0 371 Total Fixed assets, Net 16,460 51,697 49,560 52,194 Total Long-Term Assets $ 58,239 $ 109,099 $ 110,158 $ 110,611 Total Assets $ 179,775 $ 236,603 $ 255,731 $ 255,250 Current Liabilities: Accounts Payable $ 44,339 $ 45,742 $ 47,644 $ 50,529 Accrued Expenses 10,539 12,379 14,503 14,346 Current portion of Lease Obligations 1,463 2,267 2,705 2,861 Notes Payable 18,401 22,666 21,177 23,258 Other Current Liabilities 7,121 3,407 2,411 2,028 Total Current Liabilities $ 81,863 $ 86,461 $ 88,441 $ 93,022 Long-Term Liabilities: Deferred Gain on Sale of Property $ 507 $ 427 $ 347 $ 307 Deferred Tax Liability 1,074 5,151 4,145 4,719 Lease Obligations (net of current portion) 6,321 7,291 8,092 8,066 Notes Payable (net) 10,089 22,261 18,401 16,253 Other Long-Term Liabilities 4,389 5,572 4,642 3,027 Revolving Term Credit Facilities (net) 12,717 41,479 51,980 46,628 Total Non-Current Liabilities $ 35,097 $ 82,181 $ 87,607 $ 79,000 Total Liabilities $ 116,960 $ 168,642 $ 176,048 $ 172,022 Shareholders Equity 62,815 67,961 79,683 83,228 Total Liabilities and Equity $ 179,775 $ 236,603 $ 255,731 $ 255,250 Source: SEC Filings and Company internal statements 23 Valuation Assumptions Confidential: BGL considered several analyses and factors in rendering its opinion. BGL’s opinion is based on all such analyses and factors taken as a whole and not on any one analysis or factor.

Net Working Capital • The historical financial information presented was derived from the Company’s publicly available financial information for the years 2021, 2022, 2023, and quarter ending June 2024 • Projected net working capital was provided by the Company and was prepared in August 2024. Projected net working capital has been shared with Tadano and was used in both management and management forecast updated cases Budget ($ in thousands) Historical Projected 2021A 2022A 2023A Jun-24 2024B 2025P 2026P 2027P 2028P Current Assets: Accounts Receivable 32,554 45, 606 49, 658 53, 410 53, 643 57, 463 62,219 67,269 71, 994 Inventory 64, 965 69, 801 82, 337 82, 268 83, 811 87,430 93,347 97, 289 102,701 Prepaids & Other Current Assets 2,436 3, 907 4, 097 3,659 4, 034 4,523 4, 998 5, 409 5,770 Total Current Assets $ 99, 955 $ 119, 314 $ 136,092 $ 139,337 $ 141, 488 $ 149,416 $ 160, 564 $ 169, 967 $ 180, 464 Current Liabilities: Accounts Payable 44, 339 45,742 47, 644 50,529 52,471 57,344 61, 991 67,230 72, 021 Accrued Expenses 10, 539 12, 379 14,503 14, 346 14, 329 15, 741 17,395 18,825 20, 082 Customer Deposits 7,121 3, 407 2, 411 2,021 3,047 3, 047 3,047 3,047 3, 047 Total Current Liabilities $ 61,999 $ 61, 528 $ 64,558 $ 66,896 $ 69,848 $ 76, 133 $ 82, 434 $ 89, 103 $ 95, 150 Net Working Capital $ 37,956 $ 57, 786 $ 71,534 $ 72,441 $ 71,640 $ 73,283 $ 78, 130 $ 80, 863 $ 85, 314 Source: SEC Filings, Company internal statements, and Company projections 24 Valuation Assumptions Confidential: BGL considered several analyses and factors in rendering its opinion. BGL’s opinion is based on all such analyses and factors taken as a whole and not on any one analysis or factor.

Fully Diluted Share Count and Estimated Seller Transaction Expenses (1) Fully Diluted Shares Outstanding Detail Estimated Seller Transaction Expenses Per Share Merger Consideration $ 5. 80 Per Share Merger Consideration $ 5.80 Basic Shares Outstanding as of 09/11/2024 20,397,358 Sell-Side M&A Fee and Out of Pocket Expenses $ 2,956,130 (+) Restricted Stock Units to Vest at Close 262,884 Seller's Legal Expenses 850,000 (1) (+) Options to Vest at Close 3,262 Fairness Opinion Fee and Legal Expenses 350,000 (2) (+) Michael Coffey PSUs to RSUs 150,000 Employee Retention Bonuses 1,542,294 (3) (+) Transaction RSUs to be Awarded at Close 300,000 Transaction Committee Compensation 250,000 Total Fully Diluted Shares Outstanding 21,113,504 Proxy Expense - Information Agent 45,000 Dataroom Expense 50,000 (1) Assumes treasury stock methodology Accounting & Tax Support 56,415 (2) Other Legal Support 39,999 Performance stock units granted to Michael Coffey on 4/11/2022 converted to restricted stock units to vest upon a successful transaction Management Deal-Related Travel 12,997 close Misc. Regulatory Costs & Fees 20,000 (3) Total Estimated Seller Transaction Expenses $ 6,172,835 Restricted stock units to be granted to Michael Coffey and Joseph Doolan at the signing of a Definitive Agreement in amounts equal to 100,000 and 50,000 units, respectively. (1) Preliminary based on estimates from respective 25 Valuation Assumptions service providers and BGL out-of-pocket expenses as of Confidential: BGL considered several analyses and factors in rendering its opinion. BGL’s opinion is based on all such analyses and factors taken as a whole and not on any one analysis or factor. September 11, 2024

Clic III. S k to u m ed m it M arya of ste A r t nit alle ys s etsyle
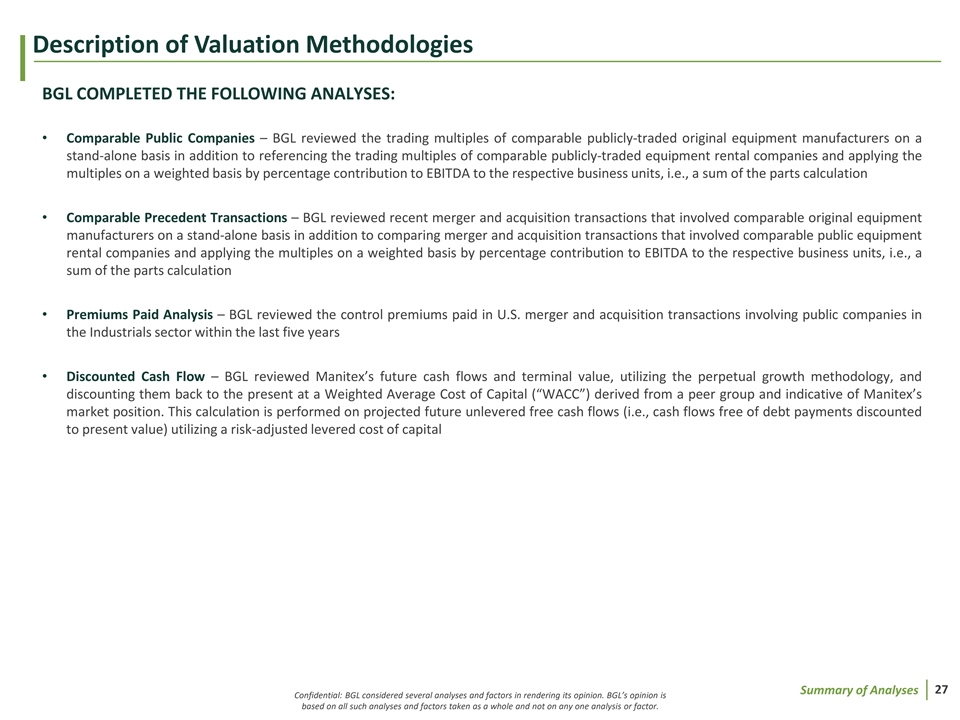
Description of Valuation Methodologies BGL COMPLETED THE FOLLOWING ANALYSES: • Comparable Public Companies – BGL reviewed the trading multiples of comparable publicly-traded original equipment manufacturers on a stand-alone basis in addition to referencing the trading multiples of comparable publicly-traded equipment rental companies and applying the multiples on a weighted basis by percentage contribution to EBITDA to the respective business units, i.e., a sum of the parts calculation • Comparable Precedent Transactions – BGL reviewed recent merger and acquisition transactions that involved comparable original equipment manufacturers on a stand-alone basis in addition to comparing merger and acquisition transactions that involved comparable public equipment rental companies and applying the multiples on a weighted basis by percentage contribution to EBITDA to the respective business units, i.e., a sum of the parts calculation • Premiums Paid Analysis – BGL reviewed the control premiums paid in U.S. merger and acquisition transactions involving public companies in the Industrials sector within the last five years • Discounted Cash Flow – BGL reviewed Manitex’s future cash flows and terminal value, utilizing the perpetual growth methodology, and discounting them back to the present at a Weighted Average Cost of Capital (“WACC”) derived from a peer group and indicative of Manitex’s market position. This calculation is performed on projected future unlevered free cash flows (i.e., cash flows free of debt payments discounted to present value) utilizing a risk-adjusted levered cost of capital 27 Summary of Analyses Confidential: BGL considered several analyses and factors in rendering its opinion. BGL’s opinion is based on all such analyses and factors taken as a whole and not on any one analysis or factor.

Relative Valuation Summary Enterprise Value Net Share Price TTM Jun-24 EBITDA: $33.0 $ in millions, except per share Implied EV / EBITDA: $183.8 $191.3 $3.70 $4.06 5.6x – 5.8x Comparable Public Companies Implied EV / EBITDA: $203.5 $211.8 $4.64 $5.03 6.2x – 6.4x Implied EV / EBITDA: $209.4 $218.0 $4.92 $5.32 6.4x – 6.6x Precedent Transactions Implied EV / EBITDA: $201.4 $213.9 $4.54 $5.13 6.1x – 6.5x Implied EV / EBITDA: $208.8 $209.8 $4.89 $4.93 6.3x – 6.4x Premiums Paid Analysis Implied EV / EBITDA: $211.7 $212.7 $5.02 $5.07 6.4x – 6.5x Implied EV / EBITDA: $203.7 $212.0 $4.65 $5.04 6.2x – 6.4x Discounted Cash Flows Analysis Implied EV / EBITDA: $203.1 $211.3 $4.62 $5.01 6.2x – 6.4x 52-Week Low 52-Week High $3.21 $9.02 Transaction Value: Transaction Value: $227.8 $5.80 28 Public market trading data as of September 11, 2024 Summary of Analyses Confidential: BGL considered several analyses and factors in rendering its opinion. BGL’s opinion is based on all such analyses and factors taken as a whole and not on any one analysis or factor. Updated Mgmt Mgmt 1-Week 1-Day Sum of Sum of OEM OEM Forecast Case Premium Premium the Parts the Parts
Comparable Public Companies • The Comparable Public Company Analysis involves an analysis of publicly traded companies exhibiting similar business, geographic, operating and financial characteristics to the Company. This methodology, therefore, operates under the assumption that comparable companies should be valued similarly in the public market • BGL reviewed the trading multiples of publicly-traded original equipment manufacturers (“OEM”) and equipment rental companies • Five publicly-held companies that are involved in original equipment manufacturing and four public-held companies that are involved in equipment rental were selected for the comparable group • While generally similar in terms of business orientation, these companies have meaningful differences with respect to size, growth, financial performance, capital, location, geographic diversification, diversification of business lines, and market expectations of future performance, all of which have important consequences with respect to market valuations • The following observations were made regarding comparisons of the Company to the comparable companies: – Comparability: – Size: Manitex’s revenues are substantially lower than the revenues of comparable companies. Typically, smaller companies trade at discounts to larger companies – Growth: Historically, the Company has experienced, in total, revenue growth that is similar to the median and mean growth rates of the selected comparable companies – Margins: As measured by EBITDA margin, the Company’s profitability is similar to the median EBITDA margin of the comparable companies. Typically, companies with higher profitability trade at a premium to companies with lower profitability – Control: Individual shares of the public companies represent non-controlling ownership interests. A controlling interest is considered to have greater value than a non-controlling interest because it gives the owner the ability to influence the business. Typically, a premium is paid for controlling interests in companies – Liquidity: Shares of actively traded public companies generally can be liquidated quickly on the open market without material loss of value. Shares of the Company generally cannot be liquidated quickly without material loss of value and, therefore, typically would be valued at a discount as compared to the comparable public companies • BGL’s analysis focused on the enterprise value to trailing twelve-months EBITDA trading multiple for the OEM group on a stand-alone basis as well as both comparable groups on a weighted basis attributable to the respective business unit’s contribution to EBITDA. Additional trading multiples were taken into consideration for this analysis 29 Summary of Analyses Confidential: BGL considered several analyses and factors in rendering its opinion. BGL’s opinion is based on all such analyses and factors taken as a whole and not on any one analysis or factor.

Comparable Public Companies – Original Equipment Manufacturers (“OEM”) Company Business Description Cargotec Corporation (HSLE: CGBV) Cargotec is a provider of cargo and load handling solutions comprised of two brands, Hiab and MacGregor. Hiab is a provider of on-road truck mounted cranes and other load handling solutions serving logistics, construction, and a variety of other industries. MacGregor is a maritime cargo and load handling business with a portfolio of products, services and solutions, all designed to perform with the sea. The Manitowoc Company, Inc. (NYSE: MTW) Manitowoc is a provider of engineered lifting solutions. The company designs, manufacturers, and distributes crawler-mounted lattice-boom cranes under the Manitowoc brand; a line of top-slewing and self-erecting tower cranes under the Potain brand; mobile hydraulic cranes under the Grove, Shuttlelift, and National Crane branes, and hydraulic boom trucks under the National Crane brand. The company also provides aftermarket services. Palfinger AG (WBAG: PAL) Palfinger produces and sells crane and lifting solutions worldwide. Products include loader cranes, timber and recycling cranes, knuckle boom cranes, telescopic cranes, stiff boom cranes, winches and offshore equipment, offshore cranes, and other lifting solutions. Tadano manufactures and sells construction and vehicle-mounted cranes. It offers all-terrain, rough terrain, truck, Tadano Ltd. (TSE:6395) crawler, and cargo cranes; components for hydraulic cranes; vehicle and industrial vehicle carriers; elevated road/bridge inspection vehicles, pole digging and lighting cars, track and land vehicles, hydraulic cranes for ships, lifters and lifting houses; and aerial work platforms. Terex Corporation manufactures and sells aerial work platforms and material processing machinery worldwide. It Terex Corporation (NYSE: TEX) operates in two segments, Materials Processing (MP) and Aerial Work Platforms (AWP). The MP segment designs, manufactures, services, and markets materials processing and specialty equipment. The AWP segment designs, manufactures, services, and markets aerial work platform equipment, utility equipment, and telehandlers under the Terex and Genie brands. Its products include lifting solutions as well as related components and replacement parts for construction and maintenance of industrial, commercial, institutional, and other applications. 30 Summary of Analyses Confidential: BGL considered several analyses and factors in rendering its opinion. BGL’s opinion is based on all such analyses and factors taken as a whole and not on any one analysis or factor.

Comparable Public Companies – Original Equipment Manufacturers (“OEM”) ($ in millions, except per share data) As of September 11, 2024 2023 TTM Jun-24 2024B 2025P Market Enterprise EBITDA EBITDA EBITDA 3-Yr. Rev. EBITDA Company Share Price Revenue EBITDA EPS Revenue EBITDA EPS Revenue EBITDA Revenue EBITDA Capitalization Value Margin Margin Margin CAGR Margin Original Equipment Manufacturers (1) $ 4 9.67 $ 3,183 $ 3,228 $ 2 ,726 $ 3 76 13.8% $ 5 .95 $ 2 ,732 $ 3 78 13.8% $ 2 2.44 $ 2 ,747 $ 3 96 14.4% 10.7% $ 2 ,723 $ 3 89 14.3% Cargotec Corporation Manitowoc Company, Inc., The 9 .09 3 19 7 53 2 ,228 1 75 7.9% 1 .12 2 ,215 1 37 6.2% 0 .24 2 ,176 1 32 6.1% 8.2% 2 ,228 1 50 6.7% Palfinger AG 2 3.67 8 23 1 ,733 2 ,646 3 28 12.4% 3 .42 2 ,604 3 26 12.5% 3 .48 2 ,615 3 08 11.8% 7.7% 2 ,690 3 29 12.2% Tadano Ltd. 6 .49 8 24 9 11 2 ,000 1 74 8.7% 0 .43 1 ,941 1 87 9.6% 0 .48 2 ,137 1 95 9.1% 8.2% 2 ,146 2 02 9.4% Terex Corporation 4 9.91 3 ,339 3 ,685 5 ,152 6 86 13.3% 7 .67 5 ,187 6 90 13.3% 7 .37 5 ,021 7 38 14.7% 8.9% 5 ,007 7 18 14.3% Mean $ 1,698 $ 2,062 $ 2,950 $ 348 11.2% $ 3.72 $ 2,936 $ 344 11.1% $ 6.80 $ 2,939 $ 354 11.2% 8.7% $ 2 ,959 $ 3 57 11.4% Median $ 824 $ 1,733 $ 2,646 $ 328 12.4% $ 3.42 $ 2,604 $ 326 12.5% $ 3.48 $ 2,615 $ 308 11.8% 8.2% $ 2 ,690 $ 3 29 12.2% 2023 Enterprise Value / 2023 TTM Jun-24 Enterprise Value / TTM June-24 Enterprise Value / 2024B Enterprise Value / 2025P Price-to- Price-to- Company Revenue EBITDA Revenue EBITDA Revenue EBITDA Revenue EBITDA Earnings Earnings Original Equipment Manufacturers (1) 8.3x 1.2x 8.6x 2.2x 1.2x 8.5x 1.2x 8.2x 1.2x 8.3x Cargotec Corporation Manitowoc Company, Inc., The 8.1x 0.3x 4.3x 37.2x 0.3x 5.5x 0.3x 5.7x 0.3x 5.0x Palfinger AG 6.9x 0.7x 5.3x 6.8x 0.7x 5.3x 0.7x 5.6x 0.6x 5.3x Tadano Ltd. 14.9x 0.5x 5.2x 13.7x 0.5x 4.9x 0.4x 4.7x 0.4x 4.5x Terex Corporation 6.5x 0.7x 5.4x 6.8x 0.7x 5.3x 0.7x 5.0x 0.7x 5.1x Mean 9.0x 0.7x 5.8x 13.3x 0.7x 5.9x 0.7x 5.8x 0.7x 5.7x Median 8.1x 0.7x 5.3x 6.8x 0.7x 5.3x 0.7x 5.6x 0.6x 5.1x Notes: Sources: SEC Filings, Investor Presentations, Press Releases, and S&P Capital IQ; (1) Cargotec Corporation reflects pro forma revenue and EBITDA for the demerger of Kalmar completed June 30, 2024 31 Summary of Analyses Confidential: BGL considered several analyses and factors in rendering its opinion. BGL’s opinion is based on all such analyses and factors taken as a whole and not on any one analysis or factor.
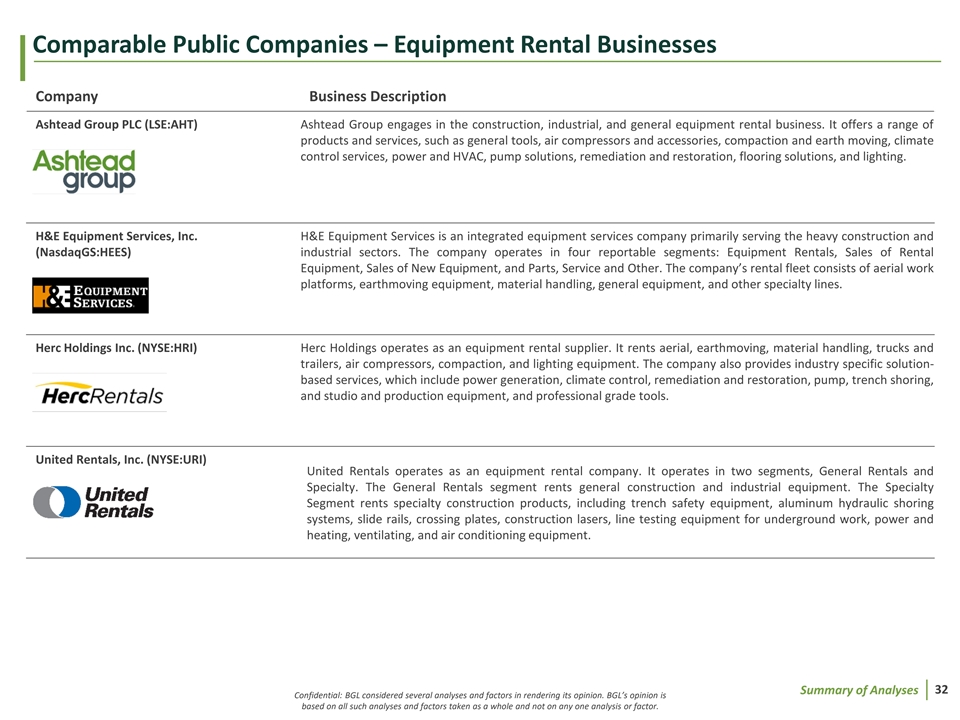
Comparable Public Companies – Equipment Rental Businesses Company Business Description Ashtead Group PLC (LSE:AHT) Ashtead Group engages in the construction, industrial, and general equipment rental business. It offers a range of products and services, such as general tools, air compressors and accessories, compaction and earth moving, climate control services, power and HVAC, pump solutions, remediation and restoration, flooring solutions, and lighting. H&E Equipment Services, Inc. H&E Equipment Services is an integrated equipment services company primarily serving the heavy construction and (NasdaqGS:HEES) industrial sectors. The company operates in four reportable segments: Equipment Rentals, Sales of Rental Equipment, Sales of New Equipment, and Parts, Service and Other. The company’s rental fleet consists of aerial work platforms, earthmoving equipment, material handling, general equipment, and other specialty lines. Herc Holdings Inc. (NYSE:HRI) Herc Holdings operates as an equipment rental supplier. It rents aerial, earthmoving, material handling, trucks and trailers, air compressors, compaction, and lighting equipment. The company also provides industry specific solution- based services, which include power generation, climate control, remediation and restoration, pump, trench shoring, and studio and production equipment, and professional grade tools. United Rentals, Inc. (NYSE:URI) United Rentals operates as an equipment rental company. It operates in two segments, General Rentals and Specialty. The General Rentals segment rents general construction and industrial equipment. The Specialty Segment rents specialty construction products, including trench safety equipment, aluminum hydraulic shoring systems, slide rails, crossing plates, construction lasers, line testing equipment for underground work, power and heating, ventilating, and air conditioning equipment. 32 Summary of Analyses Confidential: BGL considered several analyses and factors in rendering its opinion. BGL’s opinion is based on all such analyses and factors taken as a whole and not on any one analysis or factor.
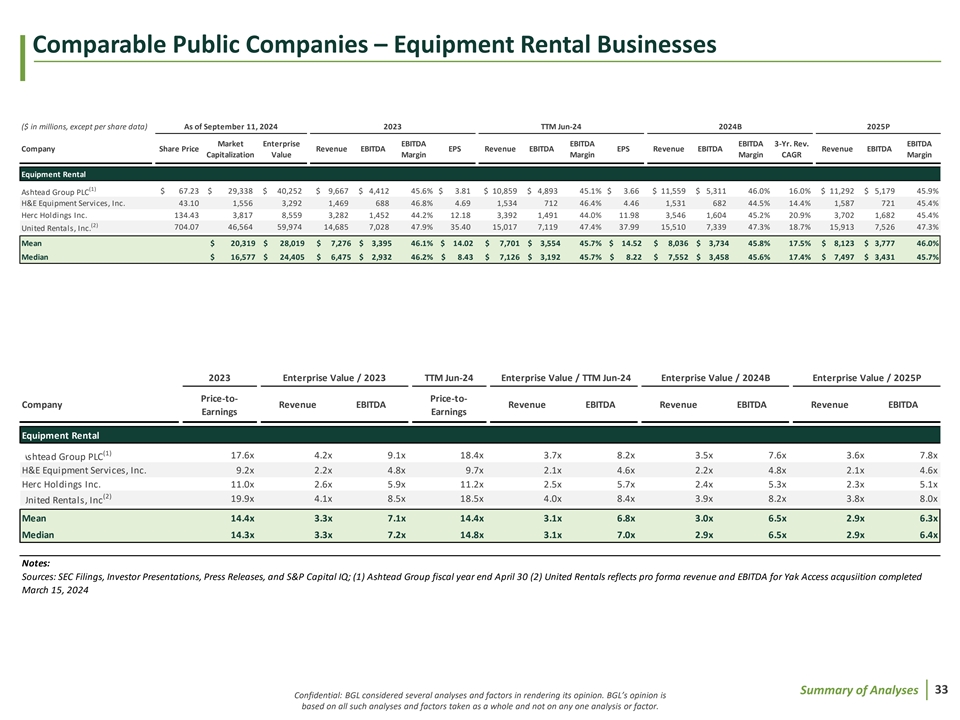
Comparable Public Companies – Equipment Rental Businesses ($ in millions, except per share data) As of September 11, 2024 2023 TTM Jun-24 2024B 2025P Market Enterprise EBITDA EBITDA EBITDA 3-Yr. Rev. EBITDA Company Share Price Revenue EBITDA EPS Revenue EBITDA EPS Revenue EBITDA Revenue EBITDA Capitalization Value Margin Margin Margin CAGR Margin Equipment Rental (1) $ 67.23 $ 29,338 $ 40,252 $ 9 ,667 $ 4,412 45.6% $ 3.81 $ 1 0,859 $ 4 ,893 45.1% $ 3 .66 $ 1 1,559 $ 5 ,311 46.0% 16.0% $ 1 1,292 $ 5 ,179 45.9% Ashtead Group PLC H&E Equipment Services, Inc. 4 3.10 1,556 3 ,292 1,469 688 46.8% 4 .69 1 ,534 7 12 46.4% 4 .46 1 ,531 6 82 44.5% 14.4% 1 ,587 7 21 45.4% Herc Holdings Inc. 1 34.43 3 ,817 8 ,559 3 ,282 1 ,452 44.2% 1 2.18 3 ,392 1 ,491 44.0% 1 1.98 3 ,546 1 ,604 45.2% 20.9% 3 ,702 1 ,682 45.4% (2) 704.07 46,564 59,974 14,685 7 ,028 47.9% 3 5.40 15,017 7,119 47.4% 37.99 1 5,510 7 ,339 47.3% 18.7% 1 5,913 7 ,526 47.3% United Rentals, Inc. Mean $ 20,319 $ 28,019 $ 7,276 $ 3,395 46.1% $ 14.02 $ 7,701 $ 3,554 45.7% $ 14.52 $ 8,036 $ 3,734 45.8% 17.5% $ 8,123 $ 3,777 46.0% Median $ 16,577 $ 24,405 $ 6,475 $ 2,932 46.2% $ 8.43 $ 7,126 $ 3,192 45.7% $ 8.22 $ 7,552 $ 3,458 45.6% 17.4% $ 7 ,497 $ 3,431 45.7% 2023 Enterprise Value / 2023 TTM Jun-24 Enterprise Value / TTM Jun-24 Enterprise Value / 2024B Enterprise Value / 2025P Price-to- Price-to- Company Revenue EBITDA Revenue EBITDA Revenue EBITDA Revenue EBITDA Earnings Earnings Equipment Rental (1) 17.6x 4.2x 9.1x 18.4x 3.7x 8.2x 3.5x 7.6x 3.6x 7.8x Ashtead Group PLC H&E Equipment Services, Inc. 9.2x 2.2x 4.8x 9.7x 2.1x 4.6x 2.2x 4.8x 2.1x 4.6x Herc Holdings Inc. 11.0x 2.6x 5.9x 11.2x 2.5x 5.7x 2.4x 5.3x 2.3x 5.1x (2) 19.9x 4.1x 8.5x 18.5x 4.0x 8.4x 3.9x 8.2x 3.8x 8.0x United Rentals, Inc Mean 14.4x 3.3x 7.1x 14.4x 3.1x 6.8x 3.0x 6.5x 2.9x 6.3x Median 14.3x 3.3x 7.2x 14.8x 3.1x 7.0x 2.9x 6.5x 2.9x 6.4x Notes: Sources: SEC Filings, Investor Presentations, Press Releases, and S&P Capital IQ; (1) Ashtead Group fiscal year end April 30 (2) United Rentals reflects pro forma revenue and EBITDA for Yak Access acqusiition completed March 15, 2024 33 Summary of Analyses Confidential: BGL considered several analyses and factors in rendering its opinion. BGL’s opinion is based on all such analyses and factors taken as a whole and not on any one analysis or factor.

Comparable Public Companies – OEM Valuation Summary Comparable Public Original Equipment Manufacturers (1) Median EV to TTM EBITDA Multiple Range ($ in thousands) (2.0%) Median 2.0% 5.2x 5.3x 5.5x TTM June 2024 Adjusted EBITDA $ 32,965 Enterprise Value Range Implied EV Range Before (Discount) / Premium $ 172,621 $ 179,667 (2) Control Premium 28.9% 28.9% (3) Liquidity Discount (14.8%) (14.8%) (4) Comparability Discount (7.6%) (7.6%) Total (Discount) / Premium 6.5% 6.5% Implied Enterprise Value $ 183,773 $ 191,274 (5) Implied Value Per Share $ 3.70 $ 4.06 Implied Adjusted EBITDA Multiple Range 5.6x 5.8x Implied Manitex Enterprise Value Range: $183.8 - $191.3 million 5.6x - 5.8x Adjusted TTM June 2024 EBITDA Implied Share Value Range: $3.70 - $4.06 per share Notes: (1) Range equals the median multiple plus or minus 2.0% (2) Based on the S&P Capital IQ 1-day control premium for U.S. public transactions announced within the last five years for Industrials companies (3) Source: Duff & Phelps Stocks, Bonds, Bills, and Inflation 2021 (4) Size Premium for companies in market capitalization Decile 10B, per Center for Research in Security Prices Deciles Size Data (data as of 12/2023) (5) Assumes net debt of $84.2 million as of June 30, 2024, non-controlling interest of Rabern of $15.3 million, estimated seller transaction expenses of $6.2 million, and 21.1 million outstanding shares of common stock on a fully diluted basis as of September 11, 2024 34 Summary of Analyses Confidential: BGL considered several analyses and factors in rendering its opinion. BGL’s opinion is based on all such analyses and factors taken as a whole and not on any one analysis or factor.

Comparable Public Companies – Sum of the Parts Valuation Summary Comparable Public Original Equipment Manufacturers Comparable Public Equipment Rental Median EV to TTM (1) (1) Median EV to TTM EBITDA Multiple Range EBITDA Multiple Range ($ in thousands) (2.0%) Median 2.0% (2.0%) Median 2.0% 5.2x 5.3x 5.5x 6.8x 7.0x 7.1x TTM June 2024 EBITDA Attributable to OEM Business TTM June 2024 EBITDA Attributable to Rental Business $ 21,419 $ 11,546 % EBITDA Attributable to OEM Business % EBITDA Attributable to Rental Business 65.0% 35.0% Implied EV from OEM Business Implied EV from Rental Business $ 112,161 $ 116,739 $ 79,018 $ 82,244 Implied Enterprise Value Range Implied EV Range Before (Discount) / Premium $ 191,180 $ 198,983 (2) Control Premium 28.9% 28.9% (3) Liquidity Discount (14.8%) (14.8%) (4) Comparability Discount (7.6%) (7.6%) Total (Discount) / Premium 6.5% 6.5% Implied Enterprise Value $ 203,530 $ 211,837 (5) Implied Value Per Share $ 4.64 $ 5.03 Implied Adjusted EBITDA Multiple Range 6.2x 6.4x Implied Manitex Enterprise Value Range: $203.5 - $211.8 million 6.2x - 6.4x Adjusted TTM June 2024 EBITDA Implied Share Value Range: $4.64 - $5.03 per share Notes: (1) Range equals the median multiple plus or minus 2.0% (2) Based on the S&P Capital IQ 1-day control premium for U.S. public transactions announced within the last five years for Industrials companies (3) Source: Duff & Phelps Stocks, Bonds, Bills, and Inflation 2021 (4) Size Premium for companies in market capitalization Decile 10B, per Center for Research in Security Prices Deciles Size Data (data as of 12/2023) (5) Assumes net debt of $84.2 million as of June 30, 2024, non-controlling interest of Rabern of $15.3 million, estimated seller transaction expenses of $6.2 million, and 21.1 million outstanding shares of common stock on a fully diluted basis as of September 11, 2024 35 Summary of Analyses Confidential: BGL considered several analyses and factors in rendering its opinion. BGL’s opinion is based on all such analyses and factors taken as a whole and not on any one analysis or factor.

Comparable Precedent Transactions • BGL reviewed recent merger and acquisition transactions that involved comparable original equipment manufacturers and equipment rental companies • In determining the precedent transactions, BGL conducted a broad search for transactions within the original equipment manufacturing and equipment rental industries over the time period January 2021 to the present. Over this time period, eight transactions were identified for which public information was available • The following observations were made concerning comparisons of the Proposed Merger to the comparable precedent transactions: – Comparability: – Size: As measured by Enterprise Value, the Proposed Merger is below the range of comparable transactions, resulting in an adjustment for size when in comparison to the peer transactions – Timing: There are not material time period differences within the peer transaction set to apply a time period modification discount or premium • BGL’s review focused on the enterprise value to trailing twelve-months EBITDA multiple for original equipment manufacturing transactions on a stand-alone basis as well as on a weighted basis attributable to the respective business unit’s contribution to EBITDA • BGL reviewed the one-day and one-week control premiums paid in public U.S. merger and acquisition transactions in the Industrials sector within the past five years 36 Summary of Analyses Confidential: BGL considered several analyses and factors in rendering its opinion. BGL’s opinion is based on all such analyses and factors taken as a whole and not on any one analysis or factor.

Comparable Precedent OEM Transactions ($ in millions) Enterprise TTM Enterprise Value / TTM Closed Date Target Acquirer Value Revenue EBITDA Revenue EBITDA Existing Shareholders (1) Jul-24 Kalmar Oyj (HLSE:KALMAR) $ 2,071 $ 2,006 $ 274 1.0x 7.6x (Cargotec Demerger ) The Crosby Group (2) Jan-23 535 584 78 0.9x 6.9x KITO Corporation (Kohlberg Kravis Roberts & Co.) Hitachi Construction Machinery Itochu and Sep-22 8, 625 7,811 1, 229 1.1x 7.0x (3) Japan Industrial Partners Co., Ltd. (TSE:6305) Mean $ 3,744 $ 3,467 $ 527 1.0x 7.2x Median $ 2,071 $ 2, 006 $ 274 1.0x 7.0x Notes: Source: SEC Filings, Investor Presentations, Press Releases, and S&P Capital IQ (1) Partial demerger of Cargotec Corporation with existing shareholders issued a proportionate amount of shares of the receiving company, Kalmar Corporation, listed on the Nasdaq Helsinki on July 1, 2024 at €30 per share. Financials as of TTM June 2024 (2) TTM September 2022 financials. Assumes USD to JPY conversion rate of 120 (3) Minority sale by Hitachi Ltd. of a 26% stake in the Company 37 Summary of Analyses Confidential: BGL considered several analyses and factors in rendering its opinion. BGL’s opinion is based on all such analyses and factors taken as a whole and not on any one analysis or factor.
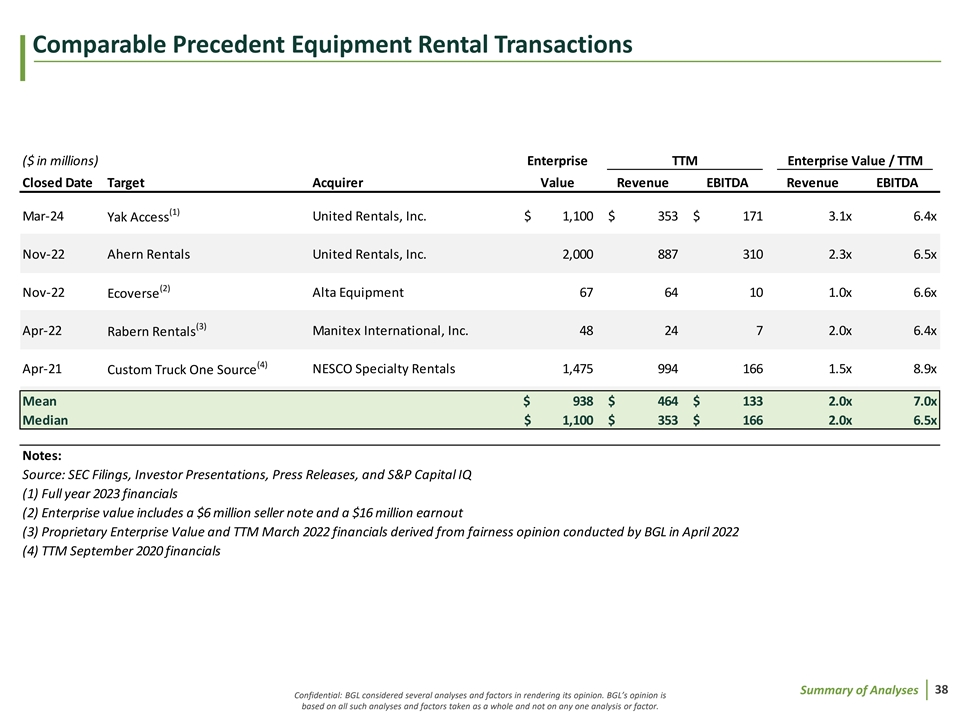
Comparable Precedent Equipment Rental Transactions ($ in millions) Enterprise TTM Enterprise Value / TTM Closed Date Target Acquirer Value Revenue EBITDA Revenue EBITDA (1) Mar-24 Yak Access United Rentals, Inc. $ 1, 100 $ 353 $ 171 3.1x 6.4x Nov-22 Ahern Rentals United Rentals, Inc. 2, 000 887 310 2.3x 6.5x (2) Nov-22 Alta Equipment 67 64 10 1.0x 6.6x Ecoverse (3) Apr-22 Manitex International, Inc. 48 24 7 2.0x 6.4x Rabern Rentals (4) Apr-21 NESCO Specialty Rentals 1,475 994 166 1.5x 8.9x Custom Truck One Source Mean $ 938 $ 464 $ 133 2.0x 7.0x Median $ 1, 100 $ 353 $ 166 2.0x 6.5x Notes: Source: SEC Filings, Investor Presentations, Press Releases, and S&P Capital IQ (1) Full year 2023 financials (2) Enterprise value includes a $6 million seller note and a $16 million earnout (3) Proprietary Enterprise Value and TTM March 2022 financials derived from fairness opinion conducted by BGL in April 2022 (4) TTM September 2020 financials 38 Summary of Analyses Confidential: BGL considered several analyses and factors in rendering its opinion. BGL’s opinion is based on all such analyses and factors taken as a whole and not on any one analysis or factor.

Comparable Precedent Transactions – OEM Valuation Summary Comparable Precedent Original Equipment Manufacturers (1) Transactions Median EV to TTM EBITDA Multiple Range ($ in thousands) (2.0%) Median 2.0% 6.9x 7.0x 7.2x TTM June 2024 Adjusted EBITDA $ 32, 965 Implied Enterprise Value Range Implied EV Range Before (Discount) / Premium $ 226,775 $ 236,031 (2) Comparability Discount (7.6%) (7.6%) Total (Discount) / Premium (7.6%) (7.6%) Implied Enterprise Value $ 209,449 $ 217,998 (3) Implied Value Per Share $ 4.92 $ 5.32 Implied Adjusted EBITDA Multiple Range 6.4x 6.6x Implied Manitex Enterprise Value Range: $209.4 - $218.0 million 6.4x - 6.6x Adjusted TTM June 2024 EBITDA Implied Share Value Range: $4.92 - $5.32 per share Notes: (1) Range equals the median multiple plus or minus 2.0% (2) Size Premium for companies in market capitalization Decile 10B, per Center for Research in Security Prices Deciles Size Data (data as of 12/2023) (3) Assumes net debt of $84.2 million as of June 30, 2024, non-controlling interest of Rabern of $15.3 million, estimated seller transaction expenses of $6.2 million, and 21.1 million outstanding shares of common stock on a fully diluted basis as of September 11, 2024 39 Summary of Analyses Confidential: BGL considered several analyses and factors in rendering its opinion. BGL’s opinion is based on all such analyses and factors taken as a whole and not on any one analysis or factor.
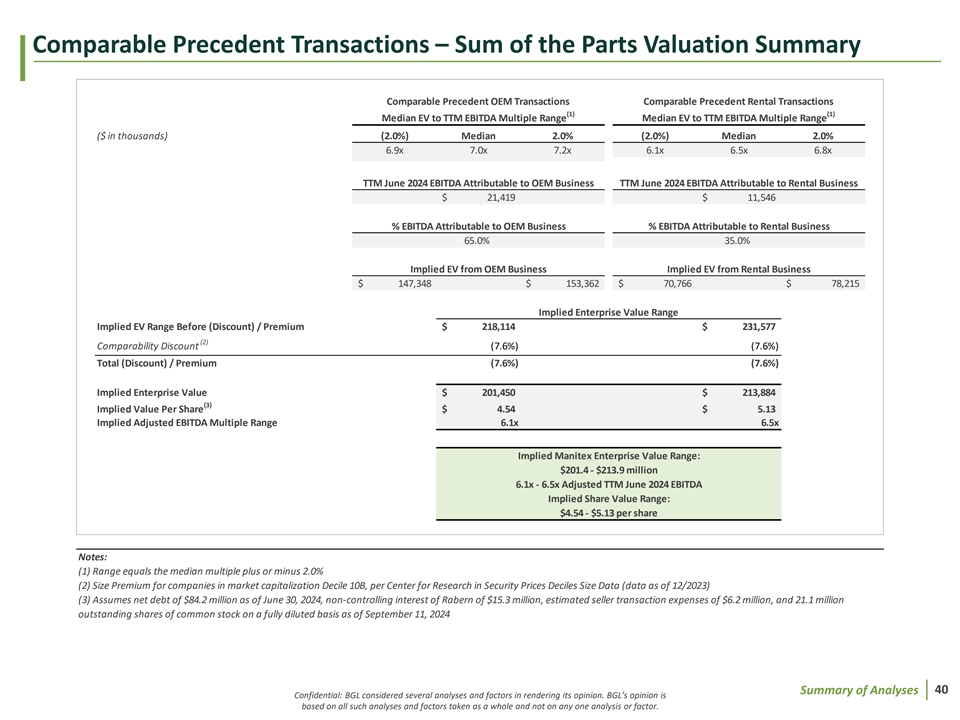
Comparable Precedent Transactions – Sum of the Parts Valuation Summary Comparable Precedent OEM Transactions Comparable Precedent Rental Transactions (1) (1) Median EV to TTM EBITDA Multiple Range Median EV to TTM EBITDA Multiple Range ($ in thousands) (2.0%) Median 2.0% (2.0%) Median 2.0% 6.9x 7.0x 7.2x 6.1x 6.5x 6.8x TTM June 2024 EBITDA Attributable to OEM Business TTM June 2024 EBITDA Attributable to Rental Business $ 21,419 $ 11,546 % EBITDA Attributable to OEM Business % EBITDA Attributable to Rental Business 65.0% 35.0% Implied EV from OEM Business Implied EV from Rental Business $ 147,348 $ 153,362 $ 70,766 $ 78,215 Implied Enterprise Value Range Implied EV Range Before (Discount) / Premium $ 218,114 $ 231,577 (2) Comparability Discount (7.6%) (7.6%) Total (Discount) / Premium (7.6%) (7.6%) Implied Enterprise Value $ 201,450 $ 213,884 (3) Implied Value Per Share $ 4.54 $ 5.13 Implied Adjusted EBITDA Multiple Range 6.1x 6.5x Implied Manitex Enterprise Value Range: $201.4 - $213.9 million 6.1x - 6.5x Adjusted TTM June 2024 EBITDA Implied Share Value Range: $4.54 - $5.13 per share Notes: (1) Range equals the median multiple plus or minus 2.0% (2) Size Premium for companies in market capitalization Decile 10B, per Center for Research in Security Prices Deciles Size Data (data as of 12/2023) (3) Assumes net debt of $84.2 million as of June 30, 2024, non-controlling interest of Rabern of $15.3 million, estimated seller transaction expenses of $6.2 million, and 21.1 million outstanding shares of common stock on a fully diluted basis as of September 11, 2024 40 Summary of Analyses Confidential: BGL considered several analyses and factors in rendering its opinion. BGL’s opinion is based on all such analyses and factors taken as a whole and not on any one analysis or factor.

Premiums Paid Valuation Summary 1-Day 1-Week Manitex Closing Share Price as of September 11, 2024 Manitex Closing Share Price as of September 05, 2024 ($ in thousands) $ 3. 81 $ 3. 79 (1,2) (1,2) 1-Day Transaction Premium 1-Week Transaction Premium (2.0%) Median 2.0% (2.0%) Median 2.0% 28.3% 28.9% 29.5% 32.6% 33.2% 33.9% Implied Premium Share Price $ 4. 89 $ 4. 93 $ 5. 02 $ 5. 07 (3) Implied Enterprise Value $ 208, 840 $ 209, 770 $ 211, 686 $ 212, 749 Implied Adjusted EBITDA Multiple Range 6.3x 6.4x 6.4x 6.5x Implied Manitex Enterprise Value Range: Implied Manitex Enterprise Value Range: $208.8 - $209.8 million $211.7 - $212.7 million 6.3x - 6.4x Adjusted TTM June 2024 EBITDA 6.4x - 6.5x Adjusted TTM June 2024 EBITDA Implied Share Value Range: Implied Share Value Range: $4.89 - $4.93 per share $5.02 - $5.07 per share Notes: (1) Range equals the median multiple plus or minus 2.0% (2) Based on the S&P CapitalIQ control premiums for 85 U.S. public transactions announced within the last five years for Industrials companies; detail available within the appendix (3) Assumes net debt of $84.2 million as of June 30, 2024, non-controlling interest of Rabern of $15.3 million, estimated seller transaction expenses of $6.2 million, and 21.2 million outstanding shares of common stock on a fully diluted basis as of September 11, 2024 41 Summary of Analyses Confidential: BGL considered several analyses and factors in rendering its opinion. BGL’s opinion is based on all such analyses and factors taken as a whole and not on any one analysis or factor.

Discounted Cash Flow • BGL reviewed Manitex’s implied Enterprise and Equity Value by calculating the Company’s future cash flows and discounting them to the present at a WACC derived from a peer group and indicative of Manitex’s market position. This calculation is performed on projected future unlevered free cash flows (i.e., cash flows free of debt payments discounted to present value) utilizing a risk-adjusted levered cost of capital • In performing the discounted cash flow calculation, BGL considered the following: – The cost of debt of Manitex considering its assets, projected cash flow, and business risk profile – The cost of equity of Manitex considering its assets, projected cash flow, and business risk profile – The proportion of debt and equity utilized to capitalize the business – The relative premium to account for the Company’s respective size – The terminal growth rate applicable to the business in four years which, for the purpose of this analysis, is assumed to be 1.40%, in- line with the weighted average of the Organization for Economic Co-Operation and Development’s Real GDP Long-Term Forecast for the U.S., Canada, Eurozone, and of All Other OECD Countries, weighted for the Company’s respective revenue exposure to each geography 42 Summary of Analyses Confidential: BGL considered several analyses and factors in rendering its opinion. BGL’s opinion is based on all such analyses and factors taken as a whole and not on any one analysis or factor.

Discounted Cash Flow (Perpetuity Method) – Management Case Jul - Dec Projected ($ in thousands) 2024 2025 2026 2027 2028 Weighted Average Cost of Capital Revenue $ 132,884 $ 346,519 $ 382,922 $ 414,409 $ 442,067 Cost of Debt Cost of Equity (2) Growth % n/a 12.1% 10.5% 8.2% 6.7% Risk-free Rate 4.1% (3) Adjusted EBITDA 1 7,070 4 9,248 5 5,232 6 1,384 6 6,804 Market Risk Premium 5.0% (1) Margin % 12.8% 14.2% 14.4% 14.8% 15.1% Interest Rate 8.0% Levered Beta 1.57 (4) Adjusted EBIT 1 4,853 3 6,774 4 2,592 4 7,896 5 3,130 Tax Rate 25.0% Size Premium 7.6% Margin % 11.2% 10.6% 11.1% 11.6% 12.0% After Tax Cost of Debt 6.0% Cost of Equity 19.6% (4) (5) Less: Cash Taxes @25% 3,713 9,194 1 0,648 1 1,974 1 3,282 Debt-to-Total Cap. 26.9% Equity-to-Total Cap. 73.1% Unlevered Adjusted Net Income 1 1,140 2 7,581 3 1,944 3 5,922 3 9,847 Plus: Depreciation & Amortization 2,218 1 2,474 1 2,640 1 3,488 1 3,674 Weighted Average Cost of Capital 15.9% Less: Change in Working Capital 801 ( 1,644) ( 4,847) ( 2,733) ( 4,451) Less: Capital Expenditures ( 4,493) (13,157) (14,608) (20,980) (14,911) Notes: Unlevered Free Cash Flow $ 9 ,666 $ 25,254 $ 25,129 $ 25,697 $ 34,159 (1) Company's weighted average cost of debt as of 6/30/2024 (2) US 20 Year Treasury Rate as of 9/11/2024; Source: Bloomberg Discount Rate (WACC) 15.9% (3) Kroll Cost of Capital Navigator (data as of 07/2024) Perpetuity Growth Rate 1.4% (4) Size Premium for companies in market capitalization Decile 10B, per Center for 2028 Unlevered Free Cash Flow $ 34,159 Research in Security Prices Deciles Size Data (data as of 12/2023) Terminal Value - at Perpetuity Growth Rate 238,959 (5) Median ratio of public comparables as of 9/11/2024 Present Value of Terminal Value 122,889 (6) Net debt as of 06/30/2024 Present Value of Free Cash Flows 8 4,854 (7) Value of Non-Controlling Interest of Rabern as of 06/30/2024 Implied Enterprise Value $ 207,743 (8) Estimated seller transaction expenses based on Per Share Merger Consideration of $5.80 (6) Less: Closing Date Net Debt (84,184) Implied Valuation Multiple (7) Less: Non-Controlling Interest of Rabern (15,258) Implied EV / TTM Jun-24 EBITDA 6.3x (8) Less: Estimated Seller Transaction Expenses ( 6,173) Implied Equity Value $ 102,128 Implied Enterprise Valuation Range: WACC $203.7 - $212.0 million ###### 15.70% 15.80% 15.90% 16.00% 16.10% 6.2x - 6.4x TTM Jun-24 EBITDA Multiple Range 1.25% $ 208,948 $ 207,616 $ 206,304 $ 205,013 $ 203,741 Implied Equity Value: 1.33% 2 09,688 2 08,344 2 07,020 2 05,717 2 04,433 1.40% 2 10,436 2 09,079 2 07,743 2 06,428 2 05,132 $98.1 - $106.3 million 1.48% 2 11,192 2 09,822 2 08,474 2 07,146 2 05,839 Implied Price per Share: 1.55% 2 11,955 2 10,573 2 09,212 2 07,872 2 06,552 $4.65 - $5.04 per share Note: BGL used the half year convention in its preparation of the DCF analysis; assumes the Company exhausts existing deferred tax assets 43 Summary of Analyses Confidential: BGL considered several analyses and factors in rendering its opinion. BGL’s opinion is based on all such analyses and factors taken as a whole and not on any one analysis or factor. Perpetuity Growth

Discounted Cash Flow (Perpetuity Method) – Updated Management Forecast Jul - Dec Projected ($ in thousands) 2024 2025 2026 2027 2028 Weighted Average Cost of Capital Revenue $ 132,884 $ 324,502 $ 397,600 $ 421,747 $ 442,067 Cost of Debt Cost of Equity (2) Growth % n/a 5.0% 22.5% 6.1% 4.8% Risk-free Rate 4.1% (3) Adjusted EBITDA 1 7,070 4 3,624 5 9,019 6 3,221 6 6,804 Market Risk Premium 5.0% (1) Margin % 12.8% 13.4% 14.8% 15.0% 15.1% Interest Rate 8.0% Levered Beta 1.57 (4) Adjusted EBIT 1 4,853 3 1,150 4 6,379 4 9,733 5 3,130 Tax Rate 25.0% Size Premium 7.6% Margin % 11.2% 9.6% 11.7% 11.8% 12.0% After Tax Cost of Debt 6.0% Cost of Equity 19.6% (4) (5) Less: Cash Taxes @25% 3,713 7,788 1 1,595 1 2,433 1 3,282 Debt-to-Total Cap. 26.9% Equity-to-Total Cap. 73.1% Unlevered Adjusted Net Income 1 1,140 2 3,363 3 4,785 3 7,300 3 9,847 Plus: Depreciation & Amortization 2,218 1 2,474 1 2,640 1 3,488 1 3,674 Weighted Average Cost of Capital 15.9% Less: Change in Working Capital 801 ( 1,644) ( 4,847) ( 2,733) ( 4,451) Less: Capital Expenditures ( 4,493) (13,157) (14,608) (20,980) (14,911) Notes: Unlevered Free Cash Flow $ 9 ,666 $ 21,036 $ 27,970 $ 27,075 $ 34,159 (1) Company's weighted average cost of debt as of 6/30/2024 (2) US 20 Year Treasury Rate as of 9/11/2024; Source: Bloomberg Discount Rate (WACC) 15.9% (3) Kroll Cost of Capital Navigator (data as of 07/2024) Perpetuity Growth Rate 1.4% (4) Size Premium for companies in market capitalization Decile 10B, per Center for 2028 Unlevered Free Cash Flow $ 34,159 Research in Security Prices Deciles Size Data (data as of 12/2023) Terminal Value - at Perpetuity Growth Rate 238,959 (5) Median ratio of public comparables as of 9/11/2024 Present Value of Terminal Value 122,889 (6) Net debt as of 06/30/2024 Present Value of Free Cash Flows 8 4,214 (7) Value of Non-Controlling Interest of Rabern as of 06/30/2024 Implied Enterprise Value $ 207,103 (8) Estimated seller transaction expenses based on Per Share Merger Consideration of $5.80 (6) Less: Closing Date Net Debt (84,184) Implied Valuation Multiple (7) Less: Non-Controlling Interest of Rabern (15,258) Implied EV / TTM Jun-24 EBITDA 6.3x (8) Less: Estimated Seller Transaction Expenses ( 6,173) Implied Equity Value $ 101,489 Implied Enterprise Valuation Range: WACC $203.1 - $211.3 million ###### 15.70% 15.80% 15.90% 16.00% 16.10% 6.2x - 6.4x TTM Jun-24 EBITDA Multiple Range 1.25% $ 208,309 $ 206,976 $ 205,665 $ 204,373 $ 203,101 Implied Equity Value: 1.33% 2 09,049 2 07,704 2 06,380 2 05,077 2 03,793 1.40% 2 09,796 2 08,439 2 07,103 2 05,788 2 04,493 $97.5 - $105.7 million 1.48% 2 10,552 2 09,182 2 07,834 2 06,506 2 05,199 Implied Price per Share: 1.55% 2 11,316 2 09,933 2 08,572 2 07,232 2 05,913 $4.62 - $5.01 per share Note: BGL used the half year convention in its preparation of the DCF analysis; assumes the Company exhausts existing deferred tax assets 44 Summary of Analyses Confidential: BGL considered several analyses and factors in rendering its opinion. BGL’s opinion is based on all such analyses and factors taken as a whole and not on any one analysis or factor. Perpetuity Growth

Other Considerations • BGL also considered a number of qualitative factors including, but not limited to, the following: – Results of and feedback from sales process – Opportunities for investment to enhance margins and growth – Historical and current order intake and backlog – Industry cyclicality and the current stage of the business cycle – End markets served – Geographic markets served – Risks of executing growth opportunities and achieving projected Revenue and Adjusted EBITDA 45 Summary of Analyses Confidential: BGL considered several analyses and factors in rendering its opinion. BGL’s opinion is based on all such analyses and factors taken as a whole and not on any one analysis or factor.

Click to Ie Vd . D it M isca la sim ter e t rs itle style

Disclaimers The materials are for discussion purposes only. BGL expressly disclaims any and all liability, whether direct or indirect, in contract or tort or otherwise, to any person in connection with the materials. The materials were prepared for specific persons familiar with the business and affairs of the Company for use in a specific context and were not prepared with a view to public disclosure or to conform with any disclosure standards under any state, federal or international securities laws or other laws, rules or regulations, and none of the Transaction Committee, the Company or BGL takes any responsibility for the use of the materials by persons other than the Transaction Committee. The materials are provided on a confidential basis solely for the information of the Transaction Committee and may not be disclosed, summarized, reproduced, disseminated or quoted or otherwise referred to, in whole or in part, without BGL’s express prior written consent. The materials necessarily are based on financial, economic, market and other conditions as in effect on, and the information available to BGL as of, the date of the materials. Although subsequent developments may affect the contents of the materials, BGL has not undertaken, and is under no obligation, to update, revise or reaffirm the materials, except as may be expressly contemplated by BGL’s engagement letter. The materials are not intended to provide the sole basis for evaluation of the Proposed Merger and do not purport to contain all information that may be required. The materials do not address the underlying business decision of the Company or any other party to proceed with or effect the Proposed Merger, or the relative merits of the Proposed Merger as compared to any alternative business strategies or transactions that might be available for the Company or any other party. The materials do not constitute any opinion, nor do the materials constitute a recommendation to the Board, the Transaction Committee, the Company, any security holder of the Company or any other party as to how to vote or act with respect to any matter relating to the Proposed Merger or otherwise or whether to buy or sell any assets or securities of any company. BGL’s only opinion is the opinion, if any, that is actually delivered to the Transaction Committee. In preparing the materials BGL has acted as an independent contractor and nothing in the materials is intended to create or shall be construed as creating a fiduciary or other relationship between BGL and any party. The materials may not reflect information known to other professionals in other business areas of BGL and its affiliates. The preparation of the materials was a complex process involving quantitative and qualitative judgments and determinations with respect to the financial, comparative and other analytic methods employed and the adaption and application of these methods to the unique facts and circumstances presented and, therefore, is not readily susceptible to partial analysis or summary description. Furthermore, BGL did not attribute any particular weight to any analysis or factor considered by it, but rather made qualitative judgments as to the significance and relevance of each analysis and factor. Each analytical technique has inherent strengths and weaknesses, and the nature of the available information may further affect the value of particular techniques. Accordingly, the analyses contained in the materials must be considered as a whole. Selecting portions of the analyses, analytic methods and factors without considering all analyses and factors could create a misleading or incomplete view. The materials reflect judgments and assumptions with regard to industry performance, general business, economic, regulatory, market and financial conditions and other matters, many of which are beyond the control of the participants in the Proposed Merger. Any estimates of value contained in the materials are not necessarily indicative of actual value or predictive of future results or values, which may be significantly more or less favorable. Any analyses relating to the value of assets, businesses or securities do not purport to be appraisals or to reflect the prices at which any assets, businesses or securities may actually be sold. The materials do not constitute a valuation opinion or credit rating. The materials do not address the consideration to be paid or received in, the terms of any arrangements, understandings, agreements or documents related to, or the form, structure or any other portion or aspect of, the Proposed Merger or otherwise. Furthermore, the materials do not address the fairness of any portion or aspect of the Proposed Merger to any party. In preparing the materials, BGL has not conducted any physical inspection or independent appraisal or evaluation of any of the assets, properties or liabilities (contingent or otherwise) of the Company or any other party and has no obligation to evaluate the solvency of the Company or any other party under any law. 47 Disclaimers Confidential: BGL considered several analyses and factors in rendering its opinion. BGL’s opinion is based on all such analyses and factors taken as a whole and not on any one analysis or factor.

Disclaimers All budgets, projections, estimates, financial analyses, reports and other information with respect to operations (including, without limitation, estimates of potential cost savings and synergies) reflected in the materials have been prepared by management of the relevant party or are derived from such budgets, projections, estimates, financial analyses, reports and other information or from other sources, which involve numerous and significant subjective determinations made by management of the relevant party and/or which such management has reviewed and found reasonable. The budgets, projections and estimates (including, without limitation, estimates of potential cost savings and synergies) contained in the materials may or may not be achieved and differences between projected results and those actually achieved may be material. BGL has relied upon representations made by management of the Company and other participants in the Proposed Merger that such budgets, projections and estimates have been reasonably prepared in good faith on bases reflecting the best currently available estimates and judgments of such management (or, with respect to information obtained from public sources, represent reasonable estimates), and BGL expresses no opinion with respect to such budgets, projections or estimates or the assumptions on which they are based. The scope of the financial analysis contained herein is based on discussions with the Company (including, without limitation, regarding the methodologies to be utilized), and BGL does not make any representation, express or implied, as to the sufficiency or adequacy of such financial analysis or the scope thereof for any particular purpose. BGL has assumed and relied upon the accuracy and completeness of the financial and other information provided to, discussed with or reviewed by it without (and without assuming responsibility for) independent verification of such information, makes no representation or warranty (express or implied) in respect of the accuracy or completeness of such information and has further relied upon the assurances of the Company and other participants in the Proposed Merger that they are not aware of any facts or circumstances that would make such information inaccurate or misleading. In addition, BGL has relied upon and assumed, without independent verification, that there has been no change in the business, assets, liabilities, financial condition, results of operations, cash flows or prospects of the Company or any other participant in the Proposed Merger since the respective dates of the most recent financial statements and other information, financial or otherwise, provided to, discussed with or reviewed by BGL that would be material to its analyses, and that the final forms of any draft documents reviewed by BGL will not differ in any material respect from such draft documents. The materials are not an offer to sell or a solicitation of an indication of interest to purchase any security, option, commodity, future, loan or currency. The materials do not constitute a commitment by BGL or any of its affiliates to underwrite, subscribe for or place any securities, to extend or arrange credit, or to provide any other services. BGL provides mergers and acquisitions, restructuring and other advisory and consulting services to clients, which may have in the past included, or may currently or in the future include, one or more Interested Parties, for which services BGL has received, and may receive, compensation. Although BGL in the course of such activities and relationships or otherwise may have acquired, or may in the future acquire, information about one or more Interested Parties or the Proposed Merger, or that otherwise may be of interest to the Board, the Transaction Committee, or the Company, BGL shall have no obligation to, and may not be contractually permitted to, disclose such information, or the fact that BGL is in possession of such information, to the Board, the Transaction Committee, or the Company or to use such information on behalf of the Board, the Transaction Committee, or the Company. BGL’s personnel may make statements or provide advice that is contrary to information contained in the materials. 48 Disclaimers Confidential: BGL considered several analyses and factors in rendering its opinion. BGL’s opinion is based on all such analyses and factors taken as a whole and not on any one analysis or factor.

Click to eV d.it A M pp ae sn te dix r title style

Institutional Buyers and Sellers – Q4 2023 Top 15 Institutional Shareholders, Sellers • (1) (1) Total Shares Total Shares % of Outstanding Shares as Change in (1) # Shareholder Sep-23 Dec-23 of 12/31/2023 Shares % Change 1.) Columbia Management Investment Advisers 897, 523 595,561 2.94% ( 301,962) ( 33.64)% 2.) WealthTrust Axiom, LLC 988,930 875, 408 4. 32% (113,522) ( 11.48)% 3.) Royce & Associates, LP 1,470,134 1, 372,734 6.78% (97,400) (6.63)% 4.) Wedbush Asset Management, LLC 415,938 327, 810 1. 62% ( 88,128) (21.19)% 5.) First Wilshire Securities Management, Inc. 1, 035,466 990,321 4.89% (45,145) (4.36)% 6.) Adirondack Research & Management, Inc. 85, 452 53,605 0. 27% ( 31,847) ( 37.27)% 7.) Morgan Stanley Brokerage Investments 67, 745 44, 041 0. 22% (23,704) ( 34.99)% 8.) Essex Investment Management Company, LLC 324, 610 303,202 1. 50% (21,408) (6.59)% 9.) Cutter & Company, Inc., Asset Management Arm 13, 495 - - ( 13,495) ( 100.00)% 10.) Pacific Ridge Capital Partners, LLC 973,569 961, 368 4. 75% ( 12,201) ( 1.25)% 11.) Tower Research Capital LLC 11, 200 - - (11,200) (100.00)% 12.) Citadel Advisors LLC 17, 620 8, 917 0.04% (8,703) (49.39)% 13.) First Eagle Investment Management, LLC 301,084 297, 584 1. 47% ( 3,500) (1.16)% 14.) Victory Capital Management Inc. 1,498 - - ( 1,498) (100.00)% 15.) Comerica Bank, Banking Investments 480 80 - (400) (83.33)% Top 15 Total 6,604,744 5,830,631 28.79% (774,113) (11.72)% All Other Sellers 90,185 89, 973 0.44% (212) (0.24)% Total 6,694,929 5,920,604 29.23% (774,325) (11.57)% Top 15 Institutional Shareholders, Buyers (1) Total Shares Total Shares % of Outstanding Shares as Change in (1) # Shareholder Sep-23 Dec-23 of 12/31/2023 Shares % Change 1.) Vanguard Group, Inc., The 201, 968 858,483 4. 24% 656, 515 325. 06% 2.) Ancora Advisors LLC 31, 640 88, 400 0. 44% 56, 760 179. 39% 3.) Susquehanna International Group New Position 35, 041 0. 17% 35, 041 New Position 4.) Bank of America Corporation, Asset Management New Position 30, 813 0. 15% 30, 813 New Position 5.) 683 Capital Management, LLC New Position 29, 961 0. 15% 29, 961 New Position 6.) O'Shaughnessy Asset Management, LLC New Position 28, 767 0.14% 28, 767 New Position 7.) AE Wealth Management, LLC New Position 26, 604 0. 13% 26, 604 New Position 8.) Millennium Management LLC New Position 20, 404 0. 10% 20,404 New Position 9.) Qube Research & Technologies Ltd 2 20, 335 0.10% 20, 333 nm 10.) BlackRock, Inc. 56,647 76,595 0. 38% 19,948 35. 21% 11.) Geode Capital Management, LLC 132,209 150, 055 0. 74% 17, 846 13. 50% 12.) UBS Asset Management AG New Position 17, 776 0. 09% 17,776 New Position 13.) ExodusPoint Capital Management, LP New Position 15,180 0.08% 15,180 New Position 14.) Belvedere Trading, LLC, Asset Management New Position 13, 939 0. 07% 13, 939 New Position 15.) LPL Financial Corporation, Asset Management New Position 13, 431 0.07% 13, 431 New Position Top 15 Total 422,466 1,425,784 7.04% 1,003,318 237.49% All Other Purchasers 2,183,483 2,335,658 11.53% 152, 175 6. 97% Total 2,605,949 3,761,442 18.57% 1,155,493 44.34% (1) Percentage of Basic Shares Outstanding Source: S&P Capital IQ and SEC Filings; Total share value and 50 Appendix change in share price based on December 29, 2023 share Confidential: BGL considered several analyses and factors in rendering its opinion. BGL’s opinion is closing share price of $8.74 based on all such analyses and factors taken as a whole and not on any one analysis or factor. Source: Capital IQ as of May 12, 2021 (1) Based on a weighted average price per share at the time of purchase
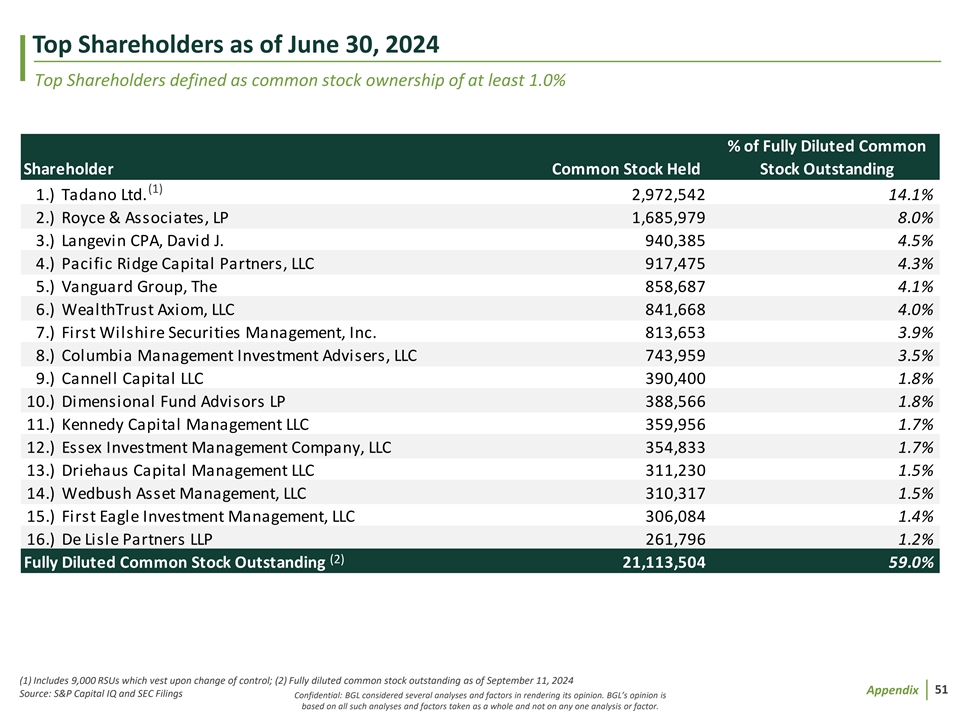
Top Shareholders as of June 30, 2024 Top Shareholders defined as common stock ownership of at least 1.0% % of Fully Diluted Common Shareholder Common Stock Held Stock Outstanding (1) 1.) Tadano Ltd. 2 ,972,542 14.1% 2.) Royce & Associates, LP 1 ,685,979 8.0% 3.) Langevin CPA, David J. 940,385 4.5% 4.) Pacific Ridge Capital Partners, LLC 917,475 4.3% 5.) Vanguard Group, The 858,687 4.1% 6.) WealthTrust Axiom, LLC 841,668 4.0% 7.) First Wilshire Securities Management, Inc. 813,653 3.9% 8.) Columbia Management Investment Advisers, LLC 743,959 3.5% 9.) Cannell Capital LLC 390,400 1.8% 10.) Dimensional Fund Advisors LP 388,566 1.8% 11.) Kennedy Capital Management LLC 359,956 1.7% 12.) Essex Investment Management Company, LLC 354,833 1.7% 13.) Driehaus Capital Management LLC 311,230 1.5% 14.) Wedbush Asset Management, LLC 310,317 1.5% 15.) First Eagle Investment Management, LLC 306,084 1.4% 16.) De Lisle Partners LLP 261,796 1.2% (2) Fully Diluted Common Stock Outstanding 21,113,504 59.0% (1) Includes 9,000 RSUs which vest upon change of control; (2) Fully diluted common stock outstanding as of September 11, 2024 51 Appendix Source: S&P Capital IQ and SEC Filings Confidential: BGL considered several analyses and factors in rendering its opinion. BGL’s opinion is based on all such analyses and factors taken as a whole and not on any one analysis or factor.

Share Price Trading Distribution Analysis Share Price Trading Distribution: September 12, 2023 – September 11, 2024 Share Price Trading Distribution: April 1, 2024 – September 11, 2024 Offer Net Share Price at Offer Net Share Price at 28.0% 28.0% $5.80 per share of $5.80 per share of common stock (diluted) common stock (diluted) 24.0% 24.0% 62.1% of shares of common stock have traded at or below $5.80 in the trailing 52-week period 40.0% of shares of common 20.0% stock have traded at or 20.0% below $5.80 in the trailing 52-week period 16.3% 16.6% 16.4% 16.0% 16.0% 14.5% 14.3% 13.1% 12.6% 12.0% 12.0% 11.0% 11.3% 12.0% 10.6% 8.7% 7.4% 7.4% 8.0% 8.0% 6.8% 5.3% 5.3% 4.9% 4.0% 3.0% 4.0% 2.4% 0.0% 0.0% Volume-Weighted Average Price Range Volume-Weighted Average Price Range Note: This analysis is limited to publicly available trading information and excludes private exchanges, i.e., dark pools 52 Appendix Source: Bloomberg Confidential: BGL considered several analyses and factors in rendering its opinion. BGL’s opinion is based on all such analyses and factors taken as a whole and not on any one analysis or factor.

Manitex International Company Overview Manufacturer of straight-mast and articulated cranes, aerial work platforms, electric cranes, and complementary aftermarket products and accessories utilized across specialized industrial applications and rental provider of construction equipment in Texas Key highlights include: Portfolio of original equipment and regional rental equipment operation, serving a multi-billion-dollar global addressable market Established and aligned brands supported by dealer channels delivering tailored solutions to a diverse range of end-users Asset light assembly model with recently upgraded ERP systems and processes Five Proprietary Global Brands Spanning 30 – 78 Years of Continuous Operations Global Footprint United States 1 Assembly Site, 4 Rental Locations Manufactured Original Equipment Rental of Third-Party Italy Manufactured Equipment 3 Assembly Sites Hydraulic Articulated (“Knuckle Straight-Mast Boom & Consumables Aerial Work Platforms Electric Cranes Boom”) Cranes Cranes 29% 12% 2% 46% 11% Romania 1 Fabrication and Assembly Site Chile, Argentina, France, Mexico, Spain, Singapore Company-owned Market Share Leader distribution sites Rental Platform in European Brands with Opportunity to Penetrate U.S. Market in Established U.S. Northern Texas Market % % of 2023 Sales excluding chassis sales 53 Appendix Confidential: BGL considered several analyses and factors in rendering its opinion. BGL’s opinion is based on all such analyses and factors taken as a whole and not on any one analysis or factor.
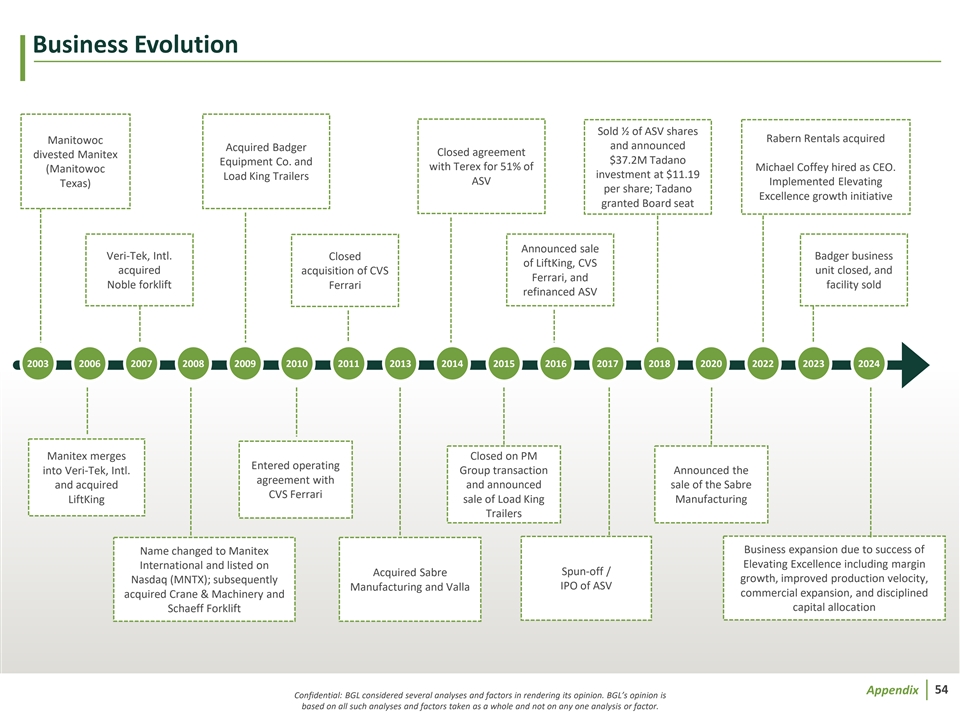
Business Evolution Sold ½ of ASV shares Rabern Rentals acquired Manitowoc and announced Acquired Badger Closed agreement divested Manitex $37.2M Tadano Equipment Co. and with Terex for 51% of Michael Coffey hired as CEO. (Manitowoc investment at $11.19 Load King Trailers ASV Implemented Elevating Texas) per share; Tadano Excellence growth initiative granted Board seat Announced sale Veri-Tek, Intl. Closed Badger business of LiftKing, CVS acquired acquisition of CVS unit closed, and Ferrari, and Noble forklift facility sold Ferrari refinanced ASV 2003 2006 2007 2008 2009 2010 2011 2013 2014 2015 2016 2017 2018 2020 2022 2023 2024 Manitex merges Closed on PM Entered operating into Veri-Tek, Intl. Group transaction Announced the agreement with and acquired and announced sale of the Sabre CVS Ferrari LiftKing sale of Load King Manufacturing Trailers Business expansion due to success of Name changed to Manitex Elevating Excellence including margin International and listed on Acquired Sabre Spun-off / growth, improved production velocity, Nasdaq (MNTX); subsequently IPO of ASV Manufacturing and Valla commercial expansion, and disciplined acquired Crane & Machinery and capital allocation Schaeff Forklift 54 Appendix Confidential: BGL considered several analyses and factors in rendering its opinion. BGL’s opinion is based on all such analyses and factors taken as a whole and not on any one analysis or factor.

Investment • In May 2018, Tadano completed a strategic investment in Manitex through the acquisition of 2,918,542 shares of common stock at $11.19 per share. In subsequent periods, Tadano acquired 45,000 additional shares and holds 9,000 restricted stock units (“RSUs”) which will vest upon a change of control and collectively owns 14.1% of the fully diluted common stock outstanding as of June 30, 2024 • Tadano stated at the time that Manitex’s portfolio of lifting solutions complemented Tadano’s portfolio, and the strategic alliance would allow Tadano to benefit from Manitex’s brand recognition and distribution in North America. Manitex would benefit from Tadano’s brand and distribution in Asia, with Manitex sales in the continent representing only 1.7% of total sales in 2023 (1) Key Terms of Securities Purchase Agreement Board Member History Director Date Appointed • So long as Tadano owns at least 10% of the Company’s issued and outstanding shares of common stock, Tadano shall have the right to nominate one individual to serve on the Company’s Board of Directors Takashi Fukui June 2024 • So long as Tadano owns at least 10% of the Company’s issued and outstanding shares of common stock, (Executive Officer) the Company is prohibited, absent Tadano’s consent, from, among other items: – Increasing the number of directors on the Company’s board of directors to a number greater than ten Shinichi Imura (CEO & President January 2024 – Entering into certain related person or affiliated transactions, subject to certain exceptions Tadano America) – Authorizing or approving any plan of dissolution or liquidating distribution of the Company – Certain asset sales by the Company Takashi Kiso (Executive Officer January 2023 Equivalent) • So long as Tadano owns at least a majority its original investment, Tadano has certain preemptive rights to purchase its pro rata share of specified equity securities issued by the Company • If the Board of Directors approves a sale of the Company to any Person Tadano will consent to, vote for, Ingo Schiller raise no objections against, and waive dissenters’ and appraisal rights (if any) with respect to, such sale June 2018 (CEO & President Tadano America) (1) Securities Purchase Agreement dated May 24, 2018 (“Securities Purchase Agreement”) 55 Appendix Confidential: BGL considered several analyses and factors in rendering its opinion. BGL’s opinion is based on all such analyses and factors taken as a whole and not on any one analysis or factor.

Five Year Premiums Paid Detail Target Stock Target Stock Target Stock Announced Date Closed Date Target Acquirer Transaction Value 1-Day Premium 1-Week Premium 1-Month Premium 7/3/2024 Pending Desktop Metal, Inc. Nano Dimension Ltd. $ 2 88 27.3% 34.8% (5.4%) 7/1/2024 Pending Spirit AeroSystems Holdings, Inc. The Boeing Company 8 ,600 13.3% 12.6% 22.9% 6/28/2024 Pending ARC Document Solutions, Inc. Undisclosed 221 24.5% 25.0% 21.7% 6/3/2024 Pending Stericycle, Inc. Waste Management, Inc. 7 ,798 20.3% 20.0% 34.3% 5/24/2024 Pending Innovative Solutions and Support, Inc. Undisclosed 119 45.3% 37.3% 9.4% 2/29/2024 Pending Sterling Check Corp. First Advantage Corporation 2 ,223 34.2% 29.6% 20.0% 1/29/2024 Pending McGrath RentCorp WillScot Holdings Corporation 3 ,854 11.6% 9.7% 4.3% 12/23/2023 Pending Stratasys Ltd. Nano Dimension Ltd. 1 ,052 25.9% 30.6% 50.0% 12/3/2023 Pending Hawaiian Holdings, Inc. Alaska Air Group, Inc. 2 ,976 270.4% 257.1% 297.4% 4/15/2024 7/2/2024 Encore Wire Corporation Prysmian S.p.A. 4 ,194 11.1% 7.7% 28.6% 3/11/2024 5/23/2024 The L.S. Starrett Company MiddleGround Management, LP 136 63.2% 62.4% 19.7% 2/9/2024 5/15/2024 Masonite International Corporation Owens Corning 4 ,390 37.7% 42.9% 49.5% 1/19/2024 4/19/2024 Kaman Corporation Arcline Investment Management LP 1 ,919 105.1% 99.1% 97.4% 1/2/2024 3/28/2024 PGT Innovations, Inc. MITER Brands 3 ,197 3.2% 1.8% 28.3% 12/22/2023 4/1/2024 Daseke, Inc. TFI International Inc. 1 ,175 69.0% 77.4% 84.9% 12/11/2023 4/9/2024 Eagle Bulk Shipping Inc. Star Bulk Carriers Corp. 1 ,110 17.3% 10.2% 26.6% 11/9/2023 7/18/2024 Astra Space, Inc. Undisclosed 87 (32.4%) (38.3%) (61.8%) 11/1/2023 12/21/2023 Patriot Transportation Holding, Inc. Blue Horizon Partners, Inc. 67 111.7% 109.8% 97.4% 10/13/2023 12/20/2023 P&F Industries, Inc. ShoreView Industries 50 97.0% 97.0% 99.4% 10/5/2023 5/10/2024 SP Plus Corporation Metropolis Technologies, Inc. 1 ,690 52.5% 48.4% 40.2% 8/7/2023 11/30/2023 Veritiv Corporation Clayton, Dubilier & Rice, LLC 2 ,940 20.4% 21.3% 36.4% 7/19/2023 10/17/2023 Heritage-Crystal Clean, Inc J.F. Lehman and Company, LLC 1 ,355 6.8% 10.0% 23.7% 6/5/2023 10/18/2023 CIRCOR International, Inc. KKR & Co. Inc. 1 ,722 81.7% 91.9% 111.2% 4/17/2023 7/13/2023 Charah Solutions, Inc. SER Capital Partners 343 57.3% 206.1% 54.6% 3/21/2023 7/1/2023 U.S. Xpress Enterprises, Inc. Knight-Swift Transportation Holdings Inc. 843 352.7% 321.8% 341.0% 3/14/2023 8/1/2023 Univar Solutions Inc. Apollo Global Management, Inc. 8 ,520 16.0% 6.3% 7.7% 3/8/2023 6/1/2023 Kimball International, Inc. HNI Corporation 563 92.2% 86.6% 81.4% 2/9/2023 7/20/2023 Berkshire Grey, Inc. SoftBank Group Corp. 279 (22.2%) 3.7% 55.1% 1/23/2023 5/24/2023 Evoqua Water Technologies Corp. Xylem Inc. 7 ,658 28.9% 23.8% 32.8% 12/18/2022 7/28/2023 Aerojet Rocketdyne Holdings, Inc. L3Harris Technologies, Inc. 5 ,127 5.7% 7.6% 13.3% 12/16/2022 5/3/2023 Maxar Technologies Inc. Advent International, L.P. 6 ,570 129.4% 121.6% 111.0% 11/7/2022 3/20/2023 IAA, Inc. Ritchie Bros. Holdings Inc 8 ,367 13.1% 17.1% 29.6% 10/27/2022 3/27/2023 Altra Industrial Motion Corp. Regal Rexnord Corporation 5 ,185 54.0% 71.2% 84.4% 8/17/2022 12/27/2022 Hill International, Inc. Global Infrastructure Solutions Inc. 288 95.4% 100.0% 94.3% 8/4/2022 3/17/2023 Atlas Air Worldwide Holdings, Inc. Apollo Global Management, Inc. 5 ,118 5.9% 40.1% 66.4% 7/31/2022 10/13/2022 Romeo Power, Inc. Nikola Corporation 176 34.1% 41.8% 62.7% 7/25/2022 10/7/2022 Infrastructure and Energy Alternatives, Inc. MasTec, Inc. 1 ,208 34.3% 49.4% 50.6% 6/24/2022 9/15/2022 USA Truck, Inc. Schenker, Inc. 473 117.6% 124.7% 104.9% 5/16/2022 9/14/2022 ManTech International Corporation The Carlyle Group Inc. 4 ,399 17.1% 18.3% 14.5% 4/14/2022 5/24/2022 Vidler Water Resources, Inc. D.R. Horton, Inc. 289 (3.2%) (1.1%) 33.4% 3/29/2022 10/11/2022 Nielsen Holdings plc Brookfield Business Partners L.P. 16,143 26.1% 20.5% 59.4% 3/21/2022 5/2/2022 Huttig Building Products, Inc. Woodgrain Inc. 403 14.1% 17.8% 11.8% 3/18/2022 5/2/2022 CCOM Group, Inc. Goodman Distribution, Inc. 35 50.6% 54.9% 57.6% Reviewed transactions between August 1, 2019 through September 1, 2024 56 Appendix Source: S&P Capital IQ Confidential: BGL considered several analyses and factors in rendering its opinion. BGL’s opinion is based on all such analyses and factors taken as a whole and not on any one analysis or factor.

Five Year Premiums Paid Detail Cont’d Target Stock Target Stock Target Stock Announced Date Closed Date Target Acquirer Transaction Value 1-Day Premium 1-Week Premium 1-Month Premium 2/14/2022 7/25/2022 Cornerstone Building Brands, Inc. Clayton, Dubilier & Rice, LLC 5 ,027 34.0% 53.9% 50.9% 2/9/2022 5/2/2022 US Ecology, Inc. Republic Services, Inc. 2 ,330 70.4% 68.5% 50.2% 12/13/2021 4/5/2022 SPX FLOW, Inc. Lone Star Americas Acquisitions, Inc. 4 ,112 1.0% 2.3% 7.8% 10/25/2021 2/15/2022 PAE Incorporated Amentum Government Services Holdings LLC 2 ,070 70.3% 73.0% 76.6% 10/12/2021 2/25/2022 R. R. Donnelley & Sons Company Chatham Asset Management, LLC 2 ,518 120.1% 93.1% 140.6% 9/10/2021 11/23/2021 Echo Global Logistics, Inc. TJC LP 1 ,464 54.1% 47.0% 51.4% 9/3/2021 10/26/2021 AFA Protective Systems, Inc. Pavion Corp. 138 598.1% 273.7% 317.7% 8/11/2021 11/12/2021 The ExOne Company Desktop Metal, Inc. 612 47.4% 61.7% 41.6% 8/10/2021 12/14/2021 Kansas City Southern Canadian Pacific Kansas City Limited 31,655 11.5% 12.7% 9.7% 7/15/2021 10/14/2021 GP Strategies Corporation Learning Technologies Group plc 422 32.3% 42.0% 29.7% 7/14/2021 11/30/2021 Covanta Holding Corporation EQT Partners AB 5 ,385 9.0% 12.9% 17.4% 6/21/2021 10/1/2021 Lydall, Inc. Unifrax I LLC 1 ,446 86.5% 72.5% 74.0% 6/21/2021 11/30/2021 Raven Industries, Inc. CNH Industrial N.V. 2 ,137 50.2% 34.9% 35.2% 6/17/2021 11/22/2021 CAI International, Inc. Mitsubishi HC Capital Inc. 987 40.3% 48.0% 33.5% 5/28/2021 7/28/2022 Welbilt, Inc. Ali Group S.r.l. 4 ,933 20.5% 21.3% 6.8% 4/19/2021 7/19/2021 Knoll, Inc. MillerKnoll, Inc. 2 ,051 46.1% 50.0% 43.6% 4/15/2021 5/21/2021 General Finance Corporation United Rentals 610 55.5% 63.8% 59.0% 3/31/2021 8/31/2021 KushCo Holdings, Inc. Greenlane Holdings, Inc. 136 (31.0%) (34.4%) (48.2%) 3/25/2021 6/15/2021 Houston Wire & Cable Company Omni Cable Corporation 138 39.5% 44.0% 28.0% 3/12/2021 1/0/1900 Aegion Corporation Undisclosed 1 ,204 10.0% 9.6% 34.8% 2/16/2021 5/17/2021 Aegion Corporation New Mountain Capital, L.L.C. 1 ,247 39.9% 44.0% 43.3% 2/8/2021 5/25/2021 Cubic Corporation Veritas Capital Fund Management 3 ,493 18.5% 22.7% 17.6% 2/4/2021 6/4/2021 CoreLogic, Inc. Insight Venture Management 8 ,021 (1.0%) 6.4% 6.6% 12/7/2020 4/14/2021 SEACOR Holdings Inc. AIP, LLC 1 ,235 14.4% 24.9% 40.7% 11/24/2020 12/30/2020 The Goldfield Corporation First Reserve Corporation 234 63.9% 63.9% 48.0% 11/16/2020 12/24/2020 HD Supply Holdings, Inc. The Home Depot, Inc. 10,315 25.0% 28.0% 32.8% 11/15/2020 1/29/2021 Foundation Building Materials, Inc. American Securities LLC 1 ,441 27.0% 33.2% 9.3% 11/13/2020 1/29/2021 Mikros Systems Corporation McKean Defense Group, LLC 5 13.0% 23.8% 30.0% 9/16/2020 11/9/2020 ClearStar, Inc. Hanover Investors Management LLP 23 24.4% 20.7% 20.7% 9/11/2020 11/10/2020 Torotel, Inc. TT Group Industries, Inc. 43 208.5% 193.8% 177.9% 9/11/2020 9/4/2020 HYB Holding Corp. Undisclosed 14 (65.7%) (34.2%) (63.7%) 8/27/2020 1/1/2021 BMC Stock Holdings, Inc. Builders FirstSource, Inc. 3 ,039 13.7% 12.4% 43.1% 7/16/2020 10/1/2020 InnerWorkings, Inc. HH Global Limited 331 127.3% 143.9% 86.3% 7/6/2020 10/8/2020 Vivint Solar, Inc. Sunrun Inc. 3 ,638 9.2% 15.9% 22.5% 3/2/2020 7/1/2020 Mobile Mini, Inc. WillScot Mobile Mini Holdings Corp. 1 ,901 8.2% 2.5% 1.1% 1/30/2020 7/1/2021 Navistar International Corporation Dusk Inc. 9 ,415 84.6% 70.2% 53.8% 11/12/2019 2/3/2020 Continental Building Products, Inc. CertainTeed Gypsum & Ceiling USA, Inc. 1 ,564 15.6% 21.7% 32.7% 11/6/2019 3/27/2020 Aircastle Limited Marubeni Corporation 6 ,916 16.0% 19.1% 46.5% 9/23/2019 12/19/2019 Arotech Corporation Greenbriar Equity Group, L.P. 107 32.7% 26.1% 28.2% 8/28/2019 12/31/2019 Ecology & Environment, Inc. WSP Global Inc. 66 50.0% 45.1% 41.9% 8/9/2019 1/9/2020 Wesco Aircraft Holdings, Inc. Pattonair Limited 1 ,949 7.1% 6.2% 1.6% 8/2/2019 10/11/2019 Navigant Consulting, Inc. Guidehouse LLP 1 ,234 16.5% 15.8% 19.1% Median $ 1,446 28.9% 33.2% 35.2% Mean $ 2,927 51.2% 50.4% 50.6% Reviewed transactions between August 1, 2019 through September 1, 2024 57 Appendix Source: S&P Capital IQ Confidential: BGL considered several analyses and factors in rendering its opinion. BGL’s opinion is based on all such analyses and factors taken as a whole and not on any one analysis or factor.

CHICAGO CLEVELAND LOS ANGELES NEW YORK CHICAGO CLEVELAND LOS ANGELES NEW YORK One Magnificent Mile One Cleveland Center Hudson Pacific Properties Building 489 5th Avenue One Magnificent Mile One Cleveland Center Wells Fargo Center Avenue of the Americas 980 N. Michigan Avenue 1375 East 9th Street 11601 Wilshire Blvd. 23rd Floor 980 N. Michigan Avenue 1375 East 9th Street 11601 Wilshire Blvd. 6th Avenue Suite 1800 Suite 2500 5th Floor New York, NY 10017 Suite 1800 Suite 2500 5th Floor 27th Floor Chicago, IL 60611 Cleveland, OH 44114 Los Angeles, CA 90025 p. 917.688.2780 Chicago, IL 60611 Cleveland, OH 44114 Los Angeles, CA 90025 New York, NY 10019 p. 312.658.1600 p. 216.920.6613 p. 310.266.5367 p. 312.658.160 p. 216.920.6613 p. 310.266.5367 p. 917.688.2780 Securities transactions are conducted through Brown, Gibbons, Lang & Company Securities, LLC, an affiliate of Brown Securities transactions are conducted through Brown, Gibbons, Lang & Company Securities, LLC, an affiliate of 58 Gibbons Lang & Company LLC, and a registered broker-dealer and member of FINRA and SIPC. Confidential: BGL considered several analyses and factors in rendering its opinion. BGL’s opinion is Brown Gibbons Lang & Company LLC, and a registered broker-dealer and member of FINRA and SIPC. based on all such analyses and factors taken as a whole and not on any one analysis or factor.