
Exhibit (C)(3) STRICTLY CONFIDENTIAL DECEMBER 2023 The blacked out information indicates information has been omitted on the basis of a confidential treatment request pursuant to Rule 24b-2 of the Securities Exchange Act of 1934, as amended. This information has been filed separately with the Securities and Exchange Commission. Discussion Materials of Brown Gibbons Lang & Company for the Board of Directors of Manitex, dated December 6, 2023. Project ELEVATE Board of Directors Meeting Discussion Materials December 6, 2023 ••• CH CH CH CHI I I ICA CA CA CAG G G GO O O O • • • • C C C CLE LE LE LEVE VE VE VELA LA LA LAN N N ND D D D • • • • PHI PHI PHI PHIL L L LA A A AD D D DE E E EL L L LPHI PHI PHI PHIA A A A • • • • S S S SA A A AN N N N AN AN AN ANT T T TO O O ON N N NIO IO IO IO B B B BG G G GLC LC LC LCO. O. O. O.COM COM COM COM
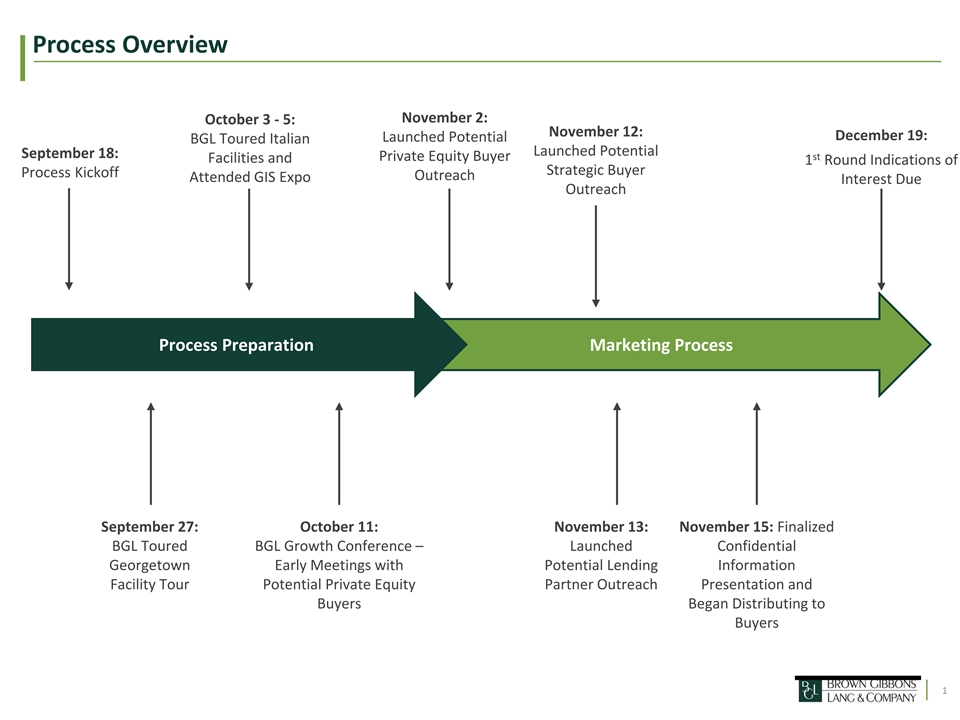
Process Overview November 2: October 3 - 5: November 12: December 19: Launched Potential BGL Toured Italian Launched Potential September 18: st Private Equity Buyer Facilities and 1 Round Indications of Strategic Buyer Process Kickoff Outreach Attended GIS Expo Interest Due Outreach Process Preparation Marketing Process September 27: October 11: November 13: November 15: Finalized BGL Toured BGL Growth Conference – Launched Confidential Georgetown Early Meetings with Potential Lending Information Facility Tour Potential Private Equity Partner Outreach Presentation and Buyers Began Distributing to Buyers 1

Marketing Summary Potential Buyer Outreach Private Equity Strategics Firms Total Parties % Total Received Confidential Information Presentation 1 36 37 21% Negotiating NDA 1 3 4 2% Expressed Interest Prior to Executing NDA 2 1 3 2% Total Interested Parties 4 40 44 25% Called and/or Sent Teaser and NDA 23 26 49 28% Passed After Call and /or Reviewing Teaser 9 57 66 37% Passed After Reviewing Confidential Information Presentation 2 15 17 10% Parties on Hold 0 1 1 1% Total Parties 38 139 177 100% Potential Lending Partner Outreach Total Parties % Total Received Confidential Information Presentation 7 58% Negotiating NDA 1 8% Expressed Interest Prior to Executing NDA 1 8% Total Interested Parties 9 75% Definitive Called and/or Sent Teaser and NDA 3 25% Bids: Total Parties 12 100% TBD 2 *As of December 5, 2023
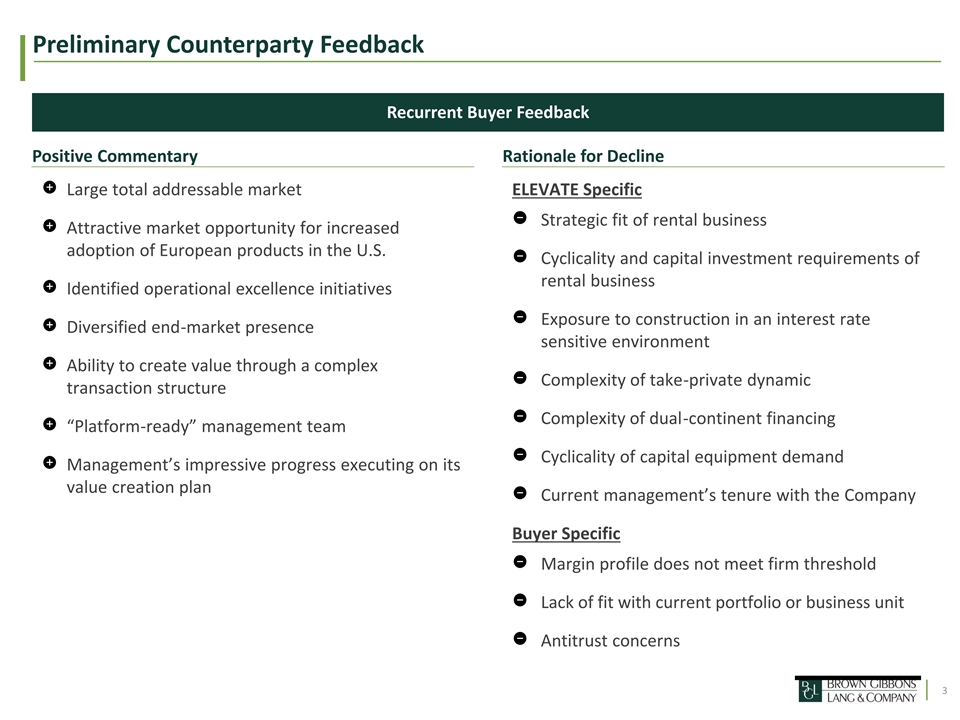
Preliminary Counterparty Feedback Recurrent Buyer Feedback Positive Commentary Rationale for Decline Large total addressable market ELEVATE Specific Strategic fit of rental business Attractive market opportunity for increased adoption of European products in the U.S. Cyclicality and capital investment requirements of rental business Identified operational excellence initiatives Exposure to construction in an interest rate Diversified end-market presence sensitive environment Ability to create value through a complex Complexity of take-private dynamic transaction structure Complexity of dual-continent financing “Platform-ready” management team Cyclicality of capital equipment demand Management’s impressive progress executing on its value creation plan Current management’s tenure with the Company Buyer Specific Margin profile does not meet firm threshold Lack of fit with current portfolio or business unit Antitrust concerns 3

Next Steps & Timing December January February S M T W T F S S M T W T F S S M T W T F S 1 2 1 2 3 4 5 6 1 2 3 3 9 7 13 4 10 4 5 6 7 8 8 9 10 11 12 5 6 7 8 9 10 16 14 20 11 17 11 12 13 14 15 15 16 17 18 19 12 13 14 15 16 17 21 18 18 19 20 21 22 23 22 23 24 25 26 27 19 20 21 22 23 24 24 25 26 27 28 29 30 28 29 30 31 25 26 27 28 29 31 Next Steps: December 19: Initial Indications of Interest Due — Bidders are requested to deliver a non-binding preliminary offer letter inclusive of purchase price, transaction structure, material conditions and assumptions, capital structure and financing, timing to close, and required reviews and approvals December 20 - 22: Evaluate Indications of Interest; Extend Invitations to a Select Group of Parties to Attend a Management Presentation January 8 - 26: Management Presentations; Data Room Opened to Buyers — Management meetings conducted with potential Buyers, location to be determined (BGL present) February 5 - 9: Mike Coffey and Joe Doolan in Italy February 8: Letters of Intent Due February 9 - 15: Evaluate Letters of Intent and Select Preferred Buyer(s) February 16: Begin Public Company Final Diligence Process 4

Public Company Transaction Process Timeline Prior to Merger Agreement Execution: • Prepare and negotiate Merger Agreement and related documents • Buyer forms wholly-owned U.S. subsidiary (“Merger Sub”) to merge with ELEVATE • Begin preparing proxy statement for special meeting of shareholders • Commence and complete a Fairness Opinion • ELEVATE and Buyer’s respective boards of directors approve the transaction, Merger Agreement, and related documents Merger Agreement Execution (“M”): • Buyer, Merger Sub, and ELEVATE execute the Merger Agreement • Joint public announcement of transaction and filing of 8-K by ELEVATE Subsequent to Merger Agreement Execution: • M + 2 Days: Antitrust notification filings • M + 5 Days: — Finalize and file preliminary proxy statement with the SEC — File appropriate documentation with Nasdaq to tee up delisting of ELEVATE shares upon effectiveness of merger • M + 15 Days: Receipt of SEC comments on proxy statement, if any; respond to any comments received • M + 32 Days: Antitrust clearance / termination of HSR waiting period 5 Source: Illustrative Schedule prepared by Bryan Cave Leighton Paisner LLP dated August 18,2021

Appendix
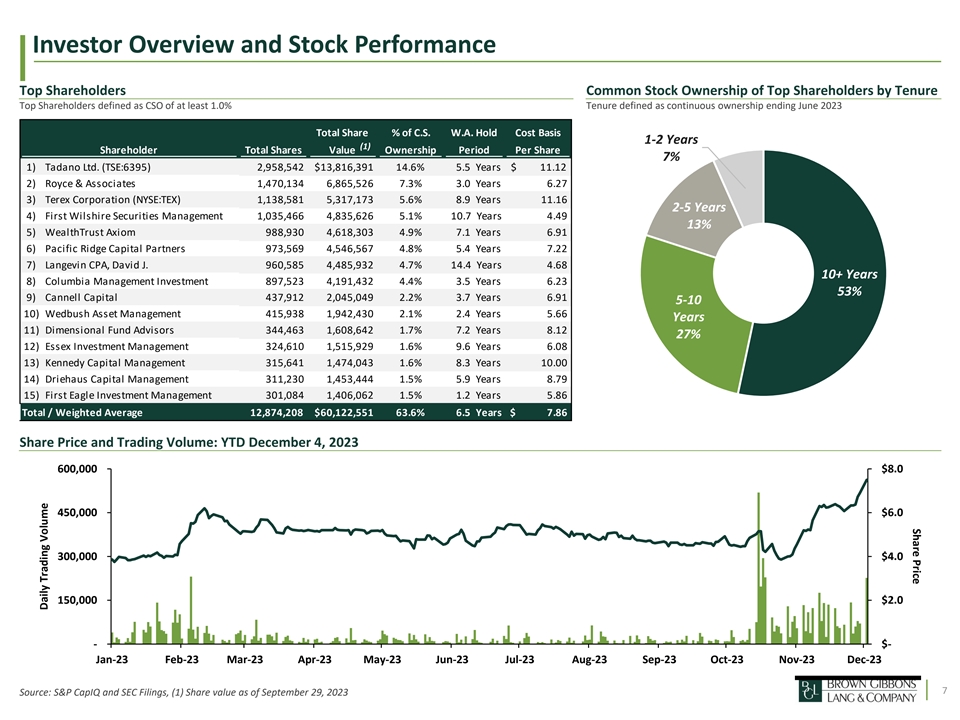
Share Price Investor Overview and Stock Performance Top Shareholders Common Stock Ownership of Top Shareholders by Tenure Top Shareholders defined as CSO of at least 1.0% Tenure defined as continuous ownership ending June 2023 • (1) Total Share % of C.S. W.A. Hold Cost Basis 1-2 Years (1) Shareholder Total Shares Value Ownership Period Per Share 7% 1) Tadano Ltd. (TSE:6395) 2,958,542 $13,816,391 14.6% 5.5 Years $ 11.12 2) Royce & Associates 1,470,134 6,865,526 7.3% 3.0 Years 6.27 3) Terex Corporation (NYSE:TEX) 1,138,581 5,317,173 5.6% 8.9 Years 11.16 2-5 Years 4) First Wilshire Securities Management 1,035,466 4,835,626 5.1% 10.7 Years 4.49 13% 5) WealthTrust Axiom 988,930 4,618,303 4.9% 7.1 Years 6.91 6) Pacific Ridge Capital Partners 973,569 4,546,567 4.8% 5.4 Years 7.22 7) Langevin CPA, David J. 960,585 4,485,932 4.7% 14.4 Years 4.68 10+ Years 8) Columbia Management Investment 897,523 4,191,432 4.4% 3.5 Years 6.23 53% 9) Cannell Capital 437,912 2,045,049 2.2% 3.7 Years 6.91 5-10 10) Wedbush Asset Management 415,938 1,942,430 2.1% 2.4 Years 5.66 Years 11) Dimensional Fund Advisors 344,463 1,608,642 1.7% 7.2 Years 8.12 27% 12) Essex Investment Management 324,610 1,515,929 1.6% 9.6 Years 6.08 13) Kennedy Capital Management 315,641 1,474,043 1.6% 8.3 Years 10.00 14) Driehaus Capital Management 311,230 1,453,444 1.5% 5.9 Years 8.79 15) First Eagle Investment Management 301,084 1,406,062 1.5% 1.2 Years 5.86 Total / Weighted Average 12,874,208 $60,122,551 63.6% 6.5 Years $ 7.86 Share Price and Trading Volume: YTD December 4, 2023 600,000 $8.0 450,000 $6.0 300,000 $4.0 150,000 $2.0 - $- Jan-23 Feb-23 Mar-23 Apr-23 May-23 Jun-23 Jul-23 Aug-23 Sep-23 Oct-23 Nov-23 Dec-23 7 Source: S&P CapIQ and SEC Filings, (1) Share value as of September 29, 2023 Source: Capital IQ as of May 12, 2021 (1) Based on a weighted average price per share at the time of purchase Daily Trading Volume

Investor Overview and Stock Performance (cont’d) (1,2) Top 15 Institutional Shareholders, Buyers: Mar. 2023 – Sep. 2023 # Shareholder Total Shares Share Value Change in Shares Change in Share Value % Change W.A. Hold Period Cost Basis Per Share • (1) 1.) Wedbush Asset Management 415,938 $ 1,942,430 187,381 $ 888,309 82. 0% 2.4 Years $ 5.66 2.) First Wilshire Securities Management 1,035,466 4,835,626 77,712 442,674 8.1% 10.7 Years 4.49 3.) First Eagle Investment Management 301,084 1,406,062 66,787 330,780 28.5% 1.2 Years 5. 86 4.) Essex Investment Management 324,610 1,515,929 32,803 183,593 11. 2% 9.6 Years 6.08 5.) Adirondack Research & Management 85,452 399,061 31,126 159,037 57. 3% 5.3 Years 6. 46 6.) Legato Capital Management 121,770 568,666 27,859 156,053 29. 7% 0.8 Years 4. 38 7.) Pacific Ridge Capital Partners 973,569 4,546,567 23,904 150,668 2.5% 5.4 Years 7.22 8.) Royce & Associates 1,470,134 6,865,526 2,399 20,641 0. 2% 3.0 Years 6.27 9.) Cannell Capital 437,912 2,045,049 2,429 13,214 0.6% 3.7 Years 6. 91 10.) Cutter & Company, Inc. 13,495 63,022 800 3,967 6.3% 2.8 Years 5.11 11.) BlackRock, Inc. 56,647 264,541 444 3,526 0.8% 7.7 Years 11. 65 12.) Comerica Bank 480 2,242 480 2,242 nm 0.2 Years 4.67 13.) Lord, Abbett & Co. 2,617 12,221 326 1,773 14. 2% 5.4 Years 8. 79 14.) Wells Fargo & Company 105 490 10 50 10. 5% 4.9 Years 7.41 15.) Qube Research and Technologies 2 9 2 9 nm 0.2 Years 4. 67 (1,2) Top 15 Institutional Shareholders, Sellers: Mar. 2023 – Sep. 2023 # Shareholder Total Shares Share Value Change in Shares Change in Share Value % Change W.A. Hold Period Cost Basis Per Share 1.) Dimensional Fund Advisors 344,463 $ 1,608,642 (62,888) $ (319,163) ( 15.4)% 7.2 Years $ 8. 12 2.) Columbia Management 897,523 4,191,432 (35,086) (194,184) ( 3.8)% 3.5 Years 6. 23 3.) Morgan Stanley 67,745 316,369 (35,910) (183,485) (34.6)% 9.0 Years 7. 81 4.) Ergoteles - - (33,074) (179,923) ( 100.0)% 0.5 Years 4.00 5.) Susquehanna International Group - - (21,151) (115,061) (100.0)% 0.4 Years 4.30 6.) Citadel Advisors 17,620 82,285 (20,586) (106,464) (53.9)% 0.7 Years 5.21 7.) Jane Street Group - - (17,330) (94,275) (100.0)% 0.5 Years 4.00 8.) Millennium Management - - (14,129) (76,862) ( 100.0)% 0.5 Years 4.00 9.) Renaissance Technologies 88,440 413,015 (11,100) (59,759) (11.2)% 3.3 Years 5. 56 10.) LPL Financial Corporation - - (10,119) (55,047) ( 100.0)% 0.2 Years 5.21 11.) Merrill Lynch & Co. - - (10,000) (54,400) ( 100.0)% 4.8 Years 9. 47 12.) Acadian Asset Management - - (7,192) (37,171) (100.0)% 2.2 Years 7. 18 13.) Tower Research Capital 11,200 52,304 (5,463) (28,989) (32.8)% 0.9 Years 4.11 14.) WealthTrust Axiom 988,930 4,618,303 (6,850) (28,679) (0.7)% 7.1 Years 6.91 15.) Ironwood Investment Management 90,205 421,257 (5,252) (26,566) ( 5.5)% 13.6 Years 2. 10 Source: S&P CapIQ and SEC Filings; (1) Net percentage change in shares owned as of March 31, 2023 vs. September 29, 2023, (2) Total shares and share value as of 8 September 29, 2023 Source: Capital IQ as of May 12, 2021 (1) Based on a weighted average price per share at the time of purchase

Detailed Marketing Update – Buyer Outreach 9

Detailed Marketing Update – Buyer Outreach (cont’d) 10

Detailed Marketing Update – Buyer Outreach (cont’d) 11
Detailed Marketing Update – Lender Outreach 12