Exhibit (C)(8) STRICTLY CONFIDENTIAL MARCH 2024 The blacked out information indicates information has been omitted on the basis of a confidential treatment request pursuant to Rule 24b-2 of the Securities Exchange Act of 1934, as amended. This information has been filed separately with the Securities and Exchange Commission. Discussion Materials of Brown Gibbons Lang & Company for the Board of Directors of Manitex, dated March 27, 2024. Project ELEVATE Board of Directors Process Update – March 27, 2024 CHICAGO • CLEVELAND • LOS ANGELES • NEW YORK BGLCO.COM

Process Update Additional Bid Received • On March 20, 2024, submitted an Indication of Interest at $5.50 to $6.50 per share, reflecting an implied EV / 2023 EBITDA multiple of 5.94x to 6.57x Other key terms in the letter include: – No financing contingency – Expressly notes the need to confirm in writing that Tadano is not a potential buyer and will consent to a transaction – Assumes North American leadership remains in place – Requires facility visits to Georgetown, Italy, and Romania in conjunction with management presentations • Prior to bid, held two (2) one hour “Fireside Chats” with Mike Coffey, which included participation from senior leadership from Other Updates • On March 11, 2024, a virtual dataroom was opened to the four initial bidders • , who verbally indicated on February 23 they were considering submitting a bid at 5.0x 2023 EBITDA communicated on March 12 that due to timing considerations and lack of bandwidth, they would not be pursuing the opportunity further at this time 2

Marketing Update – Buyer Outreach • BGL launched a broad marketing process in early November 2023 that included strategic buyers and financial sponsors, designed to clear the market • In total, 190 parties were contacted in the ELEVATE marketing process • 72 Confidential Information Presentations were distributed • Five Indications of Interest were received • , who both submitted an Indication of Interest, have had “Fireside Chat” discussions with Mike Coffey Private Equity Strategics Firms Total Parties % Total Submitted Indication of Interest 0 5 5 3% Passed After Reviewing Confidential Information Presentation but May Reconsider 2 3 5 3% Total Interested Parties 2 8 10 5% Passed After Reviewing Confidential Information Presentation 7 52 59 31% Passed After In Person Fireside Chat Discussion 0 3 3 2% Passed After Call and /or Reviewing Teaser 12 58 70 37% Unresponsive Parties 20 28 48 25% Parties on Hold 0 1 1 1% Total Parties 41 150 191 100% 3

Comparable Public Company Group – Historical EBITDA Multiples • The OEM group median EV/EBITDA multiple has traded between a range of 5.7x to 6.2x since the February 26th meeting • Excluding Konecranes and Cargotec who both recently reported record sales and profitability and individual corporate restructuring initiatives, the current median multiple declines to 5.4x 3-Year TTM ($ in millions, except per share data) Market Enterprise TTM NTM Revenue EBITDA Debt/ EV/EBITDA Company Cap. Value Revenue Gross Profit EBITDA Revenue EBITDA CAGR Margin EBITDA Current 1/2/2024 3-Year Trl 5-Year Trl Original Equipment Manufacturers Cargotec Corporation $ 4,494.1 $ 4 ,692.7 $ 5,050.1 $ 1,221.7 $ 606.4 $ 4 ,445.8 $ 5 56.3 1 1.9% 1 2.0% 1.6x 7.2x 6.8x 10.0x 9.1x Konecranes Plc 4,278.7 4,676.7 4,384.1 2,373.6 5 41.9 4,426.9 609.1 7.7% 1 2.4% 1 .9x 8 .1x 7.0x 8.5x 8 .9x Manitowoc Company, Inc., The 474.5 8 72.4 2,227.8 425.2 168.7 2,299.3 1 65.0 1 5.6% 7 .6% 2 .6x 4.7x 4 .6x 6 .0x 5 .9x Palfinger AG 873.2 1 ,673.4 2,703.5 691.5 2 82.3 2 ,477.4 2 84.5 1 6.8% 1 0.4% 3 .0x 5.4x 6 .2x 8.0x 8.2x Terex Corporation 4,197.6 4 ,570.9 5 ,151.5 1 ,176.6 6 86.3 5 ,167.1 732.7 18.7% 13.3% 1.1x 6.2x 6.0x 8.6x 1 0.2x Mean 2,863.6 3,297.2 3,903.4 1,177.7 457.1 3,763.3 469.5 1 4.1% 1 1.1% 2.0x 6.3x 6.1x 8.2x 8.5x Median $ 4,197.6 $ 4,570.9 $ 4,384.1 $ 1,176.6 $ 541.9 $ 4,426.9 $ 556.3 1 5.6% 12.0% 1.9x 6.2x 6.2x 8.5x 8.9x Equipment Rental Alta Equipment Group Inc. $ 4 20.9 $ 1 ,572.9 $ 1,876.8 $ 507.2 $ 2 01.3 $ 1,968.4 $ 207.5 29.0% 10.7% 5.9x 7.8x 7.6x 9.6x nm Ashtead Group plc 30,910.9 42,000.7 10,674.9 10,051.4 4 ,826.0 1 1,340.6 5,190.6 18.5% 45.2% 2 .3x 8.7x 8 .8x 1 0.9x 6.5x H&E Equipment Services, Inc. 2 ,267.0 3,872.5 1 ,469.2 6 84.5 688.2 1,579.9 732.8 1 3.4% 46.8% 2.3x 5 .6x 5 .6x 7 .1x 5.1x Herc Holdings Inc. 4,749.6 9 ,157.6 3,282.0 1,223.0 1,452.0 3 ,439.3 1,553.5 22.6% 44.2% 3 .1x 6 .3x 6.2x 7.0x 5.1x United Rentals, Inc. 4 7,342.3 59,641.3 14,332.0 5 ,921.0 7,028.0 1 5,022.5 7 ,056.4 1 8.9% 49.0% 1 .8x 8.5x 6.7x 8 .9x 5 .5x Mean 17,138.1 23,249.0 6,327.0 3,677.4 2,839.1 6,670.1 2,948.1 20.5% 39.2% 3.1x 7.4x 7.0x 8.7x 5.6x Median $ 4,749.6 $ 9,157.6 $ 3,282.0 $ 1,223.0 $ 1,452.0 $ 3,439.3 $ 1,553.5 1 8.9% 4 5.2% 2.3x 7.8x 6.7x 8.9x 5.3x Consolidated Mean 10,645.7 14,240.0 3,958.5 2,147.3 1,095.9 3,997.2 1,162.4 16.9% 2 3.7% 2.8x 6.7x 6.6x 8.4x 7.0x Consolidated Median $ 4,238.1 $ 4,623.8 $ 3,833.1 $ 1,199.8 $ 687.3 $ 3,933.1 $ 732.8 1 7.6% 2 8.8% 2.3x 6.3x 6.2x 8.3x 6.2x Median OEM EV/EBITDA multiples are 6.2x, 8.5x, and 8.9x, for FY2023, trailing 3-Year, and trailing 5-Year, respectively, in line with the received preliminary Indications of Interest multiples 4 Source: S&P Capital IQ and FactSet as of March 26, 2024


Indications of Interest Valuation Summary FY2023 PF Adj. EBITDA $ 32.5 3-Year Avg. PF Adj. EBITDA 24.8 5-Year Avg. PF Adj. EBITDA 22.0 Date Submitted 12/21/2023 12/22/2023 12/21/2023 1/25/2024 3/20/2024 (in millions) Low High Low High Low High Low High Low High FY2023 PF Adj. EBITDA $ 3 3.3 $ 3 3.3 $ 33.3 $ 33.3 $ 3 3.3 $ 3 3.3 $ 33.3 $ 33.3 $ 32.5 $ 32.5 EV / FY2023 PF Adj. EBITDA Multiple 4.6x 5.4x 5.0x 6.0x 5.1x 6.0x 5.5x 6.5x 5.9x 6.6x Enterprise Value $ 154.8 $ 180.6 $ 166.5 $ 200.0 $ 170.0 $ 200.0 $ 183.0 $ 217.0 $ 193.3 $ 213.5 Multiple on 3-Year Average PF Adj. EBITDA 6.2x 7.3x 6.7x 8.1x 6.9x 8.1x 7.4x 8.7x 7.8x 8.6x Multiple on 5-Year Average PF Adj. EBITDA 7.1x 8.2x 7.6x 9.1x 7.7x 9.1x 8.3x 9.9x 8.8x 9.7x (4) Implied Gross Share Price $ 3 .60 $ 4.87 $ 4 .17 $ 5.83 $ 4.35 $ 5 .83 $ 4 .99 $ 6.67 $ 5 .50 $ 6 .50 Indications of Interest Valuations Summary Historical Pro Forma Adjusted EBITDA: 2019 – 2023 ($ in millions) ($ in millions) $193 $214 5-Year Avg: $32.5 ($5.50) ($6.50) $22.0 $183 $217 3-Year Avg: $24.9 $24.8 ($4.99) ($6.67) $21.2 $170 $200 $17.3 ($4.35) ($5.83) $14.1 $167 $200 ($4.17) ($5.83) $155 $181 ($3.60) ($4.87) 2019 2020 2021 2022 2023 $100.0 $125.0 $150.0 $175.0 $200.0 $225.0 $250.0 Enterprise Value ($ in millions) IOI Multiple Ranges on PF Adj. 2023 EBITDA: 4.6x – 6.6x, 3-Year Avg.: 6.2x – 8.7x, 5-Year Avg.: 7.1x – 9.9x (1) Enterprise value based on 6.0x to 7.0x multiple of EBITDA less normalized capital expenditures of $7.5 million (2) (3) Held “Fireside Chat” discussion with BGL and Mike Coffey on 10/11 6 (4) Implied Gross Share Price includes reduction of Net Debt as of 12/31/2023 from Enterprise Value, excludes deal expenses and redemption of Rabern minority interest (5) Indication of interest based on 2023 actual EBITDA versus other parties whose indications are based on 2023 estimated EBITDA

Impact of Capital Structure on Valuation – Q2 2021 vs. Q4 2023 (1) (2) (in millions, except per share) Q2 2021 Capital Structure Q4 2023 Capital Structure Shares Outstanding 20.00 20.22 Debt $32.39 $91.35 Cash $17.41 $9.27 Debt per Share $1.62 $4.52 Cash per Share ($0.87) ($0.46) Net Debt per Share $0.75 $4.06 Illustrative Analysis of Indications of Interest Received – 2021 vs. 2023 Capital Structure Per Share Values at 4.6x EV / 2023 Adj. EBITDA Per Share Values at 6.6x EV / 2023 Adj. EBITDA EV / Share: EV / Share: $10.68 $10.56 Net Debt / Share: ($0.75) EV / Share: EV / Share: $7.74 $7.66 Net Debt / Share: ($4.06) Net Debt / Share: ($0.75) Net Debt / Share: ($4.06) Equity Value / Share: $9.93 Equity Value / Share: Equity Value / Share: $6.99 $6.50 Equity Value / Share: $3.60 Q2 2021 Capital Structure Q4 2023 Capital Structure Q2 2021 Capital Structure Q4 2023 Capital Structure (1) Source: 6/30/2021 Form 10-Q 7 (2) Based on Balance Sheet as of 12/31/23

Share Price Analysis as of March 26, 2024 • Overall equity market sentiment has continued to trend positively since October with the S&P 500 up ~20% • Despite the pullback in share price year-to-date, MNTX has outperformed the broader equity market and its public OEM peers since October Trading Activity Comparison to Market and Comp Groups – Share Price Indexed to 30 Trading Days Prior to Teaser Launch (30 Trading Days Prior to Teaser Launch = 100) 12/27/23: 12/19/23: st 52-Wk High 1 Round Indications MNTX: $9.02 / share of Interest Due $8.65 / share 3/26/24 MNTX: 11/15/23: 10/11/23: $7.21 / share Began CIP Distribution BGL Growth Conference 11/2/23: MNTX: Meetings Teaser Launch; +57.4% $6.35 / share with Sponsors 3Q23 Earnings Release +51.1% MNTX: +31.8% $4.58 / share +20.2% -30 -27 -24 -21 -18 -15 -12 -9 -6 -3 0 +3 +6 +9 +12 +15 +18 +21 +24 +27 +30 +33 +36 +39 +42 +45 +48 +51 +54 +57 +60 +63 +66 +69 +72 +75 +78 +81 +84 +87 +90 +93 +96 10/1/2023 11/1/2023 12/1/2023 1/1/2024 2/1/2024 3/1/2024 3/26/2024 (2) (1) MNTX Trading Volume MNTX S&P 500 OE Comp Group Rental Comp Group Source: S&P Capital IQ Trading Data as of 03/26/2024 Share Price Volume Volume $ 2023 Average $5.20 45,810 $238,115 180-Day Average $6.59 89,861 $591,829 90-Day Average $7.39 69,931 $516,948 60-Day Average $7.01 60,865 $426,440 30-Day Average $6.71 69,402 $465,720 7-Day Average $6.93 52,106 $361,244 03/26/2024 Close $7.21 52,796 $380,659 52-Week Low (10/27/2023) $3.86 36,664 $141,523 52-Week High (12/27/2023) $9.02 87,158 $786,165 MNTX has increased 57.4% since 9/21/2023 compared to +20.2% for the S&P 500, +31.8% for the OEM Comparable Group, and +51.1% for the Rental Comparable Group (1) OE Comp Group: Cargotec Corporation, Konecranes, Manitowoc Company, Palfinger AG, Terex Corporation 8 (2) Rental Comp Group: Alta Equipment Group, Ashtead Group, H&E Equipment Services, Herc Holdings, United Rentals

Investor Profiles 9

Investor Profiles 10

Investor Profiles 11
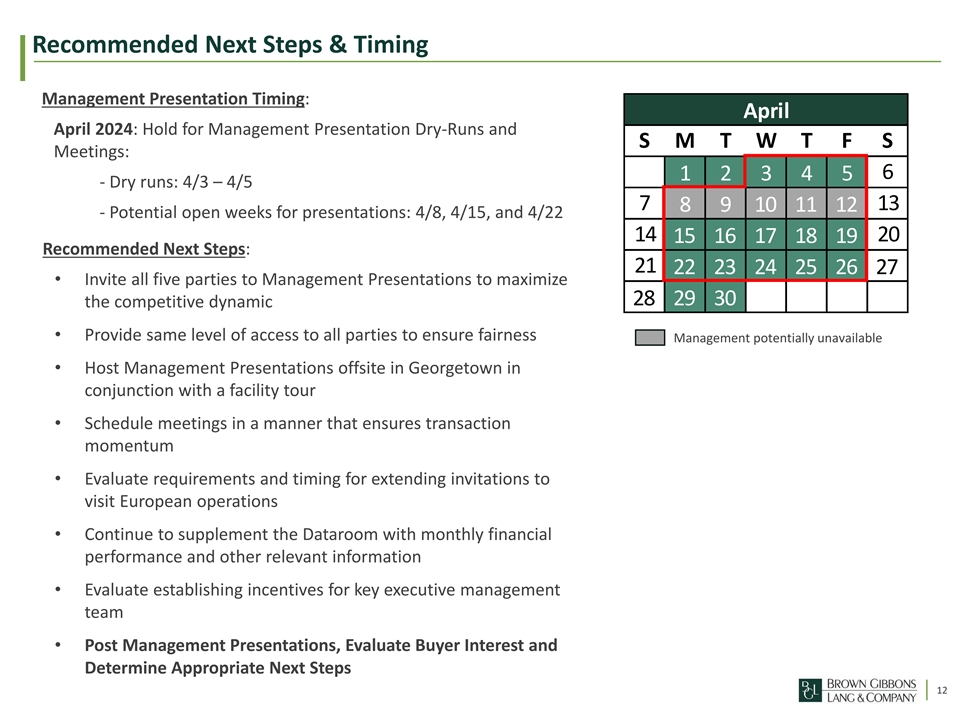
Recommended Next Steps & Timing Management Presentation Timing: April May April 2024: Hold for Management Presentation Dry-Runs and S M T W T F S Meetings: 6 1 2 3 4 5 - Dry runs: 4/3 – 4/5 7 13 8 9 10 11 12 - Potential open weeks for presentations: 4/8, 4/15, and 4/22 14 20 15 16 17 18 19 Recommended Next Steps: 21 22 23 24 25 26 27 • Invite all five parties to Management Presentations to maximize 28 29 30 the competitive dynamic • Provide same level of access to all parties to ensure fairness Management potentially unavailable • Host Management Presentations offsite in Georgetown in conjunction with a facility tour • Schedule meetings in a manner that ensures transaction momentum • Evaluate requirements and timing for extending invitations to visit European operations • Continue to supplement the Dataroom with monthly financial performance and other relevant information • Evaluate establishing incentives for key executive management team • Post Management Presentations, Evaluate Buyer Interest and Determine Appropriate Next Steps 12

Process Timeline Week 7 – Week 14 M + 2 Days: Negotiate Merger Agreement, Antitrust notification begin preparing proxy filings M + 15 Days: statement, initiate Fairness Week 5 Receipt of SEC comments Opinion process April 2024 Invite select motivated Week 14 on proxy statement, if parties to tour (Week 1) any; respond to Buyer, Merger Sub, and European facilities comments received ELEVATE execute the Hold for Management Merger Agreement (“M”) Presentations Management Presentations and Final Due Diligence (Stage A) Final Due Diligence (Stage B) Facility Tours Prior to Merger Agreement Execution After Merger Agreement Execution M + 32 Days: Week 14 Antitrust clearance / Joint public announcement termination of HSR waiting Week 3 Week 6 of transaction and filing of period Receive refreshed 8-K Request Letters of bids Intent and negotiate Week 14 M + 5 Days: offers Board of Directors File preliminary proxy statement approves the transaction, with the SEC; file documentation Merger Agreement, and with Nasdaq to tee up delisting related documents upon effectiveness of merger 13
Appendix: Marketing Update Detail

Marketing Update – Buyer Outreach 15

Marketing Update – Buyer Outreach Cont’d 16

Marketing Update – Buyer Outreach Cont’d 17

Marketing Update – Buyer Outreach Cont’d 18
Marketing Update – Buyer Outreach Cont’d 19

Appendix: Indications of Interest

Following Pages Redacted: 21-40.