UNITED STATES
SECURITIES AND EXCHANGE COMMISSION
Washington, D.C. 20549
FORM N-CSR
CERTIFIED SHAREHOLDER REPORT OF REGISTERED
MANAGEMENT INVESTMENT COMPANIES
Investment Company Act file number 811-21667
Fidelity Central Investment Portfolios LLC
(Exact name of registrant as specified in charter)
245 Summer St., Boston, MA 02210
(Address of principal executive offices) (Zip code)
Marc Bryant, Secretary
245 Summer St.
Boston, Massachusetts 02210
(Name and address of agent for service)
Registrant's telephone number, including area code:
617-563-7000
Date of fiscal year end: | August 31 |
Date of reporting period: | February 28, 2017 |
Item 1.
Reports to Stockholders
Fidelity® High Income Central Fund 2 Semi-Annual Report February 28, 2017 |
 |
Contents
To view a fund's proxy voting guidelines and proxy voting record for the 12-month period ended June 30, visit http://www.fidelity.com/proxyvotingresults or visit the Securities and Exchange Commission's (SEC) web site at http://www.sec.gov.
You may also call 1-800-544-8544 to request a free copy of the proxy voting guidelines.
Standard & Poor's, S&P and S&P 500 are registered service marks of The McGraw-Hill Companies, Inc. and have been licensed for use by Fidelity Distributors Corporation.
Other third-party marks appearing herein are the property of their respective owners.
All other marks appearing herein are registered or unregistered trademarks or service marks of FMR LLC or an affiliated company. © 2017 FMR LLC. All rights reserved.
A fund files its complete schedule of portfolio holdings with the SEC for the first and third quarters of each fiscal year on Form N-Q. Forms N-Q are available on the SEC’s web site at http://www.sec.gov. A fund's Forms N-Q may be reviewed and copied at the SEC’s Public Reference Room in Washington, DC. Information regarding the operation of the SEC's Public Reference Room may be obtained by calling 1-800-SEC-0330.
Investment Summary (Unaudited)
Top Five Holdings as of February 28, 2017
| (by issuer, excluding cash equivalents) | % of fund's net assets | % of fund's net assets 6 months ago |
| Community Health Systems, Inc. | 2.5 | 2.2 |
| Valeant Pharmaceuticals International, Inc. | 1.9 | 2.8 |
| Altice SA | 1.5 | 1.6 |
| Laureate Education, Inc. | 1.4 | 2.2 |
| Freeport-McMoRan, Inc. | 1.4 | 0.7 |
| 8.7 |
Top Five Market Sectors as of February 28, 2017
| % of fund's net assets | % of fund's net assets 6 months ago | |
| Energy | 12.2 | 11.4 |
| Healthcare | 11.5 | 13.3 |
| Telecommunications | 9.1 | 8.9 |
| Banks & Thrifts | 6.5 | 6.3 |
| Cable/Satellite TV | 5.6 | 4.4 |
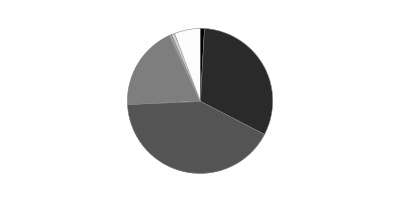
Quality Diversification (% of fund's net assets)
| As of February 28, 2017 | ||
| BBB | 1.0% | |
| BB | 30.4% | |
| B | 42.6% | |
| CCC,CC,C | 16.1% | |
| Not Rated | 0.4% | |
| Equities | 1.1% | |
| Short-Term Investments and Net Other Assets | 8.4% | |

| As of August 31, 2016 | ||
| BBB | 1.0% | |
| BB | 31.6% | |
| B | 41.6% | |
| CCC,CC,C | 18.8% | |
| Not Rated | 0.6% | |
| Equities | 0.6% | |
| Short-Term Investments and Net Other Assets | 5.8% | |
We have used ratings from Moody's Investors Service, Inc. Where Moody's® ratings are not available, we have used S&P® ratings. All ratings are as of the date indicated and do not reflect subsequent changes.
Asset Allocation (% of fund's net assets)
| As of February 28, 2017* | ||
| Nonconvertible Bonds | 79.2% | |
| Convertible Bonds, Preferred Stocks | 1.1% | |
| Common Stocks | 0.1% | |
| Bank Loan Obligations | 6.5% | |
| Other Investments | 4.7% | |
| Short-Term Investments and Net Other Assets (Liabilities) | 8.4% | |

* Foreign investments - 22.9%
| As of August 31, 2016* | ||
| Nonconvertible Bonds | 80.4% | |
| Convertible Bonds, Preferred Stocks | 0.5% | |
| Common Stocks | 0.1% | |
| Bank Loan Obligations | 8.2% | |
| Other Investments | 5.0% | |
| Short-Term Investments and Net Other Assets (Liabilities) | 5.8% | |

* Foreign investments - 24.3%
Investments February 28, 2017 (Unaudited)
Showing Percentage of Net Assets
| Corporate Bonds - 79.3% | |||
| Principal Amount | Value | ||
| Convertible Bonds - 0.1% | |||
| Capital Goods - 0.1% | |||
| General Cable Corp. 4.5% 11/15/29 (a) | $838,000 | $620,644 | |
| Diversified Financial Services - 0.0% | |||
| Ensco Jersey Finance Ltd. 3% 1/31/24 (b) | 430,000 | 438,331 | |
| TOTAL CONVERTIBLE BONDS | 1,058,975 | ||
| Nonconvertible Bonds - 79.2% | |||
| Aerospace - 0.2% | |||
| Huntington Ingalls Industries, Inc. 5% 11/15/25 (b) | 790,000 | 830,401 | |
| Orbital ATK, Inc. 5.5% 10/1/23 | 695,000 | 722,800 | |
| 1,553,201 | |||
| Air Transportation - 0.2% | |||
| Allegiant Travel Co. 5.5% 7/15/19 | 735,000 | 757,050 | |
| U.S. Airways pass-thru certificates Series 2013-1 Class B, 5.375% 5/15/23 | 319,248 | 329,624 | |
| United Continental Holdings, Inc. 6.375% 6/1/18 | 155,000 | 162,363 | |
| XPO Logistics, Inc. 6.125% 9/1/23 (b) | 725,000 | 761,250 | |
| 2,010,287 | |||
| Automotive & Auto Parts - 0.5% | |||
| Allison Transmission, Inc. 5% 10/1/24 (b) | 1,160,000 | 1,180,300 | |
| Penske Automotive Group, Inc. 5.5% 5/15/26 | 940,000 | 933,608 | |
| Tenneco, Inc. 5% 7/15/26 | 655,000 | 656,638 | |
| The Goodyear Tire & Rubber Co. 5% 5/31/26 | 1,415,000 | 1,443,300 | |
| 4,213,846 | |||
| Banks & Thrifts - 1.7% | |||
| Ally Financial, Inc.: | |||
| 4.25% 4/15/21 | 2,345,000 | 2,418,281 | |
| 5.75% 11/20/25 | 5,405,000 | 5,709,031 | |
| BNP Paribas SA 6.75% (b)(c)(d) | 1,555,000 | 1,586,858 | |
| Royal Bank of Scotland Group PLC 5.125% 5/28/24 | 5,315,000 | 5,379,593 | |
| 15,093,763 | |||
| Broadcasting - 0.5% | |||
| AMC Networks, Inc. 5% 4/1/24 | 170,000 | 171,595 | |
| CBS Radio, Inc. 7.25% 11/1/24 (b) | 615,000 | 656,513 | |
| Gray Television, Inc. 5.875% 7/15/26 (b) | 620,000 | 628,723 | |
| iHeartCommunications, Inc.: | |||
| 9% 9/15/22 | 780,000 | 627,900 | |
| 10.625% 3/15/23 | 1,205,000 | 1,000,150 | |
| 11.25% 3/1/21 (b) | 915,000 | 748,013 | |
| Sirius XM Radio, Inc. 5.375% 7/15/26 (b) | 910,000 | 928,200 | |
| 4,761,094 | |||
| Building Materials - 0.9% | |||
| Builders FirstSource, Inc. 5.625% 9/1/24 (b) | 1,175,000 | 1,208,781 | |
| Building Materials Corp. of America: | |||
| 5.5% 2/15/23 (b) | 1,185,000 | 1,232,400 | |
| 6% 10/15/25 (b) | 1,165,000 | 1,237,813 | |
| CEMEX Finance LLC 6% 4/1/24 (b) | 1,260,000 | 1,308,825 | |
| GCP Applied Technologies, Inc. 9.5% 2/1/23 (b) | 790,000 | 896,492 | |
| Ply Gem Industries, Inc. 6.5% 2/1/22 | 840,000 | 865,368 | |
| U.S. Concrete, Inc.: | |||
| 6.375% 6/1/24 | 445,000 | 470,588 | |
| 6.375% 6/1/24 (b) | 430,000 | 454,725 | |
| USG Corp. 5.5% 3/1/25 (b) | 495,000 | 525,938 | |
| 8,200,930 | |||
| Cable/Satellite TV - 5.0% | |||
| Altice SA 7.75% 5/15/22 (b) | 12,655,000 | 13,461,756 | |
| Altice U.S. Finance SA: | |||
| 5.375% 7/15/23 (b) | 1,620,000 | 1,688,850 | |
| 5.5% 5/15/26 (b) | 3,150,000 | 3,256,313 | |
| CCO Holdings LLC/CCO Holdings Capital Corp.: | |||
| 5.125% 2/15/23 | 670,000 | 697,638 | |
| 5.125% 5/1/23 (b) | 1,665,000 | 1,727,438 | |
| 5.125% 5/1/27 (b) | 1,750,000 | 1,817,813 | |
| 5.5% 5/1/26 (b) | 1,160,000 | 1,231,050 | |
| 5.75% 9/1/23 | 1,160,000 | 1,216,550 | |
| 5.875% 4/1/24 (b) | 2,245,000 | 2,407,763 | |
| Cequel Communications Holdings I LLC/Cequel Capital Corp.: | |||
| 5.125% 12/15/21 (b) | 760,000 | 767,843 | |
| 5.125% 12/15/21 (b) | 1,654,000 | 1,683,474 | |
| CSC Holdings, Inc. 5.5% 4/15/27 (b) | 2,075,000 | 2,134,656 | |
| DISH DBS Corp.: | |||
| 5% 3/15/23 | 865,000 | 888,788 | |
| 5.875% 7/15/22 | 550,000 | 589,875 | |
| 6.75% 6/1/21 | 1,122,000 | 1,237,005 | |
| 7.75% 7/1/26 | 385,000 | 450,450 | |
| Unitymedia KabelBW GmbH 6.125% 1/15/25 (b) | 1,680,000 | 1,776,600 | |
| Virgin Media Finance PLC 4.875% 2/15/22 | 845,000 | 752,050 | |
| Virgin Media Secured Finance PLC 5.5% 8/15/26 (b) | 930,000 | 953,148 | |
| VTR Finance BV 6.875% 1/15/24 (b) | 940,000 | 996,400 | |
| Ziggo Bond Finance BV 6% 1/15/27 (b) | 775,000 | 777,906 | |
| Ziggo Secured Finance BV 5.5% 1/15/27 (b) | 3,170,000 | 3,209,625 | |
| 43,722,991 | |||
| Capital Goods - 1.7% | |||
| AECOM Technology Corp. 5.75% 10/15/22 | 465,000 | 489,994 | |
| Amsted Industries, Inc. 5% 3/15/22 (b) | 470,000 | 474,700 | |
| Belden, Inc. 5.25% 7/15/24 (b) | 1,595,000 | 1,600,981 | |
| CNH Industrial NV 4.5% 8/15/23 | 775,000 | 787,013 | |
| General Cable Corp. 5.75% 10/1/22 (d) | 8,479,000 | 8,309,420 | |
| Shale-Inland Holdings LLC/Shale-Inland Finance Corp. 8.75% 11/15/19 (b) | 3,345,000 | 2,341,500 | |
| SPX Flow, Inc.: | |||
| 5.625% 8/15/24 (b) | 385,000 | 395,588 | |
| 5.875% 8/15/26 (b) | 385,000 | 390,775 | |
| 14,789,971 | |||
| Chemicals - 4.4% | |||
| A. Schulman, Inc. 6.875% 6/1/23 (b) | 2,425,000 | 2,558,375 | |
| Axalta Coating Systems 4.875% 8/15/24 (b) | 1,160,000 | 1,183,200 | |
| Blue Cube Spinco, Inc.: | |||
| 9.75% 10/15/23 | 1,175,000 | 1,401,188 | |
| 10% 10/15/25 | 1,455,000 | 1,767,825 | |
| CF Industries Holdings, Inc.: | |||
| 3.45% 6/1/23 | 1,635,000 | 1,518,506 | |
| 5.15% 3/15/34 | 1,270,000 | 1,203,325 | |
| 5.375% 3/15/44 | 2,520,000 | 2,236,500 | |
| Evolution Escrow Issuer LLC 7.5% 3/15/22 (b) | 2,250,000 | 2,351,250 | |
| Koppers, Inc. 6% 2/15/25 (b) | 875,000 | 910,000 | |
| Momentive Performance Materials, Inc. 3.88% 10/24/21 | 4,365,000 | 4,277,700 | |
| MPM Escrow LLC/MPM Finance Escrow Corp. 8.875% 10/15/20 (e) | 2,875,000 | 0 | |
| Platform Specialty Products Corp. 6.5% 2/1/22 (b) | 1,725,000 | 1,802,625 | |
| The Chemours Co. LLC: | |||
| 6.625% 5/15/23 | 1,985,000 | 2,106,581 | |
| 7% 5/15/25 | 4,570,000 | 4,964,163 | |
| Trinseo Materials Operating SCA/Trinseo Materials Finance, Inc. 6.75% 5/1/22 (b) | 375,000 | 396,563 | |
| Tronox Finance LLC 6.375% 8/15/20 | 7,055,000 | 7,178,463 | |
| Valvoline Finco Two LLC 5.5% 7/15/24 (b) | 335,000 | 353,425 | |
| Versum Materials, Inc. 5.5% 9/30/24 (b) | 480,000 | 502,200 | |
| W. R. Grace & Co.-Conn.: | |||
| 5.125% 10/1/21 (b) | 645,000 | 678,863 | |
| 5.625% 10/1/24 (b) | 1,095,000 | 1,163,438 | |
| 38,554,190 | |||
| Consumer Products - 0.2% | |||
| Edgewell Personal Care Co. 5.5% 6/15/25 (b) | 45,000 | 46,463 | |
| Tempur Sealy International, Inc. 5.5% 6/15/26 | 1,155,000 | 1,134,788 | |
| Wolverine World Wide, Inc. 5% 9/1/26 (b) | 775,000 | 734,313 | |
| 1,915,564 | |||
| Containers - 2.0% | |||
| Ardagh Packaging Finance PLC/Ardagh MP Holdings U.S.A., Inc.: | |||
| 4.289% 5/15/21 (b)(d) | 2,120,000 | 2,175,650 | |
| 4.625% 5/15/23 (b) | 3,885,000 | 3,952,988 | |
| 6% 6/30/21 (b) | 1,145,000 | 1,187,938 | |
| Consolidated Container Co. LLC/Consolidated Container Capital, Inc. 10.125% 7/15/20 (b) | 2,290,000 | 2,364,425 | |
| Crown Americas LLC/Crown Americas Capital Corp. IV 4.5% 1/15/23 | 365,000 | 374,581 | |
| Crown Americas LLC/Crown Americas Capital Corp. V 4.25% 9/30/26 (b) | 385,000 | 371,044 | |
| Graphic Packaging International, Inc. 4.125% 8/15/24 | 670,000 | 664,975 | |
| Owens-Brockway Glass Container, Inc.: | |||
| 5% 1/15/22 (b) | 925,000 | 962,000 | |
| 5.375% 1/15/25 (b) | 1,870,000 | 1,928,438 | |
| Reynolds Group Issuer, Inc./Reynolds Group Issuer LLC/Reynolds Group Issuer (Luxembourg) SA 5.125% 7/15/23 (b) | 1,605,000 | 1,663,181 | |
| Sealed Air Corp. 5.25% 4/1/23 (b) | 870,000 | 913,500 | |
| Silgan Holdings, Inc. 4.75% 3/15/25 (b) | 1,190,000 | 1,197,438 | |
| 17,756,158 | |||
| Diversified Financial Services - 3.8% | |||
| Adient Global Holdings Ltd. 4.875% 8/15/26 (b) | 770,000 | 764,225 | |
| AerCap Ireland Capital Ltd./AerCap Global Aviation Trust 4.625% 10/30/20 | 1,965,000 | 2,096,419 | |
| Aircastle Ltd.: | |||
| 5% 4/1/23 | 755,000 | 795,581 | |
| 5.125% 3/15/21 | 1,210,000 | 1,291,675 | |
| 5.5% 2/15/22 | 970,000 | 1,046,388 | |
| CIT Group, Inc.: | |||
| 5% 8/15/22 | 925,000 | 980,500 | |
| 5.375% 5/15/20 | 1,600,000 | 1,712,000 | |
| FLY Leasing Ltd.: | |||
| 6.375% 10/15/21 | 4,525,000 | 4,706,000 | |
| 6.75% 12/15/20 | 590,000 | 618,025 | |
| Icahn Enterprises LP/Icahn Enterprises Finance Corp.: | |||
| 4.875% 3/15/19 | 1,960,000 | 1,991,850 | |
| 6% 8/1/20 | 650,000 | 676,007 | |
| 6.25% 2/1/22 (b) | 445,000 | 459,463 | |
| 6.75% 2/1/24 (b) | 435,000 | 451,313 | |
| ILFC E-Capital Trust I 4.67% 12/21/65 (b)(d) | 1,170,000 | 1,099,800 | |
| ILFC E-Capital Trust II 4.92% 12/21/65 (b)(d) | 1,750,000 | 1,638,438 | |
| Intelsat Connect Finance SA 12.5% 4/1/22 (b) | 359,000 | 313,228 | |
| International Lease Finance Corp. 5.875% 8/15/22 | 570,000 | 643,291 | |
| MSCI, Inc.: | |||
| 4.75% 8/1/26 (b) | 495,000 | 497,723 | |
| 5.75% 8/15/25 (b) | 520,000 | 553,800 | |
| Navient Corp.: | |||
| 5% 10/26/20 | 345,000 | 346,622 | |
| 6.625% 7/26/21 | 675,000 | 703,688 | |
| SLM Corp.: | |||
| 4.875% 6/17/19 | 1,665,000 | 1,698,300 | |
| 7.25% 1/25/22 | 605,000 | 630,713 | |
| 8% 3/25/20 | 2,370,000 | 2,571,142 | |
| Springleaf Financial Corp. 8.25% 12/15/20 | 1,195,000 | 1,313,006 | |
| Tervita Escrow Corp. 7.625% 12/1/21 (b) | 3,260,000 | 3,406,700 | |
| 33,005,897 | |||
| Diversified Media - 2.3% | |||
| Clear Channel Worldwide Holdings, Inc. Series A: | |||
| 6.5% 11/15/22 | 2,220,000 | 2,242,200 | |
| 7.625% 3/15/20 | 3,434,000 | 3,373,905 | |
| Lamar Media Corp. 5.75% 2/1/26 | 535,000 | 575,125 | |
| MDC Partners, Inc. 6.5% 5/1/24 (b) | 8,020,000 | 7,749,325 | |
| National CineMedia LLC 5.75% 8/15/26 | 775,000 | 790,500 | |
| Nielsen Co. S.a.r.l. (Luxembourg) 5% 2/1/25 (b) | 875,000 | 881,563 | |
| Nielsen Finance LLC/Nielsen Finance Co. 5% 4/15/22 (b) | 4,760,000 | 4,902,800 | |
| 20,515,418 | |||
| Energy - 11.2% | |||
| AmeriGas Partners LP/AmeriGas Finance Corp.: | |||
| 5.5% 5/20/25 | 865,000 | 876,894 | |
| 5.75% 5/20/27 | 760,000 | 763,800 | |
| Antero Resources Corp.: | |||
| 5.125% 12/1/22 | 890,000 | 894,450 | |
| 5.625% 6/1/23 (Reg. S) | 815,000 | 825,188 | |
| Antero Resources Finance Corp. 5.375% 11/1/21 | 990,000 | 1,012,275 | |
| Baytex Energy Corp.: | |||
| 5.125% 6/1/21 (b) | 275,000 | 250,250 | |
| 5.625% 6/1/24 (b) | 830,000 | 759,392 | |
| Calfrac Holdings LP 7.5% 12/1/20 (b) | 875,000 | 807,188 | |
| Callon Petroleum Co. 6.125% 10/1/24 (b) | 335,000 | 349,238 | |
| Carrizo Oil & Gas, Inc. 6.25% 4/15/23 | 545,000 | 551,813 | |
| Chesapeake Energy Corp.: | |||
| 4.875% 4/15/22 | 1,640,000 | 1,469,440 | |
| 5.375% 6/15/21 | 2,430,000 | 2,235,600 | |
| 5.75% 3/15/23 | 745,000 | 677,950 | |
| 6.125% 2/15/21 | 606,000 | 584,790 | |
| 8% 12/15/22 (b) | 868,000 | 917,910 | |
| 8% 1/15/25 (b) | 435,000 | 431,738 | |
| Citgo Petroleum Corp. 6.25% 8/15/22 (b) | 4,325,000 | 4,465,563 | |
| Compressco Partners LP/Compressco Finance, Inc. 7.25% 8/15/22 | 655,000 | 632,075 | |
| Concho Resources, Inc.: | |||
| 4.375% 1/15/25 | 1,730,000 | 1,755,950 | |
| 5.5% 4/1/23 | 60,000 | 62,100 | |
| Continental Resources, Inc.: | |||
| 4.5% 4/15/23 | 770,000 | 754,600 | |
| 5% 9/15/22 | 3,420,000 | 3,488,400 | |
| Crestwood Midstream Partners LP/Crestwood Midstream Finance Corp. 6.25% 4/1/23 | 315,000 | 326,813 | |
| CVR Refining LLC/Coffeyville Finance, Inc. 6.5% 11/1/22 | 1,665,000 | 1,681,650 | |
| Denbury Resources, Inc.: | |||
| 4.625% 7/15/23 | 3,020,000 | 2,355,600 | |
| 5.5% 5/1/22 | 2,150,000 | 1,773,750 | |
| Ensco PLC: | |||
| 4.5% 10/1/24 | 780,000 | 670,800 | |
| 5.2% 3/15/25 | 420,000 | 371,700 | |
| 5.75% 10/1/44 | 1,156,000 | 901,680 | |
| Exterran Partners LP/EXLP Finance Corp. 6% 4/1/21 | 435,000 | 435,000 | |
| Ferrellgas LP/Ferrellgas Finance Corp. 6.5% 5/1/21 | 430,000 | 420,325 | |
| FTS International, Inc. 6.25% 5/1/22 | 1,790,000 | 1,691,550 | |
| Hilcorp Energy I LP/Hilcorp Finance Co.: | |||
| 5% 12/1/24 (b) | 2,275,000 | 2,178,313 | |
| 5.75% 10/1/25 (b) | 810,000 | 803,925 | |
| Holly Energy Partners LP/Holly Finance Corp. 6% 8/1/24 (b) | 575,000 | 603,750 | |
| Hornbeck Offshore Services, Inc.: | |||
| 5% 3/1/21 | 40,000 | 25,900 | |
| 5.875% 4/1/20 | 75,000 | 49,875 | |
| NGL Energy Partners LP/NGL Energy Finance Corp.: | |||
| 5.125% 7/15/19 | 435,000 | 436,088 | |
| 7.5% 11/1/23 (b) | 1,115,000 | 1,173,538 | |
| Noble Holding International Ltd.: | |||
| 4.625% 3/1/21 | 455,000 | 431,113 | |
| 5.25% 3/15/42 | 620,000 | 412,300 | |
| 6.05% 3/1/41 | 755,000 | 572,384 | |
| 7.2% 4/1/25 (d) | 1,040,000 | 1,007,500 | |
| 7.75% 1/15/24 | 4,145,000 | 4,053,603 | |
| Northern Tier Energy LLC/Northern Tier Finance Corp. 7.125% 11/15/20 | 960,000 | 997,200 | |
| NRG Yield Operating LLC 5% 9/15/26 (b) | 775,000 | 759,500 | |
| Pacific Drilling SA 5.375% 6/1/20 (b) | 445,000 | 205,813 | |
| Parsley Energy LLC/Parsley: | |||
| 5.25% 8/15/25 (b) | 575,000 | 580,750 | |
| 6.25% 6/1/24 (b) | 165,000 | 173,352 | |
| PBF Holding Co. LLC/PBF Finance Corp. 7% 11/15/23 | 2,760,000 | 2,773,800 | |
| PBF Logistics LP/PBF Logistics Finance, Inc. 6.875% 5/15/23 | 155,000 | 157,713 | |
| PDC Energy, Inc. 6.125% 9/15/24 (b) | 290,000 | 299,425 | |
| Peabody Securities Finance Corp.: | |||
| 6% 3/31/22 (b) | 280,000 | 285,600 | |
| 6.375% 3/31/25 (b) | 350,000 | 357,000 | |
| Range Resources Corp. 5% 3/15/23 (b) | 385,000 | 372,969 | |
| Rice Energy, Inc.: | |||
| 6.25% 5/1/22 | 445,000 | 454,737 | |
| 7.25% 5/1/23 | 325,000 | 343,688 | |
| Rose Rock Midstream LP/Rose Rock Finance Corp.: | |||
| 5.625% 7/15/22 | 770,000 | 756,525 | |
| 5.625% 11/15/23 | 845,000 | 823,875 | |
| Sabine Pass Liquefaction LLC: | |||
| 5.625% 4/15/23 (d) | 3,215,000 | 3,535,761 | |
| 5.75% 5/15/24 | 1,360,000 | 1,505,275 | |
| 6.25% 3/15/22 | 1,810,000 | 2,041,825 | |
| SM Energy Co.: | |||
| 5% 1/15/24 | 1,345,000 | 1,260,938 | |
| 5.625% 6/1/25 | 1,995,000 | 1,887,769 | |
| 6.125% 11/15/22 | 1,980,000 | 1,994,850 | |
| 6.5% 11/15/21 | 650,000 | 664,625 | |
| 6.5% 1/1/23 | 1,650,000 | 1,654,125 | |
| 6.75% 9/15/26 | 520,000 | 529,100 | |
| Southwestern Energy Co.: | |||
| 4.1% 3/15/22 | 3,725,000 | 3,315,250 | |
| 5.8% 1/23/20 (d) | 2,470,000 | 2,445,300 | |
| Summit Midstream Holdings LLC 5.75% 4/15/25 | 665,000 | 674,975 | |
| SunCoke Energy Partners LP/SunCoke Energy Partners Finance Corp. 7.375% 2/1/20 (b) | 355,000 | 362,100 | |
| Sunoco LP/Sunoco Finance Corp.: | |||
| 6.25% 4/15/21 | 1,680,000 | 1,705,200 | |
| 6.375% 4/1/23 | 2,245,000 | 2,267,450 | |
| Targa Resources Partners LP/Targa Resources Partners Finance Corp.: | |||
| 4.25% 11/15/23 | 2,335,000 | 2,317,488 | |
| 5.125% 2/1/25 (b) | 470,000 | 488,800 | |
| 5.25% 5/1/23 | 330,000 | 340,725 | |
| 5.375% 2/1/27 (b) | 470,000 | 489,975 | |
| 6.375% 8/1/22 | 311,000 | 321,108 | |
| 6.75% 3/15/24 | 235,000 | 256,738 | |
| Teine Energy Ltd. 6.875% 9/30/22 (b) | 600,000 | 624,000 | |
| Tesoro Logistics LP/Tesoro Logistics Finance Corp.: | |||
| 5.875% 10/1/20 | 882,000 | 909,563 | |
| 6.125% 10/15/21 | 890,000 | 928,938 | |
| 6.25% 10/15/22 | 2,075,000 | 2,220,250 | |
| Transocean, Inc. 9% 7/15/23 (b) | 770,000 | 829,675 | |
| Weatherford International Ltd.: | |||
| 6.5% 8/1/36 | 540,000 | 498,150 | |
| 7% 3/15/38 | 975,000 | 918,938 | |
| Weatherford International, Inc. 6.8% 6/15/37 | 1,000,000 | 942,500 | |
| Western Refining Logistics LP/WNRL Finance Co. 7.5% 2/15/23 | 1,180,000 | 1,280,300 | |
| Whiting Petroleum Corp.: | |||
| 5.75% 3/15/21 | 535,000 | 532,325 | |
| 6.25% 4/1/23 | 235,000 | 235,588 | |
| WPX Energy, Inc.: | |||
| 6% 1/15/22 | 1,195,000 | 1,220,394 | |
| 8.25% 8/1/23 | 730,000 | 817,600 | |
| 98,303,306 | |||
| Entertainment/Film - 0.7% | |||
| AMC Entertainment Holdings, Inc. 5.875% 11/15/26 (b) | 785,000 | 802,914 | |
| CBS Outdoor Americas Capital LLC/CBS Outdoor Americas Capital Corp.: | |||
| 5.25% 2/15/22 | 1,500,000 | 1,558,125 | |
| 5.625% 2/15/24 | 400,000 | 420,000 | |
| 5.875% 3/15/25 | 2,285,000 | 2,402,106 | |
| New Cotai LLC/New Cotai Capital Corp. 10.625% 5/1/19 pay-in-kind (b)(d) | 1,089,984 | 843,886 | |
| 6,027,031 | |||
| Environmental - 0.8% | |||
| Covanta Holding Corp.: | |||
| 5.875% 3/1/24 | 1,787,000 | 1,816,039 | |
| 6.375% 10/1/22 | 1,081,000 | 1,114,781 | |
| 7.25% 12/1/20 | 825,000 | 847,688 | |
| LBC Tank Terminals Holding Netherlands BV 6.875% 5/15/23 (b) | 2,780,000 | 2,891,200 | |
| 6,669,708 | |||
| Food & Drug Retail - 2.4% | |||
| Albertsons Companies LLC/Safeway, Inc./New Albertson's, Inc./Albertson's LLC: | |||
| 5.75% 3/15/25 (b) | 2,405,000 | 2,409,509 | |
| 6.625% 6/15/24 (b) | 1,255,000 | 1,330,300 | |
| BI-LO LLC/BI-LO Finance Corp.: | |||
| 8.625% 9/15/18 pay-in-kind (b)(d) | 8,285,000 | 3,334,713 | |
| 9.25% 2/15/19 (b) | 7,234,000 | 6,094,645 | |
| Performance Food Group, Inc. 5.5% 6/1/24 (b) | 500,000 | 518,750 | |
| Rite Aid Corp.: | |||
| 6.75% 6/15/21 | 1,640,000 | 1,709,700 | |
| 7.7% 2/15/27 | 364,000 | 434,980 | |
| Tops Holding LLC/Tops Markets II Corp. 8% 6/15/22 (b) | 6,255,000 | 5,129,100 | |
| 20,961,697 | |||
| Food/Beverage/Tobacco - 3.6% | |||
| Bumble Bee Acquisition Corp. 9% 12/15/17 (b) | 1,821,000 | 1,814,171 | |
| C&S Group Enterprises LLC 5.375% 7/15/22 (b) | 6,655,000 | 6,571,813 | |
| Cott Beverages, Inc.: | |||
| 5.375% 7/1/22 | 70,000 | 71,750 | |
| 6.75% 1/1/20 | 40,000 | 41,350 | |
| ESAL GmbH 6.25% 2/5/23 (b) | 4,585,000 | 4,676,700 | |
| JBS Investments GmbH: | |||
| 7.25% 4/3/24 (b) | 2,160,000 | 2,300,400 | |
| 7.75% 10/28/20 (b) | 2,030,000 | 2,146,725 | |
| JBS U.S.A. LLC/JBS U.S.A. Finance, Inc.: | |||
| 5.75% 6/15/25 (b) | 785,000 | 810,513 | |
| 7.25% 6/1/21 (b) | 605,000 | 623,150 | |
| 7.25% 6/1/21 (b) | 1,995,000 | 2,054,850 | |
| Lamb Weston Holdings, Inc.: | |||
| 4.625% 11/1/24 (b) | 1,055,000 | 1,073,463 | |
| 4.875% 11/1/26 (b) | 635,000 | 644,843 | |
| Minerva Luxembourg SA 6.5% 9/20/26 (b) | 2,320,000 | 2,302,600 | |
| Pinnacle Foods Finance LLC/Pinnacle Foods Finance Corp. 5.875% 1/15/24 | 420,000 | 444,150 | |
| Post Holdings, Inc.: | |||
| 5% 8/15/26 (b) | 570,000 | 551,116 | |
| 5.5% 3/1/25 (b) | 1,115,000 | 1,135,906 | |
| 5.75% 3/1/27 (b) | 865,000 | 875,276 | |
| 7.75% 3/15/24 (b) | 580,000 | 643,800 | |
| U.S. Foods, Inc. 5.875% 6/15/24 (b) | 770,000 | 808,500 | |
| Vector Group Ltd. 6.125% 2/1/25 (b) | 1,750,000 | 1,802,500 | |
| 31,393,576 | |||
| Gaming - 1.3% | |||
| Boyd Gaming Corp. 6.375% 4/1/26 | 395,000 | 427,094 | |
| GLP Capital LP/GLP Financing II, Inc. 5.375% 4/15/26 | 345,000 | 360,956 | |
| Golden Nugget Escrow, Inc. 8.5% 12/1/21 (b) | 430,000 | 459,025 | |
| Jacobs Entertainment, Inc. 7.875% 2/1/24 (b) | 225,000 | 231,188 | |
| MGM Growth Properties Operating Partnership LP 4.5% 9/1/26 (b) | 1,100,000 | 1,069,750 | |
| MGM Mirage, Inc.: | |||
| 7.75% 3/15/22 | 660,000 | 770,550 | |
| 8.625% 2/1/19 | 894,000 | 987,870 | |
| Penn National Gaming, Inc. 5.625% 1/15/27 (b) | 185,000 | 185,694 | |
| Scientific Games Corp.: | |||
| 6.625% 5/15/21 | 2,055,000 | 1,931,700 | |
| 7% 1/1/22 (b) | 1,085,000 | 1,152,813 | |
| 7% 1/1/22 (b) | 800,000 | 851,000 | |
| 10% 12/1/22 | 1,485,000 | 1,575,956 | |
| Seminole Hard Rock Entertainment, Inc. 5.875% 5/15/21 (b) | 445,000 | 456,125 | |
| Wynn Macau Ltd. 5.25% 10/15/21 (b) | 1,310,000 | 1,339,475 | |
| 11,799,196 | |||
| Healthcare - 10.5% | |||
| Acadia Healthcare Co., Inc. 5.625% 2/15/23 | 695,000 | 714,113 | |
| AMAG Pharmaceuticals, Inc. 7.875% 9/1/23 (b) | 1,495,000 | 1,442,675 | |
| AmSurg Corp. 5.625% 7/15/22 | 985,000 | 1,025,631 | |
| Centene Corp. 4.75% 5/15/22 | 1,190,000 | 1,233,138 | |
| Community Health Systems, Inc.: | |||
| 5.125% 8/1/21 | 5,385,000 | 5,290,763 | |
| 6.875% 2/1/22 | 15,941,000 | 13,988,168 | |
| 7.125% 7/15/20 | 1,285,000 | 1,207,900 | |
| CTR Partnership LP/CareTrust Capital Corp. 5.875% 6/1/21 | 725,000 | 744,938 | |
| DaVita HealthCare Partners, Inc.: | |||
| 5% 5/1/25 | 1,295,000 | 1,303,016 | |
| 5.125% 7/15/24 | 1,500,000 | 1,530,938 | |
| Endo Finance LLC/Endo Ltd./Endo Finco, Inc. 6% 2/1/25 (b)(d) | 1,980,000 | 1,769,625 | |
| HCA Holdings, Inc.: | |||
| 4.5% 2/15/27 | 775,000 | 773,063 | |
| 5.25% 6/15/26 | 1,105,000 | 1,167,156 | |
| 5.375% 2/1/25 | 3,515,000 | 3,677,569 | |
| 5.875% 3/15/22 | 620,000 | 684,325 | |
| 5.875% 5/1/23 | 1,150,000 | 1,250,625 | |
| 5.875% 2/15/26 | 1,300,000 | 1,394,250 | |
| 6.25% 2/15/21 | 1,045,000 | 1,137,744 | |
| HealthSouth Corp.: | |||
| 5.75% 11/1/24 | 1,000,000 | 1,020,000 | |
| 5.75% 9/15/25 | 695,000 | 703,688 | |
| IMS Health, Inc. 5% 10/15/26 (b) | 1,055,000 | 1,070,825 | |
| Kindred Healthcare, Inc.: | |||
| 8% 1/15/20 | 4,905,000 | 4,954,050 | |
| 8.75% 1/15/23 | 3,435,000 | 3,336,244 | |
| Mallinckrodt International Finance SA/Mallinckrodt CB LLC: | |||
| 5.625% 10/15/23 (b) | 900,000 | 864,000 | |
| 5.75% 8/1/22 (b) | 730,000 | 715,400 | |
| MPT Operating Partnership LP/MPT Finance Corp.: | |||
| 5.25% 8/1/26 | 490,000 | 494,900 | |
| 5.5% 5/1/24 | 575,000 | 590,813 | |
| 6.375% 3/1/24 | 735,000 | 784,613 | |
| Ortho-Clinical Diagnostics, Inc. 6.625% 5/15/22 (b) | 3,915,000 | 3,494,138 | |
| Sabra Health Care LP/Sabra Capital Corp.: | |||
| 5.375% 6/1/23 | 3,010,000 | 3,010,000 | |
| 5.5% 2/1/21 | 2,645,000 | 2,744,188 | |
| Teleflex, Inc. 4.875% 6/1/26 | 1,345,000 | 1,355,088 | |
| Tenet Healthcare Corp.: | |||
| 4.375% 10/1/21 | 3,120,000 | 3,143,400 | |
| 4.4634% 6/15/20 (d) | 1,235,000 | 1,250,438 | |
| 4.5% 4/1/21 | 220,000 | 222,750 | |
| 6% 10/1/20 | 395,000 | 418,700 | |
| 8.125% 4/1/22 | 5,309,000 | 5,561,178 | |
| Valeant Pharmaceuticals International, Inc.: | |||
| 5.375% 3/15/20 (b) | 1,850,000 | 1,658,063 | |
| 5.5% 3/1/23 (b) | 2,050,000 | 1,652,813 | |
| 5.625% 12/1/21 (b) | 590,000 | 497,075 | |
| 5.875% 5/15/23 (b) | 5,025,000 | 4,089,094 | |
| 6.125% 4/15/25 (b) | 2,840,000 | 2,261,350 | |
| 6.75% 8/15/21 (b) | 800,000 | 712,000 | |
| 7.25% 7/15/22 (b) | 3,095,000 | 2,785,500 | |
| 7.5% 7/15/21 (b) | 1,785,000 | 1,639,969 | |
| VPI Escrow Corp. 6.375% 10/15/20 (b) | 1,345,000 | 1,223,950 | |
| 92,589,864 | |||
| Homebuilders/Real Estate - 1.4% | |||
| Beazer Homes U.S.A., Inc. 8.75% 3/15/22 (b) | 560,000 | 607,533 | |
| Brookfield Residential Properties, Inc./Brookfield Residential U.S. Corp. 6.125% 7/1/22 (b) | 270,000 | 278,100 | |
| Brookfield Residential Properties, Inc.: | |||
| 6.375% 5/15/25 (b) | 470,000 | 481,750 | |
| 6.5% 12/15/20 (b) | 815,000 | 838,961 | |
| Communications Sales & Leasing, Inc. 8.25% 10/15/23 | 305,000 | 330,544 | |
| Kennedy-Wilson, Inc. 5.875% 4/1/24 | 775,000 | 807,938 | |
| Lennar Corp. 4.125% 1/15/22 | 865,000 | 875,813 | |
| Mattamy Group Corp. 6.875% 12/15/23 (b) | 345,000 | 360,525 | |
| Odebrecht Finance Ltd.: | |||
| 4.375% 4/25/25 (b) | 500,000 | 235,000 | |
| 5.25% 6/27/29 (Reg. S) | 455,000 | 195,650 | |
| Realogy Group LLC/Realogy Co.-Issuer Corp. 5.25% 12/1/21 (b) | 615,000 | 639,600 | |
| Shea Homes Ltd. Partnership/Corp. 6.125% 4/1/25 (b) | 590,000 | 600,325 | |
| Starwood Property Trust, Inc. 5% 12/15/21 (b) | 865,000 | 898,519 | |
| Taylor Morrison Communities, Inc./Monarch Communities, Inc. 5.625% 3/1/24 (b) | 2,265,000 | 2,338,613 | |
| TRI Pointe Homes, Inc. 5.875% 6/15/24 | 300,000 | 310,500 | |
| WCI Communities, Inc. 6.875% 8/15/21 | 385,000 | 404,731 | |
| William Lyon Homes, Inc.: | |||
| 5.75% 4/15/19 | 345,000 | 349,313 | |
| 5.875% 1/31/25 (b) | 580,000 | 580,725 | |
| 7% 8/15/22 | 1,030,000 | 1,071,200 | |
| 12,205,340 | |||
| Hotels - 0.4% | |||
| ESH Hospitality, Inc. 5.25% 5/1/25 (b) | 2,370,000 | 2,390,738 | |
| Hilton Escrow Issuer LLC 4.25% 9/1/24 (b) | 1,080,000 | 1,068,120 | |
| 3,458,858 | |||
| Leisure - 0.4% | |||
| Carlson Travel, Inc.: | |||
| 6.75% 12/15/23 (b) | 355,000 | 371,863 | |
| 9.5% 12/15/24 (b) | 640,000 | 684,800 | |
| Silversea Cruises 7.25% 2/1/25 (b) | 385,000 | 401,363 | |
| Studio City Co. Ltd.: | |||
| 5.875% 11/30/19 (b) | 615,000 | 636,525 | |
| 7.25% 11/30/21 (b) | 1,295,000 | 1,382,413 | |
| 3,476,964 | |||
| Metals/Mining - 1.9% | |||
| Bluescope Steel Ltd./Bluescope Steel Finance 6.5% 5/15/21 (b) | 280,000 | 298,200 | |
| Eldorado Gold Corp. 6.125% 12/15/20 (b) | 440,000 | 452,100 | |
| First Quantum Minerals Ltd.: | |||
| 7% 2/15/21 (b) | 485,000 | 502,278 | |
| 7.25% 5/15/22 (b) | 245,000 | 253,269 | |
| Freeport-McMoRan, Inc.: | |||
| 3.55% 3/1/22 | 1,985,000 | 1,843,569 | |
| 3.875% 3/15/23 | 3,740,000 | 3,440,800 | |
| 4.55% 11/14/24 | 4,150,000 | 3,880,250 | |
| 5.4% 11/14/34 | 1,540,000 | 1,351,350 | |
| 6.75% 2/1/22 (b) | 805,000 | 837,200 | |
| 6.875% 2/15/23 (b) | 770,000 | 812,350 | |
| Murray Energy Corp. 11.25% 4/15/21 (b) | 1,125,000 | 883,125 | |
| Novelis Corp. 5.875% 9/30/26 (b) | 775,000 | 797,281 | |
| SunCoke Energy Partners LP/SunCoke Energy Partners Finance Corp. 7.375% 2/1/20 (b) | 450,000 | 459,000 | |
| Teck Resources Ltd. 8.5% 6/1/24 (b) | 715,000 | 834,763 | |
| Walter Energy, Inc. 9.5% 10/15/19 (b)(e) | 770,000 | 0 | |
| 16,645,535 | |||
| Paper - 0.1% | |||
| Boise Cascade Co. 5.625% 9/1/24 (b) | 335,000 | 342,538 | |
| Louisiana-Pacific Corp. 4.875% 9/15/24 | 385,000 | 387,888 | |
| NewPage Corp. 11.375% 12/31/2114 (e) | 4,077,567 | 0 | |
| 730,426 | |||
| Restaurants - 0.1% | |||
| KFC Holding Co./Pizza Hut Holding LLC 5% 6/1/24 (b) | 1,135,000 | 1,165,191 | |
| Services - 3.1% | |||
| Algeco Scotsman Global Finance PLC 8.5% 10/15/18 (b) | 1,150,000 | 1,118,375 | |
| Anna Merger Sub, Inc. 7.75% 10/1/22 (b) | 5,460,000 | 4,804,800 | |
| APX Group, Inc.: | |||
| 6.375% 12/1/19 | 868,000 | 892,955 | |
| 7.875% 12/1/22 | 2,310,000 | 2,500,575 | |
| 8.75% 12/1/20 | 2,205,000 | 2,282,175 | |
| Aramark Services, Inc.: | |||
| 4.75% 6/1/26 | 770,000 | 771,925 | |
| 5.125% 1/15/24 | 530,000 | 555,228 | |
| Avis Budget Car Rental LLC/Avis Budget Finance, Inc. 5.125% 6/1/22 (b) | 555,000 | 544,594 | |
| Corrections Corp. of America 5% 10/15/22 | 570,000 | 581,400 | |
| Garda World Security Corp.: | |||
| 7.25% 11/15/21 (b) | 1,050,000 | 1,005,375 | |
| 7.25% 11/15/21 (b) | 150,000 | 143,250 | |
| Herc Rentals, Inc.: | |||
| 7.5% 6/1/22 (b) | 385,000 | 415,800 | |
| 7.75% 6/1/24 (b) | 385,000 | 423,500 | |
| Hertz Corp. 6.25% 10/15/22 | 935,000 | 892,925 | |
| IHS Markit Ltd. 5% 11/1/22 (b) | 200,000 | 210,250 | |
| Laureate Education, Inc. 10% 9/1/19 (b)(d) | 5,990,000 | 6,267,038 | |
| Ritchie Brothers Auctioneers, Inc. 5.375% 1/15/25 (b) | 285,000 | 293,194 | |
| The GEO Group, Inc. 6% 4/15/26 | 345,000 | 359,145 | |
| The ServiceMaster Co. 5.125% 11/15/24 (b) | 860,000 | 875,050 | |
| United Rentals North America, Inc.: | |||
| 5.5% 5/15/27 | 600,000 | 613,236 | |
| 5.875% 9/15/26 | 1,975,000 | 2,078,688 | |
| 27,629,478 | |||
| Steel - 0.2% | |||
| Cliffs Natural Resources, Inc. 8.25% 3/31/20 (b) | 665,000 | 726,513 | |
| Commercial Metals Co. 4.875% 5/15/23 | 590,000 | 603,275 | |
| Evraz, Inc. NA Canada 7.5% 11/15/19 (b) | 780,000 | 801,450 | |
| 2,131,238 | |||
| Super Retail - 0.5% | |||
| Asbury Automotive Group, Inc. 6% 12/15/24 | 1,125,000 | 1,170,000 | |
| Claire's Stores, Inc.: | |||
| 6.125% 3/15/20 (b) | 1,105,000 | 465,481 | |
| 9% 3/15/19 (b) | 695,000 | 317,963 | |
| DBP Holding Corp. 7.75% 10/15/20 (b) | 2,085,000 | 1,553,325 | |
| JC Penney Corp., Inc.: | |||
| 6.375% 10/15/36 | 281,000 | 214,965 | |
| 7.4% 4/1/37 | 185,000 | 149,850 | |
| Netflix, Inc. 4.375% 11/15/26 (b) | 430,000 | 426,238 | |
| 4,297,822 | |||
| Technology - 3.0% | |||
| CDW LLC/CDW Finance Corp.: | |||
| 5% 9/1/25 | 505,000 | 512,262 | |
| 5.5% 12/1/24 | 495,000 | 519,750 | |
| Compiler Finance Sub, Inc. 7% 5/1/21 (b) | 1,370,000 | 633,625 | |
| Conduent Finance, Inc./Xerox Business Service LLC 10.5% 12/15/24 (b) | 915,000 | 1,044,244 | |
| Diamond 1 Finance Corp./Diamond 2 Finance Corp.: | |||
| 5.45% 6/15/23 (b) | 1,540,000 | 1,663,668 | |
| 5.875% 6/15/21 (b) | 1,435,000 | 1,518,429 | |
| 7.125% 6/15/24 (b) | 800,000 | 883,933 | |
| Inception Merger Sub, Inc./Rackspace Hosting, Inc. 8.625% 11/15/24 (b) | 3,090,000 | 3,256,088 | |
| Lucent Technologies, Inc.: | |||
| 6.45% 3/15/29 | 3,375,000 | 3,729,375 | |
| 6.5% 1/15/28 | 190,000 | 210,900 | |
| Micron Technology, Inc.: | |||
| 5.25% 1/15/24 (b) | 2,455,000 | 2,485,688 | |
| 5.5% 2/1/25 | 850,000 | 877,625 | |
| 7.5% 9/15/23 (b) | 1,220,000 | 1,360,300 | |
| Nuance Communications, Inc. 5.625% 12/15/26 (b) | 2,590,000 | 2,645,038 | |
| Open Text Corp. 5.875% 6/1/26 (b) | 770,000 | 808,500 | |
| Parametric Technology Corp. 6% 5/15/24 | 280,000 | 298,900 | |
| Qorvo, Inc. 6.75% 12/1/23 | 445,000 | 485,050 | |
| Sabre GLBL, Inc. 5.25% 11/15/23 (b) | 705,000 | 715,575 | |
| Symantec Corp. 5% 4/15/25 (b) | 800,000 | 821,155 | |
| VeriSign, Inc. 4.625% 5/1/23 | 695,000 | 708,900 | |
| Western Digital Corp.: | |||
| 7.375% 4/1/23 (b) | 815,000 | 894,463 | |
| 10.5% 4/1/24 | 605,000 | 707,850 | |
| 26,781,318 | |||
| Telecommunications - 8.8% | |||
| Altice Financing SA: | |||
| 6.5% 1/15/22 (b) | 2,900,000 | 3,034,125 | |
| 6.625% 2/15/23 (b) | 1,565,000 | 1,647,163 | |
| 7.5% 5/15/26 (b) | 2,370,000 | 2,544,788 | |
| Altice Finco SA: | |||
| 7.625% 2/15/25 (b) | 1,455,000 | 1,505,925 | |
| 8.125% 1/15/24 (b) | 2,665,000 | 2,858,213 | |
| Broadview Networks Holdings, Inc. 10.5% 11/15/17 | 1,200,000 | 1,200,000 | |
| Cincinnati Bell, Inc. 7% 7/15/24 (b) | 775,000 | 819,563 | |
| Columbus International, Inc. 7.375% 3/30/21 (b) | 1,815,000 | 1,931,396 | |
| CommScope Technologies Finance LLC 6% 6/15/25 (b) | 405,000 | 433,350 | |
| Frontier Communications Corp.: | |||
| 8.875% 9/15/20 | 455,000 | 482,300 | |
| 10.5% 9/15/22 | 1,385,000 | 1,439,957 | |
| 11% 9/15/25 | 4,155,000 | 4,175,775 | |
| GCI, Inc. 6.875% 4/15/25 | 1,835,000 | 1,903,813 | |
| Inmarsat Finance PLC 4.875% 5/15/22 (b) | 395,000 | 395,000 | |
| Intelsat Jackson Holdings SA: | |||
| 5.5% 8/1/23 | 2,385,000 | 1,961,663 | |
| 7.5% 4/1/21 | 770,000 | 704,550 | |
| 8% 2/15/24 (b) | 1,085,000 | 1,177,225 | |
| Intelsat Luxembourg SA 7.75% 6/1/21 | 267,000 | 150,188 | |
| Level 3 Financing, Inc.: | |||
| 5.125% 5/1/23 | 2,010,000 | 2,050,200 | |
| 5.25% 3/15/26 (b) | 790,000 | 796,913 | |
| 5.375% 1/15/24 | 1,765,000 | 1,811,331 | |
| 5.375% 5/1/25 | 335,000 | 345,888 | |
| 5.625% 2/1/23 | 830,000 | 856,975 | |
| Neptune Finco Corp.: | |||
| 6.625% 10/15/25 (b) | 3,340,000 | 3,686,525 | |
| 10.125% 1/15/23 (b) | 1,175,000 | 1,360,063 | |
| 10.875% 10/15/25 (b) | 835,000 | 1,006,175 | |
| Sable International Finance Ltd. 6.875% 8/1/22 (b) | 1,790,000 | 1,932,663 | |
| SFR Group SA: | |||
| 6% 5/15/22 (b) | 1,865,000 | 1,934,359 | |
| 6.25% 5/15/24 (b) | 695,000 | 705,418 | |
| 7.375% 5/1/26 (b) | 1,955,000 | 2,025,869 | |
| Sprint Capital Corp. 6.875% 11/15/28 | 1,685,000 | 1,796,631 | |
| Sprint Communications, Inc. 6% 11/15/22 | 1,335,000 | 1,381,578 | |
| Sprint Corp.: | |||
| 7.125% 6/15/24 | 4,245,000 | 4,583,284 | |
| 7.25% 9/15/21 | 2,850,000 | 3,106,500 | |
| 7.875% 9/15/23 | 3,935,000 | 4,377,688 | |
| T-Mobile U.S.A., Inc.: | |||
| 6% 3/1/23 | 1,150,000 | 1,216,125 | |
| 6% 4/15/24 | 1,840,000 | 1,964,200 | |
| 6.125% 1/15/22 | 1,155,000 | 1,221,413 | |
| 6.5% 1/15/26 | 630,000 | 692,213 | |
| 6.625% 4/1/23 | 3,625,000 | 3,851,563 | |
| Telecom Italia Capital SA 6.375% 11/15/33 | 770,000 | 777,700 | |
| Telesat Canada/Telesat LLC 8.875% 11/15/24 (b) | 735,000 | 802,988 | |
| ViaSat, Inc. 6.875% 6/15/20 | 870,000 | 892,446 | |
| Wind Acquisition Finance SA: | |||
| 4.75% 7/15/20 (b) | 2,455,000 | 2,494,894 | |
| 7.375% 4/23/21 (b) | 290,000 | 301,963 | |
| Zayo Group LLC/Zayo Capital, Inc. 5.75% 1/15/27 (b) | 615,000 | 650,240 | |
| 76,988,799 | |||
| Transportation Ex Air/Rail - 1.5% | |||
| Navios Maritime Acquisition Corp./Navios Acquisition Finance U.S., Inc. 8.125% 11/15/21 (b) | 2,620,000 | 2,351,450 | |
| Navios Maritime Holdings, Inc.: | |||
| 7.375% 1/15/22 (b) | 6,285,000 | 4,745,175 | |
| 8.125% 2/15/19 | 2,475,000 | 2,094,469 | |
| Navios South American Logistics, Inc./Navios Logistics Finance U.S., Inc. 7.25% 5/1/22 (b) | 420,000 | 399,000 | |
| Teekay Corp. 8.5% 1/15/20 | 3,525,000 | 3,525,000 | |
| Ultrapetrol (Bahamas) Ltd. 8.875% 6/15/21 (e) | 1,230,000 | 246,000 | |
| 13,361,094 | |||
| Utilities - 3.9% | |||
| Calpine Corp. 5.5% 2/1/24 | 2,045,000 | 2,024,550 | |
| Cortes NP Acquisition Corp. 9.25% 10/15/24 (b) | 1,540,000 | 1,653,575 | |
| Dolphin Subsidiary II, Inc. 7.25% 10/15/21 | 1,920,000 | 2,044,800 | |
| Dynegy, Inc.: | |||
| 7.375% 11/1/22 | 2,585,000 | 2,539,763 | |
| 7.625% 11/1/24 | 9,795,000 | 9,305,250 | |
| Global Partners LP/GLP Finance Corp.: | |||
| 6.25% 7/15/22 | 1,790,000 | 1,754,200 | |
| 7% 6/15/23 | 3,075,000 | 3,059,625 | |
| InterGen NV 7% 6/30/23 (b) | 6,150,000 | 5,596,500 | |
| NRG Energy, Inc. 7.875% 5/15/21 | 70,000 | 72,625 | |
| NSG Holdings II LLC/NSG Holdings, Inc. 7.75% 12/15/25 (b) | 812,013 | 880,019 | |
| Pattern Energy Group, Inc. 5.875% 2/1/24 (b) | 440,000 | 451,550 | |
| PPL Energy Supply LLC: | |||
| 4.6% 12/15/21 | 1,095,000 | 901,733 | |
| 6.5% 6/1/25 | 810,000 | 664,200 | |
| RJS Power Holdings LLC 4.625% 7/15/19 (b)(d) | 1,260,000 | 1,225,350 | |
| The AES Corp.: | |||
| 3.9307% 6/1/19 (d) | 180,000 | 180,072 | |
| 6% 5/15/26 | 1,515,000 | 1,560,450 | |
| 33,914,262 | |||
| TOTAL NONCONVERTIBLE BONDS | 696,624,013 | ||
| TOTAL CORPORATE BONDS | |||
| (Cost $677,630,179) | 697,682,988 | ||
| Shares | Value | ||
| Common Stocks - 0.1% | |||
| Automotive & Auto Parts - 0.1% | |||
| Chassix Holdings, Inc. (f) | 13,838 | 462,466 | |
| Chassix Holdings, Inc. warrants 7/29/20 (f) | 3,722 | 33,945 | |
| TOTAL AUTOMOTIVE & AUTO PARTS | 496,411 | ||
| Banks & Thrifts - 0.0% | |||
| CIT Group, Inc. | 9,691 | 415,744 | |
| Environmental - 0.0% | |||
| Tervita Corp. Class A | 10,214 | 71,672 | |
| Metals/Mining - 0.0% | |||
| Warrior Met Coal LLC Class A (g) | 399 | 107,930 | |
| Telecommunications - 0.0% | |||
| Broadview Networks Holdings, Inc. (f) | 78,000 | 97,500 | |
| TOTAL COMMON STOCKS | |||
| (Cost $5,195,166) | 1,189,257 | ||
| Preferred Stocks - 1.0% | |||
| Convertible Preferred Stocks - 0.5% | |||
| Banks & Thrifts - 0.1% | |||
| Bank of America Corp. Series L 7.25% (f) | 1,066 | 1,268,540 | |
| Energy - 0.4% | |||
| Chesapeake Energy Corp. Series A 5.75% (f) | 4,800 | 3,090,000 | |
| TOTAL CONVERTIBLE PREFERRED STOCKS | 4,358,540 | ||
| Nonconvertible Preferred Stocks - 0.5% | |||
| Environmental - 0.5% | |||
| Tervita Corp. Series A | 559,673 | 3,927,234 | |
| TOTAL PREFERRED STOCKS | |||
| (Cost $7,349,636) | 8,285,774 | ||
| Principal Amount | Value | ||
| Bank Loan Obligations - 6.5% | |||
| Automotive & Auto Parts - 0.0% | |||
| Chassix, Inc. term loan 12% 7/29/19 | 160,793 | 160,793 | |
| Broadcasting - 0.2% | |||
| CBS Radio, Inc. term loan 4.5% 10/17/23 (d) | 1,770,566 | 1,786,058 | |
| Cable/Satellite TV - 0.6% | |||
| Charter Communication Operating LLC term loan: | |||
| 2.79% 7/1/20 (d) | 836,954 | 840,670 | |
| 2.79% 1/3/21 (d) | 1,189,107 | 1,194,018 | |
| Virgin Media Bristol LLC Tranche 1LN, term loan 3.52% 1/31/25 (d) | 1,320,000 | 1,325,135 | |
| WideOpenWest Finance LLC Tranche B, term loan 4.5539% 8/19/23 (d) | 1,541,138 | 1,551,247 | |
| TOTAL CABLE/SATELLITE TV | 4,911,070 | ||
| Capital Goods - 0.2% | |||
| Rexnord LLC Tranche B, term loan 3.7703% 8/21/23 (d) | 833,178 | 837,736 | |
| SRAM LLC. Tranche B, term loan 4.0396% 4/10/20 (d) | 617,588 | 616,044 | |
| TOTAL CAPITAL GOODS | 1,453,780 | ||
| Chemicals - 0.1% | |||
| Tronox Pigments (Netherlands) B.V. Tranche B, term loan 4.5% 3/19/20 (d) | 963,683 | 970,159 | |
| Containers - 0.1% | |||
| Reynolds Group Holdings, Inc. Tranche B, term loan 3.7806% 2/5/23 (d) | 1,177,050 | 1,185,878 | |
| Energy - 0.6% | |||
| California Resources Corp. Tranche 1LN, term loan 11.375% 12/31/21 (d) | 825,000 | 929,503 | |
| FTS International, Inc. Tranche B, term loan 5.75% 4/16/21 (d) | 3,640,000 | 3,481,878 | |
| Seadrill Operating LP Tranche B, term loan 4% 2/21/21 (d) | 1,168,974 | 875,632 | |
| TOTAL ENERGY | 5,287,013 | ||
| Entertainment/Film - 0.1% | |||
| CBS Outdoor Americas Capital LLC/CBS Outdoor Americas Capital Corp. Tranche B, term loan 3.0306% 1/31/21 (d) | 721,875 | 724,763 | |
| Gaming - 0.3% | |||
| Caesars Growth Properties Holdings, LLC Tranche 1LN, term loan 6.25% 5/8/21 (d) | 3,131,371 | 3,148,343 | |
| Healthcare - 1.0% | |||
| Community Health Systems, Inc. Tranche H, term loan 4.077% 1/27/21(d) | 1,642,789 | 1,613,859 | |
| DJO Finance LLC Tranche B 1LN, term loan 4.25% 6/7/20 (d) | 626,220 | 614,478 | |
| Kindred Healthcare, Inc. Tranche B, term loan 4.3125% 4/9/21 (d) | 1,181,359 | 1,173,243 | |
| Ortho-Clinical Diagnostics, Inc. Tranche B, term loan 4.75% 6/30/21 (d) | 5,403,749 | 5,351,602 | |
| TOTAL HEALTHCARE | 8,753,182 | ||
| Insurance - 0.5% | |||
| HUB International Ltd. Tranche B 1LN, term loan 4.0345% 10/2/20 (d) | 4,153,480 | 4,184,839 | |
| Services - 1.4% | |||
| Acosta, Inc. Tranche B, term loan 4.289% 9/26/21 (d) | 1,962,542 | 1,914,087 | |
| ARAMARK Corp. Tranche F, term loan 3.4982% 2/24/21 (d) | 1,380,950 | 1,393,779 | |
| Brand Energy & Infrastructure Services, Inc. Tranche B, term loan 4.7709% 11/26/20 (d) | 2,053,656 | 2,054,087 | |
| Garda World Security Corp.: | |||
| term loan: | |||
| 4% 11/8/20 (d) | 104,738 | 105,130 | |
| 4% 11/8/20 (d) | 1,112,001 | 1,116,171 | |
| Tranche DD, term loan 4% 11/8/20 (d) | 284,465 | 285,532 | |
| Laureate Education, Inc. Tranche B, term loan 8.5093% 3/17/21 (d) | 5,896,221 | 5,948,874 | |
| TOTAL SERVICES | 12,817,660 | ||
| Steel - 0.1% | |||
| JMC Steel Group, Inc. Tranche B, term loan 4.75% 6/14/21 (d) | 691,525 | 697,576 | |
| Super Retail - 0.3% | |||
| Davids Bridal, Inc. Tranche B, term loan 5.25% 10/11/19 (d) | 1,757,864 | 1,561,756 | |
| Sears Holdings Corp. Tranche ABL, term loan 5.5% 6/30/18 (d) | 1,193,143 | 1,180,472 | |
| TOTAL SUPER RETAIL | 2,742,228 | ||
| Technology - 0.3% | |||
| Information Resources, Inc. Tranche B 1LN, term loan 5.25% 1/18/24 (d) | 185,000 | 187,198 | |
| Kronos, Inc. term loan 5.0339% 11/1/23 (d) | 1,750,000 | 1,769,863 | |
| Renaissance Learning, Inc. Tranche 1LN, term loan 4.75% 4/9/21 (d) | 819,139 | 818,116 | |
| TOTAL TECHNOLOGY | 2,775,177 | ||
| Telecommunications - 0.3% | |||
| Polycom, Inc. Tranche B, term loan 6.25% 9/27/23 (d) | 743,460 | 748,665 | |
| Radiate Holdco LLC Tranche B, term loan 3.7806% 2/1/24 (d) | 1,320,000 | 1,329,715 | |
| Sprint Communications, Inc. Tranche B, term loan 3.3125% 2/3/24 (d) | 615,000 | 615,879 | |
| TOTAL TELECOMMUNICATIONS | 2,694,259 | ||
| Utilities - 0.4% | |||
| Calpine Construction Finance Co. LP Tranche B 1LN, term loan 3.03% 5/3/20 (d) | 1,704,111 | 1,703,395 | |
| Cortes NP Acquisition Corp. Tranche B, term loan 6.0302% 11/30/23 (d) | 1,141,853 | 1,149,938 | |
| Vistra Operations Co. LLC Tranche B 2LN, term loan 4.0222% 12/14/23 (d) | 360,000 | 362,081 | |
| TOTAL UTILITIES | 3,215,414 | ||
| TOTAL BANK LOAN OBLIGATIONS | |||
| (Cost $56,346,133) | 57,508,192 | ||
| Preferred Securities - 4.7% | |||
| Banks & Thrifts - 4.7% | |||
| Bank of America Corp.: | |||
| 6.1% (c)(d) | 1,850,000 | 2,025,156 | |
| 6.25% (c)(d) | 1,320,000 | 1,452,870 | |
| Barclays Bank PLC 7.625% 11/21/22 | 2,485,000 | 2,721,730 | |
| Barclays PLC: | |||
| 6.625% (c)(d) | 6,135,000 | 6,182,596 | |
| 8.25% (c)(d) | 1,460,000 | 1,574,853 | |
| Citigroup, Inc.: | |||
| 5.875% (c)(d) | 5,905,000 | 6,245,455 | |
| 6.3% (c)(d) | 910,000 | 977,975 | |
| Credit Agricole SA: | |||
| 6.625% (b)(c)(d) | 1,410,000 | 1,410,020 | |
| 7.875% (b)(c)(d) | 1,995,000 | 2,064,456 | |
| 8.125% (b)(c)(d) | 780,000 | 845,674 | |
| Credit Suisse Group AG: | |||
| 6.25% (b)(c)(d) | 560,000 | 574,374 | |
| 7.5% (b)(c)(d) | 855,000 | 939,631 | |
| Deutsche Bank AG 7.5% (c)(d) | 710,000 | 707,337 | |
| Goldman Sachs Group, Inc. 5.375% (c)(d) | 670,000 | 702,818 | |
| JPMorgan Chase & Co.: | |||
| 5.3% (c)(d) | 1,675,000 | 1,763,053 | |
| 6.125% (c)(d) | 470,000 | 508,530 | |
| 6.75% (c)(d) | 910,000 | 1,012,576 | |
| Lloyds Banking Group PLC 7.5% (c)(d) | 1,960,000 | 2,106,301 | |
| Royal Bank of Scotland Group PLC: | |||
| 7.5% (c)(d) | 2,815,000 | 2,839,799 | |
| 8% (c)(d) | 590,000 | 598,735 | |
| 8.625% (c)(d) | 1,610,000 | 1,724,494 | |
| Societe Generale: | |||
| 6% (b)(c)(d) | 220,000 | 208,553 | |
| 8% (b)(c)(d) | 1,740,000 | 1,835,808 | |
| TOTAL PREFERRED SECURITIES | |||
| (Cost $39,152,559) | 41,022,794 | ||
| Shares | Value | ||
| Money Market Funds - 7.6% | |||
| Fidelity Cash Central Fund, 0.60% (h) | |||
| (Cost $66,741,520) | 66,736,150 | 66,749,497 | |
| TOTAL INVESTMENT PORTFOLIO - 99.2% | |||
| (Cost $852,415,193) | 872,438,502 | ||
| NET OTHER ASSETS (LIABILITIES) - 0.8% | 7,398,234 | ||
| NET ASSETS - 100% | $879,836,736 |
Legend
(a) Security initially issued at one coupon which converts to a higher coupon at a specified date. The rate shown is the rate at period end.
(b) Security exempt from registration under Rule 144A of the Securities Act of 1933. These securities may be resold in transactions exempt from registration, normally to qualified institutional buyers. At the end of the period, the value of these securities amounted to $334,997,714 or 38.1% of net assets.
(c) Security is perpetual in nature with no stated maturity date.
(d) Coupon rates for floating and adjustable rate securities reflect the rates in effect at period end.
(e) Non-income producing - Security is in default.
(f) Non-income producing
(g) Restricted securities - Investment in securities not registered under the Securities Act of 1933 (excluding 144A issues). At the end of the period, the value of restricted securities (excluding 144A issues) amounted to $107,930 or 0.0% of net assets.
(h) Affiliated fund that is generally available only to investment companies and other accounts managed by Fidelity Investments. The rate quoted is the annualized seven-day yield of the fund at period end. A complete unaudited listing of the fund's holdings as of its most recent quarter end is available upon request. In addition, each Fidelity Central Fund's financial statements are available on the SEC's website or upon request.
Additional information on each restricted holding is as follows:
| Security | Acquisition Date | Acquisition Cost |
| Warrior Met Coal LLC Class A | 4/11/14 - 7/8/14 | $771,969 |
Affiliated Central Funds
Information regarding fiscal year to date income earned by the Fund from investments in Fidelity Central Funds is as follows:
| Fund | Income earned |
| Fidelity Cash Central Fund | $135,400 |
| Total | $135,400 |
Investment Valuation
The following is a summary of the inputs used, as of February 28, 2017, involving the Fund's assets and liabilities carried at fair value. The inputs or methodology used for valuing securities may not be an indication of the risk associated with investing in those securities. For more information on valuation inputs, and their aggregation into the levels used below, please refer to the Investment Valuation section in the accompanying Notes to Financial Statements.
| Valuation Inputs at Reporting Date: | ||||
| Description | Total | Level 1 | Level 2 | Level 3 |
| Investments in Securities: | ||||
| Equities: | ||||
| Consumer Discretionary | $496,411 | $-- | $-- | $496,411 |
| Energy | 3,197,930 | -- | 3,090,000 | 107,930 |
| Financials | 1,684,284 | 1,684,284 | -- | -- |
| Industrials | 3,998,906 | -- | -- | 3,998,906 |
| Telecommunication Services | 97,500 | 97,500 | -- | -- |
| Corporate Bonds | 697,682,988 | -- | 697,682,988 | -- |
| Bank Loan Obligations | 57,508,192 | -- | 57,347,399 | 160,793 |
| Preferred Securities | 41,022,794 | -- | 41,022,794 | -- |
| Money Market Funds | 66,749,497 | 66,749,497 | -- | -- |
| Total Investments in Securities: | $872,438,502 | $68,531,281 | $799,143,181 | $4,764,040 |
Other Information
Distribution of investments by country or territory of incorporation, as a percentage of Total Net Assets, is as follows (Unaudited):
| United States of America | 77.1% |
| Canada | 4.4% |
| Luxembourg | 4.3% |
| United Kingdom | 3.2% |
| Netherlands | 1.8% |
| France | 1.4% |
| Marshall Islands | 1.3% |
| Ireland | 1.3% |
| Cayman Islands | 1.2% |
| Bermuda | 1.1% |
| Austria | 1.0% |
| Others (Individually Less Than 1%) | 1.9% |
| 100.0% |
See accompanying notes which are an integral part of the financial statements.
Financial Statements
Statement of Assets and Liabilities
| February 28, 2017 (Unaudited) | ||
| Assets | ||
| Investment in securities, at value — See accompanying schedule: Unaffiliated issuers (cost $785,673,673) | $805,689,005 | |
| Fidelity Central Funds (cost $66,741,520) | 66,749,497 | |
| Total Investments (cost $852,415,193) | $872,438,502 | |
| Cash | 583,071 | |
| Receivable for investments sold | ||
| Regular delivery | 7,368,625 | |
| Delayed delivery | 928 | |
| Interest receivable | 12,265,406 | |
| Distributions receivable from Fidelity Central Funds | 33,102 | |
| Total assets | 892,689,634 | |
| Liabilities | ||
| Payable for investments purchased | $9,316,321 | |
| Distributions payable | 3,529,656 | |
| Other payables and accrued expenses | 6,921 | |
| Total liabilities | 12,852,898 | |
| Net Assets | $879,836,736 | |
| Net Assets consist of: | ||
| Paid in capital | $865,921,988 | |
| Distributions in excess of net investment income | (399,276) | |
| Accumulated undistributed net realized gain (loss) on investments and foreign currency transactions | (5,709,285) | |
| Net unrealized appreciation (depreciation) on investments | 20,023,309 | |
| Net Assets, for 7,736,169 shares outstanding | $879,836,736 | |
| Net Asset Value, offering price and redemption price per share ($879,836,736 ÷ 7,736,169 shares) | $113.73 |
See accompanying notes which are an integral part of the financial statements.
Statement of Operations
| Six months ended February 28, 2017 (Unaudited) | ||
| Investment Income | ||
| Dividends | $1,710,853 | |
| Interest | 26,363,843 | |
| Income from Fidelity Central Funds | 135,400 | |
| Total income | 28,210,096 | |
| Expenses | ||
| Custodian fees and expenses | $11,898 | |
| Independent directors' fees and expenses | 1,743 | |
| Total expenses before reductions | 13,641 | |
| Expense reductions | (2,140) | 11,501 |
| Net investment income (loss) | 28,198,595 | |
| Realized and Unrealized Gain (Loss) | ||
| Net realized gain (loss) on: | ||
| Investment securities: | ||
| Unaffiliated issuers | (5,711,471) | |
| Fidelity Central Funds | 2,241 | |
| Foreign currency transactions | (55) | |
| Total net realized gain (loss) | (5,709,285) | |
| Change in net unrealized appreciation (depreciation) on investment securities | 28,575,594 | |
| Net gain (loss) | 22,866,309 | |
| Net increase (decrease) in net assets resulting from operations | $51,064,904 |
See accompanying notes which are an integral part of the financial statements.
Statement of Changes in Net Assets
| Six months ended February 28, 2017 (Unaudited) | Year ended August 31, 2016 | |
| Increase (Decrease) in Net Assets | ||
| Operations | ||
| Net investment income (loss) | $28,198,595 | $54,779,685 |
| Net realized gain (loss) | (5,709,285) | (16,146,194) |
| Change in net unrealized appreciation (depreciation) | 28,575,594 | 24,505,879 |
| Net increase (decrease) in net assets resulting from operations | 51,064,904 | 63,139,370 |
| Distributions to shareholders from net investment income | (28,597,871) | (51,667,996) |
| Affiliated share transactions | ||
| Proceeds from sales of shares | – | 40,817,659 |
| Reinvestment of distributions | 4,961,018 | 7,898,787 |
| Net increase (decrease) in net assets resulting from share transactions | 4,961,018 | 48,716,446 |
| Total increase (decrease) in net assets | 27,428,051 | 60,187,820 |
| Net Assets | ||
| Beginning of period | 852,408,685 | 792,220,865 |
| End of period | $879,836,736 | $852,408,685 |
| Other Information | ||
| Distributions in excess of net investment income end of period | $(399,276) | $– |
| Shares | ||
| Sold | – | 399,851 |
| Issued in reinvestment of distributions | 44,570 | 75,168 |
| Net increase (decrease) | 44,570 | 475,019 |
See accompanying notes which are an integral part of the financial statements.
Financial Highlights — Fidelity High Income Central Fund 2
| Six months ended (Unaudited) February 28, | Years ended August 31, | |||||
| 2017 | 2016 | 2015 | 2014 | 2013 | 2012 | |
| Selected Per–Share Data | ||||||
| Net asset value, beginning of period | $110.82 | $109.78 | $118.45 | $114.34 | $113.92 | $106.05 |
| Income from Investment Operations | ||||||
| Net investment income (loss)A | 3.658 | 7.278 | 7.064 | 7.292 | 7.828 | 8.659 |
| Net realized and unrealized gain (loss) | 2.961 | .631 | (8.871) | 3.876 | (.180) | 6.901 |
| Total from investment operations | 6.619 | 7.909 | (1.807) | 11.168 | 7.648 | 15.560 |
| Distributions from net investment income | (3.709) | (6.869) | (6.863) | (7.058) | (7.228) | (7.690) |
| Total distributions | (3.709) | (6.869) | (6.863) | (7.058) | (7.228) | (7.690) |
| Net asset value, end of period | $113.73 | $110.82 | $109.78 | $118.45 | $114.34 | $113.92 |
| Total ReturnB,C | 6.09% | 7.75% | (1.58)% | 9.97% | 6.79% | 15.22% |
| Ratios to Average Net AssetsD,E | ||||||
| Expenses before reductionsF | - %G | -% | -% | -% | -% | -% |
| Expenses net of fee waivers, if anyF | - %G | -% | -% | -% | -% | -% |
| Expenses net of all reductionsF | - %G | -% | -% | -% | -% | -% |
| Net investment income (loss) | 6.64%G | 6.93% | 6.19% | 6.20% | 6.73% | 7.93% |
| Supplemental Data | ||||||
| Net assets, end of period (000 omitted)�� | $879,837 | $852,409 | $792,221 | $872,004 | $790,909 | $740,594 |
| Portfolio turnover rateH | 49 %G | 47% | 40% | 56% | 42% | 36% |
A Calculated based on average shares outstanding during the period.
B Total returns for periods of less than one year are not annualized.
C Total returns would have been lower if certain expenses had not been reduced during the applicable periods shown.
D Fees and expenses of any underlying Fidelity Central Funds are not included in the Fund's expense ratio. The Fund indirectly bears its proportionate share of the expenses of any underlying Fidelity Central Funds.
E Expense ratios reflect operating expenses of the Fund. Expenses before reductions do not reflect amounts reimbursed by the investment adviser or reductions from expense offset arrangements and do not represent the amount paid by the Fund during periods when reimbursements or reductions occur. Expenses net of fee waivers reflect expenses after reimbursement by the investment adviser but prior to reductions from expense offset arrangements. Expenses net of all reductions represent the net expenses paid by the Fund.
F Amount represents less than .005%.
G Annualized
H Amount does not include the portfolio activity of any underlying Fidelity Central Funds.
See accompanying notes which are an integral part of the financial statements.
Notes to Financial Statements (Unaudited)
For the period ended February 28, 2017
1. Organization.
Fidelity High Income Central Fund 2 (the Fund) is a fund of Fidelity Central Investment Portfolios LLC (the LLC) and is authorized to issue an unlimited number of shares. Shares of the Fund are only offered to other investment companies and accounts managed by Fidelity Management & Research Company (FMR), or its affiliates (the Investing Funds). The LLC is registered under the Investment Company Act of 1940, as amended (the 1940 Act), as an open-end management investment company organized as a Delaware Limited Liability Company.
2. Investments in Fidelity Central Funds.
The Fund invests in Fidelity Central Funds, which are open-end investment companies generally available only to other investment companies and accounts managed by the investment adviser and its affiliates. The Fund's Schedule of Investments lists each of the Fidelity Central Funds held as of period end, if any, as an investment of the Fund, but does not include the underlying holdings of each Fidelity Central Fund. As an Investing Fund, the Fund indirectly bears its proportionate share of the expenses of the underlying Fidelity Central Funds.
The Money Market Central Funds seek preservation of capital and current income and are managed by Fidelity Investments Money Management, Inc. (FIMM), an affiliate of the investment adviser. Annualized expenses of the Money Market Central Funds as of their most recent shareholder report date are less than .005%.
A complete unaudited list of holdings for each Fidelity Central Fund is available upon request or at the Securities and Exchange Commission (the SEC) website at www.sec.gov. In addition, the financial statements of the Fidelity Central Funds are available on the SEC website or upon request.
3. Significant Accounting Policies.
The financial statements have been prepared in conformity with accounting principles generally accepted in the United States of America (GAAP), which require management to make certain estimates and assumptions at the date of the financial statements. Actual results could differ from those estimates. Subsequent events, if any, through the date that the financial statements were issued have been evaluated in the preparation of the financial statements. The following summarizes the significant accounting policies of the Fund:
Investment Valuation. Investments are valued as of 4:00 p.m. Eastern time on the last calendar day of the period. The Board of Directors (the Board) has delegated the day to day responsibility for the valuation of the Fund's investments to the Fair Value Committee (the Committee) established by the Fund's investment adviser. In accordance with valuation policies and procedures approved by the Board, the Fund attempts to obtain prices from one or more third party pricing vendors or brokers to value its investments. When current market prices, quotations or currency exchange rates are not readily available or reliable, investments will be fair valued in good faith by the Committee, in accordance with procedures adopted by the Board. Factors used in determining fair value vary by investment type and may include market or investment specific events, changes in interest rates and credit quality. The frequency with which these procedures are used cannot be predicted and they may be utilized to a significant extent. The Committee oversees the Fund's valuation policies and procedures and reports to the Board on the Committee's activities and fair value determinations. The Board monitors the appropriateness of the procedures used in valuing the Fund's investments and ratifies the fair value determinations of the Committee.
The Fund categorizes the inputs to valuation techniques used to value its investments into a disclosure hierarchy consisting of three levels as shown below:
- Level 1 – quoted prices in active markets for identical investments
- Level 2 – other significant observable inputs (including quoted prices for similar investments, interest rates, prepayment speeds, etc.)
- Level 3 – unobservable inputs (including the Fund's own assumptions based on the best information available)
Valuation techniques used to value the Fund's investments by major category are as follows:
Debt securities, including restricted securities, are valued based on evaluated prices received from third party pricing vendors or from brokers who make markets in such securities. Corporate bonds, bank loan obligations and preferred securities are valued by pricing vendors who utilize matrix pricing which considers yield or price of bonds of comparable quality, coupon, maturity and type or by broker-supplied prices. When independent prices are unavailable or unreliable, debt securities may be valued utilizing pricing methodologies which consider similar factors that would be used by third party pricing vendors. Debt securities are generally categorized as Level 2 in the hierarchy but may be Level 3 depending on the circumstances. The Fund invests a significant portion of its assets in below investment grade securities. The value of these securities can be more volatile due to changes in the credit quality of the issuer and is sensitive to changes in economic, market and regulatory conditions.
Equity securities, including restricted securities, for which market quotations are readily available, are valued at the last reported sale price or official closing price as reported by a third party pricing vendor on the primary market or exchange on which they are traded and are categorized as Level 1 in the hierarchy. In the event there were no sales during the day or closing prices are not available, securities are valued at the last quoted bid price or may be valued using the last available price and are generally categorized as Level 2 in the hierarchy. For equity securities, including restricted securities, where observable inputs are limited, assumptions about market activity and risk are used and these securities may be categorized as Level 3 in the hierarchy.
Investments in open-end mutual funds, including the Fidelity Central Funds, are valued at their closing net asset value (NAV) each business day and are categorized as Level 1 in the hierarchy.
Changes in valuation techniques may result in transfers in or out of an assigned level within the disclosure hierarchy. The aggregate value of investments by input level as of February 28, 2017, is included at the end of the Fund's Schedule of Investments.
Foreign Currency. The Fund may use foreign currency contracts to facilitate transactions in foreign-denominated securities. Gains and losses from these transactions may arise from changes in the value of the foreign currency or if the counterparties do not perform under the contracts' terms.
Foreign-denominated assets, including investment securities, and liabilities are translated into U.S. dollars at the exchange rates at period end. Purchases and sales of investment securities, income and dividends received and expenses denominated in foreign currencies are translated into U.S. dollars at the exchange rate in effect on the transaction date.
The effects of exchange rate fluctuations on investments are included with the net realized and unrealized gain (loss) on investment securities. Other foreign currency transactions resulting in realized and unrealized gain (loss) are disclosed separately.
Investment Transactions and Income. For financial reporting purposes, the Fund's investment holdings and NAV include trades executed through the end of the last business day of the period. The NAV per share for processing shareholder transactions is calculated as of the close of business of the New York Stock Exchange (NYSE), normally 4:00 p.m. Eastern time and includes trades executed through the end of the prior business day. Gains and losses on securities sold are determined on the basis of identified cost and may include proceeds received from litigation. Dividend income is recorded on the ex-dividend date, except for certain dividends from foreign securities where the ex-dividend date may have passed, which are recorded as soon as the Fund is informed of the ex-dividend date. Non-cash dividends included in dividend income, if any, are recorded at the fair market value of the securities received. Income and capital gain distributions from Fidelity Central Funds, if any, are recorded on the ex-dividend date. Certain distributions received by the Fund represent a return of capital or capital gain. The Fund determines the components of these distributions subsequent to the ex-dividend date, based upon receipt of tax filings or other correspondence relating to the underlying investment. These distributions are recorded as a reduction of cost of investments and/or as a realized gain. Interest income is accrued as earned and includes coupon interest and amortization of premium and accretion of discount on debt securities as applicable. Investment income is recorded net of foreign taxes withheld where recovery of such taxes is uncertain. Debt obligations may be placed on non-accrual status and related interest income may be reduced by ceasing current accruals and writing off interest receivables when the collection of all or a portion of interest has become doubtful based on consistently applied procedures. A debt obligation is removed from non-accrual status when the issuer resumes interest payments or when collectability of interest is reasonably assured.
Expenses. Expenses directly attributable to a fund are charged to that fund. Expenses attributable to more than one fund are allocated among the respective funds on the basis of relative net assets or other appropriate methods. Expense estimates are accrued in the period to which they relate and adjustments are made when actual amounts are known.
Income Tax Information and Distributions to Shareholders. Each year, effective September 1, 2016, the Fund intends to qualify as a regulated investment company under Subchapter M of the Internal Revenue Code, including distributing substantially all of its taxable income and realized gains. As a result, no provision for U.S. Federal income taxes is required. The Fund files a U.S. federal tax return, in addition to state and local tax returns as required. The Fund's federal income tax returns are subject to examination by the Internal Revenue Service (IRS) for a period of three fiscal years after they are filed. State and local tax returns may be subject to examination for an additional fiscal year depending on the jurisdiction. Prior to September 1, 2016, the Fund was a partnership for tax purposes, and no provision was made for U.S. Federal income taxes because the Fund allocated, at least annually among its partners, each partner's share of the Fund's income and expenses and capital gains and losses as determined by income tax regulations for inclusion in each partner's tax return. Due to the Fund's previous partnership structure, paid in capital includes any accumulated net investment income/(loss) and net realized gain/(loss) on investments prior to September 1, 2016.
Dividends are declared and recorded daily and paid monthly from net investment income. Distributions from realized gains, if any, are declared and recorded on the ex-dividend date. Income and capital gain distributions are determined in accordance with income tax regulations, which may differ from GAAP.
Capital accounts within the financial statements are adjusted for permanent book-tax differences. These adjustments have no impact on net assets or the results of operations. Capital accounts are not adjusted for temporary book-tax differences which will reverse in a subsequent period.
The federal tax cost of investment securities and unrealized appreciation (depreciation) as of period end were as follows:
| Gross unrealized appreciation | $41,707,214 |
| Gross unrealized depreciation | (21,771,174) |
| Net unrealized appreciation (depreciation) on securities | $19,936,040 |
| Tax Cost | $852,502,462 |
Delayed Delivery Transactions and When-Issued Securities. During the period, the Fund transacted in securities on a delayed delivery or when-issued basis. Payment and delivery may take place after the customary settlement period for that security. The price of the underlying securities and the date when the securities will be delivered and paid for are fixed at the time the transaction is negotiated. The Fund may receive compensation for interest forgone in the purchase of a delayed delivery or when-issued security. With respect to purchase commitments, the Fund identifies securities as segregated in its records with a value at least equal to the amount of the commitment. Losses may arise due to changes in the value of the underlying securities or if the counterparty does not perform under the contract's terms, or if the issuer does not issue the securities due to political, economic, or other factors.
Restricted Securities. The Fund may invest in securities that are subject to legal or contractual restrictions on resale. These securities generally may be resold in transactions exempt from registration or to the public if the securities are registered. Disposal of these securities may involve time-consuming negotiations and expense, and prompt sale at an acceptable price may be difficult. Information regarding restricted securities is included at the end of the Fund's Schedule of Investments.
Loans and Other Direct Debt Instruments. The Fund invests in direct debt instruments which are interests in amounts owed to lenders by corporate or other borrowers. These instruments may be in the form of loans, trade claims or other receivables and may include standby financing commitments such as revolving credit facilities that obligate the Fund to supply additional cash to the borrower on demand. Loans may be acquired through assignment or participation. The Fund did not have any unfunded loan commitments, which are contractual obligations for future funding, at period end.
4. Purchases and Sales of Investments.
Purchases and sales of securities, other than short-term securities, aggregated $192,452,499 and $214,700,224, respectively.
5. Fees and Other Transactions with Affiliates.
Management Fee and Expense Contract. FMR Co., Inc. (the investment adviser), an affiliate of FMR, provides the Fund with investment management services. The Fund does not pay any fees for these services. Pursuant to the Fund's management contract with the investment adviser, FMR pays the investment adviser a portion of the management fees it receives from the Investing Funds. In addition, under an expense contract, FMR also pays all other expenses of the Fund, excluding custody fees, fees and expenses of the independent Directors, and certain exceptions such as interest expense and extraordinary expenses.
Interfund Trades. The Fund may purchase from or sell securities to other Fidelity Funds under procedures adopted by the Board. The procedures have been designed to ensure these interfund trades are executed in accordance with Rule 17a-7 of the 1940 Act. Interfund trades are included within the respective purchases and sales amounts shown in the Purchases and Sales of Investments note.
Other. During the period, the investment adviser reimbursed the Fund for certain losses in the amount of $2,956.
6. Expense Reductions.
FMR has voluntarily agreed to reimburse a portion of the Fund's operating expenses. For the period, the reimbursement reduced the expenses by $1,743.
In addition, through arrangements with the Fund's custodian, credits realized as a result of certain uninvested cash balances were used to reduce the Fund's expenses. During the period, these credits reduced the Fund's custody expenses by $397.
7. Other.
The Fund's organizational documents provide former and current directors and officers with a limited indemnification against liabilities arising in connection with the performance of their duties to the Fund. In the normal course of business, the Fund may also enter into contracts that provide general indemnifications. The Fund's maximum exposure under these arrangements is unknown as this would be dependent on future claims that may be made against the Fund. The risk of material loss from such claims is considered remote.
At the end of the period, mutual funds managed by FMR or its affiliates were the owners of record of all of the outstanding shares of the Fund.
8. Litigation.
The Fund, and other entities managed by FMR or its affiliates, became aware in March 2015 that they were named as defendants in a lawsuit originally filed in the United States Bankruptcy Court for the Southern District of New York in 2009. The lawsuit was brought by creditors of Motors Liquidation Company (f/k/a General Motors), which went through Chapter 11 bankruptcy proceedings in 2009, and is captioned Official Committee of Unsecured Creditors of Motors Liquidation Company v. JPMorgan Chase Bank, N.A., et al., Adversary No. 09-00504 (REG). The plaintiffs are seeking an order that the Fund and other defendants return proceeds received in 2009 in full payment of the principal and interest on General Motors secured debt. The plaintiffs contend that the Fund and the other defendants were not secured creditors at the time of the 2009 payments and, thus, were not entitled to payment in full. In January 2015, the Court of Appeals ruled that JPMorgan, as administrative agent for all of the debtholders, released the security interest on certain collateral securing the debt prior to the 2009 payments. The parties to the dispute have commenced discovery on the value of remaining, unreleased collateral. At this time, Management cannot determine the amount of loss that may be realized, but expects the amount to be less than the $1,316,020 received in 2009. The Fund was not previously aware that it had been named as a defendant in this case because, in 2009, the Bankruptcy Court allowed the plaintiffs to refrain from serving any of the defendants other than JPMorgan with notice of the filing of the lawsuit. The Fund is exploring all available options for minimizing any loss and will also incur legal costs in defending the case.
Shareholder Expense Example
As a shareholder of the Fund, you incur two types of costs: (1) transaction costs, and (2) ongoing costs, including other Fund expenses. This Example is intended to help you understand your ongoing costs (in dollars) of investing in the Fund and to compare these costs with the ongoing costs of investing in other mutual funds.
The Example is based on an investment of $1,000 invested at the beginning of the period and held for the entire period (September 1, 2016 to February 28, 2017).
Actual Expenses
The first line of the accompanying table provides information about actual account values and actual expenses. You may use the information in this line, together with the amount you invested, to estimate the expenses that you paid over the period. Simply divide your account value by $1,000.00 (for example, an $8,600 account value divided by $1,000.00 = 8.6), then multiply the result by the number in the first line under the heading entitled "Expenses Paid During Period" to estimate the expenses you paid on your account during this period. In addition, the Fund, as a shareholder in the underlying Fidelity Central Funds, will indirectly bear its pro-rata share of the fees and expenses incurred by the underlying Fidelity Central Funds. These fees and expenses are not included in the Fund's annualized expense ratio used to calculate the expense estimate in the table below.
Hypothetical Example for Comparison Purposes
The second line of the accompanying table provides information about hypothetical account values and hypothetical expenses based on the Fund's actual expense ratio and an assumed rate of return of 5% per year before expenses, which is not the Fund's actual return. The hypothetical account values and expenses may not be used to estimate the actual ending account balance or expenses you paid for the period. You may use this information to compare the ongoing costs of investing in the Fund and other funds. To do so, compare this 5% hypothetical example with the 5% hypothetical examples that appear in the shareholder reports of the other funds. In addition, the Fund, as a shareholder in the underlying Fidelity Central Funds, will indirectly bear its pro-rata share of the fees and expenses incurred by the underlying Fidelity Central Funds. These fees and expenses are not included in the Fund's annualized expense ratio used to calculate the expense estimate in the table below.
Please note that the expenses shown in the table are meant to highlight your ongoing costs only and do not reflect any transaction costs. Therefore, the second line of the table is useful in comparing ongoing costs only, and will not help you determine the relative total costs of owning different funds.
| Annualized Expense Ratio-A | Beginning Account Value September 1, 2016 | Ending Account Value February 28, 2017 | Expenses Paid During Period-B September 1, 2016 to February 28, 2017 | |
| Actual | .0028% | $1,000.00 | $1,060.90 | $.01 |
| Hypothetical-C | $1,000.00 | $1,024.78 | $.01 |
A Annualized expense ratio reflects expenses net of applicable fee waivers.
B Expenses are equal to the Fund's annualized expense ratio, multiplied by the average account value over the period, multiplied by 181/365 (to reflect the one-half year period).
C 5% return per year before expenses
![]()
Corporate Headquarters
245 Summer St.
Boston, MA 02210
www.fidelity.com
HICII-SANN-0417
1.861965.108
Fidelity® Specialized High Income Central Fund Semi-Annual Report February 28, 2017 |
|
Contents
To view a fund's proxy voting guidelines and proxy voting record for the 12-month period ended June 30, visit http://www.fidelity.com/proxyvotingresults or visit the Securities and Exchange Commission's (SEC) web site at http://www.sec.gov.
You may also call 1-800-544-8544 to request a free copy of the proxy voting guidelines.
Standard & Poor's, S&P and S&P 500 are registered service marks of The McGraw-Hill Companies, Inc. and have been licensed for use by Fidelity Distributors Corporation.
Other third-party marks appearing herein are the property of their respective owners.
All other marks appearing herein are registered or unregistered trademarks or service marks of FMR LLC or an affiliated company. © 2017 FMR LLC. All rights reserved.
A fund files its complete schedule of portfolio holdings with the SEC for the first and third quarters of each fiscal year on Form N-Q. Forms N-Q are available on the SEC’s web site at http://www.sec.gov. A fund's Forms N-Q may be reviewed and copied at the SEC’s Public Reference Room in Washington, DC. Information regarding the operation of the SEC's Public Reference Room may be obtained by calling 1-800-SEC-0330.
Investment Summary (Unaudited)
Top Five Holdings as of February 28, 2017
| (by issuer, excluding cash equivalents) | % of fund's net assets | % of fund's net assets 6 months ago |
| T-Mobile U.S.A., Inc. | 3.9 | 3.9 |
| Sabine Pass Liquefaction LLC | 3.8 | 3.5 |
| Icahn Enterprises LP/Icahn Enterprises Finance Corp. | 3.8 | 3.1 |
| Wynn Macau Ltd. | 2.8 | 2.4 |
| Bank of America Corp. | 2.6 | 2.4 |
| 16.9 |
Top Five Market Sectors as of February 28, 2017
| % of fund's net assets | % of fund's net assets 6 months ago | |
| Energy | 12.1 | 10.6 |
| Telecommunications | 10.5 | 10.7 |
| Banks & Thrifts | 10.1 | 11.0 |
| Diversified Financial Services | 9.3 | 9.7 |
| Technology | 6.8 | 6.5 |
Quality Diversification (% of fund's net assets)
| As of February 28, 2017 | ||
| BBB | 3.1% | |
| BB | 74.5% | |
| B | 17.9% | |
| Not Rated | 0.1% | |
| Short-Term Investments and Net Other Assets | 4.4% | |

| As of August 31, 2016 | ||
| BBB | 3.0% | |
| BB | 76.2% | |
| B | 16.0% | |
| Short-Term Investments and Net Other Assets | 4.8% | |
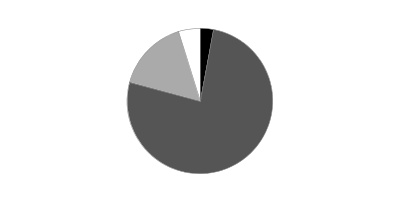
We have used ratings from Moody's Investors Service, Inc. Where Moody's® ratings are not available, we have used S&P® ratings. All ratings are as of the date indicated and do not reflect subsequent changes.
Asset Allocation (% of fund's net assets)
| As of February 28, 2017 * | ||
| Nonconvertible Bonds | 80.8% | |
| Bank Loan Obligations | 5.6% | |
| Other Investments | 9.2% | |
| Short-Term Investments and Net Other Assets (Liabilities) | 4.4% | |

* Foreign investments - 29.3%
| As of August 31, 2016 * | ||
| Nonconvertible Bonds | 79.5% | |
| Bank Loan Obligations | 5.3% | |
| Other Investments | 10.4% | |
| Short-Term Investments and Net Other Assets (Liabilities) | 4.8% | |

* Foreign investments - 25.4%
Investments February 28, 2017 (Unaudited)
Showing Percentage of Net Assets
| Nonconvertible Bonds - 80.8% | |||
| Principal Amount | Value | ||
| Air Transportation - 2.0% | |||
| Air Canada 7.75% 4/15/21 (a) | $1,820,000 | $2,042,950 | |
| Air Canada Trust Series 2015-1 equipment trust certificate Class C, 5% 3/15/20 (a) | 1,710,000 | 1,710,599 | |
| Allegiant Travel Co. 5.5% 7/15/19 | 5,920,000 | 6,097,600 | |
| American Airlines Group, Inc. 5.5% 10/1/19 (a) | 1,880,000 | 1,950,500 | |
| Continental Airlines, Inc.: | |||
| pass-thru trust certificates 9.798% 4/1/21 | 358,347 | 395,974 | |
| 5.5% 4/29/22 | 689,265 | 716,836 | |
| 9.25% 5/10/17 | 103,491 | 104,526 | |
| Delta Air Lines, Inc. pass-thru trust certificates 8.021% 2/10/24 | 574,729 | 649,444 | |
| United Air Lines, Inc. pass-thru trust certificates Class B, 7.336% 7/2/19 | 832,353 | 876,967 | |
| United Continental Holdings, Inc. 5% 2/1/24 | 800,000 | 797,000 | |
| TOTAL AIR TRANSPORTATION | 15,342,396 | ||
| Automotive & Auto Parts - 0.7% | |||
| IHO Verwaltungs GmbH 4.75% 9/15/26 pay-in-kind (a)(b) | 510,000 | 503,625 | |
| Tenneco, Inc. 5% 7/15/26 | 1,020,000 | 1,022,550 | |
| ZF North America Capital, Inc. 4.75% 4/29/25 (a) | 3,790,000 | 3,903,700 | |
| TOTAL AUTOMOTIVE & AUTO PARTS | 5,429,875 | ||
| Banks & Thrifts - 0.9% | |||
| Ally Financial, Inc.: | |||
| 4.25% 4/15/21 | 1,520,000 | 1,567,500 | |
| 5.75% 11/20/25 | 1,700,000 | 1,795,625 | |
| Royal Bank of Scotland Group PLC 5.125% 5/28/24 | 3,630,000 | 3,674,115 | |
| TOTAL BANKS & THRIFTS | 7,037,240 | ||
| Broadcasting - 0.2% | |||
| AMC Networks, Inc. 4.75% 12/15/22 | 625,000 | 631,250 | |
| Sirius XM Radio, Inc. 5.375% 7/15/26 (a) | 930,000 | 948,600 | |
| TOTAL BROADCASTING | 1,579,850 | ||
| Building Materials - 2.7% | |||
| Building Materials Corp. of America: | |||
| 5% 2/15/27 (a) | 1,550,000 | 1,581,000 | |
| 5.125% 2/15/21 (a) | 2,120,000 | 2,210,100 | |
| 5.375% 11/15/24 (a) | 7,395,000 | 7,601,321 | |
| 6% 10/15/25 (a) | 1,710,000 | 1,816,875 | |
| Eagle Materials, Inc. 4.5% 8/1/26 | 1,520,000 | 1,512,400 | |
| Masco Corp.: | |||
| 3.5% 4/1/21 | 810,000 | 826,119 | |
| 4.375% 4/1/26 | 1,030,000 | 1,071,097 | |
| U.S. Concrete, Inc. 6.375% 6/1/24 (a) | 600,000 | 634,500 | |
| USG Corp. 5.5% 3/1/25 (a) | 3,435,000 | 3,649,688 | |
| TOTAL BUILDING MATERIALS | 20,903,100 | ||
| Cable/Satellite TV - 5.5% | |||
| Altice U.S. Finance SA: | |||
| 5.375% 7/15/23 (a) | 9,515,000 | 9,919,388 | |
| 5.5% 5/15/26 (a) | 2,025,000 | 2,093,344 | |
| CCO Holdings LLC/CCO Holdings Capital Corp.: | |||
| 5.125% 2/15/23 | 550,000 | 572,688 | |
| 5.125% 5/1/23 (a) | 2,980,000 | 3,091,750 | |
| 5.125% 5/1/27 (a) | 2,090,000 | 2,170,988 | |
| 5.5% 5/1/26 (a) | 3,545,000 | 3,762,131 | |
| 5.75% 2/15/26 (a) | 1,570,000 | 1,679,900 | |
| 5.875% 4/1/24 (a) | 2,130,000 | 2,284,425 | |
| 5.875% 5/1/27 (a) | 2,500,000 | 2,685,250 | |
| CSC Holdings, Inc. 5.5% 4/15/27 (a) | 2,025,000 | 2,083,219 | |
| DISH DBS Corp. 5.125% 5/1/20 | 3,280,000 | 3,419,400 | |
| Unitymedia Hessen GmbH & Co. KG/Unitymedia NRW GmbH 5% 1/15/25 (a) | 1,140,000 | 1,171,350 | |
| Virgin Media Secured Finance PLC: | |||
| 5.5% 1/15/25 (a) | 650,000 | 667,875 | |
| 5.5% 8/15/26 (a) | 4,275,000 | 4,381,405 | |
| Ziggo Secured Finance BV 5.5% 1/15/27 (a) | 3,320,000 | 3,361,500 | |
| TOTAL CABLE/SATELLITE TV | 43,344,613 | ||
| Capital Goods - 0.2% | |||
| AECOM 5.125% 3/15/27 (a) | 1,585,000 | 1,610,598 | |
| Belden, Inc. 5.25% 7/15/24 (a) | 330,000 | 331,238 | |
| TOTAL CAPITAL GOODS | 1,941,836 | ||
| Chemicals - 0.6% | |||
| CF Industries Holdings, Inc.: | |||
| 3.4% 12/1/21 (a) | 715,000 | 716,866 | |
| 3.45% 6/1/23 | 2,305,000 | 2,140,769 | |
| 4.5% 12/1/26 (a) | 515,000 | 527,520 | |
| Versum Materials, Inc. 5.5% 9/30/24 (a) | 930,000 | 973,013 | |
| TOTAL CHEMICALS | 4,358,168 | ||
| Consumer Products - 0.3% | |||
| Edgewell Personal Care Co. 5.5% 6/15/25 (a) | 2,585,000 | 2,669,013 | |
| Containers - 1.3% | |||
| Ardagh Packaging Finance PLC/Ardagh MP Holdings U.S.A., Inc.: | |||
| 3.9634% 12/15/19 (a)(b) | 1,075,518 | 1,097,028 | |
| 4.25% 9/15/22 (a)(c) | 1,215,000 | 1,215,000 | |
| 4.289% 5/15/21 (a)(b) | 1,525,000 | 1,565,031 | |
| 4.625% 5/15/23 (a) | 2,510,000 | 2,553,925 | |
| Crown Americas LLC/Crown Americas Capital Corp. V 4.25% 9/30/26 (a) | 1,510,000 | 1,455,263 | |
| Owens-Brockway Glass Container, Inc. 5.375% 1/15/25 (a) | 900,000 | 928,125 | |
| Sealed Air Corp. 6.875% 7/15/33 (a) | 120,000 | 130,200 | |
| Silgan Holdings, Inc. 4.75% 3/15/25 (a) | 1,060,000 | 1,066,625 | |
| TOTAL CONTAINERS | 10,011,197 | ||
| Diversified Financial Services - 9.3% | |||
| AerCap Ireland Capital Ltd./AerCap Global Aviation Trust: | |||
| 3.95% 2/1/22 | 1,990,000 | 2,059,411 | |
| 4.625% 7/1/22 | 1,410,000 | 1,501,819 | |
| 5% 10/1/21 | 4,690,000 | 5,073,923 | |
| Aircastle Ltd.: | |||
| 5% 4/1/23 | 520,000 | 547,950 | |
| 5.125% 3/15/21 | 4,735,000 | 5,054,613 | |
| 6.25% 12/1/19 | 8,390,000 | 9,145,100 | |
| FLY Leasing Ltd. 6.375% 10/15/21 | 1,665,000 | 1,731,600 | |
| Icahn Enterprises LP/Icahn Enterprises Finance Corp.: | |||
| 4.875% 3/15/19 | 2,294,000 | 2,331,278 | |
| 5.875% 2/1/22 | 22,275,000 | 22,746,761 | |
| 6% 8/1/20 | 2,965,000 | 3,083,630 | |
| 6.25% 2/1/22 (a) | 410,000 | 423,325 | |
| 6.75% 2/1/24 (a) | 740,000 | 767,750 | |
| ILFC E-Capital Trust II 4.92% 12/21/65 (a)(b) | 1,755,000 | 1,643,119 | |
| International Lease Finance Corp.: | |||
| 4.625% 4/15/21 | 510,000 | 542,222 | |
| 6.25% 5/15/19 | 2,165,000 | 2,349,090 | |
| MSCI, Inc.: | |||
| 4.75% 8/1/26 (a) | 3,230,000 | 3,247,765 | |
| 5.25% 11/15/24 (a) | 3,460,000 | 3,641,650 | |
| Navient Corp.: | |||
| 5% 10/26/20 | 170,000 | 170,799 | |
| 5.875% 10/25/24 | 405,000 | 379,688 | |
| SLM Corp.: | |||
| 4.875% 6/17/19 | 1,495,000 | 1,524,900 | |
| 5.5% 1/15/19 | 1,380,000 | 1,424,850 | |
| 5.5% 1/25/23 | 3,230,000 | 3,092,725 | |
| TOTAL DIVERSIFIED FINANCIAL SERVICES | 72,483,968 | ||
| Diversified Media - 0.1% | |||
| Nielsen Finance LLC/Nielsen Finance Co. 5% 4/15/22 (a) | 485,000 | 499,550 | |
| Energy - 12.1% | |||
| Antero Resources Corp.: | |||
| 5% 3/1/25 (a) | 1,680,000 | 1,629,600 | |
| 5.125% 12/1/22 | 4,870,000 | 4,894,350 | |
| 5.625% 6/1/23 (Reg. S) | 4,530,000 | 4,586,625 | |
| Cheniere Corpus Christi Holdings LLC: | |||
| 5.875% 3/31/25 (a) | 2,155,000 | 2,278,913 | |
| 7% 6/30/24 (a) | 1,070,000 | 1,198,400 | |
| Concho Resources, Inc. 4.375% 1/15/25 | 2,180,000 | 2,212,700 | |
| Continental Resources, Inc.: | |||
| 3.8% 6/1/24 | 495,000 | 458,494 | |
| 4.5% 4/15/23 | 1,445,000 | 1,416,100 | |
| CVR Refining LLC/Coffeyville Finance, Inc. 6.5% 11/1/22 | 3,421,000 | 3,455,210 | |
| Ensco PLC: | |||
| 4.5% 10/1/24 | 455,000 | 391,300 | |
| 5.2% 3/15/25 | 2,310,000 | 2,044,350 | |
| 8% 1/31/24 (a) | 880,000 | 902,000 | |
| Gibson Energy, Inc. 6.75% 7/15/21 (a) | 3,695,000 | 3,833,563 | |
| Hilcorp Energy I LP/Hilcorp Finance Co.: | |||
| 5% 12/1/24 (a) | 6,247,000 | 5,981,503 | |
| 5.75% 10/1/25 (a) | 1,470,000 | 1,458,975 | |
| Nabors Industries, Inc. 5.5% 1/15/23 (a) | 899,000 | 927,656 | |
| NGL Energy Partners LP/NGL Energy Finance Corp. 6.125% 3/1/25 (a) | 990,000 | 987,525 | |
| Noble Holding International Ltd.: | |||
| 4.625% 3/1/21 | 881,000 | 834,748 | |
| 7.75% 1/15/24 | 3,005,000 | 2,938,740 | |
| NRG Yield Operating LLC 5% 9/15/26 (a) | 2,445,000 | 2,396,100 | |
| PBF Holding Co. LLC/PBF Finance Corp. 8.25% 2/15/20 | 1,525,000 | 1,559,313 | |
| Sabine Pass Liquefaction LLC: | |||
| 5.625% 2/1/21 (b) | 6,450,000 | 7,008,119 | |
| 5.625% 3/1/25 | 10,850,000 | 11,907,875 | |
| 5.75% 5/15/24 | 7,260,000 | 8,035,513 | |
| 5.875% 6/30/26 (a) | 1,490,000 | 1,671,303 | |
| 6.25% 3/15/22 | 1,165,000 | 1,314,213 | |
| Southwestern Energy Co.: | |||
| 5.8% 1/23/20 (b) | 1,150,000 | 1,138,500 | |
| 6.7% 1/23/25 (b) | 625,000 | 600,000 | |
| Sunoco LP/Sunoco Finance Corp.: | |||
| 5.5% 8/1/20 | 1,650,000 | 1,662,375 | |
| 6.375% 4/1/23 | 3,030,000 | 3,060,300 | |
| Targa Resources Partners LP/Targa Resources Partners Finance Corp.: | |||
| 4.125% 11/15/19 | 1,110,000 | 1,129,425 | |
| 5.125% 2/1/25 (a) | 460,000 | 478,400 | |
| 5.25% 5/1/23 | 275,000 | 283,938 | |
| 5.375% 2/1/27 (a) | 460,000 | 479,550 | |
| 6.75% 3/15/24 | 1,640,000 | 1,791,700 | |
| Tesoro Logistics LP/Tesoro Logistics Finance Corp.: | |||
| 5.5% 10/15/19 | 485,000 | 514,100 | |
| 5.875% 10/1/20 | 620,000 | 639,375 | |
| 6.125% 10/15/21 | 350,000 | 365,313 | |
| 6.25% 10/15/22 | 935,000 | 1,000,450 | |
| The Williams Companies, Inc.: | |||
| 3.7% 1/15/23 | 1,500,000 | 1,470,000 | |
| 4.55% 6/24/24 | 3,855,000 | 3,912,825 | |
| TOTAL ENERGY | 94,849,439 | ||
| Environmental - 0.4% | |||
| Covanta Holding Corp. 5.875% 3/1/24 | 3,400,000 | 3,455,250 | |
| Food & Drug Retail - 0.4% | |||
| Tesco PLC 6.15% 11/15/37 (a) | 3,055,000 | 3,110,198 | |
| Food/Beverage/Tobacco - 4.3% | |||
| Darling International, Inc. 5.375% 1/15/22 | 1,625,000 | 1,687,969 | |
| ESAL GmbH 6.25% 2/5/23 (a) | 8,775,000 | 8,950,500 | |
| JBS Investments GmbH: | |||
| 7.25% 4/3/24 (a) | 4,285,000 | 4,563,525 | |
| 7.75% 10/28/20 (a) | 2,320,000 | 2,453,400 | |
| JBS U.S.A. LLC/JBS U.S.A. Finance, Inc.: | |||
| 5.875% 7/15/24 (a) | 3,850,000 | 4,023,250 | |
| 7.25% 6/1/21 (a) | 865,000 | 890,950 | |
| 7.25% 6/1/21 (a) | 2,335,000 | 2,405,050 | |
| 8.25% 2/1/20 (a) | 3,235,000 | 3,315,875 | |
| Lamb Weston Holdings, Inc.: | |||
| 4.625% 11/1/24 (a) | 1,770,000 | 1,800,975 | |
| 4.875% 11/1/26 (a) | 595,000 | 604,223 | |
| Minerva Luxembourg SA 6.5% 9/20/26 (a) | 575,000 | 570,688 | |
| Vector Group Ltd. 6.125% 2/1/25 (a) | 2,030,000 | 2,090,900 | |
| TOTAL FOOD/BEVERAGE/TOBACCO | 33,357,305 | ||
| Gaming - 4.7% | |||
| GLP Capital LP/GLP Financing II, Inc. 5.375% 4/15/26 | 355,000 | 371,419 | |
| MCE Finance Ltd. 5% 2/15/21 (a) | 7,625,000 | 7,701,250 | |
| MGM Growth Properties Operating Partnership LP 4.5% 9/1/26 (a) | 4,455,000 | 4,332,488 | |
| Scientific Games Corp.: | |||
| 7% 1/1/22 (a) | 590,000 | 627,613 | |
| 7% 1/1/22 (a) | 2,115,000 | 2,247,188 | |
| Wynn Macau Ltd. 5.25% 10/15/21 (a) | 21,115,000 | 21,590,088 | |
| TOTAL GAMING | 36,870,046 | ||
| Healthcare - 3.5% | |||
| HCA Holdings, Inc.: | |||
| 4.5% 2/15/27 | 3,115,000 | 3,107,213 | |
| 5% 3/15/24 | 1,030,000 | 1,085,363 | |
| 5.25% 6/15/26 | 7,245,000 | 7,652,531 | |
| IMS Health, Inc. 5% 10/15/26 (a) | 1,030,000 | 1,045,450 | |
| Mallinckrodt International Finance SA/Mallinckrodt CB LLC: | |||
| 4.875% 4/15/20 (a) | 340,000 | 340,850 | |
| 5.5% 4/15/25 (a) | 1,595,000 | 1,483,350 | |
| MPT Operating Partnership LP/MPT Finance Corp.: | |||
| 5.25% 8/1/26 | 785,000 | 792,850 | |
| 6.375% 3/1/24 | 960,000 | 1,024,800 | |
| Sabra Health Care LP/Sabra Capital Corp.: | |||
| 5.375% 6/1/23 | 665,000 | 665,000 | |
| 5.5% 2/1/21 | 5,385,000 | 5,586,938 | |
| Teleflex, Inc. 4.875% 6/1/26 | 4,980,000 | 5,017,350 | |
| TOTAL HEALTHCARE | 27,801,695 | ||
| Homebuilders/Real Estate - 2.2% | |||
| Lennar Corp.: | |||
| 4.75% 4/1/21 | 2,115,000 | 2,202,244 | |
| 4.875% 12/15/23 | 900,000 | 929,250 | |
| Mattamy Group Corp. 6.875% 12/15/23 (a) | 1,105,000 | 1,154,725 | |
| PulteGroup, Inc.: | |||
| 4.25% 3/1/21 | 4,300,000 | 4,401,050 | |
| 5% 1/15/27 | 1,000,000 | 999,000 | |
| Starwood Property Trust, Inc. 5% 12/15/21 (a) | 1,530,000 | 1,589,288 | |
| Taylor Morrison Communities, Inc./Monarch Communities, Inc.: | |||
| 5.25% 4/15/21 (a) | 1,680,000 | 1,722,000 | |
| 5.625% 3/1/24 (a) | 1,500,000 | 1,548,750 | |
| 5.875% 4/15/23 (a) | 785,000 | 826,213 | |
| VEREIT Operating Partnership LP: | |||
| 4.125% 6/1/21 | 710,000 | 725,194 | |
| 4.875% 6/1/26 | 710,000 | 743,725 | |
| TOTAL HOMEBUILDERS/REAL ESTATE | 16,841,439 | ||
| Hotels - 0.2% | |||
| Hilton Escrow Issuer LLC 4.25% 9/1/24 (a) | 1,815,000 | 1,795,035 | |
| Leisure - 0.4% | |||
| Hilton Grand Vacations Borrower LLC/Hilton Grand Vacations Borrower, Inc. 6.125% 12/1/24 (a) | 515,000 | 543,325 | |
| NCL Corp. Ltd. 4.75% 12/15/21 (a) | 2,510,000 | 2,560,200 | |
| TOTAL LEISURE | 3,103,525 | ||
| Metals/Mining - 1.6% | |||
| ArcelorMittal SA 6.125% 6/1/25 | 1,300,000 | 1,460,875 | |
| Freeport-McMoRan, Inc.: | |||
| 3.55% 3/1/22 | 1,735,000 | 1,611,381 | |
| 3.875% 3/15/23 | 1,395,000 | 1,283,400 | |
| 4.55% 11/14/24 | 2,320,000 | 2,169,200 | |
| Lundin Mining Corp. 7.5% 11/1/20 (a) | 3,545,000 | 3,766,563 | |
| Teck Resources Ltd. 4.75% 1/15/22 | 1,905,000 | 1,978,819 | |
| TOTAL METALS/MINING | 12,270,238 | ||
| Paper - 0.2% | |||
| Sappi Papier Holding GmbH 7.75% 7/15/17 (a) | 1,855,000 | 1,867,985 | |
| Restaurants - 0.2% | |||
| KFC Holding Co./Pizza Hut Holding LLC 5% 6/1/24 (a) | 1,845,000 | 1,894,077 | |
| Services - 1.6% | |||
| Aramark Services, Inc.: | |||
| 4.75% 6/1/26 | 2,415,000 | 2,421,038 | |
| 5.125% 1/15/24 | 4,015,000 | 4,206,114 | |
| IHS Markit Ltd. 4.75% 2/15/25 (a) | 655,000 | 675,063 | |
| The ServiceMaster Co. 5.125% 11/15/24 (a) | 1,160,000 | 1,180,300 | |
| United Rentals North America, Inc. 4.625% 7/15/23 | 4,192,000 | 4,303,130 | |
| TOTAL SERVICES | 12,785,645 | ||
| Steel - 2.5% | |||
| Steel Dynamics, Inc.: | |||
| 5% 12/15/26 (a) | 1,630,000 | 1,684,833 | |
| 5.125% 10/1/21 | 8,800,000 | 9,075,000 | |
| 5.25% 4/15/23 | 1,300,000 | 1,353,755 | |
| 5.5% 10/1/24 | 6,715,000 | 7,143,417 | |
| TOTAL STEEL | 19,257,005 | ||
| Super Retail - 0.8% | |||
| L Brands, Inc.: | |||
| 5.625% 10/15/23 | 700,000 | 731,500 | |
| 6.75% 7/1/36 | 2,765,000 | 2,658,077 | |
| 6.875% 11/1/35 | 1,010,000 | 970,863 | |
| Sally Holdings LLC 5.625% 12/1/25 | 2,050,000 | 2,085,875 | |
| TOTAL SUPER RETAIL | 6,446,315 | ||
| Technology - 6.4% | |||
| CDW LLC/CDW Finance Corp. 5% 9/1/25 | 445,000 | 451,399 | |
| EMC Corp. 2.65% 6/1/20 | 2,400,000 | 2,340,233 | |
| Lucent Technologies, Inc.: | |||
| 6.45% 3/15/29 | 4,490,000 | 4,961,450 | |
| 6.5% 1/15/28 | 515,000 | 571,650 | |
| Micron Technology, Inc.: | |||
| 5.25% 8/1/23 (a) | 2,135,000 | 2,153,681 | |
| 5.25% 1/15/24 (a) | 1,370,000 | 1,387,125 | |
| 5.625% 1/15/26 (a) | 3,060,000 | 3,144,150 | |
| Nuance Communications, Inc.: | |||
| 5.375% 8/15/20 (a) | 2,022,000 | 2,061,389 | |
| 6% 7/1/24 (a) | 1,995,000 | 2,062,331 | |
| NXP BV/NXP Funding LLC: | |||
| 3.875% 9/1/22 (a) | 2,490,000 | 2,549,138 | |
| 4.125% 6/1/21 (a) | 4,975,000 | 5,164,548 | |
| 4.625% 6/15/22 (a) | 2,450,000 | 2,603,125 | |
| 4.625% 6/1/23 (a) | 995,000 | 1,059,675 | |
| Open Text Corp. 5.875% 6/1/26 (a) | 4,260,000 | 4,473,000 | |
| Qorvo, Inc.: | |||
| 6.75% 12/1/23 | 6,450,000 | 7,030,500 | |
| 7% 12/1/25 | 3,345,000 | 3,696,225 | |
| Sensata Technologies BV 5% 10/1/25 (a) | 1,460,000 | 1,481,900 | |
| Sensata Technologies UK Financing Co. PLC 6.25% 2/15/26 (a) | 1,410,000 | 1,519,275 | |
| Symantec Corp. 5% 4/15/25 (a) | 715,000 | 733,907 | |
| VeriSign, Inc. 5.25% 4/1/25 | 1,012,000 | 1,053,745 | |
| TOTAL TECHNOLOGY | 50,498,446 | ||
| Telecommunications - 10.2% | |||
| Altice Financing SA: | |||
| 6.5% 1/15/22 (a) | 890,000 | 931,163 | |
| 6.625% 2/15/23 (a) | 3,480,000 | 3,662,700 | |
| 7.5% 5/15/26 (a) | 9,520,000 | 10,222,100 | |
| Columbus International, Inc. 7.375% 3/30/21 (a) | 6,331,000 | 6,737,007 | |
| Level 3 Financing, Inc. 5.25% 3/15/26 (a) | 1,519,000 | 1,532,291 | |
| Sable International Finance Ltd. 6.875% 8/1/22 (a) | 3,240,000 | 3,498,228 | |
| Sprint Communications, Inc.: | |||
| 7% 3/1/20 (a) | 2,980,000 | 3,255,650 | |
| 9% 11/15/18 (a) | 3,760,000 | 4,112,500 | |
| T-Mobile U.S.A., Inc.: | |||
| 6% 3/1/23 | 5,535,000 | 5,853,263 | |
| 6% 4/15/24 | 1,450,000 | 1,547,875 | |
| 6.375% 3/1/25 | 5,795,000 | 6,229,509 | |
| 6.464% 4/28/19 | 4,455,000 | 4,488,769 | |
| 6.5% 1/15/24 | 1,700,000 | 1,826,650 | |
| 6.5% 1/15/26 | 1,360,000 | 1,494,300 | |
| 6.542% 4/28/20 | 2,030,000 | 2,085,825 | |
| 6.625% 4/1/23 | 6,980,000 | 7,416,250 | |
| Telecom Italia Capital SA: | |||
| 6% 9/30/34 | 2,501,000 | 2,469,738 | |
| 6.375% 11/15/33 | 1,995,000 | 2,014,950 | |
| Telecom Italia SpA 5.303% 5/30/24 (a) | 2,000,000 | 2,035,000 | |
| Wind Acquisition Finance SA 4.75% 7/15/20 (a) | 8,170,000 | 8,302,763 | |
| TOTAL TELECOMMUNICATIONS | 79,716,531 | ||
| Utilities - 5.3% | |||
| Calpine Corp. 5.25% 6/1/26 (a) | 3,125,000 | 3,171,875 | |
| Dolphin Subsidiary II, Inc. 7.25% 10/15/21 | 3,057,000 | 3,255,705 | |
| DPL, Inc. 6.75% 10/1/19 | 3,375,000 | 3,510,000 | |
| NRG Energy, Inc. 6.25% 5/1/24 | 2,995,000 | 2,995,000 | |
| NSG Holdings II LLC/NSG Holdings, Inc. 7.75% 12/15/25 (a) | 7,420,561 | 8,042,033 | |
| PPL Energy Supply LLC 6.5% 6/1/25 | 620,000 | 508,400 | |
| RJS Power Holdings LLC 4.625% 7/15/19 (a)(b) | 6,480,000 | 6,301,800 | |
| The AES Corp.: | |||
| 3.9307% 6/1/19 (b) | 204,000 | 204,082 | |
| 4.875% 5/15/23 | 5,470,000 | 5,431,710 | |
| 6% 5/15/26 | 1,555,000 | 1,601,650 | |
| 7.375% 7/1/21 | 5,414,000 | 6,104,285 | |
| TOTAL UTILITIES | 41,126,540 | ||
| TOTAL NONCONVERTIBLE BONDS | |||
| (Cost $608,069,467) | 632,647,520 | ||
| Bank Loan Obligations - 5.6% | |||
| Aerospace - 0.7% | |||
| TransDigm, Inc.: | |||
| Tranche D, term loan 3.9835% 6/4/21 (b) | 3,319,275 | 3,331,125 | |
| Tranche F, term loan 3.7806% 6/9/23 (b) | 2,030,752 | 2,040,540 | |
| TOTAL AEROSPACE | 5,371,665 | ||
| Air Transportation - 0.2% | |||
| American Airlines, Inc. Tranche B, term loan 3.27% 12/14/23 (b) | 1,650,000 | 1,658,250 | |
| Broadcasting - 0.2% | |||
| Nielsen Finance LLC Tranche B 3LN, term loan 3.2728% 10/4/23 (b) | 1,416,450 | 1,432,187 | |
| Cable/Satellite TV - 0.4% | |||
| Zayo Group LLC: | |||
| term loan 2.7806% 1/19/21 (b) | 725,000 | 730,285 | |
| Tranche 1LN, term loan 1/19/24 (d) | 58,500 | 59,048 | |
| Tranche B 1LN, term loan 3.5% 1/19/24 (b) | 121,500 | 122,637 | |
| Ziggo Secured Finance Partnership Tranche E, term loan 3.267% 4/15/25 (b) | 2,565,000 | 2,572,336 | |
| TOTAL CABLE/SATELLITE TV | 3,484,306 | ||
| Containers - 0.2% | |||
| Ardagh Holdings U.S.A., Inc. Tranche B, term loan 4.0093% 12/17/21 (b) | 1,636,956 | 1,641,048 | |
| Electric Utilities No Longer Use - 0.0% | |||
| Limetree Bay Terminals LLC term loan 2/10/24 (d) | 155,000 | 155,969 | |
| Food & Drug Retail - 0.2% | |||
| Albertson's LLC term loan 4.3023% 6/22/23 (b) | 350,476 | 355,428 | |
| JBS USA Lux SA Tranche B, term loan 3.2794% 10/30/22 (b) | 1,525,000 | 1,533,266 | |
| TOTAL FOOD & DRUG RETAIL | 1,888,694 | ||
| Food/Beverage/Tobacco - 0.1% | |||
| Pinnacle Foods Finance LLC Tranche B, term loan 2.78% 2/3/24 (b) | 560,000 | 562,565 | |
| Gaming - 0.3% | |||
| Scientific Games Corp. Tranche B 3LN, term loan 4.8456% 10/1/21 (b) | 2,597,228 | 2,637,277 | |
| Healthcare - 0.7% | |||
| Envision Healthcare Corp. Tranche B, term loan 4% 12/1/23 (b) | 2,245,000 | 2,272,120 | |
| Valeant Pharmaceuticals International, Inc. Tranche BD 2LN, term loan 5.03% 2/13/19 (b) | 2,775,468 | 2,787,625 | |
| TOTAL HEALTHCARE | 5,059,745 | ||
| Restaurants - 0.2% | |||
| Burger King Worldwide, Inc. Tranche B, term loan 3.25% 2/17/24 (b) | 1,550,000 | 1,549,039 | |
| Services - 0.6% | |||
| Garda World Security Corp.: | |||
| term loan 4% 11/8/20 (b) | 2,189,172 | 2,197,382 | |
| Tranche DD, term loan 4% 11/8/20 (b) | 560,021 | 562,121 | |
| Xerox Business Services LLC Tranche B, term loan 6.2756% 12/7/23 (b) | 1,680,000 | 1,707,300 | |
| TOTAL SERVICES | 4,466,803 | ||
| Super Retail - 0.2% | |||
| PetSmart, Inc. term loan 4% 3/11/22 (b) | 1,629,218 | 1,603,753 | |
| Technology - 0.4% | |||
| Go Daddy Operating Co. LLC Tranche B, term loan: | |||
| 2/15/24 (d)(e) | 1,183,934 | 1,186,562 | |
| 3.27% 2/15/24 (b) | 891,066 | 893,044 | |
| Rackspace Hosting, Inc. term loan 4.5345% 11/3/23 (b) | 390,000 | 394,146 | |
| TTM Technologies, Inc. Tranche B 1LN, term loan 5.25% 5/31/21 (b) | 451,613 | 458,952 | |
| TOTAL TECHNOLOGY | 2,932,704 | ||
| Telecommunications - 0.3% | |||
| Level 3 Financing, Inc. Tranche B, term loan 2/22/24 (d) | 1,575,000 | 1,582,308 | |
| Sprint Communications, Inc. Tranche B, term loan 3.3125% 2/3/24 (b) | 545,000 | 545,779 | |
| Telesat LLC Tranche B 4LN, term loan 3.85% 11/17/23 (b) | 50,000 | 50,500 | |
| TOTAL TELECOMMUNICATIONS | 2,178,587 | ||
| Utilities - 0.9% | |||
| Calpine Construction Finance Co. LP Tranche B 1LN, term loan 3.03% 5/3/20 (b) | 4,309,746 | 4,307,936 | |
| Calpine Corp.: | |||
| Tranche B 6LN, term loan 3.75% 1/1/23 (b) | 1,697,850 | 1,705,541 | |
| Tranche B, term loan 3.0746% 11/30/17 (b) | 1,125,000 | 1,125,281 | |
| TOTAL UTILITIES | 7,138,758 | ||
| TOTAL BANK LOAN OBLIGATIONS | |||
| (Cost $43,183,604) | 43,761,350 | ||
| Preferred Securities - 9.2% | |||
| Banks & Thrifts - 9.2% | |||
| Bank of America Corp.: | |||
| 6.1% (b)(f) | 2,440,000 | 2,671,016 | |
| 6.25% (b)(f) | 12,760,000 | 14,044,414 | |
| 6.5% (b)(f) | 3,245,000 | 3,618,875 | |
| Barclays Bank PLC 7.625% 11/21/22 | 9,175,000 | 10,049,043 | |
| Barclays PLC: | |||
| 6.625% (b)(f) | 1,775,000 | 1,788,771 | |
| 8.25% (b)(f) | 2,085,000 | 2,249,020 | |
| BNP Paribas SA 7.375% (a)(b)(f) | 1,865,000 | 1,903,302 | |
| Citigroup, Inc.: | |||
| 5.875% (b)(f) | 3,735,000 | 3,950,343 | |
| 5.95% (b)(f) | 7,450,000 | 7,896,424 | |
| 5.95% (b)(f) | 1,115,000 | 1,167,724 | |
| 6.125% (b)(f) | 2,860,000 | 3,075,916 | |
| Credit Agricole SA: | |||
| 6.625% (a)(b)(f) | 9,580,000 | 9,580,134 | |
| 7.875% (a)(b)(f) | 1,480,000 | 1,531,526 | |
| JPMorgan Chase & Co.: | |||
| 5.3% (b)(f) | 560,000 | 589,439 | |
| 6% (b)(f) | 2,040,000 | 2,146,367 | |
| 6.1% (b)(f) | 1,135,000 | 1,220,165 | |
| 6.75% (b)(f) | 3,910,000 | 4,350,739 | |
| TOTAL BANKS & THRIFTS | 71,833,218 | ||
| TOTAL PREFERRED SECURITIES | |||
| (Cost $68,689,671) | 71,833,218 | ||
| Shares | Value | ||
| Money Market Funds - 3.0% | |||
| Fidelity Cash Central Fund, 0.60% (g) | |||
| (Cost $23,377,973) | 23,373,299 | 23,377,973 | |
| TOTAL INVESTMENT PORTFOLIO - 98.6% | |||
| (Cost $743,320,715) | 771,620,061 | ||
| NET OTHER ASSETS (LIABILITIES) - 1.4% | 11,297,072 | ||
| NET ASSETS - 100% | $782,917,133 |
Legend
(a) Security exempt from registration under Rule 144A of the Securities Act of 1933. These securities may be resold in transactions exempt from registration, normally to qualified institutional buyers. At the end of the period, the value of these securities amounted to $321,361,559 or 41.0% of net assets.
(b) Coupon rates for floating and adjustable rate securities reflect the rates in effect at period end.
(c) Security or a portion of the security purchased on a delayed delivery or when-issued basis.
(d) The coupon rate will be determined upon settlement of the loan after period end.
(e) Position represents an unfunded loan commitment. At period end, the total principal amount and market value of unfunded commitments totaled $1,183,934 and $1,186,562, respectively.
(f) Security is perpetual in nature with no stated maturity date.
(g) Affiliated fund that is generally available only to investment companies and other accounts managed by Fidelity Investments. The rate quoted is the annualized seven-day yield of the fund at period end. A complete unaudited listing of the fund's holdings as of its most recent quarter end is available upon request. In addition, each Fidelity Central Fund's financial statements are available on the SEC's website or upon request.
Affiliated Central Funds
Information regarding fiscal year to date income earned by the Fund from investments in Fidelity Central Funds is as follows:
| Fund | Income earned |
| Fidelity Cash Central Fund | $49,997 |
| Total | $49,997 |
Investment Valuation
The following is a summary of the inputs used, as of February 28, 2017, involving the Fund's assets and liabilities carried at fair value. The inputs or methodology used for valuing securities may not be an indication of the risk associated with investing in those securities. For more information on valuation inputs, and their aggregation into the levels used below, please refer to the Investment Valuation section in the accompanying Notes to Financial Statements.
| Valuation Inputs at Reporting Date: | ||||
| Description | Total | Level 1 | Level 2 | Level 3 |
| Investments in Securities: | ||||
| Corporate Bonds | $632,647,520 | $-- | $632,647,520 | $-- |
| Bank Loan Obligations | 43,761,350 | -- | 43,761,350 | -- |
| Preferred Securities | 71,833,218 | -- | 71,833,218 | -- |
| Money Market Funds | 23,377,973 | 23,377,973 | -- | -- |
| Total Investments in Securities: | $771,620,061 | $23,377,973 | $748,242,088 | $-- |
Other Information
Distribution of investments by country or territory of incorporation, as a percentage of Total Net Assets, is as follows (Unaudited):
| United States of America | 70.7% |
| Cayman Islands | 4.7% |
| Luxembourg | 4.4% |
| United Kingdom | 3.9% |
| Canada | 3.1% |
| Bermuda | 2.5% |
| Austria | 2.3% |
| Netherlands | 2.1% |
| Ireland | 2.0% |
| France | 1.6% |
| Multi-National | 1.3% |
| Others (Individually Less Than 1%) | 1.4% |
| 100.0% |
See accompanying notes which are an integral part of the financial statements.
Financial Statements
Statement of Assets and Liabilities
| February 28, 2017 (Unaudited) | ||
| Assets | ||
| Investment in securities, at value — See accompanying schedule: Unaffiliated issuers (cost $719,942,742) | $748,242,088 | |
| Fidelity Central Funds (cost $23,377,973) | 23,377,973 | |
| Total Investments (cost $743,320,715) | $771,620,061 | |
| Cash | 163,607 | |
| Receivable for investments sold | 7,823,240 | |
| Interest receivable | 9,136,499 | |
| Distributions receivable from Fidelity Central Funds | 7,037 | |
| Total assets | 788,750,444 | |
| Liabilities | ||
| Payable for investments purchased | ||
| Regular delivery | $4,613,841 | |
| Delayed delivery | 1,215,000 | |
| Distributions payable | 53 | |
| Other payables and accrued expenses | 4,417 | |
| Total liabilities | 5,833,311 | |
| Net Assets | $782,917,133 | |
| Net Assets consist of: | ||
| Paid in capital | $751,505,083 | |
| Distributions in excess of net investment income | (326,058) | |
| Accumulated undistributed net realized gain (loss) on investments | 3,438,762 | |
| Net unrealized appreciation (depreciation) on investments | 28,299,346 | |
| Net Assets, for 7,549,433 shares outstanding | $782,917,133 | |
| Net Asset Value, offering price and redemption price per share ($782,917,133 ÷ 7,549,433 shares) | $103.71 |
See accompanying notes which are an integral part of the financial statements.
Statement of Operations
| Six months ended February 28, 2017 (Unaudited) | ||
| Investment Income | ||
| Dividends | $2,507,795 | |
| Interest | 18,810,990 | |
| Income from Fidelity Central Funds | 49,997 | |
| Total income | 21,368,782 | |
| Expenses | ||
| Custodian fees and expenses | $6,343 | |
| Independent directors' fees and expenses | 1,647 | |
| Total expenses before reductions | 7,990 | |
| Expense reductions | (2,247) | 5,743 |
| Net investment income (loss) | 21,363,039 | |
| Realized and Unrealized Gain (Loss) | ||
| Net realized gain (loss) on: | ||
| Investment securities: | ||
| Unaffiliated issuers | 5,633,738 | |
| Fidelity Central Funds | 5,483 | |
| Total net realized gain (loss) | 5,639,221 | |
| Change in net unrealized appreciation (depreciation) on investment securities | 1,785,301 | |
| Net gain (loss) | 7,424,522 | |
| Net increase (decrease) in net assets resulting from operations | $28,787,561 |
See accompanying notes which are an integral part of the financial statements.
Statement of Changes in Net Assets
| Six months ended February 28, 2017 (Unaudited) | Year ended August 31, 2016 | |
| Increase (Decrease) in Net Assets | ||
| Operations | ||
| Net investment income (loss) | $21,363,039 | $46,452,119 |
| Net realized gain (loss) | 5,639,221 | (37,522,215) |
| Change in net unrealized appreciation (depreciation) | 1,785,301 | 50,540,780 |
| Net increase (decrease) in net assets resulting from operations | 28,787,561 | 59,470,684 |
| Distributions to shareholders from net investment income | (21,689,097) | (45,340,740) |
| Distributions to shareholders from net realized gain | (2,200,459) | – |
| Total distributions | (23,889,556) | (45,340,740) |
| Affiliated share transactions | ||
| Proceeds from sales of shares | 1 | 74,737,848 |
| Reinvestment of distributions | 23,889,165 | 45,340,038 |
| Cost of shares redeemed | (79,995,954) | (49,995,417) |
| Net increase (decrease) in net assets resulting from share transactions | (56,106,788) | 70,082,469 |
| Total increase (decrease) in net assets | (51,208,783) | 84,212,413 |
| Net Assets | ||
| Beginning of period | 834,125,916 | 749,913,503 |
| End of period | $782,917,133 | $834,125,916 |
| Other Information | ||
| Distributions in excess of net investment income end of period | $(326,058) | $– |
| Shares | ||
| Sold | –(a) | 746,796 |
| Issued in reinvestment of distributions | 232,897 | 457,967 |
| Redeemed | (776,738) | (500,303) |
| Net increase (decrease) | (543,841) | 704,460 |
(a) Amount represents less than one share.
See accompanying notes which are an integral part of the financial statements.
Financial Highlights — Fidelity Specialized High Income Central Fund
| Six months ended (Unaudited) February 28, | Years ended August 31, | |||||
| 2017 | 2016 | 2015 | 2014 | 2013 | 2012 | |
| Selected Per–Share Data | ||||||
| Net asset value, beginning of period | $103.06 | $101.49 | $107.68 | $103.63 | $104.86 | $98.66 |
| Income from Investment Operations | ||||||
| Net investment income (loss)A | 2.756 | 5.682 | 5.462 | 5.687 | 6.163 | 6.937 |
| Net realized and unrealized gain (loss) | .983 | 1.436 | (6.176) | 3.995 | (1.387) | 5.796 |
| Total from investment operations | 3.739 | 7.118 | (.714) | 9.682 | 4.776 | 12.733 |
| Distributions from net investment income | (2.800) | (5.548) | (5.476) | (5.632) | (6.006) | (6.533) |
| Distributions from net realized gain | (.289) | – | – | – | – | – |
| Total distributions | (3.089) | (5.548) | (5.476) | (5.632) | (6.006) | (6.533) |
| Net asset value, end of period | $103.71 | $103.06 | $101.49 | $107.68 | $103.63 | $104.86 |
| Total ReturnB,C | 3.70% | 7.39% | (.70)% | 9.53% | 4.58% | 13.31% |
| Ratios to Average Net AssetsD,E | ||||||
| Expenses before reductionsF | - %G | -% | -% | -% | -% | -% |
| Expenses net of fee waivers, if anyF | - %G | -% | -% | -% | -% | -% |
| Expenses net of all reductionsF | - %G | -% | -% | -% | -% | -% |
| Net investment income (loss) | 5.41%G | 5.75% | 5.22% | 5.34% | 5.80% | 6.82% |
| Supplemental Data | ||||||
| Net assets, end of period (000 omitted) | $782,917 | $834,126 | $749,914 | $474,640 | $396,497 | $464,917 |
| Portfolio turnover rateH | 46%G | 46% | 49% | 78% | 72% | 41% |
A Calculated based on average shares outstanding during the period.
B Total returns for periods of less than one year are not annualized.
C Total returns would have been lower if certain expenses had not been reduced during the applicable periods shown.
D Fees and expenses of any underlying Fidelity Central Funds are not included in the Fund's expense ratio. The Fund indirectly bears its proportionate share of the expenses of any underlying Fidelity Central Funds.
E Expense ratios reflect operating expenses of the Fund. Expenses before reductions do not reflect amounts reimbursed by the investment adviser or reductions from expense offset arrangements and do not represent the amount paid by the Fund during periods when reimbursements or reductions occur. Expenses net of fee waivers reflect expenses after reimbursement by the investment adviser but prior to reductions from expense offset arrangements. Expenses net of all reductions represent the net expenses paid by the Fund.
F Amount represents less than .005%.
G Annualized
H Amount does not include the portfolio activity of any underlying Fidelity Central Funds.
See accompanying notes which are an integral part of the financial statements.
Notes to Financial Statements (Unaudited)
For the period ended February 28, 2017
1. Organization.
Fidelity Specialized High Income Central Fund (the Fund) is a fund of Fidelity Central Investment Portfolios LLC (the LLC) and is authorized to issue an unlimited number of shares. Shares of the Fund are only offered to other investment companies and accounts managed by Fidelity Management & Research Company (FMR), or its affiliates (the Investing Funds). The LLC is registered under the Investment Company Act of 1940, as amended (the 1940 Act), as an open-end management investment company organized as a Delaware Limited Liability Company.
2. Investments in Fidelity Central Funds.
The Fund invests in Fidelity Central Funds, which are open-end investment companies generally available only to other investment companies and accounts managed by the investment adviser and its affiliates. The Fund's Schedule of Investments lists each of the Fidelity Central Funds held as of period end, if any, as an investment of the Fund, but does not include the underlying holdings of each Fidelity Central Fund. As an Investing Fund, the Fund indirectly bears its proportionate share of the expenses of the underlying Fidelity Central Funds.
The Money Market Central Funds seek preservation of capital and current income and are managed by Fidelity Investments Money Management, Inc. (FIMM), an affiliate of the investment adviser. Annualized expenses of the Money Market Central Funds as of their most recent shareholder report date are less than .005%.
A complete unaudited list of holdings for each Fidelity Central Fund is available upon request or at the Securities and Exchange Commission (the SEC) website at www.sec.gov. In addition, the financial statements of the Fidelity Central Funds are available on the SEC website or upon request.
3. Significant Accounting Policies.
The financial statements have been prepared in conformity with accounting principles generally accepted in the United States of America (GAAP), which require management to make certain estimates and assumptions at the date of the financial statements. Actual results could differ from those estimates. Subsequent events, if any, through the date that the financial statements were issued have been evaluated in the preparation of the financial statements. The following summarizes the significant accounting policies of the Fund:
Investment Valuation. Investments are valued as of 4:00 p.m. Eastern time on the last calendar day of the period. The Board of Directors (the Board) has delegated the day to day responsibility for the valuation of the Fund's investments to the Fair Value Committee (the Committee) established by the Fund's investment adviser. In accordance with valuation policies and procedures approved by the Board, the Fund attempts to obtain prices from one or more third party pricing vendors or brokers to value its investments. When current market prices, quotations or currency exchange rates are not readily available or reliable, investments will be fair valued in good faith by the Committee, in accordance with procedures adopted by the Board. Factors used in determining fair value vary by investment type and may include market or investment specific events, changes in interest rates and credit quality. The frequency with which these procedures are used cannot be predicted and they may be utilized to a significant extent. The Committee oversees the Fund's valuation policies and procedures and reports to the Board on the Committee's activities and fair value determinations. The Board monitors the appropriateness of the procedures used in valuing the Fund's investments and ratifies the fair value determinations of the Committee.
The Fund categorizes the inputs to valuation techniques used to value its investments into a disclosure hierarchy consisting of three levels as shown below:
- Level 1 – quoted prices in active markets for identical investments
- Level 2 – other significant observable inputs (including quoted prices for similar investments, interest rates, prepayment speeds, etc.)
- Level 3 – unobservable inputs (including the Fund's own assumptions based on the best information available)
Valuation techniques used to value the Fund's investments by major category are as follows:
Debt securities, including restricted securities, are valued based on evaluated prices received from third party pricing vendors or from brokers who make markets in such securities. Corporate bonds, bank loan obligations and preferred securities are valued by pricing vendors who utilize matrix pricing which considers yield or price of bonds of comparable quality, coupon, maturity and type or by broker-supplied prices. When independent prices are unavailable or unreliable, debt securities may be valued utilizing pricing methodologies which consider similar factors that would be used by third party pricing vendors. Debt securities are generally categorized as Level 2 in the hierarchy but may be Level 3 depending on the circumstances. The Fund invests a significant portion of its assets in below investment grade securities. The value of these securities can be more volatile due to changes in the credit quality of the issuer and is sensitive to changes in economic, market and regulatory conditions.
Investments in open-end mutual funds, including other Fidelity Central Funds, are valued at their closing net asset value (NAV) each business day and are categorized as Level 1 in the hierarchy.
Changes in valuation techniques may result in transfers in or out of an assigned level within the disclosure hierarchy. The aggregate value of investments by input level as of February 28, 2017, is included at the end of the Fund's Schedule of Investments.
Investment Transactions and Income. For financial reporting purposes, the Fund's investment holdings and NAV include trades executed through the end of the last business day of the period. The NAV per share for processing shareholder transactions is calculated as of the close of business of the New York Stock Exchange (NYSE), normally 4:00 p.m. Eastern time and includes trades executed through the end of the prior business day. Gains and losses on securities sold are determined on the basis of identified cost and may include proceeds received from litigation. Dividend income is recorded on the ex-dividend date. Income and capital gain distributions from Fidelity Central Funds, if any, are recorded on the ex-dividend date. Interest income is accrued as earned and includes coupon interest and amortization of premium and accretion of discount on debt securities as applicable. Debt obligations may be placed on non-accrual status and related interest income may be reduced by ceasing current accruals and writing off interest receivables when the collection of all or a portion of interest has become doubtful based on consistently applied procedures. A debt obligation is removed from non-accrual status when the issuer resumes interest payments or when collectability of interest is reasonably assured.
Expenses. Expenses directly attributable to a fund are charged to that fund. Expenses attributable to more than one fund are allocated among the respective funds on the basis of relative net assets or other appropriate methods. Expense estimates are accrued in the period to which they relate and adjustments are made when actual amounts are known.
Income Tax Information and Distributions to Shareholders. Each year, effective September 1, 2016, the Fund intends to qualify as a regulated investment company under Subchapter M of the Internal Revenue Code, including distributing substantially all of its taxable income and realized gains. As a result, no provision for U.S. Federal income taxes is required. The Fund files a U.S. federal tax return, in addition to state and local tax returns as required. The Fund's federal income tax returns are subject to examination by the Internal Revenue Service (IRS) for a period of three fiscal years after they are filed. State and local tax returns may be subject to examination for an additional fiscal year depending on the jurisdiction. Prior to September 1, 2016, the Fund was a partnership for tax purposes, and no provision was made for U.S. Federal income taxes because the Fund allocated, at least annually among its partners, each partner's share of the Fund's income and expenses and capital gains and losses as determined by income tax regulations for inclusion in each partner's tax return. Due to the Fund's previous partnership structure, paid in capital includes any accumulated net investment income/(loss) and net realized gain/(loss) on investments prior to September 1, 2016.
Dividends are declared and recorded daily and paid monthly from net investment income. Distributions from realized gains, if any, are declared and recorded on the ex-dividend date. Income and capital gain distributions are determined in accordance with income tax regulations, which may differ from GAAP.
Capital accounts within the financial statements are adjusted for permanent book-tax differences. These adjustments have no impact on net assets or the results of operations. Capital accounts are not adjusted for temporary book-tax differences which will reverse in a subsequent period.
The federal tax cost of investment securities and unrealized appreciation (depreciation) as of period end were as follows:
| Gross unrealized appreciation | $29,995,027 |
| Gross unrealized depreciation | (1,762,264) |
| Net unrealized appreciation (depreciation) on securities | $28,232,763 |
| Tax Cost | $743,387,298 |
Delayed Delivery Transactions and When-Issued Securities. During the period, the Fund transacted in securities on a delayed delivery or when-issued basis. Payment and delivery may take place after the customary settlement period for that security. The price of the underlying securities and the date when the securities will be delivered and paid for are fixed at the time the transaction is negotiated. The securities purchased on a delayed delivery or when-issued basis are identified as such in the Fund's Schedule of Investments. The Fund may receive compensation for interest forgone in the purchase of a delayed delivery or when-issued security. With respect to purchase commitments, the Fund identifies securities as segregated in its records with a value at least equal to the amount of the commitment. Losses may arise due to changes in the value of the underlying securities or if the counterparty does not perform under the contract's terms, or if the issuer does not issue the securities due to political, economic, or other factors.
Restricted Securities. The Fund may invest in securities that are subject to legal or contractual restrictions on resale. These securities generally may be resold in transactions exempt from registration or to the public if the securities are registered. Disposal of these securities may involve time-consuming negotiations and expense, and prompt sale at an acceptable price may be difficult. Information regarding restricted securities is included at the end of the Fund's Schedule of Investments.
Loans and Other Direct Debt Instruments. The Fund invests in direct debt instruments which are interests in amounts owed to lenders by corporate or other borrowers. These instruments may be in the form of loans, trade claims or other receivables and may include standby financing commitments such as revolving credit facilities that obligate the Fund to supply additional cash to the borrower on demand. Loans may be acquired through assignment or participation. The Fund also invests in unfunded load commitments, which are contractual obligations for future funding. Information regarding unfunded commitments is included at the end of the Fund's Schedule of Investments.
4. Purchases and Sales of Investments.
Purchases and sales of securities, other than short-term securities, aggregated $176,623,243 and $229,560,344, respectively.
5. Fees and Other Transactions with Affiliates.
Management Fee and Expense Contract. FMR Co., Inc. (the investment adviser), an affiliate of FMR, provides the Fund with investment management services. The Fund does not pay any fees for these services. Pursuant to the Fund's management contract with the investment adviser, FMR pays the investment adviser a portion of the management fees it receives from the Investing Funds. In addition, under an expense contract, FMR also pays all other expenses of the Fund, excluding custody fees, the compensation of the independent Directors, and certain exceptions such as interest expense.
Interfund Trades. The Fund may purchase from or sell securities to other Fidelity Funds under procedures adopted by the Board. The procedures have been designed to ensure these interfund trades are executed in accordance with Rule 17a-7 of the 1940 Act. Interfund trades are included within the respective purchases and sales amounts shown in the Purchases and Sales of Investments note.
6. Expense Reductions.
FMR has voluntarily agreed to reimburse a portion of the Fund's operating expenses. For the period, the reimbursement reduced the expenses by $1,647.
In addition, through arrangements with the Fund's custodian, credits realized as a result of certain uninvested cash balances were used to reduce the Fund's expenses. During the period, these credits reduced the Fund's custody expenses by $600.
7. Other.
The Fund's organizational documents provide former and current directors and officers with a limited indemnification against liabilities arising in connection with the performance of their duties to the Fund. In the normal course of business, the Fund may also enter into contracts that provide general indemnifications. The Fund's maximum exposure under these arrangements is unknown as this would be dependent on future claims that may be made against the Fund. The risk of material loss from such claims is considered remote.
At the end of the period, mutual funds managed by FMR or its affiliates were the owners of record of all of the outstanding shares of the fund.
Shareholder Expense Example
As a shareholder of the Fund, you incur two types of costs: (1) transaction costs, and (2) ongoing costs, including other Fund expenses. This Example is intended to help you understand your ongoing costs (in dollars) of investing in the Fund and to compare these costs with the ongoing costs of investing in other mutual funds.
The Example is based on an investment of $1,000 invested at the beginning of the period and held for the entire period (September 1, 2016 to February 28, 2017).
Actual Expenses
The first line of the accompanying table provides information about actual account values and actual expenses. You may use the information in this line, together with the amount you invested, to estimate the expenses that you paid over the period. Simply divide your account value by $1,000.00 (for example, an $8,600 account value divided by $1,000.00 = 8.6), then multiply the result by the number in the first line under the heading entitled "Expenses Paid During Period" to estimate the expenses you paid on your account during this period. In addition, the Fund, as a shareholder in the underlying Fidelity Central Funds, will indirectly bear its pro-rata share of the fees and expenses incurred by the underlying Fidelity Central Funds. These fees and expenses are not included in the Fund's annualized expense ratio used to calculate the expense estimate in the table below.
Hypothetical Example for Comparison Purposes
The second line of the accompanying table provides information about hypothetical account values and hypothetical expenses based on the Fund's actual expense ratio and an assumed rate of return of 5% per year before expenses, which is not the Fund's actual return. The hypothetical account values and expenses may not be used to estimate the actual ending account balance or expenses you paid for the period. You may use this information to compare the ongoing costs of investing in the Fund and other funds. To do so, compare this 5% hypothetical example with the 5% hypothetical examples that appear in the shareholder reports of the other funds. In addition, the Fund, as a shareholder in the underlying Fidelity Central Funds, will indirectly bear its pro-rata share of the fees and expenses incurred by the underlying Fidelity Central Funds. These fees and expenses are not included in the Fund's annualized expense ratio used to calculate the expense estimate in the table below.
Please note that the expenses shown in the table are meant to highlight your ongoing costs only and do not reflect any transaction costs. Therefore, the second line of the table is useful in comparing ongoing costs only, and will not help you determine the relative total costs of owning different funds.
| Annualized Expense Ratio-A | Beginning Account Value September 1, 2016 | Ending Account Value February 28, 2017 | Expenses Paid During Period-B September 1, 2016 to February 28, 2017 | |
| Actual | .0016% | $1,000.00 | $1,037.00 | $.01 |
| Hypothetical-C | $1,000.00 | $1,024.79 | $.01 |
A Annualized expense ratio reflects expenses net of applicable fee waivers.
B Expenses are equal to the Fund's annualized expense ratio, multiplied by the average account value over the period, multiplied by 181/365 (to reflect the one-half year period).
C 5% return per year before expenses
![]()
Corporate Headquarters
245 Summer St.
Boston, MA 02210
www.fidelity.com
SHI-SANN-0417
1.820820.111
Item 2.
Code of Ethics
Not applicable.
Item 3.
Audit Committee Financial Expert
Not applicable.
Item 4.
Principal Accountant Fees and Services
Not applicable.
Item 5.
Audit Committee of Listed Registrants
Not applicable.
Item 6.
Investments
(a)
Not applicable.
(b)
Not applicable
Item 7.
Disclosure of Proxy Voting Policies and Procedures for Closed-End Management Investment Companies
Not applicable.
Item 8.
Portfolio Managers of Closed-End Management Investment Companies
Not applicable.
Item 9.
Purchase of Equity Securities by Closed-End Management Investment Company and Affiliated Purchasers
Not applicable.
Item 10.
Submission of Matters to a Vote of Security Holders
There were no material changes to the procedures by which shareholders may recommend nominees to the Fidelity Central Investment Portfolios LLC’s Board of Trustees.
Item 11.
Controls and Procedures
(a)(i) The President and Treasurer and the Chief Financial Officer have concluded that the Fidelity Central Investment Portfolios LLC’s (the “Trust”) disclosure controls and
procedures (as defined in Rule 30a-3(c) under the Investment Company Act) provide reasonable assurances that material information relating to the Trust is made known to them by the appropriate persons, based on their evaluation of these controls and procedures as of a date within 90 days of the filing date of this report.
(a)(ii) There was no change in the Trust’s internal control over financial reporting (as defined in Rule 30a-3(d) under the Investment Company Act) that occurred during the second fiscal quarter of the period covered by this report that has materially affected, or is reasonably likely to materially affect, the Trust’s internal control over financial reporting.
Item 12.
Exhibits
(a) | (1) | Not applicable. |
(a) | (2) | Certification pursuant to Rule 30a-2(a) under the Investment Company Act of 1940 (17 CFR 270.30a-2(a)) is filed and attached hereto as Exhibit 99.CERT. |
(a) | (3) | Not applicable. |
(b) | Certification pursuant to Rule 30a-2(b) under the Investment Company Act of 1940 (17 CFR 270.30a-2(b)) is furnished and attached hereto as Exhibit 99.906CERT. |
SIGNATURES
Pursuant to the requirements of the Securities Exchange Act of 1934 and the Investment Company Act of 1940, the registrant has duly caused this report to be signed on its behalf by the undersigned, thereunto duly authorized.
Fidelity Central Investment Portfolios LLC
By: | /s/Stacie M. Smith |
Stacie M. Smith | |
President and Treasurer | |
Date: | May 1, 2017 |
Pursuant to the requirements of the Securities Exchange Act of 1934 and the Investment Company Act of 1940, this report has been signed below by the following persons on behalf of the registrant and in the capacities and on the dates indicated.
By: | /s/Stacie M. Smith |
Stacie M. Smith | |
President and Treasurer | |
Date: | May 1, 2017 |
By: | /s/Howard J. Galligan III |
Howard J. Galligan III | |
Chief Financial Officer | |
Date: | May 1, 2017 |