UNITED STATES
SECURITIES AND EXCHANGE COMMISSION
Washington, D.C. 20549
FORM N-CSR
CERTIFIED SHAREHOLDER REPORT OF REGISTERED
MANAGEMENT INVESTMENT COMPANIES
Investment Company Act file number 811-21667
Fidelity Central Investment Portfolios LLC
(Exact name of registrant as specified in charter)
245 Summer St., Boston, MA 02210
(Address of principal executive offices) (Zip code)
Marc Bryant, Secretary
245 Summer St.
Boston, Massachusetts 02210
(Name and address of agent for service)
Registrant's telephone number, including area code:
617-563-7000
Date of fiscal year end: | September 30 |
Date of reporting period: | March 31, 2018 |
Item 1.
Reports to Stockholders
Fidelity® High Income Central Fund 1 Semi-Annual Report March 31, 2018 |
 |
Contents
To view a fund's proxy voting guidelines and proxy voting record for the 12-month period ended June 30, visit http://www.fidelity.com/proxyvotingresults or visit the Securities and Exchange Commission's (SEC) web site at http://www.sec.gov.
You may also call 1-800-544-8544 to request a free copy of the proxy voting guidelines.
Standard & Poor's, S&P and S&P 500 are registered service marks of The McGraw-Hill Companies, Inc. and have been licensed for use by Fidelity Distributors Corporation.
Other third-party marks appearing herein are the property of their respective owners.
All other marks appearing herein are registered or unregistered trademarks or service marks of FMR LLC or an affiliated company. © 2018 FMR LLC. All rights reserved.
A fund files its complete schedule of portfolio holdings with the SEC for the first and third quarters of each fiscal year on Form N-Q. Forms N-Q are available on the SEC’s web site at http://www.sec.gov. A fund's Forms N-Q may be reviewed and copied at the SEC’s Public Reference Room in Washington, DC. Information regarding the operation of the SEC's Public Reference Room may be obtained by calling 1-800-SEC-0330.
Investment Summary (Unaudited)
Top Five Holdings as of March 31, 2018
| (by issuer, excluding cash equivalents) | % of fund's net assets |
| Icahn Enterprises LP/Icahn Enterprises Finance Corp. | 3.7 |
| CCO Holdings LLC/CCO Holdings Capital Corp. | 3.0 |
| TransDigm, Inc. | 2.2 |
| Altice SA | 1.8 |
| Global Partners LP/GLP Finance Corp. | 1.8 |
| 12.5 |
Top Five Market Sectors as of March 31, 2018
| % of fund's net assets | |
| Energy | 17.3 |
| Diversified Financial Services | 8.2 |
| Cable/Satellite TV | 7.8 |
| Utilities | 7.2 |
| Healthcare | 6.6 |
Quality Diversification (% of fund's net assets)
| As of March 31, 2018 | ||
| BBB | 0.7% | |
| BB | 45.9% | |
| B | 38.0% | |
| CCC,CC,C | 10.2% | |
| Not Rated | 2.8% | |
| Equities | 0.2% | |
| Short-Term Investments and Net Other Assets | 2.2% | |
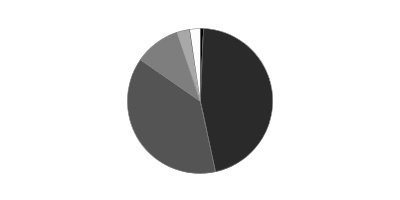
We have used ratings from Moody's Investors Service, Inc. Where Moody's® ratings are not available, we have used S&P® ratings. All ratings are as of the date indicated and do not reflect subsequent changes.
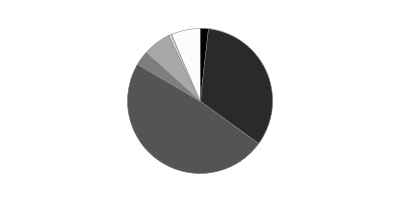
Asset Allocation (% of fund's net assets)
| As of March 31, 2018* | ||
| Nonconvertible Bonds | 83.9% | |
| Convertible Bonds, Preferred Stocks | 0.8% | |
| Common Stocks | 0.2% | |
| Bank Loan Obligations | 8.7% | |
| Other Investments | 4.2% | |
| Short-Term Investments and Net Other Assets (Liabilities) | 2.2% | |

* Foreign investments - 24.0%
Schedule of Investments March 31, 2018 (Unaudited)
Showing Percentage of Net Assets
| Corporate Bonds - 84.7% | |||
| Principal Amount | Value | ||
| Convertible Bonds - 0.8% | |||
| Broadcasting - 0.3% | |||
| DISH Network Corp.: | |||
| 2.375% 3/15/24 | $750,000 | $663,218 | |
| 3.375% 8/15/26 | 770,000 | 741,664 | |
| 1,404,882 | |||
| Utilities - 0.5% | |||
| SolarCity Corp. 1.625% 11/1/19 | 2,040,000 | 1,861,490 | |
| TOTAL CONVERTIBLE BONDS | 3,266,372 | ||
| Nonconvertible Bonds - 83.9% | |||
| Aerospace - 2.1% | |||
| Bombardier, Inc.: | |||
| 6.125% 1/15/23 (a) | 2,545,000 | 2,538,612 | |
| 7.5% 12/1/24 (a) | 1,350,000 | 1,397,250 | |
| TransDigm, Inc.: | |||
| 6% 7/15/22 | 1,900,000 | 1,938,000 | |
| 6.375% 6/15/26 | 275,000 | 277,063 | |
| 6.5% 5/15/25 | 1,895,000 | 1,913,950 | |
| 8,064,875 | |||
| Air Transportation - 1.2% | |||
| Allegiant Travel Co. 5.5% 7/15/19 | 550,000 | 558,250 | |
| American Airlines Group, Inc. 4.625% 3/1/20 (a) | 550,000 | 554,125 | |
| U.S. Airways pass-thru certificates: | |||
| Series 2012-2C, 5.45% 6/3/18 | 940,000 | 944,700 | |
| Series 2013-1 Class B, 5.375% 11/15/21 | 154,954 | 159,603 | |
| United Air Lines, Inc. pass-thru trust certificates Class B, 7.336% 7/2/19 | 369,159 | 382,080 | |
| United Continental Holdings, Inc. 4.25% 10/1/22 | 1,940,000 | 1,901,200 | |
| 4,499,958 | |||
| Automotive & Auto Parts - 0.3% | |||
| American Tire Distributors, Inc. 10.25% 3/1/22 (a) | 440,000 | 449,350 | |
| Delphi Technologies PLC 5% 10/1/25 (a) | 560,000 | 536,900 | |
| Jaguar Land Rover PLC 4.5% 10/1/27 (a) | 370,000 | 348,263 | |
| 1,334,513 | |||
| Banks & Thrifts - 0.1% | |||
| Ally Financial, Inc. 8% 11/1/31 | 320,000 | 390,400 | |
| Broadcasting - 0.8% | |||
| Sirius XM Radio, Inc.: | |||
| 3.875% 8/1/22 (a) | 1,330,000 | 1,276,800 | |
| 5% 8/1/27 (a) | 2,065,000 | 1,941,100 | |
| 3,217,900 | |||
| Building Materials - 0.3% | |||
| Building Materials Corp. of America 4.75% 1/15/28 (a) | 1,050,000 | 987,998 | |
| Cable/Satellite TV - 7.1% | |||
| Altice SA: | |||
| 7.625% 2/15/25 (a) | 570,000 | 487,350 | |
| 7.75% 5/15/22 (a) | 7,045,000 | 6,542,973 | |
| Altice U.S. Finance SA 5.375% 7/15/23 (a) | 1,625,000 | 1,646,125 | |
| Cablevision Systems Corp. 5.875% 9/15/22 | 805,000 | 798,721 | |
| CCO Holdings LLC/CCO Holdings Capital Corp.: | |||
| 4% 3/1/23 (a) | 3,805,000 | 3,662,313 | |
| 5% 2/1/28 (a) | 3,635,000 | 3,407,813 | |
| 5.125% 5/1/27 (a) | 2,910,000 | 2,762,754 | |
| 5.5% 5/1/26 (a) | 1,855,000 | 1,815,581 | |
| CSC Holdings, Inc. 5.5% 4/15/27 (a) | 925,000 | 885,688 | |
| DISH DBS Corp.: | |||
| 5.875% 11/15/24 | 800,000 | 713,000 | |
| 7.75% 7/1/26 | 345,000 | 324,731 | |
| Virgin Media Secured Finance PLC 5.5% 8/15/26 (a) | 2,140,000 | 2,079,802 | |
| Ziggo Bond Finance BV 5.875% 1/15/25 (a) | 1,635,000 | 1,545,075 | |
| Ziggo Secured Finance BV 5.5% 1/15/27 (a) | 1,325,000 | 1,245,116 | |
| 27,917,042 | |||
| Capital Goods - 0.5% | |||
| J.B. Poindexter & Co., Inc. 9% 4/1/22 (a) | 1,801,000 | 1,857,281 | |
| Chemicals - 4.0% | |||
| CF Industries Holdings, Inc.: | |||
| 3.4% 12/1/21 (a) | 580,000 | 572,552 | |
| 3.45% 6/1/23 | 600,000 | 576,000 | |
| 4.5% 12/1/26 (a) | 420,000 | 425,919 | |
| Evolution Escrow Issuer LLC 7.5% 3/15/22 (a) | 650,000 | 674,765 | |
| NOVA Chemicals Corp.: | |||
| 4.875% 6/1/24 (a) | 1,110,000 | 1,062,825 | |
| 5.25% 6/1/27 (a) | 840,000 | 798,000 | |
| Nufarm Australia Ltd. 6.375% 10/15/19 (a) | 1,080,000 | 1,093,500 | |
| Olin Corp.: | |||
| 5% 2/1/30 | 435,000 | 416,513 | |
| 5.125% 9/15/27 | 1,725,000 | 1,701,281 | |
| Platform Specialty Products Corp. 5.875% 12/1/25 (a) | 1,350,000 | 1,319,625 | |
| TPC Group, Inc. 8.75% 12/15/20 (a) | 2,800,000 | 2,813,160 | |
| Trinseo Materials Operating SCA/Trinseo Materials Finance, Inc. 5.375% 9/1/25 (a) | 1,175,000 | 1,154,438 | |
| Tronox Finance PLC 5.75% 10/1/25 (a) | 235,000 | 228,538 | |
| Tronox, Inc. 6.5% 4/15/26 | 1,305,000 | 1,305,000 | |
| Valvoline, Inc. 4.375% 8/15/25 | 970,000 | 942,113 | |
| Versum Materials, Inc. 5.5% 9/30/24 (a) | 580,000 | 600,300 | |
| 15,684,529 | |||
| Consumer Products - 0.3% | |||
| Coty, Inc. 6.5% 4/15/26 (a) | 900,000 | 904,500 | |
| Prestige Brands, Inc. 6.375% 3/1/24 (a) | 370,000 | 378,325 | |
| 1,282,825 | |||
| Containers - 3.1% | |||
| Ard Securities Finance Sarl 8.75% 1/31/23 pay-in-kind (a)(b) | 765,000 | 801,338 | |
| Ardagh Packaging Finance PLC/Ardagh MP Holdings U.S.A., Inc.: | |||
| 4.25% 9/15/22 (a) | 925,000 | 920,375 | |
| 4.625% 5/15/23 (a) | 3,445,000 | 3,457,919 | |
| 6% 2/15/25 (a) | 2,350,000 | 2,361,750 | |
| Crown Americas LLC/Crown Americas Capital Corp. V 4.25% 9/30/26 | 1,930,000 | 1,785,250 | |
| OI European Group BV 4% 3/15/23 (a) | 1,380,000 | 1,314,450 | |
| Reynolds Group Issuer, Inc./Reynolds Group Issuer LLC/Reynolds Group Issuer (Luxembourg) SA: | |||
| 3 month U.S. LIBOR + 3.500% 5.2215% 7/15/21 (a)(b)(c) | 1,300,000 | 1,316,250 | |
| 5.75% 10/15/20 | 373,106 | 377,770 | |
| 12,335,102 | |||
| Diversified Financial Services - 8.2% | |||
| Aircastle Ltd. 4.125% 5/1/24 | 385,000 | 377,300 | |
| Chobani LLC/Finance Corp., Inc. 7.5% 4/15/25 (a) | 760,000 | 782,800 | |
| CIT Group, Inc.: | |||
| 4.125% 3/9/21 | 470,000 | 472,350 | |
| 5.25% 3/7/25 | 395,000 | 404,409 | |
| 6.125% 3/9/28 | 355,000 | 368,313 | |
| Crown Americas LLC / Crown Americas Capital Corp. IV 4.75% 2/1/26 (a) | 955,000 | 923,963 | |
| FLY Leasing Ltd. 5.25% 10/15/24 | 1,830,000 | 1,770,525 | |
| Icahn Enterprises LP/Icahn Enterprises Finance Corp.: | |||
| 5.875% 2/1/22 | 8,745,000 | 8,766,835 | |
| 6.25% 2/1/22 | 4,515,000 | 4,594,013 | |
| 6.375% 12/15/25 | 1,030,000 | 1,035,150 | |
| ILFC E-Capital Trust I 3 month U.S. LIBOR + 1.550% 4.64% 12/21/65 (a)(b)(c) | 1,810,000 | 1,764,750 | |
| ILFC E-Capital Trust II 3 month U.S. LIBOR + 1.800% 4.89% 12/21/65 (a)(b)(c) | 4,940,000 | 4,828,850 | |
| MSCI, Inc. 4.75% 8/1/26 (a) | 2,985,000 | 2,955,150 | |
| Quicken Loans, Inc. 5.25% 1/15/28 (a) | 1,035,000 | 967,725 | |
| Radiate Holdco LLC/Radiate Financial Service Ltd.: | |||
| 6.625% 2/15/25 (a) | 640,000 | 595,200 | |
| 6.875% 2/15/23 (a) | 185,000 | 178,988 | |
| Tempo Acquisition LLC 6.75% 6/1/25 (a) | 1,385,000 | 1,383,269 | |
| 32,169,590 | |||
| Diversified Media - 0.5% | |||
| E.W. Scripps Co. 5.125% 5/15/25 (a) | 785,000 | 730,050 | |
| MDC Partners, Inc. 6.5% 5/1/24 (a) | 1,415,000 | 1,376,088 | |
| 2,106,138 | |||
| Energy - 16.1% | |||
| Antero Resources Corp.: | |||
| 5.125% 12/1/22 | 2,200,000 | 2,216,500 | |
| 5.625% 6/1/23 (Reg. S) | 2,205,000 | 2,249,100 | |
| Calfrac Holdings LP 7.5% 12/1/20 (a) | 550,000 | 541,063 | |
| Cheniere Corpus Christi Holdings LLC: | |||
| 5.875% 3/31/25 | 1,615,000 | 1,689,694 | |
| 7% 6/30/24 | 1,475,000 | 1,631,719 | |
| Chesapeake Energy Corp.: | |||
| 4.875% 4/15/22 | 2,630,000 | 2,432,750 | |
| 5.75% 3/15/23 | 1,715,000 | 1,545,644 | |
| 8% 12/15/22 (a) | 1,057,000 | 1,115,135 | |
| 8% 1/15/25 (a) | 560,000 | 541,800 | |
| 8% 6/15/27 (a) | 1,010,000 | 964,550 | |
| CNX Midstream Partners LP 6.5% 3/15/26 (a) | 215,000 | 212,044 | |
| Consolidated Energy Finance SA: | |||
| 3 month U.S. LIBOR + 3.750% 5.8745% 6/15/22 (a)(b)(c) | 3,330,000 | 3,328,838 | |
| 6.875% 6/15/25 (a) | 945,000 | 989,888 | |
| Continental Resources, Inc.: | |||
| 4.375% 1/15/28 (a) | 1,155,000 | 1,126,125 | |
| 4.5% 4/15/23 | 2,460,000 | 2,487,675 | |
| 4.9% 6/1/44 | 395,000 | 378,213 | |
| Covey Park Energy LLC 7.5% 5/15/25 (a) | 485,000 | 482,575 | |
| Crestwood Midstream Partners LP/Crestwood Midstream Finance Corp. 5.75% 4/1/25 | 1,045,000 | 1,035,856 | |
| Diamond Offshore Drilling, Inc. 7.875% 8/15/25 | 730,000 | 731,825 | |
| Endeavor Energy Resources LP/EER Finance, Inc.: | |||
| 5.5% 1/30/26 (a) | 220,000 | 218,900 | |
| 5.75% 1/30/28 (a) | 220,000 | 219,175 | |
| Energy Transfer Equity LP 4.25% 3/15/23 | 1,360,000 | 1,322,600 | |
| Ensco PLC: | |||
| 4.5% 10/1/24 | 2,460,000 | 1,955,700 | |
| 5.2% 3/15/25 | 3,400,000 | 2,737,000 | |
| 7.75% 2/1/26 | 575,000 | 527,563 | |
| Exterran Energy Solutions LP 8.125% 5/1/25 (a) | 600,000 | 636,000 | |
| Exterran Partners LP/EXLP Finance Corp. 6% 4/1/21 | 2,925,000 | 2,928,656 | |
| FTS International, Inc. 6.25% 5/1/22 | 550,000 | 551,375 | |
| Hess Infrastructure Partners LP 5.625% 2/15/26 (a) | 655,000 | 643,538 | |
| Hilcorp Energy I LP/Hilcorp Finance Co.: | |||
| 5% 12/1/24 (a) | 4,040,000 | 3,979,400 | |
| 5.75% 10/1/25 (a) | 1,635,000 | 1,618,650 | |
| Indigo Natural Resources LLC 6.875% 2/15/26 (a) | 1,220,000 | 1,149,850 | |
| Jonah Energy LLC 7.25% 10/15/25 (a) | 695,000 | 625,500 | |
| Nabors Industries, Inc.: | |||
| 5.5% 1/15/23 | 880,000 | 860,297 | |
| 5.75% 2/1/25 (a) | 1,385,000 | 1,307,094 | |
| Newfield Exploration Co. 5.375% 1/1/26 | 395,000 | 407,838 | |
| NextEra Energy Partners LP: | |||
| 4.25% 9/15/24 (a) | 340,000 | 329,800 | |
| 4.5% 9/15/27 (a) | 235,000 | 221,488 | |
| NGL Energy Partners LP/NGL Energy Finance Corp. 6.125% 3/1/25 | 260,000 | 247,650 | |
| NGPL PipeCo LLC: | |||
| 4.375% 8/15/22 (a) | 125,000 | 124,219 | |
| 4.875% 8/15/27 (a) | 125,000 | 123,125 | |
| Noble Holding International Ltd.: | |||
| 7.7% 4/1/25 (b) | 865,000 | 765,525 | |
| 7.75% 1/15/24 | 1,524,000 | 1,413,510 | |
| Parsley Energy LLC/Parsley: | |||
| 5.25% 8/15/25 (a) | 200,000 | 198,250 | |
| 5.375% 1/15/25 (a) | 355,000 | 354,113 | |
| PBF Logistics LP/PBF Logistics Finance, Inc. 6.875% 5/15/23 (a) | 780,000 | 789,750 | |
| Precision Drilling Corp.: | |||
| 5.25% 11/15/24 | 325,000 | 304,688 | |
| 6.5% 12/15/21 | 213,000 | 214,598 | |
| 7.125% 1/15/26 (a) | 415,000 | 410,850 | |
| 7.75% 12/15/23 | 1,265,000 | 1,314,019 | |
| Range Resources Corp.: | |||
| 4.875% 5/15/25 | 1,905,000 | 1,766,888 | |
| 5% 3/15/23 | 2,030,000 | 1,946,364 | |
| Sanchez Energy Corp. 7.25% 2/15/23 (a) | 780,000 | 783,900 | |
| SemGroup Corp. 7.25% 3/15/26 | 475,000 | 473,813 | |
| Southwestern Energy Co. 4.1% 3/15/22 | 390,000 | 373,425 | |
| Targa Resources Partners LP/Targa Resources Partners Finance Corp.: | |||
| 4.25% 11/15/23 | 765,000 | 734,400 | |
| 5% 1/15/28 (a) | 1,315,000 | 1,254,181 | |
| 5.125% 2/1/25 | 380,000 | 378,100 | |
| 5.25% 5/1/23 | 380,000 | 382,850 | |
| TerraForm Power Operating LLC 5% 1/31/28 (a) | 265,000 | 251,419 | |
| U.S.A. Compression Partners LP / 6.875% 4/1/26 (a) | 140,000 | 142,100 | |
| Weatherford International Ltd.: | |||
| 6.5% 8/1/36 | 485,000 | 345,563 | |
| 7% 3/15/38 | 210,000 | 152,250 | |
| 63,186,968 | |||
| Entertainment/Film - 0.6% | |||
| New Cotai LLC/New Cotai Capital Corp. 10.625% 5/1/19 pay-in-kind (a)(b) | 2,518,007 | 2,486,532 | |
| Environmental - 0.2% | |||
| LBC Tank Terminals Holding Netherlands BV 6.875% 5/15/23 (a) | 875,000 | 899,063 | |
| Food & Drug Retail - 0.9% | |||
| Albertsons Companies LLC/Safeway, Inc./New Albertson's, Inc./Albertson's LLC 5.75% 3/15/25 | 1,220,000 | 1,040,416 | |
| Albertsons, Inc.: | |||
| 7.75% 6/15/26 | 318,000 | 273,480 | |
| 8% 5/1/31 | 925,000 | 760,813 | |
| 8.7% 5/1/30 | 235,000 | 207,388 | |
| Tops Holding LLC/Tops Markets II Corp. 8% 6/15/22 (a)(d) | 2,365,000 | 1,087,900 | |
| 3,369,997 | |||
| Food/Beverage/Tobacco - 0.8% | |||
| C&S Group Enterprises LLC 5.375% 7/15/22 (a) | 1,205,000 | 1,135,556 | |
| Post Holdings, Inc.: | |||
| 5% 8/15/26 (a) | 395,000 | 375,250 | |
| 5.625% 1/15/28 (a) | 825,000 | 787,875 | |
| 5.75% 3/1/27 (a) | 710,000 | 701,125 | |
| 2,999,806 | |||
| Gaming - 3.8% | |||
| CRC Escrow Issuer LLC/CRC Finance LLC 5.25% 10/15/25 (a) | 2,610,000 | 2,502,155 | |
| MCE Finance Ltd. 4.875% 6/6/25 (a) | 1,195,000 | 1,142,624 | |
| MGM Growth Properties Operating Partnership LP: | |||
| 4.5% 9/1/26 | 4,310,000 | 4,116,050 | |
| 4.5% 1/15/28 | 955,000 | 895,599 | |
| Scientific Games Corp.: | |||
| 5% 10/15/25 (a) | 820,000 | 797,450 | |
| 6.625% 5/15/21 | 2,015,000 | 2,062,856 | |
| Station Casinos LLC 5% 10/1/25 (a) | 1,085,000 | 1,030,750 | |
| Wynn Las Vegas LLC/Wynn Las Vegas Capital Corp. 5.25% 5/15/27 (a) | 1,485,000 | 1,457,156 | |
| Wynn Macau Ltd.: | |||
| 4.875% 10/1/24 (a) | 450,000 | 438,750 | |
| 5.5% 10/1/27 (a) | 390,000 | 382,200 | |
| 14,825,590 | |||
| Healthcare - 6.5% | |||
| Catalent Pharma Solutions 4.875% 1/15/26 (a) | 655,000 | 638,625 | |
| Charles River Laboratories International, Inc. 5.5% 4/1/26 (a) | 280,000 | 284,550 | |
| Community Health Systems, Inc. 6.25% 3/31/23 | 2,010,000 | 1,851,713 | |
| HCA Holdings, Inc.: | |||
| 4.5% 2/15/27 | 2,350,000 | 2,267,750 | |
| 5% 3/15/24 | 2,450,000 | 2,474,500 | |
| Hologic, Inc.: | |||
| 4.375% 10/15/25 (a) | 960,000 | 926,400 | |
| 4.625% 2/1/28 (a) | 180,000 | 172,800 | |
| Kindred Healthcare, Inc.: | |||
| 8% 1/15/20 | 340,000 | 359,975 | |
| 8.75% 1/15/23 | 395,000 | 417,713 | |
| MPT Operating Partnership LP/MPT Finance Corp.: | |||
| 5% 10/15/27 | 565,000 | 553,870 | |
| 5.25% 8/1/26 | 1,860,000 | 1,853,025 | |
| Sabra Health Care LP/Sabra Capital Corp.: | |||
| 5.375% 6/1/23 | 390,000 | 388,050 | |
| 5.5% 2/1/21 | 730,000 | 744,381 | |
| Service Corp. International 4.625% 12/15/27 | 1,035,000 | 998,775 | |
| SP Finco LLC 6.75% 7/1/25 (a) | 455,000 | 441,350 | |
| Teleflex, Inc.: | |||
| 4.625% 11/15/27 | 515,000 | 495,487 | |
| 4.875% 6/1/26 | 2,200,000 | 2,178,000 | |
| Tenet Healthcare Corp.: | |||
| 4.375% 10/1/21 | 1,125,000 | 1,105,313 | |
| 4.625% 7/15/24 (a) | 740,000 | 711,325 | |
| 6.75% 6/15/23 | 920,000 | 900,450 | |
| THC Escrow Corp. III 5.125% 5/1/25 (a) | 430,000 | 413,338 | |
| Valeant Pharmaceuticals International, Inc.: | |||
| 5.625% 12/1/21 (a) | 2,790,000 | 2,664,450 | |
| 5.875% 5/15/23 (a) | 1,420,000 | 1,260,250 | |
| 9% 12/15/25 (a) | 545,000 | 541,594 | |
| Wellcare Health Plans, Inc. 5.25% 4/1/25 | 855,000 | 858,206 | |
| 25,501,890 | |||
| Homebuilders/Real Estate - 2.1% | |||
| Beazer Homes U.S.A., Inc. 5.875% 10/15/27 | 950,000 | 879,938 | |
| Howard Hughes Corp. 5.375% 3/15/25 (a) | 1,055,000 | 1,041,813 | |
| Lennar Corp.: | |||
| 5.25% 6/1/26 (a) | 2,220,000 | 2,192,250 | |
| 5.875% 11/15/24 (a) | 580,000 | 600,300 | |
| M.D.C. Holdings, Inc. 6% 1/15/43 | 330,000 | 308,138 | |
| M/I Homes, Inc. 5.625% 8/1/25 | 265,000 | 257,964 | |
| Pisces Midco, Inc. 8% 4/15/26 (a)(e) | 730,000 | 730,000 | |
| Starwood Property Trust, Inc. 4.75% 3/15/25 (a) | 490,000 | 477,750 | |
| Taylor Morrison Communities, Inc./Monarch Communities, Inc. 5.875% 4/15/23 (a) | 950,000 | 980,590 | |
| William Lyon Homes, Inc. 7% 8/15/22 | 765,000 | 784,125 | |
| 8,252,868 | |||
| Hotels - 0.3% | |||
| Wyndham Hotels & Resorts, Inc. 5.375% 4/15/26 (a)(e) | 995,000 | 995,000 | |
| Insurance - 0.2% | |||
| Acrisure LLC 7% 11/15/25 (a) | 755,000 | 724,800 | |
| Leisure - 0.7% | |||
| NVA Holdings, Inc. 6.875% 4/1/26 (a) | 210,000 | 211,575 | |
| Studio City Co. Ltd.: | |||
| 5.875% 11/30/19 (a) | 460,000 | 468,648 | |
| 7.25% 11/30/21 (a) | 1,040,000 | 1,082,900 | |
| Viking Cruises Ltd. 5.875% 9/15/27 (a) | 895,000 | 848,013 | |
| 2,611,136 | |||
| Metals/Mining - 1.9% | |||
| ArcelorMittal SA 6.125% 6/1/25 | 480,000 | 522,000 | |
| Constellium NV 5.875% 2/15/26 (a) | 795,000 | 783,075 | |
| First Quantum Minerals Ltd.: | |||
| 7% 2/15/21 (a) | 1,150,000 | 1,152,875 | |
| 7.25% 5/15/22 (a) | 655,000 | 655,000 | |
| 7.25% 4/1/23 (a) | 1,075,000 | 1,058,875 | |
| 7.5% 4/1/25 (a) | 1,010,000 | 991,694 | |
| FMG Resources (August 2006) Pty Ltd. 5.125% 5/15/24 (a) | 525,000 | 517,776 | |
| Freeport-McMoRan, Inc. 3.875% 3/15/23 | 625,000 | 604,000 | |
| SunCoke Energy Partners LP/SunCoke Energy Partners Finance Corp. 7.5% 6/15/25 (a) | 1,120,000 | 1,153,600 | |
| 7,438,895 | |||
| Publishing/Printing - 0.3% | |||
| Multi-Color Corp. 4.875% 11/1/25 (a) | 1,185,000 | 1,107,975 | |
| Restaurants - 1.6% | |||
| 1011778 BC Unlimited Liability Co./New Red Finance, Inc.: | |||
| 4.25% 5/15/24 (a) | 920,000 | 878,600 | |
| 5% 10/15/25 (a) | 1,340,000 | 1,275,948 | |
| Golden Nugget, Inc. 6.75% 10/15/24 (a) | 2,565,000 | 2,584,238 | |
| KFC Holding Co./Pizza Hut Holding LLC 5% 6/1/24 (a) | 700,000 | 695,625 | |
| Yum! Brands, Inc. 5.35% 11/1/43 | 915,000 | 828,075 | |
| 6,262,486 | |||
| Services - 3.6% | |||
| APX Group, Inc.: | |||
| 7.625% 9/1/23 | 720,000 | 745,200 | |
| 8.75% 12/1/20 | 3,281,000 | 3,297,405 | |
| Aramark Services, Inc. 4.75% 6/1/26 | 2,750,000 | 2,660,625 | |
| Ashtead Capital, Inc.: | |||
| 4.125% 8/15/25 (a) | 375,000 | 360,000 | |
| 4.375% 8/15/27 (a) | 395,000 | 375,250 | |
| Avantor, Inc.: | |||
| 6% 10/1/24 (a) | 740,000 | 736,300 | |
| 9% 10/1/25 (a) | 1,340,000 | 1,312,363 | |
| CDK Global, Inc. 4.875% 6/1/27 (a) | 460,000 | 442,750 | |
| Hertz Corp. 7.625% 6/1/22 (a) | 1,785,000 | 1,805,081 | |
| Laureate Education, Inc. 8.25% 5/1/25 (a) | 1,445,000 | 1,549,763 | |
| Prime Security One MS, Inc. 4.875% 7/15/32 (a) | 1,075,000 | 929,875 | |
| 14,214,612 | |||
| Steel - 1.1% | |||
| ArcelorMittal SA 7.25% 10/15/39 (b) | 485,000 | 573,513 | |
| Cliffs Natural Resources, Inc.: | |||
| 4.875% 1/15/24 (a) | 1,035,000 | 1,003,950 | |
| 5.75% 3/1/25 (a) | 2,010,000 | 1,919,550 | |
| Commercial Metals Co. 5.375% 7/15/27 | 825,000 | 812,625 | |
| 4,309,638 | |||
| Super Retail - 0.3% | |||
| Netflix, Inc. 4.375% 11/15/26 | 1,145,000 | 1,082,025 | |
| Technology - 3.0% | |||
| Gartner, Inc. 5.125% 4/1/25 (a) | 905,000 | 905,000 | |
| Micron Technology, Inc.: | |||
| 5.5% 2/1/25 | 555,000 | 575,813 | |
| 5.625% 1/15/26 (a) | 500,000 | 517,500 | |
| NXP BV/NXP Funding LLC 4.125% 6/1/21 (a) | 1,435,000 | 1,449,350 | |
| Open Text Corp. 5.875% 6/1/26 (a) | 2,920,000 | 3,003,074 | |
| Sensata Technologies BV 5% 10/1/25 (a) | 1,910,000 | 1,881,350 | |
| Solera LLC/Solera Finance, Inc. 10.5% 3/1/24 (a) | 1,545,000 | 1,718,813 | |
| Symantec Corp. 5% 4/15/25 (a) | 1,825,000 | 1,840,021 | |
| 11,890,921 | |||
| Telecommunications - 3.7% | |||
| Altice Finco SA 7.625% 2/15/25 (a) | 1,310,000 | 1,291,988 | |
| Equinix, Inc. 5.375% 4/1/23 | 366,000 | 373,778 | |
| Frontier Communications Corp. 11% 9/15/25 | 1,640,000 | 1,228,975 | |
| Gogo Intermediate Holdings LLC/Gogo Finance Co., Inc. 12.5% 7/1/22 (a) | 1,725,000 | 1,940,625 | |
| SBA Communications Corp. 4.875% 9/1/24 | 260,000 | 255,125 | |
| Sprint Communications, Inc. 6% 11/15/22 | 360,000 | 353,250 | |
| Sprint Corp.: | |||
| 7.25% 9/15/21 | 1,320,000 | 1,364,550 | |
| 7.875% 9/15/23 | 530,000 | 541,263 | |
| T-Mobile U.S.A., Inc. 6.625% 4/1/23 | 2,665,000 | 2,753,291 | |
| Telenet Finance Luxembourg Notes SARL 5.5% 3/1/28 (a) | 2,400,000 | 2,295,000 | |
| Wind Tre SpA 5% 1/20/26 (a) | 1,760,000 | 1,490,931 | |
| Zayo Group LLC/Zayo Capital, Inc. 6.375% 5/15/25 | 525,000 | 543,375 | |
| 14,432,151 | |||
| Transportation Ex Air/Rail - 1.3% | |||
| Navios Maritime Acquisition Corp./Navios Acquisition Finance U.S., Inc. 8.125% 11/15/21 (a) | 4,640,000 | 3,793,200 | |
| Navios Maritime Holdings, Inc.: | |||
| 7.375% 1/15/22 (a) | 475,000 | 374,656 | |
| 11.25% 8/15/22 (a) | 815,000 | 816,019 | |
| 4,983,875 | |||
| Utilities - 6.4% | |||
| Dolphin Subsidiary II, Inc. 7.25% 10/15/21 | 3,270,000 | 3,543,863 | |
| DPL, Inc. 6.75% 10/1/19 | 1,390,000 | 1,435,175 | |
| Dynegy, Inc.: | |||
| 7.625% 11/1/24 | 1,230,000 | 1,326,863 | |
| 8.125% 1/30/26 (a) | 785,000 | 866,444 | |
| Global Partners LP/GLP Finance Corp.: | |||
| 6.25% 7/15/22 | 1,785,000 | 1,776,075 | |
| 7% 6/15/23 | 4,980,000 | 5,017,350 | |
| InterGen NV 7% 6/30/23 (a) | 230,000 | 230,000 | |
| NRG Yield Operating LLC 5% 9/15/26 | 970,000 | 953,025 | |
| NSG Holdings II LLC/NSG Holdings, Inc. 7.75% 12/15/25 (a) | 4,706,915 | 5,165,840 | |
| Talen Energy Supply LLC 10.5% 1/15/26 (a) | 1,000,000 | 860,000 | |
| The AES Corp. 4.875% 5/15/23 | 3,975,000 | 4,044,563 | |
| 25,219,198 | |||
| TOTAL NONCONVERTIBLE BONDS | 328,643,577 | ||
| TOTAL CORPORATE BONDS | |||
| (Cost $334,092,393) | 331,909,949 | ||
| Shares | Value | ||
| Common Stocks - 0.2% | |||
| Energy - 0.2% | |||
| Forbes Energy Services Ltd. | 76,687 | 728,527 | |
| Telecommunications - 0.0% | |||
| CUI Acquisition Corp. Class E (f)(g) | 0 | 16,065 | |
| TOTAL COMMON STOCKS | |||
| (Cost $4,254,449) | 744,592 | ||
| Principal Amount | Value | ||
| Bank Loan Obligations - 8.7% | |||
| Aerospace - 1.1% | |||
| TransDigm, Inc.: | |||
| Tranche B, term loan 3 month U.S. LIBOR + 2.750% 4.773% 6/9/23 (b)(c) | 3,414,167 | 3,422,702 | |
| Tranche G, term loan 3 month U.S. LIBOR + 2.500% 4.7065% 8/22/24 (b)(c) | 962,812 | 965,489 | |
| TOTAL AEROSPACE | 4,388,191 | ||
| Air Transportation - 0.4% | |||
| American Airlines, Inc. Tranche B, term loan 3 month U.S. LIBOR + 2.000% 3.7766% 12/14/23 (b)(c) | 1,341,450 | 1,342,295 | |
| Cable/Satellite TV - 0.7% | |||
| CSC Holdings LLC Tranche B, term loan 3 month U.S. LIBOR + 2.500% 4.2766% 1/25/26 (b)(c) | 165,000 | 164,949 | |
| Numericable LLC Tranche B 12LN, term loan 3 month U.S. LIBOR + 3.000% 4.7202% 1/31/26 (b)(c) | 867,825 | 841,790 | |
| Unitymedia Finance LLC Tranche B, term loan 3 month U.S. LIBOR + 2.250% 4.0266% 9/30/25 (b)(c) | 1,200,000 | 1,197,000 | |
| Zayo Group LLC term loan 3 month U.S. LIBOR + 2.000% 3.8769% 1/19/21 (b)(c) | 598,950 | 600,543 | |
| TOTAL CABLE/SATELLITE TV | 2,804,282 | ||
| Chemicals - 0.1% | |||
| Tronox Blocked Borrower LLC Tranche B, term loan 3 month U.S. LIBOR + 3.000% 4.6934% 9/22/24 (b)(c) | 60,314 | 60,829 | |
| Tronox Finance LLC Tranche B, term loan 3 month U.S. LIBOR + 3.000% 5.302% 9/22/24 (b)(c) | 139,186 | 140,375 | |
| TOTAL CHEMICALS | 201,204 | ||
| Containers - 0.1% | |||
| Crown Americas LLC Tranche B 1LN, term loan 3 month U.S. LIBOR + 2.000% 1/29/25 (c)(h) | 85,000 | 85,730 | |
| Reynolds Group Holdings, Inc. Tranche B, term loan 3 month U.S. LIBOR + 2.750% 4.6269% 2/5/23 (b)(c) | 243,476 | 244,605 | |
| TOTAL CONTAINERS | 330,335 | ||
| Energy - 0.3% | |||
| California Resources Corp. Tranche B, term loan 3 month U.S. LIBOR + 4.750% 6.5721% 12/31/22 (b)(c) | 450,000 | 456,048 | |
| Forbes Energy Services LLC Tranche B, term loan 12% 4/13/21 (b)(g) | 768,493 | 774,257 | |
| TOTAL ENERGY | 1,230,305 | ||
| Entertainment/Film - 0.2% | |||
| AMC Entertainment, Inc. Tranche B, term loan 3 month U.S. LIBOR + 2.250% 4.0266% 12/15/22 (b)(c) | 766,081 | 767,522 | |
| Food & Drug Retail - 0.4% | |||
| Albertson's LLC Tranche B, term loan 3 month U.S. LIBOR + 3.000% 4.9563% 6/22/23 (b)(c) | 486,524 | 479,834 | |
| Tops Markets LLC term loan: | |||
| 3 month U.S. LIBOR + 9.500% 2/23/19 (c)(h) | 466,159 | 466,159 | |
| 3 month U.S. LIBOR + 9.500% 11.375% 2/23/19 (b)(c) | 466,159 | 466,159 | |
| TOTAL FOOD & DRUG RETAIL | 1,412,152 | ||
| Food/Beverage/Tobacco - 0.2% | |||
| Post Holdings, Inc. Tranche B, term loan 3 month U.S. LIBOR + 2.000% 3.88% 5/24/24 (b)(c) | 906,392 | 907,751 | |
| Gaming - 0.8% | |||
| CityCenter Holdings LLC Tranche B, term loan 3 month U.S. LIBOR + 2.500% 4.3769% 4/18/24 (b)(c) | 982,575 | 986,387 | |
| Golden Entertainment, Inc. Tranche B, term loan: | |||
| 3 month U.S. LIBOR + 3.000% 4.88% 10/20/24 (b)(c) | 1,286,775 | 1,292,411 | |
| 3 month U.S. LIBOR + 7.000% 8.86% 10/20/25 (b)(c) | 430,000 | 432,150 | |
| Scientific Games Corp. Tranche B 5LN, term loan 3 month U.S. LIBOR + 2.750% 4.7219% 8/14/24 (b)(c) | 434,138 | 435,518 | |
| TOTAL GAMING | 3,146,466 | ||
| Healthcare - 0.1% | |||
| HCA Holdings, Inc. Tranche B 10LN, term loan 3 month U.S. LIBOR + 2.000% 3.8769% 3/13/25 (b)(c) | 480,000 | 483,523 | |
| Hotels - 0.0% | |||
| Wyndham Hotels & Resorts, Inc. Tranche B, term loan 3 month U.S. LIBOR + 1.750% 3/29/25 (c)(h) | 105,000 | 105,263 | |
| Insurance - 0.0% | |||
| Acrisure LLC Tranche B, term loan 3 month U.S. LIBOR + 4.250% 5.9913% 11/22/23 (b)(c) | 9,950 | 10,062 | |
| Leisure - 0.0% | |||
| Delta 2 SARL Tranche B, term loan 3 month U.S. LIBOR + 2.500% 4.3769% 2/1/24 (b)(c) | 160,000 | 159,600 | |
| Publishing/Printing - 0.5% | |||
| Springer Science+Business Media Deutschland GmbH Tranche B 13LN, term loan 3 month U.S. LIBOR + 3.500% 5.3769% 8/24/22 (b)(c) | 1,729,323 | 1,734,182 | |
| Services - 0.2% | |||
| Almonde, Inc.: | |||
| Tranche 2LN, term loan 3 month U.S. LIBOR + 7.250% 9.2342% 6/13/25 (b)(c) | 65,000 | 64,319 | |
| Tranche B 1LN, term loan 3 month U.S. LIBOR + 3.500% 5.4842% 6/13/24 (b)(c) | 303,475 | 303,059 | |
| Aramark Services, Inc. Tranche B-1, term loan 3 month U.S. LIBOR + 2.000% 3.8769% 3/11/25 (b)(c) | 384,038 | 386,438 | |
| Filtration Group Corp. Tranche B, term loan 3 month U.S. LIBOR + 3.000% 3/27/25 (c)(h) | 40,000 | 40,100 | |
| TOTAL SERVICES | 793,916 | ||
| Technology - 2.1% | |||
| Ceridian HCM Holding, Inc. Tranche B 2LN, term loan 3 month U.S. LIBOR + 3.500% 5.3769% 9/15/20 (b)(c) | 1,226,144 | 1,227,984 | |
| Kronos, Inc. Tranche B 1LN, term loan 3 month U.S. LIBOR + 3.500% 4.8796% 11/1/23 (b)(c) | 2,301,794 | 2,315,397 | |
| Landesk Group, Inc. term loan 3 month U.S. LIBOR + 9.000% 10.88% 1/20/25 (b)(c) | 445,000 | 424,530 | |
| Solera LLC Tranche B, term loan 3 month U.S. LIBOR + 2.750% 3/3/23 (c)(h) | 279,288 | 279,762 | |
| Syniverse Holdings, Inc.: | |||
| Tranche B 2LN, term loan 3 month U.S. LIBOR + 9.000% 10.7179% 3/11/24 (b)(c) | 445,000 | 450,006 | |
| Tranche B, term loan 3 month U.S. LIBOR + 5.000% 6.7179% 3/9/23 (b)(c) | 1,790,000 | 1,809,135 | |
| Uber Technologies, Inc. Tranche B, term loan 3 month U.S. LIBOR + 4.000% 5.8769% 7/13/23 (b)(c) | 1,837,025 | 1,841,948 | |
| TOTAL TECHNOLOGY | 8,348,762 | ||
| Telecommunications - 1.2% | |||
| Altice Financing SA Tranche B, term loan: | |||
| 3 month U.S. LIBOR + 2.750% 4.4702% 7/15/25 (b)(c) | 511,138 | 500,276 | |
| 3 month U.S. LIBOR + 2.750% 4.4702% 1/31/26 (b)(c) | 887,775 | 870,579 | |
| Radiate Holdco LLC Tranche B, term loan 3 month U.S. LIBOR + 3.000% 4.8769% 2/1/24 (b)(c) | 1,668,150 | 1,657,724 | |
| SFR Group SA Tranche B 11LN, term loan 3 month U.S. LIBOR + 2.750% 4.5223% 7/31/25 (b)(c) | 1,538,375 | 1,488,378 | |
| TOTAL TELECOMMUNICATIONS | 4,516,957 | ||
| Utilities - 0.3% | |||
| The AES Corp. Tranche B, term loan 3 month U.S. LIBOR + 2.000% 3.9436% 5/24/22 (b)(c) | 1,262,250 | 1,262,477 | |
| TOTAL BANK LOAN OBLIGATIONS | |||
| (Cost $33,787,613) | 33,945,245 | ||
| Preferred Securities - 4.2% | |||
| Banks & Thrifts - 3.5% | |||
| Bank of America Corp.: | |||
| 6.1% (b)(i) | 2,010,000 | 2,120,523 | |
| 6.25% (b)(i) | 2,310,000 | 2,459,424 | |
| Barclays Bank PLC 7.625% 11/21/22 | 2,215,000 | 2,492,118 | |
| Citigroup, Inc.: | |||
| 5.875% (b)(i) | 2,735,000 | 2,826,071 | |
| 5.95% (b)(i) | 760,000 | 798,394 | |
| Goldman Sachs Group, Inc. 5% (b)(i) | 1,900,000 | 1,887,388 | |
| Royal Bank of Scotland Group PLC 7.5% (b)(i) | 995,000 | 1,035,206 | |
| TOTAL BANKS & THRIFTS | 13,619,124 | ||
| Energy - 0.7% | |||
| Andeavor Logistics LP 6.875% (b)(i) | 1,270,000 | 1,288,288 | |
| Sunoco Logistics Partners LP 6.25% (b)(i) | 1,566,000 | 1,509,654 | |
| TOTAL ENERGY | 2,797,942 | ||
| TOTAL PREFERRED SECURITIES | |||
| (Cost $15,772,046) | 16,417,066 | ||
| Shares | Value | ||
| Money Market Funds - 2.0% | |||
| Fidelity Cash Central Fund, 1.72% (j) | |||
| (Cost $7,961,584) | 7,959,992 | 7,961,584 | |
| TOTAL INVESTMENT IN SECURITIES - 99.8% | |||
| (Cost $395,868,085) | 390,978,436 | ||
| NET OTHER ASSETS (LIABILITIES) - 0.2% | 978,974 | ||
| NET ASSETS - 100% | $391,957,410 |
Amounts shown as 0 may represent less than 1 share.
Legend
(a) Security exempt from registration under Rule 144A of the Securities Act of 1933. These securities may be resold in transactions exempt from registration, normally to qualified institutional buyers. At the end of the period, the value of these securities amounted to $188,699,632 or 48.1% of net assets.
(b) Coupon rates for floating and adjustable rate securities reflect the rates in effect at period end.
(c) Coupon is indexed to a floating interest rate which may be multiplied by a specified factor and/or subject to caps or floors.
(d) Non-income producing - Security is in default.
(e) Security or a portion of the security purchased on a delayed delivery or when-issued basis.
(f) Non-income producing
(g) Level 3 security
(h) The coupon rate will be determined upon settlement of the loan after period end.
(i) Security is perpetual in nature with no stated maturity date.
(j) Affiliated fund that is generally available only to investment companies and other accounts managed by Fidelity Investments. The rate quoted is the annualized seven-day yield of the fund at period end. A complete unaudited listing of the fund's holdings as of its most recent quarter end is available upon request. In addition, each Fidelity Central Fund's financial statements are available on the SEC's website or upon request.
Affiliated Central Funds
Information regarding fiscal year to date income earned by the Fund from investments in Fidelity Central Funds is as follows:
| Fund | Income earned |
| Fidelity Cash Central Fund | $96,248 |
| Total | $96,248 |
Amounts in the income column in the above table include any capital gain distributions from underlying funds, which are presented in the corresponding line-item in the Statement of Operations if applicable.
Investment Valuation
The following is a summary of the inputs used, as of March 31, 2018, involving the Fund's assets and liabilities carried at fair value. The inputs or methodology used for valuing securities may not be an indication of the risk associated with investing in those securities. For more information on valuation inputs, and their aggregation into the levels used below, please refer to the Investment Valuation section in the accompanying Notes to Financial Statements.
| Valuation Inputs at Reporting Date: | ||||
| Description | Total | Level 1 | Level 2 | Level 3 |
| Investments in Securities: | ||||
| Equities: | ||||
| Energy | $728,527 | $728,527 | $-- | $-- |
| Telecommunication Services | 16,065 | -- | -- | 16,065 |
| Corporate Bonds | 331,909,949 | -- | 331,909,949 | -- |
| Bank Loan Obligations | 33,945,245 | -- | 33,170,988 | 774,257 |
| Preferred Securities | 16,417,066 | -- | 16,417,066 | -- |
| Money Market Funds | 7,961,584 | 7,961,584 | -- | -- |
| Total Investments in Securities: | $390,978,436 | $8,690,111 | $381,498,003 | $790,322 |
Other Information
Distribution of investments by country or territory of incorporation, as a percentage of Total Net Assets, is as follows (Unaudited):
| United States of America | 76.0% |
| Canada | 5.8% |
| Luxembourg | 4.9% |
| United Kingdom | 2.9% |
| Netherlands | 2.4% |
| Multi-National | 2.1% |
| Ireland | 1.7% |
| Cayman Islands | 1.1% |
| Others (Individually Less Than 1%) | 3.1% |
| 100.0% |
See accompanying notes which are an integral part of the financial statements.
Financial Statements
Statement of Assets and Liabilities
| March 31, 2018 (Unaudited) | ||
| Assets | ||
| Investment in securities, at value — See accompanying schedule: Unaffiliated issuers (cost $387,906,501) | $383,016,852 | |
| Fidelity Central Funds (cost $7,961,584) | 7,961,584 | |
| Total Investment in Securities (cost $395,868,085) | $390,978,436 | |
| Cash | 28,318 | |
| Receivable for investments sold | 1,545,624 | |
| Receivable for fund shares sold | 30,209 | |
| Interest receivable | 5,834,199 | |
| Distributions receivable from Fidelity Central Funds | 20,682 | |
| Total assets | 398,437,468 | |
| Liabilities | ||
| Payable for investments purchased | ||
| Regular delivery | $4,374,378 | |
| Delayed delivery | 1,725,000 | |
| Payable for fund shares redeemed | 369,099 | |
| Distributions payable | 7,228 | |
| Other payables and accrued expenses | 4,353 | |
| Total liabilities | 6,480,058 | |
| Net Assets | $391,957,410 | |
| Net Assets consist of: | ||
| Paid in capital | $394,892,296 | |
| Distributions in excess of net investment income | (286,339) | |
| Accumulated undistributed net realized gain (loss) on investments | 2,241,102 | |
| Net unrealized appreciation (depreciation) on investments | (4,889,649) | |
| Net Assets, for 4,159,643 shares outstanding | $391,957,410 | |
| Net Asset Value, offering price and redemption price per share ($391,957,410 ÷ 4,159,643 shares) | $94.23 |
See accompanying notes which are an integral part of the financial statements.
Statement of Operations
| Six months ended March 31, 2018 (Unaudited) | ||
| Investment Income | ||
| Dividends | $600,173 | |
| Interest | 13,799,871 | |
| Income from Fidelity Central Funds | 96,248 | |
| Total income | 14,496,292 | |
| Expenses | ||
| Custodian fees and expenses | $6,085 | |
| Independent directors' fees and expenses | 924 | |
| Legal | 4 | |
| Miscellaneous | 6 | |
| Total expenses before reductions | 7,019 | |
| Expense reductions | (2,621) | 4,398 |
| Net investment income (loss) | 14,491,894 | |
| Realized and Unrealized Gain (Loss) | ||
| Net realized gain (loss) on: | ||
| Investment securities: | ||
| Unaffiliated issuers | 3,428,608 | |
| Total net realized gain (loss) | 3,428,608 | |
| Change in net unrealized appreciation (depreciation) on investment securities | (19,772,277) | |
| Net gain (loss) | (16,343,669) | |
| Net increase (decrease) in net assets resulting from operations | $(1,851,775) |
See accompanying notes which are an integral part of the financial statements.
Statement of Changes in Net Assets
| Six months ended March 31, 2018 (Unaudited) | Year ended September 30, 2017 | |
| Increase (Decrease) in Net Assets | ||
| Operations | ||
| Net investment income (loss) | $14,491,894 | $36,284,230 |
| Net realized gain (loss) | 3,428,608 | 19,954,116 |
| Change in net unrealized appreciation (depreciation) | (19,772,277) | (2,133,192) |
| Net increase (decrease) in net assets resulting from operations | (1,851,775) | 54,105,154 |
| Distributions to shareholders from net investment income | (14,471,513) | (36,596,557) |
| Distributions to shareholders from net realized gain | (16,090,994) | (1,402,290) |
| Total distributions | (30,562,507) | (37,998,847) |
| Affiliated share transactions | ||
| Proceeds from sales of shares | 37,251,977 | 33,665,085 |
| Reinvestment of distributions | 30,555,229 | 37,995,896 |
| Cost of shares redeemed | (145,898,796) | (380,292,695) |
| Net increase (decrease) in net assets resulting from share transactions | (78,091,590) | (308,631,714) |
| Total increase (decrease) in net assets | (110,505,872) | (292,525,407) |
| Net Assets | ||
| Beginning of period | 502,463,282 | 794,988,689 |
| End of period | $391,957,410 | $502,463,282 |
| Other Information | ||
| Distributions in excess of net investment income end of period | $(286,339) | $(306,720) |
| Shares | ||
| Sold | 384,169 | 340,251 |
| Issued in reinvestment of distributions | 315,270 | 383,006 |
| Redeemed | (1,529,107) | (3,843,320) |
| Net increase (decrease) | (829,668) | (3,120,063) |
See accompanying notes which are an integral part of the financial statements.
Financial Highlights
Fidelity High Income Central Fund 1
| Six months ended (Unaudited) March 31, | Years endedSeptember 30, | |||||
| 2018 | 2017 | 2016 | 2015 | 2014 | 2013 | |
| Selected Per–Share Data | ||||||
| Net asset value, beginning of period | $100.71 | $98.03 | $93.94 | $102.00 | $101.40 | $101.43 |
| Income from Investment Operations | ||||||
| Net investment income (loss)A | 2.888 | 6.145 | 6.453 | 6.303 | 6.317 | 6.723 |
| Net realized and unrealized gain (loss) | (3.317) | 2.919 | 3.688 | (8.196) | .503 | (.282) |
| Total from investment operations | (.429) | 9.064 | 10.141 | (1.893) | 6.820 | 6.441 |
| Distributions from net investment income | (2.877) | (6.169) | (6.051) | (6.167) | (6.220) | (6.471) |
| Distributions from net realized gain | (3.174) | (.215) | – | – | – | – |
| Total distributions | (6.051) | (6.384) | (6.051) | (6.167) | (6.220) | (6.471) |
| Net asset value, end of period | $94.23 | $100.71 | $98.03 | $93.94 | $102.00 | $101.40 |
| Total ReturnB,C | (.46)% | 9.54% | 11.32% | (2.06)% | 6.77% | 6.46% |
| Ratios to Average Net AssetsD,E | ||||||
| Expenses before reductionsF | - %G | -% | -% | -% | -% | -% |
| Expenses net of fee waivers, if anyF | - %G | -% | -% | -% | -% | -% |
| Expenses net of all reductionsF | - %G | -% | -% | -% | -% | -% |
| Net investment income (loss) | 5.93%G | 6.18% | 6.92% | 6.31% | 6.07% | 6.54% |
| Supplemental Data | ||||||
| Net assets, end of period (000 omitted) | $391,957 | $502,463 | $794,989 | $1,012,111 | $457,907 | $406,018 |
| Portfolio turnover rateH | 66%G | 58% | 59% | 57% | 74% | 87% |
A Calculated based on average shares outstanding during the period.
B Total returns for periods of less than one year are not annualized.
C Total returns would have been lower if certain expenses had not been reduced during the applicable periods shown.
D Fees and expenses of any underlying Fidelity Central Funds are not included in the Fund's expense ratio. The Fund indirectly bears its proportionate share of the expenses of any underlying Fidelity Central Funds.
E Expense ratios reflect operating expenses of the Fund. Expenses before reductions do not reflect amounts reimbursed by the investment adviser or reductions from expense offset arrangements and do not represent the amount paid by the Fund during periods when reimbursements or reductions occur. Expenses net of fee waivers reflect expenses after reimbursement by the investment adviser but prior to reductions from expense offset arrangements. Expenses net of all reductions represent the net expenses paid by the Fund.
F Amount represents less than .005%.
G Annualized
H Amount does not include the portfolio activity of any underlying Fidelity Central Funds.
See accompanying notes which are an integral part of the financial statements.
Notes to Financial Statements (Unaudited)
For the period ended March 31, 2018
1. Organization.
Fidelity High Income Central Fund 1 (the Fund) is a fund of Fidelity Central Investment Portfolios LLC (the LLC) and is authorized to issue an unlimited number of shares. Shares of the Fund are only offered to other investment companies and accounts managed by Fidelity Management & Research Company (FMR), or its affiliates (the Investing Funds). The LLC is registered under the Investment Company Act of 1940, as amended (the 1940 Act), as an open-end management investment company organized as a Delaware Limited Liability Company.
2. Investments in Fidelity Central Funds.
The Fund invests in Fidelity Central Funds, which are open-end investment companies generally available only to other investment companies and accounts managed by the investment adviser and its affiliates. The Fund's Schedule of Investments lists each of the Fidelity Central Funds held as of period end, if any, as an investment of the Fund, but does not include the underlying holdings of each Fidelity Central Fund. As an Investing Fund, the Fund indirectly bears its proportionate share of the expenses of the underlying Fidelity Central Funds.
The Money Market Central Funds seek preservation of capital and current income and are managed by Fidelity Investments Money Management, Inc. (FIMM), an affiliate of the investment adviser. Annualized expenses of the Money Market Central Funds as of their most recent shareholder report date are less than .005%.
A complete unaudited list of holdings for each Fidelity Central Fund is available upon request or at the Securities and Exchange Commission (the SEC) website at www.sec.gov. In addition, the financial statements of the Fidelity Central Funds are available on the SEC website or upon request.
3. Significant Accounting Policies.
The Fund is an investment company and applies the accounting and reporting guidance of the Financial Accounting Standards Board (FASB) Accounting Standards Codification Topic 946 Financial Services – Investments Companies. The financial statements have been prepared in conformity with accounting principles generally accepted in the United States of America (GAAP), which require management to make certain estimates and assumptions at the date of the financial statements. Actual results could differ from those estimates. Subsequent events, if any, through the date that the financial statements were issued have been evaluated in the preparation of the financial statements. The following summarizes the significant accounting policies of the Fund:
Investment Valuation. Investments are valued as of 4:00 p.m. Eastern time on the last calendar day of the period. The Board of Directors (the Board) has delegated the day to day responsibility for the valuation of the Fund's investments to the Fair Value Committee (the Committee) established by the Fund's investment adviser. In accordance with valuation policies and procedures approved by the Board, the Fund attempts to obtain prices from one or more third party pricing vendors or brokers to value its investments. When current market prices, quotations or currency exchange rates are not readily available or reliable, investments will be fair valued in good faith by the Committee, in accordance with procedures adopted by the Board. Factors used in determining fair value vary by investment type and may include market or investment specific events, changes in interest rates and credit quality. The frequency with which these procedures are used cannot be predicted and they may be utilized to a significant extent. The Committee oversees the Fund's valuation policies and procedures and reports to the Board on the Committee's activities and fair value determinations. The Board monitors the appropriateness of the procedures used in valuing the Fund's investments and ratifies the fair value determinations of the Committee.
The Fund categorizes the inputs to valuation techniques used to value its investments into a disclosure hierarchy consisting of three levels as shown below:
- Level 1 – quoted prices in active markets for identical investments
- Level 2 – other significant observable inputs (including quoted prices for similar investments, interest rates, prepayment speeds, etc.)
- Level 3 – unobservable inputs (including the Fund's own assumptions based on the best information available)
Valuation techniques used to value the Fund's investments by major category are as follows:
Debt securities, including restricted securities, are valued based on evaluated prices received from third party pricing vendors or from brokers who make markets in such securities. Corporate bonds, bank loan obligations and preferred securities are valued by pricing vendors who utilize matrix pricing which considers yield or price of bonds of comparable quality, coupon, maturity and type or by broker-supplied prices. When independent prices are unavailable or unreliable, debt securities may be valued utilizing pricing methodologies which consider similar factors that would be used by third party pricing vendors. Debt securities are generally categorized as Level 2 in the hierarchy but may be Level 3 depending on the circumstances. The Fund invests a significant portion of its assets in below investment grade securities. The value of these securities can be more volatile due to changes in the credit quality of the issuer and is sensitive to changes in economic, market and regulatory conditions.
Equity securities, including restricted securities, for which market quotations are readily available, are valued at the last reported sale price or official closing price as reported by a third party pricing vendor on the primary market or exchange on which they are traded and are categorized as Level 1 in the hierarchy. In the event there were no sales during the day or closing prices are not available, securities are valued at the last quoted bid price or may be valued using the last available price and are generally categorized as Level 2 in the hierarchy. For equity securities, including restricted securities, where observable inputs are limited, assumptions about market activity and risk are used and these securities may be categorized as Level 3 in the hierarchy.
Investments in open-end mutual funds, including the Fidelity Central Funds, are valued at their closing net asset value (NAV) each business day and are categorized as Level 1 in the hierarchy.
Changes in valuation techniques may result in transfers in or out of an assigned level within the disclosure hierarchy. The aggregate value of investments by input level as of March 31, 2018 is included at the end of the Fund's Schedule of Investments.
Investment Transactions and Income. For financial reporting purposes, the Fund's investment holdings and NAV include trades executed through the end of the last business day of the period. The NAV per share for processing shareholder transactions is calculated as of the close of business of the New York Stock Exchange (NYSE), normally 4:00 p.m. Eastern time and includes trades executed through the end of the prior business day. Gains and losses on securities sold are determined on the basis of identified cost and includes proceeds received from litigation. Dividend income is recorded on the ex-dividend date, except for certain dividends from foreign securities where the ex-dividend date may have passed, which are recorded as soon as the Fund is informed of the ex-dividend date. Non-cash dividends included in dividend income, if any, are recorded at the fair market value of the securities received. Income and capital gain distributions from Fidelity Central Funds, if any, are recorded on the ex-dividend date. Interest income is accrued as earned and includes coupon interest and amortization of premium and accretion of discount on debt securities as applicable. Paid in Kind (PIK) income is recorded at the fair market value of the securities received. Debt obligations may be placed on non-accrual status and related interest income may be reduced by ceasing current accruals and writing off interest receivables when the collection of all or a portion of interest has become doubtful based on consistently applied procedures. A debt obligation is removed from non-accrual status when the issuer resumes interest payments or when collectability of interest is reasonably assured.
Expenses. Expenses directly attributable to a fund are charged to that fund. Expenses attributable to more than one fund are allocated among the respective funds on the basis of relative net assets or other appropriate methods. Expense estimates are accrued in the period to which they relate and adjustments are made when actual amounts are known.
Income Tax Information and Distributions to Shareholders. Each year, the Fund intends to qualify as a regulated investment company under Subchapter M of the Internal Revenue Code, including distributing substantially all of its taxable income and realized gains. As a result, no provision for U.S. Federal income taxes is required. The Fund files a U.S. federal tax return, in addition to state and local tax returns as required. The Fund's federal income tax returns are subject to examination by the Internal Revenue Service (IRS) for a period of three fiscal years after they are filed. State and local tax returns may be subject to examination for an additional fiscal year depending on the jurisdiction.
Distributions are declared and recorded daily and paid monthly from net investment income. Distributions from realized gains, if any, are declared and recorded on the ex-dividend date. Income and capital gain distributions are determined in accordance with income tax regulations, which may differ from GAAP.
Capital accounts within the financial statements are adjusted for permanent book-tax differences. These adjustments have no impact on net assets or the results of operations. Capital accounts are not adjusted for temporary book-tax differences which will reverse in a subsequent period.
Book-tax differences are primarily due to defaulted bonds and losses deferred due to wash sales.
As of period end, the cost and unrealized appreciation (depreciation) in securities, and derivatives if applicable, for federal income tax purposes were as follows:
| Gross unrealized appreciation | $7,685,659 |
| Gross unrealized depreciation | (12,667,698) |
| Net unrealized appreciation (depreciation) | $(4,982,039) |
| Tax cost | $395,960,475 |
Delayed Delivery Transactions and When-Issued Securities. During the period, the Fund transacted in securities on a delayed delivery or when-issued basis. Payment and delivery may take place after the customary settlement period for that security. The price of the underlying securities and the date when the securities will be delivered and paid for are fixed at the time the transaction is negotiated. The securities purchased on a delayed delivery or when-issued basis are identified as such in the Fund's Schedule of Investments. The Fund may receive compensation for interest forgone in the purchase of a delayed delivery or when-issued security. With respect to purchase commitments, the Fund identifies securities as segregated in its records with a value at least equal to the amount of the commitment. Losses may arise due to changes in the value of the underlying securities or if the counterparty does not perform under the contract's terms, or if the issuer does not issue the securities due to political, economic, or other factors.
Restricted Securities. The Fund may invest in securities that are subject to legal or contractual restrictions on resale. These securities generally may be resold in transactions exempt from registration or to the public if the securities are registered. Disposal of these securities may involve time-consuming negotiations and expense, and prompt sale at an acceptable price may be difficult. Information regarding restricted securities is included at the end of the Fund's Schedule of Investments.
Loans and Other Direct Debt Instruments. The Fund invests in direct debt instruments which are interests in amounts owed to lenders by corporate or other borrowers. These instruments may be in the form of loans, trade claims or other receivables and may include standby financing commitments such as revolving credit facilities that obligate the Fund to supply additional cash to the borrower on demand. Loans may be acquired through assignment or participation. The Fund did not have any unfunded loan commitments, which are contractual obligations for future funding, at period end.
New Accounting Pronouncement. In March 2017, the Financial Accounting Standards Board (FASB) issued an Accounting Standards Update (ASU), ASU 2017-08, which amends the amortization period for certain callable debt securities that are held at a premium. The amendment requires the premium to be amortized to the earliest call date. The amendments do not require an accounting change for securities held at a discount. The ASU is effective for annual periods beginning after December 15, 2018. Management is currently evaluating the potential impact of these changes to the financial statements.
4. Purchases and Sales of Investments.
Purchases and sales of securities, other than short-term securities, aggregated $152,082,043 and $241,038,567, respectively.
5. Fees and Other Transactions with Affiliates.
Management Fee and Expense Contract. FMR Co., Inc. (the investment adviser), an affiliate of FMR, provides the Fund with investment management services. The Fund does not pay any fees for these services. Pursuant to the Fund's management contract with the investment adviser, FMR pays the investment adviser a portion of the management fees it receives from the Investing Funds. In addition, under an expense contract, FMR also pays all other expenses of the Fund, excluding custody fees, the compensation of the independent Directors, and certain miscellaneous expenses such as proxy and shareholder meeting expenses.
Brokerage Commissions. The Fund placed a portion of its portfolio transactions with brokerage firms which are affiliates of the investment adviser. Brokerage commissions are included in net realized gain (loss) and change in net unrealized appreciation (depreciation) in the Statement of Operations. The commissions paid to these affiliated firms were $422 for the period.
Interfund Trades. The Fund may purchase from or sell securities to other Fidelity Funds under procedures adopted by the Board. The procedures have been designed to ensure these interfund trades are executed in accordance with Rule 17a-7 of the 1940 Act. Interfund trades are included within the respective purchases and sales amounts shown in the Purchases and Sales of Investments note.
6. Expense Reductions.
Through arrangements with the Fund's custodian, credits realized as a result of certain uninvested cash balances were used to reduce the Fund's expenses. During the period, these credits reduced the Fund's custody expenses by $2,621.
7. Other.
The Fund's organizational documents provide former and current directors and officers with a limited indemnification against liabilities arising in connection with the performance of their duties to the Fund. In the normal course of business, the Fund may also enter into contracts that provide general indemnifications. The Fund's maximum exposure under these arrangements is unknown as this would be dependent on future claims that may be made against the Fund. The risk of material loss from such claims is considered remote.
At the end of the period, mutual funds managed by FMR or its affiliates were the owners of record of all of the outstanding shares of the Fund.
Shareholder Expense Example
As a shareholder of the Fund, you incur two types of costs: (1) transaction costs and (2) ongoing costs, including other Fund expenses. This Example is intended to help you understand your ongoing costs (in dollars) of investing in the Fund and to compare these costs with the ongoing costs of investing in other mutual funds.
The Example is based on an investment of $1,000 invested at the beginning of the period and held for the entire period (October 1, 2017 to March 31, 2018).
Actual Expenses
The first line of the accompanying table provides information about actual account values and actual expenses. You may use the information in this line, together with the amount you invested, to estimate the expenses that you paid over the period. Simply divide your account value by $1,000.00 (for example, an $8,600 account value divided by $1,000.00 = 8.6), then multiply the result by the number in the first line under the heading entitled "Expenses Paid During Period" to estimate the expenses you paid on your account during this period. In addition, the Fund, as a shareholder in the underlying Fidelity Central Funds, will indirectly bear its pro-rata share of the fees and expenses incurred by the underlying Fidelity Central Funds. These fees and expenses are not included in the Fund's annualized expense ratio used to calculate the expense estimate in the table below.
Hypothetical Example for Comparison Purposes
The second line of the accompanying table provides information about hypothetical account values and hypothetical expenses based on the Fund's actual expense ratio and an assumed rate of return of 5% per year before expenses, which is not the Fund's actual return. The hypothetical account values and expenses may not be used to estimate the actual ending account balance or expenses you paid for the period. You may use this information to compare the ongoing costs of investing in the Fund and other funds. To do so, compare this 5% hypothetical example with the 5% hypothetical examples that appear in the shareholder reports of the other funds. In addition, the Fund, as a shareholder in the underlying Fidelity Central Funds, will indirectly bear its pro-rata share of the fees and expenses incurred by the underlying Fidelity Central Funds. These fees and expenses are not included in the Fund's annualized expense ratio used to calculate the expense estimate in the table below.
Please note that the expenses shown in the table are meant to highlight your ongoing costs only and do not reflect any transaction costs. Therefore, the second line of the table is useful in comparing ongoing costs only, and will not help you determine the relative total costs of owning different funds.
| Annualized Expense Ratio-A | Beginning Account Value October 1, 2017 | Ending Account Value March 31, 2018 | Expenses Paid During Period-B October 1, 2017 to March 31, 2018 | |
| Actual | .0029% | $1,000.00 | $995.40 | $.01 |
| Hypothetical-C | $1,000.00 | $1,024.92 | $.01 |
A Annualized expense ratio reflects expenses net of applicable fee waivers.
B Expenses are equal to the Fund's annualized expense ratio, multiplied by the average account value over the period, multiplied by 182/365 (to reflect the one-half year period).
C 5% return per year before expenses
![]()
Corporate Headquarters
245 Summer St.
Boston, MA 02210
www.fidelity.com
HP1-SANN-0518
1.807410.113
Fidelity® Floating Rate Central Fund Semi-Annual Report March 31, 2018 |
|
Contents
To view a fund's proxy voting guidelines and proxy voting record for the 12-month period ended June 30, visit http://www.fidelity.com/proxyvotingresults or visit the Securities and Exchange Commission's (SEC) web site at http://www.sec.gov.
You may also call 1-800-544-8544 to request a free copy of the proxy voting guidelines.
Standard & Poor's, S&P and S&P 500 are registered service marks of The McGraw-Hill Companies, Inc. and have been licensed for use by Fidelity Distributors Corporation.
Other third-party marks appearing herein are the property of their respective owners.
All other marks appearing herein are registered or unregistered trademarks or service marks of FMR LLC or an affiliated company. © 2018 FMR LLC. All rights reserved.
A fund files its complete schedule of portfolio holdings with the SEC for the first and third quarters of each fiscal year on Form N-Q. Forms N-Q are available on the SEC’s web site at http://www.sec.gov. A fund's Forms N-Q may be reviewed and copied at the SEC’s Public Reference Room in Washington, DC. Information regarding the operation of the SEC's Public Reference Room may be obtained by calling 1-800-SEC-0330.
Investment Summary (Unaudited)
Top Five Holdings as of March 31, 2018
| (by issuer, excluding cash equivalents) | % of fund's net assets |
| Intelsat Jackson Holdings SA | 2.1 |
| Albertson's LLC | 1.9 |
| Caesars Resort Collection LLC | 1.9 |
| Bass Pro Shops LLC. | 1.5 |
| Charter Communication Operating LLC | 1.5 |
| 8.9 |
Top Five Market Sectors as of March 31, 2018
| % of fund's net assets | |
| Technology | 13.3 |
| Services | 7.3 |
| Telecommunications | 7.3 |
| Gaming | 7.0 |
| Healthcare | 5.8 |
Quality Diversification (% of fund's net assets)
| As of March 31, 2018 | ||
| BBB | 1.9% | |
| BB | 33.1% | |
| B | 48.4% | |
| CCC,CC,C | 3.3% | |
| Not Rated | 6.2% | |
| Equities | 0.7% | |
| Short-Term Investments and Net Other Assets | 6.4% | |
We have used ratings from Moody's Investors Service, Inc. Where Moody's® ratings are not available, we have used S&P® ratings. All ratings are as of the date indicated and do not reflect subsequent changes.
Asset Allocation (% of fund's net assets)
| As of March 31, 2018* | ||
| Bank Loan Obligations | 90.5% | |
| Nonconvertible Bonds | 2.4% | |
| Common Stocks | 0.7% | |
| Short-Term Investments and Net Other Assets (Liabilities) | 6.4% | |

* Foreign investments – 11.0%
Schedule of Investments March 31, 2018 (Unaudited)
Showing Percentage of Net Assets
| Bank Loan Obligations - 90.5%(a) | |||
| Principal Amount | Value | ||
| Aerospace - 1.2% | |||
| DAE Aviation Holdings, Inc. Tranche B, term loan 3 month U.S. LIBOR + 3.750% 5.63% 7/7/22(b)(c) | $3,377,527 | $3,404,446 | |
| TransDigm, Inc.: | |||
| Tranche B, term loan 3 month U.S. LIBOR + 2.750% 4.773% 6/9/23 (b)(c) | 14,391,388 | 14,427,366 | |
| Tranche G, term loan 3 month U.S. LIBOR + 2.500% 4.7065% 8/22/24 (b)(c) | 6,223,138 | 6,240,438 | |
| Wesco Aircraft Hardware Corp.: | |||
| Tranche A, term loan 3 month U.S. LIBOR + 2.750% 10/4/21 (c)(d) | 500,000 | 493,750 | |
| Tranche B, term loan 3 month U.S. LIBOR + 2.500% 4.81% 2/28/21 (b)(c) | 3,145,000 | 3,121,413 | |
| TOTAL AEROSPACE | 27,687,413 | ||
| Air Transportation - 0.3% | |||
| Hanjin International Corp. Tranche B, term loan 3 month U.S. LIBOR + 2.500% 4.2341% 10/18/20 (b)(c) | 1,000,000 | 1,003,130 | |
| Transplace Holding, Inc. Tranche B 1LN, term loan 3 month U.S. LIBOR + 4.250% 5.9613% 10/5/24 (b)(c) | 3,491,250 | 3,502,597 | |
| XPO Logistics, Inc. Tranche B, term loan 3 month U.S. LIBOR + 2.000% 3.9198% 2/23/25 (b)(c) | 2,245,000 | 2,252,027 | |
| TOTAL AIR TRANSPORTATION | 6,757,754 | ||
| Automotive & Auto Parts - 1.2% | |||
| Caliber Holdings Corp.: | |||
| Tranche 1LN, term loan 3 month U.S. LIBOR + 3.000% 4.8769% 2/1/24 (b)(c) | 1,623,950 | 1,633,093 | |
| Tranche 2LN, term loan 3 month U.S. LIBOR + 7.250% 8.898% 2/1/25 (b)(c) | 450,000 | 455,625 | |
| Chrysler Group LLC term loan 3 month U.S. LIBOR + 2.000% 3.86% 12/31/18 (b)(c) | 836,478 | 839,096 | |
| CWGS Group LLC Tranche B 1LN, term loan 3 month U.S. LIBOR + 3.000% 4.7017% 11/8/23(b)(c) | 1,087,254 | 1,089,298 | |
| Hertz Corp. Tranche B 1LN, term loan 3 month U.S. LIBOR + 2.750% 4.4434% 6/30/23 (b)(c) | 5,884,879 | 5,882,113 | |
| Navistar, Inc. Tranche B, term loan 3 month U.S. LIBOR + 3.500% 5.21% 11/6/24 (b)(c) | 5,000,000 | 5,022,900 | |
| North American Lifting Holdings, Inc.: | |||
| Tranche 1LN, term loan 3 month U.S. LIBOR + 4.500% 6.802% 11/27/20 (b)(c) | 6,477,174 | 6,088,543 | |
| Tranche 2LN, term loan 3 month U.S. LIBOR + 9.000% 10.6934% 11/27/21 (b)(c) | 2,641,000 | 2,139,210 | |
| The Gates Corp. Tranche B 1LN, term loan 3 month U.S. LIBOR + 3.000% 4.9039% 3/31/24 (b)(c) | 641,865 | 644,940 | |
| UOS LLC Tranche B 1LN, term loan 3 month U.S. LIBOR + 5.500% 7.3769% 4/18/23 (b)(c) | 2,382,796 | 2,448,323 | |
| TOTAL AUTOMOTIVE & AUTO PARTS | 26,243,141 | ||
| Banks & Thrifts - 0.1% | |||
| Lions Gate Capital Holdings Ll Tranche B, term loan 3 month U.S. LIBOR + 2.250% 4.1038% 3/24/25 (b)(c) | 3,000,000 | 3,002,490 | |
| Broadcasting - 1.1% | |||
| CBS Radio, Inc. Tranche B 1LN, term loan 3 month U.S. LIBOR + 2.750% 4.6225% 11/18/24 (b)(c) | 6,483,750 | 6,509,426 | |
| Clear Channel Communications, Inc. Tranche D, term loan 3 month U.S. LIBOR + 6.750% 0% 1/30/19(c)(e) | 10,685,000 | 8,428,969 | |
| ION Media Networks, Inc. Tranche B, term loan 3 month U.S. LIBOR + 2.750% 4.54% 12/18/20 (b)(c) | 3,344,713 | 3,348,894 | |
| Raycom Media, Inc. Tranche B, term loan 3 month U.S. LIBOR + 2.250% 3.8707% 8/23/24 (b)(c) | 2,333,275 | 2,335,212 | |
| Sinclair Television Group, Inc. Tranche B-1, term loan 3 month U.S. LIBOR + 2.500% 12/7/24 (c)(d) | 4,000,000 | 4,015,000 | |
| TOTAL BROADCASTING | 24,637,501 | ||
| Building Materials - 1.1% | |||
| Beacon Roofing Supply, Inc. Tranche B, term loan 3 month U.S. LIBOR + 2.250% 3.9362% 1/2/25 (b)(c) | 3,500,000 | 3,515,015 | |
| Gopher Sub, Inc.: | |||
| Tranche B 1LN, term loan 3 month U.S. LIBOR + 3.000% 5.302% 2/1/25 (b)(c) | 1,427,097 | 1,423,529 | |
| Tranche B 2LN, term loan 3 month U.S. LIBOR + 6.750% 9.052% 2/1/26 (b)(c) | 600,000 | 603,000 | |
| GYP Holdings III Corp. Tranche B, term loan 3 month U.S. LIBOR + 3.000% 4.7723% 4/1/23 (b)(c) | 3,995,429 | 4,012,090 | |
| HD Supply, Inc. Tranche B 4LN, term loan 3 month U.S. LIBOR + 2.500% 4.802% 10/17/23 (b)(c) | 1,481,306 | 1,489,824 | |
| Jeld-Wen, Inc. Tranche B, term loan 3 month U.S. LIBOR + 2.000% 4.302% 12/14/24 (b)(c) | 3,561,075 | 3,574,429 | |
| Traverse Midstream Partners Ll Tranche B, term loan 3 month U.S. LIBOR + 4.000% 5.85% 9/27/24 (b)(c) | 4,135,000 | 4,155,675 | |
| Ventia Deco LLC Tranche B, term loan 3 month U.S. LIBOR + 3.500% 5.1934% 5/21/22 (b)(c) | 4,957,958 | 5,007,537 | |
| TOTAL BUILDING MATERIALS | 23,781,099 | ||
| Cable/Satellite TV - 2.7% | |||
| Altice U.S. Finance SA Tranche B, term loan 3 month U.S. LIBOR + 2.250% 4.1269% 7/28/25 (b)(c) | 1,980,038 | 1,975,582 | |
| Cable One, Inc. Tranche B, term loan 3 month U.S. LIBOR + 2.250% 4.56% 5/1/24 (b)(c) | 1,260,475 | 1,263,626 | |
| Charter Communication Operating LLC Tranche B, term loan 3 month U.S. LIBOR + 2.000% 3.88% 4/30/25 (b)(c) | 32,917,500 | 33,027,115 | |
| CSC Holdings LLC Tranche B, term loan 3 month U.S. LIBOR + 2.500% 4.2766% 1/25/26 (b)(c) | 5,865,000 | 5,863,182 | |
| MCC Iowa LLC Tranche M, term loan 3 month U.S. LIBOR + 2.000% 3.74% 1/15/25 (b)(c) | 1,079,575 | 1,081,259 | |
| Virgin Media Bristol LLC Tranche B, term loan 3 month U.S. LIBOR + 2.500% 4.2766% 1/15/26 (b)(c) | 5,500,000 | 5,526,950 | |
| WideOpenWest Finance LLC Tranche B, term loan 3 month U.S. LIBOR + 3.250% 5.1038% 8/19/23 (b)(c) | 11,952,469 | 11,676,128 | |
| Zayo Group LLC Tranche B 2LN, term loan 3 month U.S. LIBOR + 2.250% 4.1269% 1/19/24 (b)(c) | 965,000 | 969,275 | |
| TOTAL CABLE/SATELLITE TV | 61,383,117 | ||
| Capital Goods - 0.5% | |||
| AECOM Tranche B, term loan 3 month U.S. LIBOR + 1.750% 3.6269% 3/13/25 (b)(c) | 3,100,000 | 3,103,875 | |
| Doosan Bobcat Tranche B, term loan 3 month U.S. LIBOR + 2.000% 4.302% 5/18/24 (b)(c) | 1,744,314 | 1,744,785 | |
| Gardner Denver, Inc. Tranche B, term loan 3 month U.S. LIBOR + 2.750% 4.4434% 7/30/24 (b)(c) | 1,134,300 | 1,139,325 | |
| Onex Wizard U.S. Acquisition, Inc. Tranche B, term loan 3 month U.S. LIBOR + 3.000% 4.6269% 3/13/22 (b)(c) | 4,427,965 | 4,450,105 | |
| TOTAL CAPITAL GOODS | 10,438,090 | ||
| Chemicals - 2.9% | |||
| Ashland LLC Tranche B, term loan 3 month U.S. LIBOR + 2.000% 3.7847% 5/17/24 (b)(c) | 1,985,000 | 1,997,406 | |
| ASP Chromaflo Intermediate Holdings, Inc. Tranche B 1LN, term loan 3 month U.S. LIBOR + 3.500% 5.3769% 11/18/23 (b)(c) | 2,093,500 | 2,106,584 | |
| Ineos Styrolution U.S. Holding LLC Tranche B, term loan 3 month U.S. LIBOR + 2.000% 3.9944% 3/29/24 (b)(c) | 1,526,987 | 1,529,857 | |
| Invictus U.S. Newco LLC: | |||
| Tranche 1LN, term loan 3 month U.S. LIBOR + 3.000% 4.8769% 2/13/25 (b)(c) | 2,005,000 | 2,018,794 | |
| Tranche 2LN, term loan 3 month U.S. LIBOR + 6.750% 2/13/26 (c)(d) | 1,500,000 | 1,519,995 | |
| Jade Germany GmbH Tranche B, term loan 3 month U.S. LIBOR + 5.500% 7.953% 5/31/23 (b)(c) | 2,977,500 | 2,987,415 | |
| Kraton Polymers LLC Tranche B 1LN, term loan 3 month U.S. LIBOR + 2.500% 4.3769% 3/8/25 (b)(c) | 3,500,000 | 3,519,250 | |
| MacDermid, Inc.: | |||
| Tranche B 6LN, term loan 3 month U.S. LIBOR + 3.000% 4% 6/7/23 (b)(c) | 3,078,767 | 3,096,470 | |
| Tranche B 7LN, term loan 3 month U.S. LIBOR + 2.500% 4.148% 6/7/20 (b)(c) | 1,294,874 | 1,298,604 | |
| Methanol Holdings (TRINIDAD) Ltd. Tranche B, term loan 3 month U.S. LIBOR + 3.500% 5.3769% 6/30/22 (b)(c) | 2,801,196 | 2,801,196 | |
| OCI Partners LP Tranche B, term loan 3 month U.S. LIBOR + 4.250% 6.552% 3/13/25 (b)(c) | 6,750,000 | 6,780,915 | |
| Oxea Corp. Tranche B, term loan 3 month U.S. LIBOR + 3.500% 5.25% 10/11/24 (b)(c) | 6,418,913 | 6,442,983 | |
| PQ Corp. Tranche B, term loan 3 month U.S. LIBOR + 2.500% 4.2907% 2/8/25 (b)(c) | 2,768,063 | 2,778,000 | |
| The Chemours Co. LLC Tranche B, term loan 3 month U.S. LIBOR + 2.500% 6.25% 5/12/22 (b)(c) | 2,537,349 | 2,534,178 | |
| Thermon Holding Corp. Tranche B, term loan 3 month U.S. LIBOR + 3.750% 5.4142% 10/30/24 (b)(c) | 2,700,000 | 2,713,500 | |
| Trinseo Materials Operating SCA/Trinseo Materials Finance, Inc. Tranche B, term loan 3 month U.S. LIBOR + 2.500% 4.3769% 9/6/24 (b)(c) | 1,990,000 | 1,996,846 | |
| Tronox Blocked Borrower LLC Tranche B, term loan 3 month U.S. LIBOR + 3.000% 4.6934% 9/22/24 (b)(c) | 2,867,928 | 2,892,421 | |
| Tronox Finance LLC Tranche B, term loan 3 month U.S. LIBOR + 3.000% 5.302% 9/22/24 (b)(c) | 6,618,297 | 6,674,817 | |
| U.S. Coatings Acquisition, Inc. Tranche B, term loan 3 month U.S. LIBOR + 2.000% 3.6934% 6/1/24 (b)(c) | 1,955,000 | 1,957,698 | |
| Univar, Inc. Tranche B, term loan 3 month U.S. LIBOR + 2.500% 4.3769% 7/1/24 (b)(c) | 3,034,686 | 3,053,652 | |
| Venator Materials LLC Tranche B, term loan 3 month U.S. LIBOR + 3.000% 4.8769% 8/8/24 (b)(c) | 1,368,125 | 1,374,966 | |
| W. R. Grace & Co.-Conn.: | |||
| Tranche B 1LN, term loan 3 month U.S. LIBOR + 1.750% 2/23/25 (c)(d) | 1,131,053 | 1,134,355 | |
| Tranche B 2LN, term loan 3 month U.S. LIBOR + 1.750% 2/23/25 (c)(d) | 1,938,947 | 1,944,609 | |
| TOTAL CHEMICALS | 65,154,511 | ||
| Consumer Products - 1.1% | |||
| CSM Bakery Supplies Tranche B 1LN, term loan 3 month U.S. LIBOR + 4.000% 5.7% 7/3/20 (b)(c) | 3,666,183 | 3,617,606 | |
| HLF Financing U.S. LLC Tranche B, term loan 3 month U.S. LIBOR + 5.500% 7.3769% 2/15/23 (b)(c) | 8,780,876 | 8,863,241 | |
| Prestige Brands, Inc. term loan 3 month U.S. LIBOR + 2.500% 3.648% 1/26/24 (b)(c) | 1,835,404 | 1,838,689 | |
| Weight Watchers International, Inc. Tranche B, term loan 3 month U.S. LIBOR + 4.750% 6.4464% 11/29/24 (b)(c) | 10,862,500 | 10,981,336 | |
| TOTAL CONSUMER PRODUCTS | 25,300,872 | ||
| Consumer Services - 0.1% | |||
| Optiv Security, Inc. Tranche B 1LN, term loan 3 month U.S. LIBOR + 3.250% 5.125% 2/1/24 (b)(c) | 1,560,504 | 1,503,936 | |
| Containers - 1.8% | |||
| Berlin Packaging, LLC: | |||
| Tranche 2LN, term loan 3 month U.S. LIBOR + 6.750% 8.42% 10/1/22 (b)(c) | 1,871,000 | 1,883,629 | |
| Tranche B, term loan 3 month U.S. LIBOR + 3.250% 5.0303% 10/1/21 (b)(c) | 6,186,277 | 6,210,342 | |
| Berry Global, Inc.: | |||
| Tranche P, term loan 3 month U.S. LIBOR + 2.000% 3.7396% 1/6/21 (b)(c) | 7,384,667 | 7,412,359 | |
| Tranche Q, term loan 3 month U.S. LIBOR + 2.000% 3.8231% 10/1/22 (b)(c) | 3,833,019 | 3,849,808 | |
| BWAY Holding Co. Tranche B, term loan 3 month U.S. LIBOR + 3.250% 4.9632% 4/3/24 (b)(c) | 1,488,750 | 1,495,390 | |
| Charter Nex U.S., Inc. Tranche B 1LN, term loan 3 month U.S. LIBOR + 3.000% 4.8769% 5/16/24 (b)(c) | 1,344,838 | 1,346,855 | |
| Consolidated Container Co. Tranche B 1LN, term loan 3 month U.S. LIBOR + 3.000% 4.8769% 5/22/24 (b)(c) | 2,497,466 | 2,512,450 | |
| Crown Americas LLC Tranche B 1LN, term loan 3 month U.S. LIBOR + 2.000% 1/29/25 (c)(d) | 3,160,000 | 3,187,144 | |
| Hostess Brands LLC Tranche B, term loan 3 month U.S. LIBOR + 2.250% 4.1269% 8/3/22 (b)(c) | 369,812 | 371,314 | |
| Plastipak Packaging, Inc. Tranche B, term loan 3 month U.S. LIBOR + 2.750% 4.63% 10/14/24 (b)(c) | 999,975 | 1,004,475 | |
| Printpack Holdings, Inc. Tranche B, term loan 3 month U.S. LIBOR + 3.000% 4.9375% 7/26/23 (b)(c) | 1,265,725 | 1,268,889 | |
| Reynolds Group Holdings, Inc. Tranche B, term loan 3 month U.S. LIBOR + 2.750% 4.6269% 2/5/23 (b)(c) | 9,237,170 | 9,280,030 | |
| Signode Packaging Systems, Inc. Tranche B, term loan 3 month U.S. LIBOR + 2.750% 5.4234% 5/1/21 (b)(c) | 1,615,991 | 1,613,971 | |
| TOTAL CONTAINERS | 41,436,656 | ||
| Diversified Financial Services - 3.4% | |||
| AlixPartners LLP Tranche B, term loan 3 month U.S. LIBOR + 2.750% 5.052% 4/4/24 (b)(c) | 3,960,000 | 3,975,959 | |
| Bcp Renaissance Parent LLC Tranche B, term loan 3 month U.S. LIBOR + 4.000% 5.7723% 10/31/24 (b)(c) | 4,015,000 | 4,031,743 | |
| Cypress Intermediate Holdings, Inc. Tranche B 1LN, term loan 3 month U.S. LIBOR + 3.000% 4.88% 4/27/24 (b)(c) | 2,977,500 | 2,985,480 | |
| Deerfield Holdings Corp. Tranche B, term loan 3 month U.S. LIBOR + 3.250% 5.0003% 2/13/25 (b)(c) | 2,240,000 | 2,242,800 | |
| Delos Finance SARL Tranche B, term loan 3 month U.S. LIBOR + 1.750% 3.4434% 10/6/23 (b)(c) | 3,682,000 | 3,696,581 | |
| Duff & Phelps Corp. Tranche B, term loan 3 month U.S. LIBOR + 3.250% 4.9434% 10/12/24 (b)(c) | 925,000 | 926,156 | |
| Finco I LLC Tranche B, term loan 3 month U.S. LIBOR + 2.750% 4.6269% 7/14/22 (b)(c) | 2,995,278 | 3,028,975 | |
| Fly Funding II SARL Tranche B, term loan 3 month U.S. LIBOR + 2.000% 3.8% 2/9/23 (b)(c) | 6,408,814 | 6,408,814 | |
| Flying Fortress Holdings, Inc. Tranche B, term loan 3 month U.S. LIBOR + 1.750% 4.052% 10/30/22 (b)(c) | 3,000,000 | 3,010,620 | |
| Focus Financial Partners LLC Tranche B 1LN, term loan 3 month U.S. LIBOR + 2.750% 4.4434% 7/3/24 (b)(c) | 2,036,097 | 2,041,187 | |
| Greensky Holdings LLC Tranche B, term loan 3 month U.S. LIBOR + 3.250% 3/22/25 (c)(d) | 2,130,000 | 2,132,663 | |
| HarbourVest Partners LLC Tranche B 1LN, term loan 3 month U.S. LIBOR + 2.250% 4.552% 3/1/25 (b)(c) | 5,120,000 | 5,115,750 | |
| IBC Capital U.S. LLC: | |||
| Tranche 2LN, term loan 3 month U.S. LIBOR + 7.000% 9.0714% 9/9/22 (b)(c) | 2,495,000 | 2,485,644 | |
| Tranche B 1LN, term loan 3 month U.S. LIBOR + 3.750% 5.8214% 9/10/21 (b)(c) | 2,323,214 | 2,324,376 | |
| Kingpin Intermediate Holdings LLC Tranche B, term loan 3 month U.S. LIBOR + 4.250% 6.13% 7/3/24 (b)(c) | 2,992,500 | 3,022,425 | |
| NAB Holdings LLC Tranche B, term loan 3 month U.S. LIBOR + 3.000% 5.302% 6/30/24 (b)(c) | 1,910,400 | 1,919,952 | |
| Ocwen Loan Servicing LLC Tranche B, term loan 3 month U.S. LIBOR + 5.000% 6.7864% 12/5/20 (b)(c) | 1,324,476 | 1,331,098 | |
| Quest Software U.S. Holdings, Inc. Tranche B, term loan 3 month U.S. LIBOR + 5.500% 7.2723% 10/31/22 (b)(c) | 5,429,623 | 5,521,275 | |
| Recess Holdings, Inc. Tranche B, term loan: | |||
| 3 month U.S. LIBOR + 3.750% 9/29/24 (c)(f) | 241,667 | 242,573 | |
| 3 month U.S. LIBOR + 3.750% 6.203% 9/29/24 (b)(c) | 1,779,392 | 1,786,064 | |
| SAI Global GP Tranche B, term loan 3 month U.S. LIBOR + 4.500% 6.802% 12/8/23 (b)(c)(g) | 2,962,500 | 2,940,281 | |
| The Edelman Financial Center L Tranche B, term loan 3 month U.S. LIBOR + 4.250% 5.9702% 11/9/24 (b)(c) | 3,990,000 | 4,044,863 | |
| TransUnion LLC Tranche B, term loan 3 month U.S. LIBOR + 2.000% 3.8769% 4/9/23 (b)(c) | 6,831,991 | 6,847,636 | |
| UFC Holdings LLC Tranche B 1LN, term loan 3 month U.S. LIBOR + 3.250% 5.13% 8/18/23 (b)(c) | 3,258,750 | 3,273,512 | |
| TOTAL DIVERSIFIED FINANCIAL SERVICES | 75,336,427 | ||
| Diversified Media - 0.1% | |||
| Lamar Media Corp. Tranche B, term loan 3 month U.S. LIBOR + 1.750% 3.5625% 3/16/25 (b)(c) | 3,245,000 | 3,249,056 | |
| Energy - 4.9% | |||
| Arctic LNG Carriers Ltd. Tranche B 1LN, term loan 3 month U.S. LIBOR + 4.500% 6.3769% 5/18/23 (b)(c) | 4,347,287 | 4,379,892 | |
| Bcp Raptor LLC Tranche B, term loan 3 month U.S. LIBOR + 4.250% 6.0389% 6/22/24 (b)(c) | 3,970,000 | 3,989,850 | |
| California Resources Corp.: | |||
| Tranche 1LN, term loan 3 month U.S. LIBOR + 10.375% 12.2288% 12/31/21 (b)(c) | 8,640,000 | 9,749,722 | |
| Tranche B, term loan 3 month U.S. LIBOR + 4.750% 6.5721% 12/31/22 (b)(c) | 11,030,000 | 11,178,243 | |
| Chesapeake Energy Corp. Tranche 1LN, term loan 3 month U.S. LIBOR + 7.500% 9.4436% 8/23/21 (b)(c) | 18,450,000 | 19,573,421 | |
| Chief Exploration & Development, LLC. Tranche 2LN, term loan 3 month U.S. LIBOR + 6.500% 8.4161% 5/16/21 (b)(c) | 4,118,000 | 4,076,820 | |
| Citgo Petroleum Corp. Tranche B, term loan 3 month U.S. LIBOR + 3.500% 5.1947% 7/29/21(b)(c) | 8,627,855 | 8,635,016 | |
| Delek U.S. Holdings, Inc. Tranche B 1LN, term loan 3 month U.S. LIBOR + 2.500% 3/13/25 (c)(d) | 1,910,000 | 1,913,591 | |
| Empire Generating Co. LLC: | |||
| Tranche B, term loan 3 month U.S. LIBOR + 4.250% 6.03% 3/14/21 (b)(c) | 1,046,586 | 860,817 | |
| Tranche C, term loan 3 month U.S. LIBOR + 4.250% 6.03% 3/14/21 (b)(c) | 103,727 | 86,093 | |
| Energy Transfer Equity LP Tranche B, term loan 3 month U.S. LIBOR + 2.000% 3.8538% 2/2/24 (b)(c) | 4,000,000 | 3,990,000 | |
| Foresight Energy LLC Tranche B 1LN, term loan 3 month U.S. LIBOR + 5.750% 7.6269% 3/28/22 (b)(c) | 1,980,000 | 1,944,934 | |
| FTS International, Inc. Tranche B, term loan 3 month U.S. LIBOR + 4.750% 6.6269% 4/16/21 (b)(c) | 9,787,395 | 9,811,864 | |
| Gavilan Resources LLC Tranche 2LN, term loan 3 month U.S. LIBOR + 6.000% 7.7864% 3/1/24 (b)(c) | 5,500,000 | 5,503,465 | |
| Gulf Finance LLC Tranche B 1LN, term loan 3 month U.S. LIBOR + 5.250% 7.56% 8/25/23 (b)(c) | 7,385,455 | 6,785,386 | |
| Lucid Energy Group Ii LLC Tranche B 1LN, term loan 3 month U.S. LIBOR + 3.000% 4.7864% 1/31/25 (b)(c) | 4,000,000 | 3,972,520 | |
| Medallion Midland Acquisition Tranche B, term loan 3 month U.S. LIBOR + 3.250% 5.1269% 10/30/24 (b)(c) | 5,625,900 | 5,611,835 | |
| Seadrill Operating LP Tranche B, term loan 3 month U.S. LIBOR + 6.000% 8.302% 2/21/21 (b)(c) | 1,222,197 | 1,021,549 | |
| Terra-Gen Finance Co. LLC Tranche B, term loan 3 month U.S. LIBOR + 4.250% 6.1269% 12/9/21 (b)(c) | 4,455,848 | 4,032,543 | |
| TerraForm AP Acquisition Holdings LLC Tranche B, term loan 3 month U.S. LIBOR + 4.250% 6.552% 6/26/22 (b)(c) | 2,943,055 | 2,960,537 | |
| TerraForm Power Operating LLC Tranche B, term loan 3 month U.S. LIBOR + 2.750% 4.6269% 11/8/22 (b)(c) | 1,057,350 | 1,062,309 | |
| TOTAL ENERGY | 111,140,407 | ||
| Entertainment/Film - 0.6% | |||
| AMC Entertainment Holdings, Inc. Tranche B, term loan 3 month U.S. LIBOR + 2.250% 4.0266% 12/15/23 (b)(c) | 4,430,199 | 4,439,414 | |
| AMC Entertainment, Inc. Tranche B, term loan 3 month U.S. LIBOR + 2.250% 4.0266% 12/15/22 (b)(c) | 1,466,250 | 1,469,007 | |
| CDS U.S. Intermediate Holdings, Inc.: | |||
| Tranche B 1LN, term loan 3 month U.S. LIBOR + 3.750% 6.052% 7/8/22 (b)(c) | 4,644,207 | 4,642,256 | |
| Tranche B 2LN, term loan 3 month U.S. LIBOR + 8.250% 10.552% 7/8/23 (b)(c) | 760,000 | 750,500 | |
| SMG U.S. Midco 2, Inc.: | |||
| Tranche B 1LN, term loan 3 month U.S. LIBOR + 3.250% 5.1369% 1/23/25 (b)(c) | 2,850,000 | 2,871,375 | |
| Tranche B 2LN, term loan 3 month U.S. LIBOR + 7.000% 8.8769% 1/23/26 (b)(c) | 110,000 | 112,200 | |
| TOTAL ENTERTAINMENT/FILM | 14,284,752 | ||
| Environmental - 0.4% | |||
| Hd Supply Waterworks Ltd. Tranche B, term loan 3 month U.S. LIBOR + 3.000% 5.1157% 8/1/24 (b)(c) | 798,000 | 801,990 | |
| The Brickman Group, Ltd. Tranche B 1LN, term loan 3 month U.S. LIBOR + 3.000% 4.846% 12/18/20 (b)(c) | 3,346,116 | 3,363,215 | |
| Wrangler Buyer Corp. Tranche B, term loan 3 month U.S. LIBOR + 3.000% 4.8769% 9/28/24 (b)(c) | 1,670,813 | 1,678,565 | |
| WTG Holdings III Corp. Tranche B 1LN, term loan 3 month U.S. LIBOR + 3.000% 5.302% 12/20/24 (b)(c) | 2,588,513 | 2,604,691 | |
| TOTAL ENVIRONMENTAL | 8,448,461 | ||
| Food & Drug Retail - 4.2% | |||
| Agro Merchants Intermediate Ho Tranche B, term loan 3 month U.S. LIBOR + 3.750% 6.052% 12/6/24 (b)(c) | 2,912,903 | 2,931,108 | |
| Albertson's LLC Tranche B, term loan: | |||
| 3 month U.S. LIBOR + 2.750% 4.6269% 8/25/21 (b)(c) | 30,701,453 | 30,307,247 | |
| 3 month U.S. LIBOR + 3.000% 4.9563% 6/22/23 (b)(c) | 10,304,266 | 10,162,582 | |
| 3 month U.S. LIBOR + 3.000% 5.2916% 12/21/22 (b)(c) | 2,691,654 | 2,662,127 | |
| GOBP Holdings, Inc. Tranche B, term loan 3 month U.S. LIBOR + 3.500% 5.802% 10/21/21 (b)(c) | 6,143,273 | 6,163,731 | |
| JBS USA Lux SA Tranche B, term loan 3 month U.S. LIBOR + 2.500% 4.6815% 10/30/22 (b)(c) | 11,328,594 | 11,288,490 | |
| Lannett Co., Inc.: | |||
| Tranche B, term loan 3 month U.S. LIBOR + 4.750% 6.6269% 11/25/20 (b)(c) | 312,590 | 311,027 | |
| Tranche B, term loan 3 month U.S. LIBOR + 5.375% 7.2519% 11/25/22 (b)(c) | 19,033,371 | 18,954,002 | |
| Pizza Hut Holdings LLC Tranche B, term loan 3 month U.S. LIBOR + 2.000% 3.8082% 6/16/23 (b)(c) | 2,216,362 | 2,220,529 | |
| RPI Finance Trust Tranche B 6LN, term loan 3 month U.S. LIBOR + 2.000% 4.302% 3/27/23 (b)(c) | 4,391,590 | 4,409,728 | |
| Smart & Final, Inc. Tranche B, term loan 3 month U.S. LIBOR + 3.500% 5.1934% 11/15/22 (b)(c) | 5,721,971 | 5,632,594 | |
| TOTAL FOOD & DRUG RETAIL | 95,043,165 | ||
| Food/Beverage/Tobacco - 1.7% | |||
| Arctic Glacier Group Holdings, Inc. Tranche B, term loan 3 month U.S. LIBOR + 3.500% 5.3769% 3/20/24 (b)(c) | 999,919 | 1,007,728 | |
| Arterra Wines Canada, Inc. Tranche B, term loan 3 month U.S. LIBOR + 2.750% 4.9518% 12/16/23 (b)(c) | 2,468,750 | 2,476,477 | |
| Chobani LLC Tranche B, term loan 3 month U.S. LIBOR + 3.500% 5.3769% 10/7/23 (b)(c) | 9,164,876 | 9,203,093 | |
| CTI Foods Holdings Co. LLC Tranche 1LN, term loan 3 month U.S. LIBOR + 3.500% 5.15% 6/28/20 (b)(c) | 1,778,379 | 1,604,987 | |
| Eg Finco Ltd. Tranche B, term loan 3 month U.S. LIBOR + 4.000% 2/6/25 (c)(d) | 1,445,000 | 1,441,026 | |
| Post Holdings, Inc. Tranche B, term loan 3 month U.S. LIBOR + 2.000% 3.88% 5/24/24 (b)(c) | 10,202,975 | 10,218,279 | |
| Shearer's Foods, Inc.: | |||
| Tranche 2LN, term loan 3 month U.S. LIBOR + 6.750% 9.052% 6/30/22 (b)(c) | 4,827,000 | 4,452,908 | |
| Tranche B 1LN, term loan 3 month U.S. LIBOR + 3.938% 6.2395% 6/30/21 (b)(c) | 3,028,128 | 3,019,286 | |
| U.S. Foods, Inc. Tranche B, term loan 3 month U.S. LIBOR + 2.500% 4.3769% 6/27/23 (b)(c) | 3,930,000 | 3,953,226 | |
| TOTAL FOOD/BEVERAGE/TOBACCO | 37,377,010 | ||
| Gaming - 6.8% | |||
| Affinity Gaming LLC Tranche B, term loan 3 month U.S. LIBOR + 3.250% 5.1269% 7/1/23 (b)(c) | 1,912,903 | 1,923,271 | |
| AP Gaming I LLC Tranche B, term loan 3 month U.S. LIBOR + 4.250% 6.1269% 2/15/24 (b)(c) | 2,276,063 | 2,301,669 | |
| Aristocrat Technologies, Inc.: | |||
| Tranche B 2LN, term loan 3 month U.S. LIBOR + 2.000% 3.7447% 10/20/21 (b)(c) | 4,591,521 | 4,612,550 | |
| Tranche B, term loan 3 month U.S. LIBOR + 2.000% 3.7447% 10/19/24 (b)(c) | 2,992,500 | 3,003,722 | |
| Boyd Gaming Corp. Tranche B 1LN, term loan 3 month U.S. LIBOR + 2.500% 4.2363% 9/15/23 (b)(c) | 2,757,207 | 2,769,753 | |
| Caesars Resort Collection LLC Tranche B 1LN, term loan 3 month U.S. LIBOR + 2.750% 4.6269% 12/22/24 (b)(c) | 41,396,250 | 41,659,515 | |
| CCM Merger, Inc. Tranche B, term loan 3 month U.S. LIBOR + 2.750% 4.6269% 8/8/21 (b)(c) | 2,858,863 | 2,874,044 | |
| Churchill Downs, Inc. Tranche B, term loan 3 month U.S. LIBOR + 2.000% 3.65% 12/27/24 (b)(c) | 1,341,638 | 1,344,992 | |
| CityCenter Holdings LLC Tranche B, term loan 3 month U.S. LIBOR + 2.500% 4.3769% 4/18/24 (b)(c) | 3,371,508 | 3,384,590 | |
| Cyan Blue Holdco 3 Ltd. Tranche B, term loan 3 month U.S. LIBOR + 2.750% 5.052% 8/25/24 (b)(c) | 1,776,597 | 1,772,156 | |
| Eldorado Resorts, Inc. Tranche B, term loan 3 month U.S. LIBOR + 2.250% 4.1282% 4/17/24 (b)(c) | 3,375,018 | 3,383,456 | |
| Gaming VC Holdings SA Tranche B2 1LN, term loan 3 month U.S. LIBOR + 2.500% 3/15/24 (c)(d) | 4,585,000 | 4,589,768 | |
| Gateway Casinos & Entertainment Ltd. Tranche B 1LN, term loan 3 month U.S. LIBOR + 3.000% 4.7503% 3/13/25 (b)(c) | 4,445,000 | 4,474,159 | |
| Golden Entertainment, Inc. Tranche B, term loan: | |||
| 3 month U.S. LIBOR + 3.000% 4.88% 10/20/24 (b)(c) | 11,970,000 | 12,022,429 | |
| 3 month U.S. LIBOR + 7.000% 8.86% 10/20/25 (b)(c) | 1,000,000 | 1,005,000 | |
| Golden Nugget, Inc. Tranche B 1LN, term loan 3 month U.S. LIBOR + 3.250% 4.9788% 10/4/23 (b)(c) | 18,792,336 | 18,954,513 | |
| Greektown Holdings LLC Tranche B, term loan 3 month U.S. LIBOR + 2.750% 4.8769% 4/25/24 (b)(c) | 1,374,613 | 1,375,300 | |
| Las Vegas Sands LLC term loan 3 month U.S. LIBOR + 1.750% 3.6269% 3/27/25(b)(c) | 994,975 | 996,557 | |
| MGM Mirage, Inc. Tranche A, term loan 3 month U.S. LIBOR + 2.250% 4.1269% 4/25/21 (b)(c) | 2,182,031 | 2,190,214 | |
| Mohegan Tribal Gaming Authority Tranche B, term loan 3 month U.S. LIBOR + 4.000% 5.8769% 10/14/23 (b)(c) | 2,405,546 | 2,398,041 | |
| Penn National Gaming, Inc. Tranche B, term loan 3 month U.S. LIBOR + 2.500% 4.3769% 1/19/24 (b)(c) | 756,800 | 760,448 | |
| Scientific Games Corp. Tranche B 5LN, term loan 3 month U.S. LIBOR + 2.750% 4.7219% 8/14/24 (b)(c) | 15,028,688 | 15,076,479 | |
| Seminole Tribe Florida Tranche B, term loan 3 month U.S. LIBOR + 2.000% 3.8769% 7/6/24 (b)(c) | 2,487,500 | 2,495,062 | |
| Station Casinos LLC Tranche B, term loan 3 month U.S. LIBOR + 2.500% 4.38% 6/8/23 (b)(c) | 9,270,406 | 9,294,509 | |
| Tropicana Entertainment, Inc. Tranche B, term loan 3 month U.S. LIBOR + 3.000% 4.8769% 11/27/20 (b)(c) | 661,979 | 665,289 | |
| Wynn America LLC Tranche A 1LN, term loan 3 month U.S. LIBOR + 1.750% 3.63% 12/31/21 (b)(c) | 6,140,000 | 6,128,518 | |
| Yonkers Racing Corp. Tranche B 1LN, term loan 3 month U.S. LIBOR + 3.250% 5.13% 5/31/24 (b)(c) | 1,953,600 | 1,964,599 | |
| TOTAL GAMING | 153,420,603 | ||
| Healthcare - 5.4% | |||
| Albany Molecular Research, Inc. Tranche B, term loan: | |||
| 3 month U.S. LIBOR + 3.250% 5.1269% 8/30/24 (b)(c) | 4,186,481 | 4,196,947 | |
| 3 month U.S. LIBOR + 7.000% 8.8769% 8/30/25 (b)(c) | 630,000 | 633,150 | |
| American Renal Holdings, Inc. Tranche B, term loan 3 month U.S. LIBOR + 3.250% 5.1269% 6/22/24 (b)(c) | 2,888,175 | 2,885,460 | |
| Community Health Systems, Inc.: | |||
| Tranche G, term loan 3 month U.S. LIBOR + 2.750% 4.7342% 12/31/19 (b)(c) | 8,947,586 | 8,716,470 | |
| Tranche H, term loan 3 month U.S. LIBOR + 3.000% 4.9842% 1/27/21 (b)(c) | 7,629,579 | 7,323,327 | |
| Concentra, Inc. Tranche B 1LN, term loan 3 month U.S. LIBOR + 2.750% 4.53% 6/1/22 (b)(c) | 1,635,000 | 1,645,905 | |
| CVS Holdings I LP: | |||
| Tranche 2LN, term loan 3 month U.S. LIBOR + 6.750% 8.54% 2/6/26 (b)(c) | 1,000,000 | 996,250 | |
| Tranche B 1LN, term loan 3 month U.S. LIBOR + 3.000% 4.79% 2/6/25 (b)(c) | 1,675,000 | 1,663,493 | |
| Envision Healthcare Corp. Tranche B, term loan 3 month U.S. LIBOR + 3.000% 4.88% 12/1/23 (b)(c) | 2,905,080 | 2,913,795 | |
| Equian Buyer Corp. Tranche B, term loan 3 month U.S. LIBOR + 3.250% 5.1539% 5/19/24 (b)(c) | 4,488,693 | 4,509,252 | |
| Ghx Ultimate Parent Corp. Tranche B, term loan 3 month U.S. LIBOR + 3.000% 4.6934% 6/30/24 (b)(c) | 1,364,688 | 1,368,099 | |
| HCA Holdings, Inc.: | |||
| Tranche B 10LN, term loan 3 month U.S. LIBOR + 2.000% 3.8769% 3/13/25 (b)(c) | 11,000,000 | 11,080,740 | |
| Tranche B 11LN, term loan 3 month U.S. LIBOR + 1.750% 3.6269% 3/18/23 (b)(c) | 5,335,616 | 5,356,478 | |
| Innoviva, Inc. Tranche B, term loan 3 month U.S. LIBOR + 4.500% 6.3725% 8/18/22 (b)(c) | 1,388,475 | 1,398,889 | |
| Kindred Healthcare, Inc. Tranche B, term loan 3 month U.S. LIBOR + 3.500% 5.25% 4/9/21 (b)(c) | 1,837,639 | 1,842,233 | |
| MPH Acquisition Holdings LLC Tranche B, term loan 3 month U.S. LIBOR + 2.750% 5.052% 6/7/23 (b)(c) | 2,533,141 | 2,543,274 | |
| Onex Schumacher Finance LP Tranche B 1LN, term loan 3 month U.S. LIBOR + 4.000% 5.8769% 7/31/22 (b)(c) | 627,353 | 609,317 | |
| Ortho-Clinical Diagnostics, Inc. Tranche B, term loan 3 month U.S. LIBOR + 3.750% 5.4434% 6/30/21 (b)(c) | 15,408,830 | 15,528,248 | |
| PAREXEL International Corp. Tranche B, term loan 3 month U.S. LIBOR + 2.750% 4.6269% 8/11/24 (b)(c) | 5,925,225 | 5,925,225 | |
| Press Ganey Holdings, Inc.: | |||
| Tranche 2LN, term loan 3 month U.S. LIBOR + 6.500% 8.3769% 10/21/24 (b)(c) | 673,321 | 680,896 | |
| Tranche B 1LN, term loan 3 month U.S. LIBOR + 3.000% 4.8769% 10/21/23 (b)(c) | 4,136,555 | 4,157,238 | |
| Prospect Medical Holdings, Inc. Tranche 1LN, term loan 3 month U.S. LIBOR + 5.500% 7.1875% 2/22/24 (b)(c) | 3,245,000 | 3,245,000 | |
| U.S. Anesthesia Partners, Inc. Tranche B, term loan 3 month U.S. LIBOR + 3.000% 4.8769% 6/23/24 (b)(c) | 2,640,842 | 2,652,937 | |
| U.S. Renal Care, Inc.: | |||
| Tranche 2LN, term loan 3 month U.S. LIBOR + 8.000% 10.302% 12/31/23 (b)(c) | 4,000,000 | 4,005,000 | |
| Tranche B 1LN, term loan 3 month U.S. LIBOR + 4.250% 5.9434% 12/31/22 (b)(c) | 9,638,654 | 9,670,750 | |
| Valeant Pharmaceuticals International, Inc. Tranche B, term loan 3 month U.S. LIBOR + 3.500% 5.24% 4/1/22 (b)(c) | 9,558,350 | 9,655,750 | |
| Vizient, Inc. Tranche B 3LN, term loan 3 month U.S. LIBOR + 3.500% 4.398% 2/11/23 (b)(c) | 1,335,662 | 1,346,521 | |
| Wink Holdco, Inc. Tranche B, term loan 3 month U.S. LIBOR + 3.000% 4.6642% 12/1/24 (b)(c) | 4,738,125 | 4,714,434 | |
| TOTAL HEALTHCARE | 121,265,078 | ||
| Homebuilders/Real Estate - 1.9% | |||
| DTZ U.S. Borrower LLC Tranche B 1LN, term loan 3 month U.S. LIBOR + 3.250% 5.1829% 11/4/21 (b)(c) | 5,438,335 | 5,408,098 | |
| Lightstone Holdco LLC: | |||
| Tranche B 1LN, term loan 3 month U.S. LIBOR + 3.750% 5.398% 1/30/24 (b)(c) | 4,731,737 | 4,753,645 | |
| Tranche C 1LN, term loan 3 month U.S. LIBOR + 3.750% 5.6269% 1/30/24 (b)(c) | 300,452 | 301,843 | |
| MGM Growth Properties Operating Partner LP Tranche B, term loan 3 month U.S. LIBOR + 2.000% 3.8769% 3/23/25 (b)(c) | 4,773,814 | 4,783,504 | |
| Pisces Midco, Inc. Tranche B, term loan 3 month U.S. LIBOR + 3.750% 3/29/25 (c)(d) | 5,000,000 | 5,000,000 | |
| Realogy Group LLC Tranche B, term loan 3 month U.S. LIBOR + 2.250% 3.9613% 2/8/25 (b)(c) | 6,969,627 | 7,003,360 | |
| VICI Properties, LLC Tranche B 1LN, term loan 3 month U.S. LIBOR + 2.000% 3.8538% 12/22/24 (b)(c) | 15,000,682 | 15,041,334 | |
| TOTAL HOMEBUILDERS/REAL ESTATE | 42,291,784 | ||
| Hotels - 1.5% | |||
| ESH Hospitality, Inc. Tranche B, term loan 3 month U.S. LIBOR + 2.250% 3.898% 8/30/23 (b)(c) | 2,817,109 | 2,831,195 | |
| Four Seasons Holdings, Inc. Tranche B, term loan 3 month U.S. LIBOR + 2.500% 4.3769% 11/30/23 (b)(c) | 7,631,704 | 7,669,863 | |
| Hilton Worldwide Finance LLC Tranche B 2LN, term loan 3 month U.S. LIBOR + 2.000% 3.8715% 10/25/23 (b)(c) | 4,082,243 | 4,101,878 | |
| La Quinta Intermediate Holdings LLC Tranche B LN, term loan 3 month U.S. LIBOR + 2.750% 4.4702% 4/14/21 (b)(c) | 3,070,550 | 3,073,437 | |
| Playa Resorts Holding BV Tranche B, term loan 3 month U.S. LIBOR + 3.250% 5% 4/27/24 (b)(c) | 10,438,721 | 10,488,305 | |
| Wyndham Hotels & Resorts, Inc. Tranche B, term loan 3 month U.S. LIBOR + 1.750% 3/29/25 (c)(d) | 6,015,000 | 6,030,038 | |
| TOTAL HOTELS | 34,194,716 | ||
| Insurance - 2.6% | |||
| Acrisure LLC Tranche B, term loan 3 month U.S. LIBOR + 4.250% 5.9913% 11/22/23 (b)(c) | 6,144,623 | 6,213,750 | |
| Alliant Holdings Intermediate LLC Tranche B, term loan 3 month U.S. LIBOR + 3.250% 5.1269% 8/14/22 (b)(c) | 7,872,355 | 7,916,125 | |
| AmWINS Group, Inc.: | |||
| Tranche 2LN, term loan 3 month U.S. LIBOR + 6.750% 8.6269% 1/25/25 (b)(c) | 320,000 | 322,134 | |
| Tranche B 1LN, term loan 3 month U.S. LIBOR + 2.750% 4.5872% 1/25/24 (b)(c) | 1,975,000 | 1,984,875 | |
| Asurion LLC: | |||
| Tranche B 6LN, term loan 3 month U.S. LIBOR + 2.750% 4.6269% 11/3/23 (b)(c) | 4,759,775 | 4,790,285 | |
| Tranche B, term loan: | |||
| 3 month U.S. LIBOR + 2.750% 4.6269% 8/4/22 (b)(c) | 7,598,872 | 7,641,653 | |
| 3 month U.S. LIBOR + 6.000% 7.8769% 8/4/25 (b)(c) | 6,285,000 | 6,446,839 | |
| HUB International Ltd. Tranche B 1LN, term loan 3 month U.S. LIBOR + 3.000% 4.8388% 10/2/20 (b)(c) | 8,294,835 | 8,335,148 | |
| USI, Inc. Tranche B, term loan 3 month U.S. LIBOR + 3.000% 5.302% 5/16/24 (b)(c) | 12,558,427 | 12,579,400 | |
| VF Holdings Corp. term loan 3 month U.S. LIBOR + 3.250% 5.1269% 6/30/23 (b)(c) | 1,970,000 | 1,986,016 | |
| TOTAL INSURANCE | 58,216,225 | ||
| Leisure - 2.6% | |||
| 24 Hour Fitness Worldwide, Inc. Tranche B, term loan 3 month U.S. LIBOR + 3.750% 6.052% 5/30/21 (b)(c) | 4,502,477 | 4,536,246 | |
| Crown Finance U.S., Inc. Tranche B 1LN, term loan 3 month U.S. LIBOR + 2.500% 4.3769% 2/28/25 (b)(c) | 11,000,000 | 10,981,300 | |
| Delta 2 SARL Tranche B, term loan 3 month U.S. LIBOR + 2.500% 4.3769% 2/1/24 (b)(c) | 15,389,747 | 15,351,273 | |
| Equinox Holdings, Inc.: | |||
| Tranche 2LN, term loan 3 month U.S. LIBOR + 7.000% 8.8769% 9/8/24 (b)(c) | 1,000,000 | 1,022,500 | |
| Tranche B-1, term loan 3 month U.S. LIBOR + 3.000% 4.8769% 3/8/24 (b)(c) | 2,970,075 | 2,987,391 | |
| Fitness International LLC Tranche B, term loan 3 month U.S. LIBOR + 3.500% 5.3769% 7/1/20 (b)(c) | 1,305,167 | 1,314,956 | |
| Intrawest Resorts Holdings, Inc. Tranche B 1LN, term loan 3 month U.S. LIBOR + 3.250% 5.1269% 7/31/24 (b)(c) | 6,972,525 | 7,001,600 | |
| LTF Merger Sub, Inc. Tranche B, term loan 3 month U.S. LIBOR + 2.750% 4.7342% 6/10/22 (b)(c) | 6,397,353 | 6,402,662 | |
| NVA Holdings, Inc. Tranche B 3LN, term loan 3 month U.S. LIBOR + 2.750% 5.052% 2/2/25 (b)(c) | 1,330,000 | 1,331,104 | |
| Varsity Brands Holding Co., Inc. Tranche B 1LN, term loan 3 month U.S. LIBOR + 3.500% 5.3769% 12/15/24 (b)(c) | 7,980,000 | 8,041,845 | |
| TOTAL LEISURE | 58,970,877 | ||
| Metals/Mining - 0.4% | |||
| American Rock Salt Co. LLC Tranche B, term loan 3 month U.S. LIBOR + 3.750% 5.5907% 3/21/25 (b)(c) | 3,410,000 | 3,427,050 | |
| Murray Energy Corp. Tranche B 2LN, term loan 3 month U.S. LIBOR + 7.250% 9.552% 4/16/20 (b)(c) | 7,330,606 | 6,194,362 | |
| TOTAL METALS/MINING | 9,621,412 | ||
| Paper - 0.4% | |||
| Caraustar Industries, Inc. Tranche B, term loan 3 month U.S. LIBOR + 5.500% 7.802% 3/14/22 (b)(c) | 4,336,200 | 4,350,900 | |
| Flex Acquisition Co., Inc. Tranche B 1LN, term loan 3 month U.S. LIBOR + 3.000% 4.6947% 12/29/23 (b)(c) | 5,267,700 | 5,289,930 | |
| TOTAL PAPER | 9,640,830 | ||
| Publishing/Printing - 2.9% | |||
| Cengage Learning, Inc. Tranche B, term loan 3 month U.S. LIBOR + 4.250% 6.0364% 6/7/23 (b)(c) | 7,653,777 | 6,951,007 | |
| Getty Images, Inc. Tranche B, term loan 3 month U.S. LIBOR + 3.500% 5.802% 10/18/19 (b)(c) | 5,334,991 | 5,099,025 | |
| Harland Clarke Holdings Corp. Tranche B 7LN, term loan 3 month U.S. LIBOR + 4.750% 7.052% 11/3/23 (b)(c) | 6,242,698 | 6,291,266 | |
| Houghton Mifflin Harcourt Publishing, Inc. Tranche B, term loan 3 month U.S. LIBOR + 3.000% 4.8769% 5/29/21 (b)(c) | 8,819,655 | 8,036,910 | |
| Learning Care Group (U.S.) No 2 Tranche B 1LN, term loan 3 month U.S. LIBOR + 3.250% 5.107% 3/6/25 (b)(c) | 3,385,000 | 3,410,388 | |
| McGraw-Hill Global Education Holdings, LLC term loan 3 month U.S. LIBOR + 4.000% 5.8769% 5/4/22 (b)(c) | 15,347,820 | 15,144,461 | |
| Merrill Communications LLC Tranche B, term loan 3 month U.S. LIBOR + 5.250% 7.0223% 6/1/22 (b)(c) | 2,605,874 | 2,625,418 | |
| Multi-Color Corp. Tranche B, term loan 3 month U.S. LIBOR + 2.250% 4.1269% 10/31/24 (b)(c) | 1,506,225 | 1,511,873 | |
| Proquest LLC Tranche B, term loan 3 month U.S. LIBOR + 3.750% 5.6269% 10/24/21 (b)(c) | 3,341,149 | 3,383,949 | |
| Springer Science+Business Media Deutschland GmbH Tranche B 13LN, term loan 3 month U.S. LIBOR + 3.500% 5.3769% 8/24/22 (b)(c) | 13,009,427 | 13,045,984 | |
| TOTAL PUBLISHING/PRINTING | 65,500,281 | ||
| Restaurants - 1.3% | |||
| Burger King Worldwide, Inc. Tranche B, term loan 3 month U.S. LIBOR + 2.250% 4.2937% 2/17/24 (b)(c) | 10,497,647 | 10,499,852 | |
| CEC Entertainment, Inc. Tranche B, term loan 3 month U.S. LIBOR + 3.250% 5.1269% 2/14/21 (b)(c) | 6,488,988 | 6,096,923 | |
| IRB Holdings Corp. Tranche B 1LN, term loan 3 month U.S. LIBOR + 3.250% 4.9362% 2/5/25 (b)(c) | 4,000,000 | 4,041,240 | |
| K-Mac Holdings Corp.: | |||
| Tranche 2LN, term loan 3 month U.S. LIBOR + 6.750% 8.5364% 3/16/26 (b)(c) | 260,000 | 262,925 | |
| Tranche B 1LN, term loan 3 month U.S. LIBOR + 3.250% 5.0364% 3/16/25 (b)(c) | 1,900,000 | 1,908,550 | |
| Red Lobster Hospitality LLC Tranche B, term loan 3 month U.S. LIBOR + 5.250% 7.1269% 7/28/21 (b)(c) | 1,982,462 | 1,986,189 | |
| Tacala Investment Corp. term loan 3 month U.S. LIBOR + 3.250% 4.9142% 2/1/25 (b)(c) | 3,285,000 | 3,300,407 | |
| TOTAL RESTAURANTS | 28,096,086 | ||
| Services - 7.2% | |||
| Access CIG LLC Tranche 1LN, term loan: | |||
| 3 month U.S. LIBOR + 3.750% 2/27/25 (c)(f) | 517,986 | 523,326 | |
| 3 month U.S. LIBOR + 3.750% 5.625% 2/27/25 (b)(c) | 2,482,014 | 2,507,604 | |
| Acosta, Inc. Tranche B, term loan 3 month U.S. LIBOR + 3.250% 5.1269% 9/26/21 (b)(c) | 1,792,170 | 1,497,663 | |
| Almonde, Inc.: | |||
| Tranche 2LN, term loan 3 month U.S. LIBOR + 7.250% 9.2342% 6/13/25 (b)(c) | 5,225,000 | 5,170,294 | |
| Tranche B 1LN, term loan 3 month U.S. LIBOR + 3.500% 5.4842% 6/13/24 (b)(c) | 13,447,462 | 13,429,039 | |
| Ancestry.Com Operations, Inc. Tranche B 1LN, term loan 3 month U.S. LIBOR + 3.250% 5.13% 10/19/23 (b)(c) | 4,902,576 | 4,923,412 | |
| Aramark Services, Inc. Tranche B-1, term loan 3 month U.S. LIBOR + 2.000% 3.8769% 3/11/25 (b)(c) | 7,980,000 | 8,029,875 | |
| Avantor, Inc. Tranche B, term loan 3 month U.S. LIBOR + 4.000% 5.8769% 11/21/24 (b)(c) | 2,992,500 | 3,023,053 | |
| Brand Energy & Infrastructure Services, Inc. Tranche B, term loan 3 month U.S. LIBOR + 4.250% 6.0012% 6/21/24 (b)(c) | 8,453,687 | 8,522,923 | |
| Bright Horizons Family Solutions Tranche B, term loan 3 month U.S. LIBOR + 2.000% 3.8816% 11/7/23 (b)(c) | 1,737,232 | 1,745,918 | |
| Coinmach Service Corp. Tranche B, term loan 3 month U.S. LIBOR + 3.250% 5.0834% 11/14/22 (b)(c) | 7,273,321 | 7,312,742 | |
| EAB Global, Inc. Tranche B, term loan 3 month U.S. LIBOR + 3.500% 5.4841% 11/17/24 (b)(c) | 2,090,000 | 2,090,878 | |
| Filtration Group Corp. Tranche B, term loan 3 month U.S. LIBOR + 3.000% 3/27/25 (c)(d) | 2,400,000 | 2,406,000 | |
| Flexera Software LLC: | |||
| Tranche B 1LN, term loan 3 month U.S. LIBOR + 3.250% 5.13% 2/26/25 (b)(c) | 1,310,000 | 1,315,463 | |
| Tranche B 2LN, term loan 3 month U.S. LIBOR + 7.250% 9.13% 2/26/26 (b)(c) | 115,000 | 115,670 | |
| ION Trading Technologies Ltd. Tranche B, term loan 3 month U.S. LIBOR + 2.750% 5.052% 11/21/24 (b)(c) | 6,982,500 | 6,912,675 | |
| KAR Auction Services, Inc. Tranche B, term loan 3 month U.S. LIBOR + 2.500% 4.8125% 3/9/23 (b)(c) | 1,414,017 | 1,419,913 | |
| KUEHG Corp.: | |||
| Tranche B 1LN, term loan 3 month U.S. LIBOR + 3.750% 6.052% 8/13/22 (b)(c) | 8,852,917 | 8,888,860 | |
| Tranche B, term loan 3 month U.S. LIBOR + 8.250% 9.9434% 8/22/25 (b)(c) | 1,000,000 | 1,012,500 | |
| Laureate Education, Inc. Tranche B 1LN, term loan 3 month U.S. LIBOR + 3.500% 5.3769% 4/26/24 (b)(c) | 29,592,675 | 29,720,219 | |
| Lineage Logistics Holdings, LLC. Tranche B, term loan 3 month U.S. LIBOR + 3.000% 4.8769% 2/27/25 (b)(c) | 12,060,000 | 12,024,785 | |
| On Assignment, Inc. Tranche B, term loan 3 month U.S. LIBOR + 2.000% 4/2/25 (c)(d) | 1,825,000 | 1,830,712 | |
| Prime Security Services Borrower LLC Tranche B 1LN, term loan 3 month U.S. LIBOR + 2.750% 4.6269% 5/2/22 (b)(c) | 12,275,962 | 12,362,508 | |
| Prometric Holdings, Inc. Tranche B 1LN, term loan 3 month U.S. LIBOR + 3.000% 4.77% 1/29/25 (b)(c) | 1,360,000 | 1,367,657 | |
| Science Applications International Corp. Tranche B, term loan 3 month U.S. LIBOR + 2.000% 3.8125% 5/4/22 (b)(c) | 2,354,601 | 2,375,204 | |
| The GEO Group, Inc. Tranche B, term loan 3 month U.S. LIBOR + 2.250% 4.13% 3/23/24 (b)(c) | 1,821,600 | 1,825,699 | |
| The ServiceMaster Co. Tranche B, term loan 3 month U.S. LIBOR + 2.500% 4.3769% 11/8/23 (b)(c) | 2,960,025 | 2,968,491 | |
| Thomson Reuters IP&S Tranche B, term loan 1 month U.S. LIBOR + 3.250% 5.1269% 10/3/23 (b)(c) | 4,634,777 | 4,661,242 | |
| TMK Hawk Parent Corp. Tranche B, term loan 3 month U.S. LIBOR + 3.500% 5.15% 9/26/24 (b)(c) | 1,527,489 | 1,535,508 | |
| Wash Multifamily Acquisition, Inc.: | |||
| Tranche B 1LN, term loan 3 month U.S. LIBOR + 3.250% 5.1269% 5/14/22 (b)(c) | 8,195,432 | 8,236,409 | |
| Tranche B 2LN, term loan 3 month U.S. LIBOR + 7.000% 8.8769% 5/14/23 (b)(c)(g) | 645,000 | 638,550 | |
| Xerox Business Services LLC Tranche B, term loan 3 month U.S. LIBOR + 3.000% 4.8769% 12/7/23 (b)(c) | 2,578,600 | 2,590,410 | |
| TOTAL SERVICES | 162,985,202 | ||
| Steel - 0.2% | |||
| Atkore International, Inc. Tranche B 1LN, term loan 3 month U.S. LIBOR + 3.000% 5.06% 12/22/23 (b)(c) | 1,775,550 | 1,785,759 | |
| JMC Steel Group, Inc. Tranche B, term loan 3 month U.S. LIBOR + 2.750% 4.999% 6/14/21 (b)(c) | 3,256,770 | 3,271,426 | |
| TOTAL STEEL | 5,057,185 | ||
| Super Retail - 4.6% | |||
| Academy Ltd. Tranche B, term loan 3 month U.S. LIBOR + 4.000% 5.7766% 7/2/22 (b)(c) | 5,948,435 | 4,729,006 | |
| Bass Pro Shops LLC. Tranche B, term loan 3 month U.S. LIBOR + 5.000% 6.8769% 9/25/24 (b)(c) | 33,501,500 | 33,166,485 | |
| BJ's Wholesale Club, Inc.: | |||
| Tranche 2LN, term loan 3 month U.S. LIBOR + 7.500% 9.1905% 2/3/25 (b)(c) | 2,500,000 | 2,503,900 | |
| Tranche B 1LN, term loan 3 month U.S. LIBOR + 3.500% 5.1905% 2/3/24 (b)(c) | 15,657,793 | 15,636,499 | |
| Burlington Coat Factory Warehouse Corp. Tranche B, term loan 3 month U.S. LIBOR + 2.500% 4.38% 11/17/24 (b)(c) | 9,199,386 | 9,208,585 | |
| Davids Bridal, Inc. Tranche B, term loan 3 month U.S. LIBOR + 4.000% 6.31% 10/11/19 (b)(c) | 3,020,144 | 2,569,629 | |
| G-III Apparel Group Ltd. Tranche B, term loan 3 month U.S. LIBOR + 5.250% 7.0208% 12/1/22 (b)(c) | 1,500,000 | 1,514,070 | |
| Harbor Freight Tools U.S.A., Inc. Tranche B, term loan 3 month U.S. LIBOR + 2.500% 4.3769% 8/19/23 (b)(c) | 5,251,838 | 5,256,617 | |
| JC Penney Corp., Inc. Tranche B, term loan 3 month U.S. LIBOR + 4.250% 6.2342% 6/23/23 (b)(c) | 7,262,274 | 7,100,035 | |
| Party City Holdings, Inc. term loan 3 month U.S. LIBOR + 2.750% 4.4874% 8/19/22 (b)(c) | 6,782,317 | 6,803,546 | |
| PETCO Animal Supplies, Inc. Tranche B 1LN, term loan 3 month U.S. LIBOR + 3.000% 4.7723% 1/26/23 (b)(c) | 5,067,545 | 3,702,146 | |
| PetSmart, Inc. term loan 3 month U.S. LIBOR + 3.000% 4.68% 3/11/22 (b)(c) | 5,535,700 | 4,430,442 | |
| Red Ventures LLC Tranche B 1LN, term loan 3 month U.S. LIBOR + 4.000% 5.648% 11/8/24 (b)(c) | 5,970,000 | 6,016,029 | |
| Sports Authority, Inc. Tranche B, term loan 3 month U.S. LIBOR + 6.000% 0% 11/16/17 (c)(e) | 3,200,170 | 8,544 | |
| TOTAL SUPER RETAIL | 102,645,533 | ||
| Technology - 13.0% | |||
| Abacus Innovations Corp. Tranche B, term loan 3 month U.S. LIBOR + 1.750% 3.6875% 8/16/23 (b)(c) | 2,255,905 | 2,268,313 | |
| Aptean, Inc.: | |||
| Tranche 2LN, term loan 3 month U.S. LIBOR + 9.500% 11.81% 12/20/23 (b)(c) | 795,000 | 798,315 | |
| Tranche B 1LN, term loan 3 month U.S. LIBOR + 4.250% 6.56% 12/20/22 (b)(c) | 2,227,500 | 2,230,284 | |
| ATS Consolidated, Inc. Tranche B 1LN, term loan 3 month U.S. LIBOR + 3.750% 5.398% 2/28/25 (b)(c) | 2,420,000 | 2,439,675 | |
| Cavium, Inc. Tranche B 1LN, term loan 3 month U.S. LIBOR + 2.250% 4.1269% 8/16/22 (b)(c) | 1,905,442 | 1,905,442 | |
| Ceridian HCM Holding, Inc. Tranche B 2LN, term loan 3 month U.S. LIBOR + 3.500% 5.3769% 9/15/20 (b)(c) | 6,028,039 | 6,037,081 | |
| Cologix Holdings, Inc. Tranche B 1LN, term loan 3 month U.S. LIBOR + 3.000% 4.8613% 3/20/24 (b)(c) | 3,734,831 | 3,732,516 | |
| Compuware Corp. Tranche B 3LN, term loan 3 month U.S. LIBOR + 3.500% 5.15% 12/15/21 (b)(c) | 7,286,726 | 7,368,702 | |
| Cvent, Inc. Tranche B, term loan 3 month U.S. LIBOR + 3.750% 5.6269% 11/29/24 (b)(c) | 3,500,000 | 3,517,500 | |
| Dell International LLC Tranche B, term loan 3 month U.S. LIBOR + 2.000% 3.88% 9/7/23 (b)(c) | 8,993,405 | 9,000,870 | |
| DG Investment Intermediate Holdings, Inc. Tranche B 1LN, term loan 3 month U.S. LIBOR + 3.000% 1/26/25 (c)(f) | 152,903 | 152,521 | |
| Digicert Holdings, Inc. Tranche B, term loan: | |||
| 3 month U.S. LIBOR + 4.750% 6.5223% 10/31/24 (b)(c) | 7,385,000 | 7,463,503 | |
| 3 month U.S. LIBOR + 8.000% 9.7723% 10/31/25 (b)(c) | 1,455,345 | 1,466,711 | |
| EIG Investors Corp. Tranche B, term loan 3 month U.S. LIBOR + 4.000% 5.9563% 2/9/23 (b)(c) | 5,464,686 | 5,498,841 | |
| Electro Rent Corp. Tranche B 1LN, term loan 3 month U.S. LIBOR + 5.000% 6.9842% 1/31/24 (b)(c) | 1,598,158 | 1,602,153 | |
| Epicor Software Corp. Tranche B, term loan 3 month U.S. LIBOR + 3.250% 5.13% 6/1/22 (b)(c) | 9,719,487 | 9,757,490 | |
| EPV Merger Sub, Inc.: | |||
| Tranche 2LN, term loan 3 month U.S. LIBOR + 7.250% 8.9613% 3/8/26 (b)(c) | 545,000 | 547,725 | |
| Tranche B 1LN, term loan 3 month U.S. LIBOR + 3.250% 4.9613% 3/8/25 (b)(c) | 1,230,000 | 1,227,700 | |
| EXC Holdings III Corp. Tranche B, term loan: | |||
| 3 month U.S. LIBOR + 3.500% 5.1605% 12/2/24 (b)(c) | 1,581,038 | 1,594,208 | |
| 3 month U.S. LIBOR + 7.500% 9.1605% 11/16/25 (b)(c) | 1,000,000 | 1,014,380 | |
| First Data Corp. Tranche B, term loan: | |||
| 3 month U.S. LIBOR + 2.250% 4.1215% 7/10/22 (b)(c) | 17,715,713 | 17,739,629 | |
| 3 month U.S. LIBOR + 2.250% 4.1215% 4/26/24 (b)(c) | 3,558,560 | 3,562,581 | |
| Global Payments, Inc. Tranche B 3LN, term loan 3 month U.S. LIBOR + 1.750% 3.6269% 4/22/23 (b)(c) | 1,533,815 | 1,539,567 | |
| Go Daddy Operating Co. LLC Tranche B, term loan 3 month U.S. LIBOR + 2.250% 4.1269% 2/15/24 (b)(c) | 11,915,961 | 11,945,751 | |
| Hyland Software, Inc.: | |||
| Tranche 2LN, term loan 3 month U.S. LIBOR + 7.000% 8.8769% 7/7/25 (b)(c) | 500,000 | 502,915 | |
| Tranche B 1LN, term loan 3 month U.S. LIBOR + 3.250% 5.1269% 7/1/22 (b)(c) | 2,476,278 | 2,495,742 | |
| I-Logic Technologies Bidco Ltd. Tranche B, term loan 3 month U.S. LIBOR + 4.000% 6.302% 12/21/24 (b)(c) | 3,740,625 | 3,743,730 | |
| Infor U.S., Inc. Tranche B 6LN, term loan 3 month U.S. LIBOR + 2.750% 4.6269% 2/1/22 (b)(c) | 2,959,551 | 2,964,079 | |
| Kronos, Inc.: | |||
| term loan 3 month U.S. LIBOR + 8.250% 10.0234% 11/1/24 (b)(c) | 7,835,000 | 8,115,728 | |
| Tranche B 1LN, term loan 3 month U.S. LIBOR + 3.500% 4.8796% 11/1/23 (b)(c) | 6,930,131 | 6,971,088 | |
| Landesk Group, Inc. term loan: | |||
| 3 month U.S. LIBOR + 4.250% 6.13% 1/20/24 (b)(c) | 7,295,815 | 7,160,185 | |
| 3 month U.S. LIBOR + 9.000% 10.88% 1/20/25 (b)(c) | 1,000,000 | 954,000 | |
| Lux FinCo U.S. SPV Tranche B 3LN, term loan 3 month U.S. LIBOR + 3.500% 5.3769% 10/16/22 (b)(c) | 2,742,584 | 2,740,884 | |
| MA FinanceCo. LLC: | |||
| Tranche B 2LN, term loan 3 month U.S. LIBOR + 2.500% 4.148% 11/20/21 (b)(c) | 2,730,000 | 2,695,875 | |
| Tranche B 3LN, term loan: | |||
| 3 month U.S. LIBOR + 2.750% 4.398% 6/21/24 (b)(c) | 12,853,936 | 12,701,360 | |
| 3 month U.S. LIBOR + 2.750% 4.398% 6/21/24 (b)(c) | 2,096,064 | 2,071,183 | |
| Marketo, Inc. Tranche B 1LN, term loan 3 month U.S. LIBOR + 3.250% 5.0435% 2/7/25 (b)(c) | 3,665,000 | 3,653,565 | |
| Mcafee LLC Tranche B, term loan: | |||
| 3 month U.S. LIBOR + 4.500% 6.3769% 9/29/24 (b)(c) | 12,609,343 | 12,730,141 | |
| 3 month U.S. LIBOR + 8.500% 10.3769% 9/29/25 (b)(c) | 4,000,000 | 4,042,000 | |
| MH Sub I LLC Tranche B, term loan 3 month U.S. LIBOR + 3.750% 5.5266% 9/15/24 (b)(c) | 3,980,000 | 3,979,284 | |
| Microsemi Corp. Tranche B, term loan 3 month U.S. LIBOR + 2.000% 3.7422% 1/15/23 (b)(c) | 1,386,841 | 1,387,798 | |
| Mitchell International, Inc. Tranche B, term loan: | |||
| 3 month U.S. LIBOR + 3.250% 11/20/24 (c)(f) | 185,448 | 185,401 | |
| 3 month U.S. LIBOR + 3.250% 5.1269% 12/1/24 (b)(c) | 2,299,552 | 2,298,977 | |
| 3 month U.S. LIBOR + 7.250% 8.9434% 12/1/25 (b)(c) | 1,000,000 | 1,003,750 | |
| Omnitracs Midco LLC Tranche B 1LN, term loan 3 month U.S. LIBOR + 2.750% 5.0211% 3/19/25 (b)(c) | 3,000,000 | 3,003,750 | |
| Rackspace Hosting, Inc. Tranche B, term loan 3 month U.S. LIBOR + 3.000% 4.7867% 11/3/23 (b)(c) | 10,357,072 | 10,313,365 | |
| Renaissance Learning, Inc.: | |||
| Tranche 1LN, term loan 3 month U.S. LIBOR + 3.750% 5.4434% 4/9/21 (b)(c) | 5,005,773 | 5,020,390 | |
| Tranche 2LN, term loan 3 month U.S. LIBOR + 7.000% 8.6934% 4/9/22 (b)(c) | 2,627,000 | 2,631,387 | |
| Solera LLC Tranche B, term loan 3 month U.S. LIBOR + 3.250% 4.6269% 3/3/23 (b)(c) | 6,086,492 | 6,096,840 | |
| Sophia L.P. term loan 3 month U.S. LIBOR + 3.250% 4.9434% 9/30/22 (b)(c) | 6,689,536 | 6,705,055 | |
| SS&C Technologies, Inc.: | |||
| Tranche B 1LN, term loan 3 month U.S. LIBOR + 2.250% 4.1269% 7/8/22 (b)(c) | 2,230,061 | 2,240,854 | |
| Tranche B 2LN, term loan 3 month U.S. LIBOR + 2.250% 4.1269% 7/8/22 (b)(c) | 25,407 | 25,530 | |
| Tranche B 3LN, term loan 3 month U.S. LIBOR + 2.500% 2/27/25 (c)(d) | 12,530,103 | 12,586,237 | |
| Tranche B 4LN, term loan 3 month U.S. LIBOR + 2.500% 2/27/25 (c)(d) | 4,469,897 | 4,489,923 | |
| Sybil Software LLC. Tranche B, term loan 3 month U.S. LIBOR + 2.750% 4.4434% 9/30/23 (b)(c) | 4,372,043 | 4,395,871 | |
| Syniverse Holdings, Inc. Tranche B, term loan 3 month U.S. LIBOR + 5.000% 6.7179% 3/9/23 (b)(c) | 6,500,000 | 6,569,485 | |
| Tempo Acquisition LLC Tranche B, term loan 3 month U.S. LIBOR + 3.000% 4.8769% 5/1/24 (b)(c) | 10,932,462 | 10,983,736 | |
| TIBCO Software, Inc. Tranche B, term loan 3 month U.S. LIBOR + 3.500% 5.38% 12/4/20 (b)(c) | 842,585 | 844,869 | |
| Travelclick, Inc. Tranche B 1LN, term loan 3 month U.S. LIBOR + 4.000% 5.8769% 5/12/21 (b)(c) | 1,526,458 | 1,526,458 | |
| TTM Technologies, Inc. Tranche B, term loan: | |||
| 3 month U.S. LIBOR + 2.500% 9/28/24 (c)(d) | 5,205,000 | 5,211,506 | |
| 3 month U.S. LIBOR + 2.500% 4.3769% 9/28/24 (b)(c) | 1,990,000 | 1,992,488 | |
| Uber Technologies, Inc. Tranche B, term loan: | |||
| 3 month U.S. LIBOR + 4.000% 3/21/25 (c)(d) | 8,500,000 | 8,531,875 | |
| 3 month U.S. LIBOR + 4.000% 5.8769% 7/13/23 (b)(c) | 2,244,711 | 2,250,727 | |
| Vantiv LLC Tranche B, term loan 3 month U.S. LIBOR + 2.000% 3.7766% 8/7/24 (b)(c) | 5,000,000 | 5,024,100 | |
| WEX, Inc. Tranche B, term loan 3 month U.S. LIBOR + 2.250% 4.1269% 7/1/23 (b)(c) | 6,215,846 | 6,252,955 | |
| TOTAL TECHNOLOGY | 293,506,544 | ||
| Telecommunications - 6.9% | |||
| Altice Financing SA Tranche B, term loan: | |||
| 3 month U.S. LIBOR + 2.750% 4.4702% 7/15/25 (b)(c) | 5,477,481 | 5,361,085 | |
| 3 month U.S. LIBOR + 2.750% 4.4702% 1/31/26 (b)(c) | 3,491,250 | 3,423,624 | |
| Digicel International Finance Ltd. Tranche B, term loan 3 month U.S. LIBOR + 3.750% 5.02% 5/25/24 (b)(c) | 6,250,711 | 6,215,582 | |
| Evo Payments International LLC Tranche B 1LN, term loan 3 month U.S. LIBOR + 4.000% 5.64% 12/22/23 (b)(c) | 2,970,000 | 2,992,275 | |
| Frontier Communications Corp.: | |||
| Tranche A, term loan 3 month U.S. LIBOR + 2.750% 4.63% 3/31/21 (b)(c) | 7,265,576 | 7,188,415 | |
| Tranche B 1LN, term loan 3 month U.S. LIBOR + 3.750% 5.63% 6/15/24 (b)(c) | 19,845,088 | 19,559,914 | |
| GTT Communications, Inc. Tranche B, term loan 3 month U.S. LIBOR + 3.250% 5.1875% 1/9/24 (b)(c) | 1,204,750 | 1,205,051 | |
| Intelsat Jackson Holdings SA: | |||
| Tranche B, term loan 3 month U.S. LIBOR + 3.750% 5.7063% 11/27/23 (b)(c) | 34,775,000 | 34,775,000 | |
| Tranche B-4, term loan 3 month U.S. LIBOR + 4.500% 6.4563% 1/2/24 (b)(c) | 4,000,000 | 4,102,840 | |
| Tranche B-5, term loan 6.625% 1/2/24 | 6,205,000 | 6,276,109 | |
| Level 3 Financing, Inc. Tranche B, term loan 3 month U.S. LIBOR + 2.250% 4.1113% 2/22/24 (b)(c) | 10,090,000 | 10,107,355 | |
| Neptune Finco Corp. Tranche B, term loan 3 month U.S. LIBOR + 2.250% 4.0364% 7/17/25 (b)(c) | 4,914,175 | 4,896,778 | |
| Neustar, Inc.: | |||
| Tranche 2LN, term loan 3 month U.S. LIBOR + 8.000% 10.302% 8/8/25 (b)(c) | 875,000 | 880,469 | |
| Tranche B 3LN, term loan 3 month U.S. LIBOR + 2.500% 4.802% 1/8/20 (b)(c) | 325,708 | 326,727 | |
| Tranche B 4LN, term loan 3 month U.S. LIBOR + 3.500% 5.3769% 8/8/24 (b)(c) | 3,034,750 | 3,043,611 | |
| Onvoy LLC Tranche B 1LN, term loan 3 month U.S. LIBOR + 4.500% 6.802% 2/10/24 (b)(c) | 2,970,000 | 2,858,625 | |
| Radiate Holdco LLC Tranche B, term loan 3 month U.S. LIBOR + 3.000% 4.8769% 2/1/24 (b)(c) | 11,096,152 | 11,026,801 | |
| Sable International Finance Ltd. Tranche B 4LN, term loan 3 month U.S. LIBOR + 3.250% 5.1269% 1/31/25 (b)(c) | 14,250,000 | 14,285,625 | |
| Securus Technologies, Inc. Tranche B, term loan: | |||
| 3 month U.S. LIBOR + 4.500% 6.3769% 11/1/24 (b)(c) | 3,990,000 | 4,032,414 | |
| 3 month U.S. LIBOR + 8.250% 9.898% 11/1/25 (b)(c) | 3,000,000 | 3,026,250 | |
| SFR Group SA Tranche B 11LN, term loan 3 month U.S. LIBOR + 2.750% 4.5223% 7/31/25 (b)(c) | 7,320,302 | 7,082,392 | |
| Telesat LLC Tranche B 4LN, term loan 3 month U.S. LIBOR + 3.000% 5.31% 11/17/23 (b)(c) | 3,075,226 | 3,084,206 | |
| TOTAL TELECOMMUNICATIONS | 155,751,148 | ||
| Textiles/Apparel - 0.1% | |||
| ABB Optical Group LLC Tranche B, term loan 3 month U.S. LIBOR + 5.000% 6.8042% 6/15/23 (b)(c) | 1,649,875 | 1,654,000 | |
| Transportation Ex Air/Rail - 0.4% | |||
| International Seaways Operating Corp. Tranche B, term loan 3 month U.S. LIBOR + 5.500% 7.15% 6/22/22 (b)(c) | 4,917,191 | 4,884,393 | |
| Navios Maritime Partners LP Tranche B, term loan 3 month U.S. LIBOR + 5.000% 7.08% 9/14/20 (b)(c) | 3,135,002 | 3,154,596 | |
| TOTAL TRANSPORTATION EX AIR/RAIL | 8,038,989 | ||
| Utilities - 2.9% | |||
| Cortes NP Acquisition Corp. Tranche B, term loan 3 month U.S. LIBOR + 4.000% 5.6701% 11/30/23 (b)(c) | 4,260,468 | 4,276,445 | |
| Dynegy, Inc. Tranche C-2, term loan 3 month U.S. LIBOR + 2.750% 4.6038% 2/7/24 (b)(c) | 6,353,004 | 6,389,025 | |
| Exgen Renewables Iv LLC Tranche B, term loan 3 month U.S. LIBOR + 3.000% 4.99% 11/28/24 (b)(c) | 3,990,000 | 4,027,426 | |
| Exgen Texas Power LLC Tranche B, term loan 3 month U.S. LIBOR + 4.750% 0% 9/18/21 (c)(e) | 4,289,435 | 2,614,754 | |
| Green Energy Partners/Stonewall LLC Tranche B 1LN, term loan 3 month U.S. LIBOR + 5.500% 7.802% 11/13/21 (b)(c) | 4,032,735 | 3,947,039 | |
| Houston Fuel Oil Terminal Co. Tranche B, term loan 3 month U.S. LIBOR + 3.500% 5.8% 8/19/21 (b)(c) | 7,810,379 | 7,883,641 | |
| InterGen NV Tranche B, term loan 3 month U.S. LIBOR + 4.500% 6.24% 6/13/20 (b)(c) | 7,024,150 | 7,053,441 | |
| Limetree Bay Terminals LLC term loan 3 month U.S. LIBOR + 4.000% 5.8538% 2/15/24 (b)(c) | 3,395,703 | 3,390,610 | |
| Moxie Patriot LLC Tranche B, term loan 3 month U.S. LIBOR + 5.750% 8.052% 12/19/20 (b)(c) | 7,314,713 | 7,200,457 | |
| Pike Corp. Tranche B, term loan 3 month U.S. LIBOR + 3.500% 5.39% 3/13/25 (b)(c) | 4,000,000 | 4,035,000 | |
| Tex Operations Co. LLC: | |||
| Tranche B, term loan 3 month U.S. LIBOR + 2.500% 4.3769% 8/4/23 (b)(c) | 6,987,993 | 7,030,690 | |
| Tranche C, term loan 3 month U.S. LIBOR + 2.500% 4.148% 8/4/23 (b)(c) | 1,241,482 | 1,249,068 | |
| USIC Holdings, Inc. Tranche B, term loan 3 month U.S. LIBOR + 3.500% 5.802% 12/9/23 (b)(c) | 1,975,000 | 1,989,813 | |
| Vistra Operations Co. LLC Tranche B 2LN, term loan 3 month U.S. LIBOR + 2.250% 4.0582% 12/14/23 (b)(c) | 3,456,250 | 3,475,501 | |
| TOTAL UTILITIES | 64,562,910 | ||
| TOTAL BANK LOAN OBLIGATIONS | |||
| (Cost $2,041,026,363) | 2,037,625,261 | ||
| Nonconvertible Bonds - 2.4% | |||
| Aerospace - 0.0% | |||
| DAE Funding LLC 4% 8/1/20 (h) | 905,000 | 882,375 | |
| Chemicals - 0.2% | |||
| TPC Group, Inc. 8.75% 12/15/20 (h) | 3,780,000 | 3,797,766 | |
| Containers - 0.3% | |||
| Reynolds Group Issuer, Inc./Reynolds Group Issuer LLC/Reynolds Group Issuer (Luxembourg) SA 3 month U.S. LIBOR + 3.500% 5.2215% 7/15/21 (b)(c)(h) | 5,780,000 | 5,852,250 | |
| Energy - 0.2% | |||
| Cheniere Corpus Christi Holdings LLC: | |||
| 5.125% 6/30/27 | 1,605,000 | 1,592,963 | |
| 7% 6/30/24 | 1,000,000 | 1,106,250 | |
| Consolidated Energy Finance SA: | |||
| 3 month U.S. LIBOR + 3.750% 5.8745% 6/15/22 (b)(c)(h) | 1,000,000 | 999,651 | |
| 6.875% 6/15/25 (h) | 1,000,000 | 1,047,500 | |
| TOTAL ENERGY | 4,746,364 | ||
| Gaming - 0.2% | |||
| Scientific Games Corp. 5% 10/15/25 (h) | 3,060,000 | 2,975,850 | |
| Sugarhouse HSP Gaming Prop Mezz LP/Sugarhouse HSP Gaming Finance Corp. 5.875% 5/15/25 (h) | 1,367,000 | 1,302,068 | |
| TOTAL GAMING | 4,277,918 | ||
| Healthcare - 0.4% | |||
| Tenet Healthcare Corp.: | |||
| 4.625% 7/15/24 (h) | 2,500,000 | 2,403,125 | |
| 7.5% 1/1/22 (h) | 900,000 | 948,375 | |
| THC Escrow Corp. III 5.125% 5/1/25 (h) | 1,000,000 | 961,250 | |
| Valeant Pharmaceuticals International, Inc.: | |||
| 5.5% 11/1/25 (h) | 2,515,000 | 2,448,353 | |
| 9% 12/15/25 (h) | 1,275,000 | 1,267,031 | |
| TOTAL HEALTHCARE | 8,028,134 | ||
| Leisure - 0.1% | |||
| Studio City Co. Ltd.: | |||
| 5.875% 11/30/19 (h) | 1,220,000 | 1,242,936 | |
| 7.25% 11/30/21 (h) | 2,000,000 | 2,082,500 | |
| TOTAL LEISURE | 3,325,436 | ||
| Paper - 0.1% | |||
| Xerium Technologies, Inc. 9.5% 8/15/21 | 2,500,000 | 2,575,000 | |
| Publishing/Printing - 0.0% | |||
| Cenveo Corp. 6% 8/1/19 (e)(h) | 450,000 | 202,500 | |
| Services - 0.1% | |||
| APX Group, Inc.: | |||
| 7.625% 9/1/23 | 1,000,000 | 1,035,000 | |
| 7.875% 12/1/22 | 1,450,000 | 1,504,593 | |
| Brand Energy & Infrastructure Services, Inc. 8.5% 7/15/25 (h) | 395,000 | 412,281 | |
| TOTAL SERVICES | 2,951,874 | ||
| Super Retail - 0.1% | |||
| JC Penney Corp., Inc. 5.875% 7/1/23 (h) | 1,020,000 | 976,650 | |
| PetSmart, Inc. 5.875% 6/1/25 (h) | 1,000,000 | 722,500 | |
| TOTAL SUPER RETAIL | 1,699,150 | ||
| Technology - 0.3% | |||
| Diamond 1 Finance Corp./Diamond 2 Finance Corp.: | |||
| 3.48% 6/1/19 (h) | 1,004,000 | 1,008,473 | |
| 4.42% 6/15/21 (h) | 3,030,000 | 3,107,513 | |
| NXP BV/NXP Funding LLC 4.125% 6/1/21 (h) | 2,665,000 | 2,691,650 | |
| TOTAL TECHNOLOGY | 6,807,636 | ||
| Telecommunications - 0.4% | |||
| Altice Financing SA 7.5% 5/15/26 (h) | 3,095,000 | 3,033,100 | |
| SFR Group SA: | |||
| 6% 5/15/22 (h) | 450,000 | 439,866 | |
| 6.25% 5/15/24 (h) | 1,930,000 | 1,819,025 | |
| 7.375% 5/1/26 (h) | 3,010,000 | 2,867,025 | |
| TOTAL TELECOMMUNICATIONS | 8,159,016 | ||
| TOTAL NONCONVERTIBLE BONDS | |||
| (Cost $53,845,568) | 53,305,419 | ||
| Shares | Value | ||
| Common Stocks - 0.7% | |||
| Chemicals - 0.2% | |||
| LyondellBasell Industries NV Class A | 52,192 | 5,515,651 | |
| Energy - 0.3% | |||
| Expro Holdings U.S., Inc. (g) | 240,349 | 4,686,806 | |
| Expro Holdings U.S., Inc. (g)(h) | 88,205 | 1,719,998 | |
| TOTAL ENERGY | 6,406,804 | ||
| Metals/Mining - 0.1% | |||
| Warrior Metropolitan Coal, Inc. | 52,896 | 1,481,617 | |
| Publishing/Printing - 0.1% | |||
| Tribune Media Co. Class A | 35,222 | 1,426,843 | |
| Telecommunications - 0.0% | |||
| Consolidated Communications Holdings, Inc. | 23,635 | 259,040 | |
| TOTAL COMMON STOCKS | |||
| (Cost $19,491,834) | 15,089,955 | ||
| Other - 0.0% | |||
| Other - 0.0% | |||
| Tribune Co. Claim (g)(i) | |||
| (Cost $45,406) | 45,944 | 45,944 | |
| Money Market Funds - 10.0% | |||
| Fidelity Cash Central Fund, 1.72% (j) | |||
| (Cost $226,050,053) | 226,011,109 | 226,056,311 | |
| TOTAL INVESTMENT IN SECURITIES - 103.6% | |||
| (Cost $2,340,459,224) | 2,332,122,890 | ||
| NET OTHER ASSETS (LIABILITIES) - (3.6)% | (80,220,990) | ||
| NET ASSETS - 100% | $2,251,901,900 |
Legend
(a) Remaining maturities of bank loan obligations may be less than the stated maturities shown as a result of contractual or optional prepayments by the borrower. Such prepayments cannot be predicted with certainty.
(b) Coupon rates for floating and adjustable rate securities reflect the rates in effect at period end.
(c) Coupon is indexed to a floating interest rate which may be multiplied by a specified factor and/or subject to caps or floors.
(d) The coupon rate will be determined upon settlement of the loan after period end.
(e) Non-income producing - Security is in default.
(f) Position represents an unfunded loan commitment. At period end, the total principal amount and market value of unfunded commitments totaled $1,098,003 and $1,103,821, respectively.
(g) Level 3 security
(h) Security exempt from registration under Rule 144A of the Securities Act of 1933. These securities may be resold in transactions exempt from registration, normally to qualified institutional buyers. At the end of the period, the value of these securities amounted to $47,211,611 or 2.1% of net assets.
(i) Non-income producing
(j) Affiliated fund that is generally available only to investment companies and other accounts managed by Fidelity Investments. The rate quoted is the annualized seven-day yield of the fund at period end. A complete unaudited listing of the fund's holdings as of its most recent quarter end is available upon request. In addition, each Fidelity Central Fund's financial statements are available on the SEC's website or upon request.
Affiliated Central Funds
Information regarding fiscal year to date income earned by the Fund from investments in Fidelity Central Funds is as follows:
| Fund | Income earned |
| Fidelity Cash Central Fund | $1,695,122 |
| Total | $1,695,122 |
Amounts in the income column in the above table include any capital gain distributions from underlying funds, which are presented in the corresponding line-item in the Statement of Operations if applicable.
Investment Valuation
The following is a summary of the inputs used, as of March 31, 2018, involving the Fund's assets and liabilities carried at fair value. The inputs or methodology used for valuing securities may not be an indication of the risk associated with investing in those securities. For more information on valuation inputs, and their aggregation into the levels used below, please refer to the Investment Valuation section in the accompanying Notes to Financial Statements.
| Valuation Inputs at Reporting Date: | ||||
| Description | Total | Level 1 | Level 2 | Level 3 |
| Investments in Securities: | ||||
| Equities: | ||||
| Consumer Discretionary | $1,426,843 | $1,426,843 | $-- | $-- |
| Energy | 7,888,421 | 1,481,617 | -- | 6,406,804 |
| Materials | 5,515,651 | 5,515,651 | -- | -- |
| Telecommunication Services | 259,040 | 259,040 | -- | -- |
| Bank Loan Obligations | 2,037,625,261 | -- | 2,034,046,430 | 3,578,831 |
| Corporate Bonds | 53,305,419 | -- | 53,305,419 | -- |
| Other | 45,944 | -- | -- | 45,944 |
| Money Market Funds | 226,056,311 | 226,056,311 | -- | -- |
| Total Investments in Securities: | $2,332,122,890 | $234,739,462 | $2,087,351,849 | $10,031,579 |
Other Information
Distribution of investments by country or territory of incorporation, as a percentage of Total Net Assets, is as follows (Unaudited):
| United States of America | 89.0% |
| Luxembourg | 4.9% |
| Canada | 1.3% |
| Netherlands | 1.1% |
| Others (Individually Less Than 1%) | 3.7% |
| 100.0% |
See accompanying notes which are an integral part of the financial statements.
Financial Statements
Statement of Assets and Liabilities
| March 31, 2018 (Unaudited) | ||
| Assets | ||
| Investment in securities, at value — See accompanying schedule: Unaffiliated issuers (cost $2,114,409,171) | $2,106,066,579 | |
| Fidelity Central Funds (cost $226,050,053) | 226,056,311 | |
| Total Investment in Securities (cost $2,340,459,224) | $2,332,122,890 | |
| Cash | 10,278,261 | |
| Receivable for investments sold | 17,039,533 | |
| Receivable for fund shares sold | 20,160 | |
| Dividends receivable | 18,311 | |
| Interest receivable | 9,897,400 | |
| Distributions receivable from Fidelity Central Funds | 339,041 | |
| Total assets | 2,369,715,596 | |
| Liabilities | ||
| Payable for investments purchased | $116,984,721 | |
| Payable for fund shares redeemed | 257,742 | |
| Distributions payable | 558,797 | |
| Other payables and accrued expenses | 12,436 | |
| Total liabilities | 117,813,696 | |
| Net Assets | $2,251,901,900 | |
| Net Assets consist of: | ||
| Paid in capital | $2,257,690,847 | |
| Undistributed net investment income | 1,235,412 | |
| Accumulated undistributed net realized gain (loss) on investments | 1,311,975 | |
| Net unrealized appreciation (depreciation) on investments | (8,336,334) | |
| Net Assets, for 21,813,410 shares outstanding | $2,251,901,900 | |
| Net Asset Value, offering price and redemption price per share ($2,251,901,900 ÷ 21,813,410 shares) | $103.23 |
See accompanying notes which are an integral part of the financial statements.
Statement of Operations
| Six months ended March 31, 2018 (Unaudited) | ||
| Investment Income | ||
| Dividends | $480,678 | |
| Interest | 45,093,241 | |
| Income from Fidelity Central Funds | 1,695,122 | |
| Total income | 47,269,041 | |
| Expenses | ||
| Custodian fees and expenses | $17,665 | |
| Independent directors' fees and expenses | 3,388 | |
| Legal | 16,805 | |
| Miscellaneous | 22 | |
| Total expenses before reductions | 37,880 | |
| Expense reductions | (16,360) | 21,520 |
| Net investment income (loss) | 47,247,521 | |
| Realized and Unrealized Gain (Loss) | ||
| Net realized gain (loss) on: | ||
| Investment securities: | ||
| Unaffiliated issuers | 1,681,357 | |
| Total net realized gain (loss) | 1,681,357 | |
| Change in net unrealized appreciation (depreciation) on: | ||
| Investment securities: | ||
| Unaffiliated issuers | 3,750,453 | |
| Fidelity Central Funds | 1 | |
| Total change in net unrealized appreciation (depreciation) | 3,750,454 | |
| Net gain (loss) | 5,431,811 | |
| Net increase (decrease) in net assets resulting from operations | $52,679,332 |
See accompanying notes which are an integral part of the financial statements.
Statement of Changes in Net Assets
| Six months ended March 31, 2018 (Unaudited) | Year ended September 30, 2017 | |
| Increase (Decrease) in Net Assets | ||
| Operations | ||
| Net investment income (loss) | $47,247,521 | $82,079,389 |
| Net realized gain (loss) | 1,681,357 | 4,385,070 |
| Change in net unrealized appreciation (depreciation) | 3,750,454 | 4,876,219 |
| Net increase (decrease) in net assets resulting from operations | 52,679,332 | 91,340,678 |
| Distributions to shareholders from net investment income | (46,670,952) | (81,420,546) |
| Distributions to shareholders from net realized gain | (5,780,280) | (808,840) |
| Total distributions | (52,451,232) | (82,229,386) |
| Affiliated share transactions | ||
| Proceeds from sales of shares | 635,276,235 | 243,935,396 |
| Reinvestment of distributions | 49,333,144 | 23,568,043 |
| Cost of shares redeemed | (67,441,610) | (256,527,613) |
| Net increase (decrease) in net assets resulting from share transactions | 617,167,769 | 10,975,826 |
| Total increase (decrease) in net assets | 617,395,869 | 20,087,118 |
| Net Assets | ||
| Beginning of period | 1,634,506,031 | 1,614,418,913 |
| End of period | $2,251,901,900 | $1,634,506,031 |
| Other Information | ||
| Undistributed net investment income end of period | $1,235,412 | $658,843 |
| Shares | ||
| Sold | 6,145,347 | 2,363,592 |
| Issued in reinvestment of distributions | 477,739 | 228,146 |
| Redeemed | (653,007) | (2,479,226) |
| Net increase (decrease) | 5,970,079 | 112,512 |
See accompanying notes which are an integral part of the financial statements.
Financial Highlights
Fidelity Floating Rate Central Fund
| Six months ended (Unaudited) March 31, | Years endedSeptember 30, | |||||
| 2018 | 2017 | 2016 | 2015 | 2014 | 2013 | |
| Selected Per–Share Data | ||||||
| Net asset value, beginning of period | $103.17 | $102.63 | $102.02 | $107.17 | $106.39 | $104.53 |
| Income from Investment Operations | ||||||
| Net investment income (loss)A | 2.491 | 5.268 | 5.424 | 5.449 | 5.658 | 6.526 |
| Net realized and unrealized gain (loss) | .361 | .545 | .357 | (5.445) | .412 | .838 |
| Total from investment operations | 2.852 | 5.813 | 5.781 | .004 | 6.070 | 7.364 |
| Distributions from net investment income | (2.467) | (5.223) | (5.171) | (5.154) | (5.290) | (5.504) |
| Distributions from net realized gain | (.325) | (.050) | – | – | – | – |
| Total distributions | (2.792) | (5.273) | (5.171) | (5.154) | (5.290) | (5.504) |
| Net asset value, end of period | $103.23 | $103.17 | $102.63 | $102.02 | $107.17 | $106.39 |
| Total ReturnB,C | 2.80% | 5.77% | 5.95% | (.03)% | 5.78% | 7.19% |
| Ratios to Average Net AssetsD,E | ||||||
| Expenses before reductions | - %F,G | .06% | - %G | - %G | - %G | - %G |
| Expenses net of fee waivers, if any | - %F,G | .06% | - %G | - %G | - %G | - %G |
| Expenses net of all reductions | - %F,G | .06% | - %G | - %G | - %G | - %G |
| Net investment income (loss) | 4.85%F | 5.09% | 5.45% | 5.15% | 5.25% | 6.15% |
| Supplemental Data | ||||||
| Net assets, end of period (000 omitted) | $2,251,902 | $1,634,506 | $1,614,419 | $1,597,788 | $1,653,285 | $1,342,624 |
| Portfolio turnover rateH | 55%F | 78% | 48% | 37%I | 66% | 90% |
A Calculated based on average shares outstanding during the period.
B Total returns for periods of less than one year are not annualized.
C Total returns would have been lower if certain expenses had not been reduced during the applicable periods shown.
D Fees and expenses of any underlying Fidelity Central Funds are not included in the Fund's expense ratio. The Fund indirectly bears its proportionate share of the expenses of any underlying Fidelity Central Funds.
E Expense ratios reflect operating expenses of the Fund. Expenses before reductions do not reflect amounts reimbursed by the investment adviser or reductions from expense offset arrangements and do not represent the amount paid by the Fund during periods when reimbursements or reductions occur. Expenses net of fee waivers reflect expenses after reimbursement by the investment adviser but prior to reductions from expense offset arrangements. Expenses net of all reductions represent the net expenses paid by the Fund.
F Annualized
G Amount represents less than .005%.
H Amount does not include the portfolio activity of any underlying Fidelity Central Funds.
I Portfolio turnover rate excludes securities received or delivered in-kind.
See accompanying notes which are an integral part of the financial statements.
Notes to Financial Statements (Unaudited)
For the period ended March 31, 2018
1. Organization.
Fidelity Floating Rate Central Fund (the Fund) is a fund of Fidelity Central Investment Portfolios LLC (the LLC) and is authorized to issue an unlimited number of shares. Shares of the Fund are only offered to other investment companies and accounts managed by Fidelity Management & Research Company (FMR), or its affiliates (the Investing Funds). The LLC is registered under the Investment Company Act of 1940, as amended (the 1940 Act), as an open-end management investment company organized as a Delaware Limited Liability Company.
2. Investments in Fidelity Central Funds.
The Fund invests in Fidelity Central Funds, which are open-end investment companies generally available only to other investment companies and accounts managed by the investment adviser and its affiliates. The Fund's Schedule of Investments lists each of the Fidelity Central Funds held as of period end, if any, as an investment of the Fund, but does not include the underlying holdings of each Fidelity Central Fund. As an Investing Fund, the Fund indirectly bears its proportionate share of the expenses of the underlying Fidelity Central Funds.
The Money Market Central Funds seek preservation of capital and current income and are managed by Fidelity Investments Money Management, Inc. (FIMM), an affiliate of the investment adviser. Annualized expenses of the Money Market Central Funds as of their most recent shareholder report date are less than .005%.
A complete unaudited list of holdings for each Fidelity Central Fund is available upon request or at the Securities and Exchange Commission (the SEC) website at www.sec.gov. In addition, the financial statements of the Fidelity Central Funds are available on the SEC website or upon request.
3. Significant Accounting Policies.
The Fund is an investment company and applies the accounting and reporting guidance of the Financial Accounting Standards Board (FASB) Accounting Standards Codification Topic 946 Financial Services – Investments Companies. The financial statements have been prepared in conformity with accounting principles generally accepted in the United States of America (GAAP), which require management to make certain estimates and assumptions at the date of the financial statements. Actual results could differ from those estimates. Subsequent events, if any, through the date that the financial statements were issued have been evaluated in the preparation of the financial statements. The following summarizes the significant accounting policies of the Fund:
Investment Valuation. Investments are valued as of 4:00 p.m. Eastern time on the last calendar day of the period. The Board of Directors (the Board) has delegated the day to day responsibility for the valuation of the Fund's investments to the Fair Value Committee (the Committee) established by the Fund's policies and procedures approved by the Board, the Fund attempts to obtain prices from one or more third party pricing vendors or brokers to value its investments. When current market prices, quotations or currency exchange rates are not readily available or reliable, investments will be fair valued in good faith by the Committee, in accordance with procedures adopted by the Board. Factors used in determining fair value vary by investment type and may include market or investment specific events, changes in interest rates and credit quality. The frequency with which these procedures are used cannot be predicted and they may be utilized to a significant extent. The Committee oversees the Fund's valuation policies and procedures and reports to the Board on the Committee's activities and fair value determinations. The Board monitors the appropriateness of the procedures used in valuing the Fund's investments and ratifies the fair value determinations of the Committee.
The Fund categorizes the inputs to valuation techniques used to value its investments into a disclosure hierarchy consisting of three levels as shown below:
- Level 1 – quoted prices in active markets for identical investments
- Level 2 – other significant observable inputs (including quoted prices for similar investments, interest rates, prepayment speeds, etc.)
- Level 3 – unobservable inputs (including the Fund's own assumptions based on the best information available)
Valuation techniques used to value the Fund's investments by major category are as follows:
Debt securities, including restricted securities, are valued based on evaluated prices received from third party pricing vendors or from brokers who make markets in such securities. Corporate bonds and bank loan obligations are valued by pricing vendors who utilize matrix pricing which considers yield or price of bonds of comparable quality, coupon, maturity and type or by broker-supplied prices. When independent prices are unavailable or unreliable, debt securities may be valued utilizing pricing methodologies which consider similar factors that would be used by third party pricing vendors. Debt securities are generally categorized as Level 2 in the hierarchy but may be Level 3 depending on the circumstances. The Fund invests a significant portion of its assets in below investment grade securities. The value of these securities can be more volatile due to changes in the credit quality of the issuer and is sensitive to changes in economic, market and regulatory conditions.
Equity securities, including restricted securities, for which market quotations are readily available, are valued at the last reported sale price or official closing price as reported by a third party pricing vendor on the primary market or exchange on which they are traded and are categorized as Level 1 in the hierarchy. In the event there were no sales during the day or closing prices are not available, securities are valued at the last quoted bid price or may be valued using the last available price and are generally categorized as Level 2 in the hierarchy. For foreign equity securities, when market or security specific events arise, comparisons to the valuation of American Depositary Receipts (ADRs), futures contracts, Exchange-Traded Funds (ETFs) and certain indexes as well as quoted prices for similar securities may be used and would be categorized as Level 2 in the hierarchy. Utilizing these techniques may result in transfers between Level 1 and Level 2. For equity securities, including restricted securities, where observable inputs are limited, assumptions about market activity and risk are used and these securities may be categorized as Level 3 in the hierarchy.
Investments in open-end mutual funds, including the Fidelity Central Funds, are valued at their closing net asset value (NAV) each business day and are categorized as Level 1 in the hierarchy.
Changes in valuation techniques may result in transfers in or out of an assigned level within the disclosure hierarchy. The aggregate value of investments by input level as of March 31, 2018 is included at the end of the Fund's Schedule of Investments.
Investment Transactions and Income. For financial reporting purposes, the Fund's investment holdings and NAV include trades executed through the end of the last business day of the period. The NAV per share for processing shareholder transactions is calculated as of the close of business of the New York Stock Exchange (NYSE), normally 4:00 p.m. Eastern time and includes trades executed through the end of the prior business day. Gains and losses on securities sold are determined on the basis of identified cost. Dividend income is recorded on the ex-dividend date, except for certain dividends from foreign securities where the ex-dividend date may have passed, which are recorded as soon as the Fund is informed of the ex-dividend date. Non-cash dividends included in dividend income, if any, are recorded at the fair market value of the securities received. Income and capital gain distributions from Fidelity Central Funds, if any, are recorded on the ex-dividend date. Certain distributions received by the Fund represent a return of capital or capital gain. The Fund determines the components of these distributions subsequent to the ex-dividend date, based upon receipt of tax filings or other correspondence relating to the underlying investment. These distributions are recorded as a reduction of cost of investments and/or as a realized gain. Interest income is accrued as earned and includes coupon interest and amortization of premium and accretion of discount on debt securities as applicable. Debt obligations may be placed on non-accrual status and related interest income may be reduced by ceasing current accruals and writing off interest receivables when the collection of all or a portion of interest has become doubtful based on consistently applied procedures. A debt obligation is removed from non-accrual status when the issuer resumes interest payments or when collectability of interest is reasonably assured. The Fund earns certain fees in connection with its floating rate loan purchasing activities. These fees are in addition to interest payments earned and may include amendment fees, consent fees and prepayment fees. These fees are recorded as Interest in the accompanying financial statements.
Expenses. Expenses directly attributable to a fund are charged to that fund. Expenses attributable to more than one fund are allocated among the respective funds on the basis of relative net assets or other appropriate methods. Expense estimates are accrued in the period to which they relate and adjustments are made when actual amounts are known.
Income Tax Information and Distributions to Shareholders. Each year, the Fund intends to qualify as a regulated investment company under Subchapter M of the Internal Revenue Code, including distributing substantially all of its taxable income and realized gains. As a result, no provision for U.S. Federal income taxes is required. The Fund files a U.S. federal tax return, in addition to state and local tax returns as required. The Fund's federal income tax returns are subject to examination by the Internal Revenue Service (IRS) for a period of three fiscal years after they are filed. State and local tax returns may be subject to examination for an additional fiscal year depending on the jurisdiction.
Distributions are declared and recorded daily and paid monthly from net investment income. Distributions from realized gains, if any, are declared and recorded on the ex-dividend date. Income and capital gain distributions are determined in accordance with income tax regulations, which may differ from GAAP.
Capital accounts within the financial statements are adjusted for permanent book-tax differences. These adjustments have no impact on net assets or the results of operations. Capital accounts are not adjusted for temporary book-tax differences which will reverse in a subsequent period.
Book-tax differences are primarily due to losses deferred due to wash sales.
As of period end, the cost and unrealized appreciation (depreciation) in securities, and derivatives if applicable, for federal income tax purposes were as follows:
| Gross unrealized appreciation | $21,229,888 |
| Gross unrealized depreciation | (29,615,385) |
| Net unrealized appreciation (depreciation) | $(8,385,497) |
| Tax cost | $2,340,508,387 |
Restricted Securities. The Fund may invest in securities that are subject to legal or contractual restrictions on resale. These securities generally may be resold in transactions exempt from registration or to the public if the securities are registered. Disposal of these securities may involve time-consuming negotiations and expense, and prompt sale at an acceptable price may be difficult. Information regarding restricted securities is included at the end of the Fund's Schedule of Investments.
Loans and Other Direct Debt Instruments. The Fund invests in direct debt instruments which are interests in amounts owed to lenders by corporate or other borrowers. These instruments may be in the form of loans, trade claims or other receivables and may include standby financing commitments such as revolving credit facilities that obligate the Fund to supply additional cash to the borrower on demand. Loans may be acquired through assignment or participation. The Fund also invests in unfunded loan commitments, which are contractual obligations for future funding. Information regarding unfunded commitments is included at the end of the Fund's Schedule of Investments.
New Accounting Pronouncement. In March 2017, the Financial Accounting Standards Board (FASB) issued an Accounting Standards Update (ASU), ASU 2017-08, which amends the amortization period for certain callable debt securities that are held at a premium. The amendment requires the premium to be amortized to the earliest call date. The amendments do not require an accounting change for securities held at a discount. The ASU is effective for annual periods beginning after December 15, 2018. Management is currently evaluating the potential impact of these changes to the financial statements.
4. Purchases and Sales of Investments.
Purchases and sales of securities (including principal repayments of bank loan obligations), other than short-term securities, aggregated $1,087,653,946 and $498,533,986, respectively.
5. Fees and Other Transactions with Affiliates.
Management Fee and Expense Contract. FMR Co., Inc. (the investment adviser), an affiliate of FMR, provides the Fund with investment management services. The Fund does not pay any fees for these services. Pursuant to the Fund's management contract with the investment adviser, FMR pays the investment adviser a portion of the management fees it receives from the Investing Funds. In addition, under an expense contract, FMR also pays all other expenses of the Fund, excluding custody fees, the compensation of the independent Directors, and certain miscellaneous expenses such as proxy and shareholder meeting expenses.
Interfund Trades. The Fund may purchase from or sell securities to other Fidelity Funds under procedures adopted by the Board. The procedures have been designed to ensure these interfund trades are executed in accordance with Rule 17a-7 of the 1940 Act. Interfund trades are included within the respective purchases and sales amounts shown in the Purchases and Sales of Investments note.
Other. During the period, the investment adviser reimbursed the Fund for certain losses in the amount of $3,420.
6. Expense Reductions.
Through arrangements with the Fund's custodian, credits realized as a result of certain uninvested cash balances were used to reduce the Fund's expenses. During the period, these credits reduced the Fund's custody expenses by $16,360.
7. Other.
The Fund's organizational documents provide former and current directors and officers with a limited indemnification against liabilities arising in connection with the performance of their duties to the Fund. In the normal course of business, the Fund may also enter into contracts that provide general indemnifications. The Fund's maximum exposure under these arrangements is unknown as this would be dependent on future claims that may be made against the Fund. The risk of material loss from such claims is considered remote.
At the end of the period, mutual funds managed by FMR or its affiliates were the owners of record of all of the outstanding shares of the Fund.
8. Litigation.
The Fund, and other entities managed by FMR or its affiliates were named as defendants in a lawsuit filed in the United States Bankruptcy Court for the Southern District of New York in 2009. The lawsuit was brought by creditors of Motors Liquidation Company (f/k/a General Motors), which went through Chapter 11 bankruptcy proceedings in 2009, and is captioned Official Committee of Unsecured Creditors of Motors Liquidation Company v. JPMorgan Chase Bank, N.A., et al., Adversary No. 09-00504 (REG). The plaintiffs are seeking an order that the Fund and other defendants return proceeds received in 2009 in full payment of the principal and interest on General Motors secured debt. The plaintiffs contend that the Fund and the other defendants were not secured creditors at the time of the 2009 payments and, thus, were not entitled to payment in full. In January 2015, the Court of Appeals ruled that JPMorgan, as administrative agent for all of the debtholders, released the security interest on certain collateral securing the debt prior to the 2009 payments. In September 2017, an opinion was issued in a trial intended to help determine the value of any remaining, unreleased collateral. Management is evaluating the impact of this ruling and the parties have agreed to mediation. At this time, Management cannot determine the amount of loss that may be realized, but expects the amount to be less than the $32,518,731 received in 2009. The Fund is also incurring legal costs in defending the case.
Shareholder Expense Example
As a shareholder of the Fund, you incur two types of costs: (1) transaction costs, and (2) ongoing costs, including other Fund expenses. This Example is intended to help you understand your ongoing costs (in dollars) of investing in the Fund and to compare these costs with the ongoing costs of investing in other mutual funds.
The Example is based on an investment of $1,000 invested at the beginning of the period and held for the entire period (October 1, 2017 to March 31, 2018).
Actual Expenses
The first line of the accompanying table provides information about actual account values and actual expenses. You may use the information in this line, together with the amount you invested, to estimate the expenses that you paid over the period. Simply divide your account value by $1,000.00 (for example, an $8,600 account value divided by $1,000.00 = 8.6), then multiply the result by the number in the first line under the heading entitled "Expenses Paid During Period" to estimate the expenses you paid on your account during this period. In addition, the Fund, as a shareholder in the underlying Fidelity Central Funds, will indirectly bear its pro-rata share of the fees and expenses incurred by the underlying Fidelity Central Funds. These fees and expenses are not included in the Fund's annualized expense ratio used to calculate the expense estimate in the table below.
Hypothetical Example for Comparison Purposes
The second line of the accompanying table provides information about hypothetical account values and hypothetical expenses based on the Fund's actual expense ratio and an assumed rate of return of 5% per year before expenses, which is not the Fund's actual return. The hypothetical account values and expenses may not be used to estimate the actual ending account balance or expenses you paid for the period. You may use this information to compare the ongoing costs of investing in the Fund and other funds. To do so, compare this 5% hypothetical example with the 5% hypothetical examples that appear in the shareholder reports of the other funds. In addition, the Fund, as a shareholder in the underlying Fidelity Central Funds, will indirectly bear its pro-rata share of the fees and expenses incurred by the underlying Fidelity Central Funds. These fees and expenses are not included in the Fund's annualized expense ratio used to calculate the expense estimate in the table below.
Please note that the expenses shown in the table are meant to highlight your ongoing costs only and do not reflect any transaction costs. Therefore, the second line of the table is useful in comparing ongoing costs only, and will not help you determine the relative total costs of owning different funds.
| Annualized Expense Ratio-A | Beginning Account Value October 1, 2017 | Ending Account Value March 31, 2018 | Expenses Paid During Period-B October 1, 2017 to March 31, 2018 | |
| Actual | .0039% | $1,000.00 | $1,028.00 | $.02 |
| Hypothetical-C | $1,000.00 | $1,024.91 | $.02 |
A Annualized expense ratio reflects expenses net of applicable fee waivers.
B Expenses are equal to the Fund's annualized expense ratio, multiplied by the average account value over the period, multiplied by 182/365 (to reflect the one-half year period).
C 5% return per year before expenses
![]()
Corporate Headquarters
245 Summer St.
Boston, MA 02210
www.fidelity.com
FR1-SANN-0518
1.814673.113
Fidelity® Equity Sector Central Funds Semi-Annual Report March 31, 2018 |
|
Contents
To view a fund's proxy voting guidelines and proxy voting record for the 12-month period ended June 30, visit http://www.fidelity.com/proxyvotingresults or visit the Securities and Exchange Commission's (SEC) web site at http://www.sec.gov.
You may also call 1-800-544-8544 to request a free copy of the proxy voting guidelines.
Standard & Poor's, S&P and S&P 500 are registered service marks of The McGraw-Hill Companies, Inc. and have been licensed for use by Fidelity Distributors Corporation.
Other third-party marks appearing herein are the property of their respective owners.
All other marks appearing herein are registered or unregistered trademarks or service marks of FMR LLC or an affiliated company. © 2018 FMR LLC. All rights reserved.
A fund files its complete schedule of portfolio holdings with the SEC for the first and third quarters of each fiscal year on Form N-Q. Forms N-Q are available on the SEC’s web site at http://www.sec.gov. A fund's Forms N-Q may be reviewed and copied at the SEC’s Public Reference Room in Washington, DC. Information regarding the operation of the SEC's Public Reference Room may be obtained by calling 1-800-SEC-0330.
Fidelity® Consumer Discretionary Central Fund
Investment Summary (Unaudited)
Top Ten Stocks as of March 31, 2018
| % of fund's net assets | |
| Amazon.com, Inc. | 17.4 |
| Home Depot, Inc. | 7.4 |
| McDonald's Corp. | 3.9 |
| The Walt Disney Co. | 3.8 |
| Comcast Corp. Class A | 3.5 |
| Netflix, Inc. | 3.4 |
| Charter Communications, Inc. Class A | 3.2 |
| Dollar Tree, Inc. | 2.9 |
| The Booking Holdings, Inc. | 2.9 |
| Lowe's Companies, Inc. | 2.8 |
| 51.2 |
Top Industries (% of fund's net assets)
| As of March 31, 2018 | ||
| Hotels, Restaurants & Leisure | 24.5% | |
| Internet & Direct Marketing Retail | 24.2% | |
| Specialty Retail | 17.8% | |
| Media | 12.1% | |
| Textiles, Apparel & Luxury Goods | 5.3% | |
| All Others* | 16.1% | |
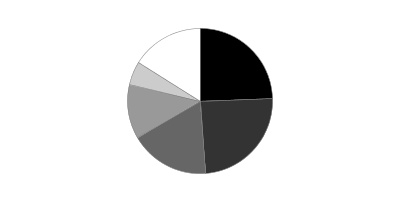
* Includes short-term investments and net other assets (liabilities).
Fidelity® Consumer Discretionary Central Fund
Schedule of Investments March 31, 2018 (Unaudited)
Showing Percentage of Net Assets
| Common Stocks - 99.8% | |||
| Shares | Value | ||
| Air Freight & Logistics - 0.1% | |||
| Air Freight & Logistics - 0.1% | |||
| XPO Logistics, Inc. (a) | 20,200 | $2,056,562 | |
| Auto Components - 0.2% | |||
| Auto Parts & Equipment - 0.2% | |||
| Aptiv PLC | 42,800 | 3,636,716 | |
| Tenneco, Inc. | 2,183 | 119,781 | |
| 3,756,497 | |||
| Automobiles - 2.3% | |||
| Automobile Manufacturers - 2.3% | |||
| Ferrari NV | 28,395 | 3,422,165 | |
| General Motors Co. | 245,600 | 8,925,104 | |
| Tesla, Inc. (a) | 97,216 | 25,872,094 | |
| Thor Industries, Inc. | 48,600 | 5,597,262 | |
| 43,816,625 | |||
| Beverages - 0.8% | |||
| Distillers & Vintners - 0.7% | |||
| Constellation Brands, Inc. Class A (sub. vtg.) | 57,635 | 13,136,169 | |
| Soft Drinks - 0.1% | |||
| Monster Beverage Corp. (a) | 51,733 | 2,959,645 | |
| TOTAL BEVERAGES | 16,095,814 | ||
| Building Products - 0.1% | |||
| Building Products - 0.1% | |||
| Masco Corp. | 72,600 | 2,935,944 | |
| Chemicals - 0.0% | |||
| Specialty Chemicals - 0.0% | |||
| Sherwin-Williams Co. | 1,500 | 588,180 | |
| Commercial Services & Supplies - 0.2% | |||
| Diversified Support Services - 0.2% | |||
| Copart, Inc. (a) | 72,400 | 3,687,332 | |
| Distributors - 0.7% | |||
| Distributors - 0.7% | |||
| LKQ Corp. (a) | 255,400 | 9,692,430 | |
| Pool Corp. | 23,400 | 3,421,548 | |
| 13,113,978 | |||
| Diversified Consumer Services - 0.8% | |||
| Education Services - 0.6% | |||
| Adtalem Global Education, Inc. (a) | 51,900 | 2,467,845 | |
| Grand Canyon Education, Inc. (a) | 79,130 | 8,302,320 | |
| New Oriental Education & Technology Group, Inc. sponsored ADR | 20,900 | 1,831,885 | |
| 12,602,050 | |||
| Specialized Consumer Services - 0.2% | |||
| Service Corp. International | 23,900 | 901,986 | |
| ServiceMaster Global Holdings, Inc. (a) | 51,911 | 2,639,674 | |
| 3,541,660 | |||
| TOTAL DIVERSIFIED CONSUMER SERVICES | 16,143,710 | ||
| Electronic Equipment & Components - 0.1% | |||
| Electronic Equipment & Instruments - 0.1% | |||
| ADT, Inc. | 172,500 | 1,367,925 | |
| Food & Staples Retailing - 1.0% | |||
| Food Distributors - 0.7% | |||
| Performance Food Group Co. (a) | 459,575 | 13,718,314 | |
| Hypermarkets & Super Centers - 0.3% | |||
| Costco Wholesale Corp. | 14,949 | 2,816,840 | |
| Walmart, Inc. | 42,300 | 3,763,431 | |
| 6,580,271 | |||
| TOTAL FOOD & STAPLES RETAILING | 20,298,585 | ||
| Health Care Providers & Services - 0.0% | |||
| Health Care Services - 0.0% | |||
| National Vision Holdings, Inc. | 19,710 | 636,830 | |
| Hotels, Restaurants & Leisure - 24.5% | |||
| Casinos & Gaming - 4.1% | |||
| Boyd Gaming Corp. | 99,200 | 3,160,512 | |
| Caesars Entertainment Corp. (a) | 400,200 | 4,502,250 | |
| Churchill Downs, Inc. | 11,800 | 2,879,790 | |
| Eldorado Resorts, Inc. (a) | 284,083 | 9,374,739 | |
| Las Vegas Sands Corp. | 404,815 | 29,106,199 | |
| Melco Crown Entertainment Ltd. sponsored ADR | 84,700 | 2,454,606 | |
| MGM Mirage, Inc. | 486,200 | 17,026,724 | |
| Penn National Gaming, Inc. (a) | 166,559 | 4,373,839 | |
| PlayAGS, Inc. (a) | 63,400 | 1,474,684 | |
| Wynn Resorts Ltd. | 24,015 | 4,379,375 | |
| 78,732,718 | |||
| Hotels, Resorts & Cruise Lines - 8.7% | |||
| Accor SA | 28,600 | 1,543,120 | |
| Bluegreen Vacations Corp. | 233,180 | 4,936,421 | |
| Carnival Corp. | 250,800 | 16,447,464 | |
| Hilton Grand Vacations, Inc. (a) | 267,100 | 11,490,642 | |
| Hilton Worldwide Holdings, Inc. | 408,926 | 32,207,012 | |
| Hyatt Hotels Corp. Class A | 61,900 | 4,720,494 | |
| ILG, Inc. | 53,400 | 1,661,274 | |
| Marriott International, Inc. Class A | 228,508 | 31,072,518 | |
| Marriott Vacations Worldwide Corp. | 72,500 | 9,657,000 | |
| Royal Caribbean Cruises Ltd. | 264,528 | 31,145,527 | |
| Wyndham Worldwide Corp. | 204,258 | 23,373,243 | |
| 168,254,715 | |||
| Leisure Facilities - 1.0% | |||
| Cedar Fair LP (depositary unit) | 30,573 | 1,953,003 | |
| Drive Shack, Inc. (a) | 43,917 | 209,923 | |
| Planet Fitness, Inc. (a) | 31,300 | 1,182,201 | |
| Vail Resorts, Inc. | 76,978 | 17,066,023 | |
| 20,411,150 | |||
| Restaurants - 10.7% | |||
| ARAMARK Holdings Corp. | 177,663 | 7,028,348 | |
| Chipotle Mexican Grill, Inc. (a) | 3,200 | 1,033,952 | |
| Compass Group PLC | 62,400 | 1,274,250 | |
| Darden Restaurants, Inc. | 95,473 | 8,139,073 | |
| Del Frisco's Restaurant Group, Inc. (a) | 116,900 | 1,782,725 | |
| Del Taco Restaurants, Inc. (a) | 57,614 | 596,881 | |
| DineEquity, Inc. | 18,157 | 1,190,736 | |
| Domino's Pizza, Inc. | 45,920 | 10,725,075 | |
| Dunkin' Brands Group, Inc. | 159,255 | 9,505,931 | |
| Jack in the Box, Inc. | 37,511 | 3,200,814 | |
| McDonald's Corp. | 482,530 | 75,458,041 | |
| Papa John's International, Inc. | 30,300 | 1,736,190 | |
| Restaurant Brands International, Inc. | 161,000 | 9,162,510 | |
| Ruth's Hospitality Group, Inc. | 102,023 | 2,494,462 | |
| Shake Shack, Inc. Class A (a) | 50,800 | 2,114,804 | |
| Starbucks Corp. | 814,941 | 47,176,934 | |
| Texas Roadhouse, Inc. Class A | 77,500 | 4,477,950 | |
| U.S. Foods Holding Corp. (a) | 348,400 | 11,417,068 | |
| Wingstop, Inc. | 101,977 | 4,816,374 | |
| Yum! Brands, Inc. | 52,027 | 4,429,059 | |
| 207,761,177 | |||
| TOTAL HOTELS, RESTAURANTS & LEISURE | 475,159,760 | ||
| Household Durables - 2.6% | |||
| Home Furnishings - 0.3% | |||
| Mohawk Industries, Inc. (a) | 20,000 | 4,644,400 | |
| Homebuilding - 2.2% | |||
| Cavco Industries, Inc. (a) | 21,246 | 3,691,493 | |
| D.R. Horton, Inc. | 314,300 | 13,778,912 | |
| Lennar Corp.: | |||
| Class A | 169,600 | 9,996,224 | |
| Class B | 2,792 | 133,150 | |
| LGI Homes, Inc. (a)(b) | 18,500 | 1,305,545 | |
| New Home Co. LLC (a) | 77,000 | 853,160 | |
| NVR, Inc. (a) | 2,540 | 7,112,000 | |
| Taylor Morrison Home Corp. (a) | 56,600 | 1,317,648 | |
| TopBuild Corp. (a) | 5,300 | 405,556 | |
| TRI Pointe Homes, Inc. (a) | 240,800 | 3,956,344 | |
| 42,550,032 | |||
| Household Appliances - 0.1% | |||
| Techtronic Industries Co. Ltd. | 428,500 | 2,514,906 | |
| TOTAL HOUSEHOLD DURABLES | 49,709,338 | ||
| Internet & Direct Marketing Retail - 24.2% | |||
| Internet & Direct Marketing Retail - 24.2% | |||
| Amazon.com, Inc. (a) | 233,127 | 337,414,031 | |
| Boohoo.Com PLC (a) | 473,400 | 984,979 | |
| Liberty Interactive Corp. QVC Group Series A (a) | 365,585 | 9,201,774 | |
| Netflix, Inc. (a) | 223,179 | 65,915,918 | |
| The Booking Holdings, Inc. (a) | 26,957 | 56,081,073 | |
| Wayfair LLC Class A (a) | 5,300 | 357,909 | |
| Zalando SE (a)(c) | 9,900 | 539,395 | |
| 470,495,079 | |||
| Internet Software & Services - 0.9% | |||
| Internet Software & Services - 0.9% | |||
| 2U, Inc. (a) | 65,500 | 5,503,965 | |
| Alphabet, Inc. Class A (a) | 8,500 | 8,815,690 | |
| CarGurus, Inc. Class A | 2,700 | 103,869 | |
| Facebook, Inc. Class A (a) | 17,562 | 2,806,232 | |
| MINDBODY, Inc. (a) | 8,600 | 334,540 | |
| 17,564,296 | |||
| IT Services - 0.4% | |||
| Data Processing & Outsourced Services - 0.4% | |||
| Global Payments, Inc. | 24,400 | 2,721,088 | |
| PayPal Holdings, Inc. (a) | 63,300 | 4,802,571 | |
| 7,523,659 | |||
| Leisure Products - 0.5% | |||
| Leisure Products - 0.5% | |||
| Mattel, Inc. (b) | 748,000 | 9,836,200 | |
| Media - 12.1% | |||
| Advertising - 0.0% | |||
| Interpublic Group of Companies, Inc. | 28,000 | 644,840 | |
| Broadcasting - 0.1% | |||
| CBS Corp. Class B | 50,700 | 2,605,473 | |
| Cable & Satellite - 6.9% | |||
| Charter Communications, Inc. Class A (a) | 196,337 | 61,104,001 | |
| Comcast Corp. Class A | 1,962,871 | 67,071,302 | |
| Naspers Ltd. Class N | 18,684 | 4,563,923 | |
| 132,739,226 | |||
| Movies & Entertainment - 5.1% | |||
| Cinemark Holdings, Inc. | 217,765 | 8,203,208 | |
| Liberty Media Corp. Liberty Formula One Group Series C (a) | 45,300 | 1,397,505 | |
| Lions Gate Entertainment Corp. Class B | 7,200 | 173,376 | |
| Live Nation Entertainment, Inc. (a) | 58,100 | 2,448,334 | |
| The Walt Disney Co. | 735,178 | 73,841,278 | |
| Time Warner, Inc. | 108,461 | 10,258,241 | |
| Twenty-First Century Fox, Inc. Class A | 56,100 | 2,058,309 | |
| 98,380,251 | |||
| TOTAL MEDIA | 234,369,790 | ||
| Multiline Retail - 4.6% | |||
| Department Stores - 0.3% | |||
| Kohl's Corp. | 33,600 | 2,201,136 | |
| Macy's, Inc. | 129,500 | 3,851,330 | |
| 6,052,466 | |||
| General Merchandise Stores - 4.3% | |||
| B&M European Value Retail S.A. | 413,893 | 2,272,247 | |
| Dollar General Corp. | 185,480 | 17,351,654 | |
| Dollar Tree, Inc. (a) | 599,853 | 56,926,050 | |
| Ollie's Bargain Outlet Holdings, Inc. (a) | 28,800 | 1,736,640 | |
| Target Corp. | 74,900 | 5,200,307 | |
| 83,486,898 | |||
| TOTAL MULTILINE RETAIL | 89,539,364 | ||
| Personal Products - 0.1% | |||
| Personal Products - 0.1% | |||
| Estee Lauder Companies, Inc. Class A | 6,900 | 1,033,068 | |
| Real Estate Management & Development - 0.1% | |||
| Real Estate Services - 0.1% | |||
| Redfin Corp. (b) | 78,700 | 1,796,721 | |
| Software - 0.2% | |||
| Application Software - 0.1% | |||
| Adobe Systems, Inc. (a) | 7,700 | 1,663,816 | |
| Home Entertainment Software - 0.1% | |||
| Activision Blizzard, Inc. | 28,300 | 1,909,118 | |
| TOTAL SOFTWARE | 3,572,934 | ||
| Specialty Retail - 17.8% | |||
| Apparel Retail - 5.0% | |||
| Burlington Stores, Inc. (a) | 199,600 | 26,576,740 | |
| Inditex SA | 57,438 | 1,805,773 | |
| Ross Stores, Inc. | 424,769 | 33,123,487 | |
| The Children's Place Retail Stores, Inc. | 33,900 | 4,584,975 | |
| TJX Companies, Inc. | 367,390 | 29,964,328 | |
| 96,055,303 | |||
| Automotive Retail - 2.0% | |||
| AutoZone, Inc. (a) | 25,074 | 16,265,253 | |
| O'Reilly Automotive, Inc. (a) | 91,868 | 22,726,306 | |
| 38,991,559 | |||
| Home Improvement Retail - 10.3% | |||
| Floor & Decor Holdings, Inc. Class A | 38,744 | 2,019,337 | |
| Home Depot, Inc. | 807,141 | 143,864,812 | |
| Lowe's Companies, Inc. | 608,009 | 53,352,790 | |
| 199,236,939 | |||
| Specialty Stores - 0.5% | |||
| Signet Jewelers Ltd. | 26,800 | 1,032,336 | |
| Tiffany & Co., Inc. | 14,900 | 1,455,134 | |
| Ulta Beauty, Inc. (a) | 39,400 | 8,048,238 | |
| 10,535,708 | |||
| TOTAL SPECIALTY RETAIL | 344,819,509 | ||
| Technology Hardware, Storage & Peripherals - 0.2% | |||
| Technology Hardware, Storage & Peripherals - 0.2% | |||
| Apple, Inc. | 28,800 | 4,832,064 | |
| Textiles, Apparel & Luxury Goods - 5.3% | |||
| Apparel, Accessories & Luxury Goods - 2.9% | |||
| adidas AG | 19,947 | 4,826,536 | |
| Canada Goose Holdings, Inc. | 66,500 | 2,225,183 | |
| Carter's, Inc. | 54,500 | 5,673,450 | |
| G-III Apparel Group Ltd. (a) | 99,663 | 3,755,302 | |
| Kering SA | 4,000 | 1,913,596 | |
| LVMH Moet Hennessy - Louis Vuitton SA | 17,330 | 5,340,642 | |
| Prada SpA | 639,800 | 3,009,775 | |
| PVH Corp. | 162,400 | 24,592,232 | |
| Swatch Group AG (Bearer) | 2,240 | 987,381 | |
| Tapestry, Inc. | 74,300 | 3,908,923 | |
| 56,233,020 | |||
| Footwear - 2.4% | |||
| NIKE, Inc. Class B | 701,356 | 46,598,093 | |
| TOTAL TEXTILES, APPAREL & LUXURY GOODS | 102,831,113 | ||
| TOTAL COMMON STOCKS | |||
| (Cost $1,321,896,144) | 1,937,580,877 | ||
| Money Market Funds - 0.8% | |||
| Fidelity Cash Central Fund, 1.72% (d) | 3,330,448 | 3,331,114 | |
| Fidelity Securities Lending Cash Central Fund 1.72% (d)(e) | 11,271,768 | 11,274,022 | |
| TOTAL MONEY MARKET FUNDS | |||
| (Cost $14,604,009) | 14,605,136 | ||
| TOTAL INVESTMENT IN SECURITIES - 100.6% | |||
| (Cost $1,336,500,153) | 1,952,186,013 | ||
| NET OTHER ASSETS (LIABILITIES) - (0.6)% | (11,586,310) | ||
| NET ASSETS - 100% | $1,940,599,703 |
Legend
(a) Non-income producing
(b) Security or a portion of the security is on loan at period end.
(c) Security exempt from registration under Rule 144A of the Securities Act of 1933. These securities may be resold in transactions exempt from registration, normally to qualified institutional buyers. At the end of the period, the value of these securities amounted to $539,395 or 0.0% of net assets.
(d) Affiliated fund that is generally available only to investment companies and other accounts managed by Fidelity Investments. The rate quoted is the annualized seven-day yield of the fund at period end. A complete unaudited listing of the fund's holdings as of its most recent quarter end is available upon request. In addition, each Fidelity Central Fund's financial statements are available on the SEC's website or upon request.
(e) Investment made with cash collateral received from securities on loan.
Affiliated Central Funds
Information regarding fiscal year to date income earned by the Fund from investments in Fidelity Central Funds is as follows:
| Fund | Income earned |
| Fidelity Cash Central Fund | $54,272 |
| Fidelity Securities Lending Cash Central Fund | 107,254 |
| Total | $161,526 |
Amounts in the income column in the above table include any capital gain distributions from underlying funds, which are presented in the corresponding line-item in the Statement of Operations if applicable.
Investment Valuation
The following is a summary of the inputs used, as of March 31, 2018, involving the Fund's assets and liabilities carried at fair value. The inputs or methodology used for valuing securities may not be an indication of the risk associated with investing in those securities. For more information on valuation inputs, and their aggregation into the levels used below, please refer to the Investment Valuation section in the accompanying Notes to Financial Statements.
| Valuation Inputs at Reporting Date: | ||||
| Description | Total | Level 1 | Level 2 | Level 3 |
| Investments in Securities: | ||||
| Common Stocks | $1,937,580,877 | $1,924,909,781 | $12,671,096 | $-- |
| Money Market Funds | 14,605,136 | 14,605,136 | -- | -- |
| Total Investments in Securities: | $1,952,186,013 | $1,939,514,917 | $12,671,096 | $-- |
See accompanying notes which are an integral part of the financial statements.
Fidelity® Consumer Discretionary Central Fund
Financial Statements
Statement of Assets and Liabilities
| March 31, 2018 (Unaudited) | ||
| Assets | ||
| Investment in securities, at value (including securities loaned of $11,012,896) — See accompanying schedule: Unaffiliated issuers (cost $1,321,896,144) | $1,937,580,877 | |
| Fidelity Central Funds (cost $14,604,009) | 14,605,136 | |
| Total Investment in Securities (cost $1,336,500,153) | $1,952,186,013 | |
| Cash | 649,630 | |
| Receivable for investments sold | 1,152,458 | |
| Receivable for fund shares sold | 333,989 | |
| Dividends receivable | 688,888 | |
| Distributions receivable from Fidelity Central Funds | 9,828 | |
| Other receivables | 29 | |
| Total assets | 1,955,020,835 | |
| Liabilities | ||
| Payable for investments purchased | $2,301,485 | |
| Payable for fund shares redeemed | 840,660 | |
| Other payables and accrued expenses | 8,462 | |
| Collateral on securities loaned | 11,270,525 | |
| Total liabilities | 14,421,132 | |
| Net Assets | $1,940,599,703 | |
| Net Assets consist of: | ||
| Paid in capital | $1,267,001,149 | |
| Undistributed net investment income | 3,269,710 | |
| Accumulated undistributed net realized gain (loss) on investments and foreign currency transactions | 54,640,175 | |
| Net unrealized appreciation (depreciation) on investments and assets and liabilities in foreign currencies | 615,688,669 | |
| Net Assets, for 6,323,032 shares outstanding | $1,940,599,703 | |
| Net Asset Value, offering price and redemption price per share ($1,940,599,703 ÷ 6,323,032 shares) | $306.91 |
See accompanying notes which are an integral part of the financial statements.
Statement of Operations
| Six months ended March 31, 2018 (Unaudited) | ||
| Investment Income | ||
| Dividends | $9,296,485 | |
| Income from Fidelity Central Funds (including $107,254 from security lending) | 161,526 | |
| Total income | 9,458,011 | |
| Expenses | ||
| Custodian fees and expenses | $12,700 | |
| Independent directors' fees and expenses | 3,216 | |
| Interest | 1,866 | |
| Miscellaneous | 22 | |
| Total expenses before reductions | 17,804 | |
| Expense reductions | (355) | 17,449 |
| Net investment income (loss) | 9,440,562 | |
| Realized and Unrealized Gain (Loss) | ||
| Net realized gain (loss) on: | ||
| Investment securities: | ||
| Unaffiliated issuers | 80,731,155 | |
| Fidelity Central Funds | (54) | |
| Foreign currency transactions | 4,782 | |
| Total net realized gain (loss) | 80,735,883 | |
| Change in net unrealized appreciation (depreciation) on: | ||
| Investment securities: | ||
| Unaffiliated issuers | 145,316,692 | |
| Fidelity Central Funds | 797 | |
| Assets and liabilities in foreign currencies | (2,302) | |
| Total change in net unrealized appreciation (depreciation) | 145,315,187 | |
| Net gain (loss) | 226,051,070 | |
| Net increase (decrease) in net assets resulting from operations | $235,491,632 |
See accompanying notes which are an integral part of the financial statements.
Statement of Changes in Net Assets
| Six months ended March 31, 2018 (Unaudited) | Year ended September 30, 2017 | |
| Increase (Decrease) in Net Assets | ||
| Operations | ||
| Net investment income (loss) | $9,440,562 | $18,629,366 |
| Net realized gain (loss) | 80,735,883 | 69,549,384 |
| Change in net unrealized appreciation (depreciation) | 145,315,187 | 142,968,418 |
| Net increase (decrease) in net assets resulting from operations | 235,491,632 | 231,147,168 |
| Distributions to shareholders from net investment income | (8,106,199) | (16,424,895) |
| Distributions to shareholders from net realized gain | (91,997,571) | – |
| Total distributions | (100,103,770) | (16,424,895) |
| Affiliated share transactions | ||
| Proceeds from sales of shares | 215,431,233 | 139,542,270 |
| Reinvestment of distributions | 100,103,770 | 16,424,481 |
| Cost of shares redeemed | (92,066,655) | (367,978,846) |
| Net increase (decrease) in net assets resulting from share transactions | 223,468,348 | (212,012,095) |
| Total increase (decrease) in net assets | 358,856,210 | 2,710,178 |
| Net Assets | ||
| Beginning of period | 1,581,743,493 | 1,579,033,315 |
| End of period | $1,940,599,703 | $1,581,743,493 |
| Other Information | ||
| Undistributed net investment income end of period | $3,269,710 | $1,935,347 |
| Shares | ||
| Sold | 708,805 | 537,543 |
| Issued in reinvestment of distributions | 336,402 | 61,740 |
| Redeemed | (296,495) | (1,372,701) |
| Net increase (decrease) | 748,712 | (773,418) |
See accompanying notes which are an integral part of the financial statements.
Financial Highlights
Fidelity Consumer Discretionary Central Fund
| Six months ended (Unaudited) March 31, | Years endedSeptember 30, | |||||
| 2018 | 2017 | 2016 | 2015 | 2014 | 2013 | |
| Selected Per–Share Data | ||||||
| Net asset value, beginning of period | $283.76 | $248.76 | $234.10 | $213.75 | $196.26 | $150.90 |
| Income from Investment Operations | ||||||
| Net investment income (loss)A | 1.57 | 3.14 | 3.75 | 3.36 | 2.23 | 2.00 |
| Net realized and unrealized gain (loss) | 38.77 | 34.62 | 14.67 | 20.24 | 17.43 | 45.30 |
| Total from investment operations | 40.34 | 37.76 | 18.42 | 23.60 | 19.66 | 47.30 |
| Distributions from net investment income | (1.39) | (2.76) | (3.76) | (3.25) | (2.17) | (1.94) |
| Distributions from net realized gain | (15.80) | – | – | – | – | – |
| Total distributions | (17.19) | (2.76) | (3.76) | (3.25) | (2.17) | (1.94) |
| Net asset value, end of period | $306.91 | $283.76 | $248.76 | $234.10 | $213.75 | $196.26 |
| Total ReturnB,C | 14.42% | 15.25% | 7.91% | 11.01% | 10.03% | 31.56% |
| Ratios to Average Net AssetsD,E | ||||||
| Expenses before reductionsF | - %G | -% | -% | -% | -% | -% |
| Expenses net of fee waivers, if anyF | - %G | -% | -% | -% | -% | -% |
| Expenses net of all reductionsF | - %G | -% | -% | -% | -% | -% |
| Net investment income (loss) | 1.03%G | 1.17% | 1.54% | 1.41% | 1.06% | 1.17% |
| Supplemental Data | ||||||
| Net assets, end of period (000 omitted) | $1,940,600 | $1,581,743 | $1,579,033 | $1,487,901 | $1,431,901 | $1,340,686 |
| Portfolio turnover rateH | 36%G | 40%I | 27% | 68% | 169%I | 122%I |
A Calculated based on average shares outstanding during the period.
B Total returns for periods of less than one year are not annualized.
C Total returns would have been lower if certain expenses had not been reduced during the applicable periods shown.
D Fees and expenses of any underlying Fidelity Central Funds are not included in the Fund's expense ratio. The Fund indirectly bears its proportionate share of the expenses of any underlying Fidelity Central Funds.
E Expense ratios reflect operating expenses of the Fund. Expenses before reductions do not reflect amounts reimbursed by the investment adviser or reductions from expense offset arrangements and do not represent the amount paid by the Fund during periods when reimbursements or reductions occur. Expenses net of fee waivers reflect expenses after reimbursement by the investment adviser but prior to reductions from expense offset arrangements. Expenses net of all reductions represent the net expenses paid by the Fund.
F Amount represents less than .005%.
G Annualized
H Amount does not include the portfolio activity of any underlying Fidelity Central Funds.
I Portfolio turnover rate excludes securities received or delivered in-kind.
See accompanying notes which are an integral part of the financial statements.
Fidelity® Consumer Staples Central Fund
Investment Summary (Unaudited)
Top Ten Stocks as of March 31, 2018
| % of fund's net assets | |
| The Coca-Cola Co. | 8.7 |
| Procter & Gamble Co. | 8.1 |
| Philip Morris International, Inc. | 7.5 |
| PepsiCo, Inc. | 7.2 |
| Monster Beverage Corp. | 4.3 |
| CVS Health Corp. | 3.8 |
| Altria Group, Inc. | 3.7 |
| Mondelez International, Inc. | 3.7 |
| Costco Wholesale Corp. | 3.3 |
| Spectrum Brands Holdings, Inc. | 3.1 |
| 53.4 |
Top Industries (% of fund's net assets)
| As of March 31, 2018 | ||
| Beverages | 28.2% | |
| Food Products | 19.1% | |
| Household Products | 14.8% | |
| Tobacco | 13.2% | |
| Food & Staples Retailing | 12.8% | |
| All Others* | 11.9% | |
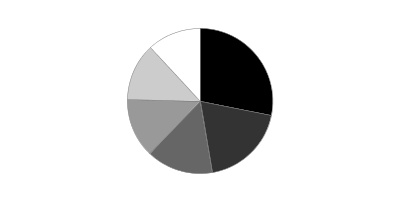
* Includes short-term investments and net other assets (liabilities).
Fidelity® Consumer Staples Central Fund
Schedule of Investments March 31, 2018 (Unaudited)
Showing Percentage of Net Assets
| Common Stocks - 98.7% | |||
| Shares | Value | ||
| Beverages - 28.2% | |||
| Brewers - 1.2% | |||
| Beijing Yanjing Brewery Co. Ltd. Class A | 8,419,200 | $10,213,121 | |
| China Resources Beer Holdings Co. Ltd. | 81,210 | 354,014 | |
| Molson Coors Brewing Co. Class B | 61,500 | 4,632,795 | |
| 15,199,930 | |||
| Distillers & Vintners - 2.1% | |||
| Constellation Brands, Inc. Class A (sub. vtg.) | 110,766 | 25,245,787 | |
| Kweichow Moutai Co. Ltd. (A Shares) | 6,818 | 741,029 | |
| 25,986,816 | |||
| Soft Drinks - 24.9% | |||
| Britvic PLC | 293,323 | 2,808,707 | |
| Coca-Cola Bottling Co. Consolidated | 58,287 | 10,064,416 | |
| Coca-Cola European Partners PLC | 462,258 | 19,257,668 | |
| Coca-Cola FEMSA S.A.B. de CV sponsored ADR | 38,100 | 2,530,983 | |
| Coca-Cola HBC AG | 29,590 | 1,093,499 | |
| Coca-Cola West Co. Ltd. | 58,600 | 2,420,441 | |
| Dr. Pepper Snapple Group, Inc. | 171,000 | 20,242,980 | |
| Fever-Tree Drinks PLC | 47,949 | 1,770,611 | |
| Monster Beverage Corp. (a) | 955,578 | 54,668,617 | |
| PepsiCo, Inc. | 833,200 | 90,943,780 | |
| The Coca-Cola Co. | 2,556,161 | 111,014,070 | |
| 316,815,772 | |||
| TOTAL BEVERAGES | 358,002,518 | ||
| Chemicals - 0.3% | |||
| Specialty Chemicals - 0.3% | |||
| Frutarom Industries Ltd. | 39,500 | 3,615,991 | |
| Food & Staples Retailing - 12.8% | |||
| Drug Retail - 6.0% | |||
| CVS Health Corp. | 768,803 | 47,827,235 | |
| Rite Aid Corp. (a)(b) | 800,901 | 1,345,514 | |
| Walgreens Boots Alliance, Inc. | 410,980 | 26,906,861 | |
| 76,079,610 | |||
| Food Distributors - 1.3% | |||
| Sysco Corp. | 254,300 | 15,247,828 | |
| United Natural Foods, Inc. (a) | 32,600 | 1,399,844 | |
| 16,647,672 | |||
| Food Retail - 1.3% | |||
| Kroger Co. | 494,323 | 11,834,093 | |
| Sprouts Farmers Market LLC (a) | 205,500 | 4,823,085 | |
| 16,657,178 | |||
| Hypermarkets & Super Centers - 4.2% | |||
| Costco Wholesale Corp. | 222,700 | 41,963,361 | |
| Walmart, Inc. | 136,000 | 12,099,920 | |
| 54,063,281 | |||
| TOTAL FOOD & STAPLES RETAILING | 163,447,741 | ||
| Food Products - 19.1% | |||
| Agricultural Products - 1.6% | |||
| Bunge Ltd. | 130,369 | 9,639,484 | |
| Darling International, Inc. (a) | 408,800 | 7,072,240 | |
| Ingredion, Inc. | 28,700 | 3,700,004 | |
| 20,411,728 | |||
| Packaged Foods & Meats - 17.5% | |||
| ConAgra Foods, Inc. | 453,200 | 16,714,016 | |
| Danone SA | 105,300 | 8,537,965 | |
| JBS SA | 2,898,800 | 8,209,659 | |
| Kellogg Co. | 261,900 | 17,026,119 | |
| Mondelez International, Inc. | 1,118,012 | 46,654,641 | |
| Post Holdings, Inc. (a) | 118,600 | 8,985,136 | |
| The Hain Celestial Group, Inc. (a) | 387,989 | 12,442,807 | |
| The Hershey Co. | 91,400 | 9,044,944 | |
| The J.M. Smucker Co. | 196,500 | 24,367,965 | |
| The Kraft Heinz Co. | 567,500 | 35,349,575 | |
| The Simply Good Foods Co. | 1,363,000 | 18,713,990 | |
| TreeHouse Foods, Inc. (a) | 423,773 | 16,217,793 | |
| 222,264,610 | |||
| TOTAL FOOD PRODUCTS | 242,676,338 | ||
| Hotels, Restaurants & Leisure - 1.2% | |||
| Restaurants - 1.2% | |||
| Compass Group PLC | 31,340 | 639,984 | |
| U.S. Foods Holding Corp. (a) | 435,408 | 14,268,320 | |
| 14,908,304 | |||
| Household Durables - 0.1% | |||
| Housewares & Specialties - 0.1% | |||
| Newell Brands, Inc. | 48,500 | 1,235,780 | |
| Household Products - 14.8% | |||
| Household Products - 14.8% | |||
| Colgate-Palmolive Co. | 321,920 | 23,075,226 | |
| Essity AB Class B | 636,400 | 17,575,731 | |
| Procter & Gamble Co. | 1,300,293 | 103,087,229 | |
| Reckitt Benckiser Group PLC | 53,200 | 4,490,494 | |
| Spectrum Brands Holdings, Inc. (b) | 381,551 | 39,566,839 | |
| 187,795,519 | |||
| Internet & Direct Marketing Retail - 0.1% | |||
| Internet & Direct Marketing Retail - 0.1% | |||
| Amazon.com, Inc. (a) | 1,300 | 1,881,542 | |
| Multiline Retail - 0.1% | |||
| General Merchandise Stores - 0.1% | |||
| Dollar Tree, Inc. (a) | 11,500 | 1,091,350 | |
| Personal Products - 8.8% | |||
| Personal Products - 8.8% | |||
| Avon Products, Inc. (a) | 5,957,700 | 16,919,868 | |
| Coty, Inc. Class A | 1,724,178 | 31,552,457 | |
| Estee Lauder Companies, Inc. Class A | 114,167 | 17,093,083 | |
| Herbalife Ltd. (a) | 104,832 | 10,217,975 | |
| Ontex Group NV (b) | 157,600 | 4,211,919 | |
| Unilever NV (Certificaten Van Aandelen) (Bearer) | 569,854 | 32,165,661 | |
| 112,160,963 | |||
| Tobacco - 13.2% | |||
| Tobacco - 13.2% | |||
| Altria Group, Inc. | 751,567 | 46,837,655 | |
| British American Tobacco PLC sponsored ADR | 448,146 | 25,853,543 | |
| Philip Morris International, Inc. | 952,253 | 94,653,948 | |
| 167,345,146 | |||
| TOTAL COMMON STOCKS | |||
| (Cost $1,110,901,950) | 1,254,161,192 | ||
| Money Market Funds - 1.3% | |||
| Fidelity Cash Central Fund, 1.72% (c) | 11,102,345 | 11,104,566 | |
| Fidelity Securities Lending Cash Central Fund 1.72% (c)(d) | 5,168,100 | 5,169,134 | |
| TOTAL MONEY MARKET FUNDS | |||
| (Cost $16,273,184) | 16,273,700 | ||
| TOTAL INVESTMENT IN SECURITIES - 100.0% | |||
| (Cost $1,127,175,134) | 1,270,434,892 | ||
| NET OTHER ASSETS (LIABILITIES) - 0.0% | 439,434 | ||
| NET ASSETS - 100% | $1,270,874,326 |
Legend
(a) Non-income producing
(b) Security or a portion of the security is on loan at period end.
(c) Affiliated fund that is generally available only to investment companies and other accounts managed by Fidelity Investments. The rate quoted is the annualized seven-day yield of the fund at period end. A complete unaudited listing of the fund's holdings as of its most recent quarter end is available upon request. In addition, each Fidelity Central Fund's financial statements are available on the SEC's website or upon request.
(d) Investment made with cash collateral received from securities on loan.
Affiliated Central Funds
Information regarding fiscal year to date income earned by the Fund from investments in Fidelity Central Funds is as follows:
| Fund | Income earned |
| Fidelity Cash Central Fund | $140,014 |
| Fidelity Securities Lending Cash Central Fund | 95,897 |
| Total | $235,911 |
Amounts in the income column in the above table include any capital gain distributions from underlying funds, which are presented in the corresponding line-item in the Statement of Operations if applicable.
Investment Valuation
The following is a summary of the inputs used, as of March 31, 2018, involving the Fund's assets and liabilities carried at fair value. The inputs or methodology used for valuing securities may not be an indication of the risk associated with investing in those securities. For more information on valuation inputs, and their aggregation into the levels used below, please refer to the Investment Valuation section in the accompanying Notes to Financial Statements.
| Valuation Inputs at Reporting Date: | ||||
| Description | Total | Level 1 | Level 2 | Level 3 |
| Investments in Securities: | ||||
| Common Stocks | $1,254,161,192 | $1,208,613,058 | $45,548,134 | $-- |
| Money Market Funds | 16,273,700 | 16,273,700 | -- | -- |
| Total Investments in Securities: | $1,270,434,892 | $1,224,886,758 | $45,548,134 | $-- |
Other Information
Distribution of investments by country or territory of incorporation, as a percentage of Total Net Assets, is as follows (Unaudited):
| United States of America | 88.9% |
| Netherlands | 2.5% |
| United Kingdom | 2.3% |
| Sweden | 1.4% |
| Others (Individually Less Than 1%) | 4.9% |
| 100.0% |
See accompanying notes which are an integral part of the financial statements.
Fidelity® Consumer Staples Central Fund
Financial Statements
Statement of Assets and Liabilities
| March 31, 2018 (Unaudited) | ||
| Assets | ||
| Investment in securities, at value (including securities loaned of $5,395,852) — See accompanying schedule: Unaffiliated issuers (cost $1,110,901,950) | $1,254,161,192 | |
| Fidelity Central Funds (cost $16,273,184) | 16,273,700 | |
| Total Investment in Securities (cost $1,127,175,134) | $1,270,434,892 | |
| Cash | 670,726 | |
| Receivable for investments sold | 3,706,517 | |
| Receivable for fund shares sold | 226,777 | |
| Dividends receivable | 4,033,208 | |
| Distributions receivable from Fidelity Central Funds | 17,745 | |
| Other receivables | 894 | |
| Total assets | 1,279,090,759 | |
| Liabilities | ||
| Payable for investments purchased | $2,532,209 | |
| Payable for fund shares redeemed | 500,431 | |
| Other payables and accrued expenses | 12,978 | |
| Collateral on securities loaned | 5,170,815 | |
| Total liabilities | 8,216,433 | |
| Net Assets | $1,270,874,326 | |
| Net Assets consist of: | ||
| Paid in capital | $1,052,097,735 | |
| Undistributed net investment income | 4,138,745 | |
| Accumulated undistributed net realized gain (loss) on investments and foreign currency transactions | 71,342,736 | |
| Net unrealized appreciation (depreciation) on investments and assets and liabilities in foreign currencies | 143,295,110 | |
| Net Assets, for 6,095,311 shares outstanding | $1,270,874,326 | |
| Net Asset Value, offering price and redemption price per share ($1,270,874,326 ÷ 6,095,311 shares) | $208.50 |
See accompanying notes which are an integral part of the financial statements.
Statement of Operations
| Six months ended March 31, 2018 (Unaudited) | ||
| Investment Income | ||
| Dividends | $13,776,463 | |
| Income from Fidelity Central Funds (including $95,897 from security lending) | 235,911 | |
| Total income | 14,012,374 | |
| Expenses | ||
| Custodian fees and expenses | $18,487 | |
| Independent directors' fees and expenses | 2,265 | |
| Miscellaneous | 15 | |
| Total expenses before reductions | 20,767 | |
| Expense reductions | (355) | 20,412 |
| Net investment income (loss) | 13,991,962 | |
| Realized and Unrealized Gain (Loss) | ||
| Net realized gain (loss) on: | ||
| Investment securities: | ||
| Unaffiliated issuers | 78,968,257 | |
| Fidelity Central Funds | 2,631 | |
| Foreign currency transactions | 103,178 | |
| Total net realized gain (loss) | 79,074,066 | |
| Change in net unrealized appreciation (depreciation) on: | ||
| Investment securities: | ||
| Unaffiliated issuers | (121,693,430) | |
| Fidelity Central Funds | (1,658) | |
| Assets and liabilities in foreign currencies | 15,970 | |
| Total change in net unrealized appreciation (depreciation) | (121,679,118) | |
| Net gain (loss) | (42,605,052) | |
| Net increase (decrease) in net assets resulting from operations | $(28,613,090) |
See accompanying notes which are an integral part of the financial statements.
Statement of Changes in Net Assets
| Six months ended March 31, 2018 (Unaudited) | Year ended September 30, 2017 | |
| Increase (Decrease) in Net Assets | ||
| Operations | ||
| Net investment income (loss) | $13,991,962 | $32,867,546 |
| Net realized gain (loss) | 79,074,066 | 118,402,188 |
| Change in net unrealized appreciation (depreciation) | (121,679,118) | (70,956,689) |
| Net increase (decrease) in net assets resulting from operations | (28,613,090) | 80,313,045 |
| Distributions to shareholders from net investment income | (12,751,105) | (29,842,447) |
| Distributions to shareholders from net realized gain | (97,894,284) | (17,679,983) |
| Total distributions | (110,645,389) | (47,522,430) |
| Affiliated share transactions | ||
| Proceeds from sales of shares | 168,796,794 | 82,258,610 |
| Reinvestment of distributions | 110,645,389 | 47,521,494 |
| Cost of shares redeemed | (52,391,617) | (264,262,776) |
| Net increase (decrease) in net assets resulting from share transactions | 227,050,566 | (134,482,672) |
| Total increase (decrease) in net assets | 87,792,087 | (101,692,057) |
| Net Assets | ||
| Beginning of period | 1,183,082,239 | 1,284,774,296 |
| End of period | $1,270,874,326 | $1,183,082,239 |
| Other Information | ||
| Undistributed net investment income end of period | $4,138,745 | $2,897,888 |
| Shares | ||
| Sold | 760,841 | 370,634 |
| Issued in reinvestment of distributions | 500,820 | 211,946 |
| Redeemed | (242,644) | (1,141,143) |
| Net increase (decrease) | 1,019,017 | (558,563) |
See accompanying notes which are an integral part of the financial statements.
Financial Highlights
Fidelity Consumer Staples Central Fund
| Six months ended (Unaudited) March 31, | Years endedSeptember 30, | |||||
| 2018 | 2017 | 2016 | 2015 | 2014 | 2013 | |
| Selected Per–Share Data | ||||||
| Net asset value, beginning of period | $233.06 | $228.00 | $202.36 | $205.11 | $181.33 | $161.05 |
| Income from Investment Operations | ||||||
| Net investment income (loss)A | 2.48 | 6.10 | 5.30 | 5.31 | 5.20 | 4.77 |
| Net realized and unrealized gain (loss) | (6.41) | 7.65 | 25.50 | (2.84) | 23.75 | 20.13 |
| Total from investment operations | (3.93) | 13.75 | 30.80 | 2.47 | 28.95 | 24.90 |
| Distributions from net investment income | (2.37) | (5.62) | (5.16) | (5.22) | (5.17) | (4.62) |
| Distributions from net realized gain | (18.26) | (3.07) | – | – | – | – |
| Total distributions | (20.63) | (8.69) | (5.16) | (5.22) | (5.17) | (4.62) |
| Net asset value, end of period | $208.50 | $233.06 | $228.00 | $202.36 | $205.11 | $181.33 |
| Total ReturnB,C | (2.14)% | 6.23% | 15.29% | 1.07% | 16.13% | 15.58% |
| Ratios to Average Net AssetsD,E | ||||||
| Expenses before reductions | - %F,G | - %G | - %G | - %G | .01% | .01% |
| Expenses net of fee waivers, if any | - %F,G | - %G | - %G | - %G | .01% | .01% |
| Expenses net of all reductions | - %F,G | - %G | - %G | - %G | .01% | .01% |
| Net investment income (loss) | 2.23%F | 2.62% | 2.38% | 2.45% | 2.67% | 2.72% |
| Supplemental Data | ||||||
| Net assets, end of period (000 omitted) | $1,270,874 | $1,183,082 | $1,284,774 | $1,097,772 | $1,166,861 | $1,016,534 |
| Portfolio turnover rateH | 105%F | 54%I | 50% | 65% | 36%I | 34%I |
A Calculated based on average shares outstanding during the period.
B Total returns for periods of less than one year are not annualized.
C Total returns would have been lower if certain expenses had not been reduced during the applicable periods shown.
D Fees and expenses of any underlying Fidelity Central Funds are not included in the Fund's expense ratio. The Fund indirectly bears its proportionate share of the expenses of any underlying Fidelity Central Funds.
E Expense ratios reflect operating expenses of the Fund. Expenses before reductions do not reflect amounts reimbursed by the investment adviser or reductions from expense offset arrangements and do not represent the amount paid by the Fund during periods when reimbursements or reductions occur. Expenses net of fee waivers reflect expenses after reimbursement by the investment adviser but prior to reductions from expense offset arrangements. Expenses net of all reductions represent the net expenses paid by the Fund.
F Annualized
G Amount represents less than .005%.
H Amount does not include the portfolio activity of any underlying Fidelity Central Funds.
I Portfolio turnover rate excludes securities received or delivered in-kind.
See accompanying notes which are an integral part of the financial statements.
Fidelity® Energy Central Fund
Investment Summary (Unaudited)
Top Ten Stocks as of March 31, 2018
| % of fund's net assets | |
| Chevron Corp. | 8.4 |
| EOG Resources, Inc. | 6.9 |
| Diamondback Energy, Inc. | 5.5 |
| Exxon Mobil Corp. | 5.2 |
| Halliburton Co. | 5.1 |
| Pioneer Natural Resources Co. | 4.2 |
| Delek U.S. Holdings, Inc. | 3.8 |
| Phillips 66 Co. | 3.8 |
| RSP Permian, Inc. | 3.6 |
| Continental Resources, Inc. | 3.1 |
| 49.6 |
Top Industries (% of fund's net assets)
| As of March 31, 2018 | ||
| Oil, Gas & Consumable Fuels | 82.2% | |
| Energy Equipment & Services | 13.2% | |
| Chemicals | 1.9% | |
| Machinery | 0.6% | |
| Gas Utilities | 0.4% | |
| All Others* | 1.7% | |
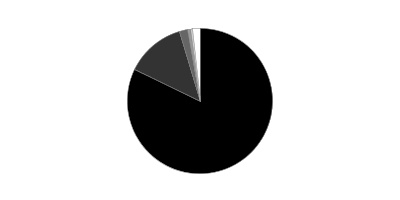
* Includes short-term investments and net other assets (liabilities).
Fidelity® Energy Central Fund
Schedule of Investments March 31, 2018 (Unaudited)
Showing Percentage of Net Assets
| Common Stocks - 98.6% | |||
| Shares | Value | ||
| Chemicals - 1.9% | |||
| Commodity Chemicals - 1.9% | |||
| LG Chemical Ltd. | 7,573 | $2,748,270 | |
| LyondellBasell Industries NV Class A | 160,950 | 17,009,196 | |
| 19,757,466 | |||
| Energy Equipment & Services - 13.2% | |||
| Oil & Gas Drilling - 2.5% | |||
| Nabors Industries Ltd. | 1,626,025 | 11,365,915 | |
| Odfjell Drilling Ltd. (a) | 736,222 | 3,011,330 | |
| Precision Drilling Corp. (a) | 792,400 | 2,201,880 | |
| Shelf Drilling Ltd. (b)(c) | 812,900 | 6,844,338 | |
| Trinidad Drilling Ltd. (a) | 1,042,751 | 1,440,677 | |
| Xtreme Drilling & Coil Services Corp. (a) | 1,150,300 | 1,910,694 | |
| 26,774,834 | |||
| Oil & Gas Equipment & Services - 10.7% | |||
| Baker Hughes, a GE Co. Class A | 792,536 | 22,008,725 | |
| C&J Energy Services, Inc. (a) | 54,800 | 1,414,936 | |
| Dril-Quip, Inc. (a) | 127,900 | 5,729,920 | |
| Frank's International NV (d) | 225,560 | 1,224,791 | |
| Halliburton Co. | 1,169,117 | 54,878,352 | |
| Liberty Oilfield Services, Inc. Class A (a)(d) | 20,800 | 351,312 | |
| NCS Multistage Holdings, Inc. (d) | 227,500 | 3,412,500 | |
| Newpark Resources, Inc. (a) | 17,751 | 143,783 | |
| Oceaneering International, Inc. | 233,251 | 4,324,474 | |
| RigNet, Inc. (a) | 266,875 | 3,629,500 | |
| Schlumberger Ltd. | 216,152 | 14,002,327 | |
| Smart Sand, Inc. (a)(d) | 128,700 | 749,034 | |
| TechnipFMC PLC | 67,900 | 1,999,655 | |
| Weatherford International PLC (a)(d) | 470,400 | 1,077,216 | |
| 114,946,525 | |||
| TOTAL ENERGY EQUIPMENT & SERVICES | 141,721,359 | ||
| Gas Utilities - 0.4% | |||
| Gas Utilities - 0.4% | |||
| Indraprastha Gas Ltd. (a) | 976,720 | 4,227,348 | |
| Machinery - 0.6% | |||
| Industrial Machinery - 0.6% | |||
| Cactus, Inc. (a) | 69,800 | 1,879,714 | |
| ProPetro Holding Corp. | 291,500 | 4,631,935 | |
| 6,511,649 | |||
| Oil, Gas & Consumable Fuels - 82.2% | |||
| Integrated Oil & Gas - 16.8% | |||
| Chevron Corp. | 792,364 | 90,361,191 | |
| Exxon Mobil Corp. | 748,964 | 55,880,204 | |
| Occidental Petroleum Corp. | 297,600 | 19,332,096 | |
| Suncor Energy, Inc. | 416,700 | 14,389,710 | |
| 179,963,201 | |||
| Oil & Gas Exploration & Production - 48.4% | |||
| Anadarko Petroleum Corp. | 365,261 | 22,065,417 | |
| Cabot Oil & Gas Corp. | 1,092,300 | 26,193,354 | |
| Callon Petroleum Co. (a) | 1,043,255 | 13,812,696 | |
| Centennial Resource Development, Inc.: | |||
| Class A (a) | 45,400 | 833,090 | |
| Class A (a) | 402,500 | 7,385,875 | |
| Cimarex Energy Co. | 170,622 | 15,953,157 | |
| Concho Resources, Inc. (a) | 139,853 | 21,024,101 | |
| ConocoPhillips Co. | 239,142 | 14,178,729 | |
| Continental Resources, Inc. (a) | 561,272 | 33,086,984 | |
| Devon Energy Corp. | 779,181 | 24,770,164 | |
| Diamondback Energy, Inc. (a) | 464,463 | 58,763,859 | |
| Encana Corp. | 2,370,000 | 26,066,597 | |
| EOG Resources, Inc. | 699,001 | 73,583,835 | |
| Extraction Oil & Gas, Inc. (a) | 516,746 | 5,921,909 | |
| Hess Corp. | 200,365 | 10,142,476 | |
| Marathon Oil Corp. | 390,717 | 6,302,265 | |
| Parsley Energy, Inc. Class A (a) | 985,132 | 28,558,977 | |
| PDC Energy, Inc. (a) | 138,780 | 6,804,383 | |
| Pioneer Natural Resources Co. | 263,593 | 45,280,006 | |
| PrairieSky Royalty Ltd. (d) | 91,800 | 2,007,223 | |
| Ring Energy, Inc. (a) | 283,494 | 4,068,139 | |
| RSP Permian, Inc. (a) | 831,370 | 38,974,626 | |
| Viper Energy Partners LP | 598,300 | 15,202,803 | |
| Whiting Petroleum Corp. (a) | 121,100 | 4,098,024 | |
| WildHorse Resource Development Corp. (a)(d) | 149,500 | 2,853,955 | |
| WPX Energy, Inc. (a) | 763,900 | 11,290,442 | |
| 519,223,086 | |||
| Oil & Gas Refining & Marketing - 11.4% | |||
| Andeavor | 149,000 | 14,983,440 | |
| Delek U.S. Holdings, Inc. | 1,003,920 | 40,859,544 | |
| Phillips 66 Co. | 421,085 | 40,390,473 | |
| Reliance Industries Ltd. | 264,698 | 3,618,884 | |
| Valero Energy Corp. | 246,940 | 22,908,624 | |
| 122,760,965 | |||
| Oil & Gas Storage & Transport - 5.6% | |||
| Cheniere Energy, Inc. (a) | 187,800 | 10,037,910 | |
| Enterprise Products Partners LP | 450,300 | 11,023,344 | |
| GasLog Partners LP | 125,700 | 2,928,810 | |
| Gener8 Maritime, Inc. (a) | 811,308 | 4,583,890 | |
| Golar LNG Ltd. (d) | 207,500 | 5,677,200 | |
| Noble Midstream Partners LP | 144,492 | 6,737,662 | |
| Noble Midstream Partners LP (e) | 45,454 | 2,119,520 | |
| Plains GP Holdings LP Class A | 102,300 | 2,225,025 | |
| Teekay LNG Partners LP | 69,300 | 1,240,470 | |
| The Williams Companies, Inc. | 538,304 | 13,382,237 | |
| 59,956,068 | |||
| TOTAL OIL, GAS & CONSUMABLE FUELS | 881,903,320 | ||
| Semiconductors & Semiconductor Equipment - 0.3% | |||
| Semiconductor Equipment - 0.3% | |||
| SolarEdge Technologies, Inc. (a) | 66,900 | 3,518,940 | |
| TOTAL COMMON STOCKS | |||
| (Cost $920,282,575) | 1,057,640,082 | ||
| Money Market Funds - 2.1% | |||
| Fidelity Cash Central Fund, 1.72% (f) | 11,583,158 | 11,585,475 | |
| Fidelity Securities Lending Cash Central Fund 1.72% (f)(g) | 11,360,381 | 11,362,654 | |
| TOTAL MONEY MARKET FUNDS | |||
| (Cost $22,946,928) | 22,948,129 | ||
| TOTAL INVESTMENT IN SECURITIES - 100.7% | |||
| (Cost $943,229,503) | 1,080,588,211 | ||
| NET OTHER ASSETS (LIABILITIES) - (0.7)% | (7,368,754) | ||
| NET ASSETS - 100% | $1,073,219,457 |
Legend
(a) Non-income producing
(b) Security exempt from registration under Rule 144A of the Securities Act of 1933. These securities may be resold in transactions exempt from registration, normally to qualified institutional buyers. At the end of the period, the value of these securities amounted to $6,844,338 or 0.6% of net assets.
(c) Level 3 security
(d) Security or a portion of the security is on loan at period end.
(e) Restricted securities - Investment in securities not registered under the Securities Act of 1933 (excluding 144A issues). At the end of the period, the value of restricted securities (excluding 144A issues) amounted to $2,119,520 or 0.2% of net assets.
(f) Affiliated fund that is generally available only to investment companies and other accounts managed by Fidelity Investments. The rate quoted is the annualized seven-day yield of the fund at period end. A complete unaudited listing of the fund's holdings as of its most recent quarter end is available upon request. In addition, each Fidelity Central Fund's financial statements are available on the SEC's website or upon request.
(g) Investment made with cash collateral received from securities on loan.
Additional information on each restricted holding is as follows:
| Security | Acquisition Date | Acquisition Cost |
| Noble Midstream Partners LP | 6/21/17 | $1,838,614 |
Affiliated Central Funds
Information regarding fiscal year to date income earned by the Fund from investments in Fidelity Central Funds is as follows:
| Fund | Income earned |
| Fidelity Cash Central Fund | $81,349 |
| Fidelity Securities Lending Cash Central Fund | 28,047 |
| Total | $109,396 |
Amounts in the income column in the above table include any capital gain distributions from underlying funds, which are presented in the corresponding line-item in the Statement of Operations if applicable.
Investment Valuation
The following is a summary of the inputs used, as of March 31, 2018, involving the Fund's assets and liabilities carried at fair value. The inputs or methodology used for valuing securities may not be an indication of the risk associated with investing in those securities. For more information on valuation inputs, and their aggregation into the levels used below, please refer to the Investment Valuation section in the accompanying Notes to Financial Statements.
| Valuation Inputs at Reporting Date: | ||||
| Description | Total | Level 1 | Level 2 | Level 3 |
| Investments in Securities: | ||||
| Common Stocks | $1,057,640,082 | $1,039,938,182 | $10,857,562 | $6,844,338 |
| Money Market Funds | 22,948,129 | 22,948,129 | -- | -- |
| Total Investments in Securities: | $1,080,588,211 | $1,062,886,311 | $10,857,562 | $6,844,338 |
Other Information
Distribution of investments by country or territory of incorporation, as a percentage of Total Net Assets, is as follows (Unaudited):
| United States of America | 87.9% |
| Canada | 4.5% |
| Bermuda | 1.9% |
| Netherlands | 1.7% |
| Curacao | 1.3% |
| Others (Individually Less Than 1%) | 2.7% |
| 100.0% |
See accompanying notes which are an integral part of the financial statements.
Fidelity® Energy Central Fund
Financial Statements
Statement of Assets and Liabilities
| March 31, 2018 (Unaudited) | ||
| Assets | ||
| Investment in securities, at value (including securities loaned of $11,251,720) — See accompanying schedule: Unaffiliated issuers (cost $920,282,575) | $1,057,640,082 | |
| Fidelity Central Funds (cost $22,946,928) | 22,948,129 | |
| Total Investment in Securities (cost $943,229,503) | $1,080,588,211 | |
| Cash | 33,190 | |
| Receivable for investments sold | 9,522,670 | |
| Receivable for fund shares sold | 176,151 | |
| Dividends receivable | 553,885 | |
| Distributions receivable from Fidelity Central Funds | 14,112 | |
| Total assets | 1,090,888,219 | |
| Liabilities | ||
| Payable for investments purchased | $5,629,245 | |
| Payable for fund shares redeemed | 414,460 | |
| Other payables and accrued expenses | 267,051 | |
| Collateral on securities loaned | 11,358,006 | |
| Total liabilities | 17,668,762 | |
| Net Assets | $1,073,219,457 | |
| Net Assets consist of: | ||
| Paid in capital | $958,211,139 | |
| Undistributed net investment income | 452,451 | |
| Accumulated undistributed net realized gain (loss) on investments and foreign currency transactions | (22,545,497) | |
| Net unrealized appreciation (depreciation) on investments and assets and liabilities in foreign currencies | 137,101,364 | |
| Net Assets, for 8,779,694 shares outstanding | $1,073,219,457 | |
| Net Asset Value, offering price and redemption price per share ($1,073,219,457 ÷ 8,779,694 shares) | $122.24 |
See accompanying notes which are an integral part of the financial statements.
Statement of Operations
| Six months ended March 31, 2018 (Unaudited) | ||
| Investment Income | ||
| Dividends | $7,259,912 | |
| Income from Fidelity Central Funds (including $28,047 from security lending) | 109,396 | |
| Total income | 7,369,308 | |
| Expenses | ||
| Custodian fees and expenses | $13,326 | |
| Independent directors' fees and expenses | 1,806 | |
| Miscellaneous | 12 | |
| Total expenses before reductions | 15,144 | |
| Expense reductions | (1,146) | 13,998 |
| Net investment income (loss) | 7,355,310 | |
| Realized and Unrealized Gain (Loss) | ||
| Net realized gain (loss) on: | ||
| Investment securities: | ||
| Unaffiliated issuers | (17,625,886) | |
| Fidelity Central Funds | 1,901 | |
| Foreign currency transactions | 7,306 | |
| Total net realized gain (loss) | (17,616,679) | |
| Change in net unrealized appreciation (depreciation) on: | ||
| Unaffiliated issuers (net of decrease in deferred foreign taxes of $179,828) | 61,623,363 | |
| Fidelity Central Funds | (2,202) | |
| Assets and liabilities in foreign currencies | (3,809) | |
| Total change in net unrealized appreciation (depreciation) | 61,617,352 | |
| Net gain (loss) | 44,000,673 | |
| Net increase (decrease) in net assets resulting from operations | $51,355,983 |
See accompanying notes which are an integral part of the financial statements.
Statement of Changes in Net Assets
| Six months ended March 31, 2018 (Unaudited) | Year ended September 30, 2017 | |
| Increase (Decrease) in Net Assets | ||
| Operations | ||
| Net investment income (loss) | $7,355,310 | $22,383,101 |
| Net realized gain (loss) | (17,616,679) | 28,509,040 |
| Change in net unrealized appreciation (depreciation) | 61,617,352 | (97,314,042) |
| Net increase (decrease) in net assets resulting from operations | 51,355,983 | (46,421,901) |
| Distributions to shareholders from net investment income | (8,879,539) | (19,197,625) |
| Distributions to shareholders from net realized gain | (10,209,103) | (803,218) |
| Total distributions | (19,088,642) | (20,000,843) |
| Affiliated share transactions | ||
| Proceeds from sales of shares | 126,324,337 | 150,404,019 |
| Reinvestment of distributions | 19,088,642 | 20,000,500 |
| Cost of shares redeemed | (44,787,221) | (168,642,695) |
| Net increase (decrease) in net assets resulting from share transactions | 100,625,758 | 1,761,824 |
| Total increase (decrease) in net assets | 132,893,099 | (64,660,920) |
| Net Assets | ||
| Beginning of period | 940,326,358 | 1,004,987,278 |
| End of period | $1,073,219,457 | $940,326,358 |
| Other Information | ||
| Undistributed net investment income end of period | $452,451 | $1,976,680 |
| Shares | ||
| Sold | 1,037,673 | 1,212,563 |
| Issued in reinvestment of distributions | 156,809 | 170,756 |
| Redeemed | (367,814) | (1,315,136) |
| Net increase (decrease) | 826,668 | 68,183 |
See accompanying notes which are an integral part of the financial statements.
Financial Highlights
Fidelity Energy Central Fund
| Six months ended (Unaudited) March 31, | Years endedSeptember 30, | |||||
| 2018 | 2017 | 2016 | 2015 | 2014 | 2013 | |
| Selected Per–Share Data | ||||||
| Net asset value, beginning of period | $118.24 | $127.46 | $103.49 | $154.78 | $144.89 | $123.82 |
| Income from Investment Operations | ||||||
| Net investment income (loss)A | .88 | 2.84B | 1.72 | 2.32 | 2.37 | 2.25 |
| Net realized and unrealized gain (loss) | 5.44 | (9.52) | 23.93 | (51.31) | 9.87 | 20.98 |
| Total from investment operations | 6.32 | (6.68) | 25.65 | (48.99) | 12.24 | 23.23 |
| Distributions from net investment income | (1.08) | (2.44) | (1.68) | (2.30) | (2.35) | (2.16) |
| Distributions from net realized gain | (1.24) | (.10) | – | – | – | – |
| Total distributions | (2.32) | (2.54) | (1.68) | (2.30) | (2.35) | (2.16) |
| Net asset value, end of period | $122.24 | $118.24 | $127.46 | $103.49 | $154.78 | $144.89 |
| Total ReturnC,D | 5.36% | (5.20)% | 25.02% | (31.92)% | 8.44% | 18.97% |
| Ratios to Average Net AssetsE,F | ||||||
| Expenses before reductionsG | - %H | -% | -% | -% | -% | -% |
| Expenses net of fee waivers, if anyG | - %H | -% | -% | -% | -% | -% |
| Expenses net of all reductionsG | - %H | -% | -% | -% | -% | -% |
| Net investment income (loss) | 1.44%H | 2.32%B | 1.55% | 1.80% | 1.52% | 1.72% |
| Supplemental Data | ||||||
| Net assets, end of period (000 omitted) | $1,073,219 | $940,326 | $1,004,987 | $803,804 | $1,106,807 | $1,055,394 |
| Portfolio turnover rateI | 41%H | 82%J | 105% | 70% | 109%J | 93%J |
A Calculated based on average shares outstanding during the period.
B Net Investment income per share reflects a large, non-recurring dividend which amounted to $1.32 per share. Excluding this non-recurring dividend, the ratio of net investment income (loss) to average net assets would have been 1.25%.
C Total returns for periods of less than one year are not annualized.
D Total returns would have been lower if certain expenses had not been reduced during the applicable periods shown.
E Fees and expenses of any underlying Fidelity Central Funds are not included in the Fund's expense ratio. The Fund indirectly bears its proportionate share of the expenses of any underlying Fidelity Central Funds.
F Expense ratios reflect operating expenses of the Fund. Expenses before reductions do not reflect amounts reimbursed by the investment adviser or reductions from expense offset arrangements and do not represent the amount paid by the Fund during periods when reimbursements or reductions occur. Expenses net of fee waivers reflect expenses after reimbursement by the investment adviser but prior to reductions from expense offset arrangements. Expenses net of all reductions represent the net expenses paid by the Fund.
G Amount represents less than .005%.
H Annualized
I Amount does not include the portfolio activity of any underlying Fidelity Central Funds.
J Portfolio turnover rate excludes securities received or delivered in-kind.
See accompanying notes which are an integral part of the financial statements.
Fidelity® Financials Central Fund
Investment Summary (Unaudited)
Top Ten Stocks as of March 31, 2018
| % of fund's net assets | |
| Bank of America Corp. | 6.2 |
| JPMorgan Chase & Co. | 5.0 |
| Berkshire Hathaway, Inc. Class B | 4.9 |
| Citigroup, Inc. | 4.5 |
| Capital One Financial Corp. | 3.9 |
| Wells Fargo & Co. | 3.8 |
| Goldman Sachs Group, Inc. | 3.6 |
| Huntington Bancshares, Inc. | 3.3 |
| TD Ameritrade Holding Corp. | 3.3 |
| E*TRADE Financial Corp. | 3.1 |
| 41.6 |
Top Industries (% of fund's net assets)
| As of March 31, 2018 | ||
| Banks | 31.4% | |
| Capital Markets | 18.9% | |
| Equity Real Estate Investment Trusts (Reits) | 16.2% | |
| Insurance | 14.0% | |
| Consumer Finance | 7.9% | |
| All Others* | 11.6% | |
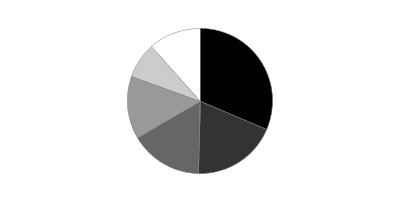
* Includes short-term investments and net other assets (liabilities).
Fidelity® Financials Central Fund
Schedule of Investments March 31, 2018 (Unaudited)
Showing Percentage of Net Assets
| Common Stocks - 97.4% | |||
| Shares | Value | ||
| Banks - 31.4% | |||
| Diversified Banks - 19.5% | |||
| Bank of America Corp. | 7,150,900 | $214,455,487 | |
| Citigroup, Inc. | 2,286,171 | 154,316,543 | |
| JPMorgan Chase & Co. | 1,568,640 | 172,503,341 | |
| Wells Fargo & Co. | 2,500,000 | 131,025,000 | |
| 672,300,371 | |||
| Regional Banks - 11.9% | |||
| Bank of the Ozarks, Inc. | 500,000 | 24,135,000 | |
| CoBiz, Inc. | 900,000 | 17,640,000 | |
| East West Bancorp, Inc. | 400,000 | 25,016,000 | |
| First Citizen Bancshares, Inc. | 10,000 | 4,132,400 | |
| First Horizon National Corp. | 200,000 | 3,766,000 | |
| First Republic Bank | 115,100 | 10,659,411 | |
| Huntington Bancshares, Inc. | 7,500,000 | 113,250,000 | |
| PNC Financial Services Group, Inc. | 584,800 | 88,445,152 | |
| Popular, Inc. | 400,000 | 16,648,000 | |
| Preferred Bank, Los Angeles | 150,000 | 9,630,000 | |
| Prosperity Bancshares, Inc. | 25,000 | 1,815,750 | |
| Signature Bank (a) | 254,200 | 36,083,690 | |
| SunTrust Banks, Inc. | 827,300 | 56,289,492 | |
| United Community Bank, Inc. | 75,000 | 2,373,750 | |
| Wintrust Financial Corp. | 40,000 | 3,442,000 | |
| 413,326,645 | |||
| TOTAL BANKS | 1,085,627,016 | ||
| Capital Markets - 18.9% | |||
| Asset Management & Custody Banks - 4.4% | |||
| Affiliated Managers Group, Inc. | 190,000 | 36,020,200 | |
| BlackRock, Inc. Class A | 87,900 | 47,617,188 | |
| Invesco Ltd. | 250,000 | 8,002,500 | |
| Northern Trust Corp. | 594,900 | 61,352,037 | |
| 152,991,925 | |||
| Financial Exchanges & Data - 3.2% | |||
| Cboe Global Markets, Inc. | 483,100 | 55,121,710 | |
| IntercontinentalExchange, Inc. | 762,700 | 55,311,004 | |
| 110,432,714 | |||
| Investment Banking & Brokerage - 11.3% | |||
| E*TRADE Financial Corp. (a) | 1,900,000 | 105,279,000 | |
| Goldman Sachs Group, Inc. | 500,000 | 125,930,000 | |
| Greenhill & Co., Inc. (b) | 75,000 | 1,387,500 | |
| Hamilton Lane, Inc. Class A | 250,000 | 9,307,500 | |
| Investment Technology Group, Inc. | 700,000 | 13,818,000 | |
| Lazard Ltd. Class A | 275,000 | 14,454,000 | |
| PJT Partners, Inc. | 150,000 | 7,515,000 | |
| TD Ameritrade Holding Corp. | 1,900,000 | 112,537,000 | |
| 390,228,000 | |||
| TOTAL CAPITAL MARKETS | 653,652,639 | ||
| Consumer Finance - 7.9% | |||
| Consumer Finance - 7.9% | |||
| Capital One Financial Corp. | 1,398,800 | 134,033,016 | |
| Discover Financial Services | 400,000 | 28,772,000 | |
| OneMain Holdings, Inc. (a) | 447,900 | 13,410,126 | |
| SLM Corp. (a) | 3,250,000 | 36,432,500 | |
| Synchrony Financial | 1,800,000 | 60,354,000 | |
| 273,001,642 | |||
| Diversified Financial Services - 4.9% | |||
| Multi-Sector Holdings - 4.9% | |||
| Berkshire Hathaway, Inc. Class B (a) | 850,000 | 169,558,000 | |
| Equity Real Estate Investment Trusts (REITs) - 16.2% | |||
| Diversified REITs - 0.7% | |||
| Spirit Realty Capital, Inc. | 876,900 | 6,804,744 | |
| VEREIT, Inc. | 956,624 | 6,658,103 | |
| Washington REIT (SBI) | 326,600 | 8,916,180 | |
| 22,379,027 | |||
| Health Care REITs - 1.3% | |||
| CareTrust (REIT), Inc. | 190,750 | 2,556,050 | |
| Healthcare Realty Trust, Inc. | 419,421 | 11,622,156 | |
| Sabra Health Care REIT, Inc. | 239,300 | 4,223,645 | |
| Ventas, Inc. | 380,792 | 18,860,628 | |
| Welltower, Inc. | 128,103 | 6,972,646 | |
| 44,235,125 | |||
| Hotel & Resort REITs - 0.7% | |||
| DiamondRock Hospitality Co. | 570,900 | 5,960,196 | |
| Host Hotels & Resorts, Inc. | 520,911 | 9,709,781 | |
| Sunstone Hotel Investors, Inc. | 630,300 | 9,593,166 | |
| 25,263,143 | |||
| Industrial REITs - 1.5% | |||
| Americold Realty Trust | 187,000 | 3,567,960 | |
| DCT Industrial Trust, Inc. | 313,600 | 17,668,224 | |
| Duke Realty Corp. | 508,500 | 13,465,080 | |
| Prologis, Inc. | 149,223 | 9,399,557 | |
| Rexford Industrial Realty, Inc. | 143,200 | 4,122,728 | |
| Terreno Realty Corp. | 92,800 | 3,202,528 | |
| 51,426,077 | |||
| Office REITs - 2.0% | |||
| Boston Properties, Inc. | 181,189 | 22,326,109 | |
| Corporate Office Properties Trust (SBI) | 203,600 | 5,258,988 | |
| Douglas Emmett, Inc. | 258,900 | 9,517,164 | |
| Highwoods Properties, Inc. (SBI) | 219,825 | 9,632,732 | |
| Hudson Pacific Properties, Inc. | 312,340 | 10,160,420 | |
| SL Green Realty Corp. | 132,600 | 12,839,658 | |
| 69,735,071 | |||
| Residential REITs - 2.5% | |||
| American Homes 4 Rent Class A | 363,312 | 7,295,305 | |
| AvalonBay Communities, Inc. | 145,194 | 23,878,605 | |
| Colony NorthStar, Inc. | 289,513 | 1,627,063 | |
| Education Realty Trust, Inc. | 239,300 | 7,837,075 | |
| Equity Lifestyle Properties, Inc. | 137,144 | 12,037,129 | |
| Equity Residential (SBI) | 179,125 | 11,037,683 | |
| Essex Property Trust, Inc. | 75,523 | 18,176,876 | |
| Mid-America Apartment Communities, Inc. | 40,783 | 3,721,041 | |
| 85,610,777 | |||
| Retail REITs - 2.1% | |||
| Acadia Realty Trust (SBI) | 218,200 | 5,367,720 | |
| Agree Realty Corp. | 82,573 | 3,966,807 | |
| DDR Corp. | 372,183 | 2,728,101 | |
| General Growth Properties, Inc. | 233,859 | 4,784,755 | |
| National Retail Properties, Inc. | 288,037 | 11,308,333 | |
| Simon Property Group, Inc. | 143,746 | 22,187,195 | |
| Taubman Centers, Inc. | 65,725 | 3,740,410 | |
| The Macerich Co. | 102,600 | 5,747,652 | |
| Urban Edge Properties | 621,785 | 13,275,110 | |
| 73,106,083 | |||
| Specialized REITs - 5.4% | |||
| American Tower Corp. | 357,988 | 52,029,976 | |
| CoreSite Realty Corp. | 30,570 | 3,064,948 | |
| Corrections Corp. of America | 231,900 | 4,526,688 | |
| Crown Castle International Corp. | 86,700 | 9,503,187 | |
| Equinix, Inc. | 82,652 | 34,560,107 | |
| Extra Space Storage, Inc. | 92,510 | 8,081,674 | |
| Four Corners Property Trust, Inc. | 173,200 | 3,999,188 | |
| Gaming & Leisure Properties | 125,966 | 4,216,082 | |
| Outfront Media, Inc. | 256,128 | 4,799,839 | |
| Potlatch Corp. | 101,708 | 5,293,901 | |
| Public Storage | 122,574 | 24,562,604 | |
| Safety Income and Growth, Inc. | 22,304 | 356,641 | |
| SBA Communications Corp. Class A (a) | 114,891 | 19,637,170 | |
| Uniti Group, Inc. (b) | 122,434 | 1,989,553 | |
| Weyerhaeuser Co. | 279,714 | 9,789,990 | |
| 186,411,548 | |||
| TOTAL EQUITY REAL ESTATE INVESTMENT TRUSTS (REITS) | 558,166,851 | ||
| Hotels, Restaurants & Leisure - 0.0% | |||
| Hotels, Resorts & Cruise Lines - 0.0% | |||
| Hilton Grand Vacations, Inc. (a) | 32,100 | 1,380,942 | |
| Insurance - 14.0% | |||
| Life & Health Insurance - 4.0% | |||
| MetLife, Inc. | 1,900,000 | 87,191,000 | |
| Torchmark Corp. | 600,000 | 50,502,000 | |
| 137,693,000 | |||
| Multi-Line Insurance - 3.5% | |||
| American International Group, Inc. | 860,900 | 46,850,178 | |
| Hartford Financial Services Group, Inc. | 1,474,600 | 75,971,392 | |
| 122,821,570 | |||
| Property & Casualty Insurance - 5.2% | |||
| Aspen Insurance Holdings Ltd. | 150,000 | 6,727,500 | |
| Axis Capital Holdings Ltd. | 75,000 | 4,317,750 | |
| Chubb Ltd. | 415,000 | 56,759,550 | |
| FNF Group | 850,000 | 34,017,000 | |
| The Travelers Companies, Inc. | 550,000 | 76,373,000 | |
| 178,194,800 | |||
| Reinsurance - 1.3% | |||
| Reinsurance Group of America, Inc. | 284,400 | 43,797,600 | |
| TOTAL INSURANCE | 482,506,970 | ||
| IT Services - 1.6% | |||
| Data Processing & Outsourced Services - 1.6% | |||
| Visa, Inc. Class A | 240,000 | 28,708,800 | |
| WEX, Inc. (a) | 175,000 | 27,408,500 | |
| 56,117,300 | |||
| Mortgage Real Estate Investment Trusts - 0.3% | |||
| Mortgage REITs - 0.3% | |||
| AGNC Investment Corp. | 600,000 | 11,352,000 | |
| Real Estate Management & Development - 1.0% | |||
| Real Estate Development - 0.4% | |||
| Howard Hughes Corp. (a) | 67,276 | 9,360,110 | |
| VICI Properties, Inc. (b) | 254,500 | 4,662,440 | |
| 14,022,550 | |||
| Real Estate Operating Company - 0.1% | |||
| The RMR Group, Inc. | 32,700 | 2,287,365 | |
| Real Estate Services - 0.5% | |||
| CBRE Group, Inc. (a) | 345,002 | 16,290,994 | |
| TOTAL REAL ESTATE MANAGEMENT & DEVELOPMENT | 32,600,909 | ||
| Software - 0.4% | |||
| Application Software - 0.4% | |||
| Black Knight, Inc. (a) | 275,000 | 12,952,500 | |
| Thrifts & Mortgage Finance - 0.8% | |||
| Thrifts & Mortgage Finance - 0.8% | |||
| MGIC Investment Corp. (a) | 1,158,000 | 15,054,000 | |
| NMI Holdings, Inc. (a) | 200,000 | 3,310,000 | |
| Radian Group, Inc. | 490,395 | 9,337,121 | |
| 27,701,121 | |||
| TOTAL COMMON STOCKS | |||
| (Cost $2,540,043,313) | 3,364,617,890 | ||
| Money Market Funds - 2.8% | |||
| Fidelity Cash Central Fund, 1.72% (c) | 87,953,831 | 87,971,422 | |
| Fidelity Securities Lending Cash Central Fund 1.72% (c)(d) | 7,213,459 | 7,214,902 | |
| TOTAL MONEY MARKET FUNDS | |||
| (Cost $95,185,603) | 95,186,324 | ||
| TOTAL INVESTMENT IN SECURITIES - 100.2% | |||
| (Cost $2,635,228,916) | 3,459,804,214 | ||
| NET OTHER ASSETS (LIABILITIES) - (0.2)% | (7,017,833) | ||
| NET ASSETS - 100% | $3,452,786,381 |
Legend
(a) Non-income producing
(b) Security or a portion of the security is on loan at period end.
(c) Affiliated fund that is generally available only to investment companies and other accounts managed by Fidelity Investments. The rate quoted is the annualized seven-day yield of the fund at period end. A complete unaudited listing of the fund's holdings as of its most recent quarter end is available upon request. In addition, each Fidelity Central Fund's financial statements are available on the SEC's website or upon request.
(d) Investment made with cash collateral received from securities on loan.
Affiliated Central Funds
Information regarding fiscal year to date income earned by the Fund from investments in Fidelity Central Funds is as follows:
| Fund | Income earned |
| Fidelity Cash Central Fund | $428,782 |
| Fidelity Securities Lending Cash Central Fund | 4,432 |
| Total | $433,214 |
Amounts in the income column in the above table include any capital gain distributions from underlying funds, which are presented in the corresponding line-item in the Statement of Operations if applicable.
Investment Valuation
All investments are categorized as Level 1 under the Fair Value Hierarchy. The inputs or methodology used for valuing securities may not be an indication of the risk associated with investing in those securities. For more information on valuation inputs please refer to the Investment Valuation section in the accompanying Notes to Financial Statements.
See accompanying notes which are an integral part of the financial statements.
Fidelity® Financials Central Fund
Financial Statements
Statement of Assets and Liabilities
| March 31, 2018 (Unaudited) | ||
| Assets | ||
| Investment in securities, at value (including securities loaned of $7,058,858) — See accompanying schedule: Unaffiliated issuers (cost $2,540,043,313) | $3,364,617,890 | |
| Fidelity Central Funds (cost $95,185,603) | 95,186,324 | |
| Total Investment in Securities (cost $2,635,228,916) | $3,459,804,214 | |
| Cash | 1,902,421 | |
| Receivable for investments sold | 3,284,336 | |
| Receivable for fund shares sold | 585,426 | |
| Dividends receivable | 4,445,463 | |
| Distributions receivable from Fidelity Central Funds | 91,108 | |
| Other receivables | 378,271 | |
| Total assets | 3,470,491,239 | |
| Liabilities | ||
| Payable for investments purchased | $8,931,701 | |
| Payable for fund shares redeemed | 1,543,817 | |
| Other payables and accrued expenses | 15,190 | |
| Collateral on securities loaned | 7,214,150 | |
| Total liabilities | 17,704,858 | |
| Net Assets | $3,452,786,381 | |
| Net Assets consist of: | ||
| Paid in capital | $2,551,508,509 | |
| Undistributed net investment income | 8,778,917 | |
| Accumulated undistributed net realized gain (loss) on investments and foreign currency transactions | 67,923,399 | |
| Net unrealized appreciation (depreciation) on investments and assets and liabilities in foreign currencies | 824,575,556 | |
| Net Assets, for 32,769,565 shares outstanding | $3,452,786,381 | |
| Net Asset Value, offering price and redemption price per share ($3,452,786,381 ÷ 32,769,565 shares) | $105.37 |
See accompanying notes which are an integral part of the financial statements.
Statement of Operations
| Six months ended March 31, 2018 (Unaudited) | ||
| Investment Income | ||
| Dividends | $29,003,025 | |
| Income from Fidelity Central Funds (including $4,432 from security lending) | 433,214 | |
| Total income | 29,436,239 | |
| Expenses | ||
| Custodian fees and expenses | $21,106 | |
| Independent directors' fees and expenses | 5,898 | |
| Miscellaneous | 39 | |
| Total expenses before reductions | 27,043 | |
| Expense reductions | (173) | 26,870 |
| Net investment income (loss) | 29,409,369 | |
| Realized and Unrealized Gain (Loss) | ||
| Net realized gain (loss) on: | ||
| Investment securities: | ||
| Unaffiliated issuers | 81,897,242 | |
| Fidelity Central Funds | 29 | |
| Foreign currency transactions | 25,297 | |
| Total net realized gain (loss) | 81,922,568 | |
| Change in net unrealized appreciation (depreciation) on: | ||
| Investment securities: | ||
| Unaffiliated issuers | 74,346,340 | |
| Fidelity Central Funds | 599 | |
| Assets and liabilities in foreign currencies | 120 | |
| Total change in net unrealized appreciation (depreciation) | 74,347,059 | |
| Net gain (loss) | 156,269,627 | |
| Net increase (decrease) in net assets resulting from operations | $185,678,996 |
See accompanying notes which are an integral part of the financial statements.
Statement of Changes in Net Assets
| Six months ended March 31, 2018 (Unaudited) | Year ended September 30, 2017 | |
| Increase (Decrease) in Net Assets | ||
| Operations | ||
| Net investment income (loss) | $29,409,369 | $49,326,890 |
| Net realized gain (loss) | 81,922,568 | 200,982,383 |
| Change in net unrealized appreciation (depreciation) | 74,347,059 | 427,820,853 |
| Net increase (decrease) in net assets resulting from operations | 185,678,996 | 678,130,126 |
| Distributions to shareholders from net investment income | (26,714,594) | (43,257,778) |
| Distributions to shareholders from net realized gain | (190,098,519) | (3,602,990) |
| Total distributions | (216,813,113) | (46,860,768) |
| Affiliated share transactions | ||
| Proceeds from sales of shares | 382,712,537 | 270,611,265 |
| Reinvestment of distributions | 216,813,113 | 46,860,360 |
| Cost of shares redeemed | (145,691,049) | (462,706,324) |
| Net increase (decrease) in net assets resulting from share transactions | 453,834,601 | (145,234,699) |
| Total increase (decrease) in net assets | 422,700,484 | 486,034,659 |
| Net Assets | ||
| Beginning of period | 3,030,085,897 | 2,544,051,238 |
| End of period | $3,452,786,381 | $3,030,085,897 |
| Other Information | ||
| Undistributed net investment income end of period | $8,778,917 | $6,084,142 |
| Shares | ||
| Sold | 3,525,969 | 2,840,660 |
| Issued in reinvestment of distributions | 2,030,161 | 486,452 |
| Redeemed | (1,339,280) | (4,796,839) |
| Net increase (decrease) | 4,216,850 | (1,469,727) |
See accompanying notes which are an integral part of the financial statements.
Financial Highlights
Fidelity Financials Central Fund
| Six months ended (Unaudited) March 31, | Years endedSeptember 30, | |||||
| 2018 | 2017 | 2016 | 2015 | 2014 | 2013 | |
| Selected Per–Share Data | ||||||
| Net asset value, beginning of period | $106.12 | $84.74 | $80.86 | $83.90 | $72.85 | $58.36 |
| Income from Investment Operations | ||||||
| Net investment income (loss)A | .96 | 1.70 | 1.59 | 1.57 | 1.54 | 1.63 |
| Net realized and unrealized gain (loss) | 5.69 | 21.29 | 3.79 | (3.30) | 10.84 | 14.22 |
| Total from investment operations | 6.65 | 22.99 | 5.38 | (1.73) | 12.38 | 15.85 |
| Distributions from net investment income | (.90) | (1.50) | (1.50) | (1.31) | (1.33) | (1.36) |
| Distributions from net realized gain | (6.50) | (.12) | – | – | – | – |
| Total distributions | (7.40) | (1.61)B | (1.50) | (1.31) | (1.33) | (1.36) |
| Net asset value, end of period | $105.37 | $106.12 | $84.74 | $80.86 | $83.90 | $72.85 |
| Total ReturnC,D | 6.20% | 27.34% | 6.68% | (2.18)% | 17.08% | 27.41% |
| Ratios to Average Net AssetsE,F | ||||||
| Expenses before reductions | - %G,H | - %H | - %H | - %H | - %H | .01% |
| Expenses net of fee waivers, if any | - %G,H | - %H | - %H | - %H | - %H | .01% |
| Expenses net of all reductions | - %G,H | - %H | - %H | - %H | - %H | .01% |
| Net investment income (loss) | 1.76%G | 1.75% | 1.94% | 1.80% | 1.92% | 2.44% |
| Supplemental Data | ||||||
| Net assets, end of period (000 omitted) | $3,452,786 | $3,030,086 | $2,544,051 | $2,301,182 | $2,387,026 | $1,956,278 |
| Portfolio turnover rateI | 35%G | 52%J | 57% | 40% | 43%J | 249%J |
A Calculated based on average shares outstanding during the period.
B Total distributions of $1.61 per share is comprised of distributions from net investment income of $1.495 and distributions from net realized gain of $.119 per share.
C Total returns for periods of less than one year are not annualized.
D Total returns would have been lower if certain expenses had not been reduced during the applicable periods shown.
E Fees and expenses of any underlying Fidelity Central Funds are not included in the Fund's expense ratio. The Fund indirectly bears its proportionate share of the expenses of any underlying Fidelity Central Funds.
F Expense ratios reflect operating expenses of the Fund. Expenses before reductions do not reflect amounts reimbursed by the investment adviser or reductions from expense offset arrangements and do not represent the amount paid by the Fund during periods when reimbursements or reductions occur. Expenses net of fee waivers reflect expenses after reimbursement by the investment adviser but prior to reductions from expense offset arrangements. Expenses net of all reductions represent the net expenses paid by the Fund.
G Annualized
H Amount represents less than .005%.
I Amount does not include the portfolio activity of any underlying Fidelity Central Funds.
J Portfolio turnover rate excludes securities received or delivered in-kind.
See accompanying notes which are an integral part of the financial statements.
Fidelity® Health Care Central Fund
Investment Summary (Unaudited)
Top Ten Stocks as of March 31, 2018
| % of fund's net assets | |
| UnitedHealth Group, Inc. | 8.7 |
| Becton, Dickinson & Co. | 6.4 |
| Boston Scientific Corp. | 5.4 |
| Humana, Inc. | 4.9 |
| Amgen, Inc. | 4.3 |
| Vertex Pharmaceuticals, Inc. | 3.4 |
| AstraZeneca PLC (United Kingdom) | 3.1 |
| Alexion Pharmaceuticals, Inc. | 2.8 |
| Cigna Corp. | 2.5 |
| Roche Holding AG (participation certificate) | 2.5 |
| 44.0 |
Top Industries (% of fund's net assets)
| As of March 31, 2018 | ||
| Biotechnology | 29.4% | |
| Health Care Equipment & Supplies | 27.4% | |
| Health Care Providers & Services | 19.9% | |
| Pharmaceuticals | 16.2% | |
| Health Care Technology | 2.8% | |
| All Others* | 4.3% | |

* Includes short-term investments and net other assets (liabilities).
Fidelity® Health Care Central Fund
Schedule of Investments March 31, 2018 (Unaudited)
Showing Percentage of Net Assets
| Common Stocks - 96.7% | |||
| Shares | Value | ||
| Biotechnology - 29.2% | |||
| Biotechnology - 29.2% | |||
| Abeona Therapeutics, Inc. (a) | 550,000 | $7,892,500 | |
| AC Immune SA (a)(b) | 372,000 | 3,846,480 | |
| Acceleron Pharma, Inc. (a) | 190,000 | 7,429,000 | |
| Acorda Therapeutics, Inc. (a) | 420,000 | 9,933,000 | |
| Alexion Pharmaceuticals, Inc. (a) | 680,000 | 75,792,800 | |
| Alnylam Pharmaceuticals, Inc. (a) | 230,000 | 27,393,000 | |
| Amgen, Inc. | 669,998 | 114,221,259 | |
| AnaptysBio, Inc. (a) | 180,700 | 18,807,256 | |
| Argenx SE ADR | 220,000 | 17,696,800 | |
| Ascendis Pharma A/S sponsored ADR (a) | 326,000 | 21,320,400 | |
| Atara Biotherapeutics, Inc. (a) | 420,000 | 16,380,000 | |
| Audentes Therapeutics, Inc. (a) | 260,000 | 7,813,000 | |
| BeiGene Ltd. ADR (a) | 185,000 | 31,080,000 | |
| Biogen, Inc. (a) | 234,000 | 64,073,880 | |
| BioMarin Pharmaceutical, Inc. (a) | 116,000 | 9,404,120 | |
| bluebird bio, Inc. (a) | 71,524 | 12,212,723 | |
| Blueprint Medicines Corp. (a) | 300,000 | 27,510,000 | |
| Cellectis SA sponsored ADR (a) | 154,600 | 4,871,446 | |
| Coherus BioSciences, Inc. (a)(b) | 212,120 | 2,343,926 | |
| CytomX Therapeutics, Inc. (a) | 103,500 | 2,944,575 | |
| Five Prime Therapeutics, Inc. (a) | 156,387 | 2,686,729 | |
| Global Blood Therapeutics, Inc. (a) | 155,000 | 7,486,500 | |
| GlycoMimetics, Inc. (a)(b) | 480,000 | 7,790,400 | |
| Heron Therapeutics, Inc. (a) | 245,050 | 6,763,380 | |
| Insmed, Inc. (a) | 868,700 | 19,563,124 | |
| Intercept Pharmaceuticals, Inc. (a)(b) | 106,651 | 6,561,170 | |
| La Jolla Pharmaceutical Co. (a)(b) | 200,000 | 5,956,000 | |
| Loxo Oncology, Inc. (a) | 136,000 | 15,690,320 | |
| Neurocrine Biosciences, Inc. (a) | 440,200 | 36,505,786 | |
| Prothena Corp. PLC (a) | 19,500 | 715,845 | |
| Sage Therapeutics, Inc. (a) | 5,100 | 821,457 | |
| Sarepta Therapeutics, Inc. (a) | 590,000 | 43,713,100 | |
| Spark Therapeutics, Inc. (a)(b) | 220,000 | 14,649,800 | |
| TESARO, Inc. (a)(b) | 344,000 | 19,656,160 | |
| uniQure B.V. (a) | 166,045 | 3,902,058 | |
| Vertex Pharmaceuticals, Inc. (a) | 550,000 | 89,639,000 | |
| Xencor, Inc. (a) | 374,101 | 11,215,548 | |
| Zai Lab Ltd. ADR (b) | 260,000 | 5,551,000 | |
| 781,833,542 | |||
| Diversified Consumer Services - 0.2% | |||
| Specialized Consumer Services - 0.2% | |||
| Carriage Services, Inc. | 203,800 | 5,637,108 | |
| Health Care Equipment & Supplies - 26.9% | |||
| Health Care Equipment - 26.9% | |||
| Atricure, Inc. (a) | 535,000 | 10,978,200 | |
| Baxter International, Inc. | 1,020,000 | 66,340,800 | |
| Becton, Dickinson & Co. | 786,000 | 170,326,200 | |
| Boston Scientific Corp. (a) | 5,300,000 | 144,796,000 | |
| Danaher Corp. | 230,000 | 22,519,300 | |
| DexCom, Inc. (a)(b) | 517,322 | 38,364,600 | |
| Edwards Lifesciences Corp. (a) | 217,300 | 30,317,696 | |
| Fisher & Paykel Healthcare Corp. | 720,000 | 6,868,541 | |
| Insulet Corp. (a) | 440,900 | 38,217,212 | |
| Integra LifeSciences Holdings Corp. (a) | 600,000 | 33,204,000 | |
| Intuitive Surgical, Inc. (a) | 114,000 | 47,062,620 | |
| Penumbra, Inc. (a) | 266,000 | 30,762,900 | |
| Stryker Corp. | 340,000 | 54,712,800 | |
| Wright Medical Group NV (a)(b) | 1,246,400 | 24,728,576 | |
| 719,199,445 | |||
| Health Care Providers & Services - 19.8% | |||
| Health Care Distributors & Services - 0.8% | |||
| Amplifon SpA | 420,000 | 7,467,601 | |
| EBOS Group Ltd. | 1,000,000 | 12,972,465 | |
| 20,440,066 | |||
| Health Care Facilities - 1.4% | |||
| HCA Holdings, Inc. | 400,000 | 38,800,000 | |
| Health Care Services - 1.4% | |||
| Diplomat Pharmacy, Inc. (a) | 230,000 | 4,634,500 | |
| G1 Therapeutics, Inc. | 290,000 | 10,744,500 | |
| Premier, Inc. (a) | 290,000 | 9,079,900 | |
| United Drug PLC (United Kingdom) | 1,040,000 | 12,665,162 | |
| 37,124,062 | |||
| Managed Health Care - 16.2% | |||
| Cigna Corp. | 404,000 | 67,766,960 | |
| Humana, Inc. | 486,000 | 130,651,380 | |
| Molina Healthcare, Inc. (a) | 35,400 | 2,873,772 | |
| UnitedHealth Group, Inc. | 1,090,000 | 233,259,998 | |
| 434,552,110 | |||
| TOTAL HEALTH CARE PROVIDERS & SERVICES | 530,916,238 | ||
| Health Care Technology - 2.8% | |||
| Health Care Technology - 2.8% | |||
| athenahealth, Inc. (a) | 88,000 | 12,586,640 | |
| Castlight Health, Inc. (a) | 700,500 | 2,556,825 | |
| Castlight Health, Inc. Class B (a) | 449,262 | 1,639,806 | |
| Cerner Corp. (a) | 270,000 | 15,660,000 | |
| Medidata Solutions, Inc. (a) | 112,000 | 7,034,720 | |
| Teladoc, Inc. (a) | 900,000 | 36,270,000 | |
| 75,747,991 | |||
| Internet Software & Services - 0.5% | |||
| Internet Software & Services - 0.5% | |||
| Benefitfocus, Inc. (a)(b) | 570,585 | 13,922,274 | |
| Life Sciences Tools & Services - 1.1% | |||
| Life Sciences Tools & Services - 1.1% | |||
| Agilent Technologies, Inc. | 85,000 | 5,686,500 | |
| Hangzhou Tigermed Consulting Co. Ltd. Class A | 720,000 | 6,148,240 | |
| Lonza Group AG | 69,000 | 16,253,975 | |
| 28,088,715 | |||
| Pharmaceuticals - 16.2% | |||
| Pharmaceuticals - 16.2% | |||
| Allergan PLC | 186,000 | 31,301,940 | |
| AstraZeneca PLC (United Kingdom) | 1,220,000 | 83,864,309 | |
| Avexis, Inc. (a) | 60,000 | 7,414,800 | |
| Bristol-Myers Squibb Co. | 700,000 | 44,275,000 | |
| CymaBay Therapeutics, Inc. (a) | 396,200 | 5,146,638 | |
| Dechra Pharmaceuticals PLC | 900,000 | 33,183,756 | |
| Impax Laboratories, Inc. (a) | 160,000 | 3,112,000 | |
| Indivior PLC (a) | 2,300,000 | 13,152,844 | |
| Jazz Pharmaceuticals PLC (a) | 52,000 | 7,851,480 | |
| Jiangsu Hengrui Medicine Co. Ltd. (A Shares) | 1,540,000 | 21,303,602 | |
| Mylan NV (a) | 150,000 | 6,175,500 | |
| MyoKardia, Inc. (a) | 124,743 | 6,087,458 | |
| Nektar Therapeutics (a) | 585,000 | 62,162,100 | |
| Roche Holding AG (participation certificate) | 290,000 | 66,525,167 | |
| RPI International Holdings LP (a)(c)(d) | 41,845 | 5,855,162 | |
| The Medicines Company (a) | 366,800 | 12,082,392 | |
| TherapeuticsMD, Inc. (a)(b) | 1,000,000 | 4,870,000 | |
| Theravance Biopharma, Inc. (a)(b) | 433,508 | 10,512,569 | |
| Tonghua Dongbao Pharmaceutical Co. Ltd. Class A | 2,199,944 | 9,352,684 | |
| 434,229,401 | |||
| TOTAL COMMON STOCKS | |||
| (Cost $2,018,363,137) | 2,589,574,714 | ||
| Preferred Stocks - 1.1% | |||
| Convertible Preferred Stocks - 0.6% | |||
| Biotechnology - 0.2% | |||
| Biotechnology - 0.2% | |||
| BioNTech AG Series A (c)(d) | 25,477 | 5,721,982 | |
| Health Care Providers & Services - 0.1% | |||
| Health Care Services - 0.1% | |||
| 1Life Healthcare, Inc. Series G (a)(c)(d) | 438,101 | 2,917,753 | |
| Software - 0.1% | |||
| Application Software - 0.1% | |||
| Outset Medical, Inc. Series C (c)(d) | 997,101 | 2,572,521 | |
| Textiles, Apparel & Luxury Goods - 0.2% | |||
| Textiles - 0.2% | |||
| Generation Bio Series B(c)(d) | 49,800 | 455,456 | |
| Harmony Biosciences II, Inc. Series A(c)(d) | 3,606,378 | 3,606,378 | |
| 4,061,834 | |||
| TOTAL CONVERTIBLE PREFERRED STOCKS | 15,274,090 | ||
| Nonconvertible Preferred Stocks - 0.5% | |||
| Health Care Equipment & Supplies - 0.5% | |||
| Health Care Equipment - 0.5% | |||
| Sartorius AG (non-vtg.) | 100,000 | 13,965,607 | |
| TOTAL PREFERRED STOCKS | |||
| (Cost $22,695,089) | 29,239,697 | ||
| Money Market Funds - 3.5% | |||
| Fidelity Cash Central Fund, 1.72% (e) | 35,106,988 | 35,114,009 | |
| Fidelity Securities Lending Cash Central Fund 1.72% (e)(f) | 58,602,418 | 58,614,139 | |
| TOTAL MONEY MARKET FUNDS | |||
| (Cost $93,722,058) | 93,728,148 | ||
| TOTAL INVESTMENT IN SECURITIES - 101.3% | |||
| (Cost $2,134,780,284) | 2,712,542,559 | ||
| NET OTHER ASSETS (LIABILITIES) - (1.3)% | (34,617,807) | ||
| NET ASSETS - 100% | $2,677,924,752 |
Legend
(a) Non-income producing
(b) Security or a portion of the security is on loan at period end.
(c) Level 3 security
(d) Restricted securities - Investment in securities not registered under the Securities Act of 1933 (excluding 144A issues). At the end of the period, the value of restricted securities (excluding 144A issues) amounted to $21,129,251 or 0.8% of net assets.
(e) Affiliated fund that is generally available only to investment companies and other accounts managed by Fidelity Investments. The rate quoted is the annualized seven-day yield of the fund at period end. A complete unaudited listing of the fund's holdings as of its most recent quarter end is available upon request. In addition, each Fidelity Central Fund's financial statements are available on the SEC's website or upon request.
(f) Investment made with cash collateral received from securities on loan.
Additional information on each restricted holding is as follows:
| Security | Acquisition Date | Acquisition Cost |
| 1Life Healthcare, Inc. Series G | 4/10/14 | $2,885,246 |
| BioNTech AG Series A | 12/29/17 | $5,579,683 |
| Generation Bio Series B 0.00 | 2/21/18 | $455,456 |
| Harmony Biosciences II, Inc. Series A | 9/22/17 | $3,606,378 |
| Outset Medical, Inc. Series C | 4/19/17 | $2,583,987 |
| RPI International Holdings LP | 5/21/15 - 3/23/16 | $5,567,439 |
Affiliated Central Funds
Information regarding fiscal year to date income earned by the Fund from investments in Fidelity Central Funds is as follows:
| Fund | Income earned |
| Fidelity Cash Central Fund | $381,831 |
| Fidelity Securities Lending Cash Central Fund | 458,977 |
| Total | $840,808 |
Amounts in the income column in the above table include any capital gain distributions from underlying funds, which are presented in the corresponding line-item in the Statement of Operations if applicable.
Investment Valuation
The following is a summary of the inputs used, as of March 31, 2018, involving the Fund's assets and liabilities carried at fair value. The inputs or methodology used for valuing securities may not be an indication of the risk associated with investing in those securities. For more information on valuation inputs, and their aggregation into the levels used below, please refer to the Investment Valuation section in the accompanying Notes to Financial Statements.
| Valuation Inputs at Reporting Date: | ||||
| Description | Total | Level 1 | Level 2 | Level 3 |
| Investments in Securities: | ||||
| Common Stocks | $2,589,574,714 | $2,433,330,076 | $150,389,476 | $5,855,162 |
| Preferred Stocks | 29,239,697 | 13,965,607 | -- | 15,274,090 |
| Money Market Funds | 93,728,148 | 93,728,148 | -- | -- |
| Total Investments in Securities: | $2,712,542,559 | $2,541,023,831 | $150,389,476 | $21,129,252 |
Other Information
Distribution of investments by country or territory of incorporation, as a percentage of Total Net Assets, is as follows (Unaudited):
| United States of America | 82.8% |
| United Kingdom | 4.8% |
| Switzerland | 3.2% |
| Ireland | 2.0% |
| Cayman Islands | 1.8% |
| China | 1.4% |
| Netherlands | 1.2% |
| Others (Individually Less Than 1%) | 2.8% |
| 100.0% |
See accompanying notes which are an integral part of the financial statements.
Fidelity® Health Care Central Fund
Financial Statements
Statement of Assets and Liabilities
| March 31, 2018 (Unaudited) | ||
| Assets | ||
| Investment in securities, at value (including securities loaned of $57,355,018) — See accompanying schedule: Unaffiliated issuers (cost $2,041,058,226) | $2,618,814,411 | |
| Fidelity Central Funds (cost $93,722,058) | 93,728,148 | |
| Total Investment in Securities (cost $2,134,780,284) | $2,712,542,559 | |
| Cash | 864,889 | |
| Receivable for investments sold | 31,323,714 | |
| Receivable for fund shares sold | 437,337 | |
| Dividends receivable | 1,638,923 | |
| Distributions receivable from Fidelity Central Funds | 122,098 | |
| Total assets | 2,746,929,520 | |
| Liabilities | ||
| Payable for investments purchased | $9,304,913 | |
| Payable for fund shares redeemed | 1,071,477 | |
| Other payables and accrued expenses | 25,751 | |
| Collateral on securities loaned | 58,602,627 | |
| Total liabilities | 69,004,768 | |
| Net Assets | $2,677,924,752 | |
| Net Assets consist of: | ||
| Paid in capital | $2,044,798,330 | |
| Undistributed net investment income | 4,902,902 | |
| Accumulated undistributed net realized gain (loss) on investments and foreign currency transactions | 50,447,561 | |
| Net unrealized appreciation (depreciation) on investments and assets and liabilities in foreign currencies | 577,775,959 | |
| Net Assets, for 6,652,207 shares outstanding | $2,677,924,752 | |
| Net Asset Value, offering price and redemption price per share ($2,677,924,752 ÷ 6,652,207 shares) | $402.56 |
See accompanying notes which are an integral part of the financial statements.
Statement of Operations
| Six months ended March 31, 2018 (Unaudited) | ||
| Investment Income | ||
| Dividends | $12,847,072 | |
| Income from Fidelity Central Funds (including $458,977 from security lending) | 840,808 | |
| Total income | 13,687,880 | |
| Expenses | ||
| Custodian fees and expenses | $37,208 | |
| Independent directors' fees and expenses | 4,472 | |
| Miscellaneous | 29 | |
| Total expenses before reductions | 41,709 | |
| Expense reductions | (773) | 40,936 |
| Net investment income (loss) | 13,646,944 | |
| Realized and Unrealized Gain (Loss) | ||
| Net realized gain (loss) on: | ||
| Investment securities: | ||
| Unaffiliated issuers | 63,376,711 | |
| Fidelity Central Funds | 306 | |
| Foreign currency transactions | (70,107) | |
| Total net realized gain (loss) | 63,306,910 | |
| Change in net unrealized appreciation (depreciation) on: | ||
| Investment securities: | ||
| Unaffiliated issuers | 31,742,412 | |
| Fidelity Central Funds | (1,945) | |
| Assets and liabilities in foreign currencies | (34,717) | |
| Total change in net unrealized appreciation (depreciation) | 31,705,750 | |
| Net gain (loss) | 95,012,660 | |
| Net increase (decrease) in net assets resulting from operations | $108,659,604 |
See accompanying notes which are an integral part of the financial statements.
Statement of Changes in Net Assets
| Six months ended March 31, 2018 (Unaudited) | Year ended September 30, 2017 | |
| Increase (Decrease) in Net Assets | ||
| Operations | ||
| Net investment income (loss) | $13,646,944 | $19,629,276 |
| Net realized gain (loss) | 63,306,910 | 68,783,111 |
| Change in net unrealized appreciation (depreciation) | 31,705,750 | 231,574,812 |
| Net increase (decrease) in net assets resulting from operations | 108,659,604 | 319,987,199 |
| Distributions to shareholders from net investment income | (11,081,712) | (17,273,204) |
| Distributions to shareholders from net realized gain | (75,390,756) | – |
| Total distributions | (86,472,468) | (17,273,204) |
| Affiliated share transactions | ||
| Proceeds from sales of shares | 357,688,696 | 320,100,993 |
| Reinvestment of distributions | 86,472,468 | 17,272,856 |
| Cost of shares redeemed | (123,522,254) | (263,237,243) |
| Net increase (decrease) in net assets resulting from share transactions | 320,638,910 | 74,136,606 |
| Total increase (decrease) in net assets | 342,826,046 | 376,850,601 |
| Net Assets | ||
| Beginning of period | 2,335,098,706 | 1,958,248,105 |
| End of period | $2,677,924,752 | $2,335,098,706 |
| Other Information | ||
| Undistributed net investment income end of period | $4,902,902 | $2,337,670 |
| Shares | ||
| Sold | 899,203 | 930,340 |
| Issued in reinvestment of distributions | 224,594 | 48,063 |
| Redeemed | (307,598) | (759,261) |
| Net increase (decrease) | 816,199 | 219,142 |
See accompanying notes which are an integral part of the financial statements.
Financial Highlights
Fidelity Health Care Central Fund
| Six months ended (Unaudited) March 31, | Years endedSeptember 30, | |||||
| 2018 | 2017 | 2016 | 2015 | 2014 | 2013 | |
| Selected Per–Share Data | ||||||
| Net asset value, beginning of period | $400.12 | $348.64 | $326.12 | $309.84 | $222.42 | $163.64 |
| Income from Investment Operations | ||||||
| Net investment income (loss)A | 2.16 | 3.39 | 2.85 | 2.36 | 1.34 | 1.73 |
| Net realized and unrealized gain (loss) | 14.27 | 51.07 | 22.25 | 15.99 | 87.35 | 58.70 |
| Total from investment operations | 16.43 | 54.46 | 25.10 | 18.35 | 88.69 | 60.43 |
| Distributions from net investment income | (1.76) | (2.98) | (2.58) | (2.07) | (1.27) | (1.65) |
| Distributions from net realized gain | (12.23) | – | – | – | – | – |
| Total distributions | (13.99) | (2.98) | (2.58) | (2.07) | (1.27) | (1.65) |
| Net asset value, end of period | $402.56 | $400.12 | $348.64 | $326.12 | $309.84 | $222.42 |
| Total ReturnB,C | 4.27% | 15.72% | 7.73% | 5.85% | 39.95% | 37.14% |
| Ratios to Average Net AssetsD,E | ||||||
| Expenses before reductions | - %F,G | - %G | - %G | - %G | .01% | .01% |
| Expenses net of fee waivers, if any | - %F,G | - %G | - %G | - %G | .01% | .01% |
| Expenses net of all reductions | - %F,G | - %G | - %G | - %G | .01% | .01% |
| Net investment income (loss) | 1.08%F | .95% | .85% | .66% | .49% | .93% |
| Supplemental Data | ||||||
| Net assets, end of period (000 omitted) | $2,677,925 | $2,335,099 | $1,958,248 | $1,749,910 | $1,806,204 | $1,415,691 |
| Portfolio turnover rateH | 85%F | 79%I | 68% | 97% | 131%I | 113%I |
A Calculated based on average shares outstanding during the period.
B Total returns for periods of less than one year are not annualized.
C Total returns would have been lower if certain expenses had not been reduced during the applicable periods shown.
D Fees and expenses of any underlying Fidelity Central Funds are not included in the Fund's expense ratio. The Fund indirectly bears its proportionate share of the expenses of any underlying Fidelity Central Funds.
E Expense ratios reflect operating expenses of the Fund. Expenses before reductions do not reflect amounts reimbursed by the investment adviser or reductions from expense offset arrangements and do not represent the amount paid by the Fund during periods when reimbursements or reductions occur. Expenses net of fee waivers reflect expenses after reimbursement by the investment adviser but prior to reductions from expense offset arrangements. Expenses net of all reductions represent the net expenses paid by the Fund.
F Annualized
G Amount represents less than .005%.
H Amount does not include the portfolio activity of any underlying Fidelity Central Funds.
I Portfolio turnover rate excludes securities received or delivered in-kind.
See accompanying notes which are an integral part of the financial statements.
Fidelity® Industrials Central Fund
Investment Summary (Unaudited)
Top Ten Stocks as of March 31, 2018
| % of fund's net assets | |
| United Technologies Corp. | 6.1 |
| Northrop Grumman Corp. | 5.0 |
| Honeywell International, Inc. | 4.7 |
| General Dynamics Corp. | 4.2 |
| Union Pacific Corp. | 3.9 |
| The Boeing Co. | 3.5 |
| FedEx Corp. | 3.1 |
| Caterpillar, Inc. | 3.0 |
| IHS Markit Ltd. | 2.8 |
| Fortive Corp. | 2.7 |
| 39.0 |
Top Industries (% of fund's net assets)
| As of March 31, 2018 | ||
| Aerospace & Defense | 28.9% | |
| Machinery | 20.6% | |
| Industrial Conglomerates | 7.3% | |
| Road & Rail | 7.3% | |
| Electrical Equipment | 6.4% | |
| All Others* | 29.5% | |
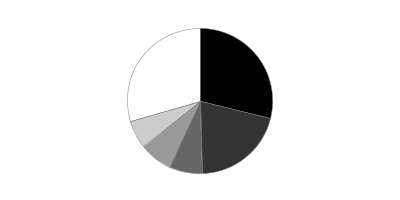
* Includes short-term investments and net other assets (liabilities).
Fidelity® Industrials Central Fund
Schedule of Investments March 31, 2018 (Unaudited)
Showing Percentage of Net Assets
| Common Stocks - 98.8% | |||
| Shares | Value | ||
| Aerospace & Defense - 28.9% | |||
| Aerospace & Defense - 28.9% | |||
| Astronics Corp. (a) | 130,405 | $4,864,107 | |
| Axon Enterprise, Inc. (a)(b) | 266,500 | 10,476,115 | |
| Bombardier, Inc. Class B (sub. vtg.) (a) | 5,346,400 | 15,561,765 | |
| Elbit Systems Ltd. | 54,600 | 6,637,722 | |
| General Dynamics Corp. | 346,089 | 76,451,060 | |
| Huntington Ingalls Industries, Inc. | 83,300 | 21,471,408 | |
| Moog, Inc. Class A | 125,800 | 10,367,178 | |
| Northrop Grumman Corp. | 263,696 | 92,061,548 | |
| Raytheon Co. | 217,414 | 46,922,289 | |
| Spirit AeroSystems Holdings, Inc. Class A | 192,300 | 16,095,510 | |
| Teledyne Technologies, Inc. (a) | 115,556 | 21,628,617 | |
| Textron, Inc. | 161,200 | 9,505,964 | |
| The Boeing Co. | 197,900 | 64,887,452 | |
| TransDigm Group, Inc. | 62,772 | 19,267,238 | |
| United Technologies Corp. | 879,386 | 110,644,345 | |
| 526,842,318 | |||
| Air Freight & Logistics - 4.9% | |||
| Air Freight & Logistics - 4.9% | |||
| Air Transport Services Group, Inc. (a) | 236,200 | 5,508,184 | |
| FedEx Corp. | 231,300 | 55,537,443 | |
| XPO Logistics, Inc. (a) | 276,000 | 28,099,560 | |
| 89,145,187 | |||
| Airlines - 4.2% | |||
| Airlines - 4.2% | |||
| Allegiant Travel Co. | 66,800 | 11,526,340 | |
| Delta Air Lines, Inc. | 456,700 | 25,031,727 | |
| Southwest Airlines Co. | 533,133 | 30,537,858 | |
| Spirit Airlines, Inc. (a) | 276,800 | 10,457,504 | |
| 77,553,429 | |||
| Building Products - 4.1% | |||
| Building Products - 4.1% | |||
| A.O. Smith Corp. | 212,106 | 13,487,821 | |
| Fortune Brands Home & Security, Inc. | 171,241 | 10,084,382 | |
| Johnson Controls International PLC | 799,400 | 28,170,856 | |
| Masco Corp. | 588,100 | 23,782,764 | |
| 75,525,823 | |||
| Commercial Services & Supplies - 2.9% | |||
| Diversified Support Services - 1.8% | |||
| Cintas Corp. | 115,000 | 19,616,700 | |
| KAR Auction Services, Inc. | 246,500 | 13,360,300 | |
| 32,977,000 | |||
| Environmental & Facility Services - 1.1% | |||
| Waste Connection, Inc. (United States) | 269,450 | 19,330,343 | |
| TOTAL COMMERCIAL SERVICES & SUPPLIES | 52,307,343 | ||
| Construction & Engineering - 4.4% | |||
| Construction & Engineering - 4.4% | |||
| AECOM (a) | 356,735 | 12,710,468 | |
| Fluor Corp. | 397,300 | 22,733,506 | |
| Jacobs Engineering Group, Inc. | 461,600 | 27,303,640 | |
| KBR, Inc. | 1,044,100 | 16,903,979 | |
| 79,651,593 | |||
| Electrical Equipment - 6.4% | |||
| Electrical Components & Equipment - 6.4% | |||
| Acuity Brands, Inc. | 82,300 | 11,455,337 | |
| AMETEK, Inc. | 446,017 | 33,883,911 | |
| Emerson Electric Co. | 326,800 | 22,320,440 | |
| Fortive Corp. | 644,987 | 49,999,392 | |
| 117,659,080 | |||
| Electronic Equipment & Components - 0.6% | |||
| Electronic Equipment & Instruments - 0.6% | |||
| ADT, Inc. (b) | 1,464,000 | 11,609,520 | |
| Household Durables - 0.7% | |||
| Homebuilding - 0.7% | |||
| Lennar Corp. Class A | 106,600 | 6,283,004 | |
| TRI Pointe Homes, Inc. (a) | 370,300 | 6,084,029 | |
| 12,367,033 | |||
| Industrial Conglomerates - 7.3% | |||
| Industrial Conglomerates - 7.3% | |||
| General Electric Co. | 1,808,144 | 24,373,781 | |
| Honeywell International, Inc. | 590,412 | 85,320,438 | |
| ITT, Inc. | 491,300 | 24,063,874 | |
| 133,758,093 | |||
| Machinery - 20.6% | |||
| Agricultural & Farm Machinery - 1.6% | |||
| Deere & Co. | 188,300 | 29,246,756 | |
| Construction Machinery & Heavy Trucks - 7.2% | |||
| Allison Transmission Holdings, Inc. | 929,646 | 36,311,973 | |
| Caterpillar, Inc. | 375,269 | 55,307,145 | |
| WABCO Holdings, Inc. (a) | 230,400 | 30,843,648 | |
| Wabtec Corp. (b) | 108,301 | 8,815,701 | |
| 131,278,467 | |||
| Industrial Machinery - 11.8% | |||
| Flowserve Corp. | 198,109 | 8,584,063 | |
| Gardner Denver Holdings, Inc. | 892,600 | 27,384,968 | |
| IDEX Corp. | 111,206 | 15,847,967 | |
| Ingersoll-Rand PLC | 583,162 | 49,866,183 | |
| Lincoln Electric Holdings, Inc. | 121,600 | 10,937,920 | |
| Parker Hannifin Corp. | 203,400 | 34,787,502 | |
| SMC Corp. | 11,700 | 4,735,858 | |
| Snap-On, Inc. | 268,158 | 39,564,031 | |
| The Weir Group PLC | 222,400 | 6,223,383 | |
| Xylem, Inc. | 226,100 | 17,391,612 | |
| 215,323,487 | |||
| TOTAL MACHINERY | 375,848,710 | ||
| Professional Services - 3.5% | |||
| Human Resource & Employment Services - 0.7% | |||
| Robert Half International, Inc. | 233,700 | 13,528,893 | |
| Research & Consulting Services - 2.8% | |||
| IHS Markit Ltd. (a) | 1,041,090 | 50,222,182 | |
| TOTAL PROFESSIONAL SERVICES | 63,751,075 | ||
| Road & Rail - 7.3% | |||
| Railroads - 5.7% | |||
| Norfolk Southern Corp. | 232,414 | 31,557,173 | |
| Union Pacific Corp. | 530,300 | 71,288,229 | |
| 102,845,402 | |||
| Trucking - 1.6% | |||
| J.B. Hunt Transport Services, Inc. | 126,070 | 14,769,101 | |
| Old Dominion Freight Lines, Inc. | 100,874 | 14,825,452 | |
| 29,594,553 | |||
| TOTAL ROAD & RAIL | 132,439,955 | ||
| Specialty Retail - 0.9% | |||
| Home Improvement Retail - 0.9% | |||
| Lowe's Companies, Inc. | 187,700 | 16,470,675 | |
| Trading Companies & Distributors - 2.1% | |||
| Trading Companies & Distributors - 2.1% | |||
| Bunzl PLC | 398,600 | 11,715,990 | |
| Univar, Inc. (a) | 955,578 | 26,517,290 | |
| 38,233,280 | |||
| TOTAL COMMON STOCKS | |||
| (Cost $1,425,470,023) | 1,803,163,114 | ||
| Money Market Funds - 1.5% | |||
| Fidelity Cash Central Fund, 1.72% (c) | 21,098,371 | 21,102,591 | |
| Fidelity Securities Lending Cash Central Fund 1.72% (c)(d) | 6,112,759 | 6,113,982 | |
| TOTAL MONEY MARKET FUNDS | |||
| (Cost $27,215,961) | 27,216,573 | ||
| TOTAL INVESTMENT IN SECURITIES - 100.3% | |||
| (Cost $1,452,685,984) | 1,830,379,687 | ||
| NET OTHER ASSETS (LIABILITIES) - (0.3)% | (4,742,549) | ||
| NET ASSETS - 100% | $1,825,637,138 |
Legend
(a) Non-income producing
(b) Security or a portion of the security is on loan at period end.
(c) Affiliated fund that is generally available only to investment companies and other accounts managed by Fidelity Investments. The rate quoted is the annualized seven-day yield of the fund at period end. A complete unaudited listing of the fund's holdings as of its most recent quarter end is available upon request. In addition, each Fidelity Central Fund's financial statements are available on the SEC's website or upon request.
(d) Investment made with cash collateral received from securities on loan.
Affiliated Central Funds
Information regarding fiscal year to date income earned by the Fund from investments in Fidelity Central Funds is as follows:
| Fund | Income earned |
| Fidelity Cash Central Fund | $152,408 |
| Fidelity Securities Lending Cash Central Fund | 34,627 |
| Total | $187,035 |
Amounts in the income column in the above table include any capital gain distributions from underlying funds, which are presented in the corresponding line-item in the Statement of Operations if applicable.
Investment Valuation
All investments are categorized as Level 1 under the Fair Value Hierarchy. The inputs or methodology used for valuing securities may not be an indication of the risk associated with investing in those securities. For more information on valuation inputs please refer to the Investment Valuation section in the accompanying Notes to Financial Statements.
Other Information
Distribution of investments by country or territory of incorporation, as a percentage of Total Net Assets, is as follows (Unaudited):
| United States of America | 89.5% |
| Ireland | 4.2% |
| Bermuda | 2.8% |
| Canada | 1.9% |
| Others (Individually Less Than 1%) | 1.6% |
| 100.0% |
See accompanying notes which are an integral part of the financial statements.
Fidelity® Industrials Central Fund
Financial Statements
Statement of Assets and Liabilities
| March 31, 2018 (Unaudited) | ||
| Assets | ||
| Investment in securities, at value (including securities loaned of $6,137,649) — See accompanying schedule: Unaffiliated issuers (cost $1,425,470,023) | $1,803,163,114 | |
| Fidelity Central Funds (cost $27,215,961) | 27,216,573 | |
| Total Investment in Securities (cost $1,452,685,984) | $1,830,379,687 | |
| Cash | 631,276 | |
| Receivable for fund shares sold | 319,398 | |
| Dividends receivable | 1,225,656 | |
| Distributions receivable from Fidelity Central Funds | 39,869 | |
| Total assets | 1,832,595,886 | |
| Liabilities | ||
| Payable for fund shares redeemed | $836,659 | |
| Other payables and accrued expenses | 8,405 | |
| Collateral on securities loaned | 6,113,684 | |
| Total liabilities | 6,958,748 | |
| Net Assets | $1,825,637,138 | |
| Net Assets consist of: | ||
| Paid in capital | $1,365,480,619 | |
| Undistributed net investment income | 3,417,662 | |
| Accumulated undistributed net realized gain (loss) on investments and foreign currency transactions | 79,040,868 | |
| Net unrealized appreciation (depreciation) on investments and assets and liabilities in foreign currencies | 377,697,989 | |
| Net Assets, for 6,281,027 shares outstanding | $1,825,637,138 | |
| Net Asset Value, offering price and redemption price per share ($1,825,637,138 ÷ 6,281,027 shares) | $290.66 |
See accompanying notes which are an integral part of the financial statements.
Statement of Operations
| Six months ended March 31, 2018 (Unaudited) | ||
| Investment Income | ||
| Dividends | $11,094,644 | |
| Income from Fidelity Central Funds (including $34,627 from security lending) | 187,035 | |
| Total income | 11,281,679 | |
| Expenses | ||
| Custodian fees and expenses | $11,517 | |
| Independent directors' fees and expenses | 3,102 | |
| Miscellaneous | 20 | |
| Total expenses | 14,639 | |
| Net investment income (loss) | 11,267,040 | |
| Realized and Unrealized Gain (Loss) | ||
| Net realized gain (loss) on: | ||
| Investment securities: | ||
| Unaffiliated issuers | 90,892,570 | |
| Fidelity Central Funds | 271 | |
| Foreign currency transactions | (14,564) | |
| Total net realized gain (loss) | 90,878,277 | |
| Change in net unrealized appreciation (depreciation) on: | ||
| Investment securities: | ||
| Unaffiliated issuers | 5,470,090 | |
| Fidelity Central Funds | (159) | |
| Assets and liabilities in foreign currencies | 1,317 | |
| Total change in net unrealized appreciation (depreciation) | 5,471,248 | |
| Net gain (loss) | 96,349,525 | |
| Net increase (decrease) in net assets resulting from operations | $107,616,565 |
See accompanying notes which are an integral part of the financial statements.
Statement of Changes in Net Assets
| Six months ended March 31, 2018 (Unaudited) | Year ended September 30, 2017 | |
| Increase (Decrease) in Net Assets | ||
| Operations | ||
| Net investment income (loss) | $11,267,040 | $23,192,939 |
| Net realized gain (loss) | 90,878,277 | 88,063,093 |
| Change in net unrealized appreciation (depreciation) | 5,471,248 | 172,542,231 |
| Net increase (decrease) in net assets resulting from operations | 107,616,565 | 283,798,263 |
| Distributions to shareholders from net investment income | (9,720,934) | (21,372,265) |
| Distributions to shareholders from net realized gain | (84,959,878) | (5,046,225) |
| Total distributions | (94,680,812) | (26,418,490) |
| Affiliated share transactions | ||
| Proceeds from sales of shares | 202,037,942 | 201,502,135 |
| Reinvestment of distributions | 94,680,812 | 26,417,849 |
| Cost of shares redeemed | (92,626,798) | (252,925,995) |
| Net increase (decrease) in net assets resulting from share transactions | 204,091,956 | (25,006,011) |
| Total increase (decrease) in net assets | 217,027,709 | 232,373,762 |
| Net Assets | ||
| Beginning of period | 1,608,609,429 | 1,376,235,667 |
| End of period | $1,825,637,138 | $1,608,609,429 |
| Other Information | ||
| Undistributed net investment income end of period | $3,417,662 | $1,871,556 |
| Shares | ||
| Sold | 680,753 | 753,811 |
| Issued in reinvestment of distributions | 322,578 | 100,435 |
| Redeemed | (314,071) | (944,532) |
| Net increase (decrease) | 689,260 | (90,286) |
See accompanying notes which are an integral part of the financial statements.
Financial Highlights
Fidelity Industrials Central Fund
| Six months ended (Unaudited) March 31, | Years endedSeptember 30, | |||||
| 2018 | 2017 | 2016 | 2015 | 2014 | 2013 | |
| Selected Per–Share Data | ||||||
| Net asset value, beginning of period | $287.67 | $242.21 | $209.67 | $216.95 | $198.24 | $152.47 |
| Income from Investment Operations | ||||||
| Net investment income (loss)A | 1.91 | 4.16 | 3.47 | 3.40 | 3.18 | 3.15 |
| Net realized and unrealized gain (loss) | 17.79 | 46.01 | 32.56 | (7.35) | 18.69 | 45.71 |
| Total from investment operations | 19.70 | 50.17 | 36.03 | (3.95) | 21.87 | 48.86 |
| Distributions from net investment income | (1.69) | (3.85) | (3.49) | (3.33) | (3.16) | (3.09) |
| Distributions from net realized gain | (15.02) | (.86) | – | – | – | – |
| Total distributions | (16.71) | (4.71) | (3.49) | (3.33) | (3.16) | (3.09) |
| Net asset value, end of period | $290.66 | $287.67 | $242.21 | $209.67 | $216.95 | $198.24 |
| Total ReturnB,C | 6.81% | 20.91% | 17.24% | (1.95)% | 11.03% | 32.33% |
| Ratios to Average Net AssetsD,E | ||||||
| Expenses before reductionsF | - %G | -% | -% | -% | -% | -% |
| Expenses net of fee waivers, if anyF | - %G | -% | -% | -% | -% | -% |
| Expenses net of all reductionsF | - %G | -% | -% | -% | -% | -% |
| Net investment income (loss) | 1.29%G | 1.56% | 1.50% | 1.48% | 1.46% | 1.80% |
| Supplemental Data | ||||||
| Net assets, end of period (000 omitted) | $1,825,637 | $1,608,609 | $1,376,236 | $1,173,665 | $1,301,010 | $1,198,480 |
| Portfolio turnover rateH | 68%G | 65%I | 60% | 83% | 77%I | 73%I |
A Calculated based on average shares outstanding during the period.
B Total returns for periods of less than one year are not annualized.
C Total returns would have been lower if certain expenses had not been reduced during the applicable periods shown.
D Fees and expenses of any underlying Fidelity Central Funds are not included in the Fund's expense ratio. The Fund indirectly bears its proportionate share of the expenses of any underlying Fidelity Central Funds.
E Expense ratios reflect operating expenses of the Fund. Expenses before reductions do not reflect amounts reimbursed by the investment adviser or reductions from expense offset arrangements and do not represent the amount paid by the Fund during periods when reimbursements or reductions occur. Expenses net of fee waivers reflect expenses after reimbursement by the investment adviser but prior to reductions from expense offset arrangements. Expenses net of all reductions represent the net expenses paid by the Fund.
F Amount represents less than .005%.
G Annualized
H Amount does not include the portfolio activity of any underlying Fidelity Central Funds.
I Portfolio turnover rate excludes securities received or delivered in-kind.
See accompanying notes which are an integral part of the financial statements.
Fidelity® Information Technology Central Fund
Investment Summary (Unaudited)
Top Ten Stocks as of March 31, 2018
| % of fund's net assets | |
| Microsoft Corp. | 12.3 |
| NVIDIA Corp. | 4.5 |
| Tesla, Inc. | 3.4 |
| Salesforce.com, Inc. | 3.2 |
| Adobe Systems, Inc. | 2.9 |
| Qualcomm, Inc. | 2.9 |
| Parametric Technology Corp. | 2.8 |
| Activision Blizzard, Inc. | 2.7 |
| Alibaba Group Holding Ltd. sponsored ADR | 2.6 |
| Apple, Inc. | 2.5 |
| 39.8 |
Top Industries (% of fund's net assets)
| As of March 31, 2018 | ||
| Software | 40.8% | |
| Semiconductors & Semiconductor Equipment | 22.5% | |
| Internet Software & Services | 13.6% | |
| IT Services | 6.9% | |
| Automobiles | 3.4% | |
| All Others* | 12.8% | |
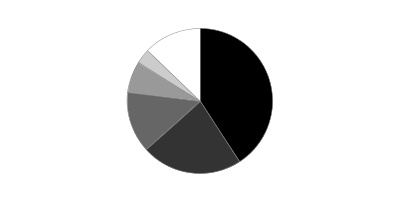
* Includes short-term investments and net other assets (liabilities).
Fidelity® Information Technology Central Fund
Schedule of Investments March 31, 2018 (Unaudited)
Showing Percentage of Net Assets
| Common Stocks - 98.8% | |||
| Shares | Value | ||
| Air Freight & Logistics - 0.2% | |||
| Air Freight & Logistics - 0.2% | |||
| Best, Inc. ADR (a) | 764,600 | $7,875,380 | |
| Automobiles - 3.4% | |||
| Automobile Manufacturers - 3.4% | |||
| Tesla, Inc. (a)(b) | 626,270 | 166,669,235 | |
| Biotechnology - 0.3% | |||
| Biotechnology - 0.3% | |||
| BeiGene Ltd. ADR (b) | 100,600 | 16,900,800 | |
| Communications Equipment - 0.8% | |||
| Communications Equipment - 0.8% | |||
| CommScope Holding Co., Inc. (b) | 305,100 | 12,194,847 | |
| Hytera Communications Corp. Ltd. Class A | 8,394,050 | 15,654,265 | |
| Palo Alto Networks, Inc. (b) | 68,400 | 12,415,968 | |
| 40,265,080 | |||
| Construction Materials - 0.0% | |||
| Construction Materials - 0.0% | |||
| Universal Cement Corp. | 387 | 296 | |
| Diversified Consumer Services - 0.9% | |||
| Education Services - 0.9% | |||
| China Online Education Group sponsored ADR (a)(b) | 7,143 | 69,430 | |
| TAL Education Group ADR | 1,207,278 | 44,777,941 | |
| 44,847,371 | |||
| Diversified Financial Services - 0.2% | |||
| Other Diversified Financial Services - 0.2% | |||
| Jianpu Technology, Inc. ADR (b) | 1,345,600 | 7,441,168 | |
| Electrical Equipment - 0.1% | |||
| Electrical Components & Equipment - 0.1% | |||
| BizLink Holding, Inc. | 548,245 | 4,425,507 | |
| Electronic Equipment & Components - 3.1% | |||
| Electronic Components - 0.2% | |||
| E Ink Holdings, Inc. | 5,989,000 | 10,285,958 | |
| Electronic Equipment & Instruments - 1.9% | |||
| Chroma ATE, Inc. | 9,602,018 | 56,729,827 | |
| Trimble, Inc. (b) | 934,100 | 33,515,508 | |
| 90,245,335 | |||
| Technology Distributors - 1.0% | |||
| Dell Technologies, Inc. (b) | 680,569 | 49,824,456 | |
| TOTAL ELECTRONIC EQUIPMENT & COMPONENTS | 150,355,749 | ||
| Internet & Direct Marketing Retail - 1.8% | |||
| Internet & Direct Marketing Retail - 1.8% | |||
| Amazon.com, Inc. (b) | 33,229 | 48,093,661 | |
| Netflix, Inc. (b) | 132,600 | 39,163,410 | |
| 87,257,071 | |||
| Internet Software & Services - 13.3% | |||
| Internet Software & Services - 13.3% | |||
| Alibaba Group Holding Ltd. sponsored ADR (b) | 685,600 | 125,835,024 | |
| Alphabet, Inc.: | |||
| Class A (b) | 68,381 | 70,920,670 | |
| Class C (b) | 68,433 | 70,608,485 | |
| Endurance International Group Holdings, Inc. (b) | 916,280 | 6,780,472 | |
| Envestnet, Inc. (b) | 434 | 24,868 | |
| Facebook, Inc. Class A (b) | 190,775 | 30,483,937 | |
| GoDaddy, Inc. (b) | 465,300 | 28,578,726 | |
| LogMeIn, Inc. | 383,743 | 44,341,504 | |
| MercadoLibre, Inc. | 95,300 | 33,963,967 | |
| MongoDB, Inc. Class A | 9,300 | 403,620 | |
| NetEase, Inc. ADR | 129,562 | 36,327,889 | |
| New Relic, Inc. (b) | 169,800 | 12,585,576 | |
| Nutanix, Inc.: | |||
| Class A (b) | 598,700 | 29,402,157 | |
| Class B (c) | 68,486 | 3,363,347 | |
| Okta, Inc. | 52,200 | 2,080,170 | |
| SMS Co., Ltd. | 963,656 | 41,071,190 | |
| Tencent Holdings Ltd. | 1,052,571 | 56,501,558 | |
| Xunlei Ltd. sponsored ADR (a)(b) | 1,814,788 | 18,311,211 | |
| Yandex NV Series A (b) | 965,300 | 38,081,085 | |
| 649,665,456 | |||
| IT Services - 6.9% | |||
| Data Processing & Outsourced Services - 4.0% | |||
| FleetCor Technologies, Inc. (b) | 265,100 | 53,682,750 | |
| Global Payments, Inc. | 195,556 | 21,808,405 | |
| PayPal Holdings, Inc. (b) | 1,246,000 | 94,534,020 | |
| Square, Inc. (b) | 556,600 | 27,384,720 | |
| 197,409,895 | |||
| IT Consulting & Other Services - 2.9% | |||
| Cognizant Technology Solutions Corp. Class A | 1,325,042 | 106,665,881 | |
| DXC Technology Co. | 320,800 | 32,250,024 | |
| 138,915,905 | |||
| TOTAL IT SERVICES | 336,325,800 | ||
| Life Sciences Tools & Services - 0.0% | |||
| Life Sciences Tools & Services - 0.0% | |||
| JHL Biotech, Inc. (b)(d) | 1,008,062 | 2,129,526 | |
| Machinery - 0.9% | |||
| Industrial Machinery - 0.9% | |||
| Minebea Mitsumi, Inc. | 2,136,257 | 45,614,171 | |
| Media - 0.8% | |||
| Advertising - 0.0% | |||
| iCar Asia Ltd. (b) | 4,023,682 | 715,339 | |
| iCar Asia Ltd. warrants 6/12/19 (b) | 591,718 | 29,654 | |
| 744,993 | |||
| Cable & Satellite - 0.7% | |||
| Naspers Ltd. Class N | 132,845 | 32,449,920 | |
| Publishing - 0.1% | |||
| China Literature Ltd. (b)(c) | 661,095 | 6,173,051 | |
| TOTAL MEDIA | 39,367,964 | ||
| Professional Services - 0.1% | |||
| Human Resource & Employment Services - 0.1% | |||
| WageWorks, Inc. (b) | 86,205 | 3,896,466 | |
| Semiconductors & Semiconductor Equipment - 22.5% | |||
| Semiconductor Equipment - 5.7% | |||
| Applied Materials, Inc. | 344,600 | 19,163,206 | |
| ASM Pacific Technology Ltd. | 4,739,400 | 66,770,259 | |
| ASML Holding NV | 151,400 | 30,061,984 | |
| Ferrotec Holdings Corp. | 597,700 | 15,042,908 | |
| GlobalWafers Co. Ltd. | 2,640,000 | 42,620,868 | |
| KLA-Tencor Corp. | 208,200 | 22,695,882 | |
| Screen Holdings Co. Ltd. | 151,400 | 13,887,167 | |
| Sino-American Silicon Products, Inc. | 18,815,000 | 69,475,742 | |
| SunEdison, Inc. (b)(d) | 1,200 | 0 | |
| 279,718,016 | |||
| Semiconductors - 16.8% | |||
| Acacia Communications, Inc. (a)(b) | 77,300 | 2,972,958 | |
| Advanced Micro Devices, Inc. (a)(b) | 2,915,288 | 29,298,644 | |
| ams AG | 739,520 | 77,247,351 | |
| ASPEED Tech, Inc. | 366,000 | 10,950,142 | |
| Broadcom Ltd. | 101,800 | 23,989,170 | |
| Cree, Inc. (b) | 918,200 | 37,012,642 | |
| Global Unichip Corp. | 629,000 | 6,849,051 | |
| Himax Technologies, Inc. sponsored ADR (a) | 5,180,390 | 31,911,202 | |
| Inphi Corp. (a)(b) | 411,229 | 12,377,993 | |
| International Quantum Epitaxy PLC (a)(b) | 11,294,100 | 20,345,779 | |
| M/A-COM Technology Solutions Holdings, Inc. (a)(b) | 1,130,917 | 18,773,222 | |
| Marvell Technology Group Ltd. | 2,298,481 | 48,268,101 | |
| Monolithic Power Systems, Inc. | 111,943 | 12,959,641 | |
| Nanya Technology Corp. | 34,236,000 | 107,955,865 | |
| NVIDIA Corp. | 945,950 | 219,072,561 | |
| Qualcomm, Inc. | 2,533,192 | 140,364,169 | |
| Semtech Corp. (b) | 270,694 | 10,570,601 | |
| Silicon Laboratories, Inc. (b) | 53,900 | 4,845,610 | |
| Silicon Motion Technology Corp. sponsored ADR (a) | 163,857 | 7,884,799 | |
| 823,649,501 | |||
| TOTAL SEMICONDUCTORS & SEMICONDUCTOR EQUIPMENT | 1,103,367,517 | ||
| Software - 40.8% | |||
| Application Software - 19.1% | |||
| Adobe Systems, Inc. (b) | 658,713 | 142,334,705 | |
| Atlassian Corp. PLC (b) | 30,140 | 1,625,149 | |
| Autodesk, Inc. (b) | 852,444 | 107,049,918 | |
| Bilibili, Inc. ADR (b) | 611,200 | 6,723,200 | |
| Citrix Systems, Inc. (b) | 1,007,557 | 93,501,290 | |
| Ellie Mae, Inc. (b) | 271,100 | 24,924,934 | |
| HubSpot, Inc. (b) | 18,900 | 2,046,870 | |
| Intuit, Inc. | 296,800 | 51,450,280 | |
| Parametric Technology Corp. (b) | 1,722,185 | 134,347,652 | |
| RealPage, Inc. (b) | 16,042 | 826,163 | |
| Salesforce.com, Inc. (b) | 1,356,009 | 157,703,847 | |
| Snap, Inc. Class A (a)(b) | 1,483,200 | 23,538,384 | |
| Splunk, Inc. (b) | 220,700 | 21,714,673 | |
| SS&C Technologies Holdings, Inc. | 243,266 | 13,048,788 | |
| Ultimate Software Group, Inc. (b) | 350,124 | 85,325,219 | |
| Workday, Inc. Class A (b) | 341,051 | 43,350,993 | |
| Zendesk, Inc. (b) | 495,749 | 23,731,505 | |
| 933,243,570 | |||
| Home Entertainment Software - 7.5% | |||
| Activision Blizzard, Inc. | 1,983,359 | 133,797,398 | |
| Electronic Arts, Inc. (b) | 983,215 | 119,204,987 | |
| Nintendo Co. Ltd. | 135,700 | 59,761,308 | |
| Nintendo Co. Ltd. ADR | 459,484 | 25,505,957 | |
| Take-Two Interactive Software, Inc. (b) | 284,065 | 27,775,876 | |
| 366,045,526 | |||
| Systems Software - 14.2% | |||
| Microsoft Corp. | 6,597,115 | 602,118,682 | |
| Oracle Corp. | 410,521 | 18,781,336 | |
| Red Hat, Inc. (b) | 400,900 | 59,938,559 | |
| ServiceNow, Inc. (b) | 104,000 | 17,206,800 | |
| 698,045,377 | |||
| TOTAL SOFTWARE | 1,997,334,473 | ||
| Technology Hardware, Storage & Peripherals - 2.7% | |||
| Technology Hardware, Storage & Peripherals - 2.7% | |||
| Apple, Inc. | 726,483 | 121,889,318 | |
| Primax Electronics Ltd. | 5,265,000 | 11,248,878 | |
| 133,138,196 | |||
| TOTAL COMMON STOCKS | |||
| (Cost $3,766,483,291) | 4,836,877,226 | ||
| Convertible Preferred Stocks - 1.0% | |||
| Internet & Direct Marketing Retail - 0.7% | |||
| Internet & Direct Marketing Retail - 0.7% | |||
| China Internet Plus Holdings Ltd.: | |||
| Series A-11 (b)(d)(e) | 2,771,770 | 15,491,589 | |
| Series B (b)(d)(e) | 3,479,801 | 19,448,817 | |
| 34,940,406 | |||
| Internet Software & Services - 0.3% | |||
| Internet Software & Services - 0.3% | |||
| Uber Technologies, Inc. Series D, 8.00% (b)(d)(e) | 489,912 | 17,195,911 | |
| TOTAL CONVERTIBLE PREFERRED STOCKS | |||
| (Cost $29,795,646) | 52,136,317 | ||
| Money Market Funds - 6.3% | |||
| Fidelity Cash Central Fund, 1.72% (f) | 49,364,228 | 49,374,101 | |
| Fidelity Securities Lending Cash Central Fund 1.72% (f)(g) | 257,477,453 | 257,528,949 | |
| TOTAL MONEY MARKET FUNDS | |||
| (Cost $306,877,302) | 306,903,050 | ||
| TOTAL INVESTMENT IN SECURITIES - 106.1% | |||
| (Cost $4,103,156,239) | 5,195,916,593 | ||
| NET OTHER ASSETS (LIABILITIES) - (6.1)% | (298,583,041) | ||
| NET ASSETS - 100% | $4,897,333,552 |
Legend
(a) Security or a portion of the security is on loan at period end.
(b) Non-income producing
(c) Security exempt from registration under Rule 144A of the Securities Act of 1933. These securities may be resold in transactions exempt from registration, normally to qualified institutional buyers. At the end of the period, the value of these securities amounted to $9,536,398 or 0.2% of net assets.
(d) Level 3 security
(e) Restricted securities - Investment in securities not registered under the Securities Act of 1933 (excluding 144A issues). At the end of the period, the value of restricted securities (excluding 144A issues) amounted to $52,136,317 or 1.1% of net assets.
(f) Affiliated fund that is generally available only to investment companies and other accounts managed by Fidelity Investments. The rate quoted is the annualized seven-day yield of the fund at period end. A complete unaudited listing of the fund's holdings as of its most recent quarter end is available upon request. In addition, each Fidelity Central Fund's financial statements are available on the SEC's website or upon request.
(g) Investment made with cash collateral received from securities on loan.
Additional information on each restricted holding is as follows:
| Security | Acquisition Date | Acquisition Cost |
| China Internet Plus Holdings Ltd. Series A-11 | 1/26/15 | $8,761,149 |
| China Internet Plus Holdings Ltd. Series B | 12/11/15 | $13,434,468 |
| Uber Technologies, Inc. Series D, 8.00% | 6/6/14 | $7,600,029 |
Affiliated Central Funds
Information regarding fiscal year to date income earned by the Fund from investments in Fidelity Central Funds is as follows:
| Fund | Income earned |
| Fidelity Cash Central Fund | $551,805 |
| Fidelity Securities Lending Cash Central Fund | 2,350,678 |
| Total | $2,902,483 |
Amounts in the income column in the above table include any capital gain distributions from underlying funds, which are presented in the corresponding line-item in the Statement of Operations if applicable.
Investment Valuation
The following is a summary of the inputs used, as of March 31, 2018, involving the Fund's assets and liabilities carried at fair value. The inputs or methodology used for valuing securities may not be an indication of the risk associated with investing in those securities. For more information on valuation inputs, and their aggregation into the levels used below, please refer to the Investment Valuation section in the accompanying Notes to Financial Statements.
| Valuation Inputs at Reporting Date: | ||||
| Description | Total | Level 1 | Level 2 | Level 3 |
| Investments in Securities: | ||||
| Common Stocks | $4,836,877,226 | $4,704,557,839 | $130,189,861 | $2,129,526 |
| Convertible Preferred Stocks | 52,136,317 | -- | -- | 52,136,317 |
| Money Market Funds | 306,903,050 | 306,903,050 | -- | -- |
| Total Investments in Securities: | $5,195,916,593 | $5,011,460,889 | $130,189,861 | $54,265,843 |
The following is a summary of transfers between Level 1 and Level 2 for the period ended March 31, 2018. Transfers are assumed to have occurred at the beginning of the period, and are primarily attributable to the valuation techniques used for foreign equity securities, as discussed in the accompanying Notes to Financial Statements:
| Transfers | Total |
| Level 1 to Level 2 | $63,406,523 |
| Level 2 to Level 1 | $59,292,324 |
The following is a reconciliation of Investments in Securities for which Level 3 inputs were used in determining value:
| Investments in Securities: | |
| Beginning Balance | $-- |
| Total Realized Gain (Loss) | -- |
| Total Unrealized Gain (Loss) | 204,517 |
| Cost of Purchases | -- |
| Proceeds of Sales | -- |
| Amortization/Accretion | -- |
| Transfers in to Level 3 | 1,925,009 |
| Transfers out of Level 3 | -- |
| Ending Balance | $2,129,526 |
| The change in unrealized gain (loss) for the period attributable to Level 3 securities held at March 31, 2018 | $204,517 |
| Convertible Preferred Stocks | |
| Beginning Balance | $58,834,506 |
| Total Realized Gain (Loss) | -- |
| Total Unrealized Gain (Loss) | (6,698,189) |
| Cost of Purchases | -- |
| Proceeds of Sales | -- |
| Amortization/Accretion | -- |
| Transfers in to Level 3 | -- |
| Transfers out of Level 3 | -- |
| Ending Balance | $52,136,317 |
| The change in unrealized gain (loss) for the period attributable to Level 3 securities held at March 31, 2018 | $(6,698,189) |
The information used in the above reconciliations represents fiscal year to date activity for any Investments in Securities identified as using Level 3 inputs at either the beginning or the end of the current fiscal period. Transfers in or out of Level 3 represent the beginning value of any Security or Instrument where a change in the pricing level occurred from the beginning to the end of the period. The cost of purchases and the proceeds of sales may include securities received or delivered through corporate actions or exchanges.
Other Information
Distribution of investments by country or territory of incorporation, as a percentage of Total Net Assets, is as follows (Unaudited):
| United States of America | 74.6% |
| Cayman Islands | 9.1% |
| Taiwan | 6.4% |
| Japan | 4.0% |
| Austria | 1.6% |
| Netherlands | 1.4% |
| Bermuda | 1.0% |
| Others (Individually Less Than 1%) | 1.9% |
| 100.0% |
See accompanying notes which are an integral part of the financial statements.
Fidelity® Information Technology Central Fund
Financial Statements
Statement of Assets and Liabilities
| March 31, 2018 (Unaudited) | ||
| Assets | ||
| Investment in securities, at value (including securities loaned of $257,223,510) — See accompanying schedule: Unaffiliated issuers (cost $3,796,278,937) | $4,889,013,543 | |
| Fidelity Central Funds (cost $306,877,302) | 306,903,050 | |
| Total Investment in Securities (cost $4,103,156,239) | $5,195,916,593 | |
| Cash | 1,850,219 | |
| Receivable for investments sold | 39,616,029 | |
| Receivable for fund shares sold | 839,485 | |
| Dividends receivable | 2,156,167 | |
| Distributions receivable from Fidelity Central Funds | 509,391 | |
| Other receivables | 23,964 | |
| Total assets | 5,240,911,848 | |
| Liabilities | ||
| Payable for investments purchased | $83,859,555 | |
| Payable for fund shares redeemed | 2,114,915 | |
| Other payables and accrued expenses | 97,498 | |
| Collateral on securities loaned | 257,506,328 | |
| Total liabilities | 343,578,296 | |
| Net Assets | $4,897,333,552 | |
| Net Assets consist of: | ||
| Paid in capital | $2,980,811,532 | |
| Undistributed net investment income | 5,743,254 | |
| Accumulated undistributed net realized gain (loss) on investments and foreign currency transactions | 818,012,100 | |
| Net unrealized appreciation (depreciation) on investments and assets and liabilities in foreign currencies | 1,092,766,666 | |
| Net Assets, for 10,949,654 shares outstanding | $4,897,333,552 | |
| Net Asset Value, offering price and redemption price per share ($4,897,333,552 ÷ 10,949,654 shares) | $447.26 |
See accompanying notes which are an integral part of the financial statements.
Statement of Operations
| Six months ended March 31, 2018 (Unaudited) | ||
| Investment Income | ||
| Dividends | $11,485,720 | |
| Income from Fidelity Central Funds (including $2,350,678 from security lending) | 2,902,483 | |
| Total income | 14,388,203 | |
| Expenses | ||
| Custodian fees and expenses | $140,931 | |
| Independent directors' fees and expenses | 7,998 | |
| Interest | 824 | |
| Miscellaneous | 52 | |
| Total expenses before reductions | 149,805 | |
| Expense reductions | (678) | 149,127 |
| Net investment income (loss) | 14,239,076 | |
| Realized and Unrealized Gain (Loss) | ||
| Net realized gain (loss) on: | ||
| Investment securities: | ||
| Unaffiliated issuers | 929,205,346 | |
| Fidelity Central Funds | 2,785 | |
| Foreign currency transactions | 158,924 | |
| Total net realized gain (loss) | 929,367,055 | |
| Change in net unrealized appreciation (depreciation) on: | ||
| Investment securities: | ||
| Unaffiliated issuers | (428,421,252) | |
| Fidelity Central Funds | (4,278) | |
| Assets and liabilities in foreign currencies | 4,492 | |
| Total change in net unrealized appreciation (depreciation) | (428,421,038) | |
| Net gain (loss) | 500,946,017 | |
| Net increase (decrease) in net assets resulting from operations | $515,185,093 |
See accompanying notes which are an integral part of the financial statements.
Statement of Changes in Net Assets
| Six months ended March 31, 2018 (Unaudited) | Year ended September 30, 2017 | |
| Increase (Decrease) in Net Assets | ||
| Operations | ||
| Net investment income (loss) | $14,239,076 | $26,875,134 |
| Net realized gain (loss) | 929,367,055 | 522,050,167 |
| Change in net unrealized appreciation (depreciation) | (428,421,038) | 713,079,382 |
| Net increase (decrease) in net assets resulting from operations | 515,185,093 | 1,262,004,683 |
| Distributions to shareholders from net investment income | (10,029,190) | (25,333,085) |
| Distributions to shareholders from net realized gain | (557,750,410) | (20,739,156) |
| Total distributions | (567,779,600) | (46,072,241) |
| Affiliated share transactions | ||
| Proceeds from sales of shares | 601,526,724 | 376,031,682 |
| Reinvestment of distributions | 567,779,600 | 46,071,593 |
| Cost of shares redeemed | (223,301,182) | (853,394,538) |
| Net increase (decrease) in net assets resulting from share transactions | 946,005,142 | (431,291,263) |
| Total increase (decrease) in net assets | 893,410,635 | 784,641,179 |
| Net Assets | ||
| Beginning of period | 4,003,922,917 | 3,219,281,738 |
| End of period | $4,897,333,552 | $4,003,922,917 |
| Other Information | ||
| Undistributed net investment income end of period | $5,743,254 | $1,533,368 |
| Shares | ||
| Sold | 1,301,655 | 1,106,380 |
| Issued in reinvestment of distributions | 1,325,072 | 132,818 |
| Redeemed | (480,300) | (2,184,326) |
| Net increase (decrease) | 2,146,427 | (945,128) |
See accompanying notes which are an integral part of the financial statements.
Financial Highlights
Fidelity Information Technology Central Fund
| Six months ended (Unaudited) March 31, | Years endedSeptember 30, | |||||
| 2018 | 2017 | 2016 | 2015 | 2014 | 2013 | |
| Selected Per–Share Data | ||||||
| Net asset value, beginning of period | $454.82 | $330.24 | $260.71 | $262.98 | $222.50 | $191.01 |
| Income from Investment Operations | ||||||
| Net investment income (loss)A | 1.44 | 2.78 | 2.48 | 2.24B | 2.33 | 1.80 |
| Net realized and unrealized gain (loss) | 53.83 | 126.52 | 69.42 | (2.37) | 39.88 | 31.33 |
| Total from investment operations | 55.27 | 129.30 | 71.90 | (.13) | 42.21 | 33.13 |
| Distributions from net investment income | (1.06) | (2.67) | (2.37) | (2.14) | (1.73) | (1.64) |
| Distributions from net realized gain | (61.77) | (2.05) | – | – | – | – |
| Total distributions | (62.83) | (4.72) | (2.37) | (2.14) | (1.73) | (1.64) |
| Net asset value, end of period | $447.26 | $454.82 | $330.24 | $260.71 | $262.98 | $222.50 |
| Total ReturnC,D | 12.77% | 39.59% | 27.68% | (.11)% | 19.01% | 17.45% |
| Ratios to Average Net AssetsE,F | ||||||
| Expenses before reductions | .01%G | .01% | .01% | .01% | .01% | .01% |
| Expenses net of fee waivers, if any | .01%G | .01% | .01% | .01% | .01% | .01% |
| Expenses net of all reductions | .01%G | .01% | .01% | .01% | .01% | .01% |
| Net investment income (loss) | .62%G | .73% | .86% | .81%B | .94% | .92% |
| Supplemental Data | ||||||
| Net assets, end of period (000 omitted) | $4,897,334 | $4,003,923 | $3,219,282 | $2,532,510 | $2,472,588 | $1,985,824 |
| Portfolio turnover rateH | 100%G | 70%I | 99% | 138% | 179%I | 157%I |
A Calculated based on average shares outstanding during the period.
B Net Investment income per share reflects a large, non-recurring dividend which amounted to $.43 per share. Excluding this non-recurring dividend, the ratio of net investment income (loss) to average net assets would have been .65%.
C Total returns for periods of less than one year are not annualized.
D Total returns would have been lower if certain expenses had not been reduced during the applicable periods shown.
E Fees and expenses of any underlying Fidelity Central Funds are not included in the Fund's expense ratio. The Fund indirectly bears its proportionate share of the expenses of any underlying Fidelity Central Funds.
F Expense ratios reflect operating expenses of the Fund. Expenses before reductions do not reflect amounts reimbursed by the investment adviser or reductions from expense offset arrangements and do not represent the amount paid by the Fund during periods when reimbursements or reductions occur. Expenses net of fee waivers reflect expenses after reimbursement by the investment adviser but prior to reductions from expense offset arrangements. Expenses net of all reductions represent the net expenses paid by the Fund.
G Annualized
H Amount does not include the portfolio activity of any underlying Fidelity Central Funds.
I Portfolio turnover rate excludes securities received or delivered in-kind.
See accompanying notes which are an integral part of the financial statements.
Fidelity® Materials Central Fund
Investment Summary (Unaudited)
Top Ten Stocks as of March 31, 2018
| % of fund's net assets | |
| DowDuPont, Inc. | 20.4 |
| LyondellBasell Industries NV Class A | 9.6 |
| The Chemours Co. LLC | 5.6 |
| Linde AG | 4.9 |
| WestRock Co. | 4.2 |
| Sherwin-Williams Co. | 3.7 |
| Steel Dynamics, Inc. | 3.0 |
| Freeport-McMoRan, Inc. | 2.9 |
| Olin Corp. | 2.9 |
| Westlake Chemical Corp. | 2.8 |
| 60.0 |
Top Industries (% of fund's net assets)
| As of March 31, 2018 | ||
| Chemicals | 67.2% | |
| Metals & Mining | 14.2% | |
| Containers & Packaging | 10.3% | |
| Construction Materials | 5.8% | |
| Trading Companies & Distributors | 1.1% | |
| All Others* | 1.4% | |
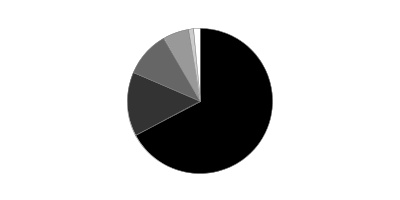
* Includes short-term investments and net other assets (liabilities).
Fidelity® Materials Central Fund
Schedule of Investments March 31, 2018 (Unaudited)
Showing Percentage of Net Assets
| Common Stocks - 97.5% | |||
| Shares | Value | ||
| Building Products - 0.2% | |||
| Building Products - 0.2% | |||
| GCP Applied Technologies, Inc. (a) | 41,900 | $1,217,195 | |
| Chemicals - 65.3% | |||
| Commodity Chemicals - 18.9% | |||
| Alpek SA de CV | 872,500 | 1,229,257 | |
| Cabot Corp. | 35,900 | 2,000,348 | |
| Ciner Resources LP | 38,800 | 1,049,540 | |
| LG Chemical Ltd. | 8,945 | 3,246,174 | |
| LyondellBasell Industries NV Class A | 467,255 | 49,379,508 | |
| Olin Corp. | 482,100 | 14,651,019 | |
| Orion Engineered Carbons SA | 122,700 | 3,325,170 | |
| Tronox Ltd. Class A | 418,400 | 7,715,296 | |
| Westlake Chemical Corp. | 127,860 | 14,211,639 | |
| 96,807,951 | |||
| Diversified Chemicals - 28.9% | |||
| Ashland Global Holdings, Inc. | 60,600 | 4,229,274 | |
| DowDuPont, Inc. | 1,639,850 | 104,474,845 | |
| Eastman Chemical Co. | 82,551 | 8,715,735 | |
| Huntsman Corp. | 72,800 | 2,129,400 | |
| The Chemours Co. LLC | 588,236 | 28,652,976 | |
| 148,202,230 | |||
| Fertilizers & Agricultural Chemicals - 5.0% | |||
| CF Industries Holdings, Inc. | 132,615 | 5,003,564 | |
| FMC Corp. | 143,200 | 10,964,824 | |
| Nutrien Ltd. | 30,587 | 1,445,603 | |
| The Mosaic Co. | 134,900 | 3,275,372 | |
| The Scotts Miracle-Gro Co. Class A | 57,172 | 4,902,499 | |
| 25,591,862 | |||
| Industrial Gases - 4.9% | |||
| Linde AG | 118,500 | 24,947,804 | |
| Specialty Chemicals - 7.6% | |||
| Axalta Coating Systems Ltd. (a) | 75,391 | 2,276,054 | |
| Celanese Corp. Class A | 77,100 | 7,726,191 | |
| Frutarom Industries Ltd. | 22,500 | 2,059,742 | |
| Platform Specialty Products Corp. (a) | 803,300 | 7,735,779 | |
| Sherwin-Williams Co. | 48,700 | 19,096,244 | |
| 38,894,010 | |||
| TOTAL CHEMICALS | 334,443,857 | ||
| Construction Materials - 5.8% | |||
| Construction Materials - 5.8% | |||
| CRH PLC sponsored ADR | 63,200 | 2,150,064 | |
| Eagle Materials, Inc. | 95,270 | 9,817,574 | |
| Martin Marietta Materials, Inc. | 34,300 | 7,110,390 | |
| Summit Materials, Inc. | 353,491 | 10,703,707 | |
| 29,781,735 | |||
| Containers & Packaging - 10.3% | |||
| Metal & Glass Containers - 1.7% | |||
| Aptargroup, Inc. | 50,000 | 4,491,500 | |
| Berry Global Group, Inc. (a) | 74,900 | 4,105,269 | |
| 8,596,769 | |||
| Paper Packaging - 8.6% | |||
| Avery Dennison Corp. | 49,800 | 5,291,250 | |
| Graphic Packaging Holding Co. | 745,343 | 11,441,015 | |
| Packaging Corp. of America | 54,100 | 6,097,070 | |
| WestRock Co. | 331,625 | 21,280,376 | |
| 44,109,711 | |||
| TOTAL CONTAINERS & PACKAGING | 52,706,480 | ||
| Energy Equipment & Services - 0.6% | |||
| Oil & Gas Equipment & Services - 0.6% | |||
| Tenaris SA sponsored ADR | 81,400 | 2,822,138 | |
| Metals & Mining - 14.2% | |||
| Copper - 3.4% | |||
| Freeport-McMoRan, Inc. | 839,400 | 14,748,258 | |
| Lundin Mining Corp. | 392,600 | 2,574,976 | |
| 17,323,234 | |||
| Diversified Metals & Mining - 2.4% | |||
| Alcoa Corp. (a) | 116,900 | 5,255,824 | |
| Elkem ASA (a)(b) | 419,700 | 1,628,800 | |
| Glencore Xstrata PLC | 1,000,741 | 4,967,492 | |
| Ivanhoe Mines Ltd. (a) | 356,100 | 751,808 | |
| 12,603,924 | |||
| Gold - 2.6% | |||
| Franco-Nevada Corp. | 20,500 | 1,401,995 | |
| Newmont Mining Corp. | 307,600 | 12,017,932 | |
| 13,419,927 | |||
| Steel - 5.8% | |||
| Allegheny Technologies, Inc. (a)(c) | 69,400 | 1,643,392 | |
| Nucor Corp. | 79,600 | 4,862,764 | |
| Reliance Steel & Aluminum Co. | 46,700 | 4,004,058 | |
| Ryerson Holding Corp. (a) | 267,562 | 2,180,630 | |
| Steel Dynamics, Inc. | 342,600 | 15,149,772 | |
| United States Steel Corp. | 51,300 | 1,805,247 | |
| 29,645,863 | |||
| TOTAL METALS & MINING | 72,992,948 | ||
| Trading Companies & Distributors - 1.1% | |||
| Trading Companies & Distributors - 1.1% | |||
| Univar, Inc. (a) | 204,190 | 5,666,273 | |
| TOTAL COMMON STOCKS | |||
| (Cost $415,835,875) | 499,630,626 | ||
| Nonconvertible Preferred Stocks - 1.9% | |||
| Chemicals - 1.9% | |||
| Commodity Chemicals - 1.9% | |||
| Braskem SA (PN-A) | |||
| (Cost $10,161,363) | 661,700 | 9,620,500 | |
| Money Market Funds - 1.1% | |||
| Fidelity Cash Central Fund, 1.72% (d) | 4,551,152 | 4,552,062 | |
| Fidelity Securities Lending Cash Central Fund 1.72% (d)(e) | 908,987 | 909,169 | |
| TOTAL MONEY MARKET FUNDS | |||
| (Cost $5,461,140) | 5,461,231 | ||
| TOTAL INVESTMENT IN SECURITIES - 100.5% | |||
| (Cost $431,458,378) | 514,712,357 | ||
| NET OTHER ASSETS (LIABILITIES) - (0.5)% | (2,390,131) | ||
| NET ASSETS - 100% | $512,322,226 |
Legend
(a) Non-income producing
(b) Security exempt from registration under Rule 144A of the Securities Act of 1933. These securities may be resold in transactions exempt from registration, normally to qualified institutional buyers. At the end of the period, the value of these securities amounted to $1,628,800 or 0.3% of net assets.
(c) Security or a portion of the security is on loan at period end.
(d) Affiliated fund that is generally available only to investment companies and other accounts managed by Fidelity Investments. The rate quoted is the annualized seven-day yield of the fund at period end. A complete unaudited listing of the fund's holdings as of its most recent quarter end is available upon request. In addition, each Fidelity Central Fund's financial statements are available on the SEC's website or upon request.
(e) Investment made with cash collateral received from securities on loan.
Affiliated Central Funds
Information regarding fiscal year to date income earned by the Fund from investments in Fidelity Central Funds is as follows:
| Fund | Income earned |
| Fidelity Cash Central Fund | $64,902 |
| Fidelity Securities Lending Cash Central Fund | 2,839 |
| Total | $67,741 |
Amounts in the income column in the above table include any capital gain distributions from underlying funds, which are presented in the corresponding line-item in the Statement of Operations if applicable.
Investment Valuation
The following is a summary of the inputs used, as of March 31, 2018, involving the Fund's assets and liabilities carried at fair value. The inputs or methodology used for valuing securities may not be an indication of the risk associated with investing in those securities. For more information on valuation inputs, and their aggregation into the levels used below, please refer to the Investment Valuation section in the accompanying Notes to Financial Statements.
| Valuation Inputs at Reporting Date: | ||||
| Description | Total | Level 1 | Level 2 | Level 3 |
| Investments in Securities: | ||||
| Common Stocks | $499,630,626 | $496,772,569 | $2,858,057 | $-- |
| Nonconvertible Preferred Stocks | 9,620,500 | 9,620,500 | -- | -- |
| Money Market Funds | 5,461,231 | 5,461,231 | -- | -- |
| Total Investments in Securities: | $514,712,357 | $511,854,300 | $2,858,057 | $-- |
Other Information
Distribution of investments by country or territory of incorporation, as a percentage of Total Net Assets, is as follows (Unaudited):
| United States of America | 76.2% |
| Netherlands | 9.6% |
| Germany | 4.9% |
| Brazil | 1.9% |
| Australia | 1.5% |
| Luxembourg | 1.3% |
| Canada | 1.2% |
| Bailiwick of Jersey | 1.0% |
| Others (Individually Less Than 1%) | 2.4% |
| 100.0% |
See accompanying notes which are an integral part of the financial statements.
Fidelity® Materials Central Fund
Financial Statements
Statement of Assets and Liabilities
| March 31, 2018 (Unaudited) | ||
| Assets | ||
| Investment in securities, at value (including securities loaned of $925,888) — See accompanying schedule: Unaffiliated issuers (cost $425,997,238) | $509,251,126 | |
| Fidelity Central Funds (cost $5,461,140) | 5,461,231 | |
| Total Investment in Securities (cost $431,458,378) | $514,712,357 | |
| Cash | 37,099 | |
| Receivable for investments sold | 1,335,541 | |
| Receivable for fund shares sold | 87,313 | |
| Dividends receivable | 384,835 | |
| Distributions receivable from Fidelity Central Funds | 15,381 | |
| Total assets | 516,572,526 | |
| Liabilities | ||
| Payable for investments purchased | $3,091,201 | |
| Payable for fund shares redeemed | 242,516 | |
| Other payables and accrued expenses | 7,508 | |
| Collateral on securities loaned | 909,075 | |
| Total liabilities | 4,250,300 | |
| Net Assets | $512,322,226 | |
| Net Assets consist of: | ||
| Paid in capital | $398,634,971 | |
| Undistributed net investment income | 1,764,207 | |
| Accumulated undistributed net realized gain (loss) on investments and foreign currency transactions | 28,668,525 | |
| Net unrealized appreciation (depreciation) on investments and assets and liabilities in foreign currencies | 83,254,523 | |
| Net Assets, for 2,076,063 shares outstanding | $512,322,226 | |
| Net Asset Value, offering price and redemption price per share ($512,322,226 ÷ 2,076,063 shares) | $246.78 |
See accompanying notes which are an integral part of the financial statements.
Statement of Operations
| Six months ended March 31, 2018 (Unaudited) | ||
| Investment Income | ||
| Dividends | $4,261,873 | |
| Income from Fidelity Central Funds (including $2,839 from security lending) | 67,741 | |
| Total income | 4,329,614 | |
| Expenses | ||
| Custodian fees and expenses | $10,961 | |
| Independent directors' fees and expenses | 918 | |
| Miscellaneous | 6 | |
| Total expenses | 11,885 | |
| Net investment income (loss) | 4,317,729 | |
| Realized and Unrealized Gain (Loss) | ||
| Net realized gain (loss) on: | ||
| Investment securities: | ||
| Unaffiliated issuers | 33,187,596 | |
| Fidelity Central Funds | (464) | |
| Foreign currency transactions | (18,696) | |
| Total net realized gain (loss) | 33,168,436 | |
| Change in net unrealized appreciation (depreciation) on: | ||
| Investment securities: | ||
| Unaffiliated issuers | (34,791,471) | |
| Fidelity Central Funds | 91 | |
| Assets and liabilities in foreign currencies | (978) | |
| Total change in net unrealized appreciation (depreciation) | (34,792,358) | |
| Net gain (loss) | (1,623,922) | |
| Net increase (decrease) in net assets resulting from operations | $2,693,807 |
See accompanying notes which are an integral part of the financial statements.
Statement of Changes in Net Assets
| Six months ended March 31, 2018 (Unaudited) | Year ended September 30, 2017 | |
| Increase (Decrease) in Net Assets | ||
| Operations | ||
| Net investment income (loss) | $4,317,729 | $7,828,862 |
| Net realized gain (loss) | 33,168,436 | 25,269,590 |
| Change in net unrealized appreciation (depreciation) | (34,792,358) | 62,323,044 |
| Net increase (decrease) in net assets resulting from operations | 2,693,807 | 95,421,496 |
| Distributions to shareholders from net investment income | (3,332,905) | (7,046,584) |
| Distributions to shareholders from net realized gain | (27,989,724) | – |
| Total distributions | (31,322,629) | (7,046,584) |
| Affiliated share transactions | ||
| Proceeds from sales of shares | 64,649,281 | 39,935,356 |
| Reinvestment of distributions | 31,322,629 | 7,046,096 |
| Cost of shares redeemed | (28,866,069) | (62,373,158) |
| Net increase (decrease) in net assets resulting from share transactions | 67,105,841 | (15,391,706) |
| Total increase (decrease) in net assets | 38,477,019 | 72,983,206 |
| Net Assets | ||
| Beginning of period | 473,845,207 | 400,862,001 |
| End of period | $512,322,226 | $473,845,207 |
| Other Information | ||
| Undistributed net investment income end of period | $1,764,207 | $779,383 |
| Shares | ||
| Sold | 245,346 | 176,402 |
| Issued in reinvestment of distributions | 120,650 | 29,792 |
| Redeemed | (109,511) | (265,555) |
| Net increase (decrease) | 256,485 | (59,361) |
See accompanying notes which are an integral part of the financial statements.
Financial Highlights
Fidelity Materials Central Fund
| Six months ended (Unaudited) March 31, | Years endedSeptember 30, | |||||
| 2018 | 2017 | 2016 | 2015 | 2014 | 2013 | |
| Selected Per–Share Data | ||||||
| Net asset value, beginning of period | $260.41 | $213.34 | $188.48 | $229.95 | $207.20 | $180.29 |
| Income from Investment Operations | ||||||
| Net investment income (loss)A | 2.22 | 4.24 | 4.48 | 4.34 | 3.57 | 3.44B |
| Net realized and unrealized gain (loss) | 1.02C | 46.66 | 24.73 | (41.59) | 22.68 | 26.85 |
| Total from investment operations | 3.24 | 50.90 | 29.21 | (37.25) | 26.25 | 30.29 |
| Distributions from net investment income | (1.78) | (3.83) | (4.35) | (4.22) | (3.50) | (3.38) |
| Distributions from net realized gain | (15.08) | – | – | – | – | – |
| Total distributions | (16.87)D | (3.83) | (4.35) | (4.22) | (3.50) | (3.38) |
| Net asset value, end of period | $246.78 | $260.41 | $213.34 | $188.48 | $229.95 | $207.20 |
| Total ReturnE,F | .94% | 24.05% | 15.62% | (16.46)% | 12.70% | 16.98% |
| Ratios to Average Net AssetsG,H | ||||||
| Expenses before reductions | - %I,J | .01% | - %J | - %J | .01% | - %J |
| Expenses net of fee waivers, if any | - %I,J | .01% | - %J | - %J | - %J | - %J |
| Expenses net of all reductions | - %I,J | .01% | - %J | - %J | - %J | - %J |
| Net investment income (loss) | 1.68%I | 1.80% | 2.21% | 1.95% | 1.57% | 1.79%B |
| Supplemental Data | ||||||
| Net assets, end of period (000 omitted) | $512,322 | $473,845 | $400,862 | $358,642 | $482,472 | $400,422 |
| Portfolio turnover rateK | 77%I | 54%L | 56% | 72% | 65%L | 64%L |
A Calculated based on average shares outstanding during the period.
B Net Investment income per share reflects a large, non-recurring dividend which amounted to $.52 per share. Excluding this non-recurring dividend, the ratio of net investment income (loss) to average net assets would have been 1.52%.
C The amount shown for a share outstanding does not correspond with the aggregate net gain (loss) on investments for the period due to the timing of sales and repurchases of shares in relation to fluctuating market values of the investments of the Fund.
D Total distributions of $16.87 per share is comprised of distributions from net investment income of $1.783 and distributions from net realized gain of $15.082 per share.
E Total returns for periods of less than one year are not annualized.
F Total returns would have been lower if certain expenses had not been reduced during the applicable periods shown.
G Fees and expenses of any underlying Fidelity Central Funds are not included in the Fund's expense ratio. The Fund indirectly bears its proportionate share of the expenses of any underlying Fidelity Central Funds.
H Expense ratios reflect operating expenses of the Fund. Expenses before reductions do not reflect amounts reimbursed by the investment adviser or reductions from expense offset arrangements and do not represent the amount paid by the Fund during periods when reimbursements or reductions occur. Expenses net of fee waivers reflect expenses after reimbursement by the investment adviser but prior to reductions from expense offset arrangements. Expenses net of all reductions represent the net expenses paid by the Fund.
I Annualized
J Amount represents less than .005%.
K Amount does not include the portfolio activity of any underlying Fidelity Central Funds.
L Portfolio turnover rate excludes securities received or delivered in-kind.
See accompanying notes which are an integral part of the financial statements.
Fidelity® Real Estate Equity Central Fund
Investment Summary (Unaudited)
Top Ten Stocks as of March 31, 2018
| % of fund's net assets | |
| Equinix, Inc. | 7.0 |
| Simon Property Group, Inc. | 5.1 |
| Public Storage | 5.0 |
| AvalonBay Communities, Inc. | 4.8 |
| Boston Properties, Inc. | 4.5 |
| Ventas, Inc. | 3.9 |
| Essex Property Trust, Inc. | 3.7 |
| DCT Industrial Trust, Inc. | 3.3 |
| Duke Realty Corp. | 2.7 |
| SL Green Realty Corp. | 2.6 |
| 42.6 |
Top Five REIT Sectors as of March 31, 2018
| % of fund's net assets | |
| REITs - Office Property | 15.8 |
| REITs - Apartments | 14.9 |
| REITs - Diversified | 14.5 |
| REITs - Health Care | 9.7 |
| REITs - Regional Malls | 8.3 |
Asset Allocation (% of fund's net assets)
| As of March 31, 2018 | ||
| Stocks | 98.8% | |
| Short-Term Investments and Net Other Assets (Liabilities) | 1.2% | |

Fidelity® Real Estate Equity Central Fund
Schedule of Investments March 31, 2018 (Unaudited)
Showing Percentage of Net Assets
| Common Stocks - 98.8% | |||
| Shares | Value | ||
| Equity Real Estate Investment Trusts (REITs) - 97.8% | |||
| Industrial REITs - 0.6% | |||
| Americold Realty Trust | 35,700 | $681,156 | |
| REITs - Apartments - 14.9% | |||
| American Homes 4 Rent Class A | 79,400 | 1,594,352 | |
| AvalonBay Communities, Inc. | 32,550 | 5,353,173 | |
| Education Realty Trust, Inc. | 52,100 | 1,706,275 | |
| Equity Residential (SBI) | 46,000 | 2,834,520 | |
| Essex Property Trust, Inc. | 17,200 | 4,139,696 | |
| Mid-America Apartment Communities, Inc. | 11,841 | 1,080,373 | |
| 16,708,389 | |||
| REITs - Diversified - 14.5% | |||
| Colony NorthStar, Inc. | 53,304 | 299,568 | |
| Corrections Corp. of America | 48,500 | 946,720 | |
| Duke Realty Corp. | 114,700 | 3,037,256 | |
| Equinix, Inc. | 18,700 | 7,819,216 | |
| Gaming & Leisure Properties | 24,500 | 820,015 | |
| Outfront Media, Inc. | 60,900 | 1,141,266 | |
| Washington REIT (SBI) | 77,500 | 2,115,750 | |
| 16,179,791 | |||
| REITs - Health Care - 9.7% | |||
| CareTrust (REIT), Inc. | 62,600 | 838,840 | |
| Healthcare Realty Trust, Inc. | 87,700 | 2,430,167 | |
| Sabra Health Care REIT, Inc. | 65,154 | 1,149,968 | |
| Ventas, Inc. | 87,200 | 4,319,016 | |
| Welltower, Inc. | 39,150 | 2,130,935 | |
| 10,868,926 | |||
| REITs - Hotels - 5.5% | |||
| DiamondRock Hospitality Co. | 138,000 | 1,440,720 | |
| Host Hotels & Resorts, Inc. | 134,100 | 2,499,624 | |
| Sunstone Hotel Investors, Inc. | 142,400 | 2,167,328 | |
| 6,107,672 | |||
| REITs - Management/Investment - 3.8% | |||
| American Tower Corp. | 4,500 | 654,030 | |
| CoreSite Realty Corp. | 10,976 | 1,100,454 | |
| National Retail Properties, Inc. | 64,200 | 2,520,492 | |
| 4,274,976 | |||
| REITs - Manufactured Homes - 2.4% | |||
| Equity Lifestyle Properties, Inc. | 30,176 | 2,648,548 | |
| REITs - Office Property - 15.8% | |||
| Boston Properties, Inc. | 40,900 | 5,039,698 | |
| Corporate Office Properties Trust (SBI) | 49,600 | 1,281,168 | |
| Douglas Emmett, Inc. | 60,900 | 2,238,684 | |
| Highwoods Properties, Inc. (SBI) | 50,600 | 2,217,292 | |
| Hudson Pacific Properties, Inc. | 72,200 | 2,348,666 | |
| SL Green Realty Corp. | 30,100 | 2,914,583 | |
| VEREIT, Inc. | 239,700 | 1,668,312 | |
| 17,708,403 | |||
| REITs - Regional Malls - 8.3% | |||
| General Growth Properties, Inc. | 67,100 | 1,372,866 | |
| Simon Property Group, Inc. | 36,650 | 5,656,928 | |
| Taubman Centers, Inc. | 14,200 | 808,122 | |
| The Macerich Co. | 25,200 | 1,411,704 | |
| 9,249,620 | |||
| REITs - Shopping Centers - 4.8% | |||
| Acadia Realty Trust (SBI) | 49,138 | 1,208,795 | |
| Cedar Realty Trust, Inc. | 120,447 | 474,561 | |
| DDR Corp. | 119,900 | 878,867 | |
| Urban Edge Properties | 130,950 | 2,795,783 | |
| 5,358,006 | |||
| REITs - Single Tenant - 3.2% | |||
| Agree Realty Corp. | 20,700 | 994,428 | |
| Four Corners Property Trust, Inc. | 43,288 | 999,520 | |
| Spirit Realty Capital, Inc. | 198,100 | 1,537,256 | |
| 3,531,204 | |||
| REITs - Storage - 6.7% | |||
| Extra Space Storage, Inc. | 21,800 | 1,904,448 | |
| Public Storage | 28,100 | 5,630,959 | |
| 7,535,407 | |||
| REITs - Warehouse/Industrial - 7.5% | |||
| DCT Industrial Trust, Inc. | 64,807 | 3,651,226 | |
| Gramercy Property Trust | 806 | 17,514 | |
| Prologis, Inc. | 46,000 | 2,897,540 | |
| Rexford Industrial Realty, Inc. | 35,500 | 1,022,045 | |
| Terreno Realty Corp. | 23,463 | 809,708 | |
| 8,398,033 | |||
| Specialized REITs - 0.1% | |||
| Safety Income and Growth, Inc. | 4,449 | 71,140 | |
| TOTAL EQUITY REAL ESTATE INVESTMENT TRUSTS (REITS) | 109,321,271 | ||
| Hotels, Restaurants & Leisure - 0.2% | |||
| Hotels, Resorts & Cruise Lines - 0.2% | |||
| Hilton Grand Vacations, Inc. (a) | 6,000 | 258,120 | |
| Real Estate Management & Development - 0.8% | |||
| Real Estate Development - 0.8% | |||
| Howard Hughes Corp. (a) | 4,100 | 570,433 | |
| VICI Properties, Inc. (b) | 14,600 | 267,472 | |
| 837,905 | |||
| TOTAL COMMON STOCKS | |||
| (Cost $108,086,756) | 110,417,296 | ||
| Money Market Funds - 0.9% | |||
| Fidelity Cash Central Fund, 1.72% (c) | 735,172 | 735,319 | |
| Fidelity Securities Lending Cash Central Fund 1.72% (c)(d) | 271,848 | 271,903 | |
| TOTAL MONEY MARKET FUNDS | |||
| (Cost $1,007,194) | 1,007,222 | ||
| TOTAL INVESTMENT IN SECURITIES - 99.7% | |||
| (Cost $109,093,950) | 111,424,518 | ||
| NET OTHER ASSETS (LIABILITIES) - 0.3% | 333,737 | ||
| NET ASSETS - 100% | $111,758,255 |
Legend
(a) Non-income producing
(b) Security or a portion of the security is on loan at period end.
(c) Affiliated fund that is generally available only to investment companies and other accounts managed by Fidelity Investments. The rate quoted is the annualized seven-day yield of the fund at period end. A complete unaudited listing of the fund's holdings as of its most recent quarter end is available upon request. In addition, each Fidelity Central Fund's financial statements are available on the SEC's website or upon request.
(d) Investment made with cash collateral received from securities on loan.
Affiliated Central Funds
Information regarding fiscal year to date income earned by the Fund from investments in Fidelity Central Funds is as follows:
| Fund | Income earned |
| Fidelity Cash Central Fund | $9,579 |
| Fidelity Securities Lending Cash Central Fund | 75 |
| Total | $9,654 |
Amounts in the income column in the above table include any capital gain distributions from underlying funds, which are presented in the corresponding line-item in the Statement of Operations if applicable.
Investment Valuation
All investments are categorized as Level 1 under the Fair Value Hierarchy. The inputs or methodology used for valuing securities may not be an indication of the risk associated with investing in those securities. For more information on valuation inputs please refer to the Investment Valuation section in the accompanying Notes to Financial Statements.
See accompanying notes which are an integral part of the financial statements.
Fidelity® Real Estate Equity Central Fund
Financial Statements
Statement of Assets and Liabilities
| March 31, 2018 (Unaudited) | ||
| Assets | ||
| Investment in securities, at value (including securities loaned of $265,640) — See accompanying schedule: Unaffiliated issuers (cost $108,086,756) | $110,417,296 | |
| Fidelity Central Funds (cost $1,007,194) | 1,007,222 | |
| Total Investment in Securities (cost $109,093,950) | $111,424,518 | |
| Cash | 60,267 | |
| Receivable for investments sold | 975,866 | |
| Receivable for fund shares sold | 8,064 | |
| Dividends receivable | 548,763 | |
| Distributions receivable from Fidelity Central Funds | 1,135 | |
| Total assets | 113,018,613 | |
| Liabilities | ||
| Payable for investments purchased | $880,691 | |
| Payable for fund shares redeemed | 103,097 | |
| Other payables and accrued expenses | 4,695 | |
| Collateral on securities loaned | 271,875 | |
| Total liabilities | 1,260,358 | |
| Net Assets | $111,758,255 | |
| Net Assets consist of: | ||
| Paid in capital | $109,035,003 | |
| Undistributed net investment income | 650,264 | |
| Accumulated undistributed net realized gain (loss) on investments and foreign currency transactions | (257,580) | |
| Net unrealized appreciation (depreciation) on investments | 2,330,568 | |
| Net Assets, for 1,112,199 shares outstanding | $111,758,255 | |
| Net Asset Value, offering price and redemption price per share ($111,758,255 ÷ 1,112,199 shares) | $100.48 |
See accompanying notes which are an integral part of the financial statements.
Statement of Operations
| Six months ended March 31, 2018 (Unaudited) | ||
| Investment Income | ||
| Dividends | $1,740,750 | |
| Income from Fidelity Central Funds (including $75 from security lending) | 9,654 | |
| Total income | 1,750,404 | |
| Expenses | ||
| Custodian fees and expenses | $6,678 | |
| Independent directors' fees and expenses | 228 | |
| Miscellaneous | 2 | |
| Total expenses before reductions | 6,908 | |
| Expense reductions | (48) | 6,860 |
| Net investment income (loss) | 1,743,544 | |
| Realized and Unrealized Gain (Loss) | ||
| Net realized gain (loss) on: | ||
| Investment securities: | ||
| Unaffiliated issuers | 584,812 | |
| Fidelity Central Funds | (115) | |
| Foreign currency transactions | (15) | |
| Total net realized gain (loss) | 584,682 | |
| Change in net unrealized appreciation (depreciation) on: | ||
| Investment securities: | ||
| Unaffiliated issuers | (10,524,094) | |
| Fidelity Central Funds | 28 | |
| Total change in net unrealized appreciation (depreciation) | (10,524,066) | |
| Net gain (loss) | (9,939,384) | |
| Net increase (decrease) in net assets resulting from operations | $(8,195,840) |
See accompanying notes which are an integral part of the financial statements.
Statement of Changes in Net Assets
| Six months ended March 31, 2018 (Unaudited) | Year ended September 30, 2017 | |
| Increase (Decrease) in Net Assets | ||
| Operations | ||
| Net investment income (loss) | $1,743,544 | $3,733,477 |
| Net realized gain (loss) | 584,682 | 4,275,580 |
| Change in net unrealized appreciation (depreciation) | (10,524,066) | (6,483,065) |
| Net increase (decrease) in net assets resulting from operations | (8,195,840) | 1,525,992 |
| Distributions to shareholders from net investment income | (1,674,474) | (2,895,366) |
| Distributions to shareholders from net realized gain | (4,488,742) | (189,674) |
| Total distributions | (6,163,216) | (3,085,040) |
| Affiliated share transactions | ||
| Proceeds from sales of shares | 8,708,585 | 9,269,293 |
| Reinvestment of distributions | 6,163,216 | 3,085,040 |
| Cost of shares redeemed | (15,901,608) | (57,435,320) |
| Net increase (decrease) in net assets resulting from share transactions | (1,029,807) | (45,080,987) |
| Total increase (decrease) in net assets | (15,388,863) | (46,640,035) |
| Net Assets | ||
| Beginning of period | 127,147,118 | 173,787,153 |
| End of period | $111,758,255 | $127,147,118 |
| Other Information | ||
| Undistributed net investment income end of period | $650,264 | $581,194 |
| Shares | ||
| Sold | 80,702 | 84,698 |
| Issued in reinvestment of distributions | 57,169 | 28,626 |
| Redeemed | (152,613) | (522,285) |
| Net increase (decrease) | (14,742) | (408,961) |
See accompanying notes which are an integral part of the financial statements.
Financial Highlights
Fidelity Real Estate Equity Central Fund
| Six months ended (Unaudited) March 31, | Years endedSeptember 30, | |||
| 2018 | 2017 | 2016 | 2015 A | |
| Selected Per–Share Data | ||||
| Net asset value, beginning of period | $112.82 | $113.15 | $95.92 | $100.00 |
| Income from Investment Operations | ||||
| Net investment income (loss)B | 1.52 | 3.00 | 3.03 | 2.53 |
| Net realized and unrealized gain (loss) | (8.50) | (.91) | 17.03 | (4.24) |
| Total from investment operations | (6.98) | 2.09 | 20.06 | (1.71) |
| Distributions from net investment income | (1.47) | (2.29) | (2.83) | (2.37) |
| Distributions from net realized gain | (3.90) | (.12) | – | – |
| Total distributions | (5.36)C | (2.42)D | (2.83) | (2.37) |
| Net asset value, end of period | $100.48 | $112.82 | $113.15 | $95.92 |
| Total ReturnE,F | (6.49)% | 1.95% | 21.08% | (1.81)% |
| Ratios to Average Net AssetsG,H | ||||
| Expenses before reductions | .01%I | .01% | .01% | .01%I |
| Expenses net of fee waivers, if any | .01%I | .01% | .01% | .01%I |
| Expenses net of all reductions | .01%I | .01% | .01% | .01%I |
| Net investment income (loss) | 2.84%I | 2.72% | 2.86% | 2.71%I |
| Supplemental Data | ||||
| Net assets, end of period (000 omitted) | $111,758 | $127,147 | $173,787 | $251,215 |
| Portfolio turnover rateJ | 50%I | 64% | 69% | 62%I |
A For the period November 3, 2014 (commencement of operations) to September 30, 2015.
B Calculated based on average shares outstanding during the period.
C Total distributions of $5.36 per share is comprised of distributions from net investment income of $1.465 and distributions from net realized gain of $3.898 per share.
D Total distributions of $2.42 per share is comprised of distributions from net investment income of $2.294 and distributions from net realized gain of $.124 per share.
E Total returns for periods of less than one year are not annualized.
F Total returns would have been lower if certain expenses had not been reduced during the applicable periods shown.
G Fees and expenses of any underlying Fidelity Central Funds are not included in the Fund's expense ratio. The Fund indirectly bears its proportionate share of the expenses of any underlying Fidelity Central Funds.
H Expense ratios reflect operating expenses of the Fund. Expenses before reductions do not reflect amounts reimbursed by the investment adviser or reductions from expense offset arrangements and do not represent the amount paid by the Fund during periods when reimbursements or reductions occur. Expense ratios before reductions for start-up periods may not be representative of longer term operating periods. Expenses net of fee waivers reflect expenses after reimbursement by the investment adviser but prior to reductions from expense offset arrangements. Expenses net of all reductions represent the net expenses paid by the Fund.
I Annualized
J Amount does not include the portfolio activity of any underlying Fidelity Central Funds.
See accompanying notes which are an integral part of the financial statements.
Fidelity® Telecom Services Central Fund
Investment Summary (Unaudited)
Top Ten Stocks as of March 31, 2018
| % of fund's net assets | |
| Verizon Communications, Inc. | 21.2 |
| AT&T, Inc. | 13.7 |
| T-Mobile U.S., Inc. | 7.9 |
| CenturyLink, Inc. | 5.1 |
| Zayo Group Holdings, Inc. | 3.8 |
| Vonage Holdings Corp. | 3.7 |
| Cogent Communications Group, Inc. | 3.3 |
| Telephone & Data Systems, Inc. | 3.0 |
| Iridium Communications, Inc. | 2.8 |
| Comcast Corp. Class A | 2.7 |
| 67.2 |
Top Industries (% of fund's net assets)
| As of March 31, 2018 | ||
| Diversified Telecommunication Services | 60.3% | |
| Wireless Telecommunication Services | 18.2% | |
| Media | 14.0% | |
| Internet Software & Services | 2.5% | |
| Equity Real Estate Investment Trusts (Reits) | 2.1% | |
| All Others* | 2.9% | |

* Includes short-term investments and net other assets (liabilities).
Fidelity® Telecom Services Central Fund
Schedule of Investments March 31, 2018 (Unaudited)
Showing Percentage of Net Assets
| Common Stocks - 98.3% | |||
| Shares | Value | ||
| Communications Equipment - 0.8% | |||
| Communications Equipment - 0.8% | |||
| Quantenna Communications, Inc. (a) | 216,600 | $2,967,420 | |
| Diversified Telecommunication Services - 60.3% | |||
| Alternative Carriers - 20.6% | |||
| CenturyLink, Inc. | 1,128,394 | 18,539,513 | |
| Cogent Communications Group, Inc. | 283,146 | 12,288,536 | |
| Globalstar, Inc. (a)(b) | 3,158,812 | 2,171,683 | |
| Iliad SA | 11,849 | 2,449,373 | |
| Iridium Communications, Inc. (a)(b) | 929,014 | 10,451,408 | |
| ORBCOMM, Inc. (a) | 235,667 | 2,208,200 | |
| Vonage Holdings Corp. (a) | 1,271,441 | 13,540,847 | |
| Zayo Group Holdings, Inc. (a) | 405,726 | 13,859,600 | |
| 75,509,160 | |||
| Integrated Telecommunication Services - 39.7% | |||
| Altice U.S.A., Inc. Class A (b) | 30,500 | 563,640 | |
| AT&T, Inc. | 1,413,148 | 50,378,726 | |
| Atlantic Tele-Network, Inc. | 92,410 | 5,509,484 | |
| Cincinnati Bell, Inc. (a) | 389,163 | 5,389,908 | |
| Consolidated Communications Holdings, Inc. (b) | 245,709 | 2,692,971 | |
| Frontier Communications Corp. (b) | 253,117 | 1,878,128 | |
| Verizon Communications, Inc. | 1,621,650 | 77,547,302 | |
| Windstream Holdings, Inc. (b) | 1,109,727 | 1,564,715 | |
| 145,524,874 | |||
| TOTAL DIVERSIFIED TELECOMMUNICATION SERVICES | 221,034,034 | ||
| Electronic Equipment & Components - 1.1% | |||
| Electronic Equipment & Instruments - 0.2% | |||
| ADT, Inc. | 100,700 | 798,551 | |
| Electronic Manufacturing Services - 0.9% | |||
| Fabrinet | 107,300 | 3,367,074 | |
| TOTAL ELECTRONIC EQUIPMENT & COMPONENTS | 4,165,625 | ||
| Equity Real Estate Investment Trusts (REITs) - 2.1% | |||
| Specialized REITs - 2.1% | |||
| American Tower Corp. | 51,763 | 7,523,234 | |
| Internet Software & Services - 2.5% | |||
| Internet Software & Services - 2.5% | |||
| Akamai Technologies, Inc. (a) | 28,900 | 2,051,322 | |
| Gogo, Inc. (a)(b) | 376,277 | 3,247,271 | |
| Pandora Media, Inc. (a)(b) | 758,600 | 3,815,758 | |
| 9,114,351 | |||
| Media - 13.8% | |||
| Cable & Satellite - 11.1% | |||
| Altice NV Class A (a)(b) | 290,131 | 2,391,130 | |
| Comcast Corp. Class A | 293,700 | 10,035,729 | |
| DISH Network Corp. Class A (a) | 107,800 | 4,084,542 | |
| GCI Liberty, Inc. (a) | 69,803 | 3,689,787 | |
| Liberty Broadband Corp. Class A (a) | 95,600 | 8,106,880 | |
| Liberty Global PLC: | |||
| Class C (a) | 301,764 | 9,182,679 | |
| LiLAC Class C (a)(c) | 87,897 | 1 | |
| Liberty Latin America Ltd. (a) | 87,897 | 1,677,954 | |
| Megacable Holdings S.A.B. de CV unit | 353,700 | 1,656,545 | |
| 40,825,247 | |||
| Movies & Entertainment - 2.7% | |||
| Lions Gate Entertainment Corp. Class B | 10,899 | 262,448 | |
| Time Warner, Inc. | 101,400 | 9,590,412 | |
| 9,852,860 | |||
| TOTAL MEDIA | 50,678,107 | ||
| Wireless Telecommunication Services - 17.7% | |||
| Wireless Telecommunication Services - 17.7% | |||
| Millicom International Cellular SA | 24,669 | 1,707,095 | |
| Shenandoah Telecommunications Co. | 196,715 | 7,081,740 | |
| Sprint Corp. (a)(b) | 1,395,042 | 6,807,805 | |
| T-Mobile U.S., Inc. (a) | 471,815 | 28,799,588 | |
| Telephone & Data Systems, Inc. | 398,780 | 11,177,803 | |
| U.S. Cellular Corp. (a) | 166,896 | 6,707,550 | |
| VimpelCom Ltd. sponsored ADR | 1,021,800 | 2,697,552 | |
| 64,979,133 | |||
| TOTAL COMMON STOCKS | |||
| (Cost $322,518,946) | 360,461,904 | ||
| Nonconvertible Preferred Stocks - 0.7% | |||
| Media - 0.2% | |||
| Cable & Satellite - 0.2% | |||
| GCI Liberty, Inc. 0.00% | 27,674 | 647,572 | |
| Wireless Telecommunication Services - 0.5% | |||
| Wireless Telecommunication Services - 0.5% | |||
| TIM Participacoes SA sponsored ADR | 94,300 | 2,043,481 | |
| TOTAL NONCONVERTIBLE PREFERRED STOCKS | |||
| (Cost $2,075,657) | 2,691,053 | ||
| Money Market Funds - 7.9% | |||
| Fidelity Cash Central Fund, 1.72% (d) | 3,176,291 | 3,176,927 | |
| Fidelity Securities Lending Cash Central Fund 1.72% (d)(e) | 25,659,495 | 25,664,627 | |
| TOTAL MONEY MARKET FUNDS | |||
| (Cost $28,838,287) | 28,841,554 | ||
| TOTAL INVESTMENT IN SECURITIES - 106.9% | |||
| (Cost $353,432,890) | 391,994,511 | ||
| NET OTHER ASSETS (LIABILITIES) - (6.9)% | (25,131,249) | ||
| NET ASSETS - 100% | $366,863,262 |
Legend
(a) Non-income producing
(b) Security or a portion of the security is on loan at period end.
(c) Level 3 security
(d) Affiliated fund that is generally available only to investment companies and other accounts managed by Fidelity Investments. The rate quoted is the annualized seven-day yield of the fund at period end. A complete unaudited listing of the fund's holdings as of its most recent quarter end is available upon request. In addition, each Fidelity Central Fund's financial statements are available on the SEC's website or upon request.
(e) Investment made with cash collateral received from securities on loan.
Affiliated Central Funds
Information regarding fiscal year to date income earned by the Fund from investments in Fidelity Central Funds is as follows:
| Fund | Income earned |
| Fidelity Cash Central Fund | $23,265 |
| Fidelity Securities Lending Cash Central Fund | 329,509 |
| Total | $352,774 |
Amounts in the income column in the above table include any capital gain distributions from underlying funds, which are presented in the corresponding line-item in the Statement of Operations if applicable.
Investment Valuation
The following is a summary of the inputs used, as of March 31, 2018, involving the Fund's assets and liabilities carried at fair value. The inputs or methodology used for valuing securities may not be an indication of the risk associated with investing in those securities. For more information on valuation inputs, and their aggregation into the levels used below, please refer to the Investment Valuation section in the accompanying Notes to Financial Statements.
| Valuation Inputs at Reporting Date: | ||||
| Description | Total | Level 1 | Level 2 | Level 3 |
| Investments in Securities: | ||||
| Common Stocks | $360,461,904 | $358,805,358 | $1,656,545 | $1 |
| Nonconvertible Preferred Stocks | 2,691,053 | 2,691,053 | -- | -- |
| Money Market Funds | 28,841,554 | 28,841,554 | -- | -- |
| Total Investments in Securities: | $391,994,511 | $390,337,965 | $1,656,545 | $1 |
See accompanying notes which are an integral part of the financial statements.
Fidelity® Telecom Services Central Fund
Financial Statements
Statement of Assets and Liabilities
| March 31, 2018 (Unaudited) | ||
| Assets | ||
| Investment in securities, at value (including securities loaned of $24,593,565) — See accompanying schedule: Unaffiliated issuers (cost $324,594,603) | $363,152,957 | |
| Fidelity Central Funds (cost $28,838,287) | 28,841,554 | |
| Total Investment in Securities (cost $353,432,890) | $391,994,511 | |
| Receivable for investments sold | 526,195 | |
| Receivable for fund shares sold | 71,437 | |
| Dividends receivable | 20,443 | |
| Distributions receivable from Fidelity Central Funds | 73,211 | |
| Total assets | 392,685,797 | |
| Liabilities | ||
| Payable for fund shares redeemed | $162,279 | |
| Other payables and accrued expenses | 3,278 | |
| Collateral on securities loaned | 25,656,978 | |
| Total liabilities | 25,822,535 | |
| Net Assets | $366,863,262 | |
| Net Assets consist of: | ||
| Paid in capital | $324,832,371 | |
| Undistributed net investment income | 1,004,765 | |
| Accumulated undistributed net realized gain (loss) on investments and foreign currency transactions | 2,464,509 | |
| Net unrealized appreciation (depreciation) on investments and assets and liabilities in foreign currencies | 38,561,617 | |
| Net Assets, for 2,145,422 shares outstanding | $366,863,262 | |
| Net Asset Value, offering price and redemption price per share ($366,863,262 ÷ 2,145,422 shares) | $171.00 |
See accompanying notes which are an integral part of the financial statements.
Statement of Operations
| Six months ended March 31, 2018 (Unaudited) | ||
| Investment Income | ||
| Dividends | $5,204,414 | |
| Income from Fidelity Central Funds (including $329,509 from security lending) | 352,774 | |
| Total income | 5,557,188 | |
| Expenses | ||
| Custodian fees and expenses | $4,625 | |
| Independent directors' fees and expenses | 677 | |
| Interest | 274 | |
| Miscellaneous | 4 | |
| Total expenses before reductions | 5,580 | |
| Expense reductions | (181) | 5,399 |
| Net investment income (loss) | 5,551,789 | |
| Realized and Unrealized Gain (Loss) | ||
| Net realized gain (loss) on: | ||
| Investment securities: | ||
| Unaffiliated issuers | 10,781,450 | |
| Fidelity Central Funds | 3,053 | |
| Foreign currency transactions | (4,889) | |
| Total net realized gain (loss) | 10,779,614 | |
| Change in net unrealized appreciation (depreciation) on: | ||
| Investment securities: | ||
| Unaffiliated issuers | (35,275,048) | |
| Fidelity Central Funds | (3,569) | |
| Assets and liabilities in foreign currencies | 45 | |
| Total change in net unrealized appreciation (depreciation) | (35,278,572) | |
| Net gain (loss) | (24,498,958) | |
| Net increase (decrease) in net assets resulting from operations | $(18,947,169) |
See accompanying notes which are an integral part of the financial statements.
Statement of Changes in Net Assets
| Six months ended March 31, 2018 (Unaudited) | Year ended September 30, 2017 | |
| Increase (Decrease) in Net Assets | ||
| Operations | ||
| Net investment income (loss) | $5,551,789 | $9,725,365 |
| Net realized gain (loss) | 10,779,614 | 29,762,911 |
| Change in net unrealized appreciation (depreciation) | (35,278,572) | (10,613,717) |
| Net increase (decrease) in net assets resulting from operations | (18,947,169) | 28,874,559 |
| Distributions to shareholders from net investment income | (5,021,846) | (9,203,456) |
| Distributions to shareholders from net realized gain | (31,019,369) | (3,625,582) |
| Total distributions | (36,041,215) | (12,829,038) |
| Affiliated share transactions | ||
| Proceeds from sales of shares | 49,421,593 | 35,075,340 |
| Reinvestment of distributions | 36,041,215 | 12,828,118 |
| Cost of shares redeemed | (43,177,960) | (68,479,567) |
| Net increase (decrease) in net assets resulting from share transactions | 42,284,848 | (20,576,109) |
| Total increase (decrease) in net assets | (12,703,536) | (4,530,588) |
| Net Assets | ||
| Beginning of period | 379,566,798 | 384,097,386 |
| End of period | $366,863,262 | $379,566,798 |
| Other Information | ||
| Undistributed net investment income end of period | $1,004,765 | $474,822 |
| Shares | ||
| Sold | 271,485 | 181,306 |
| Issued in reinvestment of distributions | 198,172 | 66,434 |
| Redeemed | (231,522) | (346,490) |
| Net increase (decrease) | 238,135 | (98,750) |
See accompanying notes which are an integral part of the financial statements.
Financial Highlights
Fidelity Telecom Services Central Fund
| Six months ended (Unaudited) March 31, | Years endedSeptember 30, | |||||
| 2018 | 2017 | 2016 | 2015 | 2014 | 2013 | |
| Selected Per–Share Data | ||||||
| Net asset value, beginning of period | $199.01 | $191.47 | $155.23 | $163.86 | $155.95 | $139.95 |
| Income from Investment Operations | ||||||
| Net investment income (loss)A | 2.79 | 4.88 | 4.49 | 3.75 | 7.09B | 4.39 |
| Net realized and unrealized gain (loss) | (11.43) | 9.03 | 36.05 | (8.58) | 7.91 | 15.88 |
| Total from investment operations | (8.64) | 13.91 | 40.54 | (4.83) | 15.00 | 20.27 |
| Distributions from net investment income | (2.62) | (4.62) | (4.30) | (3.80) | (7.09) | (4.27) |
| Distributions from net realized gain | (16.75) | (1.76) | – | – | – | – |
| Total distributions | (19.37) | (6.37)C | (4.30) | (3.80) | (7.09) | (4.27) |
| Net asset value, end of period | $171.00 | $199.01 | $191.47 | $155.23 | $163.86 | $155.95 |
| Total ReturnD,E | (4.83)% | 7.41% | 26.33% | (3.10)% | 9.75% | 14.73% |
| Ratios to Average Net AssetsF,G | ||||||
| Expenses before reductions | - %H,I | .01% | .01% | - %I | .01% | .01% |
| Expenses net of fee waivers, if any | - %H,I | .01% | .01% | - %I | .01% | .01% |
| Expenses net of all reductions | - %H,I | .01% | .01% | - %I | .01% | .01% |
| Net investment income (loss) | 3.01%H | 2.48% | 2.51% | 2.24% | 4.35%B | 3.00% |
| Supplemental Data | ||||||
| Net assets, end of period (000 omitted) | $366,863 | $379,567 | $384,097 | $277,097 | $286,592 | $295,959 |
| Portfolio turnover rateJ | 69%H | 75%K | 68% | 58% | 97%K | 82%K |
A Calculated based on average shares outstanding during the period.
B Net Investment income per share reflects a large, non-recurring dividend which amounted to $3.06 per share. Excluding this non-recurring dividend, the ratio of net investment income (loss) to average net assets would have been 2.51%.
C Total distributions of $6.37 per share is comprised of distributions from net investment income of $4.618 and distributions from net realized gain of $1.755 per share.
D Total returns for periods of less than one year are not annualized.
E Total returns would have been lower if certain expenses had not been reduced during the applicable periods shown.
F Fees and expenses of any underlying Fidelity Central Funds are not included in the Fund's expense ratio. The Fund indirectly bears its proportionate share of the expenses of any underlying Fidelity Central Funds.
G Expense ratios reflect operating expenses of the Fund. Expenses before reductions do not reflect amounts reimbursed by the investment adviser or reductions from expense offset arrangements and do not represent the amount paid by the Fund during periods when reimbursements or reductions occur. Expenses net of fee waivers reflect expenses after reimbursement by the investment adviser but prior to reductions from expense offset arrangements. Expenses net of all reductions represent the net expenses paid by the Fund.
H Annualized
I Amount represents less than .005%.
J Amount does not include the portfolio activity of any underlying Fidelity Central Funds.
K Portfolio turnover rate excludes securities received or delivered in-kind.
See accompanying notes which are an integral part of the financial statements.
Fidelity® Utilities Central Fund
Investment Summary (Unaudited)
Top Ten Stocks as of March 31, 2018
| % of fund's net assets | |
| NextEra Energy, Inc. | 12.0 |
| Sempra Energy | 8.5 |
| Exelon Corp. | 7.7 |
| FirstEnergy Corp. | 5.9 |
| NRG Energy, Inc. | 5.9 |
| Dominion Resources, Inc. | 5.8 |
| The AES Corp. | 4.7 |
| PG&E Corp. | 4.6 |
| Eversource Energy | 4.3 |
| Great Plains Energy, Inc. | 4.3 |
| 63.7 |
Top Industries (% of fund's net assets)
| As of March 31, 2018 | ||
| Electric Utilities | 47.3% | |
| Multi-Utilities | 25.3% | |
| Independent Power and Renewable Electricity Producers | 14.3% | |
| Media | 6.7% | |
| Oil, Gas & Consumable Fuels | 2.5% | |
| All Others* | 3.9% | |
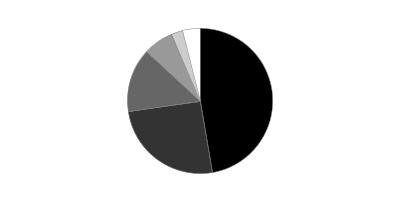
* Includes short-term investments and net other assets (liabilities).
Fidelity® Utilities Central Fund
Schedule of Investments March 31, 2018 (Unaudited)
Showing Percentage of Net Assets
| Common Stocks - 96.7% | |||
| Shares | Value | ||
| Electric Utilities - 47.3% | |||
| Electric Utilities - 47.3% | |||
| Edison International | 165,800 | $10,554,828 | |
| Eversource Energy | 400,500 | 23,597,460 | |
| Exelon Corp. | 1,087,745 | 42,432,932 | |
| FirstEnergy Corp. | 958,340 | 32,593,143 | |
| Great Plains Energy, Inc. | 739,619 | 23,512,488 | |
| NextEra Energy, Inc. | 403,165 | 65,848,940 | |
| PG&E Corp. | 571,239 | 25,094,529 | |
| Vistra Energy Corp. (a) | 998,108 | 20,790,590 | |
| Westar Energy, Inc. | 287,928 | 15,142,134 | |
| 259,567,044 | |||
| Equity Real Estate Investment Trusts (REITs) - 0.3% | |||
| Specialized REITs - 0.3% | |||
| InfraReit, Inc. | 90,802 | 1,764,283 | |
| Gas Utilities - 0.3% | |||
| Gas Utilities - 0.3% | |||
| South Jersey Industries, Inc. | 68,400 | 1,926,144 | |
| Independent Power and Renewable Electricity Producers - 14.3% | |||
| Independent Power Producers & Energy Traders - 11.4% | |||
| NRG Energy, Inc. | 1,067,443 | 32,589,035 | |
| NRG Yield, Inc. Class C | 249,200 | 4,236,400 | |
| The AES Corp. | 2,242,400 | 25,496,088 | |
| 62,321,523 | |||
| Renewable Electricity - 2.9% | |||
| NextEra Energy Partners LP | 399,282 | 15,967,287 | |
| TOTAL INDEPENDENT POWER AND RENEWABLE ELECTRICITY PRODUCERS | 78,288,810 | ||
| Media - 6.7% | |||
| Cable & Satellite - 2.8% | |||
| Comcast Corp. Class A | 453,611 | 15,499,888 | |
| Movies & Entertainment - 3.9% | |||
| Time Warner, Inc. | 226,900 | 21,460,202 | |
| TOTAL MEDIA | 36,960,090 | ||
| Multi-Utilities - 25.3% | |||
| Multi-Utilities - 25.3% | |||
| Avangrid, Inc. | 368,078 | 18,816,147 | |
| CenterPoint Energy, Inc. | 541,700 | 14,842,580 | |
| Dominion Resources, Inc. | 472,500 | 31,860,675 | |
| Public Service Enterprise Group, Inc. | 460,800 | 23,150,592 | |
| SCANA Corp. | 85,523 | 3,211,389 | |
| Sempra Energy | 420,454 | 46,762,894 | |
| 138,644,277 | |||
| Oil, Gas & Consumable Fuels - 2.5% | |||
| Oil & Gas Storage & Transport - 2.5% | |||
| Cheniere Energy Partners LP Holdings LLC | 215,563 | 5,951,694 | |
| Cheniere Energy, Inc. (a) | 147,700 | 7,894,565 | |
| 13,846,259 | |||
| TOTAL COMMON STOCKS | |||
| (Cost $434,244,880) | 530,996,907 | ||
| Money Market Funds - 1.4% | |||
| Fidelity Cash Central Fund, 1.72% (b) | |||
| (Cost $7,376,528) | 7,375,053 | 7,376,528 | |
| TOTAL INVESTMENT IN SECURITIES - 98.1% | |||
| (Cost $441,621,408) | 538,373,435 | ||
| NET OTHER ASSETS (LIABILITIES) - 1.9% | 10,639,989 | ||
| NET ASSETS - 100% | $549,013,424 |
Legend
(a) Non-income producing
(b) Affiliated fund that is generally available only to investment companies and other accounts managed by Fidelity Investments. The rate quoted is the annualized seven-day yield of the fund at period end. A complete unaudited listing of the fund's holdings as of its most recent quarter end is available upon request. In addition, each Fidelity Central Fund's financial statements are available on the SEC's website or upon request.
Affiliated Central Funds
Information regarding fiscal year to date income earned by the Fund from investments in Fidelity Central Funds is as follows:
| Fund | Income earned |
| Fidelity Cash Central Fund | $73,415 |
| Fidelity Securities Lending Cash Central Fund | 2,164 |
| Total | $75,579 |
Amounts in the income column in the above table include any capital gain distributions from underlying funds, which are presented in the corresponding line-item in the Statement of Operations if applicable.
Investment Valuation
All investments are categorized as Level 1 under the Fair Value Hierarchy. The inputs or methodology used for valuing securities may not be an indication of the risk associated with investing in those securities. For more information on valuation inputs please refer to the Investment Valuation section in the accompanying Notes to Financial Statements.
See accompanying notes which are an integral part of the financial statements.
Fidelity® Utilities Central Fund
Financial Statements
Statement of Assets and Liabilities
| March 31, 2018 (Unaudited) | ||
| Assets | ||
| Investment in securities, at value — See accompanying schedule: Unaffiliated issuers (cost $434,244,880) | $530,996,907 | |
| Fidelity Central Funds (cost $7,376,528) | 7,376,528 | |
| Total Investment in Securities (cost $441,621,408) | $538,373,435 | |
| Cash | 409,613 | |
| Receivable for investments sold | 41,549,844 | |
| Receivable for fund shares sold | 95,793 | |
| Dividends receivable | 861,722 | |
| Distributions receivable from Fidelity Central Funds | 10,920 | |
| Other receivables | 768 | |
| Total assets | 581,302,095 | |
| Liabilities | ||
| Payable for investments purchased | $32,059,125 | |
| Payable for fund shares redeemed | 227,160 | |
| Other payables and accrued expenses | 2,386 | |
| Total liabilities | 32,288,671 | |
| Net Assets | $549,013,424 | |
| Net Assets consist of: | ||
| Paid in capital | $440,632,362 | |
| Undistributed net investment income | 2,533,038 | |
| Accumulated undistributed net realized gain (loss) on investments and foreign currency transactions | 9,096,351 | |
| Net unrealized appreciation (depreciation) on investments and assets and liabilities in foreign currencies | 96,751,673 | |
| Net Assets, for 3,114,027 shares outstanding | $549,013,424 | |
| Net Asset Value, offering price and redemption price per share ($549,013,424 ÷ 3,114,027 shares) | $176.30 |
See accompanying notes which are an integral part of the financial statements.
Statement of Operations
| Six months ended March 31, 2018 (Unaudited) | ||
| Investment Income | ||
| Dividends | $6,903,676 | |
| Income from Fidelity Central Funds (including $2,164 from security lending) | 75,579 | |
| Total income | 6,979,255 | |
| Expenses | ||
| Custodian fees and expenses | $3,811 | |
| Independent directors' fees and expenses | 939 | |
| Miscellaneous | 6 | |
| Total expenses before reductions | 4,756 | |
| Expense reductions | (22) | 4,734 |
| Net investment income (loss) | 6,974,521 | |
| Realized and Unrealized Gain (Loss) | ||
| Net realized gain (loss) on: | ||
| Investment securities: | ||
| Unaffiliated issuers | 18,230,558 | |
| Fidelity Central Funds | (72) | |
| Foreign currency transactions | 4,406 | |
| Total net realized gain (loss) | 18,234,892 | |
| Change in net unrealized appreciation (depreciation) on: | ||
| Investment securities: | ||
| Unaffiliated issuers | (11,232,113) | |
| Fidelity Central Funds | (769) | |
| Assets and liabilities in foreign currencies | (314) | |
| Total change in net unrealized appreciation (depreciation) | (11,233,196) | |
| Net gain (loss) | 7,001,696 | |
| Net increase (decrease) in net assets resulting from operations | $13,976,217 |
See accompanying notes which are an integral part of the financial statements.
Statement of Changes in Net Assets
| Six months ended March 31, 2018 (Unaudited) | Year ended September 30, 2017 | |
| Increase (Decrease) in Net Assets | ||
| Operations | ||
| Net investment income (loss) | $6,974,521 | $14,082,345 |
| Net realized gain (loss) | 18,234,892 | 23,807,933 |
| Change in net unrealized appreciation (depreciation) | (11,233,196) | 35,526,805 |
| Net increase (decrease) in net assets resulting from operations | 13,976,217 | 73,417,083 |
| Distributions to shareholders from net investment income | (6,268,684) | (12,188,641) |
| Distributions to shareholders from net realized gain | (31,029,277) | – |
| Total distributions | (37,297,961) | (12,188,641) |
| Affiliated share transactions | ||
| Proceeds from sales of shares | 57,598,481 | 46,589,917 |
| Reinvestment of distributions | 37,297,961 | 12,188,125 |
| Cost of shares redeemed | (23,884,912) | (81,725,834) |
| Net increase (decrease) in net assets resulting from share transactions | 71,011,530 | (22,947,792) |
| Total increase (decrease) in net assets | 47,689,786 | 38,280,650 |
| Net Assets | ||
| Beginning of period | 501,323,638 | 463,042,988 |
| End of period | $549,013,424 | $501,323,638 |
| Other Information | ||
| Undistributed net investment income end of period | $2,533,038 | $1,827,201 |
| Shares | ||
| Sold | 326,708 | 281,722 |
| Issued in reinvestment of distributions | 214,495 | 71,826 |
| Redeemed | (133,564) | (489,262) |
| Net increase (decrease) | 407,639 | (135,714) |
See accompanying notes which are an integral part of the financial statements.
Financial Highlights
Fidelity Utilities Central Fund
| Six months ended (Unaudited) March 31, | Years endedSeptember 30, | |||||
| 2018 | 2017 | 2016 | 2015 | 2014 | 2013 | |
| Selected Per–Share Data | ||||||
| Net asset value, beginning of period | $185.24 | $162.92 | $144.05 | $155.14 | $130.43 | $116.88 |
| Income from Investment Operations | ||||||
| Net investment income (loss)A | 2.40 | 5.08 | 4.73 | 4.36 | 4.11 | 4.04 |
| Net realized and unrealized gain (loss) | 2.16 | 21.62 | 18.44 | (11.35) | 24.33 | 13.29 |
| Total from investment operations | 4.56 | 26.70 | 23.17 | (6.99) | 28.44 | 17.33 |
| Distributions from net investment income | (2.25) | (4.38) | (4.30) | (4.10) | (3.73) | (3.78) |
| Distributions from net realized gain | (11.25) | – | – | – | – | – |
| Total distributions | (13.50) | (4.38) | (4.30) | (4.10) | (3.73) | (3.78) |
| Net asset value, end of period | $176.30 | $185.24 | $162.92 | $144.05 | $155.14 | $130.43 |
| Total ReturnB,C | 2.60% | 16.66% | 16.23% | (4.66)% | 21.98% | 15.04% |
| Ratios to Average Net AssetsD,E | ||||||
| Expenses before reductionsF | - %G | -% | -% | -% | -% | -% |
| Expenses net of fee waivers, if anyF | - %G | -% | -% | -% | -% | -% |
| Expenses net of all reductionsF | - %G | -% | -% | -% | -% | -% |
| Net investment income (loss) | 2.68%G | 2.96% | 3.03% | 2.78% | 2.80% | 3.23% |
| Supplemental Data | ||||||
| Net assets, end of period (000 omitted) | $549,013 | $501,324 | $463,043 | $406,258 | $482,971 | $398,657 |
| Portfolio turnover rateH | 92%G | 47%I | 76% | 110% | 121%I | 148%I |
A Calculated based on average shares outstanding during the period.
B Total returns for periods of less than one year are not annualized.
C Total returns would have been lower if certain expenses had not been reduced during the applicable periods shown.
D Fees and expenses of any underlying Fidelity Central Funds are not included in the Fund's expense ratio. The Fund indirectly bears its proportionate share of the expenses of any underlying Fidelity Central Funds.
E Expense ratios reflect operating expenses of the Fund. Expenses before reductions do not reflect amounts reimbursed by the investment adviser or reductions from expense offset arrangements and do not represent the amount paid by the Fund during periods when reimbursements or reductions occur. Expenses net of fee waivers reflect expenses after reimbursement by the investment adviser but prior to reductions from expense offset arrangements. Expenses net of all reductions represent the net expenses paid by the Fund.
F Amount represents less than .005%.
G Annualized
H Amount does not include the portfolio activity of any underlying Fidelity Central Funds.
I Portfolio turnover rate excludes securities received or delivered in-kind.
See accompanying notes which are an integral part of the financial statements.
Notes to Financial Statements (Unaudited)
For the period ended March 31, 2018
1. Organization.
Fidelity Consumer Discretionary Central Fund (Consumer Discretionary), Fidelity Consumer Staples Central Fund (Consumer Staples), Fidelity Energy Central Fund (Energy), Fidelity Financials Central Fund (Financials), Fidelity Health Care Central Fund (Health Care), Fidelity Industrials Central Fund (Industrials), Fidelity Information Technology Central Fund (Information Technology), Fidelity Materials Central Fund (Materials), Fidelity Real Estate Equity Central Fund (Real Estate Equity), Fidelity Telecom Services Central Fund (Telecom Services), and Fidelity Utilities Central Fund (Utilities), collectively referred to as the Funds, are funds of Fidelity Central Investment Portfolios LLC (the LLC) and are authorized to issue an unlimited number of shares. The LLC is registered under the Investment Company Act of 1940, as amended (the 1940 Act), as an open-end management investment company organized as a Delaware Limited Liability Company. Shares of each Fund are only offered to other investment companies and accounts managed by Fidelity Management & Research Company (FMR), or its affiliates (the Investing Funds). All of the Funds are non-diversified, with the exception of Financials and Health Care. The Funds invest primarily in securities of companies whose principal business activities fall within specific industries. The Funds are referred to as Fidelity Central Funds and may also invest in other Fidelity Central Funds available only to investment companies and other accounts managed by FMR and its affiliates.
2. Investments in Fidelity Central Funds.
The Funds invest in Fidelity Central Funds, which are open-end investment companies generally available only to other investment companies and accounts managed by the investment adviser and its affiliates. The Funds' Schedules of Investments list each of the Fidelity Central Funds held as of period end, if any, as an investment of each Fund, but do not include the underlying holdings of each Fidelity Central Fund. As an Investing Fund, each Fund indirectly bears its proportionate share of the expenses of the underlying Fidelity Central Funds.
The Money Market Central Funds seek preservation of capital and current income and are managed by Fidelity Investments Money Management, Inc. (FIMM), an affiliate of the investment adviser. Annualized expenses of the Money Market Central Funds as of their most recent shareholder report date are less than .005%.
A complete unaudited list of holdings for each Fidelity Central Fund is available upon request or at the Securities and Exchange Commission (the SEC) website at www.sec.gov. In addition, the financial statements of the Fidelity Central Funds are available on the SEC website or upon request.
3. Significant Accounting Policies.
Each Fund is an investment company and applies the accounting and reporting guidance of the Financial Accounting Standards Board (FASB) Accounting Standards Codification Topic 946 Financial Services – Investments Companies. The financial statements have been prepared in conformity with accounting principles generally accepted in the United States of America (GAAP), which require management to make certain estimates and assumptions at the date of the financial statements. Actual results could differ from those estimates. Subsequent events, if any, through the date that the financial statements were issued have been evaluated in the preparation of the financial statements. The following summarizes the significant accounting policies of the Funds:
Investment Valuation. Investments are valued as of 4:00 p.m. Eastern time on the last calendar day of the period. The Board of Directors (the Board) has delegated the day to day responsibility for the valuation of each Fund's investments to the Fair Value Committee (the Committee) established by each Fund's investment adviser. In accordance with valuation policies and procedures approved by the Board, each Fund attempts to obtain prices from one or more third party pricing vendors or brokers to value its investments. When current market prices, quotations or currency exchange rates are not readily available or reliable, investments will be fair valued in good faith by the Committee, in accordance with procedures adopted by the Board. Factors used in determining fair value vary by investment type and may include market or investment specific events. The frequency with which these procedures are used cannot be predicted and they may be utilized to a significant extent. The Committee oversees each Fund's valuation policies and procedures and reports to the Board on the Committee's activities and fair value determinations. The Board monitors the appropriateness of the procedures used in valuing each Fund's investments and ratifies the fair value determinations of the Committee.
Each Fund categorizes the inputs to valuation techniques used to value its investments into a disclosure hierarchy consisting of three levels as shown below:
- Level 1 – quoted prices in active markets for identical investments
- Level 2 – other significant observable inputs (including quoted prices for similar investments, interest rates, prepayment speeds, etc.)
- Level 3 – unobservable inputs (including the Fund's own assumptions based on the best information available)
Valuation techniques used to value each Fund's investments by major category are as follows:
Equity securities, including restricted securities, for which market quotations are readily available, are valued at the last reported sale price or official closing price as reported by a third party pricing vendor on the primary market or exchange on which they are traded and are categorized as Level 1 in the hierarchy. In the event there were no sales during the day or closing prices are not available, securities are valued at the last quoted bid price or may be valued using the last available price and are generally categorized as Level 2 in the hierarchy. For foreign equity securities, when market or security specific events arise, comparisons to the valuation of American Depositary Receipts (ADRs), futures contracts, Exchange-Traded Funds (ETFs) and certain indexes as well as quoted prices for similar securities may be used and would be categorized as Level 2 in the hierarchy. Utilizing these techniques may result in transfers between Level 1 and Level 2. For equity securities, including restricted securities, where observable inputs are limited, assumptions about market activity and risk are used and these securities may be categorized as Level 3 in the hierarchy. Equity securities, including restricted securities, for which observable inputs are not available are valued using alternate valuation approaches, including the market approach and the income approach and are categorized as Level 3 in the hierarchy. The market approach generally consists of using comparable market transactions while the income approach generally consists of using the net present value of estimated future cash flows, adjusted as appropriate for liquidity, credit, market and/or other risk factors.
Investments in open-end mutual funds, including other Fidelity Central Funds, are valued at their closing net asset value (NAV) each business day and are categorized as Level 1 in the hierarchy.
The following provides information on Level 3 securities held by the Information Technology Central Fund that were valued at period end based on unobservable inputs. These amounts exclude valuations provided by a broker.
| Asset Type | Fair Value | Valuation Technique(s) | Unobservable Input | Amount or Range/Weighted Average | Impact to Valuation from an Increase in Input(a) |
| Equities | $52,136,317 | Market approach | Transaction price | $5.59 - $48.77 / $23.09 | Increase |
| Recovery value | Recovery value | 0.0% | Increase |
(a) Represents the expected directional change in the fair value of the Level 3 investments that would result from an increase in the corresponding input. A decrease to the unobservable input would have the opposite effect. Significant changes in these inputs could result in significantly higher or lower fair value measurements.
Changes in valuation techniques may result in transfers in or out of an assigned level within the disclosure hierarchy. The aggregate value of investments by input level as of March 31, 2018, including information on transfers between Levels 1 and 2, as well as a roll forward of Level 3 investments, is included at the end of each applicable Fund's Schedule of Investments.
Foreign Currency. The Funds may use foreign currency contracts to facilitate transactions in foreign-denominated securities. Gains and losses from these transactions may arise from changes in the value of the foreign currency or if the counterparties do not perform under the contracts' terms.
Foreign-denominated assets, including investment securities, and liabilities are translated into U.S. dollars at the exchange rates at period end. Purchases and sales of investment securities, income and dividends received and expenses denominated in foreign currencies are translated into U.S. dollars at the exchange rate in effect on the transaction date.
The effects of exchange rate fluctuations on investments are included with the net realized and unrealized gain (loss) on investment securities. Other foreign currency transactions resulting in realized and unrealized gain (loss) are disclosed separately.
Investment Transactions and Income. For financial reporting purposes, the Funds' investment holdings and NAV include trades executed through the end of the last business day of the period. The NAV per share for processing shareholder transactions is calculated as of the close of business of the New York Stock Exchange (NYSE), normally 4:00 p.m. Eastern time and includes trades executed through the end of the prior business day. Gains and losses on securities sold are determined on the basis of identified cost and may include proceeds received from litigation. Dividend income is recorded on the ex-dividend date, except for certain dividends from foreign securities where the ex-dividend date may have passed, which are recorded as soon as the Funds are informed of the ex-dividend date. Non-cash dividends included in dividend income, if any, are recorded at the fair market value of the securities received. Income and capital gain distributions from Fidelity Central Funds, if any, are recorded on the ex-dividend date. Certain distributions received by the Funds represent a return of capital or capital gain. The Funds determine the components of these distributions subsequent to the ex-dividend date, based upon receipt of tax filings or other correspondence relating to the underlying investment. These distributions are recorded as a reduction of cost of investments and/or as a realized gain. Investment income is recorded net of foreign taxes withheld where recovery of such taxes is uncertain.
Expenses. Expenses directly attributable to a fund are charged to that fund. Expenses attributable to more than one fund are allocated among the respective funds on the basis of relative net assets or other appropriate methods. Expense estimates are accrued in the period to which they relate and adjustments are made when actual amounts are known.
Income Tax Information and Distributions to Shareholders. Each year, each Fund intends to qualify as a regulated investment company under Subchapter M of the Internal Revenue Code, including distributing substantially all of its taxable income and realized gains. As a result, no provision for U.S. Federal income taxes is required. Each Fund files a U.S. federal tax return, in addition to state and local tax returns as required. Each Fund's federal income tax returns are subject to examination by the Internal Revenue Service (IRS) for a period of three fiscal years after they are filed. State and local tax returns may be subject to examination for an additional fiscal year depending on the jurisdiction. Foreign taxes are provided for based on each Fund's understanding of the tax rules and rates that exist in the foreign markets in which it invests. Consumer Discretionary and Energy are subject to a tax imposed on capital gains by certain countries in which they invest. An estimated deferred tax liability for net unrealized appreciation on the applicable securities is included in Other payables and accrued expenses on each applicable Fund's Statement of Assets & Liabilities.
Distributions are declared and recorded on the ex-dividend date. Income and capital gain distributions are determined in accordance with income tax regulations, which may differ from GAAP.
Capital accounts within the financial statements are adjusted for permanent book-tax differences. These adjustments have no impact on net assets or the results of operations. Capital accounts are not adjusted for temporary book-tax differences which will reverse in a subsequent period.
Book-tax differences are primarily due to the short-term gain distributions from the Underlying Funds, foreign currency transactions, passive foreign investment companies (PFIC), certain foreign taxes, partnerships, certain deemed distributions and losses deferred due to wash sales.
As of period end, the cost and unrealized appreciation (depreciation) in securities, and derivatives if applicable, for federal income tax purposes were as follows for each Fund:
| Tax cost | Gross unrealized appreciation | Gross unrealized depreciation | Net unrealized appreciation (depreciation) | |
| Consumer Discretionary | $1,337,753,592 | $641,929,724 | $(27,497,303) | $614,432,421 |
| Consumer Staples | 1,130,797,460 | 203,184,622 | (63,547,190) | 139,637,432 |
| Energy | 947,500,207 | 184,496,163 | (51,408,159) | 133,088,004 |
| Financials | 2,646,594,517 | 885,880,048 | (72,670,351) | 813,209,697 |
| Health Care | 2,145,906,297 | 648,596,637 | (81,960,375) | 566,636,262 |
| Industrials | 1,454,294,393 | 439,277,638 | (63,192,344) | 376,085,294 |
| Information Technology | 4,105,774,278 | 1,223,981,361 | (133,839,046) | 1,090,142,315 |
| Materials | 431,683,717 | 98,315,087 | (15,286,447) | 83,028,640 |
| Real Estate Equity | 109,785,102 | 8,762,961 | (7,123,545) | 1,639,416 |
| Telecom Services | 357,438,862 | 73,213,480 | (38,657,831) | 34,555,649 |
| Utilities | 444,524,204 | 100,160,058 | (6,310,827) | 93,849,231 |
Restricted Securities. The Funds may invest in securities that are subject to legal or contractual restrictions on resale. These securities generally may be resold in transactions exempt from registration or to the public if the securities are registered. Disposal of these securities may involve time-consuming negotiations and expense, and prompt sale at an acceptable price may be difficult. Information regarding restricted securities is included at the end of each applicable Fund's Schedule of Investments.
4. Purchases and Sales of Investments.
Purchases and sales of securities, other than short-term securities, are noted in the table below.
| Purchases ($) | Sales ($) | |
| Consumer Discretionary | 477,257,138 | 328,834,824 |
| Consumer Staples | 790,292,880 | 648,532,577 |
| Energy | 294,071,497 | 205,395,222 |
| Financials | 806,644,282 | 569,163,636 |
| Health Care | 1,325,118,695 | 1,051,167,534 |
| Industrials | 712,604,942 | 587,861,207 |
| Information Technology | 2,675,192,820 | 2,239,701,396 |
| Materials | 235,068,339 | 194,104,752 |
| Real Estate Equity | 29,808,706 | 33,503,286 |
| Telecom Services | 137,662,898 | 126,814,521 |
| Utilities | 268,622,893 | 234,169,579 |
5. Fees and Other Transactions with Affiliates.
Management Fee and Expense Contract. FMR Co., Inc. (the investment adviser), an affiliate of FMR, provides each Fund with investment management services. The Funds do not pay any fees for these services. Pursuant to each Fund's management contract with the investment adviser, FMR pays the investment adviser a portion of the management fees it receives from the Investing Funds. In addition, under an expense contract FMR pays all other expenses of each Fund, excluding custody fees, the compensation of the independent Directors, and certain miscellaneous expenses such as proxy and shareholder meeting expenses.
Brokerage Commissions. Certain Funds placed a portion of their portfolio transactions with brokerage firms which are affiliates of the investment adviser. Brokerage commissions are included in net realized gain (loss) and change in net unrealized appreciation (depreciation) in the Statement of Operations. The commissions paid to these affiliated firms were as follows:
| Amount | |
| Consumer Discretionary | $5,314 |
| Consumer Staples | 23,813 |
| Energy | 5,625 |
| Financials | 11,752 |
| Health Care | 34,851 |
| Industrials | 17,729 |
| Information Technology | 67,172 |
| Materials | 7,198 |
| Real Estate Equity | 428 |
| Telecom Services | 7,403 |
| Utilities | 7,114 |
Interfund Lending Program. Pursuant to an Exemptive Order issued by the SEC, the Funds, along with other registered investment companies having management contracts with FMR or other affiliated entities of FMR, may participate in an interfund lending program. This program provides an alternative credit facility allowing the funds to borrow from, or lend money to, other participating affiliated funds. At period end, there were no interfund loans outstanding. Each applicable fund's activity in this program during the period for which loans were outstanding was as follows:
| Borrower or Lender | Average Loan Balance | Weighted Average Interest Rate | Interest Expense | |
| Consumer Discretionary | Borrower | $7,260,333 | 1.54% | $1,866 |
| Information Technology | Borrower | 7,349,000 | 1.35% | 824 |
| Telecom Services | Borrower | 7,329,000 | 1.34% | 274 |
Interfund Trades. The Funds may purchase from or sell securities to other Fidelity Funds under procedures adopted by the Board. The procedures have been designed to ensure these interfund trades are executed in accordance with Rule 17a-7 of the 1940 Act. Interfund trades are included within the respective purchases and sales amounts shown in the Purchases and Sales of Investments note.
Prior Fiscal Year Exchanges In-Kind. During the prior period, VIP Asset Manager: Growth Portfolio and VIP Asset Manager Portfolio (the Investing Funds) completed exchange in-kind transactions with each Fund. The Investing Funds delivered investments and cash in exchange for shares of each Fund, as presented in the accompanying table. The value of investments delivered from the Investing Funds is included in proceeds from sales of shares in the accompanying Statements of Changes in Net Assets. Each Fund recognized no gain or loss for federal income tax purposes.
Details of the transactions are presented in the accompanying table:
| Fund | Value of Investments and Cash Delivered | Exchanged Number of Shares |
| Consumer Discretionary | $56,561,990 | 227,138 |
| Consumer Staples | 39,235,872 | 183,071 |
| Energy | 34,322,119 | 270,083 |
| Financials | 98,879,378 | 1,088,740 |
| Health Care | 66,542,763 | 201,413 |
| Industrials | 50,997,163 | 199,332 |
| Information Technology | 109,126,057 | 339,365 |
| Materials | 15,146,995 | 70,151 |
| Telecom Services | 12,919,521 | 69,136 |
| Utilities | 14,935,496 | 96,739 |
6. Security Lending.
Certain Funds lend portfolio securities through a lending agent from time to time in order to earn additional income. For equity securities, a lending agent is used and may loan securities to certain qualified borrowers, including Fidelity Capital Markets (FCM), a broker-dealer affiliated with the Funds. On the settlement date of the loan, each applicable Fund receives collateral (in the form of U.S. Treasury obligations, letters of credit and/or cash) against the loaned securities and maintains collateral in an amount not less than 100% of the market value of the loaned securities during the period of the loan. The market value of the loaned securities is determined at the close of business of the Funds and any additional required collateral is delivered to the Funds on the next business day. The Funds or borrower may terminate the loan at any time, and if the borrower defaults on its obligation to return the securities loaned because of insolvency or other reasons, the Funds may apply collateral received from the borrower against the obligation. The Funds may experience delays and costs in recovering the securities loaned. Any cash collateral received is invested in the Fidelity Securities Lending Cash Central Fund. The value of loaned securities and cash collateral at period end are disclosed on each applicable Fund's Statement of Assets and Liabilities. Security lending income represents the income earned on investing cash collateral, less rebates paid to borrowers and any lending agent fees associated with the loan, plus any premium payments received for lending certain types of securities. Security lending income is presented on each applicable Fund's Statement of Operations as a component of income from Fidelity Central Funds. FCM security lending activity was as follows:
| Security Lending Income From Securities Loaned to FCM | Value of Securities Loaned to FCM at Period End | |
| Consumer Discretionary | $1,631 | $52,509 |
| Consumer Staples | 597 | – |
| Energy | 4 | – |
| Financials | – | – |
| Health Care | 52,950 | 2,783,692 |
| Industrials | 474 | – |
| Information Technology | 62 | – |
| Materials | – | – |
| Real Estate Equity | – | – |
| Telecom Services | 10,261 | 111,300 |
| Utilities | – | – |
7. Expense Reductions.
Through arrangements with each applicable Fund's custodian, credits realized as a result of certain uninvested cash balances were used to reduce each applicable Fund's expenses. During the period, the reduction of expenses for each Fund is noted in the table below.
| Fund | Custody Earnings Credits |
| Consumer Discretionary | $355 |
| Consumer Staples | 355 |
| Energy | 1,146 |
| Financials | 173 |
| Health Care | 773 |
| Industrials | – |
| Information Technology | 678 |
| Materials | – |
| Real Estate Equity | 48 |
| Telecom Services | 181 |
| Utilities | 22 |
8. Other.
The Funds' organizational documents provide former and current directors and officers with a limited indemnification against liabilities arising in connection with the performance of their duties to the Funds. In the normal course of business, the Funds may also enter into contracts that provide general indemnifications. The Funds' maximum exposure under these arrangements is unknown as this would be dependent on future claims that may be made against the Funds. The risk of material loss from such claims is considered remote.
At the end of the period, mutual funds managed by FMR or its affiliates were the owners of record of all of the outstanding shares of the Funds.
Shareholder Expense Example
As a shareholder of a Fund, you incur two types of costs: (1) transaction costs, and (2) ongoing costs, including other Fund expenses. This Example is intended to help you understand your ongoing costs (in dollars) of investing in the Funds and to compare these costs with the ongoing costs of investing in other mutual funds.
The Example is based on an investment of $1,000 invested at the beginning of the period and held for the entire period (October 1, 2017 to March 31, 2018).
Actual Expenses
The first line of the accompanying table for each fund provides information about actual account values and actual expenses. You may use the information in this line, together with the amount you invested, to estimate the expenses that you paid over the period. Simply divide your account value by $1,000.00 (for example, an $8,600 account value divided by $1,000.00 = 8.6), then multiply the result by the number in the first line for a fund under the heading entitled "Expenses Paid During Period" to estimate the expenses you paid on your account during this period. In addition, each Fund, as a shareholder in the underlying Fidelity Central Funds, will indirectly bear its pro-rata share of the fees and expenses incurred by the underlying Fidelity Central Funds. These fees and expenses are not included in the Fund's annualized expense ratio used to calculate the expense estimate in the table below.
Hypothetical Example for Comparison Purposes
The second line of the accompanying table for each fund provides information about hypothetical account values and hypothetical expenses based on a fund's actual expense ratio and an assumed rate of return of 5% per year before expenses, which is not the Fund's actual return. The hypothetical account values and expenses may not be used to estimate the actual ending account balance or expenses you paid for the period. You may use this information to compare the ongoing costs of investing in the Fund and other funds. To do so, compare this 5% hypothetical example with the 5% hypothetical examples that appear in the shareholder reports of the other funds. In addition, each Fund, as a shareholder in the underlying Fidelity Central Funds, will indirectly bear its pro-rata share of the fees and expenses incurred by the underlying Fidelity Central Funds. These fees and expenses are not included in the Fund's annualized expense ratio used to calculate the expense estimate in the table below.
Please note that the expenses shown in the table are meant to highlight your ongoing costs only and do not reflect any transaction costs. Therefore, the second line of the table is useful in comparing ongoing costs only, and will not help you determine the relative total costs of owning different funds.
| Annualized Expense Ratio-A | Beginning Account Value October 1, 2017 | Ending Account Value March 31, 2018 | Expenses Paid During Period-B October 1, 2017 to March 31, 2018 | |
| Consumer Discretionary | .0019% | |||
| Actual | $1,000.00 | $1,144.20 | $.01 | |
| Hypothetical-C | $1,000.00 | $1,024.92 | $.01 | |
| Consumer Staples | .0033% | |||
| Actual | $1,000.00 | $978.60 | $.02 | |
| Hypothetical-C | $1,000.00 | $1,024.92 | $.02 | |
| Energy | .0030% | |||
| Actual | $1,000.00 | $1,053.60 | $.02 | |
| Hypothetical-C | $1,000.00 | $1,024.92 | $.02 | |
| Financials | .0016% | |||
| Actual | $1,000.00 | $1,062.00 | $.01 | |
| Hypothetical-C | $1,000.00 | $1,024.92 | $.01 | |
| Health Care | .0033% | |||
| Actual | $1,000.00 | $1,042.70 | $.02 | |
| Hypothetical-C | $1,000.00 | $1,024.92 | $.02 | |
| Industrials | .0017% | |||
| Actual | $1,000.00 | $1,068.10 | $.01 | |
| Hypothetical-C | $1,000.00 | $1,024.92 | $.01 | |
| Information Technology | .0065% | |||
| Actual | $1,000.00 | $1,127.70 | $.03 | |
| Hypothetical-C | $1,000.00 | $1,024.90 | $.03 | |
| Materials | .0046% | |||
| Actual | $1,000.00 | $1,009.40 | $.02 | |
| Hypothetical-C | $1,000.00 | $1,024.91 | $.02 | |
| Real Estate Equity | .0113% | |||
| Actual | $1,000.00 | $935.10 | $.05 | |
| Hypothetical-C | $1,000.00 | $1,024.88 | $.06 | |
| Telecom Services | .0030% | |||
| Actual | $1,000.00 | $951.70 | $.01 | |
| Hypothetical-C | $1,000.00 | $1,024.92 | $.02 | |
| Utilities | .0018% | |||
| Actual | $1,000.00 | $1,026.00 | $.01 | |
| Hypothetical-C | $1,000.00 | $1,024.92 | $.01 |
A Annualized expense ratio reflects expenses net of applicable fee waivers.
B Expenses are equal to each Fund's annualized expense ratio, multiplied by the average account value over the period, multiplied by 182/ 365 (to reflect the one-half year period). The fees and expenses of the underlying Money Market Central Funds in which each Fund invests are not included in each Fund's annualized expense ratio.
C 5% return per year before expenses
![]()
ESCIP-SANN-0518
1.831586.111
Fidelity® International Equity Central Fund Semi-Annual Report March 31, 2018 |
|
Contents
To view a fund's proxy voting guidelines and proxy voting record for the 12-month period ended June 30, visit http://www.fidelity.com/proxyvotingresults or visit the Securities and Exchange Commission's (SEC) web site at http://www.sec.gov.
You may also call 1-800-544-8544 to request a free copy of the proxy voting guidelines.
Standard & Poor's, S&P and S&P 500 are registered service marks of The McGraw-Hill Companies, Inc. and have been licensed for use by Fidelity Distributors Corporation.
Other third-party marks appearing herein are the property of their respective owners.
All other marks appearing herein are registered or unregistered trademarks or service marks of FMR LLC or an affiliated company. © 2018 FMR LLC. All rights reserved.
A fund files its complete schedule of portfolio holdings with the SEC for the first and third quarters of each fiscal year on Form N-Q. Forms N-Q are available on the SEC’s web site at http://www.sec.gov. A fund's Forms N-Q may be reviewed and copied at the SEC’s Public Reference Room in Washington, DC. Information regarding the operation of the SEC's Public Reference Room may be obtained by calling 1-800-SEC-0330.
Investment Summary (Unaudited)
Geographic Diversification (% of fund's net assets)
| As of March 31, 2018 | ||
| Japan | 19.6% | |
| United Kingdom | 16.7% | |
| France | 10.5% | |
| Germany | 8.3% | |
| Canada | 6.0% | |
| United States of America* | 5.9% | |
| Switzerland | 5.4% | |
| Netherlands | 3.7% | |
| Australia | 2.8% | |
| Other | 21.1% | |
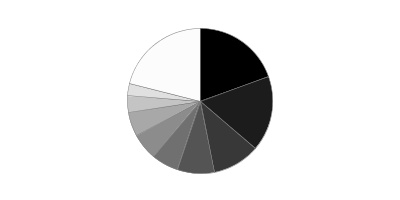
* Includes Short-Term investments and Net Other Assets (Liabilities).
Percentages are based on country or territory of incorporation and are adjusted for the effect of futures contracts, if applicable.
Asset Allocation as of March 31, 2018
| % of fund's net assets | |
| Stocks and Equity Futures | 98.3 |
| Short-Term Investments and Net Other Assets (Liabilities) | 1.7 |
Top Ten Stocks as of March 31, 2018
| % of fund's net assets | |
| Roche Holding AG (participation certificate) (Switzerland, Pharmaceuticals) | 1.6 |
| BASF AG (Germany, Chemicals) | 1.4 |
| BP PLC (United Kingdom, Oil, Gas & Consumable Fuels) | 1.3 |
| Deutsche Post AG (Germany, Air Freight & Logistics) | 1.3 |
| Sony Corp. (Japan, Household Durables) | 1.2 |
| Royal Bank of Canada (Canada, Banks) | 1.2 |
| Bunzl PLC (United Kingdom, Trading Companies & Distributors) | 1.2 |
| Compagnie de St. Gobain (France, Building Products) | 1.2 |
| Total SA (France, Oil, Gas & Consumable Fuels) | 1.1 |
| Makita Corp. (Japan, Machinery) | 1.1 |
| 12.6 |
Top Market Sectors as of March 31, 2018
| % of fund's net assets | |
| Financials | 22.7 |
| Industrials | 14.5 |
| Consumer Discretionary | 12.5 |
| Health Care | 10.3 |
| Consumer Staples | 9.8 |
| Materials | 8.2 |
| Energy | 6.3 |
| Information Technology | 4.4 |
| Real Estate | 3.2 |
| Utilities | 3.1 |
Schedule of Investments March 31, 2018 (Unaudited)
Showing Percentage of Net Assets
| Common Stocks - 97.4% | |||
| Shares | Value | ||
| Australia - 2.8% | |||
| Abacus Property Group unit | 2,985,692 | $7,997,886 | |
| Aub Group Ltd. | 679,458 | 7,416,920 | |
| Australia & New Zealand Banking Group Ltd. | 917,060 | 19,087,096 | |
| BHP Billiton Ltd. | 385,706 | 8,549,371 | |
| Blue Sky Alternative Investments Ltd. (a) | 484,886 | 3,873,134 | |
| Commonwealth Bank of Australia | 510,636 | 28,555,695 | |
| HUB24 Ltd. (b) | 491,878 | 3,824,006 | |
| TOTAL AUSTRALIA | 79,304,108 | ||
| Austria - 1.7% | |||
| Andritz AG | 400,000 | 22,344,972 | |
| Erste Group Bank AG | 543,300 | 27,274,942 | |
| TOTAL AUSTRIA | 49,619,914 | ||
| Bailiwick of Jersey - 1.7% | |||
| Glencore Xstrata PLC | 5,570,989 | 27,653,353 | |
| Randgold Resources Ltd. | 74,900 | 6,222,395 | |
| Shire PLC | 282,200 | 14,045,045 | |
| TOTAL BAILIWICK OF JERSEY | 47,920,793 | ||
| Belgium - 2.3% | |||
| Anheuser-Busch InBev SA NV | 215,416 | 23,684,295 | |
| KBC Groep NV | 285,448 | 24,838,950 | |
| Telenet Group Holding NV (b) | 116,760 | 7,793,953 | |
| Umicore SA | 156,442 | 8,263,770 | |
| TOTAL BELGIUM | 64,580,968 | ||
| Bermuda - 0.2% | |||
| Cheung Kong Infrastructure Holdings Ltd. | 515,360 | 4,224,046 | |
| Canada - 6.0% | |||
| Barrick Gold Corp. | 525,500 | 6,546,571 | |
| Canadian Natural Resources Ltd. | 158,900 | 4,995,110 | |
| Cenovus Energy, Inc. | 1,229,600 | 10,469,757 | |
| Fortis, Inc. | 153,490 | 5,181,263 | |
| Great-West Lifeco, Inc. | 363,300 | 9,271,785 | |
| Imperial Oil Ltd. | 224,700 | 5,950,839 | |
| Intact Financial Corp. | 219,700 | 16,508,835 | |
| Lundin Mining Corp. | 1,714,400 | 11,244,367 | |
| MDC Partners, Inc. Class A (b) | 1,418,300 | 10,211,760 | |
| Royal Bank of Canada | 446,100 | 34,459,481 | |
| Shopify, Inc. (b) | 46,800 | 5,830,812 | |
| Suncor Energy, Inc. | 672,300 | 23,216,228 | |
| The Toronto-Dominion Bank | 475,800 | 27,000,224 | |
| TOTAL CANADA | 170,887,032 | ||
| Cayman Islands - 0.1% | |||
| JD.com, Inc. sponsored ADR (b) | 92,900 | 3,761,521 | |
| China - 0.4% | |||
| Jiangsu Hengrui Medicine Co. Ltd. (A Shares) | 351,288 | 4,859,545 | |
| PICC Property & Casualty Co. Ltd. (H Shares) | 3,930,000 | 6,944,424 | |
| TOTAL CHINA | 11,803,969 | ||
| Denmark - 0.4% | |||
| Jyske Bank A/S (Reg.) | 125,000 | 7,431,801 | |
| Scandinavian Tobacco Group A/S (c) | 254,807 | 4,496,025 | |
| TOTAL DENMARK | 11,927,826 | ||
| France - 10.5% | |||
| Capgemini SA | 61,700 | 7,682,979 | |
| Christian Dior SA | 17,600 | 6,949,385 | |
| Compagnie de St. Gobain | 628,100 | 33,124,164 | |
| Danone SA | 237,411 | 19,249,826 | |
| ENGIE | 508,880 | 8,487,482 | |
| Iliad SA | 32,489 | 6,715,983 | |
| Ipsen SA | 92,000 | 14,280,357 | |
| Kaufman & Broad SA | 320,700 | 16,857,539 | |
| LVMH Moet Hennessy - Louis Vuitton SA | 91,829 | 28,299,239 | |
| Remy Cointreau SA | 61,100 | 8,705,901 | |
| Sanofi SA | 302,255 | 24,252,968 | |
| Societe Generale Series A | 512,600 | 27,839,505 | |
| Suez Environnement SA | 252,191 | 3,652,330 | |
| Total SA | 562,353 | 32,233,899 | |
| Total SA rights (b)(d)(e) | 552,553 | 421,531 | |
| Veolia Environnement SA | 208,200 | 4,930,178 | |
| VINCI SA | 315,394 | 31,064,766 | |
| Vivendi SA | 285,770 | 7,384,140 | |
| Wendel SA | 114,100 | 17,787,963 | |
| TOTAL FRANCE | 299,920,135 | ||
| Germany - 7.8% | |||
| BASF AG | 384,074 | 38,951,771 | |
| Bayer AG | 63,700 | 7,181,140 | |
| Deutsche Borse AG | 156,586 | 21,405,833 | |
| Deutsche Post AG | 838,356 | 36,719,422 | |
| Deutsche Telekom AG | 1,007,400 | 16,481,773 | |
| E.ON AG | 596,165 | 6,624,640 | |
| Fresenius Medical Care AG & Co. KGaA | 110,000 | 11,234,603 | |
| LEG Immobilien AG | 69,640 | 7,826,791 | |
| Linde AG | 128,300 | 27,010,998 | |
| ProSiebenSat.1 Media AG | 394,149 | 13,651,938 | |
| Rheinmetall AG | 300 | 42,580 | |
| RWE AG | 231,430 | 5,712,347 | |
| SAP SE | 227,659 | 23,900,067 | |
| Siemens Healthineers AG (b)(c) | 120,000 | 4,931,644 | |
| TOTAL GERMANY | 221,675,547 | ||
| Hong Kong - 2.3% | |||
| AIA Group Ltd. | 2,734,600 | 23,377,216 | |
| China Resources Beer Holdings Co. Ltd. | 1,653,333 | 7,207,268 | |
| CLP Holdings Ltd. | 601,960 | 6,137,590 | |
| Dah Sing Banking Group Ltd. | 2,644,800 | 5,788,968 | |
| Dah Sing Financial Holdings Ltd. | 946,400 | 6,018,378 | |
| Hysan Development Co. Ltd. | 1,661,000 | 8,814,661 | |
| Sino Land Ltd. | 5,822,000 | 9,436,593 | |
| TOTAL HONG KONG | 66,780,674 | ||
| Hungary - 0.5% | |||
| OTP Bank PLC | 332,600 | 14,962,727 | |
| India - 0.4% | |||
| Axis Bank Ltd. | 1,559,002 | 12,321,688 | |
| Indonesia - 0.3% | |||
| PT Bank Danamon Indonesia Tbk Series A | 10,066,800 | 5,042,482 | |
| PT Bank Rakyat Indonesia Tbk | 15,266,400 | 4,006,508 | |
| TOTAL INDONESIA | 9,048,990 | ||
| Ireland - 1.9% | |||
| Greencore Group PLC | 4,266,447 | 7,934,211 | |
| James Hardie Industries PLC CDI | 1,255,838 | 22,288,123 | |
| Ryanair Holdings PLC sponsored ADR (b) | 187,380 | 23,019,633 | |
| TOTAL IRELAND | 53,241,967 | ||
| Italy - 1.1% | |||
| Banca Generali SpA | 433,200 | 13,965,411 | |
| Banco di Desio e della Brianza SpA | 520,960 | 1,410,234 | |
| Enel SpA | 2,030,897 | 12,427,493 | |
| Mediaset SpA (b)(d) | 914,051 | 3,500,048 | |
| TOTAL ITALY | 31,303,186 | ||
| Japan - 19.6% | |||
| Advance Residence Investment Corp. | 4,221 | 10,912,994 | |
| AEON Financial Service Co. Ltd. | 321,000 | 7,376,016 | |
| Bandai Namco Holdings, Inc. | 376,000 | 12,350,172 | |
| Chubu Electric Power Co., Inc. | 278,010 | 3,926,968 | |
| Chugai Pharmaceutical Co. Ltd. | 231,300 | 11,694,883 | |
| Daikin Industries Ltd. | 188,400 | 20,777,915 | |
| DaikyoNishikawa Corp. | 902,300 | 14,788,884 | |
| East Japan Railway Co. | 242,600 | 22,485,045 | |
| Funai Soken Holdings, Inc. | 302,250 | 6,467,960 | |
| Honda Motor Co. Ltd. | 230,200 | 7,918,162 | |
| Hoya Corp. | 393,500 | 19,618,604 | |
| Ichigo, Inc. | 2,596,700 | 11,421,040 | |
| Iida Group Holdings Co. Ltd. | 446,200 | 8,336,503 | |
| JSR Corp. | 812,700 | 18,277,253 | |
| Keyence Corp. | 28,400 | 17,626,390 | |
| Komatsu Ltd. | 710,500 | 23,684,446 | |
| Makita Corp. | 654,600 | 31,990,226 | |
| Minebea Mitsumi, Inc. | 338,700 | 7,232,051 | |
| Mitsubishi Motors Corp. of Japan | 2,111,400 | 15,100,564 | |
| Mitsubishi UFJ Financial Group, Inc. | 2,215,500 | 14,512,509 | |
| Nidec Corp. | 50,900 | 7,840,336 | |
| Nintendo Co. Ltd. | 27,600 | 12,154,842 | |
| Nippon Paint Holdings Co. Ltd. | 323,000 | 11,853,907 | |
| Nippon Telegraph & Telephone Corp. | 281,270 | 12,952,615 | |
| Olympus Corp. | 425,500 | 16,155,444 | |
| ORIX Corp. | 915,000 | 16,136,436 | |
| Panasonic Corp. | 1,725,700 | 24,667,917 | |
| Renesas Electronics Corp. (b) | 768,400 | 7,726,967 | |
| Shin-Etsu Chemical Co. Ltd. | 39,200 | 4,054,283 | |
| SMC Corp. | 54,700 | 22,141,149 | |
| SoftBank Corp. | 142,930 | 10,678,948 | |
| Sony Corp. | 727,100 | 35,164,293 | |
| Sony Financial Holdings, Inc. | 443,900 | 8,076,598 | |
| Suzuki Motor Corp. | 455,600 | 24,534,449 | |
| Terumo Corp. | 175,000 | 9,193,647 | |
| The Suruga Bank Ltd. | 404,300 | 5,581,661 | |
| Tokyo Electron Ltd. | 47,800 | 8,991,279 | |
| Tokyo Gas Co. Ltd. | 180,224 | 4,778,930 | |
| Toyota Boshoku Corp. | 547,200 | 11,231,472 | |
| VT Holdings Co. Ltd. | 1,040,500 | 5,309,821 | |
| Welcia Holdings Co. Ltd. | 166,400 | 7,467,318 | |
| Yamaha Motor Co. Ltd. | 217,900 | 6,512,119 | |
| TOTAL JAPAN | 559,703,016 | ||
| Netherlands - 3.7% | |||
| ASML Holding NV (Netherlands) | 101,478 | 20,122,441 | |
| ASR Nederland NV | 303,900 | 12,982,980 | |
| Koninklijke Philips Electronics NV | 675,592 | 25,869,779 | |
| NIBC Holding NV (b)(c) | 874,948 | 8,686,922 | |
| Unilever NV: | |||
| (Certificaten Van Aandelen) (Bearer) | 424,825 | 23,979,435 | |
| (NY Reg.) | 252,700 | 14,249,753 | |
| TOTAL NETHERLANDS | 105,891,310 | ||
| Norway - 0.6% | |||
| Aker Bp ASA | 194,300 | 5,267,441 | |
| Statoil ASA | 548,369 | 12,978,783 | |
| TOTAL NORWAY | 18,246,224 | ||
| Portugal - 0.2% | |||
| Galp Energia SGPS SA Class B | 339,357 | 6,390,784 | |
| Singapore - 1.0% | |||
| Parkway Life REIT | 4,672,800 | 9,997,083 | |
| United Overseas Bank Ltd. | 513,500 | 10,805,180 | |
| UOL Group Ltd. | 1,168,400 | 7,660,821 | |
| TOTAL SINGAPORE | 28,463,084 | ||
| South Africa - 0.9% | |||
| Naspers Ltd. Class N | 107,700 | 26,307,775 | |
| Spain - 2.5% | |||
| Atresmedia Corporacion de Medios de Comunicacion SA (d) | 1,137,100 | 10,836,376 | |
| CaixaBank SA | 5,137,932 | 24,495,909 | |
| Cellnex Telecom Sau (c) | 238,590 | 6,367,600 | |
| Endesa SA | 196,440 | 4,322,976 | |
| Gas Natural SDG SA | 204,870 | 4,887,876 | |
| Grifols SA ADR | 468,650 | 9,935,380 | |
| Iberdrola SA | 688,483 | 5,059,143 | |
| Masmovil Ibercom SA (b) | 41,224 | 6,086,888 | |
| TOTAL SPAIN | 71,992,148 | ||
| Sweden - 2.6% | |||
| Com Hem Holding AB | 322,070 | 5,214,959 | |
| Essity AB Class B | 340,400 | 9,400,972 | |
| HEXPOL AB (B Shares) | 1,117,930 | 10,356,162 | |
| Lundin Petroleum AB | 234,673 | 5,890,855 | |
| Nordea Bank AB | 1,734,700 | 18,510,835 | |
| Rezidor Hotel Group AB | 4,530,350 | 12,696,135 | |
| Telefonaktiebolaget LM Ericsson (B Shares) (d) | 790,900 | 5,012,626 | |
| Victoria Park AB | 1,826,646 | 6,934,858 | |
| TOTAL SWEDEN | 74,017,402 | ||
| Switzerland - 5.4% | |||
| Credit Suisse Group AG | 1,378,246 | 23,147,678 | |
| Lonza Group AG | 45,000 | 10,600,418 | |
| Nestle SA (Reg. S) | 386,038 | 30,513,033 | |
| Novartis AG | 183,440 | 14,836,788 | |
| Roche Holding AG (participation certificate) | 198,010 | 45,422,925 | |
| Zurich Insurance Group AG | 92,736 | 30,590,115 | |
| TOTAL SWITZERLAND | 155,110,957 | ||
| United Kingdom - 16.7% | |||
| AstraZeneca PLC (United Kingdom) | 403,000 | 27,702,719 | |
| BP PLC | 5,557,900 | 37,488,611 | |
| British American Tobacco PLC (United Kingdom) | 430,934 | 24,910,945 | |
| BT Group PLC | 4,191 | 13,377 | |
| Bunzl PLC | 1,129,714 | 33,205,514 | |
| Conviviality PLC (a) | 451,097 | 320,242 | |
| Diageo PLC | 678,973 | 22,962,671 | |
| GlaxoSmithKline PLC | 242,400 | 4,707,660 | |
| Great Portland Estates PLC | 1,076,334 | 10,055,733 | |
| HSBC Holdings PLC (United Kingdom) | 1,466,100 | 13,767,725 | |
| Imperial Tobacco Group PLC | 125,941 | 4,286,626 | |
| Indivior PLC (b) | 1,075,000 | 6,147,525 | |
| Informa PLC | 1,231,692 | 12,417,867 | |
| International Personal Finance PLC | 2,686,792 | 8,647,392 | |
| Liberty Global PLC Class A (b) | 181,484 | 5,682,264 | |
| Melrose Industries PLC | 4,880,499 | 15,817,356 | |
| Micro Focus International PLC | 338,430 | 4,725,706 | |
| Moneysupermarket.com Group PLC | 3,106,844 | 12,501,331 | |
| National Grid PLC | 840,650 | 9,461,403 | |
| Prudential PLC | 1,023,237 | 25,532,173 | |
| Reckitt Benckiser Group PLC | 183,600 | 15,497,270 | |
| Rolls-Royce Holdings PLC | 2,135,375 | 26,107,358 | |
| Royal Dutch Shell PLC: | |||
| Class A (United Kingdom) | 496,002 | 15,692,771 | |
| Class B (United Kingdom) | 365,405 | 11,758,162 | |
| Senior Engineering Group PLC | 4,060,400 | 17,124,404 | |
| Standard Chartered PLC (United Kingdom) | 2,401,944 | 24,017,473 | |
| Standard Life PLC | 2,530,410 | 12,769,944 | |
| The Weir Group PLC | 978,600 | 27,384,003 | |
| Victrex PLC | 261,000 | 9,403,580 | |
| Virgin Money Holdings Uk PLC | 2,291,300 | 8,448,216 | |
| Vodafone Group PLC | 6,981,392 | 19,101,303 | |
| William Hill PLC | 2,437,400 | 11,295,177 | |
| TOTAL UNITED KINGDOM | 478,954,501 | ||
| United States of America - 3.8% | |||
| British American Tobacco PLC sponsored ADR | 373,900 | 21,570,291 | |
| Chevron Corp. | 108,700 | 12,396,148 | |
| Cliffs Natural Resources, Inc. (b)(d) | 1,359,500 | 9,448,525 | |
| Constellation Brands, Inc. Class A (sub. vtg.) | 39,600 | 9,025,632 | |
| Edgewell Personal Care Co. (b) | 75,700 | 3,695,674 | |
| Freeport-McMoRan, Inc. | 984,400 | 17,295,908 | |
| Molson Coors Brewing Co. Class B | 77,800 | 5,860,674 | |
| Monster Beverage Corp. (b) | 124,600 | 7,128,366 | |
| Philip Morris International, Inc. | 76,600 | 7,614,040 | |
| Post Holdings, Inc. (b) | 93,600 | 7,091,136 | |
| ResMed, Inc. | 89,000 | 8,763,830 | |
| TOTAL UNITED STATES OF AMERICA | 109,890,224 | ||
| TOTAL COMMON STOCKS | |||
| (Cost $2,413,620,414) | 2,788,252,516 | ||
| Nonconvertible Preferred Stocks - 0.5% | |||
| Germany - 0.5% | |||
| Porsche Automobil Holding SE (Germany) | |||
| (Cost $8,650,219) | 189,900 | 15,772,216 | |
| Principal Amount | Value | ||
| Government Obligations - 0.2% | |||
| United States of America - 0.2% | |||
| U.S. Treasury Bills, yield at date of purchase 1.62% 5/24/18(f) | |||
| (Cost $4,668,904) | $4,680,000 | 4,668,841 | |
| Shares | Value | ||
| Money Market Funds - 1.8% | |||
| Fidelity Cash Central Fund, 1.72% (g) | 37,971,124 | 37,978,718 | |
| Fidelity Securities Lending Cash Central Fund 1.72% (g)(h) | 13,406,110 | 13,408,791 | |
| TOTAL MONEY MARKET FUNDS | |||
| (Cost $51,385,988) | 51,387,509 | ||
| TOTAL INVESTMENT IN SECURITIES - 99.9% | |||
| (Cost $2,478,325,525) | 2,860,081,082 | ||
| NET OTHER ASSETS (LIABILITIES) - 0.1% | 3,931,262 | ||
| NET ASSETS - 100% | $2,864,012,344 |
| Futures Contracts | |||||
| Number of contracts | Expiration Date | Notional Amount | Value | Unrealized Appreciation/(Depreciation) | |
| Purchased | |||||
| Equity Index Contracts | |||||
| ICE E-mini MSCI EAFE Index Contracts (United States) | 103 | June 2018 | $10,303,090 | $55,225 | $55,225 |
| TME S&P/TSX 60 Index Contracts (Canada) | 7 | June 2018 | 984,515 | 6,073 | 6,073 |
| TOTAL FUTURES CONTRACTS | $61,298 |
The notional amount of futures purchased as a percentage of Net Assets is 0.4%
Legend
(a) Level 3 security
(b) Non-income producing
(c) Security exempt from registration under Rule 144A of the Securities Act of 1933. These securities may be resold in transactions exempt from registration, normally to qualified institutional buyers. At the end of the period, the value of these securities amounted to $24,482,191 or 0.9% of net assets.
(d) Security or a portion of the security is on loan at period end.
(e) Security or a portion of the security purchased on a delayed delivery or when-issued basis.
(f) Security or a portion of the security was pledged to cover margin requirements for futures contracts. At period end, the value of securities pledged amounted to $540,708.
(g) Affiliated fund that is generally available only to investment companies and other accounts managed by Fidelity Investments. The rate quoted is the annualized seven-day yield of the fund at period end. A complete unaudited listing of the fund's holdings as of its most recent quarter end is available upon request. In addition, each Fidelity Central Fund's financial statements are available on the SEC's website or upon request.
(h) Includes investment made with cash collateral received from securities on loan.
Affiliated Central Funds
Information regarding fiscal year to date income earned by the Fund from investments in Fidelity Central Funds is as follows:
| Fund | Income earned |
| Fidelity Cash Central Fund | $399,035 |
| Fidelity Securities Lending Cash Central Fund | 380,738 |
| Total | $779,773 |
Amounts in the income column in the above table include any capital gain distributions from underlying funds, which are presented in the corresponding line-item in the Statement of Operations if applicable.
Investment Valuation
The following is a summary of the inputs used, as of March 31, 2018, involving the Fund's assets and liabilities carried at fair value. The inputs or methodology used for valuing securities may not be an indication of the risk associated with investing in those securities. For more information on valuation inputs, and their aggregation into the levels used below, please refer to the Investment Valuation section in the accompanying Notes to Financial Statements.
| Valuation Inputs at Reporting Date: | ||||
| Description | Total | Level 1 | Level 2 | Level 3 |
| Investments in Securities: | ||||
| Equities: | ||||
| Consumer Discretionary | $359,331,689 | $317,380,512 | $41,951,177 | $-- |
| Consumer Staples | 282,355,579 | 114,030,594 | 168,004,743 | 320,242 |
| Energy | 185,150,919 | 69,731,252 | 115,419,667 | -- |
| Financials | 648,995,993 | 358,759,707 | 286,363,152 | 3,873,134 |
| Health Care | 291,434,904 | 116,181,277 | 175,253,627 | -- |
| Industrials | 408,573,300 | 314,681,754 | 93,891,546 | -- |
| Information Technology | 126,275,440 | 77,527,226 | 48,748,214 | -- |
| Materials | 237,420,337 | 161,408,677 | 76,011,660 | -- |
| Real Estate | 91,058,460 | 47,151,416 | 43,907,044 | -- |
| Telecommunication Services | 83,613,446 | 48,016,993 | 35,596,453 | -- |
| Utilities | 89,814,665 | 60,400,896 | 29,413,769 | -- |
| Government Obligations | 4,668,841 | -- | 4,668,841 | -- |
| Money Market Funds | 51,387,509 | 51,387,509 | -- | -- |
| Total Investments in Securities: | $2,860,081,082 | $1,736,657,813 | $1,119,229,893 | $4,193,376 |
| Derivative Instruments: | ||||
| Assets | ||||
| Futures Contracts | $61,298 | $61,298 | $-- | $-- |
| Total Assets | $61,298 | $61,298 | $-- | $-- |
| Total Derivative Instruments: | $61,298 | $61,298 | $-- | $-- |
The following is a summary of transfers between Level 1 and Level 2 for the period ended March 31, 2018. Transfers are assumed to have occurred at the beginning of the period, and are primarily attributable to the valuation techniques used for foreign equity securities, as discussed in the accompanying Notes to Financial Statements:
| Transfers | Total |
| Level 1 to Level 2 | $360,643,303 |
| Level 2 to Level 1 | $86,972,919 |
Value of Derivative Instruments
The following table is a summary of the Fund's value of derivative instruments by primary risk exposure as of March 31, 2018. For additional information on derivative instruments, please refer to the Derivative Instruments section in the accompanying Notes to Financial Statements.
| Primary Risk Exposure / Derivative Type | Value | |
| Asset | Liability | |
| Equity Risk | ||
| Futures Contracts(a) | $61,298 | $0 |
| Total Equity Risk | 61,298 | 0 |
| Total Value of Derivatives | $61,298 | $0 |
(a) Reflects gross cumulative appreciation (depreciation) on futures contracts as presented in the Schedule of Investments. In the Statement of Assets and Liabilities, the period end daily variation margin is included in receivable or payable for daily variation margin on futures contracts, and the net cumulative appreciation (depreciation) is included in net unrealized appreciation (depreciation).
See accompanying notes which are an integral part of the financial statements.
Financial Statements
Statement of Assets and Liabilities
| March 31, 2018 (Unaudited) | ||
| Assets | ||
| Investment in securities, at value (including securities loaned of $13,047,795) — See accompanying schedule: Unaffiliated issuers (cost $2,426,939,537) | $2,808,693,573 | |
| Fidelity Central Funds (cost $51,385,988) | 51,387,509 | |
| Total Investment in Securities (cost $2,478,325,525) | $2,860,081,082 | |
| Cash | 303,026 | |
| Receivable for investments sold | 7,511,685 | |
| Receivable for fund shares sold | 223,378 | |
| Dividends receivable | 18,985,917 | |
| Distributions receivable from Fidelity Central Funds | 154,438 | |
| Receivable for daily variation margin for on futures contracts | 111,131 | |
| Other receivables | 35,602 | |
| Total assets | 2,887,406,259 | |
| Liabilities | ||
| Payable for investments purchased | ||
| Regular delivery | $7,294,777 | |
| Delayed delivery | 421,531 | |
| Payable for fund shares redeemed | 2,161,342 | |
| Other payables and accrued expenses | 112,842 | |
| Collateral on securities loaned | 13,403,423 | |
| Total liabilities | 23,393,915 | |
| Net Assets | $2,864,012,344 | |
| Net Assets consist of: | ||
| Paid in capital | $2,373,796,267 | |
| Undistributed net investment income | 14,841,965 | |
| Accumulated undistributed net realized gain (loss) on investments and foreign currency transactions | 93,304,912 | |
| Net unrealized appreciation (depreciation) on investments and assets and liabilities in foreign currencies | 382,069,200 | |
| Net Assets, for 33,125,816 shares outstanding | $2,864,012,344 | |
| Net Asset Value, offering price and redemption price per share ($2,864,012,344 ÷ 33,125,816 shares) | $86.46 |
See accompanying notes which are an integral part of the financial statements.
Statement of Operations
| Six months ended March 31, 2018 (Unaudited) | ||
| Investment Income | ||
| Dividends | $32,581,835 | |
| Interest | 15,240 | |
| Income from Fidelity Central Funds | 779,773 | |
| Income before foreign taxes withheld | 33,376,848 | |
| Less foreign taxes withheld | (2,859,344) | |
| Total income | 30,517,504 | |
| Expenses | ||
| Custodian fees and expenses | $171,829 | |
| Independent directors' fees and expenses | 5,698 | |
| Interest | 1,573 | |
| Miscellaneous | 37 | |
| Total expenses | 179,137 | |
| Net investment income (loss) | 30,338,367 | |
| Realized and Unrealized Gain (Loss) | ||
| Net realized gain (loss) on: | ||
| Investment securities: | ||
| Unaffiliated issuers | 125,331,959 | |
| Fidelity Central Funds | 5,949 | |
| Foreign currency transactions | (321,908) | |
| Futures contracts | 4,375,655 | |
| Total net realized gain (loss) | 129,391,655 | |
| Change in net unrealized appreciation (depreciation) on: | ||
| Unaffiliated issuers (net of decrease in deferred foreign taxes of $94,684) | (73,889,529) | |
| Fidelity Central Funds | (493) | |
| Assets and liabilities in foreign currencies | 142,851 | |
| Futures contracts | (733,853) | |
| Total change in net unrealized appreciation (depreciation) | (74,481,024) | |
| Net gain (loss) | 54,910,631 | |
| Net increase (decrease) in net assets resulting from operations | $85,248,998 |
See accompanying notes which are an integral part of the financial statements.
Statement of Changes in Net Assets
| Six months ended March 31, 2018 (Unaudited) | Year ended September 30, 2017 | |
| Increase (Decrease) in Net Assets | ||
| Operations | ||
| Net investment income (loss) | $30,338,367 | $70,433,901 |
| Net realized gain (loss) | 129,391,655 | 68,040,836 |
| Change in net unrealized appreciation (depreciation) | (74,481,024) | 347,369,441 |
| Net increase (decrease) in net assets resulting from operations | 85,248,998 | 485,844,178 |
| Distributions to shareholders from net investment income | (21,693,766) | (64,190,380) |
| Distributions to shareholders from net realized gain | (90,648,501) | (961,276) |
| Total distributions | (112,342,267) | (65,151,656) |
| Affiliated share transactions | ||
| Proceeds from sales of shares | 246,819,038 | 664,808,819 |
| Reinvestment of distributions | 112,342,266 | 65,151,250 |
| Cost of shares redeemed | (562,439,384) | (194,564,633) |
| Net increase (decrease) in net assets resulting from share transactions | (203,278,080) | 535,395,436 |
| Total increase (decrease) in net assets | (230,371,349) | 956,087,958 |
| Net Assets | ||
| Beginning of period | 3,094,383,693 | 2,138,295,735 |
| End of period | $2,864,012,344 | $3,094,383,693 |
| Other Information | ||
| Undistributed net investment income end of period | $14,841,965 | $6,197,364 |
| Shares | ||
| Sold | 2,777,794 | 8,530,285 |
| Issued in reinvestment of distributions | 1,290,466 | 809,722 |
| Redeemed | (6,325,252) | (2,481,498) |
| Net increase (decrease) | (2,256,992) | 6,858,509 |
See accompanying notes which are an integral part of the financial statements.
Financial Highlights
Fidelity International Equity Central Fund
| Six months ended (Unaudited) March 31, | Years endedSeptember 30, | |||||
| 2018 | 2017 | 2016 | 2015 | 2014 | 2013 | |
| Selected Per–Share Data | ||||||
| Net asset value, beginning of period | $87.45 | $74.96 | $71.96 | $79.13 | $78.06 | $65.60 |
| Income from Investment Operations | ||||||
| Net investment income (loss)A | .87 | 2.18 | 2.09 | 2.13 | 2.74B | 2.04 |
| Net realized and unrealized gain (loss) | 1.36 | 12.27 | 2.87 | (7.28) | .64 | 12.32 |
| Total from investment operations | 2.23 | 14.45 | 4.96 | (5.15) | 3.38 | 14.36 |
| Distributions from net investment income | (.63) | (1.92) | (1.96) | (2.02) | (2.31) | (1.90) |
| Distributions from net realized gain | (2.60) | (.03) | – | – | – | – |
| Total distributions | (3.22)C | (1.96)D | (1.96) | (2.02) | (2.31) | (1.90) |
| Net asset value, end of period | $86.46 | $87.45 | $74.96 | $71.96 | $79.13 | $78.06 |
| Total ReturnE,F | 2.54% | 19.54% | 6.95% | (6.78)% | 4.24% | 22.15% |
| Ratios to Average Net AssetsG,H | ||||||
| Expenses before reductions | .01%I | .01% | .01% | .01% | .01% | .01% |
| Expenses net of fee waivers, if any | .01%I | .01% | .01% | .01% | .01% | .01% |
| Expenses net of all reductions | .01%I | .01% | .01% | .01% | .01% | .01% |
| Net investment income (loss) | 1.96%I | 2.74% | 2.87% | 2.67% | 3.34%B | 2.83% |
| Supplemental Data | ||||||
| Net assets, end of period (000 omitted) | $2,864,012 | $3,094,384 | $2,138,296 | $2,104,932 | $2,841,400 | $2,595,878 |
| Portfolio turnover rateJ | 59%I | 61% | 59% | 81% | 67% | 69% |
A Calculated based on average shares outstanding during the period.
B Net Investment income per share reflects a large, non-recurring dividend which amounted to $.69 per share. Excluding this non-recurring dividend, the ratio of net investment income (loss) to average net assets would have been 2.50%.
C Total distributions of $3.22 per share is comprised of distributions from net investment income of $0.626 and distributions from net realized gain of $2.595 per share.
D Total distributions of $1.96 per share is comprised of distributions from net investment income of $1.921 and distributions from net realized gain of $0.034 per share.
E Total returns for periods of less than one year are not annualized.
F Total returns would have been lower if certain expenses had not been reduced during the applicable periods shown.
G Fees and expenses of any underlying Fidelity Central Funds are not included in the Fund's expense ratio. The Fund indirectly bears its proportionate share of the expenses of any underlying Fidelity Central Funds.
H Expense ratios reflect operating expenses of the Fund. Expenses before reductions do not reflect amounts reimbursed by the investment adviser or reductions from expense offset arrangements and do not represent the amount paid by the Fund during periods when reimbursements or reductions occur. Expenses net of fee waivers reflect expenses after reimbursement by the investment adviser but prior to reductions from expense offset arrangements. Expenses net of all reductions represent the net expenses paid by the Fund.
I Annualized
J Amount does not include the portfolio activity of any underlying Fidelity Central Funds.
See accompanying notes which are an integral part of the financial statements.
Notes to Financial Statements (Unaudited)
For the period ended March 31, 2018
1. Organization.
Fidelity International Equity Central Fund (the Fund) is a fund of Fidelity Central Investment Portfolios LLC (the LLC) and is authorized to issue an unlimited number of shares. Shares of the Fund are only offered to other investment companies and accounts managed by Fidelity Management & Research Company (FMR), or its affiliates (the Investing Funds). The LLC is registered under the Investment Company Act of 1940, as amended (the 1940 Act), as an open-end management investment company organized as a Delaware Limited Liability Company.
2. Investments in Fidelity Central Funds.
The Fund invests in Fidelity Central Funds, which are open-end investment companies generally available only to other investment companies and accounts managed by the investment adviser and its affiliates. The Fund's Schedule of Investments lists each of the Fidelity Central Funds held as of period end, if any, as an investment of the Fund, but does not include the underlying holdings of each Fidelity Central Fund. As an Investing Fund, the Fund indirectly bears its proportionate share of the expenses of the underlying Fidelity Central Funds.
The Money Market Central Funds seek preservation of capital and current income and are managed by Fidelity Investments Money Management, Inc. (FIMM), an affiliate of the investment adviser. Annualized expenses of the Money Market Central Funds as of their most recent shareholder report date are less than .005%.
A complete unaudited list of holdings for each Fidelity Central Fund is available upon request or at the Securities and Exchange Commission (the SEC) website at www.sec.gov. In addition, the financial statements of the Fidelity Central Funds are available on the SEC website or upon request.
3. Significant Accounting Policies.
The Fund is an investment company and applies the accounting and reporting guidance of the Financial Accounting Standards Board (FASB) Accounting Standards Codification Topic 946 Financial Services – Investments Companies. The financial statements have been prepared in conformity with accounting principles generally accepted in the United States of America (GAAP), which require management to make certain estimates and assumptions at the date of the financial statements. Actual results could differ from those estimates. Subsequent events, if any, through the date that the financial statements were issued have been evaluated in the preparation of the financial statements. The following summarizes the significant accounting policies of the Fund:
Investment Valuation. Investments are valued as of 4:00 p.m. Eastern time on the last calendar day of the period. The Board of Directors (the Board) has delegated the day to day responsibility for the valuation of the Fund's investments to the Fair Value Committee (the Committee) established by the Fund's investment adviser. In accordance with valuation policies and procedures approved by the Board, the Fund attempts to obtain prices from one or more third party pricing vendors or brokers to value its investments. When current market prices, quotations or currency exchange rates are not readily available or reliable, investments will be fair valued in good faith by the Committee, in accordance with procedures adopted by the Board. Factors used in determining fair value vary by investment type and may include market or investment specific events, changes in interest rates and credit quality. The frequency with which these procedures are used cannot be predicted and they may be utilized to a significant extent. The Committee oversees the Fund's valuation policies and procedures and reports to the Board on the Committee's activities and fair value determinations. The Board monitors the appropriateness of the procedures used in valuing the Fund's investments and ratifies the fair value determinations of the Committee.
The Fund categorizes the inputs to valuation techniques used to value its investments into a disclosure hierarchy consisting of three levels as shown below:
- Level 1 – quoted prices in active markets for identical investments
- Level 2 – other significant observable inputs (including quoted prices for similar investments, interest rates, prepayment speeds, etc.)
- Level 3 – unobservable inputs (including the Fund's own assumptions based on the best information available)
Valuation techniques used to value the Fund's investments by major category are as follows:
Equity securities, including restricted securities, for which market quotations are readily available, are valued at the last reported sale price or official closing price as reported by a third party pricing vendor on the primary market or exchange on which they are traded and are categorized as Level 1 in the hierarchy. In the event there were no sales during the day or closing prices are not available, securities are valued at the last quoted bid price or may be valued using the last available price and are generally categorized as Level 2 in the hierarchy. For foreign equity securities, when market or security specific events arise, comparisons to the valuation of American Depositary Receipts (ADRs), futures contracts, Exchange-Traded Funds (ETFs) and certain indexes as well as quoted prices for similar securities may be used and would be categorized as Level 2 in the hierarchy. Utilizing these techniques may result in transfers between Level 1 and Level 2. For equity securities, including restricted securities, where observable inputs are limited, assumptions about market activity and risk are used and these securities may be categorized as Level 3 in the hierarchy.
Debt securities, including restricted securities, are valued based on evaluated prices received from third party pricing vendors or from brokers who make markets in such securities. U.S. government and government agency obligations are valued by pricing vendors who utilize matrix pricing which considers yield or price of bonds of comparable quality, coupon, maturity and type or by broker-supplied prices. When independent prices are unavailable or unreliable, debt securities may be valued utilizing pricing methodologies which consider similar factors that would be used by third party pricing vendors. Debt securities are generally categorized as Level 2 in the hierarchy but may be Level 3 depending on the circumstances.
Futures contracts are valued at the settlement price established each day by the board of trade or exchange on which they are traded and are categorized as Level 1 in the hierarchy. Investments in open-end mutual funds, including the Fidelity Central Funds, are valued at their closing net asset value (NAV) each business day and are categorized as Level 1 in the hierarchy.
Changes in valuation techniques may result in transfers in or out of an assigned level within the disclosure hierarchy. The aggregate value of investments by input level as of March 31, 2018, including information on transfers between Levels 1 and 2, is included at the end of the Fund's Schedule of Investments.
Foreign Currency. The Fund may use foreign currency contracts to facilitate transactions in foreign-denominated securities. Gains and losses from these transactions may arise from changes in the value of the foreign currency or if the counterparties do not perform under the contracts' terms.
Foreign-denominated assets, including investment securities, and liabilities are translated into U.S. dollars at the exchange rates at period end. Purchases and sales of investment securities, income and dividends received and expenses denominated in foreign currencies are translated into U.S. dollars at the exchange rate in effect on the transaction date.
The effects of exchange rate fluctuations on investments are included with the net realized and unrealized gain (loss) on investment securities. Other foreign currency transactions resulting in realized and unrealized gain (loss) are disclosed separately.
Investment Transactions and Income. For financial reporting purposes, the Fund's investment holdings and NAV include trades executed through the end of the last business day of the period. The NAV per share for processing shareholder transactions is calculated as of the close of business of the New York Stock Exchange (NYSE), normally 4:00 p.m. Eastern time and includes trades executed through the end of the prior business day. Gains and losses on securities sold are determined on the basis of identified cost and includes proceeds received from litigation. Dividend income is recorded on the ex-dividend date, except for certain dividends from foreign securities where the ex-dividend date may have passed, which are recorded as soon as the Fund is informed of the ex-dividend date. Non-cash dividends included in dividend income, if any, are recorded at the fair market value of the securities received. Income and capital gain distributions from Fidelity Central Funds, if any, are recorded on the ex-dividend date. Certain distributions received by the Fund represent a return of capital or capital gain. The Fund determines the components of these distributions subsequent to the ex-dividend date, based upon receipt of tax filings or other correspondence relating to the underlying investment. These distributions are recorded as a reduction of cost of investments and/or as a realized gain. Interest income is accrued as earned and includes coupon interest and amortization of premium and accretion of discount on debt securities as applicable. Investment income is recorded net of foreign taxes withheld where recovery of such taxes is uncertain.
Expenses. Expenses directly attributable to a fund are charged to that fund. Expenses attributable to more than one fund are allocated among the respective funds on the basis of relative net assets or other appropriate methods. Expense estimates are accrued in the period to which they relate and adjustments are made when actual amounts are known.
Income Tax Information and Distributions to Shareholders. Each year, the Fund intends to qualify as a regulated investment company under Subchapter M of the Internal Revenue Code, including distributing substantially all of its taxable income and realized gains. As a result, no provision for U.S. Federal income taxes is required. The Fund files a U.S. federal tax return, in addition to state and local tax returns as required. The Fund's federal income tax returns are subject to examination by the Internal Revenue Service (IRS) for a period of three fiscal years after they are filed. State and local tax returns may be subject to examination for an additional fiscal year depending on the jurisdiction. Foreign taxes are provided for based on the Fund's understanding of the tax rules and rates that exist in the foreign markets in which it invests.
Distributions are declared and recorded on the ex-dividend date. Income and capital gain distributions are determined in accordance with income tax regulations, which may differ from GAAP.
Capital accounts within the financial statements are adjusted for permanent book-tax differences. These adjustments have no impact on net assets or the results of operations. Capital accounts are not adjusted for temporary book-tax differences which will reverse in a subsequent period.
Book-tax differences are primarily due to futures contracts, foreign currency transactions, certain foreign taxes, passive foreign investment companies (PFIC), partnerships and losses deferred due to wash sales.
As of period end, the cost and unrealized appreciation (depreciation) in securities, and derivatives if applicable, for federal income tax purposes were as follows:
| Gross unrealized appreciation | $477,652,533 |
| Gross unrealized depreciation | (100,289,043) |
| Net unrealized appreciation (depreciation) | $377,363,490 |
| Tax cost | $2,482,717,592 |
Delayed Delivery Transactions and When-Issued Securities. During the period, the Fund transacted in securities on a delayed delivery or when-issued basis. Payment and delivery may take place after the customary settlement period for that security. The price of the underlying securities and the date when the securities will be delivered and paid for are fixed at the time the transaction is negotiated. The securities purchased on a delayed delivery or when-issued basis are identified as such in the Fund's Schedule of Investments. Losses may arise due to changes in the value of the underlying securities or if the counterparty does not perform under the contract's terms, or if the issuer does not issue the securities due to political, economic, or other factors.
Restricted Securities. The Fund may invest in securities that are subject to legal or contractual restrictions on resale. These securities generally may be resold in transactions exempt from registration or to the public if the securities are registered. Disposal of these securities may involve time-consuming negotiations and expense, and prompt sale at an acceptable price may be difficult. Information regarding restricted securities is included at the end of the Fund's Schedule of Investments.
4. Derivative Instruments.
Risk Exposures and the Use of Derivative Instruments. The Fund's investment objective allows the Fund to enter into various types of derivative contracts, including futures contracts. Derivatives are investments whose value is primarily derived from underlying assets, indices or reference rates and may be transacted on an exchange or over-the-counter (OTC). Derivatives may involve a future commitment to buy or sell a specified asset based on specified terms, to exchange future cash flows at periodic intervals based on a notional principal amount, or for one party to make one or more payments upon the occurrence of specified events in exchange for periodic payments from the other party.
The Fund used derivatives to increase returns and to manage exposure to certain risks as defined below. The success of any strategy involving derivatives depends on analysis of numerous economic factors, and if the strategies for investment do not work as intended, the Fund may not achieve its objectives.
The Fund's use of derivatives increased or decreased its exposure to the following risk:
| Equity Risk | Equity risk relates to the fluctuations in the value of financial instruments as a result of changes in market prices (other than those arising from interest rate risk or foreign exchange risk), whether caused by factors specific to an individual investment, its issuer, or all factors affecting all instruments traded in a market or market segment. |
The Fund is also exposed to additional risks from investing in derivatives, such as liquidity risk and counterparty credit risk. Liquidity risk is the risk that the Fund will be unable to close out the derivative in the open market in a timely manner. Counterparty credit risk is the risk that the counterparty will not be able to fulfill its obligation to the Fund. Counterparty credit risk related to exchange-traded futures contracts may be mitigated by the protection provided by the exchange on which they trade.
Investing in derivatives may involve greater risks than investing in the underlying assets directly and, to varying degrees, may involve risk of loss in excess of any initial investment and collateral received and amounts recognized in the Statement of Assets and Liabilities. In addition, there may be the risk that the change in value of the derivative contract does not correspond to the change in value of the underlying instrument.
Futures Contracts. A futures contract is an agreement between two parties to buy or sell a specified underlying instrument for a fixed price at a specified future date. The Fund used futures contracts to manage its exposure to the stock market.
Upon entering into a futures contract, a fund is required to deposit either cash or securities (initial margin) with a clearing broker in an amount equal to a certain percentage of the face value of the contract. Futures contracts are marked-to-market daily and subsequent daily payments (variation margin) are made or received by a fund depending on the daily fluctuations in the value of the futures contracts and are recorded as unrealized appreciation or (depreciation). This receivable and/or payable, if any, is included in daily variation margin on futures contracts in the Statement of Assets and Liabilities. Realized gain or (loss) is recorded upon the expiration or closing of a futures contract. The net realized gain (loss) and change in net unrealized appreciation (depreciation) on futures contracts during the period is presented in the Statement of Operations.
Any open futures contracts at period end are presented in the Schedule of Investments under the caption "Futures Contracts". The notional amount at value reflects each contract's exposure to the underlying instrument or index at period end and is representative of volume of activity during the period. Securities deposited to meet initial margin requirements are identified in the Schedule of Investments.
5. Purchases and Sales of Investments.
Purchases and sales of securities, other than short-term securities, aggregated $888,388,334 and $1,112,641,927, respectively.
6. Fees and Other Transactions with Affiliates.
Management Fee and Expense Contract. FMR Co., Inc. (the investment adviser), an affiliate of FMR, provides the Fund with investment management services. The Fund does not pay any fees for these services. Pursuant to the Fund's management contract with the investment adviser, FMR pays the investment adviser a portion of the management fees it receives from the Investing Funds. In addition, under an expense contract, FMR also pays all other expenses of the Fund, excluding custody fees, the compensation of the independent Directors, and certain miscellaneous expenses such as proxy and shareholder meeting expenses.
Brokerage Commissions. The Fund placed a portion of its portfolio transactions with brokerage firms which are affiliates of the investment adviser. Brokerage commissions are included in net realized gain (loss) and change in net unrealized appreciation (depreciation) in the Statement of Operations. The commissions paid to these affiliated firms were $6,647 for the period.
Interfund Lending Program. Pursuant to an Exemptive Order issued by the SEC, the Fund, along with other registered investment companies having management contracts with FMR or other affiliated entities of FMR, may participate in an interfund lending program. This program provides an alternative credit facility allowing the funds to borrow from, or lend money to, other participating affiliated funds. At period end, there were no interfund loans outstanding. The Fund's activity in this program during the period for which loans were outstanding was as follows:
| Borrower or Lender | Average Loan Balance | Weighted Average Interest Rate | Interest Expense |
| Borrower | $34,950,000 | 1.62% | $1,573 |
Interfund Trades. The Fund may purchase from or sell securities to other Fidelity Funds under procedures adopted by the Board. The procedures have been designed to ensure these interfund trades are executed in accordance with Rule 17a-7 of the 1940 Act. Interfund trades are included within the respective purchases and sales amounts shown in the Purchases and Sales of Investments note.
7. Security Lending.
The Fund lends portfolio securities through a lending agent from time to time in order to earn additional income. For equity securities, a lending agent is used and may loan securities to certain qualified borrowers, including Fidelity Capital Markets (FCM), a broker-dealer affiliated with the Fund. On the settlement date of the loan, the Fund receives collateral (in the form of U.S. Treasury obligations, letters of credit and/or cash) against the loaned securities and maintains collateral in an amount not less than 100% of the market value of the loaned securities during the period of the loan. The market value of the loaned securities is determined at the close of business of the Fund and any additional required collateral is delivered to the Fund on the next business day. The Fund or borrower may terminate the loan at any time, and if the borrower defaults on its obligation to return the securities loaned because of insolvency or other reasons, the Fund may apply collateral received from the borrower against the obligation. The Fund may experience delays and costs in recovering the securities loaned. Any cash collateral received is invested in the Fidelity Securities Lending Cash Central Fund. The value of loaned securities and cash collateral at period end are disclosed on the Fund's Statement of Assets and Liabilities. Security lending income represents the income earned on investing cash collateral, less rebates paid to borrowers and any lending agent fees associated with the loan, plus any premium payments received for lending certain types of securities. Security lending income is presented in the Statement of Operations as a component of income from Fidelity Central Funds. Total security lending income during the period amounted to $380,738. During the period, there were no securities loaned to FCM.
8. Other.
The Fund's organizational documents provide former and current directors and officers with a limited indemnification against liabilities arising in connection with the performance of their duties to the Fund. In the normal course of business, the Fund may also enter into contracts that provide general indemnifications. The Fund's maximum exposure under these arrangements is unknown as this would be dependent on future claims that may be made against the Fund. The risk of material loss from such claims is considered remote.
At the end of the period, mutual funds managed by FMR or its affiliates were the owners of record of all of the outstanding shares of the Fund.
Shareholder Expense Example
As a shareholder of the Fund, you incur two types of costs: (1) transaction costs, and (2) ongoing costs, including other Fund expenses. This Example is intended to help you understand your ongoing costs (in dollars) of investing in the Fund and to compare these costs with the ongoing costs of investing in other mutual funds.
The Example is based on an investment of $1,000 invested at the beginning of the period and held for the entire period (October 1, 2017 to March 31, 2018).
Actual Expenses
The first line of the accompanying table provides information about actual account values and actual expenses. You may use the information in this line, together with the amount you invested, to estimate the expenses that you paid over the period. Simply divide your account value by $1,000.00 (for example, an $8,600 account value divided by $1,000.00 = 8.6), then multiply the result by the number in the first line under the heading entitled "Expenses Paid During Period" to estimate the expenses you paid on your account during this period. In addition, the Fund, as a shareholder in the underlying Fidelity Central Funds, will indirectly bear its pro-rata share of the fees and expenses incurred by the underlying Fidelity Central Funds. These fees and expenses are not included in the Fund's annualized expense ratio used to calculate the expense estimate in the table below.
Hypothetical Example for Comparison Purposes
The second line of the accompanying table provides information about hypothetical account values and hypothetical expenses based on the Fund's actual expense ratio and an assumed rate of return of 5% per year before expenses, which is not the Fund's actual return. The hypothetical account values and expenses may not be used to estimate the actual ending account balance or expenses you paid for the period. You may use this information to compare the ongoing costs of investing in the Fund and other funds. To do so, compare this 5% hypothetical example with the 5% hypothetical examples that appear in the shareholder reports of the other funds. In addition, the Fund, as a shareholder in the underlying Fidelity Central Funds, will indirectly bear its pro-rata share of the fees and expenses incurred by the underlying Fidelity Central Funds. These fees and expenses are not included in the Fund's annualized expense ratio used to calculate the expense estimate in the table below.
Please note that the expenses shown in the table are meant to highlight your ongoing costs only and do not reflect any transaction costs. Therefore, the second line of the table is useful in comparing ongoing costs only, and will not help you determine the relative total costs of owning different funds.
| Annualized Expense Ratio-A | Beginning Account Value October 1, 2017 | Ending Account Value March 31, 2018 | Expenses Paid During Period-B October 1, 2017 to March 31, 2018 | |
| Actual | .0116% | $1,000.00 | $1,025.40 | $.06 |
| Hypothetical-C | $1,000.00 | $1,024.87 | $.06 |
A Annualized expense ratio reflects expenses net of applicable fee waivers.
B Expenses are equal to the Fund's annualized expense ratio, multiplied by the average account value over the period, multiplied by 182/365 (to reflect the one-half year period).
C 5% return per year before expenses
![]()
Corporate Headquarters
245 Summer St.
Boston, MA 02210
www.fidelity.com
INTCEN-SANN-0518
1.859211.110
Fidelity® Emerging Markets Equity Central Fund Semi-Annual Report March 31, 2018 |
|
Contents
To view a fund's proxy voting guidelines and proxy voting record for the 12-month period ended June 30, visit http://www.fidelity.com/proxyvotingresults or visit the Securities and Exchange Commission's (SEC) web site at http://www.sec.gov.
You may also call 1-800-544-8544 to request a free copy of the proxy voting guidelines.
Standard & Poor's, S&P and S&P 500 are registered service marks of The McGraw-Hill Companies, Inc. and have been licensed for use by Fidelity Distributors Corporation.
Other third-party marks appearing herein are the property of their respective owners.
All other marks appearing herein are registered or unregistered trademarks or service marks of FMR LLC or an affiliated company. © 2018 FMR LLC. All rights reserved.
A fund files its complete schedule of portfolio holdings with the SEC for the first and third quarters of each fiscal year on Form N-Q. Forms N-Q are available on the SEC’s web site at http://www.sec.gov. A fund's Forms N-Q may be reviewed and copied at the SEC’s Public Reference Room in Washington, DC. Information regarding the operation of the SEC's Public Reference Room may be obtained by calling 1-800-SEC-0330.
Investment Summary (Unaudited)
Geographic Diversification (% of fund's net assets)
| As of March 31, 2018 | ||
| Cayman Islands | 17.9% | |
| Korea (South) | 10.2% | |
| Brazil | 8.9% | |
| China | 8.3% | |
| South Africa | 7.8% | |
| India | 7.6% | |
| Taiwan | 5.6% | |
| Russia | 4.6% | |
| Hong Kong | 4.4% | |
| Other* | 24.7% | |
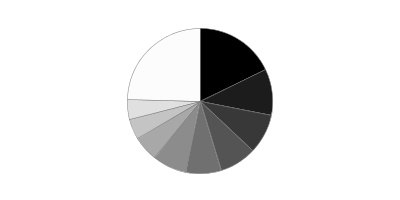
* Includes Short-Term investments and Net Other Assets (Liabilities).
Percentages are based on country or territory of incorporation and are adjusted for the effect of futures contracts, if applicable.
Asset Allocation as of March 31, 2018
| % of fund's net assets | |
| Stocks | 98.6 |
| Short-Term Investments and Net Other Assets (Liabilities) | 1.4 |
Top Ten Stocks as of March 31, 2018
| % of fund's net assets | |
| Tencent Holdings Ltd. (Cayman Islands, Internet Software & Services) | 6.1 |
| Alibaba Group Holding Ltd. sponsored ADR (Cayman Islands, Internet Software & Services) | 3.9 |
| Taiwan Semiconductor Manufacturing Co. Ltd. (Taiwan, Semiconductor & Semiconductor Equipment) | 2.9 |
| Industrial & Commercial Bank of China Ltd. (H Shares) (China, Banks) | 2.7 |
| Naspers Ltd. Class N (South Africa, Media) | 2.6 |
| JD.com, Inc. sponsored ADR (Cayman Islands, Internet & Direct Marketing Retail) | 2.3 |
| Sberbank of Russia (Russia, Banks) | 2.0 |
| China Literature Ltd. (Cayman Islands, Media) | 1.8 |
| Vale SA sponsored ADR (Brazil, Metals & Mining) | 1.2 |
| Itau Unibanco Holding SA sponsored ADR (Brazil, Banks) | 1.2 |
| 26.7 |
Top Market Sectors as of March 31, 2018
| % of fund's net assets | |
| Financials | 24.9 |
| Information Technology | 21.7 |
| Consumer Discretionary | 15.4 |
| Materials | 8.2 |
| Consumer Staples | 6.3 |
| Energy | 6.3 |
| Industrials | 4.6 |
| Telecommunication Services | 4.0 |
| Utilities | 2.9 |
| Real Estate | 2.3 |
Schedule of Investments March 31, 2018 (Unaudited)
Showing Percentage of Net Assets
| Common Stocks - 92.0% | |||
| Shares | Value | ||
| Argentina - 1.3% | |||
| Banco Macro SA sponsored ADR | 9,950 | $1,074,302 | |
| BBVA Banco Frances SA sponsored ADR | 23,235 | 529,990 | |
| Bolsas y Mercados Argentinos SA | 14,500 | 286,644 | |
| Central Puerto SA sponsored ADR (a) | 54,500 | 926,500 | |
| Grupo Financiero Galicia SA sponsored ADR | 22,456 | 1,476,707 | |
| Grupo Superveille SA sponsored ADR | 42,460 | 1,288,236 | |
| Loma Negra Compania Industrial Argentina SA ADR (a) | 9,885 | 210,748 | |
| Pampa Holding SA sponsored ADR (a) | 15,481 | 922,668 | |
| Telecom Argentina SA Class B sponsored ADR | 45,953 | 1,439,707 | |
| YPF SA Class D sponsored ADR | 54,200 | 1,171,804 | |
| TOTAL ARGENTINA | 9,327,306 | ||
| Australia - 0.0% | |||
| Frontier Digital Ventures Ltd. (a) | 590,206 | 305,065 | |
| Austria - 0.0% | |||
| Erste Group Bank AG | 5,767 | 289,517 | |
| Bailiwick of Jersey - 0.0% | |||
| Glencore Xstrata PLC | 39,946 | 199,886 | |
| Bangladesh - 0.2% | |||
| BRAC Bank Ltd. | 209,287 | 244,548 | |
| Olympic Industries Ltd. | 62,416 | 206,340 | |
| Square Pharmaceuticals Ltd. | 142,009 | 529,215 | |
| The City Bank Ltd. | 360,012 | 171,383 | |
| TOTAL BANGLADESH | 1,151,486 | ||
| Bermuda - 1.5% | |||
| AGTech Holdings Ltd. (a) | 2,476,000 | 295,606 | |
| Central European Media Enterprises Ltd. Class A (a) | 106,171 | 445,918 | |
| China Resource Gas Group Ltd. | 530,000 | 1,853,408 | |
| Credicorp Ltd. (United States) | 19,526 | 4,433,183 | |
| GP Investments Ltd. Class A (depositary receipt) (a) | 88,607 | 170,426 | |
| Nine Dragons Paper (Holdings) Ltd. | 30,000 | 45,468 | |
| Shangri-La Asia Ltd. | 1,080,000 | 2,192,894 | |
| VimpelCom Ltd. sponsored ADR | 554,700 | 1,464,408 | |
| Yue Yuen Industrial (Holdings) Ltd. | 64,533 | 258,549 | |
| TOTAL BERMUDA | 11,159,860 | ||
| Brazil - 4.1% | |||
| Azul SA sponsored ADR | 61,500 | 2,137,125 | |
| B2W Companhia Global do Varejo (a) | 704,426 | 5,470,773 | |
| Banco do Brasil SA | 378,200 | 4,700,221 | |
| BTG Pactual Participations Ltd. unit | 181,100 | 1,261,658 | |
| Centrais Eletricas Brasileiras SA (Electrobras) (a) | 75,900 | 482,788 | |
| Companhia de Saneamento de Minas Gerais | 141,030 | 2,053,862 | |
| Cosan SA Industria e Comercio | 31,685 | 398,384 | |
| Direcional Engenharia SA (a) | 610,800 | 1,124,858 | |
| International Meal Comp Holdings S.A. | 91,700 | 236,093 | |
| Iochpe-Maxion SA | 35,000 | 277,439 | |
| Localiza Rent A Car SA | 214,420 | 1,865,284 | |
| Petrobras Distribuidora SA (a) | 223,100 | 1,560,338 | |
| Vale SA sponsored ADR | 717,315 | 9,124,247 | |
| TOTAL BRAZIL | 30,693,070 | ||
| British Virgin Islands - 0.9% | |||
| Arcos Dorados Holdings, Inc. Class A (a) | 23,734 | 217,166 | |
| Despegar.com Corp. | 31,600 | 987,500 | |
| Mail.Ru Group Ltd. GDR (Reg. S) (a) | 154,262 | 5,396,085 | |
| TOTAL BRITISH VIRGIN ISLANDS | 6,600,751 | ||
| Canada - 0.3% | |||
| First Quantum Minerals Ltd. | 24,033 | 337,453 | |
| Pan American Silver Corp. | 137,700 | 2,223,855 | |
| TOTAL CANADA | 2,561,308 | ||
| Cayman Islands - 17.7% | |||
| 58.com, Inc. ADR (a) | 56,582 | 4,518,639 | |
| Alibaba Group Holding Ltd. sponsored ADR (a) | 158,522 | 29,095,128 | |
| BizLink Holding, Inc. | 56,658 | 457,351 | |
| China Biologic Products Holdings, Inc. | 8,800 | 712,800 | |
| China Literature Ltd. (a)(b)(c) | 1,454,960 | 13,585,857 | |
| China Resources Land Ltd. | 547,600 | 2,012,244 | |
| Crystal International Group Ltd. (a) | 51,667 | 52,425 | |
| ENN Energy Holdings Ltd. | 119,690 | 1,075,882 | |
| Haitian International Holdings Ltd. | 559,000 | 1,699,667 | |
| JD.com, Inc. sponsored ADR (a) | 429,599 | 17,394,464 | |
| Kingsoft Corp. Ltd. | 361,000 | 1,162,951 | |
| Momo, Inc. ADR (a) | 91,300 | 3,412,794 | |
| NetEase, Inc. ADR | 14,100 | 3,953,499 | |
| Secoo Holding Ltd. ADR | 19,900 | 208,751 | |
| Shenzhou International Group Holdings Ltd. | 22,667 | 240,154 | |
| Shimao Property Holdings Ltd. | 527,900 | 1,514,065 | |
| SITC International Holdings Co. Ltd. | 227,000 | 227,174 | |
| Sunlands Online Education Group ADR (a) | 28,700 | 238,210 | |
| Tencent Holdings Ltd. | 848,700 | 45,557,848 | |
| Uni-President China Holdings Ltd. | 3,434,400 | 2,980,054 | |
| Vipshop Holdings Ltd. ADR (a) | 87,800 | 1,459,236 | |
| Yirendai Ltd. sponsored ADR (b) | 19,300 | 776,439 | |
| TOTAL CAYMAN ISLANDS | 132,335,632 | ||
| Chile - 1.2% | |||
| CAP SA | 18,820 | 217,214 | |
| Compania Cervecerias Unidas SA sponsored ADR (b) | 92,100 | 2,708,661 | |
| Enersis SA | 5,106,237 | 1,199,826 | |
| Inversiones La Construccion SA | 67,576 | 1,318,286 | |
| LATAM Airlines Group SA | 13,855 | 216,805 | |
| S.A.C.I. Falabella | 29,441 | 282,271 | |
| Sociedad Matriz SAAM SA | 2,699,098 | 277,061 | |
| Sociedad Quimica y Minera de Chile SA (PN-B) sponsored ADR (b) | 14,000 | 688,100 | |
| Vina Concha y Toro SA | 1,065,297 | 2,275,774 | |
| TOTAL CHILE | 9,183,998 | ||
| China - 8.3% | |||
| Anhui Conch Cement Co. Ltd. (H Shares) | 176,000 | 968,522 | |
| BBMG Corp. (H Shares) | 3,933,500 | 1,792,491 | |
| China International Travel Service Corp. Ltd. (A Shares) | 241,500 | 2,031,506 | |
| China Life Insurance Co. Ltd. (H Shares) | 2,608,500 | 7,292,821 | |
| China Longyuan Power Grid Corp. Ltd. (H Shares) | 3,959,750 | 3,058,042 | |
| China Pacific Insurance (Group) Co. Ltd. (H Shares) | 1,649,100 | 7,483,146 | |
| China Petroleum & Chemical Corp. (H Shares) | 1,862,000 | 1,651,749 | |
| China Telecom Corp. Ltd. (H Shares) | 6,572,330 | 2,915,039 | |
| Guangzhou Automobile Group Co. Ltd. (H Shares) | 686,000 | 1,274,140 | |
| Hangzhou Hikvision Digital Technology Co. Ltd. Class A | 152,300 | 1,000,030 | |
| Industrial & Commercial Bank of China Ltd. (H Shares) | 22,659,000 | 19,747,002 | |
| Kweichow Moutai Co. Ltd. (A Shares) | 9,721 | 1,056,547 | |
| PICC Property & Casualty Co. Ltd. (H Shares) | 1,117,000 | 1,973,771 | |
| Qingdao Haier Co. Ltd. | 651,700 | 1,825,647 | |
| Shanghai International Airport Co. Ltd. (A Shares) | 308,137 | 2,392,669 | |
| Shenzhen Inovance Technology Co. Ltd. Class A | 151,900 | 853,951 | |
| Tsingtao Brewery Co. Ltd. (H Shares) | 492,000 | 2,583,857 | |
| Zhengzhou Yutong Bus Co. Ltd. | 500,124 | 1,777,922 | |
| TOTAL CHINA | 61,678,852 | ||
| Colombia - 0.4% | |||
| Bancolombia SA | 6,020 | 65,111 | |
| Bancolombia SA sponsored ADR | 38,256 | 1,607,517 | |
| Grupo de Inversiones Suramerica SA (a) | 63,566 | 848,135 | |
| Inversiones Argos SA | 102,208 | 688,444 | |
| TOTAL COLOMBIA | 3,209,207 | ||
| Cyprus - 0.0% | |||
| Etalon Group PLC GDR (Reg. S) | 92,053 | 280,762 | |
| Egypt - 0.1% | |||
| Six of October Development & Investment Co. (a) | 216,700 | 338,018 | |
| Greece - 0.5% | |||
| Fourlis Holdings SA | 31,367 | 217,679 | |
| Titan Cement Co. SA (Reg.) | 146,900 | 3,642,175 | |
| TOTAL GREECE | 3,859,854 | ||
| Hong Kong - 4.4% | |||
| China Overseas Land and Investment Ltd. | 1,049,600 | 3,680,727 | |
| China Resources Beer Holdings Co. Ltd. | 1,372,666 | 5,983,775 | |
| China Resources Power Holdings Co. Ltd. | 722,623 | 1,324,887 | |
| China Unicom Ltd. | 1,173,000 | 1,500,621 | |
| China Unicom Ltd. sponsored ADR (a)(b) | 214,300 | 2,749,469 | |
| CNOOC Ltd. | 3,927,000 | 5,814,666 | |
| CSPC Pharmaceutical Group Ltd. | 1,354,000 | 3,649,726 | |
| Far East Horizon Ltd. | 6,252,074 | 6,640,382 | |
| Techtronic Industries Co. Ltd. | 271,000 | 1,590,524 | |
| TOTAL HONG KONG | 32,934,777 | ||
| Hungary - 0.0% | |||
| OTP Bank PLC | 5,667 | 254,942 | |
| India - 7.6% | |||
| Adani Ports & Special Economic Zone Ltd. | 372,872 | 2,042,407 | |
| Axis Bank Ltd. | 453,913 | 3,587,535 | |
| Bajaj Auto Ltd. | 4,488 | 190,077 | |
| Bharat Petroleum Corp. Ltd. | 475,127 | 3,141,610 | |
| Bharti Airtel Ltd. | 351,750 | 2,167,352 | |
| Bharti Infratel Ltd. | 390,900 | 2,034,000 | |
| Federal Bank Ltd. | 1,440,679 | 1,993,298 | |
| Future Retail Ltd. (a) | 85,239 | 725,528 | |
| ICICI Bank Ltd. | 371,385 | 1,614,391 | |
| ICICI Bank Ltd. sponsored ADR | 344,080 | 3,045,108 | |
| Indraprastha Gas Ltd. (a) | 335,215 | 1,450,846 | |
| InterGlobe Aviation Ltd. (c) | 62,282 | 1,240,353 | |
| ITC Ltd. | 606,187 | 2,393,869 | |
| JK Cement Ltd. | 93,600 | 1,468,031 | |
| Larsen & Toubro Ltd. | 136,117 | 2,757,223 | |
| LIC Housing Finance Ltd. | 479,435 | 3,969,259 | |
| Lupin Ltd. (a) | 189,674 | 2,154,439 | |
| Mahindra & Mahindra Ltd. | 19,100 | 217,850 | |
| Manappuram General Finance & Leasing Ltd. | 858,806 | 1,456,312 | |
| Petronet LNG Ltd. | 382,368 | 1,367,309 | |
| Phoenix Mills Ltd. (a) | 249,925 | 2,283,153 | |
| Power Grid Corp. of India Ltd. | 376,461 | 1,123,670 | |
| Reliance Industries Ltd. | 527,120 | 7,206,651 | |
| SREI Infrastructure Finance Ltd. | 434,995 | 498,333 | |
| State Bank of India | 707,979 | 2,738,548 | |
| Sun Pharmaceutical Industries Ltd. | 416,959 | 3,192,268 | |
| Tejas Networks Ltd. (c) | 44,091 | 250,036 | |
| TOTAL INDIA | 56,309,456 | ||
| Indonesia - 2.4% | |||
| PT Astra International Tbk | 7,609,300 | 4,046,657 | |
| PT Bank Mandiri (Persero) Tbk | 5,221,800 | 2,928,134 | |
| PT Bank Rakyat Indonesia Tbk | 18,544,900 | 4,866,916 | |
| PT Indocement Tunggal Prakarsa Tbk | 725,300 | 848,360 | |
| PT Kalbe Farma Tbk | 7,479,800 | 817,491 | |
| PT Kino Indonesia Tbk | 18,933 | 2,723 | |
| PT Link Net Tbk | 1,621,600 | 613,197 | |
| PT Media Nusantara Citra Tbk | 14,543,900 | 1,503,614 | |
| PT Perusahaan Gas Negara Tbk Series B | 2,340,400 | 393,611 | |
| PT Semen Gresik (Persero) Tbk | 2,626,900 | 1,981,182 | |
| TOTAL INDONESIA | 18,001,885 | ||
| Israel - 0.2% | |||
| Bezeq The Israel Telecommunication Corp. Ltd. | 1,040,027 | 1,328,350 | |
| Italy - 0.6% | |||
| Prada SpA | 909,700 | 4,279,450 | |
| Japan - 0.4% | |||
| GMO Internet, Inc. | 16,900 | 340,367 | |
| Panasonic Corp. | 89,100 | 1,273,635 | |
| Sumco Corp. | 48,200 | 1,263,832 | |
| TOTAL JAPAN | 2,877,834 | ||
| Kenya - 0.2% | |||
| KCB Group Ltd. | 890,833 | 458,874 | |
| Safaricom Ltd. | 3,455,933 | 1,061,257 | |
| TOTAL KENYA | 1,520,131 | ||
| Korea (South) - 8.6% | |||
| AMOREPACIFIC Group, Inc. | 29,102 | 3,890,257 | |
| BS Financial Group, Inc. | 524,830 | 5,138,296 | |
| Coway Co. Ltd. | 18,801 | 1,589,368 | |
| Daou Technology, Inc. | 131,529 | 2,717,836 | |
| Hanon Systems | 125,183 | 1,349,329 | |
| Hyundai Fire & Marine Insurance Co. Ltd. | 65,525 | 2,399,517 | |
| Hyundai Industrial Development & Construction Co. | 23,656 | 856,258 | |
| Hyundai Mobis | 24,373 | 5,495,176 | |
| Iljin Materials Co. Ltd. | 24,909 | 874,646 | |
| InterPark INT Corp. | 85,648 | 742,581 | |
| KB Financial Group, Inc. | 126,764 | 7,243,555 | |
| KEPCO Plant Service & Engineering Co. Ltd. | 20,066 | 859,487 | |
| Korea Electric Power Corp. | 4,462 | 137,985 | |
| Korean Reinsurance Co. | 86,825 | 927,700 | |
| KT Corp. | 23,303 | 604,367 | |
| KT Corp. sponsored ADR | 29,522 | 404,451 | |
| LG Chemical Ltd. | 14,212 | 5,157,589 | |
| LG Corp. | 17,978 | 1,457,175 | |
| NAVER Corp. | 1,762 | 1,313,706 | |
| POSCO | 12,813 | 3,926,169 | |
| Samsung Electronics Co. Ltd. | 1,182 | 2,738,396 | |
| Samsung Life Insurance Co. Ltd. | 24,569 | 2,682,950 | |
| Samsung SDI Co. Ltd. | 25,047 | 4,538,931 | |
| Shinhan Financial Group Co. Ltd. | 101,682 | 4,374,490 | |
| SK Hynix, Inc. | 37,352 | 2,858,719 | |
| TOTAL KOREA (SOUTH) | 64,278,934 | ||
| Luxembourg - 0.6% | |||
| Corp. America Airports SA (a) | 6,200 | 76,508 | |
| Samsonite International SA | 930,000 | 4,253,647 | |
| Tenaris SA sponsored ADR | 1,500 | 52,005 | |
| TOTAL LUXEMBOURG | 4,382,160 | ||
| Mauritius - 0.1% | |||
| MakeMyTrip Ltd. (a)(b) | 25,400 | 881,380 | |
| Mexico - 1.6% | |||
| America Movil S.A.B. de CV Series L sponsored ADR | 62,400 | 1,191,216 | |
| Grupo Aeroportuario del Pacifico S.A.B. de CV Series B | 137,196 | 1,374,562 | |
| Grupo Financiero Banorte S.A.B. de CV Series O | 420,832 | 2,608,460 | |
| Macquarie Mexican (REIT) (c) | 1,883,363 | 2,145,032 | |
| Promotora y Operadora de Infraestructura S.A.B. de CV | 112,865 | 1,137,778 | |
| Wal-Mart de Mexico SA de CV Series V | 1,234,500 | 3,185,230 | |
| TOTAL MEXICO | 11,642,278 | ||
| Morocco - 0.1% | |||
| Attijariwafa Bank | 11,336 | 616,419 | |
| Netherlands - 1.0% | |||
| Yandex NV Series A (a) | 195,710 | 7,720,760 | |
| Nigeria - 0.9% | |||
| Dangote Cement PLC | 665,360 | 480,538 | |
| Guaranty Trust Bank PLC | 10,611,321 | 1,317,572 | |
| Guaranty Trust Bank PLC GDR (Reg. S) | 187,574 | 1,125,444 | |
| Nigerian Breweries PLC | 1,244,081 | 449,251 | |
| Transnational Corp. of Nigeria PLC (a) | 57,139,710 | 293,635 | |
| Zenith Bank PLC | 32,939,402 | 2,680,901 | |
| TOTAL NIGERIA | 6,347,341 | ||
| Oman - 0.0% | |||
| BankMuscat SAOG (a) | 12,082 | 11,486 | |
| Pakistan - 0.6% | |||
| Engro Corp. Ltd. | 87,567 | 234,966 | |
| Habib Bank Ltd. | 1,599,100 | 2,939,766 | |
| Indus Motor Co. Ltd. | 12,657 | 191,089 | |
| Maple Leaf Cement Factory Ltd. | 305,317 | 187,397 | |
| MCB Bank Ltd. | 250,267 | 477,394 | |
| Pak Electron Ltd. | 124,633 | 48,827 | |
| Shell Pakistan Ltd. | 1,567 | 4,946 | |
| United Bank Ltd. | 232,900 | 421,581 | |
| TOTAL PAKISTAN | 4,505,966 | ||
| Panama - 0.2% | |||
| Copa Holdings SA Class A | 14,000 | 1,800,820 | |
| Peru - 0.6% | |||
| Alicorp SA Class C | 71,566 | 249,568 | |
| Compania de Minas Buenaventura SA sponsored ADR | 242,028 | 3,686,086 | |
| Ferreycorp SAA | 355,797 | 280,133 | |
| TOTAL PERU | 4,215,787 | ||
| Philippines - 1.4% | |||
| Ayala Corp. | 53,215 | 971,137 | |
| BDO Unibank, Inc. | 423,473 | 1,135,680 | |
| International Container Terminal Services, Inc. | 732,777 | 1,410,989 | |
| JG Summit Holdings, Inc. | 646,587 | 779,560 | |
| Jollibee Food Corp. | 71,053 | 409,572 | |
| LT Group, Inc. | 471,533 | 170,563 | |
| Metropolitan Bank & Trust Co. | 1,436,928 | 2,366,467 | |
| Metropolitan Bank & Trust Co. rights 4/4/18 (a) | 283,394 | 58,665 | |
| PUREGOLD Price Club, Inc. | 225,067 | 226,138 | |
| Robinsons Land Corp. | 4,088,770 | 1,572,484 | |
| SM Investments Corp. | 53,355 | 944,334 | |
| Universal Robina Corp. | 154,673 | 451,109 | |
| TOTAL PHILIPPINES | 10,496,698 | ||
| Poland - 0.0% | |||
| Globe Trade Centre SA | 90,632 | 241,992 | |
| Inter Cars SA | 77 | 5,893 | |
| TOTAL POLAND | 247,885 | ||
| Romania - 0.2% | |||
| Banca Transilvania SA | 986,981 | 682,752 | |
| BRD-Groupe Societe Generale | 162,179 | 646,584 | |
| TOTAL ROMANIA | 1,329,336 | ||
| Russia - 4.6% | |||
| Lukoil PJSC sponsored ADR | 94,200 | 6,490,380 | |
| MMC Norilsk Nickel PJSC sponsored ADR | 233,500 | 4,327,923 | |
| Mobile TeleSystems OJSC | 152,110 | 781,028 | |
| Mobile TeleSystems OJSC sponsored ADR | 55,900 | 636,701 | |
| NOVATEK OAO GDR (Reg. S) | 23,800 | 3,260,600 | |
| RusHydro PJSC | 58,450,400 | 785,515 | |
| Sberbank of Russia | 1,459,920 | 6,462,002 | |
| Sberbank of Russia sponsored ADR | 452,792 | 8,435,515 | |
| Tatneft PAO | 196,400 | 2,096,762 | |
| Unipro PJSC | 25,319,800 | 1,286,145 | |
| TOTAL RUSSIA | 34,562,571 | ||
| Singapore - 0.2% | |||
| First Resources Ltd. | 1,228,500 | 1,578,805 | |
| South Africa - 7.8% | |||
| African Rainbow Minerals Ltd. | 25,900 | 221,836 | |
| Anglo American Platinum Ltd. | 3,000 | 82,103 | |
| Aspen Pharmacare Holdings Ltd. | 107,000 | 2,345,030 | |
| Barclays Africa Group Ltd. | 302,132 | 4,841,258 | |
| Barloworld Ltd. | 23,377 | 327,905 | |
| Bidvest Group Ltd. | 134,062 | 2,537,708 | |
| DRDGOLD Ltd. | 563,145 | 155,441 | |
| FirstRand Ltd. | 647,000 | 3,656,155 | |
| Imperial Holdings Ltd. | 305,267 | 6,014,446 | |
| Life Healthcare Group Holdings Ltd. | 720,300 | 1,679,863 | |
| Mr Price Group Ltd. | 128,800 | 3,100,665 | |
| MTN Group Ltd. | 299,493 | 3,010,931 | |
| Murray & Roberts Holdings Ltd. | 198,800 | 231,734 | |
| Nampak Ltd. (a) | 264,810 | 339,995 | |
| Naspers Ltd. Class N | 78,800 | 19,248,400 | |
| Nedbank Group Ltd. | 108,450 | 2,615,716 | |
| Pretoria Portland Cement Co. Ltd. (a) | 434,234 | 287,930 | |
| Sanlam Ltd. | 48,400 | 348,729 | |
| Sasol Ltd. | 90,500 | 3,087,513 | |
| Shoprite Holdings Ltd. | 14,216 | 303,299 | |
| Steinhoff Africa Retail Ltd. (a) | 50,000 | 88,481 | |
| Tiger Brands Ltd. | 125,200 | 3,934,064 | |
| TOTAL SOUTH AFRICA | 58,459,202 | ||
| Spain - 0.1% | |||
| Cemex Latam Holdings SA (a) | 68,878 | 219,399 | |
| Prosegur Cash SA (c) | 68,500 | 206,079 | |
| TOTAL SPAIN | 425,478 | ||
| Sri Lanka - 0.0% | |||
| Chevron Lubricants Lanka Ltd. | 2,815 | 1,889 | |
| Taiwan - 5.6% | |||
| Advantech Co. Ltd. | 69,695 | 500,344 | |
| Chroma ATE, Inc. | 191,000 | 1,128,450 | |
| GlobalWafers Co. Ltd. | 225,700 | 3,643,761 | |
| King's Town Bank | 955,000 | 1,212,099 | |
| LandMark Optoelectronics Corp. | 124,000 | 1,597,252 | |
| Largan Precision Co. Ltd. | 31,000 | 3,545,900 | |
| MediaTek, Inc. | 48,000 | 560,584 | |
| Nanya Technology Corp. | 426,000 | 1,343,299 | |
| PChome Online, Inc. | 71,009 | 406,114 | |
| President Chain Store Corp. | 22,833 | 232,153 | |
| Taiwan Semiconductor Manufacturing Co. Ltd. | 2,023,869 | 17,101,651 | |
| Taiwan Semiconductor Manufacturing Co. Ltd. sponsored ADR | 99,280 | 4,344,493 | |
| Unified-President Enterprises Corp. | 1,911,000 | 4,496,470 | |
| United Microelectronics Corp. | 3,047,000 | 1,611,808 | |
| TOTAL TAIWAN | 41,724,378 | ||
| Thailand - 1.1% | |||
| PTT Global Chemical PCL (For. Reg.) | 1,239,400 | 3,747,946 | |
| PTT PCL (For. Reg.) | 11,100 | 196,070 | |
| Siam Cement PCL (For. Reg.) | 202,700 | 3,243,200 | |
| Star Petroleum Refining PCL | 951,800 | 487,322 | |
| Thai Beverage PCL | 391,033 | 233,211 | |
| TOTAL THAILAND | 7,907,749 | ||
| Turkey - 1.5% | |||
| Bim Birlesik Magazalar A/S JSC | 122,000 | 2,223,354 | |
| Enerjisa Enerji A/S (c) | 40,353 | 72,620 | |
| Tupras Turkiye Petrol Rafinerileri A/S | 98,358 | 2,702,458 | |
| Turkcell Iletisim Hizmet A/S | 775,600 | 2,978,313 | |
| Turkcell Iletisim Hizmet A/S sponsored ADR (b) | 24,300 | 232,308 | |
| Turkiye Garanti Bankasi A/S | 1,067,000 | 2,958,706 | |
| TOTAL TURKEY | 11,167,759 | ||
| United Arab Emirates - 1.1% | |||
| Abu Dhabi National Oil Co. for Distribution PJSC (a) | 190,947 | 137,243 | |
| Agthia Group PJSC | 127,958 | 153,283 | |
| Aramex Co. (a) | 5,360 | 6,421 | |
| DP World Ltd. | 96,069 | 2,161,553 | |
| Dubai Financial Market PJSC | 878,530 | 248,750 | |
| Dubai Parks and Resorts PJSC (a) | 1,215,368 | 160,812 | |
| Emaar Properties PJSC | 1,879,944 | 2,968,562 | |
| National Bank of Abu Dhabi PJSC | 771,274 | 2,456,788 | |
| TOTAL UNITED ARAB EMIRATES | 8,293,412 | ||
| United Kingdom - 0.5% | |||
| Abdullah Al-Othaim Markets Co. ELS (HSBC Bank Warrant Program) warrants 7/20/20 (a)(c) | 5,800 | 238,279 | |
| Al Rajhi Banking & Investment Corp. ELS (HSBC Bank Warrant Program) warrants 1/19/21 (a)(c) | 10,900 | 219,366 | |
| ALDREES Petroleum and Transport Services Co. ELS (HSBC Warrant Program) warrants 1/30/20 (a)(c) | 29,600 | 211,305 | |
| Antofagasta PLC | 25,133 | 324,759 | |
| BGEO Group PLC | 4,833 | 241,122 | |
| Fresnillo PLC | 87,000 | 1,548,344 | |
| NMC Health PLC | 5,347 | 255,063 | |
| Saudi Co. For Hardware LLC ELS (HSBC Bank Warrant Program) warrants 5/21/18 (a)(c) | 6,700 | 235,751 | |
| Tullow Oil PLC (a) | 123,833 | 340,526 | |
| United International Transportation Co. ELS (HSBC Bank Warrant Program) warrants 7/8/20 (c) | 35,900 | 362,829 | |
| TOTAL UNITED KINGDOM | 3,977,344 | ||
| United States of America - 0.8% | |||
| Bilibili, Inc. ADR (a) | 79,100 | 870,100 | |
| Cognizant Technology Solutions Corp. Class A | 13,300 | 1,070,650 | |
| First Cash Financial Services, Inc. | 633 | 51,431 | |
| iQIYI, Inc. ADR (a) | 46,400 | 721,520 | |
| MercadoLibre, Inc. | 8,500 | 3,029,315 | |
| TOTAL UNITED STATES OF AMERICA | 5,743,016 | ||
| Vietnam - 0.5% | |||
| Bank For Foreign Trade Jsc | 143,250 | 442,760 | |
| Binh Minh Plastic JSC | 51,620 | 155,701 | |
| Ho Chi Minh City Infrastructure Investment JSC | 111,960 | 151,918 | |
| Ho Chi Minh City Securities Co. | 61,330 | 214,834 | |
| Petrovietnam Dr & Well Ser Jsc (a) | 333,460 | 279,229 | |
| PetroVietnam Technical Services Corp. | 358,400 | 331,539 | |
| Saigon Securities, Inc. | 181,440 | 310,229 | |
| Vietjet Aviation JSC | 36,640 | 359,661 | |
| Vietnam Dairy Products Corp. | 163,820 | 1,457,965 | |
| TOTAL VIETNAM | 3,703,836 | ||
| TOTAL COMMON STOCKS | |||
| (Cost $528,404,246) | 686,704,086 | ||
| Preferred Stocks - 6.6% | |||
| Convertible Preferred Stocks - 0.2% | |||
| Cayman Islands - 0.2% | |||
| China Internet Plus Holdings Ltd. Series A-11 (a)(d)(e) | 331,980 | 1,855,456 | |
| Nonconvertible Preferred Stocks - 6.4% | |||
| Brazil - 4.8% | |||
| Ambev SA sponsored ADR | 710,400 | 5,164,608 | |
| Banco do Estado Rio Grande do Sul SA | 339,660 | 2,085,420 | |
| Companhia Paranaense de Energia-Copel: | |||
| (PN-B) | 4,460 | 35,232 | |
| (PN-B) sponsored ADR (b) | 298,807 | 2,348,623 | |
| Fibria Celulose SA sponsored ADR | 171,100 | 3,336,450 | |
| Itau Unibanco Holding SA sponsored ADR | 577,786 | 9,013,462 | |
| Metalurgica Gerdau SA (PN) | 997,600 | 2,157,496 | |
| Petroleo Brasileiro SA - Petrobras (PN) sponsored ADR (non-vtg.) (a) | 636,900 | 8,273,331 | |
| Telefonica Brasil SA | 188,680 | 2,880,393 | |
| 35,295,015 | |||
| Colombia - 0.0% | |||
| Grupo de Inversiones Suramerica SA (a) | 15,591 | 198,650 | |
| Korea (South) - 1.6% | |||
| Hyundai Motor Co. Series 2 | 59,585 | 5,222,203 | |
| Samsung Electronics Co. Ltd. | 2,525 | 4,849,073 | |
| Samsung Fire & Marine Insurance Co. Ltd. | 12,006 | 2,085,268 | |
| 12,156,544 | |||
| TOTAL NONCONVERTIBLE PREFERRED STOCKS | 47,650,209 | ||
| TOTAL PREFERRED STOCKS | |||
| (Cost $30,688,672) | 49,505,665 | ||
| Principal Amount | Value | ||
| Government Obligations - 0.0% | |||
| United States of America - 0.0% | |||
| U.S. Treasury Bills, yield at date of purchase 1.74% 6/14/18 (Cost $49,822) | 50,000 | 49,832 | |
| Shares | Value | ||
| Money Market Funds - 1.9% | |||
| Fidelity Cash Central Fund, 1.72% (f) | 8,755,935 | 8,757,686 | |
| Fidelity Securities Lending Cash Central Fund 1.72% (f)(g) | 5,301,011 | 5,302,071 | |
| TOTAL MONEY MARKET FUNDS | |||
| (Cost $14,058,758) | 14,059,757 | ||
| TOTAL INVESTMENT IN SECURITIES - 100.5% | |||
| (Cost $573,201,498) | 750,319,340 | ||
| NET OTHER ASSETS (LIABILITIES) - (0.5)% | (3,931,709) | ||
| NET ASSETS - 100% | $746,387,631 |
Security Type Abbreviations
ELS – Equity-Linked Security
Categorizations in the Schedule of Investments are based on country or territory of incorporation.
Legend
(a) Non-income producing
(b) Security or a portion of the security is on loan at period end.
(c) Security exempt from registration under Rule 144A of the Securities Act of 1933. These securities may be resold in transactions exempt from registration, normally to qualified institutional buyers. At the end of the period, the value of these securities amounted to $18,767,507 or 2.5% of net assets.
(d) Restricted securities - Investment in securities not registered under the Securities Act of 1933 (excluding 144A issues). At the end of the period, the value of restricted securities (excluding 144A issues) amounted to $1,855,456 or 0.2% of net assets.
(e) Level 3 security
(f) Affiliated fund that is generally available only to investment companies and other accounts managed by Fidelity Investments. The rate quoted is the annualized seven-day yield of the fund at period end. A complete unaudited listing of the fund's holdings as of its most recent quarter end is available upon request. In addition, each Fidelity Central Fund's financial statements are available on the SEC's website or upon request.
(g) Investment made with cash collateral received from securities on loan.
Additional information on each restricted holding is as follows:
| Security | Acquisition Date | Acquisition Cost |
| China Internet Plus Holdings Ltd. Series A-11 | 1/26/15 | $1,049,339 |
Affiliated Central Funds
Information regarding fiscal year to date income earned by the Fund from investments in Fidelity Central Funds is as follows:
| Fund | Income earned |
| Fidelity Cash Central Fund | $150,829 |
| Fidelity Securities Lending Cash Central Fund | 26,651 |
| Total | $177,480 |
Amounts in the income column in the above table include any capital gain distributions from underlying funds, which are presented in the corresponding line-item in the Statement of Operations if applicable.
Investment Valuation
The following is a summary of the inputs used, as of March 31, 2018, involving the Fund's assets and liabilities carried at fair value. The inputs or methodology used for valuing securities may not be an indication of the risk associated with investing in those securities. For more information on valuation inputs, and their aggregation into the levels used below, please refer to the Investment Valuation section in the accompanying Notes to Financial Statements.
| Valuation Inputs at Reporting Date: | ||||
| Description | Total | Level 1 | Level 2 | Level 3 |
| Investments in Securities: | ||||
| Equities: | ||||
| Consumer Discretionary | $116,778,673 | $79,547,178 | $35,376,039 | $1,855,456 |
| Consumer Staples | 48,420,365 | 28,801,594 | 19,618,771 | -- |
| Energy | 45,404,584 | 26,222,599 | 19,181,985 | -- |
| Financials | 183,211,791 | 108,014,004 | 75,197,787 | -- |
| Health Care | 15,335,895 | 5,521,971 | 9,813,924 | -- |
| Industrials | 35,352,026 | 21,567,416 | 13,784,610 | -- |
| Information Technology | 162,659,380 | 115,642,975 | 47,016,405 | -- |
| Materials | 61,191,145 | 50,844,137 | 10,347,008 | -- |
| Real Estate | 17,037,039 | 3,829,334 | 13,207,705 | -- |
| Telecommunication Services | 29,993,108 | 20,762,899 | 9,230,209 | -- |
| Utilities | 20,825,745 | 10,545,399 | 10,280,346 | -- |
| Government Obligations | 49,832 | -- | 49,832 | -- |
| Money Market Funds | 14,059,757 | 14,059,757 | -- | -- |
| Total Investments in Securities: | $750,319,340 | $485,359,263 | $263,104,621 | $1,855,456 |
The following is a summary of transfers between Level 1 and Level 2 for the period ended March 31, 2018. Transfers are assumed to have occurred at the beginning of the period, and are primarily attributable to the valuation techniques used for foreign equity securities, as discussed in the accompanying Notes to Financial Statements:
| Transfers | Total |
| Level 1 to Level 2 | $155,081,529 |
| Level 2 to Level 1 | $42,539,599 |
See accompanying notes which are an integral part of the financial statements.
Financial Statements
Statement of Assets and Liabilities
| March 31, 2018 (Unaudited) | ||
| Assets | ||
| Investment in securities, at value (including securities loaned of $5,218,102) — See accompanying schedule: Unaffiliated issuers (cost $559,142,740) | $736,259,583 | |
| Fidelity Central Funds (cost $14,058,758) | 14,059,757 | |
| Total Investment in Securities (cost $573,201,498) | $750,319,340 | |
| Foreign currency held at value (cost $159,578) | 159,516 | |
| Receivable for investments sold | 3,535,568 | |
| Receivable for fund shares sold | 60,979 | |
| Dividends receivable | 2,806,275 | |
| Distributions receivable from Fidelity Central Funds | 22,336 | |
| Other receivables | 313,145 | |
| Total assets | 757,217,159 | |
| Liabilities | ||
| Payable to custodian bank | $828,865 | |
| Payable for investments purchased | 3,609,865 | |
| Payable for fund shares redeemed | 533,598 | |
| Other payables and accrued expenses | 555,650 | |
| Collateral on securities loaned | 5,301,550 | |
| Total liabilities | 10,829,528 | |
| Net Assets | $746,387,631 | |
| Net Assets consist of: | ||
| Paid in capital | $525,472,107 | |
| Undistributed net investment income | 1,654,849 | |
| Accumulated undistributed net realized gain (loss) on investments and foreign currency transactions | 42,542,998 | |
| Net unrealized appreciation (depreciation) on investments and assets and liabilities in foreign currencies | 176,717,677 | |
| Net Assets, for 2,920,890 shares outstanding | $746,387,631 | |
| Net Asset Value, offering price and redemption price per share ($746,387,631 ÷ 2,920,890 shares) | $255.53 |
See accompanying notes which are an integral part of the financial statements.
Statement of Operations
| Six months ended March 31, 2018 (Unaudited) | ||
| Investment Income | ||
| Dividends | $6,605,769 | |
| Interest | 3,347 | |
| Income from Fidelity Central Funds | 177,480 | |
| Income before foreign taxes withheld | 6,786,596 | |
| Less foreign taxes withheld | (795,109) | |
| Total income | 5,991,487 | |
| Expenses | ||
| Custodian fees and expenses | $289,741 | |
| Independent directors' fees and expenses | 1,487 | |
| Interest | 1,828 | |
| Miscellaneous | 10 | |
| Total expenses | 293,066 | |
| Net investment income (loss) | 5,698,421 | |
| Realized and Unrealized Gain (Loss) | ||
| Net realized gain (loss) on: | ||
| Investment securities: | ||
| Unaffiliated issuers | 52,183,189 | |
| Fidelity Central Funds | 814 | |
| Foreign currency transactions | (277,218) | |
| Futures contracts | 1,854,806 | |
| Total net realized gain (loss) | 53,761,591 | |
| Change in net unrealized appreciation (depreciation) on: | ||
| Unaffiliated issuers (net of decrease in deferred foreign taxes of $238,017) | 18,099,948 | |
| Fidelity Central Funds | (204) | |
| Assets and liabilities in foreign currencies | 20,047 | |
| Futures contracts | 143,531 | |
| Total change in net unrealized appreciation (depreciation) | 18,263,322 | |
| Net gain (loss) | 72,024,913 | |
| Net increase (decrease) in net assets resulting from operations | $77,723,334 |
See accompanying notes which are an integral part of the financial statements.
Statement of Changes in Net Assets
| Six months ended March 31, 2018 (Unaudited) | Year ended September 30, 2017 | |
| Increase (Decrease) in Net Assets | ||
| Operations | ||
| Net investment income (loss) | $5,698,421 | $12,093,213 |
| Net realized gain (loss) | 53,761,591 | 32,760,743 |
| Change in net unrealized appreciation (depreciation) | 18,263,322 | 92,226,717 |
| Net increase (decrease) in net assets resulting from operations | 77,723,334 | 137,080,673 |
| Distributions to shareholders from net investment income | (5,021,105) | (11,115,681) |
| Distributions to shareholders from net realized gain | (37,772,093) | (2,186,326) |
| Total distributions | (42,793,198) | (13,302,007) |
| Affiliated share transactions | ||
| Proceeds from sales of shares | 93,400,862 | 288,606,531 |
| Reinvestment of distributions | 42,175,853 | 13,077,757 |
| Cost of shares redeemed | (187,305,512) | (77,097,405) |
| Net increase (decrease) in net assets resulting from share transactions | (51,728,797) | 224,586,883 |
| Total increase (decrease) in net assets | (16,798,661) | 348,365,549 |
| Net Assets | ||
| Beginning of period | 763,186,292 | 414,820,743 |
| End of period | $746,387,631 | $763,186,292 |
| Other Information | ||
| Undistributed net investment income end of period | $1,654,849 | $977,533 |
| Shares | ||
| Sold | 365,223 | 1,346,133 |
| Issued in reinvestment of distributions | 171,552 | 60,674 |
| Redeemed | (715,022) | (355,666) |
| Net increase (decrease) | (178,247) | 1,051,141 |
See accompanying notes which are an integral part of the financial statements.
Financial Highlights
Fidelity Emerging Markets Equity Central Fund
| Six months ended (Unaudited) March 31, | Years endedSeptember 30, | |||||
| 2018 | 2017 | 2016 | 2015 | 2014 | 2013 | |
| Selected Per–Share Data | ||||||
| Net asset value, beginning of period | $246.26 | $202.55 | $172.95 | $212.25 | $198.65 | $195.55 |
| Income from Investment Operations | ||||||
| Net investment income (loss)A | 1.80 | 4.65 | 4.05 | 3.47 | 4.39 | 4.54 |
| Net realized and unrealized gain (loss) | 20.75 | 44.19 | 29.35 | (39.58) | 12.94 | 3.55 |
| Total from investment operations | 22.55 | 48.84 | 33.40 | (36.11) | 17.33 | 8.09 |
| Distributions from net investment income | (1.60) | (4.06) | (3.80) | (3.19) | (3.73) | (4.99) |
| Distributions from net realized gain | (11.68) | (1.07) | – | – | – | – |
| Total distributions | (13.28) | (5.13) | (3.80) | (3.19) | (3.73) | (4.99) |
| Net asset value, end of period | $255.53 | $246.26 | $202.55 | $172.95 | $212.25 | $198.65 |
| Total ReturnB,C | 9.38% | 24.55% | 19.51% | (17.12)% | 8.72% | 4.21% |
| Ratios to Average Net AssetsD,E | ||||||
| Expenses before reductions | .07%F | .07% | .09% | .15% | .15% | .13% |
| Expenses net of fee waivers, if any | .07%F | .07% | .09% | .15% | .15% | .13% |
| Expenses net of all reductions | .07%F | .07% | .09% | .15% | .15% | .13% |
| Net investment income (loss) | 1.39%F | 2.12% | 2.23% | 1.71% | 2.07% | 2.24% |
| Supplemental Data | ||||||
| Net assets, end of period (000 omitted) | $746,388 | $763,186 | $414,821 | $237,056 | $457,436 | $207,267 |
| Portfolio turnover rateG | 68%F | 59% | 52% | 141% | 84% | 183% |
A Calculated based on average shares outstanding during the period.
B Total returns for periods of less than one year are not annualized.
C Total returns would have been lower if certain expenses had not been reduced during the applicable periods shown.
D Fees and expenses of any underlying Fidelity Central Funds are not included in the Fund's expense ratio. The Fund indirectly bears its proportionate share of the expenses of any underlying Fidelity Central Funds.
E Expense ratios reflect operating expenses of the Fund. Expenses before reductions do not reflect amounts reimbursed by the investment adviser or reductions from expense offset arrangements and do not represent the amount paid by the Fund during periods when reimbursements or reductions occur. Expenses net of fee waivers reflect expenses after reimbursement by the investment adviser but prior to reductions from expense offset arrangements. Expenses net of all reductions represent the net expenses paid by the Fund.
F Annualized
G Amount does not include the portfolio activity of any underlying Fidelity Central Funds.
See accompanying notes which are an integral part of the financial statements.
Notes to Financial Statements (Unaudited)
For the period ended March 31, 2018
1. Organization.
Fidelity Emerging Markets Equity Central Fund (the Fund) is a fund of Fidelity Central Investment Portfolios LLC (the LLC) and is authorized to issue an unlimited number of shares. Shares of the Fund are only offered to other investment companies and accounts managed by Fidelity Management & Research Company (FMR), or its affiliates (the Investing Funds). The LLC is registered under the Investment Company Act of 1940, as amended (the 1940 Act), as an open-end management investment company organized as a Delaware Limited Liability Company. The Fund's investments in emerging markets can be subject to social, economic, regulatory, and political uncertainties and can be extremely volatile.
2. Investments in Fidelity Central Funds.
The Fund invests in Fidelity Central Funds, which are open-end investment companies generally available only to other investment companies and accounts managed by the investment adviser and its affiliates. The Fund's Schedule of Investments lists each of the Fidelity Central Funds held as of period end, if any, as an investment of the Fund, but does not include the underlying holdings of each Fidelity Central Fund. As an Investing Fund, the Fund indirectly bears its proportionate share of the expenses of the underlying Fidelity Central Funds.
The Money Market Central Funds seek preservation of capital and current income and are managed by Fidelity Investments Money Management, Inc. (FIMM), an affiliate of the investment adviser. Annualized expenses of the Money Market Central Funds as of their most recent shareholder report date are less than .005%.
A complete unaudited list of holdings for each Fidelity Central Fund is available upon request or at the Securities and Exchange Commission (the SEC) website at www.sec.gov. In addition, the financial statements of the Fidelity Central Funds are available on the SEC website or upon request.
3. Significant Accounting Policies.
The Fund is an investment company and applies the accounting and reporting guidance of the Financial Accounting Standards Board (FASB) Accounting Standards Codification Topic 946 Financial Services – Investments Companies. The financial statements have been prepared in conformity with accounting principles generally accepted in the United States of America (GAAP), which require management to make certain estimates and assumptions at the date of the financial statements. Actual results could differ from those estimates. Subsequent events, if any, through the date that the financial statements were issued have been evaluated in the preparation of the financial statements. The following summarizes the significant accounting policies of the Fund:
Investment Valuation. Investments are valued as of 4:00 p.m. Eastern time on the last calendar day of the period. The Board of Directors (the Board) has delegated the day to day responsibility for the valuation of the Fund's investments to the Fair Value Committee (the Committee) established by the Fund's investment adviser. In accordance with valuation policies and procedures approved by the Board, the Fund attempts to obtain prices from one or more third party pricing vendors or brokers to value its investments. When current market prices, quotations or currency exchange rates are not readily available or reliable, investments will be fair valued in good faith by the Committee, in accordance with procedures adopted by the Board. Factors used in determining fair value vary by investment type and may include market or investment specific events, changes in interest rates and credit quality. The frequency with which these procedures are used cannot be predicted and they may be utilized to a significant extent. The Committee oversees the Fund's valuation policies and procedures and reports to the Board on the Committee's activities and fair value determinations. The Board monitors the appropriateness of the procedures used in valuing the Fund's investments and ratifies the fair value determinations of the Committee.
The Fund categorizes the inputs to valuation techniques used to value its investments into a disclosure hierarchy consisting of three levels as shown below:
- Level 1 – quoted prices in active markets for identical investments
- Level 2 – other significant observable inputs (including quoted prices for similar investments, interest rates, prepayment speeds, etc.)
- Level 3 – unobservable inputs (including the Fund's own assumptions based on the best information available)
Valuation techniques used to value the Fund's investments by major category are as follows:
Equity securities, including restricted securities, for which market quotations are readily available, are valued at the last reported sale price or official closing price as reported by a third party pricing vendor on the primary market or exchange on which they are traded and are categorized as Level 1 in the hierarchy. In the event there were no sales during the day or closing prices are not available, securities are valued at the last quoted bid price or may be valued using the last available price and are generally categorized as Level 2 in the hierarchy. For foreign equity securities, when market or security specific events arise, comparisons to the valuation of American Depositary Receipts (ADRs), futures contracts, Exchange-Traded Funds (ETFs) and certain indexes as well as quoted prices for similar securities may be used and would be categorized as Level 2 in the hierarchy. Utilizing these techniques may result in transfers between Level 1 and Level 2. For equity securities, including restricted securities, where observable inputs are limited, assumptions about market activity and risk are used and these securities may be categorized as Level 3 in the hierarchy.
Debt securities, including restricted securities, are valued based on evaluated prices received from third party pricing vendors or from brokers who make markets in such securities. U.S. government and government agency obligations are valued by pricing vendors who utilize matrix pricing which considers yield or price of bonds of comparable quality, coupon, maturity and type or by broker-supplied prices. When independent prices are unavailable or unreliable, debt securities may be valued utilizing pricing methodologies which consider similar factors that would be used by third party pricing vendors. Debt securities are generally categorized as Level 2 in the hierarchy but may be Level 3 depending on the circumstances.
Investments in open-end mutual funds, including the Fidelity Central Funds, are valued at their closing net asset value (NAV) each business day and are categorized as Level 1 in the hierarchy.
Changes in valuation techniques may result in transfers in or out of an assigned level within the disclosure hierarchy. The aggregate value of investments by input level as of March 31, 2018, including information on transfers between Levels 1 and 2, is included at the end of the Fund's Schedule of Investments.
Foreign Currency. The Fund may use foreign currency contracts to facilitate transactions in foreign-denominated securities. Gains and losses from these transactions may arise from changes in the value of the foreign currency or if the counterparties do not perform under the contracts' terms.
Foreign-denominated assets, including investment securities, and liabilities are translated into U.S. dollars at the exchange rates at period end. Purchases and sales of investment securities, income and dividends received and expenses denominated in foreign currencies are translated into U.S. dollars at the exchange rate in effect on the transaction date.
The effects of exchange rate fluctuations on investments are included with the net realized and unrealized gain (loss) on investment securities. Other foreign currency transactions resulting in realized and unrealized gain (loss) are disclosed separately.
Investment Transactions and Income. For financial reporting purposes, the Fund's investment holdings and NAV include trades executed through the end of the last business day of the period. The NAV per share for processing shareholder transactions is calculated as of the close of business of the New York Stock Exchange (NYSE), normally 4:00 p.m. Eastern time and includes trades executed through the end of the prior business day. Gains and losses on securities sold are determined on the basis of identified cost and includes proceeds received from litigation. Dividend income is recorded on the ex-dividend date, except for certain dividends from foreign securities where the ex-dividend date may have passed, which are recorded as soon as the Fund is informed of the ex-dividend date. Non-cash dividends included in dividend income, if any, are recorded at the fair market value of the securities received. Income and capital gain distributions from Fidelity Central Funds, if any, are recorded on the ex-dividend date. Certain distributions received by the Fund represent a return of capital or capital gain. The Fund determines the components of these distributions subsequent to the ex-dividend date, based upon receipt of tax filings or other correspondence relating to the underlying investment. These distributions are recorded as a reduction of cost of investments and/or as a realized gain. Interest income is accrued as earned and includes coupon interest and amortization of premium and accretion of discount on debt securities as applicable. Investment income is recorded net of foreign taxes withheld where recovery of such taxes is uncertain.
Expenses. Expenses directly attributable to a fund are charged to that fund. Expenses attributable to more than one fund are allocated among the respective funds on the basis of relative net assets or other appropriate methods. Expense estimates are accrued in the period to which they relate and adjustments are made when actual amounts are known.
Income Tax Information and Distributions to Shareholders. Each year, the Fund intends to qualify as a regulated investment company under Subchapter M of the Internal Revenue Code, including distributing substantially all of its taxable income and realized gains. As a result, no provision for U.S. Federal income taxes is required. The Fund files a U.S. federal tax return, in addition to state and local tax returns as required. The Fund's federal income tax returns are subject to examination by the Internal Revenue Service (IRS) for a period of three fiscal years after they are filed. State and local tax returns may be subject to examination for an additional fiscal year depending on the jurisdiction. Foreign taxes are provided for based on the Fund's understanding of the tax rules and rates that exist in the foreign markets in which it invests. The Fund is subject to a tax imposed on capital gains by certain countries in which it invests. An estimated deferred tax liability for net unrealized appreciation on the applicable securities is included in Other payables and accrued expenses on the Statement of Assets & Liabilities.
Distributions are declared and recorded on the ex-dividend date. Income and capital gain distributions are determined in accordance with income tax regulations, which may differ from GAAP.
Capital accounts within the financial statements are adjusted for permanent book-tax differences. These adjustments have no impact on net assets or the results of operations. Capital accounts are not adjusted for temporary book-tax differences which will reverse in a subsequent period.
Book-tax differences are primarily due to futures contracts, foreign currency transactions, certain foreign taxes, passive foreign investment companies (PFIC), and losses deferred due to wash sales.
As of period end, the cost and unrealized appreciation (depreciation) in securities, and derivatives if applicable, for federal income tax purposes were as follows:
| Gross unrealized appreciation | $194,798,119 |
| Gross unrealized depreciation | (21,131,579) |
| Net unrealized appreciation (depreciation) | $173,666,540 |
| Tax cost | $576,652,800 |
Restricted Securities. The Fund may invest in securities that are subject to legal or contractual restrictions on resale. These securities generally may be resold in transactions exempt from registration or to the public if the securities are registered. Disposal of these securities may involve time-consuming negotiations and expense, and prompt sale at an acceptable price may be difficult. Information regarding restricted securities is included at the end of the Fund's Schedule of Investments.
4. Derivative Instruments.
Risk Exposures and the Use of Derivative Instruments. The Fund's investment objective allows the Fund to enter into various types of derivative contracts, including futures contracts. Derivatives are investments whose value is primarily derived from underlying assets, indices or reference rates and may be transacted on an exchange or over-the-counter (OTC). Derivatives may involve a future commitment to buy or sell a specified asset based on specified terms, to exchange future cash flows at periodic intervals based on a notional principal amount, or for one party to make one or more payments upon the occurrence of specified events in exchange for periodic payments from the other party.
The Fund used derivatives to increase returns and to manage exposure to certain risks as defined below. The success of any strategy involving derivatives depends on analysis of numerous economic factors, and if the strategies for investment do not work as intended, the Fund may not achieve its objectives.
The Fund's use of derivatives increased or decreased its exposure to the following risk:
| Equity Risk | Equity risk relates to the fluctuations in the value of financial instruments as a result of changes in market prices (other than those arising from interest rate risk or foreign exchange risk), whether caused by factors specific to an individual investment, its issuer, or all factors affecting all instruments traded in a market or market segment. |
The Fund is also exposed to additional risks from investing in derivatives, such as liquidity risk and counterparty credit risk. Liquidity risk is the risk that the Fund will be unable to close out the derivative in the open market in a timely manner. Counterparty credit risk is the risk that the counterparty will not be able to fulfill its obligation to the Fund. Counterparty credit risk related to exchange-traded futures contracts may be mitigated by the protection provided by the exchange on which they trade.
Investing in derivatives may involve greater risks than investing in the underlying assets directly and, to varying degrees, may involve risk of loss in excess of any initial investment and collateral received and amounts recognized in the Statement of Assets and Liabilities. In addition, there may be the risk that the change in value of the derivative contract does not correspond to the change in value of the underlying instrument.
Futures Contracts. A futures contract is an agreement between two parties to buy or sell a specified underlying instrument for a fixed price at a specified future date. The Fund used futures contracts to manage its exposure to the stock market.
Upon entering into a futures contract, a fund is required to deposit either cash or securities (initial margin) with a clearing broker in an amount equal to a certain percentage of the face value of the contract. Futures contracts are marked-to-market daily and subsequent daily payments (variation margin) are made or received by a fund depending on the daily fluctuations in the value of the futures contracts and are recorded as unrealized appreciation or (depreciation). This receivable and/or payable, if any, is included in daily variation margin on futures contracts in the Statement of Assets and Liabilities. Realized gain or (loss) is recorded upon the expiration or closing of a futures contract. The net realized gain (loss) and change in net unrealized appreciation (depreciation) on futures contracts during the period is presented in the Statement of Operations.
Any open futures contracts at period end are presented in the Schedule of Investments under the caption "Futures Contracts". The notional amount at value reflects each contract's exposure to the underlying instrument or index at period end.
5. Purchases and Sales of Investments.
Purchases and sales of securities, other than short-term securities, aggregated $265,267,626 and $327,817,717, respectively.
6. Fees and Other Transactions with Affiliates.
Management Fee and Expense Contract. FMR Co., Inc. (the investment adviser), an affiliate of FMR, provides the Fund with investment management services. The Fund does not pay any fees for these services. Pursuant to the Fund's management contract with the investment adviser, FMR pays the investment adviser a portion of the management fees it receives from the Investing Funds. In addition, under an expense contract, FMR also pays all other expenses of the Fund, excluding custody fees, the compensation of the independent Directors, and certain miscellaneous expenses such as proxy and shareholder meeting expenses.
Brokerage Commissions. The Fund placed a portion of its portfolio transactions with brokerage firms which are affiliates of the investment adviser. Brokerage commissions are included in net realized gain (loss) and change in net unrealized appreciation (depreciation) in the Statement of Operations. The commissions paid to these affiliated firms were $2,503 for the period.
Interfund Lending Program. Pursuant to an Exemptive Order issued by the SEC, the Fund, along with other registered investment companies having management contracts with FMR or other affiliated entities of FMR, may participate in an interfund lending program. This program provides an alternative credit facility allowing the funds to borrow from, or lend money to, other participating affiliated funds. At period end, there were no interfund loans outstanding. The Fund's activity in this program during the period for which loans were outstanding was as follows:
| Borrower or Lender | Average Loan Balance | Weighted Average Interest Rate | Interest Expense |
| Borrower | $10,140,000 | 1.62% | $1,828 |
Interfund Trades. The Fund may purchase from or sell securities to other Fidelity Funds under procedures adopted by the Board. The procedures have been designed to ensure these interfund trades are executed in accordance with Rule 17a-7 of the 1940 Act. Interfund trades are included within the respective purchases and sales amounts shown in the Purchases and Sales of Investments note.
Other. During the period, the investment adviser reimbursed the Fund for certain losses in the amount of $4,455.
7. Security Lending.
The Fund lends portfolio securities through a lending agent from time to time in order to earn additional income. For equity securities, a lending agent is used and may loan securities to certain qualified borrowers, including Fidelity Capital Markets (FCM), a broker-dealer affiliated with the Fund. On the settlement date of the loan, the Fund receives collateral (in the form of U.S. Treasury obligations, letters of credit and/or cash) against the loaned securities and maintains collateral in an amount not less than 100% of the market value of the loaned securities during the period of the loan. The market value of the loaned securities is determined at the close of business of the Fund and any additional required collateral is delivered to the Fund on the next business day. The Fund or borrower may terminate the loan at any time, and if the borrower defaults on its obligation to return the securities loaned because of insolvency or other reasons, the Fund may apply collateral received from the borrower against the obligation. The Fund may experience delays and costs in recovering the securities loaned. Any cash collateral received is invested in the Fidelity Securities Lending Cash Central Fund. The value of loaned securities and cash collateral at period end are disclosed on the Fund's Statement of Assets and Liabilities. Security lending income represents the income earned on investing cash collateral, less rebates paid to borrowers and any lending agent fees associated with the loan, plus any premium payments received for lending certain types of securities. Security lending income is presented in the Statement of Operations as a component of income from Fidelity Central Funds. Total security lending income during the period amounted to $26,651. During the period, there were no securities loaned to FCM.
8. Other.
The Fund's organizational documents provide former and current directors and officers with a limited indemnification against liabilities arising in connection with the performance of their duties to the Fund. In the normal course of business, the Fund may also enter into contracts that provide general indemnifications. The Fund's maximum exposure under these arrangements is unknown as this would be dependent on future claims that may be made against the Fund. The risk of material loss from such claims is considered remote.
At the end of the period, mutual funds managed by FMR or its affiliates were the owners of record of all of the outstanding shares of the Fund.
Shareholder Expense Example
As a shareholder of the Fund, you incur two types of costs: (1) transaction costs and (2) ongoing costs, including other Fund expenses. This Example is intended to help you understand your ongoing costs (in dollars) of investing in the Fund and to compare these costs with the ongoing costs of investing in other mutual funds.
The Example is based on an investment of $1,000 invested at the beginning of the period and held for the entire period (October 1, 2017 to March 31, 2018).
Actual Expenses
The first line of the accompanying table provides information about actual account values and actual expenses. You may use the information in this line, together with the amount you invested, to estimate the expenses that you paid over the period. Simply divide your account value by $1,000.00 (for example, an $8,600 account value divided by $1,000.00 = 8.6), then multiply the result by the number in the first line under the heading entitled "Expenses Paid During Period" to estimate the expenses you paid on your account during this period. In addition, the Fund, as a shareholder in the underlying Fidelity Central Funds, will indirectly bear its pro-rata share of the fees and expenses incurred by the underlying Fidelity Central Funds. These fees and expenses are not included in the Fund's annualized expense ratio used to calculate the expense estimate in the table below.
Hypothetical Example for Comparison Purposes
The second line of the accompanying table provides information about hypothetical account values and hypothetical expenses based on the Fund's actual expense ratio and an assumed rate of return of 5% per year before expenses, which is not the Fund's actual return. The hypothetical account values and expenses may not be used to estimate the actual ending account balance or expenses you paid for the period. You may use this information to compare the ongoing costs of investing in the Fund and other funds. To do so, compare this 5% hypothetical example with the 5% hypothetical examples that appear in the shareholder reports of the other funds. In addition, the Fund, as a shareholder in the underlying Fidelity Central Funds, will indirectly bear its pro-rata share of the fees and expenses incurred by the underlying Fidelity Central Funds. These fees and expenses are not included in the Fund's annualized expense ratio used to calculate the expense estimate in the table below.
Please note that the expenses shown in the table are meant to highlight your ongoing costs only and do not reflect any transaction costs. Therefore, the second line of the table is useful in comparing ongoing costs only, and will not help you determine the relative total costs of owning different funds.
| Annualized Expense Ratio-A | Beginning Account Value October 1, 2017 | Ending Account Value March 31, 2018 | Expenses Paid During Period-B October 1, 2017 to March 31, 2018 | |
| Actual | .0717% | $1,000.00 | $1,093.80 | $.37 |
| Hypothetical-C | $1,000.00 | $1,024.57 | $.36 |
A Annualized expense ratio reflects expenses net of applicable fee waivers.
B Expenses are equal to the Fund's annualized expense ratio, multiplied by the average account value over the period, multiplied by 182/365 (to reflect the one-half year period).
C 5% return per year before expenses
![]()
Corporate Headquarters
245 Summer St.
Boston, MA 02210
www.fidelity.com
EMQ-SANN-0518
1.876936.109
Item 2.
Code of Ethics
Not applicable.
Item 3.
Audit Committee Financial Expert
Not applicable.
Item 4.
Principal Accountant Fees and Services
Not applicable.
Item 5.
Audit Committee of Listed Registrants
Not applicable.
Item 6.
Investments
(a)
Not applicable.
(b)
Not applicable
Item 7.
Disclosure of Proxy Voting Policies and Procedures for Closed-End Management Investment Companies
Not applicable.
Item 8.
Portfolio Managers of Closed-End Management Investment Companies
Not applicable.
Item 9.
Purchase of Equity Securities by Closed-End Management Investment Company and Affiliated Purchasers
Not applicable.
Item 10.
Submission of Matters to a Vote of Security Holders
There were no material changes to the procedures by which shareholders may recommend nominees to the Fidelity Central Investment Portfolios LLC’s Board of Trustees.
Item 11.
Controls and Procedures
(a)(i) The President and Treasurer and the Chief Financial Officer have concluded that the Fidelity Central Investment Portfolios LLC’s (the “Trust”) disclosure controls and procedures (as defined in Rule 30a-3(c) under the Investment Company Act) provide reasonable assurances that material information relating to the Trust is made known to them by the appropriate persons, based on their evaluation of these controls and procedures as of a date within 90 days of the filing date of this report.
(a)(ii) There was no change in the Trust’s internal control over financial reporting (as defined in Rule 30a-3(d) under the Investment Company Act) that occurred during the period covered by this report that has materially affected, or is reasonably likely to materially affect, the Trust’s internal control over financial reporting.
Item 12.
Disclosure of Securities Lending Activities for Closed-End Management
Investment Companies
Not applicable.
Item 13.
Exhibits
(a) | (1) | Not applicable. |
(a) | (2) | Certification pursuant to Rule 30a-2(a) under the Investment Company Act of 1940 (17 CFR 270.30a-2(a)) is filed and attached hereto as Exhibit 99.CERT. |
(a) | (3) | Not applicable. |
(b) | Certification pursuant to Rule 30a-2(b) under the Investment Company Act of 1940 (17 CFR 270.30a-2(b)) is furnished and attached hereto as Exhibit 99.906CERT. |
SIGNATURES
Pursuant to the requirements of the Securities Exchange Act of 1934 and the Investment Company Act of 1940, the registrant has duly caused this report to be signed on its behalf by the undersigned, thereunto duly authorized.
Fidelity Central Investment Portfolios LLC
By: | /s/Stacie M. Smith |
Stacie M. Smith | |
President and Treasurer | |
Date: | May 24, 2018 |
Pursuant to the requirements of the Securities Exchange Act of 1934 and the Investment Company Act of 1940, this report has been signed below by the following persons on behalf of the registrant and in the capacities and on the dates indicated.
By: | /s/Stacie M. Smith |
Stacie M. Smith | |
President and Treasurer | |
Date: | May 24, 2018 |
By: | /s/Howard J. Galligan III |
Howard J. Galligan III | |
Chief Financial Officer | |
Date: | May 24, 2018 |