UNITED STATES
SECURITIES AND EXCHANGE COMMISSION
Washington, D.C. 20549
FORM N-CSR
CERTIFIED SHAREHOLDER REPORT OF REGISTERED
MANAGEMENT INVESTMENT COMPANIES
Investment Company Act file number 811-21667
Fidelity Central Investment Portfolios LLC
(Exact name of registrant as specified in charter)
245 Summer St., Boston, MA 02210
(Address of principal executive offices) (Zip code)
Marc Bryant, Secretary
245 Summer St.
Boston, Massachusetts 02210
(Name and address of agent for service)
Registrant's telephone number, including area code:
617-563-7000
Date of fiscal year end: | September 30 |
Date of reporting period: | March 31, 2017 |
Item 1.
Reports to Stockholders
Fidelity® Equity Sector Central Funds Semi-Annual Report March 31, 2017 |
 |
Contents
To view a fund's proxy voting guidelines and proxy voting record for the 12-month period ended June 30, visit http://www.fidelity.com/proxyvotingresults or visit the Securities and Exchange Commission's (SEC) web site at http://www.sec.gov.
You may also call 1-800-544-8544 to request a free copy of the proxy voting guidelines.
Standard & Poor's, S&P and S&P 500 are registered service marks of The McGraw-Hill Companies, Inc. and have been licensed for use by Fidelity Distributors Corporation.
Other third-party marks appearing herein are the property of their respective owners.
All other marks appearing herein are registered or unregistered trademarks or service marks of FMR LLC or an affiliated company. © 2017 FMR LLC. All rights reserved.
A fund files its complete schedule of portfolio holdings with the SEC for the first and third quarters of each fiscal year on Form N-Q. Forms N-Q are available on the SEC’s web site at http://www.sec.gov. A fund's Forms N-Q may be reviewed and copied at the SEC’s Public Reference Room in Washington, DC. Information regarding the operation of the SEC's Public Reference Room may be obtained by calling 1-800-SEC-0330.
Fidelity® Consumer Discretionary Central Fund
Investment Summary (Unaudited)
Top Ten Stocks as of March 31, 2017
| % of fund's net assets | % of fund's net assets 6 months ago | |
| Amazon.com, Inc. | 14.7 | 14.6 |
| Home Depot, Inc. | 9.1 | 8.3 |
| The Walt Disney Co. | 8.1 | 7.1 |
| Charter Communications, Inc. Class A | 7.0 | 6.1 |
| NIKE, Inc. Class B | 5.1 | 5.1 |
| Starbucks Corp. | 4.6 | 4.8 |
| Comcast Corp. Class A | 3.8 | 3.5 |
| Ross Stores, Inc. | 3.6 | 4.1 |
| Hilton, Inc. | 2.6 | 4.0 |
| Las Vegas Sands Corp. | 2.5 | 2.9 |
| 61.1 |
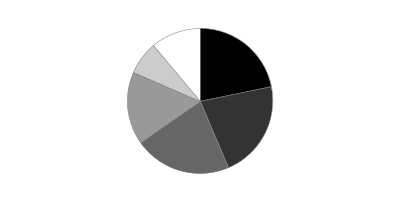
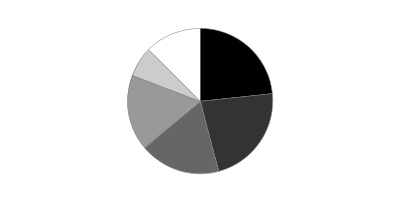
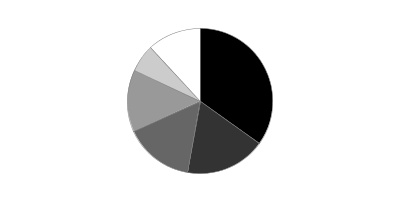
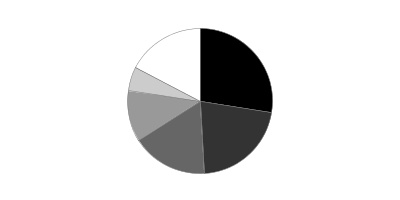
Top Industries (% of fund's net assets)
| As of March 31, 2017 | ||
| Media | 21.9% | |
| Hotels, Restaurants & Leisure | 21.7% | |
| Specialty Retail | 21.6% | |
| Internet & Direct Marketing Retail | 16.3% | |
| Textiles, Apparel & Luxury Goods | 7.4% | |
| All Others* | 11.1% | |
| As of September 30, 2016 | ||
| Specialty Retail | 23.4% | |
| Media | 22.4% | |
| Hotels, Restaurants & Leisure | 18.0% | |
| Internet & Direct Marketing Retail | 17.0% | |
| Textiles, Apparel & Luxury Goods | 6.7% | |
| All Others* | 12.5% | |
* Includes short-term investments and net other assets (liabilities).
Fidelity® Consumer Discretionary Central Fund
Investments March 31, 2017 (Unaudited)
Showing Percentage of Net Assets
| Common Stocks - 99.6% | |||
| Shares | Value | ||
| Auto Components - 1.1% | |||
| Auto Parts & Equipment - 1.1% | |||
| Tenneco, Inc. | 275,296 | $17,183,976 | |
| Automobiles - 0.9% | |||
| Automobile Manufacturers - 0.9% | |||
| Ferrari NV | 67,222 | 4,998,628 | |
| Tesla, Inc. (a) | 28,416 | 7,908,173 | |
| Thor Industries, Inc. | 7,900 | 759,427 | |
| 13,666,228 | |||
| Beverages - 2.4% | |||
| Distillers & Vintners - 1.9% | |||
| Constellation Brands, Inc. Class A (sub. vtg.) | 184,207 | 29,854,428 | |
| Soft Drinks - 0.5% | |||
| Monster Beverage Corp. (a) | 180,650 | 8,340,611 | |
| TOTAL BEVERAGES | 38,195,039 | ||
| Distributors - 0.5% | |||
| Distributors - 0.5% | |||
| LKQ Corp. (a) | 255,400 | 7,475,558 | |
| Diversified Consumer Services - 0.4% | |||
| Specialized Consumer Services - 0.4% | |||
| ServiceMaster Global Holdings, Inc. (a) | 168,411 | 7,031,159 | |
| Food & Staples Retailing - 1.6% | |||
| Food Distributors - 0.6% | |||
| Performance Food Group Co. (a) | 376,675 | 8,964,865 | |
| Hypermarkets & Super Centers - 1.0% | |||
| Costco Wholesale Corp. | 100,249 | 16,810,755 | |
| TOTAL FOOD & STAPLES RETAILING | 25,775,620 | ||
| Hotels, Restaurants & Leisure - 21.7% | |||
| Casinos & Gaming - 3.7% | |||
| Las Vegas Sands Corp. | 699,516 | 39,921,378 | |
| Melco Crown Entertainment Ltd. sponsored ADR | 301,900 | 5,597,226 | |
| MGM Mirage, Inc. | 340,300 | 9,324,220 | |
| Wynn Resorts Ltd. | 35,515 | 4,070,374 | |
| 58,913,198 | |||
| Hotels, Resorts & Cruise Lines - 3.6% | |||
| Hilton, Inc. | 723,951 | 42,322,175 | |
| Marriott International, Inc. Class A | 81,208 | 7,648,169 | |
| Park Hotels & Resorts, Inc. | 1,881 | 48,285 | |
| Royal Caribbean Cruises Ltd. | 88,428 | 8,675,671 | |
| 58,694,300 | |||
| Leisure Facilities - 2.1% | |||
| Vail Resorts, Inc. | 173,123 | 33,222,304 | |
| Restaurants - 12.3% | |||
| ARAMARK Holdings Corp. | 147,900 | 5,453,073 | |
| Buffalo Wild Wings, Inc. (a) | 57,293 | 8,751,506 | |
| Chipotle Mexican Grill, Inc. (a) | 19,800 | 8,821,296 | |
| Dave & Buster's Entertainment, Inc. (a) | 275,393 | 16,823,758 | |
| Del Taco Restaurants, Inc. (a) | 259,527 | 3,441,328 | |
| Domino's Pizza, Inc. | 80,820 | 14,895,126 | |
| Dunkin' Brands Group, Inc. | 66,300 | 3,625,284 | |
| Jack in the Box, Inc. | 216,411 | 22,013,327 | |
| McDonald's Corp. | 64,549 | 8,366,196 | |
| Panera Bread Co. Class A (a)(b) | 14,700 | 3,849,489 | |
| Papa John's International, Inc. | 138,216 | 11,062,809 | |
| Ruth's Hospitality Group, Inc. | 341,181 | 6,840,679 | |
| Shake Shack, Inc. Class A (a) | 26,000 | 868,400 | |
| Starbucks Corp. | 1,273,041 | 74,332,864 | |
| Texas Roadhouse, Inc. Class A | 36,400 | 1,620,892 | |
| U.S. Foods Holding Corp. | 262,000 | 7,330,760 | |
| Wingstop, Inc. | 20,988 | 593,541 | |
| 198,690,328 | |||
| TOTAL HOTELS, RESTAURANTS & LEISURE | 349,520,130 | ||
| Household Durables - 0.1% | |||
| Household Appliances - 0.1% | |||
| Techtronic Industries Co. Ltd. | 428,500 | 1,734,070 | |
| Household Products - 0.7% | |||
| Household Products - 0.7% | |||
| Spectrum Brands Holdings, Inc. | 86,217 | 11,985,025 | |
| Internet & Direct Marketing Retail - 16.3% | |||
| Internet & Direct Marketing Retail - 16.3% | |||
| Amazon.com, Inc. (a) | 267,526 | 237,172,503 | |
| Liberty Interactive Corp. QVC Group Series A (a) | 765,706 | 15,329,434 | |
| Netflix, Inc. (a) | 62,427 | 9,227,335 | |
| 261,729,272 | |||
| Internet Software & Services - 0.2% | |||
| Internet Software & Services - 0.2% | |||
| Facebook, Inc. Class A (a) | 25,862 | 3,673,697 | |
| Leisure Products - 0.4% | |||
| Leisure Products - 0.4% | |||
| Mattel, Inc. | 249,800 | 6,397,378 | |
| Media - 21.9% | |||
| Advertising - 1.2% | |||
| Interpublic Group of Companies, Inc. | 811,105 | 19,928,850 | |
| Cable & Satellite - 11.4% | |||
| Charter Communications, Inc. Class A (a) | 342,637 | 112,151,943 | |
| Comcast Corp. Class A | 1,646,790 | 61,902,836 | |
| DISH Network Corp. Class A (a) | 49,041 | 3,113,613 | |
| Naspers Ltd. Class N | 34,184 | 5,890,324 | |
| 183,058,716 | |||
| Movies & Entertainment - 9.3% | |||
| The Walt Disney Co. | 1,148,078 | 130,180,564 | |
| Time Warner, Inc. | 202,741 | 19,809,823 | |
| 149,990,387 | |||
| TOTAL MEDIA | 352,977,953 | ||
| Multiline Retail - 2.1% | |||
| General Merchandise Stores - 2.1% | |||
| B&M European Value Retail S.A. | 1,627,882 | 6,106,483 | |
| Dollar Tree, Inc. (a) | 357,129 | 28,020,341 | |
| 34,126,824 | |||
| Personal Products - 0.1% | |||
| Personal Products - 0.1% | |||
| Herbalife Ltd. (a) | 32,900 | 1,912,806 | |
| Specialty Retail - 21.6% | |||
| Apparel Retail - 7.7% | |||
| Burlington Stores, Inc. (a) | 49,100 | 4,776,939 | |
| Foot Locker, Inc. | 82,200 | 6,149,382 | |
| Inditex SA | 187,499 | 6,603,072 | |
| L Brands, Inc. | 294,892 | 13,889,413 | |
| Ross Stores, Inc. | 872,569 | 57,476,120 | |
| TJX Companies, Inc. | 452,090 | 35,751,277 | |
| 124,646,203 | |||
| Automotive Retail - 4.5% | |||
| Advance Auto Parts, Inc. | 83,040 | 12,311,510 | |
| AutoZone, Inc. (a) | 40,574 | 29,337,031 | |
| O'Reilly Automotive, Inc. (a) | 112,059 | 30,238,001 | |
| 71,886,542 | |||
| Home Improvement Retail - 9.1% | |||
| Home Depot, Inc. | 1,001,082 | 146,988,870 | |
| Specialty Stores - 0.3% | |||
| Dick's Sporting Goods, Inc. | 30,700 | 1,493,862 | |
| Sally Beauty Holdings, Inc. (a) | 50,344 | 1,029,031 | |
| Ulta Beauty, Inc. (a) | 5,700 | 1,625,811 | |
| 4,148,704 | |||
| TOTAL SPECIALTY RETAIL | 347,670,319 | ||
| Technology Hardware, Storage & Peripherals - 0.2% | |||
| Technology Hardware, Storage & Peripherals - 0.2% | |||
| Apple, Inc. | 24,000 | 3,447,840 | |
| Textiles, Apparel & Luxury Goods - 7.4% | |||
| Apparel, Accessories & Luxury Goods - 2.3% | |||
| adidas AG | 43,110 | 8,199,972 | |
| G-III Apparel Group Ltd. (a) | 370,916 | 8,119,351 | |
| Kate Spade & Co. (a) | 70,300 | 1,633,069 | |
| LVMH Moet Hennessy - Louis Vuitton SA | 20,049 | 4,406,619 | |
| VF Corp. | 256,019 | 14,073,364 | |
| 36,432,375 | |||
| Footwear - 5.1% | |||
| NIKE, Inc. Class B | 1,475,348 | 82,221,144 | |
| TOTAL TEXTILES, APPAREL & LUXURY GOODS | 118,653,519 | ||
| TOTAL COMMON STOCKS | |||
| (Cost $1,137,110,117) | 1,603,156,413 | ||
| Money Market Funds - 0.8% | |||
| Fidelity Cash Central Fund, 0.84% (c) | 8,801,737 | 8,803,497 | |
| Fidelity Securities Lending Cash Central Fund 0.84% (c)(d) | 4,280,750 | 4,281,178 | |
| TOTAL MONEY MARKET FUNDS | |||
| (Cost $13,084,403) | 13,084,675 | ||
| TOTAL INVESTMENT PORTFOLIO - 100.4% | |||
| (Cost $1,150,194,520) | 1,616,241,088 | ||
| NET OTHER ASSETS (LIABILITIES) - (0.4)% | (6,768,758) | ||
| NET ASSETS - 100% | $1,609,472,330 |
Legend
(a) Non-income producing
(b) Security or a portion of the security is on loan at period end.
(c) Affiliated fund that is generally available only to investment companies and other accounts managed by Fidelity Investments. The rate quoted is the annualized seven-day yield of the fund at period end. A complete unaudited listing of the fund's holdings as of its most recent quarter end is available upon request. In addition, each Fidelity Central Fund's financial statements are available on the SEC's website or upon request.
(d) Investment made with cash collateral received from securities on loan.
Affiliated Central Funds
Information regarding fiscal year to date income earned by the Fund from investments in Fidelity Central Funds is as follows:
| Fund | Income earned |
| Fidelity Cash Central Fund | $38,332 |
| Fidelity Securities Lending Cash Central Fund | 174,341 |
| Total | $212,673 |
Investment Valuation
The following is a summary of the inputs used, as of March 31, 2017, involving the Fund's assets and liabilities carried at fair value. The inputs or methodology used for valuing securities may not be an indication of the risk associated with investing in those securities. For more information on valuation inputs, and their aggregation into the levels used below, please refer to the Investment Valuation section in the accompanying Notes to Financial Statements.
| Valuation Inputs at Reporting Date: | ||||
| Description | Total | Level 1 | Level 2 | Level 3 |
| Investments in Securities: | ||||
| Common Stocks | $1,603,156,413 | $1,586,256,398 | $16,900,015 | $-- |
| Money Market Funds | 13,084,675 | 13,084,675 | -- | -- |
| Total Investments in Securities: | $1,616,241,088 | $1,599,341,073 | $16,900,015 | $-- |
See accompanying notes which are an integral part of the financial statements.
Fidelity® Consumer Discretionary Central Fund
Financial Statements
Statement of Assets and Liabilities
| March 31, 2017 (Unaudited) | ||
| Assets | ||
| Investment in securities, at value (including securities loaned of $4,294,668) — See accompanying schedule: Unaffiliated issuers (cost $1,137,110,117) | $1,603,156,413 | |
| Fidelity Central Funds (cost $13,084,403) | 13,084,675 | |
| Total Investments (cost $1,150,194,520) | $1,616,241,088 | |
| Receivable for investments sold | 12,990,591 | |
| Receivable for fund shares sold | 189,253 | |
| Dividends receivable | 612,610 | |
| Distributions receivable from Fidelity Central Funds | 11,875 | |
| Other receivables | 195,757 | |
| Total assets | 1,630,241,174 | |
| Liabilities | ||
| Payable for investments purchased | $9,433,450 | |
| Payable for fund shares redeemed | 7,042,533 | |
| Other payables and accrued expenses | 16,561 | |
| Collateral on securities loaned | 4,276,300 | |
| Total liabilities | 20,768,844 | |
| Net Assets | $1,609,472,330 | |
| Net Assets consist of: | ||
| Paid in capital | $1,130,803,188 | |
| Undistributed net investment income | 2,826,960 | |
| Accumulated undistributed net realized gain (loss) on investments and foreign currency transactions | 9,803,485 | |
| Net unrealized appreciation (depreciation) on investments and assets and liabilities in foreign currencies | 466,038,697 | |
| Net Assets, for 5,900,360 shares outstanding | $1,609,472,330 | |
| Net Asset Value, offering price and redemption price per share ($1,609,472,330 ÷ 5,900,360 shares) | $272.78 |
See accompanying notes which are an integral part of the financial statements.
Statement of Operations
| Six months ended March 31, 2017 (Unaudited) | ||
| Investment Income | ||
| Dividends | $10,020,092 | |
| Income from Fidelity Central Funds (including $174,341 from security lending) | 212,673 | |
| Total income | 10,232,765 | |
| Expenses | ||
| Custodian fees and expenses | $20,317 | |
| Independent directors' fees and expenses | 3,286 | |
| Interest | 5,949 | |
| Total expenses before reductions | 29,552 | |
| Expense reductions | (3,287) | 26,265 |
| Net investment income (loss) | 10,206,500 | |
| Realized and Unrealized Gain (Loss) | ||
| Net realized gain (loss) on: | ||
| Investment securities: | ||
| Unaffiliated issuers | 9,816,950 | |
| Fidelity Central Funds | 5,354 | |
| Foreign currency transactions | (18,819) | |
| Total net realized gain (loss) | 9,803,485 | |
| Change in net unrealized appreciation (depreciation) on: Investment securities | 138,632,948 | |
| Assets and liabilities in foreign currencies | 685 | |
| Total change in net unrealized appreciation (depreciation) | 138,633,633 | |
| Net gain (loss) | 148,437,118 | |
| Net increase (decrease) in net assets resulting from operations | $158,643,618 |
See accompanying notes which are an integral part of the financial statements.
Statement of Changes in Net Assets
| Six months ended March 31, 2017 (Unaudited) | Year ended September 30, 2016 | |
| Increase (Decrease) in Net Assets | ||
| Operations | ||
| Net investment income (loss) | $10,206,500 | $23,856,688 |
| Net realized gain (loss) | 9,803,485 | (60,572,495) |
| Change in net unrealized appreciation (depreciation) | 138,633,633 | 153,175,647 |
| Net increase (decrease) in net assets resulting from operations | 158,643,618 | 116,459,840 |
| Distributions to shareholders from net investment income | (7,379,540) | (23,912,876) |
| Affiliated share transactions | ||
| Proceeds from sales of shares | 98,304,594 | 167,822,899 |
| Reinvestment of distributions | 7,379,368 | 23,912,313 |
| Cost of shares redeemed | (226,509,025) | (193,149,714) |
| Net increase (decrease) in net assets resulting from share transactions | (120,825,063) | (1,414,502) |
| Total increase (decrease) in net assets | 30,439,015 | 91,132,462 |
| Net Assets | ||
| Beginning of period | 1,579,033,315 | 1,487,900,853 |
| End of period | $1,609,472,330 | $1,579,033,315 |
| Other Information | ||
| Undistributed net investment income end of period | $2,826,960 | $– |
| Shares | ||
| Sold | 389,751 | 687,541 |
| Issued in reinvestment of distributions | 29,209 | 98,072 |
| Redeemed | (866,338) | (793,764) |
| Net increase (decrease) | (447,378) | (8,151) |
See accompanying notes which are an integral part of the financial statements.
Financial Highlights — Fidelity Consumer Discretionary Central Fund
| Six months ended (Unaudited) March 31, | Years ended September 30, | |||||
| 2017 | 2016 | 2015 | 2014 | 2013 | 2012 | |
| Selected Per–Share Data | ||||||
| Net asset value, beginning of period | $248.76 | $234.10 | $213.75 | $196.26 | $150.90 | $114.27 |
| Income from Investment Operations | ||||||
| Net investment income (loss)A | 1.62 | 3.75 | 3.36 | 2.23 | 2.00 | 1.84 |
| Net realized and unrealized gain (loss) | 23.55 | 14.67 | 20.24 | 17.43 | 45.30 | 36.60 |
| Total from investment operations | 25.17 | 18.42 | 23.60 | 19.66 | 47.30 | 38.44 |
| Distributions from net investment income | (1.15) | (3.76) | (3.25) | (2.17) | (1.94) | (1.81) |
| Total distributions | (1.15) | (3.76) | (3.25) | (2.17) | (1.94) | (1.81) |
| Net asset value, end of period | $272.78 | $248.76 | $234.10 | $213.75 | $196.26 | $150.90 |
| Total ReturnB,C | 10.15% | 7.91% | 11.01% | 10.03% | 31.56% | 33.79% |
| Ratios to Average Net AssetsD,E | ||||||
| Expenses before reductionsF | - %G | -% | -% | -% | -% | -% |
| Expenses net of fee waivers, if anyF | - %G | -% | -% | -% | -% | -% |
| Expenses net of all reductionsF | - %G | -% | -% | -% | -% | -% |
| Net investment income (loss) | 1.26%G | 1.54% | 1.41% | 1.06% | 1.17% | 1.32% |
| Supplemental Data | ||||||
| Net assets, end of period (000 omitted) | $1,609,472 | $1,579,033 | $1,487,901 | $1,431,901 | $1,340,686 | $914,137 |
| Portfolio turnover rateH | 34%G,I | 27% | 68% | 169%I | 122%I | 191% |
A Calculated based on average shares outstanding during the period.
B Total returns for periods of less than one year are not annualized.
C Total returns would have been lower if certain expenses had not been reduced during the applicable periods shown.
D Fees and expenses of any underlying Fidelity Central Funds are not included in the Fund's expense ratio. The Fund indirectly bears its proportionate share of the expenses of any underlying Fidelity Central Funds.
E Expense ratios reflect operating expenses of the Fund. Expenses before reductions do not reflect amounts reimbursed by the investment adviser or reductions from expense offset arrangements and do not represent the amount paid by the Fund during periods when reimbursements or reductions occur. Expenses net of fee waivers reflect expenses after reimbursement by the investment adviser but prior to reductions from expense offset arrangements. Expenses net of all reductions represent the net expenses paid by the Fund.
F Amount represents less than .005%.
G Annualized
H Amount does not include the portfolio activity of any underlying Fidelity Central Funds.
I Portfolio turnover rate excludes securities received or delivered in-kind.
See accompanying notes which are an integral part of the financial statements.
Fidelity® Consumer Staples Central Fund
Investment Summary (Unaudited)
Top Ten Stocks as of March 31, 2017
| % of fund's net assets | % of fund's net assets 6 months ago | |
| Philip Morris International, Inc. | 12.6 | 4.3 |
| British American Tobacco PLC sponsored ADR | 11.4 | 11.1 |
| CVS Health Corp. | 8.5 | 9.1 |
| Kroger Co. | 5.9 | 5.9 |
| Reynolds American, Inc. | 5.8 | 4.6 |
| The Coca-Cola Co. | 5.1 | 3.7 |
| Estee Lauder Companies, Inc. Class A | 4.9 | 1.4 |
| Colgate-Palmolive Co. | 3.9 | 2.5 |
| Monster Beverage Corp. | 3.5 | 3.3 |
| Altria Group, Inc. | 3.4 | 3.9 |
| 65.0 |
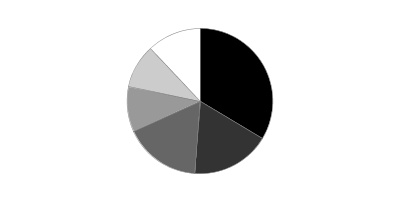
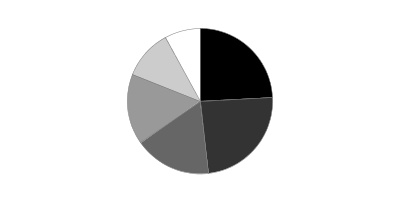
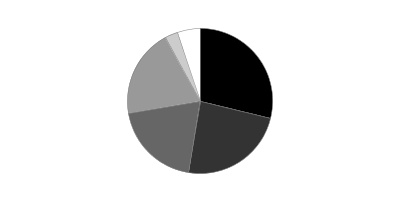
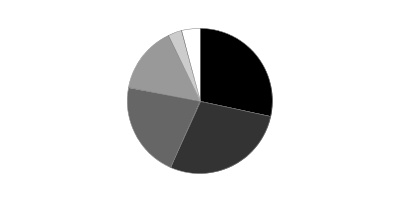
Top Industries (% of fund's net assets)
| As of March 31, 2017 | ||
| Tobacco | 33.6% | |
| Food & Staples Retailing | 17.5% | |
| Beverages | 17.1% | |
| Food Products | 9.9% | |
| Personal Products | 9.9% | |
| All Others* | 12.0% | |
| As of September 30, 2016 | ||
| Tobacco | 24.2% | |
| Food & Staples Retailing | 23.9% | |
| Beverages | 17.1% | |
| Household Products | 15.8% | |
| Food Products | 11.1% | |
| All Others* | 7.9% | |
* Includes short-term investments and net other assets (liabilities).
Fidelity® Consumer Staples Central Fund
Investments March 31, 2017 (Unaudited)
Showing Percentage of Net Assets
| Common Stocks - 96.2% | |||
| Shares | Value | ||
| Beverages - 16.9% | |||
| Brewers - 3.0% | |||
| Anheuser-Busch InBev SA NV | 317,059 | $34,741,822 | |
| China Resources Beer Holdings Co. Ltd. | 1,413,210 | 3,215,023 | |
| 37,956,845 | |||
| Distillers & Vintners - 3.2% | |||
| Brown-Forman Corp. Class B (non-vtg.) | 62,265 | 2,875,398 | |
| Constellation Brands, Inc. Class A (sub. vtg.) | 98,966 | 16,039,420 | |
| Kweichow Moutai Co. Ltd. (A Shares) | 114,018 | 6,396,305 | |
| Pernod Ricard SA | 106,874 | 12,644,062 | |
| Wuliangye Yibin Co. Ltd. Class A | 534,788 | 3,338,979 | |
| 41,294,164 | |||
| Soft Drinks - 10.7% | |||
| Britvic PLC | 964,033 | 7,820,744 | |
| Coca-Cola Bottling Co. Consolidated | 53,495 | 11,021,040 | |
| Coca-Cola European Partners PLC | 47,005 | 1,771,618 | |
| Coca-Cola FEMSA S.A.B. de CV sponsored ADR (a) | 27,849 | 1,996,773 | |
| Coca-Cola Icecek Sanayi A/S | 249,735 | 2,448,941 | |
| Embotelladora Andina SA Series A sponsored ADR Series A | 111,882 | 2,516,226 | |
| Monster Beverage Corp. (b) | 973,878 | 44,963,947 | |
| The Coca-Cola Co. | 1,542,761 | 65,474,777 | |
| 138,014,066 | |||
| TOTAL BEVERAGES | 217,265,075 | ||
| Food & Staples Retailing - 17.5% | |||
| Drug Retail - 11.6% | |||
| CVS Health Corp. | 1,384,003 | 108,644,236 | |
| Drogasil SA (b) | 140,600 | 2,634,959 | |
| Rite Aid Corp. (b) | 1,388,400 | 5,900,700 | |
| Walgreens Boots Alliance, Inc. | 382,878 | 31,798,018 | |
| 148,977,913 | |||
| Food Retail - 5.9% | |||
| Kroger Co. | 2,576,523 | 75,981,663 | |
| TOTAL FOOD & STAPLES RETAILING | 224,959,576 | ||
| Food Products - 9.9% | |||
| Agricultural Products - 2.7% | |||
| Bunge Ltd. | 434,618 | 34,447,823 | |
| Packaged Foods & Meats - 7.2% | |||
| Amplify Snack Brands, Inc. (b) | 133,226 | 1,119,098 | |
| Blue Buffalo Pet Products, Inc. (a)(b) | 230,274 | 5,296,302 | |
| Mondelez International, Inc. | 673,912 | 29,032,129 | |
| Nestle SA | 105,290 | 8,081,194 | |
| The Hain Celestial Group, Inc. (b) | 541,246 | 20,134,351 | |
| TreeHouse Foods, Inc. (b) | 345,473 | 29,247,744 | |
| 92,910,818 | |||
| TOTAL FOOD PRODUCTS | 127,358,641 | ||
| Hotels, Restaurants & Leisure - 0.8% | |||
| Restaurants - 0.8% | |||
| U.S. Foods Holding Corp. | 347,508 | 9,723,273 | |
| Household Products - 7.6% | |||
| Household Products - 7.6% | |||
| Colgate-Palmolive Co. | 678,520 | 49,660,879 | |
| Kimberly-Clark Corp. | 38,524 | 5,070,914 | |
| Procter & Gamble Co. | 377,040 | 33,877,044 | |
| Spectrum Brands Holdings, Inc. | 64,266 | 8,933,617 | |
| 97,542,454 | |||
| Personal Products - 9.9% | |||
| Personal Products - 9.9% | |||
| Avon Products, Inc. (b) | 1,421,100 | 6,252,840 | |
| Coty, Inc. Class A | 1,886,678 | 34,205,472 | |
| Estee Lauder Companies, Inc. Class A | 736,067 | 62,411,121 | |
| Herbalife Ltd. (b) | 140,632 | 8,176,344 | |
| L'Oreal SA | 35,138 | 6,752,962 | |
| Unilever NV (Certificaten Van Aandelen) (Bearer) | 134,300 | 6,667,881 | |
| Unilever PLC sponsored ADR | 49,155 | 2,425,308 | |
| 126,891,928 | |||
| Tobacco - 33.6% | |||
| Tobacco - 33.6% | |||
| Altria Group, Inc. | 607,167 | 43,363,867 | |
| British American Tobacco PLC sponsored ADR (a) | 2,215,132 | 146,907,554 | |
| ITC Ltd. | 1,163,393 | 5,027,738 | |
| Philip Morris International, Inc. | 1,426,804 | 161,086,175 | |
| Reynolds American, Inc. | 1,179,574 | 74,336,753 | |
| 430,722,087 | |||
| TOTAL COMMON STOCKS | |||
| (Cost $898,214,530) | 1,234,463,034 | ||
| Nonconvertible Preferred Stocks - 0.2% | |||
| Beverages - 0.2% | |||
| Brewers - 0.2% | |||
| Ambev SA sponsored ADR | |||
| (Cost $1,810,274) | 484,283 | 2,789,470 | |
| Money Market Funds - 14.7% | |||
| Fidelity Cash Central Fund, 0.84% (c) | 33,935,014 | 33,941,801 | |
| Fidelity Securities Lending Cash Central Fund 0.84% (c)(d) | 153,687,069 | 153,702,438 | |
| TOTAL MONEY MARKET FUNDS | |||
| (Cost $187,643,876) | 187,644,239 | ||
| TOTAL INVESTMENT PORTFOLIO - 111.1% | |||
| (Cost $1,087,668,680) | 1,424,896,743 | ||
| NET OTHER ASSETS (LIABILITIES) - (11.1)% | (142,029,727) | ||
| NET ASSETS - 100% | $1,282,867,016 |
Legend
(a) Security or a portion of the security is on loan at period end.
(b) Non-income producing
(c) Affiliated fund that is generally available only to investment companies and other accounts managed by Fidelity Investments. The rate quoted is the annualized seven-day yield of the fund at period end. A complete unaudited listing of the fund's holdings as of its most recent quarter end is available upon request. In addition, each Fidelity Central Fund's financial statements are available on the SEC's website or upon request.
(d) Investment made with cash collateral received from securities on loan.
Affiliated Central Funds
Information regarding fiscal year to date income earned by the Fund from investments in Fidelity Central Funds is as follows:
| Fund | Income earned |
| Fidelity Cash Central Fund | $75,182 |
| Fidelity Securities Lending Cash Central Fund | 786,811 |
| Total | $861,993 |
Investment Valuation
The following is a summary of the inputs used, as of March 31, 2017, involving the Fund's assets and liabilities carried at fair value. The inputs or methodology used for valuing securities may not be an indication of the risk associated with investing in those securities. For more information on valuation inputs, and their aggregation into the levels used below, please refer to the Investment Valuation section in the accompanying Notes to Financial Statements.
| Valuation Inputs at Reporting Date: | ||||
| Description | Total | Level 1 | Level 2 | Level 3 |
| Investments in Securities: | ||||
| Common Stocks | $1,234,463,034 | $1,184,972,137 | $49,490,897 | $-- |
| Nonconvertible Preferred Stocks | 2,789,470 | 2,789,470 | -- | -- |
| Money Market Funds | 187,644,239 | 187,644,239 | -- | -- |
| Total Investments in Securities: | $1,424,896,743 | $1,375,405,846 | $49,490,897 | $-- |
Other Information
Distribution of investments by country or territory of incorporation, as a percentage of Total Net Assets, is as follows (Unaudited):
| United States of America | 76.7% |
| United Kingdom | 12.3% |
| Belgium | 2.7% |
| Bermuda | 2.7% |
| France | 1.5% |
| Others (Individually Less Than 1%) | 4.1% |
| 100.0% |
See accompanying notes which are an integral part of the financial statements.
Fidelity® Consumer Staples Central Fund
Financial Statements
Statement of Assets and Liabilities
| March 31, 2017 (Unaudited) | ||
| Assets | ||
| Investment in securities, at value (including securities loaned of $150,976,786) — See accompanying schedule: Unaffiliated issuers (cost $900,024,804) | $1,237,252,504 | |
| Fidelity Central Funds (cost $187,643,876) | 187,644,239 | |
| Total Investments (cost $1,087,668,680) | $1,424,896,743 | |
| Receivable for investments sold | 6,334,582 | |
| Receivable for fund shares sold | 140,784 | |
| Dividends receivable | 7,461,195 | |
| Distributions receivable from Fidelity Central Funds | 335,991 | |
| Total assets | 1,439,169,295 | |
| Liabilities | ||
| Payable to custodian bank | $101 | |
| Payable for investments purchased | 2,008,748 | |
| Payable for fund shares redeemed | 264,571 | |
| Other payables and accrued expenses | 320,899 | |
| Collateral on securities loaned | 153,707,960 | |
| Total liabilities | 156,302,279 | |
| Net Assets | $1,282,867,016 | |
| Net Assets consist of: | ||
| Paid in capital | $888,532,137 | |
| Undistributed net investment income | 7,300,463 | |
| Accumulated undistributed net realized gain (loss) on investments and foreign currency transactions | 50,135,615 | |
| Net unrealized appreciation (depreciation) on investments and assets and liabilities in foreign currencies | 336,898,801 | |
| Net Assets, for 5,385,044 shares outstanding | $1,282,867,016 | |
| Net Asset Value, offering price and redemption price per share ($1,282,867,016 ÷ 5,385,044 shares) | $238.23 |
See accompanying notes which are an integral part of the financial statements.
Statement of Operations
| Six months ended March 31, 2017 (Unaudited) | ||
| Investment Income | ||
| Dividends | $16,223,829 | |
| Income from Fidelity Central Funds (including $786,811 from security lending) | 861,993 | |
| Total income | 17,085,822 | |
| Expenses | ||
| Custodian fees and expenses | $26,615 | |
| Independent directors' fees and expenses | 2,584 | |
| Interest | 814 | |
| Total expenses before reductions | 30,013 | |
| Expense reductions | (2,971) | 27,042 |
| Net investment income (loss) | 17,058,780 | |
| Realized and Unrealized Gain (Loss) | ||
| Net realized gain (loss) on: | ||
| Investment securities: | ||
| Unaffiliated issuers | 67,867,973 | |
| Fidelity Central Funds | (8,675) | |
| Foreign currency transactions | (43,700) | |
| Total net realized gain (loss) | 67,815,598 | |
| Change in net unrealized appreciation (depreciation) on: Investment securities (net of increase in deferred foreign taxes of $47,938) | 984,787 | |
| Assets and liabilities in foreign currencies | (16,903) | |
| Total change in net unrealized appreciation (depreciation) | 967,884 | |
| Net gain (loss) | 68,783,482 | |
| Net increase (decrease) in net assets resulting from operations | $85,842,262 |
See accompanying notes which are an integral part of the financial statements.
Statement of Changes in Net Assets
| Six months ended March 31, 2017 (Unaudited) | Year ended September 30, 2016 | |
| Increase (Decrease) in Net Assets | ||
| Operations | ||
| Net investment income (loss) | $17,058,780 | $29,480,460 |
| Net realized gain (loss) | 67,815,598 | 41,183,188 |
| Change in net unrealized appreciation (depreciation) | 967,884 | 101,713,579 |
| Net increase (decrease) in net assets resulting from operations | 85,842,262 | 172,377,227 |
| Distributions to shareholders from net investment income | (9,758,317) | (28,718,321) |
| Distributions to shareholders from net realized gain | (17,679,983) | – |
| Total distributions | (27,438,300) | (28,718,321) |
| Affiliated share transactions | ||
| Proceeds from sales of shares | 64,743,990 | 155,551,923 |
| Reinvestment of distributions | 27,437,783 | 28,717,765 |
| Cost of shares redeemed | (152,493,015) | (140,925,877) |
| Net increase (decrease) in net assets resulting from share transactions | (60,311,242) | 43,343,811 |
| Total increase (decrease) in net assets | (1,907,280) | 187,002,717 |
| Net Assets | ||
| Beginning of period | 1,284,774,296 | 1,097,771,579 |
| End of period | $1,282,867,016 | $1,284,774,296 |
| Other Information | ||
| Undistributed net investment income end of period | $7,300,463 | $– |
| Shares | ||
| Sold | 298,003 | 706,377 |
| Issued in reinvestment of distributions | 127,974 | 128,022 |
| Redeemed | (675,790) | (624,503) |
| Net increase (decrease) | (249,813) | 209,896 |
See accompanying notes which are an integral part of the financial statements.
Financial Highlights — Fidelity Consumer Staples Central Fund
| Six months ended (Unaudited) March 31, | Years ended September 30, | |||||
| 2017 | 2016 | 2015 | 2014 | 2013 | 2012 | |
| Selected Per–Share Data | ||||||
| Net asset value, beginning of period | $228.00 | $202.36 | $205.11 | $181.33 | $161.05 | $131.58 |
| Income from Investment Operations | ||||||
| Net investment income (loss)A | 3.03 | 5.30 | 5.31 | 5.20 | 4.77 | 4.33 |
| Net realized and unrealized gain (loss) | 12.00 | 25.50 | (2.84) | 23.75 | 20.13 | 29.39 |
| Total from investment operations | 15.03 | 30.80 | 2.47 | 28.95 | 24.90 | 33.72 |
| Distributions from net investment income | (1.72) | (5.16) | (5.22) | (5.17) | (4.62) | (4.25) |
| Distributions from net realized gain | (3.07) | – | – | – | – | – |
| Total distributions | (4.80)B | (5.16) | (5.22) | (5.17) | (4.62) | (4.25) |
| Net asset value, end of period | $238.23 | $228.00 | $202.36 | $205.11 | $181.33 | $161.05 |
| Total ReturnC,D | 6.83% | 15.29% | 1.07% | 16.13% | 15.58% | 25.90% |
| Ratios to Average Net AssetsE,F | ||||||
| Expenses before reductions | - %G,H | - %H | - %H | .01% | .01% | .01% |
| Expenses net of fee waivers, if any | - %G,H | - %H | - %H | .01% | .01% | - %H |
| Expenses net of all reductions | - %G,H | - %H | - %H | .01% | .01% | - %H |
| Net investment income (loss) | 2.69%G | 2.38% | 2.45% | 2.67% | 2.72% | 2.91% |
| Supplemental Data | ||||||
| Net assets, end of period (000 omitted) | $1,282,867 | $1,284,774 | $1,097,772 | $1,166,861 | $1,016,534 | $880,205 |
| Portfolio turnover rateI | 65%G,J | 50% | 65% | 36%J | 34%J | 27% |
A Calculated based on average shares outstanding during the period.
B Total distributions of $4.80 per share is comprised of distributions from net investment income of $1.724 and distributions from net realized gain of $3.073 per share.
C Total returns for periods of less than one year are not annualized.
D Total returns would have been lower if certain expenses had not been reduced during the applicable periods shown.
E Fees and expenses of any underlying Fidelity Central Funds are not included in the Fund's expense ratio. The Fund indirectly bears its proportionate share of the expenses of any underlying Fidelity Central Funds.
F Expense ratios reflect operating expenses of the Fund. Expenses before reductions do not reflect amounts reimbursed by the investment adviser or reductions from expense offset arrangements and do not represent the amount paid by the Fund during periods when reimbursements or reductions occur. Expenses net of fee waivers reflect expenses after reimbursement by the investment adviser but prior to reductions from expense offset arrangements. Expenses net of all reductions represent the net expenses paid by the Fund.
G Annualized
H Amount represents less than .005%.
I Amount does not include the portfolio activity of any underlying Fidelity Central Funds.
J Portfolio turnover rate excludes securities received or delivered in-kind.
See accompanying notes which are an integral part of the financial statements.
Fidelity® Energy Central Fund
Investment Summary (Unaudited)
Top Ten Stocks as of March 31, 2017
| % of fund's net assets | % of fund's net assets 6 months ago | |
| Exxon Mobil Corp. | 8.2 | 5.4 |
| Chevron Corp. | 7.4 | 4.0 |
| EOG Resources, Inc. | 6.5 | 6.0 |
| Baker Hughes, Inc. | 5.3 | 4.8 |
| Pioneer Natural Resources Co. | 4.7 | 4.6 |
| Anadarko Petroleum Corp. | 4.3 | 4.6 |
| Halliburton Co. | 4.0 | 1.5 |
| Diamondback Energy, Inc. | 3.7 | 3.0 |
| Schlumberger Ltd. | 3.2 | 5.7 |
| Kinder Morgan, Inc. | 2.6 | 0.6 |
| 49.9 |
Top Industries (% of fund's net assets)
| As of March 31, 2017 | ||
| Oil, Gas & Consumable Fuels | 78.8% | |
| Energy Equipment & Services | 18.5% | |
| Chemicals | 1.2% | |
| Gas Utilities | 0.3% | |
| Diversified Financial Services | 0.3% | |
| All Others* | 0.9% | |

| As of September 30, 2016 | ||
| Oil, Gas & Consumable Fuels | 79.6% | |
| Energy Equipment & Services | 16.5% | |
| Electric Utilities | 1.1% | |
| �� | Independent Power and Renewable Electricity Producers | 0.7% |
| Chemicals | 0.6% | |
| All Others* | 1.5% | |

* Includes short-term investments and net other assets (liabilities).
Fidelity® Energy Central Fund
Investments March 31, 2017 (Unaudited)
Showing Percentage of Net Assets
| Common Stocks - 99.5% | |||
| Shares | Value | ||
| Chemicals - 1.2% | |||
| Commodity Chemicals - 1.2% | |||
| LyondellBasell Industries NV Class A | 133,850 | $12,205,782 | |
| Construction & Engineering - 0.2% | |||
| Construction & Engineering - 0.2% | |||
| C&J Energy Services, Inc. (a) | 54,800 | 1,865,940 | |
| Diversified Financial Services - 0.3% | |||
| Other Diversified Financial Services - 0.3% | |||
| Smart Sand, Inc. | 157,000 | 2,551,250 | |
| Energy Equipment & Services - 18.5% | |||
| Oil & Gas Drilling - 0.9% | |||
| Ensco PLC Class A | 253,800 | 2,271,510 | |
| Nabors Industries Ltd. | 114,338 | 1,494,398 | |
| Odfjell Drilling A/S (a) | 736,222 | 1,594,853 | |
| Trinidad Drilling Ltd. (a) | 1,042,751 | 1,803,457 | |
| Xtreme Drilling & Coil Services Corp. (a) | 1,083,100 | 1,742,929 | |
| 8,907,147 | |||
| Oil & Gas Equipment & Services - 17.6% | |||
| Baker Hughes, Inc. | 868,336 | 51,943,860 | |
| Dril-Quip, Inc. (a) | 169,700 | 9,257,135 | |
| Exterran Corp. (a) | 58,060 | 1,825,987 | |
| Frank's International NV (b) | 437,760 | 4,627,123 | |
| Halliburton Co. | 800,317 | 39,383,600 | |
| National Oilwell Varco, Inc. | 270,100 | 10,828,309 | |
| Newpark Resources, Inc. (a) | 938,458 | 7,601,510 | |
| Oceaneering International, Inc. | 262,951 | 7,120,713 | |
| RigNet, Inc. (a) | 153,492 | 3,292,403 | |
| Schlumberger Ltd. | 407,052 | 31,790,761 | |
| Tesco Corp. (a) | 249,152 | 2,005,674 | |
| TETRA Technologies, Inc. (a) | 592,900 | 2,413,103 | |
| Total Energy Services, Inc. | 45,200 | 452,051 | |
| 172,542,229 | |||
| TOTAL ENERGY EQUIPMENT & SERVICES | 181,449,376 | ||
| Gas Utilities - 0.3% | |||
| Gas Utilities - 0.3% | |||
| Indraprastha Gas Ltd. | 195,344 | 3,056,805 | |
| Machinery - 0.2% | |||
| Industrial Machinery - 0.2% | |||
| ProPetro Holding Corp. (a)(b) | 172,400 | 2,222,236 | |
| Oil, Gas & Consumable Fuels - 78.8% | |||
| Coal & Consumable Fuels - 0.3% | |||
| CONSOL Energy, Inc. | 192,883 | 3,236,577 | |
| Integrated Oil & Gas - 15.6% | |||
| Chevron Corp. | 679,364 | 72,943,313 | |
| Exxon Mobil Corp. | 982,164 | 80,547,265 | |
| 153,490,578 | |||
| Oil & Gas Exploration & Production - 49.0% | |||
| Anadarko Petroleum Corp. | 685,861 | 42,523,382 | |
| Cabot Oil & Gas Corp. | 63,300 | 1,513,503 | |
| Callon Petroleum Co. (a) | 1,085,855 | 14,289,852 | |
| Canadian Natural Resources Ltd. | 71,600 | 2,344,222 | |
| Carrizo Oil & Gas, Inc. (a) | 266,871 | 7,648,523 | |
| Centennial Resource Development, Inc. Class A (c) | 45,400 | 827,642 | |
| Cimarex Energy Co. | 152,922 | 18,272,650 | |
| Concho Resources, Inc. (a) | 84,753 | 10,877,200 | |
| ConocoPhillips Co. | 214,142 | 10,679,262 | |
| Continental Resources, Inc. (a) | 296,772 | 13,479,384 | |
| Devon Energy Corp. | 232,681 | 9,707,451 | |
| Diamondback Energy, Inc. (a) | 348,763 | 36,171,955 | |
| Encana Corp. | 1,131,800 | 13,259,724 | |
| EOG Resources, Inc. | 655,801 | 63,973,388 | |
| Extraction Oil & Gas, Inc. | 560,946 | 10,405,548 | |
| Hess Corp. | 229,565 | 11,067,329 | |
| Jones Energy, Inc. (b) | 85,267 | 217,431 | |
| Marathon Oil Corp. | 644,017 | 10,175,469 | |
| Newfield Exploration Co. (a) | 439,492 | 16,221,650 | |
| Noble Energy, Inc. | 448,513 | 15,401,936 | |
| Oasis Petroleum, Inc. (a) | 333,436 | 4,754,797 | |
| Parsley Energy, Inc. Class A (a) | 613,032 | 19,929,670 | |
| PDC Energy, Inc. (a) | 251,580 | 15,686,013 | |
| Pioneer Natural Resources Co. | 247,593 | 46,109,244 | |
| QEP Resources, Inc. (a) | 416,774 | 5,297,198 | |
| Range Resources Corp. | 170,100 | 4,949,910 | |
| Resolute Energy Corp. (a)(b) | 123,200 | 4,977,280 | |
| Rice Energy, Inc. (a) | 827,238 | 19,605,541 | |
| Ring Energy, Inc. (a) | 310,216 | 3,356,537 | |
| RSP Permian, Inc. (a) | 453,670 | 18,795,548 | |
| Sanchez Energy Corp. (a)(b) | 18,035 | 172,054 | |
| Seven Generations Energy Ltd. (a) | 423,111 | 7,731,396 | |
| SM Energy Co. | 253,832 | 6,097,045 | |
| Viper Energy Partners LP | 203,100 | 3,651,738 | |
| Whiting Petroleum Corp. (a) | 283,425 | 2,681,201 | |
| WPX Energy, Inc. (a) | 634,000 | 8,489,260 | |
| 481,341,933 | |||
| Oil & Gas Refining & Marketing - 5.7% | |||
| Alon U.S.A. Energy, Inc. | 255,000 | 3,108,450 | |
| Delek U.S. Holdings, Inc. | 506,700 | 12,297,609 | |
| HollyFrontier Corp. | 86,900 | 2,462,746 | |
| Marathon Petroleum Corp. | 320,000 | 16,172,800 | |
| Phillips 66 Co. | 210,985 | 16,714,232 | |
| Western Refining, Inc. | 29,000 | 1,017,030 | |
| World Fuel Services Corp. | 114,245 | 4,141,381 | |
| 55,914,248 | |||
| Oil & Gas Storage & Transport - 8.2% | |||
| GasLog Partners LP | 125,700 | 3,079,650 | |
| Gener8 Maritime, Inc. (a) | 555,346 | 3,148,812 | |
| Golar LNG Ltd. (b) | 207,500 | 5,795,475 | |
| Kinder Morgan, Inc. | 1,167,900 | 25,390,146 | |
| Noble Midstream Partners LP | 126,875 | 6,607,650 | |
| Plains All American Pipeline LP | 391,800 | 12,384,798 | |
| Targa Resources Corp. | 164,664 | 9,863,374 | |
| Teekay LNG Partners LP | 69,300 | 1,216,215 | |
| The Williams Companies, Inc. | 430,604 | 12,741,573 | |
| 80,227,693 | |||
| TOTAL OIL, GAS & CONSUMABLE FUELS | 774,211,029 | ||
| TOTAL COMMON STOCKS | |||
| (Cost $849,529,710) | 977,562,418 | ||
| Money Market Funds - 2.9% | |||
| Fidelity Cash Central Fund, 0.84% (d) | 14,166,748 | 14,169,581 | |
| Fidelity Securities Lending Cash Central Fund 0.84% (d)(e) | 14,181,360 | 14,182,778 | |
| TOTAL MONEY MARKET FUNDS | |||
| (Cost $28,350,961) | 28,352,359 | ||
| TOTAL INVESTMENT PORTFOLIO - 102.4% | |||
| (Cost $877,880,671) | 1,005,914,777 | ||
| NET OTHER ASSETS (LIABILITIES) - (2.4)% | (23,845,050) | ||
| NET ASSETS - 100% | $982,069,727 |
Legend
(a) Non-income producing
(b) Security or a portion of the security is on loan at period end.
(c) Restricted securities - Investment in securities not registered under the Securities Act of 1933 (excluding 144A issues). At the end of the period, the value of restricted securities (excluding 144A issues) amounted to $827,642 or 0.1% of net assets.
(d) Affiliated fund that is generally available only to investment companies and other accounts managed by Fidelity Investments. The rate quoted is the annualized seven-day yield of the fund at period end. A complete unaudited listing of the fund's holdings as of its most recent quarter end is available upon request. In addition, each Fidelity Central Fund's financial statements are available on the SEC's website or upon request.
(e) Investment made with cash collateral received from securities on loan.
Additional information on each restricted holding is as follows:
| Security | Acquisition Date | Acquisition Cost |
| Centennial Resource Development, Inc. Class A | 10/11/16 | $454,000 |
Affiliated Central Funds
Information regarding fiscal year to date income earned by the Fund from investments in Fidelity Central Funds is as follows:
| Fund | Income earned |
| Fidelity Cash Central Fund | $28,923 |
| Fidelity Securities Lending Cash Central Fund | 202,533 |
| Total | $231,456 |
Investment Valuation
All investments are categorized as Level 1 under the Fair Value Hierarchy. The inputs or methodology used for valuing securities may not be an indication of the risk associated with investing in those securities. For more information on valuation inputs please refer to the Investment Valuation section in the accompanying Notes to Financial Statements.
Other Information
Distribution of investments by country or territory of incorporation, as a percentage of Total Net Assets, is as follows (Unaudited):
| United States of America | 90.0% |
| Curacao | 3.2% |
| Canada | 3.0% |
| Netherlands | 1.7% |
| Others (Individually Less Than 1%) | 2.1% |
| 100.0% |
See accompanying notes which are an integral part of the financial statements.
Fidelity® Energy Central Fund
Financial Statements
Statement of Assets and Liabilities
| March 31, 2017 (Unaudited) | ||
| Assets | ||
| Investment in securities, at value (including securities loaned of $13,906,008) — See accompanying schedule: Unaffiliated issuers (cost $849,529,710) | $977,562,418 | |
| Fidelity Central Funds (cost $28,350,961) | 28,352,359 | |
| Total Investments (cost $877,880,671) | $1,005,914,777 | |
| Receivable for investments sold | 14,486,121 | |
| Receivable for fund shares sold | 110,003 | |
| Dividends receivable | 272,685 | |
| Distributions receivable from Fidelity Central Funds | 23,890 | |
| Total assets | 1,020,807,476 | |
| Liabilities | ||
| Payable for investments purchased | $20,999,893 | |
| Payable for fund shares redeemed | 3,457,806 | |
| Other payables and accrued expenses | 99,634 | |
| Collateral on securities loaned | 14,180,416 | |
| Total liabilities | 38,737,749 | |
| Net Assets | $982,069,727 | |
| Net Assets consist of: | ||
| Paid in capital | $814,568,363 | |
| Distributions in excess of net investment income | (176,887) | |
| Accumulated undistributed net realized gain (loss) on investments and foreign currency transactions | 39,724,327 | |
| Net unrealized appreciation (depreciation) on investments and assets and liabilities in foreign currencies | 127,953,924 | |
| Net Assets, for 7,760,443 shares outstanding | $982,069,727 | |
| Net Asset Value, offering price and redemption price per share ($982,069,727 ÷ 7,760,443 shares) | $126.55 |
See accompanying notes which are an integral part of the financial statements.
Statement of Operations
| Six months ended March 31, 2017 (Unaudited) | ||
| Investment Income | ||
| Dividends | $5,293,399 | |
| Income from Fidelity Central Funds (including $202,533 from security lending) | 231,456 | |
| Total income | 5,524,855 | |
| Expenses | ||
| Custodian fees and expenses | $24,728 | |
| Independent directors' fees and expenses | 2,119 | |
| Interest | 1,853 | |
| Total expenses before reductions | 28,700 | |
| Expense reductions | (2,119) | 26,581 |
| Net investment income (loss) | 5,498,274 | |
| Realized and Unrealized Gain (Loss) | ||
| Net realized gain (loss) on: | ||
| Investment securities: | ||
| Unaffiliated issuers | 40,559,434 | |
| Fidelity Central Funds | 1,026 | |
| Foreign currency transactions | (32,915) | |
| Total net realized gain (loss) | 40,527,545 | |
| Change in net unrealized appreciation (depreciation) on: Investment securities (net of increase in deferred foreign taxes of $79,020) | (44,843,361) | |
| Assets and liabilities in foreign currencies | (769) | |
| Total change in net unrealized appreciation (depreciation) | (44,844,130) | |
| Net gain (loss) | (4,316,585) | |
| Net increase (decrease) in net assets resulting from operations | $1,181,689 |
See accompanying notes which are an integral part of the financial statements.
Statement of Changes in Net Assets
| Six months ended March 31, 2017 (Unaudited) | Year ended September 30, 2016 | |
| Increase (Decrease) in Net Assets | ||
| Operations | ||
| Net investment income (loss) | $5,498,274 | $13,813,006 |
| Net realized gain (loss) | 40,527,545 | (105,883,827) |
| Change in net unrealized appreciation (depreciation) | (44,844,130) | 296,762,640 |
| Net increase (decrease) in net assets resulting from operations | 1,181,689 | 204,691,819 |
| Distributions to shareholders from net investment income | (5,675,161) | (13,359,513) |
| Distributions to shareholders from net realized gain | (803,218) | – |
| Total distributions | (6,478,379) | (13,359,513) |
| Affiliated share transactions | ||
| Proceeds from sales of shares | 106,153,136 | 116,296,655 |
| Reinvestment of distributions | 6,478,271 | 13,359,286 |
| Cost of shares redeemed | (130,252,268) | (119,805,438) |
| Net increase (decrease) in net assets resulting from share transactions | (17,620,861) | 9,850,503 |
| Total increase (decrease) in net assets | (22,917,551) | 201,182,809 |
| Net Assets | ||
| Beginning of period | 1,004,987,278 | 803,804,469 |
| End of period | $982,069,727 | $1,004,987,278 |
| Other Information | ||
| Distributions in excess of net investment income end of period | $(176,887) | $– |
| Shares | ||
| Sold | 816,280 | 1,067,076 |
| Issued in reinvestment of distributions | 48,571 | 119,194 |
| Redeemed | (989,251) | (1,068,144) |
| Net increase (decrease) | (124,400) | 118,126 |
See accompanying notes which are an integral part of the financial statements.
Financial Highlights — Fidelity Energy Central Fund
| Six months ended (Unaudited) March 31, | Years ended September 30, | |||||
| 2017 | 2016 | 2015 | 2014 | 2013 | 2012 | |
| Selected Per–Share Data | ||||||
| Net asset value, beginning of period | $127.46 | $103.49 | $154.78 | $144.89 | $123.82 | $100.57 |
| Income from Investment Operations | ||||||
| Net investment income (loss)A | .69 | 1.72 | 2.32 | 2.37 | 2.25 | 2.15 |
| Net realized and unrealized gain (loss) | (.80) | 23.93 | (51.31) | 9.87 | 20.98 | 23.15 |
| Total from investment operations | (.11) | 25.65 | (48.99) | 12.24 | 23.23 | 25.30 |
| Distributions from net investment income | (.70) | (1.68) | (2.30) | (2.35) | (2.16) | (2.05) |
| Distributions from net realized gain | (.10) | – | – | – | – | – |
| Total distributions | (.80) | (1.68) | (2.30) | (2.35) | (2.16) | (2.05) |
| Net asset value, end of period | $126.55 | $127.46 | $103.49 | $154.78 | $144.89 | $123.82 |
| Total ReturnB,C | (.12)% | 25.02% | (31.92)% | 8.44% | 18.97% | 25.27% |
| Ratios to Average Net AssetsD,E | ||||||
| Expenses before reductions | .01%F | - %G | - %G | - %G | - %G | - %G |
| Expenses net of fee waivers, if any | .01%F | - %G | - %G | - %G | - %G | - %G |
| Expenses net of all reductions | .01%F | - %G | - %G | - %G | - %G | - %G |
| Net investment income (loss) | 1.06%F | 1.55% | 1.80% | 1.52% | 1.72% | 1.81% |
| Supplemental Data | ||||||
| Net assets, end of period (000 omitted) | $982,070 | $1,004,987 | $803,804 | $1,106,807 | $1,055,394 | $906,219 |
| Portfolio turnover rateH | 91%F,I | 105% | 70% | 109%I | 93%I | 98% |
A Calculated based on average shares outstanding during the period.
B Total returns for periods of less than one year are not annualized.
C Total returns would have been lower if certain expenses had not been reduced during the applicable periods shown.
D Fees and expenses of any underlying Fidelity Central Funds are not included in the Fund's expense ratio. The Fund indirectly bears its proportionate share of the expenses of any underlying Fidelity Central Funds.
E Expense ratios reflect operating expenses of the Fund. Expenses before reductions do not reflect amounts reimbursed by the investment adviser or reductions from expense offset arrangements and do not represent the amount paid by the Fund during periods when reimbursements or reductions occur. Expenses net of fee waivers reflect expenses after reimbursement by the investment adviser but prior to reductions from expense offset arrangements. Expenses net of all reductions represent the net expenses paid by the Fund.
F Annualized
G Amount represents less than .005%.
H Amount does not include the portfolio activity of any underlying Fidelity Central Funds.
I Portfolio turnover rate excludes securities received or delivered in-kind.
See accompanying notes which are an integral part of the financial statements.
Fidelity® Financials Central Fund
Investment Summary (Unaudited)
Top Ten Stocks as of March 31, 2017
| % of fund's net assets | % of fund's net assets 6 months ago | |
| Bank of America Corp. | 6.0 | 4.6 |
| Berkshire Hathaway, Inc. Class B | 5.8 | 5.5 |
| Citigroup, Inc. | 5.1 | 4.2 |
| Wells Fargo & Co. | 5.0 | 4.1 |
| JPMorgan Chase & Co. | 4.6 | 3.5 |
| Capital One Financial Corp. | 4.0 | 2.8 |
| Goldman Sachs Group, Inc. | 3.5 | 2.4 |
| Huntington Bancshares, Inc. | 3.1 | 1.1 |
| Chubb Ltd. | 2.6 | 3.7 |
| PNC Financial Services Group, Inc. | 2.4 | 1.4 |
| 42.1 |
Top Industries (% of fund's net assets)
| As of March 31, 2017 | ||
| Banks | 34.9% | |
| Equity Real Estate Investment Trusts (Reits) | 17.8% | |
| Capital Markets | 15.5% | |
| Insurance | 13.7% | |
| Consumer Finance | 6.3% | |
| All Others* | 11.8% | |
| As of September 30, 2016 | ||
| Banks | 27.6% | |
| Equity Real Estate Investment Trusts (Reits) | 21.5% | |
| Insurance | 16.8% | |
| Capital Markets | 11.3% | |
| Diversified Financial Services | 5.5% | |
| All Others* | 17.3% | |
* Includes short-term investments and net other assets (liabilities).
Fidelity® Financials Central Fund
Investments March 31, 2017 (Unaudited)
Showing Percentage of Net Assets
| Common Stocks - 97.4% | |||
| Shares | Value | ||
| Banks - 34.9% | |||
| Diversified Banks - 22.9% | |||
| Bank of America Corp. | 7,150,900 | $168,689,726 | |
| Citigroup, Inc. | 2,431,400 | 145,446,348 | |
| JPMorgan Chase & Co. | 1,472,300 | 129,326,832 | |
| U.S. Bancorp | 1,200,000 | 61,800,000 | |
| Wells Fargo & Co. | 2,530,400 | 140,842,064 | |
| 646,104,970 | |||
| Regional Banks - 12.0% | |||
| Bank of the Ozarks, Inc. | 337,363 | 17,546,250 | |
| CIT Group, Inc. | 550,000 | 23,611,500 | |
| CoBiz, Inc. | 913,100 | 15,340,080 | |
| First Republic Bank | 300,000 | 28,143,000 | |
| Huntington Bancshares, Inc. | 6,500,000 | 87,035,000 | |
| M&T Bank Corp. | 225,000 | 34,814,250 | |
| PNC Financial Services Group, Inc. | 550,000 | 66,132,000 | |
| Popular, Inc. | 671,947 | 27,368,401 | |
| Preferred Bank, Los Angeles | 155,628 | 8,350,998 | |
| SVB Financial Group (a) | 160,000 | 29,774,400 | |
| 338,115,879 | |||
| TOTAL BANKS | 984,220,849 | ||
| Capital Markets - 15.5% | |||
| Asset Management & Custody Banks - 4.8% | |||
| Affiliated Managers Group, Inc. | 185,000 | 30,328,900 | |
| Ameriprise Financial, Inc. | 150,000 | 19,452,000 | |
| BlackRock, Inc. Class A | 48,600 | 18,638,586 | |
| Northern Trust Corp. | 559,200 | 48,415,536 | |
| Oaktree Capital Group LLC Class A | 400,000 | 18,120,000 | |
| 134,955,022 | |||
| Financial Exchanges & Data - 3.6% | |||
| CBOE Holdings, Inc. | 483,422 | 39,191,022 | |
| IntercontinentalExchange, Inc. | 1,069,800 | 64,048,926 | |
| 103,239,948 | |||
| Investment Banking & Brokerage - 7.1% | |||
| E*TRADE Financial Corp. (a) | 1,500,000 | 52,335,000 | |
| Goldman Sachs Group, Inc. | 425,000 | 97,631,000 | |
| Investment Technology Group, Inc. | 518,359 | 10,496,770 | |
| TD Ameritrade Holding Corp. | 1,000,000 | 38,860,000 | |
| 199,322,770 | |||
| TOTAL CAPITAL MARKETS | 437,517,740 | ||
| Consumer Finance - 6.3% | |||
| Consumer Finance - 6.3% | |||
| Capital One Financial Corp. | 1,300,400 | 112,692,664 | |
| Synchrony Financial | 1,900,000 | 65,170,000 | |
| 177,862,664 | |||
| Diversified Financial Services - 5.8% | |||
| Multi-Sector Holdings - 5.8% | |||
| Berkshire Hathaway, Inc. Class B (a) | 990,900 | 165,163,212 | |
| Equity Real Estate Investment Trusts (REITs) - 17.8% | |||
| Diversified REITs - 0.9% | |||
| American Assets Trust, Inc. | 91,201 | 3,815,850 | |
| Empire State Realty Trust, Inc. | 156,632 | 3,232,884 | |
| Gramercy Property Trust | 74,100 | 1,948,830 | |
| VEREIT, Inc. | 1,421,624 | 12,069,588 | |
| Washington REIT (SBI) | 147,300 | 4,607,544 | |
| 25,674,696 | |||
| Health Care REITs - 1.9% | |||
| CareTrust (REIT), Inc. | 49,600 | 834,272 | |
| Healthcare Realty Trust, Inc. | 438,821 | 14,261,683 | |
| Sabra Health Care REIT, Inc. | 307,500 | 8,588,475 | |
| Ventas, Inc. | 344,292 | 22,392,752 | |
| Welltower, Inc. | 100,103 | 7,089,294 | |
| 53,166,476 | |||
| Hotel & Resort REITs - 0.7% | |||
| DiamondRock Hospitality Co. | 503,400 | 5,612,910 | |
| FelCor Lodging Trust, Inc. | 292,660 | 2,197,877 | |
| Host Hotels & Resorts, Inc. | 243,511 | 4,543,915 | |
| Sunstone Hotel Investors, Inc. | 434,100 | 6,654,753 | |
| 19,009,455 | |||
| Industrial REITs - 1.3% | |||
| DCT Industrial Trust, Inc. | 316,200 | 15,215,544 | |
| Duke Realty Corp. | 439,700 | 11,550,919 | |
| Prologis, Inc. | 107,323 | 5,567,917 | |
| Terreno Realty Corp. | 160,000 | 4,480,000 | |
| 36,814,380 | |||
| Office REITs - 2.1% | |||
| Boston Properties, Inc. | 159,589 | 21,131,179 | |
| Corporate Office Properties Trust (SBI) | 220,200 | 7,288,620 | |
| Douglas Emmett, Inc. | 249,100 | 9,565,440 | |
| Highwoods Properties, Inc. (SBI) | 146,425 | 7,193,860 | |
| Hudson Pacific Properties, Inc. | 268,040 | 9,284,906 | |
| Mack-Cali Realty Corp. | 158,666 | 4,274,462 | |
| Vornado Realty Trust | 18,700 | 1,875,797 | |
| 60,614,264 | |||
| Residential REITs - 2.7% | |||
| American Homes 4 Rent Class A | 162,312 | 3,726,684 | |
| Apartment Investment & Management Co. Class A | 213,365 | 9,462,738 | |
| AvalonBay Communities, Inc. | 110,794 | 20,341,778 | |
| Colony NorthStar, Inc. | 321,413 | 4,149,442 | |
| Equity Lifestyle Properties, Inc. | 96,044 | 7,401,151 | |
| Equity Residential (SBI) | 16,825 | 1,046,852 | |
| Essex Property Trust, Inc. | 57,023 | 13,202,535 | |
| Mid-America Apartment Communities, Inc. | 151,639 | 15,427,752 | |
| 74,758,932 | |||
| Retail REITs - 2.8% | |||
| Agree Realty Corp. | 132,493 | 6,354,364 | |
| Brixmor Property Group, Inc. | 97,132 | 2,084,453 | |
| Cedar Shopping Centers, Inc. | 410,300 | 2,059,706 | |
| DDR Corp. | 255,583 | 3,202,455 | |
| General Growth Properties, Inc. | 62,759 | 1,454,754 | |
| National Retail Properties, Inc. | 244,837 | 10,679,790 | |
| Pennsylvania Real Estate Investment Trust (SBI) (b) | 151,834 | 2,298,767 | |
| Simon Property Group, Inc. | 183,546 | 31,575,418 | |
| Taubman Centers, Inc. | 106,325 | 7,019,577 | |
| Urban Edge Properties | 498,176 | 13,102,029 | |
| 79,831,313 | |||
| Specialized REITs - 5.4% | |||
| American Tower Corp. | 334,788 | 40,690,134 | |
| Communications Sales & Leasing, Inc. | 98,334 | 2,541,934 | |
| CoreSite Realty Corp. | 86,070 | 7,750,604 | |
| Corrections Corp. of America | 168,200 | 5,284,844 | |
| Equinix, Inc. | 64,952 | 26,004,832 | |
| Extra Space Storage, Inc. | 225,210 | 16,753,372 | |
| Four Corners Property Trust, Inc. | 83,300 | 1,901,739 | |
| Gaming & Leisure Properties | 112,566 | 3,761,956 | |
| Outfront Media, Inc. | 211,128 | 5,605,448 | |
| Potlatch Corp. | 136,108 | 6,220,136 | |
| Public Storage | 51,674 | 11,311,955 | |
| SBA Communications Corp. Class A (a) | 122,091 | 14,696,094 | |
| Weyerhaeuser Co. | 273,914 | 9,307,598 | |
| 151,830,646 | |||
| TOTAL EQUITY REAL ESTATE INVESTMENT TRUSTS (REITS) | 501,700,162 | ||
| Hotels, Restaurants & Leisure - 0.2% | |||
| Hotels, Resorts & Cruise Lines - 0.2% | |||
| Marriott International, Inc. Class A | 58,800 | 5,537,784 | |
| Insurance - 13.7% | |||
| Insurance Brokers - 1.6% | |||
| Brown & Brown, Inc. | 200,000 | 8,344,000 | |
| Willis Group Holdings PLC | 291,800 | 38,193,702 | |
| 46,537,702 | |||
| Life & Health Insurance - 2.0% | |||
| Torchmark Corp. | 729,400 | 56,192,976 | |
| Multi-Line Insurance - 1.0% | |||
| American Financial Group, Inc. | 233,700 | 22,299,654 | |
| American International Group, Inc. | 100,000 | 6,243,000 | |
| 28,542,654 | |||
| Property & Casualty Insurance - 7.9% | |||
| Allstate Corp. | 747,800 | 60,938,222 | |
| Chubb Ltd. | 540,000 | 73,575,000 | |
| FNF Group | 900,000 | 35,046,000 | |
| The Travelers Companies, Inc. | 444,000 | 53,519,760 | |
| 223,078,982 | |||
| Reinsurance - 1.2% | |||
| Reinsurance Group of America, Inc. | 257,000 | 32,633,860 | |
| TOTAL INSURANCE | 386,986,174 | ||
| IT Services - 1.6% | |||
| Data Processing & Outsourced Services - 1.6% | |||
| Visa, Inc. Class A | 373,900 | 33,228,493 | |
| WEX, Inc. (a) | 125,000 | 12,937,500 | |
| 46,165,993 | |||
| Mortgage Real Estate Investment Trusts - 0.1% | |||
| Mortgage REITs - 0.1% | |||
| American Capital Mortgage Investment Corp. | 102,200 | 1,711,850 | |
| Real Estate Management & Development - 0.7% | |||
| Real Estate Development - 0.1% | |||
| Howard Hughes Corp. (a) | 34,576 | 4,054,036 | |
| Real Estate Operating Companie - 0.1% | |||
| Kennedy-Wilson Holdings, Inc. | 67,450 | 1,497,390 | |
| Real Estate Services - 0.5% | |||
| CBRE Group, Inc. (a) | 309,202 | 10,757,138 | |
| Invitation Homes, Inc. | 180,100 | 3,931,583 | |
| 14,688,721 | |||
| TOTAL REAL ESTATE MANAGEMENT & DEVELOPMENT | 20,240,147 | ||
| Thrifts & Mortgage Finance - 0.8% | |||
| Thrifts & Mortgage Finance - 0.8% | |||
| MGIC Investment Corp. (a) | 1,158,000 | 11,730,540 | |
| Radian Group, Inc. | 530,495 | 9,527,690 | |
| Washington Mutual, Inc. (a) | 155,200 | 2 | |
| 21,258,232 | |||
| TOTAL COMMON STOCKS | |||
| (Cost $2,138,797,835) | 2,748,364,807 | ||
| Money Market Funds - 2.5% | |||
| Fidelity Cash Central Fund, 0.84% (c) | 68,668,856 | 68,682,590 | |
| Fidelity Securities Lending Cash Central Fund 0.84% (c)(d) | 1,876,862 | 1,877,050 | |
| TOTAL MONEY MARKET FUNDS | |||
| (Cost $70,559,640) | 70,559,640 | ||
| TOTAL INVESTMENT PORTFOLIO - 99.9% | |||
| (Cost $2,209,357,475) | 2,818,924,447 | ||
| NET OTHER ASSETS (LIABILITIES) - 0.1% | 2,746,950 | ||
| NET ASSETS - 100% | $2,821,671,397 |
Legend
(a) Non-income producing
(b) Security or a portion of the security is on loan at period end.
(c) Affiliated fund that is generally available only to investment companies and other accounts managed by Fidelity Investments. The rate quoted is the annualized seven-day yield of the fund at period end. A complete unaudited listing of the fund's holdings as of its most recent quarter end is available upon request. In addition, each Fidelity Central Fund's financial statements are available on the SEC's website or upon request.
(d) Investment made with cash collateral received from securities on loan.
Affiliated Central Funds
Information regarding fiscal year to date income earned by the Fund from investments in Fidelity Central Funds is as follows:
| Fund | Income earned |
| Fidelity Cash Central Fund | $133,953 |
| Fidelity Securities Lending Cash Central Fund | 3,969 |
| Total | $137,922 |
Investment Valuation
The following is a summary of the inputs used, as of March 31, 2017, involving the Fund's assets and liabilities carried at fair value. The inputs or methodology used for valuing securities may not be an indication of the risk associated with investing in those securities. For more information on valuation inputs, and their aggregation into the levels used below, please refer to the Investment Valuation section in the accompanying Notes to Financial Statements.
| Valuation Inputs at Reporting Date: | ||||
| Description | Total | Level 1 | Level 2 | Level 3 |
| Investments in Securities: | ||||
| Common Stocks | $2,748,364,807 | $2,748,364,805 | $-- | $2 |
| Money Market Funds | 70,559,640 | 70,559,640 | -- | -- |
| Total Investments in Securities: | $2,818,924,447 | $2,818,924,445 | $-- | $2 |
See accompanying notes which are an integral part of the financial statements.
Fidelity® Financials Central Fund
Financial Statements
Statement of Assets and Liabilities
| March 31, 2017 (Unaudited) | ||
| Assets | ||
| Investment in securities, at value (including securities loaned of $1,833,454) — See accompanying schedule: Unaffiliated issuers (cost $2,138,797,835) | $2,748,364,807 | |
| Fidelity Central Funds (cost $70,559,640) | 70,559,640 | |
| Total Investments (cost $2,209,357,475) | $2,818,924,447 | |
| Receivable for investments sold | 20,892,365 | |
| Receivable for fund shares sold | 353,307 | |
| Dividends receivable | 3,798,177 | |
| Distributions receivable from Fidelity Central Funds | 33,635 | |
| Total assets | 2,844,001,931 | |
| Liabilities | ||
| Payable to custodian bank | $360 | |
| Payable for investments purchased | 18,940,856 | |
| Payable for fund shares redeemed | 1,477,556 | |
| Other payables and accrued expenses | 34,712 | |
| Collateral on securities loaned | 1,877,050 | |
| Total liabilities | 22,330,534 | |
| Net Assets | $2,821,671,397 | |
| Net Assets consist of: | ||
| Paid in capital | $2,089,978,153 | |
| Undistributed net investment income | 6,201,333 | |
| Accumulated undistributed net realized gain (loss) on investments and foreign currency transactions | 115,923,073 | |
| Net unrealized appreciation (depreciation) on investments and assets and liabilities in foreign currencies | 609,568,838 | |
| Net Assets, for 28,710,601 shares outstanding | $2,821,671,397 | |
| Net Asset Value, offering price and redemption price per share ($2,821,671,397 ÷ 28,710,601 shares) | $98.28 |
See accompanying notes which are an integral part of the financial statements.
Statement of Operations
| Six months ended March 31, 2017 (Unaudited) | ||
| Investment Income | ||
| Dividends | $24,332,563 | |
| Income from Fidelity Central Funds (including $3,969 from security lending) | 137,922 | |
| Total income | 24,470,485 | |
| Expenses | ||
| Custodian fees and expenses | $34,775 | |
| Independent directors' fees and expenses | 5,575 | |
| Interest | 628 | |
| Total expenses before reductions | 40,978 | |
| Expense reductions | (5,642) | 35,336 |
| Net investment income (loss) | 24,435,149 | |
| Realized and Unrealized Gain (Loss) | ||
| Net realized gain (loss) on: | ||
| Investment securities: | ||
| Unaffiliated issuers | 119,522,762 | |
| Fidelity Central Funds | 4,353 | |
| Foreign currency transactions | (1,052) | |
| Total net realized gain (loss) | 119,526,063 | |
| Change in net unrealized appreciation (depreciation) on: Investment securities | 287,155,491 | |
| Assets and liabilities in foreign currencies | 5,703 | |
| Total change in net unrealized appreciation (depreciation) | 287,161,194 | |
| Net gain (loss) | 406,687,257 | |
| Net increase (decrease) in net assets resulting from operations | $431,122,406 |
See accompanying notes which are an integral part of the financial statements.
Statement of Changes in Net Assets
| Six months ended March 31, 2017 (Unaudited) | Year ended September 30, 2016 | |
| Increase (Decrease) in Net Assets | ||
| Operations | ||
| Net investment income (loss) | $24,435,149 | $46,307,844 |
| Net realized gain (loss) | 119,526,063 | (13,282,024) |
| Change in net unrealized appreciation (depreciation) | 287,161,194 | 119,841,902 |
| Net increase (decrease) in net assets resulting from operations | 431,122,406 | 152,867,722 |
| Distributions to shareholders from net investment income | (18,233,816) | (43,616,969) |
| Distributions to shareholders from net realized gain | (3,602,990) | – |
| Total distributions | (21,836,806) | (43,616,969) |
| Affiliated share transactions | ||
| Proceeds from sales of shares | 181,566,544 | 345,722,943 |
| Reinvestment of distributions | 21,836,622 | 43,616,590 |
| Cost of shares redeemed | (335,068,607) | (255,720,898) |
| Net increase (decrease) in net assets resulting from share transactions | (131,665,441) | 133,618,635 |
| Total increase (decrease) in net assets | 277,620,159 | 242,869,388 |
| Net Assets | ||
| Beginning of period | 2,544,051,238 | 2,301,181,850 |
| End of period | $2,821,671,397 | $2,544,051,238 |
| Other Information | ||
| Undistributed net investment income end of period | $6,201,333 | $– |
| Shares | ||
| Sold | 1,954,544 | 4,203,336 |
| Issued in reinvestment of distributions | 235,812 | 519,116 |
| Redeemed | (3,502,197) | (3,158,480) |
| Net increase (decrease) | (1,311,841) | 1,563,972 |
See accompanying notes which are an integral part of the financial statements.
Financial Highlights — Fidelity Financials Central Fund
| Six months ended (Unaudited) March 31, | Years ended September 30, | |||||
| 2017 | 2016 | 2015 | 2014 | 2013 | 2012 | |
| Selected Per–Share Data | ||||||
| Net asset value, beginning of period | $84.74 | $80.86 | $83.90 | $72.85 | $58.36 | $44.37 |
| Income from Investment Operations | ||||||
| Net investment income (loss)A | .82 | 1.59 | 1.57 | 1.54 | 1.63 | 1.07 |
| Net realized and unrealized gain (loss) | 13.45 | 3.79 | (3.30) | 10.84 | 14.22 | 13.82 |
| Total from investment operations | 14.27 | 5.38 | (1.73) | 12.38 | 15.85 | 14.89 |
| Distributions from net investment income | (.61) | (1.50) | (1.31) | (1.33) | (1.36) | (.90) |
| Distributions from net realized gain | (.12) | – | – | – | – | – |
| Total distributions | (.73) | (1.50) | (1.31) | (1.33) | (1.36) | (.90) |
| Net asset value, end of period | $98.28 | $84.74 | $80.86 | $83.90 | $72.85 | $58.36 |
| Total ReturnB,C | 16.89% | 6.68% | (2.18)% | 17.08% | 27.41% | 33.71% |
| Ratios to Average Net AssetsD,E | ||||||
| Expenses before reductions | - %F,G | - %G | - %G | - %G | .01% | .01% |
| Expenses net of fee waivers, if any | - %F,G | - %G | - %G | - %G | .01% | .01% |
| Expenses net of all reductions | - %F,G | - %G | - %G | - %G | .01% | .01% |
| Net investment income (loss) | 1.75%F | 1.94% | 1.80% | 1.92% | 2.44% | 1.97% |
| Supplemental Data | ||||||
| Net assets, end of period (000 omitted) | $2,821,671 | $2,544,051 | $2,301,182 | $2,387,026 | $1,956,278 | $1,400,699 |
| Portfolio turnover rateH | 61%F,I | 57% | 40% | 43%I | 249%I | 383% |
A Calculated based on average shares outstanding during the period.
B Total returns for periods of less than one year are not annualized.
C Total returns would have been lower if certain expenses had not been reduced during the applicable periods shown.
D Fees and expenses of any underlying Fidelity Central Funds are not included in the Fund's expense ratio. The Fund indirectly bears its proportionate share of the expenses of any underlying Fidelity Central Funds.
E Expense ratios reflect operating expenses of the Fund. Expenses before reductions do not reflect amounts reimbursed by the investment adviser or reductions from expense offset arrangements and do not represent the amount paid by the Fund during periods when reimbursements or reductions occur. Expenses net of fee waivers reflect expenses after reimbursement by the investment adviser but prior to reductions from expense offset arrangements. Expenses net of all reductions represent the net expenses paid by the Fund.
F Annualized
G Amount represents less than .005%.
H Amount does not include the portfolio activity of any underlying Fidelity Central Funds.
I Portfolio turnover rate excludes securities received or delivered in-kind.
See accompanying notes which are an integral part of the financial statements.
Fidelity® Health Care Central Fund
Investment Summary (Unaudited)
Top Ten Stocks as of March 31, 2017
| % of fund's net assets | % of fund's net assets 6 months ago | |
| Amgen, Inc. | 8.6 | 6.8 |
| Allergan PLC | 7.6 | 7.9 |
| Medtronic PLC | 7.3 | 10.0 |
| UnitedHealth Group, Inc. | 5.9 | 3.6 |
| Boston Scientific Corp. | 5.2 | 5.0 |
| Alexion Pharmaceuticals, Inc. | 3.7 | 3.1 |
| Anthem, Inc. | 3.6 | 1.7 |
| Bristol-Myers Squibb Co. | 3.6 | 1.4 |
| Vertex Pharmaceuticals, Inc. | 3.3 | 3.6 |
| Intuitive Surgical, Inc. | 2.5 | 2.6 |
| 51.3 |
Top Industries (% of fund's net assets)
| As of March 31, 2017 | ||
| Biotechnology | 28.8% | |
| Health Care Equipment & Supplies | 23.7% | |
| Pharmaceuticals | 19.8% | |
| Health Care Providers & Services | 19.7% | |
| Health Care Technology | 2.9% | |
| All Others* | 5.1% | |
| As of September 30, 2016 | ||
| Biotechnology | 28.4% | |
| Health Care Equipment & Supplies | 28.2% | |
| Pharmaceuticals | 21.3% | |
| Health Care Providers & Services | 15.0% | |
| Health Care Technology | 3.1% | |
| All Others* | 4.0% | |
* Includes short-term investments and net other assets (liabilities).
Fidelity® Health Care Central Fund
Investments March 31, 2017 (Unaudited)
Showing Percentage of Net Assets
| Common Stocks - 97.0% | |||
| Shares | Value | ||
| Biotechnology - 28.8% | |||
| Biotechnology - 28.8% | |||
| Ablynx NV (a)(b) | 660,000 | $8,199,105 | |
| AC Immune SA (b) | 178,800 | 1,852,368 | |
| ACADIA Pharmaceuticals, Inc. (a) | 60,000 | 2,062,800 | |
| Acorda Therapeutics, Inc. (a) | 400,000 | 8,400,000 | |
| Advanced Accelerator Applications SA sponsored ADR (a) | 150,000 | 5,979,000 | |
| Advaxis, Inc. (a)(b) | 600,000 | 4,902,000 | |
| Alexion Pharmaceuticals, Inc. (a) | 630,000 | 76,381,200 | |
| Alnylam Pharmaceuticals, Inc. (a) | 126,711 | 6,493,939 | |
| Amgen, Inc. | 1,080,000 | 177,195,597 | |
| Amicus Therapeutics, Inc. (a)(b) | 1,220,000 | 8,698,600 | |
| Array BioPharma, Inc. (a) | 690,000 | 6,168,600 | |
| Ascendis Pharma A/S sponsored ADR (a) | 200,000 | 5,600,000 | |
| BeiGene Ltd. ADR (a) | 84,093 | 3,078,645 | |
| BioMarin Pharmaceutical, Inc. (a) | 400,000 | 35,112,000 | |
| bluebird bio, Inc. (a) | 43,000 | 3,908,700 | |
| Blueprint Medicines Corp. (a) | 220,000 | 8,797,800 | |
| Celgene Corp. (a) | 52,000 | 6,470,360 | |
| Cellectis SA sponsored ADR (a) | 148,000 | 3,552,000 | |
| China Biologic Products, Inc. (a) | 70,000 | 7,009,100 | |
| Curis, Inc. (a) | 1,200,000 | 3,336,000 | |
| Cytokinetics, Inc. (a) | 366,475 | 4,709,204 | |
| CytomX Therapeutics, Inc. (a) | 93,500 | 1,614,745 | |
| Five Prime Therapeutics, Inc. (a) | 105,387 | 3,809,740 | |
| Galapagos Genomics NV sponsored ADR (a) | 105,200 | 9,067,188 | |
| Heron Therapeutics, Inc. (a) | 170,550 | 2,558,250 | |
| Incyte Corp. (a) | 33,000 | 4,411,110 | |
| Insmed, Inc. (a) | 791,400 | 13,857,414 | |
| Intercept Pharmaceuticals, Inc. (a) | 73,351 | 8,295,998 | |
| La Jolla Pharmaceutical Co. (a) | 53,200 | 1,588,020 | |
| Loxo Oncology, Inc. (a) | 54,800 | 2,305,984 | |
| Neurocrine Biosciences, Inc. (a) | 250,000 | 10,825,000 | |
| Protagonist Therapeutics, Inc. (b) | 309,869 | 3,969,422 | |
| Proteostasis Therapeutics, Inc. (a) | 204,894 | 1,602,271 | |
| Prothena Corp. PLC (a) | 9,400 | 524,426 | |
| Puma Biotechnology, Inc. (a)(b) | 290,000 | 10,788,000 | |
| Regeneron Pharmaceuticals, Inc. (a) | 12,800 | 4,960,128 | |
| Spark Therapeutics, Inc. (a) | 101,423 | 5,409,903 | |
| TESARO, Inc. (a)(b) | 180,000 | 27,696,600 | |
| Ultragenyx Pharmaceutical, Inc. (a) | 260,000 | 17,622,800 | |
| Vertex Pharmaceuticals, Inc. (a) | 628,000 | 68,671,800 | |
| Xencor, Inc. (a) | 300,000 | 7,176,000 | |
| 594,661,817 | |||
| Capital Markets - 0.3% | |||
| Asset Management & Custody Banks - 0.3% | |||
| RPI International Holdings LP (c) | 41,845 | 5,661,838 | |
| Diversified Consumer Services - 0.3% | |||
| Specialized Consumer Services - 0.3% | |||
| Carriage Services, Inc. | 211,800 | 5,744,016 | |
| Health Care Equipment & Supplies - 22.9% | |||
| Health Care Equipment - 21.5% | |||
| Atricure, Inc. (a) | 500,000 | 9,575,000 | |
| Boston Scientific Corp. (a) | 4,320,000 | 107,438,400 | |
| DexCom, Inc. (a) | 370,000 | 31,350,100 | |
| Insulet Corp. (a) | 406,300 | 17,507,467 | |
| Integra LifeSciences Holdings Corp. (a) | 260,000 | 10,953,800 | |
| Intuitive Surgical, Inc. (a) | 66,000 | 50,587,020 | |
| Medtronic PLC | 1,860,000 | 149,841,600 | |
| NxStage Medical, Inc. (a) | 240,000 | 6,439,200 | |
| Penumbra, Inc. (a)(b) | 281,600 | 23,499,520 | |
| Wright Medical Group NV (a) | 900,000 | 28,008,000 | |
| Zimmer Biomet Holdings, Inc. | 70,000 | 8,547,700 | |
| 443,747,807 | |||
| Health Care Supplies - 1.4% | |||
| The Cooper Companies, Inc. | 67,000 | 13,392,630 | |
| The Spectranetics Corp. (a) | 506,730 | 14,758,511 | |
| 28,151,141 | |||
| TOTAL HEALTH CARE EQUIPMENT & SUPPLIES | 471,898,948 | ||
| Health Care Providers & Services - 19.6% | |||
| Health Care Distributors & Services - 0.9% | |||
| Amplifon SpA | 500,000 | 6,027,420 | |
| EBOS Group Ltd. | 1,000,000 | 12,793,250 | |
| Oriola-KD Oyj | 21,763 | 92,171 | |
| 18,912,841 | |||
| Health Care Facilities - 2.3% | |||
| HCA Holdings, Inc. (a) | 280,000 | 24,917,200 | |
| Universal Health Services, Inc. Class B | 180,000 | 22,401,000 | |
| 47,318,200 | |||
| Health Care Services - 3.0% | |||
| American Renal Associates Holdings, Inc. | 347,838 | 5,871,505 | |
| Envision Healthcare Corp. (a) | 300,000 | 18,396,000 | |
| Premier, Inc. (a) | 297,297 | 9,462,964 | |
| Teladoc, Inc. (a)(b) | 780,000 | 19,500,000 | |
| United Drug PLC (United Kingdom) | 880,000 | 7,739,915 | |
| 60,970,384 | |||
| Managed Health Care - 13.4% | |||
| Anthem, Inc. | 450,000 | 74,421,000 | |
| Cigna Corp. | 300,000 | 43,947,000 | |
| Humana, Inc. | 175,000 | 36,074,500 | |
| UnitedHealth Group, Inc. | 745,000 | 122,187,450 | |
| 276,629,950 | |||
| TOTAL HEALTH CARE PROVIDERS & SERVICES | 403,831,375 | ||
| Health Care Technology - 2.9% | |||
| Health Care Technology - 2.9% | |||
| athenahealth, Inc. (a) | 196,200 | 22,109,778 | |
| Castlight Health, Inc. (a) | 700,500 | 2,556,825 | |
| Castlight Health, Inc. Class B (a) | 14,900 | 54,385 | |
| Evolent Health, Inc. (a)(b) | 358,500 | 7,994,550 | |
| HealthStream, Inc. (a) | 440,000 | 10,661,200 | |
| Medidata Solutions, Inc. (a) | 300,000 | 17,307,000 | |
| 60,683,738 | |||
| Internet Software & Services - 0.4% | |||
| Internet Software & Services - 0.4% | |||
| Benefitfocus, Inc. (a) | 330,900 | 9,248,655 | |
| Life Sciences Tools & Services - 1.1% | |||
| Life Sciences Tools & Services - 1.1% | |||
| Agilent Technologies, Inc. | 440,000 | 23,262,800 | |
| Pharmaceuticals - 19.8% | |||
| Pharmaceuticals - 19.8% | |||
| Aclaris Therapeutics, Inc. (a) | 157,800 | 4,705,596 | |
| Akorn, Inc. (a) | 320,000 | 7,705,600 | |
| Allergan PLC | 660,000 | 157,687,200 | |
| Bristol-Myers Squibb Co. | 1,350,000 | 73,413,000 | |
| Catalent, Inc. (a) | 770,000 | 21,806,400 | |
| Dechra Pharmaceuticals PLC | 600,000 | 12,584,128 | |
| Eisai Co. Ltd. | 220,000 | 11,425,081 | |
| GlaxoSmithKline PLC | 1,800,000 | 37,427,292 | |
| Jazz Pharmaceuticals PLC (a) | 216,000 | 31,348,080 | |
| Jiangsu Hengrui Medicine Co. Ltd. (A Shares) | 1,500,000 | 11,832,992 | |
| Lee's Pharmaceutical Holdings Ltd. | 3,200,012 | 3,088,218 | |
| SCYNEXIS, Inc. (a)(b) | 400,000 | 1,104,000 | |
| The Medicines Company (a) | 199,009 | 9,731,540 | |
| TherapeuticsMD, Inc. (a)(b) | 1,500,900 | 10,806,480 | |
| Theravance Biopharma, Inc. (a)(b) | 404,634 | 14,898,624 | |
| 409,564,231 | |||
| Professional Services - 0.9% | |||
| Human Resource & Employment Services - 0.9% | |||
| WageWorks, Inc. (a) | 250,000 | 18,075,000 | |
| TOTAL COMMON STOCKS | |||
| (Cost $1,623,020,258) | 2,002,632,418 | ||
| Preferred Stocks - 0.9% | |||
| Convertible Preferred Stocks - 0.1% | |||
| Health Care Providers & Services - 0.1% | |||
| Health Care Services - 0.1% | |||
| 1Life Healthcare, Inc. Series G (a)(c) | 438,101 | 2,979,087 | |
| Nonconvertible Preferred Stocks - 0.8% | |||
| Health Care Equipment & Supplies - 0.8% | |||
| Health Care Equipment - 0.8% | |||
| Sartorius AG (non-vtg.) | 180,000 | 15,793,974 | |
| TOTAL PREFERRED STOCKS | |||
| (Cost $16,188,034) | 18,773,061 | ||
| Money Market Funds - 5.2% | |||
| Fidelity Cash Central Fund, 0.84% (d) | 50,987,288 | 50,997,485 | |
| Fidelity Securities Lending Cash Central Fund 0.84% (d)(e) | 55,200,483 | 55,206,004 | |
| TOTAL MONEY MARKET FUNDS | |||
| (Cost $106,201,993) | 106,203,489 | ||
| TOTAL INVESTMENT PORTFOLIO - 103.1% | |||
| (Cost $1,745,410,285) | 2,127,608,968 | ||
| NET OTHER ASSETS (LIABILITIES) - (3.1)% | (64,019,419) | ||
| NET ASSETS - 100% | $2,063,589,549 |
Legend
(a) Non-income producing
(b) Security or a portion of the security is on loan at period end.
(c) Restricted securities - Investment in securities not registered under the Securities Act of 1933 (excluding 144A issues). At the end of the period, the value of restricted securities (excluding 144A issues) amounted to $8,640,925 or 0.4% of net assets.
(d) Affiliated fund that is generally available only to investment companies and other accounts managed by Fidelity Investments. The rate quoted is the annualized seven-day yield of the fund at period end. A complete unaudited listing of the fund's holdings as of its most recent quarter end is available upon request. In addition, each Fidelity Central Fund's financial statements are available on the SEC's website or upon request.
(e) Investment made with cash collateral received from securities on loan.
Additional information on each restricted holding is as follows:
| Security | Acquisition Date | Acquisition Cost |
| 1Life Healthcare, Inc. Series G | 4/10/14 | $2,885,246 |
| RPI International Holdings LP | 5/21/15 - 3/23/16 | $5,567,439 |
Affiliated Central Funds
Information regarding fiscal year to date income earned by the Fund from investments in Fidelity Central Funds is as follows:
| Fund | Income earned |
| Fidelity Cash Central Fund | $98,698 |
| Fidelity Securities Lending Cash Central Fund | 396,699 |
| Total | $495,397 |
Investment Valuation
The following is a summary of the inputs used, as of March 31, 2017, involving the Fund's assets and liabilities carried at fair value. The inputs or methodology used for valuing securities may not be an indication of the risk associated with investing in those securities. For more information on valuation inputs, and their aggregation into the levels used below, please refer to the Investment Valuation section in the accompanying Notes to Financial Statements.
| Valuation Inputs at Reporting Date: | ||||
| Description | Total | Level 1 | Level 2 | Level 3 |
| Investments in Securities: | ||||
| Common Stocks | $2,002,632,418 | $1,948,118,207 | $48,852,373 | $5,661,838 |
| Preferred Stocks | 18,773,061 | 15,793,974 | -- | 2,979,087 |
| Money Market Funds | 106,203,489 | 106,203,489 | -- | -- |
| Total Investments in Securities: | $2,127,608,968 | $2,070,115,670 | $48,852,373�� | $8,640,925 |
Other Information
Distribution of investments by country or territory of incorporation, as a percentage of Total Net Assets, is as follows (Unaudited):
| United States of America | 73.8% |
| Ireland | 16.8% |
| United Kingdom | 2.4% |
| Netherlands | 1.4% |
| Cayman Islands | 1.0% |
| Others (Individually Less Than 1%) | 4.6% |
| 100.0% |
See accompanying notes which are an integral part of the financial statements.
Fidelity® Health Care Central Fund
Financial Statements
Statement of Assets and Liabilities
| March 31, 2017 (Unaudited) | ||
| Assets | ||
| Investment in securities, at value (including securities loaned of $53,976,201) — See accompanying schedule: Unaffiliated issuers (cost $1,639,208,292) | $2,021,405,479 | |
| Fidelity Central Funds (cost $106,201,993) | 106,203,489 | |
| Total Investments (cost $1,745,410,285) | $2,127,608,968 | |
| Cash | 88,921 | |
| Receivable for investments sold | 773,661 | |
| Receivable for fund shares sold | 246,544 | |
| Dividends receivable | 2,060,756 | |
| Distributions receivable from Fidelity Central Funds | 76,576 | |
| Total assets | 2,130,855,426 | |
| Liabilities | ||
| Payable for investments purchased | $11,559,511 | |
| Payable for fund shares redeemed | 470,668 | |
| Other payables and accrued expenses | 35,785 | |
| Collateral on securities loaned | 55,199,913 | |
| Total liabilities | 67,265,877 | |
| Net Assets | $2,063,589,549 | |
| Net Assets consist of: | ||
| Paid in capital | $1,685,058,366 | |
| Undistributed net investment income | 3,177,409 | |
| Accumulated undistributed net realized gain (loss) on investments and foreign currency transactions | (6,857,105) | |
| Net unrealized appreciation (depreciation) on investments and assets and liabilities in foreign currencies | 382,210,879 | |
| Net Assets, for 5,756,902 shares outstanding | $2,063,589,549 | |
| Net Asset Value, offering price and redemption price per share ($2,063,589,549 ÷ 5,756,902 shares) | $358.45 |
See accompanying notes which are an integral part of the financial statements.
Statement of Operations
| Six months ended March 31, 2017 (Unaudited) | ||
| Investment Income | ||
| Dividends | $8,203,580 | |
| Income from Fidelity Central Funds (including $396,699 from security lending) | 495,397 | |
| Total income | 8,698,977 | |
| Expenses | ||
| Custodian fees and expenses | $40,071 | |
| Independent directors' fees and expenses | 3,974 | |
| Interest | 1,531 | |
| Total expenses before reductions | 45,576 | |
| Expense reductions | (3,974) | 41,602 |
| Net investment income (loss) | 8,657,375 | |
| Realized and Unrealized Gain (Loss) | ||
| Net realized gain (loss) on: | ||
| Investment securities: | ||
| Unaffiliated issuers | (6,829,945) | |
| Fidelity Central Funds | 3,614 | |
| Foreign currency transactions | (30,774) | |
| Total net realized gain (loss) | (6,857,105) | |
| Change in net unrealized appreciation (depreciation) on: Investment securities | 67,721,142 | |
| Assets and liabilities in foreign currencies | (5,660) | |
| Total change in net unrealized appreciation (depreciation) | 67,715,482 | |
| Net gain (loss) | 60,858,377 | |
| Net increase (decrease) in net assets resulting from operations | $69,515,752 |
See accompanying notes which are an integral part of the financial statements.
Statement of Changes in Net Assets
| Six months ended March 31, 2017 (Unaudited) | Year ended September 30, 2016 | |
| Increase (Decrease) in Net Assets | ||
| Operations | ||
| Net investment income (loss) | $8,657,375 | $15,750,383 |
| Net realized gain (loss) | (6,857,105) | 8,080,874 |
| Change in net unrealized appreciation (depreciation) | 67,715,482 | 119,668,927 |
| Net increase (decrease) in net assets resulting from operations | 69,515,752 | 143,500,184 |
| Distributions to shareholders from net investment income | (5,479,966) | (14,262,731) |
| Affiliated share transactions | ||
| Proceeds from sales of shares | 216,413,838 | 276,507,477 |
| Reinvestment of distributions | 5,479,858 | 14,262,430 |
| Cost of shares redeemed | (180,588,038) | (211,669,660) |
| Net increase (decrease) in net assets resulting from share transactions | 41,305,658 | 79,100,247 |
| Total increase (decrease) in net assets | 105,341,444 | 208,337,700 |
| Net Assets | ||
| Beginning of period | 1,958,248,105 | 1,749,910,405 |
| End of period | $2,063,589,549 | $1,958,248,105 |
| Other Information | ||
| Undistributed net investment income end of period | $3,177,409 | $– |
| Shares | ||
| Sold | 657,774 | 834,679 |
| Issued in reinvestment of distributions | 16,757 | 42,388 |
| Redeemed | (534,495) | (626,064) |
| Net increase (decrease) | 140,036 | 251,003 |
See accompanying notes which are an integral part of the financial statements.
Financial Highlights — Fidelity Health Care Central Fund
| Six months ended (Unaudited) March 31, | Years ended September 30, | |||||
| 2017 | 2016 | 2015 | 2014 | 2013 | 2012 | |
| Selected Per–Share Data | ||||||
| Net asset value, beginning of period | $348.64 | $326.12 | $309.84 | $222.42 | $163.64 | $123.15 |
| Income from Investment Operations | ||||||
| Net investment income (loss)A | 1.48 | 2.85 | 2.36 | 1.34 | 1.73 | 1.63 |
| Net realized and unrealized gain (loss) | 9.25 | 22.25 | 15.99 | 87.35 | 58.70 | 40.46 |
| Total from investment operations | 10.73 | 25.10 | 18.35 | 88.69 | 60.43 | 42.09 |
| Distributions from net investment income | (.92) | (2.58) | (2.07) | (1.27) | (1.65) | (1.60) |
| Total distributions | (.92) | (2.58) | (2.07) | (1.27) | (1.65) | (1.60) |
| Net asset value, end of period | $358.45 | $348.64 | $326.12 | $309.84 | $222.42 | $163.64 |
| Total ReturnB,C | 3.10% | 7.73% | 5.85% | 39.95% | 37.14% | 34.34% |
| Ratios to Average Net AssetsD,E | ||||||
| Expenses before reductions | - %F,G | - %G | - %G | .01% | .01% | .01% |
| Expenses net of fee waivers, if any | - %F,G | - %G | - %G | .01% | .01% | - %G |
| Expenses net of all reductions | - %F,G | - %G | - %G | .01% | .01% | - %G |
| Net investment income (loss) | .88%F | .85% | .66% | .49% | .93% | 1.13% |
| Supplemental Data | ||||||
| Net assets, end of period (000 omitted) | $2,063,590 | $1,958,248 | $1,749,910 | $1,806,204 | $1,415,691 | $1,044,262 |
| Portfolio turnover rateH | 77%F,I | 68% | 97% | 131%I | 113%I | 120% |
A Calculated based on average shares outstanding during the period.
B Total returns for periods of less than one year are not annualized.
C Total returns would have been lower if certain expenses had not been reduced during the applicable periods shown.
D Fees and expenses of any underlying Fidelity Central Funds are not included in the Fund's expense ratio. The Fund indirectly bears its proportionate share of the expenses of any underlying Fidelity Central Funds.
E Expense ratios reflect operating expenses of the Fund. Expenses before reductions do not reflect amounts reimbursed by the investment adviser or reductions from expense offset arrangements and do not represent the amount paid by the Fund during periods when reimbursements or reductions occur. Expenses net of fee waivers reflect expenses after reimbursement by the investment adviser but prior to reductions from expense offset arrangements. Expenses net of all reductions represent the net expenses paid by the Fund.
F Annualized
G Amount represents less than .005%.
H Amount does not include the portfolio activity of any underlying Fidelity Central Funds.
I Portfolio turnover rate excludes securities received or delivered in-kind.
See accompanying notes which are an integral part of the financial statements.
Fidelity® Industrials Central Fund
Investment Summary (Unaudited)
Top Ten Stocks as of March 31, 2017
| % of fund's net assets | % of fund's net assets 6 months ago | |
| General Electric Co. | 9.0 | 11.9 |
| Honeywell International, Inc. | 5.3 | 6.1 |
| United Technologies Corp. | 4.8 | 5.4 |
| General Dynamics Corp. | 4.3 | 4.7 |
| Caterpillar, Inc. | 4.2 | 4.2 |
| Northrop Grumman Corp. | 4.0 | 3.5 |
| AECOM | 3.3 | 3.3 |
| AMETEK, Inc. | 2.9 | 3.0 |
| Norfolk Southern Corp. | 2.6 | 1.7 |
| Southwest Airlines Co. | 2.5 | 2.9 |
| 42.9 |
Top Industries (% of fund's net assets)
| As of March 31, 2017 | ||
| Aerospace & Defense | 21.0% | |
| Machinery | 20.4% | |
| Industrial Conglomerates | 14.6% | |
| Electrical Equipment | 8.7% | |
| Road & Rail | 7.7% | |
| All Others* | 27.6% | |
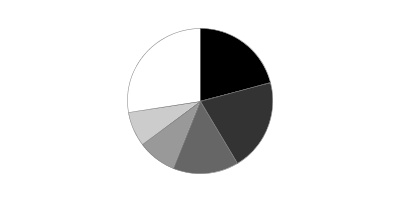
| As of September 30, 2016 | ||
| Aerospace & Defense | 25.1% | |
| Industrial Conglomerates | 19.3% | |
| Machinery | 18.4% | |
| Electrical Equipment | 8.3% | |
| Road & Rail | 6.6% | |
| All Others* | 22.3% | |
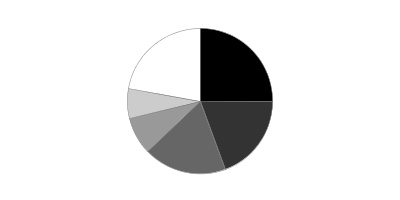
* Includes short-term investments and net other assets (liabilities).
Fidelity® Industrials Central Fund
Investments March 31, 2017 (Unaudited)
Showing Percentage of Net Assets
| Common Stocks - 98.1% | |||
| Shares | Value | ||
| Aerospace & Defense - 21.0% | |||
| Aerospace & Defense - 21.0% | |||
| Astronics Corp. (a) | 126,633 | $4,018,065 | |
| Astronics Corp. Class B | 14,914 | 476,353 | |
| Elbit Systems Ltd. | 36,500 | 4,148,225 | |
| General Dynamics Corp. | 331,189 | 61,998,581 | |
| Hexcel Corp. | 315,218 | 17,195,142 | |
| Huntington Ingalls Industries, Inc. | 65,200 | 13,055,648 | |
| Northrop Grumman Corp. | 240,696 | 57,247,137 | |
| Raytheon Co. | 183,914 | 28,046,885 | |
| Rockwell Collins, Inc. | 109,000 | 10,590,440 | |
| Teledyne Technologies, Inc. (a) | 171,482 | 21,685,614 | |
| TransDigm Group, Inc. | 71,672 | 15,779,308 | |
| United Technologies Corp. | 608,986 | 68,334,319 | |
| 302,575,717 | |||
| Airlines - 2.9% | |||
| Airlines - 2.9% | |||
| Southwest Airlines Co. | 664,633 | 35,730,670 | |
| Spirit Airlines, Inc. (a) | 110,700 | 5,874,849 | |
| 41,605,519 | |||
| Building Products - 3.4% | |||
| Building Products - 3.4% | |||
| A.O. Smith Corp. | 332,106 | 16,990,543 | |
| Fortune Brands Home & Security, Inc. | 339,941 | 20,685,410 | |
| Masco Corp. | 334,300 | 11,362,857 | |
| 49,038,810 | |||
| Commercial Services & Supplies - 4.6% | |||
| Diversified Support Services - 2.0% | |||
| Cintas Corp. | 117,200 | 14,830,488 | |
| KAR Auction Services, Inc. | 321,700 | 14,048,639 | |
| 28,879,127 | |||
| Environmental & Facility Services - 1.1% | |||
| Stericycle, Inc. (a) | 164,300 | 13,618,827 | |
| Team, Inc. (a) | 52,640 | 1,423,912 | |
| 15,042,739 | |||
| Office Services & Supplies - 1.5% | |||
| West Corp. | 895,301 | 21,863,250 | |
| TOTAL COMMERCIAL SERVICES & SUPPLIES | 65,785,116 | ||
| Construction & Engineering - 6.2% | |||
| Construction & Engineering - 6.2% | |||
| AECOM (a) | 1,333,135 | 47,446,275 | |
| Dycom Industries, Inc. (a)(b) | 176,280 | 16,385,226 | |
| Fluor Corp. | 169,500 | 8,919,090 | |
| KBR, Inc. | 1,104,100 | 16,594,623 | |
| 89,345,214 | |||
| Electrical Equipment - 8.7% | |||
| Electrical Components & Equipment - 8.2% | |||
| Acuity Brands, Inc. | 42,500 | 8,670,000 | |
| AMETEK, Inc. | 775,217 | 41,923,735 | |
| Eaton Corp. PLC | 432,824 | 32,093,900 | |
| Fortive Corp. | 580,287 | 34,944,883 | |
| 117,632,518 | |||
| Heavy Electrical Equipment - 0.5% | |||
| TPI Composites, Inc. | 430,550 | 8,184,756 | |
| TOTAL ELECTRICAL EQUIPMENT | 125,817,274 | ||
| Industrial Conglomerates - 14.6% | |||
| Industrial Conglomerates - 14.6% | |||
| General Electric Co. | 4,327,644 | 128,963,789 | |
| Honeywell International, Inc. | 606,512 | 75,735,153 | |
| Roper Technologies, Inc. | 23,084 | 4,766,615 | |
| 209,465,557 | |||
| Machinery - 20.4% | |||
| Construction Machinery & Heavy Trucks - 9.5% | |||
| Allison Transmission Holdings, Inc. | 972,675 | 35,074,661 | |
| Caterpillar, Inc. | 652,169 | 60,495,196 | |
| PACCAR, Inc. | 255,700 | 17,183,040 | |
| Wabtec Corp. (b) | 307,701 | 24,000,678 | |
| 136,753,575 | |||
| Industrial Machinery - 10.9% | |||
| Colfax Corp. (a) | 208,023 | 8,166,983 | |
| Flowserve Corp. | 464,209 | 22,477,000 | |
| IDEX Corp. | 175,106 | 16,374,162 | |
| Ingersoll-Rand PLC | 322,362 | 26,214,478 | |
| Nordson Corp. | 86,400 | 10,613,376 | |
| Parker Hannifin Corp. | 28,021 | 4,492,327 | |
| Pentair PLC | 256,446 | 16,099,680 | |
| Rexnord Corp. (a) | 700,259 | 16,161,978 | |
| Snap-On, Inc. | 124,758 | 21,042,932 | |
| TriMas Corp. (a) | 695,997 | 14,441,938 | |
| 156,084,854 | |||
| TOTAL MACHINERY | 292,838,429 | ||
| Professional Services - 3.0% | |||
| Human Resource & Employment Services - 1.4% | |||
| Recruit Holdings Co. Ltd. | 82,700 | 4,219,312 | |
| Robert Half International, Inc. | 333,000 | 16,260,390 | |
| 20,479,702 | |||
| Research & Consulting Services - 1.6% | |||
| IHS Markit Ltd. (a) | 537,600 | 22,552,320 | |
| TOTAL PROFESSIONAL SERVICES | 43,032,022 | ||
| Road & Rail - 7.7% | |||
| Railroads - 3.9% | |||
| Kansas City Southern | 10,600 | 909,056 | |
| Norfolk Southern Corp. | 338,214 | 37,869,822 | |
| Union Pacific Corp. | 172,200 | 18,239,424 | |
| 57,018,302 | |||
| Trucking - 3.8% | |||
| J.B. Hunt Transport Services, Inc. | 359,470 | 32,977,778 | |
| Old Dominion Freight Lines, Inc. | 196,774 | 16,837,951 | |
| YRC Worldwide, Inc. (a) | 416,334 | 4,583,837 | |
| 54,399,566 | |||
| TOTAL ROAD & RAIL | 111,417,868 | ||
| Trading Companies & Distributors - 5.1% | |||
| Trading Companies & Distributors - 5.1% | |||
| HD Supply Holdings, Inc. (a) | 639,097 | 26,282,864 | |
| MSC Industrial Direct Co., Inc. Class A | 186,100 | 19,123,636 | |
| Univar, Inc. (a) | 518,543 | 15,898,528 | |
| WESCO International, Inc. (a) | 54,600 | 3,797,430 | |
| Wolseley PLC | 124,105 | 7,813,836 | |
| 72,916,294 | |||
| Water Utilities - 0.5% | |||
| Water Utilities - 0.5% | |||
| AquaVenture Holdings Ltd. (b) | 422,726 | 7,215,933 | |
| TOTAL COMMON STOCKS | |||
| (Cost $1,132,892,613) | 1,411,053,753 | ||
| Money Market Funds - 1.9% | |||
| Fidelity Cash Central Fund, 0.84% (c) | 15,568,003 | 15,571,117 | |
| Fidelity Securities Lending Cash Central Fund 0.84% (c)(d) | 11,624,100 | 11,625,262 | |
| TOTAL MONEY MARKET FUNDS | |||
| (Cost $27,196,379) | 27,196,379 | ||
| TOTAL INVESTMENT PORTFOLIO - 100.0% | |||
| (Cost $1,160,088,992) | 1,438,250,132 | ||
| NET OTHER ASSETS (LIABILITIES) - 0.0% | 565,410 | ||
| NET ASSETS - 100% | $1,438,815,542 |
Legend
(a) Non-income producing
(b) Security or a portion of the security is on loan at period end.
(c) Affiliated fund that is generally available only to investment companies and other accounts managed by Fidelity Investments. The rate quoted is the annualized seven-day yield of the fund at period end. A complete unaudited listing of the fund's holdings as of its most recent quarter end is available upon request. In addition, each Fidelity Central Fund's financial statements are available on the SEC's website or upon request.
(d) Investment made with cash collateral received from securities on loan.
Affiliated Central Funds
Information regarding fiscal year to date income earned by the Fund from investments in Fidelity Central Funds is as follows:
| Fund | Income earned |
| Fidelity Cash Central Fund | $43,784 |
| Fidelity Securities Lending Cash Central Fund | 29,884 |
| Total | $73,668 |
Investment Valuation
The following is a summary of the inputs used, as of March 31, 2017, involving the Fund's assets and liabilities carried at fair value. The inputs or methodology used for valuing securities may not be an indication of the risk associated with investing in those securities. For more information on valuation inputs, and their aggregation into the levels used below, please refer to the Investment Valuation section in the accompanying Notes to Financial Statements.
| Valuation Inputs at Reporting Date: | ||||
| Description | Total | Level 1 | Level 2 | Level 3 |
| Investments in Securities: | ||||
| Common Stocks | $1,411,053,753 | $1,403,239,917 | $7,813,836 | $-- |
| Money Market Funds | 27,196,379 | 27,196,379 | -- | -- |
| Total Investments in Securities: | $1,438,250,132 | $1,430,436,296 | $7,813,836 | $-- |
See accompanying notes which are an integral part of the financial statements.
Fidelity® Industrials Central Fund
Financial Statements
Statement of Assets and Liabilities
| March 31, 2017 (Unaudited) | ||
| Assets | ||
| Investment in securities, at value (including securities loaned of $11,416,159) — See accompanying schedule: Unaffiliated issuers (cost $1,132,892,613) | $1,411,053,753 | |
| Fidelity Central Funds (cost $27,196,379) | 27,196,379 | |
| Total Investments (cost $1,160,088,992) | $1,438,250,132 | |
| Receivable for investments sold | 40,769,895 | |
| Receivable for fund shares sold | 173,339 | |
| Dividends receivable | 1,447,624 | |
| Distributions receivable from Fidelity Central Funds | 11,835 | |
| Total assets | 1,480,652,825 | |
| Liabilities | ||
| Payable for investments purchased | $29,861,166 | |
| Payable for fund shares redeemed | 331,839 | |
| Other payables and accrued expenses | 18,078 | |
| Collateral on securities loaned | 11,626,200 | |
| Total liabilities | 41,837,283 | |
| Net Assets | $1,438,815,542 | |
| Net Assets consist of: | ||
| Paid in capital | $1,089,852,407 | |
| Undistributed net investment income | 2,862,226 | |
| Accumulated undistributed net realized gain (loss) on investments and foreign currency transactions | 67,941,263 | |
| Net unrealized appreciation (depreciation) on investments and assets and liabilities in foreign currencies | 278,159,646 | |
| Net Assets, for 5,368,380 shares outstanding | $1,438,815,542 | |
| Net Asset Value, offering price and redemption price per share ($1,438,815,542 ÷ 5,368,380 shares) | $268.02 |
See accompanying notes which are an integral part of the financial statements.
Statement of Operations
| Six months ended March 31, 2017 (Unaudited) | ||
| Investment Income | ||
| Dividends | $12,121,213 | |
| Income from Fidelity Central Funds (including $29,884 from security lending) | 73,668 | |
| Total income | 12,194,881 | |
| Expenses | ||
| Custodian fees and expenses | $22,739 | |
| Independent directors' fees and expenses | 2,966 | |
| Interest | 2,929 | |
| Total expenses before reductions | 28,634 | |
| Expense reductions | (3,095) | 25,539 |
| Net investment income (loss) | 12,169,342 | |
| Realized and Unrealized Gain (Loss) | ||
| Net realized gain (loss) on: | ||
| Investment securities: | ||
| Unaffiliated issuers | 72,971,106 | |
| Fidelity Central Funds | 4,642 | |
| Foreign currency transactions | 11,740 | |
| Total net realized gain (loss) | 72,987,488 | |
| Change in net unrealized appreciation (depreciation) on: Investment securities | 78,478,175 | |
| Assets and liabilities in foreign currencies | (3,039) | |
| Total change in net unrealized appreciation (depreciation) | 78,475,136 | |
| Net gain (loss) | 151,462,624 | |
| Net increase (decrease) in net assets resulting from operations | $163,631,966 |
See accompanying notes which are an integral part of the financial statements.
Statement of Changes in Net Assets
| Six months ended March 31, 2017 (Unaudited) | Year ended September 30, 2016 | |
| Increase (Decrease) in Net Assets | ||
| Operations | ||
| Net investment income (loss) | $12,169,342 | $19,769,282 |
| Net realized gain (loss) | 72,987,488 | 73,089,730 |
| Change in net unrealized appreciation (depreciation) | 78,475,136 | 112,117,715 |
| Net increase (decrease) in net assets resulting from operations | 163,631,966 | 204,976,727 |
| Distributions to shareholders from net investment income | (9,307,116) | (19,855,967) |
| Distributions to shareholders from net realized gain | (5,046,225) | – |
| Total distributions | (14,353,341) | (19,855,967) |
| Affiliated share transactions | ||
| Proceeds from sales of shares | 92,801,718 | 106,449,437 |
| Reinvestment of distributions | 14,353,003 | 19,855,492 |
| Cost of shares redeemed | (193,853,471) | (108,854,961) |
| Net increase (decrease) in net assets resulting from share transactions | (86,698,750) | 17,449,968 |
| Total increase (decrease) in net assets | 62,579,875 | 202,570,728 |
| Net Assets | ||
| Beginning of period | 1,376,235,667 | 1,173,664,939 |
| End of period | $1,438,815,542 | $1,376,235,667 |
| Other Information | ||
| Undistributed net investment income end of period | $2,862,226 | $– |
| Shares | ||
| Sold | 359,072 | 464,554 |
| Issued in reinvestment of distributions | 56,223 | 84,112 |
| Redeemed | (728,968) | (464,180) |
| Net increase (decrease) | (313,673) | 84,486 |
See accompanying notes which are an integral part of the financial statements.
Financial Highlights — Fidelity Industrials Central Fund
| Six months ended (Unaudited) March 31, | Years ended September 30, | |||||
| 2017 | 2016 | 2015 | 2014 | 2013 | 2012 | |
| Selected Per–Share Data | ||||||
| Net asset value, beginning of period | $242.21 | $209.67 | $216.95 | $198.24 | $152.47 | $117.43 |
| Income from Investment Operations | ||||||
| Net investment income (loss)A | 2.14 | 3.47 | 3.40 | 3.18 | 3.15 | 2.81 |
| Net realized and unrealized gain (loss) | 26.16 | 32.56 | (7.35) | 18.69 | 45.71 | 34.95 |
| Total from investment operations | 28.30 | 36.03 | (3.95) | 21.87 | 48.86 | 37.76 |
| Distributions from net investment income | (1.62) | (3.49) | (3.33) | (3.16) | (3.09) | (2.72) |
| Distributions from net realized gain | (.86) | – | – | – | – | – |
| Total distributions | (2.49)B | (3.49) | (3.33) | (3.16) | (3.09) | (2.72) |
| Net asset value, end of period | $268.02 | $242.21 | $209.67 | $216.95 | $198.24 | $152.47 |
| Total ReturnC,D | 11.74% | 17.24% | (1.95)% | 11.03% | 32.33% | 32.29% |
| Ratios to Average Net AssetsE,F | ||||||
| Expenses before reductionsG | - %H | -% | -% | -% | -% | -% |
| Expenses net of fee waivers, if anyG | - %H | -% | -% | -% | -% | -% |
| Expenses net of all reductionsG | - %H | -% | -% | -% | -% | -% |
| Net investment income (loss) | 1.66%H | 1.50% | 1.48% | 1.46% | 1.80% | 1.95% |
| Supplemental Data | ||||||
| Net assets, end of period (000 omitted) | $1,438,816 | $1,376,236 | $1,173,665 | $1,301,010 | $1,198,480 | $884,067 |
| Portfolio turnover rateI | 61%H,J | 60% | 83% | 77%J | 73%J | 85% |
A Calculated based on average shares outstanding during the period.
B Total distributions of $2.49 per share is comprised of distributions from net investment income of $1.623 and distributions from net realized gain of $0.864 per share.
C Total returns for periods of less than one year are not annualized.
D Total returns would have been lower if certain expenses had not been reduced during the applicable periods shown.
E Fees and expenses of any underlying Fidelity Central Funds are not included in the Fund's expense ratio. The Fund indirectly bears its proportionate share of the expenses of any underlying Fidelity Central Funds.
F Expense ratios reflect operating expenses of the Fund. Expenses before reductions do not reflect amounts reimbursed by the investment adviser or reductions from expense offset arrangements and do not represent the amount paid by the Fund during periods when reimbursements or reductions occur. Expenses net of fee waivers reflect expenses after reimbursement by the investment adviser but prior to reductions from expense offset arrangements. Expenses net of all reductions represent the net expenses paid by the Fund.
G Amount represents less than .005%.
H Annualized
I Amount does not include the portfolio activity of any underlying Fidelity Central Funds.
J Portfolio turnover rate excludes securities received or delivered in-kind.
See accompanying notes which are an integral part of the financial statements.
Fidelity® Information Technology Central Fund
Investment Summary (Unaudited)
Top Ten Stocks as of March 31, 2017
| % of fund's net assets | % of fund's net assets 6 months ago | |
| Apple, Inc. | 11.6 | 10.2 |
| Facebook, Inc. Class A | 5.3 | 6.6 |
| Alphabet, Inc. Class C | 5.3 | 5.7 |
| Alphabet, Inc. Class A | 5.1 | 5.7 |
| Microsoft Corp. | 4.3 | 4.1 |
| Tesla, Inc. | 3.8 | 1.4 |
| Autodesk, Inc. | 3.4 | 2.2 |
| Sumco Corp. | 2.5 | 0.6 |
| JD.com, Inc. sponsored ADR | 2.4 | 0.1 |
| Trimble, Inc. | 2.3 | 2.0 |
| 46.0 |
Top Industries (% of fund's net assets)
| As of March 31, 2017 | ||
| Internet Software & Services | 22.0% | |
| Semiconductors & Semiconductor Equipment | 19.4% | |
| Software | 16.9% | |
| Technology Hardware, Storage & Peripherals | 11.6% | |
| Electronic Equipment & Components | 9.5% | |
| All Others* | 20.6% | |
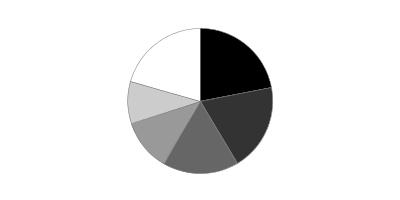
| As of September 30, 2016 | ||
| Internet Software & Services | 25.4% | |
| Semiconductors & Semiconductor Equipment | 19.8% | |
| Software | 18.2% | |
| Technology Hardware, Storage & Peripherals | 10.5% | |
| Electronic Equipment & Components | 6.2% | |
| All Others* | 19.9% | |
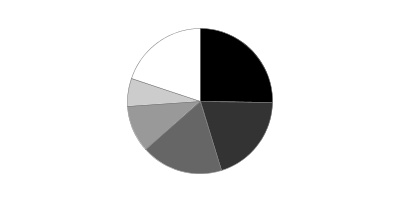
* Includes short-term investments and net other assets (liabilities).
Fidelity® Information Technology Central Fund
Investments March 31, 2017 (Unaudited)
Showing Percentage of Net Assets
| Common Stocks - 97.1% | |||
| Shares | Value | ||
| Automobiles - 3.8% | |||
| Automobile Manufacturers - 3.8% | |||
| Tesla, Inc. (a)(b) | 514,970 | $143,316,151 | |
| Biotechnology - 0.1% | |||
| Biotechnology - 0.1% | |||
| BeiGene Ltd. ADR (a) | 100,600 | 3,682,966 | |
| Genscript Biotech Corp. | 1,851,298 | 1,000,508 | |
| 4,683,474 | |||
| Chemicals - 0.9% | |||
| Industrial Gases - 0.2% | |||
| SK Materials Co., Ltd. | 37,216 | 5,412,691 | |
| Wonik Materials Co. Ltd. (a) | 38,664 | 2,024,384 | |
| 7,437,075 | |||
| Specialty Chemicals - 0.7% | |||
| Duk San Neolux Co. Ltd. (a) | 337,754 | 8,071,272 | |
| Shin-Etsu Chemical Co. Ltd. | 90,500 | 7,866,201 | |
| Soulbrain Co. Ltd. | 198,868 | 9,255,469 | |
| 25,192,942 | |||
| TOTAL CHEMICALS | 32,630,017 | ||
| Commercial Services & Supplies - 0.2% | |||
| Commercial Printing - 0.2% | |||
| Nissha Printing Co. Ltd. (b) | 383,900 | 9,096,633 | |
| Communications Equipment - 0.0% | |||
| Communications Equipment - 0.0% | |||
| Ciena Corp. (a) | 1,499 | 35,391 | |
| Palo Alto Networks, Inc. (a) | 292 | 32,903 | |
| Radware Ltd. (a) | 1,227 | 19,828 | |
| Sonus Networks, Inc. (a) | 12,827 | 84,530 | |
| Wistron NeWeb Corp. | 12,980 | 36,451 | |
| 209,103 | |||
| Construction Materials - 0.0% | |||
| Construction Materials - 0.0% | |||
| Universal Cement Corp. | 376 | 331 | |
| Consumer Finance - 0.0% | |||
| Consumer Finance - 0.0% | |||
| LendingClub Corp. (a)(b) | 1,400 | 7,686 | |
| Diversified Consumer Services - 1.6% | |||
| Education Services - 1.6% | |||
| China Online Education Group sponsored ADR (a)(b) | 18,310 | 351,918 | |
| New Oriental Education & Technology Group, Inc. sponsored ADR (a) | 541,140 | 32,674,033 | |
| TAL Education Group ADR (a)(b) | 264,863 | 28,226,450 | |
| 61,252,401 | |||
| Diversified Financial Services - 0.2% | |||
| Other Diversified Financial Services - 0.2% | |||
| GDS Holdings Ltd. ADR | 728,900 | 6,028,003 | |
| Diversified Telecommunication Services - 0.1% | |||
| Integrated Telecommunication Services - 0.1% | |||
| Bharti Infratel Ltd. | 888,307 | 4,463,448 | |
| Electrical Equipment - 0.7% | |||
| Electrical Components & Equipment - 0.7% | |||
| Acuity Brands, Inc. | 81,721 | 16,671,084 | |
| Lumenpulse, Inc. (a) | 39,311 | 372,166 | |
| Rockwell Automation, Inc. | 60,700 | 9,451,597 | |
| 26,494,847 | |||
| Electronic Equipment & Components - 9.5% | |||
| Electronic Components - 2.5% | |||
| Alps Electric Co. Ltd. | 841,500 | 23,860,491 | |
| Iriso Electronics Co. Ltd. | 13,100 | 840,151 | |
| Knowles Corp. (a)(b) | 100,206 | 1,898,904 | |
| Largan Precision Co. Ltd. | 214,000 | 33,676,379 | |
| Ledlink Optics, Inc. | 1,521,489 | 2,148,868 | |
| Lens Technology Co. Ltd. Class A | 2,576,450 | 11,492,289 | |
| Sunny Optical Technology Group Co. Ltd. | 884,738 | 6,466,334 | |
| Tong Hsing Electronics Industries Ltd. | 149,000 | 657,317 | |
| Universal Display Corp. (b) | 138,870 | 11,956,707 | |
| 92,997,440 | |||
| Electronic Equipment & Instruments - 3.4% | |||
| Anritsu Corp. | 2,522,900 | 19,080,947 | |
| Chroma ATE, Inc. | 10,430,018 | 31,556,170 | |
| Cognex Corp. | 217,555 | 18,263,742 | |
| Hexagon AB (B Shares) | 561,900 | 22,574,702 | |
| National Instruments Corp. | 275,400 | 8,967,024 | |
| Topcon Corp. | 1,674,300 | 29,957,833 | |
| 130,400,418 | |||
| Electronic Manufacturing Services - 3.1% | |||
| AAC Technology Holdings, Inc. | 1,679,065 | 19,650,127 | |
| Merry Electronics Co. Ltd. | 2,199,000 | 11,800,395 | |
| Trimble, Inc. (a) | 2,697,900 | 86,359,779 | |
| 117,810,301 | |||
| Technology Distributors - 0.5% | |||
| Dell Technologies, Inc. (a) | 300,669 | 19,266,870 | |
| TOTAL ELECTRONIC EQUIPMENT & COMPONENTS | 360,475,029 | ||
| Health Care Equipment & Supplies - 0.0% | |||
| Health Care Equipment - 0.0% | |||
| Intai Technology Corp. | 173,000 | 794,519 | |
| Health Care Providers & Services - 0.0% | |||
| Managed Health Care - 0.0% | |||
| HealthEquity, Inc. (a) | 789 | 33,493 | |
| Health Care Technology - 0.6% | |||
| Health Care Technology - 0.6% | |||
| athenahealth, Inc. (a) | 129,730 | 14,619,274 | |
| Inovalon Holdings, Inc. Class A (a)(b) | 625,935 | 7,886,781 | |
| Veeva Systems, Inc. Class A (a) | 896 | 45,947 | |
| 22,552,002 | |||
| Household Durables - 1.2% | |||
| Consumer Electronics - 1.2% | |||
| Sony Corp. | 683,000 | 23,050,187 | |
| Sony Corp. sponsored ADR | 613,102 | 20,679,930 | |
| 43,730,117 | |||
| Internet & Direct Marketing Retail - 3.5% | |||
| Internet & Direct Marketing Retail - 3.5% | |||
| Amazon.com, Inc. (a) | 44,229 | 39,210,778 | |
| Groupon, Inc. (a) | 284,700 | 1,118,871 | |
| JD.com, Inc. sponsored ADR (a) | 2,868,876 | 89,250,732 | |
| Jumei International Holding Ltd. sponsored ADR (a) | 705,355 | 2,602,760 | |
| Liberty Interactive Corp. QVC Group Series A (a) | 609 | 12,192 | |
| Netflix, Inc. (a) | 286 | 42,274 | |
| 132,237,607 | |||
| Internet Software & Services - 21.4% | |||
| Internet Software & Services - 21.4% | |||
| 58.com, Inc. ADR (a)(b) | 874,090 | 30,934,045 | |
| Akamai Technologies, Inc. (a) | 470 | 28,059 | |
| Alarm.com Holdings, Inc. (a)(b) | 10,800 | 331,992 | |
| Alphabet, Inc.: | |||
| Class A (a) | 229,581 | 194,638,772 | |
| Class C (a) | 239,433 | 198,624,039 | |
| Apptio, Inc. Class A | 4,800 | 56,304 | |
| Benefitfocus, Inc. (a) | 1,122 | 31,360 | |
| BlackLine, Inc. | 100 | 2,976 | |
| Box, Inc. Class A (a)(b) | 51,164 | 834,485 | |
| Cornerstone OnDemand, Inc. (a) | 855 | 33,251 | |
| CoStar Group, Inc. (a) | 163,600 | 33,901,192 | |
| DeNA Co. Ltd. | 980,320 | 19,957,406 | |
| eBay, Inc. (a) | 24,829 | 833,510 | |
| eGain Communications Corp. (a) | 135,036 | 195,802 | |
| Endurance International Group Holdings, Inc. (a) | 1,174,780 | 9,222,023 | |
| Envestnet, Inc. (a) | 434 | 14,018 | |
| Facebook, Inc. Class A (a) | 1,415,675 | 201,096,634 | |
| Hortonworks, Inc. (a)(b) | 403,678 | 3,960,081 | |
| LogMeIn, Inc. | 237,143 | 23,121,443 | |
| MINDBODY, Inc. (a)(b) | 135,131 | 3,709,346 | |
| MuleSoft, Inc. Class A (a) | 6,600 | 160,578 | |
| NetEase, Inc. ADR | 97,062 | 27,565,608 | |
| New Relic, Inc. (a) | 239,000 | 8,859,730 | |
| Nutanix, Inc. Class B (a)(c) | 68,486 | 1,285,482 | |
| Pandora Media, Inc. (a)(b) | 286,900 | 3,388,289 | |
| Q2 Holdings, Inc. (a) | 1,525 | 53,146 | |
| Renren, Inc. ADR (a)(b) | 79,982 | 623,860 | |
| Shopify, Inc. (a) | 5,035 | 342,833 | |
| Shopify, Inc. Class A (a) | 60,700 | 4,133,063 | |
| SMS Co., Ltd. | 941,196 | 23,865,951 | |
| Tencent Holdings Ltd. | 205,768 | 5,928,077 | |
| The Trade Desk, Inc. | 3,800 | 141,550 | |
| Twilio, Inc. Class A | 11,487 | 331,630 | |
| Twitter, Inc. (a) | 49,352 | 737,812 | |
| Xunlei Ltd. sponsored ADR (a) | 1,203,088 | 4,872,506 | |
| Yandex NV Series A (a) | 412,100 | 9,037,353 | |
| Zillow Group, Inc.: | |||
| Class A (a) | 1,249 | 42,229 | |
| Class C (a) | 1,363 | 45,892 | |
| 812,942,327 | |||
| IT Services - 3.0% | |||
| Data Processing & Outsourced Services - 2.0% | |||
| Alliance Data Systems Corp. | 200 | 49,800 | |
| Fidelity National Information Services, Inc. | 224,313 | 17,859,801 | |
| Fiserv, Inc. (a) | 153,778 | 17,732,141 | |
| FleetCor Technologies, Inc. (a) | 2,001 | 303,011 | |
| Global Payments, Inc. | 210,356 | 16,971,522 | |
| PayPal Holdings, Inc. (a) | 8,072 | 347,257 | |
| Paysafe Group PLC (a) | 2,504,058 | 14,670,175 | |
| Total System Services, Inc. | 117,453 | 6,279,037 | |
| Travelport Worldwide Ltd. | 8,198 | 96,490 | |
| Vantiv, Inc. (a) | 572 | 36,677 | |
| Visa, Inc. Class A | 4,178 | 371,299 | |
| 74,717,210 | |||
| IT Consulting & Other Services - 1.0% | |||
| Cognizant Technology Solutions Corp. Class A (a) | 323,449 | 19,251,684 | |
| Computer Sciences Corp. | 223,100 | 15,396,131 | |
| CSRA, Inc. | 113,200 | 3,315,628 | |
| EPAM Systems, Inc. (a) | 505 | 38,138 | |
| Virtusa Corp. (a) | 600 | 18,132 | |
| 38,019,713 | |||
| TOTAL IT SERVICES | 112,736,923 | ||
| Life Sciences Tools & Services - 0.1% | |||
| Life Sciences Tools & Services - 0.1% | |||
| JHL Biotech, Inc. (a) | 1,008,062 | 2,356,293 | |
| Machinery - 1.3% | |||
| Industrial Machinery - 1.3% | |||
| Han's Laser Technology Industry Group Co. Ltd. | 664,350 | 2,534,082 | |
| HIWIN Technologies Corp. | 2,868,000 | 17,986,963 | |
| Minebea Mitsumi, Inc. | 2,198,957 | 29,400,608 | |
| 49,921,653 | |||
| Media - 0.0% | |||
| Advertising - 0.0% | |||
| iCar Asia Ltd. (a) | 3,431,964 | 721,056 | |
| Professional Services - 1.0% | |||
| Human Resource & Employment Services - 0.9% | |||
| Recruit Holdings Co. Ltd. | 543,000 | 27,703,584 | |
| WageWorks, Inc. (a) | 86,205 | 6,232,622 | |
| 33,936,206 | |||
| Research & Consulting Services - 0.1% | |||
| ICF International, Inc. (a) | 62,800 | 2,593,640 | |
| Verisk Analytics, Inc. (a) | 448 | 36,351 | |
| 2,629,991 | |||
| TOTAL PROFESSIONAL SERVICES | 36,566,197 | ||
| Semiconductors & Semiconductor Equipment - 19.4% | |||
| Semiconductor Equipment - 5.2% | |||
| Amkor Technology, Inc. (a) | 70,900 | 821,731 | |
| Applied Materials, Inc. | 1,550 | 60,295 | |
| ASM Pacific Technology Ltd. | 2,335,100 | 31,759,644 | |
| Experi Corp. | 127,570 | 4,331,002 | |
| Lam Research Corp. | 187,292 | 24,040,801 | |
| Nanometrics, Inc. (a) | 107,497 | 3,274,359 | |
| Rubicon Technology, Inc. (a)(b) | 1,177,651 | 980,983 | |
| Siltronic AG (a) | 536,533 | 35,738,995 | |
| SolarEdge Technologies, Inc. (a) | 109,877 | 1,714,081 | |
| Sumco Corp. | 5,569,100 | 93,027,473 | |
| SunEdison, Inc. (a) | 1,200 | 88 | |
| 195,749,452 | |||
| Semiconductors - 14.2% | |||
| Advanced Micro Devices, Inc. (a)(b) | 989,688 | 14,399,960 | |
| Advanced Semiconductor Engineering, Inc. | 15,462,795 | 19,787,106 | |
| Ambarella, Inc. (a)(b) | 125,214 | 6,850,458 | |
| ams AG | 635,770 | 34,370,235 | |
| Analog Devices, Inc. | 225,900 | 18,512,505 | |
| ASPEED Tech, Inc. | 366,000 | 6,868,148 | |
| Broadcom Ltd. | 223,596 | 48,958,580 | |
| Cavium, Inc. (a) | 119,811 | 8,585,656 | |
| ChipMOS TECHNOLOGIES, Inc. sponsored ADR | 379,488 | 6,735,912 | |
| Cirrus Logic, Inc. (a) | 40,052 | 2,430,756 | |
| Cypress Semiconductor Corp. | 560,200 | 7,708,352 | |
| Dialog Semiconductor PLC (a) | 275,330 | 14,059,006 | |
| GlobalWafers Co. Ltd. | 7,110,000 | 53,134,815 | |
| Himax Technologies, Inc. sponsored ADR (b) | 2,025,441 | 18,472,022 | |
| Hua Hong Semiconductor Ltd. | 4,142,986 | 5,810,789 | |
| Infineon Technologies AG | 2,000 | 40,935 | |
| Inphi Corp. (a)(b) | 21,329 | 1,041,282 | |
| Integrated Device Technology, Inc. (a) | 318,127 | 7,530,066 | |
| LandMark Optoelectronics Corp. | 279,000 | 2,714,222 | |
| MagnaChip Semiconductor Corp. (a)(b) | 215,326 | 2,056,363 | |
| Marvell Technology Group Ltd. | 1,426,481 | 21,768,100 | |
| Maxim Integrated Products, Inc. | 870 | 39,115 | |
| Melexis NV | 570 | 49,382 | |
| Mellanox Technologies Ltd. (a) | 706,800 | 36,011,460 | |
| Micron Technology, Inc. (a) | 1,411,283 | 40,786,079 | |
| Monolithic Power Systems, Inc. | 163,943 | 15,099,150 | |
| NVIDIA Corp. | 285,550 | 31,104,962 | |
| NXP Semiconductors NV (a) | 367,845 | 38,071,958 | |
| ON Semiconductor Corp. (a) | 457,726 | 7,090,176 | |
| Power Integrations, Inc. | 4,813 | 316,455 | |
| Qualcomm, Inc. | 331,192 | 18,990,549 | |
| Semtech Corp. (a) | 647,194 | 21,875,157 | |
| Silergy Corp. | 215,000 | 3,963,786 | |
| Silicon Laboratories, Inc. (a) | 53,900 | 3,964,345 | |
| Silicon Motion Technology Corp. sponsored ADR | 200,257 | 9,362,015 | |
| Siliconware Precision Industries Co. Ltd. sponsored ADR | 135,662 | 1,097,506 | |
| Sitronix Technology Corp. | 409,000 | 1,327,651 | |
| Skyworks Solutions, Inc. | 4,345 | 425,723 | |
| STMicroelectronics NV: | |||
| (France) | 2,900 | 44,624 | |
| (NY Shares) unit | 370,100 | 5,721,746 | |
| Vanguard International Semiconductor Corp. | 140,000 | 266,403 | |
| Win Semiconductors Corp. | 728,000 | 3,235,556 | |
| Xilinx, Inc. | 500 | 28,945 | |
| 540,708,011 | |||
| TOTAL SEMICONDUCTORS & SEMICONDUCTOR EQUIPMENT | 736,457,463 | ||
| Software - 16.9% | |||
| Application Software - 7.2% | |||
| 8x8, Inc. (a) | 2,300 | 35,075 | |
| Adobe Systems, Inc. (a) | 31,513 | 4,100,787 | |
| ANSYS, Inc. (a) | 36,211 | 3,869,870 | |
| Aspen Technology, Inc. (a) | 64,100 | 3,776,772 | |
| Autodesk, Inc. (a) | 1,503,444 | 130,002,803 | |
| Blackbaud, Inc. | 601 | 46,079 | |
| Callidus Software, Inc. (a) | 547,050 | 11,679,518 | |
| Citrix Systems, Inc. (a) | 427 | 35,608 | |
| Ellie Mae, Inc. (a) | 93,500 | 9,375,245 | |
| Guidewire Software, Inc. (a) | 402 | 22,645 | |
| HubSpot, Inc. (a) | 18,900 | 1,144,395 | |
| iFlytek Co. Ltd. | 740,953 | 3,776,256 | |
| Intuit, Inc. | 179,180 | 20,783,088 | |
| LINE Corp. ADR (b) | 8,332 | 320,449 | |
| Mobileye NV (a) | 819 | 50,287 | |
| Parametric Technology Corp. (a) | 478,326 | 25,136,031 | |
| Paycom Software, Inc. (a) | 100 | 5,751 | |
| Paylocity Holding Corp. (a) | 100,421 | 3,879,263 | |
| RealPage, Inc. (a) | 16,042 | 559,866 | |
| Salesforce.com, Inc. (a) | 114,509 | 9,445,847 | |
| Splunk, Inc. (a) | 6,557 | 408,436 | |
| SS&C Technologies Holdings, Inc. | 243,266 | 8,611,616 | |
| Ultimate Software Group, Inc. (a) | 96,599 | 18,857,091 | |
| Workday, Inc. Class A (a) | 45,051 | 3,751,847 | |
| Zendesk, Inc. (a) | 528,769 | 14,826,683 | |
| 274,501,308 | |||
| Home Entertainment Software - 4.9% | |||
| Activision Blizzard, Inc. | 1,044,059 | 52,056,782 | |
| Electronic Arts, Inc. (a) | 556,858 | 49,849,928 | |
| Nintendo Co. Ltd. | 168,900 | 39,191,368 | |
| Nintendo Co. Ltd. ADR | 330,684 | 9,596,450 | |
| Square Enix Holdings Co. Ltd. | 545,200 | 15,426,031 | |
| Take-Two Interactive Software, Inc. (a) | 297,965 | 17,660,386 | |
| 183,780,945 | |||
| Systems Software - 4.8% | |||
| Allot Communications Ltd. (a) | 550,070 | 2,618,333 | |
| CommVault Systems, Inc. (a) | 600 | 30,480 | |
| Imperva, Inc. (a) | 122,048 | 5,010,070 | |
| Microsoft Corp. | 2,512,215 | 165,454,480 | |
| Oracle Corp. | 7,137 | 318,382 | |
| Progress Software Corp. | 92,050 | 2,674,053 | |
| Rapid7, Inc. (a)(b) | 4,650 | 69,657 | |
| ServiceNow, Inc. (a) | 4,505 | 394,052 | |
| Tableau Software, Inc. (a) | 135,206 | 6,699,457 | |
| Varonis Systems, Inc. (a) | 100 | 3,180 | |
| 183,272,144 | |||
| TOTAL SOFTWARE | 641,554,397 | ||
| Technology Hardware, Storage & Peripherals - 11.6% | |||
| Technology Hardware, Storage & Peripherals - 11.6% | |||
| Apple, Inc. | 3,046,683 | 437,686,474 | |
| BlackBerry Ltd. (a) | 2,514 | 19,472 | |
| HP, Inc. | 11,821 | 211,359 | |
| Nimble Storage, Inc. (a) | 3,500 | 43,750 | |
| Stratasys Ltd. (a) | 200 | 4,098 | |
| 437,965,153 | |||
| TOTAL COMMON STOCKS | |||
| (Cost $2,593,429,368) | 3,679,226,323 | ||
| Convertible Preferred Stocks - 1.4% | |||
| Internet & Direct Marketing Retail - 0.8% | |||
| Internet & Direct Marketing Retail - 0.8% | |||
| China Internet Plus Holdings Ltd.: | |||
| Series A-11 (a)(d) | 2,771,770 | 12,409,769 | |
| Series B (a)(d) | 3,479,801 | 16,121,222 | |
| 28,530,991 | |||
| Internet Software & Services - 0.6% | |||
| Internet Software & Services - 0.6% | |||
| Uber Technologies, Inc. Series D, 8.00% (a)(d) | 489,912 | 23,894,100 | |
| TOTAL CONVERTIBLE PREFERRED STOCKS | |||
| (Cost $29,795,646) | 52,425,091 | ||
| Money Market Funds - 6.3% | |||
| Fidelity Cash Central Fund, 0.84% (e) | 61,333,497 | 61,345,763 | |
| Fidelity Securities Lending Cash Central Fund 0.84% (e)(f) | 178,937,222 | 178,955,116 | |
| TOTAL MONEY MARKET FUNDS | |||
| (Cost $240,295,167) | 240,300,879 | ||
| TOTAL INVESTMENT PORTFOLIO - 104.8% | |||
| (Cost $2,863,520,181) | 3,971,952,293 | ||
| NET OTHER ASSETS (LIABILITIES) - (4.8)% | (180,553,214) | ||
| NET ASSETS - 100% | $3,791,399,079 |
Legend
(a) Non-income producing
(b) Security or a portion of the security is on loan at period end.
(c) Security exempt from registration under Rule 144A of the Securities Act of 1933. These securities may be resold in transactions exempt from registration, normally to qualified institutional buyers. At the end of the period, the value of these securities amounted to $1,285,482 or 0.0% of net assets.
(d) Restricted securities - Investment in securities not registered under the Securities Act of 1933 (excluding 144A issues). At the end of the period, the value of restricted securities (excluding 144A issues) amounted to $52,425,091 or 1.4% of net assets.
(e) Affiliated fund that is generally available only to investment companies and other accounts managed by Fidelity Investments. The rate quoted is the annualized seven-day yield of the fund at period end. A complete unaudited listing of the fund's holdings as of its most recent quarter end is available upon request. In addition, each Fidelity Central Fund's financial statements are available on the SEC's website or upon request.
(f) Investment made with cash collateral received from securities on loan.
Additional information on each restricted holding is as follows:
| Security | Acquisition Date | Acquisition Cost |
| China Internet Plus Holdings Ltd. Series A-11 | 1/26/15 | $8,761,149 |
| China Internet Plus Holdings Ltd. Series B | 12/11/15 | $13,434,468 |
| Uber Technologies, Inc. Series D, 8.00% | 6/6/14 | $7,600,029 |
Affiliated Central Funds
Information regarding fiscal year to date income earned by the Fund from investments in Fidelity Central Funds is as follows:
| Fund | Income earned |
| Fidelity Cash Central Fund | $106,851 |
| Fidelity Securities Lending Cash Central Fund | 887,044 |
| Total | $993,895 |
Investment Valuation
The following is a summary of the inputs used, as of March 31, 2017, involving the Fund's assets and liabilities carried at fair value. The inputs or methodology used for valuing securities may not be an indication of the risk associated with investing in those securities. For more information on valuation inputs, and their aggregation into the levels used below, please refer to the Investment Valuation section in the accompanying Notes to Financial Statements.
| Valuation Inputs at Reporting Date: | ||||
| Description | Total | Level 1 | Level 2 | Level 3 |
| Investments in Securities: | ||||
| Common Stocks | $3,679,226,323 | $3,417,071,847 | $262,154,476 | $-- |
| Convertible Preferred Stocks | 52,425,091 | -- | -- | 52,425,091 |
| Money Market Funds | 240,300,879 | 240,300,879 | -- | -- |
| Total Investments in Securities: | $3,971,952,293 | $3,657,372,726 | $262,154,476 | $52,425,091 |
The following is a summary of transfers between Level 1 and Level 2 for the period ended March 31, 2017. Transfers are assumed to have occurred at the beginning of the period, and are primarily attributable to the valuation techniques used for foreign equity securities, as discussed in the accompanying Notes to Financial Statements:
| Transfers | Total |
| Level 1 to Level 2 | $0 |
| Level 2 to Level 1 | $184,443,931 |
The following is a reconciliation of Investments in Securities for which Level 3 inputs were used in determining value:
| Investments in Securities: | |
| Convertible Preferred Stocks | |
| Beginning Balance | $48,029,540 |
| Total Realized Gain (Loss) | -- |
| Total Unrealized Gain (Loss) | 4,395,551 |
| Cost of Purchases | -- |
| Proceeds of Sales | -- |
| Amortization/Accretion | -- |
| Transfers in to Level 3 | -- |
| Transfers out of Level 3 | -- |
| Ending Balance | $52,425,091 |
| The change in unrealized gain (loss) for the period attributable to Level 3 securities held at March 31, 2017 | $4,395,551 |
The information used in the above reconciliation represents fiscal year to date activity for any Investments in Securities identified as using Level 3 inputs at either the beginning or the end of the current fiscal period. Transfers in or out of Level 3 represent the beginning value of any Security or Instrument where a change in the pricing level occurred from the beginning to the end of the period. The cost of purchases and the proceeds of sales may include securities received or delivered through corporate actions or exchanges.
Other Information
Distribution of investments by country or territory of incorporation, as a percentage of Total Net Assets, is as follows (Unaudited):
| United States of America | 66.4% |
| Japan | 10.3% |
| Cayman Islands | 9.4% |
| Taiwan | 4.9% |
| Netherlands | 1.4% |
| Singapore | 1.3% |
| Israel | 1.0% |
| Germany | 1.0% |
| Others (Individually Less Than 1%) | 4.3% |
| 100.0% |
See accompanying notes which are an integral part of the financial statements.
Fidelity® Information Technology Central Fund
Financial Statements
Statement of Assets and Liabilities
| March 31, 2017 (Unaudited) | ||
| Assets | ||
| Investment in securities, at value (including securities loaned of $175,530,533) — See accompanying schedule: Unaffiliated issuers (cost $2,623,225,014) | $3,731,651,414 | |
| Fidelity Central Funds (cost $240,295,167) | 240,300,879 | |
| Total Investments (cost $2,863,520,181) | $3,971,952,293 | |
| Receivable for investments sold | 17,954,022 | |
| Receivable for fund shares sold | 438,501 | |
| Dividends receivable | 3,722,169 | |
| Distributions receivable from Fidelity Central Funds | 207,757 | |
| Other receivables | 19,388 | |
| Total assets | 3,994,294,130 | |
| Liabilities | ||
| Payable for investments purchased | $16,270,926 | |
| Payable for fund shares redeemed | 7,538,325 | |
| Other payables and accrued expenses | 134,636 | |
| Collateral on securities loaned | 178,951,164 | |
| Total liabilities | 202,895,051 | |
| Net Assets | $3,791,399,079 | |
| Net Assets consist of: | ||
| Paid in capital | $2,495,923,020 | |
| Undistributed net investment income | 3,574,572 | |
| Accumulated undistributed net realized gain (loss) on investments and foreign currency transactions | 183,407,068 | |
| Net unrealized appreciation (depreciation) on investments and assets and liabilities in foreign currencies | 1,108,494,419 | |
| Net Assets, for 10,060,060 shares outstanding | $3,791,399,079 | |
| Net Asset Value, offering price and redemption price per share ($3,791,399,079 ÷ 10,060,060 shares) | $376.88 |
See accompanying notes which are an integral part of the financial statements.
Statement of Operations
| Six months ended March 31, 2017 (Unaudited) | ||
| Investment Income | ||
| Dividends | $11,841,833 | |
| Income from Fidelity Central Funds (including $887,044 from security lending) | 993,895 | |
| Total income | 12,835,728 | |
| Expenses | ||
| Custodian fees and expenses | $143,374 | |
| Independent directors' fees and expenses | 6,789 | |
| Interest | 7,177 | |
| Total expenses before reductions | 157,340 | |
| Expense reductions | (7,277) | 150,063 |
| Net investment income (loss) | 12,685,665 | |
| Realized and Unrealized Gain (Loss) | ||
| Net realized gain (loss) on: | ||
| Investment securities: | ||
| Unaffiliated issuers | 204,326,609 | |
| Fidelity Central Funds | (9,935) | |
| Foreign currency transactions | (170,450) | |
| Total net realized gain (loss) | 204,146,224 | |
| Change in net unrealized appreciation (depreciation) on: Investment securities | 300,317,534 | |
| Assets and liabilities in foreign currencies | 68,563 | |
| Total change in net unrealized appreciation (depreciation) | 300,386,097 | |
| Net gain (loss) | 504,532,321 | |
| Net increase (decrease) in net assets resulting from operations | $517,217,986 |
See accompanying notes which are an integral part of the financial statements.
Statement of Changes in Net Assets
| Six months ended March 31, 2017 (Unaudited) | Year ended September 30, 2016 | |
| Increase (Decrease) in Net Assets | ||
| Operations | ||
| Net investment income (loss) | $12,685,665 | $24,448,307 |
| Net realized gain (loss) | 204,146,224 | 80,623,380 |
| Change in net unrealized appreciation (depreciation) | 300,386,097 | 595,231,524 |
| Net increase (decrease) in net assets resulting from operations | 517,217,986 | 700,303,211 |
| Distributions to shareholders from net investment income | (9,111,093) | (23,265,757) |
| Distributions to shareholders from net realized gain | (20,739,156) | – |
| Total distributions | (29,850,249) | (23,265,757) |
| Affiliated share transactions | ||
| Proceeds from sales of shares | 323,755,671 | 308,526,016 |
| Reinvestment of distributions | 29,849,845 | 23,265,435 |
| Cost of shares redeemed | (268,855,912) | (322,057,547) |
| Net increase (decrease) in net assets resulting from share transactions | 84,749,604 | 9,733,904 |
| Total increase (decrease) in net assets | 572,117,341 | 686,771,358 |
| Net Assets | ||
| Beginning of period | 3,219,281,738 | 2,532,510,380 |
| End of period | $3,791,399,079 | $3,219,281,738 |
| Other Information | ||
| Undistributed net investment income end of period | $3,574,572 | $– |
| Shares | ||
| Sold | 982,329 | 1,063,038 |
| Issued in reinvestment of distributions | 94,556 | 78,375 |
| Redeemed | (765,180) | (1,106,790) |
| Net increase (decrease) | 311,705 | 34,623 |
See accompanying notes which are an integral part of the financial statements.
Financial Highlights — Fidelity Information Technology Central Fund
| Six months ended (Unaudited) March 31, | Years ended September 30, | |||||
| 2017 | 2016 | 2015 | 2014 | 2013 | 2012 | |
| Selected Per–Share Data | ||||||
| Net asset value, beginning of period | $330.24 | $260.71 | $262.98 | $222.50 | $191.01 | $150.22 |
| Income from Investment Operations | ||||||
| Net investment income (loss)A | 1.25 | 2.48 | 2.24B | 2.33 | 1.80 | 1.20 |
| Net realized and unrealized gain (loss) | 48.33 | 69.42 | (2.37) | 39.88 | 31.33 | 40.67 |
| Total from investment operations | 49.58 | 71.90 | (.13) | 42.21 | 33.13 | 41.87 |
| Distributions from net investment income | (.89) | (2.37) | (2.14) | (1.73) | (1.64) | (1.08) |
| Distributions from net realized gain | (2.05) | – | – | – | – | – |
| Total distributions | (2.94) | (2.37) | (2.14) | (1.73) | (1.64) | (1.08) |
| Net asset value, end of period | $376.88 | $330.24 | $260.71 | $262.98 | $222.50 | $191.01 |
| Total ReturnC,D | 15.19% | 27.68% | (.11)% | 19.01% | 17.45% | 27.92% |
| Ratios to Average Net AssetsE,F | ||||||
| Expenses before reductions | .01%G | .01% | .01% | .01% | .01% | .01% |
| Expenses net of fee waivers, if any | .01%G | .01% | .01% | .01% | .01% | .01% |
| Expenses net of all reductions | .01%G | .01% | .01% | .01% | .01% | .01% |
| Net investment income (loss) | .74%G | .86% | .81%B | .94% | .92% | .68% |
| Supplemental Data | ||||||
| Net assets, end of period (000 omitted) | $3,791,399 | $3,219,282 | $2,532,510 | $2,472,588 | $1,985,824 | $1,631,977 |
| Portfolio turnover rateH | 86%G,I | 99% | 138% | 179%I | 157%I | 195% |
A Calculated based on average shares outstanding during the period.
B Net Investment income per share reflects a large, non-recurring dividend which amounted to $.43 per share. Excluding this non-recurring dividend, the ratio of net investment income (loss) to average net assets would have been .65%.
C Total returns for periods of less than one year are not annualized.
D Total returns would have been lower if certain expenses had not been reduced during the applicable periods shown.
E Fees and expenses of any underlying Fidelity Central Funds are not included in the Fund's expense ratio. The Fund indirectly bears its proportionate share of the expenses of any underlying Fidelity Central Funds.
F Expense ratios reflect operating expenses of the Fund. Expenses before reductions do not reflect amounts reimbursed by the investment adviser or reductions from expense offset arrangements and do not represent the amount paid by the Fund during periods when reimbursements or reductions occur. Expenses net of fee waivers reflect expenses after reimbursement by the investment adviser but prior to reductions from expense offset arrangements. Expenses net of all reductions represent the net expenses paid by the Fund.
G Annualized
H Amount does not include the portfolio activity of any underlying Fidelity Central Funds.
I Portfolio turnover rate excludes securities received or delivered in-kind.
See accompanying notes which are an integral part of the financial statements.
Fidelity® Materials Central Fund
Investment Summary (Unaudited)
Top Ten Stocks as of March 31, 2017
| % of fund's net assets | % of fund's net assets 6 months ago | |
| E.I. du Pont de Nemours & Co. | 15.8 | 13.3 |
| WestRock Co. | 6.0 | 7.3 |
| Monsanto Co. | 5.9 | 6.6 |
| LyondellBasell Industries NV Class A | 5.0 | 4.9 |
| Ball Corp. | 4.6 | 5.8 |
| PPG Industries, Inc. | 4.6 | 5.1 |
| Graphic Packaging Holding Co. | 4.6 | 5.7 |
| The Dow Chemical Co. | 4.0 | 6.0 |
| Ecolab, Inc. | 3.6 | 5.7 |
| Eastman Chemical Co. | 3.2 | 5.3 |
| 57.3 |
Top Industries (% of fund's net assets)
| As of March 31, 2017 | ||
| Chemicals | 67.5% | |
| Containers & Packaging | 16.2% | |
| Metals & Mining | 9.8% | |
| Construction Materials | 3.1% | |
| Trading Companies & Distributors | 2.2% | |
| All Others* | 1.2% | |

| As of September 30, 2016 | ||
| Chemicals | 65.8% | |
| Containers & Packaging | 20.1% | |
| Metals & Mining | 7.1% | |
| Construction Materials | 3.9% | |
| Trading Companies & Distributors | 1.7% | |
| All Others* | 1.4% | |

* Includes short-term investments and net other assets (liabilities).
Fidelity® Materials Central Fund
Investments March 31, 2017 (Unaudited)
Showing Percentage of Net Assets
| Common Stocks - 98.8% | |||
| Shares | Value | ||
| Chemicals - 67.5% | |||
| Commodity Chemicals - 8.5% | |||
| LyondellBasell Industries NV Class A | 238,555 | $21,753,830 | |
| Olin Corp. | 152,804 | 5,022,667 | |
| Trinseo SA | 39,414 | 2,644,679 | |
| Tronox Ltd. Class A | 122,500 | 2,260,125 | |
| Westlake Chemical Corp. | 75,143 | 4,963,195 | |
| 36,644,496 | |||
| Diversified Chemicals - 27.1% | |||
| Ashland Global Holdings, Inc. | 36,072 | 4,466,074 | |
| E.I. du Pont de Nemours & Co. | 847,591 | 68,086,987 | |
| Eastman Chemical Co. | 169,151 | 13,667,401 | |
| The Chemours Co. LLC | 337,836 | 13,006,686 | |
| The Dow Chemical Co. | 273,011 | 17,347,119 | |
| 116,574,267 | |||
| Fertilizers & Agricultural Chemicals - 11.1% | |||
| Agrium, Inc. (a) | 68,293 | 6,517,839 | |
| CF Industries Holdings, Inc. | 257,015 | 7,543,390 | |
| Monsanto Co. | 225,543 | 25,531,468 | |
| The Mosaic Co. | 35,200 | 1,027,136 | |
| The Scotts Miracle-Gro Co. Class A | 79,272 | 7,403,212 | |
| 48,023,045 | |||
| Industrial Gases - 3.1% | |||
| Air Products & Chemicals, Inc. | 98,200 | 13,285,478 | |
| Specialty Chemicals - 17.7% | |||
| Axalta Coating Systems (b) | 175,091 | 5,637,930 | |
| Ecolab, Inc. | 122,554 | 15,360,918 | |
| Frutarom Industries Ltd. | 60,000 | 3,354,037 | |
| Platform Specialty Products Corp. (b) | 479,900 | 6,248,298 | |
| PPG Industries, Inc. | 186,784 | 19,627,263 | |
| Sherwin-Williams Co. | 40,600 | 12,593,714 | |
| W.R. Grace & Co. | 192,976 | 13,452,357 | |
| 76,274,517 | |||
| TOTAL CHEMICALS | 290,801,803 | ||
| Construction Materials - 3.1% | |||
| Construction Materials - 3.1% | |||
| Eagle Materials, Inc. | 137,770 | 13,382,978 | |
| Containers & Packaging - 16.2% | |||
| Metal & Glass Containers - 5.6% | |||
| Ardagh Group SA | 61,700 | 1,354,932 | |
| Ball Corp. | 265,493 | 19,715,510 | |
| Berry Plastics Group, Inc. (b) | 66,700 | 3,239,619 | |
| 24,310,061 | |||
| Paper Packaging - 10.6% | |||
| Graphic Packaging Holding Co. | 1,522,043 | 19,588,693 | |
| WestRock Co. | 500,625 | 26,047,519 | |
| 45,636,212 | |||
| TOTAL CONTAINERS & PACKAGING | 69,946,273 | ||
| Metals & Mining - 9.8% | |||
| Copper - 3.1% | |||
| Freeport-McMoRan, Inc. (b) | 1,010,400 | 13,498,944 | |
| Diversified Metals & Mining - 3.7% | |||
| Alcoa Corp. | 131,600 | 4,527,040 | |
| Glencore Xstrata PLC | 1,074,611 | 4,216,189 | |
| Rio Tinto PLC | 181,200 | 7,296,504 | |
| 16,039,733 | |||
| Gold - 3.0% | |||
| Barrick Gold Corp. | 236,955 | 4,500,871 | |
| Franco-Nevada Corp. | 57,930 | 3,795,061 | |
| Randgold Resources Ltd. sponsored ADR (a) | 50,692 | 4,424,398 | |
| 12,720,330 | |||
| TOTAL METALS & MINING | 42,259,007 | ||
| Trading Companies & Distributors - 2.2% | |||
| Trading Companies & Distributors - 2.2% | |||
| Nexeo Solutions, Inc. (c) | 300,000 | 2,658,000 | |
| Univar, Inc. (b) | 216,178 | 6,628,017 | |
| 9,286,017 | |||
| TOTAL COMMON STOCKS | |||
| (Cost $331,096,327) | 425,676,078 | ||
| Money Market Funds - 3.5% | |||
| Fidelity Cash Central Fund, 0.84% (d) | 4,503,534 | 4,504,434 | |
| Fidelity Securities Lending Cash Central Fund 0.84% (d)(e) | 10,498,814 | 10,499,864 | |
| TOTAL MONEY MARKET FUNDS | |||
| (Cost $15,004,168) | 15,004,298 | ||
| TOTAL INVESTMENT PORTFOLIO - 102.3% | |||
| (Cost $346,100,495) | 440,680,376 | ||
| NET OTHER ASSETS (LIABILITIES) - (2.3)% | (9,787,727) | ||
| NET ASSETS - 100% | $430,892,649 |
Legend
(a) Security or a portion of the security is on loan at period end.
(b) Non-income producing
(c) Restricted securities - Investment in securities not registered under the Securities Act of 1933 (excluding 144A issues). At the end of the period, the value of restricted securities (excluding 144A issues) amounted to $2,658,000 or 0.6% of net assets.
(d) Affiliated fund that is generally available only to investment companies and other accounts managed by Fidelity Investments. The rate quoted is the annualized seven-day yield of the fund at period end. A complete unaudited listing of the fund's holdings as of its most recent quarter end is available upon request. In addition, each Fidelity Central Fund's financial statements are available on the SEC's website or upon request.
(e) Investment made with cash collateral received from securities on loan.
Additional information on each restricted holding is as follows:
| Security | Acquisition Date | Acquisition Cost |
| Nexeo Solutions, Inc. | 6/9/16 | $3,000,000 |
Affiliated Central Funds
Information regarding fiscal year to date income earned by the Fund from investments in Fidelity Central Funds is as follows:
| Fund | Income earned |
| Fidelity Cash Central Fund | $11,687 |
| Fidelity Securities Lending Cash Central Fund | 11,155 |
| Total | $22,842 |
Investment Valuation
The following is a summary of the inputs used, as of March 31, 2017, involving the Fund's assets and liabilities carried at fair value. The inputs or methodology used for valuing securities may not be an indication of the risk associated with investing in those securities. For more information on valuation inputs, and their aggregation into the levels used below, please refer to the Investment Valuation section in the accompanying Notes to Financial Statements.
| Valuation Inputs at Reporting Date: | ||||
| Description | Total | Level 1 | Level 2 | Level 3 |
| Investments in Securities: | ||||
| Common Stocks | $425,676,078 | $418,379,574 | $7,296,504 | $-- |
| Money Market Funds | 15,004,298 | 15,004,298 | -- | -- |
| Total Investments in Securities: | $440,680,376 | $433,383,872 | $7,296,504 | $-- |
Other Information
Distribution of investments by country or territory of incorporation, as a percentage of Total Net Assets, is as follows (Unaudited):
| United States of America | 85.6% |
| Netherlands | 5.0% |
| Canada | 3.5% |
| Bailiwick of Jersey | 2.0% |
| United Kingdom | 1.7% |
| Others (Individually Less Than 1%) | 2.2% |
| 100.0% |
See accompanying notes which are an integral part of the financial statements.
Fidelity® Materials Central Fund
Financial Statements
Statement of Assets and Liabilities
| March 31, 2017 (Unaudited) | ||
| Assets | ||
| Investment in securities, at value (including securities loaned of $10,091,500) — See accompanying schedule: Unaffiliated issuers (cost $331,096,327) | $425,676,078 | |
| Fidelity Central Funds (cost $15,004,168) | 15,004,298 | |
| Total Investments (cost $346,100,495) | $440,680,376 | |
| Cash | 5,025 | |
| Receivable for investments sold | 3,546,758 | |
| Receivable for fund shares sold | 55,305 | |
| Dividends receivable | 805,748 | |
| Distributions receivable from Fidelity Central Funds | 4,226 | |
| Total assets | 445,097,438 | |
| Liabilities | ||
| Payable for investments purchased | $3,588,827 | |
| Payable for fund shares redeemed | 106,499 | |
| Other payables and accrued expenses | 10,313 | |
| Collateral on securities loaned | 10,499,150 | |
| Total liabilities | 14,204,789 | |
| Net Assets | $430,892,649 | |
| Net Assets consist of: | ||
| Paid in capital | $325,204,688 | |
| Undistributed net investment income | 1,232,396 | |
| Accumulated undistributed net realized gain (loss) on investments and foreign currency transactions | 9,876,043 | |
| Net unrealized appreciation (depreciation) on investments and assets and liabilities in foreign currencies | 94,579,522 | |
| Net Assets, for 1,801,260 shares outstanding | $430,892,649 | |
| Net Asset Value, offering price and redemption price per share ($430,892,649 ÷ 1,801,260 shares) | $239.22 |
See accompanying notes which are an integral part of the financial statements.
Statement of Operations
| Six months ended March 31, 2017 (Unaudited) | ||
| Investment Income | ||
| Dividends | $3,989,039 | |
| Income from Fidelity Central Funds (including $11,155 from security lending) | 22,842 | |
| Total income | 4,011,881 | |
| Expenses | ||
| Custodian fees and expenses | $14,710 | |
| Independent directors' fees and expenses | 857 | |
| Interest | 589 | |
| Total expenses before reductions | 16,156 | |
| Expense reductions | (857) | 15,299 |
| Net investment income (loss) | 3,996,582 | |
| Realized and Unrealized Gain (Loss) | ||
| Net realized gain (loss) on: | ||
| Investment securities: | ||
| Unaffiliated issuers | 9,878,548 | |
| Fidelity Central Funds | 682 | |
| Foreign currency transactions | (3,187) | |
| Total net realized gain (loss) | 9,876,043 | |
| Change in net unrealized appreciation (depreciation) on: Investment securities | 38,855,444 | |
| Assets and liabilities in foreign currencies | 241 | |
| Total change in net unrealized appreciation (depreciation) | 38,855,685 | |
| Net gain (loss) | 48,731,728 | |
| Net increase (decrease) in net assets resulting from operations | $52,728,310 |
See accompanying notes which are an integral part of the financial statements.
Statement of Changes in Net Assets
| Six months ended March 31, 2017 (Unaudited) | Year ended September 30, 2016 | |
| Increase (Decrease) in Net Assets | ||
| Operations | ||
| Net investment income (loss) | $3,996,582 | $8,528,775 |
| Net realized gain (loss) | 9,876,043 | (4,603,014) |
| Change in net unrealized appreciation (depreciation) | 38,855,685 | 51,767,904 |
| Net increase (decrease) in net assets resulting from operations | 52,728,310 | 55,693,665 |
| Distributions to shareholders from net investment income | (2,764,186) | (8,260,090) |
| Affiliated share transactions | ||
| Proceeds from sales of shares | 28,191,273 | 17,773,049 |
| Reinvestment of distributions | 2,764,001 | 8,259,536 |
| Cost of shares redeemed | (50,888,750) | (31,246,284) |
| Net increase (decrease) in net assets resulting from share transactions | (19,933,476) | (5,213,699) |
| Total increase (decrease) in net assets | 30,030,648 | 42,219,876 |
| Net Assets | ||
| Beginning of period | 400,862,001 | 358,642,125 |
| End of period | $430,892,649 | $400,862,001 |
| Other Information | ||
| Undistributed net investment income end of period | $1,232,396 | $– |
| Shares | ||
| Sold | 127,936 | 87,038 |
| Issued in reinvestment of distributions | 12,245 | 40,322 |
| Redeemed | (217,860) | (151,228) |
| Net increase (decrease) | (77,679) | (23,868) |
See accompanying notes which are an integral part of the financial statements.
Financial Highlights — Fidelity Materials Central Fund
| Six months ended (Unaudited) March 31, | Years ended September 30, | |||||
| 2017 | 2016 | 2015 | 2014 | 2013 | 2012 | |
| Selected Per–Share Data | ||||||
| Net asset value, beginning of period | $213.34 | $188.48 | $229.95 | $207.20 | $180.29 | $134.10 |
| Income from Investment Operations | ||||||
| Net investment income (loss)A | 2.13 | 4.48 | 4.34 | 3.57 | 3.44B | 3.10 |
| Net realized and unrealized gain (loss) | 25.20 | 24.73 | (41.59) | 22.68 | 26.85 | 45.95 |
| Total from investment operations | 27.33 | 29.21 | (37.25) | 26.25 | 30.29 | 49.05 |
| Distributions from net investment income | (1.45) | (4.35) | (4.22) | (3.50) | (3.38) | (2.86) |
| Total distributions | (1.45) | (4.35) | (4.22) | (3.50) | (3.38) | (2.86) |
| Net asset value, end of period | $239.22 | $213.34 | $188.48 | $229.95 | $207.20 | $180.29 |
| Total ReturnC,D | 12.85% | 15.62% | (16.46)% | 12.70% | 16.98% | 36.80% |
| Ratios to Average Net AssetsE,F | ||||||
| Expenses before reductions | .01%G | - %H | - %H | .01% | - %H | .01% |
| Expenses net of fee waivers, if any | .01%G | - %H | - %H | - %H | - %H | .01% |
| Expenses net of all reductions | .01%G | - %H | - %H | - %H | - %H | .01% |
| Net investment income (loss) | 1.88%G | 2.21% | 1.95% | 1.57% | 1.79%B | 1.86% |
| Supplemental Data | ||||||
| Net assets, end of period (000 omitted) | $430,893 | $400,862 | $358,642 | $482,472 | $400,422 | $314,540 |
| Portfolio turnover rateI | 59%G,J | 56% | 72% | 65%J | 64%J | 76% |
A Calculated based on average shares outstanding during the period.
B Net Investment income per share reflects a large, non-recurring dividend which amounted to $.52 per share. Excluding this non-recurring dividend, the ratio of net investment income (loss) to average net assets would have been 1.52%.
C Total returns for periods of less than one year are not annualized.
D Total returns would have been lower if certain expenses had not been reduced during the applicable periods shown.
E Fees and expenses of any underlying Fidelity Central Funds are not included in the Fund's expense ratio. The Fund indirectly bears its proportionate share of the expenses of any underlying Fidelity Central Funds.
F Expense ratios reflect operating expenses of the Fund. Expenses before reductions do not reflect amounts reimbursed by the investment adviser or reductions from expense offset arrangements and do not represent the amount paid by the Fund during periods when reimbursements or reductions occur. Expenses net of fee waivers reflect expenses after reimbursement by the investment adviser but prior to reductions from expense offset arrangements. Expenses net of all reductions represent the net expenses paid by the Fund.
G Annualized
H Amount represents less than .005%.
I Amount does not include the portfolio activity of any underlying Fidelity Central Funds.
J Portfolio turnover rate excludes securities received or delivered in-kind.
See accompanying notes which are an integral part of the financial statements.
Fidelity® Real Estate Equity Central Fund
Investment Summary (Unaudited)
Top Ten Stocks as of March 31, 2017
| % of fund's net assets | % of fund's net assets 6 months ago | |
| Simon Property Group, Inc. | 7.3 | 8.6 |
| Equinix, Inc. | 5.6 | 2.8 |
| Ventas, Inc. | 4.8 | 5.3 |
| Boston Properties, Inc. | 4.6 | 4.6 |
| AvalonBay Communities, Inc. | 4.5 | 4.7 |
| Extra Space Storage, Inc. | 3.4 | 3.7 |
| Mid-America Apartment Communities, Inc. | 3.3 | 0.2 |
| DCT Industrial Trust, Inc. | 3.1 | 3.5 |
| Essex Property Trust, Inc. | 3.1 | 2.2 |
| Public Storage | 2.9 | 2.6 |
| 42.6 |
Top Five REIT Sectors as of March 31, 2017
| % of fund's net assets | % of fund's net assets 6 months ago | |
| REITs - Office Property | 15.3 | 14.9 |
| REITs - Apartments | 14.5 | 13.7 |
| REITs - Diversified | 13.3 | 11.3 |
| REITs - Health Care | 12.3 | 12.0 |
| REITs - Regional Malls | 9.7 | 11.5 |
Asset Allocation (% of fund's net assets)
| As of March 31, 2017 | ||
| Stocks | 98.6% | |
| Short-Term Investments and Net Other Assets (Liabilities) | 1.4% | |

| As of September 30, 2016 | ||
| Stocks | 98.4% | |
| Short-Term Investments and Net Other Assets (Liabilities) | 1.6% | |

Fidelity® Real Estate Equity Central Fund
Investments March 31, 2017 (Unaudited)
Showing Percentage of Net Assets
| Common Stocks - 98.6% | |||
| Shares | Value | ||
| Equity Real Estate Investment Trusts (REITs) - 97.0% | |||
| REITs - Apartments - 14.5% | |||
| American Homes 4 Rent Class A | 40,800 | $936,768 | |
| Apartment Investment & Management Co. Class A | 55,300 | 2,452,555 | |
| AvalonBay Communities, Inc. | 30,150 | 5,535,540 | |
| Equity Residential (SBI) | 16,900 | 1,051,518 | |
| Essex Property Trust, Inc. | 16,300 | 3,773,939 | |
| Mid-America Apartment Communities, Inc. | 39,943 | 4,063,801 | |
| 17,814,121 | |||
| REITs - Diversified - 13.3% | |||
| Colony NorthStar, Inc. | 4 | 52 | |
| Corrections Corp. of America | 43,500 | 1,366,770 | |
| Duke Realty Corp. | 115,300 | 3,028,931 | |
| Equinix, Inc. | 17,100 | 6,846,327 | |
| Gaming & Leisure Properties | 35,600 | 1,189,752 | |
| Outfront Media, Inc. | 58,500 | 1,553,175 | |
| Vornado Realty Trust | 10,500 | 1,053,255 | |
| Washington REIT (SBI) | 39,300 | 1,229,304 | |
| 16,267,566 | |||
| REITs - Health Care - 12.3% | |||
| CareTrust (REIT), Inc. | 64,100 | 1,078,162 | |
| Healthcare Realty Trust, Inc. | 103,600 | 3,367,000 | |
| Sabra Health Care REIT, Inc. | 77,654 | 2,168,876 | |
| Ventas, Inc. | 90,800 | 5,905,632 | |
| Welltower, Inc. | 35,250 | 2,496,405 | |
| 15,016,075 | |||
| REITs - Hotels - 4.3% | |||
| DiamondRock Hospitality Co. | 129,200 | 1,440,580 | |
| FelCor Lodging Trust, Inc. | 79,800 | 599,298 | |
| Host Hotels & Resorts, Inc. | 82,800 | 1,545,048 | |
| Sunstone Hotel Investors, Inc. | 112,500 | 1,724,625 | |
| 5,309,551 | |||
| REITs - Management/Investment - 6.2% | |||
| American Assets Trust, Inc. | 28,900 | 1,209,176 | |
| American Tower Corp. | 3,800 | 461,852 | |
| CoreSite Realty Corp. | 24,876 | 2,240,084 | |
| Empire State Realty Trust, Inc. | 45,300 | 934,992 | |
| National Retail Properties, Inc. | 64,400 | 2,809,128 | |
| 7,655,232 | |||
| REITs - Manufactured Homes - 1.6% | |||
| Equity Lifestyle Properties, Inc. | 25,776 | 1,986,299 | |
| REITs - Office Property - 15.3% | |||
| Boston Properties, Inc. | 42,200 | 5,587,702 | |
| Corporate Office Properties Trust (SBI) | 53,100 | 1,757,610 | |
| Douglas Emmett, Inc. | 64,400 | 2,472,960 | |
| Highwoods Properties, Inc. (SBI) | 43,100 | 2,117,503 | |
| Hudson Pacific Properties, Inc. | 70,000 | 2,424,800 | |
| Mack-Cali Realty Corp. | 47,458 | 1,278,519 | |
| VEREIT, Inc. | 375,000 | 3,183,750 | |
| 18,822,844 | |||
| REITs - Regional Malls - 9.7% | |||
| General Growth Properties, Inc. | 23,700 | 549,366 | |
| Pennsylvania Real Estate Investment Trust (SBI) | 41,600 | 629,824 | |
| Simon Property Group, Inc. | 51,800 | 8,911,152 | |
| Taubman Centers, Inc. | 28,100 | 1,855,162 | |
| 11,945,504 | |||
| REITs - Shopping Centers - 4.9% | |||
| Brixmor Property Group, Inc. | 40,600 | 871,276 | |
| Cedar Shopping Centers, Inc. | 142,847 | 717,092 | |
| DDR Corp. | 86,400 | 1,082,592 | |
| Urban Edge Properties | 125,650 | 3,304,595 | |
| 5,975,555 | |||
| REITs - Single Tenant - 2.0% | |||
| Agree Realty Corp. | 36,100 | 1,731,356 | |
| Four Corners Property Trust, Inc. | 32,800 | 748,824 | |
| 2,480,180 | |||
| REITs - Storage - 6.3% | |||
| Extra Space Storage, Inc. | 56,000 | 4,165,840 | |
| Public Storage | 16,300 | 3,568,233 | |
| 7,734,073 | |||
| REITs - Warehouse/Industrial - 6.6% | |||
| DCT Industrial Trust, Inc. | 79,307 | 3,816,253 | |
| Gramercy Property Trust | 28,766 | 756,546 | |
| Prologis, Inc. | 42,900 | 2,225,652 | |
| Terreno Realty Corp. | 45,763 | 1,281,364 | |
| 8,079,815 | |||
| TOTAL EQUITY REAL ESTATE INVESTMENT TRUSTS (REITS) | 119,086,815 | ||
| Hotels, Restaurants & Leisure - 1.1% | |||
| Hotels, Resorts & Cruise Lines - 1.1% | |||
| Marriott International, Inc. Class A | 14,400 | 1,356,192 | |
| Real Estate Management & Development - 0.5% | |||
| Real Estate Services - 0.5% | |||
| Invitation Homes, Inc. | 28,000 | 611,240 | |
| TOTAL COMMON STOCKS | |||
| (Cost $109,283,667) | 121,054,247 | ||
| Money Market Funds - 1.2% | |||
| Fidelity Cash Central Fund, 0.84% (a) | |||
| (Cost $1,452,724) | 1,452,433 | 1,452,724 | |
| TOTAL INVESTMENT PORTFOLIO - 99.8% | |||
| (Cost $110,736,391) | 122,506,971 | ||
| NET OTHER ASSETS (LIABILITIES) - 0.2% | 251,491 | ||
| NET ASSETS - 100% | $122,758,462 |
Legend
(a) Affiliated fund that is generally available only to investment companies and other accounts managed by Fidelity Investments. The rate quoted is the annualized seven-day yield of the fund at period end. A complete unaudited listing of the fund's holdings as of its most recent quarter end is available upon request. In addition, each Fidelity Central Fund's financial statements are available on the SEC's website or upon request.
Affiliated Central Funds
Information regarding fiscal year to date income earned by the Fund from investments in Fidelity Central Funds is as follows:
| Fund | Income earned |
| Fidelity Cash Central Fund | $4,099 |
| Fidelity Securities Lending Cash Central Fund | 80 |
| Total | $4,179 |
Investment Valuation
All investments are categorized as Level 1 under the Fair Value Hierarchy. The inputs or methodology used for valuing securities may not be an indication of the risk associated with investing in those securities. For more information on valuation inputs please refer to the Investment Valuation section in the accompanying Notes to Financial Statements.
See accompanying notes which are an integral part of the financial statements.
Fidelity® Real Estate Equity Central Fund
Financial Statements
Statement of Assets and Liabilities
| March 31, 2017 (Unaudited) | ||
| Assets | ||
| Investment in securities, at value — See accompanying schedule: Unaffiliated issuers (cost $109,283,667) | $121,054,247 | |
| Fidelity Central Funds (cost $1,452,724) | 1,452,724 | |
| Total Investments (cost $110,736,391) | $122,506,971 | |
| Receivable for investments sold | 624,406 | |
| Receivable for fund shares sold | 27,789 | |
| Dividends receivable | 377,289 | |
| Distributions receivable from Fidelity Central Funds | 795 | |
| Total assets | 123,537,250 | |
| Liabilities | ||
| Payable to custodian bank | $102 | |
| Payable for investments purchased | 714,259 | |
| Payable for fund shares redeemed | 53,608 | |
| Other payables and accrued expenses | 10,819 | |
| Total liabilities | 778,788 | |
| Net Assets | $122,758,462 | |
| Net Assets consist of: | ||
| Paid in capital | $107,206,671 | |
| Undistributed net investment income | 421,864 | |
| Accumulated undistributed net realized gain (loss) on investments | 3,359,347 | |
| Net unrealized appreciation (depreciation) on investments | 11,770,580 | |
| Net Assets, for 1,107,706 shares outstanding | $122,758,462 | |
| Net Asset Value, offering price and redemption price per share ($122,758,462 ÷ 1,107,706 shares) | $110.82 |
See accompanying notes which are an integral part of the financial statements.
Statement of Operations
| Six months ended March 31, 2017 (Unaudited) | ||
| Investment Income | ||
| Dividends | $1,989,823 | |
| Income from Fidelity Central Funds (including $80 from security lending) | 4,179 | |
| Total income | 1,994,002 | |
| Expenses | ||
| Custodian fees and expenses | $10,103 | |
| Independent directors' fees and expenses | 325 | |
| Total expenses before reductions | 10,428 | |
| Expense reductions | (330) | 10,098 |
| Net investment income (loss) | 1,983,904 | |
| Realized and Unrealized Gain (Loss) | ||
| Net realized gain (loss) on: | ||
| Investment securities: | ||
| Unaffiliated issuers | 3,548,932 | |
| Fidelity Central Funds | 89 | |
| Total net realized gain (loss) | 3,549,021 | |
| Change in net unrealized appreciation (depreciation) on investment securities | (7,567,119) | |
| Net gain (loss) | (4,018,098) | |
| Net increase (decrease) in net assets resulting from operations | $(2,034,194) |
See accompanying notes which are an integral part of the financial statements.
Statement of Changes in Net Assets
| Six months ended March 31, 2017 (Unaudited) | Year ended September 30, 2016 | |
| Increase (Decrease) in Net Assets | ||
| Operations | ||
| Net investment income (loss) | $1,983,904 | $6,603,690 |
| Net realized gain (loss) | 3,549,021 | 5,770,345 |
| Change in net unrealized appreciation (depreciation) | (7,567,119) | 33,940,729 |
| Net increase (decrease) in net assets resulting from operations | (2,034,194) | 46,314,764 |
| Distributions to shareholders from net investment income | (1,562,040) | (5,975,815) |
| Distributions to shareholders from net realized gain | (189,674) | – |
| Total distributions | (1,751,714) | (5,975,815) |
| Affiliated share transactions | ||
| Proceeds from sales of shares | 6,029,690 | 9,714,965 |
| Reinvestment of distributions | 1,751,714 | 5,975,809 |
| Cost of shares redeemed | (55,024,187) | (133,457,507) |
| Net increase (decrease) in net assets resulting from share transactions | (47,242,783) | (117,766,733) |
| Total increase (decrease) in net assets | (51,028,691) | (77,427,784) |
| Net Assets | ||
| Beginning of period | 173,787,153 | 251,214,937 |
| End of period | $122,758,462 | $173,787,153 |
| Other Information | ||
| Undistributed net investment income end of period | $421,864 | $– |
| Shares | ||
| Sold | 55,866 | 91,970 |
| Issued in reinvestment of distributions | 16,754 | 55,614 |
| Redeemed | (500,816) | (1,230,554) |
| Net increase (decrease) | (428,196) | (1,082,970) |
See accompanying notes which are an integral part of the financial statements.
Financial Highlights — Fidelity Real Estate Equity Central Fund
| Six months ended (Unaudited) March 31, | Years ended September 30, | ||
| 2017 | 2016 | 2015 A | |
| Selected Per–Share Data | |||
| Net asset value, beginning of period | $113.15 | $95.92 | $100.00 |
| Income from Investment Operations | |||
| Net investment income (loss)B | 1.44 | 3.03 | 2.53 |
| Net realized and unrealized gain (loss) | (2.55) | 17.03 | (4.24) |
| Total from investment operations | (1.11) | 20.06 | (1.71) |
| Distributions from net investment income | (1.10) | (2.83) | (2.37) |
| Distributions from net realized gain | (.12) | – | – |
| Total distributions | (1.22) | (2.83) | (2.37) |
| Net asset value, end of period | $110.82 | $113.15 | $95.92 |
| Total ReturnC,D | (.92)% | 21.08% | (1.81)% |
| Ratios to Average Net AssetsE,F | |||
| Expenses before reductions | .01%G | .01% | .01%G |
| Expenses net of fee waivers, if any | .01%G | .01% | .01%G |
| Expenses net of all reductions | .01%G | .01% | .01%G |
| Net investment income (loss) | 2.66%G | 2.86% | 2.71%G |
| Supplemental Data | |||
| Net assets, end of period (000 omitted) | $122,758 | $173,787 | $251,215 |
| Portfolio turnover rateH | 75%G | 69% | 62%G |
A For the period November 3, 2014 (commencement of operations) to September 30, 2015.
B Calculated based on average shares outstanding during the period.
C Total returns for periods of less than one year are not annualized.
D Total returns would have been lower if certain expenses had not been reduced during the applicable periods shown.
E Fees and expenses of any underlying Fidelity Central Funds are not included in the Fund's expense ratio. The Fund indirectly bears its proportionate share of the expenses of any underlying Fidelity Central Funds.
F Expense ratios reflect operating expenses of the Fund. Expenses before reductions do not reflect amounts reimbursed by the investment adviser or reductions from expense offset arrangements and do not represent the amount paid by the Fund during periods when reimbursements or reductions occur. Expense ratios before reductions for start-up periods may not be representative of longer term operating periods. Expenses net of fee waivers reflect expenses after reimbursement by the investment adviser but prior to reductions from expense offset arrangements. Expenses net of all reductions represent the net expenses paid by the Fund.
G Annualized
H Amount does not include the portfolio activity of any underlying Fidelity Central Funds.
See accompanying notes which are an integral part of the financial statements.
Fidelity® Telecom Services Central Fund
Investment Summary (Unaudited)
Top Ten Stocks as of March 31, 2017
| % of fund's net assets | % of fund's net assets 6 months ago | |
| Verizon Communications, Inc. | 24.2 | 14.4 |
| AT&T, Inc. | 10.0 | 19.0 |
| T-Mobile U.S., Inc. | 7.8 | 5.7 |
| Level 3 Communications, Inc. | 4.0 | 4.1 |
| Iridium Communications, Inc. | 3.2 | 2.2 |
| Cogent Communications Group, Inc. | 3.1 | 2.3 |
| CenturyLink, Inc. | 3.1 | 2.7 |
| Liberty Global PLC Class C | 2.9 | 1.2 |
| Sprint Corp. | 2.8 | 2.8 |
| Telephone & Data Systems, Inc. | 2.6 | 2.4 |
| 63.7 |
Top Industries (% of fund's net assets)
| As of March 31, 2017 | ||
| Diversified Telecommunication Services | 65.6% | |
| Wireless Telecommunication Services | 17.0% | |
| Media | 8.6% | |
| Equity Real Estate Investment Trusts (Reits) | 2.6% | |
| Internet Software & Services | 1.3% | |
| All Others* | 4.9% | |
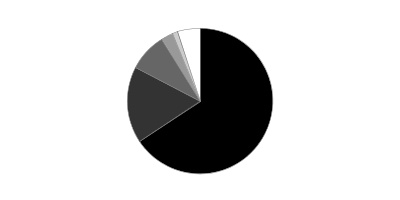
| As of September 30, 2016 | ||
| Diversified Telecommunication Services | 68.2% | |
| Wireless Telecommunication Services | 15.6% | |
| Media | 9.1% | |
| Equity Real Estate Investment Trusts (Reits) | 2.5% | |
| Semiconductors & Semiconductor Equipment | 1.0% | |
| All Others* | 3.6% | |
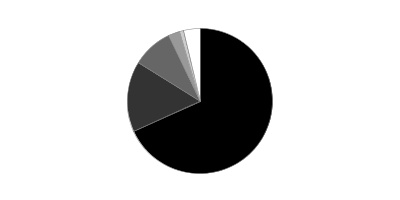
* Includes short-term investments and net other assets (liabilities).
Fidelity® Telecom Services Central Fund
Investments March 31, 2017 (Unaudited)
Showing Percentage of Net Assets
| Common Stocks - 98.9% | |||
| Shares | Value | ||
| Commercial Services & Supplies - 0.5% | |||
| Office Services & Supplies - 0.5% | |||
| West Corp. | 87,029 | $2,125,248 | |
| Diversified Telecommunication Services - 65.6% | |||
| Alternative Carriers - 18.4% | |||
| Cogent Communications Group, Inc. | 286,746 | 12,344,415 | |
| Globalstar, Inc. (a)(b) | 2,322,895 | 3,716,632 | |
| Iliad SA | 17,009 | 3,804,141 | |
| Iridium Communications, Inc. (a)(b) | 1,347,014 | 12,998,685 | |
| Level 3 Communications, Inc. (a) | 279,690 | 16,003,862 | |
| Lumos Networks Corp. (a) | 328,922 | 5,821,919 | |
| ORBCOMM, Inc. (a) | 164,867 | 1,574,480 | |
| Vonage Holdings Corp. (a) | 1,291,241 | 8,160,643 | |
| Zayo Group Holdings, Inc. (a) | 278,126 | 9,150,345 | |
| 73,575,122 | |||
| Integrated Telecommunication Services - 47.2% | |||
| AT&T, Inc. | 963,648 | 40,039,574 | |
| Atlantic Tele-Network, Inc. | 110,510 | 7,782,114 | |
| CenturyLink, Inc. (b) | 522,415 | 12,313,322 | |
| Cincinnati Bell, Inc. (a) | 492,963 | 8,725,445 | |
| Consolidated Communications Holdings, Inc. (b) | 101,883 | 2,386,100 | |
| FairPoint Communications, Inc. (a) | 200,698 | 3,331,587 | |
| Frontier Communications Corp. (b) | 3,122,366 | 6,681,863 | |
| General Communications, Inc. Class A (a) | 298,172 | 6,201,978 | |
| Verizon Communications, Inc. | 1,988,850 | 96,956,437 | |
| Windstream Holdings, Inc. (b) | 924,627 | 5,039,217 | |
| 189,457,637 | |||
| TOTAL DIVERSIFIED TELECOMMUNICATION SERVICES | 263,032,759 | ||
| Equity Real Estate Investment Trusts (REITs) - 2.6% | |||
| Specialized REITs - 2.6% | |||
| American Tower Corp. | 74,163 | 9,013,771 | |
| SBA Communications Corp. Class A (a) | 13,478 | 1,622,347 | |
| 10,636,118 | |||
| Internet & Direct Marketing Retail - 0.6% | |||
| Internet & Direct Marketing Retail - 0.6% | |||
| Liberty Interactive Corp. QVC Group Series A (a) | 121,956 | 2,441,559 | |
| Internet Software & Services - 1.3% | |||
| Internet Software & Services - 1.3% | |||
| Gogo, Inc. (a)(b) | 425,777 | 4,683,547 | |
| GTT Communications, Inc. (a) | 17,000 | 413,950 | |
| 5,097,497 | |||
| Media - 8.6% | |||
| Broadcasting - 0.6% | |||
| Nexstar Broadcasting Group, Inc. Class A | 35,101 | 2,462,335 | |
| Cable & Satellite - 7.0% | |||
| Altice NV Class A (a) | 207,280 | 4,688,983 | |
| Liberty Broadband Corp. Class A (a) | 107,500 | 9,147,175 | |
| Liberty Global PLC: | |||
| Class C (a) | 334,764 | 11,730,131 | |
| LiLAC Class C (a) | 48,097 | 1,108,155 | |
| Megacable Holdings S.A.B. de CV unit | 359,000 | 1,391,341 | |
| 28,065,785 | |||
| Movies & Entertainment - 1.0% | |||
| The Walt Disney Co. | 34,000 | 3,855,260 | |
| TOTAL MEDIA | 34,383,380 | ||
| Semiconductors & Semiconductor Equipment - 1.3% | |||
| Semiconductors - 1.3% | |||
| Broadcom Ltd. | 13,076 | 2,863,121 | |
| Qorvo, Inc. (a) | 36,367 | 2,493,322 | |
| 5,356,443 | |||
| Software - 0.7% | |||
| Application Software - 0.7% | |||
| Synchronoss Technologies, Inc. (a) | 111,400 | 2,718,160 | |
| Technology Hardware, Storage & Peripherals - 0.7% | |||
| Technology Hardware, Storage & Peripherals - 0.7% | |||
| Apple, Inc. | 19,579 | 2,812,719 | |
| Wireless Telecommunication Services - 17.0% | |||
| Wireless Telecommunication Services - 17.0% | |||
| Millicom International Cellular SA | 23,769 | 1,328,925 | |
| NII Holdings, Inc. (a) | 820,483 | 1,066,628 | |
| Shenandoah Telecommunications Co. | 157,715 | 4,423,906 | |
| Sprint Corp. (a)(b) | 1,284,542 | 11,149,825 | |
| T-Mobile U.S., Inc. (a) | 485,715 | 31,372,332 | |
| Telephone & Data Systems, Inc. | 396,380 | 10,508,034 | |
| U.S. Cellular Corp. (a) | 222,196 | 8,294,577 | |
| 68,144,227 | |||
| TOTAL COMMON STOCKS | |||
| (Cost $315,896,958) | 396,748,110 | ||
| Money Market Funds - 11.3% | |||
| Fidelity Cash Central Fund, 0.84% (c) | 4,380,502 | 4,381,378 | |
| Fidelity Securities Lending Cash Central Fund 0.84% (c)(d) | 40,884,233 | 40,888,322 | |
| TOTAL MONEY MARKET FUNDS | |||
| (Cost $45,266,844) | 45,269,700 | ||
| TOTAL INVESTMENT PORTFOLIO - 110.2% | |||
| (Cost $361,163,802) | 442,017,810 | ||
| NET OTHER ASSETS (LIABILITIES) - (10.2)% | (41,011,202) | ||
| NET ASSETS - 100% | $401,006,608 |
Legend
(a) Non-income producing
(b) Security or a portion of the security is on loan at period end.
(c) Affiliated fund that is generally available only to investment companies and other accounts managed by Fidelity Investments. The rate quoted is the annualized seven-day yield of the fund at period end. A complete unaudited listing of the fund's holdings as of its most recent quarter end is available upon request. In addition, each Fidelity Central Fund's financial statements are available on the SEC's website or upon request.
(d) Investment made with cash collateral received from securities on loan.
Affiliated Central Funds
Information regarding fiscal year to date income earned by the Fund from investments in Fidelity Central Funds is as follows:
| Fund | Income earned |
| Fidelity Cash Central Fund | $10,075 |
| Fidelity Securities Lending Cash Central Fund | 334,858 |
| Total | $344,933 |
Investment Valuation
All investments are categorized as Level 1 under the Fair Value Hierarchy. The inputs or methodology used for valuing securities may not be an indication of the risk associated with investing in those securities. For more information on valuation inputs please refer to the Investment Valuation section in the accompanying Notes to Financial Statements.
See accompanying notes which are an integral part of the financial statements.
Fidelity® Telecom Services Central Fund
Financial Statements
Statement of Assets and Liabilities
| March 31, 2017 (Unaudited) | ||
| Assets | ||
| Investment in securities, at value (including securities loaned of $39,632,974) — See accompanying schedule: Unaffiliated issuers (cost $315,896,958) | $396,748,110 | |
| Fidelity Central Funds (cost $45,266,844) | 45,269,700 | |
| Total Investments (cost $361,163,802) | $442,017,810 | |
| Receivable for fund shares sold | 46,063 | |
| Dividends receivable | 88,412 | |
| Distributions receivable from Fidelity Central Funds | 82,855 | |
| Total assets | 442,235,140 | |
| Liabilities | ||
| Payable to custodian bank | $65 | |
| Payable for investments purchased | 247,703 | |
| Payable for fund shares redeemed | 88,251 | |
| Other payables and accrued expenses | 9,371 | |
| Collateral on securities loaned | 40,883,142 | |
| Total liabilities | 41,228,532 | |
| Net Assets | $401,006,608 | |
| Net Assets consist of: | ||
| Paid in capital | $299,528,297 | |
| Undistributed net investment income | 553,385 | |
| Accumulated undistributed net realized gain (loss) on investments and foreign currency transactions | 20,071,018 | |
| Net unrealized appreciation (depreciation) on investments and assets and liabilities in foreign currencies | 80,853,908 | |
| Net Assets, for 2,009,695 shares outstanding | $401,006,608 | |
| Net Asset Value, offering price and redemption price per share ($401,006,608 ÷ 2,009,695 shares) | $199.54 |
See accompanying notes which are an integral part of the financial statements.
Statement of Operations
| Six months ended March 31, 2017 (Unaudited) | ||
| Investment Income | ||
| Dividends | $4,283,734 | |
| Interest | 44,213 | |
| Income from Fidelity Central Funds (including $334,858 from security lending) | 344,933 | |
| Total income | 4,672,880 | |
| Expenses | ||
| Custodian fees and expenses | $14,488 | |
| Independent directors' fees and expenses | 802 | |
| Total expenses before reductions | 15,290 | |
| Expense reductions | (802) | 14,488 |
| Net investment income (loss) | 4,658,392 | |
| Realized and Unrealized Gain (Loss) | ||
| Net realized gain (loss) on: | ||
| Investment securities: | ||
| Unaffiliated issuers | 23,720,380 | |
| Fidelity Central Funds | 2,441 | |
| Foreign currency transactions | (26,221) | |
| Total net realized gain (loss) | 23,696,600 | |
| Change in net unrealized appreciation (depreciation) on: Investment securities | (3,600,819) | |
| Assets and liabilities in foreign currencies | 821 | |
| Total change in net unrealized appreciation (depreciation) | (3,599,998) | |
| Net gain (loss) | 20,096,602 | |
| Net increase (decrease) in net assets resulting from operations | $24,754,994 |
See accompanying notes which are an integral part of the financial statements.
Statement of Changes in Net Assets
| Six months ended March 31, 2017 (Unaudited) | Year ended September 30, 2016 | |
| Increase (Decrease) in Net Assets | ||
| Operations | ||
| Net investment income (loss) | $4,658,392 | $8,613,167 |
| Net realized gain (loss) | 23,696,600 | 19,867,668 |
| Change in net unrealized appreciation (depreciation) | (3,599,998) | 50,711,886 |
| Net increase (decrease) in net assets resulting from operations | 24,754,994 | 79,192,721 |
| Distributions to shareholders from net investment income | (4,105,007) | (8,239,224) |
| Distributions to shareholders from net realized gain | (3,625,582) | – |
| Total distributions | (7,730,589) | (8,239,224) |
| Affiliated share transactions | ||
| Proceeds from sales of shares | 28,246,659 | 66,256,635 |
| Reinvestment of distributions | 7,730,043 | 8,238,604 |
| Cost of shares redeemed | (36,091,885) | (38,448,443) |
| Net increase (decrease) in net assets resulting from share transactions | (115,183) | 36,046,796 |
| Total increase (decrease) in net assets | 16,909,222 | 107,000,293 |
| Net Assets | ||
| Beginning of period | 384,097,386 | 277,097,093 |
| End of period | $401,006,608 | $384,097,386 |
| Other Information | ||
| Undistributed net investment income end of period | $553,385 | $– |
| Shares | ||
| Sold | 146,771 | 383,258 |
| Issued in reinvestment of distributions | 40,993 | 45,809 |
| Redeemed | (184,106) | (208,122) |
| Net increase (decrease) | 3,658 | 220,945 |
See accompanying notes which are an integral part of the financial statements.
Financial Highlights — Fidelity Telecom Services Central Fund
| Six months ended (Unaudited) March 31, | Years ended September 30, | |||||
| 2017 | 2016 | 2015 | 2014 | 2013 | 2012 | |
| Selected Per–Share Data | ||||||
| Net asset value, beginning of period | $191.47 | $155.23 | $163.86 | $155.95 | $139.95 | $111.29 |
| Income from Investment Operations | ||||||
| Net investment income (loss)A | 2.30 | 4.49 | 3.75 | 7.09B | 4.39 | 3.96 |
| Net realized and unrealized gain (loss) | 9.56 | 36.05 | (8.58) | 7.91 | 15.88 | 28.57 |
| Total from investment operations | 11.86 | 40.54 | (4.83) | 15.00 | 20.27 | 32.53 |
| Distributions from net investment income | (2.03) | (4.30) | (3.80) | (7.09) | (4.27) | (3.87) |
| Distributions from net realized gain | (1.76) | – | – | – | – | – |
| Total distributions | (3.79) | (4.30) | (3.80) | (7.09) | (4.27) | (3.87) |
| Net asset value, end of period | $199.54 | $191.47 | $155.23 | $163.86 | $155.95 | $139.95 |
| Total ReturnC,D | 6.32% | 26.33% | (3.10)% | 9.75% | 14.73% | 29.73% |
| Ratios to Average Net AssetsE,F | ||||||
| Expenses before reductions | .01%G | .01% | - %H | .01% | .01% | .01% |
| Expenses net of fee waivers, if any | .01%G | .01% | - %H | .01% | .01% | .01% |
| Expenses net of all reductions | .01%G | .01% | - %H | .01% | .01% | .01% |
| Net investment income (loss) | 2.34%G | 2.51% | 2.24% | 4.35%B | 3.00% | 3.20% |
| Supplemental Data | ||||||
| Net assets, end of period (000 omitted) | $401,007 | $384,097 | $277,097 | $286,592 | $295,959 | $253,919 |
| Portfolio turnover rateI | 109%G,J | 68% | 58% | 97%J | 82%J | 59% |
A Calculated based on average shares outstanding during the period.
B Net Investment income per share reflects a large, non-recurring dividend which amounted to $3.06 per share. Excluding this non-recurring dividend, the ratio of net investment income (loss) to average net assets would have been 2.47%.
C Total returns for periods of less than one year are not annualized.
D Total returns would have been lower if certain expenses had not been reduced during the applicable periods shown.
E Fees and expenses of any underlying Fidelity Central Funds are not included in the Fund's expense ratio. The Fund indirectly bears its proportionate share of the expenses of any underlying Fidelity Central Funds.
F Expense ratios reflect operating expenses of the Fund. Expenses before reductions do not reflect amounts reimbursed by the investment adviser or reductions from expense offset arrangements and do not represent the amount paid by the Fund during periods when reimbursements or reductions occur. Expenses net of fee waivers reflect expenses after reimbursement by the investment adviser but prior to reductions from expense offset arrangements. Expenses net of all reductions represent the net expenses paid by the Fund.
G Annualized
H Amount represents less than .005%.
I Amount does not include the portfolio activity of any underlying Fidelity Central Funds.
J Portfolio turnover rate excludes securities received or delivered in-kind.
See accompanying notes which are an integral part of the financial statements.
Fidelity® Utilities Central Fund
Investment Summary (Unaudited)
Top Ten Stocks as of March 31, 2017
| % of fund's net assets | % of fund's net assets 6 months ago | |
| NextEra Energy, Inc. | 16.9 | 14.1 |
| Sempra Energy | 12.7 | 11.9 |
| PG&E Corp. | 8.5 | 8.4 |
| Dominion Resources, Inc. | 6.1 | 7.5 |
| Avangrid, Inc. | 4.9 | 5.7 |
| Exelon Corp. | 4.8 | 4.4 |
| DTE Energy Co. | 4.7 | 4.9 |
| Great Plains Energy, Inc. | 4.5 | 2.7 |
| CenterPoint Energy, Inc. | 4.1 | 2.3 |
| FirstEnergy Corp. | 4.0 | 4.1 |
| 71.2 |
Top Industries (% of fund's net assets)
| As of March 31, 2017 | ||
| Electric Utilities | 46.6% | |
| Multi-Utilities | 38.3% | |
| Independent Power and Renewable Electricity Producers | 9.2% | |
| Media | 1.2% | |
| Gas Utilities | 1.0% | |
| All Others* | 3.7% | |
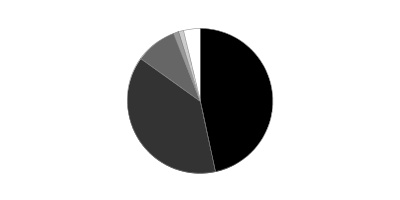
| As of September 30, 2016 | ||
| Electric Utilities | 51.8% | |
| Multi-Utilities | 37.9% | |
| Independent Power and Renewable Electricity Producers | 7.7% | |
| Gas Utilities | 1.0% | |
| Oil, Gas & Consumable Fuels | 0.9% | |
| All Others* | 0.7% | |

* Includes short-term investments and net other assets (liabilities).
Fidelity® Utilities Central Fund
Investments March 31, 2017 (Unaudited)
Showing Percentage of Net Assets
| Common Stocks - 97.2% | |||
| Shares | Value | ||
| Electric Utilities - 46.6% | |||
| Electric Utilities - 46.6% | |||
| Edison International | 118,057 | $9,398,518 | |
| Exelon Corp. | 636,645 | 22,906,487 | |
| FirstEnergy Corp. | 595,540 | 18,950,083 | |
| Great Plains Energy, Inc. | 735,419 | 21,488,943 | |
| NextEra Energy, Inc. | 625,798 | 80,333,689 | |
| OGE Energy Corp. | 239,325 | 8,371,589 | |
| PG&E Corp. | 607,726 | 40,328,697 | |
| PNM Resources, Inc. | 287,848 | 10,650,376 | |
| Westar Energy, Inc. | 175,900 | 9,546,093 | |
| 221,974,475 | |||
| Gas Utilities - 1.0% | |||
| Gas Utilities - 1.0% | |||
| South Jersey Industries, Inc. | 137,735 | 4,910,253 | |
| Independent Power and Renewable Electricity Producers - 9.2% | |||
| Independent Power Producers & Energy Traders - 5.0% | |||
| Dynegy, Inc. (a) | 271,837 | 2,136,639 | |
| NRG Energy, Inc. | 665,200 | 12,439,240 | |
| NRG Yield, Inc. Class C | 510,293 | 9,032,186 | |
| 23,608,065 | |||
| Renewable Electricity - 4.2% | |||
| NextEra Energy Partners LP | 378,682 | 12,545,735 | |
| Pattern Energy Group, Inc. | 364,246 | 7,332,272 | |
| 19,878,007 | |||
| TOTAL INDEPENDENT POWER AND RENEWABLE ELECTRICITY PRODUCERS | 43,486,072 | ||
| Media - 1.2% | |||
| Cable & Satellite - 1.2% | |||
| Charter Communications, Inc. Class A (a) | 17,100 | 5,597,172 | |
| Multi-Utilities - 38.3% | |||
| Multi-Utilities - 38.3% | |||
| Avangrid, Inc. | 542,753 | 23,197,263 | |
| Black Hills Corp. | 191,800 | 12,748,946 | |
| CenterPoint Energy, Inc. | 711,378 | 19,612,691 | |
| Dominion Resources, Inc. | 374,429 | 29,044,458 | |
| DTE Energy Co. | 221,438 | 22,611,034 | |
| SCANA Corp. | 223,189 | 14,585,401 | |
| Sempra Energy | 548,954 | 60,659,417 | |
| 182,459,210 | |||
| Oil, Gas & Consumable Fuels - 0.9% | |||
| Oil & Gas Storage & Transport - 0.9% | |||
| Cheniere Energy Partners LP Holdings LLC | 179,963 | 4,394,696 | |
| TOTAL COMMON STOCKS | |||
| (Cost $370,651,303) | 462,821,878 | ||
| Money Market Funds - 3.2% | |||
| Fidelity Cash Central Fund, 0.84% (b) | |||
| (Cost $15,005,855) | 15,002,854 | 15,005,855 | |
| TOTAL INVESTMENT PORTFOLIO - 100.4% | |||
| (Cost $385,657,158) | 477,827,733 | ||
| NET OTHER ASSETS (LIABILITIES) - (0.4)% | (1,677,931) | ||
| NET ASSETS - 100% | $476,149,802 |
Legend
(a) Non-income producing
(b) Affiliated fund that is generally available only to investment companies and other accounts managed by Fidelity Investments. The rate quoted is the annualized seven-day yield of the fund at period end. A complete unaudited listing of the fund's holdings as of its most recent quarter end is available upon request. In addition, each Fidelity Central Fund's financial statements are available on the SEC's website or upon request.
Affiliated Central Funds
Information regarding fiscal year to date income earned by the Fund from investments in Fidelity Central Funds is as follows:
| Fund | Income earned |
| Fidelity Cash Central Fund | $20,163 |
| Fidelity Securities Lending Cash Central Fund | 134 |
| Total | $20,297 |
Investment Valuation
All investments are categorized as Level 1 under the Fair Value Hierarchy. The inputs or methodology used for valuing securities may not be an indication of the risk associated with investing in those securities. For more information on valuation inputs please refer to the Investment Valuation section in the accompanying Notes to Financial Statements.
See accompanying notes which are an integral part of the financial statements.
Fidelity® Utilities Central Fund
Financial Statements
Statement of Assets and Liabilities
| March 31, 2017 (Unaudited) | ||
| Assets | ||
| Investment in securities, at value — See accompanying schedule: Unaffiliated issuers (cost $370,651,303) | $462,821,878 | |
| Fidelity Central Funds (cost $15,005,855) | 15,005,855 | |
| Total Investments (cost $385,657,158) | $477,827,733 | |
| Receivable for investments sold | 311,952 | |
| Receivable for fund shares sold | 56,261 | |
| Dividends receivable | 1,552,244 | |
| Distributions receivable from Fidelity Central Funds | 7,363 | |
| Other receivables | 771 | |
| Total assets | 479,756,324 | |
| Liabilities | ||
| Payable for investments purchased | $3,495,425 | |
| Payable for fund shares redeemed | 105,728 | |
| Other payables and accrued expenses | 5,369 | |
| Total liabilities | 3,606,522 | |
| Net Assets | $476,149,802 | |
| Net Assets consist of: | ||
| Paid in capital | $375,532,492 | |
| Undistributed net investment income | 2,194,929 | |
| Accumulated undistributed net realized gain (loss) on investments and foreign currency transactions | 6,252,729 | |
| Net unrealized appreciation (depreciation) on investments and assets and liabilities in foreign currencies | 92,169,652 | |
| Net Assets, for 2,748,958 shares outstanding | $476,149,802 | |
| Net Asset Value, offering price and redemption price per share ($476,149,802 ÷ 2,748,958 shares) | $173.21 |
See accompanying notes which are an integral part of the financial statements.
Statement of Operations
| Six months ended March 31, 2017 (Unaudited) | ||
| Investment Income | ||
| Dividends | $6,925,985 | |
| Income from Fidelity Central Funds (including $134 from security lending) | 20,297 | |
| Total income | 6,946,282 | |
| Expenses | ||
| Custodian fees and expenses | $8,999 | |
| Independent directors' fees and expenses | 935 | |
| Interest | 290 | |
| Total expenses before reductions | 10,224 | |
| Expense reductions | (935) | 9,289 |
| Net investment income (loss) | 6,936,993 | |
| Realized and Unrealized Gain (Loss) | ||
| Net realized gain (loss) on: | ||
| Investment securities: | ||
| Unaffiliated issuers | 6,250,362 | |
| Fidelity Central Funds | 87 | |
| Foreign currency transactions | 2,280 | |
| Total net realized gain (loss) | 6,252,729 | |
| Change in net unrealized appreciation (depreciation) on: Investment securities | 19,713,280 | |
| Assets and liabilities in foreign currencies | (1,692) | |
| Total change in net unrealized appreciation (depreciation) | 19,711,588 | |
| Net gain (loss) | 25,964,317 | |
| Net increase (decrease) in net assets resulting from operations | $32,901,310 |
See accompanying notes which are an integral part of the financial statements.
Statement of Changes in Net Assets
| Six months ended March 31, 2017 (Unaudited) | Year ended September 30, 2016 | |
| Increase (Decrease) in Net Assets | ||
| Operations | ||
| Net investment income (loss) | $6,936,993 | $13,622,319 |
| Net realized gain (loss) | 6,252,729 | 678,956 |
| Change in net unrealized appreciation (depreciation) | 19,711,588 | 53,765,500 |
| Net increase (decrease) in net assets resulting from operations | 32,901,310 | 68,066,775 |
| Distributions to shareholders from net investment income | (4,742,064) | (12,337,848) |
| Affiliated share transactions | ||
| Proceeds from sales of shares | 36,820,896 | 40,913,282 |
| Reinvestment of distributions | 4,741,869 | 12,337,342 |
| Cost of shares redeemed | (56,615,197) | (52,194,632) |
| Net increase (decrease) in net assets resulting from share transactions | (15,052,432) | 1,055,992 |
| Total increase (decrease) in net assets | 13,106,814 | 56,784,919 |
| Net Assets | ||
| Beginning of period | 463,042,988 | 406,258,069 |
| End of period | $476,149,802 | $463,042,988 |
| Other Information | ||
| Undistributed net investment income end of period | $2,194,929 | $– |
| Shares | ||
| Sold | 227,166 | 264,984 |
| Issued in reinvestment of distributions | 30,221 | 78,378 |
| Redeemed | (350,531) | (321,583) |
| Net increase (decrease) | (93,144) | 21,779 |
See accompanying notes which are an integral part of the financial statements.
Financial Highlights — Fidelity Utilities Central Fund
| Six months ended (Unaudited) March 31, | Years ended September 30, | |||||
| 2017 | 2016 | 2015 | 2014 | 2013 | 2012 | |
| Selected Per–Share Data | ||||||
| Net asset value, beginning of period | $162.92 | $144.05 | $155.14 | $130.43 | $116.88 | $103.95 |
| Income from Investment Operations | ||||||
| Net investment income (loss)A | 2.46 | 4.73 | 4.36 | 4.11 | 4.04 | 3.82 |
| Net realized and unrealized gain (loss) | 9.48 | 18.44 | (11.35) | 24.33 | 13.29 | 12.71 |
| Total from investment operations | 11.94 | 23.17 | (6.99) | 28.44 | 17.33 | 16.53 |
| Distributions from net investment income | (1.65) | (4.30) | (4.10) | (3.73) | (3.78) | (3.60) |
| Total distributions | (1.65) | (4.30) | (4.10) | (3.73) | (3.78) | (3.60) |
| Net asset value, end of period | $173.21 | $162.92 | $144.05 | $155.14 | $130.43 | $116.88 |
| Total ReturnB,C | 7.44% | 16.23% | (4.66)% | 21.98% | 15.04% | 16.13% |
| Ratios to Average Net AssetsD,E | ||||||
| Expenses before reductionsF | - %G | -% | -% | -% | -% | -% |
| Expenses net of fee waivers, if anyF | - %G | -% | -% | -% | -% | -% |
| Expenses net of all reductionsF | - %G | -% | -% | -% | -% | -% |
| Net investment income (loss) | 3.03%G | 3.03% | 2.78% | 2.80% | 3.23% | 3.43% |
| Supplemental Data | ||||||
| Net assets, end of period (000 omitted) | $476,150 | $463,043 | $406,258 | $482,971 | $398,657 | $320,338 |
| Portfolio turnover rateH | 44%G,I | 76% | 110% | 121%I | 148%I | 175% |
A Calculated based on average shares outstanding during the period.
B Total returns for periods of less than one year are not annualized.
C Total returns would have been lower if certain expenses had not been reduced during the applicable periods shown.
D Fees and expenses of any underlying Fidelity Central Funds are not included in the Fund's expense ratio. The Fund indirectly bears its proportionate share of the expenses of any underlying Fidelity Central Funds.
E Expense ratios reflect operating expenses of the Fund. Expenses before reductions do not reflect amounts reimbursed by the investment adviser or reductions from expense offset arrangements and do not represent the amount paid by the Fund during periods when reimbursements or reductions occur. Expenses net of fee waivers reflect expenses after reimbursement by the investment adviser but prior to reductions from expense offset arrangements. Expenses net of all reductions represent the net expenses paid by the Fund.
F Amount represents less than .005%.
G Annualized
H Amount does not include the portfolio activity of any underlying Fidelity Central Funds.
I Portfolio turnover rate excludes securities received or delivered in-kind.
See accompanying notes which are an integral part of the financial statements.
Notes to Financial Statements (Unaudited)
For the period ended March 31, 2017
1. Organization.
Fidelity Consumer Discretionary Central Fund (Consumer Discretionary), Fidelity Consumer Staples Central Fund (Consumer Staples), Fidelity Energy Central Fund (Energy), Fidelity Financials Central Fund (Financials), Fidelity Health Care Central Fund (Health Care), Fidelity Industrials Central Fund (Industrials), Fidelity Information Technology Central Fund (Information Technology), Fidelity Materials Central Fund (Materials), Fidelity Real Estate Equity Central Fund (Real Estate Equity), Fidelity Telecom Services Central Fund (Telecom Services), and Fidelity Utilities Central Fund (Utilities), collectively referred to as the Funds, are funds of Fidelity Central Investment Portfolios LLC (the LLC) and are authorized to issue an unlimited number of shares. The LLC is registered under the Investment Company Act of 1940, as amended (the 1940 Act), as an open-end management investment company organized as a Delaware Limited Liability Company. Shares of each Fund are only offered to other investment companies and accounts managed by Fidelity Management & Research Company (FMR), or its affiliates (the Investing Funds). All of the Funds are non-diversified, with the exception of Financials and Health Care. The Funds invest primarily in securities of companies whose principal business activities fall within specific industries. The Funds are referred to as Fidelity Central Funds and may also invest in other Fidelity Central Funds available only to investment companies and other accounts managed by FMR and its affiliates.
2. Investments in Fidelity Central Funds.
The Funds invest in Fidelity Central Funds, which are open-end investment companies generally available only to other investment companies and accounts managed by the investment adviser and its affiliates. The Funds' Schedules of Investments list each of the Fidelity Central Funds held as of period end, if any, as an investment of each Fund, but do not include the underlying holdings of each Fidelity Central Fund. As an Investing Fund, each Fund indirectly bears its proportionate share of the expenses of the underlying Fidelity Central Funds.
The Money Market Central Funds seek preservation of capital and current income and are managed by Fidelity Investments Money Management, Inc. (FIMM), an affiliate of the investment adviser. Annualized expenses of the Money Market Central Funds as of their most recent shareholder report date are less than .005%.
A complete unaudited list of holdings for each Fidelity Central Fund is available upon request or at the Securities and Exchange Commission (the SEC) website at www.sec.gov. In addition, the financial statements of the Fidelity Central Funds are available on the SEC website or upon request.
3. Significant Accounting Policies.
Each Fund is an investment company and applies the accounting and reporting guidance of the Financial Accounting Standards Board (FASB) Accounting Standards Codification Topic 946 Financial Services – Investments Companies. The financial statements have been prepared in conformity with accounting principles generally accepted in the United States of America (GAAP), which require management to make certain estimates and assumptions at the date of the financial statements. Actual results could differ from those estimates. Subsequent events, if any, through the date that the financial statements were issued have been evaluated in the preparation of the financial statements. The following summarizes the significant accounting policies of the Funds:
Investment Valuation. Investments are valued as of 4:00 p.m. Eastern time on the last calendar day of the period. The Board of Directors (the Board) has delegated the day to day responsibility for the valuation of each Fund's investments to the Fair Value Committee (the Committee) established by each Fund's investment adviser. In accordance with valuation policies and procedures approved by the Board, each Fund attempts to obtain prices from one or more third party pricing vendors or brokers to value its investments. When current market prices, quotations or currency exchange rates are not readily available or reliable, investments will be fair valued in good faith by the Committee, in accordance with procedures adopted by the Board. Factors used in determining fair value vary by investment type and may include market or investment specific events. The frequency with which these procedures are used cannot be predicted and they may be utilized to a significant extent. The Committee oversees each Fund's valuation policies and procedures and reports to the Board on the Committee's activities and fair value determinations. The Board monitors the appropriateness of the procedures used in valuing each Fund's investments and ratifies the fair value determinations of the Committee.
Each Fund categorizes the inputs to valuation techniques used to value its investments into a disclosure hierarchy consisting of three levels as shown below:
- Level 1 – quoted prices in active markets for identical investments
- Level 2 – other significant observable inputs (including quoted prices for similar investments, interest rates, prepayment speeds, etc.)
- Level 3 – unobservable inputs (including the Fund's own assumptions based on the best information available)
Valuation techniques used to value each Fund's investments by major category are as follows:
Equity securities, including restricted securities, for which market quotations are readily available, are valued at the last reported sale price or official closing price as reported by a third party pricing vendor on the primary market or exchange on which they are traded and are categorized as Level 1 in the hierarchy. In the event there were no sales during the day or closing prices are not available, securities are valued at the last quoted bid price or may be valued using the last available price and are generally categorized as Level 2 in the hierarchy. For foreign equity securities, when market or security specific events arise, comparisons to the valuation of American Depositary Receipts (ADRs), futures contracts, Exchange-Traded Funds (ETFs) and certain indexes as well as quoted prices for similar securities may be used and would be categorized as Level 2 in the hierarchy. Utilizing these techniques may result in transfers between Level 1 and Level 2. For equity securities, including restricted securities, where observable inputs are limited, assumptions about market activity and risk are used and these securities may be categorized as Level 3 in the hierarchy. Equity securities, including restricted securities, for which observable inputs are not available are valued using alternate valuation approaches, including the market approach and the income approach and are categorized as Level 3 in the hierarchy. The market approach generally consists of using comparable market transactions while the income approach generally consists of using the net present value of estimated future cash flows, adjusted as appropriate for liquidity, credit, market and/or other risk factors.
Investments in open-end mutual funds, including other Fidelity Central Funds, are valued at their closing net asset value (NAV) each business day and are categorized as Level 1 in the hierarchy.
The following provides information on Level 3 securities held by Information Technology that were valued at period end based on unobservable inputs. These amounts exclude valuations provided by a broker.
Information Technology:
| Asset Type | Fair Value at 03/31/2017 | Valuation Technique(s) | Unobservable Input | Amount or Range/Weighted Average | Impact to Valuation from an Increase in Input(a) |
| Equities | $52,425,091 | Market approach | Discount rate | 2.3% | Decrease |
| Transaction price | $3.86 - $48.77 / $30.68 | Increase | |||
| Enterprise value/Gross profit multiple (EV/GP) | 11.6 | Increase | |||
| Discount for lack of marketability (DLOM) | 15.0% | Decrease | |||
| Market comparable | Liquidity preference | $120.00 | Increase |
(a) Represents the expected directional change in the fair value of the Level 3 investments that would result from an increase in the corresponding input. A decrease to the unobservable input would have the opposite effect. Significant changes in these inputs could result in significantly higher or lower fair value measurements.
Changes in valuation techniques may result in transfers in or out of an assigned level within the disclosure hierarchy. The aggregate value of investments by input level as of March 31, 2017, including information on transfers between Levels 1 and 2, as well as a roll forward of Level 3 investments, is included at the end of each applicable Fund's Schedule of Investments.
Foreign Currency. The Funds may use foreign currency contracts to facilitate transactions in foreign-denominated securities. Gains and losses from these transactions may arise from changes in the value of the foreign currency or if the counterparties do not perform under the contracts' terms.
Foreign-denominated assets, including investment securities, and liabilities are translated into U.S. dollars at the exchange rates at period end. Purchases and sales of investment securities, income and dividends received and expenses denominated in foreign currencies are translated into U.S. dollars at the exchange rate in effect on the transaction date.
The effects of exchange rate fluctuations on investments are included with the net realized and unrealized gain (loss) on investment securities. Other foreign currency transactions resulting in realized and unrealized gain (loss) are disclosed separately.
Investment Transactions and Income. For financial reporting purposes, the Funds' investment holdings and NAV include trades executed through the end of the last business day of the period. The NAV per share for processing shareholder transactions is calculated as of the close of business of the New York Stock Exchange (NYSE), normally 4:00 p.m. Eastern time and includes trades executed through the end of the prior business day. Gains and losses on securities sold are determined on the basis of identified cost and may include proceeds received from litigation. Dividend income is recorded on the ex-dividend date, except for certain dividends from foreign securities where the ex-dividend date may have passed, which are recorded as soon as the Funds are informed of the ex-dividend date. Non-cash dividends included in dividend income, if any, are recorded at the fair market value of the securities received. Income and capital gain distributions from Fidelity Central Funds, if any, are recorded on the ex-dividend date. Certain distributions received by the Funds represent a return of capital or capital gain. The Funds determine the components of these distributions subsequent to the ex-dividend date, based upon receipt of tax filings or other correspondence relating to the underlying investment. These distributions are recorded as a reduction of cost of investments and/or as a realized gain. Interest income is accrued as earned and includes coupon interest and amortization of premium and accretion of discount on debt securities as applicable. Investment income is recorded net of foreign taxes withheld where recovery of such taxes is uncertain.
Expenses. Expenses directly attributable to a fund are charged to that fund. Expenses attributable to more than one fund are allocated among the respective funds on the basis of relative net assets or other appropriate methods. Expense estimates are accrued in the period to which they relate and adjustments are made when actual amounts are known.
Income Tax Information and Distributions to Shareholders. Each year, effective October 1, 2016, each Fund intends to qualify as a regulated investment company under Subchapter M of the Internal Revenue Code, including distributing substantially all of its taxable income and realized gains. As a result, no provision for U.S. Federal income taxes is required. Each Fund files a U.S. federal tax return, in addition to state and local tax returns as required. Each Fund's federal income tax returns are subject to examination by the Internal Revenue Service (IRS) for a period of three fiscal years after they are filed. State and local tax returns may be subject to examination for an additional fiscal year depending on the jurisdiction. Foreign taxes are provided for based on each Fund's understanding of the tax rules and rates that exist in the foreign markets in which it invests. Consumer Staples, Energy and Information Technology are subject to a tax imposed on capital gains by certain countries in which they invest. An estimated deferred tax liability for net unrealized appreciation on the applicable securities is included in Other payables and accrued expenses on each applicable Fund's Statement of Assets & Liabilities. Prior to October 1, 2016, each Fund was a partnership for tax purposes, and no provision was made for U.S. Federal income taxes because each Fund allocated, at least annually among its partners, each partner's share of the Fund's income and expenses and capital gains and losses as determined by income tax regulations for inclusion in each partner's tax return. Due to each Fund's previous partnership structure, paid in capital includes any accumulated net investment income (loss) and net realized gain (loss) on investments prior to October 1, 2016.
Distributions are declared and recorded on the ex-dividend date. Income and capital gain distributions are determined in accordance with income tax regulations, which may differ from GAAP.
Capital accounts within the financial statements are adjusted for permanent book-tax differences. These adjustments have no impact on net assets or the results of operations. Capital accounts are not adjusted for temporary book-tax differences which will reverse in a subsequent period.
The federal tax cost of investment securities and unrealized appreciation (depreciation) as of period end were as follows for each Fund:
| Tax cost | Gross unrealized appreciation | Gross unrealized depreciation | Net unrealized appreciation (depreciation) on securities | |
| Consumer Discretionary | $1,150,972,002 | $487,338,734 | $(22,069,648) | $465,269,086 |
| Consumer Staples | 1,089,031,890 | 354,338,761 | (18,473,908) | 335,864,853 |
| Energy | 884,267,417 | 163,209,030 | (41,561,670) | 121,647,360 |
| Financials | 2,219,042,701 | 631,497,879 | (31,616,133) | 599,881,746 |
| Health Care | 1,753,849,813 | 445,401,913 | (71,642,758) | 373,759,155 |
| Industrials | 1,162,369,860 | 289,879,896 | (13,999,624) | 275,880,272 |
| Information Technology | 2,867,897,351 | 1,178,386,522 | (74,331,580) | 1,104,054,942 |
| Materials | 347,386,867 | 98,944,437 | (5,650,928) | 93,293,509 |
| Real Estate Equity | 111,160,604 | 13,812,033 | (2,465,666) | 11,346,367 |
| Telecom Services | 363,047,547 | 92,502,908 | (13,532,645) | 78,970,263 |
| Utilities | 386,294,669 | 96,272,795 | (4,739,731) | 91,533,064 |
Restricted Securities. The Funds may invest in securities that are subject to legal or contractual restrictions on resale. These securities generally may be resold in transactions exempt from registration or to the public if the securities are registered. Disposal of these securities may involve time-consuming negotiations and expense, and prompt sale at an acceptable price may be difficult. Information regarding restricted securities is included at the end of each applicable Fund's Schedule of Investments.
4. Purchases and Sales of Investments.
Purchases and sales of securities, other than short-term securities and in-kind transactions, are noted in the table below.
| Purchases ($) | Sales ($) | |
| Consumer Discretionary | 271,052,565 | 405,185,661 |
| Consumer Staples | 402,292,521 | 523,682,511 |
| Energy | 466,479,164 | 510,668,685 |
| Financials | 817,933,959 | 1,026,131,009 |
| Health Care | 735,376,774 | 768,471,538 |
| Industrials | 437,679,494 | 570,848,177 |
| Information Technology | 1,446,575,549 | 1,506,363,749 |
| Materials | 121,632,318 | 154,356,268 |
| Real Estate Equity | 54,687,544 | 99,817,604 |
| Telecom Services | 214,142,748 | 228,857,645 |
| Utilities | 100,983,182 | 139,351,412 |
5. Fees and Other Transactions with Affiliates.
Management Fee and Expense Contract. FMR Co., Inc. (the investment adviser), an affiliate of FMR, provides each Fund with investment management services. The Funds do not pay any fees for these services. Pursuant to each Fund's management contract with the investment adviser, FMR pays the investment adviser a portion of the management fees it receives from the Investing Funds. In addition, under an expense contract FMR pays all other expenses of each Fund, excluding custody fees, fees and expenses of the independent Directors, and certain exceptions such as interest expense.
Brokerage Commissions. Certain Funds placed a portion of their portfolio transactions with brokerage firms which are affiliates of the investment adviser. Brokerage commissions are included in net realized gain (loss) and change in net unrealized appreciation (depreciation) in the Statement of Operations. The commissions paid to these affiliated firms were as follows:
| Amount | |
| Consumer Discretionary | $4,214 |
| Consumer Staples | 7,051 |
| Energy | 12,722 |
| Financials | 17,202 |
| Health Care | 22,262 |
| Industrials | 15,063 |
| Information Technology | 37,302 |
| Materials | 5,446 |
| Real Estate Equity | 385 |
| Telecom Services | 12,380 |
| Utilities | 3,811 |
Interfund Lending Program. Pursuant to an Exemptive Order issued by the SEC, the Funds, along with other registered investment companies having management contracts with FMR or other affiliated entities of FMR, may participate in an interfund lending program. This program provides an alternative credit facility allowing the funds to borrow from, or lend money to, other participating affiliated funds. At period end, there were no interfund loans outstanding. Each applicable fund's activity in this program during the period for which loans were outstanding was as follows:
| Borrower or Lender | Average Loan Balance | Weighted Average Interest Rate | Interest Expense | |
| Consumer Discretionary | Borrower | $11,156,087 | .83% | $5,949 |
| Consumer Staples | Borrower | 17,546,500 | .84% | 814 |
| Energy | Borrower | 10,456,889 | .71% | 1,853 |
| Financials | Borrower | 13,546,500 | .84% | 628 |
| Health Care | Borrower | 21,997,000 | .84% | 1,531 |
| Industrials | Borrower | 10,603,833 | .83% | 2,929 |
| Information Technology | Borrower | 23,872,923 | .83% | 7,177 |
| Materials | Borrower | 7,083,250 | .75% | 589 |
| Utilities | Borrower | 8,988,500 | .58% | 290 |
Interfund Trades. The Funds may purchase from or sell securities to other Fidelity Funds under procedures adopted by the Board. The procedures have been designed to ensure these interfund trades are executed in accordance with Rule 17a-7 of the 1940 Act. Interfund trades are included within the respective purchases and sales amounts shown in the Purchases and Sales of Investments note.
Exchanges In-Kind. During the period, VIP Asset Manager: Growth Portfolio and VIP Asset Manager Portfolio (the Investing Funds) completed exchange in-kind transactions with each Fund. The Investing Funds delivered investments and cash in exchange for shares of each Fund, as presented in the accompanying table. The value of investments delivered from the Investing Funds is included in proceeds from sales of shares in the accompanying Statements of Changes in Net Assets. Each Fund recognized no gain or loss for federal income tax purposes.
Details of the transactions are presented in the accompanying table:
| Fund | Value of Investments and Cash Delivered | Exchanged Number of Shares |
| Consumer Discretionary | $56,561,990 | 227,138 |
| Consumer Staples | 39,235,872 | 183,071 |
| Energy | 34,322,119 | 270,083 |
| Financials | 98,879,378 | 1,088,740 |
| Health Care | 66,542,763 | 201,413 |
| Industrials | 50,997,163 | 199,332 |
| Information Technology | 109,126,057 | 339,365 |
| Materials | 15,146,995 | 70,151 |
| Telecom Services | 12,919,521 | 69,136 |
| Utilities | 14,935,496 | 96,739 |
6. Security Lending.
Certain Funds lend portfolio securities through a lending agent from time to time in order to earn additional income. For equity securities, a lending agent is used and may loan securities to certain qualified borrowers, including Fidelity Capital Markets (FCM), a broker-dealer affiliated with the Funds. On the settlement date of the loan, each applicable Fund receives collateral (in the form of U.S. Treasury obligations, letters of credit and/or cash) against the loaned securities and maintains collateral in an amount not less than 100% of the market value of the loaned securities during the period of the loan. The market value of the loaned securities is determined at the close of business of the Funds and any additional required collateral is delivered to the Funds on the next business day. The Funds or borrower may terminate the loan at any time, and if the borrower defaults on its obligation to return the securities loaned because of insolvency or other reasons, the Funds may apply collateral received from the borrower against the obligation. The Funds may experience delays and costs in recovering the securities loaned. Any cash collateral received is invested in the Fidelity Securities Lending Cash Central Fund. The value of loaned securities and cash collateral at period end are disclosed on each applicable Fund's Statement of Assets and Liabilities. Security lending income represents the income earned on investing cash collateral, less rebates paid to borrowers and any lending agent fees associated with the loan, plus any premium payments received for lending certain types of securities. Security lending income is presented on each applicable Fund's Statement of Operations as a component of income from Fidelity Central Funds. FCM security lending activity was as follows:
| Security Lending Income From Securities Loaned to FCM | Value of Securities Loaned to FCM at Period End | |
| Consumer Discretionary | $2,376 | $– |
| Consumer Staples | 1,067 | – |
| Energy | 3,068 | – |
| Health Care | 114,807 | 14,956,680 |
| Industrials | 1,614 | 1,659,204 |
| Information Technology | 70,099 | 4,565,770 |
| Materials | 420 | – |
| Telecom Services | 71,035 | 435,200 |
7. Expense Reductions.
The investment adviser voluntarily agreed to reimburse a portion of each Fund's operating expenses. In addition, through arrangements with each applicable Fund's custodian, credits realized as a result of certain uninvested cash balances were used to reduce each applicable Fund's expenses. During the period, the reduction of expenses for each Fund is noted in the table below.
| Fund | Expense Reduction | Custody Earnings Credits |
| Consumer Discretionary | $3,286 | $1 |
| Consumer Staples | 2,584 | 387 |
| Energy | 2,119 | – |
| Financials | 5,575 | 67 |
| Health Care | 3,974 | – |
| Industrials | 2,966 | 129 |
| Information Technology | 6,789 | 488 |
| Materials | 857 | – |
| Real Estate Equity | 325 | 5 |
| Telecom Services | 802 | – |
| Utilities | 935 | – |
8. Other.
The Funds' organizational documents provide former and current directors and officers with a limited indemnification against liabilities arising in connection with the performance of their duties to the Funds. In the normal course of business, the Funds may also enter into contracts that provide general indemnifications. The Funds' maximum exposure under these arrangements is unknown as this would be dependent on future claims that may be made against the Funds. The risk of material loss from such claims is considered remote.
At the end of the period, mutual funds managed by FMR or its affiliates were the owners of record of all of the outstanding shares of the Funds.
Shareholder Expense Example
As a shareholder of a Fund, you incur two types of costs: (1) transaction costs, and (2) ongoing costs, including other Fund expenses. This Example is intended to help you understand your ongoing costs (in dollars) of investing in the Funds and to compare these costs with the ongoing costs of investing in other mutual funds.
The Example is based on an investment of $1,000 invested at the beginning of the period and held for the entire period (October 1, 2016 to March 31, 2017).
Actual Expenses
The first line of the accompanying table for each fund provides information about actual account values and actual expenses. You may use the information in this line, together with the amount you invested, to estimate the expenses that you paid over the period. Simply divide your account value by $1,000.00 (for example, an $8,600 account value divided by $1,000.00 = 8.6), then multiply the result by the number in the first line for a fund under the heading entitled "Expenses Paid During Period" to estimate the expenses you paid on your account during this period. In addition, each Fund, as a shareholder in the underlying Fidelity Central Funds, will indirectly bear its pro-rata share of the fees and expenses incurred by the underlying Fidelity Central Funds. These fees and expenses are not included in the Fund's annualized expense ratio used to calculate the expense estimate in the table below.
Hypothetical Example for Comparison Purposes
The second line of the accompanying table for each fund provides information about hypothetical account values and hypothetical expenses based on a fund's actual expense ratio and an assumed rate of return of 5% per year before expenses, which is not the Fund's actual return. The hypothetical account values and expenses may not be used to estimate the actual ending account balance or expenses you paid for the period. You may use this information to compare the ongoing costs of investing in the Fund and other funds. To do so, compare this 5% hypothetical example with the 5% hypothetical examples that appear in the shareholder reports of the other funds. In addition, each Fund, as a shareholder in the underlying Fidelity Central Funds, will indirectly bear its pro-rata share of the fees and expenses incurred by the underlying Fidelity Central Funds. These fees and expenses are not included in the Fund's annualized expense ratio used to calculate the expense estimate in the table below.
Please note that the expenses shown in the table are meant to highlight your ongoing costs only and do not reflect any transaction costs. Therefore, the second line of the table is useful in comparing ongoing costs only, and will not help you determine the relative total costs of owning different funds.
| Annualized Expense Ratio-A | Beginning Account Value October 1, 2016 | Ending Account Value March 31, 2017 | Expenses Paid During Period-B October 1, 2016 to March 31, 2017 | |
| Consumer Discretionary | .0032% | |||
| Actual | $1,000.00 | $1,101.50 | $.02 | |
| Hypothetical-C | $1,000.00 | $1,024.92 | $.02 | |
| Consumer Staples | .0043% | |||
| Actual | $1,000.00 | $1,068.30 | $.02 | |
| Hypothetical-C | $1,000.00 | $1,024.91 | $.02 | |
| Energy | .0051% | |||
| Actual | $1,000.00 | $998.80 | $.03 | |
| Hypothetical-C | $1,000.00 | $1,024.91 | $.03 | |
| Financials | .0025% | |||
| Actual | $1,000.00 | $1,168.90 | $.01 | |
| Hypothetical-C | $1,000.00 | $1,024.92 | $.01 | |
| Health Care | .0042% | |||
| Actual | $1,000.00 | $1,031.00 | $.02 | |
| Hypothetical-C | $1,000.00 | $1,024.91 | $.02 | |
| Industrials | .0035% | |||
| Actual | $1,000.00 | $1,117.40 | $.02 | |
| Hypothetical-C | $1,000.00 | $1,024.91 | $.02 | |
| Information Technology | .0088% | |||
| Actual | $1,000.00 | $1,151.90 | $.05 | |
| Hypothetical-C | $1,000.00 | $1,024.89 | $.04 | |
| Materials | .0072% | |||
| Actual | $1,000.00 | $1,128.50 | $.04 | |
| Hypothetical-C | $1,000.00 | $1,024.90 | $.04 | |
| Real Estate Equity | .0136% | |||
| Actual | $1,000.00 | $990.80 | $.07 | |
| Hypothetical-C | $1,000.00 | $1,024.86 | $.07 | |
| Telecom Services | .0073% | |||
| Actual | $1,000.00 | $1,063.20 | $.04 | |
| Hypothetical-C | $1,000.00 | $1,024.90 | $.04 | |
| Utilities | .0041% | |||
| Actual | $1,000.00 | $1,074.40 | $.02 | |
| Hypothetical-C | $1,000.00 | $1,024.91 | $.02 |
A Annualized expense ratio reflects expenses net of applicable fee waivers.
B Expenses are equal to each Fund's annualized expense ratio, multiplied by the average account value over the period, multiplied by 182/365 (to reflect the one-half year period). The fees and expenses of the underlying Money Market Central Funds in which each Fund invests are not included in each Fund's annualized expense ratio.
C 5% return per year before expenses
![]()
ESCIP-SANN-0517
1.831586.110
Fidelity® Emerging Markets Equity Central Fund Semi-Annual Report March 31, 2017 |
|
Contents
To view a fund's proxy voting guidelines and proxy voting record for the 12-month period ended June 30, visit http://www.fidelity.com/proxyvotingresults or visit the Securities and Exchange Commission's (SEC) web site at http://www.sec.gov.
You may also call 1-800-544-8544 to request a free copy of the proxy voting guidelines.
Standard & Poor's, S&P and S&P 500 are registered service marks of The McGraw-Hill Companies, Inc. and have been licensed for use by Fidelity Distributors Corporation.
Other third-party marks appearing herein are the property of their respective owners.
All other marks appearing herein are registered or unregistered trademarks or service marks of FMR LLC or an affiliated company. © 2017 FMR LLC. All rights reserved.
A fund files its complete schedule of portfolio holdings with the SEC for the first and third quarters of each fiscal year on Form N-Q. Forms N-Q are available on the SEC’s web site at http://www.sec.gov. A fund's Forms N-Q may be reviewed and copied at the SEC’s Public Reference Room in Washington, DC. Information regarding the operation of the SEC's Public Reference Room may be obtained by calling 1-800-SEC-0330.
Investment Summary (Unaudited)
Geographic Diversification (% of fund's net assets)
| As of March 31, 2017 | ||
| Cayman Islands | 14.6% | |
| Korea (South) | 13.3% | |
| Brazil | 8.8% | |
| India | 7.6% | |
| Taiwan | 7.4% | |
| China | 6.9% | |
| Russia | 5.8% | |
| South Africa | 5.2% | |
| Hong Kong | 4.5% | |
| Other* | 25.9% | |

* Includes Short-Term investments and Net Other Assets (Liabilities).
Percentages are based on country or territory of incorporation and are adjusted for the effect of futures contracts, if applicable.
| As of September 30, 2016 | ||
| Cayman Islands | 12.2% | |
| Korea (South) | 12.1% | |
| India | 9.2% | |
| Brazil | 7.8% | |
| Taiwan | 7.5% | |
| South Africa | 7.2% | |
| China | 7.0% | |
| Hong Kong | 5.7% | |
| Russia | 5.4% | |
| Other* | 25.9% | |
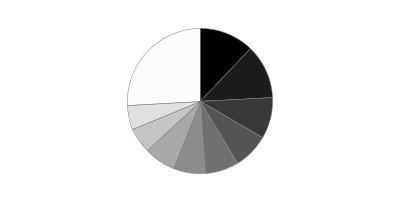
* Includes Short-Term investments and Net Other Assets (Liabilities).
Percentages are based on country or territory of incorporation and are adjusted for the effect of futures contracts, if applicable.
Asset Allocation as of March 31, 2017
| % of fund's net assets | % of fund's net assets 6 months ago | |
| Stocks and Equity Futures | 97.4 | 98.4 |
| Short-Term Investments and Net Other Assets (Liabilities) | 2.6 | 1.6 |
Top Ten Stocks as of March 31, 2017
| % of fund's net assets | % of fund's net assets 6 months ago | |
| Tencent Holdings Ltd. (Cayman Islands, Internet Software & Services) | 3.7 | 3.6 |
| Samsung Electronics Co. Ltd. (Korea (South), Technology Hardware, Storage & Peripherals) | 3.4 | 1.3 |
| Taiwan Semiconductor Manufacturing Co. Ltd. (Taiwan, Semiconductors & Semiconductor Equipment) | 2.8 | 4.1 |
| Naspers Ltd. Class N (South Africa, Media) | 2.8 | 3.5 |
| JD.com, Inc. sponsored ADR (Cayman Islands, Internet & Direct Marketing Retail) | 2.4 | 0.9 |
| Sberbank of Russia (Russia, Banks) | 2.3 | 1.3 |
| Alibaba Group Holding Ltd. sponsored ADR (Cayman Islands, Internet Software & Services) | 1.7 | 3.0 |
| Itau Unibanco Holding SA sponsored ADR (Brazil, Banks) | 1.7 | 1.4 |
| Largan Precision Co. Ltd. (Taiwan, Electronic Equipment & Components) | 1.7 | 0.5 |
| China Mobile Ltd. (Hong Kong, Wireless Telecommunications Services) | 1.4 | 1.9 |
| 23.9 |
Top Market Sectors as of March 31, 2017
| % of fund's net assets | % of fund's net assets 6 months ago | |
| Financials | 22.3 | 22.1 |
| Information Technology | 21.8 | 22.4 |
| Consumer Discretionary | 13.6 | 13.1 |
| Materials | 7.0 | 6.2 |
| Consumer Staples | 6.8 | 8.1 |
| Energy | 6.7 | 7.4 |
| Industrials | 5.7 | 5.6 |
| Telecommunication Services | 4.9 | 5.1 |
| Utilities | 3.1 | 2.7 |
| Real Estate | 2.4 | 2.5 |
Investments March 31, 2017 (Unaudited)
Showing Percentage of Net Assets
| Common Stocks - 89.4% | |||
| Shares | Value | ||
| Argentina - 0.5% | |||
| Grupo Superveille SA sponsored ADR | 19,200 | $326,400 | |
| Telecom Argentina SA Class B sponsored ADR | 40,600 | 900,914 | |
| YPF SA Class D sponsored ADR | 54,700 | 1,328,116 | |
| TOTAL ARGENTINA | 2,555,430 | ||
| Australia - 0.0% | |||
| Frontier Digital Ventures Ltd. | 490,206 | 183,514 | |
| Austria - 0.5% | |||
| Erste Group Bank AG | 74,516 | 2,426,544 | |
| Bermuda - 1.6% | |||
| AGTech Holdings Ltd. (a) | 2,352,000 | 456,993 | |
| Credicorp Ltd. (United States) | 13,957 | 2,279,178 | |
| GP Investments Ltd. Class A (depositary receipt) (a) | 88,607 | 186,803 | |
| PAX Global Technology Ltd. | 1,159,000 | 739,708 | |
| Shangri-La Asia Ltd. | 2,888,000 | 4,206,673 | |
| VimpelCom Ltd. sponsored ADR (b) | 167,600 | 683,808 | |
| TOTAL BERMUDA | 8,553,163 | ||
| Brazil - 3.5% | |||
| B2W Companhia Global do Varejo (a) | 544,960 | 2,149,829 | |
| B2W Companhia Global do Varejo rights 4/27/17 (a) | 167,044 | 80,038 | |
| BB Seguridade Participacoes SA | 178,300 | 1,663,055 | |
| BR Malls Participacoes SA | 353,100 | 1,634,325 | |
| Cielo SA | 131,060 | 1,185,175 | |
| Companhia de Saneamento de Minas Gerais | 105,930 | 1,495,594 | |
| Cosan SA Industria e Comercio | 88,285 | 1,095,878 | |
| Direcional Engenharia SA | 377,400 | 675,091 | |
| FPC Par Corretora de Seguros | 353,261 | 2,002,933 | |
| Localiza Rent A Car SA | 104,800 | 1,394,945 | |
| Minerva SA | 402,900 | 1,256,086 | |
| Smiles SA | 198,600 | 4,021,989 | |
| TOTAL BRAZIL | 18,654,938 | ||
| British Virgin Islands - 0.5% | |||
| Mail.Ru Group Ltd. GDR (Reg. S) (a) | 125,667 | 2,777,241 | |
| Canada - 0.5% | |||
| Pan American Silver Corp. | 117,200 | 2,053,344 | |
| Torex Gold Resources, Inc. (a) | 39,560 | 779,985 | |
| TOTAL CANADA | 2,833,329 | ||
| Cayman Islands - 14.3% | |||
| 51job, Inc. sponsored ADR (a) | 28,600 | 1,048,476 | |
| 58.com, Inc. ADR (a)(b) | 149,382 | 5,286,629 | |
| Airtac International Group | 75,000 | 737,037 | |
| Alibaba Group Holding Ltd. sponsored ADR (a) | 87,222 | 9,405,148 | |
| Bitauto Holdings Ltd. ADR (a)(b) | 85,700 | 2,194,777 | |
| BizLink Holding, Inc. | 86,916 | 493,597 | |
| China State Construction International Holdings Ltd. | 792,000 | 1,416,561 | |
| CK Hutchison Holdings Ltd. | 49,700 | 611,377 | |
| Ctrip.com International Ltd. ADR (a) | 105,800 | 5,200,070 | |
| Haitian International Holdings Ltd. | 509,000 | 1,184,163 | |
| JD.com, Inc. sponsored ADR (a) | 418,600 | 13,022,646 | |
| Kingsoft Corp. Ltd. | 352,000 | 969,285 | |
| Momo, Inc. ADR (a) | 35,900 | 1,223,113 | |
| NetEase, Inc. ADR | 14,300 | 4,061,200 | |
| Sino Biopharmaceutical Ltd. | 2,515,000 | 2,071,157 | |
| Sunny Optical Technology Group Co. Ltd. | 329,000 | 2,404,581 | |
| Tencent Holdings Ltd. | 692,700 | 19,956,354 | |
| Uni-President China Holdings Ltd. | 3,461,400 | 2,436,320 | |
| Vipshop Holdings Ltd. ADR (a) | 255,800 | 3,412,372 | |
| TOTAL CAYMAN ISLANDS | 77,134,863 | ||
| Chile - 1.8% | |||
| Compania Cervecerias Unidas SA sponsored ADR | 85,400 | 2,158,058 | |
| CorpBanca SA | 141,612,515 | 1,298,361 | |
| Enersis SA | 7,537,039 | 1,570,514 | |
| Inversiones La Construccion SA | 83,103 | 1,113,665 | |
| Sociedad Quimica y Minera de Chile SA (PN-B) sponsored ADR | 54,600 | 1,876,602 | |
| Vina Concha y Toro SA | 986,315 | 1,674,064 | |
| TOTAL CHILE | 9,691,264 | ||
| China - 6.9% | |||
| Anhui Conch Cement Co. Ltd. (H Shares) | 568,500 | 1,931,210 | |
| BBMG Corp. (H Shares) | 5,744,500 | 2,387,536 | |
| China Life Insurance Co. Ltd. (H Shares) | 1,316,500 | 4,027,869 | |
| China Longyuan Power Grid Corp. Ltd. (H Shares) | 1,247,750 | 969,750 | |
| China Oilfield Services Ltd. (H Shares) | 1,276,000 | 1,224,855 | |
| China Pacific Insurance (Group) Co. Ltd. (H Shares) | 973,300 | 3,512,972 | |
| China Petroleum & Chemical Corp. (H Shares) | 1,942,000 | 1,580,723 | |
| China Telecom Corp. Ltd. (H Shares) | 3,162,930 | 1,542,496 | |
| Hangzhou Hikvision Digital Technology Co. Ltd. Class A | 22,700 | 105,143 | |
| Industrial & Commercial Bank of China Ltd. (H Shares) | 10,735,000 | 7,017,152 | |
| Inner Mongoli Yili Industries Co. Ltd. (A Shares) | 250,866 | 688,806 | |
| Kweichow Moutai Co. Ltd. (A Shares) | 29,621 | 1,661,711 | |
| Maanshan Iron & Steel Ltd. (H Shares) (a) | 2,070,000 | 745,802 | |
| PICC Property & Casualty Co. Ltd. (H Shares) | 1,066,000 | 1,643,271 | |
| Qingdao Haier Co. Ltd. | 2,075,100 | 3,669,864 | |
| Shanghai International Airport Co. Ltd. (A Shares) | 262,837 | 1,144,147 | |
| Tsingtao Brewery Co. Ltd. (H Shares) | 488,000 | 2,248,009 | |
| Zhengzhou Yutong Bus Co. Ltd. | 378,214 | 1,179,602 | |
| TOTAL CHINA | 37,280,918 | ||
| Colombia - 0.3% | |||
| Bancolombia SA sponsored ADR | 43,420 | 1,731,155 | |
| Czech Republic - 0.3% | |||
| MONETA Money Bank A/S | 448,641 | 1,519,679 | |
| Egypt - 0.0% | |||
| Global Telecom Holding (a) | 6,133 | 2,277 | |
| Greece - 0.4% | |||
| Titan Cement Co. SA (Reg.) | 90,600 | 2,309,985 | |
| Hong Kong - 4.5% | |||
| AIA Group Ltd. | 183,800 | 1,158,875 | |
| China Mobile Ltd. | 146,820 | 1,614,654 | |
| China Mobile Ltd. sponsored ADR | 104,367 | 5,764,189 | |
| China Resources Beer Holdings Co. Ltd. | 1,588,666 | 3,614,182 | |
| China Resources Power Holdings Co. Ltd. | 582,723 | 1,051,248 | |
| China Unicom Ltd. | 173,000 | 232,360 | |
| China Unicom Ltd. sponsored ADR (b) | 104,000 | 1,400,880 | |
| CNOOC Ltd. | 3,933,000 | 4,701,203 | |
| Far East Horizon Ltd. | 3,839,320 | 3,606,387 | |
| Sinotruk Hong Kong Ltd. | 1,642,500 | 1,232,166 | |
| TOTAL HONG KONG | 24,376,144 | ||
| India - 7.6% | |||
| ACC Ltd. | 15,764 | 351,457 | |
| Adani Ports & Special Economic Zone Ltd. | 427,947 | 2,240,685 | |
| Axis Bank Ltd. | 219,813 | 1,663,340 | |
| Bharti Infratel Ltd. | 207,644 | 1,043,342 | |
| Coal India Ltd. | 421,151 | 1,900,244 | |
| Edelweiss Financial Services Ltd. | 374,874 | 911,465 | |
| Eicher Motors Ltd. | 4,702 | 1,854,956 | |
| Gujarat Gas Ltd. (a) | 14,910 | 176,720 | |
| ICICI Bank Ltd. | 271,763 | 1,162,196 | |
| ICICI Bank Ltd. sponsored ADR | 138,200 | 1,188,520 | |
| Indraprastha Gas Ltd. | 64,396 | 1,007,689 | |
| ITC Ltd. | 546,627 | 2,362,312 | |
| JK Cement Ltd. | 82,526 | 1,189,604 | |
| Larsen & Toubro Ltd. | 84,774 | 2,058,442 | |
| LIC Housing Finance Ltd. | 184,208 | 1,756,451 | |
| Lupin Ltd. | 142,956 | 3,185,322 | |
| Petronet LNG Ltd. | 204,986 | 1,274,131 | |
| Phoenix Mills Ltd. | 223,633 | 1,304,871 | |
| Power Grid Corp. of India Ltd. | 810,358 | 2,465,058 | |
| Reliance Industries Ltd. | 246,345 | 5,016,915 | |
| SREI Infrastructure Finance Ltd. | 434,995 | 556,319 | |
| State Bank of India | 672,764 | 3,043,308 | |
| Sun Pharmaceutical Industries Ltd. | 314,257 | 3,334,196 | |
| TOTAL INDIA | 41,047,543 | ||
| Indonesia - 1.8% | |||
| PT Astra International Tbk | 5,623,400 | 3,639,775 | |
| PT Bank Mandiri (Persero) Tbk | 2,369,250 | 2,080,239 | |
| PT Bank Rakyat Indonesia Tbk | 2,718,200 | 2,646,703 | |
| PT Kalbe Farma Tbk | 5,627,700 | 650,381 | |
| PT Link Net Tbk | 1,714,500 | 697,997 | |
| TOTAL INDONESIA | 9,715,095 | ||
| Israel - 0.5% | |||
| Bezeq The Israel Telecommunication Corp. Ltd. | 1,414,227 | 2,541,509 | |
| Japan - 1.1% | |||
| Alps Electric Co. Ltd. | 37,400 | 1,060,466 | |
| Nissha Printing Co. Ltd. | 19,600 | 464,428 | |
| Sumco Corp. | 206,100 | 3,442,740 | |
| Suzuki Motor Corp. | 22,100 | 917,895 | |
| TOTAL JAPAN | 5,885,529 | ||
| Korea (South) - 11.8% | |||
| AMOREPACIFIC Group, Inc. | 11,049 | 1,181,738 | |
| BS Financial Group, Inc. | 63,054 | 518,067 | |
| Daou Technology, Inc. | 98,762 | 1,794,387 | |
| Duk San Neolux Co. Ltd. (a) | 10,069 | 240,618 | |
| EO Technics Co. Ltd. | 4,085 | 318,815 | |
| Fila Korea Ltd. | 25,456 | 1,597,123 | |
| Hanon Systems | 111,017 | 922,078 | |
| Hyundai Fire & Marine Insurance Co. Ltd. | 62,226 | 1,949,262 | |
| Hyundai Glovis Co. Ltd. | 8,484 | 1,116,216 | |
| Hyundai Industrial Development & Construction Co. | 6,558 | 238,595 | |
| Hyundai Mipo Dockyard Co. Ltd. (a) | 12,019 | 953,086 | |
| Hyundai Mobis | 23,247 | 5,003,941 | |
| InterPark INT Corp. | 85,648 | 756,597 | |
| KB Financial Group, Inc. | 135,104 | 5,926,430 | |
| KEPCO Plant Service & Engineering Co. Ltd. | 17,016 | 950,325 | |
| Korea Electric Power Corp. | 53,803 | 2,241,573 | |
| Korea Express Co. Ltd. (a) | 11,205 | 1,669,769 | |
| Korean Reinsurance Co. | 199,663 | 2,072,935 | |
| KT Corp. | 18,520 | 529,117 | |
| KT Corp. sponsored ADR | 15,722 | 264,601 | |
| LG Chemical Ltd. | 7,326 | 1,927,722 | |
| LG Telecom Ltd. | 52,555 | 672,636 | |
| Samsung Electronics Co. Ltd. | 9,840 | 18,142,307 | |
| Samsung Fire & Marine Insurance Co. Ltd. | 2,286 | 548,329 | |
| Samsung Life Insurance Co. Ltd. | 19,585 | 1,901,882 | |
| Samsung SDI Co. Ltd. | 21,457 | 2,650,198 | |
| Shinhan Financial Group Co. Ltd. | 134,380 | 5,604,234 | |
| Shinhan Financial Group Co. Ltd. sponsored ADR | 1,200 | 50,148 | |
| SK Telecom Co. Ltd. sponsored ADR | 51,504 | 1,296,871 | |
| Viatron Technologies, Inc. | 18,665 | 333,274 | |
| TOTAL KOREA (SOUTH) | 63,372,874 | ||
| Mauritius - 0.2% | |||
| MakeMyTrip Ltd. (a) | 37,300 | 1,290,580 | |
| Mexico - 4.3% | |||
| America Movil S.A.B. de CV Series L sponsored ADR | 37,798 | 535,598 | |
| CEMEX S.A.B. de CV sponsored ADR | 366,276 | 3,322,123 | |
| Fibra Uno Administracion SA de CV | 910,200 | 1,559,600 | |
| Gruma S.A.B. de CV Series B | 206,375 | 2,904,666 | |
| Grupo Aeroportuario del Pacifico S.A.B. de CV Series B | 168,796 | 1,641,957 | |
| Grupo Comercial Chedraui S.A.B. de CV | 318,300 | 685,487 | |
| Grupo Financiero Banorte S.A.B. de CV Series O | 511,132 | 2,939,202 | |
| Infraestructura Energetica Nova S.A.B. de CV | 315,800 | 1,504,930 | |
| Macquarie Mexican (REIT) | 2,382,000 | 2,665,433 | |
| Promotora y Operadora de Infraestructura S.A.B. de CV | 98,970 | 1,069,720 | |
| Tenedora Nemak SA de CV | 986,100 | 1,099,749 | |
| Wal-Mart de Mexico SA de CV Series V (a) | 1,387,600 | 3,198,804 | |
| TOTAL MEXICO | 23,127,269 | ||
| Netherlands - 1.0% | |||
| Hangzhou Hikvision Digital Technology Co. Ltd. ELS (BNP Paribas Warrant Program) warrants 9/29/17 (a)(c) | 255,600 | 1,183,900 | |
| X5 Retail Group NV GDR (Reg. S) (a) | 41,600 | 1,399,840 | |
| Yandex NV Series A (a) | 117,110 | 2,568,222 | |
| TOTAL NETHERLANDS | 5,151,962 | ||
| Nigeria - 0.2% | |||
| Guaranty Trust Bank PLC | 1,676,919 | 136,433 | |
| Guaranty Trust Bank PLC GDR (Reg. S) | 117,474 | 469,896 | |
| Transnational Corp. of Nigeria PLC | 25,081,141 | 58,185 | |
| Zenith Bank PLC | 13,177,974 | 604,968 | |
| TOTAL NIGERIA | 1,269,482 | ||
| Pakistan - 0.5% | |||
| Habib Bank Ltd. | 955,200 | 2,456,658 | |
| Panama - 0.2% | |||
| Copa Holdings SA Class A | 10,100 | 1,133,725 | |
| Philippines - 0.5% | |||
| Metropolitan Bank & Trust Co. | 858,948 | 1,369,128 | |
| Robinsons Land Corp. | 2,847,650 | 1,304,973 | |
| TOTAL PHILIPPINES | 2,674,101 | ||
| Romania - 0.2% | |||
| Banca Transilvania SA | 1,250,145 | 779,016 | |
| Russia - 5.8% | |||
| Lukoil PJSC sponsored ADR | 101,100 | 5,354,256 | |
| Magnit OJSC GDR (Reg. S) | 35,400 | 1,352,280 | |
| MegaFon PJSC (a) | 47,900 | 543,878 | |
| MegaFon PJSC GDR | 26,300 | 307,973 | |
| MMC Norilsk Nickel PJSC sponsored ADR | 207,700 | 3,265,044 | |
| Mobile TeleSystems OJSC | 287,820 | 1,394,701 | |
| Mobile TeleSystems OJSC sponsored ADR | 9,900 | 109,197 | |
| NOVATEK OAO GDR (Reg. S) | 27,300 | 3,398,850 | |
| RusHydro PJSC (a) | 64,459,700 | 1,068,535 | |
| Sberbank of Russia | 2,171,240 | 6,163,557 | |
| Sberbank of Russia sponsored ADR | 527,992 | 6,093,028 | |
| Sistema JSFC | 2,507,300 | 990,401 | |
| Sistema JSFC sponsored GDR | 23,781 | 212,840 | |
| Unipro PJSC | 23,072,800 | 1,096,294 | |
| TOTAL RUSSIA | 31,350,834 | ||
| Singapore - 0.4% | |||
| Ascendas Real Estate Investment Trust | 541,000 | 974,601 | |
| First Resources Ltd. | 898,200 | 1,245,672 | |
| TOTAL SINGAPORE | 2,220,273 | ||
| South Africa - 5.2% | |||
| Alexander Forbes Group Holdings Ltd. | 600,835 | 287,962 | |
| Aspen Pharmacare Holdings Ltd. | 80,700 | 1,652,467 | |
| Barclays Africa Group Ltd. | 88,311 | 918,309 | |
| Bidcorp Ltd. | 51,062 | 988,413 | |
| Bidvest Group Ltd. | 120,562 | 1,382,717 | |
| FirstRand Ltd. | 605,000 | 2,090,584 | |
| Imperial Holdings Ltd. | 121,900 | 1,499,189 | |
| JSE Ltd. | 61,300 | 588,772 | |
| Life Healthcare Group Holdings Ltd. | 542,900 | 1,173,105 | |
| Life Healthcare Group Holdings Ltd. rights 4/13/17 (a) | 185,761 | 62,307 | |
| Naspers Ltd. Class N | 87,400 | 15,060,097 | |
| Nedbank Group Ltd. | 71,750 | 1,291,540 | |
| Telkom SA Ltd. | 174,697 | 976,988 | |
| TOTAL SOUTH AFRICA | 27,972,450 | ||
| Taiwan - 7.4% | |||
| Advantech Co. Ltd. | 100,000 | 836,214 | |
| Boardtek Electronics Corp. | 218,000 | 215,667 | |
| Chroma ATE, Inc. | 219,000 | 662,588 | |
| E.SUN Financial Holdings Co. Ltd. | 2,347,299 | 1,425,767 | |
| eMemory Technology, Inc. | 30,000 | 424,198 | |
| GlobalWafers Co. Ltd. | 230,000 | 1,718,848 | |
| Hon Hai Precision Industry Co. Ltd. (Foxconn) | 192,000 | 575,210 | |
| King's Town Bank | 896,000 | 889,363 | |
| LandMark Optoelectronics Corp. | 95,000 | 924,198 | |
| Largan Precision Co. Ltd. | 58,000 | 9,127,243 | |
| PChome Online, Inc. | 103,000 | 837,564 | |
| Taiwan Cement Corp. | 2,430,000 | 2,904,000 | |
| Taiwan Fertilizer Co. Ltd. | 395,000 | 546,173 | |
| Taiwan Semiconductor Manufacturing Co. Ltd. | 2,408,869 | 15,088,971 | |
| Taiwan Semiconductor Manufacturing Co. Ltd. sponsored ADR | 1,780 | 58,455 | |
| Universal Cement Corp. | 273,805 | 240,678 | |
| Vanguard International Semiconductor Corp. | 358,000 | 681,231 | |
| Wistron NeWeb Corp. | 183,590 | 515,563 | |
| Yuanta Financial Holding Co. Ltd. | 5,273,448 | 2,222,227 | |
| TOTAL TAIWAN | 39,894,158 | ||
| Thailand - 1.8% | |||
| Delta Electronics PCL (For. Reg.) | 293,900 | 748,381 | |
| Kasikornbank PCL (For. Reg.) | 584,200 | 3,213,206 | |
| PTT Global Chemical PCL (For. Reg.) | 1,198,800 | 2,555,463 | |
| PTT PCL (For. Reg.) | 214,600 | 2,416,885 | |
| Star Petroleum Refining PCL | 2,409,100 | 918,420 | |
| TOTAL THAILAND | 9,852,355 | ||
| Turkey - 1.2% | |||
| Aselsan A/S | 272,000 | 1,271,521 | |
| Bim Birlesik Magazalar A/S JSC | 131,000 | 2,014,858 | |
| Enka Insaat ve Sanayi A/S | 455,000 | 763,664 | |
| Tupras Turkiye Petrol Rafinelleri A/S | 106,358 | 2,639,599 | |
| TOTAL TURKEY | 6,689,642 | ||
| United Arab Emirates - 1.5% | |||
| DP World Ltd. | 76,706 | 1,649,179 | |
| Emaar Properties PJSC | 1,766,509 | 3,510,990 | |
| First Gulf Bank PJSC | 832,204 | 2,922,876 | |
| TOTAL UNITED ARAB EMIRATES | 8,083,045 | ||
| United Kingdom - 0.6% | |||
| Fresnillo PLC | 73,200 | 1,427,043 | |
| Mondi PLC | 80,000 | 1,931,471 | |
| TOTAL UNITED KINGDOM | 3,358,514 | ||
| TOTAL COMMON STOCKS | |||
| (Cost $396,896,141) | 481,897,058 | ||
| Preferred Stocks - 7.1% | |||
| Convertible Preferred Stocks - 0.3% | |||
| Cayman Islands - 0.3% | |||
| China Internet Plus Holdings Ltd. Series A-11 (a)(d) | 331,980 | 1,486,341 | |
| Nonconvertible Preferred Stocks - 6.8% | |||
| Brazil - 5.3% | |||
| Ambev SA sponsored ADR | 654,600 | 3,770,496 | |
| Banco do Estado Rio Grande do Sul SA | 289,260 | 1,397,052 | |
| Companhia Paranaense de Energia-Copel: | |||
| (PN-B) | 4,460 | 46,643 | |
| (PN-B) sponsored ADR (b) | 143,907 | 1,483,681 | |
| Fibria Celulose SA sponsored ADR | 167,100 | 1,527,294 | |
| Itau Unibanco Holding SA sponsored ADR | 761,586 | 9,192,343 | |
| Metalurgica Gerdau SA (PN) (a) | 981,300 | 1,551,599 | |
| Petroleo Brasileiro SA - Petrobras (PN) sponsored (non-vtg.) (a) | 430,500 | 3,969,210 | |
| Telefonica Brasil SA | 143,980 | 2,150,088 | |
| Vale SA (PN-A) sponsored ADR | 365,600 | 3,283,088 | |
| 28,371,494 | |||
| Korea (South) - 1.5% | |||
| Hyundai Motor Co. Series 2 | 34,287 | 3,176,143 | |
| Samsung Electronics Co. Ltd. | 2,728 | 3,913,885 | |
| Samsung Fire & Marine Insurance Co. Ltd. | 6,877 | 1,098,670 | |
| 8,188,698 | |||
| TOTAL NONCONVERTIBLE PREFERRED STOCKS | 36,560,192 | ||
| TOTAL PREFERRED STOCKS | |||
| (Cost $26,161,785) | 38,046,533 | ||
| Principal Amount | Value | ||
| Government Obligations - 0.7% | |||
| United States of America - 0.7% | |||
| U.S. Treasury Bills, yield at date of purchase 0.49% to 0.53% 4/6/17 to 4/27/17(e) | |||
| (Cost $3,948,638) | 3,950,000 | 3,948,166 | |
| Shares | Value | ||
| Money Market Funds - 3.9% | |||
| Fidelity Cash Central Fund, 0.84% (f) | 13,749,252 | 13,752,001 | |
| Fidelity Securities Lending Cash Central Fund 0.84% (f)(g) | 7,402,494 | 7,403,234 | |
| TOTAL MONEY MARKET FUNDS | |||
| (Cost $21,154,127) | 21,155,235 | ||
| TOTAL INVESTMENT PORTFOLIO - 101.1% | |||
| (Cost $448,160,691) | 545,046,992 | ||
| NET OTHER ASSETS (LIABILITIES) - (1.1)% | (5,727,196) | ||
| NET ASSETS - 100% | $539,319,796 |
| Futures Contracts | |||
| Expiration Date | Underlying Face Amount at Value | Unrealized Appreciation/(Depreciation) | |
| Purchased | |||
| Equity Index Contracts | |||
| 105 ICE E-mini MSCI Emerging Markets Index Contracts (United States) | June 2017 | 5,047,350 | $50,732 |
The face value of futures purchased as a percentage of Net Assets is 0.9%
Security Type Abbreviations
ELS – Equity-Linked Security
Categorizations in the Schedule of Investments are based on country or territory of incorporation.
Legend
(a) Non-income producing
(b) Security or a portion of the security is on loan at period end.
(c) Security exempt from registration under Rule 144A of the Securities Act of 1933. These securities may be resold in transactions exempt from registration, normally to qualified institutional buyers. At the end of the period, the value of these securities amounted to $1,183,900 or 0.2% of net assets.
(d) Restricted securities - Investment in securities not registered under the Securities Act of 1933 (excluding 144A issues). At the end of the period, the value of restricted securities (excluding 144A issues) amounted to $1,486,341 or 0.3% of net assets.
(e) Security or a portion of the security was pledged to cover margin requirements for futures contracts. At period end, the value of securities pledged amounted to $201,925.
(f) Affiliated fund that is generally available only to investment companies and other accounts managed by Fidelity Investments. The rate quoted is the annualized seven-day yield of the fund at period end. A complete unaudited listing of the fund's holdings as of its most recent quarter end is available upon request. In addition, each Fidelity Central Fund's financial statements are available on the SEC's website or upon request.
(g) Investment made with cash collateral received from securities on loan.
Additional information on each restricted holding is as follows:
| Security | Acquisition Date | Acquisition Cost |
| China Internet Plus Holdings Ltd. Series A-11 | 1/26/15 | $1,049,339 |
Affiliated Central Funds
Information regarding fiscal year to date income earned by the Fund from investments in Fidelity Central Funds is as follows:
| Fund | Income earned |
| Fidelity Cash Central Fund | $49,519 |
| Fidelity Securities Lending Cash Central Fund | 8,970 |
| Total | $58,489 |
Investment Valuation
The following is a summary of the inputs used, as of March 31, 2017, involving the Fund's assets and liabilities carried at fair value. The inputs or methodology used for valuing securities may not be an indication of the risk associated with investing in those securities. For more information on valuation inputs, and their aggregation into the levels used below, please refer to the Investment Valuation section in the accompanying Notes to Financial Statements.
| Valuation Inputs at Reporting Date: | ||||
| Description | Total | Level 1 | Level 2 | Level 3 |
| Investments in Securities: | ||||
| Equities: | ||||
| Consumer Discretionary | $73,071,594 | $55,607,261 | $15,977,992 | $1,486,341 |
| Consumer Staples | 36,841,802 | 36,841,802 | -- | -- |
| Energy | 36,819,285 | 30,537,359 | 6,281,926 | -- |
| Financials | 118,828,584 | 94,760,398 | 24,068,186 | -- |
| Health Care | 12,128,935 | 12,128,935 | -- | -- |
| Industrials | 30,901,056 | 30,901,056 | -- | -- |
| Information Technology | 117,403,972 | 77,855,441 | 39,548,531 | -- |
| Materials | 38,347,841 | 38,347,841 | -- | -- |
| Real Estate | 12,954,793 | 12,954,793 | -- | -- |
| Telecommunication Services | 26,409,315 | 22,638,483 | 3,770,832 | -- |
| Utilities | 16,236,414 | 13,994,841 | 2,241,573 | -- |
| Government Obligations | 3,948,165 | -- | 3,948,165 | -- |
| Money Market Funds | 21,155,236 | 21,155,236 | -- | -- |
| Total Investments in Securities: | $545,046,992 | $447,723,446 | $95,837,205 | $1,486,341 |
| Derivative Instruments: | ||||
| Assets | ||||
| Futures Contracts | $50,732 | $50,732 | $-- | $-- |
| Total Assets | $50,732 | $50,732 | $-- | $-- |
| Total Derivative Instruments: | $50,732 | $50,732 | $-- | $-- |
The following is a summary of transfers between Level 1 and Level 2 for the period ended March 31, 2017. Transfers are assumed to have occurred at the beginning of the period, and are primarily attributable to the valuation techniques used for foreign equity securities, as discussed in the accompanying Notes to Financial Statements:
| Transfers | Total |
| Level 1 to Level 2 | $0 |
| Level 2 to Level 1 | $133,846,364 |
Value of Derivative Instruments
The following table is a summary of the Fund's value of derivative instruments by primary risk exposure as of March 31, 2017. For additional information on derivative instruments, please refer to the Derivative Instruments section in the accompanying Notes to Financial Statements.
| Primary Risk Exposure / Derivative Type | Value | |
| Asset | Liability | |
| Equity Risk | ||
| Futures Contracts(a) | $50,732 | $0 |
| Total Equity Risk | 50,732 | 0 |
| Total Value of Derivatives | $50,732 | $0 |
(a) Reflects gross cumulative appreciation (depreciation) on futures contracts as presented in the Schedule of Investments. In the Statement of Assets and Liabilities, the period end daily variation margin is included in receivable or payable for daily variation margin for derivative instruments, and the net cumulative appreciation (depreciation) is included in net unrealized appreciation (depreciation).
See accompanying notes which are an integral part of the financial statements.
Financial Statements
Statement of Assets and Liabilities
| March 31, 2017 (Unaudited) | ||
| Assets | ||
| Investment in securities, at value (including securities loaned of $7,121,552) — See accompanying schedule: Unaffiliated issuers (cost $427,006,564) | $523,891,757 | |
| Fidelity Central Funds (cost $21,154,127) | 21,155,235 | |
| Total Investments (cost $448,160,691) | $545,046,992 | |
| Foreign currency held at value (cost $118,935) | 119,789 | |
| Receivable for investments sold | 1,165,543 | |
| Receivable for fund shares sold | 200,213 | |
| Dividends receivable | 1,819,208 | |
| Distributions receivable from Fidelity Central Funds | 9,913 | |
| Other receivables | 314,532 | |
| Total assets | 548,676,190 | |
| Liabilities | ||
| Payable to custodian bank | $458,516 | |
| Payable for investments purchased | 374,000 | |
| Payable for fund shares redeemed | 378,894 | |
| Payable for daily variation margin for derivative instruments | 33,888 | |
| Other payables and accrued expenses | 707,671 | |
| Collateral on securities loaned | 7,403,425 | |
| Total liabilities | 9,356,394 | |
| Net Assets | $539,319,796 | |
| Net Assets consist of: | ||
| Paid in capital | $438,090,129 | |
| Undistributed net investment income | 1,425,926 | |
| Accumulated undistributed net realized gain (loss) on investments and foreign currency transactions | 3,396,405 | |
| Net unrealized appreciation (depreciation) on investments and assets and liabilities in foreign currencies | 96,407,336 | |
| Net Assets, for 2,492,341 shares outstanding | $539,319,796 | |
| Net Asset Value, offering price and redemption price per share ($539,319,796 ÷ 2,492,341 shares) | $216.39 |
See accompanying notes which are an integral part of the financial statements.
Statement of Operations
| Six months ended March 31, 2017 (Unaudited) | ||
| Investment Income | ||
| Dividends | $4,030,479 | |
| Interest | 4,163 | |
| Income from Fidelity Central Funds | 58,489 | |
| Income before foreign taxes withheld | 4,093,131 | |
| Less foreign taxes withheld | (429,087) | |
| Total income | 3,664,044 | |
| Expenses | ||
| Custodian fees and expenses | $179,379 | |
| Independent directors' fees and expenses | 877 | |
| Total expenses before reductions | 180,256 | |
| Expense reductions | (877) | 179,379 |
| Net investment income (loss) | 3,484,665 | |
| Realized and Unrealized Gain (Loss) | ||
| Net realized gain (loss) on: | ||
| Investment securities: | ||
| Unaffiliated issuers (net of foreign taxes of $20,108) | 5,359,813 | |
| Fidelity Central Funds | 496 | |
| Foreign currency transactions | (76,842) | |
| Futures contracts | 299,264 | |
| Total net realized gain (loss) | 5,582,731 | |
| Change in net unrealized appreciation (depreciation) on: Investment securities (net of increase in deferred foreign taxes of $140,292) | 30,116,809 | |
| Assets and liabilities in foreign currencies | 75,188 | |
| Futures contracts | (12,299) | |
| Total change in net unrealized appreciation (depreciation) | 30,179,698 | |
| Net gain (loss) | 35,762,429 | |
| Net increase (decrease) in net assets resulting from operations | $39,247,094 |
See accompanying notes which are an integral part of the financial statements.
Statement of Changes in Net Assets
| Six months ended March 31, 2017 (Unaudited) | Year ended September 30, 2016 | |
| Increase (Decrease) in Net Assets | ||
| Operations | ||
| Net investment income (loss) | $3,484,665 | $8,113,164 |
| Net realized gain (loss) | 5,582,731 | (9,504,506) |
| Change in net unrealized appreciation (depreciation) | 30,179,698 | 63,033,409 |
| Net increase (decrease) in net assets resulting from operations | 39,247,094 | 61,642,067 |
| Distributions to shareholders from net investment income | (2,058,739) | (7,701,534) |
| Distributions to shareholders from net realized gain | (2,186,326) | – |
| Total distributions | (4,245,065) | (7,701,534) |
| Affiliated share transactions | ||
| Proceeds from sales of shares | 119,818,244 | 163,933,550 |
| Reinvestment of distributions | 4,165,780 | 7,659,493 |
| Cost of shares redeemed | (34,487,000) | (47,769,043) |
| Net increase (decrease) in net assets resulting from share transactions | 89,497,024 | 123,824,000 |
| Total increase (decrease) in net assets | 124,499,053 | 177,764,533 |
| Net Assets | ||
| Beginning of period | 414,820,743 | 237,056,210 |
| End of period | $539,319,796 | $414,820,743 |
| Other Information | ||
| Undistributed net investment income end of period | $1,425,926 | $– |
| Shares | ||
| Sold | 592,500 | 902,591 |
| Issued in reinvestment of distributions | 22,008 | 40,928 |
| Redeemed | (170,163) | (266,211) |
| Net increase (decrease) | 444,345 | 677,308 |
See accompanying notes which are an integral part of the financial statements.
Financial Highlights — Fidelity Emerging Markets Equity Central Fund
| Six months ended (Unaudited) March 31, | Years ended September 30, | |||||
| 2017 | 2016 | 2015 | 2014 | 2013 | 2012 | |
| Selected Per–Share Data | ||||||
| Net asset value, beginning of period | $202.55 | $172.95 | $212.25 | $198.65 | $195.55 | $166.54 |
| Income from Investment Operations | ||||||
| Net investment income (loss)A | 1.56 | 4.05 | 3.47 | 4.39 | 4.54 | 4.14 |
| Net realized and unrealized gain (loss) | 14.35 | 29.35 | (39.58) | 12.94 | 3.55 | 28.97 |
| Total from investment operations | 15.91 | 33.40 | (36.11) | 17.33 | 8.09 | 33.11 |
| Distributions from net investment income | (1.00) | (3.80) | (3.19) | (3.73) | (4.99) | (4.10) |
| Distributions from net realized gain | (1.07) | – | – | – | – | – |
| Total distributions | (2.07) | (3.80) | (3.19) | (3.73) | (4.99) | (4.10) |
| Net asset value, end of period | $216.39 | $202.55 | $172.95 | $212.25 | $198.65 | $195.55 |
| Total ReturnB,C | 8.00% | 19.51% | (17.12)% | 8.72% | 4.21% | 20.04% |
| Ratios to Average Net AssetsD,E | ||||||
| Expenses before reductions | .08%F | .09% | .15% | .15% | .13% | .16% |
| Expenses net of fee waivers, if any | .08%F | .09% | .15% | .15% | .13% | .16% |
| Expenses net of all reductions | .08%F | .09% | .15% | .15% | .13% | .16% |
| Net investment income (loss) | 1.55%F | 2.23% | 1.71% | 2.07% | 2.24% | 2.19% |
| Supplemental Data | ||||||
| Net assets, end of period (000 omitted) | $539,320 | $414,821 | $237,056 | $457,436 | $207,267 | $221,512 |
| Portfolio turnover rateG | 47%F | 52% | 141% | 84% | 183% | 103% |
A Calculated based on average shares outstanding during the period.
B Total returns for periods of less than one year are not annualized.
C Total returns would have been lower if certain expenses had not been reduced during the applicable periods shown.
D Fees and expenses of any underlying Fidelity Central Funds are not included in the Fund's expense ratio. The Fund indirectly bears its proportionate share of the expenses of any underlying Fidelity Central Funds.
E Expense ratios reflect operating expenses of the Fund. Expenses before reductions do not reflect amounts reimbursed by the investment adviser or reductions from expense offset arrangements and do not represent the amount paid by the Fund during periods when reimbursements or reductions occur. Expenses net of fee waivers reflect expenses after reimbursement by the investment adviser but prior to reductions from expense offset arrangements. Expenses net of all reductions represent the net expenses paid by the Fund.
F Annualized
G Amount does not include the portfolio activity of any underlying Fidelity Central Funds.
See accompanying notes which are an integral part of the financial statements.
Notes to Financial Statements (Unaudited)
For the period ended March 31, 2017
1. Organization.
Fidelity Emerging Markets Equity Central Fund (the Fund) is a fund of Fidelity Central Investment Portfolios LLC (the LLC) and is authorized to issue an unlimited number of shares. Shares of the Fund are only offered to other investment companies and accounts managed by Fidelity Management & Research Company (FMR), or its affiliates (the Investing Funds). The LLC is registered under the Investment Company Act of 1940, as amended (the 1940 Act), as an open-end management investment company organized as a Delaware Limited Liability Company. The Fund's investments in emerging markets can be subject to social, economic, regulatory, and political uncertainties and can be extremely volatile.
2. Investments in Fidelity Central Funds.
The Fund invests in Fidelity Central Funds, which are open-end investment companies generally available only to other investment companies and accounts managed by the investment adviser and its affiliates. The Fund's Schedule of Investments lists each of the Fidelity Central Funds held as of period end, if any, as an investment of the Fund, but does not include the underlying holdings of each Fidelity Central Fund. As an Investing Fund, the Fund indirectly bears its proportionate share of the expenses of the underlying Fidelity Central Funds.
The Money Market Central Funds seek preservation of capital and current income and are managed by Fidelity Investments Money Management, Inc. (FIMM), an affiliate of the investment adviser. Annualized expenses of the Money Market Central Funds as of their most recent shareholder report date are less than .005%.
A complete unaudited list of holdings for each Fidelity Central Fund is available upon request or at the Securities and Exchange Commission (the SEC) website at www.sec.gov. In addition, the financial statements of the Fidelity Central Funds are available on the SEC website or upon request.
3. Significant Accounting Policies.
The Fund is an investment company and applies the accounting and reporting guidance of the Financial Accounting Standards Board (FASB) Accounting Standards Codification Topic 946 Financial Services – Investments Companies. The financial statements have been prepared in conformity with accounting principles generally accepted in the United States of America (GAAP), which require management to make certain estimates and assumptions at the date of the financial statements. Actual results could differ from those estimates. Subsequent events, if any, through the date that the financial statements were issued have been evaluated in the preparation of the financial statements. The following summarizes the significant accounting policies of the Fund:
Investment Valuation. Investments are valued as of 4:00 p.m. Eastern time on the last calendar day of the period. The Board of Directors (the Board) has delegated the day to day responsibility for the valuation of the Fund's investments to the Fair Value Committee (the Committee) established by the Fund's investment adviser. In accordance with valuation policies and procedures approved by the Board, the Fund attempts to obtain prices from one or more third party pricing vendors or brokers to value its investments. When current market prices, quotations or currency exchange rates are not readily available or reliable, investments will be fair valued in good faith by the Committee, in accordance with procedures adopted by the Board. Factors used in determining fair value vary by investment type and may include market or investment specific events, changes in interest rates and credit quality. The frequency with which these procedures are used cannot be predicted and they may be utilized to a significant extent. The Committee oversees the Fund's valuation policies and procedures and reports to the Board on the Committee's activities and fair value determinations. The Board monitors the appropriateness of the procedures used in valuing the Fund's investments and ratifies the fair value determinations of the Committee.
The Fund categorizes the inputs to valuation techniques used to value its investments into a disclosure hierarchy consisting of three levels as shown below:
- Level 1 – quoted prices in active markets for identical investments
- Level 2 – other significant observable inputs (including quoted prices for similar investments, interest rates, prepayment speeds, etc.)
- Level 3 – unobservable inputs (including the Fund's own assumptions based on the best information available)
Valuation techniques used to value the Fund's investments by major category are as follows:
Equity securities, including restricted securities, for which market quotations are readily available, are valued at the last reported sale price or official closing price as reported by a third party pricing vendor on the primary market or exchange on which they are traded and are categorized as Level 1 in the hierarchy. In the event there were no sales during the day or closing prices are not available, securities are valued at the last quoted bid price or may be valued using the last available price and are generally categorized as Level 2 in the hierarchy. For foreign equity securities, when market or security specific events arise, comparisons to the valuation of American Depositary Receipts (ADRs), futures contracts, Exchange-Traded Funds (ETFs) and certain indexes as well as quoted prices for similar securities may be used and would be categorized as Level 2 in the hierarchy. Utilizing these techniques may result in transfers between Level 1 and Level 2. For equity securities, including restricted securities, where observable inputs are limited, assumptions about market activity and risk are used and these securities may be categorized as Level 3 in the hierarchy.
Debt securities, including restricted securities, are valued based on evaluated prices received from third party pricing vendors or from brokers who make markets in such securities. U.S. government and government agency obligations are valued by pricing vendors who utilize matrix pricing which considers yield or price of bonds of comparable quality, coupon, maturity and type or by broker-supplied prices. When independent prices are unavailable or unreliable, debt securities may be valued utilizing pricing methodologies which consider similar factors that would be used by third party pricing vendors. Debt securities are generally categorized as Level 2 in the hierarchy but may be Level 3 depending on the circumstances.
Futures contracts are valued at the settlement price established each day by the board of trade or exchange on which they are traded and are categorized as Level 1 in the hierarchy. Investments in open-end mutual funds, including the Fidelity Central Funds, are valued at their closing net asset value (NAV) each business day and are categorized as Level 1 in the hierarchy.
Changes in valuation techniques may result in transfers in or out of an assigned level within the disclosure hierarchy. The aggregate value of investments by input level as of March 31, 2017, including information on transfers between Levels 1 and 2, is included at the end of the Fund's Schedule of Investments.
Foreign Currency. The Fund may use foreign currency contracts to facilitate transactions in foreign-denominated securities. Gains and losses from these transactions may arise from changes in the value of the foreign currency or if the counterparties do not perform under the contracts' terms.
Foreign-denominated assets, including investment securities, and liabilities are translated into U.S. dollars at the exchange rates at period end. Purchases and sales of investment securities, income and dividends received and expenses denominated in foreign currencies are translated into U.S. dollars at the exchange rate in effect on the transaction date.
The effects of exchange rate fluctuations on investments are included with the net realized and unrealized gain (loss) on investment securities. Other foreign currency transactions resulting in realized and unrealized gain (loss) are disclosed separately.
Investment Transactions and Income. For financial reporting purposes, the Fund's investment holdings and NAV include trades executed through the end of the last business day of the period. The NAV per share for processing shareholder transactions is calculated as of the close of business of the New York Stock Exchange (NYSE), normally 4:00 p.m. Eastern time and includes trades executed through the end of the prior business day. Gains and losses on securities sold are determined on the basis of identified cost. Dividend income is recorded on the ex-dividend date, except for certain dividends from foreign securities where the ex-dividend date may have passed, which are recorded as soon as the Fund is informed of the ex-dividend date. Non-cash dividends included in dividend income, if any, are recorded at the fair market value of the securities received. Income and capital gain distributions from Fidelity Central Funds, if any, are recorded on the ex-dividend date. Certain distributions received by the Fund represent a return of capital or capital gain. The Fund determines the components of these distributions subsequent to the ex-dividend date, based upon receipt of tax filings or other correspondence relating to the underlying investment. These distributions are recorded as a reduction of cost of investments and/or as a realized gain. Interest income is accrued as earned and includes coupon interest and amortization of premium and accretion of discount on debt securities as applicable. Investment income is recorded net of foreign taxes withheld where recovery of such taxes is uncertain.
Expenses. Expenses directly attributable to a fund are charged to that fund. Expenses attributable to more than one fund are allocated among the respective funds on the basis of relative net assets or other appropriate methods. Expense estimates are accrued in the period to which they relate and adjustments are made when actual amounts are known.
Income Tax Information and Distributions to Shareholders. Each year, effective October 1, 2016, the Fund intends to qualify as a regulated investment company under Subchapter M of the Internal Revenue Code, including distributing substantially all of its taxable income and realized gains. As a result, no provision for U.S. Federal income taxes is required. The Fund files a U.S. federal tax return, in addition to state and local tax returns as required. The Fund's federal income tax returns are subject to examination by the Internal Revenue Service (IRS) for a period of three fiscal years after they are filed. State and local tax returns may be subject to examination for an additional fiscal year depending on the jurisdiction. Foreign taxes are provided for based on the Fund's understanding of the tax rules and rates that exist in the foreign markets in which it invests. The Fund is subject to a tax imposed on capital gains by certain countries in which it invests. An estimated deferred tax liability for net unrealized appreciation on the applicable securities is included in Other payables and accrued expenses on the Statement of Assets & Liabilities. Prior to October 1, 2016, the Fund was a partnership for tax purposes, and no provision was made for U.S. Federal income taxes because the Fund allocated, at least annually among its partners, each partner's share of the Fund's income and expenses and capital gains and losses as determined by income tax regulations for inclusion in each partner's tax return. Due to the Fund's previous partnership structure, paid in capital includes any accumulated net investment income (loss) and net realized gain (loss) on investments prior to October 1, 2016.
Distributions are declared and recorded on the ex-dividend date. Income and capital gain distributions are determined in accordance with income tax regulations, which may differ from GAAP.
Capital accounts within the financial statements are adjusted for permanent book-tax differences. These adjustments have no impact on net assets or the results of operations. Capital accounts are not adjusted for temporary book-tax differences which will reverse in a subsequent period.
The federal tax cost of investment securities and unrealized appreciation (depreciation) as of period end were as follows:
| Gross unrealized appreciation | $106,786,801 |
| Gross unrealized depreciation | (12,855,019) |
| Net unrealized appreciation (depreciation) on securities | $93,931,782 |
| Tax cost | $451,115,210 |
Restricted Securities. The Fund may invest in securities that are subject to legal or contractual restrictions on resale. These securities generally may be resold in transactions exempt from registration or to the public if the securities are registered. Disposal of these securities may involve time-consuming negotiations and expense, and prompt sale at an acceptable price may be difficult. Information regarding restricted securities is included at the end of the Fund's Schedule of Investments.
4. Derivative Instruments.
Risk Exposures and the Use of Derivative Instruments. The Fund's investment objective allows the Fund to enter into various types of derivative contracts, including futures contracts. Derivatives are investments whose value is primarily derived from underlying assets, indices or reference rates and may be transacted on an exchange or over-the-counter (OTC). Derivatives may involve a future commitment to buy or sell a specified asset based on specified terms, to exchange future cash flows at periodic intervals based on a notional principal amount, or for one party to make one or more payments upon the occurrence of specified events in exchange for periodic payments from the other party.
The Fund used derivatives to increase returns and to manage exposure to certain risks as defined below. The success of any strategy involving derivatives depends on analysis of numerous economic factors, and if the strategies for investment do not work as intended, the Fund may not achieve its objectives.
The Fund's use of derivatives increased or decreased its exposure to the following risk:
| Equity Risk | Equity risk relates to the fluctuations in the value of financial instruments as a result of changes in market prices (other than those arising from interest rate risk or foreign exchange risk), whether caused by factors specific to an individual investment, its issuer, or all factors affecting all instruments traded in a market or market segment. |
The Fund is also exposed to additional risks from investing in derivatives, such as liquidity risk and counterparty credit risk. Liquidity risk is the risk that the Fund will be unable to close out the derivative in the open market in a timely manner. Counterparty credit risk is the risk that the counterparty will not be able to fulfill its obligation to the Fund. Counterparty credit risk related to exchange-traded futures contracts may be mitigated by the protection provided by the exchange on which they trade.
Investing in derivatives may involve greater risks than investing in the underlying assets directly and, to varying degrees, may involve risk of loss in excess of any initial investment and collateral received and amounts recognized in the Statement of Assets and Liabilities. In addition, there may be the risk that the change in value of the derivative contract does not correspond to the change in value of the underlying instrument.
Futures Contracts. A futures contract is an agreement between two parties to buy or sell a specified underlying instrument for a fixed price at a specified future date. The Fund used futures contracts to manage its exposure to the stock market.
Upon entering into a futures contract, a fund is required to deposit either cash or securities (initial margin) with a clearing broker in an amount equal to a certain percentage of the face value of the contract. Futures contracts are marked-to-market daily and subsequent daily payments (variation margin) are made or received by a fund depending on the daily fluctuations in the value of the futures contracts and are recorded as unrealized appreciation or (depreciation). This receivable and/or payable, if any, is included in daily variation margin for derivative instruments in the Statement of Assets and Liabilities. Realized gain or (loss) is recorded upon the expiration or closing of a futures contract.
Any open futures contracts at period end are presented in the Schedule of Investments under the caption "Futures Contracts". The underlying face amount at value reflects each contract's exposure to the underlying instrument or index at period end and is representative of volume of activity during the period. Securities deposited to meet initial margin requirements are identified in the Schedule of Investments.
During the period the Fund recognized net realized gain (loss) of $299,264 and a change in net unrealized appreciation (depreciation) of $(12,299) related to its investment in futures contracts. These amounts are included in the Statement of Operations.
5. Purchases and Sales of Investments.
Purchases and sales of securities, other than short-term securities, aggregated $181,233,414 and $101,880,090, respectively.
6. Fees and Other Transactions with Affiliates.
Management Fee and Expense Contract. FMR Co., Inc. (the investment adviser), an affiliate of FMR, provides the Fund with investment management services. The Fund does not pay any fees for these services. Pursuant to the Fund's management contract with the investment adviser, FMR pays the investment adviser a portion of the management fees it receives from the Investing Funds. In addition, under an expense contract, FMR also pays all other expenses of the Fund, excluding custody fees, fees and expenses of the independent Directors, and certain exceptions such as interest expense.
Brokerage Commissions. The Fund placed a portion of its portfolio transactions with brokerage firms which are affiliates of the investment adviser. Brokerage commissions are included in net realized gain (loss) and change in net unrealized appreciation (depreciation) in the Statement of Operations. The commissions paid to these affiliated firms were $1,571 for the period.
Interfund Trades. The Fund may purchase from or sell securities to other Fidelity Funds under procedures adopted by the Board. The procedures have been designed to ensure these interfund trades are executed in accordance with Rule 17a-7 of the 1940 Act. Interfund trades are included within the respective purchases and sales amounts shown in the Purchases and Sales of Investments note.
7. Security Lending.
The Fund lends portfolio securities through a lending agent from time to time in order to earn additional income. For equity securities, a lending agent is used and may loan securities to certain qualified borrowers, including Fidelity Capital Markets (FCM), a broker-dealer affiliated with the Fund. On the settlement date of the loan, the Fund receives collateral (in the form of U.S. Treasury obligations, letters of credit and/or cash) against the loaned securities and maintains collateral in an amount not less than 100% of the market value of the loaned securities during the period of the loan. The market value of the loaned securities is determined at the close of business of the Fund and any additional required collateral is delivered to the Fund on the next business day. The Fund or borrower may terminate the loan at any time, and if the borrower defaults on its obligation to return the securities loaned because of insolvency or other reasons, the Fund may apply collateral received from the borrower against the obligation. The Fund may experience delays and costs in recovering the securities loaned. Any cash collateral received is invested in the Fidelity Securities Lending Cash Central Fund. The value of loaned securities and cash collateral at period end are disclosed on the Fund's Statement of Assets and Liabilities. Security lending income represents the income earned on investing cash collateral, less rebates paid to borrowers and any lending agent fees associated with the loan, plus any premium payments received for lending certain types of securities. Security lending income is presented in the Statement of Operations as a component of income from Fidelity Central Funds. Total security lending income during the period amounted to $8,970. During the period, there were no securities loaned to FCM.
8. Expense Reductions.
FMR has voluntarily agreed to reimburse a portion of the Fund's operating expenses. For the period, the reimbursement reduced the expenses by $877.
9. Other.
The Fund's organizational documents provide former and current directors and officers with a limited indemnification against liabilities arising in connection with the performance of their duties to the Fund. In the normal course of business, the Fund may also enter into contracts that provide general indemnifications. The Fund's maximum exposure under these arrangements is unknown as this would be dependent on future claims that may be made against the Fund. The risk of material loss from such claims is considered remote.
At the end of the period, mutual funds managed by FMR or its affiliates were the owners of record of all of the outstanding shares of the Fund.
Shareholder Expense Example
As a shareholder of the Fund, you incur two types of costs: (1) transaction costs and (2) ongoing costs, including other Fund expenses. This Example is intended to help you understand your ongoing costs (in dollars) of investing in the Fund and to compare these costs with the ongoing costs of investing in other mutual funds.
The Example is based on an investment of $1,000 invested at the beginning of the period and held for the entire period (October 1, 2016 to March 31, 2017).
Actual Expenses
The first line of the accompanying table provides information about actual account values and actual expenses. You may use the information in this line, together with the amount you invested, to estimate the expenses that you paid over the period. Simply divide your account value by $1,000.00 (for example, an $8,600 account value divided by $1,000.00 = 8.6), then multiply the result by the number in the first line under the heading entitled "Expenses Paid During Period" to estimate the expenses you paid on your account during this period. In addition, the Fund, as a shareholder in the underlying Fidelity Central Funds, will indirectly bear its pro-rata share of the fees and expenses incurred by the underlying Fidelity Central Funds. These fees and expenses are not included in the Fund's annualized expense ratio used to calculate the expense estimate in the table below.
Hypothetical Example for Comparison Purposes
The second line of the accompanying table provides information about hypothetical account values and hypothetical expenses based on the Fund's actual expense ratio and an assumed rate of return of 5% per year before expenses, which is not the Fund's actual return. The hypothetical account values and expenses may not be used to estimate the actual ending account balance or expenses you paid for the period. You may use this information to compare the ongoing costs of investing in the Fund and other funds. To do so, compare this 5% hypothetical example with the 5% hypothetical examples that appear in the shareholder reports of the other funds. In addition, the Fund, as a shareholder in the underlying Fidelity Central Funds, will indirectly bear its pro-rata share of the fees and expenses incurred by the underlying Fidelity Central Funds. These fees and expenses are not included in the Fund's annualized expense ratio used to calculate the expense estimate in the table below.
Please note that the expenses shown in the table are meant to highlight your ongoing costs only and do not reflect any transaction costs. Therefore, the second line of the table is useful in comparing ongoing costs only, and will not help you determine the relative total costs of owning different funds.
| Annualized Expense Ratio-A | Beginning Account Value October 1, 2016 | Ending Account Value March 31, 2017 | Expenses Paid During Period-B October 1, 2016 to March 31, 2017 | |
| Actual | .0798% | $1,000.00 | $1,080.00 | $.41 |
| Hypothetical-C | $1,000.00 | $1,024.53 | $.40 |
A Annualized expense ratio reflects expenses net of applicable fee waivers.
B Expenses are equal to the Fund's annualized expense ratio, multiplied by the average account value over the period, multiplied by 182/365 (to reflect the one-half year period).
C 5% return per year before expenses
![]()
Corporate Headquarters
245 Summer St.
Boston, MA 02210
www.fidelity.com
EMQ-SANN-0517
1.876936.108
Fidelity® Floating Rate Central Fund Semi-Annual Report March 31, 2017 |
|
Contents
To view a fund's proxy voting guidelines and proxy voting record for the 12-month period ended June 30, visit http://www.fidelity.com/proxyvotingresults or visit the Securities and Exchange Commission's (SEC) web site at http://www.sec.gov.
You may also call 1-800-544-8544 to request a free copy of the proxy voting guidelines.
Standard & Poor's, S&P and S&P 500 are registered service marks of The McGraw-Hill Companies, Inc. and have been licensed for use by Fidelity Distributors Corporation.
Other third-party marks appearing herein are the property of their respective owners.
All other marks appearing herein are registered or unregistered trademarks or service marks of FMR LLC or an affiliated company. © 2017 FMR LLC. All rights reserved.
A fund files its complete schedule of portfolio holdings with the SEC for the first and third quarters of each fiscal year on Form N-Q. Forms N-Q are available on the SEC’s web site at http://www.sec.gov. A fund's Forms N-Q may be reviewed and copied at the SEC’s Public Reference Room in Washington, DC. Information regarding the operation of the SEC's Public Reference Room may be obtained by calling 1-800-SEC-0330.
Investment Summary (Unaudited)
Top Five Holdings as of March 31, 2017
| (by issuer, excluding cash equivalents) | % of fund's net assets | % of fund's net assets 6 months ago |
| Albertson's LLC | 2.0 | 2.1 |
| Caesars Growth Properties Holdings, LLC | 1.3 | 1.3 |
| Laureate Education, Inc. | 1.2 | 1.1 |
| Valeant Pharmaceuticals International, Inc. | 1.2 | 1.4 |
| Charter Communication Operating LLC | 1.0 | 1.1 |
| 6.7 |
Top Five Market Sectors as of March 31, 2017
| % of fund's net assets | % of fund's net assets 6 months ago | |
| Technology | 10.9 | 10.3 |
| Services | 9.2 | 8.0 |
| Telecommunications | 8.1 | 6.0 |
| Healthcare | 7.3 | 9.2 |
| Gaming | 6.5 | 6.7 |
Quality Diversification (% of fund's net assets)
| As of March 31, 2017 | ||
| BBB | 1.5% | |
| BB | 31.8% | |
| B | 48.6% | |
| CCC,CC,C | 6.9% | |
| Not Rated | 5.7% | |
| Equities | 0.5% | |
| Short-Term Investments and Net Other Assets | 5.0% | |

| As of September 30, 2016 | ||
| BBB | 1.5% | |
| BB | 32.1% | |
| B | 48.4% | |
| CCC,CC,C | 7.0% | |
| D | 0.2% | |
| Not Rated | 4.6% | |
| Equities | 0.4% | |
| Short-Term Investments and Net Other Assets | 5.8% | |
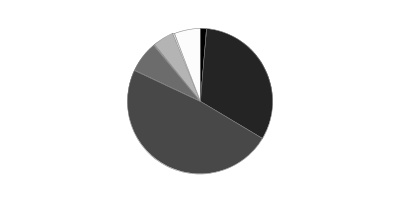
We have used ratings from Moody's Investors Service, Inc. Where Moody's® ratings are not available, we have used S&P® ratings. All ratings are as of the date indicated and do not reflect subsequent changes.
Asset Allocation (% of fund's net assets)
| As of March 31, 2017* | ||
| Bank Loan Obligations | 92.2% | |
| Nonconvertible Bonds | 2.3% | |
| Common Stocks | 0.5% | |
| Short-Term Investments and Net Other Assets (Liabilities) | 5.0% | |

* Foreign investments - 9.7%
| As of September 30, 2016* | ||
| Bank Loan Obligations | 91.3% | |
| Nonconvertible Bonds | 2.5% | |
| Common Stocks | 0.4% | |
| Short-Term Investments and Net Other Assets (Liabilities) | 5.8% | |

* Foreign investments - 7.8%
Investments March 31, 2017 (Unaudited)
Showing Percentage of Net Assets
| Bank Loan Obligations - 92.2%(a) | |||
| Principal Amount | Value | ||
| Aerospace - 0.9% | |||
| Gemini HDPE LLC Tranche B, term loan 4.039% 8/7/21 (b) | $2,347,025 | $2,369,040 | |
| TransDigm, Inc.: | |||
| Tranche C, term loan 3.9582% 2/28/20 (b) | 3,173,081 | 3,166,481 | |
| Tranche D, term loan 3.9835% 6/4/21 (b) | 5,762,649 | 5,743,113 | |
| Tranche F, term loan 3.7806% 6/9/23 (b) | 4,473,712 | 4,450,628 | |
| TOTAL AEROSPACE | 15,729,262 | ||
| Automotive & Auto Parts - 1.0% | |||
| Caliber Holdings Corp.: | |||
| Tranche 1LN, term loan 4% 2/1/24 (b) | 1,500,000 | 1,509,375 | |
| Tranche 2LN, term loan: | |||
| 2/1/25 (c) | 450,000 | 455,625 | |
| 1.5% 2/1/24 (b)(d) | 150,000 | 150,938 | |
| Chrysler Group LLC term loan 3.39% 12/31/18 (b) | 836,478 | 840,660 | |
| Federal-Mogul Corp. Tranche C, term loan 4.75% 4/15/21 (b) | 2,432,111 | 2,422,431 | |
| NN, Inc. term loan 3/22/21 (c) | 2,000,000 | 1,998,760 | |
| North American Lifting Holdings, Inc.: | |||
| Tranche 1LN, term loan 5.5% 11/27/20 (b) | 7,544,742 | 7,022,872 | |
| Tranche 2LN, term loan 10% 11/27/21 (b) | 2,641,000 | 1,521,876 | |
| The Gates Corp. Tranche B 1LN, term loan 4.25% 7/3/21 (b) | 890,183 | 890,850 | |
| TOTAL AUTOMOTIVE & AUTO PARTS | 16,813,387 | ||
| Broadcasting - 1.3% | |||
| CBS Radio, Inc. term loan 4.5% 10/17/23 (b) | 3,612,642 | 3,638,219 | |
| Clear Channel Communications, Inc. Tranche D, term loan 7.5306% 1/30/19 (b) | 10,470,000 | 8,973,628 | |
| Entercom Radio, LLC Tranche B, term loan 4.5631% 11/1/23 (b) | 1,192,708 | 1,198,374 | |
| ION Media Networks, Inc. Tranche B, term loan 4.5% 12/18/20 (b) | 3,344,713 | 3,369,798 | |
| Univision Communications, Inc. Tranche C 5LN, term loan 3.75% 3/15/24 (b) | 4,192,476 | 4,164,512 | |
| TOTAL BROADCASTING | 21,344,531 | ||
| Building Materials - 0.9% | |||
| GYP Holdings III Corp. Tranche B, term loan 4.539% 4/1/21 (b) | 4,035,761 | 4,049,200 | |
| HD Supply, Inc. Tranche B, term loan 3.7482% 10/17/23 (b) | 1,492,500 | 1,501,828 | |
| Jeld-Wen, Inc. Tranche B 3LN, term loan 4% 7/1/22 (b) | 3,226,157 | 3,244,966 | |
| Unifrax I LLC Tranche B, term loan 3/30/24 (c) | 1,000,000 | 1,005,000 | |
| Ventia Deco LLC Tranche B, term loan 5% 5/21/22 (b) | 4,974,697 | 4,987,134 | |
| TOTAL BUILDING MATERIALS | 14,788,128 | ||
| Cable/Satellite TV - 2.6% | |||
| Altice U.S. Finance SA: | |||
| term loan 3.7806% 1/15/25 (b) | 1,995,000 | 1,991,269 | |
| Tranche B, term loan 1/25/25 (c) | 1,250,000 | 1,248,050 | |
| Charter Communication Operating LLC: | |||
| term loan: | |||
| 2.79% 7/1/20 (b) | 2,432,021 | 2,437,420 | |
| 2.79% 1/3/21 (b) | 3,833,351 | 3,841,017 | |
| Tranche H, term loan 2.79% 1/15/22 (b) | 1,980,000 | 1,983,841 | |
| Tranche I, term loan 3.04% 1/15/24 (b) | 10,221,750 | 10,265,806 | |
| Liberty Cablevision of Puerto Rico Tranche 1LN, term loan 4.5232% 1/7/22 (b) | 3,480,000 | 3,464,062 | |
| Numericable LLC Tranche B, term loan 5.289% 1/15/24 (b) | 5,488,525 | 5,492,422 | |
| Virgin Media Bristol LLC Tranche 1LN, term loan 3.6622% 1/31/25 (b) | 6,000,000 | 6,013,140 | |
| WideOpenWest Finance LLC Tranche B, term loan 4.5539% 8/19/23 (b) | 4,126,507 | 4,144,829 | |
| Zayo Group LLC Tranche B 1LN, term loan 3.5% 1/19/24 (b) | 3,845,000 | 3,858,342 | |
| TOTAL CABLE/SATELLITE TV | 44,740,198 | ||
| Capital Goods - 0.7% | |||
| Onex Wizard U.S. Acquisition, Inc. Tranche B, term loan 4% 3/13/22 (b) | 4,699,106 | 4,727,911 | |
| SRAM LLC. Tranche B, term loan 4.5514% 3/15/24 (b) | 2,712,275 | 2,715,665 | |
| Wireco Worldgroup, Inc. Tranche B 1LN, term loan 6.5% 9/30/23 (b) | 1,771,100 | 1,782,169 | |
| Zodiac Pool Solutions LLC: | |||
| Tranche 2LN, term loan 10% 12/20/24 (b) | 500,000 | 495,415 | |
| Tranche B 1LN, term loan 5.5% 12/20/23 (b) | 2,493,750 | 2,508,289 | |
| TOTAL CAPITAL GOODS | 12,229,449 | ||
| Chemicals - 1.5% | |||
| Ineos Styrolution U.S. Holding LLC Tranche B, term loan 3.9022% 3/30/24 (b) | 1,790,513 | 1,791,265 | |
| Kraton Polymers LLC term loan 5% 1/6/22 (b) | 3,133,584 | 3,161,003 | |
| MacDermid, Inc.: | |||
| term loan 5% 6/7/23 (b) | 3,980,000 | 3,987,482 | |
| Tranche B 5LN, term loan 4.5% 6/7/20 (b) | 2,904,067 | 2,931,046 | |
| Royal Holdings, Inc.: | |||
| Tranche B 1LN, term loan 4.25% 6/19/22 (b) | 3,447,500 | 3,478,734 | |
| Tranche B 2LN, term loan 8.5% 6/19/23 (b) | 195,862 | 196,025 | |
| The Chemours Co. LLC Tranche B, term loan 3.79% 5/12/22 (b) | 3,466,384 | 3,483,716 | |
| Trinseo Materials Operating SCA/Trinseo Materials Finance, Inc. Tranche B 1LN, term loan 4.25% 11/5/21 (b) | 2,834,513 | 2,856,962 | |
| Tronox Pigments (Netherlands) B.V. Tranche B, term loan 4.5% 3/19/20 (b) | 1,796,667 | 1,806,405 | |
| Univar, Inc. term loan 3.6083% 7/1/22 (b) | 1,994,688 | 1,998,119 | |
| TOTAL CHEMICALS | 25,690,757 | ||
| Consumer Products - 1.2% | |||
| CSM Bakery Supplies Tranche B 1LN, term loan 5% 7/3/20 (b) | 2,595,000 | 2,439,300 | |
| Hercules Achievement, Inc. Tranche B, term loan 5.02% 12/11/21 (b) | 5,705,325 | 5,775,215 | |
| Prestige Brands, Inc. term loan 3.5306% 1/26/24 (b) | 2,576,118 | 2,597,577 | |
| Weight Watchers International, Inc. Tranche B 2LN, term loan 4.2036% 4/2/20 (b) | 6,014,463 | 5,590,985 | |
| Wilsonart LLC Tranche B, term loan 4.5% 12/19/23 (b) | 3,491,250 | 3,521,798 | |
| TOTAL CONSUMER PRODUCTS | 19,924,875 | ||
| Consumer Services - 0.2% | |||
| Optiv Security, Inc.: | |||
| Tranche 2LN, term loan 8.25% 2/1/25 (b) | 545,000 | 553,175 | |
| Tranche B 1LN, term loan 4.25% 2/1/24 (b) | 2,760,000 | 2,772,089 | |
| Rep Wwex Acquisition Parent LLC Tranche B 1LN, term loan 5.53% 2/3/24 (b) | 620,000 | 622,585 | |
| TOTAL CONSUMER SERVICES | 3,947,849 | ||
| Containers - 2.6% | |||
| Berlin Packaging, LLC: | |||
| Tranche 2LN, term loan 7.75% 10/1/22 (b) | 1,871,000 | 1,883,480 | |
| Tranche B 1LN, term loan 4.5% 10/1/21 (b) | 8,154,984 | 8,192,823 | |
| Berry Plastics Corp.: | |||
| term loan 3.2806% 10/1/22 (b) | 5,682,588 | 5,715,717 | |
| Tranche L, term loan 3.1078% 1/6/21 (b) | 5,884,667 | 5,911,148 | |
| BWAY Holding Co. Tranche B, term loan: | |||
| 3/22/24 (c) | 1,500,000 | 1,495,320 | |
| 4.755% 8/14/23 (b) | 3,430,676 | 3,421,550 | |
| Consolidated Container Co. Tranche B, term loan 5% 7/3/19 (b) | 7,464,139 | 7,445,479 | |
| Hostess Brands LLC Tranche B 1LN, term loan 4% 8/3/22 (b) | 371,669 | 375,014 | |
| Printpack Holdings, Inc. Tranche B, term loan 4% 7/26/23 (b) | 1,278,575 | 1,281,771 | |
| Reynolds Group Holdings, Inc. Tranche B, term loan 3.7806% 2/5/23 (b) | 6,999,869 | 7,023,949 | |
| Signode Packaging Systems, Inc. Tranche B, term loan 4% 5/1/21 (b) | 1,241,625 | 1,243,177 | |
| TOTAL CONTAINERS | 43,989,428 | ||
| Diversified Financial Services - 4.0% | |||
| AlixPartners LLP: | |||
| term loan 4% 7/28/22 (b) | 3,421,774 | 3,427,283 | |
| Tranche B, term loan 4.1496% 4/29/24 (b) | 4,000,000 | 4,015,000 | |
| ASP Chromaflo Intermediate Hol Tranche B 1LN, term loan 5% 11/18/23 (b) | 2,114,700 | 2,123,962 | |
| AssuredPartners, Inc. Tranche B 1LN, term loan 5.25% 10/22/22 (b) | 4,969,851 | 5,002,155 | |
| Avolon TLB Borrower 1 (U.S.) LLC Tranche B 2LN, term loan 3.7283% 3/20/22 (b) | 12,000,000 | 12,155,040 | |
| Broadstreet Partners, Inc. Tranche B, term loan 5.25% 11/8/23 (b) | 1,995,000 | 2,027,419 | |
| Constellation Brands Tranche B, term loan 4.8873% 12/16/23 (b) | 2,493,750 | 2,511,680 | |
| Cypress Intermediate Holdings, Inc. Tranche B 1LN, term loan 3/30/24 (c) | 3,000,000 | 3,009,990 | |
| Delos Finance SARL term loan 3.2482% 10/6/23 (b) | 3,682,000 | 3,719,741 | |
| Fly Funding II SARL Tranche B, term loan 3.79% 2/9/22 (b) | 3,530,058 | 3,538,883 | |
| Flying Fortress Holdings, Inc. Tranche B, term loan 3.2482% 10/30/22 (b) | 3,000,000 | 3,023,760 | |
| Fort Dearborn Holding Co., Inc. Tranche B, term loan 5.005% 10/19/23 (b) | 2,992,500 | 3,007,463 | |
| HarbourVest Partners LLC Tranche B, term loan 3.3814% 2/4/21 (b) | 1,353,496 | 1,360,264 | |
| IBC Capital U.S. LLC: | |||
| Tranche 2LN, term loan 8.1196% 9/11/22 (b) | 2,495,000 | 2,345,300 | |
| Tranche B 1LN, term loan 4.8696% 9/11/21 (b) | 2,823,380 | 2,762,197 | |
| Ocwen Loan Servicing LLC Tranche B, term loan 6% 12/5/20 (b) | 967,750 | 974,408 | |
| Quest Software U.S. Holdings, Inc. Tranche B, term loan 7% 10/31/22 (b) | 3,990,000 | 4,042,868 | |
| TransUnion LLC Tranche B 2LN, term loan 3.2806% 4/9/23 (b) | 5,878,878 | 5,911,976 | |
| UFC Holdings LLC Tranche B 1LN, term loan 4.25% 8/18/23 (b) | 3,283,500 | 3,298,144 | |
| TOTAL DIVERSIFIED FINANCIAL SERVICES | 68,257,533 | ||
| Energy - 4.4% | |||
| Alon U.S.A. Partners LP term loan 9.25% 11/26/18 (b) | 2,390,547 | 2,390,547 | |
| California Resources Corp. Tranche 1LN, term loan 11.375% 12/31/21 (b) | 3,640,000 | 4,016,121 | |
| Chesapeake Energy Corp. Tranche 1LN, term loan 8.5534% 8/23/21 (b) | 2,500,000 | 2,659,375 | |
| Chief Exploration & Development, LLC. Tranche 2LN, term loan 7.9324% 5/16/21 (b) | 4,118,000 | 4,004,755 | |
| Citgo Holding, Inc. Tranche B, term loan 9.5% 5/12/18 (b) | 3,897,331 | 3,952,556 | |
| Citgo Petroleum Corp. Tranche B, term loan 4.5% 7/29/21 (b) | 380,390 | 382,388 | |
| Crestwood Holdings Partners LLC Tranche B, term loan 9.0418% 6/19/19 (b) | 7,957,339 | 7,950,735 | |
| Empire Generating Co. LLC: | |||
| Tranche B, term loan 5.29% 3/14/21 (b) | 4,330,071 | 4,304,826 | |
| Tranche C, term loan 5.29% 3/14/21 (b) | 407,310 | 404,936 | |
| ExGen Renewables I, LLC Tranche B term loan 5.2718% 2/6/21 (b) | 1,420,514 | 1,427,617 | |
| Expro Finservices SARL Tranche B, term loan 5.75% 9/2/21 (b) | 8,122,920 | 6,373,081 | |
| Foresight Energy LLC Tranche B 1LN, term loan 3/28/22 (c) | 2,000,000 | 1,945,000 | |
| FTS International, Inc. Tranche B, term loan 5.75% 4/16/21 (b) | 2,213,815 | 1,920,950 | |
| Gavilan Resources LLC Tranche 2LN, term loan 7% 3/1/24 (b) | 3,500,000 | 3,456,250 | |
| Gulf Finance LLC Tranche B 1LN, term loan 6.25% 8/25/23 (b) | 8,571,925 | 8,536,180 | |
| International Seaways, Inc. Tranche B, term loan 5.7899% 8/5/19 (b) | 2,631,219 | 2,623,010 | |
| MRP Generation Holdings LLC Tranche B, term loan 8% 10/18/22 (b) | 2,234,386 | 2,220,421 | |
| Overseas Shipholding Group, Inc. Tranche B, term loan 5.29% 8/5/19 (b) | 690,830 | 683,921 | |
| Pacific Drilling SA Tranche B, term loan 4.625% 6/3/18 (b) | 2,234,312 | 1,019,405 | |
| Panda Temple Power, LLC term loan 7.25% 4/3/19 (b) | 1,668,875 | 1,445,663 | |
| Seadrill Operating LP Tranche B, term loan 4% 2/21/21 (b) | 3,799,844 | 2,568,049 | |
| Terra-Gen Finance Co. LLC Tranche B, term loan 5.25% 12/9/21 (b) | 4,526,531 | 4,266,256 | |
| TerraForm AP Acquisition Holdings LLC Tranche B, term loan 5.5% 6/26/22 (b) | 4,132,924 | 4,163,921 | |
| Western Refining, Inc. Tranche B, term loan 5.25% 11/12/20 (b) | 1,363,686 | 1,363,686 | |
| TOTAL ENERGY | 74,079,649 | ||
| Entertainment/Film - 0.6% | |||
| AMC Entertainment Holdings, Inc. Tranche B, term loan 3.7328% 12/15/23 (b) | 1,360,000 | 1,371,057 | |
| AMC Entertainment, Inc. Tranche B, term loan 3.6622% 12/15/22 (b) | 1,481,250 | 1,492,982 | |
| CDS U.S. Intermediate Holdings, Inc.: | |||
| Tranche B 1LN, term loan 5% 7/8/22 (b) | 2,761,688 | 2,779,528 | |
| Tranche B 2LN, term loan 9.25% 7/8/23 (b) | 760,000 | 752,400 | |
| Lions Gate Entertainment Corp. term loan 3.8544% 12/8/23 (b) | 3,200,000 | 3,216,992 | |
| TOTAL ENTERTAINMENT/FILM | 9,612,959 | ||
| Environmental - 0.6% | |||
| Metal Services LLC Tranche B, term loan 8.5% 6/30/19 (b) | 1,811,142 | 1,819,437 | |
| The Brickman Group, Ltd. Tranche B 1LN, term loan 4.0008% 12/18/20 (b) | 5,447,374 | 5,457,887 | |
| WTG Holdings III Corp.: | |||
| term loan 5.5% 1/15/21 (b) | 1,485,000 | 1,494,281 | |
| Tranche B 1LN, term loan 4.75% 1/15/21 (b) | 1,458,078 | 1,465,369 | |
| TOTAL ENVIRONMENTAL | 10,236,974 | ||
| Food & Drug Retail - 3.5% | |||
| Albertson's LLC: | |||
| term loan 4.3023% 6/22/23 (b) | 5,220,725 | 5,246,829 | |
| Tranche B 4LN, term loan 3.7806% 8/25/21 (b) | 24,268,829 | 24,368,085 | |
| Tranche B 5LN, term loan 4.4013% 12/21/22 (b) | 5,081,994 | 5,112,181 | |
| Candy Intermediate Holdings, Inc. Tranche B 1LN, term loan 5.5% 6/15/23 (b) | 2,977,500 | 2,888,175 | |
| GOBP Holdings, Inc.: | |||
| Tranche 2LN, term loan 9.25% 10/21/22 (b) | 1,871,000 | 1,869,447 | |
| Tranche B 1LN, term loan 5% 10/21/21 (b) | 4,697,789 | 4,702,205 | |
| HLF Financing U.S. LLC Tranche B, term loan 6.2806% 2/15/23 (b) | 2,000,000 | 1,999,160 | |
| JBS USA Lux SA Tranche B, term loan 3.2889% 10/30/22 (b) | 2,000,000 | 2,006,260 | |
| Pizza Hut Holdings LLC Tranche B, term loan 2.9761% 6/16/23 (b) | 2,238,750 | 2,248,556 | |
| RPI Finance Trust Tranche B 6LN, term loan: | |||
| 3/27/23 (c) | 3,164,969 | 3,171,552 | |
| 3.1529% 3/27/23 (b) | 2,835,031 | 2,840,928 | |
| Smart & Final, Inc. Tranche B, term loan 4.4157% 11/15/22 (b) | 3,721,971 | 3,652,184 | |
| TOTAL FOOD & DRUG RETAIL | 60,105,562 | ||
| Food/Beverage/Tobacco - 1.3% | |||
| Arctic Glacier Group Holdings, Inc. Tranche B, term loan 5.25% 3/20/24 (b) | 1,010,000 | 1,018,838 | |
| Blue Ribbon LLC Tranche B 1LN, term loan 5% 11/13/21 (b) | 2,861,114 | 2,698,975 | |
| Chobani LLC Tranche B, term loan 5.25% 10/7/23 (b) | 4,553,588 | 4,591,519 | |
| CTI Foods Holdings Co. LLC Tranche 1LN, term loan 4.5% 6/28/20 (b) | 1,778,379 | 1,760,595 | |
| Shearer's Foods, Inc.: | |||
| Tranche 2LN, term loan 7.75% 6/30/22 (b) | 4,827,000 | 4,682,190 | |
| Tranche B 1LN, term loan 4.9375% 6/30/21 (b) | 3,566,776 | 3,569,023 | |
| U.S. Foods, Inc. Tranche B, term loan 3.5306% 6/27/23 (b) | 3,970,000 | 4,004,102 | |
| TOTAL FOOD/BEVERAGE/TOBACCO | 22,325,242 | ||
| Gaming - 6.4% | |||
| Affinity Gaming LLC Tranche B, term loan 4.5% 7/1/23 (b) | 1,985,000 | 1,993,277 | |
| American Casino & Entertainment Properties LLC Tranche B, term loan 4.25% 7/7/22 (b) | 2,286,483 | 2,297,915 | |
| Aristocrat Technologies, Inc. Tranche B 2LN, term loan 3.1433% 10/20/21 (b) | 4,591,521 | 4,615,902 | |
| Boyd Gaming Corp. Tranche B 1LN, term loan 3.4439% 9/15/23 (b) | 3,000,000 | 3,014,520 | |
| Caesars Entertainment Resort Properties LLC Tranche B 1LN, term loan 7% 10/11/20 (b) | 12,430,115 | 12,484,559 | |
| Caesars Growth Properties Holdings, LLC Tranche 1LN, term loan 6.25% 5/8/21 (b) | 21,828,535 | 21,937,677 | |
| CCM Merger, Inc. Tranche B, term loan 4.0306% 8/8/21 (b) | 3,402,619 | 3,418,203 | |
| CityCenter Holdings LLC Tranche B, term loan 3.5306% 10/16/20 (b) | 1,713,357 | 1,728,709 | |
| Eldorado Resorts, Inc.: | |||
| Tranche B, term loan 3/16/24 (c) | 5,115,000 | 5,102,213 | |
| Tranche B, term loan 4.25% 7/23/22 (b) | 3,207,863 | 3,198,496 | |
| Gateway Casinos & Entertainment Ltd. term loan 4.8001% 2/22/23 (b) | 4,140,000 | 4,181,400 | |
| Golden Nugget, Inc. Tranche B, term loan: | |||
| 4.5% 11/21/19 (b) | 2,697,226 | 2,732,640 | |
| 4.5394% 11/21/19 (b) | 6,292,641 | 6,375,264 | |
| Graton Economic Development Authority Tranche B, term loan 4.75% 9/1/22 (b) | 4,747,677 | 4,789,219 | |
| Greektown Holdings LLC Tranche B, term loan 3/20/24 (c) | 1,385,000 | 1,384,141 | |
| MGM Mirage, Inc. Tranche A, term loan 3.0306% 4/25/21 (b) | 2,298,406 | 2,298,406 | |
| Mohegan Tribal Gaming Authority Tranche B, term loan 5.5% 10/14/23 (b) | 2,493,750 | 2,496,344 | |
| Penn National Gaming, Inc. Tranche B, term loan 3.2806% 1/19/24 (b) | 880,000 | 884,620 | |
| Scientific Games Corp. Tranche B 3LN, term loan 4.8462% 10/1/21 (b) | 14,658,848 | 14,839,738 | |
| Station Casinos LLC Tranche B, term loan 3.45% 6/8/23 (b) | 5,830,938 | 5,832,395 | |
| Tropicana Entertainment, Inc. Tranche B, term loan 4% 11/27/20 (b) | 1,388,716 | 1,394,369 | |
| Yonkers Racing Corp. Tranche B 1LN, term loan 4.25% 8/20/19 (b) | 910,087 | 910,087 | |
| TOTAL GAMING | 107,910,094 | ||
| Healthcare - 7.1% | |||
| Alere, Inc. Tranche B, term loan 4.25% 6/18/22 (b) | 2,238,682 | 2,242,689 | |
| AMAG Pharmaceuticals, Inc. Tranche B, term loan 4.75% 8/17/21 (b) | 2,023,291 | 2,021,612 | |
| American Renal Holdings, Inc. Tranche B 1LN, term loan 4.75% 8/20/19 (b) | 1,984,053 | 1,982,406 | |
| Community Health Systems, Inc.: | |||
| Tranche G, term loan 3.7976% 12/31/19 (b) | 3,151,796 | 3,129,954 | |
| Tranche H, term loan 4.0477% 1/27/21 (b) | 12,808,513 | 12,625,991 | |
| CPI Holdco LLC Tranche B 1LN, term loan 5.15% 3/21/24 (b) | 2,390,000 | 2,401,950 | |
| Drumm Investors LLC Tranche B, term loan 9.5% 5/4/18 (b) | 889,186 | 886,590 | |
| Envision Healthcare Corp. Tranche B, term loan 4% 12/1/23 (b) | 4,987,500 | 5,024,906 | |
| HCA Holdings, Inc.: | |||
| Tranche B 8LN, term loan 3.0306% 2/15/24 (b) | 3,990,000 | 4,022,080 | |
| Tranche B 9LN, term loan 2.7806% 3/18/23 (b) | 7,940,000 | 7,974,221 | |
| HCR Healthcare LLC Tranche B, term loan 5% 4/6/18 (b) | 2,643,025 | 2,418,368 | |
| InVentiv Health, Inc. Tranche B, term loan 4.804% 11/9/23 (b) | 3,990,000 | 3,998,299 | |
| Kindred Healthcare, Inc. Tranche B, term loan 4.5% 4/9/21 (b) | 4,168,591 | 4,166,840 | |
| Milk Specialties Co. Tranche B, term loan 5% 8/16/23 (b) | 2,064,625 | 2,080,110 | |
| MPH Acquisition Holdings LLC Tranche B, term loan 4.75% 6/7/23 (b) | 2,736,311 | 2,769,530 | |
| NMSC Holdings, Inc. Tranche B 1LN, term loan 6% 4/19/23 (b) | 1,765,595 | 1,761,181 | |
| Onex Schumacher Finance LP Tranche B 1LN, term loan 5% 7/31/22 (b) | 648,417 | 650,239 | |
| Ortho-Clinical Diagnostics, Inc. Tranche B, term loan 4.75% 6/30/21 (b) | 9,564,504 | 9,504,726 | |
| Patheon, Inc. Tranche B, term loan 4.25% 3/11/21 (b) | 7,867,208 | 7,867,208 | |
| Precyse Acquisition Corp. Tranche B, term loan 6.5% 10/20/22 (b) | 1,488,750 | 1,493,410 | |
| Press Ganey Holdings, Inc.: | |||
| Tranche 2LN, term loan 8.25% 10/21/24 (b) | 1,000,000 | 1,018,750 | |
| Tranche B 1LN, term loan 4.25% 10/21/23 (b) | 2,992,500 | 2,998,126 | |
| Project Ruby Ultimate Parent Corp. Tranche B, term loan 4.75% 2/9/24 (b) | 997,578 | 1,000,491 | |
| Surgery Center Holdings, Inc. Tranche B 1LN, term loan 4.75% 11/3/20 (b) | 1,861,021 | 1,880,804 | |
| U.S. Renal Care, Inc.: | |||
| Tranche 2LN, term loan 9% 12/31/23 (b) | 4,000,000 | 3,560,000 | |
| Tranche B 1LN, term loan 5.25% 12/31/22 (b) | 8,216,864 | 7,695,586 | |
| Valeant Pharmaceuticals International, Inc. Tranche B, term loan 5.57% 4/1/22 (b) | 19,407,538 | 19,450,428 | |
| Vizient, Inc. term loan 5% 2/11/23 (b) | 3,959,338 | 3,989,033 | |
| TOTAL HEALTHCARE | 120,615,528 | ||
| Homebuilders/Real Estate - 1.7% | |||
| Americold Realty Operating Partnership LP Tranche B, term loan 4.75% 12/1/22 (b) | 1,985,000 | 2,003,619 | |
| Communications Sales & Leasing, Inc. Tranche B, term loan 4% 10/24/22 (b) | 3,752,051 | 3,737,981 | |
| DTZ U.S. Borrower LLC: | |||
| Tranche 2LN, term loan 9.289% 11/4/22 (b) | 265,362 | 264,478 | |
| Tranche B 1LN, term loan 4.297% 11/4/21 (b) | 5,911,705 | 5,942,210 | |
| Lightstone Holdco LLC: | |||
| Tranche B, term loan 5.539% 1/30/24 (b) | 3,758,696 | 3,778,429 | |
| Tranche C, term loan 5.539% 1/30/24 (b) | 231,884 | 233,101 | |
| MGM Growth Properties Operating Partner LP Tranche B, term loan 3.2806% 4/25/23 (b) | 4,822,526 | 4,842,636 | |
| RE/MAX LLC Tranche B, term loan 3.6622% 12/15/23 (b) | 1,268,625 | 1,268,625 | |
| Realogy Group LLC term loan 3.2317% 7/20/22 (b) | 5,924,118 | 5,979,686 | |
| TOTAL HOMEBUILDERS/REAL ESTATE | 28,050,765 | ||
| Hotels - 1.5% | |||
| ESH Hospitality, Inc. Tranche B, term loan 3.2844% 8/30/23 (b) | 2,985,019 | 2,998,451 | |
| Four Seasons Holdings, Inc. Tranche B, term loan 3.9982% 11/30/23 (b) | 10,378,988 | 10,482,777 | |
| Hilton Worldwide Finance LLC Tranche B 2LN, term loan 2.9815% 10/25/23 (b) | 5,398,477 | 5,435,889 | |
| La Quinta Intermediate Holdings LLC Tranche B LN, term loan 3.7718% 4/14/21 (b) | 3,102,124 | 3,118,286 | |
| Playa Resorts Holding BV Tranche B, term loan 4.0399% 8/9/19 (b) | 2,623,080 | 2,624,733 | |
| TOTAL HOTELS | 24,660,136 | ||
| Insurance - 2.3% | |||
| Acrisure LLC: | |||
| Tranche B 1LN, term loan 5.75% 11/22/23 (b) | 4,226,190 | 4,289,583 | |
| Tranche B, term loan 5.75% 11/22/23 (b)(d) | 773,810 | 785,417 | |
| Alliant Holdings Intermediate LLC Tranche B, term loan 4.3873% 8/14/22 (b) | 4,922,446 | 4,943,563 | |
| AmWINS Group, Inc.: | |||
| Tranche 2LN, term loan 7.75% 1/25/25 (b) | 320,000 | 325,866 | |
| Tranche B 1LN, term loan 3.75% 1/25/24 (b) | 1,995,000 | 1,995,000 | |
| Asurion LLC: | |||
| term loan 4.25% 8/4/22 (b) | 7,480,235 | 7,512,026 | |
| Tranche B 2LN, term loan: | |||
| 4.0306% 7/8/20 (b) | 1,961,922 | 1,972,556 | |
| 8.5% 3/3/21 (b) | 2,130,000 | 2,153,963 | |
| Tranche B 5LN, term loan 4.75% 11/3/23 (b) | 3,087,118 | 3,110,271 | |
| HUB International Ltd. Tranche B 1LN, term loan 4.034% 10/2/20 (b) | 6,360,399 | 6,391,311 | |
| Lonestar Intermediate Super Holdings LLC term loan 10% 8/31/21 pay-in-kind (b) | 2,825,000 | 2,934,469 | |
| VF Holdings Corp. term loan 4.25% 6/30/23 (b) | 1,990,000 | 1,998,179 | |
| TOTAL INSURANCE | 38,412,204 | ||
| Leisure - 1.2% | |||
| 24 Hour Fitness Worldwide, Inc. Tranche B, term loan 4.75% 5/30/21 (b) | 5,438,920 | 5,418,524 | |
| Delta 2 SARL Tranche B, term loan 4.5677% 2/1/24 (b) | 1,640,000 | 1,638,360 | |
| Equinox Holdings, Inc.: | |||
| Tranche 2LN, term loan 8% 9/8/24 (b) | 1,000,000 | 1,012,920 | |
| Tranche B 1LN, term loan 4.25% 3/8/24 (b) | 3,000,000 | 3,020,640 | |
| Fitness International LLC Tranche B, term loan 6% 7/1/20 (b) | 2,594,221 | 2,623,406 | |
| LTF Merger Sub, Inc. Tranche B, term loan 4% 6/10/22 (b) | 3,650,808 | 3,657,196 | |
| SMG Tranche B 1LN, term loan 4.7238% 2/27/20 (b) | 2,548,921 | 2,552,107 | |
| TOTAL LEISURE | 19,923,153 | ||
| Metals/Mining - 1.5% | |||
| American Rock Salt Co. LLC Tranche B 1LN, term loan 4.75% 5/20/21 (b) | 1,818,119 | 1,811,301 | |
| Fortescue Metals Group Ltd. Tranche B, term loan 3.75% 6/30/19 (b) | 759,706 | 763,626 | |
| Murray Energy Corp. Tranche B 2LN, term loan 8.25% 4/16/20 (b) | 13,714,607 | 13,290,277 | |
| Peabody Energy Corp.: | |||
| term loan 3.4658% 2/7/22 (b) | 4,985,000 | 4,978,769 | |
| Tranche B, term loan 0% 9/24/20 (e) | 3,904,912 | 3,970,319 | |
| Walter Energy, Inc. Tranche B, term loan 0% 4/1/18 (e) | 3,491,235 | 0 | |
| TOTAL METALS/MINING | 24,814,292 | ||
| Paper - 0.6% | |||
| Caraustar Industries, Inc. Tranche B, term loan 6.5% 3/14/22 (b) | 4,380,000 | 4,412,850 | |
| Flex Acquisition Co., Inc. Tranche B 1LN, term loan 4.25% 12/29/23 (b) | 5,305,000 | 5,333,170 | |
| TOTAL PAPER | 9,746,020 | ||
| Publishing/Printing - 3.0% | |||
| Cengage Learning, Inc. Tranche B, term loan 5.25% 6/7/23 (b) | 7,781,200 | 7,404,279 | |
| Getty Images, Inc. Tranche B, term loan 4.75% 10/18/19 (b) | 8,494,670 | 7,416,951 | |
| Harland Clarke Holdings Corp.: | |||
| Tranche B 5LN, term loan 7% 12/31/21 (b) | 3,749,233 | 3,779,227 | |
| Tranche B 6LN, term loan 6.5% 2/9/22 (b) | 1,429,156 | 1,438,089 | |
| Houghton Mifflin Harcourt Publishing, Inc. Tranche B, term loan 4% 5/29/21 (b) | 5,895,000 | 5,423,400 | |
| McGraw-Hill Global Education Holdings, LLC term loan 5% 5/4/22 (b) | 7,948,258 | 7,851,131 | |
| Merrill Communications LLC Tranche B, term loan 6.289% 6/1/22 (b) | 2,931,322 | 2,931,322 | |
| Montreign Operating Co. LLC Tranche B 1LN, term loan 9.3073% 1/19/23 (b) | 3,495,000 | 3,560,531 | |
| Proquest LLC Tranche B, term loan 5.25% 10/24/21 (b) | 4,876,345 | 4,943,395 | |
| Springer Science+Business Media Deutschland GmbH Tranche B 9LN, term loan 4.5% 8/14/20 (b) | 6,843,067 | 6,835,745 | |
| TOTAL PUBLISHING/PRINTING | 51,584,070 | ||
| Restaurants - 1.0% | |||
| CEC Entertainment, Inc. Tranche B, term loan 4% 2/14/21 (b) | 1,966,636 | 1,948,209 | |
| Focus Brands, Inc. term loan 5% 10/5/23 (b) | 2,395,800 | 2,395,800 | |
| Landry's Acquisition Co. Tranche B 1LN, term loan 4.0389% 10/4/23 (b) | 8,889,231 | 8,954,300 | |
| Red Lobster Hospitality LLC Tranche B, term loan 6.25% 7/28/21 (b) | 3,003,005 | 3,033,035 | |
| TOTAL RESTAURANTS | 16,331,344 | ||
| Services - 9.1% | |||
| Abacus Innovations Corp. Tranche B, term loan 3.0625% 8/16/23 (b) | 2,493,750 | 2,514,323 | |
| Acosta, Inc. Tranche B, term loan 4.289% 9/26/21 (b) | 7,341,569 | 6,864,367 | |
| Ancestry.Com Operations, Inc.: | |||
| Tranch B 1LN, term loan 4.25% 10/19/23 (b) | 5,940,000 | 5,980,867 | |
| Tranche 2LN, term loan 9.27% 10/19/24 (b) | 1,500,000 | 1,535,625 | |
| Brand Energy & Infrastructure Services, Inc. Tranche B, term loan 4.7709% 11/26/20 (b) | 7,990,914 | 8,004,898 | |
| Bright Horizons Family Solutions Tranche B, term loan 3.6044% 11/7/23 (b) | 1,750,392 | 1,766,584 | |
| Cactus Wellhead LLC Tranche B, term loan 7% 7/31/20 (b) | 6,939,433 | 6,595,931 | |
| Coinmach Service Corp. Tranche B, term loan 4.2903% 11/14/19 (b) | 7,328,283 | 7,324,326 | |
| Creative Artists Agency LLC Tranche B, term loan 4.5% 2/15/24 (b) | 2,389,013 | 2,420,380 | |
| Garda World Security Corp.: | |||
| term loan 4% 11/8/20 (b) | 3,823,938 | 3,832,542 | |
| Tranche B 1LN, term loan 4% 11/8/20 (b) | 997,500 | 999,744 | |
| Tranche DD, term loan 4% 11/8/20 (b) | 664,256 | 665,751 | |
| GCA Services Group, Inc. Tranche B 1LN, term loan 6.0618% 3/1/23 (b) | 1,963,932 | 1,968,842 | |
| KAR Auction Services, Inc. Tranche B 3LN, term loan 4.5% 3/9/23 (b) | 2,539,350 | 2,565,810 | |
| Karman Buyer Corp.: | |||
| Tranche 1LN, term loan 4.25% 7/25/21 (b) | 3,687,055 | 3,645,576 | |
| Tranche 2LN, term loan 7.5% 7/25/22 (b) | 2,865,000 | 2,770,455 | |
| Kuehg Corp. Tranche B 1LN, term loan 5.25% 8/13/22 (b) | 5,931,441 | 5,961,098 | |
| Laureate Education, Inc. Tranche B, term loan 8.5093% 3/17/21 (b) | 20,927,018 | 21,083,971 | |
| Lineage Logistics Holdings, LLC. Tranche B, term loan 4.5% 4/7/21 (b) | 8,580,087 | 8,574,768 | |
| Nord Anglia Education Tranche B, term loan 4.554% 3/31/21 (b) | 9,986,026 | 10,017,282 | |
| Outerwall, Inc.: | |||
| Tranche 2LN, term loan 9.75% 9/27/24 (b) | 1,000,000 | 1,005,000 | |
| Tranche B 1LN, term loan 5.25% 9/27/23 (b) | 2,985,000 | 3,008,880 | |
| Prime Security Services Borrower LLC Tranche B 1LN, term loan 4.25% 5/2/22 (b) | 14,896,366 | 15,039,073 | |
| SAI Global GP Tranche B, term loan 5.5975% 12/8/23 (b) | 2,992,500 | 3,029,906 | |
| Science Applications International Corp. Tranche B, term loan 3.5625% 5/4/22 (b) | 2,354,601 | 2,364,914 | |
| Summit Midstream Partners LP Tranche B, term loan 7.0217% 5/16/22 (b) | 4,000,000 | 4,070,000 | |
| The GEO Group, Inc. Tranche B, term loan 3/9/24 (c) | 1,840,000 | 1,848,059 | |
| The ServiceMaster Co. Tranche B, term loan 3.2806% 11/8/23 (b) | 3,990,000 | 4,026,149 | |
| Thomson Reuters IP&S Tranche B 1LN, term loan 4.75% 10/3/23 (b) | 4,681,475 | 4,684,424 | |
| Wash Multifamily Acquisition, Inc.: | |||
| Tranche B 1LN, term loan 4.25% 5/14/22 (b) | 5,256,627 | 5,256,627 | |
| Tranche B 2LN, term loan 8% 5/14/23 (b) | 645,000 | 638,550 | |
| Xerox Business Services LLC Tranche B, term loan 6.3344% 12/7/23 (b) | 4,104,713 | 4,146,786 | |
| TOTAL SERVICES | 154,211,508 | ||
| Steel - 0.3% | |||
| Atkore International, Inc. Tranche B 1LN, term loan 4% 12/22/23 (b) | 997,500 | 1,003,425 | |
| JMC Steel Group, Inc. Tranche B, term loan 4.9062% 6/14/21 (b) | 3,289,750 | 3,334,984 | |
| TOTAL STEEL | 4,338,409 | ||
| Super Retail - 4.6% | |||
| Academy Ltd. Tranche B, term loan 5.0553% 7/2/22 (b) | 6,013,732 | 4,426,107 | |
| Bass Pro Group LLC: | |||
| term loan 5.7204% 6/9/18 (b) | 2,000,000 | 2,003,760 | |
| Tranche B, term loan 4.1044% 6/5/20 (b) | 4,861,930 | 4,776,846 | |
| Bass Pro Shops LLC. Tranche B, term loan 5.9704% 12/16/23 (b) | 10,500,000 | 10,099,740 | |
| BJ's Wholesale Club, Inc.: | |||
| Tranche 2LN, term loan 8.5% 2/3/25 (b) | 2,500,000 | 2,435,000 | |
| Tranche B 1LN, term loan 4.75% 2/3/24 (b) | 7,000,000 | 6,832,490 | |
| Davids Bridal, Inc. Tranche B, term loan 5.25% 10/11/19 (b) | 3,082,956 | 2,514,798 | |
| Harbor Freight Tools U.S.A., Inc. Tranche B, term loan 4.0389% 8/19/23 (b) | 3,980,000 | 3,971,284 | |
| JC Penney Corp., Inc. Tranche B, term loan 5.304% 6/23/23 (b) | 15,200,118 | 15,078,517 | |
| Party City Holdings, Inc. term loan 3.855% 8/19/22 (b) | 5,405,275 | 5,388,843 | |
| PETCO Animal Supplies, Inc. Tranche B 1LN, term loan 4.2873% 1/26/23 (b) | 5,163,722 | 4,855,189 | |
| PetSmart, Inc. term loan 4.02% 3/11/22 (b) | 9,622,232 | 9,177,204 | |
| Sears Holdings Corp. Tranche ABL, term loan 5.5% 6/30/18 (b) | 6,946,559 | 6,853,197 | |
| Sports Authority, Inc. Tranche B, term loan 0% 11/16/17 (e) | 3,605,188 | 215,194 | |
| TOTAL SUPER RETAIL | 78,628,169 | ||
| Technology - 10.5% | |||
| Applied Systems, Inc. Tranche B 1LN, term loan 4% 1/23/21 (b) | 1,370,063 | 1,376,571 | |
| Aptean, Inc.: | |||
| Tranche 2LN, term loan 10.5% 12/20/23 (b) | 795,000 | 793,013 | |
| Tranche B 1LN, term loan 6% 12/20/22 (b) | 2,250,000 | 2,283,750 | |
| BMC Software Finance, Inc. Tranche B, term loan: | |||
| 5% 9/10/20 (b) | 352,029 | 351,972 | |
| 5% 9/10/20 (b) | 989,742 | 990,078 | |
| Bright Bidco BV Tranche B, term loan 3/17/24 (c) | 2,000,000 | 2,011,660 | |
| Cavium, Inc. Tranche B 1LN, term loan 3.2283% 8/16/22 (b) | 1,919,841 | 1,927,040 | |
| Ceridian HCM Holding, Inc. Tranche B 2LN, term loan 4.5387% 9/15/20 (b) | 4,189,422 | 4,152,764 | |
| Cologix Holdings, Inc. Tranche B 1LN, term loan 3/20/24 (c) | 2,765,000 | 2,765,857 | |
| Computer Discount Warehouse (CDW) LLC Tranche B, term loan 3% 8/17/23 (b) | 3,039,871 | 3,052,973 | |
| Compuware Corp.: | |||
| term loan 9.25% 12/15/22 (b) | 4,730,870 | 4,738,770 | |
| Tranche B 3LN, term loan 5.25% 12/15/21 (b) | 4,391,309 | 4,397,896 | |
| Datapipe, Inc. Tranche B 1LN, term loan 5.75% 3/15/19 (b) | 6,606,606 | 6,610,768 | |
| Dell International LLC: | |||
| Tranche A 1LN, term loan 2.79% 12/31/18 (b) | 559,691 | 559,864 | |
| Tranche B, term loan 3.35% 9/7/23 (b) | 3,322,500 | 3,333,564 | |
| EIG Investors Corp. Tranche B 1LN, term loan 6.0416% 2/9/23 (b) | 7,281,452 | 7,330,020 | |
| Electro Rent Corp. Tranche B 1LN, term loan 6% 1/31/24 (b) | 2,493,750 | 2,509,336 | |
| Epicor Software Corp.: | |||
| Tranche B, term loan 4.75% 6/1/22 (b) | 4,259,202 | 4,263,462 | |
| Tranche B2 1LN, term loan 5% 6/1/22 (b) | 983,173 | 984,815 | |
| First Data Corp. Tranche B, term loan 3.9839% 7/10/22 (b) | 13,527,824 | 13,626,442 | |
| G.I. Peak Merger Sub Corp.: | |||
| Tranche 2LN, term loan 8.2801% 6/17/22 (b) | 855,000 | 835,763 | |
| Tranche B 1LN, term loan 5% 6/17/21 (b) | 1,895,520 | 1,904,997 | |
| Genesys Telecommunications Laboratories, Inc. term loan 5.0248% 12/1/23 (b) | 7,980,532 | 8,032,087 | |
| Global Payments, Inc. Tranche B, term loan 3.2806% 4/22/23 (b) | 1,549,308 | 1,557,054 | |
| Go Daddy Operating Co. LLC Tranche B, term loan: | |||
| 2/15/24 (d) | 855,856 | 856,609 | |
| 3.4122% 2/15/24 (b) | 644,144 | 644,711 | |
| Infor U.S., Inc. Tranche B 6LN, term loan 3.75% 2/1/22 (b) | 2,989,446 | 2,977,697 | |
| Information Resources, Inc.: | |||
| Tranche 2LN, term loan 9.25% 1/18/25 (b) | 1,000,000 | 993,330 | |
| Tranche B 1LN, term loan 5.25% 1/18/24 (b) | 3,620,000 | 3,659,603 | |
| Kronos, Inc. term loan: | |||
| 5.0339% 11/1/23 (b) | 6,982,500 | 7,018,181 | |
| 9.284% 11/1/24 (b) | 10,000,000 | 10,306,300 | |
| Landesk Group, Inc. term loan: | |||
| 5.25% 1/20/24 (b) | 6,310,000 | 6,337,638 | |
| 10% 1/20/25 (b) | 1,000,000 | 989,500 | |
| Lux FinCo U.S. SPV: | |||
| Tranche 2LN, term loan 9.5% 10/16/23 (b) | 810,000 | 801,900 | |
| Tranche B 3LN, term loan 4.5% 10/16/22 (b) | 2,770,641 | 2,770,641 | |
| Micron Technology, Inc. Tranche B, term loan 4.54% 4/26/22 (b) | 1,488,750 | 1,493,871 | |
| Microsemi Corp. Tranche B, term loan 3.2261% 1/15/23 (b) | 1,474,097 | 1,480,775 | |
| Rackspace Hosting, Inc. term loan 4.5345% 11/3/23 (b) | 8,064,788 | 8,114,063 | |
| Renaissance Learning, Inc.: | |||
| Tranche 1LN, term loan 4.75% 4/9/21 (b) | 8,023,867 | 8,050,587 | |
| Tranche 2LN, term loan 8% 4/9/22 (b) | 3,412,000 | 3,394,940 | |
| SolarWinds Holdings, Inc. Tranche B, term loan 4.5% 2/5/23 (b) | 2,977,538 | 2,976,049 | |
| Solera LLC Tranche B, term loan 4.25% 3/3/23 (b) | 5,143,536 | 5,163,545 | |
| Sophia L.P. term loan 4.25% 9/30/22 (b) | 5,313,705 | 5,308,710 | |
| SS&C Technologies, Inc.: | |||
| Tranche B 1LN, term loan 3.0306% 7/8/22 (b) | 2,732,273 | 2,744,241 | |
| Tranche B 2LN, term loan 3.0306% 7/8/22 (b) | 233,567 | 234,590 | |
| Sybil Software LLC. Tranche B, term loan 5% 9/30/22 (b) | 5,599,125 | 5,641,118 | |
| Syniverse Holdings, Inc. Tranche B, term loan 4% 4/23/19 (b) | 3,558,024 | 3,261,142 | |
| TTM Technologies, Inc. Tranche B 1LN, term loan 5.25% 5/31/21 (b) | 4,030,000 | 4,090,450 | |
| Uber Technologies, Inc. Tranche B, term loan 5% 7/13/23 (b) | 4,477,500 | 4,453,993 | |
| Veritas U.S., Inc. Tranche B 1LN, term loan 6.7718% 1/27/23 (b) | 1,206,952 | 1,195,390 | |
| WEX, Inc. Tranche B, term loan 4.2806% 7/1/23 (b) | 2,977,500 | 3,009,925 | |
| TOTAL TECHNOLOGY | 178,360,015 | ||
| Telecommunications - 7.5% | |||
| Altice Financing SA Tranche B, term loan 6/22/25 (c) | 2,000,000 | 2,000,000 | |
| Consolidated Communications, Inc. Tranche B 2LN, term loan 10/5/23 (c) | 2,000,000 | 2,007,500 | |
| Digicel International Finance Ltd. Tranche D 2LN, term loan 4.4982% 3/31/19 (b) | 7,035,800 | 6,939,057 | |
| DigitalGlobe, Inc. Tranche B, term loan 3.5306% 1/15/24 (b) | 1,915,200 | 1,921,195 | |
| Evo Payments International LLC Tranche B 1LN, term loan 6% 12/20/23 (b) | 3,000,000 | 3,023,760 | |
| FairPoint Communications, Inc. Tranche B, term loan 7.5% 2/14/19 (b) | 7,141,785 | 7,170,353 | |
| GTT Communications, Inc. Tranche B, term loan 5% 1/9/24 (b) | 1,216,950 | 1,232,162 | |
| Intelsat Jackson Holdings SA Tranche B 2LN, term loan 3.8873% 6/30/19 (b) | 11,085,000 | 10,841,795 | |
| Level 3 Financing, Inc. Tranche B, term loan 3.2272% 2/22/24 (b) | 10,000,000 | 10,012,500 | |
| LTS Buyer LLC Tranche B 1LN, term loan 4.2482% 4/11/20 (b) | 9,052,089 | 9,086,034 | |
| Neptune Finco Corp.: | |||
| Tranche B, term loan: | |||
| 7/17/25 (c) | 832,999 | 831,750 | |
| 3.9428% 10/11/24 (b) | 2,447,550 | 2,440,672 | |
| Tranche DD 1LN, term loan 7/17/25 (c) | 167,001 | 166,374 | |
| Neustar, Inc.: | |||
| Tranche 2LN, term loan 2/28/25 (c) | 875,000 | 882,656 | |
| Tranche B1 1LN, term loan 8/31/19 (c) | 500,000 | 506,040 | |
| Tranche B2 1LN, term loan 2/29/24 (c) | 3,050,000 | 3,084,313 | |
| Onvoy LLC Tranche B 1LN, term loan 5.5% 2/10/24 (b) | 3,000,000 | 2,990,640 | |
| Polycom, Inc. Tranche B, term loan 6.25% 9/27/23 (b) | 3,683,333 | 3,723,850 | |
| RP Crown Parent, LLC Tranche B, term loan 4.5% 10/12/23 (b) | 4,987,500 | 5,015,580 | |
| Sable International Finance Ltd. Tranche B 1LN, term loan 5.5306% 12/31/22 (b) | 5,000,000 | 5,035,400 | |
| Securus Technologies Holdings, Inc.: | |||
| Tranche 2LN, term loan 9% 4/30/21 (b) | 7,514,000 | 7,476,430 | |
| Tranche B 1LN, term loan 4.75% 4/30/20 (b) | 4,591,090 | 4,582,504 | |
| Securus Technologies, Inc. Tranche B2 1LN, term loan 5.25% 4/30/20 (b) | 2,962,500 | 2,956,960 | |
| SFR Group SA Tranche B 11LN, term loan 6/22/25 (c) | 5,500,000 | 5,477,670 | |
| Sprint Communications, Inc. Tranche B, term loan 3.3125% 2/3/24 (b) | 13,115,000 | 13,105,688 | |
| TCH-2 Holdings, LLC. Tranche B 1LN, term loan 5.5% 5/12/21 (b) | 1,541,876 | 1,557,295 | |
| Telenet Financing USD LLC Tranche B, term loan 3.9122% 1/31/25 (b) | 2,000,000 | 2,000,260 | |
| Telesat LLC Tranche B 4LN, term loan 3.85% 11/17/23 (b) | 8,457,553 | 8,518,870 | |
| Xplornet Communications, Inc. Tranche B, term loan 7% 9/9/21 (b) | 2,627,624 | 2,660,470 | |
| TOTAL TELECOMMUNICATIONS | 127,247,778 | ||
| Textiles/Apparel - 0.1% | |||
| ABB Optical Group LLC Tranche B, term loan 6.1161% 6/15/23 (b) | 1,666,625 | 1,681,208 | |
| Transportation Ex Air/Rail - 0.4% | |||
| American Commercial Barge Line Tranche B 1LN, term loan 9.75% 11/12/20 (b) | 3,272,750 | 2,994,566 | |
| Navios Maritime Partners LP Tranche B, term loan 6.13% 9/3/20 (b) | 3,300,000 | 3,260,829 | |
| TOTAL TRANSPORTATION EX AIR/RAIL | 6,255,395 | ||
| Utilities - 6.1% | |||
| Alinta Energy Finance Pty. Ltd. Tranche B, term loan: | |||
| 6.375% 8/13/18 (b) | 265,023 | 265,354 | |
| 6.375% 8/13/19 (b) | 3,972,314 | 3,977,279 | |
| APLP Holdings LP Tranche B, term loan 6% 4/13/23 (b) | 3,513,555 | 3,535,515 | |
| Calpine Corp.: | |||
| Tranche B 5LN, term loan 3.75% 1/15/24 (b) | 2,456,250 | 2,465,461 | |
| Tranche B, term loan 2.54% 11/30/17 (b) | 1,454,545 | 1,454,996 | |
| Cortes NP Acquisition Corp. Tranche B, term loan 5.0302% 11/30/23 (b) | 4,746,433 | 4,790,955 | |
| Dynegy, Inc. Tranche C, term loan 4.25% 6/27/23 (b) | 8,000,000 | 8,015,440 | |
| Energy Future Holdings Corp. term loan 4.304% 6/30/17 (b) | 12,072,000 | 12,051,840 | |
| Essential Power LLC Tranche B, term loan 4.75% 8/8/19 (b) | 6,331,908 | 6,358,818 | |
| Exgen Texas Power LLC Tranche B, term loan 5.75% 9/18/21 (b) | 4,268,677 | 2,769,304 | |
| Green Energy Partners/Stonewall LLC Tranche B 1LN, term loan 6.5% 11/13/21 (b) | 7,193,000 | 6,995,193 | |
| Houston Fuel Oil Terminal Co. Tranche B, term loan 4.25% 8/19/21 (b) | 8,891,316 | 8,846,859 | |
| InterGen NV Tranche B, term loan 5.5% 6/13/20 (b) | 9,597,894 | 9,537,907 | |
| Limetree Bay Terminals LLC term loan 6.04% 2/15/24 (b) | 3,430,000 | 3,464,300 | |
| Longview Power LLC Tranche B, term loan 7% 4/13/21 (b) | 3,930,000 | 3,294,637 | |
| Moxie Patriot LLC Tranche B, term loan 6.75% 12/19/20 (b) | 7,585,549 | 7,405,392 | |
| Southcross Energy Partners LP Tranche B, term loan 5.25% 8/4/21 (b) | 2,239,544 | 1,961,012 | |
| Southcross Holdings Borrower LP Tranche B, term loan 9% 4/13/23 | 916,402 | 809,485 | |
| Tex Operations Co. LLC: | |||
| Tranche B, term loan 3.5306% 8/4/23 (b) | 7,310,250 | 7,291,974 | |
| Tranche C, term loan 3.5306% 8/4/23 (b) | 1,671,429 | 1,667,250 | |
| USIC Holdings, Inc. Tranche 1LN, term loan 6.75% 12/9/23 (b) | 1,995,000 | 2,004,975 | |
| Vistra Operations Co. LLC Tranche B 2LN, term loan 4.1928% 12/14/23 (b) | 3,491,250 | 3,493,868 | |
| TOTAL UTILITIES | 102,457,814 | ||
| TOTAL BANK LOAN OBLIGATIONS | |||
| (Cost $1,557,038,295) | 1,559,043,685 | ||
| Nonconvertible Bonds - 2.3% | |||
| Containers - 0.3% | |||
| Ardagh Packaging Finance PLC/Ardagh MP Holdings U.S.A., Inc. 4.289% 5/15/21 (b)(f) | 2,700,000 | 2,764,125 | |
| Reynolds Group Issuer, Inc./Reynolds Group Issuer LLC/Reynolds Group Issuer (Luxembourg) SA 4.5232% 7/15/21 (b)(f) | 1,780,000 | 1,821,171 | |
| TOTAL CONTAINERS | 4,585,296 | ||
| Diversified Financial Services - 0.1% | |||
| Prime Securities Services Borrower LLC/Prime Finance, Inc. 9.25% 5/15/23 (f) | 1,500,000 | 1,644,375 | |
| Energy - 0.1% | |||
| Cheniere Corpus Christi Holdings LLC 7% 6/30/24 (f) | 1,000,000 | 1,101,250 | |
| Gaming - 0.1% | |||
| Scientific Games Corp. 7% 1/1/22 (f) | 1,285,000 | 1,371,738 | |
| Healthcare - 0.2% | |||
| MPT Operating Partnership LP/MPT Finance Corp. 5.25% 8/1/26 | 575,000 | 566,375 | |
| Tenet Healthcare Corp.: | |||
| 4.6312% 6/15/20 (b) | 2,545,000 | 2,557,725 | |
| 7.5% 1/1/22 (f) | 900,000 | 972,000 | |
| TOTAL HEALTHCARE | 4,096,100 | ||
| Leisure - 0.2% | |||
| Studio City Co. Ltd.: | |||
| 5.875% 11/30/19 (f) | 1,220,000 | 1,268,800 | |
| 7.25% 11/30/21 (f) | 2,000,000 | 2,132,500 | |
| TOTAL LEISURE | 3,401,300 | ||
| Paper - 0.1% | |||
| Xerium Technologies, Inc. 9.5% 8/15/21 | 2,500,000 | 2,540,625 | |
| Publishing/Printing - 0.0% | |||
| Cenveo Corp. 6% 8/1/19 (f) | 540,000 | 445,500 | |
| Services - 0.1% | |||
| APX Group, Inc. 7.875% 12/1/22 | 1,450,000 | 1,566,000 | |
| Super Retail - 0.1% | |||
| JC Penney Corp., Inc. 5.875% 7/1/23 (f) | 1,020,000 | 1,020,000 | |
| Technology - 0.4% | |||
| Diamond 1 Finance Corp./Diamond 2 Finance Corp.: | |||
| 3.48% 6/1/19 (f) | 1,004,000 | 1,029,263 | |
| 4.42% 6/15/21 (f) | 3,030,000 | 3,168,307 | |
| NXP BV/NXP Funding LLC 4.125% 6/1/21 (f) | 2,665,000 | 2,764,938 | |
| TOTAL TECHNOLOGY | 6,962,508 | ||
| Telecommunications - 0.6% | |||
| Altice Financing SA 7.5% 5/15/26 (f) | 3,095,000 | 3,288,438 | |
| Columbus International, Inc. 7.375% 3/30/21 (f) | 764,000 | 815,570 | |
| SFR Group SA: | |||
| 6% 5/15/22 (f) | 450,000 | 466,313 | |
| 6.25% 5/15/24 (f) | 1,930,000 | 1,942,063 | |
| 7.375% 5/1/26 (f) | 3,010,000 | 3,100,300 | |
| TOTAL TELECOMMUNICATIONS | 9,612,684 | ||
| TOTAL NONCONVERTIBLE BONDS | |||
| (Cost $36,984,539) | 38,347,376 | ||
| Shares | Value | ||
| Common Stocks - 0.5% | |||
| Chemicals - 0.3% | |||
| LyondellBasell Industries NV Class A | 52,192 | 4,759,388 | |
| Metals/Mining - 0.1% | |||
| Warrior Met Coal LLC Class A (g) | 3,793 | 904,517 | |
| Publishing/Printing - 0.1% | |||
| Tribune Media Co. Class A | 35,222 | 1,312,724 | |
| Telecommunications - 0.0% | |||
| FairPoint Communications, Inc. (h) | 32,378 | 537,475 | |
| Utilities - 0.0% | |||
| Southcross Holdings Borrower LP | 989 | 440,412 | |
| TOTAL COMMON STOCKS | |||
| (Cost $11,338,073) | 7,954,516 | ||
| Other - 0.0% | |||
| Other - 0.0% | |||
| Tribune Co. Claim (h) | |||
| (Cost $45,406) | 45,439 | 45,439 | |
| Money Market Funds - 7.8% | |||
| Fidelity Cash Central Fund, 0.84% (i) | |||
| (Cost $131,867,913) | 131,859,408 | 131,885,780 | |
| TOTAL INVESTMENT PORTFOLIO - 102.8% | |||
| (Cost $1,737,274,226) | 1,737,276,796 | ||
| NET OTHER ASSETS (LIABILITIES) - (2.8)% | (47,269,253) | ||
| NET ASSETS - 100% | $1,690,007,543 |
Legend
(a) Remaining maturities of bank loan obligations may be less than the stated maturities shown as a result of contractual or optional prepayments by the borrower. Such prepayments cannot be predicted with certainty.
(b) Coupon rates for floating and adjustable rate securities reflect the rates in effect at period end.
(c) The coupon rate will be determined upon settlement of the loan after period end.
(d) Position or a portion of the position represents an unfunded loan commitment. At period end, the total principal amount and market value of unfunded commitments totaled $1,188,396 and $1,192,824, respectively.
(e) Non-income producing - Security is in default.
(f) Security exempt from registration under Rule 144A of the Securities Act of 1933. These securities may be resold in transactions exempt from registration, normally to qualified institutional buyers. At the end of the period, the value of these securities amounted to $31,116,651 or 1.8% of net assets.
(g) Restricted securities - Investment in securities not registered under the Securities Act of 1933 (excluding 144A issues). At the end of the period, the value of restricted securities (excluding 144A issues) amounted to $904,517 or 0.1% of net assets.
(h) Non-income producing
(i) Affiliated fund that is generally available only to investment companies and other accounts managed by Fidelity Investments. The rate quoted is the annualized seven-day yield of the fund at period end. A complete unaudited listing of the fund's holdings as of its most recent quarter end is available upon request. In addition, each Fidelity Central Fund's financial statements are available on the SEC's website or upon request.
Additional information on each restricted holding is as follows:
| Security | Acquisition Date | Acquisition Cost |
| Warrior Met Coal LLC Class A | 11/4/13 - 4/14/14 | $7,614,369 |
Affiliated Central Funds
Information regarding fiscal year to date income earned by the Fund from investments in Fidelity Central Funds is as follows:
| Fund | Income earned |
| Fidelity Cash Central Fund | $368,743 |
| Total | $368,743 |
Investment Valuation
The following is a summary of the inputs used, as of March 31, 2017, involving the Fund's assets and liabilities carried at fair value. The inputs or methodology used for valuing securities may not be an indication of the risk associated with investing in those securities. For more information on valuation inputs, and their aggregation into the levels used below, please refer to the Investment Valuation section in the accompanying Notes to Financial Statements.
| Valuation Inputs at Reporting Date: | ||||
| Description | Total | Level 1 | Level 2 | Level 3 |
| Investments in Securities: | ||||
| Equities: | ||||
| Consumer Discretionary | $1,312,724 | $1,312,724 | $-- | $-- |
| Energy | 904,517 | -- | 904,517 | -- |
| Materials | 4,759,388 | 4,759,388 | -- | -- |
| Telecommunication Services | 537,475 | 537,475 | -- | -- |
| Utilities | 440,412 | -- | -- | 440,412 |
| Bank Loan Obligations | 1,559,043,685 | -- | 1,541,440,979 | 17,602,706 |
| Corporate Bonds | 38,347,376 | -- | 38,347,376 | -- |
| Other | 45,439 | -- | -- | 45,439 |
| Money Market Funds | 131,885,780 | 131,885,780 | -- | -- |
| Total Investments in Securities: | $1,737,276,796 | $138,495,367 | $1,580,692,872 | $18,088,557 |
The following is a reconciliation of Investments in Securities for which Level 3 inputs were used in determining value:
| Investments in Securities: | |
| Bank Loan Obligations | |
| Beginning Balance | $9,195,500 |
| Net Realized Gain (Loss) on Investment Securities | (21,881) |
| Net Unrealized Gain (Loss) on Investment Securities | 390,746 |
| Cost of Purchases | 3,514,649 |
| Proceeds of Sales | (3,149,777) |
| Amortization/Accretion | 60,934 |
| Transfers into Level 3 | 7,612,535 |
| Transfers out of Level 3 | -- |
| Ending Balance | $17,602,706 |
| The change in unrealized gain (loss) for the period attributable to Level 3 securities held at March 31, 2017 | $257,731 |
| Other Investments in Securities | |
| Beginning Balance | $1,396,516 |
| Net Realized Gain (Loss) on Investment Securities | -- |
| Net Unrealized Gain (Loss) on Investment Securities | (41,765) |
| Cost of Purchases | -- |
| Proceeds of Sales | -- |
| Amortization/Accretion | -- |
| Transfers into Level 3 | -- |
| Transfers out of Level 3 | (868,900) |
| Ending Balance | $485,851 |
| The change in unrealized gain (loss) for the period attributable to Level 3 securities held at March 31, 2017 | $(41,765) |
The information used in the above reconciliations represents fiscal year to date activity for any Investments in Securities identified as using Level 3 inputs at either the beginning or the end of the current fiscal period. Transfers in or out of Level 3 represent the beginning value of any Security or Instrument where a change in the pricing level occurred from the beginning to the end of the period. The cost of purchases and the proceeds of sales may include securities received or delivered through corporate actions or exchanges. Realized and unrealized gains (losses) disclosed in the reconciliations are included in Net Gain (Loss) on the Fund's Statement of Operations.
See accompanying notes which are an integral part of the financial statements.
Financial Statements
Statement of Assets and Liabilities
| March 31, 2017 (Unaudited) | ||
| Assets | ||
| Investment in securities, at value — See accompanying schedule: Unaffiliated issuers (cost $1,605,406,313) | $1,605,391,016 | |
| Fidelity Central Funds (cost $131,867,913) | 131,885,780 | |
| Total Investments (cost $1,737,274,226) | $1,737,276,796 | |
| Cash | 8,195,921 | |
| Receivable for investments sold | 23,258,847 | |
| Receivable for fund shares sold | 67,856 | |
| Interest receivable | 8,206,299 | |
| Distributions receivable from Fidelity Central Funds | 87,543 | |
| Other receivables | 287,756 | |
| Total assets | 1,777,381,018 | |
| Liabilities | ||
| Payable for investments purchased | $81,666,390 | |
| Payable for fund shares redeemed | 115,097 | |
| Distributions payable | 5,576,207 | |
| Other payables and accrued expenses | 15,781 | |
| Total liabilities | 87,373,475 | |
| Net Assets | $1,690,007,543 | |
| Net Assets consist of: | ||
| Paid in capital | $1,691,575,887 | |
| Undistributed net investment income | 47,316 | |
| Accumulated undistributed net realized gain (loss) on investments | (1,618,230) | |
| Net unrealized appreciation (depreciation) on investments | 2,570 | |
| Net Assets, for 16,315,841 shares outstanding | $1,690,007,543 | |
| Net Asset Value, offering price and redemption price per share ($1,690,007,543 ÷ 16,315,841 shares) | $103.58 |
See accompanying notes which are an integral part of the financial statements.
Statement of Operations
| Six months ended March 31, 2017 (Unaudited) | ||
| Investment Income | ||
| Dividends | $309,568 | |
| Interest | 42,409,475 | |
| Income from Fidelity Central Funds | 368,743 | |
| Total income | 43,087,786 | |
| Expenses | ||
| Custodian fees and expenses | $16,105 | |
| Independent directors' fees and expenses | 3,382 | |
| Legal | 738,578 | |
| Total expenses before reductions | 758,065 | |
| Expense reductions | (8,514) | 749,551 |
| Net investment income (loss) | 42,338,235 | |
| Realized and Unrealized Gain (Loss) | ||
| Net realized gain (loss) on: | ||
| Investment securities: | ||
| Unaffiliated issuers | (824,876) | |
| Fidelity Central Funds | 15,486 | |
| Total net realized gain (loss) | (809,390) | |
| Change in net unrealized appreciation (depreciation) on investment securities | 16,965,577 | |
| Net gain (loss) | 16,156,187 | |
| Net increase (decrease) in net assets resulting from operations | $58,494,422 |
See accompanying notes which are an integral part of the financial statements.
Statement of Changes in Net Assets
| Six months ended March 31, 2017 (Unaudited) | Year ended September 30, 2016 | |
| Increase (Decrease) in Net Assets | ||
| Operations | ||
| Net investment income (loss) | $42,338,235 | $81,626,121 |
| Net realized gain (loss) | (809,390) | (50,147,531) |
| Change in net unrealized appreciation (depreciation) | 16,965,577 | 52,616,778 |
| Net increase (decrease) in net assets resulting from operations | 58,494,422 | 84,095,368 |
| Distributions to shareholders from net investment income | (42,290,919) | (77,790,414) |
| Distributions to shareholders from net realized gain | (808,840) | – |
| Total distributions | (43,099,759) | (77,790,414) |
| Affiliated share transactions | ||
| Proceeds from sales of shares | 88,470,498 | 140,260,392 |
| Reinvestment of distributions | 6,455,387 | 11,077,827 |
| Cost of shares redeemed | (34,731,918) | (141,012,632) |
| Net increase (decrease) in net assets resulting from share transactions | 60,193,967 | 10,325,587 |
| Total increase (decrease) in net assets | 75,588,630 | 16,630,541 |
| Net Assets | ||
| Beginning of period | 1,614,418,913 | 1,597,788,372 |
| End of period | $1,690,007,543 | $1,614,418,913 |
| Other Information | ||
| Undistributed net investment income end of period | $47,316 | $– |
| Shares | ||
| Sold | 859,858 | 1,384,732 |
| Issued in reinvestment of distributions | 62,433 | 111,315 |
| Redeemed | (337,269) | (1,426,264) |
| Net increase (decrease) | 585,022 | 69,783 |
See accompanying notes which are an integral part of the financial statements.
Financial Highlights — Fidelity Floating Rate Central Fund
| Six months ended (Unaudited) March 31, | Years ended September 30, | |||||
| 2017 | 2016 | 2015 | 2014 | 2013 | 2012 | |
| Selected Per–Share Data | ||||||
| Net asset value, beginning of period | $102.63 | $102.02 | $107.17 | $106.39 | $104.53 | $95.32 |
| Income from Investment Operations | ||||||
| Net investment income (loss)A | 2.616 | 5.424 | 5.449 | 5.658 | 6.526 | 6.830 |
| Net realized and unrealized gain (loss) | .998 | .357 | (5.445) | .412 | .838 | 7.686 |
| Total from investment operations | 3.614 | 5.781 | .004 | 6.070 | 7.364 | 14.516 |
| Distributions from net investment income | (2.614) | (5.171) | (5.154) | (5.290) | (5.504) | (5.306) |
| Distributions from net realized gain | (.050) | – | – | – | – | – |
| Total distributions | (2.664) | (5.171) | (5.154) | (5.290) | (5.504) | (5.306) |
| Net asset value, end of period | $103.58 | $102.63 | $102.02 | $107.17 | $106.39 | $104.53 |
| Total ReturnB,C | 3.55% | 5.95% | (.03)% | 5.78% | 7.19% | 15.56% |
| Ratios to Average Net AssetsD,E | ||||||
| Expenses before reductions | .05%F | - %G | - %G | - %G | - %G | - %G |
| Expenses net of fee waivers, if any | .05%F | - %G | - %G | - %G | - %G | - %G |
| Expenses net of all reductions | .05%F | - %G | - %G | - %G | - %G | - %G |
| Net investment income (loss) | 5.12%F | 5.45% | 5.15% | 5.25% | 6.15% | 6.79% |
| Supplemental Data | ||||||
| Net assets, end of period (000 omitted) | $1,690,008 | $1,614,419 | $1,597,788 | $1,653,285 | $1,342,624 | $1,586,125 |
| Portfolio turnover rateH | 76%F | 48% | 37%I | 66% | 90% | 47%I |
A Calculated based on average shares outstanding during the period.
B Total returns for periods of less than one year are not annualized.
C Total returns would have been lower if certain expenses had not been reduced during the applicable periods shown.
D Fees and expenses of any underlying Fidelity Central Funds are not included in the Fund's expense ratio. The Fund indirectly bears its proportionate share of the expenses of any underlying Fidelity Central Funds.
E Expense ratios reflect operating expenses of the Fund. Expenses before reductions do not reflect amounts reimbursed by the investment adviser or reductions from expense offset arrangements and do not represent the amount paid by the Fund during periods when reimbursements or reductions occur. Expenses net of fee waivers reflect expenses after reimbursement by the investment adviser but prior to reductions from expense offset arrangements. Expenses net of all reductions represent the net expenses paid by the Fund.
F Annualized
G Amount represents less than .005%.
H Amount does not include the portfolio activity of any underlying Fidelity Central Funds.
I Portfolio turnover rate excludes securities received or delivered in-kind.
See accompanying notes which are an integral part of the financial statements.
Notes to Financial Statements (Unaudited)
For the period ended March 31, 2017
1. Organization.
Fidelity Floating Rate Central Fund (the Fund) is a fund of Fidelity Central Investment Portfolios LLC (the LLC) and is authorized to issue an unlimited number of shares. Shares of the Fund are only offered to other investment companies and accounts managed by Fidelity Management & Research Company (FMR), or its affiliates (the Investing Funds). The LLC is registered under the Investment Company Act of 1940, as amended (the 1940 Act), as an open-end management investment company organized as a Delaware Limited Liability Company.
2. Investments in Fidelity Central Funds.
The Fund invests in Fidelity Central Funds, which are open-end investment companies generally available only to other investment companies and accounts managed by the investment adviser and its affiliates. The Fund's Schedule of Investments lists each of the Fidelity Central Funds held as of period end, if any, as an investment of the Fund, but does not include the underlying holdings of each Fidelity Central Fund. As an Investing Fund, the Fund indirectly bears its proportionate share of the expenses of the underlying Fidelity Central Funds.
The Money Market Central Funds seek preservation of capital and current income and are managed by Fidelity Investments Money Management, Inc. (FIMM), an affiliate of the investment adviser. Annualized expenses of the Money Market Central Funds as of their most recent shareholder report date are less than .005%.
A complete unaudited list of holdings for each Fidelity Central Fund is available upon request or at the Securities and Exchange Commission (the SEC) website at www.sec.gov. In addition, the financial statements of the Fidelity Central Funds are available on the SEC website or upon request.
3. Significant Accounting Policies.
The Fund is an investment company and applies the accounting and reporting guidance of the Financial Accounting Standards Board (FASB) Accounting Standards Codification Topic 946 Financial Services – Investments Companies. The financial statements have been prepared in conformity with accounting principles generally accepted in the United States of America (GAAP), which require management to make certain estimates and assumptions at the date of the financial statements. Actual results could differ from those estimates. Subsequent events, if any, through the date that the financial statements were issued have been evaluated in the preparation of the financial statements. The following summarizes the significant accounting policies of the Fund:
Investment Valuation. Investments are valued as of 4:00 p.m. Eastern time on the last calendar day of the period. The Board of Directors (the Board) has delegated the day to day responsibility for the valuation of the Fund's investments to the Fair Value Committee (the Committee) established by the Fund's investment adviser. In accordance with valuation policies and procedures approved by the Board, the Fund attempts to obtain prices from one or more third party pricing vendors or brokers to value its investments. When current market prices, quotations or currency exchange rates are not readily available or reliable, investments will be fair valued in good faith by the Committee, in accordance with procedures adopted by the Board. Factors used in determining fair value vary by investment type and may include market or investment specific events, changes in interest rates and credit quality. The frequency with which these procedures are used cannot be predicted and they may be utilized to a significant extent. The Committee oversees the Fund's valuation policies and procedures and reports to the Board on the Committee's activities and fair value determinations. The Board monitors the appropriateness of the procedures used in valuing the Fund's investments and ratifies the fair value determinations of the Committee.
The Fund categorizes the inputs to valuation techniques used to value its investments into a disclosure hierarchy consisting of three levels as shown below:
- Level 1 – quoted prices in active markets for identical investments
- Level 2 – other significant observable inputs (including quoted prices for similar investments, interest rates, prepayment speeds, etc.)
- Level 3 – unobservable inputs (including the Fund's own assumptions based on the best information available)
Valuation techniques used to value the Fund's investments by major category are as follows:
Debt securities, including restricted securities, are valued based on evaluated prices received from third party pricing vendors or from brokers who make markets in such securities. Corporate bonds and bank loan obligations are valued by pricing vendors who utilize matrix pricing which considers yield or price of bonds of comparable quality, coupon, maturity and type or by broker-supplied prices. Independent prices obtained from a single source or broker are evaluated by management and may be categorized as Level 3 in the hierarchy. When independent prices are unavailable or unreliable, debt securities may be valued utilizing pricing methodologies which consider similar factors that would be used by third party pricing vendors. Debt securities are generally categorized as Level 2 in the hierarchy but may be Level 3 depending on the circumstances. The Fund invests a significant portion of its assets in below investment grade securities. The value of these securities can be more volatile due to changes in the credit quality of the issuer and is sensitive to changes in economic, market and regulatory conditions.
Equity securities, including restricted securities, for which market quotations are readily available, are valued at the last reported sale price or official closing price as reported by a third party pricing vendor on the primary market or exchange on which they are traded and are categorized as Level 1 in the hierarchy. In the event there were no sales during the day or closing prices are not available, securities are valued at the last quoted bid price or may be valued using the last available price and are generally categorized as Level 2 in the hierarchy. For foreign equity securities, when market or security specific events arise, comparisons to the valuation of American Depositary Receipts (ADRs), futures contracts, Exchange-Traded Funds (ETFs) and certain indexes as well as quoted prices for similar securities may be used and would be categorized as Level 2 in the hierarchy. Utilizing these techniques may result in transfers between Level 1 and Level 2. For equity securities, including restricted securities, where observable inputs are limited, assumptions about market activity and risk are used and these securities may be categorized as Level 3 in the hierarchy.
Investments in open-end mutual funds, including the Fidelity Central Funds, are valued at their closing net asset value (NAV) each business day and are categorized as Level 1 in the hierarchy.
Changes in valuation techniques may result in transfers in or out of an assigned level within the disclosure hierarchy. The aggregate value of investments by input level as of March 31, 2017, as well as a roll forward of Level 3 investments, is included at the end of the Fund's Schedule of Investments.
Investment Transactions and Income. For financial reporting purposes, the Fund's investment holdings and NAV include trades executed through the end of the last business day of the period. The NAV per share for processing shareholder transactions is calculated as of the close of business of the New York Stock Exchange (NYSE), normally 4:00 p.m. Eastern time and includes trades executed through the end of the prior business day. Gains and losses on securities sold are determined on the basis of identified cost. Dividend income is recorded on the ex-dividend date, except for certain dividends from foreign securities where the ex-dividend date may have passed, which are recorded as soon as the Fund is informed of the ex-dividend date. Non-cash dividends included in dividend income, if any, are recorded at the fair market value of the securities received. Income and capital gain distributions from Fidelity Central Funds, if any, are recorded on the ex-dividend date. Certain distributions received by the Fund represent a return of capital or capital gain. The Fund determines the components of these distributions subsequent to the ex-dividend date, based upon receipt of tax filings or other correspondence relating to the underlying investment. These distributions are recorded as a reduction of cost of investments and/or as a realized gain. Interest income is accrued as earned and includes coupon interest and amortization of premium and accretion of discount on debt securities as applicable. Debt obligations may be placed on non-accrual status and related interest income may be reduced by ceasing current accruals and writing off interest receivables when the collection of all or a portion of interest has become doubtful based on consistently applied procedures. A debt obligation is removed from non-accrual status when the issuer resumes interest payments or when collectability of interest is reasonably assured. The Fund earns certain fees in connection with its floating rate loan purchasing activities. These fees are in addition to interest payments earned and may include amendment fees, consent fees and prepayment fees. These fees are recorded as Interest in the accompanying financial statements.
Expenses. Expenses directly attributable to a fund are charged to that fund. Expenses attributable to more than one fund are allocated among the respective funds on the basis of relative net assets or other appropriate methods. Expense estimates are accrued in the period to which they relate and adjustments are made when actual amounts are known.
Income Tax Information and Distributions to Shareholders. Each year, effective October 1, 2016, the Fund intends to qualify as a regulated investment company under Subchapter M of the Internal Revenue Code, including distributing substantially all of its taxable income and realized gains. As a result, no provision for U.S. Federal income taxes is required. The Fund files a U.S. federal tax return, in addition to state and local tax returns as required. The Fund's federal income tax returns are subject to examination by the Internal Revenue Service (IRS) for a period of three fiscal years after they are filed. State and local tax returns may be subject to examination for an additional fiscal year depending on the jurisdiction.
Prior to October 1, 2016, the Fund was a partnership for tax purposes, and no provision was made for U.S. Federal income taxes because the Fund allocated, at least annually among its partners, each partner's share of the Fund's income and expenses and capital gains and losses as determined by income tax regulations for inclusion in each partner's tax return. Due to the Fund's previous partnership structure, paid in capital includes any accumulated net investment income (loss) and net realized gain (loss) on investments prior to October 1, 2016.
Dividends are declared and recorded daily and paid monthly from net investment income. Distributions from realized gains, if any, are declared and recorded on the ex-dividend date. Income and capital gain distributions are determined in accordance with income tax regulations, which may differ from GAAP.
Capital accounts within the financial statements are adjusted for permanent book-tax differences. These adjustments have no impact on net assets or the results of operations. Capital accounts are not adjusted for temporary book-tax differences which will reverse in a subsequent period.
The federal tax cost of investment securities and unrealized appreciation (depreciation) as of period end were as follows:
| Gross unrealized appreciation | $25,656,462 |
| Gross unrealized depreciation | (29,252,992) |
| Net unrealized appreciation (depreciation) on securities | $(3,596,530) |
| Tax Cost | $1,740,873,326 |
Restricted Securities. The Fund may invest in securities that are subject to legal or contractual restrictions on resale. These securities generally may be resold in transactions exempt from registration or to the public if the securities are registered. Disposal of these securities may involve time-consuming negotiations and expense, and prompt sale at an acceptable price may be difficult. Information regarding restricted securities is included at the end of the Fund's Schedule of Investments.
Loans and Other Direct Debt Instruments. The Fund invests in direct debt instruments which are interests in amounts owed to lenders by corporate or other borrowers. These instruments may be in the form of loans, trade claims or other receivables and may include standby financing commitments such as revolving credit facilities that obligate the Fund to supply additional cash to the borrower on demand. Loans may be acquired through assignment or participation. The Fund also invests in unfunded loan commitments, which are contractual obligations for future funding. Information regarding unfunded commitments is included at the end of the Fund's Schedule of Investments.
New Accounting Pronouncement. In March 2017, the Financial Accounting Standards Board (FASB) issued an Accounting Standards Update (ASU), ASU 2017-08, which amends the amortization period for certain callable debt securities that are held at a premium. The amendment requires the premium to be amortized to the earliest call date. The amendments do not require an accounting change for securities held at a discount. The ASU is effective for annual periods beginning after December 15, 2019. Management is currently evaluating the potential impact of these changes to the financial statements.
4. Purchase and Sales of Investments.
Purchases and sales of securities (including principal repayments of bank loan obligations), other than short-term securities, aggregated $659,337,713 and $597,170,356, respectively.
5. Fees and Other Transactions with Affiliates.
Management Fee and Expense Contract. FMR Co., Inc. (the investment adviser), an affiliate of FMR, provides the Fund with investment management services. The Fund does not pay any fees for these services. Pursuant to the Fund's management contract with the investment adviser, FMR pays the investment adviser a portion of the management fees it receives from the Investing Funds. In addition, under an expense contract, FMR also pays all other expenses of the Fund, excluding custody fees, fees and expenses of the independent Directors, and certain exceptions such as interest expense and extraordinary expenses.
Interfund Trades. The Fund may purchase from or sell securities to other Fidelity Funds under procedures adopted by the Board. The procedures have been designed to ensure these interfund trades are executed in accordance with Rule 17a-7 of the 1940 Act. Interfund trades are included within the respective purchases and sales amounts shown in the Purchases and Sales of Investments note.
6. Expense Reductions.
FMR has voluntarily agreed to reimburse a portion of the Fund's operating expenses. For the period, the reimbursement reduced the expenses by $3,382.
In addition, through arrangements with the Fund's custodian, credits realized as a result of certain uninvested cash balances were used to reduce the Fund's expenses. During the period, these credits reduced the Fund's custody expenses by $5,132.
7. Other.
The Fund's organizational documents provide former and current directors and officers with a limited indemnification against liabilities arising in connection with the performance of their duties to the Fund. In the normal course of business, the Fund may also enter into contracts that provide general indemnifications. The Fund's maximum exposure under these arrangements is unknown as this would be dependent on future claims that may be made against the Fund. The risk of material loss from such claims is considered remote.
At the end of the period, mutual funds managed by FMR or its affiliates were the owners of record of all of the outstanding shares of the Fund.
8. Litigation.
The Fund, and other entities managed by FMR or its affiliates, became aware in March 2015 that they were named as defendants in a lawsuit originally filed in the United States Bankruptcy Court for the Southern District of New York in 2009. The lawsuit was brought by creditors of Motors Liquidation Company (f/k/a General Motors), which went through Chapter 11 bankruptcy proceedings in 2009, and is captioned Official Committee of Unsecured Creditors of Motors Liquidation Company v. JPMorgan Chase Bank, N.A., et al., Adversary No. 09-00504 (REG). The plaintiffs are seeking an order that the Fund and other defendants return proceeds received in 2009 in full payment of the principal and interest on General Motors secured debt. The plaintiffs contend that the Fund and the other defendants were not secured creditors at the time of the 2009 payments and, thus, were not entitled to payment in full. In January 2015, the Court of Appeals ruled that JPMorgan, as administrative agent for all of the debtholders, released the security interest on certain collateral securing the debt prior to the 2009 payments. The parties to the dispute have commenced discovery on the value of remaining, unreleased collateral. At this time, Management cannot determine the amount of loss that may be realized, but expects the amount to be less than the $32,518,731 received in 2009. The Fund was not previously aware that it had been named as a defendant in this case because, in 2009, the Bankruptcy Court allowed the plaintiffs to refrain from serving any of the defendants other than JPMorgan with notice of the filing of the lawsuit. The Fund is exploring all available options for minimizing any loss and is incurring legal costs in defending the case.
Shareholder Expense Example
As a shareholder of the Fund, you incur two types of costs: (1) transaction costs, and (2) ongoing costs, including other Fund expenses. This Example is intended to help you understand your ongoing costs (in dollars) of investing in the Fund and to compare these costs with the ongoing costs of investing in other mutual funds.
The Example is based on an investment of $1,000 invested at the beginning of the period and held for the entire period (October 1, 2016 to March 31, 2017).
Actual Expenses
The first line of the accompanying table provides information about actual account values and actual expenses. You may use the information in this line, together with the amount you invested, to estimate the expenses that you paid over the period. Simply divide your account value by $1,000.00 (for example, an $8,600 account value divided by $1,000.00 = 8.6), then multiply the result by the number in the first line under the heading entitled "Expenses Paid During Period" to estimate the expenses you paid on your account during this period. In addition, the Fund, as a shareholder in the underlying Fidelity Central Funds, will indirectly bear its pro-rata share of the fees and expenses incurred by the underlying Fidelity Central Funds. These fees and expenses are not included in the Fund's annualized expense ratio used to calculate the expense estimate in the table below.
Hypothetical Example for Comparison Purposes
The second line of the accompanying table provides information about hypothetical account values and hypothetical expenses based on the Fund's actual expense ratio and an assumed rate of return of 5% per year before expenses, which is not the Fund's actual return. The hypothetical account values and expenses may not be used to estimate the actual ending account balance or expenses you paid for the period. You may use this information to compare the ongoing costs of investing in the Fund and other funds. To do so, compare this 5% hypothetical example with the 5% hypothetical examples that appear in the shareholder reports of the other funds. In addition, the Fund, as a shareholder in the underlying Fidelity Central Funds, will indirectly bear its pro-rata share of the fees and expenses incurred by the underlying Fidelity Central Funds. These fees and expenses are not included in the Fund's annualized expense ratio used to calculate the expense estimate in the table below.
Please note that the expenses shown in the table are meant to highlight your ongoing costs only and do not reflect any transaction costs. Therefore, the second line of the table is useful in comparing ongoing costs only, and will not help you determine the relative total costs of owning different funds.
| Annualized Expense Ratio-A | Beginning Account Value October 1, 2016 | Ending Account Value March 31, 2017 | Expenses Paid During Period-B October 1, 2016 to March 31, 2017 | |
| Actual | .0496% | $1,000.00 | $1,035.50 | $.25 |
| Hypothetical-C | $1,000.00 | $1,024.68 | $.25 |
A Annualized expense ratio reflects expenses net of applicable fee waivers.
B Expenses are equal to the Fund's annualized expense ratio, multiplied by the average account value over the period, multiplied by 182/365 (to reflect the one-half year period).
C 5% return per year before expenses
![]()
Corporate Headquarters
245 Summer St.
Boston, MA 02210
www.fidelity.com
FR1-SANN-0517
1.814673.112
Fidelity® High Income Central Fund 1 Semi-Annual Report March 31, 2017 |
|
Contents
To view a fund's proxy voting guidelines and proxy voting record for the 12-month period ended June 30, visit http://www.fidelity.com/proxyvotingresults or visit the Securities and Exchange Commission's (SEC) web site at http://www.sec.gov.
You may also call 1-800-544-8544 to request a free copy of the proxy voting guidelines.
Standard & Poor's, S&P and S&P 500 are registered service marks of The McGraw-Hill Companies, Inc. and have been licensed for use by Fidelity Distributors Corporation.
Other third-party marks appearing herein are the property of their respective owners.
All other marks appearing herein are registered or unregistered trademarks or service marks of FMR LLC or an affiliated company. © 2017 FMR LLC. All rights reserved.
A fund files its complete schedule of portfolio holdings with the SEC for the first and third quarters of each fiscal year on Form N-Q. Forms N-Q are available on the SEC’s web site at http://www.sec.gov. A fund's Forms N-Q may be reviewed and copied at the SEC’s Public Reference Room in Washington, DC. Information regarding the operation of the SEC's Public Reference Room may be obtained by calling 1-800-SEC-0330.
Investment Summary (Unaudited)
Top Five Holdings as of March 31, 2017
| (by issuer, excluding cash equivalents) | % of fund's net assets | % of fund's net assets 6 months ago |
| T-Mobile U.S.A., Inc. | 2.8 | 1.7 |
| Altice SA | 2.2 | 2.4 |
| Icahn Enterprises LP/Icahn Enterprises Finance Corp. | 2.1 | 1.7 |
| Sprint Corp. | 2.1 | 2.2 |
| Barclays PLC | 2.1 | 1.3 |
| 11.3 |
Top Five Market Sectors as of March 31, 2017
| % of fund's net assets | % of fund's net assets 6 months ago | |
| Telecommunications | 13.1 | 12.3 |
| Energy | 11.5 | 9.3 |
| Technology | 7.5 | 7.2 |
| Banks & Thrifts | 6.7 | 7.4 |
| Healthcare | 6.5 | 5.0 |
Quality Diversification (% of fund's net assets)
| As of March 31, 2017 | ||
| BBB | 0.6% | |
| BB | 44.3% | |
| B | 41.6% | |
| CCC,CC,C | 8.6% | |
| Not Rated | 1.4% | |
| Equities | 0.3% | |
| Short-Term Investments and Net Other Assets | 3.2% | |

| As of September 30, 2016 | ||
| BBB | 0.8% | |
| BB | 43.1% | |
| B | 34.1% | |
| CCC,CC,C | 10.2% | |
| Not Rated | 0.3% | |
| Equities | 0.3% | |
| Short-Term Investments and Net Other Assets | 11.2% | |
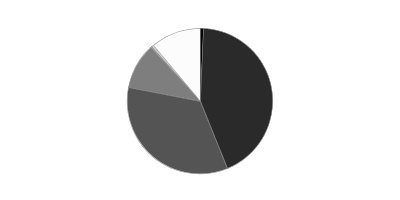
We have used ratings from Moody's Investors Service, Inc. Where Moody's® ratings are not available, we have used S&P® ratings. All ratings are as of the date indicated and do not reflect subsequent changes.
Asset Allocation (% of fund's net assets)
| As of March 31, 2017* | ||
| Nonconvertible Bonds | 80.2% | |
| Convertible Bonds, Preferred Stocks | 0.2% | |
| Common Stocks | 0.1% | |
| Bank Loan Obligations | 9.6% | |
| Other Investments | 6.7% | |
| Short-Term Investments and Net Other Assets (Liabilities) | 3.2% | |

* Foreign investments - 30.6%
| As of September 30, 2016* | ||
| Nonconvertible Bonds | 73.4% | |
| Convertible Bonds, Preferred Stocks | 0.3% | |
| Bank Loan Obligations | 7.2% | |
| Other Investments | 7.9% | |
| Short-Term Investments and Net Other Assets (Liabilities) | 11.2% | |
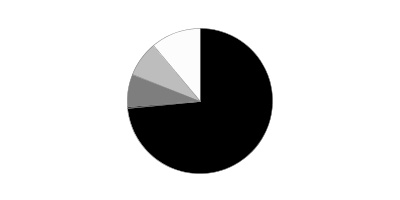
* Foreign investments - 24.6%
Investments March 31, 2017 (Unaudited)
Showing Percentage of Net Assets
| Nonconvertible Bonds - 80.2% | |||
| Principal Amount | Value | ||
| Aerospace - 0.2% | |||
| TransDigm, Inc.: | |||
| 6% 7/15/22 | $235,000 | $238,079 | |
| 6.375% 6/15/26 | 275,000 | 275,162 | |
| 6.5% 5/15/25 (a) | 915,000 | 923,006 | |
| TOTAL AEROSPACE | 1,436,247 | ||
| Air Transportation - 2.0% | |||
| Air Canada 6.625% 5/15/18 (a) | 3,030,000 | 3,152,715 | |
| Air Canada Trust Series 2015-1 equipment trust certificate Class C, 5% 3/15/20 (a) | 3,410,000 | 3,414,263 | |
| Allegiant Travel Co. 5.5% 7/15/19 | 550,000 | 568,563 | |
| American Airlines Group, Inc. 4.625% 3/1/20 (a) | 1,050,000 | 1,067,063 | |
| American Airlines, Inc. pass-thru trust certificates 5.625% 1/15/21 (a) | 161,394 | 166,639 | |
| Continental Airlines, Inc.: | |||
| pass-thru trust certificates 9.798% 4/1/21 | 903,793 | 994,173 | |
| 9.25% 5/10/17 | 123,934 | 124,864 | |
| Delta Air Lines, Inc. pass-thru trust certificates 8.021% 2/10/24 | 579,777 | 663,845 | |
| U.S. Airways pass-thru certificates: | |||
| Series 2012-2C, 5.45% 6/3/18 | 940,000 | 963,500 | |
| Series 2013-1 Class B, 5.375% 11/15/21 | 166,184 | 173,455 | |
| United Air Lines, Inc. pass-thru trust certificates Class B, 7.336% 7/2/19 | 413,456 | 436,176 | |
| TOTAL AIR TRANSPORTATION | 11,725,256 | ||
| Automotive & Auto Parts - 0.4% | |||
| Tenneco, Inc. 5% 7/15/26 | 830,000 | 812,877 | |
| ZF North America Capital, Inc. 4.75% 4/29/25 (a) | 1,625,000 | 1,681,875 | |
| TOTAL AUTOMOTIVE & AUTO PARTS | 2,494,752 | ||
| Broadcasting - 0.1% | |||
| AMC Networks, Inc. 4.75% 12/15/22 | 510,000 | 512,550 | |
| Building Materials - 1.3% | |||
| Building Materials Corp. of America: | |||
| 5% 2/15/27 (a) | 1,250,000 | 1,225,000 | |
| 5.125% 2/15/21 (a) | 870,000 | 904,800 | |
| 6% 10/15/25 (a) | 2,100,000 | 2,168,250 | |
| CEMEX Finance LLC 6% 4/1/24 (a) | 530,000 | 557,295 | |
| CEMEX S.A.B. de CV 5.7% 1/11/25 (a) | 595,000 | 617,313 | |
| Eagle Materials, Inc. 4.5% 8/1/26 | 1,895,000 | 1,885,525 | |
| U.S. Concrete, Inc. 6.375% 6/1/24 (a) | 495,000 | 512,325 | |
| TOTAL BUILDING MATERIALS | 7,870,508 | ||
| Cable/Satellite TV - 5.1% | |||
| Altice SA 7.75% 5/15/22 (a) | 12,675,000 | 13,451,313 | |
| Altice U.S. Finance SA 5.375% 7/15/23 (a) | 1,625,000 | 1,675,781 | |
| CCO Holdings LLC/CCO Holdings Capital Corp.: | |||
| 5.125% 5/1/23 (a) | 1,675,000 | 1,725,250 | |
| 5.125% 5/1/27 (a)(b) | 2,910,000 | 2,924,550 | |
| 5.5% 5/1/26 (a) | 1,855,000 | 1,919,925 | |
| CSC Holdings, Inc. 5.5% 4/15/27(a) | 2,220,000 | 2,256,075 | |
| Virgin Media Secured Finance PLC 5.5% 8/15/26 (a) | 3,600,000 | 3,654,000 | |
| Ziggo Bond Finance BV 5.875% 1/15/25 (a) | 1,635,000 | 1,647,263 | |
| Ziggo Secured Finance BV 5.5% 1/15/27 (a) | 1,325,000 | 1,324,868 | |
| TOTAL CABLE/SATELLITE TV | 30,579,025 | ||
| Capital Goods - 0.7% | |||
| AECOM 5.125% 3/15/27 (a) | 1,205,000 | 1,208,013 | |
| Belden, Inc. 5.25% 7/15/24 (a) | 360,000 | 359,100 | |
| J.B. Poindexter & Co., Inc. 9% 4/1/22 (a) | 2,245,000 | 2,351,638 | |
| TOTAL CAPITAL GOODS | 3,918,751 | ||
| Chemicals - 1.3% | |||
| CF Industries Holdings, Inc.: | |||
| 3.4% 12/1/21 (a) | 580,000 | 579,298 | |
| 3.45% 6/1/23 | 600,000 | 567,000 | |
| 4.5% 12/1/26 (a) | 420,000 | 426,594 | |
| Evolution Escrow Issuer LLC 7.5% 3/15/22 (a) | 650,000 | 672,750 | |
| Kraton Polymers LLC/Kraton Polymers Capital Corp. 7% 4/15/25 (a) | 1,575,000 | 1,596,656 | |
| Nufarm Australia Ltd. 6.375% 10/15/19 (a) | 1,790,000 | 1,834,750 | |
| Olin Corp. 5.125% 9/15/27 | 1,725,000 | 1,754,153 | |
| Versum Materials, Inc. 5.5% 9/30/24 (a) | 515,000 | 532,381 | |
| TOTAL CHEMICALS | 7,963,582 | ||
| Consumer Products - 0.3% | |||
| Edgewell Personal Care Co. 5.5% 6/15/25 (a) | 1,705,000 | 1,739,100 | |
| Containers - 2.4% | |||
| Ardagh Packaging Finance PLC/Ardagh MP Holdings U.S.A., Inc.: | |||
| 4.25% 9/15/22 (a) | 925,000 | 934,250 | |
| 4.289% 5/15/21 (a)(c) | 2,110,000 | 2,160,113 | |
| 4.625% 5/15/23 (a) | 3,445,000 | 3,470,838 | |
| 6% 2/15/25 (a) | 2,920,000 | 2,952,850 | |
| 7.25% 5/15/24 (a) | 420,000 | 449,400 | |
| Crown Americas LLC/Crown Americas Capital Corp. V 4.25% 9/30/26 (a) | 2,070,000 | 1,991,092 | |
| Reynolds Group Issuer, Inc./Reynolds Group Issuer LLC/Reynolds Group Issuer (Luxembourg) SA: | |||
| 4.5232% 7/15/21 (a)(c) | 1,300,000 | 1,330,069 | |
| 5.75% 10/15/20 | 385,000 | 396,073 | |
| Silgan Holdings, Inc. 4.75% 3/15/25 (a) | 805,000 | 808,019 | |
| TOTAL CONTAINERS | 14,492,704 | ||
| Diversified Financial Services - 4.3% | |||
| FLY Leasing Ltd. 6.75% 12/15/20 | 975,000 | 1,021,313 | |
| Icahn Enterprises LP/Icahn Enterprises Finance Corp.: | |||
| 5.875% 2/1/22 | 9,095,000 | 9,231,425 | |
| 6.25% 2/1/22 (a) | 2,810,000 | 2,852,150 | |
| 6.75% 2/1/24 (a) | 615,000 | 634,219 | |
| ILFC E-Capital Trust I 4.66% 12/21/65 (a)(c) | 1,810,000 | 1,710,450 | |
| ILFC E-Capital Trust II 4.91% 12/21/65 (a)(c) | 4,940,000 | 4,699,175 | |
| MSCI, Inc. 4.75% 8/1/26 (a) | 2,985,000 | 3,014,850 | |
| Navient Corp.: | |||
| 5% 10/26/20 | 165,000 | 164,588 | |
| 5.875% 10/25/24 | 1,695,000 | 1,581,113 | |
| Radiate Holdco LLC/Radiate Financial Service Ltd. 6.625% 2/15/25 (a) | 640,000 | 631,600 | |
| TOTAL DIVERSIFIED FINANCIAL SERVICES | 25,540,883 | ||
| Diversified Media - 0.7% | |||
| Block Communications, Inc. 6.875% 2/15/25 (a) | 490,000 | 519,400 | |
| MDC Partners, Inc. 6.5% 5/1/24 (a) | 2,430,000 | 2,317,613 | |
| National CineMedia LLC 5.75% 8/15/26 | 1,030,000 | 1,042,354 | |
| Nielsen Finance LLC/Nielsen Finance Co. 5% 4/15/22 (a) | 370,000 | 378,325 | |
| TOTAL DIVERSIFIED MEDIA | 4,257,692 | ||
| Energy - 11.2% | |||
| Antero Resources Corp.: | |||
| 5% 3/1/25 (a) | 1,380,000 | 1,353,256 | |
| 5.125% 12/1/22 | 2,200,000 | 2,228,875 | |
| 5.625% 6/1/23 (Reg. S) | 865,000 | 884,463 | |
| Calfrac Holdings LP 7.5% 12/1/20 (a) | 550,000 | 493,625 | |
| Cheniere Corpus Christi Holdings LLC: | |||
| 5.875% 3/31/25 (a) | 1,765,000 | 1,840,013 | |
| 7% 6/30/24 (a) | 1,475,000 | 1,624,344 | |
| Chesapeake Energy Corp.: | |||
| 4.875% 4/15/22 | 2,630,000 | 2,367,000 | |
| 5.75% 3/15/23 | 680,000 | 618,800 | |
| 8% 1/15/25 (a) | 900,000 | 900,000 | |
| Concho Resources, Inc. 4.375% 1/15/25 | 1,235,000 | 1,242,719 | |
| Continental Resources, Inc.: | |||
| 3.8% 6/1/24 | 375,000 | 349,688 | |
| 4.5% 4/15/23 | 1,095,000 | 1,065,566 | |
| Crestwood Midstream Partners LP/Crestwood Midstream Finance Corp. 5.75% 4/1/25 (a) | 1,045,000 | 1,067,206 | |
| CVR Refining LLC/Coffeyville Finance, Inc. 6.5% 11/1/22 | 2,315,000 | 2,332,363 | |
| Ensco PLC: | |||
| 4.5% 10/1/24 | 270,000 | 227,475 | |
| 5.2% 3/15/25 | 3,165,000 | 2,745,638 | |
| Exterran Energy Solutions LP 8.125% 5/1/25 (a) | 600,000 | 612,000 | |
| Exterran Partners LP/EXLP Finance Corp. 6% 4/1/21 | 2,525,000 | 2,506,063 | |
| Forbes Energy Services Ltd. 9% 6/15/19 (d) | 4,090,000 | 2,699,400 | |
| FTS International, Inc.: | |||
| 6.25% 5/1/22 | 550,000 | 481,250 | |
| 8.6312% 6/15/20 (a)(c) | 500,000 | 506,875 | |
| Gibson Energy, Inc. 6.75% 7/15/21 (a) | 355,000 | 370,975 | |
| Hilcorp Energy I LP/Hilcorp Finance Co.: | |||
| 5% 12/1/24 (a) | 3,090,000 | 2,896,875 | |
| 5.75% 10/1/25 (a) | 1,635,000 | 1,577,775 | |
| Nabors Industries, Inc. 5.5% 1/15/23 (a) | 735,000 | 750,159 | |
| NGL Energy Partners LP/NGL Energy Finance Corp. 6.125% 3/1/25 (a) | 755,000 | 732,350 | |
| Noble Holding International Ltd.: | |||
| 4.625% 3/1/21 | 1,091,000 | 1,003,720 | |
| 7.2% 4/1/25 (c) | 865,000 | 815,263 | |
| 7.75% 1/15/24 | 1,265,000 | 1,214,400 | |
| NRG Yield Operating LLC 5% 9/15/26 (a) | 1,645,000 | 1,599,763 | |
| Parsley Energy LLC/Parsley: | |||
| 5.25% 8/15/25 (a) | 390,000 | 393,900 | |
| 5.375% 1/15/25 (a) | 1,015,000 | 1,027,688 | |
| PBF Holding Co. LLC/PBF Finance Corp.: | |||
| 7% 11/15/23 | 1,560,000 | 1,563,900 | |
| 8.25% 2/15/20 | 235,000 | 239,700 | |
| Range Resources Corp. 5% 3/15/23 (a) | 920,000 | 906,200 | |
| Rice Energy, Inc. 6.25% 5/1/22 | 2,790,000 | 2,873,700 | |
| Sabine Pass Liquefaction LLC: | |||
| 5.75% 5/15/24 | 2,080,000 | 2,266,786 | |
| 5.875% 6/30/26 (a) | 1,035,000 | 1,141,178 | |
| Southwestern Energy Co. 6.7% 1/23/25 (c) | 530,000 | 522,050 | |
| Summit Midstream Holdings LLC 5.75% 4/15/25 | 450,000 | 447,750 | |
| Sunoco LP/Sunoco Finance Corp.: | |||
| 5.5% 8/1/20 | 1,565,000 | 1,580,650 | |
| 6.375% 4/1/23 | 1,115,000 | 1,131,725 | |
| Targa Resources Partners LP/Targa Resources Partners Finance Corp.: | |||
| 5.25% 5/1/23 | 380,000 | 388,550 | |
| 6.75% 3/15/24 | 1,445,000 | 1,567,825 | |
| Teine Energy Ltd. 6.875% 9/30/22 (a) | 3,555,000 | 3,626,100 | |
| TerraForm Power Operating LLC 6.375% 2/1/23 (a)(c) | 1,060,000 | 1,101,075 | |
| The Williams Companies, Inc.: | |||
| 3.7% 1/15/23 | 2,075,000 | 2,038,688 | |
| 4.55% 6/24/24 | 1,260,000 | 1,269,450 | |
| Whiting Petroleum Corp. 5% 3/15/19 | 790,000 | 788,025 | |
| WPX Energy, Inc.: | |||
| 5.25% 9/15/24 | 1,330,000 | 1,286,775 | |
| 6% 1/15/22 | 1,310,000 | 1,332,925 | |
| TOTAL ENERGY | 66,602,539 | ||
| Entertainment/Film - 0.3% | |||
| New Cotai LLC/New Cotai Capital Corp. 10.625% 5/1/19 pay-in-kind (a)(c) | 2,270,373 | 1,884,410 | |
| Environmental - 0.3% | |||
| ADS Waste Holdings, Inc. 5.625% 11/15/24 (a) | 660,000 | 666,600 | |
| Covanta Holding Corp. 5.875% 7/1/25 | 170,000 | 170,319 | |
| LBC Tank Terminals Holding Netherlands BV 6.875% 5/15/23 (a) | 875,000 | 907,918 | |
| TOTAL ENVIRONMENTAL | 1,744,837 | ||
| Food & Drug Retail - 1.8% | |||
| Albertsons Companies LLC/Safeway, Inc./New Albertson's, Inc./Albertson's LLC 5.75% 3/15/25 (a) | 1,850,000 | 1,794,500 | |
| Albertsons, Inc.: | |||
| 7.45% 8/1/29 | 265,000 | 251,088 | |
| 7.75% 6/15/26 | 318,000 | 310,845 | |
| 8% 5/1/31 | 1,680,000 | 1,621,200 | |
| 8.7% 5/1/30 | 235,000 | 232,650 | |
| BI-LO LLC/BI-LO Finance Corp. 9.25% 2/15/19 (a) | 590,000 | 509,613 | |
| Tesco PLC 6.15% 11/15/37 (a) | 3,880,000 | 3,933,641 | |
| Tops Holding LLC/Tops Markets II Corp. 8% 6/15/22 (a) | 2,365,000 | 1,939,300 | |
| TOTAL FOOD & DRUG RETAIL | 10,592,837 | ||
| Food/Beverage/Tobacco - 2.2% | |||
| B&G Foods, Inc. 5.25% 4/1/25 | 885,000 | 892,744 | |
| Cott Holdings, Inc. 5.5% 4/1/25 (a) | 1,380,000 | 1,404,564 | |
| ESAL GmbH 6.25% 2/5/23 (a) | 2,325,000 | 2,325,000 | |
| JBS Investments GmbH 7.25% 4/3/24 (a) | 1,229,000 | 1,272,015 | |
| JBS U.S.A. LLC/JBS U.S.A. Finance, Inc.: | |||
| 5.875% 7/15/24 (a) | 625,000 | 643,750 | |
| 7.25% 6/1/21 (a) | 2,330,000 | 2,394,075 | |
| 7.25% 6/1/21 (a) | 870,000 | 893,925 | |
| Lamb Weston Holdings, Inc. 4.625% 11/1/24 (a) | 745,000 | 759,900 | |
| Minerva Luxembourg SA 6.5% 9/20/26 (a) | 820,000 | 801,247 | |
| Vector Group Ltd. 6.125% 2/1/25 (a) | 1,690,000 | 1,725,913 | |
| TOTAL FOOD/BEVERAGE/TOBACCO | 13,113,133 | ||
| Gaming - 3.0% | |||
| GLP Capital LP/GLP Financing II, Inc. 5.375% 4/15/26 | 490,000 | 505,925 | |
| MCE Finance Ltd. 5% 2/15/21 (a) | 2,145,000 | 2,170,740 | |
| MGM Growth Properties Operating Partnership LP 4.5% 9/1/26 | 3,345,000 | 3,244,650 | |
| Scientific Games Corp.: | |||
| 6.625% 5/15/21 | 4,015,000 | 3,764,063 | |
| 7% 1/1/22 (a) | 475,000 | 507,063 | |
| Wynn Macau Ltd. 5.25% 10/15/21 (a) | 7,420,000 | 7,568,400 | |
| TOTAL GAMING | 17,760,841 | ||
| Healthcare - 6.2% | |||
| AMAG Pharmaceuticals, Inc. 7.875% 9/1/23 (a) | 3,585,000 | 3,396,788 | |
| Community Health Systems, Inc.: | |||
| 6.25% 3/31/23 | 795,000 | 808,913 | |
| 6.875% 2/1/22 | 2,935,000 | 2,524,100 | |
| DaVita HealthCare Partners, Inc.: | |||
| 5% 5/1/25 | 2,585,000 | 2,591,463 | |
| 5.75% 8/15/22 | 515,000 | 533,025 | |
| Envision Healthcare Corp. 6.25% 12/1/24 (a) | 1,765,000 | 1,853,250 | |
| HCA Holdings, Inc.: | |||
| 4.5% 2/15/27 | 3,100,000 | 3,100,000 | |
| 5% 3/15/24 | 2,450,000 | 2,569,438 | |
| 5.875% 2/15/26 | 910,000 | 960,050 | |
| HealthSouth Corp.: | |||
| 5.125% 3/15/23 | 545,000 | 545,000 | |
| 5.75% 9/15/25 | 3,580,000 | 3,575,525 | |
| IMS Health, Inc. 5% 10/15/26 (a) | 1,130,000 | 1,134,238 | |
| Kindred Healthcare, Inc. 8% 1/15/20 | 340,000 | 345,525 | |
| Mallinckrodt International Finance SA/Mallinckrodt CB LLC: | |||
| 4.875% 4/15/20 (a) | 415,000 | 415,519 | |
| 5.5% 4/15/25 (a) | 415,000 | 381,800 | |
| MPT Operating Partnership LP/MPT Finance Corp. 5.25% 8/1/26 | 1,070,000 | 1,053,950 | |
| Sabra Health Care LP/Sabra Capital Corp.: | |||
| 5.375% 6/1/23 | 390,000 | 384,150 | |
| 5.5% 2/1/21 | 730,000 | 751,900 | |
| Teleflex, Inc. 4.875% 6/1/26 | 2,200,000 | 2,211,000 | |
| Tenet Healthcare Corp.: | |||
| 4.375% 10/1/21 | 1,125,000 | 1,125,000 | |
| 6.75% 6/15/23 | 1,805,000 | 1,773,413 | |
| Valeant Pharmaceuticals International, Inc.: | |||
| 5.375% 3/15/20 (a) | 2,180,000 | 1,951,100 | |
| 5.625% 12/1/21 (a) | 620,000 | 499,100 | |
| 5.875% 5/15/23 (a) | 1,000,000 | 776,250 | |
| VPI Escrow Corp. 6.375% 10/15/20 (a) | 1,445,000 | 1,307,725 | |
| Wellcare Health Plans, Inc. 5.25% 4/1/25 | 495,000 | 506,534 | |
| TOTAL HEALTHCARE | 37,074,756 | ||
| Homebuilders/Real Estate - 3.2% | |||
| CalAtlantic Group, Inc.: | |||
| 5.25% 6/1/26 | 2,820,000 | 2,809,425 | |
| 5.875% 11/15/24 | 580,000 | 609,000 | |
| Communications Sales & Leasing, Inc. 7.125% 12/15/24 (a) | 940,000 | 954,100 | |
| Howard Hughes Corp. 5.375% 3/15/25 (a) | 680,000 | 673,200 | |
| M/I Homes, Inc. 6.75% 1/15/21 | 2,730,000 | 2,858,146 | |
| Mattamy Group Corp. 6.875% 12/15/23 (a) | 260,000 | 269,750 | |
| Odebrecht Finance Ltd. 4.375% 4/25/25 (a) | 930,000 | 334,800 | |
| Shea Homes Ltd. Partnership/Corp. 5.875% 4/1/23 (a) | 540,000 | 542,700 | |
| Starwood Property Trust, Inc. 5% 12/15/21 (a) | 1,255,000 | 1,302,063 | |
| Taylor Morrison Communities, Inc./Monarch Communities, Inc.: | |||
| 5.625% 3/1/24 (a) | 1,815,000 | 1,876,256 | |
| 5.875% 4/15/23 (a) | 950,000 | 997,500 | |
| Toll Brothers Finance Corp. 4.875% 3/15/27 | 1,530,000 | 1,530,000 | |
| William Lyon Homes, Inc.: | |||
| 5.875% 1/31/25 (a) | 440,000 | 443,300 | |
| 7% 8/15/22 | 3,570,000 | 3,730,650 | |
| TOTAL HOMEBUILDERS/REAL ESTATE | 18,930,890 | ||
| Hotels - 0.2% | |||
| Hilton Worldwide Finance LLC/Hilton Worldwide Finance Corp.: | |||
| 4.625% 4/1/25 (a) | 760,000 | 769,272 | |
| 4.875% 4/1/27 (a) | 450,000 | 454,500 | |
| TOTAL HOTELS | 1,223,772 | ||
| Leisure - 0.8% | |||
| Carlson Travel, Inc. 9.5% 12/15/24 (a) | 460,000 | 481,850 | |
| Hilton Grand Vacations Borrower LLC/Hilton Grand Vacations Borrower, Inc. 6.125% 12/1/24 (a) | 420,000 | 441,000 | |
| NCL Corp. Ltd. 4.75% 12/15/21 (a) | 2,060,000 | 2,090,900 | |
| Studio City Co. Ltd.: | |||
| 5.875% 11/30/19 (a) | 460,000 | 478,400 | |
| 7.25% 11/30/21 (a) | 1,040,000 | 1,108,900 | |
| TOTAL LEISURE | 4,601,050 | ||
| Metals/Mining - 1.9% | |||
| First Quantum Minerals Ltd.: | |||
| 7% 2/15/21 (a) | 1,150,000 | 1,184,500 | |
| 7.25% 5/15/22 (a) | 655,000 | 675,469 | |
| 7.25% 4/1/23 (a) | 605,000 | 611,806 | |
| 7.5% 4/1/25 (a) | 1,010,000 | 1,017,575 | |
| Freeport-McMoRan, Inc.: | |||
| 3.55% 3/1/22 | 3,130,000 | 2,903,075 | |
| 3.875% 3/15/23 | 625,000 | 574,763 | |
| 4.55% 11/14/24 | 2,420,000 | 2,253,625 | |
| Murray Energy Corp. 11.25% 4/15/21 (a) | 1,265,000 | 977,213 | |
| Signode Industrial Group Lux SA/Signode Industrial Group U.S., Inc. 6.375% 5/1/22 (a) | 815,000 | 835,880 | |
| TOTAL METALS/MINING | 11,033,906 | ||
| Restaurants - 0.2% | |||
| KFC Holding Co./Pizza Hut Holding LLC 5% 6/1/24 (a) | 700,000 | 714,875 | |
| Yum! Brands, Inc. 5.35% 11/1/43 | 520,000 | 452,400 | |
| TOTAL RESTAURANTS | 1,167,275 | ||
| Services - 3.9% | |||
| Anna Merger Sub, Inc. 7.75% 10/1/22 (a) | 2,070,000 | 1,757,430 | |
| APX Group, Inc.: | |||
| 6.375% 12/1/19 | 2,082,000 | 2,141,858 | |
| 7.875% 12/1/22 | 2,880,000 | 3,110,400 | |
| 8.75% 12/1/20 | 6,281,000 | 6,500,835 | |
| Aramark Services, Inc. 4.75% 6/1/26 | 2,420,000 | 2,435,125 | |
| Garda World Security Corp.: | |||
| 7.25% 11/15/21 (a) | 5,665,000 | 5,466,725 | |
| 7.25% 11/15/21 (a) | 205,000 | 197,825 | |
| IHS Markit Ltd. 4.75% 2/15/25 (a) | 530,000 | 545,900 | |
| The ServiceMaster Co. 5.125% 11/15/24 (a) | 980,000 | 1,004,500 | |
| United Rentals North America, Inc. 4.625% 7/15/23 | 358,000 | 368,740 | |
| TOTAL SERVICES | 23,529,338 | ||
| Steel - 0.3% | |||
| Steel Dynamics, Inc. 5.125% 10/1/21 | 1,650,000 | 1,701,563 | |
| Super Retail - 2.0% | |||
| Argos Merger Sub, Inc. 7.125% 3/15/23 (a) | 3,635,000 | 3,453,250 | |
| JC Penney Corp., Inc.: | |||
| 5.65% 6/1/20 | 4,596,000 | 4,550,040 | |
| 7.4% 4/1/37 | 3,055,000 | 2,428,725 | |
| L Brands, Inc. 6.75% 7/1/36 | 1,040,000 | 990,912 | |
| Netflix, Inc. 4.375% 11/15/26 (a) | 660,000 | 648,450 | |
| TOTAL SUPER RETAIL | 12,071,377 | ||
| Technology - 5.7% | |||
| Brocade Communications Systems, Inc. 4.625% 1/15/23 | 50,000 | 51,000 | |
| EMC Corp. 2.65% 6/1/20 | 1,995,000 | 1,943,748 | |
| Gartner, Inc. 5.125% 4/1/25 (a) | 405,000 | 412,594 | |
| Greeneden U.S. Holdings II LLC 10% 11/30/24 (a) | 970,000 | 1,054,875 | |
| Inception Merger Sub, Inc./Rackspace Hosting, Inc. 8.625% 11/15/24 (a) | 3,010,000 | 3,171,637 | |
| Micron Technology, Inc.: | |||
| 5.25% 8/1/23 (a) | 1,145,000 | 1,173,625 | |
| 5.25% 1/15/24 (a) | 450,000 | 462,236 | |
| NXP BV/NXP Funding LLC: | |||
| 3.875% 9/1/22 (a) | 2,725,000 | 2,786,313 | |
| 4.125% 6/1/21 (a) | 3,265,000 | 3,387,438 | |
| 4.625% 6/1/23 (a) | 1,975,000 | 2,091,031 | |
| Open Text Corp. 5.875% 6/1/26 (a) | 2,920,000 | 3,058,700 | |
| Qorvo, Inc. 6.75% 12/1/23 | 3,535,000 | 3,835,475 | |
| Sensata Technologies BV 5% 10/1/25 (a) | 1,450,000 | 1,460,875 | |
| Sensata Technologies UK Financing Co. PLC 6.25% 2/15/26 (a) | 685,000 | 726,100 | |
| Solera LLC/Solera Finance, Inc. 10.5% 3/1/24 (a) | 3,545,000 | 4,050,163 | |
| Symantec Corp. 5% 4/15/25 (a) | 1,325,000 | 1,358,693 | |
| VeriSign, Inc. 5.25% 4/1/25 | 830,000 | 860,088 | |
| WideOpenWest Finance LLC/WideOpenWest Capital Corp. 10.25% 7/15/19 | 2,288,000 | 2,382,380 | |
| TOTAL TECHNOLOGY | 34,266,971 | ||
| Telecommunications - 12.0% | |||
| Altice Financing SA: | |||
| 6.625% 2/15/23 (a) | 1,690,000 | 1,759,290 | |
| 7.5% 5/15/26 (a) | 765,000 | 812,813 | |
| Altice Finco SA 7.625% 2/15/25 (a) | 945,000 | 970,988 | |
| Columbus International, Inc. 7.375% 3/30/21 (a) | 6,430,000 | 6,864,025 | |
| CommScope Technologies Finance LLC 5% 3/15/27 (a) | 680,000 | 678,946 | |
| CyrusOne LP/CyrusOne Finance Corp. 5% 3/15/24 (a) | 170,000 | 174,675 | |
| Equinix, Inc. 5.375% 5/15/27 | 495,000 | 511,088 | |
| Neptune Finco Corp. 10.125% 1/15/23 (a) | 4,865,000 | 5,643,400 | |
| Sable International Finance Ltd. 6.875% 8/1/22 (a) | 5,530,000 | 5,847,975 | |
| SBA Communications Corp. 4.875% 9/1/24 (a) | 2,705,000 | 2,670,647 | |
| SFR Group SA: | |||
| 6% 5/15/22 (a) | 2,250,000 | 2,331,563 | |
| 6.25% 5/15/24 (a) | 3,880,000 | 3,904,250 | |
| Sprint Capital Corp. 6.875% 11/15/28 | 3,880,000 | 4,098,250 | |
| Sprint Corp.: | |||
| 7.25% 9/15/21 | 5,465,000 | 5,899,468 | |
| 7.625% 2/15/25 | 2,020,000 | 2,206,850 | |
| 7.875% 9/15/23 | 3,630,000 | 4,020,225 | |
| T-Mobile U.S.A., Inc.: | |||
| 4% 4/15/22 | 1,500,000 | 1,524,375 | |
| 5.125% 4/15/25 | 1,735,000 | 1,795,725 | |
| 6.375% 3/1/25 | 3,745,000 | 4,035,238 | |
| 6.5% 1/15/24 | 3,255,000 | 3,515,400 | |
| 6.625% 4/1/23 | 5,045,000 | 5,383,923 | |
| Telecom Italia Capital SA: | |||
| 6% 9/30/34 | 3,280,000 | 3,239,000 | |
| 6.375% 11/15/33 | 1,920,000 | 1,940,390 | |
| Telesat Canada/Telesat LLC 8.875% 11/15/24 (a) | 550,000 | 602,250 | |
| Zayo Group LLC/Zayo Capital, Inc.: | |||
| 5.75% 1/15/27 (a) | 470,000 | 495,756 | |
| 6.375% 5/15/25 | 525,000 | 566,669 | |
| TOTAL TELECOMMUNICATIONS | 71,493,179 | ||
| Transportation Ex Air/Rail - 0.9% | |||
| Navios Maritime Acquisition Corp./Navios Acquisition Finance U.S., Inc. 8.125% 11/15/21 (a) | 4,640,000 | 4,048,400 | |
| Navios Maritime Holdings, Inc. 8.125% 2/15/19 | 920,000 | 823,400 | |
| Teekay Corp. 8.5% 1/15/20 | 180,000 | 178,200 | |
| TOTAL TRANSPORTATION EX AIR/RAIL | 5,050,000 | ||
| Utilities - 5.3% | |||
| Calpine Corp. 5.25% 6/1/26 (a) | 1,080,000 | 1,096,200 | |
| Dolphin Subsidiary II, Inc. 7.25% 10/15/21 | 3,270,000 | 3,486,474 | |
| DPL, Inc. 6.75% 10/1/19 | 1,390,000 | 1,459,500 | |
| Dynegy, Inc. 7.625% 11/1/24 | 2,465,000 | 2,354,075 | |
| Global Partners LP/GLP Finance Corp.: | |||
| 6.25% 7/15/22 | 1,785,000 | 1,749,300 | |
| 7% 6/15/23 | 4,980,000 | 4,930,200 | |
| NRG Energy, Inc. 6.25% 5/1/24 | 1,645,000 | 1,639,859 | |
| NSG Holdings II LLC/NSG Holdings, Inc. 7.75% 12/15/25 (a) | 4,927,012 | 5,296,538 | |
| PPL Energy Supply LLC 6.5% 6/1/25 | 750,000 | 635,625 | |
| RJS Power Holdings LLC 4.625% 7/15/19 (a)(c) | 4,320,000 | 4,417,200 | |
| The AES Corp.: | |||
| 4.0546% 6/1/19 (c) | 780,000 | 780,000 | |
| 4.875% 5/15/23 | 3,975,000 | 3,955,125 | |
| TOTAL UTILITIES | 31,800,096 | ||
| TOTAL NONCONVERTIBLE BONDS | |||
| (Cost $461,078,680) | 478,173,820 | ||
| Shares | Value | ||
| Common Stocks - 0.1% | |||
| Energy - 0.1% | |||
| Forbes Energy Services Ltd. (Escrow) | 686,536 | 686,536 | |
| Southwestern Energy Co. (e) | 17,140 | 140,034 | |
| TOTAL ENERGY | 826,570 | ||
| Telecommunications - 0.0% | |||
| CUI Acquisition Corp. Class E, (e) | 0 | 16,065 | |
| TOTAL COMMON STOCKS | |||
| (Cost $1,401,337) | 842,635 | ||
| Convertible Preferred Stocks - 0.2% | |||
| Energy - 0.2% | |||
| Southwestern Energy Co. Series B 6.25% | |||
| (Cost $1,287,176) | 72,600 | 1,433,850 | |
| Principal Amount | Value | ||
| Bank Loan Obligations - 9.6% | |||
| Aerospace - 0.7% | |||
| TransDigm, Inc.: | |||
| Tranche D, term loan 3.9835% 6/4/21 (c) | 1,395,147 | 1,390,417 | |
| Tranche F, term loan 3.7806% 6/9/23 (c) | 2,910,988 | 2,895,968 | |
| TOTAL AEROSPACE | 4,286,385 | ||
| Air Transportation - 0.4% | |||
| American Airlines, Inc. Tranche B, term loan 3.4122% 12/14/23 (c) | 1,355,000 | 1,356,314 | |
| United Air Lines, Inc. Tranche B, term loan 4/1/24 (f) | 1,235,000 | 1,235,778 | |
| TOTAL AIR TRANSPORTATION | 2,592,092 | ||
| Cable/Satellite TV - 0.5% | |||
| WideOpenWest Finance LLC Tranche B, term loan 4.5539% 8/19/23 (c) | 2,243,725 | 2,253,687 | |
| Zayo Group LLC: | |||
| term loan 2.9761% 1/19/21 (c) | 605,000 | 607,595 | |
| Tranche B 1LN, term loan 3.5% 1/19/24 (c) | 150,000 | 150,521 | |
| TOTAL CABLE/SATELLITE TV | 3,011,803 | ||
| Containers - 0.4% | |||
| Anchor Glass Container Corp.: | |||
| Tranche 2LN, term loan 8.75% 12/7/24 (c) | 360,000 | 366,300 | |
| Tranche B 1LN, term loan 4.25% 12/7/23 (c) | 733,163 | 737,290 | |
| Reynolds Group Holdings, Inc. Tranche B, term loan 3.7806% 2/5/23 (c) | 245,941 | 246,787 | |
| Signode Packaging Systems, Inc. Tranche B, term loan 4% 5/1/21(c) | 1,026,667 | 1,027,950 | |
| TOTAL CONTAINERS | 2,378,327 | ||
| Diversified Financial Services - 0.3% | |||
| IBC Capital U.S. LLC: | |||
| Tranche 2LN, term loan 8.1196% 9/11/22 (c) | 1,515,000 | 1,424,100 | |
| Tranche B 1LN, term loan 4.8696% 9/11/21 (c) | 127,400 | 124,639 | |
| TOTAL DIVERSIFIED FINANCIAL SERVICES | 1,548,739 | ||
| Food & Drug Retail - 0.5% | |||
| Albertson's LLC term loan 4.3023% 6/22/23 (c) | 490,200 | 492,651 | |
| JBS USA Lux SA Tranche B, term loan 3.2889% 10/30/22 (c) | 1,305,000 | 1,309,085 | |
| Pizza Hut Holdings LLC Tranche B, term loan 2.9761% 6/16/23 (c) | 990,000 | 994,336 | |
| RPI Finance Trust Tranche B 6LN, term loan: | |||
| 3/27/23 (f) | 142,424 | 142,720 | |
| 3.1529% 3/27/23 (c) | 127,576 | 127,842 | |
| TOTAL FOOD & DRUG RETAIL | 3,066,634 | ||
| Gaming - 0.0% | |||
| Las Vegas Sands LLC Tranche B, term loan 2.98% 3/29/24 (c) | 144,638 | 144,678 | |
| Healthcare - 0.3% | |||
| Envision Healthcare Corp. Tranche B, term loan 4% 12/1/23 (c) | 1,830,413 | 1,844,141 | |
| Metals/Mining - 0.2% | |||
| Murray Energy Corp. Tranche B 2LN, term loan 8.25% 4/16/20 (c) | 1,193,694 | 1,156,761 | |
| Publishing/Printing - 0.7% | |||
| Springer Science+Business Media Deutschland GmbH Tranche B 9LN, term loan 4.5% 8/14/20 (c) | 4,051,703 | 4,047,368 | |
| Restaurants - 0.2% | |||
| Burger King Worldwide, Inc. Tranche B, term loan: | |||
| 3.25% 2/17/24 (c) | 1,177,545 | 1,178,039 | |
| 3.3093% 2/17/24 (c) | 189,605 | 189,684 | |
| TOTAL RESTAURANTS | 1,367,723 | ||
| Services - 1.4% | |||
| Acosta, Inc. Tranche B, term loan 4.289% 9/26/21 (c) | 768,093 | 718,167 | |
| Brand Energy & Infrastructure Services, Inc. Tranche B, term loan 4.7709% 11/26/20 (c) | 1,252,912 | 1,255,105 | |
| Garda World Security Corp.: | |||
| term loan 4% 11/8/20 (c) | 3,005,512 | 3,012,274 | |
| Tranche DD, term loan 4% 11/8/20 (c) | 768,852 | 770,582 | |
| Lineage Logistics Holdings, LLC. Tranche B, term loan 4.5% 4/7/21 (c) | 2,709,347 | 2,707,667 | |
| The GEO Group, Inc. Tranche B, term loan 3/9/24 (f) | 65,000 | 65,285 | |
| TOTAL SERVICES | 8,529,080 | ||
| Super Retail - 0.7% | |||
| BJ's Wholesale Club, Inc.: | |||
| Tranche 2LN, term loan 8.5% 2/3/25 (c) | 265,000 | 258,110 | |
| Tranche B 1LN, term loan 4.75% 2/3/24 (c) | 280,000 | 273,300 | |
| JC Penney Corp., Inc. Tranche B, term loan 5.304% 6/23/23 (c) | 3,741,088 | 3,711,160 | |
| TOTAL SUPER RETAIL | 4,242,570 | ||
| Technology - 1.8% | |||
| Ceridian HCM Holding, Inc. Tranche B 2LN, term loan 4.5387% 9/15/20 (c) | 1,275,000 | 1,263,844 | |
| Epicor Software Corp. Tranche B, term loan 4.75% 6/1/22 (c) | 1,961,233 | 1,963,194 | |
| Go Daddy Operating Co. LLC Tranche B, term loan: | |||
| 2/15/24 (g) | 901,502 | 902,295 | |
| 3.4122% 2/15/24 (c) | 678,499 | 679,096 | |
| Kronos, Inc. term loan: | |||
| 5.0339% 11/1/23 (c) | 2,319,188 | 2,331,039 | |
| 9.284% 11/1/24 (c) | 580,000 | 597,765 | |
| Landesk Group, Inc. term loan: | |||
| 5.25% 1/20/24 (c) | 240,000 | 241,051 | |
| 10% 1/20/25 (c) | 445,000 | 440,328 | |
| Rackspace Hosting, Inc. term loan 4.5345% 11/3/23 (c) | 334,163 | 336,204 | |
| Uber Technologies, Inc. Tranche B, term loan 5% 7/13/23 (c) | 1,855,675 | 1,845,933 | |
| TOTAL TECHNOLOGY | 10,600,749 | ||
| Telecommunications - 1.1% | |||
| Altice Financing SA Tranche B, term loan 6/22/25 (f) | 515,000 | 515,000 | |
| Level 3 Financing, Inc. Tranche B, term loan 3.2272% 2/22/24 (c) | 1,195,000 | 1,196,494 | |
| LTS Buyer LLC Tranche B 1LN, term loan 4.2482% 4/11/20 (c) | 772,810 | 775,708 | |
| Radiate Holdco LLC Tranche B, term loan 3.7806% 2/1/24 (c) | 1,685,000 | 1,691,555 | |
| SFR Group SA Tranche B 11LN, term loan 6/22/25 (f) | 1,550,000 | 1,543,707 | |
| Sprint Communications, Inc. Tranche B, term loan 3.3125% 2/3/24 (c) | 440,000 | 439,688 | |
| Telesat LLC Tranche B 4LN, term loan 3.85% 11/17/23 (c) | 39,900 | 40,189 | |
| TOTAL TELECOMMUNICATIONS | 6,202,341 | ||
| Utilities - 0.4% | |||
| Calpine Construction Finance Co. LP Tranche B 1LN, term loan 3.03% 5/3/20 (c) | 1,503,149 | 1,501,736 | |
| Calpine Corp. Tranche B, term loan 2.54% 11/30/17 (c) | 690,909 | 691,123 | |
| TOTAL UTILITIES | 2,192,859 | ||
| TOTAL BANK LOAN OBLIGATIONS | |||
| (Cost $56,850,035) | 57,212,250 | ||
| Preferred Securities - 6.7% | |||
| Banks & Thrifts - 6.7% | |||
| Bank of America Corp.: | |||
| 6.1% (c)(h) | 2,010,000 | 2,134,593 | |
| 6.25% (c)(h) | 3,310,000 | 3,498,953 | |
| 6.5% (c)(h) | 2,740,000 | 3,068,311 | |
| Barclays Bank PLC 7.625% 11/21/22 | 4,585,000 | 5,141,129 | |
| Barclays PLC: | |||
| 6.625% (c)(h) | 11,745,000 | 11,749,187 | |
| 8.25% (c)(h) | 355,000 | 374,388 | |
| BNP Paribas SA 7.375% (a)(c)(h) | 2,265,000 | 2,346,207 | |
| Citigroup, Inc.: | |||
| 5.875% (c)(h) | 2,735,000 | 2,831,199 | |
| 5.95% (c)(h) | 760,000 | 808,471 | |
| Credit Agricole SA: | |||
| 6.625% (a)(c)(h) | 5,180,000 | 5,123,643 | |
| 7.875% (a)(c)(h) | 205,000 | 208,829 | |
| JPMorgan Chase & Co. 5.3% (c)(h) | 455,000 | 481,553 | |
| Royal Bank of Scotland Group PLC 7.5% (c)(h) | 2,195,000 | 2,165,713 | |
| TOTAL BANKS & THRIFTS | |||
| (Cost $38,697,651) | 39,932,176 | ||
| Shares | Value | ||
| Money Market Funds - 4.2% | |||
| Fidelity Cash Central Fund, 0.84% (i) | |||
| (Cost $24,723,712) | 24,718,768 | 24,723,712 | |
| TOTAL INVESTMENT PORTFOLIO - 101.0% | |||
| (Cost $584,038,591) | 602,318,443 | ||
| NET OTHER ASSETS (LIABILITIES) - (1.0)% | (6,015,974) | ||
| NET ASSETS - 100% | $596,302,469 |
Legend
(a) Security exempt from registration under Rule 144A of the Securities Act of 1933. These securities may be resold in transactions exempt from registration, normally to qualified institutional buyers. At the end of the period, the value of these securities amounted to $272,261,727 or 45.7% of net assets.
(b) Security or a portion of the security purchased on a delayed delivery or when-issued basis.
(c) Coupon rates for floating and adjustable rate securities reflect the rates in effect at period end.
(d) Non-income producing - Security is in default.
(e) Non-income producing
(f) The coupon rate will be determined upon settlement of the loan after period end.
(g) Position represents an unfunded loan commitment. At period end, the total principal amount and market value of unfunded commitments totaled $901,502 and $902,295, respectively.
(h) Security is perpetual in nature with no stated maturity date.
(i) Affiliated fund that is generally available only to investment companies and other accounts managed by Fidelity Investments. The rate quoted is the annualized seven-day yield of the fund at period end. A complete unaudited listing of the fund's holdings as of its most recent quarter end is available upon request. In addition, each Fidelity Central Fund's financial statements are available on the SEC's website or upon request.
Affiliated Central Funds
Information regarding fiscal year to date income earned by the Fund from investments in Fidelity Central Funds is as follows:
| Fund | Income earned |
| Fidelity Cash Central Fund | $56,902 |
| Total | $56,902 |
Investment Valuation
The following is a summary of the inputs used, as of March 31, 2017, involving the Fund's assets and liabilities carried at fair value. The inputs or methodology used for valuing securities may not be an indication of the risk associated with investing in those securities. For more information on valuation inputs, and their aggregation into the levels used below, please refer to the Investment Valuation section in the accompanying Notes to Financial Statements.
| Valuation Inputs at Reporting Date: | ||||
| Description | Total | Level 1 | Level 2 | Level 3 |
| Investments in Securities: | ||||
| Equities: | ||||
| Energy | $2,260,420 | $140,034 | $1,433,850 | $686,536 |
| Telecommunication Services | 16,065 | -- | -- | 16,065 |
| Corporate Bonds | 478,173,820 | -- | 478,173,820 | -- |
| Bank Loan Obligations | 57,212,250 | -- | 57,212,250 | -- |
| Preferred Securities | 39,932,176 | -- | 39,932,176 | -- |
| Money Market Funds | 24,723,712 | 24,723,712 | -- | -- |
| Total Investments in Securities: | $602,318,443 | $24,863,746 | $576,752,096 | $702,601 |
Other Information
Distribution of investments by country or territory of incorporation, as a percentage of Total Net Assets, is as follows (Unaudited):
| United States of America | 69.4% |
| Canada | 5.6% |
| United Kingdom | 5.3% |
| Luxembourg | 4.2% |
| Cayman Islands | 3.2% |
| France | 2.6% |
| Netherlands | 2.4% |
| Ireland | 1.7% |
| Multi-National | 1.7% |
| Barbados | 1.1% |
| Others (Individually Less Than 1%) | 2.8% |
| 100.0% |
See accompanying notes which are an integral part of the financial statements.
Financial Statements
Statement of Assets and Liabilities
| March 31, 2017 (Unaudited) | ||
| Assets | ||
| Investment in securities, at value — See accompanying schedule: Unaffiliated issuers (cost $559,314,879) | $577,594,731 | |
| Fidelity Central Funds (cost $24,723,712) | 24,723,712 | |
| Total Investments (cost $584,038,591) | $602,318,443 | |
| Cash | 1,045,370 | |
| Receivable for investments sold | 240,355 | |
| Receivable for fund shares sold | 124,212 | |
| Dividends receivable | 56,718 | |
| Interest receivable | 7,581,509 | |
| Distributions receivable from Fidelity Central Funds | 11,379 | |
| Total assets | 611,377,986 | |
| Liabilities | ||
| Payable for investments purchased | ||
| Regular delivery | $13,634,078 | |
| Delayed delivery | 1,175,850 | |
| Payable for fund shares redeemed | 258,583 | |
| Distributions payable | 264 | |
| Other payables and accrued expenses | 6,742 | |
| Total liabilities | 15,075,517 | |
| Net Assets | $596,302,469 | |
| Net Assets consist of: | ||
| Paid in capital | $570,401,785 | |
| Distributions in excess of net investment income | (203,897) | |
| Accumulated undistributed net realized gain (loss) on investments | 7,824,729 | |
| Net unrealized appreciation (depreciation) on investments | 18,279,852 | |
| Net Assets, for 5,997,919 shares outstanding | $596,302,469 | |
| Net Asset Value, offering price and redemption price per share ($596,302,469 ÷ 5,997,919 shares) | $99.42 |
See accompanying notes which are an integral part of the financial statements.
Statement of Operations
| Six months ended March 31, 2017 (Unaudited) | ||
| Investment Income | ||
| Dividends | $1,555,984 | |
| Interest | 18,614,879 | |
| Income from Fidelity Central Funds | 56,902 | |
| Total income | 20,227,765 | |
| Expenses | ||
| Custodian fees and expenses | $6,785 | |
| Independent directors' fees and expenses | 1,409 | |
| Legal | 223 | |
| Total expenses before reductions | 8,417 | |
| Expense reductions | (1,674) | 6,743 |
| Net investment income (loss) | 20,221,022 | |
| Realized and Unrealized Gain (Loss) | ||
| Net realized gain (loss) on: | ||
| Investment securities: | ||
| Unaffiliated issuers | 9,223,034 | |
| Fidelity Central Funds | 3,985 | |
| Total net realized gain (loss) | 9,227,019 | |
| Change in net unrealized appreciation (depreciation) on investment securities | 1,264,032 | |
| Net gain (loss) | 10,491,051 | |
| Net increase (decrease) in net assets resulting from operations | $30,712,073 |
See accompanying notes which are an integral part of the financial statements.
Statement of Changes in Net Assets
| Six months ended March 31, 2017 (Unaudited) | Year ended September 30, 2016 | |
| Increase (Decrease) in Net Assets | ||
| Operations | ||
| Net investment income (loss) | $20,221,022 | $72,793,472 |
| Net realized gain (loss) | 9,227,019 | (49,462,147) |
| Change in net unrealized appreciation (depreciation) | 1,264,032 | 85,303,996 |
| Net increase (decrease) in net assets resulting from operations | 30,712,073 | 108,635,321 |
| Distributions to shareholders from net investment income | (20,424,919) | (68,575,216) |
| Distributions to shareholders from net realized gain | (1,402,290) | – |
| Total distributions | (21,827,209) | (68,575,216) |
| Affiliated share transactions | ||
| Proceeds from sales of shares | 21,620,824 | 147,678,266 |
| Reinvestment of distributions | 21,825,527 | 68,572,135 |
| Cost of shares redeemed | (251,017,435) | (473,432,773) |
| Net increase (decrease) in net assets resulting from share transactions | (207,571,084) | (257,182,372) |
| Total increase (decrease) in net assets | (198,686,220) | (217,122,267) |
| Net Assets | ||
| Beginning of period | 794,988,689 | 1,012,110,956 |
| End of period | $596,302,469 | $794,988,689 |
| Other Information | ||
| Distributions in excess of net investment income end of period | $(203,897) | $– |
| Shares | ||
| Sold | 220,052 | 1,567,514 |
| Issued in reinvestment of distributions | 221,888 | 735,616 |
| Redeemed | (2,553,395) | (4,968,121) |
| Net increase (decrease) | (2,111,455) | (2,664,991) |
See accompanying notes which are an integral part of the financial statements.
Financial Highlights — Fidelity High Income Central Fund 1
| Six months ended (Unaudited) March 31, | Years ended September 30, | |||||
| 2017 | 2016 | 2015 | 2014 | 2013 | 2012 | |
| Selected Per–Share Data | ||||||
| Net asset value, beginning of period | $98.03 | $93.94 | $102.00 | $101.40 | $101.43 | $91.48 |
| Income from Investment Operations | ||||||
| Net investment income (loss)A | 3.122 | 6.453 | 6.303 | 6.317 | 6.723 | 7.580 |
| Net realized and unrealized gain (loss) | 1.629 | 3.688 | (8.196) | .503 | (.282) | 9.372 |
| Total from investment operations | 4.751 | 10.141 | (1.893) | 6.820 | 6.441 | 16.952 |
| Distributions from net investment income | (3.146) | (6.051) | (6.167) | (6.220) | (6.471) | (7.002) |
| Distributions from net realized gain | (.215) | – | – | – | – | – |
| Total distributions | (3.361) | (6.051) | (6.167) | (6.220) | (6.471) | (7.002) |
| Net asset value, end of period | $99.42 | $98.03 | $93.94 | $102.00 | $101.40 | $101.43 |
| Total ReturnB,C | 4.93% | 11.32% | (2.06)% | 6.77% | 6.46% | 19.03% |
| Ratios to Average Net AssetsD,E | ||||||
| Expenses before reductionsF | - %G | -% | -% | -% | -% | -% |
| Expenses net of fee waivers, if anyF | - %G | -% | -% | -% | -% | -% |
| Expenses net of all reductionsF | - %G | -% | -% | -% | -% | -% |
| Net investment income (loss) | 6.34%G | 6.92% | 6.31% | 6.07% | 6.54% | 7.74% |
| Supplemental Data | ||||||
| Net assets, end of period (000 omitted) | $596,302 | $794,989 | $1,012,111 | $457,907 | $406,018 | $537,445 |
| Portfolio turnover rateH | 65%G | 59% | 57% | 74% | 87% | 51% |
A Calculated based on average shares outstanding during the period.
B Total returns for periods of less than one year are not annualized.
C Total returns would have been lower if certain expenses had not been reduced during the applicable periods shown.
D Fees and expenses of any underlying Fidelity Central Funds are not included in the Fund's expense ratio. The Fund indirectly bears its proportionate share of the expenses of any underlying Fidelity Central Funds.
E Expense ratios reflect operating expenses of the Fund. Expenses before reductions do not reflect amounts reimbursed by the investment adviser or reductions from expense offset arrangements and do not represent the amount paid by the Fund during periods when reimbursements or reductions occur. Expenses net of fee waivers reflect expenses after reimbursement by the investment adviser but prior to reductions from expense offset arrangements. Expenses net of all reductions represent the net expenses paid by the Fund.
F Amount represents less than .005%.
G Annualized
H Amount does not include the portfolio activity of any underlying Fidelity Central Funds.
See accompanying notes which are an integral part of the financial statements.
Notes to Financial Statements (Unaudited)
For the period ended March 31, 2017
1. Organization.
Fidelity High Income Central Fund 1 (the Fund) is a fund of Fidelity Central Investment Portfolios LLC (the LLC) and is authorized to issue an unlimited number of shares. Shares of the Fund are only offered to other investment companies and accounts managed by Fidelity Management & Research Company (FMR), or its affiliates (the Investing Funds). The LLC is registered under the Investment Company Act of 1940, as amended (the 1940 Act), as an open-end management investment company organized as a Delaware Limited Liability Company.
2. Investments in Fidelity Central Funds.
The Fund invests in Fidelity Central Funds, which are open-end investment companies generally available only to other investment companies and accounts managed by the investment adviser and its affiliates. The Fund's Schedule of Investments lists each of the Fidelity Central Funds held as of period end, if any, as an investment of the Fund, but does not include the underlying holdings of each Fidelity Central Fund. As an Investing Fund, the Fund indirectly bears its proportionate share of the expenses of the underlying Fidelity Central Funds.
The Money Market Central Funds seek preservation of capital and current income and are managed by Fidelity Investments Money Management, Inc. (FIMM), an affiliate of the investment adviser. Annualized expenses of the Money Market Central Funds as of their most recent shareholder report date are less than .005%.
A complete unaudited list of holdings for each Fidelity Central Fund is available upon request or at the Securities and Exchange Commission (the SEC) website at www.sec.gov. In addition, the financial statements of the Fidelity Central Funds are available on the SEC website or upon request.
3. Significant Accounting Policies.
The Fund is an investment company and applies the accounting and reporting guidance of the Financial Accounting Standards Board (FASB) Accounting Standards Codification Topic 946 Financial Services – Investments Companies. The financial statements have been prepared in conformity with accounting principles generally accepted in the United States of America (GAAP), which require management to make certain estimates and assumptions at the date of the financial statements. Actual results could differ from those estimates. Subsequent events, if any, through the date that the financial statements were issued have been evaluated in the preparation of the financial statements. The following summarizes the significant accounting policies of the Fund:
Investment Valuation. Investments are valued as of 4:00 p.m. Eastern time on the last calendar day of the period. The Board of Directors (the Board) has delegated the day to day responsibility for the valuation of the Fund's investments to the Fair Value Committee (the Committee) established by the Fund's investment adviser. In accordance with valuation policies and procedures approved by the Board, the Fund attempts to obtain prices from one or more third party pricing vendors or brokers to value its investments. When current market prices, quotations or currency exchange rates are not readily available or reliable, investments will be fair valued in good faith by the Committee, in accordance with procedures adopted by the Board. Factors used in determining fair value vary by investment type and may include market or investment specific events, changes in interest rates and credit quality. The frequency with which these procedures are used cannot be predicted and they may be utilized to a significant extent. The Committee oversees the Fund's valuation policies and procedures and reports to the Board on the Committee's activities and fair value determinations. The Board monitors the appropriateness of the procedures used in valuing the Fund's investments and ratifies the fair value determinations of the Committee.
The Fund categorizes the inputs to valuation techniques used to value its investments into a disclosure hierarchy consisting of three levels as shown below:
- Level 1 – quoted prices in active markets for identical investments
- Level 2 – other significant observable inputs (including quoted prices for similar investments, interest rates, prepayment speeds, etc.)
- Level 3 – unobservable inputs (including the Fund's own assumptions based on the best information available)
Valuation techniques used to value the Fund's investments by major category are as follows:
Debt securities, including restricted securities, are valued based on evaluated prices received from third party pricing vendors or from brokers who make markets in such securities. Corporate bonds, bank loan obligations and preferred securities are valued by pricing vendors who utilize matrix pricing which considers yield or price of bonds of comparable quality, coupon, maturity and type or by broker-supplied prices. When independent prices are unavailable or unreliable, debt securities may be valued utilizing pricing methodologies which consider similar factors that would be used by third party pricing vendors. Debt securities are generally categorized as Level 2 in the hierarchy but may be Level 3 depending on the circumstances. The Fund invests a significant portion of its assets in below investment grade securities. The value of these securities can be more volatile due to changes in the credit quality of the issuer and is sensitive to changes in economic, market and regulatory conditions.
Equity securities, including restricted securities, for which market quotations are readily available, are valued at the last reported sale price or official closing price as reported by a third party pricing vendor on the primary market or exchange on which they are traded and are categorized as Level 1 in the hierarchy. In the event there were no sales during the day or closing prices are not available, securities are valued at the last quoted bid price or may be valued using the last available price and are generally categorized as Level 2 in the hierarchy. For equity securities, including restricted securities, where observable inputs are limited, assumptions about market activity and risk are used and these securities may be categorized as Level 3 in the hierarchy.
Investments in open-end mutual funds, including the Fidelity Central Funds, are valued at their closing net asset value (NAV) each business day and are categorized as Level 1 in the hierarchy.
Changes in valuation techniques may result in transfers in or out of an assigned level within the disclosure hierarchy. The aggregate value of investments by input level as of March 31, 2017 is included at the end of the Fund's Schedule of Investments.
Investment Transactions and Income. For financial reporting purposes, the Fund's investment holdings and NAV include trades executed through the end of the last business day of the period. The NAV per share for processing shareholder transactions is calculated as of the close of business of the New York Stock Exchange (NYSE), normally 4:00 p.m. Eastern time and includes trades executed through the end of the prior business day. Gains and losses on securities sold are determined on the basis of identified cost and may include proceeds received from litigation. Dividend income is recorded on the ex-dividend date, except for certain dividends from foreign securities where the ex-dividend date may have passed, which are recorded as soon as the Fund is informed of the ex-dividend date. Non-cash dividends included in dividend income, if any, are recorded at the fair market value of the securities received. Income and capital gain distributions from Fidelity Central Funds, if any, are recorded on the ex-dividend date. Interest income is accrued as earned and includes coupon interest and amortization of premium and accretion of discount on debt securities as applicable. Debt obligations may be placed on non-accrual status and related interest income may be reduced by ceasing current accruals and writing off interest receivables when the collection of all or a portion of interest has become doubtful based on consistently applied procedures. A debt obligation is removed from non-accrual status when the issuer resumes interest payments or when collectability of interest is reasonably assured.
Expenses. Expenses directly attributable to a fund are charged to that fund. Expenses attributable to more than one fund are allocated among the respective funds on the basis of relative net assets or other appropriate methods. Expense estimates are accrued in the period to which they relate and adjustments are made when actual amounts are known.
Income Tax Information and Distributions to Shareholders. Each year, effective October 1, 2016, the Fund intends to qualify as a regulated investment company under Subchapter M of the Internal Revenue Code, including distributing substantially all of its taxable income and realized gains. As a result, no provision for U.S. Federal income taxes is required. The Fund files a U.S. federal tax return, in addition to state and local tax returns as required. The Fund's federal income tax returns are subject to examination by the Internal Revenue Service (IRS) for a period of three fiscal years after they are filed. State and local tax returns may be subject to examination for an additional fiscal year depending on the jurisdiction. Prior to October 1, 2016, the Fund was a partnership for tax purposes, and no provision was made for U.S. Federal income taxes because the Fund allocated, at least annually among its partners, each partner's share of the Fund's income and expenses and capital gains and losses as determined by income tax regulations for inclusion in each partner's tax return. Due to the Fund's previous partnership structure, paid in capital includes any accumulated net investment income (loss) and net realized gain (loss) on investments prior to October 1, 2016.
Dividends are declared and recorded daily and paid monthly from net investment income. Distributions from realized gains, if any, are declared and recorded on the ex-dividend date. Income and capital gain distributions are determined in accordance with income tax regulations, which may differ from GAAP.
Capital accounts within the financial statements are adjusted for permanent book-tax differences. These adjustments have no impact on net assets or the results of operations. Capital accounts are not adjusted for temporary book-tax differences which will reverse in a subsequent period.
The federal tax cost of investment securities and unrealized appreciation (depreciation) as of period end were as follows:
| Gross unrealized appreciation | $23,578,688 |
| Gross unrealized depreciation | (5,631,595) |
| Net unrealized appreciation (depreciation) on securities | $17,947,093 |
| Tax Cost | $584,371,350 |
Delayed Delivery Transactions and When-Issued Securities. During the period, the Fund transacted in securities on a delayed delivery or when-issued basis. Payment and delivery may take place after the customary settlement period for that security. The price of the underlying securities and the date when the securities will be delivered and paid for are fixed at the time the transaction is negotiated. The securities purchased on a delayed delivery or when-issued basis are identified as such in the Fund's Schedule of Investments. The Fund may receive compensation for interest forgone in the purchase of a delayed delivery or when-issued security. With respect to purchase commitments, the Fund identifies securities as segregated in its records with a value at least equal to the amount of the commitment. Losses may arise due to changes in the value of the underlying securities or if the counterparty does not perform under the contract's terms, or if the issuer does not issue the securities due to political, economic, or other factors.
Restricted Securities. The Fund may invest in securities that are subject to legal or contractual restrictions on resale. These securities generally may be resold in transactions exempt from registration or to the public if the securities are registered. Disposal of these securities may involve time-consuming negotiations and expense, and prompt sale at an acceptable price may be difficult. Information regarding restricted securities is included at the end of the Fund's Schedule of Investments.
Loans and Other Direct Debt Instruments. The Fund invests in direct debt instruments which are interests in amounts owed to lenders by corporate or other borrowers. These instruments may be in the form of loans, trade claims or other receivables and may include standby financing commitments such as revolving credit facilities that obligate the Fund to supply additional cash to the borrower on demand. Loans may be acquired through assignment or participation. The Fund also invests in unfunded loan commitments, which are contractual obligations for future funding. Information regarding unfunded commitments is included at the end of the Fund's Schedule of Investments.
New Accounting Pronouncement. In March 2017, the Financial Accounting Standards Board (FASB) issued an Accounting Standards Update (ASU), ASU 2017-08 which amends the amortization period for certain callable debt securities that are held at a premium. The amendment requires the premium to be amortized to the earliest call date. The amendments do not require an accounting change for securities held at a discount. The ASU is effective for annual periods beginning after December 15, 2019. Management is currently evaluating the potential impact of these changes to the financial statements.
4. Purchases and Sales of Investments.
Purchases and sales of securities, other than short-term securities, aggregated $199,877,134 and $339,038,603, respectively.
5. Fees and Other Transactions with Affiliates.
Management Fee and Expense Contract. FMR Co., Inc. (the investment adviser), an affiliate of FMR, provides the Fund with investment management services. The Fund does not pay any fees for these services. Pursuant to the Fund's management contract with the investment adviser, FMR pays the investment adviser a portion of the management fees it receives from the Investing Funds. In addition, under an expense contract, FMR also pays all other expenses of the Fund, excluding custody fees, fees and expenses of the independent Directors, and certain exceptions such as interest expense and extraordinary expenses.
Interfund Trades. The Fund may purchase from or sell securities to other Fidelity Funds under procedures adopted by the Board. The procedures have been designed to ensure these interfund trades are executed in accordance with Rule 17a-7 of the 1940 Act. Interfund trades are included within the respective purchases and sales amounts shown in the Purchases and Sales of Investments note.
6. Expense Reductions.
FMR has voluntarily agreed to reimburse a portion of the Fund's operating expenses. For the period, the reimbursement reduced the expenses by $1,409.
Through arrangements with the Fund's custodian, credits realized as a result of certain uninvested cash balances were used to reduce the Fund's expenses. During the period, these credits reduced the Fund's custody expenses by $265.
7. Other.
The Fund's organizational documents provide former and current directors and officers with a limited indemnification against liabilities arising in connection with the performance of their duties to the Fund. In the normal course of business, the Fund may also enter into contracts that provide general indemnifications. The Fund's maximum exposure under these arrangements is unknown as this would be dependent on future claims that may be made against the Fund. The risk of material loss from such claims is considered remote.
At the end of the period, mutual funds managed by FMR or its affiliates were the owners of record of all of the outstanding shares of the Fund.
Shareholder Expense Example
As a shareholder of the Fund, you incur two types of costs: (1) transaction costs and (2) ongoing costs, including other Fund expenses. This Example is intended to help you understand your ongoing costs (in dollars) of investing in the Fund and to compare these costs with the ongoing costs of investing in other mutual funds.
The Example is based on an investment of $1,000 invested at the beginning of the period and held for the entire period (October 1, 2016 to March 31, 2017).
Actual Expenses
The first line of the accompanying table provides information about actual account values and actual expenses. You may use the information in this line, together with the amount you invested, to estimate the expenses that you paid over the period. Simply divide your account value by $1,000.00 (for example, an $8,600 account value divided by $1,000.00 = 8.6), then multiply the result by the number in the first line under the heading entitled "Expenses Paid During Period" to estimate the expenses you paid on your account during this period. In addition, the Fund, as a shareholder in the underlying Fidelity Central Funds, will indirectly bear its pro-rata share of the fees and expenses incurred by the underlying Fidelity Central Funds. These fees and expenses are not included in the Fund's annualized expense ratio used to calculate the expense estimate in the table below.
Hypothetical Example for Comparison Purposes
The second line of the accompanying table provides information about hypothetical account values and hypothetical expenses based on the Fund's actual expense ratio and an assumed rate of return of 5% per year before expenses, which is not the Fund's actual return. The hypothetical account values and expenses may not be used to estimate the actual ending account balance or expenses you paid for the period. You may use this information to compare the ongoing costs of investing in the Fund and other funds. To do so, compare this 5% hypothetical example with the 5% hypothetical examples that appear in the shareholder reports of the other funds. In addition, the Fund, as a shareholder in the underlying Fidelity Central Funds, will indirectly bear its pro-rata share of the fees and expenses incurred by the underlying Fidelity Central Funds. These fees and expenses are not included in the Fund's annualized expense ratio used to calculate the expense estimate in the table below.
Please note that the expenses shown in the table are meant to highlight your ongoing costs only and do not reflect any transaction costs. Therefore, the second line of the table is useful in comparing ongoing costs only, and will not help you determine the relative total costs of owning different funds.
| Annualized Expense Ratio-A | Beginning Account Value October 1, 2016 | Ending Account Value March 31, 2017 | Expenses Paid During Period-B October 1, 2016 to March 31, 2017 | |
| Actual | .0022% | $1,000.00 | $1,049.30 | $.01 |
| Hypothetical-C | $1,000.00 | $1,024.92 | $.01 |
A Annualized expense ratio reflects expenses net of applicable fee waivers.
B Expenses are equal to the Fund's annualized expense ratio, multiplied by the average account value over the period, multiplied by 182/365 (to reflect the one-half year period).
C 5% return per year before expenses
![]()
Corporate Headquarters
245 Summer St.
Boston, MA 02210
www.fidelity.com
HP1-SANN-0517
1.807410.112
Fidelity® International Equity Central Fund Semi-Annual Report March 31, 2017 |
|
Contents
To view a fund's proxy voting guidelines and proxy voting record for the 12-month period ended June 30, visit http://www.fidelity.com/proxyvotingresults or visit the Securities and Exchange Commission's (SEC) web site at http://www.sec.gov.
You may also call 1-800-544-8544 to request a free copy of the proxy voting guidelines.
Standard & Poor's, S&P and S&P 500 are registered service marks of The McGraw-Hill Companies, Inc. and have been licensed for use by Fidelity Distributors Corporation.
Other third-party marks appearing herein are the property of their respective owners.
All other marks appearing herein are registered or unregistered trademarks or service marks of FMR LLC or an affiliated company. © 2017 FMR LLC. All rights reserved.
A fund files its complete schedule of portfolio holdings with the SEC for the first and third quarters of each fiscal year on Form N-Q. Forms N-Q are available on the SEC’s web site at http://www.sec.gov. A fund's Forms N-Q may be reviewed and copied at the SEC’s Public Reference Room in Washington, DC. Information regarding the operation of the SEC's Public Reference Room may be obtained by calling 1-800-SEC-0330.
Investment Summary (Unaudited)
Geographic Diversification (% of fund's net assets)
| As of March 31, 2017 | ||
| Japan | 19.9% | |
| United Kingdom | 16.8% | |
| United States of America* | 7.7% | |
| France | 7.1% | |
| Canada | 6.7% | |
| Switzerland | 6.2% | |
| Germany | 5.9% | |
| Australia | 3.8% | |
| Spain | 3.7% | |
| Other | 22.2% | |
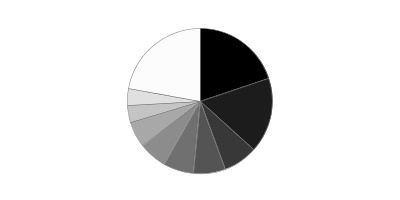
* Includes Short-Term investments and Net Other Assets (Liabilities).
Percentages are based on country or territory of incorporation and are adjusted for the effect of futures contracts, if applicable.
| As of September 30, 2016 | ||
| Japan | 18.9% | |
| United Kingdom | 17.9% | |
| France | 7.3% | |
| United States of America* | 6.8% | |
| Canada | 6.4% | |
| Germany | 6.3% | |
| Switzerland | 6.2% | |
| Australia | 4.0% | |
| Sweden | 3.1% | |
| Other | 23.1% | |

* Includes Short-Term investments and Net Other Assets (Liabilities).
Percentages are based on country or territory of incorporation and are adjusted for the effect of futures contracts, if applicable.
Asset Allocation as of March 31, 2017
| % of fund's net assets | % of fund's net assets 6 months ago | |
| Stocks and Equity Futures | 98.2 | 98.3 |
| Short-Term Investments and Net Other Assets (Liabilities) | 1.8 | 1.7 |
Top Ten Stocks as of March 31, 2017
| % of fund's net assets | % of fund's net assets 6 months ago | |
| Roche Holding AG (participation certificate) (Switzerland, Pharmaceuticals) | 1.6 | 0.7 |
| British American Tobacco PLC (United Kingdom, Tobacco) | 1.5 | 1.2 |
| Sony Corp. (Japan, Household Durables) | 1.2 | 1.1 |
| Recruit Holdings Co. Ltd. (Japan, Professional Services) | 1.2 | 0.0 |
| GlaxoSmithKline PLC (United Kingdom, Pharmaceuticals) | 1.2 | 1.3 |
| VINCI SA (France, Construction & Engineering) | 1.2 | 1.0 |
| Australia & New Zealand Banking Group Ltd. (Australia, Banks) | 1.2 | 1.5 |
| Total SA (France, Oil, Gas & Consumable Fuels) | 1.1 | 1.0 |
| BASF AG (Germany, Chemicals) | 1.1 | 0.9 |
| Sanofi SA (France, Pharmaceuticals) | 1.1 | 1.0 |
| 12.4 |
Top Market Sectors as of March 31, 2017
| % of fund's net assets | % of fund's net assets 6 months ago | |
| Financials | 22.0 | 22.3 |
| Industrials | 13.8 | 12.8 |
| Consumer Discretionary | 12.0 | 12.3 |
| Health Care | 10.0 | 10.7 |
| Consumer Staples | 10.0 | 11.2 |
| Materials | 8.1 | 7.0 |
| Energy | 6.4 | 6.0 |
| Information Technology | 4.3 | 4.8 |
| Telecommunication Services | 4.1 | 4.6 |
| Utilities | 3.2 | 3.5 |
Percentages shown as 0.0% may reflect amounts less than 0.05%.
Investments March 31, 2017 (Unaudited)
Showing Percentage of Net Assets
| Common Stocks - 96.2% | |||
| Shares | Value | ||
| Australia - 3.8% | |||
| Abacus Property Group unit | 2,196,647 | $5,437,492 | |
| Australia & New Zealand Banking Group Ltd. | 1,256,384 | 30,543,298 | |
| Insurance Australia Group Ltd. | 3,108,916 | 14,370,032 | |
| Magellan Financial Group Ltd. | 897,546 | 16,203,685 | |
| realestate.com.au Ltd. | 227,222 | 10,299,546 | |
| Rio Tinto Ltd. | 345,183 | 15,944,500 | |
| Westfield Corp. unit | 1,210,000 | 8,209,027 | |
| TOTAL AUSTRALIA | 101,007,580 | ||
| Austria - 1.6% | |||
| ams AG | 62,900 | 3,400,424 | |
| Andritz AG | 333,800 | 16,695,647 | |
| Erste Group Bank AG | 492,800 | 16,047,574 | |
| IMMOFINANZ Immobilien Anlagen AG | 3,153,900 | 6,025,964 | |
| TOTAL AUSTRIA | 42,169,609 | ||
| Bailiwick of Jersey - 1.4% | |||
| Glencore Xstrata PLC | 4,049,132 | 15,886,593 | |
| Randgold Resources Ltd. | 88,000 | 7,689,457 | |
| Shire PLC | 252,900 | 14,735,749 | |
| TOTAL BAILIWICK OF JERSEY | 38,311,799 | ||
| Belgium - 1.5% | |||
| Anheuser-Busch InBev SA NV | 186,816 | 20,470,412 | |
| KBC Groep NV | 283,245 | 18,791,689 | |
| TOTAL BELGIUM | 39,262,101 | ||
| Bermuda - 0.8% | |||
| Cheung Kong Infrastructure Holdings Ltd. | 536,360 | 4,209,993 | |
| Chow Sang Sang Holdings International Ltd. | 4,190,000 | 9,877,218 | |
| Petra Diamonds Ltd. (a) | 4,042,300 | 6,751,109 | |
| TOTAL BERMUDA | 20,838,320 | ||
| Canada - 6.6% | |||
| Barrick Gold Corp. | 518,200 | 9,843,014 | |
| Canadian Natural Resources Ltd. | 311,100 | 10,185,580 | |
| Cenovus Energy, Inc. | 631,500 | 7,146,727 | |
| Fortis, Inc. | 173,690 | 5,755,926 | |
| Great-West Lifeco, Inc. | 550,000 | 15,240,441 | |
| Imperial Oil Ltd. | 174,700 | 5,323,039 | |
| Intact Financial Corp. | 239,300 | 17,019,208 | |
| MDC Partners, Inc. Class A (b) | 855,900 | 8,045,460 | |
| Potash Corp. of Saskatchewan, Inc. (b) | 661,500 | 11,301,485 | |
| PrairieSky Royalty Ltd. | 202,522 | 4,273,239 | |
| Rogers Communications, Inc. Class B (non-vtg.) | 165,300 | 7,308,824 | |
| Royal Bank of Canada | 286,400 | 20,866,486 | |
| Suncor Energy, Inc. | 664,900 | 20,414,232 | |
| TELUS Corp. | 142,300 | 4,619,386 | |
| The Toronto-Dominion Bank | 566,400 | 28,370,045 | |
| TOTAL CANADA | 175,713,092 | ||
| Cayman Islands - 1.0% | |||
| Cheung Kong Property Holdings Ltd. | 2,962,000 | 19,952,480 | |
| Tencent Holdings Ltd. | 249,900 | 7,199,499 | |
| TOTAL CAYMAN ISLANDS | 27,151,979 | ||
| China - 0.9% | |||
| PICC Property & Casualty Co. Ltd. (H Shares) | 10,300,000 | 15,877,758 | |
| Wuliangye Yibin Co. Ltd. Class A | 1,124,662 | 7,021,891 | |
| TOTAL CHINA | 22,899,649 | ||
| Denmark - 1.1% | |||
| Danske Bank A/S | 98,370 | 3,350,189 | |
| H Lundbeck A/S | 156,600 | 7,262,309 | |
| Jyske Bank A/S (Reg.) | 170,100 | 8,605,495 | |
| Scandinavian Tobacco Group A/S | 285,557 | 4,991,597 | |
| TDC A/S | 899,990 | 4,640,880 | |
| TOTAL DENMARK | 28,850,470 | ||
| France - 7.1% | |||
| Christian Dior SA | 118,200 | 27,463,656 | |
| Danone SA | 208,500 | 14,183,202 | |
| ENGIE | 481,380 | 6,819,761 | |
| Hermes International SCA | 32,700 | 15,492,144 | |
| Ipsen SA | 115,600 | 11,562,678 | |
| Orange SA | 270,750 | 4,203,551 | |
| Sanofi SA | 329,303 | 29,767,439 | |
| Societe Generale Series A | 296,700 | 15,032,405 | |
| Suez Environnement SA | 228,991 | 3,616,678 | |
| Total SA (b) | 544,253 | 27,519,287 | |
| Total SA sponsored ADR (b) | 53,990 | 2,722,176 | |
| VINCI SA | 399,194 | 31,641,410 | |
| TOTAL FRANCE | 190,024,387 | ||
| Germany - 5.5% | |||
| BASF AG | 303,003 | 30,035,795 | |
| Bayer AG | 92,500 | 10,657,251 | |
| Deutsche Borse AG | 96,416 | 8,836,410 | |
| Deutsche Borse AG | 92,770 | 8,528,979 | |
| Deutsche Post AG | 568,101 | 19,442,427 | |
| Deutsche Telekom AG | 830,100 | 14,545,538 | |
| Fresenius SE & Co. KGaA | 182,400 | 14,658,037 | |
| ProSiebenSat.1 Media AG | 345,849 | 15,314,433 | |
| SAP AG | 243,112 | 23,851,228 | |
| TOTAL GERMANY | 145,870,098 | ||
| Hong Kong - 1.3% | |||
| China Resources Beer Holdings Co. Ltd. | 2,293,333 | 5,217,285 | |
| CLP Holdings Ltd. | 626,460 | 6,549,556 | |
| Dah Sing Banking Group Ltd. | 3,454,000 | 6,808,889 | |
| Dah Sing Financial Holdings Ltd. | 1,257,200 | 9,576,818 | |
| Power Assets Holdings Ltd. | 639,700 | 5,515,010 | |
| TOTAL HONG KONG | 33,667,558 | ||
| India - 0.7% | |||
| Axis Bank Ltd. | 2,035,394 | 15,401,964 | |
| Tata Motors Ltd. Class A | 792,785 | 3,448,725 | |
| TOTAL INDIA | 18,850,689 | ||
| Indonesia - 1.2% | |||
| PT Bank Danamon Indonesia Tbk Series A | 42,179,200 | 14,876,908 | |
| PT Bank Rakyat Indonesia Tbk | 17,125,000 | 16,674,562 | |
| TOTAL INDONESIA | 31,551,470 | ||
| Ireland - 2.2% | |||
| Greencore Group PLC | 2,594,399 | 7,989,784 | |
| James Hardie Industries PLC CDI | 1,116,445 | 17,545,469 | |
| Kerry Group PLC Class A | 113,100 | 8,892,279 | |
| Ryanair Holdings PLC sponsored ADR (a) | 295,580 | 24,527,228 | |
| TOTAL IRELAND | 58,954,760 | ||
| Isle of Man - 0.4% | |||
| Gaming VC Holdings SA | 1,076,300 | 9,891,220 | |
| Israel - 0.0% | |||
| Frutarom Industries Ltd. | 51 | 2,851 | |
| Italy - 1.1% | |||
| Banca Generali SpA | 419,900 | 10,974,758 | |
| Banco di Desio e della Brianza SpA | 1,855,961 | 4,747,894 | |
| Enel SpA | 2,144,571 | 10,091,205 | |
| Mediaset SpA | 914,051 | 3,783,425 | |
| TOTAL ITALY | 29,597,282 | ||
| Japan - 19.9% | |||
| AEON Financial Service Co. Ltd. | 971,700 | 18,302,838 | |
| AEON MALL Co. Ltd. | 817,740 | 12,868,773 | |
| Alps Electric Co. Ltd. | 169,100 | 4,794,782 | |
| Astellas Pharma, Inc. | 916,200 | 12,083,693 | |
| Bandai Namco Holdings, Inc. | 320,800 | 9,595,473 | |
| Broadleaf Co. Ltd. | 519,000 | 3,552,304 | |
| Chubu Electric Power Co., Inc. | 323,800 | 4,349,590 | |
| Chugai Pharmaceutical Co. Ltd. | 196,600 | 6,767,617 | |
| Coca-Cola Central Japan Co. Ltd. | 242,900 | 5,874,501 | |
| DaikyoNishikawa Corp. | 1,001,300 | 13,122,220 | |
| East Japan Railway Co. | 201,100 | 17,560,358 | |
| Fuji Heavy Industries Ltd. | 479,600 | 17,590,908 | |
| Hoya Corp. | 317,400 | 15,269,868 | |
| Ichigo, Inc. | 3,477,300 | 10,182,339 | |
| JSR Corp. | 668,900 | 11,277,511 | |
| KDDI Corp. | 497,200 | 13,076,757 | |
| Keyence Corp. | 28,400 | 11,372,245 | |
| Koito Manufacturing Co. Ltd. | 15,200 | 790,515 | |
| Komatsu Ltd. | 710,500 | 18,610,323 | |
| Makita Corp. | 601,800 | 21,081,649 | |
| Mitsubishi Motors Corp. of Japan | 2,377,900 | 14,264,494 | |
| Nabtesco Corp. | 472,400 | 12,517,560 | |
| Nidec Corp. | 63,400 | 6,033,621 | |
| Nintendo Co. Ltd. | 23,300 | 5,406,506 | |
| Nippon Paint Holdings Co. Ltd. | 291,800 | 10,156,517 | |
| Nippon Telegraph & Telephone Corp. | 223,970 | 9,575,461 | |
| Olympus Corp. | 452,500 | 17,464,949 | |
| Panasonic Corp. | 1,608,700 | 18,205,998 | |
| Recruit Holdings Co. Ltd. | 627,300 | 32,004,527 | |
| Shin-Etsu Chemical Co. Ltd. | 59,600 | 5,180,393 | |
| Shionogi & Co. Ltd. | 178,300 | 9,230,162 | |
| SMC Corp. | 73,800 | 21,822,474 | |
| SoftBank Corp. | 214,460 | 15,208,461 | |
| Sony Corp. | 976,900 | 32,968,855 | |
| Sony Financial Holdings, Inc. | 612,500 | 9,836,502 | |
| Start Today Co. Ltd. | 175,200 | 3,876,023 | |
| Sumco Corp. | 241,100 | 4,027,388 | |
| Sumitomo Mitsui Financial Group, Inc. | 778,700 | 28,343,721 | |
| Suzuki Motor Corp. | 470,300 | 19,533,311 | |
| Tokyo Gas Co. Ltd. | 1,082,000 | 4,941,602 | |
| Toyota Boshoku Corp. | 547,200 | 12,695,748 | |
| VT Holdings Co. Ltd. | 1,040,500 | 5,402,039 | |
| Welcia Holdings Co. Ltd. | 150,400 | 4,208,174 | |
| TOTAL JAPAN | 531,028,750 | ||
| Mexico - 0.4% | |||
| CEMEX S.A.B. de CV sponsored ADR | 1,196,400 | 10,851,348 | |
| Multi-National - 0.2% | |||
| HKT Trust/HKT Ltd. unit | 3,835,120 | 4,944,721 | |
| Netherlands - 2.7% | |||
| ASML Holding NV (Netherlands) | 89,800 | 11,915,823 | |
| Koninklijke Philips Electronics NV | 815,600 | 26,200,559 | |
| LyondellBasell Industries NV Class A | 46,100 | 4,203,859 | |
| Unilever NV: | |||
| (Certificaten Van Aandelen) (Bearer) | 399,300 | 19,824,907 | |
| (NY Reg.) | 223,100 | 11,083,608 | |
| TOTAL NETHERLANDS | 73,228,756 | ||
| Norway - 0.5% | |||
| Aker Bp ASA | 226,700 | 3,633,030 | |
| Statoil ASA | 591,469 | 10,166,496 | |
| TOTAL NORWAY | 13,799,526 | ||
| Singapore - 0.1% | |||
| UOL Group Ltd. | 372,500 | 1,856,042 | |
| South Africa - 0.6% | |||
| Naspers Ltd. Class N | 98,700 | 17,007,226 | |
| Spain - 3.7% | |||
| Amadeus IT Holding SA Class A | 161,700 | 8,204,174 | |
| Atresmedia Corporacion de Medios de Comunicacion SA | 427,300 | 5,397,189 | |
| CaixaBank SA | 4,718,632 | 20,287,694 | |
| Endesa SA | 215,060 | 5,054,255 | |
| Gas Natural SDG SA | 224,540 | 4,920,137 | |
| Grifols SA ADR | 491,950 | 9,285,556 | |
| Iberdrola SA | 1,513,360 | 10,824,904 | |
| Merlin Properties Socimi SA | 1,056,000 | 11,806,148 | |
| Prosegur Compania de Seguridad SA (Reg.) | 1,505,100 | 9,055,813 | |
| Telefonica SA | 1,218,391 | 13,637,853 | |
| TOTAL SPAIN | 98,473,723 | ||
| Sweden - 2.1% | |||
| Lundin Petroleum AB | 227,773 | 4,621,220 | |
| Nordea Bank AB | 1,653,200 | 18,873,894 | |
| Rezidor Hotel Group AB | 3,496,050 | 13,343,330 | |
| Saab AB (B Shares) | 264,400 | 11,162,418 | |
| Svenska Cellulosa AB (SCA) (B Shares) | 285,500 | 9,207,982 | |
| TOTAL SWEDEN | 57,208,844 | ||
| Switzerland - 6.2% | |||
| ABB Ltd. (Reg.) | 1,234,740 | 28,899,710 | |
| Credit Suisse Group AG | 1,086,311 | 16,162,813 | |
| Nestle SA | 345,562 | 26,522,496 | |
| Novartis AG | 269,505 | 20,012,785 | |
| Panalpina Welttransport Holding AG | 78,610 | 9,488,293 | |
| Roche Holding AG (participation certificate) | 164,380 | 42,037,507 | |
| Zurich Insurance Group AG | 88,789 | 23,703,069 | |
| TOTAL SWITZERLAND | 166,826,673 | ||
| Taiwan - 0.2% | |||
| Taiwan Semiconductor Manufacturing Co. Ltd. | 768,000 | 4,810,693 | |
| United Kingdom - 16.8% | |||
| Aggreko PLC | 1,587,800 | 17,575,948 | |
| Aldermore Group PLC (a) | 2,826,955 | 7,894,877 | |
| AstraZeneca PLC (United Kingdom) | 113,056 | 6,951,479 | |
| Aviva PLC | 3,020,015 | 20,152,753 | |
| BP PLC | 1,366,600 | 7,866,310 | |
| British American Tobacco PLC: | |||
| (United Kingdom) | 242,500 | 16,088,917 | |
| sponsored ADR (b) | 349,300 | 23,165,576 | |
| Bunzl PLC | 753,500 | 21,902,195 | |
| Centrica PLC | 2,198,300 | 5,976,723 | |
| Coca-Cola European Partners PLC | 148,600 | 5,600,734 | |
| Diageo PLC | 576,101 | 16,496,769 | |
| Dialog Semiconductor PLC (a) | 94,300 | 4,815,183 | |
| Essentra PLC | 1,252,000 | 8,235,312 | |
| GlaxoSmithKline PLC | 1,531,000 | 31,833,991 | |
| HSBC Holdings PLC (United Kingdom) | 1,535,700 | 12,526,472 | |
| Imperial Tobacco Group PLC | 168,176 | 8,148,067 | |
| Informa PLC | 1,185,470 | 9,689,852 | |
| International Personal Finance PLC | 1,601,815 | 3,286,322 | |
| Lloyds Banking Group PLC | 26,885,900 | 22,360,494 | |
| London Stock Exchange Group PLC | 59,000 | 2,344,038 | |
| Mondi PLC | 527,200 | 12,728,391 | |
| Moneysupermarket.com Group PLC | 3,318,544 | 13,729,068 | |
| National Grid PLC | 470,640 | 5,971,150 | |
| Prudential PLC | 937,581 | 19,805,362 | |
| Reckitt Benckiser Group PLC | 103,700 | 9,466,947 | |
| Rio Tinto PLC | 441,200 | 17,766,100 | |
| Rolls-Royce Holdings PLC | 2,622,359 | 24,773,584 | |
| Royal Dutch Shell PLC: | |||
| Class A (United Kingdom) | 516,502 | 13,614,100 | |
| Class B (United Kingdom) | 416,662 | 11,453,797 | |
| Shawbrook Group PLC | 2,740,000 | 11,647,986 | |
| St. James's Place Capital PLC | 644,300 | 8,572,926 | |
| Standard Chartered PLC (Hong Kong) (a) | 1,268,922 | 12,123,459 | |
| TechnipFMC PLC (France) (a) | 81,800 | 2,669,413 | |
| Victrex PLC | 359,800 | 8,565,075 | |
| Virgin Money Holdings Uk PLC | 1,746,600 | 7,015,738 | |
| Vodafone Group PLC | 6,321,928 | 16,474,857 | |
| TOTAL UNITED KINGDOM | 449,289,965 | ||
| United States of America - 4.6% | |||
| Amgen, Inc. | 28,900 | 4,741,623 | |
| Arch Coal, Inc. (a)(b) | 96,300 | 6,638,922 | |
| Biogen, Inc. (a) | 16,200 | 4,429,404 | |
| Cheniere Energy, Inc. (a) | 80,800 | 3,819,416 | |
| Chevron Corp. | 64,700 | 6,946,839 | |
| ConocoPhillips Co. | 221,500 | 11,046,205 | |
| Constellation Brands, Inc. Class A (sub. vtg.) | 29,100 | 4,716,237 | |
| Coty, Inc. Class A | 302,600 | 5,486,138 | |
| Edgewell Personal Care Co. (a) | 75,700 | 5,536,698 | |
| elf Beauty, Inc. | 99,600 | 2,868,480 | |
| Energizer Holdings, Inc. | 100,600 | 5,608,450 | |
| Enterprise Products Partners LP | 157,000 | 4,334,770 | |
| Freeport-McMoRan, Inc. (a) | 850,200 | 11,358,672 | |
| Macy's, Inc. | 145,700 | 4,318,548 | |
| Molson Coors Brewing Co. Class B | 98,500 | 9,427,435 | |
| Monster Beverage Corp. (a) | 184,500 | 8,518,365 | |
| Newell Brands, Inc. | 171,000 | 8,066,070 | |
| Phillips 66 Co. | 40,200 | 3,184,644 | |
| Plains All American Pipeline LP | 114,200 | 3,609,862 | |
| Post Holdings, Inc. (a) | 78,800 | 6,896,576 | |
| U.S.A. Compression Partners LP | 128,000 | 2,161,920 | |
| TOTAL UNITED STATES OF AMERICA | 123,715,274 | ||
| TOTAL COMMON STOCKS | |||
| (Cost $2,366,920,751) | 2,567,656,455 | ||
| Nonconvertible Preferred Stocks - 0.6% | |||
| Germany - 0.4% | |||
| Porsche Automobil Holding SE (Germany) | 189,900 | 10,360,213 | |
| Korea (South) - 0.2% | |||
| Samsung Electronics Co. Ltd. | 4,503 | 6,460,493 | |
| TOTAL NONCONVERTIBLE PREFERRED STOCKS | |||
| (Cost $14,088,272) | 16,820,706 | ||
| Principal Amount | Value | ||
| Government Obligations - 0.4% | |||
| United States of America - 0.4% | |||
| U.S. Treasury Bills, yield at date of purchase 0.49% to 0.75% 4/6/17 to 6/15/17(c) | |||
| (Cost $9,276,233) | 9,280,000 | 9,275,261 | |
| Shares | Value | ||
| Money Market Funds - 3.6% | |||
| Fidelity Cash Central Fund, 0.84% (d) | 67,842,793 | 67,856,361 | |
| Fidelity Securities Lending Cash Central Fund 0.84% (d)(e) | 29,251,463 | 29,254,388 | |
| TOTAL MONEY MARKET FUNDS | |||
| (Cost $97,109,489) | 97,110,749 | ||
| TOTAL INVESTMENT PORTFOLIO - 100.8% | |||
| (Cost $2,487,394,745) | 2,690,863,171 | ||
| NET OTHER ASSETS (LIABILITIES) - (0.8)% | (21,943,353) | ||
| NET ASSETS - 100% | $2,668,919,818 |
| Futures Contracts | |||
| Expiration Date | Underlying Face Amount at Value | Unrealized Appreciation/(Depreciation) | |
| Purchased | |||
| Equity Index Contracts | |||
| 376 ICE E-mini MSCI EAFE Index Contracts (United States) | June 2017 | 33,501,600 | $491,759 |
| 22 TME S&P/TSX 60 Index Contracts (Canada) | June 2017 | 3,017,814 | (4,430) |
| TOTAL FUTURES CONTRACTS | $487,329 |
The face value of futures purchased as a percentage of Net Assets is 1.4%
Categorizations in the Schedule of Investments are based on country or territory of incorporation.
Legend
(a) Non-income producing
(b) Security or a portion of the security is on loan at period end.
(c) Security or a portion of the security was pledged to cover margin requirements for futures contracts. At period end, the value of securities pledged amounted to $1,957,269.
(d) Affiliated fund that is generally available only to investment companies and other accounts managed by Fidelity Investments. The rate quoted is the annualized seven-day yield of the fund at period end. A complete unaudited listing of the fund's holdings as of its most recent quarter end is available upon request. In addition, each Fidelity Central Fund's financial statements are available on the SEC's website or upon request.
(e) Investment made with cash collateral received from securities on loan.
Affiliated Central Funds
Information regarding fiscal year to date income earned by the Fund from investments in Fidelity Central Funds is as follows:
| Fund | Income earned |
| Fidelity Cash Central Fund | $220,584 |
| Fidelity Securities Lending Cash Central Fund | 456,422 |
| Total | $677,006 |
Investment Valuation
The following is a summary of the inputs used, as of March 31, 2017, involving the Fund's assets and liabilities carried at fair value. The inputs or methodology used for valuing securities may not be an indication of the risk associated with investing in those securities. For more information on valuation inputs, and their aggregation into the levels used below, please refer to the Investment Valuation section in the accompanying Notes to Financial Statements.
| Valuation Inputs at Reporting Date: | ||||
| Description | Total | Level 1 | Level 2 | Level 3 |
| Investments in Securities: | ||||
| Equities: | ||||
| Consumer Discretionary | $319,843,839 | $175,268,762 | $144,575,077 | $-- |
| Consumer Staples | 268,521,910 | 145,468,260 | 123,053,650 | -- |
| Energy | 173,351,224 | 102,731,234 | 70,619,990 | -- |
| Financials | 584,978,042 | 440,275,188 | 144,702,854 | -- |
| Health Care | 268,752,097 | 67,209,475 | 201,542,622 | -- |
| Industrials | 370,995,744 | 235,508,783 | 135,486,961 | -- |
| Information Technology | 113,539,810 | 51,533,891 | 62,005,919 | -- |
| Materials | 215,323,451 | 184,687,501 | 30,635,950 | -- |
| Real Estate | 76,338,265 | 76,338,265 | -- | -- |
| Telecommunication Services | 108,236,289 | 21,513,811 | 86,722,478 | -- |
| Utilities | 84,596,490 | 59,242,943 | 25,353,547 | -- |
| Government Obligations | 9,275,261 | -- | 9,275,261 | -- |
| Money Market Funds | 97,110,749 | 97,110,749 | -- | -- |
| Total Investments in Securities: | $2,690,863,171 | $1,656,888,862 | $1,033,974,309 | $-- |
| Derivative Instruments: | ||||
| Assets | ||||
| Futures Contracts | $491,759 | $491,759 | $-- | $-- |
| Total Assets | $491,759 | $491,759 | $-- | $-- |
| Liabilities | ||||
| Futures Contracts | $(4,430) | $(4,430) | $-- | $-- |
| Total Liabilities | $(4,430) | $(4,430) | $-- | $-- |
| Total Derivative Instruments: | $487,329 | $487,329 | $-- | $-- |
The following is a summary of transfers between Level 1 and Level 2 for the period ended March 31, 2017. Transfers are assumed to have occurred at the beginning of the period, and are primarily attributable to the valuation techniques used for foreign equity securities, as discussed in the accompanying Notes to Financial Statements:
| Transfers | Total |
| Level 1 to Level 2 | $23,311,951 |
| Level 2 to Level 1 | $357,850,901 |
Value of Derivative Instruments
The following table is a summary of the Fund's value of derivative instruments by primary risk exposure as of March 31, 2017. For additional information on derivative instruments, please refer to the Derivative Instruments section in the accompanying Notes to Financial Statements.
| Primary Risk Exposure / Derivative Type | Value | |
| Asset | Liability | |
| Equity Risk | ||
| Futures Contracts(a) | $491,759 | $(4,430) |
| Total Equity Risk | 491,759 | (4,430) |
| Total Value of Derivatives | $491,759 | $(4,430) |
(a) Reflects gross cumulative appreciation (depreciation) on futures contracts as presented in the Schedule of Investments. In the Statement of Assets and Liabilities, the period end daily variation margin is included in receivable or payable for daily variation margin for derivative instruments, and the net cumulative appreciation (depreciation) is included in net unrealized appreciation (depreciation).
See accompanying notes which are an integral part of the financial statements.
Financial Statements
Statement of Assets and Liabilities
| March 31, 2017 (Unaudited) | ||
| Assets | ||
| Investment in securities, at value (including securities loaned of $28,607,196) — See accompanying schedule: Unaffiliated issuers (cost $2,390,285,256) | $2,593,752,422 | |
| Fidelity Central Funds (cost $97,109,489) | 97,110,749 | |
| Total Investments (cost $2,487,394,745) | $2,690,863,171 | |
| Cash | 33,358 | |
| Receivable for investments sold | 4,377,770 | |
| Receivable for fund shares sold | 711,760 | |
| Dividends receivable | 18,724,395 | |
| Distributions receivable from Fidelity Central Funds | 267,232 | |
| Other receivables | 15 | |
| Total assets | 2,714,977,701 | |
| Liabilities | ||
| Payable for investments purchased | $15,230,431 | |
| Payable for fund shares redeemed | 1,349,773 | |
| Payable for daily variation margin for derivative instruments | 82,269 | |
| Other payables and accrued expenses | 139,135 | |
| Collateral on securities loaned | 29,256,275 | |
| Total liabilities | 46,057,883 | |
| Net Assets | $2,668,919,818 | |
| Net Assets consist of: | ||
| Paid in capital | $2,438,724,285 | |
| Undistributed net investment income | 13,050,637 | |
| Accumulated undistributed net realized gain (loss) on investments and foreign currency transactions | 13,629,193 | |
| Net unrealized appreciation (depreciation) on investments and assets and liabilities in foreign currencies | 203,515,703 | |
| Net Assets, for 33,863,292 shares outstanding | $2,668,919,818 | |
| Net Asset Value, offering price and redemption price per share ($2,668,919,818 ÷ 33,863,292 shares) | $78.81 |
See accompanying notes which are an integral part of the financial statements.
Statement of Operations
| Six months ended March 31, 2017 (Unaudited) | ||
| Investment Income | ||
| Dividends | $27,746,607 | |
| Interest | 10,941 | |
| Income from Fidelity Central Funds | 677,006 | |
| Income before foreign taxes withheld | 28,434,554 | |
| Less foreign taxes withheld | (2,487,847) | |
| Total income | 25,946,707 | |
| Expenses | ||
| Custodian fees and expenses | $143,520 | |
| Independent directors' fees and expenses | 4,401 | |
| Total expenses before reductions | 147,921 | |
| Expense reductions | (4,401) | 143,520 |
| Net investment income (loss) | 25,803,187 | |
| Realized and Unrealized Gain (Loss) | ||
| Net realized gain (loss) on: | ||
| Investment securities: | ||
| Unaffiliated issuers (net of foreign taxes of $34,209) | 10,774,379 | |
| Fidelity Central Funds | 450 | |
| Foreign currency transactions | (115,590) | |
| Futures contracts | 3,931,230 | |
| Total net realized gain (loss) | 14,590,469 | |
| Change in net unrealized appreciation (depreciation) on: Investment securities (net of decrease in deferred foreign taxes of $284,050) | 94,081,402 | |
| Assets and liabilities in foreign currencies | (215,904) | |
| Futures contracts | 469,422 | |
| Total change in net unrealized appreciation (depreciation) | 94,334,920 | |
| Net gain (loss) | 108,925,389 | |
| Net increase (decrease) in net assets resulting from operations | $134,728,576 |
See accompanying notes which are an integral part of the financial statements.
Statement of Changes in Net Assets
| Six months ended March 31, 2017 (Unaudited) | Year ended September 30, 2016 | |
| Increase (Decrease) in Net Assets | ||
| Operations | ||
| Net investment income (loss) | $25,803,187 | $60,371,813 |
| Net realized gain (loss) | 14,590,469 | (64,615,316) |
| Change in net unrealized appreciation (depreciation) | 94,334,920 | 144,948,931 |
| Net increase (decrease) in net assets resulting from operations | 134,728,576 | 140,705,428 |
| Distributions to shareholders from net investment income | (12,752,550) | (56,453,703) |
| Distributions to shareholders from net realized gain | (961,276) | – |
| Total distributions | (13,713,826) | (56,453,703) |
| Affiliated share transactions | ||
| Proceeds from sales of shares | 490,083,945 | 125,593,399 |
| Reinvestment of distributions | 13,713,729 | 56,453,296 |
| Cost of shares redeemed | (94,188,341) | (232,934,866) |
| Net increase (decrease) in net assets resulting from share transactions | 409,609,333 | (50,888,171) |
| Total increase (decrease) in net assets | 530,624,083 | 33,363,554 |
| Net Assets | ||
| Beginning of period | 2,138,295,735 | 2,104,932,181 |
| End of period | $2,668,919,818 | $2,138,295,735 |
| Other Information | ||
| Undistributed net investment income end of period | $13,050,637 | $– |
| Shares | ||
| Sold | 6,428,825 | 1,702,941 |
| Issued in reinvestment of distributions | 185,965 | 760,600 |
| Redeemed | (1,275,797) | (3,189,303) |
| Net increase (decrease) | 5,338,993 | (725,762) |
See accompanying notes which are an integral part of the financial statements.
Financial Highlights — Fidelity International Equity Central Fund
| Six months ended (Unaudited) March 31, | Years ended September 30, | |||||
| 2017 | 2016 | 2015 | 2014 | 2013 | 2012 | |
| Selected Per–Share Data | ||||||
| Net asset value, beginning of period | $74.96 | $71.96 | $79.13 | $78.06 | $65.60 | $57.85 |
| Income from Investment Operations | ||||||
| Net investment income (loss)A | .87 | 2.09 | 2.13 | 2.74B | 2.04 | 2.08 |
| Net realized and unrealized gain (loss) | 3.45 | 2.87 | (7.28) | .64 | 12.32 | 7.65 |
| Total from investment operations | 4.32 | 4.96 | (5.15) | 3.38 | 14.36 | 9.73 |
| Distributions from net investment income | (.43) | (1.96) | (2.02) | (2.31) | (1.90) | (1.98) |
| Distributions from net realized gain | (.03) | – | – | – | – | – |
| Total distributions | (.47)C | (1.96) | (2.02) | (2.31) | (1.90) | (1.98) |
| Net asset value, end of period | $78.81 | $74.96 | $71.96 | $79.13 | $78.06 | $65.60 |
| Total ReturnD,E | 5.81% | 6.95% | (6.78)% | 4.24% | 22.15% | 17.06% |
| Ratios to Average Net AssetsF,G | ||||||
| Expenses before reductions | .01%H | .01% | .01% | .01% | .01% | .02% |
| Expenses net of fee waivers, if any | .01%H | .01% | .01% | .01% | .01% | .02% |
| Expenses net of all reductions | .01%H | .01% | .01% | .01% | .01% | .02% |
| Net investment income (loss) | 2.31%H | 2.87% | 2.67% | 3.34%B | 2.83% | 3.32% |
| Supplemental Data | ||||||
| Net assets, end of period (000 omitted) | $2,668,920 | $2,138,296 | $2,104,932 | $2,841,400 | $2,595,878 | $1,348,956 |
| Portfolio turnover rateI | 71%H | 59% | 81% | 67% | 69% | 82% |
A Calculated based on average shares outstanding during the period.
B Net Investment income per share reflects a large, non-recurring dividend which amounted to $.69 per share. Excluding this non-recurring dividend, the ratio of net investment income (loss) to average net assets would have been 2.50%.
C Total distributions of $.47 per share is comprised of distributions from net investment income of $.434 and distributions from net realized gain of $.034 per share
D Total returns for periods of less than one year are not annualized.
E Total returns would have been lower if certain expenses had not been reduced during the applicable periods shown.
F Fees and expenses of any underlying Fidelity Central Funds are not included in the Fund's expense ratio. The Fund indirectly bears its proportionate share of the expenses of any underlying Fidelity Central Funds.
G Expense ratios reflect operating expenses of the Fund. Expenses before reductions do not reflect amounts reimbursed by the investment adviser or reductions from expense offset arrangements and do not represent the amount paid by the Fund during periods when reimbursements or reductions occur. Expenses net of fee waivers reflect expenses after reimbursement by the investment adviser but prior to reductions from expense offset arrangements. Expenses net of all reductions represent the net expenses paid by the Fund.
H Annualized
I Amount does not include the portfolio activity of any underlying Fidelity Central Funds.
See accompanying notes which are an integral part of the financial statements.
Notes to Financial Statements (Unaudited)
For the period ended March 31, 2017
1. Organization.
Fidelity International Equity Central Fund (the Fund) is a fund of Fidelity Central Investment Portfolios LLC (the LLC) and is authorized to issue an unlimited number of shares. Shares of the Fund are only offered to other investment companies and accounts managed by Fidelity Management & Research Company (FMR), or its affiliates (the Investing Funds). The LLC is registered under the Investment Company Act of 1940, as amended (the 1940 Act), as an open-end management investment company organized as a Delaware Limited Liability Company.
2. Investments in Fidelity Central Funds.
The Fund invests in Fidelity Central Funds, which are open-end investment companies generally available only to other investment companies and accounts managed by the investment adviser and its affiliates. The Fund's Schedule of Investments lists each of the Fidelity Central Funds held as of period end, if any, as an investment of the Fund, but does not include the underlying holdings of each Fidelity Central Fund. As an Investing Fund, the Fund indirectly bears its proportionate share of the expenses of the underlying Fidelity Central Funds.
The Money Market Central Funds seek preservation of capital and current income and are managed by Fidelity Investments Money Management, Inc. (FIMM), an affiliate of the investment adviser. Annualized expenses of the Money Market Central Funds as of their most recent shareholder report date are less than .005%.
A complete unaudited list of holdings for each Fidelity Central Fund is available upon request or at the Securities and Exchange Commission (the SEC) website at www.sec.gov. In addition, the financial statements of the Fidelity Central Funds are available on the SEC website or upon request.
3. Significant Accounting Policies.
The Fund is an investment company and applies the accounting and reporting guidance of the Financial Accounting Standards Board (FASB) Accounting Standards Codification Topic 946 Financial Services – Investments Companies. The financial statements have been prepared in conformity with accounting principles generally accepted in the United States of America (GAAP), which require management to make certain estimates and assumptions at the date of the financial statements. Actual results could differ from those estimates. Subsequent events, if any, through the date that the financial statements were issued have been evaluated in the preparation of the financial statements. The following summarizes the significant accounting policies of the Fund:
Investment Valuation. Investments are valued as of 4:00 p.m. Eastern time on the last calendar day of the period. The Board of Directors (the Board) has delegated the day to day responsibility for the valuation of the Fund's investments to the Fair Value Committee (the Committee) established by the Fund's investment adviser. In accordance with valuation policies and procedures approved by the Board, the Fund attempts to obtain prices from one or more third party pricing vendors or brokers to value its investments. When current market prices, quotations or currency exchange rates are not readily available or reliable, investments will be fair valued in good faith by the Committee, in accordance with procedures adopted by the Board. Factors used in determining fair value vary by investment type and may include market or investment specific events, changes in interest rates and credit quality. The frequency with which these procedures are used cannot be predicted and they may be utilized to a significant extent. The Committee oversees the Fund's valuation policies and procedures and reports to the Board on the Committee's activities and fair value determinations. The Board monitors the appropriateness of the procedures used in valuing the Fund's investments and ratifies the fair value determinations of the Committee.
The Fund categorizes the inputs to valuation techniques used to value its investments into a disclosure hierarchy consisting of three levels as shown below:
- Level 1 – quoted prices in active markets for identical investments
- Level 2 – other significant observable inputs (including quoted prices for similar investments, interest rates, prepayment speeds, etc.)
- Level 3 – unobservable inputs (including the Fund's own assumptions based on the best information available)
Valuation techniques used to value the Fund's investments by major category are as follows:
Equity securities, including restricted securities, for which market quotations are readily available, are valued at the last reported sale price or official closing price as reported by a third party pricing vendor on the primary market or exchange on which they are traded and are categorized as Level 1 in the hierarchy. In the event there were no sales during the day or closing prices are not available, securities are valued at the last quoted bid price or may be valued using the last available price and are generally categorized as Level 2 in the hierarchy. For foreign equity securities, when market or security specific events arise, comparisons to the valuation of American Depositary Receipts (ADRs), futures contracts, Exchange-Traded Funds (ETFs) and certain indexes as well as quoted prices for similar securities may be used and would be categorized as Level 2 in the hierarchy. Utilizing these techniques may result in transfers between Level 1 and Level 2. For equity securities, including restricted securities, where observable inputs are limited, assumptions about market activity and risk are used and these securities may be categorized as Level 3 in the hierarchy.
Debt securities, including restricted securities, are valued based on evaluated prices received from third party pricing vendors or from brokers who make markets in such securities. U.S. government and government agency obligations are valued by pricing vendors who utilize matrix pricing which considers yield or price of bonds of comparable quality, coupon, maturity and type or by broker-supplied prices. When independent prices are unavailable or unreliable, debt securities may be valued utilizing pricing methodologies which consider similar factors that would be used by third party pricing vendors. Debt securities are generally categorized as Level 2 in the hierarchy but may be Level 3 depending on the circumstances.
Futures contracts are valued at the settlement price established each day by the board of trade or exchange on which they are traded and are categorized as Level 1 in the hierarchy. Investments in open-end mutual funds, including the Fidelity Central Funds, are valued at their closing net asset value (NAV) each business day and are categorized as Level 1 in the hierarchy.
Changes in valuation techniques may result in transfers in or out of an assigned level within the disclosure hierarchy. The aggregate value of investments by input level as of March 31, 2017, including information on transfers between Levels 1 and 2, is included at the end of the Fund's Schedule of Investments.
Foreign Currency. The Fund may use foreign currency contracts to facilitate transactions in foreign-denominated securities. Gains and losses from these transactions may arise from changes in the value of the foreign currency or if the counterparties do not perform under the contracts' terms.
Foreign-denominated assets, including investment securities, and liabilities are translated into U.S. dollars at the exchange rates at period end. Purchases and sales of investment securities, income and dividends received and expenses denominated in foreign currencies are translated into U.S. dollars at the exchange rate in effect on the transaction date.
The effects of exchange rate fluctuations on investments are included with the net realized and unrealized gain (loss) on investment securities. Other foreign currency transactions resulting in realized and unrealized gain (loss) are disclosed separately.
Investment Transactions and Income. For financial reporting purposes, the Fund's investment holdings and NAV include trades executed through the end of the last business day of the period. The NAV per share for processing shareholder transactions is calculated as of the close of business of the New York Stock Exchange (NYSE), normally 4:00 p.m. Eastern time and includes trades executed through the end of the prior business day. Gains and losses on securities sold are determined on the basis of identified cost. Dividend income is recorded on the ex-dividend date, except for certain dividends from foreign securities where the ex-dividend date may have passed, which are recorded as soon as the Fund is informed of the ex-dividend date. Non-cash dividends included in dividend income, if any, are recorded at the fair market value of the securities received. Income and capital gain distributions from Fidelity Central Funds, if any, are recorded on the ex-dividend date. Certain distributions received by the Fund represent a return of capital or capital gain. The Fund determines the components of these distributions subsequent to the ex-dividend date, based upon receipt of tax filings or other correspondence relating to the underlying investment. These distributions are recorded as a reduction of cost of investments and/or as a realized gain. Interest income is accrued as earned and includes coupon interest and amortization of premium and accretion of discount on debt securities as applicable. Investment income is recorded net of foreign taxes withheld where recovery of such taxes is uncertain.
Expenses. Expenses directly attributable to a fund are charged to that fund. Expenses attributable to more than one fund are allocated among the respective funds on the basis of relative net assets or other appropriate methods. Expense estimates are accrued in the period to which they relate and adjustments are made when actual amounts are known.
Income Tax Information and Distributions to Shareholders. Each year, effective October 1, 2016, the Fund intends to qualify as a regulated investment company under Subchapter M of the Internal Revenue Code, including distributing substantially all of its taxable income and realized gains. As a result, no provision for U.S. Federal income taxes is required. The Fund files a U.S. federal tax return, in addition to state and local tax returns as required. The Fund's federal income tax returns are subject to examination by the Internal Revenue Service (IRS) for a period of three fiscal years after they are filed. State and local tax returns may be subject to examination for an additional fiscal year depending on the jurisdiction. Prior to October 1, 2016, the Fund was a partnership for tax purposes, and no provision was made for U.S. Federal income taxes because the Fund allocated, at least annually among its partners, each partner's share of the Fund's income and expenses and capital gains and losses as determined by income tax regulations for inclusion in each partner's tax return. Due to the Fund's previous partnership structure, paid in capital includes any accumulated net investment income (loss) and net realized gain (loss) on investments prior to October 1, 2016.
Foreign taxes are provided for based on the Fund's understanding of the tax rules and rates that exist in the foreign markets in which it invests. The Fund is subject to a tax imposed on capital gains by certain countries in which it invests.
Distributions are declared and recorded on the ex-dividend date. Income and capital gain distributions are determined in accordance with income tax regulations, which may differ from GAAP.
Capital accounts within the financial statements are adjusted for permanent book-tax differences. These adjustments have no impact on net assets or the results of operations. Capital accounts are not adjusted for temporary book-tax differences which will reverse in a subsequent period.
The federal tax cost of investment securities and unrealized appreciation (depreciation) as of period end were as follows:
| Gross unrealized appreciation | $298,888,956 |
| Gross unrealized depreciation | (102,671,631) |
| Net unrealized appreciation (depreciation) on securities | $196,217,325 |
| Tax Cost | $2,494,645,846 |
4. Derivative Instruments.
Risk Exposures and the Use of Derivative Instruments. The Fund's investment objective allows the Fund to enter into various types of derivative contracts, including futures contracts. Derivatives are investments whose value is primarily derived from underlying assets, indices or reference rates and may be transacted on an exchange or over-the-counter (OTC). Derivatives may involve a future commitment to buy or sell a specified asset based on specified terms, to exchange future cash flows at periodic intervals based on a notional principal amount, or for one party to make one or more payments upon the occurrence of specified events in exchange for periodic payments from the other party.
The Fund used derivatives to increase returns and to manage exposure to certain risks as defined below. The success of any strategy involving derivatives depends on analysis of numerous economic factors, and if the strategies for investment do not work as intended, the Fund may not achieve its objectives.
The Fund's use of derivatives increased or decreased its exposure to the following risk:
| Equity Risk | Equity risk relates to the fluctuations in the value of financial instruments as a result of changes in market prices (other than those arising from interest rate risk or foreign exchange risk), whether caused by factors specific to an individual investment, its issuer, or all factors affecting all instruments traded in a market or market segment. |
The Fund is also exposed to additional risks from investing in derivatives, such as liquidity risk and counterparty credit risk. Liquidity risk is the risk that the Fund will be unable to close out the derivative in the open market in a timely manner. Counterparty credit risk is the risk that the counterparty will not be able to fulfill its obligation to the Fund. Counterparty credit risk related to exchange-traded futures contracts may be mitigated by the protection provided by the exchange on which they trade.
Investing in derivatives may involve greater risks than investing in the underlying assets directly and, to varying degrees, may involve risk of loss in excess of any initial investment and collateral received and amounts recognized in the Statement of Assets and Liabilities. In addition, there may be the risk that the change in value of the derivative contract does not correspond to the change in value of the underlying instrument.
Futures Contracts. A futures contract is an agreement between two parties to buy or sell a specified underlying instrument for a fixed price at a specified future date. The Fund used futures contracts to manage its exposure to the stock market.
Upon entering into a futures contract, a fund is required to deposit either cash or securities (initial margin) with a clearing broker in an amount equal to a certain percentage of the face value of the contract. Futures contracts are marked-to-market daily and subsequent daily payments (variation margin) are made or received by a fund depending on the daily fluctuations in the value of the futures contracts and are recorded as unrealized appreciation or (depreciation). This receivable and/or payable, if any, is included in daily variation margin for derivative instruments in the Statement of Assets and Liabilities. Realized gain or (loss) is recorded upon the expiration or closing of a futures contract.
Any open futures contracts at period end are presented in the Schedule of Investments under the caption "Futures Contracts". The underlying face amount at value reflects each contract's exposure to the underlying instrument or index at period end and is representative of volume of activity during the period. Securities deposited to meet initial margin requirements are identified in the Schedule of Investments.
During the period the Fund recognized net realized gain (loss) of $3,931,230 and a change in net unrealized appreciation (depreciation) of $469,422 related to its investment in futures contracts. These amounts are included in the Statement of Operations.
5. Purchases and Sales of Investments.
Purchases and sales of securities, other than short-term securities, aggregated $1,156,625,729 and $771,646,242, respectively.
6. Fees and Other Transactions with Affiliates.
Management Fee and Expense Contract. FMR Co., Inc. (the investment adviser), an affiliate of FMR, provides the Fund with investment management services. The Fund does not pay any fees for these services. Pursuant to the Fund's management contract with the investment adviser, FMR pays the investment adviser a portion of the management fees it receives from the Investing Funds. In addition, under an expense contract, FMR also pays all other expenses of the Fund, excluding custody fees, fees and expenses of the independent Directors, and certain exceptions such as interest expense.
Brokerage Commissions. The Fund placed a portion of its portfolio transactions with brokerage firms which are affiliates of the investment adviser. Brokerage commissions are included in net realized gain (loss) and change in net unrealized appreciation (depreciation) in the Statement of Operations. The commissions paid to these affiliated firms were $1,862 for the period.
Interfund Trades. The Fund may purchase from or sell securities to other Fidelity Funds under procedures adopted by the Board. The procedures have been designed to ensure these interfund trades are executed in accordance with Rule 17a-7 of the 1940 Act. Interfund trades are included within the respective purchases and sales amounts shown in the Purchases and Sales of Investments note.
7. Security Lending.
The Fund lends portfolio securities through a lending agent from time to time in order to earn additional income. For equity securities, a lending agent is used and may loan securities to certain qualified borrowers, including Fidelity Capital Markets (FCM), a broker-dealer affiliated with the Fund. On the settlement date of the loan, the Fund receives collateral (in the form of U.S. Treasury obligations, letters of credit and/or cash) against the loaned securities and maintains collateral in an amount not less than 100% of the market value of the loaned securities during the period of the loan. The market value of the loaned securities is determined at the close of business of the Fund and any additional required collateral is delivered to the Fund on the next business day. The Fund or borrower may terminate the loan at any time, and if the borrower defaults on its obligation to return the securities loaned because of insolvency or other reasons, the Fund may apply collateral received from the borrower against the obligation. The Fund may experience delays and costs in recovering the securities loaned. Any cash collateral received is invested in the Fidelity Securities Lending Cash Central Fund. The value of loaned securities and cash collateral at period end are disclosed on the Fund's Statement of Assets and Liabilities. Security lending income represents the income earned on investing cash collateral, less rebates paid to borrowers and any lending agent fees associated with the loan, plus any premium payments received for lending certain types of securities. Security lending income is presented in the Statement of Operations as a component of income from Fidelity Central Funds. Total security lending income during the period amounted to $456,422. During the period, there were no securities loaned to FCM.
8. Expense Reductions.
FMR has voluntarily agreed to reimburse a portion of the Fund's operating expenses. For the period, the reimbursement reduced the expenses by $4,401.
9. Other.
The Fund's organizational documents provide former and current directors and officers with a limited indemnification against liabilities arising in connection with the performance of their duties to the Fund. In the normal course of business, the Fund may also enter into contracts that provide general indemnifications. The Fund's maximum exposure under these arrangements is unknown as this would be dependent on future claims that may be made against the Fund. The risk of material loss from such claims is considered remote.
At the end of the period, mutual funds managed by FMR or its affiliates were the owners of record of all of the outstanding shares of the Fund.
Shareholder Expense Example
As a shareholder of the Fund, you incur two types of costs: (1) transaction costs, and (2) ongoing costs, including other Fund expenses. This Example is intended to help you understand your ongoing costs (in dollars) of investing in the Fund and to compare these costs with the ongoing costs of investing in other mutual funds.
The Example is based on an investment of $1,000 invested at the beginning of the period and held for the entire period (October 1, 2016 to March 31, 2017).
Actual Expenses
The first line of the accompanying table provides information about actual account values and actual expenses. You may use the information in this line, together with the amount you invested, to estimate the expenses that you paid over the period. Simply divide your account value by $1,000.00 (for example, an $8,600 account value divided by $1,000.00 = 8.6), then multiply the result by the number in the first line under the heading entitled "Expenses Paid During Period" to estimate the expenses you paid on your account during this period. In addition, the Fund, as a shareholder in the underlying Fidelity Central Funds, will indirectly bear its pro-rata share of the fees and expenses incurred by the underlying Fidelity Central Funds. These fees and expenses are not included in the Fund's annualized expense ratio used to calculate the expense estimate in the table below.
Hypothetical Example for Comparison Purposes
The second line of the accompanying table provides information about hypothetical account values and hypothetical expenses based on the Fund's actual expense ratio and an assumed rate of return of 5% per year before expenses, which is not the Fund's actual return. The hypothetical account values and expenses may not be used to estimate the actual ending account balance or expenses you paid for the period. You may use this information to compare the ongoing costs of investing in the Fund and other funds. To do so, compare this 5% hypothetical example with the 5% hypothetical examples that appear in the shareholder reports of the other funds. In addition, the Fund, as a shareholder in the underlying Fidelity Central Funds, will indirectly bear its pro-rata share of the fees and expenses incurred by the underlying Fidelity Central Funds. These fees and expenses are not included in the Fund's annualized expense ratio used to calculate the expense estimate in the table below.
Please note that the expenses shown in the table are meant to highlight your ongoing costs only and do not reflect any transaction costs. Therefore, the second line of the table is useful in comparing ongoing costs only, and will not help you determine the relative total costs of owning different funds.
| Annualized Expense Ratio-A | Beginning Account Value October 1, 2016 | Ending Account Value March 31, 2017 | Expenses Paid During Period-B October 1, 2016 to March 31, 2017 | |
| Actual | .0129% | $1,000.00 | $1,058.10 | $.07 |
| Hypothetical-C | $1,000.00 | $1,024.87 | $.07 |
A Annualized expense ratio reflects expenses net of applicable fee waivers.
B Expenses are equal to the Fund's annualized expense ratio, multiplied by the average account value over the period, multiplied by 182/365 (to reflect the one-half year period).
C 5% return per year before expenses
![]()
Corporate Headquarters
245 Summer St.
Boston, MA 02210
www.fidelity.com
INTCEN-SANN-0517
1.859211.109
Item 2.
Code of Ethics
Not applicable.
Item 3.
Audit Committee Financial Expert
Not applicable.
Item 4.
Principal Accountant Fees and Services
Not applicable.
Item 5.
Audit Committee of Listed Registrants
Not applicable.
Item 6.
Investments
(a)
Not applicable.
(b)
Not applicable
Item 7.
Disclosure of Proxy Voting Policies and Procedures for Closed-End Management Investment Companies
Not applicable.
Item 8.
Portfolio Managers of Closed-End Management Investment Companies
Not applicable.
Item 9.
Purchase of Equity Securities by Closed-End Management Investment Company and Affiliated Purchasers
Not applicable.
Item 10.
Submission of Matters to a Vote of Security Holders
There were no material changes to the procedures by which shareholders may recommend nominees to the Fidelity Central Investment Portfolios LLC’s Board of Trustees.
Item 11.
Controls and Procedures
(a)(i) The President and Treasurer and the Chief Financial Officer have concluded that the Fidelity Central Investment Portfolios LLC’s (the “Trust”) disclosure controls and procedures (as defined in Rule 30a-3(c) under the Investment Company Act) provide reasonable assurances that material information relating to the Trust is made known to them by the appropriate persons, based on their evaluation of these controls and procedures as of a date within 90 days of the filing date of this report.
(a)(ii) There was no change in the Trust’s internal control over financial reporting (as defined in Rule 30a-3(d) under the Investment Company Act) that occurred during the second fiscal quarter of the period covered by this report that has materially affected, or is reasonably likely to materially affect, the Trust’s internal control over financial reporting.
Item 12.
Exhibits
(a) | (1) | Not applicable. |
(a) | (2) | Certification pursuant to Rule 30a-2(a) under the Investment Company Act of 1940 (17 CFR 270.30a-2(a)) is filed and attached hereto as Exhibit 99.CERT. |
(a) | (3) | Not applicable. |
(b) | Certification pursuant to Rule 30a-2(b) under the Investment Company Act of 1940 (17 CFR 270.30a-2(b)) is furnished and attached hereto as Exhibit 99.906CERT. |
SIGNATURES
Pursuant to the requirements of the Securities Exchange Act of 1934 and the Investment Company Act of 1940, the registrant has duly caused this report to be signed on its behalf by the undersigned, thereunto duly authorized.
Fidelity Central Investment Portfolios LLC
By: | /s/Stacie M. Smith |
Stacie M. Smith | |
President and Treasurer | |
Date: | May 25, 2017 |
Pursuant to the requirements of the Securities Exchange Act of 1934 and the Investment Company Act of 1940, this report has been signed below by the following persons on behalf of the registrant and in the capacities and on the dates indicated.
By: | /s/Stacie M. Smith |
Stacie M. Smith | |
President and Treasurer | |
Date: | May 25, 2017 |
By: | /s/Howard J. Galligan III |
Howard J. Galligan III | |
Chief Financial Officer | |
Date: | May 25, 2017 |