INVESTMENT COMMENTARY
March 31, 2007(Unaudited)
Dividend Capital Realty Income Allocation Fund
May 10, 2007
To our shareholders:
We are pleased to submit to you Dividend Capital Realty Income Allocation Fund’s (“DCA” or “the Fund”) semi-annual report for the six-months ended March 31, 2007.
Over this period, we believe the Fund has performed according to its objectives and in our opinion, offers a unique investment proposition in the universe of publicly traded real estate investment products. Against a backdrop of heightened market volatility, and continued shrinking of investment yields in the U.S. Equity REIT market, the Fund offers the potential for a high income stream and capital appreciation of the underlying asset base. With a wider investment mandate than the average U.S. REIT fund, the Dividend Capital Realty Income Allocation Fund draws from U.S. and Canadian REIT common stock, preferred stock, debt securities and structured finance investments providing the Fund the potential to efficiently achieve its income and growth objectives. As market conditions change, this diversified structure maximizes our ability to adjust the portfolio through market cycles with an asset allocation and security selection process that offers more strategic alternatives than your typical real estate fund.
As we have mentioned in previous updates, we have been focused on diversifying our sources of income and positioning the portfolio for asset appreciation potential by (1) optimizing the common/preferred stock allocation through opportunistic relative value trades, (2) ramping up our fixed income investments through a wide range of structured products, (3) adding an allocation of floating rate securities to help further hedge interest rate exposure and (4) opportunistically improving the credit profile of our preferred security portfolio. By adjusting this mix of assets over the course of the year, we believe we have added to this base of income, while at the same time reducing the risk profile of the portfolio through heightened diversification. Our goal is to opportunistically adjust this mix as market cycles change and new issuance or secondary trading opportunities emerge.
Performance Review
During the six-months ended March 31, 2007, the public real estate securities market experienced significant price appreciation. In our opinion, a main catalyst for the performance was the continued demand for institutional quality real estate which resulted in several privatizations of listed REITs. Private investors took advantage of the fact that public market values were less than such investors evaluations of underlying real estate values. Evidence of this includes the purchase by Blackstone Group of Equity Office Properties Trust (“EOP”), which at the time was the largest U.S. private equity transaction to have closed to date. Blackstone
www.dividendcapital.com
2
purchased the company at a premium of 31% to the market price of the stock on the date that Blackstone made its initial offer to purchase EOP. In addition, real estate fundamentals have continued to improve, providing additional support to the cash flows of publicly traded real estate companies and debt securities backed by real estate. During this period, the Fund’s NAV total return was a positive 6.58% versus 13.03% for the Morgan Stanley REIT Index (RMS), 4.12% for the Merrill Lynch REIT Preferred Index (MLRP), a measure of REIT preferred stock performance, and 6.20% for the Lehman Brothers High Yield CMBS Index, a measure of high-yield commercial mortgage-backed security performance.
Effective October 2006, DCA’s level rate dividend increased to $0.1075 per month. In addition to this dividend increase, the fund paid a $0.0785 per share special income dividend, a $0.0556 per share short-term capital gain distribution and $0.0249 per share long-term capital gain distribution. The current level-rate dividend represents a yield of 8.35% based on the Fund’s market price of $15.45 on March 31, 2007.
The Fund’s objective of net asset value appreciation was also realized to a certain extent over the period. The NAV at the end of the period was $15.27, which represented a 1.26% increase in NAV for the period.
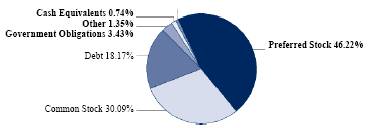
The overall performance and NAV capital appreciation of the Fund were most influenced by a conservative allocation among asset classes. The asset allocation mix was, and continues to be, determined first with the goal of delivering consistent level dividends combined with the opportunity to realize dividend growth over time and second with the goal of delivering attractive risk-adjusted total returns. As a result the Fund has invested primarily in real estate preferred stocks (46.22% of total investments as of 3/31/07), which over time have the potential to offer attractive income and lower overall volatility. The Fund has also invested in real estate common stocks (30.09% of total assets as of 3/31/07), which over time have the potential to provide an inflation hedge as well as share price and dividend growth opportunity. In addition to U.S. common stock, we have invested in Canadian real estate companies primarily via a tax-efficient total return swap. During the six months, ended March 31, 2007, our Canadian real estate investments have significantly added to DCA’s NAV appreciation. In addition to equity investments, the Fund also invests in fixed income securities, including debt and other types of investments (19.52% of total assets as of 03/31/07), which offer the potential for high current income and serves as a volatility damper. While we believe the asset allocation mix was appropriate for achieving DCA’s objectives, the Fund’s lower overall exposure to U.S. real estate common stock limited the NAV appreciation during the period.
3
Outlook
Our outlook for the real estate asset class and the public securities of real estate companies in particular remains positive, yet cautious. The U.S. economy has moderated, but is still generating real GDP growth, and adding jobs. As a result, our analysis indicates real estate fundamentals across markets and property types continue to improve, and supply remains in check. Occupancy and rent growth from tenant demand have been tempered somewhat by rising operating expenses (particularly utilities), but for the most part, net operating income is on the rise. Although valuations in the public markets are high relative to historical metrics, the demand for both commercial real estate and real estate securities remains elevated as both domestic and foreign institutional capital continues to flow into real estate. Risks to the economy include the residential housing market and subprime mortgage situation; both seem “contained” and unlikely to throw the economy into recession. Against this backdrop, with a benign interest rate environment, we remain constructive on real estate across the asset classes.
To achieve DCA’s primary objective of generating solid income derived from real estate securities, we strongly believe the current market environment underscores the importance of having a diversified, multi-asset real estate strategy. Short-term market movements will offer opportunities to adjust asset allocation between U.S. and Canadian REIT equity, preferred stocks and fixed income. The fund will aim to take advantage of compelling relative value between asset classes and re-priced investment yields. The ability to make these adjustments from more than one asset bucket should help to create not only superior relative performance, but absolute performance as well. With our focus on the quality, sustainability and (where relevant) growth potential of underlying property cash flows, we remain confident in our continued ability to identify and capitalize on attractive investment opportunities across the real estate asset class. Thank you for your continued support.

| 
|
Glenn Mueller; Ph.D.,
Real Estate Investment Strategist | Charles Song,
Managing Director and
Senior Portfolio Manager |

| |
Amitabh C. Godha,
Portfolio Manager | 
|

| Karen Kulvin
Senior Vice President |
Jeffrey Taylor
Chief Operating Officer | |
4
TOTAL RETURNS AND TRADING HISTORY
March 31, 2007(Unaudited)
Dividend Capital Realty Income Allocation Fund
Average Annual Total Returns (1)(2)
| | 6-Month | | 1-Year | | Since
Inception (7) | |
DCA at Market Price (“MP”) (2) | | 11.99 | % | 23.73 | % | 10.80 | % |
DCA at Net Asset Value (“NAV”) (2) | | 6.58 | % | 14.62 | % | 12.63 | % |
MSCI U.S. REIT Index (3) | | 13.03 | % | 22.10 | % | 28.60 | % |
Merrill Lynch REIT Preferred Index (4) | | 4.12 | % | 8.16 | % | 5.97 | % |
CMBS Index (5) | | 6.20 | % | 15.75 | % | 13.57 | % |
Trading History (1)(6)

Average Premium/Discount to NAV
1-Month | | -0.97 | % |
| | | |
3-Month | | -0.99 | % |
| | | |
1-Year | | -3.48 | % |
| | | |
Since Inception | | -2.88 | % |
52-Week
Price History Range
MP | | $ | 13.00 - $16.88 | |
NAV | | $ | 13.80 - $16.81 | |
(1) Past performance is no guarantee of future results. This chart is for illustrative purposes only and does not relate to the future performance of the Fund. For current to the most recent month-end performance, visit dividendcapital.com, or call 866.DCG.REIT (324-7348). Performance data quoted above is historical. Current performance may be higher or lower than the performance data quoted. All performance figures are net of all advisory and brokerage fees, where applicable.
(2) Total return assumes reinvestment of dividend and capital gain distributions.
(3) The MSCI U.S. REIT Index (RMS) is an unmanaged index of REIT securities of reasonable size and liquidity, weighted by market capitalization and considered representative of U.S. equity REIT performance. The index is used in comparison to the fund because the fund invests in common stock of companies primarily engaged in real estate, including REITs. Investors cannot invest directly into any index.
(4) The Merrill Lynch REIT Preferred Index is an unmanaged index of investment grade REIT preferred shares with a deal size in excess of $100 million, weighted by capitalization and considered representative of investment grade preferred real estate stock performance. The index is used in comparison to the fund because the fund invests in preferred stock of companies primarily engaged in real estate including REITs. The fund may invest significant assets in non-investment grade and unrated REIT preferred shares which are not included in this benchmark. Investors cannot invest directly into any index.
(5) The Lehman Brothers High-Yield CMBS Index is an unmanaged index of non-investment-grade and unrated CMBS, weighted by market value and comprised of all new issue U.S. CMBS transactions that have a maturity greater than one year, an original transaction size in excess of $500 million, and aggregate outstanding transaction size of at least $300 million, and is considered representative of the high-yield CMBS market. The index is used in comparison to the fund because the fund invests in commercial mortgage-backed securities. Investors cannot invest directly into any index.
(6) Market price and NAV price history are since inception, based upon closing market price.
(7) Fund inception is 02/24/2005.
5
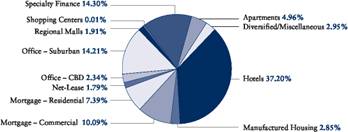
SECTOR PROFILES AS A PERCENT OF TOTAL INVESTMENTS(1)
March 31, 2007 (Unaudited)
Dividend Capital Realty Income Allocation Fund
Portfolio (3)(4)
Common Stock (2)(4)

Preferred Stock (2)(4)
(1) Sector diversification percentages are based on the Fund’s total investments at market value. Sector diversification is subject to change and may not be representative of future investments.
(2) Property-type allocation percentages are based on the total investments at market value of the preferred stock and common stock asset classes, respectively.
(3) Portfolio allocation percentages are based on the Fund’s total investments at market value. Portfolio allocation percentages on the Statement of Investments are based on the Fund’s net assets.
(4) Holdings and composition of holdings are subject to change, and may not be representative of future investments.
6
TOP TEN HOLDINGS AS A PERCENT OF TOTAL INVESTMENTS
March 31, 2007(Unaudited)
Dividend Capital Realty Income Allocation Fund
Holding (1) | | Market Value | | Percent | |
Babson CLO 2005-III, Ltd., 19.938%, 11/11/2019 | | $ | 12,526,488 | | 4.32 | % |
BioMed Realty Trust Inc., Series A, 7.250% | | 11,925,024 | | 4.12 | % |
LaSalle Hotel Properties, Series G, 7.250% | | 11,137,500 | | 3.85 | % |
NorthStar Realty Finance Corp., Series A, 8.750% | | 9,138,368 | | 3.15 | % |
RAIT Investment Trust | | 9,048,788 | | 3.12 | % |
Resource Capital Corp. | | 8,994,822 | | 3.11 | % |
Strategic Hotels and Resorts Inc., Series C, 8.250% | | 7,731,938 | | 2.67 | % |
Sorin Real Estate CDO II Ltd., Series 2005 2A, 9.490%, 01/04/2016 | | 7,401,090 | | 2.56 | % |
American Home Mortgage Investment Corp., Series A, 9.750% | | 6,789,873 | | 2.34 | % |
FelCor Lodging Trust Inc., Series C, 8.000% | | 6,583,780 | | 2.27 | % |
| | | | | | |
(1) Holdings are subject to change, and may not be representative of future investments.
7
STATEMENT OF INVESTMENTS
March 31, 2007(Unaudited)
Dividend Capital Realty Income Allocation Fund
| | Shares/Principal
Amount | | Market
Value | |
COMMON STOCK 41.28% | | | | | |
Apartments 2.10% | | | | | |
Archstone-Smith Trust | | 26,000 | | $ | 1,411,280 | |
American Campus Communities Inc. | | 9,400 | | 284,726 | |
AvalonBay Communities Inc. | | 10,500 | | 1,365,000 | |
BRE Properties Inc. | | 21,800 | | 1,376,670 | |
| | | | 4,437,676 | |
| | | | | |
Diversified/Miscellaneous 0.62% | | | | | |
Vornado Realty Trust | | 10,900 | | 1,300,806 | |
| | | | | |
Healthcare 0.33% | | | | | |
Medical Properties Trust Inc. | | 46,800 | | 687,492 | |
| | | | | |
Hotels 2.31% | | | | | |
Diamondrock Hospitality Co. | | 45,200 | | 858,800 | |
Hilton Hotels Corp. | | 66,600 | | 2,394,936 | |
Starwood Hotels & Resorts Inc. | | 25,100 | | 1,627,735 | |
| | | | 4,881,471 | |
| | | | | |
Industrial 1.20% | | | | | |
First Potomac Realty Trust | | 43,600 | | 1,245,652 | |
ProLogis | | 20,000 | | 1,298,600 | |
| | | | 2,544,252 | |
| | | | | |
Mortgage - Commercial 14.26% | | | | | |
Anthracite Capital Inc. | | 501,500 | | 6,018,000 | |
iStar Financial Inc. | | 37,300 | | 1,746,759 | |
Newcastle Investment Corp. | | 155,400 | | 4,309,242 | |
RAIT Investment Trust | | 323,865 | | 9,048,788 | |
Resource Capital Corp. | | 557,300 | | 8,994,822 | |
Resource Capital Corp. - Warrants* | | 55,000 | | 0 | |
| | | | 30,117,611 | |
| | | | | |
Office - Central Business District 2.93% | | | | | |
Boston Properties Inc. | | 27,300 | | 3,205,020 | |
Douglas Emmett Inc. | | 35,000 | | 893,550 | |
Maguire Properties Inc. | | 9,700 | | 344,932 | |
SL Green Realty Corp. | | 12,700 | | 1,742,186 | |
| | | | 6,185,688 | |
| | | | | | |
Footnotes on pages 13-14.
8
| | Shares/Principal
Amount | | Market
Value | |
COMMON STOCK (continued) | | | | | |
Office - Suburban 1.43% | | | | | |
Alexandria Real Estate Equities Inc. | | 13,100 | | $ | 1,314,847 | |
Duke Realty Corp. | | 17,100 | | 743,337 | |
Highwoods Properties Inc. | | 24,300 | | 959,607 | |
| | | | 3,017,791 | |
| | | | | |
Other Real Estate Companies 0.56% | | | | | |
Brookfield Properties Corp. | | 29,600 | | 1,192,880 | |
| | | | | |
Regional Malls 3.17% | | | | | |
General Growth Properties Inc. | | 31,200 | | 2,014,584 | |
Simon Property Group Inc. | | 27,000 | | 3,003,750 | |
Taubman Centers Inc. | | 28,800 | | 1,670,112 | |
| | | | 6,688,446 | |
| | | | | |
Self Storage 1.22% | | | | | |
Public Storage Inc. | | 27,100 | | 2,565,557 | |
| | | | | |
Shopping Centers 1.78% | | | | | |
Developers Diversified Realty Corp. | | 6,200 | | 389,980 | |
Equity One Inc. | | 53,400 | | 1,415,100 | |
Federal Realty Investment Trust | | 10,000 | | 906,200 | |
Kimco Realty Corp. | | 13,300 | | 648,242 | |
Tanger Factory Outlet Centers Inc. | | 9,700 | | 391,783 | |
| | | | 3,751,305 | |
| | | | | |
Specialty Finance 9.37% | | | | | |
Alesco Financial Inc. | | 100,000 | | 871,000 | |
Arbor Realty Trust Inc. | | 73,100 | | 2,225,164 | |
Deerfield Triarc Capital Corp. | | 261,800 | | 3,924,382 | |
Gramercy Capital Corp. | | 140,400 | | 4,307,472 | |
KKR Financial Corp. | | 148,400 | | 4,070,612 | |
NorthStar Realty Finance Corp. | | 288,500 | | 4,388,085 | |
| | | | 19,786,715 | |
| | | | | |
TOTAL COMMON STOCK
(Cost $77,215,099) | | | | 87,157,690 | |
| | | | | | |
Footnotes on pages 13-14.
9
| | Bond Rating
Moody’s/S&P | | Shares/Principal
Amount | | Market
Value | |
PREFERRED STOCK 63.39% | | | | | | | |
Apartments 3.15% | | | | | | | |
Apartment Investment & Management Co.: | | | | | | | |
Series G, 9.375% (3) | | Ba3/B+ | | 76,800 | | $ | 1,986,432 | |
Series U, 7.750% | | Ba3/B+ | | 64,200 | | 1,647,134 | |
Series V, 8.000% (3) | | Ba3/B+ | | 75,700 | | 2,006,050 | |
BRE Properties Inc., | | | | | | | |
Series C, 6.750% | | Baa3/BBB- | | 40,000 | | 1,006,252 | |
| | | | | | 6,645,868 | |
| | | | | | | |
Diversified/Miscellaneous 1.87% | | | | | | | |
Crescent Real Estate Equities Co., | | | | | | | |
Series B, 9.500% (3) | | B3/B- | | 156,000 | | 3,956,160 | |
| | | | | | | |
| | | | | | | |
Hotels 23.58% | | | | | | | |
Ashford Hospitality Trust, | | | | | | | |
Series A, 8.550% (3) | | NR/NR | | 93,300 | | 2,387,902 | |
Eagle Hospitality Properties Trust Inc., | | | | | | | |
Series A, 8.250% (3) | | NR/NR | | 212,600 | | 5,221,988 | |
FelCor Lodging Trust Inc., | | | | | | | |
Series C, 8.000% (3) | | B2/B- | | 259,000 | | 6,583,780 | |
Hersha Hospitality Trust, | | | | | | | |
Series A, 8.000% (3) | | NR/NR | | 177,400 | | 4,595,778 | |
Innkeepers USA Trust, | | | | | | | |
Series C, 8.000% | | NR/NR | | 40,100 | | 1,011,274 | |
LaSalle Hotel Properties, | | | | | | | |
Series G, 7.500% (3) | | NR/NR | | 440,000 | | 11,137,500 | |
Strategic Hotels & Resorts Inc.: | | | | | | | |
Series A, 8.500% | | NR/NR | | 25,500 | | 647,062 | |
Series A, 144, 8.500% (1)(5) | | NR/NR | | 152,000 | | 3,857,000 | |
Series C, 8.250% (3) | | NR/NR | | 301,000 | | 7,731,938 | |
Sunstone Hotel Investors Inc., | | | | | | | |
Series A, 8.000% (3) | | NR/NR | | 134,800 | | 3,466,894 | |
Winston Hotels Inc., | | | | | | | |
Series B, 8.000% (3) | | B2/NR | | 133,000 | | 3,158,750 | |
| | | | | | 49,799,866 | |
| | | | | | | |
Manufactured Housing 1.81% | | | | | | | |
Affordable Residential Communities Inc., | | | | | | | |
Series A, 8.250% (3) | | NR/NR | | 150,400 | | 3,816,400 | |
| | | | | | | | |
Footnotes on pages 13-14.
10
| | Bond Rating
Moody’s/S&P | | Shares/Principal
Amount | | Market
Value | |
PREFERRED STOCK (continued) | | | | | | | |
Mortgage - Commercial 6.40% | | | | | | | |
Anthracite Capital Inc., | | | | | | | |
Series D, 8.250% (3) | | NR/NR | | 140,000 | | $ | 3,307,500 | |
Newcastle Investment Corp.: | | | | | | | |
Series B, 9.750% (3) | | NR/NR | | 217,500 | | 5,512,537 | |
Series C, 9.750% (3) | | NR/NR | | 140,000 | | 3,500,700 | |
RAIT Investment Trust, | | | | | | | |
Series B, 8.375% | | NR/NR | | 48,300 | | 1,195,425 | |
| | | | | | 13,516,162 | |
| | | | | | | |
Mortgage - Residential 4.68% | | | | | | | |
American Home Mortgage Investment Corp.: | | | | | | | |
Series A, 9.750% (3) | | NR/NR | | 266,950 | | 6,789,873 | |
Series B, 9.250% | | NR/NR | | 29,700 | | 736,115 | |
Anworth Mortgage Asset Corp., | | | | | | | |
Series A, 8.625% (3) | | NR/NR | | 85,200 | | 2,132,130 | |
Impac Mortgage Holdings Inc., | | | | | | | |
Series C, 9.125% | | NR/NR | | 11,600 | | 232,000 | |
| | | | | | 9,890,118 | |
| | | | | | | |
Net Lease 1.13% | | | | | | | |
Entertainment Properties Trust, | | | | | | | |
Series B, 7.750% (3) | | NR/NR | | 93,400 | | 2,394,776 | |
| | | | | | | |
Office - Central Business District 1.48% | | | | | | | |
Maguire Properties Inc., | | | | | | | |
Series A, 7.625 (3)% | | NR/NR | | 120,000 | | 3,000,000 | |
SL Green Realty Corp., | | | | | | | |
Series C, 7.625% | | NR/NR | | 5,000 | | 126,875 | |
| | | | | | 3,126,875 | |
| | | | | | | |
Office - Suburban 9.01% | | | | | | | |
BioMed Realty Trust Inc., | | | | | | | |
Series A, 7.250 (3)% | | NR/NR | | 480,000 | | 11,925,024 | |
Brandywine Realty Trust: | | | | | | | |
Series C, 7.500% | | Ba1/BBB- | | 38,500 | | 972,510 | |
Series D, 7.500% (3) | | NR/NR | | 47,000 | | 1,198,500 | |
Digital Realty Trust Inc.: | | | | | | | |
Series A, 8.500% (3) | | NR/NR | | 174,300 | | 4,515,486 | |
Series B, 7.875% | | NR/NR | | 16,400 | | 420,763 | |
| | | | | | 19,032,265 | |
| | | | | | | | |
Footnotes on pages 13-14.
11
| | Bond Rating | | Shares/Principal | | Market | |
| | Moody’s/S&P | | Amount | | Value | |
PREFERRED STOCK (continued) | | | | | | | |
Regional Malls 1.21% | | | | | | | |
CBL & Associates Properties Inc., | | | | | | | |
Series D, 7.375% | | NR/NR | | 33,600 | | $ | 865,200 | |
Glimcher Realty Trust., | | | | | | | |
Series G, 8.125% (3) | | B1/B | | 60,000 | | 1,518,750 | |
Taubman Centers Inc.: | | | | | | | |
Series G, 8.000% | | B1/NR | | 400 | | 10,297 | |
Series H, 7.625% | | B1/NR | | 6,600 | | 168,094 | |
| | | | | | 2,562,341 | |
| | | | | | | |
Shopping Centers 0.01% | | | | | | | |
Developers Diversified Realty Corp., | | | | | | | |
Series I, 7.500% | | Baa3/BBB- | | 500 | | 12,781 | |
| | | | | | | |
Specialty Finance 9.06% | | | | | | | |
Capital Lease Funding, | | | | | | | |
Series A, 8.125% (3) | | NR/NR | | 156,700 | | 3,912,611 | |
NorthStar Realty Finance Corp.: | | | | | | | |
Series A, 8.750% (3) | | NR/NR | | 353,600 | | 9,138,368 | |
Series B, 8.250% (3) | | NR/NR | | 246,400 | | 6,090,712 | |
| | | | | | 19,141,691 | |
| | | | | | | |
TOTAL PREFERRED STOCK
(Cost $134,541,208) | | | | | | 133,895,303 | |
| | | | | | | |
COMMERCIAL REAL ESTATE COLLATERALIZED DEBT OBLIGATIONS 14.57% | | | | | | | |
CW Capital Cobalt II, Ltd.: | | | | | | | |
Series K, 8.983%, 04/26/2016 (1)(2)(5)(7)(9) | | Ba2/NR | | 4,000,000 | | 3,951,000 | |
Class P.S., 16.676%, 04/26/2016 (1)(2)(5)(7)(8) | | NR/NR | | 3,500,000 | | 3,454,749 | |
Sorin Real Estate CDO II Ltd., | | | | | | | |
Series 2005 2A, Class H, 9.490%, | | | | | | | |
01/04/2016 (1)(2)(5)(7)(9) | | Ba3/NR | | 7,500,000 | | 7,401,090 | |
Taberna Preferred Funding III Ltd., | | | | | | | |
Class E, 9.997%, 11/05/2015 (1)(2)(4)(7)(9) | | NR/BB+ | | 2,000,000 | | 1,910,940 | |
Taberna Preferred Funding V Ltd.: | | | | | | | |
Class B-1L, 8.222%, 02/05/2016 (1)(2)(4)(7)(9) | | NR/BBB | | 3,000,000 | | 2,870,937 | |
Class B-2L, 10.250%, 02/05/2016 (1)(2)(4)(7)(9) | | NR/BB | | 3,000,000 | | 2,865,966 | |
Vertical CRE CDO 2006-I, Ltd.: | | | | | | | |
Class G, 9.490%, 04/22/2013 (1)(2)(5)(7)(9) | | NR/BB+ | | 6,500,000 | | 6,547,710 | |
Class P.S., 14.920%, 04/22/2013 (1)(2)(5)(7)(8) | | NR/NR | | 1,800,000 | | 1,778,405 | |
| | | | | | | |
TOTAL COMMERCIAL REAL ESTATE COLLATERALIZED DEBT OBLIGATIONS (Cost $31,300,000) | | | | | | 30,780,797 | |
COLLATERALIZED LOAN OBLIGATIONS 7.52% | | | | | | | |
Babson CLO 2005-III, Ltd., | | | | | | | |
19.938%, 11/11/2019 (1)(2)(5)(7)(8) | | NR/NR | | 13,000,000 | | 12,526,488 | |
Fraser Sullivan CLO I Ltd., | | | | | | | |
16.731%, 03/15/2017 (1)(2)(5)(7)(8) | | NR/NR | | 3,400,000 | | 3,354,515 | |
TOTAL COLLATERALIZED LOAN OBLIGATIONS
(Cost $16,400,000) | | | | | | 15,881,003 | |
| | | | | | | | |
Footnotes on pages 13-14.
12
| | Bond Rating | | Shares/Principal | | Market | |
| | Moody’s/S&P | | Amount | | Value | |
| | | | | | | |
COMMERCIAL MORTGAGE-BACKED SECURITIES 0.62% | | | | | | | |
JP Morgan Chase, Series 2005-LDP2, | | | | | | | |
Class M, 5.887%, 07/15/2042 (1)(2)(5)(7) | | Ba2/NR | | 1,597,000 | | $ | 1,145,943 | |
Wachovia Bank, Series 2005 | | | | | | | |
C18, 7.125%, 05/19/2015 (1)(5)(7) | | B1/B+ | | 248,100 | | 171,180 | |
| | | | | | | |
TOTAL COMMERCIAL MORTGAGE-BACKED SECURITIES
(Cost $1,414,687) | | | | | | 1,317,123 | |
| | | | | | | |
LOAN PARTICIPATIONS 2.21% | | | | | | | |
Mervyn’s Junior Syndication Mezzanine, | | | | | | | |
8.973%, 01/01/2008 (2)(9) | | NR/NR | | 4,660,875 | | 4,660,875 | |
| | | | | | | |
TOTAL LOAN PARTICIPATIONS
(Cost $4,660,875) | | | | | | 4,660,875 | |
| | | | | | | |
U.S. GOVERNMENT OBLIGATIONS 4.70% | | | | | | | |
U.S. Treasury Notes, 6.125%, 08/15/2007 (6) | | | | 9,882,000 | | 9,923,692 | |
| | | | | | | |
TOTAL U.S. GOVERNMENT OBLIGATIONS
(Cost $9,919,605) | | | | | | 9,923,692 | |
| | | | | | | |
NON-REGISTERED INVESTMENT COMPANIES 1.85% | | | | | | | |
INVESCO Navigator Fund (1)(2)(4) | | NR/NR | | 3,946 | | 3,898,317 | |
| | | | | | | |
TOTAL NON-REGISTERED INVESTMENT COMPANIES (Cost $3.946,000) | | | | | | 3,898,317 | |
| | | | | | | |
REPURCHASE AGREEMENTS 1.01% | | | | | | | |
State Street Bank & Trust, Co., dated 03/31/2007, 3.75%, due 04/02/2007, proceeds of $2,215,547; collateralized by Fannie Mae, 6.000%, 05/15/2008, valued at $2,216,053 including accrued interest. | | NR/NR | | 2,136,341 | | 2,136,341 | |
| | | | | | | |
TOTAL REPURCHASE AGREEMENTS
(Cost $2,136,341) | | | | | | 2,136,341 | |
| | | | | | | |
TOTAL INVESTMENTS 137.15%
(Cost $281,533,815) | | | | | | $ | 289,651,141 | |
Liabilities in Excess of Other Assets (37.15%) | | | | | | (78,452,250 | ) |
NET ASSETS 100.00% | | | | | | $ | 211,198,891 | |
Footnotes to Statement of Investments:
* | Non-income producing security |
| |
(1) | Securities sold within terms of a private placement memorandum, exempt from registration under Rule 144A under the Securities Act of 1933, as amended, and may be resold in transactions exempt from registration, normally to qualified institutional buyers. As of March 31, 2007, the value of these securities amounted to $55,734,240 or 19.24% of total investments. |
| |
(2) | This security has been valued at its fair value determined in good faith by or under the direction of the Board of Trustees. |
13
(3) All or a portion of the shares held in this security are pledged as collateral for the borrowings under the Revolving Credit and Security Agreement (Note 6).
(4) This security is considered illiquid by the Adviser.
(5) This 144A security has been determined to be liquid by the Adviser.
(6) The entire principal amount of this security is pledged as collateral for the total return swaps.
(7) The expected maturity date listed herein differs from the legal maturity date due to the expected schedule of principal payments.
(8) This security represents a junior tranche whereby the holder is entitled to all residual interest, if any, which can vary. The rate listed is the Adviser’s estimated rate of residual interest as of the reporting date.
(9) The coupon rate shown on floating or adjustable rate securities represents the rate at each period.
Open Interest Rate Swap Contracts as of March 31, 2007
Counterparty | | Termination
Date | | Underlying
Notional | | Fixed Rate
Paid by the
Fund at
03/31/07 | | Floating Rate
Received by
the Fund at
03/31/07* | | Net Interest
Receivable | | Unrealized
Appreciation | |
JPMorgan Chase | | 06/14/2010 | | $ | 27,000,000 | | 4.09 | % | 5.32 | % | $ | 15,683 | | $ | 480,641 | |
JPMorgan Chase | | 06/14/2012 | | 27,000,000 | | 3.89 | % | 5.32 | % | 18,233 | | 323,610 | |
Total | | | | | | | | | | | | $ | 804,251 | |
| | | | | | | | | | | | | | | | |
* Based on one-month LIBOR (London Interbank Offered Rate).
Open Total Return Swap Contracts (“TRS”) ** as of March 31, 2007
Counterparty: Royal Bank of Canada
Contract Type | | Termination
Date | | Notional
Shares | | Underlying
Notional
($CAD) | | Unrealized
Appreciation
($USD) | |
Alexis Nihon Real Estate Investment Trust TRS | | 08/21/2008 | | 197,000 | | $ | 2,501,900 | | $ | 1,008,153 | |
Allied Properties Real Estate Investment Trust TRS | | 07/31/2008 | | 302,700 | | 5,236,710 | | 971,455 | |
Calloway Real Estate Investment Trust TRS | | 11/06/2008 | | 190,000 | | 5,266,800 | | 28,016 | |
Canadian Apartment Properties Real Estate Investment Trust | | 03/13/2009 | | 190,000 | | 4,048,900 | | (115,361) | |
Canadian Hotel Income Properties Real Estate Investment Trust TRS | | 08/19/2008
03/16/2009 | | 270,700
150,300 | | 4,385,340
2,313,117 | | (199,579)
(5,215) | |
Chartwell Senior Housing Real Estate Investment Trust TRS | | 08/21/2008 | | 175,000 | | 2,345,000 | | 124,469 | |
Firm Capital Mortgage Investment Trust TRS | | 08/28/2008 | | 160,000 | | 1,624,000 | | 76,329 | |
H&R Real Estate Investment Trust TRS | | 07/31/2008 | | 275,000 | | 6,132,500 | | 553,387 | |
Northern Property Real Estate Investment Trust TRS | | 07/31/2008 | | 188,000 | | 4,049,520 | | 670,206 | |
Primaris Retail Real Estate Investment Trust TRS | | 11/06/2008 | | 330,000 | | 5,999,400 | | 612,542 | |
RioCan Real Estate Investment Trust TRS | | 07/31/2008 | | 500,000 | | 11,445,000 | | 845,693 | |
Total | | | | 2,928,700 | | $ | 55,348,187 | | $ | 4,570,095 | |
** For each total return swap contract, the Fund receives the total return and dividend income on the underlying security and pays a floating rate based on three-month Canadian LIBOR plus a spread.
14
Open Foreign Currency Contracts as of March 31, 2007
Contracts to Sell - Canadian Dollar ($CAD)
Expiration Date | | Contract Amount
($CAD) | | Unrealized Appreciation
($USD) | |
04/30/2007 | | $ | 92,100 | | $ | 2,762 | |
05/07/2007 | | 28,800 | | 562 | |
05/22/2007 | | 57,000 | | 1,673 | |
07/31/2007 | | 84,100 | | 2,483 | |
08/07/2007 | | 27,300 | | 535 | |
08/21/2007 | | 53,900 | | 1,591 | |
11/06/2007 | | 25,800 | | 510 | |
Total Unrealized Appreciation | | | | $ | 10,116 | |
| | | | | | | |
15
STATEMENT OF ASSETS & LIABILITIES
March 31, 2007(Unaudited)
Dividend Capital Realty Income Allocation Fund
ASSETS: | | | |
Investments at market value (Identified cost — $281,533,815) | | $ | 289,651,141 | |
Cash | | 94,297 | |
Receivable for securities sold | | 1,683,390 | |
Dividends and interest receivable | | 3,098,183 | |
Swap interest receivable | | 169,774 | |
Unrealized appreciation on forward foreign currency contracts | | 10,116 | |
Unrealized appreciation on swap agreements | | 5,374,346 | |
Other assets | | 215,184 | |
TOTAL ASSETS | | $ | 300,296,431 | |
| | | |
LIABILITIES: | | | |
Line of credit payable to bank | | $ | 87,500,000 | |
Payable for line of credit fees | | 413,490 | |
Swap interest payable | | 5,500 | |
Payable for securities purchased | | 779,032 | |
Payable for investment advisory fees | | 215,053 | |
Payable for administrative fees | | 25,301 | |
Other liabilities | | 159,164 | |
TOTAL LIABILITIES | | $ | 89,097,540 | |
NET ASSETS | | $ | 211,198,891 | |
| | | |
COMPOSITION OF NET ASSETS: | | | |
Common stock, $0.001 par value (unlimited number of shares authorized) | | $ | 13,828 | |
Paid-in capital | | 195,918,876 | |
Over distributed net investment income | | (3,886,147 | ) |
Accumulated net realized gain on investments, swap contracts and foreign currency transactions | | 5,650,546 | |
Net unrealized appreciation/(depreciation) of investments, swap contracts and translation of assets and liabilities denominated in foreign currencies | | 13,501,788 | |
NET ASSETS | | $ | 211,198,891 | |
| | | |
SHARES OUTSTANDING AND NET ASSET VALUE PER SHARE: | | | |
Common shares outstanding, $0.001 par value (unlimited number of shares authorized) | | 13,828,488 | |
Net asset value per share | | $ | 15.27 | |
See accompanying Notes to Financial Statements.
16
STATEMENT OF OPERATIONS
March 31, 2007 (Unaudited)
Dividend Capital Realty Income Allocation Fund
INVESTMENT INCOME: | | | |
Dividends (net of withholding taxes of $3,120) | | $ | 9,250,921 | |
Interest | | 3,197,664 | |
Total Investment Income | | $ | 12,448,585 | |
| | | |
EXPENSES: | | | |
Line of credit interest and fees (Note 6) | | $ | 2,458,168 | |
Investment advisory fees (Note 5) | | 1,282,928 | |
Administrative fees (Note 5) | | 150,933 | |
Trustee fees and expenses (Note 5) | | 69,781 | |
Insurance expenses | | 41,816 | |
Shareholder reports expenses | | 40,496 | |
Custodian fees and expenses | | 1,426 | |
Other expenses | | 206,656 | |
| | | |
Total Expenses | | $ | 4,252,204 | |
NET INVESTMENT INCOME | | $ | 8,196,381 | |
| | | |
REALIZED AND UNREALIZED GAIN/(LOSS): | | | |
Net realized gain/(loss) from: | | | |
Investments | | (171,891 | ) |
Swap contracts | | 5,072,329 | |
Foreign currency transactions | | 4,245 | |
Net realized gain | | 4,904,683 | |
| | | |
Net change in unrealized appreciation/depreciation on: | | | |
Investments | | 1,371,757 | |
Swap contracts | | (828,474 | ) |
Translation of assets and liabilities denominated in foreign currencies | | 11,557 | |
Net change | | 554,840 | |
| | | |
INCREASE IN NET ASSETS RESULTING FROM OPERATIONS | | $ | 13,655,904 | |
See accompanying Notes to Financial Statements.
17
STATEMENT OF CHANGES IN NET ASSETS
March 31, 2007 (Unaudited)
Dividend Capital Realty Income Allocation Fund
| | For the Six Months
Ended
March 31, 2007* | | For the
Year Ended
September 30, 2006 | |
Operations: | | | | | |
Net investment income | | $ | 8,196,381 | | $ | 13,525,045 | |
Net realized gain on investments, swap transactions and foreign currency transactions | | 4,904,683 | | 1,227,850 | |
Change in net unrealized appreciation/depreciation on investments, swap transactions and foreign currency transactions | | 554,840 | | 12,175,374 | |
Increase in net assets resulting from operations | | 13,655,904 | | 26,928,269 | |
| | | | | |
Distributions to Shareholders: | | | | | |
From net investment income | | (9,953,545 | ) | (17,980,293 | ) |
From net realized gain on investments | | (1,104,803 | ) | — | |
Net decrease in net assets from distributions to shareholders | | (11,058,348 | ) | (17,980,293 | ) |
| | | | | |
Capital share transactions: | | | | | |
Net asset value of common shares issued to shareholders from reinvested dividends | | 1,653,445 | | 524,724 | |
Common share offering cost adjustment (Note 3) | | — | | 41,695 | |
Increase in net assets from capital share transactions | | 1,653,445 | | 566,419 | |
| | | | | |
Net Increase in Net Assets | | 4,251,001 | | 9,514,395 | |
| | | | | |
NET ASSETS: | | | | | |
Beginning of period | | 206,947,890 | | 197,433,495 | |
End of period (1) | | $ | 211,198,891 | | $ | 206,947,890 | |
*Unaudited
(1) Includes (over)/undistributed net investment income of ($3,886,147) and ($2,128,983), respectively.
See accompanying Notes to Financial Statements.
18
STATEMENT OF CASH FLOWS
For the six months ended March 31, 2007 (Unaudited)
Dividend Capital Realty Income Allocation Fund
Cash Flows from Operating Activities: | | | |
Net increase in net assets from operations | | $ | 13,655,904 | |
Adjustments to reconcile net increase in net assets from operations to net cash used in operating activities: | | | |
Purchase of investment securities | | (81,140,108 | ) |
Proceeds from disposition of investment securities | | 74,480,698 | |
Net sale of short-term investments | | 2,683,514 | |
Decrease in collateral for swap contracts | | (95,121 | ) |
Net realized loss from investments and foreign currencies | | (167,646 | ) |
Net change in unrealized appreciation on investments and foreign currencies | | 1,383,314 | |
Net change in unrealized appreciation on swap contracts | | (828,474 | ) |
Increase in dividends and interest receivable | | (240,509 | ) |
Decrease in net swap interest receivable | | 24,585 | |
Increase in receivable for securities sold | | (1,372,989 | ) |
Decrease in payable for securities purchased | | (1,444,736 | ) |
Decrease in prepaid expenses and other assets | | 41,630 | |
Decrease in accrued expenses and other payables | | (29,049 | ) |
Accretion/amortization of discount/premium on investment securities | | 38,234 | |
Net cash provided by operating activities | | $ | 6,989,247 | |
| | | |
Cash Flows from Financing Activities: | | | |
Proceeds from bank borrowing | | $ | 2,500,000 | |
Payment on outstanding debt | | — | |
Proceeds from shares sold | | — | |
Cash distributions paid | | (9,404,903 | ) |
Net cash provided by financing activities | | $ | (6,904,903 | ) |
| | | |
Net increase in cash | | $ | 84,344 | |
| | | |
Cash | | | |
Beginning Balance | | $ | 9,953 | |
Ending Balance | | $ | 94,297 | |
| | | |
Supplemental Disclosure of Cash Flow Information: | | | |
Cash paid for interest and fees on bank borrowing | | $ | 2,044,678 | |
Non-cash financing activities not included herein consist of reinvestment of dividends and distributions of $1,653,445.
See accompanying Notes to Financial Statements.
19
FINANCIAL HIGHLIGHTS
March 31, 2007(Unaudited)
Dividend Capital Realty Income Allocation Fund
| | For the Six
Months Ended
March 31, 2007* | | For the Year
Ended
September 30,
2006 | | For the
Period
Ended
September
30, 2005 (1) | |
PER SHARE OPERATING DATA: | | | | | | | |
Net Asset Value, Beginning of Period | | $ | 15.088 | | $ | 14.43 | | $ | 14.33 | (2) |
Income from investment operations: | | | | | | | |
Net investment income (3) | | 0.60 | | 0.99 | | 0.63 | |
Net gains on securities, realized and unrealized | | 0.39 | | 0.97 | | 0.09 | |
Total From Investment Operations | | 0.99 | | 1.96 | | 0.72 | |
| | | | | | | |
Dividends and/or Distributions to Shareholders: | | | | | | | |
Dividends from net investment income | | (0.72 | ) | (1.31 | ) | (0.57 | ) |
Dividends from net realized gain on investments | | (0.08 | ) | — | | — | |
Total Distributions | | (0.80 | ) | (1.31 | ) | (0.57 | ) |
| | | | | | | |
Offering Costs Charged to Paid-in-Capital | | — | | — | | (0.05 | ) |
| | | | | | | |
Offering Cost Adjustment | | — | | 0.00 | (8) | — | |
| | | | | | | |
Net Asset Value, End of Period | | $ | 15.27 | | $ | 15.08 | | $ | 14.43 | |
| | | | | | | |
Market Price, End of Period | | $ | 15.45 | | $ | 14.52 | | $ | 14.12 | |
| | | | | | | |
Total Return, Net Asset Value (4) | | 6.58 | % | 14.95 | % | 4.73 | % |
| | | | | | | |
Total Return, Market Value (4) | | 11.99 | % | 13.11 | % | 1.68 | % |
Net Assets, End of Period (000’s) | | $ | 211,199 | | $ | 206,948 | | $ | 197,433 | |
Ratio of Operating Expenses to Average Net Assets (5) | | 1.65 | %(7) | 1.73 | % | 1.68 | %(7) |
Ratio of Operating Expenses to Average Net Assets after reduction to custodian expenses (5) | | 1.65 | %(7) | 1.72 | % | 1.66 | %(7) |
Ratio of Total Expenses to Average Net Assets | | 3.92 | %(7) | 3.98 | % | 2.74 | %(7) |
Ratio of Total Expenses to Average Net Assets after reduction to custodian expenses | | 3.92 | %(7) | 3.97 | % | 2.72 | %(7) |
Ratio of Net Investment Income to Average Net Assets | | 7.55 | %(7) | 6.92 | % | 7.39 | %(7) |
Portfolio Turnover Rate (6) | | 25.54 | % | 71.99 | % | 92.47 | % |
*Unaudited
(l) For the period from February 24, 2005 (inception of offering) to September 30, 2005.
(2) Net of sales load of $0.675 on initial shares issued.
(3) Calculation based on average shares outstanding.
(4) Total investment return is calculated assuming a purchase of common shares of the opening of the first day and sale on the closing of the last day of each period reported. Dividends and distributions are assumed, for purposes of this calculation, to be reinvested at prices obtained under the Fund’s reinvestment plan. Total investment return is not annualized for periods of less than one year. Brokerage commissions are not reflected.
(5) Operating expenses do not include interest expense and fees on the line of credit.
(6) A portfolio turnover rate is the percentage computed by taking the lesser of purchases or sales of portfolio securities (excluding short-term investments) for a period and dividing it by monthly average of the market value of the portfolio securities during the period. Purchases and sales of investment securities (excluding short-term securities) for the six months ended March 31, 2007 were $81,140,108 and $74,480,698 respectively.
(7) Ratio annualized for the period of less than one year.
(8) Common share offering cost adjustment is less than $0.005 per share.
See accompanying Notes to Financial Statements.
20
NOTES TO FINANCIAL STATEMENTS
March 31, 2007 (Unaudited)
Dividend Capital Realty Income Allocation Fund
1. ORGANIZATION AND SUMMARY OF SIGNIFICANT ACCOUNTING POLICIES
Dividend Capital Realty Income Allocation Fund (the “Fund”) is registered as a closed-end management investment company under the Investment Company Act of 1940, as amended (the “1940 Act”). The Fund’s primary investment objective is high current income. The Fund’s secondary investment objective is capital appreciation.
Initial capitalization for the Fund was provided by Dividend Capital Investments LLC (the “Adviser”) as follows:
Organization Date | | December 3, 2004 |
Initial Capitalization Date | | February 15, 2005 |
Amount of Initial Capitalization | | $100,068 |
Common Shares Issued at Capitalization | | 7,010 |
Common Shares Authorized | | Unlimited |
Public Offering Date | | February 24, 2005 |
Security Valuation:
Pricing Procedures: All securities of the Fund are valued as of the close of regular trading on the New York Stock Exchange (“NYSE”), currently 4:00 p.m. (Eastern Standard Time), on each day that the NYSE is open.
Securities traded on the National Association of Securities Dealers Automated Quotation System (“NASDAQ”) are valued at the NASDAQ Official Closing Price (“NOCP”). Domestic exchange-listed securities and non-NASDAQ equity securities not traded on a listed exchange are valued at the last sale price as of the close of the NYSE. In the absence of trading or a NOCP, such securities are valued at the mean of the bid and asked prices. In the event exchange quotations are not available for exchange traded securities, the Fund will obtain at least one price from an independent broker/dealer.
U.S. government and agency securities having a maturity of more than 60 days are valued at the mean between the bid and asked prices. Fixed income securities having a maturity of less than 60 days are valued at amortized cost. Other debt securities are valued at the price provided by an independent pricing service or, if such a price is not available, at the value provided by at least one quotation obtained from a broker/dealer. Securities issued by private funds are priced at the value most recently provided by the private fund or at the bid provided by a broker/dealer.
Foreign exchange traded securities are valued at the last sale price at the close of the exchange on which the security is primarily traded (except in certain countries where market maker prices are used). In the absence of trading, such securities are valued at the mean between the last reported bid and asked prices or the last sale price. Non-exchange traded foreign securities (including debt) are valued at a price provided by a pricing service or at the mean value between the bid and asked prices.
21
Exchange traded options, warrants and rights are valued at the last reported sale price at the close of the exchange on which the security is primarily traded. For non-exchange traded options and exchange traded options, warrants and rights for which no sales are reported, the mean between the bid and asked prices is used. For exchange traded options, warrants and rights and foreign exchange traded equity securities in which the markets are not closed at the time that the Fund prices its securities, snapshot prices provided by individual pricing services are used.
The price for futures contracts are the daily quoted settlement prices. Single security total return swaps in which the referenced security is traded on an exchange are valued at the last sale price at the time of close of the NYSE. In the absence of trading of a referenced security, the mean between the closing bid and asked prices will be used.
Fair Valuation: If the price of a security is unavailable in accordance with the Fund’s pricing procedures, or the price of a security is suspect, e.g., due to the occurrence of a significant event (as defined below), the security may be valued at its fair value determined pursuant to procedures adopted by the Board. For this purpose, fair value is the price that the Fund reasonably expects to receive on a current sale of the security. Due to the number of variables affecting the price of a security, however; it is possible that the fair value of a security may not accurately reflect the price that the Fund could actually receive on a sale of the security. As of March 31, 2007, securities which have been fair valued represented 19.39% of the Fund’s managed assets.
The following factors, among other relevant factors, may be considered when determining the fair value of a security: (1) fundamental analytical data; (2) forces which influence the market in which the security is sold, including the liquidity and depth of the market; (3) type of security and the cost at date of purchase; (4) most recent quotation received from a broker; (5) transactions or offers with respect to the security; (6) price, yield and the extent of public or private trading in similar securities of the issuer or comparable companies; (7) price and extent of public trading of the security on foreign exchanges; (8) information on world financial markets and comparable financial products; (9) size of the Fund’s holdings; (10) financial statements of the issuer; (11) analyst reports; (12) merger proposals or tender offers; (13) value of other financial instruments, including derivative securities, traded on other markets or among dealers; (14) trading volumes on markets, exchanges or among dealers; (15) values of baskets of securities traded on other markets, exchanges or among dealers; (16) change in interest rates; (17) observations from financial institutions; (18) government (domestic or foreign) actions or pronouncements; (19) in the case of restricted securities, discount from market value of unrestricted securities of the same class at time of purchase, existence and anticipated timeframe of any undertaking to register the security and the size of the holding in relation to any unrestricted outstanding shares; (20) in the case of foreign securities, the country’s or geographic region’s political and economic
22
environment, nature of any significant events, American Depository Receipt trading, exchange-traded fund trading and foreign currency exchange activity; (21) in the case of interests in private funds, the absence of transaction activity in interests in the private fund, extraordinary restrictions on redemptions, whether the private fund’s valuation procedures provide for valuation of underlying securities at market value or fair value, actual knowledge of the value of underlying portfolio holdings, review of audited financial statements and ongoing due diligence and monitoring; and (22) in the case of emergencies or other unusual situations, the nature and duration of the event, forces influencing the operation of the financial markets, likelihood of recurrence of the event, and whether the effects of the event are isolated or affect entire markets, countries or regions.
Significant Events: An event is significant if it causes the price for a security determined at the normal time for pricing that security to no longer reflect fair value at the time that the Fund determines its net asset value. A significant event is material (a “Material Significant Event”) if a fair valuation for the security would impact the Fund’s net asset value by more than one-half of one percent (0.5%). If a Material Significant Event has occurred, the Adviser will call a meeting of the Valuation Committee to determine a fair value for the security in accordance with the Fund’s Fair Valuation Procedures.
Risk of Concentration:
Because the Fund’s investments are concentrated in the real estate industry, the value of the Fund may be subject to greater volatility than a fund with a portfolio that is less concentrated in a single industry. If the securities of real estate companies as a group fall out of favor with the investors, the Fund could underperform funds that have greater industry diversification.
Foreign Securities:
The Fund may invest a portion of its assets in foreign securities. In the event that the Fund executes a foreign security transaction, the Fund will generally enter into forward foreign currency contracts to settle specific purchases or sales of securities denominated in a foreign currency. Foreign securities may carry more risk than U.S. securities, such as political, market and currency risks. Currently, the Fund intends to invest only in those securities issued by North American issuers.
The accounting records of the Fund are maintained in U.S. dollars. Prices of securities denominated in foreign currencies are translated into U.S. dollars at the closing rate of exchange at period end. Amounts related to the purchase and sale of foreign securities and investment income are translated at the rates of exchange prevailing on the respective dates of such transactions.
The effects of changes in foreign currency exchange rates on investments is separately identified from the fluctuations arising from changes in market values of securities held and reported with all other foreign currency gains and losses in the Fund’s Statement of Operations.
23
Repurchase Agreements:
The Fund may invest in repurchase agreements, which are short-term investments in which the Fund acquires ownership of a debt security and the seller agrees to repurchase the security at a future time and specified price. Repurchase agreements are fully collateralized by the underlying debt security. The Fund will make payment for such securities only upon physical delivery or evidence of book entry transfer to the account of the custodian bank. The seller is required to maintain the value of the underlying security at not less than the repurchase proceeds due the Fund.
Distributions to Shareholders:
The Fund intends to make a level dividend distribution each month to shareholders. The level dividend rate may be modified by the Board of Trustees from time to time. Dividends and distributions to shareholders are recorded by the Fund on the ex-dividend date. Distributions paid by the Fund are subject to recharacterization for tax purposes. A portion of the distributions paid by the Fund may be reclassified to return of capital and long-term capital gains upon the final determination of the Fund’s taxable income for the year. Net realized gains, unless offset by any available capital loss carryforward, are distributed to shareholders annually.
Securities Transactions and Investment Income:
Investment security transactions are accounted for as of trade date. Dividend income is recorded on the ex-dividend date. Interest income, which includes amortization of premium and accretion of discount, is accrued as earned. Realized gains and losses from securities transactions and unrealized appreciation and depreciation of securities are determined using the highest cost basis for both financial reporting and income tax purposes.
Use of Estimates:
The Fund’s financial statements are prepared in accordance with accounting principles generally accepted in the United States of America. This requires management to make estimates and assumptions that affect the reported amounts of assets and liabilities and disclosure of contingent assets and liabilities at the date of the financial statements and the reported amounts of increases and decreases in net assets from operations during the reporting period. Actual results could differ from these estimates.
24
2. FEDERAL INCOME TAXES
No provision for federal income taxes is required since the Fund intends to continue to qualify as a regulated investment company and distribute to shareholders all of its taxable income and capital gains. Because federal income tax regulations differ from generally accepted accounting principles, income and capital gain distributions determined in accordance with tax regulations may differ from net investment income and realized gain for financial reporting purposes. Accordingly, the character of distributions and composition of net assets for tax purposes differ from those reflected in the accompanying financial statements.
At March 31, 2007 the cost of investments and net unrealized appreciation for federal income tax purposes were as follows:
Aggregate tax cost (including swaps and foreign currency) | | $ | 281,288,213 | |
| | | |
Gross unrealized appreciation | | 17,909,205 | |
Gross unrealized depreciation | | (4,171,930 | ) |
Net unrealized appreciation | | $ | 13,737,275 | |
3. CAPITAL TRANSACTIONS
There are an unlimited number of $0.001 par value common shares of beneficial interest authorized. Of the 13,828,488 common shares outstanding on March 31, 2007, Dividend Capital Investments LLC (the “Adviser”) owned 7,010 shares. The Fund issued 12,100,000 common shares in its initial public offering on February 23, 2005. These common shares were issued at $15.00 per share before the underwriting discount of $0.675 per share. An additional 1,578,500 common shares were issued pursuant to an over-allotment option on April 12, 2005. These common shares were also issued at $15.00 per share before the underwriting discount of $0.675 per share. Offering costs of $642,230 were offset against proceeds of the offering and were charged to paid-in capital of the common shares. During the year ended September 30, 2006, a $41,695 adjustment was charged to paid-in-capital for common offering costs.
Transactions in common shares for the six months ended March 31, 2007 and the year ended September 30, 2006, were as follows:
| | Six Months
Ended March 31,
2007* | | Year Ended
September 30,
2006 | |
Common shares outstanding – beginning of period | | 13,724,263 | | 13,685,510 | |
Common shares issued to shareholders from reinvested dividends | | 104,225 | | 38,753 | |
Common shares outstanding – end of period | | 13,828,488 | | 13,724,263 | |
*Unaudited
25
4. PORTFOLIO SECURITIES
Purchases and sales of investment securities, other than short-term securities, for the six months ended March 31, 2007 aggregated $81,140,108 and $74,480,698 respectively.
5. INVESTMENT ADVISORY AND ADMINISTRATION AGREEMENTS AND OTHER RELATED PARTY TRANSACTIONS
Dividend Capital Investments LLC (“Dividend Capital” or the “Adviser”) serves as the Fund’s investment adviser and administrator. Pursuant to an Investment Advisory Agreement with the Fund, as compensation for its services to the Fund, Dividend Capital receives an annual investment advisory fee of 0.85% based on the Fund���s average daily managed assets, computed daily and payable monthly. Pursuant to an Administration Agreement with the Fund, as compensation for its services to the Fund, Dividend Capital receives an annual administration fee of 0.10% based on the Fund’s average daily managed assets, computed daily and payable monthly.
Trustees of the Fund who are “interested persons” as defined in the 1940 Act receive no salary or fees from the Fund. Each Independent Trustee of the Fund receives from the Fund an annual retainer of $16,000 and a fee of $2,000 and reimbursement for related expenses for each meeting of the Board he attends. Each independent Trustee receives from the Fund a fee of $1,000 for each telephonic Board meeting he attends. The Chairman of the Board of Trustees receives from the Fund an additional annual retainer of $10,000.
Certain officers of the Trust are also officers of the Adviser.
6. LINE OF CREDIT
On April 28, 2005, the Fund executed a Revolving Credit and Security Agreement (the “Agreement”) among the Fund, Jupiter Securitization Corp. (“Jupiter”) and JP Morgan Chase Bank N.A. (“JP Morgan”) which allows the Fund to borrow against a secured line of credit from Jupiter and JP Morgan an aggregate amount up to $85,000,000. On March 16, 2007 the Agreement was amended and the line of credit was increased to $105,000,000. The borrowings under the line of credit are secured by a pledge of the Fund’s portfolio securities. Borrowings under the Agreement bear interest at a variable rate determined by the bank’s conduit program, which has historically been slightly below the 1-month LIBOR. The Fund pays fees of 0.175% per annum on 102% of the total line of credit, regardless of usage. The Fund also pays fees of 0.20% per annum on the average outstanding amount of borrowings. The average balance during the six months ended March 31, 2007 was $85,027,473 or $6.18 per share based on average shares outstanding of 13,761,566. The average cost of funding during the six months ended March 31, 2007 was 5.71%. As of March 31, 2007, the Fund had an outstanding loan amount of $87,500,000.
26
7. INVESTMENTS IN INTEREST RATE AND TOTAL RETURN SWAPS
The Fund uses interest rate swaps in connection with the line of credit. The interest rate swaps are intended to reduce or eliminate the risk or the negative affect that an increase in short-term interest rates could have on the performance of the Fund’s common shares as a result of the floating rate structure of the line of credit. In these interest rate swaps, the Fund agrees to pay the other party to the interest rate swap (the “counterparty”) a fixed rate payment in exchange for the counterparty agreeing to pay the Fund a variable rate payment that is intended to approximate the Fund’s variable rate payment obligation on the line of credit. The payment obligation is based on the notional amount of the swap. Depending on the state of interest rates in general, the use of interest rate swaps could enhance or harm the overall performance of the common shares. The market value of interest rate swaps is based on pricing models that consider the time value of money, volatility and the current and forward interest rate markets.
The Fund uses total return swaps to gain exposure to underlying referenced securities or indices. Total return swap agreements involve commitments to pay interest plus fees in exchange for a market-linked return, both based on notional amounts. To the extent the total return of the security or index underlying the transaction exceeds or falls short of the offsetting interest rate obligation, the Fund will receive a payment from or make a payment to the counterparty, respectively.
Swaps are marked to market daily. For both interest rate swaps and total return swaps, unrealized gains are reported as an asset and unrealized losses are reported as a liability on the Fund’s Statement of Assets and Liabilities. The change in value of swaps, including the accrual of periodic amounts of interest, net of the market linked return to be paid or received on the swaps, is reported as unrealized gains or losses on the Fund’s Statement of Operations. A realized gain or loss is recorded upon payment or receipt of a periodic payment or termination of a swap agreement. The Fund segregates or earmarks sufficient assets as collateral to satisfy the Fund’s current obligation with respect to total return swaps. Entering into swap agreements involves, to varying degrees, elements of credit, foreign currency, market and documentation risk in excess of the amounts recognized on the Statement of Assets and Liabilities. Such risks involve the possibility that there will be no liquid market for these agreements, that the counterparty to these agreements may default on its obligation to perform or disagree as to the meaning of the contractual items in the agreements, and that there may be unfavorable changes in foreign currency, interest rates or values in referenced indices or securities.
The Fund has adopted a non-fundamental policy to limit its investment in securities of non-U.S. issuers to 20% of the Fund’s managed assets, measured at the time of investment (the “non-U.S. issuer limitation”). As a component of its investment strategy, the Fund may enter into total return swaps where the reference security is
27
issued by a Canadian issuer or the counterparty to the swap is a Canadian financial institution. In this case, the Fund considers the non-U.S. investment limitation to apply. It is common for swap contracts to be terminated and re-initiated due to economic factors or the expiration of the term of the swap contract. In such case, the Fund may re-initiate the swap contract if deemed to be advisable by the Adviser. In cases where swap contracts are reinitiated with substantially the same terms and the same reference security and number of reference shares, such re-initiations will not be considered to be a new investment for purposes of the application of the non-U.S. issuer limitation. Accordingly, the notional value of the original swap contract that relates to the reference security in question will be the basis for determining compliance with the non-U.S. issuer limitation. As a result of this policy, the Fund’s exposure to securities of non-U.S. issuers, as measured by current notional value, could exceed 20%, in some cases significantly so. As of March 31, 2007, the Fund’s exposure to securities of non-U.S. issuers, as measured by current notional value, was 16.07% of the Fund’s managed assets.
8. FOREIGN CURRENCY CONTRACTS
A foreign currency contract is a commitment to purchase or sell a foreign currency at a future date, at a negotiated rate. The Fund may enter into foreign currency contracts to settle specific purchases or sales of securities denominated in a foreign currency and for protection from adverse exchange rate fluctuation. Risks to the Fund include the potential inability of the counterparty to meet the terms of the contract.
The net U.S. dollar value of foreign currency underlying all contractual commitments held by the Fund and the resulting unrealized appreciation or depreciation are determined using prevailing forward foreign currency exchange rates. Unrealized appreciation and depreciation on foreign currency contracts are reported in the Fund’s Statement of Assets and Liabilities as a receivable or a payable and in the Fund’s Statement of Operations with the change in unrealized appreciation or depreciation.
The Fund may realize a gain or loss upon the closing or settlement of the foreign transaction. Such realized gains and losses are reported with all other foreign currency gains and losses in the Statement of Operations.
9. ILLIQUID/RESTRICTED SECURITIES
As of March 31, 2007, investments in securities included issues that are restricted. Restricted securities are often purchased in private placement transactions, are not registered under the Securities Act of 1933, may have contractual restrictions on resale, and may be revalued under methods approved by the Board of Trustees as reflecting fair value. A security may also be considered illiquid if it lacks a readily available market. The Fund intends to invest no more than 10% of its total managed assets (determined at the time of purchase and reviewed periodically)
28
in illiquid securities. Certain restricted securities, eligible for resale to qualified institutional investors, are not subject to that limitation if the Fund’s advise; under supervision of the Board of Trustees, determines that a liquid trading market exists.
Illiquid Restricted Securities as of March 31, 2007
Description | | Shares | | Acquisition
Date | | Cost | | Market
Value | |
INVESCO Navigator Fund | | 3,946 | | 11/17/2005 | | 3,946,000 | | 3,944,110 | |
Taberna Preferred Funding III Ltd.,
Class E, 9.997%, 11/05/2015 | | 2,000,000 | | 09/15/2005 | | 2,000,000 | | 1,910,940 | |
Taberna Preferred Funding V Ltd. Class B-IL,
8.230%, 02/05/2016 | | 3,000,000 | | 03/20/2006 | | 3,000,000 | | 2,870,937 | |
Taberna Preferred Funding V Ltd. Class B-IL,
10.230%, 02/05/2016 | | 3,000,000 | | 03/20/2006 | | 3,000,000 | | 2,865,966 | |
Total | | | | | | | | $ | 11,591,953 | |
Total Managed Assets | | | | | | | | $ | 298,698,891 | |
Illiquid Restricted Securities as a % of Total Managed Assets | | | | | | | | 3.88 | % |
10. RECENT ACCOUNTING PRONOUCEMENTS
In June 2006, the Financial Accounting Standards Board (“FASB”) issued FASB Interpretation No. 48 (“FIN 48”), Accounting for Uncertainty in Income Taxes. FIN 48 clarifies the accounting for uncertainty in income taxes recognized in an enterprise’s financial statements in accordance with FASB Statement No. 109, Accounting for Income Taxes. FIN 48 requires the evaluation of tax positions taken in the course of preparing the Fund’s tax return to determine whether it is “more-than-likely-than-not” that tax positions in the Fund’s tax return will be ultimately sustained. A tax liability and expense must be recorded in respect of any tax position that, in Management’s judgment, will not be fully utilized. FIN 48 is effective for fiscal years beginning after December 15, 2006. As of March 31, 2007, the Adviser is evaluating the implications of FIN 48. Its impact in the Fund’s financial statements has not yet been determined.
In September 2006, the Financial Accounting Standards Board (FASB) issued Statement on Financial Accounting Standards (“SFAS”) No. 157, Fair Value Measurements. This standard establishes a single authoritative definition of fair value, sets out a framework for measuring fair value and requires additional disclosure about fair value measurements. SFAS No. 157 applies to fair value measurements already required or permitted by existing standards. SFAS No. 157 is effective for financial statements issued for fiscal years beginning after November 15, 2007 and interim periods within those fiscal years. The changes to current generally accepted accounting principles from the application of this Statement relate to the definition of fair value, the methods used to measure fair value, and the expanded disclosures about fair value measurements. As of March 31, 2007, the Adviser does not believe adoption of SFAS No. 157 will impact the financial statement amounts; however, additional disclosures may be required about the
29
inputs used to develop the measurements and the effect of certain measurements on changes in net assets for the period.
11. SUBSEQUENT EVENTS
Subsequent Regular Distribution
Subsequent to March 31, 2007, the Fund paid a regular monthly distribution of $0.1075 per common share on April 30, 2007 to common shareholders of record on April 18, 2007.
Results of Annual Shareholder Meeting
The Annual Meeting of Shareholders of the Fund (the “Annual Meeting”) was held on April 26, 2007 pursuant to notice given to all shareholders of record at the close of business on March 2, 2007. At the Annual Meeting, shareholders approved the following proposal:
Proposal 1.
To elect John Mezger and J. Gibson Watson, III as the Fund’s Class II Trustees for a three year term expiring in 2010. The number of shares voting for the election of Mr. Mezger was 11,882,492 and the number of shares withholding authority was 112,228. The number of shares voting for the election of Mr. Watson was 11,888,055 and the number of shares withholding authority was 106,665.
CHANGE IN THE FUND’S INDEPENDENT REGISTERED PUBLIC
ACCOUNTING FIRM
March 31, 2007 (Unaudited)
Dividend Capital Realty Income Allocation Fund
The Fund’s financial statements for the fiscal year ended September 30, 2006, were audited by Deloitte & Touche LLP (“Deloitte”), independent registered public accounting firm. On November 16, 2006, the Audit Committee selected, and the Fund’s Board, including its Independent Trustees, ratified, the selection of Deloitte as the registered public accounting firm for the Fund for the fiscal year ending September 30, 2007. Subsequently, in February 2007, the Fund was advised by Deloitte, that Deloitte would no longer be able to serve as the Fund’s Independent Registered Public Accounting Firm and would not be able to provide audit services to the Fund as a result of services an affiliate of Deloitte had been asked to provide to certain affiliates of the Fund, which would impair the independence of Deloitte with respect to the Fund. As a result, the Audit Committee recommended, and the Fund’s Board, including its Independent Trustees, accepted the resignation of Deloitte.
Deloitte’s reports on the financial statements as of and for the fiscal years ended September 30, 2006 and September 30, 2005 did not contain an adverse opinion or
30
a disclaimer of opinion, nor were they qualified or modified as to uncertainty, audit scope, or accounting principles.
During the fiscal years ended September 30, 2006 and September 30, 2005 and through the date hereof, there were no disagreements between the Fund and Deloitte concerning any matter of accounting principles or practices, financial statement disclosure, or auditing scope or procedure, which disagreements, if not resolved to the satisfaction of Deloitte, would have caused Deloitte to make reference to the subject matter of the disagreements in connection with its reports, and there were no reportable events as defined in Item 304(a)(1)(v) of Regulation S-K.
Deloitte had been the Fund’s independent registered public accounting firm since the Fund’s inception in January 2005.
On April 25, 2007, the Audit Committe recommended, and the Fund’s Board, including it’s Independent Trustees, approved the appointment of KPMG LLP as the registered public accounting firm for the Fund for the fiscal year ending September 30, 2007.
DIVIDEND REINVESTMENT PLAN
March 31, 2007 (Unaudited)
Dividend Capital Realty Income Allocation Fund
The Fund offers a dividend reinvestment plan (the “Plan”) pursuant to which shareholders, unless they otherwise elect, automatically have dividends and capital gains distributions reinvested in common shares of the Fund by The Bank of New York (the “Plan Agent”). Shareholders who elect not to participate in the Plan receive all distributions in cash paid by wire or check mailed directly to the Plan Agent.
How the Plan Works
After the Fund declares a dividend or determines to make a capital gain distribution, the Plan Agent will acquire shares for the participants’ accounts, depending upon the circumstances described below, either (i) through receipt of newly issued shares of the Fund or (ii) by open-market purchases as follows:
· If, on the payment date, the NAV is equal to or less than the market price per share plus estimated brokerage commissions, the Plan Agent will invest the distribution amount in newly issued shares on behalf of the participants. The number of newly issued shares to be credited to each participant’s account will be determined by dividing the dollar amount of the distribution by the NAV
31
on the date the shares are issued. However, if the NAV is less than 95% of the market price on the payment date, the dollar amount of the distribution will be divided by 95% of the market price on the payment date. Because common shares may be issued at less than their market price, Plan participants may get a benefit that non-participants do not.
· If, on the payment date, the NAV is greater than the market value per share plus estimated brokerage commissions, the Plan Agent will invest the distribution amount in shares acquired on behalf of the participants in open-market purchases, which may be made on the NYSE, in the over-the-counter market or in negotiated transactions and may be on such terms as to price, delivery and otherwise as the Plan Agent shall determine. It is possible that the market price for the shares may increase before the Plan Agent has completed its purchases. Therefore, the average purchase price per share the Plan Agent pays may exceed the market price thereof on the payment date. If the market price per share increases so that it equals or exceeds the NAV per share (minus brokerage commissions), it will result in the acquisition by the Plan Agent of fewer shares than if the distribution had been paid in shares issued by the Fund. Otherwise, the Plan Agent will use all distributions received in cash to purchase shares in the open market on or shortly after the payment date, but in no event more than thirty (30) days after the payment date.
Costs of the Plan
The Plan Agent’s fees for the handling of reinvestment of dividends and other distributions will be paid by the Fund. However, each participant will pay a pro rata share of brokerage commissions incurred with respect to the Plan Agent’s open-market purchases in connection with the reinvestment of dividends and other distributions. If a participant elects to have the Plan Agent sell part or all of his or her shares and remit the proceeds, the participant will be charged his or her pro rata share of brokerage commissions on the shares sold, plus a $15.00 transaction fee.
Tax Implications
The automatic reinvestment of dividends or distributions does not relieve participants of any taxes which may be payable on such dividends or distributions. Participants will receive tax information annually for their personal records and to help them prepare their federal income tax return. For further information as to the tax consequences of participation in the Plan, participants should consult with their own tax advisors.
Right to Withdraw
Participants whose shares are registered in his or her name may terminate his or her account under the Plan by notifying the Agent in writing at P.O. Box 11258, New York, NY 10286-1258, or by calling the Agent at 1-800-432-8224, or using The Bank of New York’s website at: http://stockbny.com. Such termination will be effective with respect to a particular distribution if the Participant’s notice is
32
received by the Agent prior to such distribution record date. Participants whose shares are held by a brokerage firm should contact his or her broker. If a Participant holds shares through a broker, the Participant may not be able to transfer his or her shares to another broker and continue to participate in the Plan if the new broker does not permit such participation. The Plan may be amended or terminated by the Agent or the Fund upon notice in writing mailed to each Participant at least 90 days prior to the effective date of the termination.
FUND PROXY VOTING POLICIES & PROCEDURES
March 31, 2007 (Unaudited)
Dividend Capital Realty Income Allocation Fund
The Fund has delegated to the Adviser the voting of proxies relating to its securities. The Adviser will vote such proxies in accordance with the Adviser’s policies and procedures. The policies and procedures used in determining how to vote proxies relating to portfolio securities are available without charge, upon request, by contacting the Fund at 1-866-324-7348, visiting the Fund’s website at http://www.dividendcapital.com and visiting the Securities Exchange Commission’s (the “Commission”) website at http://www.sec.gov.
Information on how proxies relating to the Fund’s portfolio securities were voted by the Adviser during the most recent 12-month period ended June 30th is available without charge, upon request, by contacting the Fund at 1-866-324-7348 and on the Commission’s website at http://www.sec.gov.
PORTFOLIO HOLDINGS
March 31, 2007 (Unaudited)
Dividend Capital Realty Income Allocation Fund
The Fund files its complete schedule of portfolio holdings with the Commission for the first and third quarters of each fiscal year on Form N-Q within 60 days after the end of the period. Copies of the Fund’s Forms N-Q are available without charge, upon request, by contacting the Fund at 1-866-324-7348 and on the Commission’s website at http://www.sec.gov. You may also review and copy Form N-Q at the Commission’s Public Reference Room in Washington, D.C. For more information about the operation of the Public Reference Room, please call the Commission at 1-800-SEC-0330.
33
KEY INFORMATION
March 31, 2007(Unaudited)
Dividend Capital Realty Income Allocation Fund
Key Information | | Officers and Trustees: |
| | |
Investment Adviser and | | Jonathan F. Zeschin |
Administrator | | Independent Trustee and |
Dividend Capital Investments LLC | | Chairman of the Board |
518 17th Street, Suite 1200 | | |
Denver, CO 80202 | | Thomas H. Mack |
| | Independent Trustee |
Custodian and Fund | | |
Accounting Agent | | John Mezger |
State Street Bank and Trust Co. | | Independent Trustee |
801 Pennsylvania | | |
Kansas City, MO 64105 | | J. Gibson Watson, III |
| | Independent Trustee |
Transfer Agent | | |
The Bank of New York | | Thomas I. Florence |
1 Wall Street | | President and Trustee |
New York, NY 10286 | | |
| | Jeffrey W. Taylor |
Legal Counsel | | Vice President and Treasurer |
Dechert LLP | | |
4675 MacArthur Court, Suite 1400 | | Derek J. Mullins |
Newport Beach, CA 92660 | | Secretary and Assistant Treasurer |
| | |
Independent Registered Public | | Jami N. VonKaenel |
Accounting Firm | | Assistant Secretary |
KPMG LLP | | |
707 17th Street, Suite 2700 | | |
Denver, CO 80202 | | |
New York Stock Exchange Symbol: DCA
This report is for shareholder information. This is not a prospectus intended for use in the purchase or sale of fund shares. Statements and other information contained in this report are as dated and are subject to change.
34