As filed with the Securities and Exchange Commission on September 4, 2009
UNITED STATES
SECURITIES AND EXCHANGE COMMISSION
Washington, D.C. 20549
FORM N-CSR
CERTIFIED SHAREHOLDER REPORT OF
REGISTERED MANAGEMENT INVESTMENT COMPANIES
| | |
| Investment Company Act file Number: 811-21680 |
DCA Total Return Fund
|
| (Exact Name of the Registrant as Specified in Charter) |
518 17th Street, Suite 1200, Denver, CO 80202
(Address of Principal Executive Offices - Zip Code)
303-228-2200
Registrant’s Telephone Number, including area code:
Jeffrey W. Taylor
President
518 17th Street, Suite 1200
Denver, CO 80202
|
| (Names and Addresses of agents for service) |
Date of fiscal year end: December 31, 2009
Date of reporting period: June 30, 2009
| Item 1. | Reports to Shareholders |
The following is a copy of the report to shareholders pursuant to Rule 30e-1 under the Investment Company Act of 1940 (the “Act”).
TABLEOF CONTENTS
The Investment Commentary included in this shareholder report contains certain forward-looking statements about the factors that may affect the performance of the Funds in the future. These statements are based on Fund management’s predictions and expectations concerning certain future events and their expected impact on the Funds, such as performance of the economy as a whole and of the global capital markets, changes in the level of interest rates, the impact of developing world events, and other factors that may influence the future performance of the Funds. Management believes these forward looking statements to be reasonable, although they are inherently uncertain and difficult to predict and there is no guarantee of their accuracy. Actual events may cause adjustments in portfolio management strategies from those currently expected to be employed.
| | |
| 1.866.324.7348 | | 2009 Semi-Annual Report (Unaudited) 1 |
SHAREHOLDER LETTER
August 18, 2009
Fellow Shareholders,
Following a historically challenging 2008, market indices continued to sell-off into early 2009, hitting new cyclical lows in March, followed by a significant rally through June 30, 2009. This rally has continued through mid-August, but may be showing signs of slowing as we write this letter. In part, we believe this rally was fueled by emerging sentiment that the worst of the financial crisis may be behind us, diminishing the near-term likelihood of the “worst-case” scenario, and a belief that the prolonged U.S. recession and corresponding global economic downturn may be reaching an end.
Thus far, 2009 has also brought significant, and we believe positive, changes to both DCA Total Return Fund and DCW Total Return Fund. We encourage you to review the corresponding proxy statement in full that outlines the proposals adopted at our March 16, 2009 shareholder meeting. In summary, the key changes included:
| • | | Changing the Funds’ prior objectives of high current income with a secondary focus on capital appreciation to an objective of total return |
| • | | Eliminating the investment policies requiring at least 80% of managed assets to be invested in securities of real estate companies |
| • | | Removing any specific limitation regarding the Funds’ investment in foreign securities |
| • | | Modifying the dividend policies from a monthly level-rate payment to quarterly distributions |
While we didn’t seek shareholder approval to modify the Funds’ policies that permitted both direct and indirect leverage, the Funds are currently being run with very little or no leverage, and we anticipate generally running them in this manner for the foreseeable future.
| | |
| 2 2009 Semi-Annual Report (Unaudited) | | www.dcclosedendfunds.com |
SHAREHOLDER LETTER (CONTINUED)
As part of this new focus, Dividend Capital Realty Income Allocation Fund changed its name to DCA Total Return, and Dividend Capital Global Realty Exposure Fund changed its name to DCW Total Return Fund. Both Funds retained their respective NYSE symbols – DCA and DCW. In addition, we are transitioning the Funds’ primary benchmarks to the MSCI World Index, which is more representative of the Funds’ revised strategies.
To assist in the execution of the Funds’ new strategies, we are pleased to announce that shareholders approved Calamos Advisors LLC to serve as the Funds’ investment sub-adviser. In this new advisory arrangement, Dividend Capital Investments will continue to provide overall investment advisory services to the Funds, including management of the Funds’ long-term real estate and debt securities portfolio, while Calamos will manage the Funds’ common equity allocations. Calamos is a diversified investment firm offering equity, fixed-income, convertible and alternative investment strategies. With roots dating back to 1977, the firm, which has 28.7 billion in assets under management as of July 31, 2009, serves institutions and individuals via separately managed accounts and a family of open-end and closed-end funds, providing a risk-managed approach to capital appreciation and income-producing strategies. We are excited to be able to partner with a high-quality investment management firm.
To sum up the anticipated implementation of the newly-adopted investment strategies, we are generally targeting under normal market conditions 50%-75% of each Fund’s net assets to be allocated to a net asset value (NAV) appreciation strategy and the remaining 25%-50% to be allocated toward more income-oriented securities. The NAV appreciation allocations are sub-advised by Calamos and currently consist of a global common equity mandate, which seeks to be relatively diversified by country and sector. The income-oriented allocations are overseen directly by Dividend Capital Investments and currently consist primarily of commercial real estate-focused debt and preferred equity securities. Dividend Capital Investments, as Adviser to the Funds, maintains responsibility for overall management of the Funds, including but not limited to establishing each Fund’s overall investment strategy and implementation of the strategies – including the portfolio profiles and asset allocation decisions – as well as analyzing and recommending the Funds’ distribution levels to the Board.
We have been pleased thus far with the results of the strategic changes. As displayed in the performance tables that follow this letter, during the six months ended June 30, 2009, DCA’s NAV total return was -4.33% while the market price total return was -15.66% and DCW’s NAV total return was 12.31% while the market price total return was 15.28%. It is also worth noting that for the second
| | |
| 1.866.324.7348 | | 2009 Semi-Annual Report (Unaudited) 3 |
SHAREHOLDER LETTER (CONTINUED)
quarter of 2009, during which substantial progress was made in the execution of the strategic portfolio changes, DCA’s NAV total return was 30.24% while the market price total return was 32.30% and DCW’s NAV total return was 33.50% while the market price total return was 40.19%.
Both Funds’ performance has been influenced by overall market conditions and by the timing of the overall allocation shifts we began to implement soon after receiving shareholder approval. The Funds benefited not only from outperformance (relative to the MSCI World Index), experienced in their Calamos-managed global common equity strategy, but also realized positive total returns from both Funds’ preferred equity portfolios. Debt securities continued to be a negative influence on both Funds’ performance as commercial real estate fundamentals weakened, continuing to call into question the overall long-term value of these securities.
An additional result of the shift to a total return strategy for both Funds is a potentially lower distribution level. On June 15th, we declared each Fund’s quarterly distribution in the amount of $0.03 per share. In establishing these dividends, we factored in the desire to base the distributions on projected net investment income as well as the Funds’ targeted allocations as previously discussed. The distribution amounts are also influenced by the lack of leverage, which we believe reduces the Funds’ overall risk profile, but results in lower return potential and contributes to lower distributions. Secondarily, the distribution amounts are influenced by floating rate securities – which given the current level of short-term interest rates, are producing relatively lower coupons – as well as by securities for which current payments are being deferred. Finally, while we intend to base future distributions on the then-current projected net investment income (possibly causing distribution amounts to fluctuate); we strived to establish a level with this distribution that we believe is indicative of future ranges. This intention is not a guarantee of a certain distribution level or that distributions in 2009 or future years will not contain return of capital, but outlines our thought process in establishing the current distribution.
In closing, we believe the strategic changes discussed above help to better position the Funds to realize shareholder value by modifying these investment vehicles to focus on total return through investment in common equity, preferred equity and debt securities across a broad range of industries and geographic regions. We believe this broader mandate has the potential to capitalize on investment opportunities that may emerge from the financial market dislocation, while seeking to reduce risk via lower leverage levels and investments in an expanded universe of securities and industries than had been historically utilized in the Funds. While more recent market performance has been positive and there have been signs of
| | |
| 4 2009 Semi-Annual Report (Unaudited) | | www.dcclosedendfunds.com |
SHAREHOLDER LETTER (CONTINUED)
stabilization in the capital markets, combined with a potential bottoming in the U.S. and global economies, we believe significant uncertainties to the economic and financial market recoveries exist. Therefore, we believe capital markets will continue to be volatile. However, we believe this environment will create compelling, long-term investment opportunities. Against this backdrop, we believe the Funds’ changes are designed to enhance the value creation potential for all shareholders.
We thank you for your continued support.
Sincerely,
| | |
 | |  |
| Jeffrey Taylor | | Jeffrey Randall |
| President | | Portfolio Manager |
| | |
| 1.866.324.7348 | | 2009 Semi-Annual Report (Unaudited) 5 |
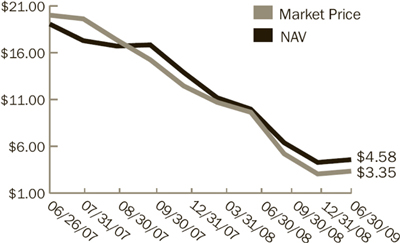
TOTAL RETURNSAND TRADING HISTORY
June 30, 2009 (Unaudited)
DCA Total Return Fund
Average Annual Total Return (1)(2)
| | | | | | | | | |
| | | January 1, 2009 to
June 30, 2009 | | | 1-Year Ended
June 30, 2009 | | | Since Inception (7) | |
DCA at Market Price (“MP”) | | -15.66 | % | | -64.39 | % | | -32.47 | % |
DCA at Net Asset Value (“NAV”) | | -4.33 | % | | -58.31 | % | | -26.53 | % |
MSCI World Index (3) | | 6.79 | % | | -36.24 | % | | -1.94 | % |
Wachovia Hybrid & Preferred Securities REIT Index SM (4) | | 23.67 | % | | -7.87 | % | | -1.70 | % |
MSCI U.S. REIT Index (5) | | -12.42 | % | | -43.74 | % | | -6.69 | % |
CMBS Index (6) | | 14.97 | % | | -51.11 | % | | -12.58 | % |
Trading History (1)(8)

| | | | |
Average Premium/Discount to NAV | | | |
3-Month | | | -21.84 | % |
1-Year | | | -24.06 | % |
Since Inception | | | -6.55 | % |
| |
52-Week Price History Range | | | |
MP | | $ | 0.89 - $5.19 | |
NAV | | $ | 1.52 - $6.13 | |
| (1) | Past performance is no guarantee of future results. Investors cannot invest directly into any index. This chart is for illustrative purposes only and does not relate to the future performance of the Fund. For current to the most recent month-end performance, visit dcclosedendfunds.com, or call 866.DCG.REIT (324.7348). Performance data quoted above is historical. Current performance may be higher or lower than the performance data quoted. Performance does not include transaction fees that may be charged by your financial advisor or brokerage firm. |
| (2) | Total return assumes reinvestment of dividend and capital gain distributions. Investors cannot invest at NAV. |
| (3) | The MSCI World Index is a market capitalization weighted index designed to measure the equity market performance of 23 economically developed markets. |
| (4) | The Wachovia Hybrid & Preferred Securities REIT IndexSM is a capitalization weighted unmanaged index of exchange listed perpetual REIT preferred stocks and depository shares. The index is compiled by Wachovia Capital Markets, LLC and calculated by the American Stock Exchange. The Fund expects to invest in securities not included in this index, such as debt securities which may have lower returns than preferred stock, and common stock and non-U.S. securities which may be riskier than U.S. preferred stock. This index also includes securities in which the Fund will not invest. |
| (5) | The MSCI U.S. REIT Index (RMS) is an unmanaged index of REIT securities of reasonable size and liquidity, weighted by market capitalization and considered representative of U.S. equity REIT performance. The index is used in comparison to the Fund because the Fund invests in common stock of companies primarily engaged in real estate, including REITs. |
| (6) | The Lehman Brothers High-Yield CMBS Index is an unmanaged index of non-investment-grade and unrated CMBS, weighted by market value and comprised of all new issue U.S. CMBS transactions that have a maturity greater than one year, an original transaction size in excess of $500 million, and aggregate outstanding transaction size of at least $300 million, and is considered representative of the high-yield CMBS market. The index is used in comparison to the Fund because the Fund invests in commercial mortgage-backed securities. |
| (7) | Fund inception is 02/24/2005. |
| (8) | Market price and NAV price history are since inception, based upon closing market price. |
| | |
| 6 2009 Semi-Annual Report (Unaudited) | | www.dcclosedendfunds.com |
PORTFOLIO PROFILE
June 30, 2009 (Unaudited)
DCA Total Return Fund (continued)
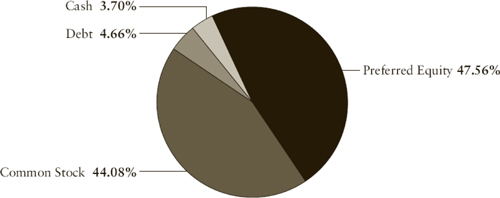
Asset Class Allocation (9)(10)
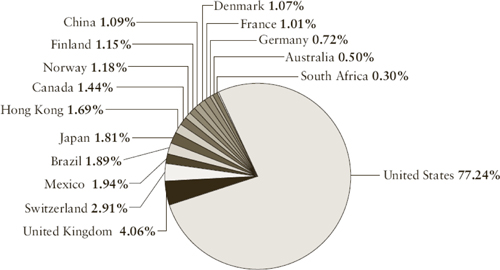
Country Allocation (9)(11)
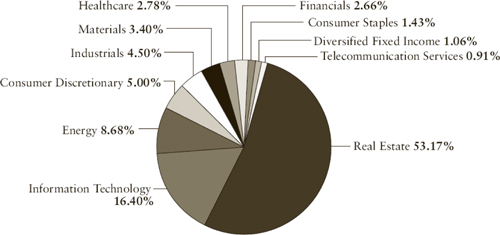
Sector Allocation (9)(11)
| (9) | Holdings and composition of holdings are subject to change, and may not be representative of future investments. |
| (10) | Asset class allocation breakdown percentages are based on the market value of the fund’s investments. |
| (11) | Country and Sector allocation breakdown percentages are based on the market value of the fund’s investments exclusive of cash or U.S. government obligations. |
| | |
| 1.866.324.7348 | | 2009 Semi-Annual Report (Unaudited) 7 |
TOTAL RETURNSAND TRADING HISTORY
June 30, 2009 (Unaudited)
DCW Total Return Fund
Average Annual Total Returns (1)(2)
| | | | | | | | | |
| | | January 1, 2009
to June 30, 2009 | | | 1-Year Ended
June 30, 2009 | | | Since
Inception (7) | |
DCW at Market Price (“MP”) | | 15.28 | % | | -57.29 | % | | -51.33 | % |
DCW at Net Asset Value (“NAV”) | | 12.31 | % | | -43.60 | % | | -41.78 | % |
MSCI World Index (3) | | 6.79 | % | | -36.24 | % | | -20.03 | % |
FTSE EPRA/NAREIT Global Real Estate Index® (4) | | 5.88 | % | | -35.86 | % | | -27.89 | % |
Wachovia Hybrid & Preferred Securities REIT IndexSM (5) | | 23.67 | % | | -7.87 | % | | -9.25 | % |
Lehman Brothers Investment Grade CMBS IndexTM (6) | | 10.44 | % | | -11.96 | % | | -5.52 | % |
| | | |
Trading History (1)(8) | | | | | | | | | |
| | | | |
Average Premium/Discount to NAV | | | |
3-Month | | | -25.25 | % |
1-Year | | | -22.29 | % |
Since Inception | | | -10.51 | % |
| |
52-Week Price History Range | | | |
MP | | $ | 1.81 - $9.46 | |
NAV | | $ | 3.09 - $9.95 | |
| (1) | Past performance is no guarantee of future results. Investors cannot invest directly into any index. This chart is for illustrative purposes only and does not relate to the future performance of the Fund. For current to the most recent month-end performance, visit dcclosedendfunds.com, or call 866.DCG.REIT (324.7348). Performance data quoted above is historical. Current performance may be higher or lower than the performance data quoted. Performance does not include transaction fees that may be charged by your financial advisor or brokerage firm. |
| (2) | Total return assumes reinvestment of dividend and capital gain distributions. Investors cannot invest at NAV. |
| (3) | The MSCI World Index is a market capitalization weighted index designed to measure the equity market performance of 23 economically developed markets. |
| (4) | The FTSE EPRA/NAREIT Global Real Estate Index® is a market capitalization weighted index, based on the last trade price of shares of all eligible companies. The index is structured in such a way that it can be considered to represent general trends in all eligible real estate stocks worldwide. The index is designed to reflect the stock performance of companies engaged in specific aspects of the North American, European and Asian real estate markets as perceived by institutional investors. Relevant real estate activities are defined as the ownership, disposure and development of income-producing real estate. |
| (5) | The Wachovia Hybrid & Preferred Securities REIT IndexSM is a capitalization weighted unmanaged index of exchange listed perpetual REIT preferred stocks and depository shares. The index is compiled by Wachovia Capital Markets, LLC and calculated by the American Stock Exchange. The Fund expects to invest in securities not included in this index, such as debt securities which may have lower returns than preferred stock, and common stock and non-U.S. securities which may be riskier than U.S. preferred stock. This index also includes securities in which the Fund will not invest. |
| (6) | The Lehman Brothers Investment Grade CMBS IndexTM is an unmanaged index of investment grade commercial mortgage backed securities (CMBS). This index is used because the fund may invest in debt securities of global real estate companies. The index only represents CMBS of U.S. real estate companies while the fund may invest in CMBS and other debt securities of global real estate companies. The fund expects to invest in securities not included in this index, such as common stock, preferred stock and non-U.S. securities which may be riskier than U.S. debt securities. This index also includes securities in which the fund will not invest. |
| | |
| 8 2009 Semi-Annual Report (Unaudited) | | www.dcclosedendfunds.com |
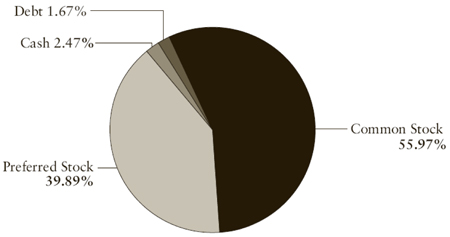
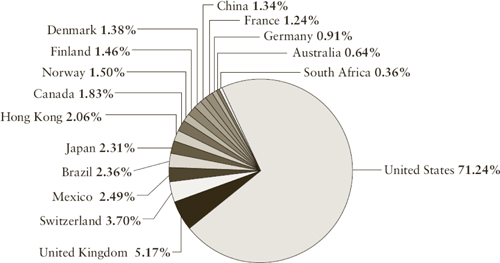
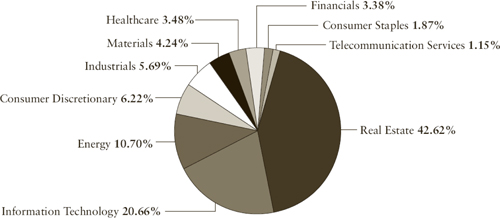
PORTFOLIO PROFILE
June 30, 2009 (Unaudited)
DCW Total Return Fund (continued)
Asset Class Allocation (9)(10)
Country Allocation (9)(11)
Sector Allocation (9)(11)
| (7) | Fund inception is 06/27/2007. |
| (8) | Market price and NAV price history are since inception, based upon closing market price. |
| (9) | Holdings and composition of holdings are subject to change, and may not be representative of future investments. |
| (10) | Asset class allocation breakdown percentages are based on the market value of the fund’s investments. |
| (11) | Country and Sector allocation breakdown percentages are based on the market value of the fund’s investments exclusive of cash or U.S. government obligations. |
| | |
| 1.866.324.7348 | | 2009 Semi-Annual Report (Unaudited) 9 |
STATEMENTOF INVESTMENTS
June 30, 2009 (Unaudited)
DCA Total Return Fund (1)
| | | | | |
| | | Shares | | Market
Value |
COMMON STOCK 43.40% | | | | | |
| | |
Aerospace & Defense 1.27% | | | | | |
General Dynamics Corp. | | 2,500 | | $ | 138,475 |
Honeywell International Inc. | | 3,300 | | | 103,620 |
United Technologies Corp. | | 2,800 | | | 145,488 |
| | | | | |
| | | | | 387,583 |
| | | | | |
| | |
Apparel Retail 0.20% | | | | | |
Guess? Inc. | | 2,400 | | | 61,872 |
| | |
Apparel, Accessories & Luxury Goods 1.48% | | | | | |
Coach Inc. | | 5,700 | | | 153,216 |
Swatch Group AG | | 9,100 | | | 297,736 |
| | | | | |
| | | | | 450,952 |
| | | | | |
| | |
Application Software 2.31% | | | | | |
Autonomy Corp. PLC* | | 22,000 | | | 520,112 |
Parametric Technology Corp.* | | 5,500 | | | 64,295 |
SAP AG | | 3,000 | | | 120,365 |
| | | | | |
| | | | | 704,772 |
| | | | | |
| | |
Asset Management & Custody Banks 1.23% | | | | | |
BlackRock Inc. | | 900 | | | 157,878 |
T. Rowe Price Group Inc. | | 5,200 | | | 216,684 |
| | | | | |
| | | | | 374,562 |
| | | | | |
| | |
Biotechnology 0.16% | | | | | |
Celgene Corp.* | | 1,000 | | | 47,840 |
| | |
Broadcasting 0.25% | | | | | |
Grupo Televisa SA | | 22,000 | | | 74,763 |
| | |
Communications Equipment 2.43% | | | | | |
Nokia OYJ | | 22,700 | | | 332,461 |
QUALCOMM Inc. | | 1,800 | | | 81,360 |
Tandberg ASA | | 10,500 | | | 176,765 |
VTech Holdings Ltd. | | 22,000 | | | 150,167 |
| | | | | |
| | | | | 740,753 |
| | | | | |
| | |
Computer Hardware 2.39% | | | | | |
Apple Inc.* | | 4,200 | | | 598,206 |
Dell Inc.* | | 9,500 | | | 130,435 |
| | | | | |
| | | | | 728,641 |
| | | | | |
Footnotes to DCA Statement of Investments on page 17.
| | |
| 10 2009 Semi-Annual Report (Unaudited) | | www.dcclosedendfunds.com |
STATEMENTOF INVESTMENTS (CONTINUED)
June 30, 2009 (Unaudited)
DCA Total Return Fund (continued)
| | | | | |
| | | Shares | | Market
Value |
COMMON STOCK (continued) | | | | | |
| | |
Computer Storage & Peripherals 0.32% | | | | | |
Logitech International SA* | | 7,000 | | $ | 96,958 |
| | |
Construction & Engineering 0.91% | | | | | |
Fluor Corp. | | 2,100 | | | 107,709 |
Jacobs Engineering Group Inc.* | | 4,000 | | | 168,360 |
| | | | | |
| | | | | 276,069 |
| | | | | |
| | |
Construction & Farm Machinery & Heavy Trucks 0.20% | | | | | |
AGCO Corp.* | | 2,100 | | | 61,047 |
| | |
Data Processing & Outsourced Services 0.60% | | | | | |
Mastercard Inc. | | 540 | | | 90,347 |
Redecard SA | | 6,000 | | | 91,860 |
| | | | | |
| | | | | 182,207 |
| | | | | |
| | |
Diversified Banks 0.92% | | | | | |
Standard Chartered PLC | | 15,000 | | | 281,329 |
| | |
Diversified Metals & Mining 1.52% | | | | | |
Anglo American PLC | | 6,400 | | | 185,683 |
BHP Billiton Ltd. | | 5,200 | | | 145,483 |
Cia Vale de Rio Doce - ADR | | 7,500 | | | 132,225 |
| | | | | |
| | | | | 463,391 |
| | | | | |
| | |
Education Services 0.18% | | | | | |
Apollo Group Inc. - Class A* | | 778 | | | 55,331 |
| | |
Electronic Manufacturing Services 0.23% | | | | | |
Trimble Navigation Ltd.* | | 3,500 | | | 68,705 |
| | |
Fertilizers & Agricultural Chemicals 0.90% | | | | | |
Fertilizantes Fosfatados SA | | 8,500 | | | 65,458 |
Syngenta AG | | 525 | | | 121,882 |
Yara International ASA | | 3,100 | | | 86,779 |
| | | | | |
| | | | | 274,119 |
| | | | | |
| | |
Footwear 1.09% | | | | | |
NIKE Inc. - Class B | | 2,375 | | | 122,978 |
Puma AG Rudolf Dassler Sport | | 950 | | | 208,997 |
| | | | | |
| | | | | 331,975 |
| | | | | |
Footnotes to DCA Statement of Investments on page 17.
| | |
| 1.866.324.7348 | | 2009 Semi-Annual Report (Unaudited) 11 |
STATEMENTOF INVESTMENTS (CONTINUED)
June 30, 2009 (Unaudited)
DCA Total Return Fund (continued)
| | | | | |
| | | Shares | | Market
Value |
COMMON STOCK (continued) | | | | | |
| | |
Gold 0.81% | | | | | |
Barrick Gold Corp | | 3,000 | | $ | 100,650 |
Zijin Minning Group Co. Ltd. | | 160,000 | | | 144,722 |
| | | | | |
| | | | | 245,372 |
| | | | | |
| | |
Health Care Equipment 0.79% | | | | | |
Intuitive Surgical Inc.* | | 450 | | | 73,647 |
Stryker Corp. | | 4,200 | | | 166,908 |
| | | | | |
| | | | | 240,555 |
| | | | | |
| | |
Health Care Supplies 1.33% | | | | | |
Alcon Inc. | | 3,500 | | | 406,420 |
| | |
Heavy Electrical Equipment 1.88% | | | | | |
ABB Ltd.* | | 13,000 | | | 204,353 |
Alstom SA | | 2,850 | | | 168,143 |
Vestas Wind Systems A/S* | | 2,800 | | | 200,699 |
| | | | | |
| | | | | 573,195 |
| | | | | |
| | |
Home Entertainment Software 1.54% | | | | | |
Nintendo Company Ltd. | | 1,700 | | | 469,933 |
| | |
Hypermarket & Super Centers 0.73% | | | | | |
Wal-Mart de Mexico SAB de CV | | 75,000 | | | 222,410 |
| | |
Integrated Oil & Gas 1.67% | | | | | |
Petroleo Brasileiro SA - ADR | | 3,500 | | | 143,431 |
Sasol Ltd. | | 2,500 | | | 87,528 |
StatoilHydro ASA | | 4,000 | | | 78,754 |
Suncor Energy Inc. | | 6,500 | | | 197,657 |
| | | | | |
| | | | | 507,370 |
| | | | | |
| | |
Internet Retail 1.37% | | | | | |
Amazon.com Inc.* | | 5,000 | | | 418,300 |
| | |
Internet Software & Service 3.53% | | | | | |
Baidu.com Inc. - ADR* | | 1,050 | | | 316,144 |
eBay Inc.* | | 12,300 | | | 210,699 |
Google Inc. - Class A* | | 1,300 | | | 548,066 |
| | | | | |
| | | | | 1,074,909 |
| | | | | |
Footnotes to DCA Statement of Investment on page 17.
| | |
| 12 2009 Semi-Annual Report (Unaudited) | | www.dcclosedendfunds.com |
STATEMENTOF INVESTMENTS (CONTINUED)
June 30, 2009 (Unaudited)
DCA Total Return Fund (continued)
| | | | | |
| | | Shares | | Market
Value |
COMMON STOCK (continued) | | | | | |
| | |
IT Consulting & Other Services 0.92% | | | | | |
Infosys Technologies Ltd. - ADR | | 7,600 | | $ | 279,528 |
| | |
Oil & Gas Drilling 1.81% | | | | | |
ENSCO International Inc. | | 3,100 | | | 108,097 |
Noble Corp. | | 5,200 | | | 157,300 |
Noble Energy Inc. | | 2,200 | | | 129,734 |
Transocean Ltd.* | | 2,100 | | | 156,009 |
| | | | | |
| | | | | 551,140 |
| | | | | |
| | |
Oil & Gas Equipment & Services 2.80% | | | | | |
AMEC PLC | | 17,000 | | | 182,633 |
Cameron International Corp.* | | 5,000 | | | 141,500 |
Halliburton Company | | 9,500 | | | 196,650 |
National Oilwell Varco Inc.* | | 6,400 | | | 209,024 |
Technip SA | | 2,500 | | | 122,364 |
| | | | | |
| | | | | 852,171 |
| | | | | |
| | |
Oil & Gas Exploration & Production 1.96% | | | | | |
Apache Corp. | | 2,600 | | | 187,590 |
CNOOC Ltd. | | 155,000 | | | 192,199 |
Nexen Inc. | | 10,000 | | | 217,255 |
| | | | | |
| | | | | 597,044 |
| | | | | |
| | |
Pharmaceuticals 0.35% | | | | | |
Novo Nordisk A/S - Class B - ADR | | 2,000 | | | 108,129 |
| | |
Photographic Products 0.17% | | | | | |
Nikon Corp. | | 3,000 | | | 52,131 |
| | |
Regional Mall - REITs 0.00% (2) | | | | | |
Simon Property Group Inc. | | 4 | | | 214 |
| | |
Semiconductors 0.76% | | | | | |
Marvell Technology Group Ltd.* | | 6,000 | | | 69,840 |
Samsung Electronics Co. Ltd. - GDR | | 700 | | | 162,644 |
| | | | | |
| | | | | 232,484 |
| | | | | |
| | |
Soft Drinks 0.63% | | | | | |
Coca-Cola Co. | | 4,000 | | | 191,960 |
| | |
Specialized Finance 0.3 7% | | | | | |
BM&F Bovespa SA | | 19,000 | | | 113,447 |
Footnotes to DCA Statement of Investments on page 17.
| | |
| 1.866.324.7348 | | 2009 Semi-Annual Report (Unaudited) 13 |
STATEMENTOF INVESTMENTS (CONTINUED)
June 30, 2009 (Unaudited)
DCA Total Return Fund (continued)
| | | | | | | |
| | | | | Shares | | Market
Value |
COMMON STOCK (continued) | | | | | | | |
| | | |
Systems Software 0.53% | | | | | | | |
Check Point Software Technologies* | | | | 4,500 | | $ | 105,615 |
Oracle Corp. | | | | 2,600 | | | 55,692 |
| | | | | | | |
| | | | | | | 161,307 |
| | | | | | | |
| | | |
Wireless Telecommunication Services 0.86% | | | | | | | |
America Movil SAB de CV - ADR | | | | 6,800 | | | 263,296 |
| | | |
TOTAL COMMON STOCK (Cost $11,184,045) | | | | | | $ | 13,224,114 |
| | | | | | | |
| | | |
| | | Bond Rating
Moody’s/S&P
(Unaudited) | | Shares | | Market
Value |
PREFERRED STOCK 46.83% | | | | | | | |
| | | |
Apartments - REITs 1.06% | | | | | | | |
BRE Properties, Inc., | | | | | | | |
Series D, 6.750% | | Baa3/BB+ | | 17,900 | | $ | 322,200 |
| | | |
Diversified/Miscellaneous - REITs 0.30% | | | | | | | |
Vornado Realty Trust, | | | | | | | |
Series G, 6.675% | | Baa3/BBB- | | 5,000 | | | 91,750 |
| | | |
Hotels - REITs 16.82% | | | | | | | |
AP AIMCAP Corp., | | | | | | | |
Series A, 8.250% (3) | | NR/NR | | 212,600 | | | 49,430 |
Host Hotels & Resorts Inc., | | | | | | | |
Series E, 8.875% | | Ba2/B- | | 1,250 | | | 25,781 |
LaSalle Hotel Properties, | | | | | | | |
Series G, 7.250% | | NR/NR | | 289,010 | | | 4,523,006 |
Strategic Hotels & Resorts Inc., | | | | | | | |
Series C, 8.250% | | NR/NR | | 83,300 | | | 526,456 |
| | | | | | | |
| | | | | | | 5,124,673 |
| | | | | | | |
| | | |
Mortgage - Residential - REITs 0.00% (2) | | | | | | | |
American Home Mortgage Investment | | | | | | | |
Series A, 9.750% (4) | | NR/NR | | 266,950 | | | 534 |
Series B, 9.250% (4) | | NR/NR | | 29,700 | | | 74 |
| | | | | | | |
| | | | | | | 608 |
| | | | | | | |
| | | |
Net Lease- REITs 3.55% | | | | | | | |
Entertainment Properties Trust, | | | | | | | |
Series B, 7.750% | | NR/NR | | 73,100 | | | 1,081,880 |
Footnotes to DCA Statement of Investment on page 17.
| | |
| 14 2009 Semi-Annual Report (Unaudited) | | www.dcclosedendfunds.com |
STATEMENTOF INVESTMENTS (CONTINUED)
June 30, 2009 (Unaudited)
DCA Total Return Fund (continued)
| | | | | | | |
| | | Bond Rating
Moody’s/S&P
(Unaudited) | | Shares | | Market
Value |
PREFERRED STOCK (continued) | | | | | | | |
| | | |
Office - REITs 0.17% | | | | | | | |
Corporate Office Properties Trust | | | | | | | |
Series H, 7.500% | | NR/NR | | 2,500 | | $ | 50,400 |
| | | |
Office - Suburban - REITs 17.21% | | | | | | | |
BioMed Realty Trust Inc., | | | | | | | |
Series A, 7.375% | | NR/NR | | 145,598 | | | 2,536,318 |
Digital Realty Trust Inc.: | | | | | | | |
Series A, 8.500% | | NR/NR | | 114,200 | | | 2,512,400 |
Series B, 7.875% | | NR/NR | | 9,400 | | | 195,990 |
| | | | | | | |
| | | | | | | 5,244,708 |
| | | | | | | |
| | | |
Regional Malls - REITs 1.39% | | | | | | | |
Taubman Centers Inc., | | | | | | | |
Series G, 8.000% | | B1/NR | | 22,198 | | | 425,092 |
| | | |
Self Storage - REITs 0.40% | | | | | | | |
Public Storage: | | | | | | | |
Series E, 7.250% | | Baa1/BBB | | 4,195 | | | 84,068 |
Series I, 7.250% | | Baa1/BBB | | 900 | | | 19,458 |
Series K, 6.750% | | Baa1/BBB | | 884 | | | 19,536 |
| | | | | | | |
| | | | | | | 123,062 |
| | | | | | | |
| | | |
Shopping Centers - REITs 5.93% | | | | | | | |
Kimco Realty Corp., | | | | | | | |
Series G, 7.750% | | Baa2/BBB- | | 85,057 | | | 1,756,427 |
Tanger Factory Outlet Centers, | | | | | | | |
Series C, 7.500% | | Ba1/BB+ | | 2,500 | | | 49,800 |
| | | | | | | |
| | | | | | | 1,806,227 |
| | | | | | | |
TOTAL PREFERRED STOCK (Cost $32,559,727) | | | | | | $ | 14,270,600 |
| | | | | | | |
Footnotes to DCA Statement of Investments on page 17.
| | |
| 1.866.324.7348 | | 2009 Semi-Annual Report (Unaudited) 15 |
STATEMENTOF INVESTMENTS (CONTINUED)
June 30, 2009 (Unaudited)
DCA Total Return Fund (continued)
| | | | | | | | |
| | | Bond Rating
Moody’s/S&P
(Unaudited) | | Principal
Amount/Shares | | Market
Value |
COMMERCIAL REAL ESTATE | | | | | | | | |
COLLATERALIZED DEBT OBLIGATIONS 2.67% | | | | | | | | |
CW Capital Cobalt II, Ltd.: | | | | | | | | |
2006-2A, Class K, 4.592%, 04/26/2016 (3)(5)(6)(7)(9) | | Caa1/BB | | $ | 4,000,000 | | $ | 182,880 |
Class P.S., 0.22%, 04/26/2016 (3)(5)(6)(7)(8) | | NR/NR | | | 3,500,000 | | | 175,000 |
Lenox Street, Ltd., Series 2007-1A, | | | | | | | | |
Class SN 0.000%, 06/04/2017 (3)(5)(6)(7)(8) | | NR/NR | | | 1,000,000 | | | — |
Sorin Real Estate CDO II Ltd., Series 2005-2A, | | | | | | | | |
Class H, 5.177%, 01/04/2016 (3)(5)(6)(7)(9) | | Caa2/BB | | | 7,500,000 | | | 345,375 |
Vertical CRE CDO, Ltd.: | | | | | | | | |
2006-CR1A Class G, 5.101%, 04/22/2013 (3)(5)(6)(7)(9) | | NR/BB+ | | | 6,500,000 | | | 102,310 |
Class P.S., 0.000%, 04/22/2013 (3)(5)(6)(7)(8) | | NR/NR | | | 1,800,000 | | | 9,000 |
| | | |
TOTAL COMMERCIAL REAL ESTATE COLLATERALIZED DEBT OBLIGATIONS (Cost $24,264,429) | | | | | | | $ | 814,565 |
| | | | | | | | |
| | | |
COLLATERALIZED LOAN OBLIGATIONS 1.54% | | | | | | | | |
Babson CLO, Ltd. | | | | | | | | |
2005-3A 0.000%, 11/11/2019 (3)(5)(6)(7)(8) | | NR/NR | | | 13,000,000 | | $ | 130,000 |
Fraser Sullivan CLO, Ltd. | | | | | | | | |
2006-1A, 5.26%, 03/15/2017 (3)(5)(6)(7)(8) | | NR/NR | | | 3,400,000 | | | 340,000 |
| | | |
TOTAL COLLATERALIZED LOAN OBLIGATIONS (Cost $16,400,000) | | | | | | | $ | 470,000 |
| | | | | | | | |
| | | |
COMMERCIAL MORTGAGE-BACKED SECURITIES 0.38% | | | | | | | | |
JP Morgan Chase, Series 2005-LDP2, | | | | | | | | |
Class M, 4.509%, 06/15/2016 (3)(5)(6)(7)(9) | | Ba3/B+ | | | 1,597,000 | | $ | 95,890 |
Wachovia Bank, Series 2005-C18 | | | | | | | | |
Class M, 4.702%, 05/19/2015 (3)(5)(7) | | B1//B- | | | 248,100 | | | 18,800 |
| | | |
TOTAL COMMERCIAL MORTGAGE-BACKED SECURITIES (Cost $1,469,845) | | | | | | | $ | 114,690 |
| | | | | | | | |
| | | |
RIGHTS 0.01% | | | | | | | | |
Rolls-Royce Group PLC - Class C, Rights* | | | | | 1,844,700 | | $ | 3,035 |
| | | |
TOTAL RIGHTS (Cost $0) | | | | | | | $ | 3,035 |
| | | | | | | | |
Footnotes to DCA Statement of Investments on page 17.
| | |
| 16 2009 Semi-Annual Report (Unaudited) | | www.dcclosedendfunds.com |
STATEMENTOF INVESTMENTS (CONTINUED)
June 30, 2009 (Unaudited)
DCA Total Return Fund (continued)
| | | | | |
| | | Shares | | Market
Value |
MONEY MARKET FUNDS 3.65% | | | | | |
AIM STIT Treasury Portfolio, | | | | | |
7-Day Yield 0.046% | | 1,110,935 | | $ | 1,110,935 |
| | |
TOTAL MONEY MARKET FUNDS (Cost $1,110,935) | | | | $ | 1,110,935 |
| | | | | |
| | |
TOTAL INVESTMENTS 98.48% (Cost $86,988,981) | | | | $ | 30,008,009 |
| | |
OTHER ASSETS LESS LIABILITIES 1.52% | | | | | 461,988 |
| | | | | |
NET ASSETS 100.00% | | | | $ | 30,469,997 |
| | | | | |
Footnotes to DCA Statement of Investments:
| * | Non-income producing security. |
| (1) | Prior to March 16, 2009, the DCA Total Return Fund was known as the Dividend Capital Realty Income Allocation Fund. |
| (2) | Less than 0.005% of net assets. |
| (3) | This security is considered illiquid by the Adviser. |
| (5) | This security was purchased pursuant to the terms of a private placement memorandum and is exempt from registration under the Securities Act of 1933, as amended (the “Securities Act”), pursuant to Rule 144A of the Securities Act. This security may only be sold in transactions exempt from registration under the Securities Act, which most commonly involves a sale to “qualified institutional buyers” under Rule 144A. As of June 30, 2009 the value of these securities amounted to $1,399,255 or 4.59% of total net assets. |
| (6) | This security has been valued at fair values determined in good faith by or under the direction of the Fund’s Board of Trustees. |
| (7) | The expected maturity date of this security listed herein is earlier than/later than the legal maturity date of the security due to the expected acceleration/deceleration of the schedule of principal payments by the issuer. |
| (8) | This security represents a junior tranche whereby the holder is entitled to all residual interest, if any, which can vary. The rate listed represents the most recent interest payment received, annualized divided by cost. |
| (9) | The coupon rate shown on floating or adjustable rate securities represents the current effective rate at June 30, 2009. |
See accompanying Notes to Financial Statements
| | |
| 1.866.324.7348 | | 2009 Semi-Annual Report (Unaudited) 17 |
STATEMENTOF INVESTMENTS (CONTINUED)
June 30, 2009 (Unaudited)
DCW Total Return Fund (1)
| | | | | |
| | | Shares | | Market
Value |
COMMON STOCK 55.59% | | | | | |
| | |
Aerospace & Defense 1.65% | | | | | |
General Dynamics Corp. | | 3,700 | | $ | 204,943 |
Honeywell International Inc. | | 5,000 | | | 157,000 |
United Technologies Corp. | | 4,100 | | | 213,036 |
| | | | | |
| | | | | 574,979 |
| | | | | |
| | |
Apparel Retail 0.26% | | | | | |
Guess? Inc. | | 3,500 | | | 90,230 |
| | |
Apparel, Accessories & Luxury Goods 1.91% | | | | | |
Coach Inc. | | 8,400 | | | 225,792 |
Swatch Group AG | | 13,400 | | | 438,424 |
| | | | | |
| | | | | 664,216 |
| | | | | |
| | |
Application Software 3.03% | | | | | |
Autonomy Corp. PLC* | | 33,000 | | | 780,170 |
Parametric Technology Corp.* | | 8,000 | | | 93,520 |
SAP AG | | 4,500 | | | 180,548 |
| | | | | |
| | | | | 1,054,238 |
| | | | | |
| | |
Asset Management & Custody Banks 1.61% | | | | | |
BlackRock Inc. | | 1,350 | | | 236,817 |
T. Rowe Price Group Inc. | | 7,700 | | | 320,859 |
| | | | | |
| | | | | 557,676 |
| | | | | |
| | |
Biotechnology 0.18% | | | | | |
Celgene Corp.* | | 1,300 | | | 62,192 |
| | |
Broadcasting 0.31% | | | | | |
Grupo Televisa SA | | 32,000 | | | 108,746 |
| | |
Communications Equipment 3.14% | | | | | |
Nokia OYJ | | 33,600 | | | 492,101 |
QUALCOMM Inc. | | 2,500 | | | 113,000 |
Tandberg ASA | | 15,500 | | | 260,939 |
VTech Holdings Ltd. | | 33,000 | | | 225,250 |
| | | | | |
| | | | | 1,091,290 |
| | | | | |
| | |
Computer Hardware 3.07% | | | | | |
Apple Inc.* | | 6,200 | | | 883,065 |
Dell Inc.* | | 13,500 | | | 185,355 |
| | | | | |
| | | | | 1,068,420 |
| | | | | |
| | |
Computer Storage & Peripherals 0.40% | | | | | |
Logitech International SA* | | 10,000 | | | 138,512 |
Footnotes to DCW Statement of Investments on page 24.
| | |
| 18 2009 Semi-Annual Report (Unaudited) | | www.dcclosedendfunds.com |
STATEMENTOF INVESTMENTS (CONTINUED)
June 30, 2009 (Unaudited)
DCW Total Return Fund (continued)
| | | | | |
| | | Shares | | Market
Value |
COMMON STOCK (continued) | | | | | |
| | |
Construction & Engineering 1.17% | | | | | |
Fluor Corp. | | 3,000 | | $ | 153,870 |
Jacobs Engineering Group Inc.* | | 6,000 | | | 252,540 |
| | | | | |
| | | | | 406,410 |
| | | | | |
| | |
Construction & Farm Machinery & Heavy Trucks 0.23% | | | | | |
AGCO Corp.* | | 2,800 | | | 81,396 |
| | |
Data Processing & Outsourced Services 0.78% | | | | | |
Mastercard Inc. | | 800 | | | 133,848 |
Redecard SA | | 9,000 | | | 137,790 |
| | | | | |
| | | | | 271,638 |
| | | | | |
| | |
Diversified Banks 1.19% | | | | | |
Standard Chartered PLC | | 22,000 | | | 412,615 |
| | |
Diversified Metals & Mining 1.97% | | | | | |
Anglo American PLC | | 9,500 | | | 275,624 |
BHP Billiton Ltd. | | 7,700 | | | 215,426 |
Cia Vale de Rio Doce - ADR | | 11,000 | | | 193,930 |
| | | | | |
| | | | | 684,980 |
| | | | | |
| | |
Education Services 0.21% | | | | | |
Apollo Group Inc. - Class A* | | 1,022 | | | 72,685 |
| | |
Electronic Manufacturing Services 0.28% | | | | | |
Trimble Navigation Ltd.* | | 5,000 | | | 98,150 |
| | |
Fertilizers & Agricultural Chemicals 1.16% | | | | | |
Fertilizantes Fosfatados SA | | 12,000 | | | 92,411 |
Syngenta AG | | 800 | | | 185,725 |
Yara International ASA | | 4,500 | | | 125,969 |
| | | | | |
| | | | | 404,105 |
| | | | | |
| | |
Footwear 1.40% | | | | | |
Nike Inc. - Class B | | 3,450 | | | 178,641 |
Puma AG Rudolf Dassler Sport | | 1,400 | | | 307,995 |
| | | | | |
| | | | | 486,636 |
| | | | | |
| | |
Gold 0.97% | | | | | |
Barrick Gold Corp. | | 4,000 | | | 134,200 |
Zijin Mining Group Co. Ltd. | | 225,000 | | | 203,515 |
| | | | | |
| | | | | 337,715 |
| | | | | |
Footnotes to DCW Statement of Investments on page 24.
| | |
| 1.866.324.7348 | | 2009 Semi-Annual Report (Unaudited) 19 |
STATEMENTOF INVESTMENTS (CONTINUED)
June 30, 2009 (Unaudited)
DCW Total Return Fund (continued)
| | | | | |
| | | Shares | | Market
Value |
COMMON STOCK (continued) | | | | | |
| | |
Health Care Equipment 0.99% | | | | | |
Intuitive Surgical Inc.* | | 600 | | $ | 98,196 |
Stryker Corp. | | 6,200 | | | 246,388 |
| | | | | |
| | | | | 344,584 |
| | | | | |
| | |
Health Care Supplies 1.74% | | | | | |
Alcon Inc. | | 5,200 | | | 603,825 |
| | |
Heavy Electrical Equipment 2.45% | | | | | |
ABB Ltd. * | | 19,200 | | | 301,814 |
Alstom SA | | 4,200 | | | 247,789 |
Vestas Wind Systems A/S* | | 4,200 | | | 301,049 |
| | | | | |
| | | | | 850,652 |
| | | | | |
| | |
Home Entertainment Software 1.99% | | | | | |
Nintendo Co. Ltd. | | 2,500 | | | 691,078 |
| | |
Hypermarkets & Super Centers 0.98% | | | | | |
Wal-Mart de Mexico SAB de CV | | 115,000 | | | 341,029 |
| | |
Integrated Oil & Gas 2.11% | | | | | |
Petroleo Brasileiro SA - ADR | | 5,000 | | | 204,900 |
Sasol Ltd. | | 3,500 | | | 122,539 |
StatoilHydro ASA | | 6,000 | | | 118,131 |
Suncor Energy Inc. | | 9,500 | | | 288,884 |
| | | | | |
| | | | | 734,454 |
| | | | | |
| | |
Internet Retail 1.69% | | | | | |
Amazon.com Inc.* | | 7,000 | | | 585,620 |
| | |
Internet Software & Services 4.51% | | | | | |
Baidu.com Inc. - ADR* | | 1,500 | | | 451,635 |
eBay Inc.* | | 18,300 | | | 313,479 |
Google Inc. - Class A* | | 1,900 | | | 801,020 |
| | | | | |
| | | | | 1,566,134 |
| | | | | |
| | |
IT Consulting & Other Services 1.20% | | | | | |
Infosys Technologies Ltd. - ADR | | 11,300 | | | 415,614 |
| | |
Oil & Gas Drilling 2.34% | | | | | |
ENSCO International Inc. | | 4,600 | | | 160,402 |
Noble Corp. | | 7,700 | | | 232,925 |
Noble Energy Inc. | | 3,200 | | | 188,704 |
Transocean Ltd.* | | 3,100 | | | 230,299 |
| | | | | |
| | | | | 812,330 |
| | | | | |
Footnotes to DCW Statement of Investments on page 24.
| | |
| 20 2009 Semi-Annual Report (Unaudited) | | www.dcclosedendfunds.com |
STATEMENTOF INVESTMENTS (CONTINUED)
June 30, 2009 (Unaudited)
DCW Total Return Fund (continued)
| | | | | |
| | | Shares | | Market
Value |
COMMON STOCK (continued) | | | | | |
| | |
Oil & Gas Equipment & Services 3.50% | | | | | |
AMEC PLC | | 25,000 | | $ | 268,578 |
Cameron International Corp.* | | 7,000 | | | 198,100 |
Halliburton Co. | | 13,000 | | | 269,100 |
National Oilwell Varco Inc.* | | 9,500 | | | 310,270 |
Technip SA | | 3,500 | | | 171,310 |
| | | | | |
| | | | | 1,217,358 |
| | | | | |
| | |
Oil & Gas Exploration & Production 2.41% | | | | | |
Apache Corp. | | 3,400 | | | 245,310 |
CNOOC Ltd. | | 215,000 | | | 266,598 |
Nexen Inc. | | 15,000 | | | 325,882 |
| | | | | |
| | | | | 837,790 |
| | | | | |
| | |
Pharmaceuticals 0.47% | | | | | |
Novo Nordisk A/S - Class B - ADR | | 3,000 | | | 162,194 |
| | |
Photographic Products 0.25% | | | | | |
Nikon Corp. | | 5,000 | | | 86,884 |
| | |
Semiconductors 0.97% | | | | | |
Marvell Technology Group Ltd.* | | 9,000 | | | 104,760 |
Samsung Electronics Co. Ltd. - GDR | | 1,000 | | | 232,348 |
| | | | | |
| | | | | 337,108 |
| | | | | |
| | |
Soft Drinks 0.83% | | | | | |
Coca-Cola Co. | | 6,000 | | | 287,940 |
| | |
Specialized Finance 0.48% | | | | | |
BM&F Bovespa SA | | 28,000 | | | 167,186 |
| | |
Systems Software 0.65% | | | | | |
Check Point Software Technologies* | | 6,500 | | | 152,555 |
Oracle Corp. | | 3,400 | | | 72,828 |
| | | | | |
| | | | | 225,383 |
| | | | | |
| | |
Wireless Telecommunication Services 1.11% | | | | | |
America Movil SAB de CV - ADR | | 10,000 | | | 387,200 |
| | |
TOTAL COMMON STOCK (Cost $16,270,117) | | | | $ | 19,321,192 |
| | | | | |
Footnotes to DCW Statement of Investments on page 24.
| | |
| 1.866.324.7348 | | 2009 Semi-Annual Report (Unaudited) 21 |
STATEMENTOF INVESTMENTS (CONTINUED)
June 30, 2009 (Unaudited)
DCW Total Return Fund (continued)
| | | | | | | |
| | | Bond Rating
Moody’s/S&P
(Unaudited) | | Shares | | Market
Value |
PREFERRED STOCK 39.64% | | | | | | | |
| | | |
Apartments - REITs 1.21% | | | | | | | |
BRE Properties Inc.: | | | | | | | |
Series C, 6.750% | | Baa3/BB+ | | 11,950 | | $ | 216,654 |
Series D, 6.750% | | Baa3/BB+ | | 11,300 | | | 203,400 |
| | | | | | | |
| | | | | | | 420,054 |
| | | | | | | |
| | | |
Diversified/Miscellaneous - REITs 1.45% | | | | | | | |
PS Business Parks Inc., | | | | | | | |
Series O, 7.375% | | Baa3/BB+ | | 15,000 | | | 286,650 |
Vordano Realty Trust: | | | | | | | |
Series F, 6.750% | | Baa3/BBB- | | 5,036 | | | 94,425 |
Series I/L, 6.625% | | Baa3/BBB- | | 6,716 | | | 124,045 |
| | | | | | | |
| | | | | | | 505,120 |
| | | | | | | |
| | | |
Hotels - REITs 3.14% | | | | | | | |
Host Hotels & Resorts Inc., | | | | | | | |
Series E, 8.875% | | Ba2/B- | | 1,250 | | | 25,781 |
LaSalle Hotel Properties: | | | | | | | |
Series D, 7.500% | | NR/NR | | 35,200 | | | 554,400 |
Series G, 7.250% | | NR/NR | | 20,600 | | | 322,390 |
Strategic Hotels & Resorts Inc., | | | | | | | |
Series C, 8.250% | | NR/NR | | 30,100 | | | 190,232 |
| | | | | | | |
| | | | | | | 1,092,803 |
| | | | | | | |
| | | |
Net Lease - REITs 4.27% | | | | | | | |
Entertainment Properties Trust, Series B, 7.750% | | NR/NR | | 25,000 | | | 370,000 |
Realty Income Corp., Series E, 6.750% | | Baa2/BB+ | | 52,867 | | | 1,114,436 |
| | | | | | | |
| | | | | | | 1,484,436 |
| | | | | | | |
| | | |
Office - Central Business District - REITs 4.60% | | | | | | | |
SL Green Realty Corp., Series C, 7.625% | | NR/NR | | 96,900 | | | 1,598,850 |
| | | |
Office - Suburban - REITs 11.00% | | | | | | | |
BioMed Realty Trust Inc., Series A, 7.375% | | NR/NR | | 121,455 | | | 2,115,746 |
Corporate Office Properties Trust SBI MD, Series H, 7.500% | | NR/NR | | 2,500 | | | 50,400 |
Digital Realty Trust Inc., Series B, 7.875% | | NR/NR | | 31,623 | | | 659,340 |
Kilroy Realty Corp., Series F, 7.500% | | NR/NR | | 54,317 | | | 996,717 |
| | | | | | | |
| | | | | | | 3,822,203 |
| | | | | | | |
| | | |
Regional Malls - REITs 0.74% | | | | | | | |
Taubman Centers, Inc., Series G, 8.000% | | B1/NR | | 13,350 | | | 255,653 |
Footnotes to DCW Statement of Investments on page 24.
| | |
| 22 2009 Semi-Annual Report (Unaudited) | | www.dcclosedendfunds.com |
STATEMENTOF INVESTMENTS (CONTINUED)
June 30, 2009 (Unaudited)
DCW Total Return Fund (continued)
| | | | | | | | |
| | | Bond Rating
Moody’s/S&P
(Unaudited) | | Shares | | Market
Value |
PREFERRED STOCK (continued) | | | | | | | | |
| | | |
Self-Storage - REITs 0.98% | | | | | | | | |
Public Storage: | | | | | | | | |
Series M, 6.625% | | Baa1/BBB | | | 5,228 | | $ | 104,403 |
Series E, 6.750% | | Baa1/BBB | | | 11,800 | | | 236,472 |
| | | | | | | | |
| | | | | | | | 340,875 |
| | | | | | | | |
| | | |
Shopping Centers - REITs 12.25% | | | | | | | | |
Kimco Realty Corp., | | | | | | | | |
Series G, 7.750% | | Baa2/BBB- | | | 203,681 | | | 4,206,012 |
Tanger Factory Outlet Centers, | | | | | | | | |
Series C, 7.500% | | Ba1/BB+ | | | 2,500 | | | 49,800 |
| | | | | | | | |
| | | | | | | | 4,255,812 |
| | | | | | | | |
| | | |
TOTAL PREFERRED STOCK (Cost $18,066,178) | | | | | | | $ | 13,775,806 |
| | | | | | | | |
| | | |
| | | Bond Rating
Moody’s/S&P
(Unaudited) | | Principal
Amount | | Market
Value |
COMMERCIAL REAL ESTATE COLLATERALIZED DEBT OBLIGATIONS 1.66% | | | | | | | | |
Gramercy Real Estate, 2007-1A: | | | | | | | | |
Class GFX, 6.000%, 08/15/2016 (2)(3)(4)(5) | | NR/BBB | | $ | 2,000,000 | | $ | 118,860 |
Class HFX, 6.000%, 08/15/2016 (2)(3)(4)(5) | | NR/BBB- | | | 5,150,000 | | | 260,693 |
Morgan Stanley Capital I, 2007-SRR4, | | | | | | | | |
Series G, 2.815%, 11/20/2052 (2)(3)(4)(5)(6) | | NR/NR | | | 5,750,000 | | | 196,248 |
| | | |
TOTAL COMMERCIAL REAL ESTATE COLLATERALIZED DEBT OBLIGATIONS (Cost $11,653,802) | | | | | | | $ | 575,801 |
| | | | | | | | |
| | | |
| | | | | Shares | | Market
Value |
| | | |
RIGHTS 0.01% | | | | | | | | |
Rolls-Royce Group PLC - Class C, Rights* | | | | | 2,702,700 | | $ | 4,446 |
| | | |
TOTAL RIGHTS (Cost $0) | | | | | | | $ | 4,446 |
| | | | | | | | |
| | | |
MONEY MARKET FUNDS 2.46% | | | | | | | | |
AIM STIT Treasury Portfolio, | | | | | | | | |
7-Day Yield 0.046% | | | | | 853,727 | | $ | 853,727 |
| | | |
TOTAL MONEY MARKET FUNDS (Cost $853,727) | | | | | | | $ | 853,727 |
| | | | | | | | |
Footnotes to DCW Statement of Investments on page 24.
| | |
| 1.866.324.7348 | | 2009 Semi-Annual Report (Unaudited) 23 |
STATEMENTOF INVESTMENTS (CONTINUED)
June 30, 2009 (Unaudited)
DCW Total Return Fund (continued)
| | | |
| | | Market
Value |
TOTAL INVESTMENTS 99.36% (Cost $46,843,824) | | $ | 34,530,972 |
OTHER ASSETS LESS LIABILITIES 0.64% | | | 223,508 |
| | | |
| |
NET ASSETS 100.00% | | $ | 34,754,480 |
| | | |
ADR – American Depository Receipts
GDR – Global Depository Receipts
Footnotes to DCW Statement of Investments:
| (1) | Prior to March 16, 2009, the DCW Total Return Fund was known as Dividend Capital Global Realty Exposure Fund. |
| (2) | This security was purchased pursuant to the terms of a private placement memorandum and is exempt from registration under the Securities Act of 1933, as amended (the “Securities Act”), pursuant to Rule 144A of the Securities Act. This security may only be sold in transactions exempt from registration under the Securities Act, which most commonly involves a sale to “qualified institutional buyers” under Rule 144A. As of June 30, 2009 the value of these securities amounted to $575,801 or 1.66% of net assets. |
| (3) | This security has been valued at fair values determined in good faith by or under the direction of the Fund’s Board of Trustees. |
| (4) | This security is considered illiquid by the Adviser. |
| (5) | The expected maturity date of this security listed herein is earlier than/later than the legal maturity date of the security due to the expected acceleration/deceleration of the schedule of principal payments by the issuer. |
| (6) | The coupon rate shown on floating or adjustable rate securities represents the current effective rate at June 30, 2009. |
See accompanying Notes to Financial Statements.
| | |
| 24 2009 Semi-Annual Report (Unaudited) | | www.dcclosedendfunds.com |
STATEMENTSOF ASSETS & LIABILITIES
June 30, 2009 (Unaudited)
| | | | | | | | |
| | | DCA Total
Return Fund(1) | | | DCW Total
Return Fund (1) | |
ASSETS: | | | | | | | | |
Investments at market value | | $ | 30,008,009 | | | $ | 34,530,972 | |
Cash | | | — | | | | 96,221 | |
Foreign currency, at value (cost $12,417) | | | 12,394 | | | | — | |
Receivable for securities sold | | | 585,432 | | | | 370,326 | |
Dividends and interest receivable | | | 612,524 | | | | 414,033 | |
Other assets | | | 46,616 | | | | 47,918 | |
| | | | | | | | |
TOTAL ASSETS | | $ | 31,264,975 | | | $ | 35,459,470 | |
| | |
LIABILITIES: | | | | | | | | |
Bank overdraft | | $ | 45,715 | | | $ | — | |
Distributions payable | | | 424,831 | | | | 227,729 | |
Payable for securities purchased | | | 247,825 | | | | 416,378 | |
Payable for investment advisory fees | | | 21,875 | | | | 28,675 | |
Payable for administrative fees | | | 11,536 | | | | 11,683 | |
Other liabilities | | | 43,196 | | | | 20,525 | |
| | | | | | | | |
TOTAL LIABILITIES | | $ | 794,978 | | | $ | 704,990 | |
| | | | | | | | |
NET ASSETS | | $ | 30,469,997 | | | $ | 34,754,480 | |
| | | | | | | | |
| | |
COMPOSITION OF NET ASSETS: | | | | | | | | |
Common stock, $0.001 par value (unlimited number of shares authorized) | | $ | 14,161 | | | $ | 7,591 | |
Paid-in capital | | | 196,809,034 | | | | 140,049,726 | |
(Over)/undistributed net investment income | | | 1,500,377 | | | | (480,934 | ) |
Accumulated net realized loss on investments, swap contracts and foreign currency transactions | | | (110,873,533 | ) | | | (92,510,393 | ) |
Net unrealized depreciation of investments, translation of assets and liabilities denominated in foreign currencies | | | (56,980,042 | ) | | | (12,311,510 | ) |
| | | | | | | | |
NET ASSETS | | $ | 30,469,997 | | | $ | 34,754,480 | |
| | | | | | | | |
| | |
COST OF INVESTMENTS | | $ | 86,988,981 | | | $ | 46,843,824 | |
| | | | | | | | |
| | |
SHARES OUTSTANDING AND NET ASSET VALUE PER SHARE: | | | | | | | | |
Common shares outstanding, $0.001 par value (unlimited number of shares authorized) | | | 14,161,010 | | | | 7,590,970 | |
Net asset value per share | | $ | 2.15 | | | $ | 4.58 | |
| (1) | Prior to March 16, 2009, the DCA Total Return Fund was known as Dividend Capital Realty Income Allocation Fund and the DCW Total Return Fund was known as the Dividend Capital Global Realty Exposure Fund. |
See accompanying Notes to Financial Statements.
| | |
| 1.866.324.7348 | | 2009 Semi-Annual Report (Unaudited) 25 |
STATEMENTSOF OPERATIONS
For the Six Months Ended June 30, 2009 (Unaudited)
| | | | | | | | |
| | | DCA Total
Return Fund (1) | | | DCW Total
Return Fund (1) | |
INVESTMENT INCOME: | | | | | | | | |
Dividends (net of withholding taxes of $10,227 and $14,933 respectively) | | $ | 881,170 | | | $ | 894,720 | |
Interest | | | 819,461 | | | | 302,905 | |
| | | | | | | | |
TOTAL INVESTMENT INCOME | | $ | 1,700,631 | | | $ | 1,197,625 | |
| | |
EXPENSES: | | | | | | | | |
Investment advisory fees (Note 5) | | $ | 126,177 | | | $ | 154,032 | |
Administrative fees (Note 5) | | | 42,362 | | | | 42,516 | |
Trustee fees and expenses (Note 5) | | | 30,527 | | | | 29,007 | |
Line of credit interest and fees (Note 6) | | | 3,601 | | | | — | |
Custodian fees and expenses | | | 19,827 | | | | 22,547 | |
Audit and tax fees | | | 35,064 | | | | 40,854 | |
Transfer agent fees and expenses | | | 14,682 | | | | 10,420 | |
Legal expenses | | | 69,216 | | | | 50,953 | |
Shareholder reports expenses | | | 12,147 | | | | 27,740 | |
Listing expenses | | | 12,781 | | | | 16,708 | |
Other expenses | | | 31,319 | | | | 28,746 | |
| | | | | | | | |
TOTAL EXPENSES | | $ | 397,703 | | | $ | 423,523 | |
| | | | | | | | |
NET INVESTMENT INCOME | | $ | 1,302,928 | | | $ | 774,102 | |
| | | | | | | | |
| | |
REALIZED AND UNREALIZED GAIN/(LOSS): | | | | | | | | |
Net realized gain/(loss) from: | | | | | | | | |
Investments | | | (17,753,222 | ) | | | (9,307,434 | ) |
Swap contracts | | | (1,195,884 | ) | | | (4,033,506 | ) |
Foreign currency transactions | | | 34,527 | | | | 59,832 | |
| | | | | | | | |
Net realized loss | | | (18,914,579 | ) | | | (13,281,108 | ) |
| | | | | | | | |
Net changed in unrealized appreciation on: | | | | | | | | |
Investments | | | 15,035,418 | | | | 12,512,017 | |
Swap contracts | | | 1,096,398 | | | | 3,112,591 | |
Translation of assets and liabilities denominated in foreign currencies | | | — | | | | 318,778 | |
| | | | | | | | |
Net change | | | 16,131,816 | | | | 15,943,386 | |
| | |
INCREASE/(DECREASE) IN NET ASSETS RESULTING FROM OPERATIONS | | $ | (1,479,835 | ) | | $ | 3,436,380 | |
| | | | | | | | |
| (1) | Prior to March 16, 2009, the DCA Total Return Fund was known as Dividend Capital Realty Income Allocation Fund and the DCW Total Return Fund was known as the Dividend Capital Global Realty Exposure Fund. |
See accompanying Notes to Financial Statements.
| | |
| 26 2009 Semi-Annual Report (Unaudited) | | www.dcclosedendfunds.com |
This Page Intentionally Left Blank
STATEMENTSOF CHANGESIN NET ASSETS
June 30, 2009 (Unaudited)
| | | | | | | | |
| | | DCA Total Return Fund (1) | |
| | | For the
Six Months Ended
June 30, 2009
(Unaudited) | | | For the
Year Ended
December 31,
2008 | |
Operations: | | | | | | | | |
Net investment income | | $ | 1, 302,928 | | | $ | 9,978,082 | |
Net realized loss on investments, swap transactions, foreign currency transactions and payment from affiliates | | | (18,914,579 | ) | | | (77,505,874 | ) |
Change in net unrealized appreciation/(depreciation) on investments, swap transactions and foreign currency transactions | | | 16,131,816 | | | | (4,589,951 | ) |
| | | | | | | | |
Decrease in net assets resulting from operations | | | (1,479,835 | ) | | | (72,117,743 | ) |
| | | | | | | | |
| | |
Distributions to Shareholders: | | | | | | | | |
From net investment income | | | (1,770,126 | ) | | | (11,775,350 | ) |
From return of capital | | | — | | | | (1,762,020 | ) |
| | | | | | | | |
Net decrease in net assets from distributions to shareholders | | | (1,770,126 | ) | | | (13,537,370 | ) |
| | | | | | | | |
| | |
Capital Share Transactions: | | | | | | | | |
Net asset value of common shares issued to shareholders from reinvested dividends | | | — | | | | 1,313,419 | |
| | | | | | | | |
Increase in net assets from capital share transactions | | | — | | | | 1,313,419 | |
| | | | | | | | |
Net Decrease in Net Assets | | | (3,249,961 | ) | | | (84,341,694 | ) |
| | |
NET ASSETS: | | | | | | | | |
Beginning of period | | | 33,719,958 | | | | 118,061,652 | |
| | | | | | | | |
End of period (2) | | $ | 30,469,997 | | | $ | 33,719,958 | |
| | | | | | | | |
| (1) | Prior to March 16, 2009, the DCA Total Return Fund was known as the Dividend Capital Realty Income Allocation Fund. |
| (2) | Includes undistributed net investment income of $1,500,377 and $1,967,575, respectively. |
See accompanying Notes to Financial Statements.
| | |
| 28 2009 Semi-Annual Report (Unaudited) | | www.dcclosedendfunds.com |
STATEMENTSOF CHANGESIN NET ASSETS (CONTINUED)
June 30, 2009 (Unaudited)
| | | | | | | | |
| | | DCW Total Return Fund (1) | |
| | | For the
Six Months Ended
June 30, 2009
(Unaudited) | | | For the
Year Ended
December 31,
2008 | |
Operations: | | | | | | | | |
Net investment income | | $ | 774,102 | | | $ | 3,880,898 | |
Net realized loss on investments, swap transactions, foreign currency transactions and payments from affiliates | | | (13,281,108 | ) | | | (73,302,507 | ) |
Change in net unrealized appreciation on investments, swap transactions and foreign currency transactions | | | 15,943,386 | | | | 9,109,336 | |
| | | | | | | | |
Increase/(decrease) in net assets resulting from operations | | | 3,436,380 | | | | (60,312,273 | ) |
| | | | | | | | |
| | |
Distributions to Shareholders: | | | | | | | | |
From net investment income | | | (1,138,646 | ) | | | (8,399,144 | ) |
From return of capital | | | — | | | | (4,095,379 | ) |
| | | | | | | | |
Net decrease in net assets from distributions to shareholders | | | (1,138,646 | ) | | | (12,494,523 | ) |
| | | | | | | | |
| | |
Capital Share Transactions: | | | | | | | | |
Net asset value of common shares issued to shareholders from reinvested dividends | | | — | | | | 830,887 | |
| | | | | | | | |
Increase in net assets from capital share transactions | | | — | | | | 830,887 | |
| | | | | | | | |
Net Increase/(Decrease) in Net Assets | | | 2,297,734 | | | | (71,975,909 | ) |
| | |
NET ASSETS: | | | | | | | | |
Beginning of period | | | 32,456,746 | | | | 104,432,655 | |
| | | | | | | | |
End of period (2) | | $ | 34,754,480 | | | $ | 32,456,746 | |
| | | | | | | | |
| (1) | Prior to March 16, 2009, the DCW Total Return Fund was known as the Dividend Capital Global Realty Exposure Fund. |
| (2) | Includes overdistributed net investment income of ($480,934) and ($116,390), respectively. |
See accompanying Notes to Financial Statements.
| | |
| 1.866.324.7348 | | 2009 Semi-Annual Report (Unaudited) 29 |
STATEMENTOF CASH FLOWS
June 30, 2009 (Unaudited)
| | | | |
| | | DCA Total Return Fund (1) | |
| | | For the
Six Months Ended
June 30, 2009
(Unaudited) | |
Cash Flows from Operating Activities: | | | | |
Net decrease in net assets from operations | | $ | (1,479,835 | ) |
Adjustments to reconcile net decrease in net assets from operations to net cash used in operating activities: | | | | |
Purchase of investment securities | | | (12,469,544 | ) |
Proceeds from disposition of investment securities | | | 19,132,479 | |
Net sale/purchase of short-term investments | | | 3,130,327 | |
Accretion/amortization of discounts/premium on investment securities | | | (8,523 | ) |
Net realized loss from investment securities | | | 17,753,222 | |
Net change in unrealized appreciation on investments, swap transactions | | | (16,131,816 | ) |
Increase in receivable for securities sold | | | (502,632 | ) |
Decrease in dividends and interest receivable | | | 334,069 | |
Decrease in net swap interest receivable | | | 39,605 | |
Decrease in other assets | | | (23,774 | ) |
Increase in distributions payable | | | 424,831 | |
Decrease in payable for securities purchased | | | (1,252,175 | ) |
Decrease in swap interest payable | | | (3,718 | ) |
Decrease in payable for line of credit fees | | | (16,106 | ) |
Decrease in payable for investment advisory fees | | | (6,755 | ) |
Increase in payable for administration fees | | | 8,167 | |
Decrease in other liabilities | | | (48,433 | ) |
| | | | |
Net Cash Provided by Operating Activities | | $ | 8,879,389 | |
| |
Cash Flows from Financing Activities: | | | | |
Payment of bank overdraft | | $ | (88,584 | ) |
Proceeds from bank overdraft | | | 45,715 | |
Payment on outstanding debt | | | (7,054,000 | ) |
Cash distributions paid | | | (1,770,126 | ) |
| | | | |
Net Cash Used by Financing Activities | | $ | (8,866,995 | ) |
| | | | |
Cash and Foreign Currency: | | | | |
Beginning balance | | $ | — | |
Ending balance | | $ | 12,394 | |
Supplemental Disclosure of Cash Flow Information: | | | | |
Cash paid for interest and fees on bank borrowing | | $ | 19,707 | |
Non-cash financing activities not included herein consist of reinvestment of dividends and distributions of $0.
| (1) | Prior to March 16, 2009, the DCA Total Return Fund was known as the Dividend Capital Realty Income Allocation Fund. |
See accompanying Notes to Financial Statements.
| | |
| 30 2009 Semi-Annual Report (Unaudited) | | www.dcclosedendfunds.com |
This Page Intentionally Left Blank
FINANCIAL HIGHLIGHTS
DCA Total Return Fund (11)
| | | | | | | | | | | | |
| | | For the Six
Months Ended
June 30, 2009
(Unaudited) | | | For the Year
Ended
December 31, 2008 | | | For the Period
Ended
December 31, 2007 (1) | |
PER SHARE OPERATING DATA: | | | | | | | | | | | | |
Net Asset Value, Beginning of Period | | $ | 2.38 | | | $ | 8.44 | | | $ | 11.03 | |
Income from investment operations: | | | | | | | | | | | | |
Net investment income/(loss) | | | 0.10 | | | | 0.71 | (4) | | | (0.00 | )(4)(5) |
Net gains/(losses) on securities, realized and unrealized | | | (0.20 | ) | | | (5.81 | ) | | | (2.26 | ) |
| | | | | | | | | | | | |
Total From Investment Operations | | | (0.10 | ) | | | (5.10 | ) | | | (2.26 | ) |
Dividends and/or Distributions to Shareholders: | | | | | | | | | | | | |
Dividends from net investment income | | | (0.13 | ) | | | (0.84 | ) | | | (0.33 | ) |
Dividends from net realized gain on investments | | | — | | | | — | | | | — | |
Distributions from return of capital | | | — | | | | (0.12 | ) | | | — | |
| | | | | | | | | | | | |
Total Distributions | | | (0.13 | ) | | | (0.96 | ) | | | (0.33 | ) |
| | | | | | | | | | | | |
Offering Costs Charged to Paid-in Capital | | | — | | | | — | | | | — | |
Offering Cost Adjustment | | | — | | | | — | | | | — | |
Net Asset Value, End of Period | | $ | 2.15 | | | $ | 2.38 | | | $ | 8.44 | |
| | | | | | | | | | | | |
Market Price, End of Period | | $ | 1.56 | | | $ | 2.00 | | | $ | 8.06 | |
| | | | | | | | | | | | |
Total Return, Net Asset Value (6) | | | (4.33 | )% | | | (65.39 | )% | | | (20.62 | )% |
| | | | | | | | | | | | |
Total Return, Market Value(6) | | | (15.66 | )% | | | (69.55 | )% | | | (25.08 | )% |
| | | | | | | | | | | | |
Net Assets, End of Period (000’s) | | $ | 30,470 | | | $ | 33,720 | | | $ | 118,062 | |
| | | |
Ratios/Supplemental Data | | | | | | | | | | | | |
Ratios of Total Expenses to Average Net Assets | | | 2.80 | %(7) | | | 3.34 | % | | | 5.20 | %(7) |
Ratio of Total Expenses to Average Net Assets after reduction to custodian expenses | | | 2.80 | %(7) | | | 3.34 | % | | | 5.20 | %(7) |
Ratio of Operating Expenses to Average Net Assets(8) | | | 2.77 | %(7) | | | 1.97 | % | | | 5.20 | %(7) |
Ratio of Operating Expenses to Average Net Assets after reduction to custodian expenses(8) | | | 2.77 | %(7) | | | 1.97 | % | | | 2.42 | %(7) |
Ratio of Net Investment Income/(Loss) to Average Net Assets | | | 9.17 | %(7) | | | 12.31 | % | | | (0.00 | )%(7) |
Portfolio Turnover Rate(9) | | | 43 | % | | | 23 | % | | | 7 | % |
Bank Borrowings: | | | | | | | | | | | | |
Loan Outstanding, End of Period (000’s) | | | N/A | | | $ | 7,054 | | | $ | 53,872 | |
Asset Coverage for Loan Outstanding | | | N/A | | | | 591 | % | | | 305 | % |
| (1) | The Fund changed its fiscal year end from September 30 to December 31. Amounts shown are for the period from October 1, 2007 to December 31, 2007. |
| (2) | For the period February 24, 2005 (inception of offering) to September 30, 2005. |
| ( 3) | Net sales load of $0. 675 on initial shares issued. |
| ( 4) | Calculation based on average shares outstanding. |
| ( 5) | Less than ($0.005) per share. |
| (6) | Total investment return is calculated assuming a purchase of common shares of the opening of the first day and sale on the closing of the last day of each period reported. Dividends and distributions are assumed, for purposes of this calculation, to be reinvested at prices obtained under the Fund’s reinvestment plan. Total investment return is not annualized for periods of less than one year. Brokerage commissions are not reflected. |
| | |
| 32 2009 Semi-Annual Report (Unaudited) | | www.dcclosedendfunds.com |
FINANCIAL HIGHLIGHTS (CONTINUED)
| | | | | | | | | | |
For the Year Ended
September 30, 2007 | | | For the Year
Ended
September 30, 2006 | | | For the Period
Ended
September 30, 2005(2) | |
| $ | 15.08 | | | $ | 14.43 | | | $ | 14.33 | (3) |
| | 1.02 | (4) | | | 0.99 | (4) | | | 0.63 | (4) |
| | (3.61 | ) | | | 0.97 | | | | 0.09 | |
| | | | | | | | | | | |
| | (2.59 | ) | | | 1.96 | | | | 0.72 | |
| | (1.38 | ) | | | (1.31 | ) | | | (0.57 | ) |
| | (0.08 | ) | | | — | | | | — | |
| | — | | | | — | | | | — | |
| | | | | | | | | | | |
| | (1.46 | ) | | | (1.31 | ) | | | (0.57 | ) |
| | | | | | | | | | | |
| | — | | | | — | | | | (0.05 | ) |
| | — | | | | 0.00 | (10) | | | — | |
| $ | 11.03 | | | $ | 15.08 | | | $ | 14.43 | |
| | | | | | | | | | | |
| $ | 11.16 | | | $ | 14.52 | | | $ | 14.12 | |
| | | | | | | | | | | |
| | (19.05 | )% | | | 14.95 | % | | | 4.73 | % |
| | | | | | | | | | | |
| | (14.93 | )% | | | 13.11 | % | | | 1.68 | % |
| | | | | | | | | | | |
| $ | 153,970 | | | $ | 206,948 | | | $ | 197,433 | |
| | 4.11 | % | | | 3.98 | % | | | 2.74 | %(7) |
| | 4.11 | % | | | 3.97 | % | | | 2.72 | %(7) |
| | 1.70 | % | | | 1.73 | % | | | 1.68 | %(7) |
| | 1.70 | % | | | 1.72 | % | | | 1.66 | %(7) |
| | 6.98 | % | | | 6.92 | % | | | 7.39 | %(7) |
| | 47 | % | | | 72 | % | | | 92 | % |
| $ | 68,872 | | | | N/A | | | | N/A | |
| | 311 | % | | | N/A | | | | N/A | |
| (7) | Ratio annualized for the period of less than one year. |
| (8) | Operating expenses do not include interest expense on the line of credit. |
| (9) | A portfolio turnover rate is the percentage computed by taking the lesser of purchases or sales of portfolio securities (excluding short-term investments) for a period and dividing it by monthly average of the market value of the portfolio securities during the period. Purchases and sales of investment securities (excluding short-term securities) for the six months ended June 30, 2009 were $12,469,544 and $19,132,479, respectively. |
| (10) | Common share offering cost adjustment is less than $0.005 per share. |
| (11) | Prior to March 16, 2009, the DCA Total Return Fund was known as the Dividend Capital Realty Income Allocation Fund. |
See accompanying Notes to Financial Statements.
| | |
| 1.866.324.7348 | | 2009 Semi-Annual Report (Unaudited) 33 |
FINANCIAL HIGHLIGHTS
DCW Total Return Fund (6)
| | | | | | | | | | | | |
| | | For the
Six Months Ended
June 30, 2009
(Unaudited) | | | For the
Year Ended
December 31, 2008 | | | For the Period
Ended
December 31, 2007 (1) | |
PER SHARE OPERATING DATA: | | | | | | | | | | | | |
Net Asset Value, Beginning of Period | | $ | 4.28 | | | $ | 13.88 | | | $ | 19.10 | (2) |
Income/(loss) from Investment Operations: | | | | | | | | | | | | |
Net investment income | | | 0.10 | | | | 0.52 | | | | 0.73 | |
Net gains/(losses) on securities, realized and unrealized | | | 0.35 | | | | (8.47 | ) | | | (5.12 | ) |
| | | | | | | | | | | | |
Total From Investment Operations | | | 0.45 | | | | (7.95 | ) | | | (4.39 | ) |
| | | | | | | | | | | | |
| | | |
Dividends and/or Distributions to Shareholders: | | | | | | | | | | | | |
Dividends from net investment income | | | (0.15 | ) | | | (1.11 | ) | | | (0.79 | ) |
Distributions from return of capital | | | — | | | | (0.54 | ) | | | — | |
| | | | | | | | | | | | |
Total Distributions | | | (0.15 | ) | | | (1.65 | ) | | | (0.79 | ) |
| | | | | | | | | | | | |
Offering Costs Charged to Paid-in Capital | | | — | | | | — | | | | (0.04 | ) |
Net Asset Value, End of Period | | $ | 4.58 | | | $ | 4.28 | | | $ | 13.88 | |
| | | | | | | | | | | | |
Market Price, End of Period | | $ | 3.35 | | | $ | 3.05 | | | $ | 12.45 | |
| | | | | | | | | | | | |
Total Return, Net Asset Value (3) | | | 12.31 | % | | | (-61.02 | )% | | | (-23.20 | )% |
| | | | | | | | | | | | |
Total Return, Net Asset Value Excluding Payment from Affiliate (3) | | | 12.31 | % | | | (-61.02 | )% | | | (-23.24 | )% |
| | | | | | | | | | | | |
Total Return, Market Value (3) | | | 15.28 | % | | | (-69.01 | )% | | | (-34.36 | )% |
| | | | | | | | | | | | |
Ratios/Supplemental Data | | | | | | | | | | | | |
Net Assets, End of Period (000’s) | | $ | 34,754 | | | $ | 32,457 | | | $ | 104,433 | |
Ratio of Total Expenses to Average Net Assets | | | 2.77 | % (4) | | | 1.70 | % | | | 1.43 | % (4) |
Ratio of Net Investment Income to Average Net Assets | | | 5.06 | % (4) | | | 5.64 | % | | | 6.97 | % (4) |
Portfolio Turnover Rate (5) | | | 50.00 | % | | | 17.00 | % | | | 1.00 | % |
| (1) | For the period June 27, 2007 (inception date of the Fund’s initial public offering) through December 31, 2007. |
| (2) | Net of sales load of $0.90 on initial shares issued. |
| (3) | Total investment return is calculated assuming a purchase of common shares of the opening of the first day and sale on the closing of the last day of each period reported. Dividends and distributions are assumed, for purposes of this calculation, to be reinvested at prices obtained under the Fund’s reinvestment plan. Total investment return is not annualized for periods of less than one year. Brokerage commissions are not reflected. |
| (4) | Ratio annualized for the period of less than one year. |
| (5) | A portfolio turnover rate is the percentage computed by taking the lesser of purchases or sales of portfolio securities (excluding short-term investments) for a period and dividing it by monthly average of the market value of the portfolio securities during the period. Purchases and sales of investment securities (excluding short-term securities) for the six months ended June 30, 2009 were $18,431,265 and $13,079,609, respectively. |
| (6) | Prior to March 16, 2009, the DCW Total Return Fund was known as the Dividend Capital Global Realty Exposure Fund. |
See accompanying Notes to Financial Statements.
| | |
| 34 2009 Semi-Annual Report (Unaudited) | | www.dcclosedendfunds.com |
NOTES TO FINANCIAL STATEMENTS
June 30, 2009 (Unaudited)
1. ORGANIZATION AND SUMMARY OF SIGNIFICANT ACCOUNTING POLICIES
DCA Total Return Fund (NYSE: “DCA”), formerly Dividend Capital Realty Income Allocation Fund, and DCW Total Return Fund, formerly Dividend Capital Global Realty Exposure Fund (NYSE: “DCW”) (collectively, “the Funds”) are registered as closed-end management investment companies under the Investment Company Act of 1940, as amended (the “1940 Act”). Each Fund’s primary investment objective is high current income. Each Fund’s secondary investment objective is capital appreciation.
Initial capitalization for each Fund was provided by Dividend Capital Investments LLC (the “Adviser”) as follows:
| | | | | | |
| | | DCA Total Return Fund | | DCW Total Return Fund |
| | |
Organization Date | | | December 3, 2004 | | | December 30, 2005 |
| | |
Initial Capitalization Date | | | February 15, 2005 | | | June 13, 2007 |
| | |
Amount of Initial Capitalization | | $ | 100,068 | | $ | 100,008 |
| | |
Common Shares Issued at Capitalization | | | 7,010 | | | 5,236 |
| | |
Common Shares Authorized | | | Unlimited | | | Unlimited |
| | |
Public Offering Date | | | February 24, 2005 | | | June 27, 2007 |
As of June 30, 2009, the Members of the Adviser’s Investment Committee were Jeffrey Randall and Jeffrey Taylor.
Security Valuation
Pricing Procedures All securities of the Funds are valued as of the close of regular trading on the New York Stock Exchange (“NYSE”), currently 4:00 p.m. (Eastern Standard Time), on each day that the NYSE is open.
Securities traded on the National Association of Securities Dealers Automated Quotation System (“NASDAQ”) are valued at the NASDAQ Official Closing Price (“NOCP”). Domestic exchange-listed securities and non-NASDAQ equity securities not traded on a listed exchange are valued at the last sale price as of the close of the NYSE. In the absence of trading or an NOCP, such securities are valued at the mean of the bid and asked prices. In the event exchange quotations are not available for exchange traded securities, the Funds will obtain at least one price from an independent broker/dealer.
U.S. government and agency securities having a maturity of more than 60 days are valued at the mean between the bid and asked prices. Fixed income securities having a maturity of less than 60 days are valued at amortized cost, which approximates fair value. Other debt securities are valued at the price provided by an independent pricing service or, if such a price is not available, at the value provided by at least one quotation obtained from a broker/dealer. Securities issued by private funds are priced at the value most recently provided by the private fund or at the bid provided by a broker/dealer.
| | |
| 1.866.324.7348 | | 2009 Semi-Annual Report (Unaudited) 35 |
NOTESTO FINANCIAL STATEMENTS (CONTINUED)
June 30, 2009 (Unaudited)
Security Valuation (continued)
Foreign exchange traded securities are valued at the last sale price at the close of the exchange on which the security is primarily traded (except in certain countries where market maker prices are used). In the absence of trading, such securities are valued at the mean between the last reported bid and asked prices or the last sale price. Fixed income securities where market quotations are not readily available are valued at fair value.
Exchange traded options, warrants and rights are valued at the last reported sale price at the close of the exchange on which the security is primarily traded. For non-exchange traded options and exchange traded options, warrants and rights for which no sales are reported, the mean between the bid and asked prices is used. For exchange traded options, warrants and rights and foreign exchange traded equity securities in which the markets are not closed at the time that the Fund prices its securities, snapshot prices provided by individual pricing services are used.
The price for futures contracts are the daily quoted settlement prices. Single security total return swaps in which the referenced security is traded on an exchange are valued at the last sale price at the time of close of the NYSE. In the absence of trading of a referenced security, the mean between the closing bid and asked prices will be used.
Fair Valuation If the price of a security is unavailable in accordance with the Funds’ pricing procedures, or the price of a security is suspect, e.g., due to the occurrence of a significant event (as defined below), the security may be valued at its fair value determined pursuant to procedures adopted by the Board. For this purpose, fair value is the price that the Funds would receive upon selling an investment in an orderly transaction to an independent buyer in the principal or most advantageous market of the investment. As of June 30, 2009, securities which have been fair valued represented 4.53% and 1.66% of DCA’s and DCW’s net assets respectively.
The following factors, among other relevant factors, may be considered when determining the fair value of a security: (1) fundamental analytical data; (2) forces which influence the market in which the security is sold, including the liquidity and depth of the market; (3) type of security and the cost at date of purchase; (4) most recent quotation received from a broker; (5) transactions or offers with respect to the security; (6) price, yield and the extent of public or private trading in similar securities of the issuer or comparable companies; (7) price and extent of public trading of the security of foreign exchanges; (8) information on world financial markets and comparable financial products; (9) size of the Funds’ holdings; (10) financial statements of the issuer; (11) analyst reports; (12) merger proposals or tender offers; (13) value of other financial instruments, including derivative securities, traded on other markets or among dealers; (14) trading volumes on markets, exchanges or among dealers; (15) values of baskets of securities traded on other markets, exchanges or among dealers; (16) change in interest rates;
| | |
| 36 2009 Semi-Annual Report (Unaudited) | | www.dcclosedendfunds.com |
NOTESTO FINANCIAL STATEMENTS (CONTINUED)
June 30, 2009 (Unaudited)
Security Valuation (continued)
(17) observations from financial institutions; (18) government (domestic or foreign) actions or pronouncements; (19) in the case of restricted securities, discount from market value of unrestricted securities of the same class at time of purchase, existence and anticipated time frame of any undertaking to register the security and the size of the holding in relation to any unrestricted outstanding shares; (20) in the case of foreign securities, the country’s or geographic region’s political and economic environment, nature of any significant events, American Depository Receipt trading, exchange-traded fund trading and foreign currency exchange activity; (21) in the case of interests in private funds, the absence of transaction activity in interests in the private fund, extraordinary restrictions on redemptions, whether the private fund’s valuation procedures provide for valuation of underlying securities at market value or fair value, actual knowledge of the value of underlying portfolio holdings, review of audited financial statements and ongoing due diligence and monitoring; and (22) in the case of emergencies or other unusual situations, the nature and duration of the event, forces influencing the operation of the financial markets, likelihood of recurrence of the event, and whether the effects of the event are isolated or affect entire markets, countries or regions.
The Funds adopted the provisions of Financial Accounting Standards Board (“FASB”) Statement of Financial Accounting Standards No. 157 (“FAS 157”). FAS 157 established a three-tier hierarchy to establish classification of fair value measurements for disclosure purposes. Inputs refer broadly to the assumptions that market participants would use in pricing the asset or liability, including assumptions about risk. Inputs may be observable or unobservable. Observable inputs are inputs that reflect the assumptions market participants would use in pricing the asset or liability that are developed based on market data obtained from sources independent of the reporting entity. Unobservable inputs are inputs that reflect the reporting entity’s own assumptions about the assumptions market participants would use in pricing the asset or liability that are developed based on the best information available.
Various inputs are used in determining the value of each Fund’s investments as of the reporting period end. These inputs are categorized in the following hierarchy under applicable financial accounting standards:
Level 1 – Quoted prices in active markets for identical investments
Level 2 – Other significant observable inputs (including quoted prices for similar investments, interest rates, prepayment speeds, credit risk, etc.)
Level 3 – Significant unobservable inputs (including each Fund’s own assumptions in determining the fair value of investments)
| | |
| 1.866.324.7348 | | 2009 Semi-Annual Report (Unaudited) 37 |
NOTESTO FINANCIAL STATEMENTS (CONTINUED)
June 30, 2009 (Unaudited)
Security Valuation (continued)
The following is a summary of the inputs used to value the Funds’ investments as of June 30, 2009.
DCA Total Return Fund
| | | | | | | | | | | | |
Investments in Securities at Value | | Level 1 –
Quoted Prices | | Level 2 –
Other Significant
Observable
Inputs | | Level 3 –
Significant
Unobservable
Inputs | | Total |
Common Stock | | $ | 13,061,540 | | $ | 162,644 | | $ | — | | $ | 13,224,184 |
Industry: | | | | | | | | | | | | |
Semiconductors | | | | | | 162,644 | | | | | | |
| | | | |
Preferred Stock | | | 14,220,562 | | | 50,038 | | | — | | | 14,270,600 |
Industry: | | | | | | | | | | | | |
Hotels - REITs | | | | | | 49,430 | | | | | | |
Mortgage - Residential - REITs | | | | | | 608 | | | | | | |
| | | | |
Commercial Real Estate Collateralized Debt Obligations | | | — | | | 814,565 | | | — | | | 814,565 |
| | | | |
Collateralized Loan Obligations | | | — | | | 470,000 | | | — | | | 470,000 |
| | | | |
Commercial Mortgage-Backed Securities | | | — | | | 114,690 | | | — | | | 114,690 |
| | | | |
Rights | | | — | | | 3,035 | | | — | | | 3,035 |
| | | | |
Money Market Funds | | | 1,110,935 | | | — | | | — | | | 1,110,935 |
| | | | | | | | | | | | |
Total | | $ | 28,393,037 | | $ | 1,614,972 | | $ | — | | $ | 30,008,009 |
DCW Total Return Fund
| | | | | | | | | | | | |
Investments in Securities at Value | | Level 1 –
Quoted Prices | | Level 2 –
Other Significant
Observable
Inputs | | Level 3 –
Significant
Unobservable
Inputs | | Total |
Common Stock | | $ | 19,088,844 | | $ | 232,348 | | $ | — | | $ | 19,321,192 |
Industry: | | | | | | | | | | | | |
Semiconductors | | | | | | 232,348 | | | | | | |
| | | | |
Preferred Stock | | | 13,775,806 | | | — | | | — | | | 13,775,806 |
| | | | |
Commercial Real Estate Collateralized Debt Obligations | | | — | | | 575,801 | | | — | | | 575,801 |
| | | | |
Rights | | | — | | | 4,446 | | | — | | | 4,446 |
| | | | |
Money Market Funds | | | 853,727 | | | — | | | — | | | 853,727 |
| | | | | | | | | | | | |
Total | | $ | 33,718,377 | | $ | 812,595 | | $ | — | | $ | 34,530,972 |
For the six months ended June 30, 2009, the Funds did not have significant unobservable inputs (Level 3) used in determining fair value. Thus, a reconciliation of assets in which significant unobservable inputs (Level 3) were used in determining fair value is not applicable.
| | |
| 38 2009 Semi-Annual Report (Unaudited) | | www.dcclosedendfunds.com |
NOTESTO FINANCIAL STATEMENTS (CONTINUED)
June 30, 2009 (Unaudited)
Security Valuation (continued)
Significant Events An event is significant if it causes the price for a security determined at the normal time for pricing that security to no longer reflect fair value at the time that the Funds determine their net asset value. A significant event is material (a “Material Significant Event”) if a fair valuation for the security would impact the Funds’ net asset value by more than one-half of one percent (0.5%). If a Material Significant Event has occurred, the Adviser will call a meeting of the Valuation Committee to determine a fair value for the security in accordance with the Funds’ Fair Valuation Procedures.
Risk of Concentration
Because the Funds’ investments are concentrated in the real estate industry, the value of the Funds may be subject to greater volatility than a fund with a portfolio that is less concentrated in a single industry. If the securities of real estate companies as a group fall out of favor with the investors, the Funds could underperform funds that have greater industry diversification.
Security Credit Risk
The Funds invest in high-yield securities, which may be subject to a greater degree of credit risk, market fluctuations and loss of income and principle, and may be more sensitive to economic conditions than lower-yielding, higher-rated securities. The Funds may acquire securities in default, and are not obligated to dispose of securities whose issuers subsequently default. As of June 30, 2009, securities with an aggregate market value of $608, representing 0.00% of DCA’s net assets, were in default.
Foreign Securities
The Funds may invest without limit in foreign securities. In the event that the Funds execute a foreign security transaction, the Funds will generally enter into forward foreign currency contracts to settle specific purchases or sales of securities denominated in a foreign currency. Foreign securities may carry more risk than U.S. securities, such as political, market and currency risks.
The accounting records of the Funds are maintained in U.S. dollars. Prices of securities denominated in foreign currencies are translated into U.S. dollars at the closing rate of exchange at period end. Amounts related to the purchase and sale of foreign securities and investment income are translated at the rates of exchange prevailing on the respective dates of such transactions.
The effects of changes in foreign currency exchange rates on investments is separately identified from the fluctuations arising from changes in market values of securities held and reported with all other foreign currency gains and losses in the Funds’ Statements of Operations.
| | |
| 1.866.324.7348 | | 2009 Semi-Annual Report (Unaudited) 39 |
NOTESTO FINANCIAL STATEMENTS (CONTINUED)
June 30, 2009 (Unaudited)
Repurchase Agreements
The Funds may invest in repurchase agreements, which are short-term investments in which the Funds acquire ownership of a debt security and the seller agrees to repurchase the security at a future time and specified price. Repurchase agreements are fully collateralized by the underlying debt security. The Funds will make payment for such securities only upon physical delivery or evidence of book entry transfer to the account of the custodian bank. The seller is required to maintain the value of the underlying security at not less than the repurchase proceeds due the Funds.
Distributions to Shareholders
The Funds intend to make dividend distributions each quarter to shareholders. The dividend rate may be modified by the Board of Trustees from time to time. Dividends and distributions to shareholders are recorded by the Funds on the ex-dividend date. Distributions paid by the Funds are subject to recharacterization for tax purposes. A portion of the distributions paid by the Funds may be reclassified to return of capital and long-term capital gains upon the final determination of the Funds’ taxable income for the year. Net realized gains, unless offset by any available capital loss carryforward, are generally distributed to shareholders annually, although net realized gains may be retained by the Funds in certain circumstances.
Securities Transactions and Investment Income
Investment security transactions are accounted for as of trade date. Dividend income is recorded on the ex-dividend date. Interest income, which includes amortization of premium and accretion of discount, is accrued as earned. Dividend income from REIT securities may include return of capital. Upon notification from the issuer, the amount of the return of capital is reclassified to adjust dividend income, reduce the cost basis and/or adjust realized gain. Realized gains and losses from securities transactions and unrealized appreciation and depreciation of securities are determined using the specific identification method for both financial reporting and income tax purposes.
Reclassifications
Certain amounts for DCA for the year ended September 30, 2007 have been reclassified to conform to the December 31, 2007 presentation.
Use of Estimates
The Funds’ financial statements are prepared in accordance with accounting principles generally accepted in the United States of America. This requires management to make estimates and assumptions that affect the reported amounts of assets and liabilities and disclosure of contingent assets and liabilities at the date of the financial statements and the reported amounts of increases and decreases in net assets from operations during the reporting period. Actual results could differ from these estimates. Management has also evaluated subsequent events through August 25, 2009, the issuance date of the financial statements.
| | |
| 40 2009 Semi-Annual Report (Unaudited) | | www.dcclosedendfunds.com |
NOTESTO FINANCIAL STATEMENTS (CONTINUED)
June 30, 2009 (Unaudited)
Investments with Off-Balance Sheet Risk
The Funds may enter into financial instrument transactions (such as swaps, futures, options and other derivatives) that may have off-balance sheet market risk. Off-balance sheet market risk exists when the maximum potential loss on a particular financial instrument is greater than the value of such financial instrument as reflected in the Funds’ Statements of Assets and Liabilities.
In addition, the use of total return swaps could adversely affect the character (capital gain vs. ordinary income) of the income recognized by the Funds for U.S. federal income tax purposes, as well as the timing of such income recognition, as compared to a direct investment in the underlying security, and could result in the Funds’ recognition of income prior to the receipt of the corresponding cash. In some market scenarios, the Funds may recognize income and never receive the corresponding cash. This outcome could result in the Funds having to sell assets in order to fund distributions, and in the investor having to pay higher income taxes than would have been the case with a more traditional investment strategy.
Indemnifications
In the normal course of business, the Funds enter into contracts that provide general indemnifications. Each Fund’s maximum exposure under this arrangement is dependent upon claims that may be made against the Funds in the future and, therefore, cannot be estimated; however, based on experience, the risk of material loss from such claims is considered remote.
2. FEDERAL INCOME TAXES
No provision for federal income taxes is required since the Funds intend to continue to qualify as regulated investment companies and distribute to shareholders all of its taxable income and capital gains.
Therefore, no federal income tax provision is required in the Funds’ financial statements. Management has analyzed each Fund’s tax positions taken on federal income tax returns for all open tax years and has concluded that as of December 31, 2008, no provision for income tax would be required in the Funds’ financial statements. Each Fund’s federal and state income and federal excise tax returns for tax years for which the applicable statutes of limitations have not expired are subject to examination by the Internal Revenue Service and state department of revenue.
Because federal income tax regulations differ from generally accepted accounting principles, income and capital gain distributions determined in accordance with tax regulations may differ from net investment income and realized gain for financial reporting purposes. Accordingly, the character of distributions and composition of net assets for tax purposes differ from those reflected in the accompanying financial statements.
| | |
| 1.866.324.7348 | | 2009 Semi-Annual Report (Unaudited) 41 |
NOTESTO FINANCIAL STATEMENTS (CONTINUED)
June 30, 2009 (Unaudited)
The Funds follow FASB Interpretation No. 48 (“FIN 48”) “Accounting for Uncertainty in Income Taxes,” which requires that the financial statement effects of a tax position taken or expected to be taken in a tax return be recognized in the financial statements when it is more likely than not, based on the technical merits, that the position will be sustained upon examination. Management has concluded that the Funds have taken no uncertain tax positions that require adjustment to the financial statements to comply with the provisions of FIN 48. The Funds file income tax returns in the U.S. federal jurisdiction and the State of Colorado. The statute of limitations on DCW’s federal tax return filings remains open for the years ended December 31, 2008 and December 31, 2007, and for September 30, 2007, September 30, 2006, and September 30, 2005 for DCA. The Funds’ Colorado tax return filings remain open for the same years ended as mentioned above for each Fund, respectively. To our knowledge there are no federal or Colorado income tax returns currently under examination.
At June 30, 2009 the cost of investments and net unrealized appreciation for federal income tax purposes were as follows:
| | | | | | | | |
| | | DCA Total
Return Fund | | | DCW Total
Return Fund | |
Aggregate tax cost (including swaps and foreign currency) | | $ | 84,314,829 | | | $ | 46,781,742 | |
Gross unrealized appreciation | | | 4,869,100 | | | | 3,318,443 | |
Gross unrealized depreciation | | | (59,175,920 | ) | | | (15,569,213 | ) |
| | | | | | | | |
Net unrealized depreciation | | $ | (54,306,820 | ) | | $ | (12,250,770 | ) |
Net investment income (loss) and net realized gain (loss) may differ from financial statements and tax purposes. These differences are primarily due to the treatment of certain investment securities and distribution allocations. These permanent differences in the character of income and distributions between financial statements and tax basis have been reclassified. Net assets of the Funds were not affected by the reclassifications.
In any year when the Funds earn net investment income, the Funds generally intend to make sufficient distributions to prevent application of excise tax under the Internal Revenue Code. However, if the Funds distribute less than the required net investment income and capital gain net income (if any), a required 4% federal excise tax on such retained income and gains will be paid.
3. CAPITAL TRANSACTIONS
DCA Total Return Fund
There are an unlimited number of $0.001 par value common shares of beneficial interest authorized. Of the 14,161,010 common shares outstanding on June 30, 2009, Dividend Capital Investments LLC (the “Adviser”) owned 10,987 shares. The Fund issued 12,100,010 common shares in its initial public offering on February 24, 2005. These common shares were issued at $15.00 per share before the underwriting discount of $0.675 per share. An additional 1,578,500 common
| | |
| 42 2009 Semi-Annual Report (Unaudited) | | www.dcclosedendfunds.com |
NOTESTO FINANCIAL STATEMENTS (CONTINUED)
June 30, 2009 (Unaudited)
shares were issued pursuant to an over-allotment option on April 12, 2005. Offering costs of $642,230 were offset against proceeds of the offering and were charged to paid-in capital of the common shares. During the year ended September 30, 2006, a $41,695 adjustment was charged to paid-in capital for common offering costs.
DCW Total Return Fund
There are an unlimited number of the Fund’s $0.001 par value common shares of beneficial interest authorized. Of the 7,590,970 common shares outstanding on June 30, 2009, the Adviser owned 6,984 shares. The Fund issued 7,500,000 common shares in its initial public offering on June 27, 2007. These common shares were issued at $20.00 per share before the underwriting discount of $0.90 per share. Offering costs of $300,000 (representing $0.04 per common share) were offset against proceeds of the offering and were charged to paid-in capital of the common shares. The Adviser has agreed to pay those offering costs of the Fund other than the underwriting discount) that exceed $0.04 per common share.
Transactions in common shares for the six months ended June 30, 2009 and the year ended December 31, 2008 were as follows:
| | | | | | | | |
| | | DCA Total Return Fund | | DCW Total Return Fund |
| | | Six Months Ended
June 30, 2009
(Unaudited) | | Year Ended
December 31,
2008 | | Six Months Ended
June 30, 2009
(Unaudited) | | Year Ended
December 31,
2008 |
Common shares outstanding – beginning of period | | 14,161,010 | | 13,989,197 | | 7,590,970 | | 7,522,785 |
| | | | |
Common shares issued in connection with initial public offering | | — | | — | | — | | — |
| | | | |
Common shares issued to shareholders from reinvested distributions | | — | | 171,813 | | — | | 68,185 |
| | | | |
Common shares outstanding – end of period | | 14,161,010 | | 14,161,010 | | 7,590,970 | | 7,590,970 |
| | |
| 1.866.324.7348 | | 2009 Semi-Annual Report (Unaudited) 43 |
NOTESTO FINANCIAL STATEMENTS (CONTINUED)
June 30, 2009 (Unaudited)
4. PORTFOLIO SECURITIES
Purchases and sales of investment securities, other than short-term securities are as follows:
| | | | | | | | | | | | |
| | | For the Six Months Ended
June 30, 2009 (Unaudited) | | For the Year Ended
December 31, 2008 |
| | | Purchases | | Sales | | Purchases | | Sales |
DCA Total Return Fund | | $ | 12,469,544 | | $ | 19,132,479 | | $ | 24,493,581 | | $ | 75,569,538 |
| | | | | | | | | | | | |
| | |
| | | For the Six Months Ended
June 30, 2009 (Unaudited) | | For the Year Ended
December 31, 2008 |
| | | Purchases | | Sales | | Purchases | | Sales |
DCW Total Return Fund | | $ | 18,431,265 | | $ | 13,079,609 | | $ | 9,741,356 | | $ | 33,921,914 |
| | | | | | | | | | | | |
5. INVESTMENT ADVISORYAND ADMINISTRATION AGREEMENTSAND OTHER RELATED PARTY TRANSACTIONS
Dividend Capital Investments LLC (“Dividend Capital” or the “Adviser”) serves as the Funds’ investment adviser and administrator. Pursuant to an Investment Advisory Agreement with the Funds, as compensation for its services to the Funds, Dividend Capital receives an annual investment advisory fee of 0.85% for DCA Total Return Fund and 1.00% for DCW Total Return Fund based on each Fund’s average daily managed assets, computed daily and payable monthly. Pursuant to an Administration Agreement with each Fund, as compensation for its services to the Funds, Dividend Capital receives an annual administration fee of 0.05% based on each Fund’s average daily managed assets, computed daily and payable monthly.
Calamos Advisors LLC (“Calamos”) serves as the Funds’ sub-adviser. Pursuant to a Sub-Advisory Agreement with the Funds and Dividend Capital, as compensation for its services to the Funds, Calamos receives an annual sub-advisory fee of 0.50% for both Funds based on each Fund’s average daily net assets, for the portion of the assets managed by Calamos. This fee is computed daily and paid quarterly by Dividend Capital and not the Funds.
The Funds have entered into a Co-Administration, tax, book keeping and pricing services agreement with ALPS Fund Services, Inc. (“ALPS”). Under this agreement, ALPS will calculate the net asset value and perform certain other administrative services for the Funds. ALPS will be compensated by each Fund the greater of a 0.07% annual rate on daily average net assets, or $125,000 annually.
Trustees of the Funds who are “interested persons” of the Funds do not receive any compensation from the Funds. Each of the Independent Trustees is paid from the Funds an annual retainer of $12,000, and a fee of $1,500 and reimbursement for related expenses for each meeting of the Board he attends. Each Independent Trustee receives from the Funds a fee of $1,000 for each telephonic Board meeting he attends. The Chairman of the Board of Trustees receives from the Funds an additional annual retainer of $5,000.
| | |
| 44 2009 Semi-Annual Report (Unaudited) | | www.dcclosedendfunds.com |
NOTESTO FINANCIAL STATEMENTS (CONTINUED)
June 30, 2009 (Unaudited)
Certain officers of the Funds are also officers of the Adviser.
6. LINEOF CREDIT
DCA Total Return Fund
On April 28, 2005, DCA Total Return Fund executed a Revolving Credit and Security Agreement (the “Agreement”) among DCA, Jupiter Securitization Corp. (“Jupiter”) and JP Morgan Chase Bank N.A. (“JP Morgan”) which allowed DCA to borrow against a secured line of credit from Jupiter and JP Morgan an aggregate amount up to $85,000,000. On March 16, 2007 the Agreement was amended and the line of credit was increased to $105,000,000. The borrowings under the line of credit were secured by a pledge of the Fund’s portfolio securities. Borrowings under the Agreement bore interest at a variable rate determined by the bank’s conduit program, which had historically been slightly below the 1-month LIBOR but more recently exceeded 1-month LIBOR. DCA paid fees of 0.175% per annum on 102% of the total line of credit, regardless of usage. DCA also paid fees of 0.20% per annum on the average outstanding amount of borrowings. The average balance for days in which borrowings were outstanding during the six months ended June 30, 2009 was $4,232,571 or $0.30 per share based on average shares outstanding of 14,161,010. The average cost of funding during this same time period was 2.12%. As of June 30, 2009, DCA had no outstanding loan balances.
DCA’s borrowing arrangement with Jupiter and JP Morgan terminated on March 14, 2008. The arrangement required that the loan be repaid in equal quarterly payments over a 1-year period ending March 14, 2009. Effective March 14, 2008, the 0.175% per annum fee on 102% of the total line of credit ceased. DCA’s borrowings were fully paid off as of February 27, 2009 and the Agreement has been terminated.
7. INVESTMENTSIN INTEREST RATEAND TOTAL RETURN SWAPS
The Funds may use interest rate swaps in connection with any line of credit and other forms of direct or indirect leverage. The interest rate swaps are intended to reduce or eliminate the risk or the negative effect that an increase in short-term interest rates could have on the performance of the Funds’ common shares as a result of the floating rate structure of the line of credit and other forms of direct or indirect leverage. In these interest rate swaps, the Funds agree to pay the other party to the interest rate swap (the “counterparty”) a fixed rate payment in exchange for the counterparty agreeing to pay the Funds a variable rate payment that is intended to approximate the Funds’ variable rate payment obligations on the line of credit. The payment obligations are based on the notional amount of the swap. Depending on the state of interest rates in general, the use of interest rate swaps could enhance or harm the overall performance of the common shares. The market value of interest rate swaps is based on pricing models that consider the time value of money, volatility and the current and forward interest rate markets.
| | |
| 1.866.324.7348 | | 2009 Semi-Annual Report (Unaudited) 45 |
NOTESTO FINANCIAL STATEMENTS (CONTINUED)
June 30, 2009 (Unaudited)
The Funds may use total return swaps to gain exposure to underlying referenced securities or indices. Total return swap agreements involve commitments to pay interest plus fees in exchange for a market-linked return, both based on notional amounts. To the extent the total return of the security or index underlying the transaction exceeds or falls short of the offsetting interest rate obligation, the Funds will receive a payment from or make a payment to the counterparty, respectively.
Swaps are marked to market daily. For both interest rate swaps and total return swaps, unrealized gains are reported as an asset and unrealized losses are reported as a liability on the Funds’ Statements of Assets and Liabilities. The change in value of swaps, including the accrual of periodic amounts of interest, net of the market linked return to be paid or received on the swaps, is reported as unrealized gains or losses on the Funds’ Statements of Operations. A realized gain or loss is recorded upon payment or receipt of a periodic payment or termination of a swap agreement. The Funds segregate or earmark sufficient assets as collateral to satisfy the Funds’ current obligation with respect to total return and interest rate swaps. Adverse changes in a Fund’s obligations may result in a requirement to post additional collateral in a timely manner. This requirement may require a Fund to sell or otherwise encumber securities at a time and in a manner that could adversely impact the Fund. Entering into swap agreements involves, to varying degrees, elements of credit, foreign currency, market and documentation risk in excess of the amounts recognized on the Statements of Assets and Liabilities. Such risks involve the possibility that there will be no liquid market for these agreements, that the counterparty to these agreements may default on its obligation to perform or disagree as to the meaning of the contractual items in the agreements, and that there may be unfavorable changes in foreign currency, interest rates or values in referenced indices or securities. As of June 30, 2009, the Funds did not have any open interest rate or total return swap contacts.
Derivative Instruments and Hedging Activities
The Funds have adopted the provisions of Financial Accounting Standards Board (“FASB”) Statement of Financial Accounting Standards (“SFAS”) No. 161, “Disclosures about Derivative Instruments and Hedging Activities.” SFAS No. 161 has established improved financial reporting about derivative instruments and hedging activities as it relates to disclosure associated with these types of investments. The following discloses the amounts related to the Fund’s use of derivative and hedging activities.
Balance Sheet - There were no derivatives instruments held by the Funds as of June 30, 2009.
| | |
| 46 2009 Semi-Annual Report (Unaudited) | | www.dcclosedendfunds.com |
NOTESTO FINANCIAL STATEMENTS (CONTINUED)
June 30, 2009 (Unaudited)
The effect of derivatives instruments on the Statement of Operations for the six months ended June 30, 2009:
DCA Total Return Fund
| | | | | | | | | |
Derivatives not accounted for as hedging instruments under Statement 133 | | Location of Gain/(Loss) On Derivatives Recognized in Income | | Realized Gain/ (Loss)
On Derivatives
Recognized
in Income | | | Change in Unrealized
Gain/(Loss) On
Derivatives Recognized
in Income |
Common equity total return swap contracts | | Net realized gain/(loss) from swap contracts/net change in unrealized appreciation on swap contracts | | $ | (1,195,884 | ) | | $ | 1,096,398 |
| | | | | | | | | |
Total | | | | $ | (1,195,884 | ) | | $ | 1,096,398 |
|
| DCW Total Return Fund |
| | | |
Derivatives not accounted for as hedging instruments under Statement 133 | | Location of Gain/(Loss) On Derivatives Recognized in Income | | Realized Gain/ (Loss)
On Derivatives
Recognized
in Income | | | Change in Unrealized
Gain/(Loss) On
Derivatives Recognized
in Income |
Common equity total return swap contracts | | Net realized gain/(loss) from swap contracts/net change in unrealized appreciation on swap contracts | | $ | (4,033,506 | ) | | $ | 3,112,591 |
| | | | | | | | | |
Total | | | | $ | (4,033,506 | ) | | $ | 3,112,591 |
8. FOREIGN CURRENCY CONTRACTS
A foreign currency contract is a commitment to purchase or sell a foreign currency at a future date, at a negotiated rate. The Funds may enter into the foreign currency contracts to settle specific purchases or sales of securities denominated in a foreign currency and for protection from adverse exchange rate fluctuation. Risks to the Funds include the potential inability of the counterparty to meet the terms of the contracts.
The net U.S dollar value of foreign currency underlying all contractual commitments held by the Funds and the resulting unrealized appreciation or depreciation are determined using prevailing forward foreign currency exchange rates. Unrealized appreciation and depreciation of foreign currency contracts are reported in the Funds’ Statements of Assets and Liabilities as a receivable or a payable and in the Funds’ Statements of Operations with the change in unrealized appreciation or depreciation.
The Funds may realize a gain or loss upon the closing or settlement of the foreign transaction. Such realized gains and losses are reported with all other foreign currency gains and losses in the Statements of Operations.
| | |
| 1.866.324.7348 | | 2009 Semi-Annual Report (Unaudited) 47 |
NOTESTO FINANCIAL STATEMENTS (CONTINUED)
June 30, 2009 (Unaudited)
9. ILLIQUIDAND/OR RESTRICTED SECURITIES
As of June 30, 2009, investments in securities included issues that are restricted. Restricted securities are often purchased in private placement transactions, are not registered under the Securities Act of 1933, may have contractual restrictions on resale, and may be revalued under methods approved by the Board of Trustees as reflecting fair value. A security may also be considered illiquid if it lacks a readily available market.
The Funds may invest, without limit, in illiquid securities.
DCA Total Return Fund
Illiquid and/or Restricted Securities as of June 30, 2009
| | | | | | | | | | | | |
Description | | Shares/
Principal
Amount | | Acquisition
Date | | Cost | | Market
Value | |
AP AIMCAP Corp., Series A, 8.250% | | $ | 212,600 | | 06/08/2005 | | $ | 3,979,606 | | $ | 49,430 | |
Bobson CLO, Ltd., 2005-3A, 0.000%, 11/11/2019 | | | 13,000,000 | | 11/09/2005 | | | 13,000,000 | | | 130,000 | |
CW Capital Cobalt II, Ltd, 2006-2A.: | | | | | | | | | | | | |
Class K, 4.592%, 04/26/2016 | | | 4,000,000 | | 05/10/2006 | | | 4,000,000 | | | 182,880 | |
Class P.S., 0.22%, 04/26/2016 | | | 3,500,000 | | 05/10/2006 | | | 3,500,000 | | | 175,000 | |
Fraser Sullivan CLO, Ltd., 2006-1A, 5.26%, 03/15/2017 | | | 3,400,000 | | 03/10/2006 | | | 3,400,000 | | | 340,000 | |
JP Morgan Chase, Series 2005-LDP2, Class M, 4.509%, 06/15/2016 | | | 1,597,000 | | 11/30/2006 | | | 1,294,082 | | | 95,890 | |
Lenox Street, Ltd., Series 2007-1A, Class SN, 0.000%, 06/04/2017 | | | 1,000,000 | | 04/20/2007 | | | 964,066 | | | — | |
Sorin Real Estate CDO II, Ltd., Series 2005 2A, Class H, 5.177%, 01/04/2016 | | | 7,500,000 | | 12/21/2005 | | | 7,500,000 | | | 345,375 | |
Vertical CRE CDO, Ltd., 2006-CR1A: | | | | | | | | | | | | |
Class G, 5.101%, 04/22/2013 | | | 6,500,000 | | 05/24/2006 | | | 6,500,000 | | | 102,310 | |
Class P.S., 0.000%, 04/22/2013 | | | 1,800,000 | | 05/24/2006 | | | 1,800,000 | | | 9,000 | |
Wachovia Bank, Series 2005-C18, Class M, 4.702%, 05/19/2015 | | | 248,100 | | 10/26/2005 | | | 167,633 | | | 18,800 | |
| | | | | | | | | | | | |
Total | | | | | | | | | | $ | 1,448,685 | |
| | | | | | | | | | | | |
Net Assets | | | | | | | | | | $ | 30,469,997 | |
| | | | | | | | | | | | |
Illiquid and/or Restricted Securities as a % of Net Assets | | | | | | | | | | | 4.75 | % |
| | | | | | | | | | | | |
| | |
| 48 2009 Semi-Annual Report (Unaudited) | | www.dcclosedendfunds.com |
NOTESTO FINANCIAL STATEMENTS (CONTINUED)
June 30, 2009 (Unaudited)
DCW Total Return Fund
Illiquid and/or Restricted Securities as of June 30, 2009
| | | | | | | | | | | | |
Description | | Principal
Amount | | Acquisition
Date | | Cost | | Market Value | |
Gramercy Real Estate, Series 2007-1A Class GFX, 6.000%, 08/15/2016 | | $ | 2,000,000 | | 07/26/2007 | | $ | 1,689,889 | | $ | 118,860 | |
| | | | | | | | | | | | |
Gramercy Real Estate, Series 2007-1A Class HFX, 6.000%, 08/15/2016 | | | 5,150,000 | | 07/26/2007 | | | 4,212,460 | | | 260,693 | |
| | | | | | | | | | | | |
Morgan Stanley Capital I 2007-SRR4 Series G, 2.815%, 11/20/2052 | | | 5,750,000 | | 06/27/2007 | | | 5,750,000 | | | 196,248 | |
| | | | | | | | | | | | |
Total | | | | | | | | | | $ | 575,801 | |
| | | | | | | | | | | | |
Net Assets | | | | | | | | | | $ | 34,754,480 | |
| | | | | | | | | | | | |
Illiquid and/or Restricted Securities as a % of Net Assets | | | | | | | | | | | 1.66 | % |
| | | | | | | | | | | | |
10. AMENDMENTTO DECLARATIONOF TRUST
On March 16, 2009, the Funds held an annual shareholders meeting (the “Annual Meeting”) at which each Fund’s shareholders approved an amendment (“Amendment”) to the Declaration of Trust (“Declaration”) to restrict certain acquisitions and dispositions of each Fund’s shares. The restrictions on acquisitions and dispositions of the Funds’ shares contained in the Amendment are intended to preserve the benefit of each Fund’s capital loss carryforwards and certain other tax attributes for tax purposes.
The Amendment is designed to prevent an ownership change (an “Ownership Change”), as defined in the Internal Revenue Code of 1986, as amended (the “Code”). Section 382 of the Code imposes significant limitations on the ability of an entity classified as a corporation to use its capital loss carryforwards to offset income in circumstances where such entity has experienced an Ownership Change and may also limit such an entity’s ability to use any built-in losses recognized within five years of any Ownership Change. Generally, there is an Ownership Change if, at any time, one or more 5% shareholders (as defined in the Code) have experienced aggregate increases in their ownership of a Fund of more than 50 percentage points looking back over the relevant testing period (generally, a trailing three-year period), which can occur as a result of acquisitions that create 5% shareholders of the Fund or increase the ownership in the Fund of 5% shareholders of the Fund.
The Amendment generally prohibits any attempt to purchase or acquire in any manner whatsoever the Fund’s shares or any option, warrant or other right to purchase or acquire shares, or any convertible securities ( the “Shares”), if as a result of such purchase or acquisition of such Shares, any person or group becomes a greater than 4.99% shareholder (as defined in the Code), which generally
| | |
| 1.866.324.7348 | | 2009 Semi-Annual Report (Unaudited) 49 |
NOTESTO FINANCIAL STATEMENTS (CONTINUED)
June 30, 2009 (Unaudited)
includes a person or group that beneficially owns 4.99% or more of the market value of the total outstanding shares, or the percentage of the Funds’ shares owned by a 4.99% shareholder (as defined in the Code) would be increased. As a result of these restrictions, certain transfers of shares by existing 4.99% shareholders are prohibited. Any attempted transfer in violation of the foregoing restrictions will be void ab initio unless the transferor or transferee obtains the written approval of the Board of Trustees, which it may grant or deny in its sole and absolute discretion. The purported transferee will not be entitled to any rights of shareholders of such Fund with respect to the shares that are the subject of the prohibited transfer, including the right to vote such shares and to receive dividends or distributions, whether liquidating or otherwise, in respect of such shares.
If the Board of Trustees determines that a transfer would be prohibited, then, upon a Fund’s written demand, the purported transferee will transfer the shares that are the subject of the prohibited transfer, or cause such shares to be transferred, to the applicable Fund, which shall be deemed an agent for the limited purpose of consummating a sale of the share to a person who is not a 4.99% shareholder. The proceeds of the sale of any such shares will be applied first to the applicable Fund acting in its role as the agent for the sale of the prohibited shares, second, to the extent of any remaining proceeds, to reimburse the intended transferee for any payments made to the transferor by such intended transferee for such shares, and the remainder, if any, to the original transferor.
11. RESULTSOF ANNUAL SHAREHOLDER MEETINGS
The Annual Meeting of Shareholders of the Funds (the “Annual Meeting”) was held on March 16, 2009 pursuant to notice given to all shareholders of record at the close of business on March 4, 2008. At the Annual Meeting, shareholders approved the following proposals:
Proposal 1 DCA — To elect Thomas H. Mack as DCA’s Class I Trustee for a three year term expiring in 2012. The number of shares voting for the election of Mr. Mack was 8,851,715 and the number of shares withholding authority was 819,322.
Proposal 1 DCW — To elect Thomas H. Mack as DCW’s Class II Trustee for a three year term expiring in 2012. The number of shares voting for the election of Mr. Mack was 4,119,109 and the number of shares voting no, or withholding authority was 305,304.
Proposal 2 DCA — To approve or disapprove the proposed investment sub-advisory agreement with Calamos Advisors LLC. The number of shares voting for the sub-advisory agreement was 7,168,218, the number of shares voting no was 546,309 and the number of shares withholding authority was 180,923.
| | |
| 50 2009 Semi-Annual Report (Unaudited) | | www.dcclosedendfunds.com |
NOTESTO FINANCIAL STATEMENTS (CONTINUED)
June 30, 2009 (Unaudited)
Proposal 2 DCW — To approve or disapprove the proposed investment sub-advisory agreement with Calamos Advisors LLC. The number of shares voting for the sub-advisory agreement was 3,111,677 the number of shares voting no was 172,937 and the number of shares withholding authority was 110,295.
Proposal 3 DCA — To approve or disapprove a change in the Fund’s Amended and Restated Agreements and Declarations of Trust Regarding Ownership and Transfer Limitations. The number of shares voting for the proposal was 7,276,421, the number of shares voting no was 451,466 and the number of shares withholding authority was 167,563.
Proposal 3 DCW — To approve or disapprove a change in the Fund’s Amended and Restated Agreements and Declarations of Trust Regarding Ownership and Transfer Limitations. The number of shares voting for the proposal was 3,051,050, the number of shares voting no was 238,553 and the number of shares withholding authority was 105,306.
12. SUBSEQUENT EVENTS
Shareholder Distributions
On July 15th, 2009 DCA paid shareholder distributions in the amount of $0.03 per share to shareholders of record as of June 26, 2009 and DCW paid shareholder distributions in the amount of $0.03 per share to shareholders of record as of June 26, 2009.
Appointment of Officers
At a meeting held on August 20th, 2009, the Board of Trustees approved the appointment of the following officers to the Funds — Jeffrey W. Taylor, President; Francis P. Gaffney as Treasurer and Principal Financial Officer; and Jami M. VonKaenel as Secretary.
| | |
| 1.866.324.7348 | | 2009 Semi-Annual Report (Unaudited) 51 |
DIVIDEND REINVESTMENT PLAN
June 30, 2009 (Unaudited)
The Funds offer a dividend reinvestment plan (the “Plan”) pursuant to which shareholders, unless they otherwise elect, automatically have dividends and capital gains distributions reinvested in common shares of the Fund by The Bank of New York (the “Plan Agent”). Shareholders who elect not to participate in the Plan receive all distributions in cash paid by wire or check mailed directly to the Plan Agent.
How the Plan Works
After the Funds declare a dividend or determine to make a capital gain distribution, the Plan Agent will acquire shares for the participants’ accounts, depending upon the circumstances described below, either (i) through receipt of newly issued shares of the Funds or (ii) by open-market purchases as follows:
| • | | If, on the payment date, the NAV is equal to or less than the market price per share plus estimated brokerage commissions, the Plan Agent will invest the distribution amount in newly issued shares on behalf of the Participants. The number of newly issued shares to be credited to each Participant’s account will be determined by dividing the dollar amount of the distribution by the NAV on the date the shares are issued. However, if the NAV is less than 95% of the market price on the payment date, the dollar amount of the distribution will be divided by 95% of the market price on the payment date. Because common shares may be issued at less than their market price, Plan Participants may get a benefit that non-participants do not. |
| • | | If, on the payment date, the NAV is greater than the market value per share plus estimated brokerage commissions, the Plan Agent will invest the distribution amount in shares acquired on behalf of the Participants in open-market purchases, which may be made on the NYSE, in the over-the-counter market or in negotiated transactions and may be on such terms as to price, delivery and otherwise as the Plan Agent shall determine. It is possible that the market price for the shares may increase before the Plan Agent has completed its purchases. Therefore, the average purchase price per share the Plan Agent pays may exceed the market price thereof on the payment date. If the market price per share increases so that it equals or exceeds the NAV per share (minus brokerage commissions), it will result in the acquisition by the Plan Agent of fewer shares than if the distribution had been paid in shares issued by the Fund. Otherwise, the Plan Agent will use all distributions received in cash to purchase shares in the open market on or shortly after the payment date, but in no event more than thirty (30) days after the payment date. |
| | |
| 52 2009 Semi-Annual Report (Unaudited) | | www.dcclosedendfunds.com |
DIVIDEND REINVESTMENT PLAN (CONTINUED)
June 30, 2009 (Unaudited)
Costs of the Plan
The Plan Agent’s fees for the handling of reinvestment of dividends and other distributions will be paid by the Funds. However, each participant will pay a pro rata share of brokerage commissions incurred with respect to the Plan Agent’s open-market purchases in connection with the reinvestment of dividends and other distributions. If the participant elects to have the Plan Agent sell part or all of his or her shares and remit the proceeds, the participant will be charged his or her pro rata share of brokerage commissions on the shares sold, plus a $15.00 transaction fee.
Tax Implications
The automatic reinvestment of dividends or distributions does not relieve participants of any taxes which may be payable on such dividends or distributions. Participants will receive tax information annually for their personal records and to help them prepare their federal income tax return. For further information as to the consequences of participation in the Plan, Participants should consult with their own tax advisors.
Right to Withdraw
Participants whose shares are registered in his or her name may terminate his or her account under the Plan by notifying the Agent in writing at BNY Mellon Shareowner Services, P.O. Box 358035, Pittsburg, PA 15252-8035, or by calling the Agent at 1.877.296.3711, or using BNY Mellon’s website at: www.melloninvestor.com/ISD. Such termination will be effective with respect to a particular distribution if the Participant’s notice is received by the Agent prior to such distribution record date. Participants whose shares are held by a brokerage firm should contact his or her broker. If a Participants holds shares through a broker, the Participant may not be able to transfer his or her shares to another broker and continue to participate in the Plan if the new broker does not permit such participation. The Plan may be amended or terminated by the Agent or the Funds upon notice in writing mailed to each Participant at least 90 days prior to the effective date of termination.
| | |
| 1.866.324.7348 | | 2009 Semi-Annual Report (Unaudited) 53 |
FUND PROXY VOTING POLICIESAND PROCEDURES
June 30, 2009 (Unaudited)
The Funds have delegated to the Adviser the voting of proxies relating to its securities. The Adviser will vote such proxies in accordance with the Adviser’s policies and procedures. So long as proxy voting authority for the Funds has been delegated to the Adviser, the Adviser has delegated to Calamos the proxy voting authority with respect to those securities that are specifically part of the portion of the Fund’s assets managed by Calamos. The policies and procedures used in determining how to vote proxies relating to portfolio securities and information regarding how the Funds voted and proxies related to securities during the most recent 12-month period ended June 30th for which an SEC filing has been made are available without charge, upon request, by contacting the Funds at 1.866.324.7348, visiting the Fund’s website at www.dcclosedendfunds.com and visiting the Securities Exchange Commission’s (the “Commission”) website at www.sec.gov.
PORTFOLIO HOLDINGS
June 30, 2009 (Unaudited)
The funds file their complete schedule of portfolio holdings with the Commission for the first and third quarters of each fiscal year on Form N-Q within 60 days after the end of the period. Copies of the Funds’ Forms N-Q are available without charge, upon request, by contracting the Funds at 1.866.324.7348 and on the Commission’s website at www.sec.gov. You may also review and copy Form N-Q at the Commission’s Public Reference Room in Washington, D.C. For more information about the operation of the Public Reference Room, please call Commission at 1.800.SEC.0330.
TRUSTEESAND OFFICERS
June 30, 2009 (Unaudited)
The business and affairs of the Funds are managed under the direction of the Board. The Board approves all significant agreements between the Funds and persons or companies furnishing services to it, including the Funds’ agreements with the Adviser, sub-adviser, co-administrators, custodian and transfer agent. The management of the Funds’ day-to-day operations is delegated to its officers and the Adviser, subject always to the investment objectives and policies of the Funds and to the general supervision of the Board. Basic information about the identity and experience of each Trustee and Officer is set forth in the charts below.
The Trustees of the Funds, their age, the position they hold with the Funds, their term of office and the length of time served, their principal occupations for at least the past five years, the number of portfolios they oversee within the Dividend Capital or Calamos Advisors LLC fund complex (“Fund Complex”) and other directorships held by each Trustee are set forth in the following charts.
| | |
| 54 2009 Semi-Annual Report (Unaudited) | | www.dcclosedendfunds.com |
TRUSTEESAND OFFICERS (CONTINUED)
June 30, 2009 (Unaudited)
| | | | | | | | |
Name, Age, Address* and Position with Fund | | Length of
Time Served | | Principal Occupation During Past Five Years
(Including Other Directorships Held) | | Number of
Funds within the
Funds**
Overseen by
Trustee | | Other
Directorships
Held Outside
Fund
Complex |
DCA: Class III; DCW: Class I (term expires 2011) |
| | | | |
Jonathan F. Zeschin Independent Trustee and Chairman of the Board Age: 56 | | Since 01/24/2005 for DCA and 05/22/2007 for DCW | | Essential Investment Partners LLC., Partner (since 2009); Essential Advisers, Inc., President (since 06/2000); and JZ Partners LLC., Managing Partner (since 08/1998). | | 2 | | Matthews Asian Funds, Trustee (since 05/2007) |
| | | | |
David W. Agostine Interested Trustee Age: 47 | | Since 09/30/2007 | | Dividend Capital Investments LLC., President (05/2007 to 06/2009); formerly Intellect Integrated Electronics, Inc., Chief Executive Officer (03/2003 to 05/2007); formerly Janus Institutional, Managing Director (01/2000 to 03/2003). | | 2 | | None |
|
DCA: Class I; DCW: Class II (term expires 2012) |
| | | | |
Thomas H. Mack Independent Trustee Age: 67 | | Since 01/24/2005 for DCA and 05/22/2007 for DCW | | Thomas H. Mack & Co., Inc., President (since 01/1991). | | 2 | | Greenwald & Associates, Director (since 01/2002) |
|
DCA: Class II; DCW: Class III (term expires 2010) |
| | | | |
John Mezger Independent Trustee Age: 55 | | Since 08/17/2005 for DCA and 05/22/2007 for DCW | | WF Option LLC., Manager (since 2004); Oak Point LLC., Manager (since 2003); Cherry Creek South Associates LLC., Manager (since 1999); and Corby Properties LLC., Manager (since 1998). | | 2 | | None |
| | | | |
J. Gibson Watson, III Independent Trustee Age: 54 | | Since 02/21/2006 for DCA and 05/22/2007 for DCW | | Prima Capital Holding, Inc., President and Chief Executive Officer and Director (since 01/2000). | | 2 | | None |
| * | Unless otherwise indicated, the business address of each Trustee is c/o Dividend Capital Investments LLC., 518 17th Street, 18th Floor, Denver, Colorado 80202. |
| ** | The term “Funds” as used herein includes DCA Total Return Fund and DCW Total Return Fund. |
| *** | Mr. Agostine is deemed to be an “interested person” as defined in Section 2(a)(19) of the 1940 Act (“Interested Trustee”), because of his affiliation with the Funds’ adviser, Dividend Capital Investments LLC. |
| | |
| 1.866.324.7348 | | 2009 Semi-Annual Report (Unaudited) 55 |
TRUSTEESAND OFFICERS (CONTINUED)
June 30, 2009 (Unaudited)
The officers of the Funds, their ages and their principal occupations for at least the past five years are set forth below. The address for each of the officers is 518 17th Street, 18th Floor, Denver, CO 80202.
| | | | |
Name and Year of Birth | | Position(s) Held with the Fund | | Principal Occupation During Past Five Years |
Jeffrey Taylor Age: 37 | | President | | Dividend Capital Investments LLC, President (since 06/2009), Chief Operating Officer (since 12/2005); and Vice President of Business Services (02/2004 — 12/2005) |
| | |
Francis P. Gaffney Age: 52 | | Vice President, Treasurer and Principal Financial Officer | | BTR Consulting, President (since 03/2009); Dividend Capital Securities, LLC, Senior Vice President, Director of Operations (03/2004 — 03/2009) |
| | |
Gordon Taylor Age: 35 | | Chief Compliance Officer | | Dividend Capital Securities, LLC, Chief Compliance Officer (since 3/2006); Cambridge Investment Research, AVP, Director of Compliance (12/2003 — 3/2006). |
| | |
| Jami M. VonKaenel Age: 31 | | Vice President, Secretary | | Dividend Capital Investments LLC and Dividend Capital Securities, Controller (since 10/2006) and Assistant Controller (06/2004 — 10/2006); formerly, Ernst and young LLP, Senior Technology and Security Risk Services (02/2004 — 06/2004); and Accenture, Analyst (01/2001 — 01/2004). |
| | |
| 56 2009 Semi-Annual Report (Unaudited) | | www.dcclosedendfunds.com |
APPROVALOF INVESTMENT ADVISORY AGREEMENT
June 30, 2009 (Unaudited)
At a meeting held on May 19, 2009, the Board, including all of the Independent Trustees, unanimously approved the continuation of the Investment Advisory Agreements between the Funds and the Adviser for another year. At each quarterly meeting, the Board received a variety of material relating to the services provided by the Adviser and performance of the Funds. The Independent Trustees met in executive session to review information provided at this and other meetings and to discuss management’s responses. In addition, in advance of the May 19, 2009 meeting, the Board requested and received extensive information from the Adviser to assist them, including information on advisory fees charged for the internal funds/accounts managed by the Adviser. The Board received and considered a variety of information about the Adviser, as well as the advisory and administrative arrangements for the Funds. The board also received and reviewed information showing comparative fee and performance information of the Funds relative to peer groups. The Board also reviewed a memorandum prepared by Fund counsel outlining the legal duties of the Board when approving an advisory agreement.
In considering the continuation of the Investment Advisory Agreement, the Board did not identify any factor as all-important or all-controlling and instead considered these factors collectively in light of either Fund’s surrounding circumstances. After considering the below factors and based on the deliberations and its evaluation of the information provided to it, the Board concluded that the continuation of the Investment Advisory Agreement for another year was in the best interest of each Fund and each shareholders and that the compensation payable to the Adviser under the Investment Advisory Agreement by each Fund is fair and reasonable in light of the services to be provided.
Investment Advisory Fee Rate
The Board reviewed and considered the contractual annual advisory fee to be paid by each Fund to the Adviser, in light of the extent and quality of the advisory services provided by the Adviser to the Fund. The Board received and considered information comparing each Fund’s contractual advisory fees and overall expenses with those of funds in the applicable peer group. The Board noted that the investment advisory fees to be received by the Adviser with respect to each Fund were on the higher end of the range relative to such Fund’s peer group. The Board also considered that such ranking for each Fund may be a result in part of the Funds being smaller than the other funds in such peer group and that the Adviser and other service providers had taken significant steps during the prior year to avoid the overall fees and expenses from being even higher for shareholders of each Fund as the assets under management declined during the year.
Nature, Extent and Quality of the Services under the Advisory Agreement
The Board received and considered information regarding the nature, extent and quality of services provided by the Adviser to the Fund under the Advisory Agreement. The Board reviewed certain background materials supplied by the
| | |
| 1.866.324.7348 | | 2009 Semi-Annual Report (Unaudited) 57 |
APPROVALOF INVESTMENT ADVISORY AGREEMENT (CONTINUED)
June 30, 2009 (Unaudited)
Adviser, including its Form ADV. The Board reviewed and considered the Adviser’s investment advisory personnel, its history as an asset manager, its performance and the amount of assets currently under management. The Board also reviewed the research and decision-making processes utilized by the Adviser, including the methods adopted to seek to achieve compliance with the investment objectives, policies and restrictions of the Funds. The Board considered, among other things, the background and experience of the Adviser’s management in connection with the Funds, including reviewing the qualifications, backgrounds and responsibilities of the management team primarily responsible for the day-to-day portfolio management of the Funds and the extent of the resources devoted to research and analysis of actual and potential investments. The Board also reviewed, among other things, the Adviser’s Code of Ethics.
The Board also reviewed and considered the recent advisory changes to the Funds, including the retention of Calamos as sub-adviser to the Funds.
Performance
The Board reviewed performance information for each Fund for the 1- and 3-year periods (for DCA only) ended March 31, 2009 and since inception, on both a market value and a reported NAV basis. That review included a comparison of each Fund’s performance to the performance of a group of comparable funds and the Fund’s benchmarks. The Board also considered the Adviser’s observations about the effect of recent market turmoil on each Fund’s performance. The Board considered, among other things, the Adviser’s performance and reputation generally and its investment techniques, risk management controls and decision-making processes.
The Adviser’s Profitability
The Board received and considered a profitability analysis prepared by the Adviser based on the fees payable under the Advisory Agreement and containing certain assumptions regarding cost and expense allocations.
Economies of Scale
The Board considered whether economies of scale, if any, in the provision of services to the Funds were being passed along to the shareholders.
Other Benefits to the Adviser
The Board reviewed and considered any other benefits derived or to be derived by the Adviser from its relationship with the Funds, including soft dollar arrangements.
| | |
| 58 2009 Semi-Annual Report (Unaudited) | | www.dcclosedendfunds.com |
APPROVALOF INVESTMENT ADVISORY AGREEMENT (CONTINUED)
June 30, 2009 (Unaudited)
The Board, including all of the Independent Trustees, concluded that:
| • | | The investment advisory fees to be received by the Adviser with respect to each Fund were on the higher end of the range relative to such Fund’s peer group, that the Adviser and other service providers had taken significant steps during the prior year to avoid the overall fees and expenses from being even higher for shareholders to each Fund as the assets under management declined during the year; |
| • | | The nature, extent and quality of services rendered by the Adviser to each Fund was appropriate, and that the desired beneficial effects of the recent structural changes on Fund performance and fees, including the retention of a subadviser, were just beginning to be realized by the Funds; |
| • | | The performance of each Fund was fair to average within its peer group, and generally at or slightly below the median during each analysis period; |
| • | | The Adviser’s current and potential future profitability in connection with the operation of each Fund is not excessive and is fair to that Fund; and |
| • | | There were no material economies of scale or other benefits accruing to the Adviser in connection with its relationship with either Fund. |
After discussion and upon a motion duly made and seconded the Board, including a majority of the Independent Trustees, unanimously approved the continuation of the Investment Advisory Agreements between the Funds and the Advisor for another year.
| | |
| 1.866.324.7348 | | 2009 Semi-Annual Report (Unaudited) 59 |
KEY INFORMATION
June 30, 2009 (Unaudited)
| | |
Key Information | | Officers and Trustees |
| |
Investment Adviser and Administrator Dividend Capital Investments LLC 518 17th Street, Suite 1200 Denver, CO 80202 Co-Administrator ALPS Fund Services, Inc. 1290 Broadway, Suite 1100 Denver, CO 80203 Custodian Union Bank 350 California Street, 6th Floor San Francisco, CA 94104 Transfer Agent BNY Mellon Shareowner Services 480 Washington Blvd. Jersey City, NJ 07310 Legal Counsel Davis Graham & Stubbs LLP 1550 17th Street, Suite 500 Denver, CO 80202 Independent Registered Public Accounting Firm Tait, Weller & Baker LLP 1818 Market Street, Suite 2400 Philadelphia, PA 19103 | | Jonathan F. Zeschin Independent Trustee and Chairman of the Board Thomas H. Mack Independent Trustee John Mezger Independent Trustee J. Gibson Watson, III Independent Trustee David W. Agostine Trustee Jeffrey W. Taylor President Francis P. Gaffney Vice President, Treasurer and Principal Financial Officer Gordon Taylor Chief Compliance Officer Jami M. VonKaenel Vice President, Secretary |
New York Stock Exchange Symbols: DCA and DCW
This report is for shareholder information. This is not a prospectus intended for use in the purchase or sale of fund shares. Statements and other information contained in this report are as dated and are subject to change.
| | |
| 60 2009 Semi-Annual Report (Unaudited) | | www.dcclosedendfunds.com |
This Page Intentionally Left Blank

Not applicable
| Item 3. | Audit Committee Financial Expert |
Not applicable
| Item 4. | Principal Accountant Fees and Services |
Not applicable
| Item 5. | Audit Committee of Listed Registrants |
Not applicable
| Item 6. | Schedule of Investments |
Included as part of the report to shareholders filed under Item 1 of this Form N-CSR.
| Item 7. | Disclosure of Proxy Voting Policies and Procedures for Closed-End Management Investment Companies |
Not applicable
| Item 8. | Portfolio Managers of Closed-End Management Investment Companies. |
Not applicable
| Item 9. | Purchases of Equity Securities by Closed-End Management Investment Company and Affiliated Purchasers. |
Not applicable.
| Item 10. | Submission of Matters to Vote of Security Holders |
There were no material changes to the procedures by which shareholders may recommend nominees to the Registrant’s Board of Trustees that were implemented after the Registrant last provided disclosure in response to the requirements of Item 407(c)(2)(iv) of Regulation S-K (17 CFR 229.407) (as required by 22(b)(15)) of Schedule 14A (17 CFR 240.14a-101), or this Item 10.
Item 11 – Controls and Procedures
| (a) | Based on an evaluation of the disclosure controls and procedures (as defined in Rule 30a-3(c) under the Act) as of a date within 90 days of the filing date of this report, the Chief Executive Officer, Treasurer, and Principal Financial and Accounting Officer of the Registrant have each concluded that such disclosure controls and procedures provide reasonable assurance that information required to be disclosed by the Registrant is accumulated and communicated to the Registrant’s management to allow timely decisions regarding required disclosure. |
| (b) | There were no changes in the Registrant’s internal controls over financial reporting (as defined in Rule 30a-3(d) under the Act) that occurred during the second fiscal quarter of the period covered by this report that have materially affected, or are reasonably likely to materially affect, the Registrant’s internal control over financial reporting. |
Item 12 – Exhibits
| (a)(2) | The certifications required by Rule 30a-2(a) of the Act (17 CFR 270.30a-2(a)) are filed and attached hereto as Exhibit 99.CERT. |
| (a)(3) | Not applicable to the Registrant. |
| (b) | The certification required by Rule 30a-2(b) of the Act (17 CFR 270.30a-2(b)) is filed and attached hereto as Exhibit 99.906CERT. |
SIGNATURES
Pursuant to the requirements of the Securities Exchange Act of 1934 and the Investment Company Act of 1940, the Registrant has duly caused this report to be signed on its behalf by the undersigned, thereunto duly authorized.
| | |
| DCA Total Return Fund |
| |
| By: | | /s/ Jeffrey W. Taylor |
| | Jeffrey W. Taylor |
| | President |
| | (Principal Executive Officer) |
Date: August 28, 2009
Pursuant to the requirements of the Securities Exchange Act of 1934 and the Investment Company Act of 1940, this report has been signed below by the following persons on behalf of the Registrant and in the capacities and on the dates indicated.
| | |
| |
| By: | | /s/ Jeffrey W. Taylor |
| | Jeffrey W. Taylor |
| | President |
| | (Principal Executive Officer) |
Date: August 28, 2009
| | |
| |
| By: | | /s/ Francis Gaffney |
| | Francis Gaffney |
| | Treasurer |
| | (Principal Financial Officer) |
Date: August 28, 2009