As filed with the Securities and Exchange Commission on September 3, 2010
UNITED STATES
SECURITIES AND EXCHANGE COMMISSION
Washington, D.C. 20549
FORM N-CSR
CERTIFIED SHAREHOLDER REPORT OF REGISTERED
MANAGEMENT INVESTMENT COMPANIES
Investment Company Act file Number: 811-21680
DCA Total Return Fund
(Exact Name of the Registrant as Specified in Charter)
518 17th Street, Suite 1200, Denver, CO 80202
(Address of Principal Executive Offices - Zip Code)
303-228-2200
Registrant’s Telephone Number, including area code:
Jeffrey W. Taylor
President
518 17th Street, Suite 1200
Denver, CO 80202
(Names and Addresses of agents for service)
Date of fiscal year end: December 31, 2010
Date of reporting period: June 30, 2010
Item 1. Reports to Shareholders
The following is a copy of the report to shareholders pursuant to Rule 30e-1 under the Investment Company Act of 1940 (the “Act”).
Table of Contents
Shareholder Letter
2
DCA Total Return Fund (DCA)
Total Returns and Trading History
6
Portfolio Profile
7
DCW Total Return Fund (DCW)
Total Returns and Trading History
8
Portfolio Profile
9
Statement of Investments
DCA Total Return Fund
10
DCW Total Return Fund
18
Statements of Assets & Liabilities
26
Statements of Operations
27
Statements of Changes in Net Assets
DCA Total Return Fund
28
DCW Total Return Fund
29
Financial Highlights
DCA Total Return Fund
30
DCW Total Return Fund
32
Notes to Financial Statements
33
Dividend Reinvestment Plan
50
Fund Proxy Voting Policies and Procedures
51
Portfolio Holdings
52
Trustees and Officers
52
Approval of Investment Advisory Agreement
55
Key Information
58
The Shareholder Letter and other information included in this shareholder report may contain certain forward-looking statements about the factors that may affect the performance of the Funds in the future. These statements are based on Fund management’s predictions and expectations concerning certain future events and their expected impact on the Funds, such as performance of the economy as a whole and of the global capital markets, changes in the level of interest rates, the impact of developing world events, and other factors that may influence the future performance of the Funds. Management believes these forward looking statements to be reasonable, although they are inherently uncertain and difficult to predict and there is no guarantee of their accuracy. Actual events may cause adjustments in portfolio management strategies from those currently expected to be employed.
1.866.324.7348
2010 Semi-Annual Report (Unaudited) 1
Shareholder Letter
August 20, 2010
Fellow Shareholders,
Following a sharp rally in the capital markets in 2009, the U.S. economy has so far struggled in 2010 to extend the recovery from the worst recession since the Great Depression. Plagued by domestic challenges to growth at home, including persistently high unemployment and a prolonged housing slump, the U.S. economy faced added uncertainty as overseas markets sent mixed signals. While China, India and Brazil posted solid economic growth year-to-date, helping drive global demand, the euro-zone debt crisis overshadowed the recovery as concerns over sovereign debt levels spread, threatening growth prospects in the EU region and beyond. The end result has been a decline in global equity values as represented by the MSCI World Index return of -9.56% over the six-month period ending June 30, 2010.
Against this back-drop the Funds have performed relatively well. As displayed in the performance tables that follow this letter, during the six-months ended June 30, 2010, DCA’s NAV total return was 19.15% while the market price total return was 7.55% and DCW’s NAV total return was -1.98% while the market price total return was -5.23%.
During this period, both Funds’ performance was negatively influenced by overall market conditions, but positively influenced by their overall asset allocations. The Funds benefited not only from outperformance (relative to the MSCI World Index) experienced in their Calamos-managed global common equity strategy, but also experienced positive total returns from both Funds’ preferred equity portfolios. DCA also materially benefited from an increase in value and realization of substantial cash flows from its Collateralized Loan Obligation holdings. The performance of these securities accounts for the majority of the performance differential between the Funds. Real estate debt securities continued to be a negative influence on both Funds’ performance as the future income generation capability of certain positions was deemed to be unlikely.
During 2010, we continued our efforts to implement strategic changes for the Funds. Most notably, pursuant to a proxy statement dated July 30, 2010 each Fund’s Board of Trustees (the “Boards”), including the Independent Trustees, approved and are asking you to approve the following:
1. A proposal to elect two Trustees to serve three year terms, each to serve until his successor has been duly elected and qualified.
2. A proposal to approve the removal of the fundamental restriction requiring each Fund to invest greater than 25% of its total assets in securities of companies in the real estate industry.
2 2010 Semi-Annual Report (Unaudited)
www.dcclosedendfunds.com
SHAREHOLDER LETTER (CONTINUED)
| | 3. | | A proposal to approve an Agreement and Plan of Reorganization reorganizing DCW into DCA (the “Reorganization”), the termination of DCW’s registration under the Investment Company Act of 1940, and the dissolution of DCW under Delaware law. |
The proposals listed above include significant and we believe positive changes for the Funds.
First, the Boards believe the removal of the fundamental restrictions requiring each Fund to invest greater than 25% of its total assets in securities of real estate companies benefits shareholders by enabling the Funds greater asset class allocation flexibility, which will in turn facilitate investment opportunities to be sourced from a wider universe of securities. This increased flexibility potentially enhances each Fund’s ability to achieve its investment objective of total return.
Second, following shareholder meetings held March 16, 2009, the Funds changed their investment objectives and certain non-fundamental investment policies. This included changing their historic objectives of high current income with a secondary focus on capital appreciation to an objective of total return, eliminating the investment policies requiring at least 80% of managed assets to be invested in securities of real estate companies, removing any specific limitations regarding the Funds’ investment in foreign securities and modifying the dividend policies from a monthly level-rate payment to quarterly distributions. These changes result in global-oriented, total return Funds with investment strategies that may include investments in a wide range of securities that may include common equity, preferred equity, debt securities and derivative instruments.
As a result of these changes, the investment strategies and securities portfolios of the Funds have become substantially similar. Given their similarities and significant overlap in investment portfolios, the Boards believe shareholders of both Funds will benefit from the economies of scale to be realized by a merger. In addition, the total annual operating expense ratio of the combined fund after the Reorganization is expected to be lower than each Fund’s current total annual operating expense ratio, because the fixed expenses of the combined fund following the Reorganization will be spread over a larger asset base.
If you have not already done so, please take time to review the current proxy statement, which will discuss some of these changes in more detail and matters to be voted upon by shareholders at the September 16, 2010 Annual Meeting of Shareholders.
In closing, we believe the strategic changes discussed above will further help position the Funds to realize shareholder value by creating a single, combined fund that is focused on total return through investment in common equity, preferred equity, debt securities and derivative instruments across a broad range of industries and geographic regions. Consistent with the steps taken beginning in 2009, we will continue to assess ongoing opportunities to enhance the Funds’ return potential.
1.866.324.7348
2010 Semi-Annual Report (Unaudited) 3
SHAREHOLDER LETTER (CONTINUED)
As evidenced by the year-to-date market performance, we continue to believe that there is a premium on investment vigilance. However, we also believe this environment will create compelling, long-term investment opportunities and that the Funds have the potential to create long-term value for shareholders.
We thank you for your continued support.
Sincerely,
Jeffrey Taylor
Jeffrey Randall
President
Portfolio Manager
4 2010 Semi-Annual Report (Unaudited)
www.dcclosedendfunds.com
This Page Intentionally Left Blank
Total Returns and Trading History
June 30, 2010 (Unaudited)
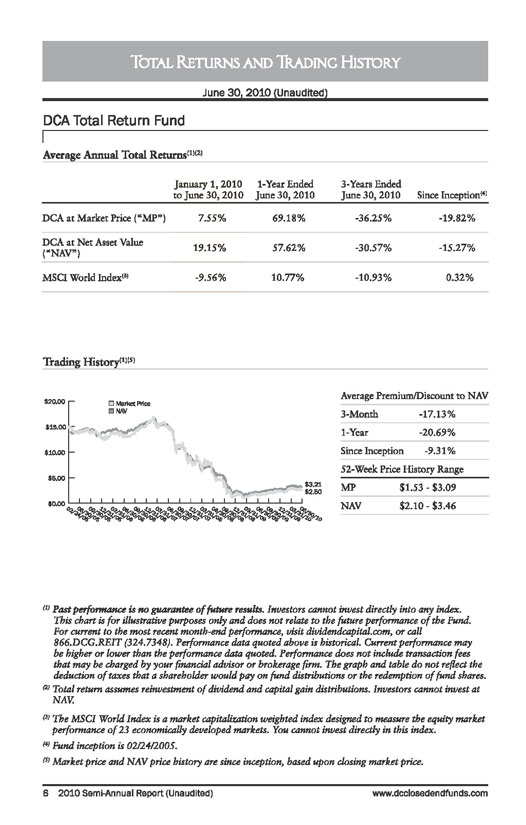
DCA Total Return Fund
Average Annual Total Returns (1)(2)
January 1, 2010
to June 30, 2010
1-Year Ended
June 30, 2010
3-Years Ended
June 30, 2010
Since Inception (4)
DCA at Market Price (“MP”)
7.55%
69.18%
-36.25%
-19.82%
DCA at Net Asset Value (“NAV”)
19.15%
57.62%
-30.57%
-15.27%
MSCI World Index (3)
-9.56%
10.77%
-10.93%
0.32%
Trading History (1)(5)
Average Premium/Discount to NAV
3-Month
-17.13%
1-Year
-20.69%
Since Inception
-9.31%
52-Week Price History Range
MP
$1.53 - $3.09
NAV
$2.10 - $3.46
(1) Past performance is no guarantee of future results. Investors cannot invest directly into any index. This chart is for illustrative purposes only and does not relate to the future performance of the Fund. For current to the most recent month-end performance, visit dividendcapital.com, or call 866.DCG.REIT (324.7348). Performance data quoted above is historical. Current performance may be higher or lower than the performance data quoted. Performance does not include transaction fees that may be charged by your financial advisor or brokerage firm. The graph and table do not reflect the deduction of taxes that a shareholder would pay on fund distributions or the redemption of fund shares.
(2) Total return assumes reinvestment of dividend and capital gain distributions. Investors cannot invest at NAV.
(3) The MSCI World Index is a market capitalization weighted index designed to measure the equity market performance of 23 economically developed markets. You cannot invest directly in this index.
(4) Fund inception is 02/24/2005.
(5) Market price and NAV price history are since inception, based upon closing market price.
6 2010 Semi-Annual Report (Unaudited)
www.dcclosedendfunds.com
Portfolio Profile
June 30, 2010 (Unaudited)
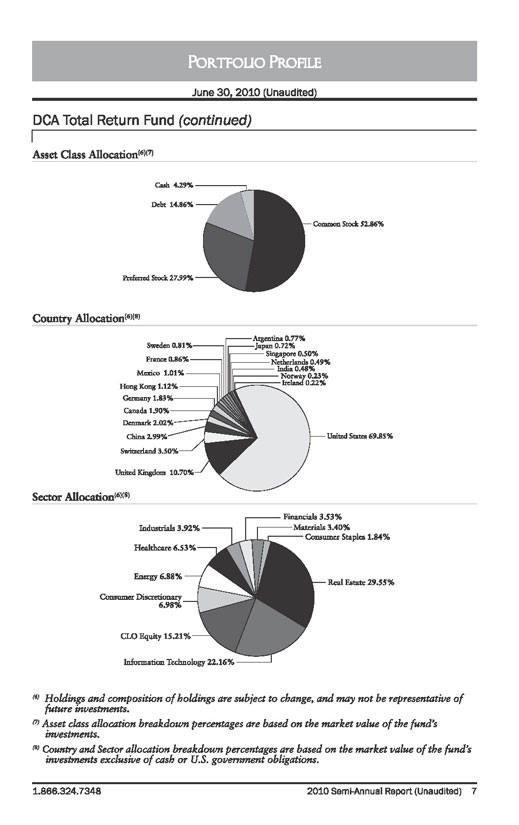
DCA Total Return Fund (continued)
Asset Class Allocation (6)(7)
Country Allocation (6)(8)
Sector Allocation (6)(8)
(6) Holdings and composition of holdings are subject to change, and may not be representative of future investments.
(7) Asset class allocation breakdown percentages are based on the market value of the fund’s investments.
(8) Country and Sector allocation breakdown percentages are based on the market value of the fund’s investments exclusive of cash or U.S. government obligations.
1.866.324.7348
2010 Semi-Annual Report (Unaudited) 7
Total Returns and Trading History
June 30, 2010 (Unaudited)
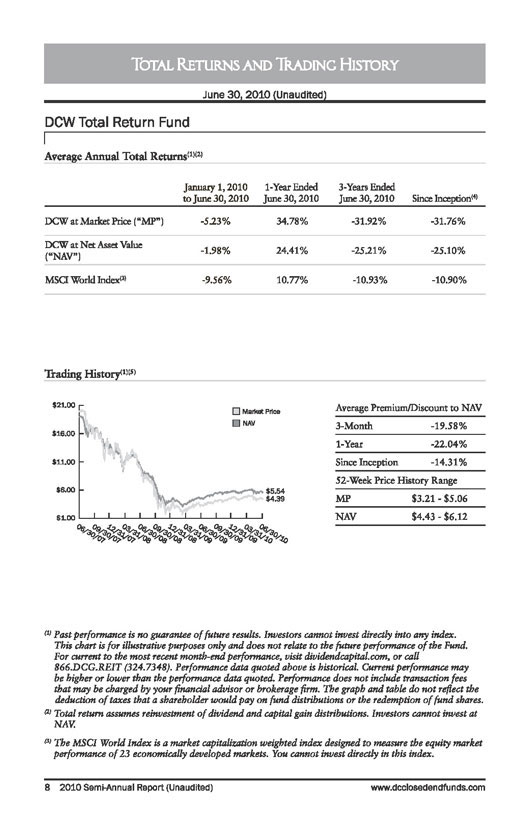
DCW Total Return Fund
Average Annual Total Returns (1)(2)
January 1, 2010 to June 30, 2010
1-Year Ended June 30, 2010
3-Years Ended June 30, 2010
Since Inception (4)
DCW at Market Price (“MP”)
-5.23%
34.78%
-31.92%
-31.76%
DCW at Net Asset Value (“NAV”)
-1.98%
24.41%
-25.21%
-25.10%
MSCI World Index (3)
-9.56%
10.77%
-10.93%
-10.90%
Trading History (1)(5)
Average Premium/Discount to NAV
3-Month
-19.58%
1-Year
-22.04%
Since Inception
-14.31%
52-Week Price History Range
MP
$3.21 - $5.06
NAV
$4.43 - $6.12
(1) Past performance is no guarantee of future results. Investors cannot invest directly into any index. This chart is for illustrative purposes only and does not relate to the future performance of the Fund. For current to the most recent month-end performance, visit dividendcapital.com, or call 866.DCG.REIT (324.7348). Performance data quoted above is historical. Current performance may be higher or lower than the performance data quoted. Performance does not include transaction fees that may be charged by your financial advisor or brokerage firm. The graph and table do not reflect the deduction of taxes that a shareholder would pay on fund distributions or the redemption of fund shares.
(2) Total return assumes reinvestment of dividend and capital gain distributions. Investors cannot invest at NAV.
(3) The MSCI World Index is a market capitalization weighted index designed to measure the equity market performance of 23 economically developed markets. You cannot invest directly in this index.
8 2010 Semi-Annual Report (Unaudited)
www.dcclosedendfunds.com

Portfolio Profile
June 30, 2010 (Unaudited)
DCW Total Return Fund (continued)
Asset Class Allocation (6)(7)
Country Allocation (6)(8)
Sector Allocation (6)(8)
(4) Fund inception is 06/27/2007.
(5) Market price and NAV price history are since inception, based upon closing market price.
(6) Holdings and composition of holdings are subject to change, and may not be representative of future investments.
(7) Asset class allocation breakdown percentages are based on the market value of the fund’s investments.
(8) Country and Sector allocation breakdown percentages are based on the market value of the fund’s investments exclusive of cash or U.S. government obligations.
1.866.324.7348
2010 Semi-Annual Report (Unaudited) 9
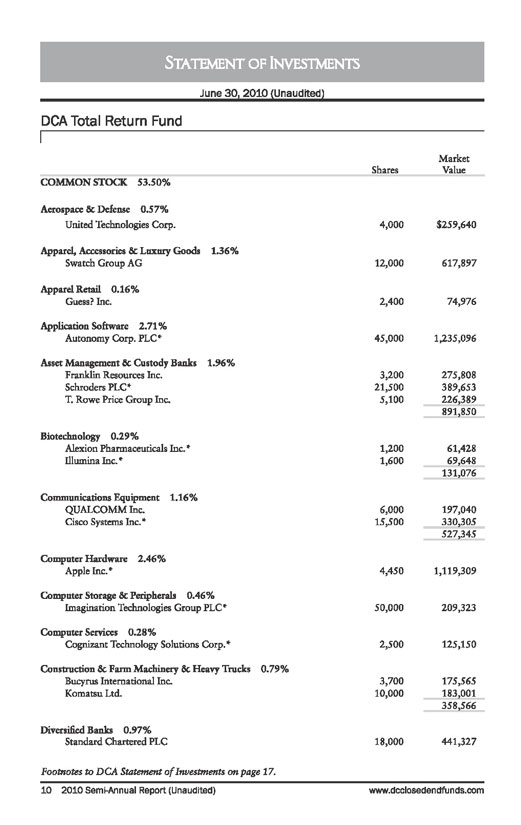
Statement of Investments
June 30, 2010 (Unaudited)
DCA Total Return Fund
Shares
Market Value
COMMON STOCK 53.50%
Aerospace & Defense 0.57%
United Technologies Corp.
4,000
$259,640
Apparel, Accessories & Luxury Goods 1.36%
Swatch Group AG
12,000
617,897
Apparel Retail 0.16%
Guess? Inc.
2,400
74,976
Application Software 2.71%
Autonomy Corp. PLC*
45,000
1,235,096
Asset Management & Custody Banks 1.96%
Franklin Resources Inc.
3,200
275,808
Schroders PLC*
21,500
389,653
T. Rowe Price Group Inc.
5,100
226,389
891,850
Biotechnology 0.29%
Alexion Pharmaceuticals Inc.*
1,200
61,428
Illumina Inc.*
1,600
69,648
131,076
Communications Equipment 1.16%
QUALCOMM Inc.
6,000
197,040
Cisco Systems Inc.*
15,500
330,305
527,345
Computer Hardware 2.46%
Apple Inc.*
4,450
1,119,309
Computer Storage & Peripherals 0.46%
Imagination Technologies Group PLC*
50,000
209,323
Computer Services 0.28%
Cognizant Technology Solutions Corp.*
2,500
125,150
Construction & Farm Machinery & Heavy Trucks 0.79%
Bucyrus International Inc.
3,700
175,565
Komatsu Ltd.
10,000
183,001
358,566
Diversified Banks 0.97%
Standard Chartered PLC
18,000
441,327
Footnotes to DCA Statement of Investments on page 17.
10 2010 Semi-Annual Report (Unaudited)
www.dcclosedendfunds.com
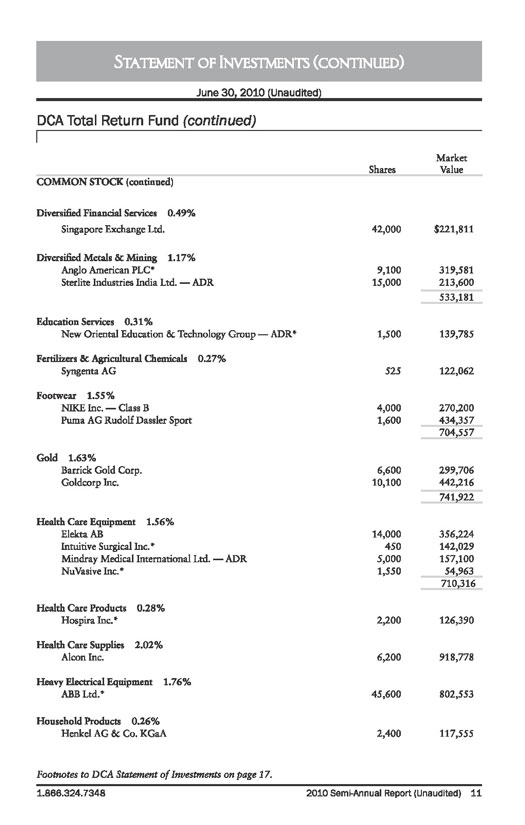
Statement of Investments (continued)
June 30, 2010 (Unaudited)
DCA Total Return Fund (continued)
Shares
Market Value
COMMON STOCK (continued)
Diversified Financial Services 0.49%
Singapore Exchange Ltd.
42,000
$221,811
Diversified Metals & Mining 1.17%
Anglo American PLC*
9,100
319,581
Sterlite Industries India Ltd. - ADR
15,000
213,600
533,181
Education Services 0.31%
New Oriental Education & Technology Group - ADR*
1,500
139,785
Fertilizers & Agricultural Chemicals 0.27%
Syngenta AG
525
122,062
Footwear 1.55%
NIKE Inc. - Class B
4,000
270,200
Puma AG Rudolf Dassler Sport
1,600
434,357
704,557
Gold 1.63%
Barrick Gold Corp.
6,600
299,706
Goldcorp Inc.
10,100
442,216
741,922
Health Care Equipment 1.56%
Elekta AB
14,000
356,224
Intuitive Surgical Inc.*
450
142,029
Mindray Medical International Ltd. - ADR
5,000
157,100
NuVasive Inc.*
1,550
54,963
710,316
Health Care Products 0.28%
Hospira Inc.*
2,200
126,390
Health Care Supplies 2.02%
Alcon Inc.
6,200
918,778
Heavy Electrical Equipment 1.76%
ABB Ltd.*
45,600
802,553
Household Products 0.26%
Henkel AG & Co. KGaA
2,400
117,555
Footnotes to DCA Statement of Investments on page 17.
1.866.324.7348
2010 Semi-Annual Report (Unaudited) 11
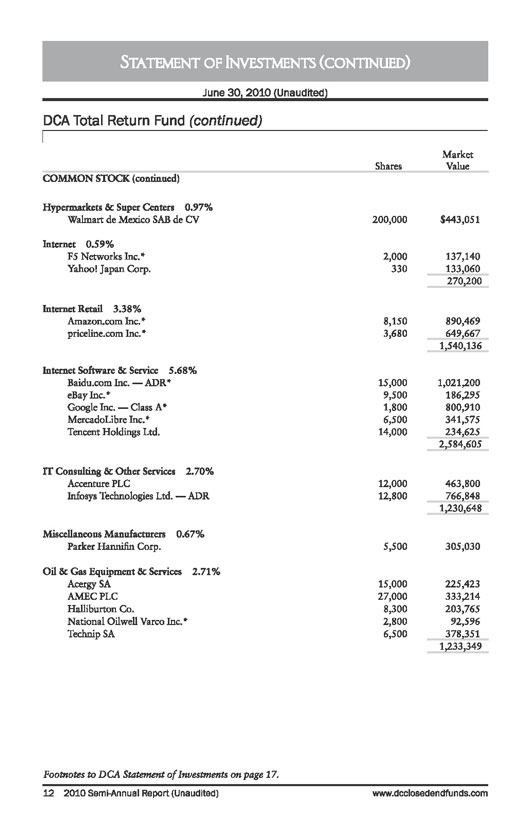
Statement of Investments (continued)
June 30, 2010 (Unaudited)
DCA Total Return Fund (continued)
Shares
Market Value
COMMON STOCK (continued)
Hypermarkets & Super Centers 0.97%
Walmart de Mexico SAB de CV
200,000
$443,051
Internet 0.59%
F5 Networks Inc.*
2,000
137,140
Yahoo! Japan Corp.
330
133,060
270,200
Internet Retail 3.38%
Amazon.com Inc.*
8,150
890,469
priceline.com Inc.*
3,680
649,667
1,540,136
Internet Software & Service 5.68%
Baidu.com Inc. - ADR*
15,000
1,021,200
eBay Inc.*
9,500
186,295
Google Inc. - Class A*
1,800
800,910
MercadoLibre Inc.*
6,500
341,575
Tencent Holdings Ltd.
14,000
234,625
2,584,605
IT Consulting & Other Services 2.70%
Accenture PLC
12,000
463,800
Infosys Technologies Ltd. - ADR
12,800
766,848
1,230,648
Miscellaneous Manufacturers 0.67%
Parker Hannifin Corp.
5,500
305,030
Oil & Gas Equipment & Services 2.71%
Acergy SA
15,000
225,423
AMEC PLC
27,000
333,214
Halliburton Co.
8,300
203,765
National Oilwell Varco Inc.*
2,800
92,596
Technip SA
6,500
378,351
1,233,349
Footnotes to DCA Statement of Investments on page 17.
12 2010 Semi-Annual Report (Unaudited)
www.dcclosedendfunds.com
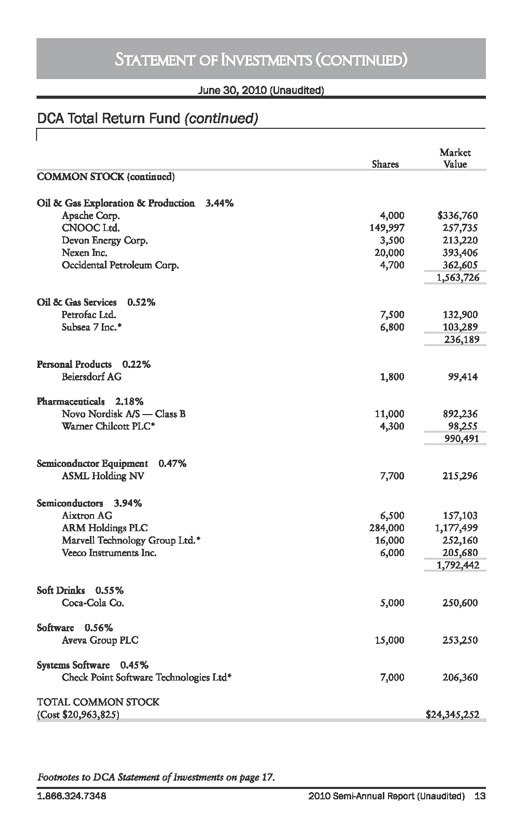
Statement of Investments (continued)
June 30, 2010 (Unaudited)
DCA Total Return Fund (continued)
Shares
Market
Value
COMMON STOCK (continued)
Oil & Gas Exploration & Production 3.44%
Apache Corp.
4,000
$336,760
CNOOC Ltd.
149,997
257,735
Devon Energy Corp.
3,500
213,220
Nexen Inc.
20,000
393,406
Occidental Petroleum Corp.
4,700
362,605
1,563,726
Oil & Gas Services 0.52%
Petrofac Ltd.
7,500
132,900
Subsea 7 Inc.*
6,800
103,289
236,189
Personal Products 0.22%
Beiersdorf AG
1,800
99,414
Pharmaceuticals 2.18%
Novo Nordisk A/S - Class B
11,000
892,236
Warner Chilcott PLC*
4,300
98,255
990,491
Semiconductor Equipment 0.47%
ASML Holding NV
7,700
215,296
Semiconductors 3.94%
Aixtron AG
6,500
157,103
ARM Holdings PLC
284,000
1,177,499
Marvell Technology Group Ltd.*
16,000
252,160
Veeco Instruments Inc.
6,000
205,680
1,792,442
Soft Drinks 0.55%
Coca-Cola Co.
5,000
250,600
Software 0.56%
Aveva Group PLC
15,000
253,250
Systems Software 0.45%
Check Point Software Technologies Ltd*
7,000
206,360
TOTAL COMMON STOCK
(Cost $20,963,825)
$24,345,252
Footnotes to DCA Statement of Investments on page 17.
1.866.324.7348
2010 Semi-Annual Report (Unaudited) 13
Statement of Investments (continued)
June 30, 2010 (Unaudited)
DCA Total Return Fund (continued)
Bond Rating Moody’s/S&P (Unaudited)
Shares
Market Value
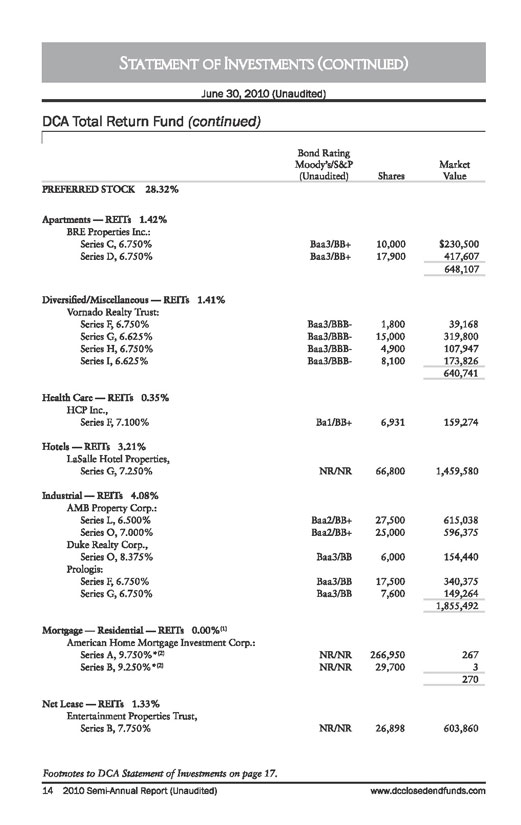
PREFERRED STOCK 28.32%
Apartments - REITs 1.42%
BRE Properties Inc.:
Series C, 6.750%
Baa3/BB+
10,000
$230,500
Series D, 6.750%
Baa3/BB+
17,900
417,607
648,107
Diversified/Miscellaneous - REITs 1.41%
Vornado Realty Trust:
Series F, 6.750%
Baa3/BBB-
1,800
39,168
Series G, 6.625%
Baa3/BBB-
15,000
319,800
Series H, 6.750%
Baa3/BBB-
4,900
107,947
Series I, 6.625%
Baa3/BBB-
8,100
173,826
640,741
Health Care - REITs 0.35%
HCP Inc.,
Series F, 7.100%
Bal/BB+
6,931
159,274
Hotels - REITs 3.21%
LaSalle Hotel Properties,
Series G, 7.250%
NR/NR
66,800
1,459,580
Industrial - REITs 4.08%
AMB Property Corp.:
Series L, 6.500%
Baa2/BB+
27,500
615,038
Series O, 7.000%
Baa2/BB+
25,000
596,375
Duke Realty Corp.,
Series O, 8.375%
Baa3/BB
6,000
154,440
Prologis:
Series F, 6.750%
Baa3/BB
17,500
340,375
Series G, 6.750%
Baa3/BB
7,600
149,264
1,855,492
Mortgage - Residential - REITs 0.00% (1)
American Home Mortgage Investment Corp.:
Series A, 9.750%* (2)
NR/NR
266,950
267
Series B, 9.250%* (2)
NR/NR
29,700
3
270
Net Lease - REITs 1.33%
Entertainment Properties Trust,
Series B, 7.750%
NR/NR
26,898
603,860
Footnotes to DCA Statement of Investments on page 17.
14 2010 Semi-Annual Report (Unaudited)
www.dcclosedendfunds.com
Statement of Investments (continued)
June 30, 2010 (Unaudited)
DCA Total Return Fund (continued)
Bond Rating Moody’s/S&P (Unaudited)
Shares
Market Value
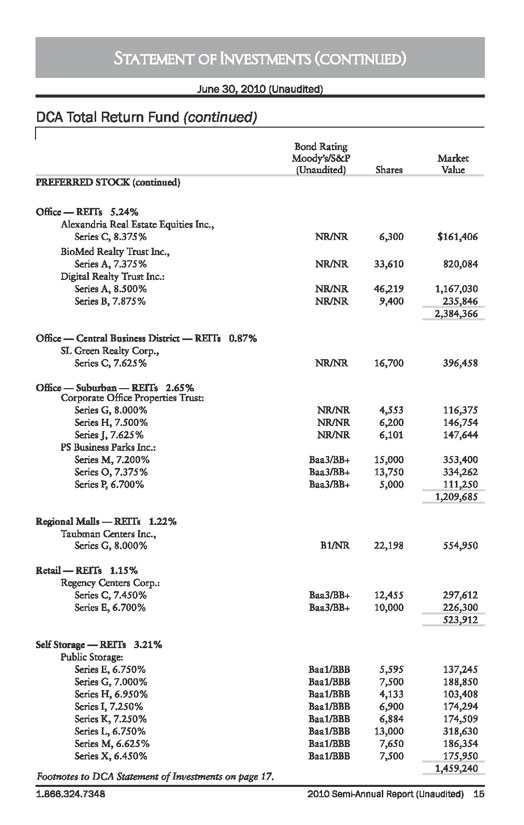
PREFERRED STOCK (continued)
Office - REITs 5.24%
Alexandria Real Estate Equities Inc.,
Series C, 8.375%
NR/NR
6,300
$161,406
BioMed Realty Trust Inc.,
Series A, 7.375%
NR/NR
33,610
820,084
Digital Realty Trust Inc.:
Series A, 8.500%
NR/NR
46,219
1,167,030
Series B, 7.875%
NR/NR
9,400
235,846
2,384,366
Office - Central Business District - REITs 0.87%
SL Green Realty Corp.,
Series C, 7.625%
NR/NR
16,700
396,458
Office - Suburban - REITs 2.65%
Corporate Office Properties Trust:
Series G, 8.000%
NR/NR
4,553
116,375
Series H, 7.500%
NR/NR
6,200
146,754
Series J, 7.625%
NR/NR
6,101
147,644
PS Business Parks Inc.:
Series M, 7.200%
Baa3/BB+
15,000
353,400
Series O, 7.375%
Baa3/BB+
13,750
334,262
Series P, 6.700%
Baa3/BB+
5,000
111,250
1,209,685
Regional Malls - REITs 1.22%
Taubman Centers Inc.,
Series G, 8.000%
Bl/NR
22,198
554,950
Retail - REITs 1.15%
Regency Centers Corp.:
Series C, 7.450%
Baa3/BB+
12,455
297,612
Series E, 6.700%
Baa3/BB+
10,000
226,300
523,912
Self Storage - REITs 3.21%
Public Storage:
Series E, 6.750%
Baal/BBB
5,595
137,245
Series G, 7.000%
Baal/BBB
7,500
188,850
Series H, 6.950%
Baal/BBB
4,133
103,408
Series I, 7.250%
Baal/BBB
6,900
174,294
Series K, 7.250%
Baal/BBB
6,884
174,509
Series L, 6.750%
Baal/BBB
13,000
318,630
Series M, 6.625%
Baal/BBB
7,650
186,354
Series X, 6.450%
Baal/BBB
7,500
175,950
1,459,240
Footnotes to DCA Statement of Investments on page 17.
1.866.324.7348
2010 Semi-Annual Report (Unaudited) 15
Statement of Investments (continued)
June 30, 2010 (Unaudited)
DCA Total Return Fund (continued)
Bond Rating Moody’s/S&P (Unaudited)
Shares
Market
Value
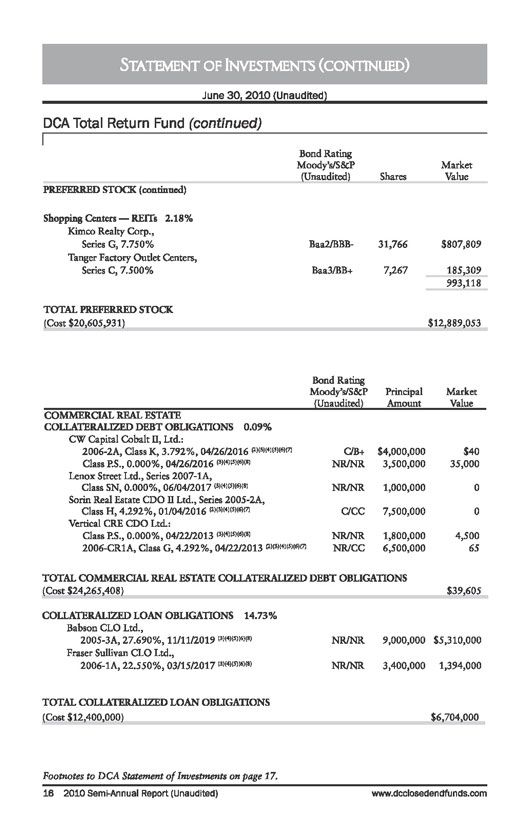
PREFERRED STOCK (continued)
Shopping Centers - REITs 2.18%
Kimco Realty Corp.,
Series G, 7.750%
Baa2/BBB-
31,766
$807,809
Tanger Factory Outlet Centers,
Series C, 7.500%
Baa3/BB+
7,267
185,309
993,118
TOTAL PREFERRED STOCK
(Cost $20,605,931)
$12,889,053
Bond Rating Moody’s/S&P (Unaudited)
Principal Amount
Market
Value
COMMERCIAL REAL ESTATE
COLLATERALIZED DEBT OBLIGATIONS 0.09%
CW Capital Cobalt II, Ltd.:
2006-2A, Class K, 3.792%, 04/26/2016 (2)(3)(4)(5)(6)(7)
C/B+
$4,000,000
$40
Class P.S., 0.000%, 04/26/2016 (3)(4)(5)(6)(8)
NR/NR
3,500,000
35,000
Lenox Street Ltd., Series 2007-1A,
Class SN, 0.000%, 06/04/2017 (3)(4)(5)(6)(8)
NR/NR
1,000,000
0
Sorin Real Estate CDO II Ltd., Series 2005-2A,
Class H, 4.292%, 01/04/2016 (2)(3)(4)(5)(6)(7)
C/CC
7,500,000
0
Vertical CRE CDO Ltd.:
Class P.S., 0.000%, 04/22/2013 (3)(4)(5)(6)(8)
NR/NR
1,800,000
4,500
2006-CR1A, Class G, 4.292%, 04/22/2013 (2)(3)(4)(5)(6)(7)
NR/CC
6,500,000
65
TOTAL COMMERCIAL REAL ESTATE COLLATERALIZED DEBT OBLIGATIONS
(Cost $24,265,408)
$39,605
COLLATERALIZED LOAN OBLIGATIONS 14.73%
Babson CLO Ltd.,
2005-3A, 27.690%, 11/11/2019 (3)(4)(5)(6)(8)
NR/NR
9,000,000
$5,310,000
Fraser Sullivan CLO Ltd.,
2006-1A, 22.550%, 03/15/2017 (3)(4)(5)(6)(8)
NR/NR
3,400,000
1,394,000
TOTAL COLLATERALIZED LOAN OBLIGATIONS
(Cost $12,400,000)
$6,704,000
Footnotes to DCA Statement of Investments on page 17.
16 2010 Semi-Annual Report (Unaudited)
www.dcclosedendfunds.com
Statement of Investments (continued)
June 30, 2010 (Unaudited)
DCA Total Return Fund (continued)
Bond Rating Moody’s/S&P (Unaudited)
Shares/
Principal Amount
Market
Value
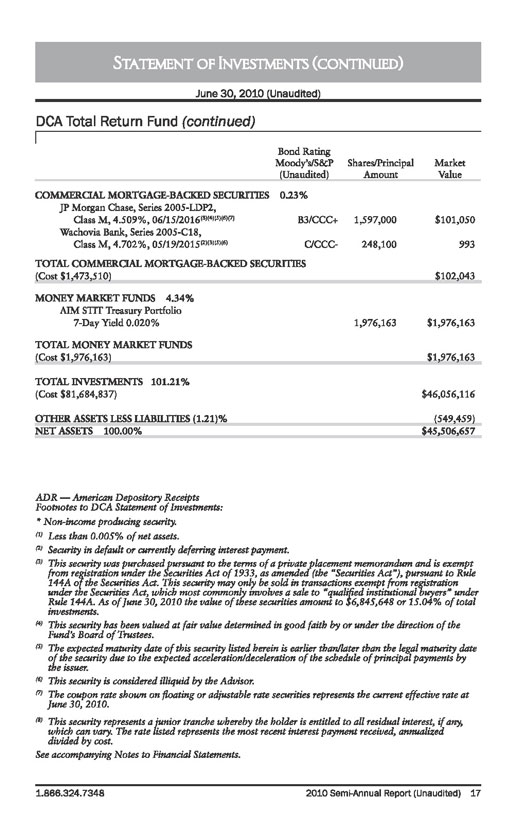
COMMERCIAL MORTGAGE-BACKED SECURITIES 0.23%
JP Morgan Chase, Series 2005-LDP2,
Class M, 4.509%, 06/15/2016 (3)(4)(5)(6)(7)
B3/CCC+
1,597,000
$101,050
Wachovia Bank, Series 2005-C18,
Class M, 4.702%, 05/19/2015 (2)(3)(5)(6)
C/CCC-
248,100
993
TOTAL COMMERCIAL MORTGAGE-BACKED SECURITIES
(Cost $1,473,510)
$102,043
MONEY MARKET FUNDS 4.34%
AIM STIT Treasury Portfolio
7-Day Yield 0.020%
1,976,163
$1,976,163
TOTAL MONEY MARKET FUNDS
(Cost $1,976,163)
$1,976,163
TOTAL INVESTMENTS 101.21%
(Cost $81,684,837)
$46,056,116
OTHER ASSETS LESS LIABILITIES (1.21)%
(549,459)
NET ASSETS 100.00%
$45,506,657
ADR – American Depository Receipts
Footnotes to DCA Statement of Investments:
* Non-income producing security.
(1) Less than 0.005% of net assets.
(2) Security in default or currently deferring interest payment.
(3) This security was purchased pursuant to the terms of a private placement memorandum and is exempt from registration under the Securities Act of 1933, as amended (the “Securities Act”), pursuant to Rule 144A of the Securities Act. This security may only be sold in transactions exempt from registration under the Securities Act, which most commonly involves a sale to “qualified institutional buyers” under Rule 144A. As of June 30, 2010 the value of these securities amount to $6,845,648 or 15.04% of total investments.
(4) This security has been valued at fair value determined in good faith by or under the direction of the Fund’s Board of Trustees.
(5) The expected maturity date of this security listed herein is earlier than/later than the legal maturity date of the security due to the expected acceleration/deceleration of the schedule of principal payments by the issuer.
{6) This security is considered illiquid by the Advisor.
(7) The coupon rate shown on floating or adjustable rate securities represents the current effective rate at June 30, 2010.
(8) This security represents a junior tranche whereby the holder is entitled to all residual interest, if any, which can vary. The rate listed represents the most recent interest payment received, annualized divided by cost.
See accompanying Notes to Financial Statements.
1.866.324.7348
2010 Semi-Annual Report (Unaudited) 17
Statement of Investments
June 30, 2010 (Unaudited)
DCW Total Return Fund
Shares
Market Value
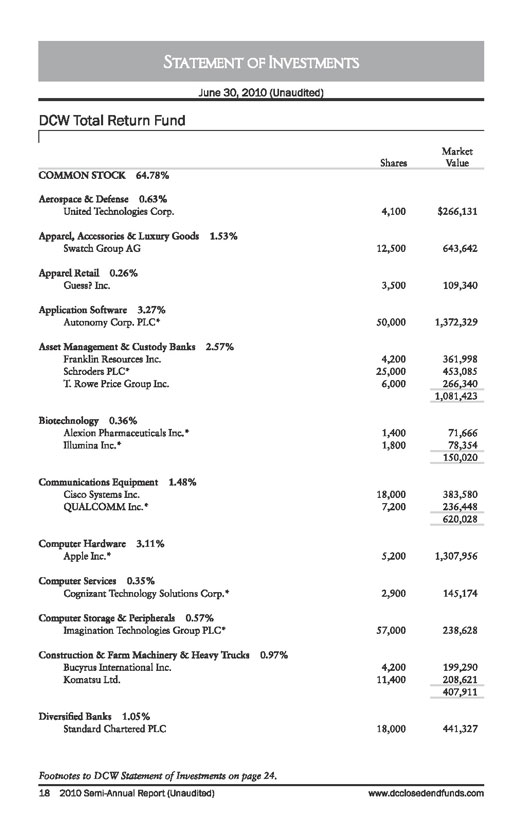
COMMON STOCK 64.78%
Aerospace & Defense 0.63%
United Technologies Corp.
4,100
$266,131
Apparel, Accessories & Luxury Goods 1.53%
Swatch Group AG
12,500
643,642
Apparel Retail 0.26%
Guess? Inc.
3,500
109,340
Application Software 3.27%
Autonomy Corp. PLC*
50,000
1,372,329
Asset Management & Custody Banks 2.57%
Franklin Resources Inc.
4,200
361,998
Schroders PLC*
25,000
453,085
T. Rowe Price Group Inc.
6,000
266,340
1,081,423
Biotechnology 0.36%
Alexion Pharmaceuticals Inc.*
1,400
71,666
Illumina Inc.*
1,800
78,354
150,020
Communications Equipment 1.48%
Cisco Systems Inc.
18,000
383,580
QUALCOMM Inc.*
7,200
236,448
620,028
Computer Hardware 3.11%
Apple Inc.*
5,200
1,307,956
Computer Services 0.35%
Cognizant Technology Solutions Corp.*
2,900
145,174
Computer Storage & Peripherals 0.57%
Imagination Technologies Group PLC*
57,000
238,628
Construction & Farm Machinery & Heavy Trucks 0.97%
Bucyrus International Inc.
4,200
199,290
Komatsu Ltd.
11,400
208,621
407,911
Diversified Banks 1.05%
Standard Chartered PLC
18,000
441,327
Footnotes to DCW Statement of Investments on page 24.
18 2010 Semi-Annual Report (Unaudited)
www.dcclosedendfunds.com
Statement of Investments (continued)
June 30, 2010 (Unaudited)
DCW Total Return Fund (continued)
Shares
Market Value
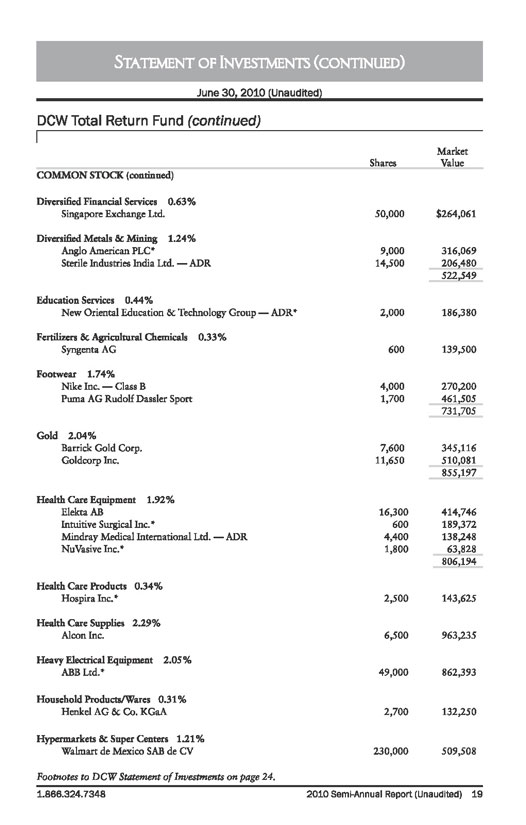
COMMON STOCK (continued)
Diversified Financial Services 0.63%
Singapore Exchange Ltd.
50,000
$264,061
Diversified Metals & Mining 1.24%
Anglo American PLC*
9,000
316,069
Sterile Industries India Ltd. - ADR
14,500
206,480
522,549
Education Services 0.44%
New Oriental Education & Technology Group - ADR*
2,000
186,380
Fertilizers & Agricultural Chemicals 0.33%
Syngenta AG
600
139,500
Footwear 1.74%
Nike Inc. - Class B
4,000
270,200
Puma AG Rudolf Dassler Sport
1,700
461,505
731,705
Gold 2.04%
Barrick Gold Corp.
7,600
345,116
Goldcorp Inc.
11,650
510,081
855,197
Health Care Equipment 1.92%
Elekta AB
16,300
414,746
Intuitive Surgical Inc.*
600
189,372
Mindray Medical International Ltd. - ADR
4,400
138,248
NuVasive Inc.*
1,800
63,828
806,194
Health Care Products 0.34%
Hospira Inc.*
2,500
143,625
Health Care Supplies 2.29%
Alcon Inc.
6,500
963,235
Heavy Electrical Equipment 2.05%
ABB Ltd.*
49,000
862,393
Household Products/Wares 0.31 %
Henkel AG & Co. KGaA
2,700
132,250
Hypermarkets & Super Centers 1.21%
Walmart de Mexico SAB de CV
230,000
509,508
Footnotes to DCW Statement of Investments on page 24.
1.866.324.7348
2010 Semi-Annual Report (Unaudited) 19
Statement of Investments (continued)
June 30, 2010 (Unaudited)
DCW Total Return Fund (continued)
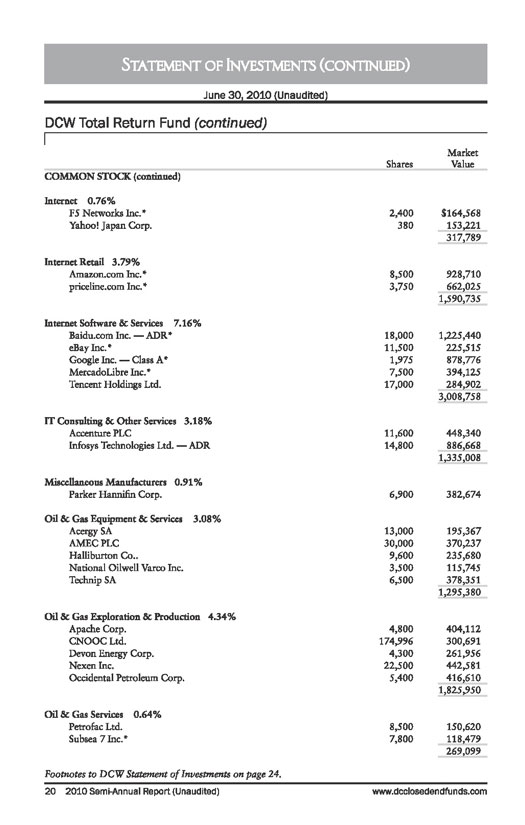
Shares Market Value COMMON STOCK (continued) Internet 0.76%
F5 Networks Inc.* 2,400 $164,568
Yahoo! Japan Corp. 380 153,221 317,789
Internet Retail 3.79%
Amazon.com Inc.* 8,500 928,710 priceline.com Inc.* 3,750 662,025 1,590,735
Internet Software & Services 7.16%
Baidu.com Inc. - ADR*
18,000
1,225,440
eBay Inc.*
11,500
225,515
Google Inc. - Class A*
1,975
878,776
MercadoLibre Inc.*
7,500
394,125
Tencent Holdings Ltd.
17,000
284,902
3,008,758
IT Consulting & Other Services 3.18%
Accenture PLC
11,600
448,340
Infosys Technologies Ltd. - ADR
14,800
886,668
1,335,008
Miscellaneous Manufacturers 0.91%
Parker Hannifin Corp.
6,900
382,674
Oil & Gas Equipment & Services 3.08%
Acergy SA
13,000
195,367
AMEC PLC
30,000
370,237
Halliburton Co.
9,600
235,680
National Oilwell Varco Inc.
3,500
115,745
Technip SA
6,500
378,351
1,295,380
Oil & Gas Exploration & Production 4.34%
Apache Corp.
4,800
404,112
CNOOC Ltd.
174,996
300,691
Devon Energy Corp.
4,300
261,956
Nexen Inc.
22,500
442,581
Occidental Petroleum Corp.
5,400
416,610
1,825,950
Oil & Gas Services 0.64%
Petrofac Ltd.
8,500
150,620
Subsea 7 Inc.*
7,800
118,479
269,099
Footnotes to DCW Statement of Investments on page 24.
20 2010 Semi-Annual Report (Unaudited)
www.dcclosedendfunds.com
Statement of Investments (continued)
June 30, 2010 (Unaudited)
DCW Total Return Fund (continued)
Shares
Market Value
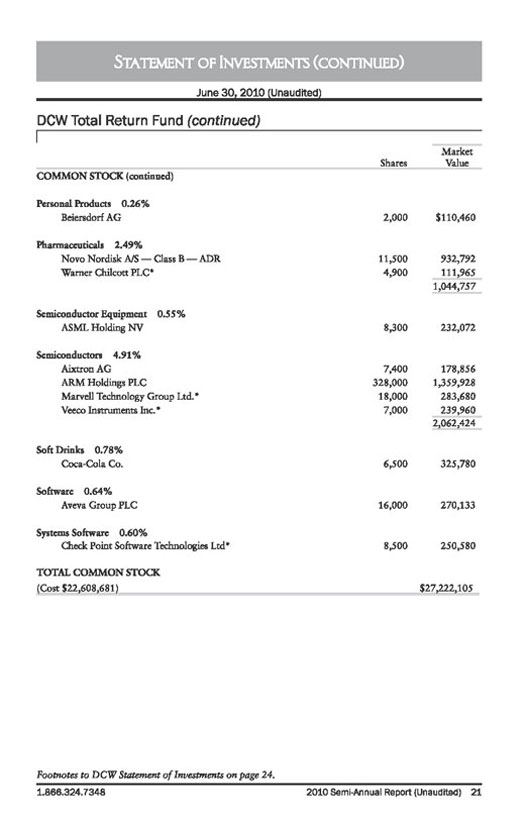
COMMON STOCK (continued)
Internet 0.76%
F5 Networks Inc.* 2,400 $164,568 Yahoo! Japan Corp. 380 153,221 317,789
Internet Retail 3.79%
Amazon.com Inc.* 8,500 928,710 priceline.com Inc.* 3,750 662,025 1,590,735
Internet Software & Services 7.16% Baidu.com Inc. - ADR* 18,000 1,225,440 eBay Inc.* 11,500 225,515
Google Inc. - Class A*
1,975
878,776
MercadoLibre Inc.*
7,500
394,125
Tencent Holdings Ltd.
17,000
284,902
3,008,758
IT Consulting & Other Services 3.18%
Accenture PLC
11,600
448,340
Infosys Technologies Ltd. - ADR
14,800
886,668
1,335,008
Miscellaneous Manufacturers 0.91%
Parker Hannifin Corp.
6,900
382,674
Oil & Gas Equipment & Services 3.08%
Acergy SA
13,000
195,367
AMEC PLC
30,000
370,237
Halliburton Co.
9,600
235,680
National Oilwell Varco Inc.
3,500
115,745
Technip SA
6,500
378,351
1,295,380
Oil & Gas Exploration & Production 4.34%
Apache Corp.
4,800
404,112
CNOOC Ltd.
174,996
300,691
Devon Energy Corp.
4,300
261,956
Nexen Inc.
22,500
442,581
Occidental Petroleum Corp.
5,400
416,610
1,825,950
Oil & Gas Services 0.64%
Petrofac Ltd.
8,500
150,620
Subsea 7 Inc.*
7,800
118,479
269,099
Footnotes to DCW Statement of Investments on page 24.
1.866.324.7348
2010 Semi-Annual Report (Unaudited) 21
Statement of Investments (continued)
June 30, 2010 (Unaudited)
DCW Total Return Fund (continued)
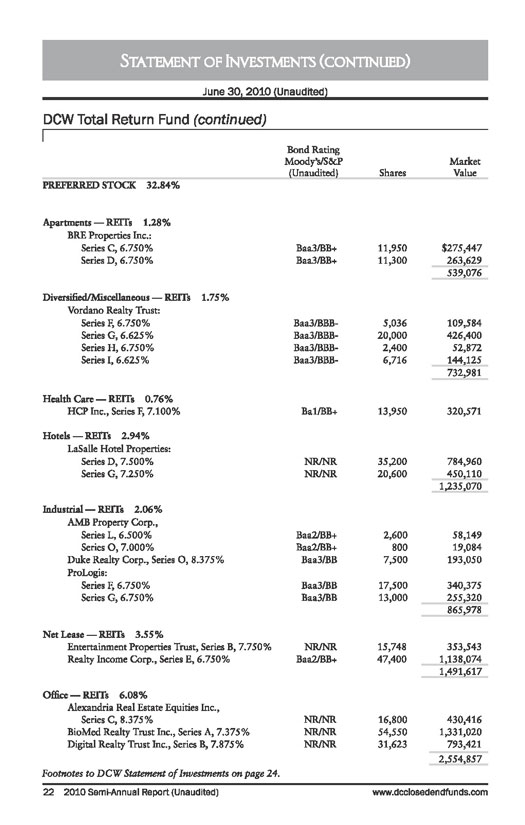
Bond Rating Moody’s/S&P (Unaudited) Shares Market Value PREFERRED STOCK 32.84%
Apartments - REITs 1.28%
BRE Properties Inc.: Series C, 6.750% Baa3/BB+ 11,950
$275,447
Series D, 6.750%
Baa3/BB+
11,300
263,629
539,076
Diversified/Miscellaneous - REITs 1.75%
Vordano Realty Trust:
Series F, 6.750%
Baa3/BBB-
5,036
109,584
Series G, 6.625%
Baa3/BBB-
20,000
426,400
Series H, 6.750%
Baa3/BBB-
2,400
52,872
Series I, 6.625%
Baa3/BBB-
6,716
144,125
732,981
Health Care - REITs 0.76%
HCP Inc., Series F, 7.100%
Bal/BB+
13,950
320,571
Hotels - REITs 2.94%
LaSalle Hotel Properties:
Series D, 7.500%
NR/NR
35,200
784,960
Series G, 7.250%
NR/NR
20,600
450,110
1,235,070
Industrial - REITs 2.06%
AMB Property Corp.,
Series L, 6.500%
Baa2/BB+ 2,600 58,149 Series O, 7.000% Baa2/BB+ 800 19,084 Duke Realty Corp., Series O, 8.375% Baa3/BB 7,500 193,050
ProLogis:
Series F, 6.750% Baa3/BB 17,500 340,375 Series G, 6.750% Baa3/BB 13,000 255,320
865,978 Net Lease - REITs 3.55%
Entertainment Properties Trust, Series B, 7.750%
NR/NR
15,748
353,543
Realty Income Corp., Series E, 6.750%
Baa2/BB+
47,400
1,138,074
1,491,617
Office - REITs 6.08%
Alexandria Real Estate Equities Inc., Series C, 8.375%
NR/NR
16,800
430,416
BioMed Realty Trust Inc., Series A, 7.375%
NR/NR
54,550
1,331,020
Digital Realty Trust Inc., Series B, 7.875%
NR/NR
31,623
793,421
2,554,857
Footnotes to DCW Statement of Investments on page 24.
22 2010 Semi-Annual Report (Unaudited)
www.dcclosedendfunds.com
Statement of Investments (continued)
June 30, 2010 (Unaudited)
DCW Total Return Fund (continued)
Bond Rating Moody’s/S&P (Unaudited)
Shares
Market
Value
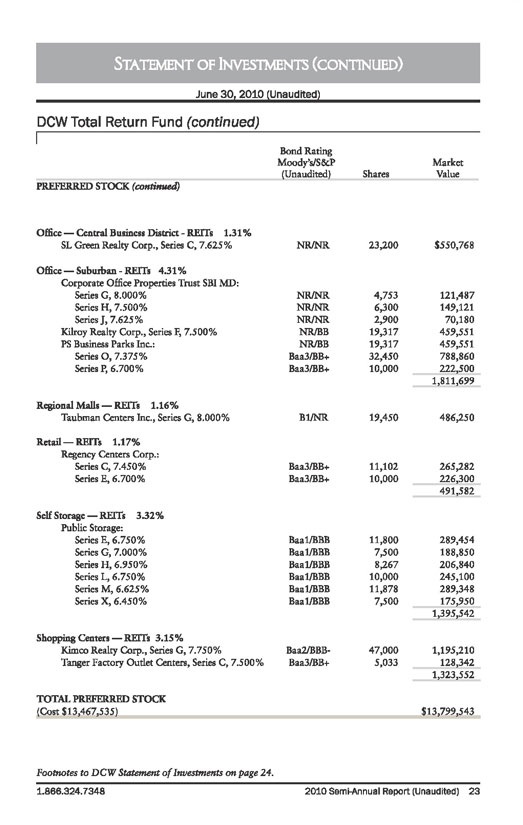
PREFERRED STOCK (continued)
Office - Central Business District - REITs 1.31%
SL Green Realty Corp., Series C, 7.625%
NR/NR
23,200
$550,768
Office - Suburban - REITs 4.31%
Corporate Office Properties Trust SBI MD:
Series G, 8.000%
NR/NR
4,753
121,487
Series H, 7.500%
NR/NR
6,300
149,121
Series J, 7.625%
NR/NR
2,900
70,180
Kilroy Realty Corp., Series F, 7.500%
NR/BB
19,317
459,551
PS Business Parks Inc.:
NR/BB
19,317
459,551
Series O, 7.375%
Baa3/BB+
32,450
788,860
Series P, 6.700%
Baa3/BB+
10,000
222,500
1,811,699
Regional Malls - REITs 1.16%
Taubman Centers Inc., Series G, 8.000%
Bl/NR
19,450
486,250
Retail - REITs 1.17%
Regency Centers Corp.:
Series C, 7.450%
Baa3/BB+
11,102
265,282
Series E, 6.700%
Baa3/BB+
10,000
226,300
491,582
Self Storage - REITs 3.32%
Public Storage:
Series E, 6.750%
Baal/BBB
11,800
289,454
Series G, 7.000%
Baal/BBB
7,500
188,850
Series H, 6.950%
Baal/BBB
8,267
206,840
Series L, 6.750%
Baal/BBB
10,000
245,100
Series M, 6.625%
Baal/BBB
11,878
289,348
Series X, 6.450%
Baal/BBB
7,500
175,950
1,395,542
Shopping Centers - REITs 3.15%
Kimco Realty Corp., Series G, 7.750%
Baa2/BBB-
47,000
1,195,210
Tanger Factory Outlet Centers, Series C, 7.500%
Baa3/BB+
5,033
128,342
1,323,552
TOTAL PREFERRED STOCK
(Cost $13,467,535)
$13,799,543
Footnotes to DCW Statement of Investments on page 24.
1.866.324.7348
2010 Semi-Annual Report (Unaudited) 23
Statement of Investments (continued)
June 30, 2010 (Unaudited)
DCW Total Return Fund (continued)
Bond Rating Moody’s/S&P (Unaudited)
Shares/ Principal Amount
Market
Value
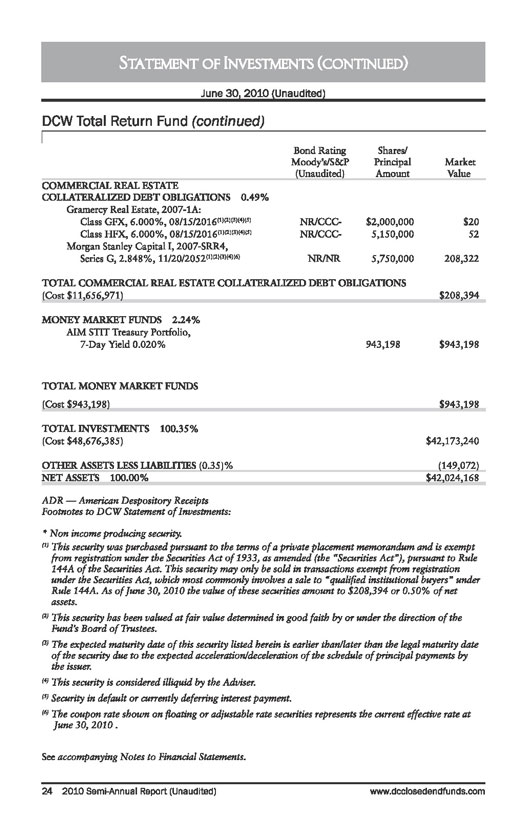
COMMERCIAL REAL ESTATE
COLLATERALIZED DEBT OBLIGATIONS 0.49%
Gramercy Real Estate, 2007-1A:
Class GFX, 6.000%, 08/15/2016 (1)(2)(3)(4)(5)
NR/CCC-
$2,000,000
$20
Class HFX, 6.000%, 08/15/2016 (1)(2)(3)(4)(5)
NR/CCC-
5,150,000
52
Morgan Stanley Capital I, 2007-SRR4,
Series G, 2.848%, 11/20/2052 (1)(2)(3)(4)(6)
NR/NR
5,750,000
208,322
TOTAL COMMERCIAL REAL ESTATE COLLATERALIZED DEBT OBLIGATIONS
(Cost $11,656,971)
$208,394
MONEY MARKET FUNDS 2.24 %
AIM STIT Treasury Portfolio,
7-Day Yield 0.020%
943,198
$943,198
TOTAL MONEY MARKET FUNDS
(Cost $943,198)
$943,198
TOTAL INVESTMENTS 100.35%
(Cost $48,676,385)
$42,173,240
OTHER ASSETS LESS LIABILITIES (0.35)%
(149,072)
NET ASSETS 100.00%
$42,024,168
ADR – American Despository Receipts
Footnotes to DCW Statement of Investments:
* Non income producing security.
(1) This security was purchased pursuant to the terms of a private placement memorandum and is exempt from registration under the Securities Act of 1933, as amended (the “Securities Act”), pursuant to Rule 144A of the Securities Act. This security may only be sold in transactions exempt from registration under the Securities Act, which most commonly involves a sale to “qualified institutional buyers” under Rule 144A. As of June 30, 2010 the value of these securities amount to $208,394 or 0.50% of net assets.
(2) This security has been valued at fair value determined in good faith by or under the direction of the Fund’s Board of Trustees.
(3)} The expected maturity date of this security listed herein is earlier than/later than the legal maturity date of the security due to the expected acceleration/deceleration of the schedule of principal payments by the issuer.
(4) This security is considered illiquid by the Adviser.
(5) Security in default or currently deferring interest payment.
(6) The coupon rate shown on floating or adjustable rate securities represents the current effective rate at June 30, 2010.
See accompanying Notes to Financial Statements.
24 2010 Semi-Annual Report (Unaudited)
www.dcclosedendfunds.com
This Page Intentionally Left Blank
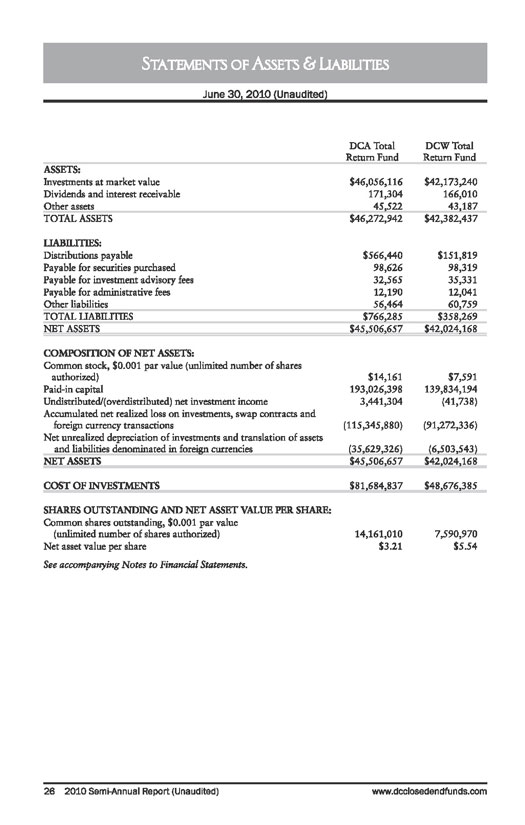
Statements of Assets & Liabilities
June 30, 2010 (Unaudited)
DCA Total Return Fund
DCW Total Return Fund
ASSETS:
Investments at market value
$46,056,116
$42,173,240
Dividends and interest receivable
171,304
166,010
Other assets
45,522
43,187
TOTAL ASSETS
$46,272,942
$42,382,437
LIABILITIES:
Distributions payable
$566,440
$151,819
Payable for securities purchased
98,626
98,319
Payable for investment advisory fees
32,565
35,331
Payable for administrative fees
12,190
12,041
Other liabilities
56,464
60,759
TOTAL LIABILITIES
$766,285
$358,269
NET ASSETS
$45,506,657
$42,024,168
COMPOSITION OF NET ASSETS:
Common stock, $0.001 par value (unlimited number of shares authorized)
$14,161
$7,591
Paid-in capital
193,026,398
139,834,194
Undistributed/(overdistributed) net investment income
3,441,304
(41,738)
Accumulated net realized loss on investments, swap contracts and foreign currency transactions
(115,345,880)
(91,272,336)
Net unrealized depreciation of investments and translation of assets and liabilities denominated in foreign currencies
(35,629,326)
(6,503,543)
NET ASSETS
$45,506,657
$42,024,168
COST OF INVESTMENTS
$81,684,837
$48,676,385
SHARES OUTSTANDING AND NET ASSET VALUE PER SHARE:
Common shares outstanding, $0.001 par value (unlimited number of shares authorized)
14,161,010
7,590,970
Net asset value per share
$3.21
$5.54
See accompanying Notes to Financial Statements.
26 2010 Semi-Annual Report (Unaudited)
www.dcclosedendfunds.com
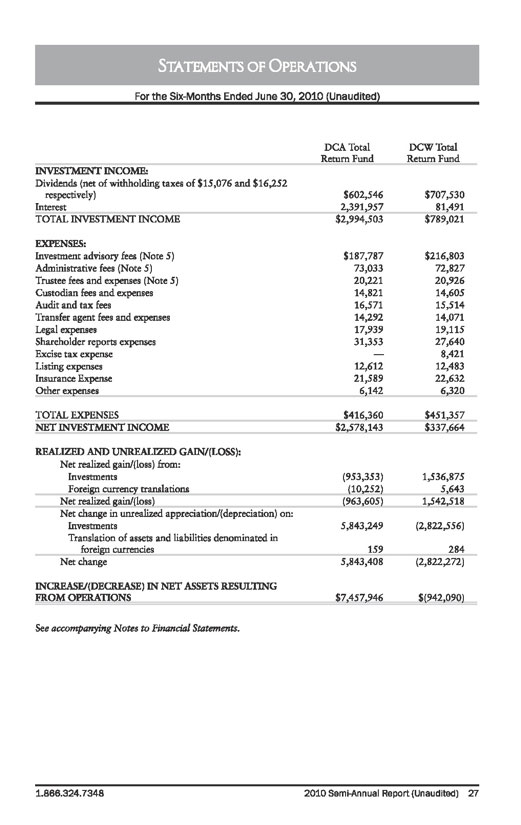
Statements of Operations
For the Six-Months Ended June 30, 2010 (Unaudited)
DCA Total
Return Fund
DCW Total Return Fund
INVESTMENT INCOME:
Dividends (net of withholding taxes of $15,076 and $16,252 respectively)
$602,546
$707,530
Interest
2,391,957
81,491
TOTAL INVESTMENT INCOME
$2,994,503
$789,021
EXPENSES:
Investment advisory fees (Note 5)
$187,787
$216,803
Administrative fees (Note 5)
73,033
72,827
Trustee fees and expenses (Note 5)
20,221
20,926
Custodian fees and expenses
14,821
14,605
Audit and tax fees
16,571
15,514
Transfer agent fees and expenses
14,292
14,071
Legal expenses
17,939
19,115
Shareholder reports expenses
31,353
27,640
Excise tax expense
—
8,421
Listing expenses
12,612
12,483
Insurance Expense
21,589
22,632
Other expenses
6,142
6,320
TOTAL EXPENSES
$416,360
$451,357
NET INVESTMENT INCOME
$2,578,143
$337,664
REALIZED AND UNREALIZED GAIN/(LOSS):
Net realized gain/(loss) from:
Investments
(953,353)
1,536,875
Foreign currency translations
(10,252)
5,643
Net realized gain/(loss)
(963,605)
1,542,518
Net change in unrealized appreciation/(depreciation) on:
Investments
5,843,249
(2,822,556)
Translation of assets and liabilities denominated in foreign currencies
159
284
Net change
5,843,408
(2,822,272)
INCREASE/(DECREASE) IN NET ASSETS RESULTING FROM OPERATIONS
$7,457,946
$(942,090)
See accompanying Notes to Financial Statements.
1.866.324.7348
2010 Semi-Annual Report (Unaudited) 27
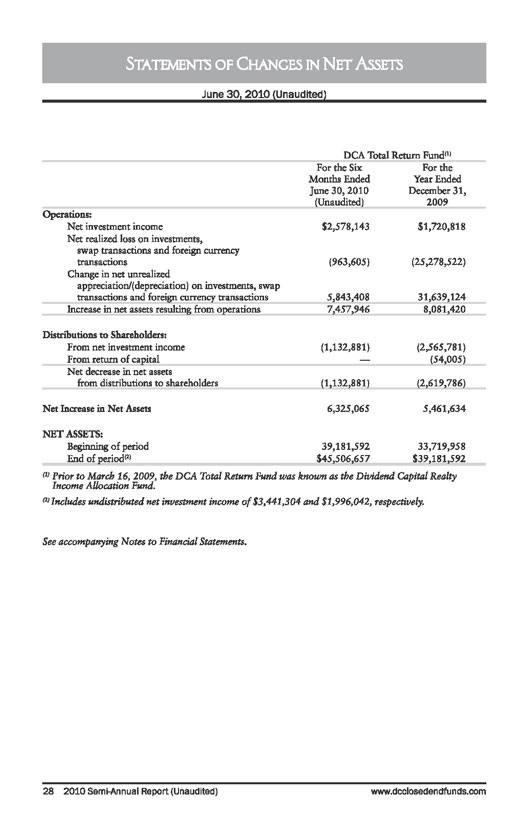
Statements of Changes in Net Assets
June 30, 2010 (Unaudited)
DCA Total Return Fund (1)
For the Six Months Ended June 30, 2010 (Unaudited)
For the
Year Ended December 31, 2009
Operations:
Net investment income
$2,578,143
$1,720,818
Net realized loss on investments, swap transactions and foreign currency transactions
(963,605)
(25,278,522)
Change in net unrealized appreciation/(depreciation) on investments, swap transactions and foreign currency transactions
5,843,408
31,639,124
Increase in net assets resulting from operations
7,457,946
8,081,420
Distributions to Shareholders:
From net investment income
(1,132,881)
(2,565,781)
From return of capital
—
(54,005)
Net decrease in net assets from distributions to shareholders
(1,132,881)
(2,619,786)
Net Increase in Net Assets
6,325,065
5,461,634
NET ASSETS:
Beginning of period
39,181,592
33,719,958
End of period (2)
$45,506,657
$39,181,592
(1) Prior to March 16, 2009, the DCA Total Return Fund was known as the Dividend Capital Realty Income Allocation Fund.
(2) Includes undistributed net investment income of $3,441,304 and $1,996,042, respectively.
See accompanying Notes to Financial Statements.
28 2010 Semi-Annual Report (Unaudited)
www.dcclosedendfunds.com
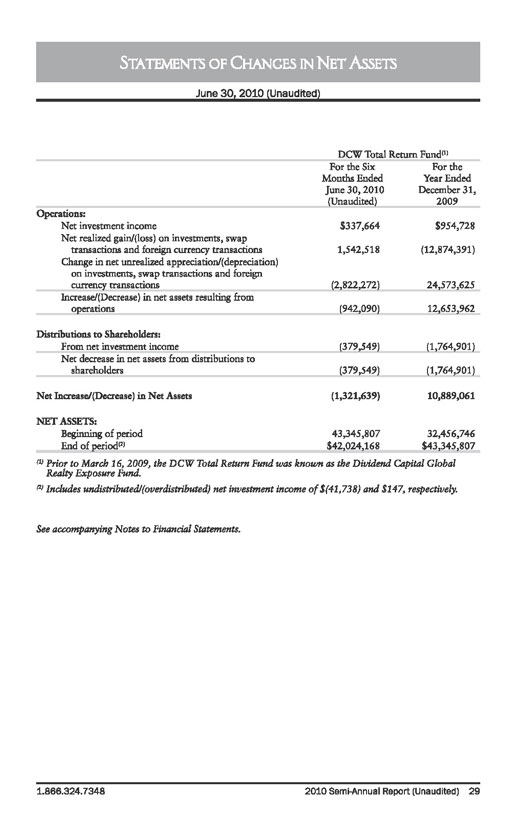
Statements of Changes in Net Assets
June 30, 2010 (Unaudited)
DCW Total Return Fund (1)
For the Six Months Ended June 30, 2010 (Unaudited)
For the
Year Ended December 31, 2009
Operations:
Net investment income
$337,664
$954,728
Net realized gain/(loss) on investments, swap transactions and foreign currency transactions
1,542,518
(12,874,391)
Change in net unrealized appreciation/(depreciation) on investments, swap transactions and foreign currency transactions
(2,822,272)
24,573,625
Increase/(Decrease) in net assets resulting from operations
(942,090)
12,653,962
Distributions to Shareholders:
From net investment income
(379,549)
(1,764,901)
Net decrease in net assets from distributions to shareholders
(379,549)
(1,764,901)
Net Increase/(Decrease) in Net Assets
(1,321,639)
10,889,061
NET ASSETS:
Beginning of period
43,345,807
32,456,746
End of period (2)
$42,024,168
$43,345,807
(1) Prior to March 16, 2009, the DCW Total Return Fund was known as the Dividend Capital Global Realty Exposure Fund.
(2) Includes undistributed/(overdistributed) net investment income of $(41,738) and $147, respectively.
See accompanying Notes to Financial Statements.
1.866.324.7348
2010 Semi-Annual Report (Unaudited) 29
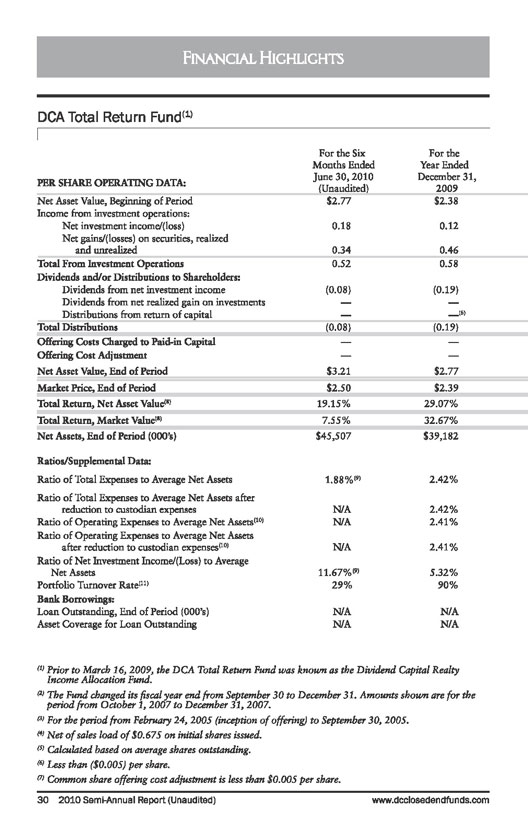
Financial Highlights
DCA Total Return Fund (1)
For the Six Months Ended June 30, 2010 (Unaudited)
For the Year Ended December 31, 2009
PER SHARE OPERATING DATA:
Net Asset Value, Beginning of Period
$2.77
$2.38
Income from investment operations:
Net investment income/(loss)
0.18
0.12
Net gains/(losses) on securities, realized and unrealized
0.34
0.46
Total From Investment Operations
0.52
0.58
Dividends and/or Distributions to Shareholders:
Dividends from net investment income
(0.08)
(0.19)
Dividends from net realized gain on investments
—
—
Distributions from return of capital
—
— (6)
Total Distributions
(0.08)
(0.19)
Offering Costs Charged to Paid-in Capital
—
—
Offering Cost Adjustment
—
—
Net Asset Value, End of Period
$3.21
$2.77
Market Price, End of Period
$2.50
$2.39
Total Return, Net Asset Value(8)
19.15%
29.07%
Total Return, Market Value(8)
7.55%
32.67%
Net Assets, End of Period (000’s)
$45,507
$39,182
Ratios/Supplemental Data:
Ratio of Total Expenses to Average Net Assets
1.88%(9)
2.42%
Ratio of Total Expenses to Average Net Assets after reduction to custodian expenses
N/A
2.42%
Ratio of Operating Expenses to Average Net Assets(10)
N/A
2.41%
Ratio of Operating Expenses to Average Net Assets after reduction to custodian expenses(10)
N/A
2.41%
Ratio of Net Investment Income/(Loss) to Average
Net Assets
11.67%(9)
5.32%
Portfolio Turnover Rate(11)
29%
90%
Bank Borrowings:
Loan Outstanding, End of Period (000’s)
N/A
N/A
Asset Coverage for Loan Outstanding
N/A
N/A
(1) Prior to March 16, 2009, the DCA Total Return Fund was known as the Dividend Capital Realty Income Allocation Fund.
(2) The Fund changed its fiscal year end from September 30 to December 31. Amounts shown are for the period from October 1, 2007 to December 31, 2007.
(3) For the period from February 24, 2005 (inception of offering) to September 30, 2005.
(4) Net of sales load of $0.675 on initial shares issued.
(5) Calculated based on average shares outstanding.
(6) Less than ($0.005) per share.
(7) Common share offering cost adjustment is less than $0.005 per share.
30 2010 Semi-Annual Report (Unaudited)
www.dcclosedendfunds.com
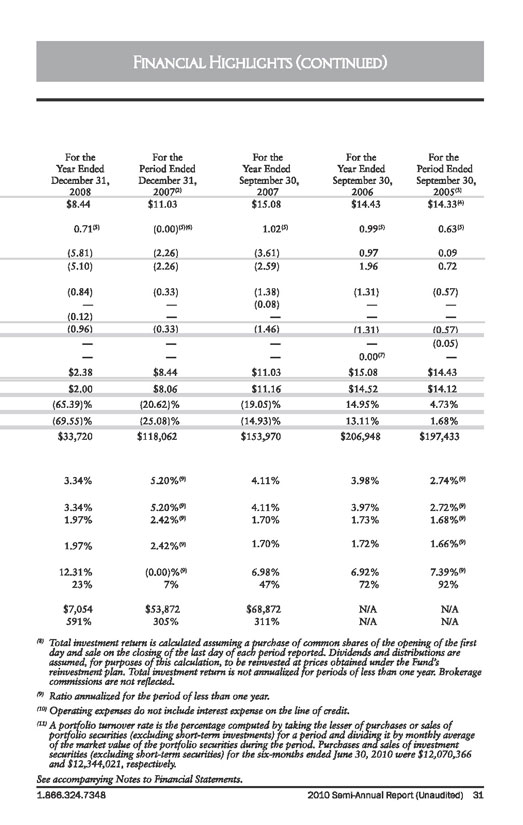
Financial Highlights (continued)
For the Year Ended December 31, 2008
For the Period Ended December 31, 2007(2)
For the Year Ended September 30, 2007
For the Year Ended September 30, 2006
For the Period
Ended September 30, 2005(3)
$8.44
$11.0.3
$15.08
$14.43
$14.33
0.71(5)
(0.00)(5)(6)
1.02(5)
0.99(5)
0.63(5)
(5.81)
(2.26)
(3.61)
0.97
0.09
(5.10)
(2.26)
(2.59)
1.96
0.72
(0.84)
(0.33)
(1.38)
(1.31)
(0.57)
—
—
(0.08)
—
—
(0.12)
—
—
—
—
(0.96)
(0.33)
(1.46)
(1.31)
(0.57)
—
—
—
—
(0.05)
—
—
—
0.00(7)
—
$2.38
$8.44
$11.03
$15.08
$14.43
$2.00
$8.06
$11.16
$14.52
$14.12
(65.39)%
(20.62)%
(19.05)%
14.95%
4.73%
(69.55)%
(25.08)%
(14.93)%
13.11%
1.68%
$33,720
$118,062
$153,970
$206,948
$197,433
3.34%
5.20%(9)
4.11%
3.98%
2.74%(9)
3.34%
5.20%(9)
4.11%
3.97%
2.72%(9)
1.97%
2.42%(9)
1.70%
1.73%
1.68%(9)
1.97%
2.42%(9)
1.70%
1.72%
1.66%(9)
12.31%
(0.00)%(9)
6.98%
6.92%
7.39%(9)
23%
7%
47%
72%
92%
$7,054
$53,872
$68,872
N/A
N/A
591%
305%
311%
N/A
N/A
(8) Total investment return is calculated assuming a purchase of common shares of the opening of the first day and sale on the closing of the last day of each period reported. Dividends and distributions are assumed, for purposes of this calculation, to be reinvested at prices obtained under the Fund’s reinvestment plan. Total investment return is not annualized for periods of less than one year. Brokerage commissions are not reflected.
(9) Ratio annualized for the period of less than one year.
(10) Operating expenses do not include interest expense on the line of credit.
(11) A portfolio turnover rate is the percentage computed by taking the lesser of purchases or sales of portfolio securities (excluding short-term investments) for a period and dividing it by monthly average of the market value of the portfolio securities during the period. Purchases and sales of investment securities (excluding short-term securities) for the six-months ended June 30, 2010 were $12,070,366 and $12,344,021, respectively.
See accompanying Notes to Financial Statements.
1.866.324.7348
2010 Semi-Annual Report (Unaudited) 31
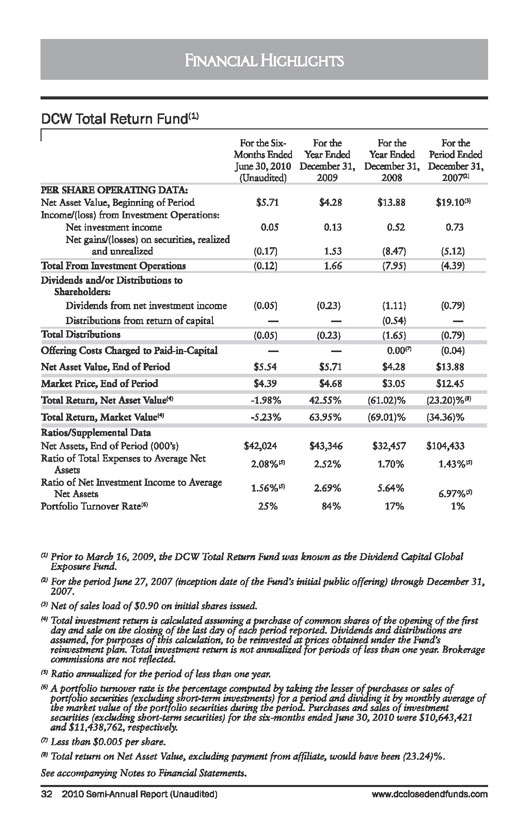
Financial Highlights
DCW Total Return Fund (1)
For the Six-Months Ended June 30,2010 (Unaudited)
For the
Year Ended December 31, 2009
For the
Year Ended December 31, 2008
For the Period Ended December 31, 2007(2)
PER SHARE OPERATING DATA:
Net Asset Value, Beginning of Period
$5.71
$4.28
$13.88
$19.10(3)
Income/floss) from Investment Operations:
Net investment income
0.05
0.13
0.52
0.73
Net gains/(losses) on securities, realized and unrealized
(0.17)
1.53
(8.47)
(5.12)
Total From Investment Operations
(0.12)
1.66
(7.95)
(4.39)
Dividends and/or Distributions to Shareholders:
Dividends from net investment income
(0.05)
(0.23)
(1.11)
(0.79)
Distributions from return of capital
—
—
(0.54)
—
Total Distributions
(0.05)
(0.23)
(1.65)
(0.79)
Offering Costs Charged to Paid-in-Capital
—
—
0.00(7)
(0.04)
Net Asset Value, End of Period
$5.54
$5.71
$4.28
$13.88
Market Price, End of Period
$4.39
$4.68
$3.05
$12.45
Total Return, Net Asset Value(4)
-1.98%
42.55%
(61.02)%
(23.20)%(8)
Total Return, Market Value(4)
-5.23 %
63.95%
(69.01)%
(34.36)%
Ratios/Supplemental Data
Net Assets, End of Period (000’s)
$42,024
$43,346
$32,457
$104,433
Ratio of Total Expenses to Average Net Assets
2.08%(5)
2.52%
1.70%
1.43%(5)
Ratio of Net Investment Income to Average Net Assets
1.56%(5)
2.69%
5.64%
6.97%(5)
Portfolio Turnover Rate(6)
25%
84%
17%
1%
(1) Prior to March 16, 2009, the DCW Total Return Fund was known as the Dividend Capital Global Exposure Fund.
(2) For the period June 27, 2007 (inception date of the Fund’s initial public offering) through December 31, 2007.
(3) Net of sales load of $0.90 on initial shares issued.
(4) Total investment return is calculated assuming a purchase of common shares of the opening of the first day and sale on the closing of the last day of each period reported. Dividends and distributions are assumed, for purposes of this calculation, to be reinvested at prices obtained under the Fund’s reinvestment plan. Total investment return is not annualized for periods of less than one year. Brokerage commissions are not reflected.
(5) Ratio annualized for the period of less than one year.
(6) A portfolio turnover rate is the percentage computed by taking the lesser of purchases or sales of portfolio securities (excluding short-term investments) for a period and dividing it by monthly average of the market value of the portfolio securities during the period. Purchases and sales of investment securities (excluding short-term securities) for the six-months ended June 30, 2010 were $10,643,421 and $11,438,762, respectively.
(7) Less than $0,005 per share.
(8) Total return on Net Asset Value, excluding payment from affiliate, would have been (23.24)%.
See accompanying Notes to Financial Statements.
32 2010 Semi-Annual Report (Unaudited)
www.dcclosedendfunds.com
Notes To Financial Statements
June 30, 2010 (Unaudited)
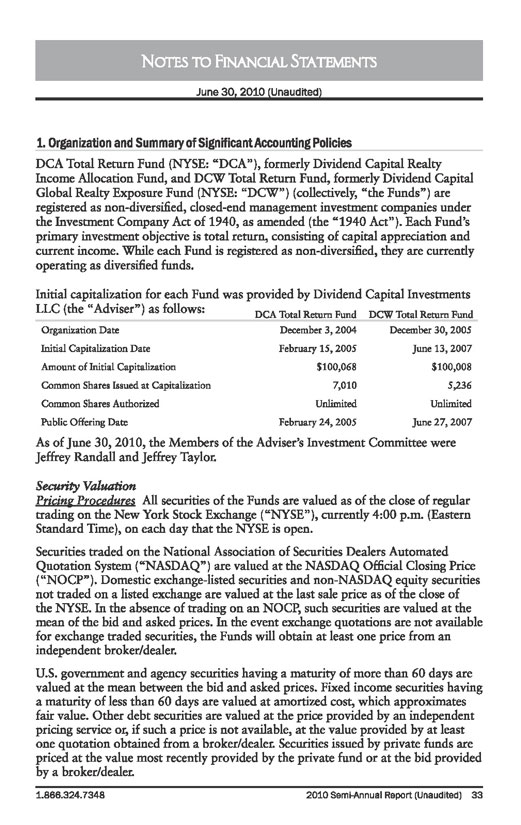
1. ORGANIZATION AND SUMMARY OF SIGNIFICANT ACCOUNTING POLICIES
DCA Total Return Fund (NYSE: “DCA”), formerly Dividend Capital Realty Income Allocation Fund, and DCW Total Return Fund, formerly Dividend Capital Global Realty Exposure Fund (NYSE: “DCW”) (collectively, “the Funds”) are registered as non-diversified, closed-end management investment companies under the Investment Company Act of 1940, as amended (the “1940 Act”). Each Fund’s primary investment objective is total return, consisting of capital appreciation and current income. While each Fund is registered as non-diversified, they are currently operating as diversified funds.
Initial capitalization for each Fund was provided by Dividend Capital Investments LLC (the “Adviser”) as follows:
DCA Total Return Fund
DCW Total Return Fund
Organization Date
December 3, 2004
December 30, 2005
Initial Capitalization Date
February 15, 2005
June 13, 2007
Amount of Initial Capitalization
$100,068
$100,008
Common Shares Issued at Capitalization
7,010
5,236
Common Shares Authorized
Unlimited
Unlimited
Public Offering Date
February 24, 2005
June 27, 2007
As of June 30, 2010, the Members of the Adviser’s Investment Committee were Jeffrey Randall and Jeffrey Taylor.
Security Valuation
Pricing Procedures All securities of the Funds are valued as of the close of regular trading on the New York Stock Exchange (“NYSE”), currently 4:00 p.m. (Eastern Standard Time), on each day that the NYSE is open.
Securities traded on the National Association of Securities Dealers Automated Quotation System (“NASDAQ”) are valued at the NASDAQ Official Closing Price (“NOCP”). Domestic exchange-listed securities and non-NASDAQ equity securities not traded on a listed exchange are valued at the last sale price as of the close of the NYSE. In the absence of trading on an NOCP, such securities are valued at the mean of the bid and asked prices. In the event exchange quotations are not available for exchange traded securities, the Funds will obtain at least one price from an independent broker/dealer.
U.S. government and agency securities having a maturity of more than 60 days are valued at the mean between the bid and asked prices. Fixed income securities having a maturity of less than 60 days are valued at amortized cost, which approximates fair value. Other debt securities are valued at the price provided by an independent pricing service or, if such a price is not available, at the value provided by at least one quotation obtained from a broker/dealer. Securities issued by private funds are priced at the value most recently provided by the private fund or at the bid provided by a broker/dealer.
1.866.324.7348
2010 Semi-Annual Report (Unaudited) 33
Notes to Financial Statements (continued)
June 30, 2010 (Unaudited)
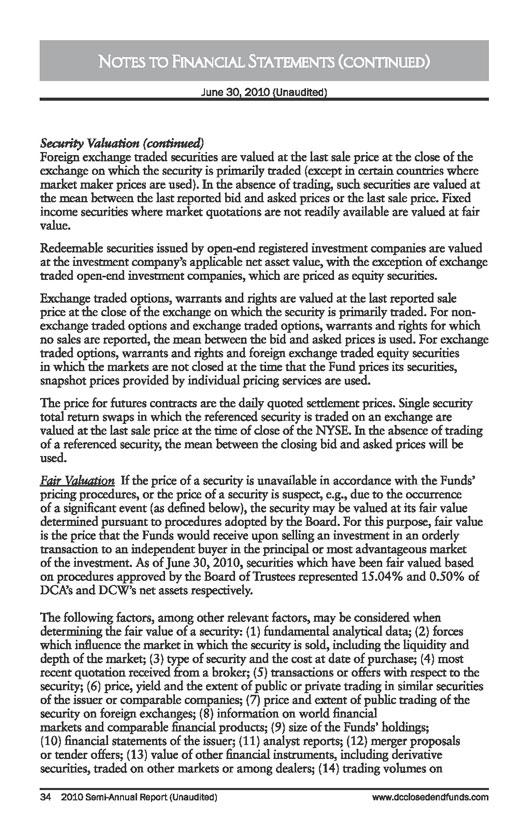
Security Valuation (continued)
Foreign exchange traded securities are valued at the last sale price at the close of the exchange on which the security is primarily traded (except in certain countries where market maker prices are used). In the absence of trading, such securities are valued at the mean between the last reported bid and asked prices or the last sale price. Fixed income securities where market quotations are not readily available are valued at fair value.
Redeemable securities issued by open-end registered investment companies are valued at the investment company’s applicable net asset value, with the exception of exchange traded open-end investment companies, which are priced as equity securities.
Exchange traded options, warrants and rights are valued at the last reported sale price at the close of the exchange on which the security is primarily traded. For non-exchange traded options and exchange traded options, warrants and rights for which no sales are reported, the mean between the bid and asked prices is used. For exchange traded options, warrants and rights and foreign exchange traded equity securities in which the markets are not closed at the time that the Fund prices its securities, snapshot prices provided by individual pricing services are used.
The price for futures contracts are the daily quoted settlement prices. Single security total return swaps in which the referenced security is traded on an exchange are valued at the last sale price at the time of close of the NYSE. In the absence of trading of a referenced security, the mean between the closing bid and asked prices will be used.
Fair Valuation If the price of a security is unavailable in accordance with the Funds’ pricing procedures, or the price of a security is suspect, e.g., due to the occurrence of a significant event (as defined below), the security may be valued at its fair value determined pursuant to procedures adopted by the Board. For this purpose, fair value is the price that the Funds would receive upon selling an investment in an orderly transaction to an independent buyer in the principal or most advantageous market of the investment. As of June 30, 2010, securities which have been fair valued based on procedures approved by the Board of Trustees represented 15.04% and 0.50% of DCA’s and DCW’s net assets respectively.
The following factors, among other relevant factors, may be considered when determining the fair value of a security: (1) fundamental analytical data; (2) forces which influence the market in which the security is sold, including the liquidity and depth of the market; (3) type of security and the cost at date of purchase; (4) most recent quotation received from a broker; (5) transactions or offers with respect to the security; (6) price, yield and the extent of public or private trading in similar securities of the issuer or comparable companies; (7) price and extent of public trading of the security on foreign exchanges; (8) information on world financial markets and comparable financial products; (9) size of the Funds’ holdings; (10) financial statements of the issuer; (11) analyst reports; (12) merger proposals or tender offers; (13) value of other financial instruments, including derivative securities, traded on other markets or among dealers; (14) trading volumes on
34 2010 Semi-Annual Report (Unaudited)
www.dcclosedendfunds.com
Notes to Financial Statements (continued)
June 30, 2010 (Unaudited)
Security Valuation (continued)
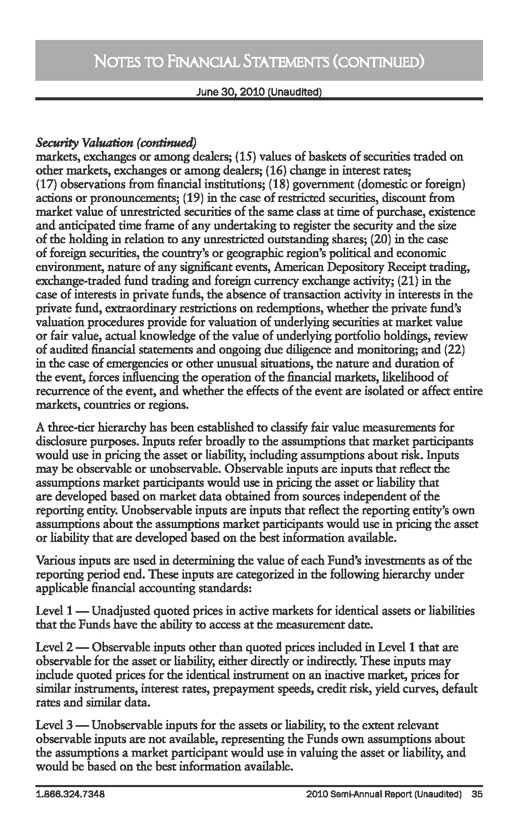
markets, exchanges or among dealers; (15) values of baskets of securities traded on other markets, exchanges or among dealers; (16) change in interest rates; (17) observations from financial institutions; (18) government (domestic or foreign) actions or pronouncements; (19) in the case of restricted securities, discount from market value of unrestricted securities of the same class at time of purchase, existence and anticipated time frame of any undertaking to register the security and the size of the holding in relation to any unrestricted outstanding shares; (20) in the case of foreign securities, the country’s or geographic region’s political and economic environment, nature of any significant events, American Depository Receipt trading, exchange-traded fund trading and foreign currency exchange activity; (21) in the case of interests in private funds, the absence of transaction activity in interests in the private fund, extraordinary restrictions on redemptions, whether the private fund’s valuation procedures provide for valuation of underlying securities at market value or fair value, actual knowledge of the value of underlying portfolio holdings, review of audited financial statements and ongoing due diligence and monitoring; and (22) in the case of emergencies or other unusual situations, the nature and duration of the event, forces influencing the operation of the financial markets, likelihood of recurrence of the event, and whether the effects of the event are isolated or affect entire markets, countries or regions.
A three-tier hierarchy has been established to classify fair value measurements for disclosure purposes. Inputs refer broadly to the assumptions that market participants would use in pricing the asset or liability, including assumptions about risk. Inputs may be observable or unobservable. Observable inputs are inputs that reflect the assumptions market participants would use in pricing the asset or liability that are developed based on market data obtained from sources independent of the reporting entity. Unobservable inputs are inputs that reflect the reporting entity’s own assumptions about the assumptions market participants would use in pricing the asset or liability that are developed based on the best information available.
Various inputs are used in determining the value of each Fund’s investments as of the reporting period end. These inputs are categorized in the following hierarchy under applicable financial accounting standards:
Level 1 – Unadjusted quoted prices in active markets for identical assets or liabilities that the Funds have the ability to access at the measurement date.
Level 2 – Observable inputs other than quoted prices included in Level 1 that are observable for the asset or liability, either directly or indirectly. These inputs may include quoted prices for the identical instrument on an inactive market, prices for similar instruments, interest rates, prepayment speeds, credit risk, yield curves, default rates and similar data.
Level 3 – Unobservable inputs for the assets or liability, to the extent relevant observable inputs are not available, representing the Funds own assumptions about the assumptions a market participant would use in valuing the asset or liability, and would be based on the best information available.
1.866.324.7348
2010 Semi-Annual Report (Unaudited) 35
Notes to Financial Statements (continued)
June 30, 2010 (Unaudited)
Security Valuation (continued)
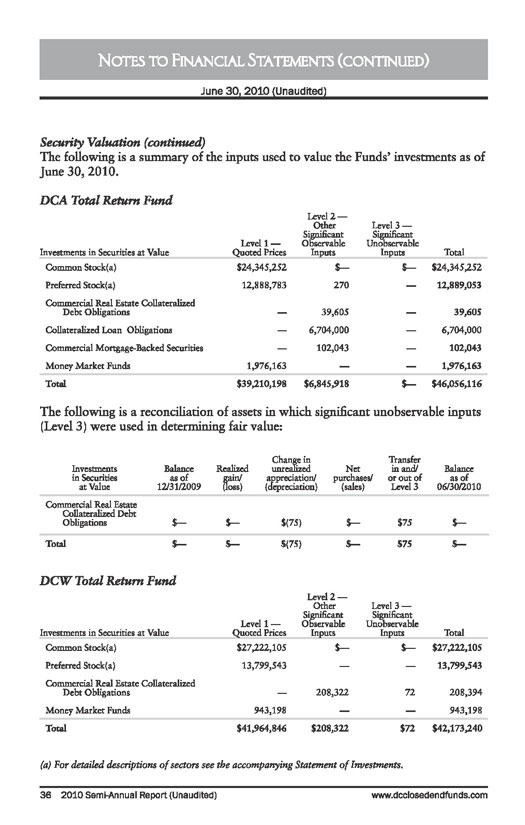
The following is a summary of the inputs used to value the Funds’ investments as of June 30, 2010.
DCA Total Return Fund
Investments in Securities at Value
Level 1 – Quoted Prices
Level 2 –
Other Significant Observable Inputs
Level 3 – Significant Unobservable Inputs
Total
Common Stock(a)
$24,345,252
$—
$—
$24,345,252
Preferred Stock(a)
12,888,783
270
—
12,889,053
Commercial Real Estate Collateralized Debt Obligations
—
39,605
—
39,605
Collateralized Loan Obligations
—
6,704,000
—
6,704,000
Commercial Mortgage-Backed Securities
—
102,043
—
102,043
Money Market Funds
1,976,163
—
—
1,976,163
Total
$39,210,198
$6,845,918
$—
$46,056,116
The following is a reconciliation of assets in which significant unobservable inputs (Level 3) were such in determining fair value:
Investments in Securities at Value
Balance
as of
12/31/2009
Realized gain/ (loss)
Change in unrealized appreciation/ (depreciation)
Net purchases/ (sales)
Transfer in and/ or out of Level 3
Balance as of 06/30/2010
Commercial Real Estate Collateralized Debt Obligations
$—
$—
$(75)
$—
$75
$—
Total
$—
$—
$(75)
$—
$75
$—
DCA Total Return Fund
Investments in Securities at Value
Level 1 – Quoted Prices
Level 2 –
Other Significant Observable Inputs
Level 3 – Significant Unobservable Inpurs
Total
Common Stock(a)
$27,222,105
$—
$—
$27,222,105
Preferred Stock(a)
13,799,543
—
—
13,799,543
Commercial Real Estate Collateralized Debt Obligations
—
208,322
72
208,394
Money Market Funds
943,198
—
—
943,198
Total
$41,964,846
$208,322
$72
$42,173,240
(a) For detailed descriptions of sectors see the accompanying Statement of Investments.
36 2010 Semi-Annual Report (Unaudited)
www.dcclosedendfunds.com
Notes to Financial Statements (continued)
June 30, 2010 (Unaudited)
Security Valuation (continued)
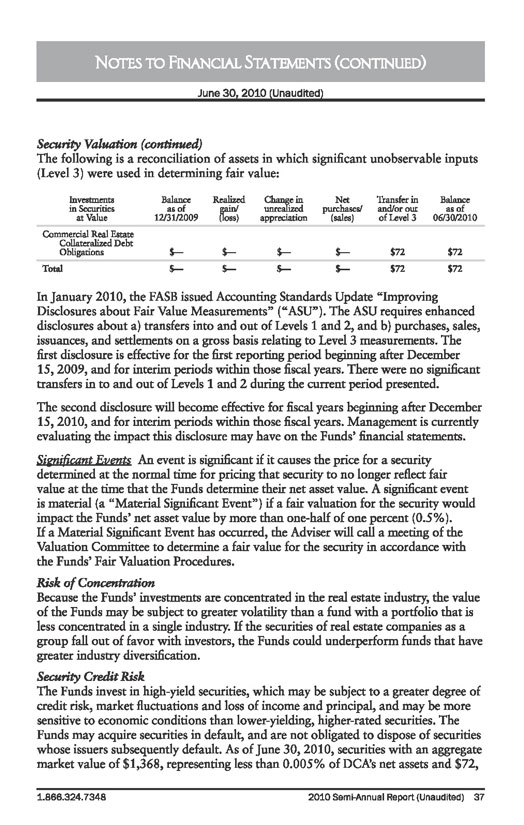
The following is a reconciliation of assets in which significant unobservable inputs (Level 3) were used in determining fair value:
Investments in Securities at Value
Balance as of 12/31/2009
Realized gain/ (loss)
Change in unrealized appreciation
Net purchases/ (sales)
Transfer in and/or out of Level 3
Balance as of 06/30/2010
Commercial Real Estate Collateralized Debt Obligations
$—
$—
$—
$—
$72
$72
Total
$—
$—
$—
$—
$72
$72
In January 2010, the FASB issued Accounting Standards Update “Improving Disclosures about Fair Value Measurements” (“ASU”). The ASU requires enhanced disclosures about a) transfers into and out of Levels 1 and 2, and b) purchases, sales, issuances, and settlements on a gross basis relating to Level 3 measurements. The first disclosure is effective for the first reporting period beginning after December 15, 2009, and for interim periods within those fiscal years. There were no significant transfers in to and out of Levels 1 and 2 during the current period presented.
The second disclosure will become effective for fiscal years beginning after December 15, 2010, and for interim periods within those fiscal years. Management is currently evaluating the impact this disclosure may have on the Funds’ financial statements.
Significant Events An event is significant if it causes the price for a security determined at the normal time for pricing that security to no longer reflect fair value at the time that the Funds determine their net asset value. A significant event is material (a “Material Significant Event”) if a fair valuation for the security would impact the Funds’ net asset value by more than one-half of one percent (0.5%). If a Material Significant Event has occurred, the Adviser will call a meeting of the Valuation Committee to determine a fair value for the security in accordance with the Funds’ Fair Valuation Procedures.
Risk of Concentration
Because the Funds’ investments are concentrated in the real estate industry, the value of the Funds may be subject to greater volatility than a fund with a portfolio that is less concentrated in a single industry. If the securities of real estate companies as a group fall out of favor with investors, the Funds could underperform funds that have greater industry diversification.
Security Credit Risk
The Funds invest in high-yield securities, which may be subject to a greater degree of credit risk, market fluctuations and loss of income and principal, and may be more sensitive to economic conditions than lower-yielding, higher-rated securities. The Funds may acquire securities in default, and are not obligated to dispose of securities whose issuers subsequently default. As of June 30, 2010, securities with an aggregate market value of $1,368, representing less than 0.005% of DCA’s net assets and $72, representing less than 0.005% of DCW’s net assets, were in default or currently deferring interest payments.
1.866.324.7348
2010 Semi-Annual Report (Unaudited) 37
Notes to Financial Statements (continued)
June 30, 2010 (Unaudited)
Foreign Securities
The Funds may invest without limit in foreign securities. In the event that the Funds execute a foreign security transaction, the Funds will generally enter into forward foreign currency contracts to settle specific purchases or sales of securities denominated in a foreign currency. Foreign securities may carry more risk than U.S. securities, such as political, market and currency risks.
The accounting records of the Funds are maintained in U.S. dollars. Prices of securities denominated in foreign currencies are translated into U.S. dollars at the closing rate of exchange at period end. Amounts related to the purchase and sale of foreign securities and investment income are translated at the rates of exchange prevailing on the respective dates of such transactions.
The effects of changes in foreign currency exchange rates on investments is separately identified from the fluctuations arising from changes in market values of securities held and reported with all other foreign currency gains and losses in the Funds’ Statements of Operations.
Repurchase Agreements
The Funds may invest in repurchase agreements, which are short-term investments in which the Funds acquire ownership of a debt security and the seller agrees to repurchase the security at a future time and specified price. Repurchase agreements are fully collateralized by the underlying debt security. The Funds will make payment for such securities only upon physical delivery or evidence of book entry transfer to the account of the custodian bank. The seller is required to maintain the value of the underlying security at not less than the repurchase proceeds due the Funds.
Distributions to Shareholders
The Funds intend to make dividend distributions each quarter to shareholders. The dividend rate may be modified by the Board of Trustees from time to time. Dividends and distributions to shareholders are recorded by the Funds on the ex-dividend date. Distributions paid by the Funds are subject to recharacterization for tax purposes. A portion of the distributions paid by the Funds may be reclassified to return of capital and long-term capital gains upon the final determination of the Funds’ taxable income for the year. Net realized gains, unless offset by any available capital loss carryforward, are generally distributed to shareholders annually, although net realized gains may be retained by the Funds in certain circumstances.
Securities Transactions and Investment Income
Investment security transactions are accounted for as of trade date. Dividend income is recorded on the ex-dividend date. Interest income, which includes
38 2010 Semi-Annual Report (Unaudited)
www.dcclosedendfunds.com
Notes to Financial Statements (continued)
June 30, 2010 (Unaudited)
amortization of premium and accretion of discount, is accrued as earned. Dividend income from RETT securities may include return of capital. Upon notification from the issuer, the amount of the return of capital is reclassified to adjust dividend income, reduce the cost basis and/or adjust realized gain. Realized gains and losses from securities transactions and unrealized appreciation and depreciation of securities are determined using the specific identification method for both financial reporting and income tax purposes.
Use of Estimates
The Funds’ financial statements are prepared in accordance with accounting principles generally accepted in the United States of America. This requires management to make estimates and assumptions that affect the reported amounts of assets and liabilities and disclosure of contingent assets and liabilities at the date of the financial statements and the reported amounts of increases and decreases in net assets from operations during the reporting period. Actual results could differ from these estimates.
Investments with Off-Balance Sheet Risk
The Funds may enter into financial instrument transactions (such as swaps, futures, options and other derivatives) that may have off-balance sheet market risk. Off-balance sheet market risk exists when the maximum potential loss on a particular financial instrument is greater than the value of such financial instrument as reflected in the Funds’ Statements of Assets and Liabilities.
Indemnifications
In the normal course of business, the Funds enter into contracts that provide general indemnifications. Each Fund’s maximum exposure under this arrangement is dependent upon claims that may be made against the Funds in the future and, therefore, cannot be estimated; however, based on experience, the risk of material loss from such claims is considered remote.
2. FEDERAL INCOME TAXES
No provision for federal income taxes is required since the Funds intend to continue to qualify as regulated investment companies and distribute to shareholders all of its taxable income and capital gains.
Because federal income tax regulations differ from generally accepted accounting principles, income and capital gain distributions determined in accordance with tax regulations may differ from net investment income and realized gain for financial reporting purposes. Accordingly, the character of distributions and composition of net assets for tax purposes differ from those reflected in the accompanying financial statements.
1.866.324.7348
2010 Semi-Annual Report (Unaudited) 39
Notes to Financial Statements (continued)
June 30, 2010 (Unaudited)
The Funds follow ASC 740 “Income Taxes” (“ASC 740”), which requires that the financial statement effects of a tax position taken or expected to be taken in a tax return be recognized in the financial statements when it is more likely than not, based on the technical merits, that the position will be sustained upon examination. Management has concluded that the Funds have taken no uncertain tax positions that require adjustment to the financial statements to comply with the provisions of ASC 740. The Funds file income tax returns in the U.S. federal jurisdiction and the State of Colorado. The statute of limitations on the Funds’ federal tax return filings remains open for the years ended December 31, 2009, December 31, 2008 and December 31, 2007, and for September 30, 2007 for DCA. The Funds’ Colorado tax return filings remain open for the same years ended as mentioned above for each Fund, respectively. To our knowledge there are no federal or Colorado income tax returns currently under examination.
As of and during the six-months ended June 30, 2010, the Funds did not have a liability for any unrecognized tax benefits in the accompanying financial statements.
The amount and characteristics of tax basis distributions and composition of distributable earnings/(accumulated losses) are finalized at fiscal year end; accordingly tax basis balances have not been determined as of June 30, 2010.
At June 30, 2010 the cost of investments and net unrealized appreciation for federal income tax purposes were as follows:
DCA Total Return Fund
DCW Total Return Fund
Aggregate tax cost (including swaps and foreign currency)
$81,684,836
$48,676,385
Gross unrealized appreciation
4,744,108
6,248,499
Gross unrealized depreciation
(40,372,828)
(12,751,644)
Net unrealized depreciation
$(35,628,720)
$(6,503,145)
The tax character of the distributions paid by the Funds during the following years ended December 31, 2009 and December 31, 2008, were as follows:
DCA Total Return Fund
DCW Total Return Fund
Distributions paid from:
Year Ended December 31, 2009
Year Ended December 31, 2008
Year Ended December 31, 2009
Year Ended December 31, 2008
Ordinary Income
$2,140,951
$11,775,350
$1,764,901
$8,399,144
Long-Term Capital Gain
—
—
—
—
Return of Capital
54,005
1,762,020
—
4,095,379
40 2010 Semi-Annual Report (Unaudited)
www.dcclosedendfunds.com
Notes to Financial Statements (continued)
June 30, 2010 (Unaudited)
Capital Loss Carryforwards:
At December 31, 2009, each Fund had available for federal income tax purposes unused capital loss carryforwards as follows:
Expiring
DCA Total
Return Fund
DCW Total
Return Fund
2015
$380,321
$1,040,591
2016
63,198,839
70,372,176
2017
47,988,239
21,327,939
Total
$111,567,399
$92,740,706
Post October Losses:
DCW intends to elect to defer to its fiscal year ending December 31, 2010, approximately $74,148 of capital losses and $6,437 of currency losses recognized during the period November 1, 2009 to December 31, 2009. DCA intends to elect to defer to its fiscal year ending December 31, 2010, approximately $2,812,212 of capital losses and $6,457 of currency losses recognized during the period November 1, 2009 to December 31, 2009.
As of December 31, 2009, the components of distributable earnings on a tax basis were as follows:
DCA Total Return Fund
DCW Total Return Fund
(Over)/Undistributed ordinary income
($6,457)
$339,102
Accumulated net realized loss
(114,379,611)
(92,814,854)
Net unrealized depreciation
(38,980,347)
(3,681,271)
Offer cumulative effect of timing differences
(492,552)
(338,955)
Total
($153,858,967)
($96,495,978)
Net investment income (loss) and net realized gain (loss) may differ from financial statements and tax purposes. These differences are primarily due to the treatment of certain investment securities and distribution allocations. These permanent differences in the character of income and distributions between financial statements and tax basis have been reclassified.
In any year when the Funds earn net investment income, the Funds generally intend to make sufficient distributions to prevent application of excise tax under the Internal Revenue Code. However, if the Funds distribute less than the required net investment income and capital gain net income (if any), a required 4% federal excise tax on such retained income and gains will be paid.
3. CAPITAL TRANSACTIONS
DCA Total Return Fund
There are an unlimited number of $0.001 par value common shares of beneficial interest authorized. Of the 14,161,010 common shares outstanding on June 30, 2010, Dividend Capital Investments LLC (the “Adviser”) owned 12,650 shares. The Fund
1.866.324.7348
2010 Semi-Annual Report (Unaudited) 41
Notes to Financial Statements (continued)
June 30, 2010 (Unaudited)
issued 12,100,010 common shares in its initial public offering on February 23, 2005. These common shares were issued at $15.00 per share before the underwriting discount of $0.675 per share. An additional 1,578,500 common shares were issued pursuant to an over-allotment option on April 12, 2005. Offering costs of $642,230 were offset against proceeds of the offering and were charged to paid-in capital of the common shares. During the year ended September 30, 2006, a $41,695 adjustment was charged to paid-in capital for common offering costs.
DCW Total Return Fund
There are an unlimited number of the Fund’s $0.001 par value common shares of beneficial interest authorized. Of the 7,590,970 common shares outstanding on June 30,2010, the Adviser owned 7,507 shares. The Fund issued 7,500,000 common shares in its initial public offering on June 27, 2007. These common shares were issued at $20.00 per share before the underwriting discount of $0.90 per share. Offering costs of $300,000 (representing $0.04 per common share) were offset against proceeds of the offering and were charged to paid-in capital of the common shares. The Adviser agreed to pay those offering costs of the Fund other than the underwriting discount) that exceed $0.04 per common share.
Transactions in common shares for the six-months ended June 30, 2010 and the year ended December 31, 2009 were as follows:
DCA Total Return Fund
DCW Total Return Fund
Six-Months Ended June 30, 2010 (Unaudited)
Year Ended December 31,
2009
Six-Months Ended June 30, 2010 (Unaudited)
Year Ended December 31,
2009
Common shares outstanding – beginning of period
14,161,010
14.161,010
7,590,970
7,590,970
Common shares issued in connection with initial public offering
—
—
—
—
Common shares issued to shareholders from reinvested distributions
—
—
—
—
Common shares outstanding – end of period
14,161.010
14,161,010
7,590,970
7,590,970
42 2010 Semi-Annual Report (Unaudited)
www.dcclosedendfunds.com
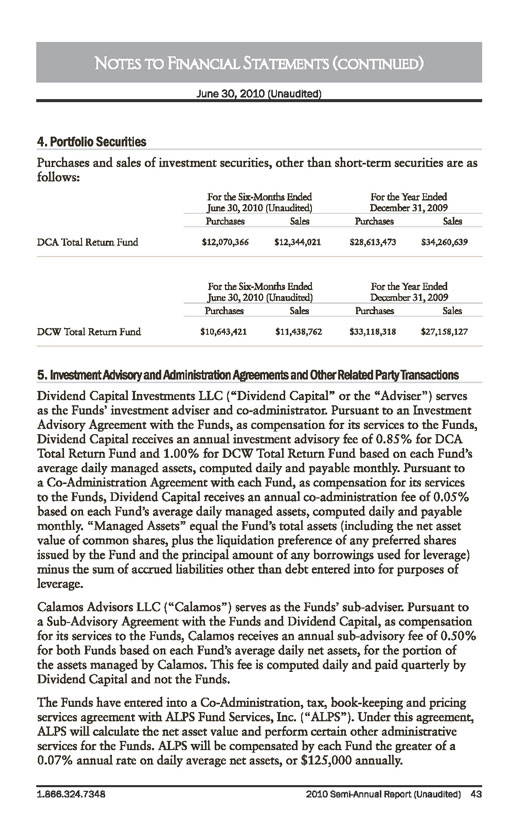
Notes to Financial Statements (continued)
June 30, 2010 (Unaudited)
4. Portfolio Securities
Purchases and sales of investment securities, other than short-term securities are as follows:
For the Six-Months Ended June 30, 2010 (Unaudited)
For the Year Ended December 31, 2009
Purchases
Sales
Purchases
Sales
DCA Total Return Fund
$12,070,366
$12,344,021
$28,613,473
$34,260,639
For the Six-Months Ended June 30, 2010 (Unaudited)
For the Year Ended December 31, 2009
Purchases
Sales
Purchases
Sales
DCW Total Return Fund
$10,643,421
$11,438,762
$33,118,318
$27,158,127
5. INVESTMENT ADVISORYAND ADMINISTRATION AGREEMENTSAND OTHER RELATED PARTY TRANSACTIONS
Dividend Capital Investments LLC (“Dividend Capital” or the “Adviser”) serves as the Funds’ investment adviser and co-administrator. Pursuant to an Investment Advisory Agreement with the Funds, as compensation for its services to the Funds, Dividend Capital receives an annual investment advisory fee of 0.85% for DCA Total Return Fund and 1.00% for DCW Total Return Fund based on each Fund’s average daily managed assets, computed daily and payable monthly. Pursuant to a Co-Administration Agreement with each Fund, as compensation for its services to the Funds, Dividend Capital receives an annual co-administration fee of 0.05% based on each Fund’s average daily managed assets, computed daily and payable monthly. “Managed Assets” equal the Fund’s total assets (including the net asset value of common shares, plus the liquidation preference of any preferred shares issued by the Fund and the principal amount of any borrowings used for leverage) minus the sum of accrued liabilities other than debt entered into for purposes of leverage.
Calamos Advisors LLC (“Calamos”) serves as the Funds’ sub-adviser. Pursuant to a Sub-Advisory Agreement with the Funds and Dividend Capital, as compensation for its services to the Funds, Calamos receives an annual sub-advisory fee of 0.50% for both Funds based on each Fund’s average daily net assets, for the portion of the assets managed by Calamos. This fee is computed daily and paid quarterly by Dividend Capital and not the Funds.
The Funds have entered into a Co-Administration, tax, book-keeping and pricing services agreement with ALPS Fund Services, Inc. (“ALPS”). Under this agreement, ALPS will calculate the net asset value and perform certain other administrative services for the Funds. ALPS will be compensated by each Fund the greater of a 0.07% annual rate on daily average net assets, or $125,000 annually.
1.866.324.7348
2010 Semi-Annual Report (Unaudited) 43
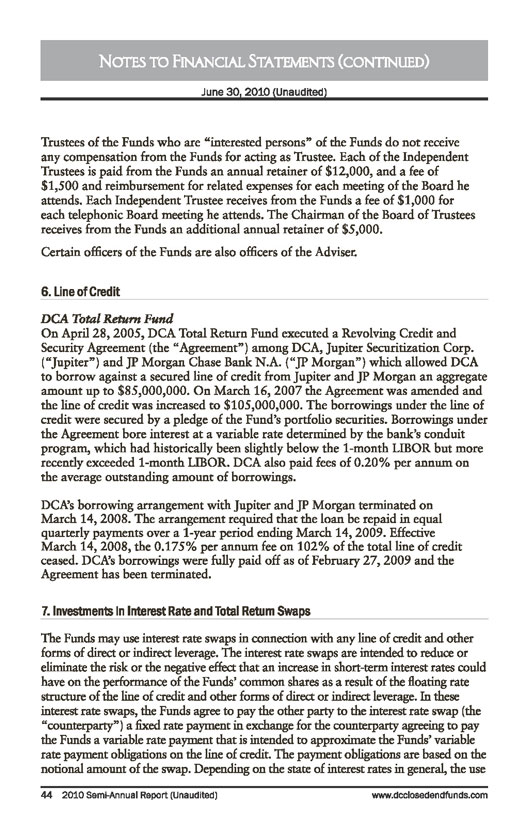
Notes to Financial Statements (continued)
June 30, 2010 (Unaudited)
Trustees of the Funds who are “interested persons” of the Funds do not receive any compensation from the Funds for acting as Trustee. Each of the Independent Trustees is paid from the Funds an annual retainer of $12,000, and a fee of $1,500 and reimbursement for related expenses for each meeting of the Board he attends. Each Independent Trustee receives from the Funds a fee of $1,000 for each telephonic Board meeting he attends. The Chairman of the Board of Trustees receives from the Funds an additional annual retainer of $5,000.
Certain officers of the Funds are also officers of the Adviser.
6. LINEOF CREDIT
DCA Total Return Fund
On April 28, 2005, DCA Total Return Fund executed a Revolving Credit and Security Agreement (the “Agreement”) among DCA, Jupiter Securitization Corp. (“Jupiter”) and JP Morgan Chase Bank N.A. (“JP Morgan”) which allowed DCA to borrow against a secured line of credit from Jupiter and JP Morgan an aggregate amount up to $85,000,000. On March 16, 2007 the Agreement was amended and the line of credit was increased to $105,000,000. The borrowings under the line of credit were secured by a pledge of the Fund’s portfolio securities. Borrowings under the Agreement bore interest at a variable rate determined by the bank’s conduit program, which had historically been slightly below the 1-month LIBOR but more recently exceeded 1-month LIBOR. DCA also paid fees of 0.20% per annum on the average outstanding amount of borrowings.
DCA’s borrowing arrangement with Jupiter and JP Morgan terminated on March 14, 2008. The arrangement required that the loan be repaid in equal quarterly payments over a 1-year period ending March 14, 2009. Effective March 14, 2008, the 0.175% per annum fee on 102% of the total line of credit ceased. DCA’s borrowings were fully paid off as of February 27, 2009 and the Agreement has been terminated.
7. INVESTMENTSIN INTEREST RATEAND TOTAL RETURN SWAPS
The Funds may use interest rate swaps in connection with any line of credit and other forms of direct or indirect leverage. The interest rate swaps are intended to reduce or eliminate the risk or the negative effect that an increase in short-term interest rates could have on the performance of the Funds’ common shares as a result of the floating rate structure of the line of credit and other forms of direct or indirect leverage. In these interest rate swaps, the Funds agree to pay the other party to the interest rate swap (the “counterparty”) a fixed rate payment in exchange for the counterparty agreeing to pay the Funds a variable rate payment that is intended to approximate the Funds’ variable rate payment obligations on the line of credit. The payment obligations are based on the notional amount of the swap. Depending on the state of interest rates in general, the use
44 2010 Semi-Annual Report (Unaudited)
www.dcclosedendfunds.com
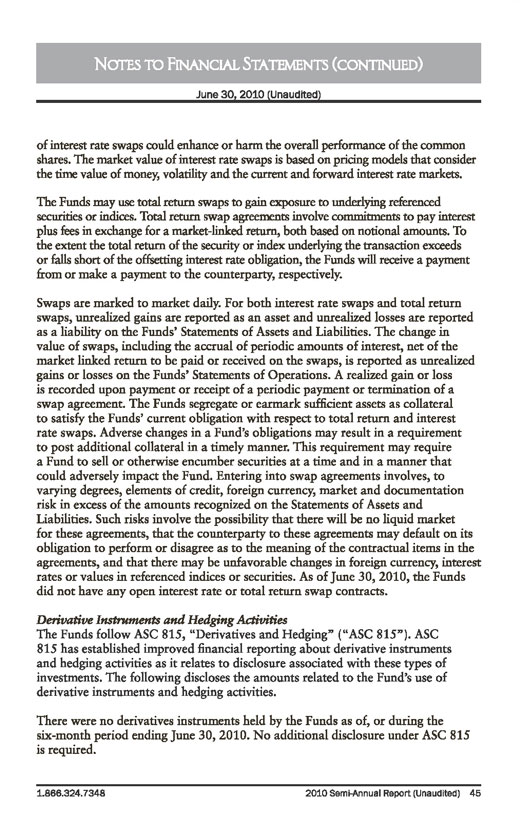
Notes to Financial Statements (continued)
June 30, 2010 (Unaudited)
of interest rate swaps could enhance or harm the overall performance of the common shares. The market value of interest rate swaps is based on pricing models that consider the time value of money, volatility and the current and forward interest rate markets.
The Funds may use total return swaps to gain exposure to underlying referenced securities or indices. Total return swap agreements involve commitments to pay interest plus fees in exchange for a market-linked return, both based on notional amounts. To the extent the total return of the security or index underlying the transaction exceeds or falls short of the offsetting interest rate obligation, the Funds will receive a payment from or make a payment to the counterparty, respectively.
Swaps are marked to market daily. For both interest rate swaps and total return swaps, unrealized gains are reported as an asset and unrealized losses are reported as a liability on the Funds’ Statements of Assets and Liabilities. The change in value of swaps, including the accrual of periodic amounts of interest, net of the market linked return to be paid or received on the swaps, is reported as unrealized gains or losses on the Funds’ Statements of Operations. A realized gain or loss is recorded upon payment or receipt of a periodic payment or termination of a swap agreement. The Funds segregate or earmark sufficient assets as collateral to satisfy the Funds’ current obligation with respect to total return and interest rate swaps. Adverse changes in a Fund’s obligations may result in a requirement to post additional collateral in a timely manner. This requirement may require a Fund to sell or otherwise encumber securities at a time and in a manner that could adversely impact the Fund. Entering into swap agreements involves, to varying degrees, elements of credit, foreign currency, market and documentation risk in excess of the amounts recognized on the Statements of Assets and Liabilities. Such risks involve the possibility that there will be no liquid market for these agreements, that the counterparty to these agreements may default on its obligation to perform or disagree as to the meaning of the contractual items in the agreements, and that there may be unfavorable changes in foreign currency, interest rates or values in referenced indices or securities. As of June 30, 2010, the Funds did not have any open interest rate or total return swap contracts.
Derivative Instruments and Hedging Activities
The Funds follow ASC 815, “Derivatives and Hedging” (“ASC 815”). ASC 815 has established improved financial reporting about derivative instruments and hedging activities as it relates to disclosure associated with these types of investments. The following discloses the amounts related to the Fund’s use of derivative instruments and hedging activities.
There were no derivatives instruments held by the Funds as of, or during the six-month period ending June 30, 2010. No additional disclosure under ASC 815 is required.
1.866.324.7348
2010 Semi-Annual Report (Unaudited) 45
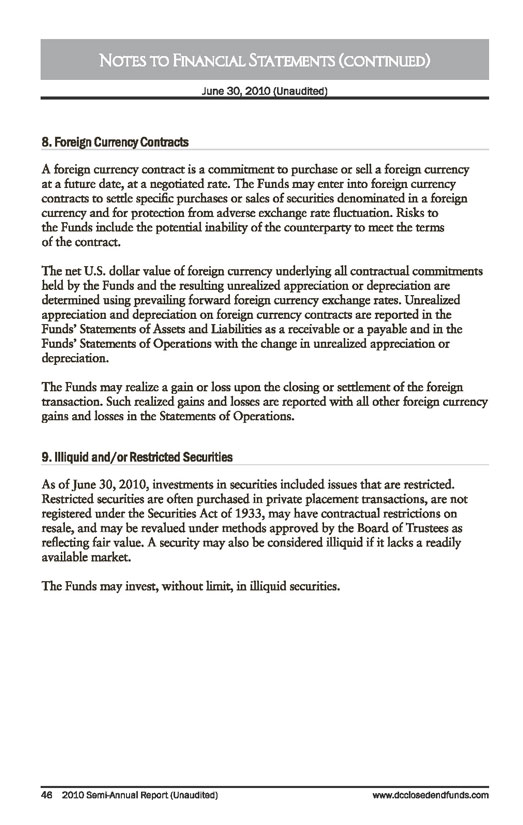
Notes to Financial Statements (continued)
June 30, 2010 (Unaudited)
8. Foreign Currency Contracts
A foreign currency contract is a commitment to purchase or sell a foreign currency at a future date, at a negotiated rate. The Funds may enter into foreign currency contracts to settle specific purchases or sales of securities denominated in a foreign currency and for protection from adverse exchange rate fluctuation. Risks to the Funds include the potential inability of the counterparty to meet the terms of the contract.
The net U.S. dollar value of foreign currency underlying all contractual commitments held by the Funds and the resulting unrealized appreciation or depreciation are determined using prevailing forward foreign currency exchange rates. Unrealized appreciation and depreciation on foreign currency contracts are reported in the Funds’ Statements of Assets and Liabilities as a receivable or a payable and in the Funds’ Statements of Operations with the change in unrealized appreciation or depreciation.
The Funds may realize a gain or loss upon the closing or settlement of the foreign transaction. Such realized gains and losses are reported with all other foreign currency gains and losses in the Statements of Operations.
9. Illiquid and/or Restricted Securities
As of June 30, 2010, investments in securities included issues that are restricted. Restricted securities are often purchased in private placement transactions, are not registered under the Securities Act of 1933, may have contractual restrictions on resale, and may be revalued under methods approved by the Board of Trustees as reflecting fair value. A security may also be considered illiquid if it lacks a readily available market.
The Funds may invest, without limit, in illiquid securities.
46 2010 Semi-Annual Report (Unaudited)
www.dcclosedendfunds.com
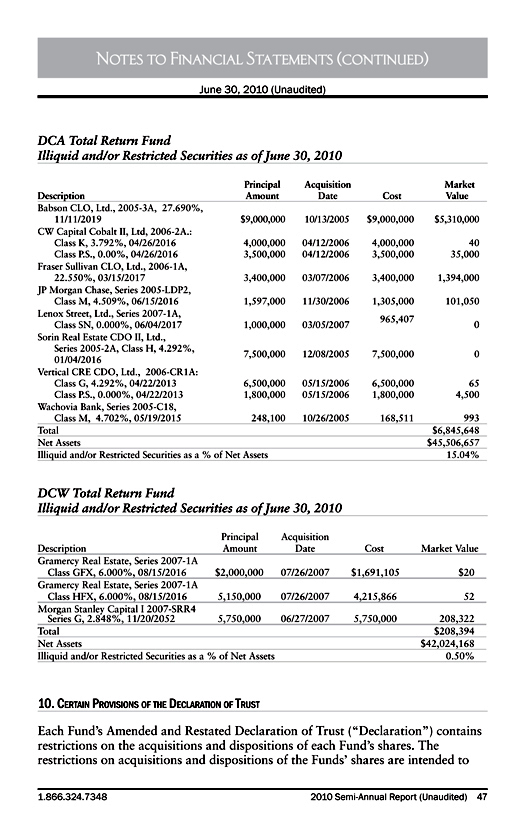
Notes to Financial Statements (continued)
June 30, 2010 (Unaudited)
DCA Total Return Fund
Illiquid and/or Restricted Securities as of June 30, 2010
Description
Principal
Amount
Acquisition
Date
Cost
Market
Value
Babson CLO, Ltd., 2005-3A, 27.690%, 11/11/2019
$9,000,000
10/13/2005
$9,000,000
$5,310,000
CW Capital Cobalt II, Ltd, 2006-2A.:
Class K, 3.792%, 04/26/2016
4,000,000
04/12/2006
4,000,000
40
Class P.S., 0.00%, 04/26/2016
3,500,000
04/12/2006
3,500,000
35,000
Fraser Sullivan CLO, Ltd., 2006-1A, 22.550%, 03/15/2017
3,400,000
03/07/2006
3,400,000
1,394,000
JP Morgan Chase, Series 2005-LDP2, Class M, 4.509%, 06/15/2016
1,597,000
11/30/2006
1,305,000
101,050
Lenox Street, Ltd., Series 2007-1A, Class SN, 0.000%, 06/04/2017
1,000,000
03/05/2007
965,407
0
Sorin Real Estate CDO II, Ltd., Series 2005-2A, Class H, 4.292%, 01/04/2016
7,500,000
12/08/2005
7,500,000
0
Vertical CRE CDO, Ltd., 2006-CR1A:
Class G, 4.292%, 04/22/2013
6,500,000
05/15/2006
6,500,000
65
Class P.S., 0.000%, 04/22/2013
1,800,000
05/15/2006
1,800,000
4,500
Wachovia Bank, Series 2005-C18, Class M, 4.702%, 05/19/2015
248,100
10/26/2005
168,511
993
Total
$6,845,648
Net Assets
$45,506,657
Illiquid and/or Restricted Securities as a % of Net Assets
15.04%
DCW Total Return Fund
Illiquid and/or Restricted Securities as of June 30, 2010
Description
Principal
Amount
Acquisition
Date
Cost
Market
Value
Gramercy Real Estate, Series 2007-1A Class GFX, 6.000%, 08/15/2016
$2,000,000
07/26/2007
$1,691,105
$20
Gramercy Real Estate, Series 2007-1A Class HFX, 6.000%, 08/15/2016
5,150,000
07/26/2007
4,215,866
52
Morgan Stanley Capital I 2007-SRR4 Series G, 2.848%, 11/20/2052
5,750,000
06/27/2007
5,750,000
208,322
Total
$208,394
Net Assets
$42,024,168
Illiquid and/or Restricted Securities as a % of Net Assets
0.50%
10. Certain Provisions of the Declaration of Trust
Each Fund’s Amended and Restated Declaration of Trust (“Declaration”) contains restrictions on the acquisitions and dispositions of each Fund’s shares. The restrictions on acquisitions and dispositions of the Funds’ shares are intended to preserve the benefit of each Fund’s capital loss carryforwards and certain other tax attributes for tax purposes.
1.866.324.7348
2010 Semi-Annual Report (Unaudited) 47
Notes to Financial Statements (continued)
June 30, 2010 (Unaudited)
The restrictions are designed to prevent an ownership change (an “Ownership Change”), as defined in the Internal Revenue Code of 1986, as amended (the “Code”). Section 382 of the Code imposes significant limitations on the ability of an entity classified as a corporation to use its capital loss carryforwards to offset income in circumstances where such entity has experienced an Ownership Change and may also limit such an entity’s ability to use any built-in losses recognized within five years of any Ownership Change. Generally, there is an Ownership Change if, at any time, one or more 5% shareholders (as defined in the Code) have experienced aggregate increases in their ownership of a Fund of more than 50 percentage points looking back over the relevant testing period (generally, a trailing three-year period), which can occur as a result of acquisitions that create 5% shareholders of the Fund or increase the ownership in the Fund of 5% shareholders of the Fund.
The restrictions generally prohibits any attempt to purchase or acquire in any manner whatsoever the Fund’s shares or any option, warrant or other right to purchase or acquire shares, or any convertible securities (the “Shares”), if as a result of such purchase or acquisition of such Shares, any person or group becomes a greater than 4.99% shareholder (as defined in the Code), which generally includes a person or group that beneficially owns 4.99% or more of the market value of the total outstanding shares, or the percentage of the Funds’ shares owned by a 4.99% shareholder (as defined in the Code) would be increased. As a result of these restrictions, certain transfers of shares by existing 4.99% shareholders are prohibited. Any attempted transfer in violation of the foregoing restrictions will be void ab initio unless the transferor or transferee obtains the written approval of the Board of Trustees, which it may grant or deny in its sole and absolute discretion. The purported transferee will not be entitled to any rights of shareholders of such Fund with respect to the shares that are the subject of the prohibited transfer, including the right to vote such shares and to receive dividends or distributions, whether liquidating or otherwise, in respect of such shares.
If the Board of Trustees determines that a transfer would be prohibited, then, upon a Fund’s written demand, the purported transferee will transfer the shares that are the subject of the prohibited transfer, or cause such shares to be transferred, to the applicable Fund, which shall be deemed an agent for the limited purpose of consummating a sale of the share to a person who is not a 4.99% shareholder. The proceeds of the sale of any such shares will be applied first to the applicable Fund acting in its role as the agent for the sale of the prohibited shares, second, to the extent of any remaining proceeds, to reimburse the intended transferee for any payments made to the transferor by such intended transferee for such shares, and the remainder, if any, to the original transferor.
48 2010 Semi-Annual Report (Unaudited)
www.dcclosedendfunds.com
Notes to Financial Statements (continued)
June 30, 2010 (Unaudited)
11. Subsequent Events
Shareholder Distributions
On July 15th, 2010 DCA paid shareholder distributions in the amount of $0.04 per share to shareholders of record as of June 30, 2010 and DCW paid shareholder distributions in the amount of $0.02 per share to shareholders of record as of June 30, 2010.
Pursuant to a joint proxy statement dated July 30, 2010 shareholders of record as of June 28, 2010 of each Fund have been asked to approve the following proposals:
1. A proposal to re-elect two current Trustees to each Fund’s Board to serve three year terms, each to serve until his successor has been duly elected and qualified.
2. A proposal to approve the removal of the fundamental restriction requiring each Fund to invest greater than 25% of its total assets in securities of companies in the real estate industry.
3. A proposal to approve an Agreement and Plan of Reorganization reorganizing DCW into DCA (the “Reorganization”), the termination of DCW’s registration under the Investment Company Act of 1940, and the dissolution of DCW under Delaware law.
The Annual Meeting of Shareholders of DCW Total Return Fund and DCA Total Return Fund will are currently scheduled to be held on September 16, 2010 at 1:00 p.m. and 1:30 p.m. respectively at the offices of the Adviser.
If approved by Shareholders on September 16, 2010, the Reorganization is anticipated to occur on or about September 24, 2010. If sufficient votes are not obtained to approve all proposals, the Boards will consider what further action to take, including adjourning the Annual Meeting and making a reasonable effort to solicit support with respect to the proposals that have not received the sufficient votes. If, after additional proxy solicitation, the Boards believe it to be unlikely that a particular proposal will pass with regard to a Fund, the Boards will consider whether it is appropriate and in the best interests of shareholders to allow the other proposals contemplated under the joint proxy statement to be implemented without inclusion of that proposal. If all proposals pass with respect to one Fund but not the other, the Boards will consider whether it is appropriate and in the best interests of shareholders to implement, to the extent feasible, the proposals with respect to one Fund, but not the other.
Management has performed a review for subsequent events through the date this report was issued. There were no additional reportable events for the Funds, other than information disclosed above, as a result of their review.
1.866.324.7348
2010 Semi-Annual Report (Unaudited) 49
Dividend Reinvestment Plan
June 30, 2010 (Unaudited)
The Funds offer a dividend reinvestment plan (the “Plan”) pursuant to which shareholders, unless they otherwise elect, automatically have dividends and capital gains distributions reinvested in common shares of the Fund by The Bank of New York (the “Plan Agent”). Shareholders who elect not to participate in the Plan receive all distributions in cash paid by wire or check mailed directly to the Plan Agent.
How the Plan Works
After the Funds declare a dividend or determine to make a capital gain distribution, the Plan Agent will acquire shares for the participants’ accounts, depending upon the circumstances described below, either (i) through receipt of newly issued shares of the Funds or (ii) by open-market purchases as follows:
If, on the payment date, the NAV is equal to or less than the market price per share plus estimated brokerage commissions, the Plan Agent will invest the distribution amount in newly issued shares on behalf of the Participants. The number of newly issued shares to be credited to each Participant’s account will be determined by dividing the dollar amount of the distribution by the NAV on the date the shares are issued. However, if the NAV is less than 95% of the market price on the payment date, the dollar amount of the distribution will be divided by 95% of the market price on the payment date. Because common shares may be issued at less than their market price, Plan Participants may get a benefit that non-participants do not.
If, on the payment date, the NAV is greater than the market value per share plus estimated brokerage commissions, the Plan Agent will invest the distribution amount in shares acquired on behalf of the Participants in open-market purchases, which may be made on the NYSE, in the over-the-counter market or in negotiated transactions and may be on such terms as to price, delivery and otherwise as the Plan Agent shall determine. It is possible that the market price for the shares may increase before the Plan Agent has completed its purchases. Therefore, the average purchase price per share the Plan Agent pays may exceed the market price thereof on the payment date. If the market price per share increases so that it equals or exceeds the NAV per share (minus brokerage commissions), it will result in the acquisition by the Plan Agent of fewer shares than if the distribution had been paid in shares issued by the Fund. Otherwise, the Plan Agent will use all distributions received in cash to purchase shares in the open market on or shortly after the payment date, but in no event more than thirty (30) days after the payment date.
Costs of the Plan
The Plan Agent’s fees for the handling of reinvestment of dividends and other distributions will be paid by the Funds. However, each participant will pay a pro rata share of brokerage commissions incurred with respect to the Plan Agent’s open-market purchases in connection with the reinvestment of dividends and other
50 2010 Semi-Annual Report (Unaudited)
www.dcclosedendfunds.com
Dividend Reinvestment Plan (continued)
June 30, 2010 (Unaudited)
distributions. If a participant elects to have the Plan Agent sell part or all of his or her shares and remit the proceeds, the participant will be charged his or her pro rata share of brokerage commissions on the shares sold, plus a $15.00 transaction fee.
Tax Implications
The automatic reinvestment of dividends or distributions does not relieve participants of any taxes which may be payable on such dividends or distributions. Participants will receive tax information annually for their personal records and to help them prepare their federal income tax return. For further information as to the tax consequences of participation in the Plan, Participants should consult with their own tax advisors.
Right to Withdraw
Participants whose shares are registered in his or her name may terminate his or her account under the Plan by notifying the Agent in writing at BNY Mellon Shareowner Services, P.O. Box 358035, Pittsburgh, PA 15252-8035, or by calling the Agent at 1.877.296.3711, or using BNY Mellon’s website at: www.melloninvestor.com/ISD. Such termination will be effective with respect to a particular distribution if the Participant’s notice is received by the Agent prior to such distribution record date. Participants whose shares are held by a brokerage firm should contact his or her broker. If a Participant holds shares through a broker, the Participant may not be able to transfer his or her shares to another broker and continue to participate in the Plan if the new broker does not permit such participation. The Plan may be amended or terminated by the Agent or the Funds upon notice in writing mailed to each Participant at least 90 days prior to the effective date of the termination. The Funds offer a dividend reinvestment plan (the “Plan”) pursuant to which shareholders, unless they otherwise elect, automatically have dividends and capital gains distributions reinvested in common shares of the Fund by The Bank of New York (the “Plan Agent”). Shareholders who elect not to participate in the Plan receive all distributions in cash paid by wire or check mailed directly to the Plan Agent.
Fund Proxy Voting Policies and Procedures
June 30, 2010 (Unaudited)
The Funds have delegated to the Adviser the voting of proxies relating to its securities. The Adviser will vote such proxies in accordance with the Adviser’s policies and procedures. So long as proxy voting authority for the Funds has been delegated to the Adviser, the Adviser has delegated to Calamos the proxy voting authority with respect to those securities that are specifically part of the portion of the Funds’ assets managed by Calamos. The policies and procedures used in determining how to vote proxies relating to portfolio securities and information
1.866.324.7348
2010 Semi-Annual Report (Unaudited) 51
Fund Proxy Voting Policies and Procedures (continued)
June 30, 2010 (Unaudited)
regarding how the Funds voted and proxies related to securities during the most recent 12-month period ended June 30th for which an SEC filing has been made are available without charge, upon request, by contacting the Funds at 1.866.324.7348, visiting the Funds’ website at www.dcclosedendfunds.com and visiting the Securities Exchange Commission’s (the “Commission”) website at www.sec.gov.
Portfolio Holdings
June 30, 2010 (Unaudited)
The Funds file their complete schedule of portfolio holdings with the Commission for the first and third quarters of each fiscal year on Form N-Q within 60 days after the end of the period. Copies of the Funds’ Forms N-Q are available without charge, upon request, by contacting the Funds at 1.866.324.7348 and on the Commission’s website at www.sec.gov. You may also review and copy Form N-Q at the Commission’s Public Reference Room in Washington, D.C. For more information about the operation of the Public Reference Room, please call the Commission at 1.800.SEC.0330.
Trustees and Officers
June 30, 2010 (Unaudited)
The business and affairs of the Funds are managed under the direction of the Board. The Board approves all significant agreements between the Funds and persons or companies furnishing services to it, including the Funds’ agreements with the Adviser, sub-adviser, co-administrators, custodian and transfer agent. The management of the Funds’ day-to-day operations is delegated to its officers and the Adviser, subject always to the investment objectives and policies of the Funds and to the general supervision of the Board.
The Trustees of the Funds, their age, the position they hold with the Funds, their term of office and the length of time served, their principal occupations for at least the past five years, the number of portfolios they oversee within the Dividend Capital or Calamos Advisors LLC fund complex (“Fund Complex”), and other directorships held by each Trustee are set forth in the charts below. Additional information about the Trustees can be found in the Statement of Additional Information, which is available without charge, upon request by calling 1-866-324-7348.
52 2010 Semi-Annual Report (Unaudited)
www.dcclosedendfunds.com
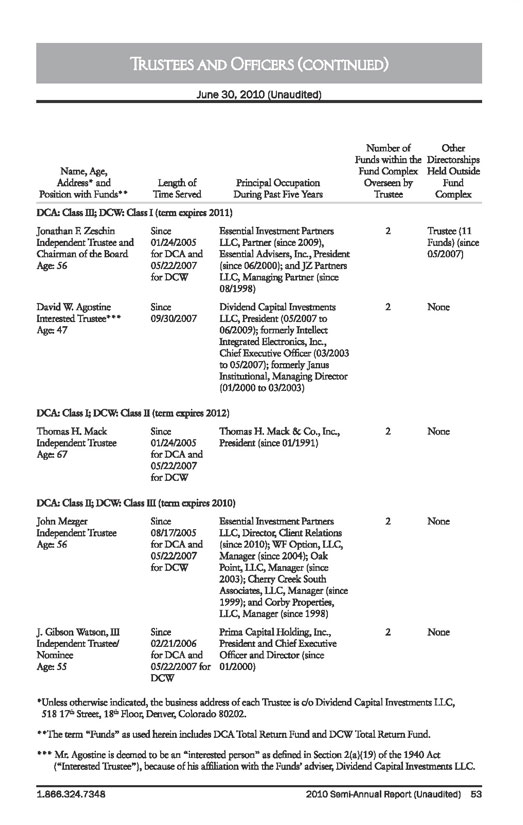
Trustees and Officers (continued)
June 30, 2010 (Unaudited)
Name, Age, Address* and Position with Funds**
Length of
Time Served
Principal Occupation During Past Five Years
Number of
Funds within the
Fund Complex Overseen by
Trustee
Other
Directorships
Held Outside
Fund
Complex
DCA: Class III; DCW: Class I (term expires 2011)
Jonathan F. Zeschin
Independent Trustee and Chairman of the Board
Age: 56
Since
01/24/2005 for DCA and 05/2272007 for DCW
Essential Investment Partners LLC, Partner (since 2009), Essential Advisers, Inc., President (since 06/2000); and JZ Partners LLC, Managing Partner (since 08/1998)
2
Trustee (11 Funds) (since 05/2007)
David W. Agostine
Interested Trustee***
Age: 47
Since
09/30/2007
Dividend Capital Investments LLC, President (05/2007 to 06/2009); formerly Intellect Integrated Electronics, Inc., Chief Executive Officer (03/2003 to 05/2007); formerly Janus Institutional, Managing Director (01/2000 to 03/2003)
2
None
DCA: Class I; DCW: Class II (term expires 2012)
Thomas H. Mack
Independent Trustee
Age: 67
Since
01/24/2005 for DCA and 05/22/2007 for DCW
Thomas H. Mack & Co., Inc., President (since 01/1991)
2
None
DCA Class II; DCW: Class III (term expires 2010)
John Mezger
Independent Trustee
Age: 56
Since
08/17/2005 for DCA and 05/22/2007 for DCW
Essential Investment Partners LLC, Director, Client Relations (since 2010); WF Option, LLC, Manager (since 2004); Oak Point, LLC, Manager (since 2003); Cherry Creek South Associates, LLC, Manager (since 1999); and Corby Properties, LLC, Manager (since 1998)
2
None
J. Gibson Watson, III
Independent Trustee/ Nominee
Age: 55
Since
02/21/2006 for DCA and 05/22/2007 for DCW
Prima Capital Holding, Inc., President and Chief Executive Officer and Director (since 01/2000)
2
None
* Unless otherwise indicated, the business address of each Trustee is c/o Dividend Capital Investments LLC, 518 17th Street, 18th Floor, Denver, Colorado 80202.
** The term “Funds” as used herein includes DCA Total Return Fund and DCW Total Return Fund.
*** Mr. Agostine is deemed to be an “interested person” as defined in Section 2(a)(19) of the 1940 Act (“Interested Trustee”), because of his affiliation with the Funds’ adviser, Dividend Capital Investments LLC.
1.866.324.7348
2010 Semi-Annual Report (Unaudited) 53
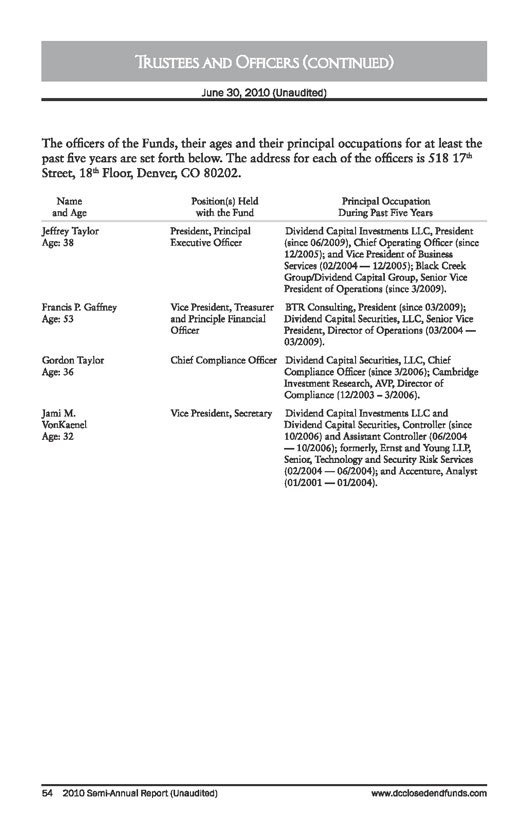
Trustees and Officers (continued)
June 30, 2010 (Unaudited)
The officers of the Funds, their ages and their principal occupations for at least the past five years are set forth below. The address for each of the officers is 518 17th Street, 18th Floor, Denver, CO 80202.
Name and Age
Position(s) Held with the Fund
Principal Occupation During Past Five Years
Jeffrey Taylor
Age: 38
President, Principal Executive Officer
Dividend Capital Investments LLC, President (since 06/2009), Chief Operating Officer (since 12/2005); and Vice President of Business Services (02/2004 — 12/2005); Black Creek Group/Dividend Capital Group, Senior Vice President of Operations (since 3/2009).
Francis P. Gaffney
Age: 53
Vice President, Treasurer and Principle Financial Officer
BTR Consulting, President (since 03/2009); Dividend Capital Securities, LLC, Senior Vice President, Director of Operations (03/2004 — 03/2009).
Gordon Taylor
Age: 36
Chief Compliance Officer
Dividend Capital Securities, LLC, Chief Compliance Officer (since 3/2006); Cambridge Investment Research, AVP, Director of Compliance (12/2003 — 3/2006).
Jami M. VonKaenel
Age: 32
Vice President, Secretary
Dividend Capital Investments LLC and Dividend Capital Securities, Controller (since 10/2006) and Assistant Controller (06/2004 — 10/2006); formerly, Ernst and Young LLP, Senior, Technology and Security Risk Services (02/2004 — 06/2004); and Accenture, Analyst (01/2001 — 01/2004).
54 2010 Semi-Annual Report (Unaudited)
www.dcclosedendfunds.com
Approval of Investment Advisory Agreement
June 30, 2010 (Unaudited)
At a meeting held on May 25, 2010, the Board, including all of the Independent Trustees, unanimously approved the continuation of the Investment Advisory Agreements between the Funds and the Adviser for another year. In connection with the approval, the Board noted that:
At each quarterly meeting, the Board received a variety of materials relating to the services provided by the Adviser and the performance of the Funds;
The Independent Trustees met in executive session to review information provided at this and other meetings and to discuss management’s responses;
In advance of this meeting, the Board requested and received extensive information from the Adviser to assist them, including information on advisory fees charged for the internal funds/accounts managed by the Adviser;
The Board received and considered a variety of information about the Adviser, as well as the advisory and administrative arrangements for the Funds;
The Board received and reviewed information showing comparative fee and performance information of the Funds relative to peer groups; and
The Board reviewed a memorandum prepared by independent trustee/Fund counsel outlining the legal duties of the Board when approving an advisory agreement.
In considering the continuation of the Investment Advisory Agreement, the Board did not identify any factor as all-important or all-controlling and instead considered these factors collectively in light of each Fund’s surrounding circumstances. After considering the below factors and based on the deliberations and its evaluation of the information provided to it, the Board concluded that the continuation of the Investment Advisory Agreement for another year was in the best interest of each Fund and each shareholders and that the compensation payable to the Adviser under the Investment Advisory Agreement by each Fund is fair and reasonable in light of the services to be provided.
Investment Advisory Fee Rate
The Board reviewed and considered the contractual annual advisory fee to be paid by each Fund to the Adviser, in light of the extent and quality of the advisory services provided by the Adviser to the Fund. The Board received and considered information comparing each Fund’s contractual advisory fees and overall expenses with those of funds in the applicable peer group. The Board noted that the investment advisory fees to be received by the Adviser with respect to each Fund were on the higher end of the range relative to such Fund’s peer group. The Board also considered that such ranking for each Fund may be a result in part of the Funds being smaller than the other funds in such peer group and that the Adviser and other service providers had taken significant steps during the prior year two years to avoid the overall fees and expenses from being even higher for shareholders of each Fund. The Board also considered the potential change to the investment advisory fee for the DCW shareholders, if the proposed reorganization of the Funds were to occur.
1.866.324.7348
2010 Semi-Annual Report (Unaudited) 55
Approval of Investment Advisory Agreement (continued)
June 30, 2010 (Unaudited)
Nature, Extent and Quality of the Services under the Advisory Agreement
The Board received and considered information regarding the nature, extent and quality of services provided by the Adviser to the Fund under the Investment Advisory Agreement. The Board reviewed certain background materials supplied by the Adviser, including its Form ADV. The Board reviewed and considered the Adviser’s investment advisory personnel, its history as an asset manager, its performance and the amount of assets currently under management. The Board also reviewed the research and decision-making processes utilized by the Adviser, including the methods adopted to seek to achieve compliance with the investment objectives, policies and restrictions of the Funds. The Board considered, among other things, the background and experience of the Adviser’s management in connection with the Funds, including reviewing the qualifications, backgrounds and responsibilities of the management team primarily responsible for the day-today portfolio management of the Funds and the extent of the resources devoted to research and analysis of actual and potential investments. The Board also reviewed, among other things, the Adviser’s Code of Ethics.
The Board also reviewed and considered the relatively recent advisory changes to the Funds, including the retention of Calamos as sub-adviser to the Funds, and the services delivered by the Adviser in the selection and oversight of Calamos.
Performance
The Board reviewed performance information for each Fund for the 1-year periods (and for DCA, the 3-year and 5-year periods) and since inception, in each case for periods ended March 31, 2010, on both a market value and a reported NAV basis The Board placed greater emphasis on the more recent performance commencing when the Funds shifted to the current total return objective and corresponding strategy. That review included a comparison of each Fund’s performance to the performance of a group of comparable funds and the Fund’s benchmarks. The Board considered, among other things, the Adviser’s performance and reputation generally and its investment techniques, risk management controls and decision-making processes.
The Adviser’s Profitability
The Board received and considered a profitability analysis prepared by the Adviser based on the fees payable under the Advisory Agreement and containing certain assumptions regarding cost and expense allocations.
Economies of Scale
The Board considered whether economies of scale, if any, in the provision of services to the Funds were being passed along to the shareholders.
Other Benefits to the Adviser
The Board reviewed and considered any other benefits derived or to be derived by the Adviser from its relationship with the Funds, including soft dollar arrangements.
56 2010 Semi-Annual Report (Unaudited)
www.dcclosedendfunds.com
Approval of Investment Advisory Agreement (continued)
June 30, 2010 (Unaudited)
The Board, including all of the Independent Trustees, concluded that:
The investment advisory fees to be received by the Adviser with respect to each Fund were on the higher end of the range relative to such Fund’s peer group, that the Adviser and other service providers had taken significant steps during the prior two years to avoid the overall fees and expenses from being even higher for shareholders of each Fund;
The nature, extent and quality of services rendered by the Adviser to each Fund was appropriate, and that the desired beneficial effects of the relatively recent structural changes on Fund performance and fees, including the retention of a subadviser, were continuing to be realized by the Funds;
The performance of each Fund during the 1-year period significantly exceeded both the median and the average return for its peer group;
The Adviser’s current and potential future profitability in connection with the operation of each Fund is not excessive and is fair to that Fund; and
There were no material economies of scale or other benefits accruing to the Adviser in connection with its relationship with either Fund.
1.866.324.7348
2010 Semi-Annual Report (Unaudited) 57
Key Information
June 30, 2010 (Unaudited)
Key Information
Officers and Trustees
Investment Adviser and
Jonathan F. Zeschin
Co-Administrator
Independent Trustee and
Dividend Capital Investments LLC
Chairman of the Board
518 17th Street, Suite 1200
Denver, CO 80202
Thomas H. Mack
Independent Trustee
Co-Administrator
ALPS Fund Services, Inc.
John Mezger
1290 Broadway, Suite 1100
Independent Trustee
Denver, CO 80203
J. Gibson Watson, III
Custodian
Independent Trustee
Union Bank
350 California Street, 6th Floor
David W. Agostine
San Francisco, CA 94104
Trustee
Transfer Agent
Jeffrey W. Taylor
BNY Mellon Shareowner Services
President, Principal Executive Officer
480 Washington Blvd.
Jersey City, NJ 07310
Francis P. Gaffney
Vice President, Treasurer and Principal
Legal Counsel
Financial Officer
Davis Graham & Stubbs LLP
1550 17th Street, Suite 500
Gordon Taylor
Denver, CO 80202
Chief Compliance Officer
Independent Registered Public
Jami M. VonKaenel
Accounting Firm
Vice President, Secretary
Tait, Weller & Baker LLP
1818 Market Street, Suite 2400
Philadelphia, PA 19103
New York Stock Exchange Symbols: DCA and DCW
This report is for shareholder information. This is not a prospectus intended for use in the purchase or sale of fund shares. Statements and other information contained in this report are as dated and are subject to change.
58 2010 Semi-Annual Report (Unaudited)
www.dcclosedendfunds.com
This Page Intentionally Left Blank
This Page Intentionally Left Blank
This Page Intentionally Left Blank
Item 2. Code of Ethics
Not applicable
Item 3. Audit Committee Financial Expert
Not applicable
Item 4. Principal Accountant Fees and Services
Not applicable
Item 5. Audit Committee of Listed Registrants
Not applicable
Item 6. Schedule of Investments
(a) Included as part of the report to shareholders filed under Item 1 of this Form N-CSR.
(b) Not applicable
Item 7. Disclosure of Proxy Voting Policies and Procedures for Closed-End Management Investment Companies
Not applicable
Item 8. Portfolio Managers of Closed-End Management Investment Companies.
Not applicable
Item 9. Purchases of Equity Securities by Closed-End Management Investment Company and Affiliated Purchasers.
Not applicable.
Item 10. Submission of Matters to Vote of Security Holders
There were no material changes to the procedures by which shareholders may recommend nominees to the Registrant’s Board of Trustees that were implemented after the Registrant last provided disclosure in response to the requirements of Item 407(c)(2)(iv) of Regulation S-K (17 CFR 229.407) (as required by 22(b)(15)) of Schedule 14A (17 CFR 240.14a-101), or this Item 10.
Item 11 – Controls and Procedures
| (a) | Based on an evaluation of the disclosure controls and procedures (as defined in Rule 30a-3(c) under the Act) as of a date within 90 days of the filing date of this report, the Chief Executive Officer, Treasurer, and Principal Financial and Accounting Officer of the Registrant have each concluded that such disclosure controls and procedures provide reasonable assurance that information required to be disclosed by the Registrant is accumulated and communicated to the Registrant’s management to allow timely decisions regarding required disclosure. |
| (b) | There were no changes in the Registrant’s internal controls over financial reporting (as defined in Rule 30a-3(d) under the Act) that occurred during the second fiscal quarter of the period covered by this report that have materially affected, or are reasonably likely to materially affect, the Registrant’s internal control over financial reporting. |
Item 12 – Exhibits
| | |
| (a)(1) | | Not applicable |
| |
| (a)(2) | | The certifications required by Rule 30a-2(a) of the Act (17 CFR 270.30a-2(a)) are filed and attached hereto as Exhibit 99.CERT. |
| |
| (a)(3) | | Not applicable to the Registrant. |
| |
| (b) | | The certification required by Rule 30a-2(b) of the Act (17 CFR 270.30a-2(b)) is filed and attached hereto as Exhibit 99.906CERT. |
SIGNATURES
Pursuant to the requirements of the Securities Exchange Act of 1934 and the Investment Company Act of 1940, the Registrant has duly caused this report to be signed on its behalf by the undersigned, thereunto duly authorized.
| | |
| DCA Total Return Fund |
| |
| By: | | /s/ Jeffrey W. Taylor |
| | Jeffrey W. Taylor |
| | President (Principal Executive Officer) |
| |
| Date: | | September 3, 2010 |
Pursuant to the requirements of the Securities Exchange Act of 1934 and the Investment Company Act of 1940, this report has been signed below by the following persons on behalf of the Registrant and in the capacities and on the dates indicated.
| | |
| By: | | /s/ Jeffrey W. Taylor |
| | Jeffrey W. Taylor |
| | President (Principal Executive Officer) |
| |
| Date: | | September 3, 2010 |
| | |
| By: | | /s/ Francis Gaffney |
| | Francis Gaffney |
| | Treasurer (Principal Financial Officer) |
| |
| Date: | | September 3, 2010 |