As filed with the Securities and Exchange Commission on March 7, 2008
UNITED STATES
SECURITIES AND EXCHANGE COMMISSION
Washington, D.C. 20549
FORM N-CSR
CERTIFIED SHAREHOLDER REPORT OF
REGISTERED MANAGEMENT INVESTMENT COMPANIES
Investment Company Act file Number: 811-4255
Dividend Capital Realty Income Allocation Fund
(Exact Name of the Registrant as Specified in Charter)
518 17th Street, Suite 1200, Denver, CO 80202
(Address of Principal Executive Offices—Zip Code)
Registrant’s Telephone Number, including area code: 303-228-2200
Derek Mullins
Secretary and Assistant Treasurer
518 17th Street, Suite 1200
Denver, CO 80202
(Names and Addresses of agents for service)
Date of fiscal year end: December 31*
Date of reporting period: December 31, 2007
* The fiscal year end of the Fund was recently changed from September 30 to December 31.
Item 1. Reports to Shareholders
The following is a copy of the report to shareholders pursuant to Rule 30e-1 under the Investment Company Act of 1940 (the “Act”).

TABLEOF CONTENTS
The Investment Commentary included in this shareholder report contains certain forward-looking statements about the factors that may affect the performance of the Funds in the future. These statements are based on Fund management’s predictions and expectations concerning certain future events and their expected impact on the Funds, such as performance of the economy as a whole and of the real estate sector, changes in the level of interest rates, the impact of developing world events, and other factors that may influence the future performance of the Funds. Management believes these forward looking statements to be reasonable, although they are inherently uncertain and difficult to predict and there is no guarantee of their accuracy. Actual events may cause adjustments in portfolio management strategies from those currently expected to be employed.
1
INVESTMENT COMMENTARY
Dividend Capital Realty Income Allocation Fund
February 27, 2008
To our shareholders:
We submit to you Dividend Capital Realty Income Allocation Fund’s (“DCA” or “the Fund”) annual report for the three-months ended December 31, 2007. This short reporting period results from changing the Fund’s fiscal year-end from September to December. This change was made to better facilitate the Fund’s management by aligning its fiscal year-end with excise tax measurement periods.
The residential sub-prime mortgage-led credit crisis that began in mid-2007 has continued to deteriorate, resulting in significant turmoil in global financial markets. This credit crisis has been indiscriminate in its scope, impacting pricing and liquidity on a wide variety of debt and credit-sensitive instruments across industries and credit quality. Its ongoing expansion has led to broad based stock market declines, pronounced concerns of a U.S. recession and aggressive interest rate cuts by the Federal Reserve.
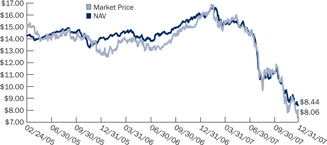
DCA’s investment mandate, which consists of allocating investments among common equity, preferred equity and debt securities of real estate companies, has not been immune from this market dislocation. As a result, the Fund’s net asset value (NAV) and market price experienced a significant decline.
As mentioned in our November 27, 2007 letter, we are disappointed with the Fund’s recent performance, but continue to focus our efforts on finding opportunities that we believe will preserve value and positioning the Fund to offer opportunity for attractive total returns as market conditions change and improve.
Performance Review
As displayed in the performance table that follows this letter, during the three months ended December 31, 2007, the Fund’s NAV total return was -20.62% while the market price total return was -25.08%. Since inception, the Fund’s NAV return has been -8.61% with a market price return of -11.50%. As reference points, the results can be compared to a return of -10.88% and -1.36% for the Wachovia Hybrid & Preferred REIT Securities Index, -13.17% and 11.38% for the MSCI U.S. REIT Index and -0.88% and 6.90% for the Lehman Brothers High Yield CMBS Index over the three-month and since inception periods, respectively.
2
INVESTMENT COMMENTARY (CONTINUED)
Dividend Capital Realty Income Allocation Fund (continued)
While we believe the benchmarks provide reference points for overall market conditions, the Fund’s performance may differ substantially from benchmark performance. These differences arise from a variety of factors, including investment allocation decisions among common stock, preferred stock and debt securities and the composition of the Fund’s investments, which may differ materially from benchmark composition. For example, the Fund invests in common stock of Canadian real estate companies, Commercial Mortgage REITs/Specialty Finance Companies, non-investment grade/unrated preferred securities and structured-finance debt securities, including Commercial Real Estate Collateralized Debt Obligations and Collateralized Loan Obligations, in proportions that are different from the representative benchmarks or may not be represented in the benchmarks. In addition, the Fund’s use of leverage has a material impact on performance. In executing the investment strategy, we construct the Fund’s portfolio in an effort to achieve the primary objective of high current income and secondary objective of capital appreciation rather, than strategic allocation decisions against representative benchmarks.
Over the fiscal time period, DCA’s NAV performance was driven by declines in the valuations of all asset classes in which we invest.
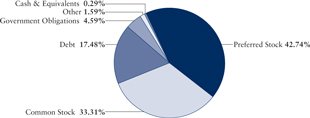
Within the preferred stock portfolio (42.75% of the Fund’s direct investments and indirect economic exposure as of 12/31/07), DCA experienced a decline in values driven by what we believe to be primarily technical rather than widespread fundamental issues. As liquidity dried up across a wide variety of credit and real estate sensitive securities, preferred stocks experienced a significant decline in trading volumes and market prices. DCA’s investments in below investment grade and non-rated preferred securities contributed to the underperformance. At this point, we believe underlying fundamentals on the majority of this portfolio remain good. In our opinion, we believe these investments represent the potential for an increase in long-term value as they are trading at attractive absolute and relative yields.
DCA’s overall debt portfolio (17.48% of the Fund’s direct investments and indirect economic exposure as of 12/31/07) experienced a significant decline in values based primarily on what we believe to be pronounced market concern over credit, real estate and structured finance related securities. DCA’s investments in structured finance debt instruments, including collateralized debt obligations and collateralized loan obligations, contributed to the underperformance. It is noteworthy that the current underlying fundamentals for the majority of the Fund’s debt positions continue to be in-line with initial underwriting expectations and therefore we believe these securities offer an attractive source of income and the potential for a recovery in value. Exceptions to this are securities issued by Taberna
3
INVESTMENT COMMENTARY (CONTINUED)
Dividend Capital Realty Income Allocation Fund (continued)
Preferred Funding III and V (combined these investments represent 0.16% of the Fund’s direct investments and indirect economic exposure as of 12/31/07), which are not currently paying their coupon and have experienced a significant and likely unrecoverable decline in value.
Finally, the financial market disruption has impacted the Fund’s common equity holdings (33.31% of the Fund’s direct investments and indirect economic exposure as of 12/31/07). The Fund experienced declines in the values of U.S. Equity REITs, Canadian real estate companies and significant declines in Commercial Mortgage REITs/Specialty Finance companies. In particular, U.S. Equity REITs have declined 26.51% from their February 7, 2007 peak and appear to be priced for a larger decline in commercial real estate values than has occurred thus far. Commercial Mortgage REITs/Specialty Finance companies have business models that contain a high degree of sensitivity to the real estate credit markets and therefore have been directly impacted by the credit crisis.
The broad based decline in all the real estate asset classes in which the Fund invests underscores the tremendous headwinds currently facing the markets.
Outlook
In our opinion, significant risks are prevalent in the U.S. economy and financial markets. The full impact of the credit crisis and ongoing declines in home prices on the U.S. economy, and therefore commercial real estate fundamentals, is uncertain. The persistence, duration and expansion of the credit crisis and de-leveraging of financial markets increase these risks. In reaction to these risks, we believe, there have been positive steps taken to address market issues. These include actions by the U.S. Federal Reserve to aggressively lower the Fed Funds Rate, the quick approval of an economic stimulus package and other measures taken by the U.S. Government.
Against this severe market disruption, we seek to take advantage of investment opportunities that are being created. In response to this, one step we intend on taking is to expand the Fund’s investment in foreign securities to include exposure outside of North America. This change was implemented to enhance investment flexibility by providing the opportunity to invest in a broader universe of real estate securities. We believe this increased investment flexibility enhances our ability to achieve the Fund’s objectives.
4
INVESTMENT COMMENTARY (CONTINUED)
Dividend Capital Realty Income Allocation Fund (continued)
In addition, in consultation with the Fund’s Board, we have eliminated the Fund’s policy that limits investment in illiquid securities. Historically, the Fund has limited investment in illiquid securities to 10% of managed assets, determined at time of purchase. As market conditions changed in 2007, we concluded that securities previously considered liquid became illiquid and have categorized them as such since June 2007. While this change did not result in violating the Fund’s limitation on illiquid securities, going forward we believe it is best to eliminate the limitation on illiquid securities to better reflect the liquidity profile of the Fund. While this has the potential to increase portfolio flexibility, we do not presently intend to increase investment in illiquid securities.
In closing, we continue to have conviction in DCA’s investment strategy, which we believe offers the potential for current income and the ability to realize NAV appreciation over time. Through our focus on execution of the Fund’s strategy and options offered by investments across the capital structure of real estate companies, we believe the Fund’s long-term investment objectives can be achieved. Thank you for your continued support.
| | |
 | |  |
| David W. Agostine | | Charles Song |
| President | | Senior Portfolio Manager |
| |
 | | |
| Jeffrey Taylor | | |
| Vice President and Treasurer | | |
5
TOTAL RETURNSAND TRADING HISTORY
December 31, 2007
Dividend Capital Realty Income Allocation Fund (continued)
Average Annual Total Returns (1)
| | | | | | | | | |
| | | October 1, 2007 to
December 31, 2007 | | | Year Ended
September 30, 2007 | | | Since
Inception (7) | |
DCA at Market Price (“MP”) | | -25.08 | % | | -14.93 | % | | -11.50 | % |
DCA at Net Asset Value (“NAV”) (2) | | -20.62 | % | | -19.05 | % | | -8.61 | % |
Wachovia Hybrid & Preferred Securities REIT IndexSM (3) | | -10.88 | % | | -1.85 | % | | -1.36 | % |
MSCI U.S. REIT Index (4) | | -13.17 | % | | 4.67 | % | | 11.38 | % |
CMBS Index (5) | | -0.88 | % | | -0.67 | % | | 6.90 | % |
Trading History(1)(6)
| | | | | |
 | | Average Premium/Discount to NAV | |
| | 1-Month | | -4.41 | % |
| | 3-Month | | -2.80 | % |
| | 1-Year | | -0.49 | % |
| | Since Inception | | -2.21 | % |
| | 52-Week Price History Range | |
| | MP | | $7.37 - $16.88 | |
| | NAV | | $8.41 - $16.81 | |
(1) | Past performance is no guarantee of future results. Investors cannot invest directly into any index. This chart is for illustrative purposes only and does not relate to the future performance of the Fund. For current to the most recent month-end performance, visit dividend capital.com, or call 866.DCG.REIT (324.7348). Performance data quoted above is historical. Current performance may be higher or lower than the performance data quoted. Performance does not include transaction fees that may be charged by your financial advisor or brokerage firm. |
(2) | Total return assumes reinvestment of dividend and capital gain distributions. Investors cannot invest at NAV. |
(3) | The Wachovia Hybrid & Preferred Securities REIT IndexSM is a capitalization weighted unmanaged index of exchange listed perpetual REIT preferred stocks and depository shares. The index is compiled by Wachovia Capital Markets, LLC and calculated by the American Stock Exchange. The Fund expects to invest in securities not included in this index, such as debt securities which may have lower returns than preferred stock, and common stock and non-U.S. securities which may be riskier than U.S. preferred stock. This index also includes securities in which the Fund will not invest. |
(4) | The MSCI U.S. REIT Index (RMS) is an unmanaged index of REIT securities of reasonable size and liquidity, weighted by market capitalization and considered representative of U.S. equity REIT performance. The index is used in comparison to the Fund because the Fund invests in common stock of companies primarily engaged in real estate, including REITs. |
(5) | The Lehman Brothers High-Yield CMBS Index is an unmanaged index of non-investment-grade and unrated CMBS, weighted by market value and comprised of all new issue U.S. CMBS transactions that have a maturity greater than one year, an original transaction size in excess of $500 million, and aggregate outstanding transaction size of at least $300 million, and is considered representative of the high-yield CMBS market. The index is used in comparison to the Fund because the Fund invests in commercial mortgage-backed securities. |
(6) | Market price and NAV price history are since inception, based upon closing market price. |
(7) | Fund inception is 02/24/2005. |
6
PORTFOLIO PROFILE
December 31, 2007
Dividend Capital Realty Income Allocation Fund (continued)
Portfolio Allocation (2)(3)
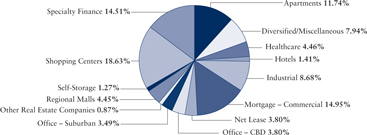
Common Stock Property Type Allocation(1)(3)(4)
Preferred Stock Property Type Allocation (1)(3)
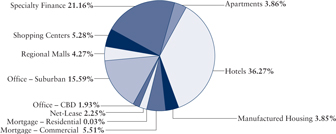
(1) | Property-type allocation percentages are based on the market value of the Fund’s direct and indirect economic exposure to the preferred stock and common stock asset classes, respectively. |
(2) | Allocation percentages are based on the Fund’s direct investments and indirect economic exposure. Indirect economic exposure is generally obtained through the use of total return swaps and such exposure is calculated by using the investment’s notional value plus or minus related unrealized gains or losses. |
(3) | Holdings and composition of holdings are subject to change, and may not be representative of future investments. |
(4) | Some or all of the common stock exposure is derived through total return swaps. |
7
INVESTMENT COMMENTARY
Dividend Capital Strategic Global Realty Fund
February 27, 2008
To our shareholders:
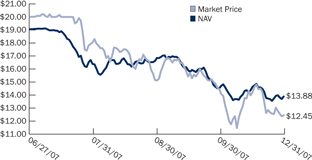
We submit to you Dividend Capital Strategic Global Realty Fund’s (“DCW” or “the Fund”) annual report for the period June 27, 2007 through December 31, 2007. This period represents DCW’s first fiscal period of operations.
Triggered by concerns within the U.S. housing market, sub-prime mortgages and the impact to credit markets around the world, this reporting period has been characterized by significant turmoil in global financial markets. This credit crisis has been indiscriminate in its scope, impacting pricing and liquidity on a wide variety of debt and credit-sensitive instruments across industries and credit quality. Credit market conditions have continued to deteriorate and as the crisis has expanded it has contributed to broad based global stock market declines. It has also led to concerns of the impact to the global economy of a U.S. recession.
DCW’s investment mandate, which consists of allocating investments among common equity, preferred equity and debt securities of global real estate companies, has not been immune from this market dislocation. As a result, the Fund’s net asset value (NAV) and market price experienced a significant decline.
We are disappointed with the Fund’s recent performance, but continue to focus our efforts on finding opportunities that we believe will preserve value and positioning the Fund to offer the opportunity for attractive total returns as market conditions change and improve.
Performance Review
As displayed in the performance table that follows this letter, the Fund’s NAV total return during the reporting period was -23.20% while the market price total return was -34.36%. As reference points, this can be compared to a return of -6.48% for the FTSE EPRA/NAREIT Global Real Estate Index, -14.93% for the Wachovia Hybrid & Preferred REIT Securities Index, and 4.51% for the Lehman Brothers CMBS Index.
While we believe the benchmarks provide reference points for overall market conditions, the Fund’s performance may differ substantially from benchmark performance. These differences arise from a variety of factors, including investment allocation decisions among common stock, preferred stock and debt securities, overall country allocation decisions and the composition of the Fund’s investments, which may differ materially from benchmark composition. For example, the Fund invests in common stock of Commercial Mortgage REITs/
8
INVESTMENT COMMENTARY (CONTINUED)
Dividend Capital Strategic Global Realty Fund (continued)
Specialty Finance Companies, non-investment grade/unrated preferred securities and investment grade structured-finance debt securities, including Commercial Real Estate Collateralized Debt Obligations, in proportions that are different from the representative benchmarks or may not be represented in the benchmarks. In addition, the Fund’s use of leverage has a material impact on performance. In executing the investment strategy, we construct the Fund’s portfolio in an effort to achieve the primary objective of high current income and secondary objective of capital appreciation, rather than strategic allocation decisions against representative benchmarks.
Over the fiscal period, DCW’s NAV performance was driven by declines in the valuations of all asset classes in which we invest.
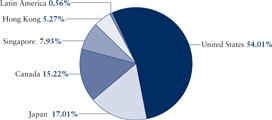
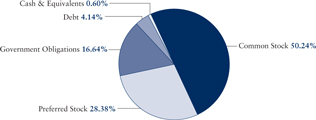
The financial market disruption impacted the Fund’s global common equity holdings (50.24% of the Fund’s direct investments and indirect economic exposure as of 12/31/07). The Fund experienced declines in the values of Japan, Canada, Singapore and U.S. Commercial Mortgage REITs/Specialty Finance Companies. Japan stock prices have also been impacted by political turmoil led by the Prime Minister’s resignation in September of 2007. Despite the declines, we believe longer-term fundamentals are positive for the markets and securities in which the Fund invests. Further, the ability to allocate investments across global markets helps to temper the impact of U.S. weakness and offers exposure to real estate securities with differing fundamental drivers.
Within the preferred stock portfolio (28.38% of the Fund’s direct investments and indirect economic exposure as of 12/31/07), DCW experienced a decline in values driven by what we believe to be primarily technical, rather than widespread fundamental issues. As liquidity dried up across a wide variety of credit and real estate sensitive securities, preferred stocks experienced a significant decline in trading volumes and market prices. DCW’s investments in below investment grade and non-rated preferred securities contributed to the underperformance. At this point, we believe underlying fundamentals on the majority of the Fund’s portfolio remain good and therefore we believe these investments represent the potential for an increase in long-term value as they are trading at attractive absolute and relative yields.
While relatively small, DCW’s debt portfolio (4.14% of the Fund’s direct investments and indirect economic exposure as of 12/31/07) experienced a significant decline in values based primarily on what we believe are market concerns over credit, real estate and structured finance related securities. DCW’s investments in structured finance debt instruments, including collateralized debt obligations, contributed to the underperformance. However, it is noteworthy that the underlying fundamentals for the Fund’s debt positions continue to be in-line with initial underwriting and we remain positive on the investment outlook for these securities.
9
INVESTMENT COMMENTARY (CONTINUED)
Dividend Capital Strategic Global Realty Fund (continued)
Outlook
In our opinion, significant risks are prevalent in the U.S. economy and global financial markets. The full impact of the credit crisis and ongoing declines in home prices on the U.S. economy, and therefore commercial real estate fundamentals, is uncertain. The persistence, duration and expansion of the credit crisis and deleveraging of financial markets increase these risks. In reaction to these risks, we believe, there have been positive steps taken to address market issues, including actions by the U.S. Federal Reserve to aggressively lower the Fed Funds Rate, the quick approval of an economic stimulus package and other measures taken by the U.S. Government. Global capital markets should benefit from a stabilization of U.S. capital markets. Finally, while the debate continues regarding de-coupling of global economies from the U.S., we believe real estate fundamentals in non-U.S. markets, particularly in Asia, remain strong.
Against this severe market disruption, we seek to take advantage of investment opportunities that are being created. We continue to have conviction in DCW’s investment strategy, which we believe offers the potential for current income and the ability to realize NAV appreciation over time. Through our focus on execution of the Fund’s strategy and options offered by investments across the capital structure of real estate companies, we believe the Fund’s long-term investment objectives can be achieved. Thank you for your continued support.
| | |
| | |
| David W. Agostine | | Charles Song |
| President | | Senior Portfolio Manager |
| |
| | |
| Jeffrey Taylor | | |
| Vice President and Treasurer | | |
10
TOTAL RETURNSAND TRADING HISTORY
December 31, 2007
Dividend Capital Strategic Global Realty Fund (continued)
Average Annual Total Returns (1)
| | | |
| | | Since
Inception (7) | |
DCW at Market Price (“MP”) | | -34.36 | % |
DCW at Net Asset Value (“NAV”) (2) | | -23.20 | % |
FTSE EPRA/NAREIT Global Real Estate Index® (3) | | -6.48 | % |
Wachovia Hybrid & Preferred Securities REIT IndexSM (4) | | -14.93 | % |
Lehman Brothers Investment Grade CMBS Index™ (5) | | 4.51 | % |
Trading History (1)(6)
| | | | | |
 | | Average Premium/Discount to NAV | |
| | 1-Month | | -5.06 | % |
| | 3-Month | | -4.24 | % |
| | 1-Year | | N/A | |
| | Since Inception | | 0.68 | % |
| | Since Inception Price History Range | |
| | MP | | $11.47 - $20.20 | |
| | NAV | | $13.56 - $19.11 | |
(1) | Past performance is no guarantee of future results. Investors cannot invest directly into any index. This chart is for illustrative purposes only and does not relate to the future performance of the Fund. For current to the most recent month-end performance, visit dividendcapital.com, or call 866.DCG.REIT (324.7348). Performance data quoted above is historical. Current performance may be higher or lower than the performance data quoted. Performance does not include transaction fees that may be charge our financial advisor or brokerage firm. |
(2) | Total return assumes reinvestment of dividend and capital gain distributions. Investors cannot invest at NAV. |
(3) | The FTSE EPRA/NAREIT Global Real Estate Index® is a market capitalization weighted index, based on the last trade price of shares of all eligible companies. The index is structured in such a way that it can be considered to represent general trends in all eligible real estate stocks worldwide. The index is designed to reflect the stock performance of companies engaged in specific aspects of the North American, European and Asian real estate markets as perceived by institutional investors. Relevant real estate activities are defined as the ownership, disposure and development of income-producing real estate. |
(4) | The Wachovia Hybrid & Preferred Securities REIT IndexSM is a capitalization weighted unmanaged index of exchange listed perpetual REIT preferred stocks and depository shares. The index is compiled by Wachovia Capital Markets, LLC and calculated by the American Stock Exchange. The Fund expects to invest in securities not included in this index, such as debt securities which may have lower returns than preferred stock, and common stock and non-U.S. securities which may be riskier than U.S. preferred stock. This index also includes securities in which the Fund will not invest. |
11
PORTFOLIO PROFILE
December 31, 2007
Dividend Capital Strategic Global Realty Fund (continued)
Country Allocation (8)(9)(11)
Security Type Allocation(8)(10)(11)
(5) | The Lehman Brothers Investment Grade CMBS Index™ is an unmanaged index of investment grade commercial mortgage backed securities (CMBS). This index is used because the fund may invest in debt securities of global real estate companies. The index only represents CMBS of U.S. real estate companies while the fund may invest in CMBS and other debt securities of global real estate companies. The fund expects to invest in securities not included in this index, such as common stock, preferred stock and non-U.S. securities which may be riskier than U.S. debt securities. This index also includes securities in which the fund will not invest. |
(6) | Market price and NAV price history are since inception, based upon closing market price. |
(7) | Fund inception is 06/27/2007. |
(8) | Allocation percentages are based on the fund’s direct investments and indirect economic exposure. Indirect economic exposure is generally obtained through the use of total return swaps and such exposure is calculated by using the investment’s notional value plus or minus related unrealized gains or losses. |
(9) | Country allocation percentages are based on the market value of the fund’s direct and indirect economic exposure exclusive of cash or U.S. government obligations. |
(10) | Security type allocation percentages are based on the market value of the fund’s direct and indirect economic exposure including cash and U.S. government obligations. |
(11) | Holdings and composition of holdings are subject to change, and may not be representative of future investments. |
12
STATEMENTOF INVESTMENTS
December 31, 2007
Dividend Capital Realty Income Allocation Fund
| | | | | |
| | | Shares | | Market
Value |
COMMON STOCK 32.10% | | | | | |
Apartments 0.49% | | | | | |
Essex Property Trust | | 5,900 | | $ | 575,191 |
| | |
Diversified/Miscellaneous 1.25% | | | | | |
Cousins Properties Inc. | | 9,300 | | | 205,530 |
Vornado Realty Trust | | 14,400 | | | 1,266,480 |
| | | | | |
| | | | | 1,472,010 |
| | | | | |
| | |
Health Care 0.84% | | | | | |
HCP Inc. | | 15,300 | | | 532,134 |
Ventas Inc. | | 10,200 | | | 461,550 |
| | | | | |
| | | | | 993,684 |
| | | | | |
| | |
Hotels 0.80% | | | | | |
Host Hotels & Resorts Inc. | | 20,000 | | | 340,800 |
LaSalle Hotel Properties | | 12,000 | | | 382,800 |
Starwood Hotels & Resorts Worldwide Inc. | | 5,100 | | | 224,553 |
| | | | | |
| | | | | 948,153 |
| | | | | |
| | |
Industrial 1.18% | | | | | |
AMB Property Corp. | | 13,200 | | | 759,792 |
ProLogis | | 9,900 | | | 627,462 |
| | | | | |
| | | | | 1,387,254 |
| | | | | |
| | |
Mortgage – Commercial 7.18% | | | | | |
Anthracite Capital Inc. | | 501,500 | | | 3,630,860 |
iStar Financial Inc. | | 37,300 | | | 971,665 |
Resource Capital Corp. | | 412,300 | | | 3,838,513 |
Resource Capital Corp.—Warrants* | | 55,000 | | | 38,399 |
| | | | | |
| | | | | 8,479,437 |
| | | | | |
| | |
Net Lease 2.17% | | | | | |
Entertainment Properties Trust | | 24,700 | | | 1,160,900 |
National Retail Properties Inc. | | 10,500 | | | 245,490 |
Realty Income Corp. | | 42,800 | | | 1,156,456 |
| | | | | |
| | | | | 2,562,846 |
| | | | | |
| | |
Office – Central Business District 2.17% | | | | | |
Boston Properties Inc. | | 16,700 | | | 1,533,227 |
SL Green Realty Corp. | | 11,000 | | | 1,028,060 |
| | | | | |
| | | | | 2,561,287 |
| | | | | |
Footnotes to DCA Statement of Investments on page 19.
13
STATEMENTOF INVESTMENTS (CONTINUED)
December 31, 2007
Dividend Capital Realty Income Allocation Fund (continued)
| | | | | |
| | | Shares | | Market
Value |
COMMON STOCK (continued) | | | | | |
Office – Suburban 1.99% | | | | | |
Alexandria Real Estate Equities Inc. | | 7,000 | | $ | 711,690 |
Digital Realty Trust Inc. | | 14,400 | | | 552,528 |
Duke Realty Corp. | | 10,900 | | | 284,272 |
Highwoods Properties Inc. | | 27,300 | | | 802,074 |
| | | | | |
| | | | | 2,350,564 |
| | | | | |
| | |
Other Real Estate Companies 0.50% | | | | | |
Brookfield Properties Corp. | | 30,500 | | | 587,125 |
| | |
Regional Malls 2.54% | | | | | |
Pennsylvania Real Estate Investment Trust | | 7,000 | | | 207,760 |
Simon Property Group Inc. | | 24,900 | | | 2,162,814 |
Taubman Centers Inc. | | 12,800 | | | 629,632 |
| | | | | |
| | | | | 3,000,206 |
| | | | | |
| | |
Self Storage 0.73% | | | | | |
Public Storage Inc. | | 11,700 | | | 858,897 |
| | |
Shopping Centers 1.98% | | | | | |
Federal Realty Investment Trust | | 22,600 | | | 1,856,590 |
Kimco Realty Corp. | | 13,200 | | | 480,480 |
| | | | | |
| | | | | 2,337,070 |
| | | | | |
| | |
Speciality Finance 8.28% | | | | | |
Arbor Realty Trust Inc. | | 73,100 | | | 1,177,641 |
Deerfield Triarc Capital Corp. | | 261,800 | | | 2,094,400 |
Gramercy Capital Corp. | | 140,400 | | | 3,413,124 |
KKR Financial Holdings LLC. | | 37,234 | | | 523,138 |
NorthStar Realty Finance Corp. | | 288,500 | | | 2,573,420 |
| | | | | |
| | | | | 9,781,723 |
| | | | | |
TOTAL COMMON STOCK (Cost $48,144,513) | | | | | 37,895,447 |
| | | | | |
Footnotes to DCA Statement of Investments on page 19.
14
STATEMENTOF INVESTMENTS (CONTINUED)
December 31, 2007
Dividend Capital Realty Income Allocation Fund (continued)
| | | | | | | |
| | | Bond Rating
Moody’s/S&P
(Unaudited) | | Shares | | Market
Value |
PREFERRED STOCK 73.28% | | | | | | | |
Apartments 2.83% | | | | | | | |
Apartment Investment & Management Co.: | | | | | | | |
Series U, 7.750% (3) | | Ba3/B+ | | 44,200 | | $ | 924,664 |
Series V, 8.000% (3) | | Ba3/B+ | | 75,700 | | | 1,554,121 |
BRE Properties Inc.: | | | | | | | |
Series C, 6.750% | | Baa3/BBB- | | 15,000 | | | 290,100 |
Series D, 6.750% | | Baa3/BBB- | | 28,500 | | | 570,000 |
| | | | | | | |
| | | | | | | 3,338,885 |
| | | | | | | |
| | | |
Hotels 26.58% | | | | | | | |
Ashford Hospitality Trust: | | | | | | | |
Series A, 8.550% (3) | | NR/NR | | 93,300 | | | 1,749,375 |
AP AIMCAP Corp., Series A, 8.250% (2)(4)* | | NR/NR | | 212,600 | | | 4,230,549 |
FelCor Lodging Trust Inc., Series C, 8.000% (3) | | B2/B- | | 259,000 | | | 4,804,450 |
Hersha Hospitality Trust, Series A, 8.000%(3) | | NR/NR | | 75,300 | | | 1,611,420 |
Innkeepers USA Trust, Series C, 8.000% | | NR/NR | | 40,100 | | | 481,200 |
LaSalle Hotel Properties, Series G, 7.250%(3) | | NR/NR | | 434,000 | | | 7,490,840 |
Strategic Hotels & Resorts Inc.: | | | | | | | |
Series A, 8.500% (3) | | NR/NR | | 177,500 | | | 3,333,450 |
Series C, 8.250% (3) | | NR/NR | | 259,000 | | | 5,050,500 |
Sunstone Hotel Investors Inc., Series A, 8.000% (3) | | NR/NR | | 134,800 | | | 2,632,644 |
| | | | | | | |
| | | | | | | 31,384,428 |
| | | | | | | |
| | | |
Manufactured Housing 2.83% | | | | | | | |
Hilltop Holdings Inc., | | | | | | | |
Series A, 8.250% (3) | | NR/NR | | 150,400 | | | 3,335,120 |
| | | |
Mortgage – Commercial 4.04% | | | | | | | |
Anthracite Capital Inc., | | | | | | | |
Series D, 8.250% (3) | | NR/NR | | 140,000 | | | 2,212,000 |
Newcastle Investment Corp., | | | | | | | |
Series C, 8.050% (3) | | NR/NR | | 165,000 | | | 2,557,500 |
| | | | | | | |
| | | | | | | 4,769,500 |
| | | | | | | |
| | | |
Mortgage – Residential 0.02% | | | | | | | |
American Home Mortgage Investment Corp.: | | | | | | | |
Series A, 9.750% (9) | | NR/NR | | 266,950 | | | 21,356 |
Series B, 9.250% (9) | | NR/NR | | 29,700 | | | 1,485 |
| | | | | | | |
| | | | | | | 22,841 |
| | | | | | | |
Footnotes to DCA Statement of Investments on page 19.
15
STATEMENTOF INVESTMENTS (CONTINUED)
December 31, 2007
Dividend Capital Realty Income Allocation Fund (continued)
| | | | | | | |
| | | Bond Rating
Moody’s/S&P
(Unaudited) | | Shares | | Market
Value |
PREFERRED STOCK (continued) | | | | | | | |
Net Lease 1.64% | | | | | | | |
Entertainment Properties Trust, | | | | | | | |
Series B, 7.750% (3) | | NR/NR | | 93,400 | | $ | 1,942,720 |
Office – Central Business District 1.42% | | | | | | | |
Maguire Properties Inc., | | | | | | | |
Series A, 7.625% (3) | | NR/NR | | 120,000 | | | 1,672,800 |
Office – Suburban 11.42% | | | | | | | |
BioMed Realty Trust Inc., Series A, 7.375%(3) | | NR/NR | | 365,000 | | | 7,464,250 |
Brandywine Realty Trust: | | | | | | | |
Series C, 7.500% | | NR/NR | | 38,831 | | | 793,706 |
Series D, 7.375% (3) | | NR/NR | | 47,000 | | | 930,600 |
Digital Realty Trust Inc.: | | | | | | | |
Series A, 8.500% (3) | | NR/NR | | 174,300 | | | 3,923,493 |
Series B, 7.875% | | NR/NR | | 16,800 | | | 372,120 |
| | | | | | | |
| | | | | | | 13,484,169 |
| | | | | | | |
Regional Malls 3.13% | | | | | | | |
CBL & Associates Properties Inc., | | NR/NR | | 41,000 | | | 803,600 |
Series D, 7.375% (3) | | | | | | | |
Glimcher Realty Trust, Series G, 8.125% (3) | | B1/B | | 60,000 | | | 1,146,000 |
Taubman Centers Inc.: | | | | | | | |
Series G, 8.000% (3) | | B1/NR | | 67,000 | | | 1,584,550 |
Series H, 7.625% | | B1/NR | | 6,600 | | | 157,080 |
| | | | | | | |
| | | | | | | 3,691,230 |
| | | | | | | |
Shopping Centers 3.87% | | | | | | | |
Kimco Realty Corp., Series G, 7.75% | | Baa2/BBB+ | | 200,000 | | | 4,572,000 |
| | | |
Speciality Finance 15.50% | | | | | | | |
CapLease Inc., Series A, 8.125% (3) | | NR/NR | | 156,700 | | | 3,018,042 |
Gramercy Capital Corp., Series A, 8.125% (3) | | NR/NR | | 280,000 | | | 5,516,000 |
NorthStar Realty Finance Corp.: | | | | | | | |
Series A, 8.750% (3) | | NR/NR | | 353,600 | | | 5,852,080 |
Series B, 8.250% (3) | | NR/NR | | 246,400 | | | 3,920,224 |
| | | | | | | |
| | | | | | | 18,306,346 |
| | | | | | | |
TOTAL PREFERRED STOCK (Cost $120,587,932) | | | | | | | 86,520,039 |
| | | | | | | |
Footnotes to DCA Statement of Investments on page 19.
16
STATEMENTOF INVESTMENTS (CONTINUED)
December 31, 2007
Dividend Capital Realty Income Allocation Fund (continued)
| | | | | | | |
| | | Bond Rating
Moody’s/S&P
(Unaudited) | | Shares/Principal
Amount | | Market
Value |
COMMERCIAL REAL ESTATE | | | | | | | |
COLLATERALIZED DEBT OBLIGATIONS 14.02% | | | | | | | |
CW Capital Cobalt II, Ltd.: | | | | | | | |
Series K, 8.203%, 04/26/2016 (1)(2)(4)(6)(8) | | Ba2/BB | | 4,000,000 | | $ | 3,121,612 |
Class P.S., 16.586%, 04/26/2016 (1)(2)(4)(6)(7) | | NR/NR | | 3,500,000 | | | 1,697,045 |
Lenox Street, Series 2007-1, 15.173%, | | | | | | | |
06/04/2017 (1)(2)(4)(6)(7) | | NR/NR | | 1,000,000 | | | 542,061 |
Sorin Real Estate CDO II Ltd., Series 2005 2A, | | | | | | | |
Class H, 8.703%, 01/04/2016 (1)(2)(4)(6)(8) | | Ba3/BB | | 7,500,000 | | | 4,791,488 |
Taberna Preferred Funding III Ltd., Class E, | | | | | | | |
9.203%, 11/05/2015 (1)(2)(4)(6)(8)(9) | | NR/B+ | | 2,000,000 | | | 256,820 |
Taberna Preferred Funding V Ltd. | | | | | | | |
Class B-IL, 7.453%, 02/05/2016 (1)(2)(4)(6)(8)(9) | | NR/B | | 3,000,000 | | | 34,929 |
Class B-2L, 9.453%, 02/05/2016 (1)(2)(4)(6)(8)(9) | | NR/CCC- | | 3,000,000 | | | 31,485 |
Vertical CRE CDO 2006-I, Ltd.: | | | | | | | |
Class G, 8.703%, 04/22/2013 (1)(2)(4)(6)(8) | | NR/BB+ | | 6,500,000 | | | 4,853,940 |
Class P.S., 15.508%, 04/22/2013 (1)(2)(4)(6)(7) | | NR/NR | | 1,800,000 | | | 1,224,000 |
TOTAL COMMERCIAL REAL ESTATE COLLATERALIZED DEBT OBLIGATIONS (Cost $32,263,574) | | | | | | | 16,553,380 |
| | | | | | | |
| | | |
COLLATERALIZED LOAN OBLIGATIONS 11.20% | | | | | | | |
Babson CLO 2005-III, Ltd., | | | | | | | |
20.810%, 11/11/2019 (1)(2)(4)(6)(7) | | NR/NR | | 13,000,000 | | | 10,930,946 |
Fraser Sullivan CLO I Ltd., | | | | | | | |
8.177%, 03/15/2017 (1)(2)(4)(6)(7) | | NR/NR | | 3,400,000 | | | 2,291,233 |
TOTAL COLLATERALIZED LOAN OBLIGATIONS (Cost $16,400,000) | | | | | | | 13,222,179 |
| | | | | | | |
| | | |
COMMERCIAL MORTGAGE-BACKED SECURITIES 0.95% | | | | | | | |
JP Morgan Chase, Series 2005-LDP2, | | | | | | | |
Class M, 5.806%, 06/15/2016 (1)(2)(4)(6)(8) | | Ba3/BB | | 1,597,000 | | | 977,667 |
Wachovia Bank, | | | | | | | |
Series 2005 C18, 7.028%, 05/19/2015 (1)(4)(6) | | B1/B+ | | 248,100 | | | 145,998 |
TOTAL COMMERCIAL MORTGAGE-BACKED SECURITIES (Cost $1,434,067) | | | | | | | 1,123,665 |
| | | | | | | |
| | | |
LOAN PARTICIPATIONS 3.79% | | | | | | | |
Mervyn’s Junior Syndication Mezzanine, | | | | | | | |
8.100%, 01/01/2008 (2)(4)(8) | | NR/NR | | 4,476,028 | | | 4,476,028 |
TOTAL LOAN PARTICIPATIONS (Cost $4,476,028) | | | | | | | 4,476,028 |
| | | | | | | |
Footnotes to DCA Statement of Investments on page 19.
17
STATEMENTOF INVESTMENTS (CONTINUED)
December 31, 2007
Dividend Capital Realty Income Allocation Fund (continued)
| | | | | | | | |
| | | Bond Rating
Moody’s/S&P
(Unaudited) | | Shares/Principal
Amount | | Market
Value | |
U.S. GOVERNMENT OBLIGATIONS 7.87% | | | | | | | | |
U.S. Treasury Notes, 4.125%, 08/15/2008 (5) | | | | 8,525,000 | | $ | 8,563,635 | |
U.S. Treasury Bills, 01/24/2008 (5) * | | | | 730,000 | | | 728,834 | |
TOTAL U.S. GOVERNMENT OBLIGATIONS (Cost $9,233,388) | | | | | | | 9,292,469 | |
| | | | | | | | |
| | | |
NON-REGISTERED INVESTMENT COMPANIES 2.68% | | | | | | | | |
INVESCO Navigator Fund, 8.665% (1)(2)(4) | | NR/NR | | 3,946 | | | 3,171,195 | |
TOTAL NON-REGISTERED INVESTMENT COMPANIES (Cost $3,946,000) | | | | | | | 3,171,195 | |
| | | | | | | | |
| | | |
REPURCHASE AGREEMENTS 0.49% | | | | | | | | |
State Street Bank & Trust Co., dated 12/31/2007, 2.75%, due 01/02/2008, proceeds of $577,609 collateralized by Fannie Mae, 6.000%, 05/15/2008, valued at $578,233 including accrued interest | | NR/NR | | 577,609 | | | 577,609 | |
TOTAL REPURCHASE AGREEMENTS (Cost $577,609) | | | | | | | 577,609 | |
| | | | | | | | |
TOTAL INVESTMENTS 146.39% (Cost $237,063,111) | | | | | | $ | 172,832,011 | |
Liabilities in Excess of Other Assets (46.39%) | | | | | | | (54,770,359 | ) |
| | | | | | | | |
NET ASSETS 100.00% | | | | | | $ | 118,061,652 | |
| | | | | | | | |
Footnotes to DCA Statement of Investments:
| * | Non-income producing security. |
(1) | This security was purchased pursuant to the terms of a private placement memorandum and is exempt from registration under the Securities Act of 1933, as amended (the “Securities Act”), pursuant to Rule 144A of the Securities Act. This security may only be sold in transactions exempt from registration under the Securities Act, which most commonly involves a sale to “qualified institutional buyers” under Rule 144A. As of December 31,2007 the value of these securities amounted to $34,070,419 or 19.71% of total investments. |
(2) | This security has been valued at its fair value determined in good faith by or under the direction of the Board of Trustees. |
(3) | All or a portion of the shares held in this security are pledged as collateral for the borrowings under the Revolving Credit and Security Agreement (Note 6). |
(4) | This security is considered illiquid by the Adviser. |
(5) | All or a portion of the entire principal amount of this security is pledged as collateral for total return swap agreements. |
(6) | The expected maturity date listed herein differs from the legal maturity date due to the expected schedule of principal payments. |
(7) | This security represents a junior tranche whereby the holder is entitled to all residual interest, if any, which can vary. The rate listed is the Adviser’s estimated rate of residual interest as of the reporting date. |
(8) | The coupon rate shown on floating or adjustable rate securities represents the current effective rate at each period. |
See accompanying Notes to Financial Statements.
18
STATEMENTOF INVESTMENTS (CONTINUED)
December 31, 2007
Dividend Capital Realty Income Allocation Fund (continued)
Open Interest Rate Swap Contracts as of December 31, 2007
| | | | | | | | | | | | | | | | | | | |
Counterparty | | Termination
Date | | Underlying
Notional | | Fixed Rate Paid
by the Fund at
12/31/07 | | | Floating Rate
Received by
the Fund at
12/31/07 | | | Net Interest
Receivable | | | Unrealized
Depreciation | |
JPMorgan Chase | | 06/14/2012 | | $ | 27,000,000 | | 4.090 | % | | 5.103 | %* | | $ | 13,669 | | | $ | (469,086 | ) |
JPMorgan Chase | | 06/14/2010 | | | 27,000,000 | | 3.890 | % | | 5.103 | %* | | | 16,369 | | | | (230,099 | ) |
Royal Bank of Canada | | 08/30/2012 | | | 32,000,000 | | 4.845 | % | | 4.839 | %** | | | (183 | ) | | | (568,130 | ) |
| | | | | | | | | | | | | | | | | | | |
Total | | | | | | | | | | | | | $ | 29,855 | | | $ | (1,267,315 | ) |
| | | | | | | | | | | | | | | | | | | |
| * | Based on one-month LIBOR (London Interbank Offered Rate). |
| ** | Based on three-month CDOR (Canadian Interbank Offered Rate). |
Open Total Return Swap Contracts (“TRS”) *** as of December 31, 2007
Counterparty: Royal Bank of Canada
| | | | | | | | | | | |
Contract Type | | Termination
Date | | Notional
Shares | | Underlying
Notional
($CAD) | | Unrealized
Appreciation
(Depreciation)
($USD) | |
Artis Real Estate Investment Trust TRS | | 09/27/2012 | | 100,000 | | $ | 1,760,720 | | $ | (258,088 | ) |
Calloway Real Estate Investment Trust TRS | | 11/30/2009 | | 145,000 | | | 3,233,500 | | | 321,748 | |
Canadian Apartment Properties Real Estate Investment Trust TRS | | 03/13/2009 | | 190,000 | | | 4,057,241 | | | (1,024,917 | ) |
Chartwell Senior Housing Real Estate Investment Trust TRS | | 08/2/2013 | | 175,000 | | | 2,450,000 | | | (469,882 | ) |
Dundee Real Estate Investment Trust TRS | | 10/18/2012 | | 113,593 | | | 4,327,893 | | | (504,116 | ) |
Firm Capital Mortgage Investment Funds TRS | | 08/2/2013 | | 160,000 | | | 1,728,000 | | | (110,239 | ) |
H&R Real Estate Investment Trust TRS | | 10/18/2012 | | 222,200 | | | 5,103,934 | | | (704,682 | ) |
Northern Property Real Estate Investment Trust TRS | | 10/18/2012 | | 188,000 | | | 4,248,800 | | | (47,621 | ) |
Primaris Retail Real Estate Investment Trust TRS | | 10/18/2012 | | 275,000 | | | 5,255,250 | | | (225,695 | ) |
| | | | | | | | | | | |
Total | | | | 1,568,793 | | $ | 32,165,338 | | $ | (3,023,492 | ) |
| | | | | | | | | | | |
| *** | For each total return swap contract, the Fund receives the total return and dividend income on the underlying security and pays a floating rate based on three-month CDOR (Canadian Interbank Offered Rate) plus a spread of 0.50%. |
19
STATEMENTOF INVESTMENTS
December 31, 2007
Dividend Capital Strategic Global Realty Fund
| | | | | | | |
| | | Bond Rating
Moody’s/S&P
(Unaudited) | | Shares | | Market
Value |
COMMON STOCK 23.53% | | | | | | | |
Building - Heavy Construction 0.82% | | | | | | | |
Socovesa S.A. - Chile (1)* | | | | 80,000 | | $ | 863,200 |
Healthcare 2.00% | | | | | | | |
Medical Properties Trust, Inc. | | | | 205,000 | | | 2,088,950 |
Hotels 1.55% | | | | | | | |
Ashford Hospitality Trust, Inc. | | | | 225,000 | | | 1,617,750 |
Mortgage - Commercial 3.66% | | | | | | | |
iStar Financial, Inc. | | | | 146,600 | | | 3,818,930 |
Real Estate Operators & Developers 1.15% | | | | | | | |
Franshion Properties China Ltd. - Hong Kong* | | | | 1,835,000 | | | 986,053 |
Sino-Ocean Land Holdings Ltd. - Hong Kong* | | | | 173,000 | | | 214,325 |
| | | | | | | |
| | | | | | | 1,200,378 |
| | | | | | | |
Specialty Finance 14.35% | | | | | | | |
Arbor Realty Trust Inc. | | | | 88,000 | | | 1,417,680 |
Gramercy Capital Corp. | | | | 236,000 | | | 5,737,160 |
JER Investors Trust Inc. | | | | 295,000 | | | 3,177,150 |
NorthStar Realty Finance Corp. | | | | 522,000 | | | 4,656,240 |
| | | | | | | |
| | | | | | | 14,988,230 |
| | | | | | | |
TOTAL COMMON STOCK | | | | | | | |
(Cost $ 32,913,316) | | | | | | | 24,577,438 |
| | | | | | | |
PREFERRED STOCK 50.22% | | | | | | | |
Apartments 1.89% | | | | | | | |
BRE Properties, Inc.: | | | | | | | |
Series C, 6.750% | | Baa3/BBB- | | 85,000 | | | 1,643,900 |
Series D, 6.750% | | Baa3/BBB- | | 16,600 | | | 332,000 |
| | | | | | | |
| | | | | | | 1,975,900 |
| | | | | | | |
Diversified/Miscellaneous 2.36% | | | | | | | |
Vornado Realty Trust: | | | | | | | |
Series F, 6.750% | | Baa3/BBB- | | 109,000 | | | 2,247,580 |
Series I/L, 6.625% | | Baa3/BBB- | | 11,000 | | | 217,470 |
| | | | | | | |
| | | | | | | 2,465,050 |
| | | | | | | |
Footnotes to DCW Statement of Investments on page 25.
20
STATEMENTOF INVESTMENTS (CONTINUED)
December 31, 2007
Dividend Capital Strategic Global Realty Fund (continued)
| | | | | | | |
| | | Bond Rating
Moody’s/S&P
(Unaudited) | | Shares | | Market
Value |
PREFERRED STOCK (continued) | | | | | | | |
Hotels 10.72% | | | | | | | |
Ashford Hospitality Trust, Inc., | | | | | | | |
Series D, 8.450% | | NR/NR | | 264,000 | | $ | 5,016,000 |
Hospitality Properties Trust, | | | | | | | |
Series C, 7.000% | | Baa3/BB+ | | 34,447 | | | 620,046 |
LaSalle Hotel Properties: | | | | | | | |
Series D, 7.500% | | NR/NR | | 76,400 | | | 1,398,120 |
Series E, 8.000% | | NR/NR | | 10,000 | | | 191,000 |
Series G, 7.250% | | NR/NR | | 27,500 | | | 474,650 |
Strategic Hotels & Resorts Inc.: | | | | | | | |
Series B, 8.250% | | NR/NR | | 74,530 | | | 1,434,703 |
Series C, 8.250% | | NR/NR | | 54,000 | | | 1,053,000 |
Sunstone Hotel Investors Inc., | | | | | | | |
Series A, 8.000% | | NR/NR | | 51,400 | | | 1,003,842 |
| | | | | | | |
| | | | | | | 11,191,361 |
| | | | | | | |
Industrial 0.47% | | | | | | | |
AMB Property Corp., Series M, 6.750% | | Baa2/BBB- | | 23,500 | | | 495,850 |
Mortgage – Commercial 5.37% | | | | | | | |
iStar Financial, Inc.: | | | | | | | |
Series F, 7.800% | | Ba1/BB+ | | 80,000 | | | 1,540,000 |
Series I, 7.500% | | Ba1/BB+ | | 62,000 | | | 1,140,800 |
Newcastle Investment Corp., | | | | | | | |
Series D, 8.375% | | NR/NR | | 200,000 | | | 2,924,000 |
| | | | | | | |
| | | | | | | 5,604,800 |
| | | | | | | |
Net Lease 2.55% | | | | | | | |
Entertainment Properties Trust, | | | | | | | |
Series B, 7.750% | | NR/NR | | 40,000 | | | 832,000 |
Lexington Realty Trust, | | | | | | | |
Series D, 7.550% | | NR/NR | | 12,800 | | | 244,480 |
Realty Income Corp., | | | | | | | |
Series E, 6.750% | | Baa2/BBB- | | 75,000 | | | 1,587,000 |
| | | | | | | |
| | | | | | | 2,663,480 |
| | | | | | | |
Office – Central Business District 2.90% | | | | | | | |
SL Green Realty Corp., | | | | | | | |
Series C, 7.625% | | NR/NR | | 133,200 | | | 3,028,968 |
Footnotes to DCW Statement of Investments on page 25.
21
STATEMENTOF INVESTMENTS (CONTINUED)
December 31, 2007
Dividend Capital Strategic Global Realty Fund (continued)
| | | | | | | |
| | | Bond Rating
Moody’s/S&P
(Unaudited) | | Shares | | Market
Value |
PREFERRED STOCK (continued) | | | | | | | |
Office - Suburban 7.99% | | | | | | | |
BioMed Realty Trust Inc., | | | | | | | |
Series A, 7.375% | | NR/NR | | 225,000 | | $ | 4,601,250 |
Digital Realty Trust Inc., | | | | | | | |
Series B, 7.875% | | NR/NR | | 50,000 | | | 1,107,500 |
Kilroy Realty Corp., | | | | | | | |
Series F, 7.500% | | NR/NR | | 120,000 | | | 2,640,000 |
| | | | | | | |
| | | | | | | 8,348,750 |
| | | | | | | |
Regional Malls 2.29% | | | | | | | |
CBL & Associates Properties Inc., | | | | | | | |
Series C, 7.750% | | NR/NR | | 30,000 | | | 660,000 |
Glimcher Realty Trust, | | | | | | | |
Series G, 8.125% | | B1/B | | 90,400 | | | 1,726,640 |
| | | | | | | |
| | | | | | | 2,386,640 |
| | | | | | | |
Shopping Centers 9.19% | | | | | | | |
Kimco Realty Corp., | | | | | | | |
Series G, 7.750% | | Baa2/BBB+ | | 400,000 | | | 9,144,000 |
Regency Centers Corp., | | | | | | | |
Series C, 7.450% | | Baa3/BBB | | 20,500 | | | 452,025 |
| | | | | | | |
| | | | | | | 9,596,025 |
| | | | | | | |
Storage 2.05% | | | | | | | |
Public Storage, Inc.: | | | | | | | |
Series E, 6.750% | | Baa1/BBB+ | | 16,900 | | | 331,409 |
Series M, 6.625% | | Baa1/BBB+ | | 95,000 | | | 1,805,000 |
| | | | | | | |
| | | | | | | 2,136,409 |
| | | | | | | |
Speciality Finance 2.44% | | | | | | | |
Gramercy Capital Corp., | | | | | | | |
Series A, 8.125% | | NR/NR | | 80,000 | | | 1,576,000 |
NorthStar Realty Finance Corp.: | | | | | | | |
Series A, 8.750% | | NR/NR | | 39,500 | | | 653,725 |
Series B, 8.250% | | NR/NR | | 20,000 | | | 318,200 |
| | | | | | | |
| | | | | | | 2,547,925 |
| | | | | | | |
TOTAL PREFERRED STOCK | | | | | | | |
(Cost $64,039,063) | | | | | | | 52,441,158 |
| | | | | | | |
Footnotes to DCW Statement of Investments on page 25.
22
STATEMENTOF INVESTMENTS (CONTINUED)
December 31, 2007
Dividend Capital Strategic Global Realty Fund (continued)
| | | | | | | | | |
| | | Bond Rating
Moody’s/S&P
(Unaudited) | | Principal
Amount | | Market
Value | |
COMMERCIAL REAL ESTATE | | | | | | | | | |
COLLATERALIZED DEBT OBLIGATIONS 7.32% | | | | | | | | | |
Gramercy Real Estate, Series 2007-1A: | | | | | | | | | |
Class GFX, 6.000%, 08/15/2016 (1)(2)(3)(4) | | NR/BBB | | $ | 2,000,000 | | $ | 1,286,260 | |
Class HFX, 6.000%, 08/15/2016 (1)(2)(3)(4) | | NR/BBB- | | | 5,150,000 | | | 2,985,713 | |
Morgan Stanley Capital I, 2007-SRR4, | | | | | | | | | |
Series G, 7.240%, 06/20/2016 (1)(2)(3)(4) | | NR/NR | | | 5,750,000 | | | 3,370,650 | |
| | | |
TOTAL COMMERCIAL REAL ESTATE | | | | | | | | | |
COLLATERALIZED DEBT OBLIGATIONS | | | | | | | | | |
(Cost $11,649,504) | | | | | | | | 7,642,623 | |
| | | | | | | | | |
| | | |
U.S. GOVERNMENT OBLIGATIONS 29.45% | | | | | | | | | |
U.S. Treasury Bills: | | | | | | | | | |
2.260%, 01/24/2008 (5) | | | | | 1,300,000 | | | 1,298,107 | |
2.280%, 01/24/2008 (5) | | | | | 29,500,000 | | | 29,457,044 | |
TOTAL U.S. GOVERNMENT OBLIGATIONS | | | | | | | | | |
(Cost $30,755,151) | | | | | | | | 30,755,151 | |
| | | | | | | | | |
| | | |
REPURCHASE AGREEMENTS 1.05% | | | | | | | | | |
State Street Bank & Trust Co. , dated 12/31/2007, 2.75%, due 01/02/2008, proceeds of $1,087,000 collateralized by Fannie Mae, 6.00%, 05/15/2008, valued at $ 1,100,769 including accrued interest. | | | | | 1,100,305 | | | 1,100,305 | |
| | | |
TOTAL REPURCHASE AGREEMENTS | | | | | | | | | |
(Cost $1,100,305) | | | | | | | | 1,100,305 | |
| | | | | | | | | |
| | | |
TOTAL INVESTMENTS 111.57% | | | | | | | $ | 116,516,675 | |
(Cost $140,457,339) | | | | | | | | | |
Liabilities in Excess of Other Assets (11.57%) | | | | | | | | (12,084,020 | ) |
| | | | | | | | | |
NET ASSETS 100.00% | | | | | | | $ | 104,432,655 | |
| | | | | | | | | |
Footnotes to DCW Statement of Investments on page 25.
23
STATEMENTOF INVESTMENTS (CONTINUED)
December 31, 2007
Dividend Capital Strategic Global Realty Fund (continued)
Footnotes to DCW Statement of Investments:
| * | Non-incoming producing security. |
(1) | This security was purchased pursuant to the terms of a private placement memorandum and is exempt from registration under the Securities Act of 1933, as amended (the “Securities Act”), pursuant to Rule 144A of the Securities Act. This security may only be sold in transactions exempt from registration under the Securities Act, which most commonly involves a sale to “qualified institutional buyers” under Rule 144A. As of December 31,2007 the value of these securities amounted to $8,505,823 or 7.30% of total investments. |
(2) | This security has been valued at fair values determined in good faith by or under the direction of the Board of Trustees. |
(3) | The expected maturity date of this security listed herein is earlier than/later than the legal maturity date of the security due to the expected acceleration/deceleration of the schedule of principal payments by the issuer. |
(4) | This security is considered illiquid by the Adviser. |
(5) | All or a portion of the principal amount of this security is pledged as collateral for total return swap agreements. See accompanying Notes to Financial Statements. |
Open Interest Rate Swap Contracts as of December 31, 2007
| | | | | | | | | | | | | | | | | | |
Counter Party | | Termination
Date | | Underlying Notional
(local currency) | | Fixed Rate Paid
by the Fund at
12/31/07 | | | Floating Rate
Received by
the Fund at
12/31/07 | | | Net Interest
Receivable | | | Unrealized
Depreciation
($USD) | |
Royal Bank of Canada | | 08/30/2012 | | 26,000,000 CAD | | 4.85 | % | | 4.84 | % * | | $ | (149 | ) | | $ | (471,738 | ) |
Deutsche Bank | | 10/4/2012 | | 3,604,314,133 JPY | | 1.45 | % | | 1.00 | % ** | | | (49,515 | ) | | | (412,954 | ) |
| | 10/4/2012 | | 21,500,000 SGD | | 3.02 | % | | 1.90 | % *** | | | (20,316 | ) | | | (37,366 | ) |
| | | | | | | | | | | | | | | | | | |
Total | | | | | | | | | | | | | | | | $ | (922,058 | ) |
| | | | | | | | | | | | | | | | | | |
| * | Based on three-month CDOR (Canadian Interbank Offered Rate). |
| ** | Based on one-month TIBOR (Tokyo Interbank Domestic Yen Offered Rate). |
| *** | Based on one-month fixing SGD swap. |
24
STATEMENTOF INVESTMENTS (CONTINUED)
December 31, 2007
Dividend Capital Strategic Global Realty Fund (continued)
Open Total Return Swap Contracts (“TRS”)^ as of December 31, 2007
| | | | | | | | | | |
Counter Party Contract Type | | Termination
Date | | Notional
Shares | | Underlying
Notional
(local currency) | | Unrealized
Appreciation
/(Depreciation)
($USD) | |
Deutsche Bank | | | | | | | | | | |
Ascendas Real Estate Investment Trust TRS | | 07/27/2010 | | 2,517,000 | | 7,851,339 SGD | | $ | (1,152,884 | ) |
Ascott Residence Trust TRS | | 07/27/2010 | | 1,668,000 | | 3,356,795 SGD | | | (686,536 | ) |
CapitaMall Trust TRS | | 07/27/2010 | | 820,000 | | 3,326,078 SGD | | | (339,628 | ) |
CDL Hospitality Trusts TRS | | 07/27/2010 | | 1,351,000 | | 3,487,952 SGD | | | (217,515 | ) |
Champion Real Estate Investment Trust TRS | | 07/26/2010 | | 5,934,000 | | 28,087,402 HKD | | | (124,265 | ) |
DA Office Investment Corporation TRS | | 08/02/2010 | | 520 | | 409,943,676 JPY | | | (299,545 | ) |
Frasers Centrepoint Trust TRS | | 08/02/2010 | | 1,977,000 | | 3,477,893 SGD | | | (410,902 | ) |
Japan Hotel and Resort, Inc. TRS | | 08/02/2010 | | 811 | | 515,659,773 JPY | | | (1,574,102 | ) |
Japan Logistics Fund, Inc. TRS | | 08/02/2010 | | 230 | | 276,140,038 JPY | | | (808,307 | ) |
Japan Real Estate Investment Corporation TRS | | 08/02/2010 | | 373 | | 542,304,671 JPY | | | (179,964 | ) |
Japan Retail Fund Investment Corporation TRS | | 08/02/2010 | | 380 | | 417,200,211 JPY | | | (1,023,499 | ) |
Kenedix Realty Investment Corporation TRS | | 08/02/2010 | | 460 | | 411,595,068 JPY | | | (612,586 | ) |
Nippon Building Fund, Inc. TRS | | 08/02/2010 | | 320 | | 557,724,060 JPY | | | (495,225 | ) |
Nippon Residential Investment Corporation TRS | | 08/02/2010 | | 660 | | 466,258,344 JPY | | | (1,196,064 | ) |
Sunlight Real Estate Investment Trust TRS | | 07/26/2010 | | 11,250,000 | | 25,628,965 HKD | | | 89,265 | |
| ^ | For each total return swap contract, the Fund receives the total return on dividend income on the underlying security and pays a floating rate based on local interest rates plus a spread of 0.30% to 0.50%. |
SGD – Singapore Dollar
HKD – Hong Kong Dollar
JPY – Japanese Yen
25
STATEMENTOF INVESTMENTS (CONTINUED)
December 31, 2007
Dividend Capital Strategic Global Realty Fund (continued)
Open Total Return Swap Contracts (“TRS”)^ as of December 31, 2007
(continued)
| | | | | | | | | | |
Counter Party Contract Type | | Termination
Date | | Notional
Shares | | Underlying
Notional
(local currency)
(CAD$) | | Unrealized
Appreciation
/(Depreciation)
($ USD) | |
Royal Bank of Canada | | | | | | | | | | |
Allied Properties Real Estate Investment Trust TRS | | 07/16/2012 | | 131,000 | | 2,812,989 | | $ | (97,319 | ) |
Artis Real Estate Investment Trust TRS | | 07/16/2012 | | 151,000 | | 2,619,790 | | | (350,301 | ) |
Artis Real Estate Investment Trust TRS | | 07/16/2012 | | 49,000 | | 833,015 | | | (96,332 | ) |
Calloway Real Estate Investment Trust TRS | | 07/16/2012 | | 88,300 | | 2,311,429 | | | (150,932 | ) |
Canadian Apartment Properties Real Estate Investment Trust TRS | | 07/16/2012 | | 180,000 | | 3,523,662 | | | (646,702 | ) |
Chartwell Senior Housing Real Estate Investment Trust TRS | | 07/16/2012 | | 148,000 | | 2,319,944 | | | (648,609 | ) |
H&R Real Estate Investment Trust TRS | | 07/16/2012 | | 127,000 | | 3,044,787 | | | (532,050 | ) |
Northern Property Real Estate Investment Trust TRS | | 07/16/2012 | | 117,000 | | 2,707,790 | | | (94,067 | ) |
Primaris Retail Real Estate Investment Trust TRS | | 07/16/2012 | | 115,000 | | 2,279,036 | | | (176,843 | ) |
RioCan Real Estate Investment Trust TRS | | 07/16/2012 | | 150,000 | | 3,766,455 | | | (499,980 | ) |
Total | | | | 26,777,054 | | | | $ | (12,324,892 | ) |
| ^ | For each total return swap contract, the Fund receives the total return on dividend income on the underlying security and pays a floating rate based on local interest rates plus a spread of 0.30% to 0.50% CAD- Canadian Dollar. |
26
STATEMENTSOF ASSETS & LIABILITIES
December 31, 2007
| | | | | | | | |
| | | Dividend Capital
Realty Income
Allocation Fund | | | Dividend Capital
Strategic Global
Realty Fund | |
ASSETS: | | | | | | | | |
Investments at market value | | $ | 172,832,011 | | | $ | 116,516,675 | |
Cash | | | — | | | | 1,100,305 | |
Receivable for securities sold | | | 2,385,348 | | | | — | |
Dividends and interest receivable | | | 3,068,772 | | | | 1,990,723 | |
Swap interest receivable | | | 149,959 | | | | 681,800 | |
Unrealized appreciation on swap agreements | | | 321,748 | | | | 89,265 | |
| | | | | | | | |
TOTAL ASSETS | | $ | 178,757,838 | | | $ | 120,378,768 | |
| | |
LIABILITIES: | | | | | | | | |
Line of credit payable to bank | | $ | 53,872,000 | | | $ | — | |
Distributions payable | | | 1,538,813 | | | | 496,544 | |
Payable for line of credit fees | | | 276,743 | | | | — | |
Payable for securities purchased | | | — | | | | 1,100,305 | |
Unrealized depreciation on swap agreements | | | 4,612,555 | | | | 13,336,215 | |
Swap interest payable | | | 5,581 | | | | 829,269 | |
Payable for investment advisory fees | | | 129,390 | | | | 87,195 | |
Payable for administrative fees | | | 15,223 | | | | 8,720 | |
Payable for trustees’ fee | | | 19,931 | | | | 9,828 | |
Payable for excise tax | | | 95,926 | | | | 21,434 | |
Other liabilities | | | 130,024 | | | | 56,603 | |
| | | | | | | | |
TOTAL LIABILITIES | | $ | 60,696,186 | | | $ | 15,946,113 | |
| | | | | | | | |
NET ASSETS | | $ | 118,061,652 | | | $ | 104,432,655 | |
| | | | | | | | |
| | |
COMPOSITION OF NET ASSETS: | | | | | | | | |
Common stock, $0.001 par value (unlimited number of shares authorized) | | $ | 13,989 | | | $ | 7,523 | |
Paid-in capital | | | 197,255,006 | | | | 143,365,588 | |
(Over)/undistributed net investment income | | | 3,249,478 | | | | (484,331 | ) |
Accumulated net realized loss on investments, swap contracts and foreign currency transactions | | | (13,934,914 | ) | | | (1,091,893 | ) |
Net unrealized depreciation of investments, swap contracts and translation of assets and liabilities denominated in foreign currencies | | | (68,521,907 | ) | | | (37,364,232 | ) |
| | | | | | | | |
NET ASSETS | | $ | 118,061,652 | | | $ | 104,432,655 | |
| | | | | | | | |
| | |
COST OF INVESTMENTS | | $ | 237,063,111 | | | $ | 140,457,339 | |
| | | | | | | | |
| | |
SHARES OUTSTANDING AND NET ASSET VALUE PER SHARE: | | | | | | | | |
Common shares outstanding, $0.001 par value (unlimited number of shares authorized) | | | 13,989,197 | | | | 7,522,785 | |
Net asset value per share | | $ | 8.44 | | | $ | 13.88 | |
See accompanying Notes to Financial Statements.
27
STATEMENTSOF OPERATIONS
December 31, 2007
| | | | | | | | | | | | |
| | | Dividend Capital Realty Income
Allocation Fund | | | Dividend Capital
Strategic Global
Realty Fund
Period Ended
December 31,
2007 (2) | |
| | Period Ended
December 31,
2007 (1) | | | Year Ended
September 30,
2007 | | |
INVESTMENT INCOME: | | | | | | | | | | | | |
Dividends (net of withholding taxes of $640, $4,353 and $0, respectively) | | $ | 398,568 | | | $ | 15,994,962 | | | $ | 3,791,833 | |
Interest | | | 1,371,245 | | | | 6,475,525 | | | | 1,464,057 | |
| | | | | | | | | | | | |
Total Investment Income | | | 1,769,813 | | | | 22,470,487 | | | | 5,255,890 | |
| | | |
EXPENSES: | | | | | | | | | | | | |
Line of credit interest and fees (Note 6) | | $ | 948,013 | | | | 4,874,287 | | | | — | |
Investment Advisory fees (Note 5) | | | 421,719 | | | | 2,427,190 | | | | 626,879 | |
Administrative fees (Note 5) | | | 49,614 | | | | 285,552 | | | | 62,688 | |
Trustee fees and expenses (Note 5) | | | 43,184 | | | | 118,397 | | | | 31,008 | |
Excise taxes | | | 95,926 | | | | — | | | | 21,434 | |
Custodian fees and expenses | | | 5,644 | | | | 17,707 | | | | 4,961 | |
Audit and tax fees | | | 74,104 | | | | 75,854 | | | | 55,725 | |
Transfer agent fees and expenses | | | 10,212 | | | | 30,135 | | | | 10,500 | |
Legal expenses | | | 51,368 | | | | 120,251 | | | | 22,040 | |
Debt issuance expense | | | 50,324 | | | | 170,827 | | | | — | |
Shareholder reports expenses | | | 13,476 | | | | 82,220 | | | | 18,308 | |
Other expenses | | | 6,848 | | | | 121,635 | | | | 40,464 | |
| | | | | | | | | | | | |
| | | |
Total Expenses | | | 1,770,432 | | | | 8,324,055 | | | | 894,007 | |
| | | | | | | | | | | | |
NET INVESTMENT INCOME/(LOSS) | | $ | (619 | ) | | $ | 14,146,432 | | | $ | 4,361,883 | |
| | | | | | | | | | | | |
| | | |
REALIZED AND UNREALIZED GAIN/(LOSS): | | | | | | | | | | | | |
Net realized gain/(loss) from: | | | | | | | | | | | | |
Investments | | | (8,889,049 | ) | | | (51,123 | ) | | | (894,751 | ) |
Swap contracts | | | (377,881 | ) | | | 8,847,040 | | | | 877,274 | |
Foreign currency transactions | | | 8,556 | | | | 5,346 | | | | (1,694 | ) |
Increase from payment by affiliate | | | — | | | | — | | | | 51,302 | |
| | | | | | | | | | | | |
Net realized gain/(loss) | | | (9,258,374 | ) | | | 8,801,263 | | | | 32,131 | |
| | | | | | | | | | | | |
Net change in unrealized appreciation/(depreciation) on: | | | | | | | | | | | | |
Investments | | | (16,292,098 | ) | | | (54,684,572 | ) | | | (23,940,664 | ) |
Swap contracts | | | (6,046,539 | ) | | | (4,447,087 | ) | | | (13,419,906 | ) |
Translation of assets and liabilities denominated in foreign currencies | | | 5,888 | | | | (4,447 | ) | | | (3,662 | ) |
| | | | | | | | | | | | |
Net change | | | (22,332,749 | ) | | | (59,136,106 | ) | | | (37,364,232 | ) |
| | | |
DECREASE IN NET ASSETS RESULTING FROM OPERATIONS | | $ | (31,591,742 | ) | | $ | (36,188,411 | ) | | $ | (32,970,218 | ) |
| | | | | | | | | | | | |
(1) | The Dividend Capital Realty Income Allocation Fund changed its fiscal year from September 30th to December 31st. Amounts shown are for the period from October 1, 2007 to December 31, 2007. |
(2) | For the period from June 27, 2007 (inception date of the Fund’s initial public offering) through December 31, 2007. |
See accompanying Notes to Financial Statements.
28
STATEMENTSOF CHANGESIN NET ASSETS
December 31, 2007
| | | | | | | | | | | | |
| | | Dividend Capital Realty Income Allocation Fund | |
| | | For the
Period Ended
December 31,
2007 (1) | | | For the
Year Ended
September 30,
2007 | | | For the
Year Ended
September 30,
2006 | |
Operations: | | | | | | | | | | | | |
Net investment income/(loss) | | $ | (619 | ) | | $ | 14,146,432 | | | $ | 13,525,045 | |
Net realized gain/(loss) on investments, swap transactions and foreign currency transactions | | | (9,258,374 | ) | | | 8,801,263 | | | | 1,227,850 | |
Change in net unrealized appreciation/(depreciation) on investments, swap transactions and foreign currency transactions | | | (22,332,749 | ) | | | (59,136,106 | ) | | | 12,175,374 | |
| | | | | | | | | | | | |
Increase/(decrease) in net assets resulting from operations | | | (31,591,742 | ) | | | (36,188,411 | ) | | | 26,928,269 | |
| | | | | | | | | | | | |
| | | |
Distributions to Shareholders: | | | | | | | | | | | | |
From net investment income | | | (4,613,247 | ) | | | (19,005,710 | ) | | | (17,980,293 | ) |
From net realized gain on investments | | | — | | | | (1,104,803 | ) | | | — | |
| | | | | | | | | | | | |
Net decrease in net assets from distributions to shareholders | | | (4,613,247 | ) | | | (20,110,513 | ) | | | (17,980,293 | ) |
| | | | | | | | | | | | |
| | | |
Capital Share Transactions: | | | | | | | | | | | | |
Net asset value of common shares issued to shareholders from reinvested dividends | | | 296,369 | | | | 3,321,306 | | | | 524,724 | |
Common share offering cost adjustment | | | — | | | | — | | | | 41,695 | |
| | | | | | | | | | | | |
Increase in net assets from capital share transactions | | | 296,369 | | | | 3,321,306 | | | | 566,419 | |
| | | | | | | | | | | | |
Net Increase (Decrease) in Net Assets | | | (35,908,620 | ) | | | (52,977,618 | ) | | | 9,514,395 | |
| | | |
NET ASSETS: | | | | | | | | | | | | |
Beginning of period | | | 153,970,272 | | | | 206,947,890 | | | | 197,433,495 | |
End of period (2) | | $ | 118,061,652 | | | $ | 153,970,272 | | | $ | 206,947,890 | |
| | | | | | | | | | | | |
(1) | The Dividend Capital Realty Income Allocation Fund changed its fiscal year from September 30th to December 31st. Amounts shown are for the period from October 1, 2007 to December 31, 2007. |
(2) | Includes (over)/undistributed net investment income of $3,249,478, $1,281,619 and ($2,128,983) respectively. |
See accompanying Notes to Financial Statements.
29
STATEMENTSOF CHANGESIN NET ASSETS (CONTINUED)
December 31, 2007
| | | | |
| | | Dividend Capital
Strategic Global
Realty Fund | |
| | | For the
Period Ended
December 31,
2007 (1) | |
Operations: | | | | |
Net investment income | | $ | 4,361,883 | |
Net realized gain on investments, swap transactions, foreign currency transactions and payments from affiliates | | | 32,131 | |
Change in net unrealized depreciation on investments, swap transactions and foreign currency transactions | | | (37,364,232 | ) |
| | | | |
Decrease in net assets resulting from operations | | | (32,970,218 | ) |
| | | | |
| |
Distributions to Shareholders: | | | | |
From net investment income | | | (5,940,370 | ) |
| | | | |
Net decrease in net assets from distributions to shareholders | | | (5,940,370 | ) |
| | | | |
| |
Capital Share Transactions: | | | | |
Proceeds from sales of common shares, net of offering costs | | | 142,950,000 | |
Net asset value of common shares issued to shareholders from reinvested dividends | | | 293,235 | |
| | | | |
Increase in net assets from capital share transactions | | | 143,243,235 | |
| | | | |
Net Increase in Net Assets | | | 104,332,647 | |
| |
NET ASSETS: | | | | |
Beginning of period | | | 100,008 | (2) |
End of period (2) | | $ | 104,432,655 | |
| | | | |
(1) | For the period June 27, 2007 (inception date of the Fund’s initial public offering) through December 31, 2007. |
(3) | Includes overdistributed net investment income of ($484,331). |
See accompanying Notes to Financial Statements.
30
STATEMENTSOF CASH FLOWS
December 31, 2007
| | | | | | | | |
| | | Dividend Capital Realty
Income Allocation Fund | |
| | | For the Period Ended
December 31, 2007(1) | | | For the Year Ended
September 30, 2007 | |
Cash Flows from Operating Activities: | | | | | | | | |
Net decrease in net assets from operations | | $ | (31,591,742 | ) | | $ | (36,188,411 | ) |
Adjustments to reconcile net increase in net assets from operations to net cash used in operating activities: | | | | | | | | |
Purchase of investment securities | | | (14,230,789 | ) | | | (130,812,042 | ) |
Proceeds from disposition of investment securities | | | 30,272,388 | | | | 135,511,809 | |
Net sale of short-term investments | | | 4,400,768 | | | | 16,115,646 | |
Net realized gain/(loss) from investments, swap transactions and foreign currency transactions | | | 9,258,374 | | | | (8,801,263 | ) |
Net change in unrealized appreciation on investments, swap transactions and foreign currency transactions | | | 22,332,749 | | | | 59,136,106 | |
Increase/decrease in dividends and interest receivable | | | (346,849 | ) | | | 135,751 | |
Decrease in net swap interest receivable | | | 13,953 | | | | 30,528 | |
Increase/decrease in receivable for securities sold | | | (2,385,348 | ) | | | 310,401 | |
Decrease in payable for securities purchased | | | 0 | | | | (2,223,768 | ) |
Decrease in prepaid expenses and other assets | | | 151,701 | | | | 105,113 | |
Increase in accrued expenses and other payables | | | (75,543 | ) | | | (27,083 | ) |
Increase/decrease in distributions payable | | | 1,538,813 | | | | (444,893 | ) |
Accretion/amortization of discounts/premium on investment securities | | | (21,597 | ) | | | 59,360 | |
| | | | | | | | |
Net Cash Provided by Operating Activities | | $ | 19,316,878 | | | $ | 32,907,254 | |
| | |
Cash Flows from Financing Activities: | | | | | | | | |
Proceeds from bank borrowing | | $ | 3,000,000 | | | $ | 7,500,000 | |
Payment on outstanding debt | | | (18,000,000 | ) | | | (23,628,000 | ) |
Cash distributions paid | | | (4,316,878 | ) | | | (16,789,207 | ) |
| | | | | | | | |
Net Cash Provided by Financing Activities | | $ | (19,316,878 | ) | | $ | (32,917,207 | ) |
| | | | | | | | |
| | |
Cash | | | | | | | | |
Beginning Balance | | $ | 0 | | | $ | 9,953 | |
Ending Balance | | $ | 0 | | | $ | 0 | |
| | |
Supplemental Disclosure of Cash Flow Information: | | | | | | | | |
Cash paid for interest and fees on bank borrowing | | $ | 1,024,168 | | | $ | 4,920,783 | |
Non-cash financing activities not included herein consist of reinvestment of dividends and distributions of $296,369 and $3,321,306, respectively.
(1) | The Dividend Capital Realty Income Allocation Fund changed its fiscal year from September 30th to December 31st. |
See accompanying Notes to Financial Statements.
31
FINANCIAL HIGHLIGHTS
Dividend Capital Realty Income Allocation Fund
| | | | |
| | | For the Period Ended
December 31, 2007 (10) | |
PER SHARE OPERATING DATA: | | | | |
Net Asset Value, Beginning of Period | | $ | 11.03 | |
Income from investment operations: | | | | |
Net investment income/(loss) (7) | | | (0.00 | ) (9) |
Net gains/(losses) on securities, realized and unrealized | | | (2.26 | ) |
| | | | |
Total From Investment Operations | | | (2.26 | ) |
Dividends and/or Distributions to Shareholders: | | | | |
Dividends from net investment income | | | (0.33 | ) |
Dividends from net realized gain on investments | | | 0.00 | |
| | | | |
Total Distributions | | | (0.33 | ) |
| | | | |
Offering Costs Charged to Paid-in Capital | | | 0.00 | |
Offering Cost Adjustment | | | 0.00 | |
Net Asset Value, End of Period | | $ | 8.44 | |
| | | | |
Market Price, End of Period | | $ | 8.06 | |
| | | | |
Total Return, Net Asset Value (3) | | | -20.62 | % |
| | | | |
Total Return, Market Value (3) | | | -25.08 | % |
Net Assets, End of Period (000’s) | | $ | 118,062 | |
Ratio of Total Expenses to Average Net Assets | | | 5.20 | % (4) |
Ratio of Total Expenses to Average Net Assets after reduction to custodian expenses | | | 5.20 | % (4) |
Ratio of Operating Expenses to Average Net Assets (6) | | | 2.42 | % (4) |
Ratio of Operating Expenses to Average Net Assets after reduction to custodian expenses (6) | | | 2.42 | % (4) |
Ratio of Net Investment Income/(Loss) to Average Net Assets | | | (0.00 | )% (9) |
Portfolio Turnover Rate (5) | | | 7.27 | % |
Bank Borrowings: | | | | |
Supplemental Data: | | | | |
Loan Outstanding, End of Period (000’s) | | $ | 53,872 | |
Asset Coverage for Loan Outstanding | | | 305 | % |
(1) | For the period from February 24, 2005 (inception of offering) to September 30, 2005. |
(2) | Net of sales load of $0.675 on initial shares issued. |
(3) | Total investment return is calculated assuming a purchase of common shares of the opening of the first day and sale on the closing of the last day of each period reported. Dividends and distributions are assumed, for purposes of this calculation, to be reinvested at prices obtained under the Fund’s reinvestment plan. Total investment return is not annualized for periods of less than one year. Brokerage commissions are not reflected. |
(4) | Ratio annualized for the period of less than one year. |
32
| | | | | | | | | | |
For the Year Ended
September 30, 2007 | | | For the Year Ended
September 30, 2006 | | | For the Period Ended
September 30, 2005 (1) | |
| $ | 15.08 | | | $ | 14.43 | | | $ | 14.33 | (2) |
| | |
| | 1.02 | | | | 0.99 | | | | 0.63 | |
| | (3.61) | | | | 0.97 | | | | 0.09 | |
| | | | | | | | | | | |
| | (2.59) | | | | 1.96 | | | | 0.72 | |
| | |
| | (1.38) | | | | (1.31 | ) | | | (0.57 | ) |
| | (0.08) | | | | 0.00 | | | | 0.00 | |
| | | | | | | | | | | |
| | (1.46) | | | | (1.31 | ) | | | (0.57 | ) |
| | | | | | | | | | | |
| | 0.00 | | | | 0.00 | | | | (0.05 | ) |
| | 0.00 | | | | 0.00 | (8) | | | 0.00 | |
| $ | 11.03 | | | $ | 15.08 | | | $ | 14.43 | |
| | | | | | | | | | | |
| $ | 11.16 | | | $ | 14.52 | | | $ | 14.12 | |
| | | | | | | | | | | |
| | -19.05 | % | | | 14.95 | % | | | 4.73 | % |
| | | | | | | | | | | |
| | -14.93 | % | | | 13.11 | % | | | 1.68 | % |
| $ | 153,970 | | | $ | 206,948 | | | $ | 197,433 | |
| | 4.11 | % | | | 3.98 | % | | | 2.74 | % (4) |
| | |
| | 4.11 | % | | | 3.97 | % | | | 2.72 | % (4) |
| | 1.70 | % | | | 1.73 | % | | | 1.68 | % (4) |
| | 1.70 | % | | | 1.72 | % | | | 1.66 | % (4) |
| | 6.98 | % | | | 6.92 | % | | | 7.39 | % (4) |
| | 47.40 | % | | | 71.99 | % | | | 92.47 | % |
| | |
| $ | 68,872 | | | | | | | | | |
| | 311 | % | | | | | | | | |
(5) | A portfolio turnover rate is the percentage computed by taking the lesser of purchases or sales of portfolio securities (excluding short-term investments) for a period and dividing it by monthly average of the market value of the portfolio securities during the period. Purchases and sales of investment securities (excluding short-term securities) for the period ended December 31, 2007 were $14,230,789 and $30,272,388, respectively. |
(6) | Operating expenses do not include interest expense on the line of credit. |
(7) | Calculation based on average shares outstanding. |
(8) | Common share offering cost adjustment is less than $0.005 per share. |
(9) | Less than ($0.005) per share. |
(10) | The Fund changed its fiscal year end from September 30 to December 31. Amounts shown are for the period from October 1, 2007 to December 31, 2007. |
See accompanying Notes to Financial Statements.
33
FINANCIAL HIGHLIGHTS (CONTINUED)
Dividend Capital Strategic Global Realty Fund
| | | | |
| | | For the Period Ended
December 31, 2007 (1) | |
PER SHARE OPERATING DATA: | | | | |
Net Asset Value, Beginning of Period | | $ | 19.10 | (2) |
Income from investment operations: | | | | |
Net investment income | | | 0.73 | |
Net losses on securities, realized and unrealized | | | (5.12 | ) |
| | | | |
Total From Investment Operations | | | (4.39 | ) |
| |
Dividends and/or Distributions to Shareholders: | | | | |
Dividends from net investment income | | | (0.79 | ) |
| | | | |
Total Distributions | | | (0.79 | ) |
| | | | |
Offering Costs Charged to Paid-in Capital | | | (0.04 | ) |
Net Asset Value, End of Period | | $ | 13.88 | |
| | | | |
Market Price, End of Period | | $ | 12.45 | |
| | | | |
Total Return, Net Asset Value (3) | | | -23.20 | % |
| | | | |
Total Return, Net Asset Value excluding payment from affiliate (3) | | | -23.24 | % |
| | | | |
Total Return, Market Value (3) | | | -34.36 | % |
Ratios/Supplemental Data | | | | |
Net Assets, End of Period (000’s) | | $ | 104,433 | |
Ratio of Total Expenses to Average Net Assets | | | 1.43 | % (4) |
Ratio of Net Investment Income to Average Net Assets | | | 6.97 | % (4) |
Portfolio Turnover Rate (5) | | | 0.95 | % |
(1) | For the period June 27, 2007 (inception date of the Fund’s initial public offering) through December 31, 2007. |
(2) | Net of sales load of $0.90 on initial shares issued. |
(3) | Total investment return is calculated assuming a purchase of common shares of the opening of the first day and sale on the closing of the last day of each period reported. Dividends and distributions are assumed, for purposes of this calculation, to be reinvested at prices obtained under the Fund’s reinvestment plan. Total investment return is not annualized for periods of less than one year. Brokerage commissions are not reflected. |
(5) | A portfolio turnover rate is the percentage computed by taking the lesser of purchases or sales of portfolio securities (excluding short-term investments) for a period and dividing it by monthly average of the market value of the portfolio securities during the period. Purchases and sales of investment securities (excluding short-term securities) for the period ended December 31, 2007 were $110,979,841 and $718,313, respectively. |
See accompanying Notes to Financial Statements.
34
NOTESTO FINANCIAL STATEMENTS
December 31, 2007
1. ORGANIZATIONAND SUMMARYOF SIGNIFICANT ACCOUNTING POLICIES
Dividend Capital Realty Income Allocation Fund (NYSE: “DCA”) and Dividend Capital Strategic Global Realty Fund (NYSE: “DCW”) (collectively, “the Funds”) are registered as closed-end management investment companies under the Investment Company Act of 1940, as amended (the “1940 Act”). Each Fund’s primary investment objective is high current income. Each Fund’s secondary investment objective is capital appreciation.
Initial capitalization for each Fund was provided by Dividend Capital Investments LLC (the “Adviser”) as follows:
| | | | | | |
| | | Dividend Capital Realty
Income Allocation Fund | | Dividend Capital Strategic
Global Realty Fund |
Organization Date | | | December 3, 2004 | | | December 30, 2005 |
Initial Capitalization Date | | | February 15, 2005 | | | June 13, 2007 |
Amount of Initial Capitalization | | $ | 100,068 | | $ | 100,008 |
Common Shares Issued at Capitalization | | | 7,010 | | | 5,236 |
Common Shares Authorized | | | Unlimited | | | Unlimited |
Public Offering Date | | | February 24, 2005 | | | June 27, 2007 |
Security Valuation
Pricing Procedures All securities of the Funds are valued as of the close of regular trading on the New York Stock Exchange (“NYSE”), currently 4:00 p.m. (Eastern Standard Time), on each day that the NYSE is open.
Securities traded on the National Association of Securities Dealers Automated Quotation System (“NASDAQ”) are valued at the NASDAQ Official Closing Price (“NOCP”). Domestic exchange-listed securities and non-NASDAQ equity securities not traded on a listed exchange are valued at the last sale price as of the close of the NYSE. In the absence of trading or a NOCP, such securities are valued at the mean of the bid and asked prices. In the event exchange quotations are not available for exchange traded securities, the Funds will obtain at least one price from an independent broker/dealer.
U.S. government and agency securities having a maturity of more than 60 days are valued at the mean between the bid and asked prices. Fixed income securities having a maturity of less than 60 days are valued at amortized cost. Other debt securities are valued at the price provided by an independent pricing service or, if such a price is not available, at the value provided by at least one quotation obtained from a broker/dealer. Securities issued by private funds are priced at the value most recently provided by the private fund or at the bid provided by a broker/dealer.
35
NOTESTO FINANCIAL STATEMENTS (CONTINUED)
December 31, 2007
Security Valuation (continued)
Foreign exchange traded securities are valued at the last sale price at the close of the exchange on which the security is primarily traded (except in certain countries where market maker prices are used). In the absence of trading, such securities are valued at the mean between the last reported bid and asked prices or the last sale price. Fixed income securities where market quotations are not readily available are valued at fair value.
Exchange traded options, warrants and rights are valued at the last reported sale price at the close of the exchange on which the security is primarily traded. For non-exchange traded options and exchange traded options, warrants and rights for which no sales are reported, the mean between the bid and asked prices is used. For exchange traded options, warrants and rights and foreign exchange traded equity securities in which the markets are not closed at the time that the Fund prices its securities, snapshot prices provided by individual pricing services are used.
The price for futures contracts are the daily quoted settlement prices. Single security total return swaps in which the referenced security is traded on an exchange are valued at the last sale price at the time of close of the NYSE. In the absence of trading of a referenced security, the mean between the closing bid and asked prices will be used.
Fair Valuation If the price of a security is unavailable in accordance with the Funds’ pricing procedures, or the price of a security is suspect, e.g., due to the occurrence of a significant event (as defined below), the security may be valued at its fair value determined pursuant to procedures adopted by the Board. For this purpose, fair value is the price that the Funds reasonably expect to receive on a current sale of the security. Due to the number of variables affecting the price of a security, however, it is possible that the fair value of a security may not accurately reflect the price that the Funds could actually receive on a sale of the security. As of December 31, 2007, securities which have been fair valued represented 24.80% and 7.32% of DCA’s and DCW’s managed assets respectively. Each Fund’s “Managed Assets” equal the Fund’s total assets (including the net asset value of common shares plus the principal amount of any borrowings used for leverage) minus the sum of accrued liabilities other than debt entered into for purposes of leverage.
The following factors, among other relevant factors, may be considered when determining the fair value of a security: (1) fundamental analytical data; (2) forces which influence the market in which the security is sold, including the liquidity and depth of the market; (3) type of security and the cost at date of purchase; (4) most recent quotation received from a broker; (5) transactions or offers with respect to the security; (6) price, yield and the extent of public or private trading in similar securities of the issuer or comparable companies; (7) price and extent of public trading of the security on foreign exchanges; (8) information on world financial
36
NOTESTO FINANCIAL STATEMENTS (CONTINUED)
December 31, 2007
Security Valuation (continued)
markets and comparable financial products; (9) size of the Funds’ holdings; (10) financial statements of the issuer; (11) analyst reports; (12) merger proposals or tender offers; (13) value of other financial instruments, including derivative securities, traded on other markets or among dealers; (14) trading volumes on markets, exchanges or among dealers; (15) values of baskets of securities traded on other markets, exchanges or among dealers; (16) change in interest rates; (17) observations from financial institutions; (18) government (domestic or foreign) actions or pronouncements; (19) in the case of restricted securities, discount from market value of unrestricted securities of the same class at time of purchase, existence and anticipated time frame of any undertaking to register the security and the size of the holding in relation to any unrestricted outstanding shares; (20) in the case of foreign securities, the country’s or geographic region’s political and economic environment, nature of any significant events, American Depository Receipt trading, exchange-traded fund trading and foreign currency exchange activity; (21) in the case of interests in private funds, the absence of transaction activity in interests in the private fund, extraordinary restrictions on redemptions, whether the private fund’s valuation procedures provide for valuation of underlying securities at market value or fair value, actual knowledge of the value of underlying portfolio holdings, review of audited financial statements and ongoing due diligence and monitoring; and (22) in the case of emergencies or other unusual situations, the nature and duration of the event, forces influencing the operation of the financial markets, likelihood of recurrence of the event, and whether the effects of the event are isolated or affect entire markets, countries or regions.
Significant Events An event is significant if it causes the price for a security determined at the normal time for pricing that security to no longer reflect fair value at the time that the Funds determine their net asset value. A significant event is material (a “Material Significant Event”) if a fair valuation for the security would impact the Funds’ net asset value by more than one-half of one percent (0.5%). If a Material Significant Event has occurred, the Adviser will call a meeting of the Valuation Committee to determine a fair value for the security in accordance with the Funds’ Fair Valuation Procedures.
Risk of Concentration
Because the Funds’ investments are concentrated in the real estate industry, the value of the Funds may be subject to greater volatility than a fund with a portfolio that is less concentrated in a single industry. If the securities of real estate companies as a group fall out of favor with the investors, the Funds could underperform funds that have greater industry diversification.
37
NOTESTO FINANCIAL STATEMENTS (CONTINUED)
December 31, 2007
Security Credit Risk
The Funds invest in high-yield securities, which may be subject to a greater degree of credit risk, market fluctuations and loss of income and principle, and may be more sensitive to economic conditions than lower-yielding, higher-rated fixed-income securities. The Funds may acquire securities in default, and are not obligated to dispose of securities whose issuers subsequently default. As of December 31, 2007, securities with an aggregate market value of $346,075, representing 0.29% of DCA’s net assets, were in default.
Foreign Securities
The Funds may invest a portion of their assets in foreign securities. In the event that the Funds execute a foreign security transaction, the Funds will generally enter into forward foreign currency contracts to settle specific purchases or sales of securities denominated in a foreign currency. Foreign securities may carry more risk than U.S. securities, such as political, market and currency risks. Upon the recommendation of management, the Trustees approved expanding DCA’s exposure to foreign securities to include securities of foreign issuers located outside of North America. As a result, DCA may now invest in securities of foreign issuers located in developed countries.
The accounting records of the Funds are maintained in U.S. dollars. Prices of securities denominated in foreign currencies are translated into U.S. dollars at the closing rate of exchange at period end. Amounts related to the purchase and sale of foreign securities and investment income are translated at the rates of exchange prevailing on the respective dates of such transactions.
The effects of changes in foreign currency exchange rates on investments is separately identified from the fluctuations arising from changes in market values of securities held and reported with all other foreign currency gains and losses in the Funds’ Statements of Operations.
Repurchase Agreements
The Funds may invest in repurchase agreements, which are short-term investments in which the Funds acquire ownership of a debt security and the seller agrees to repurchase the security at a future time and specified price. Repurchase agreements are fully collateralized by the underlying debt security. The Funds will make payment for such securities only upon physical delivery or evidence of book entry transfer to the account of the custodian bank. The seller is required to maintain the value of the underlying security at not less than the repurchase proceeds due the Funds.
38
NOTESTO FINANCIAL STATEMENTS (CONTINUED)
December 31, 2007
Distributions to Shareholders
The Funds intend to make level dividend distributions each month to shareholders. The level dividend rate may be modified by the Board of Trustees from time to time. Dividends and distributions to shareholders are recorded by the Funds on the ex-dividend date. Distributions paid by the Funds are subject to recharacterization for tax purposes. A portion of the distributions paid by the Funds may be reclassified to return of capital and long-term capital gains upon the final determination of the Funds’ taxable income for the year. Net realized gains, unless offset by any available capital loss carryforward, are generally distributed to shareholders annually, although net realized gains may be retained by the Funds in certain circumstances.
Securities Transactions and Investment Income
Investment security transactions are accounted for as of trade date. Dividend income is recorded on the ex-dividend date. Interest income, which includes amortization of premium and accretion of discount, is accrued as earned. Dividend income from REIT securities may include return of capital. Upon notification from the issuer, the amount of the return of capital is reclassified to adjust dividend income, reduce the cost basis and/or adjust realized gain. Realized gains and losses from securities transactions and unrealized appreciation and depreciation of securities are determined using the specific identification method for both financial reporting and income tax purposes.
Reclassifications
Certain amounts for the year ended September 30, 2007 have been reclassified to conform to the December 31, 2007 presentation.
Use of Estimates
The Funds’ financial statements are prepared in accordance with accounting principles generally accepted in the United States of America. This requires management to make estimates and assumptions that affect the reported amounts of assets and liabilities and disclosure of contingent assets and liabilities at the date of the financial statements and the reported amounts of increases and decreases in net assets from operations during the reporting period. Actual results could differ from these estimates.
Investments with Off-Balance Sheet Risk
The Funds enter into financial instrument transactions (such as swaps, futures, option and other derivatives) that may have off-balance sheet market risk. Off-balance sheet market risk exists when the maximum potential loss on a particular financial instrument is greater than the value of such financial instrument as reflected in the Funds’ Statements of Assets and Liabilities.
39
NOTESTO FINANCIAL STATEMENTS (CONTINUED)
December 31, 2007
Indemnifications
In the normal course of business, the Funds enter into contracts that provide general indemnifications. Each Fund’s maximum exposure under this arrangement is dependent upon claims that may be made against the Funds in the future and, therefore, cannot be estimated; however, based on experience, the risk of material loss from such claims is considered remote.
2. FEDERAL INCOME TAXES
No provision for federal income taxes is required since the Funds intend to continue to qualify as regulated investment companies and distribute to shareholders all of its taxable income and capital gains.
Therefore, no federal income tax provision is required in the Funds’ financial statements. Management has analyzed each fund’s tax positions taken on federal income tax returns for all open tax years and has concluded that as of December 31, 2007, no provision for income tax would be required in the Funds’ financial statements. Each Fund’s federal and state income and federal excise tax returns for tax years for which the applicable statutes of limitations have not expired are subject to examination by the Internal Revenue Service and state department of revenue.
Because federal income tax regulations differ from generally accepted accounting principles, income and capital gain distributions determined in accordance with tax regulations may differ from net investment income and realized gain for financial reporting purposes. Accordingly, the character of distributions and composition of net assets for tax purposes differ from those reflected in the accompanying financial statements.
The tax character of the distributions paid by the Funds during the following periods and years ended December 31, 2007, were as follows:
| | | | | | | | | | | | |
| | | Dividend Capital Realty Income
Allocation Fund | | Dividend Capital
Strategic Global
Realty Fund
Period Ended
December 31, 2007 |
| Distributions paid from: | | Period Ended
December 31, 2007 | | Year Ended
September 30, 2007 | | Year Ended
September 30, 2006 | |
Ordinary Income | | $ | 4,613,247 | | $ | 19,736,966 | | $ | 15,534,165 | | $ | 5,940,370 |
Long-Term Capital Gain | | | — | | | 373,547 | | | 798,312 | | | — |
Return of Capital | | | — | | | — | | | 1,647,816 | | | — |
Capital Loss Carryforwards:
At December 31, 2007, DCA and DCW had available for Federal income tax purposes, unused capital losses of $380,321 and $1,091,893, respectively, which expire in 2015.
40
NOTESTO FINANCIAL STATEMENTS (CONTINUED)
December 31, 2007
Post October Losses:
DCA intends to elect to defer to its fiscal year ending December 31, 2008, approximately $13,694,895 of losses recognized during the period November 1, 2007 to December 31, 2007.
As of December 31, 2007, the components of distributable earnings on a tax basis were as follows:
| | | | | | | | |
| | | Dividend Capital
Realty Income
Allocation Fund | | | Dividend Capital
Strategic Global
Realty Fund | |
Undistributed net investment income | | $ | 5,641,232 | | | $ | 668,011 | |
Accumulated net realized loss | | | — | | | | (1,091,893 | ) |
Net unrealized depreciation | | | (69,234,593 | ) | | | (38,998,780 | ) |
Offer cumulative effect of timing differences | | | (15,233,658 | ) | | | 482,206 | |
| | | | | | | | |
Total | | $ | (78,827,019 | ) | | $ | (38,940,456 | ) |
At December 31, 2007 the cost of investments and net unrealized appreciation for federal income tax purposes were as follows:
| | | | | | | | |
| | | Dividend Capital
Realty Income
Allocation Fund | | | Dividend Capital
Strategic Global
Realty Fund | |
Aggregate tax cost (including swaps and foreign currency) | | $ | 242,066,604 | | | $ | 140,457,339 | |
Gross unrealized appreciation | | | 1,403,583 | | | | 470,495 | |
Gross unrealized depreciation | | | (65,470,026 | ) | | | (24,411,159 | ) |
Net depreciation of swaps and foreign currency | | | (5,168,150 | ) | | | (15,058,116 | ) |
| | | | | | | | |
Net unrealized depreciation | | $ | (69,234,593 | ) | | $ | (38,998,780 | ) |
Net investment income (loss) and net realized gain (loss) may differ from financial statements and tax purposes. These differences are primarily due to the treatment of certain investment securities and distribution allocations. These permanent differences in the character of income and distributions between financial statements and tax basis have been reclassified.
For the year ended December 31, 2007 the Funds recorded the following reclassifications to the accounts listed below:
| | | | | | | | | | | |
| | | Paid-in Capital | | | Increase/(Decrease)
(Over)/(Undistributed) Net
Investment Income | | Accumulated Net Realized
Gain/(Loss) | |
Dividend Capital Realty Income Allocation Fund | | $ | (95,926 | ) | | $ | 6,581,725 | | $ | (6,485,799 | ) |
Dividend Capital Strategic Global Realty Fund | | | 29,868 | | | | 1,094,156 | | | (1,124,024 | ) |
Net assets of the Funds were not affected by the reclassifications.
41
NOTETO FINANCIAL STATEMENTS (CONTINUED)
December 31, 2007
In any year when the Funds earn net investment income, the Funds generally intend to make sufficient distributions to prevent application of excise tax under the Internal Revenue Code. However, if the Funds distribute less than the required net investment income and capital gain net income (if any), a required 4% federal excise tax on such retained income and gains will be paid. At December 31, 2007, the Funds retained a portion of their net investment income and therefore are subject to an estimated excise tax. Net capital losses maintained by a Fund at December 31, 2007 will not reduce the Fund’s calendar 2007 excise tax distribution requirements. The amount of net investment income retained by DCA and DCW at December 31, 2007 is estimated at $2,398,158 and $535,843, respectively. This retained income is expected to be distributed in 2008. The estimated excise tax for DCA and DCW due March 15, 2008 is $95,926 and $21,434, respectively.
3. CAPITAL TRANSACTIONS
Dividend Capital Realty Income Allocation Fund
There are an unlimited number of $0.001 par value common shares of beneficial interest authorized. Of the 13,989,197 common shares outstanding on December 31, 2007, Dividend Capital Investments LLC (the “Adviser”) owned 9,036 shares. The Fund issued 12,100,000 common shares in its initial public offering on February 23, 2005. These common shares were issued at $15.00 per share before the underwriting discount of $0.675 per share. An additional 1,578,500 common shares were issued pursuant to an over-allotment option on April 12, 2005. Offering costs of $642,230 were offset against proceeds of the offering and were charged to paid-in capital of the common shares. During the year ended September 30, 2006, a $41,695 adjustment was charged to paid-in capital for common offering costs.
Dividend Capital Strategic Global Realty Fund
There are an unlimited number of the Fund’s $0.001 par value common shares of beneficial interest authorized. Of the 7,522,785 common shares outstanding on December 31, 2007, the Adviser owned 5,441 shares. The Fund issued 7,500,000 common shares in its initial public offering on June 27, 2007. These common shares were issued at $20.00 per share before the underwriting discount of $0.90 per share. Offering costs of $300,000 (representing $0.04 per common share) were offset against proceeds of the offering and were charged to paid-in capital of the common shares. The Adviser has agreed to pay those offering costs of the Fund (other than the underwriting discount) that exceed $0.04 per common share.
42
NOTETO FINANCIAL STATEMENTS (CONTINUED)
December 31, 2007
Transactions in common shares for the period ended December 31, 2007, the year ended September 30, 2007 and the year ended September 30, 2006 were as follows:
| | | | | | | | |
| | | Dividend Capital Realty Income
Allocation Fund | | Dividend Capital
Strategic Global
Realty Fund
Period Ended
December 31,
2007 ** |
| | | Period Ended
December 31,
2007 * | | Year Ended
September 30,
2007 | | Year Ended
September 30,
2006 | |
Common shares outstanding – beginning of period | | 13,960,199 | | 13,724,263 | | 13,685,510 | | 5,236 |
Common shares issued in connection with initial public offering | | — | | — | | — | | 7,500,000 |
Common shares issued to shareholders from reinvested distributions | | 28,998 | | 235,936 | | 38,753 | | 17,549 |
Common shares outstanding – end of period | | 13,989,197 | | 13,960,199 | | 13,724,263 | | 7,522,785 |
* | Dividend Capital Realty Income Allocation Fund changed its fiscal year from September 30th to December 31st. Amounts shown are for the period from October 1, 2007 to December 31, 2007. |
| ** | For the period June 27, 2007 (inception date of the Fund’s initial public offering) through December 31, 2007. |
4. PORTFOLIO SECURITIES
Purchases and sales of investment securities, other than short-term securities are as follows:
| | | | | | | | | | | | |
| | | For the Period October 1, 2007 to
December 31, 2007 | | For the Year Ended
September 30, 2007 |
| | | Purchases | | Sales | | Purchases | | Sales |
Dividend Capital Realty Income Allocation Fund | | $ | 14,230,789 | | $ | 30,272,388 | | $ | 130,812,042 | | $ | 135,511,809 |
| | | | | | |
| | | For the Period June 27, 2007 to
December 31, 2007 |
| | | Purchases | | Sales |
Dividend Capital Strategic Global Realty Fund | | $ | 110,979,841 | | $ | 718,313 |
43
NOTETO FINANCIAL STATEMENTS (CONTINUED)
December 31, 2007
5. INVESTMENT ADVISORYAND ADMINISTRATION AGREEMENTSAND OTHER RELATED PARTY TRANSACTIONS
Dividend Capital Investments LLC (“Dividend Capital” or the “Adviser”) serves as the Funds’ investment adviser and administrator. Pursuant to an Investment Advisory Agreement with the Funds, as compensation for its services to the Funds, Dividend Capital receives an annual investment advisory fee of 0.85% for Dividend Capital Realty Income Allocation Fund and 1.00% for Dividend Capital Strategic Global Realty Fund based on each Fund’s average daily managed assets, computed daily and payable monthly. Pursuant to an Administration Agreement with each Fund, as compensation for its services to the Funds, Dividend Capital receives an annual administration fee of 0.10% based on each Fund’s average daily managed assets, computed daily and payable monthly.
Dividend Capital has entered into an administration, tax, bookkeeping and pricing services agreement with ALPS Fund Services, Inc. (“ALPS”). Under this agreement, ALPS will calculate the net asset value and perform certain other administrative services for DCW. ALPS will be compensated by Dividend Capital (not by DCW) for providing these services. Dividend Capital has entered into an Investment Accounting Agreement and a Tax Service Agreement with State Street Bank and Trust (“State Street”). Under these agreements, State Street will calculate the net asset value and perform tax administrative services for DCA. State Street will be compensated by Dividend Capital (not by DCA) for providing these services.
Trustees of the Funds who are “interested persons” of the Funds do not receive any compensation from the Funds. Each of the Independent Trustees is paid from the Funds an annual retainer of $20,000, and a fee of $2,000 and reimbursement for related expenses for each meeting of the Board he attends. Each Independent Trustee receives from the Funds a fee of $1,000 for each telephonic Board meeting he attends. The Chairman of the Board of Trustees receives from the Funds an additional annual retainer of $10,000.
Certain officers of the Funds are also officers of the Adviser.
During the period ended December 31, 2007, the Adviser voluntarily reimbursed DCW $51,302 for certain transactions. The payment increased DCW’s total return on net asset value by 0.04%.
44
NOTETO FINANCIAL STATEMENTS (CONTINUED)
December 31, 2007
6. LINEOF CREDIT
Dividend Capital Realty Income Allocation Fund
On April 28, 2005, Dividend Capital Realty Income Allocation Fund executed a Revolving Credit and Security Agreement (the “Agreement”) among DCA, Jupiter Securitization Corp. (“Jupiter”) and JP Morgan Chase Bank N.A. (“JP Morgan”) which allows DCA to borrow against a secured line of credit from Jupiter and JP Morgan an aggregate amount up to $85,000,000. On March 16, 2007 the Agreement was amended and the line of credit was increased to $105,000,000. The borrowings under the line of credit are secured by a pledge of the Fund’s portfolio securities. Borrowings under the Agreement bear interest at a variable rate determined by the bank’s conduit program, which has historically been slightly below the 1-month LIBOR. DCA pays fees of 0.175% per annum on 102% of the total line of credit, regardless of usage. DCA also pays fees of 0.20% per annum on the average outstanding amount of borrowings. The average balance during the period ended December 31, 2007 was $61,831,239 or $4.42 per share based on average shares outstanding of 13,979,741. The average cost of funding during the period ended December 31, 2007 was 5.56%. As of December 31, 2007, the Fund had an outstanding loan amount of $53,872,000.
DCA’s borrowing arrangement with Jupiter and JPMorgan is expected to terminate on March 14, 2008 and requires that the loan be repaid in equal quarterly payments over a 1-year period ending March 14, 2009. DCA is currently looking at alternative lending facilities and/or other leverage techniques. However, there can be no assurance that such alternative leverage can be obtained. Further, changes to the Fund’s leverage arrangements may result in increased fees and expenses, including higher ongoing borrowing costs.
7. INVESTMENTSIN INTEREST RATEAND TOTAL RETURN SWAPS
The Funds may use interest rate swaps in connection with the line of credit and other forms of direct or indirect leverage. The interest rate swaps are intended to reduce or eliminate the risk or the negative effect that an increase in short-term interest rates could have on the performance of the Funds’ common shares as a result of the floating rate structure of the line of credit and other forms of direct or indirect leverage. In these interest rate swaps, the Funds agree to pay the other party to the interest rate swap (the “counterparty”) a fixed rate payment in exchange for the counterparty agreeing to pay the Funds a variable rate payment that is intended to approximate the Funds’ variable rate payment obligations on the line of credit. The payment obligations are based on the notional amount of the swap. Depending on the state of interest rates in general, the use of interest rate swaps could enhance or harm the overall performance of the common shares. The market value of interest rate swaps is based on pricing models that consider the time value of money, volatility and the current and forward interest rate markets.
The Funds use total return swaps to gain exposure to underlying referenced securities or indices. Total return swap agreements involve commitments to pay interest plus fees in
45
NOTETO FINANCIAL STATEMENTS (CONTINUED)
December 31, 2007
exchange for a market-linked return, both based on notional amounts. To the extent the total return of the security or index underlying the transaction exceeds or falls short of the offsetting interest rate obligation, the Funds will receive a payment from or make a payment to the counterparty, respectively.
Swaps are marked to market daily. For both interest rate swaps and total return swaps, unrealized gains are reported as an asset and unrealized losses are reported as a liability on the Funds’ Statements of Assets and Liabilities. The change in value of swaps, including the accrual of periodic amounts of interest, net of the market linked return to be paid or received on the swaps, is reported as unrealized gains or losses on the Funds’ Statements of Operations. A realized gain or loss is recorded upon payment or receipt of a periodic payment or termination of a swap agreement. The Funds segregate or earmark sufficient assets as collateral to satisfy the Funds’ current obligation with respect to total return swaps. Entering into swap agreements involves, to varying degrees, elements of credit, foreign currency, market and documentation risk in excess of the amounts recognized on the Statements of Assets and Liabilities. Such risks involve the possibility that there will be no liquid market for these agreements, that the counterparty to these agreements may default on its obligation to perform or disagree as to the meaning of the contractual items in the agreements, and that there may be unfavorable changes in foreign currency, interest rates or values in referenced indices or securities.
Dividend Capital Realty Income Allocation Fund has adopted a non-fundamental policy to limit its investment in securities of non-U.S. issuers to 20% of DCA’s managed assets, measured at the time of investment (the “non-U.S. issuer limitation”). As a component of its investment strategy, DCA may enter into total return swaps where the reference security is issued by a Canadian issuer or the counterparty to the swap is a Canadian financial institution. In this case, DCA considers the non-U.S. investment limitation to apply. It is common for swap contracts to be terminated and re-initiated due to economic factors or the expiration of the term of the swap contract. In such case, DCA may re-initiate the swap contract if deemed to be advisable by the Adviser. In cases where swap contracts are re-initiated with substantially the same terms and the same reference security and number of reference shares, such re-initiations will not be considered to be a new investment for purposes of the application of the non-U.S. issuer limitation. Accordingly, the notional value of the original swap contract that relates to the reference security in question will be the basis for determining compliance with the non-U.S. issuer limitation. As a result of this policy, DCA’s exposure to securities of non-U.S. issuers, as measured by current notional value, could exceed 20%, in some cases significantly so. As of December 31, 2007, the DCA’s exposure to securities of non-U.S. issuers, as measured by current notional value, was 18.96% of its managed assets.
46
NOTETO FINANCIAL STATEMENTS (CONTINUED)
December 31, 2007
8. FOREIGN CURRENCY CONTRACTS
A foreign currency contract is a commitment to purchase or sell a foreign currency at a future date, at a negotiated rate. The Funds may enter into foreign currency contracts to settle specific purchases or sales of securities denominated in a foreign currency and for protection from adverse exchange rate fluctuation. Risks to the Funds include the potential inability of the counterparty to meet the terms of the contract.
The net U.S. dollar value of foreign currency underlying all contractual commitments held by the Funds and the resulting unrealized appreciation or depreciation are determined using prevailing forward foreign currency exchange rates. Unrealized appreciation and depreciation on foreign currency contracts are reported in the Funds’ Statements of Assets and Liabilities as a receivable or a payable and in the Funds’ Statements of Operations with the change in unrealized appreciation or depreciation.
The Funds may realize a gain or loss upon the closing or settlement of the foreign transaction. Such realized gains and losses are reported with all other foreign currency gains and losses in the Statements of Operations.
9. ILLIQUIDAND/OR RESTRICTED SECURITIES
As of December 31, 2007, investments in securities included issues that are restricted. Restricted securities are often purchased in private placement transactions, are not registered under the Securities Act of 1933, may have contractual restrictions on resale, and may be revalued under methods approved by the Board of Trustees as reflecting fair value. A security may also be considered illiquid if it lacks a readily available market.
Upon the recommendation of management, the Trustees have reviewed DCA’s current non-fundamental investment policies and have determined, effective February 28, 2008, to eliminate the policy limiting the Fund’s investment in illiquid/restricted securities to no more than 10% of its total managed assets (determined at the time of purchase) to better reflect changes to the liquidity profile of the Fund’s investments in current market conditions. This limitation was a voluntary operating policy and not required by the 1940 Act. The Trustees will continue to monitor the Fund’s investments in illiquid/restricted securities, and while the Fund may now invest, without limit, in such securities, management does not presently intend to increase investment to illiquid/restricted securities.
DCW may invest, without limit, in illiquid securities.
47
NOTETO FINANCIAL STATEMENTS (CONTINUED)
December 31, 2007
Dividend Capital Realty Income Allocation Fund
Illiquid and/or Restricted Securities as of December 31, 2007
| | | | | | | | | | | |
Description | | Shares | | Acquisition
Date | | Cost | | Market Value | |
| Babson CLO 2005-III, Ltd., 20.810%, 11/11/2019 | | 13,000,000 | | 11/09/2005 | | $ | 13,000,000.00 | | $ | 10,930,946 | |
| INVESCO Navigator Fund, 8.665% (1) | | 3,946 | | 11/17/2005 | | | 3,946,000.00 | | | 3,171,195 | |
| Fraser Sullivan CLO I Ltd. 8.177%, 03/15/2017 | | 3,400,000 | | 03/10/2006 | | | 3,400,000.00 | | | 2,291,233 | |
| Taberna Preferred Funding III Ltd., Class E, 9.203%, 11/05/2015 | | 2,000,000 | | 09/29/2005 | | | 2,000,000.00 | | | 256,820 | |
| Taberna Preferred Funding V Ltd., Class B-IL, 7.453%, 02/05/2016 | | 3,000,000 | | 03/29/2006 | | | 3,000,000.00 | | | 34,929 | |
| Taberna Preferred Funding V Ltd., Class B-2L, 9.453%, 02/05/2016 | | 3,000,000 | | 03/29/2006 | | | 3,000,000.00 | | | 31,485 | |
| Wachovia Bank, Series 2005 C18, 7.028%, 05/19/2015 | | 248,100 | | 10/26/2005 | | | 167,074.54 | | | 145,998 | |
Sorin Real Estate CDO II Ltd., Series 2005 2A, Class H, 8.703%, 01/04/2016 | | 7,500,000 | | 12/21/2005 | | | 7,500,000.00 | | | 4,791,488 | |
| CW Capital Cobalt II, Ltd. Series K, 8.203%, 04/26/2016 | | 4,000,000 | | 05/10/2006 | | | 4,000,000.00 | | | 3,121,612 | |
| CW Capital Cobalt II, Ltd. Class P.S., 16.586%, 04/26/2016 | | 3,500,000 | | 05/10/2006 | | | 3,500,000.00 | | | 1,697,045 | |
| Vertical CRE CDO 2006-I, Ltd. Class G, 8.703%, 04/22/2013 | | 6,500,000 | | 05/24/2006 | | | 6,500,000.00 | | | 4,853,940 | |
| Vertical CRE CDO 2006-I, Ltd. Class P.S., 15.508%, 04/22/2013 | | 1,800,000 | | 05/24/2006 | | | 1,800,000.00 | | | 1,224,000 | |
| Mervyn’s Junior Syndication Mezzanine, 8.10%, 01/01/2008 | | 4,476,028 | | 04/21/2006 | | | 4,476,028.28 | | | 4,476,028 | |
| JP Morgan Chase, Series 2005-LDP2, Class M, 5.806%, 06/15/2016 | | 1,597,000 | | 11/30/2006 | | | 1,266,992.88 | | | 977,667 | |
| Lenox Street, Series 2007-1, 15.173%, 06/04/2017 | | 1,000,000 | | 04/20/2007 | | | 963,573.93 | | | 542,061 | |
| AP AIMCAP Corp., Series A, 8.250%, | | 212,600 | | 06/08/2005 | | | 4,198,950 | | | 4,230,549 | |
| | | | | | | | | | | |
| Total | | | | | | | | | $ | 42,776,996 | |
| | | | | | | | | | | |
| Total Managed Assets | | | | | | | | | $ | 171,933,652 | |
| | | | | | | | | | | |
| Illiquid and/or Restricted Securities as a % of Total Managed Assets | | | | | | | | | | 24.88 | % |
| | | | | | | | | | | |
48
NOTETO FINANCIAL STATEMENTS (CONTINUED)
December 31, 2007
Dividend Capital Strategic Global Realty Fund
Illiquid and/or Restricted Securities as of December 31, 2007
| | | | | | | | | | | | |
Description | | Shares/
Principal
Amount | | Acquisition
Date | | Cost | | Market Value | |
Gramercy Real Estate, Series 2007-1A Class GFX, 6.000%, 08/15/2016 | | $ | 2,000,000 | | 07/26/2007 | | $ | 1,689,136 | | $ | 1,286,260 | |
Gramercy Real Estate, Series 2007-1A Class HFX, 6.000%, 08/15/2016 | | | 5,150,000 | | 07/26/2007 | | | 4,210,368 | | | 2,985,713 | |
Morgan Stanley Capital I 2007-SRR4 Series G, 7.240%, 06/20/2016 | | | 5,750,000 | | 06/27/2007 | | | 5,750,000 | | | 3,370,650 | |
| | | | | | | | | | | | |
Total | | | | | | | | | | $ | 7,642,623 | |
| | | | | | | | | | | | |
Total Net Assets | | | | | | | | | | $ | 104,432,655 | |
| | | | | | | | | | | | |
Illiquid and/or Restricted Securities as a % of Total Net Assets | | | | | | | | | | | 7.32 | % |
| | | | | | | | | | | | |
10. RECENT ACCOUNTING PRONOUNCEMENTS
In September 2006, the Financial Accounting Standards Board (“FASB”) issued Statement of Financial Accounting Standards No. 157, “Fair Value Measurements” (“SFAS No. 157”). SFAS No. 157 defines fair value, establishes a framework for measuring fair value in accordance with generally accepted accounting principles and expands disclosure about fair value measurements. SFAS No. 157 is effective for fiscal years beginning after November 15, 2007. Management is currently evaluating the impact the adoption of SFAS No. 157 will have on the Funds’ financial statement disclosures.
In February 2007, the FASB issued Statement of Financial Accounting Standards No. 159 (“SFAS No. 159”), “The Fair Value Option for Financial Assets and Financial Liabilities – Including an amendment of FASB Statement No. 115.” SFAS No. 159 permits entities to choose to measure many financial instruments and certain other items at fair value. This Statement is expected to expand the use of fair value measurement, which is consistent with the FASB’s long-term measurement objectives for accounting for financial instruments. SFAS No. 159 is effective for fiscal years beginning after November 15, 2007. Management is currently evaluating the impact the adoption of SFAS No. 159 will have on the Funds’ financial statement disclosures.
11. SUBSEQUENT EVENTS
Subsequent to December 31, 2007, Dividend Capital Realty Income Allocation Fund paid a regular monthly distribution of $0.1100 per common share on January 31, 2008 to common shareholders of record on January 17, 2008.
Subsequent to December 31, 2007, Dividend Capital Strategic Global Realty Fund paid a regular monthly distribution of $0.1500 per common share on January 31, 2008 to shareholders of record on January 17, 2008 as well as a special distribution of $.004 on January 3, 2008 to shareholders of record on December 28, 2007.
49
REPORTOF INDEPENDENT
REGISTERED PUBLIC ACCOUNTING FIRM
Dividend Capital Realty Income Allocation Fund
The Shareholders and Board of Trustees
Dividend Capital Realty Income Allocation Fund:
We have audited the accompanying statement of assets and liabilities of Dividend Capital Realty Income Allocation Fund, including the statement of investments, as of December 31, 2007, and the related statements of operations, cash flows, changes in net assets, and financial highlights for the period from October 1, 2007 to December 31, 2007 and the year ended September 30, 2007. These financial statements and financial highlights are the responsibility of the Fund’s management. Our responsibility is to express an opinion on these financial statements based on our audits. The statement of changes in net assets for the year ended September 30, 2006, and the financial highlights for the year ended September 30, 2006, and for the period from February 24, 2005 (inception of offering) to September 30, 2005, were audited by other auditors, whose report dated November 16, 2006, expressed an unqualified opinion of this information.
We conducted our audits in accordance with the standards of the Public Company Accounting Oversight Board (United States). Those standards require that we plan and perform the audit to obtain reasonable assurance about whether the financial statements and financial highlights are free of material misstatement. An audit includes examining, on a test basis, evidence supporting the amounts and disclosures in the financial statements. Our procedures included confirmation of securities owned as of December 31, 2007, by correspondence with the custodian and brokers. An audit also includes assessing the accounting principles used and significant estimates made by management, as well as evaluating the overall financial statement presentation. We believe that our audits provide a reasonable basis for our opinion.
In our opinion, the financial statements and financial highlights referred to above present fairly, in all material respects, the financial position of Dividend Capital Realty Income Allocation Fund as of December 31, 2007, and the results of its operations, cash flows, changes in its net assets, and the financial highlights for the period from October 1, 2007 to December 31, 2007, and for the year ended September 30, 2007, in conformity with U.S. generally accepted accounting principles.
|
| KPMG LLP |
|
| Denver, Colorado |
| February 27, 2008 |
50
REPORTOF INDEPENDENT
REGISTERED PUBLIC ACCOUNTING FIRM
Dividend Capital Strategic Global Realty Fund
The Shareholders and Board of Trustees
Dividend Capital Strategic Global Realty Fund:
We have audited the accompanying statement of assets and liabilities of Dividend Capital Strategic Global Realty Fund, including the statement of investments, as of December 31, 2007, and the related statements of operations, changes in net assets, and financial highlights for the period from June 27, 2007 (inception of offering) to December 31, 2007. These financial statements and financial highlights are the responsibility of the Fund’s management. Our responsibility is to express an opinion on these financial statements based on our audit.
We conducted our audit in accordance with the standards of the Public Company Accounting Oversight Board (United States). Those standards require that we plan and perform the audit to obtain reasonable assurance about whether the financial statements and financial highlights are free of material misstatement. An audit includes examining, on a test basis, evidence supporting the amounts and disclosures in the financial statements. Our procedures included confirmation of securities owned as of December 31, 2007, by correspondence with the custodian and brokers or by other appropriate auditing procedures where replies from brokers were not received. An audit also includes assessing the accounting principles used and significant estimates made by management, as well as evaluating the overall financial statement presentation. We believe that our audit provides a reasonable basis for our opinion.
In our opinion, the financial statements and financial highlights referred to above present fairly, in all material respects, the financial position of Dividend Capital Strategic Global Realty Fund as of December 31, 2007, and the results of its operations, changes in its net assets, and the financial highlights for the period from June 27, 2007 (inception of offering) to December 31, 2007, in conformity with U.S. generally accepted accounting principles.
|
| KPMG LLP |
|
| Denver, Colorado |
| February 27, 2008 |
51
SHAREHOLDER TAX INFORMATION
December 31, 2007 (Unaudited)
Certain tax information regarding the Funds is required to be provided to shareholders based upon the Funds’ income and distributions for the taxable year ended December 31, 2007.
During the period ended December 31, 2007, 1.35% and 0.62% of the dividends paid by DCA and DCW from net investment income, respectively, qualify for the corporate dividends received. Also during the period ended December 31, 2007, 1.34% and 0.62% of distributions of ordinary income by DCA and DCW, respectively, met the requirements regarding qualified dividend income.
During the period ended December 31, 2007, 2.26% and 9.03% of distributions from net investment income by DCA and DCW, respectively, is income derived from U.S. Treasury Obligations.
Please note that the distributions paid by the Funds to shareholders are subject to recharacterization for tax purposes. The final tax treatment of these distributions is reported to shareholders on Form 1099-DIV, which are mailed to shareholders by January 31st of each year. The Funds may pay distributions in excess of the Funds’ net investment company taxable income and this excess would be a tax-free return of capital distributed from the Funds’ assets. Distributions of capital decrease the Funds’ total assets and, therefore, could have the effect of increasing the Funds’ expense ratio. In addition, the Funds may have to sell portfolio securities at a less than opportune time.
The Funds own securities issued by REITs. A portion of the dividends paid by REITs may be recharacterized for tax purposes following year-end as capital gains and/or return of capital. To the extent this occurs, distributions paid by the Funds during the year also will be reclassified to reflect these REIT recharacterizations. Therefore the actual composition of the distributions paid may change substantially by year-end and, to the extent these changes do occur, they will have the effect of reducing the net investment income component of fund distributions and correspondingly increasing the capital gains and/or return of capital components.
52
DIVIDEND REINVESTMENT PLAN
December 31, 2007 (Unaudited)
The Funds offer a dividend reinvestment plan (the “Plan”) pursuant to which shareholders, unless they otherwise elect, automatically have dividends and capital gains distributions reinvested in common shares of the Fund by The Bank of New York (the “Plan Agent”). Shareholders who elect not to participate in the Plan receive all distributions in cash paid by wire or check mailed directly to the Plan Agent.
How the Plan Works
After the Funds declare a dividend or determine to make a capital gain distribution, the Plan Agent will acquire shares for the participants’ accounts, depending upon the circumstances described below, either (i) through receipt of newly issued shares of the Funds or (ii) by open-market purchases as follows:
| • | | If, on the payment date, the NAV is equal to or less than the market price per share plus estimated brokerage commissions, the Plan Agent will invest the distribution amount in newly issued shares on behalf of the Participants. The number of newly issued shares to be credited to each Participant’s account will be determined by dividing the dollar amount of the distribution by the NAV on the date the shares are issued. However, if the NAV is less than 95% of the market price on the payment date, the dollar amount of the distribution will be divided by 95% of the market price on the payment date. Because common shares may be issued at less than their market price, Plan Participants may get a benefit that non-participants do not. |
| • | | If, on the payment date, the NAV is greater than the market value per share plus estimated brokerage commissions, the Plan Agent will invest the distribution amount in shares acquired on behalf of the Participants in open-market purchases, which may be made on the NYSE, in the over-the-counter market or in negotiated transactions and may be on such terms as to price, delivery and otherwise as the Plan Agent shall determine. It is possible that the market price for the shares may increase before the Plan Agent has completed its purchases. Therefore, the average purchase price per share the Plan Agent pays may exceed the market price thereof on the payment date. If the market price per share increases so that it equals or exceeds the NAV per share (minus brokerage commissions), it will result in the acquisition by the Plan Agent of fewer shares than if the distribution had been paid in shares issued by the Fund. Otherwise, the Plan Agent will use all distributions received in cash to purchase shares in the open market on or shortly after the payment date, but in no event more than thirty (30) days after the payment date. |
53
DIVIDEND REINVESTMENT PLAN (CONTINUED)
December 31, 2007 (Unaudited)
Costs of the Plan
The Plan Agent’s fees for the handling of reinvestment of dividends and other distributions will be paid by the Funds. However, each participant will pay a pro rata share of brokerage commissions incurred with respect to the Plan Agent’s open-market purchases in connection with the reinvestment of dividends and other distributions. If a participant elects to have the Plan Agent sell part or all of his or her shares and remit the proceeds, the participant will be charged his or her pro rata share of brokerage commissions on the shares sold, plus a $15.00 transaction fee.
Tax Implications
The automatic reinvestment of dividends or distributions does not relieve participants of any taxes which may be payable on such dividends or distributions. Participants will receive tax information annually for their personal records and to help them prepare their federal income tax return. For further information as to the tax consequences of participation in the Plan, Participants should consult with their own tax advisors.
Right to Withdraw
Participants whose shares are registered in his or her name may terminate his or her account under the Plan by notifying the Agent in writing at BNY Mellon Shareowner Services, P.O. Box 358035, Pittsburgh, PA 15252-8035, or by calling the Agent at 1.877.296.3711, or using BNY Mellon’s website at: www.melloninvestor.com/ISD. Such termination will be effective with respect to a particular distribution if the Participant’s notice is received by the Agent prior to such distribution record date. Participants whose shares are held by a brokerage firm should contact his or her broker. If a Participant holds shares through a broker, the Participant may not be able to transfer his or her shares to another broker and continue to participate in the Plan if the new broker does not permit such participation. The Plan may be amended or terminated by the Agent or the Funds upon notice in writing mailed to each Participant at least 90 days prior to the effective date of the termination.
54
FUND PROXY VOTING POLICIESAND PROCEDURES
December 31, 2007 (Unaudited)
The Funds have delegated to the Adviser the voting of proxies relating to its securities. The Adviser will vote such proxies in accordance with the Adviser’s policies and procedures. The policies and procedures used in determining how to vote proxies relating to portfolio securities and information regarding how the Funds voted and proxies related to securities during the most recent 12-month period ended June 30th for which an SEC filing has been made are available without charge, upon request, by contacting the Funds at 1.866.324.7348, visiting the Funds’ website at http://www.dividendcapital.com and visiting the Securities Exchange Commission’s (the “Commission”) website at http://www.sec.gov.
PORTFOLIO HOLDINGS
December 31, 2007 (Unaudited)
The Funds file their complete schedule of portfolio holdings with the Commission for the first and third quarters of each fiscal year on Form N-Q within 60 days after the end of the period. Copies of the Funds’ Forms N-Q are available without charge, upon request, by contacting the Funds at 1.866.324.7348 and on the Commission’s website at http://www.sec.gov. You may also review and copy Form N-Q at the Commission’s Public Reference Room in Washington, D.C. For more information about the operation of the Public Reference Room, please call the Commission at 1.800.SEC.0330.
55
SARBANES-OXLEY ACTAND OTHER INFORMATION
December 31, 2007 (Unaudited)
NYSE Annual Certification
On May 17, 2007, DCA submitted a CEO annual certification to the NYSE on which the Funds’ principal executive officer certified that he was not aware, as of that date, of any violation by DCA of the NYSE’s Corporate Governance Listing Standards. In addition, as required by Section 302 of the Sarbanes-Oxley Act of 2002 and related SEC rules, the Funds’ principal executive officer and principal financial officer have made quarterly certifications, included in filings with the SEC on Forms N-CSR and N-Q, relating to, among other things, the Funds’ disclosure controls and procedures and internal controls over financial reporting, as applicable.
Appointment of Board Member
Effective September 30, 2007, Dave Agostine was appointed as President and Interested Trustee of the Funds. The appointment was unanimously approved by the Board of Trustees at a meeting held on August 22, 2007. Mr. Agostine, who was appointed President of the Adviser in July 2007, assumes the President and Trustee positions of the Funds from Thomas Florence, who continues to serve as the Chief Executive Officer of the Adviser.
TRUSTEESAND OFFICERS
December 31, 2007 (Unaudited)
The business and affairs of the Funds are managed under the direction of the Board. The Board approves all significant agreements between the Funds and persons or companies furnishing services to it, including the Funds’ agreements with the Adviser, administrator, custodian and transfer agent. The management of the Funds’ day-to-day operations is delegated to its officers and the Adviser, subject always to the investment objectives and policies of the Funds and to the general supervision of the Board.
Basic information about the identity and experience of each Trustee and Officer is set forth in the charts below.
The Trustees of the Funds, their age, the position they hold with the Funds, their term of office and the length of time served, their principal occupations for at least the past five years, the number of portfolios they oversee within the Dividend Capital fund complex (“Fund Complex”), and other directorships held by each Trustee are set forth on the next page.
56
TRUSTEESAND OFFICERS (CONTINUED)
December 31, 2007 (Unaudited)
| | | | | | | | |
Name, Age, Address* and Position with Fund | | Length of
Time Served | | Principal Occupation During Past Five Years (Including Other Directorships Held) | | Number of
Funds within the
Funds**
Overseen by Trustee | | Other
Directorships
Held Outside
Fund Complex |
Class III (term expires 2008) | | | | | | | | |
| | | | |
Jonathan F. Zeschin Independent Trustee and Chairman of the Board Age: 53 | | Since 01/24/2005 for DCA and 05/22/2007 for DCW | | Essential Advisers, Inc., President (since 06/2000); and JZ Partners LLC, Managing Partner (since 08/1998) | | 2 | | Matthews Asian Funds, Trustee (since 05/2007) |
| | | | |
David W. Agostine Interested Trustee and President*** Age: 46 | | Since 09/30/2007 | | Dividend Capital Investments LLC, President (since 05/2007); formerly Intellect Integrated Electronics, Inc., Chief Executive Officer (03/2003 to 05/2007); formerly Janus Institutional, Managing Director (01/2000 to 03/2003) | | 2 | | None |
| | | | |
| Class I (term expires 2009) | | | | | | | | |
| | | | |
Thomas H. Mack Independent Trustee Age: 65 | | Since 01/24/2005 for DCA and 05/22/2007 for DCW | | Thomas H. Mack & Co., Inc., President (since 01/1991) | | 2 | | Greenwald & Associates, Director (since 01/2002) |
| | | | |
| Class II (term expires 2010) | | | | | | | | |
| | | | |
John Mezger Independent Trustee Age: 53 | | Since 08/17/2005 for DCA and 05/22/2007 for DCW | | WF Option, LLC, Manager (since 2004); Oak Point, LLC, Manager (since 2003); Cherry Creek South Associates, LLC, Manager (since 1999); and Corby Properties, LLC, Manager (since 1998) | | 2 | | None |
| | | | |
J. Gibson Watson, III Independent Trustee/Nominee Age: 52 | | Since 02/21/2006 for DCA and 05/22/2007 for DCW | | Prima Capital Holding, Inc., President and Chief Executive Officer and Director (since 01/2000) | | 2 | | None |
* | Unless otherwise indicated, the business address of each Trustee is c/o Dividend Capital Investments LLC, 518 17th Street, 18th Floor, Denver, Colorado 80202. |
| ** | The term “Funds” as used herein includes Dividend Capital Realty Income Allocation Fund and Dividend Capital Strategic Global Realty Fund. |
| *** | Mr. Agostine is deemed to be an “interested person” as defined in Section 2(a)(19) of the 1940 Act (“Interested Trustee”), because of his affiliation with the Funds’ adviser, Dividend Capital Investments LLC. |
57
TRUSTEESAND OFFICERS (CONTINUED)
December 31, 2007
The officers of the Funds, their ages and their principal occupations for at least the past five years are set forth below. The address for each of the officers is 518 17th Street, 18th Floor, Denver, CO 80202.
| | | | |
Name and Year of Birth | | Position(s) Held with the Fund | | Principal Occupation During Past Five Years |
Jeffrey Taylor Age: 35 | | Vice President, Treasurer and Principal Financial Officer | | Dividend Capital Investments LLC, Chief Operating Officer (since 12/2005); and Vice President of Business Services (02/2004 — 12/2005); INVESCO Inc., Product Manager (07/2003 — 01/2004); and INVESCO Funds Group Inc., Manager of Marketing and Business Analytics (01/1999 — 06/2003). |
| | |
Derek Mullins Age: 34 | | Secretary and Assistant Treasurer | | Dividend Capital Investments LLC, Director of Operations (since 01/2007); and Manager of Fund Operations (11/2004 to 12/2006); formerly, ALPS Mutual Funds Services Inc., Manager of Fund Administration (11/2003 — 10/2004) and Fund Controller (01/1999 — 10/2003). |
| | |
Richard Grove Age: 38 | | Chief Compliance Officer | | Dividend Capital Investments LLC, Vice President and Chief Compliance Officer (since 08/2007); Madison Capital Advisors, LLC, Vice President and Chief Compliance Officer (05/2005 – 07/2007); Janus Capital Group, Assistant Vice President of Compliance (01/2005 – 04/2005); Janus Capital Group, Director of Compliance (02/2002 – 01/2005). |
| | |
Jami VonKaenel Age: 29 | | Assistant Secretary | | Dividend Capital Investments LLC and Dividend Capital Securities, Controller (since 10/2006) and Assistant Controller (06/2004 — 10/2006); formerly, Ernst and Young LLP, Senior, Technology and Security Risk Services (02/2004 — 06/2004); and Accenture, Analyst (01/2001 — 01/2004). |
58
KEY INFORMATION
December 31, 2007
| | |
| Key Information | | Officers and Trustees |
| |
| Investment Adviser and | | Jonathan F. Zeschin |
| Administrator | | Independent Trustee and |
| Dividend Capital Investments LLC | | Chairman of the Board |
| 518 17th Street, Suite 1200 | | |
| Denver, CO 80202 | | Thomas H. Mack |
| | Independent Trustee |
| Sub Administrator (for Dividend | | |
| Capital Strategic Global Realty Fund) | | John Mezger |
| ALPS Fund Services, Inc. | | Independent Trustee |
| 1290 Broadway, Suite 1100 | | |
| Denver, CO 80203 | | J. Gibson Watson, III |
| | Independent Trustee |
| Custodian and Fund | | |
| Accounting Agent | | David W. Agostine |
| State Street Bank and Trust Co. | | President and Trustee |
| 801 Pennsylvania | | |
| Kansas City, MO 64105 | | Jeffrey W. Taylor |
| | Vice President and Treasurer |
| Transfer Agent | | |
| BNY Mellon Shareowner Services | | Derek J. Mullins |
| 480 Washington Blvd. | | Secretary and Assistant Treasurer |
| Jersey City, NJ 07310 | | |
| | Richard Grove |
| Legal Counsel | | Chief Compliance Officer |
| Dechert LLP | | |
| 4675 MacArthur Court, Suite 1400 | | Jami N. VonKaenel |
| Newport Beach, CA 92660 | | Assistant Secretary |
| |
| Independent Registered Public | | |
| Accounting Firm | | |
| KPMG LLP | | |
| 707 17th Street, Suite 2700 | | |
| Denver, CO 80202 | | |
New York Stock Exchange Symbols: DCA and DCW
This report is for shareholder information. This is not a prospectus intended for use in the purchase or sale of fund shares. Statements and other information contained in this report are as dated and are subject to change.
59

Item 2. Code of Ethics
| | (a) | The Registrant, as of the end of the period covered by the report, has adopted a code of ethics that applies to the Registrant’s principal executive officer, principal financial officer, principal accounting officer or controller or any persons performing similar functions on behalf of the Registrant. |
| | (c) | During the period covered by this report, no amendments were made to the provisions of the code of ethics adopted in 2(a) above. |
| | (d) | During the period covered by this report, no implicit or explicit waivers to the provisions of the code of ethics adopted in 2(a) were granted. |
| | (f) | The Registrant’s Code of Ethics is attached as an Exhibit hereto. |
Item 3. Audit Committee Financial Expert
The Registrant’s Board of Trustees has determined that it has two audit committee financial experts serving on its audit committee: Jonathan F. Zeschin and Thomas H. Mack. Messrs. Zeschin and Mack are “independent” Trustees, as defined in paragraph (a)(2) of Item 3. Under applicable securities laws, a person who is determined to be an audit committee financial expert will not be deemed an “expert” for any purpose, including without limitation for the purposes of Section 11 of the Securities Act of 1933, as a result of being designated or identified as an audit committee financial expert. The designation or identification of a person as an audit committee financial expert does not impose on such person any duties, obligations, or liabilities that are greater than the duties, obligations, and liabilities imposed on such person as a member of the audit committee and Board of Trustees in the absence of such designation or identification.
Item 4. Principal Accountant Fees and Services
The Registrant changed its principal accountant during the fiscal year ended September 30, 2007. Unless otherwise noted, the fees billed and services rendered during the fiscal year ended September 30, 2007 represent those of the Registrant’s current principal accountant. For the fiscal year ended September 30, 2006, the predecessor principal accountant’s fees are disclosed.
| (a) | – (d) Aggregate fees billed to the Registrant for the period ended December 31, 2007 and the fiscal years ended September 30, 2007 and September 30, 2006, respectively, for professional services rendered by the Registrant’s principal accountant were as follows: |
| | | | | | | | | | |
| | | Period Ended
December 31,
2007 | | Fiscal Year Ended
September 30,
2007 | | | Fiscal Year Ended
September 30,
2006 |
Audit Fees | | $ | 36,000 | | $ | 52,000 | | | $ | 30,000 |
Audit-Related Fees | | | — | | | — | | | | — |
Tax Fees | | | — | | $ | 32,415 | * | | $ | 22,290 |
All Other Fees | | | — | | | — | | | | — |
* The Tax fees disclosed above were charged by the predecessor principal accountant, Deloitte and Touche LLP for services incurred through April 25, 2007, the date in which the Registrant’s Board of Trustees selected KPMG LLP as the principal accountant of the Registrant.
Aggregate fees billed by the Registrant’s principal accountant for the period ended December 31, 2007 and the fiscal years ended September 30, 2007 and September 30, 2006, respectively, for non-audit services provided to the Registrant’s investment adviser and any entity controlling, controlled by, or under common control with Dividend Capital Investments LLC (the “Adviser”) that provides ongoing services to the registered investment company, where the engagement relates directly to the operations and financial reporting of the registrant, were as follows:
| | | | | | | | |
| | | Period Ended
December 31,
2007 | | Fiscal Year Ended
September 30,
2007 | | | Fiscal Year Ended
September 30,
2006 |
Audit-Related Fees | | — | | — | | | | — |
Tax Fees | | — | | 30,074 | ** | | $ | 26,190 |
All Other Fees | | — | | — | | | | — |
** The Tax fees disclosed above were charged by the predecessor principal accountant, Deloitte and Touche LLP for services incurred through April 25, 2007, the date in which the Registrant’s Board of Trustees selected KPMG as the principal accountant of the Registrant.
These tax services were billed in connection with the preparation of tax returns and other miscellaneous tax services.
| (e)(1) | The Audit Committee pre-approves audit and non-audit services performed for the Registrant by the principal accountant. The Audit Committee also pre-approves non-audit services performed by the Registrant’s principal accountant for the Registrant’s Adviser and affiliates servicing the Registrant, if the engagement relates directly to the operations and financial reporting of the Registrant. |
| | |
| |
| | The Audit Committee may delegate pre-approval authority to a subcommittee of one or more of its members. Any decision of the subcommittee to grant pre-approvals is presented to the full Audit Committee at its next regularly scheduled meeting. |
| |
| (e)(2) | | No services described in paragraphs (b) through (d) above were approved pursuant to paragraph (c)(7)(i)(C) of Rule 2-01 of Regulation S-X. |
| |
| (f) | | Not applicable |
| |
| (g) | | Aggregate Non-Audit Fees: The aggregate non-audit fees billed by the Registrant’s accountant for services rendered to the Registrant, the Registrant’s Adviser and any entity controlling, controlled by, or under common control with the Adviser that provides ongoing services to the Registrant were $0, $62,489 and $48,480 for the period ended December 31, 2007 and the fiscal years ended September 30, 2007 and September 30, 2006, respectively. |
| |
| (h) | | Not applicable |
Item 5. Audit Committee of Listed Registrants
| | |
| |
| (a) | | The Registrant has a separately-designated standing Audit Committee established in accordance with Section 3(a)(58)(A) of the Exchange Act. The committee members are: Jonathan F. Zeschin, Thomas H. Mack, John Mezger and J. Gibson Watson III. |
| |
| (b) | | Not applicable. |
Item 6. Schedule of Investments
Included as part of the report to shareholders filed under Item 1 of this Form N-CSR.
Item 7. Disclosure of Proxy Voting Policies and Procedures for Closed-End Management Investment Companies
The Registrant has delegated, subject to the supervision of the Board, the voting of proxies relating to its voting securities to the Adviser. The Proxy and Corporate Action Voting Policies and Procedures of the Adviser are attached as Exhibit 99.PROXYPOL hereto.
Item 8. Portfolio Managers of Closed-End Management Investment Companies.
| | |
| |
| (a)(1) | | The Adviser’s investment committee (“Investment Committee”) is charged with the overall management of the Registrant’s portfolio, including the development and implementation of overall portfolio strategy and the day-to-day management of the portfolio. Members of the Investment Committee include: (1) Mr. Charles Song, |
| |
| | |
Managing Director of Investments of the Adviser; (2) Mr. Amitabh Godha, Senior Vice President of Investments of the Adviser; (3) Ms. Karen Kulvin, a Senior Vice President of Investments of the Adviser; and (4) Mr. Jeffrey Taylor, Chief Operating Officer of the Adviser (collectively, the “Committee Members”).
Effective September 30, 2007, Dr. Glenn Mueller is no longer a member of the Adviser’s Investment Committee.
Biographical Information
Biographical information regarding the Committee Members is set forth below:
Charles Song. Mr. Song, Managing Director of Investments, serves in various capacities for the real estate and fixed income portfolios managed by the Adviser. His primary responsibilities include executing portfolio management and trading decisions for the REIT equity and fixed income securities for all products and accounts managed by the Adviser . Prior to joining the Adviser in 2003, Mr. Song was a consultant for Newbridge Capital and served as an independent advisor on merger and acquisition transactions for various investment consortiums in Asia from 2000 to 2003. Additionally, Mr. Song’s experience includes co-founding Novalis Ventures, an investment fund focused on early-stage investments in the real estate industry, and working as an associate at Cahill, Warnock & Company, a private equity fund from 1998 to 2000. Mr. Song began his career in the Asset Finance Group at Lehman Brothers in New York. While at Lehman, Mr. Song structured more than 65 asset-backed securitizations, representing more than $40 billion of new issues. He is a member of the National Association of Real Estate Investment Trusts (NAREIT), the Urban Land Institute (ULI), the Commercial Mortgage Securities Association (CMSA), and the Cornell University Real Estate Council. Mr. Song holds a bachelor’s degree from Cornell University.
Amitabh Godha. Mr. Godha, Senior Vice President of Investments serves in various capacities for the real estate investment portfolios managed by the Adviser. His primary responsibilities include conducting research on the office, industrial, self-storage and specialty finance sectors of the equity REIT universe, and managing the REIT preferred and Canadian REIT portfolios. Prior to joining the Adviser in 2003, Mr. Godha served as an independent consultant, assisting early-stage companies with capital-raising and providing investment funds with merger and acquisition and leveraged buyout analyses. Mr. Godha gained direct investment experience as an associate at Cahill, Warnock & Company, a private equity fund based in Baltimore, Maryland. In 1994, Mr. Godha began his career at Lehman Brothers in New York, New York as an investment banking analyst in the Healthcare Group. Mr. Godha earned his bachelor’s degree in finance from Georgetown University and his MBA from The Wharton School of the University of Pennsylvania.
Karen Kulvin. Ms. Kulvin is Senior Vice President of Investments and serves in various capacities for the real estate fixed income investment portfolios managed by the Adviser. Prior to joining the Adviser in 2006, Ms. Kulvin was the senior vice president in charge
| | |
| |
| | of asset management for Newcastle, a public REIT that buys subordinate CMBS and other real-estate related securities for CDO execution. Prior to Newcastle, she worked on the CMBS desk at Bear Stearns. She also worked at LNR in various asset management capacities for 5 years. Ms. Kulvin received a bachelor’s degree from Tufts University and an MBA from Boston University. |
| |
| | Jeffrey Taylor, CFA. Mr. Taylor is the Chief Operating Officer of the Adviser. Mr. Taylor brings over ten years experience in investment advisor operating company functions to the Adviser. A Chartered Financial Analyst, Mr. Taylor’s background includes client service, product management, operating company analysis, strategic planning and business management roles within investment advisors. Prior to joining the Adviser in 2004, he served in various positions with INVESCO Funds Group, most notably as product manager and manager of marketing and business analytics, where he was responsible for the development of the company’s portfolio review and product rationalization processes, as well as strategic business analysis and planning initiatives. Mr. Taylor holds a bachelor’s degree from Pennsylvania State University and an MBA from the University of Colorado at Denver. |
| |
| (a)(2) | | The following table provides information about the other registered investment companies, other pooled investment vehicles and other accounts managed by the Committee Members who are primarily responsible for the day-to-day management of any other portfolio as of December 31, 2007: |
| | | | | | |
| | | | | Number of All Other
Accounts | | Total Assets of All
Other Accounts
(in millions) |
Mr. Song: | | Other Registered Investment Companies | | 2 | | $126 |
| | Other Pooled Investment Vehicles | | 2** | | $24 |
| | Other Accounts | | 5 | | $451 |
Mr. Godha | | Other Registered Investment Companies | | 2 | | $126 |
| | Other Pooled Investment Vehicles | | 1 | | $13 |
| | Other Accounts | | 5 | | $451 |
Ms. Kulvin: | | Other Registered Investment Companies | | 2 | | $126 |
| | Other Pooled Investment Vehicles | | 1 | | $13 |
| | Other Accounts | | 5 | | $451 |
| | | | | | |
| | | | | Number of All Other
Accounts | | Total Assets of All
Other Accounts
(in millions) |
Mr. Taylor: | | Other Registered Investment Companies | | 2 | | $126 |
| | Other Pooled Investment Vehicles | | 1 | | $13 |
| | Other Accounts | | 5 | | $451 |
**One account managed by Mr. Song charges a performance fee. The account has approximately $11 million in total assets.
Conflicts of Interest
From time to time, potential conflicts of interest may arise between the Committee Members’ management of the investments of the Registrant, on the one hand, and the management of other accounts, on the other. The other accounts might have similar investment objectives or strategies as the Registrant, track the same index the Registrant tracks or otherwise hold, purchase, or sell securities that are eligible to be held, purchased or sold by the Registrant. The other accounts might also have different investment objectives or strategies than the Registrant.
| | • | | Knowledge and Timing of Registrant Trades. A potential conflict of interest may arise as a result of the Committee Members’ management of the Registrant’s portfolio. Because of their position with the Adviser and the Registrant, the Committee Members know the size, timing and possible market impact of the Registrant’s trades. It is theoretically possible that the Committee Members could use this information to the advantage of other accounts they manage and to the possible detriment of the Registrant. |
| | • | | Investment Opportunities. A potential conflict of interest may arise as result of a Committee Member’s management of a number of accounts with varying investment guidelines. Often, an investment opportunity may be suitable for both the Registrant and other accounts managed by a Committee Member, but may not be available in sufficient quantities for both the Registrant and the other accounts to participate fully. Similarly, there may be limited opportunity to sell an investment held by the Registrant and another account. The Adviser has adopted policies and procedures reasonably designed to allocate investment opportunities on a fair and equitable basis over time. |
Under the Adviser’s allocation procedures, investment opportunities are allocated among various investment strategies based on individual account investment guidelines and the Adviser’s investment outlook. The Adviser has also adopted additional procedures to complement the general trade allocation policy that are designed to address potential conflicts of interest due to the side-by-side management of the Registrant and certain other accounts, including investment opportunity allocation issues.
| | |
| |
| (a)(3) | | The objective of the Adviser’s portfolio compensation program is to provide pay and long-term compensation for its employees that is competitive with the mutual fund/investment advisory market relative to the Adviser’s size and geographical location. Committee Members participate in a compensation program that includes base salary, the potential for a discretionary bonus and the potential for long-term incentives. Committee Member compensation is reviewed and may be modified each year as appropriate to reflect changes in the market, as well as to adjust the factors used to determine bonuses to promote good sustained investment performance. |
| |
| | • Base Salary. Each Committee Member is paid a base salary. In setting the base salary, the Adviser’s intention is to be competitive in light of a Committee Member’s experience and responsibilities. The base salary is also a function of industry salary rates and individual performance as measured against annual goals. |
| |
| | • Annual Bonus. Each Committee Member is eligible to receive an annual cash bonus that may be equal to as much as 200% of his annual base salary. This bonus is determined by a Committee Member’s contribution to investment management results consistent with the Registrant’s stated objectives as well as other qualitative and quantitative factors taken into consideration. |
| |
| | • Long-Term Incentive Program. Each Committee Member has the potential to participate in a long-term incentive program which may include an equity ownership program in the Adviser. Equity ownership is awarded based on individual contributions to the Adviser’s business and the long-term potential of that individual to the Adviser. |
| |
| (a)(4) | | The following table shows the dollar range of shares of the Registrant owned by the Committee Members as of December 31, 2007. |
| | | | | | |
| Name | | $0 | | $1-$10,000 | | $10,001-$50,000 |
| | | |
Mr. Song | | x | | | | |
| | | |
Mr. Godha | | | | | | x |
| | | |
Ms. Kulvin | | x | | | | |
| | | |
Mr. Taylor | | | | x | | |
Item 9. Purchases of Equity Securities by Closed-End Management Investment Company and Affiliated Purchasers.
Not applicable.
Item 10. Submission of Matters to Vote of Security Holders
Not applicable.
Item 11 – Controls and Procedures
| | |
| (a) | | Based on an evaluation of the disclosure controls and procedures (as defined in Rule 30a-3(c) under the Act) as of a date within 90 days of the filing date of this report, the Chief Executive Officer, Treasurer, and Principal Financial and Accounting Officer of the Registrant have each concluded that such disclosure controls and procedures provide reasonable assurance that information required to be disclosed by the Registrant is accumulated and communicated to the Registrant’s management to allow timely decisions regarding required disclosure. |
| |
| (b) | | There were no changes in the Registrant’s internal controls over financial reporting (as defined in Rule 30a-3(d) under the Act) that occurred during the second fiscal quarter of the period covered by this report that have materially affected, or are reasonably likely to materially affect, the Registrant’s internal control over financial reporting. |
Item 12 – Exhibits
| | |
| (a)(1)(i) | | The code of ethics that applies to the Registrant’s principal executive officer and principal financial officer is attached hereto as Exhibit 12.A.1. |
| |
| (a)(1)(ii) | | The Proxy and Corporate Action Voting Policies and Procedures of the Adviser are attached hereto as Exhibit 99.PROXYPOL |
| |
| (a)(2) | | The certifications required by Rule 30a-2(a) of the Act (17 CFR 270.30a-2(a)) are filed and attached hereto as Exhibit 99.CERT. |
| |
| (a)(3) | | Not applicable to the Registrant. |
| |
| (b) | | The certification required by Rule 30a-2(b) of the Act (17 CFR 270.30a-2(b)) is filed and attached hereto as Exhibit 99.906CERT. |
SIGNATURES
Pursuant to the requirements of the Securities Exchange Act of 1934 and the Investment Company Act of 1940, the Registrant has duly caused this report to be signed on its behalf by the undersigned, thereunto duly authorized.
| | |
Dividend Capital Realty Income Allocation Fund |
| |
| By: | | /s/ David W. Agostine |
| | David W. Agostine President (Principal Executive Officer) |
Date: February 27, 2008
Pursuant to the requirements of the Securities Exchange Act of 1934 and the Investment Company Act of 1940, this report has been signed below by the following persons on behalf of the Registrant and in the capacities and on the dates indicated.
| | |
|
| |
| By: | | /s/ David W. Agostine |
| | David W. Agostine President (Principal Executive Officer) |
Date: February 27, 2008
| | |
|
| |
| By: | | /s/ Jeffrey W. Taylor |
| | Jeffrey W. Taylor Treasurer (Principal Financial Officer) |
Date: February 27, 2008