As filed with the Securities and Exchange Commission on March 10, 2009
UNITED STATES
SECURITIES AND EXCHANGE COMMISSION
Washington, D.C. 20549
FORM N-CSR
CERTIFIED SHAREHOLDER REPORT OF
REGISTERED MANAGEMENT INVESTMENT COMPANIES
Investment Company Act file Number: 811-21680
Dividend Capital Realty Income Allocation Fund
(Exact Name of the Registrant as Specified in Charter)
518 17th Street, Suite 1200, Denver, CO 80202
(Address of Principal Executive Offices - Zip Code)
303-228-2200
Registrant’s Telephone Number, including area code:
Derek Mullins
Secretary and Assistant Treasurer
518 17th Street, Suite 1200
Denver, CO 80202
(Names and Addresses of agents for service)
Date of fiscal year end: December 31
Date of reporting period: December 31, 2008
Item 1. Reports to Shareholders
The following is a copy of the report to shareholders pursuant to Rule 30e-1 under the Investment Company Act of 1940 (the “Act”).
Dividend Capital Investments
Annual Report
December 31, 2008
Dividend Capital Realty Income
Allocation Fund
Dividend Capital Global Realty
Exposure Fund
DIVIDEND CAPITAL INVESTMENTS
1.866.324.7348 2008 Annual Report 1
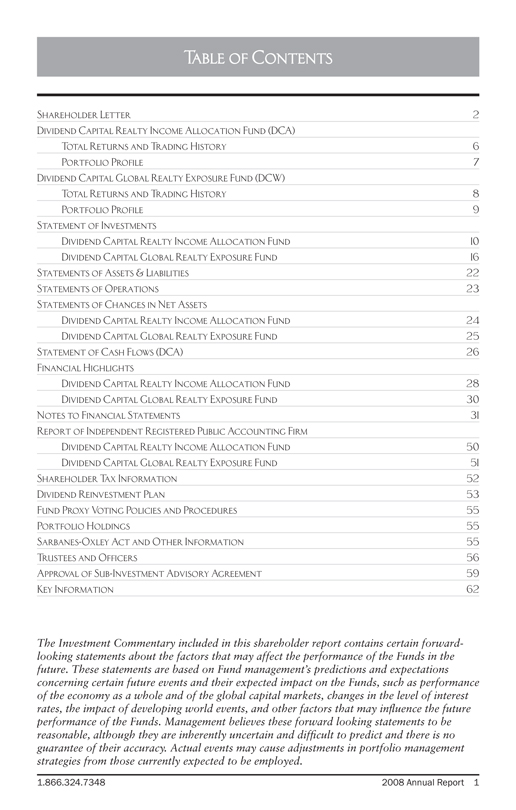
Shareholder Letter 2
Dividend Capital Realty Income Allocation Fund (DCA)
Total Returns and Trading History 6
Portfolio Profile 7
Dividend Capital Global Realty Exposure Fund (DCW)
Total Returns and Trading History 8
Portfolio Profile 9
Statement of Investments
Dividend Capital Realty Income Allocation Fund 10
Dividend Capital Global Realty Exposure Fund 16
Statements of Assets & Liabilities 22
Statements of Operations 23
Statements of Changes in Net Assets
Dividend Capital Realty Income Allocation Fund 24
Dividend Capital Global Realty Exposure Fund 25
Statement of Cash Flows (DCA) 26
Financial Highlights
Dividend Capital Realty Income Allocation Fund 28
Dividend Capital Global Realty Exposure Fund 30
Notes to Financial Statements 31
Report of Independent Registered Public Accounting Firm
Dividend Capital Realty Income Allocation Fund 50
Dividend Capital Global Realty Exposure Fund 51
Shareholder Tax Information 52
Dividend Reinvestment Plan 53
Fund Proxy Voting Policies and Procedures 55
Portfolio Holdings 55
Sarbanes-Oxley Act and Other Information 55
Trustees and Officers 56
Approval of Sub-Investment Advisory Agreement 59
Key Information 62
The Investment Commentary included in this shareholder report contains certain forward looking
statements about the factors that may affect the performance of the Funds in the
future. These statements are based on Fund management’s predictions and expectations
concerning certain future events and their expected impact on the Funds, such as performance
of the economy as a whole and of the global capital markets, changes in the level of interest
rates, the impact of developing world events, and other factors that may influence the future
performance of the Funds. Management believes these forward looking statements to be
reasonable, although they are inherently uncertain and difficult to predict and there is no
guarantee of their accuracy. Actual events may cause adjustments in portfolio management
strategies from those currently expected to be employed.
Table of Contents
2 2008 Annual Report www.dividendcapital.com
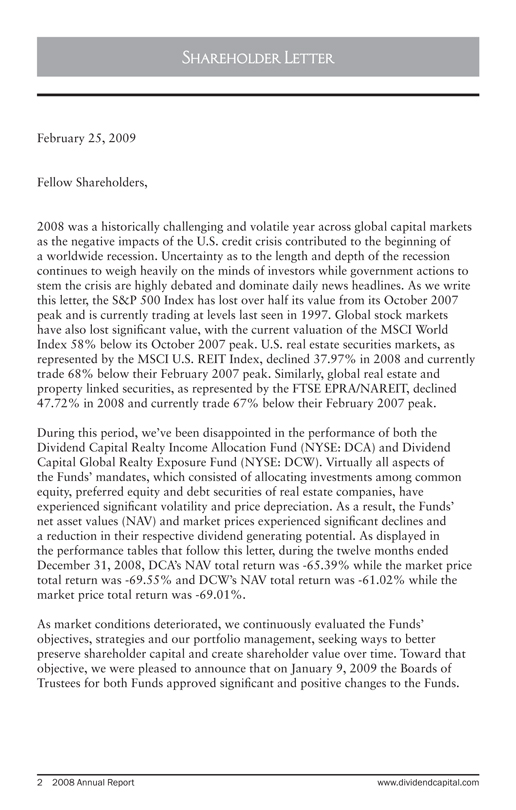
Shareholder Letter
February 25, 2009
Fellow Shareholders,
2008 was a historically challenging and volatile year across global capital markets
as the negative impacts of the U.S. credit crisis contributed to the beginning of
a worldwide recession. Uncertainty as to the length and depth of the recession
continues to weigh heavily on the minds of investors while government actions to
stem the crisis are highly debated and dominate daily news headlines. As we write
this letter, the S&P 500 Index has lost over half its value from its October 2007
peak and is currently trading at levels last seen in 1997. Global stock markets
have also lost significant value, with the current valuation of the MSCI World
Index 58% below its October 2007 peak. U.S. real estate securities markets, as
represented by the MSCI U.S. REIT Index, declined 37.97% in 2008 and currently
trade 68% below their February 2007 peak. Similarly, global real estate and
property linked securities, as represented by the FTSE EPRA/NAREIT, declined
47.72% in 2008 and currently trade 67% below their February 2007 peak.
During this period, we’ve been disappointed in the performance of both the
Dividend Capital Realty Income Allocation Fund (NYSE: DCA) and Dividend
Capital Global Realty Exposure Fund (NYSE: DCW). Virtually all aspects of
the Funds’ mandates, which consisted of allocating investments among common
equity, preferred equity and debt securities of real estate companies, have
experienced significant volatility and price depreciation. As a result, the Funds’
net asset values (NAV) and market prices experienced significant declines and
a reduction in their respective dividend generating potential. As displayed in
the performance tables that follow this letter, during the twelve months ended
December 31, 2008, DCA’s NAV total return was -65.39% while the market price
total return was -69.55% and DCW’s NAV total return was -61.02% while the
market price total return was -69.01%.
As market conditions deteriorated, we continuously evaluated the Funds’
objectives, strategies and our portfolio management, seeking ways to better
preserve shareholder capital and create shareholder value over time. Toward that
objective, we were pleased to announce that on January 9, 2009 the Boards of
Trustees for both Funds approved significant and positive changes to the Funds.
1.866.324.7348 2008 Annual Report 3
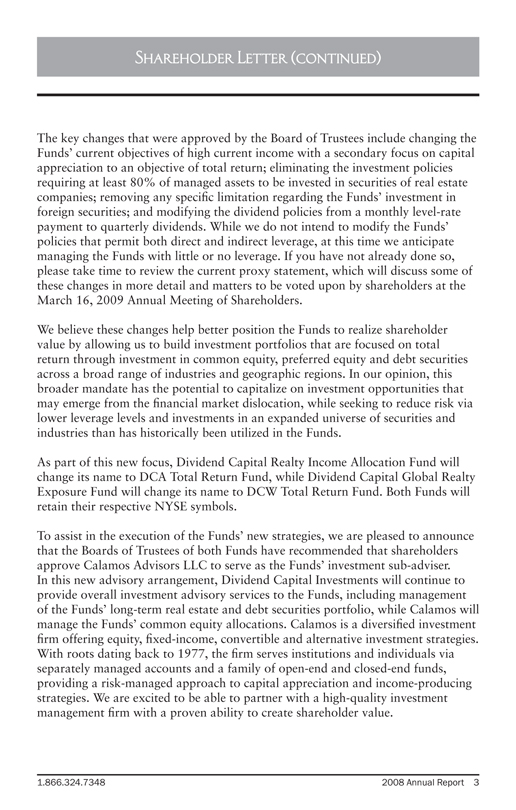
Shareholder Letter (continued)
The key changes that were approved by the Board of Trustees include changing the
Funds’ current objectives of high current income with a secondary focus on capital
appreciation to an objective of total return; eliminating the investment policies
requiring at least 80% of managed assets to be invested in securities of real estate
companies; removing any specific limitation regarding the Funds’ investment in
foreign securities; and modifying the dividend policies from a monthly level-rate
payment to quarterly dividends. While we do not intend to modify the Funds’
policies that permit both direct and indirect leverage, at this time we anticipate
managing the Funds with little or no leverage. If you have not already done so,
please take time to review the current proxy statement, which will discuss some of
these changes in more detail and matters to be voted upon by shareholders at the
March 16, 2009 Annual Meeting of Shareholders.
We believe these changes help better position the Funds to realize shareholder
value by allowing us to build investment portfolios that are focused on total
return through investment in common equity, preferred equity and debt securities
across a broad range of industries and geographic regions. In our opinion, this
broader mandate has the potential to capitalize on investment opportunities that
may emerge from the financial market dislocation, while seeking to reduce risk via
lower leverage levels and investments in an expanded universe of securities and
industries than has historically been utilized in the Funds.
As part of this new focus, Dividend Capital Realty Income Allocation Fund will
change its name to DCA Total Return Fund, while Dividend Capital Global Realty
Exposure Fund will change its name to DCW Total Return Fund. Both Funds will
retain their respective NYSE symbols.
To assist in the execution of the Funds’ new strategies, we are pleased to announce
that the Boards of Trustees of both Funds have recommended that shareholders
approve Calamos Advisors LLC to serve as the Funds’ investment sub-adviser.
In this new advisory arrangement, Dividend Capital Investments will continue to
provide overall investment advisory services to the Funds, including management
of the Funds’ long-term real estate and debt securities portfolio, while Calamos will
manage the Funds’ common equity allocations. Calamos is a diversified investment
firm offering equity, fixed-income, convertible and alternative investment strategies.
With roots dating back to 1977, the firm serves institutions and individuals via
separately managed accounts and a family of open-end and closed-end funds,
providing a risk-managed approach to capital appreciation and income-producing
strategies. We are excited to be able to partner with a high-quality investment
management firm with a proven ability to create shareholder value.
4 2008 Annual Report www.dividendcapital.com
In closing, the past eighteen months, including the period covered by this report,
have been very difficult and we believe capital markets will continue to be volatile.
However, we believe this environment will create compelling, long-term investment
opportunities and the changes to the Funds discussed in this letter are designed to
enhance the value creation potential for all shareholders.
We thank you for your continued support.
Sincerely,
David W. Agostine Jeffrey Taylor
President Vice President and Treasurer
Jeffrey Randall
Portfolio Manager
Shareholder Letter (continued)

This Page Intentionally Left Blank
6 2008 Annual Report www.dividendcapital.com
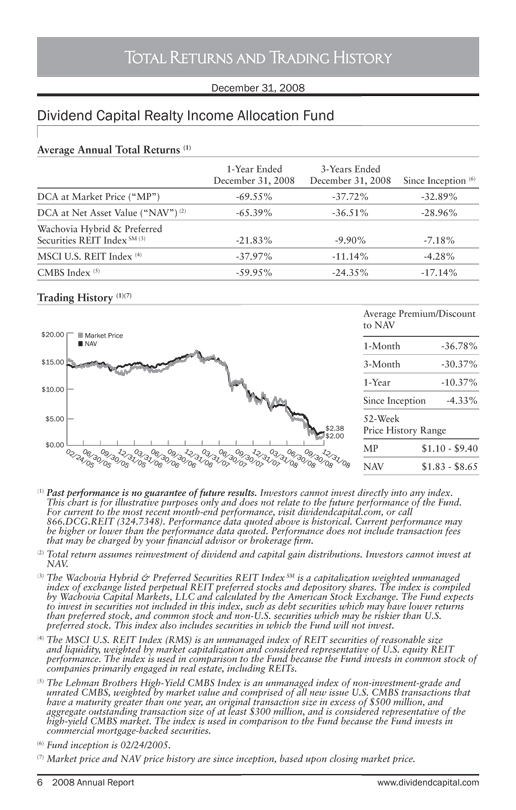
Average Annual Total Returns (1)
1-Year Ended
December 31, 2008
3-Years Ended
December 31, 2008 Since Inception (6)
DCA at Market Price (“MP”) -69.55% -37.72% -32.89%
DCA at Net Asset Value (“NAV”) (2) -65.39% -36.51% -28.96%
Wachovia Hybrid & Preferred
Securities REIT Index SM (3) -21.83% -9.90% -7.18%
MSCI U.S. REIT Index (4) -37.97% -11.14% -4.28%
CMBS Index (5) -59.95% -24.35% -17.14%
Trading History (1)(7)
(1) Past performance is no guarantee of future results. Investors cannot invest directly into any index.
This chart is for illustrative purposes only and does not relate to the future performance of the Fund.
For current to the most recent month-end performance, visit dividendcapital.com, or call
866.DCG.REIT (324.7348). Performance data quoted above is historical. Current performance may
be higher or lower than the performance data quoted. Performance does not include transaction fees
that may be charged by your financial advisor or brokerage firm.
(2) Total return assumes reinvestment of dividend and capital gain distributions. Investors cannot invest at
NAV.
(3) The Wachovia Hybrid & Preferred Securities REIT Index SM is a capitalization weighted unmanaged
index of exchange listed perpetual REIT preferred stocks and depository shares. The index is compiled
by Wachovia Capital Markets, LLC and calculated by the American Stock Exchange. The Fund expects
to invest in securities not included in this index, such as debt securities which may have lower returns
than preferred stock, and common stock and non-U.S. securities which may be riskier than U.S.
preferred stock. This index also includes securities in which the Fund will not invest.
(4) The MSCI U.S. REIT Index (RMS) is an unmanaged index of REIT securities of reasonable size
and liquidity, weighted by market capitalization and considered representative of U.S. equity REIT
performance. The index is used in comparison to the Fund because the Fund invests in common stock of
companies primarily engaged in real estate, including REITs.
(5) The Lehman Brothers High-Yield CMBS Index is an unmanaged index of non-investment-grade and
unrated CMBS, weighted by market value and comprised of all new issue U.S. CMBS transactions that
have a maturity greater than one year, an original transaction size in excess of $500 million, and
aggregate outstanding transaction size of at least $300 million, and is considered representative of the
high-yield CMBS market. The index is used in comparison to the Fund because the Fund invests in
commercial mortgage-backed securities.
(6) Fund inception is 02/24/2005.
(7) Market price and NAV price history are since inception, based upon closing market price.
Average Premium/Discount
to NAV
1-Month -36.78%
3-Month -30.37%
1-Year -10.37%
Since Inception -4.33%
52-Week
Price History Range
MP $1.10 - $9.40
NAV $1.83 - $8.65
December 31, 2008
Total Returns and Trading History
Dividend Capital Realty Income Allocation Fund
$2.38
$2.00
$0.00
$5.00
$10.00
$15.00
$20.00 Market Price
NAV
06/30/06
09/30/05
06/30/05
12/31/05
03/31/06
09/30/06
12/31/06
03/31/07
06/30/07
09/30/07
02/24/05
12/31/07
03/31/08
06/30/08
09/30/08
12/31/08
1.866.324.7348 2008 Annual Report 7
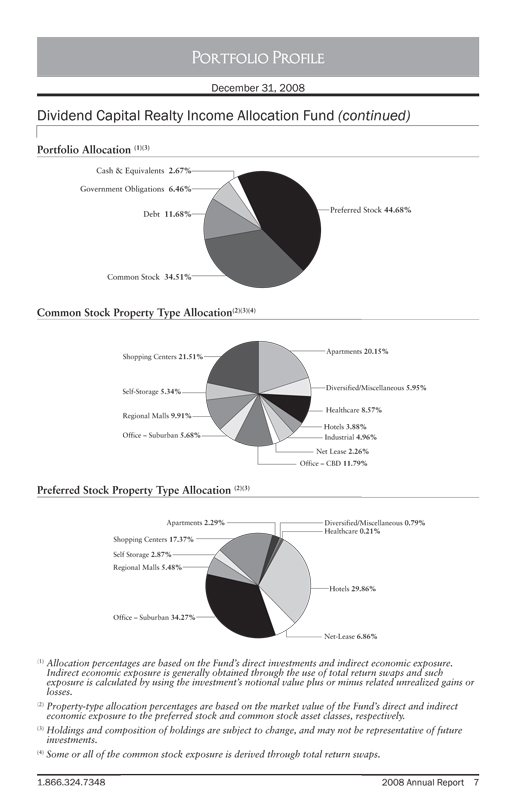
Portfolio Allocation (1)(3)
Common Stock Property Type Allocation(2)(3)(4)
Preferred Stock Property Type Allocation (2)(3)
(1) Allocation percentages are based on the Fund’s direct investments and indirect economic exposure.
Indirect economic exposure is generally obtained through the use of total return swaps and such
exposure is calculated by using the investment’s notional value plus or minus related unrealized gains or
losses.
(2) Property-type allocation percentages are based on the market value of the Fund’s direct and indirect
economic exposure to the preferred stock and common stock asset classes, respectively.
(3) Holdings and composition of holdings are subject to change, and may not be representative of future
investments.
(4) Some or all of the common stock exposure is derived through total return swaps.
December 31, 2008
Portfolio Profit Portfolio Profile
Dividend Capital Realty Income Allocation Fund (continued)
Apartments 20.15%
Healthcare 8.57%
Diversified/Miscellaneous 5.95%
Hotels 3.88%
Industrial 4.96%
Office – CBD 11.79%
Office – Suburban 5.68%
Regional Malls 9.91%
Self-Storage 5.34%
Shopping Centers 21.51%
Net Lease 2.26%
Preferred Stock 44.68%
Cash & Equivalents 2.67%
Government Obligations 6.46%
Debt 11.68%
Common Stock 34.51%
Shopping Centers 17.37%
Regional Malls 5.48%
Apartments 2.29%
Hotels 29.86%
Healthcare 0.21%
Net-Lease 6.86%
Office – Suburban 34.27%
Self Storage 2.87%
Diversified/Miscellaneous 0.79%
8 2008 Annual Report www.dividendcapital.com
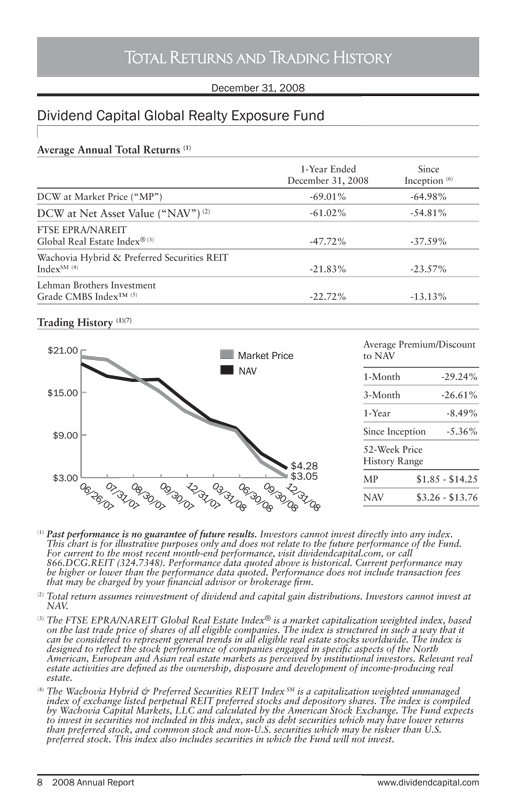
Average Annual Total Returns (1)
1-Year Ended
December 31, 2008
Since
Inception (6)
DCW at Market Price (“MP”) -69.01% -64.98%
DCW at Net Asset Value (“NAV”) (2) -61.02% -54.81%
FTSE EPRA/NAREIT
Global Real Estate Index® (3) -47.72% -37.59%
Wachovia Hybrid & Preferred Securities REIT
IndexSM (4) -21.83% -23.57%
Lehman Brothers Investment
Grade CMBS Index™ (5) -22.72% -13.13%
Trading History (1)(7)
(1) Past performance is no guarantee of future results. Investors cannot invest directly into any index.
This chart is for illustrative purposes only and does not relate to the future performance of the Fund.
For current to the most recent month-end performance, visit dividendcapital.com, or call
866.DCG.REIT (324.7348). Performance data quoted above is historical. Current performance may
be higher or lower than the performance data quoted. Performance does not include transaction fees
that may be charged by your financial advisor or brokerage firm.
(2) Total return assumes reinvestment of dividend and capital gain distributions. Investors cannot invest at
NAV.
(3) The FTSE EPRA/NAREIT Global Real Estate Index® is a market capitalization weighted index, based
on the last trade price of shares of all eligible companies. The index is structured in such a way that it
can be considered to represent general trends in all eligible real estate stocks worldwide. The index is
designed to reflect the stock performance of companies engaged in specific aspects of the North
American, European and Asian real estate markets as perceived by institutional investors. Relevant real
estate activities are defined as the ownership, disposure and development of income-producing real
estate.
(4) The Wachovia Hybrid & Preferred Securities REIT Index SM is a capitalization weighted unmanaged
index of exchange listed perpetual REIT preferred stocks and depository shares. The index is compiled
by Wachovia Capital Markets, LLC and calculated by the American Stock Exchange. The Fund expects
to invest in securities not included in this index, such as debt securities which may have lower returns
than preferred stock, and common stock and non-U.S. securities which may be riskier than U.S.
preferred stock. This index also includes securities in which the Fund will not invest.
Average Premium/Discount
to NAV
1-Month -29.24%
3-Month -26.61%
1-Year -8.49%
Since Inception -5.36%
52-Week Price
History Range
MP $1.85 - $14.25
NAV $3.26 - $13.76
Total Returns and Trading History
Dividend Capital Global Realty Exposure Fund
December 31, 2008
$3.05
$4.28
Market Price
NAV
06/26/07
07/31/07
08/30/07
09/30/07
03/31/08
12/31/07
$3.00
$9.00
$15.00
$21.00
06/30/08
09/30/08
12/31/08

1.866.324.7348 2008 Annual Report 9
Country Allocation (8)(9)(11)
Security Type Allocation(8)(10)(11)
(5) The Lehman Brothers Investment Grade CMBS Index™ is an unmanaged index of investment grade
commercial mortgage backed securities (CMBS). This index is used because the fund may invest in debt
securities of global real estate companies. The index only represents CMBS of U.S. real estate companies
while the fund may invest in CMBS and other debt securities of global real estate companies. The fund
expects to invest in securities not included in this index, such as common stock, preferred stock and
non-U.S. securities which may be riskier than U.S. debt securities. This index also includes securities in
which the fund will not invest.
(6) Fund inception is 06/27/2007.
(7) Market price and NAV price history are since inception, based upon closing market price.
(8) Allocation percentages are based on the fund’s direct investments and indirect economic exposure.
Indirect economic exposure is generally obtained through the use of total return swaps and such
exposure is calculated by using the investment’s notional value plus or minus related unrealized gains or
losses.
(9) Country allocation percentages are based on the market value of the fund’s direct and indirect economic
exposure exclusive of cash or U.S. government obligations.
(10) Security type allocation percentages are based on the market value of the fund’s direct and indirect
economic exposure including cash and U.S. government obligations.
(11) Holdings and composition of holdings are subject to change, and may not be representative of future
investments.
Portfolio Profit Portfolio Profile
Dividend Capital Global Realty Exposure Fund (continued)
December 31, 2008
Government Obligations 33.57%
Debt 1.79% Common Stock 27.72%
Preferred Stock 36.92%
Canada 11.17%
United States 59.31%
Hong Kong 4.74%
Singapore 6.33%
Japan 11.41%
Australia 5.44%
Europe 1.60%
10 2008 Annual Report www.dividendcapital.com
Shares
Market
Value
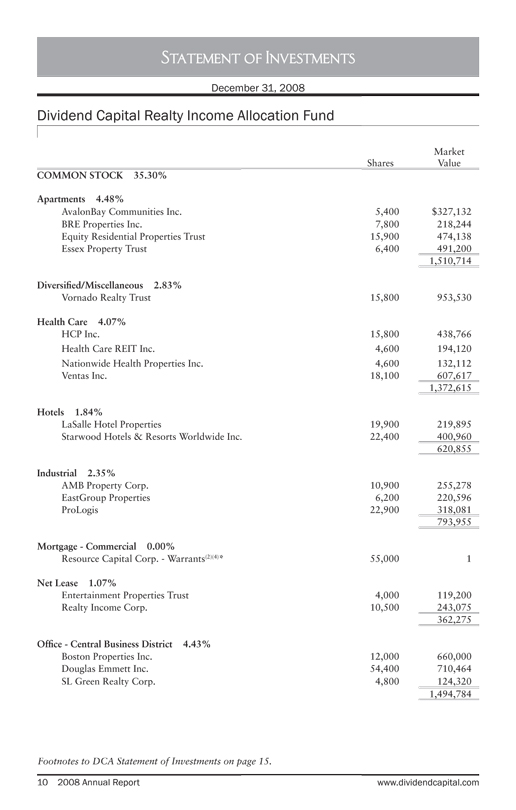
COMMON STOCK 35.30%
Apartments 4.48%
AvalonBay Communities Inc. 5,400 $327,132
BRE Properties Inc. 7,800 218,244
Equity Residential Properties Trust 15,900 474,138
Essex Property Trust 6,400 491,200
1,510,714
Diversified/Miscellaneous 2.83%
Vornado Realty Trust 15,800 953,530
Health Care 4.07%
HCP Inc. 15,800 438,766
Health Care REIT Inc. 4,600 194,120
Nationwide Health Properties Inc. 4,600 132,112
Ventas Inc. 18,100 607,617
1,372,615
Hotels 1.84%
LaSalle Hotel Properties 19,900 219,895
Starwood Hotels & Resorts Worldwide Inc. 22,400 400,960
620,855
Industrial 2.35%
AMB Property Corp. 10,900 255,278
EastGroup Properties 6,200 220,596
ProLogis 22,900 318,081
793,955
Mortgage - Commercial 0.00%
Resource Capital Corp. - Warrants(2)(4)* 55,000 1
Net Lease 1.07%
Entertainment Properties Trust 4,000 119,200
Realty Income Corp. 10,500 243,075
362,275
Office - Central Business District 4.43%
Boston Properties Inc. 12,000 660,000
Douglas Emmett Inc. 54,400 710,464
SL Green Realty Corp. 4,800 124,320
1,494,784
Statement of Investments
Dividend Capital Realty Income Allocation Fund
Footnotes to DCA Statement of Investments on page 15.
December 31, 2008
1.866.324.7348 2008 Annual Report 11
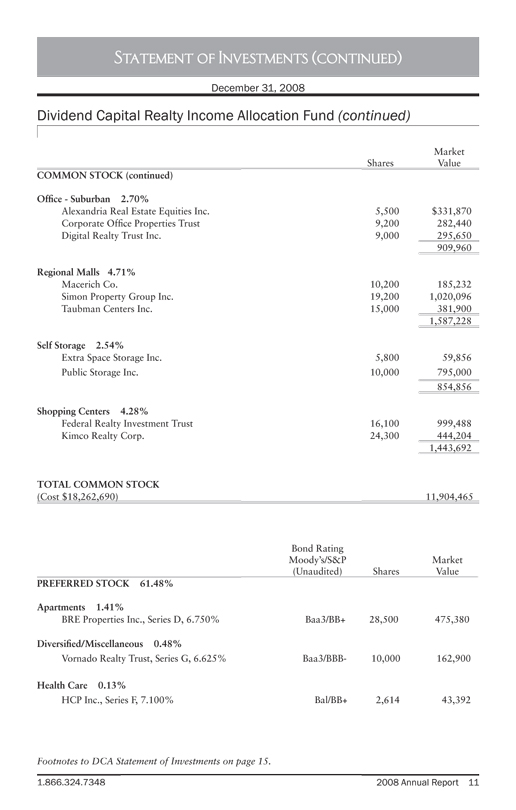
Statement of Investments (continued)
Dividend Capital Realty Income Allocation Fund (continued)
Shares
Market
Value
COMMON STOCK (continued)
Office - Suburban 2.70%
Alexandria Real Estate Equities Inc. 5,500 $331,870
Corporate Office Properties Trust 9,200 282,440
Digital Realty Trust Inc. 9,000 295,650
909,960
Regional Malls 4.71%
Macerich Co. 10,200 185,232
Simon Property Group Inc. 19,200 1,020,096
Taubman Centers Inc. 15,000 381,900
1,587,228
Self Storage 2.54%
Extra Space Storage Inc. 5,800 59,856
Public Storage Inc. 10,000 795,000
854,856
Shopping Centers 4.28%
Federal Realty Investment Trust 16,100 999,488
Kimco Realty Corp. 24,300 444,204
1,443,692
TOTAL COMMON STOCK
(Cost $18,262,690) 11,904,465
Footnotes to DCA Statement of Investments on page 15.
December 31, 2008
Bond Rating
Moody’s/S&P
(Unaudited) Shares
Market
Value
PREFERRED STOCK 61.48%
Apartments 1.41%
BRE Properties Inc., Series D, 6.750% Baa3/BB+ 28,500 475,380
Diversified/Miscellaneous 0.48%
Vornado Realty Trust, Series G, 6.625% Baa3/BBB- 10,000 162,900
Health Care 0.13%
HCP Inc., Series F, 7.100% Bal/BB+ 2,614 43,392
12 2008 Annual Report www.dividendcapital.com
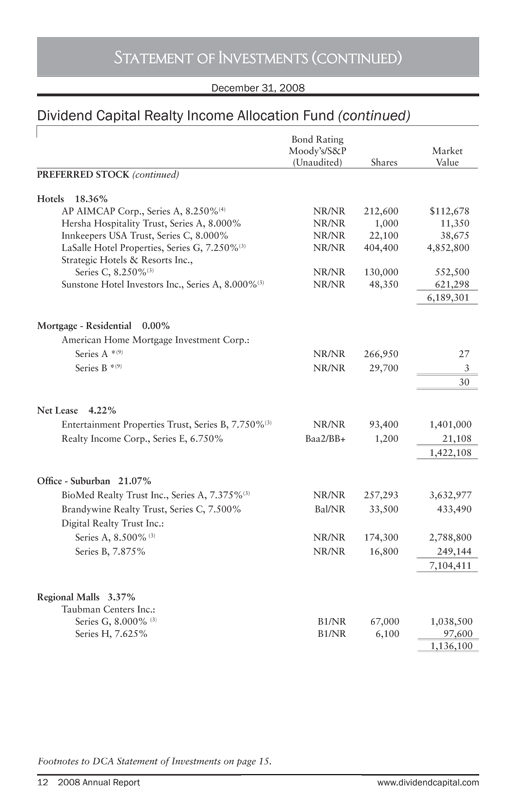
Statement of Investments (continued)
Dividend Capital Realty Income Allocation Fund (continued)
Footnotes to DCA Statement of Investments on page 15.
December 31, 2008
Bond Rating
Moody’s/S&P
(Unaudited) Shares
Market
Value
PREFERRED STOCK (continued)
Hotels 18.36%
AP AIMCAP Corp., Series A, 8.250%(4) NR/NR 212,600 $112,678
Hersha Hospitality Trust, Series A, 8.000% NR/NR 1,000 11,350
Innkeepers USA Trust, Series C, 8.000% NR/NR 22,100 38,675
LaSalle Hotel Properties, Series G, 7.250%(3) NR/NR 404,400 4,852,800
Strategic Hotels & Resorts Inc.,
Series C, 8.250%(3) NR/NR 130,000 552,500
Sunstone Hotel Investors Inc., Series A, 8.000%(3) NR/NR 48,350 621,298
6,189,301
Mortgage—Residential 0.00%
American Home Mortgage Investment Corp.:
Series A *(9) NR/NR 266,950 27
Series B *(9) NR/NR 29,700 3
30
Net Lease 4.22%
Entertainment Properties Trust, Series B, 7.750%(3) NR/NR 93,400 1,401,000
Realty Income Corp., Series E, 6.750% Baa2/BB+ 1,200 21,108
1,422,108
Office—Suburban 21.07%
BioMed Realty Trust Inc., Series A, 7.375%(3) NR/NR 257,293 3,632,977
Brandywine Realty Trust, Series C, 7.500% Bal/NR 33,500 433,490
Digital Realty Trust Inc.:
Series A, 8.500% (3) NR/NR 174,300 2,788,800
Series B, 7.875% NR/NR 16,800 249,144
7,104,411
Regional Malls 3.37%
Taubman Centers Inc.:
Series G, 8.000% (3) B1/NR 67,000 1,038,500
Series H, 7.625% B1/NR 6,100 97,600
1,136,100
1.866.324.7348 2008 Annual Report 13
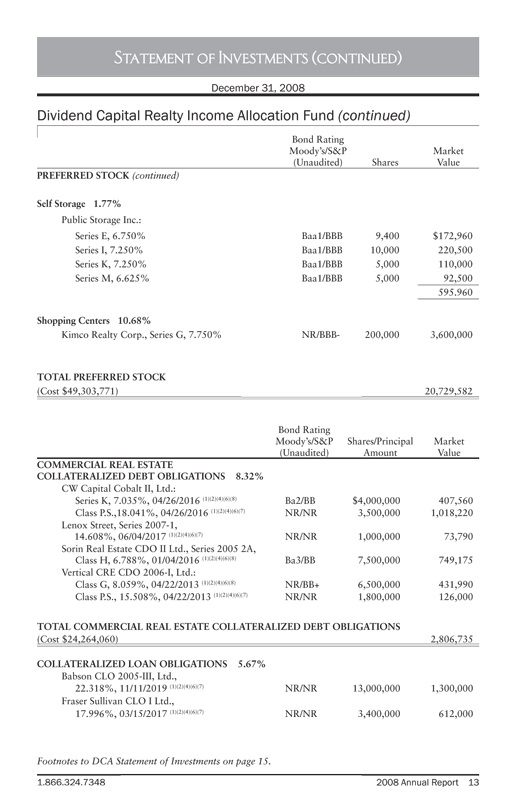
Statement of Investments (continued)
Dividend Capital Realty Income Allocation Fund (continued)
Footnotes to DCA Statement of Investments on page 15.
December 31, 2008
Bond Rating
Moody’s/S&P
(Unaudited) Shares
Market
Value
PREFERRED STOCK (continued)
Self Storage 1.77%
Public Storage Inc.:
Series E, 6.750% Baa1/BBB 9,400 $172,960
Series I, 7.250% Baa1/BBB 10,000 220,500
Series K, 7.250% Baa1/BBB 5,000 110,000
Series M, 6.625% Baa1/BBB 5,000 92,500
595.960
Shopping Centers 10.68%
Kimco Realty Corp., Series G, 7.750% NR/BBB- 200,000 3,600,000
TOTAL PREFERRED STOCK
(Cost $49,303,771) 20,729,582
Bond Rating
Moody’s/S&P
(Unaudited)
Shares/Principal
Amount
Market
Value
COMMERCIAL REAL ESTATE
COLLATERALIZED DEBT OBLIGATIONS 8.32%
CW Capital Cobalt II, Ltd.:
Series K, 7.035%, 04/26/2016 (1)(2)(4)(6)(8) Ba2/BB $4,000,000 407,560
Class P.S.,18.041%, 04/26/2016 (1)(2)(4)(6)(7) NR/NR 3,500,000 1,018,220
Lenox Street, Series 2007-1,
14.608%, 06/04/2017 (1)(2)(4)(6)(7) NR/NR 1,000,000 73,790
Sorin Real Estate CDO II Ltd., Series 2005 2A,
Class H, 6.788%, 01/04/2016 (1)(2)(4)(6)(8) Ba3/BB 7,500,000 749,175
Vertical CRE CDO 2006-I, Ltd.:
Class G, 8.059%, 04/22/2013 (1)(2)(4)(6)(8) NR/BB+ 6,500,000 431,990
Class P.S., 15.508%, 04/22/2013 (1)(2)(4)(6)(7) NR/NR 1,800,000 126,000
TOTAL COMMERCIAL REAL ESTATE COLLATERALIZED DEBT OBLIGATIONS
(Cost $24,264,060) 2,806,735
COLLATERALIZED LOAN OBLIGATIONS 5.67%
Babson CLO 2005-III, Ltd.,
22.318%, 11/11/2019 (1)(2)(4)(6)(7) NR/NR 13,000,000 1,300,000
Fraser Sullivan CLO I Ltd.,
17.996%, 03/15/2017 (1)(2)(4)(6)(7) NR/NR 3,400,000 612,000
14 2008 Annual Report www.dividendcapital.com
Bond Rating
Moody’s/S&P
(Unaudite( d)
Shares/Principal
Amount
Market
Value
COLLATERALIZED LOAN OBLIGATIONS (continued)
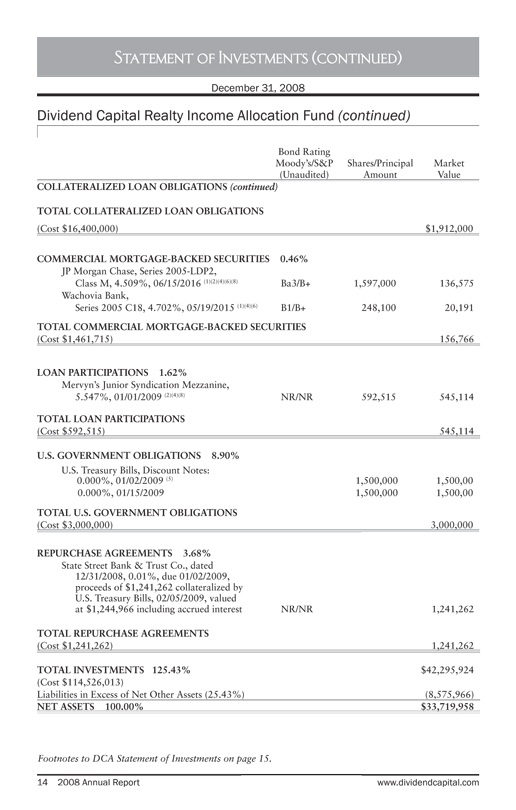
TOTAL COLLATERALIZED LOAN OBLIGATIONS
(Cost $16,400,000) $1,912,000
COMMERCIAL MORTGAGE-BACKED SECURITIES 0.46%
JP Morgan Chase, Series 2005-LDP2,
Class M, 4.509%, 06/15/2016 (1)(2)(4)(6)(8) Ba3/B+ 1,597,000 136,575
Wachovia Bank,
Series 2005 C18, 4.702%, 05/19/2015 (1)(4)(6) B1/B+ 248,100 20,191
TOTAL COMMERCIAL MORTGAGE-BACKED SECURITIES
(Cost $1,461,715) 156,766
LOAN PARTICIPATIONS 1.62%
Mervyn’s Junior Syndication Mezzanine,
5.547%, 01/01/2009 (2)(4)(8) NR/NR 592,515 545,114
TOTAL LOAN PARTICIPATIONS
(Cost $592,515) 545,114
U.S. GOVERNMENT OBLIGATIONS 8.90%
U.S. Treasury Bills, Discount Notes:
0.000%, 01/02/2009 (5) 1,500,000 1,500,00
0.000%, 01/15/2009 1,500,000 1,500,00
TOTAL U.S. GOVERNMENT OBLIGATIONS
(Cost $3,000,000) 3,000,000
REPURCHASE AGREEMENTS 3.68%
State Street Bank & Trust Co., dated
12/31/2008, 0.01%, due 01/02/2009,
proceeds of $1,241,262 collateralized by
U.S. Treasury Bills, 02/05/2009, valued
at $1,244,966 including accrued interest NR/NR 1,241,262
TOTAL REPURCHASE AGREEMENTS
(Cost $1,241,262) 1,241,262
TOTAL INVESTMENTS 125.43% $42,295,924
(Cost $114,526,013)
Liabilities in Excess of Net Other Assets (25.43%) (8,575,966)
NET ASSETS 100.00% $33,719,958
Statement of Investments (continued)
Dividend Capital Realty Income Allocation Fund (continued)
Footnotes to DCA Statement of Investments on page 15.
December 31, 2008
1.866.324.7348 2008 Annual Report 15
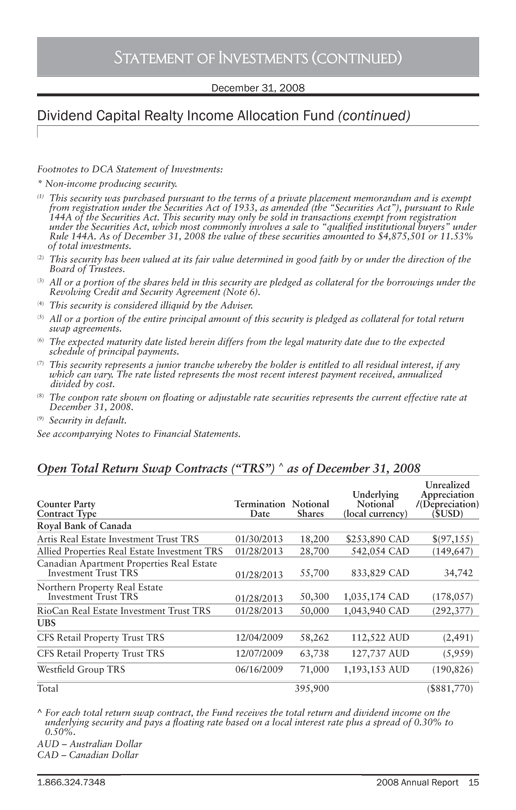
Footnotes to DCA Statement of Investments:
* Non-income producing security.
(1) This security was purchased pursuant to the terms of a private placement memorandum and is exempt
from registration under the Securities Act of 1933, as amended (the “Securities Act”), pursuant to Rule
144A of the Securities Act. This security may only be sold in transactions exempt from registration
under the Securities Act, which most commonly involves a sale to “qualified institutional buyers” under
Rule 144A. As of December 31, 2008 the value of these securities amounted to $4,875,501 or 11.53%
of total investments.
(2) This security has been valued at its fair value determined in good faith by or under the direction of the
Board of Trustees.
(3) All or a portion of the shares held in this security are pledged as collateral for the borrowings under the
Revolving Credit and Security Agreement (Note 6).
(4) This security is considered illiquid by the Adviser.
(5) All or a portion of the entire principal amount of this security is pledged as collateral for total return
swap agreements.
(6) The expected maturity date listed herein differs from the legal maturity date due to the expected
schedule of principal payments.
(7) This security represents a junior tranche whereby the holder is entitled to all residual interest, if any
which can vary. The rate listed represents the most recent interest payment received, annualized
divided by cost.
(8) The coupon rate shown on floating or adjustable rate securities represents the current effective rate at
December 31, 2008.
(9) Security in default.
See accompanying Notes to Financial Statements.
Open Total Return Swap Contracts (“TRS”) ^ as of December 31, 2008
Counter Party
Contract Type
Termination
Date
Notional
Shares
Underlying
Notional
(local currency)
Unrealized
Appreciation
/(Depreciation)
($USD)
Royal Bank of Canada
Artis Real Estate Investment Trust TRS 01/30/2013 18,200 $253,890 CAD $(97,155)
Allied Properties Real Estate Investment TRS 01/28/2013 28,700 542,054 CAD (149,647)
Canadian Apartment Properties Real Estate
Investment Trust TRS 01/28/2013 55,700 833,829 CAD 34,742
Northern Property Real Estate
Investment Trust TRS 01/28/2013 50,300 1,035,174 CAD (178,057)
RioCan Real Estate Investment Trust TRS 01/28/2013 50,000 1,043,940 CAD (292,377)
UBS
CFS Retail Property Trust TRS 12/04/2009 58,262 112,522 AUD (2,491)
CFS Retail Property Trust TRS 12/07/2009 63,738 127,737 AUD (5,959)
Westfield Group TRS 06/16/2009 71,000 1,193,153 AUD (190,826)
Total 395,900 ($881,770)
^ For each total return swap contract, the Fund receives the total return and dividend income on the
underlying security and pays a floating rate based on a local interest rate plus a spread of 0.30% to
0.50%.
AUD – Australian Dollar
CAD – Canadian Dollar
Statement of Investments (continued)
Dividend Capital Realty Income Allocation Fund (continued)
December 31, 2008
16 2008 Annual Report www.dividendcapital.com
Statement of Investments
Shares
Market
Value
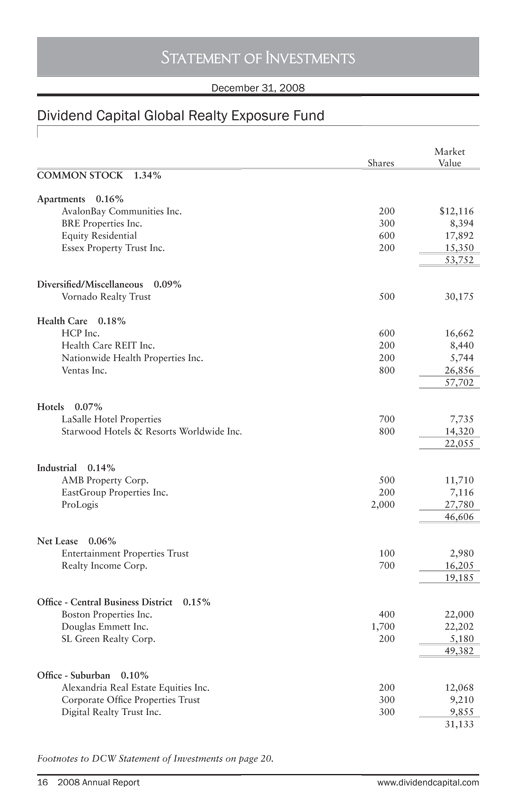
COMMON STOCK 1.34%
Apartments 0.16%
AvalonBay Communities Inc. 200 $12,116
BRE Properties Inc. 300 8,394
Equity Residential 600 17,892
Essex Property Trust Inc. 200 15,350
53,752
Diversified/Miscellaneous 0.09%
Vornado Realty Trust 500 30,175
Health Care 0.18%
HCP Inc. 600 16,662
Health Care REIT Inc. 200 8,440
Nationwide Health Properties Inc. 200 5,744
Ventas Inc. 800 26,856
57,702
Hotels 0.07%
LaSalle Hotel Properties 700 7,735
Starwood Hotels & Resorts Worldwide Inc. 800 14,320
22,055
Industrial 0.14%
AMB Property Corp. 500 11,710
EastGroup Properties Inc. 200 7,116
ProLogis 2,000 27,780
46,606
Net Lease 0.06%
Entertainment Properties Trust 100 2,980
Realty Income Corp. 700 16,205
19,185
Office—Central Business District 0.15%
Boston Properties Inc. 400 22,000
Douglas Emmett Inc. 1,700 22,202
SL Green Realty Corp. 200 5,180
49,382
Office—Suburban 0.10%
Alexandria Real Estate Equities Inc. 200 12,068
Corporate Office Properties Trust 300 9,210
Digital Realty Trust Inc. 300 9,855
31,133
Dividend Capital Global Realty Exposure Fund
Footnotes to DCW Statement of Investments on page 20.
December 31, 2008
1.866.324.7348 2008 Annual Report 17
Statement of Investments (continued)
Shares
Market
Value
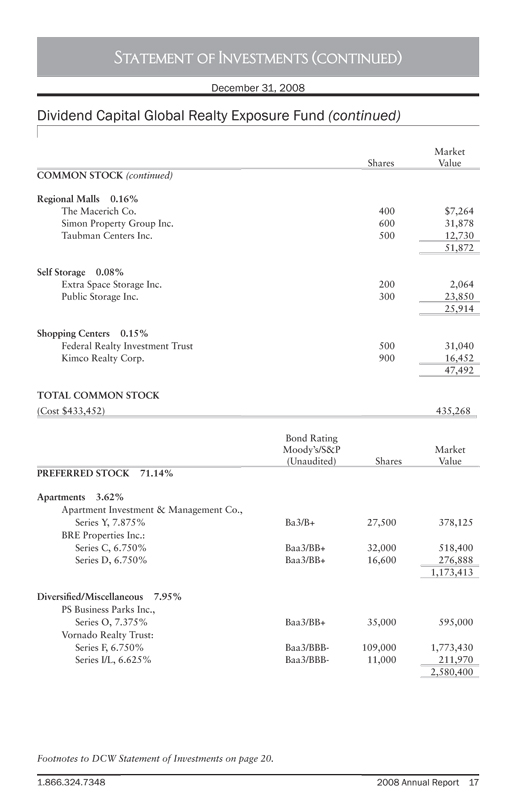
COMMON STOCK (continued)
Regional Malls 0.16%
The Macerich Co. 400 $7,264
Simon Property Group Inc. 600 31,878
Taubman Centers Inc. 500 12,730
51,872
Self Storage 0.08%
Extra Space Storage Inc. 200 2,064
Public Storage Inc. 300 23,850
25,914
Shopping Centers 0.15%
Federal Realty Investment Trust 500 31,040
Kimco Realty Corp. 900 16,452
47,492
TOTAL COMMON STOCK
(Cost $433,452) 435,268
Dividend Capital Global Realty Exposure Fund (continued)
Footnotes to DCW Statement of Investments on page 20.
Bond Rating
Moody’s/S&P
(Unaudited) Shares
Market
Value
PREFERRED STOCK 71.14%
Apartments 3.62%
Apartment Investment & Management Co.,
Series Y, 7.875% Ba3/B+ 27,500 378,125
BRE Properties Inc.:
Series C, 6.750% Baa3/BB+ 32,000 518,400
Series D, 6.750% Baa3/BB+ 16,600 276,888
1,173,413
Diversified/Miscellaneous 7.95%
PS Business Parks Inc.,
Series O, 7.375% Baa3/BB+ 35,000 595,000
Vornado Realty Trust:
Series F, 6.750% Baa3/BBB- 109,000 1,773,430
Series I/L, 6.625% Baa3/BBB- 11,000 211,970
2,580,400
December 31, 2008
18 2008 Annual Report www.dividendcapital.com
Statement of Investments (continued)
Dividend Capital Global Realty Exposure Fund (continued)
Footnotes to DCW Statement of Investments on page 20.
December 31, 2008
Bond Rating
Moody’s/S&P
(Unaudited) Shares
Market
Value
PREFERRED STOCK (continued)
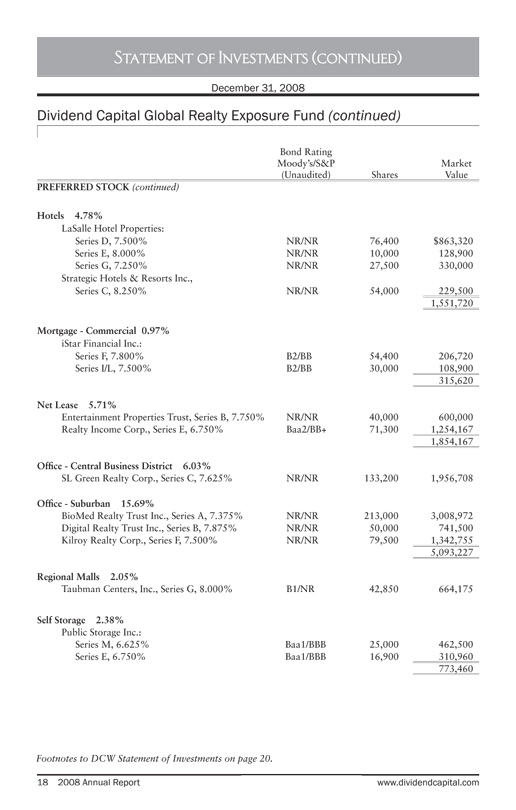
Hotels 4.78%
LaSalle Hotel Properties:
Series D, 7.500% NR/NR 76,400 $863,320
Series E, 8.000% NR/NR 10,000 128,900
Series G, 7.250% NR/NR 27,500 330,000
Strategic Hotels & Resorts Inc.,
Series C, 8.250% NR/NR 54,000 229,500
1,551,720
Mortgage—Commercial 0.97%
iStar Financial Inc.:
Series F, 7.800% B2/BB 54,400 206,720
Series I/L, 7.500% B2/BB 30,000 108,900
315,620
Net Lease 5.71%
Entertainment Properties Trust, Series B, 7.750% NR/NR 40,000 600,000
Realty Income Corp., Series E, 6.750% Baa2/BB+ 71,300 1,254,167
1,854,167
Offifice—Central Business District 6.03%
SL Green Realty Corp., Series C, 7.625% NR/NR 133,200 1,956,708
Offifice—Suburban 15.69%
BioMed Realty Trust Inc., Series A, 7.375% NR/NR 213,000 3,008,972
Digital Realty Trust Inc., Series B, 7.875% NR/NR 50,000 741,500
Kilroy Realty Corp., Series F, 7.500% NR/NR 79,500 1,342,755
5,093,227
Regional Malls 2.05%
Taubman Centers, Inc., Series G, 8.000% B1/NR 42,850 664,175
Self Storage 2.38%
Public Storage Inc.:
Series M, 6.625% Baa1/BBB 25,000 462,500
Series E, 6.750% Baa1/BBB 16,900 310,960
773,460
1.866.324.7348 2008 Annual Report 19
Statement of Investments (continued)
Dividend Capital Global Realty Exposure Fund (continued)
Bond Rating
Moody’s/S&P
(Unaudited) Shares
Market
Value
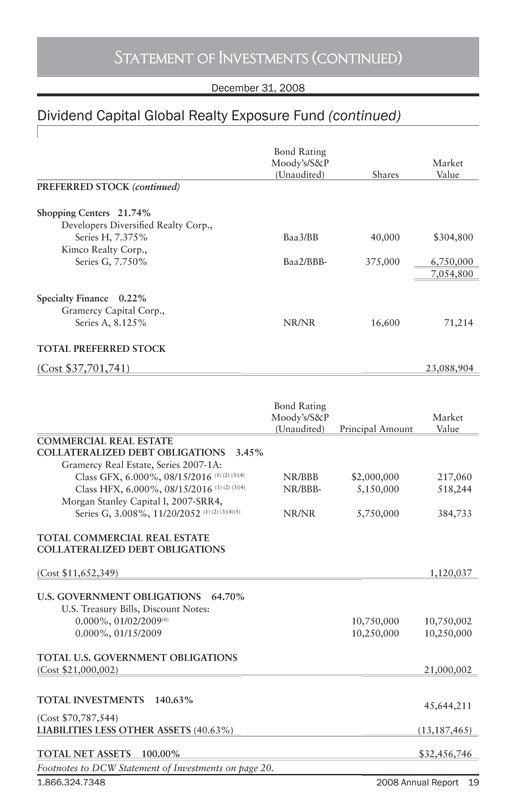
PREFERRED STOCK (continued)
Shopping Centers 21.74%
Developers Diversified Realty Corp.,
Series H, 7.375% Baa3/BB 40,000 $304,800
Kimco Realty Corp.,
Series G, 7.750% Baa2/BBB- 375,000 6,750,000
7,054,800
Specialty Finance 0.22%
Gramercy Capital Corp.,
Series A, 8.125% NR/NR 16,600 71,214
TOTAL PREFERRED STOCK
(Cost $37,701,741) 23,088,904
Bond Rating
Moody’s/S&P
(Unaudited) Principal Amount
Market
Value
COMMERCIAL REAL ESTATE
COLLATERALIZED DEBT OBLIGATIONS 3.45%
Gramercy Real Estate, Series 2007-1A:
Class GFX, 6.000%, 08/15/2016 (1) (2) (3)(4) NR/BBB $2,000,000 217,060
Class HFX, 6.000%, 08/15/2016 (1) (2) (3)(4) NR/BBB- 5,150,000 518,244
Morgan Stanley Capital I, 2007-SRR4,
Series G, 3.008%, 11/20/2052 (1) (2) (3)(4)(5) NR/NR 5,750,000 384,733
TOTAL COMMERCIAL REAL ESTATE
COLLATERALIZED DEBT OBLIGATIONS
(Cost $11,652,349) 1,120,037
U.S. GOVERNMENT OBLIGATIONS 64.70%
U.S. Treasury Bills, Discount Notes:
0.000%, 01/02/2009(6) 10,750,000 10,750,002
0.000%, 01/15/2009 10,250,000 10,250,000
TOTAL U.S. GOVERNMENT OBLIGATIONS
(Cost $21,000,002) 21,000,002
TOTAL INVESTMENTS 140.63%
45,644,211
(Cost $70,787,544)
LIABILITIES LESS OTHER ASSETS (40.63%) (13,187,465)
TOTAL NET ASSETS 100.00% $32,456,746
Footnotes to DCW Statement of Investments on page 20.
December 31, 2008

20 2008 Annual Report www.dividendcapital.com
Statement of Investments (continued)
Footnotes to DCW Statement of Investments:
(1) This security was purchased pursuant to the terms of a private placement memorandum and is exempt
from registration under the Securities Act of 1933, as amended (the “Securities Act”), pursuant to Rule
144A of the Securities Act. This security may only be sold in transactions exempt from registration
under the Securities Act, which most commonly involves a sale to “qualified institutional buyers” under
Rule 144A. As of December 31, 2008 the value of these securities amounted to $1,120,037 or 2.45% of
total investments.
(2) This security has been valued at fair values determined in good faith by or under the direction of the
Board of Trustees.
(3) The expected maturity date of this security listed herein differs from the legal maturity date due to the
expected schedule of principal payments.
(4) This security is considered illiquid by the Adviser.
(5) The coupon rate shown on floating or adjustable rate securities represents the current effective rate at
December 31, 2008.
(6) All or a portion of this security is pledged as collateral for swap agreements.
See accompanying Notes to Financial Statements.
Dividend Capital Global Realty Exposure Fund (continued)
December 31, 2008
1.866.324.7348 2008 Annual Report 21
Statement of Investments (continued)
Dividend Capital Global Realty Exposure Fund (continued)
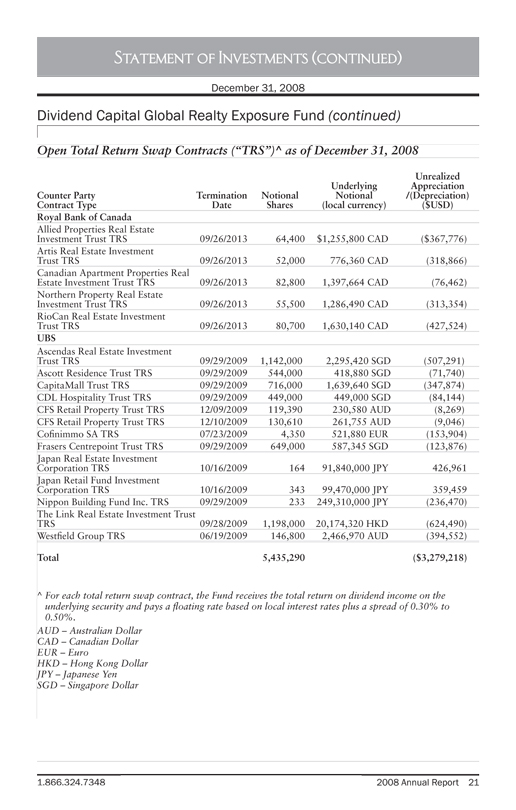
Open Total Return Swap Contracts (“TRS”)^ as of December 31, 2008
Counter Party
Contract Type
Termination
Date
Notional
Shares
Underlying
Notional
(local currency)
Unrealized
Appreciation
/(Depreciation)
($USD)
Royal Bank of Canada
Allied Properties Real Estate
Investment Trust TRS 09/26/2013 64,400 $1,255,800 CAD ($367,776)
Artis Real Estate Investment
Trust TRS 09/26/2013 52,000 776,360 CAD (318,866)
Canadian Apartment Properties Real
Estate Investment Trust TRS 09/26/2013 82,800 1,397,664 CAD (76,462)
Northern Property Real Estate
Investment Trust TRS 09/26/2013 55,500 1,286,490 CAD (313,354)
RioCan Real Estate Investment
Trust TRS 09/26/2013 80,700 1,630,140 CAD (427,524)
UBS
Ascendas Real Estate Investment
Trust TRS 09/29/2009 1,142,000 2,295,420 SGD (507,291)
Ascott Residence Trust TRS 09/29/2009 544,000 418,880 SGD (71,740)
CapitalMall Trust TRS 09/29/2009 716,000 1,639,640 SGD (347,874)
CDL Hospitality Trust TRS 09/29/2009 449,000 449,000 SGD (84,144)
CFS Retail Property Trust TRS 12/09/2009 119,390 230,580 AUD (8,269)
CFS Retail Property Trust TRS 12/10/2009 130,610 261,755 AUD (9,046)
Cofinimmo SA TRS 07/23/2009 4,350 521,880 EUR (153,904)
Frasers Centrepoint Trust TRS 09/29/2009 649,000 587,345 SGD (123,876)
Japan Real Estate Investment
Corporation TRS 10/16/2009 164 91,840,000 JPY 426,961
Japan Retail Fund Investment
Corporation TRS 10/16/2009 343 99,470,000 JPY 359,459
Nippon Building Fund Inc. TRS 09/29/2009 233 249,310,000 JPY (236,470)
The Link Real Estate Investment Trust
TRS 09/28/2009 1,198,000 20,174,320 HKD (624,490)
Westfield Group TRS 06/19/2009 146,800 2,466,970 AUD (394,552)
Total 5,435,290 ($3,279,218)
^ For each total return swap contract, the Fund receives the total return on dividend income on the
underlying security and pays a floating rate based on local interest rates plus a spread of 0.30% to
0.50%.
AUD – Australian Dollar
CAD – Canadian Dollar
EUR – Euro
HKD – Hong Kong Dollar
JPY – Japanese Yen
SGD – Singapore Dollar
December 31, 2008
22 2008 Annual Report www.dividendcapital.com
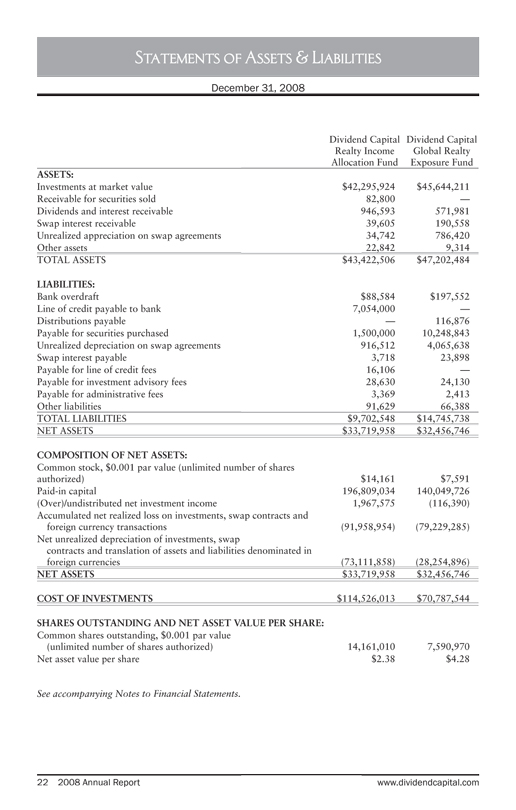
Statements of Assets & Liabilities
Dividend Capital
Realty Income
Allocation Fund
Dividend Capital
Global Realty
Exposure Fund
ASSETS:
Investments at market value $42,295,924 $45,644,211
Receivable for securities sold 82,800 —
Dividends and interest receivable 946,593 571,981
Swap interest receivable 39,605 190,558
Unrealized appreciation on swap agreements 34,742 786,420
Other assets 22,842 9,314
TOTAL ASSETS $43,422,506 $47,202,484
LIABILITIES:
Bank overdraft $88,584 $197,552
Line of credit payable to bank 7,054,000 —
Distributions payable — 116,876
Payable for securities purchased 1,500,000 10,248,843
Unrealized depreciation on swap agreements 916,512 4,065,638
Swap interest payable 3,718 23,898
Payable for line of credit fees 16,106 —
Payable for investment advisory fees 28,630 24,130
Payable for administrative fees 3,369 2,413
Other liabilities 91,629 66,388
TOTAL LIABILITIES $9,702,548 $14,745,738
NET ASSETS $33,719,958 $32,456,746
COMPOSITION OF NET ASSETS:
Common stock, $0.001 par value (unlimited number of shares
authorized) $14,161 $7,591
Paid-in capital 196,809,034 140,049,726
(Over)/undistributed net investment income 1,967,575 (116,390)
Accumulated net realized loss on investments, swap contracts and
foreign currency transactions (91,958,954) (79,229,285)
Net unrealized depreciation of investments, swap
contracts and translation of assets and liabilities denominated in
foreign currencies (73,111,858) (28,254,896)
NET ASSETS $33,719,958 $32,456,746
COST OF INVESTMENTS $114,526,013 $70,787,544
SHARES OUTSTANDING AND NET ASSET VALUE PER SHARE:
Common shares outstanding, $0.001 par value
(unlimited number of shares authorized) 14,161,010 7,590,970
Net asset value per share $2.38 $4.28
See accompanying Notes to Financial Statements.
December 31, 2008
1.866.324.7348 2008 Annual Report 23
Dividend Capital
Realty Income
Allocation Fund
Dividend Capital
Global Realty
Exposure Fund
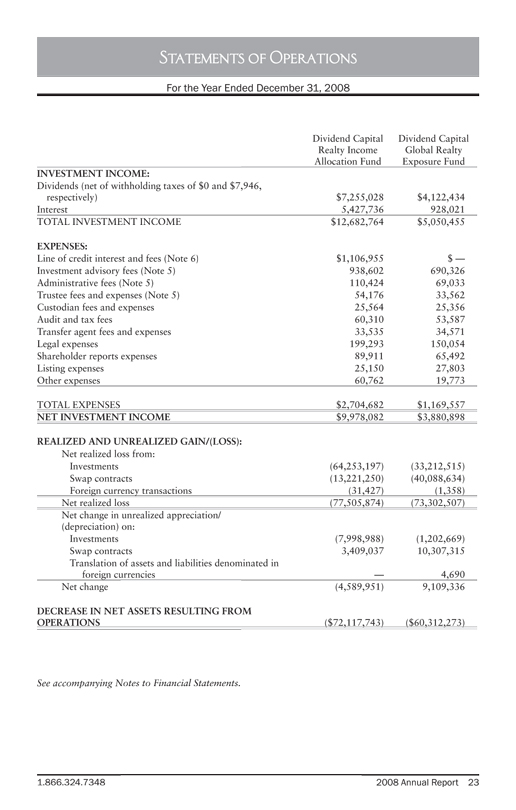
INVESTMENT INCOME:
Dividends (net of withholding taxes of $0 and $7,946,
respectively) $7,255,028 $4,122,434
Interest 5,427,736 928,021
TOTAL INVESTMENT INCOME $12,682,764 $5,050,455
EXPENSES:
Line of credit interest and fees (Note 6) $1,106,955 $ —
Investment advisory fees (Note 5) 938,602 690,326
Administrative fees (Note 5) 110,424 69,033
Trustee fees and expenses (Note 5) 54,176 33,562
Custodian fees and expenses 25,564 25,356
Audit and tax fees 60,310 53,587
Transfer agent fees and expenses 33,535 34,571
Legal expenses 199,293 150,054
Shareholder reports expenses 89,911 65,492
Listing expenses 25,150 27,803
Other expenses 60,762 19,773
TOTAL EXPENSES $2,704,682 $1,169,557
NET INVESTMENT INCOME $9,978,082 $3,880,898
REALIZED AND UNREALIZED GAIN/(LOSS):
Net realized loss from:
Investments (64,253,197) (33,212,515)
Swap contracts (13,221,250) (40,088,634)
Foreign currency transactions (31,427) (1,358)
Net realized loss (77,505,874) (73,302,507)
Net change in unrealized appreciation/
(depreciation) on:
Investments (7,998,988) (1,202,669)
Swap contracts 3,409,037 10,307,315
Translation of assets and liabilities denominated in
foreign currencies — 4,690
Net change (4,589,951) 9,109,336
DECREASE IN NET ASSETS RESULTING FROM
OPERATIONS ($72,117,743) ($60,312,273)
See accompanying Notes to Financial Statements.
Statements of Operations
For the Year Ended December 31, 2008
24 2008 Annual Report www.dividendcapital.com
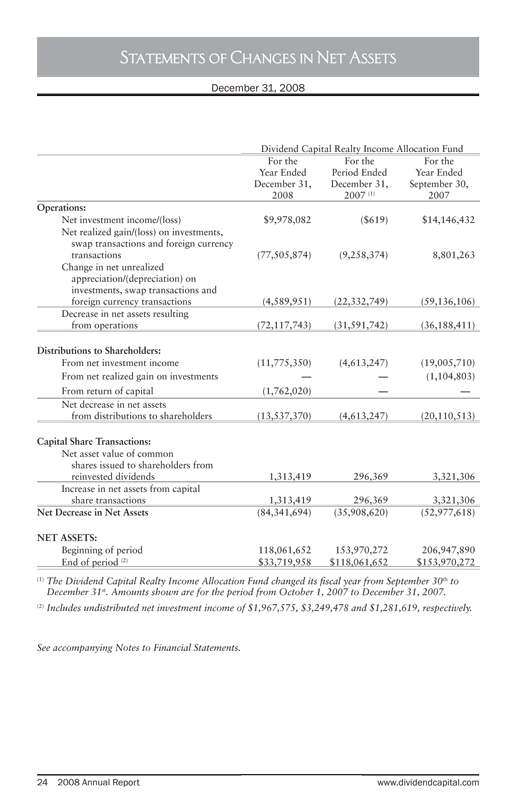
Statements of Changes in Net Assets
December 31, 2008
Dividend Capital Realty Income Allocation Fund
For the
Year Ended
December 31,
2008
For the
Period Ended
December 31,
2007 (1)
For the
Year Ended
September 30,
2007
Operations:
Net investment income/(loss) $9,978,082 ($619) $14,146,432
Net realized gain/(loss) on investments,
swap transactions and foreign currency
transactions (77,505,874) (9,258,374) 8,801,263
Change in net unrealized
appreciation/(depreciation) on
investments, swap transactions and
foreign currency transactions (4,589,951) (22,332,749) (59,136,106)
Decrease in net assets resulting
from operations (72,117,743) (31,591,742) (36,188,411)
Distributions to Shareholders:
From net investment income (11,775,350) (4,613,247) (19,005,710)
From net realized gain on investments — — (1,104,803)
From return of capital (1,762,020) — —
Net decrease in net assets
from distributions to shareholders (13,537,370) (4,613,247) (20,110,513)
Capital Share Transactions:
Net asset value of common
shares issued to shareholders from
reinvested dividends 1,313,419 296,369 3,321,306
Increase in net assets from capital
share transactions 1,313,419 296,369 3,321,306
Net Decrease in Net Assets (84,341,694) (35,908,620) (52,977,618)
NET ASSETS:
Beginning of period 118,061,652 153,970,272 206,947,890
End of period (2) $33,719,958 $118,061,652 $153,970,272
(1) The Dividend Capital Realty Income Allocation Fund changed its fiscal year from September 30th to
December 31st. Amounts shown are for the period from October 1, 2007 to December 31, 2007.
(2) Includes undistributed net investment income of $1,967,575, $3,249,478 and $1,281,619, respectively.
See accompanying Notes to Financial Statements.
1.866.324.7348 2008 Annual Report 25
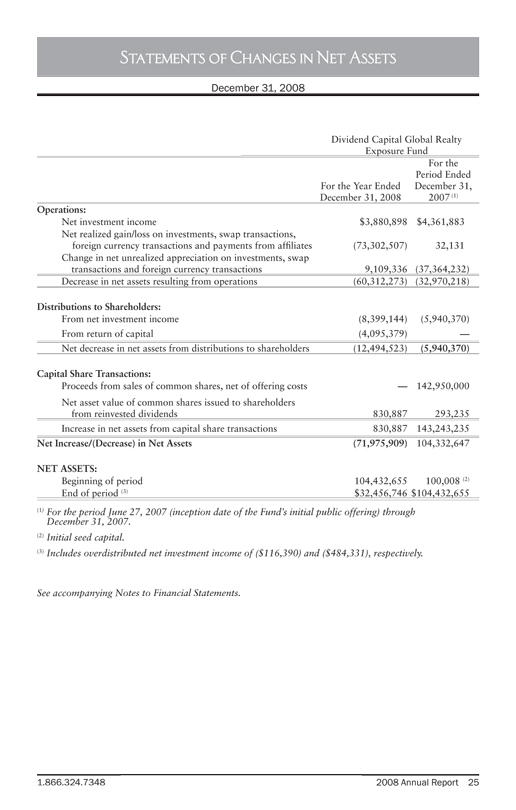
Statements of Changes in Net Assets
December 31, 2008
Dividend Capital Global Realty
Exposure Fund
For the Year Ended
December 31, 2008
For the
Period Ended
December 31,
2007 (1)
Operations:
Net investment income $3,880,898 $4,361,883
Net realized gain/loss on investments, swap transactions,
foreign currency transactions and payments from affiliates (73,302,507) 32,131
Change in net unrealized appreciation on investments, swap
transactions and foreign currency transactions 9,109,336 (37,364,232)
Decrease in net assets resulting from operations (60,312,273) (32,970,218)
Distributions to Shareholders:
From net investment income (8,399,144) (5,940,370)
From return of capital (4,095,379) —
Net decrease in net assets from distributions to shareholders (12,494,523) (5,940,370)
Capital Share Transactions:
Proceeds from sales of common shares, net of offering costs — 142,950,000
Net asset value of common shares issued to shareholders
from reinvested dividends 830,887 293,235
Increase in net assets from capital share transactions 830,887 143,243,235
Net Increase/(Decrease) in Net Assets (71,975,909) 104,332,647
NET ASSETS:
Beginning of period 104,432,655 100,008 (2)
End of period (3) $32,456,746 $104,432,655
(1) | | For the period June 27, 2007 (inception date of the Fund’s initial public offering) through |
December 31, 2007.
(2) | | Initial seed capital. |
(3) | | Includes overdistributed net investment income of ($116,390) and ($484,331), respectively. |
See accompanying Notes to Financial Statements.
26 2008 Annual Report www.dividendcapital.com
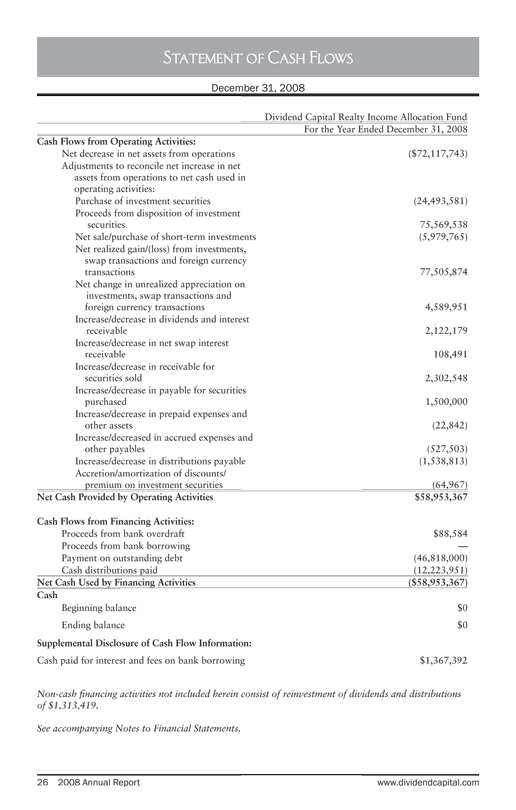
Statement of Cash Flows
Dividend Capital Realty Income Allocation Fund
For the Year Ended December 31, 2008
Cash Flows from Operating Activities:
Net decrease in net assets from operations ($72,117,743)
Adjustments to reconcile net increase in net
assets from operations to net cash used in
operating activities:
Purchase of investment securities (24,493,581)
Proceeds from disposition of investment
securities 75,569,538
Net sale/purchase of short-term investments (5,979,765)
Net realized gain/(loss) from investments,
swap transactions and foreign currency
transactions 77,505,874
Net change in unrealized appreciation on
investments, swap transactions and
foreign currency transactions 4,589,951
Increase/decrease in dividends and interest
receivable 2,122,179
Increase/decrease in net swap interest
receivable 108,491
Increase/decrease in receivable for
securities sold 2,302,548
Increase/decrease in payable for securities
purchased 1,500,000
Increase/decrease in prepaid expenses and
other assets (22,842)
Increase/decreased in accrued expenses and
other payables (527,503)
Increase/decrease in distributions payable (1,538,813)
Accretion/amortization of discounts/
premium on investment securities (64,967)
Net Cash Provided by Operating Activities $58,953,367
Cash Flows from Financing Activities:
Proceeds from bank overdraft $88,584
Proceeds from bank borrowing —
Payment on outstanding debt (46,818,000)
Cash distributions paid (12,223,951)
Net Cash Used by Financing Activities ($58,953,367)
Cash
Beginning balance $0
Ending balance $0
Supplemental Disclosure of Cash Flow Information:
Cash paid for interest and fees on bank borrowing $1,367,392
Non-cash financing activities not included herein consist of reinvestment of dividends and distributions
of $1,313,419.
See accompanying Notes to Financial Statements.
December 31, 2008

This Page Intentionally Left Blank
28 2008 Annual Report www.dividendcapital.com
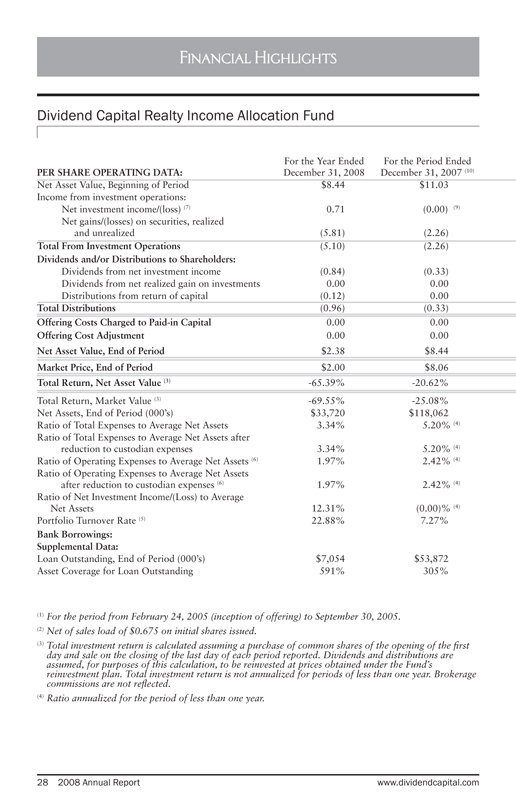
Financial Highlights
Dividend Capital Realty Income Allocation Fund
For the Year Ended
December 31, 2008
For the Period Ended
PER SHARE OPERATING DATA: December 31, 2007 (10)
Net Asset Value, Beginning of Period $8.44 $11.03
Income from investment operations:
Net investment income/(loss) (7) 0.71 (0.00) (9)
Net gains/(losses) on securities, realized
and unrealized (5.81) (2.26)
Total From Investment Operations (5.10) (2.26)
Dividends and/or Distributions to Shareholders:
Dividends from net investment income (0.84) (0.33)
Dividends from net realized gain on investments 0.00 0.00
Distributions from return of capital (0.12) 0.00
Total Distributions (0.96) (0.33)
Offering Costs Charged to Paid-in Capital 0.00 0.00
Offering Cost Adjustment 0.00 0.00
Net Asset Value, End of Period $2.38 $8.44
Market Price, End of Period $2.00 $8.06
Total Return, Net Asset Value (3) -65.39% -20.62%
Total Return, Market Value (3) -69.55% -25.08%
Net Assets, End of Period (000’s) $33,720 $118,062
Ratio of Total Expenses to Average Net Assets 3.34% 5.20% (4)
Ratio of Total Expenses to Average Net Assets after
reduction to custodian expenses 3.34% 5.20% (4)
Ratio of Operating Expenses to Average Net Assets (6) 1.97% 2.42% (4)
Ratio of Operating Expenses to Average Net Assets
after reduction to custodian expenses (6) 1.97% 2.42% (4)
Ratio of Net Investment Income/(Loss) to Average
Net Assets 12.31% (0.00)% (4)
Portfolio Turnover Rate (5) 22.88% 7.27%
Bank Borrowings:
Supplemental Data:
Loan Outstanding, End of Period (000’s) $7,054 $53,872
Asset Coverage for Loan Outstanding 591% 305%
(1) | | For the period from February 24, 2005 (inception of offering) to September 30, 2005. |
(2) | | Net of sales load of $0.675 on initial shares issued. |
(3) | | Total investment return is calculated assuming a purchase of common shares of the opening of the first |
day and sale on the closing of the last day of each period reported. Dividends and distributions are
assumed, for purposes of this calculation, to be reinvested at prices obtained under the Fund’s
reinvestment plan. Total investment return is not annualized for periods of less than one year. Brokerage
commissions are not reflected.
(4) | | Ratio annualized for the period of less than one year. |
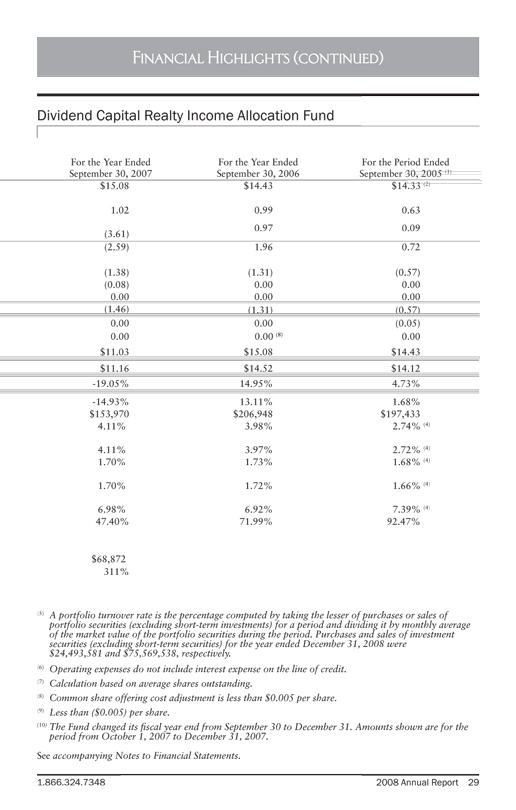
1.866.324.7348 2008 Annual Report 29
For the Year Ended
September 30, 2007
For the Year Ended
September 30, 2006
For the Period Ended
September 30, 2005 (1)
$15.08 $14.43 $14.33 (2)
1.02 0.99 0.63
(3.61)
0.97 0.09
(2.59) 1.96 0.72
(1.38) (1.31) (0.57)
(0.08) 0.00 0.00
0.00 0.00 0.00
(1.46) (1.31) (0.57)
0.00 0.00 (0.05)
0.00 0.00 (8) 0.00
$11.03 $15.08 $14.43
$11.16 $14.52 $14.12
-19.05% 14.95% 4.73%
-14.93% 13.11% 1.68%
$153,970 $206,948 $197,433
4.11% 3.98% 2.74% (4)
4.11% 3.97% 2.72% (4)
1.70% 1.73% 1.68% (4)
1.70% 1.72% 1.66% (4)
6.98% 6.92% 7.39% (4)
47.40% 71.99% 92.47%
$68,872
311%
(5) A portfolio turnover rate is the percentage computed by taking the lesser of purchases or sales of
portfolio securities (excluding short-term investments) for a period and dividing it by monthly average
of the market value of the portfolio securities during the period. Purchases and sales of investment
securities (excluding short-term securities) for the year ended December 31, 2008 were
$24,493,581 and $75,569,538, respectively.
(6) Operating expenses do not include interest expense on the line of credit.
(7) Calculation based on average shares outstanding.
(8) Common share offering cost adjustment is less than $0.005 per share.
(9) Less than ($0.005) per share.
(10) | | The Fund changed its fiscal year end from September 30 to December 31. Amounts shown are for the |
period from October 1, 2007 to December 31, 2007.
See accompanying Notes to Financial Statements.
Financial Highlights (continued)
Dividend Capital Realty Income Allocation Fund
30 2008 Annual Report www.dividendcapital.com
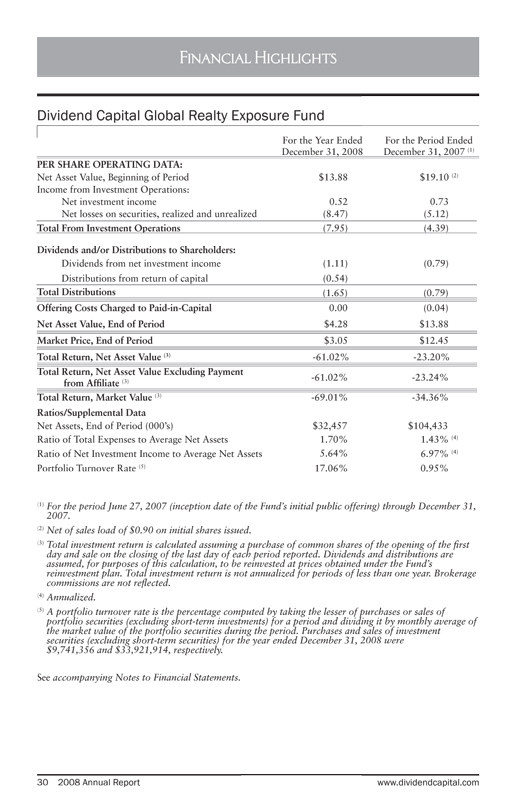
Financial Highlights
Dividend Capital Global Realty Exposure Fund
For the Year Ended
December 31, 2008
For the Period Ended
December 31, 2007 (1)
PER SHARE OPERATING DATA:
Net Asset Value, Beginning of Period $13.88 $19.10 (2)
Income from Investment Operations:
Net investment income 0.52 0.73
Net losses on securities, realized and unrealized (8.47) (5.12)
Total From Investment Operations (7.95) (4.39)
Dividends and/or Distributions to Shareholders:
Dividends from net investment income (1.11) (0.79)
Distributions from return of capital (0.54)
Total Distributions (1.65) (0.79)
Offering Costs Charged to Paid-in-Capital 0.00 (0.04)
Net Asset Value, End of Period $4.28 $13.88
Market Price, End of Period $3.05 $12.45
Total Return, Net Asset Value (3) -61.02% -23.20%
Total Return, Net Asset Value Excluding Payment
from Affiliate (3) -61.02% -23.24%
Total Return, Market Value (3) -69.01% -34.36%
Ratios/Supplemental Data
Net Assets, End of Period (000’s) $32,457 $104,433
Ratio of Total Expenses to Average Net Assets 1.70% 1.43% (4)
Ratio of Net Investment Income to Average Net Assets 5.64% 6.97% (4)
Portfolio Turnover Rate (5) 17.06% 0.95%
(1) | | For the period June 27, 2007 (inception date of the Fund’s initial public offering) through December 31, |
2007.
(2) | | Net of sales load of $0.90 on initial shares issued. |
(3) | | Total investment return is calculated assuming a purchase of common shares of the opening of the first |
day and sale on the closing of the last day of each period reported. Dividends and distributions are
assumed, for purposes of this calculation, to be reinvested at prices obtained under the Fund’s
reinvestment plan. Total investment return is not annualized for periods of less than one year. Brokerage
commissions are not reflected.
(5) | | A portfolio turnover rate is the percentage computed by taking the lesser of purchases or sales of |
portfolio securities (excluding short-term investments) for a period and dividing it by monthly average of
the market value of the portfolio securities during the period. Purchases and sales of investment
securities (excluding short-term securities) for the year ended December 31, 2008 were
$9,741,356 and $33,921,914, respectively.
See accompanying Notes to Financial Statements.
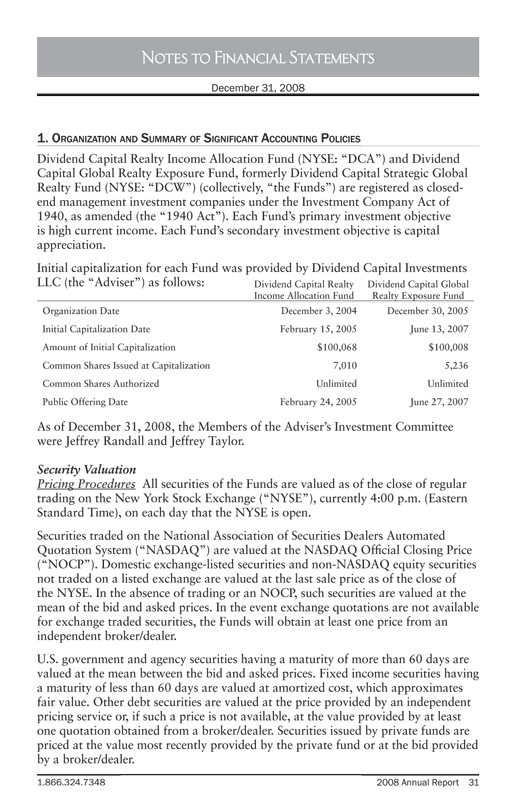
1.866.324.7348 2008 Annual Report 31
1. ORGANIZATION AND SUMMARY OF SIGNIFICANT ACCOUNTING POLICIES
Dividend Capital Realty Income Allocation Fund (NYSE: “DCA”) and Dividend
Capital Global Realty Exposure Fund, formerly Dividend Capital Strategic Global
Realty Fund (NYSE: “DCW”) (collectively, “the Funds”) are registered as closed-end
management investment companies under the Investment Company Act of
1940, as amended (the “1940 Act”). Each Fund’s primary investment objective
is high current income. Each Fund’s secondary investment objective is capital
appreciation.
Initial capitalization for each Fund was provided by Dividend Capital Investments
LLC (the “Adviser”) as follows:
As of December 31, 2008, the Members of the Adviser’s Investment Committee
were Jeffrey Randall and Jeffrey Taylor.
Security Valuation
Pricing Procedures All securities of the Funds are valued as of the close of regular
trading on the New York Stock Exchange (“NYSE”), currently 4:00 p.m. (Eastern
Standard Time), on each day that the NYSE is open.
Securities traded on the National Association of Securities Dealers Automated
Quotation System (“NASDAQ”) are valued at the NASDAQ Official Closing Price
(“NOCP”). Domestic exchange-listed securities and non-NASDAQ equity securities
not traded on a listed exchange are valued at the last sale price as of the close of
the NYSE. In the absence of trading or an NOCP, such securities are valued at the
mean of the bid and asked prices. In the event exchange quotations are not available
for exchange traded securities, the Funds will obtain at least one price from an
independent broker/dealer.
U.S. government and agency securities having a maturity of more than 60 days are
valued at the mean between the bid and asked prices. Fixed income securities having
a maturity of less than 60 days are valued at amortized cost, which approximates
fair value. Other debt securities are valued at the price provided by an independent
pricing service or, if such a price is not available, at the value provided by at least
one quotation obtained from a broker/dealer. Securities issued by private funds are
priced at the value most recently provided by the private fund or at the bid provided
by a broker/dealer.
Notes to Financial Statements
Dividend Capital Realty
Income Allocation Fund
Dividend Capital Global
Realty Exposure Fund
Organization Date December 3, 2004 December 30, 2005
Initial Capitalization Date February 15, 2005 June 13, 2007
Amount of Initial Capitalization $100,068 $100,008
Common Shares Issued at Capitalization 7,010 5,236
Common Shares Authorized Unlimited Unlimited
Public Offering Date February 24, 2005 June 27, 2007
December 31, 2008
32 2008 Annual Report www.dividendcapital.com
Security Valuation (continued)
Foreign exchange traded securities are valued at the last sale price at the close of
the exchange on which the security is primarily traded (except in certain countries
where market maker prices are used). In the absence of trading, such securities are
valued at the mean between the last reported bid and asked prices or the last sale
price. Fixed income securities where market quotations are not readily available are
valued at fair value.
Exchange traded options, warrants and rights are valued at the last reported sale
price at the close of the exchange on which the security is primarily traded. For
non-exchange traded options and exchange traded options, warrants and rights for
which no sales are reported, the mean between the bid and asked prices is used. For
exchange traded options, warrants and rights and foreign exchange traded equity
securities in which the markets are not closed at the time that the Fund prices its
securities, snapshot prices provided by individual pricing services are used.
The price for futures contracts are the daily quoted settlement prices. Single security
total return swaps in which the referenced security is traded on an exchange are
valued at the last sale price at the time of close of the NYSE. In the absence of
trading of a referenced security, the mean between the closing bid and asked prices
will be used.
Fair Valuation If the price of a security is unavailable in accordance with the Funds’
pricing procedures, or the price of a security is suspect, e.g., due to the occurrence
of a significant event (as defined below), the security may be valued at its fair value
determined pursuant to procedures adopted by the Board. For this purpose, fair
value is the price that the Funds would receive upon selling an investment in an
orderly transaction to an independent buyer in the principal or most advantageous
market of the investment. As of December 31, 2008, securities which have been
fair valued represented 13.24% and 3.45% of DCA’s and DCW’s managed assets
respectively. Each Fund’s “Managed Assets” equal the Fund’s total assets (including
the net asset value of common shares plus the principal amount of any borrowings
used for leverage) minus the sum of accrued liabilities other than debt entered into
for purposes of leverage.
The following factors, among other relevant factors, may be considered when
determining the fair value of a security: (1) fundamental analytical data; (2) forces
which influence the market in which the security is sold, including the liquidity and
depth of the market; (3) type of security and the cost at date of purchase; (4) most
recent quotation received from a broker; (5) transactions or offers with respect to
the security; (6) price, yield and the extent of public or private trading in similar
securities of the issuer or comparable companies; (7) price and extent of public
trading of the security on foreign exchanges; (8) information on world financial
Notes to Financial Statements (continued)
December 31, 2008
1.866.324.7348 2008 Annual Report 33
Security Valuation (continued)
markets and comparable financial products; (9) size of the Funds’ holdings; (10)
financial statements of the issuer; (11) analyst reports; (12) merger proposals
or tender offers; (13) value of other financial instruments, including derivative
securities, traded on other markets or among dealers; (14) trading volumes on
markets, exchanges or among dealers; (15) values of baskets of securities traded
on other markets, exchanges or among dealers; (16) change in interest rates; (17)
observations from financial institutions; (18) government (domestic or foreign)
actions or pronouncements; (19) in the case of restricted securities, discount
from market value of unrestricted securities of the same class at time of purchase,
existence and anticipated time frame of any undertaking to register the security and
the size of the holding in relation to any unrestricted outstanding shares; (20) in the
case of foreign securities, the country’s or geographic region’s political and economic
environment, nature of any significant events, American Depository Receipt trading,
exchange-traded fund trading and foreign currency exchange activity; (21) in the
case of interests in private funds, the absence of transaction activity in interests in the
private fund, extraordinary restrictions on redemptions, whether the private fund’s
valuation procedures provide for valuation of underlying securities at market value
or fair value, actual knowledge of the value of underlying portfolio holdings, review
of audited financial statements and ongoing due diligence and monitoring; and (22)
in the case of emergencies or other unusual situations, the nature and duration of
the event, forces influencing the operation of the financial markets, likelihood of
recurrence of the event, and whether the effects of the event are isolated or affect
entire markets, countries or regions.
The Funds adopted the provisions of Financial Accounting Standards Board
(“FASB”) Statement of Financial Accounting Standards No. 157 (“FAS 157”).
FAS 157 established a three-tier hierarchy to establish classification of fair value
measurements for disclosure purposes. Inputs refer broadly to the assumptions that
market participants would use in pricing the asset or liability, including assumptions
about risk. Inputs may be observable or unobservable. Observable inputs are inputs
that reflect the assumptions market participants would use in pricing the asset or
liability that are developed based on market data obtained from sources independent
of the reporting entity. Unobservable inputs are inputs that reflect the reporting
entity’s own assumptions about the assumptions market participants would use
in pricing the asset or liability that are developed based on the best information
available.
Notes to Financial Statements (continued)
December 31, 2008
34 2008 Annual Report www.dividendcapital.com
Security Valuation (continued)
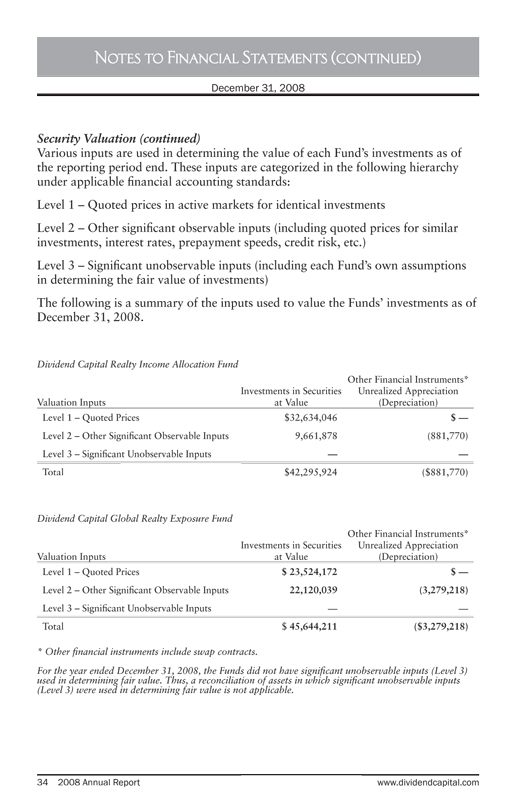
Various inputs are used in determining the value of each Fund’s investments as of
the reporting period end. These inputs are categorized in the following hierarchy
under applicable financial accounting standards:
Level 1 – Quoted prices in active markets for identical investments
Level 2 – Other significant observable inputs (including quoted prices for similar
investments, interest rates, prepayment speeds, credit risk, etc.)
Level 3 – Significant unobservable inputs (including each Fund’s own assumptions
in determining the fair value of investments)
The following is a summary of the inputs used to value the Funds’ investments as of
December 31, 2008.
Dividend Capital Realty Income Allocation Fund
Valuation Inputs
Investments in Securities
at Value
Other Financial Instruments*
Unrealized Appreciation
(Depreciation)
Level 1 – Quoted Prices $32,634,046 $ —
Level 2 – Other Significant Observable Inputs 9,661,878 (881,770)
Level 3 – Significant Unobservable Inputs — —
Total $42,295,924 ($881,770)
Dividend Capital Global Realty Exposure Fund
Valuation Inputs
Investments in Securities
at Value
Other Financial Instruments*
Unrealized Appreciation
(Depreciation)
Level 1 – Quoted Prices $ 23,524,172 $ —
Level 2 – Other Significant Observable Inputs 22,120,039 (3,279,218)
Level 3 – Significant Unobservable Inputs — —
Total $ 45,644,211 ($3,279,218)
* | | Other financial instruments include swap contracts. |
For the year ended December 31, 2008, the Funds did not have significant unobservable inputs (Level 3)
used in determining fair value. Thus, a reconciliation of assets in which significant unobservable inputs
(Level 3) were used in determining fair value is not applicable.
Notes to Financial Statements (continued)
December 31, 2008
1.866.324.7348 2008 Annual Report 35
Significant Events An event is significant if it causes the price for a security
determined at the normal time for pricing that security to no longer reflect fair
value at the time that the Funds determine their net asset value. A significant event
is material (a “Material Significant Event”) if a fair valuation for the security would
impact the Funds’ net asset value by more than one-half of one percent (0.5%).
If a Material Significant Event has occurred, the Adviser will call a meeting of the
Valuation Committee to determine a fair value for the security in accordance with
the Funds’ Fair Valuation Procedures.
Risk of Concentration
Because the Funds’ investments are concentrated in the real estate industry, the value
of the Funds may be subject to greater volatility than a fund with a portfolio that is
less concentrated in a single industry. If the securities of real estate companies as a
group fall out of favor with the investors, the Funds could underperform funds that
have greater industry diversification.
Security Credit Risk
The Funds invest in high-yield securities, which may be subject to a greater degree of
credit risk, market fluctuations and loss of income and principle, and may be more
sensitive to economic conditions than lower-yielding, higher-rated securities. The
Funds may acquire securities in default, and are not obligated to dispose of securities
whose issuers subsequently default. As of December 31, 2008, securities with an
aggregate market value of $30, representing 0.00% of DCA’s net assets, were in
default.
Foreign Securities
The Funds may invest a portion of their assets in foreign securities. In the event that
the Funds execute a foreign security transaction, the Funds will generally enter into
forward foreign currency contracts to settle specific purchases or sales of securities
denominated in a foreign currency. Foreign securities may carry more risk than U.S.
securities, such as political, market and currency risks. Upon the recommendation of
management, the Trustees approved expanding DCA’s exposure to foreign securities
to include securities of foreign issuers located outside of North America. As a result,
DCA may now invest in securities of foreign issuers located in developed countries.
The accounting records of the Funds are maintained in U.S. dollars. Prices of
securities denominated in foreign currencies are translated into U.S. dollars at the
closing rate of exchange at period end. Amounts related to the purchase and sale
of foreign securities and investment income are translated at the rates of exchange
prevailing on the respective dates of such transactions.
The effects of changes in foreign currency exchange rates on investments is separately
identified from the fluctuations arising from changes in market values of securities
held and reported with all other foreign currency gains and losses in the Funds’
Statements of Operations.
Notes to Financial Statements (continued)
December 31, 2008
36 2008 Annual Report www.dividendcapital.com
Repurchase Agreements
The Funds may invest in repurchase agreements, which are short-term investments
in which the Funds acquire ownership of a debt security and the seller agrees to
repurchase the security at a future time and specified price. Repurchase agreements
are fully collateralized by the underlying debt security. The Funds will make
payment for such securities only upon physical delivery or evidence of book entry
transfer to the account of the custodian bank. The seller is required to maintain
the value of the underlying security at not less than the repurchase proceeds due the
Funds.
Distributions to Shareholders
The Funds intend to make dividend distributions each quarter to shareholders.
The dividend rate may be modified by the Board of Trustees from time to time.
Dividends and distributions to shareholders are recorded by the Funds on the ex-dividend
date. Distributions paid by the Funds are subject to recharacterization for
tax purposes. A portion of the distributions paid by the Funds may be reclassified
to return of capital and long-term capital gains upon the final determination of
the Funds’ taxable income for the year. Net realized gains, unless offset by any
available capital loss carryforward, are generally distributed to shareholders
annually, although net realized gains may be retained by the Funds in certain
circumstances.
Securities Transactions and Investment Income
Investment security transactions are accounted for as of trade date. Dividend
income is recorded on the ex-dividend date. Interest income, which includes
amortization of premium and accretion of discount, is accrued as earned. Dividend
income from REIT securities may include return of capital. Upon notification from
the issuer, the amount of the return of capital is reclassified to adjust dividend
income, reduce the cost basis and/or adjust realized gain. Realized gains and
losses from securities transactions and unrealized appreciation and depreciation of
securities are determined using the specific identification method for both financial
reporting and income tax purposes.
Reclassifications
Certain amounts for DCA for the year ended September 30, 2007 have been
reclassified to conform to the December 31, 2007 presentation.
Use of Estimates
The Funds’ financial statements are prepared in accordance with accounting
principles generally accepted in the United States of America. This requires
management to make estimates and assumptions that affect the reported amounts
of assets and liabilities and disclosure of contingent assets and liabilities at the date
of the financial statements and the reported amounts of increases and decreases in
net assets from operations during the reporting period. Actual results could differ
from these estimates.
Notes to Financial Statements (continued)
December 31, 2008
1.866.324.7348 2008 Annual Report 37
Investments with Off-Balance Sheet Risk
The Funds enter into financial instrument transactions (such as swaps, futures,
options and other derivatives) that may have off-balance sheet market risk. Off balance
sheet market risk exists when the maximum potential loss on a particular
financial instrument is greater than the value of such financial instrument as
reflected in the Funds’ Statements of Assets and Liabilities.
In addition, the use of total return swaps could adversely affect the character
(capital gain vs. ordinary income) of the income recognized by the Funds for U.S.
federal income tax purposes, as well as the timing of such income recognition,
as compared to a direct investment in the underlying security, and could result in
the Funds’ recognition of income prior to the receipt of the corresponding cash.
In some market scenarios, the Funds may recognize income and never receive the
corresponding cash. This outcome could result in the Funds having to sell assets in
order to fund distributions, and in the investor having to pay higher income taxes
than would have been the case with a more traditional investment strategy.
Indemnifications
In the normal course of business, the Funds enter into contracts that provide
general Indemnifications. Each Fund’s maximum exposure under this arrangement
is dependent upon claims that may be made against the Funds in the future and,
therefore, cannot be estimated; however, based on experience, the risk of material
loss from such claims is considered remote.
2. FEDERAL INCOME TAXES
No provision for federal income taxes is required since the Funds intend to continue
to qualify as regulated investment companies and distribute to shareholders all of its
taxable income and capital gains.
Therefore, no federal income tax provision is required in the Funds’ financial statements.
Management has analyzed each Fund’s tax positions taken on federal income tax returns
for all open tax years and has concluded that as of December 31, 2008, no provision for
income tax would be required in the Funds’ financial statements. Each Fund’s federal
and state income and federal excise tax returns for tax years for which the applicable
statutes of limitations have not expired are subject to examination by the Internal
Revenue Service and state department of revenue.
Because federal income tax regulations differ from generally accepted accounting
principles, income and capital gain distributions determined in accordance with tax
regulations may differ from net investment income and realized gain for financial
reporting purposes. Accordingly, the character of distributions and composition of
net assets for tax purposes differ from those reflected in the accompanying financial
statements.
Notes to Financial Statements (continued)
December 31, 2008
38 2008 Annual Report www.dividendcapital.com
Effective December 31, 2007, the Funds adopted FASB Interpretation No. 48 (“FIN
48”) “Accounting for Uncertainty in Income Taxes,” which requires that the financial
statement effects of a tax position taken or expected to be taken in a tax return be
recognized in the financial statements when it is more likely than not, based on the
technical merits, that the position will be sustained upon examination. Management has
concluded that the Funds have taken no uncertain tax positions that require adjustment
to the financial statements to comply with the provisions of FIN 48. The Funds file
income tax returns in the U.S. federal jurisdiction and the State of Colorado. The statute
of limitations on the Funds’ federal tax return filings remains open for the years ended
December 31, 2008 and December 31, 2007 and for September 30, 2007, September
30, 2006 and September 30, 2005 for DCA. The Funds’ Colorado tax return filings
remain open for the years ended December 31, 2008 and December 31, 2007 and
for September 30, 2007, September 30, 2006 and September 30, 2005 for DCA. To
our knowledge there are no federal or Colorado income tax returns currently under
examination.
The tax character of the distributions paid by the Funds during the following periods
and years ended December 31, 2008, were as follows:
Dividend Capital Realty Income
Allocation Fund
Dividend Capital Global Realty
Exposure Fund
Distributions paid
from:
Year Ended
December 31,
2008
Period Ended
December 31,
2007
Year Ended
September 30,
2007
Year Ended
December 31,
2008
Period Ended
December 31,
2007
Ordinary Income $11,775,350 $4,613,247 $19,736,966 $8,399,144 $5,940,370
Long-Term Capital
Gain — — 373,547 —
Return of Capital 1,762,020 — — 4,095,379 —
Capital Loss Carryforwards:
At December 31, 2008, each Fund had available for federal income tax purposes
unused capital loss carryforwards as follows:
Expiring
Dividend Capital Realty Income
Allocation Fund
Dividend Capital Global Realty
Exposure Fund
2015 $380,321 $1,040,591
2016 63,197,578 70,372,176
Total $63,577,899 $71,412,767
Post October Losses:
DCW intends to elect to defer to its fiscal year ending December 31, 2009,
approximately $7,816,518 of capital losses and $1,647 of currency losses
recognized during the period November 1, 2008 to December 31, 2008. DCA
intends to elect to defer to its fiscal year ending December 31, 2009, approximately
Note to Financial Statements (continued)
December 31, 2008
1.866.324.7348 2008 Annual Report 39
$27,581,003 of losses recognized during the period November 1, 2008 to
December 31, 2008.
As of December 31, 2008, the components of distributable earnings on a tax basis
were as follows:
Dividend Capital
Realty Income
Allocation Fund
Dividend Capital
Global Realty
Exposure Fund
Accumulated net realized loss ($91,158,902) ($79,230,932)
Net unrealized depreciation (71,944,335) (28,254,896)
Offer cumulative effect of timing differences — (114,743)
Total ($163,103,237) ($107,600,571)
At December 31, 2008 the cost of investments and net unrealized appreciation for
federal income tax purposes were as follows:
Dividend Capital
Realty Income
Allocation Fund
Dividend Capital
Global Realty
Exposure Fund
Aggregate tax cost (including swaps and foreign currency) $114,240,259 $70,787,544
Gross unrealized appreciation 167,055 30,375
Gross unrealized depreciation (72,111,390) (25,173,708)
Net depreciation of swaps and foreign currency (1,591,010) (3,667,959)
Net unrealized depreciation ($73,535,345) ($28,811,292)
Net investment income (loss) and net realized gain (loss) may differ from financial
statements and tax purposes. These differences are primarily due to the treatment of
certain investment securities and distribution allocations. These permanent differences
in the character of income and distributions between financial statements and tax basis
have been reclassified.
For the year ended December 31, 2008 each Fund recorded the following
reclassifications to the accounts listed below:
Paid-in Capital
Increase/(Decrease)
(Over)/(Undistributed)
Net Investment Income
Increase/(Decrease)
Accumulated Net Realized
Gain/(Loss)
Dividend Capital
Realty Income
Allocation Fund ($1,759,219) $2,277,385 ($518,166)
Dividend Capital
Global Realty
Exposure Fund (4,146,681) 8,981,566 (4,834,885)
Net assets of the Funds were not affected by the reclassifications.
Note to Financial Statements (continued)
December 31, 2008
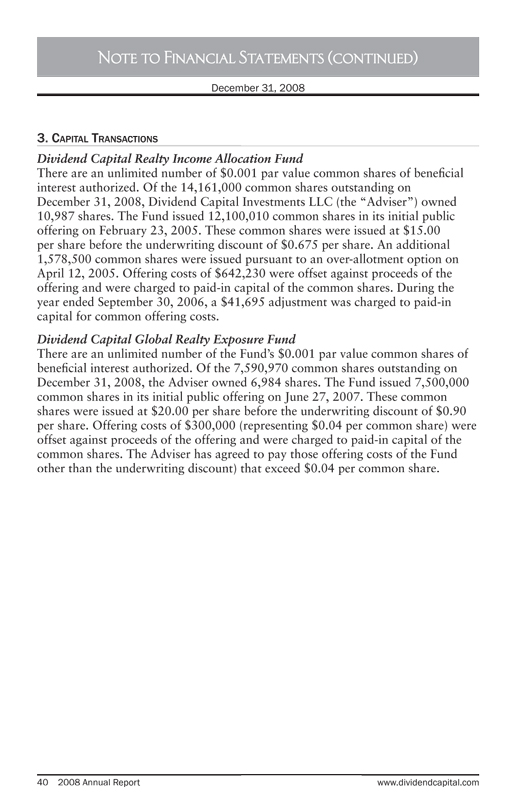
40 2008 Annual Report www.dividendcapital.com
3. CAPITAL TRANSACTIONS
Dividend Capital Realty Income Allocation Fund
There are an unlimited number of $0.001 par value common shares of beneficial
interest authorized. Of the 14,161,000 common shares outstanding on
December 31, 2008, Dividend Capital Investments LLC (the “Adviser”) owned
10,987 shares. The Fund issued 12,100,010 common shares in its initial public
offering on February 23, 2005. These common shares were issued at $15.00
per share before the underwriting discount of $0.675 per share. An additional
1,578,500 common shares were issued pursuant to an over-allotment option on
April 12, 2005. Offering costs of $642,230 were offset against proceeds of the
offering and were charged to paid-in capital of the common shares. During the
year ended September 30, 2006, a $41,695 adjustment was charged to paid-in
capital for common offering costs.
Dividend Capital Global Realty Exposure Fund
There are an unlimited number of the Fund’s $0.001 par value common shares of
beneficial interest authorized. Of the 7,590,970 common shares outstanding on
December 31, 2008, the Adviser owned 6,984 shares. The Fund issued 7,500,000
common shares in its initial public offering on June 27, 2007. These common
shares were issued at $20.00 per share before the underwriting discount of $0.90
per share. Offering costs of $300,000 (representing $0.04 per common share) were
offset against proceeds of the offering and were charged to paid-in capital of the
common shares. The Adviser has agreed to pay those offering costs of the Fund
other than the underwriting discount) that exceed $0.04 per common share.
Note to Financial Statements (continued)
December 31, 2008
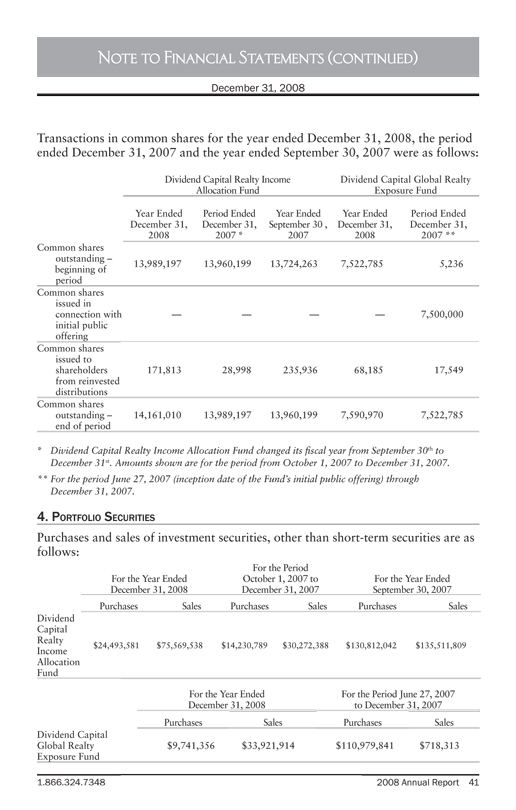
1.866.324.7348 2008 Annual Report 41
Note to Financial Statements (continued)
December 31, 2008
Transactions in common shares for the year ended December 31, 2008, the period
ended December 31, 2007 and the year ended September 30, 2007 were as follows:
Dividend Capital Realty Income
Allocation Fund
Dividend Capital Global Realty
Exposure Fund
Year Ended
December 31,
2008
Period Ended
December 31,
2007 *
Year Ended
September 30 ,
2007
Year Ended
December 31,
2008
Period Ended
December 31,
2007 **
Common shares
outstanding –
beginning of
period
13,989,197 13,960,199 13,724,263 7,522,785 5,236
Common shares
issued in
connection with
initial public
offering
— — — — 7,500,000
Common shares
issued to
shareholders
from reinvested
distributions
171,813 28,998 235,936 68,185 17,549
Common shares
outstanding –
end of period
14,161,010 13,989,197 13,960,199 7,590,970 7,522,785
* | | Dividend Capital Realty Income Allocation Fund changed its fiscal year from September 30th to |
December 31st. Amounts shown are for the period from October 1, 2007 to December 31, 2007.
** For the period June 27, 2007 (inception date of the Fund’s initial public offering) through
December 31, 2007.
4. PORTFOLIO SECURITIES
Purchases and sales of investment securities, other than short-term securities are as
follows:
For the Year Ended
December 31, 2008
For the Period
October 1, 2007 to
December 31, 2007
For the Year Ended
September 30, 2007
Purchases Sales Purchases Sales Purchases Sales
Dividend
Capital
Realty
Income
Allocation
Fund
$24,493,581 $75,569,538 $14,230,789 $30,272,388 $130,812,042 $135,511,809
For the Year Ended
December 31, 2008
For the Period June 27, 2007
to December 31, 2007
Purchases Sales Purchases Sales
Dividend Capital
Global Realty
Exposure Fund
$9,741,356 $33,921,914 $110,979,841 $718,313
42 2008 Annual Report www.dividendcapital.com
5. INVESTMENT ADVISORY AND ADMINISTRATION AGREEMENTS AND OTHER RELATED PARTY TRANSACTIONS
Dividend Capital Investments LLC (“Dividend Capital” or the “Adviser”) serves
as the Funds’ investment adviser and administrator. Pursuant to an Investment
Advisory Agreement with the Funds, as compensation for its services to the
Funds, Dividend Capital receives an annual investment advisory fee of 0.85% for
Dividend Capital Realty Income Allocation Fund and 1.00% for Dividend Capital
Global Realty Exposure Fund based on each Fund’s average daily managed assets,
computed daily and payable monthly. Pursuant to an Administration Agreement
with each Fund, as compensation for its services to the Funds, Dividend Capital
receives an annual administration fee of 0.10% based on each Fund’s average daily
managed assets, computed daily and payable monthly.
Dividend Capital has entered into an administration, tax, bookkeeping and pricing
services agreement with ALPS Fund Services, Inc. (“ALPS”). Under this agreement,
ALPS will calculate the net asset value and perform certain other administrative
services for DCW. ALPS will be compensated by Dividend Capital (not by DCW)
for providing these services. Dividend Capital has entered into an Investment
Accounting Agreement and a Tax Service Agreement with State Street Bank and
Trust (“State Street”). Under these agreements, State Street will calculate the net
asset value and perform tax administrative services for DCA. State Street will be
compensated by Dividend Capital (not by DCA) for providing these services.
Trustees of the Funds who are “interested persons” of the Funds do not receive
any compensation from the Funds. Each of the Independent Trustees is paid from
the Funds an annual retainer of $20,000, and a fee of $2,000 and reimbursement
for related expenses for each meeting of the Board he attends. Each Independent
Trustee receives from the Funds a fee of $1,000 for each telephonic Board meeting
he attends. The Chairman of the Board of Trustees receives from the Funds an
additional annual retainer of $10,000.
Certain officers of the Funds are also officers of the Adviser.
6. LINE OF CREDIT
Dividend Capital Realty Income Allocation Fund
On April 28, 2005, Dividend Capital Realty Income Allocation Fund executed a
Revolving Credit and Security Agreement (the “Agreement”) among DCA, Jupiter
Securitization Corp. (“Jupiter”) and JP Morgan Chase Bank N.A. (“JP Morgan”)
which allows DCA to borrow against a secured line of credit from Jupiter and
JP Morgan an aggregate amount up to $85,000,000. On March 16, 2007 the
Agreement was amended and the line of credit was increased to $105,000,000.
The borrowings under the line of credit are secured by a pledge of the Fund’s
portfolio securities. Borrowings under the Agreement bear interest at a variable
rate determined by the bank’s conduit program, which has historically been slightly
below the 1-month LIBOR but more recently has exceeded 1-month LIBOR. DCA
pays fees of 0.175% per annum on 102% of the total line of credit, regardless
Note to Financial Statements (continued)
December 31, 2008
1.866.324.7348 2008 Annual Report 43
of usage. DCA also pays fees of 0.20% per annum on the average outstanding
amount of borrowings. The average balance during the year ended
December 31, 2008 was $29,618,470 or $2.10 per share based on average shares
outstanding of 14,117,923. The average cost of funding during the year ended
December 31, 2008 was 3.94%. As of December 31, 2008, the Fund had an
outstanding loan amount of $7,054,000.
DCA’s borrowing arrangement with Jupiter and JP Morgan terminated on
March 14, 2008. The arrangement requires that the loan be repaid in equal
quarterly payments over a 1-year period ending March 14, 2009. Effective
March 14, 2008, the 0.175% per annum fee on 102% of the total line of credit
ceased.
7. INVESTMENTS IN INTEREST RATE AND TOTAL RETURN SWAPS
The Funds may use interest rate swaps in connection with the line of credit and other
forms of direct or indirect leverage. The interest rate swaps are intended to reduce or
eliminate the risk or the negative effect that an increase in short-term interest rates could
have on the performance of the Funds’ common shares as a result of the floating rate
structure of the line of credit and other forms of direct or indirect leverage. In these
interest rate swaps, the Funds agree to pay the other party to the interest rate swap (the
“counterparty”) a fixed rate payment in exchange for the counterparty agreeing to pay
the Funds a variable rate payment that is intended to approximate the Funds’ variable
rate payment obligations on the line of credit. The payment obligations are based on the
notional amount of the swap. Depending on the state of interest rates in general, the use
of interest rate swaps could enhance or harm the overall performance of the common
shares. The market value of interest rate swaps is based on pricing models that consider
the time value of money, volatility and the current and forward interest rate markets.
The Funds use total return swaps to gain exposure to underlying referenced securities or
indices. Total return swap agreements involve commitments to pay interest plus fees in
exchange for a market-linked return, both based on notional amounts. To the extent the
total return of the security or index underlying the transaction exceeds or falls short of
the offsetting interest rate obligation, the Funds will receive a payment from or make a
payment to the counterparty, respectively.
Swaps are marked to market daily. For both interest rate swaps and total return
swaps, unrealized gains are reported as an asset and unrealized losses are reported
as a liability on the Funds’ Statements of Assets and Liabilities. The change in
value of swaps, including the accrual of periodic amounts of interest, net of the
market linked return to be paid or received on the swaps, is reported as unrealized
gains or losses on the Funds’ Statements of Operations. A realized gain or loss
is recorded upon payment or receipt of a periodic payment or termination of a
swap agreement. The Funds segregate or earmark sufficient assets as collateral to
satisfy the Funds’ current obligation with respect to total return swaps. Entering
into swap agreements involves, to varying degrees, elements of credit, foreign
Note to Financial Statements (continued)
December 31, 2008
44 2008 Annual Report www.dividendcapital.com
currency, market and documentation risk in excess of the amounts recognized on
the Statements of Assets and Liabilities. Such risks involve the possibility that there
will be no liquid market for these agreements, that the counterparty to
these agreements may default on its obligation to perform or disagree as to the
meaning of the contractual items in the agreements, and that there may be
unfavorable changes in foreign currency, interest rates or values in referenced
indices or securities.
Dividend Capital Realty Income Allocation Fund has adopted a non-fundamental
policy to limit its investment in securities of non-U.S. issuers to 20% of DCA’s
managed assets, measured at the time of investment (the “non-U.S. issuer
limitation”). As a component of its investment strategy, DCA may enter into
total return swaps where the reference security is issued by a foreign issuer
or the counterparty to the swap is a foreign financial institution. In this case,
DCA considers the non-U.S. investment limitation to apply. It is common for
swap contracts to be terminated and re-initiated due to economic factors or
the expiration of the term of the swap contract. In such case, DCA may re-initiate
the swap contract if deemed to be advisable by the Adviser. In cases where swap
contracts are re-initiated with substantially the same terms and the same reference
security and number of reference shares, such re-initiations will not be considered to
be a new investment for purposes of the application of the non-U.S. issuer limitation.
Accordingly, the notional value of the original swap contract that relates to the
reference security in question will be the basis for determining compliance with the
non-U.S. issuer limitation. As a result of this policy, DCA’s exposure to securities of
non-U.S. issuers, as measured by current notional value, could exceed 20%, in some
cases significantly so. As of December 31, 2008, the DCA’s exposure to securities of
non-U.S. issuers, as measured by current notional value, was 6.97% of its managed
assets.
Upon the recommendation of management, the Trustees reviewed DCA’s current
non-fundamental investment policies and have determined, effective immediately to
eliminate the non-U.S. issuer limitation. This limitation was a voluntary operating
policy and not required by the 1940 Act.
8. FOREIGN CURRENCY CONTRACTS
A foreign currency contract is a commitment to purchase or sell a foreign currency
at a future date, at a negotiated rate. The Funds may enter into foreign currency
contracts to settle specific purchases or sales of securities denominated in a foreign
currency and for protection from adverse exchange rate fluctuation. Risks to
the Funds include the potential inability of the counterparty to meet the terms
of the contract.
The net U.S. dollar value of foreign currency underlying all contractual commitments
held by the Funds and the resulting unrealized appreciation or depreciation are
Note to Financial Statements (continued)
December 31, 2008
1.866.324.7348 2008 Annual Report 45
determined using prevailing forward foreign currency exchange rates. Unrealized
appreciation and depreciation on foreign currency contracts are reported in the
Funds’ Statements of Assets and Liabilities as a receivable or a payable and in the
Funds’ Statements of Operations with the change in unrealized appreciation or
depreciation.
The Funds may realize a gain or loss upon the closing or settlement of the foreign
transaction. Such realized gains and losses are reported with all other foreign
currency gains and losses in the Statements of Operations.
9. ILLIQUID AND/OR RESTRICTED SECURITIES
As of December 31, 2008, investments in securities included issues that are restricted.
Restricted securities are often purchased in private placement transactions, are not
registered under the Securities Act of 1933, may have contractual restrictions on
resale, and may be revalued under methods approved by the Board of Trustees as
reflecting fair value. A security may also be considered illiquid if it lacks a readily
available market.
Upon the recommendation of management, the Trustees have reviewed DCA’s current
non-fundamental investment policies and have determined, effective
February 28, 2008, to eliminate the policy limiting the Fund’s investment in illiquid/
restricted securities to no more than 10% of its total managed assets (determined at
the time of purchase) to better reflect changes to the liquidity profile of the Fund’s
investments in current market conditions. This limitation was a voluntary operating
policy and not required by the 1940 Act. The Trustees will continue to monitor the
Fund’s investments in illiquid/restricted securities, and while the Fund may now
invest, without limit, in such securities, management does not presently intend to
increase investment to illiquid/restricted securities.
DCW may invest, without limit, in illiquid securities.
Note to Financial Statements (continued)
December 31, 2008
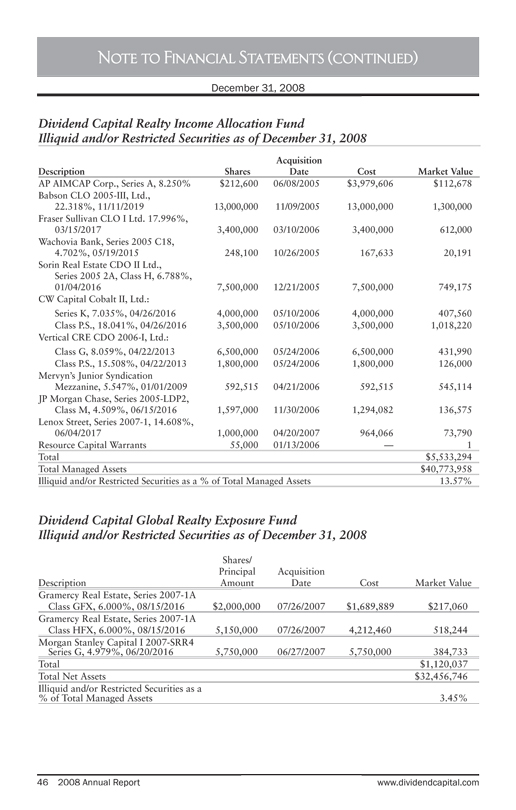
46 2008 Annual Report www.dividendcapital.com
Note to Financial Statements (continued)
Dividend Capital Realty Income Allocation Fund
Illiquid and/or Restricted Securities as of December 31, 2008
Description Shares
Acquisition
Date Cost Market Value
AP AIMCAP Corp., Series A, 8.250% $212,600 06/08/2005 $3,979,606 $112,678
Babson CLO 2005-III, Ltd.,
22.318%, 11/11/2019 13,000,000 11/09/2005 13,000,000 1,300,000
Fraser Sullivan CLO I Ltd. 17.996%,
03/15/2017 3,400,000 03/10/2006 3,400,000 612,000
Wachovia Bank, Series 2005 C18,
4.702%, 05/19/2015 248,100 10/26/2005 167,633 20,191
Sorin Real Estate CDO II Ltd.,
Series 2005 2A, Class H, 6.788%,
01/04/2016 7,500,000 12/21/2005 7,500,000 749,175
CW Capital Cobalt II, Ltd.:
Series K, 7.035%, 04/26/2016 4,000,000 05/10/2006 4,000,000 407,560
Class P.S., 18.041%, 04/26/2016 3,500,000 05/10/2006 3,500,000 1,018,220
Vertical CRE CDO 2006-I, Ltd.:
Class G, 8.059%, 04/22/2013 6,500,000 05/24/2006 6,500,000 431,990
Class P.S., 15.508%, 04/22/2013 1,800,000 05/24/2006 1,800,000 126,000
Mervyn’s Junior Syndication
Mezzanine, 5.547%, 01/01/2009 592,515 04/21/2006 592,515 545,114
JP Morgan Chase, Series 2005-LDP2,
Class M, 4.509%, 06/15/2016 1,597,000 11/30/2006 1,294,082 136,575
Lenox Street, Series 2007-1, 14.608%,
06/04/2017 1,000,000 04/20/2007 964,066 73,790
Resource Capital Warrants 55,000 01/13/2006 — 1
Total $5,533,294
Total Managed Assets $40,773,958
Illiquid and/or Restricted Securities as a % of Total Managed Assets 13.57%
Dividend Capital Global Realty Exposure Fund
Illiquid and/or Restricted Securities as of December 31, 2008
Description
Shares/
Principal
Amount
Acquisition
Date Cost Market Value
Gramercy Real Estate, Series 2007-1A
Class GFX, 6.000%, 08/15/2016 $2,000,000 07/26/2007 $1,689,889 $217,060
Gramercy Real Estate, Series 2007-1A
Class HFX, 6.000%, 08/15/2016 5,150,000 07/26/2007 4,212,460 518,244
Morgan Stanley Capital I 2007-SRR4
Series G, 4.979%, 06/20/2016 5,750,000 06/27/2007 5,750,000 384,733
Total $1,120,037
Total Net Assets $32,456,746
Illiquid and/or Restricted Securities as a
% of Total Managed Assets 3.45%
December 31, 2008
1.866.324.7348 2008 Annual Report 47
Note to Financial Statements (continued)
December 31, 2008
10. | | RECENT ACCOUNTING PRONOUNCEMENTS |
In March 2008, Statement of Financial Accounting Standards No. 161,
“Disclosures About Derivative Instruments and Hedging Activities — an
amendment of FASB Statement No. 133” (“FAS 161”) was issued and is effective
for fiscal years beginning after November 15, 2008. FAS 161 is intended to
improve financial reporting for derivative instruments by requiring enhanced
disclosure that enables investors to understand how and why an entity uses
derivatives, how derivatives are accounted for, and how derivative instruments
affect an entity’s results of operations and financial position. The Funds’
management is currently evaluating the implications of FAS 161 and the impact on
the Funds’ financial statement disclosures, if any.
At a meeting held on January 9, 2009, the Board of Trustees approved a series
of proposed strategic changes for the Funds and has approved Calamos Advisors
LLC to serve as the Funds’ sub-adviser for the non-real estate portion of the Fund’s
assets subject to shareholder approval. A proxy statement has been mailed to
shareholders of record as of January 15, 2009 with greater detail on the changes
and matters to be voted upon.
Both Funds intend to change their investment objective to total return from a
primary objective of high current income and secondary objective of capital
appreciation. In addition, the Funds will no longer be required to invest at least
80% of their managed assets in real estate securities or have any specific limitation
on investment in U.S. or non-U.S. companies, thereby permitting investment in a
broader universe of securities and industries. As part of this new focus, Dividend
Capital Realty Income Allocation Fund will change its name to DCA Total Return
Fund, while retaining its NYSE ticker symbol of DCA. Dividend Capital Global
Realty Exposure Fund will change its name to DCW Total Return Fund, while
retaining its NYSE ticker symbol of DCW.
Audit Committee Report (Unaudited)
The Audit Committee of each Board of Trustees normally meets at least
twice during each full fiscal year with the Funds’ Chief Financial Officer and
representatives of the independent auditors in a separate executive session to
discuss and review various matters as contemplated by the Audit Committee
Charter. In the performance of its oversight function, each Audit Committee has
considered and discussed the audited financial statements with management and
KPMG LLP (“KPMG”). Each Audit Committee also has discussed with KPMG the
matters required to be discussed by professional auditing standards. Each Audit
Committee also has considered whether the provision by KPMG of non-audit
48 2008 Annual Report www.dividendcapital.com
Note to Financial Statements (continued)
December 31, 2008
services to the Fund, and of professional services to the Adviser and affiliates of the
Adviser that provide services to the Funds, is compatible with maintaining KPMG’s
independence. Finally, each Audit Committee has received the written disclosures
and the letter from KPMG required by Independence Standards Board Standard
No. 1, “Independence Discussions with Audit Committees,” and has discussed
with KPMG its independence.
The members of each Fund’s Audit Committee are not professionally engaged
in the practice of auditing or accounting and are not experts in the fields of
accounting or auditing or evaluating auditor independence. The Board of Trustees
of each Fund has determined that Jonathan F. Zeschin and Thomas H. Mack
qualify as “audit committee financial experts,” as defined under the Securities
and Exchange Commission’s Regulation S-K, Item 401(h). Each Audit Committee
is in compliance with applicable rules of the NYSE for closed-end fund audit
committees, including the requirement that all members of the audit committee
be “financially literate” and that at least one member of the audit committee
have “accounting or related financial management expertise,” as determined by
each Board. Members of each Fund’s Audit Committee rely without independent
verification on the information provided to them and on the representations
made by management and the independent auditors. Accordingly, each Audit
Committee’s oversight does not provide an independent basis to determine that
management has maintained appropriate accounting and financial reporting
principles or appropriate internal controls and procedures designed to assure
compliance with accounting standards and applicable laws and regulations.
Furthermore, each Audit Committee’s considerations and discussions referred
to above do not assure that the audit of the Fund’s financial statements have
been carried out in accordance with generally accepted auditing standards, that
the financial statements are presented in accordance with generally accepted
accounting principles or that the Fund’s auditors are in fact “independent.”
Based upon the reports and discussions described in this report, and subject
to the limitations on the role and responsibilities of the Audit Committee
referred to above and in the Audit Committee Charter, each Audit Committee
recommended to the Board of Trustees that the audited financial statements of
each Fund be included in the Funds’ annual report to shareholders for the fiscal
year ended December 31, 2008. The members of each Fund’s Audit Committee,
Jonathan Zeschin, Thomas Mack, John Mezger and J. Gibson Watson, III, are
“independent” within the meaning of the 1940 Act and the NYSE corporate
governance standards for audit committees.

This Page Intentionally Left Blank
50 2008 Annual Report www.dividendcapital.com
Report of Independent
Registered Public Accounting Firm
The Shareholders and Board of Trustees
Dividend Capital Realty Income Allocation Fund:
We have audited the accompanying statement of assets and liabilities of Dividend
Capital Realty Income Allocation Fund, including the statement of investments,
as of December 31, 2008, the related statement of operations and cash flows for
the year then ended, and the statements of changes in net assets and the financial
highlights for the year ended December 31, 2008, the period from October 1,
2007 to December 31, 2007, and the year ended September 30, 2007. These
financial statements and financial highlights are the responsibility of the Fund’s
management. Our responsibility is to express an opinion on these financial
statements based on our audits. The financial highlights for the year ended
September 30, 2006, and for the period from February 24, 2005 (inception of
offering) to September 30, 2005, were audited by other auditors, whose report
dated November 16, 2006, expressed an unqualified opinion of this information.
We conducted our audits in accordance with the standards of the Public Company
Accounting Oversight Board (United States). Those standards require that we
plan and perform the audit to obtain reasonable assurance about whether the
financial statements and financial highlights are free of material misstatement.
An audit includes examining, on a test basis, evidence supporting the amounts
and disclosures in the financial statements. Our procedures included confirmation
of securities owned as of December 31, 2008, by correspondence with the
custodian and brokers or by other appropriate auditing procedures where replies
from brokers were not received. An audit also includes assessing the accounting
principles used and significant estimates made by management, as well as
evaluating the overall financial statement presentation. We believe that our audits
provide a reasonable basis for our opinion.
In our opinion, the financial statements and financial highlights referred to above
present fairly, in all material respects, the financial position of Dividend Capital
Realty Income Allocation Fund as of December 31, 2008, the results of its
operations and cash flows for the year then ended, and the changes in its net assets
and the financial highlights for the year ended December 31, 2008, for the period
from October 1, 2007 to December 31, 2007, and for the year ended
September 30, 2007, in conformity with U.S. generally accepted accounting
principles.
KPMG LLP
Denver, Colorado
February 27, 2009
December 31, 2008
Dividend Capital Realty Income Allocation Fund
1.866.324.7348 2008 Annual Report 51
Report of Independent
Registered Public Accounting Firm
The Shareholders and Board of Trustees
Dividend Capital Global Realty Exposure Fund:
We have audited the accompanying statement of assets and liabilities of Dividend
Capital Global Realty Exposure Fund, formerly Dividend Capital Strategic Global
Realty Fund, including the statement of investments, as of December 31, 2008,
the related statement of operations for the year then ended, and the statements of
changes in net assets and the financial highlights for the year ended December 31,
2008, and for the period from June 27, 2007 (inception of offering) to December
31, 2007. These financial statements and financial highlights are the responsibility
of the Fund’s management. Our responsibility is to express an opinion on these
financial statements based on our audits.
We conducted our audits in accordance with the standards of the Public Company
Accounting Oversight Board (United States). Those standards require that we
plan and perform the audit to obtain reasonable assurance about whether the
financial statements and financial highlights are free of material misstatement.
An audit includes examining, on a test basis, evidence supporting the amounts
and disclosures in the financial statements. Our procedures included confirmation
of securities owned as of December 31, 2008, by correspondence with the
custodian and brokers or by other appropriate auditing procedures where replies
from brokers were not received. An audit also includes assessing the accounting
principles used and significant estimates made by management, as well as
evaluating the overall financial statement presentation. We believe that our audits
provide a reasonable basis for our opinion.
In our opinion, the financial statements and financial highlights referred to
above present fairly, in all material respects, the financial position of Dividend
Capital Global Realty Exposure Fund as of December 31, 2008, the results of
its operations for the year then ended, and the changes in its net assets and the
financial highlights for the year ended December 31, 2008, and for the period
from June 27, 2007 (inception of offering) to December 31, 2007, in conformity
with U.S. generally accepted accounting principles.
KPMG LLP
Denver, Colorado
February 27, 2009
December 31, 2008
Dividend Capital Global Realty Exposure Fund
52 2008 Annual Report www.dividendcapital.com
Shareholder Tax Information
December 31, 2008 (Unaudited)
Certain tax information regarding the Funds is required to be provided to
shareholders based upon the Funds’ income and distributions for the taxable year
ended December 31, 2008.
During the period ended December 31, 2008, 1.57% and 0.10% of the dividends
paid by DCA and DCW from net investment income, respectively, qualify for
the corporate dividends received. Also during the period ended December 31,
2008, 1.26% and 0.00% of distributions of ordinary income by DCA and DCW,
respectively, met the requirements regarding qualified dividend income.
During the period ended December 31, 2008, 1.46% and 2.33% of distributions
from net investment income by DCA and DCW, respectively, is income derived
from U.S. Treasury Obligations.
Please note that the distributions paid by the Funds to shareholders are subject to
recharacterization for tax purposes. The final tax treatment of these distributions is
reported to shareholders on Form 1099-DIV, which will be mailed to shareholders
February 28, 2009. The Funds may pay distributions in excess of the Funds’ net
investment company taxable income and this excess would be a tax-free return
of capital distributed from the Funds’ assets. Distributions of capital decrease the
Funds’ total assets and, therefore, could have the effect of increasing the Funds’
expense ratio. In addition, the Funds may have to sell portfolio securities at a less
than opportune time.
The Funds own securities issued by REITs. A portion of the dividends paid by
REITs may be recharacterized for tax purposes following year-end as capital
gains and/or return of capital. To the extent this occurs, distributions paid
by the Funds during the year also will be reclassified to reflect these REIT
recharacterizations. Therefore the actual composition of the distributions paid
may change substantially by year-end and, to the extent these changes do occur,
they will have the effect of reducing the net investment income component of fund
distributions and correspondingly increasing the capital gains and/or return of
capital components.
1.866.324.7348 2008 Annual Report 53
The Funds offer a dividend reinvestment plan (the “Plan”) pursuant to which
shareholders, unless they otherwise elect, automatically have dividends and capital
gains distributions reinvested in common shares of the Fund by The Bank of New
York (the “Plan Agent”). Shareholders who elect not to participate in the Plan
receive all distributions in cash paid by wire or check mailed directly to the Plan
Agent.
How the Plan Works
After the Funds declare a dividend or determine to make a capital gain distribution,
the Plan Agent will acquire shares for the participants’ accounts, depending upon
the circumstances described below, either (i) through receipt of newly issued shares
of the Funds or (ii) by open-market purchases as follows:
If, on the payment date, the NAV is equal to or less than the market price per
share plus estimated brokerage commissions, the Plan Agent will invest the
distribution amount in newly issued shares on behalf of the Participants. The
number of newly issued shares to be credited to each Participant’s account will
be determined by dividing the dollar amount of the distribution by the NAV
on the date the shares are issued. However, if the NAV is less than 95% of the
market price on the payment date, the dollar amount of the distribution will
be divided by 95% of the market price on the payment date. Because common
shares may be issued at less than their market price, Plan Participants may get a
benefit that non-participants do not.
? If, on the payment date, the NAV is greater than the market value per
share plus estimated brokerage commissions, the Plan Agent will invest the
distribution amount in shares acquired on behalf of the Participants in openmarket
purchases, which may be made on the NYSE, in the over-the-counter
market or in negotiated transactions and may be on such terms as to price,
delivery and otherwise as the Plan Agent shall determine. It is possible that the
market price for the shares may increase before the Plan Agent has completed
its purchases. Therefore, the average purchase price per share the Plan Agent
pays may exceed the market price thereof on the payment date. If the market
price per share increases so that it equals or exceeds the NAV per share (minus
brokerage commissions), it will result in the acquisition by the Plan Agent of
fewer shares than if the distribution had been paid in shares issued by the Fund.
Otherwise, the Plan Agent will use all distributions received in cash to purchase
shares in the open market on or shortly after the payment date, but in no event
more than thirty (30) days after the payment date.
Dividend Reinvestment Plan
December 31, 2008 (Unaudited)
54 2008 Annual Report www.dividendcapital.com
Dividend Reinvestment Plan (continued)
December 31, 2008 (Unaudited)
Costs of the Plan
The Plan Agent’s fees for the handling of reinvestment of dividends and other
distributions will be paid by the Funds. However, each participant will pay a
pro rata share of brokerage commissions incurred with respect to the Plan Agent’s
open-market purchases in connection with the reinvestment of dividends and other
distributions. If a participant elects to have the Plan Agent sell part or all of his or
her shares and remit the proceeds, the participant will be charged his or her pro rata
share of brokerage commissions on the shares sold, plus a $15.00 transaction fee.
Tax Implications
The automatic reinvestment of dividends or distributions does not relieve
participants of any taxes which may be payable on such dividends or distributions.
Participants will receive tax information annually for their personal records and to
help them prepare their federal income tax return. For further information as to the
tax consequences of participation in the Plan, Participants should consult with their
own tax advisors.
Right to Withdraw
Participants whose shares are registered in his or her name may terminate his
or her account under the Plan by notifying the Agent in writing at BNY Mellon
Shareowner Services, P.O. Box 358035, Pittsburgh, PA 15252-8035, or by calling
the Agent at 1.877.296.3711, or using BNY Mellon’s website at:
www.melloninvestor.com/ISD. Such termination will be effective with respect to a
particular distribution if the Participant’s notice is received by the Agent prior to
such distribution record date. Participants whose shares are held by a brokerage
firm should contact his or her broker. If a Participant holds shares through a
broker, the Participant may not be able to transfer his or her shares to another
broker and continue to participate in the Plan if the new broker does not permit
such participation. The Plan may be amended or terminated by the Agent or the
Funds upon notice in writing mailed to each Participant at least 90 days prior to the
effective date of the termination.

1.866.324.7348 2008 Annual Report 55
The Funds file their complete schedule of portfolio holdings with the Commission
for the first and third quarters of each fiscal year on Form N-Q within 60 days
after the end of the period. Copies of the Funds’ Forms N-Q are available without
charge, upon request, by contacting the Funds at 1.866.324.7348 and on the
Commission’s website at www.sec.gov. You may also review and copy Form
N-Q at the Commission’s Public Reference Room in Washington, D.C. For more
information about the operation of the Public Reference Room, please call the
Commission at 1.800.SEC.0330.
NYSE Annual Certification
On May 16, 2008, the Funds submitted a CEO annual Certification to the NYSE
on which the Funds’ principal executive officer certified that he was not aware, as
of that date, of any violation by the Funds of the NYSE’s Corporate Governance
Listing Standards. In addition, as required by Section 302 of the Sarbanes-Oxley Act
of 2002 and related SEC rules, the Funds’ principal executive officer and principal
financial officer have made quarterly Certifications, included in filings with the SEC
on Forms N-CSR and N-Q, relating to, among other things, the Funds’ disclosure
controls and procedures and internal controls over financial reporting,
as applicable.
December 31, 2008 (Unaudited)
Portfolio Holdings
The Funds have delegated to the Adviser the voting of proxies relating to its
securities. The Adviser will vote such proxies in accordance with the Adviser’s
policies and procedures. The policies and procedures used in determining how to
vote proxies relating to portfolio securities and information regarding how the
Funds voted and proxies related to securities during the most recent 12-month
period ended June 30th for which an SEC filing has been made are available
without charge, upon request, by contacting the Funds at 1.866.324.7348,
visiting the Funds’ website at www.dividendcapital.com and visiting the Securities
Exchange Commission’s (the “Commission”) website at www.sec.gov.
Fund Proxy Voting Policies and Procedures
December 31, 2008 (Unaudited)
December 31, 2008 (Unaudited)
Sarbanes-Oxley Act and Other Information
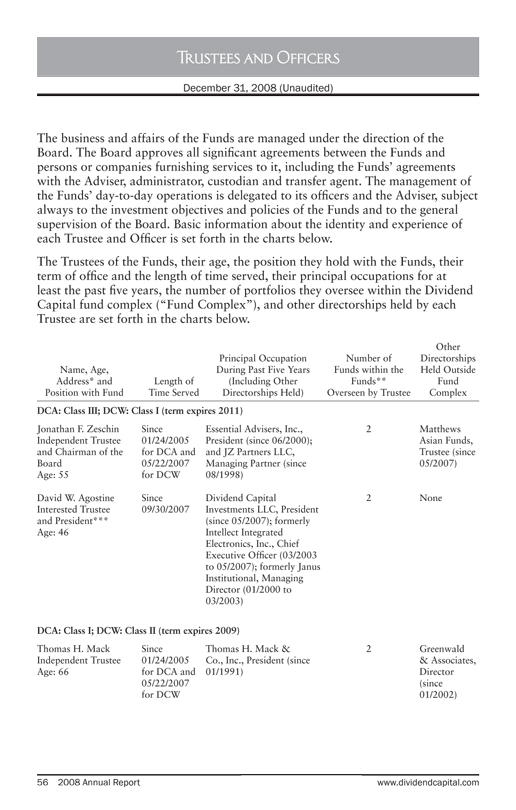
56 2008 Annual Report www.dividendcapital.com
The business and affairs of the Funds are managed under the direction of the
Board. The Board approves all significant agreements between the Funds and
persons or companies furnishing services to it, including the Funds’ agreements
with the Adviser, administrator, custodian and transfer agent. The management of
the Funds’ day-to-day operations is delegated to its officers and the Adviser, subject
always to the investment objectives and policies of the Funds and to the general
supervision of the Board. Basic information about the identity and experience of
each Trustee and Officer is set forth in the charts below.
The Trustees of the Funds, their age, the position they hold with the Funds, their
term of office and the length of time served, their principal occupations for at
least the past five years, the number of portfolios they oversee within the Dividend
Capital fund complex (“Fund Complex”), and other directorships held by each
Trustee are set forth in the charts below.
Name, Age,
Address* and
Position with Fund
Length of
Time Served
Principal Occupation
During Past Five Years
(Including Other
Directorships Held)
Number of
Funds within the
Funds**
Overseen by Trustee
Other
Directorships
Held Outside
Fund
Complex
DCA: Class III; DCW: Class I (term expires 2011)
Jonathan F. Zeschin
Independent Trustee
and Chairman of the
Board
Age: 55
Since
01/24/2005
for DCA and
05/22/2007
for DCW
Essential Advisers, Inc.,
President (since 06/2000);
and JZ Partners LLC,
Managing Partner (since
08/1998)
Asian Funds,
Trustee (since
05/2007)
David W. Agostine
Interested Trustee
and President***
Age: 46
Since
09/30/2007
Dividend Capital
Investments LLC, President
(since 05/2007); formerly
Intellect Integrated
Electronics, Inc., Chief
Executive Officer (03/2003
to 05/2007); formerly Janus
Institutional, Managing
Director (01/2000 to
03/2003)
DCA: Class I; DCW: Class II (term expires 2009)
Thomas H. Mack
Independent Trustee
Age: 66
Since
01/24/2005
for DCA and
05/22/2007
for DCW
Thomas H. Mack &
Co., Inc., President (since
01/1991)
& Associates,
Director
(since
01/2002)
Trustees and Offificers
December 31, 2008 (Unaudited)
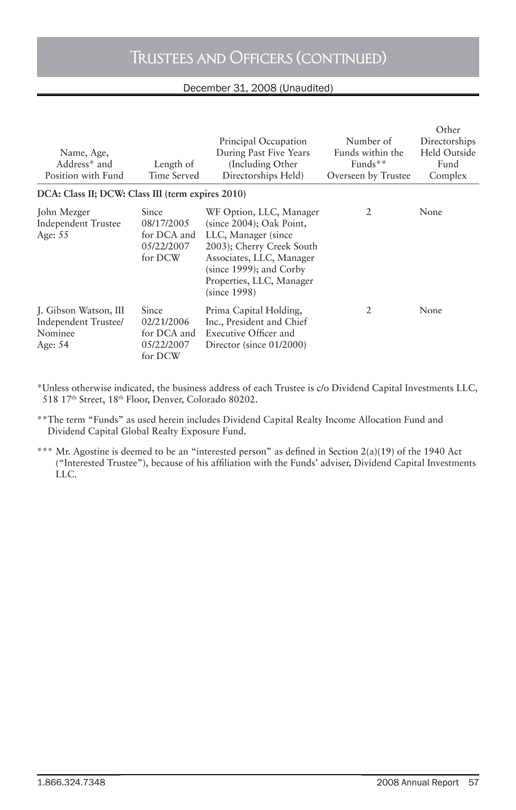
1.866.324.7348 2008 Annual Report 57
Trustees and Officers Officers (continued)
December 31, 2008 (Unaudited)
Name, Age,
Address* and
Position with Fund
Length of
Time Served
Principal Occupation
During Past Five Years
(Including Other
Directorships Held)
Number of
Funds within the
Funds**
Overseen by Trustee
Other
Directorships
Held Outside
Fund
Complex
DCA: Class II; DCW: Class III (term expires 2010)
John Mezger
Independent Trustee
Age: 55
Since
08/17/2005
for DCA and
05/22/2007
for DCW
WF Option, LLC, Manager
(since 2004); Oak Point,
LLC, Manager (since
2003); Cherry Creek South
Associates, LLC, Manager
(since 1999); and Corby
Properties, LLC, Manager
(since 1998)
J. Gibson Watson, III
Independent Trustee/
Nominee
Age: 54
Since
02/21/2006
for DCA and
05/22/2007
for DCW
Prima Capital Holding,
Inc., President and Chief
Executive Officer and
Director (since 01/2000)
*Unless otherwise indicated, the business address of each Trustee is c/o Dividend Capital Investments LLC,
518 17th Street, 18th Floor, Denver, Colorado 80202.
**The term “Funds” as used herein includes Dividend Capital Realty Income Allocation Fund and
Dividend Capital Global Realty Exposure Fund.
*** Mr. Agostine is deemed to be an “interested person” as defined in Section 2(a)(19) of the 1940 Act
(“Interested Trustee”), because of his affiliation with the Funds’ adviser, Dividend Capital Investments
LLC.
58 2008 Annual Report www.dividendcapital.com
Trustees and Officers Officers (continued)
December 31, 2008 (Unaudited)
The officers of the Funds, their ages and their principal occupations for at least the
past five years are set forth below. The address for each of the officers is 518 17th
Street, 18th Floor, Denver, CO 80202.
Name and
Year of Birth
Position(s) Held with the
Fund
Principal Occupation
During Past Five Years
Jeffrey Taylor
Age: 36
Vice President, Treasurer
and Principal Financial
Officer
Dividend Capital Investments LLC, Chief
Operating Officer (since 12/2005); and Vice
President of Business Services (02/2004 —
12/2005); INVESCO Inc., Product Manager
(07/2003 — 01/2004); and INVESCO Funds
Group Inc., Manager of Marketing and Business
Analytics (01/1999 — 06/2003).
Derek Mullins
Age: 35
Secretary and Assistant
Treasurer
Dividend Capital Investments LLC, Director
of Operations (since 01/2007); and Manager
of Fund Operations (11/2004 to 12/2006);
formerly, ALPS Mutual Funds Services Inc.,
Manager of Fund Administration (11/2003
— 10/2004) and Fund Controller (01/1999 —
10/2003).
Gordon Taylor
Age: 34
Chief Compliance Officer Dividend Capital Securities, LLC, Chief
Compliance Officer (since 3/2006); Cambridge
Investment Research, AVP, Director of
Compliance (12/2003 – 3/2006).
Jami VonKaenel
Age: 30
Assistant Secretary Dividend Capital Investments LLC and
Dividend Capital Securities, Controller (since
10/2006) and Assistant Controller (06/2004
— 10/2006); formerly, Ernst and Young LLP,
Senior, Technology and Security Risk Services
(02/2004 — 06/2004); and Accenture, Analyst
(01/2001 — 01/2004).
1.866.324.7348 2008 Annual Report 59
To assist in the execution of the Funds’ new strategies, the Board of Trustees of
both Funds recommended that shareholders approve Calamos Advisors LLC
to serve as sub-adviser to the Funds. Under this new advisory arrangement, the
Adviser will continue to provide overall investment advisory services to the Funds,
including management of the Funds’ long-term real estate and debt securities
portfolio, while Calamos Advisors LLC will manage the Funds’ common equity
allocations. Set forth below is a discussion regarding the basis for the Board of
Trustees’ approval of the sub-advisory agreement with Calamos Advisors LLC.
At a meeting held on January 9, 2009, the Board, including all of the Independent
Trustees, unanimously approved a new Sub-Advisory Agreement among the Funds,
the Adviser and Calamos Advisors LLC (the “Sub-Adviser”). In advance of the
January 9, 2009 meeting, the Board requested and received extensive information
from the Sub-Adviser to assist them in their review. The Board received and
considered a variety of information about the Sub-Adviser, as well as the subadvisory
arrangement for the Funds. The Board also reviewed a memorandum
prepared by Fund counsel outlining the legal duties of the Board when considering
an advisory agreement.
At the Board meeting, representatives of the Sub-Adviser made a presentation
regarding the firm generally and the services to be provided, and responded to
questions from the Board. The Independent Trustees discussed the presentation
given at the meeting by representatives of the Sub-Adviser and the materials
distributed in connection therewith. The Board noted that the Adviser undertook
an extensive and deliberate search process before recommending the Sub-Adviser.
This process included identifying a universe of potential managers and determining
which manager’s investment strategy fit best with the Funds, while providing
opportunities for closed-end fund synergies.
In particular, the Board considered the following factors:
(i) | | Fund Changes. The Board considered the Adviser’s explanation of its rationale |
for proposing various changes to the objectives, strategies and overall management
of the Funds. The Board noted that these changes were being recommended by
the Adviser in response to a significant and ongoing market dislocation that
contributed to large NAV declines, resulting reduction of the Funds’ dividend
paying capacity and overall ability to achieve their current objectives within the
current strategies. The Board concluded that these changes would better position
the Funds to realize long-term shareholder value.
The Board also considered the Adviser’s recommendation to engage the Sub-
Adviser to assist in the execution of the Funds’ new strategies. The Board noted
that the Adviser would continue in its capacity as adviser to the Funds with
responsibility for overall management of the Funds, including but not limited
to establishing the Funds’ overall investment strategy, portfolio profile and asset
allocation, analyzing and recommending to the Board the Funds’ distribution
Approval of Sub-Investment Advisory Agreement
December 31, 2008 (Unaudited)
60 2008 Annual Report www.dividendcapital.com
levels, overseeing the Sub-Adviser and discretionary management of the long-term
real estate and debt securities portfolio of the Funds. The Board concluded that the
addition of the Sub-Adviser would provide the Funds access to greater investment
resources and expertise than was otherwise available under the current advisory
structure.
ii) The nature, extent and quality of services to be provided by the Sub-Adviser.
The Trustees reviewed the services to be provided by the Sub-Adviser to the Funds,
including, but not limited to, making the day-to-day investment decisions for the
common equity portion of the Funds’ investments focused on total return, and
generally managing that portion in accordance with the stated investment objective
and policies of the Funds. The Trustees considered the Sub-Adviser’s knowledge
of the closed-end fund marketplace, development and management of closed-end
fund strategies and reputation within the closed-end fund market. The Trustees
received information concerning the investment philosophy and investment process
to be applied by the Sub-Adviser in managing a portion of the Funds. The Trustees
also considered the Sub-Adviser’s in-house research and analytical capabilities
as well as other resources available to the Sub-Adviser’s personnel. The Trustees
also discussed with officers and the proposed portfolio managers of the Funds the
investment strategy of the Funds and the type of transactions that would be made
on behalf of the Funds. The Trustees considered the investment team’s tenure and
stability and the favorable history, reputation and background of the proposed
portfolio managers for the Funds. On this basis, the Board concluded that the
Funds may benefit from the nature, extent and quality of the services expected to
be provided by the Sub-Adviser.
(iii) Investment Performance of the Sub-Adviser. The Board took into consideration
composite performance information provided by the Sub-Adviser in managing
accounts with a global, U.S. biased all cap or large cap strategy. The Board
considered the length and quality of the Sub-Adviser’s track record and ability to
outperform over many market cycles. While aware that past performance is not
necessarily indicative of future results, the Board concluded that the historical
performance provided by the Sub-Adviser compared favorably in relation to
various broad market indices, and that it was reasonable to expect that the Sub-
Adviser would provide satisfactory performance in the future.
(iv) Consideration of the Sub-Advisory Fee; Cost of the services to be provided
and profits to be realized by the Sub-Adviser from the relationship with the Funds.
Trustees received and reviewed information regarding the fees to be paid by the
Adviser to the Sub-Adviser pursuant to the Sub-Advisory Agreement. The Board
examined this information in order to determine the reasonableness of the fees
in light of the nature and quality of services to be provided and any potential
additional benefits to be received by the Sub-Adviser or its affiliates in connection
with providing such sub-advisory services to the Funds. The Trustees considered
Approval of Sub-Investment Advisory Agreement (continued)
December 31, 2008 (Unaudited)
1.866.324.7348 2008 Annual Report 61
the level of sub-advisory fees to be paid by the Adviser and compared it to the
sub-advisory fees paid by other equity oriented closed-end funds. The Board
acknowledged that it was difficult to make precise comparisons with other funds in
the peer group since the Funds’ new investment mandate would be a combination
of investment styles. The Board noted that the peer group information as a whole
was useful in assessing whether the Sub-Adviser would be providing services at a
cost that was competitive with the other funds. The Board also considered that the
sub-advisory fees would be paid by the Adviser out of its management fee and not
by the Funds. The Board noted that because the engagement of the Sub-Adviser
was new there was no historical profitability with regard to its arrangements
with the Funds. The Board considered that any projection of profitability would
be uncertain, given that such a projection would depend on many assumptions
which are, by their nature, speculative. Accordingly, the Board did not consider
the Sub-Adviser’s anticipated profitability in determining whether to approve the
Sub-Advisory Agreement. The Board took into consideration the fact that the
sub-advisory fee was negotiated at arm’s-length and is paid out of the assets of the
Adviser. The Board concluded that the sub-advisory fees were fair and reasonable
in light of the services to be provided by the Sub-Adviser.
(v) | | The extent to which economies of scale would be realized as the Funds grow |
and whether fee levels would reflect such economies of scale. The Board did not
review specific information regarding whether there will be economies of scale
with respect to the Sub-Adviser’s management of the Funds because it regards
that information as less relevant at the sub-adviser level, although the Board did
note that the Funds’ asset levels had been significantly reduced over the past year.
Rather, the Board considered information regarding economies of scale in the
context of the renewal of the Funds’ advisory agreement with the Adviser.
(vi) Fall-out benefits. The Trustees also considered certain “fall-out” benefits
received by the Sub-Adviser, including research provided to the Sub-Adviser
in connection with portfolio transactions effected on behalf of the Funds (i.e.,
soft dollar arrangements), the ability of the Sub-Adviser to aggregate securities
transactions of the Funds with those of its other advisory clients, and reputational
benefits to the Sub-Adviser. The Board concluded that these benefits were fair and
reasonable in light of the services to be provided by the Sub-Adviser and similar to
those received by other investment advisers in comparable situations.
In considering the approval of the Sub-Advisory Agreement, the Board did not
identify any factor as all-important or all-controlling and instead considered
these factors collectively in light of the Funds’ surrounding circumstances. After
considering the above factors and based on the deliberations and its evaluation of
the information provided to it, the Board concluded that the approval of the Sub-
Advisory Agreement was in the best interest of the Funds and their shareholders
and that the compensation payable to the Sub-Adviser under the Sub-Advisory
Agreement was fair and reasonable in light of the services to be provided.
Approval of Sub-Investment Advisory Agreement (continued)
December 31, 2008 (Unaudited)

62 2008 Annual Report www.dividendcapital.com
Key Information
Investment Adviser and
Administrator
Dividend Capital Investments LLC
518 17th Street, Suite 1200
Denver, CO 80202
Sub Administrator (for Dividend
Capital Global Realty Exposure Fund)
ALPS Fund Services, Inc.
1290 Broadway, Suite 1100
Denver, CO 80203
Custodian and Fund
Accounting Agent
State Street Bank and Trust Co.
801 Pennsylvania
Kansas City, MO 64105
Transfer Agent
BNY Mellon Shareowner Services
480 Washington Blvd.
Jersey City, NJ 07310
Legal Counsel
Dechert LLP
4675 MacArthur Court, Suite 1400
Newport Beach, CA 92660
Independent Registered Public
Accounting Firm
KPMG LLP
707 17th Street, Suite 2700
Denver, CO 80202
Officers and Trustees
Jonathan F. Zeschin
Independent Trustee and
Chairman of the Board
Thomas H. Mack
Independent Trustee
John Mezger
Independent Trustee
J. Gibson Watson, III
Independent Trustee
David W. Agostine
President and Trustee
Jeffrey W. Taylor
Vice President and Treasurer
Derek J. Mullins
Secretary and Assistant Treasurer
Gordon Taylor
Chief Compliance Officer
Jami N. VonKaenel
Assistant Secretary
New York Stock Exchange Symbols: DCA and DCW
This report is for shareholder information. This is not a prospectus intended
for use in the purchase or sale of fund shares. Statements and other information
contained in this report are as dated and are subject to change.
Key Information
December 31, 2008

This Page Intentionally Left Blank

This Page Intentionally Left Blank
The Funds are neither insured nor guaranteed
by the U.S. Government, the FDIC, the
Federal Reserve Board or any other
governmental agency or insurer.
Must be accompanied or preceded by a
current prospectus.
For more information, please call
1.866.324.7348.
Item 2. Code of Ethics
| | (a) | The Registrant, as of the end of the period covered by the report, has adopted a code of ethics that applies to the Registrant’s principal executive officer, principal financial officer, principal accounting officer or controller or any persons performing similar functions on behalf of the Registrant. |
| | (c) | During the period covered by this report, no amendments were made to the provisions of the code of ethics adopted in 2(a) above. |
| | (d) | During the period covered by this report, no implicit or explicit waivers to the provisions of the code of ethics adopted in 2(a) were granted. |
| | (f) | The Registrant’s Code of Ethics is attached as an Exhibit hereto. |
Item 3. Audit Committee Financial Expert
The Registrant’s Board of Trustees has determined that it has two audit committee financial experts serving on its audit committee: Jonathan F. Zeschin and Thomas H. Mack. Messrs. Zeschin and Mack are “independent” Trustees, as defined in paragraph (a)(2) of Item 3. Under applicable securities laws, a person who is determined to be an audit committee financial expert will not be deemed an “expert” for any purpose, including without limitation for the purposes of Section 11 of the Securities Act of 1933, as a result of being designated or identified as an audit committee financial expert. The designation or identification of a person as an audit committee financial expert does not impose on such person any duties, obligations, or liabilities that are greater than the duties, obligations, and liabilities imposed on such person as a member of the audit committee and Board of Trustees in the absence of such designation or identification.
Item 4. Principal Accountant Fees and Services
(a) – (d) Aggregate fees billed to the Registrant for the fiscal year ended December 31, 2008, the period ended December 31, 2007 and the fiscal year ended September 30, 2007, respectively, for professional services rendered by the Registrant’s principal accountant were as follows:
| | | | | | |
| | | Fiscal Year Ended December 31, 2008 | | Period Ended December 31, 2007* | | Fiscal Year Ended September 30, 2007 |
Audit Fees | | $59,000 | | $36,000 | | $52,000 |
Audit-Related Fees | | -- | | -- | | -- |
Tax Fees | | $50,000** | | | | $32,415*** |
All Other Fees | | -- | | -- | | |
* The Registrant changed its fiscal year from September 30th to December 31st in 2007.
** Indicates fees paid by the Fund to KPMG for the preparation of a private letter ruling request filed by the Fund with the Internal Revenue Service in connection with the late filing of the Fund’s tax return for the fiscal period ended December 31, 2007.
*** The Tax fees disclosed above were charged by the predecessor principal accountant, Deloitte and Touche LLP for services incurred through April 25, 2007, the date in which the Registrant’s Board of Trustees selected KPMG LLP as the principal accountant of the Registrant.
Aggregate fees billed by the Registrant’s principal accountant for the fiscal year ended December 31, 2008, period ended December 31, 2007 and September 30, 2007, respectively, for non-audit services provided to the Registrant’s investment adviser and any entity controlling, controlled by, or under common control with Dividend Capital Investments LLC (the “Adviser”) that provides ongoing services to the registered investment company, where the engagement relates directly to the operations and financial reporting of the registrant, were as follows:
| | | | | | |
| | | Fiscal Year Ended December 31, 2008 | | Period Ended December 31, 2007 | | Fiscal Year Ended September 30, 2007 |
Audit-Related Fees | | -- | | -- | | -- |
Tax Fees | | -- | | -- | | $30,074 **** |
All Other Fees | | -- | | -- | | -- |
**** The Tax fees disclosed above were charged by the predecessor principal accountant, Deloitte and Touche LLP for services incurred through April 25, 2007, the date in which the Registrant’s Board of Trustees selected KPMG as the principal accountant of the Registrant.
These tax services were billed in connection with the preparation of tax returns and other miscellaneous tax services.
| | (e)(1) | The Audit Committee pre-approves audit and non-audit services performed for the Registrant by the principal accountant. The Audit Committee also pre-approves non-audit services performed by the Registrant’s principal accountant for the Registrant’s Adviser and affiliates servicing the Registrant, if the engagement relates directly to the operations and financial reporting of the Registrant. |
| | |
| | The Audit Committee may delegate pre-approval authority to a subcommittee of one or more of its members. Any decision of the subcommittee to grant pre-approvals is presented to the full Audit Committee at its next regularly scheduled meeting. |
| |
| (e)(2) | | No services described in paragraphs (b) through (d) above were approved pursuant to paragraph (c)(7)(i)(C) of Rule 2-01 of Regulation S-X. |
| |
| (f) | | Not applicable |
| |
| (g) | | Aggregate Non-Audit Fees: The aggregate non-audit fees billed by the Registrant’s accountant for services rendered to the Registrant, the Registrant’s Adviser and any entity controlling, controlled by, or under common control with the Adviser that provides ongoing services to the Registrant were $50,000, $0 and $62, 489 for the fiscal year ended December 31, 2008, the period ended December 31, 2007 and the fiscal year ended September 30, 2007, respectively. |
| |
| (h) | | Not applicable |
Item 5. Audit Committee of Listed Registrants
| | |
| (a) | | The Registrant has a separately-designated standing Audit Committee established in accordance with Section 3(a)(58)(A) of the Exchange Act. The committee members are: Jonathan F. Zeschin, Thomas H. Mack, John Mezger and J. Gibson Watson III. |
| |
| (b) | | Not applicable. |
Item 6. Schedule of Investments
Included as part of the report to shareholders filed under Item 1 of this Form N-CSR.
Item 7. Disclosure of Proxy Voting Policies and Procedures for Closed-End Management Investment Companies
The Registrant has delegated, subject to the supervision of the Board, the voting of proxies relating to its voting securities to the Adviser. The Proxy and Corporate Action Voting Policies and Procedures of the Adviser are attached as Exhibit 99.PROXYPOL hereto.
Item 8. Portfolio Managers of Closed-End Management Investment Companies.
| (a)(1) | The Adviser’s investment committee (“Investment Committee”) is charged with the overall management of the Registrant’s portfolio, including the development and implementation of overall portfolio strategy and the day-to-day management of the portfolio. Members of the Investment Committee include: (1) Mr. Jeffrey Taylor, Chief Operating Officer of the Adviser; and (2) Mr. Jeffrey Randall, Vice President and Portfolio Manager of the Adviser (collectively, the “Committee Members”). |
Effective April 11, 2008, December 31, 2008 and December 31, 2008, respectively, Mr. Charles Song, Ms. Karen Kulvin and Mr. Amitabh Godha are no longer members of the Adviser’s Investment Committee.
Biographical Information
Biographical information regarding the Committee Members is set forth below:
Jeffrey Randall, CFA. Mr. Randall is Vice President and Portfolio Manager for the Adviser. Prior to joining the Adviser in January 2008, Mr. Randall was Senior Analyst at A.G. Edwards & Sons, where he focused on the public lodging sector. While at A.G. Edwards, Mr. Randall was often quoted in numerous print media publications and was featured on CNBC, BloombergTV and Nightly Business Report for his views on the REIT industry. In May 2007, he was ranked 3rd by Forbes/StarMine for earnings estimates among all REIT analysts. Prior to joining A.G. Edwards in 2004, Mr. Randall was an Associate Analyst at JMP Securities, where he followed the hotel/resort and restaurant industries. He has over ten years experience in the financial industry and 15 years experience in the real estate industry. Mr. Randall has also held positions with Deloitte & Touche, Duff & Phelps, and Arthur Andersen, where he practiced as a Certified Public Accountant. Mr. Randall received his Bachelor of Science in Accounting from the University of Colorado and his Master of Business Administration in Finance from the University of Southern California.
Jeffrey Taylor, CFA. Mr. Taylor is the Chief Operating Officer of the Adviser. Mr. Taylor brings over ten years experience in investment advisor operating company functions to the Adviser. A Chartered Financial Analyst, Mr. Taylor’s background includes client service, product management, operating company analysis, strategic planning and business management roles within investment advisors. Prior to joining the Adviser in 2004, he served in various positions with INVESCO Funds Group, most notably as product manager and manager of marketing and business analytics, where he was responsible for the development of the company’s portfolio review and product rationalization processes, as well as strategic business analysis and planning initiatives. Mr. Taylor holds a bachelor’s degree from Pennsylvania State University and an MBA from the University of Colorado at Denver.
| (a)(2) | The following table provides information about the other registered investment companies, other pooled investment vehicles and other accounts managed by the Committee Members who are primarily responsible for the day-to-day management of any other portfolio as of December 31, 2008: |
| | | | | | | | |
| | | | Number of All Other
Accounts | | Total Assets of All
Other Accounts (in
millions) | | |
Mr. Randall: | | Other Registered Investment Companies | | 1 | | $32 | | |
| | Other Pooled Investment Vehicles | | 0 | | $- | | |
| | Other Accounts | | 1 | | $106 | | |
| | | | |
Mr. Taylor: | | Other Registered Investment Companies | | 1 | | $32 | | |
| | Other Pooled Investment Vehicles | | 0 | | $- | | |
| | Other Accounts | | 1 | | $106 | | |
Conflicts of Interest
From time to time, potential conflicts of interest may arise between the Committee Members’ management of the investments of the Registrant, on the one hand, and the management of other accounts, on the other. The other accounts might have similar investment objectives or strategies as the Registrant, track the same index the Registrant tracks or otherwise hold, purchase, or sell securities that are eligible to be held, purchased or sold by the Registrant. The other accounts might also have different investment objectives or strategies than the Registrant.
| | — | Knowledge and Timing of Registrant Trades. A potential conflict of interest may arise as a result of the Committee Members’ management of the Registrant’s portfolio. Because of their position with the Adviser and the Registrant, the Committee Members know the size, timing and possible market impact of the Registrant’s trades. It is theoretically possible that the Committee Members could use this information to the advantage of other accounts they manage and to the possible detriment of the Registrant. |
| | — | Investment Opportunities. A potential conflict of interest may arise as result of a Committee Member’s management of a number of accounts with varying investment guidelines. Often, an investment opportunity may be suitable for both the Registrant and other accounts managed by a Committee Member, but may not be available in sufficient quantities for both the Registrant and the other accounts to participate fully. Similarly, there may be limited opportunity to sell an investment held by the Registrant and another account. The Adviser has adopted policies and procedures reasonably designed to allocate investment opportunities on a fair and equitable basis over time. |
Under the Adviser’s allocation procedures, investment opportunities are allocated among various investment strategies based on individual account investment guidelines and the Adviser’s investment
outlook. The Adviser has also adopted additional procedures to complement the general trade allocation policy that are designed to address potential conflicts of interest due to the side-by-side management of the Registrant and certain other accounts, including investment opportunity allocation issues.
| (a)(3) | The objective of the Adviser’s portfolio compensation program is to provide pay and long-term compensation for its employees that is competitive with the mutual fund/investment advisory market relative to the Adviser’s size and geographical location. Committee Members participate in a compensation program that includes base salary, the potential for a discretionary bonus and the potential for long-term incentives. Committee Member compensation is reviewed and may be modified each year as appropriate to reflect changes in the market, as well as to adjust the factors used to determine bonuses to promote good sustained investment performance. |
| | — | Base Salary. Each Committee Member is paid a base salary. In setting the base salary, the Adviser’s intention is to be competitive in light of a Committee Member’s experience and responsibilities. The base salary is also a function of industry salary rates and individual performance as measured against annual goals. |
| | — | Annual Bonus. Each Committee Member is eligible to receive an annual cash bonus that may be equal to as much as 200% of his annual base salary. This bonus is determined by a Committee Member’s contribution to investment management results consistent with the Registrant’s stated objectives as well as other qualitative and quantitative factors taken into consideration. |
| | — | Long-Term Incentive Program. Each Committee Member has the potential to participate in a long-term incentive program which may include an equity ownership program in the Adviser. Equity ownership is awarded based on individual contributions to the Adviser’s business and the long-term potential of that individual to the Adviser. |
| (a)(4) | The following table shows the dollar range of shares of the Registrant owned by the Committee Members as of December 31, 2008. |
| | | | | | |
| Name | | $0 | | $1-$10,000 | | $10,001-$50,000 |
| | | | |
Mr. Randall | | | | X | | |
| | | | |
Mr. Taylor | | | | X | | |
Item 9. Purchases of Equity Securities by Closed-End Management Investment Company and Affiliated Purchasers.
Not applicable.
Item 10. Submission of Matters to Vote of Security Holders
There were no material changes to the procedures by which shareholders may recommend nominees to the Registrant’s Board of Trustees that were implemented after the Registrant last provided disclosure in response to the requirements of Item 407(c)(2)(iv) of Regulation S-K (17 CFR 229.407) (as required by 22(b)(15)) of Schedule 14A (17 CFR 240.14a-101), or this Item 10.
Item 11 – Controls and Procedures
| (a) | Based on an evaluation of the disclosure controls and procedures (as defined in Rule 30a-3(c) under the Act) as of a date within 90 days of the filing date of this report, the Chief Executive Officer, Treasurer, and Principal Financial and Accounting Officer of the Registrant have each concluded that such disclosure controls and procedures provide reasonable assurance that information required to be disclosed by the Registrant is accumulated and communicated to the Registrant’s management to allow timely decisions regarding required disclosure. |
| (b) | There were no changes in the Registrant’s internal controls over financial reporting (as defined in Rule 30a-3(d) under the Act) that occurred during the second fiscal quarter of the period covered by this report that have materially affected, or are reasonably likely to materially affect, the Registrant’s internal control over financial reporting. |
Item 12 - Exhibits
| (a)(1)(i) | The code of ethics that applies to the Registrant’s principal executive officer and principal financial officer is attached hereto as Exhibit 12.A.1. |
| (a)(1)(ii) | The Proxy and Corporate Action Voting Policies and Procedures of the Adviser are attached hereto as Exhibit 99.PROXYPOL |
| (a)(2) | The certifications required by Rule 30a-2(a) of the Act (17 CFR 270.30a-2(a)) are filed and attached hereto as Exhibit 99.CERT. |
| (a)(3) | Not applicable to the Registrant. |
| (b) | The certification required by Rule 30a-2(b) of the Act (17 CFR 270.30a-2(b)) is filed and attached hereto as Exhibit 99.906CERT. |
SIGNATURES
Pursuant to the requirements of the Securities Exchange Act of 1934 and the Investment Company Act of 1940, the Registrant has duly caused this report to be signed on its behalf by the undersigned, thereunto duly authorized.
Dividend Capital Realty Income Allocation Fund
| | |
| By: | | /s/ David W. Agostine |
| | David W. Agostine |
| | President (Principal Executive Officer) |
Date: February 26, 2009
Pursuant to the requirements of the Securities Exchange Act of 1934 and the Investment Company Act of 1940, this report has been signed below by the following persons on behalf of the Registrant and in the capacities and on the dates indicated.
| | |
| By: | | /s/ David W. Agostine |
| | David W. Agostine |
| | President (Principal Executive Officer) |
Date: February 26, 2009
| | |
| By: | | /s/ Jeffrey W. Taylor |
| | Jeffrey W. Taylor |
| | Treasurer (Principal Financial Officer) |
Date: February 26, 2009