As filed with the Securities and Exchange Commission on March 10, 2010
UNITED STATES
SECURITIES AND EXCHANGE COMMISSION
Washington, D.C. 20549
FORM N-CSR
CERTIFIED SHAREHOLDER REPORT OF REGISTERED
MANAGEMENT INVESTMENT COMPANIES
Investment Company Act file Number: 811-21680
DCA Total Return Fund
(Exact Name of the Registrant as Specified in Charter)
518 17th Street, Suite 1200, Denver, CO 80202
(Address of Principal Executive Offices - Zip Code)
Registrant’s Telephone Number, including area code: 303-228-2200
Jeffrey W. Taylor
President
518 17th Street, Suite 1200
Denver, CO 80202
(Names and Addresses of agents for service)
Date of fiscal year end: December 31
Date of reporting period: December 31, 2009
| Item 1. | Reports to Shareholders |
The following is a copy of the report to shareholders pursuant to Rule 30e-1 under the Investment Company Act of 1940 (the “Act”).
Dividend Capital Investments
DCA Total Return Fund
DCW Total Return Fund
Annual Report
December 31, 2009
Dividend Capital Investments
Table of Contents
Shareholder Letter 2
DCA Total Return Fund (DCA)
Total Returns and Trading History 6
Portfolio Profile 7
DCW Total Return Fund (DCW)
Total Returns and Trading History 8
Portfolio Profile 9
Statement of Investments
DCA Total Return Fund 10
DCW Total Return Fund 18
Statements of Assets & Liabilities 26
Statements of Operations 27
Statements of Changes in Net Assets
DCA Total Return Fund 28
DCW Total Return Fund 29
Financial Highlights
DCA Total Return Fund 30
DCW Total Return Fund 32
Notes to Financial Statements 33
Report of Independent Registered Public Accounting Firm
DCA Total Return Fund 54
DCW Total Return Fund 55
Shareholder Tax Information 56
Dividend Reinvestment Plan 57
Change in Independent Registered Public Accounting Firm 58
Fund Proxy Voting Policies and Procedures 59
Portfolio Holdings 60
Trustees and Officers 60
Key Information 63
The Investment Commentary included in this shareholder report contains certain forward-looking statements about the factors that may affect the performance of the Funds in the future. These statements are based on Fund management’s predictions and expectations concerning certain future events and their expected impact on the Funds, such as performance of the economy as a whole and of the global capital markets, changes in the level of interest rates, the impact of developing world events, and other factors that may influence the future performance of the Funds. Management believes these forward looking statements to be reasonable, although they are inherently uncertain and difficult to predict and there is no guarantee of their accuracy. Actual events may cause adjustments in portfolio management strategies from those currently expected to be employed.
1.866.324.7348 2009 Annual Report 1
Shareholder Letter
February 23, 2010
Fellow Shareholders,
2009 can be categorized as a year of pronounced change. In many ways the capital markets reflected a mirror image of 2008, as indices rebounded sharply from new cyclical lows reached in March, followed by a significant 48.26% rally through December 31, 2009 (as represented by the MSCI World Index March 31, 2009 through December 31, 2009). In part, we believe the rally was fueled by sentiment that the worst of the financial crisis had passed, diminishing the near-term likelihood of the “worst-case” scenario. This sentiment was reflected in the significant appreciation realized by lower quality, higher levered and higher risk securities during the rally — the same types of securities that exhibited significant declines in 2008. We also feel a belief emerged that the so-called “great recession” may have bottomed in the second half of the year. In our view, while the employment picture currently remains poor, this turning point was somewhat supported by the fourth quarter’s estimated 5.7% GDP growth.
2009 also brought significant, and we believe positive, changes to both DCA Total Return Fund and DCW Total Return Fund. While we encourage you to review the proxy statement that outlines the proposals adopted at our March 16, 2009 shareholder meeting, the key changes implemented this year include:
Changing the Funds’ prior objectives of high current income with a secondary focus on capital appreciation to an objective of total return
Eliminating the investment policies requiring at least 80% of managed assets to be invested in securities of real estate companies
Removing any specific limitation regarding the Funds’ investment in foreign securities
Modifying the dividend policies from a monthly level-rate payment to quarterly distributions
In addition, while we did not seek shareholder approval to modify the Funds’ policies that permitted both direct and indirect leverage, the Funds were run with very little or no leverage over the balance of 2009.
As part of this new focus, Dividend Capital Realty Income Allocation Fund changed its name to DCA Total Return Fund, and Dividend Capital Global Realty Exposure Fund changed its name to DCW Total Return Fund. Both Funds retained their respective NYSE symbols – DCA and DCW. In addition, we transitioned the Funds’ primary benchmarks to the MSCI World Index, which is more representative of the Funds’ revised strategies.
2 2009 Annual Report www.dcclosedendfunds.com
Shareholder Letter (continued)
To assist in the execution of the Funds’ new strategies, Calamos Advisors LLC was approved to serve as the Funds’ investment sub-adviser. In the revised advisory arrangement, Dividend Capital Investments provides overall investment advisory services to the Funds, including management of the Funds’ long-term real estate and debt securities portfolio, while Calamos manages the Funds’ common equity allocations. Calamos is a diversified investment firm offering equity, fixed-income, convertible and alternative investment strategies. With roots dating back to 1977, the firm, which had $31.3 billion in assets under management as of January 31, 2010, serves institutions and individuals via separately managed accounts and a family of open-end and closed-end funds, providing a risk-managed approach to capital appreciation and income-producing strategies.
Following shareholder approval of the changes, for the rest of 2009 we generally targeted 50%-75% of each Fund’s net assets to be allocated to a NAV appreciation strategy and the remaining 25%-50% allocated toward more income-oriented securities. The NAV appreciation allocations have been sub-advised by Calamos and currently consist of a global common equity mandate. The income-oriented allocations have been overseen directly by Dividend Capital Investments and currently consist primarily of commercial real estate debt and preferred equity securities. Dividend Capital Investments, as adviser to the Funds, also maintained responsibility for overall management of the Funds, including but not limited to establishing each Fund’s overall investment strategy, implementation of the strategies — including the portfolio profiles and asset allocation decisions — as well as analyzing and recommending the Funds’ distribution levels to the Board.
We were pleased with the results of these strategic changes. As displayed in the performance tables that follow this letter, during the twelve months ended December 31, 2009, DCA’s NAV total return was 29.07% while the market price total return was 32.67%, and DCW’s NAV total return was 42.55% while the market price total return was 63.95%. It is also worth noting that for the period March 31, 2009 through December 31, 2009, during which the markets experienced significant appreciation and substantial progress was made in the execution of the strategic portfolio changes, DCA’s NAV total return was 72.29% while the market price total return was 108.11%, and DCW’s NAV total return was 69.44% while the market price total return was 99.38%.
During 2009, both Funds’ performance was influenced by overall market conditions and by the timing of the overall allocation shifts we began to implement soon after receiving shareholder approval. The Funds benefited not only from outperformance (relative to the MSCI World Index) experienced in their Calamos-managed global common equity strategies, but also realized positive total return from both Funds’ preferred equity portfolios. Real estate debt securities continued to be a negative influence on both Funds’ performance as commercial real estate fundamentals weakened, continuing to call into question the overall long-term value and income generation capability of these securities.
1.866.324.7348 2009 Annual Report 3
Shareholder Letter (continued)
An additional result of the shift to a total return strategy for both Funds was a lower distribution level than was historically realized by the Funds. Following shareholder approval, we factored in the desire to base quarterly distributions on projected net investment income as well as the Funds’ previously discussed targeted allocations. The distribution amounts were also influenced by the lack of leverage, which we believe reduced the Funds’ overall risk profile, but resulted in lower return potential and contributed to lower distributions. Secondarily, the distribution amounts were influenced by floating rate securities — which given the low level of short-term interest rates, produced relatively lower coupons — as well as by securities for which current payments were deferred. In closing, we believe the strategic changes discussed above have helped to better position the Funds to realize shareholder value by creating investment vehicles that are focused on total return through investment in common equity, preferred equity and debt securities across a broad range of industries and geographic regions. We believe this broader mandate has the potential to capitalize on investment opportunities that may emerge as capital markets continue to recover from the financial crisis. We also believe it has the potential to reduce the Funds’ risk profile via permitting investment in an expanded universe of securities and industries than has been historically utilized in the Funds. Consistent with steps taken in 2009, we will continue to assess ongoing opportunities to enhance both Funds’ return potential through a combination of potential expense reductions and a broader utilization of the global total return investment mandate. While more recent market performance has been positive following signs of stabilization in the capital markets and a potential bottoming in the U.S. and global economies, we continue to believe that there is a premium on investment vigilance. However, we also believe this environment will create compelling, long-term investment opportunities and that the Funds have the potential to create long-term value for shareholders. We thank you for your continued support.
Sincerely,
Jeffrey Taylor
President Jeffrey Randall
Portfolio Manager
4 2009 Annual Report www.dcclosedendfunds.com

This Page Intentionally Left Blank
Total Returns and Trading History
December 31, 2009
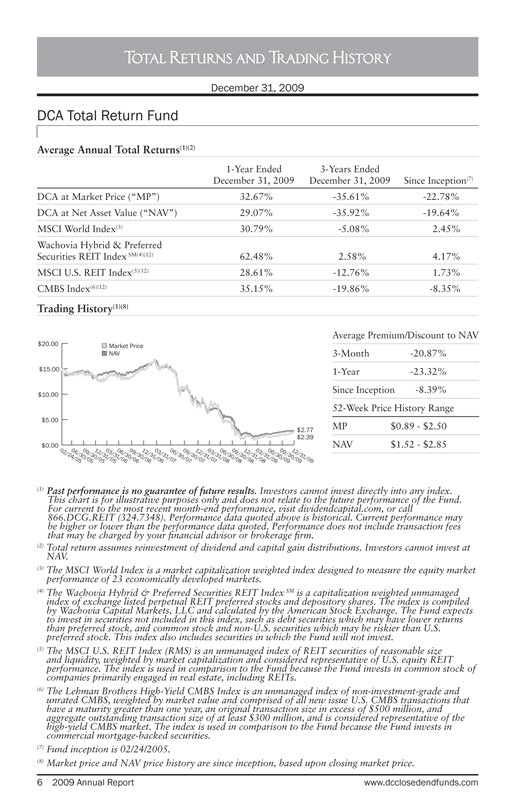
DCA Total Return Fund
Average Annual Total Returns(1)(2)
1-Year Ended December 31, 2009 3-Years Ended December 31, 2009 Since Inception(7)
DCA at Market Price (“MP”) 32.67% -35.61% -22.78%
DCA at Net Asset Value (“NAV”) 29.07% -35.92% -19.64%
MSCI World Index(3) 30.79% -5.08% 2.45%
Wachovia Hybrid & Preferred Securities REIT Index SM(4)(12) 62.48% 2.58% 4.17%
MSCI U.S. REIT Index(5)(12) 28.61% -12.76% 1.73%
CMBS Index(6)(12) 35.15% -19.86% -8.35%
Trading History(1)(8)
$20.00
$15.00
$10.00
$5.00
$0.00
$2.77
$2.39
02/24/05
06/30/05
09/30/05
12/31/05
03/31/06
06/30/06
09/30/06
12/31/06
03/31/07
06/30/07
09/30/07
12/31/07
03/31/08
06/30/08
09/30/08
12/31/08
03/31/09
06/30/09
09/30/09
12/31/09
Market Price
NAV
Average Premium/Discount to NAV
3-Month -20.87%
1-Year -23.32%
Since Inception -8.39%
52-Week Price History Range
MP $0.89—$2.50
NAV $1.52—$2.85
(1) Past performance is no guarantee of future results. Investors cannot invest directly into any index.
This chart is for illustrative purposes only and does not relate to the future performance of the Fund.
For current to the most recent month-end performance, visit dividendcapital.com, or call
866.DCG.REIT (324.7348). Performance data quoted above is historical. Current performance may
be higher or lower than the performance data quoted. Performance does not include transaction fees
that may be charged by your financial advisor or brokerage firm.
(2) Total return assumes reinvestment of dividend and capital gain distributions. Investors cannot invest at
NAV.
(3) The MSCI World Index is a market capitalization weighted index designed to measure the equity market
performance of 23 economically developed markets.
(4) The Wachovia Hybrid & Preferred Securities REIT Index SM is a capitalization weighted unmanaged
index of exchange listed perpetual REIT preferred stocks and depository shares. The index is compiled
by Wachovia Capital Markets, LLC and calculated by the American Stock Exchange. The Fund expects
to invest in securities not included in this index, such as debt securities which may have lower returns
than preferred stock, and common stock and non-U.S. securities which may be riskier than U.S.
preferred stock. This index also includes securities in which the Fund will not invest.
(5) The MSCI U.S. REIT Index (RMS) is an unmanaged index of REIT securities of reasonable size
and liquidity, weighted by market capitalization and considered representative of U.S. equity REIT
performance. The index is used in comparison to the Fund because the Fund invests in common stock of
companies primarily engaged in real estate, including REITs.
(6) The Lehman Brothers High-Yield CMBS Index is an unmanaged index of non-investment-grade and
unrated CMBS, weighted by market value and comprised of all new issue U.S. CMBS transactions that
have a maturity greater than one year, an original transaction size in excess of $500 million, and
aggregate outstanding transaction size of at least $300 million, and is considered representative of the
high-yield CMBS market. The index is used in comparison to the Fund because the Fund invests in
commercial mortgage-backed securities.
(7) Fund inception is 02/24/2005.
(8) Market price and NAV price history are since inception, based upon closing market price.
6 2009 Annual Report www.dcclosedendfunds.com
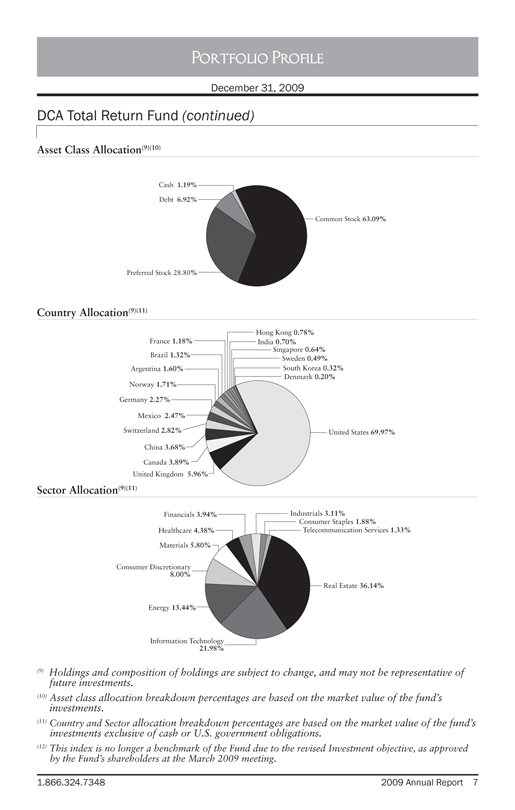
Portfolio Profile
December 31, 2009
DCA Total Return Fund (continued)
Asset Class Allocation(9)(10)
Cash 1.19%
Debt 6.92%
Common Stock 63.09%
Preferred Stock 28.80%
Country Allocation(9)(11)
France 1.18%
Brazil 1.32%
Argentina 1.60%
Norway 1.71%
Germany 2.27%
Mexico 2.47%
Switzerland 2.82%
China 3.68%
Canada 3.89%
United Kingdom 5.96%
Hong Kong 0.78%
India 0.70%
Singapore 0.64%
Sweden 0.49%
South Korea 0.32%
Denmark 0.20%
United States 69.97%
Sector Allocation(9)(11)
Financials 3.94%
Healthcare 4.38%
Materials 5.80%
Consumer Discretionary 8.00%
Energy 13.44%
Information Technology 21.98%
Industrials 3.11%
Consumer Staples 1.88%
Telecommunication Services 1.33%
Real Estate 36.14%
(9) Holdings and composition of holdings are subject to change, and may not be representative of future investments.
(10) Asset class allocation breakdown percentages are based on the market value of the fund’s investments.
(11) Country and Sector allocation breakdown percentages are based on the market value of the fund’s investments exclusive of cash or U.S. government obligations.
(12) This index is no longer a benchmark of the Fund due to the revised Investment objective, as approved by the Fund’s shareholders at the March 2009 meeting.
1.866.324.7348 2009 Annual Report 7
Total Returns and Trading History
December 31, 2009
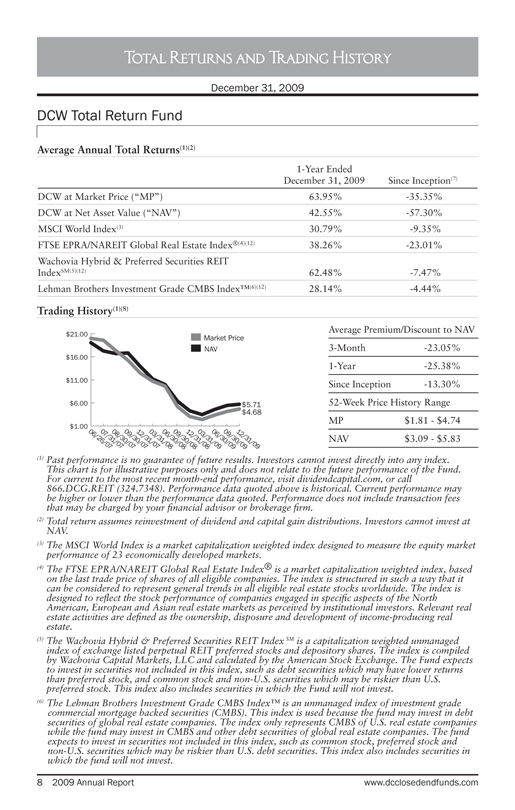
DCW Total Return Fund
Average Annual Total Returns(1)(2)
1-Year Ended December 31, 2009 Since Inception(7)
DCW at Market Price (“MP”) 63.95% -35.35%
DCW at Net Asset Value (“NAV”) 42.55% -57.30%
MSCI World Index(3) 30.79% -9.35%
FTSE EPRA/NAREIT Global Real Estate Index®(4)(12) 38.26% -23.01%
Wachovia Hybrid & Preferred Securities REIT IndexSM(5)(12) 62.48% -7.47%
Lehman Brothers Investment Grade CMBS Index™(6)(12) 28.14% -4.44%
Trading History(1)(8)
$21.00 $16.00 $11.00 $6.00 $1.00
Market Price
NAV
$5.71 $4.68
06/26/07 07/31/07 08/30/07 09/30/07 12/31/07 03/31/08 06/30/08 09/30/08 12/31/08 03/31/09 06/30/09 09/30/09 12/31/09
Average Premium/Discount to NAV
3-Month -23.05%
1-Year -25.38%
Since Inception -13.30%
52-Week Price History Range
MP $1.81—$4.74
NAV $3.09—$5.83
(1) Past performance is no guarantee of future results. Investors cannot invest directly into any index. This chart is for illustrative purposes only and does not relate to the future performance of the Fund. For current to the most recent month-end performance, visit dividendcapital.com, or call 866.DCG.REIT (324.7348). Performance data quoted above is historical. Current performance may be higher or lower than the performance data quoted. Performance does not include transaction fees that may be charged by your financial advisor or brokerage firm.
(2) Total return assumes reinvestment of dividend and capital gain distributions. Investors cannot invest at NAV.
(3) The MSCI World Index is a market capitalization weighted index designed to measure the equity market performance of 23 economically developed markets.
(4) The FTSE EPRA/NAREIT Global Real Estate Index® is a market capitalization weighted index, based on the last trade price of shares of all eligible companies. The index is structured in such a way that it can be considered to represent general trends in all eligible real estate stocks worldwide. The index is designed to reflect the stock performance of companies engaged in specific aspects of the North American, European and Asian real estate markets as perceived by institutional investors. Relevant real estate activities are defined as the ownership, disposure and development of income-producing real estate.
(5) The Wachovia Hybrid & Preferred Securities REIT Index SM is a capitalization weighted unmanaged index of exchange listed perpetual REIT preferred stocks and depository shares. The index is compiled by Wachovia Capital Markets, LLC and calculated by the American Stock Exchange. The Fund expects to invest in securities not included in this index, such as debt securities which may have lower returns than preferred stock, and common stock and non-U.S. securities which may be riskier than U.S. preferred stock. This index also includes securities in which the Fund will not invest.
(6) The Lehman Brothers Investment Grade CMBS Index™ is an unmanaged index of investment grade commercial mortgage backed securities (CMBS). This index is used because the fund may invest in debt securities of global real estate companies. The index only represents CMBS of U.S. real estate companies while the fund may invest in CMBS and other debt securities of global real estate companies. The fund expects to invest in securities not included in this index, such as common stock, preferred stock and non-U.S. securities which may be riskier than U.S. debt securities. This index also includes securities in which the fund will not invest.
8 2009 Annual Report www.dcclosedendfunds.com
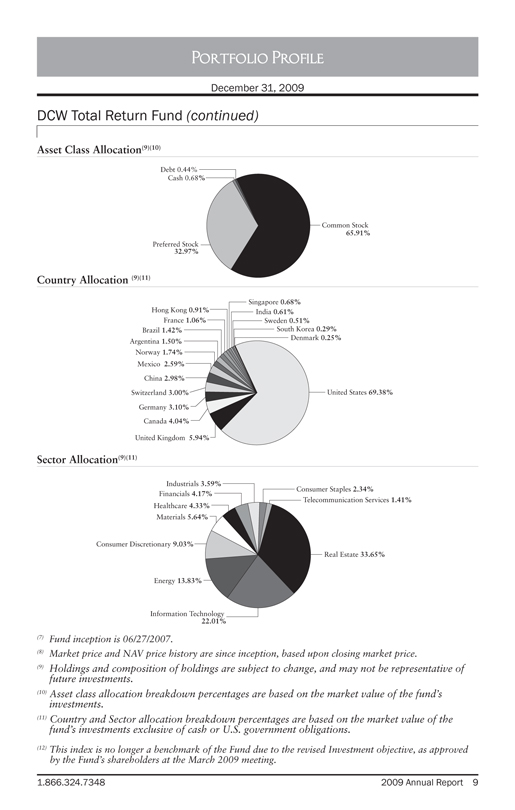
Portfolio Profile
December 31, 2009
DCW Total Return Fund (continued)
Asset Class Allocation(9)(10)
Debt 0.44%
Cash 0.68%
Preferred Stock 32.97%
Common Stock 65.91%
Country Allocation (9)(11)
Hong Kong 0.91%
France 1.06%
Brazil 1.42%
Argentina 1.50%
Norway 1.74%
Mexico 2.59%
China 2.98%
Switzerland 3.00%
Germany 3.10%
Canada 4.04%
United Kingdom 5.94%
Singapore 0.68%
India 0.61%
Sweden 0.51%
South Korea 0.29%
Denmark 0.25%
United States 69.38%
Sector Allocation(9)(11)
Industrials 3.59%
Financials 4.17% Healthcare 4.33%
Materials 5.64%
Consumer Discretionary 9.03%
Energy 13.83%
Information Technology 22.01%
Consumer Staples 2.34%
Telecommunication Services 1.41%
Real Estate 33.65%
(7) Fund inception is 06/27/2007.
(8) Market price and NAV price history are since inception, based upon closing market price.
(9) Holdings and composition of holdings are subject to change, and may not be representative of future investments.
(10) Asset class allocation breakdown percentages are based on the market value of the fund’s investments.
(11) Country and Sector allocation breakdown percentages are based on the market value of the fund’s investments exclusive of cash or U.S. government obligations.
(12) This index is no longer a benchmark of the Fund due to the revised Investment objective, as approved by the Fund’s shareholders at the March 2009 meeting.
1.866.324.7348 2009 Annual Report 9
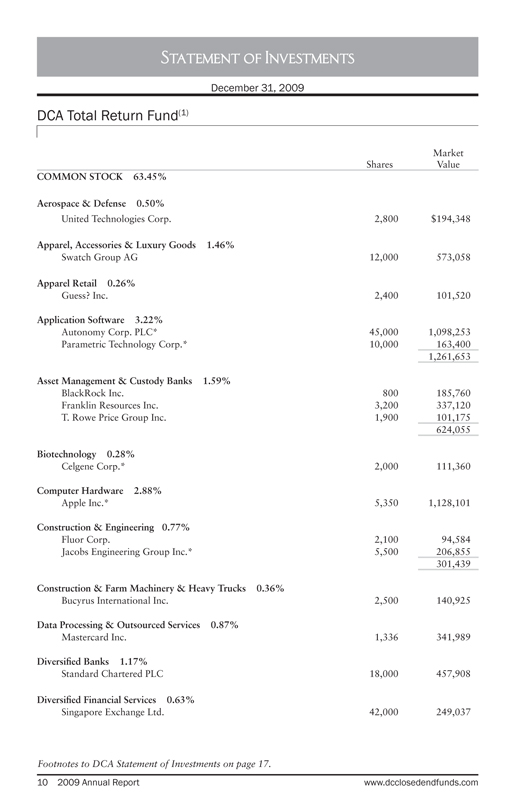
Statement of Investments
December 31, 2009
DCA Total Return Fund(1)
Shares Market Value
COMMON STOCK 63.45%
Aerospace & Defense 0.50%
United Technologies Corp. 2,800 $194,348
Apparel, Accessories & Luxury Goods 1.46%
Swatch Group AG 12,000 573,058
Apparel Retail 0.26%
Guess? Inc. 2,400 101,520
Application Software 3.22%
Autonomy Corp. PLC* 45,000 1,098,253
Parametric Technology Corp.* 10,000 163,400 1,261,653
Asset Management & Custody Banks 1.59%
BlackRock Inc. 800 185,760
Franklin Resources Inc. 3,200 337,120
T. Rowe Price Group Inc. 1,900 101,175 624,055
Biotechnology 0.28%
Celgene Corp.* 2,000 111,360
Computer Hardware 2.88%
Apple Inc.* 5,350 1,128,101
Construction & Engineering 0.77%
Fluor Corp. 2,100 94,584
Jacobs Engineering Group Inc.* 5,500 206,855 301,439
Construction & Farm Machinery & Heavy Trucks 0.36%
Bucyrus International Inc. 2,500 140,925
Data Processing & Outsourced Services 0.87%
Mastercard Inc. 1,336 341,989
Diversified Banks 1.17%
Standard Chartered PLC 18,000 457,908
Diversified Financial Services 0.63%
Singapore Exchange Ltd. 42,000 249,037
Footnotes to DCA Statement of Investments on page 17.
10 2009 Annual Report www.dcclosedendfunds.com

Statement of Investments (continued)
December 31, 2009
DCA Total Return Fund (continued)
Shares Market Value
COMMON STOCK (continued)
Diversified Metals & Mining 2.99%
Anglo American PLC* 9,600 $420,364
HudBay Minerals Inc.* 10,000 129,751
Sterlite Industries India Ltd. — ADR 15,000 273,300
Vale SA — ADR 12,000 348,360 1,171,775
Education Services 0.29%
New Oriental Education & Technology Group — ADR* 1,500 113,415
Fertilizers & Agricultural Chemicals 1.13%
Syngenta AG 700 196,713
Yara International ASA 5,400 245,946 442,659
Footwear 2.04%
NIKE Inc. — Class B 4,000 264,280
Puma AG Rudolf Dassler Sport 1,600 535,596 799,876
Gold 1.34%
Barrick Gold Corp. 4,000 157,520
Goldcorp Inc. 9,300 367,696 525,216
Health Care Equipment 1.27%
Elekta AB 8,000 191,204
Intuitive Surgical Inc.* 450 136,494
Mindray Medical International Ltd. — ADR 5,000 169,600 497,298
Health Care Supplies 2.60%
Alcon Inc. 6,200 1,018,971
Heavy Electrical Equipment 0.84%
ABB Ltd.* 17,000 327,691
Home Entertainment Software 0.80%
Perfect World Co. Ltd — ADR 8,000 315,520
Hypermarkets & Super Centers 1.14%
Walmart de Mexico SAB de CV 100,000 445,651
Footnotes to DCA Statement of Investments on page 17.
1.866.324.7348 2009 Annual Report 11
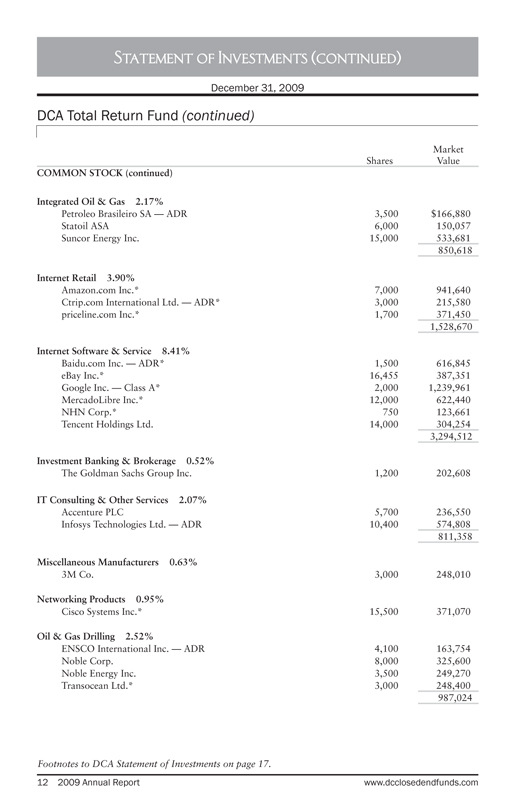
Statement of Investments (continued)
December 31, 2009
DCA Total Return Fund (continued)
Shares Market Value
COMMON STOCK (continued)
Integrated Oil & Gas 2.17%
Petroleo Brasileiro SA — ADR 3,500 $166,880
Statoil ASA 6,000 150,057
Suncor Energy Inc. 15,000 533,681 850,618
Internet Retail 3.90%
Amazon.com Inc.* 7,000 941,640
Ctrip.com International Ltd. — ADR* 3,000 215,580
priceline.com Inc.* 1,700 371,450 1,528,670
Internet Software & Service 8.41%
Baidu.com Inc. — ADR* 1,500 616,845
eBay Inc.* 16,455 387,351
Google Inc. — Class A* 2,000 1,239,961
MercadoLibre Inc.* 12,000 622,440
NHN Corp.* 750 123,661
Tencent Holdings Ltd. 14,000 304,254 3,294,512
Investment Banking & Brokerage 0.52%
The Goldman Sachs Group Inc. 1,200 202,608
IT Consulting & Other Services 2.07%
Accenture PLC 5,700 236,550
Infosys Technologies Ltd. — ADR 10,400 574,808 811,358
Miscellaneous Manufacturers 0.63%
3M Co. 3,000 248,010
Networking Products 0.95%
Cisco Systems Inc.* 15,500 371,070
Oil & Gas Drilling 2.52%
ENSCO International Inc. — ADR 4,100 163,754
Noble Corp. 8,000 325,600
Noble Energy Inc. 3,500 249,270
Transocean Ltd.* 3,000 248,400 987,024
Footnotes to DCA Statement of Investments on page 17.
12 2009 Annual Report www.dcclosedendfunds.com
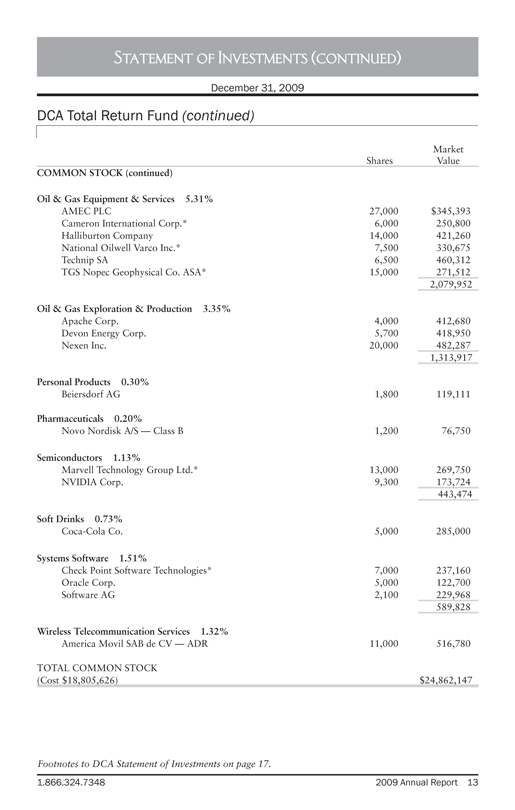
Statement of Investments (continued)
December 31, 2009
DCA Total Return Fund (continued)
Shares Market Value
COMMON STOCK (continued)
Oil & Gas Equipment & Services 5.31%
AMEC PLC 27,000 $345,393
Cameron International Corp.* 6,000 250,800
Halliburton Company 14,000 421,260
National Oilwell Varco Inc.* 7,500 330,675
Technip SA 6,500 460,312
TGS Nopec Geophysical Co. ASA* 15,000 271,512 2,079,952
Oil & Gas Exploration & Production 3.35%
Apache Corp. 4,000 412,680
Devon Energy Corp. 5,700 418,950
Nexen Inc. 20,000 482,287 1,313,917
Personal Products 0.30%
Beiersdorf AG 1,800 119,111
Pharmaceuticals 0.20%
Novo Nordisk A/S — Class B 1,200 76,750
Semiconductors 1.13%
Marvell Technology Group Ltd.* 13,000 269,750
NVIDIA Corp. 9,300 173,724 443,474
Soft Drinks 0.73%
Coca-Cola Co. 5,000 285,000
Systems Software 1.51%
Check Point Software Technologies* 7,000 237,160
Oracle Corp. 5,000 122,700
Software AG 2,100 229,968 589,828
Wireless Telecommunication Services 1.32%
America Movil SAB de CV — ADR 11,000 516,780
TOTAL COMMON STOCK
(Cost $18,805,626) $24,862,147
Footnotes to DCA Statement of Investments on page 17.
1.866.324.7348 2009 Annual Report 13
Statement of Investments (continued)
December 31, 2009
DCA Total Return Fund (continued)
Bond Rating Moody’s/S&P (Unaudited) Shares Market Value
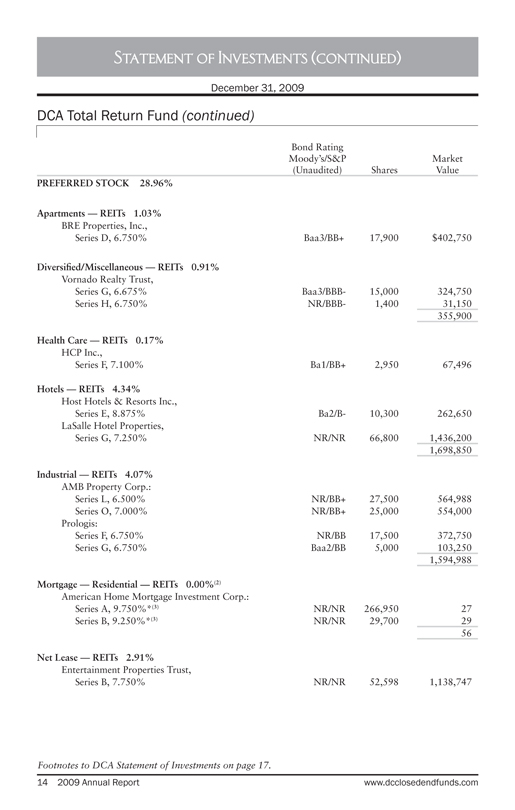
PREFERRED STOCK 28.96%
Apartments — REITs 1.03%
BRE Properties, Inc.,
Series D, 6.750% Baa3/BB+ 17,900 $402,750
Diversified/Miscellaneous — REITs 0.91%
Vornado Realty Trust,
Series G, 6.675% Baa3/BBB- 15,000 324,750
Series H, 6.750% NR/BBB- 1,400 31,150 355,900
Health Care — REITs 0.17%
HCP Inc.,
Series F, 7.100% Ba1/BB+ 2,950 67,496
Hotels — REITs 4.34%
Host Hotels & Resorts Inc.,
Series E, 8.875% Ba2/B- 10,300 262,650
LaSalle Hotel Properties,
Series G, 7.250% NR/NR 66,800 1,436,200 1,698,850
Industrial — REITs 4.07%
AMB Property Corp.:
Series L, 6.500% NR/BB+ 27,500 564,988
Series O, 7.000% NR/BB+ 25,000 554,000
Prologis:
Series F, 6.750% NR/BB 17,500 372,750
Series G, 6.750% Baa2/BB 5,000 103,250 1,594,988
Mortgage — Residential — REITs 0.00%(2)
American Home Mortgage Investment Corp.:
Series A, 9.750%*(3) NR/NR 266,950 27
Series B, 9.250%*(3) NR/NR 29,700 29 56
Net Lease — REITs 2.91%
Entertainment Properties Trust,
Series B, 7.750% NR/NR 52,598 1,138,747
Footnotes to DCA Statement of Investments on page 17.
14 2009 Annual Report www.dcclosedendfunds.com
Statement of Investments (continued)
December 31, 2009
DCA Total Return Fund (continued)
Bond Rating Moody’s/S&P (Unaudited) Shares Market Value
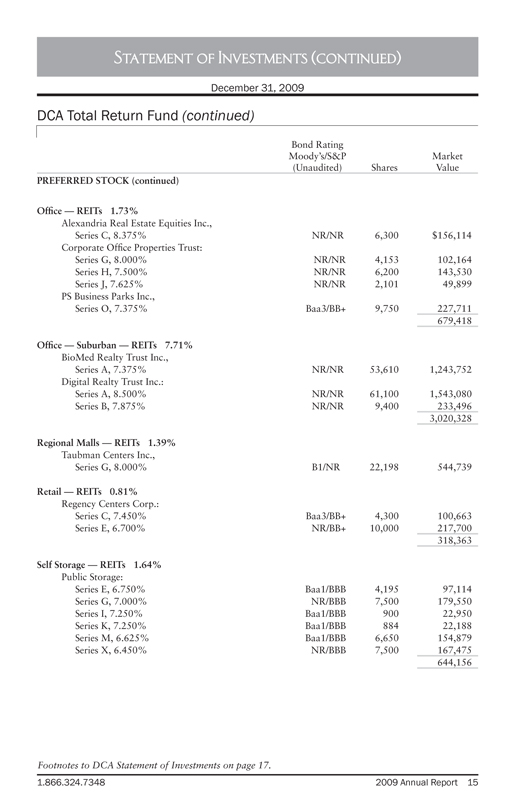
PREFERRED STOCK (continued)
Office — REITs 1.73%
Alexandria Real Estate Equities Inc.,
Series C, 8.375% NR/NR 6,300 $156,114
Corporate Office Properties Trust:
Series G, 8.000% NR/NR 4,153 102,164
Series H, 7.500% NR/NR 6,200 143,530
Series J, 7.625% NR/NR 2,101 49,899
PS Business Parks Inc.,
Series O, 7.375% Baa3/BB+ 9,750 227,711 679,418
Office — Suburban — REITs 7.71%
BioMed Realty Trust Inc.,
Series A, 7.375% NR/NR 53,610 1,243,752
Digital Realty Trust Inc.:
Series A, 8.500% NR/NR 61,100 1,543,080
Series B, 7.875% NR/NR 9,400 233,496 3,020,328
Regional Malls — REITs 1.39%
Taubman Centers Inc.,
Series G, 8.000% B1/NR 22,198 544,739
Retail — REITs 0.81%
Regency Centers Corp.:
Series C, 7.450% Baa3/BB+ 4,300 100,663
Series E, 6.700% NR/BB+ 10,000 217,700 318,363
Self Storage — REITs 1.64%
Public Storage:
Series E, 6.750% Baa1/BBB 4,195 97,114
Series G, 7.000% NR/BBB 7,500 179,550
Series I, 7.250% Baa1/BBB 900 22,950
Series K, 7.250% Baa1/BBB 884 22,188
Series M, 6.625% Baa1/BBB 6,650 154,879
Series X, 6.450% NR/BBB 7,500 167,475 644,156
Footnotes to DCA Statement of Investments on page 17.
1.866.324.7348 2009 Annual Report 15
Statement of Investments (continued)
December 31, 2009
DCA Total Return Fund (continued)
Bond Rating Moody’s/S&P (Unaudited) Shares Market Value
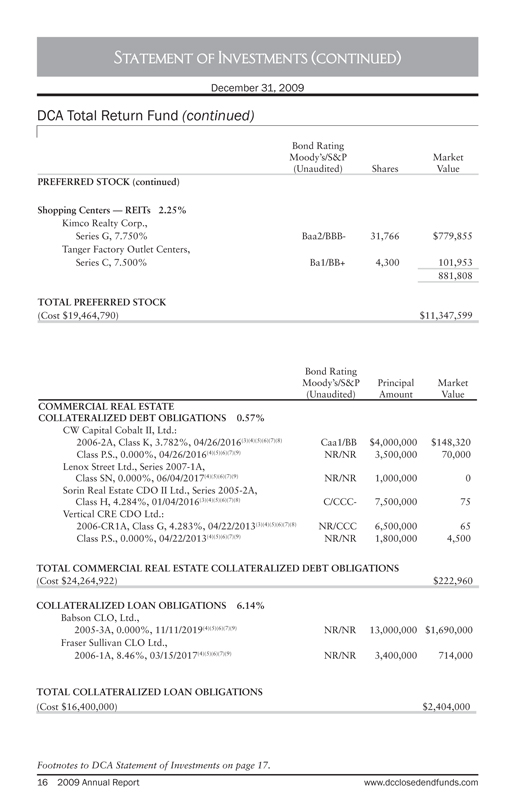
PREFERRED STOCK (continued)
Shopping Centers — REITs 2.25%
Kimco Realty Corp.,
Series G, 7.750% Baa2/BBB- 31,766 $779,855
Tanger Factory Outlet Centers,
Series C, 7.500% Ba1/BB+ 4,300 101,953 881,808
TOTAL PREFERRED STOCK
(Cost $19,464,790) $11,347,599
Bond Rating Moody’s/S&P (Unaudited) Principal Amount Market Value
COMMERCIAL REAL ESTATE
COLLATERALIZED DEBT OBLIGATIONS 0.57%
CW Capital Cobalt II, Ltd.:
2006-2A, Class K, 3.782%, 04/26/2016(3)(4)(5)(6)(7)(8) Caa1/BB $4,000,000 $148,320
Class P.S., 0.000%, 04/26/2016(4)(5)(6)(7)(9) NR/NR 3,500,000 70,000
Lenox Street Ltd., Series 2007-1A,
Class SN, 0.000%, 06/04/2017(4)(5)(6)(7)(9) NR/NR 1,000,000 0
Sorin Real Estate CDO II Ltd., Series 2005-2A,
Class H, 4.284%, 01/04/2016(3)(4)(5)(6)(7)(8) C/CCC- 7,500,000 75
Vertical CRE CDO Ltd.:
2006-CR1A, Class G, 4.283%, 04/22/2013(3)(4)(5)(6)(7)(8) NR/CCC 6,500,000 65
Class P.S., 0.000%, 04/22/2013(4)(5)(6)(7)(9) NR/NR 1,800,000 4,500
TOTAL COMMERCIAL REAL ESTATE COLLATERALIZED DEBT OBLIGATIONS
(Cost $24,264,922) $222,960
COLLATERALIZED LOAN OBLIGATIONS 6.14%
Babson CLO, Ltd.,
2005-3A, 0.000%, 11/11/2019(4)(5)(6)(7)(9) NR/NR 13,000,000 $1,690,000
Fraser Sullivan CLO Ltd.,
2006-1A, 8.46%, 03/15/2017(4)(5)(6)(7)(9) NR/NR 3,400,000 714,000
TOTAL COLLATERALIZED LOAN OBLIGATIONS (Cost $16,400,000) $2,404,000
Footnotes to DCA Statement of Investments on page 17.
16 2009 Annual Report www.dcclosedendfunds.com
Statement of Investments (continued)
December 31, 2009
DCA Total Return Fund (continued)
Bond Rating Moody’s/S&P (Unaudited) Shares/Principal Amount Market Value
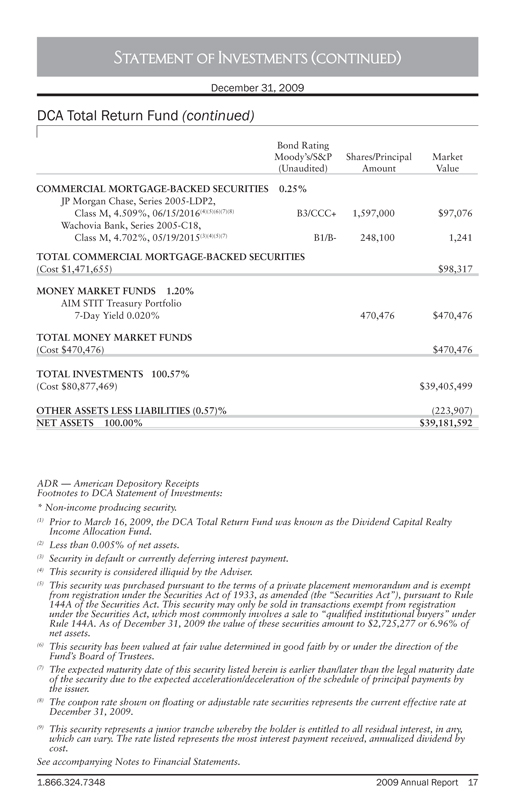
COMMERCIAL MORTGAGE-BACKED SECURITIES 0.25%
JP Morgan Chase, Series 2005-LDP2,
Class M, 4.509%, 06/15/2016(4)(5)(6)(7)(8) B3/CCC+ 1,597,000 $97,076
Wachovia Bank, Series 2005-C18,
Class M, 4.702%, 05/19/2015(3)(4)(5)(7) B1/B- 248,100 1,241
TOTAL COMMERCIAL MORTGAGE-BACKED SECURITIES (Cost $1,471,655) $98,317
MONEY MARKET FUNDS 1.20%
AIM STIT Treasury Portfolio
7-Day Yield 0.020% 470,476 $470,476
TOTAL MONEY MARKET FUNDS (Cost $470,476) $470,476
TOTAL INVESTMENTS 100.57% (Cost $80,877,469) $39,405,499
OTHER ASSETS LESS LIABILITIES (0.57)%(223,907)
NET ASSETS 100.00% $39,181,592
ADR — American Depository Receipts Footnotes to DCA Statement of Investments:
* Non-income producing security.
(1) Prior to March 16, 2009, the DCA Total Return Fund was known as the Dividend Capital Realty Income Allocation Fund.
(2) Less than 0.005% of net assets.
(3) Security in default or currently deferring interest payment.
(4) This security is considered illiquid by the Adviser.
(5) This security was purchased pursuant to the terms of a private placement memorandum and is exempt from registration under the Securities Act of 1933, as amended (the “Securities Act”), pursuant to Rule 144A of the Securities Act. This security may only be sold in transactions exempt from registration under the Securities Act, which most commonly involves a sale to “qualified institutional buyers” under Rule 144A. As of December 31, 2009 the value of these securities amount to $2,725,277 or 6.96% of net assets.
(6) This security has been valued at fair value determined in good faith by or under the direction of the Fund’s Board of Trustees.
(7) The expected maturity date of this security listed herein is earlier than/later than the legal maturity date of the security due to the expected acceleration/deceleration of the schedule of principal payments by the issuer.
(8) The coupon rate shown on floating or adjustable rate securities represents the current effective rate at December 31, 2009.
(9) This security represents a junior tranche whereby the holder is entitled to all residual interest, in any, which can vary. The rate listed represents the most interest payment received, annualized dividend by cost.
See accompanying Notes to Financial Statements.
1.866.324.7348 2009 Annual Report 17
Statement of Investments
December 31, 2009
DCW Total Return Fund(1)
Shares Market Value
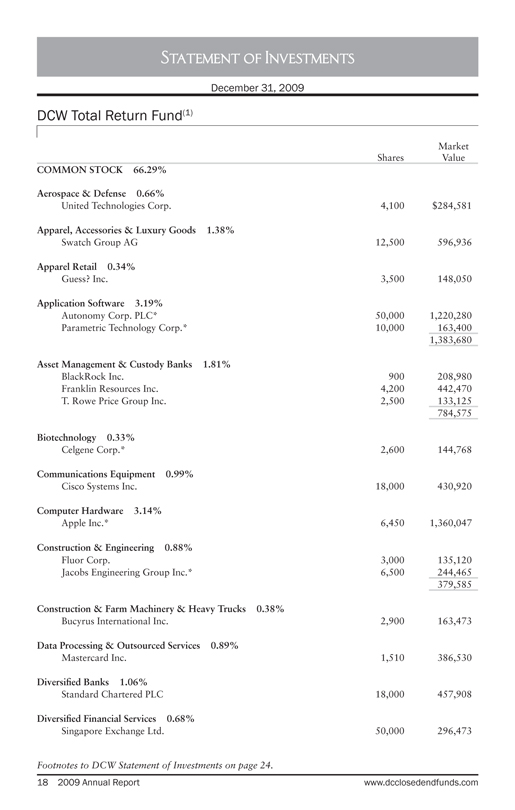
COMMON STOCK 66.29%
Aerospace & Defense 0.66%
United Technologies Corp. 4,100 $284,581
Apparel, Accessories & Luxury Goods 1.38%
Swatch Group AG 12,500 596,936
Apparel Retail 0.34%
Guess? Inc. 3,500 148,050
Application Software 3.19%
Autonomy Corp. PLC* 50,000 1,220,280
Parametric Technology Corp.* 10,000 163,400 1,383,680
Asset Management & Custody Banks 1.81%
BlackRock Inc. 900 208,980
Franklin Resources Inc. 4,200 442,470
T. Rowe Price Group Inc. 2,500 133,125 784,575
Biotechnology 0.33%
Celgene Corp.* 2,600 144,768
Communications Equipment 0.99%
Cisco Systems Inc. 18,000 430,920
Computer Hardware 3.14%
Apple Inc.* 6,450 1,360,047
Construction & Engineering 0.88%
Fluor Corp. 3,000 135,120
Jacobs Engineering Group Inc.* 6,500 244,465 379,585
Construction & Farm Machinery & Heavy Trucks 0.38%
Bucyrus International Inc. 2,900 163,473
Data Processing & Outsourced Services 0.89%
Mastercard Inc. 1,510 386,530
Diversified Banks 1.06%
Standard Chartered PLC 18,000 457,908
Diversified Financial Services 0.68%
Singapore Exchange Ltd. 50,000 296,473
Footnotes to DCW Statement of Investments on page 24.
18 2009 Annual Report www.dcclosedendfunds.com
Statement of Investments (continued)
December 31, 2009
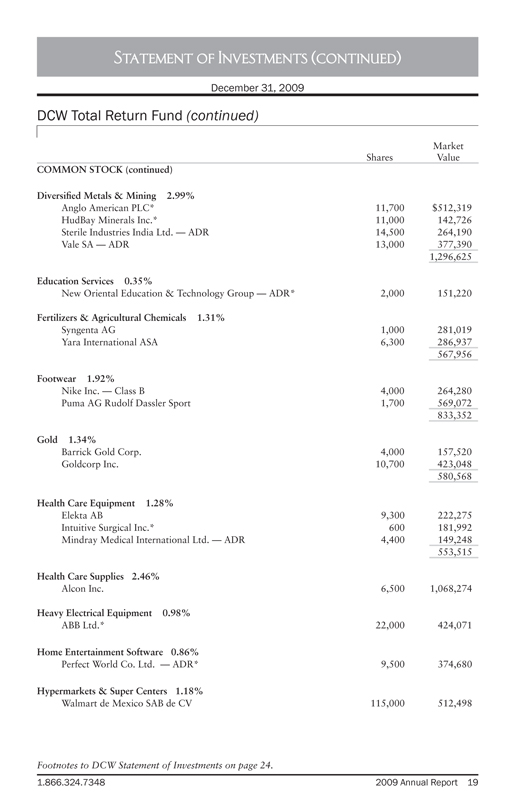
DCW Total Return Fund (continued)
Shares Market Value
COMMON STOCK (continued)
Diversified Metals & Mining 2.99%
Anglo American PLC* 11,700 $512,319
HudBay Minerals Inc.* 11,000 142,726
Sterile Industries India Ltd. — ADR 14,500 264,190
Vale SA — ADR 13,000 377,390 1,296,625
Education Services 0.35%
New Oriental Education & Technology Group — ADR* 2,000 151,220
Fertilizers & Agricultural Chemicals 1.31%
Syngenta AG 1,000 281,019
Yara International ASA 6,300 286,937 567,956
Footwear 1.92%
Nike Inc. — Class B 4,000 264,280
Puma AG Rudolf Dassler Sport 1,700 569,072 833,352
Gold 1.34%
Barrick Gold Corp. 4,000 157,520
Goldcorp Inc. 10,700 423,048 580,568
Health Care Equipment 1.28%
Elekta AB 9,300 222,275
Intuitive Surgical Inc.* 600 181,992
Mindray Medical International Ltd. — ADR 4,400 149,248 553,515
Health Care Supplies 2.46%
Alcon Inc. 6,500 1,068,274
Heavy Electrical Equipment 0.98%
ABB Ltd.* 22,000 424,071
Home Entertainment Software 0.86%
Perfect World Co. Ltd. — ADR* 9,500 374,680
Hypermarkets & Super Centers 1.18%
Walmart de Mexico SAB de CV 115,000 512,498
Footnotes to DCW Statement of Investments on page 24.
1.866.324.7348 2009 Annual Report 19

Statement of Investments (continued)
December 31, 2009
DCW Total Return Fund (continued)
Shares Market Value
COMMON STOCK (continued)
Integrated Oil & Gas 2.37%
Petroleo Brasileiro SA — ADR 5,000 $238,400
StatoilHydro ASA 6,000 150,057
Suncor Energy Inc. 18,000 640,417 1,028,874
Internet Retail 4.18%
Amazon.com Inc.* 8,500 1,143,420
Ctrip.com International Ltd. — ADR* 3,500 251,510
priceline.com Inc.* 1,900 415,150 1,810,080
Internet Software & Services 8.66%
Baidu.com Inc. — ADR* 1,800 740,214
eBay Inc.* 18,882 444,482
Google Inc. — Class A* 2,300 1,425,954
MercadoLibre Inc.* 12,500 648,375
NHN Corp.* 750 123,661
Tencent Holdings Ltd. 17,000 369,451 3,752,137
Investment Banking & Brokerage 0.62%
The Goldman Sachs Group Inc. 1,600 270,144
IT Consulting & Other Services 2.24%
Accenture PLC 6,600 273,900
Infosys Technologies Ltd. — ADR 12,600 696,402 970,302
Miscellaneous Manufacturers 0.71%
3M Co. 3,700 305,879
Oil & Gas Drilling 2.64%
ENSCO International Inc. — ADR 4,600 183,724
Noble Corp. 8,500 345,950
Noble Energy Inc. 4,000 284,880
Transocean Ltd.* 4,000 331,200 1,145,754
Footnotes to DCW Statement of Investments on page 24.
20 2009 Annual Report www.dcclosedendfunds.com
Statement of Investments (continued)
December 31, 2009
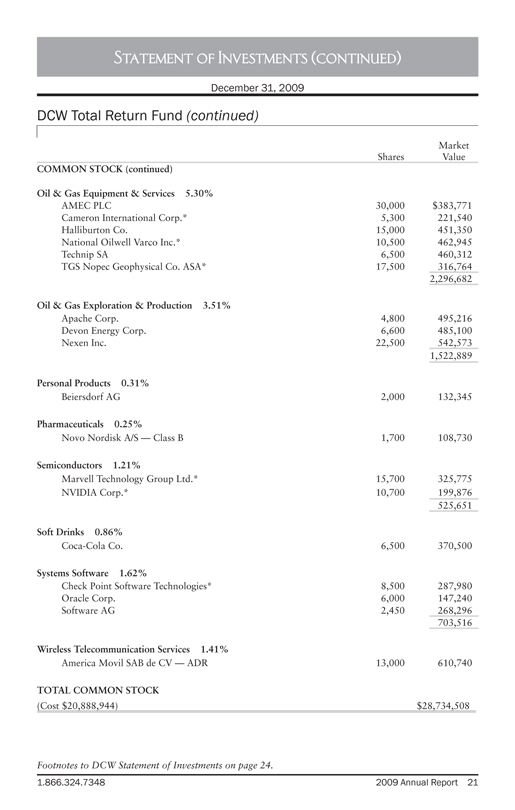
DCW Total Return Fund (continued)
Shares Market Value
COMMON STOCK (continued)
Oil & Gas Equipment & Services 5.30%
AMEC PLC 30,000 $383,771
Cameron International Corp.* 5,300 221,540
Halliburton Co. 15,000 451,350
National Oilwell Varco Inc.* 10,500 462,945
Technip SA 6,500 460,312
TGS Nopec Geophysical Co. ASA* 17,500 316,764 2,296,682
Oil & Gas Exploration & Production 3.51%
Apache Corp. 4,800 495,216
Devon Energy Corp. 6,600 485,100
Nexen Inc. 22,500 542,573 1,522,889
Personal Products 0.31%
Beiersdorf AG 2,000 132,345
Pharmaceuticals 0.25%
Novo Nordisk A/S — Class B 1,700 108,730
Semiconductors 1.21%
Marvell Technology Group Ltd.* 15,700 325,775
NVIDIA Corp.* 10,700 199,876 525,651
Soft Drinks 0.86%
Coca-Cola Co. 6,500 370,500
Systems Software 1.62%
Check Point Software Technologies* 8,500 287,980
Oracle Corp. 6,000 147,240
Software AG 2,450 268,296 703,516
Wireless Telecommunication Services 1.41%
America Movil SAB de CV — ADR 13,000 610,740
TOTAL COMMON STOCK
(Cost $20,888,944) $28,734,508
Footnotes to DCW Statement of Investments on page 24.
1.866.324.7348 2009 Annual Report 21
Statement of Investments (continued)
December 31, 2009
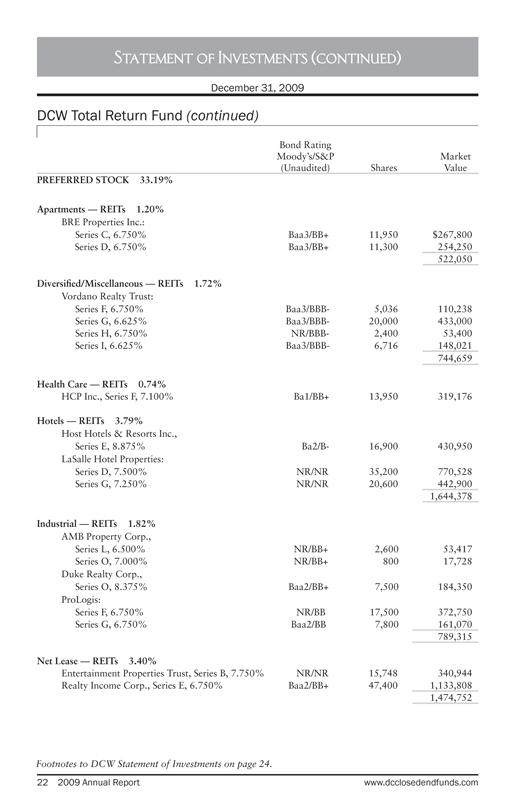
DCW Total Return Fund (continued)
Bond Rating Moody’s/S&P (Unaudited) Shares Market Value
PREFERRED STOCK 33.19%
Apartments — REITs 1.20%
BRE Properties Inc.:
Series C, 6.750% Baa3/BB+ 11,950 $267,800
Series D, 6.750% Baa3/BB+ 11,300 254,250 522,050
Diversified/Miscellaneous — REITs 1.72%
Vordano Realty Trust:
Series F, 6.750% Baa3/BBB- 5,036 110,238
Series G, 6.625% Baa3/BBB- 20,000 433,000
Series H, 6.750% NR/BBB- 2,400 53,400
Series I, 6.625% Baa3/BBB- 6,716 148,021 744,659
Health Care — REITs 0.74%
HCP Inc., Series F, 7.100% Ba1/BB+ 13,950 319,176
Hotels — REITs 3.79%
Host Hotels & Resorts Inc.,
Series E, 8.875% Ba2/B- 16,900 430,950
LaSalle Hotel Properties:
Series D, 7.500% NR/NR 35,200 770,528
Series G, 7.250% NR/NR 20,600 442,900 1,644,378
Industrial — REITs 1.82%
AMB Property Corp.,
Series L, 6.500% NR/BB+ 2,600 53,417
Series O, 7.000% NR/BB+ 800 17,728
Duke Realty Corp.,
Series O, 8.375% Baa2/BB+ 7,500 184,350
ProLogis:
Series F, 6.750% NR/BB 17,500 372,750
Series G, 6.750% Baa2/BB 7,800 161,070 789,315
Net Lease — REITs 3.40%
Entertainment Properties Trust, Series B, 7.750% NR/NR 15,748 340,944
Realty Income Corp., Series E, 6.750% Baa2/BB+ 47,400 1,133,808 1,474,752
Footnotes to DCW Statement of Investments on page 24.
22 2009 Annual Report www.dcclosedendfunds.com
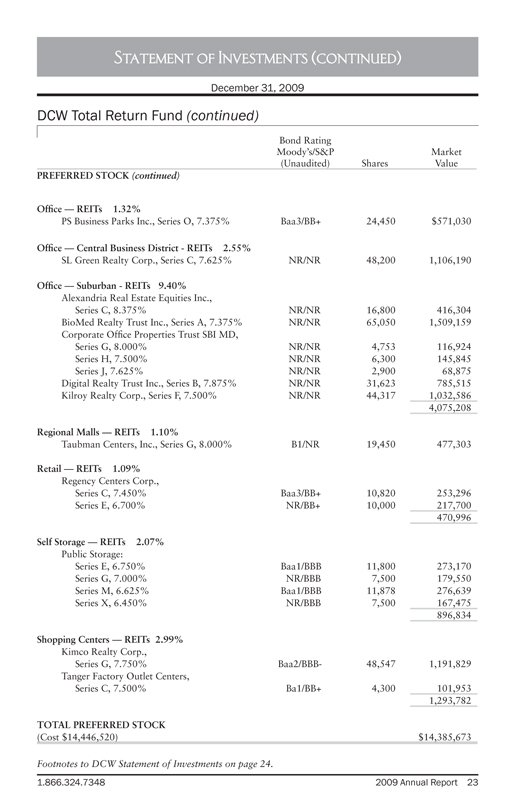
Statement of Investments (continued)
December 31, 2009
DCW Total Return Fund (continued)
Bond Rating Moody’s/S&P (Unaudited) Shares Market Value
PREFERRED STOCK (continued)
Office — REITs 1.32%
PS Business Parks Inc., Series O, 7.375% Baa3/BB+ 24,450 $571,030
Office — Central Business District—REITs 2.55%
SL Green Realty Corp., Series C, 7.625% NR/NR 48,200 1,106,190
Office — Suburban—REITs 9.40%
Alexandria Real Estate Equities Inc., Series C, 8.375% NR/NR 16,800 416,304
BioMed Realty Trust Inc., Series A, 7.375% NR/NR 65,050 1,509,159
Corporate Office Properties Trust SBI MD, Series G, 8.000% NR/NR 4,753 116,924
Series H, 7.500% NR/NR 6,300 145,845
Series J, 7.625% NR/NR 2,900 68,875
Digital Realty Trust Inc., Series B, 7.875% NR/NR 31,623 785,515
Kilroy Realty Corp., Series F, 7.500% NR/NR 44,317 1,032,586 4,075,208
Regional Malls — REITs 1.10%
Taubman Centers, Inc., Series G, 8.000% B1/NR 19,450 477,303
Retail — REITs 1.09%
Regency Centers Corp.,
Series C, 7.450% Baa3/BB+ 10,820 253,296
Series E, 6.700% NR/BB+ 10,000 217,700 470,996
Self Storage — REITs 2.07%
Public Storage:
Series E, 6.750% Baa1/BBB 11,800 273,170
Series G, 7.000% NR/BBB 7,500 179,550
Series M, 6.625% Baa1/BBB 11,878 276,639
Series X, 6.450% NR/BBB 7,500 167,475 896,834
Shopping Centers — REITs 2.99%
Kimco Realty Corp.,
Series G, 7.750% Baa2/BBB- 48,547 1,191,829
Tanger Factory Outlet Centers,
Series C, 7.500% Ba1/BB+ 4,300 101,953 1,293,782
TOTAL PREFERRED STOCK (Cost $14,446,520) $14,385,673
Footnotes to DCW Statement of Investments on page 24.
1.866.324.7348 2009 Annual Report 23
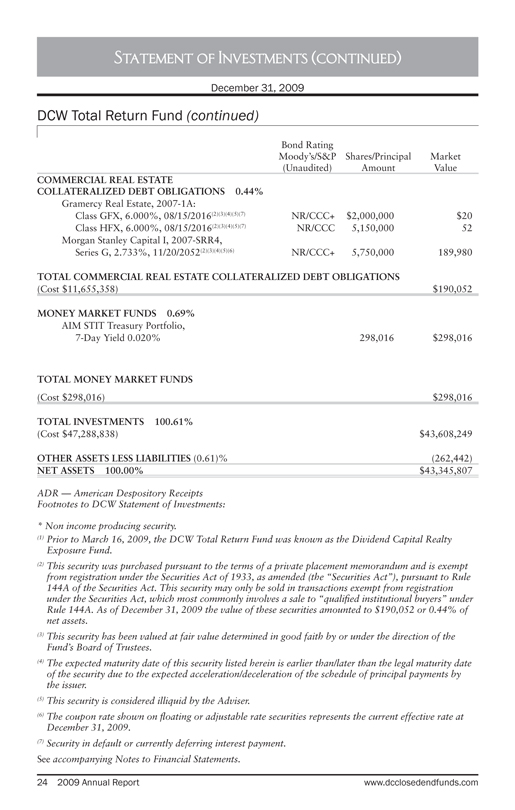
Statement of Investments (continued)
December 31, 2009
DCW Total Return Fund (continued)
Bond Rating Moody’s/S&P Shares/Principal Market (Unaudited) Amount Value
COMMERCIAL REAL ESTATE
COLLATERALIZED DEBT OBLIGATIONS 0.44%
Gramercy Real Estate, 2007-1A:
Class GFX, 6.000%, 08/15/2016(2)(3)(4)(5)(7) NR/CCC+ $2,000,000 $20
Class HFX, 6.000%, 08/15/2016(2)(3)(4)(5)(7) NR/CCC 5,150,000 52
Morgan Stanley Capital I, 2007-SRR4,
Series G, 2.733%, 11/20/2052(2)(3)(4)(5)(6) NR/CCC+ 5,750,000 189,980
TOTAL COMMERCIAL REAL ESTATE COLLATERALIZED DEBT OBLIGATIONS (Cost $11,655,358) $190,052
MONEY MARKET FUNDS 0.69%
AIM STIT Treasury Portfolio,
7-Day Yield 0.020% 298,016 $298,016
TOTAL MONEY MARKET FUNDS (Cost $298,016) $298,016
TOTAL INVESTMENTS 100.61% (Cost $47,288,838) $43,608,249
OTHER ASSETS LESS LIABILITIES (0.61)%(262,442)
NET ASSETS 100.00% $43,345,807
ADR — American Despository Receipts Footnotes to DCW Statement of Investments:
* Non income producing security.
(1) Prior to March 16, 2009, the DCW Total Return Fund was known as the Dividend Capital Realty Exposure Fund.
(2) This security was purchased pursuant to the terms of a private placement memorandum and is exempt from registration under the Securities Act of 1933, as amended (the “Securities Act”), pursuant to Rule 144A of the Securities Act. This security may only be sold in transactions exempt from registration under the Securities Act, which most commonly involves a sale to “qualified institutional buyers” under Rule 144A. As of December 31, 2009 the value of these securities amounted to $190,052 or 0.44% of net assets.
(3) This security has been valued at fair value determined in good faith by or under the direction of the Fund’s Board of Trustees.
(4) The expected maturity date of this security listed herein is earlier than/later than the legal maturity date of the security due to the expected acceleration/deceleration of the schedule of principal payments by the issuer.
(5) This security is considered illiquid by the Adviser.
(6) The coupon rate shown on floating or adjustable rate securities represents the current effective rate at December 31, 2009.
(7) Security in default or currently deferring interest payment. See accompanying Notes to Financial Statements.
24 2009 Annual Report www.dcclosedendfunds.com

This Page Intentionally Left Blank
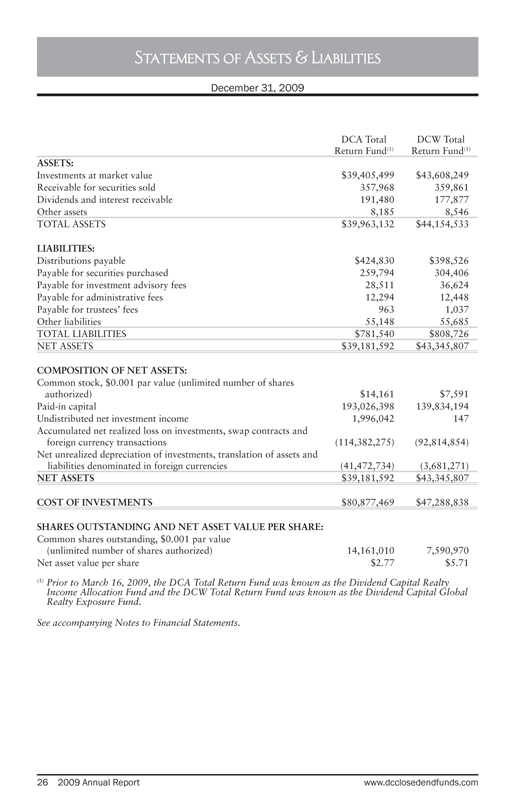
Statements of Assets & Liabilities
December 31, 2009
DCA Total Return Fund(1) DCW Total Return Fund(1)
ASSETS:
Investments at market value $39,405,499 $43,608,249
Receivable for securities sold 357,968 359,861
Dividends and interest receivable 191,480 177,877
Other assets 8,185 8,546
TOTAL ASSETS $39,963,132 $44,154,533
LIABILITIES:
Distributions payable $424,830 $398,526
Payable for securities purchased 259,794 304,406
Payable for investment advisory fees 28,511 36,624
Payable for administrative fees 12,294 12,448
Payable for trustees’ fees 963 1,037
Other liabilities 55,148 55,685
TOTAL LIABILITIES $781,540 $808,726
NET ASSETS $39,181,592 $43,345,807
COMPOSITION OF NET ASSETS:
Common stock, $0.001 par value (unlimited number of shares authorized) $14,161 $7,591
Paid-in capital 193,026,398 139,834,194
Undistributed net investment income 1,996,042 147
Accumulated net realized loss on investments, swap contracts and foreign currency transactions (114,382,275) (92,814,854)
Net unrealized depreciation of investments, translation of assets and liabilities denominated in foreign currencies (41,472,734) (3,681,271)
NET ASSETS $39,181,592 $43,345,807
COST OF INVESTMENTS $80,877,469 $47,288,838
SHARES OUTSTANDING AND NET ASSET VALUE PER SHARE:
Common shares outstanding, $0.001 par value (unlimited number of shares authorized) 14,161,010 7,590,970
Net asset value per share $2.77 $5.71
(1) Prior to March 16, 2009, the DCA Total Return Fund was known as the Dividend Capital Realty Income Allocation Fund and the DCW Total Return Fund was known as the Dividend Capital Global Realty Exposure Fund.
See accompanying Notes to Financial Statements.
26 2009 Annual Report www.dcclosedendfunds.com
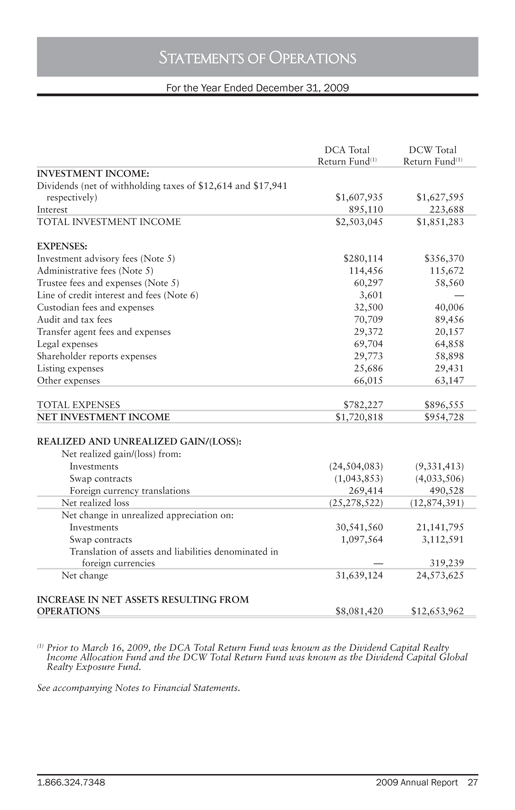
Statements of Operations
For the Year Ended December 31, 2009
DCA Total Return Fund(1) DCW Total Return Fund(1)
INVESTMENT INCOME:
Dividends (net of withholding taxes of $12,614 and $17,941 respectively) $1,607,935 $1,627,595
Interest 895,110 223,688
TOTAL INVESTMENT INCOME $2,503,045 $1,851,283
EXPENSES:
Investment advisory fees (Note 5) $280,114 $356,370
Administrative fees (Note 5) 114,456 115,672
Trustee fees and expenses (Note 5) 60,297 58,560
Line of credit interest and fees (Note 6) 3,601 —
Custodian fees and expenses 32,500 40,006
Audit and tax fees 70,709 89,456
Transfer agent fees and expenses 29,372 20,157
Legal expenses 69,704 64,858
Shareholder reports expenses 29,773 58,898
Listing expenses 25,686 29,431
Other expenses 66,015 63,147
TOTAL EXPENSES $782,227 $896,555
NET INVESTMENT INCOME $1,720,818 $954,728
REALIZED AND UNREALIZED GAIN/(LOSS):
Net realized gain/(loss) from:
Investments (24,504,083) (9,331,413)
Swap contracts (1,043,853) (4,033,506)
Foreign currency translations 269,414 490,528
Net realized loss (25,278,522) (12,874,391)
Net change in unrealized appreciation on:
Investments 30,541,560 21,141,795
Swap contracts 1,097,564 3,112,591
Translation of assets and liabilities denominated in foreign currencies — 319,239
Net change 31,639,124 24,573,625
INCREASE IN NET ASSETS RESULTING FROM
OPERATIONS $8,081,420 $12,653,962
(1) Prior to March 16, 2009, the DCA Total Return Fund was known as the Dividend Capital Realty Income Allocation Fund and the DCW Total Return Fund was known as the Dividend Capital Global Realty Exposure Fund.
See accompanying Notes to Financial Statements.
1.866.324.7348 2009 Annual Report 27
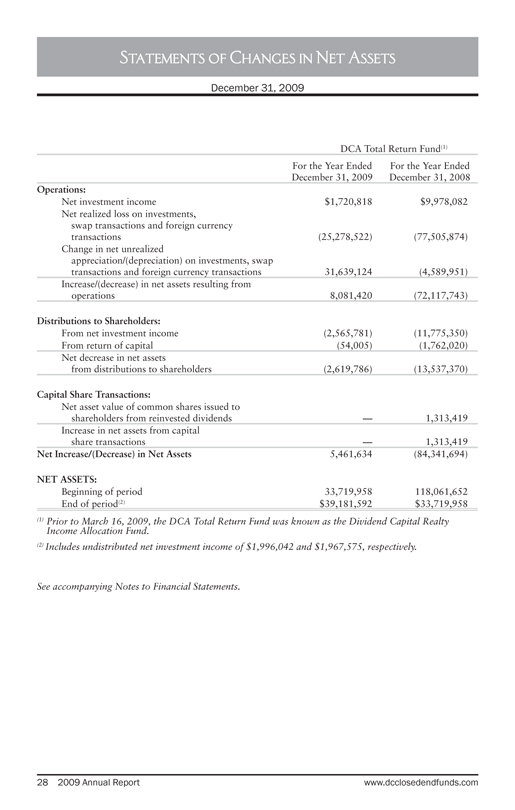
Statements of Changes in Net Assets
December 31, 2009
DCA Total Return Fund(1)
For the Year Ended December 31, 2009 For the Year Ended December 31, 2008
Operations:
Net investment income $1,720,818 $9,978,082
Net realized loss on investments, swap transactions and foreign currency transactions (25,278,522) (77,505,874)
Change in net unrealized appreciation/(depreciation) on investments, swap transactions and foreign currency transactions 31,639,124 (4,589,951)
Increase/(decrease) in net assets resulting from operations 8,081,420 (72,117,743)
Distributions to Shareholders:
From net investment income (2,565,781) (11,775,350)
From return of capital (54,005) (1,762,020)
Net decrease in net assets from distributions to shareholders (2,619,786) (13,537,370)
Capital Share Transactions:
Net asset value of common shares issued to shareholders from reinvested dividends — 1,313,419
Increase in net assets from capital share transactions — 1,313,419
Net Increase/(Decrease) in Net Assets 5,461,634 (84,341,694)
NET ASSETS:
Beginning of period 33,719,958 118,061,652
End of period(2) $39,181,592 $33,719,958
(1) Prior to March 16, 2009, the DCA Total Return Fund was known as the Dividend Capital Realty Income Allocation Fund.
(2) Includes undistributed net investment income of $1,996,042 and $1,967,575, respectively.
See accompanying Notes to Financial Statements.
28 2009 Annual Report www.dcclosedendfunds.com
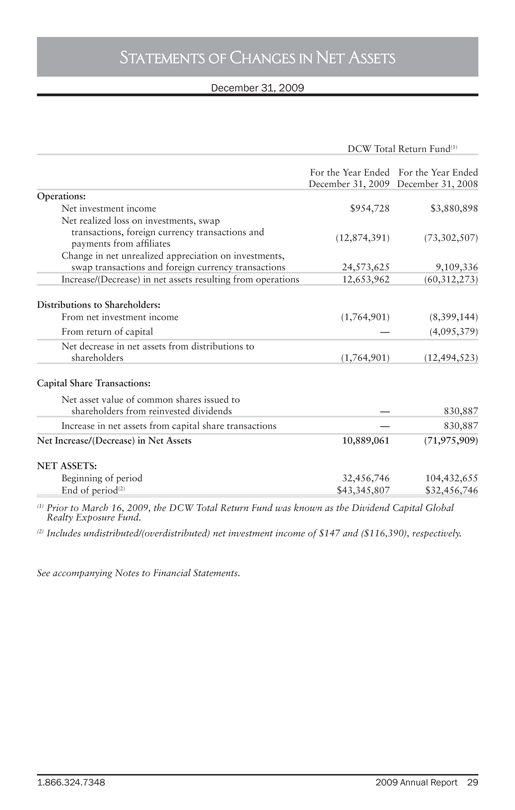
Statements of Changes in Net Assets
December 31, 2009
DCW Total Return Fund(1)
For the Year Ended December 31, 2009 For the Year Ended December 31, 2008
Operations:
Net investment income $954,728 $3,880,898
Net realized loss on investments, swap transactions, foreign currency transactions and payments from affiliates (12,874,391)(73,302,507)
Change in net unrealized appreciation on investments, swap transactions and foreign currency transactions 24,573,625 9,109,336
Increase/(Decrease) in net assets resulting from operations 12,653,962(60,312,273)
Distributions to Shareholders:
From net investment income (1,764,901)(8,399,144)
From return of capital —(4,095,379)
Net decrease in net assets from distributions to shareholders (1,764,901)(12,494,523)
Capital Share Transactions:
Net asset value of common shares issued to shareholders from reinvested dividends — 830,887
Increase in net assets from capital share transactions — 830,887
Net Increase/(Decrease) in Net Assets 10,889,061(71,975,909)
NET ASSETS:
Beginning of period 32,456,746 104,432,655
End of period(2) $43,345,807 $32,456,746
(1) Prior to March 16, 2009, the DCW Total Return Fund was known as the Dividend Capital Global Realty Exposure Fund.
(2) Includes undistributed/(overdistributed) net investment income of $147 and ($116,390), respectively.
See accompanying Notes to Financial Statements.
1.866.324.7348 2009 Annual Report 29
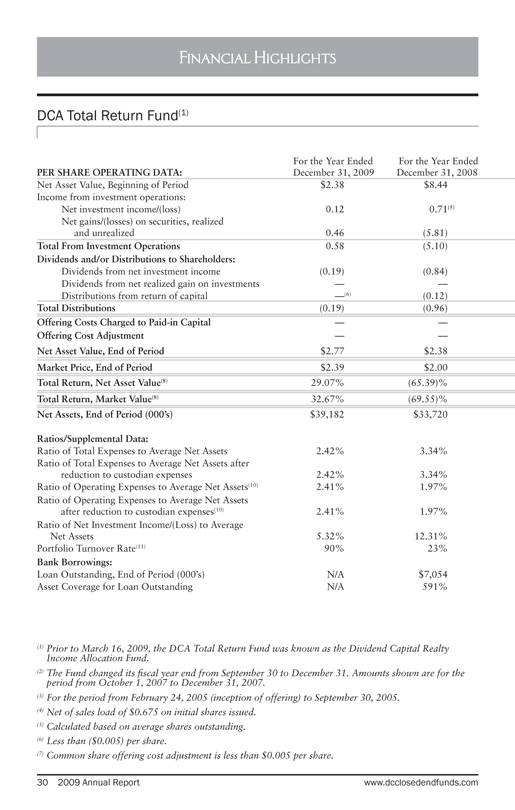
Financial Highlights
DCA Total Return Fund(1)
For the Year Ended For the Year Ended
PER SHARE OPERATING DATA: December 31, 2009 December 31, 2008
Net Asset Value, Beginning of Period $2.38 $8.44
Income from investment operations:
Net investment income/(loss) 0.12 0.71(5)
Net gains/(losses) on securities, realized and unrealized 0.46 (5.81)
Total From Investment Operations 0.58 (5.10)
Dividends and/or Distributions to Shareholders:
Dividends from net investment income (0.19) (0.84)
Dividends from net realized gain on investments — —
Distributions from return of capital —(6)(0.12)
Total Distributions (0.19) (0.96)
Offering Costs Charged to Paid-in Capital — —
Offering Cost Adjustment — —
Net Asset Value, End of Period $2.77 $2.38
Market Price, End of Period $2.39 $2.00
Total Return, Net Asset Value(8) 29.07%(65.39)%
Total Return, Market Value(8) 32.67%(69.55)%
Net Assets, End of Period (000’s) $39,182 $33,720
Ratios/Supplemental Data:
Ratio of Total Expenses to Average Net Assets 2.42% 3.34%
Ratio of Total Expenses to Average Net Assets after reduction to custodian expenses 2.42% 3.34%
Ratio of Operating Expenses to Average Net Assets(10) 2.41% 1.97%
Ratio of Operating Expenses to Average Net Assets after reduction to custodian expenses(10) 2.41% 1.97%
Ratio of Net Investment Income/(Loss) to Average
Net Assets 5.32% 12.31%
Portfolio Turnover Rate(11) 90% 23%
Bank Borrowings:
Loan Outstanding, End of Period (000’s) N/A $7,054
Asset Coverage for Loan Outstanding N/A 591%
(1) Prior to March 16, 2009, the DCA Total Return Fund was known as the Dividend Capital Realty Income Allocation Fund.
(2) The Fund changed its fiscal year end from September 30 to December 31. Amounts shown are for the period from October 1, 2007 to December 31, 2007.
(3) For the period from February 24, 2005 (inception of offering) to September 30, 2005. (4) Net of sales load of $0.675 on initial shares issued.
(5) Calculated based on average shares outstanding. (6) Less than ($0.005) per share.
(7) Common share offering cost adjustment is less than $0.005 per share.
30 2009 Annual Report www.dcclosedendfunds.com
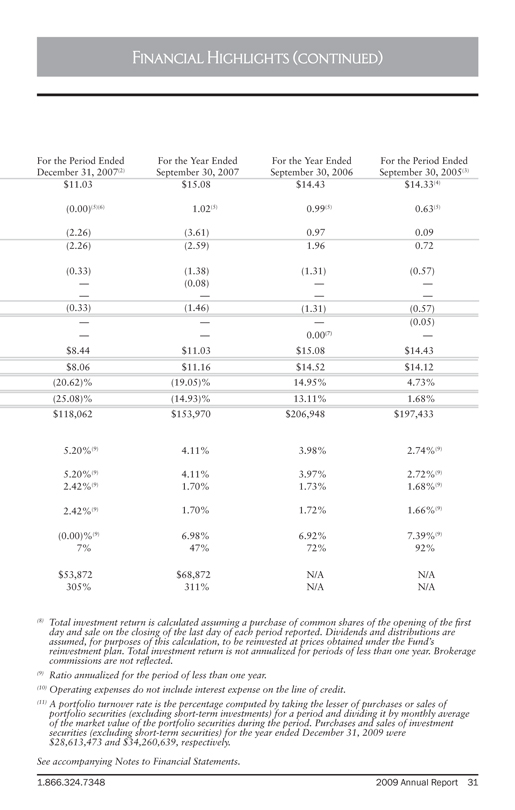
Financial Highlights (continued)
For the Period Ended December 31, 2007(2)
For the Year Ended September 30, 2007
For the Year Ended September 30, 2006
For the Period Ended September 30, 2005(3)
$11.03 $15.08 $14.43 $14.33(4)
(0.00)(5)(6) 1.02(5) 0.99(5) 0.63(5)
(2.26) (3.61) 0.97 0.09
(2.26) (2.59) 1.96 0.72
(0.33) (1.38) (1.31) (0.57)
— (0.08) — —
— — — —
(0.33) (1.46) (1.31) (0.57)
— — — (0.05)
— — 0.00(7) —
$8.44 $11.03 $15.08 $14.43
$8.06 $11.16 $14.52 $14.12
(20.62)% (19.05)% 14.95% 4.73%
(25.08)% (14.93)% 13.11% 1.68%
$118,062 $153,970 $206,948 $197,433
5.20%(9) 4.11% 3.98% 2.74%(9)
5.20%(9) 4.11% 3.97% 2.72%(9)
2.42%(9) 1.70% 1.73% 1.68%(9)
2.42%(9) 1.70% 1.72% 1.66%(9)
(0.00)%(9) 6.98% 6.92% 7.39%(9)
7% 47% 72% 92%
$53,872 $68,872 N/A N/A
305% 311% N/A N/A
(8) Total investment return is calculated assuming a purchase of common shares of the opening of the first day and sale on the closing of the last day of each period reported. Dividends and distributions are assumed, for purposes of this calculation, to be reinvested at prices obtained under the Fund’s reinvestment plan. Total investment return is not annualized for periods of less than one year. Brokerage commissions are not reflected.
(9) Ratio annualized for the period of less than one year.
(10) Operating expenses do not include interest expense on the line of credit.
(11) A portfolio turnover rate is the percentage computed by taking the lesser of purchases or sales of portfolio securities (excluding short-term investments) for a period and dividing it by monthly average of the market value of the portfolio securities during the period. Purchases and sales of investment securities (excluding short-term securities) for the year ended December 31, 2009 were $28,613,473 and $34,260,639, respectively.
See accompanying Notes to Financial Statements.
1.866.324.7348 2009 Annual Report 31
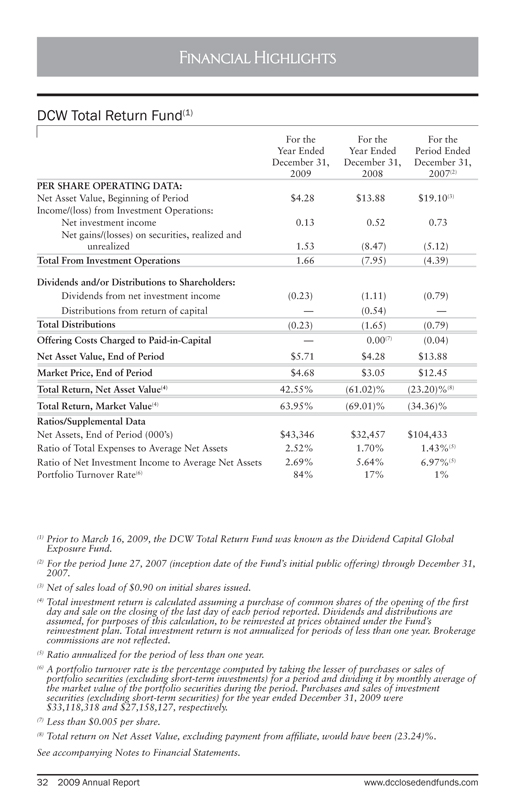
Financial Highlights
DCW Total Return Fund(1)
For the Year Ended December 31, 2009 For the Year Ended December 31, 2008 For the Period Ended December 31, 2007(2)
PER SHARE OPERATING DATA:
Net Asset Value, Beginning of Period $4.28 $13.88 $19.10(3)
Income/(loss) from Investment Operations:
Net investment income 0.13 0.52 0.73
Net gains/(losses) on securities, realized and unrealized 1.53(8.47)(5.12)
Total From Investment Operations 1.66(7.95)(4.39)
Dividends and/or Distributions to Shareholders:
Dividends from net investment income (0.23)(1.11)(0.79)
Distributions from return of capital —(0.54) —
Total Distributions (0.23)(1.65)(0.79)
Offering Costs Charged to Paid-in-Capital — 0.00(7)(0.04)
Net Asset Value, End of Period $5.71 $4.28 $13.88
Market Price, End of Period $4.68 $3.05 $12.45
Total Return, Net Asset Value(4) 42.55%(61.02)%(23.20)%(8)
Total Return, Market Value(4) 63.95%(69.01)%(34.36)%
Ratios/Supplemental Data
Net Assets, End of Period (000’s) $43,346 $32,457 $104,433
Ratio of Total Expenses to Average Net Assets 2.52% 1.70% 1.43%(5)
Ratio of Net Investment Income to Average Net Assets 2.69% 5.64% 6.97%(5)
Portfolio Turnover Rate(6) 84% 17% 1%
(1) Prior to March 16, 2009, the DCW Total Return Fund was known as the Dividend Capital Global Exposure Fund.
(2) For the period June 27, 2007 (inception date of the Fund’s initial public offering) through December 31, 2007.
(3) Net of sales load of $0.90 on initial shares issued.
(4) Total investment return is calculated assuming a purchase of common shares of the opening of the first day and sale on the closing of the last day of each period reported. Dividends and distributions are assumed, for purposes of this calculation, to be reinvested at prices obtained under the Fund’s reinvestment plan. Total investment return is not annualized for periods of less than one year. Brokerage commissions are not reflected.
(5) Ratio annualized for the period of less than one year.
(6) A portfolio turnover rate is the percentage computed by taking the lesser of purchases or sales of portfolio securities (excluding short-term investments) for a period and dividing it by monthly average of the market value of the portfolio securities during the period. Purchases and sales of investment securities (excluding short-term securities) for the year ended December 31, 2009 were $33,118,318 and $27,158,127, respectively.
(7) Less than $0.005 per share.
(8) Total return on Net Asset Value, excluding payment from affiliate, would have been (23.24)%.
See accompanying Notes to Financial Statements.
32 2009 Annual Report www.dcclosedendfunds.com
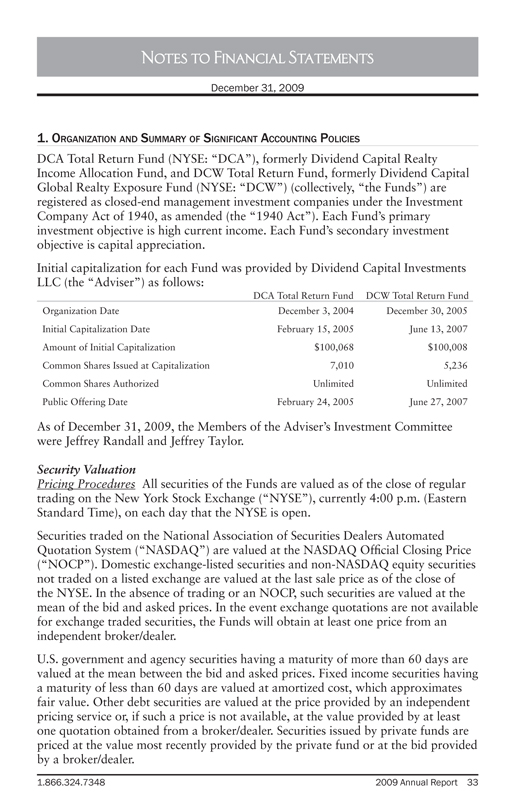
Notes to Financial Statements
December 31, 2009
1. ORGANIZATION AND SUMMARY OF SIGNIFICANT ACCOUNTING POLICIES
DCA Total Return Fund (NYSE: “DCA”), formerly Dividend Capital Realty Income Allocation Fund, and DCW Total Return Fund, formerly Dividend Capital Global Realty Exposure Fund (NYSE: “DCW”) (collectively, “the Funds”) are registered as closed-end management investment companies under the Investment Company Act of 1940, as amended (the “1940 Act”). Each Fund’s primary investment objective is high current income. Each Fund’s secondary investment objective is capital appreciation.
Initial capitalization for each Fund was provided by Dividend Capital Investments LLC (the “Adviser”) as follows:
DCA Total Return Fund DCW Total Return Fund
Organization Date December 3, 2004 December 30, 2005
Initial Capitalization Date February 15, 2005 June 13, 2007
Amount of Initial Capitalization $100,068 $100,008
Common Shares Issued at Capitalization 7,010 5,236
Common Shares Authorized Unlimited Unlimited
Public Offering Date February 24, 2005 June 27, 2007
As of December 31, 2009, the Members of the Adviser’s Investment Committee were Jeffrey Randall and Jeffrey Taylor.
Security Valuation
Pricing Procedures All securities of the Funds are valued as of the close of regular trading on the New York Stock Exchange (“NYSE”), currently 4:00 p.m. (Eastern Standard Time), on each day that the NYSE is open.
Securities traded on the National Association of Securities Dealers Automated Quotation System (“NASDAQ”) are valued at the NASDAQ Official Closing Price (“NOCP”). Domestic exchange-listed securities and non-NASDAQ equity securities not traded on a listed exchange are valued at the last sale price as of the close of the NYSE. In the absence of trading or an NOCP, such securities are valued at the mean of the bid and asked prices. In the event exchange quotations are not available for exchange traded securities, the Funds will obtain at least one price from an independent broker/dealer.
U.S. government and agency securities having a maturity of more than 60 days are valued at the mean between the bid and asked prices. Fixed income securities having a maturity of less than 60 days are valued at amortized cost, which approximates fair value. Other debt securities are valued at the price provided by an independent pricing service or, if such a price is not available, at the value provided by at least one quotation obtained from a broker/dealer. Securities issued by private funds are priced at the value most recently provided by the private fund or at the bid provided by a broker/dealer.
1.866.324.7348 2009 Annual Report 33
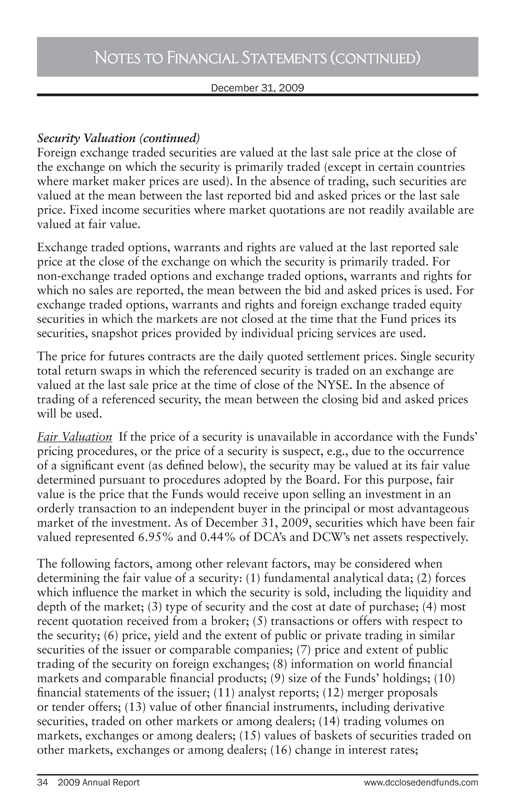
Notes to Financial Statements (continued)
December 31, 2009
Security Valuation (continued)
Foreign exchange traded securities are valued at the last sale price at the close of the exchange on which the security is primarily traded (except in certain countries where market maker prices are used). In the absence of trading, such securities are valued at the mean between the last reported bid and asked prices or the last sale price. Fixed income securities where market quotations are not readily available are valued at fair value.
Exchange traded options, warrants and rights are valued at the last reported sale price at the close of the exchange on which the security is primarily traded. For non-exchange traded options and exchange traded options, warrants and rights for which no sales are reported, the mean between the bid and asked prices is used. For exchange traded options, warrants and rights and foreign exchange traded equity securities in which the markets are not closed at the time that the Fund prices its securities, snapshot prices provided by individual pricing services are used.
The price for futures contracts are the daily quoted settlement prices. Single security total return swaps in which the referenced security is traded on an exchange are valued at the last sale price at the time of close of the NYSE. In the absence of trading of a referenced security, the mean between the closing bid and asked prices will be used.
Fair Valuation If the price of a security is unavailable in accordance with the Funds’ pricing procedures, or the price of a security is suspect, e.g., due to the occurrence of a significant event (as defined below), the security may be valued at its fair value determined pursuant to procedures adopted by the Board. For this purpose, fair value is the price that the Funds would receive upon selling an investment in an orderly transaction to an independent buyer in the principal or most advantageous market of the investment. As of December 31, 2009, securities which have been fair valued represented 6.95% and 0.44% of DCA’s and DCW’s net assets respectively.
The following factors, among other relevant factors, may be considered when determining the fair value of a security: (1) fundamental analytical data; (2) forces which influence the market in which the security is sold, including the liquidity and depth of the market; (3) type of security and the cost at date of purchase; (4) most recent quotation received from a broker; (5) transactions or offers with respect to the security; (6) price, yield and the extent of public or private trading in similar securities of the issuer or comparable companies; (7) price and extent of public trading of the security on foreign exchanges; (8) information on world financial markets and comparable financial products; (9) size of the Funds’ holdings; (10) financial statements of the issuer; (11) analyst reports; (12) merger proposals or tender offers; (13) value of other financial instruments, including derivative securities, traded on other markets or among dealers; (14) trading volumes on markets, exchanges or among dealers; (15) values of baskets of securities traded on other markets, exchanges or among dealers; (16) change in interest rates;
34 2009 Annual Report www.dcclosedendfunds.com
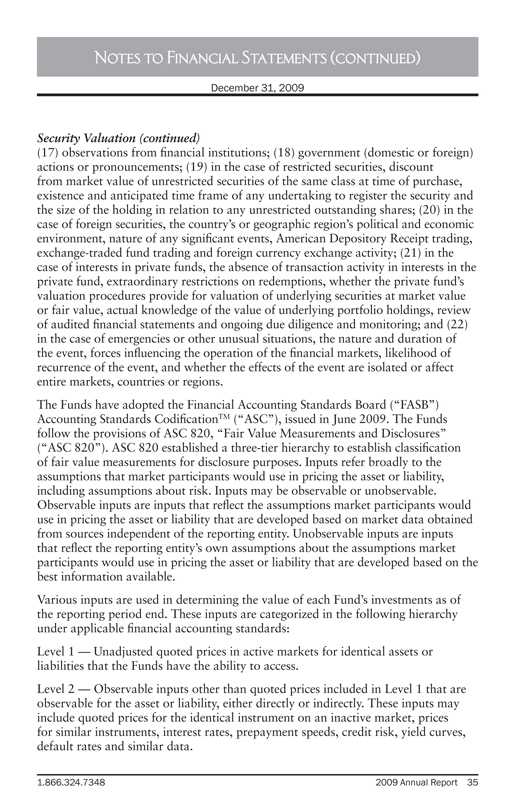
Notes to Financial Statements (continued)
December 31, 2009
Security Valuation (continued)
(17) observations from financial institutions; (18) government (domestic or foreign) actions or pronouncements; (19) in the case of restricted securities, discount from market value of unrestricted securities of the same class at time of purchase, existence and anticipated time frame of any undertaking to register the security and the size of the holding in relation to any unrestricted outstanding shares; (20) in the case of foreign securities, the country’s or geographic region’s political and economic environment, nature of any significant events, American Depository Receipt trading, exchange-traded fund trading and foreign currency exchange activity; (21) in the case of interests in private funds, the absence of transaction activity in interests in the private fund, extraordinary restrictions on redemptions, whether the private fund’s valuation procedures provide for valuation of underlying securities at market value or fair value, actual knowledge of the value of underlying portfolio holdings, review of audited financial statements and ongoing due diligence and monitoring; and (22) in the case of emergencies or other unusual situations, the nature and duration of the event, forces influencing the operation of the financial markets, likelihood of recurrence of the event, and whether the effects of the event are isolated or affect entire markets, countries or regions.
The Funds have adopted the Financial Accounting Standards Board (“FASB”) Accounting Standards CodificationTM (“ASC”), issued in June 2009. The Funds follow the provisions of ASC 820, “Fair Value Measurements and Disclosures” (“ASC 820”). ASC 820 established a three-tier hierarchy to establish classification of fair value measurements for disclosure purposes. Inputs refer broadly to the assumptions that market participants would use in pricing the asset or liability, including assumptions about risk. Inputs may be observable or unobservable. Observable inputs are inputs that reflect the assumptions market participants would use in pricing the asset or liability that are developed based on market data obtained from sources independent of the reporting entity. Unobservable inputs are inputs that reflect the reporting entity’s own assumptions about the assumptions market participants would use in pricing the asset or liability that are developed based on the best information available.
Various inputs are used in determining the value of each Fund’s investments as of the reporting period end. These inputs are categorized in the following hierarchy under applicable financial accounting standards: Level 1 — Unadjusted quoted prices in active markets for identical assets or liabilities that the Funds have the ability to access.
Level 2 — Observable inputs other than quoted prices included in Level 1 that are observable for the asset or liability, either directly or indirectly. These inputs may include quoted prices for the identical instrument on an inactive market, prices for similar instruments, interest rates, prepayment speeds, credit risk, yield curves, default rates and similar data.
1.866.324.7348 2009 Annual Report 35
Notes to Financial Statements (continued)
December 31, 2009
Security Valuation (continued)
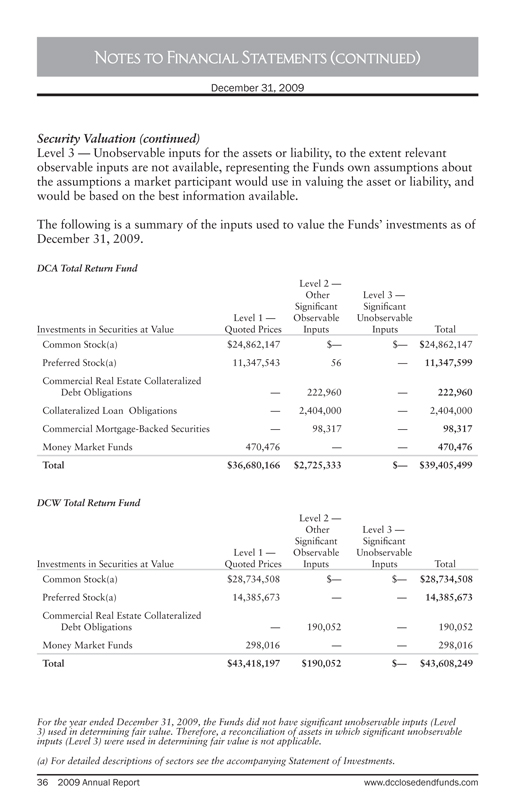
Level 3 — Unobservable inputs for the assets or liability, to the extent relevant observable inputs are not available, representing the Funds own assumptions about the assumptions a market participant would use in valuing the asset or liability, and would be based on the best information available.
The following is a summary of the inputs used to value the Funds’ investments as of December 31, 2009.
DCA Total Return Fund
Level 1 — Level 2 — Other Significant Observable Level 3 — Significant Unobservable
Investments in Securities at Value Quoted Prices Inputs Inputs Total
Common Stock(a) $24,862,147 $— $— $24,862,147
Preferred Stock(a) 11,347,543 56 — 11,347,599
Commercial Real Estate Collateralized
Debt Obligations — 222,960 — 222,960
Collateralized Loan Obligations — 2,404,000 — 2,404,000
Commercial Mortgage-Backed Securities — 98,317 — 98,317
Money Market Funds 470,476 — — 470,476
Total $36,680,166 $2,725,333 $ — $39,405,499
DCW Total Return Fund
Level 1 — Level 2 — Other Significant Observable Level 3 — Significant Unobservable
Investments in Securities at Value Quoted Prices Inputs Inputs Total
Common Stock(a) $28,734,508 $— $— $28,734,508
Preferred Stock(a) 14,385,673 — — 14,385,673
Commercial Real Estate Collateralized
Debt Obligations — 190,052 — 190,052
Money Market Funds 298,016 — — 298,016
Total $43,418,197 $190,052 $— $43,608,249
For the year ended December 31, 2009, the Funds did not have significant unobservable inputs (Level 3) used in determining fair value. Therefore, a reconciliation of assets in which significant unobservable inputs (Level 3) were used in determining fair value is not applicable.
(a) For detailed descriptions of sectors see the accompanying Statement of Investments.
36 2009 Annual Report www.dcclosedendfunds.com
Notes to Financial Statements (continued)
December 31, 2009
Significant Events An event is significant if it causes the price for a security determined at the normal time for pricing that security to no longer reflect fair value at the time that the Funds determine their net asset value. A significant event is material (a “Material Significant Event”) if a fair valuation for the security would impact the Funds’ net asset value by more than one-half of one percent (0.5%). If a Material Significant Event has occurred, the Adviser will call a meeting of the Valuation Committee to determine a fair value for the security in accordance with the Funds’ Fair Valuation Procedures.
In January 2010, the FASB issued Accounting Standards Update “Improving Disclosures about Fair Value Measurements” that requires additional disclosures regarding fair value measurements. Certain required disclosures are effective for interim and annual reporting periods beginning after December 15, 2009, and other required disclosures are effective for fiscal years beginning after December 15, 2010, and for interim periods within those fiscal years. Management is currently evaluating the impact it will have on its financial statement disclosures.
Risk of Concentration
Because the Funds’ investments are concentrated in the real estate industry, the value of the Funds may be subject to greater volatility than a fund with a portfolio that is less concentrated in a single industry. If the securities of real estate companies as a group fall out of favor with investors, the Funds could underperform funds that have greater industry diversification.
Security Credit Risk
The Funds invest in high-yield securities, which may be subject to a greater degree of credit risk, market fluctuations and loss of income and principal, and may be more sensitive to economic conditions than lower-yielding, higher-rated securities. The Funds may acquire securities in default, and are not obligated to dispose of securities whose issuers subsequently default. As of December 31, 2009, securities with an aggregate market value of $149,757, representing 0.38% of DCA’s net assets and $72, representing less than 0.005% of DCW’s net assets, were in default or currently deferring interest payments.
Foreign Securities
The Funds may invest without limit in foreign securities. In the event that the Funds execute a foreign security transaction, the Funds will generally enter into forward foreign currency contracts to settle specific purchases or sales of securities denominated in a foreign currency. Foreign securities may carry more risk than U.S. securities, such as political, market and currency risks.
The accounting records of the Funds are maintained in U.S. dollars. Prices of securities denominated in foreign currencies are translated into U.S. dollars at the closing rate of exchange at period end. Amounts related to the purchase and sale of foreign securities and investment income are translated at the rates of exchange prevailing on the respective dates of such transactions.
1.866.324.7348 2009 Annual Report 37
Notes to Financial Statements (continued)
December 31, 2009
The effects of changes in foreign currency exchange rates on investments is separately identified from the fluctuations arising from changes in market values of securities held and reported with all other foreign currency gains and losses in the Funds’ Statements of Operations.
Repurchase Agreements
The Funds may invest in repurchase agreements, which are short-term investments in which the Funds acquire ownership of a debt security and the seller agrees to repurchase the security at a future time and specified price. Repurchase agreements are fully collateralized by the underlying debt security. The Funds will make payment for such securities only upon physical delivery or evidence of book entry transfer to the account of the custodian bank. The seller is required to maintain the value of the underlying security at not less than the repurchase proceeds due the Funds.
Distributions to Shareholders
The Funds intend to make dividend distributions each quarter to shareholders. The dividend rate may be modified by the Board of Trustees from time to time. Dividends and distributions to shareholders are recorded by the Funds on the ex-dividend date. Distributions paid by the Funds are subject to recharacterization for tax purposes. A portion of the distributions paid by the Funds may be reclassified to return of capital and long-term capital gains upon the final determination of the Funds’ taxable income for the year. Net realized gains, unless offset by any available capital loss carryforward, are generally distributed to shareholders annually, although net realized gains may be retained by the Funds in certain circumstances.
Securities Transactions and Investment Income
Investment security transactions are accounted for as of trade date. Dividend income is recorded on the ex-dividend date. Interest income, which includes amortization of premium and accretion of discount, is accrued as earned. Dividend income from REIT securities may include return of capital. Upon notification from the issuer, the amount of the return of capital is reclassified to adjust dividend income, reduce the cost basis and/or adjust realized gain. Realized gains and losses from securities transactions and unrealized appreciation and depreciation of securities are determined using the specific identification method for both financial reporting and income tax purposes.
Reclassifications
Certain amounts for DCA for the year ended September 30, 2007 have been reclassified to conform to the December 31, 2007 presentation.
Use of Estimates
The Funds’ financial statements are prepared in accordance with accounting principles generally accepted in the United States of America. This requires
38 2009 Annual Report www.dcclosedendfunds.com
Notes to Financial Statements (continued)
December 31, 2009
management to make estimates and assumptions that affect the reported amounts of assets and liabilities and disclosure of contingent assets and liabilities at the date of the financial statements and the reported amounts of increases and decreases in net assets from operations during the reporting period. Actual results could differ from these estimates.
Investments with Off-Balance Sheet Risk
The Funds may enter into financial instrument transactions (such as swaps, futures, options and other derivatives) that may have off-balance sheet market risk. Off-balance sheet market risk exists when the maximum potential loss on a particular financial instrument is greater than the value of such financial instrument as reflected in the Funds’ Statements of Assets and Liabilities.
In addition, the use of total return swaps could adversely affect the character (capital gain vs. ordinary income) of the income recognized by the Funds for U.S. federal income tax purposes, as well as the timing of such income recognition, as compared to a direct investment in the underlying security, and could result in the Funds’ recognition of income prior to the receipt of the corresponding cash. In some market scenarios, the Funds may recognize income and never receive the corresponding cash. This outcome could result in the Funds having to sell assets in order to fund distributions, and in the investor having to pay higher income taxes than would have been the case with a more traditional investment strategy.
Indemnifications
In the normal course of business, the Funds enter into contracts that provide general indemnifications. Each Fund’s maximum exposure under this arrangement is dependent upon claims that may be made against the Funds in the future and, therefore, cannot be estimated; however, based on experience, the risk of material loss from such claims is considered remote.
2. Federal Income Taxes
No provision for federal income taxes is required since the Funds intend to continue to qualify as regulated investment companies and distribute to shareholders all of its taxable income and capital gains.
Because federal income tax regulations differ from generally accepted accounting principles, income and capital gain distributions determined in accordance with tax regulations may differ from net investment income and realized gain for financial reporting purposes. Accordingly, the character of distributions and composition of net assets for tax purposes differ from those reflected in the accompanying financial statements.
The Funds follow ASC 740 “Income Taxes” (“ASC 740”), which requires that the financial statement effects of a tax position taken or expected to be taken in a tax return
1.866.324.7348 2009 Annual Report 39
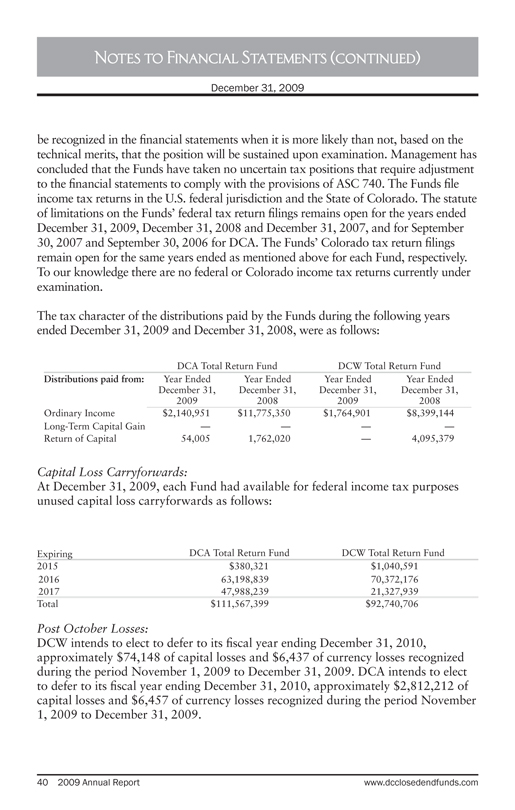
Notes to Financial Statements (continued)
December 31, 2009
be recognized in the financial statements when it is more likely than not, based on the technical merits, that the position will be sustained upon examination. Management has concluded that the Funds have taken no uncertain tax positions that require adjustment to the financial statements to comply with the provisions of ASC 740. The Funds file income tax returns in the U.S. federal jurisdiction and the State of Colorado. The statute of limitations on the Funds’ federal tax return filings remains open for the years ended December 31, 2009, December 31, 2008 and December 31, 2007, and for September 30, 2007 and September 30, 2006 for DCA. The Funds’ Colorado tax return filings remain open for the same years ended as mentioned above for each Fund, respectively. To our knowledge there are no federal or Colorado income tax returns currently under examination.
The tax character of the distributions paid by the Funds during the following years ended December 31, 2009 and December 31, 2008, were as follows:
DCA Total Return Fund DCW Total Return Fund
Distributions paid from: Year Ended Year Ended Year Ended Year Ended
December 31, December 31, December 31, December 31,
2009 2008 2009 2008
Ordinary Income $2,140,951 $11,775,350 $1,764,901 $8,399,144
Long-Term Capital Gain — — — —
Return of Capital 54,005 1,762,020 — 4,095,379
Capital Loss Carryforwards:
At December 31, 2009, each Fund had available for federal income tax purposes unused capital loss carryforwards as follows:
Expiring DCA Total Return Fund DCW Total Return Fund
2015 $380,321 $1,040,591
2016 63,198,839 70,372,176
2017 47,988,239 21,327,939
Total $111,567,399 $92,740,706
Post October Losses:
DCW intends to elect to defer to its fiscal year ending December 31, 2010, approximately $74,148 of capital losses and $6,437 of currency losses recognized during the period November 1, 2009 to December 31, 2009. DCA intends to elect to defer to its fiscal year ending December 31, 2010, approximately $2,812,212 of capital losses and $6,457 of currency losses recognized during the period November 1, 2009 to December 31, 2009.
40 2009 Annual Report www.dcclosedendfunds.com
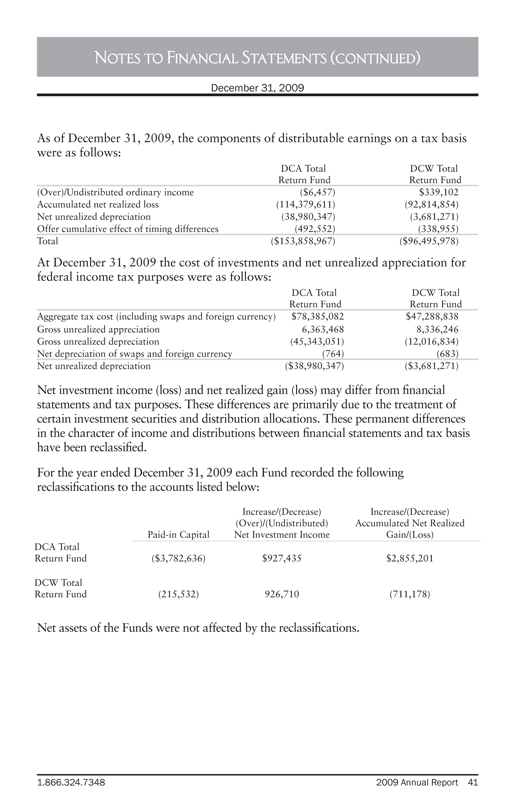
Notes to Financial Statements (continued)
December 31, 2009
As of December 31, 2009, the components of distributable earnings on a tax basis were as follows:
DCA Total DCW Total
Return Fund Return Fund
(Over)/Undistributed ordinary income ($6,457) $339,102
Accumulated net realized loss (114,379,611) (92,814,854)
Net unrealized depreciation (38,980,347) (3,681,271)
Offer cumulative effect of timing differences (492,552) (338,955)
Total ($153,858,967) ($96,495,978)
At December 31, 2009 the cost of investments and net unrealized appreciation for federal income tax purposes were as follows:
DCA Total DCW Total
Return Fund Return Fund
Aggregate tax cost (including swaps and foreign currency) $78,385,082 $47,288,838
Gross unrealized appreciation 6,363,468 8,336,246
Gross unrealized depreciation (45,343,051) (12,016,834)
Net depreciation of swaps and foreign currency (764) (683)
Net unrealized depreciation ($38,980,347) ($3,681,271)
Net investment income (loss) and net realized gain (loss) may differ from financial statements and tax purposes. These differences are primarily due to the treatment of certain investment securities and distribution allocations. These permanent differences in the character of income and distributions between financial statements and tax basis have been reclassified.
For the year ended December 31, 2009 each Fund recorded the following reclassifications to the accounts listed below:
Increase/(Decrease) Increase/(Decrease)
(Over)/(Undistributed) Accumulated Net Realized
Paid-in Capital Net Investment Income Gain/(Loss)
DCA Total
Return Fund($3,782,636) $927,435 $2,855,201
DCW Total
Return Fund(215,532) 926,710 (711,178)
Net assets of the Funds were not affected by the reclassifications.
1.866.324.7348 2009 Annual Report 41
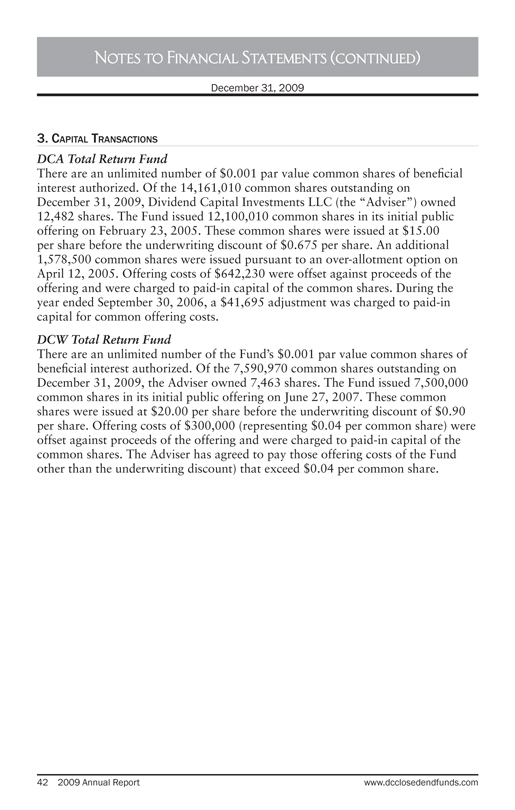
Notes to Financial Statements (continued)
December 31, 2009
3. Capital Transactions
DCA Total Return Fund
There are an unlimited number of $0.001 par value common shares of beneficial interest authorized. Of the 14,161,010 common shares outstanding on December 31, 2009, Dividend Capital Investments LLC (the “Adviser”) owned 12,482 shares. The Fund issued 12,100,010 common shares in its initial public offering on February 23, 2005. These common shares were issued at $15.00 per share before the underwriting discount of $0.675 per share. An additional 1,578,500 common shares were issued pursuant to an over-allotment option on April 12, 2005. Offering costs of $642,230 were offset against proceeds of the offering and were charged to paid-in capital of the common shares. During the year ended September 30, 2006, a $41,695 adjustment was charged to paid-in capital for common offering costs.
DCW Total Return Fund
There are an unlimited number of the Fund’s $0.001 par value common shares of beneficial interest authorized. Of the 7,590,970 common shares outstanding on December 31, 2009, the Adviser owned 7,463 shares. The Fund issued 7,500,000 common shares in its initial public offering on June 27, 2007. These common shares were issued at $20.00 per share before the underwriting discount of $0.90 per share. Offering costs of $300,000 (representing $0.04 per common share) were offset against proceeds of the offering and were charged to paid-in capital of the common shares. The Adviser has agreed to pay those offering costs of the Fund other than the underwriting discount) that exceed $0.04 per common share.
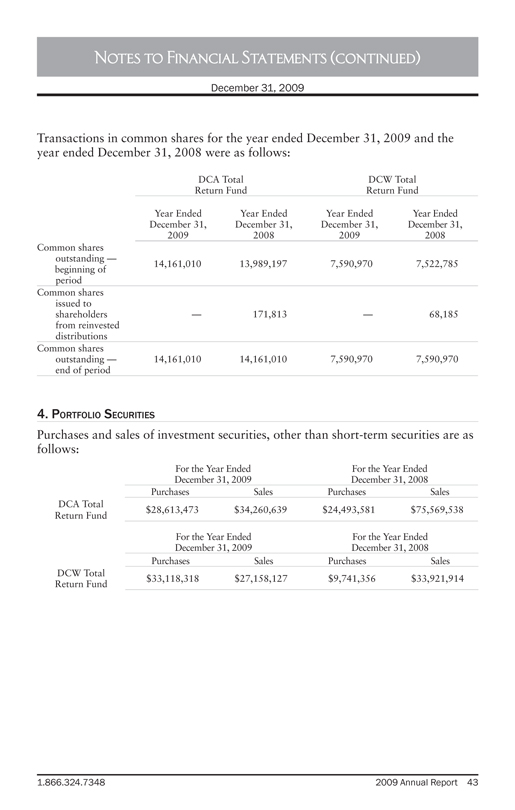
Notes to Financial Statements (continued)
December 31, 2009
Transactions in common shares for the year ended December 31, 2009 and the year ended December 31, 2008 were as follows:
DCA Total DCW Total
Return Fund Return Fund
Year Ended Year Ended Year Ended Year Ended
December 31, December 31, December 31, December 31,
2009 2008 2009 2008
Common shares
outstanding —
beginning of 14,161,010 13,989,197 7,590,970 7,522,785
period
Common shares
issued to
shareholders — 171,813 — 68,185
from reinvested
distributions
Common shares
outstanding — 14,161,010 14,161,010 7,590,970 7,590,970
end of period
4. Portfolio Securities
Purchases and sales of investment securities, other than short-term securities are as follows:
For the Year Ended For the Year Ended
December 31, 2009 December 31, 2008
Purchases Sales Purchases Sales
DCA Total $28,613,473 $34,260,639 $24,493,581 $75,569,538
Return Fund
For the Year Ended For the Year Ended
December 31, 2009 December 31, 2008
Purchases Sales Purchases Sales
DCW Total
Return Fund $33,118,318 $27,158,127 $9,741,356 $33,921,914

Notes to Financial Statements (continued)
December 31, 2009
5. Investment Advisory And Administration Agreements And Other Related Party Transactions
Dividend Capital Investments LLC (“Dividend Capital” or the “Adviser”) serves as the Funds’ investment adviser and co-administrator. Pursuant to an Investment Advisory Agreement with the Funds, as compensation for its services to the Funds, Dividend Capital receives an annual investment advisory fee of 0.85% for DCA Total Return Fund and 1.00% for DCW Total Return Fund based on each Fund’s average daily managed assets, computed daily and payable monthly. Pursuant to a Co-Administration Agreement with each Fund, as compensation for its services to the Funds, Dividend Capital receives an annual co-administration fee of 0.05% based on each Fund’s average daily managed assets, computed daily and payable monthly.
Calamos Advisors LLC (“Calamos”) serves as the Funds’ sub-adviser. Pursuant to a Sub-Advisory Agreement with the Funds and Dividend Capital, as compensation for its services to the Funds, Calamos receives an annual sub-advisory fee of 0.50% for both Funds based on each Fund’s average daily net assets, for the portion of the assets managed by Calamos. This fee is computed daily and paid quarterly by Dividend Capital and not the Funds.
The Funds have entered into a Co-Administration, tax, bookkeeping and pricing services agreement with ALPS Fund Services, Inc. (“ALPS”). Under this agreement, ALPS will calculate the net asset value and perform certain other administrative services for the Funds. ALPS will be compensated by each Fund the greater of a 0.07% annual rate on daily average net assets, or $125,000 annually.
Trustees of the Funds who are “interested persons” of the Funds do not receive any compensation from the Funds for acting as Trustee. Each of the Independent Trustees is paid from the Funds an annual retainer of $12,000, and a fee of $1,500 and reimbursement for related expenses for each meeting of the Board he attends. Each Independent Trustee receives from the Funds a fee of $1,000 for each telephonic Board meeting he attends. The Chairman of the Board of Trustees receives from the Funds an additional nnual retainer of $5,000.
Certain officers of the Funds are also officers of the Adviser.
6. Line Of Credit
DCA Total Return Fund
On April 28, 2005, DCA Total Return Fund executed a Revolving Credit and Security Agreement (the “Agreement”) among DCA, Jupiter Securitization Corp. (“Jupiter”) and JP Morgan Chase Bank N.A. (“JP Morgan”) which allowed DCA to borrow against a secured line of credit from Jupiter and JP Morgan an aggregate amount up to $85,000,000. On March 16, 2007 the Agreement was amended and the line of credit was increased to $105,000,000. The borrowings under the line of credit were secured by a pledge of the Fund’s portfolio securities. Borrowings under
44 2009 Annual Report www.dcclosedendfunds.com
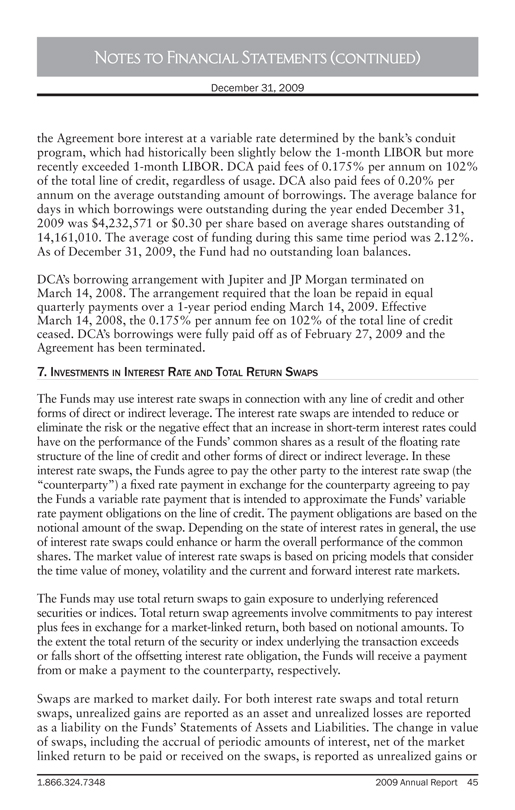
Notes to Financial Statements (continued)
December 31, 2009
the Agreement bore interest at a variable rate determined by the bank’s conduit program, which had historically been slightly below the 1-month LIBOR but more recently exceeded 1-month LIBOR. DCA paid fees of 0.175% per annum on 102% of the total line of credit, regardless of usage. DCA also paid fees of 0.20% per annum on the average outstanding amount of borrowings. The average balance for days in which borrowings were outstanding during the year ended December 31, 2009 was $4,232,571 or $0.30 per share based on average shares outstanding of 14,161,010. The average cost of funding during this same time period was 2.12%. As of December 31, 2009, the Fund had no outstanding loan balances.
DCA’s borrowing arrangement with Jupiter and JP Morgan terminated on March 14, 2008. The arrangement required that the loan be repaid in equal quarterly payments over a 1-year period ending March 14, 2009. Effective March 14, 2008, the 0.175% per annum fee on 102% of the total line of credit ceased. DCA’s borrowings were fully paid off as of February 27, 2009 and the Agreement has been terminated.
7. Investments In Interest Rate And Total Return Swaps
The Funds may use interest rate swaps in connection with any line of credit and other forms of direct or indirect leverage. The interest rate swaps are intended to reduce or eliminate the risk or the negative effect that an increase in short-term interest rates could have on the performance of the Funds’ common shares as a result of the floating rate structure of the line of credit and other forms of direct or indirect leverage. In these interest rate swaps, the Funds agree to pay the other party to the interest rate swap (the “counterparty”) a fixed rate payment in exchange for the counterparty agreeing to pay the Funds a variable rate payment that is intended to approximate the Funds’ variable rate payment obligations on the line of credit. The payment obligations are based on the notional amount of the swap. Depending on the state of interest rates in general, the use of interest rate swaps could enhance or harm the overall performance of the common shares. The market value of interest rate swaps is based on pricing models that consider the time value of money, volatility and the current and forward interest rate markets.
The Funds may use total return swaps to gain exposure to underlying referenced securities or indices. Total return swap agreements involve commitments to pay interest plus fees in exchange for a market-linked return, both based on notional amounts. To the extent the total return of the security or index underlying the transaction exceeds or falls short of the offsetting interest rate obligation, the Funds will receive a payment from or make a payment to the counterparty, respectively.
Swaps are marked to market daily. For both interest rate swaps and total return swaps, unrealized gains are reported as an asset and unrealized losses are reported as a liability on the Funds’ Statements of Assets and Liabilities. The change in value of swaps, including the accrual of periodic amounts of interest, net of the market linked return to be paid or received on the swaps, is reported as unrealized gains or
1.866.324.7348 2009 Annual Report 45
Notes to Financial Statements (continued)
December 31, 2009
losses on the Funds’ Statements of Operations. A realized gain or loss is recorded upon payment or receipt of a periodic payment or termination of a swap agreement. The Funds segregate or earmark sufficient assets as collateral to satisfy the Funds’ current obligation with respect to total return and interest rate swaps. Adverse changes in a Fund’s obligations may result in a requirement to post additional collateral in a timely manner. This requirement may require a Fund to sell or otherwise encumber securities at a time and in a manner that could adversely impact the Fund. Entering into swap agreements involves, to varying degrees, elements of credit, foreign currency, market and documentation risk in excess of the amounts recognized on the Statements of Assets and Liabilities. Such risks involve the possibility that there will be no liquid market for these agreements, that the counterparty to these agreements may default on its obligation to perform or disagree as to the meaning of the contractual items in the agreements, and that there may be unfavorable changes in foreign currency, interest rates or values in referenced indices or securities. As of December 31, 2009, the Funds did not have any open interest rate or total return swap contracts.
Derivative Instruments and Hedging Activities
The Funds follow ASC 815, “Derivatives and Hedging” (“ASC 815”). ASC 815 has established improved financial reporting about derivative instruments and hedging activities as it relates to disclosure associated with these types of investments. The following discloses the amounts related to the Fund’s use of derivative instruments and hedging activities.
46 2009 Annual Report www.dcclosedendfunds.com
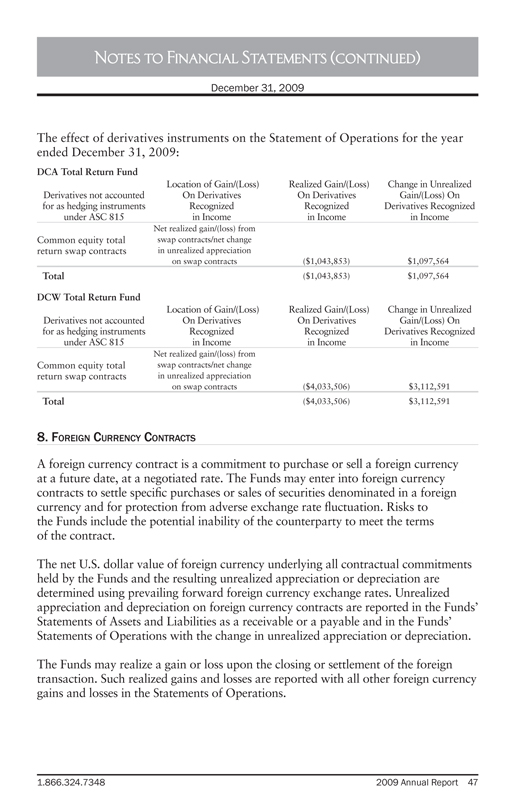
Notes to Financial Statements (continued)
December 31, 2009
The effect of derivatives instruments on the Statement of Operations for the year ended December 31, 2009:
DCA Total Return Fund
Derivatives not accounted for as hedging instruments under ASC 815
Location of Gain/(Loss) On Derivatives Recognized in Income
Realized Gain/(Loss) On Derivatives Recognized in Income
Change in Unrealized Gain/(Loss) On Derivatives Recognized in Income
Common equity total return swap contracts
Net realized gain/(loss) from swap contracts/net change in unrealized appreciation on swap contracts ($1,043,853) $1,097,564
Total ($1,043,853) $1,097,564
DCW Total Return Fund
Derivatives not accounted for as hedging instruments under ASC 815
Location of Gain/(Loss) On Derivatives Recognized in Income
Realized Gain/(Loss) On Derivatives Recognized in Income
Change in Unrealized Gain/(Loss) On Derivatives Recognized in Income
Common equity total return swap contracts
Net realized gain/(loss) from swap contracts/net change in unrealized appreciation on swap contracts ($4,033,506) $3,112,591
Total ($4,033,506) $3,112,591
8. Foreign Currency Contracts
A foreign currency contract is a commitment to purchase or sell a foreign currency at a future date, at a negotiated rate. The Funds may enter into foreign currency contracts to settle specific purchases or sales of securities denominated in a foreign currency and for protection from adverse exchange rate fluctuation. Risks to the Funds include the potential inability of the counterparty to meet the terms of the contract.
The net U.S. dollar value of foreign currency underlying all contractual commitments held by the Funds and the resulting unrealized appreciation or depreciation are determined using prevailing forward foreign currency exchange rates. Unrealized appreciation and depreciation on foreign currency contracts are reported in the Funds’ Statements of Assets and Liabilities as a receivable or a payable and in the Funds’ Statements of Operations with the change in unrealized appreciation or depreciation.
The Funds may realize a gain or loss upon the closing or settlement of the foreign transaction. Such realized gains and losses are reported with all other foreign currency gains and losses in the Statements of Operations.
1.866.324.7348 2009 Annual Report 47
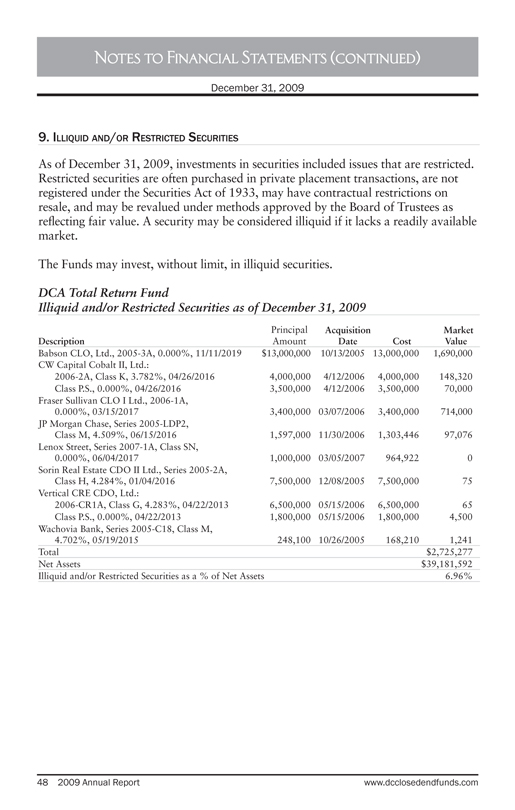
Notes to Financial Statements (continued)
December 31, 2009
9. Illiquid And/Or Restricted Securities
As of December 31, 2009, investments in securities included issues that are restricted. Restricted securities are often purchased in private placement transactions, are not registered under the Securities Act of 1933, may have contractual restrictions on resale, and may be revalued under methods approved by the Board of Trustees as reflecting fair value. A security may be considered illiquid if it lacks a readily available market.
The Funds may invest, without limit, in illiquid securities.
DCA Total Return Fund
Illiquid and/or Restricted Securities as of December 31, 2009
Description
Principal Acquisition
Amount Date
Cost
Market Value
Babson CLO, Ltd., 2005-3A, 0.000%, 11/11/2019 $13,000,000 10/13/2005 13,000,000 1,690,000
CW Capital Cobalt II, Ltd.:
2006-2A, Class K, 3.782%, 04/26/2016 4,000,000 4/12/2006 4,000,000 148,320
Class P.S., 0.000%, 04/26/2016 3,500,000 4/12/2006 3,500,000 70,000
Fraser Sullivan CLO I Ltd., 2006-1A,
0.000%, 03/15/2017 3,400,000 03/07/2006 3,400,000 714,000
JP Morgan Chase, Series 2005-LDP2,
Class M, 4.509%, 06/15/2016 1,597,000 11/30/2006 1,303,446 97,076
Lenox Street, Series 2007-1A, Class SN,
0.000%, 06/04/2017 1,000,000 03/05/2007 964,922 0
Sorin Real Estate CDO II Ltd., Series 2005-2A,
Class H, 4.284%, 01/04/2016 7,500,000 12/08/2005 7,500,000 75
Vertical CRE CDO, Ltd.:
2006-CR1A, Class G, 4.283%, 04/22/2013 6,500,000 05/15/2006 6,500,000 65
Class P.S., 0.000%, 04/22/2013 1,800,000 05/15/2006 1,800,000 4,500
Wachovia Bank, Series 2005-C18, Class M,
4.702%, 05/19/2015 248,100 10/26/2005 168,210 1,241
Total $2,725,277
Net Assets $39,181,592
Illiquid and/or Restricted Securities as a % of Net Assets 6.96%
48 2009 Annual Report www.dcclosedendfunds.com
Notes to Financial Statements (continued)
December 31, 2009
DCW Total Return Fund
Illiquid and/or Restricted Securities as of December 31, 2009
Description
Principal Amount
Acquisition Date
Cost
Market Value
Gramercy Real Estate, Series 2007-1A:
Class GFX, 6.000%, 08/15/2016 $2,000,000 07/26/2007 $1,690,679 $20
Class HFX, 6.000%, 08/15/2016 5,150,000 07/26/2007 4,212,679 52
Morgan Stanley Capital I 2007-SRR4
Series G, 2.733%, 11/20/2052 5,750,000 06/27/2007 5,750,000 189,980
Total $190,052
Net Assets $43,345,807
Illiquid and/or Restricted Securities as a % of Net Assets 0.44%
10. Amendment To Declaration Of Trust
On March 16, 2009, the Funds held an annual shareholders meeting (the “Annual Meeting”) at which each Fund’s shareholders approved an amendment (“Amendment”) to the Declaration of Trust (“Declaration”) to restrict certain acquisitions and dispositions of each Fund’s shares. The restrictions on acquisitions and dispositions of the Funds’ shares contained in the Amendment are intended to preserve the benefit of each Fund’s capital loss carryforwards and certain other tax attributes for tax purposes.
The Amendment is designed to prevent an ownership change (an “Ownership Change”), as defined in the Internal Revenue Code of 1986, as amended (the “Code”). Section 382 of the Code imposes significant limitations on the ability of an entity classified as a corporation to use its capital loss carryforwards to offset income in circumstances where such entity has experienced an Ownership Change and may also limit such an entity’s ability to use any built-in losses recognized within five years of any Ownership Change. Generally, there is an Ownership Change if, at any time, one or more 5% shareholders (as defined in the Code) have experienced aggregate increases in their ownership of a Fund of more than 50 percentage points looking back over the relevant testing period (generally, a trailing three-year period), which can occur as a result of acquisitions that create 5% shareholders of the Fund or increase the ownership in the Fund of 5% shareholders of the Fund.
The Amendment generally prohibits any attempt to purchase or acquire in any manner whatsoever the Fund’s shares or any option, warrant or other right to purchase or acquire shares, or any convertible securities (the “Shares”), if as a result of such purchase or acquisition of such Shares, any person or group becomes a greater than 4.99% shareholder (as defined in the Code), which generally includes a person or group that beneficially owns 4.99% or more of the market value of the total outstanding shares, or the percentage of the Funds’ shares owned
1.866.324.7348 2009 Annual Report 49
Notes to Financial Statements (continued)
December 31, 2009
by a 4.99% shareholder (as defined in the Code) would be increased. As a result of these restrictions, certain transfers of shares by existing 4.99% shareholders are prohibited. Any attempted transfer in violation of the foregoing restrictions will be void ab initio unless the transferor or transferee obtains the written approval of the Board of Trustees, which it may grant or deny in its sole and absolute discretion. The purported transferee will not be entitled to any rights of shareholders of such Fund with respect to the shares that are the subject of the prohibited transfer, including the right to vote such shares and to receive dividends or distributions, whether liquidating or otherwise, in respect of such shares.
If the Board of Trustees determines that a transfer would be prohibited, then, upon a Fund’s written demand, the purported transferee will transfer the shares that are the subject of the prohibited transfer, or cause such shares to be transferred, to the applicable Fund, which shall be deemed an agent for the limited purpose of consummating a sale of the share to a person who is not a 4.99% shareholder. The proceeds of the sale of any such shares will be applied first to the applicable Fund acting in its role as the agent for the sale of the prohibited shares, second, to the extent of any remaining proceeds, to reimburse the intended transferee for any payments made to the transferor by such intended transferee for such shares, and the remainder, if any, to the original transferor.
11. Investment Strategy
At shareholder meetings held March 16, 2009 investors approved the appointment of Calamos Advisors LLC as sub-advisor to the Funds. Concurrent with the approval of a sub-advisor, the Funds changed their investment objectives and certain non-fundamental investment policies. This included changing their historic objectives of high current income with a secondary focus on capital appreciation to an objective of total return, eliminating the investment policies requiring at least 80% of managed assets to be invested in securities of real estate companies, removing any specific limitation regarding the Funds’ investment in foreign securities and modifying the dividend policies from a monthly level-rate payment to quarterly distributions. These changes result in global-oriented, total return Funds with an investment strategy that may include investment in a wide range of securities including common equity, preferred equity, debt and derivative instruments on a global basis. In addition, the Funds may invest without limit in below investment grade or unrated securities as well as illiquid securities.
As part of this new focus, Dividend Capital Realty Income Allocation Fund changed its name to DCA Total Return Fund, and Dividend Capital Global Realty Exposure Fund changed its name to DCW Total Return Fund.
50 2009 Annual Report www.dcclosedendfunds.com
Notes to Financial Statements (continued)
December 31, 2009
12. Subsequent Events
Shareholder Distributions
On January 15th, 2010 DCA paid shareholder distributions in the amount of $0.03 per share to shareholders of record as of December 31, 2009 and DCW paid shareholder distributions in the amount of $0.0525 per share to shareholders of record as of December 31, 2009.
Management has performed a review for subsequent events through February 24, 2010, the date this report was issued. There were no additional reportable events for the Funds, other than information disclosed above, as a result of their review.
Audit Committee Report (Unaudited)
The Audit Committee of each Board of Trustees normally meets at least twice during each full fiscal year with the Funds’ Principle Financial Officer and representatives of the independent auditors in a separate executive session to discuss and review various matters as contemplated by the Audit Committee Charter. In the performance of its oversight function, each Audit Committee has considered and discussed the audited financial statements with management and Tait, Weller & Baker LLP (“TWB”). Each Audit Committee also has discussed with TWB the matters required to be discussed by professional auditing standards. Each Audit Committee also has considered whether the provision by TWB of non-audit services to the Fund, and of professional services to the Adviser and affiliates of the Adviser that provide services to the Funds, is compatible with maintaining TWB’s independence. Finally, each Audit Committee has received the written disclosures and the letter from TWB required by Public Company Accounting Oversight Board Independence Rules, “Communication with Audit Committees Concerning Independence,” and has discussed with TWB its independence. The members of each Fund’s Audit Committee are not professionally engaged in the practice of auditing or accounting and are not experts in the fields of accounting or auditing or evaluating auditor independence. The Board of Trustees of each Fund has determined that Jonathan F. Zeschin and Thomas H. Mack qualify as “audit committee financial experts,” as defined under the Securities and Exchange Commission’s Regulation S-K, Item 401(h). Each Audit Committee is in compliance with applicable rules of the NYSE for closed-end fund audit committees, including the requirement that all members of the audit committee be “financially literate” and that at least one member of the audit committee have “accounting or related financial management expertise,” as determined by each Board. Members of each Fund’s Audit Committee rely without independent verification on the information provided to them and on the representations made by management and the independent auditors. Accordingly, each Audit Committee’s oversight does not provide an independent basis to determine that management has maintained appropriate accounting and financial reporting principles or appropriate internal controls and procedures designed to assure
1.866.324.7348 2009 Annual Report 51
Notes to Financial Statements (continued)
December 31, 2009
compliance with accounting standards and applicable laws and regulations. Furthermore, each Audit Committee’s considerations and discussions referred to above do not assure that the audit of the Fund’s financial statements have been carried out in accordance with generally accepted auditing standards, that the financial statements are presented in accordance with generally accepted accounting principles or that the Fund’s auditors are in fact “independent.” Based upon the reports and discussions described in this report, and subject to the limitations on the role and responsibilities of the Audit Committee referred to above and in the Audit Committee Charter, each Audit Committee recommended to the Board of Trustees that the audited financial statements of each Fund be included in the Funds’ annual report to shareholders for the fiscal year ended December 31, 2009. The members of each Fund’s Audit Committee, Jonathan Zeschin, Thomas Mack, John Mezger and J. Gibson Watson, III, are “independent” within the meaning of the 1940 Act and the NYSE corporate governance standards for audit committees.
52 2009 Annual Report www.dcclosedendfunds.com

This Page Intentionally Left Blank
Report of Independent Registered Public Accounting Firm
December 31, 2009
DCA Total Return Fund
The Shareholders and Board of Trustees of DCA Total Return Fund:
We have audited the accompanying statement of assets and liabilities of the DCA Total Return Fund, formerly Dividend Capital Realty Income Allocation Fund (the “Fund”), including the statement of investments, as of December 31, 2009, and the related statement of operations, the statement of changes in net assets, and financial highlights for the year then ended. These financial statements and financial highlights are the responsibility of the Fund’s management. Our responsibility is to express an opinion on these financial statements and financial highlights based on our audit. The statement of changes in net assets for the year ended December 31, 2008 and financial highlights for the year then ended, the period October 1, 2007 to December 31, 2007 and the year ended September 30, 2007 were audited by other auditors, whose report dated February 27, 2009 expressed an unqualified opinion on such statement and financial highlights. The financial highlights for the year ended September 30, 2006, and for the period February 24, 2005 (inception of offering) to September 30, 2005, were audited by other auditors, whose report dated November 16, 2006, expressed an unqualified opinion on such financial highlights.
We conducted our audit in accordance with the standards of the Public Company Accounting Oversight Board (United States). Those standards require that we plan and perform the audit to obtain reasonable assurance about whether the financial statements and financial highlights are free of material misstatement. The Fund is not required to have, nor were we engaged to perform, an audit of its internal control over financial reporting. Our audit included consideration of internal control over financial reporting as a basis for designing audit procedures that are appropriate in the circumstances, but not for the purpose of expressing an opinion on the effectiveness of the Fund’s internal control over financial reporting. Accordingly, we express no such opinion. An audit includes examining, on a test basis, evidence supporting the amounts and disclosures in the financial statements. Our procedures included confirmation of securities owned as of December 31, 2009, by correspondence with the custodian and brokers or by other appropriate audit procedures where broker replies were not received. An audit also includes assessing the accounting principles used and significant estimates made by management, as well as evaluating the overall financial statement presentation. We believe that our audit provides a reasonable basis for our opinion.
In our opinion, the financial statements and financial highlights referred to above present fairly, in all material respects, the financial position of DCA Total Return Fund as of December 31, 2009, and the results of its operations, the changes in its net assets and the financial highlights for the year then ended, in conformity with accounting principles generally accepted in the United States of America.
Tait, Weller & Baker LLP Philadelphia, Pennsylvania February 24, 2010
54 2009 Annual Report www.dcclosedendfunds.com
Report of Independent Registered Public Accounting Firm
December 31, 2009
DCW Total Return Fund
The Shareholders and Board of Trustees of DCW Total Return Fund:
We have audited the accompanying statement of assets and liabilities of the DCW Total Return Fund, formerly Dividend Capital Global Realty Exposure Fund (the “Fund”), including the statement of investments, as of December 31, 2009, and the related statement of operations, the statement of changes in net assets, and financial highlights for the year then ended. These financial statements and financial highlights are the responsibility of the Fund’s management. Our responsibility is to express an opinion on these financial statements and financial highlights based on our audit. The statement of changes in net assets for the year ended December 31, 2008 and financial highlights for the year then ended, and the period June 27, 2007 (inception of offering) to December 31, 2007, were audited by other auditors, whose report dated February 27, 200, expressed an unqualified opinion on such statement and financial highlights.
We conducted our audit in accordance with the standards of the Public Company Accounting Oversight Board (United States). Those standards require that we plan and perform the audit to obtain reasonable assurance about whether the financial statements and financial highlights are free of material misstatement. The Fund is not required to have, nor were we engaged to perform, an audit of its internal control over financial reporting. Our audit included consideration of internal control over financial reporting as a basis for designing audit procedures that are appropriate in the circumstances, but not for the purpose of expressing an opinion on the effectiveness of the Fund’s internal control over financial reporting. Accordingly, we express no such opinion. An audit includes examining, on a test basis, evidence supporting the amounts and disclosures in the financial statements. Our procedures included confirmation of securities owned as of December 31, 2009, by correspondence with the custodian and brokers or by other appropriate audit procedures where broker replies were not received. An audit also includes assessing the accounting principles used and significant estimates made by management, as well as evaluating the overall financial statement presentation. We believe that our audit provides a reasonable basis for our opinion.
In our opinion, the financial statements and financial highlights referred to above present fairly, in all material respects, the financial position of DCW Total Return Fund as of December 31, 2009, and the results of its operations, the changes in its net assets and the financial highlights for the year then ended, in conformity with accounting principles generally accepted in the United States of America.
Tait, Weller & Baker LLP Philadelphia, Pennsylvania February 24, 2010
1.866.324.7348 2009 Annual Report 55
Shareholder Tax Information
December 31, 2009 (Unaudited)
Certain tax information regarding the Funds is required to be provided to shareholders based upon the Funds’ income and distributions for the taxable year ended December 31, 2009.
During the period ended December 31, 2009, 2.57% and 4.07% of the dividends paid by DCA and DCW from net investment income, respectively, qualify for the corporate dividends received. Also during the year ended December 31, 2009, 7.32% and 12.18% of distributions of ordinary income by DCA and DCW, respectively, met the requirements regarding qualified dividend income.
During the year ended December 31, 2009, 0.00% and 0.09% of distributions from net investment income by DCA and DCW, respectively, is income derived from U.S. Treasury Obligations.
Please note that the distributions paid by the Funds to shareholders are subject to recharacterization for tax purposes. The final tax treatment of these distributions is reported to shareholders on Form 1099-DIV. The Funds may pay distributions in excess of the Funds’ net investment company taxable income and this excess would be a tax-free return of capital distributed from the Funds’ assets. Distributions of capital decrease the Funds’ total assets and, therefore, could have the effect of increasing the Funds’ expense ratio. In addition, the Funds may have to sell portfolio securities at a less than opportune time.
The Funds own securities issued by REITs. A portion of the dividends paid by REITs may be recharacterized for tax purposes following year-end as capital gains and/or return of capital. To the extent this occurs, distributions paid by the Funds during the year also will be reclassified to reflect these REIT recharacterizations. Therefore the actual composition of the distributions paid may change substantially by year-end and, to the extent these changes do occur, they will have the effect of reducing the net investment income component of fund distributions and correspondingly increasing the capital gains and/or return of capital components.
56 2009 Annual Report www.dcclosedendfunds.com
Dividend Reinvestment Plan
December 31, 2009 (Unaudited)
The Funds offer a dividend reinvestment plan (the “Plan”) pursuant to which shareholders, unless they otherwise elect, automatically have dividends and capital gains distributions reinvested in common shares of the Fund by The Bank of New York (the “Plan Agent”). Shareholders who elect not to participate in the Plan receive all distributions in cash paid by wire or check mailed directly to the Plan Agent.
How the Plan Works
After the Funds declare a dividend or determine to make a capital gain distribution, the Plan Agent will acquire shares for the participants’ accounts, depending upon the circumstances described below, either (i) through receipt of newly issued shares of the Funds or (ii) by open-market purchases as follows:
If, on the payment date, the NAV is equal to or less than the market price per share plus estimated brokerage commissions, the Plan Agent will invest the distribution amount in newly issued shares on behalf of the Participants. The number of newly issued shares to be credited to each Participant’s account will be determined by dividing the dollar amount of the distribution by the NAV on the date the shares are issued. However, if the NAV is less than 95% of the market price on the payment date, the dollar amount of the distribution will be divided by 95% of the market price on the payment date. Because common shares may be issued at less than their market price, Plan Participants may get a benefit that non-participants do not.
If, on the payment date, the NAV is greater than the market value per share plus estimated brokerage commissions, the Plan Agent will invest the distribution amount in shares acquired on behalf of the Participants in open-market purchases, which may be made on the NYSE, in the over-the-counter market or in negotiated transactions and may be on such terms as to price, delivery and otherwise as the Plan Agent shall determine. It is possible that the market price for the shares may increase before the Plan Agent has completed its purchases. Therefore, the average purchase price per share the Plan Agent pays may exceed the market price thereof on the payment date. If the market price per share increases so that it equals or exceeds the NAV per share (minus brokerage commissions), it will result in the acquisition by the Plan Agent of fewer shares than if the distribution had been paid in shares issued by the Fund. Otherwise, the Plan Agent will use all distributions received in cash to purchase shares in the open market on or shortly after the payment date, but in no event more than thirty (30) days after the payment date.
1.866.324.7348 2009 Annual Report 57
Dividend Reinvestment Plan (continued)
December 31, 2009 (Unaudited)
Costs of the Plan
The Plan Agent’s fees for the handling of reinvestment of dividends and other distributions will be paid by the Funds. However, each participant will pay a pro rata share of brokerage commissions incurred with respect to the Plan Agent’s open-market purchases in connection with the reinvestment of dividends and other distributions. If a participant elects to have the Plan Agent sell part or all of his or her shares and remit the proceeds, the participant will be charged his or her pro rata share of brokerage commissions on the shares sold, plus a $15.00 transaction fee.
Tax Implications
The automatic reinvestment of dividends or distributions does not relieve participants of any taxes which may be payable on such dividends or distributions. Participants will receive tax information annually for their personal records and to help them prepare their federal income tax return. For further information as to the tax consequences of participation in the Plan, Participants should consult with their own tax advisors.
Right to Withdraw
Participants whose shares are registered in his or her name may terminate his or her account under the Plan by notifying the Agent in writing at BNY Mellon Shareowner Services, P.O. Box 358035, Pittsburgh, PA 15252-8035, or by calling the Agent at 1.877.296.3711, or using BNY Mellon’s website at: www.melloninvestor.com/ISD. Such termination will be effective with respect to a particular distribution if the Participant’s notice is received by the Agent prior to such distribution record date. Participants whose shares are held by a brokerage firm should contact his or her broker. If a Participant holds shares through a broker, the Participant may not be able to transfer his or her shares to another broker and continue to participate in the Plan if the new broker does not permit such participation. The Plan may be amended or terminated by the Agent or the Funds upon notice in writing mailed to each Participant at least 90 days prior to the effective date of the termination.
Change in Independent Registered Public Accounting Firm
December 31, 2009 (Unaudited)
The Board of Trustees approved Tait, Weller & Baker LLP, as the Funds’ independent registered public accounting firm to replace KPMG LLP, for the Funds’ fiscal year ended December 31, 2009. The report of the financial statements audited by KPMG LLP for the DCA Total Return Fund for the year ended December 31, 2008, the period October 1, 2007 to December 31, 2007, and the year ended September 30, 2007, did not contain an adverse opinion or disclaimer of opinion,
58 2009 Annual Report www.dcclosedendfunds.com
Change in Independent Registered
Public Accounting Firm (continued)
December 31, 2009 (Unaudited)
and were not qualified or modified as to uncertainty, audit scope or accounting principles. The report of the financial statements audited by KPMG LLP for the DCW Total Return Fund for the year ended December 31, 2008, the period June 27, 2007 (inception of offering) to December 31, 2007, did not contain an adverse opinion or disclaimer of opinion, and were not qualified or modified as to uncertainty, audit scope or accounting principles. The report of the financial statement for the DCA Total Return Fund for the year ended September 30, 2006, and for the period February 24, 2005 (inception of offering) to September 30, 2005, were audited by other auditors, whose report dated November 16, 2006, expressed an unqualified opinion on such financial statements. There were no disagreements between the Funds and KPMG LLP and/or the other auditor firm on any matters of accounting principles or practices, financial statement disclosure, or auditing scope or procedures, which disagreements, if not resolved to the satisfaction of KPMG LLP and/or the other auditor firm would have caused it to make reference to the subject matter of the disagreements in connection with its reports on the financial statements of such years, and there were no “reportable events” of the kind described in Item 304(a)(1)(v) of Regulation S-K. The Funds did not consult Tait, Weller & Baker LLP regarding either (1) the application of accounting principles to a specified transaction, either completed or proposed, or the type of audit opinion that might be rendered on the Funds’ financial statements, or (2) any matter that was the subject of a disagreement or a reportable event, as such terms are defined in Item S-K 304 of Regulation S-K.
Fund Proxy Voting Policies and Procedures
December 31, 2009 (Unaudited)
The Funds have delegated to the Adviser the voting of proxies relating to its securities. The Adviser will vote such proxies in accordance with the Adviser’s policies and procedures. So long as proxy voting authority for the Funds has been delegated to the Adviser, the Adviser has delegated to Calamos the proxy voting authority with respect to those securities that are specifically part of the portion of the Funds’ assets managed by Calamos. The policies and procedures used in determining how to vote proxies relating to portfolio securities and information regarding how the Funds voted and proxies related to securities during the most recent 12-month period ended June 30th for which an SEC filing has been made are available without charge, upon request, by contacting the Funds at 1.866.324.7348, visiting the Funds’ website at www.dcclosedendfunds.com and visiting the Securities Exchange Commission’s (the “Commission”) website at www.sec.gov.
1.866.324.7348 2009 Annual Report 59
Portfolio Holdings
December 31, 2009 (Unaudited)
The Funds file their complete schedule of portfolio holdings with the Commission for the first and third quarters of each fiscal year on Form N-Q within 60 days after the end of the period. Copies of the Funds’ Forms N-Q are available without charge, upon request, by contacting the Funds at 1.866.324.7348 and on the Commission’s website at www.sec.gov. You may also review and copy Form N-Q at the Commission’s Public Reference Room in Washington, D.C. For more information about the operation of the Public Reference Room, please call the Commission at 1.800.SEC.0330.
Trustees and Officers
December 31, 2009 (Unaudited)
The business and affairs of the Funds are managed under the direction of the Board. The Board approves all significant agreements between the Funds and persons or companies furnishing services to it, including the Funds’ agreements with the Adviser, sub-adviser, co-administrators, custodian and transfer agent. The management of the Funds’ day-to-day operations is delegated to its officers and the Adviser, subject always to the investment objectives and policies of the Funds and to the general supervision of the Board.
The Trustees of the Funds, their age, the position they hold with the Funds, their term of office and the length of time served, their principal occupations for at least the past five years, the number of portfolios they oversee within the Dividend Capital or Calamos Advisors LLC fund complex (“Fund Complex”), and other directorships held by each Trustee are set forth in the charts below. Additional information about the Trustees can be found in the Statement of Additional Information, which is available without charge, upon request by calling 1-866-324-7348.
60 2009 Annual Report www.dcclosedendfunds.com
Trustees and Officers (continued)
December 31, 2009 (Unaudited)
Number of Other
Funds within the Directorships
Name, Age, Fund Complex Held Outside
Address* and Length of Principal Occupation Overseen by Fund
Position with Funds** Time Served During Past Five Years Trustee Complex
DCA: Class III; DCW: Class I (term expires 2011)
Jonathan F. Zeschin Since Essential Investment Partners 2 Matthews
Independent Trustee 01/24/2005 LLC, Partner (since 2009), Asian Funds,
and Chairman of the for DCA and Essential Advisers, Inc., Trustee (11
Board 05/22/2007 President (since 06/2000); and Funds) (since
Age: 56 for DCW JZ Partners LLC, Managing 05/2007)
Partner (since 08/1998)
David W. Agostine Since Dividend Capital Investments 2 None
Interested Trustee*** 09/30/2007 LLC, President (05/2007 to
Age: 47 06/2009); formerly Intellect
Integrated Electronics, Inc.,
Chief Executive Officer
(03/2003 to 05/2007);
formerly Janus Institutional,
Managing Director (01/2000
to 03/2003)
DCA: Class I; DCW: Class II (term expires 2012)
Thomas H. Mack Since Thomas H. Mack & Co., 2 None
Independent Trustee 01/24/2005 Inc., President (since 01/1991)
Age: 67 for DCA and
05/22/2007
for DCW
DCA: Class II; DCW: Class III (term expires 2010)
John Mezger Since WF Option, LLC, Manager 2 None
Independent Trustee 08/17/2005(since 2004); Oak Point, LLC,
Age: 56 for DCA and Manager (since 2003); Cherry
05/22/2007 Creek South Associates,
for DCW LLC, Manager (since 1999);
and Corby Properties, LLC,
Manager (since 1998)
J. Gibson Watson, III Since Prima Capital Holding, Inc., 2 None
Independent Trustee/ 02/21/2006 President and Chief Executive
Nominee for DCA and Officer and Director (since
Age: 55 05/22/2007 01/2000)
for DCW
*Unless otherwise indicated, the business address of each Trustee is c/o Dividend Capital Investments LLC, 518 17th Street, 18th Floor, Denver, Colorado 80202.
**The term “Funds” as used herein includes DCA Total Return Fund and DCW Total Return Fund.
*** Mr. Agostine is deemed to be an “interested person” as defined in Section 2(a)(19) of the 1940 Act (“Interested Trustee”), because of his affiliation with the Funds’ adviser, Dividend Capital Investments LLC.
1.866.324.7348 2009 Annual Report 61
Trustees and Officers (continued)
December 31, 2009 (Unaudited)
The officers of the Funds, their ages and their principal occupations for at least the past five years are set forth below. The address for each of the officers is 518 17th Street, 18th Floor, Denver, CO 80202.
Name Position(s) Held Principal Occupation
and Age with the Fund During Past Five Years
Jeffrey Taylor President Dividend Capital Investments LLC, President
Age: 37(since 06/2009), Chief Operating Officer (since
12/2005); and Vice President of Business
Services (02/2004 — 12/2005); Black Creek
Group/Dividend Capital Group, Senior Vice
President of Operations (since 3/2009).
Francis P. Gaffney Vice President, Treasurer BTR Consulting, President (since 03/2009);
Age: 52 and Principle Financial Dividend Capital Securities, LLC, Senior Vice
Officer President, Director of Operations (03/2004 —
03/2009).
Gordon Taylor Chief Compliance Officer Dividend Capital Securities, LLC, Chief
Age: 35 Compliance Officer (since 3/2006); Cambridge
Investment Research, AVP, Director of
Compliance (12/2003 – 3/2006).
Jami M. Vice President, Secretary Dividend Capital Investments LLC and
VonKaenel Dividend Capital Securities, Controller (since
Age: 31 10/2006) and Assistant Controller (06/2004
— 10/2006); formerly, Ernst and Young LLP,
Senior, Technology and Security Risk Services
(02/2004 — 06/2004); and Accenture, Analyst
(01/2001 — 01/2004).
62 2009 Annual Report www.dcclosedendfunds.com
Key Information
December 31, 2009
Key Information Officers and Trustees
Investment Adviser and Jonathan F. Zeschin
Administrator Independent Trustee and
Dividend Capital Investments LLC Chairman of the Board
518 17th Street, Suite 1200
Denver, CO 80202 Thomas H. Mack
Independent Trustee
Co-Administrator
ALPS Fund Services, Inc. John Mezger
1290 Broadway, Suite 1100 Independent Trustee
Denver, CO 80203
J. Gibson Watson, III
Custodian Independent Trustee
Union Bank
350 California Street, 6th Floor David W. Agostine
San Francisco, CA 94104 Trustee
Transfer Agent Jeffrey W. Taylor
BNY Mellon Shareowner Services President
480 Washington Blvd.
Jersey City, NJ 07310 Francis P. Gaffney
Vice President, Treasurer and Principal
Legal Counsel Financial Officer
Davis Graham & Stubbs LLP
1550 17th Street, Suite 500 Gordon Taylor
Denver, CO 80202 Chief Compliance Officer
Independent Registered Public Jami M. VonKaenel
Accounting Firm Vice President, Secretary
Tait, Weller & Baker LLP
1818 Market Street, Suite 2400
Philadelphia, PA 19103
New York Stock Exchange Symbols: DCA and DCW
This report is for shareholder information. This is not a prospectus intended for use in the purchase or sale of fund shares. Statements and other information contained in this report are as dated and are subject to change.
1.866.324.7348 2009 Annual Report 63

This Page Intentionally Left Blank

This Page Intentionally Left Blank

The Funds are neither insured nor guaranteed by the U.S. Government, the FDIC, the Federal Reserve Board or any other governmental agency or insurer.
Must be accompanied or preceded by a current prospectus.
For more information, please call 1.866.324.7348.
Dividend Capital Investments
| | (a) | | The Registrant, as of the end of the period covered by the report, has adopted a code of ethics that applies to the Registrant’s principal executive officer, principal financial officer, principal accounting officer or controller or any persons performing similar functions on behalf of the Registrant. |
| | (c) | | During the period covered by this report, the Code of Ethics was amended to reflect the new name of the Registrant. No other amendments were made to the provisions of the code of ethics adopted in 2(a) above. |
| | (d) | | During the period covered by this report, no implicit or explicit waivers to the provisions of the code of ethics adopted in 2(a) were granted. |
| | (f) | | The Registrant’s Code of Ethics is attached as an Exhibit hereto. |
| Item 3. | Audit Committee Financial Expert |
The Registrant’s Board of Trustees has determined that it has two audit committee financial experts serving on its audit committee: Jonathan F. Zeschin and Thomas H. Mack. Messrs. Zeschin and Mack are “independent” Trustees, as defined in paragraph (a)(2) of Item 3. Under applicable securities laws, a person who is determined to be an audit committee financial expert will not be deemed an “expert” for any purpose, including without limitation for the purposes of Section 11 of the Securities Act of 1933, as a result of being designated or identified as an audit committee financial expert. The designation or identification of a person as an audit committee financial expert does not impose on such person any duties, obligations, or liabilities that are greater than the duties, obligations, and liabilities imposed on such person as a member of the audit committee and Board of Trustees in the absence of such designation or identification.
| Item 4. | Principal Accountant Fees and Services |
(a) – (d) Aggregate fees billed to the Registrant for the fiscal year ended December 31, 2009 for professional services rendered by the Registrant’s principal accountant were as follows:
| | | | | | | |
| | | Fiscal Year Ended
December 31, 2008
| | | Fiscal Year Ended
December 31, 2009
|
Audit Fees | | $ | 59,000 | | | $ | 25,000 |
Audit-Related Fees | | | — | | | | — |
Tax Fees | | $ | 50,000 | * | | $ | 5,000 |
All Other Fees | | | — | | | | — |
| * | | Indicates fees paid by the Fund to KPMG for the preparation of a private letter ruling request filed by the Fund with the Internal Revenue Service in connection with the late filing of the Fund’s tax return for the fiscal period ended December 31, 2007. |
Aggregate fees billed by the Registrant’s principal accountant for the fiscal year ended December 31, 2009 for non-audit services provided to the Registrant’s investment adviser and any entity controlling, controlled by, or under common control with Dividend Capital Investments LLC (the “Adviser”) that provides ongoing services to the registered investment company, where the engagement relates directly to the operations and financial reporting of the registrant, were as follows:
| | | | |
| | | Fiscal Year Ended
December 31, 2008
| | Fiscal Year Ended
December 31, 2009
|
Audit-Related Fees | | — | | — |
Tax Fees | | — | | — |
All Other Fees | | — | | — |
| | |
(e)(1) | | The Audit Committee pre-approves audit and non-audit services performed for the Registrant by the principal accountant. The Audit Committee also pre-approves non-audit services performed by the Registrant’s principal accountant for the Registrant’s Adviser and affiliates servicing the Registrant, if the engagement relates directly to the operations and financial reporting of the Registrant. |
| |
| | | The Audit Committee may delegate pre-approval authority to a subcommittee of one or more of its members. Any decision of the subcommittee to grant pre-approvals is presented to the full Audit Committee at its next regularly scheduled meeting. |
| |
(e)(2) | | No services described in paragraphs (b) through (d) above were approved pursuant to paragraph (c)(7)(i)(C) of Rule 2-01 of Regulation S-X. |
| |
(f) | | Not applicable |
| |
(g) | | Aggregate Non-Audit Fees: The aggregate non-audit fees billed by the Registrant’s accountant for services rendered to the Registrant, the Registrant’s Adviser and any entity controlling, controlled by, or under common control with the Adviser that provides ongoing services to the Registrant were $5,000 and $50,000 for the fiscal years ended December 31, 2009 and December 31, 2008, respectively. |
| |
(h) | | Not applicable |
| Item 5. | Audit Committee of Listed Registrants |
| | (a) | | The Registrant has a separately-designated standing Audit Committee established in accordance with Section 3(a)(58)(A) of the Exchange Act. The committee members are: Jonathan F. Zeschin, Thomas H. Mack, John Mezger and J. Gibson Watson III. |
| Item 6. | Schedule of Investments |
Included as part of the report to shareholders filed under Item 1 of this Form N-CSR.
| Item 7. | Disclosure of Proxy Voting Policies and Procedures for Closed-End Management Investment Companies |
The Registrant has delegated, subject to the supervision of the Board, the voting of proxies relating to its voting securities to the Adviser and Sub-Adviser, each with respect to the portion of the Fund’s assets under its management. The Proxy and Corporate Action Voting Policies and Procedures of the Adviser and Sub-Adviser are attached as Exhibit 99.PROXYPOL hereto.
| Item 8. | Portfolio Managers of Closed-End Management Investment Companies. |
(a)(1) Adviser’s Portfolio Management Team
The Adviser’s investment committee (“Investment Committee”) is charged with the overall management of the Registrant’s portfolio, including the development and implementation of overall portfolio strategy and the day-to-day management of the portfolio. Members of the Investment Committee include: (1) Mr. Jeffrey Taylor, President and Chief Operating Officer of the Adviser; and (2) Mr. Jeffrey Randall, Vice President and Portfolio Manager of the Adviser (collectively, the “Committee Members”).
Biographical Information
Biographical information regarding the Adviser’s Committee Members is set forth below:
Jeffrey Randall, CFA. Mr. Randall is Vice President and Portfolio Manager for the Adviser. In addition to his position with the Adviser, Mr. Randall is also a Vice President of Dividend Capital Total Realty Trust Inc and a Vice President of Black Creek Group LLC. Prior to joining the Adviser in January 2008, Mr. Randall was Senior Analyst at A.G. Edwards & Sons, where he focused on the public lodging sector. While at A.G. Edwards, Mr. Randall was often quoted in numerous print media publications and was featured on CNBC, BloombergTV and Nightly Business Report for his views on the REIT industry. In May 2007, he was ranked 3rd by Forbes/StarMine for earnings estimates among all REIT analysts. Prior to joining A.G. Edwards in 2004, Mr. Randall was an Associate Analyst at JMP Securities, where he followed the hotel/resort and restaurant industries. He has over ten years experience in the financial industry and 15 years experience in the real estate industry. Mr. Randall has also held positions with Deloitte & Touche, Duff & Phelps, and Arthur Andersen, where he practiced as a Certified Public Accountant. Mr. Randall received his Bachelor of Science in Accounting from the University of Colorado and his Master of Business Administration in Finance from the University of Southern California.
Jeffrey Taylor, CFA. Mr. Taylor is the President and Chief Operating Officer of the Adviser. In addition to his position with the Adviser, Mr. Taylor is also the Senior Vice President of Operations for Black Creek Group LLC. Prior to joining the Adviser in 2004, he served in various positions with INVESCO Funds Group, most notably as product manager and manager of marketing and business analytics, where he was responsible for the development of the company’s portfolio review and product rationalization processes, as well as strategic business analysis and planning initiatives. Mr. Taylor holds a bachelor’s degree from Pennsylvania State University and an MBA from the University of Colorado at Denver.
Sub-Adviser’s Portfolio Management Team
Calamos Advisors employs a team approach to portfolio management, led by the Co-CIOs and comprised generally of the Co-CIOs, directors, senior strategy analysts, intermediate analysts and junior analysts. The Co-CIOs, directors and senior strategy analysts are supported by and lead a team of investment professionals whose valuable contributions create a synergy of expertise that can be applied across many different investment strategies.
Portfolio holdings are reviewed and trading activity is discussed on a regular basis by team members. Team members, including the Co-CIOs and senior strategy analysts, may each make trading decisions guided by the Fund’s investment objective and strategy.
While day-to-day management of the Fund is a team effort, the Co-CIOs, along with the senior strategy analysts, have joint primary and supervisory responsibility for the Fund and work with all team members in developing and executing the Fund’s investment program. Each is further identified below.
Biographical Information
Biographical information regarding the Sub-Adviser’s portfolio management team is set forth below:
John P. Calamos, Sr. and Nick P. Calamos, Co-CIOs of Calamos Advisors, generally focus on firmwide risk management and the top-down approach of diversification by country and industry sector and macro-level investment themes.
| | |
| | | Nick P. Calamos, Co-CIO of Calamos Advisors, also focuses on portfolio level risk management, sector and country weightings, bottom-up fundamental security analysis, and corresponding research and analysis for key holdings. As Co-CIOs, Messrs, John P. Calamos, Sr. and Nick P. Calamos direct the team’s focus on macro themes, upon which the portfolio’s strategy is based. The team, as a whole, implements the investment strategies, under the general direction and supervision of the Co-CIOs and the senior strategy analysts. John Calamos, Jr., Jeff Scudieri, Jon Vacko, John Hillenbrand, Steve Klouda, Bryan Lloyd, Dino Dussias, Chris Hartman and Joe Wysocki are each senior strategy analysts. |
| |
| | | During the past five years, John P. Calamos, Sr. has been President and Trustee of the Trust and chairman, CEO and Co-CIO of CALAMOS ADVISORS and its predecessor company, and Nick P. Calamos has been Vice President and Trustee of the Trust (through June 2006) and Senior Executive Vice President and Co-CIO of CALAMOS ADVISORS and its predecessor company. John P. Calamos, Jr., Executive Vice President of CALAMOS ADVISORS, joined the firm in 1985 and has held various senior investment positions since that time. Jeff Scudieri joined Calamos in 1997 and has been a senior strategy analyst since September 2002. Jon Vacko joined Calamos in 2000 and has been a senior strategy analyst since July 2002. John Hillenbrand joined Calamos in 2002 and has been a senior strategy analyst since August 2002. Steve Klouda joined Calamos in 1994 and has been a senior strategy analyst since July 2002. Bryan Lloyd joined Calamos in October 2003 and has been a senior strategy analyst since June 2006. Dino Dussias joined Calamos in October 1995 and has been a senior strategy analyst since April 2007. Chris Hartman joined Calamos in February 1997 and has been a senior strategy analyst since May 2007. Joe Wysocki joined Calamos in October 2003 and has been a senior strategy analyst since February 2007. |
| |
(a)(2) | | The following table provides information about the other registered investment companies, other pooled investment vehicles and other accounts managed by the Adviser’s Committee Members who are primarily responsible for the day-to-day management of any other portfolio as of December 31, 2009: |
| | | | | | | |
| | | | | Number of All Other
Accounts
| | Total Assets of All
Other Accounts
(in millions)
|
Mr. Jeffrey Randall: | | Other Registered Investment Companies | | 1 | | $ | 43 |
| | | Other Pooled Investment Vehicles | | 0 | | $ | — |
| | | Other Accounts | | 1 | | $ | 73 |
Mr. Jeffrey Taylor: | | Other Registered Investment Companies | | 1 | | $ | 43 |
| | | Other Pooled Investment Vehicles | | 0 | | $ | — |
| | | Other Accounts | | 1 | | $ | 73 |
None of the accounts listed above have all or a portion of their advisory fee based on performance of the account.
The following table provides information about the other registered investment companies, other pooled investment vehicles and other accounts managed by the Sub-Adviser’s Portfolio Management team who are primarily responsible for the day-to-day management of any other portfolio as of December 31, 2009:
| | | | | | | |
| | | | | Number of All Other
Accounts
| | Total Assets of All
Other Accounts
(in millions)
|
Mr. John P. Calamos Sr.: | | Other Registered Investment Companies | | 25 | | $ | 24,403 |
| | | Other Pooled Investment Vehicles | | 12 | | $ | 1,005 |
| | | Other Accounts | | 14,972 | | $ | 7,305 |
Mr. Nick P. Calamos: | | Other Registered Investment Companies | | 25 | | $ | 24,403 |
| | | Other Pooled Investment Vehicles | | 12 | | $ | 1,005 |
| | | Other Accounts | | 14,972 | | $ | 7,305 |
Mr. John P. Calamos, Jr.: | | Other Registered Investment Companies | | 25 | | $ | 24,403 |
| | | Other Pooled Investment Vehicles | | 12 | | $ | 1,005 |
| | | Other Accounts | | 14,972 | | $ | 7,305 |
Mr. Jeff Scudieri: | | Other Registered Investment Companies | | 25 | | $ | 24,403 |
| | | Other Pooled Investment Vehicles | | 12 | | $ | 1,005 |
| | | Other Accounts | | 14,972 | | $ | 7,305 |
Mr. Jon Vacko: | | Other Registered Investment Companies | | 25 | | $ | 24,403 |
| | | Other Pooled Investment Vehicles | | 12 | | $ | 1,005 |
| | | Other Accounts | | 14,972 | | $ | 7,305 |
Mr. John Hillenbrand: | | Other Registered Investment Companies | | 25 | | $ | 24,403 |
| | | Other Pooled Investment Vehicles | | 12 | | $ | 1,005 |
| | | Other Accounts | | 14,972 | | $ | 7,305 |
Mr. Steve Klouda: | | Other Registered Investment Companies | | 25 | | $ | 24,403 |
| | | Other Pooled Investment Vehicles | | 12 | | $ | 1,005 |
| | | Other Accounts | | 14,972 | | $ | 7,305 |
Mr. Bryan Lloyd: | | Other Registered Investment Companies | | 25 | | $ | 24,403 |
| | | Other Pooled Investment Vehicles | | 12 | | $ | 1,005 |
| | | Other Accounts | | 14,972 | | $ | 7,305 |
Mr. Dino Dussias: | | Other Registered Investment Companies | | 25 | | $ | 24,403 |
| | | Other Pooled Investment Vehicles | | 12 | | $ | 1,005 |
| | | Other Accounts | | 14,972 | | $ | 7,305 |
Mr. Christopher Hartman: | | Other Registered Investment Companies | | 25 | | $ | 24,403 |
| | | Other Pooled Investment Vehicles | | 12 | | $ | 1,005 |
| | | Other Accounts | | 14,972 | | $ | 7,305 |
Mr. Joe Wysocki: | | Other Registered Investment Companies | | 25 | | $ | 24,403 |
| | | Other Pooled Investment Vehicles | | 12 | | $ | 1,005 |
| | | Other Accounts | | 14,972 | | $ | 7,305 |
Number of Accounts and Assets for which Advisory Fee is performance based as of December 31, 2009
| | | | | | | |
| | | | | Accounts
| | Assets
(in Millions)
|
Mr. John P. Calamos Sr. | | Registered Investment Companies | | 3 | | $ | 306 |
| | | Other Pooled Investment Vehicles | | 2 | | $ | 19 |
| | | Other Accounts | | 0 | | $ | — |
Mr. Nick P. Calamos | | Registered Investment Companies | | 3 | | $ | 306 |
| | | Other Pooled Investment Vehicles | | 2 | | $ | 19 |
| | | Other Accounts | | 0 | | $ | — |
Mr. John P. Calamos, Jr. | | Registered Investment Companies | | 3 | | $ | 306 |
| | | Other Pooled Investment Vehicles | | 2 | | $ | 19 |
| | | Other Accounts | | 0 | | $ | — |
Mr. Jeff Scudieri | | Registered Investment Companies | | 3 | | $ | 306 |
| | | Other Pooled Investment Vehicles | | 2 | | $ | 19 |
| | | Other Accounts | | 0 | | $ | — |
Mr. Jon Vacko | | Registered Investment Companies | | 3 | | $ | 306 |
| | | Other Pooled Investment Vehicles | | 2 | | $ | 19 |
| | | Other Accounts | | 0 | | $ | — |
Mr. John Hillenbrand | | Registered Investment Companies | | 3 | | $ | 306 |
| | | Other Pooled Investment Vehicles | | 2 | | $ | 19 |
| | | Other Accounts | | 0 | | $ | — |
Mr. Steve Klouda | | Registered Investment Companies | | 3 | | $ | 306 |
| | | Other Pooled Investment Vehicles | | 2 | | $ | 19 |
| | | Other Accounts | | 0 | | $ | — |
Mr. Bryan Lloyd | | Registered Investment Companies | | 3 | | $ | 306 |
| | | Other Pooled Investment Vehicles | | 2 | | $ | 19 |
| | | Other Accounts | | 0 | | $ | — |
Mr. Dino Dussias | | Registered Investment Companies | | 3 | | $ | 306 |
| | | Other Pooled Investment Vehicles | | 2 | | $ | 19 |
| | | Other Accounts | | 0 | | $ | — |
Mr. Christopher Hartman | | Registered Investment Companies | | 3 | | $ | 306 |
| | | Other Pooled Investment Vehicles | | 2 | | $ | 19 |
| | | Other Accounts | | 0 | | $ | — |
Mr. Joe Wysocki | | Registered Investment Companies | | 3 | | $ | 306 |
| | | Other Pooled Investment Vehicles | | 2 | | $ | 19 |
| | | Other Accounts | | 0 | | $ | — |
Conflicts of Interest
From time to time, potential conflicts of interest may arise between the Committee Members’ management of the investments of the Registrant, on the one hand, and the management of other accounts, on the other. The other accounts might have similar investment objectives or strategies as the Registrant, track the same index the Registrant tracks or otherwise hold, purchase, or sell securities that are eligible to be held, purchased or sold by the Registrant. The other accounts might also have different investment objectives or strategies than the Registrant.
| | • | | Knowledge and Timing of Registrant Trades. A potential conflict of interest may arise as a result of the Committee Members’ management of the Registrant’s portfolio. Because of their position with the Adviser and the Registrant, the Committee Members know the size, timing and possible market impact of the Registrant’s trades. It is theoretically possible that the Committee Members could use this information to the advantage of other accounts they manage and to the possible detriment of the Registrant. |
| | • | | Investment Opportunities. A potential conflict of interest may arise as result of a Committee Member’s management of a number of accounts with varying investment guidelines. Often, an investment opportunity may be suitable for both the Registrant and other accounts managed by a Committee Member, but may not be available in sufficient quantities for both the Registrant and the other accounts to participate fully. Similarly, there may be limited opportunity to sell an investment held by the Registrant and another account. The Adviser has adopted policies and procedures reasonably designed to allocate investment opportunities on a fair and equitable basis over time. |
Under the Adviser’s allocation procedures, investment opportunities are allocated among various investment strategies based on individual account investment guidelines and the Adviser’s investment outlook. The Adviser has also adopted additional procedures to complement the general trade allocation policy that are designed to address potential conflicts of interest due to the side-by-side management of the Registrant and certain other accounts, including investment opportunity allocation issues.
(a)(3) Adviser’s Portfolio Management Team Compensation
The objective of the Adviser’s portfolio compensation program is to provide pay and long-term compensation for its employees that is competitive with the real estate management, and mutual fund/investment advisory market relative to the Adviser’s size and geographical location. Committee Members participate in a compensation program that includes base salary, the potential for a discretionary bonus and the potential for long-term incentives. Committee Member compensation is reviewed and may be modified each year as appropriate to reflect changes in the market, as well as to adjust the factors used to determine bonuses to promote good sustained investment performance.
| | • | | Base Salary. Each Committee Member is paid a base salary by the Adviser or one of its related companies. In setting the base salary, the Adviser’s intention is to be competitive in light of a Committee Member’s experience and responsibilities. The base salary is also a function of industry salary rates and individual performance as measured against annual goals. |
| | • | | Annual Bonus. Each Committee Member is eligible to receive from the Adviser or one of its related companies an annual cash bonus that may be equal to as much as 200% of his annual base salary. This bonus is determined by a Committee Member’s contribution to investment management results consistent with the Registrant’s stated objectives as well as other qualitative and quantitative factors taken into consideration. |
| | • | | Long-Term Incentive Program. Each Committee Member has the potential to participate in a long-term incentive program which may include an equity ownership program in the Adviser or one of its related companies. Equity ownership is awarded based on individual contributions to the Adviser’s business and the long-term potential of that individual to the Adviser. |
Sub-Adviser’s Portfolio Management Team Compensation
As of October 31, 2009, Team Leaders John P. Calamos, Sr., Nick P. Calamos and John P. Calamos, Jr. receive all of their compensation from Calamos Advisors. Each has entered into an employment agreement that provides for compensation in the form of an annual base salary and a target bonus, both components payable in cash. Their target bonus is set at a percentage of the respective base salary, ranging from 300% to 600%, with a maximum annual bonus opportunity of 150% of the target bonus. For example, the target bonus for a Team Leader who earns $500,000 would range from $1,500,000 to $3,000,000 and the Team Leader’s maximum annual bonus opportunity would range from $2,250,000 to $5,000,000. Also, due to the ownership and executive management positions with Calamos Asset Management, Inc., additional multiple corporate objectives are utilized to determine the target bonus for John P. Calamos, Sr., Nick P. Calamos and John P. Calamos, Jr. For 2009, the additional corporate objectives were distribution effectiveness, as measured by redemption rates and sales growth; investment performance, as measured by risk-adjusted performance of the investment strategies managed by Calamos Advisors over a blended short and long-term measurement period; income growth, as measured by operating margin and return on invested capital and the corporate investment portfolio; management evaluation, based upon several factors including the execution of strategic initiatives; and stockholder return relative to the industry peer group.
As of October 31, 2009, Jeff Scudieri, Jon Vacko, John Hillenbrand, Steve Klouda, Bryan Lloyd, Dino Dussias, Chris Hartman and Joe Wysocki receive all of their compensation from Calamos Advisors. They each receive compensation in the form of an annual base salary, a discretionary bonus (payable in cash) and long-term incentive awards. Each of these associates has a bonus range opportunity which is expressed as a percentage of base salary. Each of these associates is also eligible for discretionary long-term incentive awards, however these awards are not guaranteed from year to year. Long-term incentive awards consist of restricted stock units or a combination of restricted stock units and stock options.
| | |
(a)(4) | | The following table shows the dollar range of shares of the Registrant owned by the Committee Members as of December 31, 2009. |
| | | | | | |
Name
| | $0
| | $1-$10,000
| | $10,001-$50,000
|
Mr. Randall | | | | X | | |
Mr. Taylor | | | | | | X |
| Item 9. | Purchases of Equity Securities by Closed-End Management Investment Company and Affiliated Purchasers. |
Not applicable.
| Item 10. | Submission of Matters to Vote of Security Holders |
There were no material changes to the procedures by which shareholders may recommend nominees to the Registrant’s Board of Trustees that were implemented after the Registrant last provided disclosure in response to the requirements of Item 407(c)(2)(iv) of Regulation S-K (17 CFR 229.407) (as required by 22(b)(15)) of Schedule 14A (17 CFR 240.14a-101), or this Item 10.
Item 11 - Controls and Procedures
| (a) | | Based on an evaluation of the disclosure controls and procedures (as defined in Rule 30a-3(c) under the Act) as of a date within 90 days of the filing date of this report, the Chief Executive Officer and Principal Financial Officer of the Registrant have each concluded that such disclosure controls and procedures provide reasonable assurance that information required to be disclosed by the Registrant is accumulated and communicated to the Registrant’s management to allow timely decisions regarding required disclosure. |
| (b) | | There were no changes in the Registrant’s internal controls over financial reporting (as defined in Rule 30a-3(d) under the Act) that occurred during the second fiscal quarter of the period covered by this report that have materially affected, or are reasonably likely to materially affect, the Registrant’s internal control over financial reporting. |
Item 12 - Exhibits
| | | |
| |
| | (a)(1)(i) | | The code of ethics that applies to the Registrant’s principal executive officer and principal financial officer is attached hereto as Exhibit 99.CODE ETH. |
| |
| | (a)(1)(ii) | | The Proxy and Corporate Action Voting Policies and Procedures of the Adviser and Sub-Adviser are attached hereto as Exhibit 99.PROXY VOTING. |
| |
| | (a)(2) | | The certifications required by Rule 30a-2(a) of the Act (17 CFR 270.30a-2(a)) are filed and attached hereto as Exhibit 99.CERT. |
| |
| | (a)(3) | | Not applicable to the Registrant. |
| |
| | (b) | | The certification required by Rule 30a-2(b) of the Act (17 CFR 270.30a-2(b)) is filed and attached hereto as Exhibit 99.906 CERT. |
SIGNATURES
Pursuant to the requirements of the Securities Exchange Act of 1934 and the Investment Company Act of 1940, the Registrant has duly caused this report to be signed on its behalf by the undersigned, thereunto duly authorized.
DCA Total Return Fund
| | |
| |
By: | | /S/ JEFFREY W. TAYLOR |
| | | Jeffrey W. Taylor President (Principal Executive Officer) |
Date: March 10, 2010
Pursuant to the requirements of the Securities Exchange Act of 1934 and the Investment Company Act of 1940, this report has been signed below by the following persons on behalf of the Registrant and in the capacities and on the dates indicated.
| | |
| |
By: | | /S/ JEFFREY W. TAYLOR |
| | | Jeffrey W. Taylor President (Principal Executive Officer) |
Date: March 10, 2010
| | |
| |
By: | | /S/ FRANCIS GAFFNEY |
| | | Francis Gaffney Treasurer (Principal Financial Officer) |
Date: March 10, 2010