UNITED STATES
SECURITIES AND EXCHANGE COMMISSION
Washington, D.C. 20549
FORM N-CSR
CERTIFIED SHAREHOLDER REPORT OF REGISTERED
MANAGEMENT INVESTMENT COMPANIES
Investment Company Act file number 811-21714
MML Series Investment Fund II
(Exact name of registrant as specified in charter)
100 Bright Meadow Blvd., Enfield, CT 06082
(Address of principal executive offices) (Zip code)
Jeffrey M. Dube
100 Bright Meadow Blvd., Enfield, CT 06082
(Name and address of agent for service)
Registrant’s telephone number, including area code: (860) 562-1000
Date of fiscal year end: 12/31/2014
Date of reporting period: 12/31/2014
Item 1. Reports to Stockholders.
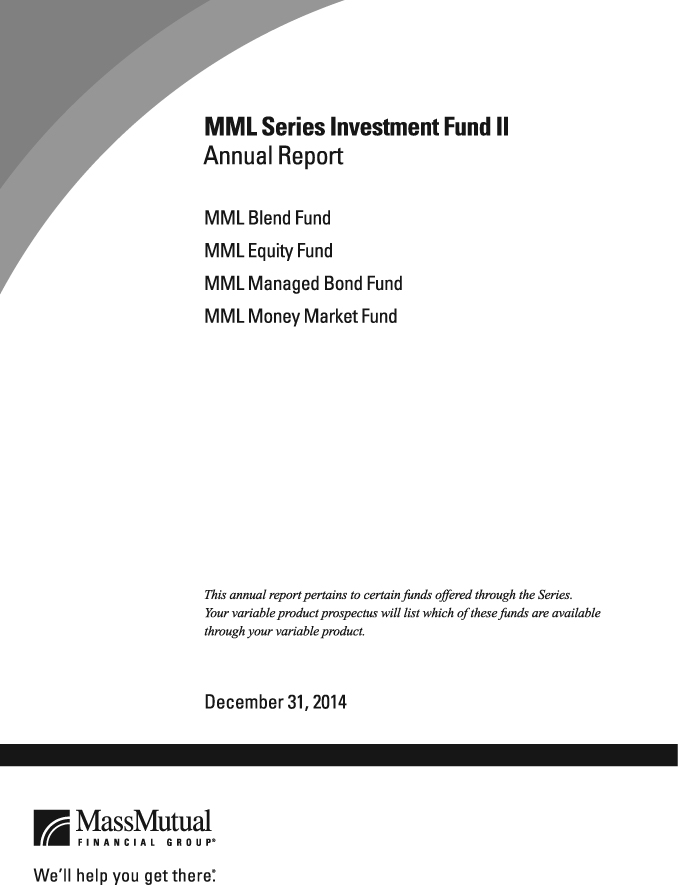
Table of Contents
This material must be preceded or accompanied by a current prospectus (or summary prospectus, if available) for the MML Series Investment Fund II. Investors should consider a Fund’s investment objective, risks, and charges and expenses carefully before investing. This and other information about the investment company is available in the prospectus (or summary prospectus, if available). Read it carefully before investing.
MML Series Investment Fund II – President’s Letter to Shareholders (Unaudited)
To Our Shareholders

Jeffrey M. Dube
“At MassMutual, our customers – and their dreams for their future – matter most to us. We strive to help you take the right steps to help yourself prepare for a retirement that grants you the freedom to live the life you imagine – retirement on your terms.”
December 31, 2014
I am pleased to present you with the MML Series Investment Fund II Annual Report, covering the year ended December 31, 2014. U.S. stocks and bonds rose in 2014, with stocks reaching new heights and outperforming their foreign counterparts by a considerable margin. The accelerating expansion of the U.S. economy provided an accommodative investing environment that stood in sharp contrast to the challenges faced by some of the world’s other large economies in Europe and the Far East.
The performance of U.S. equity markets during 2014 was encouraging, but the volatility that resurfaced during the fourth quarter and the struggles of some foreign markets serve as ongoing reminders that retirement investors should not focus on short-term performance – but rather on making investment decisions that are based on their long-term goals and objectives. Individuals who are saving for retirement may have the advantage of not needing to access their funds in the short term. Even those who have begun withdrawing their retirement savings may choose to have the majority of their account balance remain invested, since retirement can last for decades. We believe retirement investors give themselves a greater opportunity to reach their retirement income goals when they follow certain investment guidelines, such as the ones below.
Investment concepts to keep in mind
Avoid focusing on daily market performance
Investing for retirement is a long-term proposition. While most retirement investors seem to understand that the financial markets experience volatility from time to time, seasoned investors typically take a long-term approach to investing and avoid focusing on short-term results.
The one thing you can control is your contribution level
Of course, you can’t control the performance of your investments. What you can control, however, is how often and how much you save. Contributing to your retirement account on a regular basis and increasing your contribution level as often as possible can help you boost your retirement savings.*
Take advantage of asset allocation and diversification*
Stocks, bonds, and short-term/money market investments are investment types that generally perform differently at different times, depending on the economic climate. Each of these categories contains an even broader array of sub-categories, such as small-cap stocks, international stocks, and high-yield bonds. Many financial professionals believe investors can help reduce their over-exposure to one or two poorly performing investment types by including a mix of investment types and sub-categories in their retirement strategy.
Who Matters Most
MassMutual believes “Who Matters Most to You Says the Most About You.” At MassMutual, our customers – and their dreams for their future – matter most to us. We strive to help you take the right steps to help yourself prepare for a retirement that grants you the freedom to live the life you imagine – retirement on your terms. To get there, we believe you may benefit most by maintaining a plan that
| | * | Systematic investing and asset allocation do not ensure a profit or protect against loss in a declining market. Systematic investing involves continuous investment in securities regardless of fluctuating price levels. Investors should consider their ability to continue investing through periods of low price levels. |
(Continued)
1
MML Series Investment Fund II – President’s Letter to Shareholders (Unaudited) (Continued)
takes into consideration your specific goals, how comfortable you are with the market’s ups and downs, and how long you have to save and invest for your future. If you work with a financial professional, this may be an excellent time to contact him or her for assistance in reviewing your personal retirement investment strategy and making any adjustments that may be appropriate. Thank you for your confidence in MassMutual.
Sincerely,

Jeffrey M. Dube
President
The information provided is the opinion of MassMutual Retirement Services Investments Marketing as of 1/1/15 and is subject to change without notice. It is not to be construed as tax, legal or investment advice. Of course, past performance does not guarantee future results.
2
MML Series Investment Fund II – Economic and Market Overview (Unaudited)
December 31, 2014
Investors drive U.S. stocks up, oil down; central bank concludes bond buying in 2014
Major U.S. stock indexes rose in 2014, with the Standard & Poor’s 500 Index (“S&P 500”) and the Dow Jones Industrial Average (the “Dow”), two of the most widely followed U.S. stock market benchmarks, repeatedly reaching new highs and finishing the year near record territory. U.S. bonds also advanced for the year. Foreign markets did not fare as well, as economic growth slowed substantially in Europe, Japan reentered a recession, and China’s economy also stumbled.
Investors navigated periods of volatility and other challenges in an environment that included political action over federal spending and midterm elections that left Republicans with majorities in both houses of the U.S. Congress, geopolitical conflicts in Eastern Europe and the Middle East, the end of government bond purchases through the Federal Reserve’s (the “Fed”) Quantitative Easing program (“QE”), and a precipitous decline in the price of oil. In the U.S., ongoing improvement in employment, corporate profitability, and other key economic measures – including a rebound and acceleration in gross domestic product (“GDP”) – helped bolster stock prices. Housing was a surprisingly notable laggard during much of the year and failed to echo other economic improvements.
The Fed began “tapering” its monthly QE bond purchases to $75 billion in January 2014. The Fed’s monthly reduction proceeded systematically in additional $10 billion increments thereafter during 2014, and the central bank made its last monthly buys in October 2014. There was some first-quarter market movement attributable to the tapering, but investors ultimately seemed to accept the inevitable end of the program and the reductions became less of a factor in market movements as the year progressed. The Fed also helped keep short-term interest rates at historically low levels by continuing the federal funds rate at 0.0% to 0.25% – the level the rate has occupied since December 2008. The federal funds rate is the interest rate that banks and other financial institutions charge each other for borrowing funds overnight. The Fed reassured investors following its September 2014 meeting that short-term interest rates would remain low for a “considerable time” after the end of QE. Fed statements in mid-December indicated the central bank intends to be “patient” in raising short-term interest rates. While not ruling out rate hikes later in 2015, the Fed allayed investors’ fears that better-than-expected economic growth might cause the central bank to accelerate its timetable for normalizing rates from near-zero levels. The statement also noted that the Fed continues to pay close attention to the slow improvement of credit growth in the U.S. and core inflation that is below the central bank’s 2% target.
The price of oil declined steadily over the second half of the year due to investor concerns about slowing economic growth and falling demand in foreign markets colliding with an overabundant supply. West Texas Intermediate (WTI) crude oil started the year at more than $98 per barrel, gushed to nearly $108 in June, then trickled down steadily to finish 2014 at $53.45 – down more than 45% for the full year. U.S. retail gasoline prices accelerated from about $3.41 per gallon at the beginning of January to nearly $3.79 in late April. Gasoline parked in the $3.74 to $3.78 per gallon range until late June before rolling downhill to approximately $2.39 at the end of the year, which gave drivers the lowest gas prices since 2009. Gold prices gyrated but changed little, cresting to $1,385 per ounce in mid-March 2014, falling to $1,142 in early November, and finishing the year at $1,206 – just $1.50 more than the precious metal’s 2014 opening price.
Market performance
U.S. stocks of all sizes outperformed their foreign counterparts during 2014, with stocks of mid-size and large U.S companies outpacing their small-company counterparts. The major technology stock benchmark in the U.S., the NASDAQ Composite® Index, returned 14.75% for the year and led all U.S. broad market indexes. The S&P 500® Index of large-capitalization U.S. stocks posted a 13.69% advance, and the blue-chip Dow Jones Industrial AverageSM rose 10.04%. The Russell 2000® Index of small-capitalization stocks underperformed other key stock benchmarks, but still advanced 4.89%. The MSCI Emerging Markets Index, a measure of the performance of emerging stock markets throughout the world, declined 2.19% for the year and outperformed the MSCI EAFE Index, a barometer for foreign stocks in developed markets, which fell 4.90%.
Bonds rewarded investors, but underperformed most U.S. stock indexes during the year, with the Barclays U.S. Aggregate Bond Index, a broad measure of the U.S. investment-grade bond markets, rising 5.97%. Unrelenting low interest rates continued to take their toll, and shorter-term debt investments barely managed to stay in positive territory. In this environment, the Barclays U.S.
3
MML Series Investment Fund II – Economic and Market Overview (Unaudited) (Continued)
1-3 Year Government Bond Index, which measures the performance of short-term U.S. government bonds, returned just 0.64%; and Treasury bills, as measured by the Citigroup 3-Month Treasury Bill Index, gained only 0.03%. The impact of lower oil prices on energy companies in the second half of the year worked against high-yield bonds, as many issuers of such bonds are energy companies. Despite losing ground in the third and fourth quarters, the Barclays U.S. Corporate High-Yield Index, a measure of the performance of fixed-rate, non-investment-grade debt from corporate sectors, still managed to advance 2.45% for the year.*
Q1 2014: Stocks suffer early losses, then recover
U.S. stocks ended the first quarter of 2014 with only minimal changes, as a sell-off early in the quarter gave way to a recovery that more than offset previous losses in most cases. The decline was relatively brief and confined to a two-week stretch in late January and the beginning of February. A weak December 2013 employment report, concerns about emerging markets, and the Fed’s ongoing downsizing of QE were all factors weighing on share prices. Worries about emerging markets eased later in the quarter, however, and enabled stocks to embark on a recovery.
Resurgent concerns over some aspects of U.S. economic growth and a flight to quality due to emerging-market volatility helped drive up prices of U.S. Treasury securities. Reassuring comments from new U.S. Federal Reserve Chair Janet Yellen helped bolster the market. Yellen replaced Ben Bernanke at the end of January and is the first woman to lead the Fed. Fiscal woes afflicting the federal government eased a bit in the first quarter. On February 15, President Obama signed legislation extending the federal debt ceiling through March 2015.
One factor keeping investors on edge during the quarter was turmoil in Ukraine, specifically the country’s Crimea region, which has been governed as an independent republic since 1992 and is home to many pro-Russian sympathizers. On March 16, a referendum in Crimea yielded the decision to become part of Russia, a move not recognized by the West. Russia’s support of this referendum, together with the build-up of Russian troops along the Russia/Ukraine border, triggered economic sanctions against Russia by Western nations, including the United States. The political upheaval did not significantly damage stock prices, so most broad equity benchmarks ended the quarter only modestly below their all-time highs.
Q2 2014: Stocks continue their record-setting pace
Stocks of U.S. and foreign companies overcame a brief and relatively mild sell-off during the first half of April to surge into fresh high ground in the second quarter of 2014, as an ongoing global economic recovery, receding concerns about Ukraine, and stimulative monetary policy from central banks provided a supportive backdrop for equity prices. Stocks’ solid second quarter followed a shaky first quarter in which performance was much more muted. In the fixed-income market, yields of longer-term U.S. Treasury securities declined during April and May before recovering somewhat in June. Weak U.S. economic growth in the first quarter, which was initially estimated at just 0.1% and was subsequently revised much lower – making it the first negative reading in three years – helped drive the April drop.
The European Central Bank (“ECB”) provided a boost for the markets in early June, when ECB President Mario Draghi announced reductions in the central bank’s key interest rates. Notably, the ECB’s deposit rate turned negative for the first time, in essence charging euro zone banks for parking funds with the central bank. The ECB also introduced a fresh series of low-cost loans to banks in an effort to jump-start lending. These moves helped lift the performance of stocks in the United States, Europe, and Japan, as well as in emerging markets.
Global stock prices also reacted favorably to remarks coming out of the Fed meeting on June 18, which stated the central bank would continue to reduce the amount of monthly bond purchases and reaffirmed its intention to keep short-term interest rates near zero in an ongoing effort to incentivize job creation and economic growth.
Energy stocks rose during the quarter, spurred by concerns about potential disruptions in Iraq’s oil production amid widespread terrorist activity by the Islamic State in Iraq and Syria (“ISIS”), a radical Sunni group.
| * | Indexes are unmanaged, do not incur fees or expenses and cannot be purchased directly for investment. |
4
MML Series Investment Fund II – Economic and Market Overview (Unaudited) (Continued)
Q3 2014: Gains narrow as concerns increase about global growth
Large-capitalization U.S. stocks overcame negative markets in July and September to finish the third quarter of 2014 with modest upside progress. However, shares of small and mid-size U.S. companies, foreign stocks from developed and emerging markets, and high-yield bonds struggled, as investors took a more risk-averse approach. Bonds were basically flat for the quarter.
Trouble overseas was one reason for increased investor caution. At the end of July, U.S. stocks suffered a sharp one-day decline after Argentina effectively defaulted on its bonds for the second time in 13 years. Around the same time, the share price of Banco Espirito Santo, Portugal’s largest bank, plunged after it reported a huge $4.8 billion first-half loss that wiped out the bank’s capital cushion and forced it to seek new funding.
In Eastern Europe, the standoff between Ukraine and Russia intensified. In the Middle East, there was a resurgence of the conflict between Israel and Hamas, and the threat of ISIS continued to grow.
Despite these developments, the negative impact on U.S. markets was relatively fleeting, as investor sentiment was buoyed by encouraging news about the U.S. economy. Data reported at the end of July showed that GDP, a broad measure of economic activity, advanced a robust 4.0% in the second quarter after contracting 2.1% in a first quarter hampered by severe winter weather. At the end of September, the second-quarter figure was revised upward to 4.6%.
Healthy U.S. economic growth stood in stark contrast to the euro zone, where economic activity was stagnant – and Japan, whose economy contracted sharply in the second quarter, according to data that became available in the third quarter. This discrepancy among developed nations helped trigger a significant rally in the U.S. dollar, which depressed the dollar-denominated returns of foreign markets.
Q4 2014: Volatility increases, but U.S. stocks hit new all-time highs
Investors shook off numerous concerns to drive U.S. stocks to healthy gains in the fourth quarter and to new highs for the year. Plunging crude oil prices, the spread of the Ebola virus in West Africa and beyond, and disappointing economic data from Europe and China were some of the factors keeping investors on edge and contributing to two noteworthy – but relatively short – sell-offs during the quarter. In November, the market reacted positively to the results of the U.S. midterm elections, but the impact was muted, as investors had anticipated Republicans would take control of the U.S. Senate weeks prior to the elections.
Oil’s decline – partly a result of increasing supply from North American shale beds – accelerated in late November after the Organization of Petroleum Exporting Countries (“OPEC”) announced its decision not to cut production. Good news on the U.S. economy was a major factor lifting share prices. GDP expanded by an upwardly revised 5.0% in the third quarter, its fastest pace since the third quarter of 2003. This strong performance stood in stark contrast to near-recessionary conditions afflicting most other key developed nations. Notably, the 18-member euro zone barely managed positive economic growth during the third quarter and rose just 0.2%. Foreign markets underperformed, as the U.S. dollar rose against other major currencies driven by U.S. economic strength and declining oil prices.
As 2014 drew to a close, the low price of oil, the weakness of overseas economies, and possible actions by the Fed and other central banks around the world were on the minds of many investors as they focused on the factors likely to impact the markets in the year ahead. Investors will also likely keep an eye out for continued economic growth here at home and improvement abroad, which may help create a favorable environment for stocks and bonds in 2015.
The information provided is the opinion of MassMutual Retirement Services Investment Services as of 1/1/15 and is subject to change without notice. It is not to be construed as tax, legal, or investment advice. Of course, past performance does not guarantee future results.
5
MML Blend Fund – Portfolio Manager Report (Unaudited)
What is the investment approach of MML Blend Fund, and who is the Fund’s subadviser?
The Fund seeks to achieve as high a level of total rate of return over an extended period of time as is considered consistent with prudent investment risk and the preservation of capital. The Fund invests across different asset classes (equity securities, fixed income securities, including bank loans and Rule 144A securities, and money market instruments), each represented by a different segment of the Fund’s portfolio. The subadviser typically adjusts the allocation among the three segments, based on its judgment about each segment’s potential for returns in comparison with those of other segments and corresponding risk. The Fund’s subadviser is Babson Capital Management LLC (Babson Capital).
How did the Fund perform during the 12 months ended December 31, 2014?
The Fund’s Initial Class shares returned 10.99%, trailing the 13.69% return of the S&P 500® Index (the “stock component’s benchmark”), a widely recognized, unmanaged index representative of common stocks of larger capitalized U.S. companies. Conversely, the Fund outpaced the 5.97% return of the Barclays U.S. Aggregate Bond Index (the “bond component’s benchmark”), an unmanaged index of fixed-rate investment-grade securities with at least one year to maturity, combining the Barclays U.S. Treasury Bond Index, the Barclays U.S. Government-Related Bond Index, the Barclays U.S. Corporate Bond Index, and the Barclays U.S. Securitized Bond Index. The Fund also outpaced the 7.14% return of the Lipper Balanced Fund Index, an unmanaged, equally weighted index of the 30 largest mutual funds within the Lipper Balanced Category. Finally, the Fund outperformed the 10.62% return of the Custom Balanced Index (the “blend benchmark”), which comprises the stock component’s benchmark and the bond component’s benchmark. The weightings of each index are 60% and 40%, respectively.
For a discussion on the economic and market environment during the 12-month period ended December 31, 2014, please see the Economic and Market Overview, beginning on page 3.
Subadviser discussion of factors that contributed to the Fund’s performance
With respect to the Fund’s stock versus bond allocation, the Fund benefited from an overweight position in U.S. equities during the year, as strong corporate fundamentals led to continued robust returns on stocks.
In the Fund’s stock investments, biotechnology and financial stocks detracted from performance; however, the Fund’s underweight stake (relative to the stock component’s benchmark) in the energy sector, which suffered due to plunging oil prices in the second half of 2014, helped improve full-year results on a relative basis. It was a difficult year for stock picking, as stocks with value characteristics, including Fund holdings such as chemical manufacturer Dow Chemical, underperformed the market. Fund holdings with growth characteristics, like consumer technology giant Apple, did better. In health care, the Fund held an overweight allocation to larger, more established companies such as the drug manufacturer Pfizer, relative to smaller biotechnology companies such as Celgene, which worked against performance. The Fund also held an overweight position in the large computer hardware maker Hewlett-Packard relative to the small solar panel maker First Solar, which benefited performance.
The Fund’s bond investments outperformed the bond component’s benchmark due to good credit selection and an overweight position in strong-performing convertible bonds. In order to maintain the Fund’s overweight position in stocks, the Fund held an underweight stake in bonds, which benefited performance, as the stock component’s benchmark more than doubled the returns of the bond component’s benchmark. General bond positioning was consistent with the benchmark during the year. The Fund’s cash position was kept to a minimum throughout 2014. The Fund uses derivative instruments for yield curve, duration, and credit risk management. In aggregate, these positions modestly detracted from full-year performance. (Derivatives are securities that derive their value from the performance of one or more other investments and take the form of a contract between two or more parties. Most derivatives are used for hedging, speculation, or both.)
Subadviser outlook
Although companies faced an array of challenges in 2014, such as slow growth in Europe, geopolitical tensions, and the collapse in oil prices, we believe that earnings may be poised to grow in 2015. Currently, U.S. assets are in demand due to relatively strong economic growth and the rising value of the U.S. dollar. We believe the dollar is likely to remain strong; consequently, our view is that international flows to U.S. assets are likely to persist in 2015.
6
MML Blend Fund – Portfolio Manager Report (Unaudited) (Continued)
We continue to believe stocks may be in a secular bull market. Inevitably, within such a long-term trend, there will be periods of cyclical declines, but over the long term, we think stocks can provide attractive annualized returns for the Fund. Rather than trading into and out of the market, we believe the way to profit from the secular bull market is for the Fund to hold companies we view as favorable investments over the long term.
| | | | |
MML Blend Fund
Portfolio Characteristics
(% of Net Assets) on 12/31/14 | |
| | |
Common Stock | | | 67.2 | % |
Corporate Debt | | | 15.1 | % |
U.S. Government Agency Obligations and Instrumentalities | | | 9.2 | % |
Non-U.S. Government Agency Obligations | | | 6.1 | % |
U.S. Treasury Obligations | | | 1.0 | % |
Municipal Obligations | | | 0.4 | % |
Sovereign Debt Obligations | | | 0.4 | % |
Preferred Stock | | | 0.1 | % |
Purchased Options | | | 0.1 | % |
| | | | | |
Total Long-Term Investments | | | 99.6 | % |
Short-Term Investments and Other Assets and Liabilities | | | 0.4 | % |
| | | | | |
Net Assets | | | 100.0 | % |
| | | | | |
7
MML Blend Fund – Portfolio Manager Report (Unaudited) (Continued)
Growth of a $10,000 Investment
Hypothetical Investments in MML Blend Fund Initial Class, the S&P 500 Index, the Barclays U.S. Aggregate Bond Index, the Lipper Balanced Fund Index, and the Custom Balanced Index.
| | | | | | | | | | | | |
| | | | |
| TOTAL RETURN | | One Year
1/1/14 -
12/31/14 | | | Five Year
Average
Annual
1/1/10 -
12/31/14 | | | Ten Year
Average
Annual
1/1/05 -
12/31/14 | |
| Initial Class | | | 10.99% | | | | 12.14% | | | | 7.42% | |
| S&P 500 Index* | | | 13.69% | | | | 15.45% | | | | 7.67% | |
| Barclays U.S. Aggregate Bond Index | | | 5.97% | | | | 4.45% | | | | 4.71% | |
| Lipper Balanced Fund Index | | | 7.14% | | | | 9.49% | | | | 6.01% | |
| Custom Balanced Index | | | 10.62% | | | | 11.18% | | | | 6.77% | |
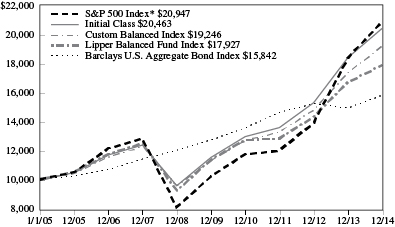
Hypothetical Investments in MML Blend Fund Service Class, the S&P 500 Index, the Barclays U.S. Aggregate Bond Index, the Lipper Balanced Fund Index, and the Custom Balanced Index.
| | | | | | | | | | | | |
| | | | |
| TOTAL RETURN | | One Year
1/1/14 -
12/31/14 | | | Five Year
Average
Annual
1/1/10 -
12/31/14 | | | Since
Inception
Average
Annual
8/15/08 -
12/31/14 | |
| Service Class | | | 10.71% | | | | 11.86% | | | | 9.02% | |
| S&P 500 Index* | | | 13.69% | | | | 15.45% | | | | 9.95% | |
| Barclays U.S. Aggregate Bond Index | | | 5.97% | | | | 4.45% | | | | 5.06% | |
| Lipper Balanced Fund Index | | | 7.14% | | | | 9.49% | | | | 7.09% | + |
| Custom Balanced Index | | | 10.62% | | | | 11.18% | | | | 8.42% | + |
GROWTH OF $10,000 INVESTMENT FOR THE PAST 10 YEARS
GROWTH OF $10,000 INVESTMENT SINCE INCEPTION
* Benchmark
+ From 9/2/08.
Performance data quoted represents past performance; past performance is not predictive of future results. The investment return and principal value of shares of the Fund will fluctuate with market conditions so that shares of the Fund, when redeemed, may be worth more or less than their original cost. Current performance of the Fund may be lower or higher than the performance quoted. Performance data current to the most recent month end may be obtained by accessing the website at www.massmutual.com.
Investors should note that the Fund is a professionally managed mutual fund, while the S&P 500 Index, the Barclays U.S. Aggregate Bond Index, the Lipper Balanced Fund Index, and the Custom Balanced Index are unmanaged, do not incur expenses, and cannot be purchased directly by investors. Investors should read the Fund’s prospectus with regard to the Fund’s investment objective, risks, and charges and expenses in conjunction with these financial statements. The Fund’s return reflects changes in the net asset value per share without the deduction of any product charges (e.g., cost of insurance, mortality and expense risk charges, administrative fees, and CDSL). The inclusion of these charges would have reduced the performance shown here.
8
MML Equity Fund – Portfolio Manager Report (Unaudited)
What is the investment approach of MML Equity Fund, and who are the Fund’s subadvisers?
The Fund’s primary objective is to achieve a superior total rate of return over an extended period of time from both capital appreciation and current income. Its secondary objective is the preservation of capital when business and economic conditions indicate that investing for defensive purposes is appropriate. The Fund invests primarily in common stocks of companies that the subadvisers believe are undervalued in the marketplace, with a focus on securities of larger size companies. Under normal circumstances, the Fund invests at least 80% of its net assets in common stocks, preferred stocks, securities convertible into common or preferred stocks, and other securities, such as warrants and stock rights, whose value is based on stock prices. The Fund’s two subadvisers are OppenheimerFunds, Inc. (OFI), which managed approximately 57% of the Fund’s portfolio; and Loomis, Sayles & Company, L.P. (Loomis Sayles), which was responsible for approximately 43% of the Fund’s portfolio, as of December 31, 2014.
How did the Fund perform during the 12 months ended December 31, 2014?
The Fund’s Initial Class shares returned 11.57%, lagging the 13.45% return of the Russell 1000® Value Index (the “benchmark”), an unmanaged index consisting of those Russell 1000 securities (representing the 1,000 largest U.S. companies, based on market capitalization) with greater than average value orientation that tend to exhibit lower price-to-book ratios and lower forecasted growth rates than securities in the growth universe.
For a discussion on the economic and market environment during the 12-month period ended December 31, 2014, please see the Economic and Market Overview, beginning on page 3.
Subadviser discussion of factors that contributed to the Fund’s performance
With respect to the OFI component of the Fund, holdings that were top detractors from performance included Transocean Ltd. (energy), Sanofi (health care), and General Electric Co. (industrials). Transocean, an international provider of offshore contract drilling services for oil and gas wells, suffered as a result of low oil prices during the second half of the year. Sanofi is a global and diversified health care company based in France. In October 2014, the company issued a warning about declining sales of its diabetes drugs in the U.S. in 2015, due to pricing pressures, and fired its well-liked CEO. General Electric (GE), a diversified manufacturer, was hampered by supply chain challenges in its wind turbine business, combined with a miss on operating margins. We sold the Fund’s position in GE during the period. Conversely, holdings that were contributors to performance this period included Delta Air Lines, Inc. (industrials), Apple, Inc. (information technology), and Edison International (utilities). Delta, the second-largest airline in the U.S. by passenger volume, benefited from strong revenue growth in both the domestic market and in Latin America. Additionally, company management announced a new capital deployment plan that was well received by investors. Apple rallied in April 2014 after iPhone sales exceeded expectations. The company announced a seven-for-one stock split and increased both its dividend and share repurchases. Edison International, a regional utility in Southern California, performed well in 2014 after management provided an outlook that was greater than analyst expectations, driven by unexpected cost reductions and tax savings.
For the Fund’s Loomis Sayles component, Noble Energy (energy), Terex Corporation (industrials), and Sanofi were holdings that detracted the most from performance. In addition to commodity price pressure, Noble, an independent exploration and production company, suffered from news that the Israeli government was considering renegotiating some rights the company has to a large offshore gas field. Terex, a diversified global manufacturer, also underperformed due to a poor earnings report. Conversely, Forest Laboratories, Covidien, and United Healthcare contributed most to returns. Forest Laboratories, a pharmaceutical company, was the best absolute performer as a result of its acquisition by Actavis. In another acquisition, Medtronic’s offer to purchase Covidien, a global medical equipment company, for a combination of cash and stock drove up Covidien’s shares. U.S.-managed-care company UnitedHealth’s management team hosted an upbeat investor meeting in the fourth quarter, which led analysts to believe UnitedHealth will be able to offset increasing cost and utilization trends.
Subadviser outlook
OFI utilizes in-depth fundamental research to identify companies that may be poised for an unanticipated acceleration in return over a multi-year time horizon. We believe this longer-term approach provides a more comprehensive outlook of potential
9
MML Equity Fund – Portfolio Manager Report (Unaudited) (Continued)
investments by focusing on all three financial statements – income statement, balance sheet, and statement of cash flows – and may help us identify companies for the Fund whose potential for growth has yet to be fully reflected in the current stock price. Regardless of market conditions in 2015, we will continue to seek companies that meet our criteria for the Fund.
Loomis Sayles’ view is that 2015 could prove to be another difficult year if interest rates remain depressed. At year-end, the Loomis Sayles Fund component was underweight in utilities and real estate investment trusts (“REITs”) on the belief that valuations are unattractive and could remain so into 2015. We believe that a market correction is possible and could provide buying opportunities. As always, we assess opportunities for the Fund according to our risk/reward analysis, regardless of the direction of the markets.
| | | | |
MML Equity Fund
Largest Holdings
(% of Net Assets) on 12/31/14 | |
| | |
Citigroup, Inc. | | | 2.9 | % |
UnitedHealth Group, Inc. | | | 2.2 | % |
Suncor Energy, Inc. | | | 1.8 | % |
Eaton Corp. PLC | | | 1.8 | % |
Verizon Communications, Inc. | | | 1.7 | % |
American International Group, Inc. | | | 1.7 | % |
Merck & Co., Inc. | | | 1.7 | % |
Bank of America Corp. | | | 1.6 | % |
EMC Corp. | | | 1.6 | % |
Microsoft Corp. | | | 1.5 | % |
| | | | | |
| | | | 18.5 | % |
| | | | | |
| | | | |
MML Equity Fund
Sector Table
(% of Net Assets) on 12/31/14 | |
| | |
Financial | | | 25.3 | % |
Consumer, Non-cyclical | | | 19.5 | % |
Industrial | | | 11.0 | % |
Technology | | | 9.6 | % |
Energy | | | 9.6 | % |
Communications | | | 9.6 | % |
Consumer, Cyclical | | | 9.3 | % |
Utilities | | | 2.8 | % |
Basic Materials | | | 2.2 | % |
Mutual Funds | | | 1.0 | % |
| | | | | |
Total Long-Term Investments | | | 99.9 | % |
Short-Term Investments and Other Assets and Liabilities | | | 0.1 | % |
| | | | | |
Net Assets | | | 100.0 | % |
| | | | | |
10
MML Equity Fund – Portfolio Manager Report (Unaudited) (Continued)
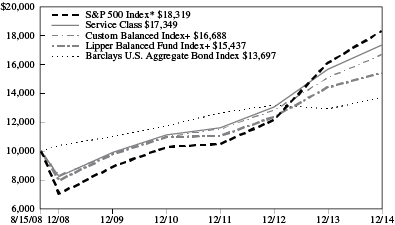
Growth of a $10,000 Investment
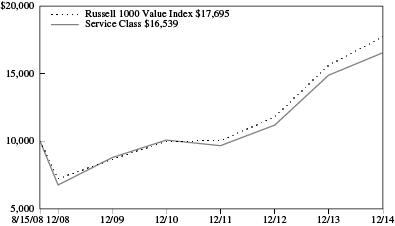
Hypothetical Investments in MML Equity Fund Initial Class and the Russell 1000 Value Index.
| | | | | | | | | | | | |
| | | | |
| TOTAL RETURN | | One Year
1/1/14 -
12/31/14 | | | Five Year
Average
Annual
1/1/10 -
12/31/14 | | | Ten Year
Average
Annual
1/1/05 -
12/31/14 | |
| Initial Class | | | 11.57% | | | | 13.77% | | | | 6.30% | |
| Russell 1000 Value Index | | | 13.45% | | | | 15.42% | | | | 7.30% | |
Hypothetical Investments in MML Equity Fund Service Class and the Russell 1000 Value Index.
| | | | | | | | | | | | |
| | | | |
| TOTAL RETURN | | One Year
1/1/14 -
12/31/14 | | | Five Year
Average
Annual
1/1/10 -
12/31/14 | | | Since
Inception
Average
Annual
8/15/08 -
12/31/14 | |
| Service Class | | | 11.29% | | | | 13.48% | | | | 8.20% | |
| Russell 1000 Value Index | | | 13.45% | | | | 15.42% | | | | 9.36% | |
GROWTH OF $10,000 INVESTMENT FOR THE PAST 10 YEARS
GROWTH OF $10,000 INVESTMENT SINCE INCEPTION
Performance data quoted represents past performance; past performance is not predictive of future results. The investment return and principal value of shares of the Fund will fluctuate with market conditions so that shares of the Fund, when redeemed, may be worth more or less than their original cost. Current performance of the Fund may be lower or higher than the performance quoted. Performance data current to the most recent month end may be obtained by accessing the website at www.massmutual.com.
Investors should note that the Fund is a professionally managed mutual fund, while the Russell 1000 Value Index is unmanaged, does not incur expenses, and cannot be purchased directly by investors. Investors should read the Fund’s prospectus with regard to the Fund’s investment objective, risks, and charges and expenses in conjunction with these financial statements. The Fund’s return reflects changes in the net asset value per share without the deduction of any product charges (e.g., cost of insurance, mortality and expense risk charges, administrative fees, and CDSL). The inclusion of these charges would have reduced the performance shown here.
11
MML Managed Bond Fund – Portfolio Manager Report (Unaudited)
What is the investment approach of MML Managed Bond Fund, and who is the Fund’s subadviser?
The Fund’s investment objective is to achieve as high a total rate of return on an annual basis as is considered consistent with the preservation of capital. Under normal circumstances, the Fund invests at least 80% of its net assets in investment grade fixed income securities (rated Baa or higher by Moody’s or BBB or higher by Standard & Poor’s or, if unrated, determined to be of comparable quality by the subadviser). The Fund’s subadviser is Babson Capital Management LLC (Babson Capital).
How did the Fund perform during the 12 months ended December 31, 2014?
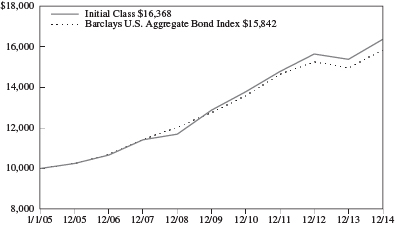
The Fund’s Initial Class shares returned 6.46%, outperforming the 5.97% return of the Barclays U.S. Aggregate Bond Index (the “benchmark”), an unmanaged index of fixed-rate investment-grade securities with at least one year to maturity, combining the Barclays U.S. Treasury Bond Index, the Barclays U.S. Government-Related Bond Index, the Barclays U.S. Corporate Bond Index, and the Barclays U.S. Securitized Bond Index.
For a discussion on the economic and market environment during the 12-month period ended December 31, 2014, please see the Economic and Market Overview, beginning on page 3.
Subadviser discussion of factors that contributed to the Fund’s performance
In 2014, an underweight position, relative to the benchmark, in Treasuries and overweight positioning in investment-grade corporate bonds and convertible securities helped drive Fund performance. Within investment-grade corporate bonds, Fund holdings in the industrial and financial sectors were the main standouts. Fund holdings in chemicals and electric utilities were the best-performing bonds in those sectors. Conversely, the Fund’s underweight allocations to foreign government debt and oil services bonds were the primary detractors from the Fund’s results.
The Fund’s allocation to high-yield corporate bonds rated BB also benefited performance in 2014. Within corporate bonds, the Fund started rotating into bonds with longer maturities, based on pricing and fundamentals. The Fund remained overweight in corporate bonds throughout the year. Corporate fundamentals continued to be strong, in our view, but have started showing mixed signals, with robust profitability offset by increasing debt on corporate balance sheets. Companies rated BBB continued to exhibit stronger revenue growth and profitability compared to their counterparts in the higher-rated A category.
In “securitized” bonds, which bond issuers create by pooling various types of contractual debt (such as mortgages, auto loans, or credit card debt), agency mortgage-backed securities (MBS) were the primary contributor to performance. (“Agency” refers to government-sponsored entities that issue bonds backed by mortgage loans, including Ginnie Mae, Fannie Mae, Freddie Mac, and the Federal Home Loan Banks.) Positioning in bonds with lower stated interest rates also helped lift the Fund’s full-year performance, as did a modest allocation to agency collateralized mortgage obligation (CMO) securities – which offered attractive pricing and the potential to add income to the Fund. The Fund’s investments in commercial mortgage-backed securities (CMBS) and asset-backed securities (ABS) also benefited the Fund. Conversely, non-agency residential mortgage-backed securities (RMBS) worked against performance. In CMBS, Fund purchases were primarily in shorter-maturity securities. Within the ABS sector, new issue supply was strong and there was solid demand for these securities. The Fund held an overweight stake in the securitized sectors during 2014.
The Fund uses derivative instruments, which are securities that derive their value from the performance of one or more other investments and take the form of a contract between two or more parties. Most derivatives are used for hedging, speculation, or both. In aggregate, derivative positions primarily detracted from Fund performance during the year.
Subadviser outlook
Recent challenges to the market have been numerous. Geopolitical tensions remained at the forefront, Europe continued to post disappointing economic data, and Asia is embracing quantitative easing. At the same time, the Federal Reserve (the “Fed”) continued to guide markets, suggesting that future decisions on monetary policy would be driven by economic data. Many investors are expecting an eventual rate hike in 2015, but the Fed may choose to keep rates low, as the Consumer Price Index (CPI) has declined over the last few months and our view is that there is not yet sufficient upward wage pressure in the corporate sector. (CPI measures changes in the price of a market basket of consumer goods and services.)
12
MML Managed Bond Fund – Portfolio Manager Report (Unaudited) (Continued)
Over the past few months, markets have been buffeted by a rash of mostly negative themes, such as the divergence between central bank monetary policies, slower growth in Europe and Asia, and geopolitical disagreements. As volatility has ticked up, we believe the low interest rate environment and lack of yield differential among many bonds suggests individual security selection may continue to trump other strategies in the bond market.
| | | | |
MML Managed Bond Fund
Portfolio Characteristics
(% of Net Assets) on 12/31/14 | |
| | |
Corporate Debt | | | 43.9 | % |
U.S. Government Agency Obligations and Instrumentalities | | | 27.4 | % |
Non-U.S. Government Agency Obligations | | | 18.2 | % |
U.S. Treasury Obligations | | | 7.2 | % |
Municipal Obligations | | | 1.0 | % |
Sovereign Debt Obligations | | | 0.8 | % |
Purchased Options | | | 0.2 | % |
Preferred Stock | | | 0.2 | % |
| | | | | |
Total Long-Term Investments | | | 98.9 | % |
Short-Term Investments and Other Assets and Liabilities | | | 1.1 | % |
| | | | | |
Net Assets | | | 100.0 | % |
| | | | | |
13
MML Managed Bond Fund – Portfolio Manager Report (Unaudited) (Continued)
Growth of a $10,000 Investment
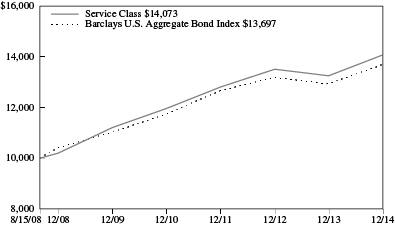
Hypothetical Investments in MML Managed Bond Fund Initial Class and the Barclays U.S. Aggregate Bond Index.
| | | | | | | | | | | | |
| | | | |
| TOTAL RETURN | | One Year
1/1/14 -
12/31/14 | | | Five Year
Average
Annual
1/1/10 -
12/31/14 | | | Ten Year
Average
Annual
1/1/05 -
12/31/14 | |
| Initial Class | | �� | 6.46% | | | | 4.92% | | | | 5.05% | |
| Barclays U.S. Aggregate Bond Index | | | 5.97% | | | | 4.45% | | | | 4.71% | |
Hypothetical Investments in MML Managed Bond Fund Service Class and the Barclays U.S. Aggregate Bond Index.
| | | | | | | | | | | | |
| | | | |
| TOTAL RETURN | | One Year
1/1/14 -
12/31/14 | | | Five Year
Average
Annual
1/1/10 -
12/31/14 | | | Since
Inception
Average
Annual
8/15/08 -
12/31/14 | |
| Service Class | | | 6.19% | | | | 4.66% | | | | 5.50% | |
| Barclays U.S. Aggregate Bond Index | | | 5.97% | | | | 4.45% | | | | 5.06% | |
GROWTH OF $10,000 INVESTMENT FOR THE PAST 10 YEARS
GROWTH OF $10,000 INVESTMENT SINCE INCEPTION
Performance data quoted represents past performance; past performance is not predictive of future results. The investment return and principal value of shares of the Fund will fluctuate with market conditions so that shares of the Fund, when redeemed, may be worth more or less than their original cost. Current performance of the Fund may be lower or higher than the performance quoted. Performance data current to the most recent month end may be obtained by accessing the website at www.massmutual.com.
Investors should note that the Fund is a professionally managed mutual fund, while the Barclays U.S. Aggregate Bond Index is unmanaged, does not incur expenses, and cannot be purchased directly by investors. Investors should read the Fund’s prospectus with regard to the Fund’s investment objective, risks, and charges and expenses in conjunction with these financial statements. The Fund’s return reflects changes in the net asset value per share without the deduction of any product charges (e.g., cost of insurance, mortality and expense risk charges, administrative fees, and CDSL). The inclusion of these charges would have reduced the performance shown here.
14
MML Money Market Fund – Portfolio Manager Report (Unaudited)
What is the investment approach of MML Money Market Fund, and who is the Fund’s subadviser?
The Fund’s investment objectives are to achieve the preservation of capital, liquidity, and high current income. These objectives are of equal importance. The Fund invests in high quality U.S. dollar-denominated debt instruments of domestic and foreign issuers. It is important to note that this Fund seeks to maintain, but does not guarantee, a stable net asset value per share. An investment in the Fund is not insured or guaranteed by the Federal Deposit Insurance Corporation or any other government agency. Although the Fund seeks to maintain a stable net asset value per share, it is possible to lose money by investing in the Fund. The Fund’s subadviser is Babson Capital Management LLC (Babson Capital).
How did the Fund perform during the 12 months ended December 31, 2014?
The Fund’s Initial Class shares returned 0.00%, modestly trailing the 0.03% return of the Citigroup 3-Month Treasury Bill Index (the “benchmark”), an unmanaged index representing the performance of 3-month U.S. Treasury bills that reflects reinvestment of all distributions and changes in market prices. During the period, the Fund waived certain fees to allow it to achieve the 0.00% return. The Fund’s Initial Class shares would have had a negative return if the waiver had not been in effect.
For a discussion on the economic and market environment during the 12-month period ended December 31, 2014, please see the Economic and Market Overview, beginning on page 3.
Subadviser discussion of factors that contributed to the Fund’s performance
The Fund continued to return low nominal yields in 2014 due to the Federal Reserve’s (the “Fed”) accommodative stance on interest rates. Short-term interest rates did not change significantly over the last year. The Fund’s allocation to high-quality commercial paper contributed to performance and allowed the Fund to earn additional income. (Commercial paper is the commonly used name for short-term unsecured promissory notes sold by banks and corporations to meet short-term debt obligations.) During the period, interest in the sector increased from investors who typically purchase longer-maturity securities due to the potential for rising interest rates. The demand drove up prices and suppressed short-term interest rates, which worked against any income increase for the Fund. Additionally, a seasonal contraction in Treasury bill supply took place in mid-April, and commercial paper rates declined slightly as a result.
We continue to search for opportunities to add income to the Fund, given the current challenging environment. Purchasing high-quality floating-rate securities allowed the Fund to enhance income without sacrificing credit quality, which contributed to performance during the period. Demand has picked up for this sector, and adding floating-rate securities to the Fund became challenging over the latter part of the year. The Fund does not have exposure to European banks. The lack of allocation to these bonds limits the opportunity to add income, but does help the overall credit quality of the Fund. Finally, the Fund also found incremental value in U.S. agency discount notes over Treasury bills and, when appropriate, added to the Fund’s position in this sector as well. (U.S. Agency discount notes are short-term debt securities issued at a discount to their face value by government-sponsored entities, including Ginnie Mae, Fannie Mae, Freddie Mac, and the Federal Home Loan Banks.)
Subadviser outlook
Recent challenges to the market have been numerous. Geopolitical tensions remained at the forefront, Europe continued to post disappointing economic data, and Asia is embracing quantitative easing. At the same time, the Fed continued to guide markets, suggesting that future decisions on monetary policy would be driven by economic data. Many investors are expecting an eventual rate hike in 2015, but the Fed may choose to keep rates low, as the Consumer Price Index (“CPI”) has declined over the last few months, and our view is that there is not yet sufficient upward wage pressure in the corporate sector. (CPI measures changes in the price of a market basket of consumer goods and services.)
With low front-end interest rates, and, in our view, the possibility of a rate hike in late 2015 now more likely, we continue to believe focusing on high-quality bond issuers in short maturities is a sound strategy that allows the Fund to quickly adjust to changing market conditions and maintain the commitment to preservation of principal and liquidity.
15
MML Money Market Fund – Portfolio Manager Report (Unaudited) (Continued)
| | | | |
MML Money Market Fund
Portfolio Characteristics
(% of Net Assets) on 12/31/2014 | |
| | |
Commercial Paper | | | 74.5 | % |
Discount Notes | | | 12.5 | % |
U.S. Government Obligations | | | 9.4 | % |
Corporate Debt | | | 2.9 | % |
U.S. Treasury Bills | | | 0.8 | % |
Time Deposits | | | 0.0 | % |
| | | | | |
Total Short-Term Investments | | | 100.1 | % |
Other Assets and Liabilities | | | (0.1 | )% |
| | | | | |
Net Assets | | | 100.0 | % |
| | | | | |
16
MML Money Market Fund – Portfolio Manager Report (Unaudited) (Continued)
Growth of a $10,000 Investment
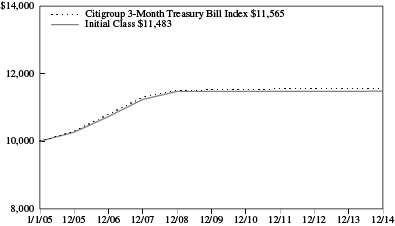
Hypothetical Investments in MML Money Market Fund Initial Class and the Citigroup 3-Month Treasury Bill Index.
| | | | | | | | | | | | |
| | | | |
| TOTAL RETURN | | One Year
1/1/14 -
12/31/14 | | | Five Year
Average
Annual
1/1/10 -
12/31/14 | | | Ten Year
Average
Annual
1/1/05 -
12/31/14 | |
| Initial Class | | | 0.00% | † | | | 0.00% | † | | | 1.39% | |
| Citigroup 3-Month Treasury Bill Index | | | 0.03% | | | | 0.07% | | | | 1.46% | |
GROWTH OF $10,000 INVESTMENT FOR THE PAST 10 YEARS
† Amount is less than 0.005%
Performance data quoted represents past performance; past performance is not predictive of future results. The investment return and principal value of shares of the Fund will fluctuate with market conditions so that shares of the Fund, when redeemed, may be worth more or less than their original cost. Current performance of the Fund may be lower or higher than the performance quoted. Performance data current to the most recent month end may be obtained by accessing the website at www.massmutual.com.
Investors should note that the Fund is a professionally managed mutual fund, while the Citigroup 3-Month Treasury Bill Index is unmanaged, does not incur expenses, and cannot be purchased directly by investors. Investors should read the Fund’s prospectus with regard to the Fund’s investment objective, risks, and charges and expenses in conjunction with these financial statements. The Fund’s return reflects changes in the net asset value per share without the deduction of any product charges (e.g., cost of insurance, mortality and expense risk charges, administrative fees, and CDSL). The inclusion of these charges would have reduced the performance shown here. An investment in the MML Money Market Fund is not insured or guaranteed by the Federal Deposit Insurance Corporation or any other government agency. Although the Fund seeks to maintain a stable net asset value per share, it is possible to lose money by investing in the Fund.
17
MML Blend Fund – Portfolio of Investments
December 31, 2014
| | | | | | | | |
| | | Number of
Shares | | | Value | |
| EQUITIES — 67.3% | |
|
| COMMON STOCK — 67.2% | |
| Basic Materials — 1.6% | |
| Chemicals — 1.2% | |
Air Products & Chemicals, Inc. | | | 3,085 | | | $ | 444,950 | |
Airgas, Inc. | | | 2 | | | | 230 | |
CF Industries Holdings, Inc. | | | 1,838 | | | | 500,929 | |
The Dow Chemical Co. | | | 33,073 | | | | 1,508,460 | |
E.I. du Pont de Nemours & Co. | | | 19,960 | | | | 1,475,842 | |
Eastman Chemical Co. | | | 4,170 | | | | 316,336 | |
Ecolab, Inc. | | | 722 | | | | 75,464 | |
International Flavors & Fragrances, Inc. | | | 540 | | | | 54,734 | |
LyondellBasell Industries NV Class A | | | 18,400 | | | | 1,460,776 | |
Monsanto Co. | | | 4 | | | | 478 | |
The Mosaic Co. | | | 19,000 | | | | 867,350 | |
PPG Industries, Inc. | | | 4,109 | | | | 949,795 | |
Praxair, Inc. | | | 6 | | | | 777 | |
The Sherwin-Williams Co. | | | 613 | | | | 161,244 | |
Sigma-Aldrich Corp. | | | 3,646 | | | | 500,486 | |
| | | | | | | | |
| | | | | | | 8,317,851 | |
| | | | | | | | |
| Forest Products & Paper — 0.1% | |
International Paper Co. | | | 12,187 | | | | 652,979 | |
MeadWestvaco Corp. | | | 387 | | | | 17,179 | |
| | | | | | | | |
| | | | | | | 670,158 | |
| | | | | | | | |
| Iron & Steel — 0.0% | |
Allegheny Technologies, Inc. | | | 45 | | | | 1,565 | |
Nucor Corp. | | | 56 | | | | 2,747 | |
| | | | | | | | |
| | | | | | | 4,312 | |
| | | | | | | | |
| Mining — 0.3% | |
Alcoa, Inc. | | | 88,026 | | | | 1,389,931 | |
Freeport-McMoRan, Inc. | | | 8,464 | | | | 197,719 | |
Newmont Mining Corp. | | | 3,770 | | | | 71,253 | |
Vulcan Materials Co. | | | 65 | | | | 4,272 | |
| | | | | | | | |
| | | | | | | 1,663,175 | |
| | | | | | | | |
| | | | | | | 10,655,496 | |
| | | | | | | | |
| Communications — 7.6% | |
| Advertising — 0.1% | |
The Interpublic Group of Companies, Inc. | | | 8,422 | | | | 174,925 | |
Omnicom Group, Inc. | | | 9,747 | | | | 755,100 | |
| | | | | | | | |
| | | | | | | 930,025 | |
| | | | | | | | |
| Internet — 2.2% | |
Akamai Technologies, Inc. (a) | | | 226 | | | | 14,229 | |
Amazon.com, Inc. (a) | | | 220 | | | | 68,277 | |
eBay, Inc. (a) | | | 28,177 | | | | 1,581,293 | |
Expedia, Inc. | | | 16,867 | | | | 1,439,767 | |
| | | | | | | | |
| | | Number of
Shares | | | Value | |
F5 Networks, Inc. (a) | | | 6,880 | | | $ | 897,599 | |
Facebook, Inc. Class A (a) | | | 28,500 | | | | 2,223,570 | |
Google, Inc. Class A (a) | | | 2,540 | | | | 1,347,876 | |
Google, Inc. Class C (a) | | | 2,400 | | | | 1,263,360 | |
Netflix, Inc. (a) | | | 1,619 | | | | 553,067 | |
The Priceline Group, Inc. (a) | | | 1,101 | | | | 1,255,371 | |
Symantec Corp. | | | 18,855 | | | | 483,725 | |
TripAdvisor, Inc. (a) | | | 2,637 | | | | 196,879 | |
VeriSign, Inc. (a) | | | 32,491 | | | | 1,851,987 | |
Yahoo!, Inc. (a) | | | 36,829 | | | | 1,860,233 | |
| | | | | | | | |
| | | | | | | 15,037,233 | |
| | | | | | | | |
| Media — 2.8% | |
Cablevision Systems Corp. Class A | | | 83,100 | | | | 1,715,184 | |
CBS Corp. Class B | | | 57 | | | | 3,154 | |
Comcast Corp. Class A | | | 57,112 | | | | 3,313,067 | |
DIRECTV (a) | | | 26,128 | | | | 2,265,298 | |
Discovery Communications, Inc. Series A (a) | | | 600 | | | | 20,670 | |
Discovery Communications, Inc. Series C (a) | | | 600 | | | | 20,232 | |
Gannett Co., Inc. | | | 54,012 | | | | 1,724,603 | |
The McGraw Hill Financial, Inc. | | | 2,948 | | | | 262,313 | |
News Corp. Class A (a) | | | 10,866 | | | | 170,488 | |
Nielsen NV | | | 4,600 | | | | 205,758 | |
Scripps Networks Interactive Class A | | | 10,472 | | | | 788,227 | |
Time Warner Cable, Inc. | | | 8,066 | | | | 1,226,516 | |
Time Warner, Inc. | | | 41,815 | | | | 3,571,837 | |
Twenty-First Century Fox Class A | | | 19,367 | | | | 743,790 | |
Viacom, Inc. Class B | | | 15,210 | | | | 1,144,553 | |
The Walt Disney Co. | | | 21,312 | | | | 2,007,377 | |
| | | | | | | | |
| | | | | | | 19,183,067 | |
| | | | | | | | |
| Telecommunications — 2.5% | |
AT&T, Inc. | | | 90,009 | | | | 3,023,402 | |
CenturyLink, Inc. | | | 12,528 | | | | 495,858 | |
Cisco Systems, Inc. | | | 143,942 | | | | 4,003,747 | |
Corning, Inc. | | | 44,567 | | | | 1,021,921 | |
Frontier Communications Corp. | | | 164,956 | | | | 1,100,257 | |
Harris Corp. | | | 3,570 | | | | 256,397 | |
Juniper Networks, Inc. | | | 28,689 | | | | 640,339 | |
Motorola Solutions, Inc. | | | 37 | | | | 2,482 | |
QUALCOMM, Inc. | | | 25,200 | | | | 1,873,116 | |
Verizon Communications, Inc. | | | 96,355 | | | | 4,507,487 | |
Windstream Corp. | | | 6,556 | | | | 54,021 | |
| | | | | | | | |
| | | | | | | 16,979,027 | |
| | | | | | | | |
| | | | | | | 52,129,352 | |
| | | | | | | | |
| Consumer, Cyclical — 6.0% | |
| Airlines — 0.6% | |
Delta Air Lines, Inc. | | | 37,000 | | | | 1,820,030 | |
Southwest Airlines Co. | | | 44,983 | | | | 1,903,681 | |
| | | | | | | | |
| | | | | | | 3,723,711 | |
| | | | | | | | |
The accompanying notes are an integral part of the financial statements.
18
MML Blend Fund – Portfolio of Investments (Continued)
| | | | | | | | |
| | | Number of
Shares | | | Value | |
| Apparel — 0.3% | |
Nike, Inc. Class B | | | 19,482 | | | $ | 1,873,194 | |
VF Corp. | | | 2,300 | | | | 172,270 | |
| | | | | | | | |
| | | | | | | 2,045,464 | |
| | | | | | | | |
| Auto Manufacturers — 0.3% | |
Ford Motor Co. | | | 88,513 | | | | 1,371,952 | |
General Motors Co. | | | 19,100 | | | | 666,781 | |
Paccar, Inc. | | | 2,522 | | | | 171,521 | |
| | | | | | | | |
| | | | | | | 2,210,254 | |
| | | | | | | | |
| Automotive & Parts — 0.3% | |
BorgWarner, Inc. | | | 4,700 | | | | 258,265 | |
Delphi Automotive PLC | | | 8,200 | | | | 596,304 | |
The Goodyear Tire & Rubber Co. | | | 43,751 | | | | 1,249,966 | |
Johnson Controls, Inc. | | | 72 | | | | 3,481 | |
| | | | | | | | |
| | | | | | | 2,108,016 | |
| | | | | | | | |
| Distribution & Wholesale — 0.1% | |
Fastenal Co. | | | 82 | | | | 3,900 | |
Fossil Group, Inc. (a) | | | 120 | | | | 13,289 | |
Genuine Parts Co. | | | 2,834 | | | | 302,019 | |
W.W. Grainger, Inc. | | | 2 | | | | 510 | |
| | | | | | | | |
| | | | | | | 319,718 | |
| | | | | | | | |
| Home Builders — 0.0% | |
D.R. Horton, Inc. | | | 47 | | | | 1,189 | |
PulteGroup, Inc. | | | 9,373 | | | | 201,144 | |
| | | | | | | | |
| | | | | | | 202,333 | |
| | | | | | | | |
| Home Furnishing — 0.1% | |
Harman International Industries, Inc. | | | 1,869 | | | | 199,441 | |
Whirlpool Corp. | | | 2,803 | | | | 543,053 | |
| | | | | | | | |
| | | | | | | 742,494 | |
| | | | | | | | |
| Housewares — 0.0% | |
Newell Rubbermaid, Inc. | | | 5,738 | | | | 218,560 | |
| | | | | | | | |
| Leisure Time — 0.1% | |
Carnival Corp. | | | 11,664 | | | | 528,729 | |
Harley-Davidson, Inc. | | | 5,302 | | | | 349,455 | |
| | | | | | | | |
| | | | | | | 878,184 | |
| | | | | | | | |
| Lodging — 0.5% | |
Marriott International, Inc. Class A | | | 15,269 | | | | 1,191,440 | |
Starwood Hotels & Resorts Worldwide, Inc. | | | 6,815 | | | | 552,492 | |
Wyndham Worldwide Corp. | | | 14,809 | | | | 1,270,020 | |
Wynn Resorts Ltd. | | | 2,358 | | | | 350,776 | |
| | | | | | | | |
| | | | | | | 3,364,728 | |
| | | | | | | | |
| Retail — 3.7% | |
AutoNation, Inc. (a) | | | 99 | | | | 5,981 | |
AutoZone, Inc. (a) | | | 994 | | | | 615,395 | |
Bed Bath & Beyond, Inc. (a) | | | 8,464 | | | | 644,703 | |
Best Buy Co., Inc. | | | 46,492 | | | | 1,812,258 | |
Coach, Inc. | | | 3,920 | | | | 147,235 | |
| | | | | | | | |
| | | Number of
Shares | | | Value | |
Costco Wholesale Corp. | | | 14,596 | | | $ | 2,068,983 | |
CVS Health Corp. | | | 29,264 | | | | 2,818,416 | |
Darden Restaurants, Inc. | | | 54 | | | | 3,166 | |
Dollar General Corp. (a) | | | 3,200 | | | | 226,240 | |
Dollar Tree, Inc. (a) | | | 5,840 | | | | 411,019 | |
Family Dollar Stores, Inc. | | | 35 | | | | 2,772 | |
GameStop Corp. Class A | | | 6,851 | | | | 231,564 | |
The Gap, Inc. | | | 7,990 | | | | 336,459 | |
The Home Depot, Inc. | | | 46,407 | | | | 4,871,343 | |
Kohl’s Corp. | | | 17,530 | | | | 1,070,031 | |
Lowe’s Cos., Inc. | | | 35,395 | | | | 2,435,176 | |
Macy’s, Inc. | | | 17,951 | | | | 1,180,278 | |
McDonald’s Corp. | | | 11,060 | | | | 1,036,322 | |
Nordstrom, Inc. | | | 4,008 | | | | 318,195 | |
O’Reilly Automotive, Inc. (a) | | | 3,693 | | | | 711,346 | |
PetSmart, Inc. | | | 1,800 | | | | 146,331 | |
Ross Stores, Inc. | | | 7,392 | | | | 696,770 | |
Staples, Inc. | | | 15,765 | | | | 285,662 | |
Starbucks Corp. | | | 2,477 | | | | 203,238 | |
Target Corp. | | | 10,486 | | | | 795,992 | |
Tiffany & Co. | | | 1,102 | | | | 117,760 | |
The TJX Cos., Inc. | | | 1,506 | | | | 103,282 | |
Urban Outfitters, Inc. (a) | | | 700 | | | | 24,591 | |
Wal-Mart Stores, Inc. | | | 11,122 | | | | 955,157 | |
Walgreens Boots Alliance, Inc. | | | 14,357 | | | | 1,094,003 | |
Yum! Brands, Inc. | | | 2,635 | | | | 191,960 | |
| | | | | | | | |
| | | | | | | 25,561,628 | |
| | | | | | | | |
| Textiles — 0.0% | |
Cintas Corp. | | | 978 | | | | 76,714 | |
| | | | | | | | |
| Toys, Games & Hobbies — 0.0% | |
Hasbro, Inc. | | | 61 | | | | 3,354 | |
Mattel, Inc. | | | 90 | | | | 2,785 | |
| | | | | | | | |
| | | | | | | 6,139 | |
| | | | | | | | |
| | | | | | | 41,457,943 | |
| | | | | | | | |
| Consumer, Non-cyclical — 16.9% | |
| Agriculture — 1.4% | |
Altria Group, Inc. | | | 53,259 | | | | 2,624,071 | |
Archer-Daniels-Midland Co. | | | 42,892 | | | | 2,230,384 | |
Lorillard, Inc. | | | 14,712 | | | | 925,974 | |
Philip Morris International, Inc. | | | 42,436 | | | | 3,456,412 | |
Reynolds American, Inc. | | | 2,034 | | | | 130,725 | |
| | | | | | | | |
| | | | | | | 9,367,566 | |
| | | | | | | | |
| Beverages — 1.4% | |
Brown-Forman Corp. Class B | | | 6 | | | | 527 | |
The Coca-Cola Co. | | | 66,030 | | | | 2,787,787 | |
Coca-Cola Enterprises, Inc. | | | 6,678 | | | | 295,301 | |
Constellation Brands, Inc. Class A (a) | | | 12 | | | | 1,178 | |
Dr. Pepper Snapple Group, Inc. | | | 13,104 | | | | 939,295 | |
Keurig Green Mountain, Inc. | | | 2,140 | | | | 283,325 | |
Molson Coors Brewing Co. Class B | | | 4,933 | | | | 367,607 | |
Monster Beverage Corp. (a) | | | 4,700 | | | | 509,245 | |
The accompanying notes are an integral part of the financial statements.
19
MML Blend Fund – Portfolio of Investments (Continued)
| | | | | | | | |
| | | Number of
Shares | | | Value | |
PepsiCo, Inc. | | | 43,760 | | | $ | 4,137,946 | |
| | | | | | | | |
| | | | | | | 9,322,211 | |
| | | | | | | | |
| Biotechnology — 1.4% | |
Alexion Pharmaceuticals, Inc. (a) | | | 2,270 | | | | 420,018 | |
Amgen, Inc. | | | 36,821 | | | | 5,865,217 | |
Biogen Idec, Inc. (a) | | | 5,992 | | | | 2,033,984 | |
Celgene Corp. (a) | | | 7,956 | | | | 889,958 | |
Regeneron Pharmaceuticals, Inc. (a) | | | 570 | | | | 233,843 | |
Vertex Pharmaceuticals, Inc. (a) | | | 100 | | | | 11,880 | |
| | | | | | | | |
| | | | | | | 9,454,900 | |
| | | | | | | | |
| Commercial Services — 1.1% | |
The ADT Corp. | | | 3,000 | | | | 108,690 | |
Automatic Data Processing, Inc. | | | 2,109 | | | | 175,827 | |
Equifax, Inc. | | | 1,742 | | | | 140,875 | |
H&R Block, Inc. | | | 11,463 | | | | 386,074 | |
Iron Mountain, Inc. | | | 48 | | | | 1,856 | |
MasterCard, Inc. Class A | | | 14,100 | | | | 1,214,856 | |
McKesson Corp. | | | 9,645 | | | | 2,002,109 | |
Moody’s Corp. | | | 3,330 | | | | 319,047 | |
Paychex, Inc. | | | 5,164 | | | | 238,422 | |
Quanta Services, Inc. (a) | | | 4,613 | | | | 130,963 | |
Robert Half International, Inc. | | | 1,826 | | | | 106,602 | |
Total System Services, Inc. | | | 2,607 | | | | 88,534 | |
United Rentals, Inc. (a) | | | 5,280 | | | | 538,613 | |
Visa, Inc. Class A | | | 2,908 | | | | 762,478 | |
Western Union Co. | | | 86,788 | | | | 1,554,373 | |
| | | | | | | | |
| | | | | | | 7,769,319 | |
| | | | | | | | |
| Cosmetics & Personal Care — 1.0% | |
Avon Products, Inc. | | | 189,192 | | | | 1,776,513 | |
Colgate-Palmolive Co. | | | 3,856 | | | | 266,797 | |
The Estee Lauder Cos., Inc. Class A | | | 5,210 | | | | 397,002 | |
The Procter & Gamble Co. | | | 52,329 | | | | 4,766,648 | |
| | | | | | | | |
| | | | | | | 7,206,960 | |
| | | | | | | | |
| Foods — 0.8% | |
Campbell Soup Co. | | | 1,624 | | | | 71,456 | |
ConAgra Foods, Inc. | | | 3,574 | | | | 129,665 | |
General Mills, Inc. | | | 4,062 | | | | 216,627 | |
The Hershey Co. | | | 1,647 | | | | 171,173 | |
Hormel Foods Corp. | | | 1,666 | | | | 86,799 | |
The J.M. Smucker Co. | | | 1,925 | | | | 194,387 | |
Kellogg Co. | | | 9,128 | | | | 597,336 | |
Kraft Foods Group, Inc. | | | 11,858 | | | | 743,022 | |
The Kroger Co. | | | 20,029 | | | | 1,286,062 | |
McCormick & Co., Inc. | | | 161 | | | | 11,962 | |
Mondelez International, Inc. Class A | | | 30,675 | | | | 1,114,269 | |
Safeway, Inc. | | | 18,800 | | | | 660,256 | |
Sysco Corp. | | | 2,434 | | | | 96,605 | |
Tyson Foods, Inc. Class A | | | 4,901 | | | | 196,481 | |
Whole Foods Market, Inc. | | | 4,250 | | | | 214,285 | |
| | | | | | | | |
| | | | | | | 5,790,385 | |
| | | | | | | | |
| | | | | | | | |
| | | Number of
Shares | | | Value | |
| Health Care – Products — 3.0% | |
Baxter International, Inc. | | | 10,061 | | | $ | 737,371 | |
Becton, Dickinson & Co. | | | 3,986 | | | | 554,692 | |
Boston Scientific Corp. (a) | | | 33,304 | | | | 441,278 | |
C.R. Bard, Inc. | | | 5,422 | | | | 903,414 | |
CareFusion Corp. (a) | | | 26,190 | | | | 1,554,115 | |
Covidien PLC | | | 12,500 | | | | 1,278,500 | |
Edwards Lifesciences Corp. (a) | | | 11,820 | | | | 1,505,632 | |
Intuitive Surgical, Inc. (a) | | | 46 | | | | 24,331 | |
Johnson & Johnson | | | 77,692 | | | | 8,124,252 | |
Medtronic, Inc. | | | 48,848 | | | | 3,526,825 | |
St. Jude Medical, Inc. | | | 9,591 | | | | 623,703 | |
Stryker Corp. | | | 5,150 | | | | 485,799 | |
Varian Medical Systems, Inc. (a) | | | 3,697 | | | | 319,827 | |
Zimmer Holdings, Inc. | | | 4,615 | | | | 523,433 | |
| | | | | | | | |
| | | | | | | 20,603,172 | |
| | | | | | | | |
| Health Care – Services — 1.3% | |
Aetna, Inc. | | | 16,077 | | | | 1,428,120 | |
Anthem, Inc. | | | 10,826 | | | | 1,360,503 | |
Cigna Corp. | | | 11,792 | | | | 1,213,515 | |
DaVita HealthCare Partners, Inc. (a) | | | 3,730 | | | | 282,510 | |
Humana, Inc. | | | 5,244 | | | | 753,196 | |
Laboratory Corporation of America Holdings (a) | | | 1,842 | | | | 198,752 | |
Quest Diagnostics, Inc. | | | 3,309 | | | | 221,901 | |
Tenet Healthcare Corp. (a) | | | 49 | | | | 2,483 | |
Thermo Fisher Scientific, Inc. | | | 6,091 | | | | 763,141 | |
UnitedHealth Group, Inc. | | | 23,564 | | | | 2,382,085 | |
Universal Health Services, Inc. Class B | | | 1,570 | | | | 174,678 | |
| | | | | | | | |
| | | | | | | 8,780,884 | |
| | | | | | | | |
| Household Products — 0.4% | |
Avery Dennison Corp. | | | 2,515 | | | | 130,478 | |
The Clorox Co. | | | 10,443 | | | | 1,088,265 | |
Kimberly-Clark Corp. | | | 10,565 | | | | 1,220,680 | |
| | | | | | | | |
| | | | | | | 2,439,423 | |
| | | | | | | | |
| Pharmaceuticals — 5.1% | |
Abbott Laboratories | | | 37,322 | | | | 1,680,236 | |
AbbVie, Inc. | | | 52,422 | | | | 3,430,496 | |
Actavis PLC (a) | | | 4,978 | | | | 1,281,387 | |
Allergan, Inc. | | | 9,407 | | | | 1,999,834 | |
AmerisourceBergen Corp. | | | 12,607 | | | | 1,136,647 | |
Bristol-Myers Squibb Co. | | | 35,267 | | | | 2,081,811 | |
Cardinal Health, Inc. | | | 10,878 | | | | 878,181 | |
DENTSPLY International, Inc. | | | 1,356 | | | | 72,234 | |
Eli Lilly & Co. | | | 23,814 | | | | 1,642,928 | |
Express Scripts Holding Co. (a) | | | 18,301 | | | | 1,549,546 | |
Gilead Sciences, Inc. (a) | | | 53,700 | | | | 5,061,762 | |
Hospira, Inc. (a) | | | 3,017 | | | | 184,791 | |
Mead Johnson Nutrition Co. | | | 2,912 | | | | 292,772 | |
Merck & Co., Inc. | | | 90,383 | | | | 5,132,851 | |
The accompanying notes are an integral part of the financial statements.
20
MML Blend Fund – Portfolio of Investments (Continued)
| | | | | | | | |
| | | Number of
Shares | | | Value | |
Mylan, Inc. (a) | | | 12,247 | | | $ | 690,363 | |
Patterson Cos., Inc. | | | 86 | | | | 4,137 | |
Perrigo Co. PLC | | | 210 | | | | 35,104 | |
Pfizer, Inc. | | | 245,941 | | | | 7,661,062 | |
Zoetis, Inc. | | | 20 | | | | 861 | |
| | | | | | | | |
| | | | | | | 34,817,003 | |
| | | | | | | | |
| | | | | | | 115,551,823 | |
| | | | | | | | |
| Diversified — 0.0% | |
| Holding Company – Diversified — 0.0% | |
Leucadia National Corp. | | | 12,537 | | | | 281,080 | |
| | | | | | | | |
| Energy — 5.2% | |
| Coal — 0.0% | |
CONSOL Energy, Inc. | | | 81 | | | | 2,739 | |
| | | | | | | | |
| Oil & Gas — 4.3% | |
Anadarko Petroleum Corp. | | | 10,348 | | | | 853,710 | |
Apache Corp. | | | 12,221 | | | | 765,890 | |
Cabot Oil & Gas Corp. | | | 48 | | | | 1,421 | |
California Resources Corp. (a) | | | 7,886 | | | | 43,452 | |
Chesapeake Energy Corp. | | | 25,490 | | | | 498,839 | |
Chevron Corp. | | | 43,138 | | | | 4,839,221 | |
Cimarex Energy Co. | | | 1,490 | | | | 157,940 | |
ConocoPhillips | | | 21,139 | | | | 1,459,859 | |
Denbury Resources, Inc. | | | 10,274 | | | | 83,528 | |
Devon Energy Corp. | | | 12,647 | | | | 774,123 | |
Diamond Offshore Drilling, Inc. | | | 78 | | | | 2,863 | |
Ensco PLC Class A | | | 5,400 | | | | 161,730 | |
EOG Resources, Inc. | | | 6,478 | | | | 596,430 | |
EQT Corp. | | | 3,097 | | | | 234,443 | |
Exxon Mobil Corp. | | | 104,697 | | | | 9,679,238 | |
Helmerich & Payne, Inc. | | | 3,060 | | | | 206,305 | |
Hess Corp. | | | 13,732 | | | | 1,013,696 | |
Marathon Oil Corp. | | | 25,227 | | | | 713,672 | |
Marathon Petroleum Corp. | | | 16,213 | | | | 1,463,385 | |
Murphy Oil Corp. | | | 6,611 | | | | 333,988 | |
Nabors Industries Ltd. | | | 49,565 | | | | 643,354 | |
Newfield Exploration Co. (a) | | | 10,100 | | | | 273,912 | |
Noble Corp. PLC | | | 3,500 | | | | 57,995 | |
Noble Energy, Inc. | | | 56 | | | | 2,656 | |
Occidental Petroleum Corp. | | | 1,615 | | | | 130,185 | |
Phillips 66 | | | 27,469 | | | | 1,969,527 | |
Pioneer Natural Resources Co. | | | 1 | | | | 149 | |
QEP Resources, Inc. | | | 89 | | | | 1,800 | |
Range Resources Corp. | | | 99 | | | | 5,292 | |
Southwestern Energy Co. (a) | | | 3,600 | | | | 98,244 | |
Tesoro Corp. | | | 17,287 | | | | 1,285,288 | |
Valero Energy Corp. | | | 21,400 | | | | 1,059,300 | |
| | | | | | | | |
| | | | | | | 29,411,435 | |
| | | | | | | | |
| Oil & Gas Services — 0.9% | |
Baker Hughes, Inc. | | | 631 | | | | 35,380 | |
Cameron International Corp. (a) | | | 2,706 | | | | 135,165 | |
FMC Technologies, Inc. (a) | | | 40 | | | | 1,873 | |
| | | | | | | | |
| | | Number of
Shares | | | Value | |
Halliburton Co. | | | 25,567 | | | $ | 1,005,550 | |
National Oilwell Varco, Inc. | | | 24,594 | | | | 1,611,645 | |
Schlumberger Ltd. | | | 29,344 | | | | 2,506,271 | |
Transocean Ltd. | | | 47,300 | | | | 867,009 | |
| | | | | | | | |
| | | | | | | 6,162,893 | |
| | | | | | | | |
| Pipelines — 0.0% | |
Kinder Morgan, Inc. | | | 38 | | | | 1,608 | |
Spectra Energy Corp. | | | 64 | | | | 2,323 | |
The Williams Cos., Inc. | | | 48 | | | | 2,157 | |
| | | | | | | | |
| | | | | | | 6,088 | |
| | | | | | | | |
| | | | | | | 35,583,155 | |
| | | | | | | | |
| Financial — 11.0% | |
| Banks — 3.1% | |
Bank of America Corp. | | | 166,198 | | | | 2,973,282 | |
Bank of New York Mellon Corp. | | | 30,007 | | | | 1,217,384 | |
BB&T Corp. | | | 9,066 | | | | 352,577 | |
Capital One Financial Corp. | | | 14,942 | | | | 1,233,462 | |
Comerica, Inc. | | | 4,421 | | | | 207,080 | |
Fifth Third Bancorp | | | 13,921 | | | | 283,640 | |
Huntington Bancshares, Inc. | | | 63,300 | | | | 665,916 | |
KeyCorp | | | 53,064 | | | | 737,590 | |
M&T Bank Corp. | | | 1,355 | | | | 170,215 | |
Northern Trust Corp. | | | 3,859 | | | | 260,097 | |
PNC Financial Services Group, Inc. | | | 18,218 | | | | 1,662,028 | |
Regions Financial Corp. | | | 63,715 | | | | 672,830 | |
State Street Corp. | | | 8,176 | | | | 641,816 | |
SunTrust Banks, Inc. | | | 30,500 | | | | 1,277,950 | |
U.S. Bancorp | | | 40,402 | | | | 1,816,070 | |
Wells Fargo & Co. | | | 127,116 | | | | 6,968,499 | |
Zions Bancorp | | | 2,141 | | | | 61,040 | |
| | | | | | | | |
| | | | | | | 21,201,476 | |
| | | | | | | | |
| Diversified Financial — 3.1% | |
American Express Co. | | | 13,249 | | | | 1,232,687 | |
Ameriprise Financial, Inc. | | | 6,976 | | | | 922,576 | |
BlackRock, Inc. | | | 3,350 | | | | 1,197,826 | |
The Charles Schwab Corp. | | | 15,012 | | | | 453,212 | |
Citigroup, Inc. | | | 50,351 | | | | 2,724,493 | |
CME Group, Inc. | | | 90 | | | | 7,978 | |
Discover Financial Services | | | 14,383 | | | | 941,943 | |
E*TRADE Financial Corp. (a) | | | 14,161 | | | | 343,475 | |
Franklin Resources, Inc. | | | 9,087 | | | | 503,147 | |
The Goldman Sachs Group, Inc. | | | 13,980 | | | | 2,709,743 | |
IntercontinentalExchange, Inc. | | | 3 | | | | 658 | |
Invesco Ltd. | | | 8,012 | | | | 316,634 | |
JP Morgan Chase & Co. | | | 95,822 | | | | 5,996,541 | |
Legg Mason, Inc. | | | 11,626 | | | | 620,480 | |
Morgan Stanley | | | 47,397 | | | | 1,839,004 | |
The NASDAQ OMX Group, Inc. | | | 3,245 | | | | 155,630 | |
Navient Corp. | | | 26,091 | | | | 563,827 | |
T. Rowe Price Group, Inc. | | | 4,906 | | | | 421,229 | |
| | | | | | | | |
| | | | | | | 20,951,083 | |
| | | | | | | | |
The accompanying notes are an integral part of the financial statements.
21
MML Blend Fund – Portfolio of Investments (Continued)
| | | | | | | | |
| | | Number of
Shares | | | Value | |
| Insurance — 4.3% | |
ACE Ltd. | | | 13,610 | | | $ | 1,563,517 | |
Aflac, Inc. | | | 14,472 | | | | 884,095 | |
The Allstate Corp. | | | 13,335 | | | | 936,784 | |
American International Group, Inc. | | | 69,346 | | | | 3,884,069 | |
Aon PLC | | | 8,335 | | | | 790,408 | |
Assurant, Inc. | | | 14,596 | | | | 998,804 | |
Berkshire Hathaway, Inc. Class B (a) | | | 56,716 | | | | 8,515,907 | |
The Chubb Corp. | | | 8,020 | | | | 829,829 | |
Cincinnati Financial Corp. | | | 6,019 | | | | 311,965 | |
Genworth Financial, Inc. Class A (a) | | | 23,829 | | | | 202,547 | |
The Hartford Financial Services Group, Inc. | | | 21,952 | | | | 915,179 | |
Lincoln National Corp. | | | 18,151 | | | | 1,046,768 | |
Loews Corp. | | | 1,883 | | | | 79,124 | |
Marsh & McLennan Cos., Inc. | | | 5,813 | | | | 332,736 | |
MetLife, Inc. | | | 44,790 | | | | 2,422,691 | |
Principal Financial Group, Inc. | | | 17,529 | | | | 910,456 | |
The Progressive Corp. | | | 15,014 | | | | 405,228 | |
Prudential Financial, Inc. | | | 8,027 | | | | 726,122 | |
Torchmark Corp. | | | 9,982 | | | | 540,725 | |
The Travelers Cos., Inc. | | | 16,597 | | | | 1,756,792 | |
Unum Group | | | 20,531 | | | | 716,121 | |
XL Group PLC | | | 27,988 | | | | 961,948 | |
| | | | | | | | |
| | | | | | | 29,731,815 | |
| | | | | | | | |
| Real Estate — 0.0% | |
CBRE Group, Inc. (a) | | | 87 | | | | 2,980 | |
| | | | | | | | |
| Real Estate Investment Trusts (REITS) — 0.5% | |
American Tower Corp. | | | 589 | | | | 58,223 | |
Apartment Investment & Management Co. Class A | | | 85 | | | | 3,158 | |
AvalonBay Communities, Inc. | | | 1 | | | | 163 | |
Boston Properties, Inc. | | | 1,573 | | | | 202,429 | |
Crown Castle International Corp. | | | 700 | | | | 55,090 | |
Equity Residential | | | 11,256 | | | | 808,631 | |
General Growth Properties, Inc. | | | 14,200 | | | | 399,446 | |
HCP, Inc. | | | 4,935 | | | | 217,288 | |
Health Care REIT, Inc. | | | 72 | | | | 5,448 | |
Host Hotels & Resorts, Inc. | | | 15,937 | | | | 378,822 | |
Kimco Realty Corp. | | | 7,667 | | | | 192,748 | |
The Macerich Co. | | | 2,400 | | | | 200,184 | |
Plum Creek Timber Co., Inc. | | | 63 | | | | 2,696 | |
Prologis, Inc. | | | 38 | | | | 1,635 | |
Public Storage | | | 143 | | | | 26,434 | |
Simon Property Group, Inc. | | | 3,735 | | | | 680,181 | |
Ventas, Inc. | | | 25 | | | | 1,793 | |
Vornado Realty Trust | | | 373 | | | | 43,906 | |
Weyerhaeuser Co. | | | 626 | | | | 22,467 | |
| | | | | | | | |
| | | | | | | 3,300,742 | |
| | | | | | | | |
| Savings & Loans — 0.0% | |
Hudson City Bancorp, Inc. | | | 6,230 | | | | 63,048 | |
| | | | | | | | |
| | | Number of
Shares | | | Value | |
People’s United Financial, Inc. | | | 5,451 | | | $ | 82,746 | |
| | | | | | | | |
| | | | | | | 145,794 | |
| | | | | | | | |
| | | | | | | 75,333,890 | |
| | | | | | | | |
| Industrial — 6.5% | |
| Aerospace & Defense — 1.3% | |
The Boeing Co. | | | 9,172 | | | | 1,192,176 | |
General Dynamics Corp. | | | 11,022 | | | | 1,516,848 | |
L-3 Communications Holdings, Inc. | | | 2,860 | | | | 360,961 | |
Lockheed Martin Corp. | | | 12,115 | | | | 2,332,985 | |
Northrop Grumman Corp. | | | 6,828 | | | | 1,006,379 | |
Raytheon Co. | | | 9,759 | | | | 1,055,631 | |
Rockwell Collins, Inc. | | | 2,268 | | | | 191,601 | |
United Technologies Corp. | | | 13,070 | | | | 1,503,050 | |
| | | | | | | | |
| | | | | | | 9,159,631 | |
| | | | | | | | |
| Building Materials — 0.0% | |
Masco Corp. | | | 8,925 | | | | 224,910 | |
| | | | | | | | |
| Electrical Components & Equipment — 0.1% | |
Emerson Electric Co. | | | 15,369 | | | | 948,728 | |
| | | | | | | | |
| Electronics — 0.3% | |
Agilent Technologies, Inc. | | | 3,963 | | | | 162,245 | |
Allegion PLC | | | 2,433 | | | | 134,934 | |
Amphenol Corp. Class A | | | 64 | | | | 3,444 | |
FLIR Systems, Inc. | | | 24,552 | | | | 793,275 | |
Garmin Ltd. | | | 3,700 | | | | 195,471 | |
PerkinElmer, Inc. | | | 20 | | | | 875 | |
TE Connectivity Ltd. | | | 4,800 | | | | 303,600 | |
Waters Corp. (a) | | | 1,050 | | | | 118,356 | |
| | | | | | | | |
| | | | | | | 1,712,200 | |
| | | | | | | | |
| Engineering & Construction — 0.0% | |
Fluor Corp. | | | 2,909 | | | | 176,373 | |
Jacobs Engineering Group, Inc. (a) | | | 1,420 | | | | 63,460 | |
| | | | | | | | |
| | | | | | | 239,833 | |
| | | | | | | | |
| Environmental Controls — 0.1% | |
Republic Services, Inc. | | | 337 | | | | 13,564 | |
Stericycle, Inc. (a) | | | 97 | | | | 12,715 | |
Waste Management, Inc. | | | 8,073 | | | | 414,306 | |
| | | | | | | | |
| | | | | | | 440,585 | |
| | | | | | | | |
| Hand & Machine Tools — 0.1% | |
Snap-on, Inc. | | | 1,671 | | | | 228,493 | |
Stanley Black & Decker, Inc. | | | 1,929 | | | | 185,338 | |
| | | | | | | | |
| | | | | | | 413,831 | |
| | | | | | | | |
| Machinery – Construction & Mining — 0.5% | |
Caterpillar, Inc. | | | 33,375 | | | | 3,054,814 | |
Ingersoll-Rand PLC | | | 6,000 | | | | 380,340 | |
Joy Global, Inc. | | | 2,600 | | | | 120,952 | |
| | | | | | | | |
| | | | | | | 3,556,106 | |
| | | | | | | | |
| Machinery – Diversified — 0.4% | |
Cummins, Inc. | | | 3,945 | | | | 568,751 | |
The accompanying notes are an integral part of the financial statements.
22
MML Blend Fund – Portfolio of Investments (Continued)
| | | | | | | | |
| | | Number of
Shares | | | Value | |
Deere & Co. | | | 10,250 | | | $ | 906,817 | |
Flowserve Corp. | | | 2,170 | | | | 129,831 | |
Rockwell Automation, Inc. | | | 2,163 | | | | 240,526 | |
Roper Industries, Inc. | | | 2,633 | | | | 411,669 | |
Xylem, Inc. | | | 3,355 | | | | 127,725 | |
| | | | | | | | |
| | | | | | | 2,385,319 | |
| | | | | | | | |
| Manufacturing — 2.3% | |
3M Co. | | | 14,302 | | | | 2,350,105 | |
Danaher Corp. | | | 12,956 | | | | 1,110,459 | |
Dover Corp. | | | 4,473 | | | | 320,804 | |
Eaton Corp. PLC | | | 3,066 | | | | 208,365 | |
General Electric Co. | | | 257,386 | | | | 6,504,144 | |
Honeywell International, Inc. | | | 8,882 | | | | 887,489 | |
Illinois Tool Works, Inc. | | | 17,355 | | | | 1,643,518 | |
Leggett & Platt, Inc. | | | 3,686 | | | | 157,060 | |
Pall Corp. | | | 61 | | | | 6,174 | |
Parker Hannifin Corp. | | | 4,048 | | | | 521,990 | |
Pentair PLC | | | 18,123 | | | | 1,203,730 | |
Textron, Inc. | | | 13,672 | | | | 575,728 | |
| | | | | | | | |
| | | | | | | 15,489,566 | |
| | | | | | | | |
| Metal Fabricate & Hardware — 0.0% | |
Precision Castparts Corp. | | | 6 | | | | 1,445 | |
| | | | | | | | |
| Packaging & Containers — 0.2% | |
Ball Corp. | | | 19,502 | | | | 1,329,451 | |
Bemis Co., Inc. | | | 1,896 | | | | 85,718 | |
Owens-Illinois, Inc. (a) | | | 4,316 | | | | 116,489 | |
Sealed Air Corp. | | | 53 | | | | 2,249 | |
| | | | | | | | |
| | | | | | | 1,533,907 | |
| | | | | | | | |
| Transportation — 1.2% | |
American ExpressNorfolk Southern Corp. | | | 10,113 | | | | 1,108,486 | |
C.H. Robinson Worldwide, Inc. | | | 11,320 | | | | 847,755 | |
CSX Corp. | | | 24,607 | | | | 891,512 | |
Expeditors International of Washington, Inc. | | | 26 | | | | 1,160 | |
FedEx Corp. | | | 6,560 | | | | 1,139,210 | |
Ryder System, Inc. | | | 5,938 | | | | 551,343 | |
Union Pacific Corp. | | | 24,242 | | | | 2,887,949 | |
United Parcel Service, Inc. Class B | | | 9,070 | | | | 1,008,312 | |
| | | | | | | | |
| | | | | | | 8,435,727 | |
| | | | | | | | |
| | | | | | | 44,541,788 | |
| | | | | | | | |
| Technology — 10.4% | |
| Computers — 4.7% | |
Accenture PLC Class A | | | 1,600 | | | | 142,896 | |
Apple, Inc. | | | 147,137 | | | | 16,240,982 | |
Cognizant Technology Solutions Corp. Class A (a) | | | 16,556 | | | | 871,839 | |
Computer Sciences Corp. | | | 29,926 | | | | 1,886,834 | |
EMC Corp. | | | 51,624 | | | | 1,535,298 | |
Hewlett-Packard Co. | | | 83,174 | | | | 3,337,773 | |
| | | | | | | | |
| | | Number of
Shares | | | Value | |
International Business Machines Corp. | | | 27,230 | | | $ | 4,368,781 | |
NetApp, Inc. | | | 8,398 | | | | 348,097 | |
SanDisk Corp. | | | 9,283 | | | | 909,548 | |
Seagate Technology PLC | | | 9,500 | | | | 631,750 | |
Teradata Corp. (a) | | | 21,086 | | | | 921,037 | |
Western Digital Corp. | | | 11,852 | | | | 1,312,016 | |
| | | | | | | | |
| | | | | | | 32,506,851 | |
| | | | | | | | |
| Office Equipment/Supplies — 0.4% | |
Pitney Bowes, Inc. | | | 85,189 | | | | 2,076,056 | |
Xerox Corp. | | | 64,245 | | | | 890,436 | |
| | | | | | | | |
| | | | | | | 2,966,492 | |
| | | | | | | | |
| Semiconductors — 2.0% | |
Altera Corp. | | | 6,186 | | | | 228,511 | |
Analog Devices, Inc. | | | 7,354 | | | | 408,294 | |
Applied Materials, Inc. | | | 12,939 | | | | 322,440 | |
Avago Technologies Ltd. | | | 2,900 | | | | 291,711 | |
Broadcom Corp. Class A | | | 14,364 | | | | 622,392 | |
Intel Corp. | | | 167,923 | | | | 6,093,926 | |
KLA-Tencor Corp. | | | 1,389 | | | | 97,675 | �� |
Lam Research Corp. | | | 4,123 | | | | 327,119 | |
Linear Technology Corp. | | | 11,605 | | | | 529,188 | |
Microchip Technology, Inc. | | | 4,621 | | | | 208,453 | |
Micron Technology, Inc. (a) | | | 45,717 | | | | 1,600,552 | |
NVIDIA Corp. | | | 52,826 | | | | 1,059,161 | |
Texas Instruments, Inc. | | | 24,874 | | | | 1,329,888 | |
Xilinx, Inc. | | | 7,356 | | | | 318,441 | |
| | | | | | | | |
| | | | | | | 13,437,751 | |
| | | | | | | | |
| Software — 3.3% | |
Adobe Systems, Inc. (a) | | | 13,240 | | | | 962,548 | |
Autodesk, Inc. (a) | | | 6,037 | | | | 362,582 | |
CA, Inc. | | | 29,673 | | | | 903,543 | |
Cerner Corp. (a) | | | 800 | | | | 51,728 | |
Citrix Systems, Inc. (a) | | | 5,477 | | | | 349,433 | |
The Dun & Bradstreet Corp. | | | 6,456 | | | | 780,918 | |
Electronic Arts, Inc. (a) | | | 15,637 | | | | 735,173 | |
Fidelity National Information Services, Inc. | | | 5,300 | | | | 329,660 | |
Fiserv, Inc. (a) | | | 9,976 | | | | 707,997 | |
Intuit, Inc. | | | 3,450 | | | | 318,055 | |
Microsoft Corp. | | | 258,295 | | | | 11,997,803 | |
Oracle Corp. | | | 97,357 | | | | 4,378,144 | |
Red Hat, Inc. (a) | | | 21 | | | | 1,452 | |
Salesforce.com, Inc. (a) | | | 11,544 | | | | 684,675 | |
| | | | | | | | |
| | | | | | | 22,563,711 | |
| | | | | | | | |
| | | | | | | 71,474,805 | |
| | | | | | | | |
| Utilities — 2.0% | |
| Electric — 1.9% | |
The AES Corp. | | | 28,487 | | | | 392,266 | |
Ameren Corp. | | | 6,360 | | | | 293,387 | |
The accompanying notes are an integral part of the financial statements.
23
MML Blend Fund – Portfolio of Investments (Continued)
| | | | | | | | |
| | | Number of
Shares | | | Value | |
American Electric Power Co., Inc. | | | 20,385 | | | $ | 1,237,777 | |
CenterPoint Energy, Inc. | | | 10,631 | | | | 249,084 | |
CMS Energy Corp. | | | 7,903 | | | | 274,629 | |
Consolidated Edison, Inc. | | | 2,782 | | | | 183,640 | |
Dominion Resources, Inc. | | | 6,616 | | | | 508,770 | |
DTE Energy Co. | | | 5,060 | | | | 437,032 | |
Duke Energy Corp. | | | 7,390 | | | | 617,361 | |
Edison International | | | 18,726 | | | | 1,226,179 | |
Entergy Corp. | | | 6,898 | | | | 603,437 | |
Exelon Corp. | | | 28,940 | | | | 1,073,095 | |
FirstEnergy Corp. | | | 3,680 | | | | 143,483 | |
Integrys Energy Group, Inc. | | | 54 | | | | 4,204 | |
NextEra Energy, Inc. | | | 4,060 | | | | 431,537 | |
Northeast Utilities | | | 812 | | | | 43,458 | |
NRG Energy, Inc. | | | 11,400 | | | | 307,230 | |
Pepco Holdings, Inc. | | | 20,043 | | | | 539,758 | |
PG&E Corp. | | | 19,316 | | | | 1,028,384 | |
Pinnacle West Capital Corp. | | | 1,496 | | | | 102,192 | |
PPL Corp. | | | 16,718 | | | | 607,365 | |
Public Service Enterprise Group, Inc. | | | 18,724 | | | | 775,361 | |
SCANA Corp. | | | 3,747 | | | | 226,319 | |
The Southern Co. | | | 27,822 | | | | 1,366,338 | |
TECO Energy, Inc. | | | 95 | | | | 1,947 | |
Wisconsin Energy Corp. | | | 4,482 | | | | 236,381 | |
Xcel Energy, Inc. | | | 5,472 | | | | 196,554 | |
| | | | | | | | |
| | | | | | | 13,107,168 | |
| | | | | | | | |
| Gas — 0.1% | |
AGL Resources, Inc. | | | 2,562 | | | | 139,655 | |
NiSource, Inc. | | | 713 | | | | 30,245 | |
Sempra Energy | | | 1,261 | | | | 140,425 | |
| | | | | | | | |
| | | | | | | 310,325 | |
| | | | | | | | |
| | | | | | | 13,417,493 | |
| | | | | | | | |
| | |
TOTAL COMMON STOCK
(Cost $288,696,643) | | | | | | | 460,426,825 | |
| | | | | | | | |
|
| PREFERRED STOCK — 0.1% | |
| Financial — 0.1% | |
| Insurance — 0.1% | |
The Allstate Corp.
5.100% | | | 20,000 | | | | 506,600 | |
| | | | | | | | |
| | |
TOTAL PREFERRED STOCK
(Cost $500,000) | | | | | | | 506,600 | |
| | | | | | | | |
| | |
TOTAL EQUITIES
(Cost $289,196,643) | | | | | | | 460,933,425 | |
| | | | | | | | |
| | | | | | | | |
| | | Principal
Amount | | | Value | |
| BONDS & NOTES — 32.2% | |
|
| CORPORATE DEBT — 15.1% | |
| Advertising — 0.1% | |
The Interpublic Group of Cos., Inc.
2.250% 11/15/17 | | $ | 200,000 | | | $ | 200,379 | |
WPP Finance 2010
4.750% 11/21/21 | | | 85,000 | | | | 92,939 | |
WPP Finance 2010
5.625% 11/15/43 | | | 475,000 | | | | 542,711 | |
| | | | | | | | |
| | | | | | | 836,029 | |
| | | | | | | | |
| Aerospace & Defense — 0.1% | |
BAE Systems Holdings, Inc. (b)
6.375% 6/01/19 | | | 255,000 | | | | 294,403 | |
Exelis, Inc.
4.250% 10/01/16 | | | 315,000 | | | | 325,776 | |
L-3 Communications Corp.
4.750% 7/15/20 | | | 25,000 | | | | 26,848 | |
United Technologies Corp.
6.125% 7/15/38 | | | 80,000 | | | | 105,531 | |
| | | | | | | | |
| | | | | | | 752,558 | |
| | | | | | | | |
| Agriculture — 0.1% | |
Altria Group, Inc.
2.850% 8/09/22 | | | 195,000 | | | | 189,481 | |
Altria Group, Inc.
4.250% 8/09/42 | | | 105,000 | | | | 100,623 | |
Bunge Ltd. Finance Corp.
3.200% 6/15/17 | | | 225,000 | | | | 231,355 | |
Philip Morris International, Inc.
6.375% 5/16/38 | | | 35,000 | | | | 44,749 | |
| | | | | | | | |
| | | | | | | 566,208 | |
| | | | | | | | |
| Airlines — 0.0% | |
American Airlines Pass Through Trust, Series 2014-1, Class A
3.700% 4/01/28 | | | 105,000 | | | | 105,525 | |
American Airlines Pass-Through Trust, Series 2014-1, Class B
4.375% 4/01/24 | | | 45,000 | | | | 46,117 | |
United Airlines Pass-Through Trust,
Series 2014-1, Class A
4.000% 10/11/27 | | | 130,000 | | | | 131,950 | |
| | | | | | | | |
| | | | | | | 283,592 | |
| | | | | | | | |
| Auto Manufacturers — 0.2% | |
Daimler Finance NA LLC (b)
2.625% 9/15/16 | | | 200,000 | | | | 204,887 | |
General Motors Co.
3.500% 10/02/18 | | | 215,000 | | | | 219,300 | |
General Motors Co.
5.200% 4/01/45 | | | 260,000 | | | | 274,300 | |
Hyundai Capital America (b)
2.550% 2/06/19 | | | 170,000 | | | | 170,023 | |
The accompanying notes are an integral part of the financial statements.
24
MML Blend Fund – Portfolio of Investments (Continued)
| | | | | | | | |
| | | Principal
Amount | | | Value | |
Volvo Treasury AB (b)
5.950% 4/01/15 | | $ | 500,000 | | | $ | 505,824 | |
| | | | | | | | |
| | | | | | | 1,374,334 | |
| | | | | | | | |
| Automotive & Parts — 0.1% | |
Lear Corp.
8.125% 3/15/20 | | | 245,000 | | | | 257,862 | |
Lear Corp.
4.750% 1/15/23 | | | 75,000 | | | | 74,813 | |
TRW Automotive, Inc. (b)
7.250% 3/15/17 | | | 145,000 | | | | 160,225 | |
| | | | | | | | |
| | | | | | | 492,900 | |
| | | | | | | | |
| Banks — 1.3% | |
Associated Banc-Corp.
2.750% 11/15/19 | | | 460,000 | | | | 459,655 | |
Associated Banc-Corp.
4.250% 1/15/25 | | | 735,000 | | | | 737,030 | |
Associated Banc-Corp.
5.125% 3/28/16 | | | 350,000 | | | | 365,381 | |
Bank of America Corp.
3.625% 3/17/16 | | | 200,000 | | | | 205,619 | |
Bank of America Corp.
4.000% 4/01/24 | | | 360,000 | | | | 374,841 | |
Bank of America Corp.
4.500% 4/01/15 | | | 175,000 | | | | 176,644 | |
Bank of America Corp.
5.875% 2/07/42 | | | 95,000 | | | | 118,879 | |
Barclays PLC
4.375% 9/11/24 | | | 235,000 | | | | 226,470 | |
Deutsche Bank AG
1.400% 2/13/17 | | | 220,000 | | | | 219,541 | |
Deutsche Bank AG
2.500% 2/13/19 | | | 345,000 | | | | 349,224 | |
Discover Bank
2.000% 2/21/18 | | | 250,000 | | | | 249,349 | |
Export-Import Bank of Korea
1.750% 2/27/18 | | | 55,000 | | | | 54,695 | |
Export-Import Bank of Korea
4.000% 1/11/17 | | | 200,000 | | | | 209,666 | |
First Horizon National Corp.
5.375% 12/15/15 | | | 635,000 | | | | 657,416 | |
FirstMerit Corp.
4.350% 2/04/23 | | | 80,000 | | | | 84,035 | |
HSBC Holdings PLC
6.500% 9/15/37 | | | 125,000 | | | | 160,611 | |
ICICI Bank Ltd. (b)
4.700% 2/21/18 | | | 395,000 | | | | 416,552 | |
ICICI Bank Ltd. (b)
4.750% 11/25/16 | | | 290,000 | | | | 303,073 | |
ICICI Bank Ltd. (b)
5.500% 3/25/15 | | | 440,000 | | | | 444,101 | |
JP Morgan Chase & Co.
3.375% 5/01/23 | | | 140,000 | | | | 138,504 | |
| | | | | | | | |
| | | Principal
Amount | | | Value | |
JP Morgan Chase & Co.
3.875% 9/10/24 | | $ | 220,000 | | | $ | 220,187 | |
KFW
2.125% 1/17/23 | | | 600,000 | | | | 598,901 | |
Regions Financial Corp.
5.750% 6/15/15 | | | 260,000 | | | | 265,400 | |
Regions Financial Corp.
7.500% 5/15/18 | | | 130,000 | | | | 150,916 | |
Skandinaviska Enskilda Banken AB (b)
2.375% 3/25/19 | | | 200,000 | | | | 201,296 | |
State Street Corp.
3.300% 12/16/24 | | | 365,000 | | | | 370,455 | |
SVB Financial Group
5.375% 9/15/20 | | | 75,000 | | | | 84,335 | |
Valley National Bancorp
5.125% 9/27/23 | | | 245,000 | | | | 265,608 | |
Wachovia Bank NA
6.600% 1/15/38 | | | 50,000 | | | | 69,250 | |
Wells Fargo & Co.
4.480% 1/16/24 | | | 345,000 | | | | 367,841 | |
| | | | | | | | |
| | | | | | | 8,545,475 | |
| | | | | | | | |
| Beverages — 0.1% | |
Anheuser-Busch Cos, Inc.
6.500% 2/01/43 | | | 25,000 | | | | 34,039 | |
Fomento Economico Mexicano SAB de CV
2.875% 5/10/23 | | | 85,000 | | | | 79,280 | |
Pernod Ricard SA (b)
2.950% 1/15/17 | | | 300,000 | | | | 306,944 | |
| | | | | | | | |
| | | | | | | 420,263 | |
| | | | | | | | |
| Biotechnology — 0.0% | |
Amgen, Inc.
5.150% 11/15/41 | | | 225,000 | | | | 253,609 | |
| | | | | | | | |
| Building Materials — 0.3% | |
CRH America, Inc.
8.125% 7/15/18 | | | 220,000 | | | | 263,297 | |
Elementia SAB de CV (b)
5.500% 1/15/25 | | | 160,000 | | | | 153,600 | |
Lafarge SA (b)
6.200% 7/09/15 | | | 600,000 | | | | 613,740 | |
Lafarge SA
6.500% 7/15/16 | | | 190,000 | | | | 202,350 | |
Martin Marietta Material, Inc. FRN
1.357% 6/30/17 | | | 220,000 | | | | 222,412 | |
Masco Corp.
4.800% 6/15/15 | | | 560,000 | | | | 568,628 | |
Owens Corning, Inc.
4.200% 12/01/24 | | | 205,000 | | | | 202,307 | |
Owens Corning, Inc.
6.500% 12/01/16 | | | 13,000 | | | | 14,164 | |
The accompanying notes are an integral part of the financial statements.
25
MML Blend Fund – Portfolio of Investments (Continued)
| | | | | | | | |
| | | Principal
Amount | | | Value | |
Owens Corning, Inc.
9.000% 6/15/19 | | $ | 55,000 | | | $ | 66,560 | |
| | | | | | | | |
| | | | | | | 2,307,058 | |
| | | | | | | | |
| Chemicals — 0.6% | |
Ashland, Inc.
4.750% 8/15/22 | | | 1,575,000 | | | | 1,575,000 | |
Cabot Corp.
5.000% 10/01/16 | | | 390,000 | | | | 413,499 | |
Cytec Industries, Inc.
3.500% 4/01/23 | | | 65,000 | | | | 65,124 | |
Cytec Industries, Inc.
8.950% 7/01/17 | | | 38,000 | | | | 43,418 | |
The Dow Chemical Co.
8.550% 5/15/19 | | | 65,000 | | | | 80,811 | |
E.I. du Pont de Nemours & Co.
6.000% 7/15/18 | | | 30,000 | | | | 34,165 | |
Ecolab, Inc.
4.350% 12/08/21 | | | 75,000 | | | | 81,719 | |
Incitec Pivot Finance LLC (b)
6.000% 12/10/19 | | | 110,000 | | | | 122,319 | |
Incitiec Pivot Ltd (b)
4.000% 12/07/15 | | | 463,000 | | | | 473,615 | |
Methanex Corp.
5.250% 3/01/22 | | | 20,000 | | | | 21,484 | |
Rockwood Specialties Group, Inc.
4.625% 10/15/20 | | | 690,000 | | | | 712,425 | |
RPM International, Inc.
3.450% 11/15/22 | | | 250,000 | | | | 246,202 | |
RPM International, Inc.
6.125% 10/15/19 | | | 100,000 | | | | 113,653 | |
RPM International, Inc.
6.500% 2/15/18 | | | 205,000 | | | | 229,070 | |
Valspar Corp.
7.250% 6/15/19 | | | 125,000 | | | | 146,435 | |
| | | | | | | | |
| | | | | | | 4,358,939 | |
| | | | | | | | |
| Commercial Services — 0.2% | |
The ADT Corp.
2.250% 7/15/17 | | | 290,000 | | | | 280,575 | |
Brambles USA, Inc. (b)
3.950% 4/01/15 | | | 250,000 | | | | 251,726 | |
Cardtronics, Inc., Convertible
1.000% 12/01/20 | | | 200,000 | | | | 197,875 | |
Donnelley (R.R.) & Sons Co.
5.500% 5/15/15 | | | 57,000 | | | | 57,570 | |
ERAC USA Finance LLC (b)
2.800% 11/01/18 | | | 65,000 | | | | 66,394 | |
ERAC USA Finance LLC (b)
6.700% 6/01/34 | | | 78,000 | | | | 100,339 | |
Leidos Holdings, Inc.
4.450% 12/01/20 | | | 270,000 | | | | 259,457 | |
| | | | | | | | |
| | | Principal
Amount | | | Value | |
The Western Union Co.
5.930% 10/01/16 | | $ | 180,000 | | | $ | 193,263 | |
| | | | | | | | |
| | | | | | | 1,407,199 | |
| | | | | | | | |
| Computers — 0.2% | |
Apple, Inc.
2.400% 5/03/23 | | | 240,000 | | | | 233,280 | |
Apple, Inc.
3.850% 5/04/43 | | | 115,000 | | | | 115,083 | |
EMC Corp.
3.375% 6/01/23 | | | 304,000 | | | | 305,104 | |
SanDisk Corp., Convertible
0.500% 10/15/20 | | | 405,000 | | | | 486,506 | |
| | | | | | | | |
| | | | | | | 1,139,973 | |
| | | | | | | | |
| Cosmetics & Personal Care — 0.0% | |
Avon Products, Inc.
6.500% 3/01/19 | | | 130,000 | | | | 129,675 | |
The Procter & Gamble Co.
5.800% 8/15/34 | | | 45,000 | | | | 59,819 | |
| | | | | | | | |
| | | | | | | 189,494 | |
| | | | | | | | |
| Distribution & Wholesale — 0.1% | |
Arrow Electronics, Inc.
4.500% 3/01/23 | | | 105,000 | | | | 108,535 | |
Ingram Micro, Inc.
4.950% 12/15/24 | | | 480,000 | | | | 479,842 | |
| | | | | | | | |
| | | | | | | 588,377 | |
| | | | | | | | |
| Diversified Financial — 1.9% | |
AerCap Ireland Capital Ltd. (b)
4.500% 5/15/21 | | | 765,000 | | | | 774,562 | |
Affiliated Managers Group, Inc.
4.250% 2/15/24 | | | 216,000 | | | | 225,043 | |
Air Lease Corp.
3.375% 1/15/19 | | | 375,000 | | | | 379,688 | |
Air Lease Corp.
3.875% 4/01/21 | | | 265,000 | | | | 266,325 | |
Air Lease Corp.
5.625% 4/01/17 | | | 80,000 | | | | 86,200 | |
American Express Co.
6.150% 8/28/17 | | | 230,000 | | | | 256,266 | |
American Express Co. VRN
6.800% 9/01/66 | | | 20,000 | | | | 20,950 | |
American Express Co.
8.125% 5/20/19 | | | 135,000 | | | | 166,999 | |
Ares Finance Co. LLC (b)
4.000% 10/08/24 | | | 355,000 | | | | 348,681 | |
BlackRock, Inc.
5.000% 12/10/19 | | | 90,000 | | | | 101,752 | |
Citigroup, Inc.
4.750% 5/19/15 | | | 10,000 | | | | 10,147 | |
Citigroup, Inc.
5.375% 8/09/20 | | | 245,000 | | | | 278,456 | |
The accompanying notes are an integral part of the financial statements.
26
MML Blend Fund – Portfolio of Investments (Continued)
| | | | | | | | |
| | | Principal
Amount | | | Value | |
Citigroup, Inc.
5.500% 2/15/17 | | $ | 500,000 | | | $ | 537,492 | |
Citigroup, Inc.
5.875% 1/30/42 | | | 100,000 | | | | 125,784 | |
Citigroup, Inc.
8.125% 7/15/39 | | | 90,000 | | | | 137,784 | |
Citigroup, Inc.
8.500% 5/22/19 | | | 123,000 | | | | 153,266 | |
Eaton Vance Corp.
3.625% 6/15/23 | | | 97,000 | | | | 98,990 | |
Eaton Vance Corp.
6.500% 10/02/17 | | | 16,000 | | | | 17,952 | |
Ford Motor Credit Co. LLC
3.000% 6/12/17 | | | 240,000 | | | | 246,242 | |
General Electric Capital Corp.
4.625% 1/07/21 | | | 225,000 | | | | 250,783 | |
General Electric Capital Corp.
6.875% 1/10/39 | | | 260,000 | | | | 367,772 | |
General Motors Financial Co., Inc.
2.625% 7/10/17 | | | 200,000 | | | | 200,867 | |
General Motors Financial Co., Inc.
2.750% 5/15/16 | | | 170,000 | | | | 172,763 | |
General Motors Financial Co., Inc.
3.000% 9/25/17 | | | 280,000 | | | | 283,158 | |
The Goldman Sachs Group, Inc.
1.600% 11/23/15 | | | 290,000 | | | | 291,519 | |
The Goldman Sachs Group, Inc.
3.625% 2/07/16 | | | 120,000 | | | | 123,127 | |
The Goldman Sachs Group, Inc.
5.375% 3/15/20 | | | 225,000 | | | | 252,157 | |
The Goldman Sachs Group, Inc.
5.625% 1/15/17 | | | 455,000 | | | | 488,032 | |
The Goldman Sachs Group, Inc.
5.750% 1/24/22 | | | 200,000 | | | | 231,357 | |
The Goldman Sachs Group, Inc.
6.250% 2/01/41 | | | 60,000 | | | | 75,849 | |
The Goldman Sachs Group, Inc.
6.345% 2/15/34 | | | 75,000 | | | | 89,220 | |
The Goldman Sachs Group, Inc.
6.750% 10/01/37 | | | 75,000 | | | | 94,303 | |
Hyundai Capital America (b)
1.625% 10/02/15 | | | 145,000 | | | | 145,595 | |
Hyundai Capital America (b)
2.875% 8/09/18 | | | 135,000 | | | | 137,726 | |
Icahn Enterprises LP/Icahn Enterprises Finance Corp.
3.500% 3/15/17 | | | 1,015,000 | | | | 1,015,000 | |
International Lease Finance Corp.
3.875% 4/15/18 | | | 270,000 | | | | 270,000 | |
International Lease Finance Corp.
5.750% 5/15/16 | | | 865,000 | | | | 897,437 | |
Janus Capital Group, Inc.
6.700% 6/15/17 | | | 375,000 | | | | 414,910 | |
| | | | | | | | |
| | | Principal
Amount | | | Value | |
JP Morgan Chase & Co.
4.500% 1/24/22 | | $ | 200,000 | | | $ | 218,350 | |
JP Morgan Chase & Co.
4.950% 3/25/20 | | | 50,000 | | | | 55,235 | |
JP Morgan Chase & Co.
5.600% 7/15/41 | | | 195,000 | | | | 236,088 | |
Lazard Group LLC
4.250% 11/14/20 | | | 470,000 | | | | 495,357 | |
Lazard Group LLC
6.850% 6/15/17 | | | 228,000 | | | | 253,810 | |
Legg Mason, Inc.
5.625% 1/15/44 | | | 260,000 | | | | 297,403 | |
Leighton Finance USA Pty Ltd. (b)
5.950% 11/13/22 | | | 120,000 | | | | 127,252 | |
Merrill Lynch & Co., Inc.
7.750% 5/14/38 | | | 95,000 | | | | 134,169 | |
Morgan Stanley
3.800% 4/29/16 | | | 150,000 | | | | 154,953 | |
Morgan Stanley
4.000% 7/24/15 | | | 250,000 | | | | 254,706 | |
Morgan Stanley
4.350% 9/08/26 | | | 130,000 | | | | 130,777 | |
Morgan Stanley
5.450% 1/09/17 | | | 265,000 | | | | 284,534 | |
Morgan Stanley
5.625% 9/23/19 | | | 235,000 | | | | 265,267 | |
Morgan Stanley
5.750% 1/25/21 | | | 115,000 | | | | 132,014 | |
Stifel Financial Corp.
4.250% 7/18/24 | | | 140,000 | | | | 140,830 | |
| | | | | | | | |
| | | | | | | 13,214,899 | |
| | | | | | | | |
| Electric — 0.8% | |
The AES Corp.
7.750% 10/15/15 | | | 34,000 | | | | 35,445 | |
CMS Energy Corp.
5.050% 2/15/18 | | | 400,000 | | | | 434,966 | |
Entergy Louisiana LLC
4.950% 1/15/45 | | | 165,000 | | | | 167,442 | |
Florida Power & Light Co.
4.950% 6/01/35 | | | 125,000 | | | | 144,199 | |
Georgia Power Co.
4.300% 3/15/42 | | | 106,000 | | | | 111,317 | |
IPALCO Enterprises, Inc.
5.000% 5/01/18 | | | 400,000 | | | | 422,000 | |
IPALCO Enterprises, Inc. (b)
7.250% 4/01/16 | | | 280,000 | | | | 295,400 | |
Kansas Gas & Electric Co.
5.647% 3/29/21 | | | 179,985 | | | | 190,568 | |
LG&E and KU Energy LLC
4.375% 10/01/21 | | | 275,000 | | | | 292,706 | |
Metropolitan Edison Co. (b)
4.000% 4/15/25 | | | 215,000 | | | | 219,280 | |
The accompanying notes are an integral part of the financial statements.
27
MML Blend Fund – Portfolio of Investments (Continued)
| | | | | | | | |
| | | Principal
Amount | | | Value | |
National Fuel Gas Co.
3.750% 3/01/23 | | $ | 125,000 | | | $ | 126,430 | |
Nevada Power Co. Series N
6.650% 4/01/36 | | | 135,000 | | | | 186,682 | |
Niagara Mohawk Power Corp. (b)
2.721% 11/28/22 | | | 200,000 | | | | 195,771 | |
NiSource Finance Corp.
4.800% 2/15/44 | | | 200,000 | | | | 213,089 | |
NiSource Finance Corp.
5.800% 2/01/42 | | | 175,000 | | | | 212,982 | |
Oncor Electric Delivery Co.
6.800% 9/01/18 | | | 15,000 | | | | 17,484 | |
Oncor Electric Delivery Co.
7.500% 9/01/38 | | | 40,000 | | | | 60,219 | |
Pacific Gas & Electric Co.
5.800% 3/01/37 | | | 120,000 | | | | 146,998 | |
Pennsylvania Electric Co. (b)
4.150% 4/15/25 | | | 295,000 | | | | 297,551 | |
PPL Capital Funding, Inc.
1.900% 6/01/18 | | | 55,000 | | | | 54,907 | |
PPL Capital Funding, Inc.
5.000% 3/15/44 | | | 190,000 | | | | 211,457 | |
Puget Energy, Inc.
6.500% 12/15/20 | | | 271,000 | | | | 318,477 | |
Southern California Edison Co.
5.950% 2/01/38 | | | 105,000 | | | | 138,593 | |
State Grid Overseas Investment Ltd. (b)
1.750% 5/22/18 | | | 200,000 | | | | 196,148 | |
Transelec SA (b)
4.625% 7/26/23 | | | 175,000 | | | | 181,461 | |
Tri-State Generation & Transmission Association, Series 2003, Class A (b)
6.040% 1/31/18 | | | 151,141 | | | | 160,202 | |
Virginia Electric and Power Co.
6.350% 11/30/37 | | | 150,000 | | | | 208,614 | |
Wisconsin Public Service Corp.
5.650% 11/01/17 | | | 225,000 | | | | 244,167 | |
| | | | | | | | |
| | | | | | | 5,484,555 | |
| | | | | | | | |
| Electrical Components & Equipment — 0.1% | |
Anixter, Inc.
5.950% 3/01/15 | | | 510,000 | | | | 511,275 | |
| | | | | | | | |
| Electronics — 0.1% | |
Amphenol Corp.
4.000% 2/01/22 | | | 100,000 | | | | 104,875 | |
Arrow Electronics, Inc.
6.000% 4/01/20 | | | 220,000 | | | | 247,043 | |
Avnet, Inc.
4.875% 12/01/22 | | | 123,000 | | | | 130,536 | |
Jabil Circuit, Inc.
7.750% 7/15/16 | | | 185,000 | | | | 198,181 | |
| | | | | | | | |
| | | Principal
Amount | | | Value | |
Jabil Circuit, Inc.
8.250% 3/15/18 | | $ | 95,000 | | | $ | 108,006 | |
| | | | | | | | |
| | | | | | | 788,641 | |
| | | | | | | | |
| Engineering & Construction — 0.0% | |
BAA Funding Ltd. (b)
2.500% 6/25/17 | | | 200,000 | | | | 200,120 | |
| | | | | | | | |
| Entertainment — 0.0% | |
International Game Technology
5.500% 6/15/20 | | | 125,000 | | | | 129,586 | |
| | | | | | | | |
| Environmental Controls — 0.0% | |
Republic Services, Inc.
3.800% 5/15/18 | | | 140,000 | | | | 148,121 | |
Republic Services, Inc.
5.250% 11/15/21 | | | 25,000 | | | | 28,307 | |
| | | | | | | | |
| | | | | | | 176,428 | |
| | | | | | | | |
| Foods — 0.2% | |
ConAgra Foods, Inc.
4.950% 8/15/20 | | | 150,000 | | | | 164,756 | |
ConAgra Foods, Inc.
6.625% 8/15/39 | | | 75,000 | | | | 95,978 | |
ConAgra Foods, Inc.
7.000% 4/15/19 | | | 153,000 | | | | 178,217 | |
Delhaize Group
6.500% 6/15/17 | | | 210,000 | | | | 231,661 | |
Kraft Foods, Inc.
4.125% 2/09/16 | | | 280,000 | | | | 290,403 | |
Kraft Foods, Inc.
6.500% 2/09/40 | | | 63,000 | | | | 83,962 | |
Tyson Foods, Inc.
2.650% 8/15/19 | | | 65,000 | | | | 65,592 | |
Tyson Foods, Inc.
3.950% 8/15/24 | | | 140,000 | | | | 144,721 | |
Tyson Foods, Inc.
4.875% 8/15/34 | | | 105,000 | | | | 115,182 | |
Tyson Foods, Inc.
6.600% 4/01/16 | | | 220,000 | | | | 234,521 | |
WM Wrigley Jr. Co. (b)
2.400% 10/21/18 | | | 80,000 | | | | 80,563 | |
| | | | | | | | |
| | | | | | | 1,685,556 | |
| | | | | | | | |
| Forest Products & Paper — 0.1% | |
Domtar Corp.
9.500% 8/01/16 | | | 30,000 | | | | 33,118 | |
Domtar Corp.
10.750% 6/01/17 | | | 40,000 | | | | 47,543 | |
International Paper Co.
4.750% 2/15/22 | | | 100,000 | | | | 109,099 | |
International Paper Co.
7.300% 11/15/39 | | | 110,000 | | | | 145,850 | |
International Paper Co.
9.375% 5/15/19 | | | 70,000 | | | | 89,358 | |
The accompanying notes are an integral part of the financial statements.
28
MML Blend Fund – Portfolio of Investments (Continued)
| | | | | | | | |
| | | Principal
Amount | | | Value | |
The Mead Corp.
7.550% 3/01/47 | | $ | 260,000 | | | $ | 326,140 | |
| | | | | | | | |
| | | | | | | 751,108 | |
| | | | | | | | |
| Gas — 0.1% | |
Boston Gas Co. (b)
4.487% 2/15/42 | | | 100,000 | | | | 107,741 | |
The Laclede Group, Inc.
4.700% 8/15/44 | | | 290,000 | | | | 302,071 | |
| | | | | | | | |
| | | | | | | 409,812 | |
| | | | | | | | |
| Hand & Machine Tools — 0.0% | |
Kennametal, Inc.
2.650% 11/01/19 | | | 150,000 | | | | 148,413 | |
| | | | | | | | |
| Health Care – Products — 0.1% | |
Boston Scientific Corp.
6.000% 1/15/20 | | | 170,000 | | | | 191,586 | |
Hospira, Inc.
5.200% 8/12/20 | | | 150,000 | | | | 160,924 | |
Johnson & Johnson
5.850% 7/15/38 | | | 40,000 | | | | 54,625 | |
| | | | | | | | |
| | | | | | | 407,135 | |
| | | | | | | | |
| Health Care – Services — 0.2% | |
Anthem, Inc., Convertible
2.750% 10/15/42 | | | 100,000 | | | | 172,125 | |
Cigna Corp.
2.750% 11/15/16 | | | 175,000 | | | | 179,702 | |
Cigna Corp.
5.125% 6/15/20 | | | 100,000 | | | | 111,442 | |
Howard Hughes Medical Institute
3.500% 9/01/23 | | | 150,000 | | | | 156,853 | |
Kaiser Foundation Hospitals
3.500% 4/01/22 | | | 75,000 | | | | 77,352 | |
Roche Holdings, Inc. (b)
6.000% 3/01/19 | | | 35,000 | | | | 40,425 | |
UnitedHealth Group, Inc.
2.750% 2/15/23 | | | 80,000 | | | | 78,490 | |
UnitedHealth Group, Inc.
3.950% 10/15/42 | | | 55,000 | | | | 54,671 | |
UnitedHealth Group, Inc.
6.875% 2/15/38 | | | 230,000 | | | | 322,747 | |
| | | | | | | | |
| | | | | | | 1,193,807 | |
| | | | | | | | |
| Holding Company – Diversified — 0.0% | |
Hutchison Whampoa International Ltd. (b)
5.750% 9/11/19 | | | 220,000 | | | | 250,845 | |
| | | | | | | | |
| Home Furnishing — 0.0% | |
Whirlpool Corp.
3.700% 3/01/23 | | | 110,000 | | | | 111,710 | |
Whirlpool Corp.
5.150% 3/01/43 | | | 50,000 | | | | 55,365 | |
| | | | | | | | |
| | | | | | | 167,075 | |
| | | | | | | | |
| | | | | | | | |
| | | Principal
Amount | | | Value | |
| Household Products — 0.1% | |
Avery Dennison Corp.
3.350% 4/15/23 | | $ | 70,000 | | | $ | 69,586 | |
Jarden Corp., Convertible
1.500% 6/15/19 | | | 271,000 | | | | 357,042 | |
| | | | | | | | |
| | | | | | | 426,628 | |
| | | | | | | | |
| Housewares — 0.0% | |
Newell Rubbermaid, Inc.
2.050% 12/01/17 | | | 150,000 | | | | 149,543 | |
| | | | | | | | |
| Insurance — 1.1% | |
Aflac, Inc.
3.625% 6/15/23 | | | 235,000 | | | | 240,691 | |
Aflac, Inc.
8.500% 5/15/19 | | | 110,000 | | | | 137,469 | |
The Allstate Corp.
5.550% 5/09/35 | | | 150,000 | | | | 185,890 | |
The Allstate Corp. VRN
5.750% 8/15/53 | | | 320,000 | | | | 337,200 | |
The Allstate Corp.
7.450% 5/16/19 | | | 18,000 | | | | 21,797 | |
Arch Capital Group US, Inc.
5.144% 11/01/43 | | | 170,000 | | | | 188,880 | |
AXIS Specialty Finance PLC
2.650% 4/01/19 | | | 95,000 | | | | 95,240 | |
Brown & Brown, Inc.
4.200% 9/15/24 | | | 300,000 | | | | 303,408 | |
The Chubb Corp. VRN
6.375% 3/29/67 | | | 245,000 | | | | 262,652 | |
CNA Financial Corp.
3.950% 5/15/24 | | | 180,000 | | | | 182,008 | |
CNA Financial Corp.
7.350% 11/15/19 | | | 180,000 | | | | 214,838 | |
Five Corners Funding Trust (b)
4.419% 11/15/23 | | | 215,000 | | | | 227,346 | |
The Hartford Financial Services Group, Inc. VRN
8.125% 6/15/38 | | | 220,000 | | | | 251,863 | |
Liberty Mutual Group, Inc. (b)
4.250% 6/15/23 | | | 97,000 | | | | 99,956 | |
Lincoln National Corp.
4.300% 6/15/15 | | | 100,000 | | | | 101,582 | |
Marsh & McLennan Cos., Inc.
4.800% 7/15/21 | | | 200,000 | | | | 222,284 | |
Marsh & McLennan Cos., Inc.
5.875% 8/01/33 | | | 100,000 | | | | 123,197 | |
MetLife Capital Trust IV (b)
7.875% 12/15/67 | | | 345,000 | | | | 440,738 | |
MetLife, Inc. Series A
6.817% 8/15/18 | | | 45,000 | | | | 52,358 | |
Principal Financial Group, Inc.
8.875% 5/15/19 | | | 120,000 | | | | 150,985 | |
The accompanying notes are an integral part of the financial statements.
29
MML Blend Fund – Portfolio of Investments (Continued)
| | | | | | | | |
| | | Principal
Amount | | | Value | |
The Progressive Corp. VRN
6.700% 6/15/37 | | $ | 356,000 | | | $ | 385,103 | |
Prudential Financial, Inc.
4.500% 11/15/20 | | | 125,000 | | | | 135,662 | |
Prudential Financial, Inc. VRN
5.200% 3/15/44 | | | 305,000 | | | | 301,950 | |
Prudential Financial, Inc. VRN
5.625% 6/15/43 | | | 245,000 | | | | 250,464 | |
Prudential Financial, Inc.
6.200% 11/15/40 | | | 75,000 | | | | 95,507 | |
Prudential Financial, Inc. VRN
8.875% 6/15/38 | | | 260,000 | | | | 303,550 | |
QBE Capital Funding III Ltd. VRN (b)
7.250% 5/24/41 | | | 200,000 | | | | 218,000 | |
QBE Insurance Group Ltd. (b)
2.400% 5/01/18 | | | 115,000 | | | | 115,012 | |
Reinsurance Group of America, Inc.
4.700% 9/15/23 | | | 225,000 | | | | 241,775 | |
Reinsurance Group of America, Inc.
5.000% 6/01/21 | | | 225,000 | | | | 247,810 | |
Reinsurance Group of America, Inc.
6.450% 11/15/19 | | | 220,000 | | | | 254,724 | |
The Travelers Cos., Inc.
6.250% 6/15/37 | | | 125,000 | | | | 166,052 | |
USF&G Capital I (b)
8.500% 12/15/45 | | | 150,000 | | | | 223,743 | |
Voya Financial, Inc.
5.500% 7/15/22 | | | 125,000 | | | | 141,202 | |
Voya Financial, Inc. VRN
5.650% 5/15/53 | | | 205,000 | | | | 202,950 | |
Willis Group Holdings PLC
4.125% 3/15/16 | | | 55,000 | | | | 56,686 | |
Willis North America, Inc.
7.000% 9/29/19 | | | 97,000 | | | | 113,131 | |
| | | | | | | | |
| | | | | | | 7,293,703 | |
| | | | | | | | |
| Internet — 0.3% | |
Baidu, Inc.
3.250% 8/06/18 | | | 285,000 | | | | 291,331 | |
Expedia, Inc.
4.500% 8/15/24 | | | 870,000 | | | | 878,501 | |
Expedia, Inc.
7.456% 8/15/18 | | | 425,000 | | | | 494,304 | |
LinkedIn Corp., Convertible (b)
0.500% 11/01/19 | | | 225,000 | | | | 237,375 | |
| | | | | | | | |
| | | | | | | 1,901,511 | |
| | | | | | | | |
| Investment Companies — 0.2% | |
Ares Capital Corp.
3.875% 1/15/20 | | | 300,000 | | | | 299,139 | |
FS Investment Corp.
4.000% 7/15/19 | | | 390,000 | | | | 388,461 | |
Xstrata Finance Canada Ltd. (b)
2.050% 10/23/15 | | | 225,000 | | | | 226,464 | |
| | | | | | | | |
| | | Principal
Amount | | | Value | |
Xstrata Finance Canada Ltd. (b)
5.800% 11/15/16 | | $ | 195,000 | | | $ | 208,599 | |
| | | | | | | | |
| | | | | | | 1,122,663 | |
| | | | | | | | |
| Iron & Steel — 0.3% | |
Allegheny Technologies, Inc.
9.375% 6/01/19 | | | 180,000 | | | | 209,419 | |
ArcelorMittal
4.250% 8/05/15 | | | 414,000 | | | | 420,210 | |
ArcelorMittal
5.000% 2/25/17 | | | 70,000 | | | | 72,800 | |
ArcelorMittal
5.750% 8/05/20 | | | 285,000 | | | | 295,688 | |
Cliffs Natural Resources, Inc.
5.700% 1/15/18 | | | 120,000 | | | | 78,000 | |
Commercial Metals Co.
6.500% 7/15/17 | | | 125,000 | | | | 133,125 | |
Reliance Steel & Aluminum Co.
4.500% 4/15/23 | | | 145,000 | | | | 142,108 | |
Reliance Steel & Aluminum Co.
6.200% 11/15/16 | | | 245,000 | | | | 261,496 | |
Reliance Steel & Aluminum Co.
6.850% 11/15/36 | | | 255,000 | | | | 297,530 | |
| | | | | | | | |
| | | | | | | 1,910,376 | |
| | | | | | | | |
| Leisure Time — 0.0% | |
Carnival Corp.
1.875% 12/15/17 | | | 125,000 | | | | 124,065 | |
| | | | | | | | |
| Lodging — 0.2% | |
Choice Hotels International, Inc.
5.700% 8/28/20 | | | 250,000 | | | | 269,375 | |
Marriott International, Inc.
3.250% 9/15/22 | | | 265,000 | | | | 266,065 | |
Marriott International, Inc.
5.810% 11/10/15 | | | 70,000 | | | | 72,876 | |
Marriott International, Inc.
6.200% 6/15/16 | | | 160,000 | | | | 171,315 | |
Starwood Hotels & Resorts Worldwide, Inc.
6.750% 5/15/18 | | | 40,000 | | | | 45,530 | |
Wyndham Worldwide Corp.
2.500% 3/01/18 | | | 200,000 | | | | 199,658 | |
Wyndham Worldwide Corp.
2.950% 3/01/17 | | | 75,000 | | | | 76,593 | |
Wynn Las Vegas LLC/Wynn Las Vegas Capital Corp.
7.750% 8/15/20 | | | 425,000 | | | | 452,723 | |
| | | | | | | | |
| | | | | | | 1,554,135 | |
| | | | | | | | |
| Machinery – Diversified — 0.2% | |
CNH Industrial Capital LLC
3.250% 2/01/17 | | | 105,000 | | | | 103,425 | |
CNH Industrial Capital LLC (b)
3.375% 7/15/19 | | | 230,000 | | | | 219,650 | |
The accompanying notes are an integral part of the financial statements.
30
MML Blend Fund – Portfolio of Investments (Continued)
| | | | | | | | |
| | | Principal
Amount | | | Value | |
CNH Industrial Capital LLC
3.625% 4/15/18 | | $ | 116,000 | | | $ | 114,260 | |
CNH Industrial Capital LLC
3.875% 11/01/15 | | | 380,000 | | | | 381,900 | |
CNH Industrial Capital LLC
6.250% 11/01/16 | | | 220,000 | | | | 230,450 | |
Xylem, Inc.
3.550% 9/20/16 | | | 200,000 | | | | 207,839 | |
Xylem, Inc.
4.875% 10/01/21 | | | 100,000 | | | | 108,034 | |
| | | | | | | | |
| | | | | | | 1,365,558 | |
| | | | | | | | |
| Manufacturing — 0.3% | |
Eaton Corp.
1.500% 11/02/17 | | | 140,000 | | | | 139,189 | |
General Electric Co.
4.125% 10/09/42 | | | 270,000 | | | | 279,507 | |
Harsco Corp
2.700% 10/15/15 | | | 1,098,000 | | | | 1,096,627 | |
Ingersoll-Rand Global Holding Co. Ltd.
6.875% 8/15/18 | | | 180,000 | | | | 208,956 | |
SPX Corp.
6.875% 9/01/17 | | | 200,000 | | | | 218,500 | |
Textron, Inc.
6.200% 3/15/15 | | | 180,000 | | | | 181,801 | |
Tyco Electronics Group SA
6.550% 10/01/17 | | | 200,000 | | | | 225,126 | |
| | | | | | | | |
| | | | | | | 2,349,706 | |
| | | | | | | | |
| Media — 0.2% | |
21st Century Fox America Co.
6.900% 8/15/39 | | | 100,000 | | | | 135,568 | |
Comcast Corp.
6.400% 5/15/38 | | | 175,000 | | | | 233,661 | |
Globo Comunicacao e Participacoes SA STEP (b)
6.250% 7/29/49 | | | 320,000 | | | | 327,360 | |
NBCUniversal Media LLC
6.400% 4/30/40 | | | 20,000 | | | | 26,796 | |
Time Warner Cable, Inc.
6.750% 6/15/39 | | | 110,000 | | | | 143,801 | |
Time Warner Cable, Inc.
8.250% 4/01/19 | | | 45,000 | | | | 55,086 | |
Time Warner Cable, Inc.
8.750% 2/14/19 | | | 65,000 | | | | 80,460 | |
Time Warner, Inc.
4.700% 1/15/21 | | | 125,000 | | | | 136,821 | |
Time Warner, Inc.
6.100% 7/15/40 | | | 135,000 | | | | 164,406 | |
Time Warner, Inc.
6.250% 3/29/41 | | | 25,000 | | | | 31,044 | |
Viacom, Inc.
6.250% 4/30/16 | | | 195,000 | | | | 208,319 | |
| | | | | | | | |
| | | | | | | 1,543,322 | |
| | | | | | | | |
| | | | | | | | |
| | | Principal
Amount | | | Value | |
| Mining — 0.3% | |
Freeport-McMoRan, Inc.
2.375% 3/15/18 | | $ | 105,000 | | | $ | 103,845 | |
Freeport-McMoRan, Inc.
4.000% 11/14/21 | | | 795,000 | | | | 787,688 | |
Freeport-McMoRan, Inc.
5.450% 3/15/43 | | | 155,000 | | | | 146,564 | |
Rio Tinto Finance USA Ltd.
9.000% 5/01/19 | | | 255,000 | | | | 322,616 | |
Vale Overseas Ltd.
6.250% 1/23/17 | | | 305,000 | | | | 325,316 | |
Vale Overseas Ltd.
6.875% 11/10/39 | | | 80,000 | | | | 85,205 | |
Vulcan Materials Co.
6.500% 12/01/16 | | | 15,000 | | | | 15,975 | |
| | | | | | | | |
| | | | | | | 1,787,209 | |
| | | | | | | | |
| Office Equipment/Supplies — 0.1% | |
Pitney Bowes, Inc.
4.625% 3/15/24 | | | 270,000 | | | | 276,376 | |
Pitney Bowes, Inc.
4.750% 1/15/16 | | | 125,000 | | | | 129,265 | |
Pitney Bowes, Inc.
4.750% 5/15/18 | | | 20,000 | | | | 21,294 | |
Pitney Bowes, Inc.
5.750% 9/15/17 | | | 31,000 | | | | 33,925 | |
Xerox Corp.
5.625% 12/15/19 | | | 10,000 | | | | 11,239 | |
| | | | | | | | |
| | | | | | | 472,099 | |
| | | | | | | | |
| Office Furnishings — 0.0% | |
Steelcase, Inc.
6.375% 2/15/21 | | | 100,000 | | | | 115,432 | |
| | | | | | | | |
| Oil & Gas — 1.0% | |
Anadarko Petroleum Corp.
6.450% 9/15/36 | | | 135,000 | | | | 162,229 | |
Chesapeake Energy Corp.
3.250% 3/15/16 | | | 725,000 | | | | 723,187 | |
Chesapeake Energy Corp., Convertible
2.250% 12/15/38 | | | 45,000 | | | | 40,416 | |
Chesapeake Energy Corp., Convertible
2.500% 5/15/37 | | | 460,000 | | | | 446,775 | |
ConocoPhillips
6.500% 2/01/39 | | | 110,000 | | | | 146,151 | |
Devon Energy Corp.
5.600% 7/15/41 | | | 175,000 | | | | 194,407 | |
Ecopetrol SA
4.250% 9/18/18 | | | 40,000 | | | | 41,600 | |
EQT Corp.
4.875% 11/15/21 | | | 110,000 | | | | 118,834 | |
Motiva Enterprises LLC (b)
5.750% 1/15/20 | | | 215,000 | | | | 239,895 | |
Motiva Enterprises LLC (b)
6.850% 1/15/40 | | | 170,000 | | | | 209,685 | |
The accompanying notes are an integral part of the financial statements.
31
MML Blend Fund – Portfolio of Investments (Continued)
| | | | | | | | |
| | | Principal
Amount | | | Value | |
Newfield Exploration Co.
6.875% 2/01/20 | | $ | 200,000 | | | $ | 203,000 | |
Nexen, Inc.
7.500% 7/30/39 | | | 25,000 | | | | 34,696 | |
Pemex Project Funding Master Trust
6.625% 6/15/38 | | | 37,000 | | | | 42,458 | |
Petrobras Global Finance BV
2.000% 5/20/16 | | | 195,000 | | | | 186,254 | |
Petrobras Global Finance BV
3.000% 1/15/19 | | | 110,000 | | | | 97,248 | |
Petrobras Global Finance BV
3.250% 3/17/17 | | | 560,000 | | | | 527,800 | |
Petrobras International Finance Co.
3.875% 1/27/16 | | | 275,000 | | | | 269,857 | |
Petrobras International Finance Co.
5.375% 1/27/21 | | | 240,000 | | | | 222,377 | |
Petrobras International Finance Co.
6.750% 1/27/41 | | | 100,000 | | | | 90,957 | |
Petroleos Mexicanos
3.125% 1/23/19 | | | 50,000 | | | | 50,125 | |
Petroleos Mexicanos
5.500% 1/21/21 | | | 285,000 | | | | 308,512 | |
Petroleos Mexicanos
6.375% 1/23/45 | | | 80,000 | | | | 90,600 | |
Phillips 66
5.875% 5/01/42 | | | 100,000 | | | | 115,159 | |
Pioneer Natural Resources Co.
5.875% 7/15/16 | | | 240,000 | | | | 254,899 | |
Rowan Cos., Inc.
4.875% 6/01/22 | | | 325,000 | | | | 316,251 | |
Rowan Cos., Inc.
5.000% 9/01/17 | | | 220,000 | | | | 229,240 | |
Shell International Finance BV
5.500% 3/25/40 | | | 75,000 | | | | 91,328 | |
Talisman Energy, Inc.
5.500% 5/15/42 | | | 125,000 | | | | 117,991 | |
Talisman Energy, Inc.
7.750% 6/01/19 | | | 205,000 | | | | 236,133 | |
Transocean, Inc.
4.950% 11/15/15 | | | 357,000 | | | | 357,894 | |
Transocean, Inc.
5.050% 12/15/16 | | | 200,000 | | | | 200,958 | |
Valero Energy Corp.
6.125% 2/01/20 | | | 200,000 | | | | 226,822 | |
| | | | | | | | |
| | | | | | | 6,593,738 | |
| | | | | | | | |
| Oil & Gas Services — 0.3% | |
Baker Hughes, Inc.
5.125% 9/15/40 | | | 200,000 | | | | 219,377 | |
Hornbeck Offshore Services, Inc.
1.500% 9/01/19 | | | 405,000 | | | | 336,656 | |
SEACOR Holdings, Inc., Convertible
3.000% 11/15/28 | | | 140,000 | | | | 127,575 | |
| | | | | | | | |
| | | Principal
Amount | | | Value | |
SESI LLC
6.375% 5/01/19 | | $ | 105,000 | | | $ | 101,850 | |
Superior Energy Services, Inc.
7.125% 12/15/21 | | | 836,000 | | | | 802,560 | |
Weatherford International Ltd.
4.500% 4/15/22 | | | 125,000 | | | | 111,253 | |
Weatherford International Ltd.
5.950% 4/15/42 | | | 245,000 | | | | 207,448 | |
Weatherford International Ltd.
6.000% 3/15/18 | | | 75,000 | | | | 80,063 | |
| | | | | | | | |
| | | | | | | 1,986,782 | |
| | | | | | | | |
| Packaging & Containers — 0.0% | |
Brambles USA Inc., Series A (b)
5.350% 4/01/20 | | | 90,000 | | | | 100,289 | |
| | | | | | | | |
| Pharmaceuticals — 0.3% | |
AbbVie, Inc.
4.400% 11/06/42 | | | 75,000 | | | | 77,375 | |
McKesson Corp.
1.292% 3/10/17 | | | 95,000 | | | | 94,515 | |
McKesson Corp.
2.284% 3/15/19 | | | 95,000 | | | | 94,802 | |
McKesson Corp.
3.796% 3/15/24 | | | 45,000 | | | | 46,228 | |
McKesson Corp.
4.750% 3/01/21 | | | 150,000 | | | | 165,851 | |
McKesson Corp.
4.883% 3/15/44 | | | 60,000 | | | | 66,094 | |
McKesson Corp.
6.000% 3/01/41 | | | 125,000 | | | | 154,635 | |
Medco Health Solutions, Inc.
2.750% 9/15/15 | | | 250,000 | | | | 253,281 | |
Merck Sharp & Dohme Corp.
5.850% 6/30/39 | | | 45,000 | | | | 58,883 | |
Mylan, Inc. (b)
7.875% 7/15/20 | | | 575,000 | | | | 612,487 | |
Teva Pharmaceutical Finance Co. LLC
6.150% 2/01/36 | | | 80,000 | | | | 98,964 | |
| | | | | | | | |
| | | | | | | 1,723,115 | |
| | | | | | | | |
| Pipelines — 0.6% | |
Access Midstream Partners LP/ACMP Finance Corp.
4.875% 5/15/23 | | | 615,000 | | | | 624,225 | |
Boardwalk Pipelines LLC
5.500% 2/01/17 | | | 175,000 | | | | 184,610 | |
Boardwalk Pipelines LP
5.875% 11/15/16 | | | 390,000 | | | | 414,078 | |
CenterPoint Energy Resources Corp.
4.500% 1/15/21 | | | 100,000 | | | | 109,662 | |
CenterPoint Energy Resources Corp.
5.850% 1/15/41 | | | 100,000 | | | | 127,961 | |
DCP Midstream LLC (b)
9.750% 3/15/19 | | | 20,000 | | | | 25,016 | |
The accompanying notes are an integral part of the financial statements.
32
MML Blend Fund – Portfolio of Investments (Continued)
| | | | | | | | |
| | | Principal
Amount | | | Value | |
DCP Midstream Operating LLC
3.875% 3/15/23 | | $ | 40,000 | | | $ | 38,277 | |
El Paso Pipeline Partners Operating Co. LLC
4.100% 11/15/15 | | | 125,000 | | | | 127,898 | |
Energy Transfer Partners LP FRN
3.250% 11/01/66 | | | 250,000 | | | | 223,750 | |
Enterprise Products Operating LP
3.200% 2/01/16 | | | 100,000 | | | | 102,368 | |
Enterprise Products Operating LP
5.950% 2/01/41 | | | 150,000 | | | | 176,354 | |
Gulf South Pipeline Co. LP (b)
5.050% 2/01/15 | | | 150,000 | | | | 150,447 | |
Kinder Morgan Energy Partners LP
6.000% 2/01/17 | | | 130,000 | | | | 140,430 | |
Kinder Morgan Energy Partners LP
6.500% 2/01/37 | | | 120,000 | | | | 134,883 | |
Kinder Morgan Energy Partners LP
6.950% 1/15/38 | | | 10,000 | | | | 11,541 | |
Kinder Morgan Finance Co. LLC (b)
6.000% 1/15/18 | | | 150,000 | | | | 162,570 | |
ONEOK Partners LP
3.250% 2/01/16 | | | 100,000 | | | | 102,002 | |
ONEOK Partners LP
6.125% 2/01/41 | | | 120,000 | | | | 129,086 | |
Southern Natural Gas Co. LLC (b)
5.900% 4/01/17 | | | 250,000 | | | | 268,810 | |
Texas Eastern Transmission LP (b)
6.000% 9/15/17 | | | 175,000 | | | | 192,784 | |
TransCanada PipeLines Ltd.
6.200% 10/15/37 | | | 125,000 | | | | 147,417 | |
The Williams Cos., Inc.
3.700% 1/15/23 | | | 100,000 | | | | 89,809 | |
Williams Partners LP
5.250% 3/15/20 | | | 365,000 | | | | 396,218 | |
| | | | | | | | |
| | | | | | | 4,080,196 | |
| | | | | | | | |
| Real Estate — 0.0% | |
AMB Property LP
4.500% 8/15/17 | | | 175,000 | | | | 186,483 | |
Post Apartment Homes LP
3.375% 12/01/22 | | | 50,000 | | | | 49,269 | |
| | | | | | | | |
| | | | | | | 235,752 | |
| | | | | | | | |
| Real Estate Investment Trusts (REITS) — 0.6% | |
American Tower Corp.
3.400% 2/15/19 | | | 185,000 | | | | 188,297 | |
American Tower Corp.
3.450% 9/15/21 | | | 425,000 | | | | 417,834 | |
American Tower Corp.
4.500% 1/15/18 | | | 330,000 | | | | 350,456 | |
ARC Properties Operating Partnership LP
2.000% 2/06/17 | | | 225,000 | | | | 214,440 | |
| | | | | | | | |
| | | Principal
Amount | | | Value | |
ARC Properties Operating Partnership LP
3.000% 2/06/19 | | $ | 110,000 | | | $ | 101,785 | |
Boston Properties LP
3.700% 11/15/18 | | | 100,000 | | | | 105,443 | |
Boston Properties LP
4.125% 5/15/21 | | | 140,000 | | | | 149,019 | |
Brandywine Operating Partners LP
4.950% 4/15/18 | | | 200,000 | | | | 214,991 | |
DDR Corp.
4.750% 4/15/18 | | | 60,000 | | | | 64,092 | |
DDR Corp.
7.875% 9/01/20 | | | 60,000 | | | | 73,996 | |
Developers Diversified Realty Corp.
5.500% 5/01/15 | | | 390,000 | | | | 395,695 | |
Duke Realty LP
8.250% 8/15/19 | | | 225,000 | | | | 277,582 | |
ERP Operating LP
4.625% 12/15/21 | | | 75,000 | | | | 82,051 | |
Federal Realty Investment Trust
5.900% 4/01/20 | | | 55,000 | | | | 63,568 | |
HCP, Inc.
2.625% 2/01/20 | | | 180,000 | | | | 178,130 | |
Highwoods Realty LP
7.500% 4/15/18 | | | 265,000 | | | | 307,082 | |
ProLogis LP
2.750% 2/15/19 | | | 90,000 | | | | 91,285 | |
Realty Income Corp.
2.000% 1/31/18 | | | 465,000 | | | | 465,857 | |
Simon Property Group LP
5.650% 2/01/20 | | | 35,000 | | | | 40,175 | |
Ventas Realty LP/Ventas Capital Corp.
4.250% 3/01/22 | | | 100,000 | | | | 105,072 | |
| | | | | | | | |
| | | | | | | 3,886,850 | |
| | | | | | | | |
| Retail — 0.5% | |
Bed Bath & Beyond, Inc.
3.749% 8/01/24 | | | 65,000 | | | | 65,896 | |
Bed Bath & Beyond, Inc.
5.165% 8/01/44 | | | 145,000 | | | | 151,711 | |
CVS Health Corp.
6.125% 9/15/39 | | | 175,000 | | | | 226,117 | |
CVS Pass-Through Trust (b)
5.926% 1/10/34 | | | 302,084 | | | | 351,283 | |
El Puerto de Liverpool SAB de CV (b)
3.950% 10/02/24 | | | 445,000 | | | | 438,103 | |
The Home Depot, Inc.
5.950% 4/01/41 | | | 150,000 | | | | 195,911 | |
Macy’s Retail Holdings, Inc.
7.450% 7/15/17 | | | 110,000 | | | | 125,058 | |
McDonald’s Corp.
6.300% 10/15/37 | | | 100,000 | | | | 130,668 | |
O’Reilly Automotive, Inc.
3.850% 6/15/23 | | | 105,000 | | | | 109,405 | |
The accompanying notes are an integral part of the financial statements.
33
MML Blend Fund – Portfolio of Investments (Continued)
| | | | | | | | |
| | | Principal
Amount | | | Value | |
O’Reilly Automotive, Inc.
4.875% 1/14/21 | | $ | 150,000 | | | $ | 164,694 | |
QVC, Inc.
3.125% 4/01/19 | | | 155,000 | | | | 154,950 | |
QVC, Inc.
4.375% 3/15/23 | | | 150,000 | | | | 150,516 | |
QVC, Inc.
4.450% 2/15/25 | | | 245,000 | | | | 239,454 | |
QVC, Inc.
5.125% 7/02/22 | | | 30,000 | | | | 31,573 | |
Tiffany & Co. (b)
4.900% 10/01/44 | | | 165,000 | | | | 170,055 | |
Walgreens Boots Alliance, Inc.
2.700% 11/18/19 | | | 110,000 | | | | 110,560 | |
Walgreens Boots Alliance, Inc.
3.800% 11/18/24 | | | 220,000 | | | | 224,378 | |
Walgreens Boots Alliance, Inc.
4.800% 11/18/44 | | | 315,000 | | | | 332,127 | |
| | | | | | | | |
| | | | | | | 3,372,459 | |
| | | | | | | | |
| Savings & Loans — 0.1% | |
Glencore Funding LLC (b)
1.700% 5/27/16 | | | 156,000 | | | | 156,248 | |
Glencore Funding LLC (b)
2.500% 1/15/19 | | | 252,000 | | | | 248,138 | |
Glencore Funding LLC (b)
3.125% 4/29/19 | | | 145,000 | | | | 145,348 | |
| | | | | | | | |
| | | | | | | 549,734 | |
| | | | | | | | |
| Semiconductors — 0.2% | |
Intel Corp.
3.250% 8/01/39 | | | 205,000 | | | | 356,444 | |
KLA-Tencor Corp.
4.650% 11/01/24 | | | 350,000 | | | | 362,336 | |
Micron Technology, Inc., Convertible
2.125% 2/15/33 | | | 226,000 | | | | 725,319 | |
Micron Technology, Inc., Convertible
3.000% 11/15/43 | | | 85,000 | | | | 111,828 | |
| | | | | | | | |
| | | | | | | 1,555,927 | |
| | | | | | | | |
| Software — 0.1% | |
Broadridge Financial Solutions, Inc.
3.950% 9/01/20 | | | 110,000 | | | | 114,337 | |
CA, Inc.
2.875% 8/15/18 | | | 125,000 | | | | 127,101 | |
Citrix Systems, Inc., Convertible (b)
0.500% 4/15/19 | | | 345,000 | | | | 363,328 | |
Microsoft Corp.
3.000% 10/01/20 | | | 80,000 | | | | 83,404 | |
| | | | | | | | |
| | | | | | | 688,170 | |
| | | | | | | | |
| Telecommunications — 0.7% | |
America Movil SAB de CV
5.000% 3/30/20 | | | 130,000 | | | | 143,356 | |
| | | | | | | | |
| | | Principal
Amount | | | Value | |
America Movil SAB de CV
6.125% 3/30/40 | | $ | 135,000 | | | $ | 159,733 | |
AT&T, Inc.
6.500% 9/01/37 | | | 300,000 | | | | 370,634 | |
AT&T, Inc.
6.550% 2/15/39 | | | 25,000 | | | | 30,814 | |
British Telecom PLC
9.625% 12/15/30 | | | 55,000 | | | | 86,353 | |
CenturyLink, Inc.
6.150% 9/15/19 | | | 140,000 | | | | 151,200 | |
CenturyLink, Inc.
7.600% 9/15/39 | | | 45,000 | | | | 44,550 | |
Cisco Systems, Inc.
5.500% 1/15/40 | | | 55,000 | | | | 67,022 | |
Deutsche Telekom International Finance BV
8.750% 6/15/30 | | | 60,000 | | | | 88,630 | |
Embarq Corp.
7.082% 6/01/16 | | | 110,000 | | | | 118,538 | |
ENTEL Chile SA (b)
4.875% 10/30/24 | | | 200,000 | | | | 203,225 | |
Qwest Corp.
8.375% 5/01/16 | | | 550,000 | | | | 595,538 | |
Rogers Communications, Inc.
6.800% 8/15/18 | | | 20,000 | | | | 23,083 | |
Rogers Communications, Inc.
7.500% 8/15/38 | | | 30,000 | | | | 41,926 | |
Sprint Communications, Inc. (b)
9.000% 11/15/18 | | | 415,000 | | | | 472,021 | |
Telecom Italia Capital
6.000% 9/30/34 | | | 45,000 | | | | 45,000 | |
Telefonaktiebolaget LM Ericsson
4.125% 5/15/22 | | | 150,000 | | | | 156,898 | |
Telefonica Emisiones SAU
3.992% 2/16/16 | | | 300,000 | | | | 308,548 | |
Telefonica Emisiones SAU
5.462% 2/16/21 | | | 125,000 | | | | 139,374 | |
Telefonica Emisiones SAU
6.421% 6/20/16 | | | 93,000 | | | | 99,487 | |
Verizon Communications, Inc. (b)
2.625% 2/21/20 | | | 262,000 | | | | 259,005 | |
Verizon Communications, Inc.
3.500% 11/01/24 | | | 275,000 | | | | 270,187 | |
Verizon Communications, Inc. (b)
4.862% 8/21/46 | | | 207,000 | | | | 212,636 | |
Verizon Communications, Inc. (b)
5.012% 8/21/54 | | | 181,000 | | | | 187,253 | |
Verizon Communications, Inc.
5.150% 9/15/23 | | | 225,000 | | | | 248,452 | |
Verizon Communications, Inc.
6.550% 9/15/43 | | | 182,000 | | | | 233,169 | |
| | | | | | | | |
| | | | | | | 4,756,632 | |
| | | | | | | | |
The accompanying notes are an integral part of the financial statements.
34
MML Blend Fund – Portfolio of Investments (Continued)
| | | | | | | | |
| | | Principal
Amount | | | Value | |
| Transportation — 0.2% | |
Asciano Finance (b)
3.125% 9/23/15 | | $ | 160,000 | | | $ | 161,869 | |
Asciano Finance (b)
4.625% 9/23/20 | | | 105,000 | | | | 109,647 | |
Asciano Finance (b)
5.000% 4/07/18 | | | 250,000 | | | | 268,765 | |
Burlington Northern Santa Fe LLC
6.750% 3/15/29 | | | 190,000 | | | | 238,730 | |
Con-way, Inc.
7.250% 1/15/18 | | | 75,000 | | | | 85,232 | |
CSX Corp.
7.250% 5/01/27 | | | 50,000 | | | | 63,773 | |
Norfolk Southern Corp.
6.000% 5/23/2111 | | | 100,000 | | | | 128,260 | |
Ryder System, Inc.
2.550% 6/01/19 | | | 65,000 | | | | 65,090 | |
Union Pacific Corp.
4.000% 2/01/21 | | | 125,000 | | | | 137,092 | |
| | | | | | | | |
| | | | | | | 1,258,458 | |
| | | | | | | | |
| Trucking & Leasing — 0.2% | |
GATX Corp.
3.500% 7/15/16 | | | 250,000 | | | | 257,931 | |
GATX Corp.
3.900% 3/30/23 | | | 95,000 | | | | 98,712 | |
GATX Corp.
4.750% 5/15/15 | | | 85,000 | | | | 86,218 | |
GATX Corp.
4.750% 6/15/22 | | | 150,000 | | | | 164,947 | |
Penske Truck Leasing Co. LP/PTL Finance Corp. (b)
2.500% 3/15/16 | | | 620,000 | | | | 628,532 | |
Penske Truck Leasing Co. LP/PTL Finance Corp. (b)
2.500% 6/15/19 | | | 290,000 | | | | 288,232 | |
| | | | | | | | |
| | | | | | | 1,524,572 | |
| | | | | | | | |
| | |
TOTAL CORPORATE DEBT
(Cost $98,724,944) | | | | | | | 103,463,887 | |
| | | | | | | | |
|
| MUNICIPAL OBLIGATIONS — 0.4% | |
JobsOhio Beverage System Series B
4.532% 1/01/35 | | | 325,000 | | | | 348,754 | |
Orange County, CA, Local Transportation Authority BAB
6.908% 2/15/41 | | | 230,000 | | | | 326,593 | |
San Diego County Regional Airport Authority
5.594% 7/01/43 | | | 450,000 | | | | 503,069 | |
State of California
5.950% 4/01/16 | | | 175,000 | | | | 186,456 | |
State of California BAB
7.550% 4/01/39 | | | 120,000 | | | | 185,183 | |
| | | | | | | | |
| | | Principal
Amount | | | Value | |
State of California BAB
7.600% 11/01/40 | | $ | 350,000 | | | $ | 546,115 | |
State of Illinois
5.365% 3/01/17 | | | 575,000 | | | | 615,566 | |
| | | | | | | | |
| | | | | | | 2,711,736 | |
| | | | | | | | |
| | |
TOTAL MUNICIPAL OBLIGATIONS
(Cost $2,516,650) | | | | | | | 2,711,736 | |
| | | | | | | | |
|
| NON-U.S. GOVERNMENT AGENCY OBLIGATIONS — 6.1% | |
| Auto Floor Plan ABS — 0.0% | |
NCF Dealer Floorplan Master Trust,
Series 2014-1A, Class A FRN (b)
1.666% 10/20/20 | | | 230,000 | | | | 230,000 | |
| | | | | | | | |
| Automobile ABS — 0.2% | |
American Credit Acceptance Receivables Trust, Series 2014-3, Class A (b)
0.990% 8/10/18 | | | 388,055 | | | | 387,652 | |
Avis Budget Rental Car Funding AESOP LLC, Series 2014-2A, Class A (b)
2.500% 2/20/21 | | | 230,000 | | | | 229,046 | |
Capital Automotive REIT, Series 2014-1A, Class A (b)
3.660% 10/15/44 | | | 160,000 | | | | 159,203 | |
Capital Automotive REIT, Series 2012-1A, Class A (b)
4.700% 7/15/42 | | | 231,508 | | | | 236,911 | |
CPS Auto Trust, Series 2014-A, Class A (b)
1.210% 8/15/18 | | | 196,914 | | | | 196,544 | |
CPS Auto Trust, Series 2012-A, Class A (b)
2.780% 6/17/19 | | | 60,880 | | | | 61,683 | |
Flagship Credit Auto Trust, Series 2013-2, Class A (b)
1.940% 1/15/19 | | | 180,243 | | | | 181,011 | |
Rental Car Finance Corp., Series 2011-1A, Class A1 (b)
2.510% 2/25/16 | | | 51,667 | | | | 51,736 | |
| | | | | | | | |
| | | | | | | 1,503,786 | |
| | | | | | | | |
| Commercial MBS — 2.0% | |
Banc of America Commercial Mortgage, Inc., Series 2007-4, Class A4 VRN
5.754% 2/10/51 | | | 291,585 | | | | 317,780 | |
Banc of America Commercial Mortgage, Inc., Series 2007-4, Class AM VRN
5.821% 2/10/51 | | | 220,000 | | | | 239,677 | |
Banc of America Commercial Mortgage, Inc., Series 2008-1, Class A4 VRN
6.245% 2/10/51 | | | 299,818 | | | | 331,644 | |
Banc of America Commercial Mortgage, Inc., Series 2008-1, Class AM VRN
6.288% 2/10/51 | | | 215,000 | | | | 237,916 | |
The accompanying notes are an integral part of the financial statements.
35
MML Blend Fund – Portfolio of Investments (Continued)
| | | | | | | | |
| | | Principal
Amount | | | Value | |
Bear Stearns Commercial Mortgage Securities, Series 2006-PW14, Class A4
5.201% 12/11/38 | | $ | 350,000 | | | $ | 370,643 | |
Bear Stearns Commercial Mortgage Securities, Series 2006-PW14, Class AM
5.243% 12/11/38 | | | 225,000 | | | | 239,271 | |
Bear Stearns Commercial Mortgage Securities, Series 2007-T26, Class AM VRN
5.513% 1/12/45 | | | 425,000 | | | | 456,280 | |
Bear Stearns Commercial Mortgage Securities, Series 2007-PW17, Class A4 VRN
5.694% 6/11/50 | | | 235,000 | | | | 254,880 | |
Bear Stearns Commercial Mortgage Securities, Series 2007-PW18, Class A4
5.700% 6/11/50 | | | 275,000 | | | | 298,896 | |
Bear Stearns Commercial Mortgage Securities, Series 2006-PW12, Class AM VRN
5.743% 9/11/38 | | | 400,000 | | | | 421,094 | |
Bear Stearns Commercial Mortgage Securities, Series 2007-T28, Class AM VRN
5.835% 9/11/42 | | | 155,000 | | | | 169,806 | |
Commercial Mortgage Pass Through Certificates, Series 2012-CR4, Class B (b)
3.703% 10/15/45 | | | 195,000 | | | | 197,367 | |
Commercial Mortgage Pass Through Certificates, Series 2014-UBS2, Class A5
3.961% 3/10/47 | | | 319,000 | | | | 341,047 | |
Commercial Mortgage Pass Through Certificates, Series 2007-C9, Class AM VRN
5.650% 12/10/49 | | | 225,000 | | | | 243,991 | |
Commercial Mortgage Pass Through Certificates, Series 2007-C9, Class A4 VRN
5.796% 12/10/49 | | | 476,000 | | | | 519,879 | |
DBCCRE Mortgage Trust, Series 2014-ARCP, Class A (b)
4.238% 1/10/34 | | | 165,000 | | | | 177,580 | |
DBRR Trust, Series 2013-EZ3, Class A VRN (b)
1.636% 12/18/49 | | | 289,570 | | | | 291,063 | |
DBUBS Mortgage Trust, Series 2011-LC2A, Class A2 (b)
3.386% 7/10/44 | | | 181,860 | | | | 186,858 | |
DBUBS Mortgage Trust, Series 2011-LC1A, Class B VRN (b)
5.471% 11/10/46 | | | 110,000 | | | | 124,540 | |
GCCFC Commercial Mortgage Trust, Series 2006-GG7, Class AM VRN
5.819% 7/10/38 | | | 215,000 | | | | 226,678 | |
| | | | | | | | |
| | | Principal
Amount | | | Value | |
Greenwich Capital Commercial Funding Corp., Series 2006-GG7, Class A4 VRN
5.819% 7/10/38 | | $ | 478,630 | | | $ | 500,878 | |
GS Mortgage Securities Corp., Series 2014-4R, Class AS FRN (b)
0.349% 1/26/34 | | | 295,000 | | | | 277,618 | |
GS Mortgage Securities Corp. II, Series 2012-GC6, Class AS (b)
4.948% 1/10/45 | | | 100,000 | | | | 112,002 | |
JP Morgan Chase Commercial Mortgage Securities Corp., Series 2006-CB17, Class A4
5.429% 12/12/43 | | | 725,000 | | | | 764,560 | |
JP Morgan Chase Commercial Mortgage Securities Corp., Series 2007-CB18, Class AM VRN
5.466% 6/12/47 | | | 265,000 | | | | 282,039 | |
ML-CFC Commercial Mortgage Trust,
Series 2007-9, Class AM VRN
5.856% 9/12/49 | | | 260,000 | | | | 283,853 | |
Morgan Stanley Capital I, Series 2011-C2, Class B VRN (b)
5.200% 6/15/44 | | | 250,000 | | | | 277,673 | |
Morgan Stanley Capital I, Series 2006-IQ12, Class AM
5.370% 12/15/43 | | | 200,000 | | | | 213,300 | |
Morgan Stanley Capital I, Series 2007-HQ11, Class A4 VRN
5.447% 2/12/44 | | | 440,000 | | | | 468,400 | |
Morgan Stanley Capital I, Series 2006-HQ8, Class AM VRN
5.461% 3/12/44 | | | 275,000 | | | | 286,459 | |
Morgan Stanley Capital I, Series 2007-HQ11, Class AM VRN
5.478% 2/12/44 | | | 300,000 | | | | 320,458 | |
Morgan Stanley Capital I, Series 2007-IQ14, Class A2
5.610% 4/15/49 | | | 161,026 | | | | 162,045 | |
Morgan Stanley Capital I, Series 2008-T29, Class A4 VRN
6.278% 1/11/43 | | | 163,908 | | | | 182,896 | |
STRIPs Ltd., Series 2012-1A, Class A (b)
1.500% 12/25/44 | | | 177,346 | | | | 159,611 | |
TIAA Seasoned Commercial Mortgage Trust, Series 2007-C4, Class AJ VRN
5.560% 8/15/39 | | | 200,000 | | | | 205,367 | |
VFC LLC, Series 2014-2, Class A, (Acquired 7/9/14, Cost $250,000) (b) (c)
2.750% 7/20/30 | | | 165,394 | | | | 165,398 | |
VNO Mortgage Trust, Series 2013-PENN, Class A (b)
3.808% 12/13/29 | | | 240,000 | | | | 254,260 | |
The accompanying notes are an integral part of the financial statements.
36
MML Blend Fund – Portfolio of Investments (Continued)
| | | | | | | | |
| | | Principal
Amount | | | Value | |
Wachovia Bank Commercial Mortgage Trust, Series 2006-C29, Class AM 5.339% 11/15/48 | | $ | 270,000 | | | $ | 286,990 | |
Wachovia Bank Commercial Mortgage Trust, Series 2006-C23, Class AM VRN
5.466% 1/15/45 | | | 295,000 | | | | 306,945 | |
Wachovia Bank Commercial Mortgage Trust, Series 2007-C31, Class A4 5.509% 4/15/47 | | | 750,000 | | | | 789,861 | |
Wachovia Bank Commercial Mortgage Trust, Series 2007-C31, Class AM VRN
5.591% 4/15/47 | | | 200,000 | | | | 213,496 | |
Wachovia Bank Commercial Mortgage Trust, Series 2007-C33, Class A4 VRN
5.941% 2/15/51 | | | 189,269 | | | | 201,965 | |
Wachovia Bank Commercial Mortgage Trust, Series 2007-C33, Class AM VRN
5.941% 2/15/51 | | | 235,000 | | | | 254,843 | |
Wells Fargo Commercial Mortgage Trust, Series 2010-C1, Class A1 (b)
3.349% 11/15/43 | | | 71,742 | | | | 74,413 | |
Wells Fargo Reremic Trust, Series 2012-IO, Class A (b)
1.750% 8/20/21 | | | 101,963 | | | | 101,932 | |
WF-RBS Commercial Mortgage Trust,
Series 2011-C3, Class A2 (b)
3.240% 3/15/44 | | | 175,000 | | | | 179,426 | |
WF-RBS Commercial Mortgage Trust,
Series 2011-C2, Class A2 (b)
3.791% 2/15/44 | | | 200,000 | | | | 203,852 | |
WF-RBS Commercial Mortgage Trust,
Series 2012-C8, Class B
4.311% 8/15/45 | | | 190,000 | | | | 201,405 | |
| | | | | | | | |
| | | | | | | 13,378,835 | |
| | | | | | | | |
| Home Equity ABS — 0.7% | |
Aames Mortgage Investment Trust,
Series 2005-1, Class M4 FRN 1.280% 6/25/35 | | | 179,150 | | | | 176,117 | |
Aames Mortgage Investment Trust,
Series 2004-1, Class M5 FRN
1.880% 1/25/35 | | | 342,209 | | | | 333,630 | |
ACE Securities Corp., Series 2005-AG1, Class A1B1 FRN
0.440% 8/25/35 | | | 100,068 | | | | 99,391 | |
Asset-Backed Funding Certificates,
Series 2005-WMC1, Class M1 FRN
0.830% 6/25/35 | | | 83,994 | | | | 83,305 | |
| | | | | | | | |
| | | Principal
Amount | | | Value | |
Asset-Backed Securities Corp. Trust,
Series 2005-HE2, Class M1 FRN
0.845% 2/25/35 | | $ | 53,460 | | | $ | 53,007 | |
Bayview Financial Mortgage Pass-Through Trust, Series 2005-B, Class M1 FRN
0.620% 4/28/39 | | | 219,075 | | | | 215,415 | |
Bear Stearns Asset-Backed Securities I Trust, Series 2006-EC2, Class M1 FRN
0.555% 2/25/36 | | | 129,077 | | | | 121,619 | |
Citigroup Mortgage Loan Trust, Series 2006-SHL1, Class A1 FRN (b)
0.370% 11/25/45 | | | 242,885 | | | | 234,371 | |
Citigroup Mortgage Loan Trust, Series 2003-HE4, Class A FRN (b)
0.580% 12/25/33 | | | 12,707 | | | | 12,700 | |
Citigroup Mortgage Loan Trust, Series 2005-OPT4, Class M2 FRN
0.600% 7/25/35 | | | 83,878 | | | | 81,734 | |
Countrywide Asset-Backed Certificates,
Series 2005-3, Class MV2 FRN 0.605% 8/25/35 | | | 87,062 | | | | 86,704 | |
Countrywide Asset-Backed Certificates,
Series 2004-5, Class 3A FRN
0.630% 9/25/34 | | | 42,294 | | | | 42,005 | |
Countrywide Asset-Backed Certificates,
Series 2005-6, Class M1 FRN 0.660% 12/25/35 | | | 32,232 | | | | 32,113 | |
First Franklin Mortgage Loan Trust, Series 2005-FF6, Class M1 FRN 0.590% 5/25/36 | | | 237,276 | | | | 231,898 | |
First Franklin Mortgage Loan Trust, Series 2005-FF7, Class M1 FRN 0.620% 7/25/35 | | | 225,796 | | | | 221,522 | |
Fremont Home Loan Trust,
Series 2005-E, Class 2A3 FRN 0.410% 1/25/36 | | | 104,884 | | | | 102,007 | |
GSAMP Trust, Series 2005-AHL, Class M1 FRN
0.600% 4/25/35 | | | 96,191 | | | | 91,681 | |
Home Equity Asset Trust, Series 2006-4, Class 2A3 FRN
0.340% 8/25/36 | | | 78,460 | | | | 77,577 | |
Home Equity Asset Trust,
Series 2005-4, Class M2 FRN 0.830% 10/25/35 | | | 35,135 | | | | 35,025 | |
JP Morgan Mortgage Acquisition Corp.,
Series 2005-FLD1, Class M2 FRN 0.905% 7/25/35 | | | 90,376 | | | | 89,827 | |
Lake Country Mortgage Loan Trust, Series 2005-HE1, Class M1 FRN (b)
0.950% 12/25/32 | | | 83,652 | | | | 83,654 | |
The accompanying notes are an integral part of the financial statements.
37
MML Blend Fund – Portfolio of Investments (Continued)
| | | | | | | | |
| | | Principal
Amount | | | Value | |
Long Beach Mortgage Loan Trust,
Series 2005-1, Class M2 FRN 0.965% 2/25/35 | | $ | 255,219 | | | $ | 244,225 | |
Long Beach Mortgage Loan Trust, Series 2005-WL1, Class M2 FRN 0.995% 6/25/35 | | | 322,278 | | | | 310,732 | |
MASTR Asset-Backed Securities Trust,
Series 2005-WMC1, Class M3 FRN
0.890% 3/25/35 | | | 295,000 | | | | 273,743 | |
Merrill Lynch Mortgage Synthetic, Series 2005-ACR1, Class M1 FRN (b)
0.905% 6/28/35 | | | 294,793 | | | | 290,633 | |
Merrill Lynch Mortgage Synthetic, Series 2005-ACR1, Class M2 FRN (b)
0.935% 6/28/35 | | | 220,000 | | | | 204,353 | |
Morgan Stanley Capital, Inc., Series 2005-WMC6, Class M2 FRN
0.920% 7/25/35 | | | 186,673 | | | | 185,792 | |
NovaStar Mortgage Funding Trust, Series 2005-3, Class A2D FRN 0.540% 1/25/36 | | | 355,754 | | | | 353,206 | |
Park Place Securities, Inc., Series 2005-WHQ4, Class A1A FRN
0.430% 9/25/35 | | | 120,183 | | | | 119,721 | |
Park Place Securities, Inc., Series 2005-WCW3, Class A2C FRN
0.550% 8/25/35 | | | 120,746 | | | | 119,348 | |
Park Place Securities, Inc., Series 2005-WHQ1, Class M2 FRN
0.670% 3/25/35 | | | 105,786 | | | | 104,566 | |
Residential Asset Securities Corp., Series 2005-EMX4, Class M1 FRN
0.600% 11/25/35 | | | 215,241 | | | | 211,235 | |
Specialty Underwriting & Residential Finance, Series 2005-AB1, Class A1C FRN
0.510% 3/25/36 | | | 7,019 | | | | 7,018 | |
Structured Asset Investment Loan Trust,
Series 2005-7, Class A5 FRN
0.530% 8/25/35 | | | 73,282 | | | | 72,752 | |
| | | | | | | | |
| | | | | | | 5,002,626 | |
| | | | | | | | |
| Other ABS — 2.2% | |
321 Henderson Receivables LLC,
Series 2005-1A, Class A1 FRN (b)
0.391% 11/15/40 | | | 147,334 | | | | 143,713 | |
AIMCO CLO Ltd., Series 2014-AA,
Class A FRN (b)
1.763% 7/20/26 | | | 360,000 | | | | 358,160 | |
Alterna Funding I LLC, Series 2014-1A, Class NOTE (b)
1.639% 2/15/21 | | | 263,570 | | | | 263,075 | |
| | | | | | | | |
| | | Principal
Amount | | | Value | |
Apidos CLO XV, Series 2013-15A, Class A1 FRN (b)
1.581% 10/20/25 | | $ | 500,000 | | | $ | 494,437 | |
Applebee’s/IHOP Funding LLC, Series 2014-1, Class A2 (b)
4.277% 9/05/44 | | | 380,000 | | | | 381,244 | |
ARL Second LLC, Series 2014-1A, Class A1 (b)
2.920% 6/15/44 | | | 199,173 | | | | 197,859 | |
Avery Point CLO Ltd., Series 2014-5A, Class A FRN (b)
1.688% 7/17/26 | | | 350,000 | | | | 347,254 | |
Avery Point III CLO Ltd., Series 2013-3A, Class A FRN (b)
1.631% 1/18/25 | | | 250,000 | | | | 247,791 | |
BCC Funding VIII LLC, Series 2014-1A, Class A (b)
1.794% 6/20/20 | | | 150,866 | | | | 150,609 | |
Birchwood Park CLO Ltd., Series 2014-1A, Class A FRN (b)
1.674% 7/15/26 | | | 345,000 | | | | 341,458 | |
BlueMountain CLO Ltd., Series 2013-2A, Class A FRN (b)
1.432% 1/22/25 | | | 250,000 | | | | 245,992 | |
CAN Capital Funding LLC, Series 2014-1A, Class A (b)
3.117% 4/15/20 | | | 250,000 | | | | 248,125 | |
Carlyle Global Market Strategies, Series 2014-1A, Class A FRN (b)
1.748% 4/17/25 | | | 555,000 | | | | 552,839 | |
CKE Restaurant Holdings, Inc., Series 2013-1A, Class A2 (b)
4.474% 3/20/43 | | | 150,931 | | | | 154,860 | |
CLI Funding V LLC, Series 2014-2A, Class A (b)
3.380% 10/18/29 | | | 137,667 | | | | 137,727 | |
Consumers Securitization Funding LLC,
Series 2014-A, Class A2 2.962% 11/01/25 | | | 190,000 | | | | 193,937 | |
Cronos Containers Program I Ltd., Series 2014-2A, Class A (b)
3.270% 11/18/29 | | | 297,222 | | | | 297,136 | |
Diamond Resorts Owner Trust, Series 2013-2, Class A (b)
2.270% 5/20/26 | | | 269,769 | | | | 271,088 | |
Diamond Resorts Owner Trust, Series 2014-1, Class A (b)
2.540% 5/20/27 | | | 190,764 | | | | 190,636 | |
Domino’s Pizza Master Issuer LLC,
Series 2012-1A, Class A2 (b)
5.216% 1/25/42 | | | 449,306 | | | | 471,772 | |
The accompanying notes are an integral part of the financial statements.
38
MML Blend Fund – Portfolio of Investments (Continued)
| | | | | | | | |
| | | Principal
Amount | | | Value | |
Drug Royalty Corp., Inc., Series 2012-1, Class A2 (b)
5.800% 7/15/24 | | $ | 126,667 | | | $ | 131,205 | |
Eaton Vance CLO, Series 2014-1A, Class A FRN (b)
1.685% 7/15/26 | | | 450,000 | | | | 446,310 | |
Fairway Outdoor Funding LLC, Series 2012-1A, Class A2 (b)
4.212% 10/15/42 | | | 418,193 | | | | 417,404 | |
Global Container Assets Ltd., Series 2013-1A, Class A1 (b)
2.200% 11/05/28 | | | 218,500 | | | | 217,390 | |
Global SC Finance II SRL, Series 2014-1A, Class A1 (b)
3.190% 7/17/29 | | | 239,583 | | | | 237,393 | |
Global SC Finance II SRL, Series 2013-2A, Class A (b)
3.670% 11/17/28 | | | 236,292 | | | | 239,047 | |
GoldenTree Loan Opportunities VII Ltd., Series 2013-7A, Class A FRN (b)
1.384% 4/25/25 | | | 565,000 | | | | 554,184 | |
HFG Healthco-4 LLC, Series 2011-1A, Class A FRN (b)
2.407% 6/02/17 | | | 250,000 | | | | 253,847 | |
Hilton Grand Vacations Trust, Series 2013-A, Class A (b)
2.280% 1/25/26 | | | 136,343 | | | | 137,066 | |
Horizon Funding Trust, Series 2013-1A, Class A (b)
3.000% 5/15/18 | | | 114,105 | | | | 114,604 | |
Icon Brand Holdings LLC, Series 2012-1A, Class A (b)
4.229% 1/25/43 | | | 179,515 | | | | 178,840 | |
Icon Brand Holdings LLC, Series 2013-1A, Class A (b)
4.352% 1/25/43 | | | 158,214 | | | | 158,783 | |
ING Investment Management CLO Ltd., Series 2012-3A, Class A FRN (b)
1.681% 10/15/22 | | | 250,000 | | | | 248,775 | |
ING Investment Management CLO Ltd., Series 2013-3A, Class A1 FRN (b)
1.681% 1/18/26 | | | 260,000 | | | | 257,835 | |
LCM Ltd., Series 10AR, Class AR FRN (b)
1.491% 4/15/22 | | | 500,000 | | | | 497,552 | |
LCM Ltd., Series 16A, Class A FRN (b)
1.758% 7/15/26 | | | 460,000 | | | | 457,225 | |
Madison Park Funding XII Ltd.,
Series 2014-12A, Class A FRN (b)
1.731% 7/20/26 | | | 465,000 | | | | 463,473 | |
Nations Equipment Finance Funding II LLC,
Series 2014-1A, Class A (b) 1.558% 7/20/18 | | | 249,192 | | | | 248,896 | |
| | | | | | | | |
| | | Principal
Amount | | | Value | |
New York City Tax Lien, Series 2012-AA, Class A (b)
1.230% 11/10/25 | | $ | 26,211 | | | $ | 26,185 | |
Oak Hill Credit Partners VIII Ltd., Series 2013-8A, Class A FRN (b)
1.351% 4/20/25 | | | 355,000 | | | | 348,975 | |
OHA Loan Funding Ltd., Series 2013-1A, Class A FRN (b)
1.481% 7/23/25 | | | 270,000 | | | | 266,655 | |
Orange Lake Timeshare Trust, Series 2014-AA, Class A (b)
2.290% 7/09/29 | | | 107,733 | | | | 107,853 | |
Race Point VIII CLO Ltd., Series 2013-8A, Class A FRN (b)
1.482% 2/20/25 | | | 250,000 | | | | 246,810 | |
Race Point VIII CLO Ltd., Series 2012-7A, Class A FRN (b)
1.652% 11/08/24 | | | 250,000 | | | | 248,775 | |
Sierra Receivables Funding Co. LLC, Series 2012-3A, Class A (b)
1.870% 8/20/29 | | | 209,531 | | | | 210,594 | |
Sierra Receivables Funding Co. LLC, Series 2012-1A, Class A (b)
2.840% 11/20/28 | | | 83,005 | | | | 84,322 | |
Sierra Receivables Funding Co. LLC, Series 2011-1A, Class A (b)
3.350% 4/20/26 | | | 93,043 | | | | 94,427 | |
Sonic Capital LLC, Series 2011-1A, Class A2 (b)
5.438% 5/20/41 | | | 281,777 | | | | 297,099 | |
Spirit Master Funding LLC, Series 2014-4A, Class A1 (b)
3.501% 1/20/45 | | | 160,000 | | | | 160,050 | |
SpringCastle America Funding LLC, Series 2014-AA, Class A (b)
2.700% 5/25/23 | | | 544,734 | | | | 543,383 | |
Springleaf Funding Trust, Series 2013-AA, Class A (b)
2.580% 9/15/21 | | | 225,000 | | | | 225,648 | |
Structured Receivables Finance LLC, Series 2010-B, Class A (b)
3.730% 8/15/36 | | | 140,605 | | | | 147,753 | |
SVO VOI Mortgage LLC, Series 2012-AA, Class A (b)
2.000% 9/20/29 | | | 266,249 | | | | 264,665 | |
Textainer Marine Containers III Ltd., Series 2014-1A, Class A (b)
3.270% 10/20/39 | | | 157,333 | | | | 156,230 | |
Trafigura Securitisation Finance PLC, Series 2012-1A, Class A FRN (b)
2.561% 10/15/15 | | | 315,000 | | | | 316,301 | |
The accompanying notes are an integral part of the financial statements.
39
MML Blend Fund – Portfolio of Investments (Continued)
| | | | | | | | |
| | | Principal
Amount | | | Value | |
Trinity Rail Leasing LP, Series 2004-1A, Class A (b)
5.270% 8/14/27 | | $ | 101,035 | | | $ | 106,632 | |
Trip Rail Master Funding LLC, Series 2011-1A, Class A1A (b)
4.370% 7/15/41 | | | 117,809 | | | | 123,629 | |
| | | | | | | | |
| | | | | | | 14,925,527 | |
| | | | | | | | |
| Student Loans ABS — 0.9% | |
Access Group, Inc., Series 2007-A, Class A2 FRN
0.363% 8/25/26 | | | 35,755 | | | | 35,658 | |
Access Group, Inc., Series 2003-A, Class A3 FRN
1.220% 7/01/38 | | | 327,820 | | | | 300,744 | |
Access Group, Inc., Series 2008-1, Class A FRN
1.534% 10/27/25 | | | 363,001 | | | | 366,023 | |
College Loan Corp. Trust, Series 2007-1, Class B2 FRN
1.654% 1/25/47 | | | 350,000 | | | | 295,750 | |
EdLinc Student Loan Funding Trust, Series 2012-1, Class B FRN (b)
4.410% 11/26/40 | | | 270,000 | | | | 301,626 | |
Education Funding Capital Trust I, Series 2004-1, Class A4 FRN
1.651% 6/15/43 | | | 500,000 | | | | 497,190 | |
Education Funding Capital Trust I,
Series 2004-1, Class A6 FRN 1.656% 6/15/43 | | | 200,000 | | | | 197,700 | |
Education Funding Capital Trust I, Series 2004-1, Class B1 FRN 1.907% 6/15/43 | | | 100,000 | | | | 97,160 | |
Goal Capital Funding Trust, Series 2006-1, Class A3 FRN
0.353% 11/25/26 | | | 150,175 | | | | 149,402 | |
Goal Capital Funding Trust, Series 2007-1, Class C1 FRN
0.655% 6/25/42 | | | 111,773 | | | | 111,095 | |
KeyCorp Student Loan Trust, Series 2004-A, Class 2A2 FRN
0.534% 10/28/41 | | | 195,608 | | | | 195,027 | |
Mississippi Higher Education Assistance Corp., Series 2014-1, Class A1 FRN
0.850% 10/25/35 | | | 283,374 | | | | 282,608 | |
National Collegiate Student Loan Trust, Series 2006-3, Class A3 FRN
0.320% 10/25/27 | | | 543,189 | | | | 536,273 | |
Navient Student Loan Trust, Series 2014-8, Class B FRN
1.655% 7/26/49 | | | 155,000 | | | | 150,237 | |
Navient Student Loan Trust, Series 2014-1, Class B FRN
1.655% 6/25/48 | | | 220,000 | | | | 213,603 | |
| | | | | | | | |
| | | Principal
Amount | | | Value | |
Nelnet Student Loan Trust, Series 2006-3, Class B FRN
0.505% 6/25/41 | | $ | 162,843 | | | $ | 147,116 | |
Nelnet Student Loan Trust, Series 2014-6A, Class A FRN (b)
0.820% 11/25/47 | | | 291,633 | | | | 290,008 | |
Nelnet Student Loan Trust, Series 2005-4, Class A4R2 FRN
0.858% 3/22/32 | | | 200,000 | | | | 186,656 | |
Nelnet Student Loan Trust, Series 2010-4A, Class A FRN (b)
0.970% 4/25/46 | | | 111,448 | | | | 111,852 | |
Northstar Education Finance, Inc., Series 2006-A, Class A3 FRN
0.446% 5/28/26 | | | 49,628 | | | | 49,581 | |
Panhandle-Plains Student Finance Corp., Series 2001-A2
1.656% 12/01/31 | | | 300,000 | | | | 287,851 | |
SLC Student Loan Trust, Series 2006-A, Class A5 FRN
0.401% 7/15/36 | | | 157,827 | | | | 156,923 | |
SLC Student Loan Trust, Series 2006-A, Class B FRN
0.531% 7/15/36 | | | 125,000 | | | | 118,990 | |
SLM Student Loan Trust, Series 2004-6, Class B FRN
0.614% 4/25/25 | | | 250,000 | | | | 244,555 | |
SLM Student Loan Trust, Series 2003-5, Class A7 FRN
0.950% 6/17/30 | | | 50,000 | | | | 50,000 | |
SLM Student Loan Trust, Series 2002-7, Class A10 FRN
2.640% 3/15/28 | | | 190,000 | | | | 190,000 | |
SLM Student Loan Trust, Series 2003-5, Class A9 FRN
2.640% 6/17/30 | | | 350,000 | | | | 350,000 | |
South Carolina Student Loan Corp., Series 2014-1, Class A2 FRN
1.155% 1/03/33 | | | 290,000 | | | | 288,624 | |
| | | | | | | | |
| | | | | | | 6,202,252 | |
| | | | | | | | |
| WL Collateral CMO — 0.1% | |
Connecticut Avenue Securities Trust, Series 2014-C04, Class 1M1 FRN
2.119% 11/25/24 | | | 160,593 | | | | 160,593 | |
Countrywide Home Loans, Inc., Series 2004-2, Class 1A1 FRN
2.659% 2/25/34 | | | 29,883 | | | | 29,299 | |
Countrywide Home Loans, Inc., Series 2003-42, Class 1A1 FRN
2.904% 9/25/33 | | | 7,805 | | | | 7,464 | |
GSR Mortgage Loan Trust, Series 2004-9, Class 2A1 FRN
2.475% 8/25/34 | | | 21,871 | | | | 20,677 | |
The accompanying notes are an integral part of the financial statements.
40
MML Blend Fund – Portfolio of Investments (Continued)
| | | | | | | | |
| | | Principal
Amount | | | Value | |
HSI Asset Securitization Corp. Trust, Series 2005, Class IIA3 FRN 0.530% 7/25/35 | | $ | 6,442 | | | $ | 6,408 | |
IndyMac Index Mortgage Loan Trust, Series 2004-AR4, Class 1A FRN 2.409% 8/25/34 | | | 78,206 | | | | 66,349 | |
Merrill Lynch Mortgage Investors, Inc., Series 2005-A8, Class A3A2 FRN
0.420% 8/25/36 | | | 68,496 | | | | 63,059 | |
Merrill Lynch Mortgage Investors, Inc., Series 2003-A4, Class IA FRN 2.448% 7/25/33 | | | 5,425 | | | | 5,353 | |
Merrill Lynch Mortgage Investors, Inc., Series 2004-A1, Class IA FRN 2.605% 2/25/34 | | | 10,149 | | | | 9,512 | |
Morgan Stanley Mortgage Loan Trust, Series 2004-2AR, Class 1A FRN 2.375% 2/25/34 | | | 270 | | | | 271 | |
Structured Adjustable Rate Mortgage Loan Trust, Series 2004-2, Class 2A FRN
2.569% 3/25/34 | | | 51,581 | | | | 51,158 | |
WaMu Mortgage Pass-Through Certificates, Series 2004-AR2, Class A FRN
1.513% 4/25/44 | | | 120,120 | | | | 124,419 | |
| | | | | | | | |
| | | | | | | 544,562 | |
| | | | | | | | |
| WL Collateral PAC — 0.0% | |
Structured Asset Securities Corp., Series 2007-BC4, Class A3 FRN 0.405% 11/25/37 | | | 107,654 | | | | 106,588 | |
Structured Asset Securities Corp., Series 2002-11A, Class 2A1 FRN 2.759% 6/25/32 | | | 32,198 | | | | 31,077 | |
| | | | | | | | |
| | | | | | | 137,665 | |
| | | | | | | | |
| | |
TOTAL NON-U.S. GOVERNMENT AGENCY OBLIGATIONS
(Cost $41,704,774) | | | | | | | 41,925,253 | |
| | | | | | | | |
|
| SOVEREIGN DEBT OBLIGATIONS — 0.4% | |
Brazilian Government International Bond
4.875% 1/22/21 | | | 100,000 | | | | 106,250 | |
Mexico Government International Bond
4.750% 3/08/44 | | | 360,000 | | | | 375,300 | |
Peruvian Government International Bond
6.550% 3/14/37 | | | 95,000 | | | | 123,263 | |
Poland Government International Bond
6.375% 7/15/19 | | | 230,000 | | | | 269,100 | |
Province of Quebec Canada
2.625% 2/13/23 | | | 442,000 | | | | 441,459 | |
Province of Quebec Canada
7.500% 9/15/29 | | | 90,000 | | | | 133,010 | |
| | | | | | | | |
| | | Principal
Amount | | | Value | |
Republic of Brazil International Bond
5.625% 1/07/41 | | $ | 305,000 | | | $ | 328,637 | |
Republic of Turkey International Bond
3.250% 3/23/23 | | | 200,000 | | | | 189,750 | |
Republic of Turkey International Bond
4.875% 4/16/43 | | | 81,000 | | | | 80,682 | |
Republic of Turkey International Bond
6.750% 4/03/18 | | | 145,000 | | | | 161,313 | |
United Mexican States
5.125% 1/15/20 | | | 200,000 | | | | 220,500 | |
United Mexican States
6.750% 9/27/34 | | | 160,000 | | | | 208,960 | |
| | | | | | | | |
| | | | | | | 2,638,224 | |
| | | | | | | | |
| | |
TOTAL SOVEREIGN DEBT OBLIGATIONS
(Cost $2,474,445) | | | | | | | 2,638,224 | |
| | | | | | | | |
|
| U.S. GOVERNMENT AGENCY OBLIGATIONS AND INSTRUMENTALITIES — 9.2% | |
| Collateralized Mortgage Obligations — 0.7% | |
Federal Home Loan Mortgage Corp.
Series 4303, Class AP
3.000% 8/15/43 | | | 905,060 | | | | 932,178 | |
Series 4290, Class CA
3.500% 12/15/38 | | | 489,269 | | | | 513,191 | |
Series 2617, Class Z
5.500% 5/15/33 | | | 477,450 | | | | 536,634 | |
Series 2693, Class Z
5.500% 10/15/33 | | | 818,273 | | | | 910,162 | |
Federal National Mortgage Association
Series 2014-7, Class VA
3.500% 5/25/25 | | | 284,266 | | | | 302,458 | |
Series 2014-48, Class AB
4.000% 10/25/40 | | | 703,235 | | | | 750,526 | |
Series 2007-32, Class Z
5.500% 4/25/37 | | | 273,117 | | | | 303,590 | |
Series 2010-60, Class HJ
5.500% 5/25/40 | | | 186,319 | | | | 205,767 | |
Federal National Mortgage Association Benchmark REMIC
Series 2007-B2, Class ZA
5.500% 6/25/37 | | | 219,832 | | | | 240,431 | |
U.S. Department of Veteran Affairs Series 1992-1, Class 2Z
7.750% 5/15/22 | | | 181,704 | | | | 203,156 | |
| | | | | | | | |
| | | | | | | 4,898,093 | |
| | | | | | | | |
| Pass-Through Securities — 8.5% | |
Federal Home Loan Mortgage Corp. Pool #E85346 6.000%
9/01/16 | | | 6,853 | | | | 7,124 | |
The accompanying notes are an integral part of the financial statements.
41
MML Blend Fund – Portfolio of Investments (Continued)
| | | | | | | | |
| | | Principal
Amount | | | Value | |
Pool #E85389 6.000%
9/01/16 | | $ | 3,811 | | | $ | 3,950 | |
Pool #E85542 6.000%
10/01/16 | | | 9,104 | | | | 9,448 | |
Pool #G11431 6.000%
2/01/18 | | | 7,681 | | | | 8,035 | |
Pool #E85089 6.500%
8/01/16 | | | 26,596 | | | | 27,684 | |
Pool #E85301 6.500%
9/01/16 | | | 12,826 | | | | 13,350 | |
Pool #C55867 7.500%
2/01/30 | | | 89,690 | | | | 105,159 | |
Pool #C01079 7.500%
10/01/30 | | | 11,802 | | | | 14,062 | |
Pool #C01135 7.500%
2/01/31 | | | 35,972 | | | | 42,819 | |
Pool #C00470 8.000%
8/01/26 | | | 23,667 | | | | 28,043 | |
Pool #G00924 8.000%
3/01/28 | | | 28,852 | | | | 34,146 | |
Pool #554904 9.000%
3/01/17 | | | 177 | | | | 188 | |
Federal National Mortgage Association Pool #725692 2.270%
10/01/33 FRN | | | 111,192 | | | | 117,674 | |
Pool #888586 2.340%
10/01/34 FRN | | | 187,308 | | | | 198,752 | |
Pool #890564 3.000%
6/01/43 | | | 731,676 | | | | 743,708 | |
Pool #AO8629 3.500%
7/01/42 | | | 1,177,858 | | | | 1,230,172 | |
Pool #AP6609 3.500%
9/01/42 | | | 439,397 | | | | 458,913 | |
Pool #AB8527 3.500%
3/01/43 | | | 167,488 | | | | 174,666 | |
Pool #AR8708 3.500%
4/01/43 | | | 234,671 | | | | 244,727 | |
Pool #AT0998 3.500%
4/01/43 | | | 1,158,244 | | | | 1,207,876 | |
Pool #AT4050 3.500%
5/01/43 | | | 305,682 | | | | 318,781 | |
Pool #MA1463 3.500%
6/01/43 | | | 760,117 | | | | 792,689 | |
Pool #AB6261 4.000%
9/01/42 | | | 1,826,847 | | | | 1,966,073 | |
Pool #587994 6.000%
6/01/16 | | | 10,456 | | | | 10,790 | |
Pool #564594 7.000%
1/01/31 | | | 12,260 | | | | 14,248 | |
Pool #572844 7.000%
4/01/31 | | | 26,407 | | | | 30,927 | |
Pool #253795 7.000%
5/01/31 | | | 93,596 | | | | 109,409 | |
| | | | | | | | |
| | | Principal
Amount | | | Value | |
Pool #499386 7.500%
9/01/29 | | $ | 2,097 | | | $ | 2,497 | |
Pool #521006 7.500%
12/01/29 | | | 743 | | | | 883 | |
Pool #522769 7.500%
12/01/29 | | | 74 | | | | 88 | |
Pool #252981 7.500%
1/01/30 | | | 11,631 | | | | 13,816 | |
Pool #524874 7.500%
2/01/30 | | | 617 | | | | 665 | |
Pool #531196 7.500%
2/01/30 | | | 1,135 | | | | 1,355 | |
Pool #524317 7.500%
3/01/30 | | | 5,155 | | | | 6,079 | |
Pool #530299 7.500%
3/01/30 | | | 322 | | | | 377 | |
Pool #530520 7.500%
3/01/30 | | | 13,206 | | | | 15,655 | |
Pool #253183 7.500%
4/01/30 | | | 5,138 | | | | 6,108 | |
Pool #253265 7.500%
5/01/30 | | | 4,003 | | | | 4,729 | |
Pool #536999 8.000%
3/01/30 | | | 135 | | | | 162 | |
Pool #526380 8.000%
5/01/30 | | | 6,633 | | | | 8,017 | |
Pool #536949 8.000%
5/01/30 | | | 2,983 | | | | 3,614 | |
Pool #535351 8.000%
6/01/30 | | | 5,102 | | | | 6,143 | |
Pool #253481 8.000%
10/01/30 | | | 3,852 | | | | 4,652 | |
Pool #190317 8.000%
8/01/31 | | | 1,516 | | | | 1,827 | |
Pool #596656 8.000%
8/01/31 | | | 1,567 | | | | 1,776 | |
Pool #602008 8.000%
8/01/31 | | | 4,385 | | | | 5,294 | |
Federal National Mortgage Association TBA
Pool #3348 2.500%
9/01/27 (d) | | | 10,325,000 | | | | 10,520,207 | |
Pool #4241 3.000%
8/01/42 (d) | | | 2,650,000 | | | | 2,682,090 | |
Pool #1963 3.500%
8/01/42 (d) | | | 2,550,000 | | | | 2,659,570 | |
Pool #9174 4.000%
4/01/42 (d) | | | 3,925,000 | | | | 4,190,551 | |
Pool #18718 4.500%
3/01/40 (d) | | | 7,075,000 | | | | 7,682,455 | |
Government National Mortgage Association
Pool #783896 3.500%
5/15/44 | | | 986,463 | | | | 1,038,445 | |
The accompanying notes are an integral part of the financial statements.
42
MML Blend Fund – Portfolio of Investments (Continued)
| | | | | | | | |
| | | Principal
Amount | | | Value | |
Pool #359587 7.000%
6/15/23 | | $ | 634 | | | $ | 711 | |
Pool #337539 7.000%
7/15/23 | | | 1,022 | | | | 1,160 | |
Pool #363066 7.000%
8/15/23 | | | 11,861 | | | | 13,487 | |
Pool #354674 7.000%
10/15/23 | | | 9,671 | | | | 10,934 | |
Pool #362651 7.000%
10/15/23 | | | 20,403 | | | | 22,880 | |
Pool #368814 7.000%
10/15/23 | | | 4,780 | | | | 5,396 | |
Pool #352021 7.000%
11/15/23 | | | 5,062 | | | | 5,690 | |
Pool #371967 7.000%
11/15/23 | | | 779 | | | | 889 | |
Pool #591581 7.000%
8/15/32 | | | 15,547 | | | | 18,340 | |
Pool #205884 7.500%
5/15/17 | | | 15,093 | | | | 15,917 | |
Pool #213760 7.500%
6/15/17 | | | 3,794 | | | | 4,009 | |
Government National Mortgage Association II
Pool #82488 1.625%
3/20/40 FRN | | | 203,554 | | | | 210,839 | |
Pool #82462 3.500%
1/20/40 FRN | | | 154,103 | | | | 161,010 | |
Pool #G2MA2149 4.000%
8/20/44 | | | 4,360,467 | | | | 4,678,645 | |
Government National Mortgage Association TBA
Pool #188 3.000%
11/01/42 (d) | | | 8,850,000 | | | | 9,049,816 | |
Pool #207 3.500%
1/01/43 (d) | | | 1,975,000 | | | | 2,073,904 | |
Pool #232 4.000%
12/01/42 (d) | | | 4,950,000 | | | | 5,306,168 | |
| | | | | | | | |
| | | | | | | 58,350,263 | |
| | | | | | | | |
| | |
TOTAL U.S. GOVERNMENT AGENCY OBLIGATIONS AND INSTRUMENTALITIES
(Cost $62,971,415) | | | | | | | 63,248,356 | |
| | | | | | | | |
|
| U.S. TREASURY OBLIGATIONS — 1.0% | |
| U.S. Treasury Bonds & Notes — 1.0% | |
U.S. Treasury Bond
2.875% 5/15/43 | | | 280,000 | | | | 286,654 | |
U.S. Treasury Bond
3.000% 11/15/44 | | | 70,000 | | | | 73,571 | |
U.S. Treasury Bond
3.375% 5/15/44 | | | 2,070,000 | | | | 2,332,404 | |
| | | | | | | | |
| | | Principal
Amount | | | Value | |
U.S. Treasury Bond (e) (f)
4.500% 2/15/36 | | $ | 1,590,000 | | | $ | 2,122,576 | |
U.S. Treasury Inflation Index
0.375% 7/15/23 | | | 897,899 | | | | 887,728 | |
U.S. Treasury Note
2.250% 11/15/24 | | | 1,080,000 | | | | 1,087,319 | |
U.S. Treasury Note
2.375% 8/15/24 | | | 220,000 | | | | 223,930 | |
| | | | | | | | |
| | | | | | | 7,014,182 | |
| | | | | | | | |
| | |
TOTAL U.S. TREASURY OBLIGATIONS
(Cost $6,600,011) | | | | | | | 7,014,182 | |
| | | | | | | | |
| | |
TOTAL BONDS & NOTES
(Cost $214,992,239) | | | | | | | 221,001,638 | |
| | | | | | | | |
| | |
| | | Notional
Amount | | | | |
| PURCHASED OPTIONS — 0.1% | |
| Financial — 0.1% | |
| Diversified Financial — 0.1% | |
3-Month USD LIBOR BBA 10 Year Swaption, Call, Expires 4/25/16, Strike 2.50 (OTC — Credit Suisse International); Underlying swap terminates 4/27/26 | | $ | 17,900,000 | | | | 473,414 | |
| | | | | | | | |
| | |
TOTAL PURCHASED OPTIONS
(Cost $314,078) | | | | | | | 473,414 | |
| | | | | | | | |
| | |
TOTAL LONG-TERM INVESTMENTS
(Cost $504,502,960) | | | | | | | 682,408,477 | |
| | | | | | | | |
| | |
| | | Principal
Amount | | | | |
|
| SHORT-TERM INVESTMENTS — 6.7% | |
| Commercial Paper — 6.5% | |
Amphenol Corp. (b)
0.650% 3/27/15 | | $ | 2,130,000 | | | | 2,126,731 | |
Apache Corp. (b)
0.400% 1/05/15 | | | 2,650,000 | | | | 2,649,882 | |
Bell Canada (b)
0.500% 3/17/15 | | | 4,000,000 | | | | 3,995,833 | |
Bemis Co., Inc. (b)
0.520% 1/20/15 | | | 3,997,000 | | | | 3,995,903 | |
Block Financial LLC (b)
0.470% 2/02/15 | | | 3,525,000 | | | | 3,523,527 | |
Mondelez International, Inc. (b)
0.350% 1/02/15 | | | 4,098,000 | | | | 4,097,960 | |
The accompanying notes are an integral part of the financial statements.
43
MML Blend Fund – Portfolio of Investments (Continued)
| | | | | | | | |
| | | Principal
Amount | | | Value | |
Pacific Gas & Electric Co. (b)
0.500% 1/09/15 | | $ | 2,733,000 | | | $ | 2,732,696 | |
Pentair Finance (b)
0.590% 2/06/15 | | | 1,270,000 | | | | 1,269,251 | |
Public Service Co. Colorado (b)
0.750% 1/29/15 | | | 3,196,000 | | | | 3,194,136 | |
Sempra Energy Holdings (b)
0.530% 2/10/15 | | | 4,314,000 | | | | 4,311,460 | |
Tate & Lyle International Finance PLC (b)
0.500% 3/04/15 | | | 4,000,000 | | | | 3,996,556 | |
Time Warner Cable, Inc. (b)
0.500% 2/27/15 | | | 4,548,000 | | | | 4,544,400 | |
Vodafone Group PLC (b)
0.480% 4/01/15 | | | 2,000,000 | | | | 1,997,600 | |
Vodafone Group PLC (b)
0.499% 6/01/15 | | | 2,000,000 | | | | 1,995,889 | |
| | | | | | | | |
| | | | | | | 44,431,824 | |
| | | | | | | | |
| Repurchase Agreement — 0.0% | |
State Street Bank & Trust Co. Repurchase Agreement, dated 12/31/14, 0.010%, due 1/02/15 (g) | | | 299,264 | | | | 299,264 | |
| | | | | | | | |
| Time Deposits — 0.0% | |
Euro Time Deposit
0.010% 1/02/15 | | | 5,978 | | | | 5,978 | |
| | | | | | | | |
| U.S. Treasury Bills — 0.2% | | | | | | | | |
U.S. Treasury Bill
0.000% 1/08/15 | | | 1,000,000 | | | | 999,990 | |
| | | | | | | | |
| | |
TOTAL SHORT-TERM INVESTMENTS
(Cost $45,737,056) | | | | | | | 45,737,056 | |
| | | | | | | | |
| | |
TOTAL INVESTMENTS — 106.3%
(Cost $550,240,016) (h) | | | | | | | 728,145,533 | |
| | |
| Other Assets/(Liabilities) — (6.3)% | | | | | | | (42,931,950 | ) |
| | | | | | | | |
| | |
| NET ASSETS — 100.0% | | | | | | $ | 685,213,583 | |
| | | | | | | | |
Notes to Portfolio of Investments
Percentages are stated as a percent of net assets.
| CLO | Collateralized Loan Obligation |
| CMO | Collateralized Mortgage Obligation |
| MBS | Mortgage-Backed Security |
| PAC | Planned Amortization Class |
| (a) | Non-income producing security. |
| (b) | Securities exempt from registration under rule 144A of the Securities Act of 1933. These securities may be resold in transactions exempt from registration, normally to qualified institutional buyers. At December 31, 2014, these securities amounted to a value of $82,928,288 or 12.10% of net assets. |
| (c) | Restricted security. Certain securities are restricted as to resale. At December 31, 2014, these securities amounted to a value of $165,398 or 0.02% of net assets. The Fund generally bears the costs, if any, associated with the disposition of restricted securities. |
| (d) | A portion of this security is purchased on a when-issued, delayed-delivery or forward commitment basis. (Note 2). |
| (e) | A portion of this security is held as collateral for open futures contracts. (Note 2). |
| (f) | All or a portion of this security is held as collateral for open swap agreements. (Note 2). |
| (g) | Maturity value of $299,264. Collateralized by U.S. Government Agency obligations with a rate of 2.500%, maturity date of 3/20/28, and an aggregate market value, including accrued interest, of $307,548. |
| (h) | See Note 6 for aggregate cost for federal tax purposes. |
The accompanying notes are an integral part of the financial statements.
44
MML Equity Fund – Portfolio of Investments
December 31, 2014
| | | | | | | | |
| | | Number of
Shares | | | Value | |
| EQUITIES — 98.9% | |
|
| COMMON STOCK — 98.9% | |
| Basic Materials — 2.2% | |
| Chemicals — 1.4% | |
E.I. du Pont de Nemours & Co. | | | 75,457 | | | $ | 5,579,290 | |
LyondellBasell Industries NV Class A | | | 35,850 | | | | 2,846,132 | |
Potash Corp. of Saskatchewan, Inc. | | | 96,398 | | | | 3,404,777 | |
| | | | | | | | |
| | | | | | | 11,830,199 | |
| | | | | | | | |
| Mining — 0.8% | | | | | | | | |
Freeport-McMoRan, Inc. | | | 98,380 | | | | 2,298,157 | |
Vulcan Materials Co. | | | 69,417 | | | | 4,562,779 | |
| | | | | | | | |
| | | | | | | 6,860,936 | |
| | | | | | | | |
| | | | | | | 18,691,135 | |
| | | | | | | | |
| Communications — 9.6% | | | | | | | | |
| Advertising — 0.6% | | | | | | | | |
Omnicom Group, Inc. | | | 69,465 | | | | 5,381,453 | |
| | | | | | | | |
| Internet — 1.8% | | | | | | | | |
AOL, Inc. (a) | | | 84,426 | | | | 3,897,948 | |
Liberty Interactive Corp. Class A (a) | | | 169,861 | | | | 4,997,311 | |
Symantec Corp. | | | 236,105 | | | | 6,057,274 | |
| | | | | | | | |
| | | | | | | 14,952,533 | |
| | | | | | | | |
| Media — 3.4% | | | | | | | | |
Comcast Corp. Class A | | | 168,239 | | | | 9,759,544 | |
DISH Network Corp. Class A (a) | | | 49,520 | | | | 3,609,513 | |
Liberty Global PLC Series A (a) | | | 79,069 | | | | 3,969,659 | |
Viacom, Inc. Class B | | | 60,046 | | | | 4,518,462 | |
The Walt Disney Co. | | | 77,370 | | | | 7,287,480 | |
| | | | | | | | |
| | | | | | | 29,144,658 | |
| | | | | | | | |
| Telecommunications — 3.8% | | | | | | | | |
Cisco Systems, Inc. | | | 172,544 | | | | 4,799,311 | |
Knowles Corp. (a) (b) | | | 172,920 | | | | 4,072,266 | |
Motorola Solutions, Inc. | | | 71,131 | | | | 4,771,468 | |
Verizon Communications, Inc. | | | 315,444 | | | | 14,756,470 | |
Vodafone Group PLC Sponsored ADR (United Kingdom) | | | 119,468 | | | | 4,082,222 | |
| | | | | | | | |
| | | | | | | 32,481,737 | |
| | | | | | | | |
| | | | | | | 81,960,381 | |
| | | | | | | | |
| Consumer, Cyclical — 9.3% | | | | | | | | |
| Airlines — 1.2% | | | | | | | | |
Delta Air Lines, Inc. | | | 201,130 | | | | 9,893,585 | |
| | | | | | | | |
| Auto Manufacturers — 0.9% | | | | | | | | |
Ford Motor Co. | | | 187,260 | | | | 2,902,530 | |
General Motors Co. | | | 128,761 | | | | 4,495,047 | |
| | | | | | | | |
| | | | | | | 7,397,577 | |
| | | | | | | | |
| Automotive & Parts — 0.8% | | | | | | | | |
Johnson Controls, Inc. | | | 136,800 | | | | 6,612,912 | |
| | | | | | | | |
| | | | | | | | |
| | | Number of
Shares | | | Value | |
| Entertainment — 0.3% | | | | | | | | |
Cinemark Holdings, Inc. | | | 80,700 | | | $ | 2,871,306 | |
| | | | | | | | |
| Household Products — 0.6% | | | | | | | | |
Reckitt Benckiser Group PLC Sponsored ADR (United Kingdom) (b) | | | 328,490 | | | | 5,443,079 | |
| | | | | | | | |
| Housewares — 0.4% | | | | | | | | |
Newell Rubbermaid, Inc. | | | 79,300 | | | | 3,020,537 | |
| | | | | | | | |
| Leisure Time — 0.8% | | | | | | | | |
Royal Caribbean Cruises Ltd. | | | 84,360 | | | | 6,953,795 | |
| | | | | | | | |
| Retail — 4.3% | | | | | | | | |
AutoNation, Inc. (a) | | | 50,255 | | | | 3,035,905 | |
Costco Wholesale Corp. | | | 27,260 | | | | 3,864,105 | |
CVS Health Corp. | | | 47,689 | | | | 4,592,928 | |
Family Dollar Stores, Inc. | | | 43,773 | | | | 3,467,259 | |
The Gap, Inc. | | | 81,940 | | | | 3,450,493 | |
Kohl’s Corp. | | | 36,080 | | | | 2,202,323 | |
Lowe’s Cos., Inc. | | | 70,659 | | | | 4,861,339 | |
Staples, Inc. | | | 177,040 | | | | 3,207,965 | |
Wal-Mart Stores, Inc. | | | 55,540 | | | | 4,769,775 | |
Walgreens Boots Alliance, Inc. | | | 46,950 | | | | 3,577,590 | |
| | | | | | | | |
| | | | | | | 37,029,682 | |
| | | | | | | | |
| | | | | | | 79,222,473 | |
| | | | | | | | |
| Consumer, Non-cyclical — 19.5% | | | | | | | | |
| Agriculture — 1.5% | | | | | | | | |
Lorillard, Inc. | | | 132,930 | | | | 8,366,614 | |
Philip Morris International, Inc. | | | 54,033 | | | | 4,400,988 | |
| | | | | | | | |
| | | | | | | 12,767,602 | |
| | | | | | | | |
| Beverages — 1.2% | | | | | | | | |
PepsiCo, Inc. | | | 103,245 | | | | 9,762,847 | |
| | | | | | | | |
| Biotechnology — 0.5% | | | | | | | | |
Amgen, Inc. | | | 26,060 | | | | 4,151,098 | |
| | | | | | | | |
| Commercial Services — 0.4% | | | | | | | | |
Apollo Education Group, Inc. (a) | | | 103,200 | | | | 3,520,152 | |
| | | | | | | | |
| Foods — 1.3% | | | | | | | | |
ConAgra Foods, Inc. | | | 55,950 | | | | 2,029,866 | |
Kraft Foods Group, Inc. | | | 75,450 | | | | 4,727,697 | |
Mondelez International, Inc. Class A | | | 129,575 | | | | 4,706,812 | |
| | | | | | | | |
| | | | | | | 11,464,375 | |
| | | | | | | | |
| Health Care – Products — 1.1% | | | | | | | | |
Baxter International, Inc. | | | 49,360 | | | | 3,617,594 | |
Covidien PLC | | | 57,303 | | | | 5,860,951 | |
| | | | | | | | |
| | | | | | | 9,478,545 | |
| | | | | | | | |
| Health Care – Services — 3.4% | | | | | | | | |
HCA Holdings, Inc. (a) | | | 92,345 | | | | 6,777,199 | |
Thermo Fisher Scientific, Inc. | | | 29,830 | | | | 3,737,401 | |
UnitedHealth Group, Inc. | | | 182,466 | | | | 18,445,488 | |
| | | | | | | | |
| | | | | | | 28,960,088 | |
| | | | | | | | |
The accompanying notes are an integral part of the financial statements.
45
MML Equity Fund – Portfolio of Investments (Continued)
| | | | | | | | |
| | | Number of
Shares | | | Value | |
| Pharmaceuticals — 10.1% | | | | | | | | |
Actavis PLC (a) | | | 14,431 | | | $ | 3,714,684 | |
Bristol-Myers Squibb Co. | | | 63,478 | | | | 3,747,106 | |
Cardinal Health, Inc. | | | 127,470 | | | | 10,290,653 | |
Eli Lilly & Co. | | | 141,358 | | | | 9,752,288 | |
Express Scripts Holding Co. (a) | | | 45,222 | | | | 3,828,947 | |
Gilead Sciences, Inc. (a) | | | 32,020 | | | | 3,018,205 | |
Indivior PLC Sponsored ADR
(United Kingdom) (a) | | | 13,140 | | | | 148,477 | |
Merck & Co., Inc. | | | 256,912 | | | | 14,590,033 | |
Pfizer, Inc. | | | 303,299 | | | | 9,447,764 | |
Quintiles Transnational Holdings, Inc. (a) | | | 35,330 | | | | 2,079,877 | |
Roche Holding AG Sponsored ADR (Switzerland) | | | 220,420 | | | | 7,492,076 | |
Sanofi ADR (France) | | | 190,264 | | | | 8,677,941 | |
Teva Pharmaceutical Industries Ltd. Sponsored ADR (Israel) | | | 166,708 | | | | 9,587,377 | |
| | | | | | | | |
| | | | | | | 86,375,428 | |
| | | | | | | | |
| | | | | | | 166,480,135 | |
| | | | | | | | |
| Energy — 9.6% | | | | | | | | |
| Oil & Gas — 6.8% | | | | | | | | |
Anadarko Petroleum Corp. | | | 27,800 | | | | 2,293,500 | |
BP PLC Sponsored ADR (United Kingdom) | | | 114,880 | | | | 4,379,226 | |
Chevron Corp. | | | 61,790 | | | | 6,931,602 | |
Cobalt International Energy, Inc. (a) | | | 126,031 | | | | 1,120,416 | |
Hess Corp. | | | 46,176 | | | | 3,408,712 | |
Marathon Oil Corp. | | | 156,659 | | | | 4,431,883 | |
Noble Energy, Inc. | | | 79,556 | | | | 3,773,341 | |
Occidental Petroleum Corp. | | | 65,270 | | | | 5,261,415 | |
Phillips 66 | | | 45,150 | | | | 3,237,255 | |
Royal Dutch Shell PLC A Shares Sponsored ADR (United Kingdom) | | | 66,460 | | | | 4,449,497 | |
Suncor Energy, Inc. | | | 483,300 | | | | 15,359,274 | |
Valero Energy Corp. | | | 67,928 | | | | 3,362,436 | |
| | | | | | | | |
| | | | | | | 58,008,557 | |
| | | | | | | | |
| Oil & Gas Services — 2.1% | | | | | | | | |
National Oilwell Varco, Inc. | | | 117,270 | | | | 7,684,703 | |
Schlumberger Ltd. | | | 106,058 | | | | 9,058,414 | |
Transocean Ltd. (b) | | | 65,450 | | | | 1,199,698 | |
| | | | | | | | |
| | | | | | | 17,942,815 | |
| | | | | | | | |
| Pipelines — 0.7% | | | | | | | | |
Enbridge, Inc. | | | 125,930 | | | | 6,474,061 | |
| | | | | | | | |
| | | | | | | 82,425,433 | |
| | | | | | | | |
| Financial — 25.3% | | | | | | | | |
| Banks — 7.4% | | | | | | | | |
Bank of America Corp. | | | 755,979 | | | | 13,524,464 | |
Capital One Financial Corp. | | | 102,480 | | | | 8,459,724 | |
Fifth Third Bancorp | | | 287,067 | | | | 5,848,990 | |
KeyCorp | | | 302,260 | | | | 4,201,414 | |
| | | | | | | | |
| | | Number of
Shares | | | Value | |
PNC Financial Services Group, Inc. | | | 62,071 | | | $ | 5,662,737 | |
State Street Corp. | | | 98,709 | | | | 7,748,657 | |
U.S. Bancorp | | | 107,880 | | | | 4,849,206 | |
Wells Fargo & Co. | | | 136,091 | | | | 7,460,509 | |
Zions Bancorp | | | 188,136 | | | | 5,363,757 | |
| | | | | | | | |
| | | | | | | 63,119,458 | |
| | | | | | | | |
| Diversified Financial — 10.3% | | | | | | | | |
Ameriprise Financial, Inc. | | | 42,633 | | | | 5,638,214 | |
Citigroup, Inc. | | | 462,689 | | | | 25,036,102 | |
CME Group, Inc. | | | 23,330 | | | | 2,068,205 | |
Discover Financial Services | | | 90,126 | | | | 5,902,352 | |
FNF Group | | | 144,934 | | | | 4,992,976 | |
The Goldman Sachs Group, Inc. | | | 52,830 | | | | 10,240,039 | |
Invesco Ltd. | | | 90,060 | | | | 3,559,171 | |
JP Morgan Chase & Co. | | | 159,871 | | | | 10,004,727 | |
Legg Mason, Inc. | | | 75,029 | | | | 4,004,298 | |
Morgan Stanley | | | 309,150 | | | | 11,995,020 | |
Navient Corp. | | | 144,974 | | | | 3,132,888 | |
T. Rowe Price Group, Inc. | | | 19,760 | | | | 1,696,594 | |
| | | | | | | | |
| | | | | | | 88,270,586 | |
| | | | | | | | |
| Insurance — 6.1% | | | | | | | | |
Aflac, Inc. | | | 52,730 | | | | 3,221,276 | |
The Allstate Corp. | | | 100,070 | | | | 7,029,917 | |
American International Group, Inc. | | | 262,600 | | | | 14,708,226 | |
Aon PLC | | | 58,430 | | | | 5,540,917 | |
MetLife, Inc. | | | 213,341 | | | | 11,539,615 | |
Sun Life Financial, Inc. (b) | | | 27,110 | | | | 977,587 | |
The Travelers Cos., Inc. | | | 38,916 | | | | 4,119,258 | |
Unum Group | | | 145,964 | | | | 5,091,224 | |
| | | | | | | | |
| | | | | | | 52,228,020 | |
| | | | | | | | |
| Real Estate Investment Trusts (REITS) — 1.5% | | | | | |
Equity Residential | | | 60,120 | | | | 4,319,021 | |
Public Storage | | | 23,410 | | | | 4,327,338 | |
Weyerhaeuser Co. | | | 128,665 | | | | 4,617,787 | |
| | | | | | | | |
| | | | | | | 13,264,146 | |
| | | | | | | | |
| | | | | | | 216,882,210 | |
| | | | | | | | |
| Industrial — 11.0% | | | | | | | | |
| Aerospace & Defense — 0.7% | | | | | | | | |
Northrop Grumman Corp. | | | 41,727 | | | | 6,150,143 | |
| | | | | | | | |
| Building Materials — 0.7% | | | | | | | | |
Louisiana-Pacific Corp. (a) | | | 351,300 | | | | 5,817,528 | |
| | | | | | | | |
| Electronics — 0.8% | | | | | | | | |
TE Connectivity Ltd. | | | 110,160 | | | | 6,967,620 | |
| | | | | | | | |
| Environmental Controls — 0.8% | | | | | | | | |
Waste Management, Inc. | | | 127,940 | | | | 6,565,881 | |
| | | | | | | | |
| Machinery – Construction & Mining — 1.0% | | | | | |
Caterpillar, Inc. | | | 28,200 | | | | 2,581,146 | |
Ingersoll-Rand PLC | | | 58,889 | | | | 3,732,974 | |
Terex Corp. | | | 82,483 | | | | 2,299,626 | |
| | | | | | | | |
| | | | | | | 8,613,746 | |
| | | | | | | | |
The accompanying notes are an integral part of the financial statements.
46
MML Equity Fund – Portfolio of Investments (Continued)
| | | | | | | | |
| | | Number of
Shares | | | Value | |
| Machinery – Diversified — 0.4% | | | | | |
Deere & Co. | | | 36,505 | | | $ | 3,229,597 | |
| | | | | | | | |
| Manufacturing — 4.8% | | | | | | | | |
Danaher Corp. | | | 86,238 | | | | 7,391,459 | |
Eaton Corp. PLC | | | 222,174 | | | | 15,098,945 | |
Honeywell International, Inc. | | | 51,601 | | | | 5,155,972 | |
Illinois Tool Works, Inc. | | | 62,523 | | | | 5,920,928 | |
Parker Hannifin Corp. | | | 57,563 | | | | 7,422,749 | |
| | | | | | | | |
| | | | | | | 40,990,053 | |
| | | | | | | | |
| Packaging & Containers — 0.6% | | | | | |
Sealed Air Corp. | | | 133,794 | | | | 5,676,879 | |
| | | | | | | | |
| Transportation — 1.2% | | | | | | | | |
American ExpressNorfolk Southern Corp. | | | 48,198 | | | | 5,282,983 | |
CSX Corp. | | | 144,150 | | | | 5,222,554 | |
| | | | | | | | |
| | | | | | | 10,505,537 | |
| | | | | | | | |
| | | | | | | 94,516,984 | |
| | | | | | | | |
| Technology — 9.6% | | | | | | | | |
| Computers — 4.2% | | | | | | | | |
Apple, Inc. | | | 110,207 | | | | 12,164,649 | |
EMC Corp. | | | 454,101 | | | | 13,504,964 | |
International Business Machines Corp. | | | 9,210 | | | | 1,477,652 | |
SanDisk Corp. | | | 48,930 | | | | 4,794,161 | |
Synopsys, Inc. (a) | | | 55,580 | | | | 2,416,063 | |
Western Digital Corp. | | | 13,970 | | | | 1,546,479 | |
| | | | | | | | |
| | | | | | | 35,903,968 | |
| | | | | | | | |
| Internet — 0.2% | | | | | |
Check Point Software Technologies Ltd. (a) | | | 25,930 | | | | 2,037,320 | |
| | | | | | | | |
| Semiconductors — 2.3% | | | | | | | | |
Broadcom Corp. Class A | | | 196,690 | | | | 8,522,578 | |
Intel Corp. | | | 233,850 | | | | 8,486,417 | |
Micron Technology, Inc. (a) | | | 73,146 | | | | 2,560,841 | |
| | | | | | | | |
| | | | | | | 19,569,836 | |
| | | | | | | | |
| Software — 2.9% | | | | | |
Citrix Systems, Inc. (a) | | | 63,350 | | | | 4,041,730 | |
Microsoft Corp. | | | 283,424 | | | | 13,165,045 | |
Oracle Corp. | | | 175,230 | | | | 7,880,093 | |
| | | | | | | | |
| | | | | | | 25,086,868 | |
| | | | | | | | |
| | | | | | | 82,597,992 | |
| | | | | | | | |
| Utilities — 2.8% | | | | | | | | |
| Electric — 2.8% | | | | | | | | |
Calpine Corp. (a) | | | 162,464 | | | | 3,595,328 | |
Edison International | | | 134,430 | | | | 8,802,477 | |
Entergy Corp. | | | 39,450 | | | | 3,451,086 | |
NextEra Energy, Inc. | | | 39,521 | | | | 4,200,687 | |
| | | | | | | | |
| | | Number of
Shares | | | Value | |
PG&E Corp. | | | 72,976 | | | $ | 3,885,242 | |
| | | | | | | | |
| | | | | | | 23,934,820 | |
| | | | | | | | |
| | |
TOTAL COMMON STOCK
(Cost $641,534,783) | | | | | | | 846,711,563 | |
| | | | | | | | |
| | |
TOTAL EQUITIES
(Cost $641,534,783) | | | | | | | 846,711,563 | |
| | | | | | | | |
| | |
| MUTUAL FUNDS — 1.0% | | | | | | | | |
| Diversified Financial — 1.0% | | | | | | | | |
State Street Navigator Securities Lending Prime Portfolio (c) | | | 7,997,075 | | | | 7,997,075 | |
| | | | | | | | |
| | |
TOTAL MUTUAL FUNDS
(Cost $7,997,075) | | | | | | | 7,997,075 | |
| | | | | | | | |
| | |
TOTAL LONG-TERM
INVESTMENTS
(Cost $649,531,858) | | | | | | | 854,708,638 | |
| | | | | | | | |
| | |
| | | Principal
Amount | | | | |
|
| SHORT-TERM INVESTMENTS — 1.2% | |
| Repurchase Agreement — 1.2% | | | | | |
State Street Bank & Trust Co. Repurchase Agreement, dated 12/31/14, 0.010%, due 1/02/15 (d) | | $ | 10,452,834 | | | | 10,452,834 | |
| | | | | | | | |
| Time Deposits — 0.0% | |
Euro Time Deposit
0.010% 1/02/15 | | | 31,219 | | | | 31,219 | |
| | | | | | | | |
| | |
TOTAL SHORT-TERM INVESTMENTS
(Cost $10,484,053) | | | | | | | 10,484,053 | |
| | | | | | | | |
| |
TOTAL INVESTMENTS —101.1%
| | | | | |
| (Cost $660,015,911) (e) | | | | | | | 865,192,691 | |
| | |
| Other Assets/(Liabilities) —(1.1)% | | | | | | | (9,284,859 | ) |
| | | | | | | | |
| | |
| NET ASSETS — 100.0% | | | | | | $ | 855,907,832 | |
| | | | | | | | |
Notes to Portfolio of Investments
Percentages are stated as a percent of net assets.
| ADR | American Depositary Receipt |
| (a) | Non-income producing security. |
The accompanying notes are an integral part of the financial statements.
47
MML Equity Fund – Portfolio of Investments (Continued)
Notes to Portfolio of Investments (Continued)
| (b) | Denotes all or a portion of security on loan. The total value of securities on loan as of December 31, 2014, was $7,783,317 or 0.91% of net assets. Total securities on loan may not correspond with the amounts identified in the Portfolio of Investments because pending sales may be in the process of recall from the brokers. (Note 2). |
| (c) | Represents investment of security lending collateral. (Note 2). |
| (d) | Maturity value of $10,452,840. Collateralized by U.S. Government Agency obligations with rates ranging from 2.500% – 3.500%, maturity dates ranging from 4/01/28 – 1/01/32, and an aggregate market value, including accrued interest, of $10,664,178. |
| (e) | See Note 6 for aggregate cost for federal tax purposes. |
The accompanying notes are an integral part of the financial statements.
48
MML Managed Bond Fund – Portfolio of Investments
December 31, 2014
| | | | | | | | |
| | | Number of
Shares | | | Value | |
| EQUITIES — 0.2% | | | | | |
| |
| PREFERRED STOCK — 0.2% | | | | | |
| Financial — 0.2% | |
| Insurance — 0.2% | |
The Allstate Corp. 5.100% | | | 95,000 | | | $ | 2,406,350 | |
| | | | | | | | |
| | |
TOTAL PREFERRED STOCK
(Cost $2,375,000) | | | | | | | 2,406,350 | |
| | | | | | | | |
| | |
TOTAL EQUITIES
(Cost $2,375,000) | | | | | | | 2,406,350 | |
| | | | | | | | |
| | |
| | | Principal
Amount | | | | |
| BONDS & NOTES — 98.5% | | | | | |
| |
| CORPORATE DEBT — 43.9% | | | | | |
| Advertising — 0.3% | | | | | |
The Interpublic Group of Cos., Inc. 2.250% 11/15/17 | | $ | 1,050,000 | | | | 1,051,988 | |
WPP Finance 2010
4.750% 11/21/21 | | | 763,000 | | | | 834,266 | |
WPP Finance 2010
5.625% 11/15/43 | | | 2,800,000 | | | | 3,199,137 | |
| | | | | | | | |
| | | | | | | 5,085,391 | |
| | | | | | | | |
| Aerospace & Defense — 0.2% | | | | | |
BAE Systems Holdings, Inc. (a)
6.375% 6/01/19 | | | 670,000 | | | | 773,530 | |
Exelis, Inc.
4.250% 10/01/16 | | | 1,790,000 | | | | 1,851,236 | |
L-3 Communications Corp.
4.750% 7/15/20 | | | 100,000 | | | | 107,393 | |
United Technologies Corp.
6.125% 7/15/38 | | | 350,000 | | | | 461,697 | |
| | | | | | | | |
| | | | | | | 3,193,856 | |
| | | | | | | | |
| Agriculture — 0.2% | | | | | |
Altria Group, Inc.
2.850% 8/09/22 | | | 1,000,000 | | | | 971,696 | |
Altria Group, Inc.
4.250% 8/09/42 | | | 515,000 | | | | 493,530 | |
Altria Group, Inc.
9.700% 11/10/18 | | | 112,000 | | | | 142,218 | |
Altria Group, Inc.
9.950% 11/10/38 | | | 170,000 | | | | 290,811 | |
Bunge Ltd. Finance Corp.
3.200% 6/15/17 | | | 1,200,000 | | | | 1,233,892 | |
Philip Morris International, Inc.
6.375% 5/16/38 | | | 160,000 | | | | 204,570 | |
| | | | | | | | |
| | | | | | | 3,336,717 | |
| | | | | | | | |
| | | | | | | | |
| | | Principal
Amount | | | Value | |
| Airlines — 0.1% | | | | | |
American Airlines Pass Through Trust,
Series 2014-1, Class A
3.700% 4/01/28 | | $ | 635,000 | | | $ | 638,175 | |
American Airlines Pass-Through Trust,
Series 2014-1, Class B
4.375% 4/01/24 | | | 275,000 | | | | 281,828 | |
United Air Lines, Inc. (b)
10.110% 2/19/49 | | | 99,563 | | | | 39,577 | |
United Airlines Pass-Through Trust, Series 2014-1, Class A
4.000% 10/11/27 | | | 810,000 | | | | 822,150 | |
| | | | | | | | |
| | | | | | | 1,781,730 | |
| | | | | | | | |
| Auto Manufacturers — 0.5% | | | | | |
Daimler Finance NA LLC (a)
2.625% 9/15/16 | | | 900,000 | | | | 921,992 | |
General Motors Co.
3.500% 10/02/18 | | | 1,275,000 | | | | 1,300,500 | |
General Motors Co.
5.200% 4/01/45 | | | 1,575,000 | | | | 1,661,625 | |
Hyundai Capital America (a)
1.450% 2/06/17 | | | 1,895,000 | | | | 1,887,879 | |
Hyundai Capital America (a)
2.550% 2/06/19 | | | 1,045,000 | | | | 1,045,143 | |
| | | | | | | | |
| | | | | | | 6,817,139 | |
| | | | | | | | |
| Automotive & Parts — 0.2% | | | | | |
Lear Corp.
8.125% 3/15/20 | | | 1,327,000 | | | | 1,396,667 | |
Lear Corp.
4.750% 1/15/23 | | | 440,000 | | | | 438,900 | |
TRW Automotive, Inc. (a)
7.250% 3/15/17 | | | 820,000 | | | | 906,100 | |
| | | | | | | | |
| | | | | | | 2,741,667 | |
| | | | | | | | |
| Banks — 3.8% | | | | | |
Associated Banc-Corp.
2.750% 11/15/19 | | | 2,805,000 | | | | 2,802,896 | |
Associated Banc-Corp.
4.250% 1/15/25 | | | 4,455,000 | | | | 4,467,305 | |
Associated Banc-Corp.
5.125% 3/28/16 | | | 1,400,000 | | | | 1,461,524 | |
Bank of America Corp.
3.625% 3/17/16 | | | 925,000 | | | | 950,988 | |
Bank of America Corp.
4.000% 4/01/24 | | | 2,285,000 | | | | 2,379,199 | |
Bank of America Corp.
4.500% 4/01/15 | | | 700,000 | | | | 706,577 | |
Bank of America Corp.
5.650% 5/01/18 | | | 1,230,000 | | | | 1,366,497 | |
Bank of America Corp.
5.750% 12/01/17 | | | 780,000 | | | | 861,820 | |
The accompanying notes are an integral part of the financial statements.
49
MML Managed Bond Fund – Portfolio of Investments (Continued)
| | | | | | | | |
| | | Principal
Amount | | | Value | |
Bank of America Corp.
5.875% 2/07/42 | | $ | 470,000 | | | $ | 588,140 | |
Barclays PLC
4.375% 9/11/24 | | | 1,385,000 | | | | 1,334,726 | |
Credit Suisse AG
5.400% 1/14/20 | | | 1,410,000 | | | | 1,576,785 | |
Deutsche Bank AG
1.400% 2/13/17 | | | 1,350,000 | | | | 1,347,185 | |
Deutsche Bank AG
2.500% 2/13/19 | | | 2,130,000 | | | | 2,156,080 | |
Discover Bank
2.000% 2/21/18 | | | 1,385,000 | | | | 1,381,391 | |
Export-Import Bank of Korea
1.750% 2/27/18 | | | 505,000 | | | | 502,202 | |
Export-Import Bank of Korea
4.000% 1/11/17 | | | 650,000 | | | | 681,415 | |
First Horizon National Corp.
5.375% 12/15/15 | | | 9,870,000 | | | | 10,218,421 | |
FirstMerit Corp.
4.350% 2/04/23 | | | 460,000 | | | | 483,200 | |
HSBC Holdings PLC
5.250% 3/14/44 | | | 3,205,000 | | | | 3,590,097 | |
HSBC Holdings PLC
6.500% 9/15/37 | | | 570,000 | | | | 732,385 | |
ICICI Bank Ltd. (a)
4.700% 2/21/18 | | | 1,250,000 | | | | 1,318,201 | |
ICICI Bank Ltd. (a)
4.750% 11/25/16 | | | 1,276,000 | | | | 1,333,522 | |
ICICI Bank Ltd. (a)
5.500% 3/25/15 | | | 2,570,000 | | | | 2,593,952 | |
JP Morgan Chase & Co.
3.875% 9/10/24 | | | 1,420,000 | | | | 1,421,208 | |
JP Morgan Chase & Co.
6.000% 1/15/18 | | | 275,000 | | | | 307,680 | |
MUFG Union Bank NA
2.625% 9/26/18 | | | 500,000 | | | | 507,373 | |
Regions Financial Corp.
7.500% 5/15/18 | | | 765,000 | | | | 888,085 | |
Skandinaviska Enskilda Banken AB (a)
2.375% 3/25/19 | | | 680,000 | | | | 684,406 | |
State Street Corp.
3.300% 12/16/24 | | | 2,300,000 | | | | 2,334,374 | |
SVB Financial Group
5.375% 9/15/20 | | | 475,000 | | | | 534,119 | |
UBS AG
5.750% 4/25/18 | | | 1,095,000 | | | | 1,231,808 | |
Valley National Bancorp
5.125% 9/27/23 | | | 1,530,000 | | | | 1,658,698 | |
Wachovia Bank NA
5.850% 2/01/37 | | | 25,000 | | | | 31,543 | |
Wachovia Bank NA
6.600% 1/15/38 | | | 325,000 | | | | 450,122 | |
| | | | | | | | |
| | | Principal
Amount | | | Value | |
Wells Fargo & Co.
4.600% 4/01/21 | | $ | 210,000 | | | $ | 233,658 | |
| | | | | | | | |
| | | | | | | 55,117,582 | |
| | | | | | | | |
| Beverages — 0.1% | | | | | |
Anheuser-Busch Cos, Inc.
6.500% 2/01/43 | | | 125,000 | | | | 170,194 | |
Pernod Ricard SA (a)
2.950% 1/15/17 | | | 1,400,000 | | | | 1,432,405 | |
| | | | | | | | |
| | | | | | | 1,602,599 | |
| | | | | | | | |
| Biotechnology — 0.1% | | | | | |
Amgen, Inc.
5.150% 11/15/41 | | | 950,000 | | | | 1,070,792 | |
| | | | | | | | |
| Building Materials — 0.6% | | | | | |
CRH America, Inc.
8.125% 7/15/18 | | | 1,195,000 | | | | 1,430,180 | |
Elementia SAB de CV (a)
5.500% 1/15/25 | | | 1,000,000 | | | | 960,000 | |
Lafarge SA
6.500% 7/15/16 | | | 1,185,000 | | | | 1,262,025 | |
Martin Marietta Material, Inc. FRN
1.357% 6/30/17 | | | 1,365,000 | | | | 1,379,966 | |
Masco Corp.
4.800% 6/15/15 | | | 1,875,000 | | | | 1,903,890 | |
Owens Corning, Inc.
4.200% 12/01/24 | | | 1,245,000 | | | | 1,228,648 | |
Owens Corning, Inc.
9.000% 6/15/19 | | | 590,000 | | | | 714,004 | |
| | | | | | | | |
| | | | | | | 8,878,713 | |
| | | | | | | | |
| Chemicals — 2.0% | | | | | | | | |
Ashland, Inc.
4.750% 8/15/22 | | | 9,620,000 | | | | 9,620,000 | |
Ashland, Inc.
6.875% 5/15/43 | | | 2,977,000 | | | | 3,170,505 | |
Cabot Corp.
5.000% 10/01/16 | | | 2,215,000 | | | | 2,348,463 | |
Cytec Industries, Inc.
3.500% 4/01/23 | | | 380,000 | | | | 380,722 | |
Cytec Industries, Inc.
8.950% 7/01/17 | | | 125,000 | | | | 142,823 | |
The Dow Chemical Co.
8.550% 5/15/19 | | | 250,000 | | | | 310,811 | |
E.I. du Pont de Nemours & Co.
6.000% 7/15/18 | | | 115,000 | | | | 130,967 | |
Ecolab, Inc.
4.350% 12/08/21 | | | 375,000 | | | | 408,596 | |
Incitec Pivot Finance LLC (a)
6.000% 12/10/19 | | | 640,000 | | | | 711,675 | |
Incitec Pivot Ltd. (a)
4.000% 12/07/15 | | | 2,377,000 | | | | 2,431,495 | |
Methanex Corp.
5.250% 3/01/22 | | | 350,000 | | | | 375,975 | |
The accompanying notes are an integral part of the financial statements.
50
MML Managed Bond Fund – Portfolio of Investments (Continued)
| | | | | | | | |
| | | Principal
Amount | | | Value | |
Rockwood Specialties Group, Inc.
4.625% 10/15/20 | | $ | 4,115,000 | | | $ | 4,248,737 | |
RPM International, Inc.
3.450% 11/15/22 | | | 1,425,000 | | | | 1,403,353 | |
RPM International, Inc.
6.125% 10/15/19 | | | 550,000 | | | | 625,089 | |
RPM International, Inc.
6.500% 2/15/18 | | | 1,390,000 | | | | 1,553,203 | |
Valspar Corp.
7.250% 6/15/19 | | | 315,000 | | | | 369,017 | |
| | | | | | | | |
| | | | | | | 28,231,431 | |
| | | | | | | | |
| Commercial Services — 0.7% | | | | | |
The ADT Corp.
2.250% 7/15/17 | | | 1,770,000 | | | | 1,712,475 | |
Brambles USA, Inc. (a)
3.950% 4/01/15 | | | 1,010,000 | | | | 1,016,975 | |
Cardtronics, Inc., Convertible
1.000% 12/01/20 | | | 1,250,000 | | | | 1,236,719 | |
Donnelley (R.R.) & Sons Co.
5.500% 5/15/15 | | | 59,000 | | | | 59,590 | |
ERAC USA Finance LLC (a)
2.800% 11/01/18 | | | 395,000 | | | | 403,468 | |
ERAC USA Finance LLC (a)
6.700% 6/01/34 | | | 125,000 | | | | 160,799 | |
Leidos Holdings, Inc.
4.450% 12/01/20 | | | 1,590,000 | | | | 1,527,915 | |
The Western Union Co.
5.930% 10/01/16 | | | 4,020,000 | | | | 4,316,218 | |
| | | | | | | | |
| | | | | | | 10,434,159 | |
| | | | | | | | |
| Computers — 0.5% | | | | | |
Apple, Inc.
1.000% 5/03/18 | | | 1,960,000 | | | | 1,930,914 | |
Apple, Inc.
3.850% 5/04/43 | | | 615,000 | | | | 615,445 | |
Electronic Data Systems LLC
7.450% 10/15/29 | | | 300,000 | | | | 379,046 | |
Hewlett-Packard Co.
5.500% 3/01/18 | | | 750,000 | | | | 827,777 | |
SanDisk Corp., Convertible
0.500% 10/15/20 | | | 2,513,000 | | | | 3,018,741 | |
| | | | | | | | |
| | | | | | | 6,771,923 | |
| | | | | | | | |
| Cosmetics & Personal Care — 0.1% | | | | | |
Avon Products, Inc.
5.000% 3/15/23 | | | 360,000 | | | | 321,300 | |
Avon Products, Inc.
6.500% 3/01/19 | | | 790,000 | | | | 788,025 | |
The Procter & Gamble Co.
5.800% 8/15/34 | | | 175,000 | | | | 232,628 | |
| | | | | | | | |
| | | | | | | 1,341,953 | |
| | | | | | | | |
| | | | | | | | |
| | | Principal
Amount | | | Value | |
| Distribution & Wholesale — 0.3% | | | | | | | | |
Arrow Electronics, Inc.
4.500% 3/01/23 | | $ | 660,000 | | | $ | 682,220 | |
Ingram Micro, Inc.
4.950% 12/15/24 | | | 3,045,000 | | | | 3,043,995 | |
| | | | | | | | |
| | | | | | | 3,726,215 | |
| | | | | | | | |
| Diversified Financial — 5.1% | | | | | | | | |
AerCap Ireland Capital Ltd. (a)
4.500% 5/15/21 | | | 4,735,000 | | | | 4,794,187 | |
Affiliated Managers Group, Inc.
4.250% 2/15/24 | | | 1,322,000 | | | | 1,377,346 | |
Air Lease Corp.
3.375% 1/15/19 | | | 2,270,000 | | | | 2,298,375 | |
Air Lease Corp.
3.875% 4/01/21 | | | 1,630,000 | | | | 1,638,150 | |
Air Lease Corp.
5.625% 4/01/17 | | | 535,000 | | | | 576,462 | |
American Express Co.
6.150% 8/28/17 | | | 295,000 | | | | 328,689 | |
American Express Co. VRN
6.800% 9/01/66 | | | 185,000 | | | | 193,787 | |
American Express Co.
8.125% 5/20/19 | | | 810,000 | | | | 1,001,994 | |
Ares Finance Co. LLC (a)
4.000% 10/08/24 | | | 2,080,000 | | | | 2,042,978 | |
BlackRock, Inc.
5.000% 12/10/19 | | | 580,000 | | | | 655,737 | |
Citigroup, Inc.
4.750% 5/19/15 | | | 1,590,000 | | | | 1,613,438 | |
Citigroup, Inc.
5.375% 8/09/20 | | | 1,100,000 | | | | 1,250,210 | |
Citigroup, Inc.
5.875% 5/29/37 | | | 490,000 | | | | 593,569 | |
Citigroup, Inc.
5.875% 1/30/42 | | | 475,000 | | | | 597,472 | |
Citigroup, Inc.
6.125% 11/21/17 | | | 745,000 | | | | 830,738 | |
Citigroup, Inc.
8.500% 5/22/19 | | | 486,000 | | | | 605,589 | |
Eaton Vance Corp.
3.625% 6/15/23 | | | 567,000 | | | | 578,632 | |
Eaton Vance Corp.
6.500% 10/02/17 | | | 168,000 | | | | 188,494 | |
Ford Motor Credit Co. LLC
3.000% 6/12/17 | | | 1,250,000 | | | | 1,282,509 | |
Ford Motor Credit Co. LLC
12.000% 5/15/15 | | | 2,000,000 | | | | 2,078,694 | |
General Electric Capital Corp.
1.600% 11/20/17 | | | 1,380,000 | | | | 1,388,479 | |
General Electric Capital Corp.
5.500% 1/08/20 | | | 115,000 | | | | 131,626 | |
General Electric Capital Corp.
5.625% 5/01/18 | | | 190,000 | | | | 213,794 | |
The accompanying notes are an integral part of the financial statements.
51
MML Managed Bond Fund – Portfolio of Investments (Continued)
| | | | | | | | |
| | | Principal
Amount | | | Value | |
General Electric Capital Corp.
6.875% 1/10/39 | | $ | 1,040,000 | | | $ | 1,471,087 | |
General Motors Financial Co., Inc.
2.625% 7/10/17 | | | 1,275,000 | | | | 1,280,527 | |
General Motors Financial Co., Inc.
2.750% 5/15/16 | | | 960,000 | | | | 975,600 | |
General Motors Financial Co., Inc.
3.000% 9/25/17 | | | 1,650,000 | | | | 1,668,612 | |
The Goldman Sachs Group, Inc.
3.300% 5/03/15 | | | 900,000 | | | | 907,307 | |
The Goldman Sachs Group, Inc.
3.625% 2/07/16 | | | 380,000 | | | | 389,902 | |
The Goldman Sachs Group, Inc.
5.375% 3/15/20 | | | 950,000 | | | | 1,064,662 | |
The Goldman Sachs Group, Inc.
5.625% 1/15/17 | | | 975,000 | | | | 1,045,782 | |
The Goldman Sachs Group, Inc.
5.750% 1/24/22 | | | 950,000 | | | | 1,098,948 | |
The Goldman Sachs Group, Inc.
6.125% 2/15/33 | | | 335,000 | | | | 410,613 | |
The Goldman Sachs Group, Inc.
6.150% 4/01/18 | | | 150,000 | | | | 168,363 | |
The Goldman Sachs Group, Inc.
6.345% 2/15/34 | | | 335,000 | | | | 398,518 | |
The Goldman Sachs Group, Inc.
6.750% 10/01/37 | | | 345,000 | | | | 433,794 | |
Hyundai Capital America (a)
1.625% 10/02/15 | | | 680,000 | | | | 682,789 | |
Hyundai Capital America (a)
2.875% 8/09/18 | | | 800,000 | | | | 816,157 | |
Hyundai Capital America (a)
4.000% 6/08/17 | | | 1,120,000 | | | | 1,170,172 | |
Icahn Enterprises LP/Icahn Enterprises Finance Corp.
3.500% 3/15/17 | | | 6,450,000 | | | | 6,450,000 | |
International Lease Finance Corp.
3.875% 4/15/18 | | | 1,515,000 | | | | 1,515,000 | |
International Lease Finance Corp.
5.750% 5/15/16 | | | 4,742,000 | | | | 4,919,825 | |
Janus Capital Group, Inc.
6.700% 6/15/17 | | | 2,375,000 | | | | 2,627,762 | |
JP Morgan Chase & Co.
4.500% 1/24/22 | | | 950,000 | | | | 1,037,164 | |
JP Morgan Chase & Co.
4.950% 3/25/20 | | | 1,655,000 | | | | 1,828,287 | |
JP Morgan Chase & Co.
5.600% 7/15/41 | | | 1,125,000 | | | | 1,362,048 | |
Lazard Group LLC
4.250% 11/14/20 | | | 2,985,000 | | | | 3,146,041 | |
Lazard Group LLC
6.850% 6/15/17 | | | 1,368,000 | | | | 1,522,858 | |
Legg Mason, Inc.
5.625% 1/15/44 | | | 1,600,000 | | | | 1,830,171 | |
| | | | | | | | |
| | | Principal
Amount | | | Value | |
Leighton Finance USA Pty Ltd. (a)
5.950% 11/13/22 | | $ | 685,000 | | | $ | 726,399 | |
Merrill Lynch & Co., Inc.
7.750% 5/14/38 | | | 400,000 | | | | 564,922 | |
Morgan Stanley
3.800% 4/29/16 | | | 600,000 | | | | 619,811 | |
Morgan Stanley
4.000% 7/24/15 | | | 950,000 | | | | 967,882 | |
Morgan Stanley
4.350% 9/08/26 | | | 840,000 | | | | 845,019 | |
Morgan Stanley
5.450% 1/09/17 | | | 330,000 | | | | 354,326 | |
Morgan Stanley
5.750% 1/25/21 | | | 625,000 | | | | 717,469 | |
Morgan Stanley
6.625% 4/01/18 | | | 1,000,000 | | | | 1,139,035 | |
National Rural Utilities Cooperative Finance Corp.
10.375% 11/01/18 | | | 155,000 | | | | 201,923 | |
Stifel Financial Corp.
4.250% 7/18/24 | | | 895,000 | | | | 900,304 | |
| | | | | | | | |
| | | | | | | 73,520,028 | |
| | | | | | | | |
| Electric — 2.4% | | | | | |
The AES Corp.
7.750% 10/15/15 | | | 167,000 | | | | 174,098 | |
Berkshire Hathaway Energy
5.950% 5/15/37 | | | 1,100,000 | | | | 1,368,917 | |
CMS Energy Corp.
5.050% 2/15/18 | | | 1,250,000 | | | | 1,359,269 | |
Entergy Louisiana LLC
4.950% 1/15/45 | | | 1,005,000 | | | | 1,019,873 | |
Florida Power & Light Co.
4.950% 6/01/35 | | | 630,000 | | | | 726,763 | |
Georgia Power Co.
4.300% 3/15/42 | | | 473,000 | | | | 496,726 | |
IPALCO Enterprises, Inc.
5.000% 5/01/18 | | | 2,215,000 | | | | 2,336,825 | |
IPALCO Enterprises, Inc. (a)
7.250% 4/01/16 | | | 1,791,000 | | | | 1,889,505 | |
Kansas Gas & Electric Co.
5.647% 3/29/21 | | | 211,918 | | | | 224,378 | |
LG&E and KU Energy LLC
4.375% 10/01/21 | | | 1,100,000 | | | | 1,170,826 | |
Metropolitan Edison Co. (a)
4.000% 4/15/25 | | | 1,345,000 | | | | 1,371,772 | |
National Fuel Gas Co.
3.750% 3/01/23 | | | 710,000 | | | | 718,123 | |
Nevada Power Co. Series N
6.650% 4/01/36 | | | 550,000 | | | | 760,555 | |
NextEra Energy Capital Holdings, Inc.
1.200% 6/01/15 | | | 5,000,000 | | | | 5,009,410 | |
Niagara Mohawk Power Corp. (a)
2.721% 11/28/22 | | | 1,070,000 | | | | 1,047,376 | |
The accompanying notes are an integral part of the financial statements.
52
MML Managed Bond Fund – Portfolio of Investments (Continued)
| | | | | | | | |
| | | Principal
Amount | | | Value | |
NiSource Finance Corp.
4.800% 2/15/44 | | $ | 1,135,000 | | | $ | 1,209,280 | |
NiSource Finance Corp.
5.800% 2/01/42 | | | 950,000 | | | | 1,156,191 | |
Oncor Electric Delivery Co.
6.800% 9/01/18 | | | 60,000 | | | | 69,937 | |
Oncor Electric Delivery Co.
7.500% 9/01/38 | | | 495,000 | | | | 745,207 | |
Pacific Gas & Electric Co.
5.800% 3/01/37 | | | 543,000 | | | | 665,167 | |
Pennsylvania Electric Co. (a)
4.150% 4/15/25 | | | 1,860,000 | | | | 1,876,082 | |
PPL Capital Funding, Inc.
1.900% 6/01/18 | | | 320,000 | | | | 319,456 | |
PPL Capital Funding, Inc.
5.000% 3/15/44 | | | 1,180,000 | | | | 1,313,262 | |
Puget Energy, Inc.
6.500% 12/15/20 | | | 1,580,000 | | | | 1,856,802 | |
Southern California Edison Co.
5.950% 2/01/38 | | | 545,000 | | | | 719,363 | |
State Grid Overseas Investment Ltd. (a)
1.750% 5/22/18 | | | 1,170,000 | | | | 1,147,466 | |
Transelec SA (a)
4.625% 7/26/23 | | | 1,075,000 | | | | 1,114,690 | |
Tri-State Generation & Transmission Association, Series 2003, Class A (a)
6.040% 1/31/18 | | | 184,532 | | | | 195,595 | |
Tri-State Generation & Transmission Association, Series 2003, Class B (a)
7.144% 7/31/33 | | | 480,000 | | | | 613,829 | |
Union Electric Co.
6.700% 2/01/19 | | | 505,000 | | | | 592,401 | |
Virginia Electric and Power Co.
6.350% 11/30/37 | | | 640,000 | | | | 890,086 | |
Wisconsin Public Service Corp.
5.650% 11/01/17 | | | 380,000 | | | | 412,371 | |
| | | | | | | | |
| | | | | | | 34,571,601 | |
| | | | | | | | |
| Electrical Components & Equipment — 0.0% | | | | | |
Anixter, Inc.
5.950% 3/01/15 | | | 600,000 | | | | 601,500 | |
| | | | | | | | |
| Electronics — 0.4% | | | | | | | | |
Amphenol Corp.
2.550% 1/30/19 | | | 1,320,000 | | | | 1,329,178 | |
Amphenol Corp.
4.000% 2/01/22 | | | 475,000 | | | | 498,157 | |
Arrow Electronics, Inc.
6.000% 4/01/20 | | | 725,000 | | | | 814,120 | |
Avnet, Inc.
4.875% 12/01/22 | | | 653,000 | | | | 693,007 | |
Jabil Circuit, Inc.
7.750% 7/15/16 | | | 1,015,000 | | | | 1,087,319 | |
Jabil Circuit, Inc.
8.250% 3/15/18 | | | 605,000 | | | | 687,824 | |
| | | | | | | | |
| | | Principal
Amount | | | Value | |
Tech Data Corp.
3.750% 9/21/17 | | $ | 885,000 | | | $ | 914,220 | |
| | | | | | | | |
| | | | | | | 6,023,825 | |
| | | | | | | | |
| Engineering & Construction — 0.1% | | | | | |
BAA Funding Ltd. (a)
2.500% 6/25/17 | | | 1,135,000 | | | | 1,135,681 | |
| | | | | | | | |
| Entertainment — 0.0% | | | | | | | | |
International Game Technology
5.500% 6/15/20 | | | 550,000 | | | | 570,179 | |
| | | | | | | | |
| Environmental Controls — 0.1% | | | | | |
Republic Services, Inc.
3.800% 5/15/18 | | | 595,000 | | | | 629,513 | |
Republic Services, Inc.
5.250% 11/15/21 | | | 100,000 | | | | 113,229 | |
Waste Management, Inc.
6.100% 3/15/18 | | | 90,000 | | | | 101,841 | |
| | | | | | | | |
| | | | | | | 844,583 | |
| | | | | | | | |
| Foods — 0.7% | | | | | |
ConAgra Foods, Inc.
4.950% 8/15/20 | | | 600,000 | | | | 659,023 | |
ConAgra Foods, Inc.
6.625% 8/15/39 | | | 350,000 | | | | 447,899 | |
ConAgra Foods, Inc.
7.000% 4/15/19 | | | 364,000 | | | | 423,993 | |
Delhaize America, Inc.
9.000% 4/15/31 | | | 855,000 | | | | 1,163,184 | |
Delhaize Group
6.500% 6/15/17 | | | 1,235,000 | | | | 1,362,385 | |
General Mills, Inc.
5.400% 6/15/40 | | | 70,000 | | | | 82,618 | |
Kraft Foods, Inc.
4.125% 2/09/16 | | | 1,100,000 | | | | 1,140,868 | |
Kraft Foods, Inc.
6.500% 2/09/40 | | | 260,000 | | | | 346,511 | |
Tyson Foods, Inc.
2.650% 8/15/19 | | | 430,000 | | | | 433,917 | |
Tyson Foods, Inc.
3.950% 8/15/24 | | | 895,000 | | | | 925,180 | |
Tyson Foods, Inc.
4.875% 8/15/34 | | | 660,000 | | | | 724,001 | |
Tyson Foods, Inc.
6.600% 4/01/16 | | | 2,300,000 | | | | 2,451,809 | |
WM Wrigley Jr. Co. (a)
2.400% 10/21/18 | | | 475,000 | | | | 478,345 | |
| | | | | | | | |
| | | | | | | 10,639,733 | |
| | | | | | | | |
| Forest Products & Paper — 0.2% | | | | | |
Domtar Corp.
9.500% 8/01/16 | | | 160,000 | | | | 176,629 | |
Domtar Corp.
10.750% 6/01/17 | | | 245,000 | | | | 291,200 | |
International Paper Co.
4.750% 2/15/22 | | | 425,000 | | | | 463,672 | |
The accompanying notes are an integral part of the financial statements.
53
MML Managed Bond Fund – Portfolio of Investments (Continued)
| | | | | | | | |
| | | Principal
Amount | | | Value | |
International Paper Co.
7.300% 11/15/39 | | $ | 765,000 | | | $ | 1,014,321 | |
International Paper Co.
9.375% 5/15/19 | | | 200,000 | | | | 255,310 | |
The Mead Corp.
7.550% 3/01/47 | | | 1,000,000 | | | | 1,254,384 | |
| | | | | | | | |
| | | | | | | 3,455,516 | |
| | | | | | | | |
| Gas — 0.2% | | | | | |
Boston Gas Co. (a)
4.487% 2/15/42 | | | 450,000 | | | | 484,834 | |
The Laclede Group, Inc.
4.700% 8/15/44 | | | 1,840,000 | | | | 1,916,592 | |
| | | | | | | | |
| | | | | | | 2,401,426 | |
| | | | | | | | |
| Hand & Machine Tools — 0.1% | | | | | |
Kennametal, Inc.
2.650% 11/01/19 | | | 800,000 | | | | 791,535 | |
| | | | | | | | |
| Health Care – Products — 0.1% | | | | | |
Boston Scientific Corp.
6.000% 1/15/20 | | | 650,000 | | | | 732,536 | |
Hospira, Inc.
5.200% 8/12/20 | | | 900,000 | | | | 965,544 | |
Johnson & Johnson
5.850% 7/15/38 | | | 175,000 | | | | 238,983 | |
| | | | | | | | |
| | | | | | | 1,937,063 | |
| | | | | | | | |
| Health Care – Services — 0.5% | | | | | |
Anthem, Inc., Convertible
2.750% 10/15/42 | | | 650,000 | | | | 1,118,812 | |
Cigna Corp.
2.750% 11/15/16 | | | 800,000 | | | | 821,495 | |
Cigna Corp.
5.125% 6/15/20 | | | 450,000 | | | | 501,489 | |
Howard Hughes Medical Institute
3.500% 9/01/23 | | | 880,000 | | | | 920,205 | |
Kaiser Foundation Hospitals
3.500% 4/01/22 | | | 375,000 | | | | 386,761 | |
Roche Holdings, Inc. (a)
6.000% 3/01/19 | | | 98,000 | | | | 113,189 | |
Roche Holdings, Inc. (a)
7.000% 3/01/39 | | | 680,000 | | | | 987,801 | |
UnitedHealth Group, Inc.
3.950% 10/15/42 | | | 350,000 | | | | 347,905 | |
UnitedHealth Group, Inc.
6.875% 2/15/38 | | | 1,160,000 | | | | 1,627,768 | |
| | | | | | | | |
| | | | | | | 6,825,425 | |
| | | | | | | | |
| Holding Company – Diversified — 0.1% | | | | | |
Hutchison Whampoa International Ltd. (a)
5.750% 9/11/19 | | | 725,000 | | | | 826,649 | |
| | | | | | | | |
| Home Furnishing — 0.1% | | | | | |
Whirlpool Corp.
3.700% 3/01/23 | | | 630,000 | | | | 639,795 | |
| | | | | | | | |
| | | Principal
Amount | | | Value | |
Whirlpool Corp.
5.150% 3/01/43 | | $ | 290,000 | | | $ | 321,115 | |
| | | | | | | | |
| | | | | | | 960,910 | |
| | | | | | | | |
| Household Products — 0.2% | | | | | | | | |
Avery Dennison Corp.
3.350% 4/15/23 | | | 410,000 | | | | 407,574 | |
Jarden Corp., Convertible
1.500% 6/15/19 | | | 1,740,000 | | | | 2,292,450 | |
| | | | | | | | |
| | | | | | | 2,700,024 | |
| | | | | | | | |
| Housewares — 0.1% | | | | | |
Newell Rubbermaid, Inc.
2.050% 12/01/17 | | | 850,000 | | | | 847,411 | |
| | | | | | | | |
| Insurance — 3.2% | | | | | |
Aflac, Inc.
8.500% 5/15/19 | | | 285,000 | | | | 356,170 | |
The Allstate Corp.
5.550% 5/09/35 | | | 630,000 | | | | 780,737 | |
The Allstate Corp. VRN
5.750% 8/15/53 | | | 2,065,000 | | | | 2,175,994 | |
The Allstate Corp.
7.450% 5/16/19 | | | 47,000 | | | | 56,915 | |
American International Group, Inc.
6.250% 5/01/36 | | | 2,200,000 | | | | 2,850,987 | |
Arch Capital Group US, Inc.
5.144% 11/01/43 | | | 1,040,000 | | | | 1,155,498 | |
AXIS Specialty Finance PLC
2.650% 4/01/19 | | | 590,000 | | | | 591,491 | |
Brown & Brown, Inc.
4.200% 9/15/24 | | | 1,775,000 | | | | 1,795,164 | |
The Chubb Corp. VRN
6.375% 3/29/67 | | | 1,507,000 | | | | 1,615,579 | |
CNA Financial Corp.
3.950% 5/15/24 | | | 1,120,000 | | | | 1,132,497 | |
CNA Financial Corp.
7.350% 11/15/19 | | | 670,000 | | | | 799,675 | |
Five Corners Funding Trust (a)
4.419% 11/15/23 | | | 1,315,000 | | | | 1,390,509 | |
The Hartford Financial Services Group, Inc. VRN
8.125% 6/15/68 | | | 1,385,000 | | | | 1,585,592 | |
Liberty Mutual Group, Inc. (a)
4.250% 6/15/23 | | | 566,000 | | | | 583,251 | |
Lincoln National Corp.
4.300% 6/15/15 | | | 425,000 | | | | 431,724 | |
Lincoln National Corp.
8.750% 7/01/19 | | | 670,000 | | | | 837,185 | |
Marsh & McLennan Cos., Inc.
4.800% 7/15/21 | | | 850,000 | | | | 944,707 | |
Marsh & McLennan Cos., Inc.
5.875% 8/01/33 | | | 600,000 | | | | 739,180 | |
MetLife Capital Trust IV (a)
7.875% 12/15/67 | | | 1,960,000 | | | | 2,503,900 | |
The accompanying notes are an integral part of the financial statements.
54
MML Managed Bond Fund – Portfolio of Investments (Continued)
| | | | | | | | |
| | | Principal
Amount | | | Value | |
MetLife, Inc. Series A
6.817% 8/15/18 | | $ | 145,000 | | | $ | 168,710 | |
Principal Financial Group, Inc.
8.875% 5/15/19 | | | 290,000 | | | | 364,880 | |
The Progressive Corp. VRN
6.700% 6/15/67 | | | 2,039,000 | | | | 2,205,688 | |
Prudential Financial, Inc.
4.500% 11/15/20 | | | 475,000 | | | | 515,516 | |
Prudential Financial, Inc. VRN
5.200% 3/15/44 | | | 1,800,000 | | | | 1,782,000 | |
Prudential Financial, Inc. VRN
5.625% 6/15/43 | | | 1,680,000 | | | | 1,717,464 | |
Prudential Financial, Inc.
6.200% 11/15/40 | | | 350,000 | | | | 445,701 | |
Prudential Financial, Inc. VRN
8.875% 6/15/68 | | | 1,475,000 | | | | 1,722,063 | |
QBE Capital Funding III Ltd. VRN (a)
7.250% 5/24/41 | | | 1,305,000 | | | | 1,422,450 | |
QBE Insurance Group Ltd. (a)
2.400% 5/01/18 | | | 655,000 | | | | 655,068 | |
Reinsurance Group of America, Inc.
4.700% 9/15/23 | | | 1,480,000 | | | | 1,590,344 | |
Reinsurance Group of America, Inc.
5.000% 6/01/21 | | | 1,220,000 | | | | 1,343,679 | |
Reinsurance Group of America, Inc.
6.450% 11/15/19 | | | 1,305,000 | | | | 1,510,973 | |
The Travelers Cos., Inc.
6.250% 6/15/37 | | | 550,000 | | | | 730,630 | |
USF&G Capital I (a)
8.500% 12/15/45 | | | 885,000 | | | | 1,320,086 | |
Voya Financial, Inc.
5.500% 7/15/22 | | | 600,000 | | | | 677,770 | |
Voya Financial, Inc. VRN
5.650% 5/15/53 | | | 1,175,000 | | | | 1,163,250 | |
Willis Group Holdings PLC
4.125% 3/15/16 | | | 455,000 | | | | 468,947 | |
Willis North America, Inc.
7.000% 9/29/19 | | | 566,000 | | | | 660,124 | |
WR Berkley Corp.
4.625% 3/15/22 | | | 2,600,000 | | | | 2,788,048 | |
| | | | | | | | |
| | | | | | | 45,580,146 | |
| | | | | | | | |
| Internet — 0.8% | | | | | |
Baidu, Inc.
2.750% 6/09/19 | | | 405,000 | | | | 403,219 | |
Baidu, Inc.
3.250% 8/06/18 | | | 1,690,000 | | | | 1,727,542 | |
Expedia, Inc.
4.500% 8/15/24 | | | 5,490,000 | | | | 5,543,643 | |
Expedia, Inc.
7.456% 8/15/18 | | | 2,550,000 | | | | 2,965,828 | |
| | | | | | | | |
| | | Principal
Amount | | | Value | |
LinkedIn Corp., Convertible (a)
0.500% 11/01/19 | | $ | 1,370,000 | | | $ | 1,445,350 | |
| | | | | | | | |
| | | | | | | 12,085,582 | |
| | | | | | | | |
| Investment Companies — 0.4% | | | | | |
Ares Capital Corp.
3.875% 1/15/20 | | | 1,840,000 | | | | 1,834,717 | |
FS Investment Corp.
4.000% 7/15/19 | | | 2,450,000 | | | | 2,440,330 | |
Xstrata Finance Canada Ltd. (a)
2.050% 10/23/15 | | | 1,225,000 | | | | 1,232,971 | |
Xstrata Finance Canada Ltd. (a)
5.800% 11/15/16 | | | 240,000 | | | | 256,738 | |
| | | | | | | | |
| | | | | | | 5,764,756 | |
| | | | | | | | |
| Iron & Steel — 0.8% | | | | | |
Allegheny Technologies, Inc.
9.375% 6/01/19 | | | 220,000 | | | | 255,957 | |
ArcelorMittal
4.250% 8/05/15 | | | 3,850,000 | | | | 3,907,750 | |
ArcelorMittal
5.000% 2/25/17 | | | 825,000 | | | | 858,000 | |
ArcelorMittal
5.750% 8/05/20 | | | 1,200,000 | | | | 1,245,000 | |
Cliffs Natural Resources, Inc.
5.700% 1/15/18 | | | 705,000 | | | | 458,250 | |
Commercial Metals Co.
6.500% 7/15/17 | | | 765,000 | | | | 814,725 | |
Reliance Steel & Aluminum Co.
4.500% 4/15/23 | | | 815,000 | | | | 798,746 | |
Reliance Steel & Aluminum Co.
6.200% 11/15/16 | | | 1,870,000 | | | | 1,995,907 | |
Reliance Steel & Aluminum Co.
6.850% 11/15/36 | | | 1,045,000 | | | | 1,219,289 | |
Tupy Overseas SA (a)
6.625% 7/17/24 | | | 300,000 | | | | 288,000 | |
| | | | | | | | |
| | | | | | | 11,841,624 | |
| | | | | | | | |
| Leisure Time — 0.1% | | | | | |
Carnival Corp.
1.875% 12/15/17 | | | 750,000 | | | | 744,390 | |
| | | | | | | | |
| Lodging — 0.7% | | | | | |
Choice Hotels International, Inc.
5.700% 8/28/20 | | | 1,100,000 | | | | 1,185,250 | |
Marriott International, Inc.
3.250% 9/15/22 | | | 1,345,000 | | | | 1,350,404 | |
Marriott International, Inc.
3.375% 10/15/20 | | | 1,290,000 | | | | 1,320,676 | |
Marriott International, Inc.
5.810% 11/10/15 | | | 300,000 | | | | 312,324 | |
Marriott International, Inc.
6.200% 6/15/16 | | | 945,000 | | | | 1,011,831 | |
Starwood Hotels & Resorts Worldwide, Inc.
6.750% 5/15/18 | | | 220,000 | | | | 250,417 | |
The accompanying notes are an integral part of the financial statements.
55
MML Managed Bond Fund – Portfolio of Investments (Continued)
| | | | | | | | |
| | | Principal
Amount | | | Value | |
Wyndham Worldwide Corp.
2.500% 3/01/18 | | $ | 1,160,000 | | | $ | 1,158,018 | |
Wyndham Worldwide Corp.
2.950% 3/01/17 | | | 350,000 | | | | 357,432 | |
Wyndham Worldwide Corp.
6.000% 12/01/16 | | | 6,000 | | | | 6,452 | |
Wynn Las Vegas LLC
7.750% 8/15/20 | | | 2,400,000 | | | | 2,556,552 | |
| | | | | | | | |
| | | | | | | 9,509,356 | |
| | | | | | | | |
| Machinery – Diversified — 0.4% | | | | | |
CNH Industrial Capital LLC
3.250% 2/01/17 | | | 1,650,000 | | | | 1,625,250 | |
CNH Industrial Capital LLC (a)
3.375% 7/15/19 | | | 1,530,000 | | | | 1,461,150 | |
CNH Industrial Capital LLC
3.625% 4/15/18 | | | 655,000 | | | | 645,175 | |
CNH Industrial Capital LLC
6.250% 11/01/16 | | | 1,240,000 | | | | 1,298,900 | |
Xylem, Inc.
3.550% 9/20/16 | | | 800,000 | | | | 831,354 | |
Xylem, Inc.
4.875% 10/01/21 | | | 375,000 | | | | 405,128 | |
| | | | | | | | |
| | | | | | | 6,266,957 | |
| | | | | | | | |
| Manufacturing — 1.1% | | | | | |
Cooper US, Inc.
6.100% 7/01/17 | | | 535,000 | | | | 589,510 | |
Eaton Corp.
1.500% 11/02/17 | | | 715,000 | | | | 710,858 | |
General Electric Co.
4.125% 10/09/42 | | | 1,430,000 | | | | 1,480,352 | |
General Electric Co.
5.250% 12/06/17 | | | 335,000 | | | | 371,620 | |
Harsco Corp
2.700% 10/15/15 | | | 6,715,000 | | | | 6,706,606 | |
Ingersoll-Rand Global Holding Co. Ltd.
6.875% 8/15/18 | | | 310,000 | | | | 359,868 | |
SPX Corp.
6.875% 9/01/17 | | | 1,195,000 | | | | 1,305,537 | |
Textron, Inc.
6.200% 3/15/15 | | | 1,050,000 | | | | 1,060,505 | |
Textron, Inc.
7.250% 10/01/19 | | | 730,000 | | | | 866,547 | |
Tyco Electronics Group SA
6.550% 10/01/17 | | | 1,775,000 | | | | 1,997,991 | |
Tyco Electronics Group SA
7.125% 10/01/37 | | | 335,000 | | | | 456,650 | |
| | | | | | | | |
| | | | | | | 15,906,044 | |
| | | | | | | | |
| Media — 0.9% | | | | | |
21st Century Fox America Co.
6.900% 8/15/39 | | | 420,000 | | | | 569,387 | |
21st Century Fox America Co.
8.000% 10/17/16 | | | 1,500,000 | | | | 1,675,019 | |
| | | | | | | | |
| | | Principal
Amount | | | Value | |
BSKYB Finance PLC (a)
5.625% 10/15/15 | | $ | 1,415,000 | | | $ | 1,468,307 | |
CBS Corp.
7.875% 7/30/30 | | | 315,000 | | | | 440,249 | |
Comcast Corp.
6.400% 5/15/38 | | | 190,000 | | | | 253,689 | |
Comcast Corp.
6.950% 8/15/37 | | | 515,000 | | | | 725,581 | |
Globo Comunicacao e Participacoes SA (a)
4.875% 4/11/22 | | | 1,300,000 | | | | 1,332,500 | |
Globo Comunicacao e Participacoes SA STEP (a)
6.250% 7/29/49 | | | 1,950,000 | | | | 1,994,850 | |
Grupo Televisa SAB
6.625% 1/15/40 | | | 109,000 | | | | 132,155 | |
NBCUniversal Media LLC
6.400% 4/30/40 | | | 65,000 | | | | 87,087 | |
Time Warner Cable, Inc.
6.750% 6/15/39 | | | 985,000 | | | | 1,287,672 | |
Time Warner Cable, Inc.
8.250% 4/01/19 | | | 75,000 | | | | 91,811 | |
Time Warner Cable, Inc.
8.750% 2/14/19 | | | 325,000 | | | | 402,302 | |
Time Warner, Inc.
4.700% 1/15/21 | | | 650,000 | | | | 711,469 | |
Time Warner, Inc.
6.100% 7/15/40 | | | 650,000 | | | | 791,585 | |
Time Warner, Inc.
6.250% 3/29/41 | | | 210,000 | | | | 260,765 | |
Viacom, Inc.
6.250% 4/30/16 | | | 265,000 | | | | 283,100 | |
| | | | | | | | |
| | | | | | | 12,507,528 | |
| | | | | | | | |
| Mining — 0.7% | | | | | |
Freeport-McMoRan, Inc.
2.375% 3/15/18 | | | 585,000 | | | | 578,568 | |
Freeport-McMoRan, Inc.
4.000% 11/14/21 | | | 4,775,000 | | | | 4,731,080 | |
Freeport-McMoRan, Inc.
5.450% 3/15/43 | | | 880,000 | | | | 832,105 | |
Newmont Mining Corp.
5.125% 10/01/19 | | | 960,000 | | | | 1,028,776 | |
Vale Overseas Ltd.
5.625% 9/15/19 | | | 200,000 | | | | 212,804 | |
Vale Overseas Ltd.
6.250% 1/11/16 | | | 770,000 | | | | 800,492 | |
Vale Overseas Ltd.
6.250% 1/23/17 | | | 1,070,000 | | | | 1,141,273 | |
Vale Overseas Ltd.
6.875% 11/10/39 | | | 335,000 | | | | 356,795 | |
Vulcan Materials Co.
6.500% 12/01/16 | | | 73,000 | | | | 77,745 | |
| | | | | | | | |
| | | | | | | 9,759,638 | |
| | | | | | | | |
The accompanying notes are an integral part of the financial statements.
56
MML Managed Bond Fund – Portfolio of Investments (Continued)
| | | | | | | | |
| | | Principal
Amount | | | Value | |
| Office Equipment/Supplies — 0.2% | | | | | |
Pitney Bowes, Inc.
4.625% 3/15/24 | | $ | 1,675,000 | | | $ | 1,714,552 | |
Pitney Bowes, Inc.
4.750% 1/15/16 | | | 820,000 | | | | 847,982 | |
Pitney Bowes, Inc.
4.750% 5/15/18 | | | 250,000 | | | | 266,178 | |
Pitney Bowes, Inc.
5.750% 9/15/17 | | | 166,000 | | | | 181,663 | |
Xerox Corp.
5.625% 12/15/19 | | | 85,000 | | | | 95,529 | |
| | | | | | | | |
| | | | | | | 3,105,904 | |
| | | | | | | | |
| Office Furnishings — 0.0% | | | | | |
Steelcase, Inc.
6.375% 2/15/21 | | | 100,000 | | | | 115,432 | |
| | | | | | | | |
Oil & Gas — 3.2% | | | | | | | | |
Anadarko Petroleum Corp.
6.375% 9/15/17 | | | 2,000,000 | | | | 2,223,604 | |
Anadarko Petroleum Corp.
6.450% 9/15/36 | | | 545,000 | | | | 654,923 | |
Cenovus Energy, Inc.
5.700% 10/15/19 | | | 540,000 | | | | 594,884 | |
Cenovus Energy, Inc.
6.750% 11/15/39 | | | 545,000 | | | | 620,867 | |
Chesapeake Energy Corp.
3.250% 3/15/16 | | | 4,025,000 | | | | 4,014,937 | |
Chesapeake Energy Corp., Convertible
2.250% 12/15/38 | | | 240,000 | | | | 215,550 | |
Chesapeake Energy Corp., Convertible
2.500% 5/15/37 | | | 2,310,000 | | | | 2,243,587 | |
ConocoPhillips
6.500% 2/01/39 | | | 475,000 | | | | 631,107 | |
Devon Energy Corp.
5.600% 7/15/41 | | | 700,000 | | | | 777,628 | |
Devon Energy Corp.
6.300% 1/15/19 | | | 260,000 | | | | 296,761 | |
Ecopetrol SA
4.250% 9/18/18 | | | 255,000 | | | | 265,200 | |
EQT Corp.
4.875% 11/15/21 | | | 500,000 | | | | 540,154 | |
Motiva Enterprises LLC (a)
5.750% 1/15/20 | | | 820,000 | | | | 914,947 | |
Motiva Enterprises LLC (a)
6.850% 1/15/40 | | | 655,000 | | | | 807,903 | |
Newfield Exploration Co.
6.875% 2/01/20 | | | 1,200,000 | | | | 1,218,000 | |
Nexen, Inc.
7.500% 7/30/39 | | | 150,000 | | | | 208,178 | |
Petrobras Global Finance BV
2.000% 5/20/16 | | | 1,160,000 | | | | 1,107,974 | |
Petrobras Global Finance BV
3.000% 1/15/19 | | | 640,000 | | | | 565,805 | |
| | | | | | | | |
| | | Principal
Amount | | | Value | |
Petrobras Global Finance BV
3.250% 3/17/17 | | $ | 4,440,000 | | | $ | 4,184,700 | |
Petrobras International Finance Co.
3.875% 1/27/16 | | | 1,599,000 | | | | 1,569,099 | |
Petrobras International Finance Co.
5.375% 1/27/21 | | | 1,005,000 | | | | 931,203 | |
Petrobras International Finance Co.
6.750% 1/27/41 | | | 425,000 | | | | 386,567 | |
Petroleos Mexicanos
3.125% 1/23/19 | | | 325,000 | | | | 325,813 | |
Petroleos Mexicanos
5.500% 1/21/21 | | | 1,190,000 | | | | 1,288,175 | |
Petroleos Mexicanos
6.375% 1/23/45 | | | 595,000 | | | | 673,837 | |
Petroleos Mexicanos Co.
6.625% 6/15/35 | | | 140,000 | | | | 161,700 | |
Phillips 66
5.875% 5/01/42 | | | 450,000 | | | | 518,218 | |
Pioneer Natural Resources Co.
5.875% 7/15/16 | | | 1,150,000 | | | | 1,221,392 | |
Pioneer Natural Resources Co.
7.500% 1/15/20 | | | 1,050,000 | | | | 1,231,190 | |
Rowan Cos., Inc.
4.875% 6/01/22 | | | 1,850,000 | | | | 1,800,200 | |
Rowan Cos., Inc.
5.000% 9/01/17 | | | 1,055,000 | | | | 1,099,310 | |
Shell International Finance BV
5.500% 3/25/40 | | | 325,000 | | | | 395,754 | |
Talisman Energy, Inc.
5.500% 5/15/42 | | | 600,000 | | | | 566,356 | |
Talisman Energy, Inc.
7.750% 6/01/19 | | | 545,000 | | | | 627,769 | |
Transocean, Inc.
4.950% 11/15/15 | | | 2,030,000 | | | | 2,035,085 | |
Transocean, Inc.
5.050% 12/15/16 | | | 7,720,000 | | | | 7,756,963 | |
Valero Energy Corp.
6.125% 2/01/20 | | | 800,000 | | | | 907,287 | |
| | | | | | | | |
| | | | | | | 45,582,627 | |
| | | | | | | | |
| Oil & Gas Services — 1.0% | | | | | |
Baker Hughes, Inc.
5.125% 9/15/40 | | | 800,000 | | | | 877,507 | |
Hornbeck Offshore Services, Inc.
1.500% 9/01/19 | | | 2,490,000 | | | | 2,069,813 | |
SEACOR Holdings, Inc., Convertible
3.000% 11/15/28 | | | 895,000 | | | | 815,569 | |
SESI LLC
6.375% 5/01/19 | | | 3,150,000 | | | | 3,055,500 | |
Superior Energy Services, Inc.
7.125% 12/15/21 | | | 4,859,000 | | | | 4,664,640 | |
Weatherford International Ltd.
4.500% 4/15/22 | | | 650,000 | | | | 578,516 | |
The accompanying notes are an integral part of the financial statements.
57
MML Managed Bond Fund – Portfolio of Investments (Continued)
| | | | | | | | |
| | | Principal
Amount | | | Value | |
Weatherford International Ltd.
5.950% 4/15/42 | | $ | 1,455,000 | | | $ | 1,231,986 | |
Weatherford International Ltd.
6.000% 3/15/18 | | | 525,000 | | | | 560,443 | |
| | | | | | | | |
| | | | | | | 13,853,974 | |
| | | | | | | | |
| Packaging & Containers — 0.1% | | | | | |
Bemis Co., Inc.
6.800% 8/01/19 | | | 840,000 | | | | 988,322 | |
Brambles USA Inc., Series A (a)
5.350% 4/01/20 | | | 490,000 | | | | 546,017 | |
| | | | | | | | |
| | | | | | | 1,534,339 | |
| | | | | | | | |
| Pharmaceuticals — 0.9% | | | | | |
AbbVie, Inc.
4.400% 11/06/42 | | | 500,000 | | | | 515,834 | |
McKesson Corp.
1.292% 3/10/17 | | | 590,000 | | | | 586,986 | |
McKesson Corp.
2.284% 3/15/19 | | | 600,000 | | | | 598,747 | |
McKesson Corp.
3.796% 3/15/24 | | | 655,000 | | | | 672,871 | |
McKesson Corp.
4.750% 3/01/21 | | | 600,000 | | | | 663,405 | |
McKesson Corp.
4.883% 3/15/44 | | | 625,000 | | | | 688,481 | |
McKesson Corp.
6.000% 3/01/41 | | | 550,000 | | | | 680,393 | |
Mead Johnson Nutrition Co.
4.900% 11/01/19 | | | 1,010,000 | | | | 1,109,985 | |
Mead Johnson Nutrition Co.
5.900% 11/01/39 | | | 590,000 | | | | 726,335 | |
Medco Health Solutions, Inc.
2.750% 9/15/15 | | | 1,880,000 | | | | 1,904,677 | |
Merck Sharp & Dohme Corp.
5.850% 6/30/39 | | | 180,000 | | | | 235,532 | |
Mylan, Inc. (a)
7.875% 7/15/20 | | | 2,875,000 | | | | 3,062,436 | |
Pfizer, Inc.
7.200% 3/15/39 | | | 395,000 | | | | 574,232 | |
Teva Pharmaceutical Finance Co. LLC
6.150% 2/01/36 | | | 395,000 | | | | 488,633 | |
Wyeth
6.000% 2/15/36 | | | 360,000 | | | | 468,324 | |
| | | | | | | | |
| | | | | | | 12,976,871 | |
| | | | | | | | |
| Pipelines — 1.5% | | | | | |
Access Midstream Partners LP/ACMP Finance Corp.
4.875% 5/15/23 | | | 3,610,000 | | | | 3,664,150 | |
Boardwalk Pipelines LLC
5.500% 2/01/17 | | | 200,000 | | | | 210,983 | |
Boardwalk Pipelines LP
5.875% 11/15/16 | | | 2,390,000 | | | | 2,537,556 | |
| | | | | | | | |
| | | Principal
Amount | | | Value | |
CenterPoint Energy Resources Corp.
4.500% 1/15/21 | | $ | 475,000 | | | $ | 520,893 | |
CenterPoint Energy Resources Corp.
5.850% 1/15/41 | | | 425,000 | | | | 543,833 | |
DCP Midstream LLC (a)
9.750% 3/15/19 | | | 35,000 | | | | 43,778 | |
DCP Midstream Operating LLC
3.875% 3/15/23 | | | 190,000 | | | | 181,818 | |
El Paso Pipeline Partners Operating Co. LLC
4.100% 11/15/15 | | | 2,000,000 | | | | 2,046,362 | |
Energy Transfer Partners LP FRN
3.250% 11/01/66 | | | 1,375,000 | | | | 1,230,625 | |
Energy Transfer Partners LP
9.700% 3/15/19 | | | 1,050,000 | | | | 1,317,873 | |
Enterprise Products Operating LP
3.200% 2/01/16 | | | 450,000 | | | | 460,657 | |
Enterprise Products Operating LP
5.950% 2/01/41 | | | 455,000 | | | | 534,941 | |
Gulf South Pipeline Co. LP (a)
5.050% 2/01/15 | | | 190,000 | | | | 190,566 | |
Kinder Morgan Energy Partners LP
6.000% 2/01/17 | | | 185,000 | | | | 199,843 | |
Kinder Morgan Energy Partners LP
6.500% 2/01/37 | | | 150,000 | | | | 168,604 | |
Kinder Morgan Energy Partners LP
6.950% 1/15/38 | | | 175,000 | | | | 201,973 | |
Kinder Morgan Finance Co. LLC (a)
6.000% 1/15/18 | | | 2,700,000 | | | | 2,926,260 | |
Magellan Midstream Partners LP
6.550% 7/15/19 | | | 560,000 | | | | 654,363 | |
ONEOK Partners LP
3.250% 2/01/16 | | | 450,000 | | | | 459,010 | |
ONEOK Partners LP
6.125% 2/01/41 | | | 440,000 | | | | 473,316 | |
Southern Natural Gas Co. LLC (a)
5.900% 4/01/17 | | | 310,000 | | | | 333,324 | |
Texas Eastern Transmission LP (a)
6.000% 9/15/17 | | | 230,000 | | | | 253,373 | |
TransCanada PipeLines Ltd.
6.200% 10/15/37 | | | 130,000 | | | | 153,314 | |
The Williams Cos., Inc.
3.700% 1/15/23 | | | 570,000 | | | | 511,909 | |
Williams Partners LP
5.250% 3/15/20 | | | 1,415,000 | | | | 1,536,022 | |
| | | | | | | | |
| | | | | | | 21,355,346 | |
| | | | | | | | |
| Real Estate — 0.1% | | | | | |
AMB Property LP
4.500% 8/15/17 | | | 760,000 | | | | 809,868 | |
Post Apartment Homes LP
3.375% 12/01/22 | | | 400,000 | | | | 394,150 | |
| | | | | | | | |
| | | | | | | 1,204,018 | |
| | | | | | | | |
The accompanying notes are an integral part of the financial statements.
58
MML Managed Bond Fund – Portfolio of Investments (Continued)
| | | | | | | | |
| | | Principal
Amount | | | Value | |
| Real Estate Investment Trusts (REITS) — 1.9% | | | | | |
American Tower Corp.
3.400% 2/15/19 | | $ | 1,100,000 | | | $ | 1,119,601 | |
American Tower Corp.
3.450% 9/15/21 | | | 2,690,000 | | | | 2,644,647 | |
American Tower Corp.
4.500% 1/15/18 | | | 1,375,000 | | | | 1,460,232 | |
American Tower Corp.
4.625% 4/01/15 | | | 2,700,000 | | | | 2,724,108 | |
ARC Properties Operating Partnership LP
2.000% 2/06/17 | | | 1,390,000 | | | | 1,324,765 | |
ARC Properties Operating Partnership LP
3.000% 2/06/19 | | | 695,000 | | | | 643,095 | |
Boston Properties LP
3.700% 11/15/18 | | | 475,000 | | | | 500,855 | |
Boston Properties LP
4.125% 5/15/21 | | | 580,000 | | | | 617,365 | |
Brandywine Operating Partners LP
4.950% 4/15/18 | | | 800,000 | | | | 859,963 | |
DDR Corp.
4.750% 4/15/18 | | | 1,000,000 | | | | 1,068,197 | |
DDR Corp.
7.500% 4/01/17 | | | 1,000,000 | | | | 1,120,382 | |
DDR Corp.
7.875% 9/01/20 | | | 1,000,000 | | | | 1,233,272 | |
DDR Corp.
9.625% 3/15/16 | | | 1,250,000 | | | | 1,372,196 | |
Duke Realty LP
8.250% 8/15/19 | | | 1,375,000 | | | | 1,696,337 | |
ERP Operating LP
4.625% 12/15/21 | | | 375,000 | | | | 410,254 | |
Federal Realty Investment Trust
5.900% 4/01/20 | | | 330,000 | | | | 381,408 | |
HCP, Inc.
2.625% 2/01/20 | | | 970,000 | | | | 959,925 | |
Highwoods Realty LP
5.850% 3/15/17 | | | 1,800,000 | | | | 1,953,448 | |
Highwoods Realty LP
7.500% 4/15/18 | | | 195,000 | | | | 225,966 | |
Mack-Cali Realty LP
7.750% 8/15/19 | | | 515,000 | | | | 608,966 | |
ProLogis LP
2.750% 2/15/19 | | | 530,000 | | | | 537,566 | |
Realty Income Corp.
2.000% 1/31/18 | | | 2,445,000 | | | | 2,449,506 | |
Simon Property Group LP
5.650% 2/01/20 | | | 140,000 | | | | 160,700 | |
Ventas Realty LP/Ventas Capital Corp.
4.000% 4/30/19 | | | 1,325,000 | | | | 1,402,225 | |
Ventas Realty LP/Ventas Capital Corp.
4.250% 3/01/22 | | | 475,000 | | | | 499,092 | |
| | | | | | | | |
| | | | | | | 27,974,071 | |
| | | | | | | | |
| | | | | | | | |
| | | Principal
Amount | | | Value | |
| Retail — 1.4% | | | | | |
Bed Bath & Beyond, Inc.
3.749% 8/01/24 | | $ | 415,000 | | | $ | 420,721 | |
Bed Bath & Beyond, Inc.
5.165% 8/01/44 | | | 860,000 | | | | 899,806 | |
CVS Health Corp.
6.125% 9/15/39 | | | 560,000 | | | | 723,574 | |
CVS Pass-Through Trust (a)
5.926% 1/10/34 | | | 1,301,286 | | | | 1,513,217 | |
CVS Pass-Through Trust (a)
7.507% 1/10/32 | | | 8,931 | | | | 11,389 | |
El Puerto de Liverpool SAB de CV (a)
3.950% 10/02/24 | | | 2,620,000 | | | | 2,579,390 | |
The Home Depot, Inc.
5.950% 4/01/41 | | | 600,000 | | | | 783,646 | |
Macy’s Retail Holdings, Inc.
7.450% 7/15/17 | | | 610,000 | | | | 693,505 | |
McDonald’s Corp.
6.300% 10/15/37 | | | 400,000 | | | | 522,672 | |
O’Reilly Automotive, Inc.
3.850% 6/15/23 | | | 609,000 | | | | 634,550 | |
O’Reilly Automotive, Inc.
4.875% 1/14/21 | | | 575,000 | | | | 631,328 | |
QVC, Inc.
3.125% 4/01/19 | | | 960,000 | | | | 959,691 | |
QVC, Inc.
4.375% 3/15/23 | | | 835,000 | | | | 837,874 | |
QVC, Inc.
4.450% 2/15/25 | | | 1,380,000 | | | | 1,348,762 | |
QVC, Inc.
5.125% 7/02/22 | | | 545,000 | | | | 573,567 | |
Target Corp.
7.000% 1/15/38 | | | 475,000 | | | | 681,213 | |
Tiffany & Co. (a)
4.900% 10/01/44 | | | 990,000 | | | | 1,020,330 | |
Wal-Mart Stores, Inc.
6.200% 4/15/38 | | | 730,000 | | | | 977,707 | |
Wal-Mart Stores, Inc.
6.500% 8/15/37 | | | 515,000 | | | | 708,651 | |
Walgreens Boots Alliance, Inc.
2.700% 11/18/19 | | | 685,000 | | | | 688,485 | |
Walgreens Boots Alliance, Inc.
3.800% 11/18/24 | | | 1,370,000 | | | | 1,397,263 | |
Walgreens Boots Alliance, Inc.
4.800% 11/18/44 | | | 1,975,000 | | | | 2,082,383 | |
| | | | | | | | |
| | | | | | | 20,689,724 | |
| | | | | | | | |
| Savings & Loans — 0.3% | | | | | |
Glencore Funding LLC (a)
1.700% 5/27/16 | | | 1,919,000 | | | | 1,922,051 | |
Glencore Funding LLC (a)
2.500% 1/15/19 | | | 1,472,000 | | | | 1,449,442 | |
Glencore Funding LLC (a)
3.125% 4/29/19 | | | 1,115,000 | | | | 1,117,676 | |
| | | | | | | | |
| | | | | | | 4,489,169 | |
| | | | | | | | |
The accompanying notes are an integral part of the financial statements.
59
MML Managed Bond Fund – Portfolio of Investments (Continued)
| | | | | | | | |
| | | Principal
Amount | | | Value | |
| Semiconductors — 0.7% | | | | | |
Applied Materials, Inc.
5.850% 6/15/41 | | $ | 1,000,000 | | | $ | 1,211,789 | |
Intel Corp.
3.250% 8/01/39 | | | 1,225,000 | | | | 2,129,969 | |
KLA-Tencor Corp.
4.650% 11/01/24 | | | 2,110,000 | | | | 2,184,371 | |
Micron Technology, Inc., Convertible
2.125% 2/15/33 | | | 1,018,000 | | | | 3,267,144 | |
Micron Technology, Inc., Convertible
3.000% 11/15/43 | | | 514,000 | | | | 676,231 | |
| | | | | | | | |
| | | | | | | 9,469,504 | |
| | | | | | | | |
| Software — 0.5% | | | | | |
Broadridge Financial Solutions, Inc.
3.950% 9/01/20 | | | 655,000 | | | | 680,825 | |
CA, Inc.
2.875% 8/15/18 | | | 730,000 | | | | 742,266 | |
CA, Inc.
5.375% 12/01/19 | | | 1,530,000 | | | | 1,693,383 | |
Citrix Systems, Inc., Convertible (a) 0.500% 4/15/19 | | | 2,090,000 | | | | 2,201,031 | |
Microsoft Corp.
3.000% 10/01/20 | | | 340,000 | | | | 354,468 | |
Oracle Corp.
1.200% 10/15/17 | | | 1,425,000 | | | | 1,419,928 | |
| | | | | | | | |
| | | | | | | 7,091,901 | |
| | | | | | | | |
| Telecommunications — 1.7% | | | | | | | | |
America Movil SAB de CV
5.000% 3/30/20 | | | 500,000 | | | | 551,370 | |
America Movil SAB de CV
6.125% 3/30/40 | | | 525,000 | | | | 621,185 | |
AT&T, Inc.
6.500% 9/01/37 | | | 1,135,000 | | | | 1,402,234 | |
AT&T, Inc.
6.550% 2/15/39 | | | 455,000 | | | | 560,822 | |
British Telecom PLC
9.625% 12/15/30 | | | 495,000 | | | | 777,175 | |
CenturyLink, Inc.
6.150% 9/15/19 | | | 560,000 | | | | 604,800 | |
Cisco Systems, Inc.
5.500% 1/15/40 | | | 345,000 | | | | 420,410 | |
Deutsche Telekom International Finance BV
8.750% 6/15/30 | | | 475,000 | | | | 701,650 | |
Embarq Corp.
7.082% 6/01/16 | | | 780,000 | | | | 840,541 | |
Embarq Corp.
7.995% 6/01/36 | | | 145,000 | | | | 162,038 | |
ENTEL Chile SA (a)
4.875% 10/30/24 | | | 1,250,000 | | | | 1,270,159 | |
Qwest Corp.
8.375% 5/01/16 | | | 2,960,000 | | | | 3,205,076 | |
| | | | | | | | |
| | | Principal
Amount | | | Value | |
Rogers Communications, Inc.
7.500% 8/15/38 | | $ | 50,000 | | | $ | 69,876 | |
Sprint Communications, Inc. (a)
9.000% 11/15/18 | | | 2,600,000 | | | | 2,957,240 | |
Telecom Italia Capital
6.000% 9/30/34 | | | 115,000 | | | | 115,000 | |
Telefonaktiebolaget LM Ericsson
4.125% 5/15/22 | | | 700,000 | | | | 732,192 | |
Telefonica Emisiones SAU
3.992% 2/16/16 | | | 1,200,000 | | | | 1,234,190 | |
Telefonica Emisiones SAU
5.462% 2/16/21 | | | 475,000 | | | | 529,621 | |
Telefonica Emisiones SAU
6.421% 6/20/16 | | | 773,000 | | | | 826,918 | |
Verizon Communications, Inc. (a) 2.625% 2/21/20 | | | 1,650,000 | | | | 1,631,136 | |
Verizon Communications, Inc.
3.500% 11/01/24 | | | 1,660,000 | | | | 1,630,948 | |
Verizon Communications, Inc. (a) 4.862% 8/21/46 | | | 918,000 | | | | 942,994 | |
Verizon Communications, Inc. (a) 5.012% 8/21/54 | | | 1,083,000 | | | | 1,120,417 | |
Verizon Communications, Inc.
6.550% 9/15/43 | | | 1,082,000 | | | | 1,386,203 | |
| | | | | | | | |
| | | | | | | 24,294,195 | |
| | | | | | | | |
| Transportation — 0.8% | |
Asciano Finance (a)
3.125% 9/23/15 | | | 925,000 | | | | 935,806 | |
Asciano Finance (a)
4.625% 9/23/20 | | | 610,000 | | | | 636,997 | |
Asciano Finance (a)
5.000% 4/07/18 | | | 1,150,000 | | | | 1,236,318 | |
Burlington Northern Santa Fe LLC 6.150% 5/01/37 | | | 720,000 | | | | 947,632 | |
Canadian Pacific Railway Co. Ltd 7.250% 5/15/19 | | | 1,010,000 | | | | 1,207,536 | |
Con-way, Inc.
7.250% 1/15/18 | | | 1,285,000 | | | | 1,460,302 | |
CSX Corp.
7.250% 5/01/27 | | | 50,000 | | | | 63,773 | |
Norfolk Southern Corp.
6.000% 5/23/2111 | | | 375,000 | | | | 480,976 | |
Ryder System, Inc.
2.500% 3/01/18 | | | 2,980,000 | | | | 3,037,794 | |
Ryder System, Inc.
2.550% 6/01/19 | | | 425,000 | | | | 425,585 | |
Union Pacific Corp.
4.000% 2/01/21 | | | 500,000 | | | | 548,369 | |
Union Pacific Corp.
5.375% 6/01/33 | | | 520,000 | | | | 612,224 | |
| | | | | | | | |
| | | | | | | 11,593,312 | |
| | | | | | | | |
The accompanying notes are an integral part of the financial statements.
60
MML Managed Bond Fund – Portfolio of Investments (Continued)
| | | | | | | | |
| | | Principal
Amount | | | Value | |
| Trucking & Leasing — 0.4% | | | | | | | | |
GATX Corp.
2.375% 7/30/18 | | $ | 865,000 | | | $ | 870,575 | |
GATX Corp.
3.500% 7/15/16 | | | 875,000 | | | | 902,758 | |
GATX Corp.
3.900% 3/30/23 | | | 530,000 | | | | 550,709 | |
GATX Corp.
4.750% 5/15/15 | | | 315,000 | | | | 319,514 | |
GATX Corp.
4.750% 6/15/22 | | | 925,000 | | | | 1,017,173 | |
Penske Truck Leasing Co. LP/PTL Finance Corp. (a)
2.500% 6/15/19 | | | 1,805,000 | | | | 1,793,993 | |
TTX Co. (a)
3.050% 11/15/22 | | | 900,000 | | | | 897,956 | |
| | | | | | | | |
| | | | | | | 6,352,678 | |
| | | | | | | | |
| | |
| TOTAL CORPORATE DEBT (Cost $603,595,253) | | | | | | | 630,434,042 | |
| | | | | | | | |
| |
| MUNICIPAL OBLIGATIONS — 1.0% | | | | | |
JobsOhio Beverage System Series B 4.532% 1/01/35 | | | 3,950,000 | | | | 4,238,705 | |
New York City Municipal Water Finance Authority BAB
5.882% 6/15/44 | | | 105,000 | | | | 141,793 | |
Orange County, CA, Local Transportation Authority BAB
6.908% 2/15/41 | | | 1,350,000 | | | | 1,916,959 | |
State of California
5.950% 4/01/16 | | | 410,000 | | | | 436,839 | |
State of California BAB
7.550% 4/01/39 | | | 120,000 | | | | 185,183 | |
State of California BAB
7.600% 11/01/40 | | | 3,160,000 | | | | 4,930,643 | |
State of Illinois
5.365% 3/01/17 | | | 2,200,000 | | | | 2,355,210 | |
| | | | | | | | |
| | | | | | | 14,205,332 | |
| | | | | | | | |
| | |
TOTAL MUNICIPAL OBLIGATIONS (Cost $13,378,759) | | | | | | | 14,205,332 | |
| | | | | | | | |
|
| NON-U.S. GOVERNMENT AGENCY OBLIGATIONS — 18.2% | |
| Auto Floor Plan ABS — 0.1% | |
NCF Dealer Floorplan Master Trust,
Series 2014-1A, Class A FRN (a)
1.666% 10/20/20 | | | 1,500,000 | | | | 1,500,002 | |
| | | | | | | | |
| | | | | | | | |
| | | Principal
Amount | | | Value | |
| Automobile ABS — 0.9% | |
American Credit Acceptance Receivables Trust, Series 2014-3, Class A (a)
0.990% 8/10/18 | | $ | 2,483,549 | | | $ | 2,480,970 | |
Avis Budget Rental Car Funding AESOP LLC, Series 2014-2A, Class A (a)
2.500% 2/20/21 | | | 1,560,000 | | | | 1,553,532 | |
Capital Automotive REIT, Series 2014-1A, Class A (a)
3.660% 10/15/44 | | | 900,000 | | | | 895,518 | |
Capital Automotive REIT, Series 2012-1A, Class A (a)
4.700% 7/15/42 | | | 1,200,948 | | | | 1,228,972 | |
CFC LLC, Series 2014-2A, Class A (a)
1.440% 11/16/20 | | | 1,753,083 | | | | 1,745,101 | |
CPS Auto Trust, Series 2014-A, Class A (a)
1.210% 8/15/18 | | | 1,213,705 | | | | 1,211,427 | |
CPS Auto Trust, Series 2014-D, Class A (a)
1.490% 4/15/19 | | | 1,480,000 | | | | 1,476,330 | |
CPS Auto Trust, Series 2013-D, Class A (a)
1.540% 7/16/18 | | | 1,254,017 | | | | 1,256,428 | |
CPS Auto Trust, Series 2011-B, Class A (a)
3.680% 9/17/18 | | | 256,549 | | | | 260,219 | |
Rental Car Finance Corp., Series 2011-1A, Class A1 (a)
2.510% 2/25/16 | | | 270,000 | | | | 270,363 | |
| | | | | | | | |
| | | | | | | 12,378,860 | |
| | | | | | | | |
| Commercial MBS — 5.6% | |
Banc of America Commercial Mortgage, Inc., Series 2007-4, Class A4 VRN
5.754% 2/10/51 | | | 1,637,702 | | | | 1,784,822 | |
Banc of America Commercial Mortgage, Inc., Series 2008-1, Class A4 VRN
6.245% 2/10/51 | | | 1,784,752 | | | | 1,974,203 | |
Banc of America Commercial Mortgage, Inc., Series 2008-1, Class AM VRN
6.288% 2/10/51 | | | 1,310,000 | | | | 1,449,626 | |
Bear Stearns Commercial Mortgage Securities, Series 2005-PWR7, Class A3 VRN
5.116% 2/11/41 | | | 574,448 | | | | 575,806 | |
Bear Stearns Commercial Mortgage Securities, Series 2006-PW14, Class A4
5.201% 12/11/38 | | | 1,345,000 | | | | 1,424,327 | |
The accompanying notes are an integral part of the financial statements.
61
MML Managed Bond Fund – Portfolio of Investments (Continued)
| | | | | | | | |
| | | Principal
Amount | | | Value | |
Bear Stearns Commercial Mortgage Securities, Series 2006-PW14, Class AM
5.243% 12/11/38 | | $ | 925,000 | | | $ | 983,669 | |
Bear Stearns Commercial Mortgage Securities, Series 2004-PWR4, Class A3 VRN
5.468% 6/11/41 | | | 62,683 | | | | 62,691 | |
Bear Stearns Commercial Mortgage Securities, Series 2007-T26, Class A4 VRN
5.471% 1/12/45 | | | 787,029 | | | | 843,045 | |
Bear Stearns Commercial Mortgage Securities, Series 2007-T26, Class AM VRN
5.513% 1/12/45 | | | 2,545,000 | | | | 2,732,315 | |
Bear Stearns Commercial Mortgage Securities, Series 2007-PW18, Class A4
5.700% 6/11/50 | | | 1,400,000 | | | | 1,521,652 | |
Bear Stearns Commercial Mortgage Securities, Series 2006-PW12, Class AM VRN
5.743% 9/11/38 | | | 1,650,000 | | | | 1,737,015 | |
Bear Stearns Commercial Mortgage Securities, Series 2007-T28, Class AM VRN
5.835% 9/11/42 | | | 1,395,000 | | | | 1,528,258 | |
Bear Stearns Commercial Mortgage Securities, Series 2007-PW17, Class AM VRN
5.896% 6/11/50 | | | 2,870,000 | | | | 3,148,679 | |
Commercial Mortgage Pass Through Certificates, Series 2012-CR4, Class B (a)
3.703% 10/15/45 | | | 1,060,000 | | | | 1,072,868 | |
Commercial Mortgage Pass Through Certificates, Series 2014-UBS2, Class AM
4.199% 3/10/47 | | | 1,375,000 | | | | 1,465,874 | |
Commercial Mortgage Pass Through Certificates, Series 2014-CR14, Class A4 VRN
4.236% 2/10/47 | | | 1,410,000 | | | | 1,538,410 | |
Commercial Mortgage Pass Through Certificates, Series 2007-C9, Class AM VRN
5.650% 12/10/49 | | | 1,335,000 | | | | 1,447,678 | |
Commercial Mortgage Pass Through Certificates, Series 2006-C7, Class AM VRN
5.781% 6/10/46 | | | 950,000 | | | | 1,004,235 | |
| | | | | | | | |
| | | Principal
Amount | | | Value | |
Commercial Mortgage Pass Through Certificates, Series 2007-C9, Class A4 VRN
5.796% 12/10/49 | | $ | 2,487,000 | | | $ | 2,716,260 | |
Credit Suisse Mortgage Capital Certificates, Series 2006-C1, Class A4 VRN
5.467% 2/15/39 | | | 1,145,000 | | | | 1,179,225 | |
DBCCRE Mortgage Trust, Series 2014-ARCP, Class A (a)
4.238% 1/10/34 | | | 995,000 | | | | 1,070,861 | |
DBRR Trust, Series 2013-EZ3, Class A VRN (a)
1.636% 12/18/49 | | | 1,689,158 | | | | 1,697,868 | |
DBUBS Mortgage Trust, Series 2011-LC2A, Class A2 (a)
3.386% 7/10/44 | | | 767,854 | | | | 788,955 | |
Greenwich Capital Commercial Funding Corp., Series 2006-GG7, Class A4 VRN
5.819% 7/10/38 | | | 2,544,345 | | | | 2,662,616 | |
GS Mortgage Securities Corp., Series 2014-4R, Class AS FRN (a)
0.349% 1/26/34 | | | 1,735,000 | | | | 1,632,769 | |
GS Mortgage Securities Corp. II, Series 2012-GC6, Class AS (a)
4.948% 1/10/45 | | | 488,000 | | | | 546,569 | |
JP Morgan Chase Commercial Mortgage Securities Corp., Series 2011-C4, Class A2 (a)
3.341% 7/15/46 | | | 358,730 | | | | 368,191 | |
JP Morgan Chase Commercial Mortgage Securities Corp., Series 2006-CB17, Class A4
5.429% 12/12/43 | | | 1,240,000 | | | | 1,307,662 | |
JP Morgan Chase Commercial Mortgage Securities Corp., Series 2007-CB18, Class AM VRN
5.466% 6/12/47 | | | 1,620,000 | | | | 1,724,160 | |
Merrill Lynch/Countrywide Commercial Mortgage Trust, Series 2006-4, Class AM
5.204% 12/12/49 | | | 3,000,000 | | | | 3,196,963 | |
Merrill Lynch/Countrywide Commercial Mortgage Trust, Series 2007-9, Class A4
5.700% 9/12/49 | | | 2,520,000 | | | | 2,733,993 | |
Merrill Lynch/Countrywide Commercial Mortgage Trust, Series 2006-2, Class A4 VRN
5.869% 6/12/46 | | | 1,261,802 | | | | 1,324,009 | |
Morgan Stanley Capital I, Series 2011-C2, Class B VRN (a) 5.200% 6/15/44 | | | 1,325,000 | | | | 1,471,666 | |
The accompanying notes are an integral part of the financial statements.
62
MML Managed Bond Fund – Portfolio of Investments (Continued)
| | | | | | | | |
| | | Principal
Amount | | | Value | |
Morgan Stanley Capital I, Series 2006-IQ12, Class AM
5.370% 12/15/43 | | $ | 950,000 | | | $ | 1,013,175 | |
Morgan Stanley Capital I, Series 2007-HQ11, Class A4 VRN
5.447% 2/12/44 | | | 2,100,000 | | | | 2,235,547 | |
Morgan Stanley Capital I, Series 2007-HQ11, Class AM VRN
5.478% 2/12/44 | | | 1,520,000 | | | | 1,623,652 | |
Morgan Stanley Capital I, Series 2007-IQ14, Class A2
5.610% 4/15/49 | | | 303,985 | | | | 305,910 | |
Morgan Stanley Capital I, Series 2008-T29, Class A4 VRN
6.278% 1/11/43 | | | 801,329 | | | | 894,159 | |
STRIPs Ltd., Series 2012-1A, Class A (a)
1.500% 12/25/44 | | | 927,034 | | | | 834,331 | |
TIAA Seasoned Commercial Mortgage Trust, Series 2007-C4, Class AJ VRN
5.560% 8/15/39 | | | 975,000 | | | | 1,001,166 | |
TIAA Seasoned Commercial Mortgage Trust, Series 2007-C4, Class A3 VRN
5.560% 8/15/39 | | | 472,042 | | | | 474,513 | |
VFC LLC, (Acquired 7/9/14, Cost $1,400,000) Series 2014-2, Class A (a) (c)
2.750% 7/20/30 | | | 926,208 | | | | 926,227 | |
VNO Mortgage Trust, Series 2013-PENN, Class A (a)
3.808% 12/13/29 | | | 1,450,000 | | | | 1,536,155 | |
Wachovia Bank Commercial Mortgage Trust, Series 2005-C22, Class AM VRN
5.319% 12/15/44 | | | 2,255,000 | | | | 2,321,194 | |
Wachovia Bank Commercial Mortgage Trust, Series 2006-C29, Class AM
5.339% 11/15/48 | | | 3,015,000 | | | | 3,204,720 | |
Wachovia Bank Commercial Mortgage Trust, Series 2006-C23, Class AM VRN
5.466% 1/15/45 | | | 1,920,000 | | | | 1,997,742 | |
Wachovia Bank Commercial Mortgage Trust, Series 2007-C31, Class A4
5.509% 4/15/47 | | | 1,240,000 | | | | 1,305,903 | |
Wachovia Bank Commercial Mortgage Trust, Series 2007-C31, Class AM VRN
5.591% 4/15/47 | | | 1,400,000 | | | | 1,494,473 | |
Wachovia Bank Commercial Mortgage Trust, Series 2007-C33, Class AM VRN
5.941% 2/15/51 | | | 1,525,000 | | | | 1,653,766 | |
| | | | | | | | |
| | | Principal
Amount | | | Value | |
Wachovia Bank Commercial Mortgage Trust, Series 2006-C26, Class AM VRN
5.969% 6/15/45 | | $ | 2,667,000 | | | $ | 2,811,625 | |
Wells Fargo Commercial Mortgage Trust, Series 2010-C1, Class A1 (a)
3.349% 11/15/43 | | | 322,838 | | | | 334,857 | |
Wells Fargo Reremic Trust, Series 2012-IO, Class A (a)
1.750% 8/20/21 | | | 522,176 | | | | 522,014 | |
WF-RBS Commercial Mortgage Trust, Series 2011-C3, Class A2 (a)
3.240% 3/15/44 | | | 750,000 | | | | 768,967 | |
WF-RBS Commercial Mortgage Trust, Series 2013-UBS1, Class A3
3.591% 3/15/46 | | | 2,325,000 | | | | 2,428,991 | |
WF-RBS Commercial Mortgage Trust, Series 2011-C2, Class A2 (a)
3.791% 2/15/44 | | | 650,000 | | | | 662,519 | |
| | | | | | | | |
| | | | | | | 81,068,546 | |
| | | | | | | | |
| Home Equity ABS — 2.2% | |
Aames Mortgage Investment Trust, Series 2004-1, Class M5 FRN
1.894% 1/25/35 | | | 1,184,570 | | | | 1,154,874 | |
ACE Securities Corp., Series 2005-AG1, Class A1B1 FRN
0.440% 8/25/35 | | | 371,939 | | | | 369,424 | |
ACE Securities Corp., Series 2005-HE7, Class A2D FRN
0.499% 11/25/35 | | | 788,481 | | | | 778,352 | |
Aegis Asset-Backed Securities Trust, Series 2005-2, Class M1 FRN
0.590% 6/25/35 | | | 415,683 | | | | 407,695 | |
Asset-Backed Funding Certificates, Series 2005-WMC1, Class M1 FRN
0.830% 6/25/35 | | | 356,974 | | | | 354,046 | |
Asset-Backed Securities Corp. Trust, Series 2005-HE2, Class M1 FRN
0.845% 2/25/35 | | | 310,231 | | | | 307,603 | |
Bayview Financial Mortgage Pass-Through Trust, Series 2005-C, Class M1 FRN
0.670% 6/28/44 | | | 1,328,316 | | | | 1,331,431 | |
Bear Stearns Asset-Backed Securities I Trust, Series 2006-EC2, Class M1 FRN
0.569% 2/25/36 | | | 770,429 | | | | 725,914 | |
Bear Stearns Asset-Backed Securities Trust, Series 2005-HE9, Class M1 FRN
0.665% 10/25/35 | | | 675,359 | | | | 666,855 | |
BNC Mortgage Loan Trust, Series 2007-1, Class A2 FRN
0.230% 3/25/37 | | | 133,895 | | | | 133,608 | |
The accompanying notes are an integral part of the financial statements.
63
MML Managed Bond Fund – Portfolio of Investments (Continued)
| | | | | | | | |
| | | Principal
Amount | | | Value | |
Citigroup Mortgage Loan Trust, Series 2006-SHL1, Class A1 FRN (a)
0.370% 11/25/45 | | $ | 1,428,078 | | | $ | 1,378,016 | |
Citigroup Mortgage Loan Trust, Series 2003-HE4, Class A FRN (a)
0.580% 12/25/33 | | | 52,322 | | | | 52,294 | |
Citigroup Mortgage Loan Trust, Series 2005-OPT4, Class M2 FRN
0.600% 7/25/35 | | | 467,780 | | | | 455,822 | |
Countrywide Asset-Backed Certificates, Series 2005-3, Class MV2 FRN
0.619% 8/25/35 | | | 502,857 | | | | 500,788 | |
Countrywide Asset-Backed Certificates, Series 2004-5, Class 3A FRN
0.630% 9/25/34 | | | 180,089 | | | | 178,860 | |
Countrywide Asset-Backed Certificates, Series 2005-8, Class M1 FRN
0.640% 12/25/35 | | | 469,180 | | | | 468,485 | |
Countrywide Asset-Backed Certificates, Series 2005-6, Class M1 FRN
0.660% 12/25/35 | | | 315,155 | | | | 313,991 | |
Countrywide Partnership Trust, Series 2004-EC1, Class M1 FRN
1.070% 2/25/35 | | | 541,680 | | | | 478,839 | |
Credit-Based Asset Servicing and Securitization LLC, Series 2006-RP2, Class A2 FRN (a)
0.460% 7/25/36 | | | 337,867 | | | | 336,826 | |
First Franklin Mortgage Loan Trust, Series 2005-FF6, Class M1 FRN
0.590% 5/25/36 | | | 1,649,980 | | | | 1,612,584 | |
First Franklin Mortgage Loan Trust, Series 2005-FF4, Class M1 FRN
0.600% 5/25/35 | | | 1,015,190 | | | | 1,011,102 | |
First Franklin Mortgage Loan Trust, Series 2005-FF7, Class M1 FRN
0.620% 7/25/35 | | | 1,146,351 | | | | 1,124,650 | |
Fremont Home Loan Trust, Series 2005-E, Class 2A3 FRN
0.410% 1/25/36 | | | 433,521 | | | | 421,626 | |
GSAMP Trust, Series 2005-AHL, Class M1 FRN
0.600% 4/25/35 | | | 384,765 | | | | 366,723 | |
Home Equity Asset Trust, Series 2006-4, Class 2A3 FRN
0.340% 8/25/36 | | | 333,454 | | | | 329,701 | |
Lake Country Mortgage Loan Trust, Series 2005-HE1, Class M1 FRN (a)
0.950% 12/25/32 | | | 430,935 | | | | 430,943 | |
Long Beach Mortgage Loan Trust, Series 2005-1, Class M2 FRN
0.965% 2/25/35 | | | 1,056,079 | | | | 1,010,585 | |
| | | | | | | | |
| | | Principal
Amount | | | Value | |
Long Beach Mortgage Loan Trust, Series 2005-WL1, Class M2 FRN
0.995% 6/25/35 | | $ | 1,950,337 | | | $ | 1,880,462 | |
MASTR Asset-Backed Securities Trust, Series 2005-WMC1, Class M3 FRN
0.890% 3/25/35 | | | 1,785,000 | | | | 1,656,377 | |
Merrill Lynch Mortgage Synthetic, Series 2005-ACR1, Class M1 FRN (a)
0.905% 6/28/35 | | | 1,735,811 | | | | 1,711,317 | |
Merrill Lynch Mortgage Synthetic, Series 2005-ACR1, Class M2 FRN (a)
0.935% 6/28/35 | | | 950,000 | | | | 882,433 | |
Morgan Stanley Capital, Inc., Series 2005-WMC6, Class M2 FRN
0.920% 7/25/35 | | | 1,067,099 | | | | 1,062,066 | |
New Century Home Equity Loan Trust, Series 1997-NC5, Class A6 STEP
6.693% 10/25/28 | | | 110 | | | | 111 | |
NovaStar Mortgage Funding Trust, Series 2005-3, Class A2D FRN
0.540% 1/25/36 | | | 2,213,579 | | | | 2,197,725 | |
Park Place Securities, Inc., Series 2005-WHQ4, Class A1A FRN
0.430% 9/25/35 | | | 697,112 | | | | 694,433 | |
Park Place Securities, Inc., Series 2005-WCW3, Class A2C
FRN 0.550% 8/25/35 | | | 517,482 | | | | 511,492 | |
Park Place Securities, Inc., Series 2005-WHQ1, Class M2 FRN
0.670% 3/25/35 | | | 423,143 | | | | 418,263 | |
Residential Asset Mortgage Products, Inc., Series 2005-EFC5, Class M1 FRN
0.570% 10/25/35 | | | 1,305,000 | | | | 1,256,015 | |
Residential Asset Mortgage Products, Inc., Series 2005-EFC4, Class M1 FRN
0.580% 9/25/35 | | | 857,077 | | | | 845,055 | |
Residential Asset Securities Corp., Series 2005-EMX4, Class M1 FRN
0.600% 11/25/35 | | | 1,249,910 | | | | 1,226,645 | |
Structured Asset Investment Loan Trust, Series 2005-7, Class A5 FRN
0.530% 8/25/35 | | | 372,929 | | | | 370,233 | |
| | | | | | | | |
| | | | | | | 31,414,264 | |
| | | | | | | | |
| Other ABS — 6.8% | |
321 Henderson Receivables LLC, Series 2006-4A, Class A1 FRN (a)
0.361% 12/15/41 | | | 574,910 | | | | 566,029 | |
AIMCO CLO Ltd., Series 2014-AA, Class A FRN (a)
1.763% 7/20/26 | | | 2,250,000 | | | | 2,238,498 | |
The accompanying notes are an integral part of the financial statements.
64
MML Managed Bond Fund – Portfolio of Investments (Continued)
| | | | | | | | |
| | | Principal
Amount | | | Value | |
Alterna Funding I LLC, Series 2014-1A, Class NOTE (a)
1.639% 2/15/21 | | $ | 1,757,130 | | | $ | 1,753,836 | |
Apidos CLO XV, Series 2013-15A, Class A1 FRN (a)
1.581% 10/20/25 | | | 745,000 | | | | 736,712 | |
Applebee’s/IHOP Funding LLC, Series 2014-1, Class A2 (a)
4.277% 9/05/44 | | | 2,500,000 | | | | 2,508,183 | |
ARL First LLC, Series 2012-1A, Class A1 FRN (a)
1.911% 12/15/42 | | | 2,101,283 | | | | 2,112,096 | |
Ascentium Equipment Receivables LLC, Series 2014-1A, Class A2 (a)
1.040% 1/10/17 | | | 1,209,258 | | | | 1,208,616 | |
Avery Point CLO Ltd., Series 2014-5A, Class A FRN (a)
1.688% 7/17/26 | | | 2,200,000 | | | | 2,182,741 | |
Avery Point III CLO Ltd., Series 2013-3A, Class A FRN (a)
1.631% 1/18/25 | | | 1,250,000 | | | | 1,238,953 | |
BCC Funding VIII LLC, Series 2014-1A, Class A (a)
1.794% 6/20/20 | | | 833,040 | | | | 831,624 | |
Birchwood Park CLO Ltd., Series 2014-1A, Class A FRN (a)
1.674% 7/15/26 | | | 2,180,000 | | | | 2,157,620 | |
Blue Hill CLO Ltd., Series 2013-1A, Class A FRN (a)
1.711% 1/15/26 | | | 825,000 | | | | 819,049 | |
BlueMountain CLO Ltd., Series 2013-2A, Class A FRN (a)
1.432% 1/22/25 | | | 930,000 | | | | 915,091 | |
BlueMountain CLO Ltd., Series 2013-3A, Class A FRN (a)
1.633% 10/29/25 | | | 650,000 | | | | 645,114 | |
CAN Capital Funding LLC, Series 2014-1A, Class A (a)
3.117% 4/15/20 | | | 1,500,000 | | | | 1,488,750 | |
Carlyle Global Market Strategies, Series 2014-1A, Class A FRN (a)
1.748% 4/17/25 | | | 3,415,000 | | | | 3,401,705 | |
Carlyle Global Market Strategies CLO Ltd., Series 2013-1A, Class A1 FRN (a)
1.533% 2/14/25 | | | 750,000 | | | | 740,156 | |
CKE Restaurant Holdings, Inc., Series 2013-1A, Class A2 (a)
4.474% 3/20/43 | | | 1,187,975 | | | | 1,218,900 | |
CLI Funding V LLC, Series 2014-2A, Class A (a)
3.380% 10/18/29 | | | 826,000 | | | | 826,361 | |
| | | | | | | | |
| | | Principal
Amount | | | Value | |
Cronos Containers Program I Ltd., Series 2014-2A, Class A (a)
3.270% 11/18/29 | | $ | 1,783,333 | | | $ | 1,782,815 | |
Diamond Resorts Owner Trust, Series 2014-1, Class A (a)
2.540% 5/20/27 | | | 1,144,581 | | | | 1,143,817 | |
Domino’s Pizza Master Issuer LLC, Series 2012-1A, Class A2 (a)
5.216% 1/25/42 | | | 3,111,325 | | | | 3,266,891 | |
Dong Fang Container Finance II SPV Ltd., Series 2014-1A, Class A1 (a)
1.950% 11/25/39 | | | 1,958,333 | | | | 1,942,706 | |
Drug Royalty Corp., Inc., Series 2012-1, Class A2 (a)
5.800% 7/15/24 | | | 506,667 | | | | 524,819 | |
Eagle I Ltd., Series 2014-1A, Class A1 (a)
2.570% 12/15/39 | | | 1,100,000 | | | | 1,098,680 | |
Eaton Vance CLO, Series 2014-1A, Class A FRN (a)
1.685% 7/15/26 | | | 2,925,000 | | | | 2,901,012 | |
Edsouth Indenture LLC, Series 2014-4, Class B FRN (a)
1.661% 6/25/48 | | | 1,200,000 | | | | 1,044,180 | |
Fairway Outdoor Funding LLC, Series 2012-1A, Class A2 (a)
4.212% 10/15/42 | | | 2,161,446 | | | | 2,157,366 | |
Galaxy XII CLO Ltd., Series 2012-12A, Class A FRN (a)
1.632% 5/19/23 | | | 1,000,000 | | | | 996,632 | |
Global Container Assets Ltd., Series 2013-1A, Class A1 (a)
2.200% 11/05/28 | | | 1,349,558 | | | | 1,342,705 | |
Global SC Finance II SRL, Series 2014-1A, Class A1 (a)
3.190% 7/17/29 | | | 1,408,750 | | | | 1,395,872 | |
Global SC Finance II SRL, Series 2013-2A, Class A (a)
3.670% 11/17/28 | | | 1,448,958 | | | | 1,465,855 | |
GoldenTree Loan Opportunities VII Ltd., Series 2013-7A, Class A FRN (a)
1.384% 4/25/25 | | | 3,600,000 | | | | 3,531,082 | |
Hercules Capital Funding Trust, Series 2012-1A, Class A (a)
3.320% 12/16/17 | | | 270,589 | | | | 272,111 | |
Hercules Capital Funding Trust, Series 2014-1A, Class A (a)
3.524% 4/16/21 | | | 1,000,000 | | | | 1,000,000 | |
HFG Healthco-4 LLC, Series 2011-1A, Class A FRN (a)
2.407% 6/02/17 | | | 1,425,000 | | | | 1,446,926 | |
Hilton Grand Vacations Trust, Series 2013-A, Class A (a)
2.280% 1/25/26 | | | 1,789,499 | | | | 1,798,993 | |
The accompanying notes are an integral part of the financial statements.
65
MML Managed Bond Fund – Portfolio of Investments (Continued)
| | | | | | | | |
| | | Principal
Amount | | | Value | |
Horizon Funding Trust, Series 2013-1A, Class A (a)
3.000% 5/15/18 | | $ | 665,254 | | | $ | 668,164 | |
Icon Brand Holdings LLC, Series 2012-1A, Class A (a)
4.229% 1/25/43 | | | 976,385 | | | | 972,717 | |
Icon Brand Holdings LLC, Series 2013-1A, Class A (a)
4.352% 1/25/43 | | | 1,017,088 | | | | 1,020,749 | |
ING Investment Management CLO Ltd., Series 2012-3A, Class A FRN (a)
1.681% 10/15/22 | | | 700,000 | | | | 696,571 | |
ING Investment Management CLO Ltd., Series 2013-3A, Class A1 FRN (a)
1.681% 1/18/26 | | | 1,850,000 | | | | 1,834,599 | |
LCM Ltd., Series 10AR, Class AR FRN (a)
1.491% 4/15/22 | | | 3,250,000 | | | | 3,234,088 | |
LCM Ltd., Series 16A, Class A FRN (a)
1.758% 7/15/26 | | | 2,850,000 | | | | 2,832,806 | |
Madison Park Funding XII Ltd., Series 2014-12A, Class A FRN (a)
1.731% 7/20/26 | | | 2,900,000 | | | | 2,890,479 | |
Marriott Vacation Club Owner Trust, Series 2012-1A, Class A (a)
2.510% 5/20/30 | | | 520,388 | | | | 525,267 | |
Nations Equipment Finance Funding II LLC, Series 2014-1A, Class A (a)
1.558% 7/20/18 | | | 1,412,086 | | | | 1,410,411 | |
New York City Tax Lien, Series 2012-AA, Class A (a)
1.230% 11/10/25 | | | 133,787 | | | | 133,658 | |
Nomad CLO Ltd., Series 2013-1A, Class A1 FRN (a)
1.431% 1/15/25 | | | 1,575,000 | | | | 1,550,857 | |
Oak Hill Credit Partners VIII Ltd., Series 2013-8A, Class A FRN (a)
1.351% 4/20/25 | | | 2,100,000 | | | | 2,064,359 | |
OHA Loan Funding Ltd., Series 2013-1A, Class A FRN (a)
1.481% 7/23/25 | | | 1,710,000 | | | | 1,688,817 | |
OnDeck Asset Securitization Trust, Series 2014-1A, Class A (a)
3.150% 5/17/18 | | | 1,200,000 | | | | 1,196,704 | |
Orange Lake Timeshare Trust, Series 2014-AA, Class A (a)
2.290% 7/09/29 | | | 673,332 | | | | 674,080 | |
Oxford Finance Funding Trust, Series 2014-1A, Class A (a)
3.475% 12/15/22 | | | 750,000 | | | | 748,305 | |
Race Point VIII CLO Ltd., Series 2013-8A, Class A FRN (a)
1.482% 2/20/25 | | | 700,000 | | | | 691,067 | |
| | | | | | | | |
| | | Principal
Amount | | | Value | |
Race Point VIII CLO Ltd., Series 2012-7A, Class A FRN (a)
1.652% 11/08/24 | | $ | 1,200,000 | | | $ | 1,194,120 | |
Sierra Receivables Funding Co. LLC, Series 2012-1A, Class A (a)
2.840% 11/20/28 | | | 219,719 | | | | 223,205 | |
Sierra Timeshare Receivables Funding LLC, Series 2013-3A, Class A (a)
2.200% 10/20/30 | | | 970,018 | | | | 973,038 | |
Sonic Capital LLC, Series 2011-1A, Class A2 (a)
5.438% 5/20/41 | | | 1,643,236 | | | | 1,732,587 | |
Spirit Master Funding LLC, Series 2014-4A, Class A1 (a)
3.501% 1/20/45 | | | 1,000,000 | | | | 1,000,310 | |
SpringCastle America Funding LLC, Series 2014-AA, Class A (a)
2.700% 5/25/23 | | | 3,086,826 | | | | 3,079,170 | |
Springleaf Funding Trust, Series 2013-AA, Class A (a)
2.580% 9/15/21 | | | 1,450,000 | | | | 1,454,175 | |
Structured Receivables Finance LLC, Series 2010-B, Class A (a)
3.730% 8/15/36 | | | 393,692 | | | | 413,709 | |
SVO VOI Mortgage LLC, Series 2012-AA, Class A (a)
2.000% 9/20/29 | | | 1,522,142 | | | | 1,513,085 | |
Textainer Marine Containers III Ltd., Series 2014-1A, Class A (a)
3.270% 10/20/39 | | | 983,333 | | | | 976,438 | |
Trafigura Securitisation Finance PLC, Series 2012-1A, Class A FRN (a)
2.561% 10/15/15 | | | 2,137,000 | | | | 2,145,826 | |
Trip Rail Master Funding LLC, Series 2011-1A, Class A1A (a)
4.370% 7/15/41 | | | 441,786 | | | | 463,608 | |
Westgate Resorts LLC, Series 2012-2A, Class A (a)
3.000% 1/20/25 | | | 320,498 | | | | 322,286 | |
| | | | | | | | |
| | | | | | | 97,027,751 | |
| | | | | | | | |
| Student Loans ABS — 2.6% | |
Access Group, Inc., Series 2007-A, Class A2 FRN
0.363% 8/25/26 | | | 139,046 | | | | 138,672 | |
Access Group, Inc., Series 2003-A, Class A3 FRN
1.220% 7/01/38 | | | 1,081,806 | | | | 992,456 | |
College Loan Corp. Trust, Series 2002-1, Class B1 FRN (a)
1.636% 3/01/42 | | | 1,050,000 | | | | 882,000 | |
The accompanying notes are an integral part of the financial statements.
66
MML Managed Bond Fund – Portfolio of Investments (Continued)
| | | | | | | | |
| | | Principal
Amount | | | Value | |
College Loan Corp. Trust, Series 2007-1, Class B2 FRN
1.654% 1/25/47 | | $ | 1,500,000 | | | $ | 1,267,500 | |
College Loan Corp. Trust I, Series 2002-1, Class A5 FRN (a)
0.994% 3/01/42 | | | 700,000 | | | | 671,860 | |
Education Funding Capital Trust I, Series 2004-1, Class A4 FRN
1.651% 6/15/43 | | | 1,750,000 | | | | 1,740,165 | |
Education Funding Capital Trust I, Series 2004-1, Class A6 FRN
1.656% 6/15/43 | | | 1,100,000 | | | | 1,087,350 | |
Education Funding Capital Trust I, Series 2004-1, Class A5 FRN
1.665% 6/15/43 | | | 1,075,000 | | | | 1,057,974 | |
Education Funding Capital Trust I, Series 2004-1, Class B1 FRN
1.907% 6/15/43 | | | 450,000 | | | | 437,222 | |
Educational Funding of the South, Inc., Series 2011-1, Class B FRN
3.934% 4/25/46 | | | 625,000 | | | | 697,146 | |
GCO Education Loan Funding Trust, Series 2006-2A, Class A2L FRN (a)
0.333% 8/25/25 | | | 214,982 | | | | 214,648 | |
Goal Capital Funding Trust, Series 2006-1, Class A3 FRN
0.353% 11/25/26 | | | 807,545 | | | | 803,387 | |
Higher Education Funding I, Series 2004-1, Class B1 FRN (a)
0.717% 1/01/44 | | | 450,000 | | | | 382,096 | |
Higher Education Funding I, Series 2004-1, Class B2 FRN (a)
1.640% 1/01/44 | | | 450,000 | | | | 370,661 | |
KeyCorp Student Loan Trust, Series 2006-A, Class 2A4 FRN
0.565% 9/27/35 | | | 1,560,000 | | | | 1,499,347 | |
Mississippi Higher Education Assistance Corp., Series 2014-1, Class A1 FRN
0.850% 10/25/35 | | | 1,889,158 | | | | 1,884,051 | |
National Collegiate Student Loan Trust, Series 2006-3, Class A3 FRN
0.320% 10/25/27 | | | 3,493,693 | | | | 3,449,207 | |
Nelnet Student Loan Trust, Series 2005-4, Class A4A FRN
0.468% 3/22/32 | | | 325,000 | | | | 303,467 | |
Nelnet Student Loan Trust, Series 2006-3, Class B FRN
0.505% 6/25/41 | | | 1,180,615 | | | | 1,066,593 | |
Nelnet Student Loan Trust, Series 2014-6A, Class A FRN (a)
0.820% 11/25/47 | | | 2,916,330 | | | | 2,900,084 | |
Nelnet Student Loan Trust, Series 2010-4A, Class A FRN (a)
0.970% 4/25/46 | | | 458,173 | | | | 459,834 | |
| | | | | | | | |
| | | Principal
Amount | | | Value | |
Northstar Education Finance, Inc., Series 2006-A, Class A3 FRN
0.446% 5/28/26 | | $ | 264,020 | | | $ | 263,770 | |
Panhandle-Plains Student Finance Corp., Series 2001-A2
1.656% 12/01/31 | | | 1,900,000 | | | | 1,823,058 | |
SLC Student Loan Trust, Series 2006-A, Class A5 FRN
0.401% 7/15/36 | | | 1,104,790 | | | | 1,098,459 | |
SLC Student Loan Trust, Series 2006-A, Class B FRN
0.531% 7/15/36 | | | 378,000 | | | | 359,826 | |
SLM Private Education Loan Trust, Series 2013-R1, Class A FRN (a)
1.670% 3/25/33 | | | 932,202 | | | | 941,100 | |
SLM Student Loan Trust, Series 2007-3, Class B FRN
0.384% 1/25/28 | | | 2,400,000 | | | | 2,102,567 | |
SLM Student Loan Trust, Series 2003-5, Class A7 FRN
0.950% 6/17/30 | | | 250,000 | | | | 250,000 | |
SLM Student Loan Trust, Series 2002-7, Class A10 FRN
1.080% 3/15/28 | | | 965,000 | | | | 965,000 | |
SLM Student Loan Trust, Series 2003-2, Class A7 FRN
1.660% 9/15/28 | | | 650,000 | | | | 650,000 | |
SLM Student Loan Trust, Series 2013-2, Class B FRN
1.670% 6/25/43 | | | 1,420,000 | | | | 1,398,498 | |
SLM Student Loan Trust, Series 2002-7, Class A11 FRN
2.640% 3/15/28 | | | 1,850,000 | | | | 1,850,000 | |
South Carolina Student Loan Corp., Series 2014-1, Class A2 FRN
1.170% 1/03/33 | | | 1,800,000 | | | | 1,791,457 | |
South Carolina Student Loan Corp., Series 2014-1, Class B FRN
1.670% 8/01/35 | | | 1,100,000 | | | | 1,034,541 | |
| | | | | | | | |
| | | | | | | 36,833,996 | |
| | | | | | | | |
| WL Collateral CMO — 0.0% | |
Bank of America Mortgage Securities, Series 2004-G, Class 2A7 FRN
2.690% 8/25/34 | | | 107,438 | | | | 104,301 | |
Countrywide Home Loans, Inc., Series 2004-2, Class 1A1 FRN
2.659% 2/25/34 | | | 28,175 | | | | 27,624 | |
Countrywide Home Loans, Inc., Series 2003-42, Class 1A1 FRN
2.904% 9/25/33 | | | 7,687 | | | | 7,352 | |
GSR Mortgage Loan Trust, Series 2004-9, Class 2A1 FRN
2.475% 8/25/34 | | | 21,474 | | | | 20,302 | |
The accompanying notes are an integral part of the financial statements.
67
MML Managed Bond Fund – Portfolio of Investments (Continued)
| | | | | | | | |
| | | Principal
Amount | | | Value | |
HSI Asset Securitization Corp. Trust, Series 2005, Class IIA3 FRN
0.530% 7/25/35 | | $ | 63,224 | | | $ | 62,892 | |
IndyMac Index Mortgage Loan Trust, Series 2004-AR4, Class 1A FRN
2.409% 8/25/34 | | | 76,329 | | | | 64,757 | |
Merrill Lynch Mortgage Investors, Inc., Series 2005-A8, Class A3A2 FRN
0.420% 8/25/36 | | | 114,862 | | | | 105,745 | |
Merrill Lynch Mortgage Investors, Inc., Series 2003-A4, Class IA FRN
2.448% 7/25/33 | | | 5,113 | | | | 5,045 | |
Merrill Lynch Mortgage Investors, Inc., Series 2004-A1, Class IA FRN
2.605% 2/25/34 | | | 9,762 | | | | 9,150 | |
Morgan Stanley Mortgage Loan Trust, Series 2004-2AR, Class 1A FRN
2.375% 2/25/34 | | | 258 | | | | 259 | |
Structured Adjustable Rate Mortgage Loan Trust, Series 2004-2, Class 2A FRN
2.569% 3/25/34 | | | 50,447 | | | | 50,033 | |
WaMu Mortgage Pass-Through Certificates, Series 2004-AR2, Class A FRN
1.513% 4/25/44 | | | 121,081 | | | | 125,414 | |
| | | | | | | | |
| | | | | | | 582,874 | |
| | | | | | | | |
| WL Collateral PAC — 0.0% | |
Structured Asset Securities Corp., Series 2007-BC4, Class A3 FRN
0.405% 11/25/37 | | | 456,313 | | | | 451,793 | |
Structured Asset Securities Corp., Series 2002-11A, Class 2A1 FRN
2.759% 6/25/32 | | | 32,440 | | | | 31,310 | |
| | | | | | | | |
| | | | | | | 483,103 | |
| | | | | | | | |
| | |
| TOTAL NON-U.S. GOVERNMENT AGENCY OBLIGATIONS (Cost $258,699,115) | | | | | | | 261,289,396 | |
| | | | | | | | |
|
| SOVEREIGN DEBT OBLIGATIONS — 0.8% | |
Brazilian Government International Bond
4.875% 1/22/21 | | | 425,000 | | | | 451,563 | |
Colombia Government International Bond
7.375% 3/18/19 | | | 725,000 | | | | 851,875 | |
Mexico Government International Bond
4.750% 3/08/44 | | | 1,955,000 | | | | 2,038,087 | |
Peruvian Government International Bond
6.550% 3/14/37 | | | 405,000 | | | | 525,488 | |
| | | | | | | | |
| | | Principal
Amount | | | Value | |
Poland Government International Bond 6.375% 7/15/19 | | $ | 690,000 | | | $ | 807,300 | |
Province of Quebec Canada
7.500% 9/15/29 | | | 390,000 | | | | 576,378 | |
Republic of Brazil International Bond 5.625% 1/07/41 | | | 1,315,000 | | | | 1,416,912 | |
Republic of Brazil International Bond 5.875% 1/15/19 | | | 876,000 | | | | 976,740 | |
Republic of Turkey International Bond 3.250% 3/23/23 | | | 405,000 | | | | 384,244 | |
Republic of Turkey International Bond 4.875% 4/16/43 | | | 474,000 | | | | 472,142 | |
Republic of Turkey International Bond 6.750% 4/03/18 | | | 840,000 | | | | 934,500 | |
United Mexican States
5.125% 1/15/20 | | | 850,000 | | | | 937,125 | |
United Mexican States
6.750% 9/27/34 | | | 685,000 | | | | 894,610 | |
| | | | | | | | |
| | | | | | | 11,266,964 | |
| | | | | | | | |
| | |
TOTAL SOVEREIGN DEBT OBLIGATIONS
(Cost $10,408,951) | | | | | | | 11,266,964 | |
| | | | | | | | |
|
U.S. GOVERNMENT AGENCY OBLIGATIONS
AND INSTRUMENTALITIES — 27.4% | |
| Collateralized Mortgage Obligations — 2.0% | |
Federal Home Loan Mortgage Corp. | | | | | | | | |
Series 4303, Class AP
3.000% 8/15/43 | | | 5,699,672 | | | | 5,870,445 | |
Series 4290, Class CA
3.500% 12/15/38 | | | 3,006,182 | | | | 3,153,162 | |
Series 2617, Class Z
5.500% 5/15/33 | | | 3,020,957 | | | | 3,395,430 | |
Series 2693, Class Z
5.500% 10/15/33 | | | 5,122,074 | | | | 5,697,266 | |
Series 2178, Class PB
7.000% 8/15/29 | | | 104,346 | | | | 119,078 | |
Federal National Mortgage Association | | | | | | | | |
Series 2014-7, Class VA
3.500% 5/25/25 | | | 1,789,476 | | | | 1,904,001 | |
Series 2014-48, Class AB
4.000% 10/25/40 | | | 4,420,334 | | | | 4,717,593 | |
Series 2007-32, Class Z
5.500% 4/25/37 | | | 1,690,374 | | | | 1,878,974 | |
Series 2010-60, Class HJ
5.500% 5/25/40 | | | 1,164,496 | | | | 1,286,044 | |
Federal National Mortgage Association Benchmark REMIC Series 2007-B2, Class ZA
5.500% 6/25/37 | | | 1,394,797 | | | | 1,525,493 | |
The accompanying notes are an integral part of the financial statements.
68
MML Managed Bond Fund – Portfolio of Investments (Continued)
| | | | | | | | |
| | | Principal
Amount | | | Value | |
U.S. Department of Veteran Affairs | | | | | | | | |
Series 1992-1, Class 2Z
7.750% 5/15/22 | | $ | 109,022 | | | $ | 121,893 | |
| | | | | | | | |
| | | | | | | 29,669,379 | |
| | | | | | | | |
| Pass-Through Securities — 25.4% | |
Federal Home Loan Mortgage Corp. | | | | | | | | |
Pool #G11630 3.500%
6/01/19 | | | 205,546 | | | | 217,285 | |
Pool #J13972 3.500%
1/01/26 | | | 129,752 | | | | 137,365 | |
Pool #C91344 3.500%
11/01/30 | | | 293,472 | | | | 309,899 | |
Pool #C91424 3.500%
1/01/32 | | | 202,908 | | | | 214,266 | |
Pool #C91239 4.500%
3/01/29 | | | 19,131 | | | | 20,868 | |
Pool #C91251 4.500%
6/01/29 | | | 128,807 | | | | 140,500 | |
Pool #G05253 5.000%
2/01/39 | | | 631,600 | | | | 696,610 | |
Pool #C90939 5.500%
12/01/25 | | | 69,702 | | | | 77,742 | |
Pool #D97258 5.500%
4/01/27 | | | 143,682 | | | | 160,581 | |
Pool #C91026 5.500%
4/01/27 | | | 119,012 | | | | 132,957 | |
Pool #C91074 5.500%
8/01/27 | | | 11,144 | | | | 12,456 | |
Pool #D97417 5.500%
10/01/27 | | | 63,517 | | | | 70,868 | |
Pool #C91128 5.500%
12/01/27 | | | 5,899 | | | | 6,588 | |
Pool #C91148 5.500%
1/01/28 | | | 230,899 | | | | 257,860 | |
Pool #C91176 5.500%
5/01/28 | | | 80,856 | | | | 90,382 | |
Pool #C91217 5.500%
11/01/28 | | | 33,028 | | | | 36,949 | |
Pool #E85389 6.000%
9/01/16 | | | 9,604 | | | | 9,953 | |
Pool #G11431 6.000%
2/01/18 | | | 7,764 | | | | 8,123 | |
Pool #E85409 6.500%
9/01/16 | | | 22,388 | | | | 23,222 | |
Pool #E85032 6.500%
9/01/16 | | | 2,882 | | | | 2,989 | |
Pool #E85301 6.500%
9/01/16 | | | 30,044 | | | | 31,271 | |
Pool #C01079 7.500%
10/01/30 | | | 3,302 | | | | 3,935 | |
Pool #C01135 7.500%
2/01/31 | | | 10,091 | | | | 12,011 | |
| | | | | | | | |
| | | Principal
Amount | | | Value | |
Pool #554904 9.000%
3/01/17 | | $ | 50 | | | $ | 53 | |
Federal National Mortgage Association | | | | | | | | |
Pool #775539 2.117%
5/01/34 FRN | | | 119,840 | | | | 127,934 | |
Pool #725692 2.270%
10/01/33 FRN | | | 299,754 | | | | 317,230 | |
Pool #888586 2.340%
10/01/34 FRN | | | 302,474 | | | | 320,955 | |
Pool #AO8180 3.000%
9/01/42 | | | 58,215 | | | | 59,045 | |
Pool #AP8668 3.000%
12/01/42 | | | 312,539 | | | | 316,800 | |
Pool #AR1975 3.000%
12/01/42 | | | 73,249 | | | | 74,247 | |
Pool #AB7401 3.000%
12/01/42 | | | 256,805 | | | | 260,307 | |
Pool #AB7397 3.000%
12/01/42 | | | 262,970 | | | | 266,555 | |
Pool #AR0306 3.000%
1/01/43 | | | 21,160 | | | | 21,449 | |
Pool #AR5391 3.000%
1/01/43 | | | 187,619 | | | | 190,177 | |
Pool #AL3215 3.000%
2/01/43 | | | 246,982 | | | | 250,349 | |
Pool #AR4109 3.000%
2/01/43 | | | 211,432 | | | | 214,315 | |
Pool #AR4432 3.000%
3/01/43 | | | 90,601 | | | | 91,836 | |
Pool #AT0169 3.000%
3/01/43 | | | 410,786 | | | | 416,386 | |
Pool #AB8809 3.000%
3/01/43 | | | 132,416 | | | | 134,221 | |
Pool #MA1368 3.000%
3/01/43 | | | 454,589 | | | | 460,786 | |
Pool #AR2174 3.000%
4/01/43 | | | 450,073 | | | | 456,209 | |
Pool #890564 3.000%
6/01/43 | | | 4,403,772 | | | | 4,476,193 | |
Pool #AB1485 3.500%
9/01/30 | | | 149,175 | | | | 157,525 | |
Pool #MA0625 3.500%
1/01/31 | | | 236,643 | | | | 249,890 | |
Pool #AJ3722 3.500%
12/01/31 | | | 322,231 | | | | 340,269 | |
Pool #MA1084 3.500%
6/01/32 | | | 2,465,655 | | | | 2,603,674 | |
Pool #MA1138 3.500%
8/01/32 | | | 40,952 | | | | 43,244 | |
Pool #AB6353 3.500%
10/01/32 | | | 3,000,866 | | | | 3,168,844 | |
The accompanying notes are an integral part of the financial statements.
69
MML Managed Bond Fund – Portfolio of Investments (Continued)
| | | | | | | | |
| | | Principal
Amount | | | Value | |
Pool #AP9736 3.500%
10/01/42 | | $ | 1,793,442 | | | $ | 1,873,097 | |
Pool #AQ0546 3.500%
11/01/42 | | | 451,032 | | | | 471,064 | |
Pool #AB8527 3.500%
3/01/43 | | | 1,977,294 | | | | 2,062,024 | |
Pool #AR8708 3.500%
4/01/43 | | | 1,314,156 | | | | 1,370,470 | |
Pool #AT0998 3.500%
4/01/43 | | | 6,585,176 | | | | 6,867,361 | |
Pool #AT4050 3.500%
5/01/43 | | | 1,769,248 | | | | 1,845,064 | |
Pool #MA1463 3.500%
6/01/43 | | | 4,277,427 | | | | 4,460,721 | |
Pool #AB6261 4.000%
9/01/42 | | | 11,518,048 | | | | 12,395,849 | |
Pool #AA3980 4.500%
4/01/28 | | | 189,393 | | | | 208,421 | |
Pool #AD0836 5.500%
11/01/28 | | | 219,527 | | | | 245,313 | |
Pool #587994 6.000%
6/01/16 | | | 3,914 | | | | 4,039 | |
Pool #253880 6.500%
7/01/16 | | | 11,607 | | | | 12,012 | |
Pool #575667 7.000%
3/01/31 | | | 14,204 | | | | 16,652 | |
Pool #497120 7.500%
8/01/29 | | | 382 | | | | 455 | |
Pool #529453 7.500%
1/01/30 | | | 3,113 | | | | 3,717 | |
Pool #531196 7.500%
2/01/30 | | | 406 | | | | 485 | |
Pool #532418 7.500%
2/01/30 | | | 4,841 | | | | 5,780 | |
Pool #530299 7.500%
3/01/30 | | | 474 | | | | 555 | |
Pool #536386 7.500%
4/01/30 | | | 551 | | | | 657 | |
Pool #535996 7.500%
6/01/31 | | | 13,618 | | | | 16,237 | |
Pool #523499 8.000%
11/01/29 | | | 447 | | | | 525 | |
Pool #252926 8.000%
12/01/29 | | | 371 | | | | 446 | |
Pool #532819 8.000%
3/01/30 | | | 218 | | | | 264 | |
Pool #537033 8.000%
4/01/30 | | | 4,734 | | | | 5,730 | |
Pool #534703 8.000%
5/01/30 | | | 3,285 | | | | 3,959 | |
Pool #253437 8.000%
9/01/30 | | | 288 | | | | 347 | |
| | | | | | | | |
| | | Principal
Amount | | | Value | |
Pool #253481 8.000%
10/01/30 | | $ | 178 | | | $ | 215 | |
Pool #602008 8.000%
8/01/31 | | | 7,582 | | | | 9,153 | |
Pool #596656 8.000%
8/01/31 | | | 3,257 | | | | 3,692 | |
Pool #190317 8.000%
8/01/31 | | | 6,501 | | | | 7,834 | |
Pool #597220 8.000%
9/01/31 | | | 3,714 | | | | 4,508 | |
Federal National Mortgage Association TBA | | | | | | | | |
Pool #3348 2.500%
9/01/27 (d) | | | 65,250,000 | | | | 66,483,630 | |
Pool #4241 3.000%
8/01/42 (d) | | | 13,520,000 | | | | 13,683,719 | |
Pool #1963 3.500%
8/01/42 (d) | | | 23,950,000 | | | | 24,979,103 | |
Pool #9174 4.000%
4/01/42 (d) | | | 23,050,000 | | | | 24,609,475 | |
Pool #18718 4.500%
3/01/40 (d) | | | 44,450,000 | | | | 48,266,450 | |
Government National Mortgage Association | | | | | | | | |
Pool #783896 3.500%
5/15/44 | | | 6,182,484 | | | | 6,508,271 | |
Pool #371146 7.000%
9/15/23 | | | 947 | | | | 1,068 | |
Pool #352022 7.000%
11/15/23 | | | 13,600 | | | | 15,426 | |
Pool #374440 7.000%
11/15/23 | | | 771 | | | | 872 | |
Pool #491089 7.000%
12/15/28 | | | 33,539 | | | | 39,122 | |
Pool #483598 7.000%
1/15/29 | | | 4,082 | | | | 4,764 | |
Pool #480539 7.000%
4/15/29 | | | 536 | | | | 627 | |
Pool #478658 7.000%
5/15/29 | | | 2,627 | | | | 3,085 | |
Pool #488634 7.000%
5/15/29 | | | 2,828 | | | | 3,309 | |
Pool #500928 7.000%
5/15/29 | | | 5,238 | | | | 6,142 | |
Pool #499410 7.000%
7/15/29 | | | 1,516 | | | | 1,782 | |
Pool #508655 7.000%
7/15/29 | | | 166 | | | | 194 | |
Pool #510083 7.000%
7/15/29 | | | 2,721 | | | | 3,179 | |
Pool #493723 7.000%
8/15/29 | | | 13,240 | | | | 15,555 | |
The accompanying notes are an integral part of the financial statements.
70
MML Managed Bond Fund – Portfolio of Investments (Continued)
| | | | | | | | |
| | | Principal
Amount | | | Value | |
Pool #516706 7.000%
8/15/29 | | $ | 178 | | | $ | 198 | |
Pool #505558 7.000%
9/15/29 | | | 1,693 | | | | 1,987 | |
Pool #581417 7.000%
7/15/32 | | | 30,458 | | | | 35,844 | |
Pool #591581 7.000%
8/15/32 | | | 15,938 | | | | 18,801 | |
Pool #203940 7.500%
4/15/17 | | | 4,136 | | | | 4,370 | |
Pool #193870 7.500%
5/15/17 | | | 3,937 | | | | 4,184 | |
Pool #181168 7.500%
5/15/17 | | | 942 | | | | 1,002 | |
Pool #192796 7.500%
6/15/17 | | | 532 | | | | 566 | |
Pool #226163 7.500%
7/15/17 | | | 6,619 | | | | 7,056 | |
Government National Mortgage Association II | | | | | | | | |
Pool #008746 1.625%
11/20/25 FRN | | | 8,146 | | | | 8,340 | |
Pool #080136 1.625%
11/20/27 FRN | | | 1,509 | | | | 1,550 | |
Pool #82488 1.625%
3/20/40 FRN | | | 1,038,543 | | | | 1,075,711 | |
Pool #82462 3.500%
1/20/40 FRN | | | 1,130,087 | | | | 1,180,739 | |
Pool #G2MA2149 4.000%
8/20/44 | | | 25,823,657 | | | | 27,707,978 | |
Government National Mortgage Association TBA | | | | | | | | |
Pool #188 3.000%
11/01/42 (d) | | | 55,750,000 | | | | 57,008,729 | |
Pool #207 3.500%
1/01/43 (d) | | | 11,700,000 | | | | 12,285,914 | |
Pool #232 4.000%
12/01/42 (d) | | | 28,775,000 | | | | 30,845,450 | |
| | | | | | | | |
| | | | | | | 364,404,011 | |
| | | | | | | | |
| | |
TOTAL U.S. GOVERNMENT AGENCY OBLIGATIONS AND INSTRUMENTALITIES
(Cost $392,802,426) | | | | | | | 394,073,390 | |
| | | | | | | | |
|
| U.S. TREASURY OBLIGATIONS — 7.2% | |
| U.S. Treasury Bonds & Notes — 7.2% | |
U.S. Treasury Bond (e) (f)
2.750% 8/15/42 | | | 14,015,000 | | | | 14,022,042 | |
U.S. Treasury Bond
2.875% 5/15/43 | | | 7,600,000 | | | | 7,780,614 | |
U.S. Treasury Bond
3.000% 11/15/44 | | | 2,000,000 | | | | 2,102,031 | |
| | | | | | | | |
| | | Principal
Amount | | | Value | |
U.S. Treasury Bond
3.375% 5/15/44 | | $ | 13,310,000 | | | $ | 14,997,247 | |
U.S. Treasury Bond
4.500% 2/15/36 | | | 11,010,000 | | | | 14,697,836 | |
U.S. Treasury Inflation Index
0.375% 7/15/23 | | | 5,509,836 | | | | 5,447,420 | |
U.S. Treasury Note
1.000% 9/15/17 | | | 4,700,000 | | | | 4,701,056 | |
U.S. Treasury Note
1.000% 12/15/17 | | | 4,030,000 | | | | 4,020,870 | |
U.S. Treasury Note
1.500% 11/30/19 | | | 8,500,000 | | | | 8,444,717 | |
U.S. Treasury Note
1.625% 4/30/19 | | | 11,880,000 | | | | 11,918,981 | |
U.S. Treasury Note
2.250% 11/15/24 | | | 11,200,000 | | | | 11,275,906 | |
U.S. Treasury Note
2.375% 8/15/24 | | | 3,690,000 | | | | 3,755,908 | |
| | | | | | | | |
| | | | | | | 103,164,628 | |
| | | | | | | | |
| | |
TOTAL U.S. TREASURY OBLIGATIONS
(Cost $97,045,271) | | | | | | | 103,164,628 | |
| | | | | | | | |
| | |
TOTAL BONDS & NOTES
(Cost $1,375,929,775) | | | | | | | 1,414,433,752 | |
| | | | | | | | |
| | |
| | | Notional
Amount | | | | |
| PURCHASED OPTIONS — 0.2% | |
| Financial — 0.2% | |
| Diversified Financial — 0.2% | |
3-Month LIBOR BBA 10 Year Swaption, Call, Expires 4/25/16, Strike 2.5 (OTC-Credit Suisse International); Underlying swap terminates 4/27/26 | | $ | 110,730,000 | | | | 2,928,555 | |
| | | | | | | | |
| | |
TOTAL PURCHASED OPTIONS
(Cost $1,942,897) | | | | | | | 2,928,555 | |
| | | | | | | | |
| | |
TOTAL LONG-TERM INVESTMENTS
(Cost $1,380,247,672) | | | | | | | 1,419,768,657 | |
| | | | | | | | |
The accompanying notes are an integral part of the financial statements.
71
MML Managed Bond Fund – Portfolio of Investments (Continued)
| | | | | | | | |
| | | Principal
Amount | | | Value | |
| SHORT-TERM INVESTMENTS — 20.1% | |
| Commercial Paper — 20.1% | |
AGL Capital Corp. (a)
0.510% 3/11/15 | | $ | 8,000,000 | | | $ | 7,992,027 | |
Agrium, Inc.
0.380% 1/20/15 | | | 5,200,000 | | | | 5,198,957 | |
Amphenol Corp. (a)
0.500% 3/11/15 | | | 9,400,000 | | | | 9,390,992 | |
Bacardi USA, Inc. (a)
0.670% 1/28/15 | | | 4,250,000 | | | | 4,247,864 | |
Baxter International, Inc. (a)
0.400% 1/26/15 | | | 15,000,000 | | | | 14,995,833 | |
Bell Canada (a)
0.500% 3/17/15 | | | 5,000,000 | | | | 4,994,792 | |
Block Financial LLC (a)
0.050% 2/18/15 | | | 10,000,000 | | | | 9,993,333 | |
Block Financial LLC (a)
0.470% 2/02/15 | | | 10,000,000 | | | | 9,995,822 | |
Carnival Corp. (a)
0.700% 3/18/15 | | $ | 10,000,000 | | | $ | 9,985,222 | |
CBS Corp. (a)
0.380% 1/13/15 | | | 5,465,000 | | | | 5,464,308 | |
Centrica PLC (a)
0.750% 1/15/15 | | | 15,000,000 | | | | 14,995,625 | |
Daimler Finance North America LLC (a)
0.600% 3/10/15 | | | 10,000,000 | | | | 9,988,667 | |
Dominion Resources (a)
0.430% 2/23/15 | | | 4,400,000 | | | | 4,397,215 | |
Duke Energy Corp. (a)
0.350% 2/24/15 | | | 13,500,000 | | | | 13,492,913 | |
Duke Energy Corp. (a)
0.450% 3/20/15 | | | 5,000,000 | | | | 4,995,125 | |
Ecolab, Inc. (a)
0.500% 3/12/15 | | | 10,000,000 | | | | 9,990,278 | |
Holcim US Finance SARL & Cie (a)
0.380% 2/02/15 | | | 10,000,000 | | | | 9,996,622 | |
Holcim US Finance SARL & Cie (a)
0.380% 2/04/15 | | | 2,000,000 | | | | 1,999,282 | |
Hyundai Capital America (a)
0.380% 1/21/15 | | | 5,000,000 | | | | 4,998,944 | |
Marriott International, Inc. (a)
0.520% 3/12/15 | | | 8,000,000 | | | | 7,991,911 | |
Mondelez International, Inc. (a)
0.350% 1/02/15 | | | 6,607,000 | | | | 6,606,936 | |
National Grid USA (a)
0.380% 2/03/15 | | | 11,000,000 | | | | 10,996,168 | |
ONEOK Partners LP (a)
0.400% 1/16/15 | | | 3,600,000 | | | | 3,599,400 | |
ONEOK Partners LP (a)
0.420% 1/13/15 | | | 6,000,000 | | | | 5,999,160 | |
Pentair Finance (a)
0.400% 1/02/15 | | | 2,000,000 | | | | 1,999,978 | |
| | | | | | | | |
| | | Principal
Amount | | | Value | |
Pentair Finance (a)
0.450% 3/05/15 | | $ | 6,500,000 | | | $ | 6,494,881 | |
Pentair Finance (a)
0.500% 1/30/15 | | | 3,000,000 | | | | 2,998,792 | |
Pentair Finance (a)
0.700% 3/23/15 | | | 8,565,000 | | | | 8,551,510 | |
Plains All American Pipeline LP (a)
0.450% 1/15/15 | | | 10,000,000 | | | | 9,998,250 | |
PPG Industries, Inc.
0.430% 1/22/15 | | | 5,000,000 | | | | 4,998,746 | |
Sempra Energy Holdings (a)
0.530% 2/10/15 | | | 10,000,000 | | | | 9,994,111 | |
Sempra Energy Holdings (a)
0.715% 3/06/15 | | | 10,000,000 | | | | 9,987,556 | |
Tate & Lyle International Finance PLC (a)
0.480% 2/27/15 | | | 5,600,000 | | | | 5,595,744 | |
Tate & Lyle International Finance PLC (a)
0.500% 3/04/15 | | | 3,200,000 | | | | 3,197,244 | |
Tate & Lyle International Finance PLC (a)
0.630% 1/30/15 | | | 1,300,000 | | | | 1,299,340 | |
Tate & Lyle International Finance PLC (a)
0.720% 3/19/15 | | | 8,500,000 | | | | 8,486,910 | |
Vodafone Group PLC (a)
0.470% 6/08/15 | | | 5,000,000 | | | | 4,989,686 | |
Vodafone Group PLC (a)
0.499% 6/01/15 | | | 8,000,000 | | | | 7,983,558 | |
Vodafone Group PLC (a)
0.550% 4/08/15 | | | 5,000,000 | | | | 4,992,590 | |
Vodafone Group PLC
0.570% 6/01/15 | | | 2,000,000 | | | | 1,995,218 | |
VW Credit, Inc. (a)
0.220% 1/02/15 | | | 3,000,000 | | | | 2,999,982 | |
| | | | | | | | |
| | | | | | | 288,871,492 | |
| | | | | | | | |
| | |
TOTAL SHORT-TERM INVESTMENTS
(Cost $288,871,492) | | | | | | | 288,871,492 | |
| | | | | | | | |
| |
| TOTAL INVESTMENTS — 119.0% | | | | | |
| (Cost $1,669,119,164) (g) | | | | | | | 1,708,640,149 | |
| | |
| Other Assets/(Liabilities) — (19.0)% | | | | | | | (272,641,165 | ) |
| | | | | | | | |
| | |
| NET ASSETS — 100.0% | | | | | | $ | 1,435,998,984 | |
| | | | | | | | |
The accompanying notes are an integral part of the financial statements.
72
MML Managed Bond Fund – Portfolio of Investments (Continued)
Notes to Portfolio of Investments
Percentages are stated as a percent of net assets.
| CLO | Collateralized Loan Obligation |
| CMO | Collateralized Mortgage Obligation |
| MBS | Mortgage-Backed Security |
| PAC | Planned Amortization Class |
| (a) | Securities exempt from registration under rule 144A of the Securities Act of 1933. These securities may be resold in transactions exempt from registration, normally to qualified institutional buyers. At December 31, 2014, these securities amounted to a value of $507,202,427 or 35.32% of net assets. |
| (b) | Security is currently in default due to bankruptcy or failure to make payment of principal or interest of the issuer. Income is not being accrued. At December 31, 2014, these securities amounted to a value of $39,577 or 0.00% of net assets. |
| (c) | Restricted security. Certain securities are restricted as to resale. At December 31, 2014, these securities amounted to a value of $926,227 or 0.06% of net assets. The Fund generally bears the costs, if any, associated with the disposition of restricted securities. |
| (d) | A portion of this security is purchased on a when-issued, delayed-delivery or forward commitment basis. (Note 2). |
| (e) | A portion of this security is held as collateral for open futures contracts. (Note 2). |
| (f) | A portion of this security is held as collateral for open swap agreements (Note 2). |
| (g) | See Note 6 for aggregate cost for federal tax purposes. |
The accompanying notes are an integral part of the financial statements.
73
MML Money Market Fund – Portfolio of Investments
December 31, 2014
| | | | | | | | |
| | | Principal
Amount | | | Value | |
| SHORT-TERM INVESTMENTS — 100.1% | | | | | |
| Commercial Paper — 74.5% | | | | | |
ABB Treasury Center USA, Inc. (a)
0.120% 1/05/15 | | $ | 3,250,000 | | | $ | 3,249,957 | |
Air Products & Chemicals, Inc. (a)
0.110% 1/07/15 | | | 2,825,000 | | | | 2,824,948 | |
Air Products & Chemicals, Inc. (a)
0.130% 2/02/15 | | | 3,000,000 | | | | 2,999,653 | |
American Honda Finance Corp.
0.120% 1/09/15 | | | 6,000,000 | | | | 5,999,840 | |
Anheuser-Busch InBev Worldwide, Inc. (a)
0.100% 1/08/15 | | | 1,050,000 | | | | 1,049,980 | |
Bank of Nova Scotia (a)
0.200% 2/10/15 | | | 3,550,000 | | | | 3,549,211 | |
Basin Electric Power Cooperative (a) 0.200% 1/06/15 | | | 5,000,000 | | | | 4,999,861 | |
Basin Electric Power Cooperative (a) 0.160% 2/19/15 | | | 885,000 | | | | 884,807 | |
BMW US Capital LLC (a)
0.110% 1/29/15 | | | 6,000,000 | | | | 5,999,487 | |
Brown-Forman Corp. (a)
0.213% 1/14/15 | | | 1,200,000 | | | | 1,199,909 | |
Brown-Forman Corp. (a)
0.200% 1/20/15 | | | 5,000,000 | | | | 4,999,472 | |
Cargill Global Funding PLC (a)
0.120% 1/07/15 | | | 6,500,000 | | | | 6,499,870 | |
Caterpillar Financial Services Corp. 0.100% 1/05/15 | | | 6,000,000 | | | | 5,999,933 | |
CDP Financial, Inc. (a)
0.150% 1/20/15 | | | 6,100,000 | | | | 6,099,517 | |
Coca-Cola Co., The (a)
0.100% 1/15/15 | | | 4,125,000 | | | | 4,124,840 | |
Coca-Cola Co., The (a)
0.210% 3/11/15 | | | 2,125,000 | | | | 2,124,145 | |
ConocoPhillips Qatar Funding Ltd. (a) 0.120% 1/05/15 | | | 2,500,000 | | | | 2,499,967 | |
ConocoPhillips Qatar Funding Ltd. (a) 0.140% 2/18/15 | | | 3,000,000 | | | | 2,999,440 | |
Dover Corp. (a)
0.120% 1/06/15 | | | 6,000,000 | | | | 5,999,900 | |
Eli Lilly & Co. (a)
0.180% 3/25/15 | | | 6,000,000 | | | | 5,997,510 | |
Emerson Electric Co. (a)
0.110% 1/26/15 | | | 1,250,000 | | | | 1,249,905 | |
Emerson Electric Co. (a)
0.110% 2/26/15 | | | 5,000,000 | | | | 4,999,144 | |
General Electric Capital Corp.
0.180% 2/05/15 | | | 656,000 | | | | 655,885 | |
General Electric Capital Corp.
0.152% 2/05/15 | | | 3,000,000 | | | | 2,999,558 | |
Illinois Tool Works, Inc. (a)
0.120% 1/20/15 | | | 5,600,000 | | | | 5,599,645 | |
| | | | | | | | |
| | | Principal
Amount | | | Value | |
John Deere Capital Corp. (a)
0.135% 2/09/15 | | $ | 5,950,000 | | | $ | 5,949,130 | |
L’Oreal USA, Inc. (a)
0.100% 1/23/15 | | | 3,500,000 | | | | 3,499,786 | |
MUFG Union Bank NA
0.180% 1/16/15 | | | 4,875,000 | | | | 4,874,634 | |
National Rural Utilities Cooperative Finance Corp.
0.110% 1/09/15 | | | 3,250,000 | | | | 3,249,921 | |
National Rural Utilities Cooperative Finance Corp.
0.130% 1/20/15 | | | 3,000,000 | | | | 2,999,794 | |
Nestle Capital Corp. (a)
0.220% 7/06/15 | | | 600,000 | | | | 599,318 | |
NSTAR Electric Co.
0.300% 1/08/15 | | | 6,000,000 | | | | 5,999,650 | |
Paccar Financial Corp.
0.150% 1/23/15 | | | 3,250,000 | | | | 3,249,702 | |
Paccar Financial Corp.
0.110% 1/26/15 | | | 1,450,000 | | | | 1,449,889 | |
Paccar Financial Corp.
0.110% 1/28/15 | | | 1,500,000 | | | | 1,499,876 | |
Praxair, Inc.
0.100% 1/28/15 | | | 4,225,000 | | | | 4,224,683 | |
Precision Castparts Corp. (a)
0.110% 1/02/15 | | | 6,250,000 | | | | 6,249,981 | |
Proctor & Gamble Co. (a)
0.110% 1/07/15 | | | 1,500,000 | | | | 1,499,973 | |
Proctor & Gamble Co. (a)
0.150% 2/02/15 | | | 5,000,000 | | | | 4,999,333 | |
Reckitt Benckiser Treasury Services PLC (a)
0.250% 1/13/15 | | | 3,750,000 | | | | 3,749,687 | |
Reckitt Benckiser Treasury Services PLC (a)
0.200% 2/06/15 | | | 800,000 | | | | 799,840 | |
Reckitt Benckiser Treasury Services PLC (a)
0.140% 2/12/15 | | | 411,000 | | | | 410,933 | |
Reckitt Benckiser Treasury Services PLC (a)
0.180% 2/12/15 | | | 800,000 | | | | 799,832 | |
Reckitt Benckiser Treasury Services PLC (a)
0.220% 4/21/15 | | | 480,000 | | | | 479,677 | |
Roche Holding, Inc. (a)
0.090% 3/09/15 | | | 5,600,000 | | | | 5,599,062 | |
Rockwell Automation, Inc. (a)
0.150% 1/05/15 | | | 2,000,000 | | | | 1,999,967 | |
Rockwell Automation, Inc. (a)
0.220% 1/12/15 | | | 3,813,000 | | | | 3,812,744 | |
The accompanying notes are an integral part of the financial statements.
74
MML Money Market Fund – Portfolio of Investments (Continued)
| | | | | | | | |
| | | Principal
Amount | | | Value | |
Rockwell Automation, Inc. (a)
0.220% 1/21/15 | | $ | 361,000 | | | $ | 360,956 | |
Toyota Motor Credit Corp.
0.140% 3/03/15 | | | 5,000,000 | | | | 4,998,814 | |
Unilever Capital Corp. (a)
0.110% 1/20/15 | | | 3,819,000 | | | | 3,818,778 | |
UnitedHealth Group, Inc. (a)
0.210% 1/08/15 | | | 1,225,000 | | | | 1,224,950 | |
UnitedHealth Group, Inc. (a)
0.320% 1/12/15 | | | 2,000,000 | | | | 1,999,804 | |
Walt Disney Co., The (a)
0.060% 2/17/15 | | | 3,300,000 | | | | 3,299,742 | |
Westpac Securities New Zealand Ltd. (a)
0.140% 2/06/15 | | | 2,875,000 | | | | 2,874,598 | |
Wisconsin Gas Co.
0.150% 1/06/15 | | | 6,121,000 | | | | 6,120,872 | |
| | | | | | | | |
| | | | | | | 188,302,310 | |
| | | | | | | | |
| Corporate Debt — 2.9% | | | | | |
Bank of Nova Scotia FRN
1.270% 1/12/15 | | | 2,563,000 | | | | 2,563,839 | |
General Electric Capital Corp. FRN 0.611% 1/09/15 | | | 1,050,000 | | | | 1,050,094 | |
General Electric Capital Corp. VRN 1.000% 8/11/15 | | | 1,500,000 | | | | 1,507,251 | |
International Business Machines Corp. FRN
0.263% 7/29/15 | | | 2,210,000 | | | | 2,210,619 | |
| | | | | | | | |
| | | | | | | 7,331,803 | |
| | | | | | | | |
| Discount Notes — 12.5% | | | | | |
Federal Farm Credit Discount Notes 0.075% 1/08/15 | | | 200,000 | | | | 199,997 | |
Federal Farm Credit Discount Notes 0.105% 3/31/15 | | | 200,000 | | | | 199,948 | |
Federal Farm Credit Discount Notes 0.140% 5/05/15 | | | 120,000 | | | | 119,942 | |
Federal Farm Credit Discount Notes 0.225% 8/27/15 | | | 450,000 | | | | 449,331 | |
Federal Home Loan Bank Discount Notes
0.065% 2/20/15 | | | 400,000 | | | | 399,964 | |
Federal Home Loan Bank Discount Notes
0.080% 1/16/15 | | | 700,000 | | | | 699,977 | |
Federal Home Loan Bank Discount Notes
0.085% 1/30/15 | | | 260,000 | | | | 259,982 | |
Federal Home Loan Bank Discount Notes
0.090% 1/08/15 | | | 600,000 | | | | 599,990 | |
Federal Home Loan Bank Discount Notes
0.095% 2/20/15 | | | 1,400,000 | | | | 1,399,815 | |
| | | | | | | | |
| | | Principal
Amount | | | Value | |
Federal Home Loan Bank Discount Notes
0.100% 2/18/15 | | $ | 1,800,000 | | | $ | 1,799,760 | |
Federal Home Loan Bank Discount Notes
0.110% 3/06/15 | | | 2,825,000 | | | | 2,824,448 | |
Federal Home Loan Bank Discount Notes
0.145% 2/04/15 | | | 300,000 | | | | 299,959 | |
Federal Home Loan Bank Discount Notes
0.180% 4/17/15 | | | 750,000 | | | | 749,603 | |
Federal Home Loan Bank Discount Notes
0.180% 4/24/15 | | | 750,000 | | | | 749,576 | |
Federal Home Loan Bank Discount Notes
0.200% 3/18/15 | | | 300,000 | | | | 299,873 | |
Federal Home Loan Mortgage Corp. 0.055% 2/13/15 | | | 637,000 | | | | 636,958 | |
Federal Home Loan Mortgage Corp. 0.055% 2/17/15 | | | 600,000 | | | | 599,957 | |
Federal Home Loan Mortgage Corp. 0.055% 2/19/15 | | | 1,770,000 | | | | 1,769,867 | |
Federal Home Loan Mortgage Corp. 0.060% 1/28/15 | | | 220,000 | | | | 219,990 | |
Federal Home Loan Mortgage Corp. 0.060% 2/06/15 | | | 1,000,000 | | | | 999,940 | |
Federal Home Loan Mortgage Corp. 0.060% 2/09/15 | | | 700,000 | | | | 699,955 | |
Federal Home Loan Mortgage Corp. 0.060% 2/11/15 | | | 360,000 | | | | 359,975 | |
Federal Home Loan Mortgage Corp. 0.060% 2/24/15 | | | 300,000 | | | | 299,973 | |
Federal Home Loan Mortgage Corp. 0.065% 2/02/15 | | | 300,000 | | | | 299,983 | |
Federal Home Loan Mortgage Corp. 0.065% 2/03/15 | | | 300,000 | | | | 299,982 | |
Federal Home Loan Mortgage Corp. 0.065% 2/19/15 | | | 400,000 | | | | 399,965 | |
Federal Home Loan Mortgage Corp. 0.070% 1/08/15 | | | 800,000 | | | | 799,989 | |
Federal Home Loan Mortgage Corp. 0.070% 1/12/15 | | | 600,000 | | | | 599,987 | |
Federal Home Loan Mortgage Corp. 0.070% 1/14/15 | | | 300,000 | | | | 299,992 | |
Federal Home Loan Mortgage Corp. 0.070% 2/13/15 | | | 200,000 | | | | 199,983 | |
Federal Home Loan Mortgage Corp. 0.075% 1/20/15 | | | 200,000 | | | | 199,992 | |
Federal Home Loan Mortgage Corp. 0.075% 1/22/15 | | | 212,000 | | | | 211,991 | |
Federal Home Loan Mortgage Corp. 0.075% 1/28/15 | | | 300,000 | | | | 299,983 | |
Federal Home Loan Mortgage Corp. 0.075% 1/29/15 | | | 500,000 | | | | 499,971 | |
Federal Home Loan Mortgage Corp. 0.080% 1/23/15 | | | 300,000 | | | | 299,985 | |
The accompanying notes are an integral part of the financial statements.
75
MML Money Market Fund – Portfolio of Investments (Continued)
| | | | | | | | |
| | | Principal
Amount | | | Value | |
Federal Home Loan Mortgage Corp. 0.080% 2/02/15 | | $ | 445,000 | | | $ | 444,952 | |
Federal Home Loan Mortgage Corp. 0.090% 1/28/15 | | | 300,000 | | | | 299,980 | |
Federal Home Loan Mortgage Corp. 0.100% 2/09/15 | | | 100,000 | | | | 99,989 | |
Federal National Mortgage Association 0.050% 2/17/15 | | | 675,000 | | | | 674,956 | |
Federal National Mortgage Association 0.060% 2/11/15 | | | 1,120,000 | | | | 1,119,923 | |
Federal National Mortgage Association 0.065% 2/17/15 | | | 1,000,000 | | | | 999,915 | |
Federal National Mortgage Association 0.075% 1/20/15 | | | 400,000 | | | | 399,984 | |
Federal National Mortgage Association 0.075% 2/18/15 | | | 300,000 | | | | 299,931 | |
Federal National Mortgage Association 0.085% 2/26/15 | | | 4,800,000 | | | | 4,799,365 | |
Federal National Mortgage Association 0.090% 1/05/15 | | | 200,000 | | | | 199,994 | |
Federal National Mortgage Association 0.150% 2/26/15 | | | 900,000 | | | | 899,790 | |
Federal National Mortgage Association 0.180% 5/13/15 | | | 135,000 | | | | 134,911 | |
| | | | | | | | |
| | | | | | | 31,424,273 | |
| | | | | | | | |
| Time Deposits — 0.0% | | | | | |
Euro Time Deposit
0.010% 1/02/15 | | | 21,874 | | | | 21,874 | |
| | | | | | | | |
| U.S. Government Obligations — 9.4% | | | | | |
U.S. Treasury Note
0.125% 4/30/15 | | | 2,475,000 | | | | 2,475,148 | |
U.S. Treasury Note
0.250% 2/28/15 | | | 5,000,000 | | | | 5,001,524 | |
U.S. Treasury Note
0.250% 5/31/15 | | | 3,000,000 | | | | 3,001,789 | |
U.S. Treasury Note
0.250% 8/15/15 | | | 5,000,000 | | | | 5,004,478 | |
U.S. Treasury Note
0.375% 4/15/15 | | | 2,500,000 | | | | 2,501,981 | |
U.S. Treasury Note
0.375% 6/30/15 | | | 5,000,000 | | | | 5,006,430 | |
U.S. Treasury Note
2.125% 5/31/15 | | | 825,000 | | | | 831,912 | |
| | | | | | | | |
| | | | 23,823,262 | |
| | | | | | | | |
| U.S. Treasury Bills — 0.8% | |
U.S. Treasury Bill
0.000% 5/28/15 | | | 2,000,000 | | | | 1,999,228 | |
| | | | | | | | |
| | | | | | |
| | | | | Value | |
| | |
TOTAL SHORT-TERM INVESTMENTS
(Cost $252,902,750) | | | | $ | 252,902,750 | |
| | | | | | |
| | |
| TOTAL INVESTMENTS — 100.1% (Cost $252,902,750) (b) | | | | | 252,902,750 | |
| | |
| Other Assets/(Liabilities) — (0.1)% | | | | | (201,680 | ) |
| | | | | | |
| | |
| NET ASSETS — 100.0% | | | | $ | 252,701,070 | |
| | | | | | |
Notes to Portfolio of Investments
Percentages are stated as a percent of net assets.
| (a) | Securities exempt from registration under rule 144A of the Securities Act of 1933. These securities may be resold in transactions exempt from registration, normally to qualified institutional buyers. At December 31, 2014, these securities amounted to a value of $133,979,259 or 53.02% of net assets. |
| (b) | See Note 6 for aggregate cost for federal tax purposes. |
The accompanying notes are an integral part of the financial statements.
76
[THIS PAGE INTENTIONALLY LEFT BLANK]
MML Series Investment Fund II – Financial Statements
Statements of Assets and Liabilities
December 31, 2014
| | | | | | | | | | | | | | | | |
| | | MML
Blend Fund | | | MML
Equity Fund | | | MML
Managed Bond
Fund | | | MML
Money Market
Fund | |
| Assets: | | | | | | | | | | | | | | | | |
Investments, at value (Note 2) (a) | | $ | 682,408,477 | | | $ | 854,708,638 | | | $ | 1,419,768,657 | | | $ | - | |
Short-term investments, at value (Note 2) (b) | | | 45,737,056 | | | | 10,484,053 | | | | 288,871,492 | | | | 252,902,750 | |
| | | | | | | | | | | | | | | | |
Total investments (c) | | | 728,145,533 | | | | 865,192,691 | | | | 1,708,640,149 | | | | 252,902,750 | |
| | | | | | | | | | | | | | | | |
Receivables from: | | | | | | | | | | | | | | | | |
Investments sold | | | 768,666 | | | | 4,657,687 | | | | 2,708,784 | | | | - | |
Investments sold on a when-issued basis (Note 2) | | | 13,918,377 | | | | - | | | | 80,395,518 | | | | - | |
Investment adviser (Note 3) | | | - | | | | - | | | | - | | | | 81,612 | |
Fund shares sold | | | 49,624 | | | | 52,742 | | | | 2,355,529 | | | | 224,038 | |
Variation margin on open derivative instruments (Note 2) | | | 24,128 | | | | - | | | | 158,582 | | | | - | |
Interest and dividends | | | 2,060,424 | | | | 1,295,087 | | | | 8,978,858 | | | | 25,827 | |
Foreign taxes withheld | | | - | | | | 53,526 | | | | - | | | | - | |
| | | | | | | | | | | | | | | | |
Total assets | | | 744,966,752 | | | | 871,251,733 | | | | 1,803,237,420 | | | | 253,234,227 | |
| | | | | | | | | | | | | | | | |
| Liabilities: | | | | | | | | | | | | | | | | |
Payables for: | | | | | | | | | | | | | | | | |
Investments purchased | | | 73,801 | | | | 5,469,231 | | | | 7,794,194 | | | | - | |
Fund shares repurchased | | | 1,026,625 | | | | 1,227,989 | | | | 254,224 | | | | 337,762 | |
Investments purchased on a when-issued basis (Note 2) | | | 57,811,557 | | | | - | | | | 356,839,028 | | | | - | |
Securities on loan (Note 2) | | | - | | | | 7,997,075 | | | | - | | | | - | |
Trustees’ fees and expenses (Note 3) | | | 181,182 | | | | 229,064 | | | | 179,603 | | | | 47,333 | |
Collateral held for when-issued securities (Note 2) | | | - | | | | - | | | | 340,000 | | | | - | |
Affiliates (Note 3): | | | | | | | | | | | | | | | | |
Investment advisory fees | | | 258,602 | | | | 311,444 | | | | 491,921 | | | | 107,704 | |
Service fees | | | 23,861 | | | | 34,442 | | | | 132,445 | | | | - | |
Due to custodian | | | 307,109 | | | | - | | | | 1,180,055 | | | | - | |
Accrued expense and other liabilities | | | 70,432 | | | | 74,656 | | | | 26,966 | | | | 40,358 | |
| | | | | | | | | | | | | | | | |
Total liabilities | | | 59,753,169 | | | | 15,343,901 | | | | 367,238,436 | | | | 533,157 | |
| | | | | | | | | | | | | | | | |
Net assets | | $ | 685,213,583 | | | $ | 855,907,832 | | | $ | 1,435,998,984 | | | $ | 252,701,070 | |
| | | | | | | | | | | | | | | | |
| Net assets consist of: | | | | | | | | | | | | | | | | |
Paid-in capital | | $ | 462,546,772 | | | $ | 600,037,926 | | | $ | 1,399,425,535 | | | $ | 252,738,369 | |
Undistributed (accumulated) net investment income (loss) | | | 116,669 | | | | 17,298,659 | | | | 140,475 | | | | - | |
Distributions in excess of net investment income | | | - | | | | - | | | | - | | | | (37,376 | ) |
Accumulated net realized gain (loss) on investments and foreign currency transactions | | | 44,775,187 | | | | 33,394,497 | | | | (1,850,139 | ) | | | 77 | |
Net unrealized appreciation (depreciation) on investments and foreign currency translations | | | 177,774,955 | | | | 205,176,750 | | | | 38,283,113 | | | | - | |
| | | | | | | | | | | | | | | | |
Net assets | | $ | 685,213,583 | | | $ | 855,907,832 | | | $ | 1,435,998,984 | | | $ | 252,701,070 | |
| | | | | | | | | | | | | | | | |
| | | | | | | | | | | | | | | | |
(a) Cost of investments: | | $ | 504,502,960 | | | $ | 649,531,858 | | | $ | 1,380,247,672 | | | $ | - | |
(b) Cost of short-term investments: | | $ | 45,737,056 | | | $ | 10,484,053 | | | $ | 288,871,492 | | | $ | 252,902,750 | |
(c) Securities on loan with market value of: | | $ | - | | | $ | 7,783,317 | | | $ | - | | | $ | - | |
The accompanying notes are an integral part of the financial statements.
78
MML Series Investment Fund II – Financial Statements (Continued)
Statements of Assets and Liabilities
December 31, 2014
| | | | | | | | | | | | | | | | |
| | | MML
Blend Fund | | | MML
Equity Fund | | | MML
Managed Bond
Fund | | | MML
Money Market
Fund | |
| Initial Class shares: | | | | | | | | | | | | | | | | |
Net assets | | $ | 644,880,861 | | | $ | 799,222,410 | | | $ | 1,218,504,169 | | | $ | 252,701,070 | |
| | | | | | | | | | | | | | | | |
Shares outstanding (a) | | | 26,305,812 | | | | 26,396,482 | | | | 95,058,331 | | | | 252,961,499 | |
| | | | | | | | | | | | | | | | |
Net asset value, offering price and redemption price per share | | $ | 24.51 | | | $ | 30.28 | | | $ | 12.82 | | | $ | 1.00 | |
| | | | | | | | | | | | | | | | |
| Service Class shares: | | | | | | | | | | | | | | | | |
Net assets | | $ | 40,332,722 | | | $ | 56,685,422 | | | $ | 217,494,815 | | | $ | - | |
| | | | | | | | | | | | | | | | |
Shares outstanding (a) | | | 1,647,785 | | | | 1,888,801 | | | | 16,996,619 | | | | - | |
| | | | | | | | | | | | | | | | |
Net asset value, offering price and redemption price per share | | $ | 24.48 | | | $ | 30.01 | | | $ | 12.80 | | | $ | - | |
| | | | | | | | | | | | | | | | |
| (a) | Authorized unlimited number of shares with no par value. |
The accompanying notes are an integral part of the financial statements.
79
MML Series Investment Fund II – Financial Statements (Continued)
Statements of Operations
For the Year Ended December 31, 2014
| | | | | | | | | | | | | | | | |
| | | MML
Blend Fund | | | MML
Equity Fund | | | MML
Managed Bond
Fund | | | MML
Money Market
Fund | |
| Investment income (Note 2): | | | | | | | | | | | | | | | | |
Dividends (a) | | $ | 9,414,330 | | | $ | 21,132,926 | | | $ | 121,125 | | | $ | - | |
Interest (b) | | | 6,615,187 | | | | 940 | | | | 38,679,823 | | | | 293,295 | |
Securities lending net income | | | - | | | | 105,568 | | | | - | | | | - | |
| | | | | | | | | | | | | | | | |
Total investment income | | | 16,029,517 | | | | 21,239,434 | | | | 38,800,948 | | | | 293,295 | |
| | | | | | | | | | | | | | | | |
| Expenses (Note 3): | | | | | | | | | | | | | | | | |
Investment advisory fees | | | 2,811,586 | | | | 3,365,586 | | | | 5,192,205 | | | | 1,222,672 | |
Custody fees | | | 84,888 | | | | 70,546 | | | | - | * | | | 29,310 | |
Audit fees | | | 34,336 | | | | 33,623 | | | | 35,334 | | | | 29,395 | |
Legal fees | | | 9,286 | | | | 10,342 | | | | - | * | | | 5,252 | |
Proxy fees | | | 1,028 | | | | 1,028 | | | | - | * | | | 1,028 | |
Shareholder reporting fees | | | 59,440 | | | | 75,489 | | | | - | * | | | 25,050 | |
Trustees’ fees | | | 41,004 | | | | 50,398 | | | | 61,806 | | | | 15,704 | |
| | | | | | | | | | | | | | | | |
| | | 3,041,568 | | | | 3,607,012 | | | | 5,289,345 | | | | 1,328,411 | |
Distribution and Service fees: | | | | | | | | | | | | | | | | |
Service Class | | | 86,840 | | | | 122,041 | | | | 490,538 | | | | - | |
| | | | | | | | | | | | | | | | |
Total expenses | | | 3,128,408 | | | | 3,729,053 | | | | 5,779,883 | | | | 1,328,411 | |
Expenses waived (Note 3): | | | | | | | | | | | | | | | | |
Initial Class fees reimbursed by adviser | | | - | | | | - | | | | - | | | | (1,035,116 | ) |
| | | | | | | | | | | | | | | | |
Net expenses | | | 3,128,408 | | | | 3,729,053 | | | | 5,779,883 | | | | 293,295 | |
| | | | | | | | | | | | | | | | |
Net investment income (loss) | | | 12,901,109 | | | | 17,510,381 | | | | 33,021,065 | | | | - | |
| | | | | | | | | | | | | | | | |
| Realized and unrealized gain (loss): | | | | | | | | | | | | | | | | |
Net realized gain (loss) on: | | | | | | | | | | | | | | | | |
Investment transactions | | | 50,799,547 | | | | 66,556,681 | | | | 18,305,330 | | | | 3,067 | |
Futures contracts | | | 281,828 | | | | - | | | | 1,890,892 | | | | - | |
Swap agreements | | | (80,512 | ) | | | - | | | | (500,860 | ) | | | - | |
Foreign currency transactions | | | (532 | ) | | | (5,169 | ) | | | (3,158 | ) | | | - | |
| | | | | | | | | | | | | | | | |
Net realized gain (loss) | | | 51,000,331 | | | | 66,551,512 | | | | 19,692,204 | | | | 3,067 | |
| | | | | | | | | | | | | | | | |
Net change in unrealized appreciation (depreciation) on: | | | | | | | | | | | | | | | | |
Investment transactions | | | 6,176,743 | | | | 7,130,582 | | | | 30,641,305 | | | | - | |
Futures contracts | | | 195,032 | | | | - | | | | 579,101 | | | | - | |
Swap agreements | | | (36,020 | ) | | | - | | | | (291,905 | ) | | | - | |
Translation of assets and liabilities in foreign currencies | | | (2,251 | ) | | | (30 | ) | | | (13,347 | ) | | | - | |
| | | | | | | | | | | | | | | | |
Net change in unrealized appreciation (depreciation) | | | 6,333,504 | | | | 7,130,552 | | | | 30,915,154 | | | | - | |
| | | | | | | | | | | | | | | | |
Net realized gain (loss) and change in unrealized appreciation (depreciation) | | | 57,333,835 | | | | 73,682,064 | | | | 50,607,358 | | | | 3,067 | |
| | | | | | | | | | | | | | | | |
Net increase (decrease) in net assets resulting from operations | | $ | 70,234,944 | | | $ | 91,192,445 | | | $ | 83,628,423 | | | $ | 3,067 | |
| | | | | | | | | | | | | | | | |
| | | | | | | | | | | | | | | | |
(a) Net of withholding tax of: | | $ | 656 | | | $ | 293,356 | | | $ | - | | | $ | - | |
(b) Net of withholding tax of: | | $ | - | | | $ | - | | | $ | 1,358 | | | $ | - | |
| * | Paid by MassMutual pursuant to investment advisory agreement dated 12/15/11 for a period of at least three years. The agreement can only be amended or terminated after that period upon approval of a majority of the Independent Trustees. |
The accompanying notes are an integral part of the financial statements.
80
[THIS PAGE INTENTIONALLY LEFT BLANK]
MML Series Investment Fund II – Financial Statements (Continued)
Statements of Changes in Net Assets
| | | | | | | | |
| | | MML Blend Fund | |
| | | Year
Ended
December 31, 2014 | | | Year
Ended
December 31, 2013 | |
| Increase (Decrease) in Net Assets: | | | | | | | | |
| Operations: | | | | | | | | |
Net investment income (loss) | | $ | 12,901,109 | | | $ | 12,371,031 | |
Net realized gain (loss) on investment transactions | | | 51,000,331 | | | | 57,915,277 | |
Net change in unrealized appreciation (depreciation) on investments | | | 6,333,504 | | | | 47,812,182 | |
| | | | | | | | |
Net increase (decrease) in net assets resulting from operations | | | 70,234,944 | | | | 118,098,490 | |
| | | | | | | | |
| Distributions to shareholders (Note 2): | | | | | | | | |
From net investment income: | | | | | | | | |
Initial Class | | | (13,207,894 | ) | | | (12,528,027 | ) |
Service Class | | | (651,465 | ) | | | (488,868 | ) |
| | | | | | | | |
Total distributions from net investment income | | | (13,859,359 | ) | | | (13,016,895 | ) |
| | | | | | | | |
From net realized gains: | | | | | | | | |
Initial Class | | | (6,458,277 | ) | | | - | |
Service Class | | | (334,379 | ) | | | - | |
| | | | | | | | |
Total distributions from net realized gains | | | (6,792,656 | ) | | | - | |
| | | | | | | | |
| Net fund share transactions (Note 5): | | | | | | | | |
Initial Class | | | (41,634,244 | ) | | | (45,921,034 | ) |
Service Class | | | 6,796,017 | | | | 4,534,289 | |
| | | | | | | | |
Increase (decrease) in net assets from fund share transactions | | | (34,838,227 | ) | | | (41,386,745 | ) |
| | | | | | | | |
Total increase (decrease) in net assets | | | 14,744,702 | | | | 63,694,850 | |
| Net assets | | | | | | | | |
Beginning of year | | | 670,468,881 | | | | 606,774,031 | |
| | | | | | | | |
End of year | | $ | 685,213,583 | | | $ | 670,468,881 | |
| | | | | | | | |
Undistributed (accumulated) net investment income (loss) included in net assets at end of year | | $ | 116,669 | | | $ | 656,595 | |
| | | | | | | | |
Distributions in excess of net investment income included in net assets at end of year | | $
| -
|
| | $ | - | |
| | | | | | | | |
The accompanying notes are an integral part of the financial statements.
82
| | | | | | | | | | | | | | | | | | | | | | |
| MML Equity Fund | | | MML Managed Bond Fund | | | MML Money Market Fund | |
Year
Ended
December 31, 2014 | | | Year
Ended
December 31, 2013 | | | Year
Ended
December 31, 2014 | | | Year
Ended
December 31, 2013 | | | Year
Ended
December 31, 2014 | | | Year
Ended
December 31, 2013 | |
| | | | | | | | | | | | | | | | | | | | | | |
| | | | | | | | | | | | | | | | | | | | | | |
| $ | 17,510,381 | | | $ | 12,956,655 | | | $ | 33,021,065 | | | $ | 30,121,579 | | | $ | - | | | $ | - | |
| | 66,551,512 | | | | 113,379,605 | | | | 19,692,204 | | | | (9,544,037 | ) | | | 3,067 | | | | 1,807 | |
| | 7,130,552 | | | | 94,798,436 | | | | 30,915,154 | | | | (41,447,689 | ) | | | - | | | | - | |
| | | | | | | | | | | | | | | | | | | | | | |
| | | | | | | | | | | | | | | | | | | | | | |
| | 91,192,445 | | | | 221,134,696 | | | | 83,628,423 | | | | (20,870,147 | ) | | | 3,067 | | | | 1,807 | |
| | | | | | | | | | | | | | | | | | | | | | |
| | | | | | | | | | | | | | | | | | | | | | |
| | | | | | | | | | | | | | | | | | | | | | |
| | (12,166,595 | ) | | | (13,691,072 | ) | | | (37,555,588 | ) | | | (33,739,776 | ) | | | (7,668 | ) | | | (5,934 | ) |
| | (705,046 | ) | | | (609,725 | ) | | | (5,910,650 | ) | | | (4,613,488 | ) | | | - | | | | - | |
| | | | | | | | | | | | | | | | | | | | | | |
| | (12,871,641 | ) | | | (14,300,797 | ) | | | (43,466,238 | ) | | | (38,353,264 | ) | | | (7,668 | ) | | | (5,934 | ) |
| | | | | | | | | | | | | | | | | | | | | | |
| | | | | | | | | | | | | | | | | | | | | | |
| | - | | | | - | | | | - | | | | (12,245,770 | ) | | | (1,789 | ) | | | - | |
| | - | | | | - | | | | - | | | | (1,790,842 | ) | | | - | | | | - | |
| | | | | | | | | | | | | | | | | | | | | | |
| | - | | | | - | | | | - | | | | (14,036,612 | ) | | | (1,789 | ) | | | - | |
| | | | | | | | | | | | | | | | | | | | | | |
| | | | | | | | | | | | | | | | | | | | | | |
| | (61,870,837 | ) | | | (120,444,180 | ) | | | 60,389,551 | | | | 159,427,193 | | | | (19,693,194 | ) | | | (27,538,855 | ) |
| | 10,417,990 | | | | 6,608,216 | | | | 33,556,721 | | | | 38,654,446 | | | | - | | | | - | |
| | | | | | | | | | | | | | | | | | | | | | |
| | (51,452,847 | ) | | | (113,835,964 | ) | | | 93,946,272 | | | | 198,081,639 | | | | (19,693,194 | ) | | | (27,538,855 | ) |
| | | | | | | | | | | | | | | | | | | | | | |
| | 26,867,957 | | | | 92,997,935 | | | | 134,108,457 | | | | 124,821,616 | | | | (19,699,584 | ) | | | (27,542,982 | ) |
| | | | | | | | | | | | | | | | | | | | | | |
| | 829,039,875 | | | | 736,041,940 | | | | 1,301,890,527 | | | | 1,177,068,911 | | | | 272,400,654 | | | | 299,943,636 | |
| | | | | | | | | | | | | | | | | | | | | | |
| $ | 855,907,832 | | | $ | 829,039,875 | | | $ | 1,435,998,984 | | | $ | 1,301,890,527 | | | $ | 252,701,070 | | | $ | 272,400,654 | |
| | | | | | | | | | | | | | | | | | | | | | |
$ |
17,298,659 |
| | $ | 12,780,374 | | | $ | 140,475 | | | $ | 7,448,008 | | | $ | - | | | $ | - | |
| | | | | | | | | | | | | | | | | | | | | | |
| $ | - | | | $ | - | | | $ | - | | | $ | - | | | $ | (37,376 | ) | | $ | (31,393 | ) |
| | | | | | | | | | | | | | | | | | | | | | |
83
MML Series Investment Fund II – Financial Statements (Continued)
Financial Highlights (For a share outstanding throughout each period)
MML Blend Fund
| | | | | | | | | | | | | | | | | | | | | | | | | | | | | | | | | | | | | | | | | | | | | | | | |
| | | | | | Income (loss) from investment
operations | | | Less distributions to shareholders | | | | | | | | | Ratios / Supplemental Data | |
| | | Net asset
value,
beginning
of the
period | | | Net
investment
income
(loss)c | | | Net
realized
and
unrealized
gain (loss)
on
investments | | | Total
income
(loss) from
investment
operations | | | From net
investment
income | | | From net
realized
gains | | | Total
distributions | | | Net
asset
value,
end of
the
period | | | Total
returnm | | | Net
assets,
end of
the
period
(000’s) | | | Ratio of
expenses
to average
daily net
assets | | | Net
investment
income
(loss) to
average
daily net
assets | |
| Initial Class | | | | | | | | | | | | | | | | | | | | | | | | | | | | | | | | | |
| 12/31/14 | | $ | 22.78 | | | $ | 0.45 | | | $ | 2.01 | | | $ | 2.46 | | | $ | (0.49 | ) | | $ | (0.24 | ) | | $ | (0.73 | ) | | $ | 24.51 | | | | 10.99% | | | $ | 644,881 | | | | 0.45% | | | | 1.92% | |
| 12/31/13 | | | 19.33 | | | | 0.41 | | | | 3.48 | | | | 3.89 | | | | (0.44 | ) | | | - | | | | (0.44 | ) | | | 22.78 | | | | 20.31% | | | | 639,537 | | | | 0.46% | | | | 1.94% | |
| 12/31/12 | | | 17.52 | | | | 0.39 | | | | 1.82 | | | | 2.21 | | | | (0.40 | ) | | | - | | | | (0.40 | ) | | | 19.33 | | | | 12.65% | | | | 584,660 | | | | 0.46% | | | | 2.09% | |
| 12/31/11 | | | 17.08 | | | | 0.36 | | | | 0.45 | | | | 0.81 | | | | (0.37 | ) | | | - | | | | (0.37 | ) | | | 17.52 | | | | 4.78% | | | | 552,072 | | | | 0.49% | | | | 2.05% | |
| 12/31/10 | | | 15.51 | | | | 0.36 | | | | 1.55 | | | | 1.91 | | | | (0.34 | ) | | | - | | | | (0.34 | ) | | | 17.08 | | | | 12.50% | | | | 590,576 | | | | 0.48% | | | | 2.25% | |
| Service Class | | | | | | | | | | | | | | | | | | | | | | | | | | | | | | | | | |
| 12/31/14 | | $ | 22.75 | | | $ | 0.39 | | | $ | 2.01 | | | $ | 2.40 | | | $ | (0.43 | ) | | $ | (0.24 | ) | | $ | (0.67 | ) | | $ | 24.48 | | | | 10.71% | | | $ | 40,333 | | | | 0.70% | | | | 1.68% | |
| 12/31/13 | | | 19.30 | | | | 0.36 | | | | 3.47 | | | | 3.83 | | | | (0.38 | ) | | | - | | | | (0.38 | ) | | | 22.75 | | | | 20.01% | | | | 30,932 | | | | 0.71% | | | | 1.70% | |
| 12/31/12 | | | 17.50 | | | | 0.35 | | | | 1.80 | | | | 2.15 | | | | (0.35 | ) | | | - | | | | (0.35 | ) | | | 19.30 | | | | 12.36% | | | | 22,114 | | | | 0.71% | | | | 1.85% | |
| 12/31/11 | | | 17.06 | | | | 0.32 | | | | 0.44 | | | | 0.76 | | | | (0.32 | ) | | | - | | | | (0.32 | ) | | | 17.50 | | | | 4.52% | | | | 12,331 | | | | 0.74% | | | | 1.82% | |
| 12/31/10 | | | 15.49 | | | | 0.32 | | | | 1.55 | | | | 1.87 | | | | (0.30 | ) | | | - | | | | (0.30 | ) | | | 17.06 | | | | 12.22% | | | | 9,398 | | | | 0.73% | | | | 2.01% | |
| | | | | | | | | | | | | | | | | | | | |
| | | Year ended December 31 | |
| | | 2014 | | | 2013 | | | 2012 | | | 2011 | | | 2010 | |
Portfolio turnover rate | | | 183 | % | | | 235 | % | | | 251 | % | | | 285 | % | | | 242 | % |
| c | Per share amount calculated on the average shares method. |
| m | Total return does not reflect expenses that apply at the separate account level or to related insurance products. Inclusion of these charges would reduce the total return figures for all periods shown. |
The accompanying notes are an integral part of the financial statements.
84
MML Series Investment Fund II – Financial Statements (Continued)
Financial Highlights (For a share outstanding throughout each period)
MML Equity Fund
| | | | | | | | | | | | | | | | | | | | | | | | | | | | | | | | | | | | | | | | | | | | |
| | | | | | Income (loss) from investment
operations | | | Less distributions to shareholders | | | | | | | | | Ratios / Supplemental Data: | |
| | | Net asset
value,
beginning
of the
period | | | Net
investment
income
(loss)c | | | Net
realized
and
unrealized
gain (loss)
on
investments | | | Total
income
(loss) from
investment
operations | | | From net
investment
income | | | Total
distributions | | | Net
asset
value,
end of
the
period | | | Total
returnm | | | Net
assets,
end of
the
period
(000’s) | | | Ratio of
expenses
to average
daily net
assets | | | Net
investment
income
(loss) to
average
daily net
assets | |
Initial Class | | | | | | | | | | | | | | | | | | | | | | | | | | | | | | | | | | | | | |
| 12/31/14 | | $ | 27.55 | | | $ | 0.61 | | | $ | 2.57 | | | $ | 3.18 | | | $ | (0.45 | ) | | $ | (0.45 | ) | | $ | 30.28 | | | | 11.57% | | | $ | 799,222 | | | | 0.43% | | | | 2.12% | |
| 12/31/13 | | | 21.07 | | | | 0.41 | | | | 6.54 | | | | 6.95 | | | | (0.47 | ) | | | (0.47 | ) | | | 27.55 | | | | 33.27% | | | | 787,449 | | | | 0.44% | | | | 1.69% | |
| 12/31/12 | | | 18.51 | | | | 0.38 | | | | 2.58 | | | | 2.96 | | | | (0.40 | ) | | | (0.40 | ) | | | 21.07 | | | | 16.05% | | | | 709,969 | | | | 0.44% | | | | 1.92% | |
| 12/31/11 | | | 19.57 | | | | 0.34 | | | | (1.09 | ) | | | (0.75 | ) | | | (0.31 | ) | | | (0.31 | ) | | | 18.51 | | | | (3.76% | ) | | | 778,897 | | | | 0.44% | | | | 1.72% | |
| 12/31/10 | | | 17.41 | | | | 0.27 | | | | 2.22 | | | | 2.49 | | | | (0.33 | ) | | | (0.33 | ) | | | 19.57 | | | | 14.77% | | | | 909,171 | | | | 0.44% | | | | 1.54% | |
Service Class | | | | | | | | | | | | | | | | | | | | | | | | | | | | | | | | | | | | | |
| 12/31/14 | | $ | 27.34 | | | $ | 0.52 | | | $ | 2.56 | | | $ | 3.08 | | | $ | (0.41 | ) | | $ | (0.41 | ) | | $ | 30.01 | | | | 11.29% | | | $ | 56,685 | | | | 0.68% | | | | 1.82% | |
| 12/31/13 | | | 20.93 | | | | 0.35 | | | | 6.49 | | | | 6.84 | | | | (0.43 | ) | | | (0.43 | ) | | | 27.34 | | | | 32.94% | | | | 41,591 | | | | 0.69% | | | | 1.44% | |
| 12/31/12 | | | 18.41 | | | | 0.34 | | | | 2.54 | | | | 2.88 | | | | (0.36 | ) | | | (0.36 | ) | | | 20.93 | | | | 15.76% | | | | 26,073 | | | | 0.69% | | | | 1.69% | |
| 12/31/11 | | | 19.48 | | | | 0.30 | | | | (1.09 | ) | | | (0.79 | ) | | | (0.28 | ) | | | (0.28 | ) | | | 18.41 | | | | (4.00% | ) | | | 18,493 | | | | 0.69% | | | | 1.55% | |
| 12/31/10 | | | 17.35 | | | | 0.23 | | | | 2.21 | | | | 2.44 | | | | (0.31 | ) | | | (0.31 | ) | | | 19.48 | | | | 14.48% | | | | 11,470 | | | | 0.69% | | | | 1.31% | |
| | | | | | | | | | | | | | | | | | | | |
| | | Year ended December 31 | |
| | | 2014 | | | 2013 | | | 2012 | | | 2011 | | | 2010 | |
Portfolio turnover rate | | | 38 | % | | | 100 | % | | | 65 | % | | | 65 | % | | | 113 | % |
| c | Per share amount calculated on the average shares method. |
| m | Total return does not reflect expenses that apply at the separate account level or to related insurance products. Inclusion of these charges would reduce the total return figures for all periods shown. |
The accompanying notes are an integral part of the financial statements.
85
MML Series Investment Fund II – Financial Statements (Continued)
Financial Highlights (For a share outstanding throughout each period)
MML Managed Bond Fund
| | | | | | | | | | | | | | | | | | | | | | | | | | | | | | | | | | | | | | | | | | | | | | | | |
| | | | | | Income (loss) from investment
operations | | | Less distributions to shareholders | | | | | | | | | Ratios / Supplemental Data | |
| | | Net asset
value,
beginning
of the
period | | | Net
investment
income
(loss)c | | | Net
realized
and
unrealized
gain (loss)
on
investments | | | Total
income
(loss) from
investment
operations | | | From net
investment
income | | | From
net
realized
gains | | | Total
distributions | | | Net
asset
value,
end of
the
period | | | Total
returnm | | | Net
assets,
end of
the
period
(000’s) | | | Ratio of
expenses
to average
daily net
assets | | | Net
investment
income
(loss) to
average
daily net
assets | |
Initial Class | | | | | | | | | | | | | | | | | | | | | | | | | | | | | | | | | | | | | | | | | |
| 12/31/14 | | $ | 12.44 | | | $ | 0.32 | | | $ | 0.47 | | | $ | 0.79 | | | $ | (0.41 | ) | | $ | - | | | $ | (0.41 | ) | | $ | 12.82 | | | | 6.46% | | | $ | 1,218,504 | | | | 0.39% | | | | 2.47% | |
| 12/31/13 | | | 13.20 | | | | 0.31 | | | | (0.52 | ) | | | (0.21 | ) | | | (0.40 | ) | | | (0.15 | ) | | | (0.55 | ) | | | 12.44 | | | | (1.64% | ) | | | 1,123,545 | | | | 0.39% | | | | 2.46% | |
| 12/31/12 | | | 12.99 | | | | 0.35 | | | | 0.38 | | | | 0.73 | | | | (0.38 | ) | | | (0.14 | ) | | | (0.52 | ) | | | 13.20 | | | | 5.77% | | | | 1,027,945 | | | | 0.40% | | | | 2.66% | |
| 12/31/11 | | | 12.80 | | | | 0.47 | | | | 0.44 | | | | 0.91 | | | | (0.48 | ) | | | (0.24 | ) | | | (0.72 | ) | | | 12.99 | | | | 7.31% | | | | 864,477 | | | | 0.41% | | | | 3.63% | |
| 12/31/10 | | | 12.49 | | | | 0.54 | | | | 0.32 | | | | 0.86 | | | | (0.49 | ) | | | (0.06 | ) | | | (0.55 | ) | | | 12.80 | | | | 6.96% | | | | 869,339 | | | | 0.41% | | | | 4.18% | |
Service Class | | | | | | | | | | | | | | | | | | | | | | | | | | | | | | | | | | | | | | | | | |
| 12/31/14 | | $ | 12.42 | | | $ | 0.28 | | | $ | 0.48 | | | $ | 0.76 | | | $ | (0.38 | ) | | $ | - | | | $ | (0.38 | ) | | $ | 12.80 | | | | 6.19% | | | $ | 217,495 | | | | 0.64% | | | | 2.22% | |
| 12/31/13 | | | 13.18 | | | | 0.28 | | | | (0.52 | ) | | | (0.24 | ) | | | (0.37 | ) | | | (0.15 | ) | | | (0.52 | ) | | | 12.42 | | | | (1.88% | ) | | | 178,346 | | | | 0.64% | | | | 2.21% | |
| 12/31/12 | | | 12.97 | | | | 0.32 | | | | 0.38 | | | | 0.70 | | | | (0.35 | ) | | | (0.14 | ) | | | (0.49 | ) | | | 13.18 | | | | 5.51% | | | | 149,124 | | | | 0.65% | | | | 2.40% | |
| 12/31/11 | | | 12.79 | | | | 0.43 | | | | 0.44 | | | | 0.87 | | | | (0.45 | ) | | | (0.24 | ) | | | (0.69 | ) | | | 12.97 | | | | 7.04% | | | | 101,863 | | | | 0.66% | | | | 3.34% | |
| 12/31/10 | | | 12.48 | | | | 0.50 | | | | 0.33 | | | | 0.83 | | | | (0.46 | ) | | | (0.06 | ) | | | (0.52 | ) | | | 12.79 | | | | 6.70% | | | | 65,262 | | | | 0.66% | | | | 3.92% | |
| | | | | | | | | | | | | | | | | | | | |
| | | Year ended December 31 | |
| | | 2014 | | | 2013 | | | 2012 | | | 2011 | | | 2010 | |
Portfolio turnover rate | | | 368 | % | | | 313 | % | | | 279 | % | | | 186 | % | | | 199 | %q |
| c | Per share amount calculated on the average shares method. |
| m | Total return does not reflect expenses that apply at the separate account level or to related insurance products. Inclusion of these charges would reduce the total return figures for all periods shown. |
| q | Portfolio turnover rate excludes securities sold from redemptions in-kind. Amount would be 208% including securities sold from redemptions in-kind. |
The accompanying notes are an integral part of the financial statements.
86
MML Series Investment Fund II – Financial Statements (Continued)
Financial Highlights (For a share outstanding throughout each period)
MML Money Market Fund
| | | | | | | | | | | | | | | | | | | | | | | | | | | | | | | | | | | | | | | | | | | | | | | | |
| | | | | | Income (loss) from investment
operations | | | Less distributions to shareholders | | | | | | | | | Ratios / Supplemental Data | |
| | | Net asset
value,
beginning
of the
period | | | Net
investment
income
(loss)c,j | | | Net
realized
and
unrealized
gain (loss)
on
investments | | | Total
income
(loss) from
investment
operations | | | From net
investment
income | | | From
net
realized
gains | | | Total
distributions | | | Net
asset
value,
end of
the
period | | | Total
returnm | | | Net
assets,
end of
the
period
(000’s) | | | Ratio of
expenses
to average
daily net
assets
before
expense
waivers | | | Ratio of
expenses
to average
daily net
assets
after
expense
waiversj | |
Initial Class | | | | | | | | | | | | | | | | | | | | | | | | | | | | | | | | | | | | | | | | | |
| 12/31/14 | | $ | 1.00 | | | $ | - | | | $ | 0.00 | d | | $ | 0.00 | d | | $ | (0.00 | )d | | $ | (0.00 | )d | | $ | (0.00 | )d | | $ | 1.00 | | | | 0.00% | e | | $ | 252,701 | | | | 0.51% | | | | 0.11% | |
| 12/31/13 | | | 1.00 | | | | - | | | | 0.00 | d | | | 0.00 | d | | | (0.00 | )d | | | - | | | | (0.00 | )d | | | 1.00 | | | | 0.00% | e | | | 272,401 | | | | 0.51% | | | | 0.14% | |
| 12/31/12 | | | 1.00 | | | | - | | | | 0.00 | d | | | 0.00 | d | | | (0.00 | )d | | | (0.00 | )d | | | (0.00 | )d | | | 1.00 | | | | 0.00% | e | | | 299,944 | | | | 0.52% | | | | 0.16% | |
| 12/31/11 | | | 1.00 | | | | - | | | | 0.00 | d | | | 0.00 | d | | | (0.00 | )d | | | (0.00 | )d | | | (0.00 | )d | | | 1.00 | | | | 0.00% | e | | | 189,532 | | | | 0.54% | | | | 0.17% | |
| 12/31/10 | | | 1.00 | | | | - | | | | 0.00 | d | | | 0.00 | d | | | (0.00 | )d | | | - | | | | (0.00 | )d | | | 1.00 | | | | 0.00% | e | | | 188,956 | | | | 0.54% | | | | 0.24% | |
| c | Per share amount calculated on the average shares method. |
| d | Amount is less than $0.005 per share. |
| e | Amount is less than 0.005%. |
| j | Computed after giving effect to an agreement by MML Advisers and/or MassMutual to waive certain fees and expenses of the Fund. |
| m | Total return does not reflect expenses that apply at the separate account level or to related insurance products. Inclusion of these charges would reduce the total return figures for all periods shown. |
The accompanying notes are an integral part of the financial statements.
87
Notes to Financial Statements
MML Series Investment Fund II (the “Trust”) is registered under the Investment Company Act of 1940, as amended (the “1940 Act”), as a no-load, open-end, management investment company. The Trust is organized under the laws of the Commonwealth of Massachusetts as a Massachusetts business trust pursuant to an Agreement and Declaration of Trust dated February 8, 2005, which was amended and restated as of February 28, 2005 and December 15, 2011, as it may be further amended from time to time. The following are four series of the Trust (each individually referred to as a “Fund” or collectively as the “Funds”):
MML Blend Fund (“Blend Fund”)
MML Equity Fund (“Equity Fund”)
MML Managed Bond Fund (“Managed Bond Fund”)
MML Money Market Fund (“Money Market Fund”)
The Trust makes shares of the Funds available for the investment of assets of various separate investment accounts established by Massachusetts Mutual Life Insurance Company (“MassMutual”) and by life insurance companies which are subsidiaries of MassMutual. Shares of the Trust are not offered to the general public. MassMutual, MML Bay State Life Insurance Company, and C.M. Life Insurance Company are the record owners of all of the outstanding shares of the Funds.
Each share class of a Fund represents an interest in the same portfolio of assets. The principal difference among the classes is the level of shareholder and distribution service expenses borne by the classes. Because each class will have different fees and expenses, performance and share prices will vary between the classes. The classes of shares are offered to different types of investors, as outlined in the Funds’ Prospectus.
On July 23, 2014, the U.S. Securities and Exchange Commission adopted amendments to money market fund regulations, which structurally change the way that certain money market funds will be required to operate. These amendments are generally not effective until sometime in 2016, but when implemented may affect the Fund’s operations and return potential.
| 2. | | Significant Accounting Policies |
The following is a summary of significant accounting policies followed consistently by each Fund in the preparation of the financial statements in conformity with accounting principles generally accepted in the United States of America (“generally accepted accounting principles”). The preparation of the financial statements in accordance with generally accepted accounting principles requires management to make estimates and assumptions that affect the reported amounts and disclosures in the financial statements. Actual results could differ from those estimates.
Investment Valuation
The net asset value of each Fund’s shares is determined once daily as of the close of regular trading on the New York Stock Exchange (“NYSE”), on each day the NYSE is open for trading (a “business day”). The NYSE normally closes at 4:00 p.m. Eastern Time, but may close earlier on some days.
Equity securities and derivative contracts that are actively traded on a national securities exchange or contract market are valued on the basis of information furnished by a pricing service, which provides the last reported sale price, or, in the case of futures contracts, the settlement price, for securities or derivatives listed on the exchange or contract market or the official closing price on the NASDAQ National Market System, or in the case of over-the-counter (“OTC”) securities for which an official closing price is unavailable or not reported on the NASDAQ System, the last reported bid price. Portfolio securities traded on more than one national securities exchange are valued at the last price at the close of the exchange representing the principal market for such securities. Debt securities (other than short-term obligations) are valued on the basis of valuations furnished by a pricing service, which generally determines valuations taking into account factors such as institutional-size trading in similar securities, yield, quality, coupon rate, maturity, type of issue, trading characteristics, and other market data. For all Funds other than the Money Market Fund, short-term debt securities with remaining maturities of 60 days or less are valued at either amortized cost or at original cost plus accrued interest, whichever the Funds’ investment adviser determines more closely approximates current market
88
Notes to Financial Statements (Continued)
value. The Money Market Fund’s portfolio securities are valued at amortized cost, which approximates current market value, in accordance with Rule 2a-7 under the 1940 Act pursuant to which the Money Market Fund must adhere to certain conditions. It is the intention of the Money Market Fund to maintain a stable net asset value per share, although this cannot be assured. Shares of other open-end mutual funds are valued at their closing net asset values as reported on each business day.
Investments for which market quotations are readily available are marked to market daily based on those quotations. Market quotations may be provided by third-party vendors or market makers, and may be determined on the basis of a variety of factors, such as broker quotations, financial modeling, and other market data, such as market indexes and yield curves, counterparty information, and foreign exchange rates. U.S. Government and agency securities may be valued on the basis of market quotations or using a model that may incorporate market observable data such as reported sales of similar securities, broker quotes, yields, bids, offers, quoted market prices, and reference data. The fair values of OTC derivative contracts, including forward, swap, and option contracts related to interest rates, foreign currencies, credit standing of reference entities, equity prices, or commodity prices, may be based on market quotations or may be modeled using a series of techniques, including simulation models, depending on the contract and the terms of the transaction. The fair values of asset-backed securities and mortgage-backed securities are estimated based on models that consider the estimated cash flows of each debt tranche of the issuer, establish a benchmark yield, and develop an estimated tranche-specific spread to the benchmark yield based on the unique attributes of the tranche including, but not limited to, prepayment speed assumptions and attributes of the collateral. Restricted securities are generally valued at a discount to similar publicly traded securities.
Investments for which market quotations are not available or for which a pricing service or vendor does not provide a value, or for which such market quotations or values are considered by the investment adviser or subadviser to be unreliable (including, for example, certain foreign securities, thinly-traded securities, certain restricted securities, certain initial public offerings, or securities whose values may have been affected by a significant event) are stated at fair valuations determined in good faith by the Funds’ Valuation Committee1 in accordance with procedures approved annually by the Board of Trustees (“Trustees”), and under the general oversight of the Trustees. The Funds’ Valuation Committee employs various methods to determine fair valuations including a regular review of key inputs and assumptions and review of any related market activity. The Funds’ Valuation Committee reports to the Trustees at their regularly scheduled meetings. It is possible that fair value prices will be used by the Funds to a significant extent. The value determined for an investment using the Funds’ fair value procedures may differ from recent market prices for the investment and may be significantly different from the value realized upon the sale of such investment.
The Funds may invest in securities that are traded principally in foreign markets and that trade on weekends and other days when the Funds do not price their shares. As a result, the values of the Funds’ portfolio securities may change on days when the prices of the Funds’ shares are not calculated. The prices of the Funds’ shares will reflect any such changes when the prices of the Funds’ shares are next calculated, which is the next business day. The Funds may use fair value pricing more frequently for securities primarily traded in foreign markets because, among other things, most foreign markets close well before the Funds value their securities. The earlier close of these foreign markets gives rise to the possibility that significant events, including broad market moves, may have occurred in the interim. The Funds’ investments may be priced based on fair values provided by a third-party vendor, based on certain factors and methodologies applied by such vendor, in the event that there is movement in the U.S. market, between the close of the foreign market and the time the Funds calculate their net asset values. All assets and liabilities expressed in foreign currencies are converted into U.S. dollars at the mean between the buying and selling rates of such currencies against the U.S. dollar at the end of each business day.
Fair value is defined as the price that would be received to sell an asset or paid to transfer a liability in an orderly transaction between market participants at the measurement date. A three-tier hierarchy is utilized to maximize the use of observable market data inputs and minimize the use of unobservable inputs and to establish classification of fair value measurements for disclosure purposes. Inputs refer broadly to the assumptions that market participants would use in pricing the asset or liability, including assumptions about risk, for example, the risk inherent in a particular valuation technique used to measure fair value (such as a pricing model) and/or the risk inherent in the inputs to the valuation technique. Inputs may be observable or unobservable. Observable inputs are inputs that reflect the assumptions market participants would use in pricing the asset or liability and are
| 1 | The Valuation Committee consists of the President, Treasurer, Assistant Treasurers, Vice Presidents (except for the CCO), Secretary, and Assistant Secretaries of the Trust, as well as such alternate members as the Trustees may from time to time designate. The Valuation Committee reviews and determines the fair valuation of portfolio securities and the Funds’ pricing procedures in general. |
89
Notes to Financial Statements (Continued)
developed based on market data obtained from sources independent of the reporting entity. Unobservable inputs are inputs that reflect the reporting entity’s own assumptions about the assumptions market participants would use in pricing the asset or liability and are developed based on the best information available in the circumstances. The three-tier hierarchy of inputs is summarized in the three broad Levels listed below. The inputs or methodology used for valuing investments are not necessarily an indication of the risk associated with investing in those investments and the determination of the significance of a particular input to the fair value measurement in its entirety requires judgment and consideration of factors specific to each security.
Level 1 – quoted prices (unadjusted) in active markets for identical investments that the Funds can access at the measurement date
The types of assets and liabilities categorized in Level 1 generally include actively traded domestic and certain foreign equity securities, derivatives actively traded on a national securities exchange (such as some warrants, rights, futures, and options), and shares of open-end mutual funds.
Level 2 – other significant observable inputs (including quoted prices for similar investments, interest rates, prepayment speeds, credit risk, etc.)
The types of assets and liabilities categorized in Level 2 generally include debt securities such as U.S. government and agency securities, mortgage-backed securities, asset-backed securities, municipal obligations, sovereign debt obligations, bank loans, corporate bonds, and those securities valued at amortized cost; OTC derivatives such as swaps, options, swaptions, and forward foreign currency exchange contracts; certain restricted securities; and non-exchange traded equity securities and certain foreign equity securities traded on particular foreign exchanges that close before the Funds determine their net asset values.
Level 3 – significant unobservable inputs (including the Funds’ own assumptions in determining the fair value of investments)
The types of assets and liabilities categorized in Level 3 generally include securities for which prices, spreads, or any of the other aforementioned key inputs are unobservable. Generally, securities whose trading has been suspended or that have been de-listed from their current primary trading exchange; securities in default or bankruptcy proceedings for which there is no current market quotation; securities and certain derivatives valued by broker quotes which may include brokers’ assumptions; and any illiquid Rule 144A securities or restricted securities issued by non-public entities are categorized in Level 3.
The availability of observable inputs can vary from security to security and is affected by a wide variety of factors, including, for example, the type of security, whether the security is new and not yet established in the marketplace, the liquidity of markets, and other characteristics particular to the security. To the extent that valuation is based on models or inputs that are less observable or unobservable in the market, the determination of fair value requires more judgment. Accordingly, the degree of judgment exercised in determining fair value is greatest for instruments categorized in Level 3.
Changes in valuation techniques may result in transfers in or out of an investment’s assigned Level within the hierarchy. In addition, in periods of market dislocation, the observability of prices and inputs may be reduced for many instruments. This condition, as well as changes related to liquidity of investments, could cause a security to be reclassified between Level 1, Level 2, or Level 3.
In certain cases, the inputs used to measure fair value may fall into different levels of the fair value hierarchy. In such cases, for disclosure purposes the level in the fair value hierarchy within which the fair value measurement falls is determined based on the lowest level input that is significant to the overall fair value measurement.
The Money Market Fund characterized all investments at Level 2, as of December 31, 2014. For the Money Market Fund, the level classification by major category of investments is the same as the category presentation in the Portfolio of Investments.
90
Notes to Financial Statements (Continued)
The following is the aggregate value by input level, as of December 31, 2014, for the remaining Funds’ investments:
| | | | | | | | | | | | | | | | |
| | | Level 1 | | | Level 2 | | | Level 3 | | | Total | |
Blend Fund Asset Investments | | | | | | | | | | | | | | | | |
Common Stock | | $ | 460,426,825 | | | $ | - | | | $ | - | | | $ | 460,426,825 | |
Preferred Stock | | | 506,600 | | | | - | | | | - | | | | 506,600 | |
Corporate Debt | | | - | | | | 103,463,887 | | | | - | | | | 103,463,887 | |
Municipal Obligations | | | - | | | | 2,711,736 | | | | - | | | | 2,711,736 | |
Non-U.S. Government Agency Obligations | | | - | | | | 41,759,855 | | | | 165,398 | | | | 41,925,253 | |
Sovereign Debt Obligations | | | - | | | | 2,638,224 | | | | - | | | | 2,638,224 | |
U.S. Government Agency Obligations and Instrumentalities | | | - | | | | 63,248,356 | | | | - | | | | 63,248,356 | |
U.S. Treasury Obligations | | | - | | | | 7,014,182 | | | | - | | | | 7,014,182 | |
Purchased Options | | | - | | | | 473,414 | | | | - | | | | 473,414 | |
Short-Term Investments | | | - | | | | 45,737,056 | | | | - | | | | 45,737,056 | |
| | | | | | | | | | | | | | | | |
| Total Investments | | $ | 460,933,425 | | | $ | 267,046,710 | | | $ | 165,398 | | | $ | 728,145,533 | |
| | | | | | | | | | | | | | | | |
Asset Derivatives | | | | | | | | | | | | |
Futures Contracts | | $ | 342,579 | | | $ | - | | | $ | - | | | $ | 342,579 | |
| | | | | | | | | | | | | | | | |
Liability Derivatives | | | | | | | | |
Futures Contracts | | $ | (209,171 | ) | | $ | - | | | $ | - | | | $ | (209,171 | ) |
Swap Agreements | | | - | | | | (385,111 | ) | | | - | | | | (385,111 | ) |
| | | | | | | | | | | | | | | | |
| Total | | $ | (209,171 | ) | | $ | (385,111 | ) | | $ | - | | | $ | (594,282 | ) |
| | | | | | | | | | | | | | | | |
| | | | |
Equity Fund | | | | | | | | | | | | | | | | |
Asset Investments | | | | | | | | | | | | | | | | |
Common Stock | | $ | 833,776,408 | | | $ | 12,935,155 | | | $ | - | | | $ | 846,711,563 | |
Mutual Funds | | | 7,997,075 | | | | - | | | | - | | | | 7,997,075 | |
Short-Term Investments | | | - | | | | 10,484,053 | | | | - | | | | 10,484,053 | |
| | | | | | | | | | | | | | | | |
| Total Investments | | $ | 841,773,483 | | | $ | 23,419,208 | | | $ | - | | | $ | 865,192,691 | |
| | | | | | | | | | | | | | | | |
| | | | |
Managed Bond Fund | | | | | | | | | | | | | | | | |
Asset Investments | | | | | | | | | | | | | | | | |
Preferred Stock | | $ | 2,406,350 | | | $ | - | | | $ | - | | | $ | 2,406,350 | |
Corporate Debt | | | - | | | | 630,434,042 | | | | - | | | | 630,434,042 | |
Municipal Obligations | | | - | | | | 14,205,332 | | | | - | | | | 14,205,332 | |
Non-U.S. Government Agency Obligations | | | - | | | | 260,363,169 | | | | 926,227 | | | | 261,289,396 | |
Sovereign Debt Obligations | | | - | | | | 11,266,964 | | | | - | | | | 11,266,964 | |
U.S. Government Agency Obligations and Instrumentalities | | | - | | | | 394,073,390 | | | | - | | | | 394,073,390 | |
U.S. Treasury Obligations | | | - | | | | 103,164,628 | | | | - | | | | 103,164,628 | |
Purchased Options | | | - | | | | 2,928,555 | | | | - | | | | 2,928,555 | |
Short-Term Investments | | | - | | | | 288,871,492 | | | | - | | | | 288,871,492 | |
| | | | | | | | | | | | | | | | |
| Total Investments | | $ | 2,406,350 | | | $ | 1,705,307,572 | | | $ | 926,227 | | | $ | 1,708,640,149 | |
| | | | | | | | | | | | | | | | |
Asset Derivatives | | | | | | | | | | | | |
Futures Contracts | | $ | 531,209 | | | $ | - | | | $ | - | | | $ | 531,209 | |
| | | | | | | | | | | | | | | | |
Liability Derivatives | | | | | | | | | | | | |
Futures Contracts | | $ | (141,553 | ) | | $ | - | | | $ | - | | | $ | (141,553 | ) |
Swap Agreements | | | - | | | | (2,344,058 | ) | | | - | | | | (2,344,058 | ) |
| | | | | | | | | | | | | | | | |
| Total | | $ | (141,553 | ) | | $ | (2,344,058 | ) | | $ | - | | | $ | (2,485,611 | ) |
| | | | | | | | | | | | | | | | |
91
Notes to Financial Statements (Continued)
The following table shows Funds with certain assets and liabilities, which approximate fair value and would be categorized at Level 2 as of December 31, 2014.
| | | | | | |
Statements of Asset and Liabilities location: | | Blend
Fund | | Equity
Fund | | Managed
Bond
Fund |
Receivables from: | | | | | | |
Investments sold on a when-issued basis | | X | | | | X |
Payables for: | | | | | | |
Investments purchased on a when-issued basis | | X | | | | X |
Securities on loan | | | | X | | |
Collateral held for when-issued securities | | | | | | X |
Due to custodian | | X | | | | X |
The following table shows transfers between Level 1 and Level 2 of the fair value hierarchy:
| | | | | | | | | | | | | | | | |
| | | Transfers In * | | | Transfers Out * | |
| | | Level 1 —
Quoted Prices | | | Level 2 —
Other
Significant
Observable
Inputs | | | Level 1 —
Quoted Prices | | | Level 2 —
Other
Significant
Observable
Inputs | |
| Equity Fund | | $ | - | | | $ | 3,188,500 | | | $ | (3,188,500 | ) | | $ | - | |
| * | The Fund(s) recognize transfers between the Levels as of the beginning of the year. Transfers occurred between Level 1 and Level 2 as inputs were less observable. |
Following is a reconciliation of investments for which significant unobservable inputs (Level 3) were used in determining value:
Asset Valuation Inputs
| | | | | | | | | | | | | | | | | | | | | | | | | | | | | | | | | | | | | | | | |
| | | Investments in Securities | |
| | | Balance
as of
12/31/13 | | | Accrued
Discounts
(Premiums) | | | Realized
Gain
(Loss) | | | Change in
Unrealized
Appreciation
(Depreciation) | | | Purchases | | | (Sales) | | | Transfers
into
Level 3* | | | Transfers
(out) of
Level 3* | | | Balance
as of
12/31/14 | | | Net Change
in Unrealized
Appreciation
(Depreciation)
from
Investments
Still Held
as of
12/31/14 | |
Blend Fund | | | | | | | | | | | | | | | | | | | | | | | | | | | | | | | | | | | | | | | | |
Preferred Stock | | $ | - | | | $ | - | | | $ | (40 | ) | | $ | 40 | | | $ | - | | | $ | - | †† | | $ | - | ** | | $ | - | | | $ | - | | | $ | - | |
Non-U.S. Government | | | | | | | | | | | | | | | | | | | | | | | | | | | | | | | | | | | | | | | | |
Agency Obligations† | | | 948,100 | | | | - | | | | 1,102 | | | | 802 | | | | 459,916 | | | | (1,034,606 | ) | | | - | | | | (209,916 | )*** | | | 165,398 | | | | 3 | |
| | | | | | | | | | | | | | | | | | | | | | | | | | | | | | | | | | | | | | | | |
| | $ | 948,100 | | | $ | - | | | $ | 1,062 | | | $ | 842 | | | $ | 459,916 | | | $ | (1,034,606 | ) | | $ | - | | | $ | (209,916 | ) | | $ | 165,398 | | | $ | 3 | |
| | | | | | | | | | | | | | | | | | | | | | | | | | | | | | | | | | | | | | | | |
Managed Bond Fund | | | | | | | | | | | | | | | | | | | | | | | | | | | | | | | | | | | | | | | | |
Non-U.S. Government | | | | | | | | | | | | | | | | | | | | | | | | | | | | | | | | | | | | | | | | |
Agency Obligations† | | $ | 1,172,650 | | | $ | - | | | $ | 1,363 | | | $ | 1,006 | | | $ | 1,400,000 | | | $ | (1,648,792 | ) | | $ | - | | | $ | - | | | $ | 926,227 | | | $ | 19 | |
| | | | | | | | | | | | | | | | | | | | | | | | | | | | | | | | | | | | | | | | |
| * | The Fund(s) recognize transfers between the Levels as of the beginning of the year. |
| ** | Transfers occurred between Level 2 and Level 3 as inputs were less observable. |
| *** | Transfers occurred between Level 3 and Level 2 as inputs were more observable. |
| † | Represents (i) an illiquid 144A security valued by a broker quote or vendor price or (ii) a restricted security issued by a non-public entity valued by a broker quote or vendor price. |
| †† | Represents security at $0 value at the time of sale. |
92
Notes to Financial Statements (Continued)
None of the unobservable inputs, individually or collectively, had a material impact on the Fund(s).
Derivative Instruments
Derivatives are financial instruments whose values are based on the values of one or more indicators, such as a security, asset, currency, interest rate, or index. Derivative transactions can create investment leverage and may be highly volatile. Gains or losses from derivatives can be substantially greater than the derivatives original cost and can sometimes be unlimited. A Fund may not be able to close out a derivative transaction at a favorable time or price. For those Funds that held derivatives during the year ended December 31, 2014, the following table shows how the Fund used these types of derivatives during the period (marked with an “A”), as well as additional uses, if any, it may have for them in the future (marked with an “M”).
| | | | |
Type of Derivatives and Objective for Use | | Blend Fund | | Managed Bond Fund |
Futures Contracts* | | | �� | |
Hedging/Risk Management | | A | | A |
Duration/Credit Quality Management | | A | | A |
Substitution for Direct Investment | | A | | A |
Intention to Create Investment Leverage in Portfolio | | M | | M |
| | | |
Interest Rate Swaps** | | | | |
Hedging/Risk Management | | A | | A |
Duration Management | | M | | M |
Asset/Liability Management | | M | | M |
Substitution for Direct Investment | | M | | M |
Intention to Create Investment Leverage in Portfolio | | M | | M |
| | | |
Credit Default Swaps (Protection Buyer) | | | | |
Hedging/Risk Management | | A | | A |
Duration/Credit Quality Management | | A | | A |
Income | | A | | A |
Substitution for Direct Investment | | A | | A |
Intention to Create Investment Leverage in Portfolio | | M | | M |
| | | |
Options (Purchased) | | | | |
Hedging/Risk Management | | A | | A |
Duration/Credit Quality Management | | A | | A |
Substitution for Direct Investment | | A | | A |
Directional Investment | | A | | A |
Intention to Create Investment Leverage in Portfolio | | M | | M |
| * | Includes any options purchased or written on futures contracts, if applicable. |
| ** | Includes any caps, floors, and collars, and related purchased or written options, if applicable. |
93
Notes to Financial Statements (Continued)
At December 31, 2014, and during the year then ended, the Fund(s) had the following derivatives and transactions in derivatives, grouped into the indicated risk categories:
| | | | | | | | | | | | | | | | |
| | | Credit
Risk | | | Equity
Risk | | | Interest
Rate
Risk | | | Total | |
| Blend Fund | | | | | | | | | | | | | | | | |
| Asset Derivatives | | | | | | | | | | | | | | | | |
Purchased Options* | | $ | - | | | $ | - | | | $ | 473,414 | | | $ | 473,414 | |
Futures Contracts^^ | | | - | | | | - | | | | 342,579 | | | | 342,579 | |
| | | | | | | | | | | | | | | | |
Total Value | | $ | - | | | $ | - | | | $ | 815,993 | | | $ | 815,993 | |
| | | | | | | | | | | | | | | | |
| Liability Derivatives | | | | | | | | | | | | | | | | |
Futures Contracts^^ | | $ | - | | | $ | - | | | $ | (209,171 | ) | | $ | (209,171 | ) |
Swap Agreements^^,^^^ | | | (143,112 | ) | | | - | | | | (241,999 | ) | | | (385,111 | ) |
| | | | | | | | | | | | | | | | |
Total Value | | $ | (143,112 | ) | | $ | - | | | $ | (451,170 | ) | | $ | (594,282 | ) |
| | | | | | | | | | | | | | | | |
| Realized Gain (Loss)# | | | | | | | | | | | | | | | | |
Purchased Options | | $ | - | | | $ | - | | | $ | 287,668 | | | $ | 287,668 | |
Futures Contracts | | | - | | | | (24,894 | ) | | | 306,722 | | | | 281,828 | |
Swap Agreements | | | (18,588 | ) | | | - | | | | (61,924 | ) | | | (80,512 | ) |
| | | | | | | | | | | | | | | | |
Total Realized Gain (Loss) | | $ | (18,588 | ) | | $ | (24,894 | ) | | $ | 532,466 | | | $ | 488,984 | |
| | | | | | | | | | | | | | | | |
| Change in Appreciation (Depreciation)## | | | | | | | | | | | | | | | | |
Purchased Options | | $ | - | | | $ | - | | | $ | 159,336 | | | $ | 159,336 | |
Futures Contracts | | | - | | | | - | | | | 195,032 | | | | 195,032 | |
Swap Agreements | | | (19,720 | ) | | | - | | | | (16,300 | ) | | | (36,020 | ) |
| | | | | | | | | | | | | | | | |
Total Change in Appreciation (Depreciation) | | $ | (19,720 | ) | | $ | - | | | $ | 338,068 | | | $ | 318,348 | |
| | | | | | | | | | | | | | | | |
| Number of Contracts, Notional Amounts or Shares/Units† | | | | | | | | | | | | | | | | |
Purchased Options | | $ | - | | | $ | - | | | $ | 17,900,000 | | | $ | 17,900,000 | |
Futures Contracts | | | - | | | | 68 | | | | 386 | | | | 454 | |
Swap Agreements | | $ | 8,225,000 | | | $ | - | | | $ | 9,246,818 | | | $ | 17,471,818 | |
| | | | |
| Managed Bond Fund | | | | | | | | | | | | | | | | |
| Asset Derivatives | | | | | | | | | | | | | | | | |
Purchased Options* | | $ | - | | | $ | - | | | $ | 2,928,555 | | | $ | 2,928,555 | |
Futures Contracts^^ | | | - | | | | - | | | | 531,209 | | | | 531,209 | |
| | | | | | | | | | | | | | | | |
Total Value | | $ | - | | | $ | - | | | $ | 3,459,764 | | | $ | 3,459,764 | |
| | | | | | | | | | | | | | | | |
| Liability Derivatives | | | | | | | | | | | | | | | | |
Futures Contracts^^ | | $ | - | | | $ | - | | | $ | (141,553 | ) | | $ | (141,553 | ) |
Swap Agreements^^, ^^^ | | | (846,675 | ) | | | - | | | | (1,497,383 | ) | | | (2,344,058 | ) |
| | | | | | | | | | | | | | | | |
Total Value | | $ | (846,675 | ) | | $ | - | | | $ | (1,638,936 | ) | | $ | (2,485,611 | ) |
| | | | | | | | | | | | | | | | |
| Realized Gain (Loss)# | | | | | | | | | | | | | | | | |
Purchased Options | | $ | - | | | $ | - | | | $ | 1,779,521 | | | $ | 1,779,521 | |
Futures Contracts | | | - | | | | - | | | | 1,890,892 | | | | 1,890,892 | |
Swap Agreements | | | (111,990 | ) | | | - | | | | (388,870 | ) | | | (500,860 | ) |
| | | | | | | | | | | | | | | | |
Total Realized Gain (Loss) | | $ | (111,990 | ) | | $ | - | | | $ | 3,281,543 | | | $ | 3,169,553 | |
| | | | | | | | | | | | | | | | |
94
Notes to Financial Statements (Continued)
| | | | | | | | | | | | | | | | |
| | | Credit
Risk | | | Equity
Risk | | | Interest
Rate
Risk | | | Total | |
| Managed Bond Fund (Continued) | | | | | | | | | | | | | | | | |
| Change in Appreciation (Depreciation)## | | | | | | | | | | | | | | | | |
Purchased Options | | $ | - | | | $ | - | | | $ | 985,658 | | | $ | 985,658 | |
Futures Contracts | | | - | | | | - | | | | 579,101 | | | | 579,101 | |
Swap Agreements | | | (116,798 | ) | | | - | | | | (175,107 | ) | | | (291,905 | ) |
| | | | | | | | | | | | | | | | |
Total Change in Appreciation (Depreciation) | | $ | (116,798 | ) | | $ | - | | | $ | 1,389,652 | | | $ | 1,272,854 | |
| | | | | | | | | | | | | | | | |
| Number of Contracts, Notional Amounts or Shares/Units† | | | | | | | | | | | | | | | | |
Purchased Options | | $ | - | | | $ | - | | | $ | 110,730,000 | | | $ | 110,730,000 | |
Futures Contracts | | | - | | | | - | | | | 1,668 | | | | 1,668 | |
Swap Agreements | | $ | 48,650,000 | | | $ | - | | | $ | 55,634,545 | | | $ | 104,284,545 | |
| * | Statements of Assets and Liabilities location: Investments, at value. |
| ^^ | Cumulative appreciation (depreciation) on futures contracts and centrally cleared swaps is reported in “Futures Contracts” and “Swap Agreements” below. Only current day’s variation margin, if any, is reported within the Statements of Assets and Liabilities. |
| ^^^ | Represents centrally cleared swaps, which are not subject to a master netting agreement. |
| # | Statements of Operations location: Amounts are included in net realized gain (loss) on: investment transactions, futures contracts or swap agreements, as applicable. |
| ## | Statements of Operations location: Amounts are included in net change in unrealized appreciation (depreciation) on: investment transactions, futures contracts or swap agreements, as applicable. |
| † | Amount(s) disclosed represent average number of contracts for futures contracts or notional amounts for purchased options and swap agreements, which is indicative of volume of this derivative type, for the months that the Fund held such derivatives during the year ended December 31, 2014. |
The following table presents the Funds’ derivative assets by counterparty net of amounts available for offset under a master netting agreement (“MNA”), or similar agreement, and net of the related collateral received by the Fund(s) as of December 31, 2014.
| | | | | | | | | | | | | | | | |
| | | Counterparty | | Derivative
Assets
Subject to a
MNA by
Counterparty† | | | Financial
Instruments
Available for
Offset | | Collateral
received** | | | Net
Amount* | |
| Blend Fund | | | | | | | | | | | | | | |
| | Credit Suisse International | | $ | 473,414 | | | $ - | | $ | (329,673 | ) | | $ | 143,741 | |
| | | | | | | | | | | | | | | | |
| Managed Bond Fund | | | | | | | | | | | | | | |
| | Credit Suisse International | | $ | 2,928,555 | | | $ - | | $ | (2,916,583 | ) | | $ | 11,972 | |
| | | | | | | | | | | | | | | | |
| * | Represents the net amount receivable from the counterparty in the event of default. |
| ** | The amount presented here may be less than the total amount of collateral received/pledged as the net amount of derivative assets and liabilities for a counterparty cannot be less than $0. |
| † | The amount presented here may be less than the total amount shown in the Statement of Assets and Liabilities as some derivatives held by the counterparty are not covered within the master netting agreements. |
Such agreements typically permit a single net payment in the event of default, including the bankruptcy or insolvency of the counterparty. Typically, the Fund(s) and counterparties are not permitted to sell, re-pledge, or use the collateral they receive.
Further details regarding the derivatives and other investments held by the Fund(s) during the year ended December 31, 2014, are discussed below.
95
Notes to Financial Statements (Continued)
Futures Contracts
A Fund may seek to manage a variety of different risks, such as interest rate risk, equity price risk, and currency risk, through the use of futures contracts. A Fund may use interest rate futures contracts to adjust the interest rate sensitivity (duration) of its portfolio or the credit exposure of the portfolio. Interest rate futures contracts obligate the long or short holder to take or make delivery of a specified quantity of a financial instrument, such as a specific fixed-income security, during a specified future period at a specified price. A Fund may use index futures to hedge against broad market risks to its portfolio or to gain broad market exposure when it holds uninvested cash or as an inexpensive substitute for cash investments directly in securities or other assets. Securities index futures contracts are contracts to buy or sell units of a securities index at a specified future date at a price agreed upon when the contract is made and are settled in cash. Positions in futures may be closed out only on an exchange or board of trade which provides a secondary market for such futures. Because futures contracts are exchange-traded, they typically have minimal exposure to counterparty risk.
Parties to a futures contract are not required to post the entire notional amount of the contract, but rather a small percentage of that amount (by way of margin), both at the time they enter into futures transactions, and then on a daily basis if their positions decline in value; as a result, futures contracts are highly leveraged. Such payments are known as variation margin and are recorded by the Funds as unrealized gains or losses. Because futures markets are highly leveraged, they can be extremely volatile, and there can be no assurance that the pricing of a futures contract will correlate precisely with the pricing of the asset or index underlying it or the asset or liability of the Fund that is the subject of the hedge. It may not always be possible for a Fund to enter into a closing transaction with respect to a futures contract it has entered into, at a favorable time or price. When a Fund enters into a futures transaction, it is subject to the risk that the value of the futures contract will move in a direction unfavorable to it. When the Fund uses futures contracts for hedging purposes, it is likely that the Fund will have an asset or liability that will offset any loss (or gain) on the transactions, at least in part.
When a futures contract is closed, the Fund records a realized gain or loss equal to the difference between the value of the contract at the time it was opened and the value at the time it was closed. Futures contracts are valued at the settlement price established each day by the board of trade or exchange on which they are traded.
The Fund(s) listed in the following table had open futures contracts at December 31, 2014:
| | | | | | | | | | | | | | | | |
| | | Expiration
Date | | | Number of
Contracts | | | Notional
Amount | | | Net Unrealized
Appreciation/
(Depreciation) | |
Blend Fund | | | | | | | | | | | | | | | | |
Futures Contracts — Long | | | | | | | | | | | | | | | | |
U.S. Treasury Note 10 Year | | | 03/20/15 | | | | 147 | | | $ | 18,639,141 | | | $ | 99,546 | |
U.S. Ultra Bond | | | 03/20/15 | | | | 40 | | | | 6,607,500 | | | | 243,033 | |
U.S. Treasury Note 2 Year | | | 03/31/15 | | | | 162 | | | | 35,412,188 | | | | (30,801 | ) |
| | | | | | | | | | | | | | | | |
| | | $ | 311,778 | |
| | | | | | | | | | | | | | | | |
Futures Contracts — Short | | | | | | | | | | | | | | | | |
U.S. Long Bond | | | 03/20/15 | | | | 46 | | | $ | (6,649,875 | ) | | $ | (171,098 | ) |
U.S. Treasury Note 5 Year | | | 03/31/15 | | | | 73 | | | | (8,681,867 | ) | | | (7,272 | ) |
| | | | | | | | | | | | | | | | |
| | | $ | (178,370 | ) |
| | | | | | | | | | | | | | | | |
Managed Bond Fund | | | | | | | | | | | | | | | | |
Futures Contracts — Long | | | | | | | | | | | | | | | | |
U.S. Long Bond | | | 03/20/15 | | | | 21 | | | $ | 3,035,813 | | | $ | 83,805 | |
U.S. Treasury Note 10 Year | | | 03/20/15 | | | | 417 | | | | 52,874,297 | | | | 337,436 | |
U.S. Ultra Bond | | | 03/20/15 | | | | 15 | | | | 2,477,813 | | | | 93,865 | |
U.S. Treasury Note 2 Year | | | 03/31/15 | | | | 712 | | | | 155,638,750 | | | | (141,553 | ) |
U.S. Treasury Note 5 Year | | | 03/31/15 | | | | 329 | | | | 39,127,867 | | | | 16,103 | |
| | | | | | | | | | | | | | | | |
| | | $ | 389,656 | |
| | | | | | | | | | | | | | | | |
96
Notes to Financial Statements (Continued)
Swap Agreements
Swap agreements are typically two-party contracts entered into primarily by institutional investors. In a standard “swap” transaction, two parties agree to exchange the returns (or differentials in rates of return) earned or realized on particular predetermined investments or instruments, which may be adjusted for an interest factor. The gross returns to be exchanged or “swapped” between the parties are generally calculated with respect to a “notional amount,” (i.e., the return on or increase in value of a particular dollar amount invested at a particular interest rate or in a “basket” of securities representing a particular index).
Interest Rate Swaps. When a Fund enters into an interest rate swap, it typically agrees to make payments to its counterparty based on a specified long- or short-term interest rate, and will receive payments from its counterparty based on another interest rate. Other forms of interest rate swap agreements include interest rate caps, under which, in return for a specified payment stream, one party agrees to make payments to the other to the extent that interest rates exceed a specified rate, or “cap”; interest rate floors, under which, in return for a specified payment stream, one party agrees to make payments to the other to the extent that interest rates fall below a specified rate, or “floor”; and interest rate collars, under which a party sells a cap and purchases a floor or vice versa in an attempt to protect itself against interest rate movements exceeding given minimum or maximum levels. A Fund may enter into an interest rate swap in order, for example, to hedge against the effect of interest rate changes on the value of specific securities in its portfolio, or to adjust the interest rate sensitivity (duration) or the credit exposure of its portfolio overall, or otherwise as a substitute for a direct investment in debt securities.
Credit Default Swaps. A Fund also may enter into credit default swap transactions, as a “buyer” or “seller” of credit protection. In a credit default swap, one party provides what is in effect insurance against a default or other adverse credit event affecting an issuer of debt securities (typically referred to as a “reference entity”). In general, the buyer of credit protection is obligated to pay the protection seller an upfront amount or a periodic stream of payments over the term of the swap. If a “credit event” occurs, the buyer has the right to deliver to the seller bonds or other obligations of the reference entity (with a value up to the full notional value of the swap), and to receive a payment equal to the par value of the bonds or other obligations. Credit events that would trigger a request that the seller make payment are specific to each credit default swap agreement, but generally include bankruptcy, failure to pay, restructuring, obligation acceleration, obligation default, or repudiation/moratorium. When a Fund buys protection, it may or may not own securities of the reference entity. If it does own securities of the reference entity, the swap serves as a hedge against a decline in the value of the securities due to the occurrence of a credit event involving the issuer of the securities. If the Fund does not own securities of the reference entity, the credit default swap may be seen to create a short position in the reference entity. If a Fund is a buyer and no credit event occurs, the Fund will typically recover nothing under the swap, but will have had to pay the required upfront payment or stream of continuing payments under the swap. When a Fund sells protection under a credit default swap, the position may have the effect of creating leverage in the Fund’s portfolio through the Fund’s indirect long exposure to the issuer or securities on which the swap is written. When a Fund sells protection, it may do so either to earn additional income or to create such a “synthetic” long position.
Whenever a Fund enters into a swap agreement, it takes on counterparty risk — the risk that its counterparty will be unable or unwilling to meet its obligations under the swap agreement. The Fund also takes the risk that the market will move against its position in the swap agreement. In the case of an interest rate swap, the value of the swap may increase or decrease depending on changes in interest rates. In the case of a credit default swap, the swap will become more or less valuable depending on the credit of the issuer of the underlying security, and, if a credit event occurs under a swap where the Fund is the seller of credit protection, the Fund could be required to purchase the security at par value, resulting in a significant loss to the Fund. When the Fund enters into any type of swap for hedging purposes, it is likely that the Fund will have an asset or liability that will offset any loss (or gain) on the swap, at least in part. Swap agreements may be non-transferable or otherwise highly illiquid, and a Fund may not be able to terminate or transfer a swap agreement at any particular time or at an acceptable price.
Swaptions. A Fund may also enter into options on swap agreements (“swaptions”). A swaption is a contract that gives a counterparty the right (but not the obligation) to enter into a new swap agreement or to shorten, extend, cancel, or otherwise modify an existing swap agreement, at some designated future time on specified terms. A Fund may write (sell) and purchase put and call swaptions. Depending on the terms of the particular option agreement, a Fund will generally incur a greater degree of risk when it writes a swaption than it will incur when it purchases a swaption. When a Fund purchases a swaption, it risks losing only the amount of the premium it has paid should it decide to let the option expire unexercised. However, when a Fund writes a swaption, upon exercise of the option the Fund will become obligated according to the terms of the underlying agreement. A Fund
97
Notes to Financial Statements (Continued)
may enter into swaptions for the same purposes as swaps. For information regarding the accounting treatment of options, see “Options” below.
Centrally Cleared Swaps. Certain clearinghouses currently offer clearing for limited types of derivatives transactions, principally certain interest rate swaps, certain index swaps, and credit derivatives. In a cleared derivative transaction, a Fund typically enters into the transaction with a financial institution counterparty, and performance of the transaction is effectively guaranteed by a central clearinghouse, thereby reducing or eliminating the Fund’s exposure to the credit risk of its original counterparty. The Fund will be required to post amounts (“initial margin”) with the clearinghouse or at the instruction of the clearinghouse; the initial margin required by a clearinghouse may be greater than the initial margin the Fund would be required to post in an uncleared transaction. If cash is deposited as the initial margin, it is shown as collateral on a Fund’s Statement of Assets and Liabilities. Swap agreements are marked-to-market daily and subsequent payments (“variation margin”) are made or received by a Fund depending on whether unrealized gains or losses are incurred. These amounts are reflected as receivables or payables on a Fund’s Statement of Assets and Liabilities (“Variation margin on open derivative instruments”) and as a component of net change in unrealized appreciation/depreciation on a Fund’s Statement of Operations. Only a limited number of transaction types are currently eligible for clearing.
During the term of a swap transaction, changes in the value of the swap are recognized as unrealized gains or losses by marking to market to reflect the market value of the swap. When the swap is terminated, a Fund will record a realized gain or loss equal to the difference, if any, between the proceeds from (or cost of) the closing transaction and a Fund’s basis in the agreement. Upfront swap premium payments paid or received by a Fund, if any, are recorded within the value of the open swap agreement on the Fund’s Statement of Assets and Liabilities and represent payments paid or received upon entering into the swap agreement to compensate for differences between stated terms of the swap agreement and prevailing market conditions (credit spreads, currency exchange rates, and other relevant factors). These upfront payments are recorded as realized gain or loss on the Fund’s Statement of Operations upon termination or maturity of the swap agreement.
During the term of a swap transaction, the periodic net payments can be made for a set period of time or may be triggered by a predetermined credit event. The net periodic payments may be based on a fixed or variable interest rate, the change in market value of a specified security, basket of securities or index, or the return generated by a security. These periodic payments received or made by the Funds are recorded in the accompanying Statements of Operations as realized gains and losses, respectively.
The Fund(s) listed in the following table had open swap transactions at December 31, 2014. A Fund’s current exposure to a counterparty is the fair value of the transaction.
| | | | | | | | | | | | | | | | | | | | | | | | |
| | | | | | | | |
| | | Currency | | | Notional
Amount | | Expiration
Date | | Receive
(Pay) Fixed
Rate | | Deliverable on Default | | Unrealized
Appreciation
(Depreciation) | | | Premium
(Received)
Paid | | | Value | |
| Blend Fund* | | | | | | | | | | | | |
Credit Default Swaps — Buy Protection | | | | | | | | | | | | |
Centrally Cleared Swaps | | | | | | | | | | | | |
| | | EUR | | | 3,600,000 | | 12/20/19 | | (1.000)% | | ITRAXX Europe Series 22† | | $ | (14,175 | ) | | $ | (54,988 | ) | | $ | (69,163 | ) |
| | | USD | | | 4,625,000 | | 12/20/19 | | (1.000)% | | CDX.NA.IG.23† | | | (5,545 | ) | | | (68,404 | ) | | | (73,949 | ) |
| | | | | | | | | | | | | | | | | | | | | | | | |
| | | | | | | | | | | | | | $ | (19,720 | ) | | $ | (123,392 | ) | | $ | (143,112 | ) |
| | | | | | | | | | | | | | | | | | | | | | | | |
| | | | | | | | |
| | | Currency | | | Notional
Amount | | Expiration
Date | | Payments
Made by Fund | | Payments Received by Fund | | Unrealized
Appreciation
(Depreciation) | | | Premium
Received
(Paid) | | | Value | |
Interest Rate Swaps | | | | | | | | | | | | |
Centrally Cleared Swaps | | | | | | | | | | | | |
| | | USD | | | 5,385,000 | | 4/29/24 | | Fixed 2.765% | | 3-Month USD-LIBOR-BBA | | $ | (241,999 | ) | | $ | - | | | $ | (241,999 | ) |
| | | | | | | | | | | | | | | | | | | | | | | | |
98
Notes to Financial Statements (Continued)
| | | | | | | | | | | | | | | | | | | | | | | | |
| | | Currency | | Notional
Amount | | | Expiration Date | | Receive
(Pay) Fixed
Rate | | Deliverable on Default | | Unrealized
Appreciation
(Depreciation) | | | Premium
(Received)
Paid | | | Value | |
Managed Bond Fund** | | | | | | | | | | | | |
Credit Default Swaps — Buy Protection | | | | | | | | | | | | |
Centrally Cleared Swaps | | | | | | | | | | | | |
| | EUR | | | 21,350,000 | | | 12/20/19 | | (1.000)% | | ITRAXX Europe Series 22† | | $ | (84,069 | ) | | $ | (326,106 | ) | | $ | (410,175 | ) |
| | USD | | | 27,300,000 | | | 12/20/19 | | (1.000)% | | CDX.NA.IG.23† | | | (32,729 | ) | | | (403,771 | ) | | | (436,500 | ) |
| | | | | | | | | | | | | | | | | | | | | | | | |
| | | | | | | | | | | | | | $ | (116,798 | ) | | $ | (729,877 | ) | | $ | (846,675 | ) |
| | | | | | | | | | | | | | | | | | | | | | |
| | | | | | | | |
| | | Currency | | Notional
Amount | | | Expiration Date | | Payments
Made by
Fund | | Payments Received by Fund | | Unrealized
Appreciation
(Depreciation) | | | Premium
Received
(Paid) | | | Value | |
Interest Rate Swaps | | | | | | | | | | | | |
Centrally Cleared Swaps | | | | | | | | | | | | |
| | USD | | | 33,320,000 | | | 4/29/24 | | Fixed 2.765% | | 3-Month USD-LIBOR-BBA | | $ | (1,497,383 | ) | | $ | - | | | $ | (1,497,383 | ) |
| | | | | | | | | | | | | | | | | | | | | | | | |
| * | Collateral for swap agreements held by Goldman Sachs & Co. amounted to $174,798 in securities at December 31, 2014; and collateral for swap agreements received from Credit Suisse International amounted to $83,498 in securities at December 31, 2014. |
| ** | Collateral for swap agreements held by Goldman Sachs & Co. amounted to $1,041,148 in securities at December 31, 2014; and collateral for swap agreements received from Credit Suisse International amounted to $489,417 in securities at December 31, 2014. |
| † | Payment is based on a percentage of the index. Reference entities are a number of individual issuers comprising the index. |
Options
A Fund may purchase call options on securities or an index of securities to enhance investment performance or to protect against changes in market prices. A Fund that invests in debt securities may also purchase call options to adjust the interest rate sensitivity of its portfolio or the credit exposure of the portfolio.
Call Options. A call option gives the holder the right to purchase, and obligates the writer to sell, a security at the strike price at any time before the expiration date.
Purchasing call options. A Fund may purchase call options to hedge against an increase in the price of securities that the Fund wants ultimately to buy. A Fund may also purchase a call option as a long directional investment hoping to profit from an anticipated increase in the value of the underlying security. In order for a call option to be profitable, the market price of the underlying security must rise sufficiently above the exercise price to cover the premium and transaction costs. These costs will reduce any profit the Fund might have realized had it bought the underlying security at the time it purchased the call option.
When a Fund purchases an option, it runs the risk that it will lose its entire investment in the option in a relatively short period of time, unless the Fund exercises the option or enters into a closing sale transaction before the option’s expiration. If the price of the underlying security does not rise (in the case of a call) to an extent sufficient to cover the option premium and transaction costs, the Fund will lose part or all of its investment in the option. This contrasts with an investment by a Fund in the underlying security, since the Fund will not realize a loss if the security’s price does not change. Premiums paid for purchasing options that expire are treated as realized losses.
OTC Options. OTC options purchased or sold by a Fund are not traded on securities or options exchanges or backed by clearinghouses. Rather, they are entered into directly between a Fund and the counterparty to the option. In the case of an OTC option purchased by the Fund, the value of the option to the Fund will depend on the willingness and ability of the option writer to perform its obligations to the Fund. In addition, OTC options may not be transferable and there may be little or no secondary market for them, so they may be considered illiquid. It may not be possible to enter into closing transactions with respect to OTC
99
Notes to Financial Statements (Continued)
options or otherwise to terminate such options, and as a result a Fund may be required to remain obligated on an unfavorable OTC option until its expiration. OTC options are valued using prices supplied by a primary pricing source, selected pursuant to procedures approved by the Trustees.
Inflation-Indexed Bonds
The Funds may invest in inflation-indexed bonds, which are fixed income securities whose principal value or coupon is periodically adjusted according to the rate of inflation, as measured by the Consumer Price Index for All Urban Consumers (“CPI-U”) (for U.S. Treasury inflation-indexed bonds) or, generally, by a comparable inflation index calculated by the foreign government issuing the inflation-indexed bonds.
If the periodic adjustment rate measuring inflation falls, the principal value of inflation-indexed bonds will be adjusted downward, and consequently the interest payable on these securities (calculated with respect to a smaller principal amount) will be reduced. Repayment of the original bond principal upon maturity (as adjusted for inflation) is guaranteed in the case of U.S. Treasury inflation-indexed bonds, even during a period of deflation. However, the current market value of the bonds is not guaranteed, and will fluctuate. The Funds may also invest in other inflation related bonds which may or may not provide a similar guarantee. If a guarantee of principal is not provided, the adjusted principal value of the bond repaid at maturity may be less than the original principal. Any adjustments to the principal amount of an inflation-indexed bond due to inflation will be reflected as increases or decreases to interest income. Such adjustments may have a significant impact on the Fund’s distributions.
The value of inflation-indexed bonds is generally based on changes in real interest rates, which in turn are tied to the relationship between nominal interest rates and the rate of inflation. Therefore, if nominal interest rates increased at a faster rate than inflation, real interest rates might rise, leading to a decrease in value of inflation-indexed bonds. While the values of these securities are expected to be protected from long-term inflationary trends, short-term increases in inflation may lead to a decline in value. There can be no assurance that the CPI-U or any foreign inflation index will accurately measure the real rate of inflation, or that the rate of inflation in a foreign country will correlate to the rate of inflation in the United States. Additionally, if interest rates rise due to reasons other than inflation, investors in these securities may not be protected to the extent that the increase is not reflected in the bond’s inflation measure.
Repurchase Agreements
Each Fund may enter into repurchase agreements with certain banks and broker-dealers whereby a Fund acquires a security for cash and obtains a simultaneous commitment from the seller to repurchase the security at an agreed upon price and date. A Fund, through its custodian, takes possession of the securities collateralizing the repurchase agreement in a segregated account. Repurchase agreements must be fully collateralized at all times, but involve some risk to a Fund if the other party should default on its obligation and the Fund is delayed or prevented from recovering the collateral, or if the Fund is required to return collateral to a borrower at a time when it may realize a loss on the investment of that collateral.
When-Issued, Delayed-Delivery, Forward Commitment, and To-Be-Announced Transactions
A Fund may enter into when-issued, delayed-delivery, forward commitment, or to-be-announced (“TBA”) transactions (collectively, the “Forward Transactions”) in order to lock in the purchase price of the underlying security, or in order to adjust the interest rate exposure of the Fund’s existing portfolio. In Forward Transactions, a Fund commits to purchase or sell particular securities, with payment and delivery to take place at a future date. In the case of TBA purchase commitments, the unit price and the estimated principal amount are established when the Fund enters into a commitment, with the actual principal amount being within a specified range of the estimate. Although a Fund does not typically pay for the securities in these types of transactions until they are delivered, it immediately assumes the risks of ownership, including the risk of price fluctuation. As a result, each of these types of transactions may create investment leverage in the Fund’s portfolio and increase the volatility of the Fund. If a Fund’s counterparty fails to deliver a security purchased in a Forward Transaction, there may be a loss, and the Fund may have missed an opportunity to make an alternative investment.
100
Notes to Financial Statements (Continued)
These securities are valued on the basis of valuations furnished by a pricing service, selected pursuant to procedures approved by the Trustees, which determines valuations taking into account appropriate factors such as institutional-size trading in similar groups of securities, yield, quality, coupon rate, maturity, type of issue, trading characteristics, and other market data. Securities for which no market quotation is available are valued at fair value in accordance with procedures approved by the Trustees. The Funds record on a daily basis the unrealized appreciation (depreciation) based upon changes in the values of these securities. When a Forward Transaction is closed, the Funds record a realized gain or loss equal to the difference between the value of the transaction at the time it was opened and the value of the transaction at the time it was closed.
Securities Lending
The Blend Fund, Equity Fund, and Managed Bond Fund may lend their securities; however, lending cannot exceed 10% of the total assets of the Managed Bond Fund taken at current value, and 33% of the total assets of the Blend Fund and Equity Fund, respectively, taken at current value. The Funds’ securities lending activities are governed by a Securities Lending Agency Agreement (“Lending Agreement”) between each Fund and the lending agent (“agent”). The Lending Agreement authorizes the agent to lend qualifying U.S. and foreign securities held by a Fund to approved borrowers (each a “Borrower”).
Each Fund expects that in connection with any securities on loan, the loan will be secured continuously by collateral consisting of cash or securities adjusted daily to have market value at least equal to the current market value of the securities loaned. The market value of the loaned securities is determined at the close of business of a Fund and any additional collateral is delivered to the Fund the next business day. As with other extensions of credit, the Funds may bear the risk of delay in recovery or even loss of rights in the collateral should the Borrower of the securities fail financially. The Funds receive compensation for lending their securities in the form of a securities loan fee paid by the Borrower, as well as a share of the income earned on investment of the cash collateral received for the loan of securities. At December 31, 2014, the Funds’ collateral was equal to or greater than 100% of the market value of securities on loan.
The Funds employ the agent to implement their securities lending program and the agent receives a fee from the Funds for its services. In addition, the Funds may be required to pay a rebate to the Borrower. Accordingly, a Fund’s compensation for lending its securities is reduced by any such fees or rebate paid to the securities lending agent or Borrower, respectively. For the year ended December 31, 2014, the Fund(s) earned securities lending net income as follows:
| | | | | | | | | | | | |
| | | Securities
Lending Gross
Income | | | Securities
Lending Fees
and Expenses | | | Securities
Lending Net
Income | |
Equity Fund | | $ | 131,960 | | | $ | 26,392 | | | $ | 105,568 | |
Accounting for Investment Transactions
Investment transactions are accounted for on the trade date. Realized gains and losses on sales of investments and unrealized appreciation and depreciation of investments are computed by the specific identification cost method. Proceeds received from litigation, if any, are included in realized gains on investment transactions for any investments that are no longer held in the portfolio and as a reduction in cost for investments that continue to be held in the portfolio. Interest income, adjusted for amortization of discounts and premiums on debt securities, is earned from the settlement date and is recorded on the accrual basis. Dividend income is recorded on the ex-dividend date. Withholding taxes on foreign interest, dividends, and capital gains have been provided for in accordance with the applicable country’s tax rules and rates. Foreign dividend income is recorded on the ex-dividend date or as soon as practicable after the Fund determines the existence of a dividend declaration after exercising reasonable due diligence. Distributions received on securities that represent a return of capital or capital gain are recorded as a reduction of cost of investments and/or as a realized gain. The Funds estimate the components of distributions received that may be considered return of capital distributions or capital gain distributions.
101
Notes to Financial Statements (Continued)
Foreign Currency Translation
The books and records of the Funds are maintained in U.S. dollars. The market values of foreign currencies, foreign securities, and other assets and liabilities denominated in foreign currencies are translated into U.S. dollars at the mean of the buying and selling rates of such currencies against the U.S. dollar at the end of each business day. Purchases and sales of foreign securities and income and expense items are translated at the rates of exchange prevailing on the respective dates of such transactions. The Funds do not isolate that portion of the results of operations arising from changes in the exchange rates from that portion arising from changes in the market prices of securities. Net realized foreign currency gains and losses resulting from changes in exchange rates include foreign currency gains and losses between trade date and settlement date on investment securities transactions, foreign currency transactions, and the difference between the amounts of dividends or interest recorded on the books of the Funds and the amount actually received.
Allocation of Operating Activity
In maintaining the records for the Funds, the income and expense accounts are allocated daily to each class of shares. Investment income and loss, and unrealized and realized gains or losses are prorated among the classes of shares based on the relative net assets of each. Expenses are allocated to each class of shares depending on the nature of the expenditures. Expenses of a Fund not directly attributable to the operations of any specific class of shares of the Fund are prorated among the classes to which the expense relates based on relative net assets.
Foreign Securities
The Funds may invest in foreign securities. Foreign securities, including American Depositary Receipts, are subject to additional risks compared to securities of U.S. issuers, including international trade, currency, political, regulatory, and diplomatic risks. In addition, fluctuations in currency exchange rates may adversely affect the values of foreign securities and the price of a Fund’s shares. Emerging markets securities are subject to greater risks than securities issued in developed foreign markets, including less liquidity, greater price volatility, higher relative rates of inflation, greater political, economic, and social instability, greater custody and operational risks, and greater volatility in currency exchange rates.
Federal Income Tax
It is each Fund’s intent to continue to comply with the provisions of subchapter M of the Internal Revenue Code of 1986, as amended (the “Code”), applicable to a regulated investment company. Under such provisions, the Funds would not be subject to federal income taxes on their ordinary income and net realized capital gains to the extent they are distributed or deemed to have been distributed to their shareholders. Therefore, the Funds have not made any provision for federal income tax.
Dividends and Distributions to Shareholders
Dividends from net investment income are declared and paid quarterly for the Blend Fund and Managed Bond Fund and annually for the Equity Fund and at other times as may be required to satisfy tax or regulatory requirements. Dividends from net investment income are declared daily and paid monthly for the Money Market Fund. Distributions of any net realized capital gains of each Fund are declared and paid annually and at other times as may be required to satisfy tax or regulatory requirements.
Distributions to shareholders are recorded on the ex-dividend date. Income and capital gain distributions are determined in accordance with income tax regulations, which may differ from generally accepted accounting principles. As a result, net investment income and net realized capital gains on investment transactions for a reporting period may differ significantly from distributions during such period.
102
Notes to Financial Statements (Continued)
| 3. | | Advisory Fees and Other Transactions |
Investment Advisory Fees and Investment Subadvisers
MML Investment Advisers, LLC (“MML Advisers”), a wholly-owned subsidiary of MassMutual, serves as investment adviser to each Fund. Under investment advisory agreements between MML Advisers and the Trust on behalf of each Fund, MML Advisers is responsible for providing investment management services for each Fund. In return for these services, MML Advisers receives advisory fees, based upon each Fund’s average daily net assets, at the following annual rates:
|
0.50% on the first $100 million; |
0.45% on the next $200 million; |
0.40% on the next $200 million; and |
0.35% on any excess over $500 million |
MassMutual served as the Funds’ investment adviser, at the same annual rates as noted above, pursuant to the investment advisory agreements through March 31, 2014.
MML Advisers has entered into investment subadvisory agreements with Babson Capital Management LLC (“Babson Capital”), a wholly-owned subsidiary of MM Asset Management Holding LLC, itself a wholly-owned subsidiary of MassMutual Holding LLC, a controlled subsidiary of MassMutual, on behalf of certain Funds. These agreements provide that Babson Capital manage the investment and reinvestment of assets of these Funds. Babson Capital receives a subadvisory fee from MML Advisers, based upon each Fund’s average daily net assets at the following annual rates:
| | |
Blend Fund | | 0.13% (Equity Segment) |
| | 0.09% (Money Market and Bond Segments) |
Managed Bond Fund | | 0.10% |
Money Market Fund | | 0.05% |
In addition, Cornerstone Real Estate Advisers LLC (“Cornerstone”) serves as sub-subadviser for the Blend Fund and Managed Bond Fund and is primarily responsible for managing each Fund’s commercial mortgage-backed securities. Cornerstone is a wholly-owned subsidiary of Babson Capital. The appointment of Cornerstone as a sub-subadviser to each Fund does not relieve Babson Capital of any obligation or liability to any of the Funds that it would otherwise have pursuant to investment subadvisory agreements between MML Advisers and Babson Capital with respect to each Fund, and any and all acts and omissions of Cornerstone in respect of any Fund shall be considered the acts and omissions of Babson Capital.
MML Advisers has entered into an investment subadvisory agreement with OppenheimerFunds, Inc. (“OFI”), a wholly-owned subsidiary of Oppenheimer Acquisition Corp., itself an indirect majority-owned subsidiary of MassMutual Holding LLC, pursuant to which OFI serves as one of the subadvisers to the Equity Fund. This agreement provides that OFI manage the investment and reinvestment of a portion of the assets of the Fund. OFI receives a subadvisory fee from MML Advisers, based upon the average daily net assets of the portion of the Fund that OFI manages, at the following annual rate:
MML Advisers has entered into an investment subadvisory agreement with the unaffiliated investment subadviser, Loomis, Sayles & Company, L.P. (“Loomis Sayles”), pursuant to which Loomis Sayles serves as one of the subadvisers to the Equity Fund. This agreement provides that Loomis Sayles manage the investment and reinvestment of a portion of the assets of the Fund. Loomis Sayles receives a subadvisory fee from MassMutual based upon the average daily net assets of the portion of the Fund that Loomis Sayles manages.
The Funds’ subadvisory fees are paid by MML Advisers out of the advisory fees previously disclosed above.
103
Notes to Financial Statements (Continued)
Distribution and Service Fees
MML Distributors, LLC (the “Distributor”) acts as distributor to the Funds. Pursuant to a Distribution and Services Plan adopted by the Funds pursuant to Rule 12b-1 under the 1940 Act, Service Class shares of the Funds pay an annual fee of 0.25% of the average daily net asset value of Service Class shares. This fee, or a portion thereof, is paid to: (i) the Distributor for services provided and expenses incurred by it in connection with the distribution of Service Class shares, if available, of each Fund; and/or (ii) MassMutual for services provided and expenses incurred by it for purposes of maintaining or providing personal services to Service Class shareholders. The Distributor is a wholly-owned subsidiary of MassMutual.
Expense Caps and Waivers
For the Money Market Fund, MML Advisers has agreed to voluntarily waive some or all of its advisory fees and, if necessary, reimburse some or all of the Fund’s other expenses, in an attempt to allow the Initial Class shares of the Fund to maintain a 1-day yield of at least approximately 0.00%. MML Advisers may amend or discontinue this waiver at any time without advance notice.
Prior to April 1, 2014, expense caps were with MassMutual.
Expense caps and waiver amounts are reflected as a reduction of expenses on the Statement of Operations.
Deferred Compensation
Trustees of the Funds who are not officers or employees of MassMutual may elect to defer receipt of their annual fees in accordance with terms of a Non-Qualified Deferred Compensation Plan. Amounts deferred shall accrue interest or earnings and shall be recorded on the Funds’ books as other liabilities. Deferred compensation is included within Trustees’ fees and expenses in the Statements of Assets and Liabilities.
Other
Certain officers and trustees of the Funds are also employees of MassMutual. The compensation of each trustee who is not an employee of MassMutual is borne by the Funds.
| 4. | | Purchases and Sales of Investments |
Cost of purchases and proceeds from sales of investment securities (excluding short-term investments) for the year ended December 31, 2014, were as follows:
| | | | | | | | | | | | | | | | |
| | | Purchases | | | Sales | |
| | | Long-Term U.S.
Government
Securities | | | Other Long-Term
Securities | | | Long-Term U.S.
Government
Securities | | | Other Long-Term
Securities | |
Blend Fund | | $ | 749,834,465 | | | $ | 471,049,367 | | | $ | 762,960,671 | | | $ | 496,296,586 | |
Equity Fund | | | - | | | | 315,374,526 | | | | - | | | | 363,833,906 | |
Managed Bond Fund | | | 4,685,900,019 | | | | 346,941,969 | | | | 4,717,466,537 | | | | 215,991,910 | |
104
Notes to Financial Statements (Continued)
| 5. | | Capital Share Transactions |
Changes in shares outstanding for each Fund were as follows:
| | | | | | | | | | | | | | | | |
| | | Year Ended December 31, 2014 | | | Year Ended December 31, 2013 | |
| | | | |
| | | Shares | | | Amount | | | Shares | | | Amount | |
Blend Fund Initial Class | | | | | | | | | | | | | | | | |
Sold | | | 646,358 | | | $ | 15,277,002 | | | | 1,019,030 | | | $ | 21,392,562 | |
Issued as reinvestment of dividends | | | 839,814 | | | | 19,666,171 | | | | 588,570 | | | | 12,528,027 | |
Redeemed | | | (3,253,753 | ) | | | (76,577,417 | ) | | | (3,787,853 | ) | | | (79,841,623 | ) |
| | | | | | | | | | | | | | | | |
Net increase (decrease) | | | (1,767,581 | ) | | $ | (41,634,244 | ) | | | (2,180,253 | ) | | $ | (45,921,034 | ) |
| | | | | | | | | | | | | | | | |
Blend Fund Service Class | | | | | | | | | | | | | | | | |
Sold | | | 372,316 | | | $ | 8,795,548 | | | | 304,259 | | | $ | 6,487,837 | |
Issued as reinvestment of dividends | | | 42,149 | | | | 985,844 | | | | 22,947 | | | | 488,868 | |
Redeemed | | | (126,416 | ) | | | (2,985,375 | ) | | | (113,275 | ) | | | (2,442,416 | ) |
| | | | | | | | | | | | | | | | |
Net increase (decrease) | | | 288,049 | | | $ | 6,796,017 | | | | 213,931 | | | $ | 4,534,289 | |
| | | | | | | | | | | | | | | | |
Equity Fund Initial Class | | | | | | | | | | | | | | | | |
Sold | | | 522,167 | | | $ | 14,978,313 | | | | 702,152 | | | $ | 17,045,325 | |
Issued as reinvestment of dividends | | | 410,767 | | | | 12,166,595 | | | | 555,280 | | | | 13,691,072 | |
Redeemed | | | (3,114,178 | ) | | | (89,015,745 | ) | | | (6,373,212 | ) | | | (151,180,577 | ) |
| | | | | | | | | | | | | | | | |
Net increase (decrease) | | | (2,181,244 | ) | | $ | (61,870,837 | ) | | | (5,115,780 | ) | | $ | (120,444,180 | ) |
| | | | | | | | | | | | | | | | |
Equity Fund Service Class | | | | | | | | | | | | | | | | |
Sold | | | 468,038 | | | $ | 13,279,986 | | | | 416,482 | | | $ | 10,168,585 | |
Issued as reinvestment of dividends | | | 23,994 | | | | 705,046 | | | | 24,903 | | | | 609,725 | |
Redeemed | | | (124,520 | ) | | | (3,567,042 | ) | | | (165,860 | ) | | | (4,170,094 | ) |
| | | | | | | | | | | | | | | | |
Net increase (decrease) | | | 367,512 | | | $ | 10,417,990 | | | | 275,525 | | | $ | 6,608,216 | |
| | | | | | | | | | | | | | | | |
Managed Bond Fund Initial Class | | | | | | | | | | | | | | | | |
Sold | | | 14,167,319 | | | $ | 180,775,482 | | | | 19,304,672 | | | $ | 246,974,020 | |
Issued as reinvestment of dividends | | | 2,963,553 | | | | 37,555,588 | | | | 3,615,259 | | | | 45,985,546 | |
Redeemed | | | (12,398,257 | ) | | | (157,941,519 | ) | | | (10,456,821 | ) | | | (133,532,373 | ) |
| | | | | | | | | | | | | | | | |
Net increase (decrease) | | | 4,732,615 | | | $ | 60,389,551 | | | | 12,463,110 | | | $ | 159,427,193 | |
| | | | | | | | | | | | | | | | |
Managed Bond Fund Service Class | | | | | | | | | | | | | | | | |
Sold | | | 3,056,751 | | | $ | 38,924,947 | | | | 3,868,002 | | | $ | 49,036,031 | |
Issued as reinvestment of dividends | | | 467,135 | | | | 5,910,650 | | | | 504,074 | | | | 6,404,330 | |
Redeemed | | | (888,381 | ) | | | (11,278,876 | ) | | | (1,323,627 | ) | | | (16,785,915 | ) |
| | | | | | | | | | | | | | | | |
Net increase (decrease) | | | 2,635,505 | | | $ | 33,556,721 | | | | 3,048,449 | | | $ | 38,654,446 | |
| | | | | | | | | | | | | | | | |
Money Market Fund Initial Class | | | | | | | | | | | | | | | | |
Sold | | | 74,499,780 | | | $ | 74,424,512 | | | | 108,498,443 | | | $ | 108,390,776 | |
Issued as reinvestment of dividends | | | 9,467 | | | | 9,457 | | | | 5,940 | | | | 5,934 | |
Redeemed | | | (94,222,104 | ) | | | (94,127,163 | ) | | | (136,070,638 | ) | | | (135,935,565 | ) |
| | | | | | | | | | | | | | | | |
Net increase (decrease) | | | (19,712,857 | ) | | $ | (19,693,194 | ) | | | (27,566,255 | ) | | $ | (27,538,855 | ) |
| | | | | | | | | | | | | | | | |
105
Notes to Financial Statements (Continued)
| 6. | | Federal Income Tax Information |
At December 31, 2014, the cost of securities and the unrealized appreciation (depreciation) in the value of investments owned by the Funds, as computed on a federal income tax basis, were as follows:
| | | | | | | | | | | | | | | | |
| | | Federal Income
Tax Cost | | | Tax Basis
Unrealized
Appreciation | | | Tax Basis
Unrealized
(Depreciation) | | | Net Unrealized
Appreciation
(Depreciation) | |
Blend Fund | | $ | 555,511,865 | | | $ | 178,316,370 | | | $ | (5,682,702 | ) | | $ | 172,633,668 | |
Equity Fund | | | 664,251,859 | | | | 210,117,600 | | | | (9,176,768 | ) | | | 200,940,832 | |
Managed Bond Fund | | | 1,677,368,241 | | | | 44,846,004 | | | | (13,574,096 | ) | | | 31,271,908 | |
Note: The aggregate cost for investments for the Money Market Fund at December 31, 2014, is the same for financial reporting and federal income tax purposes.
Net capital loss carryforwards may be applied against any net realized taxable gains in succeeding years, subject to the carryforward period limitations, where applicable. On December 22, 2010, the Regulated Investment Company Modernization Act of 2010 (the “Modernization Act”) was signed by the President. The Modernization Act changed the capital loss carryforward rules as they relate to regulated investment companies. Capital losses generated in tax years beginning after the date of enactment may now be carried forward indefinitely, and retain the character of the original loss. Under pre-enactment law, capital losses could be carried forward for up to eight tax years as short-term capital losses. The provisions affecting the utilization of capital loss carryforwards under the Modernization Act also require the utilization of post-enactment losses prior to the utilization of pre-enactment losses.
At December 31, 2014, for federal income tax purposes, there were no unused capital losses.
Net capital loss carryforwards for the Fund(s) shown in the above table are from post-enactment years and are, therefore, subject to the eight-year carryforward period and possible expiration.
Generally accepted accounting principles in the United States of America require that only distributions in excess of tax basis earnings and profits be reported in the financial statements as a return of capital.
The tax character of distributions (including capital gain dividends, if any, designated pursuant to Section 852 of the Code) paid during the year ended December 31, 2014, was as follows:
| | | | | | | | | | | | |
| | | Ordinary
Income | | | Long Term
Capital Gain | | | Return of
Capital | |
Blend Fund | | $ | 13,859,359 | | | $ | 6,792,656 | | | $ | - | |
Equity Fund | | | 12,871,641 | | | | - | | | | - | |
Managed Bond Fund | | | 43,466,238 | | | | - | | | | - | |
Money Market Fund | | | 9,457 | | | | - | | | | - | |
The tax character of distributions (including capital gain dividends, if any, designated pursuant to Section 852 of the Code) paid during the year ended December 31, 2013, was as follows:
| | | | | | | | | | | | |
| | | Ordinary
Income | | | Long Term
Capital Gain | | | Return of
Capital | |
Blend Fund | | $ | 13,016,895 | | | $ | - | | | $ | - | |
Equity Fund | | | 14,300,797 | | | | - | | | | - | |
Managed Bond Fund | | | 41,703,937 | | | | 10,685,939 | | | | - | |
Money Market Fund | | | 5,934 | | | | - | | | | - | |
106
Notes to Financial Statements (Continued)
Capital accounts within the financial statements are periodically adjusted for permanent differences between book and tax accounting. These adjustments have no impact on net assets or the results of operations. Temporary book and tax accounting differences will reverse in subsequent periods. At December 31, 2014, temporary book and tax accounting differences were primarily attributable to investments in futures contracts, swap agreements, premium amortization accruals, the deferral of wash sale losses, non-taxable dividends, defaulted bond income accruals, and deferred Trustee compensation.
At December 31, 2014, the components of distributable earnings on a tax basis were as follows:
| | | | | | | | | | | | | | | | |
| | | Undistributed
Ordinary
Income | | | Undistributed
Long Term
Capital Gain
(Capital Loss
Carryover) | | | Other
Temporary
Differences | | | Unrealized
Appreciation
(Depreciation) | |
Blend Fund | | $ | 19,922,252 | | | $ | 30,542,033 | | | $ | (178,987 | ) | | $ | 172,381,513 | |
Equity Fund | | | 17,525,010 | | | | 37,630,445 | | | | (226,351 | ) | | | 200,940,802 | |
Managed Bond Fund | | | 6,992,473 | | | | - | | | | (175,273 | ) | | | 29,756,249 | |
Money Market Fund | | | 9,175 | | | | - | | | | (46,474 | ) | | | - | |
During the year ended December 31, 2014, the following amounts were reclassified due to permanent differences between book and tax accounting:
| | | | | | | | | | | | |
| | | Paid-in
Capital | | | Accumulated
Net Realized
Gain (Loss) on
Investments | | | Undistributed
Net Investment
Income (Loss) | |
Blend Fund | | $ | 5,893 | | | $ | (424,217 | ) | | $ | 418,324 | |
Equity Fund | | | (48,344 | ) | | | 168,799 | | | | (120,455 | ) |
Managed Bond Fund | | | 4,108 | | | | (3,141,748 | ) | | | 3,137,640 | |
Money Market Fund | | | 1,234 | | | | (2,919 | ) | | | 1,685 | |
The Funds did not have any unrecognized tax benefits at December 31, 2014, nor were there any increases or decreases in unrecognized tax benefits for the year then ended. The Funds recognize interest and penalties, if any, related to unrecognized tax benefits as an income tax expense in the Statements of Operations. During the year ended December 31, 2014, the Funds did not incur any such interest or penalties. The Funds are subject to examination by U.S. federal and state tax authorities for returns filed for the prior three fiscal years. Foreign taxes are provided for based on the Funds’ understanding of the tax rules and rates that exist in the foreign markets in which they invest.
Under the Funds’ organizational documents, current and former Trustees and Officers are provided with specified rights to indemnification against liabilities arising in connection with the performance of their duties to the Funds, and shareholders are indemnified against personal liability for obligations of the Funds. In the normal course of business, the Funds may also enter into contracts that provide general indemnifications. The Funds’ maximum exposure under these arrangements is unknown as this would be dependent on future claims that may be made against the Funds. The risk of material loss from such claims is considered remote.
| 8. | | New Accounting Pronouncements |
In June 2014, The Financial Accounting Standards Board (“FASB”) issued Accounting Standards Update No. 2014-11, Transfers & Servicing (Topic 860): “Repurchase-to-Maturity Transactions, Repurchase Financings, and Disclosures” (“ASU 2014-11”) to improve the financial reporting of repurchase agreements and other similar transactions. ASU 2014-11
107
Notes to Financial Statements (Continued)
includes expanded disclosure requirements for entities that enter into reverse repurchase agreements and similar transactions accounted for as secured borrowings. ASU 2014-11 is effective for annual reporting periods beginning after December 15, 2014 and interim periods beginning after December 15, 2015. Management is currently evaluating the implications of these changes and their impact on the financial statements.
On December 7, 2010, the Trust was named as a defendant and putative member of the proposed defendant class of shareholders named in an adversary proceeding brought by The Official Committee of Unsecured Creditors of Tribune Company (the “Official Committee”) in the U.S. Bankruptcy Court for the District of Delaware, in connection with Tribune Company’s Chapter 11 bankruptcy proceeding (In re Tribune Company). The proceeding relates to a leveraged buyout (“LBO”) transaction by which Tribune Company converted to a privately-held company in 2007, and the putative defendant class is comprised of beneficial owners of shares of Tribune Company who received proceeds (the “Proceeds”) of the LBO. The Official Committee seeks to recover payments of those Proceeds.
The potential amount sought to be recovered from the Blend Fund plus interest and the Official Committee’s court costs, is approximately $207,400.
In addition, on June 2, 2011, the Blend Fund was named as a defendant in a closely related, parallel adversary proceeding brought in connection with the Tribune Company’s LBO by Deutsche Bank Trust Company Americas, in its capacity as successor indenture trustee for a certain series of Senior Notes, Law Debenture Trust Company of New York, in its capacity as successor indenture trustee for a certain series of Senior Notes, and Wilmington Trust Company, in its capacity as successor indenture trustee for the PHONES Notes (together, the “Plaintiffs”), in the United States District Court for the District of Massachusetts. The Plaintiffs also seek to recover payments of the Proceeds.
The Fund cannot predict the outcome of these proceedings. Accordingly, the Fund has not accrued any amounts related to these proceedings. If the proceedings were to be decided in a manner adverse to the Fund, or if the Fund was to enter into a settlement agreement with the Official Committee or the Plaintiffs, as applicable, the payment of such judgment or settlement could potentially have a material adverse effect on the Fund’s net asset value depending on the net assets of the Fund at the time of such judgment or settlement.
In preparation of these financial statements, management has evaluated the events and transactions subsequent to December 31, 2014, through the date when the financial statements were issued, and determined that there are no subsequent events or transactions that would require adjustments to or disclosures in the Funds’ financial statements.
108
Report of Independent Registered Public Accounting Firm
To the Board of Trustees of MML Series Investment Fund II and Shareholders of MML Blend Fund, MML Equity Fund, MML Managed Bond Fund, and MML Money Market Fund (collectively, the “Funds”):
We have audited the accompanying statements of assets and liabilities, including the portfolios of investments, of the Funds as of December 31, 2014, and the related statements of operations for the year then ended, the statements of changes in net assets for each of the two years in the period then ended, and the financial highlights for each of the periods presented. These financial statements and financial highlights are the responsibility of the Funds’ management. Our responsibility is to express an opinion on these financial statements and financial highlights based on our audits.
We conducted our audits in accordance with the standards of the Public Company Accounting Oversight Board (United States). Those standards require that we plan and perform the audit to obtain reasonable assurance about whether the financial statements and financial highlights are free of material misstatement. The Funds are not required to have, nor were we engaged to perform, an audit of their internal control over financial reporting. Our audits included consideration of internal control over financial reporting as a basis for designing audit procedures that are appropriate in the circumstances, but not for the purpose of expressing an opinion on the effectiveness of the Funds’ internal control over financial reporting. Accordingly, we express no such opinion. An audit also includes examining, on a test basis, evidence supporting the amounts and disclosures in the financial statements, assessing the accounting principles used and significant estimates made by management, as well as evaluating the overall financial statement presentation. Our procedures included confirmation of securities owned as of December 31, 2014, by correspondence with the custodian and brokers; where replies were not received from brokers, we performed other auditing procedures. We believe that our audits provide a reasonable basis for our opinion.
In our opinion, the financial statements and financial highlights referred to above present fairly, in all material respects, the financial position of each of the Funds as of December 31, 2014, the results of their operations for the year ended, the changes in their net assets for each of the two years in the period then ended, and the financial highlights for each of the periods presented, in conformity with accounting principles generally accepted in the United States of America.
Deloitte & Touche LLP
Boston, Massachusetts
February 23, 2015
109
Trustees and Officers (Unaudited)
The following table lists the Trust’s Trustees and Officers as of December 31, 2014; their address and age; their position with the Trust; the length of time holding that position with the Trust; their principal occupation(s) during the past five years; the number of portfolios in the fund complex they oversee; and other directorships they hold in companies subject to registration or reporting requirements of the Securities Exchange Act of 1934 (generally called “public companies”) or in registered investment companies. The Trust’s Statement of Additional Information includes additional information about the Trust’s Trustees and is available, without charge, upon request by calling 1-888-309-3539 or by writing MML Series Investment Fund II, c/o Massachusetts Mutual Life Insurance Company, 1295 State Street, Springfield, Massachusetts 01111-0001, Attention: Retirement Services Marketing.
Disinterested Trustees
| | | | | | | | | | |
Name, Address*, and Age | | Position(s)
Held with
Trust | | Term of
Office** and
Length of
Time Served | | Principal Occupation(s)
During Past 5 Years | | Number of
Portfolios in
Fund Complex
Overseen by Trustee | | Other Directorships
Held by Trustee |
Richard H. Ayers Age: 72 | | Chairman Trustee | | Since 2012 Since 2012 | | Retired. | | 89 | | Director (2008-2011), Celera Corporation; Director (1996-2008), Applera Corporation; Chairman (since 2010), Trustee (since 1996), MassMutual Select Funds (open-end investment company); Chairman (since 2010), Trustee (since 1999), MML Series Investment Fund (open-end investment company); Chairman and Trustee (since 2012), MassMutual Premier Funds (open-end investment company). |
| | | | | |
Allan W. Blair Age: 66 | | Trustee | | Since 2012 | | Retired; President and Chief Executive Officer (1996-2014), Economic Development Council of Western Massachusetts; President and Chief Executive Officer (1984-2014), Westover Metropolitan Development Corporation. | | 89 | | Trustee (since 2003), MassMutual Select Funds (open-end investment company); Trustee (since 2003), MML Series Investment Fund (open-end investment company); Trustee (since 2012), MassMutual Premier Funds (open-end investment company). |
| | | | | |
Nabil N. El-Hage Age: 56 | | Trustee Chairman | | Since 2005 (2006-2012) | | Chairman (since 2011), Academy of Executive Education, LLC; Consultant (2010-2011); Senior Associate Dean for External Relations (2009-2010), Thomas Henry Carroll Ford Foundation Adjunct Professor of Business Administration (2009-2010), Professor of Management Practice (2005-2009), Harvard Business School. | | 89 | | Director (since 2011), Argo Group International Holdings, Ltd.; Director (2007-2010), Virtual Radiologic Corporation; Trustee (since 2012), MassMutual Select Funds (open-end investment company); Trustee (since 2012), MML Series Investment Fund (open-end investment company); Trustee (since 2003), Chairman (2006-2012), MassMutual Premier Funds (open-end investment company). |
| | | | | |
Maria D. Furman Age: 60 | | Trustee | | Since 2005 | | Retired. | | 89 | | Trustee (since 2011), GMO Series Trust (open-end investment company); Trustee (since 2012), MassMutual Select Funds (open-end investment company); Trustee (since 2012), MML Series Investment Fund (open-end investment company); Trustee (since 2004), MassMutual Premier Funds (open-end investment company). |
110
Trustees and Officers (Unaudited) (Continued)
| | | | | | | | | | |
Name, Address*, and Age | | Position(s)
Held with
Trust | | Term of
Office** and
Length of
Time Served | | Principal Occupation(s) During Past 5 Years | | Number of
Portfolios in
Fund Complex
Overseen by Trustee | | Other Directorships Held by Trustee |
R. Alan Hunter, Jr. Age: 68 | | Trustee | | Since 2012 | | Retired. | | 89 | | Director (since 2007), Actuant Corporation; Trustee (since 2003), MassMutual Select Funds (open-end investment company); Trustee (since 2003), MML Series Investment Fund (open-end investment company); Trustee (since 2012), MassMutual Premier Funds (open-end investment company). |
| | | | | |
F. William Marshall, Jr. Age: 72 | | Trustee | | Since 2012 | | Retired; Consultant (1999-2009). | | 127*** | | Trustee (since 2000), Denver Board – Oppenheimer Funds; Trustee (since 1996), MassMutual Select Funds (open-end investment company); Trustee (since 1996), MML Series Investment Fund (open-end investment company); Trustee (since 2012), MassMutual Premier Funds (open-end investment company). |
| | | | | |
C. Ann Merrifield Age: 63 | | Trustee | | Since 2005 | | Retired; President and Chief Executive Officer (2012-2014), PathoGenetix; Senior Vice President, Genzyme Business Excellence Initiative (2009-2011), President, Biosurgery (2003-2009), Genzyme Corporation. | | 89 | | Director (since 2014), Flexion Therapeutics; Director (since 2014), InVivo Therapeutics; Trustee (since 2012), MassMutual Select Funds (open-end investment company); Trustee (since 2012), MML Series Investment Fund (open-end investment company); Trustee (since 2004), MassMutual Premier Funds (open-end investment company). |
| | | | | |
Susan B. Sweeney Age: 62 | | Trustee | | Since 2012 | | Retired; Senior Vice President and Chief Investment Officer (2010-2014), Selective Insurance Group (property and casualty company); Senior Managing Director (2008-2010), Ironwood Capital (private equity firm). | | 91^ | | Trustee (since 2012), Babson Capital Corporate Investors (closed-end investment company); Trustee (since 2012), Babson Capital Participation Investors (closed-end investment company); Trustee (since 2009), MassMutual Select Funds (open-end investment company); Trustee (since 2009), MML Series Investment Fund (open-end investment company); Trustee (since 2012), MassMutual Premier Funds (open-end investment company). |
111
Trustees and Officers (Unaudited) (Continued)
Interested Trustees
| | | | | | | | | | |
Name, Address*, and Age | | Position(s)
Held with
Trust | | Term of
Office** and
Length of
Time Served | | Principal Occupation(s) During Past 5 Years | | Number of
Portfolios in
Fund Complex
Overseen by Trustee | | Other Directorships Held by Trustee |
Robert E. Joyal^^ Age: 69 | | Trustee | | Since 2012 | | Retired. | | 91^ | | Director (since 2013), Leucadia National Corporation (holding company); Director (since 2012), Ormat Technologies, Inc.; Director (2006-2014), Jefferies Group LLC (investment bank); Director (2007-2011), Scottish Re Group Ltd.; Director (2003-2010), Alabama Aircraft Industries, Inc.; Trustee (since 2003), Babson Capital Corporate Investors (closed-end investment company); Trustee (since 2003), Babson Capital Participation Investors (closed-end investment company); Trustee (since 2003), MassMutual Select Funds (open-end investment company); Trustee (since 2003), MML Series Investment Fund (open-end investment company); Trustee (since 2012), MassMutual Premier Funds (open-end investment company). |
| | | | | |
Elaine A. Sarsynski^^^ Age: 59 | | Trustee Vice Chairperson | | Since 2011 (2011-2012) | | Executive Vice President (since 2008), MassMutual Retirement Services Division, MassMutual; Chairman (since 2013), President, Chairman & CEO (2012-2013), Chairman & CEO (2008-2012), President & CEO (2006-2008), MassMutual International LLC. | | 89 | | Director (since 2012), Horizon Technology Finance Management LLC; Director (since 2013), MML Advisers; Trustee (since 2008), MassMutual Select Funds (open-end investment company); Trustee (since 2008), MML Series Investment Fund (open-end investment company); Vice Chairperson (2011-2012), Trustee (since 2011), MassMutual Premier Funds (open-end investment company). |
Principal Officers who are Not Trustees
| | | | | | | | |
Name, Address*, and Age | | Position(s) Held
with Trust | | Term of
Office# and
Length of
Time Served | | Principal Occupation(s) During Past 5 Years | | Number of
Portfolios in
Fund Complex
Overseen by Officer |
Jeffrey M. Dube
Age: 46 | | President | | Since
2014 | | Vice President (since 2012), Assistant Vice President (2011-2012), Managing Director (2009-2011), MassMutual; President (since 2014), MML Series Investment Fund (open-end investment company). | | 36 |
| | | | |
Michael C. Eldredge Age: 50 | | Vice President | | Since
2009 | | Head of Investments and portfolio manager (since 2014), MML Advisers; Vice President (since 2008), MassMutual; Vice President (2005-2008), ING; Vice President (since 2009), MassMutual Select Funds (open-end investment company); Vice President (since 2009), MML Series Investment Fund (open-end investment company); Vice President (since 2009), MassMutual Premier Funds (open-end investment company). | | 89 |
112
Trustees and Officers (Unaudited) (Continued)
| | | | | | | | |
Name, Address*, and Age | | Position(s) Held
with Trust | | Term of
Office# and
Length of
Time Served | | Principal Occupation(s) During Past 5 Years | | Number of
Portfolios in
Fund Complex
Overseen by Officer |
Andrew M. Goldberg Age: 48 | | Vice President, Secretary, and Chief Legal Officer Assistant Clerk | | Since
2008
(2005-
2008) | | Assistant Vice President and Counsel (since 2004), MassMutual; Assistant Secretary (since 2013), MML Advisers; Vice President, Secretary, and Chief Legal Officer (since 2008), Assistant Secretary (2001-2008), MassMutual Select Funds (open-end investment company); Vice President, Secretary, and Chief Legal Officer (since 2008), Assistant Secretary (2001-2008), MML Series Investment Fund (open-end investment company); Vice President, Secretary, (formerly known as “Clerk”), and Chief Legal Officer (since 2008), Assistant Clerk (2004-2008), MassMutual Premier Funds (open-end investment company). | | 89 |
| | | | |
Brian K. Haendiges
Age: 54 | | Vice President | | Since
2014 | | Vice President (since 2014) MML Advisers; Senior Vice President (since 2014), Vice President (2010-2014), MassMutual; Vice President (since 2014), MassMutual Select Funds (open-end investment company); Vice President (since 2014), MML Series Investment Fund (open-end investment company); Vice President (since 2014), MassMutual Premier Funds (open-end investment company). | | 89 |
| | | | |
Nicholas H. Palmerino Age: 49 | | Chief Financial Officer and Treasurer | | Since
2006 | | Vice President (since 2014), Assistant Vice President (2006-2014), MassMutual; Chief Financial Officer and Treasurer (since 2006), MassMutual Select Funds (open-end investment company); Chief Financial Officer and Treasurer (since 2006), MML Series Investment Fund (open-end investment company); Chief Financial Officer and Treasurer (since 2006), MassMutual Premier Funds (open-end investment company). | | 89 |
| | | | |
Philip S. Wellman Age: 50 | | Vice President and Chief Compliance Officer | | Since
2007 | | Vice President and Chief Compliance Officer (since 2013), MML Advisers; Vice President and Associate General Counsel (since 2014), Vice President, Associate General Counsel, and Chief Compliance Officer (Mutual Funds and Investment Advisory) (2008- 2014), Vice President, Associate General Counsel, and Chief Compliance Officer (Mutual Funds) (2007-2008), MassMutual; Vice President and Chief Compliance Officer (since 2007), MassMutual Select Funds (open-end investment company); Vice President and Chief Compliance Officer (since 2007), MML Series Investment Fund (open-end investment company); Vice President and Chief Compliance Officer (since 2007), MassMutual Premier Funds (open-end investment company). | | 89 |
| | | | |
Eric H. Wietsma Age: 48 | | Vice President | | Since
2006
| | Director and President (since 2013), MML Advisers; Senior Vice President (since 2010), Corporate Vice President (2007-2010), MassMutual; President (since 2008), Vice President (2006-2008), MassMutual Select Funds (open-end investment company); Vice President (since 2006), MML Series Investment Fund (open-end investment company); President (since 2008), Vice President (2006-2008), MassMutual Premier Funds (open-end investment company). | | 89 |
| * | The address of each Trustee and Principal Officer is the same as that for the Trust; 100 Bright Meadow Blvd., Enfield, CT 06082. |
| ** | Each Trustee of the Trust serves until the next meeting of shareholders called for the purpose of electing Trustees and until the election and qualification of his or her successor or until he or she dies, resigns, or is removed. Notwithstanding the foregoing, unless the Trustees determine that it is desirable and in the best interest of the Trust that an exception to the retirement policy of the Trust be made, a Trustee shall retire and cease to serve as a Trustee upon the conclusion of the calendar year in which such Trustee attains the age of seventy-two years. Such an exception was made for any Trustee who attained the age of seventy-two years during 2014. Such Trustees shall retire and cease to serve as a Trustee on or before December 31, 2015. |
| | The Chairperson is elected to hold such office for a term of three years or until their successor is elected and qualified to carry out the duties and responsibilities of their office, or until he or she retires, dies, resigns, is removed, or becomes disqualified. |
| *** | Denver Board – Oppenheimer Funds is deemed to be part of the Fund Complex because it is managed by OFI Global Asset Management, Inc., an affiliate of MML Advisers. |
| ^ | Babson Capital Participation Investors and Babson Capital Corporate Investors are deemed to be a part of the Fund Complex because they are managed by Babson Capital Management LLC, an affiliate of MML Advisers. |
| ^^ | Mr. Joyal is an “Interested Person,” as that term is defined in the 1940 Act, through his position as a director of Leucadia National Corporation, which controls Jefferies Group LLC, a broker-dealer that may execute portfolio transactions and/or engage in principal transactions with the Funds, other investment companies advised by MML Advisers or holding themselves out to investors as related companies for purposes of investment or investor services, or any other advisory accounts over which MML Advisers has brokerage placement discretion. |
| ^^^ | Ms. Sarsynski is an Interested Person as a director of MML Advisers. |
| # | The President, Treasurer, and Secretary are elected to hold such office until their successor is elected and qualified to carry out the duties and responsibilities of their office, or until he or she dies, resigns, is removed, or becomes disqualified. Each other officer shall hold office at the pleasure of the Trustees. |
113
Federal Tax Information (Unaudited)
For corporate shareholders, a portion of the ordinary dividends paid during the Fund(s)’ year ended December 31, 2014, qualified for the dividends received deduction, as follows:
| | | | |
| |
| | | Dividends Received
Deductions | |
Blend Fund | | | 29.26% | |
Equity Fund | | | 100.00% | |
114
Other Information (Unaudited)
Proxy Voting
A description of the policies and procedures that each Fund’s investment adviser and subadvisers use to vote proxies relating to the Fund’s portfolio securities is available, without charge, upon request, by calling 1-888-309-3539, and on the Securities and Exchange Commission’s (“SEC”) website at http://www.sec.gov.
Information regarding how the Funds voted proxies relating to portfolio securities during the most recent 12-month period ended June 30 is available, without charge, upon request, on the MassMutual website at http://www.massmutual.com/funds and on the SEC’s website at http://www.sec.gov.
Quarterly Reporting
The Funds file their complete schedule of portfolio holdings with the SEC for the first and third quarters of each fiscal year on Form N-Q. The Funds’ Forms N-Q are available on the SEC’s website at http://www.sec.gov and may be reviewed and copied at the SEC’s Public Reference Room in Washington D.C. Information on the operation of the SEC’s Public Reference Room may be obtained by calling 1-800-SEC-0330.
115
Other Information (Unaudited) (Continued)
Fund Expenses December 31, 2014
Expense Examples:
The following information is in regards to expenses for the six months ended December 31, 2014:
As a shareholder of the Funds, you incur ongoing costs, including advisory fees, distribution and/or service (12b-1) fees, and other Fund expenses. These examples are intended to help you understand your ongoing costs (in dollars) of investing in the Funds and to compare these costs with the ongoing costs of investing in other mutual funds. These examples are based on an investment of $1,000 invested for the six months ended December 31, 2014.
Actual Expenses:
The first four columns of the table below provide information about actual account values and actual expenses. You may use this information, together with the amount you invested, to estimate the expenses that you paid over the period. Simply divide your account value by $1,000 (for example, an $8,600 account value divided by $1,000 = 8.6), then multiply the result by the number under the heading entitled “Operating Expenses Incurred” to estimate the expenses you paid on your account during this period.
Hypothetical Example for Comparison Purposes:
The last two columns of the table below provide information about hypothetical account values and hypothetical expenses based on the Fund’s actual expense ratio and an assumed rate of return of 5% per year before expenses, which is not the Fund’s actual return. The hypothetical account values and expenses may not be used to estimate the actual ending account balance or expenses you paid for the period. You may use this information to compare the ongoing costs of investing in the Fund and other funds. To do so, compare this 5% hypothetical example with the 5% hypothetical examples that appear in the shareholder reports of the other funds.
Please note that the expenses shown in the table are meant to highlight your ongoing costs only and do not reflect any transactional costs. Therefore, the last two columns of the table are useful in comparing ongoing costs only, and will not help you determine the relative total costs of owning different funds. In addition, if these transactional costs were included, your costs would have been higher.
| | | | | | | | | | | | | | | | | | | | | | | | |
| | | Beginning
Value | | | Annualized
Expense
Ratio | | | Ending
Value (Based
on Actual
Returns and
Expenses) | | | Operating
Expenses
Incurred* | | | Ending
Value
(Based on
Hypothetical
Returns and
Expenses) | | | Operating
Expenses
Incurred* | |
| Blend Fund | | | | | | | | | | | | | | | | | | | | | | | | |
Initial Class | | $ | 1,000 | | | | 0.45 | % | | $ | 1,042.80 | | | $ | 2.32 | | | $ | 1,022.90 | | | $ | 2.29 | |
Service Class | | | 1,000 | | | | 0.70 | % | | | 1,041.50 | | | | 3.60 | | | | 1,021.70 | | | | 3.57 | |
| Equity Fund | | | | | | | | | | | | | | | | | | | | | | | | |
Initial Class | | | 1,000 | | | | 0.43 | % | | | 1,039.10 | | | | 2.21 | | | | 1,023.00 | | | | 2.19 | |
Service Class | | | 1,000 | | | | 0.68 | % | | | 1,037.80 | | | | 3.49 | | | | 1,021.80 | | | | 3.47 | |
| Managed Bond Fund | | | | | | | | | | | | | | | | | | | | | | | | |
Initial Class | | | 1,000 | | | | 0.39 | % | | | 1,017.00 | | | | 1.98 | | | | 1,023.20 | | | | 1.99 | |
Service Class | | | 1,000 | | | | 0.64 | % | | | 1,015.80 | | | | 3.25 | | | | 1,022.00 | | | | 3.26 | |
| Money Market Fund | | | | | | | | | | | | | | | | | | | | | | | | |
Initial Class | | | 1,000 | | | | 0.11 | % | | | 1,000.00 | | | | 0.55 | | | | 1,024.70 | | | | 0.56 | |
| * | Expenses are calculated using the annualized expense ratio for the six months ended December 31, 2014, multiplied by the average account value over the period, multiplied by the number of days in the period, divided by the number of days in the year, unless stated otherwise. |
116
Underwriter:
MML Distributors, LLC
100 Bright Meadow Blvd.
Enfield, CT 06082

| | |
| © 2015 Massachusetts Mutual Life Insurance Company, Springfield, MA 01111-0001. All rights reserved. www.massmutual.com. MassMutual Financial Group is a marketing name for Massachusetts Mutual Life Insurance Company (MassMutual) and its affiliated companies and sales representatives. Investment Adviser: MML Investment Advisers, LLC | | CRN201603-190347 |
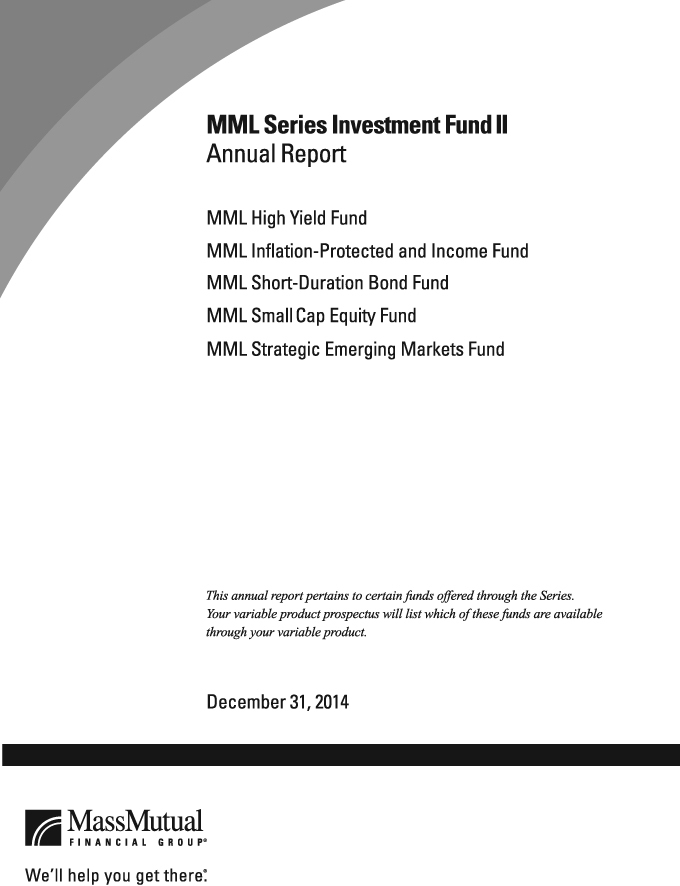
Table of Contents
This material must be preceded or accompanied by a current prospectus (or summary prospectus, if available) for the MML Series Investment Fund II. Investors should consider a Fund’s investment objective, risks, and charges and expenses carefully before investing. This and other information about the investment company is available in the prospectus (or summary prospectus, if available). Read it carefully before investing.
MML Series Investment Fund II – President’s Letter to Shareholders (Unaudited)
To Our Shareholders

Jeffrey M. Dube
“At MassMutual, our customers – and their dreams for their future – matter most to us. We strive to help you take the right steps to help yourself prepare for a retirement that grants you the freedom to live the life you imagine – retirement on your terms.”
December 31, 2014
I am pleased to present you with the MML Series Investment Fund II Annual Report, covering the year ended December 31, 2014. U.S. stocks and bonds rose in 2014, with stocks reaching new heights and outperforming their foreign counterparts by a considerable margin. The accelerating expansion of the U.S. economy provided an accommodative investing environment that stood in sharp contrast to the challenges faced by some of the world’s other large economies in Europe and the Far East.
The performance of U.S. equity markets during 2014 was encouraging, but the volatility that resurfaced during the fourth quarter and the struggles of some foreign markets serve as ongoing reminders that retirement investors should not focus on short-term performance – but rather on making investment decisions that are based on their long-term goals and objectives. Individuals who are saving for retirement may have the advantage of not needing to access their funds in the short term. Even those who have begun withdrawing their retirement savings may choose to have the majority of their account balance remain invested, since retirement can last for decades. We believe retirement investors give themselves a greater opportunity to reach their retirement income goals when they follow certain investment guidelines, such as the ones below.
Investment concepts to keep in mind
Avoid focusing on daily market performance
Investing for retirement is a long-term proposition. While most retirement investors seem to understand that the financial markets experience volatility from time to time, seasoned investors typically take a long-term approach to investing and avoid focusing on short-term results.
The one thing you can control is your contribution level
Of course, you can’t control the performance of your investments. What you can control, however, is how often and how much you save. Contributing to your retirement account on a regular basis and increasing your contribution level as often as possible can help you boost your retirement savings.*
Take advantage of asset allocation and diversification*
Stocks, bonds, and short-term/money market investments are investment types that generally perform differently at different times, depending on the economic climate. Each of these categories contains an even broader array of sub-categories, such as small-cap stocks, international stocks, and high-yield bonds. Many financial professionals believe investors can help reduce their over-exposure to one or two poorly performing investment types by including a mix of investment types and sub-categories in their retirement strategy.
Who Matters Most
MassMutual believes “Who Matters Most to You Says the Most About You.” At MassMutual, our customers – and their dreams for their future – matter most to us. We strive to help you take the right steps to help yourself prepare for a retirement that grants you the freedom to live the life you imagine – retirement on your terms. To get there, we believe you may benefit most by maintaining a plan that
| | * | Systematic investing and asset allocation do not ensure a profit or protect against loss in a declining market. Systematic investing involves continuous investment in securities regardless of fluctuating price levels. Investors should consider their ability to continue investing through periods of low price levels. |
(Continued)
1
MML Series Investment Fund II – President’s Letter to Shareholders (Unaudited) (Continued)
takes into consideration your specific goals, how comfortable you are with the market’s ups and downs, and how long you have to save and invest for your future. If you work with a financial professional, this may be an excellent time to contact him or her for assistance in reviewing your personal retirement investment strategy and making any adjustments that may be appropriate. Thank you for your confidence in MassMutual.
Sincerely,

Jeffrey M. Dube
President
The information provided is the opinion of MassMutual Retirement Services Investments Marketing as of 1/1/15 and is subject to change without notice. It is not to be construed as tax, legal or investment advice. Of course, past performance does not guarantee future results.
2
MML Series Investment Fund II – Economic and Market Overview (Unaudited)
December 31, 2014
Investors drive U.S. stocks up, oil down; central bank concludes bond buying in 2014
Major U.S. stock indexes rose in 2014, with the Standard & Poor’s 500 Index (“S&P 500”) and the Dow Jones Industrial Average (the “Dow”), two of the most widely followed U.S. stock market benchmarks, repeatedly reaching new highs and finishing the year near record territory. U.S. bonds also advanced for the year. Foreign markets did not fare as well, as economic growth slowed substantially in Europe, Japan reentered a recession, and China’s economy also stumbled.
Investors navigated periods of volatility and other challenges in an environment that included political action over federal spending and midterm elections that left Republicans with majorities in both houses of the U.S. Congress, geopolitical conflicts in Eastern Europe and the Middle East, the end of government bond purchases through the Federal Reserve’s (the “Fed”) Quantitative Easing program (“QE”), and a precipitous decline in the price of oil. In the U.S., ongoing improvement in employment, corporate profitability, and other key economic measures – including a rebound and acceleration in gross domestic product (“GDP”) – helped bolster stock prices. Housing was a surprisingly notable laggard during much of the year and failed to echo other economic improvements.
The Fed began “tapering” its monthly QE bond purchases to $75 billion in January 2014. The Fed’s monthly reduction proceeded systematically in additional $10 billion increments thereafter during 2014, and the central bank made its last monthly buys in October 2014. There was some first-quarter market movement attributable to the tapering, but investors ultimately seemed to accept the inevitable end of the program and the reductions became less of a factor in market movements as the year progressed. The Fed also helped keep short-term interest rates at historically low levels by continuing the federal funds rate at 0.0% to 0.25% – the level the rate has occupied since December 2008. The federal funds rate is the interest rate that banks and other financial institutions charge each other for borrowing funds overnight. The Fed reassured investors following its September 2014 meeting that short-term interest rates would remain low for a “considerable time” after the end of QE. Fed statements in mid-December indicated the central bank intends to be “patient” in raising short-term interest rates. While not ruling out rate hikes later in 2015, the Fed allayed investors’ fears that better-than-expected economic growth might cause the central bank to accelerate its timetable for normalizing rates from near-zero levels. The statement also noted that the Fed continues to pay close attention to the slow improvement of credit growth in the U.S. and core inflation that is below the central bank’s 2% target.
The price of oil declined steadily over the second half of the year due to investor concerns about slowing economic growth and falling demand in foreign markets colliding with an overabundant supply. West Texas Intermediate (WTI) crude oil started the year at more than $98 per barrel, gushed to nearly $108 in June, then trickled down steadily to finish 2014 at $53.45 – down more than 45% for the full year. U.S. retail gasoline prices accelerated from about $3.41 per gallon at the beginning of January to nearly $3.79 in late April. Gasoline parked in the $3.74 to $3.78 per gallon range until late June before rolling downhill to approximately $2.39 at the end of the year, which gave drivers the lowest gas prices since 2009. Gold prices gyrated but changed little, cresting to $1,385 per ounce in mid-March 2014, falling to $1,142 in early November, and finishing the year at $1,206 – just $1.50 more than the precious metal’s 2014 opening price.
Market performance
U.S. stocks of all sizes outperformed their foreign counterparts during 2014, with stocks of mid-size and large U.S companies outpacing their small-company counterparts. The major technology stock benchmark in the U.S., the NASDAQ Composite® Index, returned 14.75% for the year and led all U.S. broad market indexes. The S&P 500® Index of large-capitalization U.S. stocks posted a 13.69% advance, and the blue-chip Dow Jones Industrial AverageSM rose 10.04%. The Russell 2000® Index of small-capitalization stocks underperformed other key stock benchmarks, but still advanced 4.89%. The MSCI Emerging Markets Index, a measure of the performance of emerging stock markets throughout the world, declined 2.19% for the year and outperformed the MSCI EAFE Index, a barometer for foreign stocks in developed markets, which fell 4.90%.
Bonds rewarded investors, but underperformed most U.S. stock indexes during the year, with the Barclays U.S. Aggregate Bond Index, a broad measure of the U.S. investment-grade bond markets, rising 5.97%. Unrelenting low interest rates continued to take their toll, and shorter-term debt investments barely managed to stay in positive territory. In this environment, the Barclays U.S.
3
MML Series Investment Fund II – Economic and Market Overview (Unaudited) (Continued)
1-3 Year Government Bond Index, which measures the performance of short-term U.S. government bonds, returned just 0.64%; and Treasury bills, as measured by the Citigroup 3-Month Treasury Bill Index, gained only 0.03%. The impact of lower oil prices on energy companies in the second half of the year worked against high-yield bonds, as many issuers of such bonds are energy companies. Despite losing ground in the third and fourth quarters, the Barclays U.S. Corporate High-Yield Index, a measure of the performance of fixed-rate, non-investment-grade debt from corporate sectors, still managed to advance 2.45% for the year.*
Q1 2014: Stocks suffer early losses, then recover
U.S. stocks ended the first quarter of 2014 with only minimal changes, as a sell-off early in the quarter gave way to a recovery that more than offset previous losses in most cases. The decline was relatively brief and confined to a two-week stretch in late January and the beginning of February. A weak December 2013 employment report, concerns about emerging markets, and the Fed’s ongoing downsizing of QE were all factors weighing on share prices. Worries about emerging markets eased later in the quarter, however, and enabled stocks to embark on a recovery.
Resurgent concerns over some aspects of U.S. economic growth and a flight to quality due to emerging-market volatility helped drive up prices of U.S. Treasury securities. Reassuring comments from new U.S. Federal Reserve Chair Janet Yellen helped bolster the market. Yellen replaced Ben Bernanke at the end of January and is the first woman to lead the Fed. Fiscal woes afflicting the federal government eased a bit in the first quarter. On February 15, President Obama signed legislation extending the federal debt ceiling through March 2015.
One factor keeping investors on edge during the quarter was turmoil in Ukraine, specifically the country’s Crimea region, which has been governed as an independent republic since 1992 and is home to many pro-Russian sympathizers. On March 16, a referendum in Crimea yielded the decision to become part of Russia, a move not recognized by the West. Russia’s support of this referendum, together with the build-up of Russian troops along the Russia/Ukraine border, triggered economic sanctions against Russia by Western nations, including the United States. The political upheaval did not significantly damage stock prices, so most broad equity benchmarks ended the quarter only modestly below their all-time highs.
Q2 2014: Stocks continue their record-setting pace
Stocks of U.S. and foreign companies overcame a brief and relatively mild sell-off during the first half of April to surge into fresh high ground in the second quarter of 2014, as an ongoing global economic recovery, receding concerns about Ukraine, and stimulative monetary policy from central banks provided a supportive backdrop for equity prices. Stocks’ solid second quarter followed a shaky first quarter in which performance was much more muted. In the fixed-income market, yields of longer-term U.S. Treasury securities declined during April and May before recovering somewhat in June. Weak U.S. economic growth in the first quarter, which was initially estimated at just 0.1% and was subsequently revised much lower – making it the first negative reading in three years – helped drive the April drop.
The European Central Bank (“ECB”) provided a boost for the markets in early June, when ECB President Mario Draghi announced reductions in the central bank’s key interest rates. Notably, the ECB’s deposit rate turned negative for the first time, in essence charging euro zone banks for parking funds with the central bank. The ECB also introduced a fresh series of low-cost loans to banks in an effort to jump-start lending. These moves helped lift the performance of stocks in the United States, Europe, and Japan, as well as in emerging markets.
Global stock prices also reacted favorably to remarks coming out of the Fed meeting on June 18, which stated the central bank would continue to reduce the amount of monthly bond purchases and reaffirmed its intention to keep short-term interest rates near zero in an ongoing effort to incentivize job creation and economic growth.
Energy stocks rose during the quarter, spurred by concerns about potential disruptions in Iraq’s oil production amid widespread terrorist activity by the Islamic State in Iraq and Syria (“ISIS”), a radical Sunni group.
| * | Indexes are unmanaged, do not incur fees or expenses and cannot be purchased directly for investment. |
4
MML Series Investment Fund II – Economic and Market Overview (Unaudited) (Continued)
Q3 2014: Gains narrow as concerns increase about global growth
Large-capitalization U.S. stocks overcame negative markets in July and September to finish the third quarter of 2014 with modest upside progress. However, shares of small and mid-size U.S. companies, foreign stocks from developed and emerging markets, and high-yield bonds struggled, as investors took a more risk-averse approach. Bonds were basically flat for the quarter.
Trouble overseas was one reason for increased investor caution. At the end of July, U.S. stocks suffered a sharp one-day decline after Argentina effectively defaulted on its bonds for the second time in 13 years. Around the same time, the share price of Banco Espirito Santo, Portugal’s largest bank, plunged after it reported a huge $4.8 billion first-half loss that wiped out the bank’s capital cushion and forced it to seek new funding.
In Eastern Europe, the standoff between Ukraine and Russia intensified. In the Middle East, there was a resurgence of the conflict between Israel and Hamas, and the threat of ISIS continued to grow.
Despite these developments, the negative impact on U.S. markets was relatively fleeting, as investor sentiment was buoyed by encouraging news about the U.S. economy. Data reported at the end of July showed that GDP, a broad measure of economic activity, advanced a robust 4.0% in the second quarter after contracting 2.1% in a first quarter hampered by severe winter weather. At the end of September, the second-quarter figure was revised upward to 4.6%.
Healthy U.S. economic growth stood in stark contrast to the euro zone, where economic activity was stagnant – and Japan, whose economy contracted sharply in the second quarter, according to data that became available in the third quarter. This discrepancy among developed nations helped trigger a significant rally in the U.S. dollar, which depressed the dollar-denominated returns of foreign markets.
Q4 2014: Volatility increases, but U.S. stocks hit new all-time highs
Investors shook off numerous concerns to drive U.S. stocks to healthy gains in the fourth quarter and to new highs for the year. Plunging crude oil prices, the spread of the Ebola virus in West Africa and beyond, and disappointing economic data from Europe and China were some of the factors keeping investors on edge and contributing to two noteworthy – but relatively short – sell-offs during the quarter. In November, the market reacted positively to the results of the U.S. midterm elections, but the impact was muted, as investors had anticipated Republicans would take control of the U.S. Senate weeks prior to the elections.
Oil’s decline – partly a result of increasing supply from North American shale beds – accelerated in late November after the Organization of Petroleum Exporting Countries (“OPEC”) announced its decision not to cut production. Good news on the U.S. economy was a major factor lifting share prices. GDP expanded by an upwardly revised 5.0% in the third quarter, its fastest pace since the third quarter of 2003. This strong performance stood in stark contrast to near-recessionary conditions afflicting most other key developed nations. Notably, the 18-member euro zone barely managed positive economic growth during the third quarter and rose just 0.2%. Foreign markets underperformed, as the U.S. dollar rose against other major currencies driven by U.S. economic strength and declining oil prices.
As 2014 drew to a close, the low price of oil, the weakness of overseas economies, and possible actions by the Fed and other central banks around the world were on the minds of many investors as they focused on the factors likely to impact the markets in the year ahead. Investors will also likely keep an eye out for continued economic growth here at home and improvement abroad, which may help create a favorable environment for stocks and bonds in 2015.
The information provided is the opinion of MassMutual Retirement Services Investment Services as of 1/1/15 and is subject to change without notice. It is not to be construed as tax, legal, or investment advice. Of course, past performance does not guarantee future results.
5
MML High Yield Fund – Portfolio Manager Report (Unaudited)
What is the investment approach of MML High Yield Fund, and who is the Fund’s subadviser?
The Fund seeks to achieve a high level of total return, with an emphasis on current income, by investing primarily in high yield debt and related securities. Under normal circumstances, the Fund invests at least 80% of its net assets in lower rated fixed income securities (rated below Baa3 by Moody’s or BBB- by Standard & Poor’s (using the lower rating) or, if unrated, determined by the Fund’s subadviser to be of comparable quality). The Fund’s subadviser is Babson Capital Management LLC (Babson Capital).
How did the Fund perform during the 12 months ended December 31, 2014?
The Fund’s Class II shares returned 1.05%, underperforming the 2.45% return of the Barclays U.S. Corporate High-Yield Bond Index (the “benchmark”), which covers the universe of fixed rate, non-investment-grade debt from corporate sectors.
For a discussion on the economic and market environment during the 12-month period ended December 31, 2014, please see the Economic and Market Overview, beginning on page 3.
Subadviser discussion of factors that contributed to the Fund’s performance
A substantial decline in the price of oil drove an increase in volatility in the high-yield bond market late in the year, with December finishing with the worst return for high-yield bonds of any December on record. At the same time, there was elevated volatility in stocks resulting from falling oil prices and the uncertainty concerning the Federal Reserve’s (the “Fed”) plans to raise interest rates.
The Fund underperformed the benchmark primarily due to overweight positions, relative to the benchmark, in the energy sector and lower-rated securities. Within energy, there was significant selling pressure due to the decline in commodity prices, particularly oil. At times during the period, investors drove down higher-rated bonds as much or more than their lower-rated counterparts. The Fund attempted to take advantage of this market discrepancy by selling certain bond holdings with lower-rated energy exposure and redeploying the proceeds from the sales into higher-rated bonds with energy-sector exposure – thus, increasing credit quality while maintaining the potential for capital appreciation.
We also selectively reduced the Fund’s investments in bonds rated CCC, in light of increased market volatility and the reduced liquidity off CCC bonds in today’s challenging market environment. We are not overly concerned with rising interest rates at this point and have been comfortable increasing the Fund’s allocation to higher-rated bonds with greater sensitivity to interest rate movements. At year-end, however, the Fund remained underweight in BB bonds, relative to the benchmark, on our belief that bonds rated B and CCC, which are rated lower than BB, may have the potential to outperform in 2015, given their recent underperformance.
As 2014 came to a close, the Fund’s overweight positions by sector, relative to the benchmark, included energy, industrial, consumer cyclical, transportation, capital goods, and basic industry. Conversely, the Fund held underweight positions in the communications, consumer non-cyclical, utility, finance, natural gas, banking, insurance, technology, and real estate investment trusts (REITs) sectors.
Subadviser outlook
In general, we believe fundamentals for U.S. high-yield bonds are likely to remain relatively stable in the coming year, although oil prices will be a major factor in 2015 since energy represents approximately 15% of the high-yield market. Excluding energy, we believe corporate fundamentals, including balance sheet leverage and earnings growth, have the potential to remain stable in the near term, which may keep default rates below normal. Developments in U.S. fiscal and monetary policies are likely to continue to have a bearing on performance as we move forward. Regarding monetary policy, our view is that it does not appear the Fed will be increasing target interest rates in the beginning of 2015, so the timing and speed of an eventual increase in rates will likely be an important consideration throughout the year.
6
MML High Yield Fund – Portfolio Manager Report (Unaudited) (Continued)
| | | | |
MML High Yield Fund
Portfolio Characteristics
(% of Net Assets) on 12/31/14 | |
| | |
Corporate Debt | | | 90.6 | % |
Bank Loans | | | 3.8 | % |
| | | | | |
Total Long-Term Investments | | | 94.4 | % |
Short-Term Investments and Other Assets and Liabilities | | | 5.6 | % |
| | | | | |
Net Assets | | | 100.0 | % |
| | | | | |
7
MML High Yield Fund – Portfolio Manager Report (Unaudited) (Continued)
Growth of a $10,000 Investment
Hypothetical Investments in MML High Yield Fund Class II, Service Class I, and the Barclays U.S. Corporate High-Yield Bond Index.
| | | | | | | | |
| | | |
TOTAL RETURN | | One Year 1/1/14 -
12/31/14 | | | Since
Inception Average
Annual 5/3/10 -
12/31/14 | |
| Class II | | | 1.05% | | | | 8.79% | |
| Service Class I | | | 0.71% | | | | 8.50% | |
| Barclays U.S. Corporate High-Yield Bond Index | | | 2.45% | | | | 8.11% | |
GROWTH OF $10,000 INVESTMENT SINCE INCEPTION
Performance data quoted represents past performance; past performance is not predictive of future results. The investment return and principal value of shares of the Fund will fluctuate with market conditions so that shares of the Fund, when redeemed, may be worth more or less than their original cost. Current performance of the Fund may be lower or higher than the performance quoted. Performance data current to the most recent month end may be obtained by accessing the website at www.massmutual.com.
Investors should note that the Fund is a professionally managed mutual fund, while the Barclays U.S. Corporate High-Yield Bond Index is unmanaged, does not incur expenses, and cannot be purchased directly by investors. Investors should read the Fund’s prospectus with regard to the Fund’s investment objective, risks, and charges and expenses in conjunction with these financial statements. The Fund’s return reflects changes in the net asset value per share without the deduction of any product charges (e.g., cost of insurance, mortality and expense risk charges, administrative fees, and CDSL). The inclusion of these charges would have reduced the performance shown here.
8
MML Inflation-Protected and Income Fund – Portfolio Manager Report (Unaudited)
What is the investment approach of MML Inflation-Protected and Income Fund, and who is the Fund’s subadviser?
The Fund seeks to achieve as high a total rate of real return on an annual basis as is considered consistent with prudent investment risk and the preservation of capital. Under normal circumstances, the Fund invests at least 80% of its net assets in inflation-indexed bonds and other income-producing securities. The Fund’s subadviser is Babson Capital Management LLC (Babson Capital).
How did the Fund perform during the 12 months ended December 31, 2014?
The Fund’s Initial Class shares returned 3.45%, underperforming the 3.64% return of the Barclays U.S. Treasury Inflation Protected Securities (TIPS) Index (Series-L) (the “benchmark”), an unmanaged index that measures the broad performance of U.S. Treasury inflation-indexed bonds.
How do inflation-indexed bonds protect against inflation?
Like many other fixed-income securities, inflation-indexed bonds pay income twice a year, based on a stated coupon rate. However, both the principal and the interest payment are adjusted for the level of inflation. The inflation rate – as measured by the Consumer Price Index for All Urban Consumers (“CPI-U”) – results in an adjustment to the principal amount of an inflation-protected security. The coupon rate is then applied to the adjusted principal amount to determine the interest payment. For example, assuming an inflation rate of 3%, a security with a par value of $1,000 and an annual coupon rate of 1.75%, the adjusted principal amount after one year would be $1,030 ($1,000 increased by 3%). The semi-annual interest payment would be calculated by multiplying $1,030 by 1.75% and dividing by 2 instead of using the original $1,000 par value to calculate the amount of interest.
For a discussion on the economic and market environment during the 12-month period ended December 31, 2014, please see the Economic and Market Overview, beginning on page 3.
Subadviser discussion of factors that contributed to the Fund’s performance
Consumer prices, as measured by the U.S. Bureau of Labor Statistics, declined as year-over-year unadjusted Headline Consumer Price Index (“CPI”) came in at 1.3%, down from 1.5% at the start of the year. (CPI measures changes in the price of a market basket of consumer goods and services.) Core CPI, which does not include food and energy prices, remained largely unchanged at 1.7%. Both CPI measures remained below the Federal Reserve’s (the “Fed”) 2% inflation target. Energy costs decreased 5.3% from the beginning of the year.
Our cautious view and its tactical approach to trading in inflation markets was positive in 2014, and the Fund’s timely shifts in exposure to TIPS were beneficial to returns. Specifically, an underweight position, relative to the benchmark, in short-maturity TIPS contributed to performance, as did an overweight exposure to 5-, 10-, and 30-year maturity TIPS during the first half of the year. Tactically reducing the Fund’s TIPS exposure in the fourth quarter helped preserve gains in the Fund, as recent inflation data was lower than expected. The Fund’s modestly overweight exposure to 5-year and 30-year TIPS worked against Fund returns in the second half of the year.
The Fund also invested in high-quality income-producing securities, including asset-backed and money market securities, whose income contributed positively during the year. Asset-backed securities (ABS) were the main driver of performance. An allocation to high-quality commercial paper – i.e., short-term unsecured promissory notes sold by banks and corporations to meet short-term debt obligations – also helped performance.
The Fund may use derivative instruments, which are securities that derive their value from the performance of one or more other investments and take the form of a contract between two or more parties. Most derivatives are used for hedging, speculation, or both. During the year, the Fund’s use of derivatives contributed to performance.
9
MML Inflation-Protected and Income Fund – Portfolio Manager Report (Unaudited) (Continued)
Subadviser outlook
Given recent material weakness in the market, we are reasonably optimistic about TIPS as we enter 2015. As a result, the Fund is positioned with a modest overweight to inflation exposure. In our view, the U.S. economic recovery is likely to continue in 2015 and outshine the anemic growth that is expected in the struggling economies of Europe, Japan, and the emerging markets. The Fed concluded its asset purchase program in October, but the December Federal Open Market Committee statement suggests that the Fed will remain patient before normalizing policy. Changes in policy are expected to be driven primarily by changes in labor market conditions and developments in inflation.
| | | | |
MML Inflation-Protected and
Income Fund
Portfolio Characteristics
(% of Net Assets) on 12/31/14 | |
| | |
U.S. Treasury Obligations | | | 97.1 | % |
Non-U.S. Government Agency Obligations | | | 33.5 | % |
Corporate Debt | | | 7.8 | % |
U.S. Government Agency Obligations and Instrumentalities | | | 0.3 | % |
Municipal Obligations | | | 0.1 | % |
Purchased Options | | | 0.1 | % |
| | | | | |
Total Long-Term Investments | | | 138.9 | % |
Short-Term Investments and Other Assets and Liabilities | | | (38.9 | )% |
| | | | | |
Net Assets | | | 100.0 | % |
| | | | | |
10
MML Inflation-Protected and Income Fund – Portfolio Manager Report (Unaudited) (Continued)
Growth of a $10,000 Investment
Hypothetical Investments in MML Inflation-Protected and Income Fund Initial Class and the Barclays U.S. Treasury Inflation Protected Securities (TIPS) Index (Series-L).
| | | | | | | | | | | | |
| | | | |
| TOTAL RETURN | | One Year 1/1/14 -
12/31/14 | | | Five Year Average
Annual 1/1/10 -
12/31/14 | | | Ten Year Average
Annual 1/1/05 -
12/31/14 | |
| Initial Class | | | 3.45% | | | | 4.08% | | | | 3.66% | |
Barclays U.S. Treasury Inflation Protected Securities (TIPS) Index (Series-L) | | | 3.64% | | | | 4.11% | | | | 4.37% | |
Hypothetical Investments in MML Inflation-Protected and Income Fund Service Class and the Barclays U.S. Treasury Inflation Protected Securities (TIPS) Index (Series-L).
| | | | | | | | | | | | |
| | | | |
| TOTAL RETURN | | One Year 1/1/14 -
12/31/14 | | | Five Year Average
Annual 1/1/10 -
12/31/14 | | | Since
Inception Average
Annual 8/15/08 -
12/31/14 | |
| Service Class | | | 3.16% | | | | 3.80% | | | | 3.31% | |
Barclays U.S. Treasury Inflation Protected Securities (TIPS) Index (Series-L) | | | 3.64% | | | | 4.11% | | | | 3.82% | |
GROWTH OF $10,000 INVESTMENT FOR THE PAST 10 YEARS
GROWTH OF $10,000 INVESTMENT SINCE INCEPTION
Performance data quoted represents past performance; past performance is not predictive of future results. The investment return and principal value of shares of the Fund will fluctuate with market conditions so that shares of the Fund, when redeemed, may be worth more or less than their original cost. Current performance of the Fund may be lower or higher than the performance quoted. Performance data current to the most recent month end may be obtained by accessing the website at www.massmutual.com.
Investors should note that the Fund is a professionally managed mutual fund, while the Barclays U.S. Treasury Inflation Protected Securities (TIPS) Index (Series-L) is unmanaged, does not incur expenses, and cannot be purchased directly by investors. Investors should read the Fund’s prospectus with regard to the Fund’s investment objective, risks, and charges and expenses in conjunction with these financial statements. The Fund’s return reflects changes in the net asset value per share without the deduction of any product charges (e.g., cost of insurance, mortality and expense risk charges, administrative fees, and CDSL). The inclusion of these charges would have reduced the performance shown here.
11
MML Short-Duration Bond Fund – Portfolio Manager Report (Unaudited)
What is the investment approach of MML Short-Duration Bond Fund, and who is the Fund’s subadviser?
The Fund seeks to achieve a high total rate of return primarily from current income while minimizing fluctuations in capital values by investing primarily in a diversified portfolio of short-term investment grade fixed income securities. Under normal circumstances, the Fund invests at least 80% of its net assets in investment grade fixed income securities (rated Baa or higher by Moody’s or BBB or higher by Standard & Poor’s or, if unrated, determined to be of comparable quality by the subadviser). The Fund’s subadviser is Babson Capital Management LLC (Babson Capital).
How did the Fund perform during the 12 months ended December 31, 2014?
The Fund’s Class II shares returned 1.46%, outperforming the 0.64% return of the Barclays U.S. 1-3 Year Government Bond Index (the “benchmark”), an unmanaged index of U.S. government bonds with one to three years remaining to the scheduled payment of principal.
For a discussion on the economic and market environment during the 12-month period ended December 31, 2014, please see the Economic and Market Overview, beginning on page 3.
Subadviser discussion of factors that contributed to the Fund’s performance
The Fund benefited from an overweight position, relative to the benchmark, in investment-grade corporate bonds during the year. Bonds rated BBB continued to exhibit stronger revenue growth and profitability compared to bonds with an A rating. Fund holdings in industries such as banking and real estate investment trusts (REITs) were the best performers during the year, while Fund holdings in the consumer products, oil equipment, and aerospace industries were main detractors. Overall, the Fund’s allocation to high-yield corporate bonds in the BB category also helped drive performance.
In “securitized” bonds, which bond issuers create by pooling various types of contractual debt (such as mortgages, auto loans, or credit card debt), the Fund’s allocation to commercial mortgage-backed securities (CMBS) was the primary contributor to performance. In CMBS, the Fund’s purchases were primarily in shorter-maturity securities. The Fund’s allocation to asset-backed securities (ABS) also helped drive returns for the year. There was a strong supply of and demand for new issues in ABS. In addition, 15-year U.S. agency mortgage-backed securities (MBS) also contributed to performance. (“Agency” refers to government-sponsored entities that issue bonds backed by mortgage loans, including Ginnie Mae, Fannie Mae, Freddie Mac, and the Federal Home Loan Banks.) During the year, the Fund reduced its agency MBS exposure and added agency collateralized mortgage obligation (CMO) securities. CMOs offered attractive pricing and the potential to add income to the Fund.
The Fund’s general positioning and cash holdings helped manage interest rate sensitivity and were beneficial to Fund performance during the year. An underweight stake in government agency bonds detracted from performance. The Fund uses derivative instruments for yield curve, duration, and credit risk management. Over the last year, performance from the Fund’s credit derivative hedges was a modest detractor from returns, while the Fund’s allocation to 10-year interest rate swaps contributed positively to the Fund’s results. (Derivatives are securities that derive their value from the performance of one or more other investments and take the form of a contract between two or more parties. Most derivatives are used for hedging, speculation, or both.)
Subadviser outlook
Recent challenges to the market have been numerous. Geopolitical tensions remained at the forefront, and Europe continued to post disappointing economic data. At the same time, the Federal Reserve (the “Fed”) continued to guide markets, suggesting that future decisions on monetary policy would be driven by economic data. Moving forward, many are expecting an eventual rate hike in 2015, but the Fed may be able to keep rates low, as the Consumer Price Index (CPI) has declined over the last few months and our view is that there is not yet wage pressure in the corporate sector. (CPI measures changes in the price of a market basket of consumer goods and services.)
Over the past few months, markets have been buffeted by a rash of mostly negative themes, such as the divergence between central bank monetary policies, slower growth in Europe and Asia, and geopolitical disagreements. As volatility has ticked up, we believe the low interest rate environment and lack of yield differential among many bonds suggests individual security selection may continue to trump other strategies in the bond market.
12
MML Short-Duration Bond Fund – Portfolio Manager Report (Unaudited) (Continued)
| | | | |
MML Short-Duration Bond Fund
Portfolio Characteristics
(% of Net Assets) on 12/31/14 | |
| | |
Corporate Debt | | | 38.4 | % |
U.S. Treasury Obligations | | | 27.1 | % |
Non-U.S. Government Agency Obligations | | | 26.2 | % |
U.S. Government Agency Obligations and Instrumentalities | | | 5.6 | % |
Municipal Obligations | | | 0.5 | % |
Purchased Options | | | 0.3 | % |
| | | | | |
Total Long-Term Investments | | | 98.1 | % |
Short-Term Investments and Other Assets and Liabilities | | | 1.9 | % |
| | | | | |
Net Assets | | | 100.0 | % |
| | | | | |
13
MML Short-Duration Bond Fund – Portfolio Manager Report (Unaudited) (Continued)
Growth of a $10,000 Investment
Hypothetical Investments in MML Short-Duration Bond Fund Class II, Service Class I, and the Barclays U.S. 1-3 Year Government Bond Index.
| | | | | | | | |
| | | |
| TOTAL RETURN | | One Year 1/1/14 -
12/31/14 | | | Since
Inception Average
Annual 5/3/10 -
12/31/14 | |
| Class II | | | 1.46% | | | | 2.54% | |
| Service Class I | | | 1.11% | | | | 2.29% | |
| Barclays U.S. 1-3 Year Government Bond Index | | | 0.64% | | | | 0.96% | |
GROWTH OF $10,000 INVESTMENT SINCE INCEPTION
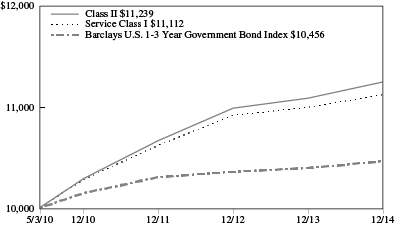
Performance data quoted represents past performance; past performance is not predictive of future results. The investment return and principal value of shares of the Fund will fluctuate with market conditions so that shares of the Fund, when redeemed, may be worth more or less than their original cost. Current performance of the Fund may be lower or higher than the performance quoted. Performance data current to the most recent month end may be obtained by accessing the website at www.massmutual.com.
Investors should note that the Fund is a professionally managed mutual fund, while the Barclays U.S. 1-3 Year Government Bond Index is unmanaged, does not incur expenses, and cannot be purchased directly by investors. Investors should read the Fund’s prospectus with regard to the Fund’s investment objective, risks, and charges and expenses in conjunction with these financial statements. The Fund’s return reflects changes in the net asset value per share without the deduction of any product charges (e.g., cost of insurance, mortality and expense risk charges, administrative fees, and CDSL). The inclusion of these charges would have reduced the performance shown here.
14
MML Small Cap Equity Fund – Portfolio Manager Report (Unaudited)
What is the investment approach of MML Small Cap Equity Fund, and who is the Fund’s subadviser?
The Fund seeks capital appreciation by investing primarily in common stocks of small-capitalization U.S. companies that the Fund’s subadviser believes have favorable business trends or prospects based on fundamental analysis. Under normal circumstances, the Fund invests at least 80% of its net assets in securities of companies whose market capitalizations at the time of purchase are within the market capitalization range of companies included in the Russell 2000® Index. The Fund’s subadviser is OppenheimerFunds, Inc. (OFI).
How did the Fund perform during the 12 months ended December 31, 2014?
The Fund’s Initial Class shares returned 12.16%, significantly exceeding the 4.89% return of the Russell 2000 Index (the “benchmark”), a widely recognized, unmanaged index representative of common stocks of smaller capitalized U.S. companies.
For a discussion on the economic and market environment during the 12-month period ended December 31, 2014, please see the Economic and Market Overview, beginning on page 3.
Subadviser discussion of factors that contributed to the Fund’s performance
The Fund outperformed the benchmark primarily due to stronger relative stock selection in the industrials, energy, consumer discretionary, and materials sectors. Conversely, the Fund underperformed the benchmark primarily in the health care and consumer staples sectors due to weaker relative stock selection, and an underweight position in utilities, relative to the benchmark.
Fund holdings that contributed to performance included Cavium (information technology), Century Aluminum (materials), LaSalle Hotel Properties (financials), Fortinet (Information Technology), and EPL Oil & Gas (energy). Cavium is a provider of integrated semiconductor processors enabling processing for networks, communications, storage, wireless, security, and video applications. Rising expectations for accelerating revenue growth propelled this stock higher during the reporting period. We believe Cavium is at a positive inflection point in its revenue cycle, so we added to the Fund’s investment in this holding. Century Aluminum advanced due to several factors, including rising London Metal Exchange aluminum prices. LaSalle Hotel Properties is a real estate investment trust (REIT) focused primarily on upmarket full-service hotel properties. During 2014, the company announced sales and profits that topped expectations. Network security company Fortinet released strong third-quarter earnings, and raised its fourth-quarter guidance. EPL Oil & Gas, an independent oil and natural gas exploration and production company with operations concentrated in the Gulf of Mexico, spiked higher after Energy XXI announced its intention to acquire EPL.
Top Fund holdings that detracted from performance included information technology stocks Infloblox, Web.com Group, Finisar, and Unisys. The Fund’s position in Pier 1 Imports, Inc. (consumer discretionary) also hindered returns. We sold the Fund’s positions in all of these holdings by year-end. Infoblox is a leader in “automated network control” solutions and security whose stock price suffered a setback after management reported a deceleration in growth and a slowdown for the full year. Web.com Group is a provider of Internet services and online marketing solutions, primarily to small businesses. The company missed expectations during the year, sending its stock price lower. Finisar’s products enable high-speed data communications over both local and storage area networks. A disappointing quarterly result – with earnings that missed estimates – combined with a less-optimistic outlook from management drove down the company’s shares. Unisys is an IT consulting business that missed second-quarter earnings estimates. Finally, Pier 1 Imports, a specialty retailer of decorative home furnishings and accessories, declined as a result of earnings that fell short of consensus estimates – leading to falling forecasts. Revenues largely met expectations, with comparable store sales finishing better than anticipated; however, profitability was under pressure due to increased promotional activity that narrowed gross margins.
Subadviser outlook
We aim to construct an “all-weather” portfolio for the Fund by targeting companies we believe may have sustainable competitive advantages, skilled management with a proven track record of executing effectively, and financial resources with the potential to generate improving profitability, gain market share, and/or return significant cash to shareholders. In our view, during times of volatile or slow economic growth, such companies can widen their lead over weaker competitors. We seek to invest in companies for the Fund that are characterized by these qualities at compelling valuations and believe this disciplined approach is essential in seeking superior long-term performance for the Fund’s shareholders. Regardless of market conditions in 2015, we will continue to seek companies that meet our criteria for the Fund.
15
MML Small Cap Equity Fund – Portfolio Manager Report (Unaudited) (Continued)
| | | | |
MML Small Cap Equity Fund
Largest Holdings
(% of Net Assets) on 12/31/14 | |
| | |
LaSalle Hotel Properties | | | 2.2 | % |
Korn/Ferry International | | | 2.1 | % |
Prestige Brands Holdings, Inc. | | | 2.0 | % |
KAR Auction Services, Inc. | | | 2.0 | % |
STAG Industrial, Inc. | | | 2.0 | % |
Dana Holding Corp. | | | 2.0 | % |
Western Refining, Inc. | | | 2.0 | % |
WellCare Health Plans, Inc. | | | 1.9 | % |
Chatham Lodging Trust | | | 1.7 | % |
Mattress Firm Holding Corp. | | | 1.7 | % |
| | | | | |
| | | | 19.6 | % |
| | | | | |
| | | | |
MML Small Cap Equity Fund
Sector Table
(% of Net Assets) on 12/31/14 | |
| | |
Consumer, Non-cyclical | | | 28.2 | % |
Financial | | | 22.8 | % |
Technology | | | 15.2 | % |
Mutual Funds | | | 11.3 | % |
Consumer, Cyclical | | | 10.2 | % |
Industrial | | | 9.7 | % |
Basic Materials | | | 7.1 | % |
Energy | | | 5.0 | % |
Communications | | | 1.2 | % |
Utilities | | | 0.4 | % |
| | | | | |
Total Long-Term Investments | | | 111.1 | % |
Short-Term Investments and Other Assets and Liabilities | | | (11.1 | )% |
| | | | | |
Net Assets | | | 100.0 | % |
| | | | | |
16
MML Small Cap Equity Fund – Portfolio Manager Report (Unaudited) (Continued)
Growth of a $10,000 Investment
Hypothetical Investments in MML Small Cap Equity Fund Initial Class and the Russell 2000 Index.
| | | | | | | | | | | | |
| | | | |
| TOTAL RETURN | | One Year 1/1/14 -
12/31/14 | | | Five Year Average
Annual 1/1/10 -
12/31/14 | | | Ten Year Average
Annual 1/1/05 -
12/31/14 | |
| Initial Class | | | 12.16% | | | | 17.71% | | | | 7.58% | |
| Russell 2000 Index | | | 4.89% | | | | 15.55% | | | | 7.77% | |
Hypothetical Investments in MML Small Cap Equity Fund Service Class and the Russell 2000 Index.
| | | | | | | | | | | | |
| | | | |
| TOTAL RETURN | | One Year 1/1/14 -
12/31/14 | | | Five Year Average
Annual 1/1/10 -
12/31/14 | | | Since
Inception Average
Annual 8/15/08 -
12/31/14 | |
| Service Class | | | 11.88% | | | | 17.42% | | | | 11.08% | |
| Russell 2000 Index | | | 4.89% | | | | 15.55% | | | | 9.14% | |
GROWTH OF $10,000 INVESTMENT FOR THE PAST 10 YEARS
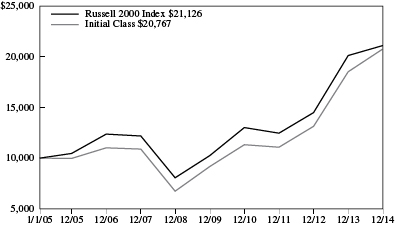
GROWTH OF $10,000 INVESTMENT SINCE INCEPTION
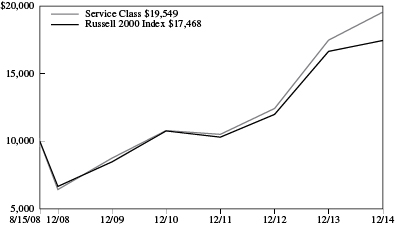
Performance data quoted represents past performance; past performance is not predictive of future results. The investment return and principal value of shares of the Fund will fluctuate with market conditions so that shares of the Fund, when redeemed, may be worth more or less than their original cost. Current performance of the Fund may be lower or higher than the performance quoted. Performance data current to the most recent month end may be obtained by accessing the website at www.massmutual.com.
Investors should note that the Fund is a professionally managed mutual fund, while the Russell 2000 Index is unmanaged, does not incur expenses, and cannot be purchased directly by investors. Investors should read the Fund’s prospectus with regard to the Fund’s investment objective, risks, and charges and expenses in conjunction with these financial statements. The Fund’s return reflects changes in the net asset value per share without the deduction of any product charges (e.g., cost of insurance, mortality and expense risk charges, administrative fees, and CDSL). The inclusion of these charges would have reduced the performance shown here.
17
MML Strategic Emerging Markets Fund – Portfolio Manager Report (Unaudited)
What is the investment approach of MML Strategic Emerging Markets Fund, and who is the Fund’s subadviser?
The Fund seeks long-term capital growth by investing mainly in common stocks of issuers in developing and emerging markets throughout the world and at times, up to 100% of its total assets in foreign securities. Under normal market conditions, the Fund will invest at least 80% of its net assets in equity securities of issuers whose principal activities are in a developing (or emerging) market, i.e., are in a developing market or are economically tied to a developing market country. The Fund will invest in at least three developing markets. In general, countries may be considered developing or emerging markets if they are included in any one of the MSCI emerging markets indexes, classified as a developing or emerging market, or classified under a similar or corresponding classification, by organizations such as the World Bank and the International Monetary Fund, or have economies, industries, and stock markets with similar characteristics. The Fund’s subadviser is OppenheimerFunds, Inc. (OFI).
How did the Fund perform during the 12 months ended December 31, 2014?
The Fund’s Class II Shares returned -5.41%, lagging the -2.19% return of the MSCI Emerging Markets (EM) Index (the “benchmark”), an unmanaged market capitalization-weighted index of equity securities of companies domiciled in various countries. The index is designed to represent the performance of emerging stock markets throughout the world and excludes certain market segments unavailable to U.S.-based investors.
For a discussion on the economic and market environment during the 12-month period ended December 31, 2014, please see the Economic and Market Overview, beginning on page 3.
Subadviser discussion of factors that contributed to the Fund’s performance
The Fund underperformed the benchmark primarily due to weak relative stock selection in the consumer staples, energy, and information technology sectors. The Fund’s relative performance excelled in the materials, industrials, and consumer discretionary sectors, where strong stock selection was a benefit. An underweight position, relative to the benchmark, in the materials sector also helped returns.
On a country basis, an overweight position in Russia, stock selection and an underweight position in China, in tandem with overweight positions in the United Kingdom and Italy detracted from performance. An overweight position and stock selection in India, an underweight position in South Korea, and stock selection in Brazil produced positive relative performance.
The Fund holdings that were top detractors from performance for the year included Yandex (information technology – Russia), Novatek (energy – Russia), Magnit (consumer staples – Russia), Petroleo Brasileiro (energy – Brazil), and Tullow Oil (energy – United Kingdom). In a difficult period for energy and Russian stocks, these holdings experienced declines, as the energy sector fell amid declining oil prices.
Top-performing Fund holdings in 2014 included Baidu, Inc. (information technology – China); Housing Development Finance Corporation Ltd. (financials – India); ICICI Bank Ltd. (financials – India); Zee Entertainment Enterprises (consumer discretionary – India); and Taiwan Semiconductor Manufacturing Co., Ltd. (information technology – Taiwan). Baidu, the leading Internet search provider in China, continued to narrow the monetization gap between mobile devices and personal computers, and transitioned from being primarily a search-driven advertising platform to an integrated mobile Internet ecosystem. Housing Development Finance is the leading provider of housing loans in India. During the year, the stock benefited from increasingly positive investor sentiment towards India. ICICI Bank and Zee Entertainment Enterprises were also beneficiaries of the positive performance of Indian stocks. ICICI Bank is the largest private sector bank in India whose checking and savings deposits have been growing. Zee Entertainment Enterprises is an integrated media and entertainment company engaged primarily in broadcasting and content development, production and its delivery via satellite. The company reported an increase in operating revenues in October. Taiwan Semiconductor Manufacturing is engaged in the research, development, manufacture, and distribution of integrated circuit-related products. The company had strong sales in 2014, as its chips are used in Apple’s iPhone 6 and iPhone 6 Plus.
At year-end, the Fund had its most significant overweight positions in the consumer staples, consumer discretionary, and health care sectors – and was underweight in all other sectors relative to the benchmark. On a country basis, the Fund had its largest overweight positions in India, the United Kingdom, Hong Kong, Russia, and France, with its most significant underweight stakes in South Korea, Taiwan, China, and South Africa.
18
MML Strategic Emerging Markets Fund – Portfolio Manager Report (Unaudited) (Continued)
Subadviser outlook
As active managers, we seek high-quality, attractively valued companies for the Fund, regardless of the prevailing macro-economic environment. We focus on companies that we believe have unique and durable competitive advantages and long-tailed growth opportunities. The Fund invests in these companies for the long term, resulting in relatively low turnover. Regardless of market conditions in 2015, we will continue to seek companies that meet our criteria for the Fund.
| | | | |
MML Strategic Emerging Markets Fund
Largest Holdings
(% of Net Assets) on 12/31/14 | |
| | |
Baidu, Inc. Sponsored ADR
(Cayman Islands) | | | 4.8 | % |
Housing Development Finance Corp. | | | 3.1 | % |
Infosys Technologies Ltd. | | | 2.6 | % |
ICICI Bank Ltd. Sponsored ADR (India) | | | 2.2 | % |
Magnit OJSC | | | 2.1 | % |
Tencent Holdings Ltd. | | | 2.1 | % |
Taiwan Semiconductor Manufacturing Co. Ltd. | | | 2.0 | % |
America Movil SAB de CV Sponsored ADR (Mexico) | | | 2.0 | % |
NovaTek OAO | | | 1.9 | % |
Prada SpA | | | 1.7 | % |
| | | | | |
| | | | 24.5 | % |
| | | | | |
| | | | |
MML Strategic Emerging Markets Fund
Sector Table
(% of Net Assets) on 12/31/14 | |
| | |
Financial | | | 21.7 | % |
Consumer, Non-cyclical | | | 20.2 | % |
Communications | | | 19.1 | % |
Consumer, Cyclical | | | 12.3 | % |
Technology | | | 5.6 | % |
Mutal Funds | | | 5.0 | % |
Energy | | | 4.8 | % |
Industrial | | | 4.6 | % |
Diversified | | | 3.4 | % |
Basic Materials | | | 2.4 | % |
| | | | | |
Total Long-Term Investments | | | 99.1 | % |
Short-Term Investments and Other Assets and Liabilities | | | 0.9 | % |
| | | | | |
Net Assets | | | 100.0 | % |
| | | | | |
19
MML Strategic Emerging Markets Fund – Portfolio Manager Report (Unaudited) (Continued)
Growth of a $10,000 Investment
Hypothetical Investments in MML Strategic Emerging Markets Fund Class II and the MSCI EM Index.
| | | | | | | | | | | | |
| | | | |
| TOTAL RETURN | | One Year 1/1/14 -
12/31/14 | | | Five Year
Average
Annual 1/1/10 -
12/31/14 | | | Since
Inception
Average
Annual 5/1/09 -
12/31/14 | |
| Class II | | | -5.41% | | | | -1.32% | | | | 6.66% | |
| MSCI EM Index | | | -2.19% | | | | 1.78% | | | | 9.30% | |
Hypothetical Investments in MML Strategic Emerging Markets Fund Service Class I and the MSCI EM Index.
| | | | | | | | | | | | |
| | | | |
| TOTAL RETURN | | One Year 1/1/14 -
12/31/14 | | | Five Year
Average
Annual 1/1/10 -
12/31/14 | | | Since
Inception
Average
Annual 8/27/08 -
12/31/14 | |
| Service Class I | | | -5.63% | | | | -1.58% | | | | 1.43% | |
| MSCI EM Index | | | -2.19% | | | | 1.78% | | | | 2.74% | |
GROWTH OF $10,000 INVESTMENT SINCE INCEPTION
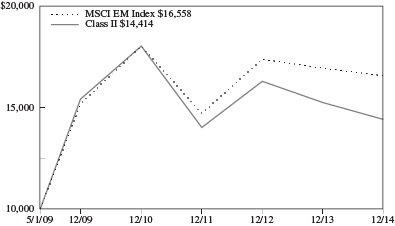
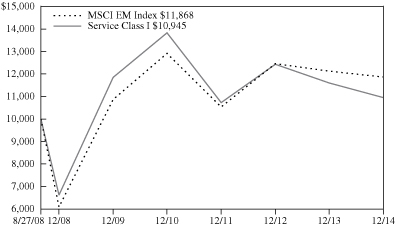
Performance data quoted represents past performance; past performance is not predictive of future results. The investment return and principal value of shares of the Fund will fluctuate with market conditions so that shares of the Fund, when redeemed, may be worth more or less than their original cost. Current performance of the Fund may be lower or higher than the performance quoted. Performance data current to the most recent month end may be obtained by accessing the website at www.massmutual.com.
Investors should note that the Fund is a professionally managed mutual fund, while the MSCI EM Index is unmanaged, does not incur expenses, and cannot be purchased directly by investors. Investors should read the Fund’s prospectus with regard to the Fund’s investment objective, risks, and charges and expenses in conjunction with these financial statements. The Fund’s return reflects changes in the net asset value per share without the deduction of any product charges (e.g., cost of insurance, mortality and expense risk charges, administrative fees, and CDSL). The inclusion of these charges would have reduced the performance shown here.
20
MML High Yield Fund – Portfolio of Investments
December 31, 2014
| | | | | | | | |
| | | Principal
Amount | | | Value | |
| BONDS & NOTES — 94.4% | | | | | | | | |
| | |
| BANK LOANS — 3.8% | | | | | | | | |
| Electronics — 0.9% | | | | | | | | |
RP Crown Parent LLC, 2nd Lien Term Loan
11.250% 12/20/19 | | $ | 1,500,000 | | | $ | 1,261,245 | |
| | | | | | | | |
| Oil & Gas — 2.0% | | | | | | | | |
Caelus Energy Alaska O3 LLC, 2nd Lien Term Loan
8.750% 4/02/21 | | | 3,139,220 | | | | 2,746,817 | |
| | | | | | | | |
| Pharmaceuticals — 0.9% | | | | | | | | |
Synarc-Biocore Holdings LLC, 2nd Lien Term Loan
9.250% 3/04/22 | | | 1,468,985 | | | | 1,283,526 | |
| | | | | | | | |
| | |
TOTAL BANK LOANS
(Cost $6,086,299) | | | | | | | 5,291,588 | |
| | | | | | | | |
| | |
| CORPORATE DEBT — 90.6% | | | | | | | | |
| Aerospace & Defense — 1.2% | | | | | | | | |
Moog, Inc. (a)
5.250% 12/01/22 | | | 556,000 | | | | 562,950 | |
TransDigm, Inc.
6.500% 7/15/24 | | | 1,210,000 | | | | 1,216,050 | |
| | | | | | | | |
| | | | | | | 1,779,000 | |
| | | | | | | | |
| Agriculture — 1.6% | | | | | | | | |
Pinnacle Operating Corp. (a)
9.000% 11/15/20 | | | 2,204,000 | | | | 2,270,120 | |
| | | | | | | | |
| Airlines — 1.0% | | | | | | | | |
Intrepid Aviation Group Holdings LLC/Intrepid Finance Co. (a)
6.875% 2/15/19 | | | 1,453,000 | | | | 1,409,410 | |
| | | | | | | | |
| Apparel — 1.6% | | | | | | | | |
Perry Ellis International, Inc.
7.875% 4/01/19 | | | 2,189,000 | | | | 2,243,725 | |
| | | | | | | | |
| Auto Manufacturers — 2.1% | | | | | | | | |
Allied Specialty Vehicles, Inc. (a)
8.500% 11/01/19 | | | 2,808,000 | | | | 2,941,380 | |
| | | | | | | | |
| Automotive & Parts — 3.3% | | | | | | | | |
Accuride Corp.
9.500% 8/01/18 | | | 1,545,000 | | | | 1,591,350 | |
Cooper Tire & Rubber Co.
8.000% 12/15/19 | | | 285,000 | | | | 318,487 | |
Dana Holding Corp.
5.500% 12/15/24 | | | 574,000 | | | | 579,740 | |
International Automotive Components Group SA (a)
9.125% 6/01/18 | | | 2,100,000 | | | | 2,189,250 | |
| | | | | | | | |
| | | | | | | 4,678,827 | |
| | | | | | | | |
| | | | | | | | |
| | | Principal
Amount | | | Value | |
| Banks — 1.1% | | | | | | | | |
Ally Financial, Inc.
8.000% 11/01/31 | | $ | 1,230,000 | | | $ | 1,568,250 | |
| | | | | | | | |
| Building Materials — 1.8% | | | | | | | | |
Headwaters, Inc.
7.250% 1/15/19 | | | 1,500,000 | | | | 1,560,000 | |
Roofing Supply Group LLC/Roofing Supply Finance, Inc. (a)
10.000% 6/01/20 | | | 974,000 | | | | 966,111 | |
| | | | | | | | |
| | | | | | | 2,526,111 | |
| | | | | | | | |
| Chemicals — 2.1% | | | | | | | | |
Cornerstone Chemical Co. (a)
9.375% 3/15/18 | | | 1,060,000 | | | | 1,081,200 | |
Omnova Solutions, Inc.
7.875% 11/01/18 | | | 972,000 | | | | 981,720 | |
TPC Group, Inc. (a)
8.750% 12/15/20 | | | 911,000 | | | | 885,947 | |
| | | | | | | | |
| | | | | | | 2,948,867 | |
| | | | | | | | |
| Coal — 1.9% | | | | | | | | |
Murray Energy Corp. (a)
9.500% 12/05/20 | | | 253,000 | | | | 253,000 | |
Murray Energy Corp. (a)
8.625% 6/15/21 | | | 1,394,000 | | | | 1,331,270 | |
SunCoke Energy Partners LP/SunCoke Energy Partners Finance Corp. (a)
7.375% 2/01/20 | | | 810,000 | | | | 841,388 | |
SunCoke Energy Partners LP/SunCoke Energy Partners Finance Corp. (a)
7.375% 2/01/20 | | | 215,000 | | | | 223,331 | |
| | | | | | | | |
| | | | | | | 2,648,989 | |
| | | | | | | | |
| Commercial Services — 5.4% | | | | | | | | |
The ADT Corp.
5.250% 3/15/20 | | | 831,000 | | | | 841,387 | |
Multi-Color Corp. (a)
6.125% 12/01/22 | | | 1,200,000 | | | | 1,200,000 | |
Mustang Merger Corp. (a)
8.500% 8/15/21 | | | 4,355,000 | | | | 4,137,250 | |
StoneMor Partners LP/Cornerstone Family Services of WV
7.875% 6/01/21 | | | 1,385,000 | | | | 1,412,700 | |
| | | | | | | | |
| | | | | | | 7,591,337 | |
| | | | | | | | |
| Computers — 0.3% | | | | | | | | |
IHS, Inc. (a)
5.000% 11/01/22 | | | 446,000 | | | | 441,540 | |
| | | | | | | | |
| Distribution & Wholesale — 0.3% | | | | | | | | |
Global Partners LP/GLP Finance Corp. (a)
6.250% 7/15/22 | | | 518,000 | | | | 502,460 | |
| | | | | | | | |
The accompanying notes are an integral part of the financial statements.
21
MML High Yield Fund – Portfolio of Investments (Continued)
| | | | | | | | |
| | | Principal
Amount | | | Value | |
| Diversified Financial — 1.6% | | | | | | | | |
E*TRADE Financial Corp.
5.375% 11/15/22 | | $ | 694,000 | | | $ | 709,615 | |
Icahn Enterprises LP/Icahn Enterprises Finance Corp.
5.875% 2/01/22 | | | 1,500,000 | | | | 1,506,563 | |
| | | | | | | | |
| | | | | | | 2,216,178 | |
| | | | | | | | |
| Electric — 0.5% | | | | | | | | |
Dynegy Finance I, Inc./Dynegy Finance II, Inc. (a)
7.625% 11/01/24 | | | 650,000 | | | | 663,000 | |
| | | | | | | | |
| Electronics — 0.4% | | | | | | | | |
Rexel SA (a)
5.250% 6/15/20 | | | 567,000 | | | | 571,253 | |
| | | | | | | | |
| Engineering & Construction — 1.0% | | | | | | | | |
Weekley Homes LLC/Weekley Finance Corp.
6.000% 2/01/23 | | | 775,000 | | | | 736,250 | |
Zachry Holdings, Inc. (a)
7.500% 2/01/20 | | | 686,000 | | | | 689,430 | |
| | | | | | | | |
| | | | | | | 1,425,680 | |
| | | | | | | | |
| Foods — 1.4% | | | | | | | | |
Hearthside Group Holdings LLC/Hearthside Finance Co. (a)
6.500% 5/01/22 | | | 300,000 | | | | 292,500 | |
JBS Investments GmbH (a)
7.750% 10/28/20 | | | 1,600,000 | | | | 1,656,800 | |
| | | | | | | | |
| | | | | | | 1,949,300 | |
| | | | | | | | |
| Forest Products & Paper — 2.7% | | | | | | | | |
Appvion, Inc. (a)
9.000% 6/01/20 | | | 1,975,000 | | | | 1,352,875 | |
Xerium Technologies, Inc.
8.875% 6/15/18 | | | 2,308,000 | | | | 2,424,842 | |
| | | | | | | | |
| | | | | | | 3,777,717 | |
| | | | | | | | |
| Gas — 0.5% | | | | | | | | |
LBC Tank Terminals Holding Netherlands BV (a)
6.875% 5/15/23 | | | 646,000 | | | | 649,230 | |
| | | | | | | | |
| Health Care – Products — 1.3% | | | | | | | | |
Alere, Inc.
6.500% 6/15/20 | | | 1,485,000 | | | | 1,492,425 | |
Halyard Health, Inc. (a)
6.250% 10/15/22 | | | 320,000 | | | | 324,800 | |
| | | | | | | | |
| | | | | | | 1,817,225 | |
| | | | | | | | |
| Health Care – Services — 2.7% | | | | | | | | |
Fresenius Medical Care US Finance II, Inc. (a)
4.750% 10/15/24 | | | 638,000 | | | | 644,380 | |
HCA, Inc.
5.250% 4/15/25 | | | 669,000 | | | | 699,105 | |
| | | | | | | | |
| | | Principal
Amount | | | Value | |
Kindred Escrow Corp. II (a)
8.750% 1/15/23 | | $ | 1,197,000 | | | $ | 1,288,271 | |
Tenet Healthcare Corp.
8.125% 4/01/22 | | | 1,040,000 | | | | 1,162,200 | |
| | | | | | | | |
| | | | | | | 3,793,956 | |
| | | | | | | | |
| Holding Company – Diversified — 0.7% | | | | | |
Carlson Travel Holdings, Inc. (a)
7.500% 8/15/19 | | | 1,025,000 | | | | 1,032,688 | |
| | | | | | | | |
| Home Builders — 1.9% | | | | | | | | |
Brookfield Residential Properties, Inc. (a)
6.500% 12/15/20 | | | 1,255,000 | | | | 1,311,475 | |
William Lyon Homes, Inc.
8.500% 11/15/20 | | | 1,351,000 | | | | 1,455,703 | |
| | | | | | | | |
| | | | | | | 2,767,178 | |
| | | | | | | | |
| Insurance — 0.6% | | | | | | | | |
Onex York Acquisition Corp. (a)
8.500% 10/01/22 | | | 922,000 | | | | 922,000 | |
| | | | | | | | |
| Leisure Time — 3.3% | | | | | | | | |
Brunswick Corp. (a)
4.625% 5/15/21 | | | 495,000 | | | | 485,100 | |
Brunswick Corp.
7.375% 9/01/23 | | | 285,000 | | | | 309,225 | |
Brunswick Corp.
7.125% 8/01/27 | | | 2,245,000 | | | | 2,402,150 | |
Carlson Wagonlit BV (a)
6.875% 6/15/19 | | | 1,409,000 | | | | 1,472,405 | |
| | | | | | | | |
| | | | | | | 4,668,880 | |
| | | | | | | | |
| Lodging — 1.1% | | | | | | | | |
MGM Resorts International
6.000% 3/15/23 | | | 1,500,000 | | | | 1,507,500 | |
| | | | | | | | |
| Machinery – Diversified — 1.3% | | | | | | | | |
Welltec A/S (a)
8.000% 2/01/19 | | | 1,412,000 | | | | 1,313,160 | |
Zebra Technologies Corp. (a)
7.250% 10/15/22 | | | 494,000 | | | | 518,700 | |
| | | | | | | | |
| | | | | | | 1,831,860 | |
| | | | | | | | |
| Manufacturing — 3.5% | | | | | | | | |
CTP Transportation Products LLC/CTP Finance, Inc. (a)
8.250% 12/15/19 | | | 675,000 | | | | 712,125 | |
EnPro Industries, Inc. (a)
5.875% 9/15/22 | | | 1,080,000 | | | | 1,090,800 | |
JB Poindexter & Co., Inc. (a)
9.000% 4/01/22 | | | 2,990,000 | | | | 3,229,200 | |
| | | | | | | | |
| | | | | | | 5,032,125 | |
| | | | | | | | |
| Media — 8.5% | | | | | | | | |
CCO Holdings LLC/CCO Holdings Capital Corp.
5.750% 1/15/24 | | | 838,000 | | | | 846,380 | |
The accompanying notes are an integral part of the financial statements.
22
MML High Yield Fund – Portfolio of Investments (Continued)
| | | | | | | | |
| | | Principal
Amount | | | Value | |
CCOH Safari LLC
5.500% 12/01/22 | | $ | 1,082,000 | | | $ | 1,098,230 | |
CCOH Safari LLC
5.750% 12/01/24 | | | 1,583,000 | | | | 1,600,809 | |
Cogeco Cable, Inc. (a)
4.875% 5/01/20 | | | 710,000 | | | | 710,000 | |
DISH DBS Corp. (a)
5.875% 11/15/24 | | | 696,000 | | | | 699,480 | |
Entercom Radio LLC
10.500% 12/01/19 | | | 1,000,000 | | | | 1,085,000 | |
Harron Communications LP/Harron Finance Corp. (a)
9.125% 4/01/20 | | | 1,226,000 | | | | 1,336,340 | |
LIN Television Corp. (a)
5.875% 11/15/22 | | | 564,000 | | | | 558,360 | |
Numericable-SFR (a)
6.000% 5/15/22 | | | 475,000 | | | | 477,612 | |
Numericable-SFR (a)
6.250% 5/15/24 | | | 260,000 | | | | 261,950 | |
RCN Telecom Services LLC/RCN Capital Corp. (a)
8.500% 8/15/20 | | | 2,031,000 | | | | 2,091,930 | |
Sirius XM Radio, Inc. (a)
6.000% 7/15/24 | | | 465,000 | | | | 476,625 | |
Townsquare Radio LLC/Townsquare Radio, Inc. (a)
9.000% 4/01/19 | | | 710,000 | | | | 756,150 | |
| | | | | | | | |
| | | | | | | 11,998,866 | |
| | | | | | | | |
| Mining — 1.5% | | | | | | | | |
Alcoa, Inc.
5.125% 10/01/24 | | | 630,000 | | | | 667,655 | |
First Quantum Minerals Ltd. (a)
7.250% 5/15/22 | | | 1,071,000 | | | | 963,900 | |
Hecla Mining Co.
6.875% 5/01/21 | | | 638,000 | | | | 561,440 | |
| | | | | | | | |
| | | | | | | 2,192,995 | |
| | | | | | | | |
| Oil & Gas — 9.2% | | | | | | | | |
American Energy – Woodford LLC/AEW Finance Corp. (a)
9.000% 9/15/22 | | | 653,000 | | | | 417,920 | |
Baytex Energy Corp. (a)
5.625% 6/01/24 | | | 1,150,000 | | | | 977,500 | |
California Resources Corp. (a)
6.000% 11/15/24 | | | 970,000 | | | | 819,650 | |
Calumet Specialty Products Partners LP/Calumet Finance Corp. (a)
6.500% 4/15/21 | | | 1,322,000 | | | | 1,176,580 | |
CVR Refining LLC/Coffeyville Finance, Inc.
6.500% 11/01/22 | | | 1,737,000 | | | | 1,650,150 | |
| | | | | | | | |
| | | Principal
Amount | | | Value | |
Hilcorp Energy I LP/Hilcorp Finance Co. (a)
5.000% 12/01/24 | | $ | 750,000 | | | $ | 660,000 | |
Jupiter Resources, Inc. (a)
8.500% 10/01/22 | | | 1,500,000 | | | | 1,128,750 | |
Magnum Hunter Resources Corp.
9.750% 5/15/20 | | | 2,135,000 | | | | 1,686,650 | |
Millennium Offshore Services Superholdings LLC (a)
9.500% 2/15/18 | | | 1,281,000 | | | | 1,274,595 | |
Precision Drilling Corp. (a)
5.250% 11/15/24 | | | 1,050,000 | | | | 861,000 | |
Sabine Oil & Gas LLC / Sabine Oil & Gas Finance Corp.
9.750% 2/15/17 | | | 1,720,000 | | | | 894,400 | |
Seventy Seven Energy, Inc.
6.500% 7/15/22 | | | 675,000 | | | | 394,875 | |
Summit Midstream Holdings LLC/Summit Midstream Finance Corp.
5.500% 8/15/22 | | | 400,000 | | | | 380,000 | |
Summit Midstream Holdings LLC/Summit Midstream Finance Corp.
7.500% 7/01/21 | | | 640,000 | | | | 672,000 | |
| | | | | | | | |
| | | | | | | 12,994,070 | |
| | | | | | | | |
| Packaging & Containers — 2.0% | | | | | | | | |
Ardagh Finance Holdings SA (a)
8.625% 6/15/19 | | | 521,921 | | | | 514,092 | |
Sealed Air Corp. (a)
4.875% 12/01/22 | | | 371,000 | | | | 368,218 | |
Sealed Air Corp. (a)
5.125% 12/01/24 | | | 371,000 | | | | 374,710 | |
Sealed Air Corp. (a)
6.875% 7/15/33 | | | 1,580,000 | | | | 1,615,550 | |
| | | | | | | | |
| | | | | | | 2,872,570 | |
| | | | | | | | |
| Pharmaceuticals — 2.5% | | | | | | | | |
BioScrip, Inc. (a)
8.875% 2/15/21 | | | 2,049,000 | | | | 1,844,100 | |
Capsugel SA (a)
7.000% 5/15/19 | | | 410,000 | | | | 414,100 | |
Endo Finance LLC/Endo Finco, Inc. (a)
5.375% 1/15/23 | | | 1,285,000 | | | | 1,259,300 | |
| | | | | | | | |
| | | | | | | 3,517,500 | |
| | | | | | | | |
| Pipelines — 0.2% | | | | | | | | |
Tesoro Logistics LP/Tesoro Logistics Finance Corp. (a)
6.250% 10/15/22 | | | 358,000 | | | | 357,105 | |
| | | | | | | | |
| Real Estate — 0.2% | | | | | | | | |
Forestar USA Real Estate Group, Inc. (a)
8.500% 6/01/22 | | | 276,000 | | | | 269,100 | |
| | | | | | | | |
The accompanying notes are an integral part of the financial statements.
23
MML High Yield Fund – Portfolio of Investments (Continued)
| | | | | | | | |
| | | Principal
Amount | | | Value | |
| Retail — 1.2% | | | | | | | | |
Landry’s, Inc. (a)
9.375% 5/01/20 | | $ | 930,000 | | | $ | 985,800 | |
The Pantry, Inc.
8.375% 8/01/20 | | | 640,000 | | | | 700,800 | |
| | | | | | | | |
| | | | | | | 1,686,600 | |
| | | | | | | | |
| Savings & Loans — 0.7% | | | | | | | | |
Consolidated Energy Finance SA (a)
6.750% 10/15/19 | | | 1,078,000 | | | | 1,053,745 | |
| | | | | | | | |
| Semiconductors — 1.2% | | | | | | | | |
Micron Technology, Inc. (a)
5.500% 2/01/25 | | | 1,650,000 | | | | 1,666,500 | |
| | | | | | | | |
| Software — 1.9% | | | | | | | | |
Audatex North America, Inc. (a)
6.000% 6/15/21 | | | 1,135,000 | | | | 1,169,050 | |
Audatex North America, Inc. (a)
6.125% 11/01/23 | | | 1,004,000 | | | | 1,036,630 | |
MSCI, Inc. (a)
5.250% 11/15/24 | | | 410,000 | | | | 424,350 | |
| | | | | | | | |
| | | | | | | 2,630,030 | |
| | | | | | | | |
| Storage & Warehousing — 1.2% | | | | | | | | |
Niska Gas Storage Canada ULC/Niska Gas Storage Canada Finance Corp. (a)
6.500% 4/01/19 | | | 2,205,000 | | | | 1,659,263 | |
| | | | | | | | |
| Telecommunications — 5.6% | | | | | | | | |
Altice Financing SA (a)
6.500% 1/15/22 | | | 875,000 | | | | 855,312 | |
Altice Finco SA (a)
8.125% 1/15/24 | | | 815,000 | | | | 794,625 | |
Altice SA (a)
7.750% 5/15/22 | | | 1,210,000 | | | | 1,212,269 | |
DigitalGlobe, Inc. (a)
5.250% 2/01/21 | | | 600,000 | | | | 570,000 | |
Frontier Communications Corp.
7.625% 4/15/24 | | | 1,100,000 | | | | 1,133,000 | |
Sprint Corp.
7.250% 9/15/21 | | | 745,000 | | | | 738,481 | |
Sprint Corp.
7.875% 9/15/23 | | | 1,460,000 | | | | 1,441,312 | |
West Corp. (a)
5.375% 7/15/22 | | | 1,270,000 | | | | 1,216,025 | |
| | | | | | | | |
| | | | | | | 7,961,024 | |
| | | | | | | | |
| Transportation — 6.5% | | | | | | | | |
Era Group, Inc.
7.750% 12/15/22 | | | 2,000,000 | | | | 2,060,000 | |
The Kenan Advantage Group, Inc. (a)
8.375% 12/15/18 | | | 3,190,000 | | | | 3,285,700 | |
Quality Distribution LLC/QD Capital Corp.
9.875% 11/01/18 | | | 724,000 | | | | 754,770 | |
| | | | | | | | |
| | | Principal
Amount | | | Value | |
Topaz Marine SA (a)
8.625% 11/01/18 | | $ | 1,709,000 | | | $ | 1,570,229 | |
Watco Cos. LLC/Watco Finance Corp. (a)
6.375% 4/01/23 | | | 1,531,000 | | | | 1,515,690 | |
| | | | | | | | |
| | | | | | | 9,186,389 | |
| | | | | | | | |
| | |
TOTAL CORPORATE DEBT
(Cost $131,901,478) | | | | | | | 128,221,543 | |
| | | | | | | | |
| | |
TOTAL BONDS & NOTES
(Cost $137,987,777) | | | | | | | 133,513,131 | |
| | | | | | | | |
| | |
TOTAL LONG-TERM INVESTMENTS
(Cost $137,987,777) | | | | | | | 133,513,131 | |
| | | | | | | | |
| |
| SHORT-TERM INVESTMENTS — 4.1% | | | | | |
| Time Deposits — 4.1% | | | | | | | | |
Euro Time Deposit
0.010% 1/02/15 | | | 5,826,120 | | | | 5,826,120 | |
| | | | | | | | |
| | |
TOTAL SHORT-TERM INVESTMENTS
(Cost $5,826,120) | | | | | | | 5,826,120 | |
| | | | | | | | |
| | |
TOTAL INVESTMENTS — 98.5%
(Cost $143,813,897) (b) | | | | | | | 139,339,251 | |
| | |
| Other Assets/(Liabilities) — 1.5% | | | | | | | 2,192,381 | |
| | | | | | | | |
| | |
| NET ASSETS — 100.0% | | | | | | $ | 141,531,632 | |
| | | | | | | | |
Notes to Portfolio of Investments
| Percentages | are stated as a percent of net assets. |
| (a) | Securities exempt from registration under rule 144A of the Securities Act of 1933. These securities may be resold in transactions exempt from registration, normally to qualified institutional buyers. At December 31, 2014, these securities amounted to a value of $83,136,604 or 58.74% of net assets. |
| (b) | See Note 6 for aggregate cost for federal tax purposes. |
Country weightings, as a percentage of net assets, is as follows:
| | | | |
United States | | | 77.5 | % |
Luxembourg | | | 6.1 | % |
Canada | | | 5.4 | % |
Netherlands | | | 1.5 | % |
Austria | | | 1.2 | % |
Denmark | | | 0.9 | % |
France | | | 0.9 | % |
Marshall Islands | | | 0.9 | % |
| | | | |
Total Long-Term Investments | | | 94.4 | % |
Short-Term Investments and Other Assets and Liabilities | | | 5.6 | % |
| | | | |
Net Assets | | | 100.0 | % |
| | | | |
The accompanying notes are an integral part of the financial statements.
24
MML Inflation-Protected and Income Fund – Portfolio of Investments
December 31, 2014
| | | | | | | | |
| | | Principal
Amount | | | Value | |
| BONDS & NOTES — 138.8% | | | | | | | | |
| | |
| CORPORATE DEBT — 7.8% | | | | | | | | |
| Auto Manufacturers — 0.3% | | | | | | | | |
Nissan Motor Acceptance Corp. FRN (a)
0.785% 3/03/17 | | $ | 1,400,000 | | | $ | 1,404,453 | |
| | | | | | | | |
| Banks — 0.8% | | | | | | | | |
Deutsche Bank AG FRN
0.843% 2/13/17 | | | 2,250,000 | | | | 2,253,224 | |
First Horizon National Corp.
5.375% 12/15/15 | | | 390,000 | | | | 403,767 | |
The Huntington National Bank FRN
0.658% 4/24/17 | | | 935,000 | | | | 934,030 | |
| | | | | | | | |
| | | | | | | 3,591,021 | |
| | | | | | | | |
| Computers — 0.2% | | | | | | | | |
Hewlett-Packard Co.
2.650% 6/01/16 | | | 800,000 | | | | 815,170 | |
| | | | | | | | |
| Diversified Financial — 0.9% | | | | | | | | |
Ford Motor Credit Co. LLC
12.000% 5/15/15 | | | 800,000 | | | | 831,478 | |
The Goldman Sachs Group, Inc. FRN
0.860% 6/04/17 | | | 1,875,000 | | | | 1,871,136 | |
The Goldman Sachs Group, Inc. FRN
1.043% 12/15/17 | | | 1,750,000 | | | | 1,747,415 | |
| | | | | | | | |
| | | | | | | 4,450,029 | |
| | | | | | | | |
| Electric — 1.1% | | | | | | | | |
NextEra Energy Capital Holdings, Inc.
1.200% 6/01/15 | | | 5,000,000 | | | | 5,009,410 | |
| | | | | | | | |
| Foods — 1.1% | | | | | | | | |
The Kroger Co.
4.950% 1/15/15 | | | 5,000,000 | | | | 5,005,875 | |
| | | | | | | | |
| Media — 1.3% | | | | | | | | |
Time Warner Cable Inc, Series A
3.500% 2/01/15 | | | 975,000 | | | | 976,857 | |
Viacom, Inc.
1.250% 2/27/15 | | | 5,000,000 | | | | 5,004,435 | |
| | | | | | | | |
| | | | | | | 5,981,292 | |
| | | | | | | | |
| Office Equipment/Supplies — 1.1% | | | | | | | | |
Xerox Corp.
4.250% 2/15/15 | | | 5,142,000 | | | | 5,162,316 | |
| | | | | | | | |
| Oil & Gas — 0.4% | | | | | | | | |
Petrobras Global Finance BV FRN
2.603% 3/17/17 | | | 1,230,000 | | | | 1,135,413 | |
Transocean, Inc.
4.950% 11/15/15 | | | 670,000 | | | | 671,678 | |
| | | | | | | | |
| | | | | | | 1,807,091 | |
| | | | | | | | |
| Real Estate Investment Trusts (REITS) — 0.2% | | | | | |
DDR Corp.
9.625% 3/15/16 | | | 950,000 | | | | 1,042,869 | |
| | | | | | | | |
| | | | | | | | |
| | | Principal
Amount | | | Value | |
| Telecommunications — 0.1% | | | | | | | | |
GTP Acquisition Partners I LLC (a)
4.347% 6/15/41 | | $ | 520,000 | | | $ | 529,628 | |
| | | | | | | | |
| Transportation — 0.3% | | | | | | | | |
Ryder System, Inc.
3.150% 3/02/15 | | | 1,500,000 | | | | 1,505,699 | |
| | | | | | | | |
| | |
TOTAL CORPORATE DEBT
(Cost $31,813,331) | | | | | | | 36,304,853 | |
| | | | | | | | |
| |
| MUNICIPAL OBLIGATIONS — 0.1% | | | | | |
Louisiana State Public Facilities Authority FRN
1.133% 4/26/27 | | | 364,053 | | | | 360,500 | |
| | | | | | | | |
| | |
TOTAL MUNICIPAL OBLIGATIONS
(Cost $364,053) | | | | | | | 360,500 | |
| | | | | | | | |
| | |
| NON-U.S. GOVERNMENT AGENCY OBLIGATIONS — 33.5% | | | | | | | | |
| Auto Floor Plan ABS — 0.1% | | | | | | | | |
NCF Dealer Floorplan Master Trust, Series 2014-1A, Class A FRN (a)
1.666% 10/20/20 | | | 330,000 | | | | 330,000 | |
| | | | | | | | |
| Automobile ABS — 10.9% | | | | | | | | |
American Credit Acceptance Receivables Trust, Series 2014-2, Class A (a)
0.990% 10/10/17 | | | 251,890 | | | | 251,719 | |
American Credit Acceptance Receivables Trust, Series 2014-3, Class A (a)
0.990% 8/10/18 | | | 698,498 | | | | 697,773 | |
American Credit Acceptance Receivables Trust, Series 2014-1, Class A (a)
1.140% 3/12/18 | | | 488,101 | | | | 488,359 | |
American Credit Acceptance Receivables Trust, Series 2013-2, Class A (a)
1.320% 2/15/17 | | | 253,894 | | | | 254,144 | |
American Credit Acceptance Receivables Trust, Series 2014-4, Class A (a)
1.330% 7/10/18 | | | 1,700,000 | | | | 1,697,909 | |
American Credit Acceptance Receivables Trust, Series 2013-1, Class A (a)
1.450% 4/16/18 | | | 342,895 | | | | 343,713 | |
The accompanying notes are an integral part of the financial statements.
25
MML Inflation-Protected and Income Fund – Portfolio of Investments (Continued)
| | | | | | | | |
| | | Principal
Amount | | | Value | |
American Credit Acceptance Receivables Trust, Series 2012-3, Class A (a)
1.640% 11/15/16 | | $ | 58,072 | | | $ | 58,130 | |
AmeriCredit Automobile Receivables Trust, Series 2014-3, Class A2B FRN
0.477% 4/09/18 | | | 1,200,000 | | | | 1,199,584 | |
AmeriCredit Automobile Receivables Trust, Series 2014-4, Class A2B FRN
0.557% 4/09/18 | | | 1,400,000 | | | | 1,400,003 | |
AmeriCredit Automobile Receivables Trust, Series 2014-1, Class A2
0.570% 7/10/17 | | | 331,490 | | | | 331,383 | |
AmeriCredit Automobile Receivables Trust, Series 2013-4, Class A2
0.740% 11/08/16 | | | 162,867 | | | | 162,905 | |
AmeriCredit Automobile Receivables Trust, Series 2010-3, Class C
3.340% 4/08/16 | | | 133,627 | | | | 133,906 | |
ARI Fleet Lease Trust, Series 2013-A, Class A2 (a)
0.700% 12/15/15 | | | 127,751 | | | | 127,792 | |
ARI Fleet Lease Trust, Series 2012-A, Class A FRN (a)
0.711% 3/15/20 | | | 132,439 | | | | 132,507 | |
Bank of The West Auto Trust,
Series 2014-1, Class A4 (a)
1.650% 3/16/20 | | | 600,000 | | | | 599,874 | |
California Republic Auto Receivables Trust, Series 2014-3, Class A2
0.630% 6/15/17 | | | 1,000,000 | | | | 999,722 | |
California Republic Auto Receivables Trust, Series 2013-2, Class A2
1.230% 3/15/19 | | | 552,461 | | | | 553,442 | |
California Republic Auto Receivables Trust, Series 2013-1, Class A2 (a)
1.410% 9/17/18 | | | 1,645,698 | | | | 1,650,834 | |
Capital Auto Receivables Asset Trust, Series 2014-3, Class A1 FRN
0.486% 2/21/17 | | | 965,000 | | | | 963,258 | |
Capital Auto Receivables Asset Trust, Series 2014-1, Class A1B FRN
0.516% 5/20/16 | | | 1,435,000 | | | | 1,435,214 | |
CarNow Auto Receivables Trust,
Series 2014-1A, Class A (a)
0.960% 1/17/17 | | | 1,359,892 | | | | 1,359,365 | |
CarNow Auto Receivables Trust,
Series 2013-1A, Class A (a)
1.160% 10/16/17 | | | 43,211 | | | | 43,211 | |
CFC LLC, Series 2014-2A, Class A (a)
1.440% 11/16/20 | | | 455,802 | | | | 453,726 | |
CFC LLC, Series 2014-1A, Class A (a)
1.460% 12/17/18 | | | 376,107 | | | | 376,014 | |
| | | | | | | | |
| | | Principal
Amount | | | Value | |
CFC LLC, Series 2013-1A, Class A (a)
1.650% 7/17/17 | | $ | 65,120 | | | $ | 65,209 | |
CFC LLC, Series 2013-2A, Class A (a)
1.750% 11/15/17 | | | 368,824 | | | | 369,770 | |
Chesapeake Funding LLC,
Series 2012-2A, Class A FRN (a)
0.607% 5/07/24 | | | 500,255 | | | | 500,071 | |
Chesapeake Funding LLC,
Series 2012-1A, Class A FRN (a)
0.907% 11/07/23 | | | 307,928 | | | | 308,168 | |
CPS Auto Trust, Series 2014-B, Class A (a)
1.110% 11/15/18 | | | 823,710 | | | | 821,292 | |
CPS Auto Trust, Series 2014-A, Class A (a)
1.210% 8/15/18 | | | 343,704 | | | | 343,059 | |
CPS Auto Trust, Series 2014-C, Class A (a)
1.310% 2/15/19 | | | 818,909 | | | | 816,590 | |
CPS Auto Trust, Series 2012-D, Class A (a)
1.480% 3/16/20 | | | 315,786 | | | | 316,515 | |
CPS Auto Trust, Series 2014-D, Class A (a)
1.490% 4/15/19 | | | 1,200,000 | | | | 1,197,024 | |
CPS Auto Trust, Series 2013-D, Class A (a)
1.540% 7/16/18 | | | 752,410 | | | | 753,857 | |
CPS Auto Trust, Series 2013-C, Class A (a)
1.640% 4/16/18 | | | 532,128 | | | | 533,783 | |
CPS Auto Trust, Series 2012-C, Class A (a)
1.820% 12/16/19 | | | 354,517 | | | | 357,102 | |
CPS Auto Trust, Series 2013-B, Class A (a)
1.820% 9/15/20 | | | 725,295 | | | | 727,375 | |
CPS Auto Trust, Series 2012-A, Class A (a)
2.780% 6/17/19 | | | 236,996 | | | | 240,122 | |
CPS Auto Trust, Series 2011-B, Class A (a)
3.680% 9/17/18 | | | 306,908 | | | | 311,299 | |
Credit Acceptance Auto Loan Trust,
Series 2013-1A, Class A (a)
1.210% 10/15/20 | | | 1,185,000 | | | | 1,186,263 | |
Credit Acceptance Auto Loan Trust,
Series 2013-2A, Class A (a)
1.500% 4/15/21 | | | 250,000 | | | | 250,662 | |
Credit Acceptance Auto Loan Trust,
Series 2012-2A, Class A (a)
1.520% 3/16/20 | | | 1,514,862 | | | | 1,518,426 | |
The accompanying notes are an integral part of the financial statements.
26
MML Inflation-Protected and Income Fund – Portfolio of Investments (Continued)
| | | | | | | | |
| | | Principal
Amount | | | Value | |
Credit Acceptance Auto Loan Trust,
Series 2014-2A, Class A (a)
1.880% 3/15/22 | | $ | 840,000 | | | $ | 841,088 | |
DT Auto Owner Trust, Series 2014-1A, Class A (a)
0.660% 7/17/17 | | | 334,861 | | | | 334,858 | |
DT Auto Owner Trust, Series 2013-2A, Class A (a)
0.810% 9/15/16 | | | 148,552 | | | | 148,567 | |
DT Auto Owner Trust, Series 2014-3A, Class A (a)
0.980% 4/16/18 | | | 550,000 | | | | 549,667 | |
Enterprise Fleet Financing LLC,
Series 2012-2, Class A2 (a)
0.720% 4/20/18 | | | 170,639 | | | | 170,691 | |
Enterprise Fleet Financing LLC,
Series 2014-1, Class A2 (a)
0.870% 9/20/19 | | | 777,034 | | | | 776,541 | |
Exeter Automobile Receivables Trust, Series 2014-2A, Class A (a)
1.060% 8/15/18 | | | 500,192 | | | | 499,147 | |
Exeter Automobile Receivables Trust, Series 2013-1A, Class A (a)
1.290% 10/16/17 | | | 122,009 | | | | 122,158 | |
Exeter Automobile Receivables Trust, Series 2014-1A, Class A (a)
1.290% 5/15/18 | | | 471,900 | | | | 472,176 | |
Exeter Automobile Receivables Trust, Series 2012-2A, Class A (a)
1.300% 6/15/17 | | | 192,394 | | | | 192,493 | |
Exeter Automobile Receivables Trust, Series 2014-3A, Class A (a)
1.320% 1/15/19 | | | 468,396 | | | | 467,844 | |
Exeter Automobile Receivables Trust, Series 2013-2A, Class A (a)
1.490% 11/15/17 | | | 363,670 | | | | 364,227 | |
First Investors Auto Owner Trust,
Series 2013-3A, Class A2 (a)
0.890% 9/15/17 | | | 640,426 | | | | 640,812 | |
First Investors Auto Owner Trust,
Series 2013-1A, Class A2 (a)
0.900% 10/15/18 | | | 672,997 | | | | 673,636 | |
First Investors Auto Owner Trust,
Series 2014-3A, Class A2 (a)
1.060% 11/15/18 | | | 1,860,000 | | | | 1,856,574 | |
First Investors Auto Owner Trust,
Series 2013-2A, Class A2 (a)
1.230% 3/15/19 | | | 464,822 | | | | 465,907 | |
Flagship Credit Auto Trust,
Series 2014-1, Class A (a)
1.210% 4/15/19 | | | 596,546 | | | | 595,170 | |
Flagship Credit Auto Trust,
Series 2014-2, Class A (a)
1.430% 12/16/19 | | | 568,990 | | | | 567,238 | |
| | | | | | | | |
| | | Principal
Amount | | | Value | |
Navistar Financial Dealer Note Master Trust, Series 2014-1, Class A (a)
0.920% 10/25/19 | | $ | 2,700,000 | | | $ | 2,700,000 | |
Oscar US Funding Trust,
Series 2014-1A, Class A2 (a)
1.000% 8/15/17 | | | 950,000 | | | | 950,445 | |
Prestige Auto Receivables Trust,
Series 2014-1A, Class A2 (a)
0.970% 3/15/18 | | | 342,408 | | | | 342,123 | |
Rental Car Finance Corp.,
Series 2011-1A, Class A1 (a)
2.510% 2/25/16 | | | 100,000 | | | | 100,134 | |
Santander Drive Auto Receivables Trust, Series 2014-4, Class A2B FRN
0.481% 1/16/18 | | | 800,000 | | | | 800,002 | |
Santander Drive Auto Receivables Trust, Series 2014-1, Class A2B FRN
0.531% 6/15/17 | | | 279,639 | | | | 279,640 | |
Santander Drive Auto Receivables Trust, Series 2013-5, Class A2B FRN
0.541% 4/17/17 | | | 275,284 | | | | 275,328 | |
Santander Drive Auto Receivables Trust, Series 2014-5, Class A2B FRN
0.561% 4/16/18 | | | 1,600,000 | | | | 1,600,000 | |
Santander Drive Auto Receivables Trust, Series 2013-A, Class A3 (a)
1.020% 1/16/18 | | | 1,678,883 | | | | 1,681,477 | |
Santander Drive Auto Receivables Trust, Series 2013-2, Class B
1.330% 3/15/18 | | | 685,000 | | | | 686,487 | |
Santander Drive Auto Receivables Trust, Series 2012-4, Class B
1.830% 3/15/17 | | | 388,306 | | | | 388,989 | |
Santander Drive Auto Receivables Trust, Series 2012-4, Class C
2.940% 12/15/17 | | | 470,000 | | | | 477,103 | |
Santander Drive Auto Receivables Trust, Series 2012-3, Class C
3.010% 4/16/18 | | | 960,000 | | | | 973,688 | |
Tidewater Auto Receivables Trust,
Series 2014-AA, Class A2 (a)
0.960% 7/15/17 | | | 839,352 | | | | 839,092 | |
Tidewater Auto Receivables Trust,
Series 2012-AA, Class A3 (a)
1.990% 4/15/19 | | | 299,001 | | | | 299,636 | |
United Auto Credit Securitization Trust, Series 2014-1, Class A2 (a)
0.740% 6/15/16 | | | 670,000 | | | | 669,916 | |
Westlake Automobile Receivables Trust, Series 2014-1A, Class A2 (a)
0.700% 5/15/17 | | | 570,000 | | | | 569,814 | |
Westlake Automobile Receivables Trust, Series 2014-2A, Class A2 (a)
0.970% 10/16/17 | | | 400,000 | | | | 399,749 | |
The accompanying notes are an integral part of the financial statements.
27
MML Inflation-Protected and Income Fund – Portfolio of Investments (Continued)
| | | | | | | | |
| | | Principal
Amount | | | Value | |
Westlake Automobile Receivables Trust, Series 2013-1A, Class A2 (a)
1.120% 1/15/18 | | $ | 438,362 | | | $ | 438,936 | |
Wheels SPV LLC, Series 2012-1, Class A2 (a)
1.190% 3/20/21 | | | 48,415 | | | | 48,448 | |
| | | | | | | | |
| | | | | | | 50,590,875 | |
| | | | | | | | |
| Commercial MBS — 1.4% | | | | | | | | |
Banc of America Commercial Mortgage, Inc., 2007-3 A4 VRN
5.547% 6/10/49 | | | 800,000 | | | | 858,180 | |
Banc of America Merrill Lynch Commercial Mortgage, Inc.,
Series 2005-6, Class A4 VRN
5.152% 9/10/47 | | | 1,247,434 | | | | 1,273,075 | |
Bear Stearns Commercial Mortgage Securities Trust, Series 2006-T22, Class A4 VRN
5.575% 4/12/38 | | | 528,451 | | | | 547,926 | |
Commercial Mortgage Pass Through Certificates, Series 2014-BBG, Class A FRN (a)
0.961% 3/15/29 | | | 665,000 | | | | 661,420 | |
DBRR Trust, Series 2013-EZ3, Class A VRN (a)
1.636% 12/18/49 | | | 508,941 | | | | 511,565 | |
JP Morgan Chase Commercial Mortgage Securities Corp.,
Series 2005-LDP2, Class AM
4.780% 7/15/42 | | | 550,000 | | | | 556,539 | |
STRIPs Ltd., Series 2012-1A, Class A (a)
1.500% 12/25/44 | | | 1,743,228 | | | | 1,568,905 | |
VFC LLC, Series 2014-2, Class A (Acquired 7/9/14,
Cost $400,000) (a) (b)
2.750% 7/20/30 | | | 264,631 | | | | 264,636 | |
Wells Fargo Reremic Trust,
Series 2012-IO, Class A (a)
1.750% 8/20/21 | | | 363,051 | | | | 362,939 | |
| | | | | | | | |
| | | | | | | 6,605,185 | |
| | | | | | | | |
| Home Equity ABS — 0.9% | | | | | | | | |
ACE Securities Corp.,
Series 2005-AG1, Class A1B1 FRN
0.440% 8/25/35 | | | 178,434 | | | | 177,228 | |
ACE Securities Corp.,
Series 2005-HE5, Class M2 FRN
0.660% 8/25/35 | | | 518,314 | | | | 515,859 | |
Asset-Backed Securities Corp. Trust,
Series 2005-HE2, Class M1 FRN
0.845% 2/25/35 | | | 105,543 | | | | 104,649 | |
| | | | | | | | |
| | | Principal
Amount | | | Value | |
Countrywide Asset-Backed Certificates,
Series 2004-5, Class 3A FRN
0.630% 9/25/34 | | $ | 83,564 | | | $ | 82,994 | |
Countrywide Asset-Backed Certificates,
Series 2005-6, Class M1 FRN
0.660% 12/25/35 | | | 315,155 | | | | 313,991 | |
Credit-Based Asset Servicing and Securitization LLC, Series 2006-RP2, Class A2 FRN (a)
0.460% 7/25/36 | | | 222,469 | | | | 221,784 | |
First Franklin Mortgage Loan Trust,
Series 2005-FF6, Class M1 FRN
0.590% 5/25/36 | | | 467,251 | | | | 456,661 | |
First Franklin Mortgage Loan Trust,
Series 2005-FF4, Class M1 FRN
0.600% 5/25/35 | | | 299,527 | | | | 298,320 | |
Home Equity Asset Trust, Series 2005-4, Class M2 FRN
0.830% 10/25/35 | | | 72,337 | | | | 72,110 | |
Lake Country Mortgage Loan Trust,
Series 2005-HE1, Class M1 FRN (a)
0.950% 12/25/32 | | | 164,769 | | | | 164,772 | |
Long Beach Mortgage Loan Trust,
Series 2005-WL1, Class M2 FRN
0.995% 6/25/35 | | | 600,104 | | | | 578,604 | |
Mastr Asset Backed Securities Trust,
Series 2005-WMC1, Class M2 FRN
0.845% 3/25/35 | | | 207,591 | | | | 205,688 | |
Merrill Lynch Mortgage Synthetic,
Series 2005-ACR1, Class M1 FRN (a)
0.905% 6/28/35 | | | 658,949 | | | | 649,651 | |
Morgan Stanley Home Equity Loan Trust, Series 2005-3, Class M1 FRN
0.620% 8/25/35 | | | 230,839 | | | | 228,875 | |
Park Place Securities, Inc.,
Series 2005-WCW3, Class A2C FRN
0.550% 8/25/35 | | | 250,116 | | | | 247,221 | |
| | | | | | | | |
| | | | | | | 4,318,407 | |
| | | | | | | | |
| Other ABS — 10.6% | | | | | | | | |
321 Henderson Receivables I LLC,
Series 2006-1A, Class A1 FRN (a)
0.361% 3/15/41 | | | 1,769,488 | | | | 1,739,014 | |
321 Henderson Receivables I LLC,
Series 2006-2A, Class A1 FRN (a)
0.361% 6/15/41 | | | 1,853,953 | | | | 1,806,303 | |
321 Henderson Receivables LLC,
Series 2006-3A, Class A1 FRN (a)
0.361% 9/15/41 | | | 468,862 | | | | 459,947 | |
321 Henderson Receivables LLC,
Series 2006-4A, Class A1 FRN (a)
0.361% 12/15/41 | | | 880,331 | | | | 866,732 | |
The accompanying notes are an integral part of the financial statements.
28
MML Inflation-Protected and Income Fund – Portfolio of Investments (Continued)
| | | | | | | | |
| | | Principal
Amount | | | Value | |
Alterna Funding I LLC, Series 2014-1A, Class NOTE (a)
1.639% 2/15/21 | | $ | 456,854 | | | $ | 455,997 | |
ARL First LLC, Series 2012-1A, Class A1 FRN (a)
1.911% 12/15/42 | | | 1,619,086 | | | | 1,627,417 | |
Ascentium Equipment Receivables LLC, Series 2014-1A, Class A2 (a)
1.040% 1/10/17 | | | 940,534 | | | | 940,035 | |
Ascentium Equipment Receivables LLC, Series 2014-1A, Class B (a)
1.580% 10/10/18 | | | 435,000 | | | | 434,025 | |
BCC Funding VIII LLC, Series 2014-1A, Class A (a)
1.794% 6/20/20 | | | 255,816 | | | | 255,381 | |
CCG Receivables Truste, Series 2013-1, Class A2 (a)
1.050% 8/14/20 | | | 330,547 | | | | 330,919 | |
CIT Equipment Collateral,
Series 2014-VT1, Class A2 (a)
0.860% 5/22/17 | | | 600,000 | | | | 599,962 | |
CLI Funding LLC, Series 2006-1A, Class A FRN (a)
0.342% 8/18/21 | | | 2,825,800 | | | | 2,817,909 | |
Diamond Resorts Owner Trust,
Series 2013-1, Class A (a)
1.950% 1/20/25 | | | 1,007,301 | | | | 1,005,380 | |
Diamond Resorts Owner Trust,
Series 2013-2, Class A (a)
2.270% 5/20/26 | | | 762,391 | | | | 766,118 | |
Direct Capital Funding IV LLC,
Series 2013-1, Class A (a)
1.673% 12/20/17 | | | 138,867 | | | | 139,034 | |
Dong Fang Container Finance II SPV Ltd., Series 2014-1A, Class A1 (a)
1.950% 11/25/39 | | | 783,333 | | | | 777,082 | |
Drug Royalty Corp., Inc., Series 2014-1, Class A1 FRN (a)
3.082% 7/15/23 | | | 779,563 | | | | 784,082 | |
Dryden XI-Leveraged Loan CDO,
Series 2006-11A, Class A1 FRN (a)
0.480% 4/12/20 | | | 558,126 | | | | 553,263 | |
FNA Trust, Series 2014-1A, Class A (a)
1.296% 12/10/22 | | | 1,600,000 | | | | 1,599,000 | |
Galaxy VIII CLO Ltd., Series 2007-8A, Class A FRN (a)
0.474% 4/25/19 | | | 538,397 | | | | 536,965 | |
GE Dealer Floorplan Master Note Trust, Series 2014-1, Class A FRN 0.546% 7/20/19 | | | 750,000 | | | | 750,001 | |
Global Container Assets Ltd., Series 2013-1A, Class A1 (a)
2.200% 11/05/28 | | | 417,720 | | | | 415,599 | |
| | | | | | | | |
| | | Principal
Amount | | | Value | |
Global Container Assets Ltd., Series 2013-1A, Class A2 (a)
3.300% 11/05/28 | | $ | 950,000 | | | $ | 930,736 | |
Hercules Capital Funding Trust, Series 2012-1A, Class A (a)
3.320% 12/16/17 | | | 142,121 | | | | 142,921 | |
HFG Healthco-4 LLC, Series 2011-1A,
Class A FRN (a)
2.407% 6/02/17 | | | 475,000 | | | | 482,309 | |
Hilton Grand Vacations Trust,
Series 2014-AA, Class A (a)
1.770% 11/25/26 | | | 417,145 | | | | 412,048 | |
Icon Brand Holdings LLC, Series 2012-1A,
Class A (a)
4.229% 1/25/43 | | | 319,624 | | | | 318,423 | |
ING Investment Management CLO V Ltd., Series 2007-5A,
Class A1A FRN (a)
0.462% 5/01/22 | | | 716,716 | | | | 712,679 | |
LEAF II Receivables Funding LLC, Series 2013-1, Class A2 (a)
0.880% 11/15/15 | | | 758,856 | | | | 759,008 | |
Macquarie Equipment Funding Trust, Series 2014-A, Class A2 (a)
0.800% 11/21/16 | | | 500,000 | | | | 496,098 | |
Marriott Vacation Club Owner Trust, Series 2009-2A, Class A (a)
4.809% 7/20/31 | | | 846,578 | | | | 852,505 | |
Morgan Stanley ABS Capital I, Inc. Trust, Series 2005-WMC4, Class M4 FRN
1.115% 4/25/35 | | | 902,070 | | | | 890,944 | |
Nations Equipment Finance Funding I LLC, Series 2013-1A, Class A (a)
1.697% 11/20/16 | | | 143,934 | | | | 144,092 | |
Nations Equipment Finance Funding II LLC, Series 2014-1A, Class A (a)
1.558% 7/20/18 | | | 415,319 | | | | 414,827 | |
Nationstar Agency Advance Funding Trust, Series 2013-T1A, Class AT1 (a)
0.997% 2/15/45 | | | 500,000 | | | | 499,820 | |
Navitas Equipment Receivables LLC, Series 2013-1, Class A (a)
1.950% 11/15/16 | | | 664,350 | | | | 664,383 | |
New York City Tax Lien, Series 2014-A, Class A (a)
1.030% 11/10/27 | | | 304,933 | | | | 304,565 | |
New York City Tax Lien, Series 2013-A, Class A (a)
1.190% 11/10/26 | | | 93,766 | | | | 93,703 | |
New York City Tax Lien, Series 2012-AA, Class A (a)
1.230% 11/10/25 | | | 242,504 | | | | 242,269 | |
The accompanying notes are an integral part of the financial statements.
29
MML Inflation-Protected and Income Fund – Portfolio of Investments (Continued)
| | | | | | | | |
| | | Principal
Amount | | | Value | |
Octagon Loan Funding Ltd., Series 2014-1A, Class X FRN (a)
1.196% 11/18/26 | �� | $ | 1,335,000 | | | $ | 1,334,311 | |
OneMain Financial Issuance Trust, Series 2014-1A, Class A (a)
2.430% 6/18/24 | | | 320,000 | | | | 319,994 | |
Oxford Finance Funding Trust, Series 2014-1A, Class A (a)
3.475% 12/15/22 | | | 240,000 | | | | 239,458 | |
PFS Financing Corp., Series 2013-AA, Class A FRN (a)
0.711% 2/15/18 | | | 2,545,000 | | | | 2,536,442 | |
PFS Financing Corp., Series 2014-AA, Class A FRN (a)
0.761% 2/15/19 | | | 1,900,000 | | | | 1,896,372 | |
PFS Financing Corp., Series 2014-BA, Class A FRN (a)
0.761% 10/15/19 | | | 1,100,000 | | | | 1,100,002 | |
RAAC, Series 2006-RP2, Class A FRN (a)
0.420% 2/25/37 | | | 457,875 | | | | 453,637 | |
RAAC, Series 2005-RP2, Class M1 FRN (a)
0.820% 6/25/35 | | | 456,000 | | | | 455,351 | |
Sierra Receivables Funding Co. LLC, Series 2012-1A, Class A (a)
2.840% 11/20/28 | | | 992,398 | | | | 1,008,142 | |
Sierra Receivables Funding Co. LLC, Series 2011-2A, Class A (a)
3.260% 5/20/28 | | | 375,158 | | | | 381,058 | |
Sierra Timeshare 2013-1 Receivables Funding LLC, Series 2013-1A, Class A (a)
1.590% 11/20/29 | | | 306,211 | | | | 306,702 | |
Sonic Capital LLC, Series 2011-1A, Class A2 (a)
5.438% 5/20/41 | | | 588,664 | | | | 620,672 | |
Springleaf Funding Trust, Series 2013-AA, Class A (a)
2.580% 9/15/21 | | | 400,000 | | | | 401,152 | |
SVO VOI Mortgage LLC, Series 2012-AA, Class A (a)
2.000% 9/20/29 | | | 904,243 | | | | 898,863 | |
SVO VOI Mortgage LLC, Series 2010-AA, Class A (a)
3.650% 7/20/27 | | | 615,420 | | | | 628,508 | |
TAL Advantage LLC, Series 2006-1A FRN (a)
0.356% 4/20/21 | | | 680,000 | | | | 674,927 | |
TAL Advantage LLC, Series 2014-2A, Class A1 (a)
1.700% 5/20/39 | | | 1,080,057 | | | | 1,071,726 | |
| | | | | | | | |
| | | Principal
Amount | | | Value | |
TAL Advantage LLC, Series 2010-1A, Class A (a)
3.250% 7/21/25 | | $ | 725,833 | | | $ | 734,558 | |
TICP CLO Ltd. FRN (a)
1.235% 1/20/27 | | | 575,000 | | | | 574,894 | |
Trade MAPS 1 Ltd., Series 2013-1A, Class A FRN (a)
0.862% 12/10/18 | | | 1,870,000 | | | | 1,872,422 | |
Trafigura Securitisation Finance PLC, Series 2012-1A, Class A FRN (a)
2.561% 10/15/15 | | | 1,006,000 | | | | 1,010,155 | |
Trip Rail Master Funding LLC, Series 2011-1A, Class A1B FRN (a)
2.661% 7/15/41 | | | 618,500 | | | | 639,773 | |
Triton Container Finance LLC, Series 2007-1A, Class NOTE FRN (a)
0.310% 2/26/19 | | | 218,750 | | | | 218,678 | |
Westgate Resorts LLC, Series 2014-1A, Class A (a)
2.150% 12/20/26 | | | 660,502 | | | | 652,589 | |
Westgate Resorts LLC, Series 2012-2A, Class A (a)
3.000% 1/20/25 | | | 1,098,405 | | | | 1,104,534 | |
| | | | | | | | |
| | | | | | | 49,156,415 | |
| | | | | | | | |
Student Loans ABS — 9.5% | | | | | | | | |
Academic Loan Funding Trust, Series 2013-1A, Class A FRN (a)
0.969% 12/26/44 | | | 3,986,589 | | | | 3,975,229 | |
Access Group, Inc., Series 2007-1, Class A2 FRN
0.264% 4/25/17 | | | 1,071,731 | | | | 1,070,488 | |
Access Group, Inc., Series 2006-1, Class A2 FRN
0.343% 8/25/23 | | | 1,001,750 | | | | 994,451 | |
Access Group, Inc., Series 2007-A, Class A2 FRN
0.363% 8/25/26 | | | 67,537 | | | | 67,354 | |
Access Group, Inc., Series 2005-2, Class A3 FRN
0.413% 11/22/24 | | | 284,581 | | | | 282,677 | |
Access Group, Inc., Series 2005-A, Class A2 FRN
0.454% 4/27/26 | | | 380,735 | | | | 380,407 | |
Access Group, Inc., Series 2005-B, Class A2 FRN
0.464% 7/25/22 | | | 300,036 | | | | 298,792 | |
Access Group, Inc., Series 2004-A, Class A2 FRN
0.494% 4/25/29 | | | 383,907 | | | | 381,342 | |
Access Group, Inc., Series 2003-A, Class A3 FRN
1.220% 7/01/38 | | | 327,820 | | | | 300,744 | |
The accompanying notes are an integral part of the financial statements.
30
MML Inflation-Protected and Income Fund – Portfolio of Investments (Continued)
| | | | | | | | |
| | | Principal
Amount | | | Value | |
Access Group, Inc., Series 2008-1, Class A FRN
1.534% 10/27/25 | | $ | 2,416,945 | | | $ | 2,437,061 | |
ALG Student Loan Trust I, Series 2006-1A, Class A2 FRN (a)
0.333% 4/28/20 | | | 483,117 | | | | 482,665 | |
Brazos Higher Education Authority, Series 2005-2, Class A10 FRN
0.375% 12/26/19 | | | 577,157 | | | | 575,298 | |
CIT Education Loan Trust,
Series 2005-1, Class A3 FRN
0.361% 3/15/26 | | | 1,203,849 | | | | 1,195,502 | |
College Loan Corp. Trust, Series 2007-1, Class B2 FRN
1.654% 1/25/47 | | | 1,175,000 | | | | 992,875 | |
Collegiate Funding Services Education Loan Trust, Series 2004-A, Class A3 FRN
0.465% 9/28/26 | | | 749,570 | | | | 746,622 | |
Education Funding Capital Trust I, Series 2004-1, Class A6 FRN
1.520% 6/15/43 | | | 400,000 | | | | 395,400 | |
Education Funding Capital Trust I, Series 2004-1, Class A4 FRN
1.651% 6/15/43 | | | 1,300,000 | | | | 1,292,694 | |
Education Funding Capital Trust I, Series 2004-1, Class B1 FRN
1.907% 6/15/43 | | | 100,000 | | | | 97,161 | |
Education Loan Asset-Backed Trust I, Series 2012-1, Class A1 FRN (a)
0.620% 6/25/22 | | | 431,052 | | | | 431,054 | |
GCO Education Loan Funding Trust, Series 2007-1A, Class A5L FRN (a)
0.303% 5/25/23 | | | 207,772 | | | | 206,402 | |
GCO Education Loan Funding Trust, Series 2006-2A, Class A2L FRN (a)
0.333% 8/25/25 | | | 773,039 | | | | 771,838 | |
Goal Capital Funding Trust, Series 2006-1, Class A3 FRN
0.353% 11/25/26 | | | 300,350 | | | | 298,804 | |
KeyCorp Student Loan Trust, Series 2006-A, Class 2A3 FRN
0.445% 6/27/29 | | | 1,057,761 | | | | 1,051,178 | |
KeyCorp Student Loan Trust,
Series 2004-A, Class 2A2 FRN
0.534% 10/28/41 | | | 2,061,812 | | | | 2,055,691 | |
KeyCorp Student Loan Trust,
Series 2000-A, Class A2 FRN
0.553% 5/25/29 | | | 1,320,312 | | | | 1,236,651 | |
KeyCorp Student Loan Trust,
Series 2006-A, Class 2A4 FRN
0.565% 9/27/35 | | | 1,320,000 | | | | 1,268,678 | |
| | | | | | | | |
| | | Principal
Amount | | | Value | |
National Collegiate Student Loan Trust, Series 2007-1, Class A2 FRN
0.300% 11/27/28 | | $ | 657,777 | | | $ | 650,482 | |
National Collegiate Student Loan Trust, Series 2006-3, Class A3 FRN
0.320% 10/25/27 | | | 1,111,068 | | | | 1,096,921 | |
National Collegiate Student Loan Trust, Series 2005-2, Class A3 FRN
0.360% 2/25/28 | | | 1,281,903 | | | | 1,278,350 | |
National Collegiate Student Loan Trust, Series 2004-1, Class A2 FRN
0.515% 6/25/27 | | | 1,023,663 | | | | 1,012,933 | |
Navient Private Education Loan Trust, Series 2014-AA, Class A1 FRN (a)
0.641% 5/16/22 | | | 1,362,416 | | | | 1,362,419 | |
Nelnet Student Loan Trust,
Series 2006-3, Class B FRN
0.505% 6/25/41 | | | 635,089 | | | | 573,753 | |
Nelnet Student Loan Trust,
Series 2014-6A, Class A FRN (a)
0.820% 11/25/47 | | | 583,266 | | | | 580,017 | |
Nelnet Student Loan Trust,
Series 2010-4A, Class A FRN (a)
0.970% 4/25/46 | | | 210,512 | | | | 211,275 | |
Nelnet Student Loan Trust,
Series 2014-2A, Class B FRN (a)
1.669% 6/25/41 | | | 375,000 | | | | 342,673 | |
Northstar Education Finance, Inc.,
Series 2006-A, Class A3 FRN
0.446% 5/28/26 | | | 311,663 | | | | 311,368 | |
Pennsylvania Higher Education Assistance Agency FRN
0.834% 4/25/19 | | | 71,468 | | | | 71,552 | |
Pennsylvania Higher Education Assistance Agency, Series 2004-1, Class A2 FRN
1.650% 4/25/44 | | | 600,000 | | | | 596,926 | |
SLC Student Loan Trust, Series 2006-A, Class A5 FRN
0.401% 7/15/36 | | | 1,270,508 | | | | 1,263,228 | |
SLM Student Loan Trust,
Series 2003-10A, Class A1A FRN (a)
0.304% 12/15/16 | | | 100,000 | | | | 100,000 | |
SLM Student Loan Trust,
Series 2003-10A, Class A1C FRN (a)
0.307% 12/15/16 | | | 25,000 | | | | 25,000 | |
SLM Student Loan Trust, Series 2005-1, Class A2 FRN
0.314% 4/27/20 | | | 51,523 | | | | 51,278 | |
SLM Student Loan Trust, Series 2002-6, Class A4L FRN
0.421% 3/15/19 | | | 166,957 | | | | 166,896 | |
The accompanying notes are an integral part of the financial statements.
31
MML Inflation-Protected and Income Fund – Portfolio of Investments (Continued)
| | | | | | | | |
| | | Principal
Amount | | | Value | |
SLM Student Loan Trust,
Series 2007-7, Class A2 FRN
0.434% 1/25/16 | | $ | 5,600 | | | $ | 5,599 | |
SLM Student Loan Trust,
Series 2003-6, Class A4 FRN
0.441% 12/17/18 | | | 16,425 | | | | 16,418 | |
SLM Student Loan Trust,
Series 2003-3, Class A4 FRN
0.461% 12/15/17 | | | 74,599 | | | | 74,563 | |
SLM Student Loan Trust,
Series 2007-6, Class A2 FRN
0.484% 1/25/19 | | | 12,138 | | | | 12,138 | |
SLM Student Loan Trust,
Series 2008-7, Class A2 FRN
0.734% 10/25/17 | | | 125,734 | | | | 125,881 | |
SLM Student Loan Trust,
Series 2014-A, Class A1 FRN (a)
0.761% 7/15/22 | | | 1,466,328 | | | | 1,467,584 | |
SLM Student Loan Trust,
Series 2003-11, Class B FRN
0.891% 12/15/38 | | | 763,844 | | | | 716,866 | |
SLM Student Loan Trust,
Series 2012-E, Class A1 FRN (a)
0.911% 10/16/23 | | | 311,670 | | | | 312,471 | |
SLM Student Loan Trust,
Series 2003-5, Class A7 FRN
0.950% 6/17/30 | | | 550,000 | | | | 550,000 | |
SLM Student Loan Trust,
Series 2012-B, Class A1 FRN (a)
1.261% 12/15/21 | | | 1,546,979 | | | | 1,551,656 | |
SLM Student Loan Trust,
Series 2012-C, Class A1 FRN (a)
1.261% 8/15/23 | | | 257,546 | | | | 258,866 | |
SLM Student Loan Trust,
Series 2008-4, Class A2 FRN
1.284% 7/25/16 | | | 26,287 | | | | 26,347 | |
SLM Student Loan Trust,
Series 2003-5, Class A9 FRN
1.320% 6/17/30 | | | 700,000 | | | | 700,000 | |
SLM Student Loan Trust,
Series 2005-6, Class A5B FRN
1.434% 7/27/26 | | | 1,142,364 | | | | 1,162,599 | |
SLM Student Loan Trust,
Series 2012-A, Class A1 FRN (a)
1.561% 8/15/25 | | | 285,664 | | | | 288,545 | |
SLM Student Loan Trust,
Series 2003-2, Class A7 FRN
1.660% 9/15/28 | | | 750,000 | | | | 750,000 | |
Social Professional Loan Program LLC, Series 2014-B, Class A1 FRN (a)
1.405% 8/25/32 | | | 1,600,000 | | | | 1,599,980 | |
| | | | | | | | |
| | | Principal
Amount | | | Value | |
Social Professional Loan Program LLC, Series 2014-A, Class A1 FRN (a)
1.770% 6/25/25 | | $ | 1,027,431 | | | $ | 1,037,853 | |
South Carolina Student Loan Corp., Series 2005-1, Class A2 FRN
0.356% 12/01/20 | | | 342,915 | | | | 340,926 | |
| | | | | | | | |
| | | | | | | 43,980,421 | |
| | | | | | | | |
| WL Collateral CMO — 0.1% | | | | | |
Credit Suisse First Boston Mortgage Securities Corp., Series 2005-CF1, Class M1 FRN (a)
0.855% 3/25/45 | | | 659,125 | | | | 629,223 | |
| | | | | | | | |
| WL Collateral PAC — 0.0% | | | | | |
Structured Asset Securities Corp.,
Series 2007-BC4, Class A3 FRN
0.405% 11/25/37 | | | 209,890 | | | | 207,811 | |
| | | | | | | | |
| | |
TOTAL NON-U.S. GOVERNMENT AGENCY OBLIGATIONS
(Cost $155,269,291) | | | | | | | 155,818,337 | |
| | | | | | | | |
|
| U.S. GOVERNMENT AGENCY OBLIGATIONS AND INSTRUMENTALITIES — 0.3% | |
| Pass-Through Securities — 0.3% | | | | | | | | |
Federal Home Loan Mortgage Corp., Pool #1Q0239 FRN
2.380% 3/01/37 | | | 1,277,761 | | | | 1,369,594 | |
Government National Mortgage Association II,
Pool #82462 FRN
3.500% 1/20/40 | | | 325,328 | | | | 339,910 | |
| | | | | | | | |
| | | | | | | 1,709,504 | |
| | | | | | | | |
| | |
TOTAL U.S. GOVERNMENT AGENCY OBLIGATIONS AND INSTRUMENTALITIES
(Cost $1,647,475) | | | | | | | 1,709,504 | |
| | | | | | | | |
| |
| U.S. TREASURY OBLIGATIONS — 97.1% | | | | | |
| U.S. Treasury Bonds & Notes — 97.1% | | | | | |
U.S. Treasury Inflation Index (c)
0.125% 4/15/16 | | | 19,578,832 | | | | 19,519,175 | |
U.S. Treasury Inflation Index (c) (d) (e)
0.125% 4/15/17 | | | 22,215,600 | | | | 22,232,950 | |
U.S. Treasury Inflation Index (c)
0.125% 4/15/18 | | | 22,968,639 | | | | 22,882,507 | |
U.S. Treasury Inflation Index (c)
0.125% 4/15/19 | | | 36,749,863 | | | | 36,345,027 | |
U.S. Treasury Inflation Index (c)
0.125% 1/15/22 | | | 17,637,511 | | | | 17,155,231 | |
U.S. Treasury Inflation Index (c)
0.125% 7/15/22 | | | 20,460,375 | | | | 19,934,482 | |
The accompanying notes are an integral part of the financial statements.
32
MML Inflation-Protected and Income Fund – Portfolio of Investments (Continued)
| | | | | | | | |
| | | Principal
Amount | | | Value | |
U.S. Treasury Inflation Index (c)
0.125% 1/15/23 | | $ | 19,679,414 | | | $ | 19,029,068 | |
U.S. Treasury Inflation Index (c)
0.125% 7/15/24 | | | 32,140,964 | | | | 30,953,259 | |
U.S. Treasury Inflation Index (c)
0.375% 7/15/23 | | | 15,000,736 | | | | 14,830,808 | |
U.S. Treasury Inflation Index (c)
0.625% 7/15/21 | | | 18,358,109 | | | | 18,589,017 | |
U.S. Treasury Inflation Index (c)
0.625% 1/15/24 | | | 24,316,986 | | | | 24,421,476 | |
U.S. Treasury Inflation Index (c)
0.625% 2/15/43 | | | 6,186,472 | | | | 5,816,249 | |
U.S. Treasury Inflation Index (c)
0.750% 2/15/42 | | | 8,800,953 | | | | 8,551,366 | |
U.S. Treasury Inflation Index (c)
1.125% 1/15/21 | | | 17,769,308 | | | | 18,459,254 | |
U.S. Treasury Inflation Index (c)
1.250% 7/15/20 | | | 15,765,824 | | | | 16,546,721 | |
U.S. Treasury Inflation Index (c)
1.375% 7/15/18 | | | 6,931,739 | | | | 7,260,456 | |
U.S. Treasury Inflation Index (c)
1.375% 1/15/20 | | | 7,895,123 | | | | 8,286,793 | |
U.S. Treasury Inflation Index (c)
1.375% 2/15/44 | | | 16,897,627 | | | | 19,124,684 | |
U.S. Treasury Inflation Index (c)
1.625% 1/15/18 | | | 7,662,054 | | | | 8,023,006 | |
U.S. Treasury Inflation Index (c)
1.750% 1/15/28 | | | 7,367,360 | | | | 8,340,655 | |
U.S. Treasury Inflation Index (c)
1.875% 7/15/19 | | | 6,805,991 | | | | 7,304,741 | |
U.S. Treasury Inflation Index (c)
2.000% 1/15/26 | | | 8,374,590 | | | | 9,596,761 | |
U.S. Treasury Inflation Index (c)
2.125% 1/15/19 | | | 5,529,850 | | | | 5,941,995 | |
U.S. Treasury Inflation Index (c)
2.125% 2/15/40 | | | 2,416,942 | | | | 3,132,961 | |
U.S. Treasury Inflation Index (c)
2.125% 2/15/41 | | | 4,337,200 | | | | 5,662,757 | |
U.S. Treasury Inflation Index (c)
2.375% 1/15/17 | | | 9,655,172 | | | | 10,129,637 | |
U.S. Treasury Inflation Index (c)
2.375% 1/15/25 | | | 10,903,269 | | | | 12,801,113 | |
U.S. Treasury Inflation Index (c)
2.375% 1/15/27 | | | 7,200,168 | | | | 8,617,139 | |
U.S. Treasury Inflation Index (c)
2.500% 1/15/29 | | | 6,436,745 | | | | 7,987,093 | |
U.S. Treasury Inflation Index (c) (d)
2.625% 7/15/17 | | | 7,166,558 | | | | 7,682,772 | |
U.S. Treasury Inflation Index (c)
3.375% 4/15/32 | | | 5,792,501 | | | | 8,215,394 | |
U.S. Treasury Inflation Index (c)
3.625% 4/15/28 | | | 6,489,046 | | | | 8,918,889 | |
| | | | | | | | |
| | | Principal
Amount | | | Value | |
U.S. Treasury Inflation Index (c)
3.875% 4/15/29 | | $ | 6,290,449 | | | $ | 9,003,205 | |
| | | | | | | | |
| | | | | | | 451,296,641 | |
| | | | | | | | |
| | |
TOTAL U.S. TREASURY OBLIGATIONS
(Cost $453,848,390) | | | | | | | 451,296,641 | |
| | | | | | | | |
| | |
TOTAL BONDS & NOTES
(Cost $642,942,540) | | | | | | | 645,489,835 | |
| | | | | | | | |
| | |
| | | Notional
Amount | | | | |
| |
| PURCHASED OPTIONS — 0.1% | | | | | |
| Financial — 0.1% | | | | | | | | |
| Diversified Financial — 0.1% | | | | | | | | |
3-Month USD LIBOR BBA 10 Year Swaption, Call, Expires 4/25/16, Strike 2.50 (OTC-Credit Suisse International); Underlying swap terminates 4/27/26 | | $ | 15,435,000 | | | | 408,220 | |
| | | | | | | | |
| | |
| TOTAL PURCHASED OPTIONS (Cost $270,826) | | | | | | | 408,220 | |
| | | | | | | | |
| | |
| TOTAL LONG-TERM INVESTMENTS (Cost $643,213,366) | | | | | | | 645,898,055 | |
| | | | | | | | |
| | |
| | | Principal
Amount | | | | |
| |
| SHORT-TERM INVESTMENTS — 43.1% | | | | | |
| Commercial Paper — 42.9% | | | | | | | | |
AGL Capital Corp. (a)
0.520% 3/11/15 | | $ | 7,000,000 | | | | 6,993,022 | |
Airgas, Inc. (a)
0.440% 3/16/15 | | | 7,000,000 | | | | 6,993,669 | |
Amphenol Corp. (a)
0.420% 2/13/15 | | | 6,400,000 | | | | 6,396,789 | |
Amphenol Corp. (a)
0.500% 3/11/15 | | | 600,000 | | | | 599,425 | |
AutoZone, Inc. . (a)
0.400% 1/05/15 | | | 2,400,000 | | | | 2,399,893 | |
Baxter International, Inc. (a)
0.400% 1/26/15 | | | 5,970,000 | | | | 5,968,342 | |
Baxter International, Inc. (a)
0.400% 1/28/15 | | | 4,000,000 | | | | 3,998,800 | |
Becton, Dickinson & Co.
0.450% 1/14/15 | | | 7,000,000 | | | | 6,998,863 | |
Bell Canada (a)
0.500% 3/17/15 | | | 7,000,000 | | | | 6,992,708 | |
The accompanying notes are an integral part of the financial statements.
33
MML Inflation-Protected and Income Fund – Portfolio of Investments (Continued)
| | | | | | | | |
| | | Principal
Amount | | | Value | |
Bemis Co., Inc. (a)
0.520% 1/20/15 | | $ | 5,000,000 | | | $ | 4,998,628 | |
Block Financial LLC (a)
0.470% 2/02/15 | | | 6,400,000 | | | | 6,397,326 | |
Carnival Corp. (a)
0.700% 3/18/15 | | | 7,000,000 | | | | 6,989,656 | |
CBS Corp. (a)
0.380% 1/13/15 | | | 6,400,000 | | | | 6,399,189 | |
Centrica PLC (a)
0.750% 1/15/15 | | | 7,000,000 | | | | 6,997,958 | |
Dominion Resources, Inc. (a)
0.430% 2/26/15 | | | 4,500,000 | | | | 4,496,990 | |
Duke Energy Corp. (a)
0.350% 2/24/15 | | | 5,500,000 | | | | 5,497,113 | |
Ecolab, Inc. (a)
0.450% 3/04/15 | | | 6,800,000 | | | | 6,794,730 | |
FMC Corp. (a)
0.450% 3/03/15 | | | 6,800,000 | | | | 6,794,815 | �� |
Glencore Funding LLC (a)
0.450% 2/02/15 | | | 6,400,000 | | | | 6,397,440 | |
Holcim US Finance SARL & Cie (a)
0.380% 1/07/15 | | | 6,000,000 | | | | 5,999,620 | |
Hyundai Capital America (a)
0.380% 1/21/15 | | | 6,000,000 | | | | 5,998,733 | |
Marriott International, Inc. (a)
0.520% 3/12/15 | | | 7,000,000 | | | | 6,992,922 | |
Monsanto Co. (a)
0.380% 2/09/15 | | | 6,000,000 | | | | 5,997,530 | |
National Grid USA (a)
0.380% 2/03/15 | | | 1,000,000 | | | | 999,652 | |
National Grid USA (a)
0.400% 2/03/15 | | | 2,900,000 | | | | 2,898,937 | |
National Grid USA (a)
0.430% 1/20/15 | | | 3,100,000 | | | | 3,099,297 | |
ONEOK Partners LP (a)
0.400% 1/16/15 | | | 6,400,000 | | | | 6,398,933 | |
Pall Corp. (a)
0.350% 1/08/15 | | | 6,000,000 | | | | 5,999,592 | |
Pentair Finance (a)
0.450% 3/12/15 | | | 7,000,000 | | | | 6,993,875 | |
Plains All American Pipeline LP (a)
0.450% 1/15/15 | | | 6,800,000 | | | | 6,798,810 | |
PPG Industries, Inc.
0.420% 1/14/15 | | | 7,000,000 | | | | 6,998,938 | |
Sempra Energy Holdings (a)
0.530% 2/10/15 | | | 4,000,000 | | | | 3,997,644 | |
Sempra Energy Holdings (a)
0.715% 3/06/15 | | | 3,000,000 | | | | 2,996,267 | |
Tate & Lyle International Finance PLC (a)
0.480% 2/27/15 | | | 6,400,000 | | | | 6,395,136 | |
Vodafone Group PLC (a)
0.500% 4/10/15 | | | 1,000,000 | | | | 998,625 | |
Vodafone Group PLC (a)
0.570% 6/01/15 | | | 5,500,000 | | | | 5,486,850 | |
| | | | | | | | |
| | | Principal
Amount | | | Value | |
Xcel Energy, Inc. (a)
0.380% 1/09/15 | | $ | 5,500,000 | | | $ | 5,499,536 | |
| | | | | | | | |
| | | | | | | 199,656,253 | |
| | | | | | | | |
| Repurchase Agreement — 0.1% | | | | | |
State Street Bank & Trust Co. Repurchase Agreement, dated 12/31/14, 0.010%, due 1/02/15 (f) | | | 247,490 | | | | 247,490 | |
| | | | | | | | |
| Time Deposits — 0.1% | | | | | |
Euro Time Deposit,
0.010%, due 1/02/15 | | | 236,358 | | | | 236,358 | |
| | | | | | | | |
| | |
TOTAL SHORT-TERM INVESTMENTS
(Cost $200,140,101) | | | | | | | 200,140,101 | |
| | | | | | | | |
| | |
TOTAL INVESTMENTS — 182.0%
(Cost $843,353,467) (g) | | | | | | | 846,038,156 | |
| | |
| Other Assets/(Liabilities) — (82.0)% | | | | | | | (381,169,527 | ) |
| | | | | | | | |
| | |
| NET ASSETS — 100.0% | | | | | | $ | 464,868,629 | |
| | | | | | | | |
Notes to Portfolio of Investments
| Percentages | are stated as a percent of net assets. |
| CDO | Collateralized Debt Obligation |
| CLO | Collateralized Loan Obligation |
| CMO | Collateralized Mortgage Obligation |
| MBS | Mortgage-Backed Security |
| PAC | Planned Amortization Class |
| (a) | Securities exempt from registration under rule 144A of the Securities Act of 1933. These securities may be resold in transactions exempt from registration, normally to qualified institutional buyers. At December 31, 2014, these securities amounted to a value of $293,408,646 or 63.12% of net assets. |
| (b) | Restricted security. Certain securities are restricted as to resale. At December 31, 2014, these securities amounted to a value of $264,636 or 0.06% of net assets. The Fund generally bears the costs, if any, associated with the disposition of restricted securities. |
| (c) | All or a portion of this security is held as collateral for open reverse repurchase agreements. (Note 2). |
| (d) | All or a portion of this security is held as collateral for open swap agreements. (Note 2). |
| (e) | A portion of this security is held as collateral for open futures contracts. (Note 2). |
| (f) | Maturity value of $247,490. Collateralized by U.S. Government Agency obligations with a rate of 2.500%, maturity date of 3/20/28, and an aggregate market value, including accrued interest, of $256,290. |
| (g) | See Note 6 for aggregate cost for federal tax purposes. |
The accompanying notes are an integral part of the financial statements.
34
MML Short-Duration Bond Fund – Portfolio of Investments
December 31, 2014
| | | | | | | | |
| | | Principal
Amount | | | Value | |
| BONDS & NOTES — 97.8% | |
|
| CORPORATE DEBT — 38.4% | |
| Aerospace & Defense — 0.1% | |
Exelis, Inc.
4.250% 10/01/16 | | $ | 270,000 | | | $ | 279,237 | |
| | | | | | | | |
| Agriculture — 0.1% | |
Bunge Ltd. Finance Corp.
3.200% 6/15/17 | | | 200,000 | | | | 205,649 | |
| | | | | | | | |
| Airlines — 0.0% | |
American Airlines Pass-Through Trust, Series 2014-1, Class B
4.375% 4/01/24 | | | 40,000 | | | | 40,993 | |
United Air Lines, Inc. (a)
10.110% 12/19/49 | | | 6,355 | | | | 2,526 | |
| | | | | | | | |
| | | | | | | 43,519 | |
| | | | | | | | |
| Auto Manufacturers — 0.7% | |
General Motors Co.
3.500% 10/02/18 | | | 205,000 | | | | 209,100 | |
Hyundai Capital America (b)
2.550% 2/06/19 | | | 170,000 | | | | 170,023 | |
Volkswagen Group of America Finance LLC (b)
1.600% 11/20/17 | | | 200,000 | | | | 199,269 | |
Volvo Treasury AB (b)
5.950% 4/01/15 | | | 750,000 | | | | 758,736 | |
| | | | | | | | |
| | | | | | | 1,337,128 | |
| | | | | | | | |
| Automotive & Parts — 0.2% | |
Lear Corp.
8.125% 3/15/20 | | | 311,000 | | | | 327,327 | |
| | | | | | | | |
| Banks — 2.7% | |
Deutsche Bank AG
1.400% 2/13/17 | | | 210,000 | | | | 209,562 | |
Deutsche Bank AG
2.500% 2/13/19 | | | 335,000 | | | | 339,102 | |
First Horizon National Corp.
5.375% 12/15/15 | | | 1,984,000 | | | | 2,054,037 | |
ICICI Bank Ltd. (b)
5.500% 3/25/15 | | | 1,530,000 | | | | 1,544,260 | |
Regions Financial Corp.
5.750% 6/15/15 | | | 515,000 | | | | 525,696 | |
Regions Financial Corp.
7.500% 5/15/18 | | | 130,000 | | | | 150,916 | |
Skandinaviska Enskilda Banken AB (b)
2.375% 3/25/19 | | | 200,000 | | | | 201,296 | |
SVB Financial Group
5.375% 9/15/20 | | | 75,000 | | | | 84,335 | |
| | | | | | | | |
| | | | | | | 5,109,204 | |
| | | | | | | | |
| Building Materials — 0.7% | |
Lafarge SA (b)
6.200% 7/09/15 | | | 400,000 | | | | 409,160 | |
| | | | | | | | |
| | | Principal
Amount | | | Value | |
Lafarge SA
6.500% 7/15/16 | | $ | 185,000 | | | $ | 197,025 | |
Martin Marietta Material, Inc. FRN
1.357% 6/30/17 | | | 205,000 | | | | 207,247 | |
Masco Corp.
4.800% 6/15/15 | | | 490,000 | | | | 497,550 | |
Owens Corning, Inc.
6.500% 12/01/16 | | | 39,000 | | | | 42,492 | |
| | | | | | | | |
| | | | | | | 1,353,474 | |
| | | | | | | | |
| Chemicals — 1.4% | |
Ashland, Inc.
3.000% 3/15/16 | | | 641,000 | | | | 644,205 | |
Cabot Corp.
5.000% 10/01/16 | | | 330,000 | | | | 349,884 | |
Incitec Pivot Ltd. (b)
4.000% 12/07/15 | | | 1,090,000 | | | | 1,114,989 | |
LyondellBasell Industries NV
5.000% 4/15/19 | | | 200,000 | | | | 218,153 | |
RPM International, Inc.
6.125% 10/15/19 | | | 300,000 | | | | 340,957 | |
| | | | | | | | |
| | | | | | | 2,668,188 | |
| | | | | | | | |
| Commercial Services — 0.6% | |
The ADT Corp.
2.250% 7/15/17 | | | 295,000 | | | | 285,412 | |
Brambles USA, Inc. (b)
3.950% 4/01/15 | | | 265,000 | | | | 266,830 | |
Donnelley (R.R.) & Sons Co.
5.500% 5/15/15 | | | 11,000 | | | | 11,110 | |
The Western Union Co.
5.930% 10/01/16 | | | 545,000 | | | | 585,159 | |
| | | | | | | | |
| | | | | | | 1,148,511 | |
| | | | | | | | |
| Computers — 0.2% | |
Hewlett-Packard Co.
2.125% 9/13/15 | | | 135,000 | | | | 136,060 | |
Hewlett-Packard Co.
2.200% 12/01/15 | | | 175,000 | | | | 176,727 | |
Hewlett-Packard Co.
3.000% 9/15/16 | | | 85,000 | | | | 87,276 | |
| | | | | | | | |
| | | | | | | 400,063 | |
| | | | | | | | |
| Distribution & Wholesale — 0.2% | |
Arrow Electronics, Inc.
3.375% 11/01/15 | | | 345,000 | | | | 351,220 | |
Arrow Electronics, Inc.
3.000% 3/01/18 | | | 105,000 | | | | 107,671 | |
| | | | | | | | |
| | | | | | | 458,891 | |
| | | | | | | | |
| Diversified Financial — 9.7% | |
AerCap Ireland Capital Ltd. (b)
4.500% 5/15/21 | | | 710,000 | | | | 718,875 | |
Air Lease Corp.
3.375% 1/15/19 | | | 365,000 | | | | 369,563 | |
The accompanying notes are an integral part of the financial statements.
35
MML Short-Duration Bond Fund – Portfolio of Investments (Continued)
| | | | | | | | |
| | | Principal
Amount | | | Value | |
Air Lease Corp.
5.625% 4/01/17 | | $ | 1,315,000 | | | $ | 1,416,912 | |
Citigroup, Inc.
5.500% 2/15/17 | | | 2,250,000 | | | | 2,418,714 | |
ERAC USA Finance LLC (b)
5.900% 11/15/15 | | | 1,000,000 | | | | 1,043,364 | |
Ford Motor Credit Co. LLC
3.875% 1/15/15 | | | 455,000 | | | | 455,344 | |
Ford Motor Credit Co. LLC
12.000% 5/15/15 | | | 215,000 | | | | 223,460 | |
General Motors Financial Co., Inc.
2.625% 7/10/17 | | | 190,000 | | | | 190,824 | |
General Motors Financial Co., Inc. 2.750% 5/15/16 | | | 145,000 | | | | 147,356 | |
General Motors Financial Co., Inc. 3.000% 9/25/17 | | | 235,000 | | | | 237,651 | |
The Goldman Sachs Group, Inc.
1.600% 11/23/15 | | | 230,000 | | | | 231,205 | |
Hyundai Capital America (b)
3.750% 4/06/16 | | | 1,875,000 | | | | 1,927,747 | |
Icahn Enterprises LP/Icahn Enterprises Finance Corp.
3.500% 3/15/17 | | | 955,000 | | | | 955,000 | |
International Lease Finance Corp. FRN
2.191% 6/15/16 | | | 750,000 | | | | 749,063 | |
International Lease Finance Corp.
3.875% 4/15/18 | | | 100,000 | | | | 100,000 | |
International Lease Finance Corp.
5.750% 5/15/16 | | | 741,000 | | | | 768,787 | |
Janus Capital Group, Inc.
6.700% 6/15/17 | | | 953,000 | | | | 1,054,424 | |
JP Morgan Chase & Co.
3.450% 3/01/16 | | | 890,000 | | | | 913,499 | |
Lazard Group LLC
6.850% 6/15/17 | | | 219,000 | | | | 243,791 | |
Merrill Lynch & Co., Inc.
5.700% 5/02/17 | | | 1,200,000 | | | | 1,297,207 | |
Merrill Lynch & Co., Inc.
6.050% 5/16/16 | | | 1,750,000 | | | | 1,853,120 | |
Morgan Stanley
3.800% 4/29/16 | | | 1,000,000 | | | | 1,033,019 | |
Morgan Stanley
6.000% 4/28/15 | | | 175,000 | | | | 177,832 | |
| | | | | | | | |
| | | | | | | 18,526,757 | |
| | | | | | | | |
| Electric — 1.4% | |
IPALCO Enterprises, Inc.
5.000% 5/01/18 | | | 315,000 | | | | 332,325 | |
IPALCO Enterprises, Inc. (b)
7.250% 4/01/16 | | | 2,110,000 | | | | 2,226,050 | |
Kansas Gas & Electric Co.
5.647% 3/29/21 | | | 34,836 | | | | 36,884 | |
| | | | | | | | |
| | | | | | | 2,595,259 | |
| | | | | | | | |
| | | | | | | | |
| | | Principal
Amount | | | Value | |
| Electrical Components & Equipment — 0.1% | | | | | |
Anixter, Inc.
5.950% 3/01/15 | | $ | 115,000 | | | $ | 115,287 | |
| | | | | | | | |
| Electronics — 0.4% | | | | | | | | |
Amphenol Corp.
2.550% 1/30/19 | | | 215,000 | | | | 216,495 | |
Avnet, Inc.
6.625% 9/15/16 | | | 220,000 | | | | 237,768 | |
Jabil Circuit, Inc.
7.750% 7/15/16 | | | 145,000 | | | | 155,331 | |
Jabil Circuit, Inc.
8.250% 3/15/18 | | | 90,000 | | | | 102,321 | |
| | | | | | | | |
| | | | | | | 711,915 | |
| | | | | | | | |
| Engineering & Construction — 0.1% | | | | | | | | |
BAA Funding Ltd. (b)
2.500% 6/25/17 | | | 200,000 | | | | 200,120 | |
| | | | | | | | |
| Foods — 0.3% | | | | | | | | |
Tyson Foods, Inc.
2.650% 8/15/19 | | | 60,000 | | | | 60,547 | |
Tyson Foods, Inc.
6.600% 4/01/16 | | | 510,000 | | | | 543,662 | |
| | | | | | | | |
| | | | | | | 604,209 | |
| | | | | | | | |
| Forest Products & Paper — 0.4% | | | | | | | | |
Domtar Corp.
7.125% 8/15/15 | | | 280,000 | | | | 289,164 | |
Domtar Corp.
10.750% 6/01/17 | | | 400,000 | | | | 475,429 | |
| | | | | | | | |
| | | | | | | 764,593 | |
| | | | | | | | |
| Hand & Machine Tools — 0.1% | | | | | | | | |
Kennametal, Inc.
2.650% 11/01/19 | | | 100,000 | | | | 98,942 | |
| | | | | | | | |
| Health Care – Products — 0.1% | | | | | | | | |
Hospira, Inc.
5.200% 8/12/20 | | | 155,000 | | | | 166,288 | |
| | | | | | | | |
| Holding Company – Diversified — 0.3% | | | | | |
Leucadia National Corp.
8.125% 9/15/15 | | | 500,000 | | | | 522,285 | |
| | | | | | | | |
| Insurance — 0.1% | | | | | | | | |
AXIS Specialty Finance PLC
2.650% 4/01/19 | | | 90,000 | | | | 90,228 | |
Prudential Financial, Inc.
3.875% 1/14/15 | | | 115,000 | | | | 115,133 | |
Willis Group Holdings PLC
4.125% 3/15/16 | | | 55,000 | | | | 56,686 | |
| | | | | | | | |
| | | | | | | 262,047 | |
| | | | | | | | |
| Internet — 0.3% | | | | | | | | |
Baidu, Inc.
2.250% 11/28/17 | | | 200,000 | | | | 200,138 | |
The accompanying notes are an integral part of the financial statements.
36
MML Short-Duration Bond Fund – Portfolio of Investments (Continued)
| | | | | | | | |
| | | Principal
Amount | | | Value | |
Expedia, Inc.
7.456% 8/15/18 | | $ | 345,000 | | | $ | 401,259 | |
| | | | | | | | |
| | | | | | | 601,397 | |
| | | | | | | | |
| Investment Companies — 0.3% | | | | | | | | |
FS Investment Corp.
4.000% 7/15/19 | | | 365,000 | | | | 363,559 | |
Xstrata Finance Canada Ltd. (b)
2.050% 10/23/15 | | | 175,000 | | | | 176,139 | |
| | | | | | | | |
| | | | | | | 539,698 | |
| | | | | | | | |
| Iron & Steel — 0.4% | | | | | | | | |
Allegheny Technologies, Inc.
9.375% 6/01/19 | | | 470,000 | | | | 546,817 | |
Commercial Metals Co.
6.500% 7/15/17 | | | 120,000 | | | | 127,800 | |
Reliance Steel & Aluminum Co.
6.200% 11/15/16 | | | 185,000 | | | | 197,456 | |
| | | | | | | | |
| | | | | | | 872,073 | |
| | | | | | | | |
| Lodging — 0.1% | | | | | | | | |
Wyndham Worldwide Corp.
2.950% 3/01/17 | | | 165,000 | | | | 168,504 | |
| | | | | | | | |
| Machinery – Diversified — 0.6% | | | | | | | | |
CNH Industrial Capital LLC
3.250% 2/01/17 | | | 105,000 | | | | 103,425 | |
CNH Industrial Capital LLC (b)
3.375% 7/15/19 | | | 215,000 | | | | 205,325 | |
CNH Industrial Capital LLC
3.625% 4/15/18 | | | 100,000 | | | | 98,500 | |
CNH Industrial Capital LLC
3.875% 11/01/15 | | | 150,000 | | | | 150,750 | |
CNH Industrial Capital LLC
6.250% 11/01/16 | | | 190,000 | | | | 199,025 | |
Roper Industries, Inc.
1.850% 11/15/17 | | | 350,000 | | | | 350,425 | |
| | | | | | | | |
| | | | | | | 1,107,450 | |
| | | | | | | | |
| Manufacturing — 1.8% | | | | | | | | |
Bombardier, Inc. (b)
4.250% 1/15/16 | | | 398,000 | | | | 401,980 | |
Harsco Corp
2.700% 10/15/15 | | | 1,106,000 | | | | 1,104,617 | |
SPX Corp.
6.875% 9/01/17 | | | 170,000 | | | | 185,725 | |
Textron, Inc.
6.200% 3/15/15 | | | 900,000 | | | | 909,005 | |
Tyco Electronics Group SA
6.550% 10/01/17 | | | 700,000 | | | | 787,940 | |
| | | | | | | | |
| | | | | | | 3,389,267 | |
| | | | | | | | |
| Mining — 0.9% | | | | | | | | |
Freeport-McMoRan, Inc.
2.300% 11/14/17 | | | 400,000 | | | | 400,480 | |
| | | | | | | | |
| | | Principal
Amount | | | Value | |
Vale Overseas Ltd.
6.250% 1/11/16 | | $ | 1,250,000 | | | $ | 1,299,500 | |
| | | | | | | | |
| | | | | | | 1,699,980 | |
| | | | | | | | |
| Office Equipment/Supplies — 0.5% | | | | | | | | |
Pitney Bowes, Inc.
4.750% 1/15/16 | | | 95,000 | | | | 98,242 | |
Pitney Bowes, Inc.
4.750% 5/15/18 | | | 750,000 | | | | 798,535 | |
Pitney Bowes, Inc.
5.750% 9/15/17 | | | 33,000 | | | | 36,114 | |
| | | | | | | | |
| | | | | | | 932,891 | |
| | | | | | | | |
| Oil & Gas — 2.3% | | | | | | | | |
Canadian Natural Resources Ltd.
1.750% 1/15/18 | | | 390,000 | | | | 387,706 | |
Chesapeake Energy Corp.
3.250% 3/15/16 | | | 650,000 | | | | 648,375 | |
Chesapeake Energy Corp., Convertible
2.250% 12/15/38 | | | 40,000 | | | | 35,925 | |
Chesapeake Energy Corp., Convertible
2.500% 5/15/37 | | | 390,000 | | | | 378,787 | |
Newfield Exploration Co.
6.875% 2/01/20 | | | 150,000 | | | | 152,250 | |
Petrobras International Finance Co.
3.875% 1/27/16 | | | 1,000,000 | | | | 981,300 | |
Petroleos Mexicanos
3.125% 1/23/19 | | | 50,000 | | | | 50,125 | |
Range Resources Corp.
6.750% 8/01/20 | | | 825,000 | | | | 858,000 | |
Rowan Cos., Inc.
5.000% 9/01/17 | | | 55,000 | | | | 57,310 | |
Transocean, Inc.
4.950% 11/15/15 | | | 770,000 | | | | 771,929 | |
Transocean, Inc.
5.050% 12/15/16 | | | 100,000 | | | | 100,479 | |
| | | | | | | | |
| | | | | | | 4,422,186 | |
| | | | | | | | |
| Oil & Gas Services — 0.7% | | | | | | | | |
Cameron International Corp.
1.400% 6/15/17 | | | 300,000 | | | | 295,475 | |
SESI LLC
6.375% 5/01/19 | | | 110,000 | | | | 106,700 | |
Superior Energy Services, Inc.
7.125% 12/15/21 | | | 807,000 | | | | 774,720 | |
Weatherford International Ltd.
5.500% 2/15/16 | | | 225,000 | | | | 232,109 | |
| | | | | | | | |
| | | | | | | 1,409,004 | |
| | | | | | | | |
| Pharmaceuticals — 0.7% | | | | | | | | |
AbbVie, Inc.
1.750% 11/06/17 | | | 200,000 | | | | 200,435 | |
McKesson Corp.
1.292% 3/10/17 | | | 85,000 | | | | 84,566 | |
The accompanying notes are an integral part of the financial statements.
37
MML Short-Duration Bond Fund – Portfolio of Investments (Continued)
| | | | | | | | |
| | | Principal
Amount | | | Value | |
McKesson Corp.
2.284% 3/15/19 | | $ | 85,000 | | | $ | 84,822 | |
Mylan, Inc. (b)
7.875% 7/15/20 | | | 850,000 | | | | 905,416 | |
| | | | | | | | |
| | | | | | | 1,275,239 | |
| | | | | | | | |
| Pipelines — 0.3% | | | | | | | | |
Boardwalk Pipelines LP
5.875% 11/15/16 | | | 375,000 | | | | 398,152 | |
Energy Transfer Partners LP FRN
3.250% 11/01/66 | | | 200,000 | | | | 179,000 | |
Gulf South Pipeline Co. LP (b)
5.050% 2/01/15 | | | 35,000 | | | | 35,104 | |
| | | | | | | | |
| | | | | | | 612,256 | |
| | | | | | | | |
| Real Estate — 0.5% | | | | | | | | |
Regency Centers LP
5.250% 8/01/15 | | | 855,000 | | | | 876,162 | |
| | | | | | | | |
| Real Estate Investment Trusts (REITS) — 4.0% | | | | | |
American Tower Corp.
4.625% 4/01/15 | | | 900,000 | | | | 908,036 | |
ARC Properties Operating Partnership LP
2.000% 2/06/17 | | | 225,000 | | | | 214,440 | |
ARC Properties Operating Partnership LP
3.000% 2/06/19 | | | 110,000 | | | | 101,785 | |
DDR Corp.
7.500% 7/15/18 | | | 925,000 | | | | 1,081,217 | |
Developers Diversified Realty Corp.
5.500% 5/01/15 | | | 880,000 | | | | 892,850 | |
Duke Realty LP
5.500% 3/01/16 | | | 250,000 | | | | 262,106 | |
Duke Realty LP
5.950% 2/15/17 | | | 550,000 | | | | 596,394 | |
Duke Realty LP
8.250% 8/15/19 | | | 200,000 | | | | 246,740 | |
Federal Realty Investment Trust
6.200% 1/15/17 | | | 800,000 | | | | 875,077 | |
HCP, Inc.
6.000% 1/30/17 | | | 550,000 | | | | 600,123 | |
Highwoods Realty LP
5.850% 3/15/17 | | | 275,000 | | | | 298,443 | |
Highwoods Realty LP
7.500% 4/15/18 | | | 25,000 | | | | 28,970 | |
Realty Income Corp.
2.000% 1/31/18 | | | 25,000 | | | | 25,046 | |
Realty, Inc.
5.950% 9/15/16 | | | 750,000 | | | | 808,785 | |
UDR, Inc.
5.250% 1/15/15 | | | 400,000 | | | | 400,492 | |
UDR, Inc.
5.250% 1/15/16 | | | 350,000 | | | | 363,997 | |
| | | | | | | | |
| | | | | | | 7,704,501 | |
| | | | | | | | |
| | | | | | | | |
| | | Principal
Amount | | | Value | |
| Retail — 0.4% | | | | | | | | |
Best Buy Co., Inc.
3.750% 3/15/16 | | $ | 575,000 | | | $ | 584,344 | |
Macy’s Retail Holdings, Inc.
7.450% 7/15/17 | | | 90,000 | | | | 102,320 | |
QVC, Inc.
3.125% 4/01/19 | | | 150,000 | | | | 149,952 | |
| | | | | | | | |
| | | | | | | 836,616 | |
| | | | | | | | |
| Savings & Loans — 0.4% | | | | | | | | |
Glencore Funding LLC (b)
1.700% 5/27/16 | | | 369,000 | | | | 369,587 | |
Glencore Funding LLC (b)
3.125% 4/29/19 | | | 360,000 | | | | 360,864 | |
| | | | | | | | |
| | | | | | | 730,451 | |
| | | | | | | | |
| Semiconductors — 0.2% | | | | | | | | |
KLA-Tencor Corp.
2.375% 11/01/17 | | | 300,000 | | | | 301,580 | |
| | | | | | | | |
| Telecommunications — 1.4% | | | | | | | | |
CenturyLink, Inc.
5.000% 2/15/15 | | | 785,000 | | | | 787,944 | |
Frontier Communications Corp.
8.250% 4/15/17 | | | 795,000 | | | | 884,437 | |
Qwest Corp.
8.375% 5/01/16 | | | 315,000 | | | | 341,081 | |
Sprint Communications, Inc. (b)
9.000% 11/15/18 | | | 395,000 | | | | 449,273 | |
Telefonica Emisiones SAU
6.421% 6/20/16 | | | 130,000 | | | | 139,068 | |
Verizon Communications, Inc. (b)
2.625% 2/21/20 | | | 72,000 | | | | 71,177 | |
| | | | | | | | |
| | | | | | | 2,672,980 | |
| | | | | | | | |
| Transportation — 2.0% | | | | | | | | |
Asciano Finance (b)
3.125% 9/23/15 | | | 3,090,000 | | | | 3,126,097 | |
Asciano Finance (b)
5.000% 4/07/18 | | | 147,000 | | | | 158,034 | |
Ryder System, Inc.
2.500% 3/01/18 | | | 475,000 | | | | 484,212 | |
Ryder System, Inc.
2.550% 6/01/19 | | | 65,000 | | | | 65,090 | |
| | | | | | | | |
| | | | | | | 3,833,433 | |
| | | | | | | | |
| Trucking & Leasing — 0.7% | | | | | | | | |
GATX Corp.
3.500% 7/15/16 | | | 30,000 | | | | 30,952 | |
GATX Corp.
4.750% 5/15/15 | | | 70,000 | | | | 71,003 | |
Penske Truck Leasing Co. LP/PTL Finance Corp. (b)
2.500% 3/15/16 | | | 125,000 | | | | 126,720 | |
The accompanying notes are an integral part of the financial statements.
38
MML Short-Duration Bond Fund – Portfolio of Investments (Continued)
| | | | | | | | |
| | | Principal
Amount | | | Value | |
Penske Truck Leasing Co. LP/PTL Finance Corp. (b)
2.500% 6/15/19 | | $ | 270,000 | | | $ | 268,354 | |
Penske Truck Leasing Co. LP/PTL Finance Corp. (b)
3.750% 5/11/17 | | | 770,000 | | | | 804,733 | |
| | | | | | | | |
| | | | | | | 1,301,762 | |
| | | | | | | | |
| | |
TOTAL CORPORATE DEBT
(Cost $73,075,409) | | | | | | | 73,186,323 | |
| | | | | | | | |
| |
| MUNICIPAL OBLIGATIONS — 0.5% | | | | | |
Louisiana State Public Facilities Authority FRN
1.133% 4/26/27 | | | 153,711 | | | | 152,211 | |
North Carolina State Education Assistance Authority FRN
1.134% 1/26/26 | | | 279,101 | | | | 280,533 | |
State of Illinois
5.365% 3/01/17 | | | 400,000 | | | | 428,220 | |
| | | | | | | | |
| | | | | | | 860,964 | |
| | | | | | | | |
| | |
TOTAL MUNICIPAL OBLIGATIONS
(Cost $830,392) | | | | | | | 860,964 | |
| | | | | | | | |
|
| NON-U.S. GOVERNMENT AGENCY OBLIGATIONS — 26.2% | |
| Agency Collateral CMO — 0.3% | | | | | | | | |
Government National Mortgage Association, Series 2014-131,
Class BW FRN
3.841% 5/20/41 | | | 534,749 | | | | 559,050 | |
| | | | | | | | |
| Auto Floor Plan ABS — 0.1% | | | | | | | | |
NCF Dealer Floorplan Master Trust,
Series 2014-1A, Class A FRN (b)
1.666% 10/20/20 | | | 200,000 | | | | 200,000 | |
| | | | | | | | |
| Automobile ABS — 3.3% | | | | | | | | |
American Credit Acceptance Receivables Trust, Series 2014-2, Class A (b)
0.990% 10/10/17 | | | 139,939 | | | | 139,844 | |
American Credit Acceptance Receivables Trust, Series 2014-3, Class A (b)
0.990% 8/10/18 | | | 388,055 | | | | 387,651 | |
ARI Fleet Lease Trust, Series 2012-A, Class A FRN (b)
0.711% 3/15/20 | | | 54,741 | | | | 54,770 | |
Avis Budget Rental Car Funding AESOP LLC, Series 2012-1A, Class A (b)
2.054% 8/20/16 | | | 300,000 | | | | 301,467 | |
Capital Automotive REIT,
Series 2012-1A, Class A (b)
4.700% 7/15/42 | | | 197,747 | | | | 202,361 | |
| | | | | | | | |
| | | Principal
Amount | | | Value | |
CarNow Auto Receivables Trust,
Series 2014-1A, Class A (b)
0.960% 1/17/17 | | $ | 302,198 | | | $ | 302,081 | |
CarNow Auto Receivables Trust,
Series 2013-1A, Class A (b)
1.160% 10/16/17 | | | 11,992 | | | | 11,992 | |
CFC LLC, Series 2013-1A, Class A (b)
1.650% 7/17/17 | | | 35,682 | | | | 35,731 | |
Chesapeake Funding LLC,
Series 2012-1A, Class A FRN (b)
0.907% 11/07/23 | | | 136,857 | | | | 136,964 | |
CPS Auto Trust, Series 2014-B, Class A (b)
1.110% 11/15/18 | | | 329,484 | | | | 328,517 | |
CPS Auto Trust, Series 2014-C, Class A (b)
1.310% 2/15/19 | | | 309,366 | | | | 308,489 | |
CPS Auto Trust, Series 2014-D, Class A (b)
1.490% 4/15/19 | | | 200,000 | | | | 199,504 | |
CPS Auto Trust, Series 2013-D, Class A (b)
1.540% 7/16/18 | | | 210,048 | | | | 210,452 | |
CPS Auto Trust, Series 2013-B, Class A (b)
1.820% 9/15/20 | | | 416,659 | | | | 417,854 | |
Credit Acceptance Auto Loan Trust,
Series 2014-2A, Class A (b)
1.880% 3/15/22 | | | 370,000 | | | | 370,479 | |
Credit Acceptance Auto Loan Trust,
Series 2012-1A, Class A (b)
2.200% 9/16/19 | | | 8,749 | | | | 8,767 | |
Enterprise Fleet Financing LLC,
Series 2012-1, Class A2 (b)
1.140% 11/20/17 | | | 35,688 | | | | 35,706 | |
Exeter Automobile Receivables Trust,
Series 2014-2A, Class A (b)
1.060% 8/15/18 | | | 271,533 | | | | 270,966 | |
Exeter Automobile Receivables Trust,
Series 2014-1A, Class A (b)
1.290% 5/15/18 | | | 145,615 | | | | 145,700 | |
Exeter Automobile Receivables Trust,
Series 2014-3A, Class A (b)
1.320% 1/15/19 | | | 234,198 | | | | 233,922 | |
First Investors Auto Owner Trust,
Series 2013-3A, Class A3 (b)
1.440% 10/15/19 | | | 300,000 | | | | 300,224 | |
Flagship Credit Auto Trust, Series 2013-1, Class A (b)
1.320% 4/16/18 | | | 95,870 | | | | 95,952 | |
Flagship Credit Auto Trust, Series 2014-2, Class A (b)
1.430% 12/16/19 | | | 284,495 | | | | 283,619 | |
Flagship Credit Auto Trust, Series 2013-2, Class A (b)
1.940% 1/15/19 | | | 174,697 | | | | 175,441 | |
Hertz Vehicle Financing LLC,
Series 2010-1A, Class A2 (b)
3.740% 2/25/17 | | | 170,000 | | | | 174,391 | |
The accompanying notes are an integral part of the financial statements.
39
MML Short-Duration Bond Fund – Portfolio of Investments (Continued)
| | | | | | | | |
| | | Principal
Amount | | | Value | |
Hertz Vehicle Financing LLC,
Series 2009-2A, Class A2 (b)
5.290% 3/25/16 | | $ | 50,000 | | | $ | 50,246 | |
Oscar US Funding Trust, Series 2014-1A, Class A2 (b)
1.000% 8/15/17 | | | 340,000 | | | | 340,159 | |
Rental Car Finance Corp., Series 2011-1A, Class A1 (b)
2.510% 2/25/16 | | | 43,333 | | | | 43,392 | |
Tidewater Auto Receivables Trust,
Series 2014-AA, Class A2 (b)
0.960% 7/15/17 | | | 279,784 | | | | 279,697 | |
United Auto Credit Securitization Trust,
Series 2014-1, Class A2 (b)
0.740% 6/15/16 | | | 360,000 | | | | 359,955 | |
Westlake Automobile Receivables Trust,
Series 2014-2A, Class A2 (b)
0.970% 10/16/17 | | | 200,000 | | | | 199,875 | |
Wheels SPV LLC, Series 2012-1, Class A2 (b)
1.190% 3/20/21 | | | 18,621 | | | | 18,634 | |
| | | | | | | | |
| | | | | | | 6,424,802 | |
| | | | | | | | |
| Commercial MBS — 6.6% | | | | | | | | |
Banc of America Commercial Mortgage, Inc., 2007-3 A4 VRN
5.547% 6/10/49 | | | 350,000 | | | | 375,454 | |
Banc of America Commercial Mortgage, Inc., Series 2007-4,
Class A4 VRN
5.754% 2/10/51 | | | 252,707 | | | | 275,409 | |
Banc of America Commercial Mortgage, Inc., Series 2007-4,
Class AM VRN
5.821% 2/10/51 | | | 180,000 | | | | 196,099 | |
Banc of America Commercial Mortgage, Inc., Series 2008-1,
Class A4 VRN
6.245% 2/10/51 | | | 395,594 | | | | 437,586 | |
Bear Stearns Commercial Mortgage Securities, Series 2005-PWR9, Class A4B
4.943% 9/11/42 | | | 335,000 | | | | 342,368 | |
Bear Stearns Commercial Mortgage Securities, Series 2005-PWR7, Class A3 VRN
5.116% 2/11/41 | | | 108,979 | | | | 109,236 | |
Bear Stearns Commercial Mortgage Securities, Series 2006-PW14, Class A4
5.201% 12/11/38 | | | 255,000 | | | | 270,040 | |
Bear Stearns Commercial Mortgage Securities, Series 2006-PW14, Class AM
5.243% 12/11/38 | | | 225,000 | | | | 239,271 | |
| | | | | | | | |
| | | Principal
Amount | | | Value | |
Bear Stearns Commercial Mortgage Securities, Series 2004-PWR4, Class A3 VRN
5.468% 6/11/41 | | $ | 11,879 | | | $ | 11,881 | |
Bear Stearns Commercial Mortgage Securities, Series 2007-T26,
Class A4 VRN
5.471% 1/12/45 | | | 418,109 | | | | 447,868 | |
Bear Stearns Commercial Mortgage Securities, Series 2006-T24,
Class AM VRN
5.568% 10/12/41 | | | 290,000 | | | | 307,404 | |
Bear Stearns Commercial Mortgage Securities, Series 2007-PW17,
Class A4 VRN
5.694% 6/11/50 | | | 110,000 | | | | 119,306 | |
Bear Stearns Commercial Mortgage Securities, Series 2006-PW12,
Class AM VRN
5.743% 9/11/38 | | | 400,000 | | | | 421,094 | |
Bear Stearns Commercial Mortgage Securities, Series 2007-PW17,
Class AM VRN
5.896% 6/11/50 | | | 425,000 | | | | 466,268 | |
Commercial Mortgage Pass Through Certificates, Series 2014-BBG, Class A FRN (b)
0.961% 3/15/29 | | | 365,000 | | | | 363,035 | |
Commercial Mortgage Pass Through Certificates, Series 2014-CR14, Class A2
3.147% 2/10/47 | | | 290,000 | | | | 299,783 | |
Commercial Mortgage Pass Through Certificates, Series 2006-C7, Class A1A VRN
5.745% 6/10/46 | | | 230,964 | | | | 241,958 | |
Commercial Mortgage Pass Through Certificates, Series 2006-C7, Class AM VRN
5.781% 6/10/46 | | | 225,000 | | | | 237,845 | |
Commercial Mortgage Pass Through Certificates, Series 2007-C9, Class A4 VRN
5.796% 12/10/49 | | | 390,000 | | | | 425,951 | |
DBRR Trust, Series 2013-EZ3, Class A VRN (b)
1.636% 12/18/49 | | | 298,345 | | | | 299,883 | |
DBUBS Mortgage Trust,
Series 2011-LC3A, Class A1
2.238% 8/10/44 | | | 93,925 | | | | 94,419 | |
DBUBS Mortgage Trust,
Series 2011-LC2A, Class A2 (b)
3.386% 7/10/44 | | | 189,943 | | | | 195,162 | |
The accompanying notes are an integral part of the financial statements.
40
MML Short-Duration Bond Fund – Portfolio of Investments (Continued)
| | | | | | | | |
| | | Principal
Amount | | | Value | |
DBUBS Mortgage Trust,
Series 2011-LC1A, Class A1 (b)
3.742% 11/10/46 | | $ | 356,922 | | | $ | 365,443 | |
Greenwich Capital Commercial Funding Corp., Series 2006-GG7, Class A4 VRN
5.819% 7/10/38 | | | 105,934 | | | | 110,858 | |
GS Mortgage Securities Corp.,
Series 2014-4R, Class AS FRN (b)
0.349% 1/26/34 | | | 260,000 | | | | 244,680 | |
JP Morgan Chase Commercial Mortgage Securities Corp., Series 2005-LDP2, Class AM
4.780% 7/15/42 | | | 300,000 | | | | 303,567 | |
JP Morgan Chase Commercial Mortgage Securities Corp., Series 2006-CB17, Class A4
5.429% 12/12/43 | | | 485,000 | | | | 511,465 | |
JP Morgan Chase Commercial Mortgage Securities Corp., Series 2006-CB14, Class AM VRN
5.433% 12/12/44 | | | 480,000 | | | | 498,075 | |
Merrill Lynch/Countrywide Commercial Mortgage Trust, Series 2006-4, Class AM
5.204% 12/12/49 | | | 485,000 | | | | 516,842 | |
Merrill Lynch/Countrywide Commercial Mortgage Trust, Series 2007-9, Class A4
5.700% 9/12/49 | | | 480,000 | | | | 520,761 | |
Merrill Lynch/Countrywide Commercial Mortgage Trust, Series 2006-2, Class A4 VRN
5.869% 6/12/46 | | | 236,890 | | | | 248,569 | |
ML-CFC Commercial Mortgage Trust, Series 2007-9, Class AM VRN
5.856% 9/12/49 | | | 250,000 | | | | 272,936 | |
Morgan Stanley Capital I,
Series 2006-IQ12, Class AM
5.370% 12/15/43 | | | 200,000 | | | | 213,300 | |
Morgan Stanley Capital I, Series 2007-HQ11, Class A4 VRN
5.447% 2/12/44 | | | 400,000 | | | | 425,818 | |
Morgan Stanley Capital I,
Series 2007-HQ11, Class AM VRN
5.478% 2/12/44 | | | 300,000 | | | | 320,458 | |
Morgan Stanley Capital I, Series 2007-IQ14,
Class A2
5.610% 4/15/49 | | | 57,341 | | | | 57,704 | |
Morgan Stanley Capital I, Series 2008-T29,
Class A4 VRN
6.278% 1/11/43 | | | 136,590 | | | | 152,413 | |
STRIPs Ltd., Series 2012-1A, Class A (b)
1.500% 12/25/44 | | | 110,841 | | | | 99,757 | |
TIAA Seasoned Commercial Mortgage Trust, Series 2007-C4, Class A3 VRN
5.560% 8/15/39 | | | 89,539 | | | | 90,008 | |
| | | | | | | | |
| | | Principal
Amount | | | Value | |
TIAA Seasoned Commercial Mortgage Trust, Series 2007-C4, Class AJ VRN
5.560% 8/15/39 | | $ | 200,000 | | | $ | 205,367 | |
VFC LLC, Series 2014-2, Class A, (Acquired 7/9/14, Cost $250,000) (b) (c)
2.750% 7/20/30 | | | 165,394 | | | | 165,398 | |
Wachovia Bank Commercial Mortgage Trust, Series 2005-C22, Class AM VRN
5.319% 12/15/44 | | | 355,000 | | | | 365,421 | |
Wachovia Bank Commercial Mortgage Trust, Series 2007-C31, Class A4
5.509% 4/15/47 | | | 235,000 | | | | 247,490 | |
Wells Fargo Reremic Trust,
Series 2012-IO, Class A (b)
1.750% 8/20/21 | | | 101,963 | | | | 101,932 | |
WF-RBS Commercial Mortgage Trust, Series 2011-C3, Class A2 (b)
3.240% 3/15/44 | | | 175,000 | | | | 179,426 | |
WF-RBS Commercial Mortgage Trust, Series 2011-C2, Class A2 (b)
3.791% 2/15/44 | | | 200,000 | | | | 203,852 | |
| | | | | | | | |
| | | | | | | 12,598,860 | |
| | | | | | | | |
Home Equity ABS — 2.5% | | | | | | | | |
ACE Securities Corp., Series 2005-AG1, Class A1B1 FRN
0.440% 8/25/35 | | | 86,806 | | | | 86,219 | |
ACE Securities Corp., Series 2005-HE7, Class A2D FRN
0.485% 11/25/35 | | | 132,827 | | | | 131,120 | |
ACE Securities Corp., Series 2005-HE5, Class M2 FRN
0.660% 8/25/35 | | | 250,797 | | | | 249,610 | |
Asset-Backed Funding Certificates, Series 2005-WMC1, Class M1 FRN
0.830% 6/25/35 | | | 83,994 | | | | 83,305 | |
Asset-Backed Securities Corp. Trust, Series 2005-HE2, Class M1 FRN
0.845% 2/25/35 | | | 52,245 | | | | 51,803 | |
Bear Stearns Asset Backed Securities I Trust, Series 2006-HE3, Class A2 FRN
0.335% 4/25/36 | | | 90,487 | | | | 89,382 | |
Bear Stearns Asset-Backed Securities I Trust, Series 2005-HE12,
Class M1 FRN
0.635% 12/25/35 | | | 350,000 | | | | 337,499 | |
Citigroup Mortgage Loan Trust, Series 2003-HE4, Class A FRN (b)
0.580% 12/25/33 | | | 12,814 | | | | 12,807 | |
Citigroup Mortgage Loan Trust, Series 2005-OPT4, Class M2 FRN
0.600% 7/25/35 | | | 70,974 | | | | 69,159 | |
The accompanying notes are an integral part of the financial statements.
41
MML Short-Duration Bond Fund – Portfolio of Investments (Continued)
| | | | | | | | |
| | | Principal
Amount | | | Value | |
Countrywide Asset-Backed Certificates, Series 2005-3, Class MV2 FRN
0.605% 8/25/35 | | $ | 85,561 | | | $ | 85,209 | |
Countrywide Asset-Backed Certificates, Series 2004-5, Class 3A FRN
0.630% 9/25/34 | | | 34,449 | | | | 34,214 | |
Countrywide Partnership Trust, Series 2004-EC1, Class M1 FRN
1.070% 2/25/35 | | | 102,644 | | | | 90,736 | |
Credit-Based Asset Servicing and Securitization LLC, Series 2006-RP2, Class A2 FRN (b)
0.460% 7/25/36 | | | 51,949 | | | | 51,789 | |
Fieldstone Mortgage Investment Corp., Series 2004-4, Class M2 FRN
1.730% 10/25/35 | | | 91,037 | | | | 90,208 | |
First Franklin Mortgage Loan Trust, Series 2005-FF6, Class M1 FRN
0.590% 5/25/36 | | | 204,422 | | | | 199,789 | |
First Franklin Mortgage Loan Trust, Series 2005-FF4, Class M1 FRN
0.600% 5/25/35 | | | 162,339 | | | | 161,685 | |
Fremont Home Loan Trust, Series 2005-E, Class 2A3 FRN
0.410% 1/25/36 | | | 104,884 | | | | 102,006 | |
GSAMP Trust, Series 2005-AHL, Class M1 FRN
0.600% 4/25/35 | | | 96,191 | | | | 91,681 | |
Home Equity Asset Trust, Series 2006-4, Class 2A3 FRN
0.340% 8/25/36 | | | 71,921 | | | | 71,112 | |
JP Morgan Mortgage Acquisition Corp., Series 2005-FRE1, Class A2V2 FRN
0.375% 10/25/35 | | | 283,993 | | | | 278,241 | |
Lake Country Mortgage Loan Trust, Series 2005-HE1, Class M1 FRN (b)
0.950% 12/25/32 | | | 70,978 | | | | 70,979 | |
Long Beach Mortgage Loan Trust, Series 2005-WL1, Class M2 FRN
0.995% 6/25/35 | | | 305,608 | | | | 294,659 | |
Merrill Lynch Mortgage Investors Trust, Series 2006-FF1, Class A2C FRN
0.370% 8/25/36 | | | 95,855 | | | | 94,706 | |
Merrill Lynch Mortgage Synthetic,
Series 2005-ACR1, Class M1 FRN (b)
0.905% 6/28/35 | | | 298,261 | | | | 294,053 | |
Morgan Stanley Capital, Inc., Series 2005-WMC6, Class M2 FRN
0.920% 7/25/35 | | | 156,025 | | | | 155,289 | |
New Century Home Equity Loan Trust, Series 1997-NC5, Class A6 STEP
6.693% 10/25/28 | | | 21 | | | | 21 | |
| | | | | | | | |
| | | Principal
Amount | | | Value | |
NovaStar Mortgage Funding Trust, Series 2005-3, Class A2D FRN
0.540% 1/25/36 | | $ | 316,226 | | | $ | 313,961 | |
Option One Mortgage Loan Trust, Series 2005-5, Class A3 FRN
0.380% 12/25/35 | | | 298,143 | | | | 293,039 | |
Park Place Securities, Inc., Series 2005-WHQ4, Class A1A FRN
0.430% 9/25/35 | | | 119,683 | | | | 119,223 | |
Park Place Securities, Inc., Series 2005-WCW3, Class A2C FRN
0.550% 8/25/35 | | | 129,371 | | | | 127,873 | |
Park Place Securities, Inc., Series 2005-WHQ1, Class M2 FRN
0.670% 3/25/35 | | | 105,786 | | | | 104,566 | |
Residential Asset Securities Corp., Series 2005-EMX4, Class M1 FRN
0.600% 11/25/35 | | | 215,241 | | | | 211,235 | |
Security National Mortgage Loan Trust, Series 2006-3A, Class A1 FRN (b)
0.450% 1/25/37 | | | 217,972 | | | | 215,953 | |
Specialty Underwriting & Residential Finance, Series 2005-AB1, Class A1C FRN
0.510% 3/25/36 | | | 6,141 | | | | 6,141 | |
Structured Asset Investment Loan Trust, Series 2005-7, Class A5 FRN
0.530% 8/25/35 | | | 62,616 | | | | 62,163 | |
| | | | | | | | |
| | | | | | | 4,731,435 | |
| | | | | | | | |
Other ABS — 10.2% | | | | | | | | |
321 Henderson Receivables I LLC, Series 2006-1A, Class A1 FRN (b)
0.361% 3/15/41 | | | 217,783 | | | | 214,033 | |
321 Henderson Receivables I LLC, Series 2010-3A, Class A (b)
3.820% 12/15/48 | | | 415,054 | | | | 436,596 | |
AIMCO CLO Ltd., Series 2014-AA, Class A FRN (b)
1.763% 7/20/26 | | | 350,000 | | | | 348,211 | |
Alterna Funding I LLC, Series 2014-1A, Class NOTE (b)
1.639% 2/15/21 | | | 263,570 | | | | 263,075 | |
ARL First LLC, Series 2012-1A, Class A1 FRN (b)
1.911% 12/15/42 | | | 431,234 | | | | 433,452 | |
Ascentium Equipment Receivables LLC, Series 2014-1A, Class A2 (b)
1.040% 1/10/17 | | | 517,542 | | | | 517,268 | |
Ascentium Equipment Receivables LLC, Series 2014-1A, Class B (b)
1.580% 10/10/18 | | | 240,000 | | | | 239,462 | |
The accompanying notes are an integral part of the financial statements.
42
MML Short-Duration Bond Fund – Portfolio of Investments (Continued)
| | | | | | | | |
| | | Principal
Amount | | | Value | |
BCC Funding VIII LLC, Series 2014-1A, Class A (b)
1.794% 6/20/20 | | $ | 144,306 | | | $ | 144,061 | |
Belhurst CLO Ltd., Series 2006-1A, Class B FRN (b)
0.631% 1/15/20 | | | 500,000 | | | | 499,919 | |
Birchwood Park CLO Ltd., Series 2014-1A, Class A FRN (b)
1.674% 7/15/26 | | | 340,000 | | | | 336,510 | |
CAN Capital Funding LLC, Series 2014-1A, Class A (b)
3.117% 4/15/20 | | | 250,000 | | | | 248,125 | |
Carlyle Global Market Strategies, Series 2014-1A, Class A FRN (b)
1.748% 4/17/25 | | | 535,000 | | | | 532,917 | |
CCG Receivables Trust, Series 2014-1, Class A2 (b)
1.060% 11/15/21 | | | 220,000 | | | | 219,600 | |
CLI Funding LLC, Series 2006-1A, Class A FRN (b)
0.342% 8/18/21 | | | 445,478 | | | | 444,234 | |
Diamond Resorts Owner Trust,
Series 2014-1, Class A (b)
2.540% 5/20/27 | | | 162,149 | | | | 162,041 | |
Direct Capital Funding V LLC,
Series 2013-2, Class A2 (b)
1.730% 8/20/18 | | | 291,639 | | | | 291,816 | |
Domino’s Pizza Master Issuer LLC, Series 2012-1A, Class A2 (b)
5.216% 1/25/42 | | | 444,475 | | | | 466,699 | |
Dong Fang Container Finance II SPV Ltd., Series 2014-1A, Class A1 (b)
1.950% 11/25/39 | | | 293,750 | | | | 291,406 | |
Drug Royalty Corp., Inc., Series 2014-1, Class A1 FRN (b)
3.082% 7/15/23 | | | 266,192 | | | | 267,735 | |
Drug Royalty Corp., Inc., Series 2012-1, Class A1 FRN (b)
5.481% 7/15/24 | | | 126,667 | | | | 130,861 | |
Eaton Vance CLO, Series 2014-1A, Class A FRN (b)
1.685% 7/15/26 | | | 450,000 | | | | 446,310 | |
Element Rail Leasing I LLC,
Series 2014-1A, Class A1 (b)
2.299% 4/19/44 | | | 234,589 | | | | 232,427 | |
FNA Trust, Series 2014-1A, Class A (b)
1.296% 12/10/22 | | | 300,000 | | | | 299,812 | |
FRS I LLC, Series 2013-1A, Class A1 (b)
1.800% 4/15/43 | | | 113,672 | | | | 112,313 | |
Galaxy VIII CLO Ltd., Series 2007-8A, Class A FRN (b)
0.474% 4/25/19 | | | 310,795 | | | | 309,968 | |
| | | | | | | | |
| | | Principal
Amount | | | Value | |
Global Container Assets Ltd.,
Series 2013-1A, Class A1 (b)
2.200% 11/05/28 | | $ | 321,323 | | | $ | 319,692 | |
GoldenTree Loan Opportunities VII Ltd., Series 2013-7A, Class A FRN (b)
1.384% 4/25/25 | | | 535,000 | | | | 524,758 | |
Hercules Capital Funding Trust, Series 2012-1A, Class A (b)
3.320% 12/16/17 | | | 39,719 | | | | 39,943 | |
Hercules Capital Funding Trust, Series 2014-1A, Class A (b)
3.524% 4/16/21 | | | 250,000 | | | | 250,000 | |
HFG Healthco-4 LLC, Series 2011-1A, Class A FRN (b)
2.407% 6/02/17 | | | 250,000 | | | | 253,847 | |
Hilton Grand Vacations Trust, Series 2014-AA, Class A (b)
1.770% 11/25/26 | | | 355,017 | | | | 350,679 | |
Hilton Grand Vacations Trust, Series 2013-A, Class A (b)
2.280% 1/25/26 | | | 327,223 | | | | 328,959 | |
Horizon Funding Trust, Series 2013-1A, Class A (b)
3.000% 5/15/18 | | | 116,258 | | | | 116,767 | |
Icon Brand Holdings LLC, Series 2012-1A, Class A (b)
4.229% 1/25/43 | | | 170,758 | | | | 170,116 | |
Icon Brand Holdings LLC, Series 2013-1A, Class A (b)
4.352% 1/25/43 | | | 189,856 | | | | 190,540 | |
ING Investment Management CLO Ltd., Series 2013-3A, Class A1 FRN (b)
1.681% 1/18/26 | | | 260,000 | | | | 257,835 | |
ING Investment Management CLO V Ltd., Series 2007-5A, Class A1A FRN (b)
0.462% 5/01/22 | | | 537,537 | | | | 534,509 | |
LCM Ltd., Series 10AR, Class AR FRN (b)
1.491% 4/15/22 | | | 500,000 | | | | 497,552 | |
LCM Ltd., Series 16A, Class A FRN (b)
1.758% 7/15/26 | | | 430,000 | | | | 427,406 | |
Madison Park Funding XII Ltd., Series 2014-12A, Class A FRN (b)
1.731% 7/20/26 | | | 430,000 | | | | 428,588 | |
Marriott Vacation Club Owner Trust, Series 2009-2A, Class A (b)
4.809% 7/20/31 | | | 227,635 | | | | 229,229 | |
Morgan Stanley ABS Capital I, Inc. Trust, Series 2005-WMC4, Class M4 FRN
1.115% 4/25/35 | | | 503,013 | | | | 496,809 | |
MVW Owner Trust, Series 2013-1A, Class A (b)
2.150% 4/22/30 | | | 260,736 | | | | 260,906 | |
The accompanying notes are an integral part of the financial statements.
43
MML Short-Duration Bond Fund – Portfolio of Investments (Continued)
| | | | | | | | |
| | | Principal
Amount | | | Value | |
MVW Owner Trust, Series 2014-2, Class A (b)
2.250% 9/20/31 | | $ | 385,929 | | | $ | 383,245 | |
Nations Equipment Finance Funding I LLC, Series 2013-1A, Class A (b)
1.697% 11/20/16 | | | 81,692 | | | | 81,782 | |
Nations Equipment Finance Funding II LLC, Series 2014-1A, Class A (b)
1.558% 7/20/18 | | | 207,660 | | | | 207,413 | |
New York City Tax Lien, Series 2014-A, Class A (b)
1.030% 11/10/27 | | | 164,664 | | | | 164,465 | |
New York City Tax Lien, Series 2013-A, Class A (b)
1.190% 11/10/26 | | | 62,007 | | | | 61,965 | |
New York City Tax Lien, Series 2012-AA, Class A (b)
1.230% 11/10/25 | | | 22,412 | | | | 22,390 | |
OnDeck Asset Securitization Trust,
Series 2014-1A, Class A (b)
3.150% 5/17/18 | | | 170,000 | | | | 169,533 | |
Orange Lake Timeshare Trust,
Series 2014-AA, Class A (b)
2.290% 7/09/29 | | | 107,733 | | | | 107,853 | |
Oxford Finance Funding Trust,
Series 2014-1A, Class A (b)
3.475% 12/15/22 | | | 100,000 | | | | 99,774 | |
RAAC, Series 2006-RP2, Class A FRN (b) 0.420% 2/25/37 | | | 265,568 | | | | 263,109 | |
Race Point VIII CLO Ltd.,
Series 2012-7A, Class A FRN (b)
1.652% 11/08/24 | | | 200,000 | | | | 199,020 | |
SBA Tower Trust, Series 2014-1A,
Class C STEP (b)
2.898% 10/15/44 | | | 300,000 | | | | 300,787 | |
Sierra Receivables Funding Co. LLC,
Series 2014-2A, Class A (b)
2.050% 6/20/31 | | | 277,988 | | | | 276,637 | |
Sierra Receivables Funding Co. LLC,
Series 2013-2A, Class A (b)
2.280% 11/20/25 | | | 117,376 | | | | 118,597 | |
Sierra Receivables Funding Co. LLC,
Series 2012-1A, Class A (b)
2.840% 11/20/28 | | | 67,136 | | | | 68,201 | |
Sierra Receivables Funding Co. LLC,
Series 2011-3A, Class A (b)
3.370% 7/20/28 | | | 57,871 | | | | 59,131 | |
Sonic Capital LLC, Series 2011-1A,
Class A2 (b)
5.438% 5/20/41 | | | 479,859 | | | | 505,951 | |
SpringCastle America Funding LLC,
Series 2014-AA, Class A (b)
2.700% 5/25/23 | | | 453,945 | | | | 452,819 | |
| | | | | | | | |
| | | Principal
Amount | | | Value | |
Springleaf Funding Trust,
Series 2013-AA, Class A (b)
2.580% 9/15/21 | | $ | 225,000 | | | $ | 225,648 | |
SVO VOI Mortgage LLC,
Series 2010-AA, Class A (b)
3.650% 7/20/27 | | | 70,517 | | | | 72,017 | |
TAL Advantage LLC,
Series 2006-1A FRN (b)
0.356% 4/20/21 | | | 186,667 | | | | 185,274 | |
TAL Advantage LLC, Series 2014-2A, Class A1 (b)
1.700% 5/20/39 | | | 297,888 | | | | 295,590 | |
Trade MAPS 1 Ltd., Series 2013-1A, Class A FRN (b)
0.862% 12/10/18 | | | 605,000 | | | | 605,783 | |
Trafigura Securitisation Finance PLC, Series 2012-1A, Class A FRN (b)
2.561% 10/15/15 | | | 314,000 | | | | 315,297 | |
Trip Rail Master Funding LLC,
Series 2011-1A, Class A1B FRN (b)
2.661% 7/15/41 | | | 309,250 | | | | 319,887 | |
Triton Container Finance LLC,
Series 2007-1A, Class NOTE FRN (b)
0.310% 2/26/19 | | | 89,583 | | | | 89,554 | |
Westgate Resorts LLC, Series 2014-1A, Class A (b)
2.150% 12/20/26 | | | 316,679 | | | | 312,885 | |
| | | | | | | | |
| | | | | | | 19,531,593 | |
| | | | | | | | |
Student Loans ABS — 3.0% | | | | | | | | |
Access Group, Inc., Series 2007-A,
Class A2 FRN
0.363% 8/25/26 | | | 35,755 | | | | 35,658 | |
Access Group, Inc., Series 2004-A,
Class A2 FRN
0.494% 4/25/29 | | | 208,736 | | | | 207,342 | |
Access Group, Inc., Series 2003-A,
Class A3 FRN
1.220% 7/01/38 | | | 163,910 | | | | 150,372 | |
Brazos Student Finance Corp.,
Series 2003-A, Class A3 FRN
1.729% 7/01/38 | | | 200,000 | | | | 188,662 | |
College Loan Corp. Trust, Series 2007-1, Class B2 FRN
1.654% 1/25/47 | | | 450,000 | | | | 380,250 | |
Education Funding Capital Trust I,
Series 2004-1, Class A6 FRN
1.520% 6/15/43 | | | 200,000 | | | | 197,700 | |
Education Funding Capital Trust I,
Series 2004-1, Class A4 FRN
1.651% 6/15/43 | | | 250,000 | | | | 248,595 | |
GCO Education Loan Funding Trust, Series 2007-1A, Class A5L FRN (b)
0.303% 5/25/23 | | | 109,704 | | | | 108,980 | |
The accompanying notes are an integral part of the financial statements.
44
MML Short-Duration Bond Fund – Portfolio of Investments (Continued)
| | | | | | | | |
| | | Principal
Amount | | | Value | |
GCO Education Loan Funding Trust,
Series 2006-2A, Class A2L FRN (b)
0.333% 8/25/25 | | $ | 214,982 | | | $ | 214,648 | |
Goal Capital Funding Trust, Series 2006-1, Class A3 FRN
0.353% 11/25/26 | | | 127,507 | | | | 126,851 | |
KeyCorp Student Loan Trust,
Series 2004-A, Class 2A2 FRN
0.534% 10/28/41 | | | 119,479 | | | | 119,125 | |
KeyCorp Student Loan Trust,
Series 2006-A, Class 2A4 FRN
0.565% 9/27/35 | | | 260,000 | | | | 249,891 | |
National Collegiate Student Loan Trust, Series 2007-1, Class A2 FRN
0.300% 11/27/28 | | | 263,111 | | | | 260,193 | |
National Collegiate Student Loan Trust, Series 2006-3, Class A3 FRN
0.320% 10/25/27 | | | 462,945 | | | | 457,050 | |
National Collegiate Student Loan Trust, Series 2005-2, Class A3 FRN
0.360% 2/25/28 | | | 395,937 | | | | 394,839 | |
National Collegiate Student Loan Trust, Series 2004-1, Class A2 FRN
0.515% 6/25/27 | | | 431,551 | | | | 427,028 | |
Navient Private Education Loan Trust, Series 2014-AA, Class A2A (b)
2.740% 2/15/29 | | | 340,000 | | | | 339,800 | |
Nelnet Student Loan Trust, Series 2014-6A, Class A FRN (b)
0.820% 11/25/47 | | | 291,633 | | | | 290,008 | |
Nelnet Student Loan Trust, Series 2010-4A, Class A FRN (b)
0.970% 4/25/46 | | | 99,064 | | | | 99,424 | |
Nelnet Student Loan Trust, Series 2014-1A, Class B FRN (b)
1.669% 10/25/47 | | | 170,000 | | | | 159,789 | |
Northstar Education Finance, Inc.,
Series 2006-A, Class A3 FRN
0.446% 5/28/26 | | | 41,687 | | | | 41,648 | |
SLC Student Loan Trust, Series 2006-A,
Class A5 FRN
0.401% 7/15/36 | | | 213,067 | | | | 211,846 | |
SLM Student Loan Trust, Series 2006-10,
Class B FRN
0.454% 3/25/44 | | | 183,444 | | | | 163,094 | |
SLM Student Loan Trust, Series 2003-5,
Class A7 FRN
0.950% 6/17/30 | | | 50,000 | | | | 50,000 | |
SLM Student Loan Trust, Series 2012-A,
Class A1 FRN (b)
1.561% 8/15/25 | | | 153,819 | | | | 155,371 | |
SLM Student Loan Trust, Series 2013-4,
Class B FRN
1.670% 12/28/43 | | | 120,000 | | | | 116,608 | |
| | | | | | | | |
| | | Principal
Amount | | | Value | |
Social Professional Loan Program LLC, Series 2014-A, Class A1 FRN (b)
1.770% 6/25/25 | | $ | 389,715 | | | $ | 393,669 | |
| | | | | | | | |
| | | | | | | 5,788,441 | |
| | | | | | | | |
| WL Collateral CMO — 0.1% | |
Bank of America Mortgage Securities, Series 2004-G, Class 2A7 FRN
2.690% 8/25/34 | | | 20,464 | | | | 19,867 | |
Countrywide Home Loans, Inc.,
Series 2004-2, Class 1A1 FRN
2.659% 2/25/34 | | | 5,367 | | | | 5,262 | |
Countrywide Home Loans, Inc.,
Series 2003-42, Class 1A1 FRN
2.904% 9/25/33 | | | 1,443 | | | | 1,380 | |
GSR Mortgage Loan Trust,
Series 2004-9, Class 2A1 FRN
2.475% 8/25/34 | | | 4,097 | | | | 3,873 | |
IndyMac Index Mortgage Loan Trust, Series 2004-AR4, Class 1A FRN
2.409% 8/25/34 | | | 14,390 | | | | 12,208 | |
Merrill Lynch Mortgage Investors, Inc., Series 2005-A8, Class A3A2 FRN
0.420% 8/25/36 | | | 22,129 | | | | 20,373 | |
Merrill Lynch Mortgage Investors, Inc., Series 2003-A4, Class IA FRN
2.448% 7/25/33 | | | 970 | | | | 957 | |
Merrill Lynch Mortgage Investors, Inc., Series 2004-A1, Class IA FRN
2.605% 2/25/34 | | | 1,836 | | | | 1,721 | |
Morgan Stanley Mortgage Loan Trust, Series 2004-2AR, Class 1A FRN
2.375% 2/25/34 | | | 50 | | | | 50 | |
Structured Adjustable Rate Mortgage Loan Trust, Series 2004-2, Class 2A FRN
2.569% 3/25/34 | | | 9,636 | | | | 9,557 | |
WaMu Mortgage Pass-Through Certificates, Series 2004-AR2,
Class A FRN
1.513% 4/25/44 | | | 23,063 | | | | 23,889 | |
| | | | | | | | |
| | | | | | | 99,137 | |
| | | | | | | | |
| WL Collateral PAC — 0.1% | |
Structured Asset Securities Corp.,
Series 2007-BC4, Class A3 FRN
0.405% 11/25/37 | | | 107,654 | | | | 106,588 | |
Structured Asset Securities Corp.,
Series 2002-11A, Class 2A1 FRN
2.759% 6/25/32 | | | 6,198 | | | | 5,982 | |
| | | | | | | | |
| | | | | | | 112,570 | |
| | | | | | | | |
| | |
TOTAL NON-U.S. GOVERNMENT AGENCY OBLIGATIONS
(Cost $49,974,644) | | | | | | | 50,045,888 | |
| | | | | | | | |
The accompanying notes are an integral part of the financial statements.
45
MML Short-Duration Bond Fund – Portfolio of Investments (Continued)
| | | | | | | | |
| | | Principal
Amount | | | Value | |
| U.S. GOVERNMENT AGENCY OBLIGATIONS AND INSTRUMENTALITIES — 5.6% | | | | | |
| Collateralized Mortgage Obligations — 5.3% | |
Federal Home Loan Mortgage Corp. | | | | | | | | |
Series 4291, Class K
3.000% 5/15/38 | | $ | 1,015,639 | | | $ | 1,043,329 | |
Series 3990, Class VA
3.500% 1/15/25 | | | 622,248 | | | | 663,958 | |
Series 4290, Class CA
3.500% 12/15/38 | | | 1,397,239 | | | | 1,465,554 | |
Series 4328, Class DA
4.000% 1/15/36 | | | 1,098,413 | | | | 1,173,628 | |
Series 4325, Class MA
4.000% 9/15/39 | | | 1,340,950 | | | | 1,432,345 | |
Series 4336, Class MA
4.000% 1/15/40 | | | 2,089,955 | | | | 2,233,439 | |
Series 4323, Class CA
4.000% 3/15/40 | | | 612,729 | | | | 654,674 | |
Series 2178, Class PB
7.000% 8/15/29 | | | 19,630 | | | | 22,401 | |
Federal National Mortgage Association
Series 2014-14, Class A
3.500% 2/25/37 | | | 761,714 | | | | 798,716 | |
Series 2014-48, Class AB
4.000% 10/25/40 | | | 660,180 | | | | 704,576 | |
U.S. Department of Veteran Affairs
Series 1992-1, Class 2Z
7.750% 5/15/22 | | | 20,766 | | | | 23,218 | |
| | | | | | | | |
| | | | | | | 10,215,838 | |
| | | | | | | | |
| Pass-Through Securities — 0.3% | |
Federal Home Loan Mortgage Corp.
Pool #E85389 6.000%
9/01/16 | | | 1,830 | | | | 1,896 | |
Pool #G11431 6.000%
2/01/18 | | | 1,505 | | | | 1,575 | |
Pool #E85032 6.500%
9/01/16 | | | 549 | | | | 569 | |
Pool #E85301 6.500%
9/01/16 | | | 5,723 | | | | 5,957 | |
Pool #E85409 6.500%
9/01/16 | | | 4,265 | | | | 4,424 | |
Pool #C01079 7.500%
10/01/30 | | | 631 | | | | 752 | |
Pool #C01135 7.500%
2/01/31 | | | 1,903 | | | | 2,265 | |
Pool #554904 9.000%
3/01/17 | | | 9 | | | | 10 | |
Federal National Mortgage Association
Pool #775539 2.117%
5/01/34 FRN | | | 22,827 | | | | 24,368 | |
Pool #725692 2.270%
10/01/33 FRN | | | 56,986 | | | | 60,308 | |
| | | | | | | | |
| | | Principal
Amount | | | Value | |
Pool #888586 2.340%
10/01/34 FRN | | $ | 57,221 | | | $ | 60,717 | |
Pool #587994 6.000%
6/01/16 | | | 751 | | | | 775 | |
Pool #253880 6.500%
7/01/16 | | | 2,213 | | | | 2,290 | |
Pool #575667 7.000%
3/01/31 | | | 2,706 | | | | 3,172 | |
Pool #497120 7.500%
8/01/29 | | | 64 | | | | 76 | |
Pool #529453 7.500%
1/01/30 | | | 593 | | | | 708 | |
Pool #532418 7.500%
2/01/30 | | | 912 | | | | 1,089 | |
Pool #531196 7.500%
2/01/30 | | | 81 | | | | 96 | |
Pool #530299 7.500%
3/01/30 | | | 89 | | | | 104 | |
Pool #536386 7.500%
4/01/30 | | | 100 | | | | 119 | |
Pool #535996 7.500%
6/01/31 | | | 2,587 | | | | 3,085 | |
Pool #523499 8.000%
11/01/29 | | | 89 | | | | 105 | |
Pool #252926 8.000%
12/01/29 | | | 57 | | | | 69 | |
Pool #532819 8.000%
3/01/30 | | | 51 | | | | 62 | |
Pool #537033 8.000%
4/01/30 | | | 895 | | | | 1,083 | |
Pool #534703 8.000%
5/01/30 | | | 611 | | | | 737 | |
Pool #253437 8.000%
9/01/30 | | | 59 | | | | 71 | |
Pool #253481 8.000%
10/01/30 | | | 27 | | | | 33 | |
Pool #190317 8.000%
8/01/31 | | | 1,214 | | | | 1,462 | |
Pool #596656 8.000%
8/01/31 | | | 630 | | | | 715 | |
Pool #602008 8.000%
8/01/31 | | | 1,442 | | | | 1,741 | |
Pool #597220 8.000%
9/01/31 | | | 723 | | | | 877 | |
Government National Mortgage Association
Pool #371146 7.000%
9/15/23 | | | 581 | | | | 656 | |
Pool #352022 7.000%
11/15/23 | | | 2,738 | | | | 3,106 | |
Pool #491089 7.000%
12/15/28 | | | 6,465 | | | | 7,542 | |
Pool #483598 7.000%
1/15/29 | | | 787 | | | | 918 | |
The accompanying notes are an integral part of the financial statements.
46
MML Short-Duration Bond Fund – Portfolio of Investments (Continued)
| | | | | | | | |
| | | Principal
Amount | | | Value | |
Pool #478658 7.000%
5/15/29 | | $ | 500 | | | $ | 588 | |
Pool #500928 7.000%
5/15/29 | | | 970 | | | | 1,138 | |
Pool #499410 7.000%
7/15/29 | | | 289 | | | | 339 | |
Pool #510083
7.000% 7/15/29 | | | 518 | | | | 605 | |
Pool #493723 7.000%
8/15/29 | | | 2,486 | | | | 2,921 | |
Pool #581417 7.000%
7/15/32 | | | 5,802 | | | | 6,827 | |
Pool #591581 7.000%
8/15/32 | | | 2,990 | | | | 3,527 | |
Pool #203940 7.500%
4/15/17 | | | 795 | | | | 840 | |
Pool #181168 7.500%
5/15/17 | | | 176 | | | | 187 | |
Pool #193870 7.500%
5/15/17 | | | 739 | | | | 786 | |
Pool #226163 7.500%
7/15/17 | | | 1,263 | | | | 1,346 | |
Government National Mortgage Association II
Pool #008746 1.625%
11/20/25 FRN | | | 1,557 | | | | 1,594 | |
Pool #080136 1.625%
11/20/27 FRN | | | 277 | | | | 285 | |
Pool #82488 1.625%
3/20/40 FRN | | | 164,090 | | | | 169,962 | |
Pool #82462 3.500%
1/20/40 FRN | | | 136,980 | | | | 143,120 | |
| | | | | | | | |
| | | | | | | 527,597 | |
| | | | | | | | |
| | |
TOTAL U.S. GOVERNMENT AGENCY OBLIGATIONS AND INSTRUMENTALITIES
(Cost $10,739,827) | | | | | | | 10,743,435 | |
| | | | | | | | |
|
| U.S. TREASURY OBLIGATIONS — 27.1% | |
| U.S. Treasury Bonds & Notes — 27.1% | |
U.S. Treasury Note (d) (e)
0.875% 11/15/17 | | | 29,500,000 | | | | 29,346,739 | |
U.S. Treasury Note
1.000% 12/15/17 | | | 20,700,000 | | | | 20,653,102 | |
U.S. Treasury Note (d) (e)
1.500% 8/31/18 | | | 1,615,000 | | | | 1,622,444 | |
| | | | | | | | |
| | | | | | | 51,622,285 | |
| | | | | | | | |
| | |
TOTAL U.S. TREASURY OBLIGATIONS
(Cost $51,671,276) | | | | | | | 51,622,285 | |
| | | | | | | | |
| | |
TOTAL BONDS & NOTES
(Cost $186,291,548) | | | | | | | 186,458,895 | |
| | | | | | | | |
| | | | | | | | |
| | | Notional
Amount | | | Value | |
| PURCHASED OPTIONS — 0.3% | |
| Financial — 0.3% | |
| Diversified Financial — 0.3% | |
3-Month USD LIBOR BBA 10 Year Swaption, Call, Expires 4/25/16, Strike 2.50 (OTC - Credit Suisse International); Underlying swap terminates 4/27/26 | | $ | 17,945,000 | | | $ | 474,604 | |
| | | | | | | | |
| | |
TOTAL PURCHASED OPTIONS
(Cost $314,868) | | | | | | | 474,604 | |
| | | | | | | | |
| | |
TOTAL LONG-TERM INVESTMENTS
(Cost $186,606,416) | | | | | | | 186,933,499 | |
| | | | | | | | |
| | |
| | | Principal
Amount | | | | |
| SHORT-TERM INVESTMENTS — 1.5% | |
| Commercial Paper — 1.3% | |
Baxter International, Inc. (b)
0.400% 1/26/15 | | $ | 2,500,000 | | | | 2,499,305 | |
| | | | | | | | |
| Time Deposits — 0.2% | |
Euro Time Deposit
0.010% 1/02/15 | | | 471,123 | | | | 471,123 | |
| | | | | | | | |
| | |
TOTAL SHORT-TERM INVESTMENTS
(Cost $2,970,428) | | | | | | | 2,970,428 | |
| | | | | | | | |
| | |
TOTAL INVESTMENTS — 99.6%
(Cost $189,576,844) (f) | | | | | | | 189,903,927 | |
| | |
| Other Assets/(Liabilities) — 0.4% | | | | | | | 822,046 | |
| | | | | | | | |
| | |
| NET ASSETS — 100.0% | | | | | | $ | 190,725,973 | |
| | | | | | | | |
Notes to Portfolio of Investments
| Percentages | are stated as a percent of net assets. |
| CLO | Collateralized Loan Obligation |
| CMO | Collateralized Mortgage Obligation |
| MBS | Mortgage-Backed Security |
| PAC | Planned Amortization Class |
| (a) | Security is currently in default due to bankruptcy or failure to make payment of principal or interest of the issuer. Income is not being accrued. At December 31, 2014, these securities amounted to a value of $2,526 or 0.00% of net assets. |
| (b) | Securities exempt from registration under rule 144A of the Securities Act of 1933. These securities may be resold in transactions exempt from registration, normally to qualified |
The accompanying notes are an integral part of the financial statements.
47
MML Short-Duration Bond Fund – Portfolio of Investments (Continued)
Notes to Portfolio of Investments (Continued)
| | institutional buyers. At December 31, 2014, these securities amounted to a value of $51,024,251 or 26.75% of net assets. |
| (c) | Restricted security. Certain securities are restricted as to resale. At December 31, 2014, these securities amounted to a value of $165,398 or 0.09% of net assets. The Fund generally bears the costs, if any, associated with the disposition of restricted securities. |
| (d) | A portion of this security is held as collateral for open futures contracts. (Note 2). |
| (e) | A portion of this security is held as collateral for open swap agreements (Note 2). |
| (f) | See Note 6 for aggregate cost for federal tax purposes. |
The accompanying notes are an integral part of the financial statements.
48
MML Small Cap Equity Fund – Portfolio of Investments
December 31, 2014
| | | | | | | | |
| | | Number of
Shares | | | Value | |
| EQUITIES — 99.8% | | | | | | | | |
| |
| COMMON STOCK — 99.8% | | | | | |
| Basic Materials — 7.1% | | | | | |
| Chemicals — 3.0% | | | | | | | | |
A. Schulman, Inc. | | | 19,622 | | | $ | 795,280 | |
Cytec Industries, Inc. | | | 17,482 | | | | 807,144 | |
Intrepid Potash, Inc. (a) (b) | | | 58,730 | | | | 815,172 | |
Tronox Ltd. Class A | | | 43,620 | | | | 1,041,646 | |
| | | | | | | | |
| | | | | | | 3,459,242 | |
| | | | | | | | |
| Forest Products & Paper — 1.7% | | | | | | | | |
P.H. Glatfelter Co. | | | 74,490 | | | | 1,904,709 | |
| | | | | | | | |
| Iron & Steel — 0.5% | | | | | | | | |
AK Steel Holding Corp. (a) (b) | | | 101,260 | | | | 601,485 | |
| | | | | | | | |
| Mining — 1.9% | | | | | | | | |
Century Aluminum Co. (a) | | | 29,290 | | | | 714,676 | |
Kaiser Aluminum Corp. | | | 20,570 | | | | 1,469,315 | |
| | | | | | | | |
| | | | | | | 2,183,991 | |
| | | | | | | | |
| | | | | | | 8,149,427 | |
| | | | | | | | |
| Communications — 1.2% | | | | | | | | |
| Telecommunications — 1.2% | | | | | | | | |
Mastec, Inc. (a) | | | 33,860 | | | | 765,575 | |
RigNet, Inc. (a) | | | 14,970 | | | | 614,219 | |
| | | | | | | | |
| | | | | | | 1,379,794 | |
| | | | | | | | |
| Consumer, Cyclical — 10.2% | | | | | | | | |
| Airlines — 0.8% | | | | | | | | |
Spirit Airlines, Inc. (a) | | | 11,560 | | | | 873,705 | |
| | | | | | | | |
| Apparel — 0.5% | | | | | | | | |
Iconix Brand Group, Inc. (a) | | | 17,780 | | | | 600,786 | |
| | | | | | | | |
| Automotive & Parts — 2.0% | | | | | | | | |
Dana Holding Corp. | | | 104,454 | | | | 2,270,830 | |
| | | | | | | | |
| Entertainment — 0.7% | | | | | | | | |
International Speedway Corp. Class A | | | 27,050 | | | | 856,133 | |
| | | | | | | | |
| Home Builders — 0.9% | | | | | | | | |
KB Home | | | 61,450 | | | | 1,016,997 | |
| | | | | | | | |
| Retail — 5.3% | | | | | | | | |
Brinker International, Inc. | | | 20,050 | | | | 1,176,734 | |
Mattress Firm Holding Corp. (a) (b) | | | 34,140 | | | | 1,982,851 | |
Nu Skin Enterprises, Inc. Class A (b) | | | 13,480 | | | | 589,076 | |
Popeyes Louisiana Kitchen, Inc. (a) | | | 20,310 | | | | 1,142,844 | |
Texas Roadhouse, Inc. | | | 36,460 | | | | 1,230,890 | |
| | | | | | | | |
| | | | | | | 6,122,395 | |
| | | | | | | | |
| | | | | | | 11,740,846 | |
| | | | | | | | |
| Consumer, Non-cyclical — 28.2% | | | | | | | | |
| Biotechnology — 2.0% | | | | | | | | |
Celldex Therapeutics, Inc. (a) (b) | | | 23,310 | | | | 425,407 | |
Integra LifeSciences Holdings (a) | | | 20,360 | | | | 1,104,123 | |
| | | | | | | | |
| | | Number of
Shares | | | Value | |
MorphoSys AG (a) | | | 5,052 | | | $ | 467,754 | |
Ultragenyx Pharmaceutical, Inc. (a) | | | 7,160 | | | | 314,181 | |
| | | | | | | | |
| | | | | | | 2,311,465 | |
| | | | | | | | |
| Commercial Services — 11.8% | | | | | | | | |
ABM Industries, Inc. | | | 34,100 | | | | 976,965 | |
Booz Allen Hamilton Holding Corp. | | | 30,650 | | | | 813,144 | |
HMS Holdings Corp. (a) | | | 50,764 | | | | 1,073,151 | |
James River Group Holdings Ltd. (a) | | | 26,770 | | | | 609,285 | |
KAR Auction Services, Inc. | | | 66,050 | | | | 2,288,632 | |
Korn/Ferry International (a) | | | 85,331 | | | | 2,454,120 | |
LifeLock, Inc. (a) (b) | | | 65,790 | | | | 1,217,773 | |
On Assignment, Inc. (a) | | | 36,020 | | | | 1,195,504 | |
Paylocity Holding Corp. (a) (b) | | | 56,170 | | | | 1,466,599 | |
Team Health Holdings, Inc. (a) | | | 24,730 | | | | 1,422,717 | |
| | | | | | | | |
| | | | | | | 13,517,890 | |
| | | | | | | | |
| Foods — 2.0% | | | | | | | | |
Flowers Foods, Inc. | | | 21,805 | | | | 418,438 | |
Pinnacle Foods, Inc. | | | 51,800 | | | | 1,828,540 | |
| | | | | | | | |
| | | | | | | 2,246,978 | |
| | | | | | | | |
| Health Care – Products — 2.7% | | | | | | | | |
Dexcom, Inc. (a) | | | 14,919 | | | | 821,291 | |
NxStage Medical, Inc. (a) | | | 39,270 | | | | 704,111 | |
Spectranetics Corp. (a) | | | 45,150 | | | | 1,561,287 | |
| | | | | | | | |
| | | | | | | 3,086,689 | |
| | | | | | | | |
| Health Care – Services — 4.2% | | | | | | | | |
Acadia Healthcare Co., Inc. (a) | | | 16,760 | | | | 1,025,880 | |
HealthSouth Corp. | | | 42,101 | | | | 1,619,204 | |
WellCare Health Plans, Inc. (a) | | | 26,543 | | | | 2,178,119 | |
| | | | | | | | |
| | | | | | | 4,823,203 | |
| | | | | | | | |
| Household Products — 3.2% | | | | | | | | |
Acco Brands Corp. (a) | | | 151,800 | | | | 1,367,718 | |
Prestige Brands Holdings, Inc. (a) | | | 66,361 | | | | 2,304,054 | |
| | | | | | | | |
| | | | | | | 3,671,772 | |
| | | | | | | | |
| Pharmaceuticals — 2.3% | | | | | | | | |
AcelRx Pharmaceuticals, Inc. (a) (b) | | | 35,500 | | | | 238,915 | |
Aratana Therapeutics, Inc. (a) | | | 30,660 | | | | 546,361 | |
Keryx Biopharmaceuticals, Inc. (a) (b) | | | 57,140 | | | | 808,531 | |
Kite Pharma, Inc. (a) (b) | | | 5,030 | | | | 290,080 | |
VWR Corp. (a) (b) | | | 29,450 | | | | 761,872 | |
| | | | | | | | |
| | | | | | | 2,645,759 | |
| | | | | | | | |
| | | | | | | 32,303,756 | |
| | | | | | | | |
| Energy — 5.0% | | | | | | | | |
| Energy – Alternate Sources — 0.8% | | | | | | | | |
Renewable Energy Group, Inc. (a) | | | 97,479 | | | | 946,521 | |
| | | | | | | | |
| Oil & Gas — 2.0% | | | | | | | | |
Western Refining, Inc. | | | 59,660 | | | | 2,253,955 | |
| | | | | | | | |
The accompanying notes are an integral part of the financial statements.
49
MML Small Cap Equity Fund – Portfolio of Investments (Continued)
| | | | | | | | |
| | | Number of
Shares | | | Value | |
| Oil & Gas Services — 1.1% | | | | | | | | |
NOW, Inc. (a) (b) | | | 47,640 | | | $ | 1,225,777 | |
| | | | | | | | |
| Pipelines — 1.1% | | | | | | | | |
Cone Midstream Partners LP (a) | | | 54,910 | | | | 1,324,429 | |
| | | | | | | | |
| | | | | | | 5,750,682 | |
| | | | | | | | |
| Financial — 22.8% | | | | | | | | |
| Banks — 6.0% | | | | | | | | |
BancorpSouth, Inc. | | | 71,210 | | | | 1,602,937 | |
FirstMerit Corp. | | | 74,705 | | | | 1,411,177 | |
MB Financial, Inc. | | | 52,490 | | | | 1,724,821 | |
Talmer Bancorp, Inc. | | | 43,040 | | | | 604,282 | |
Webster Financial Corp. | | | 49,860 | | | | 1,621,946 | |
| | | | | | | | |
| | | | | | | 6,965,163 | |
| | | | | | | | |
| Diversified Financial — 0.6% | | | | | | | | |
Investment Technology Group, Inc. (a) | | | 32,090 | | | | 668,114 | |
| | | | | | | | |
| Insurance — 1.5% | | | | | | | | |
Endurance Specialty Holdings Ltd. | | | 19,360 | | | | 1,158,503 | |
Old Republic International Corp. | | | 37,180 | | | | 543,943 | |
| | | | | | | | |
| | | | | | | 1,702,446 | |
| | | | | | | | |
| Real Estate Investment Trusts (REITS) — 10.2% | |
Apollo Commercial Real Estate Finance, Inc. | | | 86,327 | | | | 1,412,310 | |
Chatham Lodging Trust | | | 69,180 | | | | 2,004,145 | |
DuPont Fabros Technology, Inc. | | | 38,910 | | | | 1,293,368 | |
LaSalle Hotel Properties | | | 62,735 | | | | 2,538,885 | |
Mid-America Apartment Communities, Inc. | | | 10,248 | | | | 765,321 | |
Redwood Trust, Inc. | | | 40,570 | | | | 799,229 | |
STAG Industrial, Inc. | | | 92,960 | | | | 2,277,520 | |
Starwood Property Trust, Inc. | | | 24,883 | | | | 578,281 | |
| | | | | | | | |
| | | | | | | 11,669,059 | |
| | | | | | | | |
| Savings & Loans — 4.5% | | | | | | | | |
BankUnited, Inc. | | | 52,219 | | | | 1,512,784 | |
First Niagara Financial Group, Inc. | | | 196,380 | | | | 1,655,483 | |
Flagstar Bancorp, Inc. (a) | | | 69,382 | | | | 1,091,379 | |
Oritani Financial Corp. | | | 57,820 | | | | 890,428 | |
| | | | | | | | |
| | | | | | | 5,150,074 | |
| | | | | | | | |
| | | | | | | 26,154,856 | |
| | | | | | | | |
| Industrial — 9.7% | | | | | | | | |
| Aerospace & Defense — 0.6% | | | | | | | | |
AAR Corp. | | | 22,910 | | | | 636,440 | |
| | | | | | | | |
| Building Materials — 1.0% | | | | | | | | |
Boise Cascade Co. (a) | | | 30,780 | | | | 1,143,477 | |
| | | | | | | | |
| Electrical Components & Equipment — 1.8% | |
Generac Holdings, Inc. (a) (b) | | | 17,710 | | | | 828,120 | |
General Cable Corp. | | | 27,630 | | | | 411,687 | |
Greatbatch, Inc. (a) | | | 16,845 | | | | 830,458 | |
| | | | | | | | |
| | | | | | | 2,070,265 | |
| | | | | | | | |
| | | | | | | | |
| | | Number of
Shares | | | Value | |
| Engineering & Construction — 0.8% | | | | | |
AECOM Technology Corp. (a) | | | 30,057 | | | $ | 912,831 | |
| | | | | | | | |
| Environmental Controls — 0.7% | | | | | |
Waste Connections, Inc. | | | 19,591 | | | | 861,808 | |
| | | | | | | | |
| Manufacturing — 0.7% | | | | | | | | |
Matthews International Corp. Class A | | | 16,510 | | | | 803,542 | |
| | | | | | | | |
| Metal Fabricate & Hardware — 0.8% | | | | | |
Rexnord Corp. (a) | | | 31,670 | | | | 893,410 | |
| | | | | | | | |
| Transportation — 2.6% | | | | | | | | |
Saia, Inc. (a) | | | 15,706 | | | | 869,484 | |
Swift Transportation Co. (a) | | | 44,205 | | | | 1,265,589 | |
XPO Logistics, Inc. (a) (b) | | | 21,180 | | | | 865,839 | |
| | | | | | | | |
| | | | | | | 3,000,912 | |
| | | | | | | | |
| Trucking & Leasing — 0.7% | | | | | | | | |
The Greenbrier Cos., Inc. (b) | | | 14,140 | | | | 759,742 | |
| | | | | | | | |
| | | | | | | 11,082,427 | |
| | | | | | | | |
| Technology — 15.2% | | | | | | | | |
| Computers — 5.2% | | | | | | | | |
CACI International, Inc. Class A (a) | | | 12,700 | | | | 1,094,486 | |
FleetMatics Group PLC (a) (b) | | | 14,970 | | | | 531,285 | |
Fortinet, Inc. (a) | | | 51,895 | | | | 1,591,101 | |
j2 Global, Inc. | | | 21,661 | | | | 1,342,982 | |
Spansion, Inc. Class A (a) (b) | | | 40,510 | | | | 1,386,252 | |
| | | | | | | | |
| | | | | | | 5,946,106 | |
| | | | | | | | |
| Semiconductors — 3.9% | | | | | | | | |
Cavium, Inc. (a) | | | 29,470 | | | | 1,821,835 | |
IPG Photonics Corp. (a) (b) | | | 7,450 | | | | 558,154 | �� |
MKS Instruments, Inc. | | | 31,780 | | | | 1,163,148 | |
Semtech Corp. (a) | | | 33,106 | | | | 912,733 | |
| | | | | | | | |
| | | | | | | 4,455,870 | |
| | | | | | | | |
Software — 6.1% | | | | | | | | |
Cornerstone OnDemand, Inc. (a) | | | 18,820 | | | | 662,464 | |
Guidewire Software, Inc. (a) | | | 33,550 | | | | 1,698,636 | |
Imperva, Inc. (a) | | | 39,620 | | | | 1,958,417 | |
Proofpoint, Inc. (a) | | | 23,570 | | | | 1,136,781 | |
SYNNEX Corp. | | | 20,350 | | | | 1,590,556 | |
| | | | | | | | |
| | | | | | | 7,046,854 | |
| | | | | | | | |
| | | | | | | 17,448,830 | |
| | | | | | | | |
| Utilities — 0.4% | | | | | | | | |
| Water — 0.4% | | | | | | | | |
Aqua America, Inc. | | | 15,085 | | | | 402,770 | |
| | | | | | | | |
| | |
TOTAL COMMON STOCK
(Cost $90,075,452) | | | | | | | 114,413,388 | |
| | | | | | | | |
| | |
TOTAL EQUITIES
(Cost $90,075,452) | | | | | | | 114,413,388 | |
| | | | | | | | |
The accompanying notes are an integral part of the financial statements.
50
MML Small Cap Equity Fund – Portfolio of Investments (Continued)
| | | | | | | | |
| | | Number of
Shares | | | Value | |
| MUTUAL FUNDS — 11.3% | | | | | | | | |
| Diversified Financial — 11.3% | | | | | | | | |
State Street Navigator Securities Lending Prime Portfolio (c) | | | 12,921,094 | | | $ | 12,921,094 | |
| | | | | | | | |
| | |
TOTAL MUTUAL FUNDS
(Cost $12,921,094) | | | | | | | 12,921,094 | |
| | | | | | | | |
| | |
TOTAL LONG-TERM INVESTMENTS
(Cost $102,996,546) | | | | | | | 127,334,482 | |
| | | | | | | | |
| | |
| | | Principal
Amount | | | | |
| |
| SHORT-TERM INVESTMENTS — 0.2% | | | | | |
| Repurchase Agreement — 0.2% | | | | | | | | |
State Street Bank & Trust Co. Repurchase Agreement, dated 12/31/14, 0.010%, due 1/02/15 (d) | | $ | 305,168 | | | | 305,168 | |
| | | | | | | | |
| | |
TOTAL SHORT-TERM INVESTMENTS
(Cost $305,168) | | | | | | | 305,168 | |
| | | | | | | | |
| | |
TOTAL INVESTMENTS — 111.3%
(Cost $103,301,714) (e) | | | | | | | 127,639,650 | |
| | |
| Other Assets/(Liabilities) — (11.3)% | | | | | | | (12,978,666 | ) |
| | | | | | | | |
| | |
| NET ASSETS — 100.0% | | | | | | $ | 114,660,984 | |
| | | | | | | | |
Notes to Portfolio of Investments
| Percentages | are stated as a percent of net assets. |
| (a) | Non-income producing security. |
| (b) | Denotes all or a portion of security on loan. The total value of securities on loan as of December 31, 2014, was $12,609,293 or 11.00% of net assets. Total securities on loan may not correspond with the amounts identified in the Portfolio of Investments because pending sales may be in the process of recall from the brokers. (Note 2). |
| (c) | Represents investment of security lending collateral. (Note 2). |
| (d) | Maturity value of $305,168. Collateralized by U.S. Government Agency obligations with a rate of 2.500%, maturity date of 1/01/33, and an aggregate market value, including accrued interest, of $312,298. |
| (e) | See Note 6 for aggregate cost for federal tax purposes. |
The accompanying notes are an integral part of the financial statements.
51
MML Strategic Emerging Markets Fund – Portfolio of Investments
December 31, 2014
| | | | | | | | |
| | | Number of
Shares | | | Value | |
| EQUITIES — 94.0% | | | | | |
| |
| COMMON STOCK — 91.8% | | | | | |
| Basic Materials — 2.4% | |
| Chemicals — 0.2% | |
Asian Paints Ltd. | | | 14,854 | | | $ | 176,218 | |
| | | | | | | | |
| Mining — 2.2% | |
Alrosa AO (a) | | | 480,418 | | | | 506,078 | |
Glencore PLC | | | 339,711 | | | | 1,563,604 | |
Grupo Mexico SAB de CV | | | 11,672 | | | | 33,852 | |
| | | | | | | | |
| | | | | | | 2,103,534 | |
| | | | | | | | |
| | | | | | | 2,279,752 | |
| | | | | | | | |
| Communications — 19.1% | |
| Internet — 12.0% | |
58.com, Inc. (a) (b) | | | 4,700 | | | | 195,285 | |
Alibaba Group Holding Ltd. Sponsored ADR (Cayman Islands) (a) | | | 7,300 | | | | 758,762 | |
B2W Cia Digital (a) | | | 31,313 | | | | 262,411 | |
Baidu, Inc. Sponsored ADR (Cayman Islands) (a) | | | 19,840 | | | | 4,522,925 | |
JD.com, Inc. (a) | | | 32,942 | | | | 762,278 | |
MercadoLibre, Inc. (b) | | | 6,810 | | | | 869,433 | |
NAVER Corp. | | | 1,179 | | | | 761,658 | |
Tencent Holdings Ltd. | | | 136,459 | | | | 1,957,959 | |
Yandex NV (a) | | | 74,510 | | | | 1,338,200 | |
| | | | | | | | |
| | | | | | | 11,428,911 | |
| | | | | | | | |
| Media — 3.4% | |
Grupo Televisa SAB Sponsored ADR (Mexico) | | | 38,210 | | | | 1,301,433 | |
Naspers Ltd. | | | 6,130 | | | | 789,225 | |
Zee Entertainment Enterprises Ltd. | | | 184,758 | | | | 1,110,178 | |
| | | | | | | | |
| | | | | | | 3,200,836 | |
| | | | | | | | |
| Telecommunications — 3.7% | |
America Movil SAB de CV Sponsored ADR (Mexico) | | | 83,940 | | | | 1,861,789 | |
MTN Group Ltd. | | | 35,025 | | | | 664,662 | |
Telefonica Brasil SA Sponsored ADR (Brazil) (b) | | | 53,620 | | | | 948,002 | |
| | | | | | | | |
| | | | | | | 3,474,453 | |
| | | | | | | | |
| | | | | | | 18,104,200 | |
| | | | | | | | |
| Consumer, Cyclical — 10.6% | |
| Apparel — 1.8% | |
Hermes International (b) | | | 382 | | | | 136,211 | |
Prada SpA | | | 280,700 | | | | 1,582,726 | |
| | | | | | | | |
| | | | | | | 1,718,937 | |
| | | | | | | | |
| Leisure Time — 0.3% | |
Qunar Cayman Islands Ltd. (a) (b) | | | 11,400 | | | | 324,102 | |
| | | | | | | | |
| Lodging — 2.2% | |
Genting Bhd | | | 398,600 | | | | 1,010,490 | |
| | | | | | | | |
| | | Number of
Shares | | | Value | |
Homeinns Hotel Group ADR (a) | | | 16,300 | | | $ | 489,326 | |
Melco Crown Entertainment Ltd. ADR (Cayman Islands) | | | 22,360 | | | | 567,944 | |
| | | | | | | | |
| | | | | | | 2,067,760 | |
| | | | | | | | |
| Retail — 6.3% | |
Almacenes Exito SA | | | 30,051 | | | | 366,462 | |
Almacenes Exito SA (c) | | | 27,300 | | | | 335,435 | |
Astra International Tbk PT | | | 2,517,000 | | | | 1,494,006 | |
Cie Financiere Richemont SA | | | 13,803 | | | | 1,222,633 | |
CP ALL PCL | | | 657,700 | | | | 849,612 | |
Jollibee Foods Corp. | | | 122,480 | | | | 584,621 | |
SM Investments Corp. | | | 50,730 | | | | 919,280 | |
Wal-Mart de Mexico SAB de CV | | | 98,254 | | | | 211,309 | |
| | | | | | | | |
| | | | | | | 5,983,358 | |
| | | | | | | | |
| | | | | | | 10,094,157 | |
| | | | | | | | |
| Consumer, Non-cyclical — 20.1% | |
| Beverages — 6.2% | |
AMBEV SA | | | 106,800 | | | | 664,296 | |
Anadolu Efes Biracilik Ve Malt Sanayii AS (a) | | | 49,531 | | | | 481,406 | |
Carlsberg A/S Class B | | | 9,344 | | | | 725,614 | |
Fomento Economico Mexicano SAB de CV | | | 96,244 | | | | 853,647 | |
Nigerian Breweries PLC | | | 465,711 | | | | 420,667 | |
Pernod-Ricard SA | | | 11,251 | | | | 1,247,477 | |
SABMiller PLC | | | 21,174 | | | | 1,095,803 | |
Tsingtao Brewery Co. Ltd. | | | 56,000 | | | | 379,493 | |
| | | | | | | | |
| | | | | | | 5,868,403 | |
| | | | | | | | |
| Commercial Services — 3.1% | |
DP World Ltd. | | | 46,206 | | | | 934,860 | |
DP World Ltd. | | | 4,291 | | | | 90,111 | |
Estacio Participacoes SA | | | 56,800 | | | | 502,662 | |
Kroton Educacional SA | | | 93,506 | | | | 538,786 | |
New Oriental Education & Technology Group, Inc. Sponsored ADR (Cayman Islands) (a) | | | 43,900 | | | | 895,999 | |
| | | | | | | | |
| | | | | | | 2,962,418 | |
| | | | | | | | |
| Cosmetics & Personal Care — 0.9% | |
Colgate-Palmolive India Ltd. | | | 11,337 | | | | 320,730 | |
Natura Cosmeticos SA | | | 40,200 | | | | 481,443 | |
| | | | | | | | |
| | | | | | | 802,173 | |
| | | | | | | | |
| Foods — 5.3% | |
BIM Birlesik Magazalar AS | | | 21,009 | | | | 449,772 | |
Cencosud SA | | | 250,480 | | | | 625,947 | |
Magnit OJSC (a) | | | 12,461 | | | | 1,991,896 | |
Tingyi Cayman Islands Holding Corp. | | | 526,000 | | | | 1,199,412 | |
Ulker Biskuvi Sanayi AS | | | 26,123 | | | | 206,740 | |
Want Want China Holdings Ltd. | | | 454,000 | | | | 595,579 | |
| | | | | | | | |
| | | | | | | 5,069,346 | |
| | | | | | | | |
The accompanying notes are an integral part of the financial statements.
52
MML Strategic Emerging Markets Fund – Portfolio of Investments (Continued)
| | | | | | | | |
| | | Number of
Shares | | | Value | |
| Health Care – Products — 0.2% | |
Shandong Weigao Group Medical Polymer Co. Ltd. Class H | | | 264,000 | | | $ | 213,417 | |
| | | | | | | | |
| Health Care – Services — 0.8% | |
Apollo Hospitals Enterprise Ltd. | | | 28,333 | | | | 506,168 | |
Diagnosticos da America SA | | | 69,500 | | | | 291,054 | |
| | | | | | | | |
| | | | | | | 797,222 | |
| | | | | | | | |
| Household Products — 0.6% | |
Hindustan Unilever Ltd. | | | 7,976 | | | | 95,433 | |
Marico Ltd. | | | 52,082 | | | | 267,462 | |
Unilever Indonesia Tbk PT | | | 77,000 | | | | 200,907 | |
| | | | | | | | |
| | | | | | | 563,802 | |
| | | | | | | | |
| Pharmaceuticals — 3.0% | |
Cipla Ltd/India | | | 53,762 | | | | 532,369 | |
Divi’s Laboratories Ltd. | | | 1,983 | | | | 53,971 | |
Dr Reddy’s Laboratories Ltd. | | | 14,257 | | | | 730,477 | |
Glenmark Pharmaceuticals Ltd. | | | 13,209 | | | | 160,578 | |
Lupin Ltd. | | | 5,629 | | | | 127,465 | |
Sinopharm Group Co. | | | 228,000 | | | | 803,966 | |
Sun Pharmaceutical Industries Ltd. | | | 30,251 | | | | 395,513 | |
| | | | | | | | |
| | | | | | | 2,804,339 | |
| | | | | | | | |
| | | | | | | 19,081,120 | |
| | | | | | | | |
| Diversified — 3.4% | |
| Holding Company – Diversified — 3.4% | |
Alfa SAB de CV | | | 50,353 | | | | 112,523 | |
Haci Omer Sabanci Holding AS | | | 214,009 | | | | 929,726 | |
Jardine Strategic Holdings Ltd. | | | 28,193 | | | | 959,432 | |
LVMH Moet Hennessy Louis Vuitton SA | | | 8,006 | | | | 1,266,021 | |
| | | | | | | | |
| | | | | | | 3,267,702 | |
| | | | | | | | |
| Energy — 4.8% | |
| Oil & Gas — 4.2% | |
NovaTek OAO (d) | | | 23,684 | | | | 1,839,347 | |
Petroleo Brasileiro SA Sponsored ADR (Brazil) | | | 114,600 | | | | 868,668 | |
Tullow Oil PLC | | | 137,927 | | | | 872,701 | |
Vallares PLC (a) | | | 35,757 | | | | 382,742 | |
| | | | | | | | |
| | | | | | | 3,963,458 | |
| | | | | | | | |
| Oil & Gas Services — 0.6% | |
China Oilfield Services Ltd. | | | 260,000 | | | | 451,932 | |
Eurasia Drilling Co. Ltd. (d) | | | 3,718 | | | | 65,768 | |
Eurasia Drilling Co. Ltd. (d) | | | 5,117 | | | | 91,083 | |
| | | | | | | | |
| | | | | | | 608,783 | |
| | | | | | | | |
| | | | | | | 4,572,241 | |
| | | | | | | | |
| Financial — 21.2% | |
| Banks — 6.5% | |
Banco Bradesco SA Sponsored ADR (Brazil) (b) | | | 37,600 | | | | 502,712 | |
| | | | | | | | |
| | | Number of
Shares | | | Value | |
Bancolombia SA Sponsored ADR (Colombia) (b) | | | 9,760 | | | $ | 467,309 | |
Commercial International Bank | | | 89,250 | | | | 612,887 | |
Grupo Financiero Inbursa SAB de CV | | | 248,971 | | | | 645,810 | |
Guaranty Trust Bank PLC | | | 1,895,266 | | | | 260,780 | |
HSBC Holdings PLC | | | 54,404 | | | | 517,238 | |
ICICI Bank Ltd. Sponsored ADR (India) | | | 181,350 | | | | 2,094,593 | |
Turkiye Garanti Bankasi AS | | | 202,894 | | | | 812,985 | |
Zenith Bank PLC | | | 2,631,327 | | | | 264,714 | |
| | | | | | | | |
| | | | | | | 6,179,028 | |
| | | | | | | | |
| Diversified Financial — 7.3% | |
BM&F BOVESPA SA | | | 262,500 | | | | 972,423 | |
Grupo Financiero Banorte SAB de CV Class O | | | 238,939 | | | | 1,320,228 | |
Hong Kong Exchanges and Clearing Ltd. | | | 33,771 | | | | 742,917 | |
Housing Development Finance Corp. | | | 163,947 | | | | 2,925,404 | |
Old Mutual PLC | | | 285,657 | | | | 850,598 | |
Shriram Transport Finance Co. Ltd. | | | 3,997 | | | | 69,789 | |
| | | | | | | | |
| | | | | | | 6,881,359 | |
| | | | | | | | |
| Insurance — 2.7% | |
AIA Group Ltd. | | | 189,200 | | | | 1,038,201 | |
China Life Insurance Co. Ltd. | | | 187,000 | | | | 729,917 | |
China Pacific Insurance Group Co. Ltd. Class H | | | 102,600 | | | | 510,910 | |
Sul America SA | | | 67,100 | | | | 322,251 | |
| | | | | | | | |
| | | | | | | 2,601,279 | |
| | | | | | | | |
| Investment Companies — 1.3% | |
Grupo Aval Acciones y Valores (b) | | | 60,500 | | | | 628,595 | |
Grupo de Inversiones Suramericana SA | | | 35,743 | | | | 595,548 | |
| | | | | | | | |
| | | | | | | 1,224,143 | |
| | | | | | | | |
| Real Estate — 3.4% | |
Cyrela Brazil Realty SA | | | 83,900 | | | | 345,685 | |
Hang Lung Properties Ltd. | | | 95,000 | | | | 429,611 | |
Hang Lung Properties Ltd. | | | 491,000 | | | | 1,368,362 | |
SM Prime Holdings, Inc. | | | 1,743,500 | | | | 661,034 | |
SOHO China Ltd. | | | 575,500 | | | | 405,393 | |
| | | | | | | | |
| | | | | | | 3,210,085 | |
| | | | | | | | |
| | | | | | | 20,095,894 | |
| | | | | | | | |
| Industrial — 4.6% | |
| Aerospace & Defense — 1.2% | |
Embraer SA Sponsored ADR (Brazil) | | | 30,260 | | | | 1,115,384 | |
| | | | | | | | |
| Building Materials — 1.9% | | | | | | | | |
Ambuja Cements Ltd. | | | 107,048 | | | | 386,121 | |
Indocement Tunggal Prakarsa Tbk PT | | | 249,000 | | | | 503,187 | |
Semen Indonesia Persero Tbk PT | | | 388,000 | | | | 504,080 | |
Ultratech Cement Ltd. | | | 9,417 | | | | 398,375 | |
| | | | | | | | |
| | | | | | | 1,791,763 | |
| | | | | | | | |
The accompanying notes are an integral part of the financial statements.
53
MML Strategic Emerging Markets Fund – Portfolio of Investments (Continued)
| | | | | | | | |
| | | Number of
Shares | | | Value | |
Engineering & Construction — 0.6% | | | | | | | | |
Airports of Thailand PCL | | | 23,700 | | | $ | 203,143 | |
Grupo Aeroportuario del Sureste SAB de CV | | | 17,457 | | | | 230,622 | |
Larsen & Toubro Ltd. | | | 8,590 | | | | 201,831 | |
| | | | | | | | |
| | | | | | | 635,596 | |
| | | | | | | | |
Metal Fabricate & Hardware — 0.9% | | | | | |
Tenaris SA Sponsored ADR (Luxembourg) (b) | | | 28,510 | | | | 861,287 | |
| | | | | | | | |
| | | | | | | 4,404,030 | |
| | | | | | | | |
| Technology — 5.6% | | | | | | | | |
| Computers — 1.0% | | | | | | | | |
Tata Consultancy Services Ltd. | | | 24,058 | | | | 976,371 | |
| | | | | | | | |
| Semiconductors — 2.0% | | | | | | | | |
Taiwan Semiconductor Manufacturing Co. Ltd. | | | 422,000 | | | | 1,862,172 | |
| | | | | | | | |
| Software — 2.6% | | | | | | | | |
Infosys Technologies Ltd. | | | 78,906 | | | | 2,450,890 | |
| | | | | | | | |
| | | | | | | 5,289,433 | |
| | | | | | | | |
| | |
TOTAL COMMON STOCK
(Cost $91,122,886) | | | | | | | 87,188,529 | |
| | | | | | | | |
| | |
| PREFERRED STOCK — 2.2% | | | | | | | | |
| Communications — 0.1% | | | | | | | | |
| Media — 0.1% | | | | | | | | |
Zee Entertainment Enterprises Ltd. 6.000% | | | 5,038,404 | | | | 69,443 | |
| | | | | | | | |
| Consumer, Cyclical — 1.6% | | | | | | | | |
| Retail — 1.6% | | | | | | | | |
Lojas Americanas SA 0.720% | | | 238,700 | | | | 1,547,074 | |
| | | | | | | | |
| Financial — 0.5% | | | | | | | | |
| Banks — 0.5% | | | | | | | | |
Banco Davivienda SA 3.570% | | | 31,316 | | | | 364,950 | |
Bancolombia SA 2.790% | | | 6,064 | | | | 72,802 | |
| | | | | | | | |
| | | | | | | 437,752 | |
| | | | | | | | |
| | |
TOTAL PREFERRED STOCK
(Cost $1,920,652) | | | | | | | 2,054,269 | |
| | | | | | | | |
| | |
TOTAL EQUITIES
(Cost $93,043,538) | | | | | | | 89,242,798 | |
| | | | | | | | |
| | |
| MUTUAL FUNDS — 5.0% | | | | | | | | |
| Diversified Financial — 5.0% | | | | | | | | |
State Street Navigator Securities Lending Prime Portfolio (e) | | | 4,734,845 | | | | 4,734,845 | |
| | | | | | | | |
| | |
TOTAL MUTUAL FUNDS
(Cost $4,734,845) | | | | | | | 4,734,845 | |
| | | | | | | | |
| | | | | | | | |
| | | Number of
Shares | | | Value | |
| WARRANTS — 0.1% | | | | | | | | |
| Consumer, Cyclical — 0.1% | | | | | | | | |
| Lodging — 0.1% | | | | | | | | |
Genting BHD, Expires 12/18/18, Strike Price 7.96 (a) | | | 81,500 | | | $ | 65,032 | |
| | | | | | | | |
| | |
TOTAL WARRANTS
(Cost $38,401) | | | | | | | 65,032 | |
| | | | | | | | |
| | |
TOTAL LONG-TERM INVESTMENTS
(Cost $97,816,784) | | | | | | | 94,042,675 | |
| | | | | | | | |
| | |
| | | Principal
Amount | | | Value | |
| SHORT-TERM INVESTMENTS — 7.0% | | | | | |
| Repurchase Agreement — 7.0% | | | | | | | | |
State Street Bank & Trust Co. Repurchase Agreement, dated 12/31/14, 0.010%, due 1/02/15 (f) | | $ | 6,683,460 | | | | 6,683,460 | |
| | | | | | | | |
| Time Deposits — 0.0% | | | | | | | | |
Euro Time Deposit
0.010% 1/02/15 | | | 22,792 | | | | 22,792 | |
| | | | | | | | |
| | |
TOTAL SHORT-TERM INVESTMENTS
(Cost $6,706,252) | | | | | | | 6,706,252 | |
| | | | | | | | |
| | |
TOTAL INVESTMENTS — 106.1%
(Cost $104,523,036) (g) | | | | | | | 100,748,927 | |
| | |
| Other Assets/(Liabilities) — (6.1)% | | | | | | | (5,795,550 | ) |
| | | | | | | | |
| | |
| NET ASSETS — 100.0% | | | | | | $ | 94,953,377 | |
| | | | | | | | |
Notes to Portfolio of Investments
| Percentages | are stated as a percent of net assets. |
| ADR | American Depositary Receipt |
| (a) | Non-income producing security. |
| (b) | Denotes all or a portion of security on loan. The total value of securities on loan as of December 31, 2014, was $4,608,996 or 4.85% of net assets. Total securities on loan may not correspond with the amounts identified in the Portfolio of Investments because pending sales may be in the process of recall from the brokers. (Note 2). |
| (c) | Securities exempt from registration under rule 144A of the Securities Act of 1933. These securities may be resold in transactions exempt from registration, normally to qualified institutional buyers. At December 31, 2014, these securities amounted to a value of $335,435 or 0.35% of net assets. |
| (d) | Security exempt from registration under Regulation S of the Securities Act of 1933, which exempts from registration securities offered and sold outside the United States. Security may not be offered or sold in the United States except pursuant to an exemption from, or in a transaction not subject |
The accompanying notes are an integral part of the financial statements.
54
MML Strategic Emerging Markets Fund – Portfolio of Investments (Continued)
Notes to Portfolio of Investments (Continued)
| | to, the registration requirements of the Securities Act of 1933. At December 31, 2014, these securities amounted to a value of $1,996,198 or 2.10% of net assets. |
| (e) | Represents investment of security lending collateral. (Note 2). |
| (f) | Maturity value of $6,683,464. Collateralized by U.S. Government Agency obligations with rates ranging from 2.500% – 2.750%, maturity dates ranging from 4/01/28 – 11/15/28, and an aggregate market value, including accrued interest, of $6,818,666. |
| (g) | See Note 6 for aggregate cost for federal tax purposes. |
Country weightings, as a percentage of net assets, is as follows:
| | | | |
India | | | 14.7 | % |
Cayman Islands | | | 13.5 | % |
Brazil | | | 9.9 | % |
Mexico | | | 6.9 | % |
United States | | | 5.9 | % |
United Kingdom | | | 5.2 | % |
Russia | | | 4.6 | % |
Hong Kong | | | 3.8 | % |
China | | | 3.3 | % |
Turkey | | | 3.0 | % |
Colombia | | | 3.0 | % |
Indonesia | | | 2.8 | % |
France | | | 2.8 | % |
Philippines | | | 2.3 | % |
Taiwan | | | 2.0 | % |
Italy | | | 1.7 | % |
South Africa | | | 1.5 | % |
Netherlands | | | 1.4 | % |
Switzerland | | | 1.3 | % |
Malaysia | | | 1.1 | % |
Thailand | | | 1.1 | % |
United Arab Emirates | | | 1.1 | % |
Bermuda | | | 1.0 | % |
Nigeria | | | 1.0 | % |
Luxembourg | | | 0.9 | % |
Republic of Korea | | | 0.8 | % |
Denmark | | | 0.8 | % |
Chile | | | 0.7 | % |
Egypt | | | 0.6 | % |
Channel Islands | | | 0.4 | % |
| | | | |
Total Long-Term Investments | | | 99.1 | % |
Short-Term Investments and Other Assets and Liabilities | | | 0.9 | % |
| | | | |
Net Assets | | | 100.0 | % |
| | | | |
The accompanying notes are an integral part of the financial statements.
55
MML Series Investment Fund II – Financial Statements
Statements of Assets and Liabilities
December 31, 2014
| | | | | | | | |
| | | MML High
Yield Fund | | | MML
Inflation-
Protected and
Income Fund | |
| Assets: | | | | | | | | |
Investments, at value (Note 2) (a) | | $ | 133,513,131 | | | $ | 645,898,055 | |
Short-term investments, at value (Note 2) (b) | | | 5,826,120 | | | | 200,140,101 | |
| | | | | | | | |
Total investments (c) | | | 139,339,251 | | | | 846,038,156 | |
| | | | | | | | |
Foreign currency, at value (d) | | | - | | | | - | |
Receivables from: | | | | | | | | |
Investments sold | | | - | | | | 8,480,108 | |
Collateral held for reverse repurchase agreements (Note 2) | | | - | | | | 3,308,030 | |
Investment adviser (Note 3) | | | 19,136 | | | | - | |
Fund shares sold | | | 1,843 | | | | 4,911,114 | |
Variation margin on open derivative instruments (Note 2) | | | - | | | | - | |
Interest and dividends | | | 2,360,127 | | | | 2,039,970 | |
Foreign taxes withheld | | | - | | | | - | |
| | | | | | | | |
Total assets | | | 141,720,357 | | | | 864,777,378 | |
| | | | | | | | |
| Liabilities: | | | | | | | | |
Payables for: | | | | | | | | |
Investments purchased | | | - | | | | - | |
Reverse repurchase agreements (Note 2) | | | - | | | | 399,247,118 | |
Interest for reverse repurchase agreements (Note 2) | | | - | | | | 145,480 | |
Fund shares repurchased | | | 16,287 | | | | 74,552 | |
Securities on loan (Note 2) | | | - | | | | - | |
Trustees’ fees and expenses (Note 3) | | | 12,379 | | | | 64,239 | |
Variation margin on open derivative instruments (Note 2) | | | - | | | | 51,459 | |
Affiliates (Note 3): | | | | | | | | |
Investment advisory fees | | | 76,945 | | | | 227,537 | |
Administration fees | | | 19,235 | | | | - | |
Service fees | | | 16,572 | | | | 32,764 | |
Due to custodian | | | - | | | | 24 | |
Accrued expense and other liabilities | | | 47,307 | | | | 65,576 | |
| | | | | | | | |
Total liabilities | | | 188,725 | | | | 399,908,749 | |
| | | | | | | | |
Net assets | | $ | 141,531,632 | | | $ | 464,868,629 | |
| | | | | | | | |
| Net assets consist of: | | | | | | | | |
Paid-in capital | | $ | 145,435,281 | | | $ | 469,964,135 | |
Undistributed (accumulated) net investment income (loss) | | | - | | | | - | |
Distributions in excess of net investment income | | | (11,845 | ) | | | (187,457 | ) |
Accumulated net realized gain (loss) on investments and foreign currency transactions | | | 582,842 | | | | (6,985,264 | ) |
Net unrealized appreciation (depreciation) on investments and foreign currency translations | | | (4,474,646 | ) | | | 2,077,215 | |
| | | | | | | | |
Net assets | | $ | 141,531,632 | | | $ | 464,868,629 | |
| | | | | | | | |
| | | | | | | | |
(a) Cost of investments: | | $ | 137,987,777 | | | $ | 643,213,366 | |
(b) Cost of short-term investments: | | $ | 5,826,120 | | | $ | 200,140,101 | |
(c) Securities on loan with market value of: | | $ | - | | | $ | - | |
(d) Cost of foreign currency: | | $ | - | | | $ | - | |
The accompanying notes are an integral part of the financial statements.
56
| | | | | | | | | | |
MML Short-
Duration
Bond Fund | | | MML Small
Cap Equity
Fund | | | MML
Strategic
Emerging
Markets Fund | |
| | | | | | | | | | |
| $ | 186,933,499 | | | $ | 127,334,482 | | | $ | 94,042,675 | |
| | 2,970,428 | | | | 305,168 | | | | 6,706,252 | |
| | | | | | | | | | |
| | 189,903,927 | | | | 127,639,650 | | | | 100,748,927 | |
| | | | | | | | | | |
| | - | | | | - | | | | 254,352 | |
| | | | | | | | | | |
| | 7 | | | | 1,599,301 | | | | 80,441 | |
| | - | | | | - | | | | - | |
| | 2,343 | | | | - | | | | 41,666 | |
| | 1,938 | | | | 9,666 | | | | 250,843 | |
| | 39,566 | | | | - | | | | - | |
| | 1,053,957 | | | | 192,647 | | | | 77,204 | |
| | - | | | | - | | | | 5,833 | |
| | | | | | | | | | |
| | 191,001,738 | | | | 129,441,264 | | | | 101,459,266 | |
| | | | | | | | | | |
| | | | | | | | | | |
| | | | | | | | | | |
| | - | | | | 1,398,192 | | | | 1,284,830 | |
| | - | | | | - | | | | - | |
| | - | | | | - | | | | - | |
| | 87,470 | | | | 323,932 | | | | 32,063 | |
| | - | | | | 12,921,094 | | | | 4,734,845 | |
| | 22,289 | | | | 27,721 | | | | 6,455 | |
| | 4,069 | | | | - | | | | - | |
| | | | | | | | | | |
| | 69,385 | | | | 66,236 | | | | 90,859 | |
| | 17,346 | | | | - | | | | 21,633 | |
| | 15,478 | | | | 5,886 | | | | 5,758 | |
| | 12,604 | | | | - | | | | 11,651 | |
| | 47,124 | | | | 37,219 | | | | 317,795 | |
| | | | | | | | | | |
| | 275,765 | | | | 14,780,280 | | | | 6,505,889 | |
| | | | | | | | | | |
| $ | 190,725,973 | | | $ | 114,660,984 | | | $ | 94,953,377 | |
| | | | | | | | | | |
| | | | | | | | | | |
| $ | 193,127,710 | | | $ | 76,284,517 | | | $ | 99,846,105 | |
| | 57,932 | | | | 1,107,846 | | | | 475,214 | |
| | - | | | | - | | | | - | |
| | (2,441,917 | ) | | | 12,930,685 | | | | (1,356,445 | ) |
| | (17,752 | ) | | | 24,337,936 | | | | (4,011,497 | ) |
| | | | | | | | | | |
| $ | 190,725,973 | | | $ | 114,660,984 | | | $ | 94,953,377 | |
| | | | | | | | | | |
| | | | | | | | | | |
| $ | 186,606,416 | | | $ | 102,996,546 | | | $ | 97,816,784 | |
| $ | 2,970,428 | | | $ | 305,168 | | | $ | 6,706,252 | |
| $ | - | | | $ | 12,609,293 | | | $ | 4,608,996 | |
| $ | - | | | $ | - | | | $ | 254,128 | |
57
MML Series Investment Fund II – Financial Statements (Continued)
Statements of Assets and Liabilities
December 31, 2014
| | | | | | | | |
| | | MML High
Yield Fund | | | MML
Inflation-
Protected and
Income Fund | |
| Initial Class shares: | | | | | | | | |
Net assets | | $ | - | | | $ | 412,860,815 | |
| | | | | | | | |
Shares outstanding (a) | | | - | | | | 40,559,959 | |
| | | | | | | | |
Net asset value, offering price and redemption price per share | | $ | - | | | $ | 10.18 | |
| | | | | | | | |
| Class II shares: | | | | | | | | |
Net assets | | $ | 116,277,125 | | | $ | - | |
| | | | | | | | |
Shares outstanding (a) | | | 11,652,914 | | | | - | |
| | | | | | | | |
Net asset value, offering price and redemption price per share | | $ | 9.98 | | | $ | - | |
| | | | | | | | |
| Service Class shares: | | | | | | | | |
Net assets | | $ | - | | | $ | 52,007,814 | |
| | | | | | | | |
Shares outstanding (a) | | | - | | | | 5,126,564 | |
| | | | | | | | |
Net asset value, offering price and redemption price per share | | $ | - | | | $ | 10.14 | |
| | | | | | | | |
| Service Class I shares: | | | | | | | | |
Net assets | | $ | 25,254,507 | | | $ | - | |
| | | | | | | | |
Shares outstanding (a) | | | 2,537,125 | | | | - | |
| | | | | | | | |
Net asset value, offering price and redemption price per share | | $ | 9.95 | | | $ | - | |
| | | | | | | | |
| (a) | Authorized unlimited number of shares with no par value. |
The accompanying notes are an integral part of the financial statements.
58
| | | | | | | | | | |
MML Short-
Duration
Bond Fund | | | MML Small
Cap Equity
Fund | | | MML
Strategic
Emerging
Markets Fund | |
| | | | | | | | | | |
| $ | - | | | $ | 104,745,416 | | | $ | - | |
| | | | | | | | | | |
| | - | | | | 9,841,440 | | | | - | |
| | | | | | | | | | |
| $ | - | | | $ | 10.64 | | | $ | - | |
| | | | | | | | | | |
| | | | | | | | | | |
| $ | 166,437,562 | | | $ | - | | | $ | 85,833,419 | |
| | | | | | | | | | |
| | 16,910,953 | | | | - | | | | 8,916,225 | |
| | | | | | | | | | |
| $ | 9.84 | | | $ | - | | | $ | 9.63 | |
| | | | | | | | | | |
| | | | | | | | | | |
| $ | - | | | $ | 9,915,568 | | | $ | - | |
| | | | | | | | | | |
| | - | | | | 942,496 | | | | - | |
| | | | | | | | | | |
| $ | - | | | $ | 10.52 | | | $ | - | |
| | | | | | | | | | |
| | | | | | | | | | |
| $ | 24,288,411 | | | $ | - | | | $ | 9,119,958 | |
| | | | | | | | | | |
| | 2,469,989 | | | | - | | | | 944,948 | |
| | | | | | | | | | |
| $ | 9.83 | | | $ | - | | | $ | 9.65 | |
| | | | | | | | | | |
59
MML Series Investment Fund II – Financial Statements (Continued)
Statements of Operations
For the Year Ended December 31, 2014
| | | | | | | | |
| | | MML High
Yield Fund | | | MML
Inflation-
Protected and
Income Fund | |
| Investment income (Note 2): | | | | | | | | |
Dividends (a) | | $ | - | | | $ | - | |
Interest | | | 11,401,182 | | | | 10,307,363 | |
Securities lending net income | | | - | | | | - | |
| | | | | | | | |
Total investment income | | | 11,401,182 | | | | 10,307,363 | |
| | | | | | | | |
| Expenses (Note 3): | | | | | | | | |
Investment advisory fees | | | 936,040 | | | | 2,182,881 | |
Custody fees | | | 58,225 | | | | 81,468 | |
Interest expense | | | - | | | | 522,436 | |
Audit fees | | | 34,719 | | | | 35,173 | |
Legal fees | | | 2,017 | | | | 2,722 | |
Proxy fees | | | 1,028 | | | | 1,028 | |
Shareholder reporting fees | | | 17,477 | | | | 36,311 | |
Trustees’ fees | | | 9,613 | | | | 23,026 | |
| | | | | | | | |
| | | 1,059,119 | | | | 2,885,045 | |
Administration fees: | | | | | | | | |
Class II | | | 195,458 | | | | - | |
Service Class I | | | 38,553 | | | | - | |
Distribution and Service fees: | | | | | | | | |
Service Class | | | - | | | | 131,928 | |
Service Class I | | | 64,254 | | | | - | |
| | | | | | | | |
Total expenses | | | 1,357,384 | | | | 3,016,973 | |
Expenses waived (Note 3): | | | | | | | | |
Class II fees reimbursed by adviser | | | (50,534 | ) | | | - | |
Service Class I fees reimbursed by adviser | | | (10,142 | ) | | | - | |
Class II advisory fees waived | | | (130,287 | ) | | | - | |
Service Class I advisory fees waived | | | (25,720 | ) | | | - | |
| | | | | | | | |
Net expenses | | | 1,140,701 | | | | 3,016,973 | |
| | | | | | | | |
Net investment income (loss) | | | 10,260,481 | | | | 7,290,390 | |
| | | | | | | | |
| Realized and unrealized gain (loss): | | | | | | | | |
Net realized gain (loss) on: | | | | | | | | |
Investment transactions | | | 628,613 | | | | 3,608,028 | |
Futures contracts | | | - | | | | (1,381,645 | ) |
Swap agreements | | | - | | | | (80,800 | ) |
Foreign currency transactions | | | - | | | | (732 | ) |
| | | | | | | | |
Net realized gain (loss) | | | 628,613 | | | | 2,144,851 | |
| | | | | | | | |
Net change in unrealized appreciation (depreciation) on: | | | | | | | | |
Investment transactions | | | (8,859,880 | ) | | | 2,026,028 | |
Futures contracts | | | - | | | | (468,426 | ) |
Swap agreements | | | - | | | | (33,193 | ) |
Translation of assets and liabilities in foreign currencies | | | - | | | | (3,095 | ) |
| | | | | | | | |
Net change in unrealized appreciation (depreciation) | | | (8,859,880 | ) | | | 1,521,314 | |
| | | | | | | | |
Net realized gain (loss) and change in unrealized appreciation (depreciation) | | | (8,231,267 | ) | | | 3,666,165 | |
| | | | | | | | |
Net increase (decrease) in net assets resulting from operations | | $ | 2,029,214 | | | $ | 10,956,555 | |
| | | | | | | | |
| | | | | | | | |
(a) Net of withholding tax of: | | $ | - | | | $ | - | |
The accompanying notes are an integral part of the financial statements.
60
| | | | | | | | | | |
MML Short-
Duration
Bond Fund | | | MML Small
Cap Equity
Fund | | | MML
Strategic
Emerging
Markets Fund | |
| | | | | | | | | | |
| $ | - | | | $ | 2,011,925 | | | $ | 1,822,648 | |
| | 4,166,872 | | | | 185 | | | | 952 | |
| | - | | | | 81,183 | | | | 33,695 | |
| | | | | | | | | | |
| | 4,166,872 | | | | 2,093,293 | | | | 1,857,295 | |
| | | | | | | | | | |
| | | | | | | | | | |
| | 812,846 | | | | 714,957 | | | | 1,075,482 | |
| | 37,348 | | | | 11,331 | | | | 312,937 | |
| | - | | | | - | | | | - | |
| | 35,252 | | | | 23,553 | | | | 72,616 | |
| | 2,986 | | | | 1,515 | | | | 1,517 | |
| | 1,028 | | | | 1,028 | | | | 1,028 | |
| | 20,838 | | | | 12,432 | | | | 16,669 | |
| | 12,676 | | | | 6,720 | | | | 6,446 | |
| | | | | | | | | | |
| | 922,974 | | | | 771,536 | | | | 1,486,695 | |
| | | | | | | | | | |
| | 180,635 | | | | - | | | | 233,260 | |
| | 22,576 | | | | - | | | | 22,807 | |
| | | | | | | | | | |
| | - | | | | 22,005 | | | | - | |
| | 56,441 | | | | - | | | | 22,807 | |
| | | | | | | | | | |
| | 1,182,626 | | | | 793,541 | | | | 1,765,569 | |
| | | | | | | | | | |
| | (7,450 | ) | | | - | | | | (281,211 | ) |
| | (1,072 | ) | | | - | | | | (27,575 | ) |
| | - | | | | - | | | | - | |
| | - | | | | - | | | | - | |
| | | | | | | | | | |
| | 1,174,104 | | | | 793,541 | | | | 1,456,783 | |
| | | | | | | | | | |
| | 2,992,768 | | | | 1,299,752 | | | | 400,512 | |
| | | | | | | | | | |
| | | | | | | | | | |
| | | | | | | | | | |
| | 757,780 | | | | 18,723,231 | | | | 1,140,072 | |
| | 563,418 | | | | - | | | | - | |
| | (72,260 | ) | | | - | | | | - | |
| | (458 | ) | | | (549 | ) | | | (51,988 | ) |
| | | | | | | | | | |
| | 1,248,480 | | | | 18,722,682 | | | | 1,088,084 | |
| | | | | | | | | | |
| | | | | | | | | | |
| | (1,020,263 | ) | | | (7,281,974 | ) | | | (5,645,467 | ) |
| | (261,918 | ) | | | - | | | | - | |
| | (27,609 | ) | | | - | | | | - | |
| | (1,938 | ) | | | - | | | | (191,383 | ) |
| | | | | | | | | | |
| | (1,311,728 | ) | | | (7,281,974 | ) | | | (5,836,850 | ) |
| | | | | | | | | | |
| | (63,248 | ) | | | 11,440,708 | | | | (4,748,766 | ) |
| | | | | | | | | | |
| $ | 2,929,520 | | | $ | 12,740,460 | | | $ | (4,348,254 | ) |
| | | | | | | | | | |
| | | | | | | | | | |
| $ | - | | | $ | - | | | $ | 156,548 | |
61
MML Series Investment Fund II – Financial Statements (Continued)
Statements of Changes in Net Assets
| | | | | | | | |
| | |
MML High Yield Fund | |
| | | Year
Ended
December 31, 2014 | | | Year
Ended
December 31, 2013 | |
| Increase (Decrease) in Net Assets: | | | | | | | | |
| Operations: | | | | | | | | |
Net investment income (loss) | | $ | 10,260,481 | | | $ | 8,957,827 | |
Net realized gain (loss) on investment transactions | | | 628,613 | | | | 6,013,649 | |
Net change in unrealized appreciation (depreciation) on investments | | | (8,859,880 | ) | | | (848,013 | ) |
| | | | | | | | |
Net increase (decrease) in net assets resulting from operations | | | 2,029,214 | | | | 14,123,463 | |
| | | | | | | | |
| Distributions to shareholders (Note 2): | | | | | | | | |
From net investment income: | | | | | | | | |
Initial Class | | | - | | | | - | |
Class II | | | (8,714,003 | ) | | | (7,607,553 | ) |
Service Class | | | - | | | | - | |
Service Class I | | | (1,714,887 | ) | | | (1,300,255 | ) |
| | | | | | | | |
Total distributions from net investment income | | | (10,428,890 | ) | | | (8,907,808 | ) |
| | | | | | | | |
From net realized gains: | | | | | | | | |
Initial Class | | | - | | | | - | |
Class II | | | (5,338,556 | ) | | | (2,919,330 | ) |
Service Class | | | - | | | | - | |
Service Class I | | | (993,785 | ) | | | (470,664 | ) |
| | | | | | | | |
Total distributions from net realized gains | | | (6,332,341 | ) | | | (3,389,994 | ) |
| | | | | | | | |
| Net fund share transactions (Note 5): | | | | | | | | |
Initial Class | | | - | | | | - | |
Class II | | | (854,480 | ) | | | 5,403,490 | |
Service Class | | | - | | | | - | |
Service Class I | | | 5,726,142 | | | | 5,271,684 | |
| | | | | | | | |
Increase (decrease) in net assets from fund share transactions | | | 4,871,662 | | | | 10,675,174 | |
| | | | | | | | |
Total increase (decrease) in net assets | | | (9,860,355 | ) | | | 12,500,835 | |
| Net assets | | | | | | | | |
Beginning of year | | | 151,391,987 | | | | 138,891,152 | |
| | | | | | | | |
End of year | | $ | 141,531,632 | | | $ | 151,391,987 | |
| | | | | | | | |
Undistributed (accumulated) net investment income (loss) included in net assets at end of year | | $ | - | | | $ | 74,396 | |
| | | | | | | | |
Distributions in excess of net investment income included in net assets at end of year | | $ | (11,845 | ) | | $ | - | |
| | | | | | | | |
The accompanying notes are an integral part of the financial statements.
62
| | | | | | | | | | | | | | |
MML
Inflation-Protected and Income Fund | | | MML
Short-Duration Bond Fund | |
Year
Ended
December 31, 2014 | | | Year
Ended
December 31, 2013 | | | Year
Ended
December 31, 2014 | | | Year
Ended
December 31, 2013 | |
| | | | | | | | | | | | | | |
| | | | | | | | | | | | | | |
| $ | 7,290,390 | | | $ | 5,457,278 | | | $ | 2,992,768 | | | $ | 2,736,847 | |
| | 2,144,851 | | | | 8,428,210 | | | | 1,248,480 | | | | 279,778 | |
| | 1,521,314 | | | | (49,115,841 | ) | | | (1,311,728 | ) | | | (1,316,971 | ) |
| | | | | | | | | | | | | | |
| | 10,956,555 | | | | (35,230,353 | ) | | | 2,929,520 | | | | 1,699,654 | |
| | | | | | | | | | | | | | |
| | | | | | | | | | | | | | |
| | | | | | | | | | | | | | |
| | (9,093,862 | ) | | | (6,144,815 | ) | | | - | | | | - | |
| | - | | | | - | | | | (4,343,604 | ) | | | (3,664,440 | ) |
| | (1,368,171 | ) | | | (940,978 | ) | | | - | | | | - | |
| | - | | | | - | | | | (499,898 | ) | | | (369,770 | ) |
| | | | | | | | | | | | | | |
| | (10,462,033 | ) | | | (7,085,793 | ) | | | (4,843,502 | ) | | | (4,034,210 | ) |
| | | | | | | | | | | | | | |
| | | | | | | | | | | | | | |
| | (7,105,127 | ) | | | (8,544,115 | ) | | | - | | | | - | |
| | - | | | | - | | | | (24,648 | ) | | | (805,227 | ) |
| | (1,153,841 | ) | | | (1,613,200 | ) | | | - | | | | - | |
| | - | | | | - | | | | (2,860 | ) | | | (100,157 | ) |
| | | | | | | | | | | | | | |
| | (8,258,968 | ) | | | (10,157,315 | ) | | | (27,508 | ) | | | (905,384 | ) |
| | | | | | | | | | | | | | |
| | | | | | | | | | | | | | |
| | 93,431,108 | | | | 5,688,025 | | | | - | | | | - | |
| | - | | | | - | | | | (27,145,769 | ) | | | 32,135,570 | |
| | (1,080,029 | ) | | | (3,445,716 | ) | | | - | | | | - | |
| | - | | | | - | | | | 2,836,801 | | | | 1,201,285 | |
| | | | | | | | | | | | | | |
| | 92,351,079 | | | | 2,242,309 | | | | (24,308,968 | ) | | | 33,336,855 | |
| | | | | | | | | | | | | | |
| | 84,586,633 | | | | (50,231,152 | ) | | | (26,250,458 | ) | | | 30,096,915 | |
| | | | | | | | | | | | | | |
| | 380,281,996 | | | | 430,513,148 | | | | 216,976,431 | | | | 186,879,516 | |
| | | | | | | | | | | | | | |
| $ | 464,868,629 | | | $ | 380,281,996 | | | $ | 190,725,973 | | | $ | 216,976,431 | |
| | | | | | | | | | | | | | |
| | | |
| $ | - | | | $ | 723,907 | | | $ | 57,932 | | | $ | 460,931 | |
| | | | | | | | | | | | | | |
| $ | (187,457 | ) | | $ | - | | | $ | - | | | $ | - | |
| | | | | | | | | | | | | | |
63
MML Series Investment Fund II – Financial Statements (Continued)
Statements of Changes in Net Assets
| | | | | | | | |
| | | MML Small Cap Equity Fund | |
| | | Year
Ended
December 31, 2014 | | | Year
Ended
December 31, 2013 | |
| Increase (Decrease) in Net Assets: | | | | | | | | |
| Operations: | | | | | | | | |
Net investment income (loss) | | $ | 1,299,752 | | | $ | 856,048 | |
Net realized gain (loss) on investment transactions | | | 18,722,682 | | | | 16,126,989 | |
Net change in unrealized appreciation (depreciation) on investments | | | (7,281,974 | ) | | | 17,177,224 | |
| | | | | | | | |
Net increase (decrease) in net assets resulting from operations | | | 12,740,460 | | | | 34,160,261 | |
| | | | | | | | |
| Distributions to shareholders (Note 2): | | | | | | | | |
From net investment income: | | | | | | | | |
Initial Class | | | (985,388 | ) | | | (950,858 | ) |
Class II | | | - | | | | - | |
Service Class | | | (72,332 | ) | | | (55,926 | ) |
Service Class I | | | - | | | | - | |
| | | | | | | | |
Total distributions from net investment income | | | (1,057,720 | ) | | | (1,006,784 | ) |
| | | | | | | | |
From net realized gains: | | | | | | | | |
Initial Class | | | (13,001,220 | ) | | | (10,569,277 | ) |
Service Class | | | (1,160,019 | ) | | | (728,020 | ) |
| | | | | | | | |
Total distributions from net realized gains | | | (14,161,239 | ) | | | (11,297,297 | ) |
| | | | | | | | |
| Net fund share transactions (Note 5): | | | | | | | | |
Initial Class | | | 2,864,770 | | | | 880,320 | |
Class II | | | - | | | | - | |
Service Class | | | 2,453,908 | | | | 1,864,948 | |
Service Class I | | | - | | | | - | |
| | | | | | | | |
Increase (decrease) in net assets from fund share transactions | | | 5,318,678 | | | | 2,745,268 | |
| | | | | | | | |
Total increase (decrease) in net assets | | | 2,840,179 | | | | 24,601,448 | |
| Net assets | | | | | | | | |
Beginning of year | | | 111,820,805 | | | | 87,219,357 | |
| | | | | | | | |
End of year | | $ | 114,660,984 | | | $ | 111,820,805 | |
| | | | | | | | |
Undistributed (accumulated) net investment income (loss) included in net assets at end of year | | $ | 1,107,846 | | | $ | 842,197 | |
| | | | | | | | |
The accompanying notes are an integral part of the financial statements.
64
| | | | | | |
| MML Strategic Emerging Markets Fund | |
Year
Ended
December 31, 2014 | | | Year
Ended
December 31, 2013 | |
| | | | | | |
| | | | | | |
| $ | 400,512 | | | $ | 458,193 | |
| | 1,088,084 | | | | (1,582,924 | ) |
| | (5,836,850 | ) | | | (1,701,019 | ) |
| | | | | | |
| | (4,348,254 | ) | | | (2,825,750 | ) |
| | | | | | |
| | | | | | |
| | | | | | |
| | - | | | | - | |
| | (286,757 | ) | | | - | |
| | - | | | | - | |
| | (4,290 | ) | | | - | |
| | | | | | |
| | (291,047 | ) | | | - | |
| | | | | | |
| | | | | | |
| | - | | | | - | |
| | - | | | | - | |
| | | | | | |
| | - | | | | - | |
| | | | | | |
| | | | | | |
| | - | | | | - | |
| | (1,726,527 | ) | | | 47,048,037 | |
| | - | | | | - | |
| | 545,947 | | | | 869,969 | |
| | | | | | |
| | (1,180,580 | ) | | | 47,918,006 | |
| | | | | | |
| | (5,819,881 | ) | | | 45,092,256 | |
| | | | | | |
| | 100,773,258 | | | | 55,681,002 | |
| | | | | | |
| $ | 94,953,377 | | | $ | 100,773,258 | |
| | | | | | |
$ |
475,214 |
| | $ | 274,367 | |
| | | | | | |
65
MML Series Investment Funds II – Financial Statements (Continued)
Statement of Cash Flows
For the Year Ended December 31, 2014
| | | | |
| | | MML Inflation-
Protected and
Income Fund | |
| Cash flows from operating activities: | | | | |
Net increase (decrease) in net assets resulting from operations | | $ | 10,956,555 | |
Adjustments to reconcile net increase in net assets resulting from operations to net cash provided by (used in) operating activities: | | | | |
Investments purchased | | | (488,804,606 | ) |
Investments sold | | | 368,230,139 | |
(Increase) decrease to the principal amount of inflation-indexed bonds | | | (5,450,407 | ) |
(Purchase) Sale of short-term investments, net | | | (37,211,521 | ) |
Amortization (accretion) of discount and premium, net | | | 2,306,235 | |
(Increase) Decrease in receivable from interest and dividends | | | (196,625 | ) |
Increase (Decrease) in payable for Trustees’ fees and expenses | | | 9,428 | |
Increase (Decrease) in payable for investment advisory fees | | | 48,994 | |
Increase (Decrease) in payable for service fees | | | (682 | ) |
Increase (Decrease) in variation margin receivable on open derivative instruments | | | 32,798 | |
Increase (Decrease) in payable for accrued expenses and other liabilities | | | (2,458 | ) |
Net change in unrealized (appreciation) depreciation on investments | | | (2,026,028 | ) |
Net realized (gain) loss from investments | | | (3,608,028 | ) |
| | | | |
Net cash from (used in) operating activities | | | (155,716,206 | ) |
| | | | |
| Cash flows from (used in) financing activities: | | | | |
Increase (Decrease) in due to custodian | | | 24 | |
Proceeds from shares sold | | | 155,041,107 | |
Payment on shares redeemed | | | (69,695,566 | ) |
Proceeds from reverse repurchase agreements | | | (196,264,544 | ) |
Repayment of reverse repurchase agreements | | | 265,320,114 | |
Increase (Decrease) in collateral held for reverse repurchase agreements | | | 1,277,863 | |
Increase (Decrease) in payable for interest for reverse repurchase agreements | | | 37,158 | |
| | | | |
Net cash from (used in) financing activities | | | 155,716,156 | |
| | | | |
| |
Net increase (decrease) in cash | | | (50 | ) |
Cash at beginning of year | | | 50 | |
| | | | |
Cash at end of year | | $ | 0 | |
| | | | |
| |
Non cash financing activities not included herein consist of: | | | | |
Reinvestment of all distributions | | $ | 18,721,001 | |
Cash paid out for interest on reverse repurchase agreements | | $ | 485,278 | |
The accompanying notes are an integral part of the financial statements.
66
MML Series Investment Fund II – Financial Statements (Continued)
Financial Highlights (For a share outstanding throughout each period)
MML High Yield Fund
| | | | | | | | | | | | | | | | | | | | | | | | | | | | | | | | | | | | | | | | | | | | | | | | | | | | |
| | | | | | Income (loss) from investment
operations | | | Less distributions to shareholders | | | | | | | | | Ratios / Supplemental Data | |
| | | Net
asset
value,
beginning
of the
period | | | Net
investment
income
(loss)c,j | | | Net
realized
and
unrealized
gain (loss)
on
investments | | | Total
income
(loss) from
investment
operations | | | From net
investment
income | | | From net
realized
gains | | | Total
distributions | | | Net
asset
value,
end of
the
period | | | Total
returnm | | | Net
assets,
end of
the
period
(000’s) | | | Ratio of
expenses
to average
daily net
assets
before
expense
waivers | | | Ratio of
expenses
to average
daily net
assets
after
expense
waiversj | | | Net
investment
income
(loss) to
average
daily net
assets | |
Class II | | | | | | | | | | | | | | | | | | | | | | | | | | | | | | | | | | | | | | | | | | | | | |
| 12/31/14 | | $ | 11.03 | | | $ | 0.72 | | | $ | (0.57 | ) | | $ | 0.15 | | | $ | (0.74 | ) | | $ | (0.46 | ) | | $ | (1.20 | ) | | $ | 9.98 | | | | 1.05% | | | $ | 116,277 | | | | 0.83% | | | | 0.69% | | | | 6.62% | |
| 12/31/13 | | | 10.93 | | | | 0.76 | | | | 0.38 | | | | 1.14 | | | | (0.74 | ) | | | (0.30 | ) | | | (1.04 | ) | | | 11.03 | | | | 10.84% | | | | 129,251 | | | | 0.84% | | | | 0.69% | | | | 6.88% | |
| 12/31/12 | | | 10.03 | | | | 0.74 | | | | 0.89 | | | | 1.63 | | | | (0.67 | ) | | | (0.06 | ) | | | (0.73 | ) | | | 10.93 | | | | 16.76% | | | | 122,192 | | | | 0.86% | | | | 0.69% | | | | 7.01% | |
| 12/31/11 | | | 10.18 | | | | 0.75 | | | | (0.15 | ) | | | 0.60 | | | | (0.75 | ) | | | - | | | | (0.75 | ) | | | 10.03 | | | | 6.07% | | | | 70,558 | | | | 0.84% | | | | 0.69% | | | | 7.28% | |
| 12/31/10g | | | 10.00 | | | | 0.48 | | | | 0.18 | | | | 0.66 | | | | (0.48 | ) | | | - | | | | (0.48 | ) | | | 10.18 | | | | 6.79% | b | | | 62,005 | | | | 0.89% | a | | | 0.69% | a | | | 7.23% | a |
Service Class I | | | | | | | | | | | | | | | | | | | | | | | | | | | | | | | | | | | | | | | | | | | | | |
| 12/31/14 | | $ | 11.01 | | | $ | 0.69 | | | $ | (0.58 | ) | | $ | 0.11 | | | $ | (0.71 | ) | | $ | (0.46 | ) | | $ | (1.17 | ) | | $ | 9.95 | | | | 0.71% | | | $ | 25,255 | | | | 1.08% | | | | 0.94% | | | | 6.38% | |
| 12/31/13 | | | 10.91 | | | | 0.73 | | | | 0.38 | | | | 1.11 | | | | (0.71 | ) | | | (0.30 | ) | | | (1.01 | ) | | | 11.01 | | | | 10.59% | | | | 22,141 | | | | 1.09% | | | | 0.94% | | | | 6.63% | |
| 12/31/12 | | | 10.01 | | | | 0.72 | | | | 0.89 | | | | 1.61 | | | | (0.65 | ) | | | (0.06 | ) | | | (0.71 | ) | | | 10.91 | | | | 16.53% | | | | 16,699 | | | | 1.11% | | | | 0.94% | | | | 6.77% | |
| 12/31/11 | | | 10.17 | | | | 0.72 | | | | (0.15 | ) | | | 0.57 | | | | (0.73 | ) | | | - | | | | (0.73 | ) | | | 10.01 | | | | 5.77% | | | | 7,353 | | | | 1.09% | | | | 0.94% | | | | 7.06% | |
| 12/31/10g | | | 10.00 | | | | 0.47 | | | | 0.17 | | | | 0.64 | | | | (0.47 | ) | | | - | | | | (0.47 | ) | | | 10.17 | | | | 6.60% | b | | | 2,010 | | | | 1.14% | a | | | 0.94% | a | | | 7.03% | a |
| | | | | | | | | | | | | | | | | | | | |
| | | Year ended December 31 | |
| | | 2014 | | | 2013 | | | 2012 | | | 2011 | | | 2010b | |
Portfolio turnover rate | | | 79% | | | | 113% | | | | 95% | | | | 69% | | | | 72% | |
| b | Percentage represents the results for the period and is not annualized. |
| c | Per share amount calculated on the average shares method. |
| g | For the period May 3, 2010 (commencement of operations) through December 31, 2010. |
| j | Computed after giving effect to an agreement by MML Advisers and/or MassMutual to waive certain fees and expenses of the Fund. |
| m | Total return does not reflect expenses that apply at the separate account level or to related insurance products. Inclusion of these charges would reduce the total return figures for all periods shown. |
The accompanying notes are an integral part of the financial statements.
67
MML Series Investment Fund II – Financial Statements (Continued)
Financial Highlights (For a share outstanding throughout each period)
MML Inflation-Protected and Income Fund
| | | | | | | | | | | | | | | | | | | | | | | | | | | | | | | | | | | | | | | | | | | | | | | | | | | | |
| | | | | | Income (loss) from investment
operations | | | Less distributions to shareholders | | | | | |
Ratios / Supplemental Data | |
| | | Net
asset
value,
beginning
of the
period | | | Net
investment
income
(loss)c | | | Net
realized
and
unrealized
gain (loss)
on
investments | | | Total
income
(loss) from
investment
operations | | | From net
investment
income | | | From net
realized
gains | | | Total
distributions | | | Net
asset
value,
end of
the
period | | | Total
returnm | | | Net
assets,
end of
the
period
(000’s) | | | Ratio of
expenses
to average
daily net
assetsn | | | Interest
expense
to average
daily net
assetsp | | | Net
investment
income
(loss) to
average
daily net
assetsn | |
Initial Class | | | | | | | | | | | | | | | | | | | | | | | | | | | | | | | | | | | | | | | | | | | | | |
| 12/31/14 | | $ | 10.35 | | | $ | 0.19 | | | $ | 0.16 | | | $ | 0.35 | | | $ | (0.29 | ) | | $ | (0.23 | ) | | $ | (0.52 | ) | | $ | 10.18 | | | | 3.45% | | | | $412,861 | | | | 0.73% | | | | 0.13% | | | | 1.85% | |
| 12/31/13 | | | 11.86 | | | | 0.16 | | | | (1.16 | ) | | | (1.00 | ) | | | (0.21 | ) | | | (0.30 | ) | | | (0.51 | ) | | | 10.35 | | | | (8.68% | ) | | | 326,380 | | | | 0.77% | | | | 0.17% | | | | 1.45% | |
| 12/31/12 | | | 11.56 | | | | 0.32 | | | | 0.47 | | | | 0.79 | | | | (0.38 | ) | | | (0.11 | ) | | | (0.49 | ) | | | 11.86 | | | | 6.89% | | | | 365,094 | | | | 0.81% | | | | 0.21% | | | | 2.70% | |
| 12/31/11 | | | 10.71 | | | | 0.51 | | | | 0.90 | | | | 1.41 | | | | (0.56 | ) | | | - | | | | (0.56 | ) | | | 11.56 | | | | 13.49% | | | | 357,595 | | | | 0.76% | | | | 0.16% | | | | 4.55% | |
| 12/31/10 | | | 10.38 | | | | 0.25 | | | | 0.42 | | | | 0.67 | | | | (0.34 | ) | | | - | | | | (0.34 | ) | | | 10.71 | | | | 6.56% | | | | 395,893 | | | | 0.80% | | | | 0.21% | | | | 2.32% | |
Service Class | | | | | | | | | | | | | | | | | | | | | | | | | | | | | | | | | | | | | | | | | | | | | |
| 12/31/14 | | $ | 10.32 | | | $ | 0.18 | | | $ | 0.14 | | | $ | 0.32 | | | $ | (0.27 | ) | | $ | (0.23 | ) | | $ | (0.50 | ) | | $ | 10.14 | | | | 3.16% | | | | $ 52,008 | | | | 0.98% | | | | 0.13% | | | | 1.75% | |
| 12/31/13 | | | 11.83 | | | | 0.13 | | | | (1.16 | ) | | | (1.03 | ) | | | (0.18 | ) | | | (0.30 | ) | | | (0.48 | ) | | | 10.32 | | | | (8.95% | ) | | | 53,902 | | | | 1.02% | | | | 0.17% | | | | 1.20% | |
| 12/31/12 | | | 11.53 | | | | 0.29 | | | | 0.47 | | | | 0.76 | | | | (0.35 | ) | | | (0.11 | ) | | | (0.46 | ) | | | 11.83 | | | | 6.65% | | | | 65,419 | | | | 1.06% | | | | 0.21% | | | | 2.44% | |
| 12/31/11 | | | 10.69 | | | | 0.45 | | | | 0.92 | | | | 1.37 | | | | (0.53 | ) | | | - | | | | (0.53 | ) | | | 11.53 | | | | 13.15% | | | | 47,034 | | | | 1.01% | | | | 0.16% | | | | 4.04% | |
| 12/31/10 | | | 10.36 | | | | 0.22 | | | | 0.43 | | | | 0.65 | | | | (0.32 | ) | | | - | | | | (0.32 | ) | | | 10.69 | | | | 6.32% | | | | 31,557 | | | | 1.05% | | | | 0.21% | | | | 2.06% | |
| | | | | | | | | | | | | | | | | | | | |
| | | Year ended December 31 | |
| | | 2014 | | | 2013 | | | 2012 | | | 2011 | | | 2010 | |
Portfolio turnover rate | | | 67 | % | | | 57 | % | | | 31 | % | | | 35 | % | | | 44 | % |
| c | Per share amount calculated on the average shares method. |
| m | Total return does not reflect expenses that apply at the separate account level or to related insurance products. Inclusion of these charges would reduce the total return figures for all periods shown. |
| n | Includes interest expense. |
| p | Interest expense incurred as a result of entering into reverse repurchase agreements is included in the Fund’s net expenses in the Statements of Operations. Income earned on investing proceeds from reverse repurchase agreements is included in interest income in the Statements of Operations. |
The accompanying notes are an integral part of the financial statements.
68
MML Series Investment Fund II – Financial Statements (Continued)
Financial Highlights (For a share outstanding throughout each period)
MML Short-Duration Bond Fund
| | | | | | | | | | | | | | | | | | | | | | | | | | | | | | | | | | | | | | | | | | | | | | | | | | | | |
| | | | | | Income (loss) from investment
operations | | | Less distributions to shareholders | | | | | | | | | Ratios / Supplemental Data | |
| | | Net
asset
value,
beginning
of the
period | | | Net
investment
income
(loss)c,j | | | Net
realized
and
unrealized
gain (loss)
on
investments | | | Total
income
(loss) from
investment
operations | | | From net
investment
income | | | From net
realized
gains | | | Total
distributions | | | Net
asset
value,
end of
the
period | | | Total
returnm | | | Net
assets,
end of
the
period
(000’s) | | | Ratio of
expenses
to average
daily net
assets
before
expense
waivers | | | Ratio of
expenses
to average
daily net
assets
after
expense
waiversj | | | Net
investment
income
(loss) to
average
daily net
assets | |
Class II | | | | | | | | | | | | | | | | | | | | | | | | | | | | | | | | | | | | | | | | | | | | | |
| 12/31/14 | | $ | 9.94 | | | $ | 0.15 | | | $ | (0.01 | ) | | $ | 0.14 | | | $ | (0.24 | ) | | $ | (0.00 | )d | | $ | (0.24 | ) | | $ | 9.84 | | | | 1.46% | | | $ | 166,438 | | | | 0.55% | | | | 0.55% | k | | | 1.50% | |
| 12/31/13 | | | 10.10 | | | | 0.14 | | | | (0.05 | ) | | | 0.09 | | | | (0.20 | ) | | | (0.05 | ) | | | (0.25 | ) | | | 9.94 | | | | 0.89% | | | | 195,279 | | | | 0.55% | | | | 0.55% | k | | | 1.38% | |
| 12/31/12 | | | 10.25 | | | | 0.16 | | | | 0.14 | | | | 0.30 | | | | (0.20 | ) | | | (0.25 | ) | | | (0.45 | ) | | | 10.10 | | | | 3.00% | | | | 166,054 | | | | 0.58% | | | | 0.55% | | | | 1.58% | |
| 12/31/11 | | | 10.13 | | | | 0.15 | | | | 0.22 | | | | 0.37 | | | | (0.17 | ) | | | (0.08 | ) | | | (0.25 | ) | | | 10.25 | | | | 3.65% | | | | 204,222 | | | | 0.55% | | | | 0.55% | | | | 1.49% | |
| 12/31/10g | | | 10.00 | | | | 0.12 | | | | 0.16 | | | | 0.28 | | | | (0.15 | ) | | | - | | | | (0.15 | ) | | | 10.13 | | | | 2.84% | b | | | 200,161 | | | | 0.57% | a | | | 0.55% | a | | | 1.83% | a |
Service Class I | | | | | | | | | | | | | | | | | | | | | | | | | | | | | | | | | | | | | | | | | | | | | |
| 12/31/14 | | $ | 9.94 | | | $ | 0.12 | | | $ | (0.01 | ) | | $ | 0.11 | | | $ | (0.22 | ) | | $ | (0.00 | )d | | $ | (0.22 | ) | | $ | 9.83 | | | | 1.11% | | | $ | 24,288 | | | | 0.80% | | | | 0.80% | k | | | 1.26% | |
| 12/31/13 | | | 10.09 | | | | 0.11 | | | | (0.03 | ) | | | 0.08 | | | | (0.18 | ) | | | (0.05 | ) | | | (0.23 | ) | | | 9.94 | | | | 0.74% | | | | 21,697 | | | | 0.80% | | | | 0.80% | k | | | 1.13% | |
| 12/31/12 | | | 10.24 | | | | 0.14 | | | | 0.14 | | | | 0.28 | | | | (0.18 | ) | | | (0.25 | ) | | | (0.43 | ) | | | 10.09 | | | | 2.77% | | | | 20,825 | | | | 0.83% | | | | 0.80% | | | | 1.35% | |
| 12/31/11 | | | 10.13 | | | | 0.13 | | | | 0.21 | | | | 0.34 | | | | (0.15 | ) | | | (0.08 | ) | | | (0.23 | ) | | | 10.24 | | | | 3.32% | | | | 13,085 | | | | 0.80% | | | | 0.80% | | | | 1.26% | |
| 12/31/10g | | | 10.00 | | | | 0.10 | | | | 0.17 | | | | 0.27 | | | | (0.14 | ) | | | - | | | | (0.14 | ) | | | 10.13 | | | | 2.74% | b | | | 6,225 | | | | 0.82% | a | | | 0.80% | a | | | 1.48% | a |
| | | | | | | | | | | | | | | | | | | | |
| | | Year ended December 31 | |
| | | 2014 | | | 2013 | | | 2012 | | | 2011 | | | 2010b,q | |
Portfolio turnover rate | | | 86% | | | | 114% | | | | 322% | | | | 317% | | | | 214% | |
| b | Percentage represents the results for the period and is not annualized. |
| c | Per share amount calculated on the average shares method. |
| d | Amount is less than $0.005 per share. |
| g | For the period May 3, 2010 (commencement of operations) through December 31, 2010. |
| j | Computed after giving effect to an agreement by MML Advisers and/or MassMutual to waive certain fees and expenses of the Fund. |
| k | Amount waived had no impact on the ratio of expenses to average daily net assets. |
| m | Total return does not reflect expenses that apply at the separate account level or to related insurance products. Inclusion of these charges would reduce the total return figures for all periods shown. |
| q | Portfolio turnover excludes securities received from subscriptions in-kind. Securities received from subscriptions in-kind had no impact on portfolio turnover. |
The accompanying notes are an integral part of the financial statements.
69
MML Series Investment Fund II – Financial Statements (Continued)
Financial Highlights (For a share outstanding throughout each period)
MML Small Cap Equity Fund
| | | | | | | | | | | | | | | | | | | | | | | | | | | | | | | | | | | | | | | | | | | | | | | | |
| | | | | | Income (loss) from investment
operations | | | Less distributions to shareholders | | | | | | | | | Ratios / Supplemental Data | |
| | | Net
asset
value,
beginning
of the
period | | | Net
investment
income
(loss)c | | | Net
realized
and
unrealized
gain (loss)
on
investments | | | Total
income
(loss) from
investment
operations | | | From net
investment
income | | | From net
realized
gains | | | Total
distributions | | | Net
asset
value,
end of
the
period | | | Total
returnm | | | Net
assets,
end of
the
period
(000’s) | | | Ratio of
expenses
to average
daily net
assets | | | Net
investment
income
(loss) to
average
daily net
assets | |
Initial Class | | | | | | | | | | | | | | | | | | | | | | | | | | | | | | | | | | | | | | | | | |
| 12/31/14 | | $ | 10.97 | | | $ | 0.13 | | | $ | 1.11 | | | $ | 1.24 | | | $ | (0.11 | ) | | $ | (1.46 | ) | | $ | (1.57 | ) | | $ | 10.64 | | | | 12.16% | | | $ | 104,745 | | | | 0.70% | | | | 1.19% | |
| 12/31/13 | | | 8.82 | | | | 0.09 | | | | 3.39 | | | | 3.48 | | | | (0.11 | ) | | | (1.22 | ) | | | (1.33 | ) | | | 10.97 | | | | 41.02% | | | | 104,147 | | | | 0.72% | | | | 0.86% | |
| 12/31/12 | | | 7.57 | | | | 0.09 | | | | 1.29 | | | | 1.38 | | | | - | | | | (0.13 | ) | | | (0.13 | ) | | | 8.82 | | | | 18.39% | | | | 82,675 | | | | 0.82% | | | | 1.09% | |
| 12/31/11 | | | 9.27 | | | | 0.05 | | | | (0.32 | ) | | | (0.27 | ) | | | (0.09 | ) | | | (1.34 | ) | | | (1.43 | ) | | | 7.57 | | | | (2.17% | ) | | | 93,881 | | | | 0.77% | | | | 0.59% | |
| 12/31/10 | | | 7.57 | | | | 0.06 | | | | 1.70 | | | | 1.76 | | | | (0.06 | ) | | | - | | | | (0.06 | ) | | | 9.27 | | | | 23.38% | | | | 130,680 | | | | 0.76% | | | | 0.70% | |
Service Class | | | | | | | | | | | | | | | | | | | | | | | | | | | | | | | | | | | | | | | | | |
| 12/31/14 | | $ | 10.87 | | | $ | 0.10 | | | $ | 1.10 | | | $ | 1.20 | | | $ | (0.09 | ) | | $ | (1.46 | ) | | $ | (1.55 | ) | | $ | 10.52 | | | | 11.88% | | | $ | 9,916 | | | | 0.95% | | | | 0.94% | |
| 12/31/13 | | | 8.76 | | | | 0.06 | | | | 3.36 | | | | 3.42 | | | | (0.09 | ) | | | (1.22 | ) | | | (1.31 | ) | | | 10.87 | | | | 40.67% | | | | 7,674 | | | | 0.97% | | | | 0.63% | |
| 12/31/12 | | | 7.53 | | | | 0.08 | | | | 1.28 | | | | 1.36 | | | | - | | | | (0.13 | ) | | | (0.13 | ) | | | 8.76 | | | | 18.09% | | | | 4,545 | | | | 1.07% | | | | 0.96% | |
| 12/31/11 | | | 9.23 | | | | 0.03 | | | | (0.32 | ) | | | (0.29 | ) | | | (0.07 | ) | | | (1.34 | ) | | | (1.41 | ) | | | 7.53 | | | | (2.41% | ) | | | 3,090 | | | | 1.02% | | | | 0.37% | |
| 12/31/10 | | | 7.54 | | | | 0.04 | | | | 1.69 | | | | 1.73 | | | | (0.04 | ) | | | - | | | | (0.04 | ) | | | 9.23 | | | | 23.08% | | | | 2,805 | | | | 1.01% | | | | 0.51% | |
| | | | | | | | | | | | | | | | | | | | |
| | | Year ended December 31 | |
| | | 2014 | | | 2013 | | | 2012 | | | 2011 | | | 2010 | |
Portfolio turnover rate | | | 65 | % | | | 65 | % | | | 92 | % | | | 103 | % | | | 62 | % |
| c | Per share amount calculated on the average shares method. |
| m | Total return does not reflect expenses that apply at the separate account level or to related insurance products. Inclusion of these charges would reduce the total return figures for all periods shown. |
The accompanying notes are an integral part of the financial statements.
70
MML Series Investment Fund II – Financial Statements (Continued)
Financial Highlights (For a share outstanding throughout each period)
MML Strategic Emerging Markets Fund
| | | | | | | | | | | | | | | | | | | | | | | | | | | | | | | | | | | | | | | | | | | | | | | | | | | | |
| | | | | | Income (loss) from investment
operations | | | Less distributions to shareholders | | | | | | | | | Ratios / Supplemental Data | |
| | | Net
asset
value,
beginning
of the
period | | | Net
investment
income
(loss)c,j | | | Net
realized
and
unrealized
gain (loss)
on
investments | | | Total
income
(loss) from
investment
operations | | | From net
investment
income | | | From net
realized
gains | | | Total
distributions | | | Net
asset
value,
end of
the
period | | | Total
returnm | | | Net
assets,
end of
the
period
(000’s) | | | Ratio of
expenses
to average
daily net
assets
before
expense
waivers | | | Ratio of
expenses
to average
daily net
assets
after
expense
waiversj | | | Net
investment
income
(loss) to
average
daily net
assets | |
Class II | | | | | | | | | | | | | | | | | | | | | | | | | | | | | | | | | | | | | | | | | | | | | |
| 12/31/14 | | $ | 10.21 | | | $ | 0.04 | | | $ | (0.59 | ) | | $ | (0.55 | ) | | $ | (0.03 | ) | | $ | - | | | $ | (0.03 | ) | | $ | 9.63 | | | | (5.41% | ) | | $ | 85,833 | | | | 1.70% | | | | 1.40% | | | | 0.42% | |
| 12/31/13 | | | 10.91 | | | | 0.08 | | | | (0.78 | ) | | | (0.70 | ) | | | - | | | | - | | | | - | | | | 10.21 | | | | (6.42% | ) | | | 91,651 | | | | 1.56% | | | | 1.40% | | | | 0.82% | |
| 12/31/12 | | | 9.43 | | | | 0.06 | | | | 1.47 | | | | 1.53 | | | | (0.05 | ) | | | - | | | | (0.05 | ) | | | 10.91 | | | | 16.20% | | | | 46,830 | | | | 1.63% | | | | 1.40% | | | | 0.56% | |
| 12/31/11 | | | 13.31 | | | | 0.03 | | | | (2.96 | ) | | | (2.93 | ) | | | (0.07 | ) | | | (0.88 | ) | | | (0.95 | ) | | | 9.43 | | | | (22.26% | ) | | | 17,992 | | | | 1.70% | | | | 1.40% | | | | 0.28% | |
| 12/31/10 | | | 11.80 | | | | 0.04 | | | | 1.96 | | | | 2.00 | | | | (0.04 | ) | | | (0.45 | ) | | | (0.49 | ) | | | 13.31 | | | | 16.99% | | | | 180 | | | | 1.65% | | | | 1.40% | | | | 0.37% | |
Service Class I | | | | | | | | | | | | | | | | | | | | | | | | | | | | | | | | | | | | | | | | | | | | | |
| 12/31/14 | | $ | 10.23 | | | $ | 0.01 | | | $ | (0.59 | ) | | $ | (0.58 | ) | | $ | (0.00 | )d | | $ | - | | | $ | (0.00 | )d | | $ | 9.65 | | | | (5.63% | ) | | $ | 9,120 | | | | 1.95% | | | | 1.65% | | | | 0.14% | |
| 12/31/13 | | | 10.97 | | | | 0.08 | | | | (0.82 | ) | | | (0.74 | ) | | | - | | | | - | | | | - | | | | 10.23 | | | | (6.75% | ) | | | 9,122 | | | | 1.81% | | | | 1.65% | | | | 0.76% | |
| 12/31/12 | | | 9.48 | | | | 0.03 | | | | 1.48 | | | | 1.51 | | | | (0.02 | ) | | | - | | | | (0.02 | ) | | | 10.97 | | | | 15.91% | | | | 8,851 | | | | 1.88% | | | | 1.65% | | | | 0.26% | |
| 12/31/11 | | | 13.32 | | | | 0.11 | | | | (3.07 | ) | | | (2.96 | ) | | | (0.00 | )d | | | (0.88 | ) | | | (0.88 | ) | | | 9.48 | | | | (22.44% | ) | | | 7,183 | | | | 1.95% | | | | 1.65% | | | | 0.84% | |
| 12/31/10 | | | 11.82 | | | | 0.01 | | | | 1.95 | | | | 1.96 | | | | (0.01 | ) | | | (0.45 | ) | | | (0.46 | ) | | | 13.32 | | | | 16.75% | | | | 27,037 | | | | 1.90% | | | | 1.65% | | | | 0.12% | |
| | | | | | | | | | | | | | | | | | | | |
| | | Year ended December 31 | |
| | | 2014 | | | 2013 | | | 2012 | | | 2011 | | | 2010 | |
Portfolio turnover rate | | | 44 | % | | | 145 | % | | | 62 | % | | | 75 | % | | | 45 | % |
| c | Per share amount calculated on the average shares method. |
| d | Amount is less than $0.005 per share. |
| j | Computed after giving effect to an agreement by MML Advisers and/or MassMutual to waive certain fees and expenses of the Fund. |
| m | Total return does not reflect expenses that apply at the separate account level or to related insurance products. Inclusion of these charges would reduce the total return figures for all periods shown. |
The accompanying notes are an integral part of the financial statements.
71
Notes to Financial Statements
MML Series Investment Fund II (the “Trust”) is registered under the Investment Company Act of 1940, as amended (the “1940 Act”), as a no-load, open-end, management investment company. The Trust is organized under the laws of the Commonwealth of Massachusetts as a Massachusetts business trust pursuant to an Agreement and Declaration of Trust dated February 8, 2005, which was amended and restated as of February 28, 2005 and December 15, 2011, as it may be further amended from time to time. The following are five series of the Trust (each individually referred to as a “Fund” or collectively as the “Funds”):
MML High Yield Fund (“High Yield Fund”)
MML Inflation-Protected and Income Fund (“Inflation-Protected and Income Fund”)
MML Short-Duration Bond Fund (“Short-Duration Bond Fund”)
MML Small Cap Equity Fund (“Small Cap Equity Fund”)
MML Strategic Emerging Markets Fund (“Strategic Emerging Markets Fund”)
The Trust makes shares of the Funds available for the investment of assets of various separate investment accounts established by Massachusetts Mutual Life Insurance Company (“MassMutual”) and by life insurance companies which are subsidiaries of MassMutual. Shares of the Trust are not offered to the general public. MassMutual, MML Bay State Life Insurance Company, and C.M. Life Insurance Company are the record owners of all of the outstanding shares of the Funds.
Each share class of a Fund represents an interest in the same portfolio of assets. The principal difference among the classes is the level of service and administration fees, and shareholder and distribution service expenses borne by the classes. Because each class will have different fees and expenses, performance and share prices will vary between the classes. The classes of shares are offered to different types of investors, as outlined in the Funds’ Prospectus.
| 2. | | Significant Accounting Policies |
The following is a summary of significant accounting policies followed consistently by each Fund in the preparation of the financial statements in conformity with accounting principles generally accepted in the United States of America (“generally accepted accounting principles”). The preparation of the financial statements in accordance with generally accepted accounting principles requires management to make estimates and assumptions that affect the reported amounts and disclosures in the financial statements. Actual results could differ from those estimates.
Investment Valuation
The net asset value of each Fund’s shares is determined once daily as of the close of regular trading on the New York Stock Exchange (“NYSE”), on each day the NYSE is open for trading (a “business day”). The NYSE normally closes at 4:00 p.m. Eastern Time, but may close earlier on some days.
Equity securities and derivative contracts that are actively traded on a national securities exchange or contract market are valued on the basis of information furnished by a pricing service, which provides the last reported sale price, or, in the case of futures contracts, the settlement price, for securities or derivatives listed on the exchange or contract market or the official closing price on the NASDAQ National Market System, or in the case of over-the-counter (“OTC”) securities for which an official closing price is unavailable or not reported on the NASDAQ System, the last reported bid price. Portfolio securities traded on more than one national securities exchange are valued at the last price at the close of the exchange representing the principal market for such securities. Debt securities (other than short-term obligations) are valued on the basis of valuations furnished by a pricing service, which generally determines valuations taking into account factors such as institutional-size trading in similar securities, yield, quality, coupon rate, maturity, type of issue, trading characteristics, and other market data. Short-term debt securities with remaining maturities of 60 days or less are valued at either amortized cost or at original cost plus accrued interest, whichever the Funds’ investment adviser determines more closely approximates current market value. Shares of other open-end mutual funds are valued at their closing net asset values as reported on each business day.
Investments for which market quotations are readily available are marked to market daily based on those quotations. Market quotations may be provided by third-party vendors or market makers, and may be determined on the basis of a variety of factors, such as broker quotations, financial modeling, and other market data, such as market indexes and yield curves, counterparty
72
Notes to Financial Statements (Continued)
information, and foreign exchange rates. U.S. Government and agency securities may be valued on the basis of market quotations or using a model that may incorporate market observable data such as reported sales of similar securities, broker quotes, yields, bids, offers, quoted market prices, and reference data. The fair values of OTC derivative contracts, including forward, swap, and option contracts related to interest rates, foreign currencies, credit standing of reference entities, equity prices, or commodity prices, may be based on market quotations or may be modeled using a series of techniques, including simulation models, depending on the contract and the terms of the transaction. The fair values of asset-backed securities and mortgage-backed securities are estimated based on models that consider the estimated cash flows of each debt tranche of the issuer, establish a benchmark yield, and develop an estimated tranche-specific spread to the benchmark yield based on the unique attributes of the tranche including, but not limited to, prepayment speed assumptions and attributes of the collateral. Restricted securities are generally valued at a discount to similar publicly traded securities.
Investments for which market quotations are not available or for which a pricing service or vendor does not provide a value, or for which such market quotations or values are considered by the investment adviser or subadviser to be unreliable (including, for example, certain foreign securities, thinly-traded securities, certain restricted securities, certain initial public offerings, or securities whose values may have been affected by a significant event) are stated at fair valuations determined in good faith by the Funds’ Valuation Committee1 in accordance with procedures approved annually by the Board of Trustees (“Trustees”), and under the general oversight of the Trustees. The Funds’ Valuation Committee employs various methods to determine fair valuations including a regular review of key inputs and assumptions and review of any related market activity. The Funds’ Valuation Committee reports to the Trustees at their regularly scheduled meetings. It is possible that fair value prices will be used by the Funds to a significant extent. The value determined for an investment using the Funds’ fair value procedures may differ from recent market prices for the investment and may be significantly different from the value realized upon the sale of such investment.
The Funds may invest in securities that are traded principally in foreign markets and that trade on weekends and other days when the Funds do not price their shares. As a result, the values of the Funds’ portfolio securities may change on days when the prices of the Funds’ shares are not calculated. The prices of the Funds’ shares will reflect any such changes when the prices of the Funds’ shares are next calculated, which is the next business day. The Funds may use fair value pricing more frequently for securities primarily traded in foreign markets because, among other things, most foreign markets close well before the Funds value their securities. The earlier close of these foreign markets gives rise to the possibility that significant events, including broad market moves, may have occurred in the interim. The Funds’ investments may be priced based on fair values provided by a third-party vendor, based on certain factors and methodologies applied by such vendor, in the event that there is movement in the U.S. market, between the close of the foreign market and the time the Funds calculate their net asset values. All assets and liabilities expressed in foreign currencies are converted into U.S. dollars at the mean between the buying and selling rates of such currencies against the U.S. dollar at the end of each business day.
Fair value is defined as the price that would be received to sell an asset or paid to transfer a liability in an orderly transaction between market participants at the measurement date. A three-tier hierarchy is utilized to maximize the use of observable market data inputs and minimize the use of unobservable inputs and to establish classification of fair value measurements for disclosure purposes. Inputs refer broadly to the assumptions that market participants would use in pricing the asset or liability, including assumptions about risk, for example, the risk inherent in a particular valuation technique used to measure fair value (such as a pricing model) and/or the risk inherent in the inputs to the valuation technique. Inputs may be observable or unobservable. Observable inputs are inputs that reflect the assumptions market participants would use in pricing the asset or liability and are developed based on market data obtained from sources independent of the reporting entity. Unobservable inputs are inputs that reflect the reporting entity’s own assumptions about the assumptions market participants would use in pricing the asset or liability and are developed based on the best information available in the circumstances. The three-tier hierarchy of inputs is summarized in the three broad Levels listed below. The inputs or methodology used for valuing investments are not necessarily an indication of the risk associated with investing in those investments and the determination of the significance of a particular input to the fair value measurement in its entirety requires judgment and consideration of factors specific to each security.
| 1 | The Valuation Committee consists of the President, Treasurer, Assistant Treasurers, Vice Presidents (except for the CCO), Secretary, and Assistant Secretaries of the Trust, as well as such alternate members as the Trustees may from time to time designate. The Valuation Committee reviews and determines the fair valuation of portfolio securities and the Funds’ pricing procedures in general. |
73
Notes to Financial Statements (Continued)
Level 1 – quoted prices (unadjusted) in active markets for identical investments that the Funds can access at the measurement date
The types of assets and liabilities categorized in Level 1 generally include actively traded domestic and certain foreign equity securities, derivatives actively traded on a national securities exchange (such as some warrants, rights, futures, and options), and shares of open-end mutual funds.
Level 2 – other significant observable inputs (including quoted prices for similar investments, interest rates, prepayment speeds, credit risk, etc.)
The types of assets and liabilities categorized in Level 2 generally include debt securities such as U.S. government and agency securities, mortgage-backed securities, asset-backed securities, municipal obligations, sovereign debt obligations, bank loans, corporate bonds, and those securities valued at amortized cost; OTC derivatives such as swaps, options, swaptions, and forward foreign currency exchange contracts; certain restricted securities; and non-exchange traded equity securities and certain foreign equity securities traded on particular foreign exchanges that close before the Funds determine their net asset values.
Level 3 – significant unobservable inputs (including the Funds’ own assumptions in determining the fair value of investments)
The types of assets and liabilities categorized in Level 3 generally include securities for which prices, spreads, or any of the other aforementioned key inputs are unobservable. Generally, securities whose trading has been suspended or that have been de-listed from their current primary trading exchange; securities in default or bankruptcy proceedings for which there is no current market quotation; securities and certain derivatives valued by broker quotes which may include brokers’ assumptions; and any illiquid Rule 144A securities or restricted securities issued by non-public entities are categorized in Level 3.
The availability of observable inputs can vary from security to security and is affected by a wide variety of factors, including, for example, the type of security, whether the security is new and not yet established in the marketplace, the liquidity of markets, and other characteristics particular to the security. To the extent that valuation is based on models or inputs that are less observable or unobservable in the market, the determination of fair value requires more judgment. Accordingly, the degree of judgment exercised in determining fair value is greatest for instruments categorized in Level 3.
Changes in valuation techniques may result in transfers in or out of an investment’s assigned Level within the hierarchy. In addition, in periods of market dislocation, the observability of prices and inputs may be reduced for many instruments. This condition, as well as changes related to liquidity of investments, could cause a security to be reclassified between Level 1, Level 2, or Level 3.
In certain cases, the inputs used to measure fair value may fall into different levels of the fair value hierarchy. In such cases, for disclosure purposes the level in the fair value hierarchy within which the fair value measurement falls is determined based on the lowest level input that is significant to the overall fair value measurement.
The High Yield Fund characterized all investments at Level 2, as of December 31, 2014. For the High Yield Fund, the level classification by major category of investments is the same as the category presentation in the Portfolio of Investments.
The following is the aggregate value by input level, as of December 31, 2014, for the remaining Funds’ investments:
74
Notes to Financial Statements (Continued)
| | | | | | | | | | | | | | | | |
| | | Level 1 | | | Level 2 | | | Level 3 | | | Total | |
Inflation-Protected and Income Fund | | | | | | | | | | | | | | | | |
Asset Investments | | | | | | | | | | | | | | | | |
Corporate Debt | | $ | - | | | $ | 36,304,853 | | | $ | - | | | $ | 36,304,853 | |
Municipal Obligations | | | - | | | | 360,500 | | | | - | | | | 360,500 | |
Non-U.S. Government Agency Obligations | | | - | | | | 155,553,701 | | | | 264,636 | | | | 155,818,337 | |
U.S. Government Agency Obligations and Instrumentalities | | | - | | | | 1,709,504 | | | | - | | | | 1,709,504 | |
U.S. Treasury Obligations | | | - | | | | 451,296,641 | | | | - | | | | 451,296,641 | |
Purchased Options | | | - | | | | 408,220 | | | | - | | | | 408,220 | |
Short-Term Investments | | | - | | | | 200,140,101 | | | | - | | | | 200,140,101 | |
| | | | | | | | | | | | | | | | |
| Total Investments | | $ | - | | | $ | 845,773,520 | | | $ | 264,636 | | | $ | 846,038,156 | |
| | | | | | | | | | | | | | | | |
Asset Derivatives | | | | | | | | | | | | | | | | |
Futures Contracts | | $ | 22,637 | | | $ | - | | | $ | - | | | $ | 22,637 | |
| | | | | | | | | | | | | | | | |
Liability Derivatives | | | | | | | | | | | | | | | | |
Futures Contracts | | $ | (393,745 | ) | | $ | - | | | $ | - | | | $ | (393,745 | ) |
Swap Agreements | | | - | | | | (370,997 | ) | | | - | | | | (370,997 | ) |
| | | | | | | | | | | | | | | | |
| Total | | $ | (393,745 | ) | | $ | (370,997 | ) | | $ | - | | | $ | (764,742 | ) |
| | | | | | | | | | | | | | | | |
| | | | |
Short-Duration Bond Fund | | | | | | | | | | | | | | | | |
Asset Investments | | | | | | | | | | | | | | | | |
Corporate Debt | | $ | - | | | $ | 73,186,323 | | | $ | - | | | $ | 73,186,323 | |
Municipal Obligations | | | - | | | | 860,964 | | | | - | | | | 860,964 | |
Non-U.S. Government Agency Obligations | | | - | | | | 49,880,490 | | | | 165,398 | | | | 50,045,888 | |
U.S. Government Agency Obligations and Instrumentalities | | | - | | | | 10,743,435 | | | | - | | | | 10,743,435 | |
U.S. Treasury Obligations | | | - | | | | 51,622,285 | | | | - | | | | 51,622,285 | |
Purchased Options | | | - | | | | 474,604 | | | | - | | | | 474,604 | |
Short-Term Investments | | | - | | | | 2,970,428 | | | | - | | | | 2,970,428 | |
| | | | | | | | | | | | | | | | |
| Total Investments | | $ | - | | | $ | 189,738,529 | | | $ | 165,398 | | | $ | 189,903,927 | |
| | | | | | | | | | | | | | | | |
Liability Derivatives | | | | | | | | | | | | | | | | |
Futures Contracts | | $ | (83,282 | ) | | $ | - | | | $ | - | | | $ | (83,282 | ) |
Swap Agreements | | | - | | | | (365,387 | ) | | | - | | | | (365,387 | ) |
| | | | | | | | | | | | | | | | |
| Total | | $ | (83,282 | ) | | $ | (365,387 | ) | | $ | - | | | $ | (448,669 | ) |
| | | | | | | | | | | | | | | | |
| | | | |
Small Cap Equity Fund | | | | | | | | | | | | | | | | |
Asset Investments | | | | | | | | | | | | | | | | |
Common Stock | | $ | 113,945,634 | | | $ | 467,754 | * | | $ | - | | | $ | 114,413,388 | |
Mutual Funds | | | 12,921,094 | | | | - | | | | - | | | | 12,921,094 | |
Short-Term Investments | | | - | | | | 305,168 | | | | - | | | | 305,168 | |
| | | | | | | | | | | | | | | | |
| Total Investments | | $ | 126,866,728 | | | $ | 772,922 | | | $ | - | | | $ | 127,639,650 | |
| | | | | | | | | | | | | | | | |
| | | | |
Strategic Emerging Markets Fund | | | | | | | | | | | | | | | | |
Asset Investments | | | | | | | | | | | | | | | | |
Common Stock | | $ | 25,962,942 | | | $ | 61,225,587 | * | | $ | - | | | $ | 87,188,529 | |
Preferred Stock | | | - | | | | 2,054,269 | | | | - | | | | 2,054,269 | |
Mutual Funds | | | 4,734,845 | | | | - | | | | - | | | | 4,734,845 | |
Warrants | | | - | | | | 65,032 | | | | - | | | | 65,032 | |
Short-Term Investments | | | - | | | | 6,706,252 | | | | - | | | | 6,706,252 | |
| | | | | | | | | | | | | | | | |
| Total Investments | | $ | 30,697,787 | | | $ | 70,051,140 | | | $ | - | | | $ | 100,748,927 | |
| | | | | | | | | | | | | | | | |
| * | Includes foreign equity securities whose values were adjusted to reflect market trading of comparable securities or other correlated instruments after the close of trading in their applicable foreign markets. |
75
Notes to Financial Statements (Continued)
The following table shows Funds with certain assets and liabilities, which approximate fair value and would be categorized at Level 2 as of December 31, 2014.
| | | | | | | | |
Statements of Assets and Liabilities location: | | Inflation-
Protected and
Income Fund | | Short-Duration
Bond Fund | | Small
Cap
Equity Fund | | Strategic
Emerging
Markets Fund |
Receivables from: | | | | | | | | |
Collateral held for reverse repurchase agreements | | X | | | | | | |
| | | | | |
Payables for: | | | | | | | | |
Reverse repurchase agreements | | X | | | | | | |
Securities on loan | | | | | | X | | X |
Due to Custodian | | X | | X | | | | X |
The following table shows transfers between Level 1 and Level 2 of the fair value hierarchy:
| | | | | | | | | | | | | | | | |
| | | Transfers In* | | | Transfers Out* | |
| | | Level 1 —
Quoted Prices | | | Level 2 —
Other
Significant
Observable
Inputs | | | Level 1 —
Quoted Prices | | | Level 2 —
Other
Significant
Observable
Inputs | |
Strategic Emerging Markets Fund | | $ | - | | | $ | 1,480,508 | | | $ | (1,480,508 | ) | | $ | - | |
| * | The Fund(s) recognize transfers between the Levels as of the beginning of the year. Transfers occurred between Level 1 and Level 2 as inputs were less observable. |
Following is a reconciliation of investments for which significant unobservable inputs (Level 3) were used in determining value:
Asset Valuation Inputs
| | | | | | | | | | | | | | | | | | | | | | | | | | | | | | | | | | | | | | | | |
| | | Investments in Securities | |
| | | Balance
as of
12/31/13 | | | Accrued
Discounts
(Premiums) | | | Realized
Gain
(Loss) | | | Change in
Unrealized
Appreciation
(Depreciation) | | | Purchases | | | (Sales) | | | Transfers
into
Level 3* | | | Transfers
(out) of
Level 3* | | | Balance
as of
12/31/14 | | | Net Change
in Unrealized
Appreciation
(Depreciation)
from
Investments
Still Held
as of
12/31/14 | |
High Yield Fund | | | | | | | | | | | | | | | | | | | | | | | | | | | | | | | | | | | | | | | | |
Corporate Debt | | $ | - | ** | | $ | - | | | $ | (573,750 | ) | | $ | 573,750 | | | $ | - | | | $ | - | *** | | $ | - | | | $ | - | | | $ | - | | | $ | - | |
| | | | | | | | | | | | | | | | | | | | | | | | | | | | | | | | | | | | | | | | |
Inflation-Protected and Income Fund | | | | | | | | | | | | | | | | | | | | | | | | | | | | | | | | | | | | | |
Non-U.S. Government | | | | | | | | | | | | | | | | | | | | | | | | | | | | | | | | | | | | | | | | |
Agency Obligations† | | $ | 1,087,257 | | | $ | - | | | $ | - | | | $ | (6,390 | ) | | $ | 400,000 | | | $ | (1,216,231 | ) | | $ | - | | | $ | - | | | $ | 264,636 | | | $ | 6 | |
Non-U.S. Government | | | | | | | | | | | | | | | | | | | | | | | | | | | | | | | | | | | | | | | | |
Agency Obligations | | | - | | | | - | | | | - | | | | - | | | | 2,594,944 | | | | - | | | | - | | | | (2,594,944 | )**** | | | - | | | | - | |
| | | | | | | | | | | | | | | | | | | | | | | | | | | | | | | | | | | | | | | | |
| | $ | 1,087,257 | | | $ | - | | | $ | - | | | $ | (6,390 | ) | | $ | 2,994,944 | | | $ | (1,216,231 | ) | | $ | - | | | $ | (2,594,944 | ) | | $ | 264,636 | | | $ | 6 | |
| | | | | | | | | | | | | | | | | | | | | | | | | | | | | | | | | | | | | | | | |
Short-Duration Bond Fund | | | | | | | | | | | | | | | | | | | | | | | | | | | | | | | | | | | | | |
Non-U.S. Government | | $ | 812,427 | | | $ | - | | | $ | 95,648 | | | $ | (98,653 | ) | | $ | 250,000 | | | $ | (894,024 | ) | | $ | - | | | $ | - | | | $ | 165,398 | | | $ | 3 | |
Agency Obligations† | | | | | | | | | | | | | | | | | | | | | | | | | | | | | | | | | | | | | | | | |
Non-U.S. Government | | | | | | | | | | | | | | | | | | | | | | | | | | | | | | | | | | | | | | | | |
Agency Obligations | | | - | | | | - | | | | - | | | | - | | | | 1,074,980 | | | | - | | | | - | | | | (1,074,980 | )**** | | | - | | | | - | |
| | | | | | | | | | | | | | | | | | | | | | | | | | | | | | | | | | | | | | | | |
| | $ | 812,427 | | | $ | - | | | $ | 95,648 | | | $ | (98,653 | ) | | $ | 1,324,980 | | | $ | (894,024 | ) | | $ | - | | | $ | (1,074,980 | ) | | $ | 165,398 | | | $ | 3 | |
| | | | | | | | | | | | | | | | | | | | | | | | | | | | | | | | | | | | | | | | |
Strategic Emerging Markets Fund | | | | | | | | | | | | | | | | | | | | | | | | | | | | | | | | | | | | | |
Common Stock | | $ | - | | | $ | - | | | $ | 1,902 | | | $ | 16,525 | | | $ | 15,336 | | | $ | (197,264 | ) | | $ | 163,501 | †† | | $ | - | | | $ | - | | | $ | - | |
| | | | | | | | | | | | | | | | | | | | | | | | | | | | | | | | | | | | | | | | |
76
Notes to Financial Statements (Continued)
| * | The Fund(s) recognize transfers between the Levels as of the beginning of the year. |
| ** | Represents security at $0 value as of December 31, 2013. |
| *** | Represents security at $0 value at the time of write-off. |
| **** | Transfers occurred between Level 3 and Level 2 as inputs were more observable. |
| † | Represents (i) an illiquid 144A security valued by a broker quote or vendor price or (ii) a restricted security issued by a non-public entity valued by a broker quote or vendor price. |
| †† | Transfers occurred between Level 2 and Level 3 as inputs were less observable. |
None of the unobservable inputs, individually or collectively, had a material impact on the Fund(s).
Derivative Instruments
Derivatives are financial instruments whose values are based on the values of one or more indicators, such as a security, asset, currency, interest rate, or index. Derivative transactions can create investment leverage and may be highly volatile. Gains or losses from derivatives can be substantially greater than the derivatives original cost and can sometimes be unlimited. A Fund may not be able to close out a derivative transaction at a favorable time or price. For those Funds that held derivatives during the year ended December 31, 2014, the following table shows how the Fund used these types of derivatives during the period (marked with an “A”), as well as additional uses, if any, it may have for them in the future (marked with an “M”).
| | | | | | |
Type of Derivative and Objective for Use | | Inflation-
Protected
and
Income
Fund | | Short-
Duration
Bond
Fund | | Strategic
Emerging
Markets
Fund |
Futures Contracts* | | | | | | |
Hedging/Risk Management | | A | | A | | |
Duration/Credit Quality Management | | A | | A | | |
Substitution for Direct Investment | | A | | A | | |
Intention to Create Investment Leverage in Portfolio | | M | | M | | |
| | | | |
Interest Rate Swaps** | | | | | | |
Hedging/Risk Management | | A | | A | | |
Duration Management | | M | | M | | |
Asset/Liability Management | | M | | M | | |
Substitution for Direct Investment | | M | | M | | |
Intention to Create Investment Leverage in Portfolio | | M | | M | | |
| | | | |
Credit Default Swaps (Protection Buyer) | | | | | | |
Hedging/Risk Management | | A | | A | | |
Duration/Credit Quality Management | | A | | A | | |
Income | | A | | A | | |
Substitution for Direct Investment | | A | | A | | |
Intention to Create Investment Leverage in Portfolio | | M | | M | | |
| | | | |
Options (Purchased) | | | | | | |
Hedging/Risk Management | | A | | A | | |
Duration/Credit Quality Management | | A | | A | | |
Substitution for Direct Investment | | A | | A | | |
Directional Investment | | A | | A | | |
Intention to Create Investment Leverage in Portfolio | | M | | M | | |
| | | | |
Rights and Warrants | | | | | | |
Result of a Corporate Action | | | | | | A |
| * | Includes any options purchased or written on futures contracts, if applicable. |
| ** | Includes any caps, floors, and collars, and related purchased or written options, if applicable. |
77
Notes to Financial Statements (Continued)
At December 31, 2014, and during the year then ended, the Fund(s) had the following derivatives and transactions in derivatives, grouped into the indicated risk categories:
| | | | | | | | | | | | | | | | |
| | | Credit
Risk | | | Equity
Risk | | | Interest
Rate
Risk | | | Total | |
| Inflation-Protected and Income Fund | | | | | | | | | | | | | | | | |
| Asset Derivatives | | | | | | | | | | | | | | | | |
Purchased Options* | | $ | - | | | $ | - | | | $ | 408,220 | | | $ | 408,220 | |
Futures Contracts^^ | | | - | | | | - | | | | 22,637 | | | | 22,637 | |
| | | | | | | | | | | | | | | | |
Total Value | | $ | - | | | $ | - | | | $ | 430,857 | | | $ | 430,857 | |
| | | | | | | | | | | | | | | | |
| Liability Derivatives | | | | | | | | | | | | | | | | |
Futures Contracts^^ | | $ | - | | | $ | - | | | $ | (393,745 | ) | | $ | (393,745 | ) |
Swap Agreements^^,^^^ | | | (162,253 | ) | | | - | | | | (208,744 | ) | | | (370,997 | ) |
| | | | | | | | | | | | | | | | |
Total Value | | $ | (162,253 | ) | | $ | - | | | $ | (602,489 | ) | | $ | (764,742 | ) |
| | | | | | | | | | | | | | | | |
| Realized Gain (Loss)# | | | | | | | | | | | | | | | | |
Purchased Options | | $ | - | | | $ | - | | | $ | 248,053 | | | $ | 248,053 | |
Futures Contracts | | | - | | | | - | | | | (1,381,645 | ) | | | (1,381,645 | ) |
Swap Agreements | | | (21,059 | ) | | | - | | | | (59,741 | ) | | | (80,800 | ) |
| | | | | | | | | | | | | | | | |
Total Realized Gain (Loss) | | $ | (21,059 | ) | | $ | - | | | $ | (1,193,333 | ) | | $ | (1,214,392 | ) |
| | | | | | | | | | | | | | | | |
| Change in Appreciation (Depreciation)## | | | | | | | | | | | | | | | | |
Purchased Options | | $ | - | | | $ | - | | | $ | 137,394 | | | $ | 137,394 | |
Futures Contracts | | | - | | | | - | | | | (468,426 | ) | | | (468,426 | ) |
Swap Agreements | | | (24,527 | ) | | | - | | | | (8,666 | ) | | | (33,193 | ) |
| | | | | | | | | | | | | | | | |
Total Change in Appreciation (Depreciation) | | $ | (24,527 | ) | | $ | - | | | $ | (339,698 | ) | | $ | (364,225 | ) |
| | | | | | | | | | | | | | | | |
| Number of Contracts Notional Amounts or Shares/Units† | | | | | | | | | | | | | | | | |
Purchased Options | | $ | - | | | $ | - | | | $ | 15,435,000 | | | $ | 15,435,000 | |
Futures Contracts | | | - | | | | - | | | | 477 | | | | 477 | |
Swap Agreements | | $ | 9,150,000 | | | $ | - | | | $ | 13,821,250 | | | $ | 22,971,250 | |
| | | | |
| Short-Duration Bond Fund | | | | | | | | | | | | | | | | |
| Asset Derivatives | | | | | | | | | | | | | | | | |
Purchased Options* | | $ | - | | | $ | - | | | $ | 474,604 | | | $ | 474,604 | |
| | | | | | | | | | | | | | | | |
| Liability Derivatives | | | | | | | | | | | | | | | | |
Futures Contracts^^ | | $ | - | | | $ | - | | | $ | (83,282 | ) | | $ | (83,282 | ) |
Swap Agreements^^,^^^ | | | (122,714 | ) | | | - | | | | (242,673 | ) | | | (365,387 | ) |
| | | | | | | | | | | | | | | | |
Total Value | | $ | (122,714 | ) | | $ | - | | | $ | (325,955 | ) | | $ | (448,669 | ) |
| | | | | | | | | | | | | | | | |
| Realized Gain (Loss)# | | | | | | | | | | | | | | | | |
Purchased Options | | $ | - | | | $ | - | | | $ | 288,391 | | | $ | 288,391 | |
Futures Contracts | | | - | | | | - | | | | 563,418 | | | | 563,418 | |
Swap Agreements | | | (16,232 | ) | | | - | | | | (56,028 | ) | | | (72,260 | ) |
| | | | | | | | | | | | | | | | |
Total Realized Gain (Loss) | | $ | (16,232 | ) | | $ | - | | | $ | 795,781 | | | $ | 779,549 | |
| | | | | | | | | | | | | | | | |
| Change in Appreciation (Depreciation)## | | | | | | | | | | | | | | | | |
Purchased Options | | $ | - | | | $ | - | | | $ | 159,736 | | | $ | 159,736 | |
Futures Contracts | | | - | | | | - | | | | (261,918 | ) | | | (261,918 | ) |
Swap Agreements | | | (16,942 | ) | | | - | | | | (10,667 | ) | | | (27,609 | ) |
| | | | | | | | | | | | | | | | |
Total Change in Appreciation (Depreciation) | | $ | (16,942 | ) | | $ | - | | | $ | (112,849 | ) | | $ | (129,791 | ) |
| | | | | | | | | | | | | | | | |
78
Notes to Financial Statements (Continued)
| | | | | | | | | | | | | | | | |
| | | Credit
Risk | | | Equity
Risk | | | Interest
Rate
Risk | | | Total | |
| Short-Duration Bond Fund (Continued) | | | | | | | | | | | | | | | | |
| Number of Contracts, Notional Amounts or Shares/Units† | | | | | | | | | | | | | | | | |
Purchased Options | | $ | - | | | $ | - | | | $ | 17,945,000 | | | $ | 17,945,000 | |
Futures Contracts | | | - | | | | - | | | | 247 | | | | 247 | |
Swap Agreements | | $ | 7,050,000 | | | $ | - | | | $ | 9,395,455 | | | $ | 16,445,455 | |
| | | | |
| Strategic Emerging Markets Fund | | | | | | | | | | | | | | | | |
| Asset Derivatives | | | | | | | | | | | | | | | | |
Warrants* | | $ | - | | | $ | 65,032 | | | $ | - | | | $ | 65,032 | |
| | | | | | | | | | | | | | | | |
| Realized Gain (Loss)# | | | | | | | | | | | | | | | | |
Rights | | $ | - | | | $ | 400 | | | $ | - | | | $ | 400 | |
| | | | | | | | | | | | | | | | |
| Change in Appreciation (Depreciation)## | | | | | | | | | | | | | | | | |
Warrants | | $ | - | | | $ | (12,848 | ) | | $ | - | | | $ | (12,848 | ) |
| | | | | | | | | | | | | | | | |
| Number of Contracts Notional Amounts or Shares/Units† | | | | | | | | | | | | | | | | |
Warrants | | | - | | | | 81,500 | | | | - | | | | 81,500 | |
Rights | | | - | | | | 15,866 | | | | - | | | | 15,866 | |
| * | Statements of Assets and Liabilities location: Investments, at value. |
| ^^ | Cumulative appreciation (depreciation) on futures contracts and centrally cleared swaps is reported in “Futures Contracts” and “Swap Agreements” below. Only current day’s variation margin, if any, is reported within the Statements of Assets and Liabilities. |
| ^^^ | Represents centrally cleared swaps, which are not subject to a master netting agreement. |
| # | Statements of Operations location: Amounts are included in net realized gain (loss) on: investment transactions, futures contracts, or swap agreements, as applicable. |
| ## | Statements of Operations location: Amounts are included in net change in unrealized appreciation (depreciation) on: investment transactions, futures contracts, or swap agreements, as applicable. |
| † | Amount(s) disclosed represent average number of contracts for futures contracts, notional amounts for purchased options and swap agreements, or shares/units outstanding for rights and warrants, which is indicative of volume of this derivative type, for the months that the Fund held such derivatives during the year ended December 31, 2014. |
The following table presents the Funds’ derivative assets by counterparty net of amounts available for offset under a master netting agreement (“MNA”), or similar agreement, and net of the related collateral received by the Fund(s) as of December 31, 2014.
| | | | | | | | | | | | | | | | | | |
| | | Counterparty | | Derivatives
Assets Subject
to a MNA by
Counterparty† | | | Financial
Instruments
Available for
Offset | | | Collateral
Received** | | | Net Amount* | |
| Inflation-Protected and Income Fund | | | | | | | | | | | | | | | | |
| | Credit Suisse International | | $ | 408,220 | | | $ | - | | | $ | (314,502 | ) | | $ | 93,718 | |
| | | | | | | | | | | | | | | | | | |
| Short-Duration Bond Fund | | | | | | | | | | | | | | | | |
| | Credit Suisse International | | $ | 474,604 | | | $ | - | | | $ | (453,818 | ) | | $ | 20,786 | |
| | | | | | | | | | | | | | | | | | |
| * | Represents the net amount receivable from the counterparty in the event of default. |
| ** | The amount presented here may be less than the total amount of collateral received/pledged as the net amount of derivative assets and liabilities for a counterparty cannot be less than $0. |
| † | The amount presented here may be less than the total amount shown in the Statement of Assets and Liabilities as some derivatives held by the counterparty are not covered within the master netting agreements. |
Such agreements typically permit a single net payment in the event of default, including the bankruptcy or insolvency of the counterparty. Typically, the Fund(s) and counterparties are not permitted to sell, re-pledge, or use the collateral they receive.
79
Notes to Financial Statements (Continued)
Further details regarding the derivatives and other investments held by the Fund(s) during the year ended December 31, 2014, are discussed below.
Futures Contracts
A Fund may seek to manage a variety of different risks, such as interest rate risk, equity price risk, and currency risk, through the use of futures contracts. A Fund may use interest rate futures contracts to adjust the interest rate sensitivity (duration) of its portfolio or the credit exposure of the portfolio. Interest rate futures contracts obligate the long or short holder to take or make delivery of a specified quantity of a financial instrument, such as a specific fixed-income security, during a specified future period at a specified price. A Fund may use index futures to hedge against broad market risks to its portfolio or to gain broad market exposure when it holds uninvested cash or as an inexpensive substitute for cash investments directly in securities or other assets. Securities index futures contracts are contracts to buy or sell units of a securities index at a specified future date at a price agreed upon when the contract is made and are settled in cash. Positions in futures may be closed out only on an exchange or board of trade which provides a secondary market for such futures. Because futures contracts are exchange-traded, they typically have minimal exposure to counterparty risk.
Parties to a futures contract are not required to post the entire notional amount of the contract, but rather a small percentage of that amount (by way of margin), both at the time they enter into futures transactions, and then on a daily basis if their positions decline in value; as a result, futures contracts are highly leveraged. Such payments are known as variation margin and are recorded by the Funds as unrealized gains or losses. Because futures markets are highly leveraged, they can be extremely volatile, and there can be no assurance that the pricing of a futures contract will correlate precisely with the pricing of the asset or index underlying it or the asset or liability of the Fund that is the subject of the hedge. It may not always be possible for a Fund to enter into a closing transaction with respect to a futures contract it has entered into, at a favorable time or price. When a Fund enters into a futures transaction, it is subject to the risk that the value of the futures contract will move in a direction unfavorable to it. When the Fund uses futures contracts for hedging purposes, it is likely that the Fund will have an asset or liability that will offset any loss (or gain) on the transactions, at least in part.
When a futures contract is closed, the Fund records a realized gain or loss equal to the difference between the value of the contract at the time it was opened and the value at the time it was closed. Futures contracts are valued at the settlement price established each day by the board of trade or exchange on which they are traded.
The Fund(s) listed in the following table had open futures contracts at December 31, 2014:
| | | | | | | | | | | | | | |
| | | Expiration
Date | | Number of
Contracts | | | Notional
Amount | | | Net Unrealized
Appreciation/
(Depreciation) | |
| Inflation-Protected and Income Fund | | | | | | | | | | | | | | |
| Futures Contracts — Short | | | | | | | | | | | | | | |
| U.S. Long Bond | | 03/20/15 | | | 5 | | | $ | (722,812 | ) | | $ | (20,008 | ) |
| U.S. Treasury Note 10 Year | | 03/20/15 | | | 87 | | | | (11,031,328 | ) | | | (65,931 | ) |
| U.S. Ultra Bond | | 03/20/15 | | | 40 | | | | (6,607,500 | ) | | | (292,753 | ) |
| U.S. Treasury Note 2 Year | | 03/31/15 | | | 113 | | | | (24,701,094 | ) | | | 22,637 | |
| U.S. Treasury Note 5 Year | | 03/31/15 | | | 62 | | | | (7,373,641 | ) | | | (15,053 | ) |
| | | | | | | | | | | | | | |
| | | | | | | | | | | | $ | (371,108 | ) |
| | | | | | | | | | | | | | |
| Short-Duration Bond Fund | | | | | | | | | | | | | | |
| Futures Contracts — Long | | | | | | | | | | | | | | |
| U.S. Treasury Note 2 Year | | 03/31/15 | | | 224 | | | $ | 48,965,000 | | | $ | (34,239 | ) |
| U.S. Treasury Note 5 Year | | 03/31/15 | | | 386 | | | | 45,906,859 | | | | (7,907 | ) |
| | | | | | | | | | | | | | |
| | | | | | | | | | | | $ | (42,146 | ) |
| | | | | | | | | | | | | | |
| Futures Contracts — Short | | | | | | | | | | | | | | |
| U.S. Treasury Note 10 Year | | 03/20/15 | | | 125 | | | $ | (15,849,609 | ) | | $ | (1,116 | ) |
| U.S. Long Bond | | 03/20/15 | | | 10 | | | | (1,445,625 | ) | | | (40,020 | ) |
| | | | | | | | | | | | | | |
| | | | | | | | | | | | $ | (41,136 | ) |
| | | | | | | | | | | | | | |
80
Notes to Financial Statements (Continued)
Swap Agreements
Swap agreements are typically two-party contracts entered into primarily by institutional investors. In a standard “swap” transaction, two parties agree to exchange the returns (or differentials in rates of return) earned or realized on particular predetermined investments or instruments, which may be adjusted for an interest factor. The gross returns to be exchanged or “swapped” between the parties are generally calculated with respect to a “notional amount,” (i.e., the return on or increase in value of a particular dollar amount invested at a particular interest rate or in a “basket” of securities representing a particular index).
Interest Rate Swaps. When a Fund enters into an interest rate swap, it typically agrees to make payments to its counterparty based on a specified long- or short-term interest rate, and will receive payments from its counterparty based on another interest rate. Other forms of interest rate swap agreements include interest rate caps, under which, in return for a specified payment stream, one party agrees to make payments to the other to the extent that interest rates exceed a specified rate, or “cap”; interest rate floors, under which, in return for a specified payment stream, one party agrees to make payments to the other to the extent that interest rates fall below a specified rate, or “floor”; and interest rate collars, under which a party sells a cap and purchases a floor or vice versa in an attempt to protect itself against interest rate movements exceeding given minimum or maximum levels. A Fund may enter into an interest rate swap in order, for example, to hedge against the effect of interest rate changes on the value of specific securities in its portfolio, or to adjust the interest rate sensitivity (duration) or the credit exposure of its portfolio overall, or otherwise as a substitute for a direct investment in debt securities.
Credit Default Swaps. A Fund also may enter into credit default swap transactions, as a “buyer” or “seller” of credit protection. In a credit default swap, one party provides what is in effect insurance against a default or other adverse credit event affecting an issuer of debt securities (typically referred to as a “reference entity”). In general, the buyer of credit protection is obligated to pay the protection seller an upfront amount or a periodic stream of payments over the term of the swap. If a “credit event” occurs, the buyer has the right to deliver to the seller bonds or other obligations of the reference entity (with a value up to the full notional value of the swap), and to receive a payment equal to the par value of the bonds or other obligations. Credit events that would trigger a request that the seller make payment are specific to each credit default swap agreement, but generally include bankruptcy, failure to pay, restructuring, obligation acceleration, obligation default, or repudiation/moratorium. When a Fund buys protection, it may or may not own securities of the reference entity. If it does own securities of the reference entity, the swap serves as a hedge against a decline in the value of the securities due to the occurrence of a credit event involving the issuer of the securities. If the Fund does not own securities of the reference entity, the credit default swap may be seen to create a short position in the reference entity. If a Fund is a buyer and no credit event occurs, the Fund will typically recover nothing under the swap, but will have had to pay the required upfront payment or stream of continuing payments under the swap. When a Fund sells protection under a credit default swap, the position may have the effect of creating leverage in the Fund’s portfolio through the Fund’s indirect long exposure to the issuer or securities on which the swap is written. When a Fund sells protection, it may do so either to earn additional income or to create such a “synthetic” long position.
Whenever a Fund enters into a swap agreement, it takes on counterparty risk — the risk that its counterparty will be unable or unwilling to meet its obligations under the swap agreement. The Fund also takes the risk that the market will move against its position in the swap agreement. In the case of an interest rate swap, the value of the swap may increase or decrease depending on changes in interest rates. In the case of a credit default swap, the swap will become more or less valuable depending on the credit of the issuer of the underlying security, and, if a credit event occurs under a swap where the Fund is the seller of credit protection, the Fund could be required to purchase the security at par value, resulting in a significant loss to the Fund. When the Fund enters into any type of swap for hedging purposes, it is likely that the Fund will have an asset or liability that will offset any loss (or gain) on the swap, at least in part. Swap agreements may be non-transferable or otherwise highly illiquid, and a Fund may not be able to terminate or transfer a swap agreement at any particular time or at an acceptable price.
Swaptions. A Fund may also enter into options on swap agreements (“swaptions”). A swaption is a contract that gives a counterparty the right (but not the obligation) to enter into a new swap agreement or to shorten, extend, cancel, or otherwise modify an existing swap agreement, at some designated future time on specified terms. A Fund may write (sell) and purchase put and call swaptions. Depending on the terms of the particular option agreement, a Fund will generally incur a greater degree of risk when it writes a swaption than it will incur when it purchases a swaption. When a Fund purchases a swaption, it risks losing only the amount of the premium it has paid should it decide to let the option expire unexercised. However, when a Fund writes a swaption, upon exercise of the option the Fund will become obligated according to the terms of the underlying agreement. A Fund
81
Notes to Financial Statements (Continued)
may enter into swaptions for the same purposes as swaps. For information regarding the accounting treatment of options, see “Options, Rights, and Warrants” below.
Centrally Cleared Swaps. Certain clearinghouses currently offer clearing for limited types of derivatives transactions, principally certain interest rate swaps, certain index swaps, and credit derivatives. In a cleared derivative transaction, a Fund typically enters into the transaction with a financial institution counterparty, and performance of the transaction is effectively guaranteed by a central clearinghouse, thereby reducing or eliminating the Fund’s exposure to the credit risk of its original counterparty. The Fund will be required to post amounts (“initial margin”) with the clearinghouse or at the instruction of the clearinghouse; the initial margin required by a clearinghouse may be greater than the initial margin the Fund would be required to post in an uncleared transaction. If cash is deposited as the initial margin, it is shown as collateral on a Fund’s Statement of Assets and Liabilities. Swap agreements are marked-to-market daily and subsequent payments (“variation margin”) are made or received by a Fund depending on whether unrealized gains or losses are incurred. These amounts are reflected as receivables or payables on a Fund’s Statement of Assets and Liabilities (“Variation margin on open derivative instruments”) and as a component of net change in unrealized appreciation/depreciation on a Fund’s Statement of Operations. Only a limited number of transaction types are currently eligible for clearing.
During the term of a swap transaction, changes in the value of the swap are recognized as unrealized gains or losses by marking to market to reflect the market value of the swap. When the swap is terminated, a Fund will record a realized gain or loss equal to the difference, if any, between the proceeds from (or cost of) the closing transaction and a Fund’s basis in the agreement. Upfront swap premium payments paid or received by a Fund, if any, are recorded within the value of the open swap agreement on the Fund’s Statement of Assets and Liabilities and represent payments paid or received upon entering into the swap agreement to compensate for differences between stated terms of the swap agreement and prevailing market conditions (credit spreads, currency exchange rates, and other relevant factors). These upfront payments are recorded as realized gain or loss on the Fund’s Statement of Operations upon termination or maturity of the swap agreement.
During the term of a swap transaction, the periodic net payments can be made for a set period of time or may be triggered by a predetermined credit event. The net periodic payments may be based on a fixed or variable interest rate, the change in market value of a specified security, basket of securities or index, or the return generated by a security. These periodic payments received or made by the Funds are recorded in the accompanying Statements of Operations as realized gains and losses, respectively.
The Fund(s) listed in the following table had open swap transactions at December 31, 2014. A Fund’s current exposure to a counterparty is the fair value of the transaction.
| | | | | | | | | | | | | | | | | | | | | | |
Currency | | Notional
Amount | | | Expiration
Date | | Receive
(Pay) Fixed
Rate | | Deliverable on Default | | Unrealized
Appreciation
(Depreciation) | | | Premium
(Received)
Paid | | | Value | |
Inflation-Protected and Income Fund* | | | | | | | | | | | | | | | | |
Credit Default Swaps - Buy Protection | | | | | | | | | | | | | | | | |
Centrally Cleared Swaps | | | | | | | | | | | | | | | | | | | |
| EUR | | | 4,950,000 | | | 12/20/19 | | (1.000)% | | ITRAXX Europe Series 22† | | $ | (19,492 | ) | | $ | (75,608 | ) | | $ | (95,100 | ) |
| USD | | | 4,200,000 | | | 12/20/19 | | (1.000)% | | CDX.NA.IG.23† | | | (5,035 | ) | | | (62,118 | ) | | | (67,153 | ) |
| | | | | | | | | | | | | | | | | | | | | | |
| | | | | | | | | | | | | (24,527 | ) | | | (137,726 | ) | | | (162,253 | ) |
| | | | | | | | | | | | | | | | | | | | | | |
| | | | | | | | | | | | | | | | | | | | | | |
Currency | | Notional
Amount | | | Expiration
Date | | Payments
Made by
Fund | | Payments Received by Fund | | Unrealized
Appreciation
(Depreciation) | | | Premium
Received
(Paid) | | | Value | |
Interest Rate Swaps | | | | | | | | | | | | | | | | |
Centrally Cleared Swaps | | | | | | | | | | | | | | | | | | | |
| USD | | | 4,645,000 | | | 4/29/24 | | Fixed 2.765% | | 3-Month USD-LIBOR-BBA | | $ | (208,744 | ) | | $ | - | | | $ | (208,744 | ) |
| | | | | | | | | | | | | | | | | | | | | | |
82
Notes to Financial Statements (Continued)
| | | | | | | | | | | | | | | | | | | | | | |
Currency | | Notional
Amount | | | Expiration
Date | | Receive
(Pay) Fixed
Rate | | Deliverable on Default | | Unrealized
Appreciation
(Depreciation) | | | Premium
(Received)
Paid | | | Value | |
Short-Duration Bond Fund** | | | | | | | | | | | | | | |
Credit Default Swaps - Buy Protection | | | | | | | | | | | | | | |
Centrally Cleared Swaps | | | | | | | | | | | | | | | | |
| EUR | | | 3,100,000 | | | 12/20/19 | | (1.000)% | | ITRAXX Europe Series 22† | | $ | (12,207 | ) | | $ | (47,350 | ) | | $ | (59,557 | ) |
| USD | | | 3,950,000 | | | 12/20/19 | | (1.000)% | | CDX.NA.IG.23† | | | (4,735 | ) | | | (58,422 | ) | | | (63,157 | ) |
| | | | | | | | | | | | | | | | | | | | | | |
| | | | | | | | | | | | | (16,942 | ) | | | (105,772 | ) | | | (122,714 | ) |
| | | | | | | | | | | | | | | | | | | | | | |
| | | | | | | | | | | | | | | | | | | | | | |
Currency | | Notional
Amount | | | Expiration
Date | | Payments
Made by
Fund | | Payments Received by Fund | | Unrealized
Appreciation
(Depreciation) | | | Premium
Received
(Paid) | | | Value | |
Interest Rate Swaps | | | | | | | | | | | | | | | | |
Centrally Cleared Swaps | | | | | | | | | | | | | | | | |
| USD | | | 5,400,000 | | | 4/29/24 | | Fixed 2.765% | | 3-Month USD-LIBOR-BBA | | $ | (242,673 | ) | | $ | - | | | $ | (242,673 | ) |
| | | | | | | | | | | | | | | | | | | | | | |
| | | | | | | | | | | | | | | | | | | | | | |
| * | Collateral for swap agreements held by Goldman Sachs & Co. amounted to $145,150 in securities at December 31, 2014; collateral for swap agreements received by Credit Suisse International amounted to $97,476 in securities at December 31, 2014. |
| ** | Collateral for swap agreements held by Goldman Sachs & Co. amounted to $174,219 in securities at December 31, 2014; collateral for swap agreements received by Credit Suisse International amounted to $76,197 in securities at December 31, 2014. |
| † | Payment is based on a percentage of the index. Reference entities are a number of individual issuers comprising the index. |
Options, Rights, and Warrants
A Fund may purchase call options on securities or an index of securities to enhance investment performance or to protect against changes in market prices. A Fund that invests in debt securities may also purchase call options to adjust the interest rate sensitivity of its portfolio or the credit exposure of the portfolio.
Call Options. A call option gives the holder the right to purchase, and obligates the writer to sell, a security at the strike price at any time before the expiration date.
Purchasing call options. A Fund may purchase call options to hedge against an increase in the price of securities that the Fund wants ultimately to buy. A Fund may also purchase a call option as a long directional investment hoping to profit from an anticipated increase in the value of the underlying security. In order for a call option to be profitable, the market price of the underlying security must rise sufficiently above the exercise price to cover the premium and transaction costs. These costs will reduce any profit the Fund might have realized had it bought the underlying security at the time it purchased the call option.
When a Fund purchases an option, it runs the risk that it will lose its entire investment in the option in a relatively short period of time, unless the Fund exercises the option or enters into a closing sale transaction before the option’s expiration. If the price of the underlying security does not rise (in the case of a call) to an extent sufficient to cover the option premium and transaction costs, the Fund will lose part or all of its investment in the option. This contrasts with an investment by a Fund in the underlying security, since the Fund will not realize a loss if the security’s price does not change. Premiums paid for purchasing options that expire are treated as realized losses.
OTC Options. OTC options purchased or sold by a Fund are not traded on securities or options exchanges or backed by clearinghouses. Rather, they are entered into directly between a Fund and the counterparty to the option. In the case of an OTC option purchased by the Fund, the value of the option to the Fund will depend on the willingness and ability of the option writer to perform its obligations to the Fund. In addition, OTC options may not be transferable and there may be little or no secondary market for them, so they may be considered illiquid. It may not be possible to enter into closing transactions with respect to OTC options or otherwise to terminate such options, and as a result a Fund may be required to remain obligated on an unfavorable OTC option until its expiration. OTC options are valued using prices supplied by a primary pricing source, selected pursuant to procedures approved by the Trustees.
83
Notes to Financial Statements (Continued)
Rights and Warrants. A Fund may purchase or hold warrants or rights in order to gain exposure to the underlying security without owning the security, including, for example, cases where the Fund hopes to lock in the price today of a security it may wish to purchase in the future. Warrants generally give the holder the right, but not the obligation, to buy a security at a stated price. In order for a warrant to be profitable, the market price of the underlying security must rise sufficiently above the exercise price to cover any premium and transaction costs. Rights may similarly confer on the holder the right to purchase or acquire securities, including through participation in a so-called rights offering. Bonds may be issued with warrants or other rights attached to purchase or acquire equity or other debt securities, typically of the bond issuer. The market prices of bonds with warrants or rights attached to purchase equity securities or bonds may, to some degree, reflect changes in the values of the underlying securities.
When a Fund purchases or otherwise acquires warrants or other rights, it runs the risk that it will lose its entire investment in the warrants or rights, unless the Fund exercises the warrant or right, acquires the underlying securities, or enters into a closing transaction before expiration. If the price of the underlying security does not rise to an extent sufficient to cover any premium and transaction costs, the Fund will lose part or all of its investment. Any premiums or purchase price paid for warrants or other rights that expire are treated as realized losses. Warrants and similar rights differ from options in that they are typically written by the issuer of the security underlying the warrant or right. Although some warrants and rights may be non-transferable, others may be traded over-the-counter or on an exchange.
Inflation-Indexed Bonds
The Funds may invest in inflation-indexed bonds, which are fixed income securities whose principal value or coupon is periodically adjusted according to the rate of inflation, as measured by the Consumer Price Index for All Urban Consumers (“CPI-U”) (for U.S. Treasury inflation-indexed bonds) or, generally, by a comparable inflation index calculated by the foreign government issuing the inflation-indexed bonds.
If the periodic adjustment rate measuring inflation falls, the principal value of inflation-indexed bonds will be adjusted downward, and consequently the interest payable on these securities (calculated with respect to a smaller principal amount) will be reduced. Repayment of the original bond principal upon maturity (as adjusted for inflation) is guaranteed in the case of U.S. Treasury inflation-indexed bonds, even during a period of deflation. However, the current market value of the bonds is not guaranteed, and will fluctuate. The Funds may also invest in other inflation related bonds which may or may not provide a similar guarantee. If a guarantee of principal is not provided, the adjusted principal value of the bond repaid at maturity may be less than the original principal. Any adjustments to the principal amount of an inflation-indexed bond due to inflation will be reflected as increases or decreases to interest income. Such adjustments may have a significant impact on the Fund’s distributions.
The value of inflation-indexed bonds is generally based on changes in real interest rates, which in turn are tied to the relationship between nominal interest rates and the rate of inflation. Therefore, if nominal interest rates increased at a faster rate than inflation, real interest rates might rise, leading to a decrease in value of inflation-indexed bonds. While the values of these securities are expected to be protected from long-term inflationary trends, short-term increases in inflation may lead to a decline in value. There can be no assurance that the CPI-U or any foreign inflation index will accurately measure the real rate of inflation, or that the rate of inflation in a foreign country will correlate to the rate of inflation in the United States. Additionally, if interest rates rise due to reasons other than inflation, investors in these securities may not be protected to the extent that the increase is not reflected in the bond’s inflation measure.
Bank Loans
Certain of the Funds may invest in bank loans including, for example, corporate loans, loan participations, direct debt, bank debt, and bridge debt. A Fund may invest in a loan by lending money to a borrower directly as part of a syndicate of lenders. In a syndicated loan, the agent that originated and structured the loan typically administers and enforces the loan on behalf of the syndicate. Failure by the agent to fulfill its obligations may delay or adversely affect receipt of payment by a Fund. A Fund may also invest in loans through novations, assignments, and participation interests. In a novation, a Fund typically assumes all of the rights of a lending institution in a loan, including the right to receive payments of principal and interest and other amounts directly from the borrower and to enforce its rights as a lender directly against the borrower. When a Fund takes an assignment of a loan, the Fund acquires some or all of the interest of another lender (or assignee) in the loan. In such cases, the Fund may be required
84
Notes to Financial Statements (Continued)
generally to rely upon the assignor to demand payment and enforce rights under the loan. If a Fund acquires a participation in the loan, the Fund purchases an indirect interest in a loan held by a third party and the Fund typically will have a contractual relationship only with the third party loan investor, not with the borrower. As a result, a Fund may have the right to receive payments of principal, interest, and any fees to which it is entitled only from the loan investor selling the participation and only upon receipt by such loan investor of such payments from the borrower. In such cases, a Fund assumes the credit risk of both the borrower and the loan investor selling the participation, and the Fund may be unable to realize some or all of the value of its interest in the loan in the event of the insolvency of the third party.
Changes in the financial condition of the borrower or economic conditions or other circumstances may reduce the capacity of the borrower to make principal and interest payments on such instruments and may lead to defaults. The value of any collateral securing a bank loan may decline after the Fund invests, and there is a risk that the value of the collateral may not be sufficient to cover the amount owed to the Fund.
At December 31, 2014, the Funds had no unfunded loan commitments.
Repurchase Agreements
Each Fund may enter into repurchase agreements with certain banks and broker-dealers whereby a Fund acquires a security for cash and obtains a simultaneous commitment from the seller to repurchase the security at an agreed upon price and date. A Fund, through its custodian, takes possession of the securities collateralizing the repurchase agreement in a segregated account. Repurchase agreements must be fully collateralized at all times, but involve some risk to a Fund if the other party should default on its obligation and the Fund is delayed or prevented from recovering the collateral, or if the Fund is required to return collateral to a borrower at a time when it may realize a loss on the investment of that collateral.
Reverse Repurchase Agreements
Each Fund may enter into reverse repurchase agreements with banks and broker-dealers to enhance return. Reverse repurchase agreements involve sales by a Fund of portfolio securities concurrently with an agreement by the Fund to repurchase the same securities at a later date at a fixed price (typically equal to the original sale price plus interest). During the reverse repurchase agreement period, the Fund continues to receive principal and interest payments on the securities and also has the opportunity to earn a return on the purchase price received by it from the counterparty.
Certain agreements have no stated maturity and can be terminated by either party at any time. Interest on the value of the reverse repurchase agreements issued and outstanding is based upon competitive market rates determined at the time of issuance. A Fund may utilize reverse repurchase agreements when it is anticipated that the interest income to be earned from the investment of the proceeds of the transaction is greater than the interest expense of the transaction. Reverse repurchase agreements generally create investment leverage and involve the risk that the market value of the security that a Fund is obligated to repurchase under the agreement may decline below the repurchase price. For financial reporting purposes, cash received in exchange for securities delivered plus accrued interest payments to be made to the counterparty is recorded as a liability in the Statements of Assets and Liabilities at face value including accrued interest. Due to the short term nature of reverse repurchase agreements, face value approximates fair value. Interest payments made by a Fund to the counterparties are recorded as a component of interest expense in the Statements of Operations. In periods of increased demand for a security, a Fund may receive a fee for use of the security by the counterparty, which may result in interest income to the Fund.
Reverse repurchase transactions are entered into by a Fund under a Master Repurchase Agreement (“MRA”), which permits the Fund, under certain circumstances, including an event of default (such as bankruptcy or insolvency), to offset payables and/or receivables under the MRA with collateral held and/or posted to the counterparty and creates one single net payment due to or from the Fund. With reverse repurchase transactions, typically a Fund and the counterparties are permitted to sell, re-pledge, or use the collateral associated with the transaction. However, bankruptcy or insolvency laws of a particular jurisdiction may impose restrictions on or prohibitions against such a right of offset in the event of an MRA counterparty’s bankruptcy or insolvency. Pursuant to the terms of the MRA, a Fund receives or posts securities as collateral with a market value in excess of the repurchase price to be paid or received by the Fund upon the maturity of the transaction. Upon a bankruptcy or insolvency of the MRA
85
Notes to Financial Statements (Continued)
counterparty, the Fund is considered an unsecured creditor with respect to excess collateral and, as such, the return of excess collateral may be delayed.
In the event the buyer of securities under an MRA files for bankruptcy or becomes insolvent, a Fund’s use of the proceeds from the sale of its securities may be restricted or forfeited, and the counterparty may fail to return/resell the securities in question to the Fund.
The following table is a summary of the Fund(s) open reverse repurchase transactions which are subject to an MRA on a net basis at December 31, 2014:
| | | | | | | | | | | | | | | | |
Counterparty | | Reverse
Repurchase
Agreements | | | Fair Value of
Non-Cash Collateral* | | | Cash Collateral
Pledged | | | Net
Amount | |
| Inflation-Protected and Income Fund | | | | | | | | | | | | | | | | |
Banque Paribas | | $ | (117,685,378 | ) | | $ | 75,732,931 | | | $ | 1,435,000 | | | $ | (40,517,447 | ) |
Barclays Bank PLC | | | (14,293,625 | ) | | | 14,293,625 | | | | - | | | | - | |
Daiwa Securities | | | (38,422,075 | ) | | | 16,198,380 | | | | - | | | | (22,223,695 | ) |
Goldman Sachs & Co. | | | (79,202,361 | ) | | | 79,057,331 | | | | 145,030 | | | | - | |
HSBC Finance Corp. | | | (127,849,100 | ) | | | 73,384,445 | | | | 1,450,000 | | | | (53,014,655 | ) |
Morgan Stanley | | | (21,794,579 | ) | | | 21,516,579 | | | | 278,000 | | | | - | |
| | | | | | | | | | | | | | | | |
| | $ | (399,247,118 | ) | | $ | 280,183,291 | | | $ | 3,308,030 | | | $ | (115,755,797 | ) |
| | | | | | | | | | | | | | | | |
| * | Collateral with a value of $297,656,797 has been pledged in connection with open reverse repurchase transactions. Collateral for reverse repurchase transactions received from Daiwa Capital Markets America, Inc. amounted to $137,216 in securities at December 31, 2014. Excess collateral pledged to the individual counterparty is not shown for financial reporting purposes. |
The Fund(s) listed in the following table had open reverse repurchase transactions at December 31, 2014:
| | | | |
Description | | Value | |
| Inflation-Protected and Income Fund | | | | |
Agreement with Banque Paribas, dated 10/03/14, 0.180%, to be repurchased on demand until 1/07/15 at value plus accrued interest. | | $ | 39,187,378 | |
Agreement with Banque Paribas, dated 10/08/14, 0.170%, to be repurchased on demand until 1/08/15 at value plus accrued interest. | | | 71,425,000 | |
Agreement with Banque Paribas, dated 11/04/14, 0.200%, to be repurchased on demand until 2/03/15 at value plus accrued interest. | | | 7,073,000 | |
Agreement with Barclays Bank PLC, dated 10/07/14, 0.240%, to be repurchased on demand until 1/07/15 at value plus accrued interest. | | | 14,293,625 | |
Agreement with Daiwa Securities, dated 10/02/14, 0.160%, to be repurchased on demand until 1/06/15 at value plus accrued interest. | | | 28,910,200 | |
Agreement with Daiwa Securities, dated 11/25/14, 0.230%, to be repurchased on demand until 1/06/15 at value plus accrued interest. | | | 9,511,875 | |
Agreement with Goldman Sachs & Co., dated 10/15/14, 0.190%, to be repurchased on demand until 1/13/15 at value plus accrued interest. | | | 16,419,792 | |
Agreement with Goldman Sachs & Co., dated 11/20/14, 0.210%, to be repurchased on demand until 2/11/15 at value plus accrued interest. | | | 62,782,569 | |
Agreement with HSBC Finance Corp., dated 10/07/14, 0.160%, to be repurchased on demand until 1/06/15 at value plus accrued interest. | | | 67,669,725 | |
Agreement with HSBC Finance Corp., dated 11/05/14, 0.170%, to be repurchased on demand until 1/06/15 at value plus accrued interest. | | | 14,595,000 | |
Agreement with HSBC Finance Corp., dated 11/05/14, 0.180%, to be repurchased on demand until 2/04/15 at value plus accrued interest. | | | 35,035,000 | |
86
Notes to Financial Statements (Continued)
| | | | |
Description | | Value | |
| Inflation-Protected and Income Fund (Continued) | | | | |
Agreement with HSBC Finance Corp., dated 11/19/14, 0.200%, to be repurchased on demand until 2/04/15 at value plus accrued interest. | | $ | 10,549,375 | |
Agreement with Morgan Stanley, dated 10/02/14, 0.190%, to be repurchased on demand until 1/06/15 at value plus accrued interest. | | | 20,638,588 | |
Agreement with Morgan Stanley, dated 11/04/14, 0.220%, to be repurchased on demand until 2/03/15 at value plus accrued interest. | | | 1,155,991 | |
| | | | |
| | $ | 399,247,118 | |
| | | | |
Average balance outstanding | | $ | 347,831,864 | |
Maximum balance outstanding | | $ | 399,247,118 | |
Average interest rate | | | 0.15 | % |
Weighted average maturity | | | 55 days | |
Average balance outstanding was calculated based on daily balances outstanding during the period that the Fund had entered into reverse repurchase transactions.
When-Issued, Delayed-Delivery, Forward Commitment, and To-Be-Announced Transactions
A Fund may enter into when-issued, delayed-delivery, forward commitment, or to-be-announced (“TBA”) transactions (collectively, the “Forward Transactions”) in order to lock in the purchase price of the underlying security, or in order to adjust the interest rate exposure of the Fund’s existing portfolio. In Forward Transactions, a Fund commits to purchase or sell particular securities, with payment and delivery to take place at a future date. In the case of TBA purchase commitments, the unit price and the estimated principal amount are established when the Fund enters into a commitment, with the actual principal amount being within a specified range of the estimate. Although a Fund does not typically pay for the securities in these types of transactions until they are delivered, it immediately assumes the risks of ownership, including the risk of price fluctuation. As a result, each of these types of transactions may create investment leverage in the Fund’s portfolio and increase the volatility of the Fund. If a Fund’s counterparty fails to deliver a security purchased in a Forward Transaction, there may be a loss, and the Fund may have missed an opportunity to make an alternative investment.
These securities are valued on the basis of valuations furnished by a pricing service, selected pursuant to procedures approved by the Trustees, which determines valuations taking into account appropriate factors such as institutional-size trading in similar groups of securities, yield, quality, coupon rate, maturity, type of issue, trading characteristics, and other market data. Securities for which no market quotation is available are valued at fair value in accordance with procedures approved by the Trustees. The Funds record on a daily basis the unrealized appreciation (depreciation) based upon changes in the values of these securities. When a Forward Transaction is closed, the Funds record a realized gain or loss equal to the difference between the value of the transaction at the time it was opened and the value of the transaction at the time it was closed.
Securities Lending
Each Fund may lend its securities; however, lending cannot exceed 33% of the total assets of the Fund taken at current value. The Funds’ securities lending activities are governed by a Securities Lending Agency Agreement (“Lending Agreement”) between each Fund and the lending agent (“agent”). The Lending Agreement authorizes the agent to lend qualifying U.S. and foreign securities held by a Fund to approved borrowers (each a “Borrower”).
Each Fund expects that in connection with any securities on loan, the loan will be secured continuously by collateral consisting of cash or securities adjusted daily to have market value at least equal to the current market value of the securities loaned. The market value of the loaned securities is determined at the close of business of a Fund and any additional collateral is delivered to the Fund the next business day. As with other extensions of credit, the Funds may bear the risk of delay in recovery or even loss of rights in the collateral should the Borrower of the securities fail financially. The Funds receive compensation for lending their securities in the form of a securities loan fee paid by the Borrower, as well as a share of the income earned on investment of the cash collateral received for the loan of securities. At December 31, 2014, the Funds’ collateral was equal to or greater than 100% of the market value of securities on loan.
87
Notes to Financial Statements (Continued)
The Funds employ the agent to implement their securities lending program and the agent receives a fee from the Funds for its services. In addition, the Funds may be required to pay a rebate to the Borrower. Accordingly, a Fund’s compensation for lending its securities is reduced by any such fees or rebate paid to the securities lending agent or Borrower, respectively. For the year ended December 31, 2014, the Fund(s) earned securities lending net income as follows:
| | | | | | | | | | | | |
| | | Securities
Lending Gross
Income | | | Securities
Lending Fees
and Expenses | | | Securities
Lending Net
Income | |
Small Cap Equity Fund | | $ | 101,483 | | | $ | 20,300 | | | $ | 81,183 | |
Strategic Emerging Markets Fund | | | 44,687 | | | | 10,992 | | | | 33,695 | |
Accounting for Investment Transactions
Investment transactions are accounted for on the trade date. Realized gains and losses on sales of investments and unrealized appreciation and depreciation of investments are computed by the specific identification cost method. Proceeds received from litigation, if any, are included in realized gains on investment transactions for any investments that are no longer held in the portfolio and as a reduction in cost for investments that continue to be held in the portfolio. Interest income, adjusted for amortization of discounts and premiums on debt securities, is earned from the settlement date and is recorded on the accrual basis. Dividend income is recorded on the ex-dividend date. Withholding taxes on foreign interest, dividends, and capital gains have been provided for in accordance with the applicable country’s tax rules and rates. Foreign dividend income is recorded on the ex-dividend date or as soon as practicable after the Fund determines the existence of a dividend declaration after exercising reasonable due diligence. Distributions received on securities that represent a return of capital or capital gain are recorded as a reduction of cost of investments and/or as a realized gain. The Funds estimate the components of distributions received that may be considered return of capital distributions or capital gain distributions.
Foreign Currency Translation
The books and records of the Funds are maintained in U.S. dollars. The market values of foreign currencies, foreign securities, and other assets and liabilities denominated in foreign currencies are translated into U.S. dollars at the mean of the buying and selling rates of such currencies against the U.S. dollar at the end of each business day. Purchases and sales of foreign securities and income and expense items are translated at the rates of exchange prevailing on the respective dates of such transactions. The Funds do not isolate that portion of the results of operations arising from changes in the exchange rates from that portion arising from changes in the market prices of securities. Net realized foreign currency gains and losses resulting from changes in exchange rates include foreign currency gains and losses between trade date and settlement date on investment securities transactions, foreign currency transactions, and the difference between the amounts of dividends or interest recorded on the books of the Funds and the amount actually received.
Allocation of Operating Activity
In maintaining the records for the Funds, the income and expense accounts are allocated daily to each class of shares. Investment income and loss, and unrealized and realized gains or losses are prorated among the classes of shares based on the relative net assets of each. Expenses are allocated to each class of shares depending on the nature of the expenditures. Administration and service fees, if any, which are directly attributable to a class of shares, are charged to that class’s operations. Expenses of a Fund not directly attributable to the operations of any specific class of shares of the Fund are prorated among the classes to which the expense relates based on relative net assets.
Foreign Securities
The Strategic Emerging Markets Fund invests substantially all of its assets in foreign securities. The other Funds may also invest in foreign securities. Foreign securities, including American Depositary Receipts, are subject to additional risks compared to securities of U.S. issuers, including international trade, currency, political, regulatory, and diplomatic risks. In addition,
88
Notes to Financial Statements (Continued)
fluctuations in currency exchange rates may adversely affect the values of foreign securities and the price of a Fund’s shares. Emerging markets securities are subject to greater risks than securities issued in developed foreign markets, including less liquidity, greater price volatility, higher relative rates of inflation, greater political, economic, and social instability, greater custody and operational risks, and greater volatility in currency exchange rates.
Federal Income Tax
It is each Fund’s intent to continue to comply with the provisions of subchapter M of the Internal Revenue Code of 1986, as amended (the “Code”), applicable to a regulated investment company. Under such provisions, the Funds would not be subject to federal income taxes on their ordinary income and net realized capital gains to the extent they are distributed or deemed to have been distributed to their shareholders. Therefore, the Funds have not made any provision for federal income tax.
Dividends and Distributions to Shareholders
Dividends from net investment income are declared and paid quarterly for the High Yield Fund, Inflation-Protected and Income Fund, and Short-Duration Bond Fund and annually for the Small Cap Equity Fund, and Strategic Emerging Markets Fund and at other times as may be required to satisfy tax or regulatory requirements. Distributions of any net realized capital gains of each Fund are declared and paid annually and at other times as may be required to satisfy tax or regulatory requirements.
Distributions to shareholders are recorded on the ex-dividend date. Income and capital gain distributions are determined in accordance with income tax regulations, which may differ from generally accepted accounting principles. As a result, net investment income and net realized capital gains on investment transactions for a reporting period may differ significantly from distributions during such period.
| 3. | | Advisory Fees and Other Transactions |
Investment Advisory Fees and Investment Subadvisers
MML Investment Advisers, LLC (“MML Advisers”), a wholly-owned subsidiary of MassMutual, serves as investment adviser to each Fund. Under the investment advisory agreements between MML Advisers and the Trust on behalf of each Fund, MML Advisers is responsible for providing investment management services for each Fund. In return for these services, MML Advisers receives advisory fees, based upon each Fund’s average daily net assets, at the following annual rates:
| | |
High Yield Fund | | 0.60% on the first $300 million; and |
| | 0.575% on any excess over $300 million |
Inflation-Protected and Income Fund | | 0.60% on the first $100 million; |
| | 0.55% on the next $200 million; |
| | 0.50% on the next $200 million; and |
| | 0.45% on any excess over $500 million |
Short-Duration Bond Fund | | 0.40% on the first $300 million; and |
| | 0.35% on any excess over $300 million |
Small Cap Equity Fund | | 0.65% on the first $100 million; |
| | 0.60% on the next $100 million; |
| | 0.55% on the next $300 million; and |
| | 0.50% on any excess over $500 million |
Strategic Emerging Markets Fund | | 1.05% on the first $500 million; and |
| | 1.00% on any excess over $500 million |
89
Notes to Financial Statements (Continued)
MassMutual served as the Funds’ investment adviser, at the same annual rates as noted above, pursuant to the investment advisory agreements through March 31, 2014.
MML Advisers has entered into investment subadvisory agreements with Babson Capital Management LLC (“Babson Capital”), a wholly-owned subsidiary of MM Asset Management Holding LLC, itself a wholly-owned subsidiary of MassMutual Holding LLC, a controlled subsidiary of MassMutual, on behalf of certain Funds. These agreements provide that Babson Capital manage the investment and reinvestment of assets of these Funds. Babson Capital receives a subadvisory fee from MML Advisers based upon each Fund’s average daily net assets, at the following annual rates:
| | | | |
High Yield Fund | | 0.20% | | |
Inflation-Protected and Income Fund | | 0.08% | | |
Short-Duration Bond Fund | | 0.08% | | |
In addition, Cornerstone Real Estate Advisers LLC (“Cornerstone”) serves as sub-subadviser for the High Yield Fund, Inflation-Protected and Income Fund, and Short-Duration Bond Fund and is primarily responsible for managing each Fund’s commercial mortgage-backed securities. Cornerstone is a wholly-owned subsidiary of Babson Capital. The appointment of Cornerstone as a sub-subadviser to each Fund does not relieve Babson Capital of any obligation or liability to any of the Funds that it would otherwise have pursuant to investment subadvisory agreements between MML Advisers and Babson Capital with respect to each Fund, and any and all acts and omissions of Cornerstone in respect to any Fund shall be considered the acts and omissions of Babson Capital.
MML Advisers has entered into investment subadvisory agreements with OppenheimerFunds, Inc. (“OFI”), a wholly-owned subsidiary of Oppenheimer Acquisition Corp., itself an indirect majority-owned subsidiary of MassMutual Holding LLC, on behalf of the Small Cap Equity Fund and the Strategic Emerging Markets Fund. These agreements provide that OFI manage the investment and reinvestment of the assets of the Funds. OFI receives a subadvisory fee from MML Advisers, based upon each Fund’s average daily net assets, at the following annual rates:
| | | | |
Small Cap Equity Fund | | 0.25% | | |
Strategic Emerging Markets Fund | | 0.70% | | |
The Funds’ subadvisory fees are paid by MML Advisers out of the advisory fees previously disclosed above.
Administration Fees
For the High Yield Fund, Short-Duration Bond Fund, and Strategic Emerging Markets Fund, under separate administrative and shareholder services agreements between the Funds and MML Advisers, MML Advisers is obligated to provide all necessary administrative and shareholder services and bear some of the class specific administrative expenses. In return for these services, MML Advisers receives an administrative services fee, based upon the average daily net assets of the applicable class of shares of the Funds, at the following annual rates:
| | | | | | | | |
| | | Class II | | | Service Class I | |
High Yield Fund | | | 0.15% | | | | 0.15% | |
Short-Duration Bond Fund | | | 0.10% | | | | 0.10% | |
Strategic Emerging Markets Fund | | | 0.25% | | | | 0.25% | |
MassMutual served as the Funds’ administrator, at the same annual rates as noted above, pursuant to the administrative and shareholder services agreements through March 31, 2014.
90
Notes to Financial Statements (Continued)
Distribution and Service Fees
MML Distributors, LLC (the “Distributor”) acts as distributor to the Funds. Pursuant to a Distribution and Services Plan adopted by the Funds pursuant to Rule 12b-1 under the 1940 Act, Service Class shares and Service Class I shares of the Funds pay an annual fee of 0.25% of the average daily net asset value of Service Class shares and Service Class I shares. This fee, or a portion thereof, is paid to: (i) the Distributor for services provided and expenses incurred by it in connection with the distribution of Service Class shares or Service Class I shares, as applicable, of each Fund; and/or (ii) MassMutual for services provided and expenses incurred by it for purposes of maintaining or providing personal services to Service Class and Service Class I shareholders. The Distributor is a wholly-owned subsidiary of MassMutual.
Expense Caps and Waivers
MML Advisers agreed to cap the fees and expenses of the Funds noted below (other than extraordinary litigation and legal expenses, Acquired Fund fees and expenses#, interest expense, short sale dividend and loan expense, or other non-recurring or unusual expenses such as organizational expenses and shareholder meeting expenses) based upon the average daily net assets of the applicable class of shares of the Fund, as follows:
| | | | | | | | |
| | | Class II | | | Service Class I | |
High Yield Fund* | | | 0.69% | | | | 0.94% | |
Short-Duration Bond Fund* | | | 0.55% | | | | 0.80% | |
Strategic Emerging Markets Fund* | | | 1.40% | | | | 1.65% | |
| # | Acquired Fund fees and expenses are expenses borne indirectly by a Fund through investments in other pooled investment vehicles. |
| * | Expense caps in effect through April 30, 2015. |
MML Advisers has agreed to waive, through April 30, 2015, 0.10% of the advisory fee for the High Yield Fund.
Prior to April 1, 2014, expense caps were with MassMutual.
Expense caps and waiver amounts are reflected as a reduction of expenses on the Statements of Operations.
Deferred Compensation
Trustees of the Funds who are not officers or employees of MassMutual may elect to defer receipt of their annual fees in accordance with terms of a Non-Qualified Deferred Compensation Plan. Amounts deferred shall accrue interest or earnings and shall be recorded on the Funds’ books as other liabilities. Deferred compensation is included within Trustees’ fees and expenses in the Statements of Assets and Liabilities.
Other
Certain officers and trustees of the Funds are also employees of MassMutual. The compensation of each trustee who is not an employee of MassMutual is borne by the Funds.
91
Notes to Financial Statements (Continued)
| 4. | | Purchases and Sales of Investments |
Cost of purchases and proceeds from sales of investment securities (excluding short-term investments) for the year ended December 31, 2014, were as follows:
| | | | | | | | | | | | | | | | |
| | | Purchases | | | Sales | |
| | | Long-Term U.S.
Government
Securities | | | Other
Long-Term
Securities | | | Long-Term U.S.
Government
Securities | | | Other
Long-Term
Securities | |
High Yield Fund | | $ | - | | | $ | 118,263,453 | | | $ | - | | | $ | 120,082,745 | |
Inflation-Protected and Income Fund | | | 340,427,295 | | | | 148,377,311 | | | | 265,525,194 | | | | 111,333,816 | |
Short-Duration Bond Fund | | | 124,074,596 | | | | 57,019,510 | | | | 81,068,714 | | | | 51,416,641 | |
Small Cap Equity Fund | | | - | | | | 71,289,556 | | | | - | | | | 75,842,616 | |
Strategic Emerging Markets Fund | | | - | | | | 42,250,161 | | | | - | | | | 42,238,512 | |
| 5. | | Capital Share Transactions |
Changes in shares outstanding for each Fund were as follows:
| | | | | | | | | | | | | | | | |
| | | Year Ended December 31, 2014 | | | Year Ended December 31, 2013 | |
| | | | |
| | | Shares | | | Amount | | | Shares | | | Amount | |
High Yield Fund Class II | | | | | | | | | | | | | | | | |
| | | | | | | | | | | | | | | | |
Sold | | | 2,056,883 | | | $ | 22,487,090 | | | | 3,443,840 | | | $ | 37,694,910 | |
Issued as reinvestment of dividends | | | 1,325,082 | | | | 14,052,559 | | | | 970,963 | | | | 10,526,883 | |
Redeemed | | | (3,445,222 | ) | | | (37,394,129 | ) | | | (3,879,285 | ) | | | (42,818,303 | ) |
| | | | | | | | | | | | | | | | |
Net increase (decrease) | | | (63,257 | ) | | $ | (854,480 | ) | | | 535,518 | | | $ | 5,403,490 | |
| | | | | | | | | | | | | | | | |
High Yield Fund Service Class I | | | | | | | | | | | | | | | | |
Sold | | | 861,593 | | | $ | 9,367,450 | | | | 807,043 | | | $ | 8,884,361 | |
Issued as reinvestment of dividends | | | 256,448 | | | | 2,708,672 | | | | 163,779 | | | | 1,770,919 | |
Redeemed | | | (592,221 | ) | | | (6,349,980 | ) | | | (490,437 | ) | | | (5,383,596 | ) |
| | | | | | | | | | | | | | | | |
Net increase (decrease) | | | 525,820 | | | $ | 5,726,142 | | | | 480,385 | | | $ | 5,271,684 | |
| | | | | | | | | | | | | | | | |
Inflation-Protected and Income Fund Initial Class | | | | | | | | | | | | | | | | |
Sold | | | 13,372,272 | | | $ | 139,115,234 | | | | 6,475,706 | | | $ | 69,760,570 | |
Issued as reinvestment of dividends | | | 1,570,956 | | | | 16,198,989 | | | | 1,321,737 | | | | 14,688,930 | |
Redeemed | | | (5,925,753 | ) | | | (61,883,115 | ) | | | (7,043,287 | ) | | | (78,761,475 | ) |
| | | | | | | | | | | | | | | | |
Net increase (decrease) | | | 9,017,475 | | | $ | 93,431,108 | | | | 754,156 | | | $ | 5,688,025 | |
| | | | | | | | | | | | | | | | |
Inflation-Protected and Income Fund Service Class | | | | | | | | | | | | | | | | |
Sold | | | 408,141 | | | $ | 4,220,012 | | | | 803,468 | | | $ | 8,666,964 | |
Issued as reinvestment of dividends | | | 245,133 | | | | 2,522,012 | | | | 229,504 | | | | 2,554,178 | |
Redeemed | | | (749,721 | ) | | | (7,822,053 | ) | | | (1,341,288 | ) | | | (14,666,858 | ) |
| | | | | | | �� | | | | | | | | | |
Net increase (decrease) | | | (96,447 | ) | | $ | (1,080,029 | ) | | | (308,316 | ) | | $ | (3,445,716 | ) |
| | | | | | | | | | | | | | | | |
Short-Duration Bond Fund Class II | | | | | | | | | | | | | | | | |
Sold | | | 3,060,083 | | | $ | 30,410,522 | | | | 6,560,827 | | | $ | 65,940,311 | |
Issued as reinvestment of dividends | | | 441,859 | | | | 4,368,252 | | | | 447,464 | | | | 4,469,667 | |
Redeemed | | | (6,230,052 | ) | | | (61,924,543 | ) | | | (3,808,654 | ) | | | (38,274,408 | ) |
| | | | | | | | | | | | | | | | |
Net increase (decrease) | | | (2,728,110 | ) | | $ | (27,145,769 | ) | | | 3,199,637 | | | $ | 32,135,570 | |
| | | | | | | | | | | | | | | | |
92
Notes to Financial Statements (Continued)
| | | | | | | | | | | | | | | | |
| | | Year Ended December 31, 2014 | | | Year Ended December 31, 2013 | |
| | | | |
| | | Shares | | | Amount | | | Shares | | | Amount | |
Short-Duration Bond Fund Service Class I | | | | | | | | | | | | | | | | |
Sold | | | 1,027,500 | | | $ | 10,194,157 | | | | 961,121 | | | $ | 9,633,479 | |
Issued as reinvestment of dividends | | | 50,890 | | | | 502,758 | | | | 47,075 | | | | 469,927 | |
Redeemed | | | (792,308 | ) | | | (7,860,114 | ) | | | (887,563 | ) | | | (8,902,121 | ) |
| | | | | | | | | | | | | | | | |
Net increase (decrease) | | | 286,082 | | | $ | 2,836,801 | | | | 120,633 | | | $ | 1,201,285 | |
| | | | | | | | | | | | | | | | |
Small Cap Equity Fund Initial Class | | | | | | | | | | | | | | | | |
Sold | | | 376,596 | | | $ | 4,057,996 | | | | 498,780 | | | $ | 5,102,244 | |
Issued as reinvestment of dividends | | | 1,385,754 | | | | 13,986,608 | | | | 1,162,090 | | | | 11,520,135 | |
Redeemed | | | (1,415,515 | ) | | | (15,179,834 | ) | | | (1,535,809 | ) | | | (15,742,059 | ) |
| | | | | | | | | | | | | | | | |
Net increase (decrease) | | | 346,835 | | | $ | 2,864,770 | | | | 125,061 | | | $ | 880,320 | |
| | | | | | | | | | | | | | | | |
Small Cap Equity Fund Service Class | | | | | | | | | | | | | | | | |
Sold | | | 253,013 | | | $ | 2,723,427 | | | | 194,709 | | | $ | 1,984,366 | |
Issued as reinvestment of dividends | | | 123,415 | | | | 1,232,351 | | | | 79,754 | | | | 783,946 | |
Redeemed | | | (140,077 | ) | | | (1,501,870 | ) | | | (87,154 | ) | | | (903,364 | ) |
| | | | | | | | | | | | | | | | |
Net increase (decrease) | | | 236,351 | | | $ | 2,453,908 | | | | 187,309 | | | $ | 1,864,948 | |
| | | | | | | | | | | | | | | | |
Strategic Emerging Markets Fund Class II | | | | | | | | | | | | | | | | |
Sold | | | 1,843,003 | | | $ | 18,572,889 | | | | 5,118,051 | | | $ | 51,553,201 | |
Issued as reinvestment of dividends | | | 26,022 | | | | 286,757 | | | | - | | | | - | |
Redeemed | | | (1,931,572 | ) | | | (20,586,173 | ) | | | (430,284 | ) | | | (4,505,164 | ) |
| | | | | | | | | | | | | | | | |
Net increase (decrease) | | | (62,547 | ) | | $ | (1,726,527 | ) | | | 4,687,767 | | | $ | 47,048,037 | |
| | | | | | | | | | | | | | | | |
Strategic Emerging Markets Fund Service Class I | | | | | | | | | | | | | | | | |
Sold | | | 224,378 | | | $ | 2,287,717 | | | | 253,767 | | | $ | 2,571,145 | |
Issued as reinvestment of dividends | | | 387 | | | | 4,290 | | | | - | | | | - | |
Redeemed | | | (171,174 | ) | | | (1,746,060 | ) | | | (169,163 | ) | | | (1,701,176 | ) |
| | | | | | | | | | | | | | | | |
Net increase (decrease) | | | 53,591 | | | $ | 545,947 | | | | 84,604 | | | $ | 869,969 | |
| | | | | | | | | | | | | | | | |
| 6. | | Federal Income Tax Information |
At December 31, 2014, the cost of securities and the unrealized appreciation (depreciation) in the value of investments owned by the Funds, as computed on a federal income tax basis, were as follows:
| | | | | | | | | | | | | | | | |
| | | Federal Income
Tax Cost | | | Tax Basis
Unrealized
Appreciation | | | Tax Basis
Unrealized
(Depreciation) | | | Net Unrealized
Appreciation
(Depreciation) | |
High Yield Fund | | $ | 144,041,391 | | | $ | 2,403,045 | | | $ | (7,105,185 | ) | | $ | (4,702,140 | ) |
Inflation-Protected and Income Fund | | | 850,813,209 | | | | 13,487,913 | | | | (18,262,966 | ) | | | (4,775,053 | ) |
Short-Duration Bond Fund | | | 192,032,915 | | | | 3,162,000 | | | | (5,290,988 | ) | | | (2,128,988 | ) |
Small Cap Equity Fund | | | 103,561,703 | | | | 25,777,356 | | | | (1,699,409 | ) | | | 24,077,947 | |
Strategic Emerging Markets Fund | | | 105,634,978 | | | | 7,828,834 | | | | (12,714,885 | ) | | | (4,886,051 | ) |
Net capital loss carryforwards may be applied against any net realized taxable gains in succeeding years, subject to the carryforward period limitations, where applicable. On December 22, 2010, the Regulated Investment Company Modernization Act of 2010 (the “Modernization Act”) was signed by the President. The Modernization Act changed the capital loss carryforward rules as they relate to regulated investment companies. Capital losses generated in tax years beginning after the date of enactment may now be carried forward indefinitely, and retain the character of the original loss. Under pre-enactment law, capital losses could be carried forward for up to eight tax years as short-term capital losses. The provisions affecting the utilization of capital loss carryforwards under the Modernization Act also require the utilization of post-enactment losses prior to the utilization of pre-enactment losses.
93
Notes to Financial Statements (Continued)
At December 31, 2014, the following Fund(s) had available, for federal income tax purposes, pre-enactment unused capital losses:
| | | | |
| | | Expiring
2017 | |
Small Cap Equity Fund | | $ | 3,561,130 | |
At December 31, 2014, the following Fund(s) had post-enactment accumulated capital loss carryforwards:
| | | | | | | | |
| | | Short Term
Capital Loss
Carryforward | | | Long term
Capital Loss
Carryforward | |
Inflation-Protected and Income Fund | | $ | 98,481 | | | $ | - | |
Short-Duration Bond Fund | | | - | | | | 119,537 | |
Strategic Emerging Markets Fund | | | 78,461 | | | | 829,769 | |
Net capital loss carryforwards for the Fund(s) shown in the above table are from post-enactment years and are, therefore, not subject to the eight-year carryforward period and possible expiration.
Generally accepted accounting principles in the United States of America require that only distributions in excess of tax basis earnings and profits be reported in the financial statements as a return of capital.
The tax character of distributions (including capital gain dividends, if any, designated pursuant to Section 852 of the Code) paid during the year ended December 31, 2014, was as follows:
| | | | | | | | | | | | |
| | | Ordinary
Income | | | Long Term
Capital Gain | | | Return of
Capital | |
High Yield Fund | | $ | 13,566,477 | | | $ | 3,194,754 | | | $ | - | |
Inflation-Protected and Income Fund | | | 10,462,032 | | | | 8,258,969 | | | | - | |
Short-Duration Bond Fund | | | 4,843,503 | | | | 27,507 | | | | - | |
Small Cap Equity Fund | | | 6,030,432 | | | | 9,188,527 | | | | - | |
Strategic Emerging Markets Fund | | | 291,047 | | | | - | | | | - | |
The tax character of distributions (including capital gain dividends, if any, designated pursuant to Section 852 of the Code) paid during the year ended December 31, 2013, was as follows:
| | | | | | | | | | | | |
| | | Ordinary
Income | | | Long Term
Capital Gain | | | Return of
Capital | |
High Yield Fund | | $ | 10,637,041 | | | $ | 1,660,761 | | | $ | - | |
Inflation-Protected and Income Fund | | | 7,085,793 | | | | 10,157,315 | | | | - | |
Short-Duration Bond Fund | | | 4,740,036 | | | | 199,558 | | | | - | |
Small Cap Equity Fund | | | 1,909,420 | | | | 10,394,661 | | | | - | |
The following Fund(s) have elected to pass through the foreign tax credit for the year ended December 31, 2014:
| | | | |
| | | Amount | |
Strategic Emerging Markets Fund | | $ | 112,911 | |
Capital accounts within the financial statements are periodically adjusted for permanent differences between book and tax accounting. These adjustments have no impact on net assets or the results of operations. Temporary book and tax accounting differences will reverse in subsequent periods. At December 31, 2014, temporary book and tax accounting differences were
94
Notes to Financial Statements (Continued)
primarily attributable to investments in forward contracts, futures contracts, swap agreements, premium amortization accruals, passive foreign investment companies, the deferral of wash sale losses, defaulted bond income accruals, partnership investments, and deferred Trustee compensation.
At December 31, 2014, the components of distributable earnings on a tax basis were as follows:
| | | | | | | | | | | | | | | | |
| | | Undistributed
Ordinary
Income | | | Undistributed
Long Term
Capital Gain
(Capital Loss
Carryover) | | | Other
Temporary
Differences | | | Unrealized
Appreciation
(Depreciation) | |
High Yield Fund | | $ | 479,194 | | | $ | 331,142 | | | $ | (11,845 | ) | | $ | (4,702,140 | ) |
Inflation-Protected and Income Fund | | | 60,909 | | | | (98,481 | ) | | | (272,893 | ) | | | (4,785,041 | ) |
Short-Duration Bond Fund | | | 120,924 | | | | (119,537 | ) | | | (27,066 | ) | | | (2,376,058 | ) |
Small Cap Equity Fund | | | 1,129,627 | | | | 16,757,388 | | | | (27,365 | ) | | | 24,077,947 | |
Strategic Emerging Markets Fund | | | 1,144,204 | | | | (908,230 | ) | | | (6,109 | ) | | | (5,122,593 | ) |
During the year ended December 31, 2014, the following amounts were reclassified due to permanent differences between book and tax accounting:
| | | | | | | | | | | | |
| | | Paid-in
Capital | | | Accumulated
Net Realized
Gain (Loss) on
Investments | | | Undistributed
Net Investment
Income (Loss) | |
High Yield Fund | | $ | (2,504 | ) | | $ | (79,664 | ) | | $ | 82,168 | |
Inflation-Protected and Income Fund | | | 1,595 | | | | (2,261,874 | ) | | | 2,260,279 | |
Short-Duration Bond Fund | | | 373 | | | | (1,448,108 | ) | | | 1,447,735 | |
Small Cap Equity Fund | | | 6,016 | | | | (29,633 | ) | | | 23,617 | |
Strategic Emerging Markets Fund | | | 75 | | | | (91,457 | ) | | | 91,382 | |
The Funds did not have any unrecognized tax benefits at December 31, 2014, nor were there any increases or decreases in unrecognized tax benefits for the year then ended. The Funds recognize interest and penalties, if any, related to unrecognized tax benefits as an income tax expense in the Statements of Operations. During the year ended December 31, 2014, the Funds did not incur any such interest or penalties. The Funds are subject to examination by U.S. federal and state tax authorities for returns filed for the prior three fiscal years. Foreign taxes are provided for based on the Funds’ understanding of the tax rules and rates that exist in the foreign markets in which they invest.
7. Indemnifications
Under the Funds’ organizational documents, current and former Trustees and Officers are provided with specified rights to indemnification against liabilities arising in connection with the performance of their duties to the Funds, and shareholders are indemnified against personal liability for obligations of the Funds. In the normal course of business, the Funds may also enter into contracts that provide general indemnifications. The Funds’ maximum exposure under these arrangements is unknown as this would be dependent on future claims that may be made against the Funds. The risk of material loss from such claims is considered remote.
8. New Accounting Pronouncements
In June 2014, The Financial Accounting Standards Board (“FASB”) issued Accounting Standards Update No. 2014-11, Transfers & Servicing (Topic 860): “Repurchase-to-Maturity Transactions, Repurchase Financings, and Disclosures” (“ASU 2014-11”) to improve the financial reporting of repurchase agreements and other similar transactions. ASU 2014-11 includes expanded disclosure requirements for entities that enter into reverse repurchase agreements and similar transactions accounted for as secured borrowings. ASU 2014-11 is effective for annual reporting periods beginning after December 15, 2014 and interim
95
Notes to Financial Statements (Continued)
periods beginning after December 15, 2015. Management is currently evaluating the implications of these changes and their impact on the financial statements.
9. Legal Proceedings
On December 7, 2010, the Trust was named as a defendant and putative member of the proposed defendant class of shareholders named in an adversary proceeding brought by The Official Committee of Unsecured Creditors of Tribune Company (the “Official Committee”) in the U.S. Bankruptcy Court for the District of Delaware, in connection with Tribune Company’s Chapter 11 bankruptcy proceeding (In re Tribune Company). The proceeding relates to a leveraged buyout (“LBO”) transaction by which Tribune Company converted to a privately-held company in 2007, and the putative defendant class is comprised of beneficial owners of shares of Tribune Company who received proceeds (the “Proceeds”) of the LBO. The Official Committee seeks to recover payments of those Proceeds.
The potential amount sought to be recovered from the Small Cap Equity Fund, plus interest and the Official Committee’s court costs, is approximately $93,500.
The Fund cannot predict the outcome of this proceeding. Accordingly, the Fund has not accrued any amounts related to these proceedings. If the proceeding were to be decided in a manner adverse to the Fund, or if the Fund was to enter into a settlement agreement with the Official Committee, the payment of such judgment or settlement could potentially have a material adverse effect on the Fund’s net asset value depending on the net assets of the Fund at the time of such judgment or settlement.
10. Subsequent Events
In preparation of these financial statements, management has evaluated the events and transactions subsequent to December 31, 2014, through the date when the financial statements were issued, and determined that there are no subsequent events or transactions that would require adjustments to or disclosures in the Funds’ financial statements.
96
Report of Independent Registered Public Accounting Firm
To the Board of Trustees of MML Series Investment Fund II and Shareholders of MML High Yield Fund, MML Inflation-Protected and Income Fund, MML Short-Duration Bond Fund, MML Small Cap Equity Fund, and MML Strategic Emerging Markets Fund (collectively, the “Funds”):
We have audited the accompanying statements of assets and liabilities, including the portfolios of investments, of the Funds as of December 31, 2014, and the related statements of operations for the year then ended, the statements of changes in net assets for each of the two years in the period then ended, and the financial highlights for each of the periods presented. These financial statements and financial highlights are the responsibility of the Funds’ management. Our responsibility is to express an opinion on these financial statements and financial highlights based on our audits.
We conducted our audits in accordance with the standards of the Public Company Accounting Oversight Board (United States). Those standards require that we plan and perform the audit to obtain reasonable assurance about whether the financial statements and financial highlights are free of material misstatement. The Funds are not required to have, nor were we engaged to perform, an audit of their internal control over financial reporting. Our audits included consideration of internal control over financial reporting as a basis for designing audit procedures that are appropriate in the circumstances, but not for the purpose of expressing an opinion on the effectiveness of the Funds’ internal control over financial reporting. Accordingly, we express no such opinion. An audit also includes examining, on a test basis, evidence supporting the amounts and disclosures in the financial statements, assessing the accounting principles used and significant estimates made by management, as well as evaluating the overall financial statement presentation. Our procedures included confirmation of securities owned as of December 31, 2014, by correspondence with the custodian and brokers; where replies were not received from brokers, we performed other auditing procedures. We believe that our audits provide a reasonable basis for our opinion.
In our opinion, the financial statements and financial highlights referred to above present fairly, in all material respects, the financial position of each of the Funds as of December 31, 2014, the results of their operations for the year ended, the changes in their net assets for each of the two years in the period then ended, and the financial highlights for each of the periods presented, in conformity with accounting principles generally accepted in the United States of America.
Deloitte & Touche LLP
Boston, Massachusetts
February 23, 2015
97
Trustees and Officers (Unaudited)
The following table lists the Trust’s Trustees and Officers as of December 31, 2014; their address and age; their position with the Trust; the length of time holding that position with the Trust; their principal occupation(s) during the past five years; the number of portfolios in the fund complex they oversee; and other directorships they hold in companies subject to registration or reporting requirements of the Securities Exchange Act of 1934 (generally called “public companies”) or in registered investment companies. The Trust’s Statement of Additional Information includes additional information about the Trust’s Trustees and is available, without charge, upon request by calling 1-888-309-3539 or by writing MML Series Investment Fund II, c/o Massachusetts Mutual Life Insurance Company, 1295 State Street, Springfield, Massachusetts 01111-0001, Attention: Retirement Services Marketing.
Disinterested Trustees
| | | | | | | | | | |
Name, Address*, and Age | | Position(s)
Held with
Trust | | Term of
Office** and
Length of
Time Served | | Principal Occupation(s)
During Past 5 Years | | Number of
Portfolios in
Fund Complex
Overseen by Trustee | | Other Directorships Held by Trustee |
Richard H. Ayers
Age: 72 | | Chairman Trustee | | Since 2012 Since 2012 | | Retired. | | 89 | | Director (2008-2011), Celera Corporation; Director (1996-2008), Applera Corporation; Chairman (since 2010), Trustee (since 1996), MassMutual Select Funds (open-end investment company); Chairman (since 2010), Trustee (since 1999), MML Series Investment Fund (open-end investment company); Chairman and Trustee (since 2012), MassMutual Premier Funds (open-end investment company). |
| | | | | |
Allan W. Blair
Age: 66 | | Trustee | | Since 2012 | | Retired; President and Chief Executive Officer (1996-2014), Economic Development Council of Western Massachusetts; President and Chief Executive Officer (1984-2014), Westover Metropolitan Development Corporation. | | 89 | | Trustee (since 2003), MassMutual Select Funds (open-end investment company); Trustee (since 2003), MML Series Investment Fund (open-end investment company); Trustee (since 2012), MassMutual Premier Funds (open-end investment company). |
| | | | | |
Nabil N. El-Hage
Age: 56 | | Trustee Chairman | | Since 2005 (2006-2012) | | Chairman (since 2011), Academy of Executive Education, LLC; Consultant (2010-2011); Senior Associate Dean for External Relations (2009-2010), Thomas Henry Carroll Ford Foundation Adjunct Professor of Business Administration (2009-2010), Professor of Management Practice (2005-2009), Harvard Business School. | | 89 | | Director (since 2011), Argo Group International Holdings, Ltd.; Director (2007-2010), Virtual Radiologic Corporation; Trustee (since 2012), MassMutual Select Funds (open-end investment company); Trustee (since 2012), MML Series Investment Fund (open-end investment company); Trustee (since 2003), Chairman (2006-2012), MassMutual Premier Funds (open-end investment company). |
| | | | | |
Maria D. Furman
Age: 60 | | Trustee | | Since 2005 | | Retired. | | 89 | | Trustee (since 2011), GMO Series Trust (open-end investment company); Trustee (since 2012), MassMutual Select Funds (open-end investment company); Trustee (since 2012), MML Series Investment Fund (open-end investment company); Trustee (since 2004), MassMutual Premier Funds (open-end investment company). |
98
Trustees and Officers (Unaudited) (Continued)
| | | | | | | | | | |
Name, Address*, and Age | | Position(s)
Held with
Trust | | Term of
Office** and
Length of
Time Served | | Principal Occupation(s)
During Past 5 Years | | Number of
Portfolios in
Fund Complex
Overseen by Trustee | | Other Directorships Held by Trustee |
R. Alan Hunter, Jr.
Age: 68 | | Trustee | | Since 2012 | | Retired. | | 89 | | Director (since 2007), Actuant Corporation; Trustee (since 2003), MassMutual Select Funds (open-end investment company); Trustee (since 2003), MML Series Investment Fund (open-end investment company); Trustee (since 2012), MassMutual Premier Funds (open-end investment company). |
| | | | | |
F. William Marshall, Jr.
Age: 72 | | Trustee | | Since 2012 | | Retired; Consultant (1999-2009). | | 127*** | | Trustee (since 2000), Denver Board – Oppenheimer Funds; Trustee (since 1996), MassMutual Select Funds (open-end investment company); Trustee (since 1996), MML Series Investment Fund (open-end investment company); Trustee (since 2012), MassMutual Premier Funds (open-end investment company). |
| | | | | |
C. Ann Merrifield
Age: 63 | | Trustee | | Since 2005 | | Retired; President and Chief Executive Officer (2012-2014), PathoGenetix; Senior Vice President, Genzyme Business Excellence Initiative (2009-2011), President, Biosurgery (2003-2009), Genzyme Corporation. | | 89 | | Director (since 2014), Flexion Therapeutics; Director (since 2014), InVivo Therapeutics; Trustee (since 2012), MassMutual Select Funds (open-end investment company); Trustee (since 2012), MML Series Investment Fund (open-end investment company); Trustee (since 2004), MassMutual Premier Funds (open-end investment company). |
| | | | | |
Susan B. Sweeney
Age: 62 | | Trustee | | Since 2012 | | Retired; Senior Vice President and Chief Investment Officer (2010-2014), Selective Insurance Group (property and casualty company); Senior Managing Director (2008-2010), Ironwood Capital (private equity firm). | | 91^ | | Trustee (since 2012), Babson Capital Corporate Investors (closed-end investment company); Trustee (since 2012), Babson Capital Participation Investors (closed-end investment company); Trustee (since 2009), MassMutual Select Funds (open-end investment company); Trustee (since 2009), MML Series Investment Fund (open-end investment company); Trustee (since 2012), MassMutual Premier Funds (open-end investment company). |
99
Trustees and Officers (Unaudited) (Continued)
Interested Trustees
| | | | | | | | | | |
Name, Address*, and
Age | | Position(s) Held
with Trust | | Term of
Office** and
Length of
Time Served | | Principal Occupation(s)
During Past 5 Years | | Number of
Portfolios in
Fund Complex
Overseen by Trustee | | Other Directorships Held by Trustee |
Robert E. Joyal^^
Age: 69 | | Trustee | | Since 2012 | | Retired. | | 91^ | | Director (since 2013), Leucadia National Corporation (holding company); Director (since 2012), Ormat Technologies, Inc.; Director (2006-2014), Jefferies Group LLC (investment bank); Director (2007-2011), Scottish Re Group Ltd.; Director (2003-2010), Alabama Aircraft Industries, Inc.; Trustee (since 2003), Babson Capital Corporate Investors (closed-end investment company); Trustee (since 2003), Babson Capital Participation Investors (closed-end investment company); Trustee (since 2003), MassMutual Select Funds (open-end investment company); Trustee (since 2003), MML Series Investment Fund (open-end investment company); Trustee (since 2012), MassMutual Premier Funds (open-end investment company). |
| | | | | |
Elaine A. Sarsynski^^^
Age: 59 | | Trustee Vice Chairperson | | Since 2011 (2011- 2012) | | Executive Vice President (since 2008), MassMutual Retirement Services Division, MassMutual; Chairman (since 2013), President, Chairman & CEO (2012-2013), Chairman & CEO (2008-2012), President & CEO (2006-2008), MassMutual International LLC. | | 89 | | Director (since 2012), Horizon Technology Finance Management LLC; Director (since 2013), MML Advisers; Trustee (since 2008), MassMutual Select Funds (open-end investment company); Trustee (since 2008), MML Series Investment Fund (open-end investment company); Vice Chairperson (2011-2012), Trustee (since 2011), MassMutual Premier Funds (open-end investment company). |
Principal Officers who are Not Trustees
| | | | | | | | |
Name, Address*, and Age | | Position(s)
Held with Trust | | Term of
Office# and
Length of
Time Served | | Principal Occupation(s) During Past 5 Years | | Number of
Portfolios in
Fund Complex
Overseen by Officer |
Jeffrey M. Dube Age: 46 | | President | | Since
2014 | | Vice President (since 2012), Assistant Vice President (2011-2012), Managing Director (2009-2011), MassMutual; President (since 2014), MML Series Investment Fund (open-end investment company). | | 36 |
| | | | |
Michael C. Eldredge
Age: 50 | | Vice President | | Since
2009 | | Head of Investments and portfolio manager (since 2014), MML Advisers; Vice President (since 2008), MassMutual; Vice President (2005-2008), ING; Vice President (since 2009), MassMutual Select Funds (open-end investment company); Vice President (since 2009), MML Series Investment Fund (open-end investment company); Vice President (since 2009), MassMutual Premier Funds (open-end investment company). | | 89 |
| | | | |
Andrew M. Goldberg
Age: 48 | | Vice President, Secretary, and Chief Legal Officer Assistant Clerk | | Since
2008 (2005-
2008) | | Assistant Vice President and Counsel (since 2004), MassMutual; Assistant Secretary (since 2013), MML Advisers; Vice President, Secretary, and Chief Legal Officer (since 2008), Assistant Secretary (2001-2008), MassMutual Select Funds (open-end investment company); Vice President, Secretary, and Chief Legal Officer (since 2008), Assistant Secretary (2001-2008), MML Series Investment Fund (open-end investment company); Vice President, Secretary, (formerly known as “Clerk”), and Chief Legal Officer (since 2008), Assistant Clerk (2004-2008), MassMutual Premier Funds (open-end investment company). | | 89 |
100
Trustees and Officers (Unaudited) (Continued)
| | | | | | | | |
Name, Address*, and Age | | Position(s)
Held with Trust | | Term of
Office# and
Length of
Time Served | | Principal Occupation(s) During Past 5 Years | | Number of
Portfolios in
Fund Complex
Overseen by Officer |
Brian K. Haendiges
Age: 54 | | Vice President | | Since
2014 | | Vice President (since 2014) MML Advisers; Senior Vice President (since 2014), Vice President (2010-2014), MassMutual; Vice President (since 2014), MassMutual Select Funds (open-end investment company); Vice President (since 2014), MML Series Investment Fund (open-end investment company); Vice President (since 2014), MassMutual Premier Funds (open-end investment company). | | 89 |
| | | | |
Nicholas H. Palmerino
Age: 49 | | Chief Financial Officer and Treasurer | | Since
2006 | | Vice President (since 2014), Assistant Vice President (2006-2014), MassMutual; Chief Financial Officer and Treasurer (since 2006), MassMutual Select Funds (open-end investment company); Chief Financial Officer and Treasurer (since 2006), MML Series Investment Fund (open-end investment company); Chief Financial Officer and Treasurer (since 2006), MassMutual Premier Funds (open-end investment company). | | 89 |
| | | | |
Philip S. Wellman
Age: 50 | | Vice President and Chief Compliance Officer | | Since
2007 | | Vice President and Chief Compliance Officer (since 2013), MML Advisers; Vice President and Associate General Counsel (since 2014), Vice President, Associate General Counsel, and Chief Compliance Officer (Mutual Funds and Investment Advisory) (2008-2014), Vice President, Associate General Counsel, and Chief Compliance Officer (Mutual Funds) (2007-2008), MassMutual; Vice President and Chief Compliance Officer (since 2007), MassMutual Select Funds (open-end investment company); Vice President and Chief Compliance Officer (since 2007), MML Series Investment Fund (open-end investment company); Vice President and Chief Compliance Officer (since 2007), MassMutual Premier Funds (open-end investment company). | | 89 |
| | | | |
Eric H. Wietsma
Age: 48 | | Vice President | | Since
2006
| | Director and President (since 2013), MML Advisers; Senior Vice President (since 2010), Corporate Vice President (2007-2010), MassMutual; President (since 2008), Vice President (2006-2008), MassMutual Select Funds (open-end investment company); Vice President (since 2006), MML Series Investment Fund (open-end investment company); President (since 2008), Vice President (2006-2008), MassMutual Premier Funds (open-end investment company). | | 89 |
| * | The address of each Trustee and Principal Officer is the same as that for the Trust; 100 Bright Meadow Blvd., Enfield, CT 06082. |
| ** | Each Trustee of the Trust serves until the next meeting of shareholders called for the purpose of electing Trustees and until the election and qualification of his or her successor or until he or she dies, resigns, or is removed. Notwithstanding the foregoing, unless the Trustees determine that it is desirable and in the best interest of the Trust that an exception to the retirement policy of the Trust be made, a Trustee shall retire and cease to serve as a Trustee upon the conclusion of the calendar year in which such Trustee attains the age of seventy-two years. Such an exception was made for any Trustee who attained the age of seventy-two years during 2014. Such Trustees shall retire and cease to serve as a Trustee on or before December 31, 2015. |
| | The Chairperson is elected to hold such office for a term of three years or until their successor is elected and qualified to carry out the duties and responsibilities of their office, or until he or she retires, dies, resigns, is removed, or becomes disqualified. |
| *** | Denver Board – Oppenheimer Funds is deemed to be part of the Fund Complex because it is managed by OFI Global Asset Management Inc., an affiliate of MML Advisers. |
| ^ | Babson Capital Participation Investors and Babson Capital Corporate Investors are deemed to be a part of the Fund Complex because they are managed by Babson Capital Management LLC, an affiliate of MML Advisers. |
| ^^ | Mr. Joyal is an “Interested Person,” as that term is defined in the 1940 Act, through his position as a director of Leucadia National Corporation, which controls Jefferies Group LLC, a broker-dealer that may execute portfolio transactions and/or engage in principal transactions with the Funds, other investment companies advised by MML Advisers or holding themselves out to investors as related companies for purposes of investment or investor services, or any other advisory accounts over which MML Advisers has brokerage placement discretion. |
| ^^^ | Ms. Sarsynski is an Interested Person as a director of MML Advisers. |
| # | The President, Treasurer, and Secretary are elected to hold such office until their successor is elected and qualified to carry out the duties and responsibilities of their office, or until he or she dies, resigns, is removed, or becomes disqualified. Each other officer shall hold office at the pleasure of the Trustees. |
101
Federal Tax Information (Unaudited)
For corporate shareholders, a portion of the ordinary dividends paid during the Fund’s year ended December 31, 2014, qualified for the dividends received deduction, as follows:
| | | | |
| |
| | | Dividends Received
Deductions | |
Small Cap Equity Fund | | | 10.99% | |
For the year ended December 31, 2014, the following Fund earned the following foreign sources of income:
| | | | |
| |
| | | Amount | |
Strategic Emerging Markets Fund | | $ | 1,837,239 | |
102
Other Information (Unaudited)
Proxy Voting
A description of the policies and procedures that each Fund’s investment adviser and subadvisers to vote proxies relating to the Fund’s portfolio securities is available, without charge, upon request, by calling 1-888-309-3539, and on the Securities and Exchange Commission’s (“SEC”) website at http://www.sec.gov.
Information regarding how the Funds voted proxies relating to portfolio securities during the most recent 12-month period ended June 30 is available, without charge, upon request, on the MassMutual website at http://www.massmutual.com/funds and on the SEC’s website at http://www.sec.gov.
Quarterly Reporting
The Funds file their complete schedule of portfolio holdings with the SEC for the first and third quarters of each fiscal year on Form N-Q. The Funds’ Forms N-Q are available on the SEC’s website at http://www.sec.gov and may be reviewed and copied at the SEC’s Public Reference Room in Washington D.C. Information on the operation of the SEC’s Public Reference Room may be obtained by calling 1-800-SEC-0330.
Trustees’ Approval of Investment Advisory Contracts
At their meeting in November 2014, the Trustees, including the Trustees who are not “interested persons” (as such term is defined in the 1940 Act) of the Trust, MML Advisers, or subadvisers, reviewed and approved a proposal to revise the management fee breakpoints of the Short-Duration Bond Fund (the “Fund”). In arriving at their decision, the Trustees considered materials provided by MML Advisers, including a revised profitability schedule for the Fund. In their deliberations, the Trustees were advised by independent counsel.
The amendment to the management agreement for the Fund is expected to become effective on May 1, 2015.
103
Other Information (Unaudited) (Continued)
Fund Expenses December 31, 2014
Expense Examples:
The following information is in regards to expenses for the six months ended December 31, 2014:
As a shareholder of the Funds, you incur ongoing costs, including advisory fees, distribution and/or service (12b-1) fees, and other Fund expenses. These examples are intended to help you understand your ongoing costs (in dollars) of investing in the Funds and to compare these costs with the ongoing costs of investing in other mutual funds. These examples are based on an investment of $1,000 invested for the six months ended December 31, 2014.
Actual Expenses:
The first four columns of the table below provide information about actual account values and actual expenses. You may use this information, together with the amount you invested, to estimate the expenses that you paid over the period. Simply divide your account value by $1,000 (for example, an $8,600 account value divided by $1,000 = 8.6), then multiply the result by the number under the heading entitled “Operating Expenses Incurred” to estimate the expenses you paid on your account during this period.
Hypothetical Example for Comparison Purposes:
The last two columns of the table below provide information about hypothetical account values and hypothetical expenses based on the Fund’s actual expense ratio and an assumed rate of return of 5% per year before expenses, which is not the Fund’s actual return. The hypothetical account values and expenses may not be used to estimate the actual ending account balance or expenses you paid for the period. You may use this information to compare the ongoing costs of investing in the Fund and other funds. To do so, compare this 5% hypothetical example with the 5% hypothetical examples that appear in the shareholder reports of the other funds.
Please note that the expenses shown in the table are meant to highlight your ongoing costs only and do not reflect any transactional costs. Therefore, the last two columns of the table are useful in comparing ongoing costs only, and will not help you determine the relative total costs of owning different funds. In addition, if these transactional costs were included, your costs would have been higher.
| | | | | | | | | | | | | | | | | | | | | | | | |
| | | Beginning
Value | | | Annualized
Expense
Ratio | | | Ending
Value (Based
on Actual
Returns and
Expenses) | | | Operating
Expenses
Incurred* | | | Ending
Value
(Based on
Hypothetical
Returns and
Expenses) | | | Operating
Expenses
Incurred* | |
| High Yield Fund | | | | | | | | | | | | | | | | | | | | | | | | |
Class II | | $ | 1,000 | | | | 0.69 | % | | $ | 951.20 | | | $ | 3.39 | | | $ | 1,021.70 | | | $ | 3.52 | |
Service Class I | | | 1,000 | | | | 0.94 | % | | | 949.20 | | | | 4.62 | | | | 1,020.50 | | | | 4.79 | |
| Inflation-Protected and Income Fund | | | | | | | | | | | | | | | | | | | | | | | | |
Initial Class | | | 1,000 | | | | 0.59 | % | | | 974.90 | | | | 2.94 | | | | 1,022.20 | | | | 3.01 | |
Service Class | | | 1,000 | | | | 0.84 | % | | | 973.60 | | | | 4.18 | | | | 1,021.00 | | | | 4.28 | |
| Short-Duration Bond Fund | | | | | | | | | | | | | | | | | | | | | | | | |
Class II | | | 1,000 | | | | 0.55 | % | | | 1,003.60 | | | | 2.78 | | | | 1,022.40 | | | | 2.80 | |
Service Class I | | | 1,000 | | | | 0.80 | % | | | 1,001.70 | | | | 4.04 | | | | 1,021.20 | | | | 4.08 | |
| Small Cap Equity Fund | | | | | | | | | | | | | | | | | | | | | | | | |
Initial Class | | | 1,000 | | | | 0.68 | % | | | 1,071.90 | | | | 3.55 | | | | 1,021.80 | | | | 3.47 | |
Service Class | | | 1,000 | | | | 0.93 | % | | | 1,070.60 | | | | 4.85 | | | | 1,020.50 | | | | 4.74 | |
| Strategic Emerging Markets Fund | | | | | | | | | | | | | | | | | | | | | | | | |
Class II | | | 1,000 | | | | 1.40 | % | | | 895.90 | | | | 6.69 | | | | 1,018.10 | | | | 7.12 | |
Service Class I | | | 1,000 | | | | 1.65 | % | | | 894.70 | | | | 7.88 | | | | 1,016.90 | | | | 8.39 | |
| * | Expenses are calculated using the annualized expense ratio for the six months ended December 31, 2014, multiplied by the average account value over the period, multiplied by the number of days in the period, divided by the number of days in the year, unless stated otherwise. |
104
Underwriter:
MML Distributors, LLC
100 Bright Meadow Blvd.
Enfield, CT 06082

| | |
| © 2015 Massachusetts Mutual Life Insurance Company, Springfield, MA 01111-0001. All rights reserved. www.massmutual.com. MassMutual Financial Group is a marketing name for Massachusetts Mutual Life Insurance Company (MassMutual) and its affiliated companies and sales representatives. Investment Adviser: MML Investment Advisers, LLC | | CRN201603-190349 |
Item 2. Code of Ethics.
As of December 31, 2014, the Registrant adopted a Code of Ethics that applies to the Principal Executive Officer and Principal Financial Officer pursuant to the Sarbanes-Oxley Act of 2002. For the year ended December 31, 2014, there were no amendments to a provision of the Code of Ethics. A copy of its Code of Ethics is filed with this Form N-CSR under Item 12(a)(1).
Item 3. Audit Committee Financial Expert.
The Registrant’s Board of Trustees has determined that R. Alan Hunter, Jr. and Nabil N. El-Hage, both members of the Audit Committee, are audit committee financial experts as defined by the Securities and Exchange Commission (the “SEC”). Mr. Hunter and Mr. El-Hage are both “independent” as defined by the SEC for purposes of audit committee financial expert determinations.
Item 4. Principal Accountant Fees and Services.
References below to Deloitte & Touche LLP include its affiliates where applicable.
| | (a) | AUDIT FEES: The aggregate fees billed to the Registrant for professional services rendered by its independent auditors, Deloitte & Touche LLP, for the audit of the Registrant’s annual financial statements for the fiscal years ended 2014 and 2013 were $291,712 and $294,615, respectively. |
| | (b) | AUDIT RELATED FEES: No such fees were billed to the Registrant by Deloitte & Touche LLP for the fiscal years ended 2014 and 2013. No such fees were billed to the Registrant’s adviser and any entity controlling, controlled by, or under common control with the adviser that provides ongoing services to the Registrant by Deloitte & Touche LLP* for the fiscal years ended 2014 and 2013. |
| | (c) | TAX FEES: The aggregate fees billed to the Registrant for professional services rendered by Deloitte & Touche LLP for the review of Form 1120-RIC, Form 8613, excise distribution projections, distribution calculation and reasonable out of pocket expenses for the fiscal years ended 2014 and 2013 were $82,163 and $51,194, respectively. No such fees were billed to the Registrant’s adviser and any entity controlling, controlled by, or under common control with the adviser that provides ongoing services to the Registrant by Deloitte & Touche LLP* for the fiscal years ended 2014 and 2013. |
| | (d) | ALL OTHER FEES: No such fees were billed to the Registrant by Deloitte & Touche LLP for the fiscal years ended 2014 and 2013. No such fees were billed to the Registrant’s adviser and any entity controlling, controlled by, or under common control with the adviser that provides ongoing services to the Registrant by Deloitte & Touche LLP* for the fiscal years ended 2014 and 2013. |
| | (e) | (1) AUDIT COMMITTEE PRE-APPOVAL POLICY: All services to be performed for the Registrant by Deloitte & Touche LLP must be pre-approved by the audit committee. All services performed during the fiscal years ended 2014 and 2013 were pre-approved by the committee. |
(2) Not applicable.
| | (g) | The aggregate non-audit fees billed by Deloitte & Touche LLP for services rendered to the Registrant, the Registrant’s adviser and any entity controlling, controlled by, or under common control with the adviser that provides ongoing services to the Registrant, for the fiscal years ended 2014 and 2013 were $1,923,158 and $814,179, respectively. |
| | (h) | The audit committee considers whether the provision of non-audit services by Deloitte & Touche LLP to the Registrant’s adviser and any entity controlling, controlled by, or under common control with the adviser that provides ongoing services to the Registrant that were not pre-approved pursuant to paragraph (c)(7)(ii) of Rule 2-01 of Regulation S-X is compatible with maintaining Deloitte & Touche LLP’s independence. |
| * | Refers to fees that were required to be approved by the audit committee for services that relate directly to the operations and financial reporting of the Registrant. |
Item 5. Audit Committee of Listed Registrants.
Not applicable to this filing.
Item 6. Investments.
Please see portfolio of investments contained in the Reports to Stockholders included under Item 1 of this form N-CSR.
Item 7. Disclosure of Proxy Voting Policies and Procedures for Closed-End Management Investment Companies.
Not applicable to this filing.
Item 8. Portfolio Managers of Closed-End Management Investment Companies.
Not applicable to this filing.
Item 9. Purchases of Equity Securities by Closed-End Management Investment Company and Affiliated Purchasers.
Not applicable to this filing.
Item 10. Submission of Matters to a Vote of Security Holders.
Not applicable to this filing.
Item 11. Controls and Procedures.
(a) The Registrant’s Principal Executive Officer and Principal Financial Officer have concluded that the Registrant’s disclosure controls and procedures (as defined in Rule 30a-3(c) under the Investment Company Act of 1940, as amended (the “1940 Act”) (17 CFR 270.30a-3(c))) are effective, as of a date within 90 days of the filing date of this Form N-CSR, to provide reasonable assurance that the information required to be disclosed by the Registrant on Form N-CSR is recorded, processed, summarized, and reported within the time periods specified in the SEC’s rules and forms, based on their evaluation of these disclosure controls and procedures required by Rule 30a-3(b) under the 1940 Act (17 CFR 270.30a-3(b)) and Rules 13a-15(b) or 15d-15(b) under the Securities Exchange Act of 1934 (17 CFR 240.13a-15(b) or 240.15d-15(b)).
(b) There were no changes in the Registrant’s internal control over financial reporting (as defined in Rule 30a-3(d) under the 1940 Act (17 CFR 270.30a-3(d))) that occurred during the Registrant’s most recent fiscal quarter that has materially affected, or is reasonably likely to materially affect, the Registrant’s internal control over financial reporting.
Item 12. Exhibits.
(a)(1) Code of Ethics (Item 2) is attached.
(a)(2) Certifications of the Principal Executive Officer and Principal Financial Officer of the Registrant as required by Rule 30a-2(a) under the 1940 Act (17 CFR 270.30a-2(a)) are attached hereto as Exhibit 99CERT.
(a)(3) Not applicable to this filing.
(b) Certifications pursuant to Section 906 of the Sarbanes-Oxley Act of 2002 as required by Rule 30a-2(b), under the 1940 Act (17 CFR 270.30a-2(b)), Rule 15d-14(b) under the Securities Exchange Act of 1934 (17 CFR 240.15d-14(b)) and Section 1350 of Chapter 63 of Title 18 of the United States Code (18 U.S.C. 1350) are attached hereto as Exhibit 99.906CERT.
SIGNATURES
Pursuant to the requirements of the Securities Exchange Act of 1934 and the Investment Company Act of 1940, the registrant has duly caused this report to be signed on its behalf by the undersigned, thereunto duly authorized.
| | | | |
| (Registrant) | | MML Series Investment Fund II | | |
| | |
| By (Signature and Title) | | /s/ Jeffrey M. Dube | | |
| | Jeffrey M. Dube, President and Principal Executive Officer | | |
| | |
| Date | | 2/25/15 | | |
Pursuant to the requirements of the Securities Exchange Act of 1934 and the Investment Company Act of 1940, this report has been signed below by the following persons on behalf of the registrant and in the capacities and on the dates indicated.
| | | | |
| By (Signature and Title) | | /s/ Jeffrey M. Dube | | |
| | Jeffrey M. Dube, President and Principal Executive Officer | | |
| | |
| Date | | 2/25/15 | | |
| | |
| By (Signature and Title) | | /s/ Nicholas H. Palmerino | | |
| | Nicholas H. Palmerino, Treasurer and Principal Financial Officer | | |
| | |
| Date | | 2/25/15 | | |